Teledyne Vehicle T400 Users Manual
T400 to the manual 72a687dc-2a25-4bc4-b1f2-ab4799c684c0
2015-02-03
: Teledyne Teledyne--Vehicle-T400-Users-Manual-464488 teledyne--vehicle-t400-users-manual-464488 teledyne pdf
Open the PDF directly: View PDF ![]() .
.
Page Count: 396 [warning: Documents this large are best viewed by clicking the View PDF Link!]
- 1. INTRODUCTION, FEATURES AND OPTIONS
- 2. SPECIFICATIONS, APPROVALS & COMPLIANCE
- 3. GETTING STARTED
- 3.1. UNPACKING THE T400 ANALYZER
- 3.2. INSTRUMENT LAYOUT
- 3.3. CONNECTIONS AND SETUP
- 3.3.1. ELECTRICAL CONNECTIONS
- 3.3.1.1. Connecting Power
- 3.3.1.2. Connecting Analog Inputs (Option)
- 3.3.1.3. Connecting Analog Outputs
- 3.3.1.4. Current Loop Analog Outputs (Option 41) Setup
- 3.3.1.5. Connecting the Status Outputs
- 3.3.1.6. Connecting the Control Inputs
- 3.3.1.7. Connecting the Concentration Alarm Relay (Option 61)
- 3.3.1.8. Connecting the Communications Interfaces
- 3.3.2. PNENUMATIC CONNECTIONS
- 3.3.3. PNEUMATIC SETUPS FOR AMBIENT AIR MONITORING
- 3.3.1. ELECTRICAL CONNECTIONS
- 3.4. STARTUP, FUNCTIONAL CHECKS, AND INITIAL CALIBRATION
- 3.5. CONFIGURING THE INTERNAL ZERO/SPAN OPTION (IZS)
- 3.6. CALIBRATION VALVE OPTIONS
- 4. OVERVIEW OF OPERATING MODES
- 5. SETUP MENU
- 5.1. SETUP ( CFG: CONFIGURATION INFORMATION
- 5.2. SETUP ( DAS: INTERNAL DATA ACQUISITION SYSTEM
- 5.3. SETUP ( ACAL: AUTOMATIC CALIBRATION OPTION
- 5.4. SETUP ( RNGE: ANALOG OUTPUT REPORTING RANGE CONFIGURATION
- 5.4.1.1. Physical Range versus Analog Output Reporting Ranges
- 5.4.1.2. Analog Output Ranges for O3 Concentration
- 5.4.1.3. RNGE ( MODE ( SNGL: Single Range Mode Configuration
- 5.4.1.4. RNGE ( MODE ( DUAL: Dual Range Mode Configuration
- 5.4.1.5. RNGE ( MODE ( AUTO: Auto Range Mode Configuration
- 5.4.1.6. SETUP ( RNGE ( UNIT: Setting the Reporting Range Unit Type
- 5.5. SETUP ( PASS: PASSWORD PROTECTION
- 5.6. SETUP ( CLK: SETTING THE T400 ANALYZER’S INTERNAL TIME-OF-DAY CLOCK AND ADJUSTING SPEED
- 5.7. SETUP ( COMM: COMMUNICATIONS PORTS
- 5.8. SETUP ( VARS: VARIABLES SETUP AND DEFINITION
- 5.9. SETUP ( DIAG :DIAGNOSTICS FUNCTIONS
- 5.10. USING THE MODEL T400 ANALYZER’S ANALOG I/O
- 5.10.1. ADJUSTING & CALIBRATING THE ANALOG OUTPUT SIGNALS
- 5.10.1.1. Calibration of the Analog Outputs
- 5.10.1.2. Enabling or Disabling the AutoCal for an Individual Analog Output
- 5.10.1.3. Automatic Group Calibration of the Analog Outputs
- 5.10.1.4. Manual Calibration of the Analog Outputs Configured for Voltage Ranges
- 5.10.1.5. Manual Adjustment of Current Loop Output Span and Offset
- 5.10.1.6. Analog Output Voltage / Current Range Selection
- 5.10.1.7. Turning an Analog Output Over-Range Feature ON/OFF
- 5.10.1.8. Adding a Recorder Offset to an Analog Output
- 5.10.1.9. Selecting a Test Channel Function for Output A4
- 5.10.2. AIN CALIBRATION
- 5.10.3. CONFIGURING ANALOG INPUTS (OPTION)
- 5.10.1. ADJUSTING & CALIBRATING THE ANALOG OUTPUT SIGNALS
- 6. COMMUNICATIONS SETUP AND OPERATION
- 6.1. DATA TERMINAL/COMMUNICATION EQUIPMENT (DTE DCE)
- 6.2. COMMUNICATION MODES, BAUD RATE AND PORT TESTING
- 6.3. RS-232
- 6.4. RS-485 (OPTION)
- 6.5. ETHERNET
- 6.6. USB PORT
- 6.7. COMMUNICATIONS PROTOCOLS
- 7. DATA ACQUISITION SYSTEM (DAS) AND APICOM
- 7.1. DAS STATUS
- 7.2. DAS STRUCTURE
- 7.3. DAS CHANNELS
- 7.4. SETUP (DAS (EDIT: ACCESSING THE DAS EDIT MODE
- 7.4.1. EDITING DAS DATA CHANNEL NAMES
- 7.4.2. EDITING DAS TRIGGERING EVENTS
- 7.4.3. EDITING SAMPLE PERIOD AND REPORT PERIOD
- 7.4.4. REPORT PERIODS IN PROGRESS WHEN INSTRUMENT IS POWERED OFF
- 7.4.5. EDITING THE NUMBER OF RECORDS
- 7.4.6. RS-232 REPORT FUNCTION
- 7.4.7. ENABLING / DISABLING THE HOLDOFF FEATURE
- 7.4.8. THE COMPACT REPORT FEATURE
- 7.4.9. THE STARTING DATE FEATURE
- 7.5. DISABLING/ENABLING DATA CHANNELS
- 7.6. REMOTE DAS CONFIGURATION
- 7.7. DAS CONFIGURATION LIMITS
- 8. REMOTE OPERATION
- 9. T400 CALIBRATION PROCEDURES
- 9.1. BEFORE CALIBRATION
- 9.2. BASIC MANUAL CALIBRATION CHECKS AND CALIBRATION OF THE T400 ANALYZER
- 9.3. MANUAL CALIBRATION CHECK AND CALIBRATION WITH VALVE OPTIONS INSTALLED
- 9.4. AUTOMATIC ZERO/SPAN CAL/CHECK (AUTOCAL)
- 9.5. O3 PHOTOMETER ELECTRONIC CALIBRATION
- 9.6. CALIBRATING THE IZS OPTION O3 GENERATOR
- 10. EPA PROTOCOL CALIBRATION
- 10.1.1. T400 CALIBRATION – GENERAL GUIDELINES
- 10.1.2. CALIBRATION EQUIPMENT, SUPPLIES, AND EXPENDABLES
- 10.1.3. CALIBRATION GAS AND ZERO AIR SOURCES
- 10.1.4. RECOMMENDED STANDARDS FOR ESTABLISHING TRACEABILITY
- 10.1.5. CALIBRATION FREQUENCY
- 10.1.6. DATA RECORDING DEVICE
- 10.1.7. RECORD KEEPING
- 10.2. LEVEL 1 CALIBRATIONS VERSUS LEVEL 2 CHECKS
- 10.3. MULTIPOINT CALIBRATION
- 10.4. AUDITING PROCEDURES
- 10.5. SUMMARY OF QUALITY ASSURANCE CHECKS
- 10.6. REFERENCES
- 11. INSTRUMENT MAINTENANCE
- 11.1. MAINTENANCE SCHEDULE
- 11.2. PREDICTIVE DIAGNOSTICS
- 11.3. MAINTENANCE PROCEDURES
- 11.3.1. REPLACING THE SAMPLE PARTICULATE FILTER
- 11.3.2. REBUILDING THE SAMPLE PUMP
- 11.3.3. REPLACING THE IZS OPTION ZERO AIR SCRUBBER
- 11.3.4. IZS DESICCANT (OPTION 56)
- 11.3.5. PERFORMING LEAK CHECKS
- 11.3.6. PERFORMING A SAMPLE FLOW CHECK
- 11.3.7. MAINTENANCE OF THE PHOTOMETER ABSORPTION TUBE
- 11.3.8. ADJUSTMENT OR REPLACEMENT OF OPTIONAL IZS OZONE GENERATOR UV LAMP
- 12. TROUBLESHOOTING & SERVICE
- 12.1. GENERAL TROUBLESHOOTING
- 12.2. USING THE ANALOG OUTPUT TEST CHANNEL
- 12.3. USING THE INTERNAL ELECTRONIC STATUS LEDS
- 12.4. GAS FLOW PROBLEMS
- 12.5. CALIBRATION PROBLEMS
- 12.6. OTHER PERFORMANCE PROBLEMS
- 12.7. SUBSYSTEM CHECKOUT
- 12.8. TROUBLE SHOOTING THE PHOTOMETER
- 12.9. TROUBLE SHOOTING THE IZS OPTIONS O3 GENERATOR
- 12.10. SERVICE PROCEDURES
- 12.11. FAQ’S
- 12.12. TECHNICAL ASSISTANCE
- 13. THEORY OF OPERATION
- 13.1. MEASUREMENT METHOD
- 13.2. PNEUMATIC OPERATION
- 13.3. ELECTRONIC OPERATION
- 13.4. FRONT PANEL TOUCHSCREEN/DISPLAY INTERFACE
- 13.5. SOFTWARE OPERATION
- 14. A PRIMER ON ELECTRO-STATIC DISCHARGE
- all-appendices-assembled-nbrd.pdf
- 1. INTRODUCTION, FEATURES AND OPTIONS
- 2. SPECIFICATIONS, APPROVALS & COMPLIANCE
- 3. GETTING STARTED
- 3.1. UNPACKING THE T400 ANALYZER
- 3.2. INSTRUMENT LAYOUT
- 3.3. CONNECTIONS AND SETUP
- 3.3.1. ELECTRICAL CONNECTIONS
- 3.3.1.1. Connecting Power
- 3.3.1.2. Connecting Analog Inputs (Option)
- 3.3.1.3. Connecting Analog Outputs
- 3.3.1.4. Current Loop Analog Outputs (Option 41) Setup
- 3.3.1.5. Connecting the Status Outputs
- 3.3.1.6. Connecting the Control Inputs
- 3.3.1.7. Connecting the Concentration Alarm Relay (Option 61)
- 3.3.1.8. Connecting the Communications Interfaces
- 3.3.2. PNENUMATIC CONNECTIONS
- 3.3.3. PNEUMATIC SETUPS FOR AMBIENT AIR MONITORING
- 3.3.1. ELECTRICAL CONNECTIONS
- 3.4. STARTUP, FUNCTIONAL CHECKS, AND INITIAL CALIBRATION
- 3.5. CONFIGURING THE INTERNAL ZERO/SPAN OPTION (IZS)
- 3.6. CALIBRATION VALVE OPTIONS
- 4. OVERVIEW OF OPERATING MODES
- 5. SETUP MENU
- 5.1. SETUP ( CFG: CONFIGURATION INFORMATION
- 5.2. SETUP ( DAS: INTERNAL DATA ACQUISITION SYSTEM
- 5.3. SETUP ( ACAL: AUTOMATIC CALIBRATION OPTION
- 5.4. SETUP ( RNGE: ANALOG OUTPUT REPORTING RANGE CONFIGURATION
- 5.4.1.1. Physical Range versus Analog Output Reporting Ranges
- 5.4.1.2. Analog Output Ranges for O3 Concentration
- 5.4.1.3. RNGE ( MODE ( SNGL: Single Range Mode Configuration
- 5.4.1.4. RNGE ( MODE ( DUAL: Dual Range Mode Configuration
- 5.4.1.5. RNGE ( MODE ( AUTO: Auto Range Mode Configuration
- 5.4.1.6. SETUP ( RNGE ( UNIT: Setting the Reporting Range Unit Type
- 5.5. SETUP ( PASS: PASSWORD PROTECTION
- 5.6. SETUP ( CLK: SETTING THE T400 ANALYZER’S INTERNAL TIME-OF-DAY CLOCK AND ADJUSTING SPEED
- 5.7. SETUP ( COMM: COMMUNICATIONS PORTS
- 5.8. SETUP ( VARS: VARIABLES SETUP AND DEFINITION
- 5.9. SETUP ( DIAG :DIAGNOSTICS FUNCTIONS
- 5.10. USING THE MODEL T400 ANALYZER’S ANALOG I/O
- 5.10.1. ADJUSTING & CALIBRATING THE ANALOG OUTPUT SIGNALS
- 5.10.1.1. Calibration of the Analog Outputs
- 5.10.1.2. Enabling or Disabling the AutoCal for an Individual Analog Output
- 5.10.1.3. Automatic Group Calibration of the Analog Outputs
- 5.10.1.4. Manual Calibration of the Analog Outputs Configured for Voltage Ranges
- 5.10.1.5. Manual Adjustment of Current Loop Output Span and Offset
- 5.10.1.6. Analog Output Voltage / Current Range Selection
- 5.10.1.7. Turning an Analog Output Over-Range Feature ON/OFF
- 5.10.1.8. Adding a Recorder Offset to an Analog Output
- 5.10.1.9. Selecting a Test Channel Function for Output A4
- 5.10.2. AIN CALIBRATION
- 5.10.3. CONFIGURING ANALOG INPUTS (OPTION)
- 5.10.1. ADJUSTING & CALIBRATING THE ANALOG OUTPUT SIGNALS
- 6. COMMUNICATIONS SETUP AND OPERATION
- 6.1. DATA TERMINAL/COMMUNICATION EQUIPMENT (DTE DCE)
- 6.2. COMMUNICATION MODES, BAUD RATE AND PORT TESTING
- 6.3. RS-232
- 6.4. RS-485 (OPTION)
- 6.5. ETHERNET
- 6.6. USB PORT
- 6.7. COMMUNICATIONS PROTOCOLS
- 7. DATA ACQUISITION SYSTEM (DAS) AND APICOM
- 7.1. DAS STATUS
- 7.2. DAS STRUCTURE
- 7.3. DAS CHANNELS
- 7.4. SETUP (DAS (EDIT: ACCESSING THE DAS EDIT MODE
- 7.4.1. EDITING DAS DATA CHANNEL NAMES
- 7.4.2. EDITING DAS TRIGGERING EVENTS
- 7.4.3. EDITING SAMPLE PERIOD AND REPORT PERIOD
- 7.4.4. REPORT PERIODS IN PROGRESS WHEN INSTRUMENT IS POWERED OFF
- 7.4.5. EDITING THE NUMBER OF RECORDS
- 7.4.6. RS-232 REPORT FUNCTION
- 7.4.7. ENABLING / DISABLING THE HOLDOFF FEATURE
- 7.4.8. THE COMPACT REPORT FEATURE
- 7.4.9. THE STARTING DATE FEATURE
- 7.5. DISABLING/ENABLING DATA CHANNELS
- 7.6. REMOTE DAS CONFIGURATION
- 7.7. DAS CONFIGURATION LIMITS
- 8. REMOTE OPERATION
- 9. T400 CALIBRATION PROCEDURES
- 9.1. BEFORE CALIBRATION
- 9.2. BASIC MANUAL CALIBRATION CHECKS AND CALIBRATION OF THE T400 ANALYZER
- 9.3. MANUAL CALIBRATION CHECK AND CALIBRATION WITH VALVE OPTIONS INSTALLED
- 9.4. AUTOMATIC ZERO/SPAN CAL/CHECK (AUTOCAL)
- 9.5. O3 PHOTOMETER ELECTRONIC CALIBRATION
- 9.6. CALIBRATING THE IZS OPTION O3 GENERATOR
- 10. EPA PROTOCOL CALIBRATION
- 10.1.1. T400 CALIBRATION – GENERAL GUIDELINES
- 10.1.2. CALIBRATION EQUIPMENT, SUPPLIES, AND EXPENDABLES
- 10.1.3. CALIBRATION GAS AND ZERO AIR SOURCES
- 10.1.4. RECOMMENDED STANDARDS FOR ESTABLISHING TRACEABILITY
- 10.1.5. CALIBRATION FREQUENCY
- 10.1.6. DATA RECORDING DEVICE
- 10.1.7. RECORD KEEPING
- 10.2. LEVEL 1 CALIBRATIONS VERSUS LEVEL 2 CHECKS
- 10.3. MULTIPOINT CALIBRATION
- 10.4. AUDITING PROCEDURES
- 10.5. SUMMARY OF QUALITY ASSURANCE CHECKS
- 10.6. REFERENCES
- 11. INSTRUMENT MAINTENANCE
- 11.1. MAINTENANCE SCHEDULE
- 11.2. PREDICTIVE DIAGNOSTICS
- 11.3. MAINTENANCE PROCEDURES
- 11.3.1. REPLACING THE SAMPLE PARTICULATE FILTER
- 11.3.2. REBUILDING THE SAMPLE PUMP
- 11.3.3. REPLACING THE IZS OPTION ZERO AIR SCRUBBER
- 11.3.4. IZS DESICCANT (OPTION 56)
- 11.3.5. PERFORMING LEAK CHECKS
- 11.3.6. PERFORMING A SAMPLE FLOW CHECK
- 11.3.7. MAINTENANCE OF THE PHOTOMETER ABSORPTION TUBE
- 11.3.8. ADJUSTMENT OR REPLACEMENT OF OPTIONAL IZS OZONE GENERATOR UV LAMP
- 12. TROUBLESHOOTING & SERVICE
- 12.1. GENERAL TROUBLESHOOTING
- 12.2. USING THE ANALOG OUTPUT TEST CHANNEL
- 12.3. USING THE INTERNAL ELECTRONIC STATUS LEDS
- 12.4. GAS FLOW PROBLEMS
- 12.5. CALIBRATION PROBLEMS
- 12.6. OTHER PERFORMANCE PROBLEMS
- 12.7. SUBSYSTEM CHECKOUT
- 12.8. TROUBLE SHOOTING THE PHOTOMETER
- 12.9. TROUBLE SHOOTING THE IZS OPTIONS O3 GENERATOR
- 12.10. SERVICE PROCEDURES
- 12.11. FAQ’S
- 12.12. TECHNICAL ASSISTANCE
- 13. THEORY OF OPERATION
- 13.1. MEASUREMENT METHOD
- 13.2. PNEUMATIC OPERATION
- 13.3. ELECTRONIC OPERATION
- 13.4. FRONT PANEL TOUCHSCREEN/DISPLAY INTERFACE
- 13.5. SOFTWARE OPERATION
- 14. A PRIMER ON ELECTRO-STATIC DISCHARGE
- APPENDIX A – Software Version-Specific Documentation
- APPENDIX B - Spare Parts
- APPENDIX C - Warranty/Repair Questionnaire
- APPENDIX D – Wire List and Electronic Schematics

Operation Manual
Model T400
Photometric Ozone Analyzer
© TELEDYNE ADVANCED POLLUTION INSTRUMENTATION (TAPI)
9480 CARROLL PARK DRIVE
SAN DIEGO, CA 92121-5201
USA
Toll-free Phone: 800-324-5190
Phone: 858-657-9800
Fax: 858-657-9816
Email: api-sales@teledyne.com
Website: http://www.teledyne-api.com/
Copyright 2010-2012 06870C DCN6332
Teledyne Advanced Pollution Instrumentation 13 January 2012

i
ABOUT TELEDYNE ADVANCED POLLUTION INSTRUMENTATION (TAPI)
Teledyne Advanced Pollution Instrumentation (TAPI), a business unit of Teledyne
Instruments, Inc., is a worldwide market leader in the design and manufacture of
precision analytical instrumentation used for air quality monitoring, continuous
emissions monitoring, and specialty process monitoring applications. Founded in San
Diego, California, in 1988, TAPI introduced a complete line of Air Quality Monitoring
(AQM) instrumentation, which comply with the United States Environmental Protection
Administration (EPA) and international requirements for the measurement of criteria
pollutants, including CO, SO2, NOX and Ozone.
Since 1988 TAPI has combined state-of-the-art technology, proven measuring
principles, stringent quality assurance systems and world class after-sales support to
deliver the best products and customer satisfaction in the business.
For further information on our company, our complete range of products, and the
applications that they serve, please visit www.teledyne-api.com or contact
sales@teledyne-api.com.
NOTICE OF COPYRIGHT
© 2010-2012 Teledyne Advanced Pollution Instrumentation. All rights reserved.
TRADEMARKS
All trademarks, registered trademarks, brand names or product names appearing in this
document are the property of their respective owners and are used herein for
identification purposes only.
06870C DCN6332

Teledyne API – Model T400 Photometric Ozone Analyzer
ii
This page intentionally left blank.
06870C DCN6332
iii
IMPORTANT SAFETY INFORMATION
Important safety messages are provided throughout this manual for the purpose of
avoiding personal injury or instrument damage. Please read these messages carefully.
Each safety message is associated with a safety alert symbol, and are placed throughout
this manual and inside the instrument. The symbols with messages are defined as
follows:
WARNING: Electrical Shock Hazard
HAZARD: Strong oxidizer
GENERAL WARNING/CAUTION: Read the accompanying message for
specific information.
CAUTION: Hot Surface Warning
Do Not Touch: Touching some parts of the instrument without
protection or proper tools could result in damage to the part(s) and/or the
instrument.
Technician Symbol: All operations marked with this symbol are to be
performed by qualified maintenance personnel only.
Electrical Ground: This symbol inside the instrument marks the central
safety grounding point for the instrument.
CAUTION
This instrument should only be used for the purpose and in the manner described
in this manual. If you use this instrument in a manner other than that for which it
was intended, unpredictable behavior could ensue with possible hazardous
consequences.
NEVER use any gas analyzer to sample combustible gas(es).
Note Technical Assistance regarding the use and maintenance of the T100 or any
other Teledyne API product can be obtained by contacting Teledyne API’s
Customer Service Department:
Phone: 800-324-5190
Email: api-customerservice@teledyne.com
or by accessing various service options on our website at
7http://www.teledyne-api.com/.
06870C DCN6332
Teledyne API – Model T400 Photometric Ozone Analyzer
iv
CONSIGNES DE SÉCURITÉ
Des consignes de sécurité importantes sont fournies tout au long du présent manuel dans
le but d’éviter des blessures corporelles ou d’endommager les instruments. Veuillez lire
attentivement ces consignes. Chaque consigne de sécurité est représentée par un
pictogramme d’alerte de sécurité; ces pictogrammes se retrouvent dans ce manuel et à
l’intérieur des instruments. Les symboles correspondent aux consignes suivantes :
AVERTISSEMENT : Risque de choc électrique
DANGER : Oxydant puissant
AVERTISSEMENT GÉNÉRAL / MISE EN GARDE : Lire la consigne
complémentaire pour des renseignements spécifiques
MISE EN GARDE : Surface chaude
Ne pas toucher : Toucher à certaines parties de l’instrument sans protection ou
sans les outils appropriés pourrait entraîner des dommages aux pièces ou à
l’instrument.
Pictogramme « technicien » : Toutes les opérations portant ce symbole doivent
être effectuées uniquement par du personnel de maintenance qualifié.
Mise à la terre : Ce symbole à l’intérieur de l’instrument détermine le point central
de la mise à la terre sécuritaire de l’instrument.
MISE EN GARDE
Cet instrument doit être utilisé aux fins décrites et de la manière
décrite dans ce manuel. Si vous utilisez cet instrument d’une autre
manière que celle pour laquelle il a été prévu, l’instrument pourrait se
comporter de façon imprévisible et entraîner des conséquences
dangereuses.
NE JAMAIS utiliser un analyseur de gaz pour échantillonner des gaz
combustibles!
06870C DCN6332

v
WARRANTY
Teledyne Advanced Pollution Instrumentation, a business unit of Teledyne Instruments,
Inc., herein referred to as TAPI, warrants its products as follows:
WARRANTY POLICY (02024D)
Prior to shipment, TAPI equipment is thoroughly inspected and tested. Should equipment failure
occur, TAPI assures its customers that prompt service and support will be available.
COVERAGE
After the warranty period and throughout the equipment lifetime, TAPI stands ready to provide
on-site or in-plant service at reasonable rates similar to those of other manufacturers in the
industry. All maintenance and the first level of field troubleshooting is to be performed by the
customer.
NON-API MANUFACTURED EQUIPMENT
Equipment provided but not manufactured by TAPI is warranted and will be repaired to the
extent and according to the current terms and conditions of the respective equipment
manufacturers warranty.
GENERAL
During the warranty period, TAPI warrants each Product manufactured by TAPI to be free from
defects in material and workmanship under normal use and service. Expendable parts are
excluded.
If a Product fails to conform to its specifications within the warranty period, TAPI shall correct
such defect by, at TAPI's discretion, repairing or replacing such defective Product or refunding
the purchase price of such Product.
The warranties set forth in this section shall be of no force or effect with respect to any Product:
(i) that has been altered or subjected to misuse, negligence or accident, or (ii) that has been used
in any manner other than in accordance with the instruction provided by TAPI, or (iii) not
properly maintained.
THE WARRANTIES SET FORTH IN THIS SECTION AND THE REMEDIES THEREFORE ARE
EXCLUSIVE AND IN LIEU OF ANY IMPLIED WARRANTIES OF MERCHANTABILITY, FITNESS
FOR PARTICULAR PURPOSE OR OTHER WARRANTY OF QUALITY, WHETHER
EXPRESSED OR IMPLIED. THE REMEDIES SET FORTH IN THIS SECTION ARE THE
EXCLUSIVE REMEDIES FOR BREACH OF ANY WARRANTY CONTAINED HEREIN. TAPI
SHALL NOT BE LIABLE FOR ANY INCIDENTAL OR CONSEQUENTIAL DAMAGES ARISING
OUT OF OR RELATED TO THIS AGREEMENT OF TAPI'S PERFORMANCE HEREUNDER,
WHETHER FOR BREACH OF WARRANTY OR OTHERWISE.
TERMS AND CONDITIONS
All units or components returned to TAPI should be properly packed for handling and returned
freight prepaid to the nearest designated Service Center. After the repair, the equipment will be
returned, freight prepaid.
ATTENTION AVOID WARRANTY INVALIDATION
Failure to comply with proper anti-Electro-Static Discharge (ESD)
handling and packing instructions and Return Merchandise Authorization
(RMA) procedures when returning parts for repair or calibration may void
your warranty. For anti-ESD handling and packing instructions please
refer to “Packing Components for Return to Teledyne API’s Customer
Service” in the Primer on Electro-Static Discharge section of this manual,
and for RMA procedures please refer to our Website at http://www.teledyne-
api.com under Customer Support > Return Authorization.
06870C DCN6332

Teledyne API – Model T400 Photometric Ozone Analyzer
vi
This page intentionally left blank.
06870C DCN6332

vii
ABOUT THIS MANUAL
Presented here is information regarding the documents that are included with this
manual (Structure) and how the content is organized (Organization).
STRUCTURE
This T400 manual, PN 06870 is comprised of multiple documents, assembled in PDF
format, as listed below.
Part No. Rev Name/Description
06870 B Operation Manual, T400 Photometric Ozone Analyzer
04402 E Appendix A, Menu Trees and related software documentation
06851 A Spare Parts List (in Appendix B of this manual)
006190200 B AKIT, Expendables
07558 A Recommended Spares Stocking Levels
04473 A IZS Expendables
04404 C Appendix C, Repair Form
06913 A Interconnect Diagram, T400 (in Appendix D of this manual)
069130100 A Interconnect Table, T400 (in Appendix D of this manual)
Schematics (in Appendix D of this manual):
04524 E PCA, 04522, Relay Board
03632 A PCA, 03631, 0-20mA Driver
04354 D PCA, 04003, Pressure/Flow Transducer Interface
04420 B
PCA, 04120, UV Detector Preamp
04421 A
PCA, 04166, UV Lamp Power Supply
04422 A
PCA, 04144, DC Heater/Thermistor
05803 B SCH, PCA 05802, MOTHERBOARD, GEN-5
06698 D SCH, PCA 06670, INTRFC, LCD TCH SCRN,
06882 B SCH, LVDS TRANSMITTER BOARD
06731 B SCH, AUX-I/O BOARD
Note We recommend that this manual be read in its entirety before any attempt
is made to operate the instrument.
06870C DCN6332

Teledyne API – Model T400 Photometric Ozone Analyzer
viii
ORGANIZATION
This manual is divided among three main parts and a collection of appendices at the end.
Part I contains introductory information that includes an overview of the calibrator,
descriptions of the available options, specifications, installation and connection
instructions, and the initial calibration and functional checks. Part I ends with a
Frequently Asked Questions (FAQs) section and a Glossary section.
Part II comprises the operating instructions, which include basic, advanced and remote
operation, calibration, diagnostics, testing, validating and verifying.
Part III provides detailed technical information, such as theory of operation,
maintenance, and troubleshooting and repair. It also contains a section that provides
important information about electro-static discharge and avoiding its consequences.
The appendices at the end of this manual provide support information such as, version-
specific software documentation, lists of spare parts and schematics.
CONVENTIONS USED
In addition to the safety symbols as presented in the Important Safety Information page,
this manual provides special notices related to the safety and effective use of the
analyzer and other pertinent information.
Special Notices appear as follows:
ATTENTION COULD DAMAGE INSTRUMENT AND VOID WARRANTY
This special notice provides information to avoid damage to your
instrument and possibly invalidate the warranty.
IMPORTANT IMPACT ON READINGS OR DATA
Could either affect accuracy of instrument readings or cause loss of data.
Note Pertinent information associated with the proper care, operation or
maintenance of the analyzer or its parts.
06870C DCN6332

ix
REVISION HISTORY
This section provides information regarding the release of and changes to this T400
Operation Manual, PN 06870.
Document PN Rev DCN Change Summary
2012 January 13, Rev C
T400 Op Manual 06870 C 6332 Technical Updates:
Figure 3-9, add connection line for =5V to external device.
In Electrical Connections section, add Concentration Relay
Alarm option (Section 3.3.1.7).
Section 3.3.1.8, modify Multidrop connection section to
clarify instructions and add detail.
Correct COM1 default baud rate value to 115,200 (was:
19,200) per DCR 7062.
Administrative Updates, i.e., reorganized structure and
renamed sections:
Converted Options section to tabular format and moved to
Section 1 as Table 1-1.
Moved FAQ’s from Section 4 to end of Troubleshooting
section.
Moved Glossary from Section 4 to end of manual after ESD
section, before Appendices.
Grouped communications setup and operation into one
section (Section 6).
Renamed Part III from “Technical Information” to
“Maintenance and Service”.
Renamed “Troubleshooting and Repair” to “Troubleshooting
and Service”.
Renamed section “Theory of Operation” to “Principles of
Operation” and moved after “Troubleshooting and Service”
section.
In Appendix B replaced M400E RSSL with T400 RSSL
Reassembled Appendix D with updated 04524 Relay Card
Schem from Rev D to Rev E and 06731 Aux I/O Schem from
Rev A to Rev B.
06870C DCN6332

Teledyne API – Model T400 Photometric Ozone Analyzer
x
Document PN Rev DCN Change Summary
2011 April 15, Rev B
T400 Op Manual 06870 B 6049 Add North American certifications
Add MODBUS Setup instructions to Remote Op section
Replace interconnects with correct documents (in Appendix D)
Add UV Safety message (in startup, mntnc, & repairs sections)
Clarify PASSWORD enable/disable description, Section 6.4.2.
2010 September 07, T400 Operation Manual, PN06870 Rev A, DCN5836, Initial Release
06870C DCN6332

xi
This page intentionally left blank.
06870C DCN6332
06870C DCN6332

xiii
TABLE OF CONTENTS
1. INTRODUCTION, FEATURES AND OPTIONS ................................................................. 25
1.1. Overview .......................................................................................................................................................25
1.2. Features ........................................................................................................................................................25
1.3. Options ..........................................................................................................................................................26
2. SPECIFICATIONS, APPROVALS & COMPLIANCE ......................................................... 29
2.1. Specifications ................................................................................................................................................29
2.2. EPA Equivalency Designation.......................................................................................................................31
2.3. Approvals and Certifications .........................................................................................................................32
2.3.1. Safety.....................................................................................................................................................32
2.3.2. EMC .......................................................................................................................................................32
2.3.3. Other Type Certifications .......................................................................................................................32
3. GETTING STARTED .......................................................................................................... 33
3.1. Unpacking the T400 Analyzer .......................................................................................................................33
3.1.1.1. Ventilation Clearance .....................................................................................................................34
3.2. Instrument layout...........................................................................................................................................35
3.2.1. Front Panel ............................................................................................................................................35
3.2.2. Rear Panel .............................................................................................................................................39
3.2.3. Internal Chassis Layout .........................................................................................................................41
3.3. Connections and Setup.................................................................................................................................42
3.3.1. Electrical Connections ...........................................................................................................................42
3.3.1.1. Connecting Power ..........................................................................................................................42
3.3.1.2. Connecting Analog Inputs (Option) ................................................................................................43
3.3.1.3. Connecting Analog Outputs ...........................................................................................................43
3.3.1.4. Current Loop Analog Outputs (Option 41) Setup ...........................................................................44
3.3.1.5. Connecting the Status Outputs ......................................................................................................46
3.3.1.6. Connecting the Control Inputs........................................................................................................47
3.3.1.7. Connecting the Concentration Alarm Relay (Option 61)................................................................48
3.3.1.8. Connecting the Communications Interfaces ..................................................................................50
3.3.2. Pnenumatic Connections.......................................................................................................................56
3.3.2.1. About Zero Air and Calibration Gas ...............................................................................................56
3.3.2.2. Pneumatic Setup for Basic Configuration.......................................................................................59
3.3.2.3. Pneumatic Setup for the T400 Analyzer with Internal Zero/Span Option (IZS) .............................60
3.3.3. Pneumatic Setups for Ambient Air Monitoring.......................................................................................61
3.3.3.1. Pneumatic Set Up for T400’s Located in the Same Room Being Monitored .................................61
3.3.3.2. Pneumatic Set Up for T400’s Monitoring Remote Locations .........................................................62
3.4. Startup, Functional Checks, and Initial Calibration .......................................................................................63
3.4.1. Start Up..................................................................................................................................................63
3.4.2. Warning Messages ................................................................................................................................63
3.4.3. Functional Check ...................................................................................................................................65
3.4.4. Initial Calibration ....................................................................................................................................65
3.4.4.1. Interferents for O3 Measurement....................................................................................................65
3.4.5. Initial Calibration Procedure for T400 Analyzers without Options .........................................................66
3.4.5.1. Verifying the T400 Reporting Range Settings................................................................................66
3.4.5.2. Verify the Expected O3 Span Gas Concentration:..........................................................................67
3.4.5.3. Initial Zero/Span Calibration Procedure: ........................................................................................69
3.5. Configuring the Internal Zero/Span Option (IZS) ..........................................................................................70
3.5.1. Verify the O3 Generator and Expected O3 Span Concentration Settings..............................................70
3.5.2. Setting the O3 Generator Low-Span (Mid Point) Output Level ..............................................................71
3.5.3. Turning on the Reference Detector Option............................................................................................72
3.5.4. Initial Calibration and Conditioning of T400 Analyzers with the IZS Option Installed............................73
3.5.4.1. Initial O3 Scrubber Conditioning .....................................................................................................73
3.5.4.2. Verifying the T400 Reporting Range Settings................................................................................74
06870C DCN6332

Table of Contents Teledyne API – Model T400 Photometric Ozone Analyzer
xiv
3.5.4.3. Initial Zero/Span Calibration Procedure: ........................................................................................74
3.6. Calibration Valve Options..............................................................................................................................74
3.6.1. Ambient Zero/Ambient Span Valves (Opt 50A) .....................................................................................74
3.6.1.1. Pneumatic Setup for the T400 Analyzer with Zero/Span Valve Option .........................................76
3.6.2. Internal Zero Span (IZS) Option (OPT 50G)..........................................................................................78
4. OVERVIEW OF OPERATING MODES .............................................................................. 83
4.1. Sample Mode ................................................................................................................................................85
4.1.1. Test Functions .......................................................................................................................................86
4.1.2. Warning Messages ................................................................................................................................88
4.2. Calibration Mode ...........................................................................................................................................89
4.3. SETUP Mode ................................................................................................................................................90
4.3.1. Password Security .................................................................................................................................90
4.3.2. Primary Setup Menu ..............................................................................................................................90
5. SETUP MENU .................................................................................................................... 93
5.1. SETUP CFG: Configuration Information...................................................................................................93
5.2. SETUP DAS: Internal Data acquisition System .......................................................................................94
5.3. SETUP ACAL: Automatic Calibration Option ...........................................................................................94
5.4. SETUP RNGE: Analog Output Reporting Range Configuration ..............................................................94
5.4.1.1. Physical Range versus Analog Output Reporting Ranges.............................................................94
5.4.1.2. Analog Output Ranges for O3 Concentration .................................................................................95
5.4.1.3. RNGE MODE SNGL: Single Range Mode Configuration .....................................................97
5.4.1.4. RNGE MODE DUAL: Dual Range Mode Configuration.......................................................98
5.4.1.5. RNGE MODE AUTO: Auto Range Mode Configuration .......................................................99
5.4.1.6. SETUP RNGE UNIT: Setting the Reporting Range Unit Type .......................................... 100
5.5. SETUP PASS: Password Protection ..................................................................................................... 101
5.6. SETUP CLK: Setting the T400 Analyzer’s Internal Time-of-Day Clock and Adjusting Speed.............. 104
5.6.1.1. Setting the Internal Clock’s Time and Day .................................................................................. 104
5.6.1.2. Adjusting the Internal Clock’s Speed........................................................................................... 105
5.7. SETUP COMM: Communications Ports ................................................................................................ 106
5.7.1. ID (Machine Identification) .................................................................................................................. 106
5.7.2. INET (Ethernet)................................................................................................................................... 106
5.7.3. COM1 and COM 2 (Mode, Baud Rate and Test Port)........................................................................ 106
5.8. SETUP VARS: Variables Setup and Definition ..................................................................................... 107
5.9. SETUP DIAG :Diagnostics Functions....................................................................................................109
5.10. Using the Model T400 Analyzer’s Analog I/O .......................................................................................... 111
5.10.1. Adjusting & Calibrating the Analog Output Signals .......................................................................... 112
5.10.1.1. Calibration of the Analog Outputs ............................................................................................. 112
5.10.1.2. Enabling or Disabling the AutoCal for an Individual Analog Output.......................................... 113
5.10.1.3. Automatic Group Calibration of the Analog Outputs ................................................................. 114
5.10.1.4. Manual Calibration of the Analog Outputs Configured for Voltage Ranges.............................. 116
5.10.1.5. Manual Adjustment of Current Loop Output Span and Offset .................................................. 118
5.10.1.6. Analog Output Voltage / Current Range Selection.................................................................... 121
5.10.1.7. Turning an Analog Output Over-Range Feature ON/OFF ........................................................ 122
5.10.1.8. Adding a Recorder Offset to an Analog Output......................................................................... 123
5.10.1.9. Selecting a Test Channel Function for Output A4..................................................................... 124
5.10.2. AIN Calibration.................................................................................................................................. 126
5.10.3. Configuring Analog Inputs (Option) .................................................................................................. 127
6. COMMUNICATIONS SETUP AND OPERATION ............................................................ 129
6.1. Data Terminal/Communication Equipment (DTE DCE)............................................................................. 129
6.2. Communication Modes, Baud Rate and Port Testing................................................................................ 129
6.2.1. Communication Modes ....................................................................................................................... 130
6.2.2. COM Port Baud Rate.......................................................................................................................... 132
6.2.3. COM Port Testing ............................................................................................................................... 133
6.3. RS-232 ....................................................................................................................................................... 134
6.4. RS-485 (Option) ......................................................................................................................................... 134
6.5. Ethernet...................................................................................................................................................... 134
6.5.1. Configuring Ethernet Communication Manually (Static IP Address) .................................................. 135
6.5.2. Configuring Ethernet Communication with Dynamic Host Configuration Protocol (DHCP) ............... 138
06870C DCN6332

Teledyne API – Model T400 Photometric Ozone Analyzer Table of Contents
xv
6.5.3. Changing the Analyzer’s HOSTNAME ............................................................................................... 141
6.6. USB Port .................................................................................................................................................... 142
6.7. Communications Protocols ........................................................................................................................ 142
6.7.1. MODBUS ............................................................................................................................................ 142
6.7.2. Hessen................................................................................................................................................ 144
6.7.3. Hessen COMM Port Configuration ..................................................................................................... 145
6.7.4. Activating Hessen Protocol................................................................................................................. 146
6.7.5. Selecting a Hessen Protocol Type...................................................................................................... 147
6.7.6. Setting The Hessen Protocol Response Mode................................................................................... 148
6.7.7. Hessen Protocol Gas List Entries ....................................................................................................... 149
6.7.7.1. Gas List Entry Format and Definitions......................................................................................... 149
6.7.7.2. Editing or Adding HESSEN Gas List Entries............................................................................... 150
6.7.7.3. Deleting HESSEN Gas List Entries ............................................................................................. 151
6.7.8. Setting Hessen Protocol Status Flags ................................................................................................ 152
6.7.9. Instrument ID ...................................................................................................................................... 153
7. DATA ACQUISITION SYSTEM (DAS) AND APICOM....................................................... 155
7.1. DAS STATUS............................................................................................................................................. 156
7.2. DAS Structure ............................................................................................................................................ 156
7.3. DAS Channels............................................................................................................................................ 157
7.3.1. DAS Default Channels........................................................................................................................ 158
7.3.2. SETUP DAS VIEW: Viewing DAS Channels and Individual Records........................................ 160
7.4. SETUP DAS EDIT: Accessing the DAS Edit Mode ........................................................................... 161
7.4.1. Editing DAS Data Channel Names ..................................................................................................... 162
7.4.2. Editing DAS Triggering Events ........................................................................................................... 163
7.4.2.1. EditiNg DAS Parameters............................................................................................................. 164
7.4.3. Editing Sample Period and Report Period.......................................................................................... 166
7.4.4. Report Periods in Progress when Instrument Is Powered Off............................................................ 167
7.4.5. Editing the Number of Records........................................................................................................... 167
7.4.6. RS-232 Report Function ..................................................................................................................... 169
7.4.7. Enabling / Disabling the HOLDOFF Feature ...................................................................................... 170
7.4.8. The Compact Report Feature ............................................................................................................. 170
7.4.9. The Starting Date Feature .................................................................................................................. 171
7.5. Disabling/Enabling Data Channels............................................................................................................. 171
7.6. Remote DAS Configuration........................................................................................................................ 172
7.7. DAS Configuration Limits ........................................................................................................................... 172
8. REMOTE OPERATION .................................................................................................... 173
8.1. Computer Mode.......................................................................................................................................... 173
8.1.1. Remote Control via APICOM.............................................................................................................. 173
8.2. Interactive Mode......................................................................................................................................... 174
8.2.1. Remote Control via a Terminal Emulation Program........................................................................... 174
8.2.1.1. Help Commands in Interactive Mode .......................................................................................... 174
8.2.1.2. Command Syntax ........................................................................................................................ 175
8.2.1.3. Data Types .................................................................................................................................. 175
8.2.1.4. Status Reporting.......................................................................................................................... 176
8.3. Remote Access by Modem ........................................................................................................................ 177
8.4. Password Security for Serial Remote Communications ............................................................................ 180
8.5. APICOM Remote Control Program............................................................................................................ 180
9. T400 CALIBRATION PROCEDURES.............................................................................. 183
9.1. Before Calibration....................................................................................................................................... 184
9.1.1. Required Equipment, Supplies, and Expendables ............................................................................. 184
9.1.2. Zero Air and Span Gas ....................................................................................................................... 184
9.2. Basic Manual Calibration Checks And Calibration of the T400 analyzer................................................... 185
9.2.1. Setup for Basic Calibration Checks and Calibration of the T400 analyzer......................................... 185
9.2.2. Performing a Basic Manual Calibration Check ................................................................................... 186
9.2.3. Performing a Basic Manual Calibration .............................................................................................. 187
9.2.3.1. Setting the Expected O3 Span Gas Concentration...................................................................... 187
9.2.3.2. Zero/Span Point Calibration Procedure....................................................................................... 188
9.2.4. Manual Calibration Checks and Calibrations Using AUTO RANGE or DUAL RANGE Modes.......... 189
06870C DCN6332

Table of Contents Teledyne API – Model T400 Photometric Ozone Analyzer
xvi
9.3. Manual Calibration Check and Calibration with Valve Options Installed ................................................... 190
9.3.1. Setup for Calibration Checks and Calibration with Valve Options Installed. ...................................... 190
9.3.2. Manual Calibration Checks with Valve Options Installed ...................................................................192
9.3.3. Manual Calibration Using Valve Options ............................................................................................ 193
9.3.3.1. Setting the Expected O3 Span Gas Concentration with the Z/S Option Installed ....................... 193
9.3.3.2. Zero/Span Point Calibration Procedure the Z/S Option Installed................................................ 194
9.3.3.3. Use of Zero/Span Valve with Remote Contact Closure .............................................................. 195
9.4. Automatic Zero/Span Cal/Check (AutoCal) ............................................................................................... 195
9.4.1. SETUP ACAL: Programming and AUTO CAL ............................................................................... 197
9.5. O3 Photometer Electronic Calibration ....................................................................................................... 199
9.5.1. Photometer Dark Calibration .............................................................................................................. 199
9.5.2. O3 Photometer Gas Flow Calibration.................................................................................................. 201
9.6. Calibrating the IZS Option O3 Generator ................................................................................................... 202
10. EPA PROTOCOL CALIBRATION ................................................................................. 205
10.1.1. T400 Calibration – General Guidelines............................................................................................. 205
10.1.2. Calibration Equipment, Supplies, and Expendables......................................................................... 206
10.1.3. Calibration Gas and Zero Air Sources.............................................................................................. 207
10.1.4. Recommended Standards for Establishing Traceability................................................................... 207
10.1.5. Calibration Frequency....................................................................................................................... 208
10.1.6. Data Recording Device..................................................................................................................... 209
10.1.7. Record Keeping ................................................................................................................................ 209
10.2. Level 1 Calibrations versus Level 2 Checks ............................................................................................ 210
10.3. Multipoint Calibration................................................................................................................................ 211
10.3.1. General information .......................................................................................................................... 211
10.3.2. Multipoint Calibration Procedure....................................................................................................... 211
10.3.3. Dynamic Multipoint Calibration Check.............................................................................................. 212
10.3.4. Linearity Test .................................................................................................................................... 213
10.3.5. O3 Loss Correction Factor ................................................................................................................ 215
10.3.6. Span Drift Check............................................................................................................................... 215
10.4. Auditing Procedures................................................................................................................................. 215
10.4.1. Data Processing Audit ...................................................................................................................... 216
10.4.2. System Audit..................................................................................................................................... 217
10.4.3. Assessment of Monitoring Data for Precision and Accuracy............................................................ 217
10.5. Summary of Quality Assurance Checks .................................................................................................. 218
10.6. References ............................................................................................................................................... 221
11. INSTRUMENT MAINTENANCE .................................................................................... 225
11.1. Maintenance Schedule............................................................................................................................. 225
11.2. Predictive Diagnostics.............................................................................................................................. 229
11.3. Maintenance Procedures ......................................................................................................................... 230
11.3.1. Replacing the Sample Particulate Filter............................................................................................ 230
11.3.2. Rebuilding the Sample Pump ........................................................................................................... 231
11.3.3. Replacing the IZS Option Zero Air Scrubber .................................................................................... 231
11.3.4. IZS Desiccant (Option 56) ................................................................................................................ 232
11.3.5. Performing Leak Checks .................................................................................................................. 232
11.3.5.1. Vacuum Leak Check and Pump Check..................................................................................... 232
11.3.5.2. Pressure Leak Check ................................................................................................................ 232
11.3.6. Performing a Sample Flow Check .................................................................................................... 234
11.3.7. Maintenance of the Photometer Absorption Tube ............................................................................ 235
11.3.7.1. Cleaning or Replacing the Absorption Tube .............................................................................235
11.3.7.2. UV Lamp Adjustment................................................................................................................. 236
11.3.7.3. UV Lamp Replacement ............................................................................................................. 238
11.3.8. Adjustment or Replacement of Optional IZS Ozone Generator UV Lamp ....................................... 239
12. TROUBLESHOOTING & SERVICE............................................................................... 243
12.1. General Troubleshooting.......................................................................................................................... 243
12.1.1. Fault Diagnosis with WARNING Messages...................................................................................... 244
12.1.2. Fault Diagnosis With Test Functions ................................................................................................ 248
12.1.3. DIAG SIGNAL I/O: Using the Diagnostic Signal I/O Function .................................................... 250
12.2. Using the Analog Output Test Channel ................................................................................................... 252
06870C DCN6332

Teledyne API – Model T400 Photometric Ozone Analyzer Table of Contents
xvii
12.3. Using the Internal Electronic Status LEDs ............................................................................................... 253
12.3.1. CPU Status Indicator ........................................................................................................................ 253
12.3.2. Relay PCA Status LEDs ................................................................................................................... 253
12.3.2.1. I2C Bus Watchdog Status LEDs ................................................................................................ 253
12.3.2.2. O3 Option Status LED s............................................................................................................. 254
12.4. Gas Flow Problems.................................................................................................................................. 255
12.4.1. Typical Flow Problems...................................................................................................................... 255
12.4.1.1. Flow is Zero ............................................................................................................................... 255
12.4.1.2. Low Flow ................................................................................................................................... 255
12.4.1.3. High Flow................................................................................................................................... 256
12.4.1.4. Actual Flow Does Not Match Displayed Flow ........................................................................... 256
12.4.1.5. Sample Pump ............................................................................................................................ 256
12.5. Calibration Problems................................................................................................................................ 256
12.5.1. Mis-Calibrated................................................................................................................................... 256
12.5.2. Non-Repeatable Zero and Span....................................................................................................... 256
12.5.3. Inability to Span – No Span Button (CALS)...................................................................................... 257
12.5.4. Inability to Zero – No Zero Button (CALZ) ........................................................................................ 257
12.6. Other Performance Problems .................................................................................................................. 257
12.6.1. Temperature Problems ..................................................................................................................... 257
12.6.1.1. Box Temperature....................................................................................................................... 257
12.6.1.2. Sample Temperature................................................................................................................. 258
12.6.1.3. UV Lamp Temperature.............................................................................................................. 258
12.6.1.4. IZS Ozone Generator Temperature (Optional) ......................................................................... 258
12.7. Subsystem Checkout ............................................................................................................................... 259
12.7.1. AC Main Power................................................................................................................................. 259
12.7.2. DC Power Supply.............................................................................................................................. 259
12.7.3. I2C Bus.............................................................................................................................................. 260
12.7.4. Touchscreen Interface ...................................................................................................................... 261
12.7.5. LCD Display Module ......................................................................................................................... 261
12.7.6. Relay PCA ........................................................................................................................................ 261
12.7.7. Photometer Pressure /Flow Sensor Assembly ................................................................................. 262
12.7.8. Motherboard...................................................................................................................................... 263
12.7.8.1. Test Channel / Analog Outputs Voltage.................................................................................... 263
12.7.8.2. A/D Functions ............................................................................................................................ 264
12.7.8.3. Status Outputs........................................................................................................................... 264
12.7.8.4. Control Inputs ............................................................................................................................ 265
12.7.9. CPU .................................................................................................................................................. 265
12.7.10. RS-232 Communications................................................................................................................ 266
12.7.10.1. General RS-232 Troubleshooting............................................................................................ 266
12.7.10.2. Troubleshooting Analyzer/Modem or Terminal Operation ...................................................... 266
12.8. Trouble Shooting the Photometer ............................................................................................................ 267
12.8.1. Checking Measure / Reference Valve .............................................................................................. 267
12.8.2. Checking The Photometer UV Lamp Power Supply......................................................................... 268
12.9. Trouble Shooting the IZS Options O3 generator ...................................................................................... 269
12.9.1. Checking The O3 Generator UV Lamp Power Supply...................................................................... 269
12.10. Service Procedures................................................................................................................................ 269
12.10.1. Repairing Sample Flow Control Assembly ..................................................................................... 269
12.10.2. Replacing The Standard Reference O3 Scrubber .......................................................................... 270
12.10.3. Replacing the IZS O3 Scrubber ...................................................................................................... 271
12.10.4. Metal Wool Scrubber Option........................................................................................................... 271
12.10.5. Disk-On-Module Replacement Procedure...................................................................................... 271
12.11. FAQ’s ..................................................................................................................................................... 272
12.12. Technical Assistance ............................................................................................................................. 274
13. THEORY OF OPERATION ............................................................................................ 275
13.1. Measurement Method .............................................................................................................................. 275
13.1.1. Calculating O3 Concentration ........................................................................................................... 275
13.1.2. The Photometer UV Absorption Path ............................................................................................... 277
13.1.3. The Reference / Measurement Cycle ............................................................................................... 278
06870C DCN6332

Table of Contents Teledyne API – Model T400 Photometric Ozone Analyzer
xviii
13.1.4. Interferent Rejection ......................................................................................................................... 279
13.2. Pneumatic Operation ............................................................................................................................... 280
13.2.1. Sample Gas Air Flow ........................................................................................................................ 280
13.2.2. Flow Rate Control ............................................................................................................................. 281
13.2.2.1. Critical Flow Orifice.................................................................................................................... 281
13.2.3. Particulate Filter................................................................................................................................ 282
13.2.4. Pneumatic Sensors........................................................................................................................... 282
13.2.4.1. Sample Pressure Sensor .......................................................................................................... 282
13.2.4.2. Sample Flow Sensor ................................................................................................................. 282
13.3. Electronic Operation................................................................................................................................. 283
13.3.1. Overview ........................................................................................................................................... 283
13.3.2. CPU .................................................................................................................................................. 284
13.3.2.1. Disk-On-Module......................................................................................................................... 285
13.3.2.2. Flash Chip ................................................................................................................................. 285
13.3.3. Motherboard...................................................................................................................................... 286
13.3.3.1. A to D Conversion ..................................................................................................................... 286
13.3.3.2. Sensor Inputs ............................................................................................................................ 286
13.3.3.3. Thermistor Interface .................................................................................................................. 286
13.3.3.4. Analog Outputs.......................................................................................................................... 287
13.3.3.5. External Digital I/O..................................................................................................................... 287
13.3.3.6. I2C Data Bus.............................................................................................................................. 287
13.3.3.7. Power Up Circuit........................................................................................................................ 288
13.3.4. Relay PCA ........................................................................................................................................ 288
13.3.4.1. Status LEDs............................................................................................................................... 290
13.3.4.2. Watchdog Circuitry .................................................................................................................... 290
13.3.4.3. Valve Control ............................................................................................................................. 291
13.3.4.4. Heater Control ........................................................................................................................... 291
13.3.4.5. Thermocouple Inputs and Configuration Jumper (JP5) ............................................................ 292
13.3.5. Power Supply/Circuit Breaker........................................................................................................... 293
13.3.5.1. Power Switch/Circuit Breaker.................................................................................................... 294
13.3.6. AC Power Configuration ................................................................................................................... 295
13.3.6.1. AC Configuration – Internal Pump (JP7)................................................................................... 296
13.3.6.2. AC Configuration – Heaters for Option Packages (JP6) ........................................................... 297
13.3.7. Photometer Layout and Operation.................................................................................................... 298
13.3.7.1. Photometer Electronic Operation .............................................................................................. 299
13.3.7.2. O3 Photometer UV Lamp Power Supply ................................................................................... 300
13.3.7.3. Photometer Temperature .......................................................................................................... 301
13.3.7.4. Photometer Gas Pressure and Flow Rate.................................................................................301
13.4. Front Panel Touchscreen/Display Interface............................................................................................. 302
13.4.1. Front Panel Interface PCA................................................................................................................ 302
13.5. Software Operation .................................................................................................................................. 303
13.5.1. Adaptive Filter ................................................................................................................................... 303
13.5.2. Calibration - Slope and Offset........................................................................................................... 304
14. A PRIMER ON ELECTRO-STATIC DISCHARGE......................................................... 305
14.1. How Static Charges are Created ............................................................................................................. 305
14.2. How Electro-Static Charges Cause Damage........................................................................................... 306
14.3. Common Myths About ESD Damage ...................................................................................................... 307
14.4. Basic Principles of Static Control ............................................................................................................. 308
14.4.1. General Rules................................................................................................................................... 308
14.4.2. Basic anti-ESD Procedures for Analyzer Repair and Maintenance ................................................. 310
14.4.2.1. Working at the Instrument Rack ................................................................................................ 310
14.4.2.2. Working at an Anti-ESD Work Bench........................................................................................ 310
14.4.2.3. Transferring Components from Rack to Bench and Back......................................................... 311
14.4.2.4. Opening Shipments from Teledyne API Customer Service ...................................................... 311
14.4.2.5. Packing Components for Return to Teledyne API Customer Service....................................... 312
06870C DCN6332

Teledyne API – Model T400 Photometric Ozone Analyzer Table of Contents
xix
LIST OF FIGURES
Figure 3-1: Front Panel Layout.......................................................................................................................35
Figure 3-2: Display Screen and Touch Control..............................................................................................36
Figure 3-3: Touchscreen/Display Mapped to Menu Charts ...........................................................................38
Figure 3-4: Rear Panel Layout .......................................................................................................................39
Figure 3-5: T400 Internal Layout – Top View with IZS Option .......................................................................41
Figure 3-6: Analog In Connector ....................................................................................................................43
Figure 3-7: T400 Analog Output Connector ...................................................................................................44
Figure 3-8: Current Loop Option Installed......................................................................................................45
Figure 3-9: Status Output Connector .............................................................................................................46
Figure 3-10: Energizing the T400 Control Inputs .............................................................................................47
Figure 3-11: Concentration Alarm Relay..........................................................................................................48
Figure 3-12: Rear Panel Connector Pin-Outs for RS-232 Mode......................................................................51
Figure 3-13: CPU Connector Pin-Outs for RS-232 Mode ................................................................................52
Figure 3-14: Jumper and Cables for Multidrop Configuration ..........................................................................54
Figure 3-15: RS-232-Multidrop PCA Host/Analyzer Interconnect Diagram .....................................................55
Figure 3-16: T400 Pneumatic Diagram – Basic Unit........................................................................................57
Figure 3-17: T400 Pneumatic Diagram with Internal Zero/Span (IZS) Option (OPT-50G)..............................58
Figure 3-18: Gas Line Connections for the T400 Analyzer – Basic Configuration ..........................................59
Figure 3-19: Gas Line Connections for the T400 Analyzer with IZS Option (OPT-50G) .................................60
Figure 3-20: Gas Line Connections when the T400 Analyzer is Located in the Room Being Monitored........61
Figure 3-21: Gas Line Connections when the T400 Analyzer is Monitoring a Remote Location ....................62
Figure 3-22: T400 Pneumatic Diagram with Zero/Span Valve Option (OPT-50A) ..........................................75
Figure 3-23: Gas Line Connections for the T400 Analyzer with Zero/Span Valve Option (OPT-50A) ............76
Figure 3-24: T400 Pneumatic Diagram with Internal Zero/Span (IZS) Option (OPT-50G)..............................78
Figure 4-1: Front Panel Display......................................................................................................................83
Figure 4-2: Viewing T400 Test Functions ......................................................................................................86
Figure 5-1: Analog Output Connector Pin Out ...............................................................................................95
Figure 5-2: Accessing the DIAG Submenus ............................................................................................... 110
Figure 5-3: Accessing the Analog I/O Configuration Submenus................................................................. 112
Figure 5-4: Setup for Calibrating Analog Output......................................................................................... 116
Figure 5-5: Setup for Checking Current Output Signal Levels.................................................................... 118
Figure 5-6: Alternative Setup Using 250Ω Resistor for Checking Current Output Signal Levels ............... 120
Figure 5-7. DIAG – Analog Inputs (Option) Configuration Menu ................................................................ 127
Figure 7-1: Default T400 DAS Channels Setup .......................................................................................... 159
Figure 7-2: APICOM User Interface for Configuring the DAS..................................................................... 172
Figure 8-1: APICOM Remote Control Program Interface ........................................................................... 181
Figure 9-1: Pneumatic connections for Manual Calibration Checks without Z/S Valve or IZS Options..... 185
Figure 9-2: Gas Line Connections for the T400 Analyzer with Zero/Span Valve Option (OPT-50A) ......... 190
Figure 9-3: Gas Line Connections for the T400 Analyzer with IZS Options (OPT-50G) ............................ 191
Figure 11-1 Replacing the Particulate Filter................................................................................................. 230
Figure 11-2 Replacing the IZS Zero Air Scrubber........................................................................................ 231
Figure 11-3: Optical Bench – Lamp Adjustment/ Installation ........................................................................ 238
Figure 11-4: O3 Generator Temperature Thermistor and DC Heater Locations ........................................... 239
Figure 11-5: Location of O3 Generator Reference Detector Adjustment Pot................................................ 240
Figure 12-1: Example of Signal I/O Function ................................................................................................ 251
Figure 12-2: CPU Status Indicator ................................................................................................................ 253
Figure 12-3: Relay PCA Status LEDS Used for Troubleshooting ................................................................. 254
Figure 12-4: Location of DC Power Test Points on Relay PCA .................................................................... 260
Figure 12-5: Critical Flow Orifice Assembly (Instruments without IZS)......................................................... 270
Figure 12-6: IZS O3 Generator Zero Air Scrubber Location.......................................................................... 271
Figure 13-1: O3 Absorption Path ................................................................................................................... 277
Figure 13-2: Reference / Measurement Gas Cycle....................................................................................... 278
Figure 13-3: T400 Pneumatic Diagram – Basic Unit..................................................................................... 280
Figure 13-4: Flow Control Assembly & Critical Flow Orifice ......................................................................... 281
Figure 13-5: T400 Electronic Block Diagram ................................................................................................ 283
Figure 13-6. CPU Board................................................................................................................................ 285
Figure 13-7: Relay PCA Layout (P/N 04523-0100)....................................................................................... 288
06870C DCN6332

Table of Contents Teledyne API – Model T400 Photometric Ozone Analyzer
xx
Figure 13-8: Relay PCA P/N 045230100 with Safety Shield In Place .......................................................... 289
Figure 13-9: Relay PCA P/N 045230200 with AC Relay Retainer in Place.................................................. 289
Figure 13-10: Status LED Locations – Relay PCA.......................................................................................... 290
Figure 13-11: Heater Control Loop Block Diagram......................................................................................... 292
Figure 13-12: Thermocouple Configuration Jumper (JP5) Pin-Outs............................................................... 293
Figure 13-13: Power Distribution Block Diagram ............................................................................................ 294
Figure 13-14: Location of AC power Configuration Jumpers .......................................................................... 295
Figure 13-15: Pump AC Power Jumpers (JP7)............................................................................................... 296
Figure 13-16: Typical Jumper Set (JP2) Set Up of Optional Metal Wool Scrubber Heater ............................ 297
Figure 13-17: O3 Photometer Layout – Top Cover Removed......................................................................... 298
Figure 13-18: O3 Photometer Electronic Block Diagram................................................................................. 299
Figure 13-19: O3 Photometer UV Lamp Power Supply Block Diagram .......................................................... 300
Figure 13-20: Front Panel and Display Interface Block Diagram.................................................................... 302
Figure 13-21: Basic Software Operation ......................................................................................................... 303
Figure 14-1: Triboelectric Charging............................................................................................................... 305
Figure 14-2: Basic anti-ESD Work Station .................................................................................................... 308
LIST OF TABLES
Table 1-1: Analyzer Options..........................................................................................................................26
Table 2-1: Model T400 Basic Unit Specifications .........................................................................................29
Table 2-2: IZS Generator Specifications with Reference Feedback Option .................................................30
Table 2-3: IZS Generator Specifications w/o Reference Feedback Option..................................................30
Table 2-4. Software Settings for EPA Equivalence.......................................................................................31
Table 3-1: Ventilation Clearance...................................................................................................................34
Table 3-2: Display Screen and Touch Control Description...........................................................................37
Table 3-3: Rear Panel Description................................................................................................................40
Table 3-4: Analog Input Pin Assignments.....................................................................................................43
Table 3-5: Analog Output Pin Outs ...............................................................................................................44
Table 3-6: Status Output Pin Assignments ...................................................................................................46
Table 3-7: Control Input Pin Assignments ....................................................................................................48
Table 3-8: Possible Warning Messages at Start-Up.....................................................................................64
Table 3-9: Zero/Span Valve Operating States for Option 50A......................................................................75
Table 3-10: Internal Zero/Span Valve Operating States.................................................................................79
Table 4-1: Analyzer Operating Modes ..........................................................................................................84
Table 4-2: Test Functions Defined................................................................................................................87
Table 4-3: Warning Messages Defined.........................................................................................................88
Table 4-4: Primary Setup Mode Features and Functions .............................................................................90
Table 4-5: Secondary Setup Mode Features and Functions ........................................................................91
Table 5-1: Password Levels....................................................................................................................... 101
Table 5-2: Variable Names (VARS) ...........................................................................................................107
Table 5-3: Diagnostic Mode (DIAG) Functions .......................................................................................... 109
Table 5-4: DIAG - Analog I/O Functions .................................................................................................... 111
Table 5-5: Voltage Tolerances for the TEST CHANNEL Calibration......................................................... 116
Table 5-6: Current Loop Output Check...................................................................................................... 120
Table 5-7: Analog Output Voltage Range Min/Max ................................................................................... 121
Table 5-8: Test Channels Functions Available on the T400’s Analog Output ........................................... 124
Table 6-1: COMM Port Communication Modes......................................................................................... 130
Table 6-2: Ethernet Status Indicators ........................................................................................................ 134
Table 6-3: LAN/Internet Default Configuration Properties ......................................................................... 139
Table 6-4: RS-232 Communication Parameters for Hessen Protocol ....................................................... 145
Table 6-5: Teledyne API Hessen Protocol Response Modes.................................................................... 148
Table 6-6: Default Hessen Status Bit Assignments ................................................................................... 152
06870C DCN6332

Teledyne API – Model T400 Photometric Ozone Analyzer Table of Contents
xxi
Table 7-1: Front Panel LED Status Indicators for DAS.............................................................................. 156
Table 7-2: DAS Data Channel Properties .................................................................................................. 157
Table 7-3: DAS Data Parameter Functions ............................................................................................... 164
Table 8-1: Terminal Mode Software Commands ....................................................................................... 174
Table 8-2: Teledyne API Serial I/O Command Types................................................................................ 175
Table 9-1: AutoCal Modes ......................................................................................................................... 195
Table 9-2: AutoCal Attribute Setup Parameters......................................................................................... 196
Table 9-3: Example AutoCal Sequence..................................................................................................... 196
Table 10-1: Daily Activity Matrix................................................................................................................... 218
Table 10-2: Activity Matrix for Audit Procedure............................................................................................ 219
Table 10-3: Activity Matrix for Data Reduction, Validation and Reporting................................................... 220
Table 10-4: Activity Matrix for Calibration Procedures................................................................................. 220
Table 11-1: T400 Maintenance Schedule .................................................................................................... 227
Table 11-2: Predictive Uses for Test Functions........................................................................................... 229
Table 12-1: Warning Messages in Display Param Field.............................................................................. 247
Table 12-2: Test Functions - Indicated Failures........................................................................................... 249
Table 12-3: Test Channel Outputs as Diagnostic Tools .............................................................................. 252
Table 12-4: Relay PCA Watchdog LED Failure Indications......................................................................... 253
Table 12-5: Relay PCA Status LED Failure Indications............................................................................... 254
Table 12-6: DC Power Test Point and Wiring Color Codes......................................................................... 259
Table 12-7: DC Power Supply Acceptable Levels ....................................................................................... 260
Table 12-8: Relay PCA Control Devices...................................................................................................... 261
Table 12-9: Analog Output Test Function - Nominal Values Voltage Outputs ............................................ 263
Table 12-10: Status Outputs Check............................................................................................................... 264
Table 12-11: T400 Control Input Pin Assignments and Corresponding Signal I/O Functions....................... 265
Table 13-1: Relay PCA Status LEDs ...........................................................................................................290
Table 13-2: Thermocouple Configuration Jumper (JP5) Pin-Outs............................................................... 292
Table 13-3: Thermocouple Settings for Optional Metal Wool Scrubber ...................................................... 293
Table 13-4: AC Power Configuration for Internal Pumps (JP7) ................................................................... 296
Table 13-5: Power Configuration for Optional Metal Wool Scrubber Heater (JP6) ..................................... 297
Table 14-1: Static Generation Voltages for Typical Activities ...................................................................... 306
Table 14-2: Sensitivity of Electronic Devices to Damage by ESD............................................................... 306
06870C DCN6332

Table of Contents Teledyne API – Model T400 Photometric Ozone Analyzer
xxii
LIST OF APPENDICES
APPENDIX A - MENU TREES and RELATED SOFTWARE DOCUMENTATION
APPENDIX A-1: Software Menu Trees
APPENDIX A-2: Setup Variables Available Via Serial I/O
APPENDIX A-3: Warnings and Test Measurements via Serial I/O
APPENDIX A-4: Signal I/O Definitions
APPENDIX A-5: DAS Functions
APPENDIX A-6: MODBUS Register Map
APPENDIX B - T400 SPARE PARTS LIST
APPENDIX C - REPAIR QUESTIONNAIRE
APPENDIX D – T400 ELECTRONIC SCHEMATICS
06870C DCN6332

23
SECTION I
–
GENERAL INFORMATION
06870C DCN6332

Teledyne API – Model T400 Photometric Ozone Analyzer
24
06870C DCN6332

25
1. INTRODUCTION, FEATURES AND OPTIONS
1.1. OVERVIEW
The Model T400 photometric ozone analyzer is a microprocessor-controlled analyzer
that measures low ranges of ozone in ambient air using a method based on the Beer-
Lambert law, an empirical relationship that relates the absorption of light to the
properties of the material through which the light is traveling over a given distance.
The intensity of an ultra violate light is measured after it passes through a chamber,
called the sample cell, where it is absorbed in proportion to the amount of ozone present.
Every three seconds, a switching valve alternates measurement between a gas stream
containing ozone and a stream that has been scrubbed of ozone.
The analyzer also measures the ambient temperature and pressure of the gas being
measured. Using results of these measurements and the Beer-Lambert equation, the
T400 analyzer calculates the amount of ozone present in the sampler gas.
The T400 analyzer’s multi-tasking software gives the ability to track and report a large
number of operational parameters in real time. These readings are compared to
diagnostic limits kept in the analyzers memory and should any fall outside of those
limits the analyzer issues automatic warnings.
Built-in data acquisition capability, using the analyzer's internal memory, allows the
logging of multiple parameters including averaged or instantaneous concentration
values, calibration data, and operating parameters such as pressure and flow rate. Stored
data are easily retrieved through the serial port or Ethernet port via our APICOM
software or from the front panel, allowing operators to perform predictive diagnostics
and enhanced data analysis by tracking parameter trends. Multiple averaging periods of
one minute to 365 days are available for over a period of one year.
1.2. FEATURES
Some of the exceptional features of your T400 photometric ozone analyzer include:
Ranges, 0-100 ppb to 0-10 ppm, user selectable
Single pass ultraviolet absorption
Microprocessor controlled for versatility
LCD Graphical User Interface with capacitive touch screen
Multi-tasking software allows viewing of test variables during operation
06870C DCN6332

Introduction Teledyne API – Model T400 Photometric Ozone Analyzer
26
Continuous self checking with alarms
Bi-directional USB, RS-232, and 10/100Base-T Ethernet ports for remote operation
(optional RS-485)
Front panel USB ports for perpheral devices
Digital status outputs provide instrument operating condition
Adaptive signal filtering optimizes response time
Optional Internal Zero/Span check and dual span points
Temperature & Pressure compensation
Internal data logging with 1 min to 365 day multiple averages
1.3. OPTIONS
The options available for your analyzer are presented in Table 1-1 with name, option
number, a description and/or comments, and if applicable, cross-references to technical
details in this manual, such as setup and calibration. To order these options or to learn
more about them, please contact the Sales department of Teledyne - Advanced Pollution
Instruments at:
TOLL-FREE: 800-324-5190
TEL: +1 858-657-9800
FAX: +1 858-657-9816
E-MAIL: apisales@teledyne.com
WEB SITE: http://www.teledyne-api.com/
Table 1-1: Analyzer Options
Option Option
Number Description/Notes Reference
Pumps Pumps meet all typical AC power supply standards while exhibiting same
pneumatic performance.
10A External Pump 100V - 120V @ 60 Hz N/A
10B External Pump 220V - 240V @ 50 Hz N/A
10C External Pump 220V - 240V @ 60 Hz N/A
10D External Pump 100V – 12V @ 50 Hz N/A
10E External Pump 100V @ 60 Hz N/A
11 Pumpless, internal or external Pump Pack N/A
13 High Voltage Internal Pump 240V @ 50Hz N/A
Rack Mount
Kits Options for mounting the analyzer in standard 19” racks
20A Rack mount brackets with 26 in. chassis slides N/A
20B Rack mount brackets with 24 in. chassis slides N/A
21 Rack mount brackets only (compatible with carrying strap, Option 29) N/A
23 Rack mount for external pump pack (no slides) N/A
06870C DCN6332
Teledyne API – Model T400 Photometric Ozone Analyzer Introduction, Features and Options
27
Option Option
Number Description/Notes Reference
Carrying Strap/Handle Side-mounted strap for hand-carrying analyzer
29
Extends from “flat” position to accommodate hand for carrying.
Recesses to 9mm (3/8”) dimension for storage.
Can be used with rack mount brackets, Option 21.
Cannot be used with rack mount slides.
N/A
CAUTION
GENERAL SAFETY HAZARD
A FULLY LOADED T400 WITH BOTH THE O3 GENERATOR AND VALVE OPTIONS
INSTALLED WEIGHS ABOUT 17 KG (40 POUNDS).
TO AVOID PERSONAL INJURY WE RECOMMEND THAT TWO PERSONS LIFT AND
CARRY THE ANALYZER.
DISCONNECT ALL CABLES AND TUBING FROM THE ANALYZER BEFORE MOVING IT.
Analog Inputs Used for connecting external voltage signals from other instrumentation (such as
meteorological instruments).
64
Also can be used for logging these signals in the analyzer’s internal
DAS
64A is USB Com Port only
64B is Analog Input and USB Com Port together.
Sections 3.3.1.2
and 5.10.3
Current Loop Analog
Outputs
Adds isolated, voltage-to-current conversion circuitry to the analyzer’s analog
outputs.
41
Can be configured for any output range between 0 and 20 mA.
May be ordered separately for any of the analog outputs.
Can be installed at the factory or retrofitted in the field.
Sections 3.3.1.4,
and 5.10.1.5
Parts Kits Spare parts and expendables
42A
Expendables Kit includes a recommended set of expendables for
one year of operation of this instrument including replacement
sample particulate filters.
Appendix B
43 Expendables Kit with IZS includes the items needed to refurbish
the internal zero air scrubber (IZS) that is included. Appendix B
45 Spare Parts Kit includes spares parts for one unit. Appendix B
Calibration Valves Used to control the flow of calibration gases generated from external sources,
rather than manually switching the rear panel pneumatic connections.
50A Ambient Zero and Ambient Span Section 3.6.1
50F
Zero Scrubber and No span (IZ) (CY5) (measures low levels of O3 in
ambient air; special order). N/A (Call Sales)
50G Zero Scrubber and Internal Span Source (IZS) Section 3.6.2
56 Desiccant Dryer for IZS (desiccant material in a scrubbder cartridge) Section 11.3.4
Communication Cables For remote serial, network and Internet communication with the analyzer.
Type Description
60A RS-232
Shielded, straight-through DB-9F to DB-25M cable, about
1.8 m long. Used to interface with older computers or
code activated switches with DB-25 serial connectors.
Section 3.3.1.8
60B RS-232
Shielded, straight-through DB-9F to DB-9F cable of about
1.8 m length. Section 3.3.1.8
60C Ethernet
Patch cable, 2 meters long, used for Internet and LAN
communications. Section 3.3.1.8
60D USB
Cable for direct connection between instrument (rear
panel USB port) and personal computer. Section 3.3.1.8
06870C DCN6332

Introduction Teledyne API – Model T400 Photometric Ozone Analyzer
28
Option Option
Number Description/Notes Reference
Concentration Alarm Relay Issues warning when gas concentration exceeds limits set by user.
61
Four (4) “dry contact” relays on the rear panel of the instrument. This
relay option is different from and in addition to the “Contact Closures”
that come standard on all TAPI instruments.
Section 3.3.1.7
RS-232 Multidrop Enables communications between host computer and up to eight analyzers.
62
Multidrop card seated on the analyzer’s CPU card.
Each instrument in the multidrop network requires this card and a
communications cable (Option 60B).
Section 3.3.1.8
Additional Option To replace manganese dioxide scrubber.
68
Metal Scrubber – a heated metal wool scrubber that functions like a
catalytic converter and improves the analyzer’s performance in some
higher humidity applications.
Special Features Built in features, software activated
N/A
Maintenance Mode Switch, located inside the instrument, places
the analyzer in maintenance mode where it can continue sampling,
yet ignore calibration, diagnostic, and reset instrument commands.
This feature is of particular use for instruments connected to
Multidrop or Hessen protocol networks.
Call Customer Service for activation.
N/A
N/A
Second Language Switch activates an alternate set of display
messages in a language other than the instrument’s default
language.
Call Customer Service for a specially programmed Disk on Module containing
the second language.
N/A
06870C DCN6332

29
2. SPECIFICATIONS, APPROVALS & COMPLIANCE
This section presents specifications for the T400 analyzer and its options, Agency
approvals, EPA equivalency designation, and CE mark compliance.
2.1. SPECIFICATIONS
Table 2-1: Model T400 Basic Unit Specifications
Parameter Specification
Ranges Min: 0-100 ppb Full scale
Max: 0-10 ppm Full scale (selectable, dual ranges and auto-ranging supported)
Measurement Units ppb, ppm, µg/m3, mg/m3 (selectable)
Zero Noise < 0.3 ppb (RMS)
Span Noise < 0.5% of reading (RMS) above 100 ppb
Lower Detectable Limit < 0.6 ppb
Zero Drift < 1.0 ppb/24 hours
Span Drift < 1% of reading/24 hours
Lag Time < 10 sec
Rise/Fall Time < 20 sec to 95%
Linearity < 1% of full scale
Precision < 0.5% of reading above 100 ppb
Sample Flow Rate 800 cc3/min 10%
Power Requirements 100V-120V, 220V-240V, 50/60Hz
Analog Output Ranges 10V, 5V, 1V, 0.1V (selectable)
Recorder Offset 10%
Standard I/O 1 Ethernet: 10/100Base-T
2 RS-232 (300 – 115,200 baud)
2 USB device ports
8 opto-isolated digital outputs
6 opto-isolated digital inputs (3 defined, 3 spare)
4 analog outputs
Optional I/O 1 USB com port
1 RS485
8 analog inputs (0-10V, 12-bit)
4 digital alarm outputs
Multidrop RS232
3 4-20mA current outputs
Operating Temperature Range 5 - 40C (with EPA Equivalency)
Humidity Range 0-90% RH, Non-Condensing
Pressure Range 25 – 31 “Hg-A
Altitude Range 0-2000m
06870C DCN6332

Specifications, Approvals & Compliance Teledyne API – Model T400 Photometric Ozone Analyzer
30
Parameter Specification
Temp Coefficient < 0.05% per deg C
Voltage Coefficient < 0.05% per Volt AC (RMS) over range of nominal 10%
Dimensions (H x W x D) 7” x 17” x 23.5” (178 x 432 x 597 mm)
Weight 28 lbs (12.7 kg)
30.6lbs. (13.8kg) with IZS Option
Environmental Conditions Installation Category (Over voltage Category) II Pollution Degree 2
Table 2-2: IZS Generator Specifications with Reference Feedback
Option
Parameter Specification
Maximum Concentration 1.0 PPM
Minimum Concentration 0.050 PPM
Resolution 0.5 ppb
Repeatability (7 days) 1% of reading
Initial Accuracy +/- 5% of target concentration
Response Time < 5 min to 95%
Table 2-3: IZS Generator Specifications w/o Reference Feedback
Option
Parameter Specification
Maximum Concentration 1.0 PPM
Minimum Concentration 0.050 PPM
Resolution 0.5 ppb
Repeatability (7 days) 2% of reading
Initial Accuracy +/- 10% of target concentration
Response Time < 5 min to 95%
06870C DCN6332

Teledyne API – Model T400 Photometric Ozone Analyzer Specifications, Approvals & Compliance
31
2.2. EPA EQUIVALENCY DESIGNATION
The T400 photometric ozone analyzer is designated as Equivalent Method Number
EQOA-0992-087, as defined in 40 CFR Part 53, when operated under the following
conditions:
Range: Any range from 100 ppb to 1 ppm.
Ambient temperature range of 5 to 40ºC.
Line voltage range of 105 – 125 VAC or 200 – 240 VAC, 50/60 Hz.
With 5-micron PTFE filter element installed in the internal filter assembly.
Sample flow of 800 ± 80 cc3/min at sea level.
Gas flow supplied by Internal or External pump.
Following Software Setting:
Table 2-4. Software Settings for EPA Equivalence
Dilution Factor 1.0
AutoCal ON or OFF
Dynamic Zero ON or OFF
Dynamic Span OFF
Dual range ON or OFF
Auto range ON or OFF
Temp/Pres compensation ON
Under the designation, the Analyzer may be operated with or without the following
options:
Rack mount with slides
Rack mount without slides, ears only
Zero/Span Valves option
Internal Zero/Span (IZS) generator
4-20mA, isolated output
06870C DCN6332

Specifications, Approvals & Compliance Teledyne API – Model T400 Photometric Ozone Analyzer
32
2.3. APPROVALS AND CERTIFICATIONS
The Teledyne API Model T400 analyzer was tested and certified for Safety and
Electromagnetic Compatibility (EMC). This section presents the compliance statements
for those requirements and directives.
2.3.1. SAFETY
IEC 61010-1:2001, Safety requirements for electrical equipment for measurement,
control, and laboratory use.
CE: 2006/95/EC, Low-Voltage Directive
North American:
cNEMKO (Canada): CAN/CSA-C22.2 No. 61010-1-04
NEMKO-CCL (US): UL No. 61010-1 (2nd Edition)
2.3.2. EMC
EN 61326-1 (IEC 61326-1), Class A Emissions/Industrial Immunity
EN 55011 (CISPR 11), Group 1, Class A Emissions
FCC 47 CFR Part 15B, Class A Emissions
CE: 2004/108/EC, Electromagnetic Compatibility Directive
2.3.3. OTHER TYPE CERTIFICATIONS
MCERTS: Sira MC 050070/04
For additional certifications, please contact Customer Service.
06870C DCN6332

33
3. GETTING STARTED
This section addresses the procedures for unpacking the instrument and inspecting for
damage, presents clearance specifications for proper ventilation, introduces the
instrument layout, then presents the procedures for getting started: making electrical and
pneumatic connections, and conducting an initial calibration check.
3.1. UNPACKING THE T400 ANALYZER
CAUTION – GENERAL SAFETY HAZARD
To avoid personal injury, always use two persons to lift and carry the Model
T400.
ATTENTION COULD DAMAGE INSTRUMENT AND VOID WARRANTY
Printed Circuit Assemblies (PCAs) are sensitive to electro-static
discharges too small to be felt by the human nervous system. Failure to
use ESD protection when working with electronic assemblies will void
the instrument warranty. Refer to Section 14 for more information on
preventing ESD damage.
CAUTION - ELECTRICAL SHOCK HAZARD
Never disconnect PCAs, wiring harnesses or electronic subassemblies while
under power.
Note Teledyne API recommends that you store shipping containers/materials
for future use if/when the instrument should be returned to the factory for
repair and/or calibration service. See Warranty section in this manual and
shipping procedures on our Website at http://www.teledyne-api.com
under Customer Support > Return Authorization.
06870C DCN6332

Getting Started Teledyne API – Model T400 Photometric Ozone Analyzer
34
Verify that there is no apparent external shipping damage. If damage has occurred,
please advise the shipper first, then Teledyne API.
Included with your analyzer is a printed record of the final performance characterization
performed on your instrument at the factory. This record, titled Final Test and
Validation Data Sheet (P/N 04314) is an important quality assurance and calibration
record for this instrument. It should be placed in the quality records file for this
instrument.
With no power to the unit, carefully remove the top cover of the analyzer and check for
internal shipping damage by carrying out the following steps:
1. Remove the setscrew located in the top, center of the Front panel.
2. Remove the two screws fastening the top cover to the unit (one per side towards the
rear).
3. Slide the cover backwards until it clears the analyzer’s front bezel.
4. Lift the cover straight up.
5. Inspect the interior of the instrument to make sure all circuit boards and other
components are in good shape and properly seated.
6. Check the connectors of the various internal wiring harnesses and pneumatic hoses
to make sure they are firmly and properly seated.
7. Verify that all of the optional hardware ordered with the unit has been installed.
These are listed on the paperwork accompanying the analyzer.
3.1.1.1. Ventilation Clearance
Whether the analyzer is set up on a bench or installed into an instrument rack, be sure to
leave sufficient ventilation clearance.
Table 3-1: Ventilation Clearance
AREA MINIMUM REQUIRED CLEARANCE
Back of the instrument 4 in.
Sides of the instrument 1 in.
Above and below the instrument 1 in.
Various rack mount kits are available for this analyzer. See Table 1-1 of this manual for
more information.
06870C DCN6332
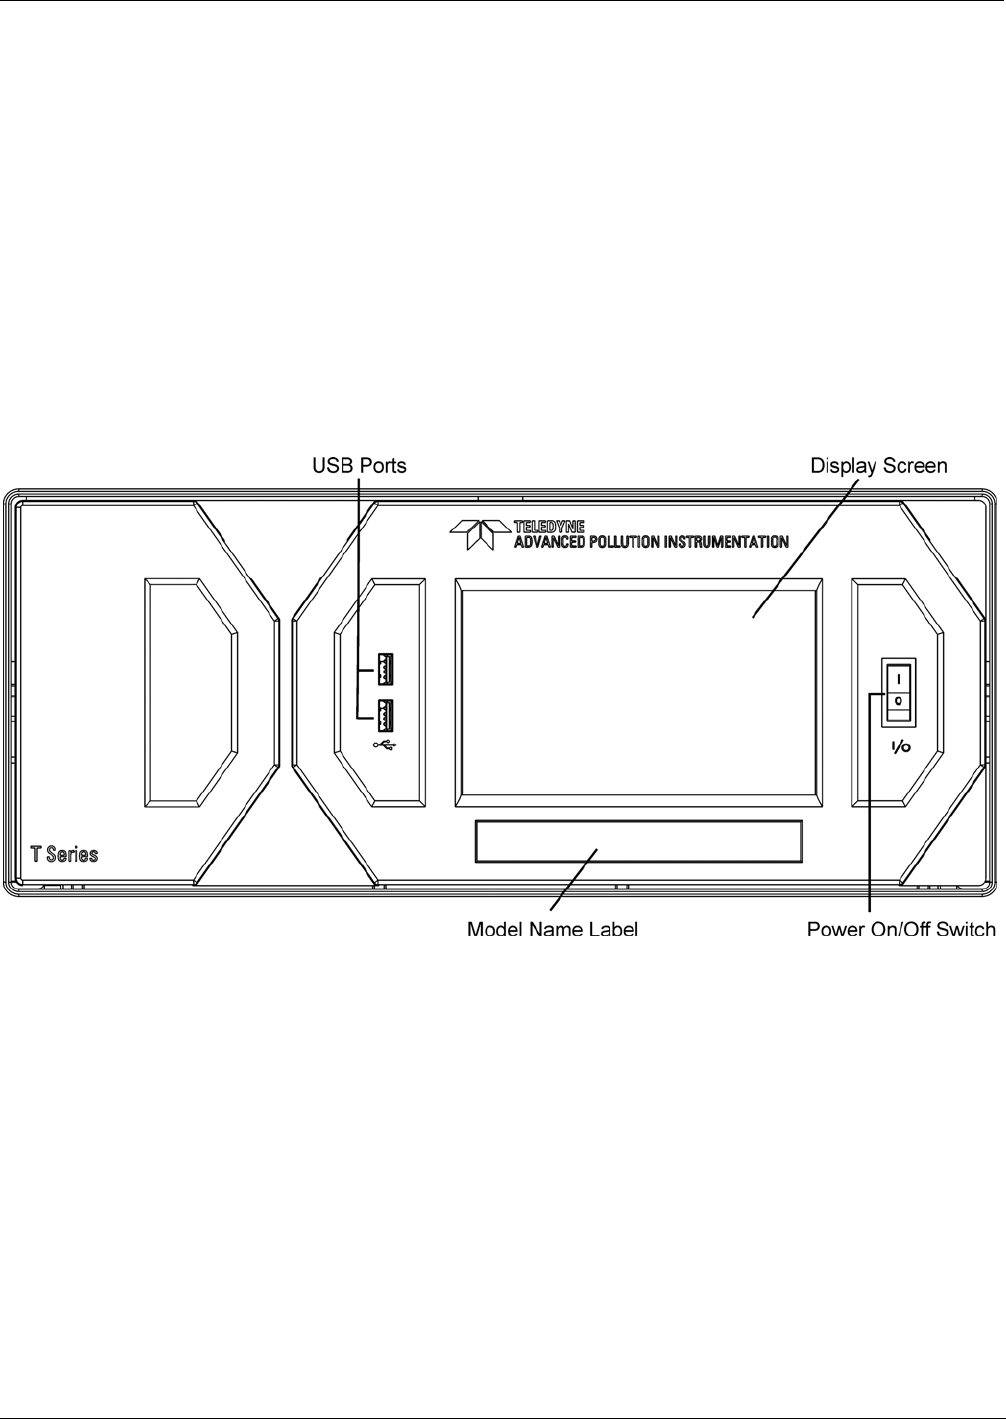
Teledyne API – Model T400 Photometric Ozone Analyzer Getting Started
35
3.2. INSTRUMENT LAYOUT
Instrument layout includes front panel and display, rear panel connectors, and internal
chassis layout.
3.2.1. FRONT PANEL
Figure 3-1 shows the analyzer’s front panel layout, followed by a close-up of the display
screen in Figure 3-2, which is described in Table 3-2. The two USB ports on the front
panel are provided for the connection of peripheral devices:
plug-in mouse (not included) to be used as an alternative to the thouchscreen
interface
thumb drive (not included) to download updates to instruction software (contact
TAPI Customer Service for information).
Figure 3-1: Front Panel Layout
06870C DCN6332
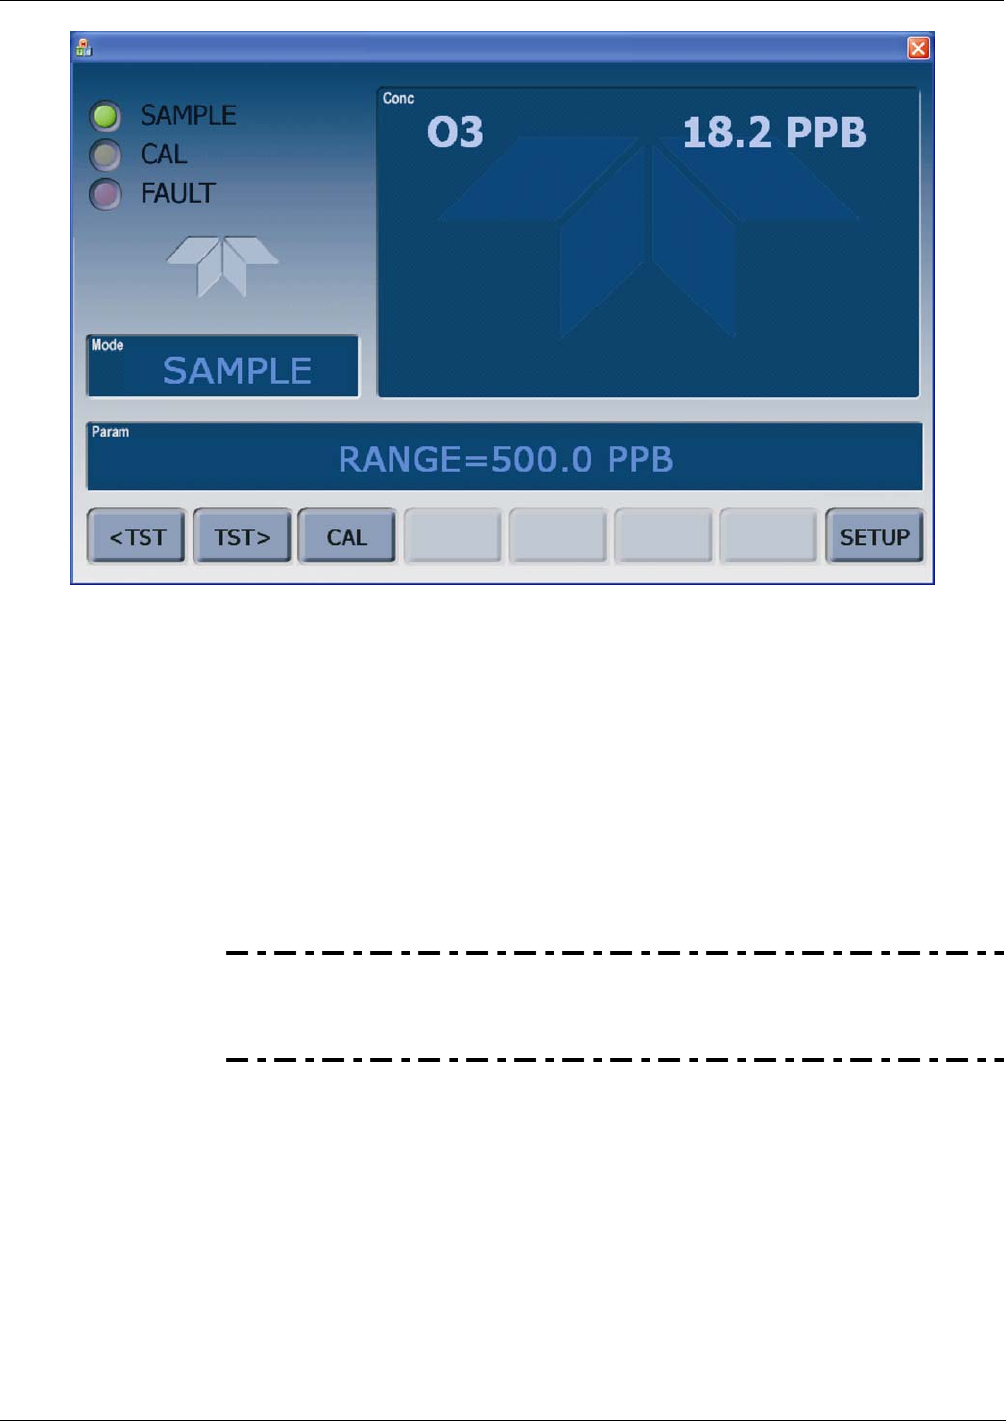
Getting Started Teledyne API – Model T400 Photometric Ozone Analyzer
36
Figure 3-2: Display Screen and Touch Control
The front panel liquid crystal display screen includes touch control. Upon analyzer start-
up, the screen shows a splash screen and other initialization indicators before the main
display appears, similar to Figure 3-2 above (may or may not display a Fault alarm). The
LEDs on the display screen indicate the Sample, Calibration and Fault states; also on the
screen is the gas concentration field (Conc), which displays real-time readouts for the
primary gas and for the secondary gas if installed. The display screen also shows what
mode the analyzer is currently in, as well as messages and data (Param). Along the
bottom of the screen is a row of touch control buttons; only those that are currently
applicable will have a label. Table 3-2 provides detailed information for each component
of the screen.
ATTENTION COULD DAMAGE INSTRUMENT AND VOID WARRANTY
Do not use hard-surfaced instruments such as pens to touch the control
buttons.
06870C DCN6332

Teledyne API – Model T400 Photometric Ozone Analyzer Getting Started
37
Table 3-2: Display Screen and Touch Control Description
Field Description/Function
LEDs indicating the states of Sample, Calibration and Fault, as follows:
Name Color State Definition
SAMPLE Green
Off
On
Blinking
Unit is not operating in sample mode, DAS is disabled.
Sample Mode active; Front Panel Display being updated; DAS data
being stored.
Unit is operating in sample mode, front panel display being updated,
DAS hold-off mode is ON, DAS disabled
CAL Yellow
Off
On
Blinking
Auto Cal disabled
Auto Cal enabled
Unit is in calibration mode
Status
FAULT Red Off
Blinking
No warnings exist
Warnings exist
Conc Displays the actual concentration of the sample gas currently being measured by the analyzer in the
currently selected units of measure
Mode Displays the name of the analyzer’s current operating mode
Param Displays a variety of informational messages such as warning messages, operational data, test function
values and response messages during interactive tasks.
Control Buttons Displays dynamic, context sensitive labels on each button, which is blank when inactive until applicable.
Figure 3-3 shows how the front panel display is mapped to the menu charts illustrated in
this manual. The Mode, Param (parameters), and Conc (gas concentration) fields in the
display screen are represented across the top row of each menu chart. The eight touch
control buttons along the bottom of the display screen are represented in the bottom row
of each menu chart.
06870C DCN6332
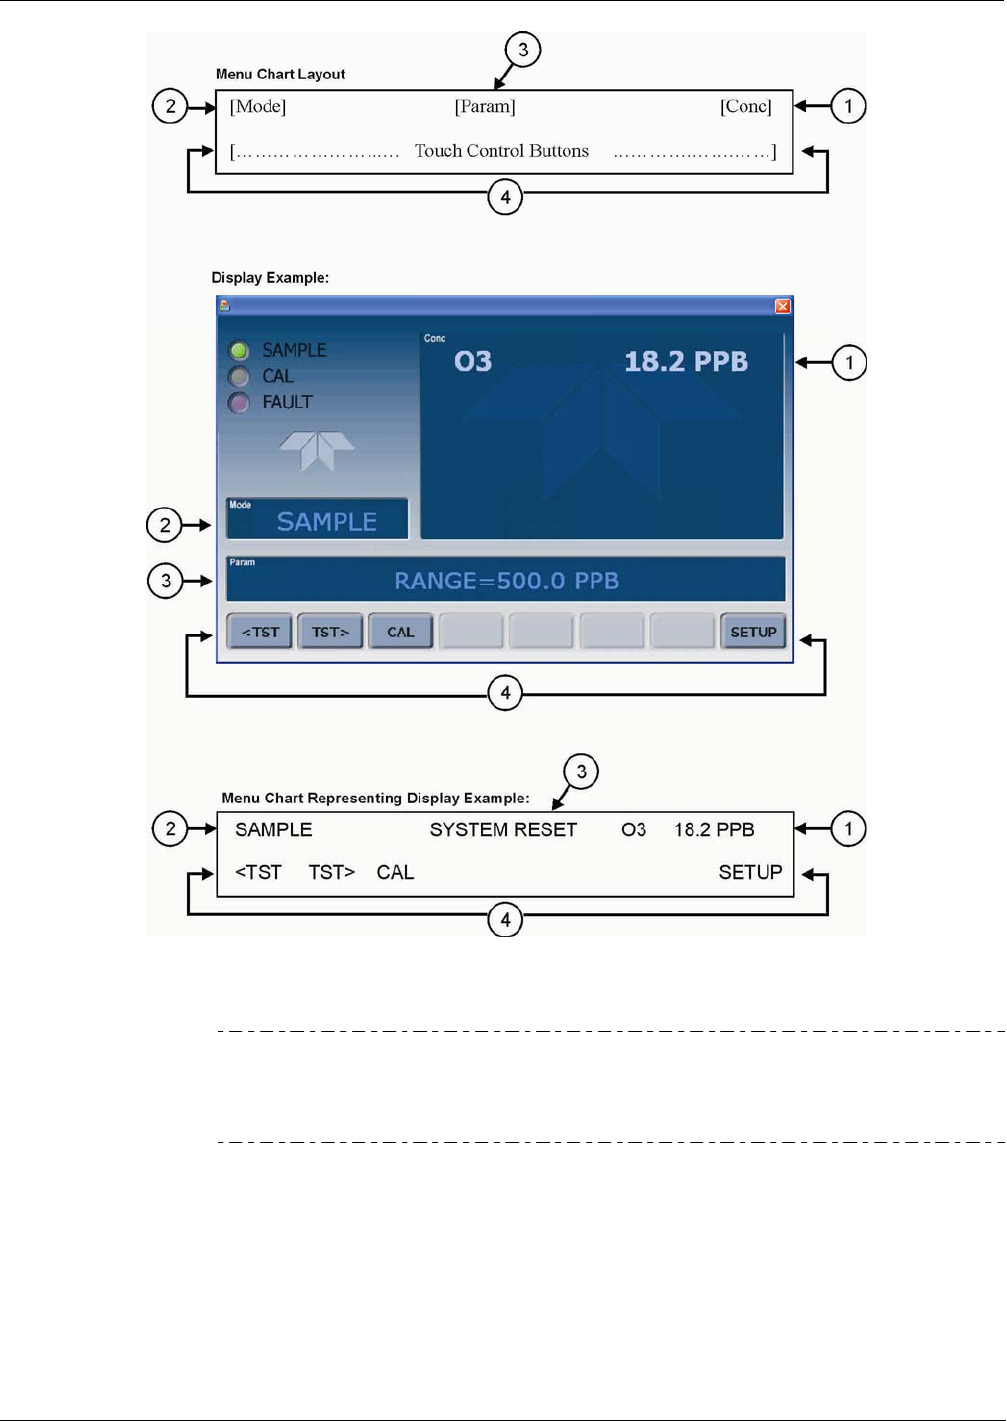
Getting Started Teledyne API – Model T400 Photometric Ozone Analyzer
38
Figure 3-3: Touchscreen/Display Mapped to Menu Charts
Note The menu charts in this manual contain condensed representations of the
analyzer’s display during the various operations being described. These
menu charts are not intended to be exact visual representations of the
actual display.
06870C DCN6332
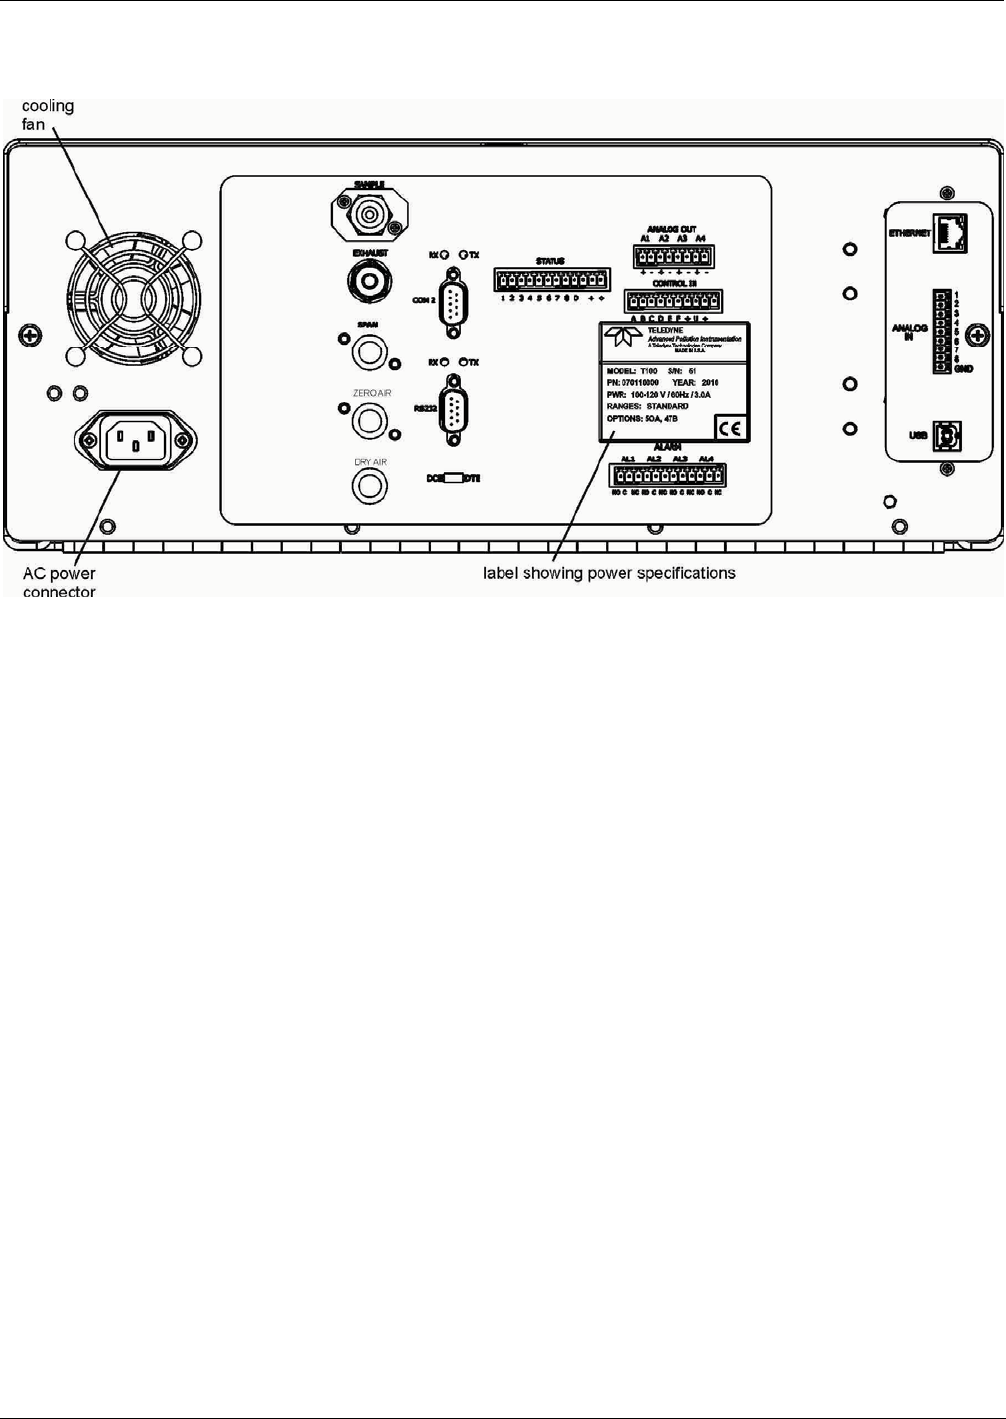

Getting Started Teledyne API – Model T400 Photometric Ozone Analyzer
40
Table 3-3: Rear Panel Description
Component Function
cooling fan Pulls ambient air into chassis through side vents and exhausts through rear.
AC power
connector
Connector for three-prong cord to apply AC power to the analyzer.
CAUTION! The cord’s power specifications (specs) MUST comply with the power
specs on the analyzer’s rear panel Model number label
Model/specs label Identifies the analyzer model number and provides power specs
SAMPLE Connect a gas line from the source of sample gas here.
Calibration gases are also inlet here on units with the zero/span valve option installed.
EXHAUST Connect an exhaust gas line of not more than 10 meters long here that leads outside
the shelter or immediate area surrounding the instrument.
SPAN On units with zero/span valve option installed, connect a gas line to the source of
calibrated span gas here.
ZERO AIR Internal Zero Air: On units with zero/span valve option installed connect the source of
zero air here.
DRY AIR On units with zero/span valve option installed connect the source of dry air here
(- <20C dew point).
RX TX LEDs indicate receive (RX) and transmit (TX) activity on the when blinking.
COM 2 Serial communications port for RS-232 or RS-485.
RS-232 Serial communications port for RS-232 only
DCE DTE Switch to select either data terminal equipment or data communication equipment
during RS-232 communication.
STATUS For ouputs to devices such as Programmable Logic Controllers (PLCs).
ANALOG OUT For voltage or current loop outputs to a strip chart recorder and/or a data logger.
CONTROL IN For remotely activating the zero and span calibration modes.
ALARM Option for concentration alarms and system warnings.
ETHERNET Connector for network or Internet remote communication, using Ethernet cable.
ANALOG IN Option for external voltage signals from other instrumentation and for logging these
signals.
USB Connector for direct connection to laptop computer, using USB cable.
Information Label Includes voltage and frequency specifications
06870C DCN6332
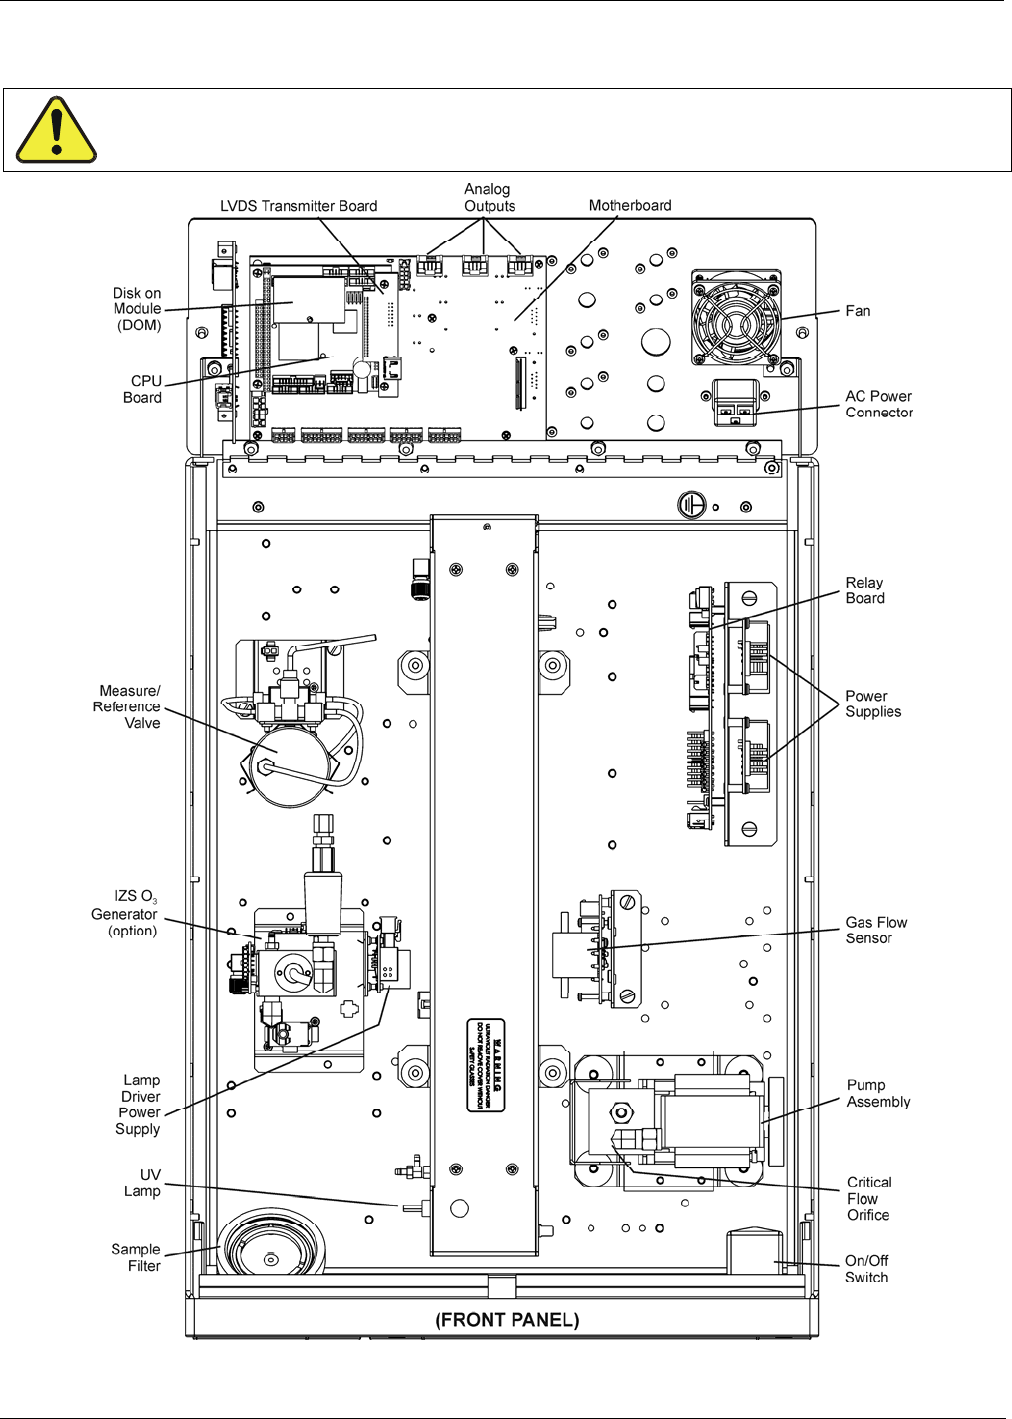
Teledyne API – Model T400 Photometric Ozone Analyzer Getting Started
41
3.2.3. INTERNAL CHASSIS LAYOUT
CAUTION – UV Radiation Risk
Do not look directly at the light of the UV lamp. Use UV adequate protection.
Figure 3-5: T400 Internal Layout – Top View with IZS Option
06870C DCN6332
Getting Started Teledyne API – Model T400 Photometric Ozone Analyzer
42
3.3. CONNECTIONS AND SETUP
This section presents the electrical (Section 3.3.1) and pneumatic (Section 3.3.2)
connections for setup and preparing for instrument operation.
3.3.1. ELECTRICAL CONNECTIONS
Note To maintain compliance with EMC standards, it is required that the cable
length be no greater than 3 meters for all I/O connections, which include
Analog In, Analog Out, Status Out, Control In, Ethernet/LAN, USB, RS-232,
and RS-485.
This section provides instructions for basic connections and for options.
3.3.1.1. Connecting Power
Attach the power cord to the analyzer and plug it into a power outlet capable of carrying
at least 10 A current at your AC voltage and that it is equipped with a functioning earth
ground.
WARNING - ELECTRICAL SHOCK HAZARD
HIGH VOLTAGES ARE PRESENT INSIDE THE ANALYZERS CASE
POWER CONNECTION MUST HAVE FUNCTIONING GROUND
CONNECTION.
DO NOT DEFEAT THE GROUND WIRE ON POWER PLUG.
TURN OFF ANALYZER POWER BEFORE DISCONNECTING OR
CONNECTING ELECTRICAL SUBASSEMBLIES.
DO NOT OPERATE WITH COVER OFF.
CAUTION - GENERAL SAFETY HAZARD
THE T400 ANALYZER CAN BE CONFIGURED FOR BOTH 100-130 V AND
210-240 V AT EITHER 50 OR 60 HZ.
TO AVOID DAMAGE TO YOUR ANALYZER, MAKE SURE THAT THE AC POWER
VOLTAGE MATCHES THE VOLTAGE INDICATED ON THE ANALYZER’S REAR
PANEL MODEL/SERIAL NUMBER/VOLTAGE SPECS LABEL BEFORE PLUGGING
THE T400 INTO LINE POWER.
06870C DCN6332

Teledyne API – Model T400 Photometric Ozone Analyzer Getting Started
43
3.3.1.2. Connecting Analog Inputs (Option)
The Analog In connector is used for connecting external voltage signals from other
instrumentation (such as meteorological instruments) and for logging these signals in the
analyzer’s internal DAS. The input voltage range for each analog input is 0-10 VDC.
Figure 3-6: Analog In Connector
Pin assignments for the Analog In connector are presented in Table 3-4.
Table 3-4: Analog Input Pin Assignments
PIN DESCRIPTION DAS PARAMETER
1
1 Analog input # 1 AIN 1
2 Analog input # 2 AIN 2
3 Analog input # 3 AIN 3
4 Analog input # 4 AIN 4
5 Analog input # 5 AIN 5
6 Analog input # 6 AIN 6
7 Analog input # 7 AIN 7
8 Analog input # 8 AIN 8
GND Analog input Ground N/A
1 See Section 7.6 for details on setting up the DAS.
3.3.1.3. Connecting Analog Outputs
The T400 is equipped with several analog output channels accessible through a
connector on the rear panel.
Channels A1 and A2 output a signal that is proportional to the O3 concentration of the
sample gas.
The default analog output voltage setting of these channels is 0 to 5 VDC with a
reporting range of 0 to 500 ppb.
An optional Current Loop output is available for each.
The output labeled A4 is special. It can be set by the user to output any one a variety of
diagnostic test functions.
The default analog output voltage setting of these channels is also 0 to 5 VDC.
See Section 5.10.1.9 for a list of available functions and their associated reporting
range.
There is no optional Current Loop output available for Channel A4.
06870C DCN6332
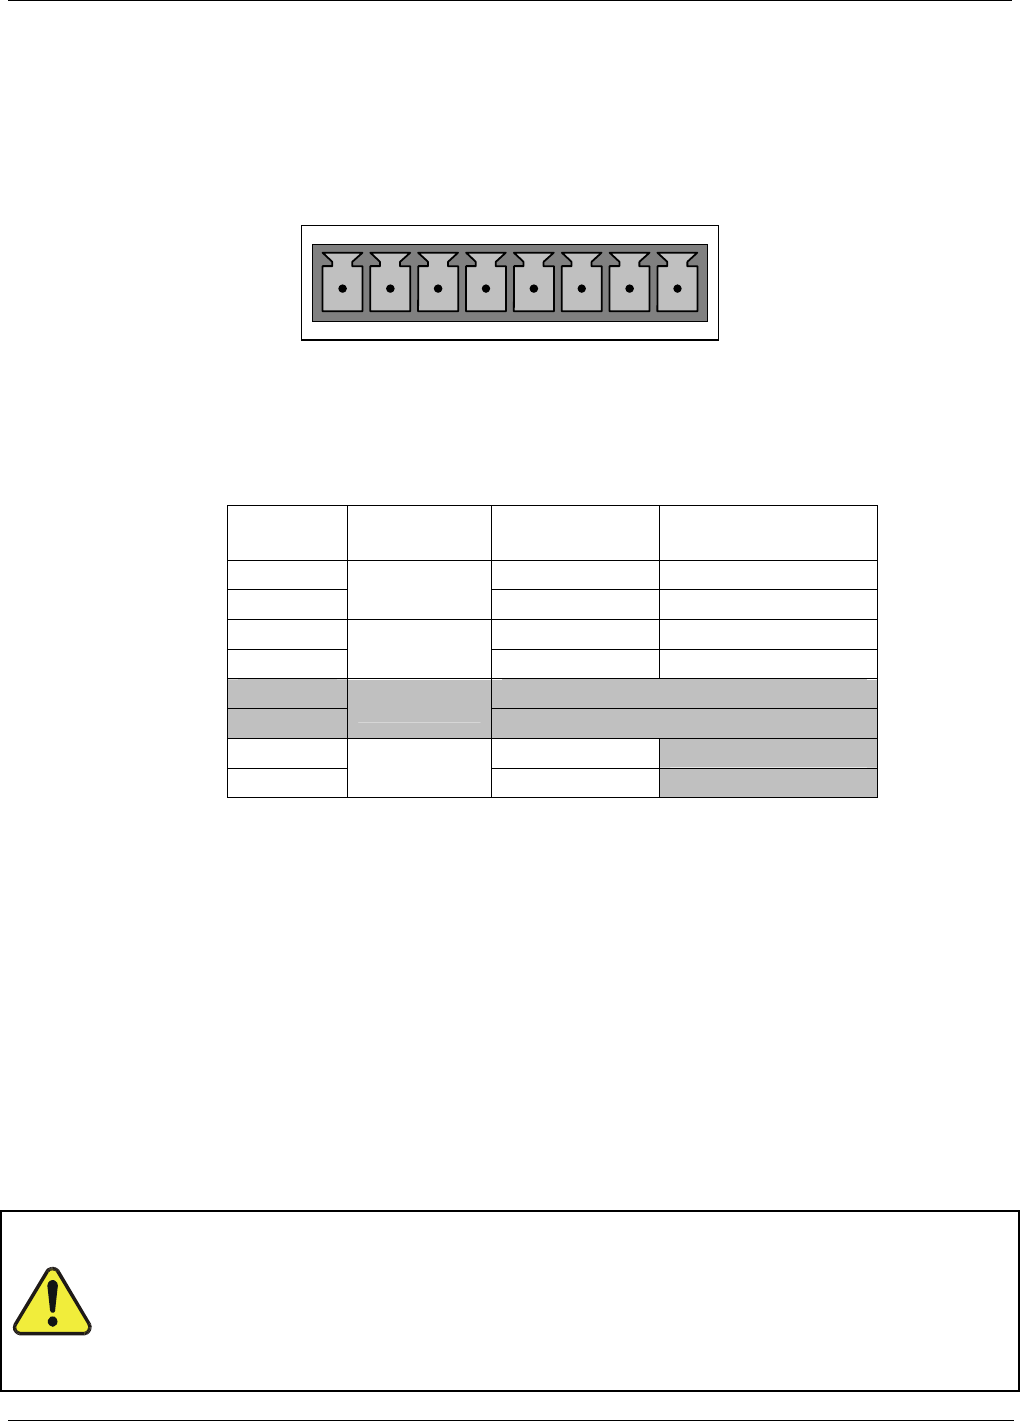
Getting Started Teledyne API – Model T400 Photometric Ozone Analyzer
44
To access these signals attach a strip chart recorder and/or data-logger to the appropriate
analog output connections on the rear panel of the analyzer. Pin-outs for the analog
output connector are:
ANALOG OUT
A1 A2 A3 A4
+ - + - + - + -
Figure 3-7: T400 Analog Output Connector
Table 3-5: Analog Output Pin Outs
Pin Analog
Output
Standard
Voltage Output
Current
Loop Option
1 V Out I Out +
2 A1 Ground I Out -
3 V Out I Out +
4 A2 Ground I Out -
5 NOT USED
6 A3
7 V Out Not Available
8 A4 Ground Not Available
To change the settings for the analog output channels, see Section 5.10
3.3.1.4. Current Loop Analog Outputs (Option 41) Setup
A current loop option is available and can be installed as a retrofit for each of the analog
outputs of the analyzer. This option converts the DC voltage analog output to a current
signal with 0-20 mA output current. The outputs can be scaled to any set of limits within
that 0-20 mA range. However, most current loop applications call for either 2-20 mA or
4-20 mA range. All current loop outputs have a +5% over-range. Ranges with the lower
limit set to more than 1 mA (e.g., 2-20 or 4-20 mA) also have a -5% under-range,
Figure 3-8 provides installation instructions and illustrates a sample combination of one
current output and two voltage outputs configuration. This section also provides
instructions for converting current loop analog outputs to standard 0-to-5 VDC outputs.
Information on calibrating or adjusting these outputs can be found in Section 5.10.1.5
CAUTION – AVOID INVALIDATING WARRANTY
Servicing or handling of circuit components requires electrostatic
discharge protection, i.e. ESD grounding straps, mats and containers.
Failure to use ESD protection when working with electronic assemblies will
void the instrument warranty. Refer to Section 14 for more information on
preventing ESD damage.
06870C DCN6332
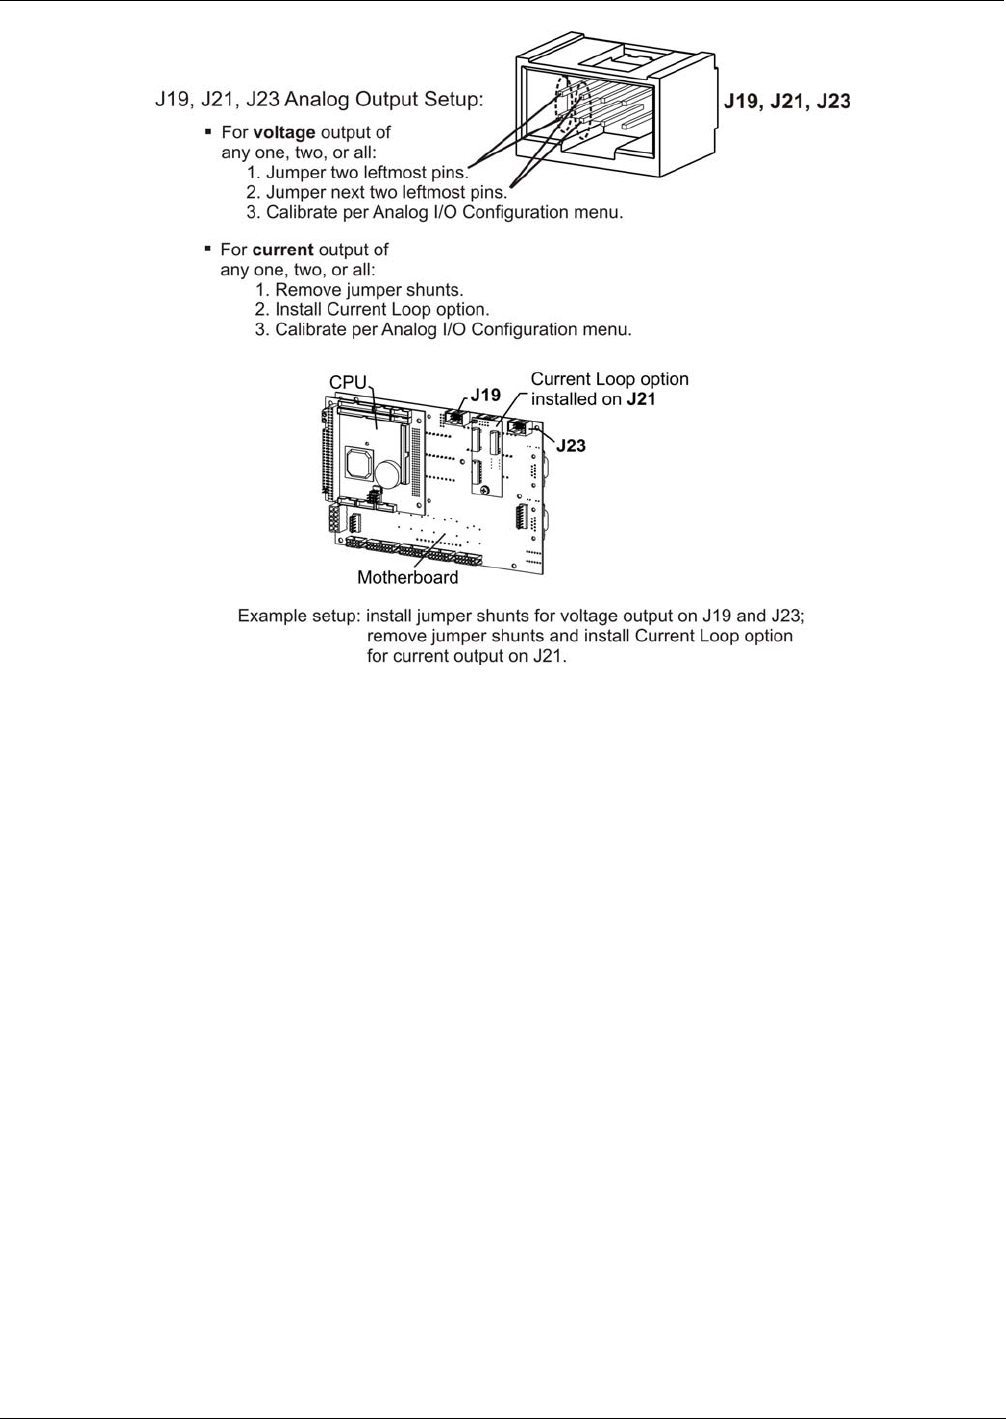
Teledyne API – Model T400 Photometric Ozone Analyzer Getting Started
45
Figure 3-8: Current Loop Option Installed
CONVERTING CURRENT LOOP ANALOG OUTPUTS TO STANDARD
VOLTAGE OUTPUTS
To convert an output configured for current loop operation to the standard 0 to 5 VDC
output operation:
1. Turn off power to the analyzer.
1. If a recording device was connected to the output being modified, disconnect it.
2. Remove the top cover
Remove the set screw located in the top, center of the rear panel
Remove the screws fastening the top cover to the unit (one per side).
Slide the cover back and lift the cover straight up.
3. Disconnect the current loop option PCA from the appropriate connector on the
motherboard (see Figure 3-8).
4. Place a shunt between the leftmost two pins of the connector (see Figure 3-8).
6 spare shunts (P/N CN0000132) were shipped with the instrument attached to
JP1 on the back of the instruments touchscreen and display PCA
5. Reattach the top case to the analyzer.
6. The analyzer is now ready to have a voltage-sensing, recording device attached to
that output.
7. Calibrate the analog output as described in Section 5.10.1.1.
06870C DCN6332
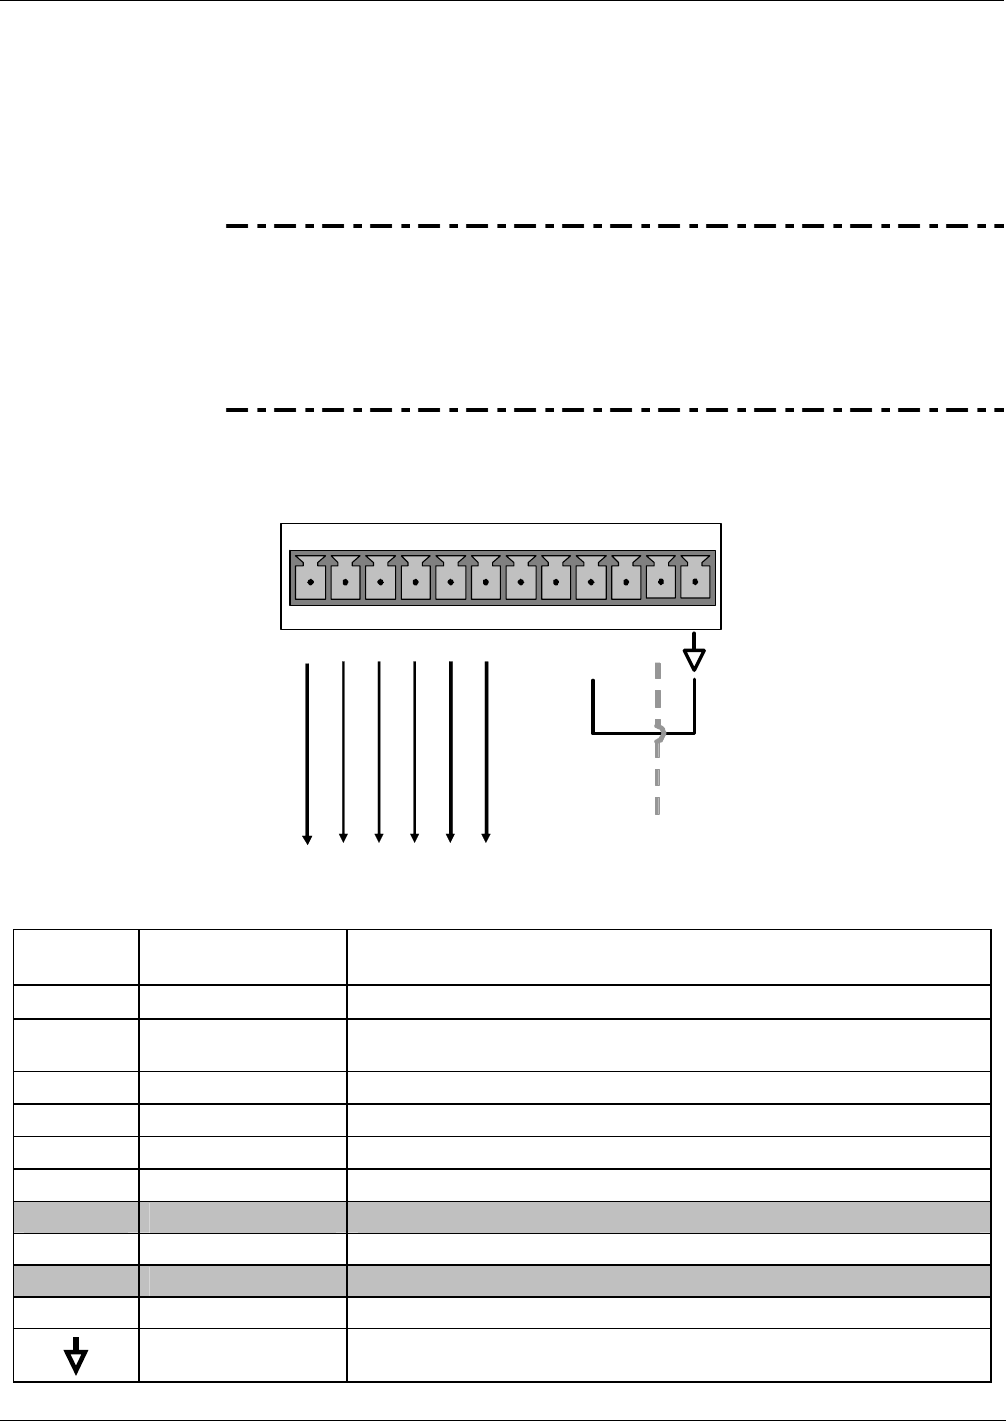
Getting Started Teledyne API – Model T400 Photometric Ozone Analyzer
46
3.3.1.5. Connecting the Status Outputs
The status outputs report analyzer conditions via optically isolated NPN transistors,
which sink up to 50 mA of DC current. These outputs can be used interface with
devices that accept logic-level digital inputs, such as programmable logic controllers
(PLCs). Each Status bit is an open collector output that can withstand up to 40 VDC.
All of the emitters of these transistors are tied together and available at D.
ATTENTION COULD DAMAGE INSTRUMENT AND VOID WARRANTY
Most PLC’s have internal provisions for limiting the current that the input
will draw from an external device. When connecting to a unit that does
not have this feature, an external dropping resistor must be used to limit
the current through the transistor output to less than 50 mA. At 50 mA, the
transistor will drop approximately 1.2V from its collector to emitter.
The status outputs are accessed via a 12-pin connector (Figure 3-9) on the analyzer’s
rear panel, labeled STATUS (Figure 3-4). Each pin’s function is defined in Table 3-6.
STATUS
1 2 3 4 5 6 7 8 D +
SYSTEM OK
HIGH RANGE
CO
N
C
VALID
ZERO CAL
SPAN CAL
DIAG MODE
+5V to external device
Figure 3-9: Status Output Connector
Table 3-6: Status Output Pin Assignments
OUTPUT # STATUS
DEFINITION CONDITION
1 SYSTEM OK ON if no faults are present.
2 CONC VALID ON if O3 concentration measurement is valid.
If the O3 concentration measurement is invalid, this bit is OFF.
3 HIGH RANGE ON if unit is in high range of DUAL or AUTO Range Modes.
4 ZERO CAL ON whenever the instrument is in CALZ mode.
5 SPAN CAL ON whenever the instrument is in CALS mode.
6 DIAG MODE ON whenever the instrument is in DIAGNOSTIC mode.
7 & 8 Unassigned
D Emitter BUSS The emitters of the transistors on pins 1 to 8 are bussed together.
Spare
+ DC Power + 5 VDC, 300 mA source (combined rating with Control Output, if used).
Digital Ground The ground level from the analyzer’s internal DC power supplies. This
connection should be used as the ground return when +5 VDC power is used.
06870C DCN6332
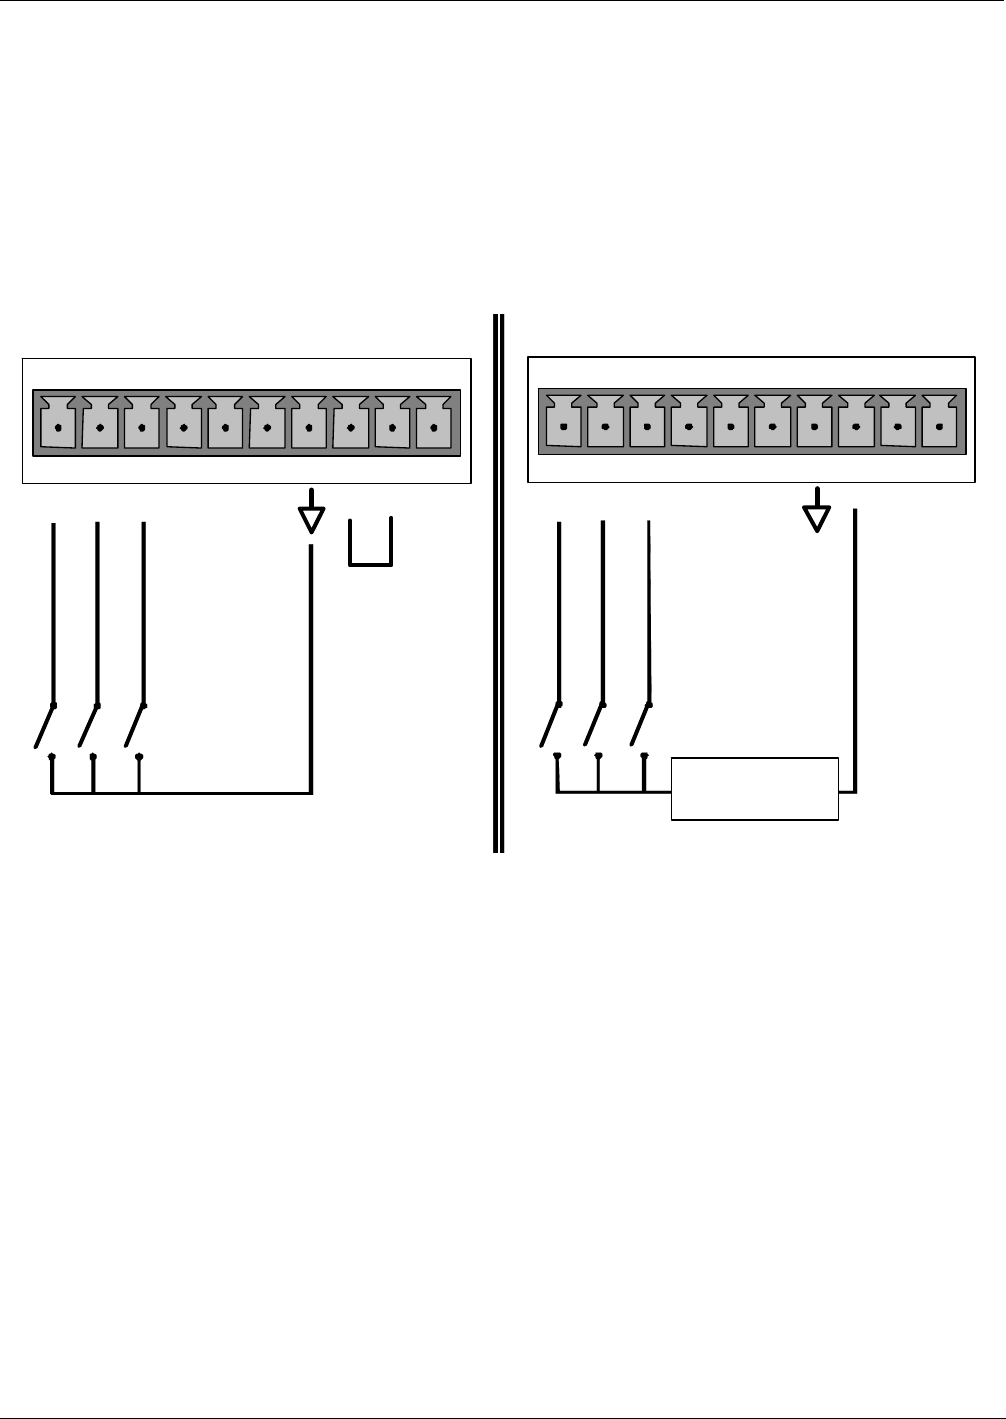
Teledyne API – Model T400 Photometric Ozone Analyzer Getting Started
47
3.3.1.6. Connecting the Control Inputs
The analyzer is equipped with three digital control inputs that can be used to activate the
To remotely activate the zero and span calibration modes, several digital control inputs
are provided through a 10-pin connector labeled CONTROL IN on the analyzer’s rear
panel.
There are two methods for energizing the control inputs. The internal +5V available
from the pin labeled “+” is the most convenient method (Figure 3-10, left). However, if
full isolation is required, an external 5 VDC power supply should be used (Figure 3-10,
right) to ensure that these inputs are truly isolated.
CONTROL IN
A B C D E F U +
LO SPAN
ZERO
SPAN
CONTROL IN
A B C D E F U +
LO SPAN
ZERO
SPAN
-
+
5 VDC Power
Supply
Local Power Connections
(non-isolated configuration)
External Power Connections
(isolated co nfiguratio n)
Figure 3-10: Energizing the T400 Control Inputs
06870C DCN6332
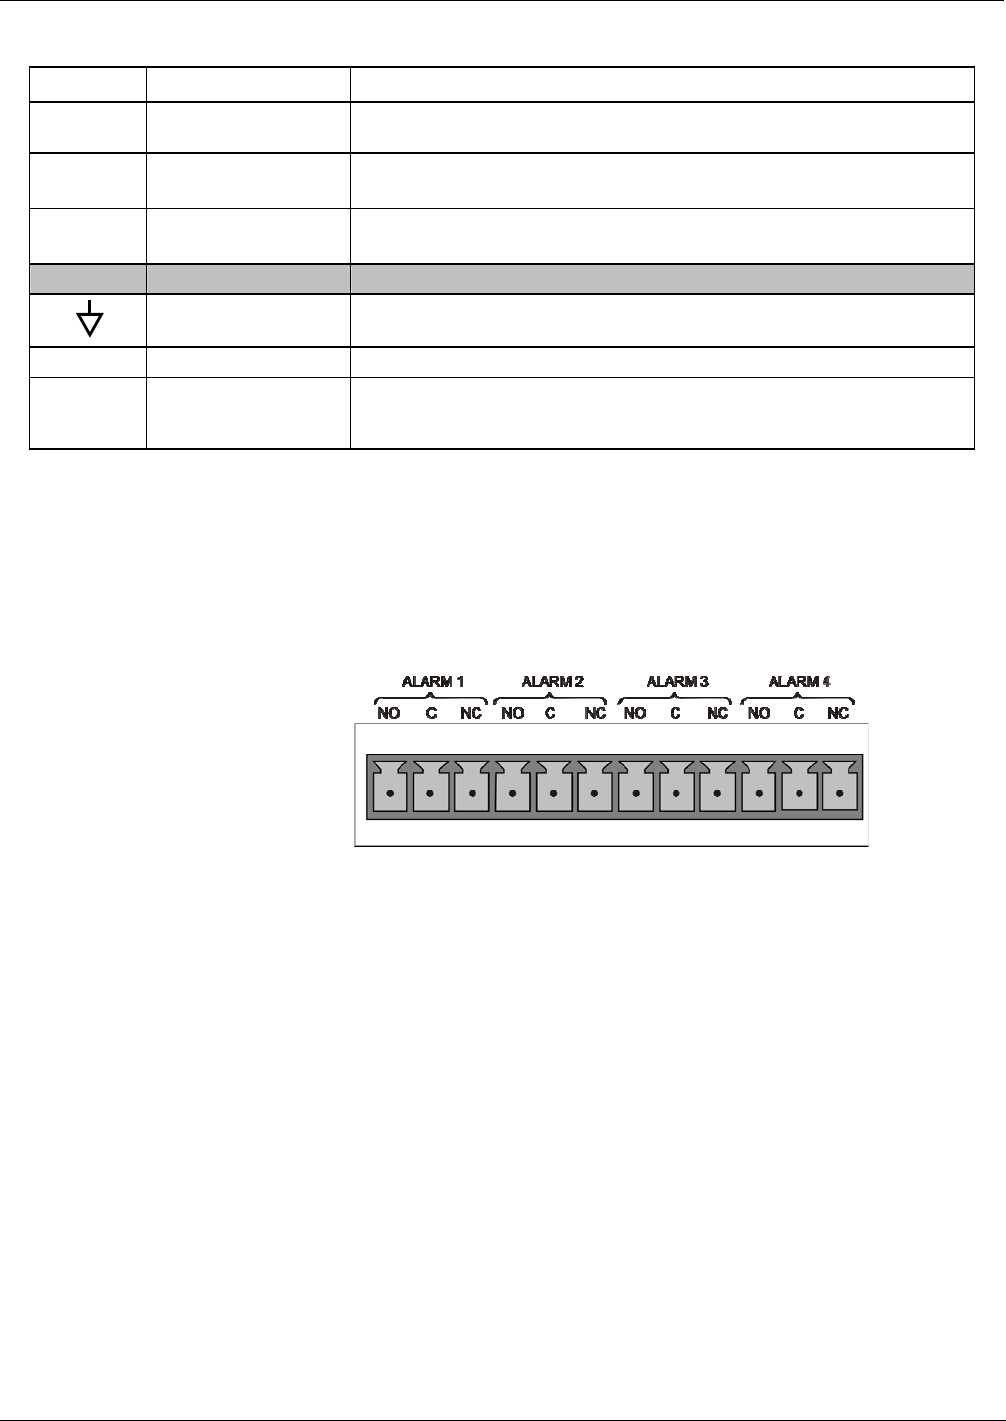
Getting Started Teledyne API – Model T400 Photometric Ozone Analyzer
48
Table 3-7: Control Input Pin Assignments
Input # Status Definition ON Condition
A REMOTE ZERO CAL The Analyzer is placed in Zero Calibration mode. The mode field of the
display will read ZERO CAL R.
B REMOTE
LO SPAN CAL
The Analyzer is placed in Lo Span Calibration mode. The mode field of the
display will read LO CAL R.
C REMOTE
SPAN CAL
The Analyzer is placed in Span Calibration mode. The mode field of the
display will read SPAN CAL R.
D, E & F Spare
Digital Ground The ground level from the analyzer’s internal DC Power Supplies (same as
chassis ground).
U External Power input Input pin for +5 VDC required to activate pins A – F.
+ 5 VDC output
Internally generated 5V DC power. To activate inputs A – F, place a
jumper between this pin and the “U” pin. The maximum amperage through
this port is 300 mA (combined with the analog output supply, if used).
3.3.1.7. Connecting the Concentration Alarm Relay (Option 61)
The concentration alarm option is comprised of four (4) “dry contact” relays on the rear
panel of the instrument. This relay option is different from and in addition to the
“Contact Closures” that come standard on all Teledyne API instruments. Each relay has
3 pins: Normally Open (NO), Common (C) and Normally Closed (NC).
Figure 3-11: Concentration Alarm Relay
Alarm 1 “System OK 2”
Alarm 2 “Conc 1”
Alarm 3 “Conc 2”
Alarm 4 “Range Bit”
“ALARM 1” RELAY
Alarm 1, which is “System OK 2” (system OK 1 is the status bit), is in the energized
state when the instrument is “OK” and there are no warnings. If there is a warning
active or if the instrument is put into the “DIAG” mode, Alarm 1 will change states.
This alarm has “reverse logic” meaning that if you put a meter across the Common and
Normally Closed pins on the connector you will find that it is OPEN when the
instrument is OK. This is so that if the instrument should turn off or lose power, it will
change states and you can record this with a data logger or other recording device.
06870C DCN6332

Teledyne API – Model T400 Photometric Ozone Analyzer Getting Started
49
“ALARM 2” RELAY & “ALARM 3” RELAY
Alarm 2 relay is associated with the “Concentration Alarm 1” set point in the software;
Alarm 3 relay is associated with the “Concentration Alarm 2” set point in the software.
Alarm 2 Relay O3 Alarm 1 = xxx PPM
Alarm 3 Relay O3 Alarm 2 = xxx PPM
Alarm 2 Relay O3 Alarm 1 = xxx PPM
Alarm 3 Relay O3 Alarm 2 = xxx PPM
Alarm 2 relay will be turned on any time the concentration value exceeds the set-point,
and will return to its normal state when the concentration value returns below the
concentration set-point.
Even though the relay on the rear panel is a NON-Latching alarm and resets when the
concentration goes back below the alarm set point, the warning on the front panel of the
instrument will remain latched until it is cleared. You can clear the warning on the front
panel either manually by pressing the CLR button on the front panel touch-screen or
remotely through the serial port.
The software for this instrument is flexible enough to allow you to configure the alarms
so that you can have two alarm levels for each concentration.
O3 Alarm 1 = 2 PPM
O3 Alarm 2 = 10 PPM
O3 Alarm 1 = 2 PPM
O3 Alarm 2 = 10 PPM
In this example, O3 Alarm 1 and O3 Alarm 1 will both be associated with the “Alarm 2”
relay on the rear panel. This allows you to have multiple alarm levels for individual
concentrations.
A more likely configuration for this would be to put one concentration on the “Alarm 1”
relay and the other concentration on the “Alarm 2” relay.
O3 Alarm 1 = 2 PPM
O3 Alarm 2 = Disabled
O3 Alarm 1 = Disabled
O3 Alarm 2 = 10 PPM
“ALARM 4” RELAY
This relay is connected to the “range bit”. If the instrument is configured for “Auto
Range” and the reading goes up into the high range, it will turn this relay on.
06870C DCN6332

Getting Started Teledyne API – Model T400 Photometric Ozone Analyzer
50
3.3.1.8. Connecting the Communications Interfaces
The T-Series analyzers are equipped with connectors for remote communications
interfaces: Ethernet, USB, RS-232, optional RS-232 Multidrop, and optional RS-485.
In addition to using the appropriate cables, each type of communication method must be
configured using the SETUP>COMM menu, Section 5.7. Although Ethernet is DHCP-
enabled by default, it can also be configured manually to set up a static IP address,
which is the recommended setting when operating the instrument via Ethernet.
ETHERNET CONNECTION
For network or Internet communication with the analyzer, connect an Ethernet cable
from the analyzer’s rear panel Ethernet interface connector to an Ethernet port. Please
refer to Section 6.5 for a description of the default configuration and setup instructions.
Configuration:
manual configuration: Section 6.5.1.
automatic configuration (default): Section 6.5.2.
USB CONNECTION
For direct communication between the analyzer and a PC, connect a USB cable between
the analyzer and desktop or laptop USB ports. The baud rate for the analyzer and the
computer must match; you may elect to change one or the other: to view and/or change
the analyzer’s baud rate, see Section 6.2.2.
Note If this option is installed, the COM2 port cannot be used for anything
other than Multidrop communication.
Configuration: Section 6.6
RS-232 CONNECTION
For RS-232 communications with data terminal equipment (DTE) or with data
communication equipment (DCE) connect either a DB9-female-to-DB9-female cable
(Teledyne API part number WR000077) or a DB9-female-to-DB25-male cable (Option
60A, Section 1.3), as applicable, from the analyzer’s rear panel RS-232 port to the
device. Adjust the DCE-DTE switch (Section 6.2) to select DTE or DCE as appropriate.
Configuration: Sections 5.7 and 6.3.
IMPORTANT IMPACT ON READINGS OR DATA
Cables that appear to be compatible because of matching connectors
may incorporate internal wiring that makes the link inoperable. Check
cables acquired from sources other than Teledyne API for pin
assignments (Figure 3-12) before using.
06870C DCN6332
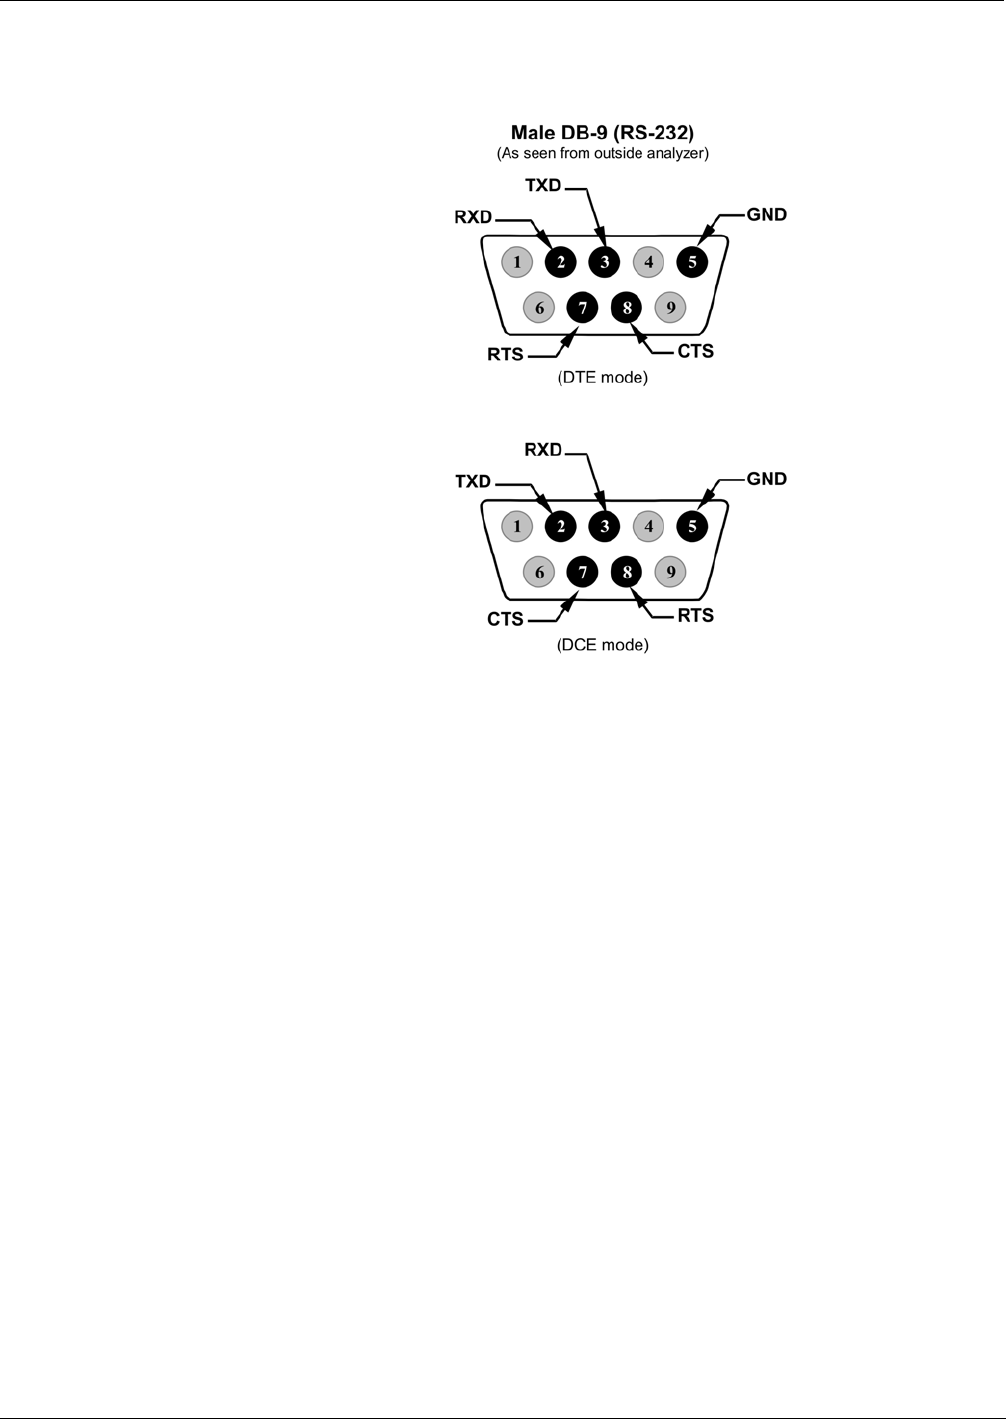
Teledyne API – Model T400 Photometric Ozone Analyzer Getting Started
51
RS-232 COM PORT CONNECTOR PIN-OUTS
Figure 3-12: Rear Panel Connector Pin-Outs for RS-232 Mode
The signals from these two connectors are routed from the motherboard via a wiring
harness to two 10-pin connectors on the CPU card, J11 and J12 (Figure 3-13).
06870C DCN6332
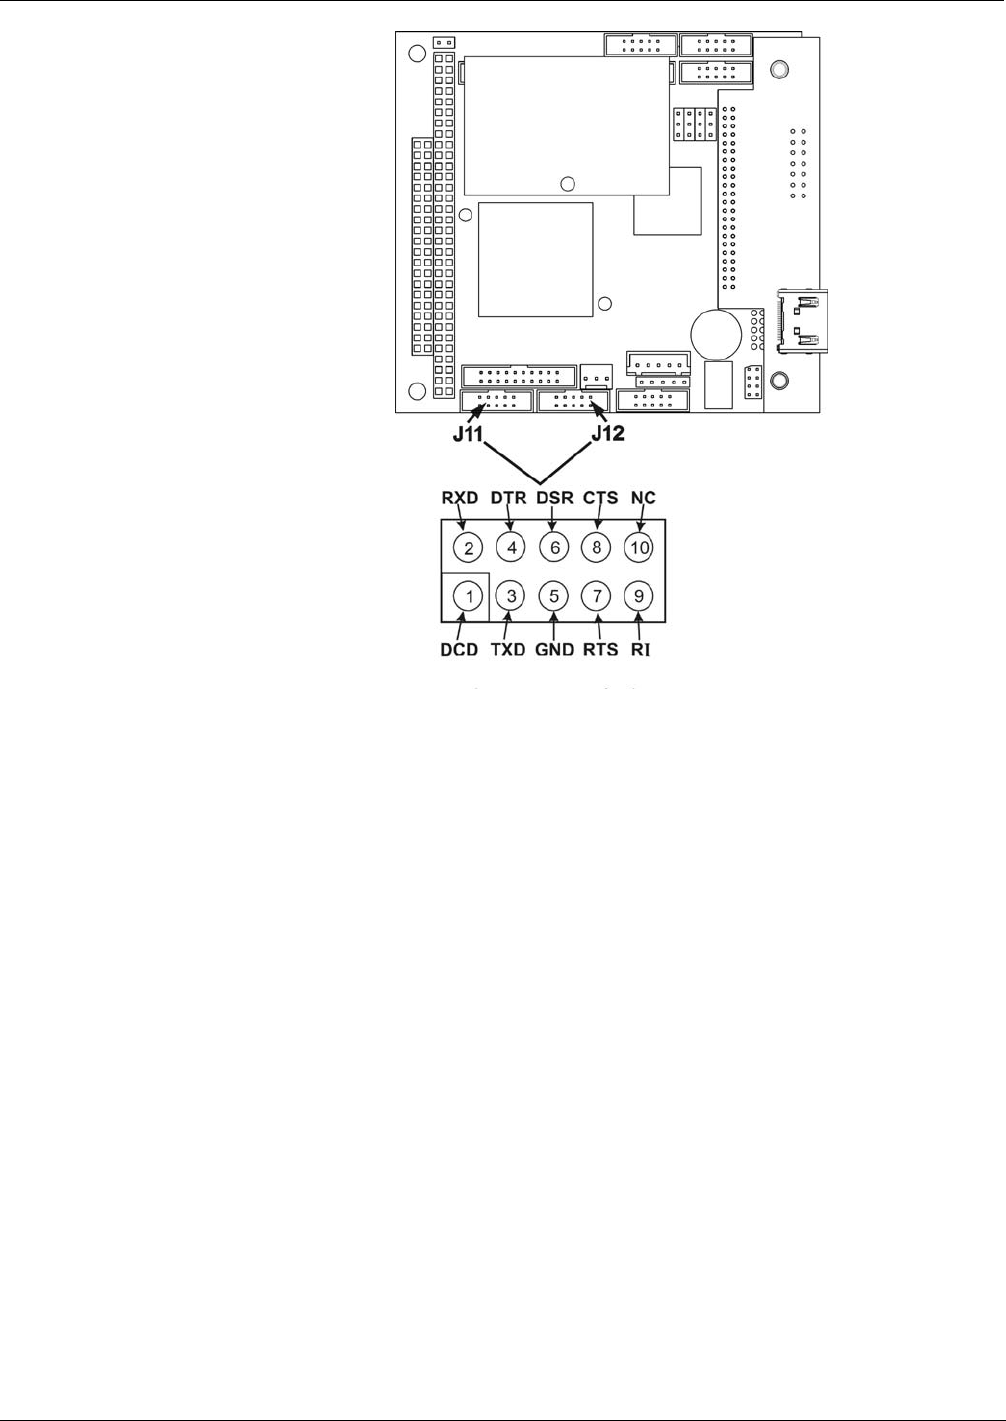
Getting Started Teledyne API – Model T400 Photometric Ozone Analyzer
52
Figure 3-13: CPU Connector Pin-Outs for RS-232 Mode
RS-232 COM PORT DEFAULT SETTINGS
As received from the factory, the analyzer is set up to emulate a DCE (Section 6.1) or
modem, with Pin 3 of the DB-9 connector designated for receiving data and Pin 2
designated for sending data.
RS-232: RS-232 (fixed) DB-9 male connector
Baud rate: 115200 bits per second (baud)
Data Bits: 8 data bits with 1 stop bit
Parity: None
COM2: RS-232 (configurable to RS 485), DB-9 female connector.
Baud rate:19200 bits per second (baud).
Data Bits: 8 data bits with 1 stop bit.
Parity: None.
Configuration: Section 6.2.2
06870C DCN6332

Teledyne API – Model T400 Photometric Ozone Analyzer Getting Started
53
RS-232 MULTIDROP (OPTION 62) CONNECTION
Note Because the RS-232 Multidrop option uses both the RS232 and COM2
DB9 connectors on the analyzer’s rear panel to connect the chain of
instruments, COM2 port is no longer available for separate RS-232 or
RS-485 operation.
ATTENTION COULD DAMAGE INSTRUMENT AND VOID WARRANTY
Printed Circuit Assemblies (PCAs) are sensitive to electro-static
discharges too small to be felt by the human nervous system. Failure to
use ESD protection when working with electronic assemblies will void
the instrument warranty. Refer to Section 14 for more information on
preventing ESD damage.
When the RS-232 Multidrop option is installed, connection adjustments and
configuration through the menu system are required. This section provides instructions
for the internal connection adjustments, then for external connections, and ends with
instructions for menu-driven configuration.
In each instrument with the Multidrop option there is a shunt jumpering two pins on the
serial Multidrop and LVDS printed circuit assembly (PCA), as shown in Figure 3-14.
This shunt must be removed from all instruments except that designated as last in the
multidrop chain, which must remain terminated. This requires powering off and opening
each instrument and making the following adjustments:
1. With NO power to the instrument, remove the top cover and lay the rear panel open
for access to the Multidrop/LVDS PCA, which is seated on the CPU.
2. On the Multidrop/LVDS PCA’s JP2 connector, remove the shunt that jumpers Pins
21 22 as indicated in Figure 3-14. (Do this for all but the last instrument in the
chaim where the shunt should remain installed at Pins 21 22).
3. Check that the following cable connections are made in all instruments (refer to
Figure 3-14):
J3 on the Multidrop/LVDS PCA to the CPU’s COM1 connector
(Note that the CPU’s COM2 connector is not used in Multidrop).
J4 on the Multidrop/LVDS PCA to J12 on the motherboard
J1 on the Multidrop/LVDS PCA to the front panel LCD
06870C DCN6332
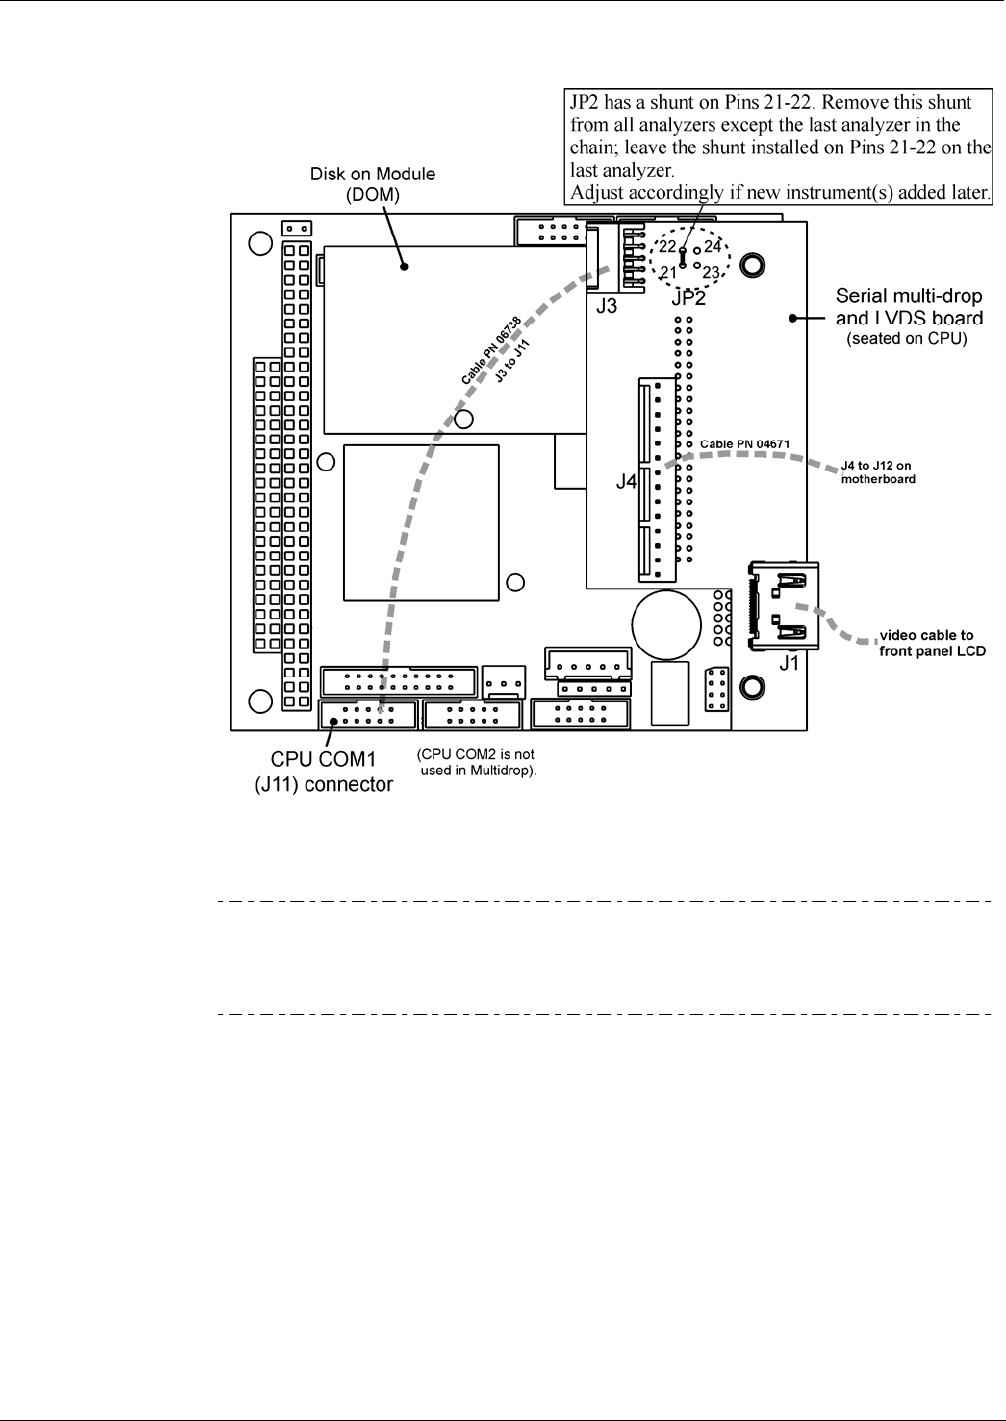
Getting Started Teledyne API – Model T400 Photometric Ozone Analyzer
54
Figure 3-14: Jumper and Cables for Multidrop Configuration
Note If you are adding an instrument to the end of a previously configured
chain, remove the shunt between Pins 21 22 of JP2 on the
Multidrop/LVDS PCA in the instrument that was previously the last
instrument in the chain.
4. Close the instrument.
5. Referring to Figure 3-15 use straight-through DB9 male DB9 female cables to
interconnect the host RS232 port to the first analyzer’s RS232 port; then from the
first analyzer’s COM2 port to the second analyzer’s RS232 port; from the second
analyzer’s COM2 port to the third analyzer’s RS232 port, etc., connecting in this
fashion up to eight analyzers, subject to the distance limitations of the RS-232
standard.
6. On the rear panel of each analyzer, adjust the DCE DTE switch so that the green
and the red LEDs (RX and TX) of the COM1 connector (labeled RS232) are both lit.
(Ensure you are using the correct RS-232 cables internally wired specifically for RS-
232 communication; see Table 1-1: Analyzer Options, “Communication Cables”
06870C DCN6332
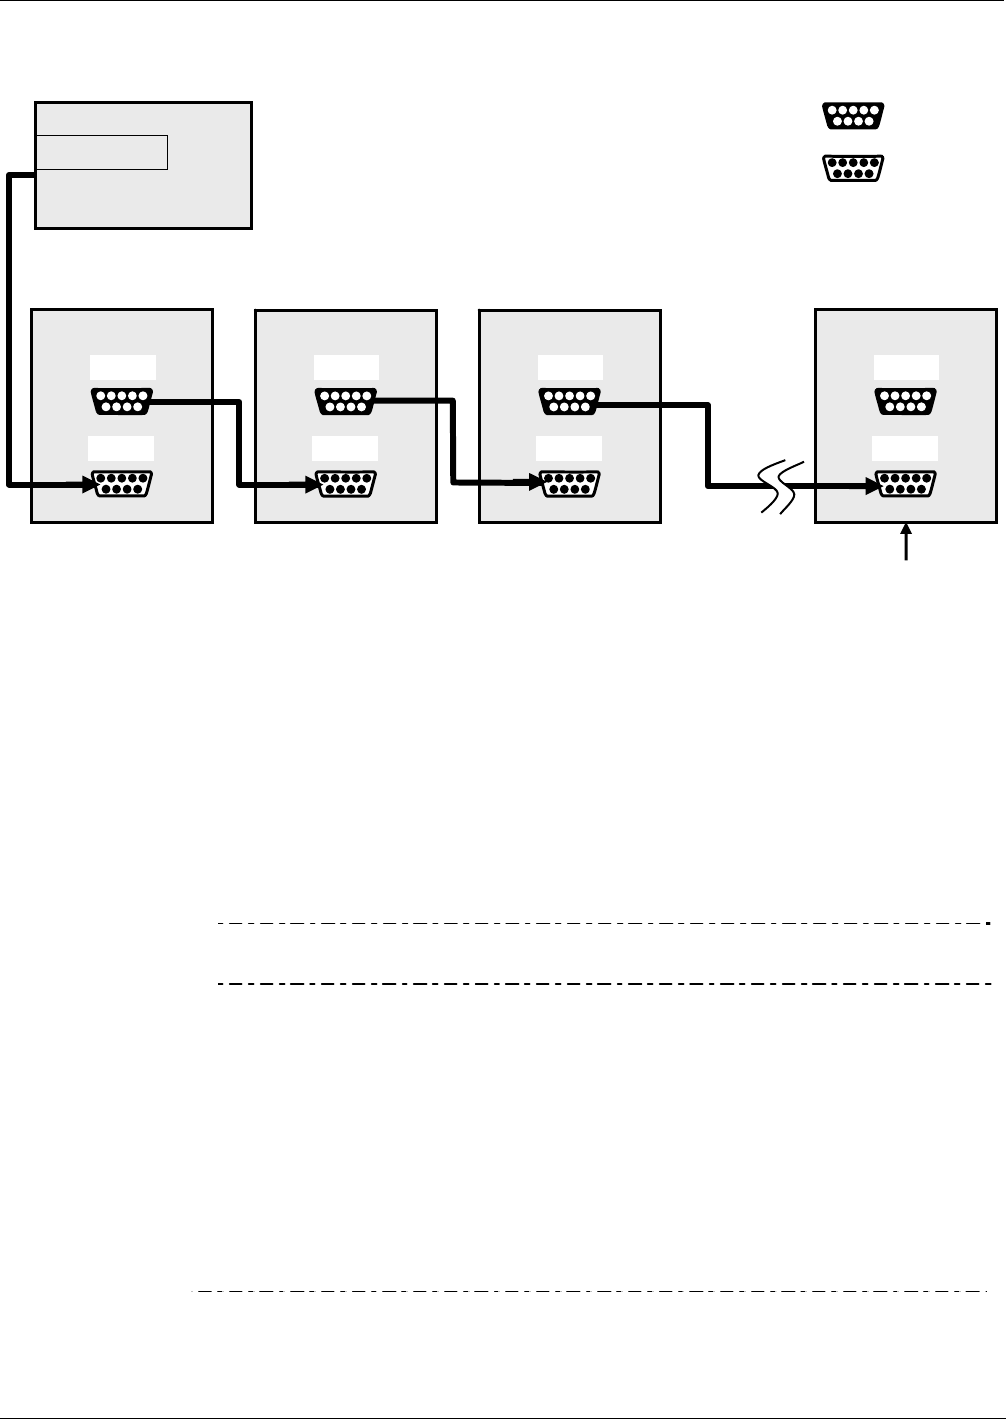
Teledyne API – Model T400 Photometric Ozone Analyzer Getting Started
55
and Section 3.3.1.8: Connecting the Communications Interfaces, ”RS-232
Connection”. )
Analyzer Analyzer Analyzer Last Analyzer
Female DB9
Male DB9
RS-232
COM2
RS-232
COM2
RS-232
COM2
RS-232
COM2
Host
RS-232 port
Ensure jumper is
installed between
JP2 pins 21 22
in last instrument
of multidrop chain.
Figure 3-15: RS-232-Multidrop PCA Host/Analyzer Interconnect Diagram
7. BEFORE communicating from the host, power on the instruments and check that
the Machine ID (Section 5.7.1) is unique for each. On the front panel menu, use
SETUP>MORE>COMM>ID. The default ID is typically either the model number or
“0”; to change the 4-digit identification number, press the button below the digit to be
changed, and press/select ENTER to accept the new ID for that instrument).
Note Teledyne API recommends setting up the first link, between the Host and
the first analyzer, and testing it before setting up the rest of the chain.
8. Next, in the SETUP>MORE>COMM>COM1 menu (do not use the COM2 menu),
edit the COM1 MODE parameter as follows: press/select EDIT and set only QUIET
MODE, COMPUTER MODE, and MULTIDROP MODE to ON. Do not change any
other settings.
9. Press/select ENTER to accept the changed settings, and ensure that COM1 MODE
now shows 35.
10. Press/select SET> to go to the COM1 BAUD RATE menu and ensure it reads the
same for all instruments (edit as needed so that all instruments are set at the same
baud rate; refer to Section 6.2.2).
Note The Instrument ID’s should not be duplicated.
The (communication) Host instrument can only address one instrument at a time.
06870C DCN6332
Getting Started Teledyne API – Model T400 Photometric Ozone Analyzer
56
COM1 port must be set at the same baud rate in all instruments in the multidrop
chain.
RS-485 CONNECTION
As delivered from the factory, COM2 is configured for RS-232 communications. This
port can be reconfigured for operation as a non-isolated, half-duplex RS-485 port. Using
COM2 for RS-485 communication disables the USB port. To reconfigure this port for
RS-485 communication, please contact the factory.
3.3.2. PNENUMATIC CONNECTIONS
This section provides not only pneumatic connection information, but also important
information about the gases required for accurate calibration (Section 3.3.2.1); it also
illustrates the pneumatic layouts for the analyzer in its basic configuration and with
options.
Before making the pneumatic connections, carefully note the following cautionary and
special messages:
CAUTION! GENERAL SAFETY HAZARD
OZONE (O3) IS A TOXIC GAS.
Obtain a Material Safety Data Sheet (MSDS) for this material. Read and
rigorously follow the safety guidelines described there.
Do not vent calibration gas and sample gas into enclosed areas
Sample and calibration gases should only come into contact with PTFE, FEP or
glass.
CAUTION!
Do not operate this instrument until removing dust plugs from SAMPLE and
EXHAUST ports on the rear panel!
CAUTION! GENERAL SAFETY HAZARD
Venting should be outside the shelter or immediate area surrounding the
instrument and conform to all safety requirements regarding exposure to O3.
3.3.2.1. About Zero Air and Calibration Gas
Zero air and span gas are required for accurate calibration.
ZERO AIR
Zero air is similar in chemical composition to the Earth’s atmosphere but scrubbed of all
components that might affect the analyzer’s readings. If your analyzer is equipped with
06870C DCN6332
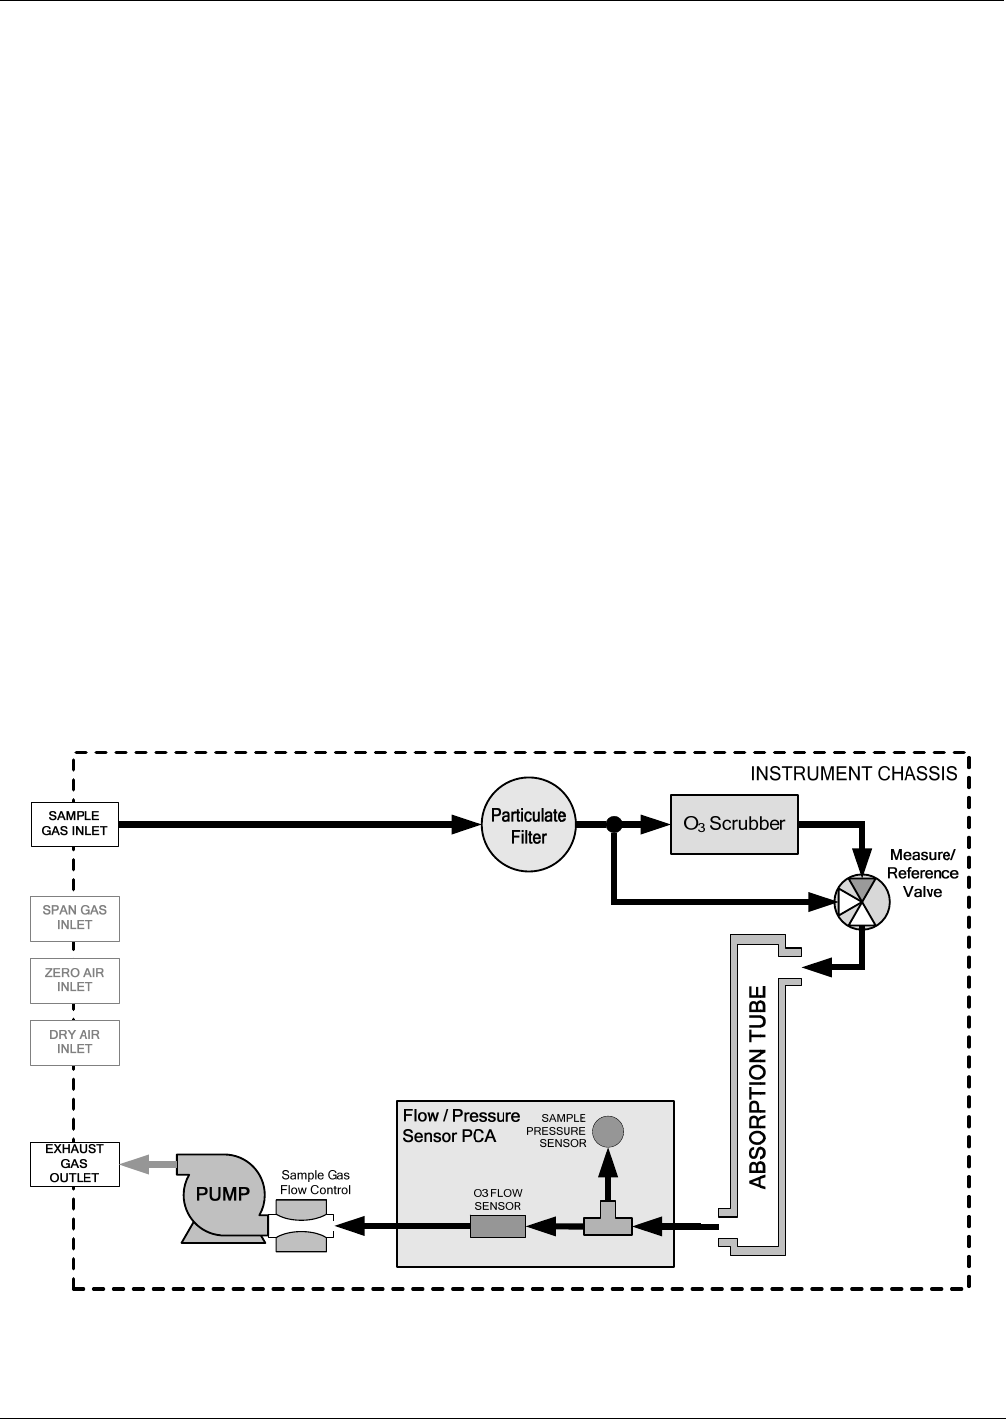
Teledyne API – Model T400 Photometric Ozone Analyzer Getting Started
57
an Internal Zero Span (IZS) or an external zero air scrubber option, it is capable of
creating zero air. For analyzers without an IZS or external zero air scrubber option, an
external zero air generator such as the Teledyne API Model 701 can be used
CALIBRATION (SPAN) GAS
Calibration gas is a gas specifically mixed to match the chemical composition of the
type of gas being measured at near full scale of the desired reporting range. Because
ozone (O3) quickly breaks down into molecular oxygen (O2), this calibration gas cannot
be supplied in precisely calibrated bottles like other gases.
If the T400 analyzer is not equipped with the optional internal zero air generator
(IZS), an external O3 generator capable supplying accurate O3 calibration mixtures
must be used.
Also, some applications, such as EPA monitoring, require multipoint calibration
checks where Span gas of several different concentrations is needed.
In either case, we recommend using a Gas Dilution Calibrator such as a TAPI
Model T700 with internal photometer option.
In the case of O3 measurements made with the Model T400 photometric ozone analyzer,
it is recommended that you use a span gas with an O3 concentration equal to 90% of the
reporting range for your application.
EXAMPLE:
If the application is to measure between 0 ppm and 500 ppb, an appropriate
span gas would be 450 ppb.
If the application is to measure between 0 ppb and 1000 ppb, an appropriate
span gas would be 800 ppb.
Figure 3-16: T400 Pneumatic Diagram – Basic Unit
06870C DCN6332
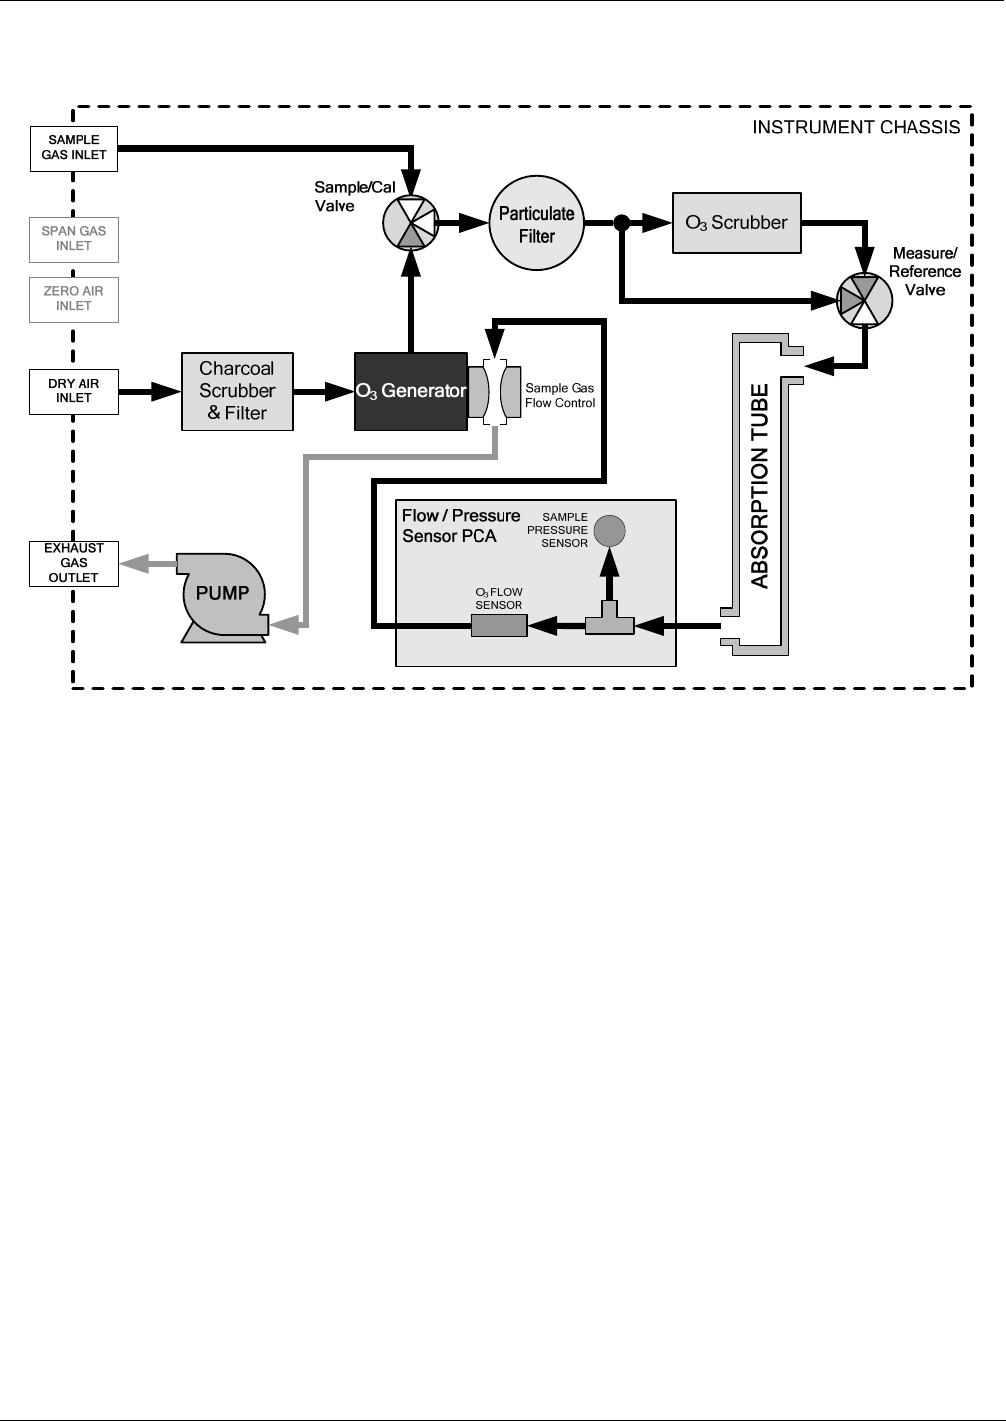
Getting Started Teledyne API – Model T400 Photometric Ozone Analyzer
58
Figure 3-17: T400 Pneumatic Diagram with Internal Zero/Span (IZS) Option (OPT-50G)
06870C DCN6332
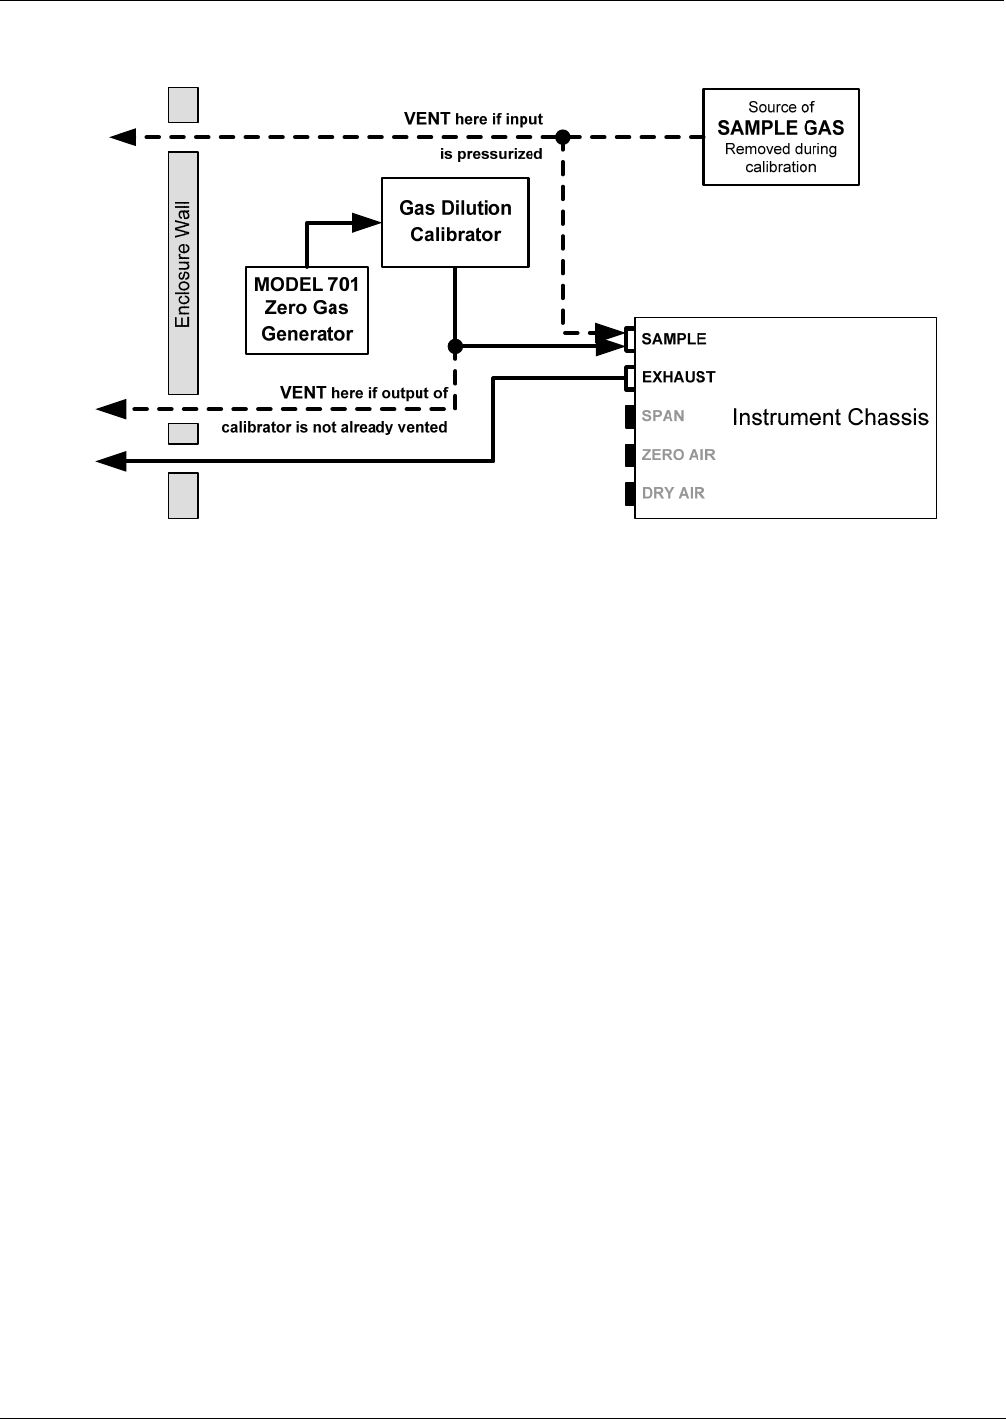
Teledyne API – Model T400 Photometric Ozone Analyzer Getting Started
59
3.3.2.2. Pneumatic Setup for Basic Configuration
Figure 3-18: Gas Line Connections for the T400 Analyzer – Basic Configuration
For the Model T400 photometric ozone analyzer in its basic configuration (i.e. without
the optional internal zero air source or valves), attach the following pneumatic lines:
SAMPLE GAS SOURCE:
Attach a sample inlet line to the sample inlet fitting.
Sample Gas pressure must equal ambient atmospheric pressure (1.0 psig)
In applications where the sample gas is received from a pressurized manifold, a
vent must be placed on the sample gas line. This vent line must be:
At least 0.2m long
No more than 2m long
Vented outside the shelter or immediate area surrounding the instrument
CAL GAS & ZERO AIR SOURCES:
The source of calibration gas is also attached to the SAMPLE inlet, but only when a
calibration operation is actually being performed.
EXHAUST OUTLET:
Attach an exhaust line to the EXHAUST outlet fitting.
The exhaust line should be a maximum of 10 meters of ¼” PTEF tubing.
Once the appropriate pneumatic connections have been made, check all pneumatic
fittings for leaks using the procedures defined in Section 11.3.4.
06870C DCN6332
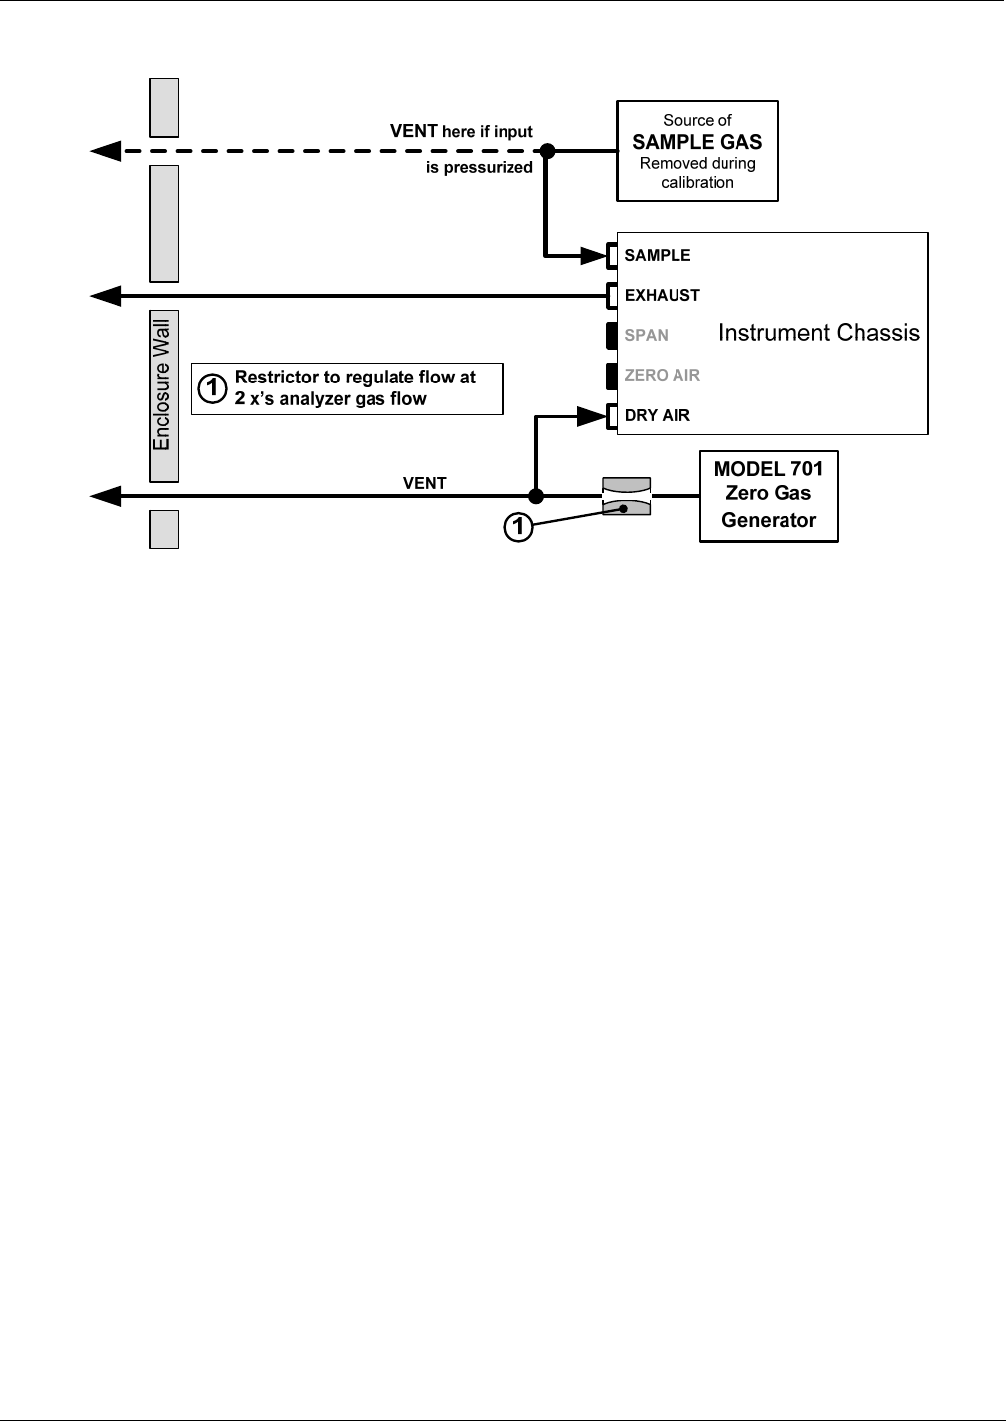
Getting Started Teledyne API – Model T400 Photometric Ozone Analyzer
60
3.3.2.3. Pneumatic Setup for the T400 Analyzer with Internal Zero/Span Option (IZS)
Figure 3-19: Gas Line Connections for the T400 Analyzer with IZS Option (OPT-50G)
For the Model T400 photometric ozone analyzer with the optional internal zero air
generator and span valve (IZS), attach the following pneumatic lines:
SAMPLE GAS SOURCE:
Attach a sample inlet line to the sample inlet fitting.
Sample Gas pressure must equal ambient atmospheric pressure (1.0 psig)
In applications where the sample gas is received from a pressurized manifold, a
vent must be placed on the sample gas line. This vent line must be:
At least 0.2m long
No more than 2m long
Vented outside the shelter or immediate area surrounding the instrument
ZERO AIR SOURCE:
Attach a gas line from the source of zero air (e.g., a Teledyne API M701 zero air
Generator) to the DRY AIR inlet.
The gas from this line will be used internally as zero air and as source air for the
internal O3 generator
EXHAUST OUTLET:
Attach an exhaust line to the EXHAUST outlet fitting.
The exhaust line should be a maximum of 10 meters of ¼” PTEF tubing.
Once the appropriate pneumatic connections have been made, check all pneumatic
fittings for leaks using the procedures defined in Section 11.3.4.
06870C DCN6332
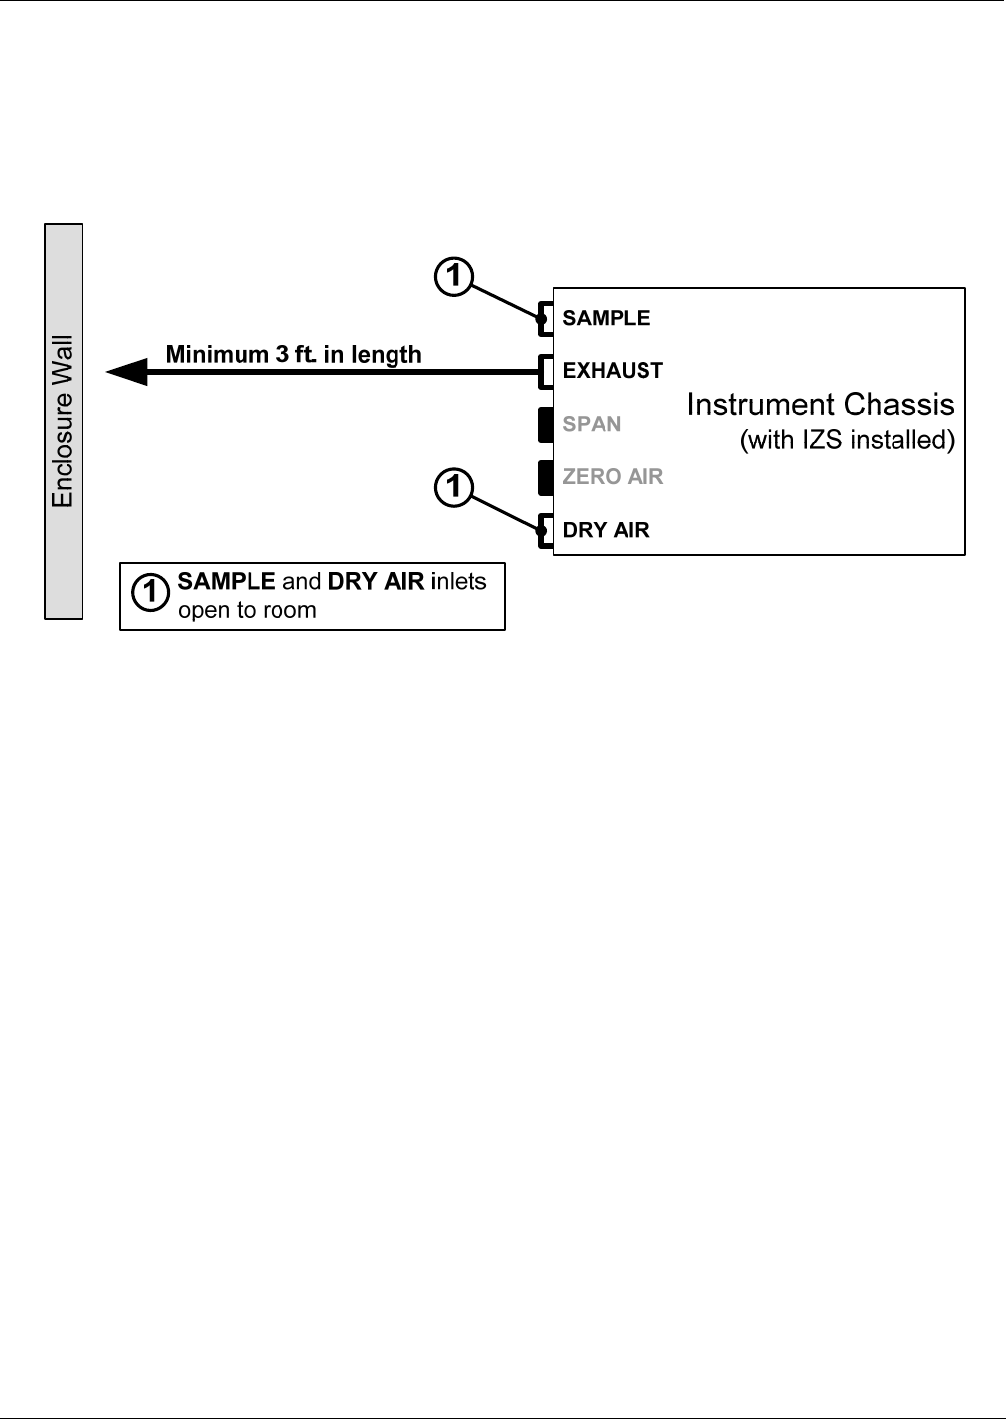
Teledyne API – Model T400 Photometric Ozone Analyzer Getting Started
61
3.3.3. PNEUMATIC SETUPS FOR AMBIENT AIR MONITORING
3.3.3.1. Pneumatic Set Up for T400’s Located in the Same Room Being Monitored
In this application is often preferred that the sample gas and the source gas for the O3
generator and internal zero air be the same chemical composition.
Figure 3-20: Gas Line Connections when the T400 Analyzer is Located in the Room Being Monitored
SAMPLE GAS & DRY AIR SOURCES
For instruments located in the same room, being monitored there is no need to attach the
gas inlet lines to the SAMPLE inlet or the dry air inlet.
EXHAUST OUTLET
Attach an outlet line to the EXHAUST outlet fitting.
In order to prevent the instrument from re-breathing its own exhaust gas (resulting in
artificially low readings) the end of the exhaust outlet line should be located at least
2 feet from the back panel of the instrument.
Once the appropriate pneumatic connections have been made, check all pneumatic
fittings for leaks using the procedures defined in Section 11.3.4.
06870C DCN6332
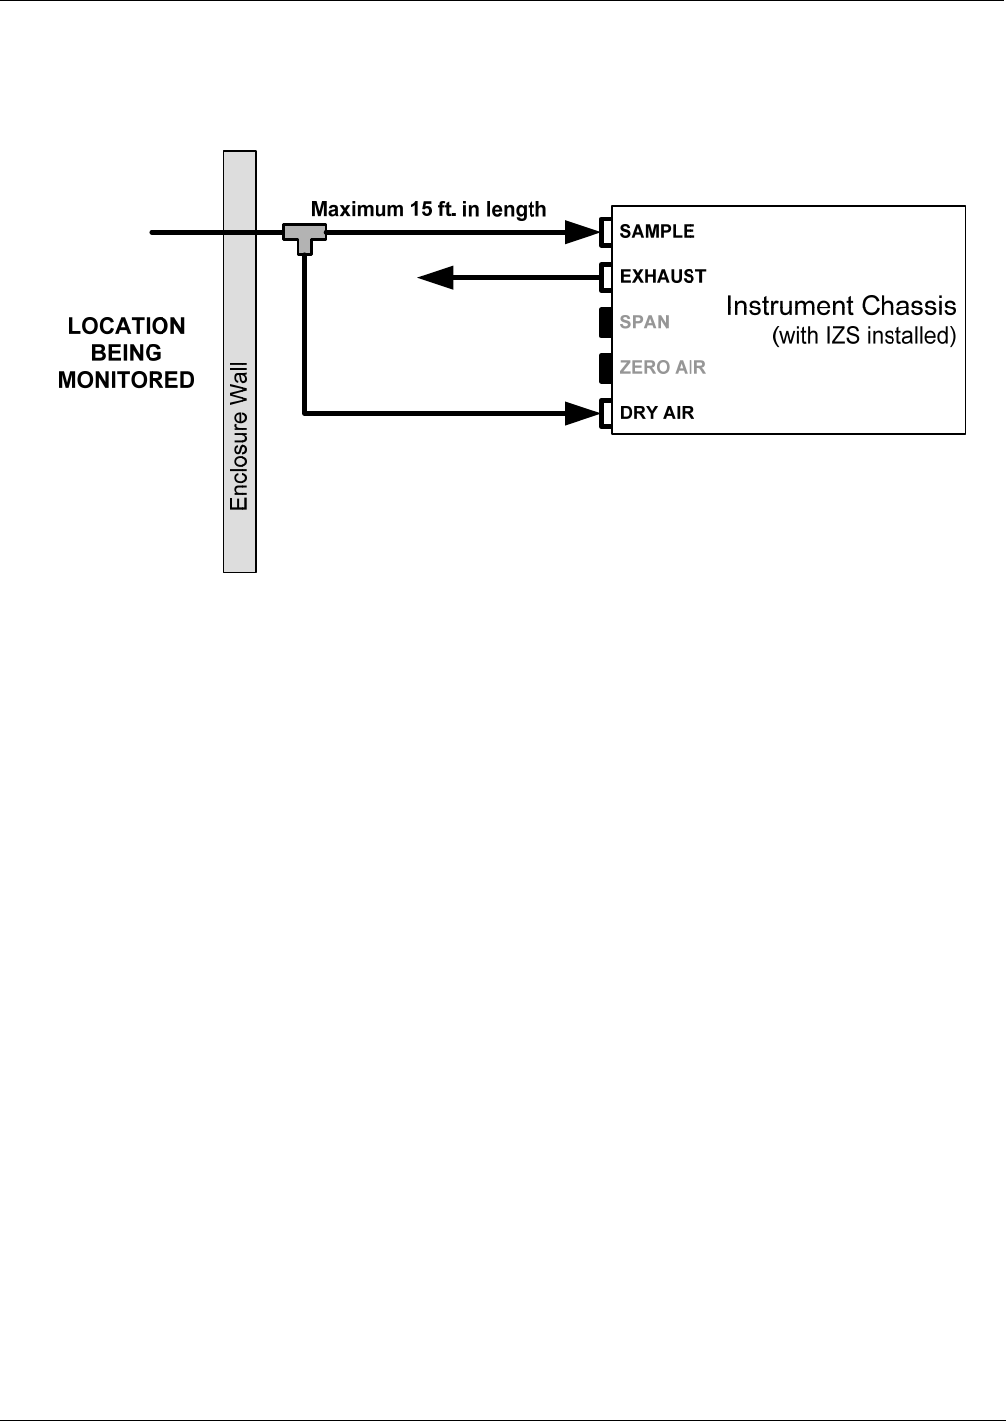
Getting Started Teledyne API – Model T400 Photometric Ozone Analyzer
62
3.3.3.2. Pneumatic Set Up for T400’s Monitoring Remote Locations
In this application it is often preferred that the Sample gas and the source gas for the O3
generator and internal zero air be the same chemical composition.
Figure 3-21: Gas Line Connections when the T400 Analyzer is Monitoring a Remote Location
SAMPLE GAS SOURCE:
Attach a sample inlet line leading from the room being monitored to the sample inlet
fitting.
DRY AIR SOURCE:
Attach a gas line leading from the room being monitored to the dry air inlet port.
This can be a separate line or, as shown above the same line with a T- fitting.
EXHAUST OUTLET:
No outlet line is required for the exhaust port of the instrument.
Once the appropriate pneumatic connections have been made, check all pneumatic
fittings for leaks using the procedures defined in Section 11.3.4.
06870C DCN6332
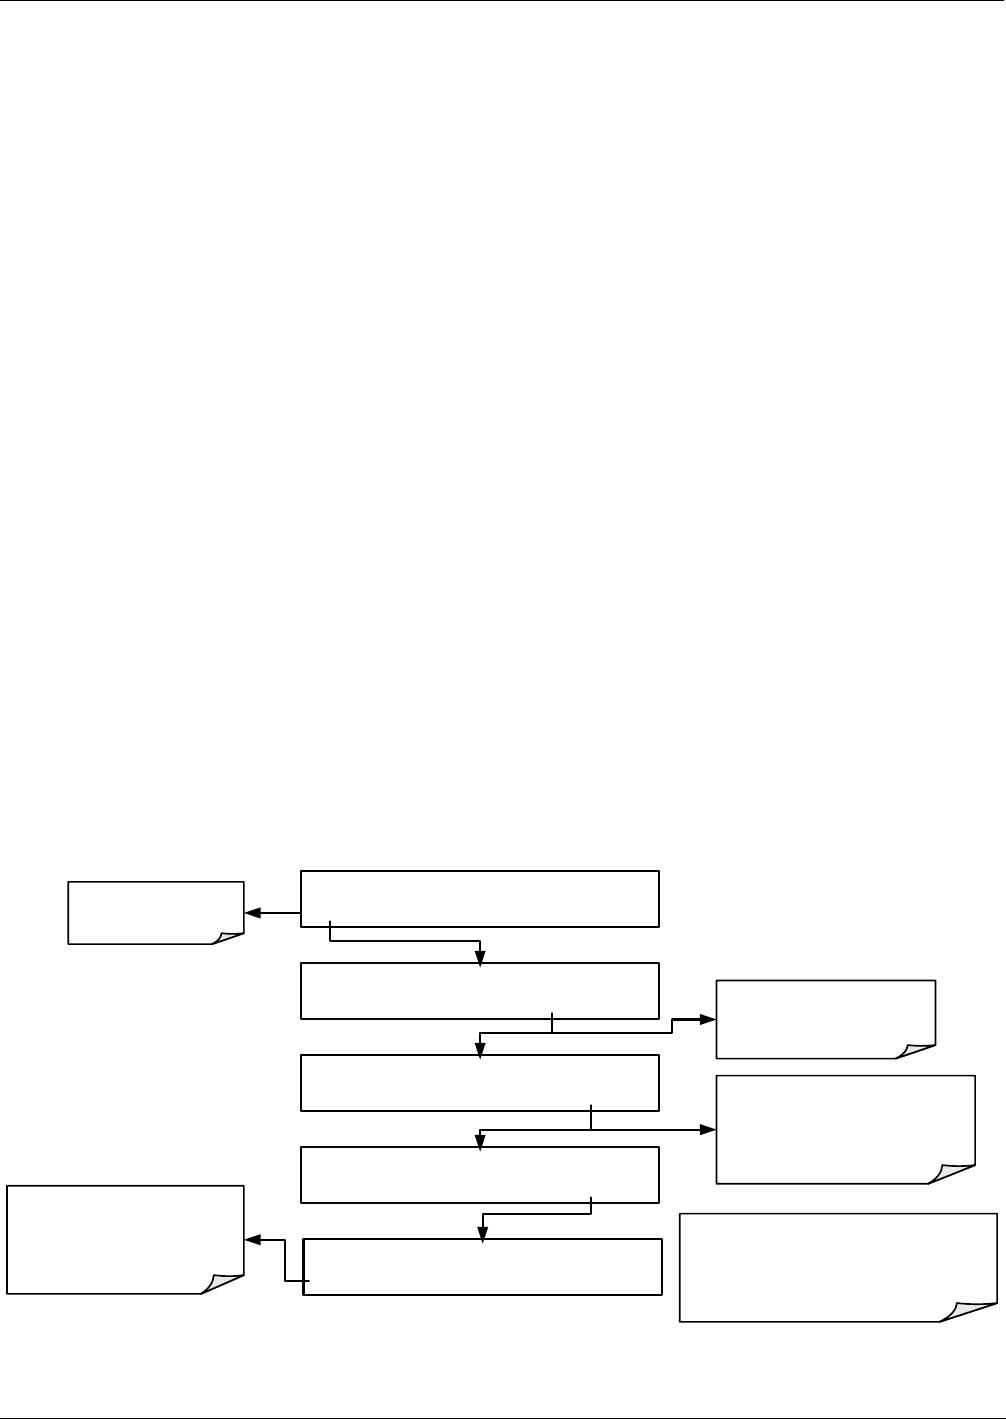
Teledyne API – Model T400 Photometric Ozone Analyzer Getting Started
63
3.4. STARTUP, FUNCTIONAL CHECKS, AND INITIAL
CALIBRATION
If you are unfamiliar with the T400 theory of operation, we recommend that you read
Section 13
For information on navigating the analyzer’s software menus, see the menu trees
described in Appendix A.1.
3.4.1. START UP
After the electrical and pneumatic connections are made, an initial functional check is in
order. Turn on the instrument. The pump and exhaust fan should start immediately. The
display will show a momentary splash screen of the Teledyne API logo and other
information during the initialization process while the CPU loads the operating system,
the firmware and the configuration data.
The analyzer should automatically switch to Sample Mode after completing the boot-up
sequence and start monitoring O3 gas. However, there is an approximately one hour
warm-up period before reliable gas measurements can be taken. During the warm-up
period, the front panel display may show messages in the Parameters field.
3.4.2. WARNING MESSAGES
Because internal temperatures and other conditions may be outside be specified limits
during the analyzer’s warm-up period, the software will suppress most warning
conditions for 30 minutes after power up. If warning messages persist after the 30
minutes warm up period is over, investigate their cause using the troubleshooting
guidelines in Section 12 of this manual.
To view and clear warning messages, press:
Suppresses the
warning messages
Press CLR to clear the current
message.
If more than one warning is
active, the next message will take
its place.
Once the last warning has
been cleared, the analyzer will
automatically switch to
SAMPLE mode
NOTE:
If a warning message persists after
several attempts to clear it, the message
may indicate a real problem and not an
artifact of the warm-up period
SAMPLE SYSTEM RESET
TEST CAL MSG CLR SETUP
SAMPLE SYSTEM RESET
TEST CAL MSG CLR SETUP
SAMPLE SYSTEM RESET
TEST CAL MSG CLR SETUP
SYSTEM SYSTEM RESET
TEST CLR SETUP
MSG returns the active
warnings to the message
field.
STANDBY RANGE=500.0 PPB O3=XXXX
TEST CAL MSG SETUP
Table 3-8 lists brief descriptions of the warning messages that may occur during start up.
06870C DCN6332

Getting Started Teledyne API – Model T400 Photometric Ozone Analyzer
64
Table 3-8: Possible Warning Messages at Start-Up
MESSAGE MEANING
ANALOG CAL WARNING The A/D or at least one D/A channel have not been calibrated.
BOX TEMP WARNING The temperature inside the T400 chassis is outside the specified limits.
CANNOT DYN SPAN1 Contact closure span calibration failed while DYN_SPAN was set to ON.
CANNOT DYN ZERO2 Contact closure zero calibration failed while DYN_ZERO was set to ON.
CONFIG INITIALIZED Configuration storage was reset to factory configuration or erased.
DATA INITIALIZED DAS data storage was erased before the last power up occurred.
LAMP DRIVER WARN CPU is unable to communicate with one of the I2C UV Lamp Drivers.
LAMP STABIL WARN Photometer lamp reference step-changes occur more than 25% of the time.
O3 GEN LAMP WARN3 The UV Lamp or Detector in the IZS module may be faulty or out of adjustment.
O3 GEN REF WARNING3 The UV Lamp or Detector in the IZS module may be faulty or out of adjustment.
O3 GEN TEMP WARN3 The UV Lamp Heater or Temperature Sensor in the IZS module may be faulty.
O3 SCRUB TEMP WARN4 The Heater or Temperature Sensor of the O3 Scrubber may be faulty.
PHOTO REF WARNING The O3 Reference value is outside of specified limits.
PHOTO TEMP WARNING The UV Lamp Temperature is outside of specified limits.
REAR BOARD NOT DET Motherboard was not detected during power up.
RELAY BOARD WARN CPU is unable to communicate with the relay PCA.
SAMPLE FLOW WARN The flow rate of the sample gas is outside the specified limits.
SAMPLE PRESS WARN The pressure of the sample gas is outside the specified limits.
SAMPLE TEMP WARN The temperature of the sample gas is outside the specified limits.
SYSTEM RESET1 The computer has rebooted.
1 Clears the next time successful zero calibration is performed.
2 Clears the next time successful span calibration is performed.
3 Only Appears if the IZS option is installed.
4 Only appears if the optional metal wool O3 scrubber is installed.
06870C DCN6332

Teledyne API – Model T400 Photometric Ozone Analyzer Getting Started
65
3.4.3. FUNCTIONAL CHECK
After the analyzer’s components have warmed up for at least 30 minutes, verify that the
software properly supports any hardware options that are installed: navigate through the
analyzer’s software menus; refer to the menu trees described in Appendix A.
Check to make sure that the analyzer is functioning within allowable operating
parameters.
Appendix C includes a list of test functions viewable from the analyzer’s front panel
as well as their expected values.
These functions are also useful tools for diagnosing problems with your analyzer
(Section 12.1.2).
The enclosed Final Test and Validation Data sheet (part number 04314) lists these
values as they were before the instrument left the factory.
Press the <TST TST> buttons to scroll through the list of Test parameters. Remember
until the unit has completed its warm up, these parameters may not have stabilized.
3.4.4. INITIAL CALIBRATION
To perform the following calibration you must have sources for zero air and calibration
(span) gas available for input into the inlet/outlet fittings on the back of the analyzer (see
Section 3.3.2).
The method for performing an initial calibration for the Model T400 photometric ozone
analyzer differs slightly depending on the whether or not any of the available internal
zero air or valve options are installed.
See Section 3.4.5 for instructions for initial calibration of the T400 analyzers in their
base configuration.
See Section 3.5.4 for instructions for initial calibration of T400 analyzers with IZS
Valve Options
See Section 9.3 for information regarding setup and calibration of T400 analyzers
with Z/S Valve options.
If you are using the T400 analyzer for EPA monitoring, only the calibration method
described in Section 10 should be used.
3.4.4.1. Interferents for O3 Measurement
The detection of O3 is subject to interference from a number of sources including, SO2,
NO2, NO, H2O AND aromatic hydrocarbon meta-xylene and mercury vapor. The Model
T400 successfully rejects interference from all of these with the exception of mercury
vapor.
If the Model T400 is installed in an environment where the presence of mercury vapor is
suspected, steps should be taken to remove the mercury vapor from the sample gas
before it enters the analyzer.
For more detailed information regarding O3 measurement interferences, see Section 13.1.4.
Note The presence of mercury vapor is highly unlikely in the types of
applications for which T400 analyzers with IZS options installed are
normally used.
06870C DCN6332

Getting Started Teledyne API – Model T400 Photometric Ozone Analyzer
66
3.4.5. INITIAL CALIBRATION PROCEDURE FOR T400 ANALYZERS
WITHOUT OPTIONS
The following procedure assumes that:
The instrument DOES NOT have any of the available Zero/Span Valve Options
installed and Cal gas will be supplied through the SAMPLE gas inlet on the back of
the analyzer.
The pneumatic setup matches that described in Section 3.3.2.2.
3.4.5.1. Verifying the T400 Reporting Range Settings
While it is possible to perform the following procedure with any range setting we
recommend that you perform this initial checkout using following reporting range
settings:
Unit of Measure: PPB
Reporting Range: 500 PPB
Mode Setting: SNGL
While these are the default setting for the T400 analyzer, it is recommended that you
verify them before proceeding with the calibration procedure, by pressing:
06870C DCN6332
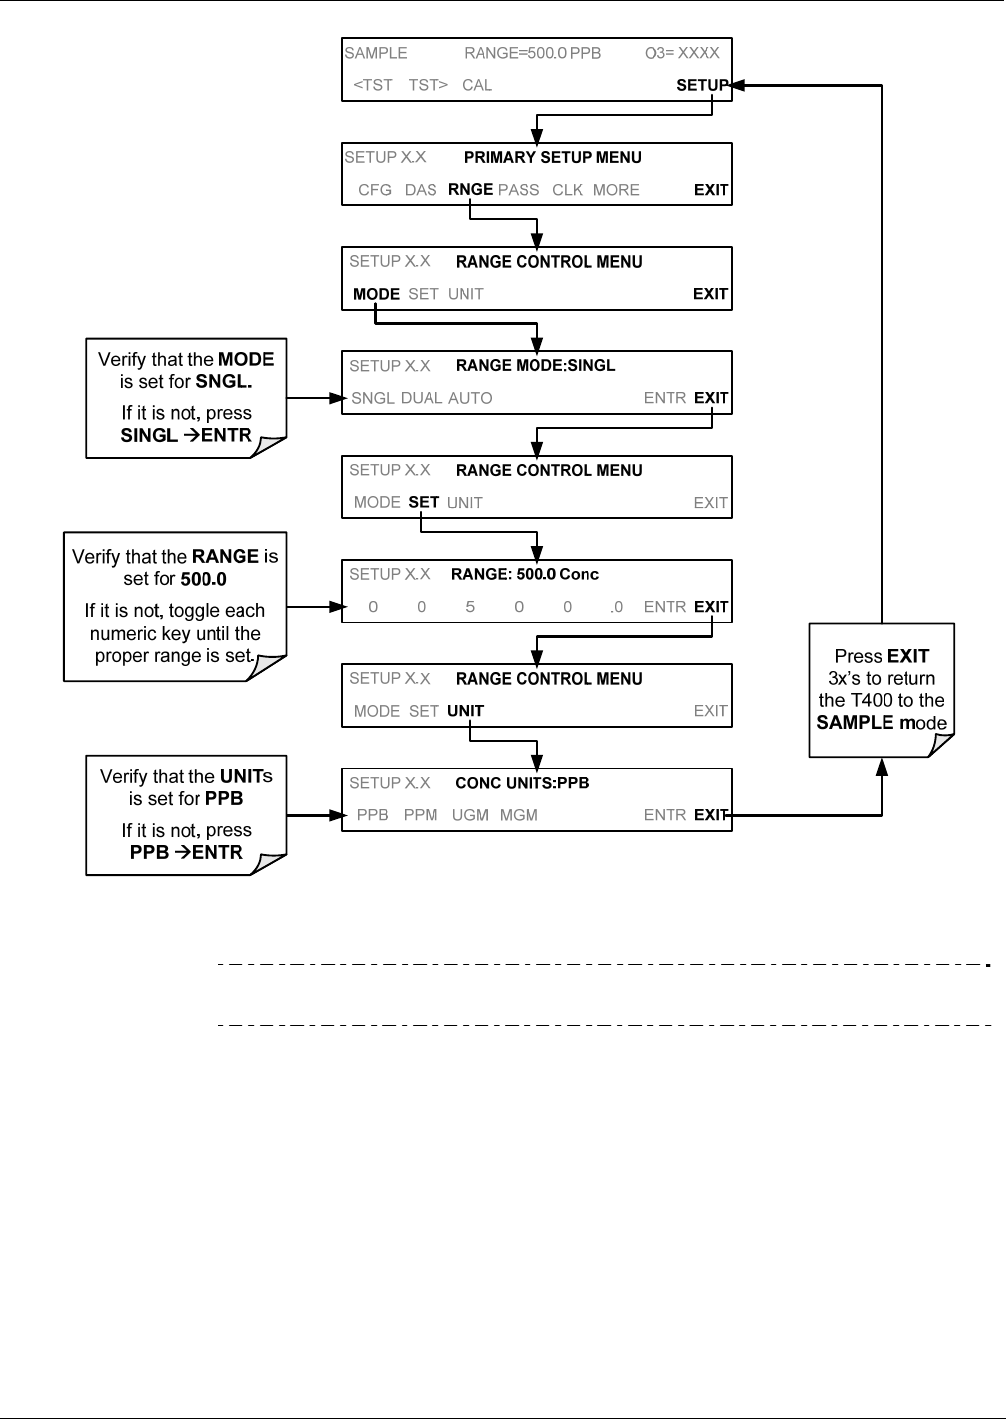
Teledyne API – Model T400 Photometric Ozone Analyzer Getting Started
67
3.4.5.2. Verify the Expected O3 Span Gas Concentration:
Note For this initial calibration, it is important to verify the PRECISE O3
Concentration Value of the SPAN gas independently.
The O3 span concentration value automatically defaults to 400.0 PPB and it is
recommended that an O3 calibration gas of that concentration be used for the initial
calibration of the unit. To verify that the analyzer span setting is set for 400 PPB, press
06870C DCN6332
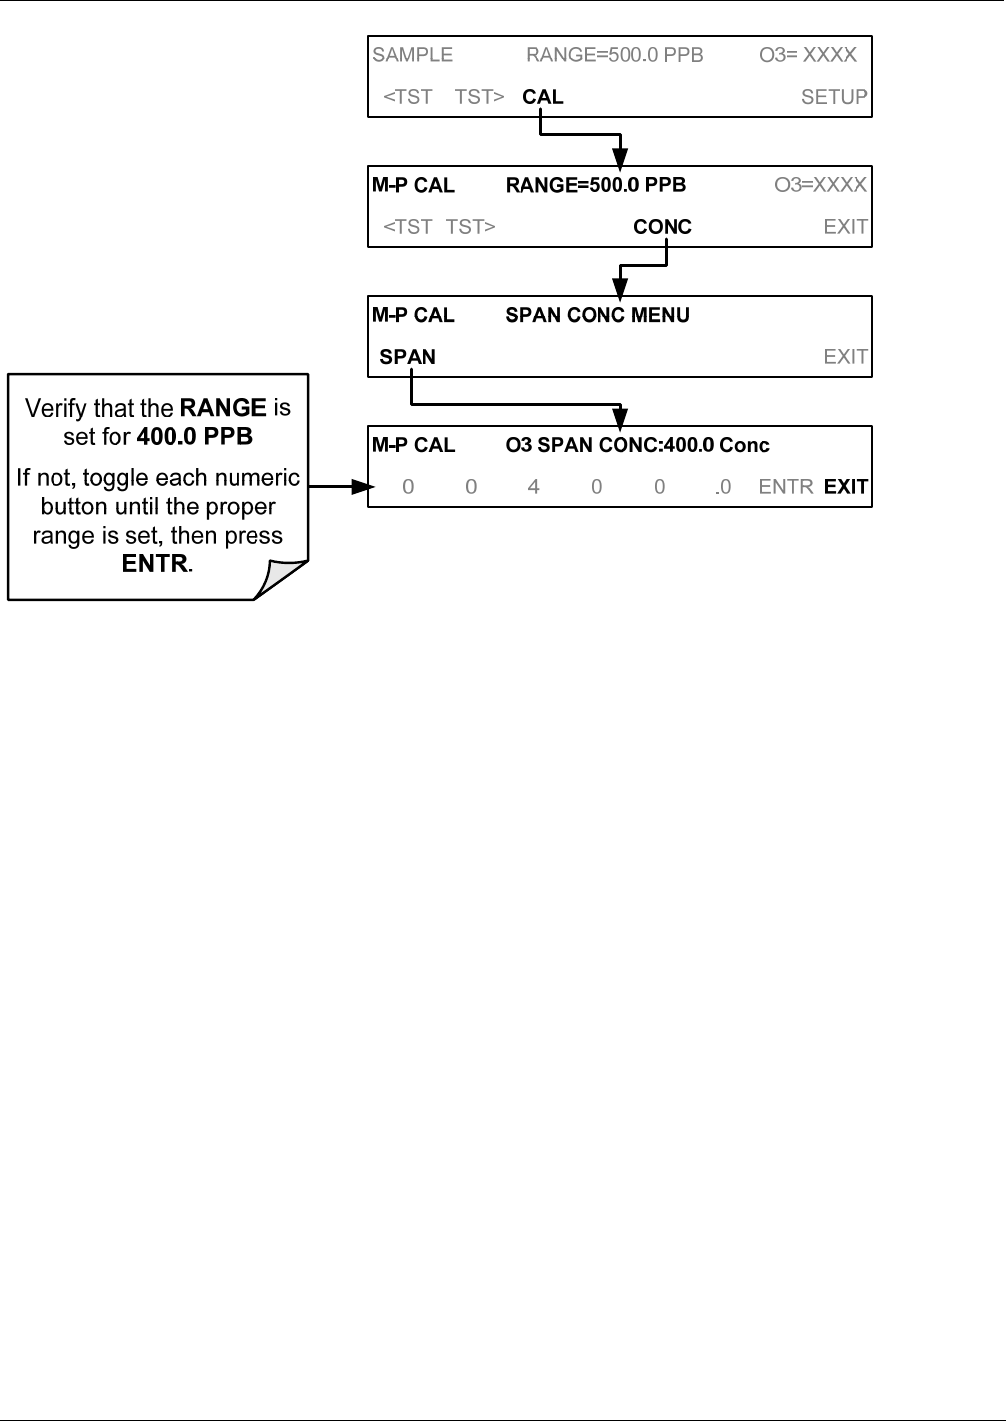
Getting Started Teledyne API – Model T400 Photometric Ozone Analyzer
68
06870C DCN6332
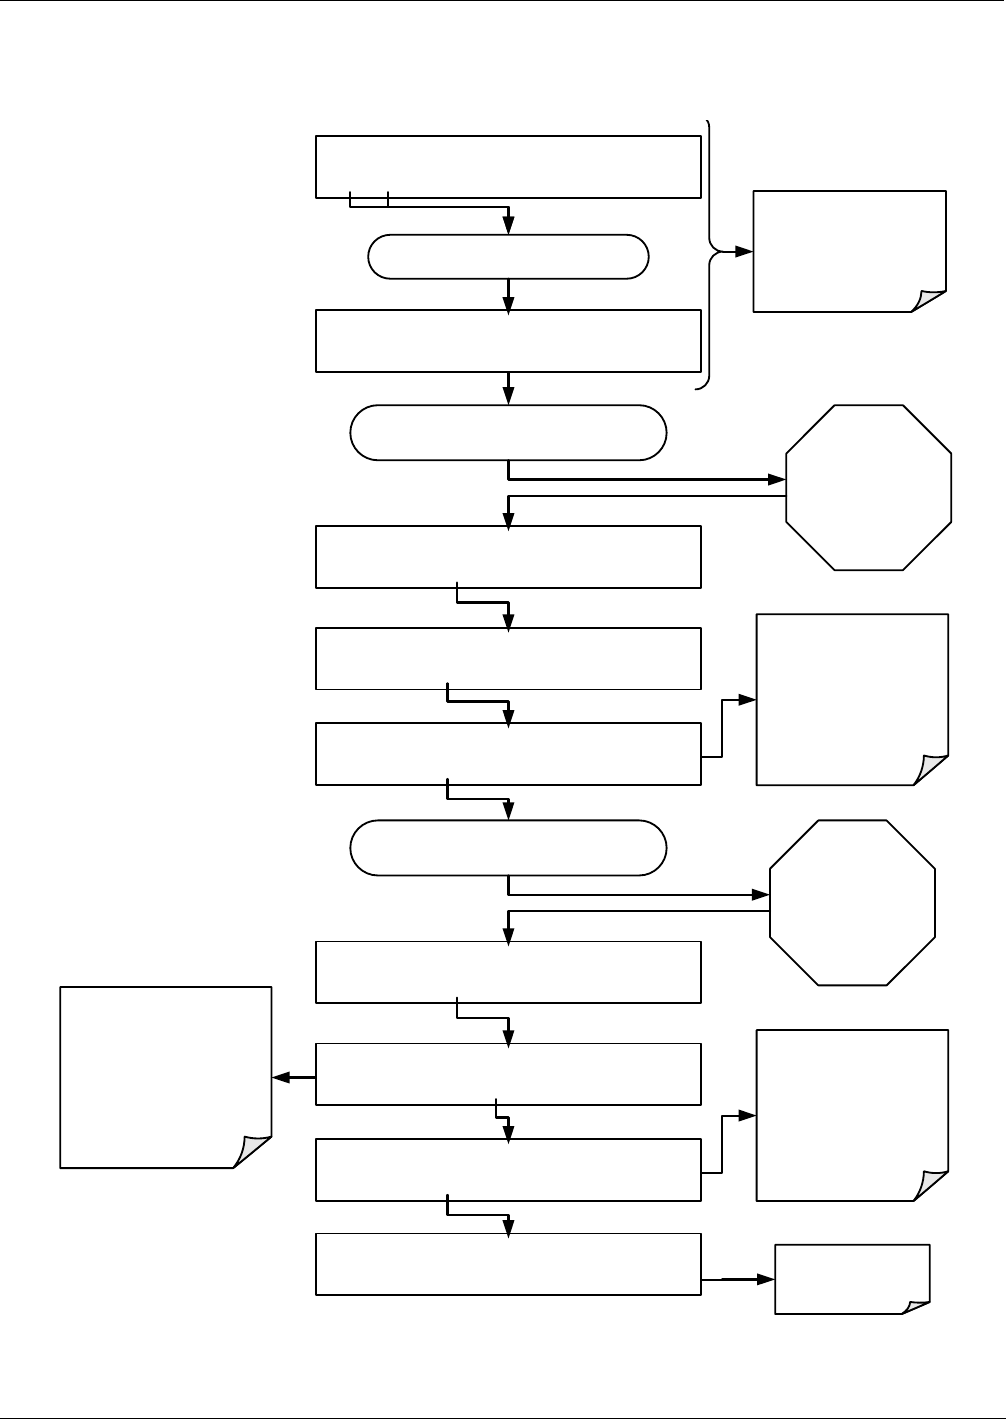
Teledyne API – Model T400 Photometric Ozone Analyzer Getting Started
69
3.4.5.3. Initial Zero/Span Calibration Procedure:
To perform an initial Calibration of the Model T400 photometric ozone analyzer, press:
Press ENTR to changes
the OFFSET & SLOPE
values based on the zero
point measurement.
Press EXIT to leave the
calibration unchanged and
return to the previous
menu.
SAMPLE STABIL=XXXX PPB O3= XXXX
< TST TST > CAL SETUP
M-P CAL STABIL=XXXX PPB O3= XXXX
<TST TST> ZERO CONC EXIT
EXIT at this point
returns to the
SAMPLE menu.
Press ENTR to changes
the OFFSET & SLOPE
values based on the zero
point measurement.
Press EXIT to leave the
calibration unchanged and
return to the previous
menu.
Allow zero gas to enter the sample port
at the rear of the analyzer.
Wait until STABIL
falls below 1.0 PPB.
This may take several
minutes.
SAMPLE STABIL=XXXX PPB O3= XXXX
< TST TST > CAL SETUP
M-P CAL STABIL=XXXX PPB O3= XXXX
<TST TST> ENTR CONC EXIT
M-P CAL STABIL=XXXX PPB O3= XXXX
<TST TST> ZERO SPAN CONC EXIT
Allow span gas to enter the sample port
at the rear of the analyzer.
Wait until STABIL
falls below 1.0 PPB.
This may take several
minutes.
M-P CAL STABIL=XXXX PPB O3= XXXX
< TST TST > CAL SETUP
M-P CAL STABIL=XXXX PPB O3= XXXX
<TST TST> ENTR CONC EXIT
M-P CAL STABIL=XXXX PPB O3= XXXX
<TST TST> ENTR CONC EXIT
The SPAN button now
appears during the transition
from zero to span.
You may see both buttons.
If either the ZERO or SPAN
buttons fail to appear see
Section 11 for
troubleshooting tips.
SAMPLE RANGE=500.0 PPB O3= XXXX
<TST TST> CAL SETUP
Set the Display to show
the STABIL test function.
This function calculates
the stability of the O3
measurement
Toggle TST> button until ...
The Model T400 Analyzer is now ready for operation.
06870C DCN6332
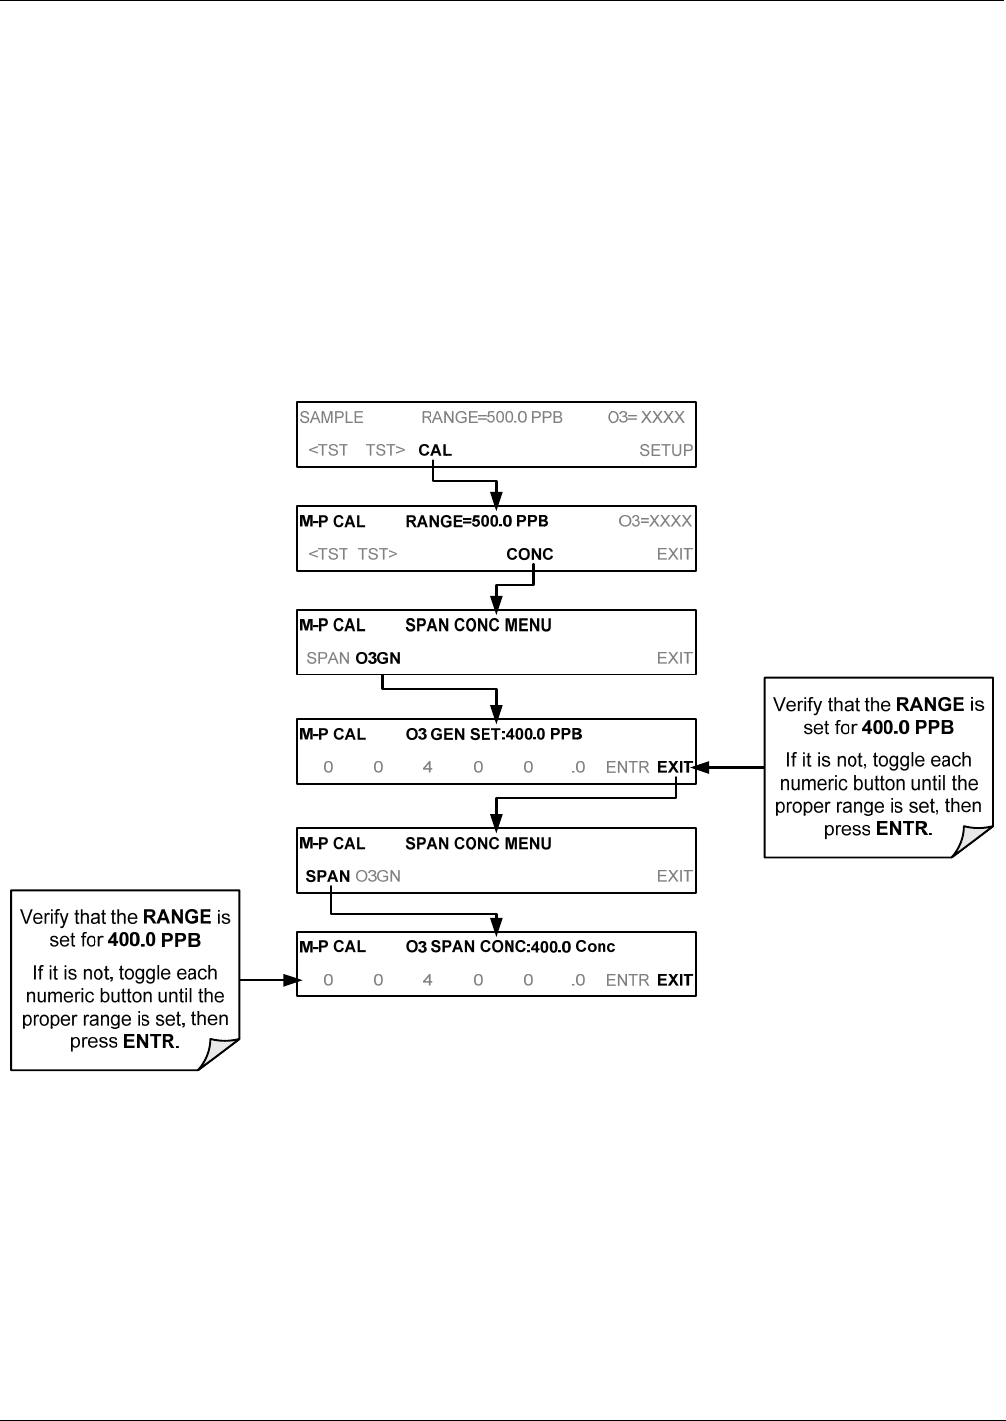
Getting Started Teledyne API – Model T400 Photometric Ozone Analyzer
70
3.5. CONFIGURING THE INTERNAL ZERO/SPAN OPTION (IZS)
In order to use the IZS option to perform calibration checks, it is necessary to configure
certain performance parameters of the O3 Generator.
3.5.1. VERIFY THE O3 GENERATOR AND EXPECTED O3 SPAN
CONCENTRATION SETTINGS
As is true for T400 analyzers without options, when the IZS option is present the O3
span concentration value also automatically defaults to 400.0 PPB. In this case, no
external source of calibration gas is required; however, it is necessary to verify that the
internal O3 generator is set to produce an O3 concentration of 400.0 PPB.
To verify/set that these levels, press
06870C DCN6332
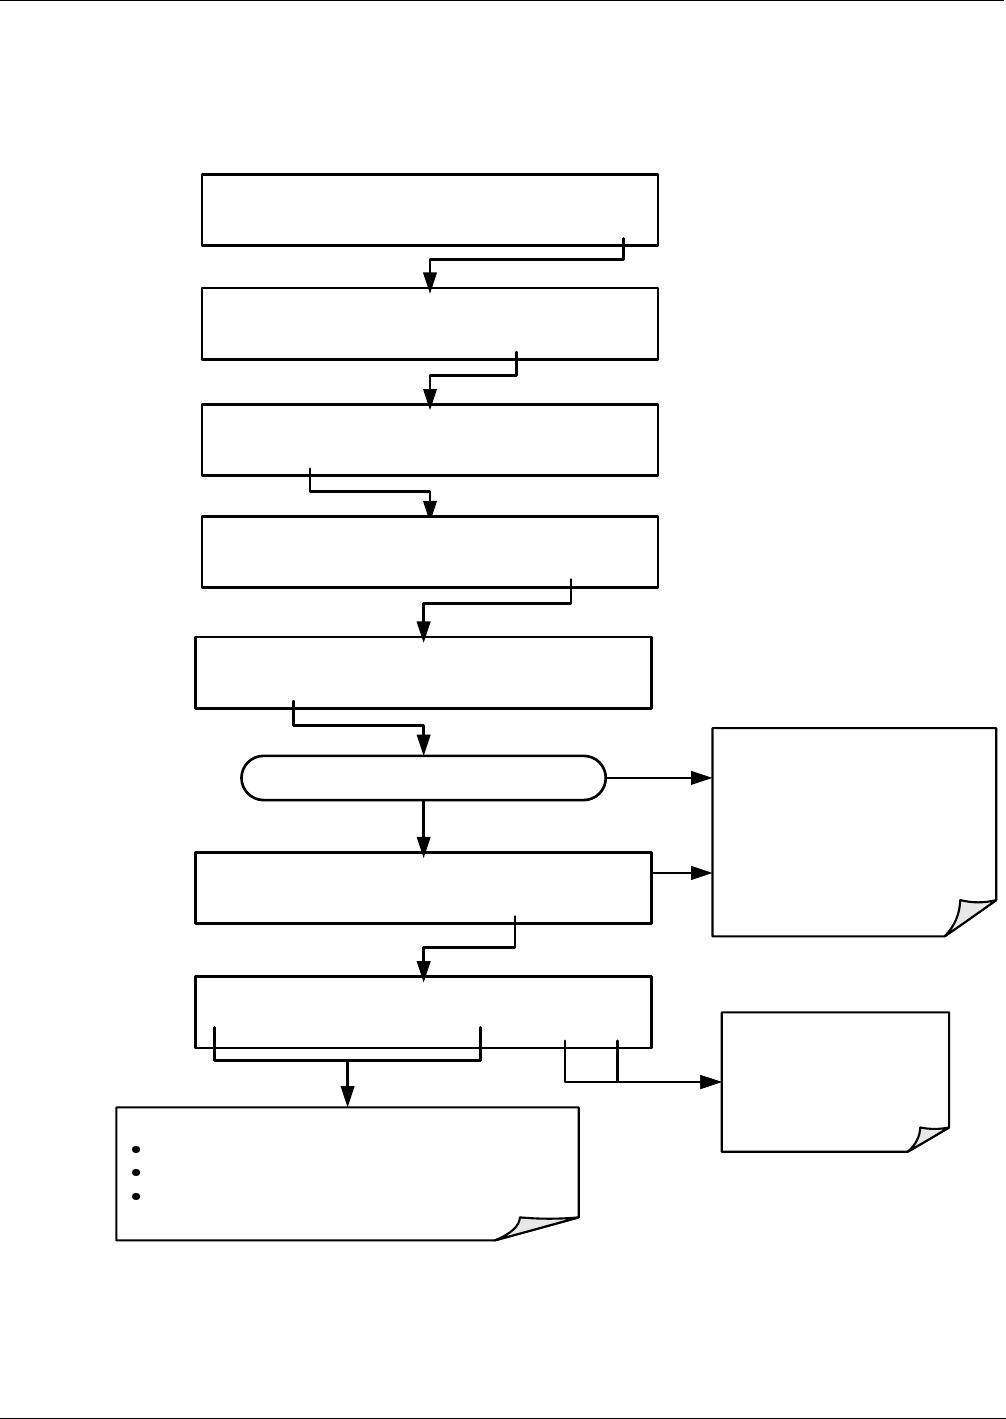
Teledyne API – Model T400 Photometric Ozone Analyzer Getting Started
71
3.5.2. SETTING THE O3 GENERATOR LOW-SPAN (MID POINT) OUTPUT
LEVEL
To set the ozone LO SPAN (Midpoint) concentration for the IZS O3 generator, press:
SETUP X.X 0) DAS_HOLD_OFF=15.0 Minutes
PREV NEXT JUMP EDIT PRNT EXIT
SETUP X.X PRIMARY SETUP MENU
CFG DAS RNGE PASS CLK MORE EXIT
SAMPLE RANGE=500.0 PPB O3= XXXX
<TST TST> CAL SETUP
SETUP X.X SECONDARY SETUP MENU
COMM VARS DIAG EXIT
SETUP X.X ENTER PASSWORD:818
8 1 8 ENTR EXIT
Continue pressing NEXT until ...
SETUP X.X 4) O3_GEN_LOW1=100.0 PPB
PREV NEXT JUMP EDIT PRNT EXIT
Sets LOW SPAN Point for
RANGE1.
To Set the LOW SPAN point for
RANGE2 in DUAL or AUTO
range modes …
Press NEXT button once more to
select O3_GEN_LOW2
then continue as shown.
SETUP X.X 4) O3_GEN_LOW1=100.0 PPB
0 1 0 0 .0 ENTR EXIT EXIT discards the new
setting
ENTR accepts the
new setting
Toggle buttonss to change setting
Only Values from 0 to 1500 will be accepted..
A value of 0 turns the lamp OFF.
The ENTR key will disappear if an invalid setting
is attempted.
06870C DCN6332
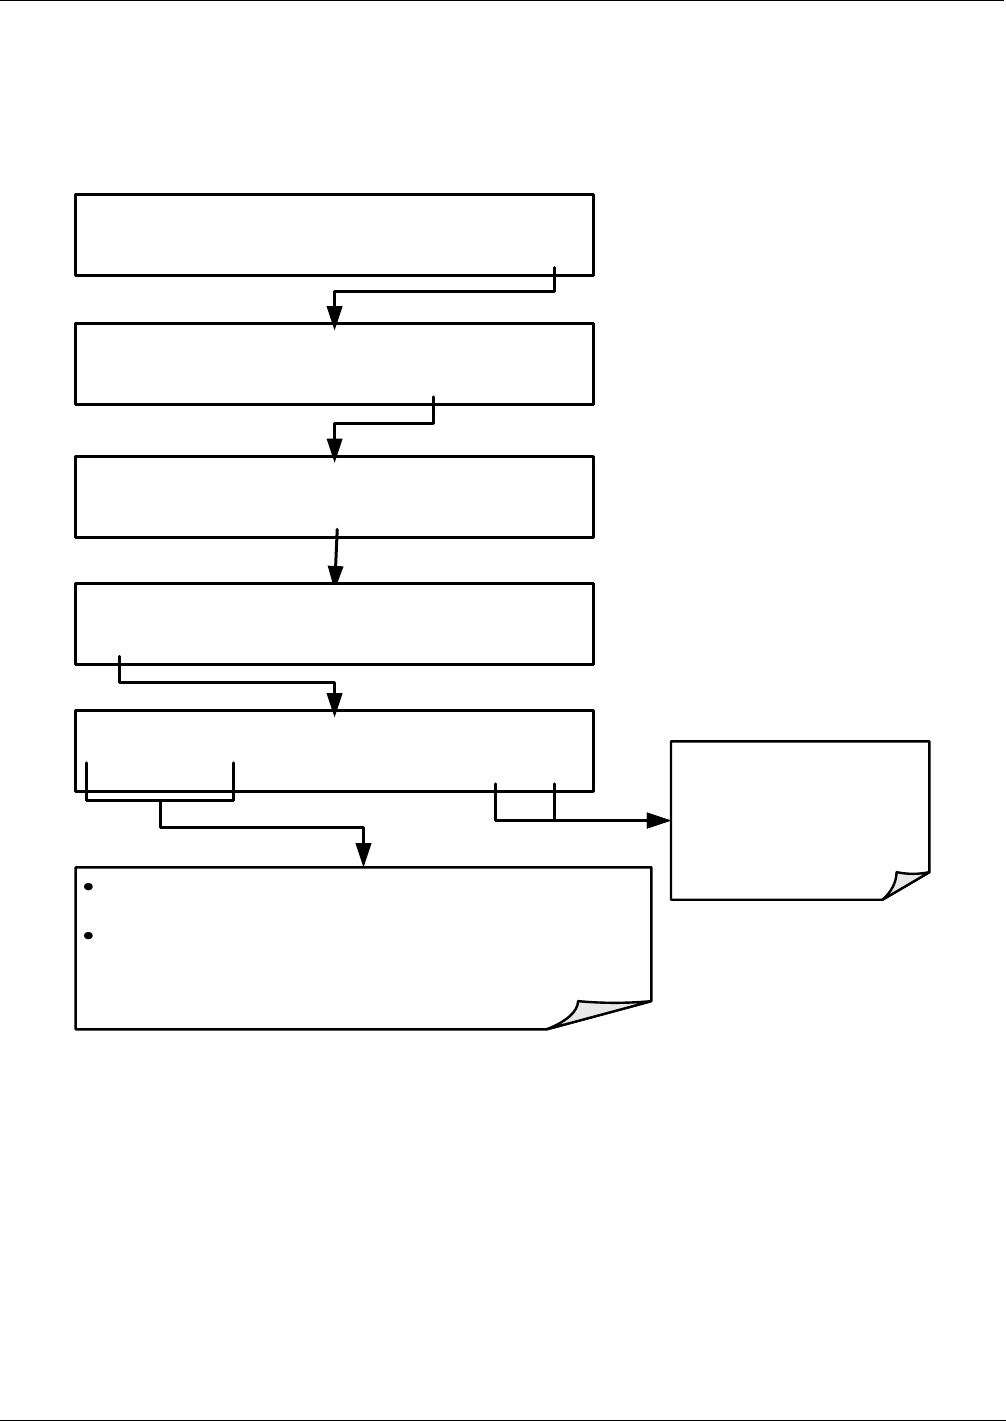
Getting Started Teledyne API – Model T400 Photometric Ozone Analyzer
72
3.5.3. TURNING ON THE REFERENCE DETECTOR OPTION
If the IZS feedback option is purchased the analyzer must be told to accept data from the
Reference Detector and actively adjust the IZS output to maintain the reference set
point(s) previously chosen by the user (see Section 3.5.2). To perform this operation:
SETUP X.X O3 CONFIG
CNST REF ENTR EXIT
SETUP X.X PRIMARY SETUP MENU
CFG DAS RNGE PASS CLK MORE EXIT
SAMPLE RANGE=500.0 PPB O3= XXXX
<TST TST> CAL SETUP
SETUP X.X SECONDARY SETUP MENU
COMM VARS DIAG O3 EXIT
SETUP X.X O3 CONFIG
MODE ADJ
EXIT discards the new
setting
ENTR accepts the
new setting
CNST - Constant Mode: In this mode, the analyzer sets the
O3 Generator drive voltage at a constant level.
REF - Reference Mode: In this mode, the analyzer uses
feedback from the O3 Reference Detector to adjust the O3
Generator Drive Voltage and stabilize the O3Generator
Output.
06870C DCN6332
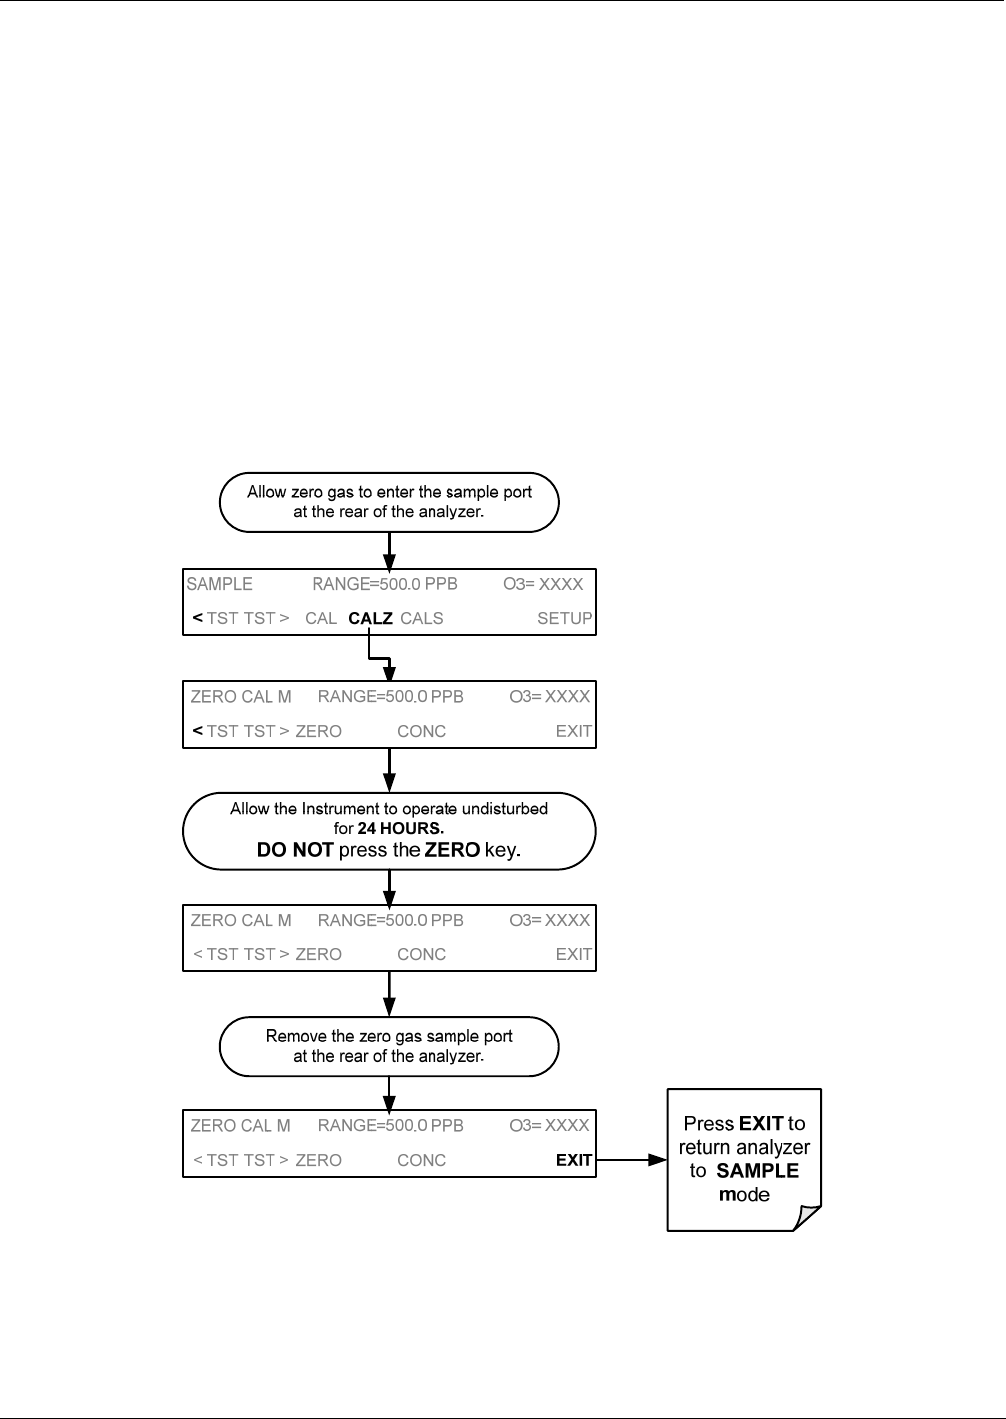
Teledyne API – Model T400 Photometric Ozone Analyzer Getting Started
73
3.5.4. INITIAL CALIBRATION AND CONDITIONING OF T400 ANALYZERS
WITH THE IZS OPTION INSTALLED
The following procedure assumes that:
The instrument has of the IZS Options installed.
The pneumatic setup matches that described in Section 3.3.2.3 or Section 3.3.3.
3.5.4.1. Initial O3 Scrubber Conditioning
The IZS option includes a charcoal O3 scrubber that creates zero air for the auto zero
calibration feature. This charcoal scrubber must be conditioned for the relative humidity
of locale being monitored.
To start this conditioning cycle, press:
06870C DCN6332

Getting Started Teledyne API – Model T400 Photometric Ozone Analyzer
74
3.5.4.2. Verifying the T400 Reporting Range Settings
While it is possible to perform the following procedure with any range setting, we
recommend that you perform this initial checkout using following reporting range
settings:
Unit of Measure: PPB
Reporting Range: 500 ppb
Mode Setting: SNGL
These are the default setting for the T400 analyzer; however, it is a good idea to verify
them before proceeding with the calibration procedure. Use the same method as
described in Section 3.4.5.1.
3.5.4.3. Initial Zero/Span Calibration Procedure:
Unlike other versions of the T400, analyzers with the IZS option installed do not require
the expected span gas concentration be set during initial start-up because no initial span
calibration is performed.
3.6. CALIBRATION VALVE OPTIONS
3.6.1. AMBIENT ZERO/AMBIENT SPAN VALVES (OPT 50A)
The Model T400 photometric ozone analyzer can be equipped with a zero/span valve
option for controlling the flow of calibration gases generated from sources external to
the instrument. This option consists of a set of two solenoid valves located inside the
analyzer that allow the user to switch the active source of gas flowing into the
instrument’s optical bench between the sample inlet, the span gas inlet and the zero air
inlet.
The user can control these valves from the front panel touchscreen either manually or by
activating the instruments AUTOCAL feature (See Section 9.4).
The valves may also be opened and closed remotely via the RS-232/485 Serial I/O ports
(see Section 8.2) or External Digital I/O Control Inputs (See Section 9.3.3.3)
06870C DCN6332
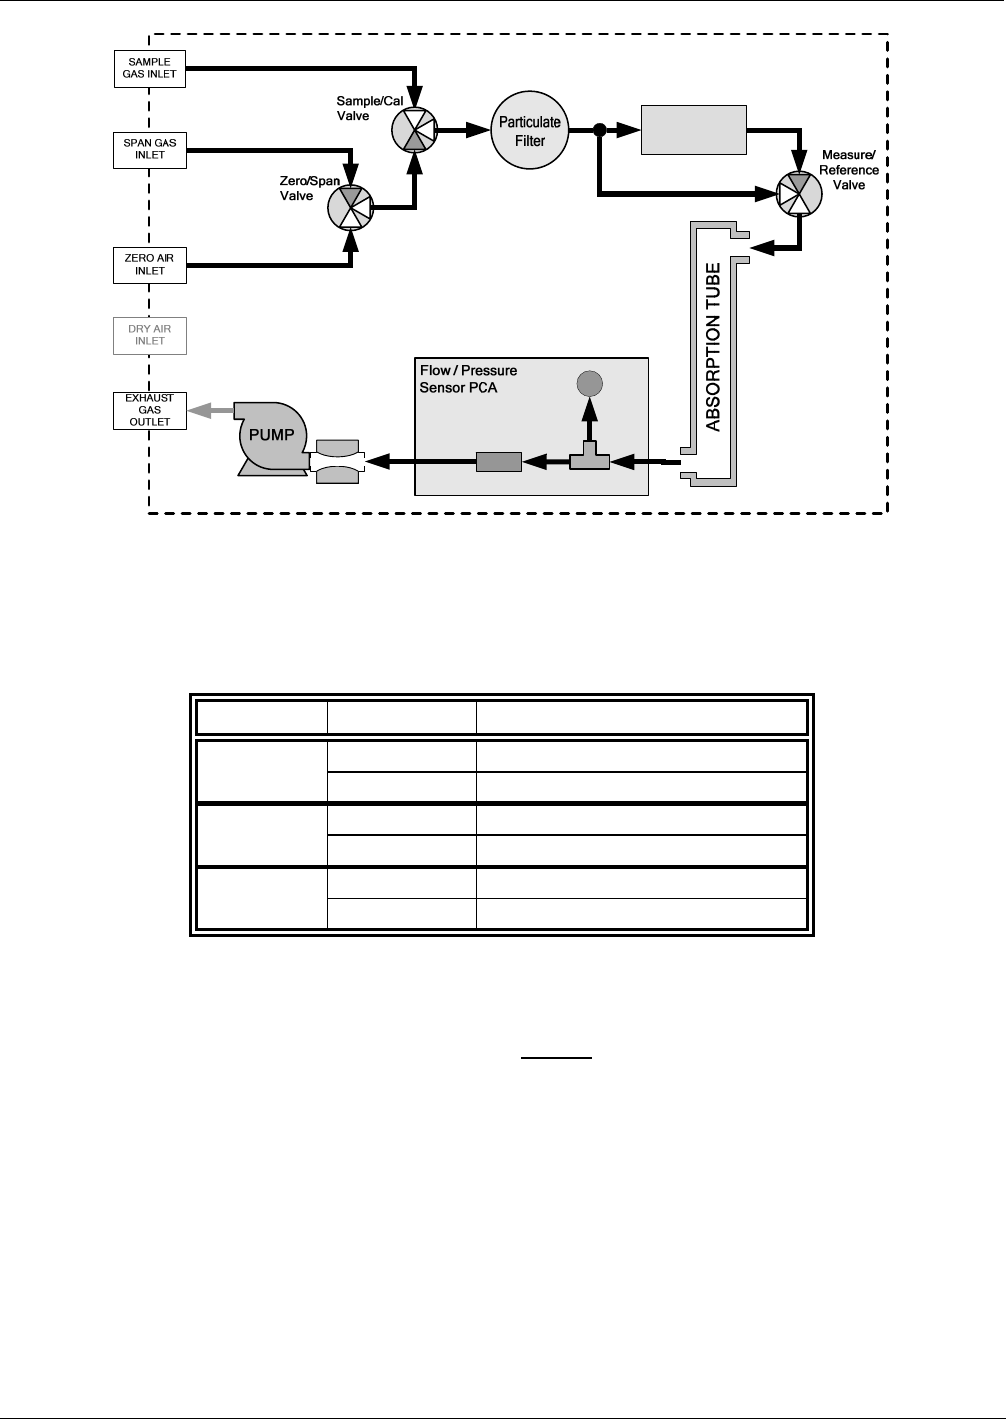
Teledyne API – Model T400 Photometric Ozone Analyzer Getting Started
75
INSTRUMENT CHASSIS
SAMPLE
PRESSURE
SENSOR
O3FLOW
SENSOR
Sample Gas
Flow Control
O3Scrubber
Figure 3-22: T400 Pneumatic Diagram with Zero/Span Valve Option (OPT-50A)
The instrument’s zero air and span gas flow rate required for this option is 800 cc/min,
however, the US EPA recommends that the cal gas flow rate be at least 1600 cc/min.
Table 3-9: Zero/Span Valve Operating States for Option 50A
Mode Valve Condition
Sample/Cal Open to SAMPLE inlet
SAMPLE
Zero/Span Open to ZERO AIR inlet
Sample/Cal Open to ZERO/SPAN Valve
ZERO CAL Zero/Span Open to ZERO AIR inlet
Sample/Cal Open to ZERO/SPAN Valve
SPAN CAL Zero/Span Open to SPAN GAS inlet
The state of the Sample/Cal valves can be controlled:
Manually via the analyzer’s front panel;
By activating the instrument’s AutoCal feature (See Section 9.4);
Remotely by using the External Digital I/O Control Inputs (See Section 9.3.3.3), or;
Remotely via the RS-232/485 Serial I/O ports (See Section 8.2).
06870C DCN6332
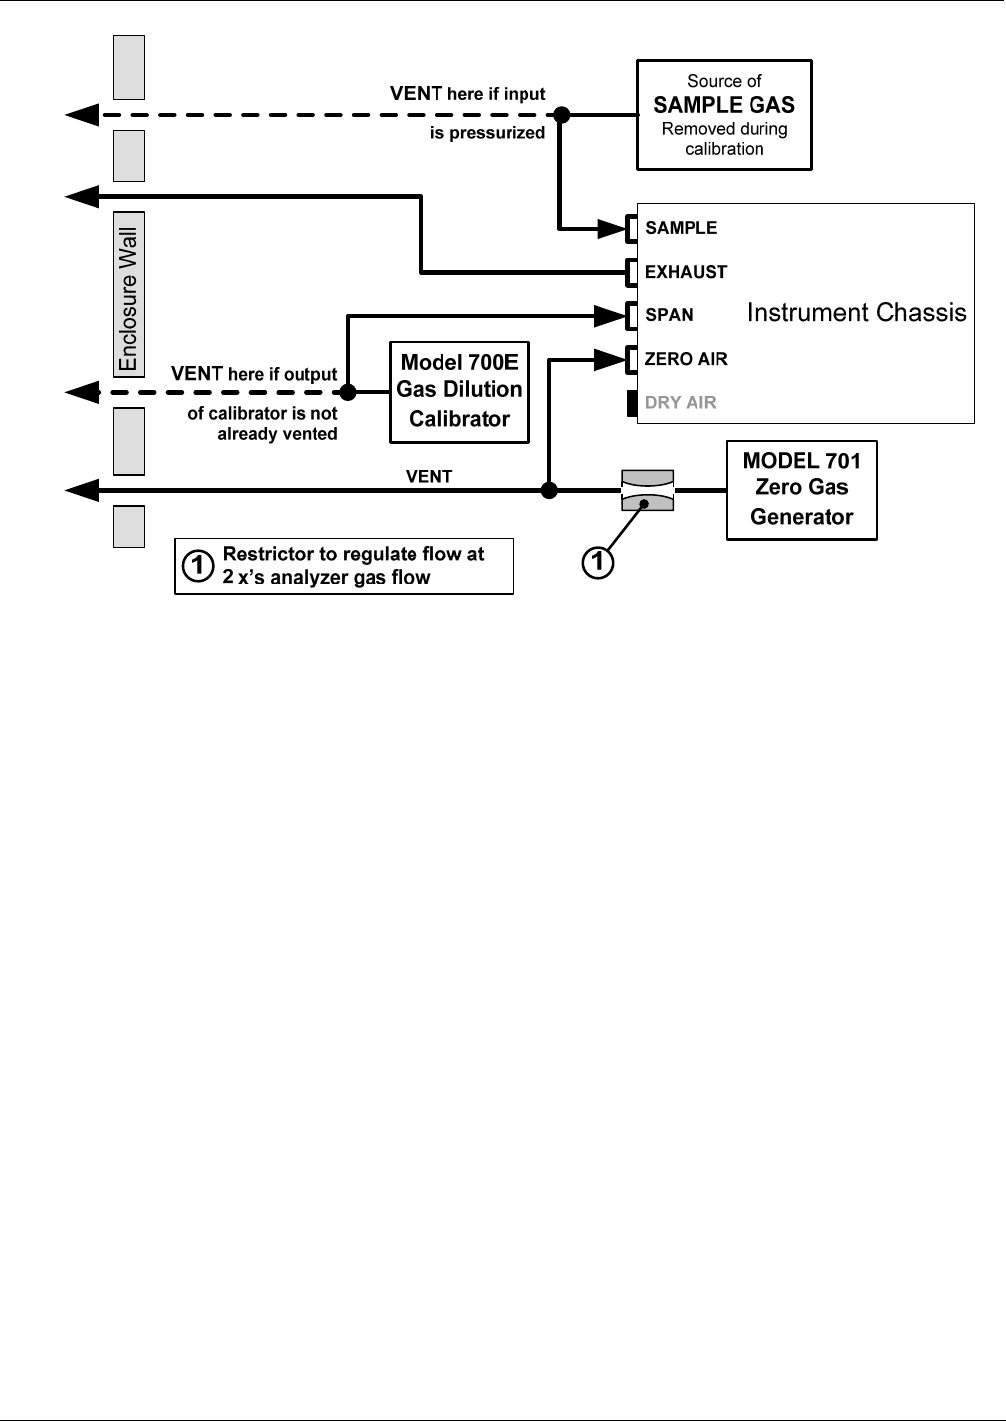
Getting Started Teledyne API – Model T400 Photometric Ozone Analyzer
76
Figure 3-23: Gas Line Connections for the T400 Analyzer with Zero/Span Valve Option (OPT-50A)
3.6.1.1. Pneumatic Setup for the T400 Analyzer with Zero/Span Valve Option
For a Model T400 photometric ozone analyzer with the optional zero/span valves, attach
the following pneumatic lines:
SAMPLE GAS SOURCE:
Attach a sample inlet line to the SAMPLE inlet fitting.
Sample Gas pressure must equal ambient atmospheric pressure (1.0 psig)
In applications where the sample gas is received from a pressurized manifold, a
vent must be placed on the sample gas line. This vent line must be:
At least 0.2m long
No more than 2m long
Vented outside the shelter or immediate area surrounding the instrument
CALIBRATION GAS SOURCES:
SPAN GAS
Attach a gas line from the source of calibration gas (e.g. a Teledyne API T700 Dynamic
Dilution Calibrator) to the SPAN inlet.
Span gas can by generated by a M700E Mass Flow Calibrator equipped with a
Photometer Option or an M703E UV Photometric Ozone Calibrator.
06870C DCN6332
Teledyne API – Model T400 Photometric Ozone Analyzer Getting Started
77
ZERO AIR
Attach a gas line from the source of zero air (e.g. a Teledyne API M701 zero air
Generator) to the ZERO AIR inlet.
Zero air can be supplied by the API M701 zero air generator.
A restrictor is required to regulate the gas flow at 2 x’s the gas flow of the analyzer.
VENTING
In order to prevent back diffusion and pressure effects, both the span gas and zero air
supply lines should be:
Vented outside the enclosure
Not less than 2 meters in length
Not greater than 10 meters in length
EXHAUST OUTLET
Attach an exhaust line to the EXHAUST OUTLET fitting. The exhaust line should be:
¼” PTEF tubing.
A maximum of 10 meters long.
Vented outside the T400 analyzer’s enclosure
CAUTION – GENERAL SAFETY HAZARD
Venting should be outside the shelter or immediate area surrounding the
instrument and conform to all safety requirements regarding exposure to O3.
Once the appropriate pneumatic connections have been made, check all pneumatic
fittings for leaks using the procedures defined in Section 11.3.4.
06870C DCN6332
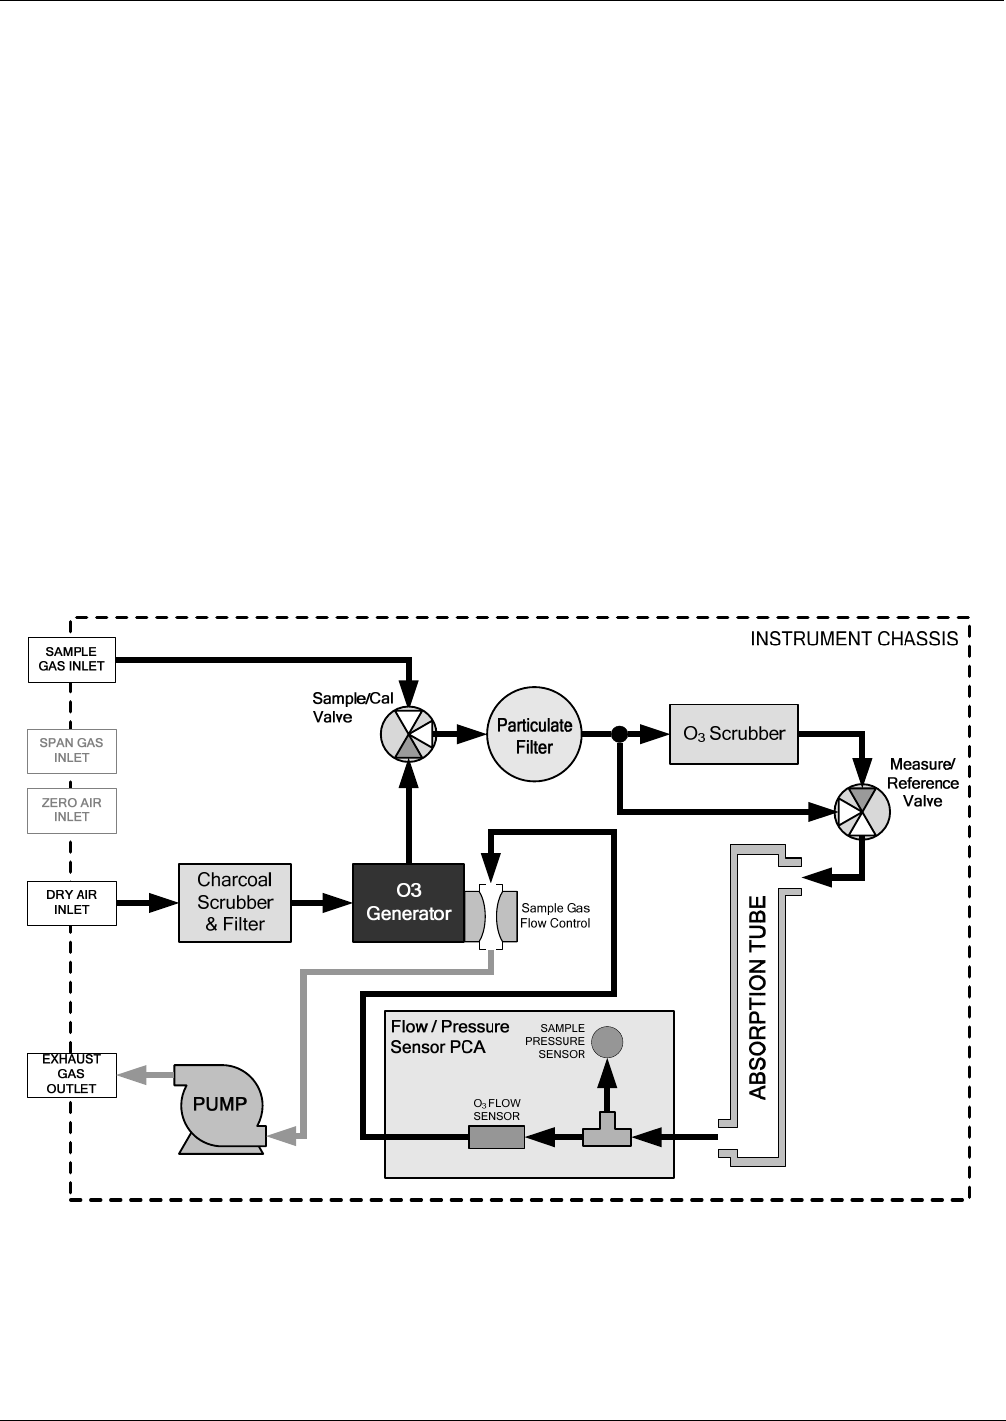
Getting Started Teledyne API – Model T400 Photometric Ozone Analyzer
78
3.6.2. INTERNAL ZERO SPAN (IZS) OPTION (OPT 50G)
The Model T400 photometric ozone analyzer can also be equipped with an internal zero
air and span gas generator. This option includes an ozone scrubber for producing zero
air, a variable ozone generator for producing calibration span gas and a valve for
switching between the sample gas inlet and the output of the scrubber/generator.
A reference detector monitors the operating level of the IZS’ ozone generator. The
detector senses the intensity of the UV lamp internal to the IZS generator and converts
this into a DC voltage. This voltage is used by the CPU as part of a feedback loop to
directly adjust the brightness of the lamp producing a more accurate and stable ozone
concentration.
The ozone output level of the generator is directly controllable by the user via the front
panel of the instrument or remotely via the analyzer’s RS-232 Serial I/O ports.
See Section 9.3 for instructions on setting the span gas level of the ozone
generator.
See Sections 3.3.2.3 and 3.5 for information on configuring this option and using the
Serial I/O ports.
See Appendix A.2 for a list of variables used to control this parameter.
See Section 9.6 for information on calibrating the output of the O3 Generator.
Figure 3-24: T400 Pneumatic Diagram with Internal Zero/Span (IZS) Option (OPT-50G)
For instructions on setting up a T400 analyzer equipped with the IZS option see Sections
3.3.2.3 and 3.3.3
06870C DCN6332
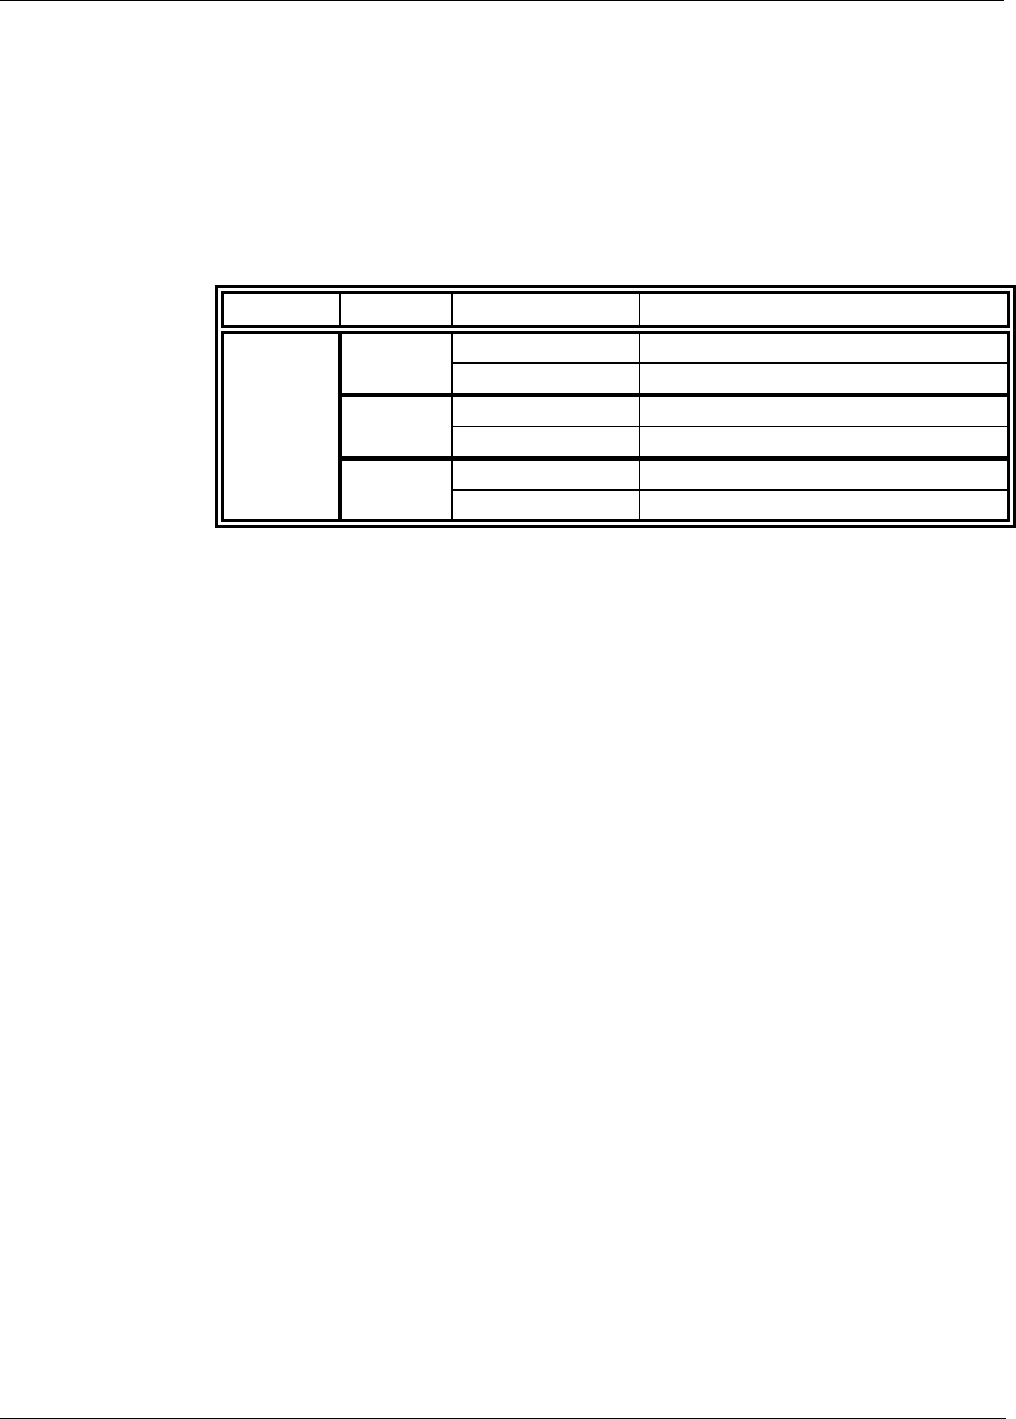
Teledyne API – Model T400 Photometric Ozone Analyzer Getting Started
79
The state of the Sample/Cal valves can be controlled:
Manually via the analyzer’s front panel;
By activating the instrument’s AutoCal feature (See Section 9.4);
Remotely by using the External Digital I/O Control Inputs (See Section 9.3), or;
Remotely via the RS-232/485 Serial I/O ports (See Section 8.2).
Table 3-10: Internal Zero/Span Valve Operating States
Option Mode Valve Condition
Sample/Cal Valve Open to SAMPLE inlet
SAMPLE
Ozone Generator OFF
Sample/Cal Valve Open to Ozone Generator
ZERO
CAL Ozone Generator OFF
Sample/Cal Valve Open to Ozone Generator
50G
SPAN
CAL Ozone Generator ON at intensity level set by user
06870C DCN6332

Getting Started Teledyne API – Model T400 Photometric Ozone Analyzer
80
This page intentionally left blank.
06870C DCN6332

81
SECTION II
–
OPERATING INSTRUCTIONS
06870C DCN6332

T400 Ozone Analyzer Operator’s Manual
82
06870C DCN6332
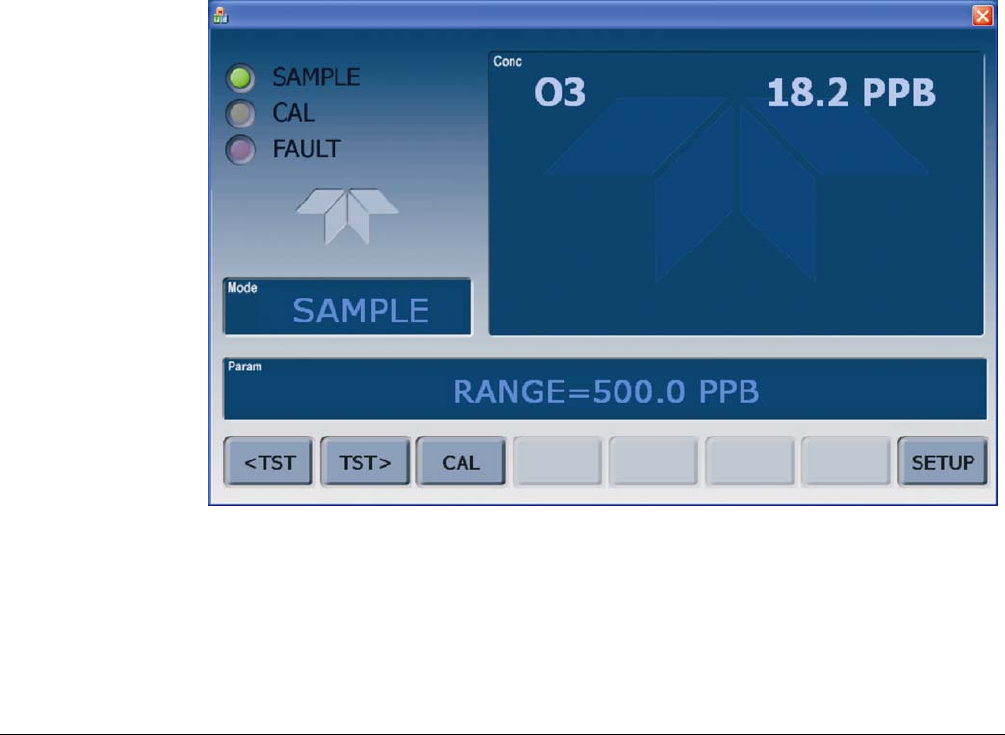
83
4. OVERVIEW OF OPERATING MODES
The T400 analyzer software has a variety of operating modes. Most commonly, the
analyzer will be operating in SAMPLE mode. In this mode, a continuous read-out of
the O3 concentrations is displayed on the front panel and is available to be output as
analog signals from the analyzer’s rear panel terminals. The SAMPLE mode also
allows:
TEST functions and WARNING messages to be examined.
Manual calibration operations to be initiated
The second most important operating mode is SETUP mode. This mode is used for
configuring the various sub systems of the analyzer such as for the DAS system, the
reporting ranges, or the serial (RS-232/RS-485/Ethernet) communication channels. The
SET UP mode is also used for performing various diagnostic tests during
troubleshooting.
Figure 4-1: Front Panel Display
The Mode field of the front panel display indicates to the user which operating mode the
unit is currently running.
In addition to SAMPLE and SETUP, other operation modes of the analyzer are
described in Table 4-1.
06870C DCN6332

Overview of Operating Modes Teledyne API - T100 UV Fluorescence SO2 Analyzer
84
Table 4-1: Analyzer Operating Modes
MODE EXPLANATION
DIAG One of the analyzer’s diagnostic modes is active.
LO CAL A Unit is performing LOW SPAN (midpoint) calibration initiated automatically by the analyzer’s
AUTOCAL feature
LO CAL R Unit is performing LOW SPAN (midpoint) calibration initiated remotely through the COM ports or
digital control inputs.
M-P CAL This is the basic calibration mode of the instrument and is activated by pressing the CAL button.
SAMPLE Sampling normally, flashing text indicates adaptive filter is on.
SAMPLE A Indicates that unit is in SAMPLE mode and AUTOCAL feature is activated.
SETUP X.#2 SETUP mode is being used to configure the analyzer. The gas measurement will continue during
this process.
SPAN CAL A1 Unit is performing SPAN calibration initiated automatically by the analyzer’s AUTOCAL feature
SPAN CAL M1 Unit is performing SPAN calibration initiated manually by the user.
SPAN CAL R1 Unit is performing SPAN calibration initiated remotely through the COM ports or digital control
inputs.
ZERO CAL A1 Unit is performing ZERO calibration procedure initiated automatically by the AUTOCAL feature
ZERO CAL M1 Unit is performing ZERO calibration procedure initiated manually by the user.
ZERO CAL R1 Unit is performing ZERO calibration procedure initiated remotely through the COM ports or digital
control inputs.
1 Only Appears on units with Z/S valve or IZS options.
2 The revision of the analyzer firmware is displayed following the word SETUP, e.g., SETUP G.3.
06870C DCN6332

Teledyne API - T100 UV Fluorescence SO2 Analyzer Overview of Operating Modes
85
4.1. SAMPLE MODE
This is the analyzer’s standard operating mode. In this mode, the instrument is a
calculating O3 concentrations.
The T400 analyzer is a computer-controlled analyzer with a dynamic menu interface for
easy and yet powerful and flexible operation. All major operations are controlled from
the front panel display and touchscreen through these user-friendly menus.
To assist in navigating the system’s software, a series of menu trees can be found in
Appendix A of this manual.
Note The flowcharts in this Section depict typical representations of the front
panel display/touchscreen interface during the various operations being
described. They are not intended to be exact and may differ slightly from
the actual display of your system.
Note The ENTR button may disappear if you select a setting that is invalid or
out of the allowable range for that parameter, such as trying to set the 24-
hour clock to 25:00:00. Once you adjust the setting to an allowable
value, the ENTR button will re-appear.
This section covers the software features of the T400 analyzer that are designed as a
computer controlled
06870C DCN6332
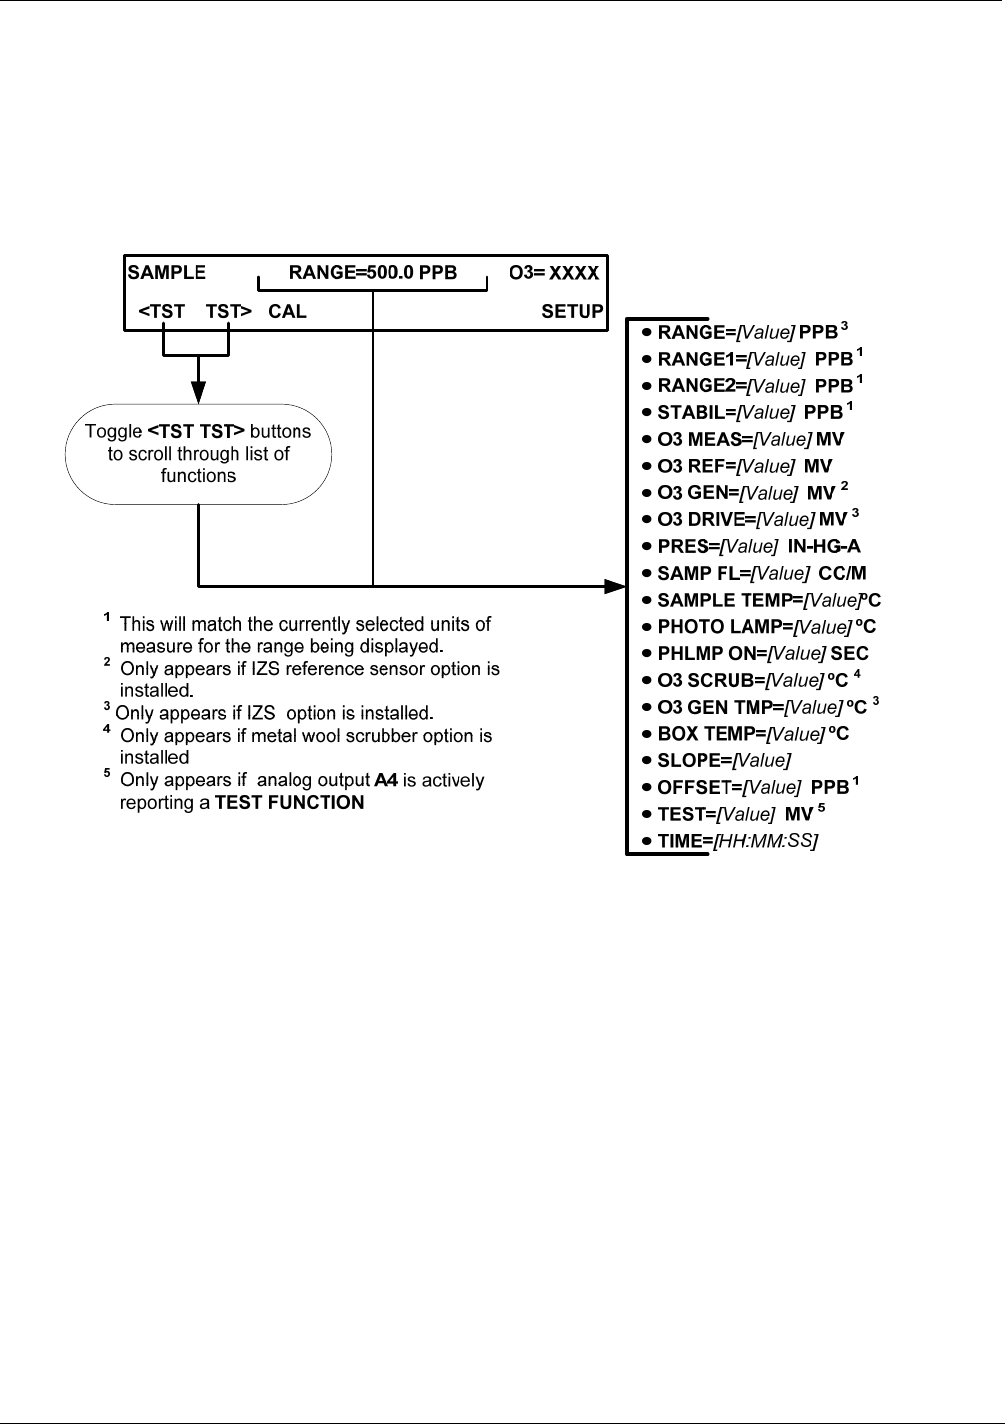
Overview of Operating Modes Teledyne API - T100 UV Fluorescence SO2 Analyzer
86
4.1.1. TEST FUNCTIONS
A variety of TEST functions are available for viewing at the front panel whenever the
analyzer is at the MAIN MENU. These functions provide information about the present
operating status of the analyzer and are useful during troubleshooting (see Section 12).
Table 4-2 lists the available TEST functions.
To view these TEST functions, press:
Figure 4-2: Viewing T400 Test Functions
06870C DCN6332

Teledyne API - T100 UV Fluorescence SO2 Analyzer Overview of Operating Modes
87
Table 4-2: Test Functions Defined
DISPLAY PARAMETER UNITS DESCRIPTION
RANGE
- -
RANGE1
RANGE2
RANGE
PPB,
PPM,
UGM
&
MGM
The Full Scale limit at which the reporting range of the
analyzer’s ANALOG OUTPUTS is currently set.
THIS IS NOT the Physical Range of the instrument. See
Section 5.4.1.1 for more information.
If DUAL or AUTO Range modes have been selected, two
RANGE functions will appear, one for each range.
STABIL STABILITY MV
Standard deviation of O3 Concentration readings. Data points
are recorded every ten seconds. The calculation uses the last
25 data points.
O3 MEAS PHOTOMEAS MV The average UV Detector output during the MEASURE portion
of the analyzer’s measurement cycle.
O3 REF PHOTOREF MV The average UV Detector output during the REFERENCE
portion of the analyzer’s measurement cycle.
O3 GEN2 O3GENREF MV
The current output of the O3 generator reference detector
representing the relative intensity of the O3 generator UV
Lamp. (2)
O3 DRIVE1 O3GENDRIVE MV The Drive voltage used to control the intensity of the O3
generator UV Lamp. (1)
PRES SAMPPRESS IN-HG-A The absolute pressure of the Sample Gas as measured by a
solid-state pressure sensor.
SAMP FL SAMPFLOW CC/MIN Sample Gas mass flow rate as measured by the Flow Sensor
located between the Optical Bench and the Sample Pump.
SAMPLE TEMP SAMPTEMP C The Temperature of the gas inside the Sample Chamber.
PHOTO LAMP PHOTOLTEMP C The Temperature of the UV Lamp in the Optical Bench.
O3 SCRUB3 O3SCRUBTEMP C The current temperature of the Metal Wool Scrubber.(3)
O3 GEN TMP1 O3GENTEMP C The Temperature of the UV Lamp in the O3 Generator.(1)
BOX TEMP BOXTEMP C The temperature inside the analyzer chassis.
SLOPE SLOPE - -
The Slope of the instrument as calculated during the last
calibration activity.
When the unit is set for SINGLE or DUAL Range mode,
this is the SLOPE of RANGE1.
When the unit is set for AUTO Range mode, this is the
SLOPE of the currently active range.
OFFSET OFFSET PPB
The Offset of the instrument as calculated during the last
calibration activity.
When the unit is set for SINGLE or DUAL Range mode, this is
the OFFSET of RANGE1.
TEST4 TESTCHAN MV Displays the signal level of whatever Test function is currently
being output by the Analog Output Channel A4.(4)
TIME CLOCKTIME HH:MM:SS
The current time. This is used to create a time stamp on DAS
readings, and by the AutoCal feature to trigger calibration
events.
1 Only appears if IZS option is installed.
2 Only appears if IZS Reference Sensor option is installed.
3 Only appears if Metal Wool Scrubber option is installed.
4 Only appears if Analog Output A4 is actively reporting a Test Function.
06870C DCN6332

Overview of Operating Modes Teledyne API - T100 UV Fluorescence SO2 Analyzer
88
4.1.2. WARNING MESSAGES
The most common and serious instrument failures will activate Warning Messages that
are displayed on the analyzer’s Front Panel. These are:
Table 4-3: Warning Messages Defined
MESSAGE MEANING
ANALOG CAL WARNING The A/D or at least one D/A channel has not been calibrated.
BOX TEMP WARNING The temperature inside the T400 chassis is outside the specified limits.
CANNOT DYN SPAN2 Contact closure span calibration failed while DYN_SPAN was set to ON.
CANNOT DYN ZERO3 Contact closure zero calibration failed while DYN_ZERO was set to ON.
CONFIG INITIALIZED Configuration storage was reset to factory configuration or erased.
DATA INITIALIZED DAS data storage was erased before the last power up occurred.
LAMP DRIVER WARN CPU is unable to communicate with one of the I2C UV Lamp Drivers.
LAMP STABIL WARN Photometer lamp reference step-changes occur more than 25% of the time.
O3 ALARM1 WARN6 O3 concentration alarm limit #1 exceeded.
O3 ALARM2 WARN6 O3 concentration alarm limit #2 exceeded.
O3 GEN LAMP WARN4 The UV Lamp or Detector in the IZS module may be faulty or out of adjustment.
O3 GEN REF WARNING4 The UV Lamp or Detector in the IZS module may be faulty or out of adjustment.
O3 GEN TEMP WARN4 The UV Lamp Heater or Temperature Sensor in the IZS module may be faulty.
O3 SCRUB TEMP WARN5 The Heater or Temperature Sensor of the O3 Scrubber may be faulty.
PHOTO REF WARNING The O3 Reference value is outside of specified limits.
PHOTO TEMP WARNING The UV Lamp Temperature is outside of specified limits.
REAR BOARD NOT DET Motherboard was not detected during power up.
RELAY BOARD WARN CPU is unable to communicate with the relay PCA.
SAMPLE FLOW WARN The flow rate of the sample gas is outside the specified limits.
SAMPLE PRESS WARN The pressure of the sample gas is outside the specified limits.
SAMPLE TEMP WARN The temperature of the sample gas is outside the specified limits.
SYSTEM RESET1 The computer has rebooted.
1 Clears 45 minutes after power up.
2 Clears the next time successful zero calibration is performed.
3 Clears the next time successful span calibration is performed.
4 Only appears if the IZS option is installed.
5 Only appears if the optional metal wool O3 scrubber is installed.
6 Only appears if concentration alarm option is elected.
See Section 12.1.1 for more information on using these messages to troubleshoot
problems.
06870C DCN6332

Teledyne API - T100 UV Fluorescence SO2 Analyzer Overview of Operating Modes
89
4.2. CALIBRATION MODE
In this mode the user can, in conjunction with introducing of zero or span gases of
known concentrations into the analyzer, cause it to adjust and recalculate the slope
(gain) and offset of the its measurement range. This mode is also used to check the
current calibration status of the instrument.
For more information about setting up and performing standard calibration
operations or checks, see Section 9.
For more information about setting up and performing EPAPressing the CAL button,
switches the T400 into calibration mode.
If the instrument includes one of the available zero/span valve options, the SAMPLE
mode display will also include CALZ and CALS buttons. Pressing either of these
buttons also puts the instrument into calibration mode.
The CALZ button is used to initiate a calibration of the analyzer’s zero point using
internally generated zero air.
The CALS button is used to calibrate the span point of the analyzer’s current
reporting range using internally generated O3 span gas.
For more information concerning calibration valve options, see Section 3.6.
For information on using the automatic calibrations feature (ACAL) in conjunction
with the one of the calibration valve options, see Sections 9.3.3 and 9.4.
Note It is recommended that this span calibration be performed at 90% of full
scale of the analyzer’s currently selected reporting range.
EXAMPLES:
If the reporting range is set for 0 to 500 ppb, an appropriate span point
would be 450 ppb.
If the of the reporting range is set for 0 to 1000 ppb, an appropriate
span point would be 900 ppb.
06870C DCN6332

Overview of Operating Modes Teledyne API - T100 UV Fluorescence SO2 Analyzer
90
4.3. SETUP MODE
The SETUP mode contains a variety of choices that are used to configure the analyzer’s
hardware and software features, perform diagnostic procedures, gather information on
the instruments performance and configure or access data from the internal data
acquisition system (DAS).
For a visual representation of the software menu trees, refer to Appendix A-1.
Setup Mode is divided between Primary and Secondary Setup menus and can be
protected through password security.
4.3.1. PASSWORD SECURITY
Setup Mode can be protected by password security through the SETUP>PASS menu
(Section 5.2) to prevent unauthorized or inadvertent configuration adjustments.
4.3.2. PRIMARY SETUP MENU
The areas accessed under the SETUP mode are shown in Table 4-4 and Table 4-5.
Table 4-4: Primary Setup Mode Features and Functions
MODE OR FEATURE CONTROL
BUTTON DESCRIPTION MANUAL
SECTION
Analyzer Configuration CFG Lists key hardware and software configuration information 5.1
Auto Cal Feature ACAL
Used to set up and operate the AutoCal feature.
Only appears if the analyzer has one of the calibration valve
options installed (see Section 3.6).
9.4
Internal Data Acquisition
(DAS) DAS Used to set up the DAS system and view recorded data 7
Analog Output Reporting
Range Configuration RNGE Used to configure the output signals generated by the
instruments analog outputs. 5.4
Calibration Password Security PASS Turns the calibration password feature ON/OFF 5.2
Internal Clock Configuration CLK Used to Set or adjust the instrument’s internal clock 5.6
Advanced SETUP features MORE This button accesses the instruments secondary setup menu See
Table 4-5
06870C DCN6332

Teledyne API - T100 UV Fluorescence SO2 Analyzer Overview of Operating Modes
91
Table 4-5: Secondary Setup Mode Features and Functions
MODE OR FEATURE CONTROL
BUTTON DESCRIPTION MANUAL
SECTION
External Communication
Channel Configuration COMM
Used to set up and operate the analyzer’s various external I/O
channels including RS-232; RS-485, modem communication
and/or Ethernet access.
8
System Status Variables VARS
Used to view various variables related to the instruments
current operational status
Changes made to any variable are not acknowledged and
recorded in the instrument’s memory until the ENTR button is
pressed.
Pressing the EXIT button ignores the new setting.
If the EXIT button is pressed before the ENTR button, the
analyzer will beep alerting the user that the newly entered
value has been lost.
5.8
System Diagnostic Features
and
Analog Output Configuration
DIAG
Used to access a variety of functions that are used to configure,
test or diagnose problems with a variety of the analyzer’s basic
systems.
Most notably, the menus used to configure the output signals
generated by theinstruments’ analog outputs are located here.
5.9 & 5.10
IMPORTANT IMPACT ON READINGS OR DATA
Any changes made to a variable (VARS) during the SETUP procedures are
not acknowledged by the instrument until the ENTR button is pressed. If
the EXIT button is pressed before the ENTR button, the analyzer will beep,
alerting the user that the newly entered value has not been accepted.
06870C DCN6332

Overview of Operating Modes Teledyne API - T100 UV Fluorescence SO2 Analyzer
92
This page intentionally left blank.
06870C DCN6332
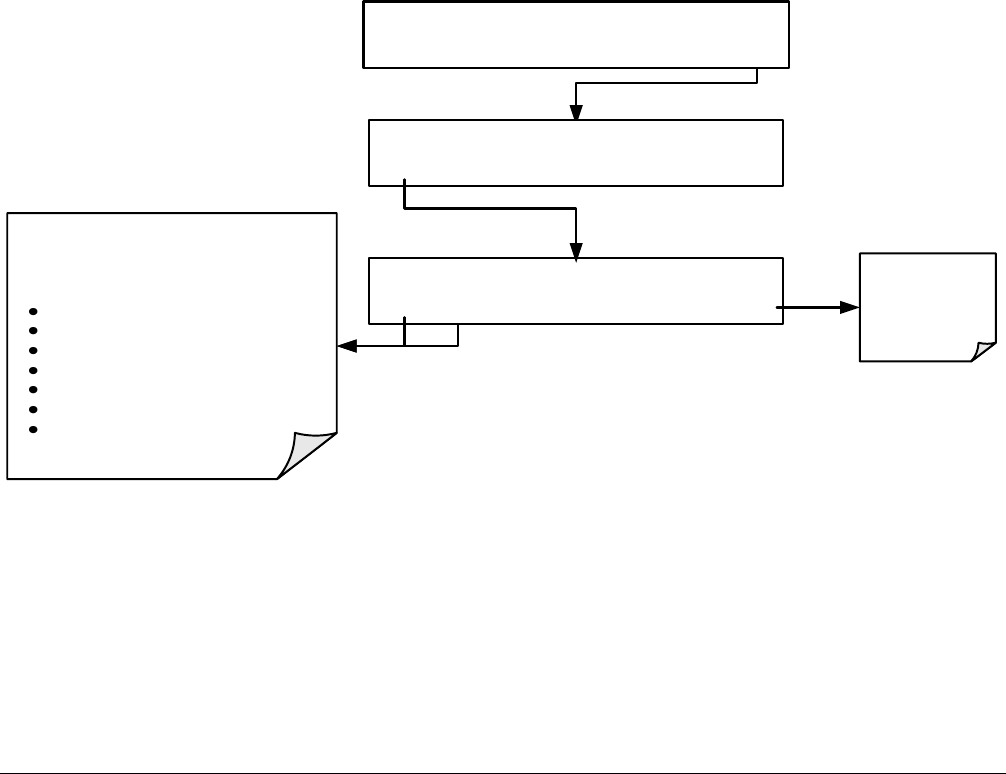
93
5. SETUP MENU
The SETUP menu is used to set instrument parameters for performing configuration,
calibration, reporting and diagnostics operations according to user needs.
5.1. SETUP CFG: CONFIGURATION INFORMATION
Pressing the CFG button displays the instrument’s configuration information. This
display lists the analyzer model, serial number, firmware revision, software library
revision, CPU type and other information. Use this information to identify the
software and hardware when contacting customer service. Special instrument or
software features or installed options may also be listed here.
To access the configuration table, press:
SETUP X.X PRIMARY SETUP MENU
CFG DAS RNGE PASS CLK MORE EXIT
SETUP X.X T400
PREV NEXT EXIT
Press exit at
any time to
return to the
SETUP menu
Press NEXT or PREV to move back and
forth through the following list of
Configuration information:
MODEL TYPE AND NUMBER
PART NUMBER
SERIAL NUMBER
SOFTWARE REVISION
LIBRARY REVISION
CPU TYPE & OS REVISION
SUPPORT info
SAMPLE RANGE=500.0 PPB O3= XXXX
<TST TST> CAL SETUP
06870C DCN6332

Setup Menu T400 Ozone Analyzer Operator’s Manual
94
5.2. SETUP DAS: INTERNAL DATA ACQUISITION SYSTEM
Use the SETUP>DAS menu to capture and record data. Refer to Section 7 for
configuration and operation details.
5.3. SETUP ACAL: AUTOMATIC CALIBRATION OPTION
The menu button for this option appears only when the instrument has the zero span
and/or IZS options. See Section 9.4 for details.
5.4. SETUP RNGE: ANALOG OUTPUT REPORTING RANGE
CONFIGURATION
Use the SETUP>RNGE menu to configure output reporting ranges, including scaled
reporting ranges to handle data resolution challenges. This section also describes
configuration for Single, Dual, and Auto Range modes.
5.4.1.1. Physical Range versus Analog Output Reporting Ranges
Functionally, the Model T400 photometric analyzer has one hardware “physical range”
that is capable of determining O3 concentrations between 0 ppb and 10,000 ppb. This
architecture improves reliability and accuracy by avoiding the need for extra, switchable,
gain-amplification circuitry. Once properly calibrated, the analyzer’s front panel will
accurately report concentrations along the entire span of its physical range.
Because, most applications use only a small part of the analyzer’s physical range, the
width of the T400 analyzer’s physical range can create data resolution problems for most
analog recording devices. For example, in an application where the expected
concentration of O3 is typically less than 500 ppb, the full scale of expected values is
only 5% of the instrument’s 10,000 ppB physical range. Unmodified, the corresponding
output signal would also be recorded across only 5% of the range of the recording
device.
The T400 solves this problem by allowing the user to select a scaled reporting range for
the analog outputs that only includes that portion of the physical range relevant to the
specific application.
Note Only the reporting range of the analog outputs is scaled. Both the DAS
values stored in the CPU’s memory and the concentration values
reported on the front panel are unaffected by the settings chosen for the
reporting range(s) of the instrument.
06870C DCN6332

T400 Ozone Analyzer Operator’s Manual Setup Menu
95
5.4.1.2. Analog Output Ranges for O3 Concentration
The analyzer has two active analog output signals related to O3 concentration that are
accessible through a connector on the rear panel.
Not Used
A
NALOG OU
T
A1 A2 A3 A4
+ - + - + - + -
O3 concentration
outputs
HIG
H
range when DUAL
mode is selected
Test Channel
See Section
7.4.6
LOW range when DUAL
mode is selected
Figure 5-1: Analog Output Connector Pin Out
The A1 and A2 channels output a signal that is proportional to the O3 concentration of
the sample gas. They can be configured:
With independent reporting ranges reporting a “single” output signal (SNGL Mode,
see Section 5.4.1.3)
to be operated completely independently (DUAL Mode, see Section 5.4.1.4).
Or to automatically switch between the two ranges dynamically as the concentration
value fluctuates (AUTO modes, see Section 5.4.1.5).
The user can set the units of measure, measure span and signal scale of each output in a
variety of combinations.
EXAMPLE:
A1 OUTPUT: Output Signal = 0-5 VDC representing 0-1000 ppb concentration values
A2 OUTPUT: Output Signal = 0 – 10 VDC representing 0-500 ppb concentration
values.
Both the A1 and A2 outputs can be:
Configured full scale outputs of: 0 - 0.1 VDC; 0 - 1VDC; 0 - 5VDC or; 0 - 10VDC.
Equipped with optional 0-20 mADC current loop drivers (OPT 41, see Section
3.3.1.4) and configured for any current output within that range (e.g. 0-20, 2-20, 4-
20, etc.).
The user may also add a signal offset independently to each output (see Section 5.10.1.8)
to match the electronic input requirements of the recorder or data logger to which the
output is connected.
06870C DCN6332

Setup Menu T400 Ozone Analyzer Operator’s Manual
96
DEFAULT SETTINGS
The default setting for these the reporting ranges of the analog output channels A1 and
A2 are:
SNGL mode
0 to 400.0 ppb
0 to 5 VDC
Reporting range span may be viewed via the front panel by viewing the RANGE test
function. If the DUAL or AUTO modes are selected, the RANGE test function will be
replaced by two separate functions, RANGE1 & RANGE2. Reporting range status is
also available as output via the external digital I/O status bits (see Section 3.3.1.5).
Note Upper span limit setting for the individual range modes are shared.
Resetting the span limit in one mode also resets the span limit for the
corresponding range in the other modes as follows:
SNGL DUAL AUTO
Range Range1 (Low) Low Range
Range2 (Hi) High Range
06870C DCN6332
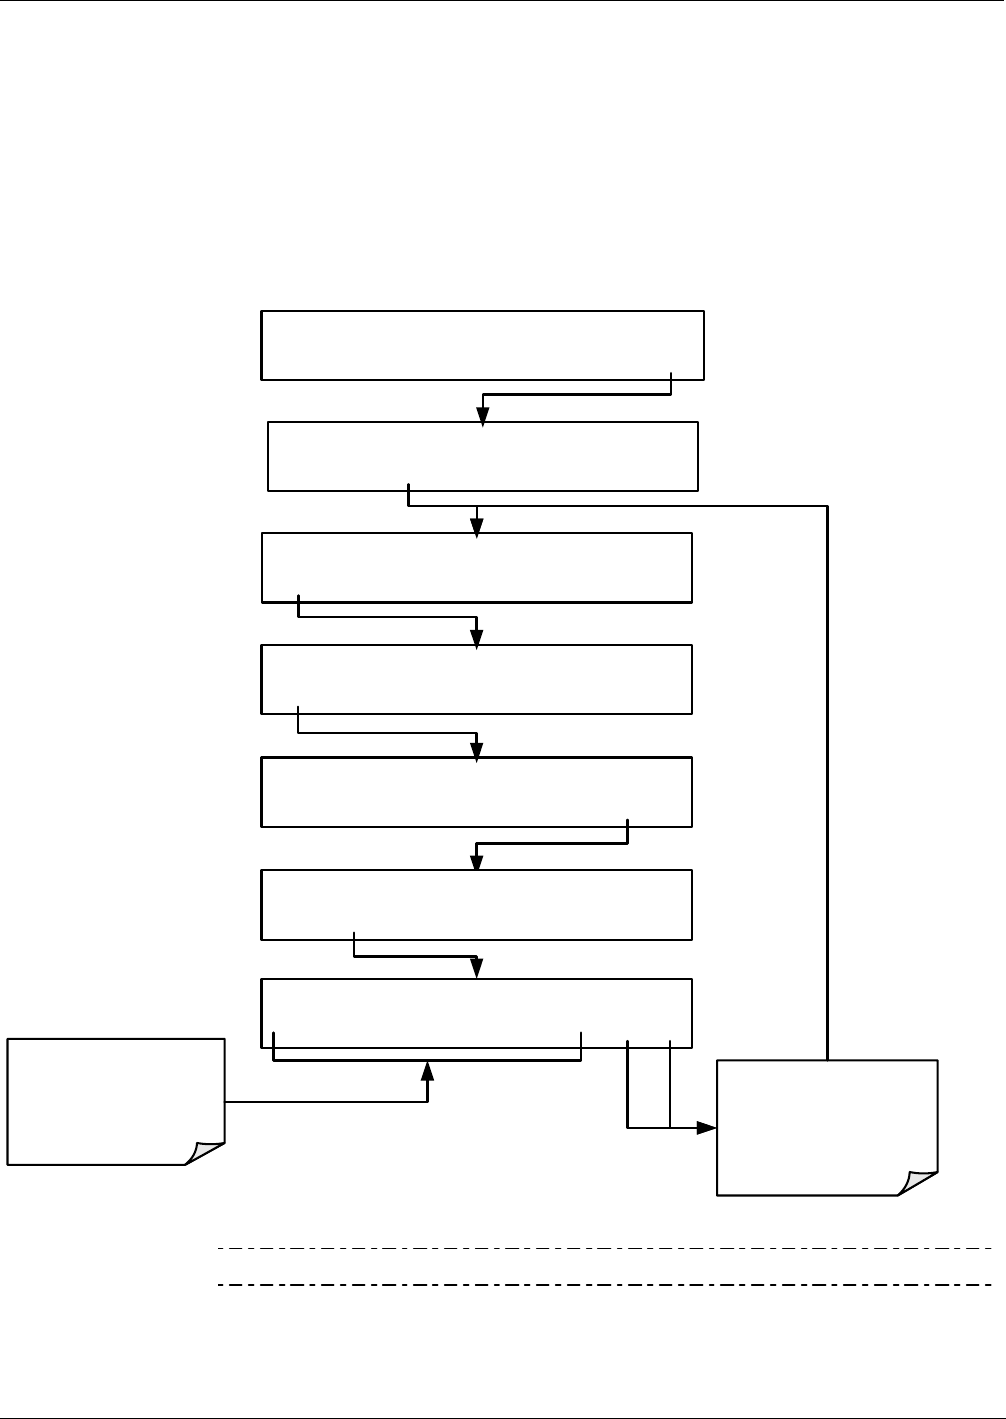
T400 Ozone Analyzer Operator’s Manual Setup Menu
97
5.4.1.3. RNGE MODE SNGL: Single Range Mode Configuration
The single range mode sets a single maximum range for the both the A1 and A2 analog
outputs. If the single range is selected both outputs are slaved together and will
represent the same reporting range span (e.g. 0-500 ppb), however their electronic signal
levels may be configured for different ranges (e.g. 0-10 VDC vs. 0-.1 VDC; See Section
5.10.1.6).
This Reporting range can be set to any value between 0.1 ppb and 10,000 ppb. To select
SINGLE range mode and set the upper limit of the reporting range, press:
SETUP X.X PRIMARY SETUP MENU
CFG DAS RNGE PASS CLK MORE EXIT
SAMPLE RANGE=500.0 PPB O3= XXXX
<TST TST> CAL SETUP
SETUP X.X RANGE MODE MENU
MODE SET UNIT EXIT
SETUP X.X RANGE MODE:SNGL
SNGL DUAL AUTO ENTR EXIT
SETUP X.X RANGE MODE:SNGL
SNGL DUAL AUTO ENTR EXIT
SETUP X.X RANGE MODE MENU
MODE SET UNIT EXIT
SETUP X.X RANGE:500.0 Conc
0 0 5 0 0 .0 ENTR EXIT
Toggle buttons to
select the upper
SPAN limit for the
reporting range
EXIT discards the new
setting
ENTR accepts the
new setting
Note This is the default reporting range mode for the analyzer.
06870C DCN6332
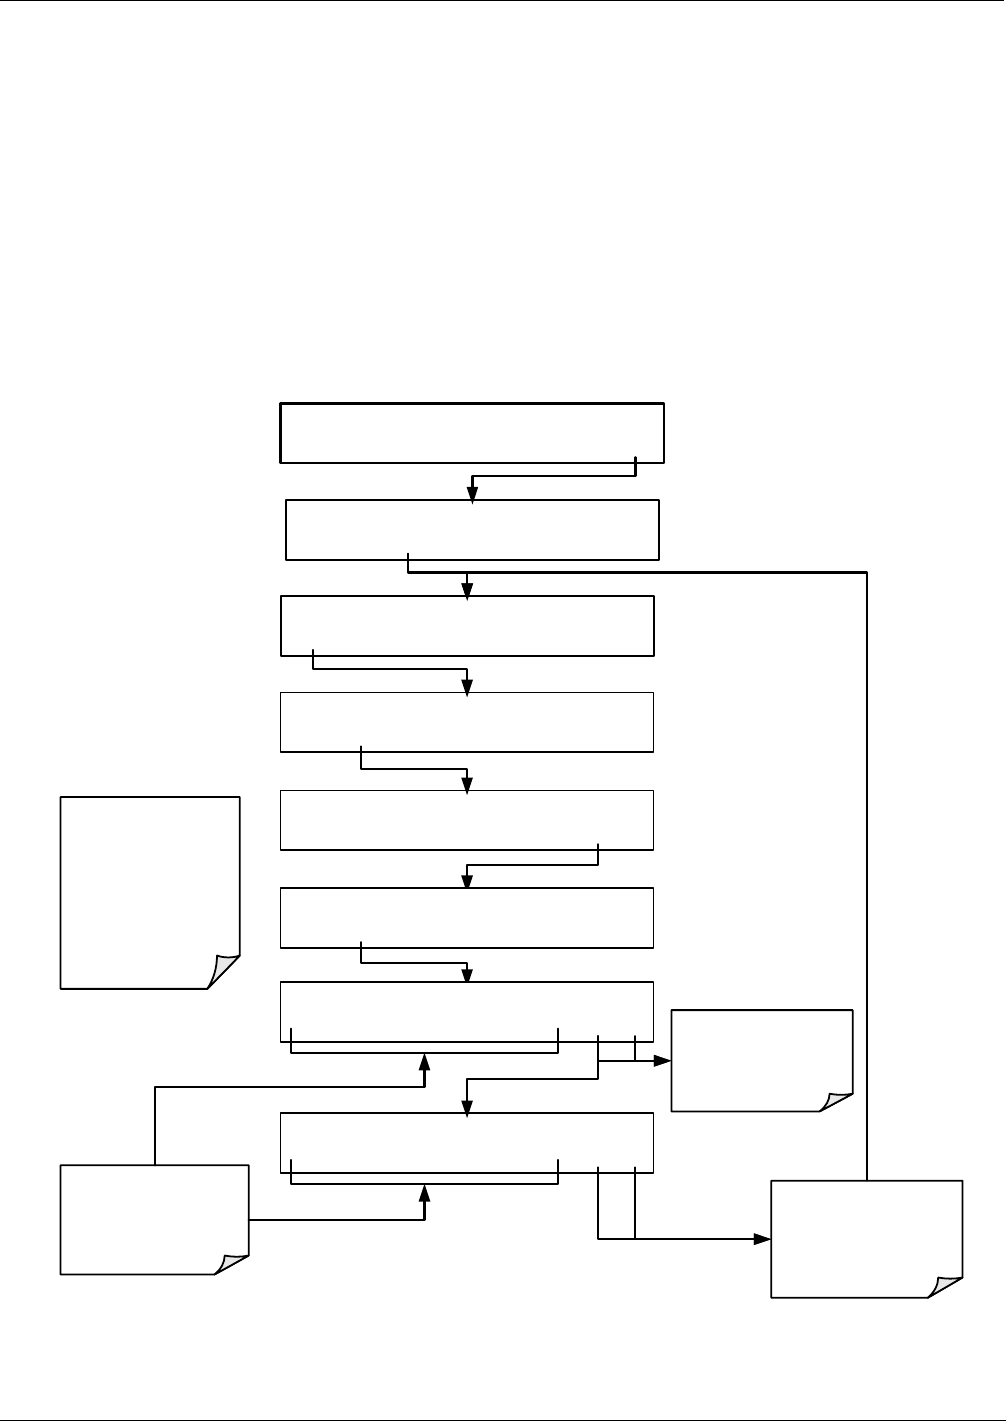
Setup Menu T400 Ozone Analyzer Operator’s Manual
98
5.4.1.4. RNGE MODE DUAL: Dual Range Mode Configuration
DUAL range mode allows the A1 and A2 outputs to be configured with separate
reporting range spans as well as separate electronic signal levels. The analyzer software
calls these two ranges LOW and HI.
The LOW range setting corresponds with the analog output labeled A1 on the rear
panel of the instrument and is viewable via the test function RANGE1.
The HIGH range setting corresponds with the A2 output and is viewable via the test
function RANGE2.
While the software labels these two ranges as LOW and HI, when in DUAL mode
their upper limits need not conform to that convention. The upper span limit of the
LOW/RANGE1 can be a higher number than that of HI/RANGE2
To set the ranges press following button stroke sequence:
.
SETUP X.X PRIMARY SETUP MENU
CFG DAS RNGE PASS CLK MORE EXIT
SAMPLE RANGE=500.0 PPB O3= XXXX
<TST TST> CAL SETUP
SETUP X.X RANGE MODE MENU
MODE SET UNIT EXIT
SETUP X.X RANGE MODE:SNGL
SNGL DUAL AUTO ENTR EXIT
SETUP X.X RANGE MODE:SNGL
SNGL DUAL AUTO ENTR EXIT
SETUP X.X RANGE MODE MENU
MODE SET UNIT EXIT
SETUP X.X HIGH RANGE:500.0 Conc
0 0 5 0 0 .0 ENTR EXIT
Toggle buttons to
select the upper
SPAN limit for the
reporting range
EXIT discards the new
setting
ENTR accepts the
new setting
SETUP X.X LOW RANGE:500.0 Conc
0 0 5 0 0 .0 ENTR EXIT
The LOW and HIGH
ranges have separate
slopes and offsets for
computing the O3
concentration.
The two ranges must
be independently
calibrated.
EXIT discards the
new setting
ENTR accepts the
new setting
06870C DCN6332
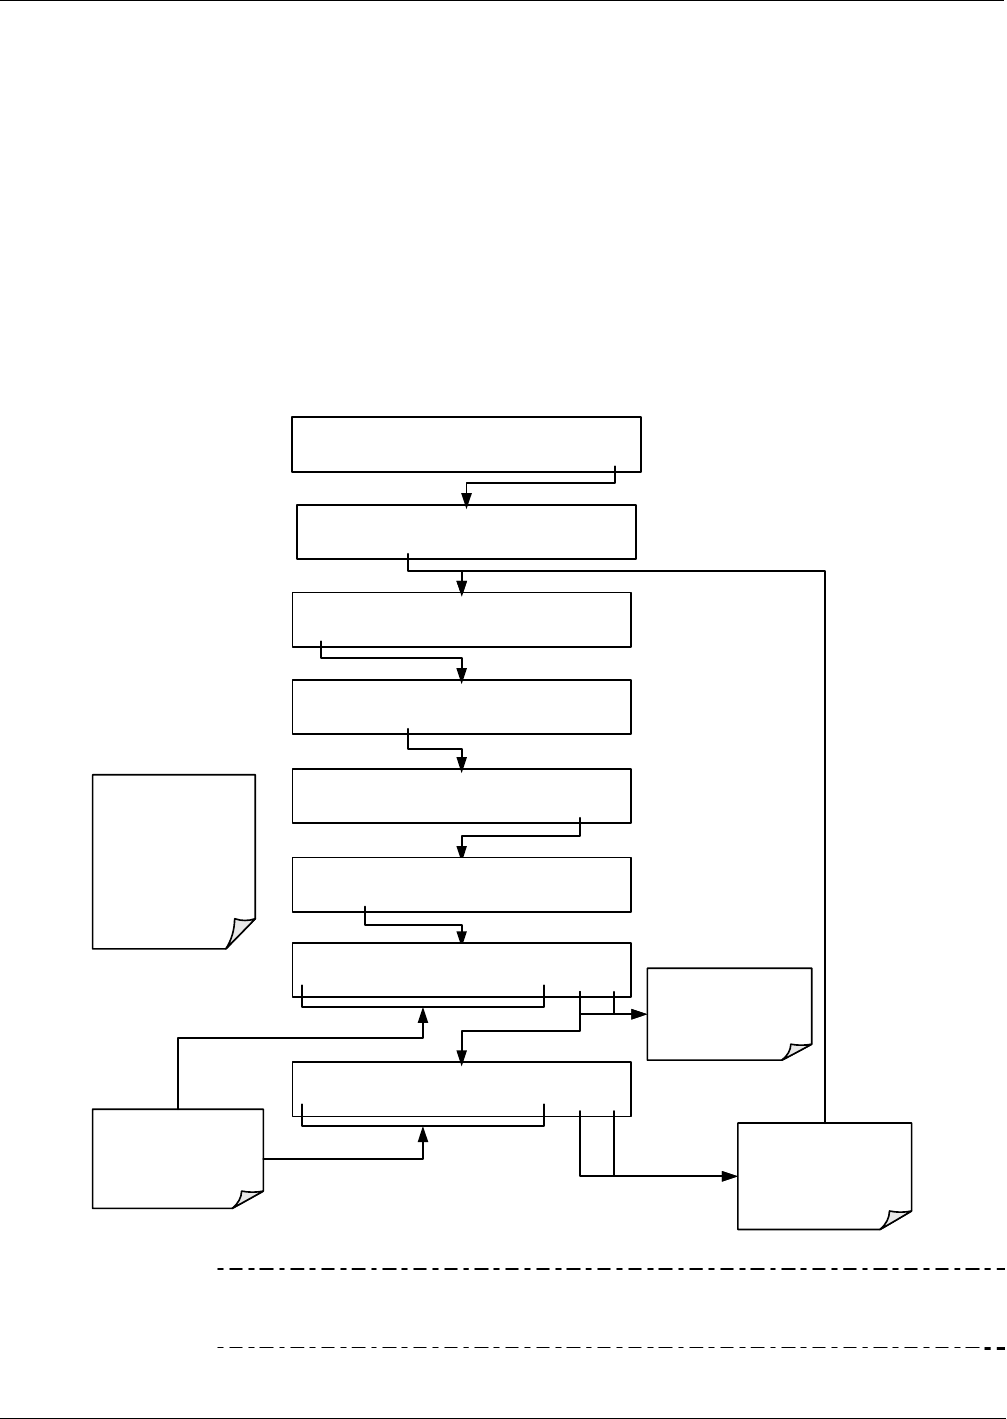
T400 Ozone Analyzer Operator’s Manual Setup Menu
99
5.4.1.5. RNGE MODE AUTO: Auto Range Mode Configuration
AUTO range mode gives the analyzer to ability to output data via a LOW range
(displayed on the front panel as RANGE1) and HIGH range (displayed on the front
panel as RANGE2) on a single analog output.
When the AUTO range mode is selected, the analyzer automatically switches back and
forth between user selected LOW & HIGH ranges depending on the level of the O3
concentration.
The unit will move from LOW range to HIGH range when the O3 concentration
exceeds to 98% of the LOW range span limit.
The unit will return from HIGH range back to LOW range once the O3 concentration
falls below 75% of the LOW range span limit.
To set the ranges press following button stroke sequence:
SETUP X.X PRIMARY SETUP MENU
CFG DAS RNGE PASS CLK MORE EXIT
SAMPLE RANGE=500.0 PPB O3= XXXX
<TST TST> CAL SETUP
SETUP X.X RANGE MODE MENU
MODE SET UNIT EXIT
SETUP X.X RANGE MODE:AUTO
SNGL DUAL AUTO ENTR EXIT
SETUP X.X RANGE MODE:SNGL
SNGL DUAL AUTO ENTR EXIT
SETUP X.X RANGE MODE MENU
MODE SET UNIT EXIT
SETUP X.X HIGH RANGE:200.0 Conc
00200.0ENTREXIT
Toggle buttons to
select the upper
SPAN limit for the
reporting range
EXIT discards the new
setting
ENTR accepts the
new setting
SETUP X.X LOW RANGE:50.0 Conc
00050.0ENTREXIT
The LOW and HIGH
ranges have separate
slopes and offsets for
computing the O3
concentration.
The two ranges must
be independently
calibrated.
EXIT discards the
new setting
ENTR accepts the
new setting
Note Do not set the LOW range (RANGE1) of the instrument with a higher span limit
than the HIGH range (RANGE2). This will cause the unit to stay in the low reporting
range perpetually and defeat the function of the AUTO range mode.
06870C DCN6332
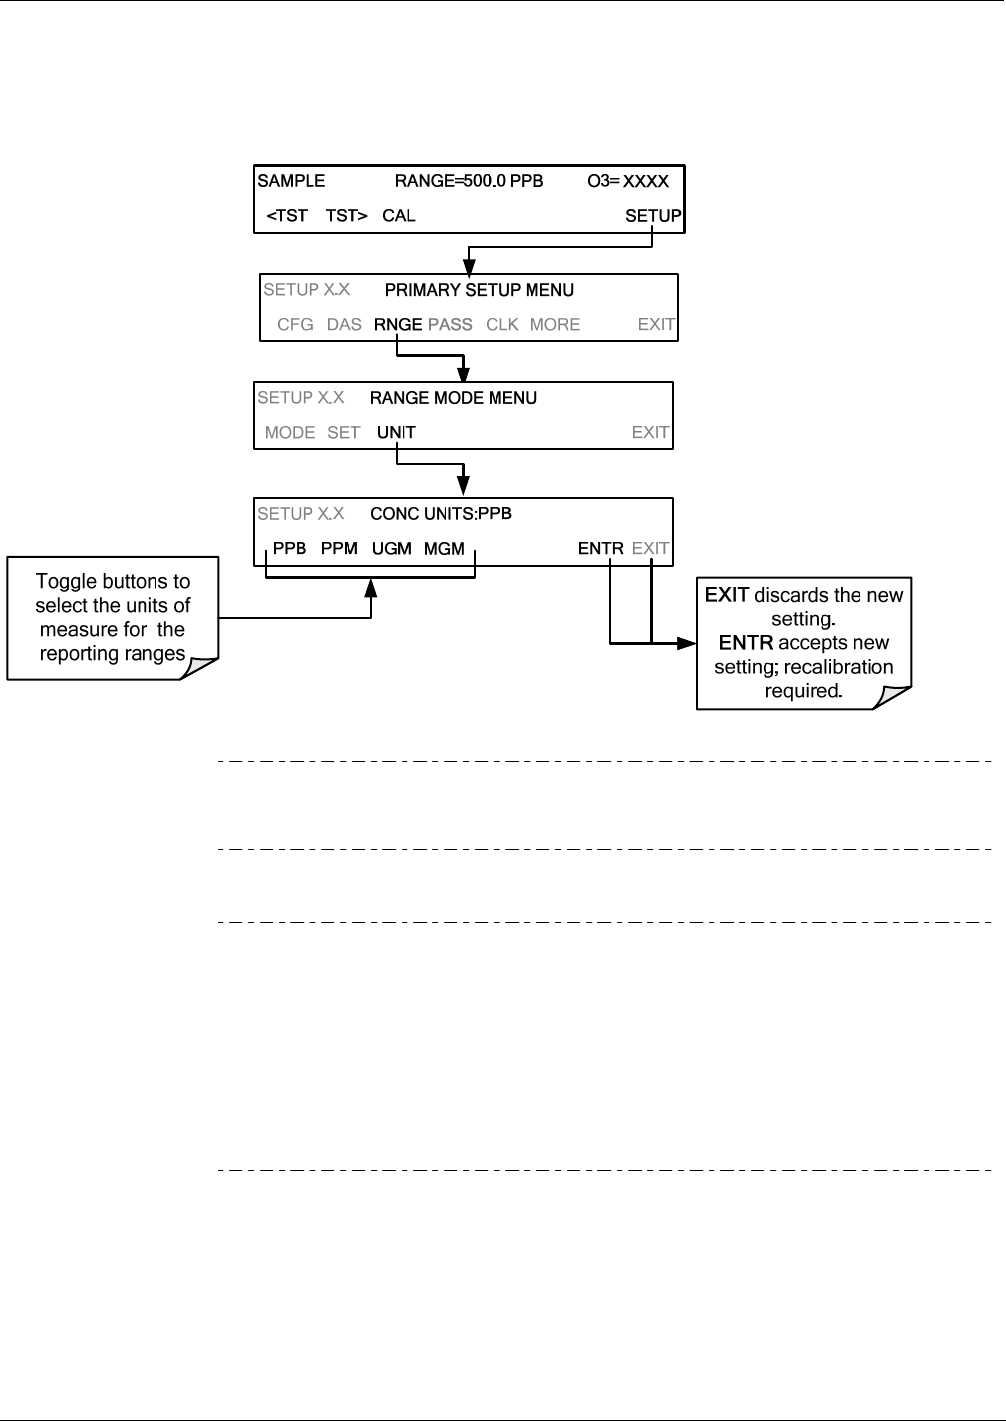
Setup Menu T400 Ozone Analyzer Operator’s Manual
100
5.4.1.6. SETUP RNGE UNIT: Setting the Reporting Range Unit Type
The T400 can display concentrations in ppb, ppm, ug/m3, mg/m3 units. Changing units
affects all of the COM port values, and all of the display values for all reporting ranges.
To change the units of measure press:
Note Concentrations displayed in mg/m3 and ug/m3 use 0C, 760 mmHg for
Standard Temperature and Pressure (STP). Consult your local
regulations for the STP used by your agency.
Note Once the Units of Measurement have been changed, the unit MUST be
recalibrated, as the “expected span values” previously in effect will no
longer be valid. Simply entering new expected span values without
running the entire calibration routine is not sufficient. The following
equations give approximate conversions between volume/volume units
and weight/volume units:
O3 ppb x 2.14 = O3 ug/m3
O3 ppm x 2.14 = O3 mg/m3.
06870C DCN6332

T400 Ozone Analyzer Operator’s Manual Setup Menu
101
5.5. SETUP PASS: PASSWORD PROTECTION
The menu system provides password protection of the calibration and setup functions to
prevent unauthorized adjustments. When the password feature has been enabled
(SETUP>PASS>ON), the system prompts the user for a password to enter the SETUP
menu. This allows normal operation of the instrument, but requires the password (101)
to access to the menus under SETUP. When PASSWORD is disabled (SETUP>OFF),
any operator can enter the Primary Setup (SETUP) and Secondary Setup
(SETUP>MORE) menus. Whether PASSWORD is enabled or disabled, a password
(default 818) is required to enter the VARS or DIAG menus in the SETUP>MORE
menu.
Table 5-1: Password Levels
PASSWORD LEVEL MENU ACCESS ALLOWED
Null (000) Operation All functions of the MAIN menu: TEST, GEN, initiate SEQ , MSG, CLR
101 Configuration/Maintenance Access to primary and secondary SETUP menus when PASSWORD enabled.
818 Configuration/Maintenance Access to DIAG and VARS menus under the secondary SETUP menu whether
PASSWORD is enabled or disabled.
06870C DCN6332
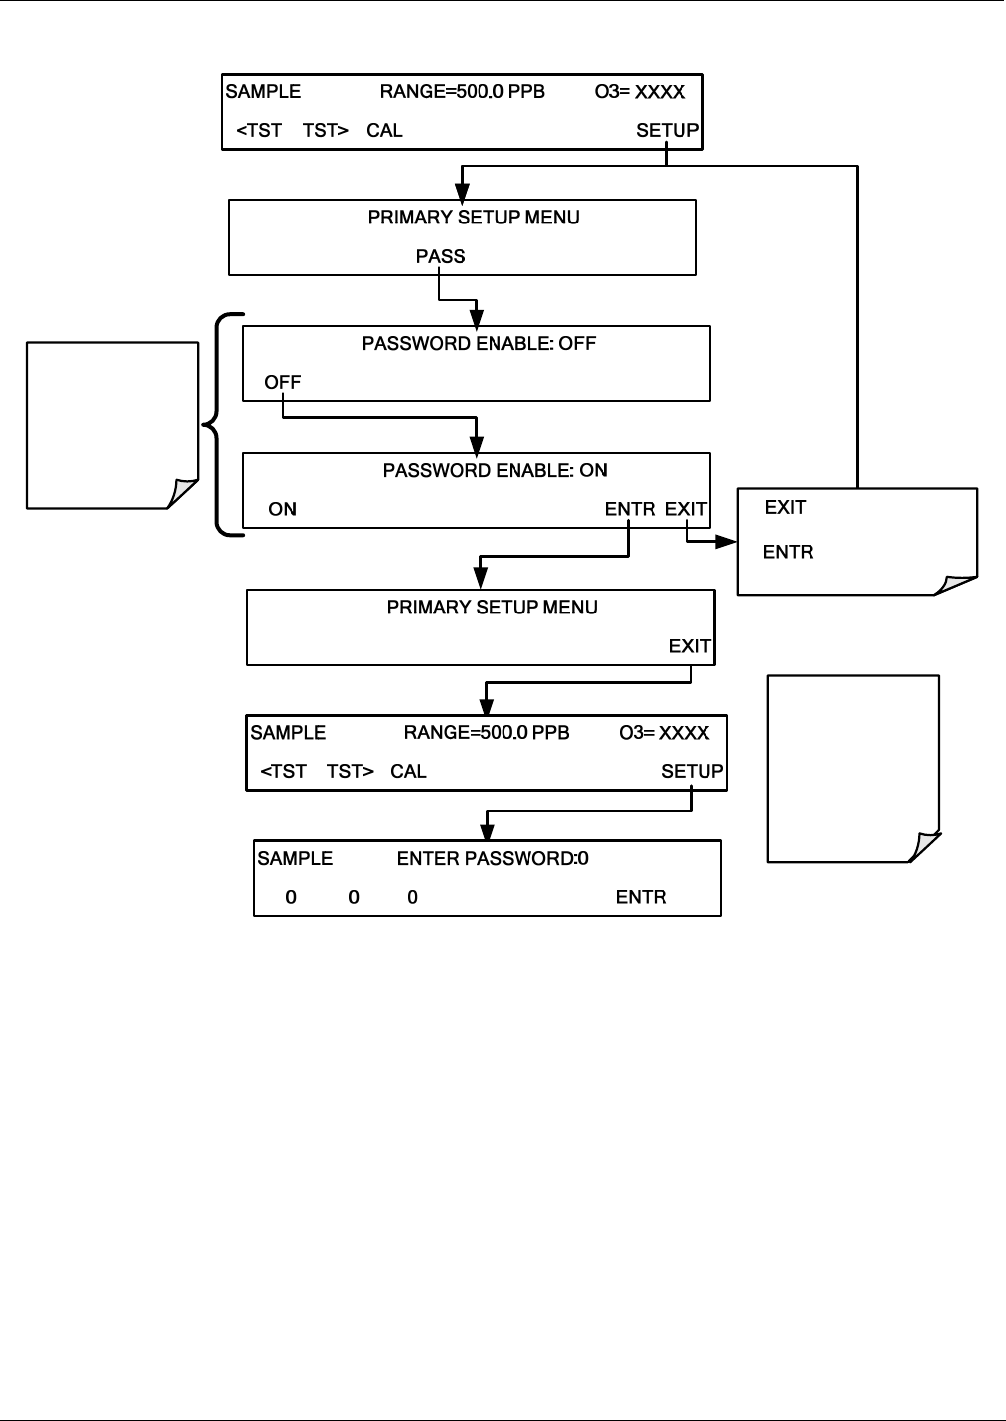
Setup Menu T400 Ozone Analyzer Operator’s Manual
102
To enable or disable password protection, press:
SETUP X.X
CFG DAS RNGE CLK MORE EXIT
SYSTEM
ENTR EXIT
SETUP X.X
Toggle OFF to ON
to enable, and ON
to OFF to disable
password feature
discards the new
setting
accepts the new
setting
SETUP X.X
CFG DAS RNGE PASS CLK MORE
EXIT the
PRIMARY SETUP
MENU after
enabling
Password so that
selecting SETUP
now prompts for
the password.
EXIT
06870C DCN6332
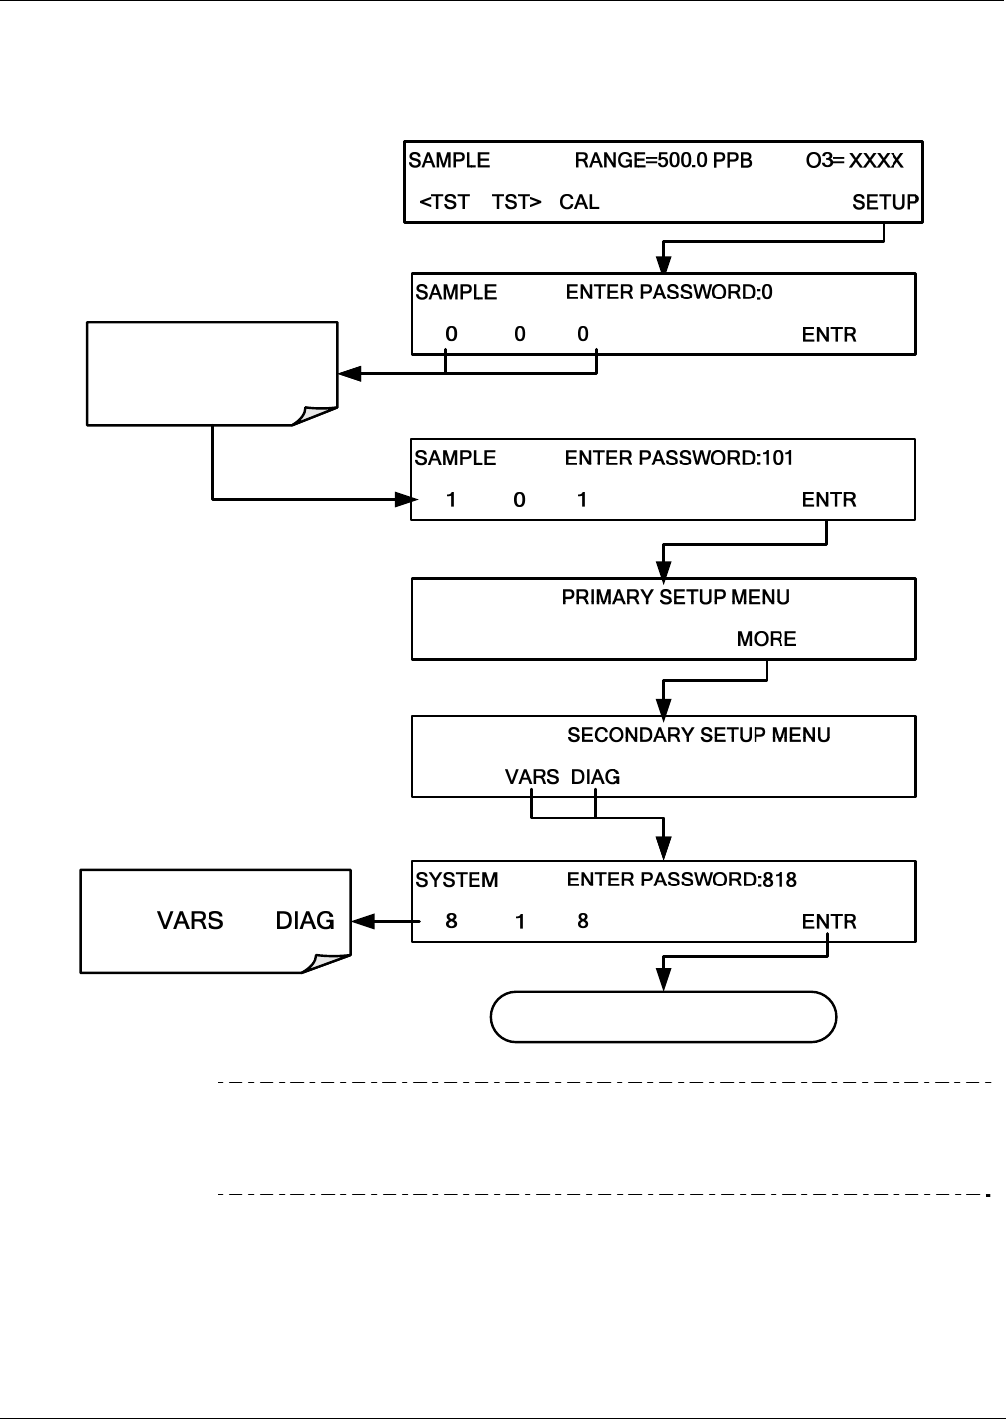
T400 Ozone Analyzer Operator’s Manual Setup Menu
103
Example: If password protection is enabled, the following menu button sequence would be required to enter the
VARS or DIAG submenus:
EXIT
SETUP X.X
COMM EXIT
Default password to
enter and
menus
analyzer enters selected menu
SETUP X.X
CFG DAS RNGE PASS CLK EXIT
EXIT
Toggle to change
password to 101
EXIT
Note Whether PASSWORD is enabled or disabled, the instrument prompts for
a password to enter the VARS and DIAG menus. The menu interface
displays the default password (818) upon either menu. Press ENTR to
access the selected menu.
06870C DCN6332
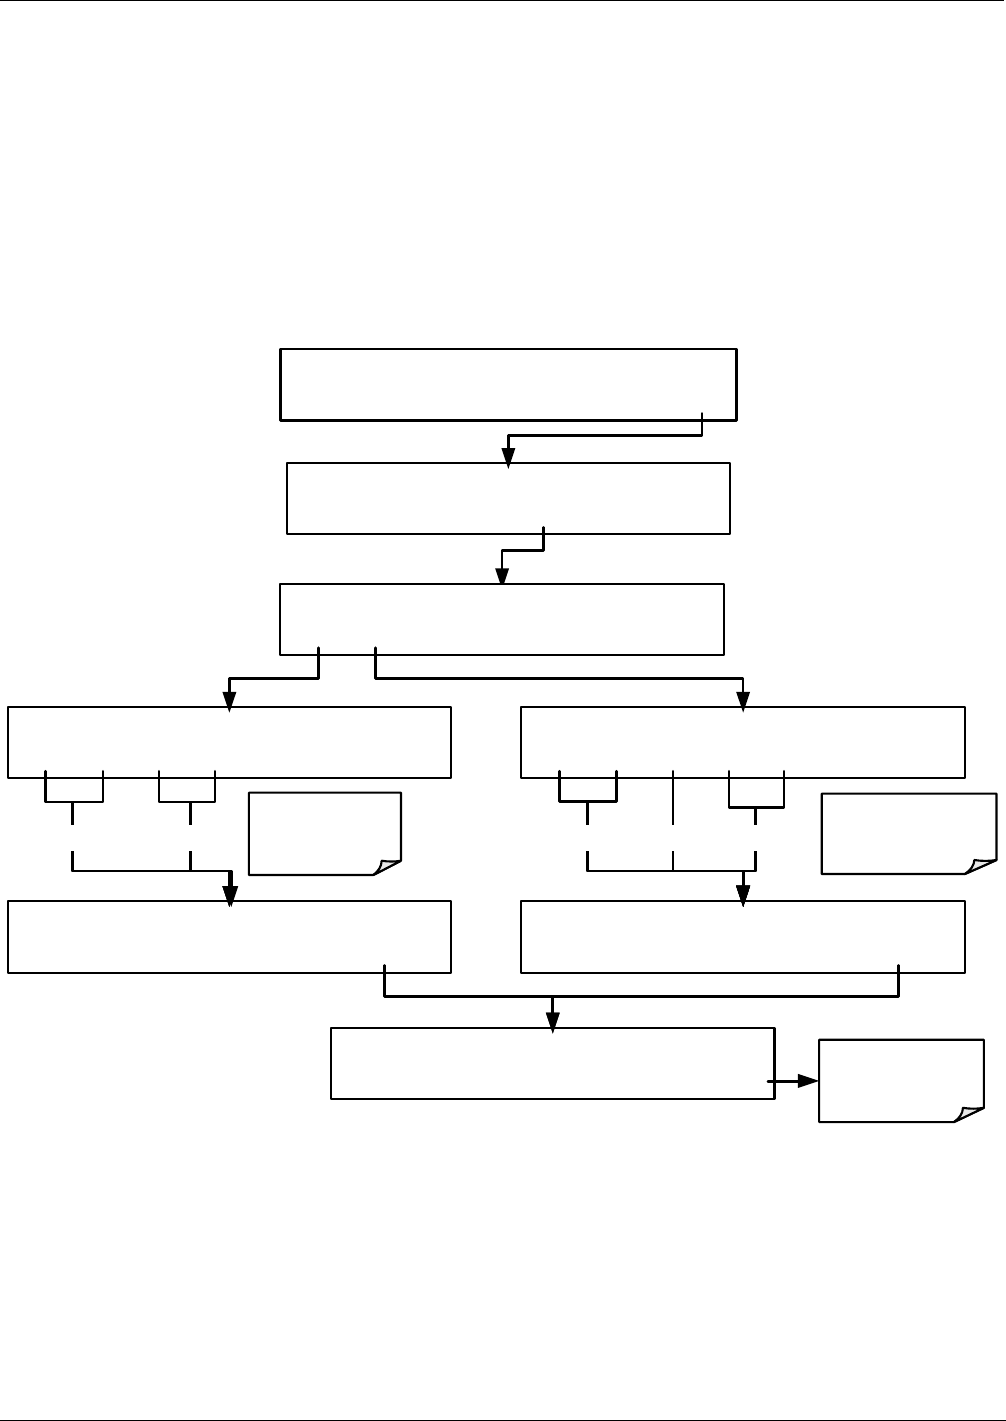
Setup Menu T400 Ozone Analyzer Operator’s Manual
104
5.6. SETUP CLK: SETTING THE T400 ANALYZER’S INTERNAL
TIME-OF-DAY CLOCK AND ADJUSTING SPEED
5.6.1.1. Setting the Internal Clock’s Time and Day
The T400 has a time of day clock that supports the DURATION step of the automatic
calibration (ACAL) sequence feature, time of day TEST function, and time stamps on
for the DAS feature and most COMM port messages.
To set the clock’s time and date, press:
SETUP X.X PRIMARY SETUP MENU
CFG DAS RNGE PASS CLK MORE EXIT
SAMPLE RANGE=500.0 PPB O3= XXXX
<TST TST> CAL SETUP
SETUP X.X TIME-OF-DAY CLOCK
TIME DATE EXIT
Toggle HOUR
and/or MINUTE
buttons to
change time.
SETUP X.X TIME: 12:00
1 2 :0 0 ENTREXIT
SETUP X.X TIME: 22:30
2 2:3 0 ENTREXIT
SETUP X.X DATE: 01-JAN-05
0 1JAN0 5 ENTREXIT
SETUP X.X DATE: 18-JUN-05
1 8JUN0 5 ENTREXIT
SETUP X.X TIME-OF-DAY CLOCK
TIME DATE EXIT
Toggle DAY,
MONTH, and/or
YEAR buttons to
change date.
EXIT returns to
SETUP X.X
display
HOUR MINUTE DAY MONTH YEAR
06870C DCN6332
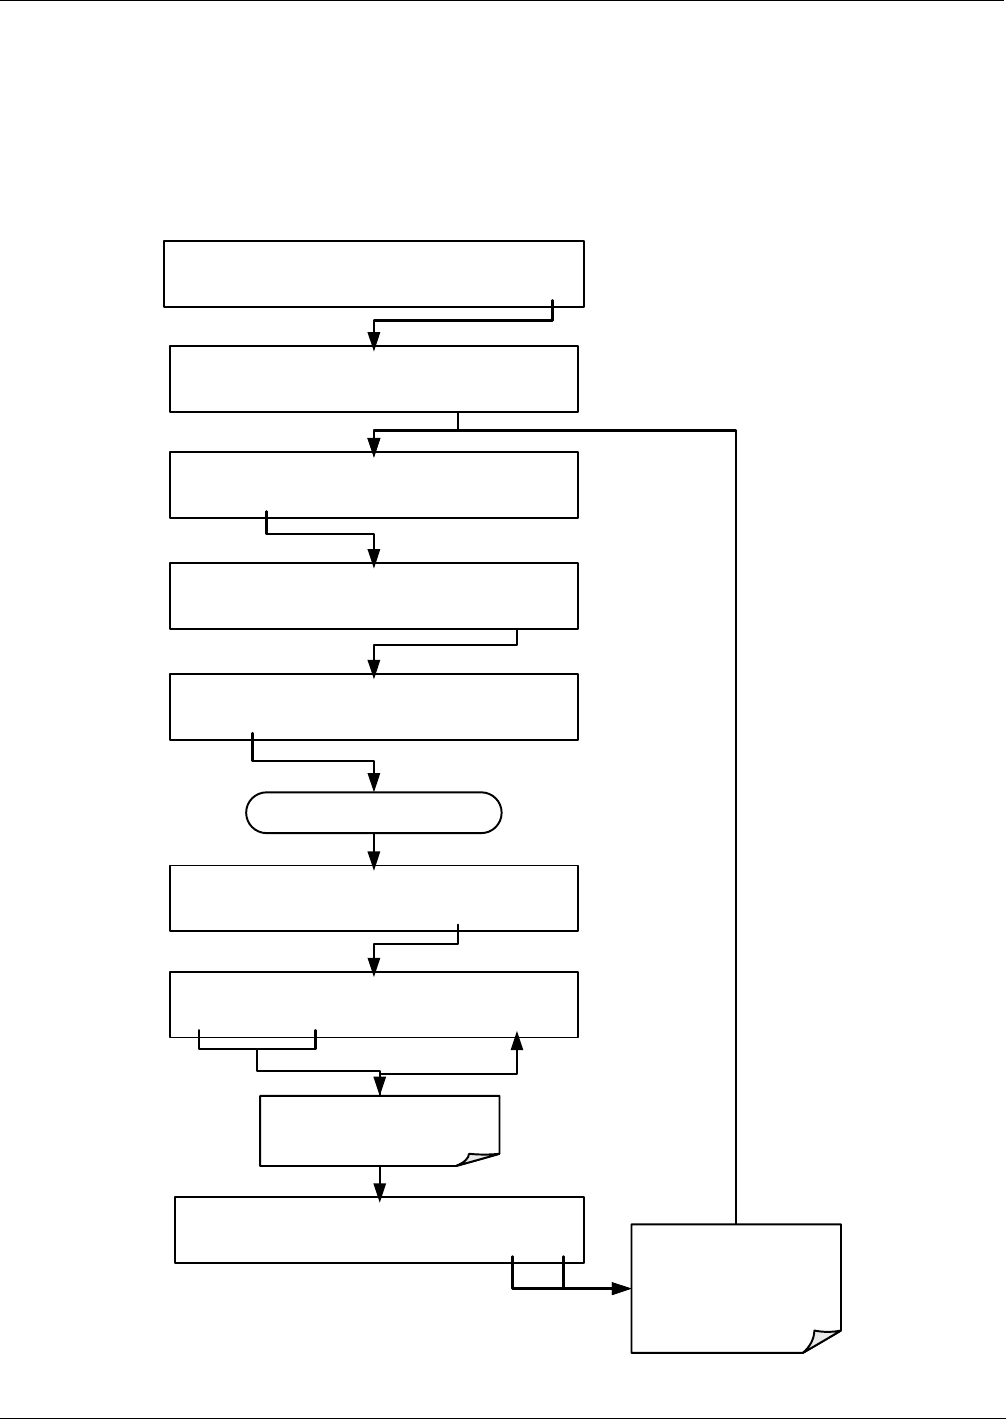
T400 Ozone Analyzer Operator’s Manual Setup Menu
105
5.6.1.2. Adjusting the Internal Clock’s Speed
In order to compensate for CPU clocks which run faster or slower, you can adjust a
variable called CLOCK_ADJ to speed up or slow down the clock by a fixed amount
every day.
The CLOCK_AD variable is accessed via the VARS submenu: To change the value of
this variable, press:
SETUP X.X 0) DAS_HOLD_OFF=15.0 Minutes
PREV NEXT JUMP EDIT ENTR EXIT
SETUP X.X SECONDARY SETUP MENU
COMM VARS DIAG EXIT
SETUP X.X ENTER SETUP PASS:0
8 1 8 ENTREXIT
Continue pressing NEXT until ...
SETUP X.X 7 CLOCK_ADJUST=0 Sec/Day
+0 0 EDIT ENTR EXIT
SETUP X.X 7) CLOCK_ADJUST=0 Sec/Day
PREV NEXT EDIT ENTR EXIT
Enter sign and number of
seconds per day the clock
gains (-) or loses(+)
SETUP X.X 7) CLOCK_ADJUST=0 Sec/Day
PREV NEXT JUMP EDIT ENTR EXIT EXIT discards the new
setting
ENTR accepts the
new setting
SETUP X.X PRIMARY SETUP MENU
CFG DAS RNGE PASS CLK MORE EXIT
SAMPLE RANGE=500.0 PPB O3= XXXX
<TST TST> CAL SETUP
06870C DCN6332
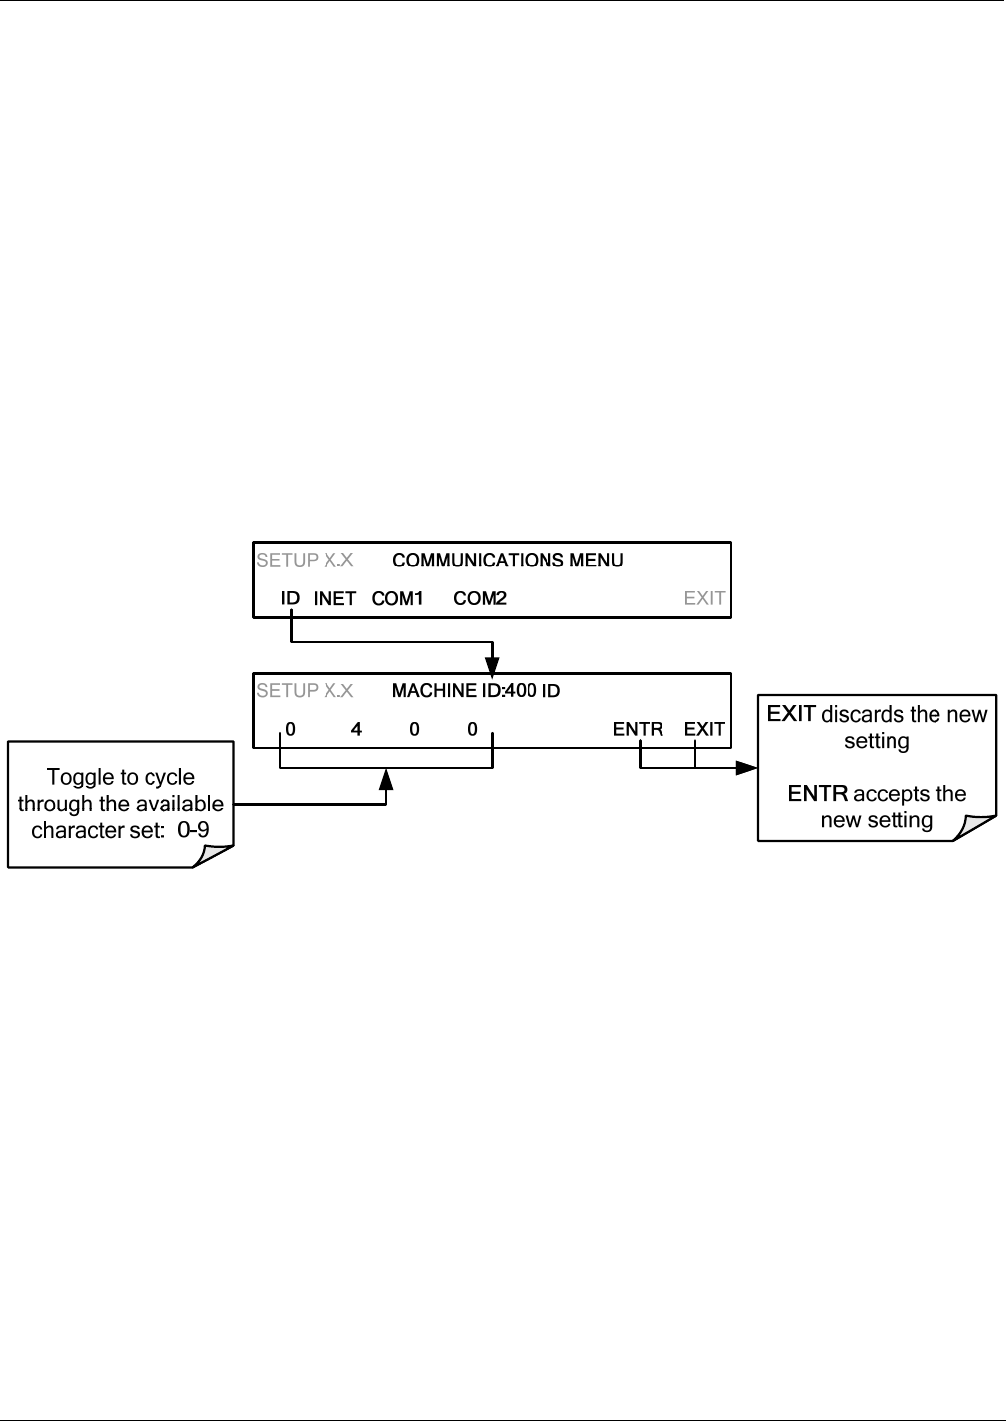
Setup Menu T400 Ozone Analyzer Operator’s Manual
106
5.7. SETUP COMM: COMMUNICATIONS PORTS
This section introduces the communications setup menu; Section 6 provides the setup
instructions and operation information. Press SETUP>ENTR>MORE>COMM to arrive
at the communications menu.
5.7.1. ID (MACHINE IDENTIFICATION)
Press ID to display and/or change the Machine ID, which must be changed to a unique
identifier (number) when more than one instrument of the same model is used:
in an RS-232 multidrop configuration
on the same Ethernet LAN
when applying MODBUS protocol
when applying Hessen protocol
The default ID is typically the same as the model number, although it may sometimes be
“0”. Press any button(s) in the MACHINE ID menu until the Machine ID Parameter
field displays the desired identifier.
The ID can be any 4-digit number and can also be used to identify analyzers in any
number of ways (e.g., location numbers, company asset number, etc.).
5.7.2. INET (ETHERNET)
Use SETUP>COMM>INET to configure Ethernet communications, whether manually
or via DHCP. Please see Section 6.5 for configuration details.
5.7.3. COM1 AND COM 2 (MODE, BAUD RATE AND TEST PORT)
Use the SETUP>COMM>COM1[COM2] menus to:
configure communication modes (Section 6.2.1)
view/set the baud rate (Section 6.2.2)
test the connections of the com ports (Section 6.2.3)
Configuring COM1 or COM2 requires setting the DCE DTE switch on the rear panel.
Section 6.1 provides DCE DTE information.
06870C DCN6332

T400 Ozone Analyzer Operator’s Manual Setup Menu
107
5.8. SETUP VARS: VARIABLES SETUP AND DEFINITION
The T400 has several-user adjustable software variables, which define certain
operational parameters. Usually, these variables are automatically set by the
instrument’s firmware, but can be manually re-defined using the VARS menu.
The following table lists all variables that are available within the 101 password
protected level. See Appendix A2 for a detailed listing of all of the T400 variables that
are accessible through the remote interface.
Table 5-2: Variable Names (VARS)
NO. VARIABLE DESCRIPTION ALLOWED
VALUES
VARS
DEFAULT
VALUES
0 DAS_HOLD_OFF
Changes the Internal Data Acquisition System
(DAS) HOLDOFF timer:
No data is stored in the DAS channels during
situations when the software considers the data to
be questionable such as during warm up of just
after the instrument returns from one of its
calibration mode to SAMPLE Mode.
May be set for
intervals
between
0.5 – 20 min
15 min.
1 CONC_PRECISION
Allows the user to set the number of significant digits to
the right of the decimal point display of concentration and
stability values.
AUTO, 1, 2,
3, 4 AUTO
2 PHOTO_LAMP4 Allows adjustment of the temperature set point for
the photometer UV lamp in the optical bench. 0 - 100C 58C
3 ,O3_GEN_LAMP1 4 Allows adjustment of the temperature set point for
the UV lamp in the O3 generator option.1 0 - 100C 48C
4 O3_GEN_LOW11 Allows adjustment of the O3 generator option for the
low (mid) span calibration point on RANGE12 during
3-point calibration checks.1
0 – 1500 ppb 100 ppb
5 O3_GEN_LOW21 Allows adjustment of the O3 Generator Option for the
low (mid) span calibration point on RANGE23 during
3-point calibration checks.1
0– 1500 ppb 100 ppb
6
O3_SCRUB_SET1,4
Allows adjustment of the temperature set point for
the heater attached to the metal wool scrubber
option along with set points for both the High and
Low alarm limits for the heater.1
0 - 200C
110C
7 CLOCK_ADJ Adjusts the speed of the analyzer’s clock. Choose the +
sign if the clock is too slow, choose the - sign if the clock
is too fast.
-60 to +60 s/day 0 sec
1 Although, this variable may appear in the list even when the associated option is not installed. It is only
effective when that option is installed and operating.
2 RANGE1 is the default range when the analyzer is set for SINGLE range mode and the LOW range when the
unit is set for AUTO range mode.
3 RANGE2 HI range when the unit is set for AUTO range mode.
4 DO NOT ADJUST OR CHANGE this values unless instructed to by Teledyne API Customer Service personnel.
06870C DCN6332
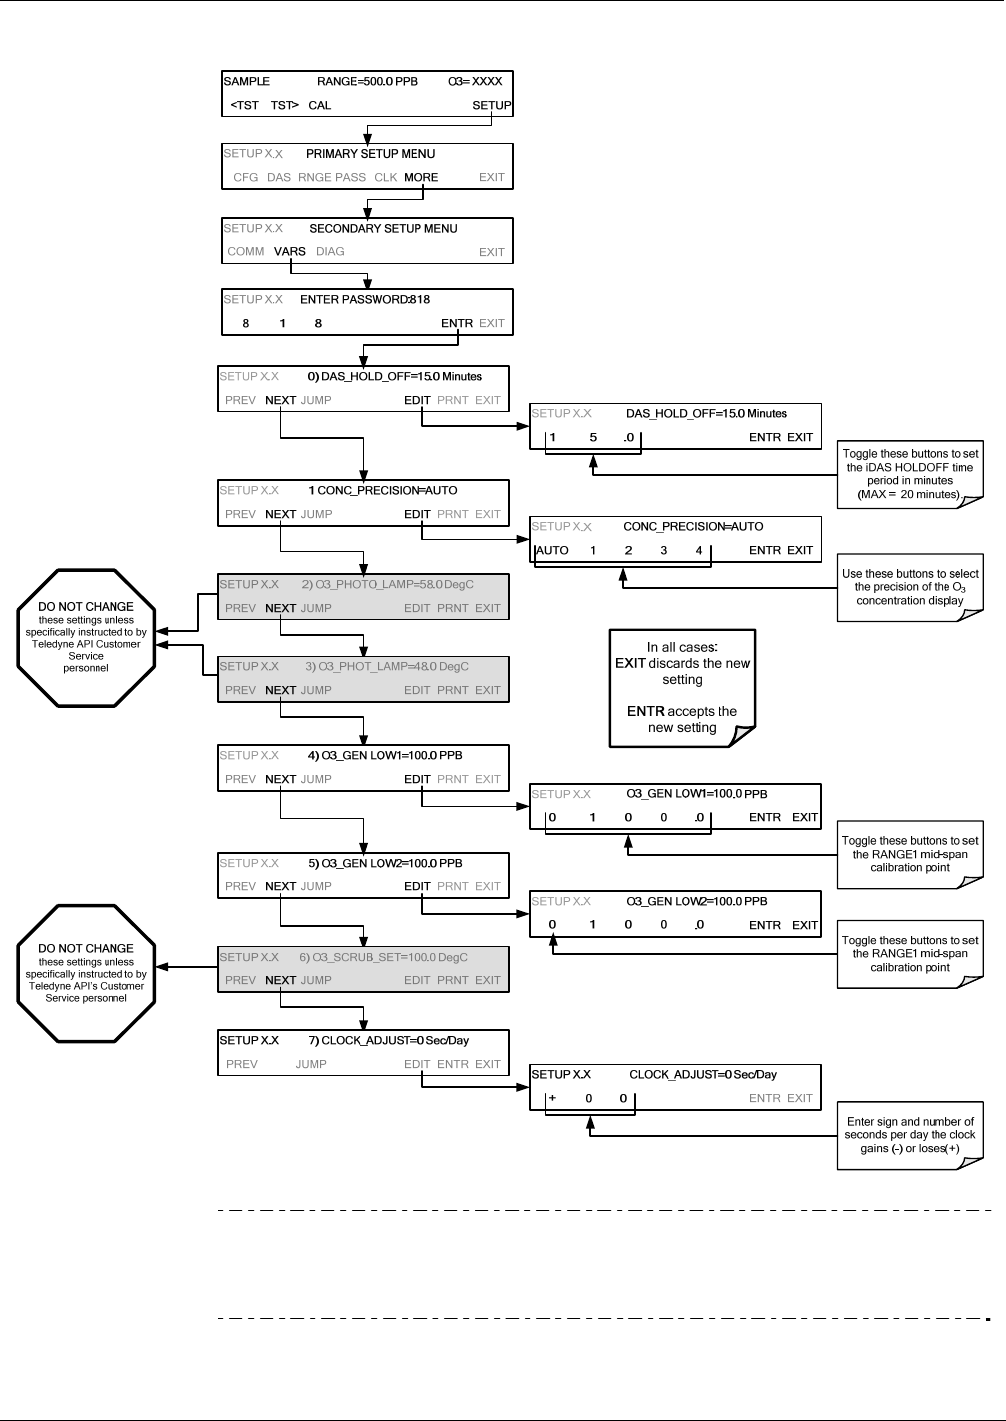
Setup Menu T400 Ozone Analyzer Operator’s Manual
108
To access and navigate the VARS menu, use the following button sequence:
IMPORTANT IMPACT ON READINGS OR DATA
There is a 2-second latency period between when a VARS value is changed and
the new value is stored into the analyzer’s memory. DO NOT turn the analyzer
off during this period or the new setting will be lost.
06870C DCN6332

T400 Ozone Analyzer Operator’s Manual Setup Menu
109
5.9. SETUP DIAG :DIAGNOSTICS FUNCTIONS
A series of diagnostic tools is grouped together under the SETUPMOREDIAG
menu. As these parameters are dependent on firmware revision, (see Appendix A).
These tools can be used in a variety of troubleshooting and diagnostic procedures and
are referred to in many places of the maintenance and trouble-shooting sections of this
manual.
The various operating modes available under the DIAG menu are:
Table 5-3: Diagnostic Mode (DIAG) Functions
DIAG SUBMENU SUBMENU FUNCTION Front Panel
Mode Indicator
MANUAL
SECTION
SIGNAL I/O
Allows observation of all digital and analog signals
in the instrument. Allows certain digital signals such
as valves and heaters to be toggled ON and OFF.
DIAG I/O 12.1.3
ANALOG OUTPUT
When entered, the analyzer performs an analog
output step test. This can be used to calibrate a
chart recorder or to test the analog output accuracy.
DIAG AOUT 12.7.8.1
ANALOG I/O
CONFIGURATION
The signal levels of the instruments analog outputs
may be calibrated (either individually or as a group).
Various electronic parameters such as signal span,
and offset are available for viewing and
configuration.
DIAG AIO 5.10
O3 GENERATOR
CALIBRATION1
The analyzer is performing an electric test. This test
simulates IR detector signal in a known manner so
that the proper functioning of the sync/demod board
can be verified.
DIAG OPTIC 9.6
DARK
CALIBRATION
The analyzer is performing a dark calibration
procedure. This procedure measures and stores
the inherent dc offset of the sync/demod board
electronics.
DIAG ELEC 9.5.1
FLOW
CALIBRATION
This function is used to calibrate the gas flow output
signals of sample gas and ozone supply. These
settings are retained when exiting DIAG.
DIAG FCAL 9.5.2
TEST CHAN
OUTPUT Configures the A4 analog output channel. DIAG TCHN 5.10.1.9
1 Only appears if the IZS option is installed.
06870C DCN6332
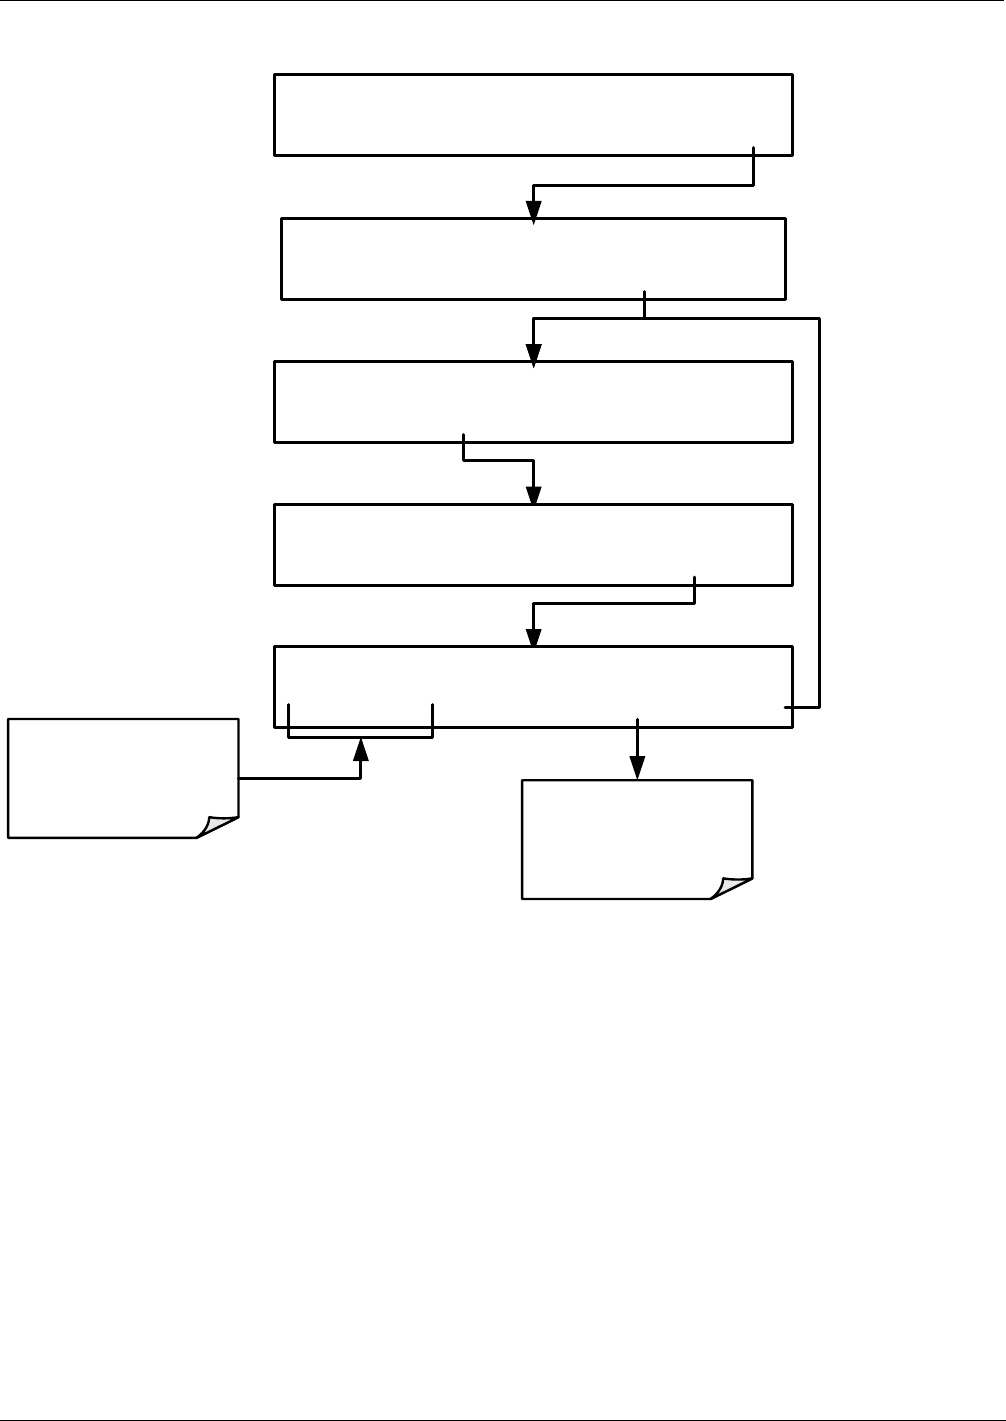
Setup Menu T400 Ozone Analyzer Operator’s Manual
110
To access the various DIAG submenus, press the following buttons:
SETUP X.X PRIMARY SETUP MENU
CFG DAS RNGE PASS CLK MORE EXIT
SAMPLE RANGE=500.0 PPB O3= XXXX
<TST TST> CAL SETUP
SETUP X.X SECONDARY SETUP MENU
COMM VARS DIAG EXIT
SETUP X.X ENTER PASSWORD:818
8 1 8 ENTR EXIT
DIAG SIGNAL I/O
PREV NEXT ENTR EXIT
Toggle to scroll
through the list of
DIAG submenus ENTR Activates the
selected DIAG
submenu
Figure 5-2: Accessing the DIAG Submenus
06870C DCN6332

T400 Ozone Analyzer Operator’s Manual Setup Menu
111
5.10. USING THE MODEL T400 ANALYZER’S ANALOG I/O
Table 5-4 lists the analog I/O functions available in the T400 analyzer.
Table 5-4: DIAG - Analog I/O Functions
SUB MENU FUNCTION MANUAL
SECTION
AOUT CALIBRATED
Initiates a calibration of the A1, A2 and A4 analog output channels that
determines the slope and offset inherent in the circuitry of each output.
These values are stored in the and applied to the output signals by the CPU
automatically
5.10.1.1
CONCOUT_11
Sets the basic electronic configuration of the A1 output. There are four
options:
RANGE: Selects the signal type (voltage or current loop) and level of the
output
A1 OFS: Allows them input of a DC offset to let the user manually adjust
the output level
AUTO CAL: Enables / Disables the AOUT CALIBRATION Feature
CALIBRATED: Performs the same calibration as AOUT CALIBRATED,
but on this one channel only.
CONCOUT_21
Sets the basic electronic configuration of the A2 output. There are three
options:
RANGE: Selects the signal type (voltage or current loop) and level of the
output
A2 OFS: Allows them input of a DC offset to let the user manually adjust
the output level
AUTO CAL: Enables / Disables the AOUT CALIBRATION Feature
CALIBRATED: Performs the same calibration as AOUT CALIBRATED,
but on this one channel only.
5.10
TEST OUTPUT1
Sets the basic electronic configuration of the A4 output. There are three
options:
RANGE: Selects the signal type (voltage or current loop) and level of the
output
A4 OFS: Allows them input of a DC offset to let the user manually adjust
the output level
AUTO CAL: Enables / Disables the AOUT CALIBRATION Feature
CALIBRATED: Performs the same calibration as AOUT CALIBRATED,
but on this one channel only.
5.10.1.9
AIN CALIBRATED Initiates a calibration of the A-to-D Converter circuit located on the
Motherboard. 5.10.2
XIN1
.
.
.
XIN8
For each of 8 external analog inputs channels, shows the gain, offset,
engineering units, and whether the channel is to show up as a Test
function.
1Changes to RANGE or REC_OFS require recalibration of this output.
06870C DCN6332
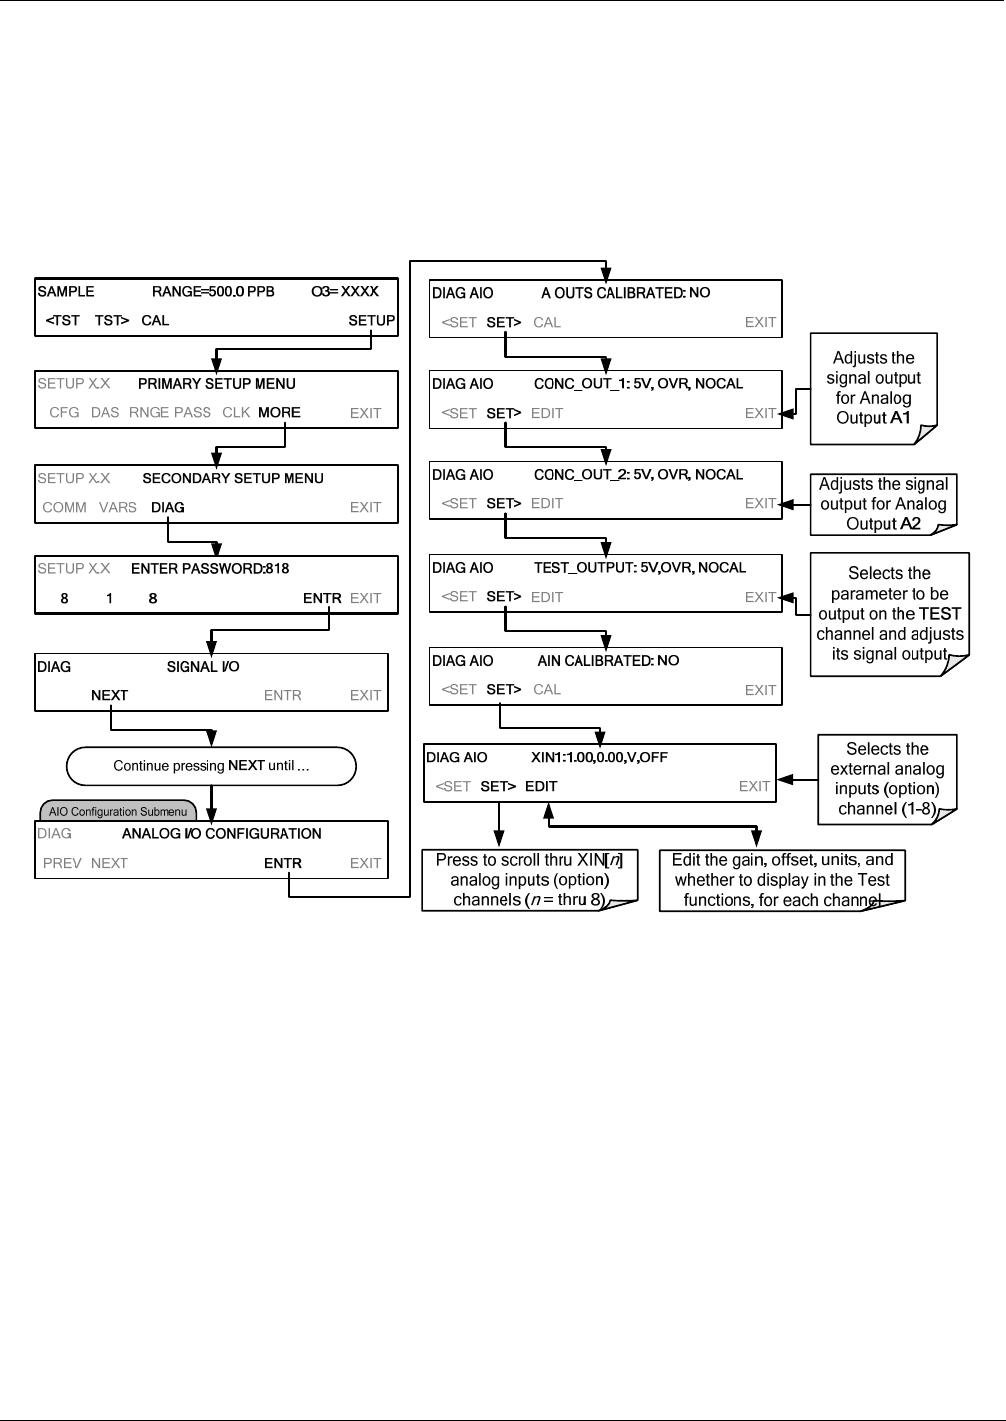
Setup Menu T400 Ozone Analyzer Operator’s Manual
112
5.10.1. ADJUSTING & CALIBRATING THE ANALOG OUTPUT SIGNALS
The T400 analyzer comes equipped with three analog outputs. The first two outputs (A1
& A2) carry analog signals that represent the currently measured O3 output (see Section
5.4.1.2). The third output (A4) can be set by the user to carry the current signal level of
any one of several operational parameters (see Table 5-8).
To access the ANALOG I/O CONFIGURATION sub menu, press:
Figure 5-3: Accessing the Analog I/O Configuration Submenus
5.10.1.1. Calibration of the Analog Outputs
TEST CHANNEL calibration needs to be carried out on first startup of the analyzer
(performed in the factory as part of the configuration process) or whenever re-calibration
is required. The analog outputs can be calibrated automatically or adjusted manually.
In its default mode, the instrument is configured for automatic calibration of all
channels, which is useful for clearing any analog calibration warnings associated with
channels that will not be used or connected to any input or recording device, e.g.,
datalogger.
Manual calibration should be used for the 0.1V range or in cases where the outputs must
be closely matched to the characteristics of the recording device. Manual calibration
requires the AUTOCAL feature to be disabled.
06870C DCN6332
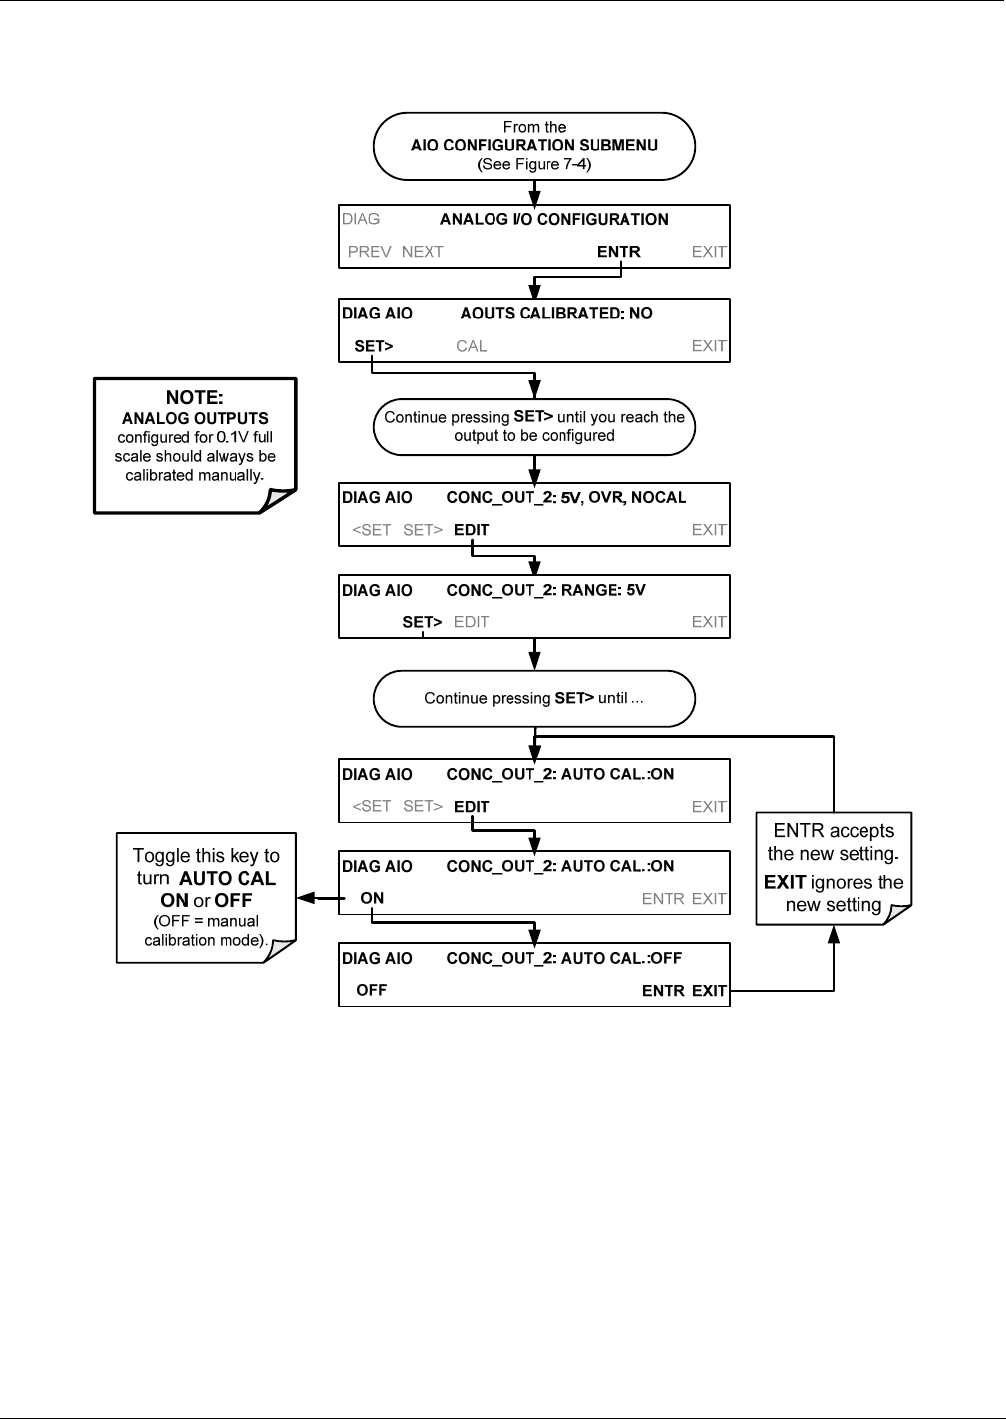
T400 Ozone Analyzer Operator’s Manual Setup Menu
113
5.10.1.2. Enabling or Disabling the AutoCal for an Individual Analog Output
To enable or disable the AutoCal feature for an individual analog output, press.
06870C DCN6332
Setup Menu T400 Ozone Analyzer Operator’s Manual
114
5.10.1.3. Automatic Group Calibration of the Analog Outputs
To calibrate the outputs as a group with the AOUTS CALIBRATION command, select
the ANALOG I/O CONFIGURATION submenu (see Figure 5-3) then press:
From the
AIO CONFIGURATION SUBMENU
(See Figure 7-4)
Analyzer
automatically
calibrates all
channels for which
AUTO-CAL is turned
ON
If any of the channels have not
been calibrated ot if at least one
channel has AUTO-CAL turned
OFF, this message will read NO.
DIAG AIO NOT AUTO CAL. CONC_OUT_1
DIAG AIO NOT AUTO CAL. CONC_OUT_2
This message
appears when
AUTO-CAL is
Turned OFF for
a channel
DIAG AIO AOUTS CALIBRATED: YES
SET> CAL EXIT
DIAG AIO AOUTS CALIBRATED: NO
SET> CAL EXIT
DIAG ANALOG I/O CONFIGURATION
PREV NEXT ENTR EXIT
DIAG AIO AUTO CALIBRATING TEST_OUTPUT
Note Manual calibration should be used for any analog output set for a 0.1V
output range or in cases where the outputs must be closely matched to
the characteristics of the recording device.
06870C DCN6332
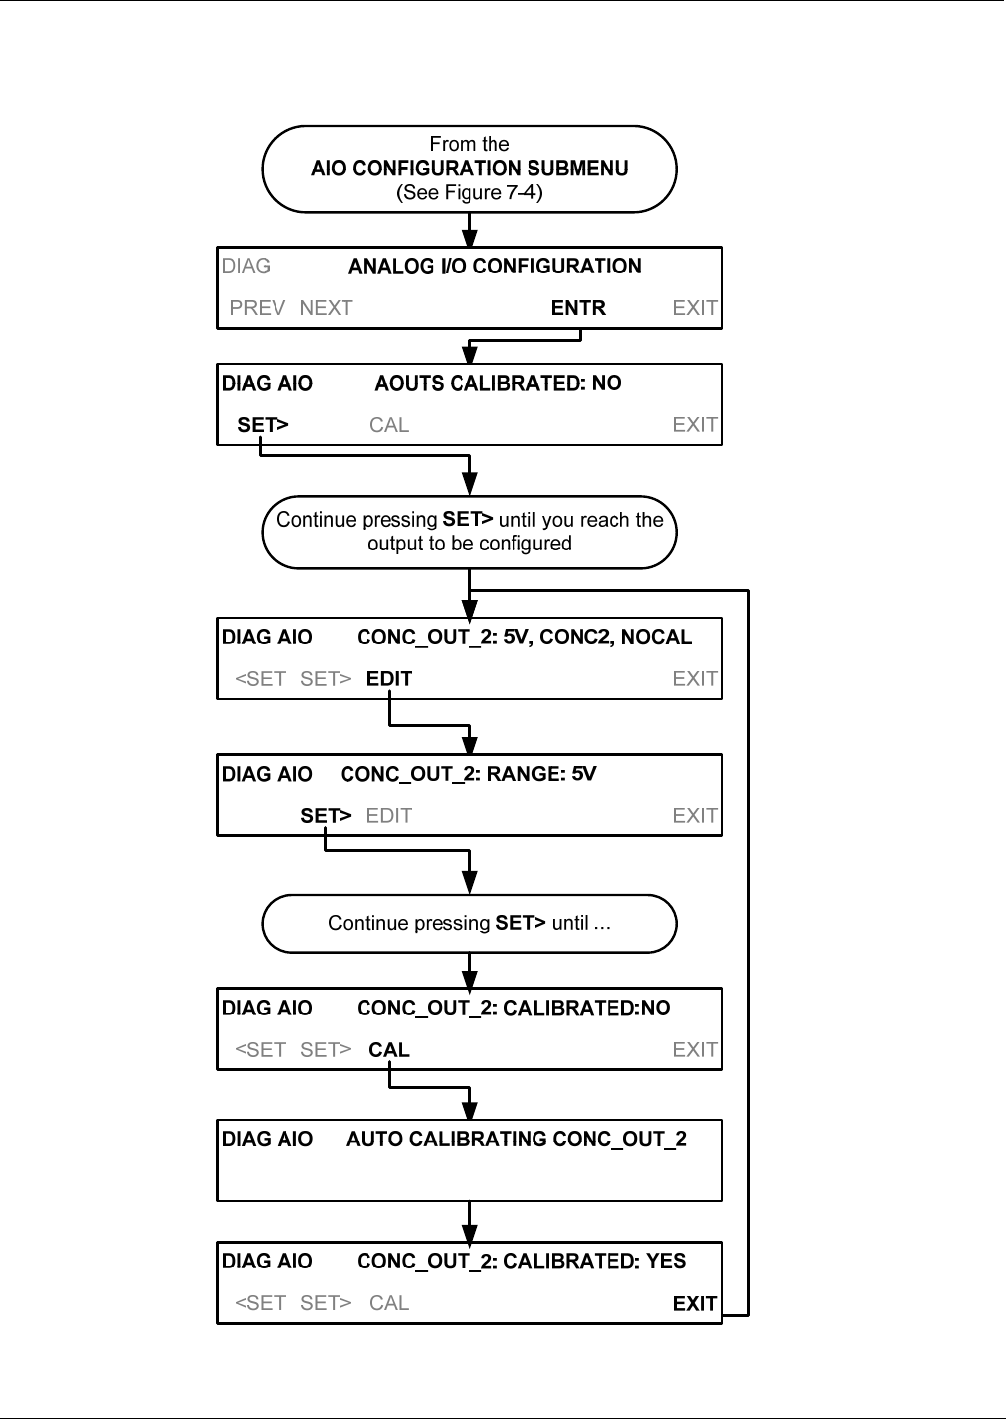
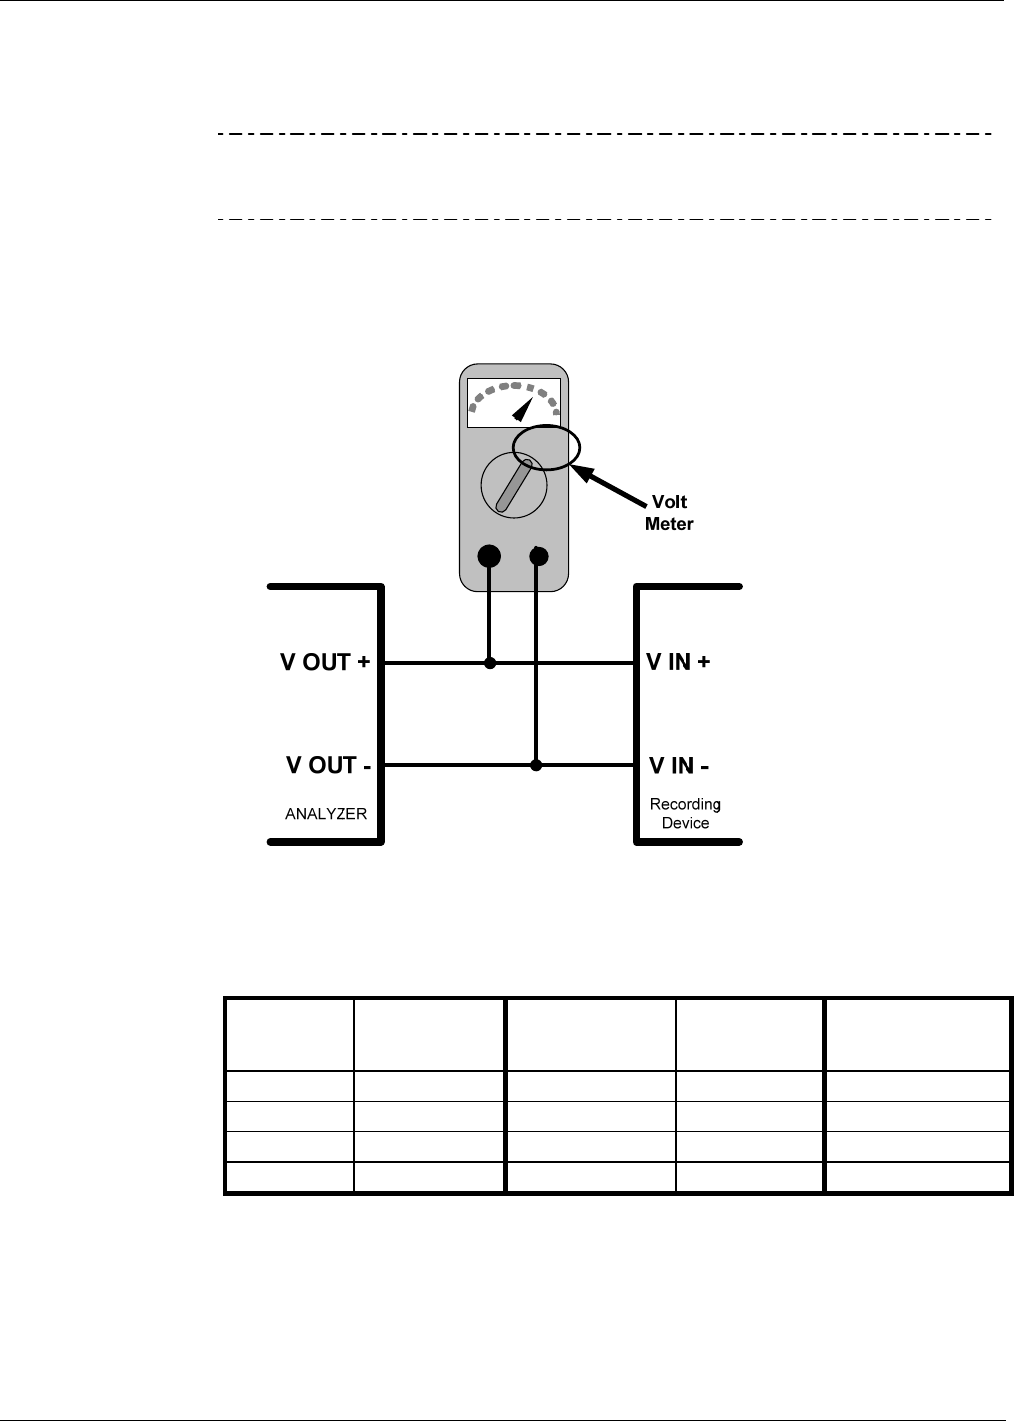
Setup Menu T400 Ozone Analyzer Operator’s Manual
116
5.10.1.4. Manual Calibration of the Analog Outputs Configured for Voltage Ranges
For highest accuracy, the voltages of the analog outputs can be manually calibrated.
Note The menu for manually adjusting the analog output signal level will only
appear if the AUTO-CAL feature is turned off for the channel being
adjusted (See Section 5.10.1.2).
Calibration is performed with a voltmeter connected across the output terminals and by
changing the actual output signal level using the front panel buttons in 100, 10 or 1
count increments. See Figure 3-7 for pin assignments and diagram of the analog output
connector.
V
+DC Gnd
Figure 5-4: Setup for Calibrating Analog Output
Table 5-5: Voltage Tolerances for the TEST CHANNEL Calibration
FULL
SCALE
ZERO
TOLERANCE SPAN VOLTAGE SPAN
TOLERANCE
MINIMUM
ADJUSTMENT
(1 count)
0.1 VDC ±0.0005V 90 mV ±0.001V 0.02 mV
1 VDC ±0.001V 900 mV ±0.001V 0.24 mV
5 VDC ±0.002V 4500 mV ±0.003V 1.22 mV
10 VDC ±0.004V 4500 mV ±0.006V 2.44 mV
To adjust the signal levels of an analog output channel manually, select the ANALOG
I/O CONFIGURATION submenu (see Figure 5-3) then press:
06870C DCN6332
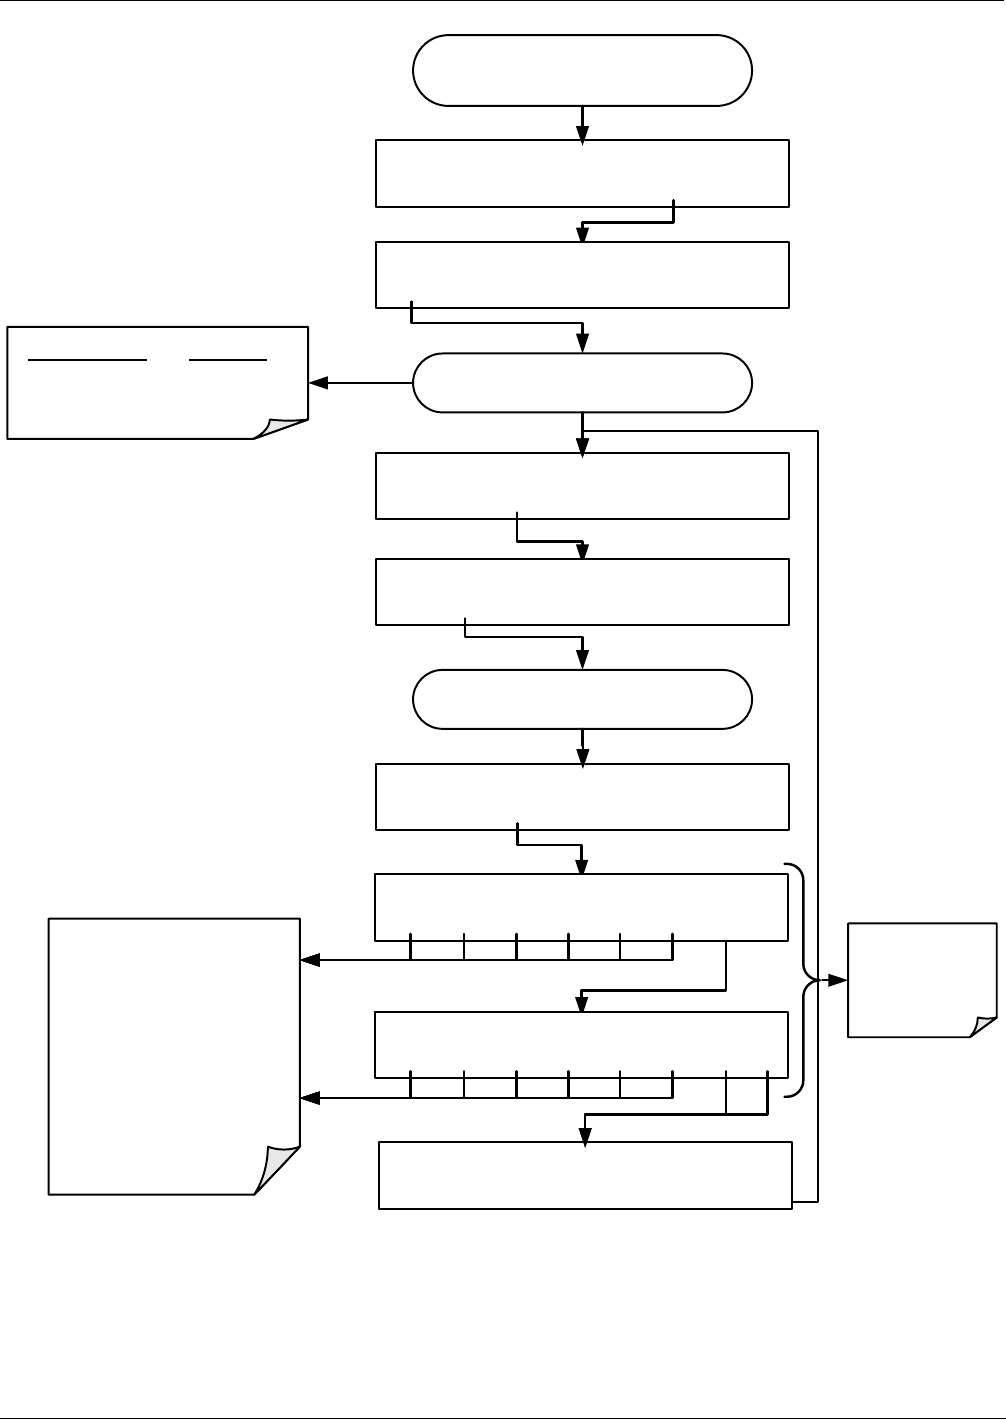
T400 Ozone Analyzer Operator’s Manual Setup Menu
117
From the
AIO CONFIGURATION SUBMENU
(See figure 7-4)
DIAG ANALOG I/O CONFIGURATION
PREV NEXT ENTR EXIT
Continue pressing SET> until you reach the
output to be configured
DIAG AIO CONC_OUT_2: 5V, CONC2, NOCAL
<SET SET> EDIT EXIT
Continue pressing SET> until ...
DIAG AIO CONC_OUT_2: CALIBRATED:NO
<SET SET> CAL EXIT
DIAG AIO CONC_OUT_2: RANGE: 5V
SET> EDIT EXIT
DIAG AIO CONC_OUT_2: VOLT-Z: 0 mV
U100 UP10 UP DOWN DN10 D100 ENTREXIT
DIAG AIO CONC_OUT_2: VOLT-S: 4500 mV
U100 UP10 UP DOWN DN10 D100 ENTREXIT
DIAG AIO CONC_OUT_2: CALIBRATED: YES
<SET SET> CAL EXIT
These menus
only appear if
AUTO-CAL is
turned OFF
These buttons increase /
decrease the analog output
signal level (not the value on the
display)
by 100, 10 or 1 counts.
Continue adjustments until the
voltage measured at the output
of the analyzer and/or the input
of the recording device matches
the value in the upper right hand
corner of the display (within the
tolerances
listed in Table 7-7
DIAG AIO AOUTS CALIBRATED: NO
SET> CAL EXIT
DISPLAYED AS = CHANNEL
CONC_OUT_1 = A1
CONC_OUT_2 = A2
TEST OUTPUT = A4
06870C DCN6332
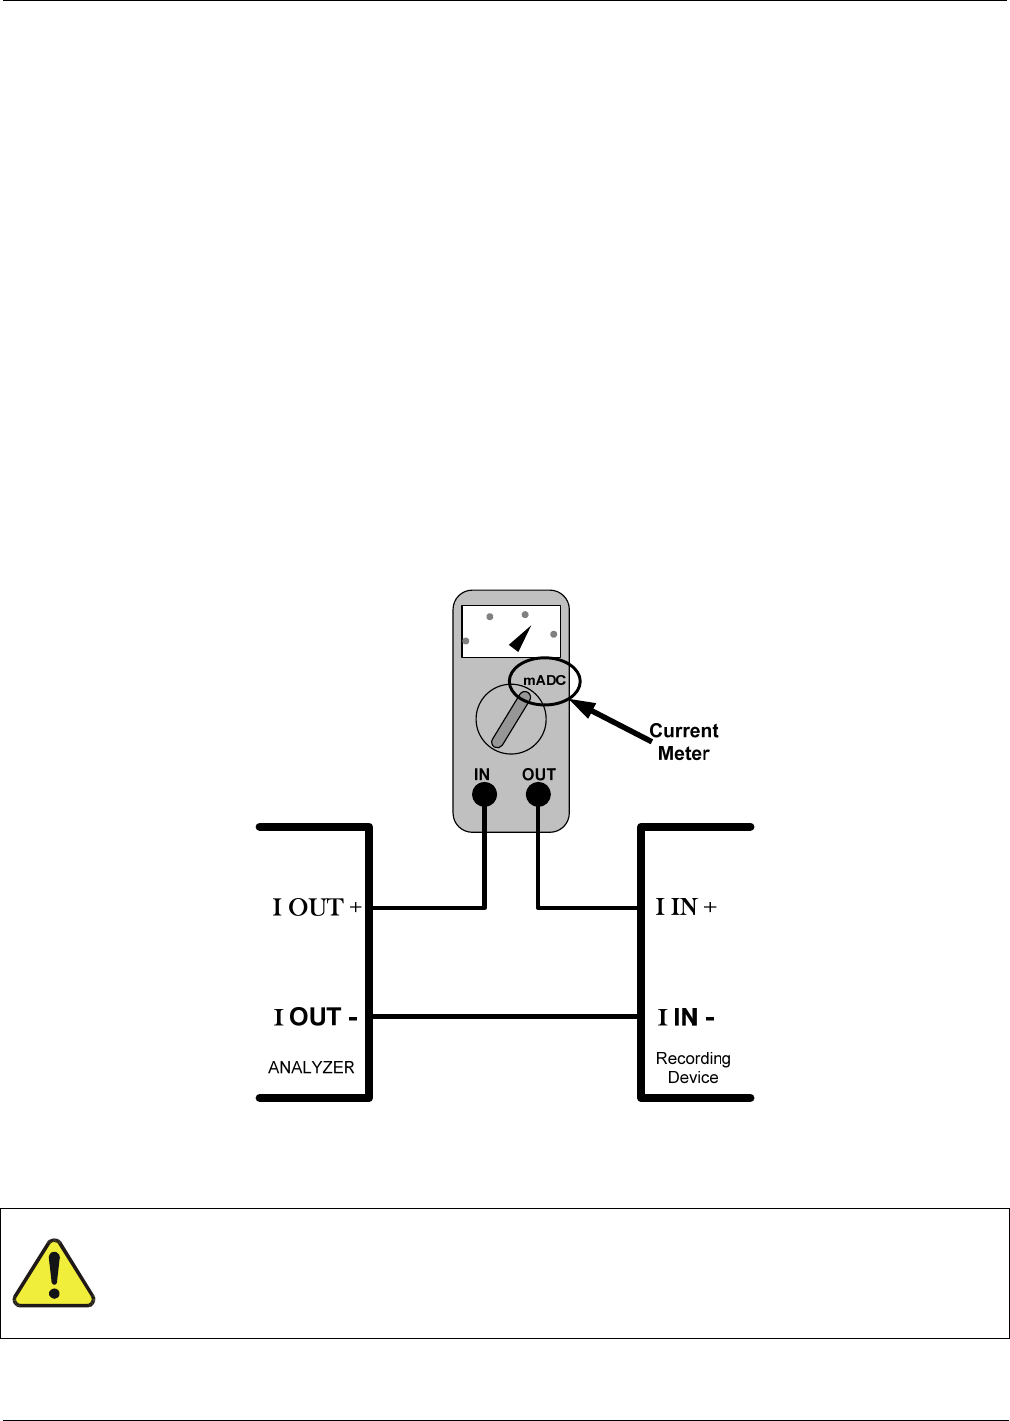
Setup Menu T400 Ozone Analyzer Operator’s Manual
118
5.10.1.5. Manual Adjustment of Current Loop Output Span and Offset
A current loop option may be purchased for the A1 and A2 Analog outputs of the
analyzer. This option places circuitry in series with the output of the D-to A converter
on the motherboard that changes the normal DC voltage output to a 0-20 milliamp
signal. The outputs can be ordered scaled to any set of limits within that 0-20 mA range,
however most current loop applications call for either 0-20 mA or 4-20mA range spans.
All current loop outputs have a + 5% over range. Ranges whose lower limit is set above
1 mA also have a –5 under range.
To switch an analog output from voltage to current loop, follow the instructions in
Section 5.10.1.6 and select CURR from the list of options on the “Output Range” menu.
Adjusting the signal zero and span levels of the current loop output is done by raising or
lowering the voltage output of the D-to-A converter circuitry on the analyzer’s
motherboard. This raises or lowers the signal level produced by the Current Loop
Option circuitry.
The software allows this adjustment to be made in 100, 10 or 1 count increments. Since
the exact amount by which the current signal is changed per D-to-A count varies from
output-to-output and instrument–to–instrument, you will need to measure the change in
the signal levels with a separate, current meter placed in series with the output circuit.
See Figure 3-7 for pin assignments and diagram of the analog output connector.
Figure 5-5: Setup for Checking Current Output Signal Levels
CAUTION – General Safety Hazard
DO NOT EXCEED 60 V PEAK VOLTAGE BETWEEN CURRENT LOOP OUTPUTS
AND INSTRUMENT GROUND.
06870C DCN6332
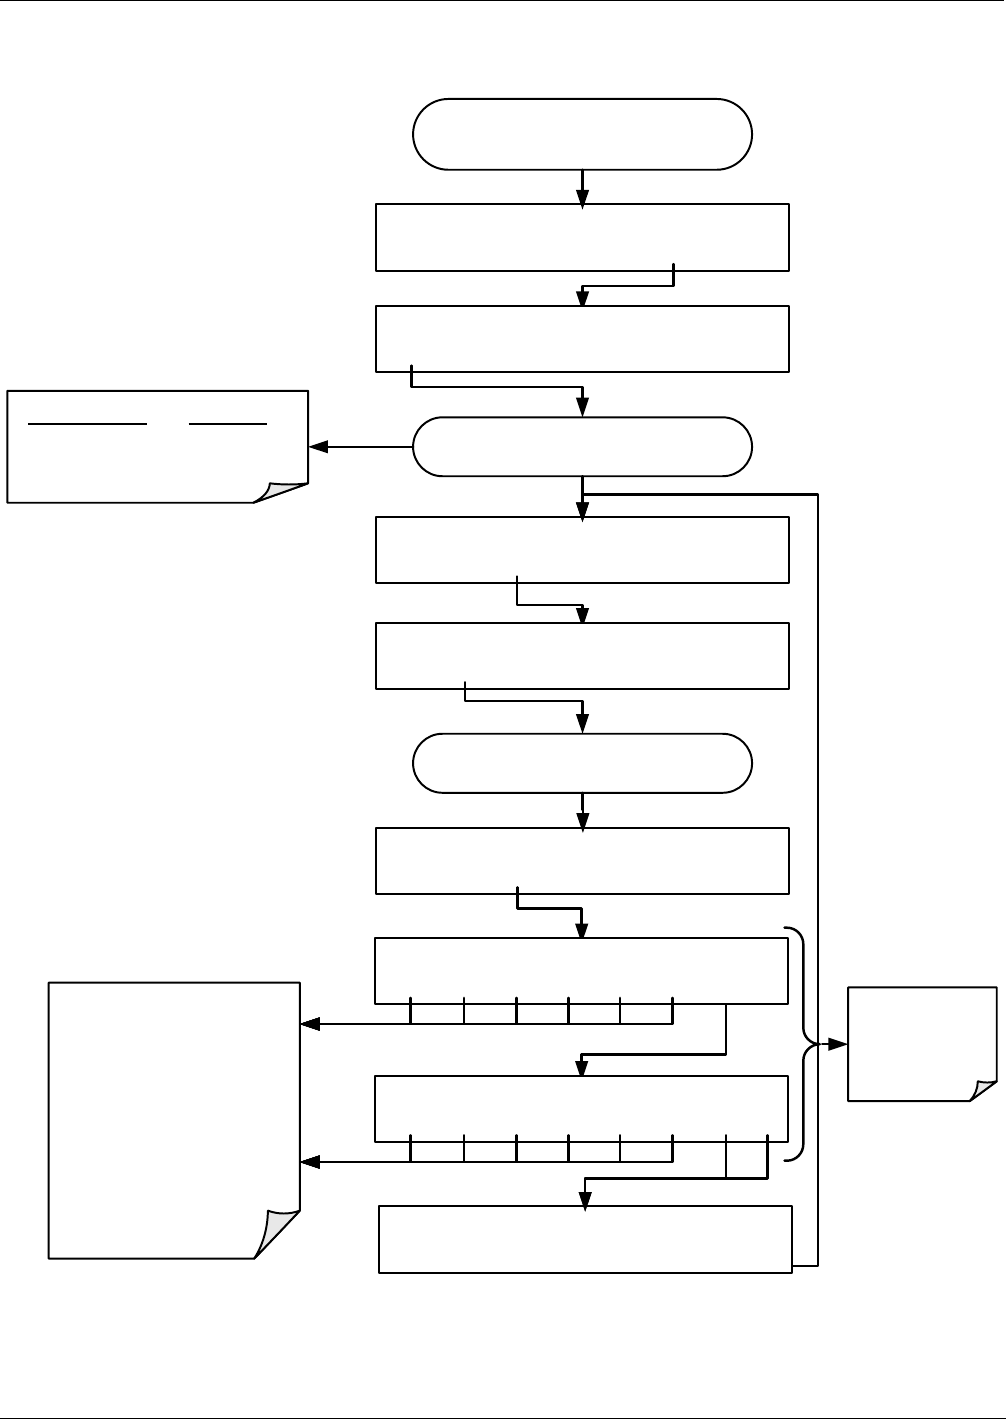
T400 Ozone Analyzer Operator’s Manual Setup Menu
119
To adjust the zero and span signal levels of the current outputs, select the ANALOG I/O
CONFIGURATION submenu (see Figure 5-3) then press:
From the
AIO CONFIGURATION SUBMENU
(See figure 7-4)
DIAG ANALOG I/O CONFIGURATION
PREV NEXT ENTR EXIT
Continue pressing SET> until you reach the
output to be configured
DIAG AIO CONC_OUT_2: 5V, CONC2, NOCAL
<SET SET> EDIT EXIT
Continue pressing SET> until ...
DIAG AIO CONC_OUT_2: CALIBRATED:NO
<SET SET> CAL EXIT
DIAG AIO CONC_OUT_2: RANGE: CURR
SET> EDIT EXIT
DIAG AIO CONC_OUT_2: CURR-Z: 0 mV
U100 UP10 UP DOWN DN10 D100 ENTREXIT
DIAG AIO CONC_OUT_2: CURR-S: 5000 mV
U100 UP10 UP DOWN DN10 D100 ENTREXIT
DIAG AIO CONC_OUT_2: CALIBRATED: YES
<SET SET> CAL EXIT
These menus
only appear if
AUTO-CAL is
turned OFF
These buttons increase /
decrease the analog output
signal level (not the value on the
display)
by 100, 10 or 1 counts.
Continue adjustments until the
voltage measured at the output
of the analyzer and/or the input
of the recording device matches
the value in the upper right hand
corner of the display (within the
tolerances
listed in Table 7-7
DIAG AIO AOUTS CALIBRATED: NO
SET> CAL EXIT
DISPLAYED AS = CHANNEL
CONC_OUT_1 = A1
CONC_OUT_2 = A2
TEST OUTPUT = A4
An alternative method for setting up the Current Loop outputs is to connect a 250 ohm
1% resistor across the current loop output in lieu of the current meter (see Figure 3-7
06870C DCN6332
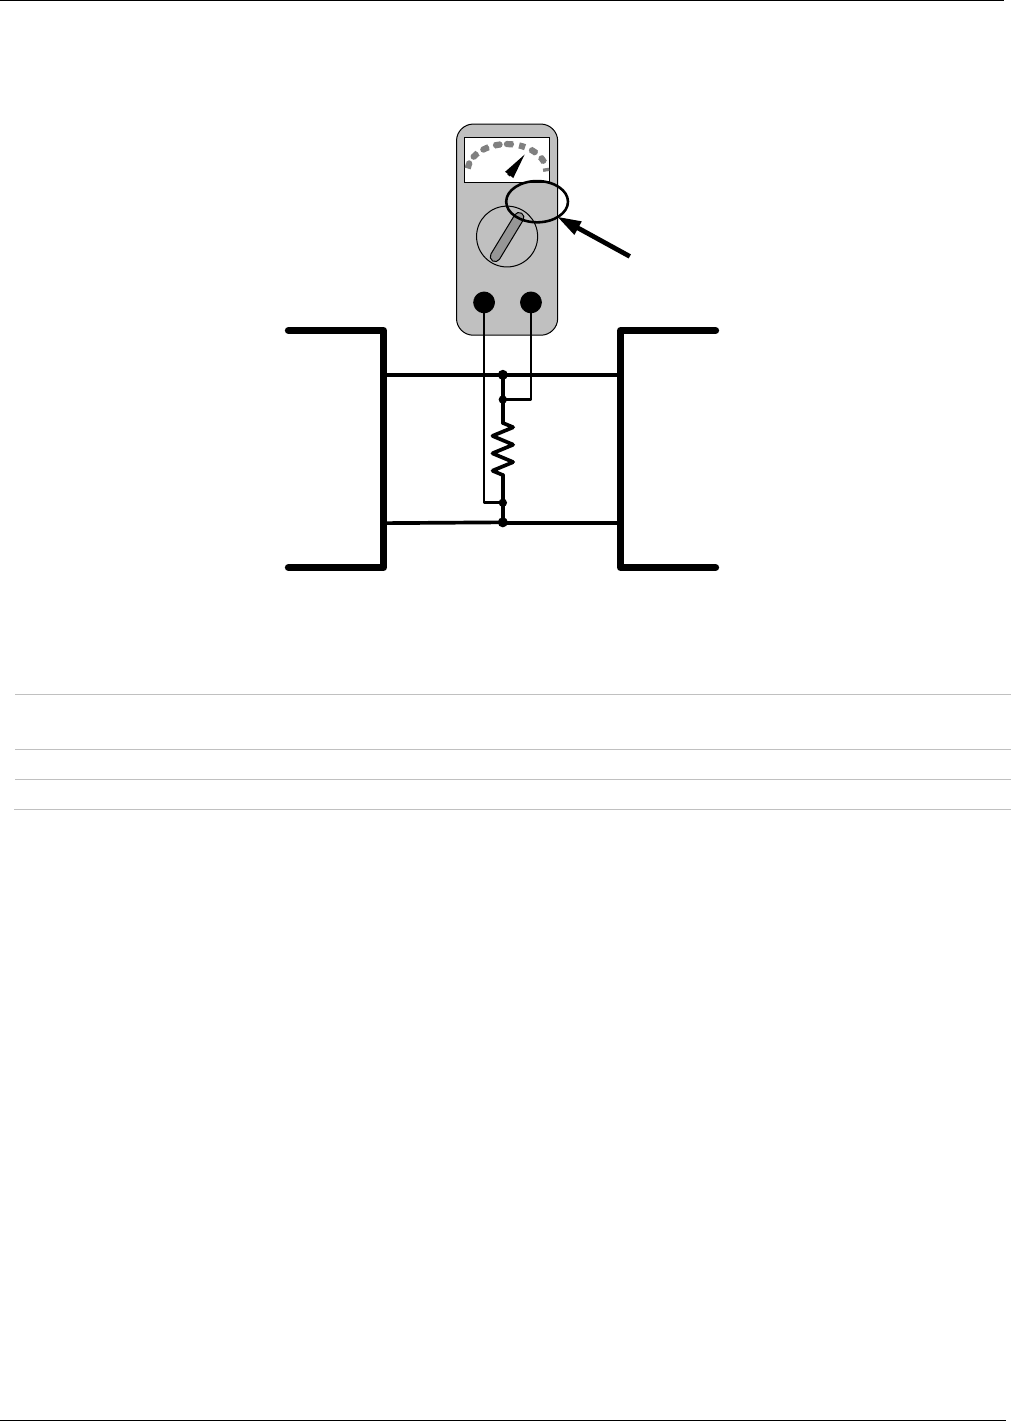
Setup Menu T400 Ozone Analyzer Operator’s Manual
120
for pin assignments and diagram of the analog output connector). Using a voltmeter
connected across the resistor follow the procedure above but adjust the output for the
following values:
V
+DC Gnd
Recording
Device
V IN +
V IN -
ANALYZER
V OUT +
V OUT -
250 Ω
Volt
Meter
Figure 5-6: Alternative Setup Using 250Ω Resistor for Checking Current Output Signal Levels
Table 5-6: Current Loop Output Check
% FS Voltage across Resistor for
2-20 mA
Voltage across Resistor for
4-20 mA
0 0.5 VDC 1 VDC
100 5.0 5.0
06870C DCN6332
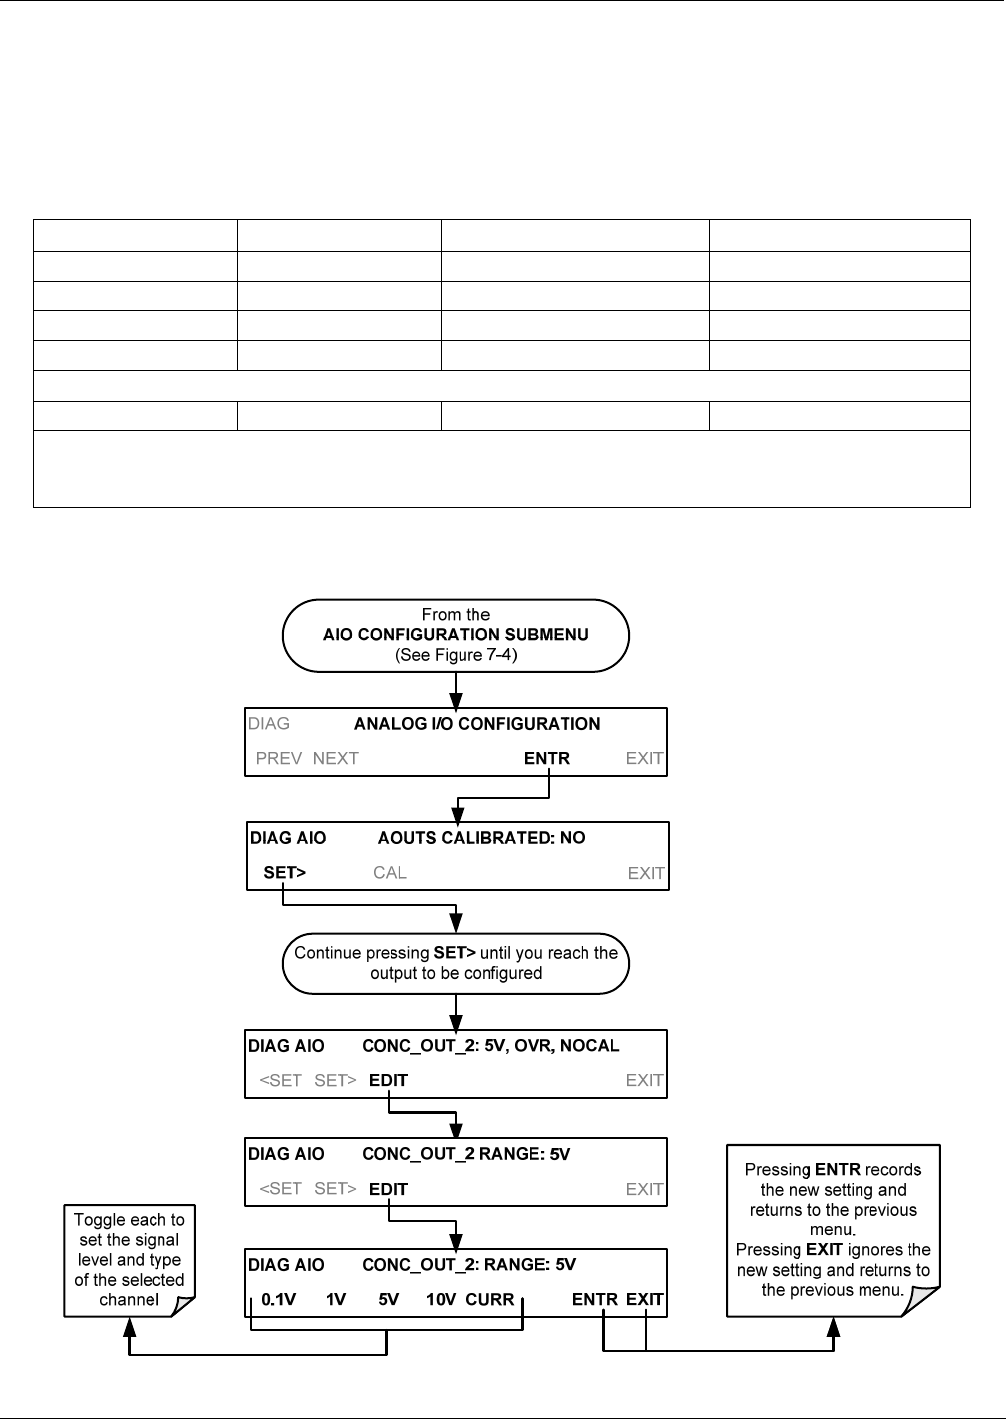
T400 Ozone Analyzer Operator’s Manual Setup Menu
121
5.10.1.6. Analog Output Voltage / Current Range Selection
In its standard configuration the analog outputs is set to output a 0 – 5 VDC signals.
Several other output ranges are available (see Table 5-7). Each range has is usable from
-5% to + 5% of the rated span.
Table 5-7: Analog Output Voltage Range Min/Max
RANGE NAME RANGE SPAN MINIMUM OUTPUT MAXIMUM OUTPUT
0.1V 0-100 mVDC -5 mVDC 105 mVDC
1V 0-1 VDC -0.05 VDC 1.05 VDC
5V 0-5 VDC -0.25 VDC 5.25 VDC
10V 0-10 VDC -0.5 VDC 10.5 VDC
The default offset for all VDC ranges is 0 VDC.
CURR 0-20 mA 0 mA 20 mA
While these are the physical limits of the current loop modules, typical applications use 2-20 or 4-20 mA for the lower and
upper limits. Please specify desired range when ordering this option.
The default offset for all current ranges is 0 mA.
To change the output type and range, select the ANALOG I/O CONFIGURATION
submenu (see Figure 5-3) then press,
06870C DCN6332
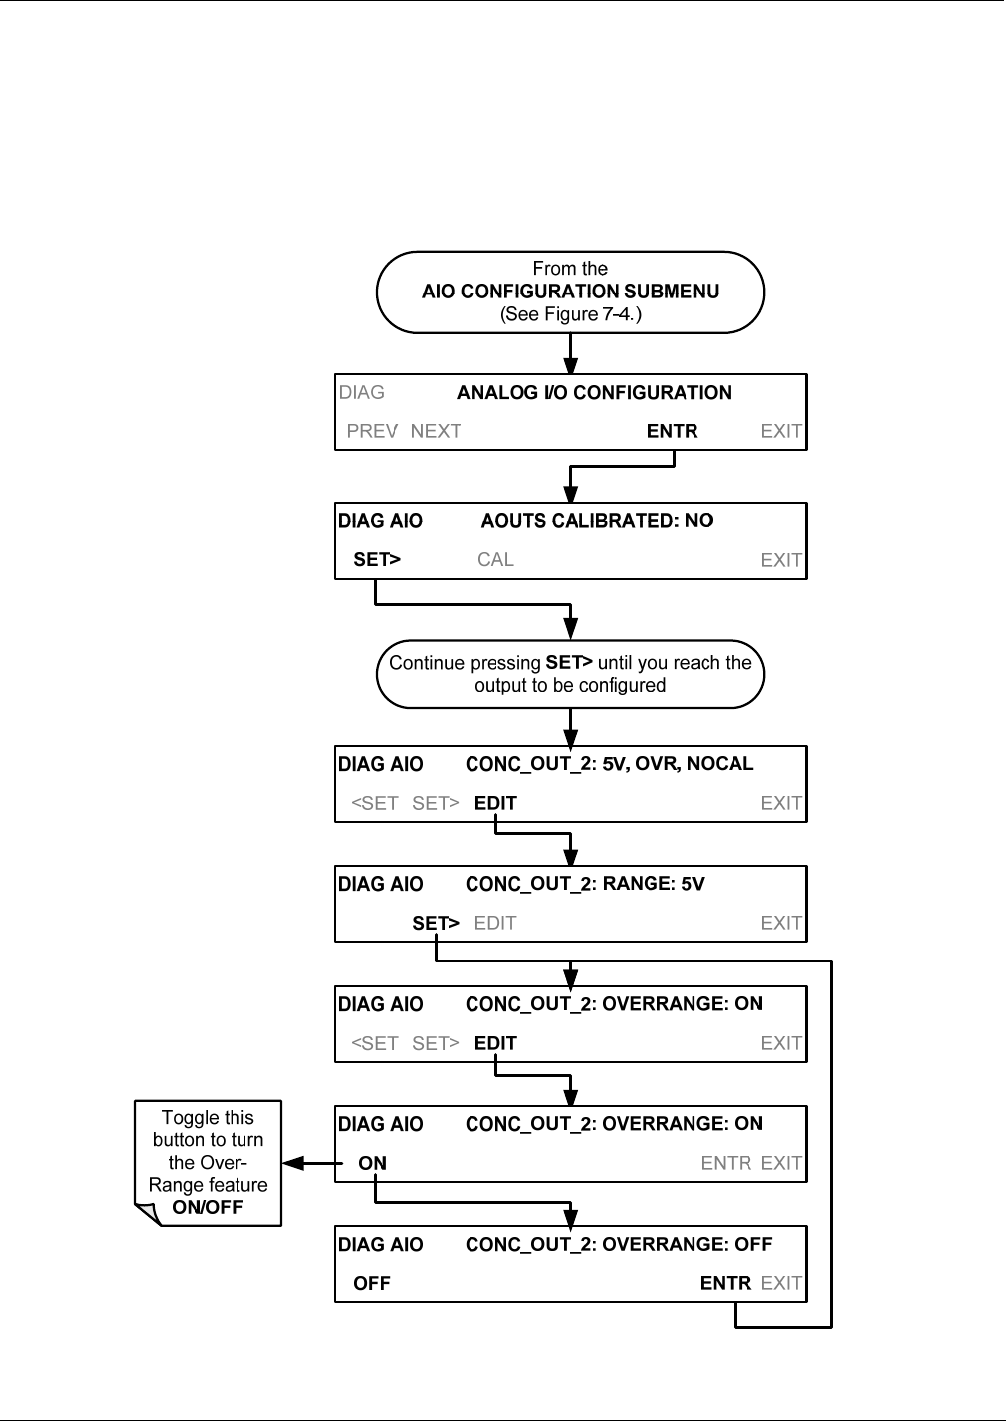
Setup Menu T400 Ozone Analyzer Operator’s Manual
122
5.10.1.7. Turning an Analog Output Over-Range Feature ON/OFF
In its default configuration, a ± 5% over-range is available on each of the T400’s analog
outputs. This over-range can be disabled if your recording device is sensitive to excess
voltage or current.
To turn the over-range feature on or off, select the ANALOG I/O CONFIGURATION
submenu (see Figure 5-3) then press
06870C DCN6332
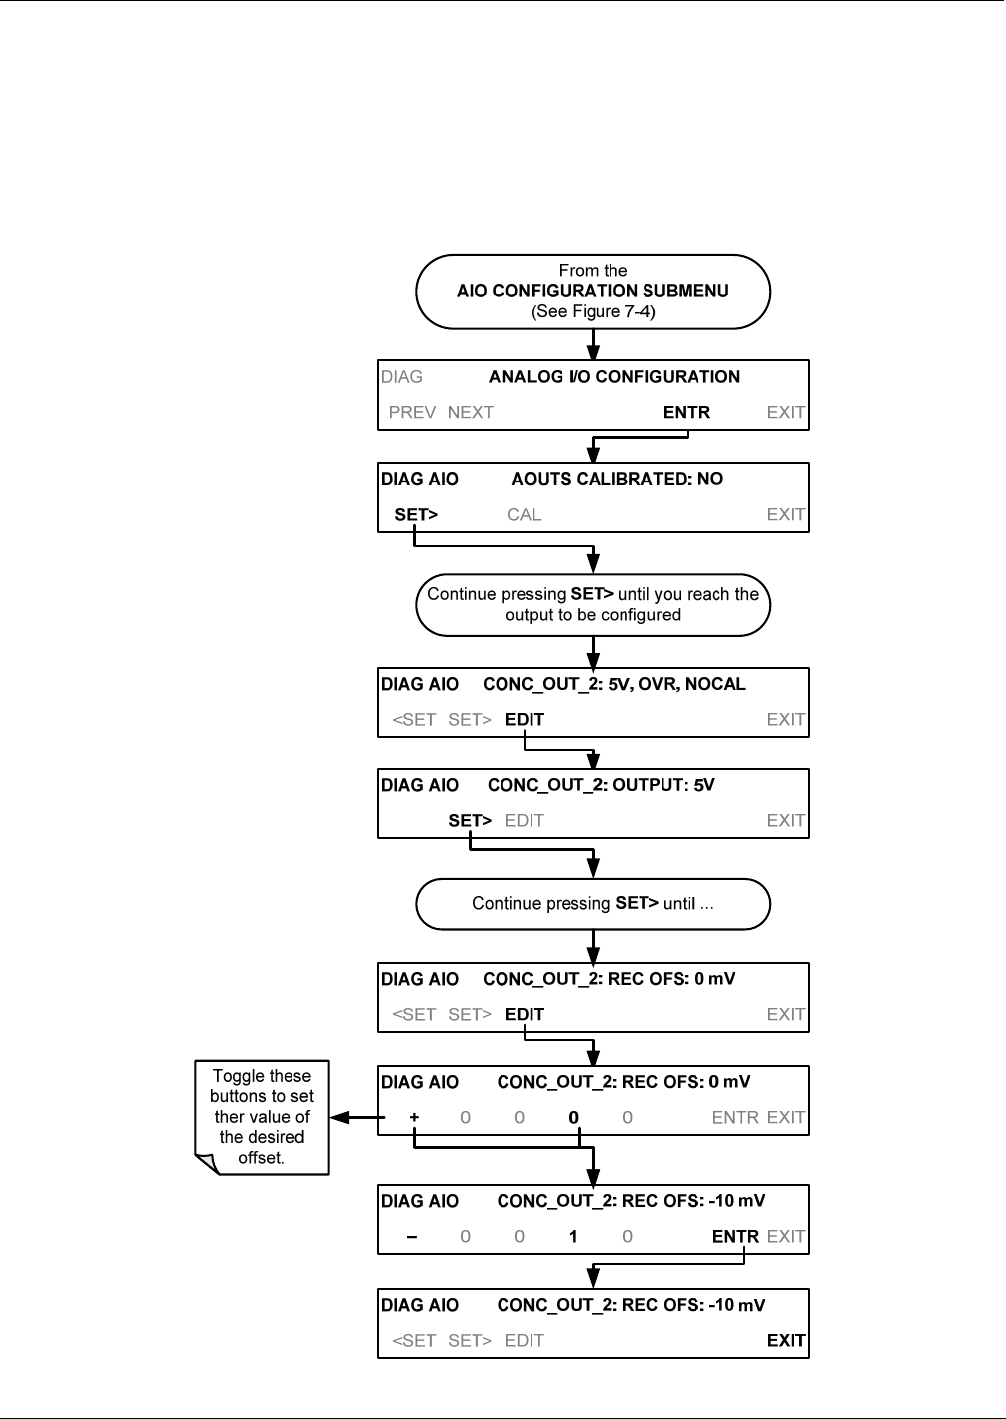
T400 Ozone Analyzer Operator’s Manual Setup Menu
123
5.10.1.8. Adding a Recorder Offset to an Analog Output
Some analog signal recorders require that the zero signal is significantly different from
the baseline of the recorder in order to record slightly negative readings from noise
around the zero point. This can be achieved in the T400 by defining a zero offset, a
small voltage (e.g., 10% of span).
To add a zero offset to a specific analog output channel, select the ANALOG I/O
CONFIGURATION submenu (see Figure 5-3) then press:
06870C DCN6332

Setup Menu T400 Ozone Analyzer Operator’s Manual
124
5.10.1.9. Selecting a Test Channel Function for Output A4
The test functions available to be reported are:
Table 5-8: Test Channels Functions Available on the T400’s Analog Output
TEST CHANNEL DESCRIPTION ZERO FULL
SCALE
NONE TEST CHANNEL IS TURNED OFF
PHOTO MEAS The raw output of the photometer during its
measure cycle 0 mV 5000 mV*
PHOTO REF The raw output of the photometer during its
reference cycle 0 mV 5000 mV*
O3 GEN REF The raw output of the O3 generator’s
reference detector 0 mV 5000 mV*
SAMPLE PRESSURE The pressure of gas in the photometer
absorption tube 0 In-Hg-A 40 In-Hg-A
SAMPLE FLOW The gas flow rate through the photometer 0 cm3/min 1000
cm3/min
SAMPLE TEMP The temperature of gas in the photometer
absorption tube 0 C 70 C
PHOTO LAMP TEMP The temperature of the photometer UV
lamp 0 C 70 C
O3 SCRUB TEMP The temperature of the optional Metal Wool
Scrubber. 0 C 70 C
O3 LAMP TEMP The temperature of the IZS Option’s O3
generator UV lamp 0 mV 5000 mV
CHASSIS TEMP The temperature inside the T400’s chassis
(same as BOX TEMP) 0 C 70 C
Once a function is selected, the instrument not only begins to output a signal on the
analog output, but also adds TEST to the list of test functions viewable via the front
panel display.
To activate the TEST Channel and select a function, press:
06870C DCN6332
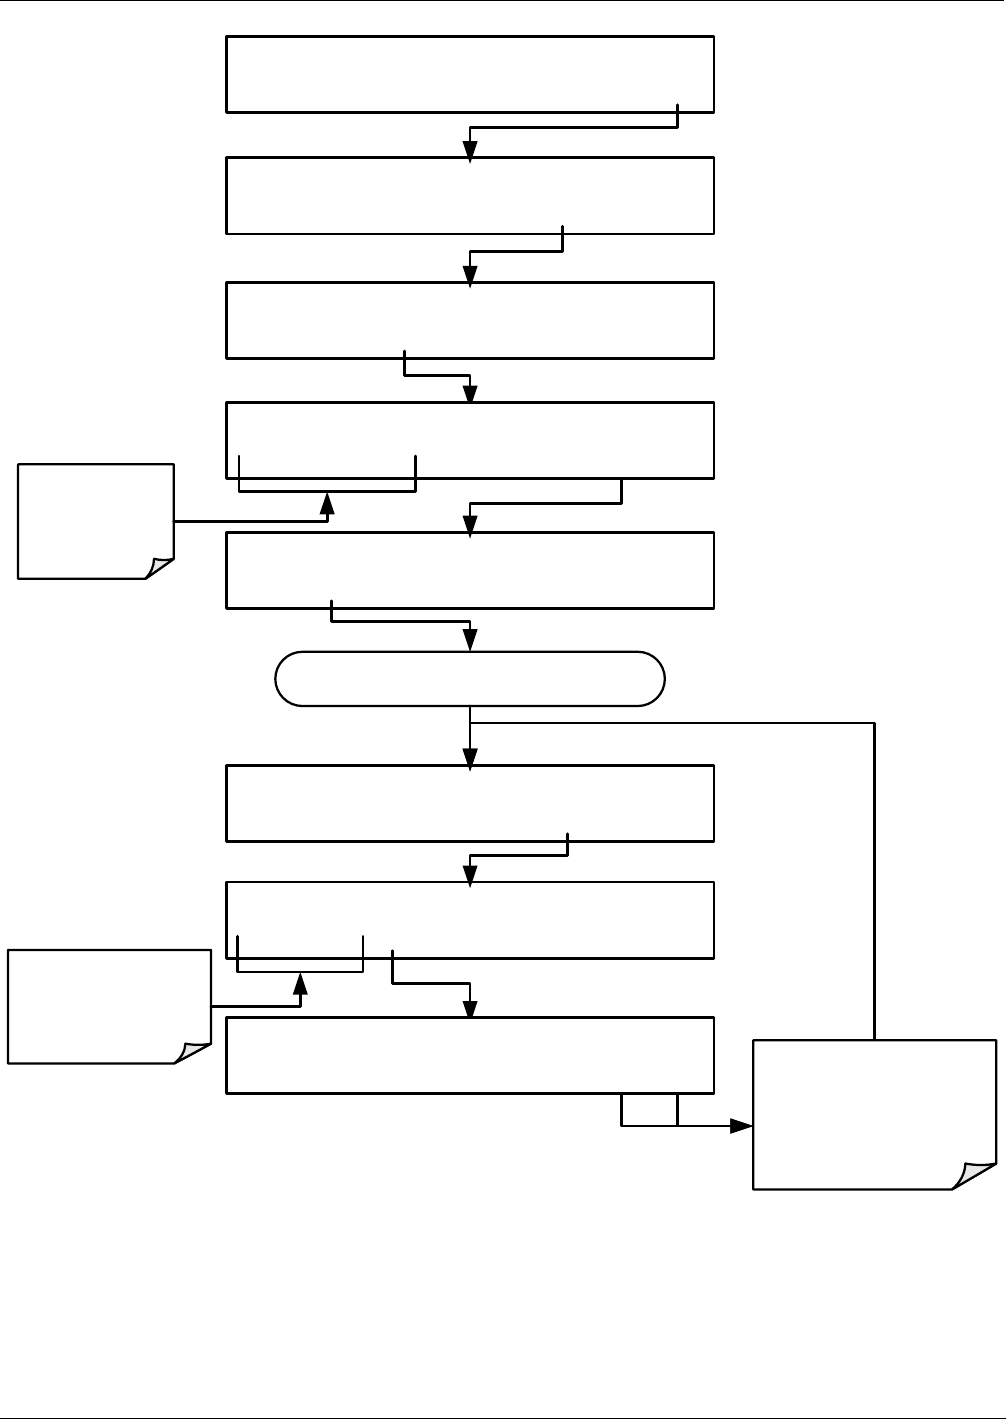
T400 Ozone Analyzer Operator’s Manual Setup Menu
125
DIAG TEST CHAN:NONE
PREV NEXT ENTR EXIT
DIAG SIGNAL I/O
PREV NEXT ENTR EXIT
DIAG TEST CHAN OUTPUT
PREV NEXT ENTR EXIT
Continue pressing NEXT until ...
Toggle these buttons
to choose a mass flow
controller TEST
channel parameter DIAG TEST CHANNEL:CHASSIS TEMP
PREV NEXT ENTR EXIT EXIT discards the new
setting
ENTR accepts the
new setting
SETUP X.X PRIMARY SETUP MENU
CFG DAS RNGE PASS CLK MORE EXIT
SAMPLE RANGE=500.0 PPB O3= XXXX
<TST TST> CAL SETUP
SETUP X.X SECONDARY SETUP MENU
COMM VARS DIAG EXIT
SETUP X.X ENTER PASSWORD:818
8 1 8 ENTR EXIT
Toggle these
buttons to enter
the correct
PASSWORD
06870C DCN6332
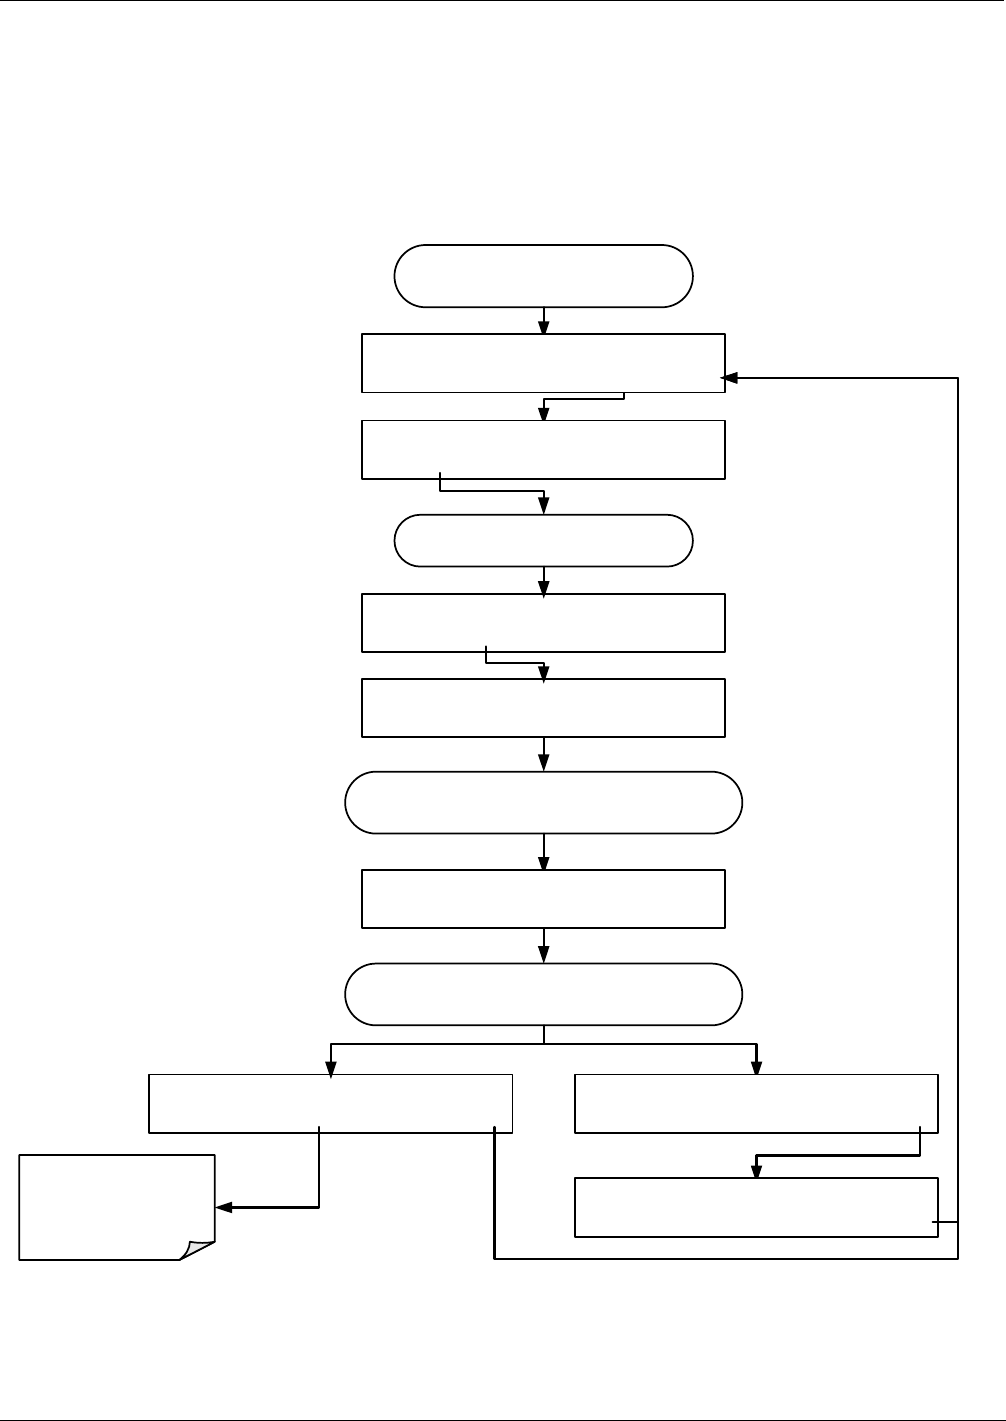
Setup Menu T400 Ozone Analyzer Operator’s Manual
126
5.10.2. AIN CALIBRATION
This is the sub-menu to conduct a calibration of the T400 analyzer’s analog inputs. This
calibration should only be necessary after major repair such as a replacement of CPU,
motherboard or power supplies.
To perform an analog input calibration, select the ANALOG I/O CONFIGURATION
submenu (see Figure 5-3) then press:
From the
AIO CONFIGURATION SUBMENU
(See Figure 7-4)
DIAG AIO AIN CALIBRATED:NO
<SET CAL EXIT
DIAG ANALOG I/O CONFIGURATION
PREV NEXT ENTR EXIT
Firmware automatically performs a zero point calibration
of the Motherboard’s analog Inputs
Continue pressing SET> until you reach the
output to be configured
DIAG AIO AOUTS CALIBRATED: NO
<SET SET> CAL EXIT
Firmware automatically performs a span point calibration
of the Motherboard’s analog Inputs
DIAG AIO CALIBRATING A/D ZERO
DIAG AIO CALIBRATING A/D SPAN
DIAG AIO A/D CALIBRATION ERROR
EXIT
DIAG AIO AIN CALIBRATED: YES
EXIT
DIAG AIO AIN CALIBRATED:NO
<SET CAL EXIT
Perform
Troubleshooting or call
Teledyne Customer
Service
06870C DCN6332
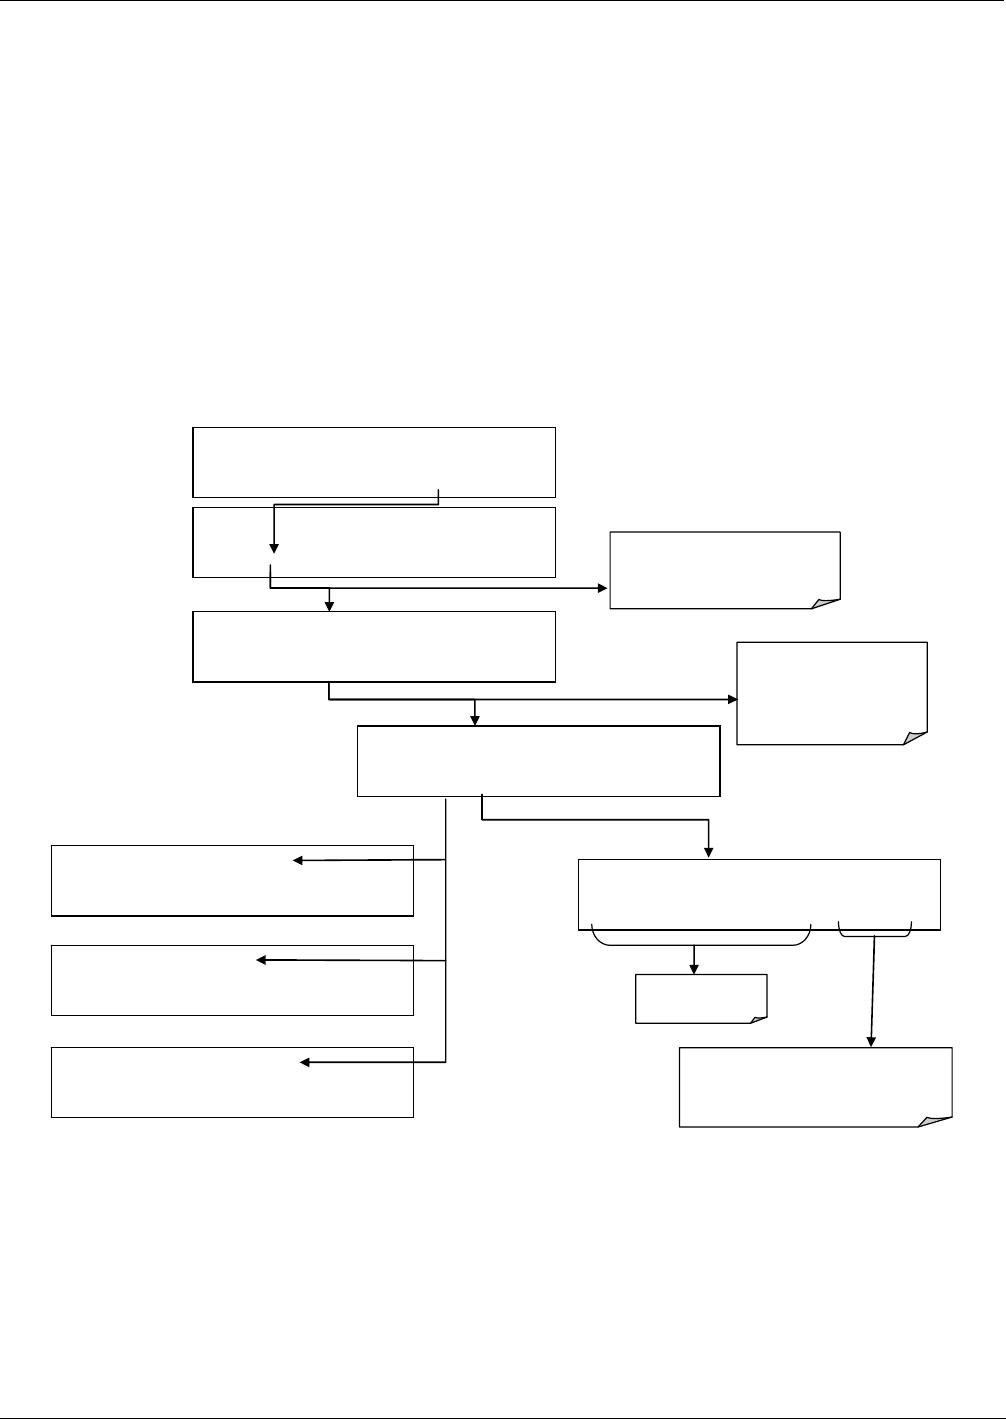
T400 Ozone Analyzer Operator’s Manual Setup Menu
127
5.10.3. CONFIGURING ANALOG INPUTS (OPTION)
To configure the analyzer’s external analog inputs option, define for each channel:
gain (number of units represented by 1 volt)
offset (volts)
engineering units to be represented in volts (each press of the touchscreen button
scrolls the list of alphanumeric characters from A-Z and 0-9)
whether to display the channel in the Test functions
To access and adjust settings for the Analog Inputs option channels press:
DIAG AIO
X
IN1 GAIN:1.00V/V
SET> EDIT EXIT
DIAG ANALOG I / O CONFIGURATION
PREV NEXT ENTR EXIT
DIAG AIO AOUTS CALIBRATED: NO
< SET SET> CAL EXIT
DIAG AIO
X
IN1 GAIN:1.00V/V
+ 0 0 1 .0 0 ENTR EXIT
Press to change
Gain value
DIAG AIO XIN1:1.00,0.00,V,OFF
< SET SET> EDIT EXIT
Press SET> to scroll to the first
channel. Continue pressing SET>
to view each of 8 channels.
Pressing ENT
R
records the new setting
and returns to the previous menu.
Pressing EXIT ignores the new setting and
returns to the previous menu.
Press EDIT at any channel
to to change Gain, Offset,
Units and whether to display
the channel in the Test
functions (OFF/ON).
DIAG AIO XIN1 OFFSET:0.00V
< SET SET> EDIT EXIT
DIAG AIO XIN1 UNITS:V
< SET SET> EDIT EXIT
DIAG AIO XIN1 DISPLAY:OFF
< SET EDIT EXIT
Figure 5-7. DIAG – Analog Inputs (Option) Configuration Menu
06870C DCN6332

Setup Menu T400 Ozone Analyzer Operator’s Manual
128
This page intentionally left blank.
06870C DCN6332

129
6. COMMUNICATIONS SETUP AND OPERATION
The T400 is equipped with an Ethernet port, a USB port and two serial communication
ports accessible via two DB-9 connectors on the rear panel of the instrument. The
COM1 connector is a male DB-9 connector and the COM2 is a female DB9 connector.
Both the RS-232 and the COM2 ports operate similarly and give the user the ability to
communicate with, issue commands to, and receive data from the analyzer through an
external computer system or terminal.
The RS-232 port (used as COM1) can also be configured to operate in single or RS-
232 multidrop mode (option 62; see Sections 3.3.1.8 and 6.3).
The COM2 port can be configured for standard RS-232 operation or half-duplex RS-
485 communication (See Sections 3.3.1.8, 6.3, and 6.4). Either of these
configurations disable use of the USB comm port.
6.1. DATA TERMINAL/COMMUNICATION EQUIPMENT (DTE DCE)
RS-232 was developed for allowing communications between data terminal equipment
(DTE) and data communication equipment (DCE). Basic data terminals always fall into
the DTE category whereas modems are always considered DCE devices.
Electronically, the difference between the DCE and DTE is the pin assignment of the
Data Receive and Data Transmit functions.
DTE devices receive data on pin 2 and transmit data on pin 3.
DCE devices receive data on pin 3 and transmit data on pin 2.
A switch located below the serial ports on the rear panel allows the user to switch
between DTE (for use with data terminals) or DCE (for use with modems). Since
computers can be either DTE or DCE, check your computer to determine which mode to
use.
6.2. COMMUNICATION MODES, BAUD RATE AND PORT TESTING
Use the SETUP>MORE>COMM menu to configure COM1 (labeled RS232 on
instrument rear panel) and/or COM2 (labeled COM2 on instrument rear panel) for
communication modes, baud rate and/or port testing for correct connection. If using a
USB option communication connection, setup requires configuring the COM2 baud rate
(Section 6.2.2) to match the computer to which the connection is made.
06870C DCN6332

Communications Setup and Operation T400 Ozone Analyzer Operator’s Manual
130
6.2.1. COMMUNICATION MODES
Each of the analyzer’s serial ports can be configured to operate in a number of different
modes, listed in Table 6-1. As modes are selected, the analyzer sums the mode ID
numbers and displays this combined number on the front panel display. For example, if
quiet mode (01), computer mode (02) and Multi-Drop-Enabled mode (32) are selected,
the analyzer would display a combined MODE ID of 35.
Table 6-1: COMM Port Communication Modes
MODE1 ID DESCRIPTION
QUIET 1
Quiet mode suppresses any feedback from the analyzer (such as warning messages)
to the remote device and is typically used when the port is communicating with a
computer program where such intermittent messages might cause communication
problems.
Such feedback is still available but a command must be issued to receive them.
COMPUTER 2 Computer mode inhibits echoing of typed characters and is used when the port is
communicating with a computer operated control program.
SECURITY 4 When enabled, the serial port requires a password before it will respond. The only
command that is active is the help screen (? CR).
E, 7, 1 2048
When turned on this mode switches the COM port settings
from
No parity; 8 data bits; 1 stop bit
to
Even parity; 7 data bits; 1 stop bit
RS-485 1024 Configures the COM2 Port for RS-485 communication. RS-485 mode has precedence
over multidrop mode if both are enabled.
MULTIDROP
PROTOCOL 32 Multidrop protocol allows a multi-instrument configuration on a single communications
channel. Multidrop requires the use of instrument IDs.
ENABLE
MODEM 64 Enables to send a modem initialization string at power-up. Asserts certain lines in the
RS-232 port to enable the modem to communicate.
ERROR
CHECKING2 128 Fixes certain types of parity errors at certain Hessen protocol installations.
XON/XOFF
HANDSHAKE2 256 Disables XON/XOFF data flow control also known as software handshaking.
HARDWARE
HANDSHAKE 8 Enables CTS/RTS style hardwired transmission handshaking. This style of data
transmission handshaking is commonly used with modems or terminal emulation
protocols as well as by Teledyne API’s APICOM software.
HARDWARE
FIFO2 512 Disables the HARDWARE FIFO (First In – First Out), When FIFO is enabled it
improves data transfer rate for that COM port.
COMMAND
PROMPT 4096 Enables a command prompt when in terminal mode.
1 Modes are listed in the order in which they appear in the
SETUP MORE COMM COM[1 OR 2] MODE menu
2 The default setting for this feature is ON. Do not disable unless instructed to by Teledyne API Customer Service
personnel.
Note Communication Modes for each COM port must be configured
independentl.
06870C DCN6332
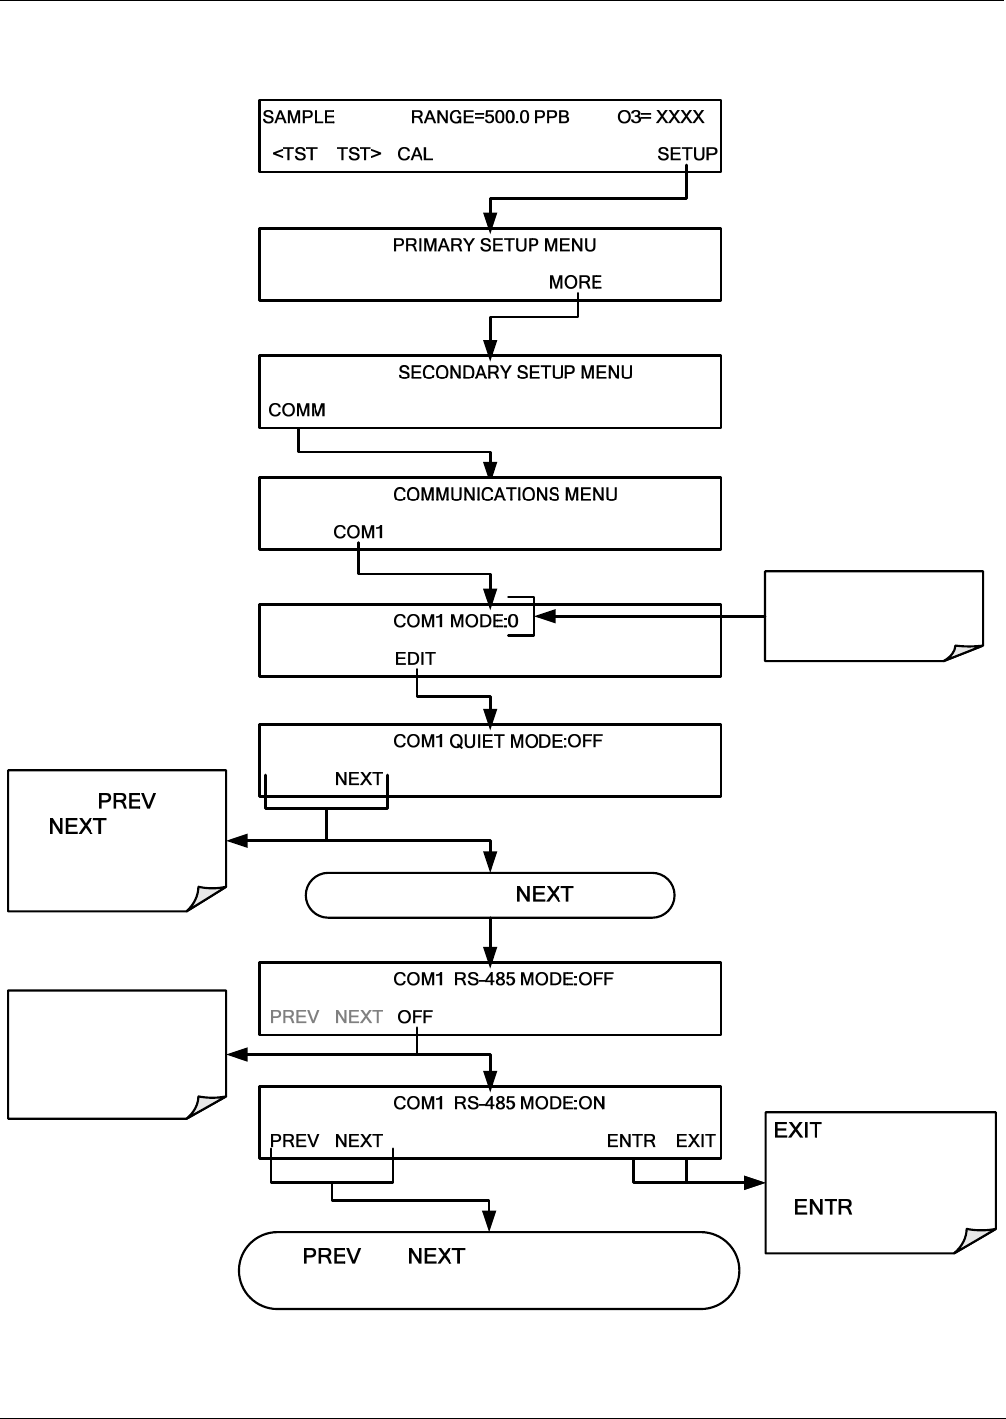
T400 Ozone Analyzer Operator’s Manual Communications Setup and Operation
131
Press the following buttons to select communication modes for a one of the COMM
Ports, such as the following example where RS-485 mode is enabled:
SETUP X.X
ID COM2 EXIT
SETUP X.X
<SET SET> EXIT
SETUP X.X
PREV OFF EXIT
discards the new
setting
accepts the
new setting
SETUP X.X
ENTR EXIT
Activate / Deactivate
the Selected mode
by toggling the ON /
OFF button SETUP X.X
OFF
Continue pressing until ...
Press and
to scroll
among the available
modes
Use and to continue selecting other
COM modes you want to turn ON or OFF
Combined Mode ID
displayed here
SETUP X.X
CFG DAS RNGE PASS CLK EXIT
SETUP X.X
VARS DIAG EXIT
06870C DCN6332
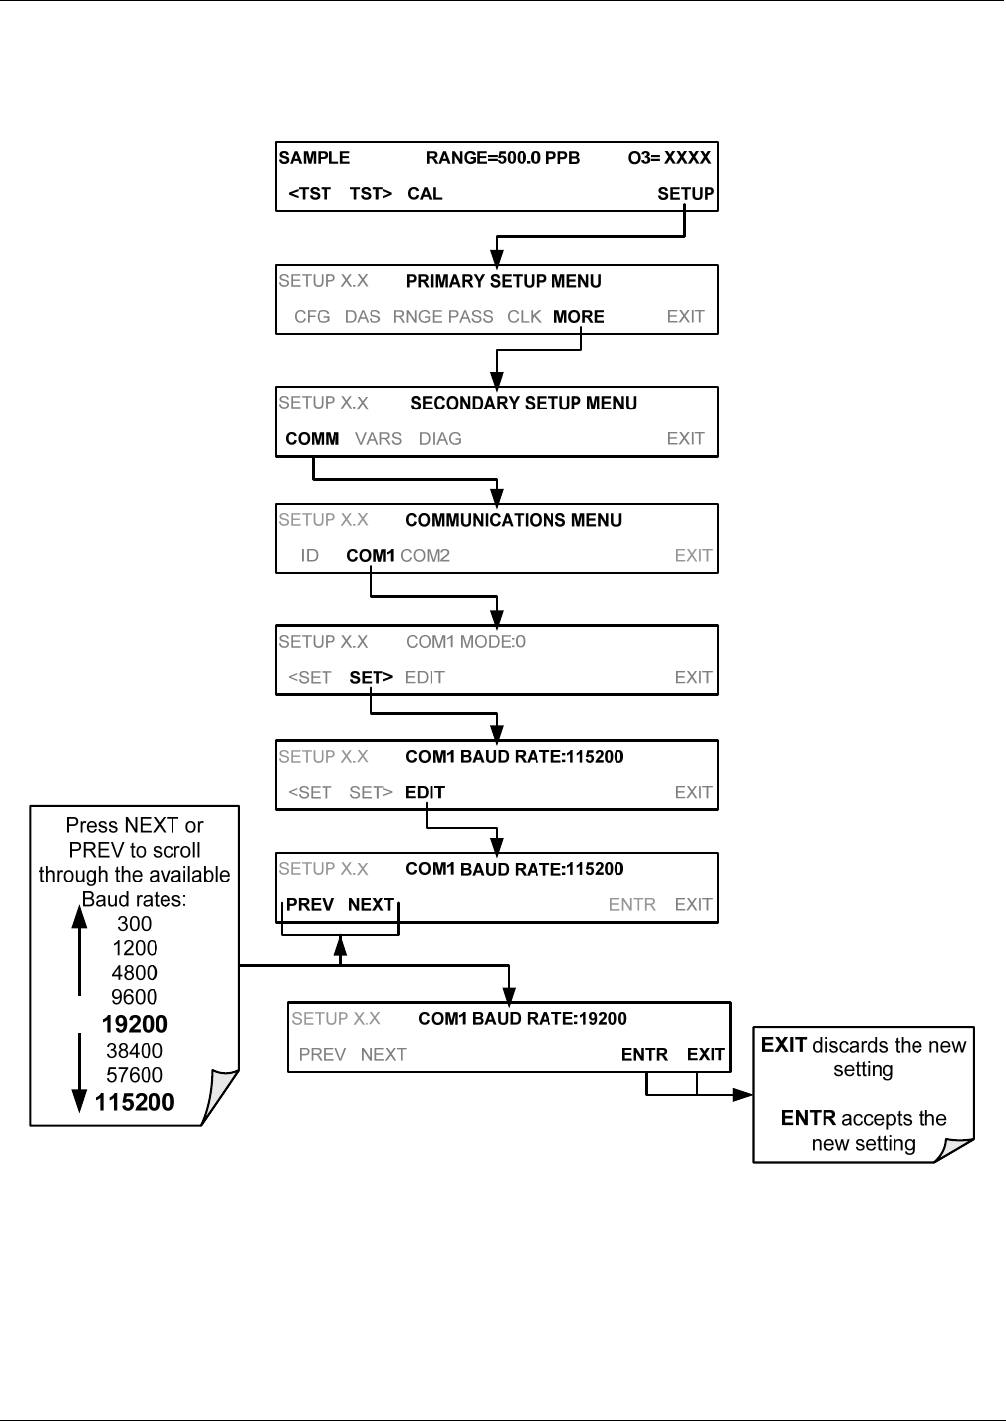
Communications Setup and Operation T400 Ozone Analyzer Operator’s Manual
132
6.2.2. COM PORT BAUD RATE
To select the baud rate of either one of the COM Ports, press:
06870C DCN6332
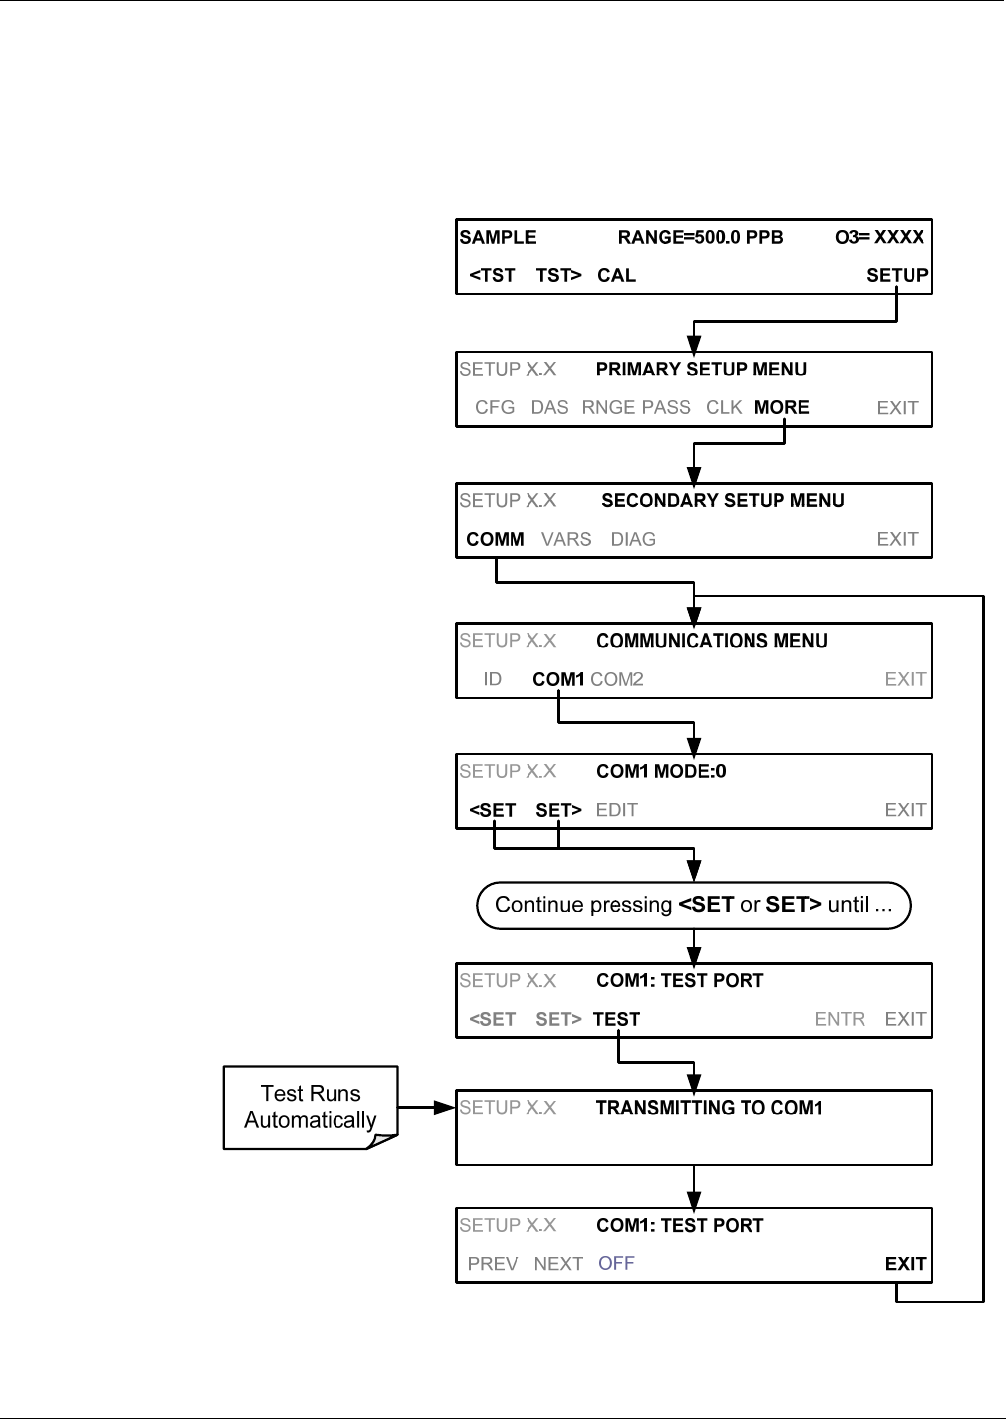
T400 Ozone Analyzer Operator’s Manual Communications Setup and Operation
133
6.2.3. COM PORT TESTING
The serial ports can be tested for correct connection and output in the COM menu. This
test sends a string of 256 ‘w’ characters to the selected COMM port. While the test is
running, the red LED on the rear panel of the analyzer should flicker.
To initiate the test press the following button sequence.
06870C DCN6332

Communications Setup and Operation T400 Ozone Analyzer Operator’s Manual
134
6.3. RS-232
The RS232 and COM2 communications (COMM) ports operate on the RS-232
protocol (default configuration). Possible configurations for these two COMM ports
are summarized as follows:
RS232 port can also be configured to operate in single or RS-232 Multidrop mode
(Option 62)
COM2 port can be left in its default configuration for standard RS-232 operation
including multidrop, or it can be reconfigured for half-duplex RS-485 operation
(please contact the factory for this configuration).
Note that when the rear panel COM2 port is in use, except for multidrop
communication, the rear panel USB port cannot be used. (Alternatively, when the USB
port is enabled, COM2 port cannot be used except for multidrop).
A code-activated switch (CAS), can also be used on either port to connect typically
between 2 and 16 send/receive instruments (host computer(s) printers, data loggers,
analyzers, monitors, calibrators, etc.) into one communications hub. Contact Teledyne
API Sales for more information on CAS systems.
To configure the analyzer’s communication ports, use the SETUP>MORE>COMM
menu.
6.4. RS-485 (OPTION)
As delivered from the factory, COM2 is configured for RS-232 communications. This
port can be reconfigured for operation as a non-isolated, half-duplex RS-485 port. To
configure RS-485, please contact the factory.
6.5. ETHERNET
When using the Ethernet interface, the analyzer can be connected to any standard
10BaseT or 100BaseT Ethernet network via low-cost network hubs, switches or routers.
The interface operates as a standard TCP/IP device on port 3000. This allows a remote
computer to connect through the network to the analyzer using APICOM, terminal
emulators or other programs.
The Ethernet connector has two LEDs that are on the connector itself, indicating its
current operating status.
Table 6-2: Ethernet Status Indicators
LED FUNCTION
amber (link) On when connection to the LAN is valid.
green (activity Flickers during any activity on the LAN.
The analyzer is shipped with DHCP enabled by default. This allows the instrument to be
connected to a network or router with a DHCP server. The instrument will automatically
be assigned an IP address by the DHCP server (Section 6.5.1). This configuration is
useful for quickly getting an instrument up and running on a network. However, for
permanent Ethernet connections, a static IP address should be used. Section 6.5.1 below
details how to configure the instrument with a static IP address.
06870C DCN6332

T400 Ozone Analyzer Operator’s Manual Communications Setup and Operation
135
6.5.1. CONFIGURING ETHERNET COMMUNICATION MANUALLY (STATIC
IP ADDRESS)
To configure Ethernet communication manually:
1. Connect a cable from the analyzer’s Ethernet port to a Local Area Network (LAN) or
Internet port.
2. From the analyzer’s front panel touchscreen, access the Communications Menu as
shown below, turning DHCP mode to OFF.
06870C DCN6332
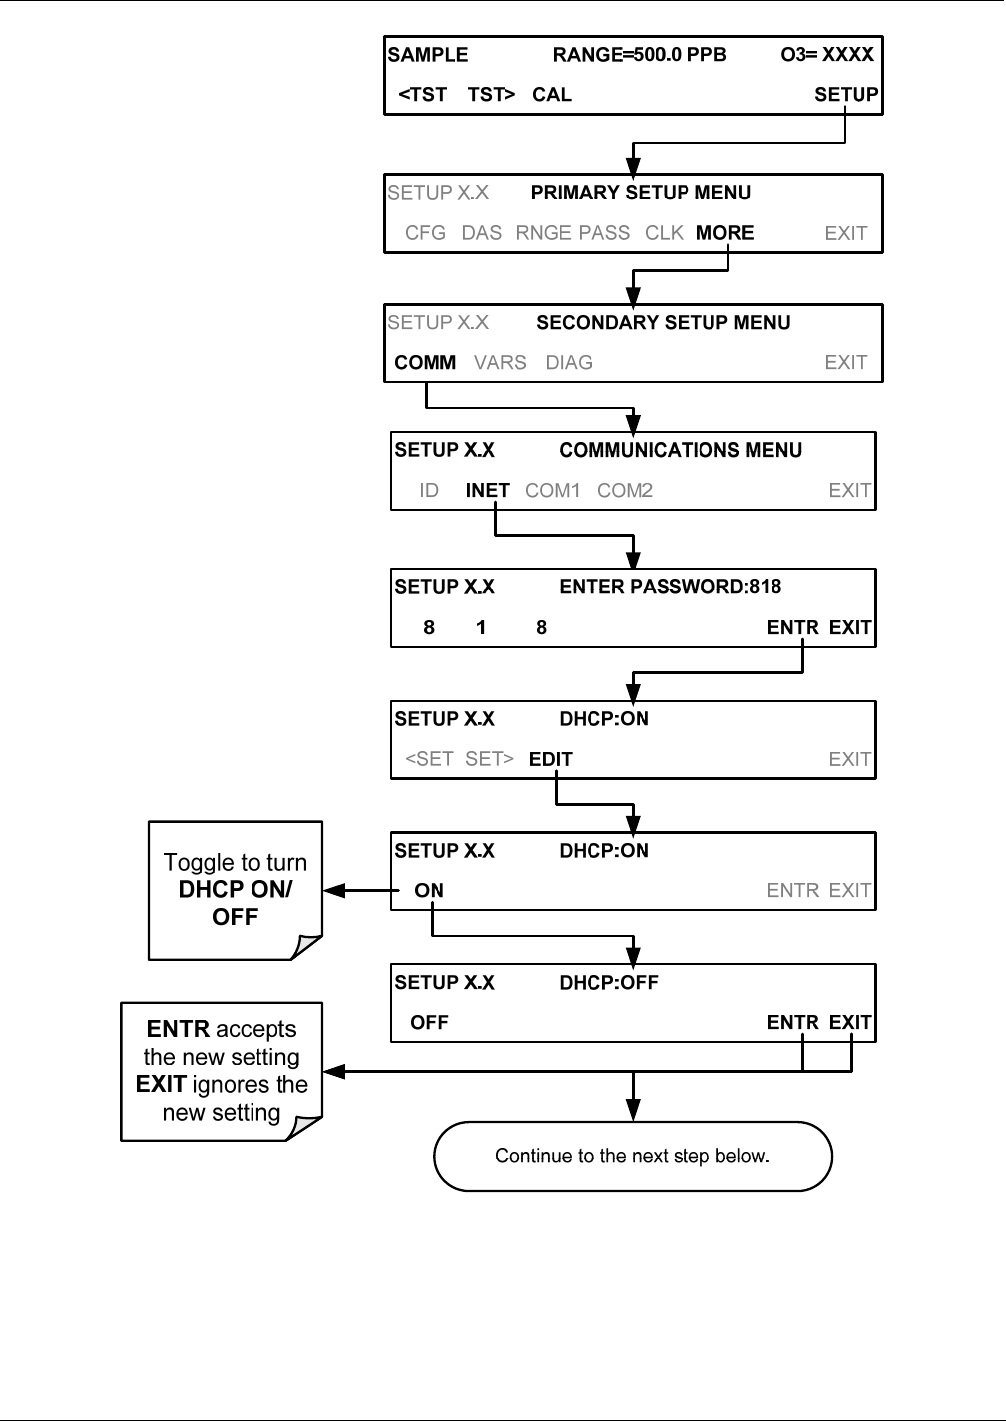
Communications Setup and Operation T400 Ozone Analyzer Operator’s Manual
136
06870C DCN6332
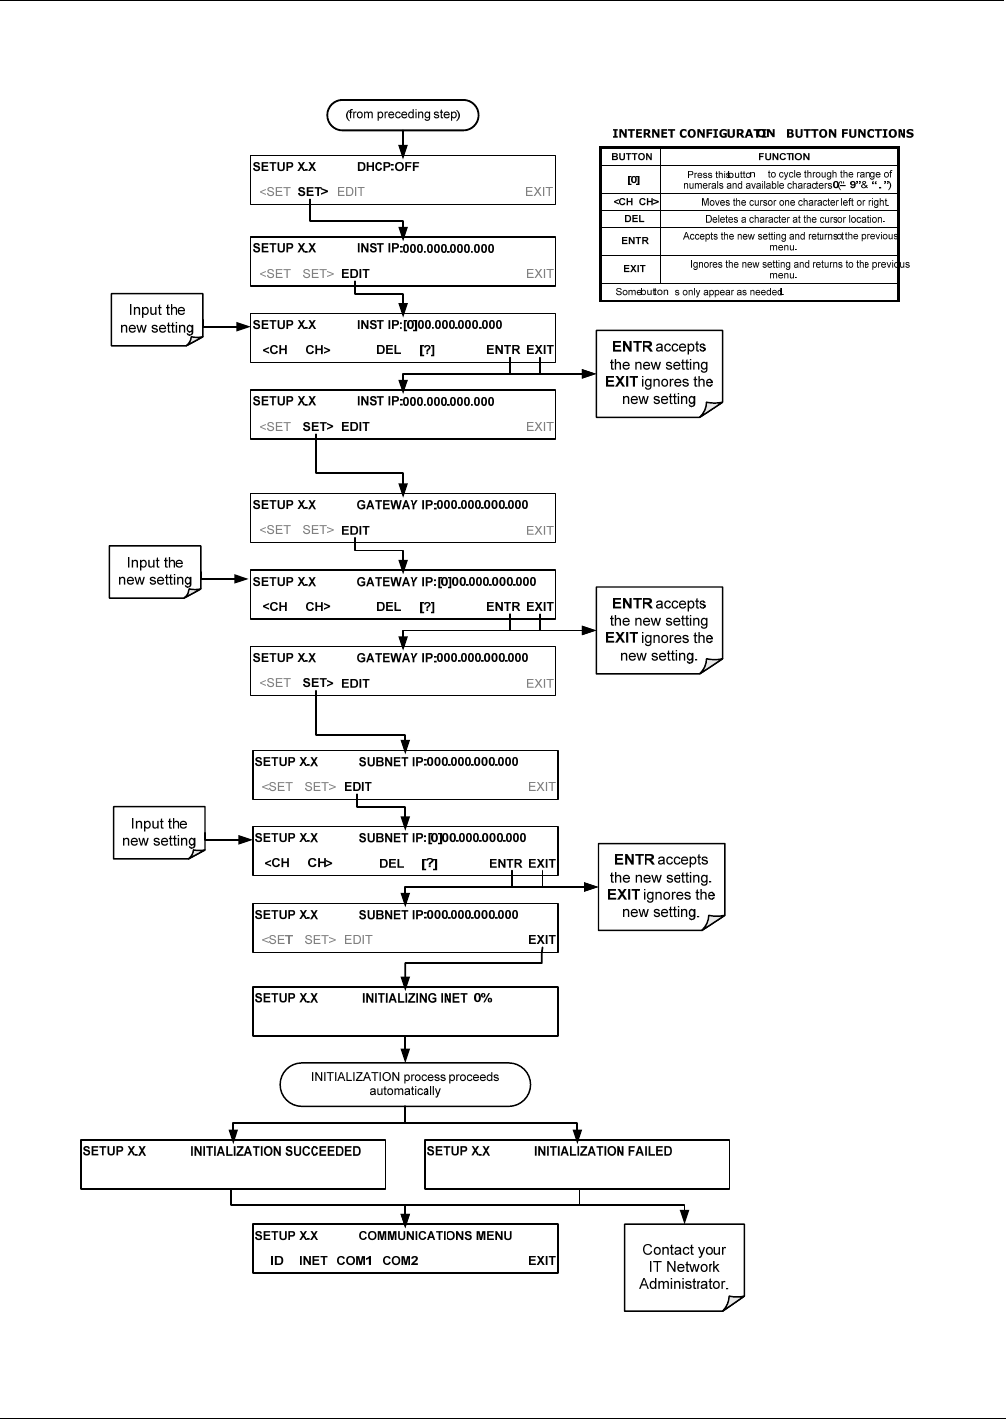
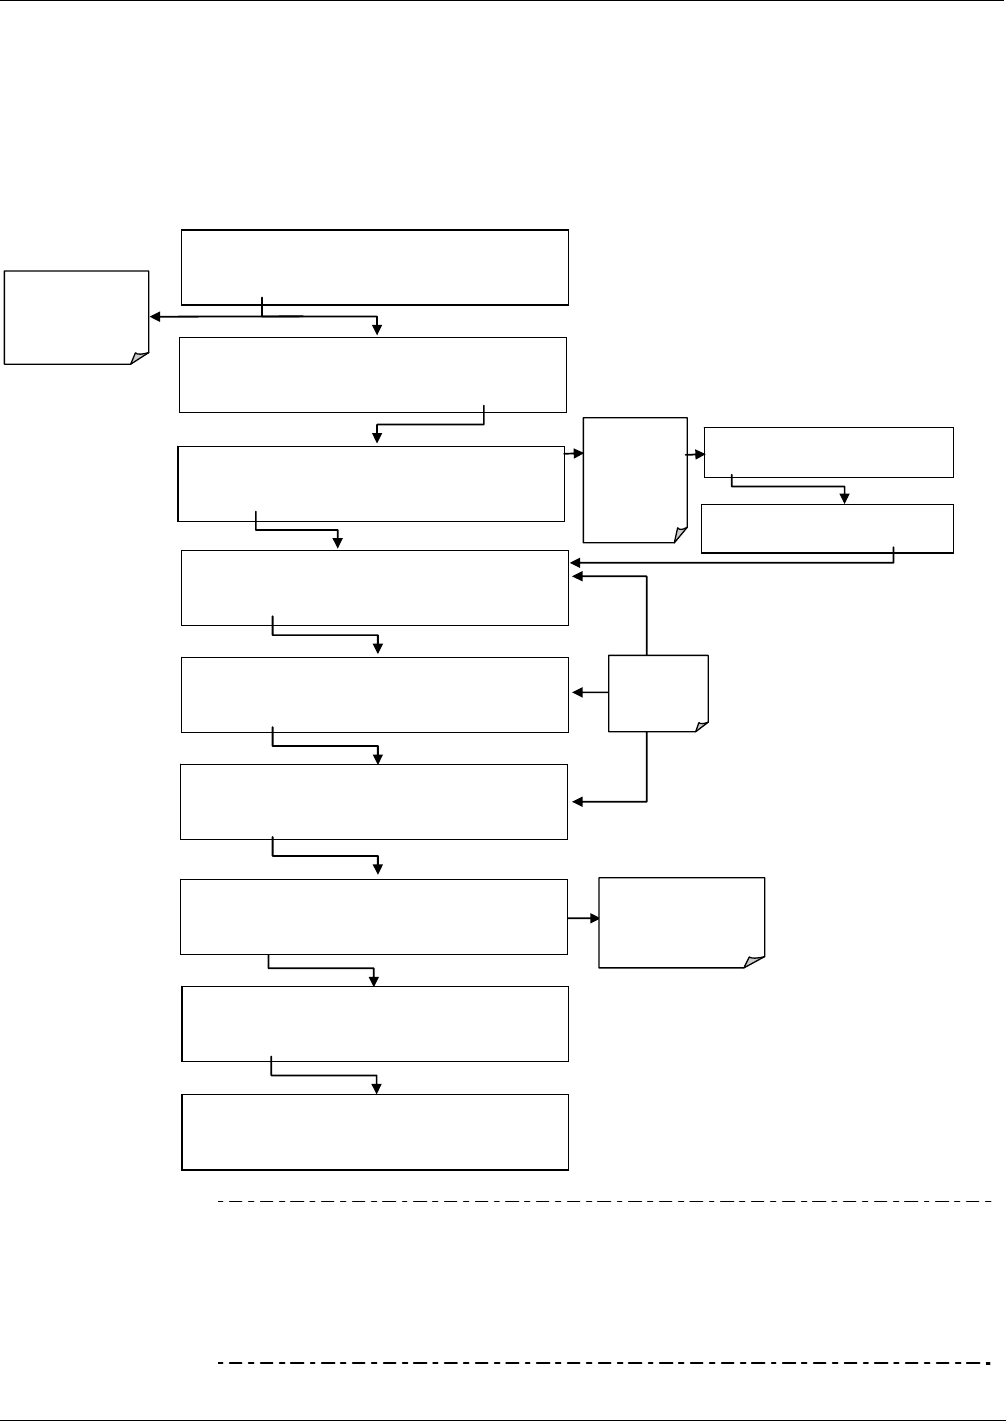
Communications Setup and Operation T400 Ozone Analyzer Operator’s Manual
138
6.5.2. CONFIGURING ETHERNET COMMUNICATION WITH DYNAMIC HOST
CONFIGURATION PROTOCOL (DHCP)
1. Consult with your network administrator to affirm that your network server is running
DHCP.
2. Access the Ethernet Menu (SETUP>MORE>COMM>INET).
3. Follow the setup sequence as follows:
SETUP X.X COMMUNICATIONS MENU
ID INET COM1 COM2 EXIT
SETUP X.X INST IP: 0.0.0.0
<SET SET> EXIT
SETUP X.X GATEWAY IP: 0.0.0.0
<SET SET> EXIT
SETUP X.X TCP PORT2: 502
<SET SET> EDIT EXIT
EDIT button
disabled
From this point on,
EXIT returns to
COMMUNICATIONS
MENU
Do not alter unless
directed to by Teledyne
Instruments Customer
Service personnel
SETUP X.X HOSTNAME:
<SET EDIT EXIT
SAMPLE ENTER SETUP PASS : 818
8 1 8 ENTR EXIT
SETUP X.X SUBNET MASK: 0.0.0.0
<SET SET> EXIT
SETUP X.X TCP PORT: 3000
<SET SET> EDIT EXIT
SETUP X.X DHCP: ON
SET> EDIT EXIT
DHCP: ON is
default setting.
If it has been
set to OFF,
press EDIT
and set to ON.
SETUP X.X DHCP: OFF
OFF ENTR EXIT
SETUP X.X DHCP: ON
ON ENTR EXIT
Note It is a good idea to check the INET settings the first time you power up
your analyzer after it has been physically connected to the LAN/Internet
to make sure that the DHCP has successfully downloaded the
appropriate information from you network server(s). The Ethernet
configuration properties are viewable via the analyzer’s front panel
(SETUP>MORE>COMM>INET).
06870C DCN6332

T400 Ozone Analyzer Operator’s Manual Communications Setup and Operation
139
Table 6-3: LAN/Internet Default Configuration Properties
PROPERTY DEFAULT STATE DESCRIPTION
DHCP STATUS On Editable
This displays whether the DHCP is turned
ON or OFF.
INSTRUMENT IP
ADDRESS
Configured by
DHCP
EDIT key disabled
when DHCP is ON
This string of four packets of 1 to 3
numbers each (e.g. 192.168.76.55.) is the
address of the analyzer itself.
GATEWAY IP
ADDRESS
Configured by
DHCP
EDIT key disabled
when DHCP is ON
A string of numbers very similar to the
Instrument IP address (e.g.
192.168.76.1.)that is the address of the
computer used by your LAN to access the
Internet.
SUBNET MASK Configured by
DHCP
EDIT key disabled
when DHCP is ON
Also a string of four packets of 1 to 3
numbers each (e.g. 255.255.252.0) that
defines that identifies the LAN the device is
connected to.
All addressable devices and computers on
a LAN must have the same subnet mask.
Any transmissions sent devices with
different assumed to be outside of the LAN
and are routed through gateway computer
onto the Internet.
TCP PORT1 3000 Editable
This number defines the terminal control
port by which the instrument is addressed
by terminal emulation software, such as
Internet or Teledyne API’ APICOM.
HOST NAME [initially blank] Editable
The name by which your analyzer will
appear when addressed from other
computers on the LAN or via the Internet.
While the default setting for all Teledyne
API analyzers is the model number, the
host name may be changed to fit customer
needs.
1 Do not change the setting for this property unless instructed to by Teledyne API Customer Service
personnel.
Note If the gateway IP, instrument IP and the subnet mask are all zeroes (e.g.
“0.0.0.0”), the DCHP was not successful, in which case you may have to
configure the analyzer’s Ethernet properties manually. Consult your
network administrator.
06870C DCN6332
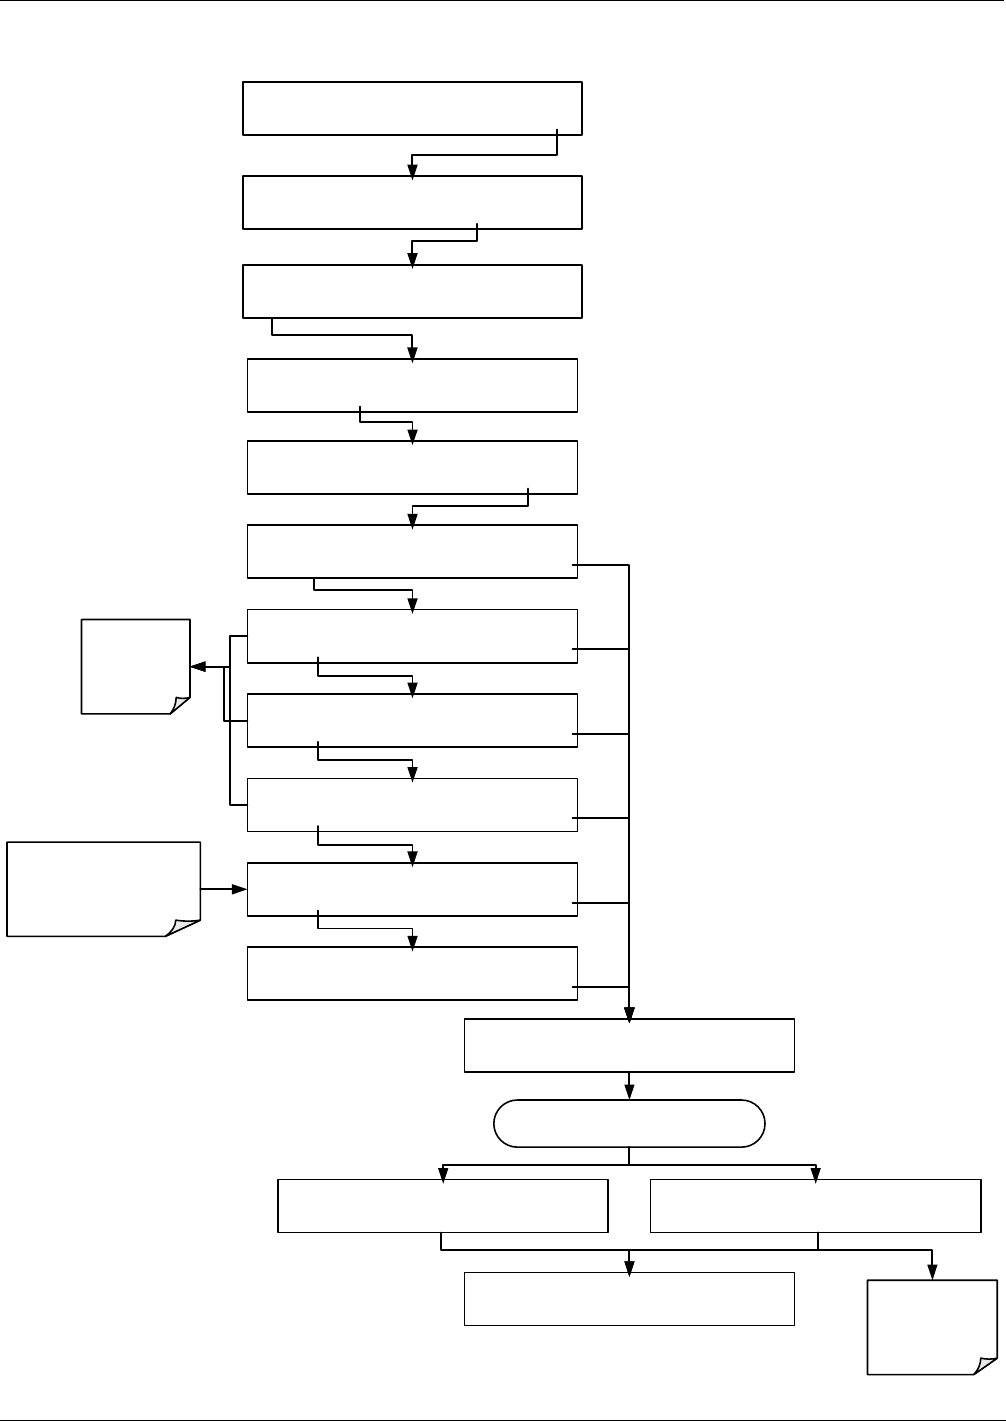
Communications Setup and Operation T400 Ozone Analyzer Operator’s Manual
140
To view the above properties listed in Table 6-3, press:
SETUP X.X COMMUNICATIONS MENU
ID INET COM1 COM2 EXIT
SETUP X.X ENTER PASSWORD:818
81 8 ENTREXIT
SETUP X.X DHCP:ON
<SET SET> EDIT EXIT
SETUP X.X INST IP:0.0.0.0
<SET SET> EXIT
SETUP X.X GATEWAY IP:0.0.0.0
<SET SET> EXIT
SETUP X.X SUBNET MASK IP:0.0.0.0
<SET SET> EXIT
SETUP X.X TCP PORT:3000
<SET SET> EDIT EXIT
SETUP X.X HOSTNAME: T400
<SET SET> EDIT EXIT
SETUP X.X INITIALIZING INET 0%
EDIT is
disabled
when DHCP
is ON
DO NOT alter unless
instructed to by Teledyne
Instruments’ customer
Service personnel
INITIALIZATION process proceeds
automatically
SETUP X.X COMMUNICATIONS MENU
ID INET COM1 COM2 EXIT
SETUP X.X INITIALIZATION SUCCEEDED SETUP X.X INITIALIZATION FAILED
Contact your
IT Network
Administrator
SETUP X.X PRIMARY SETUP MENU
CFG DAS RNGE PASS CLK MORE EXIT
SAMPLE RANGE=500.0 PPB O3= XXXX
<TST TST> CAL SETUP
SETUP X.X SECONDARY SETUP MENU
COMM VARS DIAG EXIT
06870C DCN6332
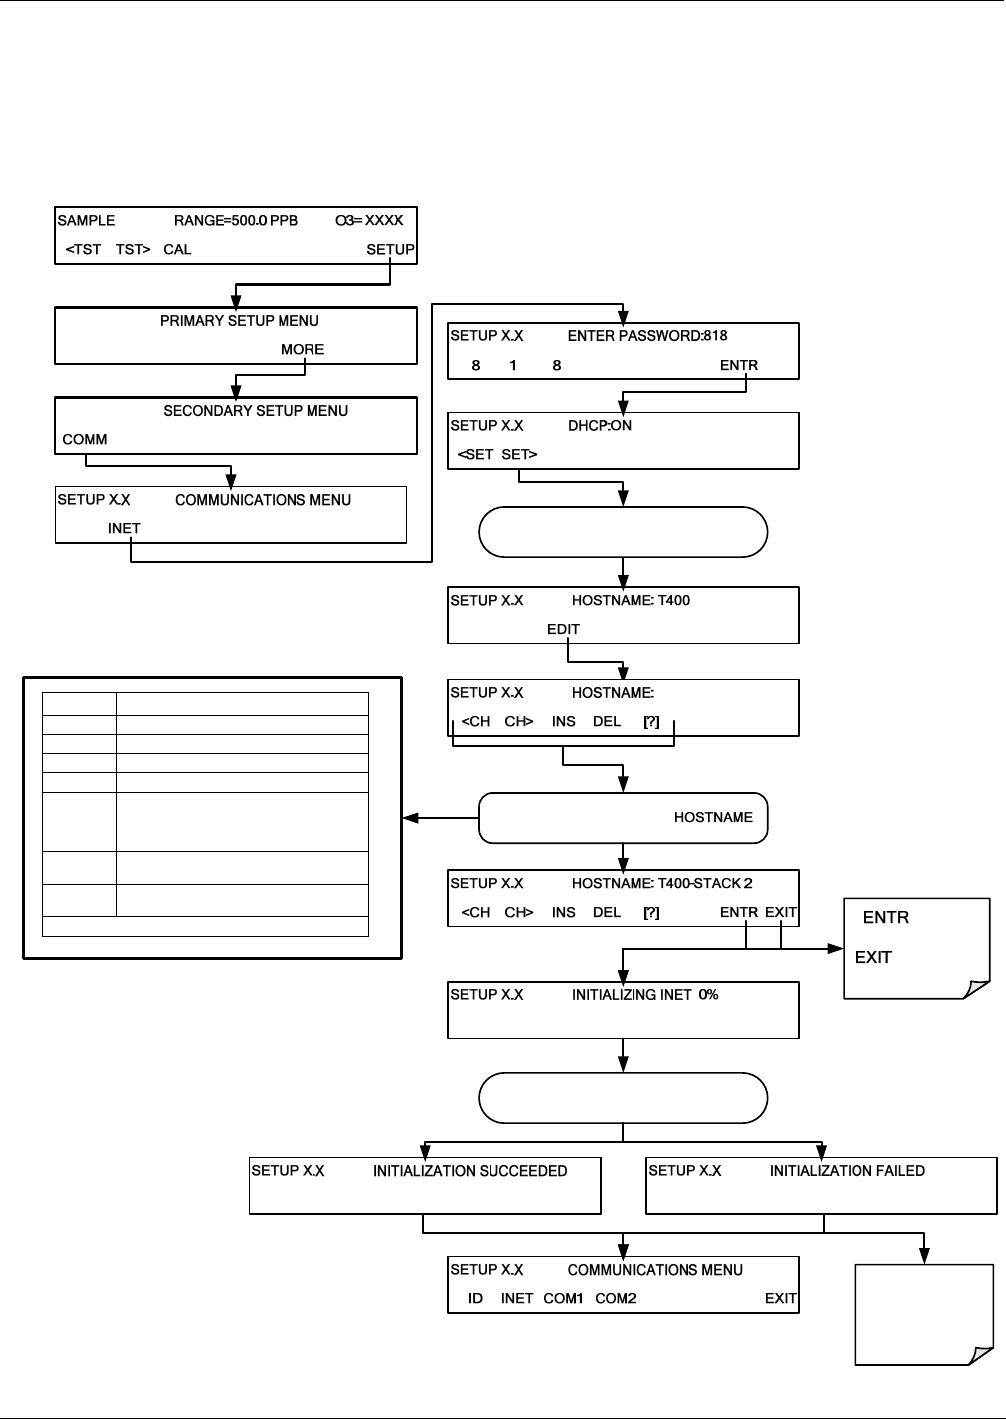
T400 Ozone Analyzer Operator’s Manual Communications Setup and Operation
141
6.5.3. CHANGING THE ANALYZER’S HOSTNAME
The HOSTNAME is the name by which the analyzer appears on your network. The
default name for all Teledyne API T400 analyzers is initially blank. To create or to
subsequently change this name (particularly if you have more than one T400 analyzer on
your network), press:
Use these buttons to edit the
ID COM1 COM2 EXIT
EXIT
EDIT EXIT
<SET SET> EXIT
INITIALIZATION process proceeds
automatically
Contact your
IT Network
Administrator
Continue pressing SET> until ...
ENTR EXIT
accepts
the new setting
ignores the
new setting
BUTTON FUNCTION
<CH Moves the cursor one character to the left.
CH> Moves the cursor one character to the right.
INS Inserts a character before the cursor location.
DEL Deletes a character at the cursor location.
[?]
Press this key to cycle through the range of
numerals and characters available for
insertion. 0-9, A-Z, space ’ ~ ! # $ % ^ & * (
) - _ = +[ ] { } < >\ | ; : , . / ?
ENTR Accepts the new setting and returns to the
previous menu.
EXIT Ignores the new setting and returns to the
previous menu.
Buttons only appear as applicable.
SETUP X.X
CFG DAS RNGE PASS CLK EXIT
SETUP X.X
VARS DIAG EXIT
06870C DCN6332

Communications Setup and Operation T400 Ozone Analyzer Operator’s Manual
142
6.6. USB PORT
Using the USB port disallows use of the rear panel COM2 port except when using the
COM2 port for multidrop communication. USB configuration requires matching the
baud rates of the instrument and the PC to which it is connected. To view or change the
instrument baud rate:
1. Go to SETUP>MORE>COMM>COM2 menu.
2. Press the SET> button until “COM2 BAUD RATE:xxxxx” appears in the Param field
of the instrument display.
3. Check that the baud rate of the instrument matches the baud rate of your PC (if they
do not match, change either one to match the other).
4. Press the ENTR button to accept any changes.
6.7. COMMUNICATIONS PROTOCOLS
Two communications protocols available with the analyzer are MODBUS and Hessen.
MODBUS setup instructions are provided here (Section 6.7.1) and registers are provided
in Appendix A. Hessen setup and operation istructions are provided in Section 6.7.2.
6.7.1. MODBUS
The following set of instructions assumes that the user is familiar with MODBUS
communications, and provides minimal information to get started. For additional
instruction, please refer to the Teledyne API MODBUS manual, PN 06276. Also refer to
www.modbus.org for MODBUS communication protocols.
Minimum Requirements
Instrument firmware with MODBUS capabilities installed.
MODBUS-compatible software (TAPI uses MODBUS Poll for testing; see
www.modbustools.com)
Personal computer
Communications cable (Ethernet or USB or RS232)
Possibly a null modem adapter or cable
06870C DCN6332
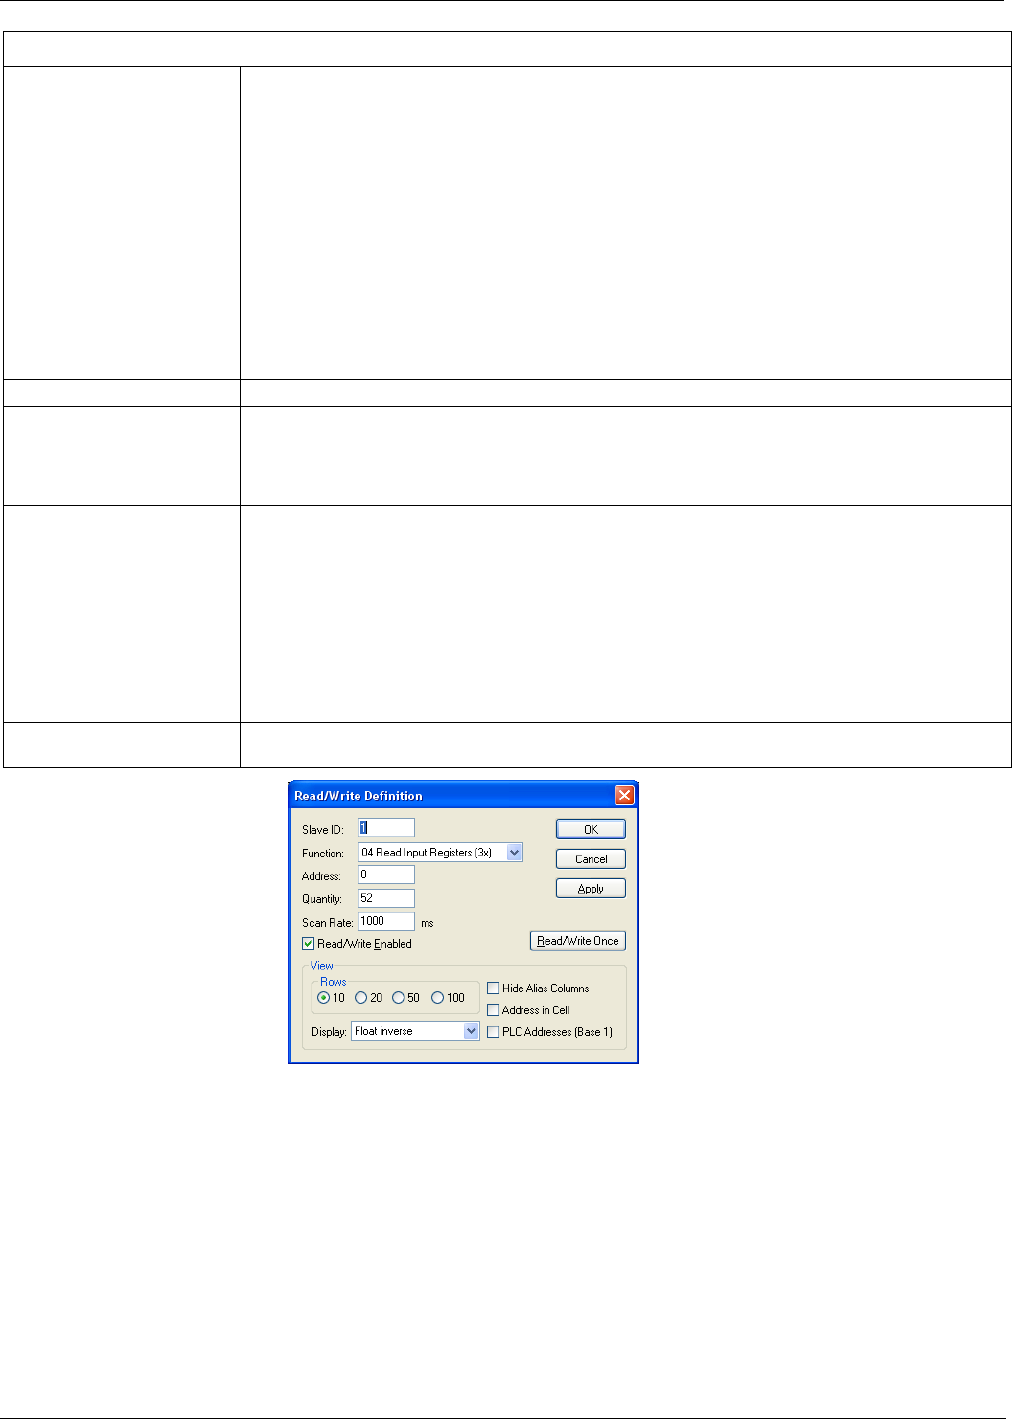
T400 Ozone Analyzer Operator’s Manual Communications Setup and Operation
143
MODBUS Setup:
Set Com Mode parameters
Comm
Slave ID
Ethernet: Using the front panel menu, go to SETUP – MORE – COMM – INET; scroll through the INET
submenu until you reach TCP PORT 2 (the standard setting is 502), then continue to TCP
PORT 2 MODBUS TCP/IP; press EDIT and toggle the menu button to change the setting
to ON, then press ENTR. (Change Machine ID if needed: see “Slave ID”).
USB/RS232: Using the front panel menu, go to SETUP – MORE – COMM – COM2 – EDIT; scroll
through the COM2 EDIT submenu until the display shows COM2 MODBUS RTU: OFF
(press OFF to change the setting to ON. Scroll NEXT to COM2 MODBUS ASCII and
ensure it is set to OFF. Press ENTR to keep the new settings. (If RTU is not available with
your communications equipment, set the COM2 MODBUS ASCII setting to ON and
ensure that COM2 MODBUS RTU is set to OFF. Press ENTR to keep the new settings).
A MODBUS slave ID must be set for each instrument. Valid slave ID’s are in the range of 1 to 247. If
your analyzer is connected to a serial network (ie. RS-485), a unique Slave ID must be assigned to each
instrument. To set the slave ID for the instrument, go to SETUP – MORE – COMM – ID. The default
MACHINE ID is the same as the model number. Toggle the menu buttons to change the ID.
Reboot analyzer For the settings to take effect, power down the analyzer, wait 5 seconds, and power up the analyzer.
Make appropriate cable
connections
Connect your analyzer either:
via its Ethernet or USB port to a PC (this may require a USB-to-RS232 adapter for your PC; if so, also
install the sofware driver from the CD supplied with the adapter, and reboot the computer if required), or
via its COM2 port to a null modem (this may require a null modem adapter or cable).
Specify MODBUS software
settings
(examples used here are for
MODBUS Poll software)
1. Click Setup / [Read / Write Definition] /.
a. In the Read/Write Definition window (see example that follows) select a Function (what you wish to
read from the analyzer).
b. Input Quantity (based on your firware’s register map).
c. In the View section of the Read/Write Definition window select a Display (typically Float Inverse).
d. Click OK.
2. Next, click Connection/Connect.
a. In the Connection Setup window (see example that follows), select the options based on your
computer.
b. Press OK.
Read the Modbus Poll Register Use the Register Map to find the test parameter names for the values displayed (see example that follows
If desired, assign an alias for each.
Example Read/Write Definition window:
06870C DCN6332
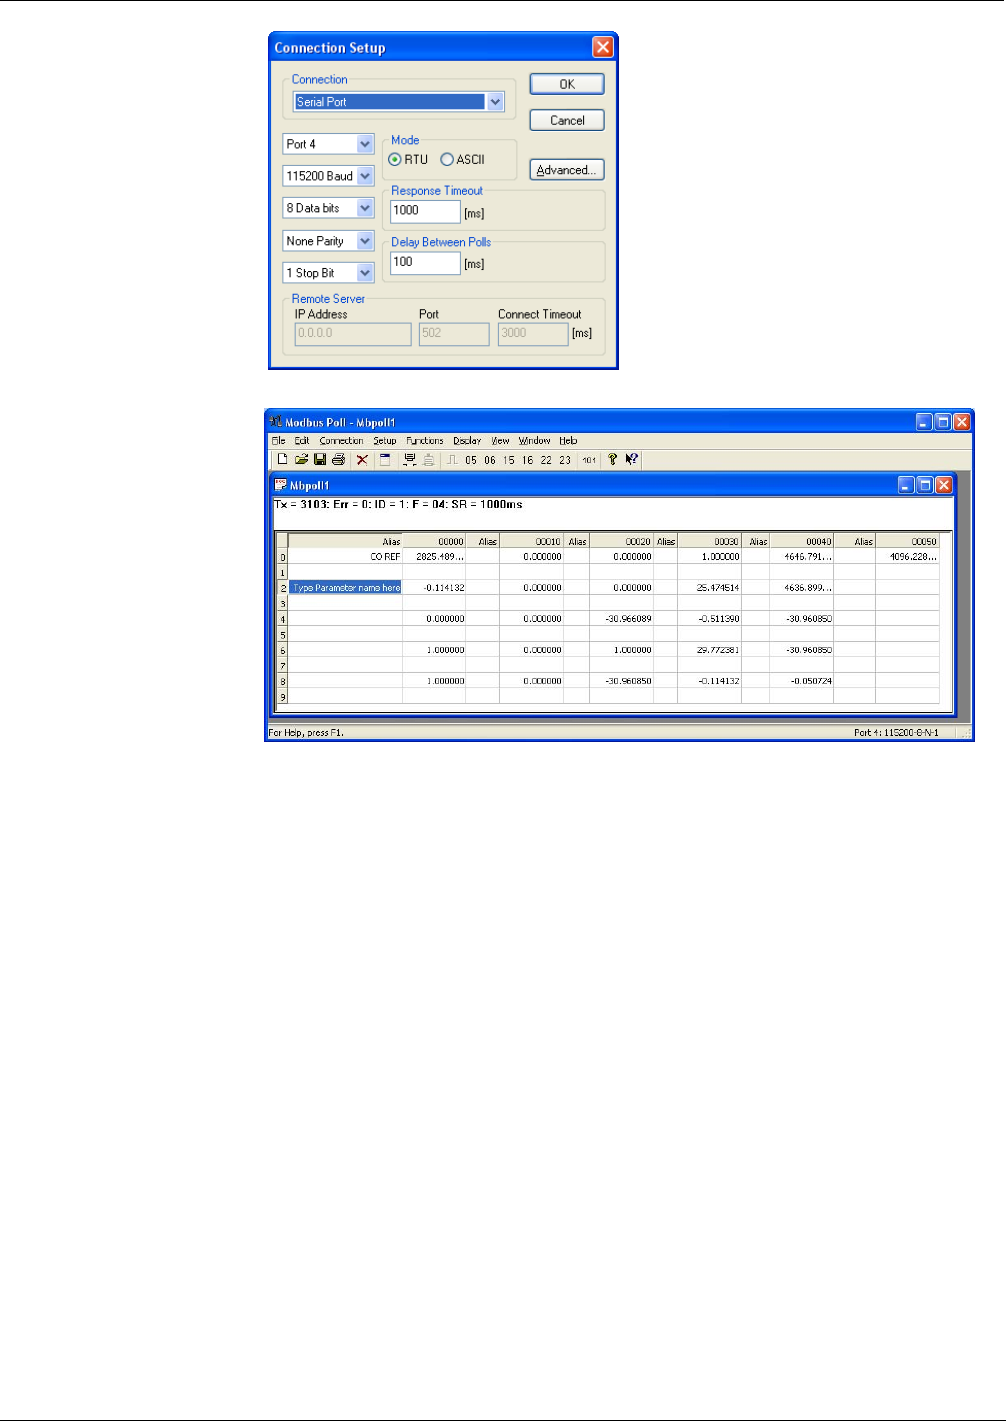
Communications Setup and Operation T400 Ozone Analyzer Operator’s Manual
144
Example Connection Setup window:
Example MODBUS Poll window:
6.7.2. HESSEN
The Hessen protocol is a multidrop protocol, in which several remote instruments are
connected via a common communications channel to a host computer. The remote
instruments are regarded as slaves of the host computer. The remote instruments are
unaware that they are connected to a multidrop bus and never initiate Hessen protocol
messages. They only respond to commands from the host computer and only when they
receive a command containing their own unique ID number.
The Hessen protocol is designed to accomplish two things: to obtain the status of remote
instruments, including the concentrations of all the gases measured; and to place remote
instruments into zero or span calibration or measure mode. API’s implementation
supports both of these principal features.
The Hessen protocol is not well defined, therefore while API’s application is completely
compatible with the protocol itself, it may be different from implementations by other
companies.
The following subs describe the basics for setting up your instrument to operate over a
Hessen Protocol network. For more detailed information as well as a list of host
computer commands and examples of command and response message syntax,
download the Manual Addendum for Hessen Protocol from the Teledyne API web site:
http://www.teledyne-api.com/manuals/index.asp .
06870C DCN6332

T400 Ozone Analyzer Operator’s Manual Communications Setup and Operation
145
6.7.3. HESSEN COMM PORT CONFIGURATION
Hessen protocol requires the communication parameters of the T400’s COMM ports to
be set differently than the standard configuration as shown in the table below.
Table 6-4: RS-232 Communication Parameters for Hessen Protocol
PARAMETER STANDARD HESSEN
Baud Rate 300 – 115200 1200
Data Bits 8 7
Stop Bits 1 2
Parity None Even
Duplex Full Half
To change the baud rate of the T400’s COMM ports, see Section 6.2.2.
Note Make sure that the communication parameters of the host computer are
also properly set.
Note The instrument software has a 200 ms. latency before it responds to
commands issued by the host computer. This latency should present no
problems, but you should be aware of it and not issue commands to the
instrument too frequently.
06870C DCN6332
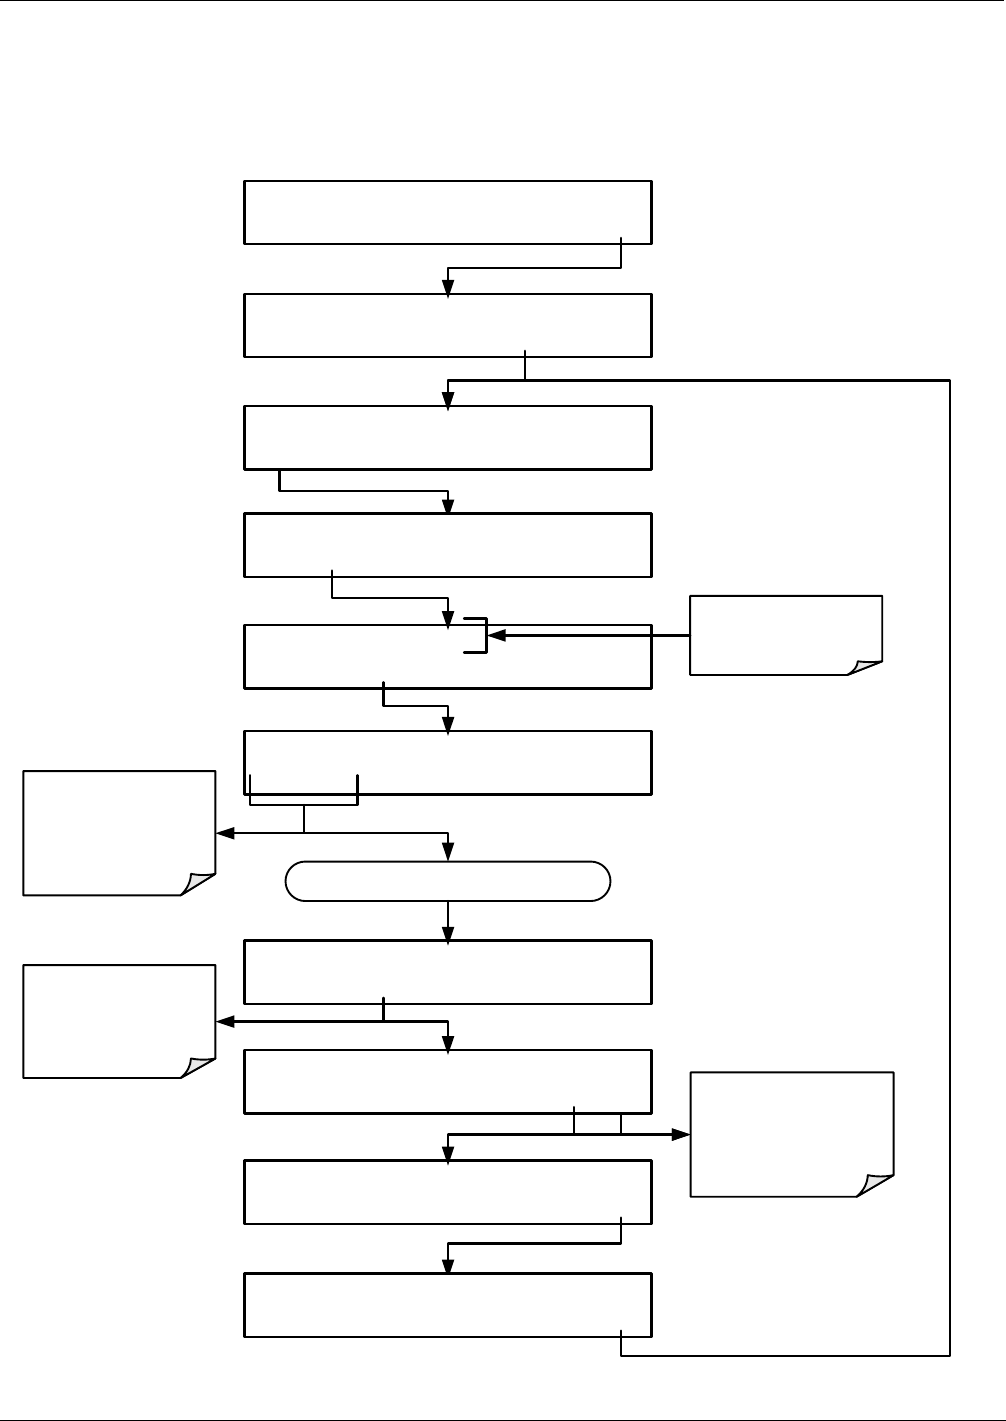
Communications Setup and Operation T400 Ozone Analyzer Operator’s Manual
146
6.7.4. ACTIVATING HESSEN PROTOCOL
The first step in configuring the T400 to operate over a Hessen protocol network is to
activate the Hessen mode for COMM ports and configure the communication parameters
for the port(s) appropriately. Press:
SETUP X.X COMMUNICATIONS MENU
ID INET COM1 COM2 EXIT
SETUP X.X COM1 MODE:0
<SET SET> EDIT EXIT
SETUP X.X COM1 QUIET MODE:OFF
PREV NEXT OFF EXIT
EXIT discards the new
setting
ENTR accepts the
new setting
SETUP X.X COM1 HESSEN PROTOCOL: OFF
PREV NEXT OFF ENTR EXIT
Activate / Deactivate
the HESSEN mode
by toggling the ON /
OFF button SETUP X.X COM1 HESSEN PROTOCOL: OFF
PREV NEXT ON ENTR EXIT
Continue pressing NEXT until ...
Use PREV and
NEXT to scroll
between the
available modes
Combined Mode ID
displayed here
SETUP X.X PRIMARY SETUP MENU
CFG DAS RNGE PASS CLK MORE EXIT
SAMPLE RANGE=500.0 PPB O3= XXXX
<TST TST> CAL SETUP
SETUP X.X SECONDARY SETUP MENU
COMM VARS DIAG EXIT
SETUP X.X COM1 MODE:16
<SET SET> EDIT EXIT
SETUP X.X COMMUNICATIONS MENU
ID HESN COM1 COM2 EXIT
06870C DCN6332
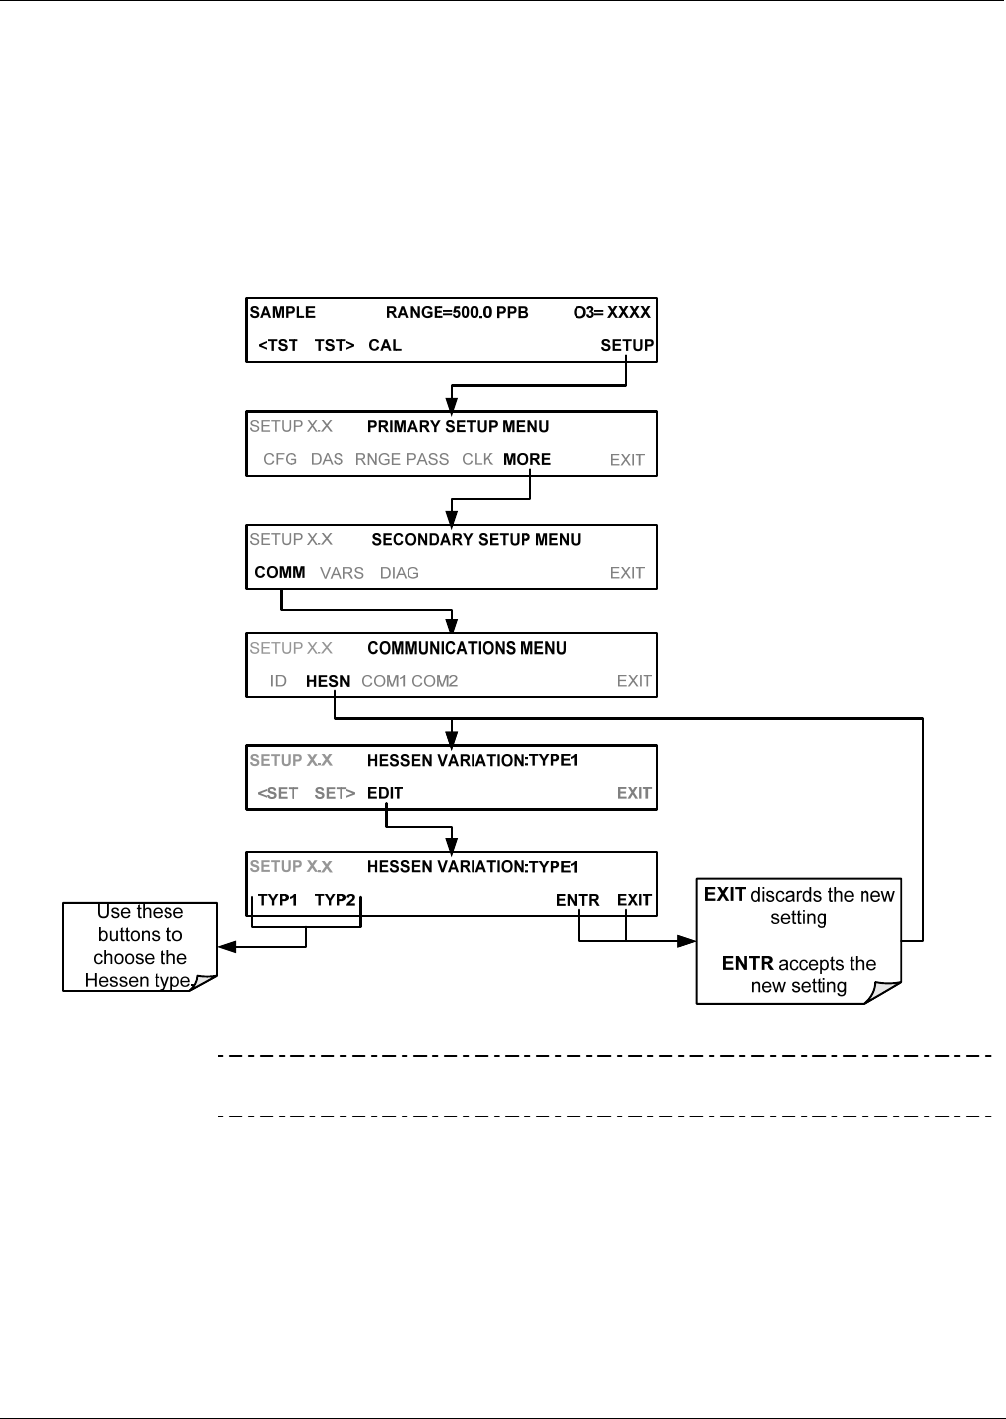
T400 Ozone Analyzer Operator’s Manual Communications Setup and Operation
147
6.7.5. SELECTING A HESSEN PROTOCOL TYPE
Currently there are two versions of Hessen Protocol in use. The original
implementation, referred to as TYPE 1, and a more recently released version, TYPE 2
that has more flexibility when operating with instruments that can measure more than
one type of gas. For more specific information about the difference between TYPE
1and TYPE 2 download the Manual Addendum for Hessen Protocol from the Teledyne
API web site: http://www.teledyne-api.com/manuals/index.asp .
To select a Hessen Protocol Type press:
Note While Hessen Protocol Mode can be activated independently for COM1
and COM2, The TYPE selection affects both Ports.
06870C DCN6332
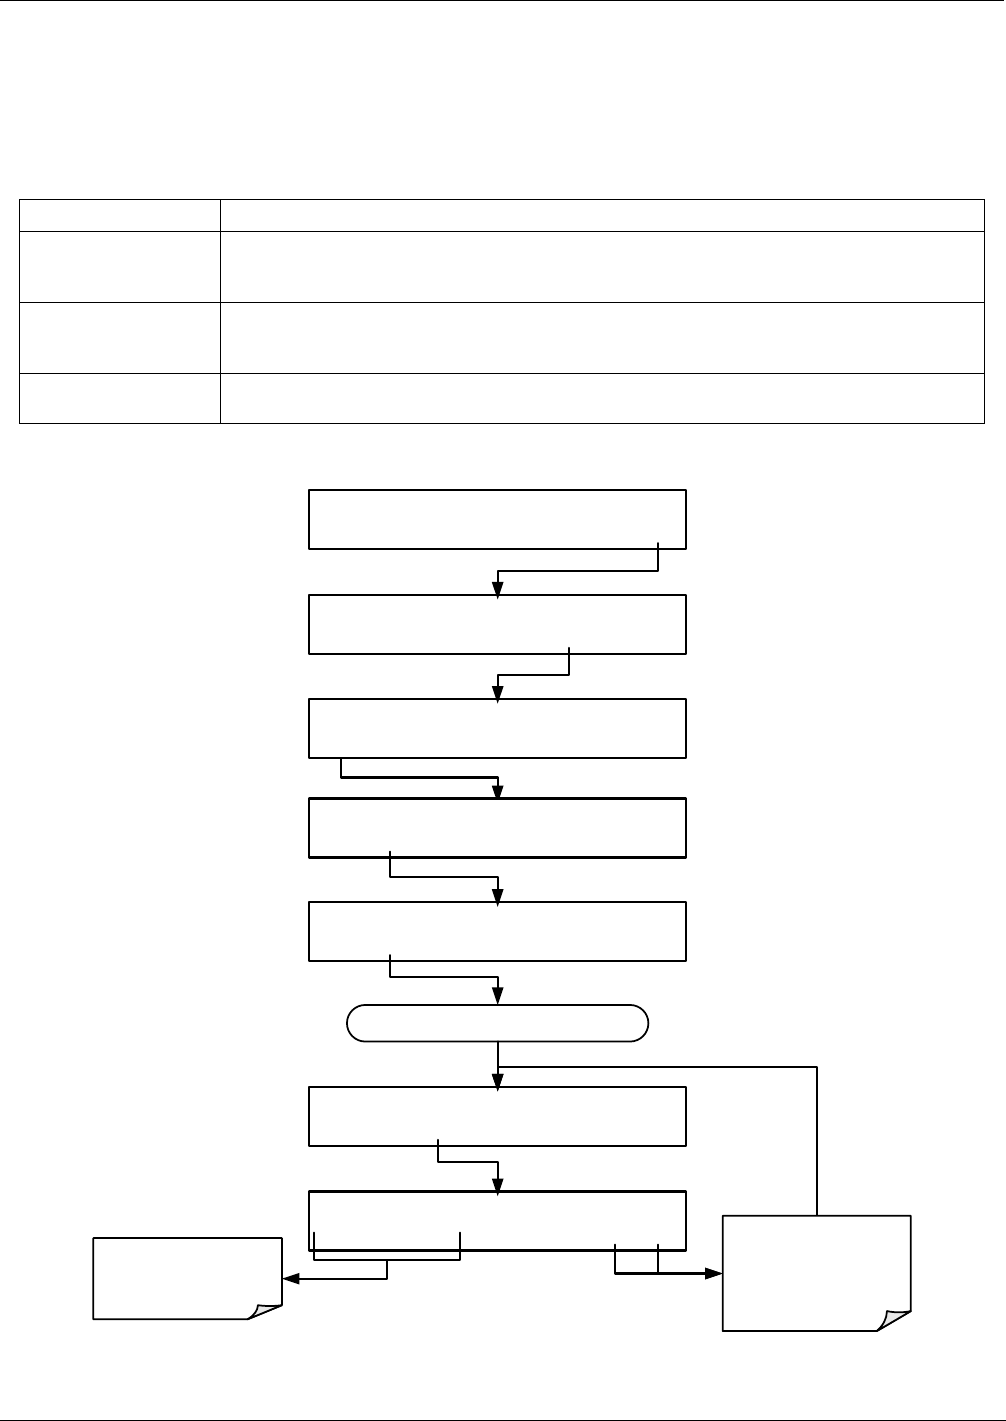
Communications Setup and Operation T400 Ozone Analyzer Operator’s Manual
148
6.7.6. SETTING THE HESSEN PROTOCOL RESPONSE MODE
The Teledyne API implementation of Hessen Protocol allows the user to choose one of
several different modes of response for the analyzer.
Table 6-5: Teledyne API Hessen Protocol Response Modes
MODE ID MODE DESCRIPTION
CMD This is the Default Setting. Reponses from the instrument are encoded as the traditional
command format. Style and format of responses depend on exact coding of the initiating
command.
BCC Responses from the instrument are always delimited with <STX> (at the beginning of the
response, <ETX> (at the end of the response followed by a 2 digit Block Check Code
(checksum), regardless of the command encoding.
TEXT Responses from the instrument are always delimited with <CR> at the beginning and the end
of the string, regardless of the command encoding.
To Select a Hessen response mode, press:
SETUP X.X HESSEN RESPONSE MODE:CMD
<SET SET> EDIT EXIT
SETUP X.X COMMUNICATIONS MENU
ID HESN COM1 COM2 EXIT
SETUP X.X HESSEN VARIATION:TYPE1
<SET SET> EDIT EXIT
SETUP X.X PRIMARY SETUP MENU
CFG DAS RNGE PASS CLK MORE EXIT
SAMPLE RANGE=500.0 PPB O3= XXXX
<TST TST> CAL SETUP
SETUP X.X SECONDARY SETUP MENU
COMM VARS DIAG EXIT
SETUP X.X HESSEN VARIATION:TYPE1
BCC TEXT CMD ENTR EXIT EXIT discards the new
setting
ENTR accepts the
new setting
Press any to choose
the Hessen Response
type.
Continue pressing NEXT until ...
06870C DCN6332

T400 Ozone Analyzer Operator’s Manual Communications Setup and Operation
149
6.7.7. HESSEN PROTOCOL GAS LIST ENTRIES
6.7.7.1. Gas List Entry Format and Definitions
The T400 analyzer keeps a list of available gas types. Each entry in this list is of the
following format.
[GAS TYPE],[RANGE],[GAS ID],[REPORTED]
Where:
GAS TYPE = The type of gas to be reported (e.g O3, CO2, NOx, etc.). In the case of
the T400 analyzer, there is only one gas type: O3.
RANGE = The concentration range for this entry in the gas list. This feature
permits the user to select which concentration range will be used for
this gas list entry. The T400 analyzer has two ranges: RANGE1 (LOW)
& RANGE2 (HIGH).
0 - The HESSEN protocol to use whatever range is currently active.
1 - The HESSEN protocol will always use RANGE1 for this gas list
entry
2 - The HESSEN protocol will always use RANGE2 for this gas list
entry
3 - Not applicable to the T400 analyzer.
GAS ID = An identification number assigned to a specific gas. In the case of the
T400 analyzer, there is only one gas O3, and its default GAS ID is 400.
This ID number should not be modified.
REPORT = States whether this list entry is to be reported or not reported when ever
this gas type or instrument is polled by the HESSEN network. If the list
entry is not to be reported this field will be blank.
The T400 analyzer is a single gas instrument that measures O3. It’s default gas list
consists of only one entry that reads:
O3, 0, 400, REPORTED
If you wish to have just the last concentration value stored for a specific range this list
entry should be edited or additional entries should be added to the list.
06870C DCN6332
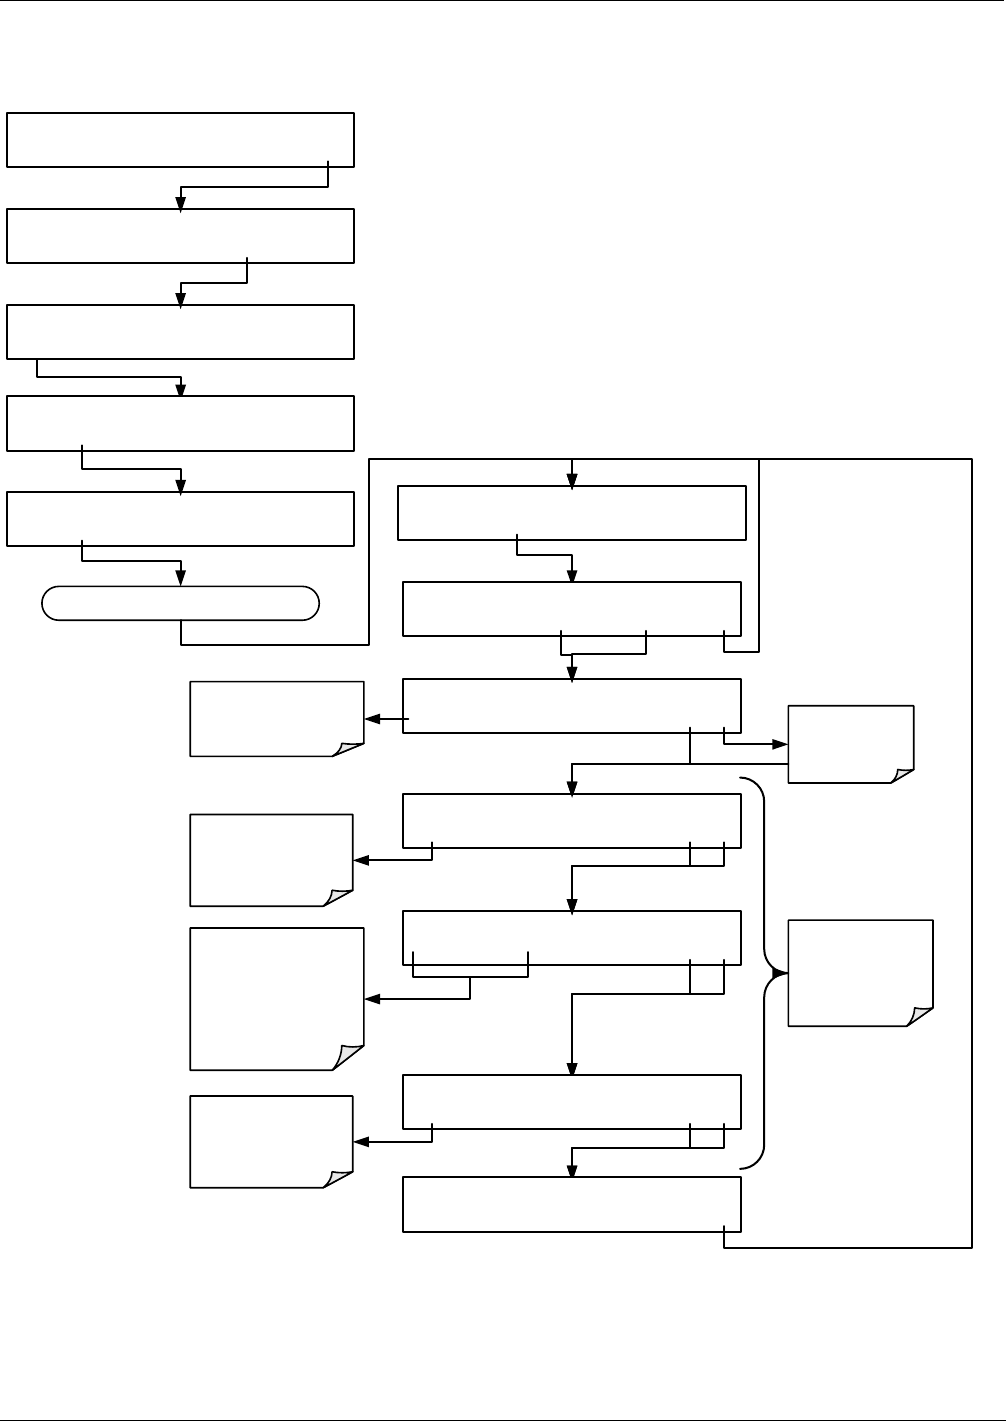
Communications Setup and Operation T400 Ozone Analyzer Operator’s Manual
150
6.7.7.2. Editing or Adding HESSEN Gas List Entries
To add or edit an entry to the Hessen Gas List, press:
SETUP X.X GAS ID:[ID Number]
000 ENTREXIT
SETUP X.X HESSEN GAS LIST
<SET SET> EDIT EXIT
SETUP X.X COMMUNICATIONS MENU
ID HESN COM1 COM2 EXIT
SETUP X.X HESSEN VARIATION:TYPE1
<SET SET> EDIT EXIT
SETUP X.X PRIMARY SETUP MENU
CFG DAS RNGE PASS CLK MORE EXIT
SAMPLE RANGE=500.0 PPB O3= XXXX
<TST TST> CAL SETUP
SETUP X.X SECONDARY SETUP MENU
COMM VARS DIAG EXIT
Toggle to set the GAS
ID to 400.
For new list entries
this number will be
displayed as
000.
Continue pressing NEXT until ...
EXIT discards the
new setting
ENTR accepts the
new setting
SETUP X.X O3, 0, 400, REPORTED
PREV NEXT INS DEL EDIT PRNT EXIT
SETUP X.X GAS TYPE:O3
ENTR EXIT
There is only one GAS
TYPE available on
this analyzer: O3 EXIT sets the
gas type to
NONE
SETUP X.X CONC RANGE:0
0ENTREXIT
Toggle to set the
concentration range
for the list entry
SETUP X.X REPORTED:ON
ON ENTR EXIT
Toggle to turn ON/
OFF the REPORT
attribute
SETUP X.X O3, 0, 400, REPORTED
PREV NEXT INS DEL EDIT PRNT EXIT
06870C DCN6332
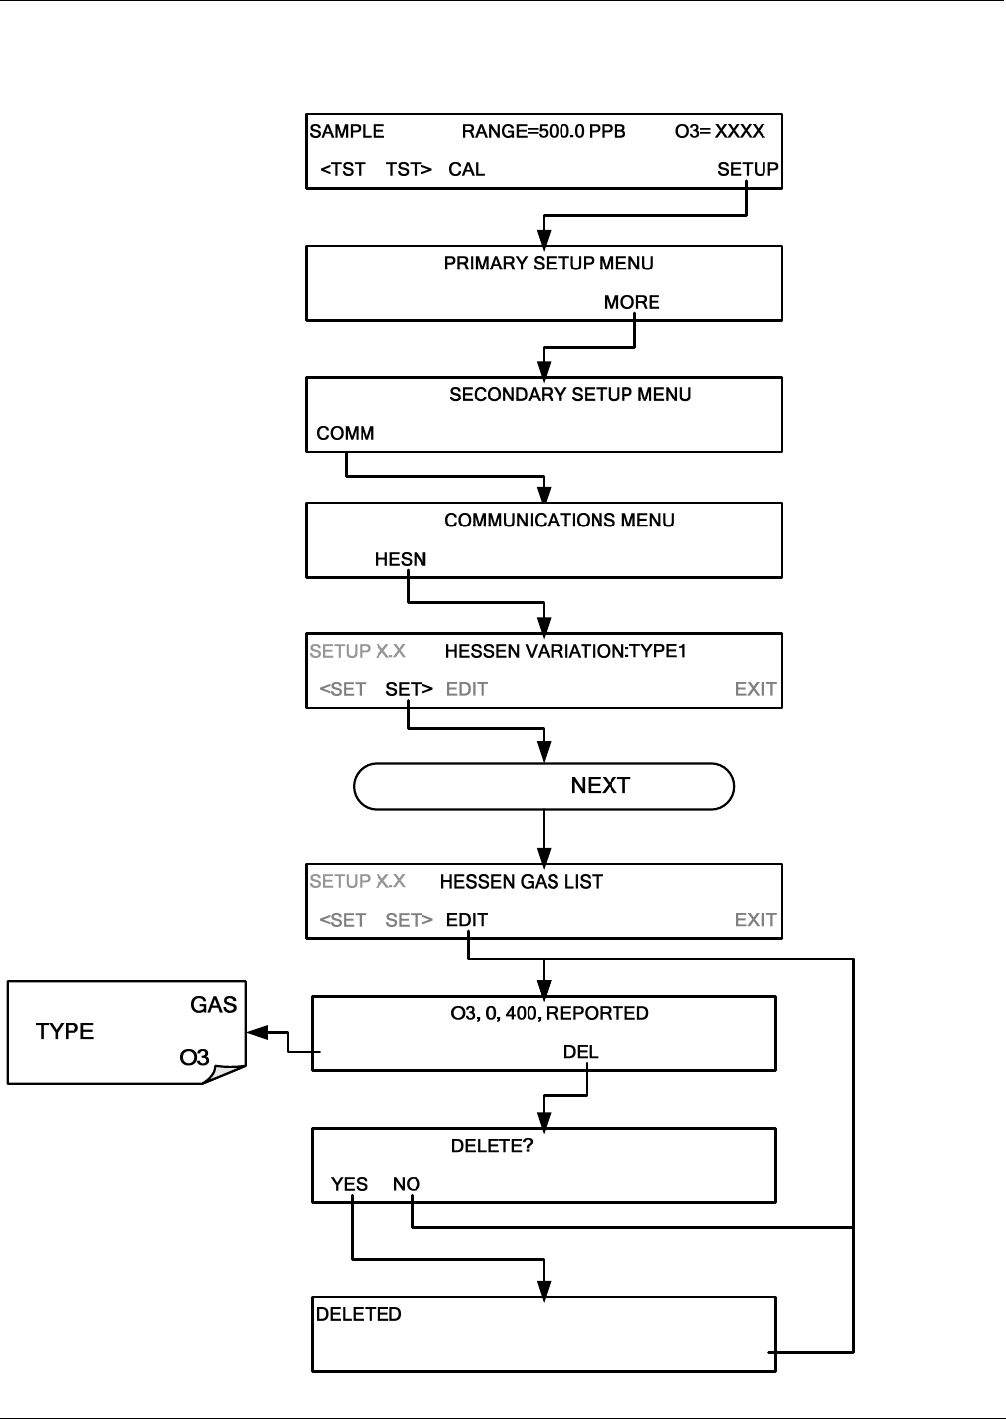
T400 Ozone Analyzer Operator’s Manual Communications Setup and Operation
151
6.7.7.3. Deleting HESSEN Gas List Entries
To delete an entry from the Hessen Gas list, press:
SETUP X.X
ID COM1 COM2 EXIT
SETUP X.X
CFG DAS RNGE PASS CLK EXIT
SETUP X.X
VARS DIAG EXIT
Continue pressing until ...
SETUP X.X
PREV NEXT INS EDIT PRNT EXIT
SETUP X.X
There is only one
available on
this analyzer:
06870C DCN6332

Communications Setup and Operation T400 Ozone Analyzer Operator’s Manual
152
6.7.8. SETTING HESSEN PROTOCOL STATUS FLAGS
Teledyne API implementation of Hessen protocols includes a set of status bits that the
instrument includes in responses to inform the host computer of its condition. Each bit
can be assigned to one operational and warning message flag. The default settings for
these bit/flags are:
Table 6-6: Default Hessen Status Bit Assignments
STATUS FLAG NAME DEFAULT BIT
ASSIGNMENT
WARNING FLAGS
SAMPLE FLOW WARNING 0001
PHOTO REF WARNING 0002
SAMPLE PRESS WARN 0004
SAMPLE TEMP WARN 0008
O3 GEN REF WARNING1 0010
O3 GEN LAMP WARNING1 0020
O3 GEN TEMP WARN1 00402
PHOTO TEMP WARNING 00402
OPERATIONAL FLAGS
In MANUAL Calibration Mode 0200
In ZERO Calibration Mode 0400
In SPAN Calibration Mode 08002
In LO SPAN Calibration Mode 08002
UNITS OF MEASURE FLAGS
UGM 0000
MGM 2000
PPB 4000
PPM 6000
SPARE/UNUSED BITS 0080, 0100,
1000, 8000
UNASSIGNED FLAGS (0000)
LAMP STABIL WARN LAMP DRIVER WARN
O3 SCRUB TEMP WARN3 ANALOG CAL WARNING
BOX TEMP WARNING CANNOT DYN ZERO
SYSTEM RESET CANNOT DYN SPAN
RELAY BOARD WARNING INVALID CONC
REAR BOARD NOT DETECTED Instrument is in MP CAL mode
Instrument is in MP CAL mode
06870C DCN6332
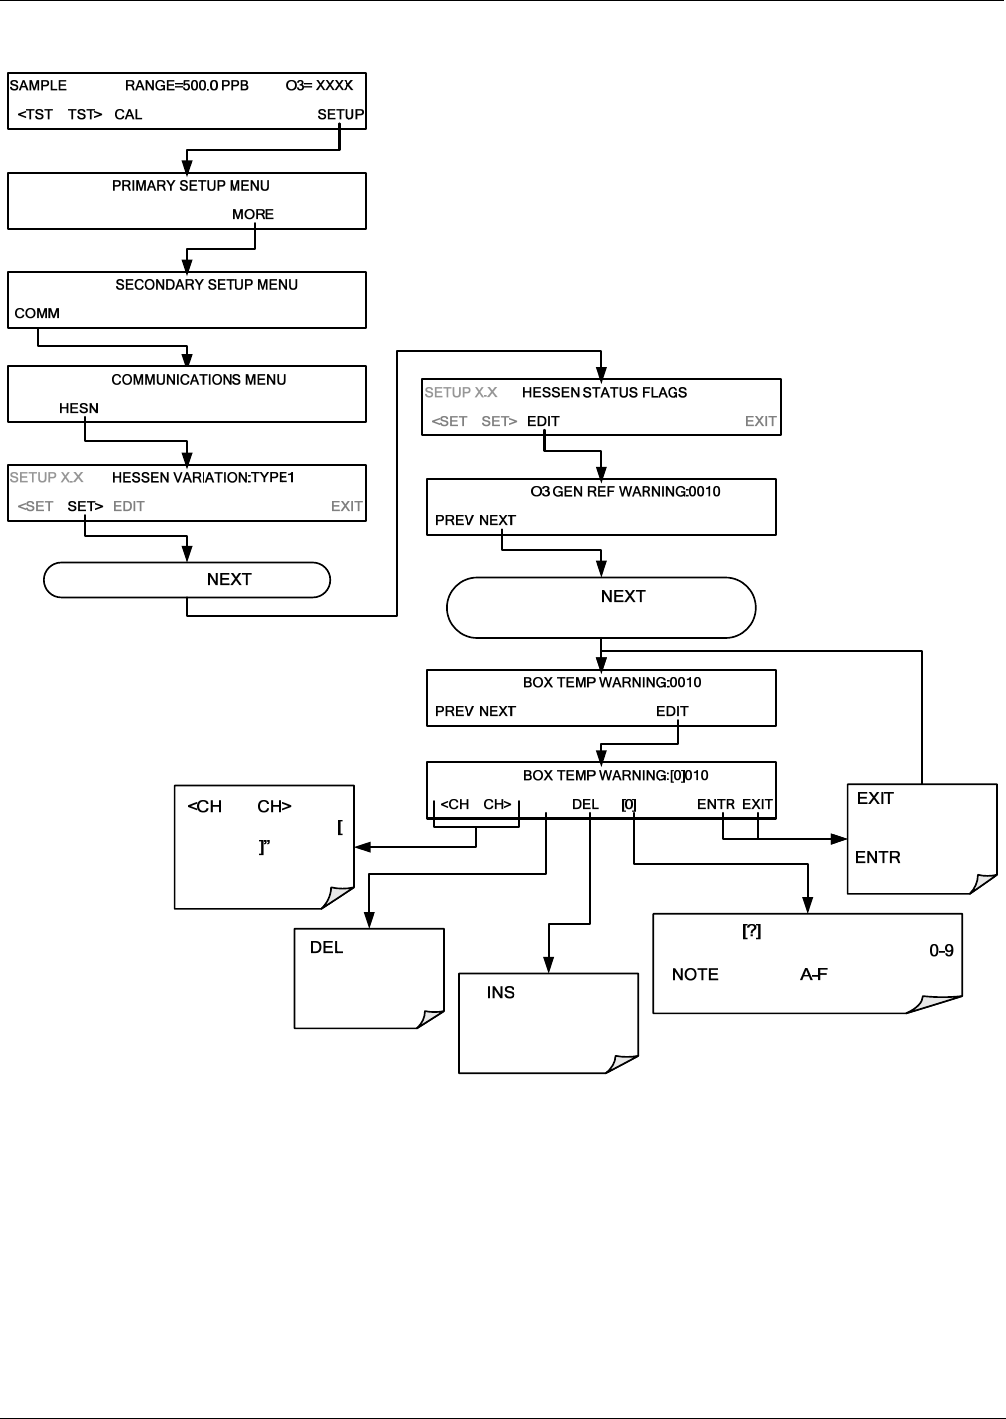
T400 Ozone Analyzer Operator’s Manual Communications Setup and Operation
153
To assign or reset the status flag bit assignments, press:
deletes the
character currently
inside the cursor
brackets.
Press this button repeatedly to cycle
through the available character set:
: Values of can also be set
but are meaningless.
and move
the cursor brackets “
left and right along the
bit string.
SETUP X.X
ID COM1 COM2 EXIT
SETUP X.X
CFG DAS RNGE PASS CLK EXIT
SETUP X.X
VARS DIAG EXIT
Continue pressing until ...
SETUP X.X
EDIT PRNT EXIT
SETUP X.X
INS
SETUP X.X
PRNT EXIT
Continue pressing until desired
flag message is displayed
discards the
new setting
accepts the
new setting
Inserts a the
character at the
current location of the
cursor brackets.
6.7.9. INSTRUMENT ID
Each instrument on a Hessen Protocol network must have a unique identifier (ID
number). If more than one T400 analyzer is on the Hessen network, refer to Section
5.7.1 for information and to customize the ID of each.
06870C DCN6332

Communications Setup and Operation T400 Ozone Analyzer Operator’s Manual
154
This page intentionally left blank.
06870C DCN6332

155
7. DATA ACQUISITION SYSTEM (DAS) AND APICOM
The T400 analyzer contains a flexible and powerful, internal data acquisition system
(DAS) that enables the analyzer to store concentration and calibration data as well as a
host of diagnostic parameters. The DAS of the T400 can store up to about one million
data points, which can, depending on individual configurations, cover days, weeks or
months of valuable measurements. The data are stored in non-volatile memory and are
retained even when the instrument is powered off. Data are stored in plain text format
for easy retrieval and use in common data analysis programs (such as spreadsheet-type
programs).
The DAS is designed to be flexible, users have full control over the type, length and
reporting time of the data. The DAS permits users to access stored data through the
instrument’s front panel or its communication ports.
The principal use of the DAS is logging data for trend analysis and predictive
diagnostics, which can assist in identifying possible problems before they affect the
functionality of the analyzer. The secondary use is for data analysis, documentation and
archival in electronic format.
To support the DAS functionality, Teledyne API offers APICOM, a program that
provides a visual interface for remote or local setup, configuration and data retrieval of
the DAS (see Section 8.1.1). Using APICOM, data can even be retrieved automatically
to a remote computer for further processing. The APICOM manual, which is included
with the program, contains a more detailed description of the DAS structure and
configuration, which is briefly described in this document.
The T400 is configured with basic DAS already enabled. The data channels included in
this basic structure may be used as is or temporarily disabled for later or occasional use.
IMPORTANT IMPACT ON READINGS OR DATA
DAS operation is suspended whenever its configuration is edited using
the analyzer’s the front panel and therefore data may be lost. To prevent
such data loss, it is recommended to use the APICOM graphical user
interface for DAS changes.
Please be aware that all stored data will be erased if the analyzer’s disk-
on-module or CPU board is replaced or if the configuration data stores
there is reset.
06870C DCN6332

Data Acquisition system (DAS) and APICOM T400 Ozone Analyzer Operator’s Manual
156
7.1. DAS STATUS
The green SAMPLE LED on the instrument front panel, which indicates the analyzer
status, also indicates certain aspects of the DAS status:
Table 7-1: Front Panel LED Status Indicators for DAS
LED STATE DAS Status
OFF
System is in calibration mode. Data logging can be enabled or disabled for this mode.
Calibration data are typically stored at the end of calibration periods, concentration data are
typically not sampled, diagnostic data should be collected.
BLINKING
Instrument is in hold-off mode, a short period after the system exits calibrations. DAS
channels can be enabled or disabled for this period. Concentration data are typically disabled
whereas diagnostic should be collected.
ON Sampling normally.
The DAS can be disabled only by disabling or deleting its individual data channels.
7.2. DAS STRUCTURE
The DAS is designed around the feature of a “record”. A record is a single data point.
The type of date recorded in a record is defined by two properties:
PARAMETER type that defines the kind of data to be stored (e.g. the average of O3
concentrations measured with three digits of precision). See Section 7.4.2.1.
A TRIGGER event that defines when the record is made (e.g. timer; every time a
calibration is performed, etc.). See Section 7.4.2.
The specific PARAMETERS and TRIGGER events that describe an individual record
are defined in a construct called a DATA CHANNEL (see Section 7.4). Each data
channel related one or more parameters with a specific trigger event and various other
operational characteristics related to the records being made (e.g. the channels name,
number or records to be made, time period between records, whether or not the record is
exported via the analyzer’s RS-232 port, etc.).
06870C DCN6332

T400 Ozone Analyzer Operator’s Manual Data Acquisition system (DAS) and APICOM
157
7.3. DAS CHANNELS
The key to the flexibility of the DAS is its ability to store a large number of
combinations of triggering events and data parameters in the form of data channels.
Users may create up to 20 data channels and each channel can contain one or more
parameters. For each channel, the following are selected:
One triggering event is selected
Up to 50 data parameters, which can be the shared between channels.
Several properties that define the structure of the channel and allow the user to
make operational decisions regarding the channel.
Table 7-2: DAS Data Channel Properties
PROPERTY DESCRIPTION DEFAULT SETTING RANGE
NAME The name of the data channel. “NONE” Up to 6 letters or digits1.
TRIGGERING
EVENT
The event that triggers the data channel to
measure and store the datum ATIMER Any available event
(see Appendix A-5).
NUMBER AND
LIST OF
PARAMETERS
A User-configurable list of data types to be
recorded in any given channel. 1-DETMES Any available parameter
(see Appendix A-5).
REPORT PERIOD The amount of time between each channel data
point. 000:01:00
000:00:01 to
366:23:59
(Days:Hours:Minutes)
NUMBER OF
RECORDS
The number of reports that will be stored in the
data file. Once the limit is exceeded, the oldest
data is over-written.
100 1 to 1 million, limited by
available storage space.
RS-232 REPORT Enables the analyzer to automatically report
channel values to the RS-232 ports. OFF OFF or ON
CHANNEL
ENABLED
Enables or disables the channel. Allows a channel
to be temporarily turned off without deleting it. ON OFF or ON
CAL HOLD OFF Disables sampling of data parameters while
instrument is in calibration mode2. OFF OFF or ON
1 More with APICOM, but only the first six are displayed on the front panel).
2 When enabled, records are not recorded until the DAS HOLD OFF period is passed after calibration mode. DAS HOLD OFF SET in
the VARS menu (see Section 6.12.)
06870C DCN6332

Data Acquisition system (DAS) and APICOM T400 Ozone Analyzer Operator’s Manual
158
7.3.1. DAS DEFAULT CHANNELS
A set of default Data Channels has been included in the analyzer’s software for logging
O3 concentration and certain predictive diagnostic data. These default channels include
but are not limited to:
CONC: Samples O3 concentration at one minute intervals and stores an average
every hour with a time and date stamp. Readings during calibration and calibration
hold off are not included in the data. By default, the last 800 hourly averages are
stored.
O3REF: Logs the O3 reference value once a day with a time and date stamp. This
data can be used to track lamp intensity and predict when lamp adjustment or
replacement will be required. By default, the last 730 daily readings are stored.
PNUMTC: Collects sample flow and sample pressure data at five-minute intervals
and stores an average once a day with a time and date stamp. This data is useful
for monitoring the condition of the pump and critical flow orifice (sample flow) and
the sample filter (clogging indicated by a drop in sample pressure) over time to
predict when maintenance will be required. The last 360 daily averages (about 1
year) are stored.
O3GEN: Logs the O3 generator drive value once a day with a time and date stamp.
This data can be used to track O3 generator lamp intensity and predict when lamp
adjustment or replacement will be required. By default, the last 360 daily readings
are stored.
CALDAT: Logs new slope and offset every time a zero or span calibration is
performed. This Data Channel also records the instrument readings just prior to
performing a calibration. This information is useful for performing predictive
diagnostics as part of a regular maintenance schedule (See Section 11.1). The
CALDAT channel collects data based on events (e.g. a calibration operation) rather
than a timed interval. This does not represent any specific length of time since it is
dependent on how often calibrations are performed.
These default data channels can be used as they are, or they can be customized from the
front panel to fit a specific application. They can also be deleted to make room for
custom user-programmed Data Channels.
Appendix A-5 lists the firmware-specific DAS configuration in plain-text format. This
text file can either be loaded into APICOM and then modified and uploaded to the
instrument or can be copied and pasted into a terminal program to be sent to the
analyzer.
IMPORTANT IMPACT ON READINGS OR DATA
Sending a DAS configuration to the analyzer through its COM ports will
replace the existing configuration and will delete all stored data. Back up
any existing data and the DAS configuration before uploading new
settings.
06870C DCN6332
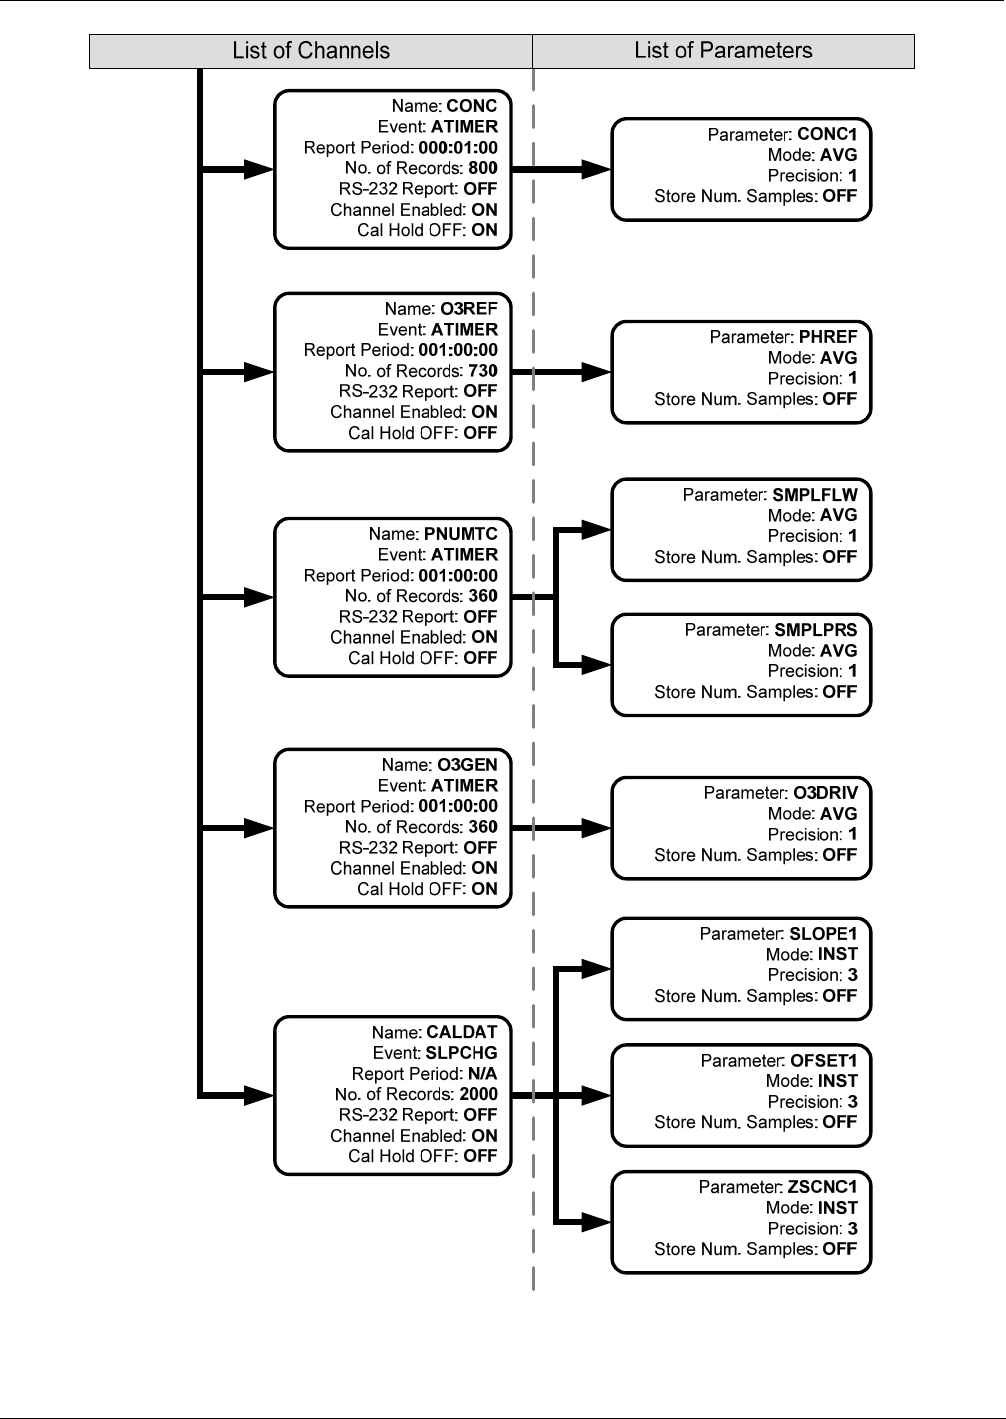
T400 Ozone Analyzer Operator’s Manual Data Acquisition system (DAS) and APICOM
159
Figure 7-1: Default T400 DAS Channels Setup
06870C DCN6332
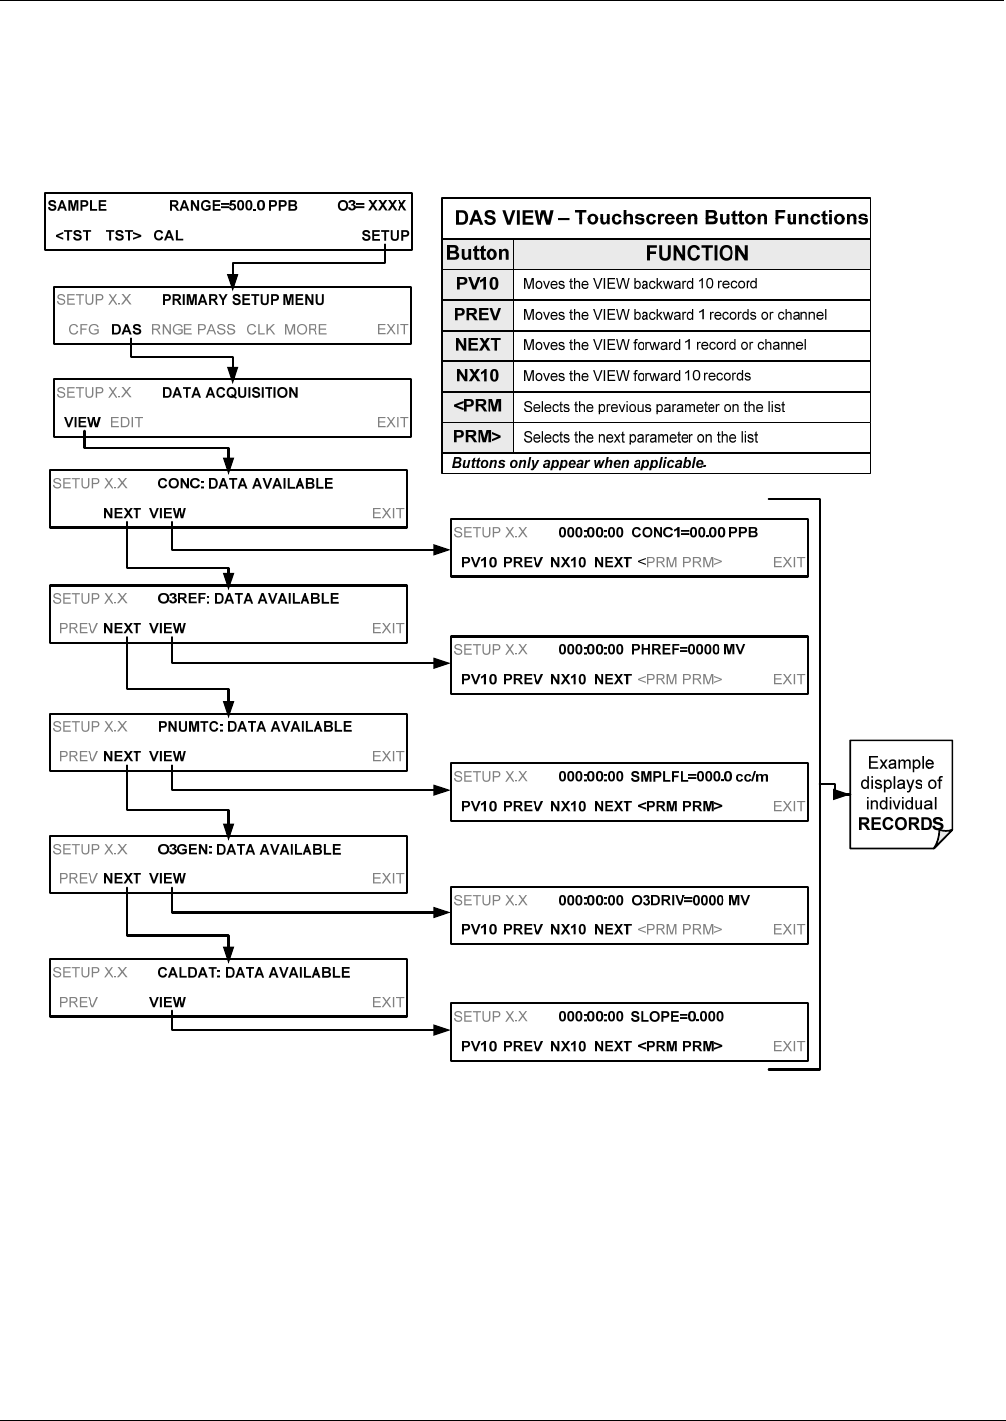
Data Acquisition system (DAS) and APICOM T400 Ozone Analyzer Operator’s Manual
160
7.3.2. SETUP DAS VIEW: VIEWING DAS CHANNELS AND INDIVIDUAL
RECORDS
DAS data and settings can be viewed on the front panel through the following
buttonstroke sequence.
06870C DCN6332
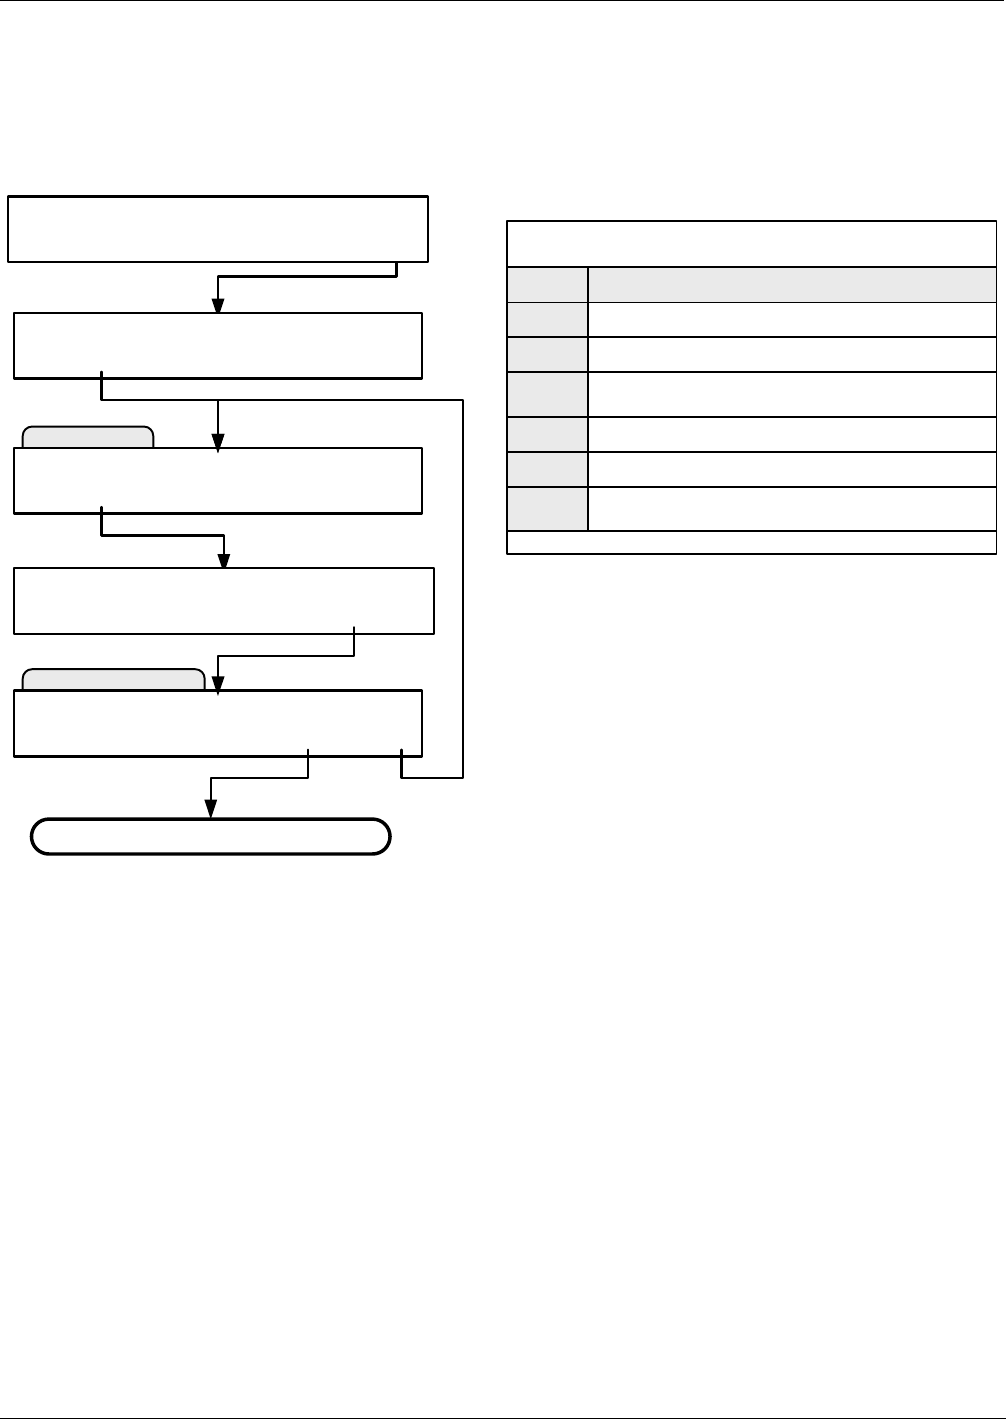
T400 Ozone Analyzer Operator’s Manual Data Acquisition system (DAS) and APICOM
161
7.4. SETUP DAS EDIT: ACCESSING THE DAS EDIT MODE
DAS configuration is most conveniently done through the APICOM remote control
program. The following list of button strokes shows how to edit using the front panel.
EDIT Channel Menu
Main DAS Menu
SETUP X.X PRIMARY SETUP MENU
CFG DAS RNGE PASS CLK MORE EXIT
SETUP X.X DATA ACQUISITION
VIEW EDIT EXIT
SAMPLE RANGE=500.0 PPB O3= XXXX
<TST TST> CAL SETUP
SETUP X.X 0) CONC: ATIMER 1, 800
PREV MEXT INS DEL EDIT PRNT EXIT
PRINT
PREV
INS
NEXT
DEL
Button
Exports the configuration of all data channels to the
RS-232 interface
Selects the previous data channel in the list
Inserts a new data channel into the list BEFORE the
selected channel
Selects the next data channel in the list
Deletes the currently selected data channel
FUNCTION
Buttons only appear when applicable
DAS EDIT – Touchscreen Button Functions
EDIT Enters EDIT mode
SETUP X.X ENTER PASSWORD:818
8 1 8 ENTR EXIT
Enters EDIT mode for the selected channel
When editing the data channels, the top line of the display indicates some of the
configuration parameters. For example, the display line:
0) CONC1: ATIMER, 4, 800
translates to the following configuration:
Channel No.: 0
NAME: CONC1
TRIGGER EVENT: ATIMER
PARAMETERS: Four parameters are included in this channel
EVENT: This channel is set up to store 800 records.
To edit the name of a data channel, follow the above button sequence and then press:
06870C DCN6332
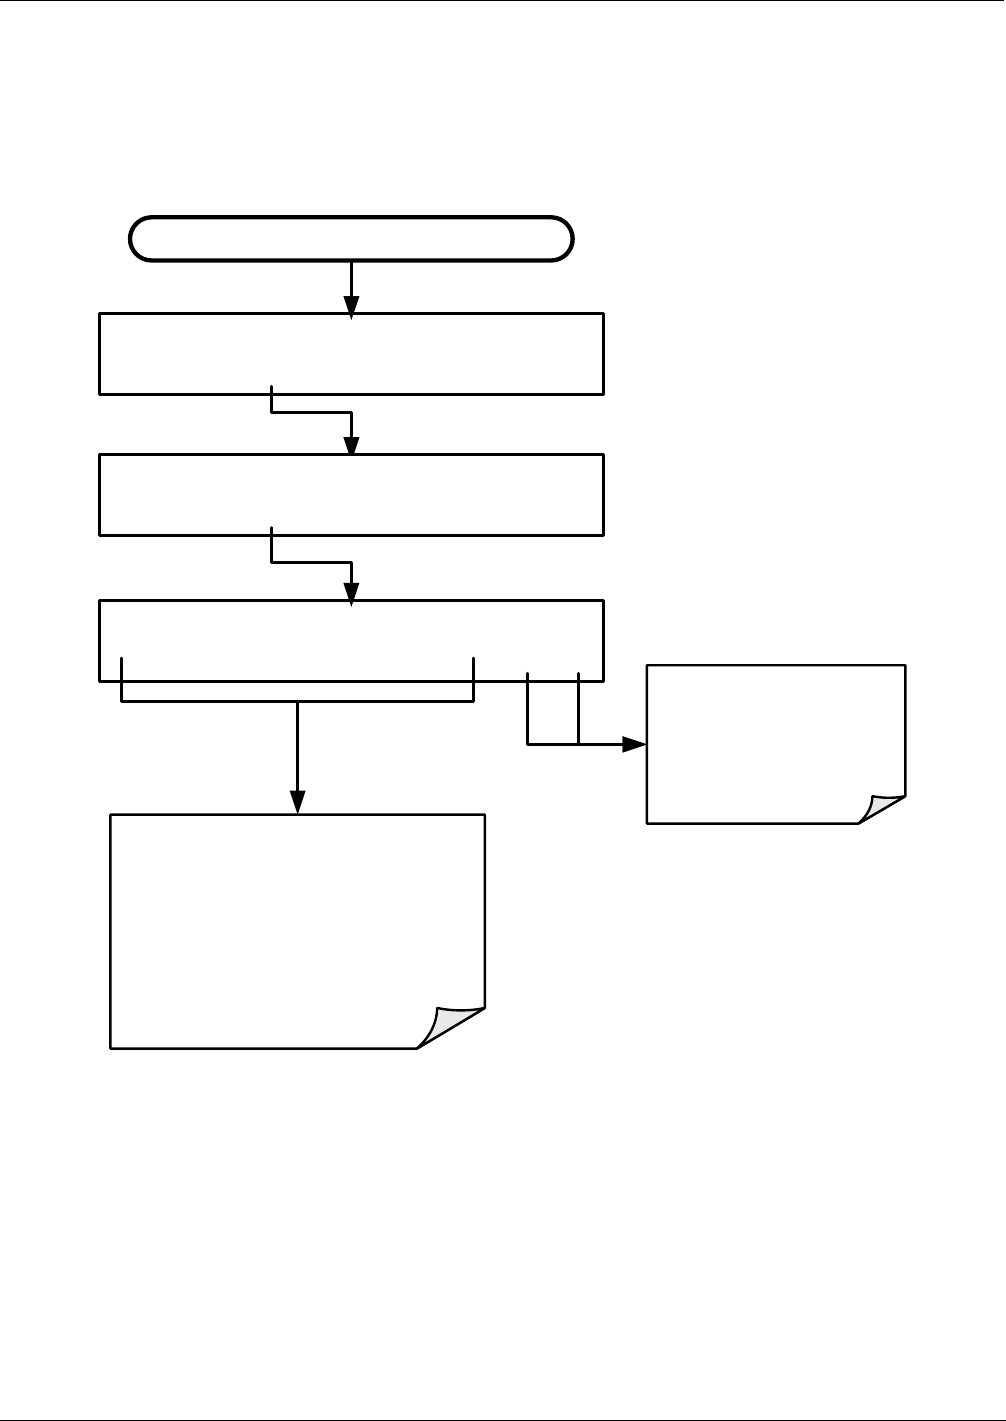
Data Acquisition system (DAS) and APICOM T400 Ozone Analyzer Operator’s Manual
162
7.4.1. EDITING DAS DATA CHANNEL NAMES
To edit the name of an DAS data channel, follow the instruction shown in Section 7.4
then press:
Starting at the EDIT CHANNEL MENU
SETUP X.X 0) CONC: ATIMER 1, 800
<SET SET> EDIT PRNT EXIT
SETUP X.X NAME: CONC
C O N C — — ENTR EXIT EXIT discards the new
setting
ENTR accepts the
new setting
Press each button repeatedly to
cycle through the available
character set and stop at the
desired character:
0-9, A-Z, space ’ ~ ! # $ % ^ &
* ( ) - _ = +[ ] { } < >\ | ; : , . / ?
SETUP X.X NAME: CONC
<SET SET> EDIT PRNT EXIT
06870C DCN6332
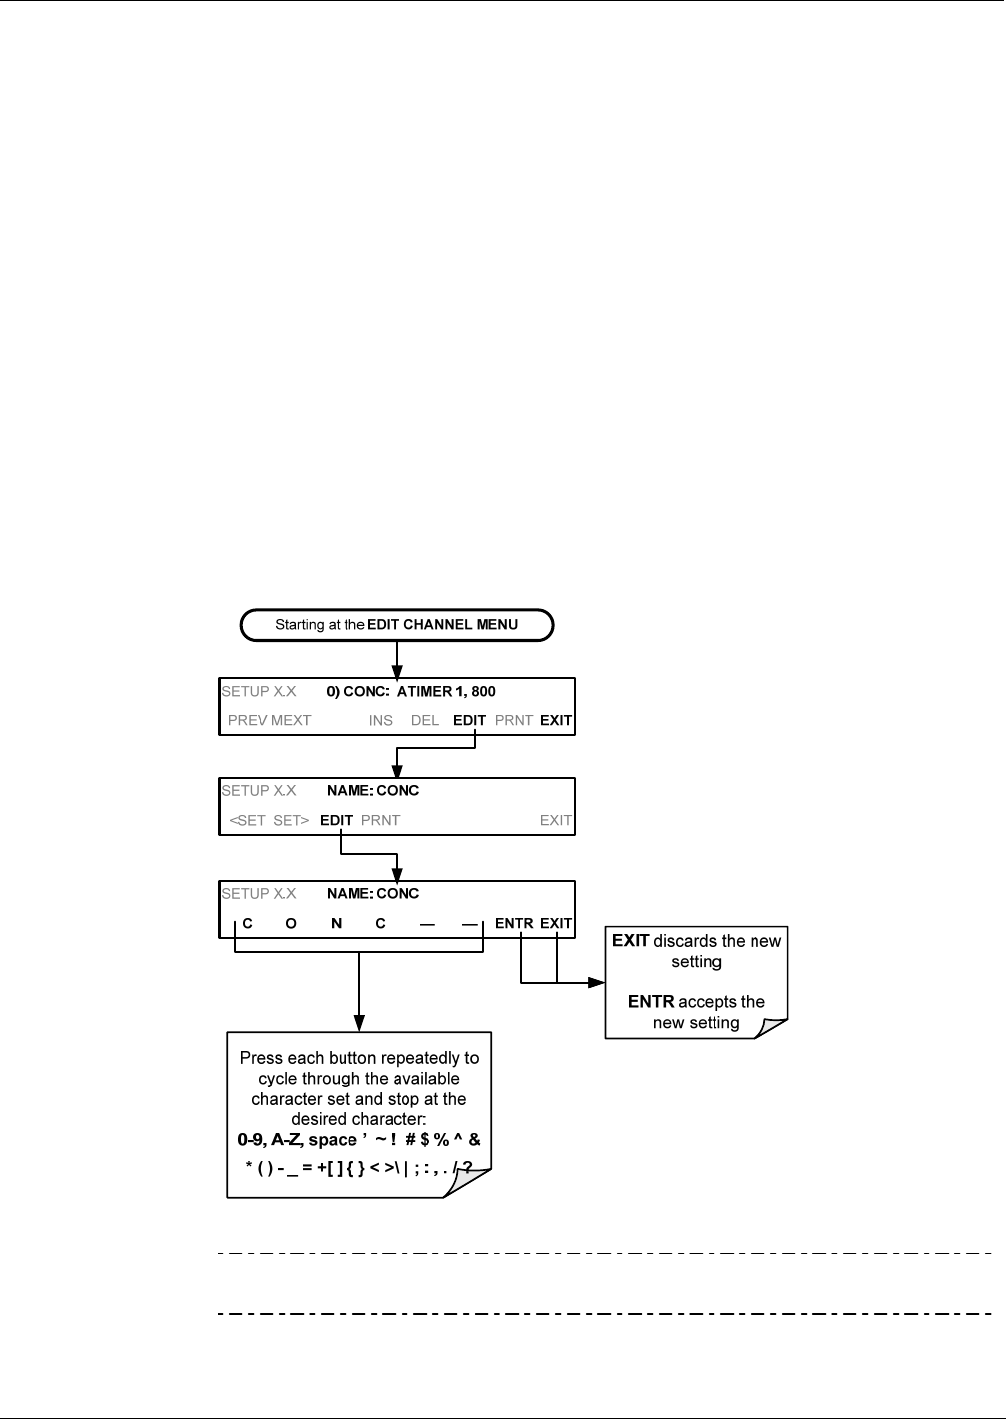
T400 Ozone Analyzer Operator’s Manual Data Acquisition system (DAS) and APICOM
163
7.4.2. EDITING DAS TRIGGERING EVENTS
Triggering events define when and how the DAS records a measurement of any given
data channel. Triggering events are firmware-specific and a complete list of Triggers for
this model analyzer can be found in Appendix A-5. The most commonly used triggering
events are:
ATIMER: Sampling at regular intervals specified by an automatic timer. Most
trending information is usually stored at such regular intervals, which can be
instantaneous or averaged.
EXITZR, EXITSP, and SLPCHG (exit zero, exit span, slope change): Sampling at
the end of (irregularly occurring) calibrations or when the response slope changes.
These triggering events create instantaneous data points, e.g., for the new slope
and offset (concentration response) values at the end of a calibration. Zero and
slope values are valuable to monitor response drift and to document when the
instrument was calibrated.
WARNINGS: Some data may be useful when stored if one of several warning
messages. This is helpful for trouble-shooting by monitoring when a particular
warning occurred.
To edit the list of data parameters associated with a specific data channel, follow the
instruction shown in Section 7.4 then press:
Note A full list of DAS Trigger Events can be found in Appendix A-5 of this
manual.
06870C DCN6332

Data Acquisition system (DAS) and APICOM T400 Ozone Analyzer Operator’s Manual
164
7.4.2.1. EditiNg DAS Parameters
Data parameters are types of data that may be measured and stored by the DAS. For
each Teledyne API analyzer model, the list of available data parameters is different,
fully defined and not customizable. Appendix A-5 lists firmware specific data
parameters for the T400. DAS parameters include things like O3 concentration
measurements, temperatures of the various heaters placed around the analyzer, pressures
and flows of the pneumatic subsystem and other diagnostic measurements as well as
calibration data such as slope and offset.
Most data parameters have associated measurement units, such as mV, ppb, cm³/min,
etc., although some parameters have no units. With the exception of concentration
readings, none of these units of measure can be changed. To change the units of
measure for concentration readings See Section 6.8.6.
Note DAS does not keep track of the units (i.e. PPM or PPB) of each
concentration value and DAS data files may contain concentrations in
multiple units if the unit was changed during data acquisition.
Each data parameter has user-configurable functions that define how the data are
recorded:
Table 7-3: DAS Data Parameter Functions
FUNCTION EFFECT
PARAMETER Instrument-specific parameter name.
SAMPLE MODE
INST: Records instantaneous reading.
AVG: Records average reading during reporting interval.
MIN: Records minimum (instantaneous) reading during reporting interval.
MAX: Records maximum (instantaneous) reading during reporting interval.
SDEV: Records the standard deviation of the data points recorded during the reporting interval.
PRECISION Decimal precision of parameter value (0-4).
STORE NUM.
SAMPLES
OFF: Stores only the average (default).
ON: Stores the average and the number of samples in each average for a parameter. This
property is only useful when the AVG sample mode is used. Note that the number of samples
is the same for all parameters in one channel and needs to be specified only for one of the
parameters in that channel.
Users can specify up to 50 parameters per data channel (the T400 provides about 40
parameters). However, the number of parameters and channels is ultimately limited by
available memory.
Data channels can be edited individually from the front panel without affecting other
data channels. However, when editing a data channel, such as during adding, deleting or
editing parameters, all data for that particular channel will be lost, because the DAS can
store only data of one format (number of parameter columns etc.) for any given channel.
In addition, an DAS configuration can only be uploaded remotely as an entire set of
channels. Hence, remote update of the DAS will always delete all current channels and
stored data.
06870C DCN6332
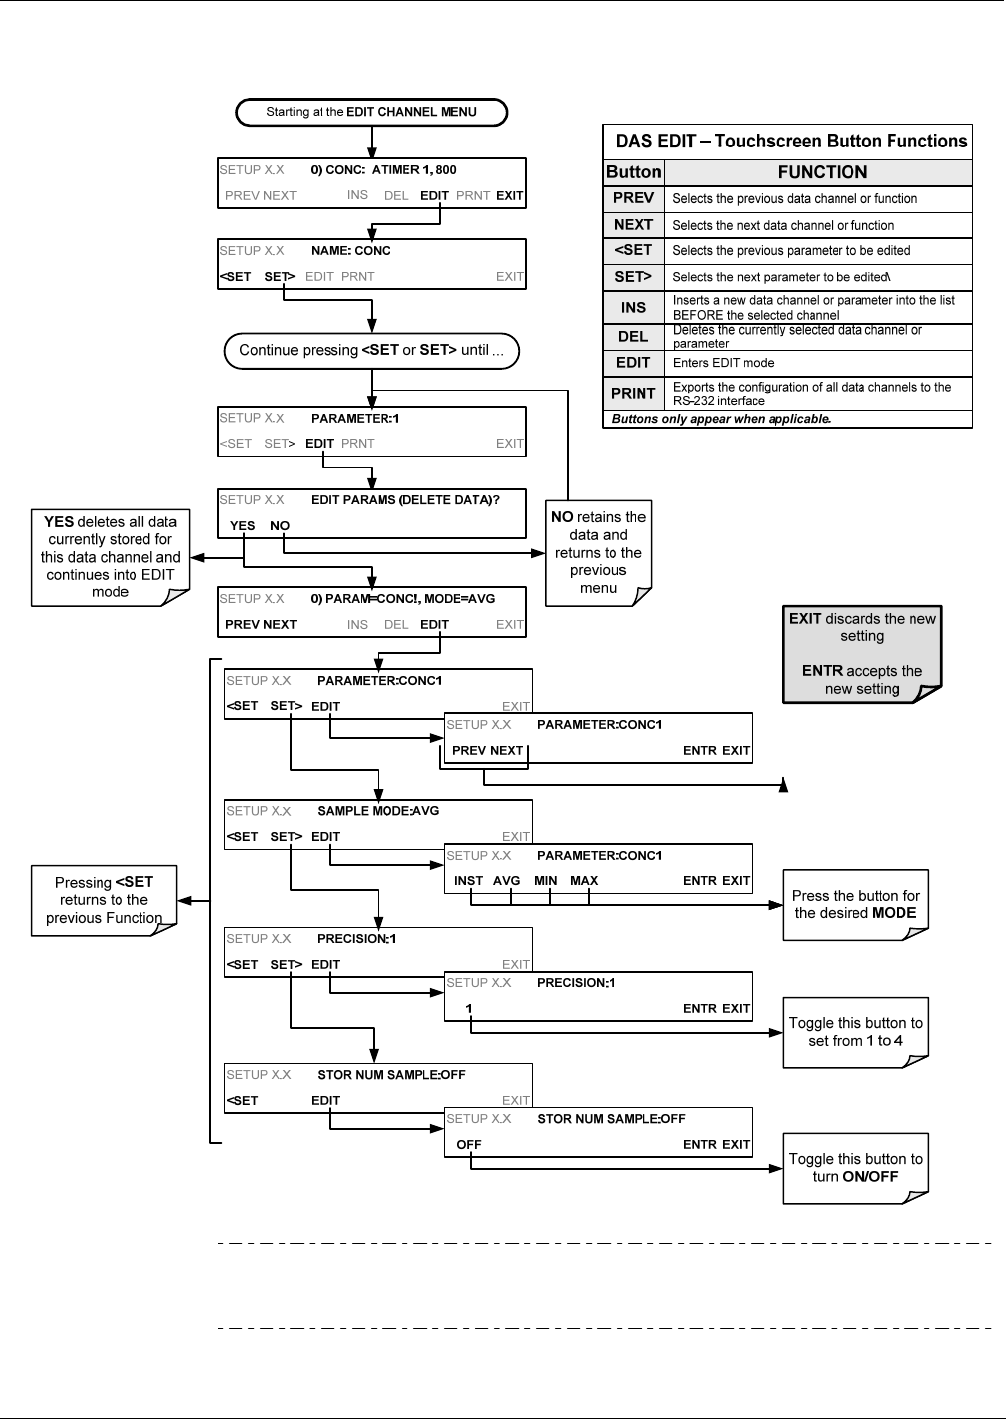
T400 Ozone Analyzer Operator’s Manual Data Acquisition system (DAS) and APICOM
165
To modify, add or delete a parameter, follow the instruction shown in Section 7.4 then
press:
Note When the STORE NUM SAMPLES feature is turned on, the instrument will
store the number of sample readings that were used to compute the AVG,
MIN or MAX value but not the readings themselves.
06870C DCN6332
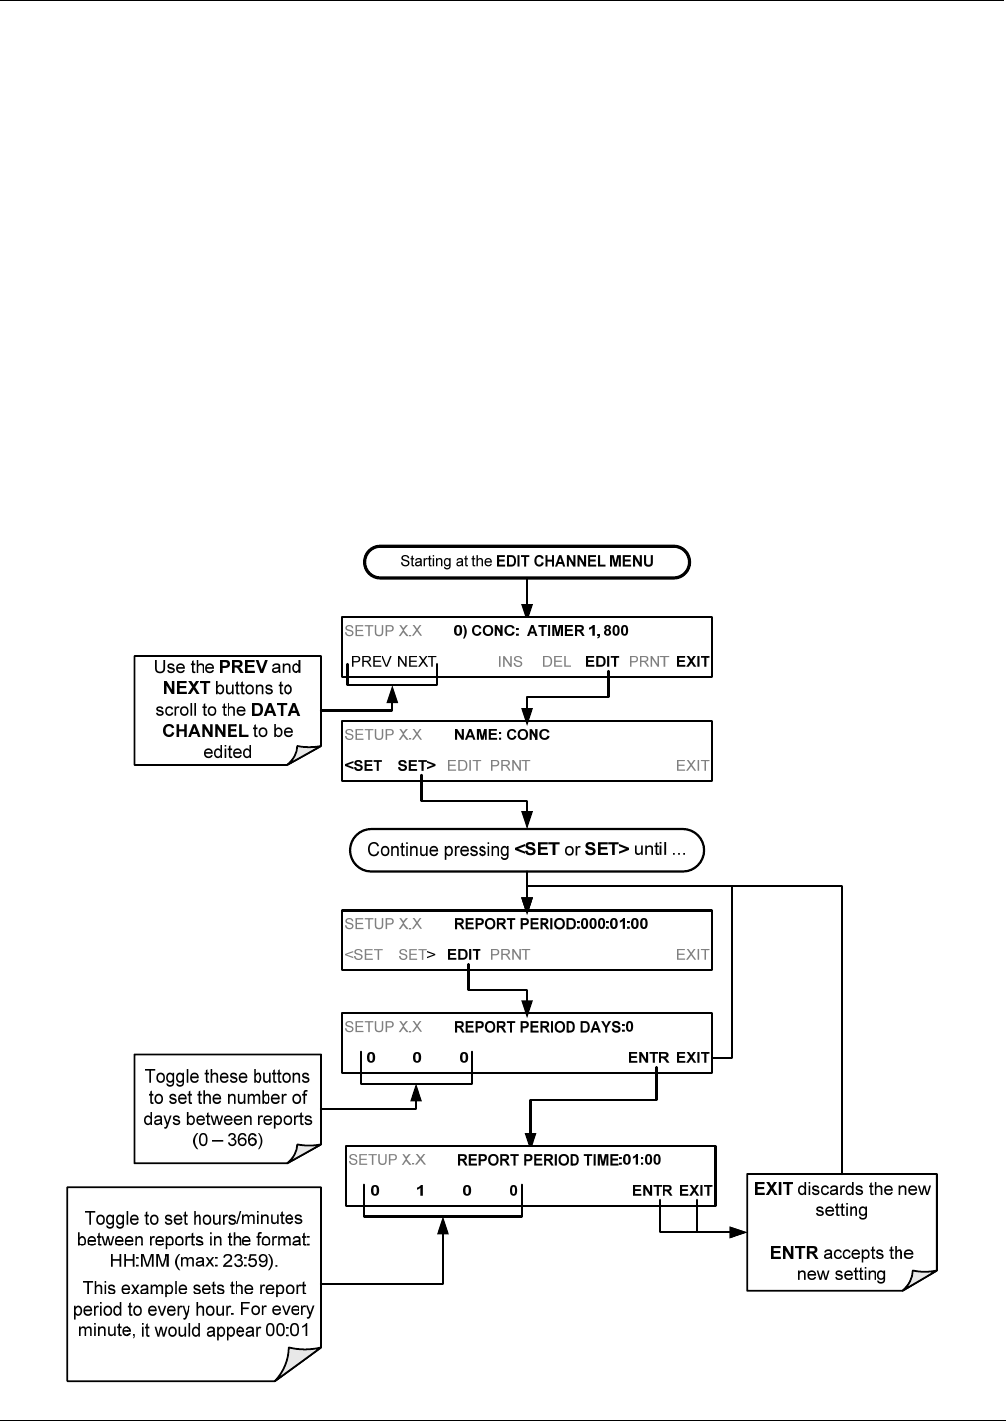
Data Acquisition system (DAS) and APICOM T400 Ozone Analyzer Operator’s Manual
166
7.4.3. EDITING SAMPLE PERIOD AND REPORT PERIOD
The DAS defines two principal time periods by which sample readings are taken and
permanently recorded:
SAMPLE PERIOD: Determines how often DAS temporarily records a sample
reading of the parameter in volatile memory. The SAMPLE PERIOD is set to one
minute by default and generally cannot be accessed from the standard DAS front
panel menu, but is available via the instruments communication ports by using
APICOM or the analyzer’s standard serial data protocol. SAMPLE PERIOD is only
used when the DAS parameter’s sample mode is set for AVG, MIN or MAX.
REPORT PERIOD: Sets how often the sample readings stored in volatile memory
are processed, (e.g. average, minimum or maximum are calculated) and the results
stored permanently in the instrument’s Disk-on-Module as well as transmitted via
the analyzer’s communication ports. The REPORT PERIOD may be set from the
front panel. If the INST sample mode is selected the instrument stores and reports
an instantaneous reading of the selected parameter at the end of the chosen report
period.
To define the REPORT PERIOD, follow the instruction shown in Section 7.4 then
press:
06870C DCN6332

T400 Ozone Analyzer Operator’s Manual Data Acquisition system (DAS) and APICOM
167
The SAMPLE PERIOD and REPORT PERIOD intervals are synchronized to the
beginning and end of the appropriate interval of the instruments internal clock.
If SAMPLE PERIOD were set for one minute the first reading would occur at the
beginning of the next full minute according to the instrument’s internal clock.
If the REPORT PERIOD were set for of one hour, the first report activity would
occur at the beginning of the next full hour according to the instrument’s internal
clock.
EXAMPLE: Given the above settings, if DAS were activated at 7:57:35 the first sample
would occur at 7:58 and the first report would be calculated at 8:00 consisting of data
points for 7:58. 7:59 and 8:00.
During the next hour (from 8:01 to 9:00), the instrument will take a sample reading
every minute and include 60 sample readings.
Note In AVG, MIN or MAX sample modes (see Section 7.4.2.1), the settings for
the SAMPLE PERIOD and the REPORT PERIOD determine the number of
data points used each time the average, minimum or maximum is
calculated, stored and reported to the COMM ports. The actual sample
readings are not stored past the end of the of the chosen REPORT
PERIOD. When the STORE NUM SAMPLES feature is turned on, the
instrument will store the number of sample readings that were used to
compute the AVG, MIN or MAX.
7.4.4. REPORT PERIODS IN PROGRESS WHEN INSTRUMENT IS
POWERED OFF
If the instrument is powered off in the middle of a REPORT PERIOD, the samples
accumulated so far during that period are lost. Once the instrument is turned back on,
the DAS restarts taking samples and temporarily them in volatile memory as part of the
REPORT PERIOD currently active at the time of restart. At the end of this REPORT
PERIOD, only the sample readings taken since the instrument was turned back on will
be included in any AVG, MIN or MAX calculation. Also, the STORE NUM
SAMPLES feature will report the number of sample readings taken since the instrument
was restarted.
7.4.5. EDITING THE NUMBER OF RECORDS
The number of data records in the DAS is limited to about a cumulative one million data
points in all channels (one megabyte of space on the disk-on-chip). However, the actual
number of records is also limited by the total number of parameters and channels and
other settings in the DAS configuration. Every additional data channel, parameter,
number of samples setting etc. will reduce the maximum amount of data points
somewhat. In general, however, the maximum data capacity is divided amongst all
channels (max: 20) and parameters (max: 50 per channel).
The DAS will check the amount of available data space and prevent the user from
specifying too many records at any given point. If, for example, the DAS memory space
can accommodate 375 more data records, the ENTR button will disappear when trying
to specify more than that number of records. This check for memory space may also
06870C DCN6332
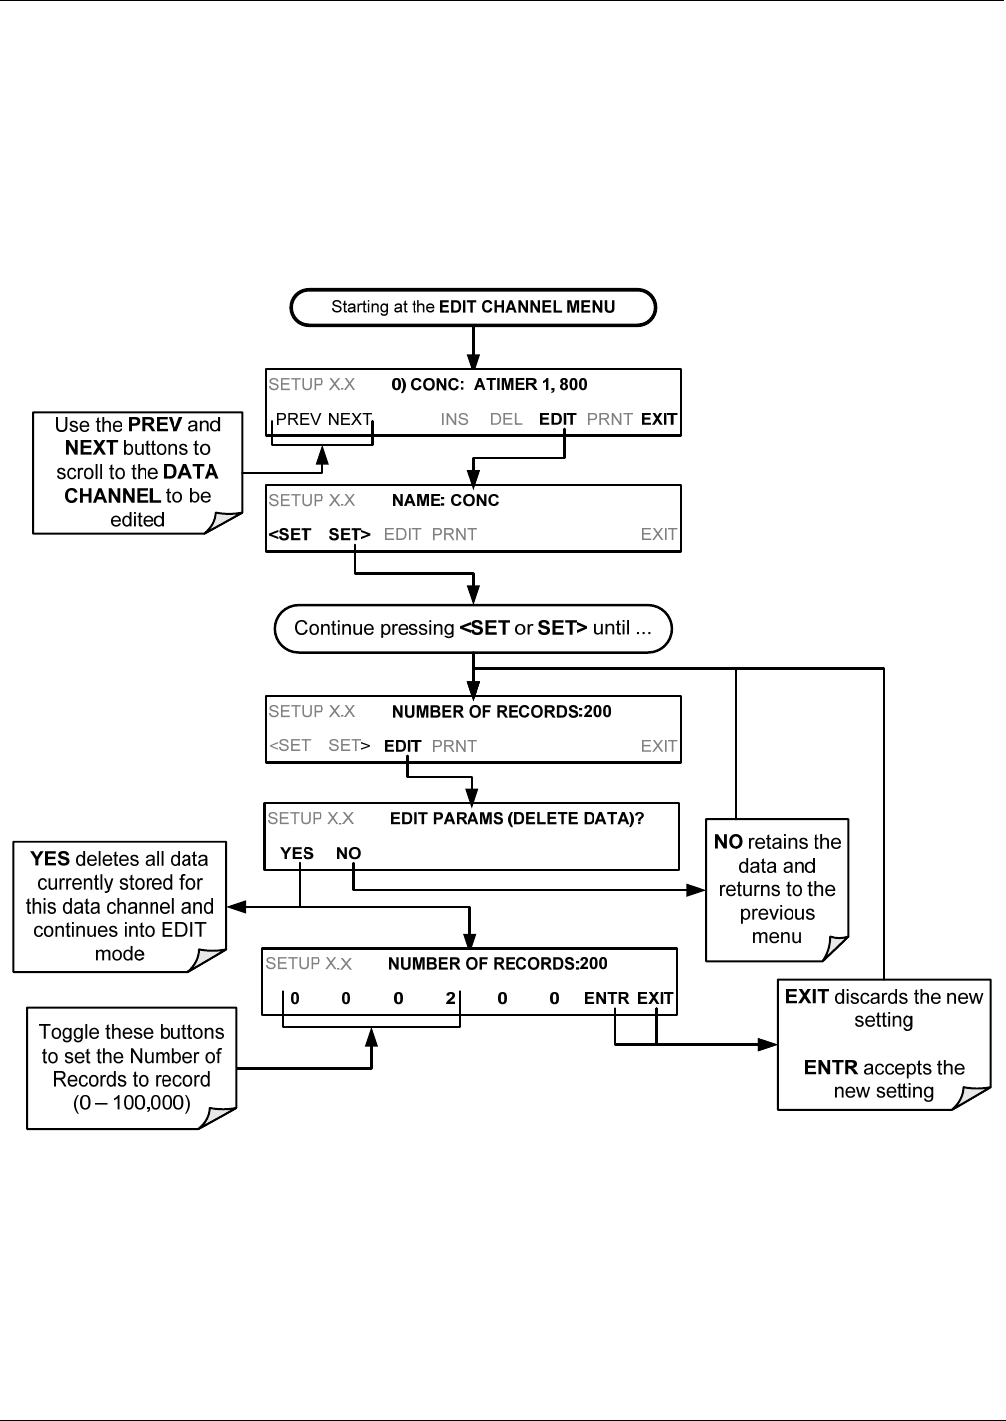
Data Acquisition system (DAS) and APICOM T400 Ozone Analyzer Operator’s Manual
168
make an upload of an DAS configuration with APICOM or a terminal program fail, if
the combined number of records would be exceeded. In this case, it is suggested to
either try to determine what the maximum number of records available is using the front
panel interface or use trial-and-error in designing the DAS script or calculate the number
of records using the DAS or APICOM manuals.
To set the NUMBER OF RECORDS, follow the instruction shown in Section 7.4 then
press:
.
06870C DCN6332
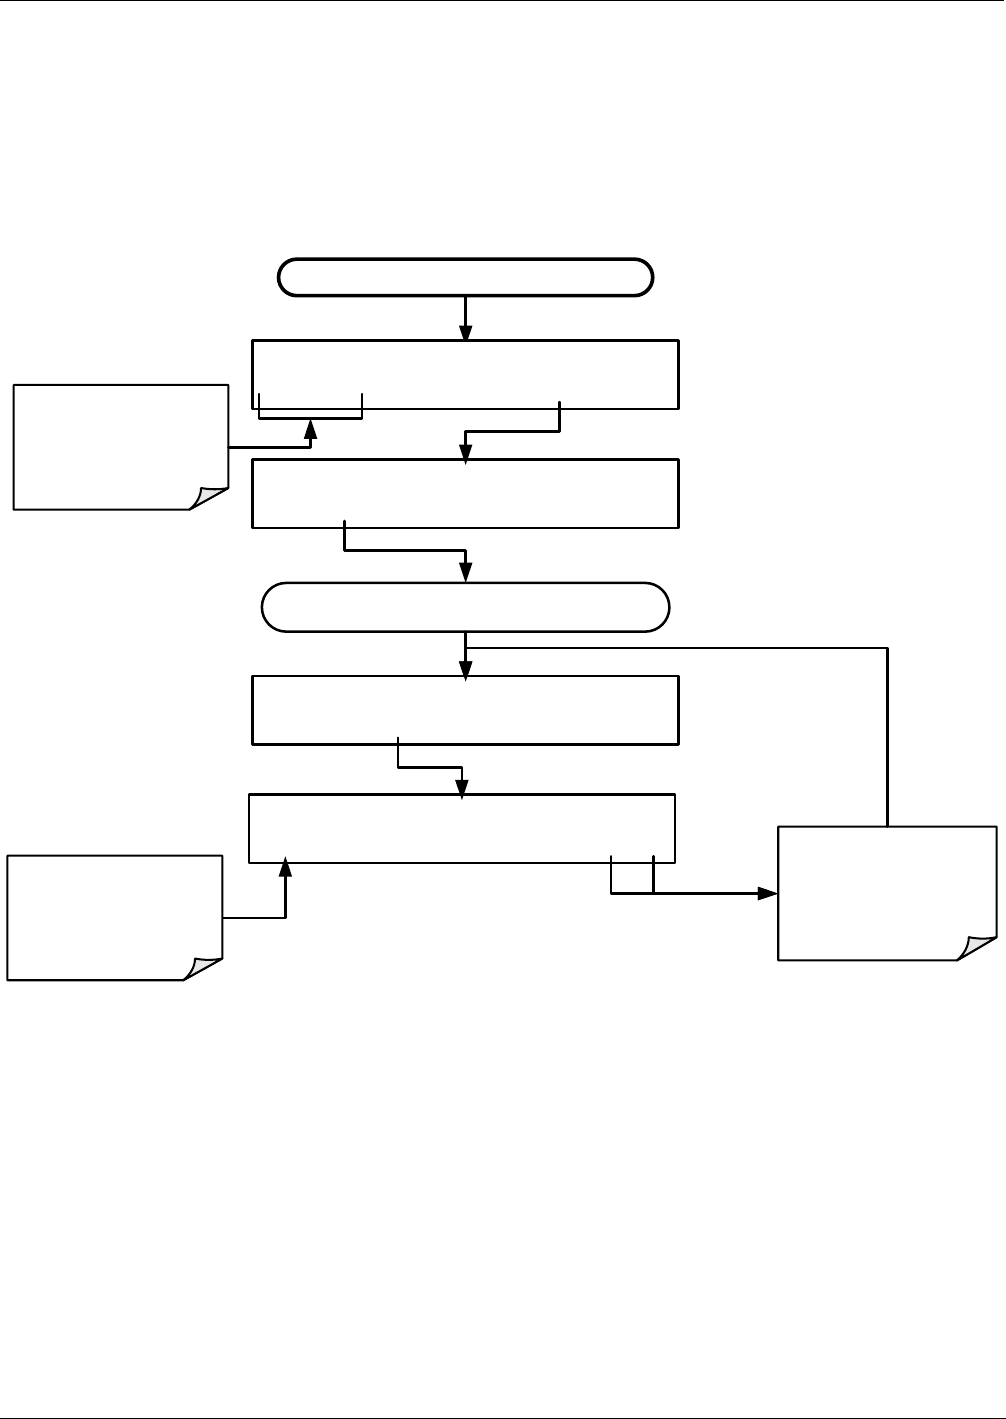
T400 Ozone Analyzer Operator’s Manual Data Acquisition system (DAS) and APICOM
169
7.4.6. RS-232 REPORT FUNCTION
The DAS can automatically report data to the communications ports, where they can be
captured with a terminal emulation program or simply viewed by the user using the
APICOM software.
To enable automatic COMM port reporting, follow the instruction shown in Section 7.4
then press:
Starting at the EDIT CHANNEL MENU
SETUP X.X 0) CONC: ATIMER 1, 800
PREV NEXT INS DEL EDIT PRNT EXIT
SETUP X.X NAME: CONC
<SET SET> EDIT PRNT EXIT
Continue pressing <SET or SET> until ...
SETUP X.X RS-232 REPORT: OFF
<SET SET>EDIT PRNT EXIT
Use the PREV and
NEXT buttons to
scroll to the DATA
CHANNEL to be
edited
SETUP X.X RS-232 REPORT: OFF
OFF ENTR EXIT EXIT discards the new
setting
ENTR accepts the
new setting
Toggle these buttons
to turn the RS-232
REPORT feature
ON/OFF
06870C DCN6332
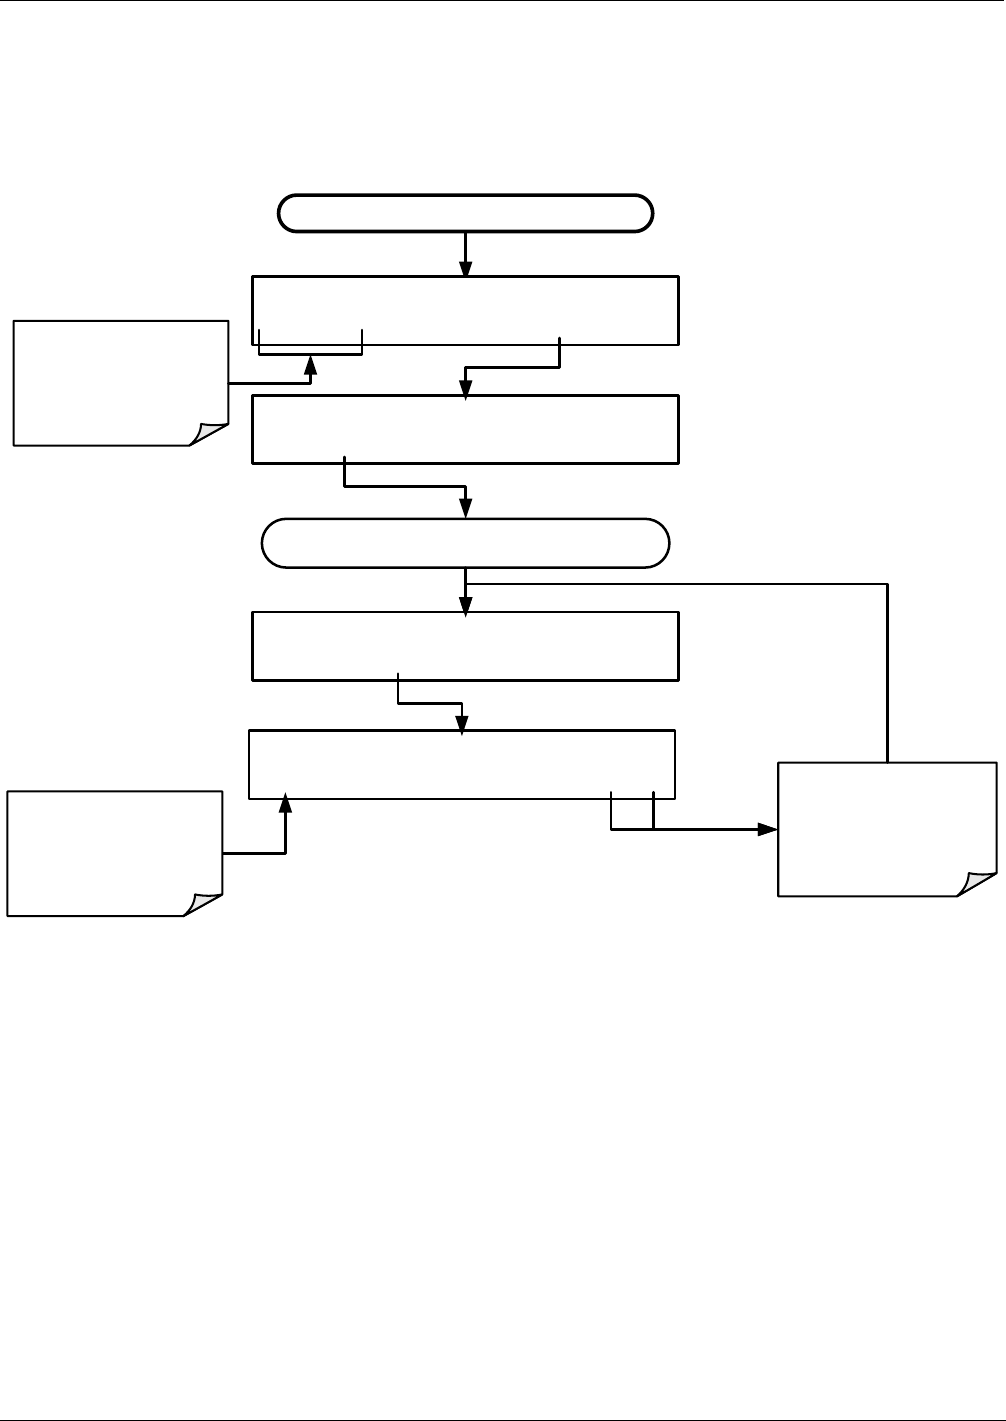
Data Acquisition system (DAS) and APICOM T400 Ozone Analyzer Operator’s Manual
170
7.4.7. ENABLING / DISABLING THE HOLDOFF FEATURE
The DAS HOLDOFF feature prevents data collection during calibration operations.
To enable or disable the HOLDOFF, follow the instruction shown in Section 7.4 then
press:
Starting at the EDIT CHANNEL MENU
SETUP X.X 0) CONC: ATIMER 1, 800
PREV NEXT INS DEL EDIT PRNT EXIT
SETUP X.X NAME: CONC
<SET SET> EDIT PRNT EXIT
Continue pressing <SET or SET> until ...
SETUP X.X CAL.HOLD OFF: OFF
<SET SET>EDIT PRNT EXIT
Use the PREV and
NEXTbuttons to scroll
to the DATA
CHANNEL to be
edited
SETUP X.X CAL.HOLD OFF: OFF
OFF ENTR EXIT EXIT discards the new
setting
ENTR accepts the
new setting
Toggle to turn the
HOLDOFF feature
ON/OFF
HOLDOFF also prevents DAS measurements from being made at certain times when
the quality of the analyzer’s O3 measurements may be suspect (e.g. while the instrument
is warming up). In this case, the length of time that the HOLDOFF feature is active is
determined by the value of the internal variable (VARS), DAS_HOLDOFF.
To set the length of the DAS_HOLDOFF period, see Section 5.8.
7.4.8. THE COMPACT REPORT FEATURE
When enabled, this option avoids unnecessary line breaks on all RS-232 reports. Instead
of reporting each parameter in one channel on a separate line, up to five parameters are
reported in one line.
The COMPACT DATA REPORT generally cannot be accessed from the standard
DASfront panel menu, but is available via the instruments communication ports by using
APICOM or the analyzer’s standard serial data protocol.
06870C DCN6332
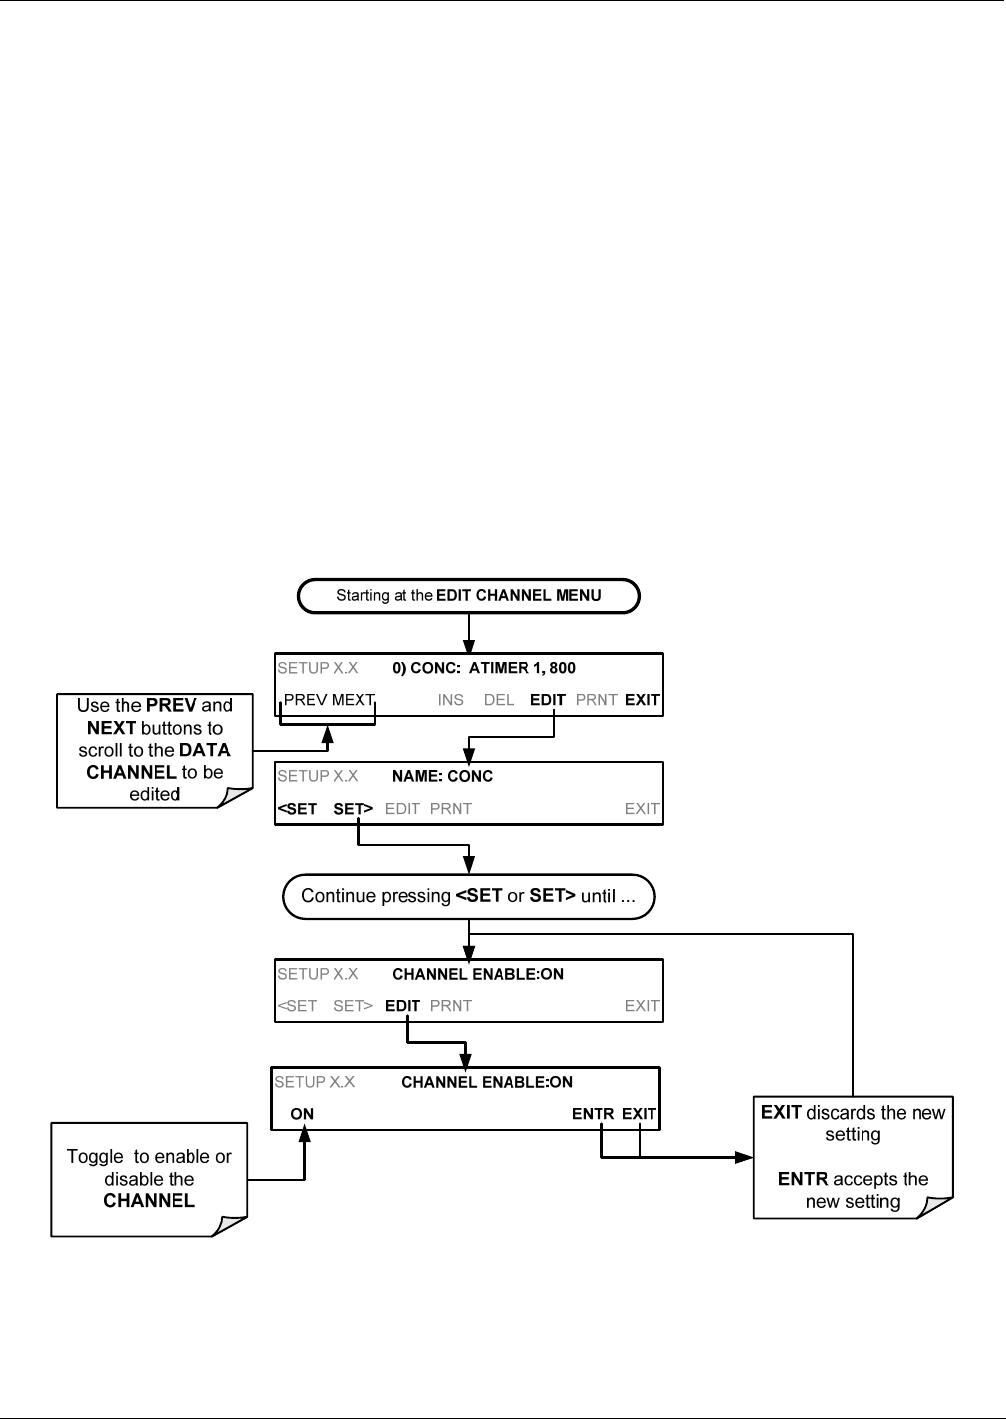
T400 Ozone Analyzer Operator’s Manual Data Acquisition system (DAS) and APICOM
171
7.4.9. THE STARTING DATE FEATURE
This option allows the user to specify a starting date for any given channel in case the
user wants to start data acquisition only after a certain time and date. If the STARTING
DATE is in the past (the default condition), the DAS ignores this setting and begins
recording data as defined by the REPORT PERIOD setting.
The STARTING DATE generally cannot be accessed from the standard DAS front
panel menu, but is available via the instruments communication ports by using APICOM
or the analyzer’s standard serial data protocol.
7.5. DISABLING/ENABLING DATA CHANNELS
Data channels can be temporarily disabled, which can reduce the read/write wear on the
disk-on-chip.
To disable a data channel, follow the instruction shown in Section 7.4 then press:
06870C DCN6332
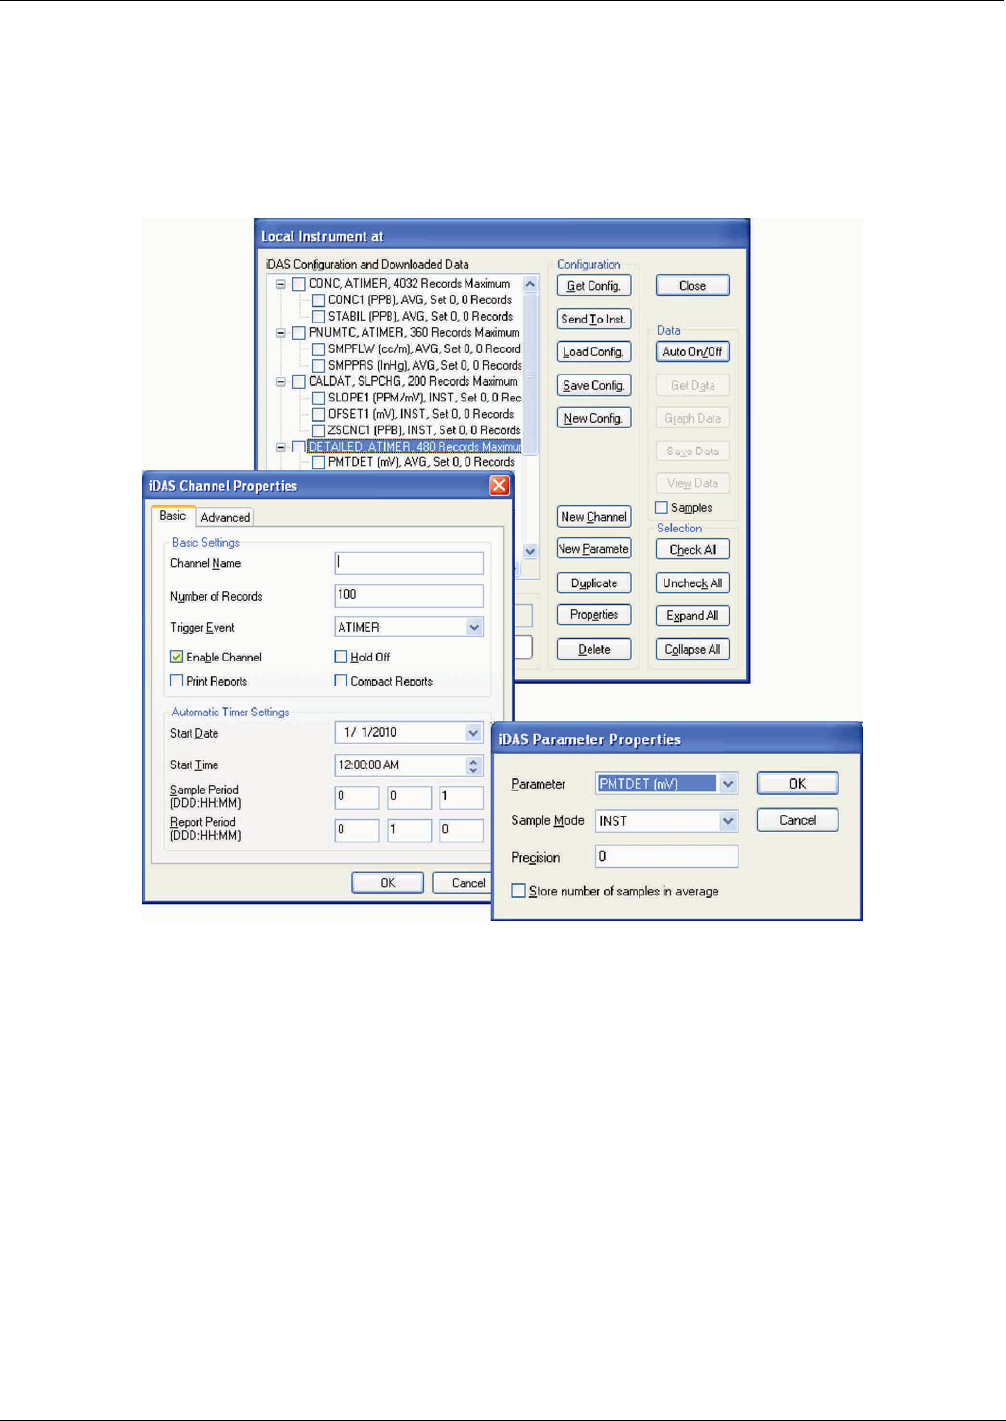
Data Acquisition system (DAS) and APICOM T400 Ozone Analyzer Operator’s Manual
172
7.6. REMOTE DAS CONFIGURATION
Editing channels, parameters and triggering events as described in this can be performed
via the APICOM remote control program using the graphic interface shown below.
Refer to Section 8 for details on remote access to the T400 analyzer.
Figure 7-2: APICOM User Interface for Configuring the DAS.
Once a DAS configuration is edited (which can be done offline and without interrupting
DAS data collection), it is conveniently uploaded to the instrument and can be stored on
a computer for later review, alteration or documentation and archival. Refer to the
APICOM manual for details on these procedures. The APICOM user manual (Teledyne
API part number 039450000) is included in the APICOM installation file, which can be
downloaded at http://www.teledyne-api.com/software/apicom/..
7.7. DAS CONFIGURATION LIMITS
The number of DAS objects are limited by the instrument’s finite storage capacity. For
information regarding the maximum number of channels, parameters, and records and
how to calculate the file size for each data channel, refer to the DAS manual
downloadable from the TAPI website at http://www.teledyne-api.com/manuals/ under
Special Manuals.
06870C DCN6332

173
8. REMOTE OPERATION
This section provides information needed when using external digital and serial I/O for
remote operation. It assumes that the electrical connections have been made as described
in Section 3.3.1.
The T400 can be remotely configured, calibrated or queried for stored data through the
rear serial ports, via either Computer mode (using a personal computer) or Interactive
mode (using a terminal emulation program).
8.1. COMPUTER MODE
Computer mode is used when the analyzer is connected to a computer with a dedicated
interface program such as APICOM.
8.1.1. REMOTE CONTROL VIA APICOM
APICOM is an easy-to-use, yet powerful interface program that allows a user to access
and control any of Teledyne API’s main line of ambient and stack-gas instruments from
a remote connection through direct cable, modem or Ethernet. Running APICOM, a user
can:
Establish a link from a remote location to the T100 through direct cable connection
via RS-232 modem or Ethernet.
View the instrument’s front panel and remotely access all functions that could be
accessed manually on the instrument.
Remotely edit system parameters and set points.
Download, view, graph and save data for predictive diagnostics or data analysis.
Retrieve, view, edit, save and upload DAS configurations (Section 7).
Check on system parameters for trouble-shooting and quality control.
APICOM is very helpful for initial setup, data analysis, maintenance and
troubleshooting. Refer to the APICOM manual available for download from
http://www.teledyne-api.com/software/apicom/.
06870C DCN6332

Remote Operation T400 Ozone Analyzer Operator’s Manual
174
8.2. INTERACTIVE MODE
Interactive mode is used with a terminal emulation program or a “dumb” computer
terminal.
8.2.1. REMOTE CONTROL VIA A TERMINAL EMULATION PROGRAM
Start a terminal emulation program such as HyperTerminal. All configuration commands
must be created following a strict syntax or be pasted in from an existing text file, which
was edited offline and then uploaded through a specifi transfer procedure. The
commands that are used to operate the analyzer in this mode are listed in Table 8-1 and
Appendix A.
8.2.1.1. Help Commands in Interactive Mode
Table 8-1: Terminal Mode Software Commands
COMMAND Function
Control-T Switches the analyzer to terminal mode (echo, edit). If
mode flags 1 & 2 are OFF, the interface can be used in
interactive mode with a terminal emulation program.
Control-C Switches the analyzer to computer mode (no echo, no
edit).
CR
(carriage return)
A carriage return is required after each command line is
typed into the terminal/computer. The command will not
be sent to the analyzer to be executed until this is done.
On personal computers, this is achieved by pressing the
ENTER button.
BS
(backspace)
Erases one character to the left of the cursor location.
ESC
(escape)
Erases the entire command line.
?[ID] CR This command prints a complete list of available
commands along with the definitions of their functionality
to the display device of the terminal or computer being
used. The ID number of the analyzer is only necessary if
multiple analyzers are on the same communications line,
such as the multi-drop setup.
Control-C Pauses the listing of commands.
Control-P Restarts the listing of commands.
06870C DCN6332

T400 Ozone Analyzer Operator’s Manual Remote Operation
175
8.2.1.2. Command Syntax
Commands are not case-sensitive and all arguments within one command (i.e. ID
numbers, buttonwords, data values, etc.) must be separated with a space character.
All Commands follow the syntax:
X [ID] COMMAND <CR>
Where
X is the command type (one letter) that defines the type of command.
Allowed designators are listed in Table 8-2 and Appendix A-6.
[ID] is the machine identification number (Section0). Example: the
Command “? 700” followed by a carriage return would print the list of
available commands for the revision of software currently installed in
the instrument assigned ID Number 700.
COMMAND is the command designator: This string is the name of the command
being issued (LIST, ABORT, NAME, EXIT, etc.). Some commands may
have additional arguments that define how the command is to be
executed. Press ? <CR> or refer to Appendix A-6 for a list of available
command designators.
<CR> is a carriage return. All commands must be terminated by a carriage
return (usually achieved by pressing the ENTER button on a computer).
Table 8-2: Teledyne API Serial I/O Command Types
COMMAND COMMAND TYPE
C Calibration
D Diagnostic
L Logon
T Test measurement
V Variable
W Warning
8.2.1.3. Data Types
Data types consist of integers, hexadecimal integers, floating-point numbers, Boolean
expressions and text strings.
Integer data are used to indicate integral quantities such as a number of records, a filter
length, etc.
They consist of an optional plus or minus sign, followed by one or more digits.
For example, +1, -12, 123 are all valid integers.
Hexadecimal integer data are used for the same purposes as integers.
They consist of the two characters “0x,” followed by one or more hexadecimal digits
(0-9, A-F, a-f), which is the ‘C’ programming language convention.
No plus or minus sign is permitted.
For example, 0x1, 0x12, 0x1234abcd are all valid hexadecimal integers.
06870C DCN6332

Remote Operation T400 Ozone Analyzer Operator’s Manual
176
Floating-point numbers are used to specify continuously variable values such as
temperature set points, time intervals, warning limits, voltages, etc.
They consist of an optional plus or minus sign, followed by zero or more digits, an
optional decimal point, and zero or more digits.
At least one digit must appear before or after the decimal point.
Scientific notation is not permitted.
For example, +1.0, 1234.5678, -0.1, 1 are all valid floating-point numbers.
Boolean expressions are used to specify the value of variables or I/O signals that may
assume only two values.
They are denoted by the keywords ON and OFF.
Text strings are used to represent data that cannot be easily represented by other data
types, such as data channel names, which may contain letters and numbers.
They consist of a quotation mark, followed by one or more printable characters,
including spaces, letters, numbers, and symbols, and a final quotation mark.
For example, “a”, “1”, “123abc”, and “()[]<>” are all valid text strings.
It is not possible to include a quotation mark character within a text string.
Some commands allow you to access variables, messages, and other items, such as DAS
data channels, by name. When using these commands,
you must type the entire name of the item
you cannot abbreviate any names
8.2.1.4. Status Reporting
Reporting of status messages as an audit trail is one of the three principal uses for the
RS-232 interface (the other two being the command line interface for controlling the
instrument and the download of data in electronic format). You can effectively disable
the reporting feature by setting the interface to quiet mode (Section 6.2.1, Table 6-1).
Status reports include warning messages, calibration and diagnostic status messages.
Refer to Appendix A-3 for a list of the possible messages, and this for information on
controlling the instrument through the RS-232 interface.
GENERAL MESSAGE FORMAT
All messages from the instrument (including those in response to a command line
request) are in the format:
X DDD:HH:MM [Id] MESSAGE<CRLF>
Where:
X is a command type designator, a single character indicating the
message type, as shown in the Table 8-2.
DDD:HH:MM is the time stamp, the date and time when the message was issued. It
consists of the Day-of-year (DDD) as a number from 1 to 366, the hour
of the day (HH) as a number from 00 to 23, and the minute (MM) as a
number from 00 to 59.
[ID] is the analyzer ID, a number with 1 to 4 digits.
06870C DCN6332

T400 Ozone Analyzer Operator’s Manual Remote Operation
177
MESSAGE is the message content that may contain warning messages, test
measurements, variable values, etc.
<CRLF> is a carriage return / line feed pair, which terminates the message.
The uniform nature of the output messages makes it easy for a host computer to parse
them into an easy structure. Keep in mind that the front panel display does not give any
information on the time a message was issued, hence it is useful to log such messages
for trouble-shooting and reference purposes. Terminal emulation programs such as
HyperTerminal can capture these messages to text files for later review.
8.3. REMOTE ACCESS BY MODEM
The T400 can be connected to a modem for remote access. This requires a cable
between the analyzer’s COM port and the modem, typically a DB-9F to DB-25M cable
(available from Teledyne API with part number WR0000024).
Once the cable has been connected, check to make sure:
DTE-DCE switch is in the DCE position.
T400 COM port is set for a baud rate that is compatible with the modem
modem is designed to operate with an 8-bit word length with one stop bit.
the MODEM ENABLE communication mode is turned ON (Mode 64, see Section
6.2.1).
Once this is completed, the appropriate setup command line for your modem can be
entered into the analyzer. The default setting for this feature is
AT Y0 &D0 &H0 &I0 S0=2 &B0 &N6 &M0 E0 Q1 &W0
This string can be altered to match your modem’s initialization and can be up to 100
characters long.
06870C DCN6332
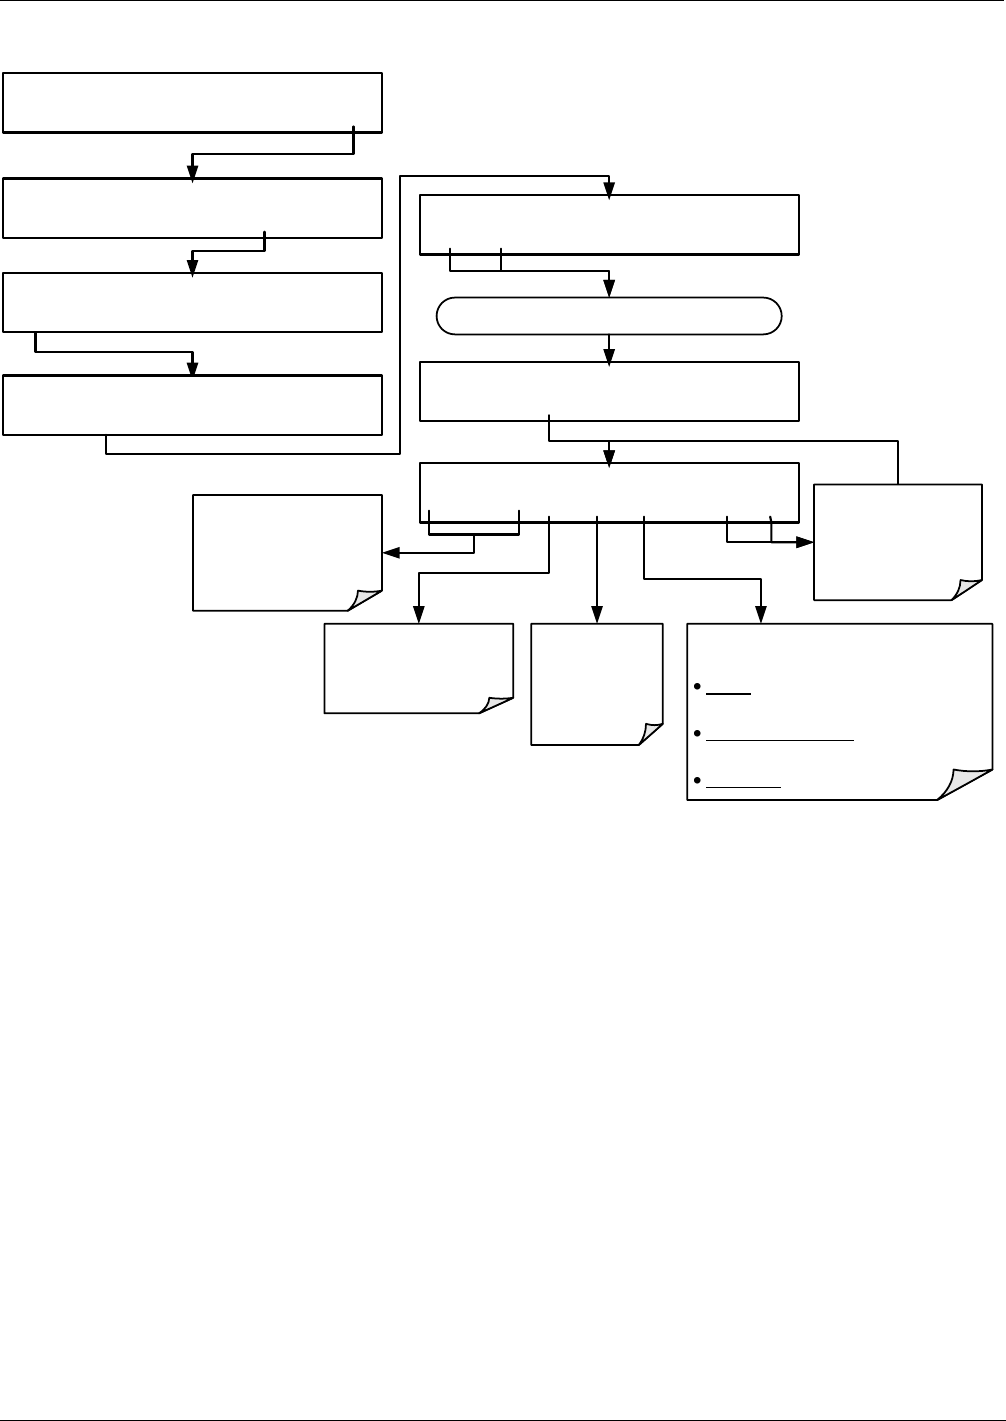
Remote Operation T400 Ozone Analyzer Operator’s Manual
178
To change this setting press:
SETUP X.X COMMUNICATIONS MENU
ID INET COM1 COM2 EXIT
SETUP X.X COM1 MODE:0
<SET SET> EDIT EXIT
SETUP X.X COM1 PORT INIT:AT Y0 &DO &H &I0
<SET SET> EDIT EXIT
Continue pressing <SET or SET> until ...
SETUP X.X COM1 PORT INIT:AT Y0 &DO &H &I0
<CH CH> INS DEL [A] ENTR EXIT EXIT discards the
new setting
ENTR accepts the
new setting
<CH and CH> move
the cursor left and
right along the text
string
The INS and CH>
buttons insert a new
character before the
cursor position
DEL deletes
character at
the cursor
position
Toggle to cycle through the available
character set:
Alpha: A-Z (Upper and Lower
Case);
Special Characters: space ’ ~ ! # $
% ^ & * ( ) - _ = +[ ] { } < > | ; : , . / ?
Numerals: 0-9
SETUP X.X PRIMARY SETUP MENU
CFG DAS RNGE PASS CLK MORE EXIT
SAMPLE RANGE=500.0 PPB O3= XXXX
<TST TST> CAL SETUP
SETUP X.X SECONDARY SETUP MENU
COMM VARS DIAG EXIT
06870C DCN6332
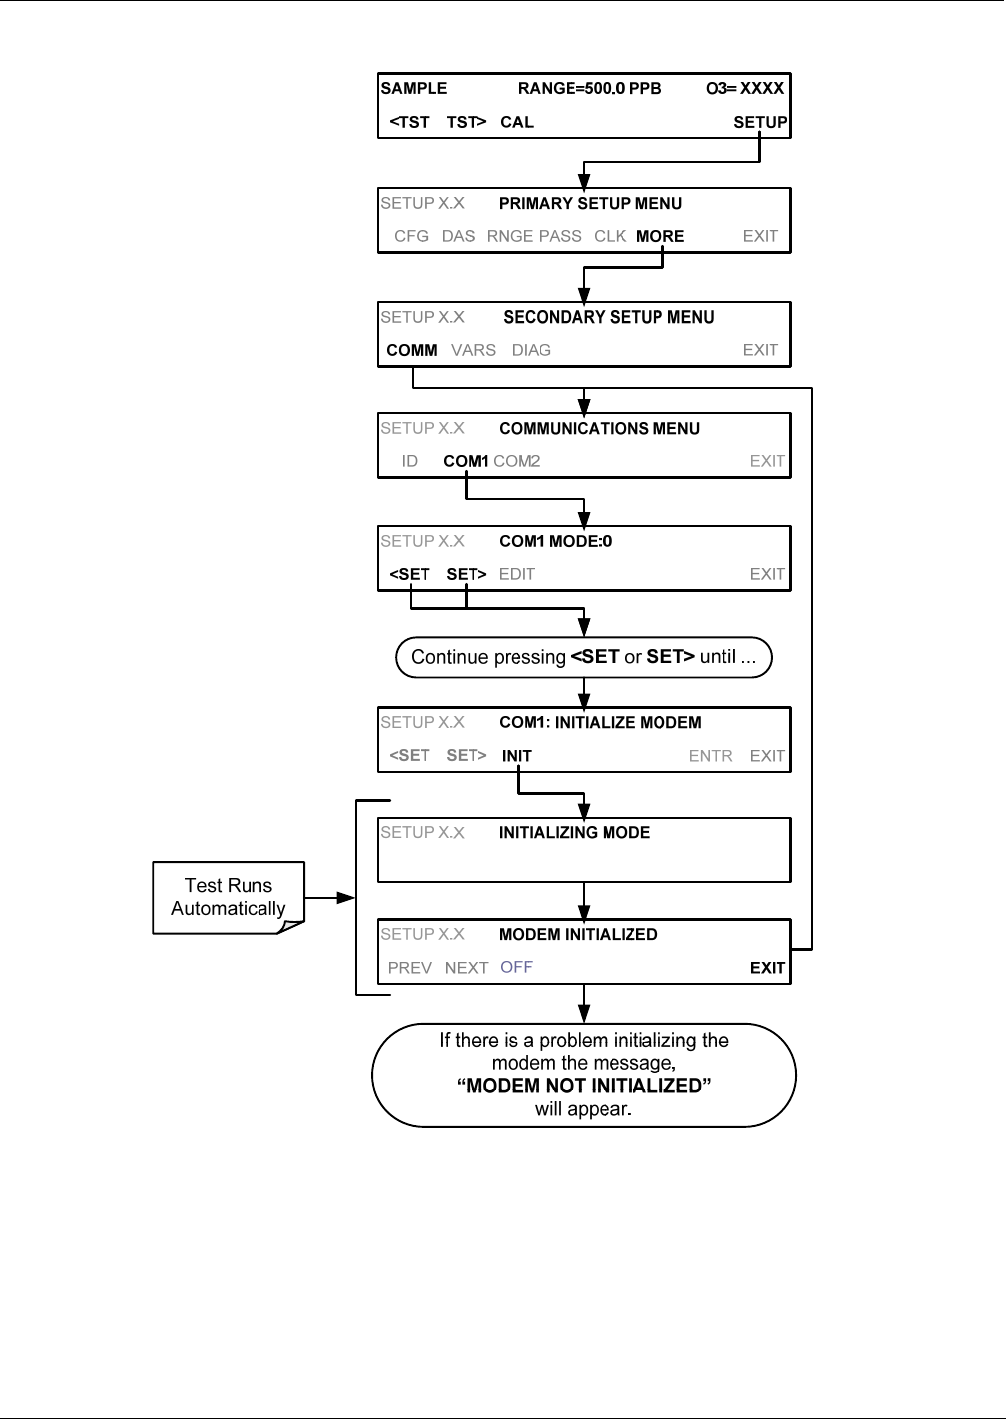
T400 Ozone Analyzer Operator’s Manual Remote Operation
179
To initialize the modem press:
06870C DCN6332

Remote Operation T400 Ozone Analyzer Operator’s Manual
180
8.4. PASSWORD SECURITY FOR SERIAL REMOTE
COMMUNICATIONS
In order to provide security for remote access of the T400, a LOGON feature can be
enabled to require a password before the instrument will accept commands. This is done
by turning on the SECURITY MODE (Mode 4, Section 6.2.1). Once the SECURITY
MODE is enabled, the following items apply.
A password is required before the port will respond or pass on commands.
If the port is inactive for one hour, it will automatically logoff, which can also be
achieved with the LOGOFF command.
Three unsuccessful attempts to log on with an incorrect password will cause
subsequent logins to be disabled for 1 hour, even if the correct password is used.
If not logged on, the only active command is the '?' request for the help screen.
The following messages will be returned at logon:
LOGON SUCCESSFUL - Correct password given
LOGON FAILED - Password not given or incorrect
LOGOFF SUCCESSFUL - Connection terminated successfully
To log on to the T400 analyzer with SECURITY MODE feature enabled, type:
LOGON 940331
940331 is the default password. To change the default password, use the variable
RS232_PASS issued as follows:
V RS232_PASS=NNNNNN
Where N is any numeral between 0 and 9.
8.5. APICOM REMOTE CONTROL PROGRAM
APICOM is an easy-to-use, yet powerful interface program that allows the user to access
and control any of Teledyne API’ main line of ambient and stack-gas instruments from a
remote connection through direct cable, modem or Ethernet. Running APICOM, a user
can:
Establish a link from a remote location to the T400 through direct cable connection
via RS-232 modem or Ethernet.
View the instrument’s front panel and remotely access all functions that could be
accessed when standing in front of the instrument.
Remotely edit system parameters and set points.
Download, view, graph and save data for predictive diagnostics or data analysis.
Check on system parameters for trouble-shooting and quality control.
APICOM is very helpful for initial setup, data analysis, maintenance and trouble-
shooting. Figure 8-1 shows examples of APICOM’s main interface, which emulates the
look and functionality of the instruments actual front panel
06870C DCN6332
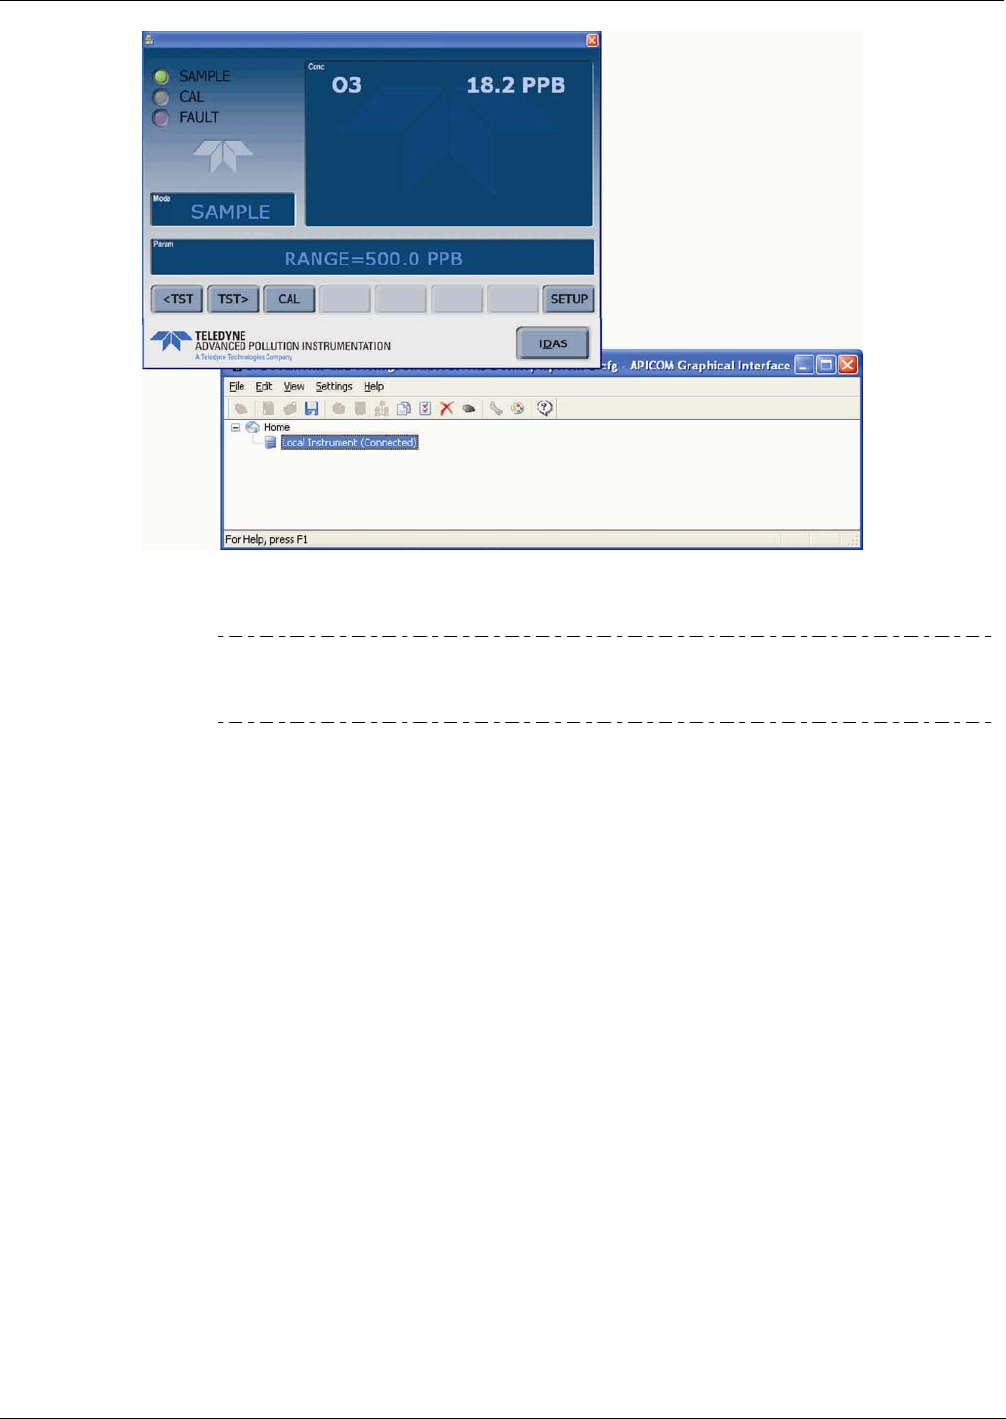
T400 Ozone Analyzer Operator’s Manual Remote Operation
181
Figure 8-1: APICOM Remote Control Program Interface
Note APICOM is included at no additional cost with the analyzer, and the latest
versions can also be downloaded also at no additional cost at
http://www.teledyne-api.com/software/apicom/.
.
06870C DCN6332

Remote Operation T400 Ozone Analyzer Operator’s Manual
182
This page intentionally left blank.
06870C DCN6332

183
9. T400 CALIBRATION PROCEDURES
This section contains a variety of information regarding the various methods for
calibrating a Model T400 Ozone Analyzer as well as other supporting information. For
information on EPA protocol calibration, please refer to Chaoter 10. This section is
organized as follows:
SECTION 9.1 – BEFORE CALIBRATION
This section contains general information you should know before about calibrating the
analyzer.
SECTION 9.2 – BASIC MANUAL CALIBRATION CHECKS AND CALIBRATION OF
THE T400 ANALYZER
This section describes the procedure for checking the calibrating and calibrating the
instrument with no zero/span valves installed or if installed, not operating. It requires
that zero air and span gas is inlet through the SAMPLE port.
Also included are instructions for selecting the reporting range to be calibrated when the
T400 analyzer is set to operate in either the DUAL range or AUTO range modes.
SECTION 9.3 – MANUAL CALIBRATION CHECK AND CALIBRATION WITH VALVE
OPTIONS INSTALLED
This section describes:
The procedure for checking the calibration of the instrument with zero/span
valves or the IZS option installed and operating but controlled manually through
the touchscreen on the Front Panel of the instrument.
The procedure for calibrating of the instrument with zero/span valves and
operating but controlled manually through the touchscreen on the front panel of
the instrument.
Instructions on activating the zero/span valves via the control in contact
closures of the analyzers external digital I/O.
SECTION 9.4 – AUTOMATIC ZERO/SPAN Cal/Check (AutoCal)
This section describes the procedure for using the AutoCal feature of the analyzer to
check or calibrate the instrument. The AutoCal feature requires that either the zero/span
valve option or the internal zero/span (IZS) option be installed and operating.
SECTION 9.5 – O3 PHOTOMETER Electronic Calibration
This section describes how to calibrate inherent electronic offsets that may be affecting
the performance of the T400 analyzer’s internal photometer.
SECTION 9.6 – CALIBRATING THE IZS Option O3 Generator
This section describes how to check the performance of the O3 generator that is included
in the IZS option (OPT – 50G; see Section 3.6.2) available for the T400 analyzer.
06870C DCN6332

T400 Calibration Procedures T400 Ozone Analyzer Operator’s Manual
184
Note Throughout this Section are various diagrams showing pneumatic
connections between the T400 and various other pieces of equipment
such as calibrators and zero air sources. These diagrams are only
intended to be schematic representations of these connections and do
not reflect actual physical locations of equipment and fitting location or
orientation. Contact your regional EPA or other appropriate governing
agency for more detailed recommendations.
9.1. BEFORE CALIBRATION
Note If any problems occur while performing the following calibration
procedures, refer to Section 12 of this manual for troubleshooting tips.
9.1.1. REQUIRED EQUIPMENT, SUPPLIES, AND EXPENDABLES
Calibration of the Model T400 O3 Analyzer requires certain amount of equipment and
supplies. These include, but are not limited to, the following:
Zero-air source
Ozone span gas source
Gas lines - All gas lines should be PTFE (Teflon) or FEP
A recording device such as a strip-chart recorder and/or data logger (optional)
9.1.2. ZERO AIR AND SPAN GAS
To perform the following calibration you must have sources for zero air and span gas
available.
ZERO AIR is similar in chemical composition to the Earth’s atmosphere but scrubbed of
all components that might affect the analyzers readings. For O3 measuring devices, zero
air should be:
Devoid of O3 and Mercury Vapor, and;
Have a dew point of -20C.
Devices that condition ambient air by drying and removing any pollutants, such as the
Teledyne API’ Model 701 Zero Air Module, are ideal for producing Zero Air.
SPan Gas is a gas specifically mixed to match the chemical composition of the type of
gas being measured at near full scale of the desired measurement range. It is
recommended that the span gas used have a concentration equal to 80% of the full
measurement range.
EXAMPLE: If the application is to measure between 0 ppm and 500 ppb, an
appropriate span gas would be 400 ppb.
06870C DCN6332
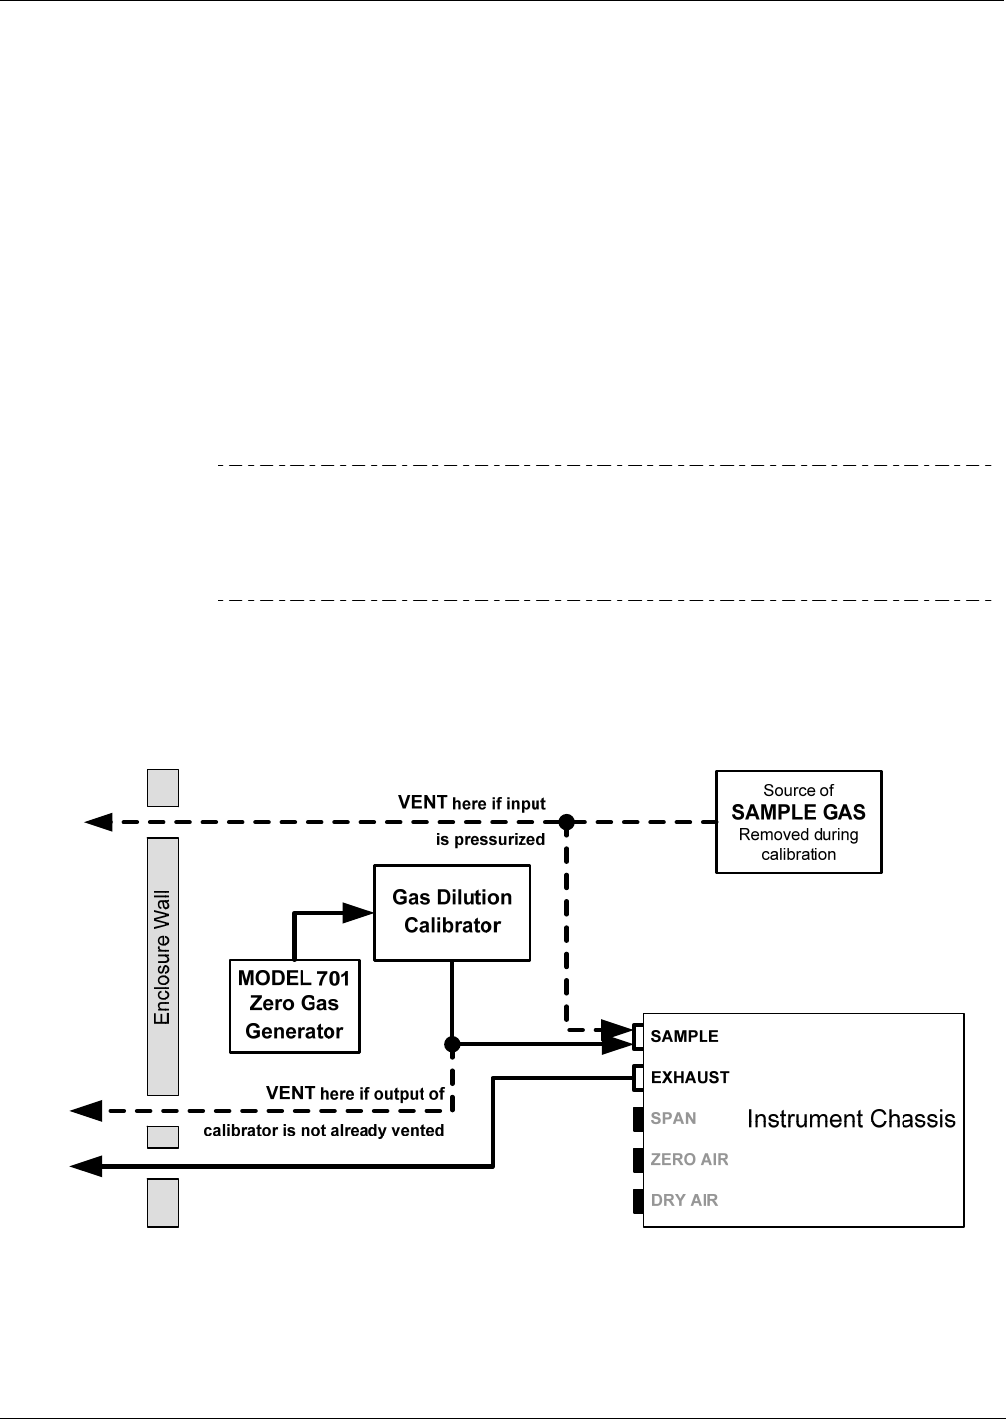
T400 Ozone Analyzer Operator’s Manual T400 Calibration Procedures
185
EXAMPLE: If the application is to measure between 0 ppb and 1000 ppb, an
appropriate Span Gas would be 800 ppb.
Because of the instability of O3, it is impractical, if not impossible, to produce stable
concentrations of bottled, pressurized O3. Therefore, when varying concentrations of O3
is required for span calibrations they must be generated locally. We Recommend using
a gas dilution calibrator with a built in O3 generator, such as a Teledyne API Model
700E, as a source for O3 span gas.
All equipment used to produce calibration gasses should be verified against EPA / NIST
traceable standards (see Section 10.1.4).
9.2. BASIC MANUAL CALIBRATION CHECKS AND CALIBRATION
OF THE T400 ANALYZER
Note ZERO/SPAN CALIBRATION CHECKS VS. ZERO/SPAN CALIBRATION
Pressing the ENTR button during the following procedure resets the
stored values for OFFSET and SLOPE and alters the instrument’s
Calibration. For ZERO /Span Calibration see Section 9.2.3.
9.2.1. SETUP FOR BASIC CALIBRATION CHECKS AND CALIBRATION OF
THE T400 ANALYZER.
Connect the Sources of Zero Air and Span Gas as shown below.
Figure 9-1: Pneumatic connections for Manual Calibration Checks without Z/S Valve
or IZS Options
06870C DCN6332
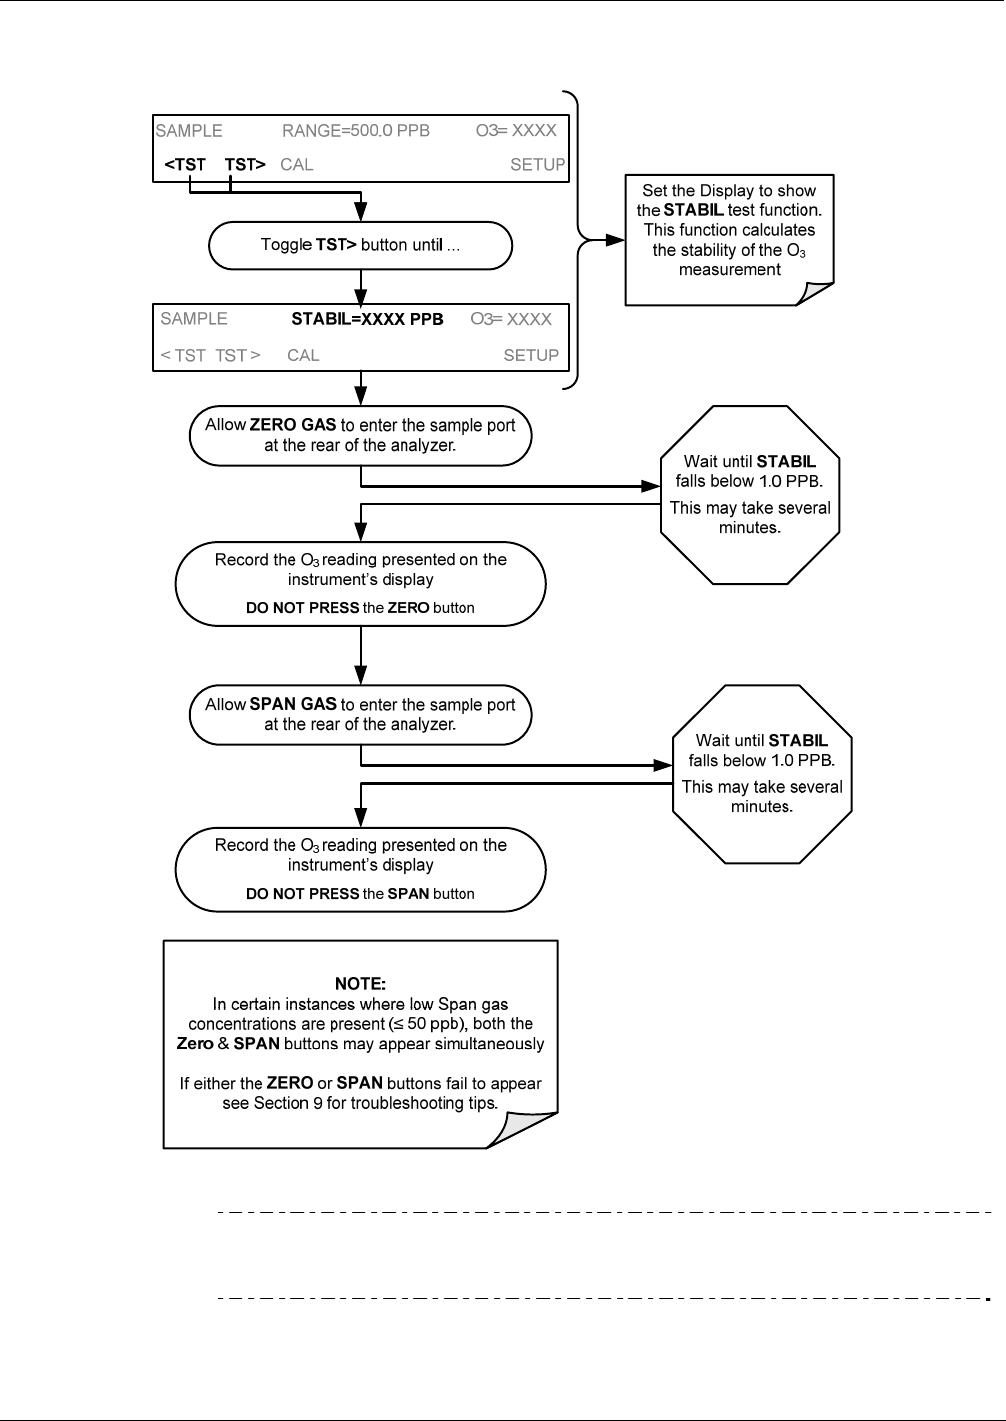
T400 Calibration Procedures T400 Ozone Analyzer Operator’s Manual
186
9.2.2. PERFORMING A BASIC MANUAL CALIBRATION CHECK
Note If the ZERO or SPAN buttons are not displayed, the measurement made
during is out of the allowable range allowed for a reliable calibration. See
Section 12 for troubleshooting tips.
06870C DCN6332
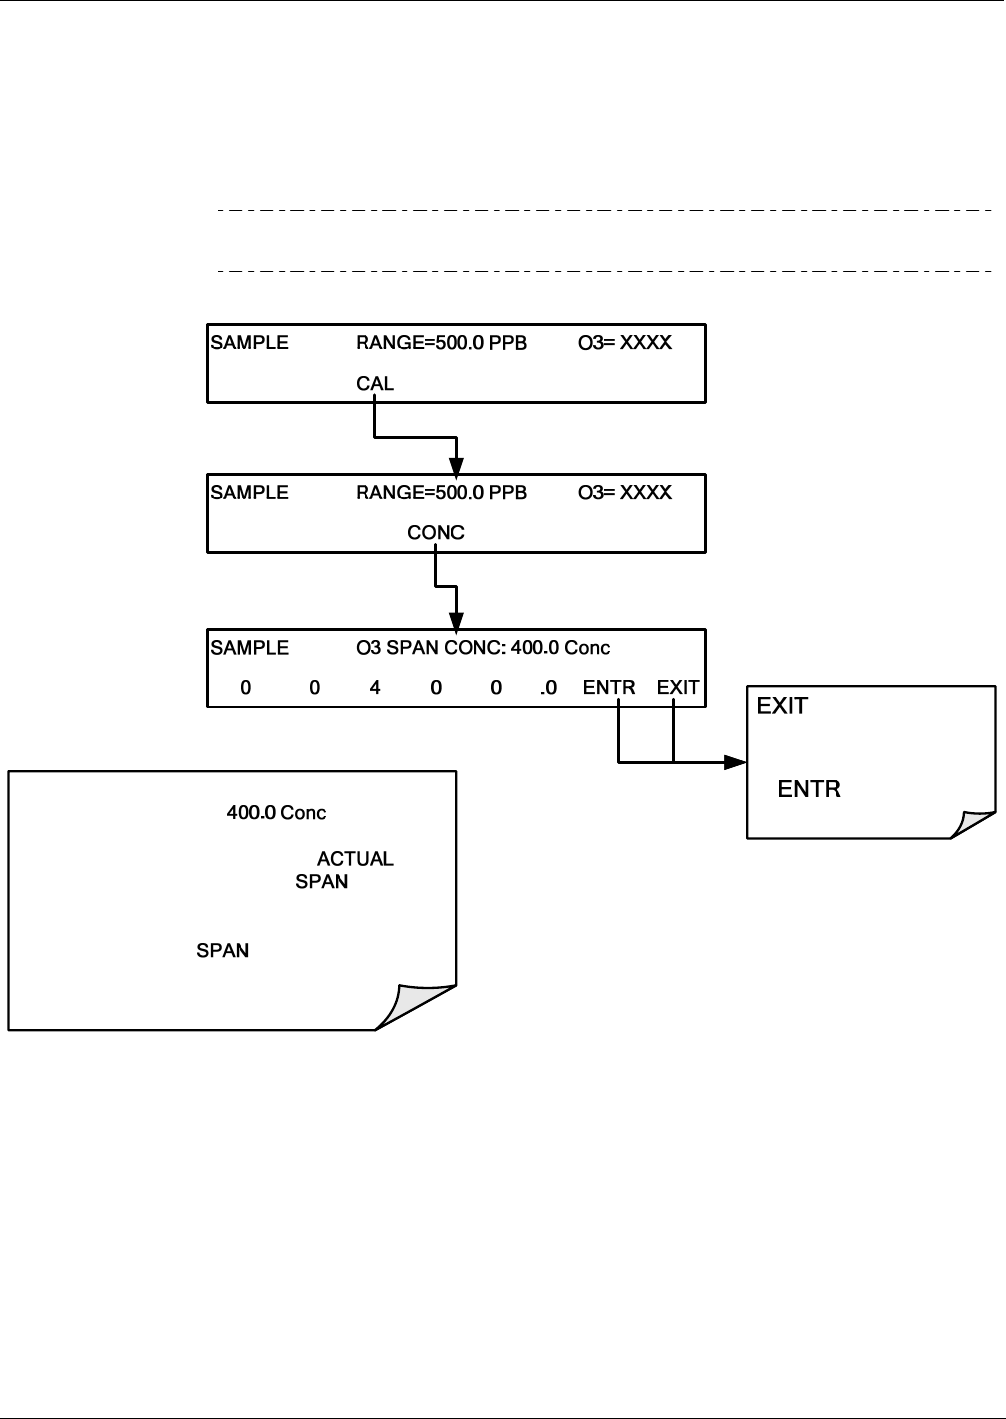
T400 Ozone Analyzer Operator’s Manual T400 Calibration Procedures
187
9.2.3. PERFORMING A BASIC MANUAL CALIBRATION
9.2.3.1. Setting the Expected O3 Span Gas Concentration
Note It is important to verify the precise O3 Concentration Value of the SPAN
gas independently.
<TST TST> SETUP
<TST TST> ZERO SETUP
The O3 span concentration value automatically
defaults to .
Make sure that you input the
concentration value of the Gas.
To change this value to meet the actual
concentration of the gas, enter the number
sequence by pressing the button under each digit
until the expected value is set.
discards the new
setting
accepts the
new setting
06870C DCN6332
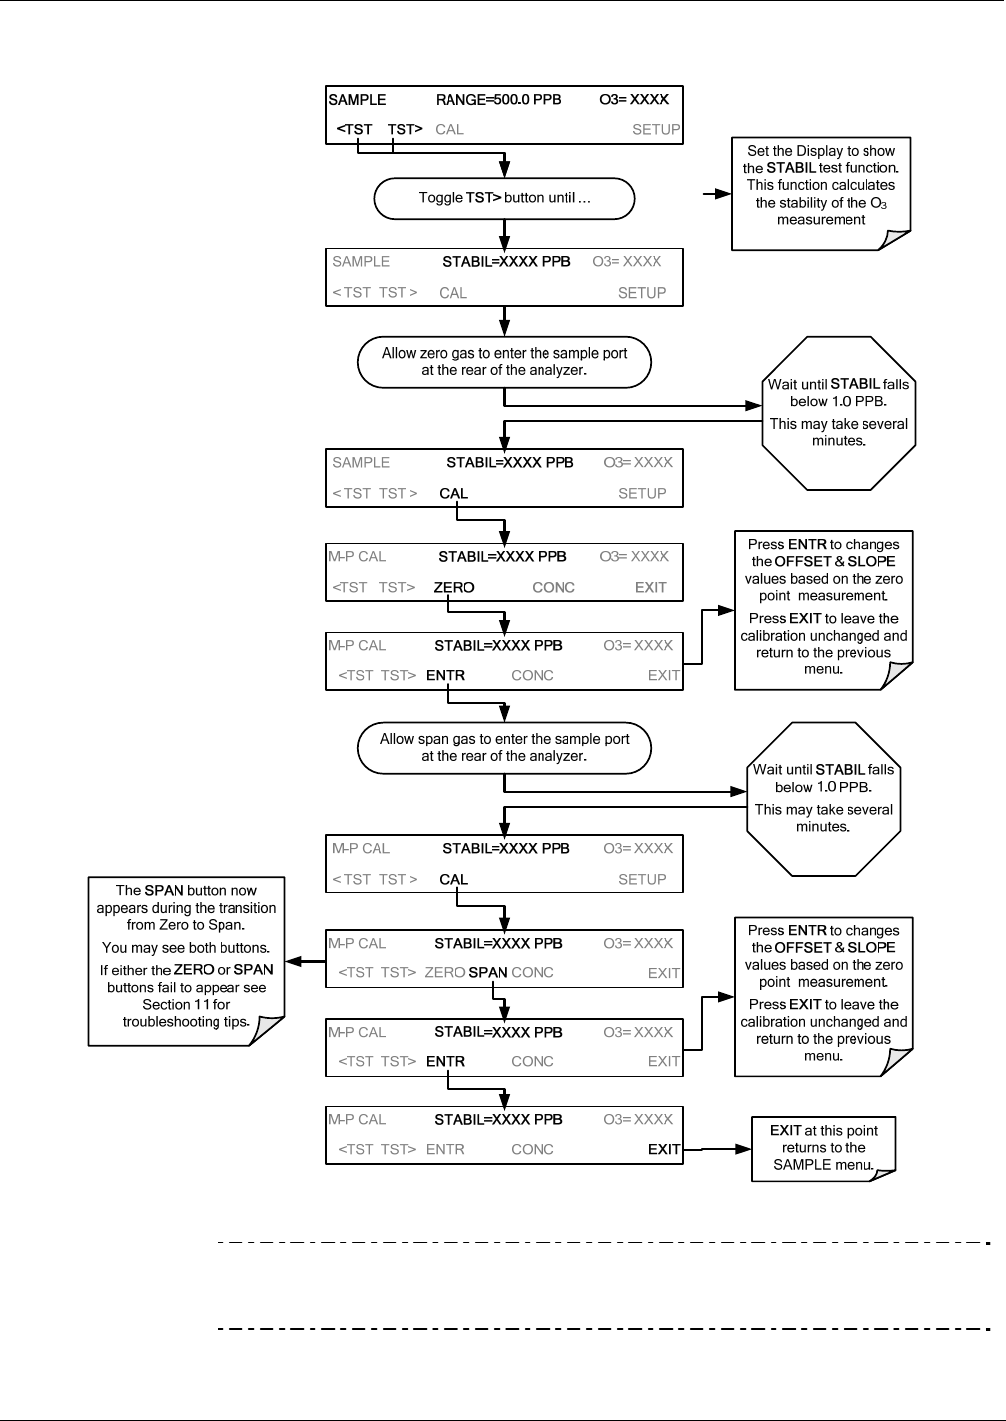
T400 Calibration Procedures T400 Ozone Analyzer Operator’s Manual
188
9.2.3.2. Zero/Span Point Calibration Procedure
Note If the ZERO or SPAN buttons are not displayed, the measurement made
during the procedure is out of the allowable range allowed for a reliable
calibration. See Section 12 for troubleshooting tips.
06870C DCN6332
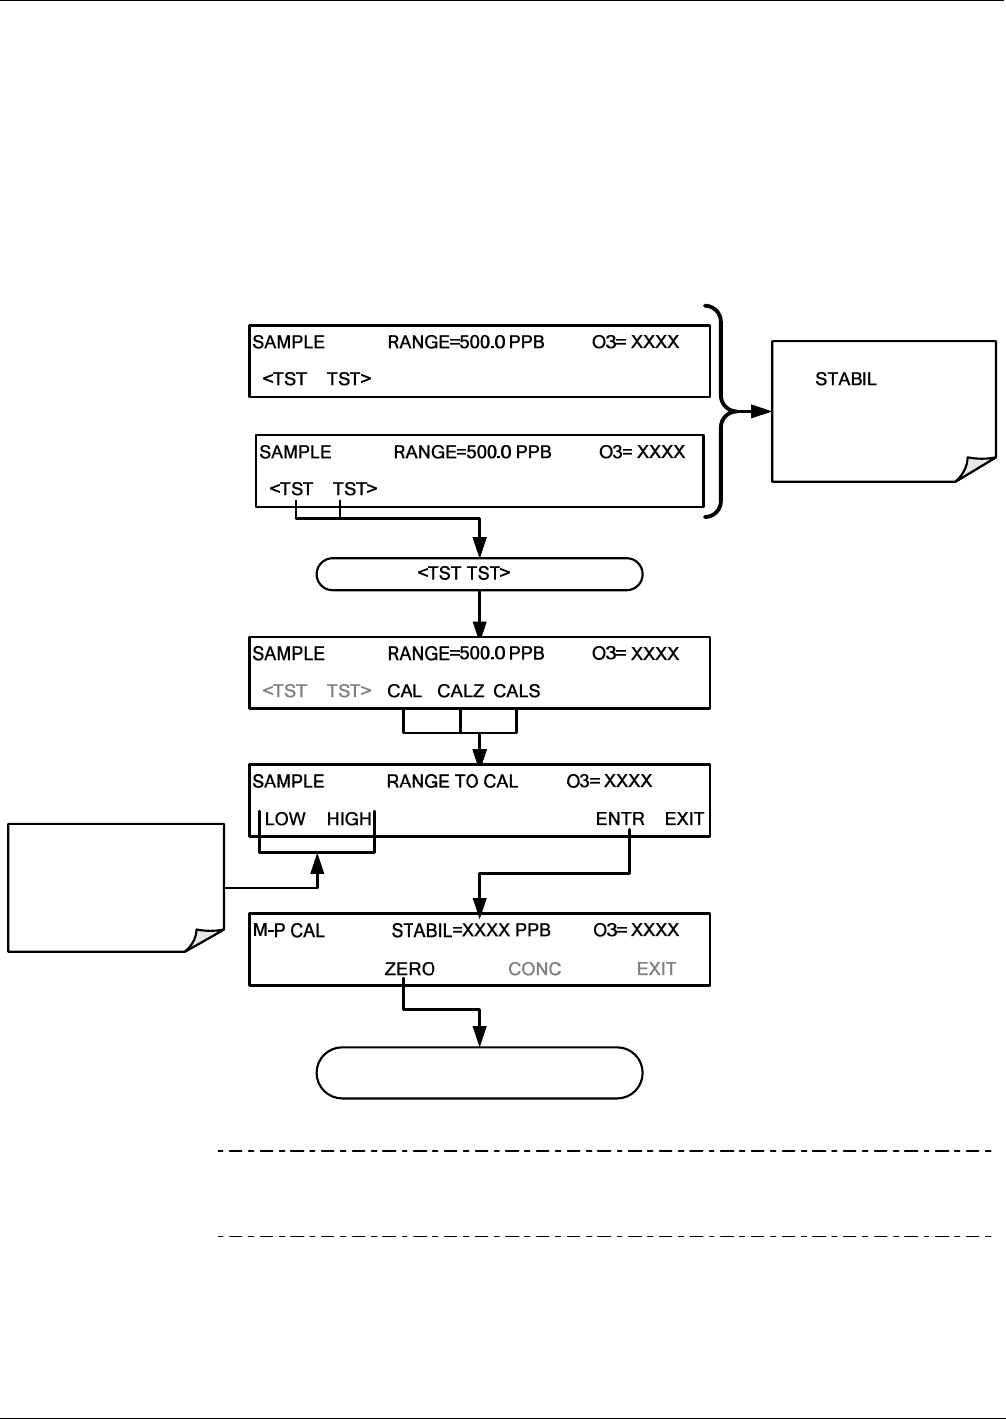
T400 Ozone Analyzer Operator’s Manual T400 Calibration Procedures
189
9.2.4. MANUAL CALIBRATION CHECKS AND CALIBRATIONS USING AUTO
RANGE OR DUAL RANGE MODES
If the analyzer is being operated in DUAL range mode or AUTO range mode, then the
HIGH and LOW ranges must be independently checked.
When the analyzer is in either DUAL or AUTO Range modes, the user must run a
separate calibration procedure for each range. After pressing the CAL, CALZ or CALS
buttons, the user is prompted for the range that is to be calibrated as seen in the CALZ
example below:
CAL SETUP
Set the Display to show
the test function.
This function calculates
the stability of the O3
measurement
Toggle the buttons until ...
CAL SETUP
SETUP
Press either to select the
RANGE to be calibrated.
LOW = RANGE1;
HIGH = RANGE2
<TST TST>
Continue the Calibration operation as
per the standard procedure
Note Once this selection is made, the calibration procedure continues as
described in Section 9.2. The other range may be calibrated by starting
over from the main SAMPLE display.
06870C DCN6332
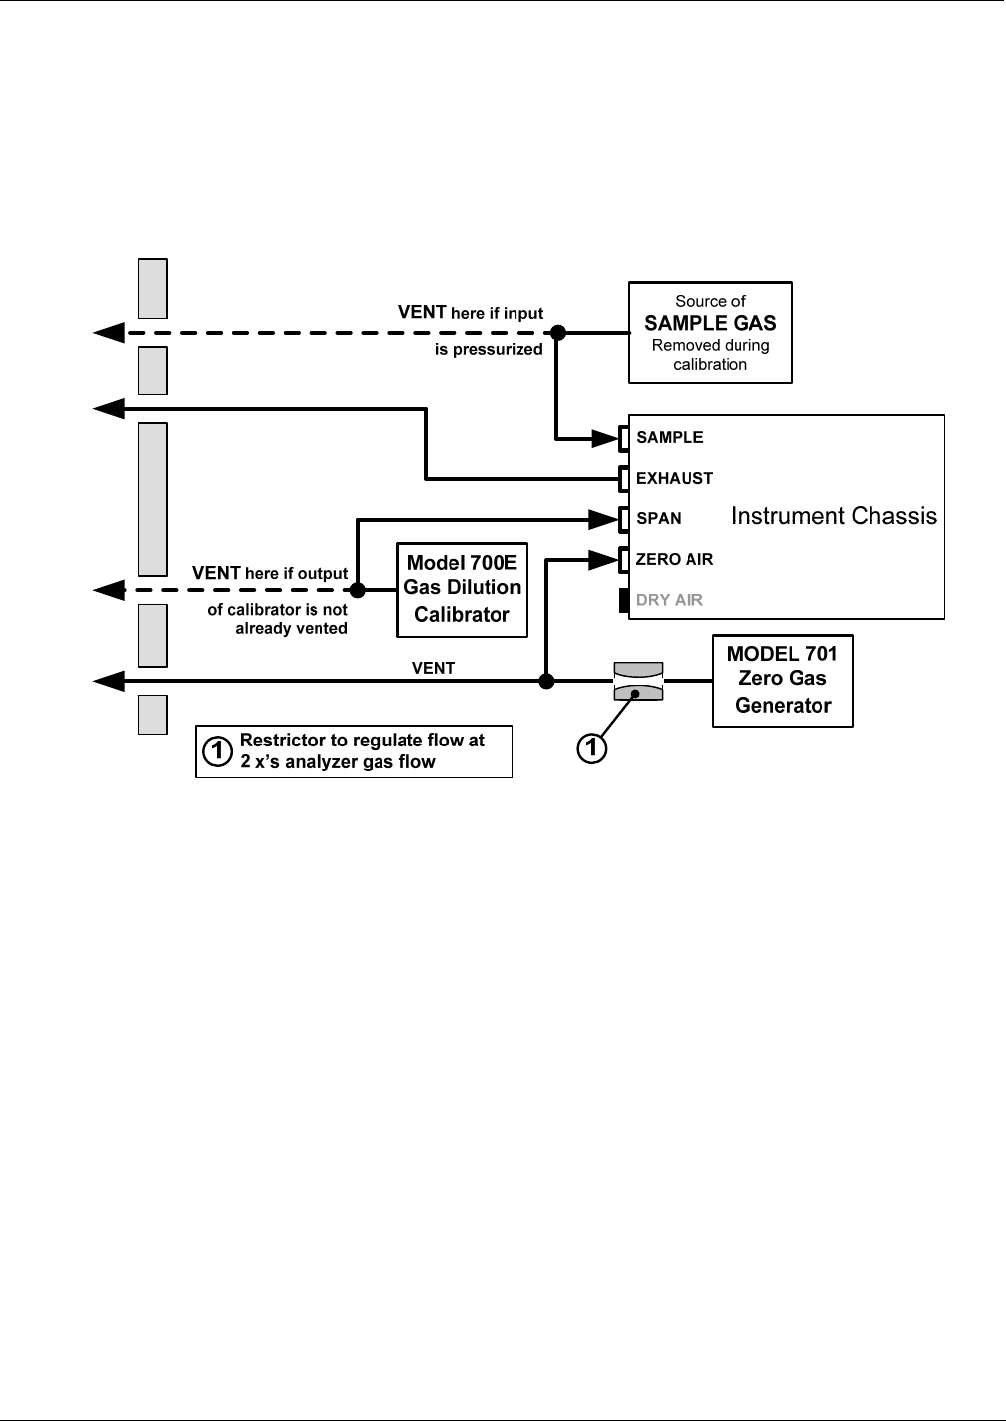
T400 Calibration Procedures T400 Ozone Analyzer Operator’s Manual
190
9.3. MANUAL CALIBRATION CHECK AND CALIBRATION WITH
VALVE OPTIONS INSTALLED
9.3.1. SETUP FOR CALIBRATION CHECKS AND CALIBRATION WITH
VALVE OPTIONS INSTALLED.
Connect the sources of zero air and span gas as shown in Figure 9-2 and Figure 9-3.
Enclosure Wall
Figure 9-2: Gas Line Connections for the T400 Analyzer with Zero/Span Valve Option (OPT-50A)
06870C DCN6332
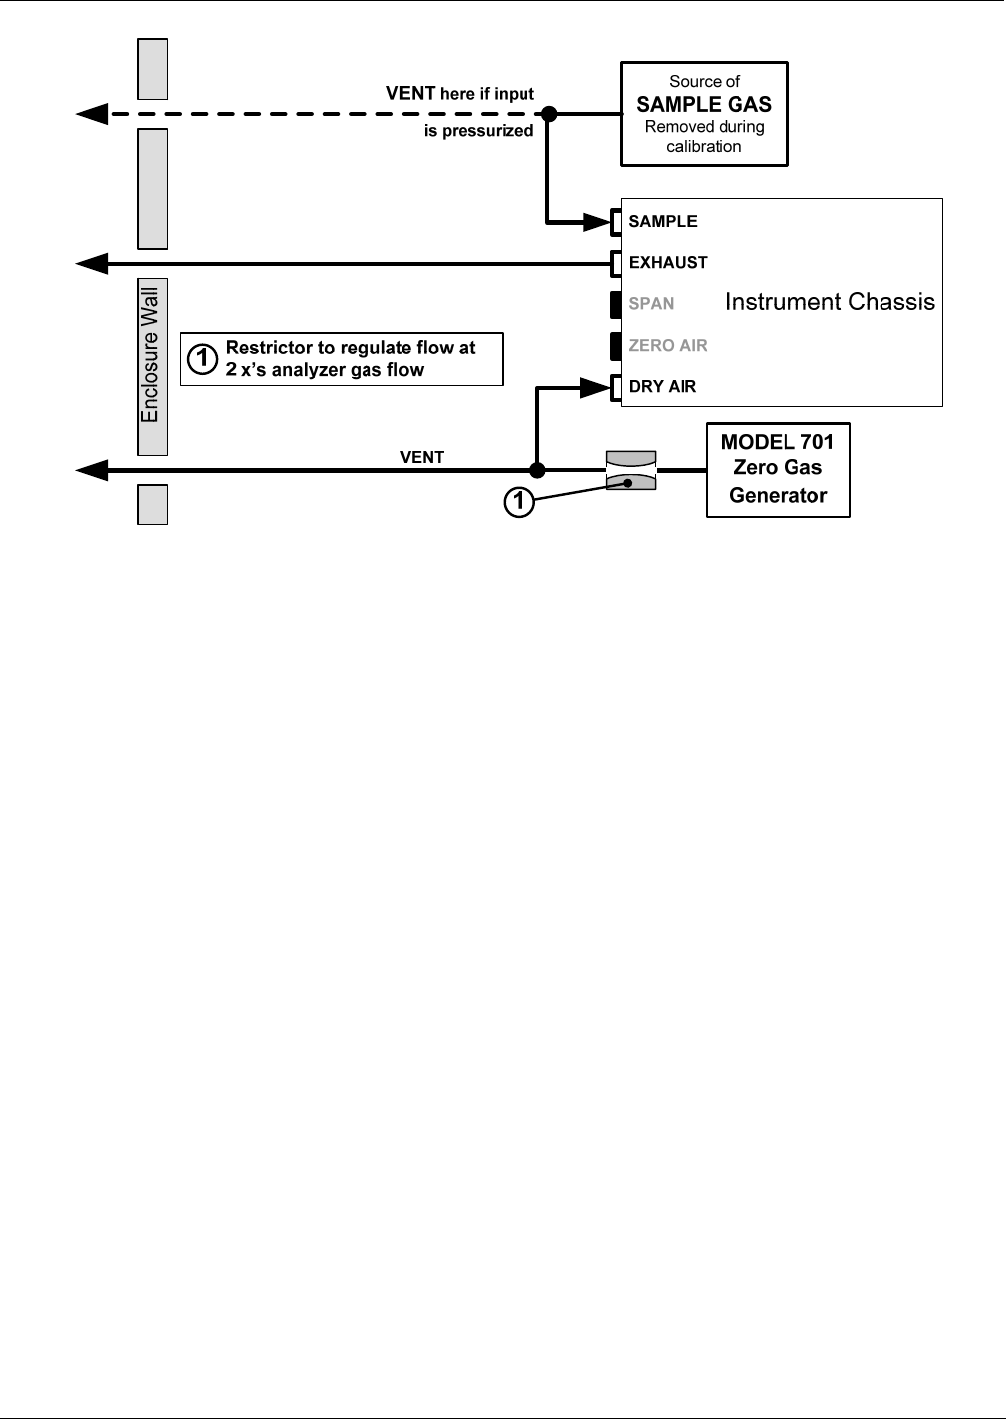
T400 Ozone Analyzer Operator’s Manual T400 Calibration Procedures
191
Figure 9-3: Gas Line Connections for the T400 Analyzer with IZS Options (OPT-50G)
06870C DCN6332
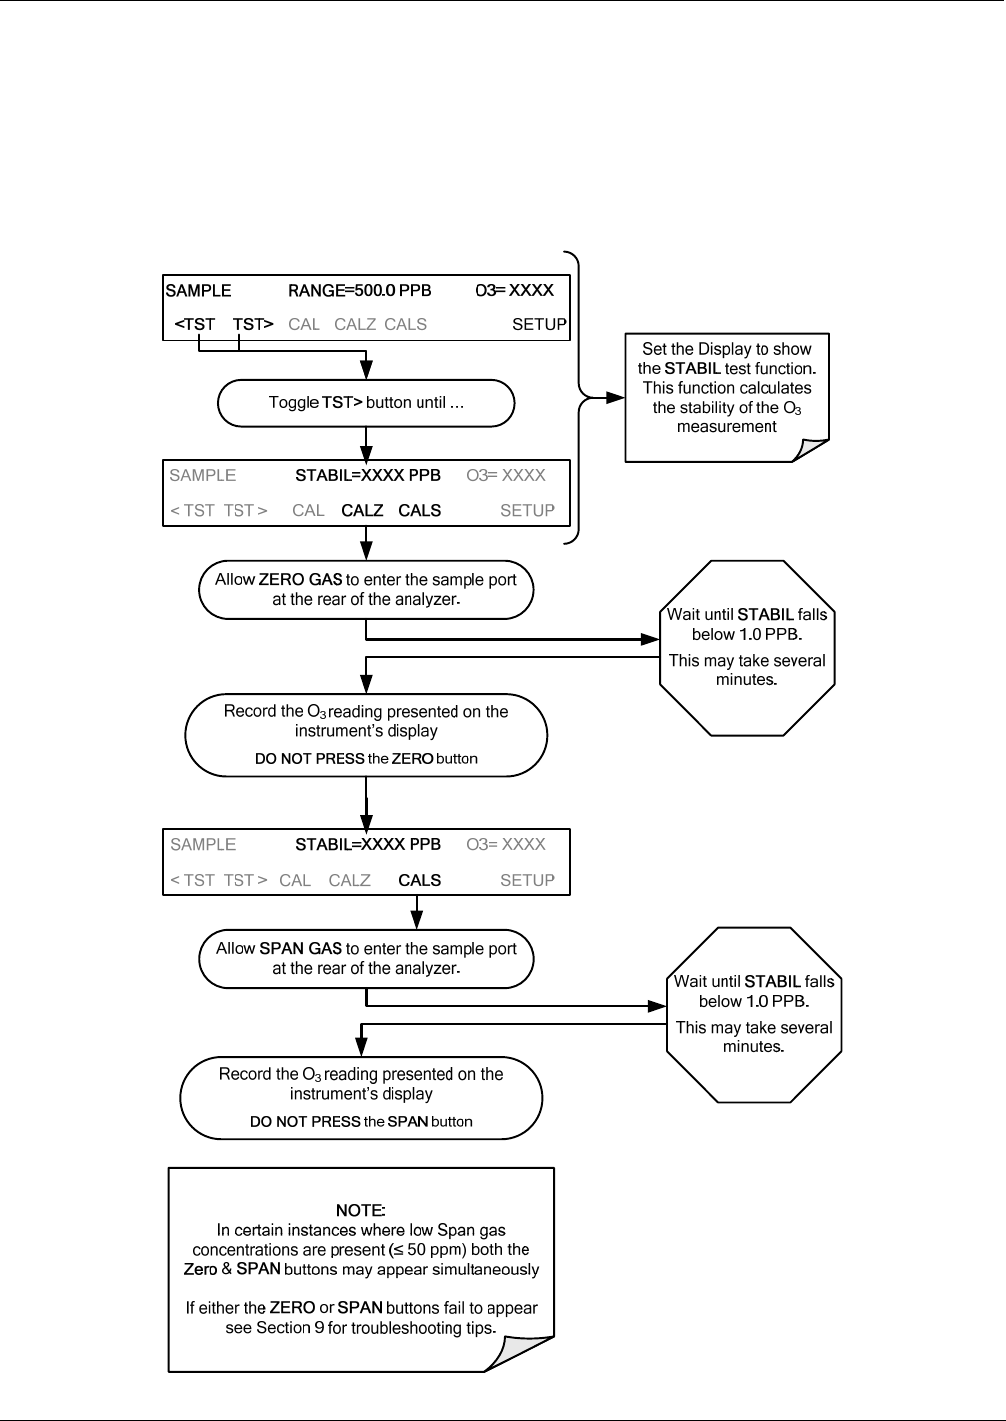
T400 Calibration Procedures T400 Ozone Analyzer Operator’s Manual
192
9.3.2. MANUAL CALIBRATION CHECKS WITH VALVE OPTIONS
INSTALLED
Performing the calibration checks on T400 analyzer’s with the Valve option installed is
similar to that described in Section 9.2, except that the ZERO And SPAN calibration
operations are initiated directly and independently with dedicated buttons (CALZ &
CALS).
06870C DCN6332
T400 Ozone Analyzer Operator’s Manual T400 Calibration Procedures
193
9.3.3. MANUAL CALIBRATION USING VALVE OPTIONS
Note While the internal Zero Span Option is a convenient tool for performing
Calibration Checks, its O3 generator is not stable enough to be used as a
source of Zero Air or Span Gas for calibrating the instrument.
Calibrations should ONLY be performed using external sources of Zero
Air and Span Gas whose accuracy is traceable to EPA or NIST standards.
On instruments with Z/S valve options, zero air and span gas is supplied to the analyzer
through the zero gas and span gas inlets (see Figure 9-2 and the zero and cal operations
are initiated directly and independently with dedicated buttons (CALZ & CALS).
9.3.3.1. Setting the Expected O3 Span Gas Concentration with the Z/S Option Installed
SAMPLE RANGE=500.0 PPB O3= XXXX
<TST TST> CAL CALZ CALS SETUP
SAMPLE RANGE=500.0 PPB O3= XXXX
<TST TST> ZERO CONC SETUP
SAMPLE O3 SPAN CONC: 400.0 Conc
0 0 4 0 0 .0 ENTR EXIT
The O3span concentration value automatically
defaults to 400.0 Conc.
Make sure that you input the ACTUAL
concentration value of the SPAN Gas.
To change this value to meet the actual
concentration of the SPAN Gas, enter the number
sequence by pressing the button under each digit
until the expected value is set.
EXIT discards the new
setting
ENTR accepts the
new setting
06870C DCN6332
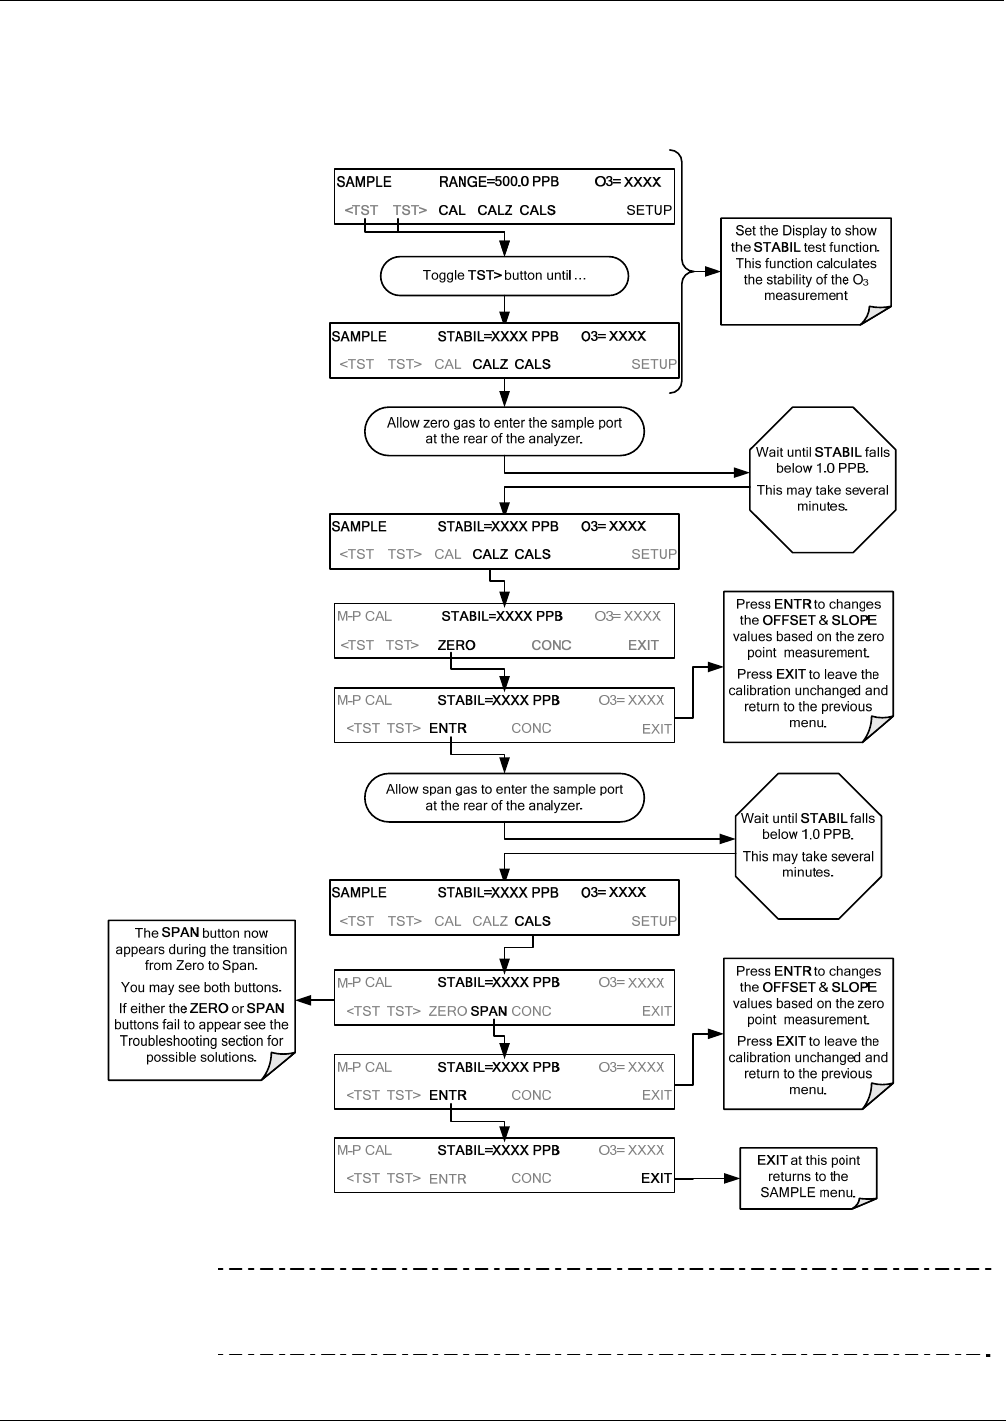
T400 Calibration Procedures T400 Ozone Analyzer Operator’s Manual
194
9.3.3.2. Zero/Span Point Calibration Procedure the Z/S Option Installed
If the T400 analyzer is set for either the AUTO or DUAL range modes, read Section
9.2.4 before proceeding.
Note If the ZERO or SPAN buttons are not displayed, the measurement made
during is out of the allowable range allowed for a reliable calibration. See
Section 12 for troubleshooting tips.
06870C DCN6332

T400 Ozone Analyzer Operator’s Manual T400 Calibration Procedures
195
9.3.3.3. Use of Zero/Span Valve with Remote Contact Closure
Contact closures for controlling calibration and calibration checks are located on the rear
panel CONTROL IN connector. Instructions for setup and use of these contacts are
found in Section 3.3.1.6.
When the contacts are closed for at least 5 seconds, the instrument switches into zero,
low span or high span mode and the internal zero/span valves will be automatically
switched to the appropriate configuration.
The remote calibration contact closures may be activated in any order.
It is recommended that contact closures remain closed for at least 10 minutes to
establish a reliable reading.
The instrument will stay in the selected mode for as long as the contacts remain
closed.
If contact closures are being used in conjunction with the analyzer’s AutoCal (see
Section 9.4) feature and the AutoCal attribute “CALIBRATE” is enabled, the T400 will
not re-calibrate the analyzer until the contact is opened. At this point, the new
calibration values will be recorded before the instrument returns to SAMPLE mode.
If the AutoCal attribute “CALIBRATE” is disabled, the instrument will return to
SAMPLE mode, leaving the instrument’s internal calibration variables unchanged.
9.4. AUTOMATIC ZERO/SPAN CAL/CHECK (AUTOCAL)
The AutoCal system allows unattended periodic operation of the ZERO/SPAN valve
options by using the T400’s internal time of day clock. AutoCal operates by executing
SEQUENCES programmed by the user to initiate the various calibration modes of the
analyzer and open and close valves appropriately. It is possible to program and run up
to three separate sequences (SEQ1, SEQ2 and SEQ3). Each sequence can operate in
one of three modes, or be disabled.
Table 9-1: AutoCal Modes
MODE NAME ACTION
DISABLED Disables the Sequence.
ZERO Causes the Sequence to perform a Zero calibration/check.
ZERO-LO Causes the Sequence to perform a Zero and Low (Midpoint) Span
concentration calibration/check.
ZERO-HI Causes the Sequence to perform a Zero and High Span concentration
calibration/check.
ZERO-LO-HI Causes the Sequence to perform a Zero, Low (Midpoint) Span and High
Span concentration calibration/check.
LO Causes the Sequence to perform a Low Span concentration
calibration/check only.
HI Causes the Sequence to perform a High Span concentration
calibration/check only.
LO-HI Causes the Sequence to perform a Low (Midpoint) Span and High Span
concentration calibration/check but no Zero Point calibration/check.
06870C DCN6332

T400 Calibration Procedures T400 Ozone Analyzer Operator’s Manual
196
For each mode, there are seven parameters that control operational details of the
SEQUENCE. They are:
Table 9-2: AutoCal Attribute Setup Parameters
ATTRIBUTE NAME ACTION
Timer Enabled Turns on the Sequence timer.
Starting Date Sequence will operate after Starting Date.
Starting Time Time of day sequence will run.
Delta Days Number of days to skip between each Seq. execution.
Delta Time Number of hours later each “Delta Days” Seq is to be run.
Duration Number of minutes the sequence operates.
Calibrate Enable to do a calibration – Disable to do a cal check only MUST be set to NO for
instruments with IZS Options installed and functioning.
The following example sets sequence #2 to do a zero-span calibration every other day
starting at 1 Am on September 4, 2001, lasting 15 minutes, without calibration. This
will start ½ hour later each iteration.
Table 9-3: Example AutoCal Sequence
MODE AND ATTRIBUTE VALUE COMMENT
Sequence 2 Define Sequence #2
Mode ZERO-HI Select Zero and Span Mode
Timer Enable ON Enable the timer
Starting Date Sept. 4, 2001 Start after Sept 4, 2001
Starting Time 01:00 First Span starts at 1:00AM
Delta Days 2 Do Sequence #2 every other day
Delta Time 00:30 Do Sequence #2 ½ hr later each day
Duration 15.0 Operate Span valve for 15 min
Calibrate NO Do not calibrate at end of Sequence
Note The programmed STARTING_TIME must be a minimum of 5 minutes later
than the real time clock for setting real time clock (See Section 5.6).
Avoid setting two or more sequences at the same time of the day. Any
new sequence that is initiated whether from a timer, the COM ports or the
contact closure inputs will override any sequence that is in progress.
The CALIBRATE attribute must always be set to NO on analyzers with IZS
Options installed and functioning.
Calibrations should ONLY be performed using external sources of Zero
Air and Span Gas whose accuracy is traceable to EPA or NIST standards.
06870C DCN6332
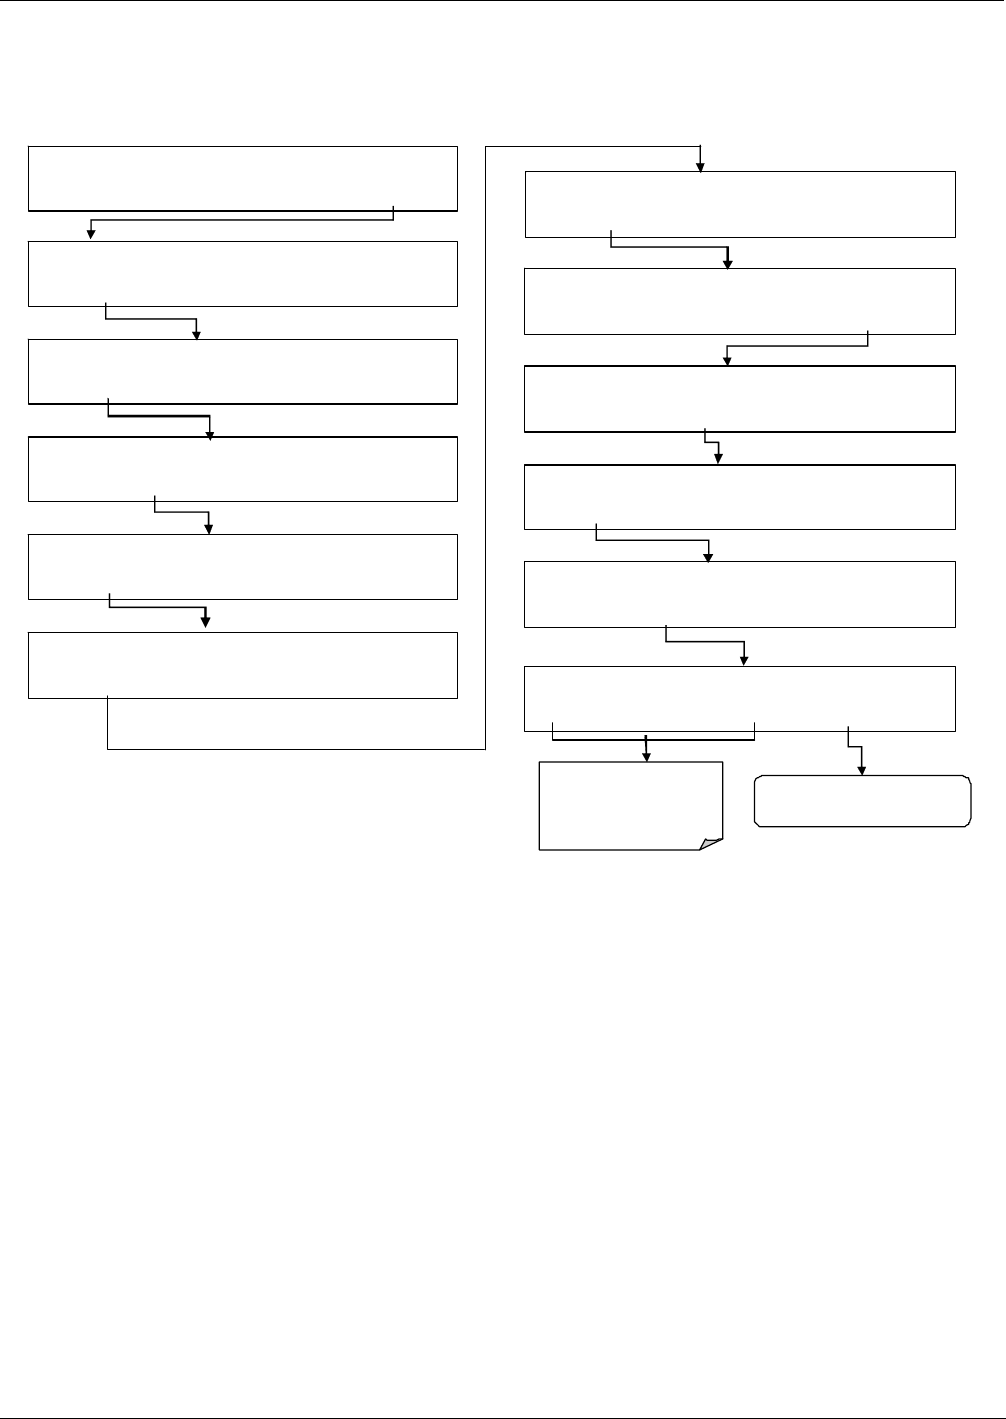
T400 Ozone Analyzer Operator’s Manual T400 Calibration Procedures
197
9.4.1. SETUP ACAL: PROGRAMMING AND AUTO CAL
To program the example Sequence sequence shown in Table 9-3, press:
CONTINUE NEXT PAGE
With STARTING TIME
SAMPLE RANGE = 500.0 PP B O3 =XXX.X
< TST TST > CAL CALZ CZLS SETUP
SETUP X.X
CFG ACAL DAS RNGE PASS CLK MORE EXIT
SETUP X.X SEQ 1) DISABLED
NEXT MODE EXIT
SETUP X.X SEQ 2) DISABLED
PREV NEXT MODE EXIT
SETUP X.X MODE: DISABLED
NEXT ENTR EXIT
SETUP X.X MODE: ZERO
PREV NEXT ENTR EXIT
SETUP X.X MODE: ZERO
–
HI
PREV NEXT ENTR EX IT
SETUP X.X SEQ 2) ZERO–HI, 1:00:00
PREV NEXT MODE SET EXIT
SETUP X.X TIMER ENABLE: ON
SET> EDIT E XIT
SETUP X.X STARTING DATE: 01
–
JAN
–
02
<SET SET> EDIT E XIT
SETUP X.X STARTING DATE: 01–JAN–02
0 4 SEP 1 0 ENTR EXIT
Toggle to set
Day, Month & Year:
Format : DD-MO N-YY
SETUP X.X MODE: ZERO–LO
PREV NEXT ENTR EXIT
06870C DCN6332
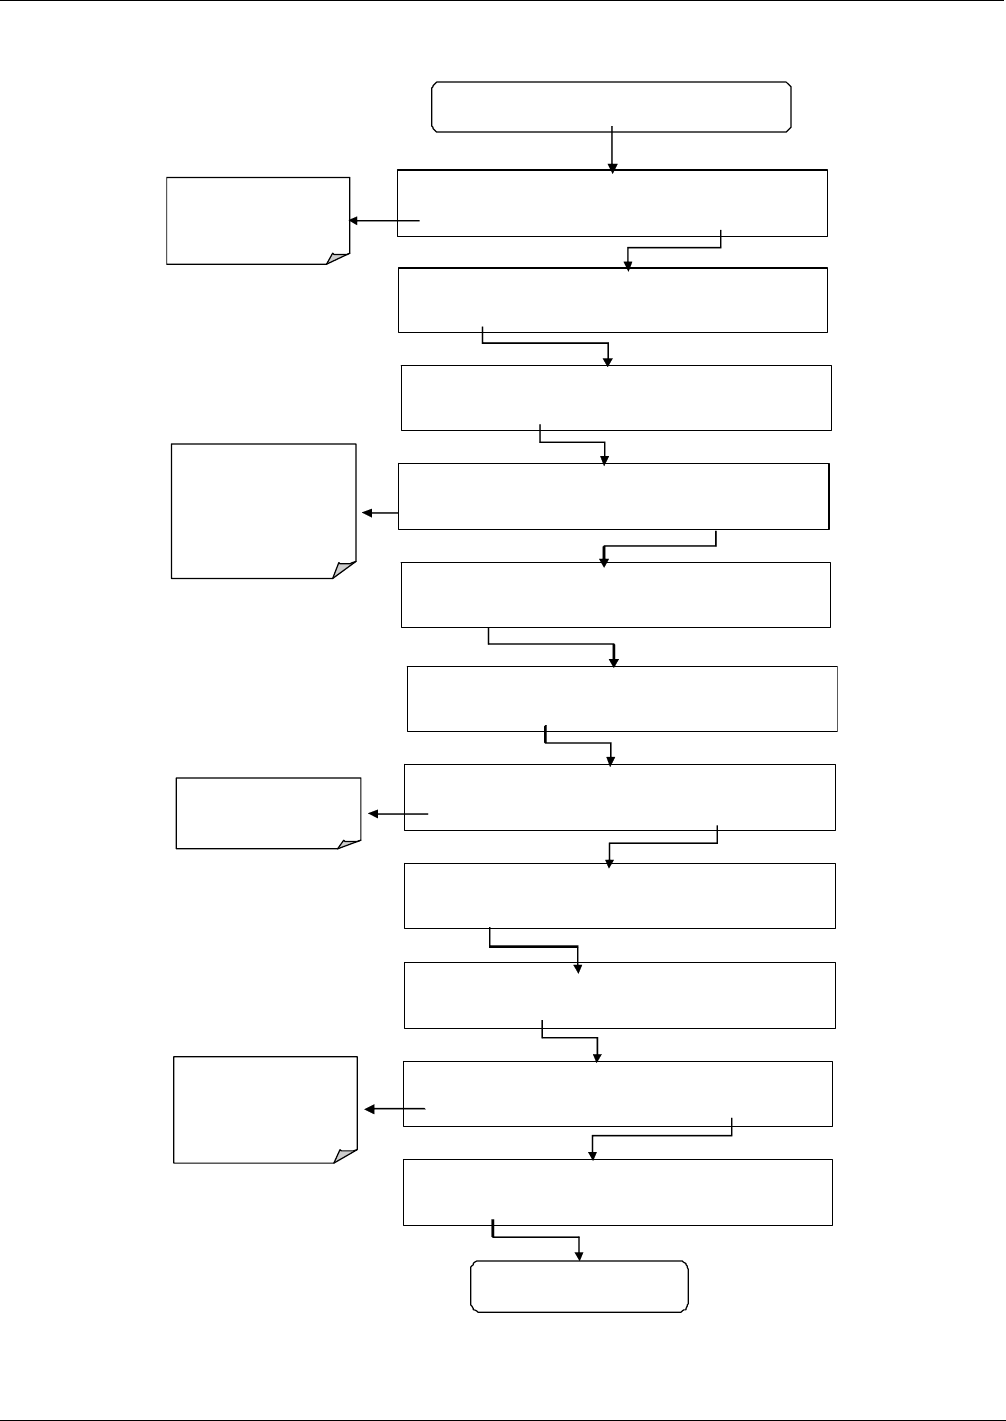
T400 Calibration Procedures T400 Ozone Analyzer Operator’s Manual
198
SETUP X.X STARTING DATE: 01
–
JAN
–
02
0 4 SEP 0 3 ENTR EXIT
Toggle to set
Day, Month & Year:
Format : DD-MON-YY
SETUP X.X STARTING DATE: 04
–
SEP
–
0
3
<SET SET> EDIT EXIT
SETUP X.X STARTING TIME:00:00
<SET S ET> EDIT EXIT
SETUP X.X STARTING TIME:00:00
1 4 : 1 5 ENTR EXIT
Toggle to set
time:
Format : HH:MM
This is a 24 hr clock . PM
hours are 13 – 24.
Example 2:15 PM = 14:15
CONTINUED FROM PREVIOUS PAGE -
STARTING DATE
CONTINUE NEXT PAGE
With DURATION TIME
SETUP X.X STARTING TIME:14:15
<SET SET> EDIT EX IT
SETUP X.X DELTA DAYS: 1
<SET SET> EDIT EXIT
SETUP X.X DELTA DAYS: 1
0 0 2 ENTR EXIT
Toggle to set
number of days between
procedures (1-367)
SETUP X.X DELTA DAYS:2
<SET SET> EDIT EXIT
SETUP X.X DELTA TIME00:00
<SET SET> EDIT EXIT
SETUP X.X DELTA TIME: 00:00
0 0 :3 0 E NTR EXIT
SETUP X.X DELTA TIME:00:30
<SET SET> EDIT EXIT
Toggle to set
delay time for each
iteration of the sequence:
HH:MM
(0 – 24:00)
06870C DCN6332
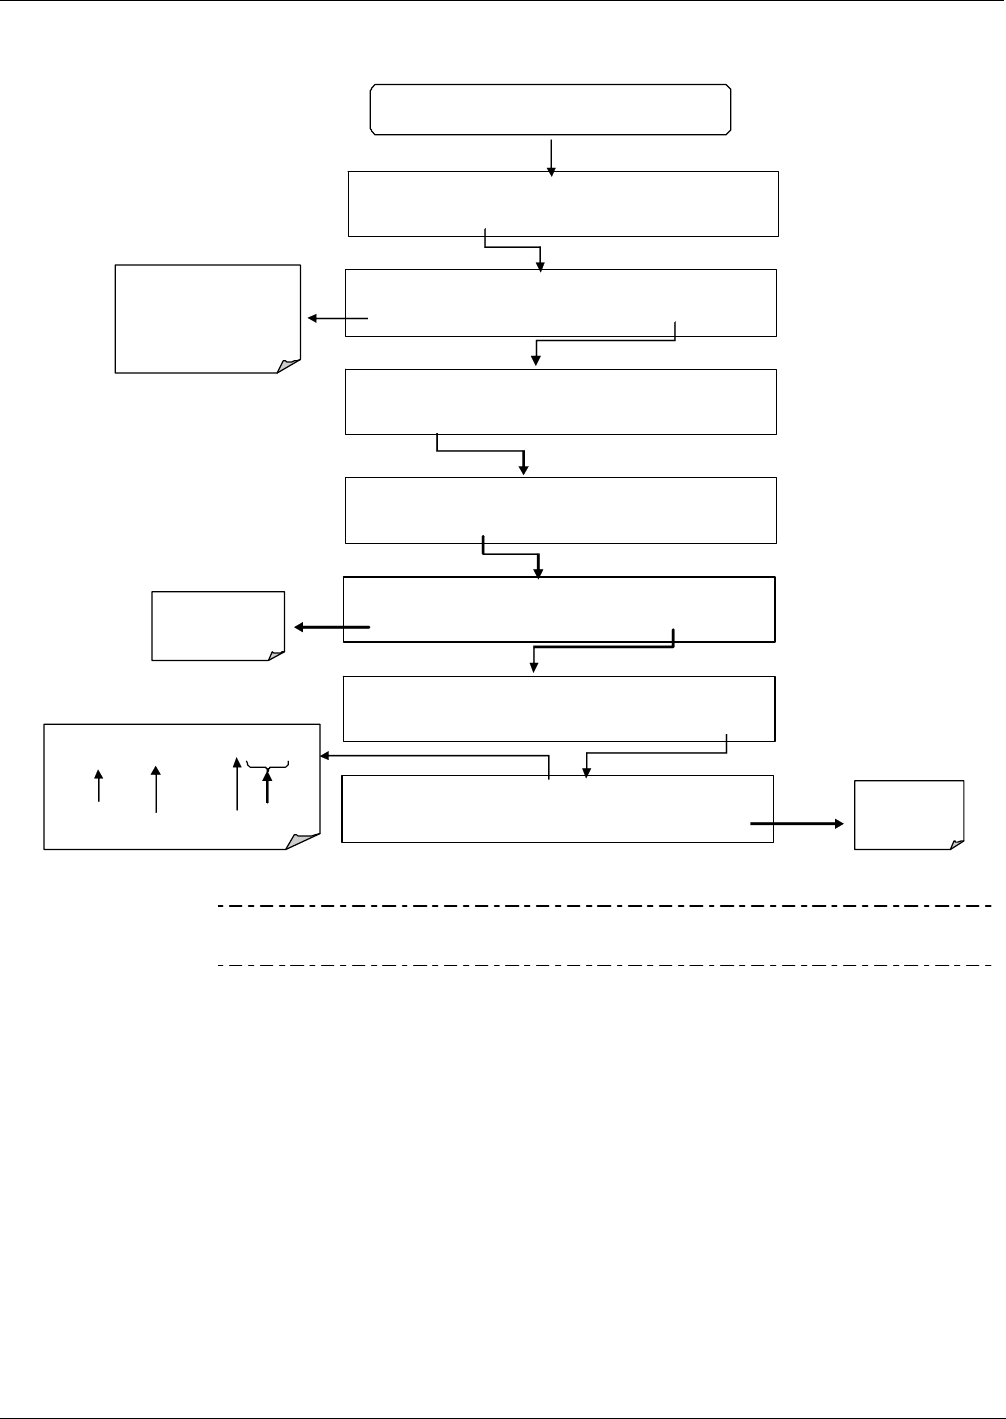
T400 Ozone Analyzer Operator’s Manual T400 Calibration Procedures
199
EXIT retu rns
to the SETUP
Menu
SETUP X.X DURATION:15.0 MINUTES
<SET SET> EDIT EXIT
SETUP X.X DURATION 15.0MINUTES
3 0 .0 ENTR EXIT
SETUP X.X DURATION:30.0 MINUTES
<SET SET> EDIT EXIT
Toggle keys to set
duration for each iteration
of the sequence:
Set in Decimal minutes
from 0.1 – 60.0
SETUP X.X CALIBRATE: OFF
<SET SET> EDIT EXIT
SETUP X.X CALIBRATE: OFF
ON ENTR EX IT
SETUP X.X C
A
LIBRATE: ON
<SET SET> EDIT EXIT
Toggle key
Between Off and
ON
SETUP X.X SEQ 2) ZERO
–
SPAN, 2:00:30
PREV NEXT MODE SET EXIT
Display show:
SEQ 2) ZERO–SPAN, 2:00:30
Sequence De lta Time
MODE Delta Days
CONTINUED FROM PREVIOUS PAGE
DELTA TIME
Note If at any time an out-of-range entry is selected (Example: Delta Days >
367) the ENTR button will disappear from the display.
9.5. O3 PHOTOMETER ELECTRONIC CALIBRATION
There are several electronic characteristics of the T400 analyzer’s photometer that may
occasionally need checking or calibration:
9.5.1. PHOTOMETER DARK CALIBRATION
The dark calibration test turns off the photometer UV lampand records any offset signal
level of the UV detector-preamp-voltage to frequency converter circuitry. This allows
the instrument to compensate for any voltage levels inherent in the Photometer detection
circuit that might affect the output of the detector circuitry and therefore the calculation
of O3 concentration.
06870C DCN6332
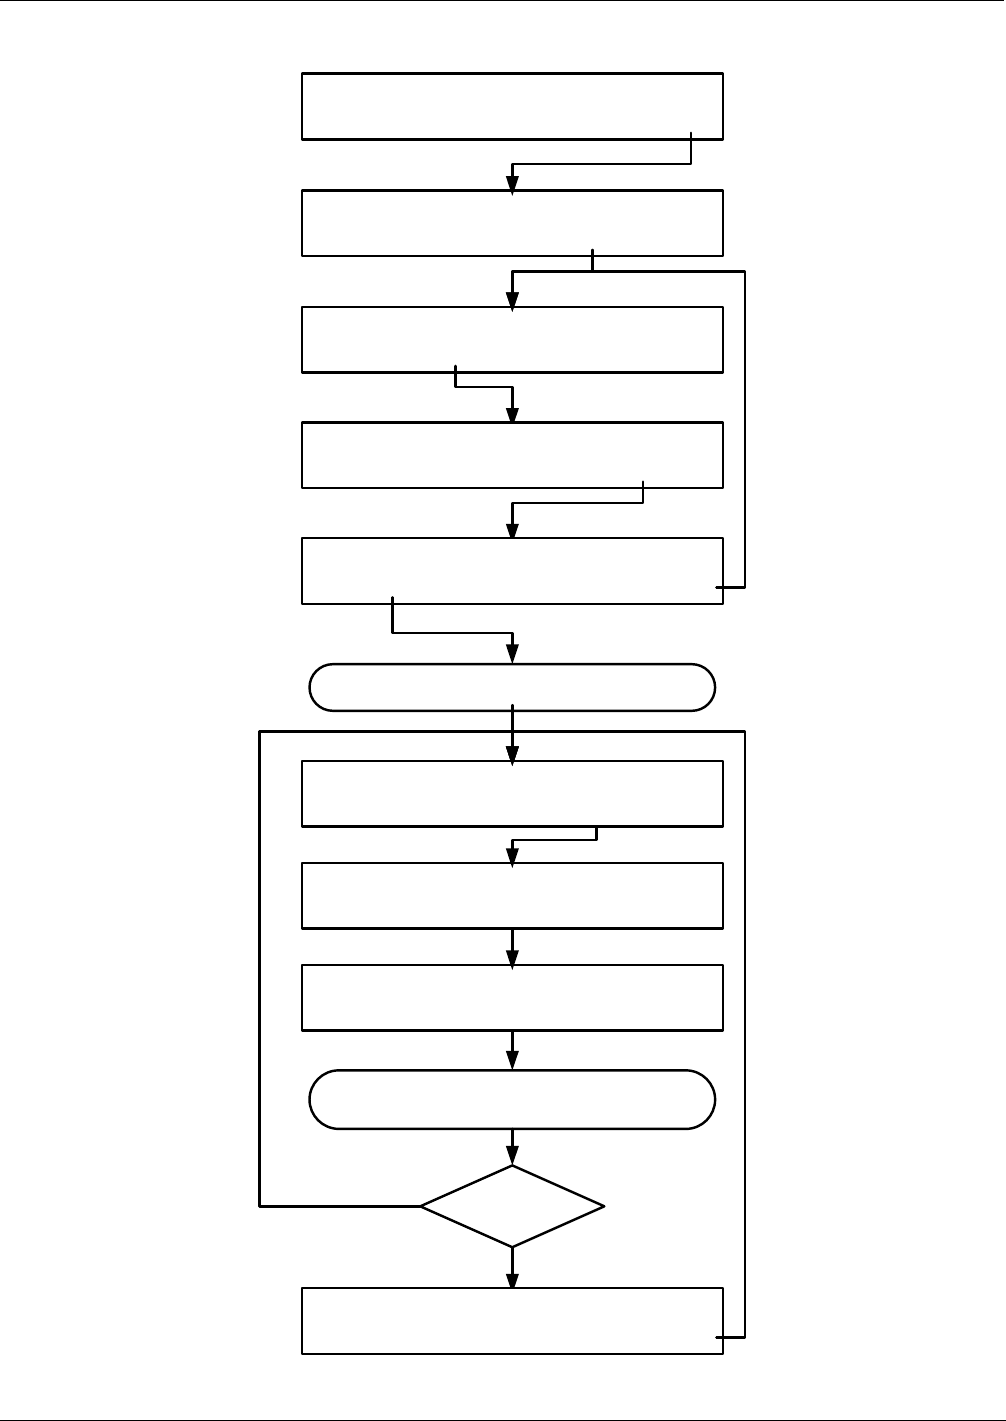
T400 Calibration Procedures T400 Ozone Analyzer Operator’s Manual
200
To activate the dark calibration feature, press:
SETUP X.X PRIMARY SETUP MENU
CFG DAS RNGE PASS CLK MORE EXIT
SAMPLE RANGE=500.0 PPB O3= XXXX
<TST TST> CAL SETUP
SETUP X.X SECONDARY SETUP MENU
COMM VARS DIAG EXIT
SETUP X.X ENTER PASSWORD:818
8 1 8 ENTREXIT
DIAG SIGNAL I/O
NEXT ENTR EXIT
Press NEXT until ...
The DARK CAL procedure progresses automatically
until ...
SETUP X.X DARK CAL 34% COMPLETE
SETUP X.X CALIBRATING DARK OFFSET
SETUP X.X DARK CALIBRATION
PREV NEXT ENTR EXIT
DARK CAL
Successful?
Yes
No
SETUP X.X INVALID DARK CAL OFFS=XXXX.X MV
EXIT
06870C DCN6332
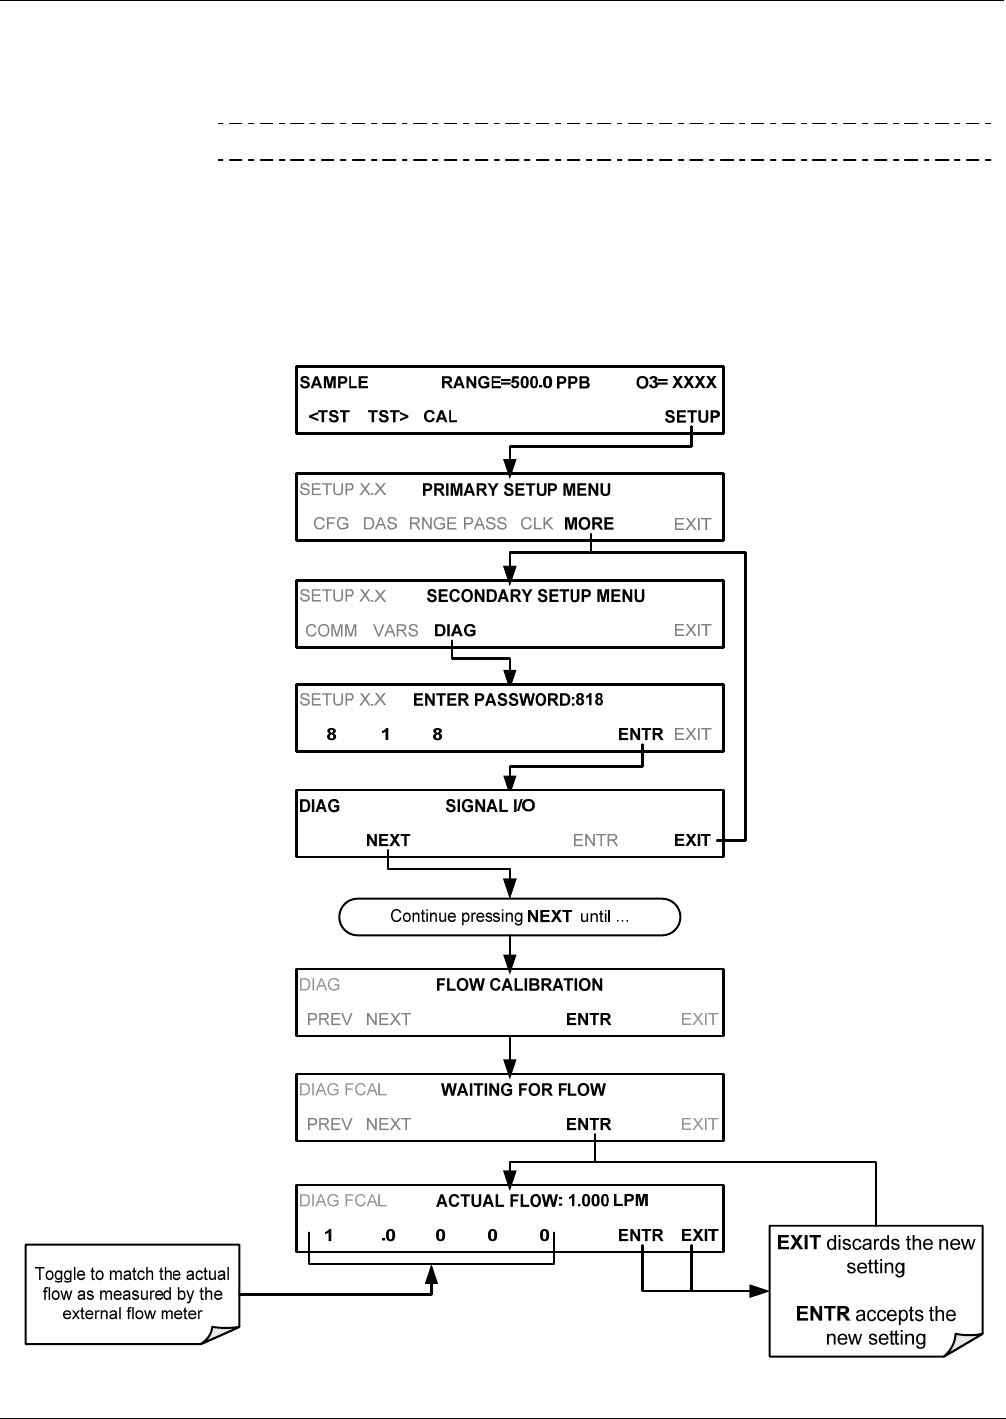
T400 Ozone Analyzer Operator’s Manual T400 Calibration Procedures
201
9.5.2. O3 PHOTOMETER GAS FLOW CALIBRATION
Note A separate flow meter is required for this procedure.
To calibrate the flow of gas through the T400 analyzer’s optional photometer bench.
1. Turn OFF the T400 analyzer.
2. Attach the flow meter directly to the SAMPLE inlet port of the analyzer.
3. Turn the analyzer ON.
4. Perform the following steps:
06870C DCN6332

T400 Calibration Procedures T400 Ozone Analyzer Operator’s Manual
202
9.6. CALIBRATING THE IZS OPTION O3 GENERATOR
The following procedure calibrates to output of the O3 generator that is included in the
IZS calibration valve option ( OPT-50G). This function:
Drives the IZS O3 Generator to output a series of O3 levels between zero and full
scale;
Measures the actual O3 output at each level, and;
Records the generator lamp drive voltage and generator’s O3 output level in a
lookup table.
Whenever a certain O3 output level is requested, the instrument’s CPU uses the data in
this table to interpolate the correct drive voltage for the desired O3 output.
Note Because the instrument waits 5–7 minutes at each step for the O3 level to
stabilize, this calibration operation often takes more than one hour to
complete.
06870C DCN6332
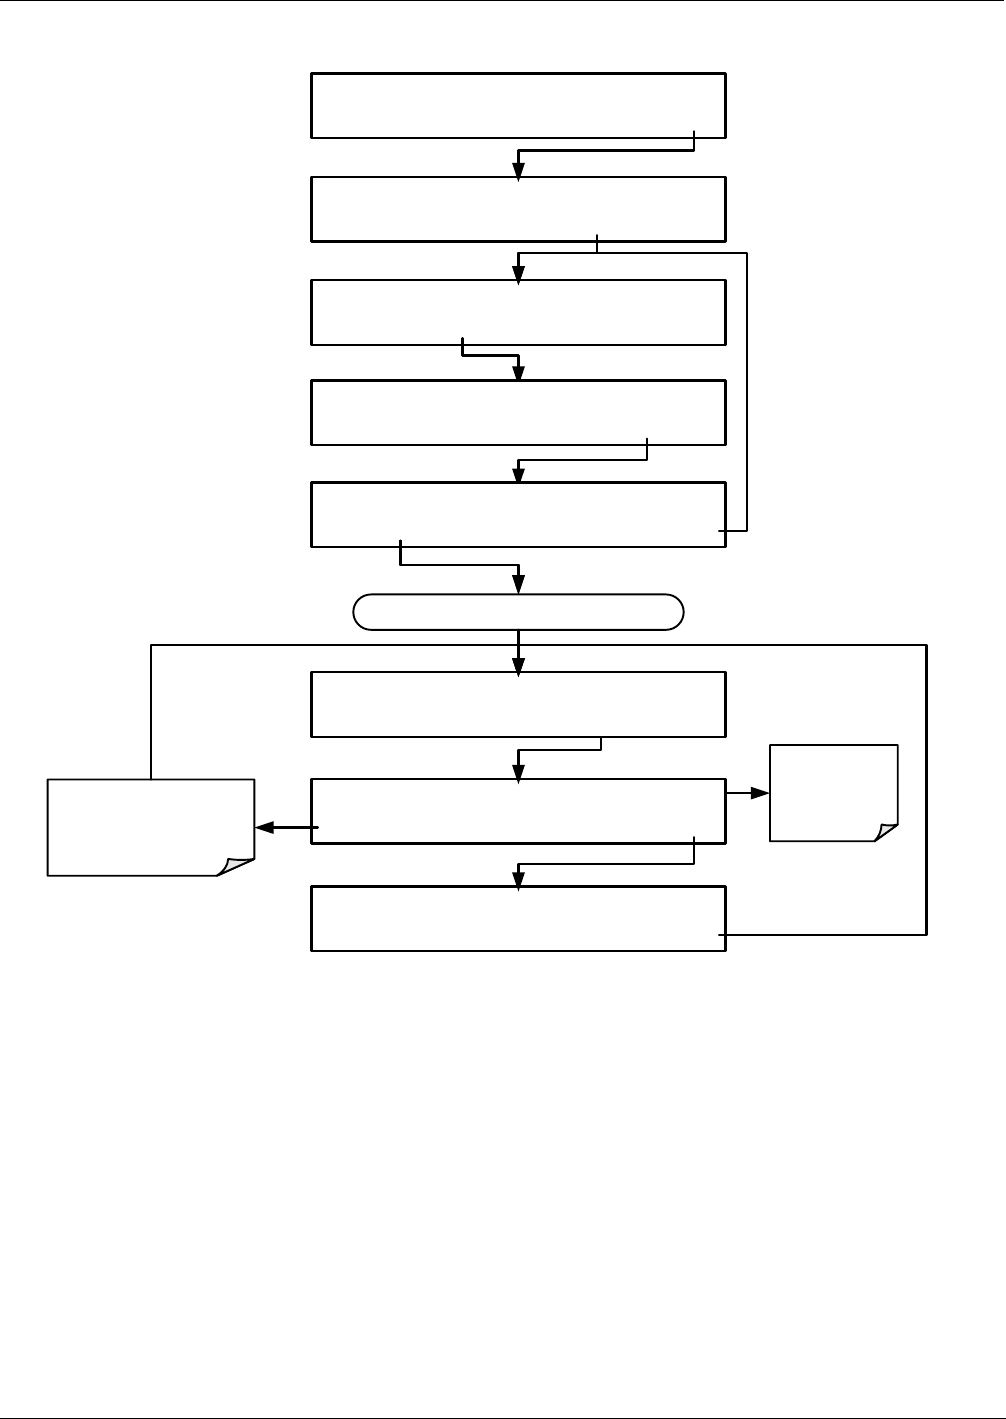
T400 Ozone Analyzer Operator’s Manual T400 Calibration Procedures
203
To calibrate the O3 Generator press:
DIAG O3GEN O3 GEN CAL [X]% COMPLETE
PREV NEXT EXIT
SETUP X.X PRIMARY SETUP MENU
CFG DAS RNGE PASS CLK MORE EXIT
SAMPLE RANGE=500.0 PPB O3= XXXX
<TST TST> CAL SETUP
SETUP X.X SECONDARY SETUP MENU
COMM VARS DIAG EXIT
SETUP X.X ENTER PASSWORD:818
8 1 8 ENTR EXIT
DIAG SIGNAL I/O
NEXT ENTR EXIT
Continue pressing NEXT until ...
DIAG O3GEN CANCELLED
PREV NEXT EXIT
Analyzer returns to the
previous menu when the
calibration operation is
complete
DIAG O3 GEN CALIBRATION
PREV NEXT ENTR EXIT
Display tracks
the % of test
completes
06870C DCN6332

204
This page intentionally left blank.
06870C DCN6332

205
10. EPA PROTOCOL CALIBRATION
In order to insure that high quality, accurate measurement information is obtained at all
times, the analyzer must be calibrated prior to use. A quality assurance program
centered on this aspect and including attention to the built-in warning features of the
analyzer, periodic inspection, regular zero/span checks and routine maintenance is
paramount to achieving this.
The US EPA strongly recommends that you obtain a copy of the publication Quality
Assurance Handbook for Air Pollution Measurement Systems (abbreviated, Q.A.
Handbook Volume II); USEPA Order Number: EPA454R98004; or NIST Order
Number: PB99-129876.
This manual can be purchased from:
EPA Technology Transfer Network (http://www.epa.gov/ttn/amtic)
National Technical Information Service (NTIS, http://www. ntis.gov/)
A bibliography and references relating to O3 monitoring are listed in Section 10.6.
10.1.1. T400 CALIBRATION – GENERAL GUIDELINES
Calibration is the process of adjusting the gain and offset of the T400 against some
recognized standard. The reliability and usefulness of all data derived from any analyzer
depends primarily upon its state of calibration.
In this section, the term dynamic calibration is used to express a multipoint check
against known standards and involves introducing gas samples of known concentration
into the instrument in order to adjust the instrument to a predetermined sensitivity and to
produce a calibration relationship. This relationship is derived from the instrumental
response to successive samples of different known concentrations. As a minimum, three
reference points and a zero point are recommended to define this relationship. The
instrument(s) supplying the zero air and Span calibration gasses used must themselves
be calibrated and that calibration must be traceable to an EPA/ NIST primary standard
(see Section 8.1.4.)
All monitoring instrument systems are subject to some drift and variation in internal
parameters and cannot be expected to maintain accurate calibration over long periods of
time. Therefore, it is necessary to check the calibration relationship on a predetermined
schedule dynamically. Zero and span checks must be used to document that the data
remains within control limits. These checks are also used in data reduction and
validation.
To ensure accurate measurements of the O3 levels, the analyzer must be calibrated at the
time of installation and re-calibrated as necessary. (Section 12 of the Q.A. Manual.11)
06870C DCN6332

EPA Protocol Calibration T400 Ozone Analyzer Operator’s Manual
206
A general procedure for dynamically calibrating a O3 analyzer can be found in 40 CFR
50 Appendix C. Calibration can be done by either diluting high concentration O3
standards with zero air or using separate supplies of O3 at known concentration.
Care must be exercised to ensure that the calibration system meets the guidelines
outlined in the revised Appendix D, 40 CFR 50.1 Detailed calibration procedures are
also discussed in the Technical Assistance Document (TAD).2 Dynamic multipoint
calibration of the T400 must be conducted by using either the UV photometric
calibration procedure or a certified transfer standard. The equipment (i.e. calibrator and
UV photometer) that is needed to carry out the calibration is commercially available, or
it can be assembled by the user.
Calibrations should be carried out at the field-monitoring site. The Analyzer should be
in operation for at least several hours (preferably overnight) before calibration. During
the calibration, the T400 should be in the CAL mode, and therefore sample the test
atmosphere through all components used during normal ambient sampling and through
as much of the ambient air inlet system as is practicable. If the instrument will be used
on more than one range, it should be calibrated separately on each applicable range.
Details of documentation, forms and procedures should be maintained with each
analyzer and also in a central backup file as described in Section 12 of the Quality
Assurance Handbook.
Personnel, equipment and reference materials used in conducting audits must be
independent from those normally used in calibrations and operations. Ozone audit
devices must be referenced to a primary UV photometer or one of the Standard
Reference Photometers maintained by NIST and the US EPA.
10.1.2. CALIBRATION EQUIPMENT, SUPPLIES, AND EXPENDABLES
The measurement of O3 in ambient air requires a certain amount of basic sampling
equipment and supplemental supplies. These include, but are not limited to, the
following:
Equivalent Method photometric O3 analyzer, such as the TAPI Model T400
Strip chart recorder and/or data logging system
Sampling lines
Sampling manifold
UV (ultraviolet) photometric calibration system
Certified calibration transfer standards
Zero-air source
Ozone generation device ("calibrator")
Spare parts and expendable supplies
Record forms
Independent audit system
When purchasing these materials, a logbook should be maintained as a reference for
future procurement needs and as a basis for future fiscal planning.
06870C DCN6332

T400 Ozone Analyzer Operator’s Manual EPA Protocol Calibration
207
SPARE PARTS AND EXPENDABLE SUPPLIES
In addition to the basic equipment described in the Q.A. Handbook, it is necessary to
maintain an inventory of spare parts and expendable supplies. Section 11 of this manual
describes the parts that require periodic replacement and the frequency of replacement.
Appendix B contains a list of spare parts and kits of expendables supplies.
10.1.3. CALIBRATION GAS AND ZERO AIR SOURCES
Production of Zero Air
Devices that condition ambient air by drying and removal of pollutants are available on
the commercial market such as the API Model 701 zero air generator.
Production of Span Gas
Because of the instability of O3, the certification of O3 concentrations as Standard
Reference Materials is impractical, if not impossible. Therefore, when O3 concentration
standards are required, they must be generated and certified locally. We Recommend
using a Gas Dilution Calibrator with a built in O3 generator, such as a
TAPI Model 700E, as a source for O3 Span Gas.
In ALL cases, the instrument(s) supplying the zero air and Span calibration gasses used
must themselves be calibrated and that calibration must be traceable to an EPA/NIST
primary standard.
10.1.4. RECOMMENDED STANDARDS FOR ESTABLISHING
TRACEABILITY
Equipment used to produce calibration gasses should be verified against EPA/NIST
traceable standards.
Ozone is the only criteria pollutant for which standard concentrations for calibration
cannot be directly traceable to an NIST-SRM (National Institute of Standards - Standard
Reference Material).
Such standards are classified into two basic groups: primary standards and transfer
standards.
A primary O3 standard is an O3 concentration standard that has been dynamically
generated and assayed by UV photometry in accordance with the procedures
prescribed by the U.S. Environmental Protection Agency (EPA) under Title 40 of the
Code of Federal Regulations, Part 50, Appendix D (40 CFR Part 50).
An O3 transfer standard is a transportable device or apparatus, which, together with
associated operational procedures, is capable of accurately reproducing O3
concentration standards or producing accurate assays of O3 concentrations that are
quantitatively related to a primary O3 standard.
It is worth noting that the requirements for the repeatability and reliability of transfer
standards are more stringent than are those for stationary, primary standards.
A Standard Reference Photometer (SRP) has been developed as a primary O3 standard
by the U.S. National Institute of Standards and Technology (NIST) and the EPA. It is a
highly stable, highly precise, computer-controlled instrument for assaying O3
concentrations. NIST maintains one or more “master” SRP’s in lieu of a Standard
Reference Materials (SRM) for ozone. A nationwide network of regionally located
SRP’s enables State and local air monitoring agencies to compare their O3 standards
06870C DCN6332

EPA Protocol Calibration T400 Ozone Analyzer Operator’s Manual
208
with authoritative O3 standards maintained and operated under closely controlled
conditions. Other SRPs are located in foreign countries.
To maintain a uniform and consistent set of references, the US EPA maintains 9
Standard Reference Photometers (SRP) around the US. It is suggested that the regional
office of the EPA be contacted for the location of a SRP nearby and that the standards be
compared. This assures a uniform standard for ozone concentration is applied
everywhere.
Currently, the U.S. SRP Network consists of SRPs located at:
EPA's National Exposure Research Laboratory (NERL), in Research Triangle Park,
North Carolina
EPA's Region I Environmental Services Division in Lexington, Massachusetts
EPA's Region II Environmental Services Division in Edison, New Jersey
EPA's Region IV Environmental Services Division in Athens, Georgia
EPA's Region V Environmental Services Division in Chicago, Illinois
EPA's Region VI Environmental Services Division in Houston, Texas
EPA's Region VII Environmental Services Division in Athens, Georgia
EPA's Region VIII Environmental Services Division in Denver, Colorado
The State of California Air Resources Board (CARB) in Sacramento, California
Commercial UV photometers meeting the requirements of a primary ozone standard as
set forth in 40 CFR Part 50 are available and are currently being used by air monitoring
agencies. Agencies have been encouraged to compare their primary O3 standards (and
O3 transfer standards) as part of their routine quality assurance (QA) programs.
Additionally, to provide a reference against which calibration standards for O3 must be
compared, the U.S. EPA has prescribed a reference calibration procedure based on the
principle of UV light absorption by ozone at a wavelength of 254 nm1. This procedure
provides an authoritative standard for all O3 measurement. Ozone transfer standards
may also be used for calibration if they have been certified against the UV calibration
procedure.3
10.1.5. CALIBRATION FREQUENCY
A system of Level 1 and Level 2 zero/span checks is recommended (see Section 10.2).
These checks must be conducted in accordance with the specific guidance given in
Subsection 9.1 of Section 2.0.9 (Ref. 11). Level 1 zero and span checks should be
conducted at least every two weeks. Level 2 checks should be conducted in between the
Level 1 checks at a frequency determined by the user. Span concentrations for both
levels should be between 70 and 90% of the reporting range.
To ensure accurate measurements of the ambient O3 concentrations, calibrate the T400
at the time of installation, and recalibrate it:
1. Any time the instrument fails above regiment of Level 1 and Level 2 checks.
2. No later than 3 months after the most recent calibration or performance audit which
indicated the T400 response to be acceptable; or
3. Following any one of the activities listed below:
An interruption of more than a few days in T400 operation.
06870C DCN6332

T400 Ozone Analyzer Operator’s Manual EPA Protocol Calibration
209
Any repairs which might affect its calibration.
Physical relocation of the T400.
Any other indication (including excessive zero or span drift) of possible
significant inaccuracy of the unit.
Following any of the activities listed in above, perform Level 1 zero and span checks to
determine if a calibration is necessary. If the zero and span drifts do not exceed the
calibration limits in Section 2.0.9 Q.A. Manual (Ref. 11) (or limits set by the local
agency), a calibration need not be performed.
10.1.6. DATA RECORDING DEVICE
Either a strip chart recorder, data acquisition system, digital data acquisition system
should be used to record the data from the T400 RS-232 port or analog outputs. If
analog readings are being used, the response of that system should be checked against a
NIST referenced voltage source or meter. Data recording device should be capable of
bi-polar operation so that negative readings can be recorded. Strip chart recorder should
be at least 6” (15 cm) wide.
10.1.7. RECORD KEEPING
Record keeping is a critical part of all quality assurance programs. Standard forms
similar to those that appear in this manual should be developed for individual programs.
Three things to consider in the development of record forms are:
1. Does the form serve a necessary function?
2. Is the documentation complete?
3. Will the forms be filed in such a manner that they can easily be retrieved when
needed?
06870C DCN6332

EPA Protocol Calibration T400 Ozone Analyzer Operator’s Manual
210
10.2. LEVEL 1 CALIBRATIONS VERSUS LEVEL 2 CHECKS
All monitoring instruments are subject to some drift and variation in internal parameters
and cannot be expected to maintain accurate calibration over long periods of time the
EPA requires a schedule of periodic checks of the analyzer’s calibration be
implemented. Zero and span checks must be used to document that the data remains
within required limits. These checks are also used in data reduction and system
validation.
A Level 1 Span check is used to document that the T400 is within control limits and
must be conducted every 2 weeks. A Level 2 Span Check is to be conducted between
the Level 1 Checks on a schedule to be determined by the user.
LEVEL 1 ZERO AND SPAN CALIBRATION (Section 12 of Q.A. Handbook)11
A Level 1 zero and span calibration is a simplified, two-point analyzer calibration used when analyzer linearity
does not need to be checked or verified. (Sometimes when no adjustments are made to the analyzer, the
Level 1 calibration may be called a zero/span check, in which case it must not be confused with a Level 2
zero/span check.) Since most analyzers have a reliably linear or near-linear output response with
concentration, they can be adequately calibrated with only two concentration standards (two-point
concentration). Furthermore, one of the standards may be zero concentration, which is relatively easily
obtained and need not be certified. Hence, only one certified concentration standard is needed for the two-
point (Level 1) zero and span calibration. Although lacking the advantages of the multipoint calibration, the
two-point zero and span calibration--because of its simplicity--can be (and should be) carried out much more
frequently. Also, two-point calibrations are easily automated. Frequency checks or updating of the
calibration relationship with a two-point zero and span calibration improves the quality of the monitoring data
by helping to keep the calibration relationship more closely matched to any changes (drifts) in the analyzer
response.
LEVEL 2 ZERO AND SPAN CHECK (Section 12 of Q.A. Handbook)11
A Level 2 zero and span check is an "unofficial" check of an analyzer's response. It may include dynamic
checks made with uncertified test concentrations, artificial stimulation of the analyzer's detector, electronic
or other types of checks of a portion of the analyzer, etc.
Level 2 zero and span checks are not to be used as a basis for analyzer zero or span adjustments,
calibration updates, or adjustment of ambient data. They are intended as quick, convenient checks to be
used between zero and span calibrations to check for possible analyzer malfunction or calibration drift.
Whenever a Level 2 zero or span check indicates a possible calibration problem, a Level 1 zero and span
(or multipoint) calibration should be carried out before any corrective action is taken.
If a Level 2 zero and span check is to be used in the quality control program, a "reference response" for the
check should be obtained immediately following a zero and span (or multipoint) calibration while the
analyzer's calibration is accurately known. Subsequent Level 2 check responses should then be compared
to the most recent reference response to determine if a change in response has occurred. For automatic
Level 2 zero and span checks, the first scheduled check following the calibration should be used for the
reference response. It should be kept in mind that any Level 2 check that involves only part of the analyzer's
system cannot provide information about the portions of the system not checked and therefore cannot be
used as a verification of the overall analyzer calibration.
06870C DCN6332

T400 Ozone Analyzer Operator’s Manual EPA Protocol Calibration
211
10.3. MULTIPOINT CALIBRATION
10.3.1. GENERAL INFORMATION
The procedures for multipoint calibration of an O3 analyzer by UV photometry or a
transfer standard have been specified in the Code of Federal Regulations1. To facilitate
these procedures, operational and calculation data forms have been developed. These
forms will aid in conducting calibrations and quality assurance checks. A detailed
description of the calibration theory and procedures for UV photometry and transfer
standards is in the Code of Federal Regulations1 and TAD.2, 3
In general, ambient monitors are always calibrated in situ without disturbing their
normal sampling setup, except for transferring the sample inlet from the ambient
sampling point to the calibration system.
Calibration should be performed with a primary UV photometer or by a transfer
standard (see Section 10.1.4). The user should be sure that all flow meters are calibrated
under the conditions of use against a reliable standard such as a soap bubble meter or
wet test meter. All volumetric flow rates should be corrected to 25°C and 760 mm Hg.
A discussion of the calibration of flow meters is in Appendix 12 of Ref. 11.
A newly installed T400 should be operated for several hours or preferably overnight
before calibration to allow it to stabilize. A brand new T400 (fresh from the factory)
may require several days of operation to fully stabilize. Allow the photometer or
transfer standard to warm up and stabilize before use, particularly if stored or
transported in cold weather.
10.3.2. MULTIPOINT CALIBRATION PROCEDURE
Multipoint Calibration consist of performing a calibration of the instrument’s Zero Point
and High Span Point, then checking its accuracy at various intermediate points between
these two.
The procedure for performing the Zero Point and High Span Point are identical to those
described in Section 9.2.3.
After the Zero and High Span points have been set, determine five approximately evenly
spaced calibration points between the Zero and High Span Point.
For each midpoint:
06870C DCN6332
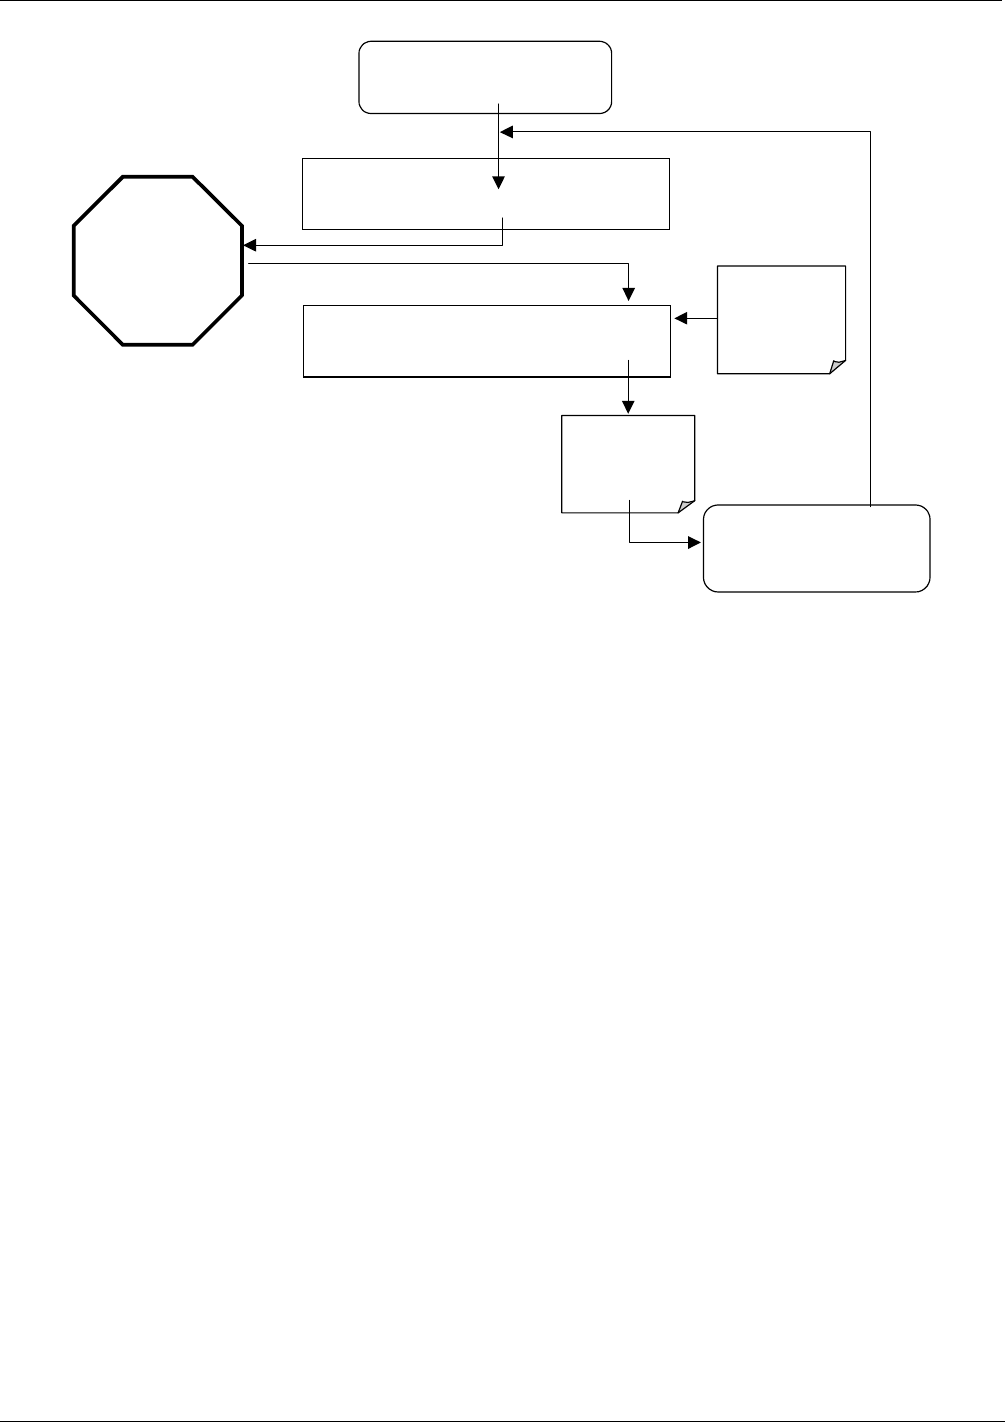
EPA Protocol Calibration T400 Ozone Analyzer Operator’s Manual
212
ZERO CAL M RANGE = 500.0 PPB O3 =XXX.X
< TST TST > ZERO SPAN CONC EXIT
WAIT 10
MINUTES
Or until the
reading
stabilizes and
the SPAN button
is displayed
SAMPLE RANGE = 500.0 PPB O3 =XXX.X
< TST TST > CAL CALZ CALS SETUP
Record the O3
reading as
displayed on the
instrument’s front
panel
Press EXIT to
Return to the
Main SAMPLE
Display
A
CTION:
Allow Calibration Gas diluted to
proper concentration for Midpoint N
ACTION:
Allow Calibration Gas diluted to
proper concentration for
Midpoint N+1
Plot the analyzer responses versus the corresponding calculated concentrations to obtain
the calibration relationships. Determine the straight line of best fit (y = mx + b);
determined by the method of least squares (e.g., see Appendix J of Volume I of the Q.A.
Handbook6).
After the best-fit line has been drawn, determine whether the analyzer response is linear.
To be considered linear, no calibration point should differ from the best-fit line by more
than 2% of full scale.
10.3.3. DYNAMIC MULTIPOINT CALIBRATION CHECK
The EPA-prescribed calibration procedure is based on photometric assays of O3
concentrations in a dynamic flow system. It is based on the same principles that the
T400 uses to measure ozone. The theory is covered in Section 13 of this manual.
Since the accuracy of the calibration standards obtained by this calibration procedure
depends entirely on the accuracy of the photometer, it is very important that the
photometer is operating properly and accurately. The fact that the photometer makes a
ratio measurement (I/Io) rather than an absolute measurement eases this task.
The checks described in this section, if carried out carefully, will provide reasonable
confidence that a photometer which has the required inherent capability is operating
properly. Checks should be carried out frequently on a new calibrator, and a
chronological record of the results should be kept. If the record of the photometer
performance shows continued adequacy and reliability, the frequency of the checks can
be reduced with no loss of confidence in the photometer. (The record, however, may
indicate the need for continued frequent verification of the system condition.) Even
where the record shows excellent stability, the checks should still be carried out
monthly, as the possibility of malfunction is always present.
06870C DCN6332

T400 Ozone Analyzer Operator’s Manual EPA Protocol Calibration
213
A well-designed properly built photometer is a precision instrument, and once it is
operating adequately, it is likely to continue to do so for some time, particularly if the
photometer is stationary and is used intermittently under ideal laboratory conditions. If
the photometer is commercially manufactured, it should include an operation/instruction
manual. Study the manual thoroughly and follow its recommendations carefully and
completely.
10.3.4. LINEARITY TEST
Because the required photometric measurement is a ratio, a simple linearity check of the
photometer is a good indication of accuracy. Linearity of commercially made
photometers may be demonstrated by the manufacturer. The linearity test is conducted
by first generating and assaying an ozone concentration near the upper range limit (80%
of full scale is recommended) of the reporting range in use.
Other data points can be created by adding zero air (Fd) to the flow of originally
generated concentration (Fo) and pass the mixture through a mixing device to ensure a
homogeneous concentration at the Inlet to the analyzer being calibrated.
The First step of performing this linearity test is to determine the dilution ratio of the
various test points according to the following formula:
Equation 10-1
)FF(
F
Rdo
o
+
=
For this test, the flow rates Fo and Fd must be accurately measured within ±2% of the
true value. To help ensure accurate flow measurements, the two flowmeters should be
of the same general type and one should be standardized against the other. The dilution
ratio R is calculated as the flow of the original concentration (Fo) divided by the total
flow (Fo + Fd).
With stable, high resolution flowmeters and with careful technique, R should be accurate
to within 1%.
06870C DCN6332

EPA Protocol Calibration T400 Ozone Analyzer Operator’s Manual
214
When Fd has been adjusted and R has been calculated, assay the diluted concentration
with the photometer and then compare the diluted assay (A2) with the original undiluted
assay (A1) by calculating the percentage of linearity error (E) according to the following
equation.
Equation 10-2
100
A
)R/A(A
E1
21 ×=
This linearity error must be <5% in magnitude and should be <3% for a well-performing
system.
Note The result is not the true linearity error because it includes possible
instrument errors in the flow measurements. This test technique should
only be used as an indicator.
If the linearity error is >5% or is greater than you expect it to be, check and verify the
accuracy of the flow dilution carefully before assuming that the photometer is
inaccurate. The test should be carried out several times at various dilution ratios, and an
averaging technique should be used to determine the final result.
If the linearity error is excessive and cannot be attributed to flow measurement
inaccuracy, check the photometer system for:
Dirty or contaminated cell, lines or manifold.
Inadequate "conditioning" of the system.
Leaking of two-way valve or other system components.
Contaminated zero-air.
Non-linear detectors in the photometer.
Faulty electronics in the photometer.
06870C DCN6332

T400 Ozone Analyzer Operator’s Manual EPA Protocol Calibration
215
10.3.5. O3 LOSS CORRECTION FACTOR
In spite of scrupulous cleaning and preconditioning, some O3 may be lost on contact
with the photometer cell walls and the gas-handling components. Any significant loss of
O3 must be quantitatively determined and used to correct the output concentration
assay. In any case, the O3 loss must not exceed 5%.
To determine O3 loss:
1. Calibrate a stable ozone analyzer with the UV calibration system, assuming no
losses.
2. Generate an O3 concentration, and measure it with the analyzer as close as
possible to the actual inlet of the photometer cell.
3. Measure the concentration as close as possible to the outlet of the cell.
4. Repeat each measurement several times to get a reliable average.
5. Measure the concentration at the output manifold. The tests should be repeated at
several different O3 concentrations.
The percentage of O3 loss is calculated as,
Equation 10-3
100
C2
)CC(
C
lossO% m
oi
m
3×
+
=
Where
Ci = O3 concentration measured at cell inlet, ppm
Co = O3 concentration measured at cell outlet, ppm, and
Cm = O3 concentration measured at output manifold, ppm.
For other configurations, the % O3 loss may have to be calculated differently. The
ozone loss correction factor is calculated as:
L = 1 - 0.01 × % O3 loss.
10.3.6. SPAN DRIFT CHECK
The first level of data validation should accept or reject monitoring data based upon
routine periodic analyzer checks. It is recommended that results from the Level 1 span
checks be used as the first level of data validation. This means up to two weeks of
monitoring data may be invalidated if the span drift for a Level 1 span check is 25%.
For this reason, it may be desirable to perform Level 1 checks more often than the
minimum recommended frequency of every 2 weeks.
10.4. AUDITING PROCEDURES
An audit is an independent assessment of the accuracy of data. Independence is
achieved by having the audit made by an operator other than the one conducting the
routine field measurements and by using audit standards and equipment different from
those routinely used in monitoring. The audit should be a true assessment of the
measurement process under normal operations without any special preparation or
06870C DCN6332

EPA Protocol Calibration T400 Ozone Analyzer Operator’s Manual
216
adjustment of the system. Routine quality control checks (such as zero and span checks)
conducted by the operator are necessary for obtaining and reporting good quality data,
but they are not considered part of the auditing procedure.
Three audits are recommended: two performance audits and a systems audit. These
audits are summarized in 10.4.2 at the end of this section. See Appendix 15 of the Q.A.
Handbook (Reference 11) for detailed procedures for a systems audit and for a
performance audit, respectively.
Proper implementation of an auditing program will serve a twofold purpose: (1) to
ensure the integrity of the data and (2) to assess the data for accuracy. The technique for
estimating the accuracy of the data is given in Section 2.0.8 of the QA Manual
(Reference 11).
MULTIPOINT CALIBRATION AUDIT
A performance audit consists of challenging the continuous analyzer with known
concentrations of O3 within the measurement range of the analyzer. The difference
between the known concentration and the analyzer response is obtained, and an estimate
of the analyzer's accuracy is determined.
Known concentrations of O3 must be generated by a stable O3 source and assayed by the
primary UV photometric procedure or may be obtained using a certified O3 transfer
standard. Procedures used to generate and assay O3 concentrations are the same as those
described in Section 10.1.3. If during a regular field audit, the differences recorded for
most analyzers are either negatively or positively biased, a check of the calibrator used
in routine calibrations of the analyzers may be advisable.
The test atmosphere must pass through all filters, scrubbers, conditioners, and other
components used during normal ambient sampling and through as much of the ambient
air inlet system as practical. Be sure the manifold includes a vent to assure that the T400
inlet is at atmospheric pressure.
Audit Procedure:
1. Turn on the zero-air flow in the audit device.
2. After stabilization, record the analyzer zero.
3. Generate an up-scale audit point.
4. After stabilization, record the O3 analyzer response.
5. Assay the audit concentration using an audit UV photometer or certified transfer
standard.
6. Repeat steps 4 and 5 for the two remaining up-scale audit points. If analyzer is
operated on 0-1.0 ppm range, four up-scale audit points must be used.
Results:
Results of the audit will be used to estimate the accuracy of the ambient air quality data.
Calculation of accuracy is described in Appendix 15 of the Q.A. Handbook (Reference
11).
10.4.1. DATA PROCESSING AUDIT
Data processing audit involves reading a strip chart record, calculating an average, and
transcribing or recording the results on the SAROAD form. The data processing audit
should be performed by an individual other than the one who originally reduced the
06870C DCN6332

T400 Ozone Analyzer Operator’s Manual EPA Protocol Calibration
217
data. Initially, the audit should be performed 1 day out of every 2 weeks of data. For
two 1-hour period within each day audited, make independent readings of the strip chart
record and continue through the actual transcription of the data on the SAROAD form.
The 2 hours selected during each day audited should be those for which either the trace
is most dynamic (in terms of spikes) or the average concentration is high.
The data processing audit is made by calculating the difference,
Equation 10-4
d = [O3]R - [O3]A
Where
d = the difference between measured and audit values, ppm,
[O3]R = the recorded analyzer response, ppm, and
[O3]A = the data processing O3 concentration, ppm.
If d exceeds 0.02 ppm, check all of the remaining data in the 2-week period.
10.4.2. SYSTEM AUDIT
A system audit is an on-site inspection and review of the quality assurance activities
used for the total measurement system (sample collection, sample analysis, data
processing, etc.); it is a qualitative appraisal of system quality.
Conduct the system audit at the startup of a new monitoring system and periodically (as
appropriate) as significant changes in system operations occur.
The recommended audit schedule depends on the purpose for which the monitoring data
are being collected. For example, Appendix A, 40 CFR 588 requires that each analyzer
in State and Local Air Monitoring Networks (SLAMS) be audited at least once a year.
Each agency must audit 25% of the reference or equivalent analyzers each quarter. If an
agency operates less than four reference or equivalent analyzers, it must randomly select
analyzers for re-auditing so that one analyzer will be audited each calendar quarter and
so that each analyzer will be audited at least once a year.
Appendix B, 40 CFR 589 requires that each PSD (prevention of significant deterioration)
reference or equivalent analyzer be audited at least once a sampling quarter. Results of
these audits are used to estimate the accuracy of ambient air data.
10.4.3. ASSESSMENT OF MONITORING DATA FOR PRECISION AND
ACCURACY
A periodic check is used to assess the data for precision. A one-point precision check
must be carried out at least once every 2 weeks on each analyzer at an O3 concentration
between 0.08 and 0.10 ppm. The analyzer must be operated in its normal sampling
mode, and the precision test gas must pass through all filters, scrubbers, conditioners,
and other components used during normal ambient sampling. Those standards used for
calibration or auditing may be used.
Estimates of single instrument accuracy for ambient air quality measurements from
continuous methods are calculated according to the procedure in Appendix 15 of the
Q.A. Handbook (Reference 11).
06870C DCN6332

EPA Protocol Calibration T400 Ozone Analyzer Operator’s Manual
218
10.5. SUMMARY OF QUALITY ASSURANCE CHECKS
Essential to quality assurance are scheduled checks for verifying the operational status
of the monitoring system:
The operator should visit the site at least once each week.
A Level 1 zero and span check must be made on the analyzer every two weeks.
Level 2 zero and span checks should be conducted at a frequency desired by the
user.
In addition, an independent precision check between 0.08 and 0.10 ppm may be required
at least once every two weeks.
Table 10-1 summarizes the quality assurance activities for routine operations. A
discussion of each activity appears in the following sections.
To provide for documentation and accountability of activities, a checklist should be
compiled and then filled out by the field operator as each activity is completed.
Table 10-1: Daily Activity Matrix
CHARACTERISTI
C ACCEPTANCE LIMITS
FREQUENCY AND
METHOD OF
MEASUREMENT
ACTION IF
REQUIREMENTS ARE NOT
MET
Shelter
Temperature
Mean temperature between 22C
and 28C (72F and 82F), daily
fluctuations not greater than 2C.
Check thermograph chart
daily for variations not
greater than 2C (4F).
Mark strip chart for the
affected time period.
Repair/adjust temp control.
Sample
Introduction
System
No moisture, foreign material, leaks,
obstructions; sample line connected
to manifold.
Weekly visual inspection. Clean, repair or replace as
needed.
Recorder
Adequate ink supply and chart
paper.
Legible ink traces.
Correct settings of chart speed and
range switches.
Correct time.
Weekly visual inspection.
Replenish and chart paper
supply
Adjust recorder time to agree
with clock note on chart.
Analyzer
Operational
Settings
Flow and regulator indicators at
proper settings.
Temperate indicators cycling or at
proper levels.
Analyzer in sample mode.
Zero/span controls locked.
Weekly visual inspection. Adjust or repair as needed.
Analyzer
Operational
Check
Zero and span within tolerance limits
as described in Subsec. 9.1.3 of
Sec. 2.0.9
(Ref. 11).
Level 1 zero and span
every 2 weeks; Level 2
between Level 1 checks
at frequency desired by
user.
Isolate source error, and
repair.
After corrective action,
recalibrate analyzer.
Precision Check Assess precision as described in
Sec. 2.0.8 (Ref. 11).
Every 2 weeks,
Sec. 2.0.8 (Ref. 11).
Calculate, report precision,
Sec. 2.0.8 (Ref. 11).
06870C DCN6332

T400 Ozone Analyzer Operator’s Manual EPA Protocol Calibration
219
Table 10-2: Activity Matrix for Audit Procedure
AUDIT ACCEPTANCE LIMITS
FREQUENCY AND
METHOD OF
MEASUREMENT
ACTION IF REQUIREMENTS
ARE NOT MET
Multipoint calibration audit
The difference between the
measured and the audit
values as a measure of
accuracy (Sec. 2.0.8 of Ref.
11).
At least once a quarter
(Sec. 2.0.8 of Ref. 11) Re-calibrate the analyzer.
Data processing audit
Adhere to stepwise
procedure for data reduction
(Sec. 8.4); no difference
exceeding
0.02 ppm.
Perform independent
check on a sample of
recorded data, e.g.,
1 day out of every 2
weeks of data, 2 hours for
each day.
Check all remaining data if
one or more audit checks
exceeds 0.02 ppm.
Systems audit Method described in this
section of the Handbook.
At the startup of a new
monitoring system, and
periodically as
appropriate; observation
and checklist.
Initiate improved methods
and/or training programs.
06870C DCN6332

EPA Protocol Calibration T400 Ozone Analyzer Operator’s Manual
220
Table 10-3: Activity Matrix for Data Reduction, Validation and Reporting
ACTIVITY ACCEPTANCE LIMITS
FREQUENCY AND
METHOD OF
MEASUREMENT
ACTION IF REQUIREMENTS
ARE NOT MET
Data reduction Stepwise procedure,
Sec. 2.7.4 Ref. 11.
Follow the method for
each strip chart.
Review the reduction
procedure.
Span drift check
Level 1 span drift check
<25%, Sec. 2.7.3
Ref 11.
Check at least every 2
weeks; Sec. 2.7.3,
Ref. 11.
Invalidate data; take
corrective action; increase
frequency of Level 1
checks until data is
acceptable.
Strip chart edit No sign of malfunction. Visually check each strip
chart.
Void data for time interval
for which malfunction is
detected.
Data reporting
Data transcribed to
SAROAD hourly data form;
Ref. 10.
Visually check. Review the data
transcribing procedure.
Table 10-4: Activity Matrix for Calibration Procedures
CALIBRATION
ACTIVITIES ACCEPTANCE LIMITS
FREQUENCY AND
METHOD OF
MEASUREMENT
ACTION IF REQUIREMENTS
ARE NOT MET
Zero-air
Zero-air, free of
contaminants
(Sec. 2.0.7 Ref. 11.).
Compare the new Zero-
air against Source known
to be free of
contaminants.
Take corrective action with
generation system as
appropriate.
Calibrator
Meet all requirement for UV
photometer as specified in
Sec. 2.7.2 QA Manual, TAD2
and the Fed. Reg.1 or
approve Transfer Standard
Sec. 2.7.1, Q.A. Manual and
TAD3.
Re-certify transfer
Standard against Primary
UV Photometer at least
Twice each quarter.
Return to supplier, or take
corrective action with
system as appropriate.
Multipoint
According to Calibration
procedure (Sec. 2.7.2 Q.A...
Manual Ref 11) and Federal
Register; data recorded.
Calibrate at least Once,
quarterly; Anytime an
audit Indicates
discrepancy; After
maintenance that May
affect the Calibration
(Subsec 2.1) Federal
Register1.
Repeat the calibration.
06870C DCN6332

T400 Ozone Analyzer Operator’s Manual EPA Protocol Calibration
221
10.6. REFERENCES
1. Calibration of Ozone Reference Methods, Code of Federal Regulations, Title 40, Part 50, Appendix D.
2. Technical Assistance Document for the Calibration of Ambient Ozone Monitors, EPA publication
available from EPA, Department E (MD-77), Research Triangle Park, N.C. 27711. EPA-600/4-79-057,
September 1979.
3. Transfer Standards for Calibration of Ambient Air Monitoring Analyzers for Ozone, EPA publication
available from EPA, Department E (MD-77), Research Triangle Park, N.C. 27711. EPA-600/4-79-056,
September 1979.
4. Ambient Air Quality Surveillance, Code of Federal Regulations, Title 40, Part 58.
5. U.S. Environmental Protection Agency. Evaluation of Ozone Calibration Procedures. EPA-600/S4-80-
050, February 1981.
6. Quality Assurance Handbook for Air Pollution Measurement Systems. Vol. I.
EPA-600/9-76-005. March 1976.
7. Field Operations Guide for Automatic Air Monitoring Equipment, U.S. Environmental Protection Agency,
Office of Air Programs; October 1972. Publication No. APTD-0736, PB 202-249, and PB 204-650.
8. Appendix A - Quality Assurance Requirements for State and Local Air Monitoring Stations (SLAMS),
Code of Federal Regulations, Title 40, Part 58.
9. Appendix B - Quality Assurance Requirements for Prevention of Significant Deterioration (PSD) Air
Monitoring, Code of Federal Regulations, Title 40, Part 50, Appendix D.
10. Aeros Manual Series Volume II: Aeros User's Manual. EPA-450/2-76-029, OAQPS No. 1.2-039.
December 1976.
11. Quality Assurance Handbook for Air Pollution Measurement Systems, Volume II, (abbreviated Q.A.
Handbook Volume II) National Technical Information Service (NTIS). Phone (703) 487-4650 part
number PB 273-518 or the USEPA Center for Environmental Research Information (513) 569-7562 part
number EPA 600/4/77/027A.
06870C DCN6332

EPA Protocol Calibration T400 Ozone Analyzer Operator’s Manual
222
This page intentionally left blank.
06870C DCN6332

223
PART III
–
MAINTENANCE AND SERVICE
06870C DCN6332

224
06870C DCN6332
225
11. INSTRUMENT MAINTENANCE
For the most part, the T400 analyzer is maintenance free, there are, however, a minimal
number of simple procedures that when performed regularly will ensure that the T400
photometer continues to operate accurately and reliably over its lifetime.
Repairs and troubleshooting are covered in Section12 of this manual.
11.1. MAINTENANCE SCHEDULE
Table 11-1 shows a typical maintenance schedule for the T400. Please note that in
certain environments (i.e. dusty, very high ambient pollutant levels) some maintenance
procedures may need to be performed more often than shown.
Note A span and zero calibration check (see CAL CHECK REQ’D Column of
Table 9-1) must be performed following some of the maintenance
procedures listed below.
- To perform a CHECK of the instrument’s Zero or Span Calibration
follow the same steps as described in Section 9.3.
- DO NOT PRESS THE ENTR BUTTON at the end of each operation.
Pressing the ENTR button resets the stored values for OFFSET and
SLOPE and alters the instruments Calibration.
- Alternatively, use the Auto cal feature described in Section9.4 with the
with the CALIBRATE ATTRIBUTE SET TO OFF
WARNING - Electrical Shock Hazard
RISK OF ELECTRICAL SHOCK. DISCONNECT POWER BEFORE PERFORMING
ANY OF THE FOLLOWING OPERATIONS THAT REQUIRE ENTRY INTO THE
INTERIOR OF THE ANALYZER.
CAUTION
Qualified Personnel
THE OPERATIONS OUTLINED IN THIS SECTION ARE TO BE PERFORMED BY
QUALIFIED MAINTENANCE PERSONNEL ONLY.
06870C DCN6332

Instrument Maintenance T400 Ozone Analyzer Operator’s Manual
226
This page intentionally left blank.
06870C DCN6332

227
Table 11-1: T400 Maintenance Schedule
DATE PERFORMED
ITEM ACTION FREQ
CAL
CHECK
REQ’D.1
MANUAL
SECTION
Particulate
Filter Replace Weekly or as
needed Yes 11.3.1
Verify Test
Functions
Record and
analyze
Weekly or after
any Maintenance
or Repair
No 12.1.2
Pump
Diaphragm Replace As Needed Yes - -
O3
Reference
Scrubber
Replace Every 2-5 years,
as needed Yes 12.10.2
IZS
Zero Air
Scrubber
Replace Annually No
12.10.3
Absorption
Tube
Inspect
- - -
Clean
Annually
- - -
As Needed
Yes 11.3.7
Perform
Flow Check Check Flow Every 6 Months No 11.3.6
Perform
Leak Check
Perform
Leak Check
Annually or after
any Maintenance
or Repair
Yes 11.3.4
Pneumatic
lines
Examine
and clean As needed Yes if
cleaned - -
06870C DCN6332

Instrument Maintenance T400 Ozone Analyzer Operator’s Manual
228
This page intentionally left blank.
06870C DCN6332

229
11.2. PREDICTIVE DIAGNOSTICS
Predictive diagnostic functions including failure warnings and alarms built into the
analyzer’s firmware allow the user to determine when repairs are necessary without
performing painstaking preventative maintenance procedures.
The Test Functions can also be used to predict failures by looking at how their values
change over time. Initially it may be useful to compare the state of these Test Functions
to the values recorded on the printed record of the final calibration performed on your
instrument at the factory, P/N 04314. The following table can be used as a basis for
taking action as these values change with time. The internal data acquisition system
(DAS) is a convenient way to record and track these changes. Use APICOM to
download and review this data from a remote location.
Table 11-2: Predictive Uses for Test Functions
FUNCTION MODE BEHAVIOR INTERPRETATION
STABIL ZERO CAL
Increasing
Pneumatic leaks – instrument & sample
system
Malfunctioning UV lamp (Bench)
O3 REF SAMPLE Decreasing UV lamp ageing
Mercury contamination
O3 DRIVE CALS Increasing Ageing IZS UV lamp (only if reference
detector option is installed)
Increasing > 1” Pneumatic Leak between sample inlet and
optical bench
PRES SAMPLE
Decreasing > 1”
Dirty particulate filter
Pneumatic obstruction between sample inlet
and optical bench
Obstruction in sampling manifold
SAMP FL SAMPLE Decreasing
Pump diaphragm deteriorating
Sample flow orifice plugged/obstructed
Pneumatic obstruction between sample inlet
and optical bench
Obstruction in sampling manifold
Increasing
Pneumatics becoming contaminated/dirty
Dirty particulate filter
Pneumatic leaks – instrument & sample
system
SLOPE SPAN CAL
Decreasing Contaminated calibration gas
Increasing
Obstructed/leaking Meas/Ref Valve
Pneumatic leaks – instrument & sample
system
OFFSET ZERO CAL
Decreasing
Contaminated zero calibration gas
Obstructed Meas/Ref Valve
Pneumatic leaks – instrument & sample
system
06870C DCN6332
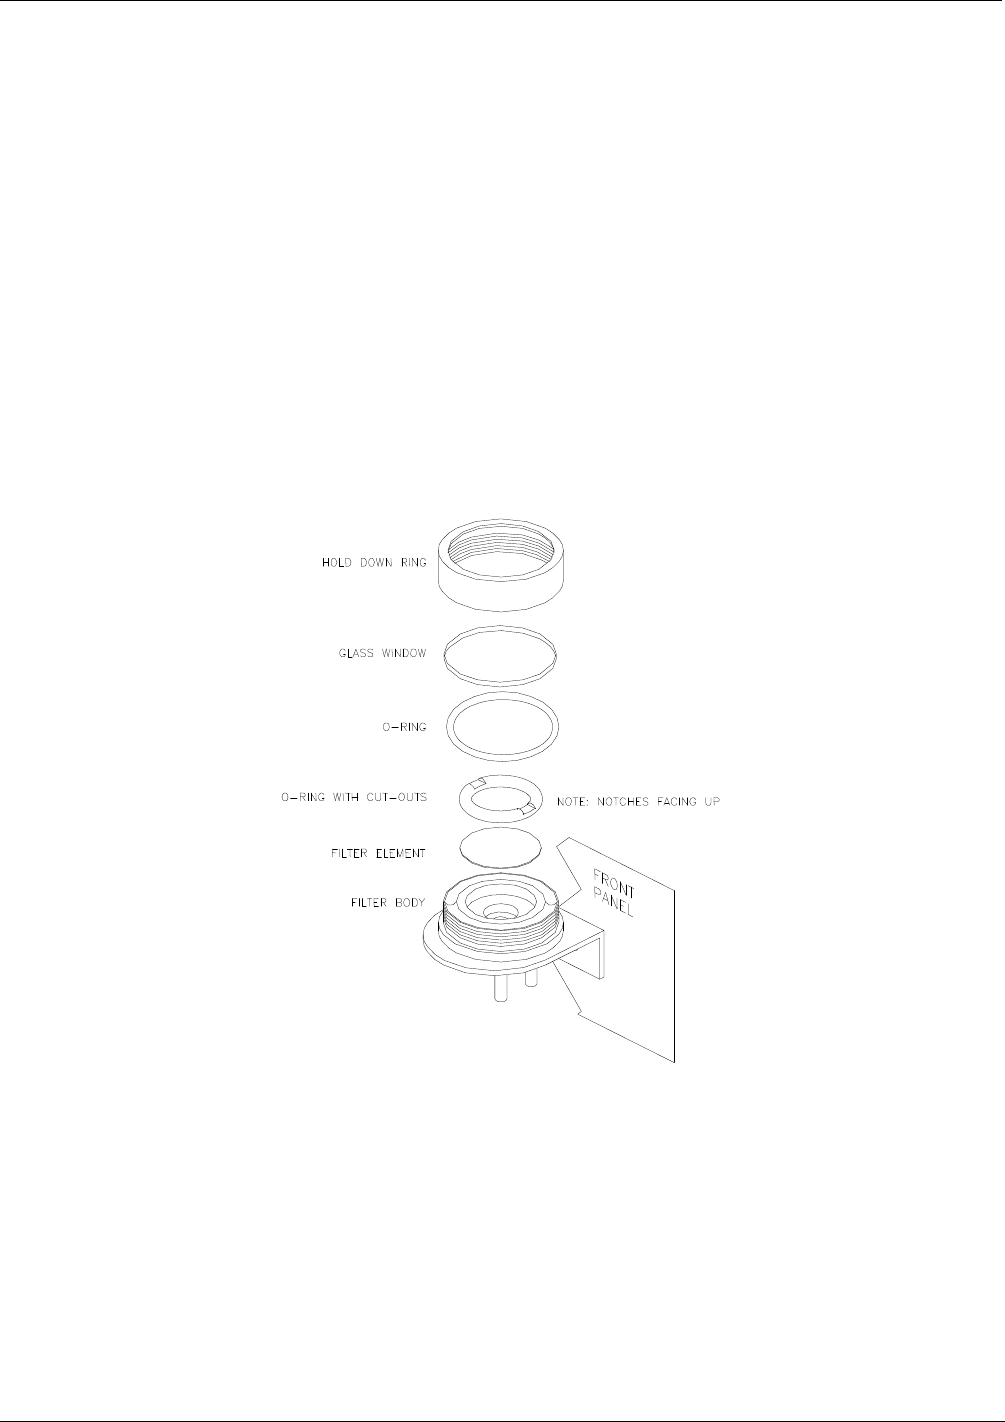
Instrument Maintenance T400 Ozone Analyzer Operator’s Manual
230
11.3. MAINTENANCE PROCEDURES
The following procedures are to be performed periodically as part of the standard
maintenance of the Model T400.
11.3.1. REPLACING THE SAMPLE PARTICULATE FILTER
The particulate filter should be inspected often for signs of plugging or contamination.
We recommend that when you change the filter; handle it and the wetted surfaces of the
filter housing as little as possible. Do not touch any part of the housing, filter element,
PTFE retaining ring, glass cover and the o-ring with your bare hands. TAPI
recommends using PTFE coated tweezers or similar handling to avoid contamination of
the sample filter assembly.
To change the filter:
1. Turn OFF the analyzer to prevent drawing debris into the instrument.
1. Open the T400’s hinged front panel and unscrew the knurled retaining ring on the
filter assembly.
Figure 11-1 Replacing the Particulate Filter
2. Carefully remove the retaining ring, PTFE o-ring, glass filter cover and filter
element.
3. Replace the filter, being careful that the element is fully seated and centered in the
bottom of the holder.
4. Re-install the PTFE o-ring with the notches up; the glass cover, then screw on the
retaining ring and hand tighten. Inspect the seal between the edge of filter and the
o-ring to assure a proper seal.
5. Re-start the Analyzer.
06870C DCN6332
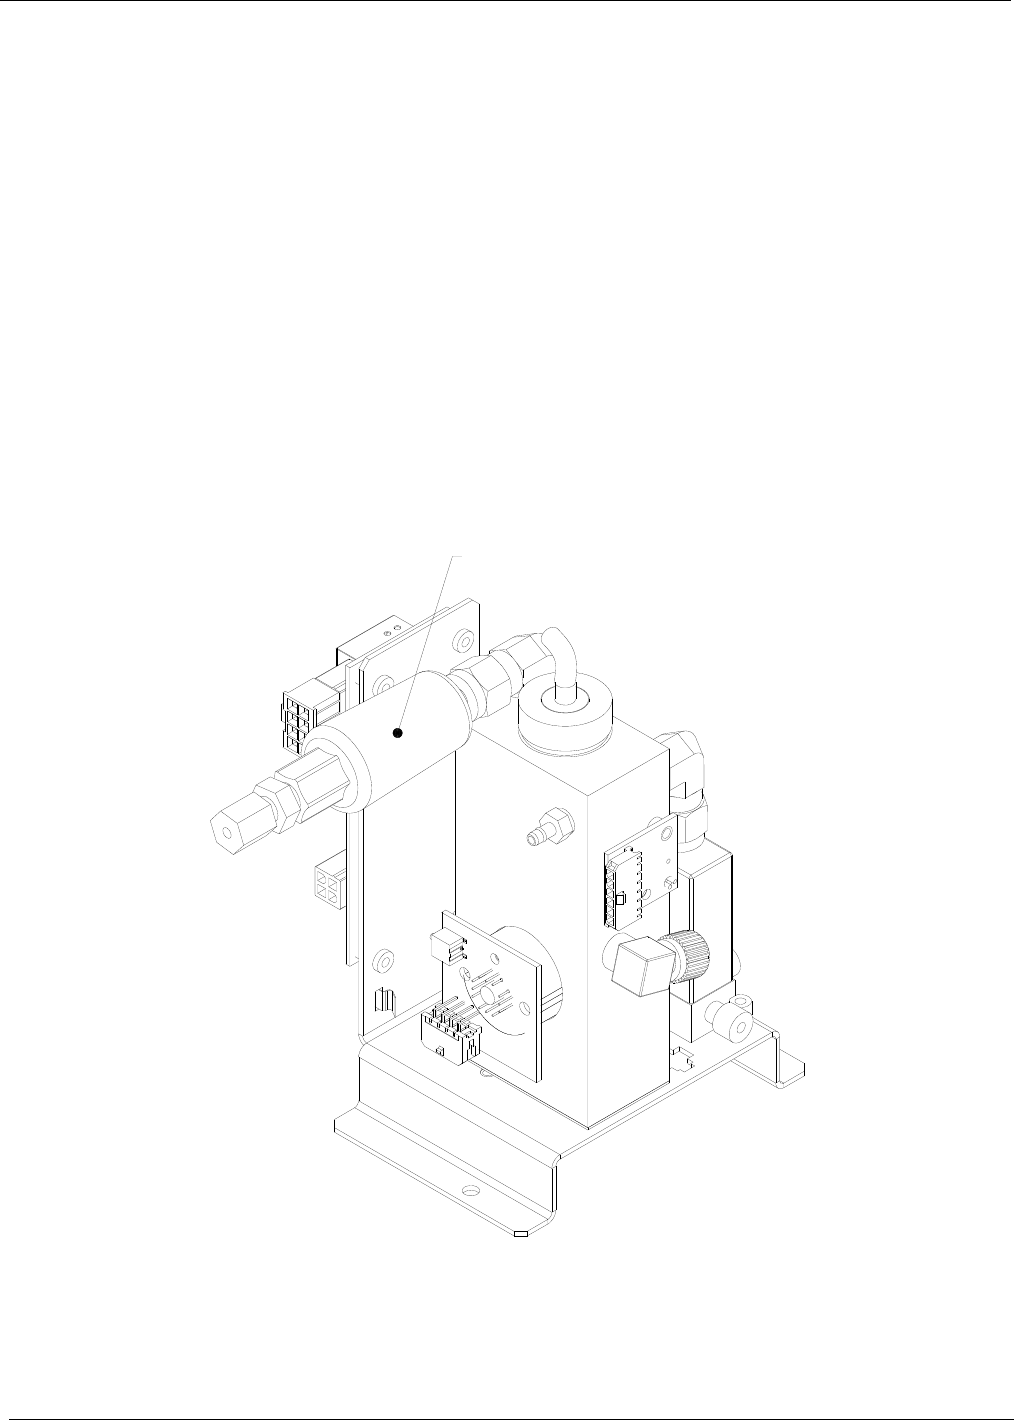
T400 Ozone Analyzer Operator’s Manual Instrument Maintenance
231
11.3.2. REBUILDING THE SAMPLE PUMP
The diaphragm in the sample pump periodically wears out and must be replaced. A
sample rebuild kit is available – see Appendix B of this manual for the part number of
the pump rebuild kit. Instructions and diagrams are included with the kit.
Always perform a flow and leak check after rebuilding the sample pump.
11.3.3. REPLACING THE IZS OPTION ZERO AIR SCRUBBER
1. Turn off the analyzer.
2. Remove the cover from the analyzer.
3. Disconnect the white nylon ¼”-1/8” fitting from the Zero Air Scrubber (See Figure
11-2).
4. Remove the old scrubber by disconnecting the 9/16” fitting at the top of the O3
generator tower, then removing the scrubber.
5. Install the new scrubber by reversing these instructions.
IZS Zero Air Scrubber
Figure 11-2 Replacing the IZS Zero Air Scrubber
06870C DCN6332

Instrument Maintenance T400 Ozone Analyzer Operator’s Manual
232
11.3.4. IZS DESICCANT (OPTION 56)
The M400E can be fitted with a desiccant dryer to provide a dry air source to the IZS
sub-system. This option consists of a rear panel mounted scrubber cartridge filled with
anhydrous calcium sulfate (CaSO4) desiccant.
The desiccant material is expendable and must be replaced at regular intervals.
The material exhibits a color change when it has been saturated with water vapor,
turning from blue to pink.
The scrubber cartridge should be refilled before the entire scrubber turns pink.
Replacement interval will depend on how often the IZS is used, as well as ambient
levels of humidity in your application.
Initially the desiccant should be frequently monitored until a standard replacement
interval can be established.
11.3.5. PERFORMING LEAK CHECKS
Leaks are the most common cause of analyzer malfunction; Section 11.3.5.1 presents a
simple leak check procedure. Section 11.3.5.2 details a more thorough procedure.
11.3.5.1. Vacuum Leak Check and Pump Check
This method is easy and fast. It detects, but does not locate most leaks; it also verifies
that the sample pump is in good condition.
1. Turn the analyzer ON, and allow enough time for flows to stabilize.
2. Cap the sample inlet port.
3. After 2 minutes, when the pressures have stabilized, note the SAMP FL and PRES
test function readings on the front panel.
4. If SAMP FL < 10 CC/M then the analyzer is free of any large leaks.
5. If PRES < 10 IN-HG-A then the sample pump diaphragm is in good condition.
11.3.5.2. Pressure Leak Check
If you cannot locate the leak by the above procedure, obtain a leak checker similar to the
TAPI part number 01960, which contains a small pump, shut-off valve and pressure
gauge. Alternatively, a tank of pressurized gas, with the two-stage regulator adjusted to
≤ 15 psi; a shutoff valve and pressure gauge may be used.
CAUTION – General Safety Hazard
Once the fittings have been wetted with soap solution, DO NOT apply / re-apply
vacuum, as this will cause soap solution to be drawn into the instrument,
contaminating it.
DO NOT exceed 15 psi pressure.
1. Turn OFF power to the instrument.
2. Install a leak checker or tank of gas as described above on the sample inlet at the
rear panel.
3. Install a cap on the exhaust fitting on the rear panel.
06870C DCN6332

T400 Ozone Analyzer Operator’s Manual Instrument Maintenance
233
4. Remove the instrument cover and locate the sample pump. Disconnect the two
fittings on the sample pump and install a union fitting in place of the pump. The
analyzer cannot be leak checked with the pump in line due to internal leakage that
normally occurs in the pump.
5. Pressurize the instrument with the leak checker, allowing enough time to pressurize
the instrument through the critical flow orifice fully. Check each fitting with soap
bubble solution, looking for bubbles. Once the fittings have been wetted with soap
solution, do not re-apply vacuum, as it will draw soap solution into the instrument
and contaminate it. Do not exceed 15 psi pressure.
6. If the instrument has one of the zero and span valve options, the normally closed
ports on each valve should also be separately checked. Connect the leak checker
to the normally closed ports and check with soap bubble solution.
7. If the analyzer is equipped with an IZS option, connect the leak checker to the dry
air inlet and check with soap bubble solution.
8. Once the leak has been located and repaired, the leak-down rate should be < 1 in-
Hg (0.4 psi) in 5 minutes after the pressure is shut off.
06870C DCN6332

Instrument Maintenance T400 Ozone Analyzer Operator’s Manual
234
11.3.6. PERFORMING A SAMPLE FLOW CHECK
Note Always use a separate calibrated flow meter capable of measuring flows
in the 0 – 1000 cc/min range to measure the gas flow rate though the
analyzer. DO NOT use the built in flow measurement viewable from the
Front Panel of the instrument. This measurement is only for detecting
major flow interruptions such as clogged or plugged gas lines. See rear
panel for sample port location.
1. Turn off power.
2. Attach the flow meter to the sample inlet port on the rear panel. Ensure that the
inlet to the Flow Meter is at atmospheric pressure.
3. Turn on instrument power.
4. Sample flow should be 800 cc/min 10%.
Low flows indicate blockage somewhere in the pneumatic pathway. High flows indicate
leaks downstream of the Flow Control Assembly.
Once an accurate measurement has been recorded by the method described above, adjust
the analyzer’s internal flow sensors by following the procedure described in
Section9.5.2.
06870C DCN6332
T400 Ozone Analyzer Operator’s Manual Instrument Maintenance
235
11.3.7. MAINTENANCE OF THE PHOTOMETER ABSORPTION TUBE
11.3.7.1. Cleaning or Replacing the Absorption Tube
Note Although this procedure should never be needed as long as the user is
careful to supply the photometer with clean, dry and particulate-free zero
air only, it is included here for those rare occasions when cleaning or
replacing the absorption tube may be required.
1. Power off the unit.
2. Remove the center cover from analyzer the optical bench
3. Locate the optical bench (see Figure 3-5).
4. Remove the top cover of the optical bench.
1. Unclip the sample thermistor from the tube.
2. Loosen the two screws on the round tube retainers at either end of the tube.
3. Using both hands, carefully rotate the tube to free it.
4. Slide the tube towards the lamp housing.
The front of the tube can now be slid past the detector block and out of the
instrument.
CAUTION
General Safety Hazard
Do not cause the tube to bind against the metal housings.
The tube may break and cause serious injury.
5. Clean the tube only with de-ionized water.
6. Air dry the tube.
7. Check the cleaning job by looking down the bore of the tube.
It should be free from dirt and lint.
8. Inspect the o-rings that seal the ends of the optical tube (these o-rings may stay
seated in the manifolds when the tube is removed.)
If there is any noticeable damage to these o-rings, they should be replaced.
9. Re-assemble the tube into the lamp housing and perform an AUTO LEAK CHECK
on the instrument.
Note Before re-tightening the retainer screws, gently push the tube all the way
towards the front of the optical bench when it is re-assembled. This will
ensure that the tube is assembled with the forward end against the stop
inside the detector manifold.
06870C DCN6332

Instrument Maintenance T400 Ozone Analyzer Operator’s Manual
236
11.3.7.2. UV Lamp Adjustment
This procedure details the steps for adjustment of the UV source lamp in the optical
bench assembly. This procedure should be done whenever the test function O3 REF
value drops below 3000 mV.
CAUTION – UV Radiation Risk
Do not look directly at the light of the UV lamp.
1. Make sure the analyzer is warmed-up and has been running for at least 15 minutes
before proceeding.
2. Remove the cover from the analyzer.
3. Locate the UV DETECTOR GAIN ADJUST POT on the photometer assembly (see
Figure 11-3).
4. Perform the following procedure:
06870C DCN6332
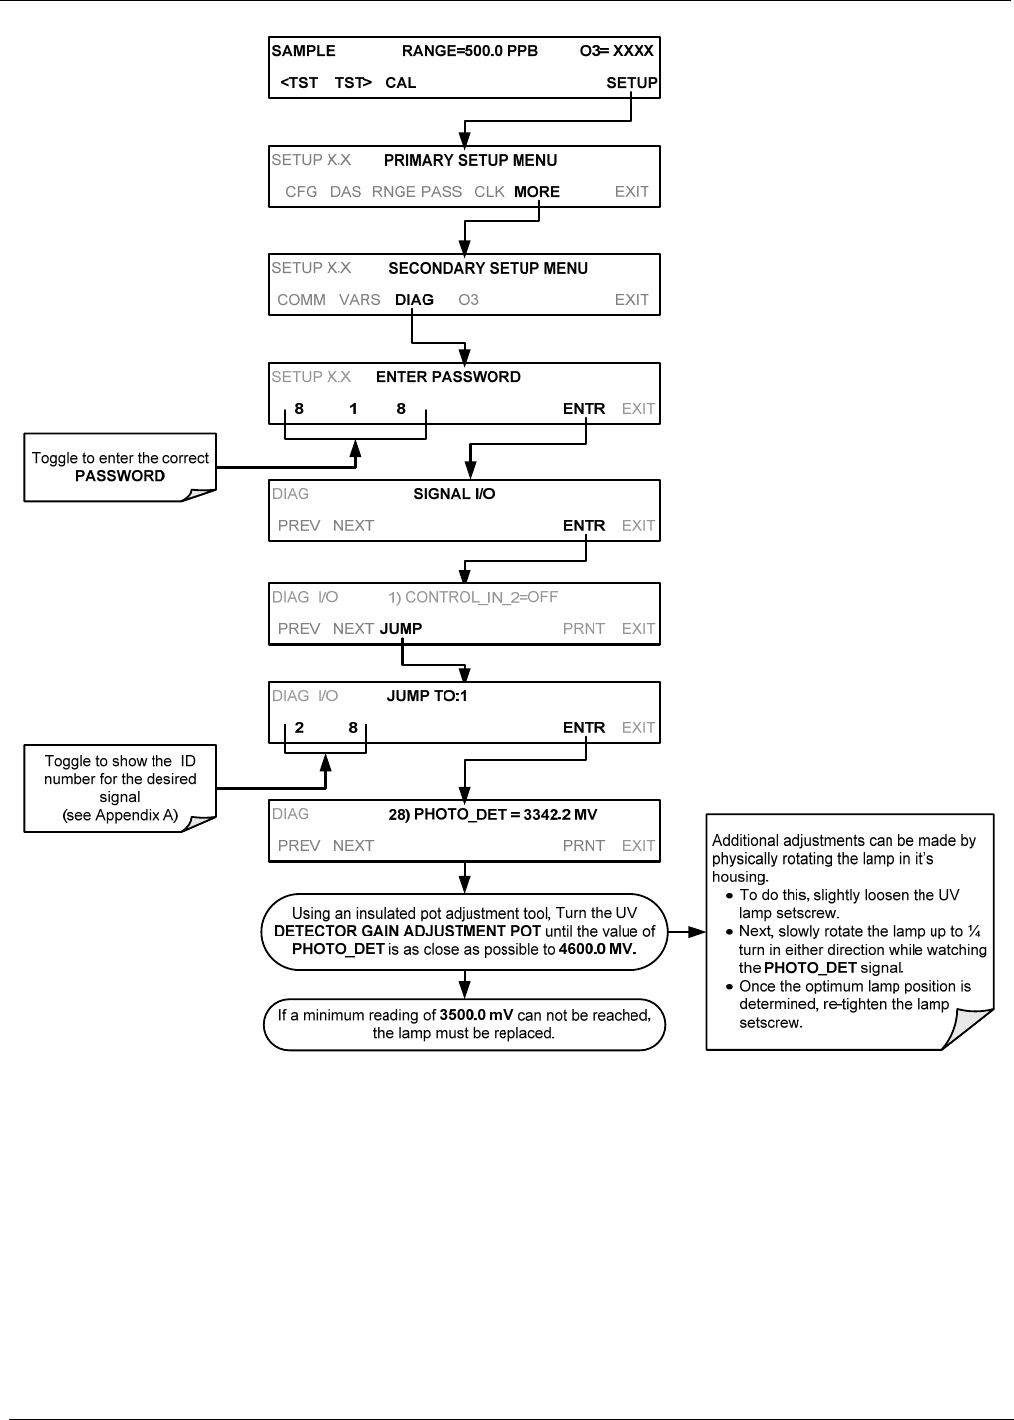
T400 Ozone Analyzer Operator’s Manual Instrument Maintenance
237
5. Replace the cover on the analyzer.
06870C DCN6332
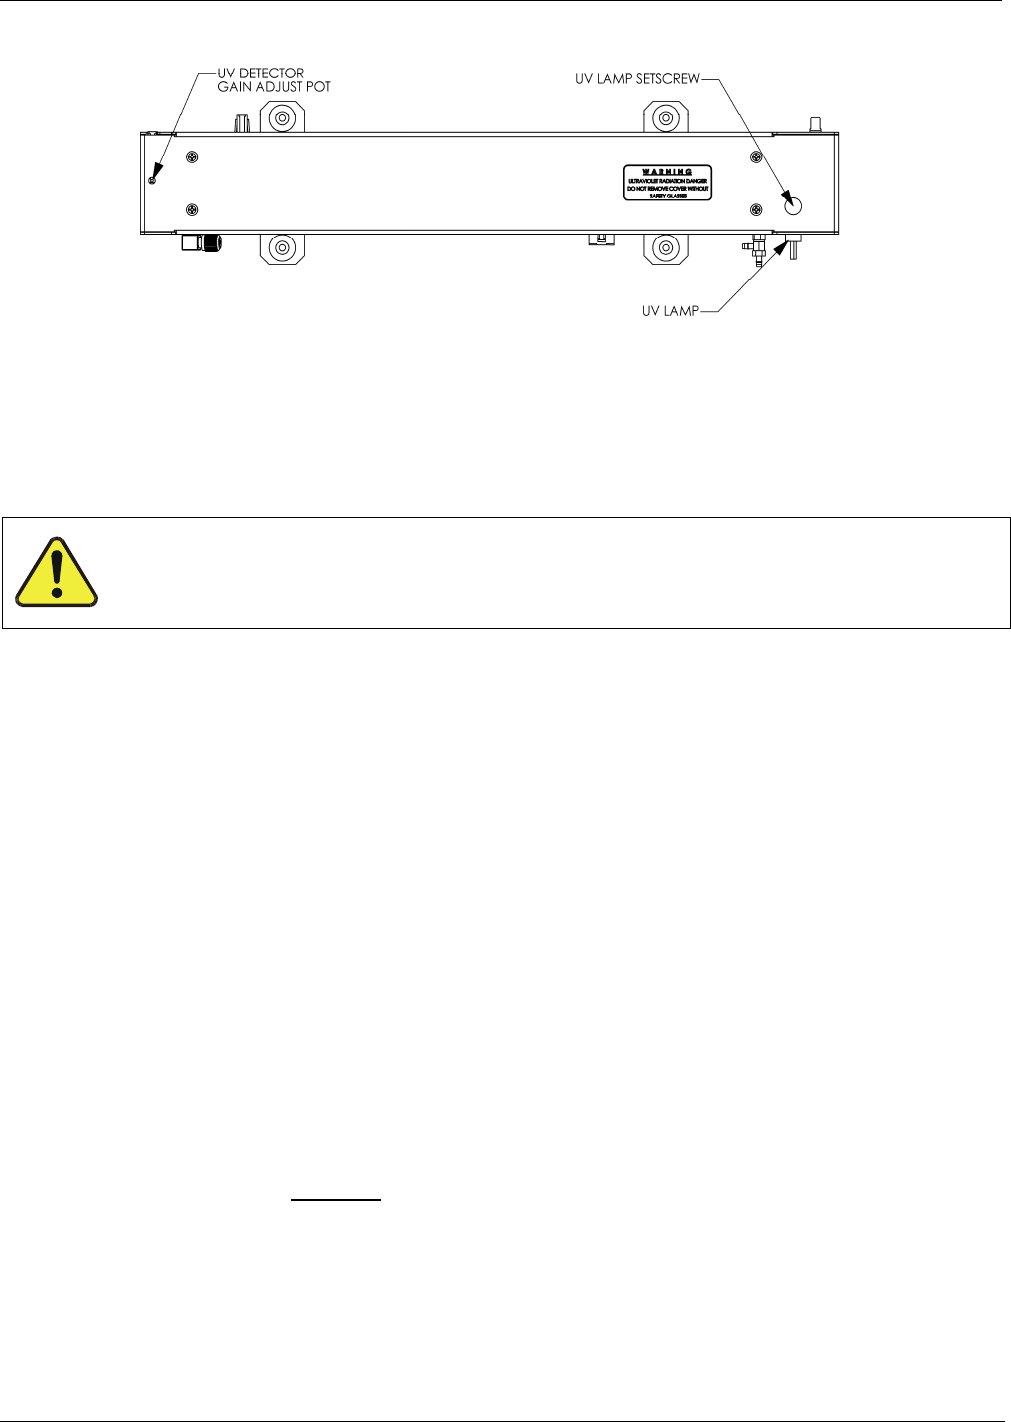
Instrument Maintenance T400 Ozone Analyzer Operator’s Manual
238
Figure 11-3: Optical Bench – Lamp Adjustment/ Installation
11.3.7.3. UV Lamp Replacement
This procedure details the steps for replacement of the UV source lamp in the optical
bench assembly. This procedure should be done whenever the lamp can no longer be
adjusted as described in Section 11.3.7.2.
CAUTION – UV Radiation Risk
Power down the instrument before proceeding with UV lamp replacement.
1. Turn the analyzer off.
2. Remove the cover from the analyzer.
3. Locate the Optical Bench Assembly (see Figure 3-5).
4. Locate the UV lamp at the front of the optical bench assembly (see Figure 13-17)
5. Unplug the lamp cable from the power supply connector on the side of the optical
bench.
6. Slightly loosen (do not remove) the UV lamp setscrew and pull the lamp from its
housing.
7. Install a new lamp in the housing, pushing it all the way in.
Leave the UV lamp setscrew loose for now.
8. Turn the analyzer back on and allow it to warm up for at least 15 minutes.
9. Turn the UV detector gain adjustment pot (See Section 11.3.7.2) clockwise to its
minimum value. The pot should click softly when the limit is reached.
10. Perform the UV Lamp Adjustment procedure described in Section 11.3.7.2 with the
following exceptions:
Slowly rotate the lamp in its housing (up to ¼ turn in either direction) until a
MINIMUM value is observed.
Make sure the lamp is pushed all the way into the housing while performing this
rotation.
If the PHOTO_DET will not drop below 5000 mV while performing this rotation,
contact TAPI Customer Service for assistance.
06870C DCN6332
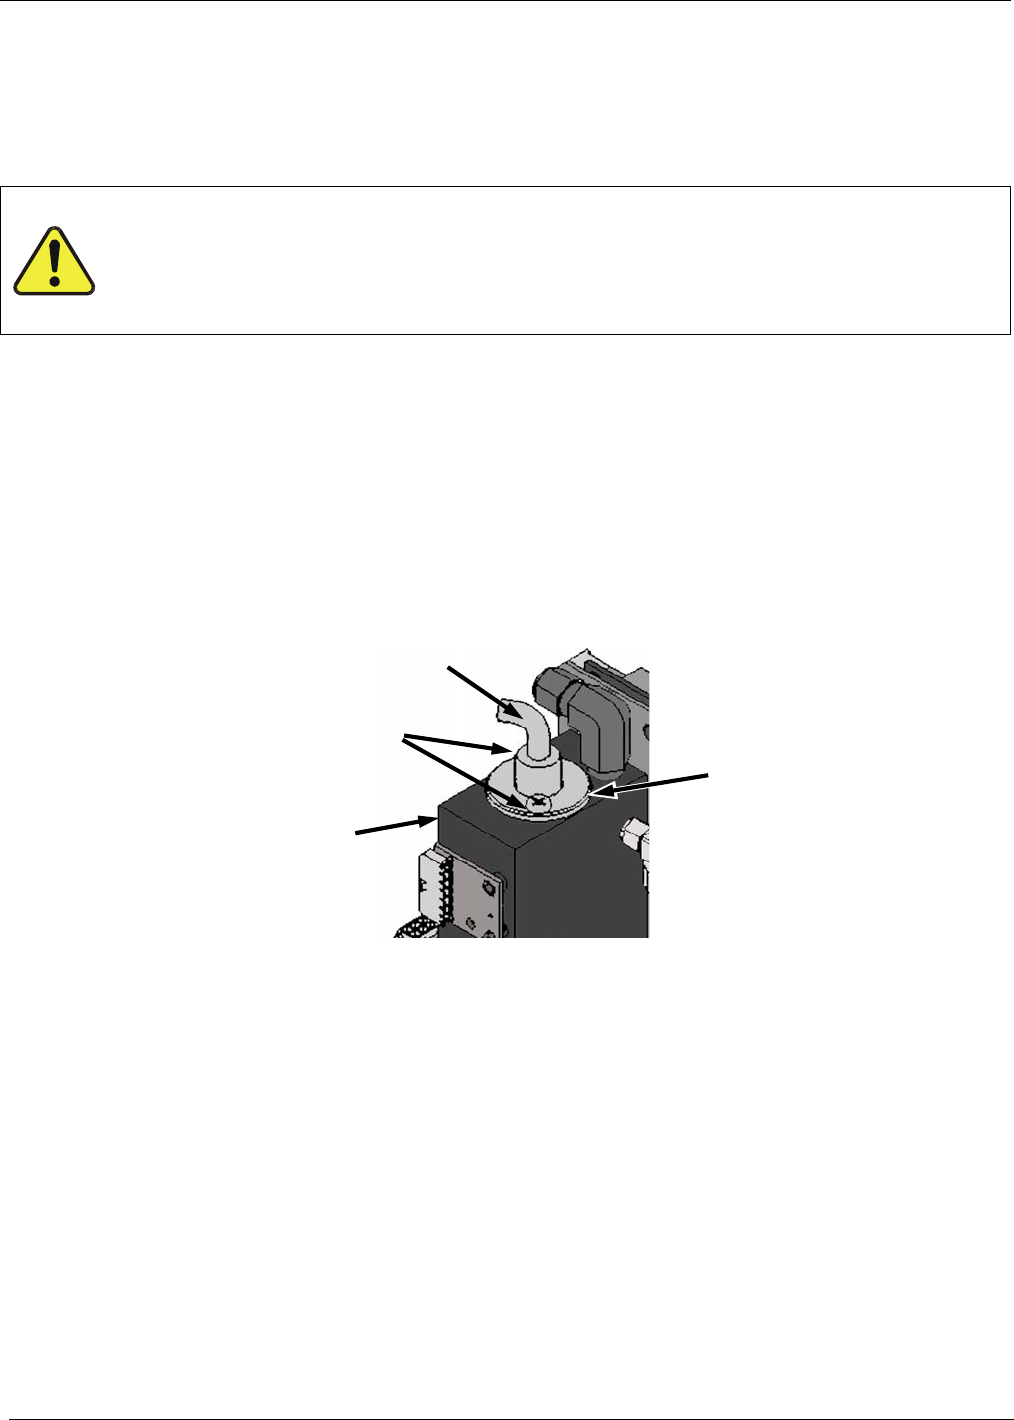
T400 Ozone Analyzer Operator’s Manual Instrument Maintenance
239
Once a lamp position is found that corresponds to a minimum observed value
for PHOTO_DET, tighten the lamp setscrew at the approximate minimum value
observed.
Adjust PHOTO_DET within the range of 4400 – 4600 mV.
11. Replace the cover on the analyzer.
GENERAL WARNING/CAUTION
The UV lamp contains mercury (Hg), which is considered hazardous waste. The
lamp should be disposed of in accordance with local regulations regarding
waste containing mercury.
11.3.8. ADJUSTMENT OR REPLACEMENT OF OPTIONAL IZS OZONE
GENERATOR UV LAMP
This procedure details the steps for replacement and initial adjustment of the UV lamp
of the O3 generator included in the IZS option (OPT-50G). If you are adjusting an
existing lamp, skip to Step 8.
1. Turn off the analyzer.
2. Remove the cover from the analyzer.
3. Locate the O3 generator (see Figure 3-5).
UV Lamp
Set Screws
O
3
Generator
Body
Lamp
O-ring
Figure 11-4: O3 Generator Temperature Thermistor and DC Heater Locations
4. Remove the two setscrews on the top of the O3 generator and gently pull out the old
lamp.
5. Inspect the o-ring beneath the nut and replace if damaged.
6. Install the new lamp in O3 generator housing.
Do not fully tighten the setscrews.
The lamp should be able to be rotated in the assembly by grasping the lamp
cable.
7. Turn on analyzer and allow it to stabilize for at least 20 minutes.
8. Locate the potentiometer used to adjust the O3 generator UV output.
06870C DCN6332

Instrument Maintenance T400 Ozone Analyzer Operator’s Manual
240
A
djustment
Pot
O
3
Generator
Reference
Detector
PCA
O
3
Generator
Body
Figure 11-5: Location of O3 Generator Reference Detector Adjustment Pot
06870C DCN6332
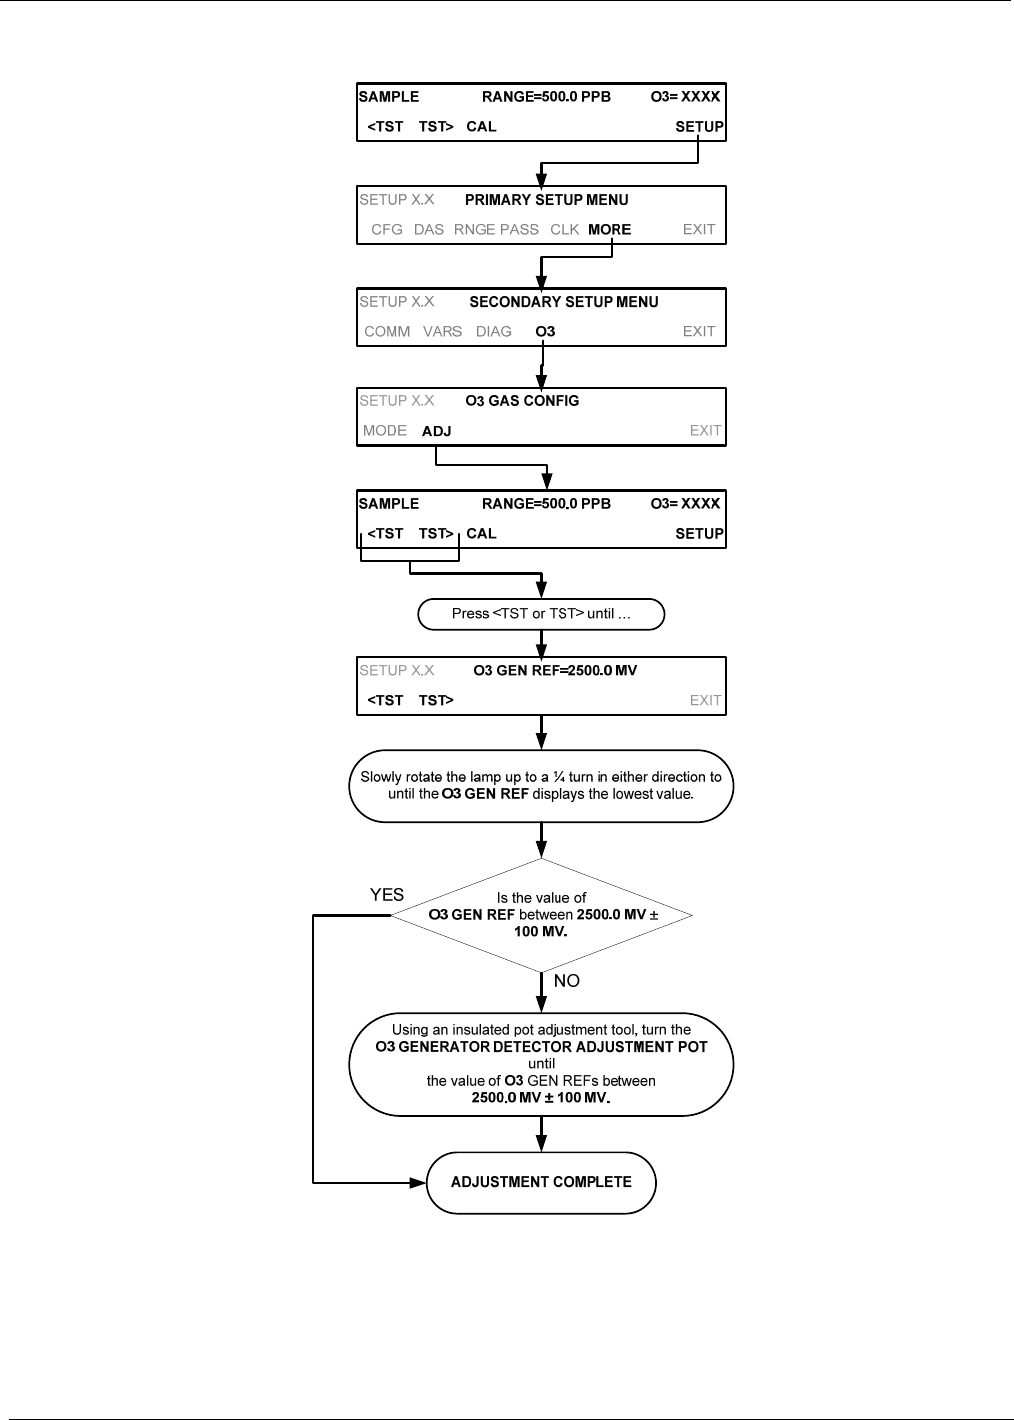

Instrument Maintenance T400 Ozone Analyzer Operator’s Manual
242
This page intentionally left blank.
06870C DCN6332
243
12. TROUBLESHOOTING & SERVICE
This section contains a variety of methods for identifying the source of performance
problems with the analyzer. Also included in this section are procedures that are used in
repairing the instrument.
QUALIFIED TECHNICIAN
The operations outlined in this Section must be performed by qualified
maintenance personnel only.
CAUTION – RISK OF ELECTRICAL SHOCK!
Some operations need to be carried out with the instrument open and
running.
Exercise caution to avoid electrical shocks and electrostatic or mechanical
damage to the analyzer.
Do not drop tools into the analyzer or leave those after your procedures.
Do not shorten or touch electric connections with metallic tools while
operating inside the analyzer.
Use common sense when operating inside a running analyzer.
12.1. GENERAL TROUBLESHOOTING
The T400 Photometric Ozone Analyzer has been designed so that problems can be
rapidly detected, evaluated and repaired. During operation, it continuously performs
diagnostic tests and provides the ability to evaluate its key operating parameters without
disturbing monitoring operations.
A systematic approach to troubleshooting will generally consist of the following five
steps:
1. Note any WARNING MESSAGES and take corrective action as necessary.
1. Examine the values of all TEST FUNCTIONS and compare them to factory values.
Note any major deviations from the factory values and take corrective action.
2. Use the internal electronic status LEDs to determine whether the electronic
communication channels are operating properly.
Verify that the DC power supplies are operating properly by checking the
voltage test points on the relay PCA.
Note that the analyzer’s DC power wiring is color-coded and these colors match
the color of the corresponding test points on the relay PCA.
06870C DCN6332

Troubleshooting & Service T400 Ozone Analyzer Operator’s Manual
244
3. Suspect a leak first!
Customer service data indicate that the majority of all problems are eventually
traced to leaks in the internal pneumatics of the analyzer or the diluent gas and
source gases delivery systems.
Check for gas flow problems such as clogged or blocked internal/external gas
lines, damaged seals, punctured gas lines, a damaged / malfunctioning pumps,
etc.
4. Follow the procedures defined in Section 3.4.3 to confirm that the analyzer’s vital
functions are working (power supplies, CPU, relay PCA, touchscreen, PMT cooler,
etc.).
See Figure 3-16 for the general layout of components and sub-assemblies in
the analyzer.
See the wiring interconnect diagram and interconnect list in Appendix D.
12.1.1. FAULT DIAGNOSIS WITH WARNING MESSAGES
The most common and/or serious instrument failures will result in a warning message
being displayed on the front panel. Table 12-1 lists warning messages, along with their
meaning and recommended corrective action.
It should be noted that if more than two or three warning messages occur at the same
time, it is often an indication that some fundamental sub-system (power supply, relay
PCA, motherboard) has failed rather than an indication of the specific failures
referenced by the warnings. In this case, a combined-error analysis needs to be
performed.
The T400 will alert the user that a Warning Message is active by flashing the FAULT
LED and displaying the Warning message in the Param field along with the CLR button
(press to clear Warning message). The MSG button displays if there is more than one
warning in queue or if you are in the TEST menu and have not yet cleared the message.
The following display/touchscreen examples provide an illustration of each::
06870C DCN6332
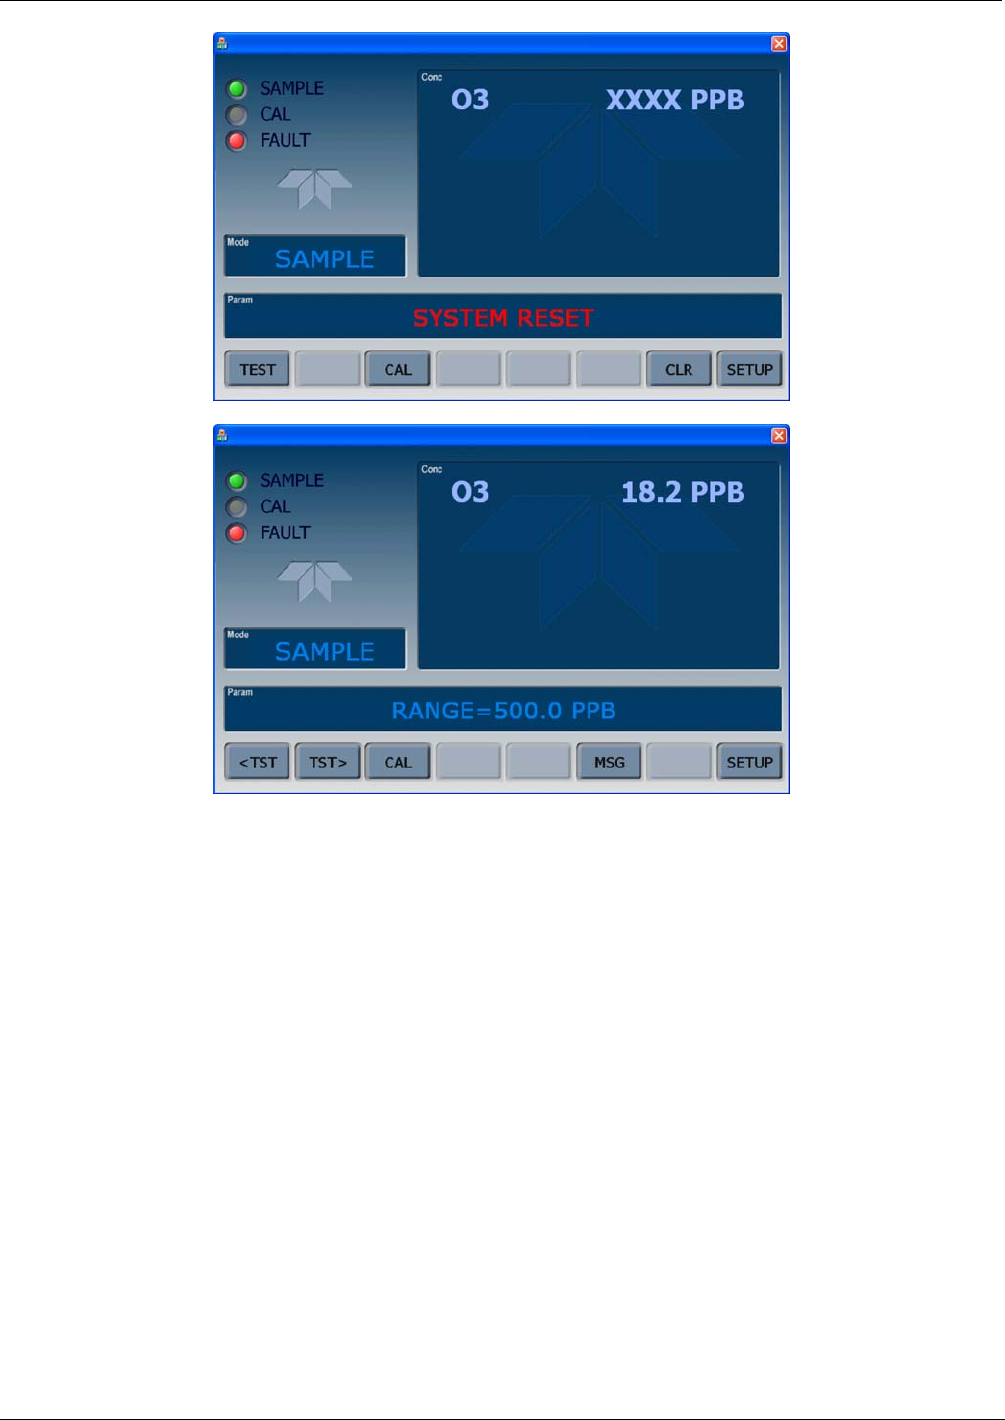
T400 Ozone Analyzer Operator’s Manual Troubleshooting & Service
245
The analyzer will also alert the user via the Serial I/O COM port(s) and cause the
FAULT LED on the front panel to blink.
To view or clear the various warning messages press:
06870C DCN6332
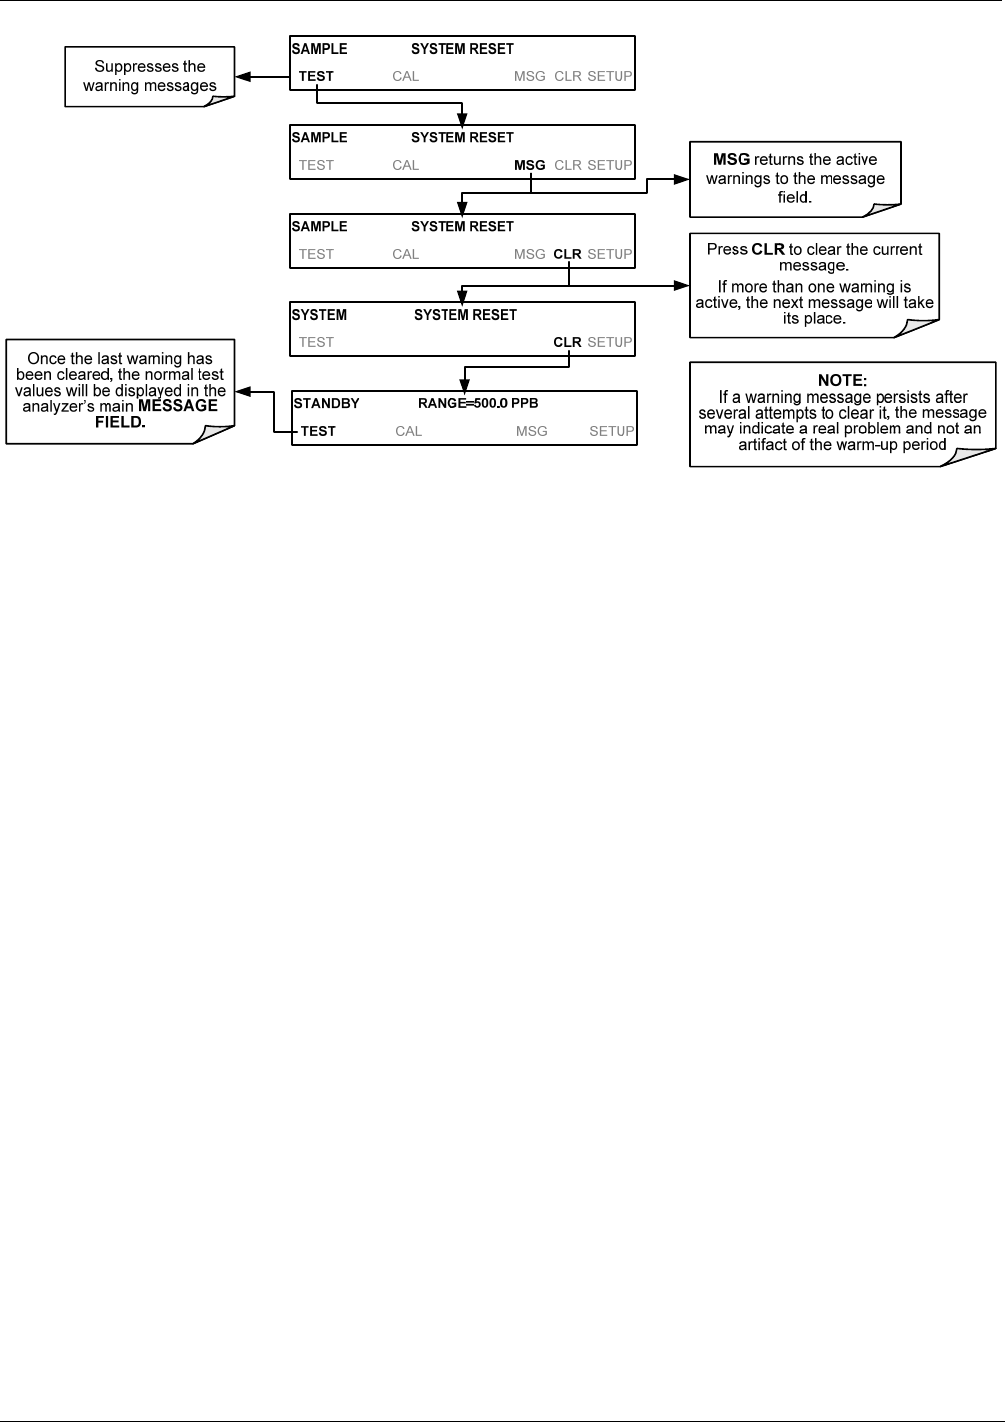
Troubleshooting & Service T400 Ozone Analyzer Operator’s Manual
246
06870C DCN6332

T400 Ozone Analyzer Operator’s Manual Troubleshooting & Service
247
Table 12-1: Warning Messages in Display Param Field
WARNING FAULT CONDITION POSSIBLE CAUSES
PHOTO TEMP WARNING
The optical bench
temperature lamp temp
is 51C.
Bench lamp heater
Bench lamp temperature sensor
Relay controlling the bench heater
Entire Relay Board
I 2C Bus
“Hot” Lamp
BOX TEMP WARNING Box Temp is < 5C
or > 48C.
Box Temperature typically runs ~7C warmer than ambient
temperature.
Poor/blocked ventilation to the analyzer
Stopped Exhaust-Fan
Ambient Temperature outside of specified range
CANNOT DYN SPAN Dynamic Span operation
failed.
Measured concentration value is too high or low
Concentration Slope value to high or too low
CANNOT DYN ZERO Dynamic Zero operation
failed.
Measured concentration value is too high
Concentration Offset value to high
CONFIG INITIALIZED
Configuration and
Calibration data reset to
original Factory state.
Failed Disk on Module
User erased data
DATA INITIALIZED Data Storage in DAS
was erased.
Failed Disk on Module
User cleared data.
LAMP STABIL WARN Reference value is
unstable.
Faulty UV source lamp
Noisy UV detector
Faulty UV lamp power supply
REAR BOARD NOT DET
Motherboard not
detected on power up.
THIS WARNING only appears on Serial I/O COM Port(s) Front Panel
Display will be frozen, blank or will not respond.
Failure of Motherboard
RELAY BOARD WARN
The CPU cannot
communicate with the
Relay Board.
I 2C Bus failure
Failed Relay Board
Loose connectors/wiring
SAMPLE FLOW WARN Sample flow rate is < 500
cc/min or > 1000 cc/min.
Failed Sample Pump
Blocked Sample Inlet/Gas Line
Dirty Particulate Filter
Leak downstream of Critical Flow Orifice
Failed Flow Sensor
SAMPLE PRES WARN
Sample Pressure is <15
in-Hg or > 35 in-Hg
Normally 29.92 in-Hg at
sea level decreasing at 1
in-Hg per 1000 ft of
altitude (with no flow –
pump disconnected).
If Sample Pressure is < 15 in-HG:
Blocked Particulate Filter
Blocked Sample Inlet/Gas Line
Failed Pressure Senor/circuitry
If Sample Pressure is > 35 in-HG:
Bad Pressure Sensor/circuitry
SAMPLE TEMP WARN Sample temperature is <
10C or > 50C.
Ambient Temperature outside of specified range
Failed Sample Temperature Sensor
Relay controlling the Bench Heater
Failed Relay Board
I 2C Bus
PHOTO REF WARNING
Occurs when Ref is
<2500 mVDC or
>4950 mVDC.
UV Lamp
UV Photo-Detector Preamp
06870C DCN6332

Troubleshooting & Service T400 Ozone Analyzer Operator’s Manual
248
WARNING FAULT CONDITION POSSIBLE CAUSES
O3 GEN TEMP
WARNING
IZS Ozone Generator
Temp is outside of
control range of 48C
3C.
No IZS option installed, instrument improperly configured
O 3 generator heater
O 3 generator temperature sensor
Relay controlling the O3 generator heater
Entire Relay Board
I 2C Bus
SYSTEM RESET
The computer has
rebooted.
This message occurs at power on.
If it is confirmed that power has not been interrupted:
Failed +5 VDC power
Fatal Error caused software to restart
Loose connector/wiring
Note A failure of the analyzer’s CPU or Motherboard can result in any or ALL
of the following messages.
12.1.2. FAULT DIAGNOSIS WITH TEST FUNCTIONS
Besides being useful as predictive diagnostic tools, the test functions viewable from the
analyzers front panel can be used to isolate and identify many operational problems
when combined with a thorough understanding of the analyzers Theory of Operation
(see Section 13).
The acceptable ranges for these test functions are listed in the “Nominal Range” column
of the analyzer Final Test and Validation Data Sheet shipped with the instrument.
Values outside these acceptable ranges indicate a failure of one or more of the analyzer’s
subsystems. Functions whose values are still within acceptable ranges but have
significantly changed from the measurement recorded on the factory data sheet may also
indicate a failure.
A worksheet has been provided in Appendix C to assist in recording the value of these
test functions.
Note A value of “XXXX” displayed for any of these TEST functions indicates an
OUT OF RANGE reading.
Note Sample Pressure measurements are represented in terms of ABSOLUTE
pressure because this is the least ambiguous method reporting gas
pressure. Absolute atmospheric pressure is about 29.92 in-Hg-A at sea
level. It decreases about 1 in-Hg per 1000 ft gain in altitude. A variety of
factors such as air conditioning systems, passing storms, and air
temperature, can also cause changes in the absolute atmospheric
pressure.
06870C DCN6332

T400 Ozone Analyzer Operator’s Manual Troubleshooting & Service
249
Table 12-2: Test Functions - Indicated Failures
TEST FUNCTION DIAGNOSTIC RELEVANCE AND CAUSES OF FAULT CONDITIONS.
TIME Time of Day clock is too fast or slow. To adjust see Section 5.6.
Battery in clock chip on CPU board may be dead.
RANGE
Incorrectly, configured Measurement Range(s) could cause response problems with a Data
logger or Chart Recorder attached to one of the Analog Output.
If the Range selected is too small, the recording device will over range.
If the Range is too big, the device will show minimal or no apparent change in readings.
STABIL Indicates noise level of instrument or stability of the O3 concentration of Sample Gas.
O3 MEAS
&
O3 REF
If the value displayed is too high the UV Source has become brighter. Adjust the variable
gain potentiometer on the UV Preamp Board in the optical bench.
If the value displayed is too low:
< 100mV – Bad UV lamp or UV lamp power supply.
< 2000mV – Lamp output has dropped, adjust UV Preamp Board or replace lamp.
If the value displayed is constantly changing:
Bad UV lamp.
Defective UV lamp power supply.
Failed I2C Bus.
If the O3 Ref value changes by more than 10mV between zero and span gas:
Defective/leaking switching valve.
PRES See Table 11-1 for SAMPLE PRES WARN.
SAMPLE FL Check for Gas Flow problems. See Section 12.4
SAMPLE TEMP Temperatures outside of the specified range or oscillating temperatures are cause for
concern.
PHOTO LAMP
Bench temp control improves instrument noise, stability and drift. Temperatures outside of
the specified range or oscillating temperatures are cause for concern. See Table 11-1 for
PHOTO TEMP WARNING.
BOX TEMP
If the Box Temperature is out of range, check fan in the Power Supply Module. Areas to the
side and rear of instrument should allow adequate ventilation.
See Table 11-1 for BOX TEMP WARNING.
O3 GEN TEMP If the O3 Generator Temperature is out of range, check the O3 Generator heater and
temperature sensor. See Table 11-1 for O3 GEN TEMP WARNING.
SLOPE
Values outside range indicate:
Contamination of the Zero Air or Span Gas supply.
Instrument is miss-calibrated.
Blocked Gas Flow.
Faulty Sample Pressure Sensor (P1) or circuitry.
Bad/incorrect Span Gas concentration.
OFFSET Values outside range indicate:
Contamination of the Zero Air supply.
06870C DCN6332

Troubleshooting & Service T400 Ozone Analyzer Operator’s Manual
250
12.1.3. DIAG SIGNAL I/O: USING THE DIAGNOSTIC SIGNAL I/O
FUNCTION
The signal I/O diagnostic mode allows access to the digital and analog I/O in the
analyzer. Some of the digital signals can be controlled through the touchscreen. These
signals, combined with a thorough understanding of the instruments Theory of
Operation (found in Section 13), are useful for troubleshooting in three ways:
The technician can view the raw, unprocessed signal level of the analyzer’s critical
inputs and outputs.
Many of the components and functions that are normally under algorithmic control
of the CPU can be manually exercised.
The technician can directly control the signal level Analog and Digital Output
signals.
This allows the technician to observe systematically the effect of directly controlling
these signals on the operation of the analyzer. Figure 12-1 is an example of how to use
the Signal I/O menu to view the raw voltage of an input signal or to control the state of
an output voltage or control signal.
06870C DCN6332

T400 Ozone Analyzer Operator’s Manual Troubleshooting & Service
251
Figure 12-1: Example of Signal I/O Function
Note Any I/O signals changed while in the signal I/O menu will remain in effect
ONLY until signal I/O menu is exited. The Analyzer regains control of
these signals upon exit. See Appendix A-4 for a complete list of the
parameters available for review under this menu.
06870C DCN6332

Troubleshooting & Service T400 Ozone Analyzer Operator’s Manual
252
12.2. USING THE ANALOG OUTPUT TEST CHANNEL
The signals available for output over the T400’s analog output channel can also be used
as diagnostic tools. See Section 5.10 for instruction on activating the analog output and
selecting a function.
Table 12-3: Test Channel Outputs as Diagnostic Tools
TEST
CHANNEL DESCRIPTION ZERO FULL
SCALE
CAUSES OF EXTREMELY
HIGH / LOW READINGS
PHOTO
MEAS
Raw output of the
photometer during its
measure cycle
0 mV 5000 mV
PHOTO
REF
Raw output of the
photometer during its
reference cycle
0 mV 5000 mV
If the value displayed is:
- >5000 mV: The UV source has become brighter; adjust the
UV Detector Gain potentiometer.
- < 100mV – Bad UV lamp or UV lamp power supply.
- < 2000mV – Lamp output has dropped, adjust UV Preamp
Board or replace lamp.
If the value displayed is constantly changing:
- Bad UV lamp.
- Defective UV lamp power supply.
- Failed I2C Bus.
If the PHOTO REFERENCE value changes by more than
10mV between zero and span gas:
- Defective/leaking M/R switching valve.
O3 GEN
REF
Raw output of the O3
generator’s reference
detector
0 mV 5000 mV
Possible failure of:
- O
3 generator UV Lamp
- O
3 generator reference detector
- O
3 generator lamp power supply
- I
2C bus
SAMPLE
PRESSURE
Pressure of gas in the
photometer
absorption tube
0 In-Hg-A 40 In-Hg-A Check for Gas Flow problems.
SAMPLE
FLOW
Gas flow rate through
the photometer 0 cm3/min 1000 cc/m Check for Gas Flow problems.
SAMPLE
TEMP
Temperature of gas in
the photometer
absorption tube
0 C 70 C Possible causes of faults are the same as SAMPLE TEMP
from Table 12-2
PHOTO
LAMP
TEMP
Temperature of the
photometer UV lamp 0 C 70 C
Possible failure of:
- Bench lamp heater
- Bench lamp temperature sensor
- Relay controlling the bench heater
- Entire Relay PCA
- I
2C Bus
- Hot” Lamp
O3 SCRUB
TEMP
Temperature of the
optional Metal Wool
Scrubber.
0 C 70 C
Possible failure of:
- Scrubber heater or temperature sensor
- Bad or loose wiring TC input connector on relay PCA
- Incorrectly configured TC input (e.g. J-type instead of K-
type)
- AC Relay controlling the scrubber heater
- Entire Relay PCA
- I
2C Bus
O3 LAMP
TEMP
Temperature of the
IZS Option’s O3
generator UV lamp
0 mV 5000 mV Same as PHOTO TEMP WARNING from Table 12-1
CHASSIS
TEMP
Temperature inside
the T400’s chassis
(same as BOX TEMP)
0 C 70 C Possible causes of faults are the same as BOX TEMP
WARNING from Table 12-1
06870C DCN6332
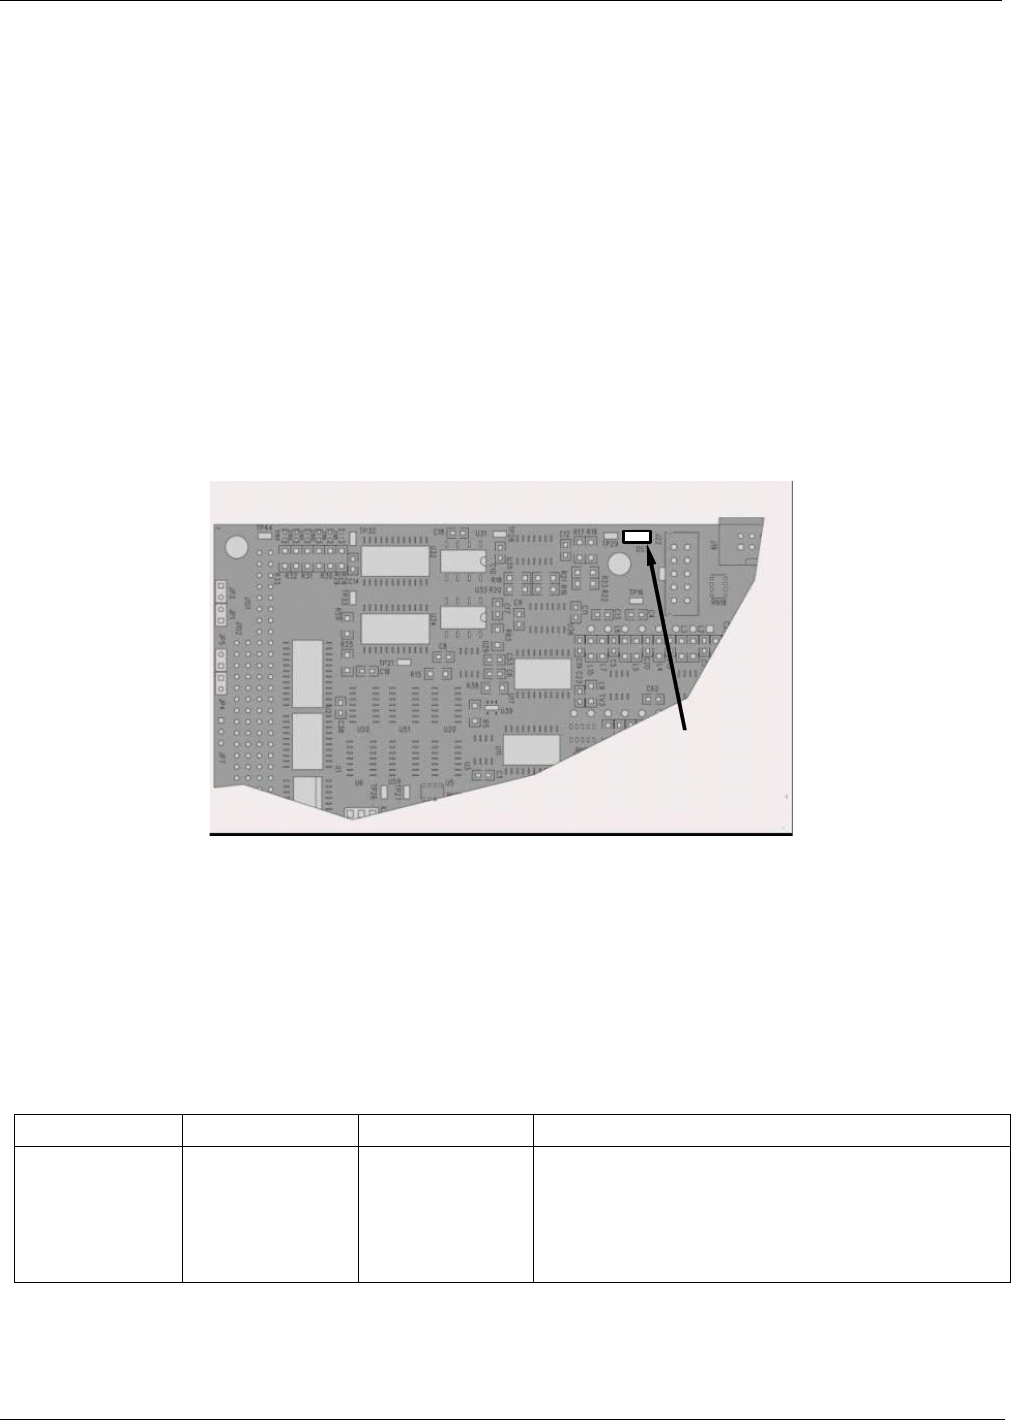
T400 Ozone Analyzer Operator’s Manual Troubleshooting & Service
253
12.3. USING THE INTERNAL ELECTRONIC STATUS LEDS
Several LEDs are located inside the instrument to assist in determining if the analyzers
CPU, I2C bus and Relay PCA are functioning properly.
12.3.1. CPU STATUS INDICATOR
DS5, a red LED, that is located on upper portion of the motherboard, just to the right of
the CPU board, flashes when the CPU is running the main program loop. After power-
up, approximately 30 – 60 seconds, DS5 should flash on and off. If characters are
written to the front panel display but DS5 does not flash then the program files have
become corrupted, contact customer service because it may be possible to recover
operation of the analyzer. If after 30 – 60 seconds, neither DS5 is flashing nor have any
characters been written to the front panel display then the CPU is bad and must be
replaced.
Motherboard
CPU Status LED
Figure 12-2: CPU Status Indicator
12.3.2. RELAY PCA STATUS LEDS
There are sixteen LEDs located on the Relay PCA. Some are not used on this model.
12.3.2.1. I2C Bus Watchdog Status LEDs
The most important is D1 (see, which indicates the health of the I2C bus.
Table 12-4: Relay PCA Watchdog LED Failure Indications
LED Function Fault Status Indicated Failure(s)
D1
(Red)
I2C bus Health
(Watchdog Circuit)
Continuously ON
or
Continuously OFF
Failed/Halted CPU
Faulty Motherboard, Valve Driver board or Relay PCA
Faulty Connectors/Wiring between Motherboard, Valve
Driver board or Relay PCA
Failed/Faulty +5 VDC Power Supply (PS1)
If D1 is blinking, then the other LEDs can be used in conjunction with DIAG Menu
Signal I/O to identify hardware failures of the relays and switches on the Relay.
06870C DCN6332
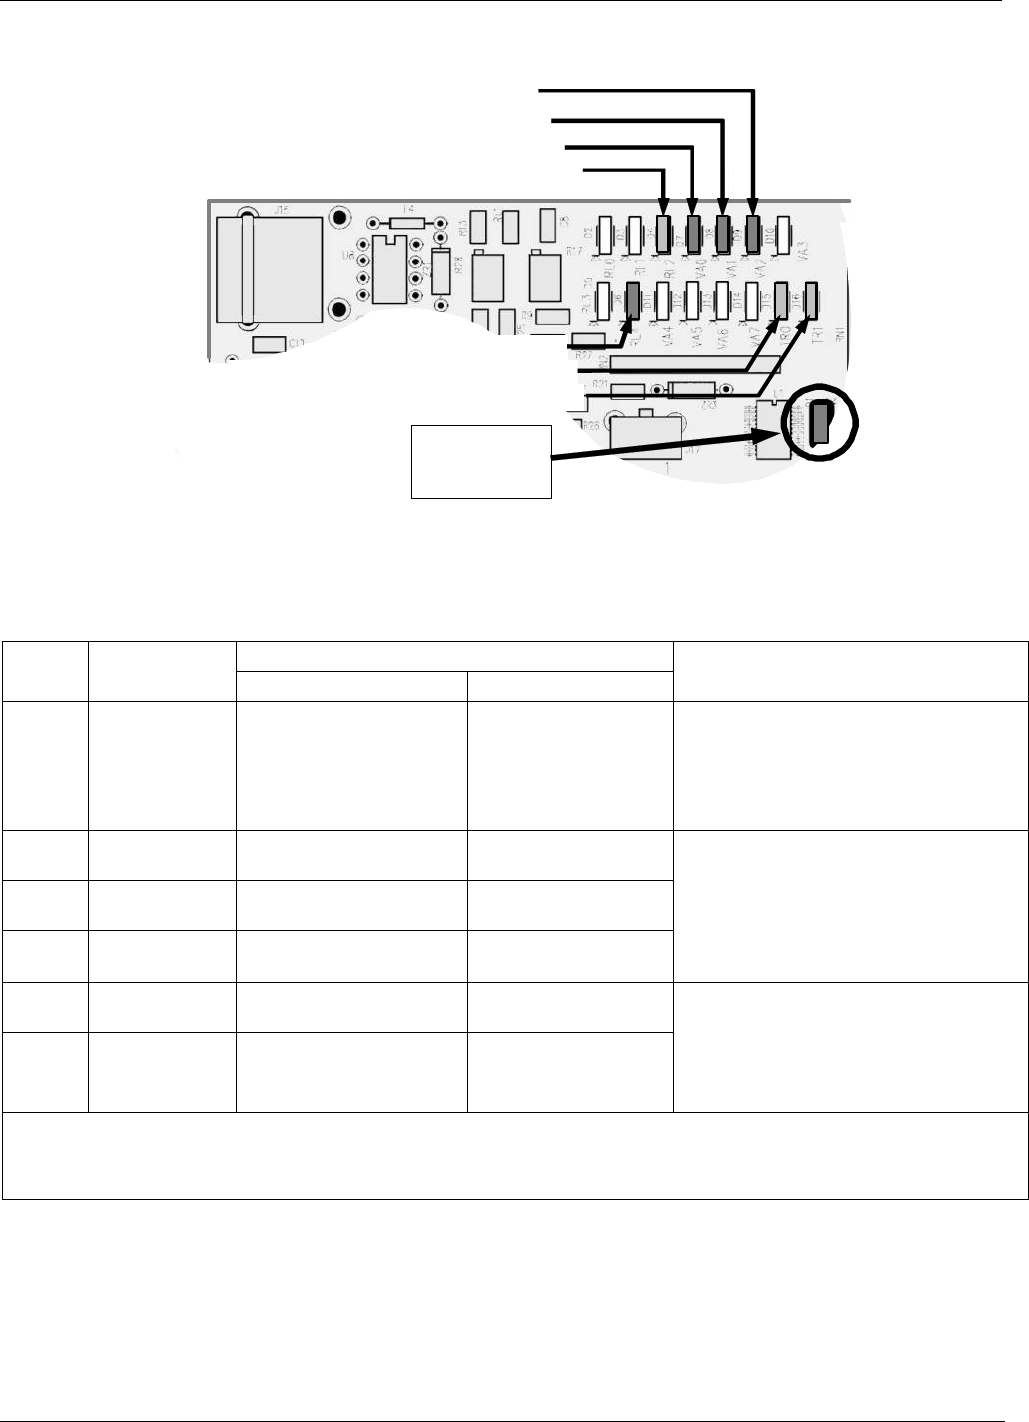
Troubleshooting & Service T400 Ozone Analyzer Operator’s Manual
254
12.3.2.2. O3 Option Status LED s
D8 (Green) – Photometer Meas/Ref Valve
D15 (Green) - Photometer Lamp Heater
D16 (Green) – IZS O3 Generator Lamp Heater
D7 (Green) Optional Zero/Span Valve
D6 (Green ) – GPT Valve
D9 (Green) – Optional Sample/Cal Valve
D1 (RED)
Watchdog
Indicator
D2 (Yellow) Optional Metal Wool Scrubber Heater
Figure 12-3: Relay PCA Status LEDS Used for Troubleshooting
Table 12-5: Relay PCA Status LED Failure Indications
SIGNAL I/O PARAMETER
LED FUNCTION ACTIVATED BY VIEW RESULT DIAGNOSTIC TECHNIQUE
D21
Yellow
Metal Wool
Scrubber
Heater1
O3_SCRUB_HEATER O3 SCRUB
Voltage displayed should change.
If not:
Failed Heater
Faulty Temperature Sensor
Failed AC Relay
Faulty Connectors/Wiring
D7
Green
Zero/Span Gas
Valve3 SPAN_VALVE N/A
D8
Green
Measure/Ref
Valve PHOTO_REF_VALVE N/A
D9
Green
Sample/Cal
Gas Valve2 CAL_VALVE N/A
Valve should audibly change states.
If not:
Failed Valve
Failed Relay Drive IC on Relay PCA
Failed Relay PCA
Faulty +12 VDC Supply (PS2)
Faulty Connectors/Wiring
D15
Green
Photometer UV
Lamp Heater PHOTO_LAMP_HEATER PHOTO_LAMP
D162
Green
IZS O3
Generator UV
Lamp Heater
O3_GEN_HEATER O3 GEN TEMP
Voltage displayed should change.
If not:
Failed Heater
Faulty Temperature Sensor
Failed AC Relay
Faulty Connectors/Wiring
1 Only applies on analyzers with metal wool scrubber installed.
2 Only applies on analyzers with IZS options installed.
3 Only apllies to instruments with calibration valve options installed.
06870C DCN6332

T400 Ozone Analyzer Operator’s Manual Troubleshooting & Service
255
12.4. GAS FLOW PROBLEMS
In general, flow problems can be divided into three categories:
Flow is too high
Flow is greater than zero, but is too low, and/or unstable
Flow is zero (no flow)
When troubleshooting flow problems, it is a good idea to first confirm that the actual
flow and not the analyzer’s flow detection hardware and software are in error.
Use an independent flow meter to perform a flow check as described in Section 11.3.6.
12.4.1. TYPICAL FLOW PROBLEMS
12.4.1.1. Flow is Zero
The unit displays a SAMPLE FLOW warning message on the front panel display or the
SAMPLE FLOW Test Function reports a zero or very low flow rate.
Confirm that the sample pump is operating (turning). If not, use an AC Voltmeter to
make sure that power is being supplied to the pump. If AC power is being supplied to
the pump, but it is not turning, replace the pump.
If the pump is operating but the unit reports no gas flow, perform a flow check as
described in Section 11.3.6.
If no independent flow meter is available:
1. Disconnect the gas lines from both the sample inlet and the exhaust outlet on the
rear panel of the instrument.
2. Make sure that the unit is in basic SAMPLE Mode.
3. Place a finger over an exhaust outlet on the rear panel of the instrument.
4. If gas is flowing through the analyzer, you will feel pulses of air being expelled from
the exhaust outlet.
If gas flows through the instrument when it is disconnected from its sources of zero air,
span gas or sample gas, the flow problem is most likely not internal to the analyzer.
Check to make sure that:
All calibrators/generators are turned on and working correctly.
Valves, regulators and gas lines are not clogged or dirty.
12.4.1.2. Low Flow
Check if the pump diaphragm is in good condition. If not, rebuild the pump (all
Teledyne API for instructions). Check the spare parts list for information of pump
rebuild kits.
Check for leaks as described in Section 11.3.4. Repair the leaking fitting, line or
valve and re-check.
Check for the sample filter and the orifice filter for dirt. Replace filters (see
Sections11.3.1 and 12.10.1 respectively).
Check for partially plugged pneumatic lines, orifices or valves. Clean or replace
them. The critical orifice should be replaced if it becomes plugged.
If an IZS option is installed in the instrument, press CALZ and CALS. If the flow
increases then suspect a bad sample/cal valve.
06870C DCN6332

Troubleshooting & Service T400 Ozone Analyzer Operator’s Manual
256
12.4.1.3. High Flow
The most common cause of high flow is a leak in the sample flow control assembly or
between there and the pump. If no leaks or loose connections are found in the fittings or
the gas line between the orifice and the pump, rebuild the sample flow control assembly
as described in Section 12.10.1 .
12.4.1.4. Actual Flow Does Not Match Displayed Flow
If the actual flow measured does not match the displayed flow, but is within the limits of
720-880 cc/min, adjust the calibration of the flow measurement as described in Section
12.10.1.
12.4.1.5. Sample Pump
The sample pump should start immediately after the front panel power switch is turned
ON. If it does not, refer to Section 12.7.1.
12.5. CALIBRATION PROBLEMS
12.5.1. MIS-CALIBRATED
There are several symptoms that can be caused by the analyzer being mis-calibrated.
This condition is indicated by out of range SLOPEs and OFFSETs as displayed
through the test functions and is frequently caused by the following:
Contaminated span gas. This can cause a large error in the slope and a small error
in the offset. Span gas contaminated with a major interferent such as Mercury
Vapor, will cause the analyzer to be calibrated to the wrong value.
Also could be caused if the span gas concentration entered into the analyzer during the
calibration procedure is not the precise concentration value of the gas used.
Dilution calibrator not set up correctly or is malfunctioning. This will also cause the
slope, but not the zero to be incorrect. Again, the analyzer is being calibrated to the
wrong value.
Too many analyzers on the manifold. This can cause either a slope or offset error
because ambient gas with its pollutants will dilute the zero or span gas.
Contaminated zero gas. This can cause either a positive or negative offset and will
indirectly affect the slope. If contaminated with O3 it will cause a positive offset.
12.5.2. NON-REPEATABLE ZERO AND SPAN
As stated earlier, leaks both in the T400 and in the external system are a common source
of unstable and non-repeatable readings.
Check for leaks in the pneumatic systems as described in Section 11.3.6. Don’t
forget to consider pneumatic components in the gas delivery system outside the
T400. Such as:
A change in zero air source such as ambient air leaking into zero air line, or;
A change in the span gas concentration due to zero air or ambient air leaking
into the span gas line.
06870C DCN6332

T400 Ozone Analyzer Operator’s Manual Troubleshooting & Service
257
Once the instrument passes a leak check, do a flow check (see Section 11.3.6) to
make sure adequate sample is being delivered to the optical bench assembly.
Confirm the sample pressure, sample temperature, and sample flow readings are
correct and have steady readings.
Verify that the sample filter element is clean and does not need to be replaced.
12.5.3. INABILITY TO SPAN – NO SPAN BUTTON (CALS)
Confirm that the O3span gas source is accurate. This can be done by
inter-comparing the source with another calibrated monitor, or having the O3source
verified by an independent traceable photometer.
Check for leaks in the pneumatic systems as described in Section 11.3.4.
Make sure that the expected span gas concentration entered into the instrument
during calibration is not too different from expected span value.
Check to make sure that there is no ambient air or zero air leaking into span gas
line.
12.5.4. INABILITY TO ZERO – NO ZERO BUTTON (CALZ)
Confirm that there is a good source of zero air. If the IZS option is installed,
compare the zero reading from the IZS zero air source to the calibration zero air
source.
Check for leaks in the pneumatic systems as described in Section 11.3.4.
Check to make sure that there is no ambient air leaking into zero air line.
12.6. OTHER PERFORMANCE PROBLEMS
Dynamic problems (i.e. problems that only manifest themselves when the analyzer is
monitoring sample gas) can be the most difficult and time consuming to isolate and
resolve. The following section provides an itemized list of the most common dynamic
problems with recommended troubleshooting checks and corrective actions.
12.6.1. TEMPERATURE PROBLEMS
Individual control loops are used to maintain the set point of the UV Lamp, IZS Ozone
Generator (Optional) and Metal Wool Scrubber (Optional) temperatures. If any of these
temperatures are out of range or are poorly controlled, the T400 will perform poorly.
12.6.1.1. Box Temperature
The box temperature sensor is mounted to the Motherboard and cannot be disconnected
to check its resistance. Rather check the BOX TEMP signal using the SIGNAL I/O
function under the DIAG Menu (see Section 12.1.2).
This parameter will vary with ambient temperature, but at ~30oC (6-7 above room
temperature) the signal should be ~1450 mV.
06870C DCN6332

Troubleshooting & Service T400 Ozone Analyzer Operator’s Manual
258
12.6.1.2. Sample Temperature
The Sample Temperature should read approximately 5.0C higher than the box
temperature.
12.6.1.3. UV Lamp Temperature
There are three possible causes for the UV Lamp temperature to have failed.
The UV Lamp heater has failed.
Check the resistance between pins 5 and 6 on the six-pin connector adjacent to
the UV Lamp on the Optical Bench.
It should be approximately 30 Ohms.
Assuming that the I2C bus is working and that there is no other failure with the Relay
board, the FET Driver on the Relay Board may have failed.
Using the PHOTO_LAMP_HEATER parameter under the SIGNAL I/O function
of the DIAG menu, as described above, turn on and off the UV Lamp Heater
(D15 on the relay board should illuminate as the heater is turned on).
Check the DC voltage present between pin 1 and 2 on J13 of the Relay Board.
If the FET Driver has failed there will be no change in the voltage across pins 1
and 2.
If the FET Driver Q2 checks out OK, the thermistor temperature sensor in the lamp
assembly may have failed.
Unplug the connector to the UV Lamp Heater/Thermistor PCB, and measure
the resistance of the thermistor between pins 5 and 6 of the 6 pin connector.
The resistance near the 58oC set point is ~8.1k ohms.
12.6.1.4. IZS Ozone Generator Temperature (Optional)
There are three possible causes for the Ozone Generator temperature to have failed.
The O3Gen heater has failed.
Check the resistance between pins 5 and 6 on the six-pin connector adjacent to
the UV Lamp on the O3Generator.
It should be approximately 5 Ohms.
Assuming that the I2C bus is working and that there is no other failure with the Relay
board, the FET Driver on the Relay Board (see 12.7.6) may have failed.
Using
the O3_GEN_HEATER parameter under the SIGNAL I/O function of the
DIAG menu, as described above, turn on and off the UV Lamp Heater.
Check the DC voltage present between pin 1 and 2 on J14 of the Relay Board.
If the FET Driver has failed there should be no change in the voltage across
pins 1 and 2.
If the FET Driver checks out OK, the thermistor temperature sensor in the lamp
assembly may have failed.
Unplug the connector to the Ozone Generator Heater/Thermistor PCB, and
measure the resistance of the thermistor between pins 5 and 6.
06870C DCN6332

T400 Ozone Analyzer Operator’s Manual Troubleshooting & Service
259
12.7. SUBSYSTEM CHECKOUT
12.7.1. AC MAIN POWER
WARNING – Electrical Shock Hazard
Should the AC power circuit breaker trip, investigate and correct the condition
causing this situation before turning the analyzer back on.
The T400 analyzer’s electronic systems will operate with any of the specified power
regimes. As long as system is connected to 100-120 VAC or 220-240 VAC at either 50
or 60 Hz it will turn on and after about 30 seconds show a front panel display.
Internally, the status LEDs located on the Relay PCA, Motherboard and CPU should
turn on as soon as the power is supplied.
If they do not, check the circuit breaker built into the ON/OFF switch on the
instruments front panel
The analyzer is correctly configured for the AC mains voltage in use if:
The Sample Pump is running.
If incorrect power is suspected, check that the correct voltage and frequency is present at
the line input on the rear panel.
Verify that the pump power configuration plug is properly wired (see Section
13.3.6.1)
If the unit is set for 230 VAC and is plugged into 115 VAC or 100 VAC the sample
pump will not start.
If the unit is set for 115 or 100 VAC and is plugged into a 230 VAC circuit, the circuit
breaker built into the ON/OFF Switch on the front panel will trip to the OFF position
immediately after power is switched on.
12.7.2. DC POWER SUPPLY
If you have determined that the analyzer’s AC mains power is working, but the unit is
still not operating properly, there may be a problem with one of the instrument’s
switching power supplies. The supplies can have two faults, namely no DC output, and
noisy output.
To assist tracing DC Power Supply problems, the wiring used to connect the various
printed circuit assemblies and DC Powered components and the associated test points on
the relay PCA follow a standard color-coding scheme as defined in the following table.
Table 12-6: DC Power Test Point and Wiring Color Codes
NAME TEST POINT# COLOR DEFINITION
DGND 1 Black Digital ground
+5V 2 Red
AGND 3 Green Analog ground
+15V 4 Blue
-15V 5 Yellow
+12R 6 Purple 12 V return (ground) line
+12V 7 Orange
06870C DCN6332
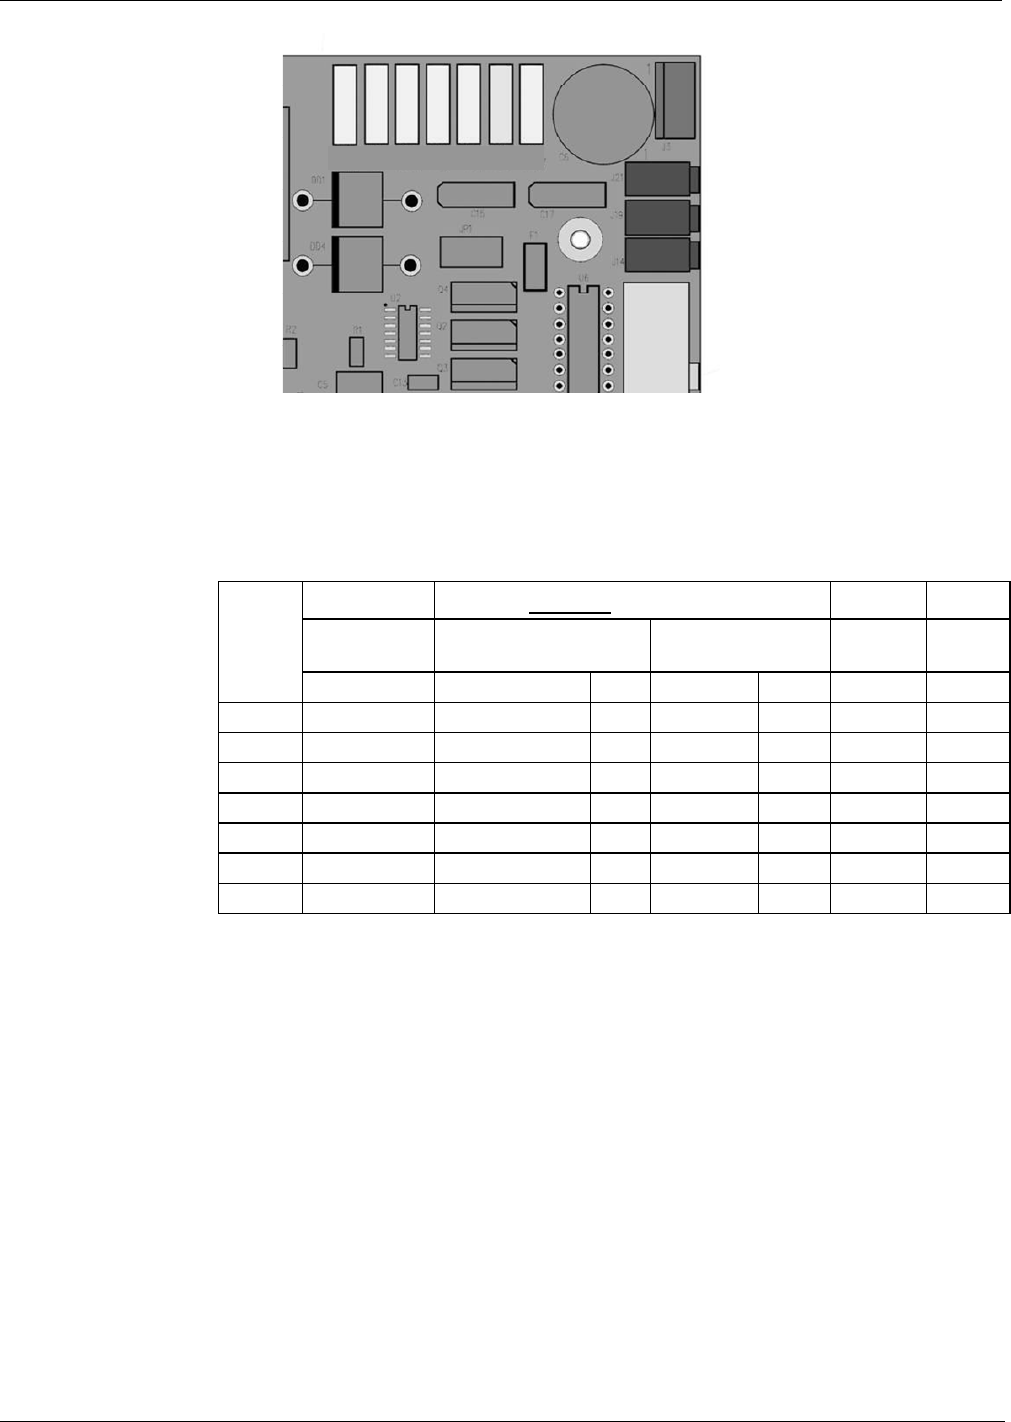
Troubleshooting & Service T400 Ozone Analyzer Operator’s Manual
260
TP1 TP2 TP3 TP4 TP5 TP6 TP7
DGND +5V AGND +15V -15V +12R 12V
Figure 12-4: Location of DC Power Test Points on Relay PCA
A voltmeter should be used to verify that the DC voltages are correct per the values in
the table below, and an oscilloscope, in AC mode, with band limiting turned on, can be
used to evaluate if the supplies are producing excessive noise (> 100 mV p-p).
Table 12-7: DC Power Supply Acceptable Levels
VOLTAGE CHECK RELAY BOARD TEST POINTS MIN V MAX V
FROM
Test Point
TO
Test Point
POWE
R
SUPPL
Y NAME # NAME #
PS1 +5 DGND 1 +5 2 +4.80 +5.25
PS1 +15 AGND 3 +15 4 +13.5 +16.0
PS1 -15 AGND 3 -15V 5 -14.0 -16.0
PS1 AGND AGND 3 DGND 1 -0.05 +0.05
PS1 Chassis DGND 1 Chassis N/A -0.05 +0.05
PS2 +12 +12V Ret 6 +12V 7 +11.8 +12.5
PS2 DGND +12V Ret 6 DGND 1 -0.05 +0.05
12.7.3. I2C BUS
Operation of the I2C bus can be verified by observing the behavior of D1 on the relay
PCA & D2 on the valve driver PCA in conjunction with the performance of the front
panel display.
Assuming that the DC power supplies are operating properly the I2C bus is operating
properly if:
If D1 on the relay PCA and is flashing, or
Pressing a button on the front panel results in a change to the display.
There is a problem with the I2C bus if D1 on the relay PCA is ON/OFF constantly and
pressing a button on the touchscreen DOES NOT results in a change to the display.
If the touchscreen interface is working but either the Watchdog LED is not flashing, the
problem may be a wiring issue between the board and the motherboard.
06870C DCN6332

T400 Ozone Analyzer Operator’s Manual Troubleshooting & Service
261
12.7.4. TOUCHSCREEN INTERFACE
Verify the functioning of the touchscreen by observing the display when pressing a
touchscreen control button. Assuming that there are no wiring problems and that the DC
power supplies are operating properly, but pressing a control button on the display does
not change the display, any of the following may be the problem:
The touchscreen controller may be malfunctioning.
The internal USB bus may be malfunctioning.
You can verify this failure by logging on to the instrument using APICOM or a terminal
program. If the analyzer responds to remote commands and the display changes
accordingly, the touchscreen interface may be faulty.
12.7.5. LCD DISPLAY MODULE
Verify the functioning of the front panel display by observing it when power is applied
to the instrument. Assuming that there are no wiring problems and that the DC power
supplies are operating properly, the display screen should light and show the splash
screen and other indications of its state as the CPU goes through its initialization
process.
12.7.6. RELAY PCA
The Relay PCA can be most easily checked by observing the condition of the status
LEDs on the Relay PCA (see Section 12.3.2), and using the SIGNAL I/O submenu
under the DIAG menu (see Section 12.1.3) to toggle each LED ON or OFF.
If D1 on the Relay PCA is flashing and the status indicator for the output in question
(Heater power, Valve Drive, etc.) toggles properly using the Signal I/O function, then
the associated control device on the Relay PCA is bad.
Several of the control devices are in sockets and can be easily replaced. The table below
lists the control device associated with a particular function.
Table 12-8: Relay PCA Control Devices
FUNCTION CONTROL
DEVICE IN SOCKET
UV Lamp Heater Q2 No
Optional IZS O3Gen Heater Q3 No
Optional Metal Wool
Scrubber K1 Yes
All Valves U5 Yes
06870C DCN6332
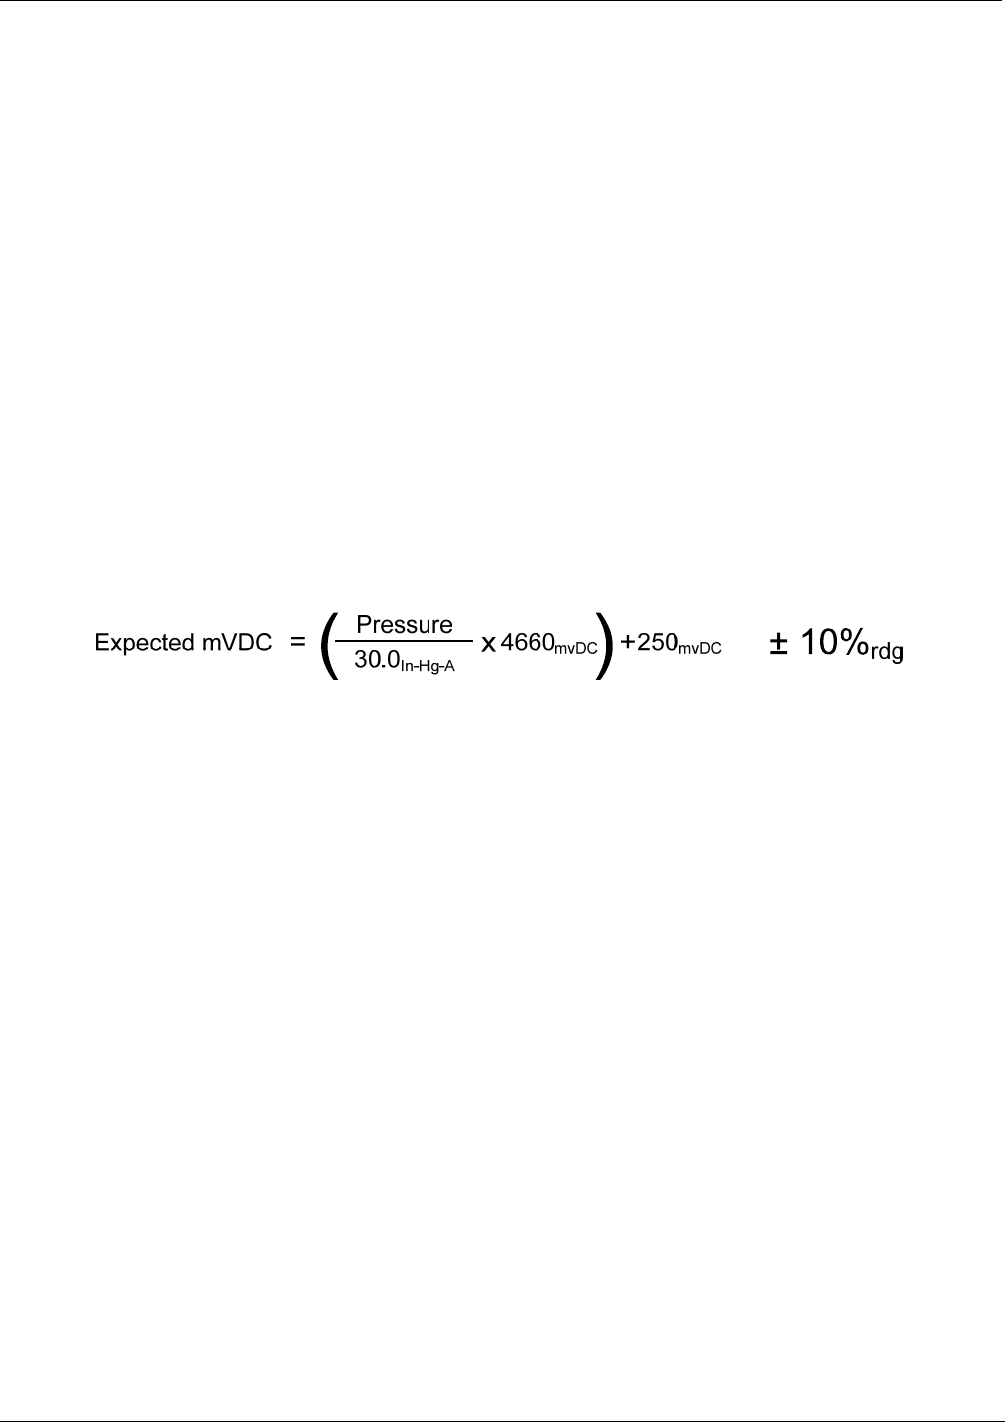
Troubleshooting & Service T400 Ozone Analyzer Operator’s Manual
262
12.7.7. PHOTOMETER PRESSURE /FLOW SENSOR ASSEMBLY
This assembly is only present in analyzers with O3 generator and/or photometer options
installed. The pressure/flow sensor PCA, located at the rear of the instrument between
the photometer and the pump (see Figure 3-5) can be checked with a Voltmeter. The
following procedure assumes that the wiring is intact and that the motherboard as well as
the power supplies are operating properly:
BASIC PCA OPERATION:
Measure the voltage across C1 it should be 5 VDC ± 0.25 VDC. If not then the
board is bad
Measure the voltage between TP2 and TP1 C1 it should be 10 VDC ± 0.25 VDC. If
not then the board is bad.
PHOTOMETER PRESSURE SENSOR:
1. Measure the pressure on the inlet side of S1 with an external pressure meter.
1. Measure the voltage across TP4 and TP1.
The expected value for this signal should be:
EXAMPLE: If the measured pressure is 20 In-Hg-A, the expected voltage level between
TP4 and TP1 would be between 2870 mVDC and 3510 mVDC.
EXAMPLE: If the measured pressure is 25 In-Hg-A, the expected voltage level between
TP4 and TP1 would be between 3533 mVDC and 4318 mVDC.
If this voltage is out of range, then either pressure transducer S1 is bad, the
board is bad or there is a pneumatic failure preventing the pressure transducer
from sensing the absorption cell pressure properly.
PHOTOMETER FLOW SENSOR
Measure the voltage across TP3 and TP1.
With proper flow (800 cc3/min through the photometer), this should be
approximately 4.5V (this voltage will vary with altitude).
With flow stopped (photometer inlet disconnected or pump turned OFF) the
voltage should be approximately 1V.
If the voltage is incorrect, the flow sensor S3 is bad, the board is bad or there is
a leak upstream of the sensor.
06870C DCN6332
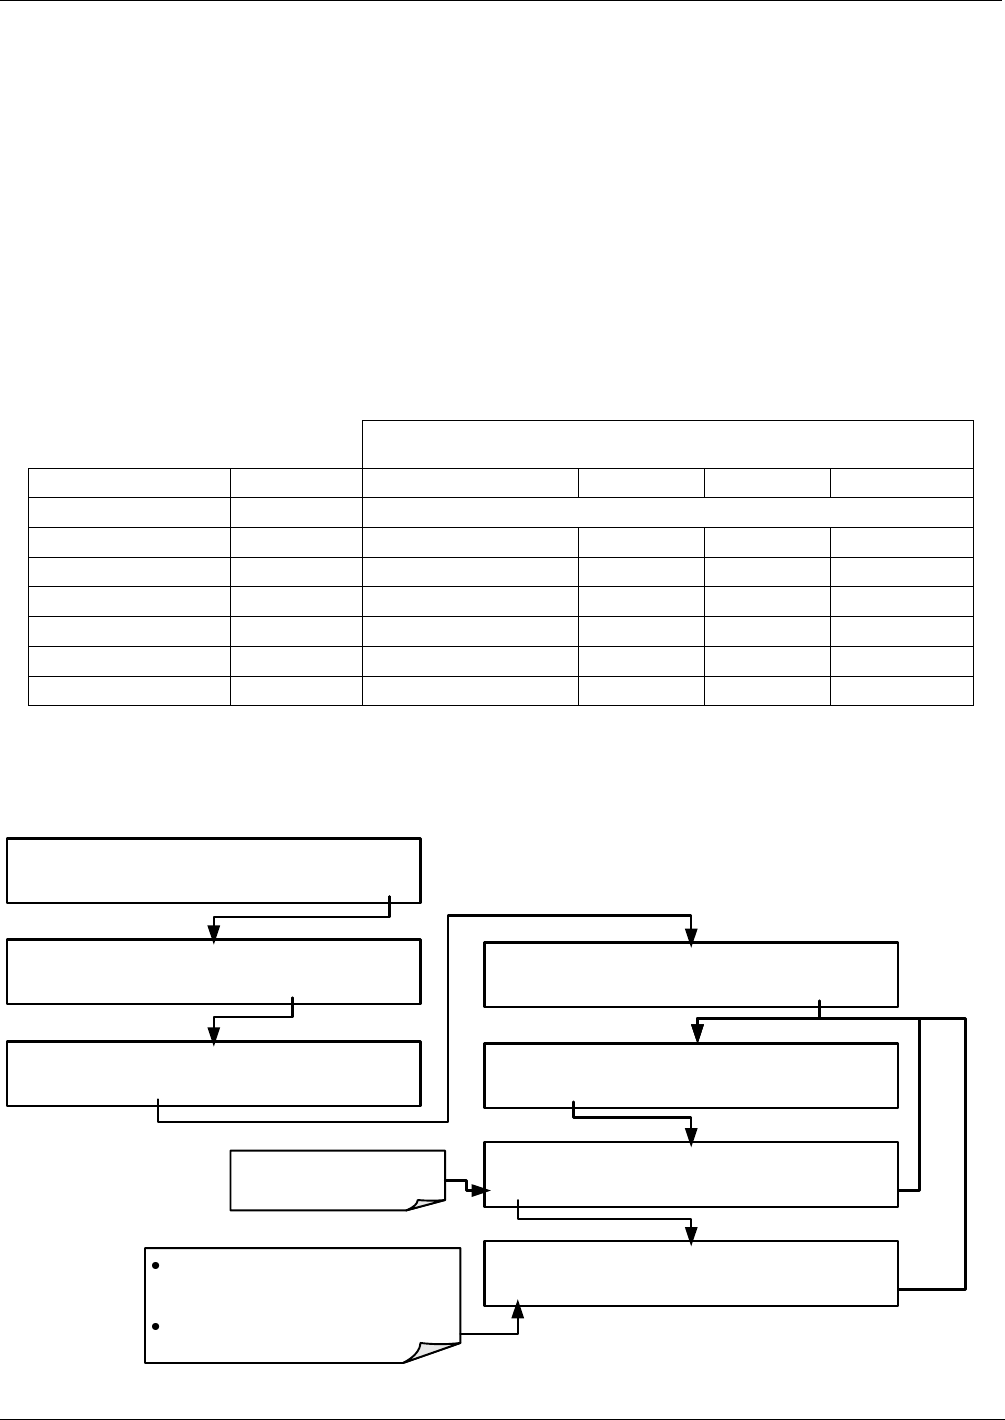
T400 Ozone Analyzer Operator’s Manual Troubleshooting & Service
263
12.7.8. MOTHERBOARD
12.7.8.1. Test Channel / Analog Outputs Voltage
The ANALOG OUTPUT submenu, located under the SETUP MORE DIAG
menu is used to verify that the T400 analyzer’s three analog outputs are working
properly. The test generates a signal on all three outputs simultaneously as shown in the
following table:
For each of the steps the output should be within 1% of the nominal value listed in the
table below except for the 0% step, which should be within 0mV ±2 to 3 mV. Make
sure you take into account any offset that may have been programmed into channel (See
Section 5.10.1.8).
Table 12-9: Analog Output Test Function - Nominal Values Voltage Outputs
FULL SCALE OUTPUT OF VOLTAGE RANGE
(see Section 5.10.1.6)
100MV 1V 5V 10V
STEP % NOMINAL OUTPUT VOLTAGE
1 0 0 0 0 0
2 20 20 mV 0.2 1 2
3 40 40 mV 0.4 2 4
4 60 60 mV 0.6 3 6
5 80 80 mV 0.8 4 8
6 100 100 mV 1.0 5 10
If one or more of the steps fails to be within these ranges, it is likely that there has been
a failure of the either or both of the DACs and their associated circuitry on the
motherboard. To perform the test connect a voltmeter to the output in question and
perform an analog output step test as follows:
DIAG SIGNAL I/O
PREV NEXT ENTR EXIT
DIAG AOUT ANALOG OUTPUT
[20%] EXIT
SETUP X.X ENTER PASSWORD
818 ENTREXIT
DIAG AOUT ANALOG OUTPUT
20% EXIT
Pressing the “n%” button pauses the
test. Brackets will appear around the
value: EXAMPLE: [20%]
Pressing the same button again will
resume the test.
Performs analog output step
test 0% to 100%
SETUP X.X SECONDARY SETUP MENU
COMM VARS DIAG EXIT
SETUP X.X PRIMARY SETUP MENU
CFG DAS RNGE PASS CLK MORE EXIT
SAMPLE RANGE=500.0 PPB O3= XXXX
<TST TST> CAL SETUP
06870C DCN6332

Troubleshooting & Service T400 Ozone Analyzer Operator’s Manual
264
12.7.8.2. A/D Functions
The simplest method to check the operation of the A-to-D converter on the motherboard
is to use the Signal I/O function under the DIAG menu to check the two A/D reference
voltages and input signals that can be easily measured with a voltmeter.
1. Use the Signal I/O function (See Section 12.1.3 and Appendix A) to view the value
of REF_4096_MV and REF_GND.
If both are within 3 mV of nominal (4096 and 0), and are stable, ±0.5 mV then
the basic A/D is functioning properly. If not then the motherboard is bad.
2. Choose a parameter in the Signal I/O function such as PHOTO_LAMP_DRIVE or
SAMPLE_FLOW.
Compare these voltages at their origin (see the interconnect drawing and
interconnect list in Appendix D) with the voltage displayed through the signal I/O
function.
If the wiring is intact but there is a large difference between the measured and
displayed voltage (±10 mV) then the motherboard is bad.
12.7.8.3. Status Outputs
To test the status output electronics:
1. Connect a jumper between the “D“pin and the “” pin on the status output
connector.
2. Connect a 1000 ohm resistor between the “+” pin and the pin for the status output
that is being tested.
3. Connect a voltmeter between the “” pin and the pin of the output being tested (see
table below).
4. Under the DIAG SIGNAL I/O menu (See Section12.1.3), scroll through the inputs
and outputs until you get to the output in question.
5. Alternately, turn on and off the output noting the voltage on the voltmeter.
It should vary between 0 volts for ON and 5 volts for OFF.
Table 12-10: Status Outputs Check
PIN (LEFT TO RIGHT) STATUS
1 ST_SYSTEM_OK
2 ST_CONC_VALID
3 ST_HIGH_RANGE
4 ST_ZERO_CAL
5 ST_SPAN_CAL
6 ST_DIAGMODE
7 ST_FLOW_ALARM
8 ST_PRESS_ALARM
06870C DCN6332

T400 Ozone Analyzer Operator’s Manual Troubleshooting & Service
265
12.7.8.4. Control Inputs
The control input bits can be tested by applying a trigger voltage to an input and
watching changes in the status of the associated function under the SIGNAL I/O
submenu:
EXAMPLE: to test the “A” control input:
1. Under the DIAG SIGNAL I/O menu (See Section12.1.3), scroll through the
inputs and outputs until you get to the output named EXT_ZERO_CAL.
2. Connect a jumper from the “+” pin on the appropriate connector to the “U” on the
same connector.
3. Connect a second jumper from the “” pin on the connector to the “A” pin.
4. The status of EXT_ZERO_CAL should change to read “ON”.
Table 12-11: T400 Control Input Pin Assignments and Corresponding
Signal I/O Functions
INPUT CORRESPONDING I/O SIGNAL
A EXT_ZERO_CAL
B EXT_LOW_SPAN_CAL1
C EXT_SPAN_CAL
D, E& F NOT USED
1 Only operates if either Z/S or IZS option is installed
12.7.9. CPU
There are two major types of CPU board failures, a complete failure and a failure
associated with the Disk On Module (DOM). If either of these failures occurs, contact
the factory.
For complete failures, assuming that the power supplies are operating properly and the
wiring is intact, the CPU is faulty if on power-on, the watchdog LED on the
motherboard is not flashing.
In some rare circumstances, this failure may be caused by a bad IC on the motherboard,
specifically U57, the large, 44 pin device on the lower right hand side of the board. If
this is true, removing U57 from its socket will allow the instrument to start up but the
measurements will be invalid.
If the analyzer stops during initialization (the front panel display shows a fault or
warning message), it is likely that the DOM, the firmware or the configuration and data
files have been corrupted.
06870C DCN6332

Troubleshooting & Service T400 Ozone Analyzer Operator’s Manual
266
12.7.10. RS-232 COMMUNICATIONS
12.7.10.1. General RS-232 Troubleshooting
Teledyne API analyzers use the RS-232 communications protocol to allow the
instrument to be connected to a variety of computer-based equipment. RS-232 has been
used for many years and as equipment has become more advanced, connections between
various types of hardware have become increasingly difficult. Generally, every
manufacturer observes the signal and timing requirements of the protocol very carefully.
Problems with RS-232 connections usually center around the following general areas:
Incorrect cabling and connectors. See Section 3.3.1.8 for connector and pin-out
information.
The BAUD rate and protocol are incorrectly configured. See Section 6.2.2.
If a modem is being used, additional configuration and wiring rules must be
observed. See Section 8.3
Incorrect setting of the DTE – DCE Switch is set correctly. See Section 6.1
Verify that cable (03596) that connects the serial COM ports of the CPU to J12 of
the motherboard is properly seated
12.7.10.2. Troubleshooting Analyzer/Modem or Terminal Operation
To troubleshoot problems with a modem connected to a Teledyne API analyzer:
Check cables for proper connection to the modem, terminal or computer.
Check to make sure the DTE-DCE is in the correct position as described in Section
6.1.
Check to make sure the set up command is correct (See Section 8.3)
Verify that the Ready to Send (RTS) signal is at logic high. The T400 sets pin 7
(RTS) to greater than 3 volts to enable modem transmission.
Make sure the BAUD rate, word length, and stop bit settings between modem and
analyzer match, See Section 6.2.2.
Use the RS-232 test function to send “w” characters to the modem, terminal or
computer; See Section 6.2.2.
Get your terminal, modem or computer to transmit data to the analyzer (holding
down the space bar is one way); the green LED should flicker as the instrument is
receiving data.
Make sure that the communications software or terminal emulation software is
functioning properly.
Note Further help with serial communications is available in a separate manual
“RS-232 Programming Notes” Teledyne API part number 013500000.
06870C DCN6332

T400 Ozone Analyzer Operator’s Manual Troubleshooting & Service
267
12.8. TROUBLE SHOOTING THE PHOTOMETER
12.8.1. CHECKING MEASURE / REFERENCE VALVE
To check the function of the photometer’s measure / reference valve:
1. Set the analyzer’s front panel display to show the O3 REF test function (see
Section 4.1.1).
2. Follow the instruction in Section 9.2.3 for performing a zero point calibration.
Press ZERO and allow the analyzer to stabilize.
3. Before completing the calibration by pressing the ENTR button, note the displayed
value.
4. Press the EXIT button to interrupt the zero point calibration process (DO NOT
PRESS the ENTR button).
5. Follow the instruction in Sections Section 9.2.3 for performing a span point
calibration of the photometer.
Press SPAN and allow the analyzer to stabilize.
6. Before completing the calibration by pressing the ENTR button, note of the
displayed value of O3 REF.
If the O3 REF value has decreased by more than 2 mV from its value with zero
gas, then there is a "cross-port" leak in the M/R valve or a bad O3 reference
scrubber. Refer to Section 12.10.2 for replacement instructions.
7. Press the EXIT button to interrupt the span point calibration process (DO NOT
PRESS the ENTR button).
06870C DCN6332
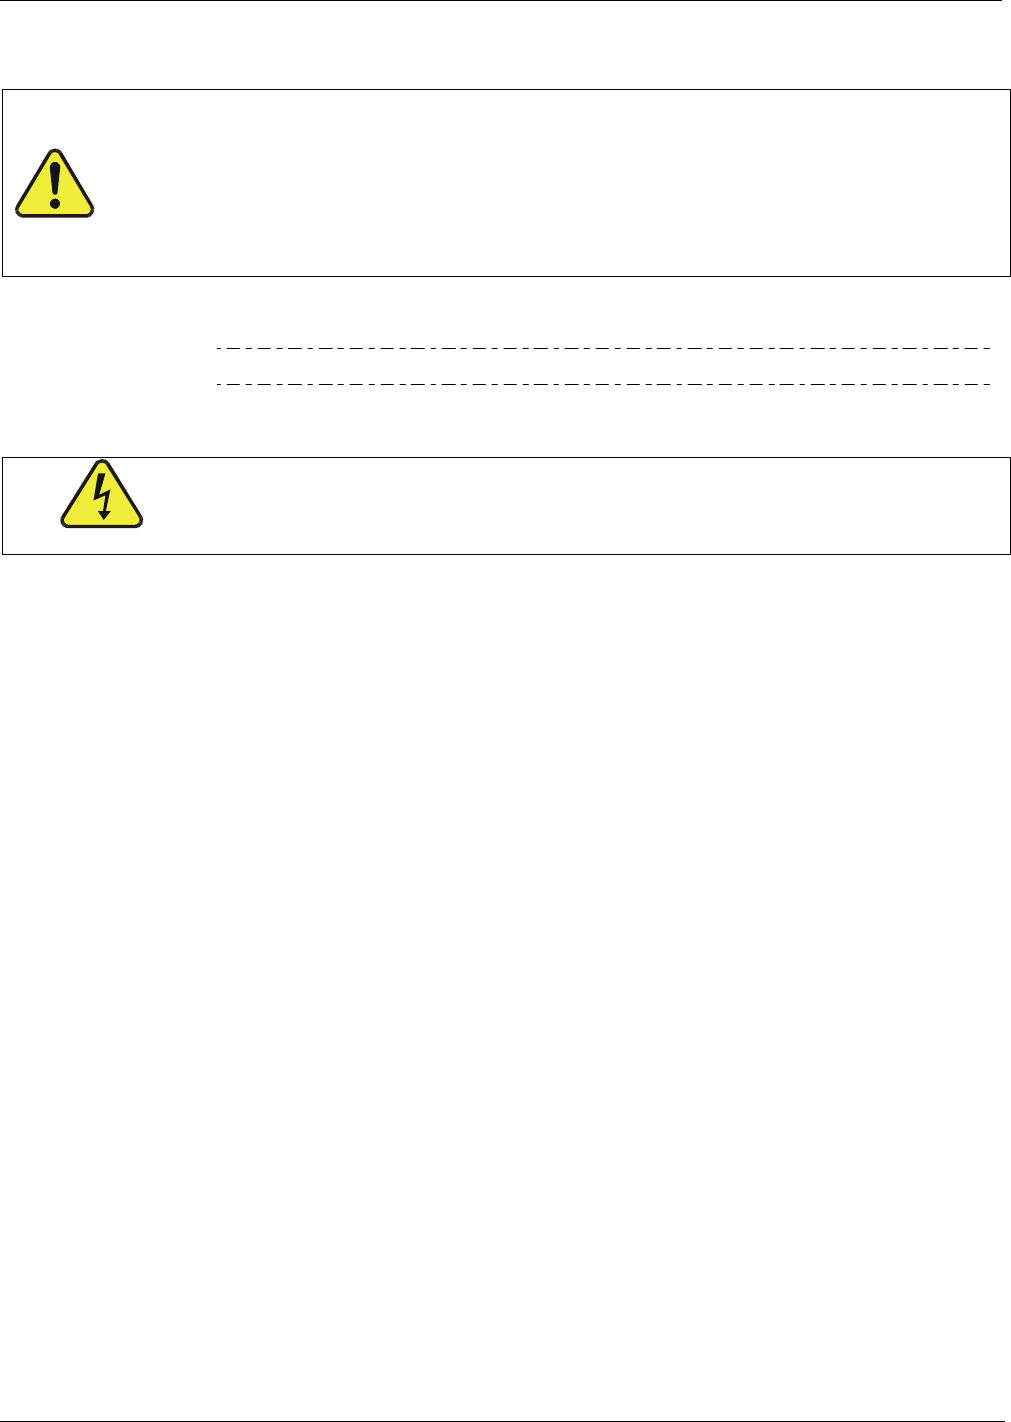
Troubleshooting & Service T400 Ozone Analyzer Operator’s Manual
268
12.8.2. CHECKING THE PHOTOMETER UV LAMP POWER SUPPLY
CAUTION - GENERAL SAFETY HAZARD
Do not look at the UV lamp while the unit is operating. UV light can cause
eye damage. Always use safety glasses made from UV blocking material
when working with the UV Lamp Assembly. (Generic plastic glasses are
not adequate).
Note A schematic of the Lamp Power Supply can be found in Appendix D.
WARNING – Electrical Shock Hazard
Hazardous voltage present - use caution.
It is not always possible to determine with certainty whether a problem is the result of
the UV Lamp or the lamp power supply, however, the following steps will provide a
reasonable confidence test of the lamp power supply.
1. Unplug the cable connector at P1 on the lamp power supply and confirm that
+15VDC is present between Pins 1 and 2 on the cable connector.
2. If this voltage is incorrect, check the DC test points on the relay PCA as described
in Section 12.7.2.
3. Remove the cover of the photometer and check for the presence of the following
voltages on the UV lamp power supply PCA (see Figure 13-17):
+4500 mVDC ± 10 mVDC between TP1 and TP4 (grnd)
If this voltage is incorrect, either the UV lamp power supply PCA is faulty or the
I2C bus is not communicating with the UV lamp power supply PCA.
+5VDC between TP3 and TP4 (grnd)
If this voltages is less than 4.8 or greater than 5.25 either the 5 VDC power
supply or the UV lamp power supply PCA are faulty...
If the above voltages check out, it is more likely that a problem is due to the UV
lamp than due to the lamp power supply.
Replace the lamp and if the problem persists, replace the lamp power supply.
06870C DCN6332

T400 Ozone Analyzer Operator’s Manual Troubleshooting & Service
269
12.9. TROUBLE SHOOTING THE IZS OPTIONS O3 GENERATOR
The only significant components of the O3 generator that might reasonably malfunction
is the power supply assembly for the UV source lamp and the lamp itself.
12.9.1. CHECKING THE O3 GENERATOR UV LAMP POWER SUPPLY
The lamp power supply for the IZS options O3 generator is the same assembly used for
the photometer’s lamp power supply. The method for checking it out is identical to that
listed in Section 12.8.2 above.
12.10. SERVICE PROCEDURES
12.10.1. REPAIRING SAMPLE FLOW CONTROL ASSEMBLY
The Critical Flow Orifice is part of the Flow Control Assembly located on the sample
pump assembly or optionally in the ozone generator for instruments with the IZS option.
The jewel orifice is protected by a sintered filter, so it is unusual for the orifice to need
replacing, but it is possible for the sintered filter and o-rings to need replacing. See the
Spare Parts list in Appendix B for part numbers and kits.
Procedure:
1. Turn off Power to the analyzer.
2. Locate the flow control assembly attached to the sample pump. See Figure 3-5.
3. Disconnect the pneumatic fittings.
4. Remove the assembly from the sample pump by disconnecting the ¼” tube fitting
on the pump inlet elbow.
5. The inlet end of the assembly is the straight ¼” tube to 1/8” male NPT fitting.
Remove the fitting and the components as shown in the exploded view in the
following figure.
6. Replace the O-rings and the sintered filter.
7. If you are replacing the Critical Flow Orifice itself, make sure that the side with the
red colored sapphire jewel is facing downstream to the flow gas flow.
8. Re-assemble in reverse order. See the Spares List in Appendix B for part numbers.
9. After re-connecting the power and pneumatic lines, verify flow rate is between 720
and 880 cc/min.
06870C DCN6332
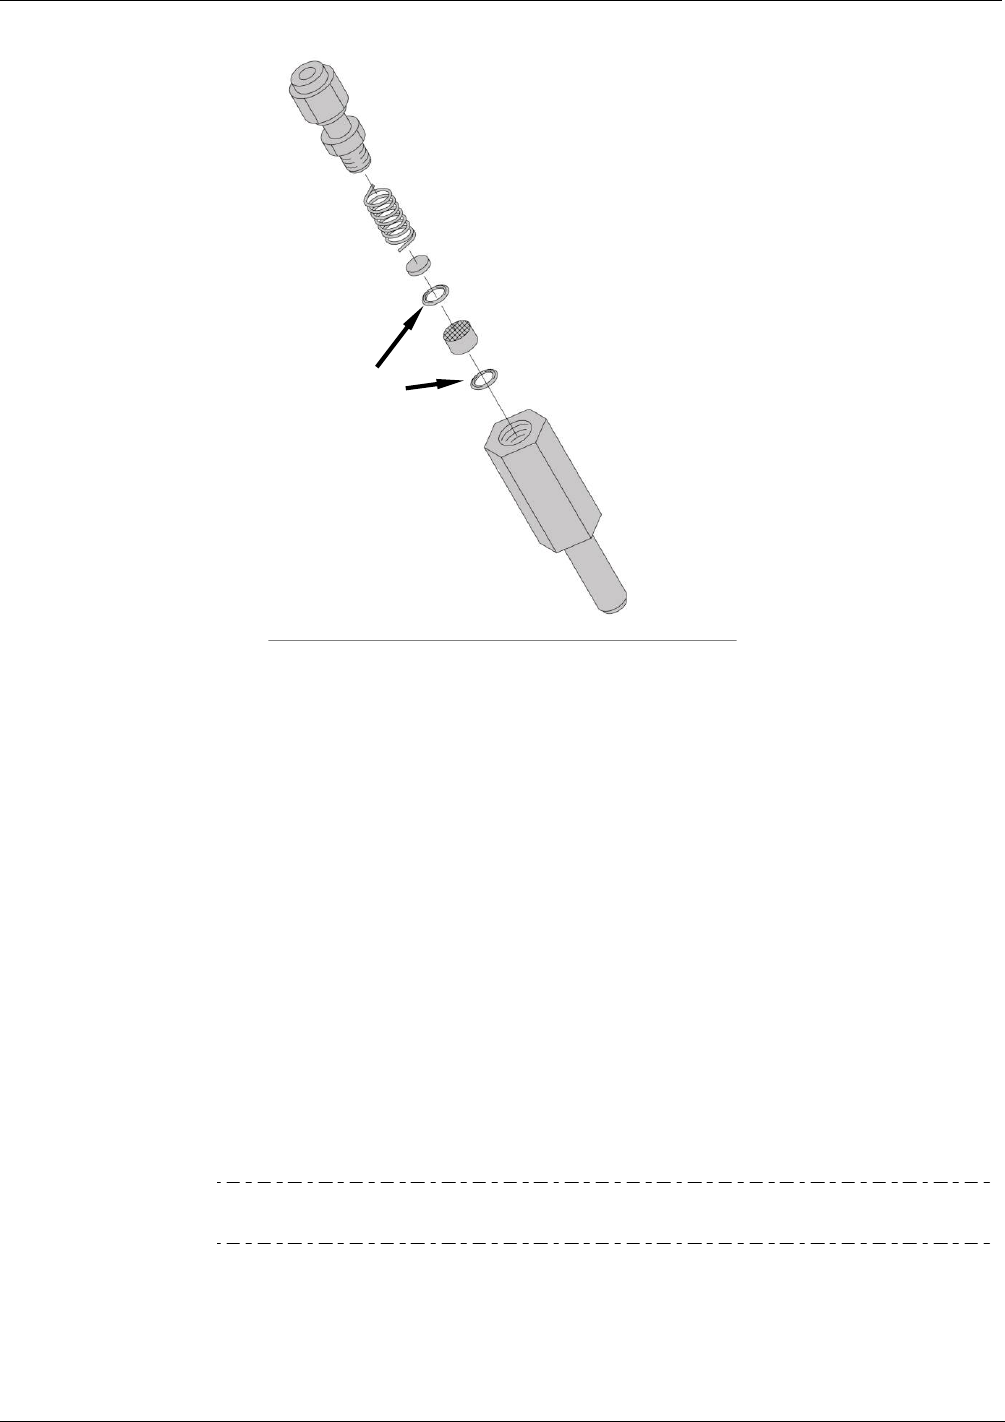
Troubleshooting & Service T400 Ozone Analyzer Operator’s Manual
270
Pneumatic Connector, Male 1/4”
(
P/N FT0000070
)
Spring
(
P/N HW0000020
)
Sintered Filter
(
P/N FL0000001
)
Critical Flow Orifice
(
P/N 00094-1000
)
O-Ring
(
P/N OR0000001
)
Housing
(
P/N 00085-0000
)
Figure 12-5: Critical Flow Orifice Assembly (Instruments without IZS)
12.10.2. REPLACING THE STANDARD REFERENCE O3 SCRUBBER
To determine whether the reference O3 scrubber requires replacement, follow the
procedures in Section 12.8.1.
1. Turn off power to the instrument.
2. Remove instrument cover.
3. The reference scrubber is a blue colored canister located at the rear of the
measure/reference valve Assembly. See Figure 3-5.
4. Disconnect the top 1/8” brass tube fitting from the scrubber.
5. Carefully remove the scrubber from the retaining clip.
6. Remove the bottom 1/8” brass tube fitting from the scrubber.
7. Perform the above steps in reverse to install the new scrubber.
Note The new scrubber should be allowed to run in the instrument for at least
24 hrs after which the instrument should be re-calibrated.
06870C DCN6332
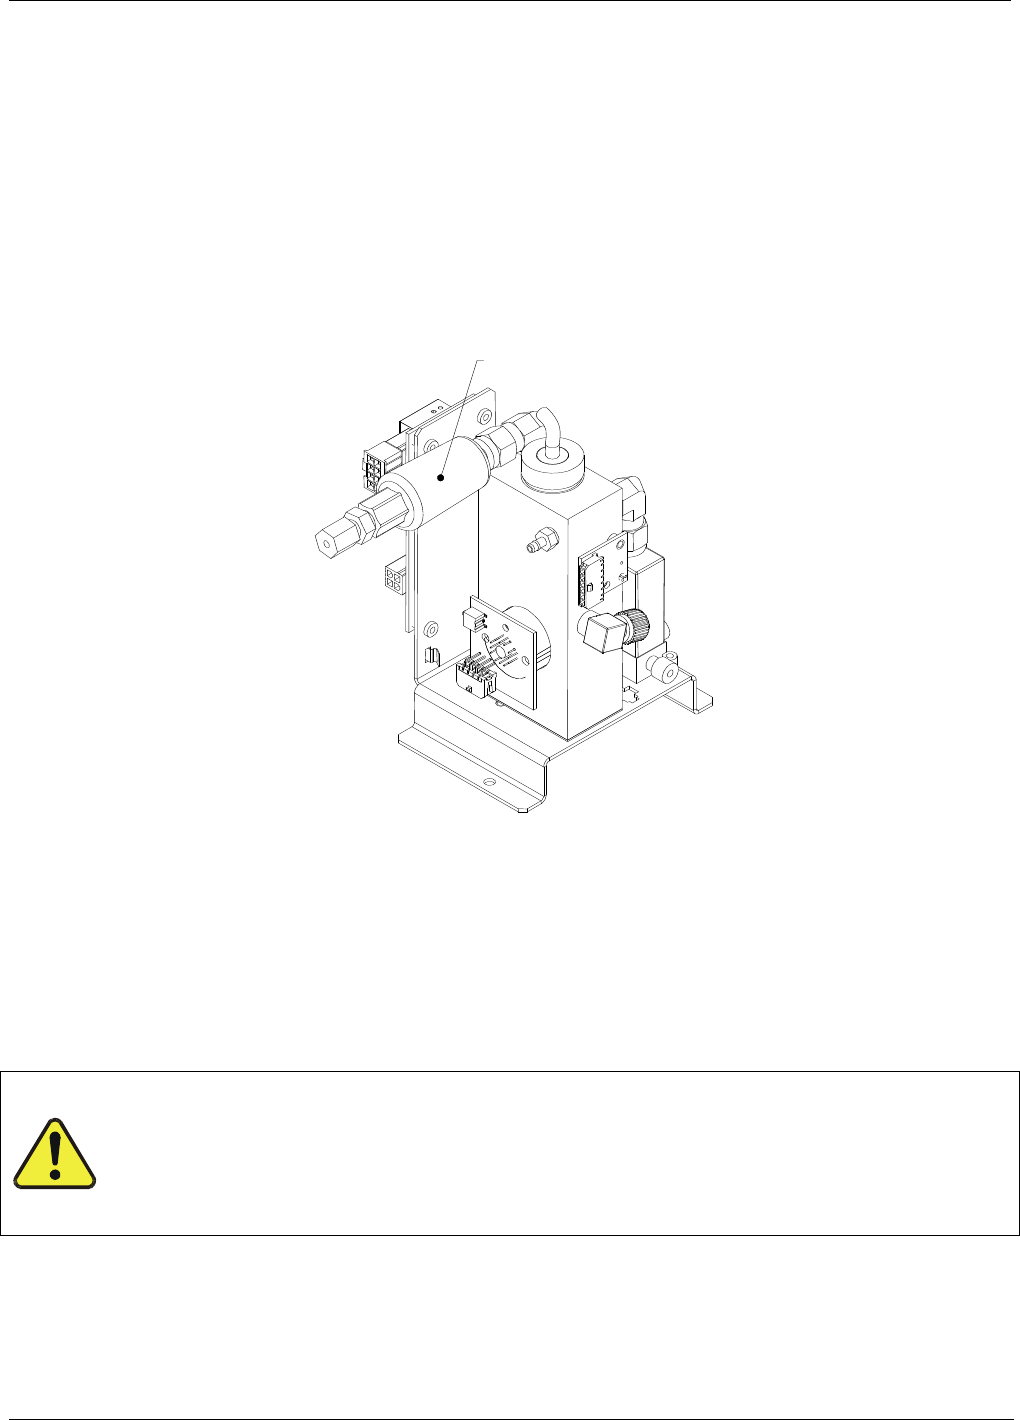
T400 Ozone Analyzer Operator’s Manual Troubleshooting & Service
271
12.10.3. REPLACING THE IZS O3 SCRUBBER
1. Turn off power to the instrument.
2. Remove instrument cover.
3. The IZS zero air scrubber is attached to the brass elbow inlet fitting on the top of the
O3 generator assembly. See Figure 12-6.
4. Disconnect 1/4” Tube Fitting nut on O3 generator inlet fitting.
5. Disconnect 1/8” tube fitting on the other end of the scrubber.
6. Install new scrubber by reversing these steps.
IZ S Z E R O A IR
SCRUBBER
Figure 12-6: IZS O3 Generator Zero Air Scrubber Location
12.10.4. METAL WOOL SCRUBBER OPTION
Contact TAPI for instructions on replacing the optional Metal Wool Scrubber.
12.10.5. DISK-ON-MODULE REPLACEMENT PROCEDURE
CAUTION
Servicing of circuit components requires electrostatic discharge protection, i.e. ESD
grounding straps, mats and containers. Failure to use ESD protection when working
with electronic assemblies will void the instrument warranty. Refer to Section 13 for
more information on preventing ESD damage.
Replacing the Disk-on-Module (DOM) will cause loss of all DAS data; it may also
cause loss of some instrument configuration parameters unless the replacement DOM
carries the exact same firmware version. Whenever changing the version of installed
software, the memory must be reset. Failure to ensure that memory is reset can cause the
06870C DCN6332

Troubleshooting & Service T400 Ozone Analyzer Operator’s Manual
272
analyzer to malfunction, and invalidate measurements. After the memory is reset, the
A/D converter must be re-calibrated, and all information collected in Step 1 below must
be re-entered before the instrument will function correctly. Also, zero and span
calibration should be performed.
1. Document all analyzer parameters that may have been changed, such as range,
auto-cal, analog output, serial port and other settings before replacing the DOM
2. Turn off power to the instrument, fold down the rear panel by loosening the
mounting screws.
3. When looking at the electronic circuits from the back of the analyzer, locate the
Disk-on-Module in the right-most socket of the CPU board.
4. The DOM should carry a label with firmware revision, date and initials of the
programmer.
5. Remove the nylon standoff clip that mounts the DOM over the CPU board, and lift
the DOM off the CPU. Do not bend the connector pins.
6. Install the new Disk-on-Module, making sure the notch at the end of the chip
matches the notch in the socket.
7. It may be necessary to straighten the pins somewhat to fit them into the socket.
Press the chip all the way in.
8. Close the rear panel and turn on power to the machine.
9. If the replacement DOM carries a firmware revision, re-enter all of the setup
information.
12.11. FAQ’S
The following list was compiled from the TAPI Customer Service Department's most
commonly asked questions relating to the Model T400 O3 Analyzer.
QUESTION ANSWER
How do I get the instrument to zero / Why is the zero
button not displayed?
See Section 12.5.4 Inability to zero.
How do I get the instrument to span / Why is the span
button not displayed?
See Section12.5.3 Inability to span.
How do I enter or change the value of my Span Gas Press the CONC button found under the CALor CALS
buttons of the main SAMPLE display menus to enter
the expected O3 span concentration. See Section
9.2.3.1 for more information.
How do I perform a midpoint calibration check? Midpoint calibration checks can be performed using
the instrument’s AutoCal feature (see Section 9.4) or
by using the control inputs on the rear panel of the
instrument (see Section 9.3.3.3). The IZS option is
required in order to perform a mid-point span check.
06870C DCN6332

T400 Ozone Analyzer Operator’s Manual Troubleshooting & Service
273
Why does the ENTR button sometimes disappear on
the Front Panel Display?
During certain types of adjustments or configuration
operations, the ENTR button will disappear if you
select a setting that is nonsensical (such as trying to
set the 24-hour clock to 25:00:00) or out of the
allowable range for that parameter (such as selecting
an DAS Holdoff period of more than 20 minutes). Once
you adjust the setting in question to an allowable
value, the ENTR button will re-appear.
How do I make the RS-232 Interface Work? See Section 6.
How do I use the DAS? See Section 7.
How do I make the instrument’s display and my data
logger agree?
This most commonly occurs when an independent
metering device is used besides the data
logger/recorded to determine gas concentration levels
while calibrating the analyzer. These disagreements
result from the analyzer, the metering device and the
data logger having slightly different ground levels.It is
possible to enter a DC offset in the analog outputs to
compensate. This procedure is located in Section
5.10.1.8 of this manual. Alternately, use the data
logger itself as the metering device during calibration
procedures.
When should I change the Particulate Filter and how
do I change it?
The Particulate filter should be changed weekly. See
Section 11.3.1 for instructions on performing this
replacement.
When should I change the Sintered Filter and how do I
change it?
The Sintered Filter does not require regular
replacement. Should its replacement be required as
part of a troubleshooting or repair exercise, see
Section 12.10.1 for instructions.
When should I change the Critical Flow Orifice and
how do I change it?
The Critical Flow Orifice does not require regular
replacement. Should its replacement be required as
part of a troubleshooting or repair exercise, see
Section 12.10.1 for instructions.
How do I set up and use the Contact Closures (Control
Inputs) on the Rear Panel of the analyzer?
See Section 3.3.1.6.
Can I automatically calibrate or check the calibration of
my analyzer?
Any analyzer into which a Zero/Span Valve Option can
be automatically calibrated using the instrument’s
AutoCal Feature. Be aware that while the AutoCal
feature can be used with the IZS Option to perform
Calibration Checks, The IZS should never be used to
perform Calibrations. See Section 9.4 for instructions
on setting up and activating the AutoCal feature.
How often should I rebuild the Sample Pump on my
analyzer?
The diaphragm of the Sample Pump should be
replaced annually. A sample rebuild kit is available.
See Appendix B of this manual for the part number of
the pump rebuild kit. Instructions and diagrams are
included with the kit.
06870C DCN6332

Troubleshooting & Service T400 Ozone Analyzer Operator’s Manual
274
12.12. TECHNICAL ASSISTANCE
If this manual and its trouble-shooting / repair sections do not solve your problems,
technical assistance may be obtained from:
TELEDYNE-API, CUSTOMER SERVICE,
9480 CARROLL PARK DRIVE
SAN DIEGO, CALIFORNIA 92121-5201USA
Toll-free Phone: 800-324-5190
Phone: 858-657-9800
Fax: 858-657-9816
Email: api-customerservice@teledyne.com
Website: http://www.teledyne-api.com/
Before you contact customer service, fill out the problem report form in Appendix C,
which is also available online for electronic submission at http://www.teledyne-
api.com/forms/.
.
06870C DCN6332

275
13. THEORY OF OPERATION
The Model T400 ozone analyzer is a microprocessor-controlled analyzer that determines
the concentration of Ozone (O3) in a sample gas drawn through the instrument. It
requires that sample and calibration gasses be supplied at ambient atmospheric pressure
in order to establish a stable gas flow through the absorption tube where the gas’ ability
to absorb ultraviolet (UV) radiation of a certain wavelength (in this case 254 nm) is
measured.
Calibration of the instrument is performed in software and does not require physical
adjustments to the instrument. During calibration, the microprocessor measures the
current state of the UV Sensor output and various other physical parameters of the
instrument and stores them in memory.
The microprocessor uses these calibration values, the UV absorption measurements
made on the Sample Gas in the absorption tube along with data regarding the current
temperature and pressure of the gas to calculate a final O3 concentration.
This concentration value and the original information from which it was calculated are
stored in one of the unit’s Internal Data Acquisition System (DAS - see Section 7) as
well as reported to the user via a Front Panel Display or a variety of digital and analog
signal outputs.
13.1. MEASUREMENT METHOD
13.1.1. CALCULATING O3 CONCENTRATION
The basic principle by which the Model T400 Ozone Analyzer works is called Beer’s
Law (also referred to as the Beer-Lambert equation). It defines the how light of a
specific wavelength is absorbed by a particular gas molecule over a certain distance at a
given temperature and pressure. The mathematical relationship between these three
parameters for gasses at standard temperature and pressure (STP) is:
Equation 13-1
I=IO e-LC at STP
Where:
Io is the intensity of the light if there was no absorption.
I is the intensity with absorption.
06870C DCN6332
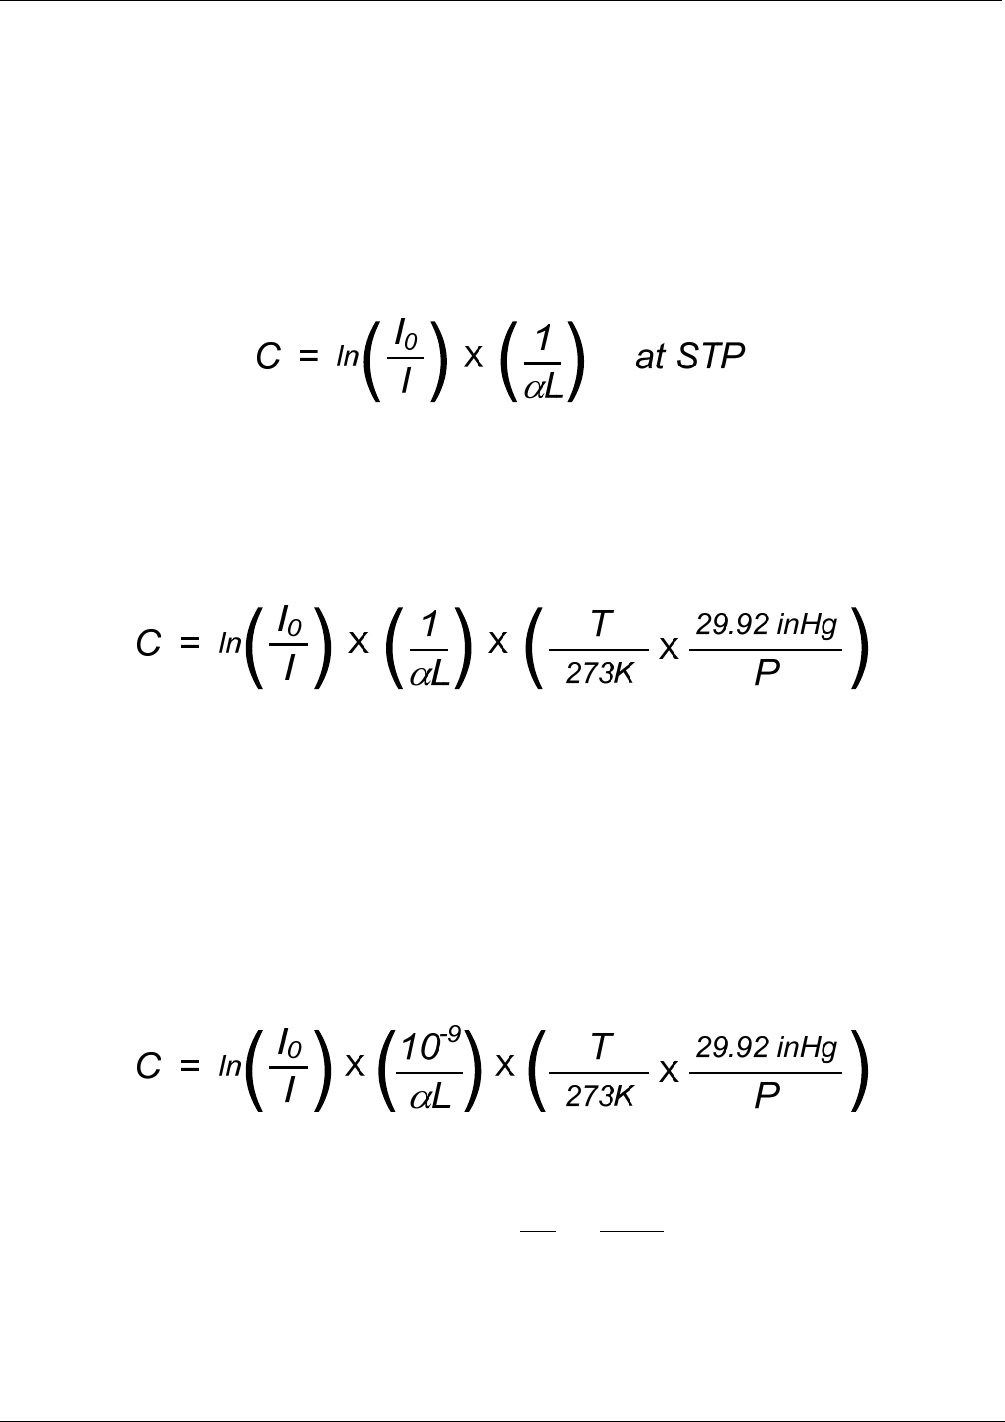
Theory of Operation T400 Ozone Analyzer Operator’s Manual
276
L is the absorption path, or the distance the light travels as it is being absorbed.
C is the concentration of the absorbing gas. In the case of the Model T400, Ozone
(O3).
is the absorption coefficient that tells how well O3 absorbs light at the specific
wavelength of interest.
To solve this equation for C, the concentration of the absorbing Gas (in this case O3), the
application of a little algebra is required to rearrange the equation as follows:
Equation 13-2
Unfortunately, both ambient temperature and pressure influence the density of the
sample gas and therefore the number of ozone molecules present in the absorption tube
thus changing the amount of light absorbed.
In order to account for this effect the following addition is made to the equation:
Equation 13-3
Where:
T = sample temperature in Kelvin
P = sample pressure in inches of mercury
Finally, to convert the result into parts per billion (PPB), the following change is made:
Equation 13-4
In a nutshell the Model T400 Ozone Analyzer:
Measures each of the above variables: sample temperature; sample pressure; the
intensity of the UV light beam with and without O3 present,
Inserts known values for the length of the absorption path and the absorption
coefficient, and
Calculates the concentration of O3 present in the sample gas.
06870C DCN6332
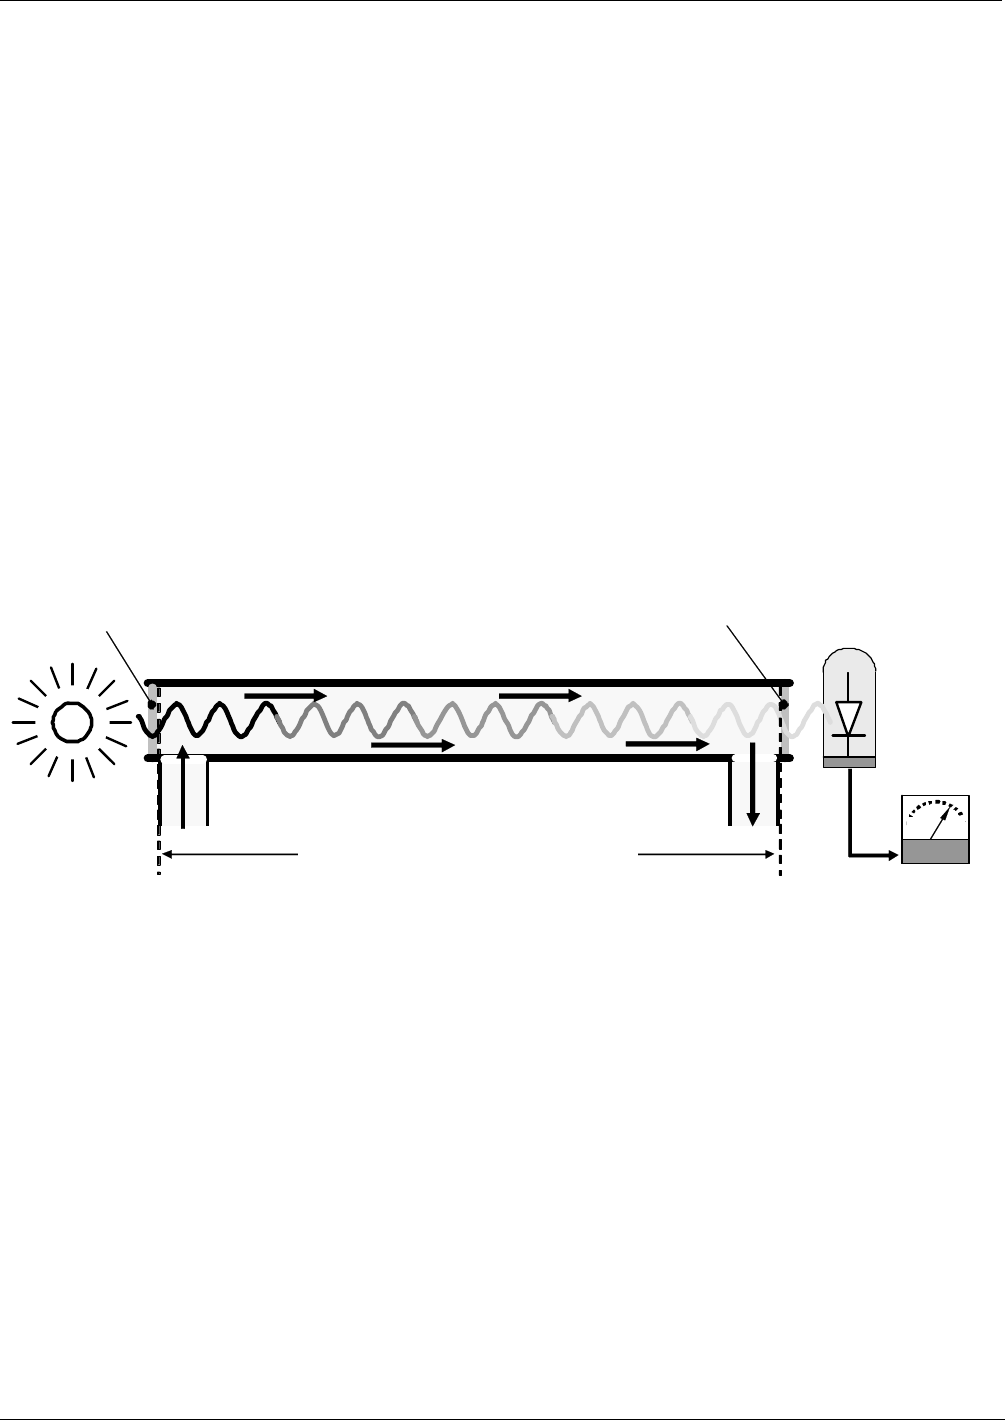
T400 Ozone Analyzer Operator’s Manual Theory of Operation
277
13.1.2. THE PHOTOMETER UV ABSORPTION PATH
In the most basic terms, the photometer of the Model T400 uses a high energy, mercury
vapor lamp to generate a beam of UV light. This beam passes through a window of
material specifically chosen to be both non-reactive to O3 and transparent to UV
radiation at 254nm and into an absorption tube filled with Sample Gas.
Because ozone is a very efficient absorber of UV radiation the absorption path length
required to create a measurable decrease in UV intensity is short enough (approximately
42 cm) that the light beam is only required to make pass through the absorption tube.
Therefore, no complex mirror system is needed to lengthen the effective path by
bouncing the beam back and forth.
Finally, the UV then passes through similar window at the other end of the absorption
tube and is detected by a specially designed vacuum diode that only detects radiation at
or very near a wavelength of 254nm. The specificity of the detector is high enough that
no extra optical filtering of the UV light is needed.
The detector assembly reacts to the UV light and outputs a voltage that varies in direct
relationship with the light’s intensity. This voltage is digitized and sent to the
instrument’s CPU to be used in computing the concentration of O3 in the absorption
tube.
UV
Source
ABSORPTION TUBE
UV Detector
Sample Gas OUT Sample Gas IN
Window Window
Absorption Path Length = 42 cm
Figure 13-1: O3 Absorption Path
06870C DCN6332
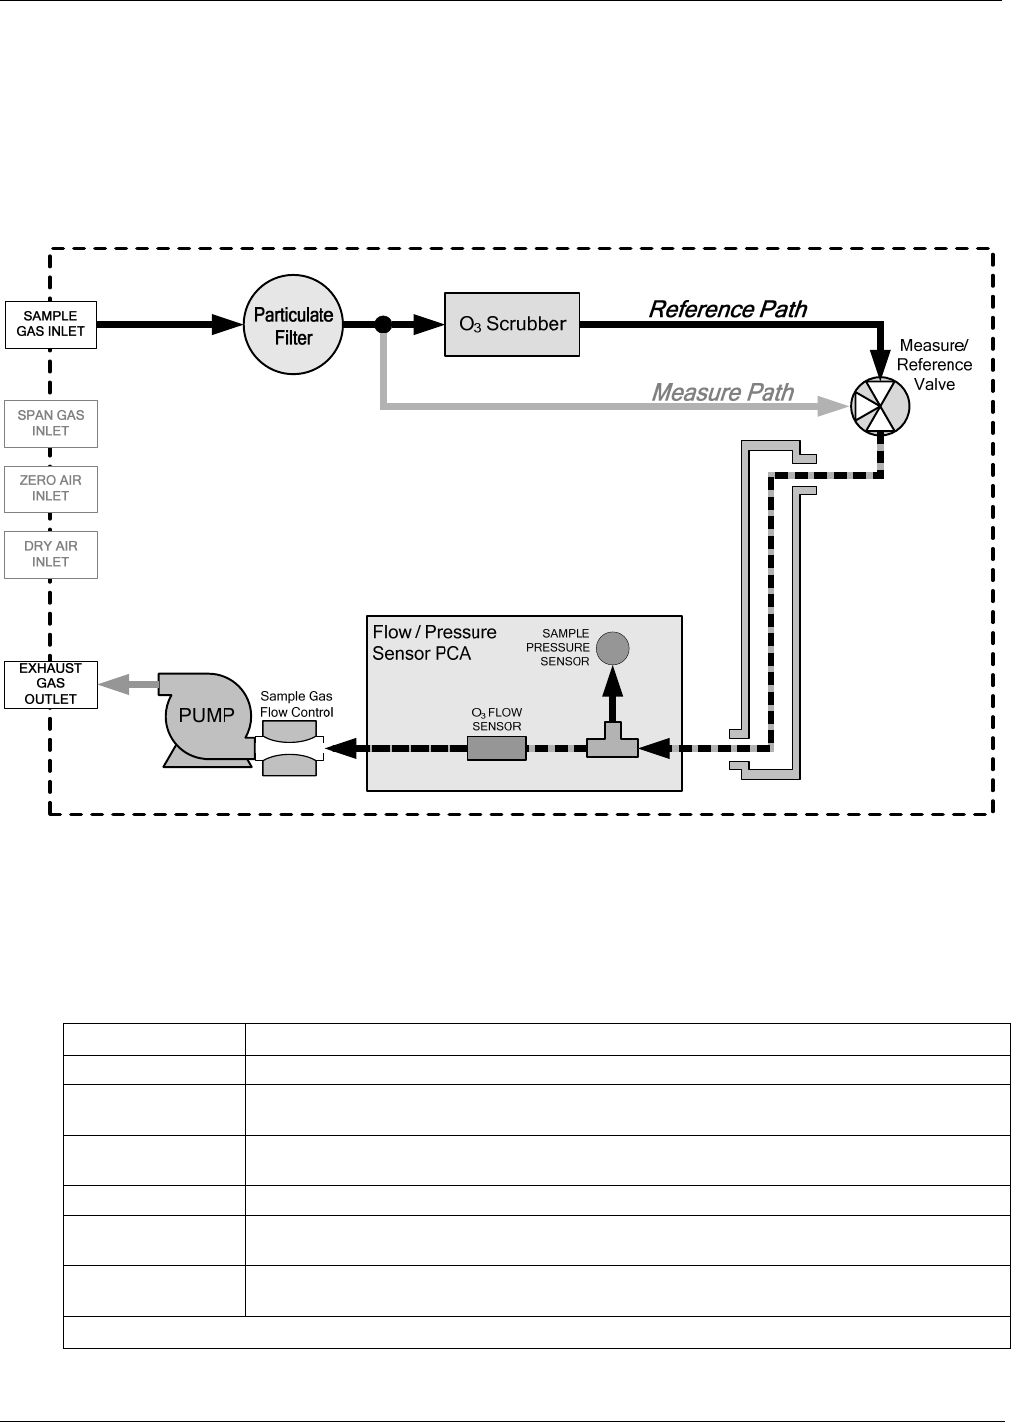
Theory of Operation T400 Ozone Analyzer Operator’s Manual
278
13.1.3. THE REFERENCE / MEASUREMENT CYCLE
In order to solve the Beer-Lambert equation (see Section 10.1.2) it is necessary to know
the intensity of the light passing through the absorption path both when O3 is present and
when it is not. The Model T400 accomplishes this be alternately sending the sample gas
directly to the absorption tube and passing it through a chemical Scrubber that removes
any O3 present.
ABSORPTION TUBE
Figure 13-2: Reference / Measurement Gas Cycle
The Measurement / Reference Cycle consists of:
TIME INDEX STATUS
0 seconds Measure/Reference Valve Opens to the Measure Path.
0 – 2 seconds Wait Period. Ensures that the Absorption tube has been adequately flushed of any
previously present gasses.
2 – 3 seconds Analyzer measures the average UV light intensity of O3 bearing Sample Gas (I) during this
period.
3 seconds Measure/Reference Valve Opens to the Reference Path.
3 – 5 seconds Wait Period. Ensures that the Absorption tube has been adequately flushed of O3 bearing
gas.
5 – 6 seconds Analyzer measures the average UV light intensity of Non-O3 bearing Sample Gas (I0) during
this period.
CYCLE REPEAT EVERY 6 SECONDS
06870C DCN6332

T400 Ozone Analyzer Operator’s Manual Theory of Operation
279
13.1.4. INTERFERENT REJECTION
The detection of O3 is subject to interference from a number of sources including, SO2,
NO2, NO, H2O, aromatic hydrocarbons such as meta-xylene and mercury vapor. The
Model T400’s basic method or operation successfully rejects interference from most of
these Interferents.
The O3 scrubber located on the reference path (see Figure 13-2) is specifically designed
ONLY to remove O3 from the sample gas. Thus, the variation in intensities of the UV
light detected during the instrument’s measurement phase versus the reference phase is
ONLY due to the presence or absence of O3. Thus, the effect of interferents on the
detected UV light intensity is ignored by the instrument.
Even if the concentration of interfering gases were to fluctuate so wildly as to be
significantly different during consecutive reference and measurement phases, this would
only cause the O3 concentration reported by the instrument to become noisy. The
average of such noisy readings would still be a relatively accurate representation of the
O3 concentration in the sample gas.
Interference from SO2, NO2, NO and H2O are very effectively rejected by the Model
T400. The two types of Interferents that may cause problems for the Model T400 are
aromatic hydrocarbons and mercury vapor.
AROMATIC HYDROCARBONS
While the instrument effectively rejected interference from meta-xylene, it should be
noted that there are a very large number of volatile aromatic hydrocarbons that could
potentially interfere with ozone detection. This is particularly true of hydrocarbons with
higher molecular weights. If the Model T400 is installed in an environment where high
aromatic hydrocarbon concentrations are suspected, specific tests should be conducted
to reveal the amount of interference these compounds may be causing.
MERCURY VAPOR
Mercury vapor absorbs radiation in the 254nm wavelength so efficiently that its
presence, even in small amounts, will reduce the intensity of UV light to almost zero
during both the Measurement and Reference Phases rendering the analyzer useless for
detecting O3.
If the Model T400 is installed in an environment where the presence of mercury vapor is
suspected, specific steps MUST be taken to remove the mercury vapor from the sample
gas before it enters the analyzer.
06870C DCN6332
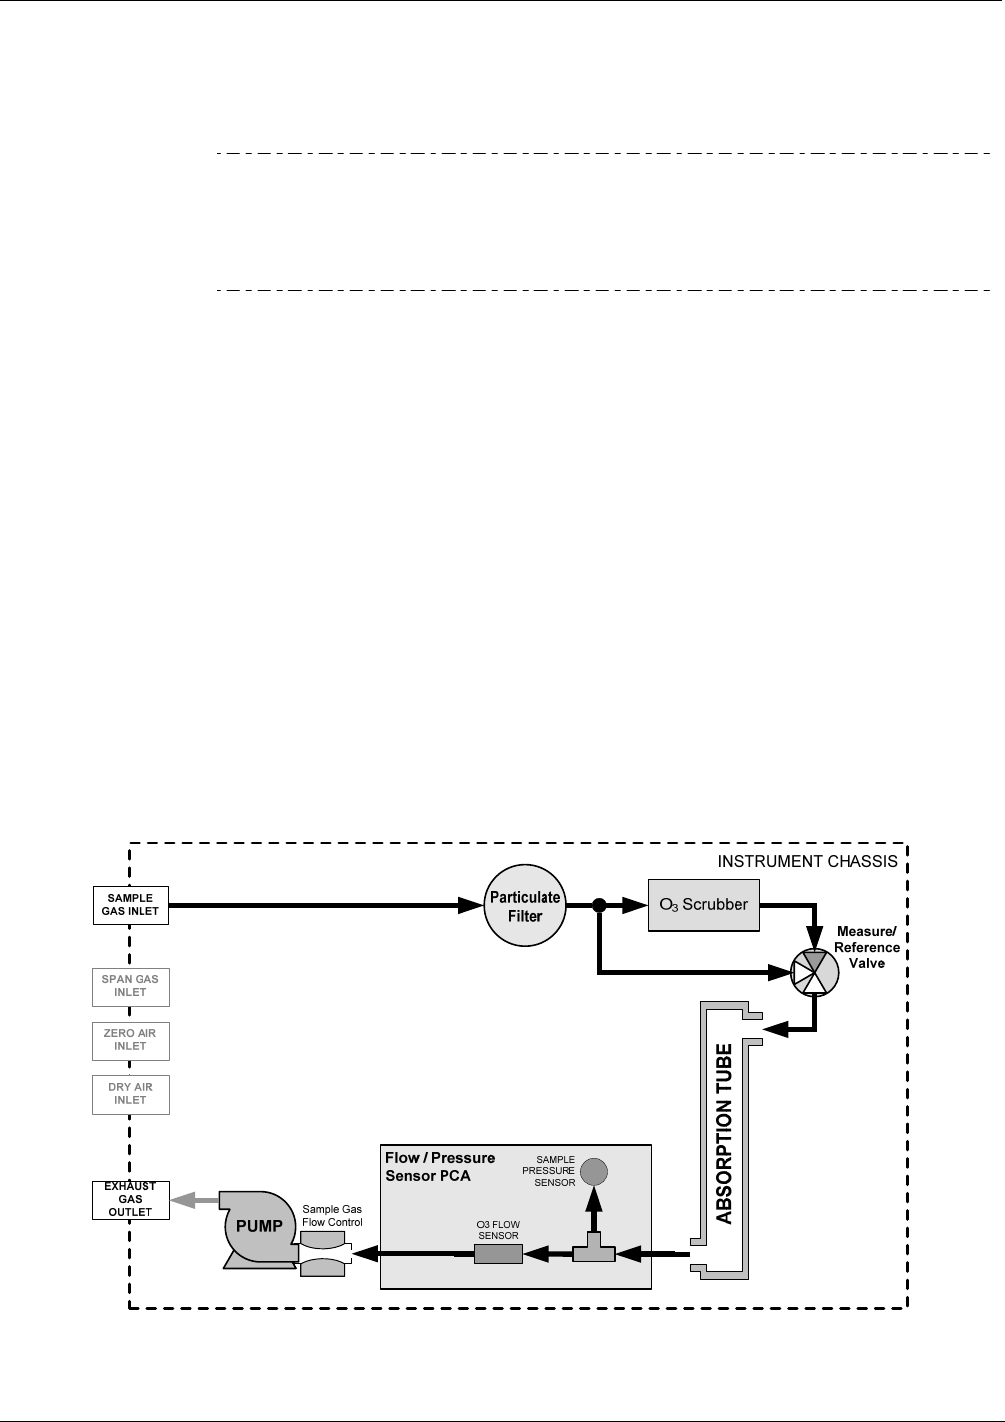
Theory of Operation T400 Ozone Analyzer Operator’s Manual
280
13.2. PNEUMATIC OPERATION
Note It is important that the sample airflow system is both leak tight and not
pressurized over ambient pressure. Regular leak checks should be
performed on the analyzer as described in the maintenance schedule,
Table 11-1. Procedures for correctly performing leak checks can be
found in Section 11.3.4.
13.2.1. SAMPLE GAS AIR FLOW
The flow of sample gas through the T400 analyzer is produced by an internal pump that
draws a small vacuum on the downstream side of a critical flow orifice thereby creating
a controlled airflow through the analyzers absorption tube and other components. This
requires the analyzer gas inlets be at or near ambient pressure usually managed by
placing a vent line on the incoming gas line (see Figure 3-18, Figure 3-19 and Figure
3-23).
By placing the pump down stream from the sample chamber, several problems are
avoided.
First, the pumping process heats and compresses the sample air complicating the
measurement process.
Additionally, certain physical parts of the pump itself are made of materials that
might chemically react with the sample gas.
Finally, in certain applications where the concentration of the target gas might be
high enough to be hazardous, maintaining a negative gas pressure relative to
ambient means that should a minor leak occur, no sample gas would be pumped
into the atmosphere surrounding analyzer.
Figure 13-3: T400 Pneumatic Diagram – Basic Unit
06870C DCN6332
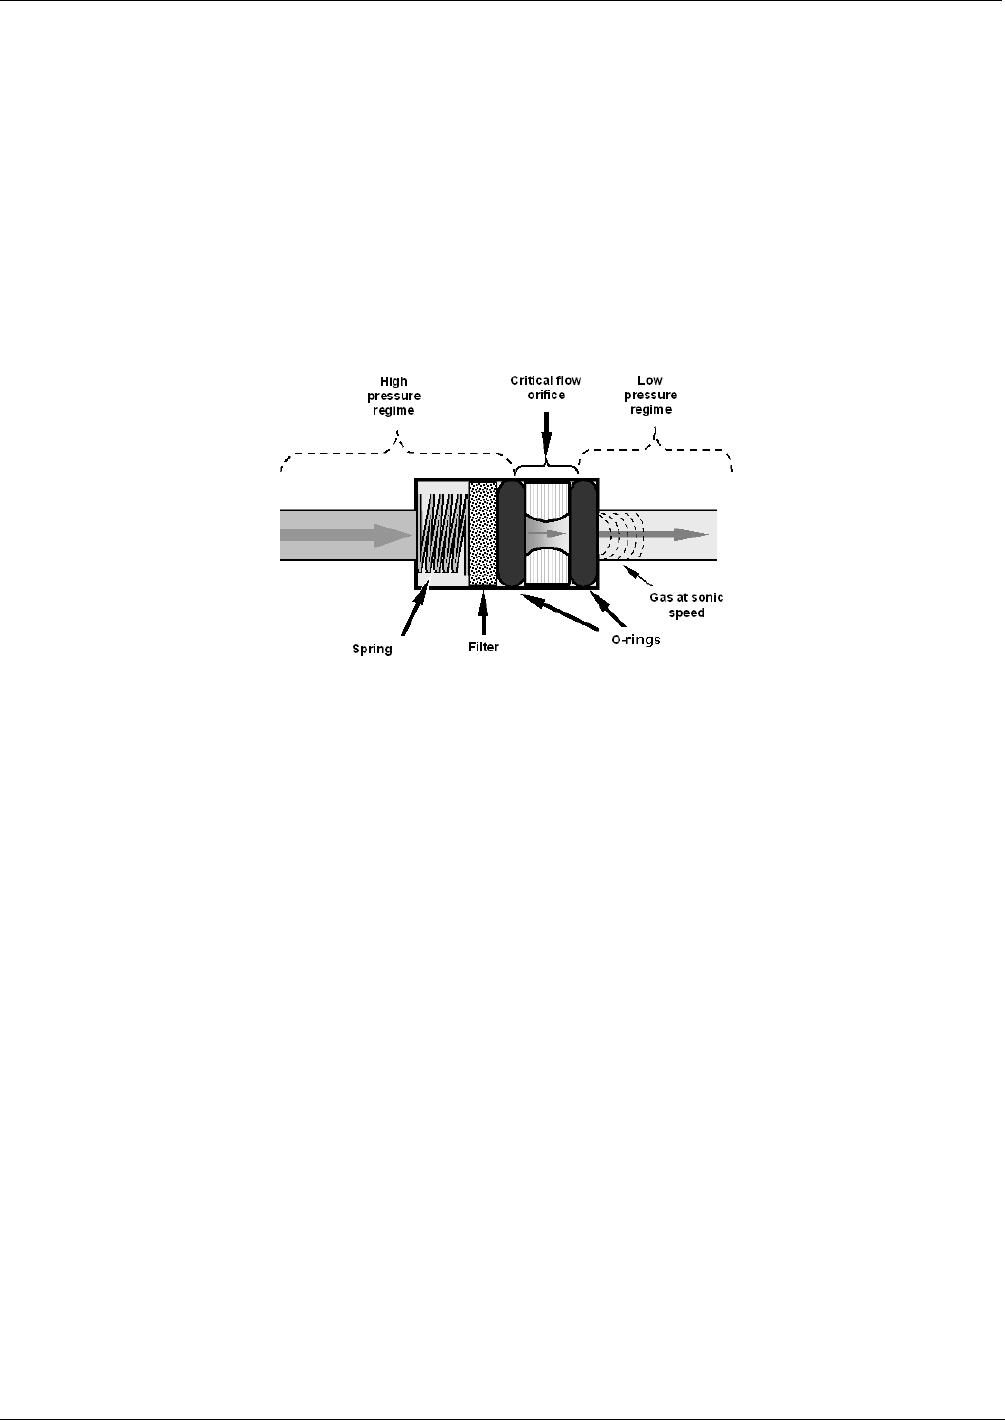
T400 Ozone Analyzer Operator’s Manual Theory of Operation
281
13.2.2. FLOW RATE CONTROL
To maintain a constant flow rate of the sample gas through the instrument, the Model
T400 uses a special flow control assembly located downstream from the absorption tube
and in the exhaust gas line just before the pump (see Figure 10-7). This assembly
consists of:
A critical flow orifice.
Two o-rings: Located just before and after the critical flow orifice, the o-rings seal
the gap between the walls of assembly housing and the critical flow orifice.
A spring: Applies mechanical force needed to form the seal between the o-rings, the
critical flow orifice and the assembly housing.
Figure 13-4: Flow Control Assembly & Critical Flow Orifice
13.2.2.1. Critical Flow Orifice
The most important component of the flow control assemblies is the critical flow orifice.
Critical flow orifices are a remarkably simple way to regulate stable gas flow rates.
They operate without moving parts by taking advantage of the laws of fluid dynamics.
By restricting the flow of gas though the orifice, a pressure differential is created. This
pressure differential combined with the action of the analyzer’s pump draws the gas
through the orifice.
As the pressure on the downstream side of the orifice (the pump side) continues to drop,
the speed that the gas flows though the orifice continues to rise. Once the ratio of
upstream pressure to downstream pressure is greater than 2:1, the velocity of the gas
through the orifice reaches the speed of sound. As long as that ratio stays at least 2:1 the
gas flow rate is unaffected by any fluctuations, surges, or changes in downstream
pressure because such variations only travel at the speed of sound themselves and are
therefore cancelled out by the sonic shockwave at the downstream exit of the critical
flow orifice.
The actual flow rate of gas through the orifice (volume of gas per unit of time), depends
on the size and shape of the aperture in the orifice. The larger the hole, the more gas
molecules (moving at the speed of sound) pass through the orifice. Using this critical
flow orifice design extends the useful life of the pump. Once the pump degrades to the
point where the sample to vacuum pressure ratio is less than 2:1, a critical flow rate can
no longer be maintained.
06870C DCN6332

Theory of Operation T400 Ozone Analyzer Operator’s Manual
282
13.2.3. PARTICULATE FILTER
The Model T400 Ozone Analyzer comes equipped with a 47 mm diameter Teflon
particulate filter with a 5-micron pore size. The filter is accessible through the front
panel, which folds down to allow access, and should be changed according to the
suggested maintenance schedule described in Table 11-1.
13.2.4. PNEUMATIC SENSORS
13.2.4.1. Sample Pressure Sensor
An absolute value pressure transducer plumbed to the outlet of the sample chamber is
used to measure sample pressure. The output of the sensor is used to compensate the
concentration measurement for changes in air pressure. This sensor is mounted to a
printed circuit board next to the internal pump (see Figure 3-5).
13.2.4.2. Sample Flow Sensor
A thermal-mass flow sensor is used to measure the sample flow through the analyzer.
The sensor is located in down stream from the absorption tube but upstream from the
critical flow orifice. This sensor is mounted to the same printed circuit board as the
pressure sensor (see Figure 3-5).
06870C DCN6332
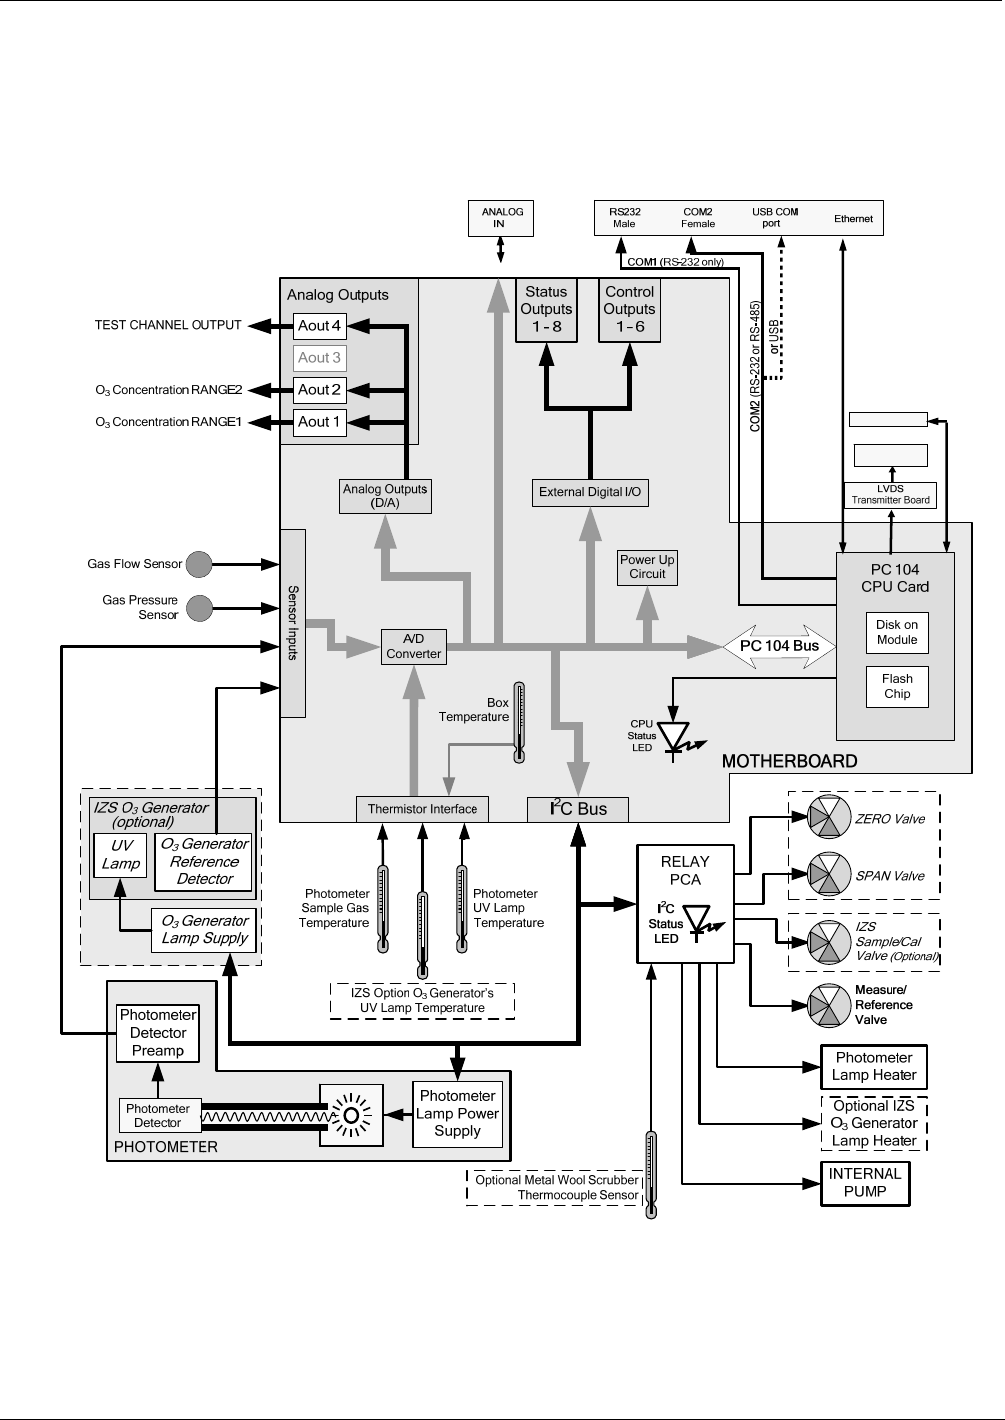
T400 Ozone Analyzer Operator’s Manual Theory of Operation
283
13.3. ELECTRONIC OPERATION
13.3.1. OVERVIEW
Absorption tube
Dis
p
la
y
Touchscreen
USB
(
I
2
C Bus
)
Figure 13-5: T400 Electronic Block Diagram
At its heart, the analyzer is a microcomputer (CPU) that controls various internal
processes, interprets data, makes calculations, and reports results using specialized
firmware developed by TAPI. It communicates with the user as well as receives data
06870C DCN6332

Theory of Operation T400 Ozone Analyzer Operator’s Manual
284
from and issues commands to a variety of peripheral devices via a separate printed
circuit assembly called the motherboard.
The motherboard collects data, performs signal conditioning duties and routs incoming
and outgoing signals between the CPU and the analyzers other major components.
An analog signal is generated by an optical bench that includes the Photometer UV
Lamp, the Absorption Tube assembly and the UV Detector and Preamp. This signal
constantly cycles between a voltage level corresponding to concentration of O3 in the
measure gas and the one corresponding to the lack of O3 in the reference gas. This
signal is transformed converted into digital data by a unipolar, analog-to-digital
converter, located on the motherboard.
A variety of sensors report other critical operational parameters, again through the signal
processing capabilities of the motherboard. This data is used to calculate O3
concentration and as trigger events for certain warning messages and control commands
issued by the CPU. They are stored in memory by the CPU and in most cases can be
viewed but the user via the front panel display.
The CPU communicates with the user and the outside world in a variety of manners:
Through the analyzer’s touchscreen and Liquid Crystal Display (LCD) over a
clocked, digital, serial I/O bus (using a protocol called I2C);
RS 232 & RS485 Serial I/O channels;
Various DCV and DCA analog outputs and;
Several sets of Digital I/O channels.
Finally, the CPU issues commands via a series of relays and switches (also over the I2C
bus) located on a separate printed circuit assembly, called the relay PCA, to control the
function of button electromechanical devices such as heaters and valves.
13.3.2. CPU
The unit’s CPU card, installed on the motherboard located inside the rear panel, is a low
power (5 VDC, 720mA max), high performance, Vortex86SX-based microcomputer
running Windows CE. Its operation and assembly conform to the PC 104 specification.
06870C DCN6332
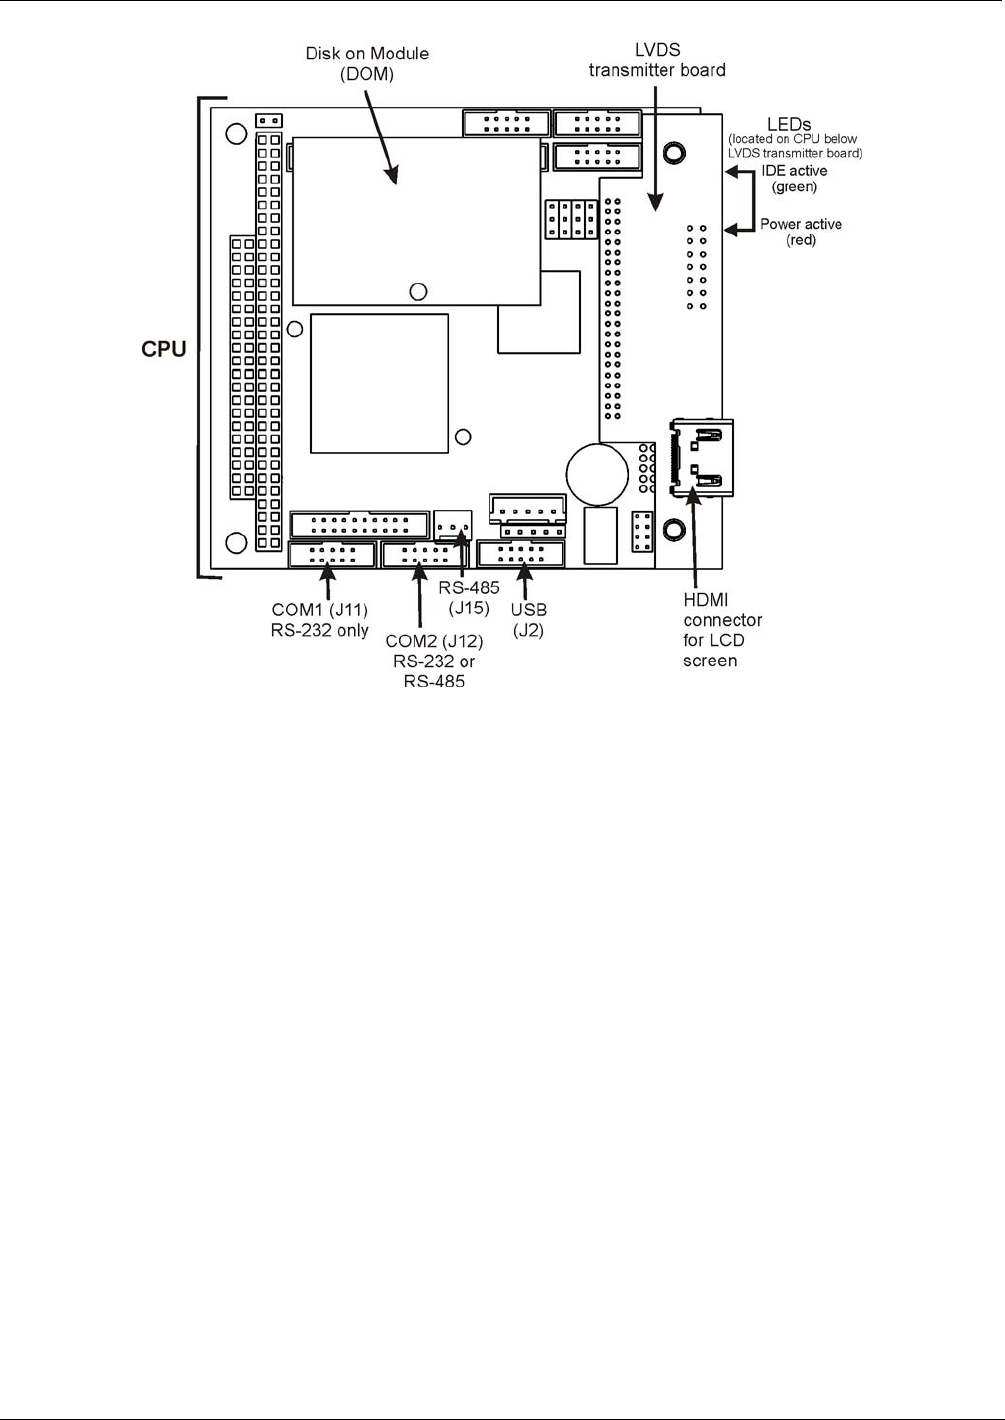
T400 Ozone Analyzer Operator’s Manual Theory of Operation
285
Figure 13-6. CPU Board
The CPU includes two types of non-volatile data storage: Disk-on Module (DOM) and
an embedded flash chip.
13.3.2.1. Disk-On-Module
The DOM is a 44-pin IDE flash drive with a storage capacity up to 128 MB. It is used to
store the computer’s operating system, the Teledyne API firmware, and most of the
operational data generated by the analyzer’s internal data acquisition system (DAS).
13.3.2.2. Flash Chip
This non-volatile, embedded flash chip includes 2 MB of storage for calibration data as
well as a backup of the analyzer configuration. Storing these key data onto a less heavily
accessed chip significantly decreases the chance of data corruption.
In the unlikely event that the flash chip should fail, the analyzer will continue to operate
with just the DOM. However, all configuration information will be lost, requiring the
unit to be recalibrated.
06870C DCN6332

Theory of Operation T400 Ozone Analyzer Operator’s Manual
286
13.3.3. MOTHERBOARD
This printed circuit assembly provides a multitude of functions including, A/D
conversion, digital input/output, PC-104 to I2C translation, temperature sensor signal
processing and is a pass through for the RS-232 and RS-485 signals.
13.3.3.1. A to D Conversion
Analog signals, such as the voltages received from the analyzers various sensors, are
converted into digital signals that the CPU can understand and manipulate by the analog
to digital converter (A/D). Under the control of the CPU, this functional block selects a
particular signal input and then coverts the selected voltage into a digital word.
The A/D consists of a voltage-to-frequency (V-F) converter, a programmable logic
device (PLD), three multiplexers, several amplifiers and some other associated devices.
The V-F converter produces a frequency proportional to its input voltage. The PLD
counts the output of the V-F during a specified time, and sends the result of that count,
in the form of a binary number, to the CPU.
The A/D can be configured for several different input modes and ranges but in the T400
is used in uni-polar mode with a +5V full scale. The converter includes a 1% over and
under-range. This allows signals from –0.05V to +5.05V to be fully converted.
For calibration purposes, two reference voltages are supplied to the A/D converter:
Reference ground and +4.096 VDC. During calibration, the device measures these two
voltages, outputs their digital equivalent to the CPU. The CPU uses these values to
compute the converter’s offset and slope and uses these factors for subsequent
conversions. See Section 5.10.2 for instructions on performing this calibration.
13.3.3.2. Sensor Inputs
The key analog sensor signals are coupled to the A/D through the master multiplexer
from two connectors on the motherboard. 100K terminating resistors on each of the
inputs prevent cross talk from appearing on the sensor signals.
O
3 DETECTOR OUTPUT: This is the primary signal used in the computation of the
O3 concentration.
GAS PRESSURE SENSOR: This sensor measures the gas pressure in the sample
chamber upstream of the critical flow orifice (see Figure 3-16). The sample
pressure is used by the CPU to calculate O3 Concentration.
GAS FLOW SENSOR: This sensor measures the flow rate of the sample gas
through the instrument. This information is used as a diagnostic tool for determining
gas flow problems
13.3.3.3. Thermistor Interface
This circuit provides excitation, termination and signal selection for several negative-
coefficient, thermistor temperature sensors located inside the analyzer. They are:
SAMPLE TEMPERATURE SENSOR: The source of this signal is a thermistor
attached to the absorption tube inside the optical bench assembly. It measures the
temperature of the sample gas in the chamber. This data is used to during the
calculation of the O3 concentration value.
06870C DCN6332

T400 Ozone Analyzer Operator’s Manual Theory of Operation
287
UV LAMP TEMPERATURE SENSOR: This thermistor, attached to the UV lamp in
the optical bench reports the current temperature of the Lamp to the CPU as part of
the lamp heater control loop.
IZS LAMP TEMPERATURE SENSOR: This thermistor attached to the UV lamp of
the O3 generator in the IZS option reports the current temperature of that lamp to
the CPU as part of a control loop that keeps the lamp temperature constant.
BOX TEMPERATURE SENSOR: A thermistor is attached to the motherboard. It
measures the analyzer’s inside temperature. This information is stored by the CPU
and can be viewed by the user for troubleshooting purposes via the front panel
display. (See Section 12.1.2).
13.3.3.4. Analog Outputs
The analyzer comes equipped with four Analog Outputs: A1, A2, A4 and a fourth (A3)
that is a spare.
A1 AND A2 OUTPUTS: The first two, A1 and A2 are normally set up to operate in
parallel so that the same data can be sent to two different recording devices. While
the names imply that one should be used for sending data to a chart recorder and
the other for interfacing with a data logger, either can be used for both applications.
Both of these channels output a signal that is proportional to the O3 concentration of the
Sample Gas. The A1 and A2 outputs can be slaved together or set up to operated
independently. A variety of scaling factors are available; see Section 5.4 for information
on setting the range type and scaling factors for these output channels.
TEST OUTPUT: The third analog output, labeled A4 is special. It can be set by the
user (see Section 5.10.1.9) to carry the current signal level of any one of the
parameters accessible through the TEST menu of the unit’s software.
In its standard configuration, the Analyzer comes with all four of these channels set up
to output a DC voltage. However, 4-20mA current loop drivers can be purchased for the
first two of these outputs, A1 and A2.
OUTPUT LOOP-BACK: All three of the functioning analog outputs are connected
back to the A/D converter through a Loop-back circuit. This permits the voltage
outputs to be calibrated by the CPU without need for any additional tools or fixtures.
13.3.3.5. External Digital I/O
This External Digital I/O performs two functions.
STATUS OUTPUTS: Logic-Level voltages are output through an optically isolated
8-pin connector located on the rear panel of the analyzer. These outputs convey
good/bad and on/off information about certain analyzer conditions. They can be
used to interface with certain types of programmable devices
CONTROL INPUTS: By connecting these digital inputs to an external source such
as a PLC or Data logger Zero and Span calibrations can be remotely initiated.
13.3.3.6. I2C Data Bus
I2C is a two-wire, clocked, bi-directional, digital serial I/O bus that is used widely in
commercial and consumer electronic systems. A transceiver on the motherboard
converts data and control signals from the PC-104 bus to I2C. The data is then fed to the
relay board, optional analog input board and valve driver board circuitry.
06870C DCN6332
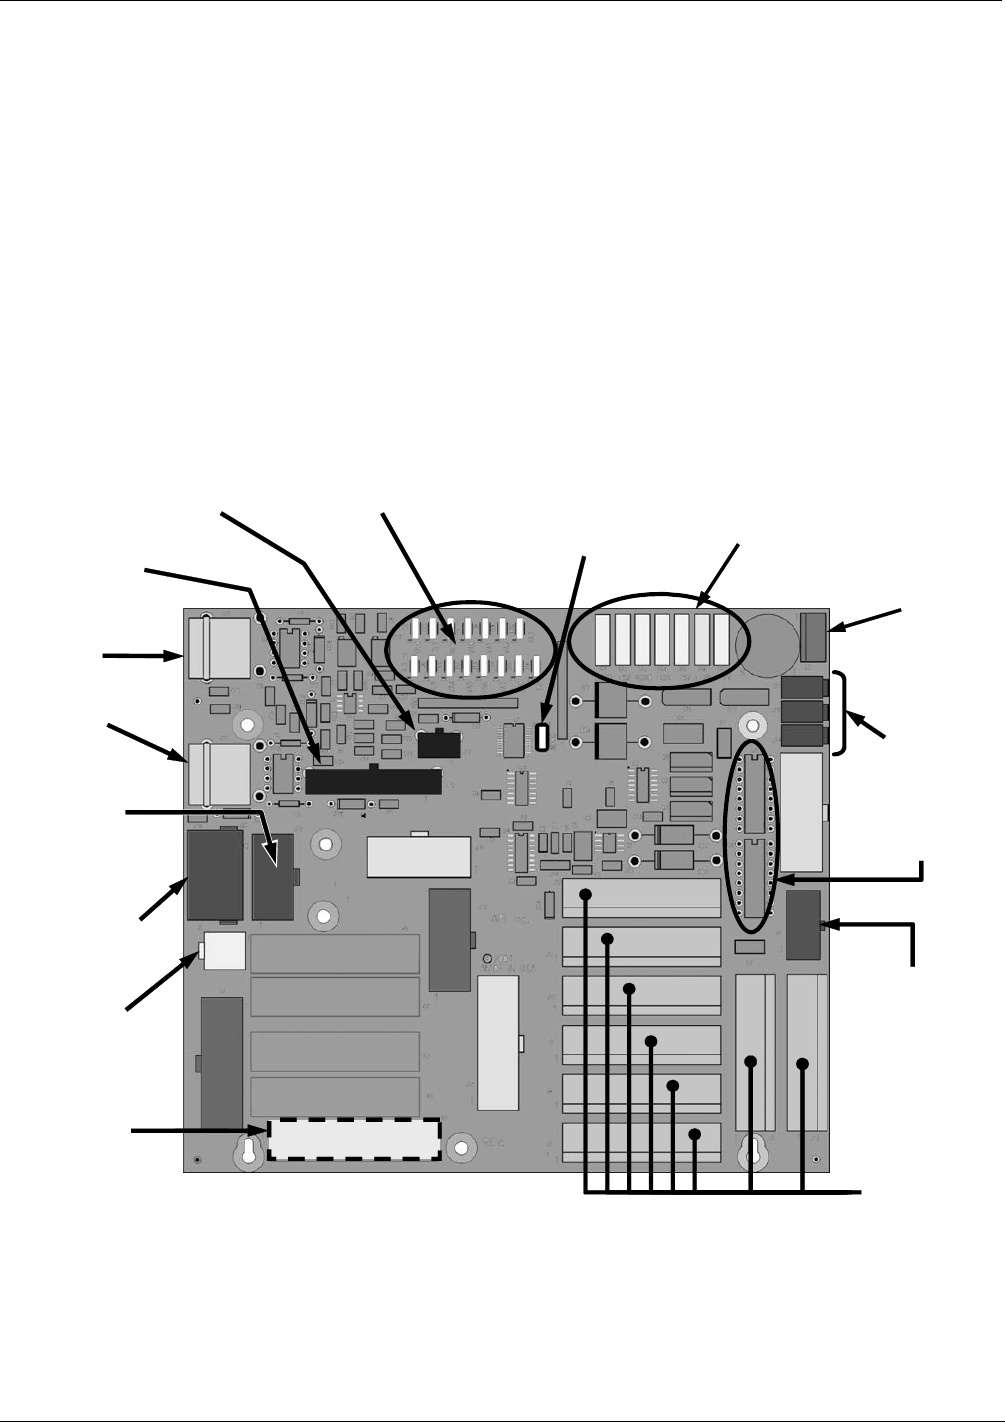
Theory of Operation T400 Ozone Analyzer Operator’s Manual
288
13.3.3.7. Power Up Circuit
This circuit monitors the +5V power supply during start-up and sets the Analog outputs,
External Digital I/O ports, and I2C circuitry to specific values until the CPU boots and
the instrument software can establish control.
13.3.4. RELAY PCA
The CPU issues commands via a series of relays and switches located on a separate
printed circuit assembly, called the relay PCA, to control the function of key
electromechanical devices such as heaters and valves. The relay PCA receives
instructions in the form of digital signals over the I2C bus, interprets these digital
instructions and activates its various switches and relays appropriately.
The relay PCA is located in the right-rear quadrant of the analyzer and is mounted
vertically on the backside of the same bracket as the instrument’s DC power supplies.
Power
Connection
for DC
Heaters
Status LED’s
(D2 through D16)
DC Power Supply
Test Points
Watchdog
Status LED (D1)
(JP5)
Thermocouple
Configuration
Jumpers
Thermocouple
Signal Output
I2C Connector
V
alve Control
Drivers
Pump Power
Output
(JP7)
Pump AC
Configuration
Jumper
AC Power
IN
DC Power
Distribution
Connectors
V
alve Control
Connector
(J15)
TC1 Input
(J16)
TC2 Input
AC Relay
(Only present if optional.
Metal Wool Scrubber
installed)
Figure 13-7: Relay PCA Layout (P/N 04523-0100)
06870C DCN6332
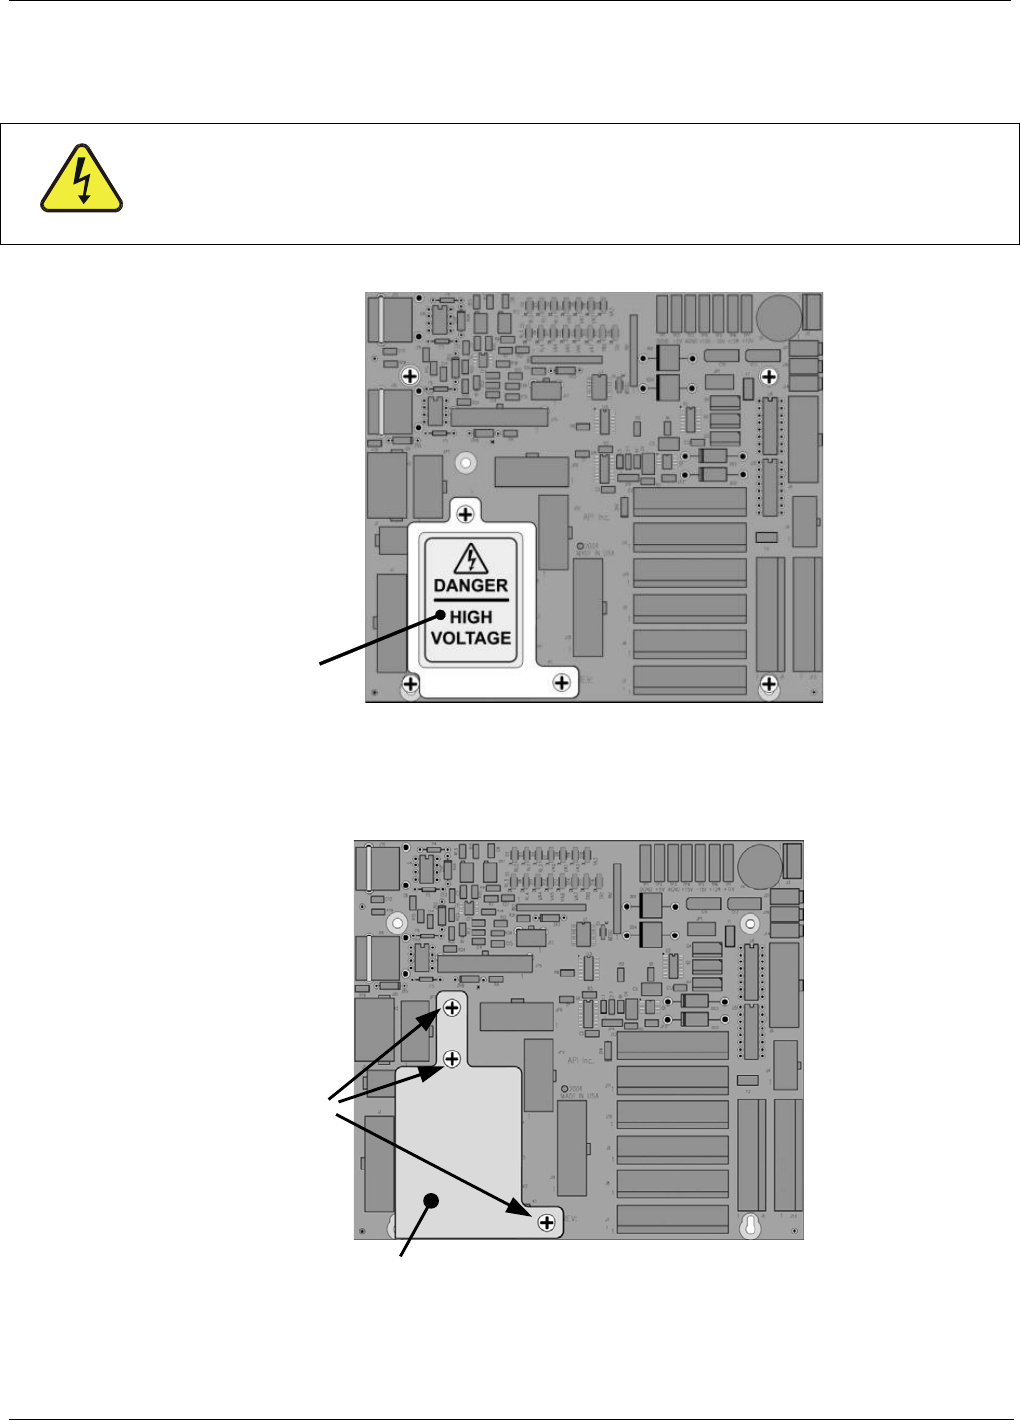
T400 Ozone Analyzer Operator’s Manual Theory of Operation
289
The most commonly used version of the Relay PCA installed in the T400 analyzer does
not include the AC relays used in instruments where there are AC powered components
requiring control. A plastic insulating safety shield covers the empty AC Relay sockets.
WARNING – Electrical Shock Hazard
NEVER REMOVE THIS SAFETY SHIELD WHILE THE INSTRUMENT IS PLUGGED IN AND
TURNED ON. THE CONTACTS OF THE AC RELAY SOCKETS BENEATH THE SHIELD
CARRY HIGH AC VOLTAGES EVEN WHEN NO RELAYS ARE PRESENT
AC Relay
Safety Shield
Figure 13-8: Relay PCA P/N 045230100 with Safety Shield In Place
On instruments where the optional Metal Wool Scrubber is installed, the relay PCA
includes a solid state AC relay (see Figure 13-7). A retainer plate is installed over the
relay to keep them securely seated in their sockets.
AC Relay
Retainer Plate
Retainer
Mounting
Screws
Figure 13-9: Relay PCA P/N 045230200 with AC Relay Retainer in Place
06870C DCN6332
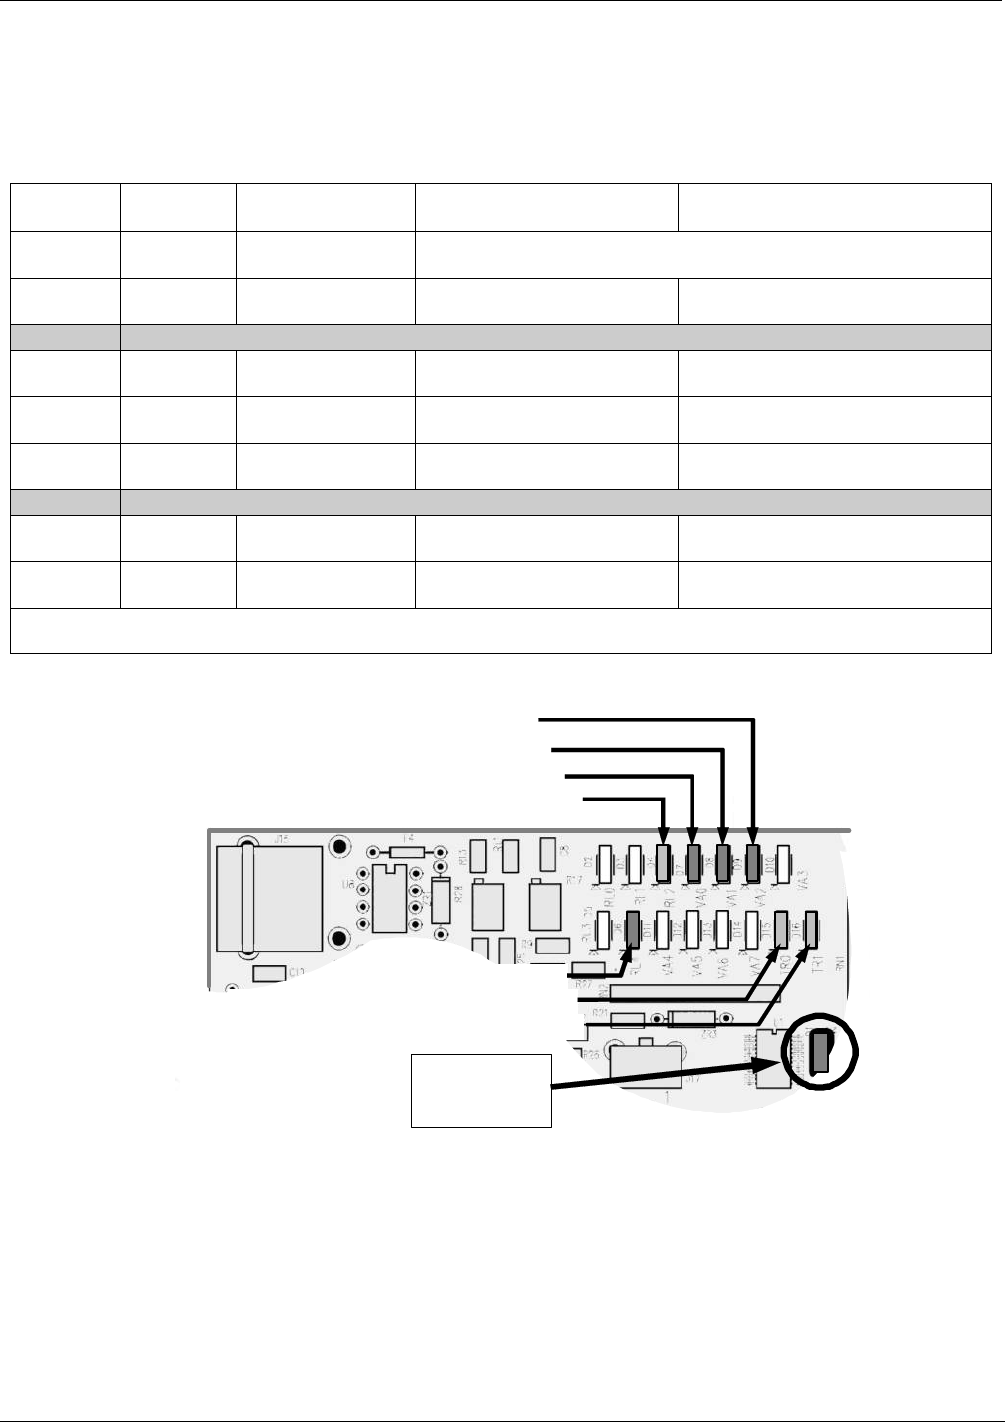
Theory of Operation T400 Ozone Analyzer Operator’s Manual
290
13.3.4.1. Status LEDs
Eight LEDs are located on the Analyzer’s relay PCA to show the current status on the
various control functions performed by the relay PCA (see Figure 13-10). They are:
Table 13-1: Relay PCA Status LEDs
LED Color Function Status When Lit Status When Unlit
D1 RED Watchdog Circuit
Cycles On/Off Every 3 Seconds under direct control of the analyzer’s
CPU.
D21 YELLOW Metal Wool
Scrubber Heater HEATING NOT HEATING
D3 – D6 SPARE
D7 GREEN
Zero/Span Gas
Valve1 Valve Open to SPAN GAS
FLOW Valve Open to ZERO GAS FLOW
D8 GREEN Measure/Ref Valve
Valve Open to REFERENCE
gas path Valve Open to MEASURE gas path
D9 GREEN Sample/Cal Gas
Valve2
Valve Open to CAL GAS
FLOW
Valve Open to SAMPLE GAS
FLOW
D10-D14 SPARE
D15 GREEN
Photometer UV
Lamp Heater HEATING NOT HEATING
D16 GREEN
IZS O3 Generator
UV Lamp Heater HEATING NOT HEATING
1 Only present when the Z/S valve option is installed.
2 Only present when either the Z/S valve option or the IZS valve option is present.
D8 (Green) – Photometer Meas/Ref Valve
D15 (Green) - Photometer Lamp Heater
D16 (Green – IZS O3 Generator Lamp Heater
D7 (Green) Optional Zero/Span Valve
D6 (Green ) – GPT Valve
D9 (Green) – Optional Sample/Cal Valve
D1 (RED)
Watchdog
Indicator
D2 (Yellow) Optional Metal Wool Scrubber Heater
Figure 13-10: Status LED Locations – Relay PCA
13.3.4.2. Watchdog Circuitry
Special circuitry on the relay PCA watches the status of LED D1. Should this LED ever
stay ON or OFF for 30 seconds, the Watchdog Circuit will automatically shut off all
valves as well as turn off the UV Source (s) and all heaters. The Sample Pump will still
be running.
06870C DCN6332

T400 Ozone Analyzer Operator’s Manual Theory of Operation
291
13.3.4.3. Valve Control
The valve that switches the gas stream to and from the analyzer’s O3 scrubber during the
measure/reference cycle (see Section 13.1.3) is operated by an electronic switch located
on the relay PCA. This switch, under CPU control, supplies the +12VDC needed to
activate each valve’s solenoid.
Similar valves also controlled by the relay PCA are included in the following optional
components:
On instruments with the ZERO/SPAN valve option (OPT- 50A) there are two
additional valves:
The ZERO/SPAN valve selects which calibration gas inlet (the ZERO gas inlet
or the SPAN Gas Inlet) is the source of gas when the analyzer is in one of its
calibration modes (see Figure 3-22).
The SAMPLE/CAL valve selects either the sample inlet when the analyzer is in
SAMPLE mode or the calibration gas stream when the analyzer is in one of its
calibration modes (see Figure 3-22).
On instruments with the IZS valve option (OPT- 50G) one additional valves (the
SAMPLE/CAL valve) selects either the sample inlet when the analyzer is in
SAMPLE mode or the dry air inlet when the analyzer is in one of its calibration
modes (see Figure 3-17).
13.3.4.4. Heater Control
In the base version of the Model T400 photometric analyzer, there is only one DC heater
operated by the relay PCA. It is attached to the Photometer UV Lamp housing and
maintains the temperature of the UV Lamp at a constant 58ºC.
Additional DC heater also controlled by the relay PCA, are included in the following
optional components:
On instruments with Zero/Span valve option (OPT-50A) the metal wool scrubber
option (OPT- 68) there is a DC heater embedded in the scrubber maintains it at a
constant 110ºC.
On instruments with the IZS valve option (OPT- 50G) there is a DC heater attached
to the IZS O3 generator UV Lamp that maintains it at a constant 48ºC
06870C DCN6332
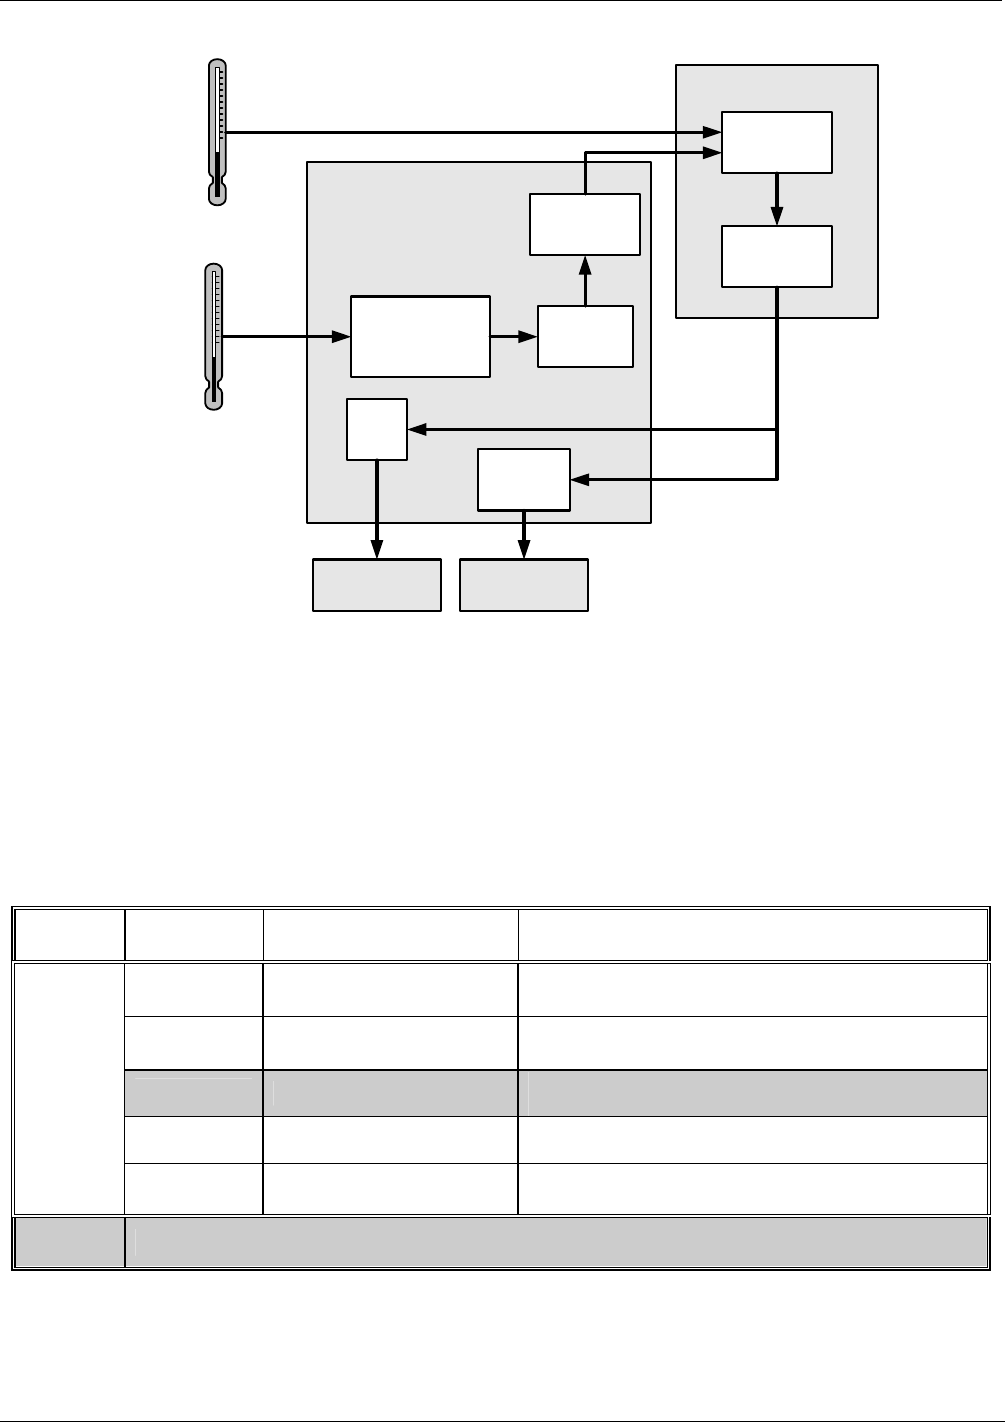
Theory of Operation T400 Ozone Analyzer Operator’s Manual
292
Thermistor(s) – Photometer Lamp
Temperature and Optional IZS O3
Generator Lamp Temperature)
RELAY PCA
DC
Control
Logic
Preamplifiers
and Signal
Conditioning
MOTHERBOARD
A/D
Converter
(V/F)
CPU
Themocouple(s)
(used on Optional Metal
Wool Scrubber)
DC HEATERS
(UV LAMP Heaters)
THERMOCOUPLE
CONFIGURATION
JUMPER
(JP5)
Cold Junction
Compensation
Solid State
AC Relays
AC HEATER
(optional
Metal Wool Scrubber)
Figure 13-11: Heater Control Loop Block Diagram.
13.3.4.5. Thermocouple Inputs and Configuration Jumper (JP5)
In its base configuration, the T400 analyzer does not include any thermocouple sensors,
however in instruments where the optional metal wool scrubber (OPT-68) is installed
one thermocouple is used to sense the temperature of the scrubber. By default, this
single thermocouple input is plugged into the TC1 input (J15) on the relay PCA. TC2
(J16) is currently not used.
Table 13-2: Thermocouple Configuration Jumper (JP5) Pin-Outs
TC INPUT JUMPER
PAIR DESCRIPTION FUNCTION
1 – 11 Gain Selector Selects preamp gain factor for J or K TC
OUT = K TC gain factor; IN = J TC gain factor
2 – 12 Output Scale Selector Selects preamp gain factor for J or K TC
OUT = 10 mV / °C; IN = 5 mV / °C
3 – 13 Type J Compensation When present, sets Cold Junction Compensation for J
type Thermocouple
4 – 14 Type K Compensation When present, sets Cold Junction Compensation for K
type Thermocouple
TC1
5 – 15 Termination Selector Selects between Isolated and grounded TC
IN = Isolate TC; OUT = Grounded TC
TC2 NOT USED
06870C DCN6332
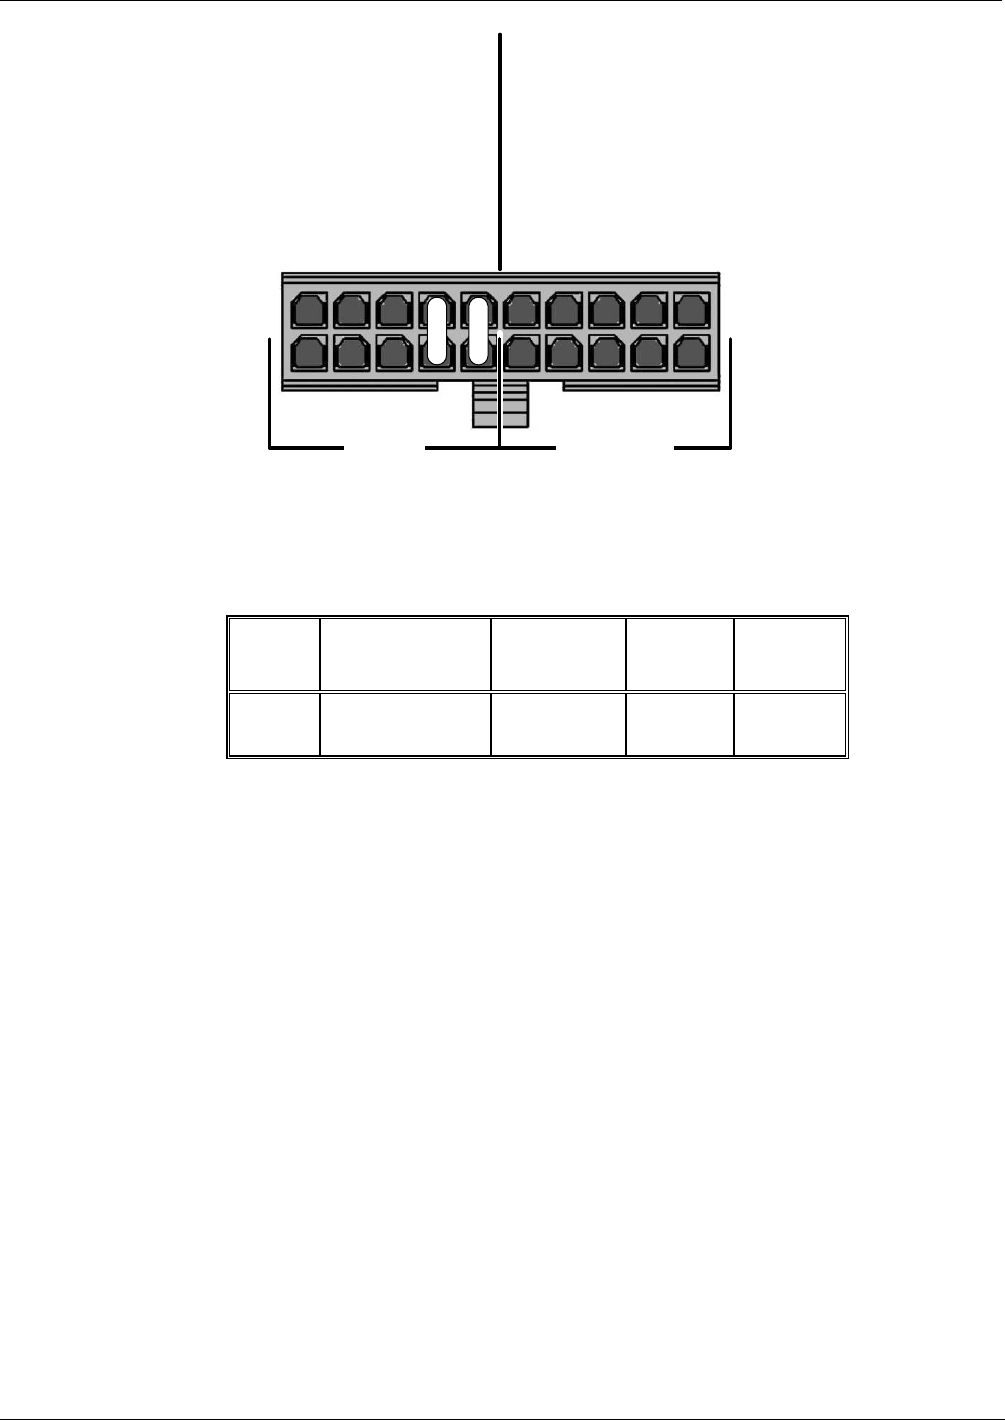
T400 Ozone Analyzer Operator’s Manual Theory of Operation
293
Input Gain Selector 1 – 11
Type J Compensation 4 – 14
Output Scale Selector 2 – 12
Type J Compensation 3 – 13
Termination Selector 5 – 15
TC2
Not Used
TC1
Figure 13-12: Thermocouple Configuration Jumper (JP5) Pin-Outs
Table 13-3: Thermocouple Settings for Optional Metal Wool Scrubber
TC
TYPE
TERMINATION
TYPE
OUTPUT
SCALE TYPE
JUMPER
BETWEE
N PINS
JUMPER
COLOR
K ISOLATED 10mV / °C 4 – 14
5 – 15 PURPLE
13.3.5. POWER SUPPLY/CIRCUIT BREAKER
The analyzer operates on 100 VAC, 115 VAC or 230 VAC power at either 50 Hz or
60Hz. Individual instruments are set up at the factory to accept any combination of
these five attributes. Power enters the analyzer through a standard IEC 320 power
receptacle located on the rear panel of the instrument. From there it is routed through
the ON/OFF Switch located in the lower right corner of the Front Panel.
AC Line power is stepped down and converted to DC power by two DC Power Supplies.
One supplies +12 VDC, for various valves and valve options, while a second supply
provides +5 VDC and 15 VDC for logic and analog circuitry as well as the power
supplies for the Photometer and IZS UV Lamps.
All AC and DC Voltages are distributed via the relay PCA.
06870C DCN6332
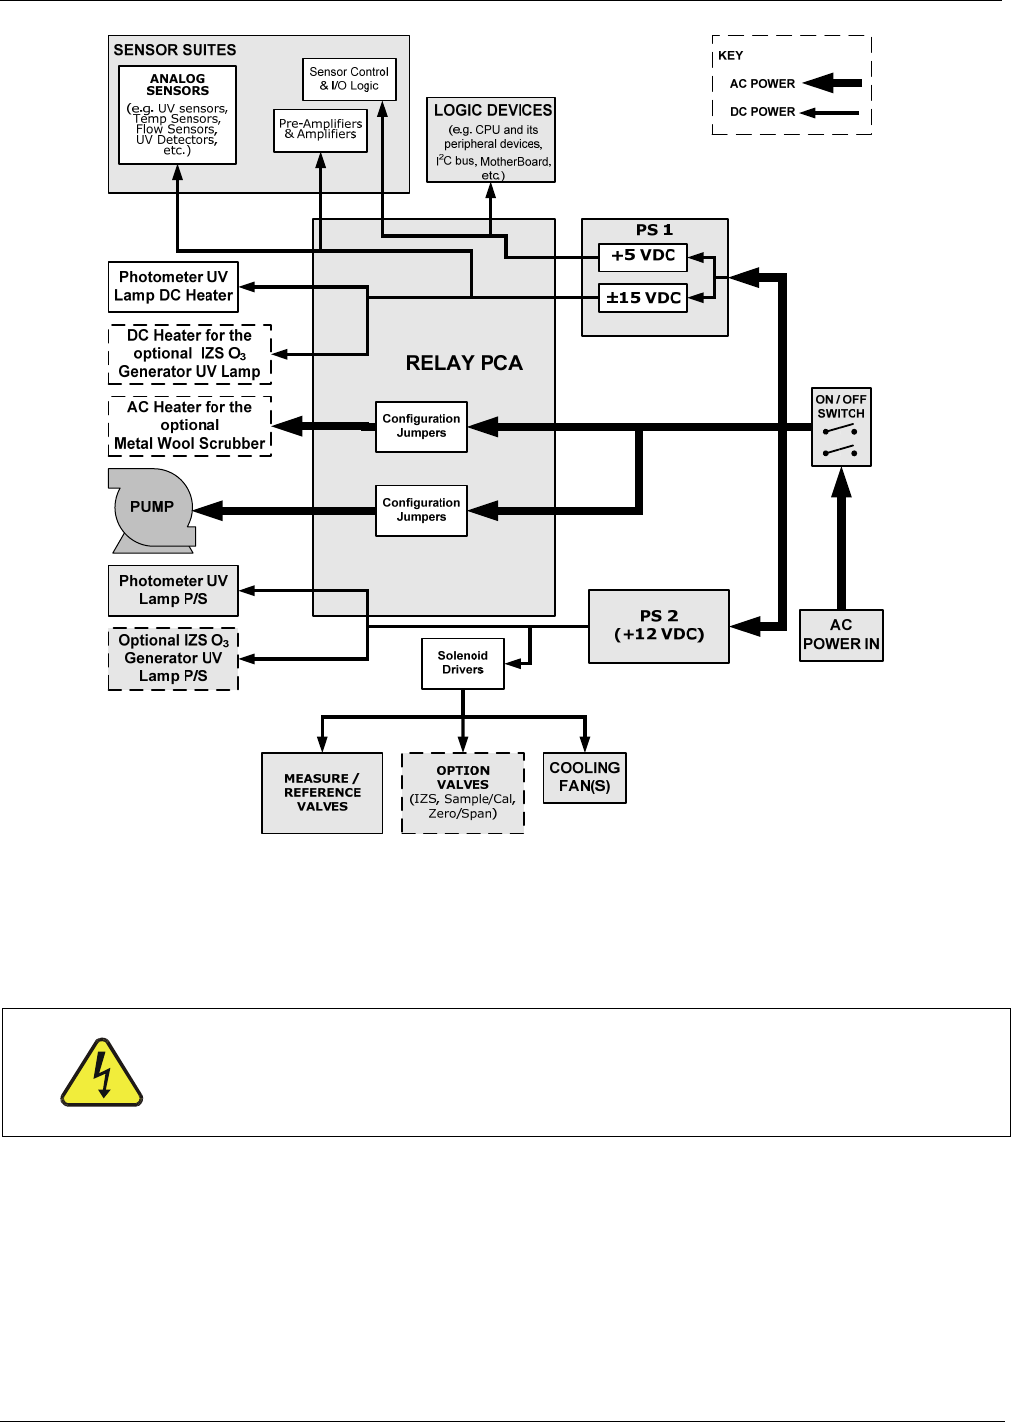
Theory of Operation T400 Ozone Analyzer Operator’s Manual
294
Figure 13-13: Power Distribution Block Diagram
13.3.5.1. Power Switch/Circuit Breaker
A 6.75 Amp circuit breaker is built into the ON/OFF Switch.
WARNING – Electrical Shock Hazard
Should the AC power circuit breaker trip, investigate and correct the condition
causing this situation before turning the analyzer back on.
06870C DCN6332
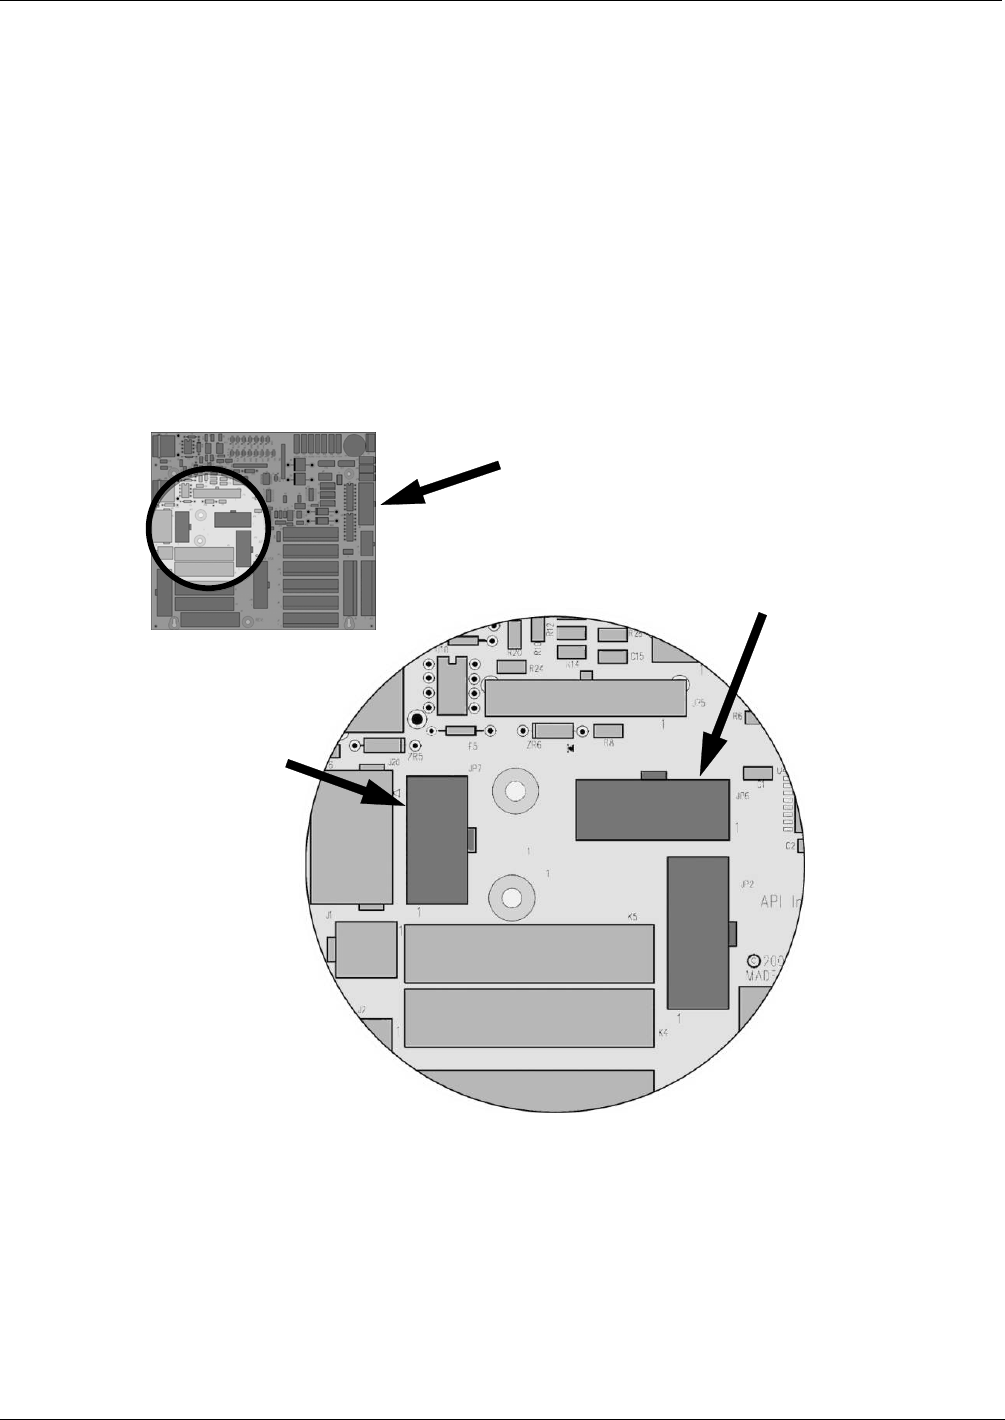
T400 Ozone Analyzer Operator’s Manual Theory of Operation
295
13.3.6. AC POWER CONFIGURATION
The T400 analyzer’s digital components will operate with any of the specified power
regimes. As long as instrument is connected to 100-120 VAC or 220-240 VAC at either
50 or 60 Hz it will turn on and after about 30 seconds show a front panel display.
Internally, the status LEDs located on the Relay PCA, Motherboard and CPU should
turn on as soon as the power is supplied.
However, some of the analyzer’s non-digital components, such as the pump and the AC
powered heater for the optional metal wool scrubber (OPT-68) must be properly
configured for the type of power being supplied to the instrument.
Configuration of the power circuits is set using several jumper sets located on the
instruments relay PCA.
JP6
Heater for the
optional Metal Wool
Scrubber (OPT-68)
JP7
Pump
Configuration
RELAY PCA
Figure 13-14: Location of AC power Configuration Jumpers
06870C DCN6332
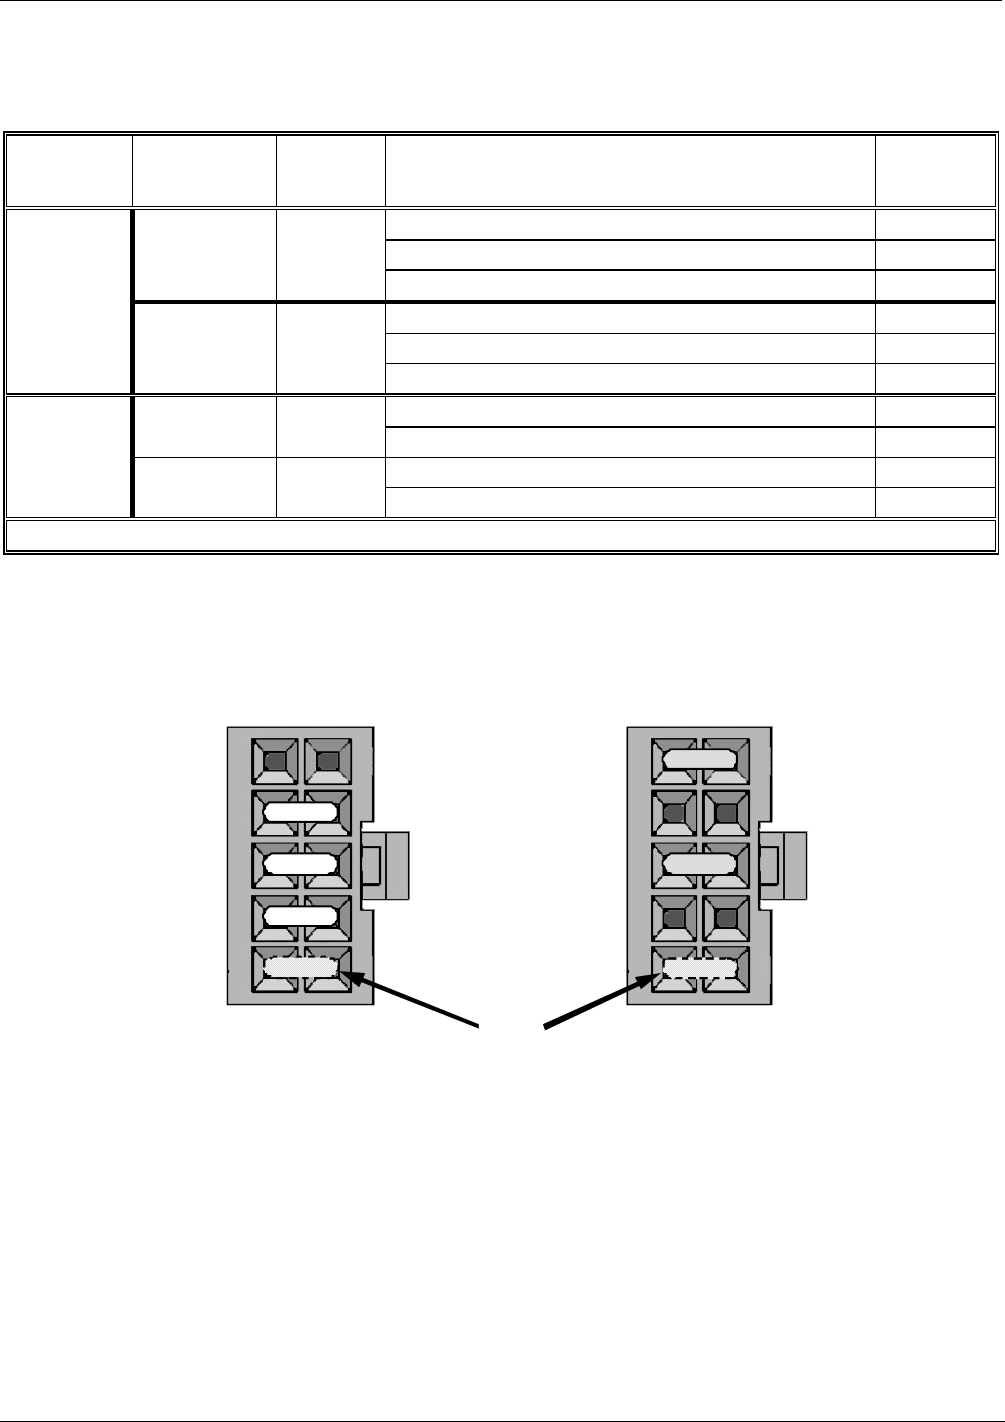
Theory of Operation T400 Ozone Analyzer Operator’s Manual
296
13.3.6.1. AC Configuration – Internal Pump (JP7)
Table 13-4: AC Power Configuration for Internal Pumps (JP7)
LINE
POWER
LINE
FREQUENCY
JUMPER
COLOR FUNCTION
JUMPER
BETWEEN
PINS
Connects pump pin 3 to 110 / 115 VAC power line 2 to 7
Connects pump pin 3 to 110 / 115 VAC power line 3 to 8
60 HZ WHITE
Connects pump pins 2 & 4 to Neutral 4 to 9
Connects pump pin 3 to 110 / 115 VAC power line 2 to 7
Connects pump pin 3 to 110 / 115 VAC power line 3 to 8
110VAC
115 VAC
50 HZ1 BLACK
Connects pump pins 2 & 4 to Neutral 4 to 9
Connects pump pins 3 and 4 together 1 to 6
60 HZ BROWN Connects pump pin 1 to 220 / 240VAC power line 3 to 8
Connects pump pins 3 and 4 together 1 to 6
220VAC
240 VAC
50 HZ1 BLUE Connects pump pin 1 to 220 / 240VAC power line 3 to 8
1 A jumper between pins 5 and 10 may be present on the jumper plug assembly, but is not functional on the T400.
110 VAC /115 VAC 220 VAC /240 VAC
1
2
3
4
5
6
7
8
9
10
1
2
3
4
5
6
7
8
9
10
May be present on 50 Hz version of jumper set.
Figure 13-15: Pump AC Power Jumpers (JP7)
06870C DCN6332
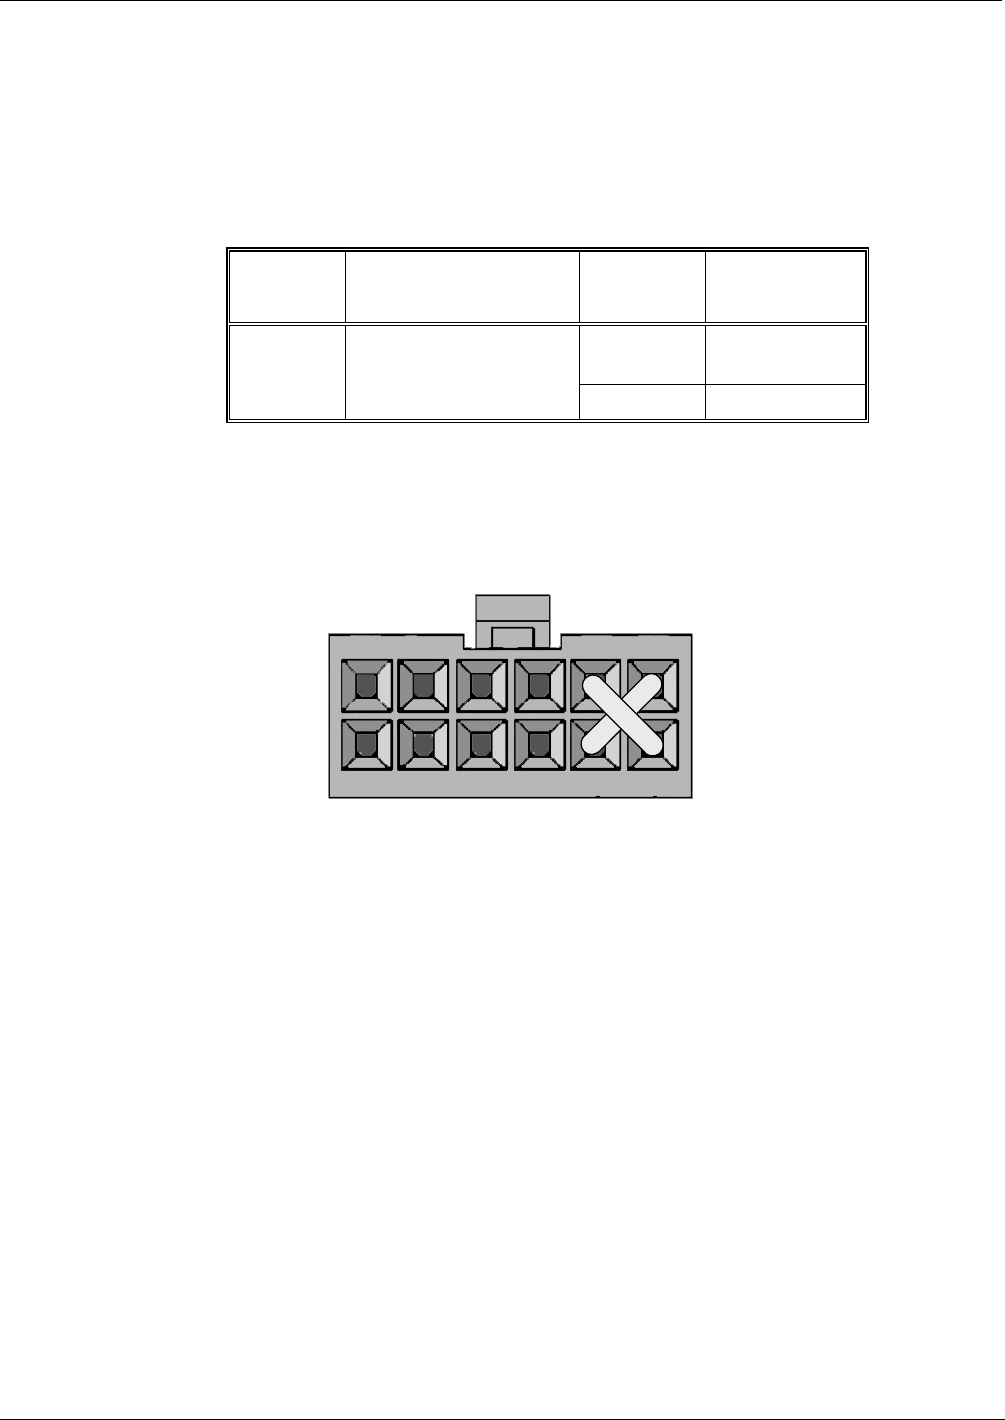
T400 Ozone Analyzer Operator’s Manual Theory of Operation
297
13.3.6.2. AC Configuration – Heaters for Option Packages (JP6)
The optional metal wool scrubber (OPT-68) includes an AC heater that maintain the
scrubber at an optimum operating temperature. Jumper set JP6 is used to connect the
heaters associated with those options to AC power. Since these heaters work with either
110/155 VAC or 220/240 VAC, there is only one jumper configuration.
Table 13-5: Power Configuration for Optional Metal Wool Scrubber Heater (JP6)
JUMPER
COLOR HEATER(S)
JUMPER
BETWEEN
PINS
FUNCTION
1 to 8 Common
RED Metal Wool Scrubber
Heater
2 to 7 Neutral to Load
6 5 4 3 2 1
10 9
12 11 8 7
Figure 13-16: Typical Jumper Set (JP2) Set Up of Optional Metal Wool Scrubber Heater
06870C DCN6332
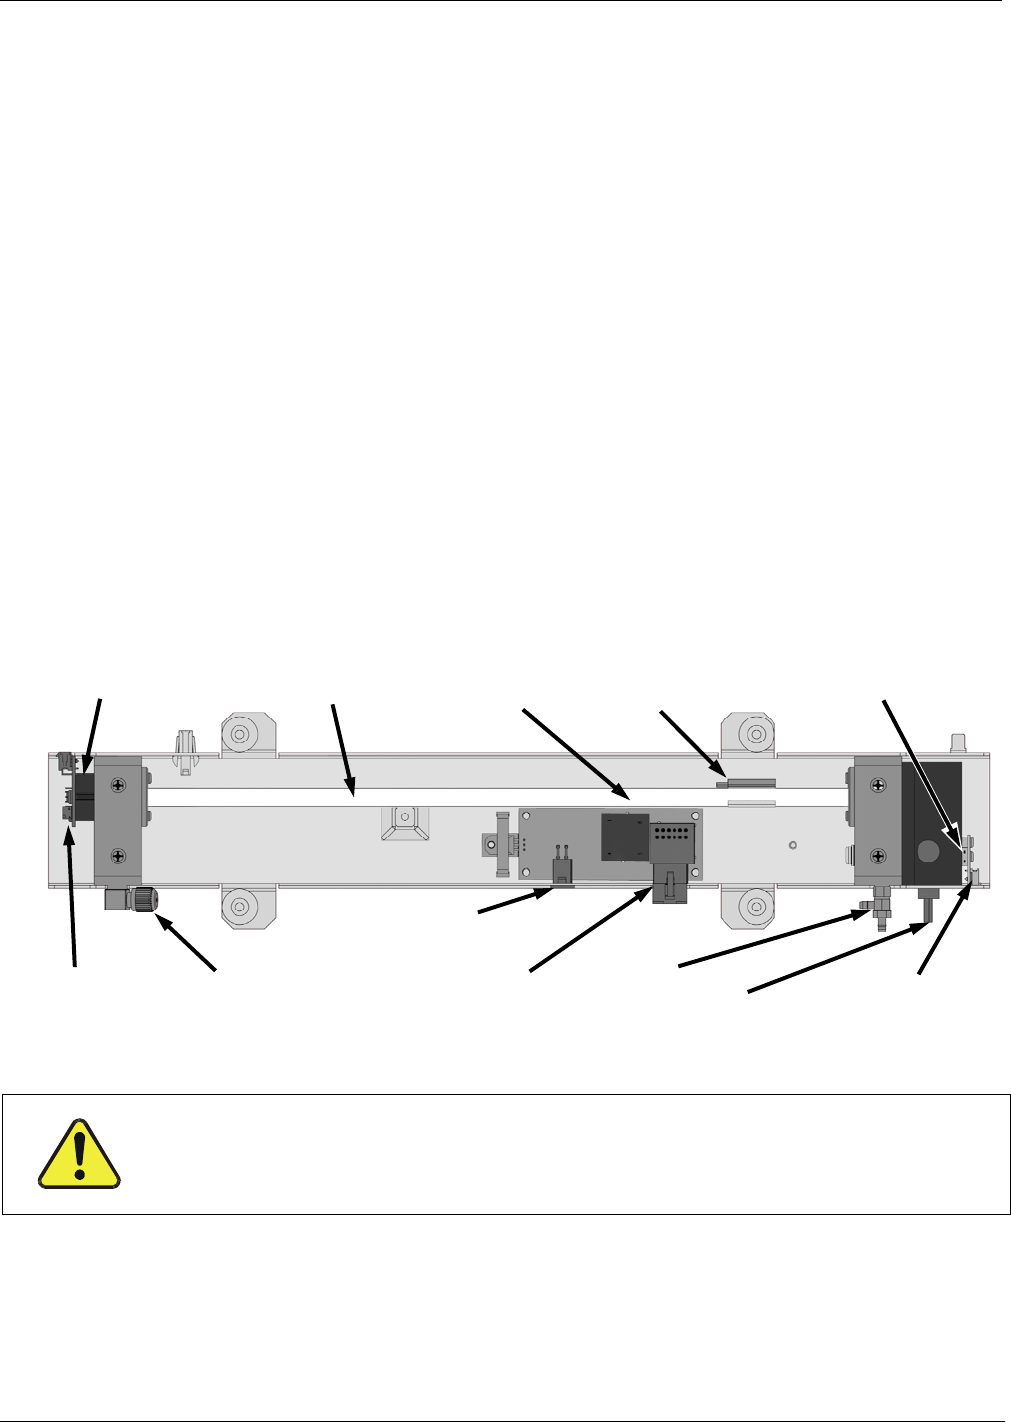
Theory of Operation T400 Ozone Analyzer Operator’s Manual
298
13.3.7. PHOTOMETER LAYOUT AND OPERATION
The Photometer is the component where the absorption of UV light by ozone is
measured and converted into a voltage. It consists of several sub-assemblies:
A mercury-vapor UV lamp. This lamp is coated in a material that optically screens
the UV radiation output to remove the O3 producing 185nm radiation. Only light at
254nm is emitted.
An AC power supply to supply the current for starting and maintaining the plasma
arc of the mercury vapor lamp.
A thermistor and DC heater attached to the UV lamp to maintain the lamp at an
optimum operating temperature.
42 cm long quartz absorption tube.
A thermistor attached to the quartz tube for measuring sample gas temperature.
Gas inlet and outlet mounting blocks that rout sample gas into and out of the
photometer.
The vacuum diode, UV detector that converts UV light to a DC current.
A preamplifier assembly, which convert the Detector’s current output into a DC
Voltage then amplifies it to a level readable by the A to D converter circuitry of the
instrument’s motherboard
Absorption Tube
UV Lamp Heater
Control PCA
Sample Gas
Outlet
UV Lamp Power
Transformer
Power Connector
from
+15 VDC power supply
UV Lamp Power
Supply
(200 VAC @ 30 kHz)
Sam
p
le Gas Inlet UV Detector
Preamp PCA
UV Detector
Sample Gas
Thermistor
UV Lamp
UV Lamp Thermistor
(UV Lamp Heater Behind Thermistor)
Figure 13-17: O3 Photometer Layout – Top Cover Removed
CAUTION – UV Radiation Risk
Do not look directly at the light of the UV lamp.
06870C DCN6332
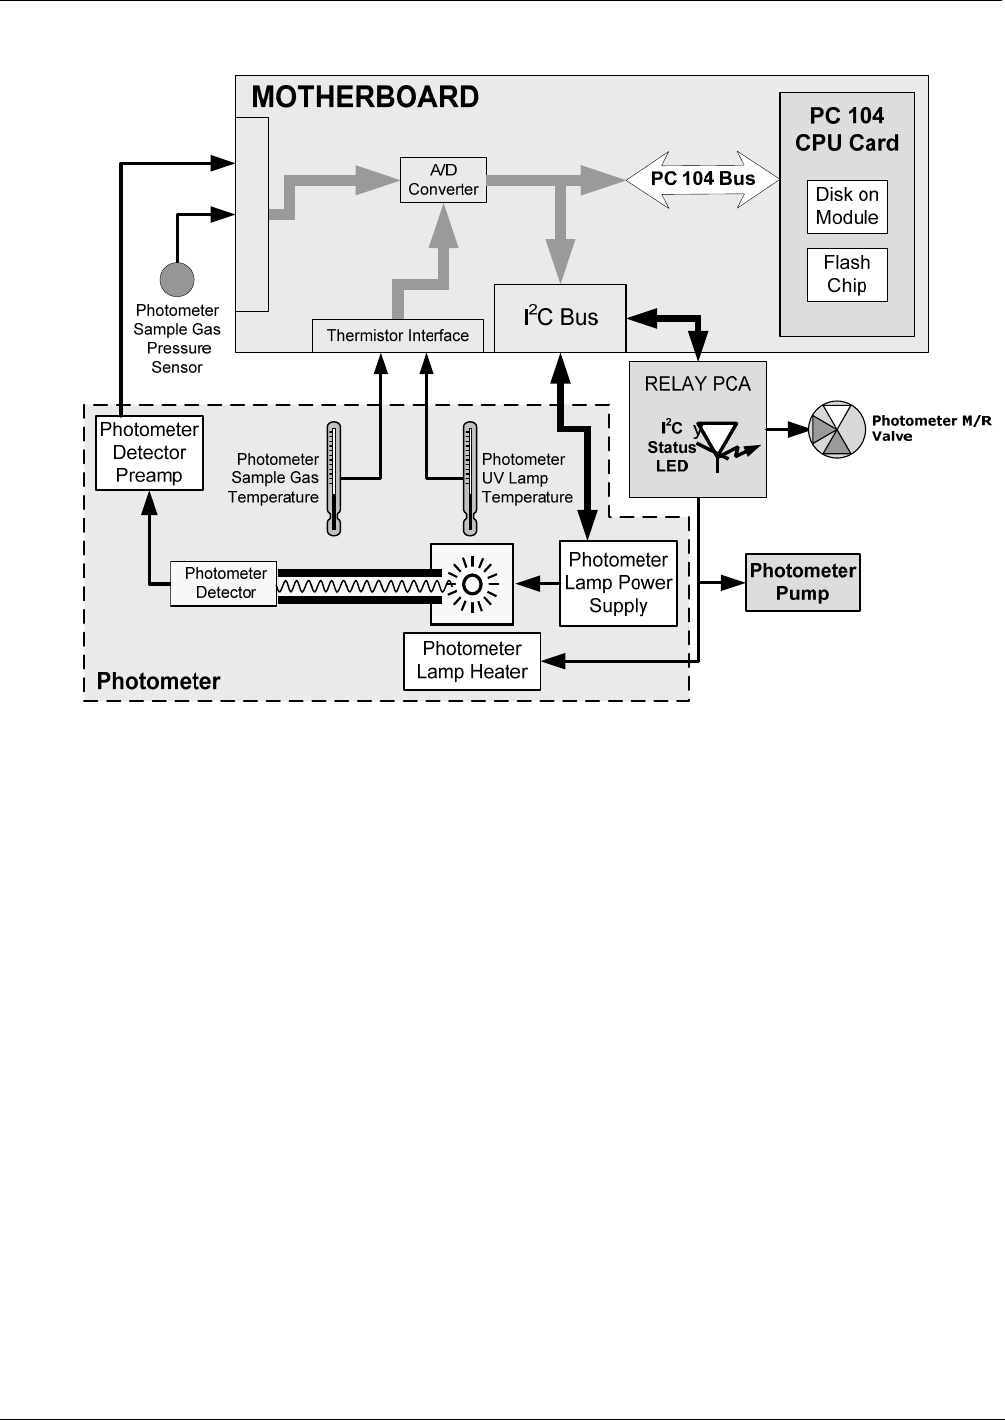
T400 Ozone Analyzer Operator’s Manual Theory of Operation
299
13.3.7.1. Photometer Electronic Operation
Sensor Inputs
Absorption tube
Figure 13-18: O3 Photometer Electronic Block Diagram
Like the O3 photometer and its subcomponents act as peripheral devices operated by the
CPU via the motherboard. Communications to and from the CPU are handled by the
motherboard.
Outgoing commands for the various devices such as the photometer pump, the UV lamp
power supply the U\V Lamp heater are issued via the I2C bus to circuitry on the relay
PCA which turns them ON/OFF. The CPU also issues commands over the I2C bus that
cause the relay PCA to cycle the measure/reference valve back and forth.
Incoming date the UV light detector is amplified locally then converted to digital
information by the motherboard. Output from the photometers temperature sensors is
also amplified and converted to digital data by the motherboard. The O3 concentration
of the sample gas is computed by the CPU using this data (along with gas pressure and
flow data received from the instrument’s pressure sensors.
06870C DCN6332
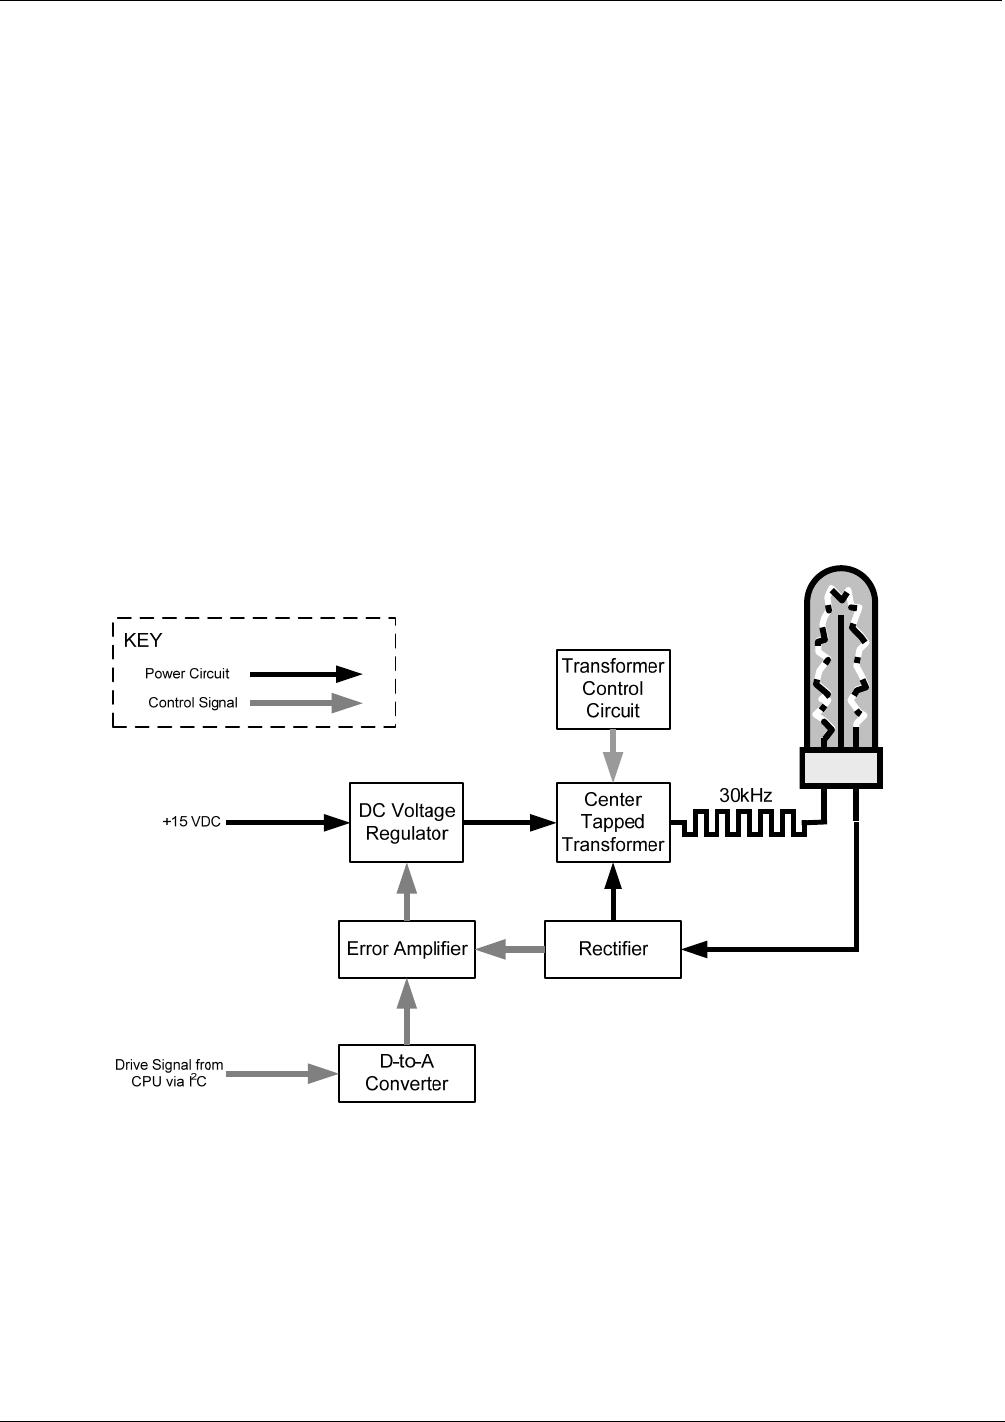
Theory of Operation T400 Ozone Analyzer Operator’s Manual
300
13.3.7.2. O3 Photometer UV Lamp Power Supply
The photometer’s UV lamp requires a high voltage AC supply voltage to create and
maintain its mercury vapor plasma arc. This AC voltage is produced by a variable
transformer, the primary of which is supplied by the output of a DC regulator (powered
by the instrument’s +15 VDC supply). A circuit made up of a control IC and several
FET’s, turns the transformer on and off converting it into a 30kHz square wave.
The DC regulator is controlled by a drive voltage supplied by an amplifier that adjusts
its output based on the difference between the rectified current output of the lamp and a
constant voltage resulting from a D-to-A converted “set-point” signal sent by the CPU
via the I2C bus. If the rectified current output by the lamp is lower than the CPU set
point voltage, the amplifier drives the regulator output voltage higher. If the current
output is higher than the set point voltage, the amplifier decreases the regulator output
voltage.
At start up, when there is no mercury vapor arc and therefore no current being output by
the lamp, the amplifier continues to drive the regulator output (and therefore the
transformer output) higher and higher until the mercury is vaporized and the plasma arc
is created (about 800 VAC). Once the arc is created, current begins to flow and the error
amplifier reduces the regulator/transformer output to a steady 200 VAC.
.
Figure 13-19: O3 Photometer UV Lamp Power Supply Block Diagram
06870C DCN6332

T400 Ozone Analyzer Operator’s Manual Theory of Operation
301
13.3.7.3. Photometer Temperature
In order to operate at peak efficiency the UV lamp of the instrument’s O3 photometer is
maintained at a constant 58ºC. This is intentionally set at a temperature higher than the
ambient temperature of the T400’s operating environment to make sure that local
changes in temperature do not affect the UV Lamp. If the lamp temperature falls below
56ºC or rises above 61ºC a warning is issued by the analyzers CPU.
This temperature is controlled as described in the section on the relay PCA (Section
13.3.4.4).
The following TEST functions report these temperatures and are viewable from the
instrument’s front panel:
PHOTO_LAMP - The temperature of the UV Lamp reported in ºC.
SAMPLE _TEMP - The temperature of the Sample gas in the absorption tube
reported in ºC.
13.3.7.4. Photometer Gas Pressure and Flow Rate
The sensors mounted to a printed circuit board next to the internal pump (see Figure 3-5)
measure the absolute pressure and the flow rate of gas inside the photometer’s
absorption tube. This information is used by the CPU to calculate the O3 concentration
of the sample gas (See Equation 13-3). Both of these measurements are made
downstream from the absorption tube but upstream of the pump. A critical flow orifice
located between the flow sensor and the pump maintains the gas flow through the
photometer at 800 cm3/min.
The following TEST functions are viewable from the instrument’s front panel:
SAMPL_FL- The flow rate of gas through the photometer measured in LPM.
PRES – The pressure of the gas inside the absorption tube. This pressure is
reported in inches of mercury-absolute (in-Hg-A), i.e. referenced to a vacuum (zero
absolute pressure). This is not the same as PSIG.
Note The T400 displays all pressures in inches of mercury-absolute (in-Hg-A).
Absolute pressure is the reading referenced to a vacuum or zero
absolute pressure. This method was chosen so that ambiguities of
pressure relative to ambient pressure can be avoided.
For example:
If the vacuum reading is 25" Hg relative to room pressure at sea level the
absolute pressure would be 5" Hg.
If the same absolute pressure was observed at 5000 ft altitude where the
atmospheric pressure was 5" lower, the relative pressure would drop to
20" Hg, however the absolute pressure would remain the same 5" Hg-A.
06870C DCN6332
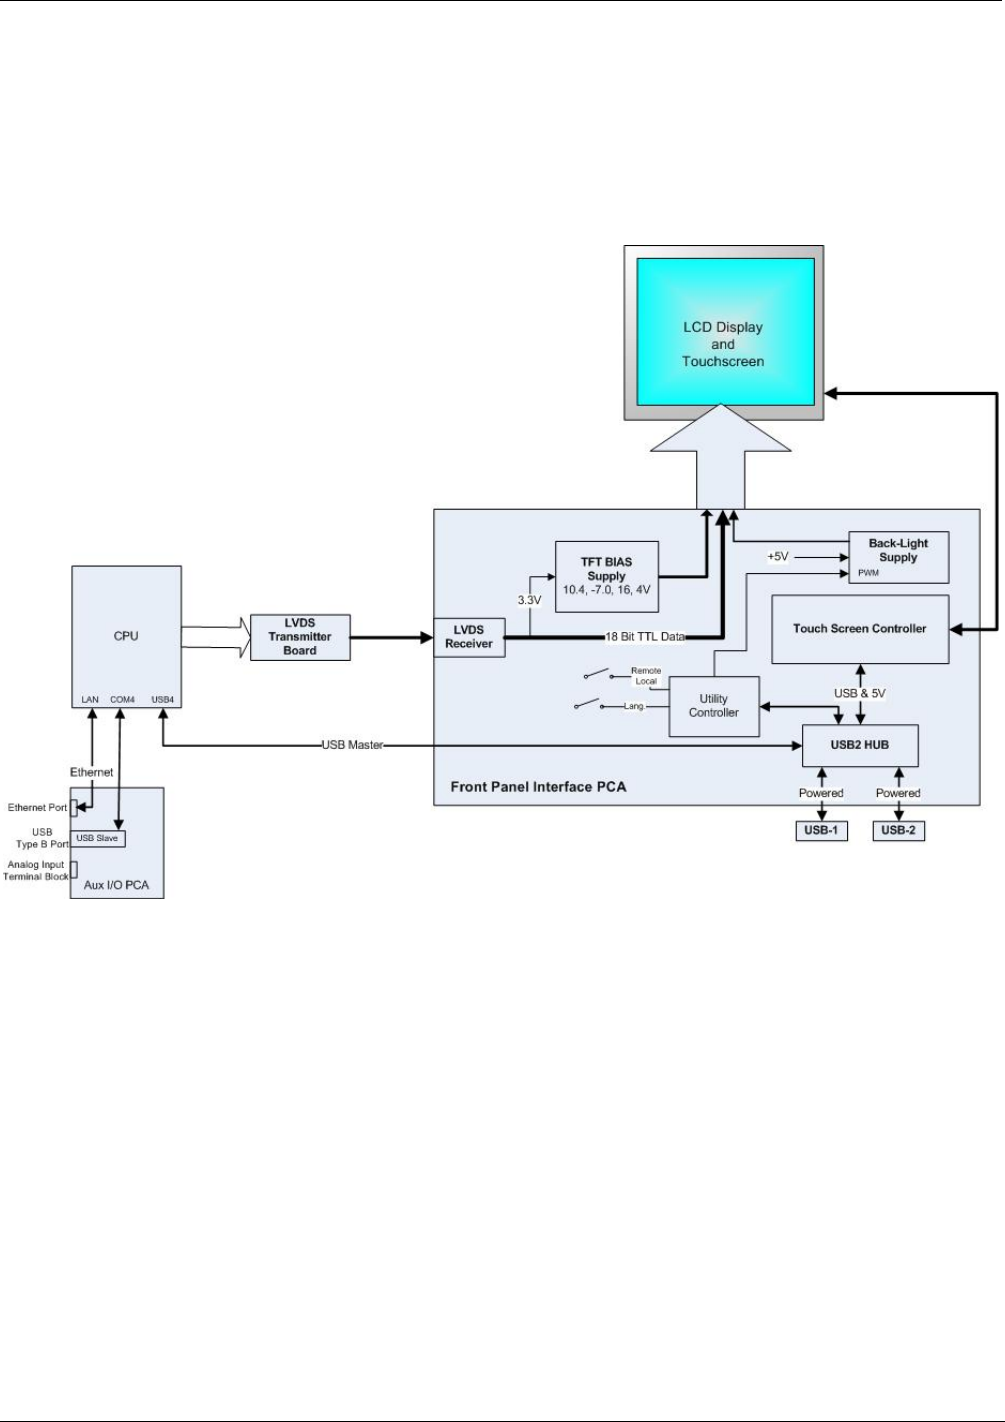
Theory of Operation T400 Ozone Analyzer Operator’s Manual
302
13.4. FRONT PANEL TOUCHSCREEN/DISPLAY INTERFACE
Users can input data and receive information directly through the front panel
touchscreen display. The LCD display is controlled directly by the CPU board. The
touchscreen is interfaced to the CPU by means of a touchscreen controller that connects
to the CPU via the internal USB bus and emulates a computer mouse.
Figure 13-20: Front Panel and Display Interface Block Diagram
13.4.1. FRONT PANEL INTERFACE PCA
The front panel interface PCA controls the various functions of the display and
touchscreen. For driving the display it provides connection between the CPU video
controller and the LCD display module. This PCA also contains:
power supply circuitry for the LCD display module
a USB hub that is used for communications with the touchscreen controller and the
two front panel USB peripheral device ports
the circuitry for powering the display backlight
06870C DCN6332
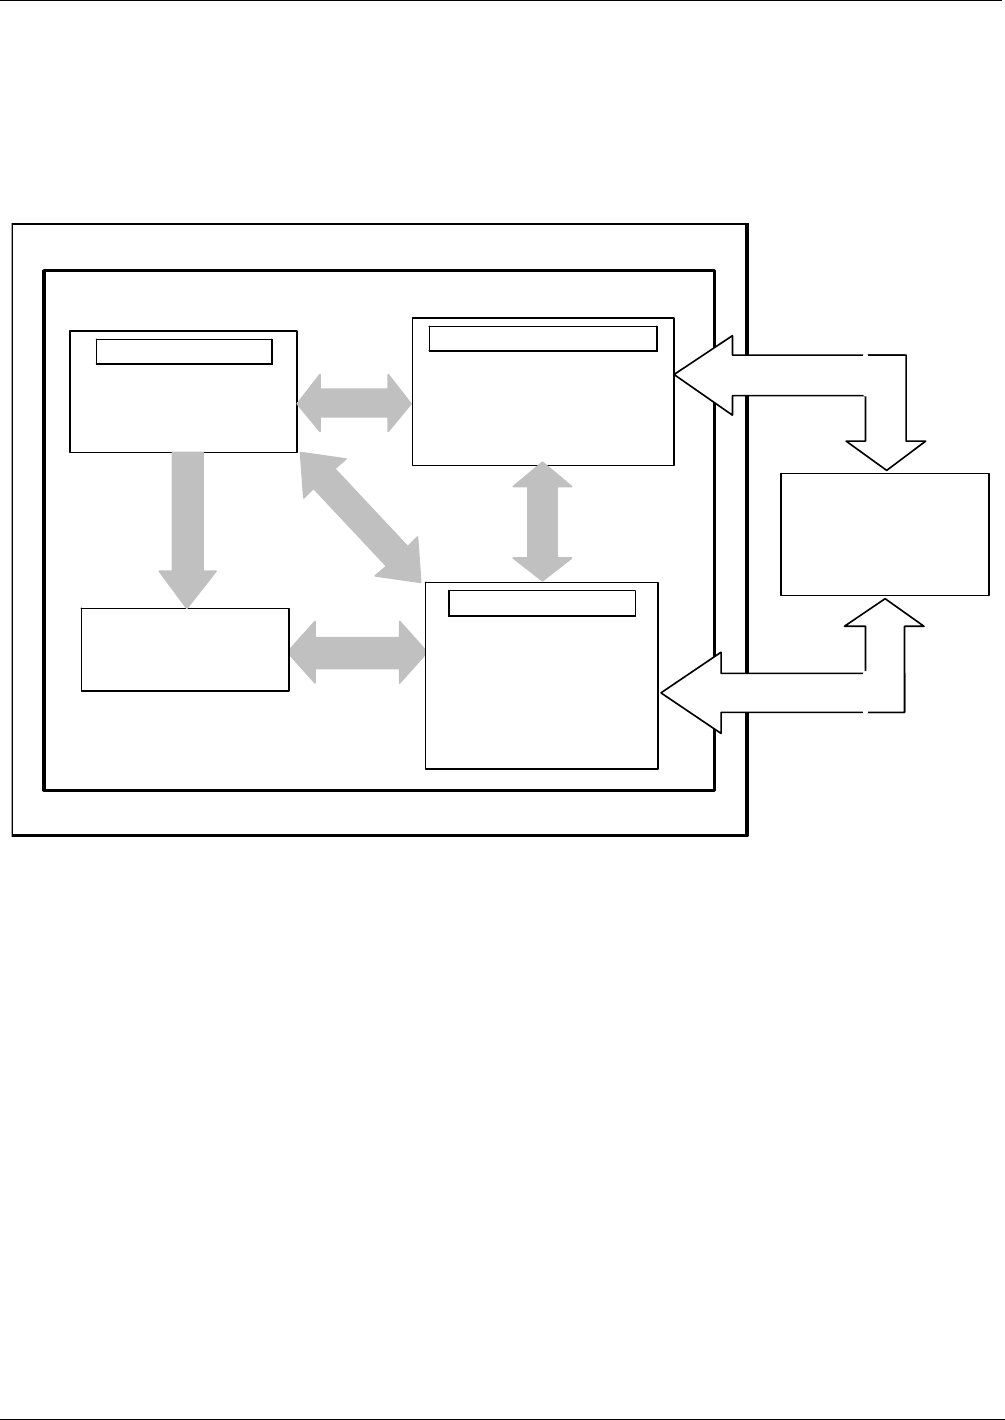
T400 Ozone Analyzer Operator’s Manual Theory of Operation
303
13.5. SOFTWARE OPERATION
The instrument’s core module is a high performance, X86-based microcomputer running
Windows CE. Inside Windows CE, special software developed by Teledyne API
interprets user commands from the various interfaces, performs procedures and tasks,
stores data in the CPU’s various memory devices, and calculates the concentration of the
gas being sampled.
Windows CE
API FIRMWARE
Instrument Operations
Calibration Procedures
Configuration Procedures
Autonomic Systems
Diagnostic Routines
Memory Handling
DAS Records
Calibration Data
System Status Data
Interface Handling
Sensor input data
Display Messages
Touchscreen
Analog output data
RS232 & RS485
External Digital I/O
Measurement
Algorithms
INSTRUMENT
HARDWARE
PC/104 BUS
PC/104 BUS
Figure 13-21: Basic Software Operation
13.5.1. ADAPTIVE FILTER
The Model T400 software processes sample Gas Measurement and Reference data
through an adaptive filter built into the software. Unlike other analyzers that average the
output signal over a fixed time period, the Model T400 averages over a set number of
samples, where a new sample is calculated approximately every 3 seconds -this is
technique is known as boxcar averaging. During operation, the software automatically
switches between two different length filters based on the conditions at hand.
During conditions of constant or nearly constant concentration, the software, by default,
computes an average of the last 32 samples, or approximately 96 seconds. This provides
the calculation portion of the software with smooth, stable readings. If a rapid change in
concentration is detected, the filter length is changed to average the last 6 samples,
approximately 18 seconds of data, to allow the analyzer to respond more quickly. If
necessary, these boxcar lengths can be changed between 1 and 1000 samples but with
corresponding tradeoffs in rise time and signal-to-noise ratio (contact customer service
for more information).
06870C DCN6332
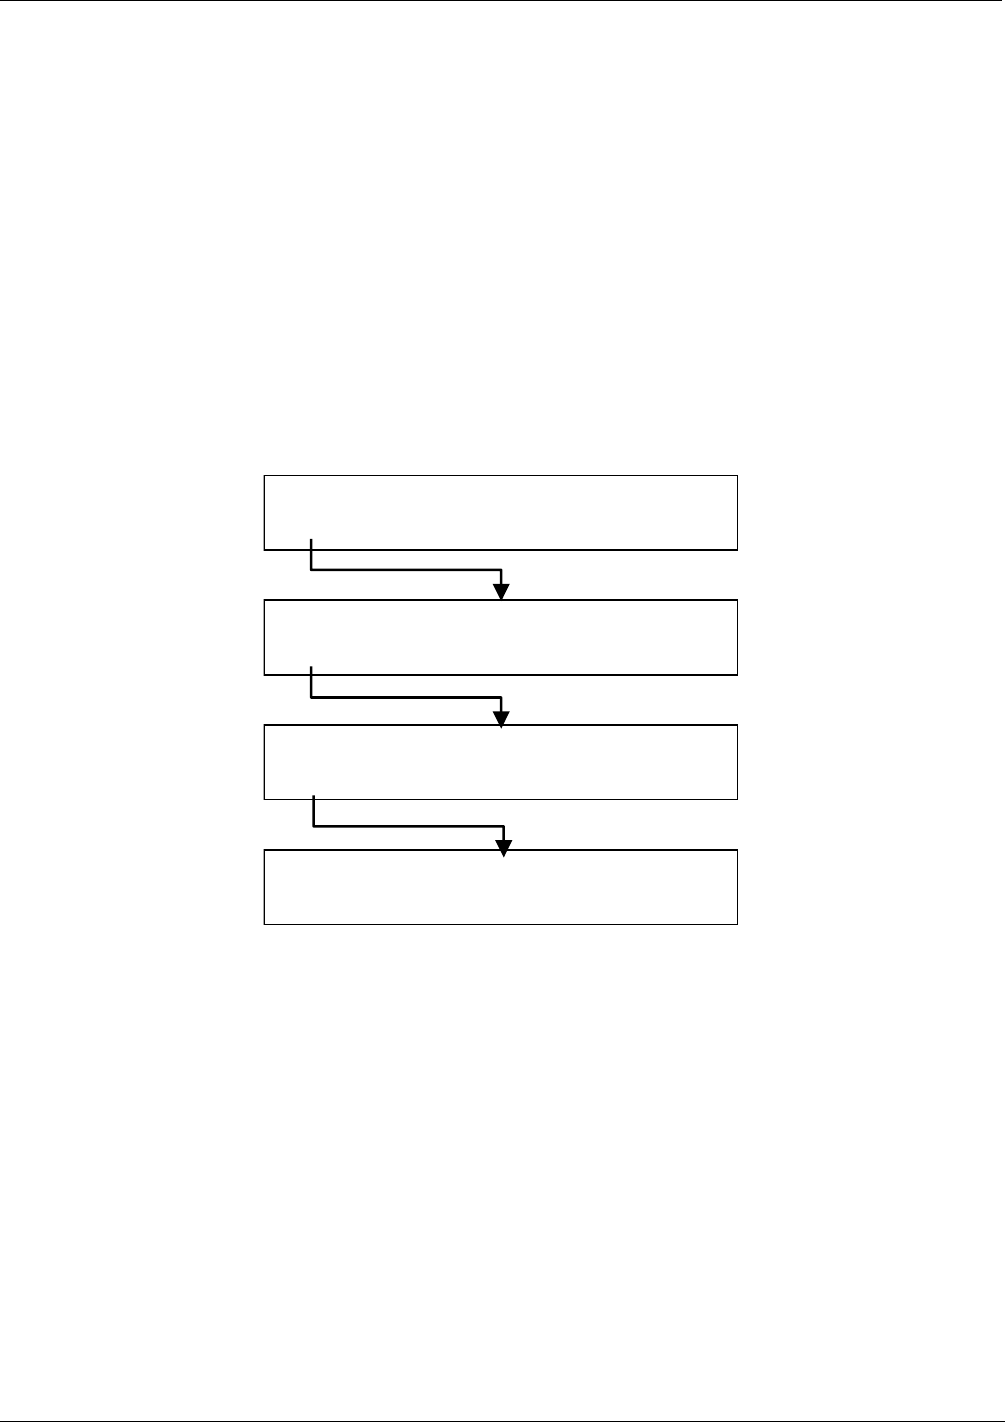
Theory of Operation T400 Ozone Analyzer Operator’s Manual
304
Two conditions must be simultaneously met to switch to the short filter. First, the
instantaneous concentration must exceed the average in the long filter by a fixed
amount. Second, the instantaneous concentration must exceed the average in the long
filter by a portion, or percentage, of the average in the long filter.
13.5.2. CALIBRATION - SLOPE AND OFFSET
Calibration of the analyzer is performed exclusively in software. During instrument
calibration, (see Sections 9 and 10) the user enters expected values for zero and span via
the front panel touchscreen and commands the instrument to make readings of calibrated
sample gases for both levels. The readings taken are adjusted, linearized and compared
to the expected values. With this information, the software computes values for
instrument slope and offset and stores these values in memory for use in calculating the
O3 concentration of the sample gas.
The instrument slope and offset values recorded during the last calibration can be
viewed by pressing the following control button sequence:
SAMPLE RANGE = 500.0 PPB O3 =XXX.X
< TST TST > CAL SETUP
SAMPLE TIME = 16:23:34 O3 =XXX.X
< TST TST > CAL SETUP
SAMPLE OFFSET = 0.000 O3 =XXX.X
< TST TST > CAL SETUP
SAMPLE SLOPE = 1.000 O3 =XXX.X
< TST TST > CAL SETUP
06870C DCN6332
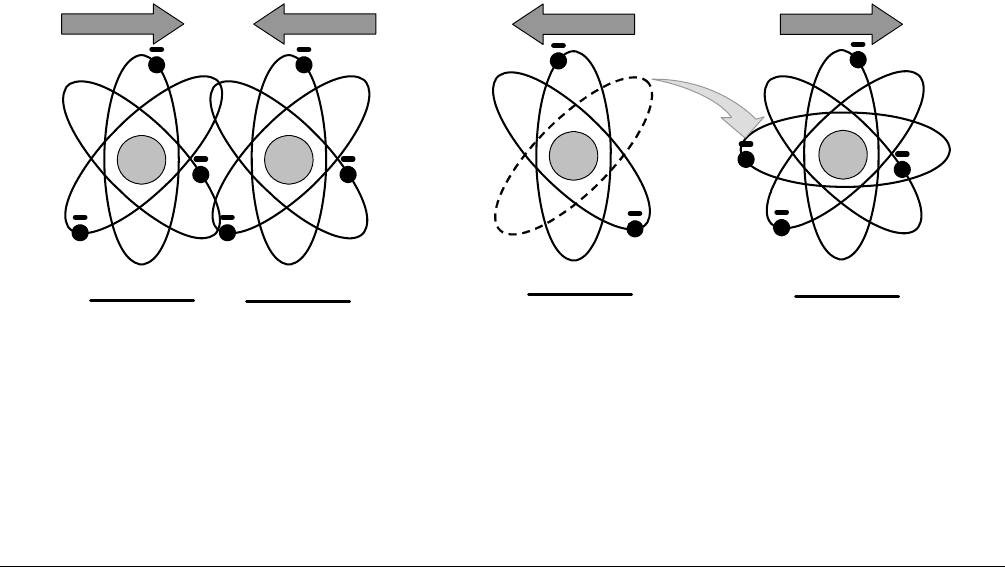
305
14. A PRIMER ON ELECTRO-STATIC DISCHARGE
Teledyne API considers the prevention of damage caused by the discharge of static
electricity to be extremely important part of making sure that your analyzer continues to
provide reliable service for a long time. This section describes how static electricity
occurs, why it is so dangerous to electronic components and assemblies as well as how
to prevent that damage from occurring.
14.1. HOW STATIC CHARGES ARE CREATED
Modern electronic devices such as the types used in the various electronic assemblies of
your analyzer, are very small, require very little power and operate very quickly.
Unfortunately, the same characteristics that allow them to do these things also make
them very susceptible to damage from the discharge of static electricity. Controlling
electrostatic discharge begins with understanding how electro-static charges occur in the
first place.
Static electricity is the result of something called triboelectric charging which happens
whenever the atoms of the surface layers of two materials rub against each other. As the
atoms of the two surfaces move together and separate, some electrons from one surface
are retained by the other.
+
+
Materials
Makes
Contact
PROTONS = 3
ELECTRONS = 3
NET CHARGE = 0
PROTONS = 3
ELECTRONS = 3
NET CHARGE = 0
Materials
Separate
+
PROTONS = 3
ELECTRONS = 2
NET CHARGE = -1
+
PROTONS = 3
ELECTRONS = 4
NET CHARGE = +1
Figure 14-1: Triboelectric Charging
If one of the surfaces is a poor conductor or even a good conductor that is not grounded,
the resulting positive or negative charge cannot bleed off and becomes trapped in place,
or static. The most common example of triboelectric charging happens when someone
wearing leather or rubber soled shoes walks across a nylon carpet or linoleum tiled floor.
With each step, electrons change places and the resulting electro-static charge builds up,
06870C DCN6332

A Primer on Electro-Static Discharge T400 Ozone Analyzer Operator’s Manual
306
quickly reaching significant levels. Pushing an epoxy printed circuit board across a
workbench, using a plastic handled screwdriver or even the constant jostling of
StyrofoamTM pellets during shipment can also build hefty static charges
Table 14-1: Static Generation Voltages for Typical Activities
MEANS OF GENERATION 65-90% RH 10-25% RH
Walking across nylon carpet 1,500V 35,000V
Walking across vinyl tile 250V 12,000V
Worker at bench 100V 6,000V
Poly bag picked up from bench 1,200V 20,000V
Moving around in a chair padded
with urethane foam 1,500V 18,000V
14.2. HOW ELECTRO-STATIC CHARGES CAUSE DAMAGE
Damage to components occurs when these static charges come into contact with an
electronic device. Current flows as the charge moves along the conductive circuitry of
the device and the typically very high voltage levels of the charge overheat the delicate
traces of the integrated circuits, melting them or even vaporizing parts of them. When
examined by microscope the damage caused by electro-static discharge looks a lot like
tiny bomb craters littered across the landscape of the component’s circuitry.
A quick comparison of the values in Table 14-1 with the those shown in the Table 14-2,
listing device susceptibility levels, shows why Semiconductor Reliability News estimates
that approximately 60% of device failures are the result of damage due to electro-static
discharge.
Table 14-2: Sensitivity of Electronic Devices to Damage by ESD.
DAMAGE SUSCEPTIBILITY VOLTAGE
RANGE
DEVICE DAMAGE BEGINS
OCCURRING AT
CATASTROPHIC
DAMAGE AT
MOSFET 10 100
VMOS 30 1800
NMOS 60 100
GaAsFET 60 2000
EPROM 100 100
JFET 140 7000
SAW 150 500
Op-AMP 190 2500
CMOS 200 3000
Schottky Diodes 300 2500
Film Resistors 300 3000
This Film Resistors 300 7000
ECL 500 500
SCR 500 1000
Schottky TTL 500 2500
06870C DCN6332

T400 Ozone Analyzer Operator’s Manual A Primer on Electro-Static Discharge
307
Potentially damaging electro-static discharges can occur:
Any time a charged surface (including the human body) discharges to a device.
Even simple contact of a finger to the leads of a sensitive device or assembly can
allow enough discharge to cause damage. A similar discharge can occur from a
charged conductive object, such as a metallic tool or fixture.
When static charges accumulated on a sensitive device discharges from the device
to another surface such as packaging materials, work surfaces, machine surfaces
or other device. In some cases, charged device discharges can be the most
destructive.
A typical example of this is the simple act of installing an electronic assembly into
the connector or wiring harness of the equipment in which it is to function. If the
assembly is carrying a static charge, as it is connected to ground a discharge will
occur.
Whenever a sensitive device is moved into the field of an existing electro-static field,
a charge may be induced on the device in effect discharging the field onto the
device. If the device is then momentarily grounded while within the electrostatic
field or removed from the region of the electrostatic field and grounded somewhere
else, a second discharge will occur as the charge is transferred from the device to
ground.
14.3. COMMON MYTHS ABOUT ESD DAMAGE
I didn’t feel a shock so there was no electro-static discharge: The human
nervous system isn’t able to feel a static discharge of less than 3500 volts. Most
devices are damaged by discharge levels much lower than that.
I didn’t touch it so there was no electro-static discharge: Electro Static charges
are fields whose lines of force can extend several inches or sometimes even feet
away from the surface bearing the charge.
It still works so there was no damage: Sometimes the damaged caused by
electro-static discharge can completely sever a circuit trace causing the device to
fail immediately. More likely, the trace will be only partially occluded by the damage
causing degraded performance of the device or worse, weakening the trace. This
weakened circuit may seem to function fine for a short time, but even the very low
voltage and current levels of the device’s normal operating levels will eat away at
the defect over time causing the device to fail well before its designed lifetime is
reached.
These latent failures are often the most costly since the failure of the equipment in
which the damaged device is installed causes down time, lost data, lost
productivity, as well as possible failure and damage to other pieces of equipment
or property.
Static Charges can’t build up on a conductive surface: There are two errors in this
statement.
Conductive devices can build static charges if they are not grounded. The charge
will be equalized across the entire device, but without access to earth ground, they
are still trapped and can still build to high enough levels to cause damage when they
are discharged.
A charge can be induced onto the conductive surface and/or discharge triggered in
the presence of a charged field such as a large static charge clinging to the surface of
a nylon jacket of someone walking up to a workbench.
06870C DCN6332
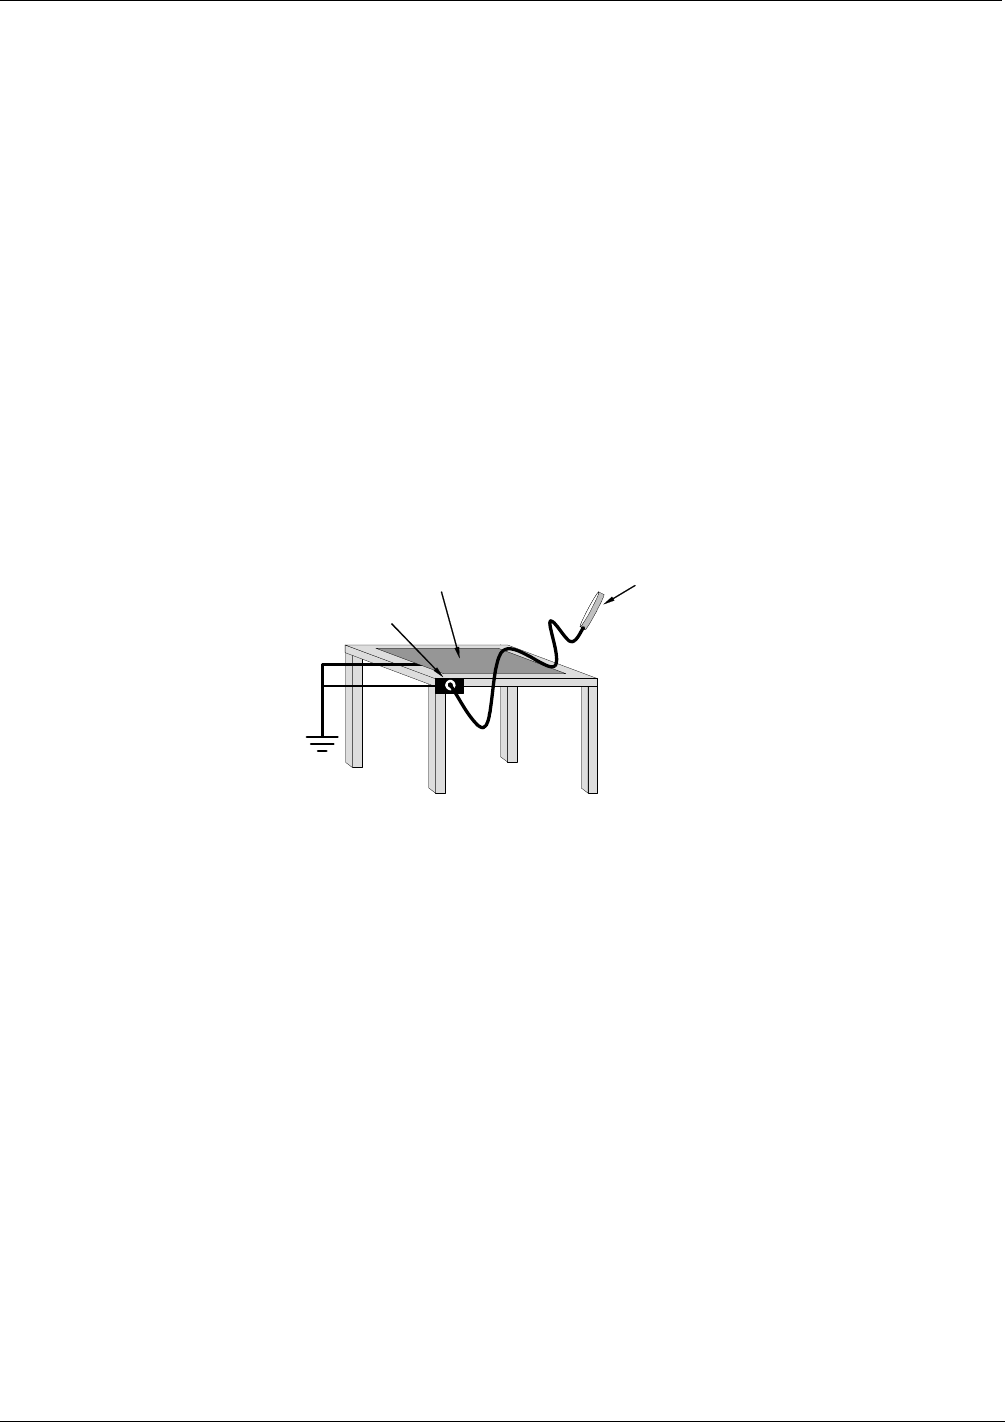
A Primer on Electro-Static Discharge T400 Ozone Analyzer Operator’s Manual
308
As long as my analyzer is properly installed, it is safe from damage caused by
static discharges: It is true that when properly installed the chassis ground of your
analyzer is tied to earth ground and its electronic components are prevented from
building static electric charges themselves. This does not prevent discharges from
static fields built up on other things, like you and your clothing, from discharging
through the instrument and damaging it.
14.4. BASIC PRINCIPLES OF STATIC CONTROL
It is impossible to stop the creation of instantaneous static electric charges. It is not,
however difficult to prevent those charges from building to dangerous levels or prevent
damage due to electro-static discharge from occurring.
14.4.1. GENERAL RULES
Only handle or work on all electronic assemblies at a properly set up ESD station.
Setting up an ESD safe workstation need not be complicated. A protective mat properly
tied to ground and a wrist strap are all that is needed to create a basic anti-ESD
workstation.
Wrist Str
a
Protective Mat
Ground Point
Figure 14-2: Basic anti-ESD Work Station
For technicians that work in the field, special lightweight and portable anti-ESD kits are
available from most suppliers of ESD protection gear. These include everything needed
to create a temporary anti-ESD work area anywhere.
Always wear an Anti-ESD wrist strap when working on the electronic
assemblies of your analyzer. An anti-ESD wrist strap keeps the person wearing it
at or near the same potential as other grounded objects in the work area and allows
static charges to dissipate before they can build to dangerous levels. Anti-ESD
wrist straps terminated with alligator clips are available for use in work areas where
there is no available grounded plug.
Also, anti-ESD wrist straps include a current limiting resistor (usually around one meg-
ohm) that protects you should you accidentally short yourself to the instrument’s power
supply.
Simply touching a grounded piece of metal is insufficient. While this may
temporarily bleed off static charges present at the time, once you stop touching the
grounded metal new static charges will immediately begin to re-build. In some
conditions, a charge large enough to damage a component can rebuild in just a few
seconds.
Always store sensitive components and assemblies in anti-ESD storage bags
or bins: Even when you are not working on them, store all devices and assemblies
06870C DCN6332

T400 Ozone Analyzer Operator’s Manual A Primer on Electro-Static Discharge
309
in a closed anti-Static bag or bin. This will prevent induced charges from building
up on the device or assembly and nearby static fields from discharging through it.
Use metallic anti-ESD bags for storing and shipping ESD sensitive
components and assemblies rather than pink-poly bags. The famous, pink-poly
bags are made of a plastic that is impregnated with a liquid (similar to liquid laundry
detergent) which very slowly sweats onto the surface of the plastic creating a
slightly conductive layer over the surface of the bag.
While this layer may equalizes any charges that occur across the whole bag, it does not
prevent the build up of static charges. If laying on a conductive, grounded surface, these
bags will allow charges to bleed away but the very charges that build up on the surface
of the bag itself can be transferred through the bag by induction onto the circuits of your
ESD sensitive device. Also, the liquid impregnating the plastic is eventually used up
after which the bag is as useless for preventing damage from ESD as any ordinary
plastic bag.
Anti-Static bags made of plastic impregnated with metal (usually silvery in color)
provide all of the charge equalizing abilities of the pink-poly bags but also, when
properly sealed, create a Faraday cage that completely isolates the contents from
discharges and the inductive transfer of static charges.
Storage bins made of plastic impregnated with carbon (usually black in color) are also
excellent at dissipating static charges and isolating their contents from field effects and
discharges.
Never use ordinary plastic adhesive tape near an ESD sensitive device or to
close an anti-ESD bag. The act of pulling a piece of standard plastic adhesive
tape, such as Scotch® tape, from its roll will generate a static charge of several
thousand or even tens of thousands of volts on the tape itself and an associated
field effect that can discharge through or be induced upon items up to a foot away.
06870C DCN6332

A Primer on Electro-Static Discharge T400 Ozone Analyzer Operator’s Manual
310
14.4.2. BASIC ANTI-ESD PROCEDURES FOR ANALYZER REPAIR AND
MAINTENANCE
14.4.2.1. Working at the Instrument Rack
When working on the analyzer while it is in the instrument rack and plugged into a
properly grounded power supply
1. Attach you anti-ESD wrist strap to ground before doing anything else.
Use a wrist strap terminated with an alligator clip and attach it to a bare metal
portion of the instrument chassis.
This will safely connect you to the same ground level to which the instrument
and all of its components are connected.
2. Pause for a second or two to allow any static charges to bleed away.
3. Open the casing of the analyzer and begin work. Up to this point, the closed metal
casing of your analyzer has isolated the components and assemblies inside from
any conducted or induced static charges.
4. If you must remove a component from the instrument, do not lay it down on a non-
ESD preventative surface where static charges may lie in wait.
5. Only disconnect your wrist strap after you have finished work and closed the case of
the analyzer.
14.4.2.2. Working at an Anti-ESD Work Bench.
When working on an instrument of an electronic assembly while it is resting on a anti-
ESD work bench
1. Plug you anti-ESD wrist strap into the grounded receptacle of the work station
before touching any items on the work station and while standing at least a foot or
so away. This will allow any charges you are carrying to bleed away through the
ground connection of the workstation and prevent discharges due to field effects
and induction from occurring.
2. Pause for a second or two to allow any static charges to bleed away.
3. Only open any anti-ESD storage bins or bags containing sensitive devices or
assemblies after you have plugged your wrist strap into the workstation.
Lay the bag or bin on the workbench surface.
Before opening the container, wait several seconds for any static charges on
the outside surface of the container to be bled away by the workstation’s
grounded protective mat.
4. Do not pick up tools that may be carrying static charges while also touching or
holding an ESD Sensitive Device.
Only lay tools or ESD-sensitive devices and assemblies on the conductive
surface of your workstation. Never lay them down on any non-ESD
preventative surface.
5. Place any static sensitive devices or assemblies in anti-static storage bags or bins
and close the bag or bin before unplugging your wrist strap.
6. Disconnecting your wrist strap is always the last action taken before leaving the
workbench.
06870C DCN6332

T400 Ozone Analyzer Operator’s Manual A Primer on Electro-Static Discharge
311
14.4.2.3. Transferring Components from Rack to Bench and Back
When transferring a sensitive device from an installed Teledyne API analyzer to an
Anti-ESD workbench or back:
1. Follow the instructions listed above for working at the instrument rack and
workstation.
2. Never carry the component or assembly without placing it in an anti-ESD bag or bin.
3. Before using the bag or container allow any surface charges on it to dissipate:
If you are at the instrument rack, hold the bag in one hand while your wrist strap
is connected to a ground point.
If you are at an anti-ESD workbench, lay the container down on the conductive
work surface.
In either case wait several seconds.
4. Place the item in the container.
5. Seal the container. If using a bag, fold the end over and fastening it with anti-ESD
tape.
Folding the open end over isolates the component(s) inside from the effects of
static fields.
Leaving the bag open or simply stapling it shut without folding it closed prevents
the bag from forming a complete protective envelope around the device.
6. Once you have arrived at your destination, allow any surface charges that may have
built up on the bag or bin during travel to dissipate:
Connect your wrist strap to ground.
If you are at the instrument rack, hold the bag in one hand while your wrist strap
is connected to a ground point.
If you are at an anti-ESD work bench, lay the container down on the conductive
work surface
In either case wait several seconds
7. Open the container.
14.4.2.4. Opening Shipments from Teledyne API Customer Service
Packing materials such as bubble pack and Styrofoam pellets are extremely efficient
generators of static electric charges. To prevent damage from ESD, Teledyne API ships
all electronic components and assemblies in properly sealed ant-ESD containers.
Static charges will build up on the outer surface of the anti-ESD container during
shipping as the packing materials vibrate and rub against each other. To prevent these
static charges from damaging the components or assemblies being shipped make sure
that you:
Always unpack shipments from Teledyne API Customer Service by:
1. Opening the outer shipping box away from the anti-ESD work area
2. Carry the still sealed ant-ESD bag, tube or bin to the anti-ESD work area
3. Follow steps 6 and 7 of Section 14.4.2.3 above when opening the anti-ESD
container at the work station
4. Reserve the anti-ESD container or bag to use when packing electronic components
or assemblies to be returned to Teledyne API
06870C DCN6332

A Primer on Electro-Static Discharge T400 Ozone Analyzer Operator’s Manual
312
14.4.2.5. Packing Components for Return to Teledyne API Customer Service
Always pack electronic components and assemblies to be sent to Teledyne API
Customer Service in anti-ESD bins, tubes or bags.
CAUTION
ESD Hazard
DO NOT use pink-poly bags.
NEVER allow any standard plastic packaging materials to touch the electronic
component/assembly directly
This includes, but is not limited to, plastic bubble-pack, Styrofoam peanuts,
open cell foam, closed cell foam, and adhesive tape
DO NOT use standard adhesive tape as a sealer. Use ONLY anti-ESD tape
1. Never carry the component or assembly without placing it in an anti-ESD bag or bin.
2. Before using the bag or container allow any surface charges on it to dissipate:
If you are at the instrument rack, hold the bag in one hand while your wrist strap
is connected to a ground point.
If you are at an anti-ESD workbench, lay the container down on the conductive
work surface.
In either case wait several seconds.
3. Place the item in the container.
4. Seal the container. If using a bag, fold the end over and fastening it with anti-ESD
tape.
Folding the open end over isolates the component(s) inside from the effects of
static fields.
Leaving the bag open or simply stapling it shut without folding it closed prevents
the bag from forming a complete protective envelope around the device.
Note If you do not already have an adequate supply of anti-ESD bags or
containers available, Teledyne API’ Customer Service department will
supply them (see Section 12.11 for contact information). Follow the
instructions listed above for working at the instrument rack and
workstation.
06870C DCN6332

T400 Ozone Analyzer Operator’s Manual A Primer on Electro-Static Discharge
313
GLOSSARY
Some terms in this glossary may not occur elsewhere in this manual.
Term Description/Definition
10BaseT an Ethernet standard that uses twisted (“T”) pairs of copper wires to transmit at 10
megabits per second (Mbps)
100BaseT same as 10BaseT except ten times faster (100 Mbps)
APICOM name of a remote control program offered by Teledyne-API to its customers
ASSY Assembly
CAS Code-Activated Switch
CEM Continuous Emission Monitoring
Chemical formulas that may be included in this document:
CO2 carbon dioxide
C3H8 propane
CH4 methane
H2O water vapor
HC general abbreviation for hydrocarbon
HNO3 nitric acid
H2S hydrogen sulfide
NO nitric oxide
NO2 nitrogen dioxide
NOX nitrogen oxides, here defined as the sum of NO and NO2
NOy
nitrogen oxides, often called odd nitrogen: the sum of NOX plus other compounds
such as HNO3 (definitions vary widely and may include nitrate (NO3), PAN, N2O
and other compounds as well)
NH3 ammonia
O2 molecular oxygen
O3 ozone
SO2 sulfur dioxide
cm3 metric abbreviation for cubic centimeter (replaces the obsolete abbreviation “cc”)
CPU Central Processing Unit
DAS Data Acquisition System
DCE Data Communication Equipment
DHCP Dynamic Host Configuration Protocol. A protocol used by LAN or Internet servers
06870C DCN6332

A Primer on Electro-Static Discharge T400 Ozone Analyzer Operator’s Manual
314
Term Description/Definition
to automatically set up the interface protocols between themselves and any other
addressable device connected to the network
DIAG Diagnostics, the diagnostic settings of the analyzer.
DOM Disk On Module, a 44-pin IDE flash drive with up to 128MB storage capacity for
instrument’s firmware, configuration settings and data
DOS Disk Operating System
DRAM Dynamic Random Access Memory
DR-DOS Digital Research DOS
DTE Data Terminal Equipment
EEPROM Electrically Erasable Programmable Read-Only Memory also referred to as a
FLASH chip or drive
Ethernet a standardized (IEEE 802.3) computer networking technology for local area
networks (LANs), facilitating communication and sharing resources
Flash non-volatile, solid-state memory
FPI Fabry-Perot Interface: a special light filter typically made of a transparent plate with
two reflecting surfaces or two parallel, highly reflective mirrors
GFC Gas Filter Correlation
I2C bus a clocked, bi-directional, serial bus for communication between individual analyzer
components
IC
Integrated Circuit, a modern, semi-conductor circuit that can contain many basic
components such as resistors, transistors, capacitors etc in a miniaturized package
used in electronic assemblies
IP Internet Protocol
IZS Internal Zero Span
LAN Local Area Network
LCD Liquid Crystal Display
LED Light Emitting Diode
LPM Liters Per Minute
MFC Mass Flow Controller
M/R Measure/Reference
NDIR Non-Dispersive Infrared
MOLAR MASS
the mass, expressed in grams, of 1 mole of a specific substance. Conversely, one
mole is the amount of the substance needed for the molar mass to be the same
number in grams as the atomic mass of that substance.
EXAMPLE: The atomic weight of Carbon is 12 therefore the molar mass of Carbon
is 12 grams. Conversely, one mole of carbon equals the amount of carbon atoms
that weighs 12 grams.
Atomic weights can be found on any Periodic Table of Elements.
NDIR Non-Dispersive Infrared
NIST-SRM National Institute of Standards and Technology - Standard Reference Material
PC Personal Computer
PCA Printed Circuit Assembly, the PCB with electronic components, ready to use
PC/AT Personal Computer / Advanced Technology
06870C DCN6332

T400 Ozone Analyzer Operator’s Manual A Primer on Electro-Static Discharge
315
Term Description/Definition
PCB Printed Circuit Board, the bare board without electronic component
PFA Per-Fluoro-Alkoxy, an inert polymer; one of the polymers that Du Pont markets as
Teflon®
PLC Programmable Logic Controller, a device that is used to control instruments based
on a logic level signal coming from the analyzer
PLD Programmable Logic Device
PLL Phase Lock Loop
PMT Photo Multiplier Tube, a vacuum tube of electrodes that multiply electrons collected
and charged to create a detectable current signal
P/N (or PN) Part Number
PSD Prevention of Significant Deterioration
PTFE Poly-Tetra-Fluoro-Ethylene, a very inert polymer material used to handle gases that
may react on other surfaces; one of the polymers that Du Pont markets as Teflon®
PVC Poly Vinyl Chloride, a polymer used for downstream tubing
Rdg Reading
RS-232
specification and standard describing a serial communication method between DTE
(Data Terminal Equipment) and DCE (Data Circuit-terminating Equipment) devices,
using a maximum cable-length of 50 feet
RS-485
specification and standard describing a binary serial communication method among
multiple devices at a data rate faster than RS-232 with a much longer distance
between the host and the furthest device
SAROAD Storage and Retrieval of Aerometric Data
SLAMS State and Local Air Monitoring Network Plan
SLPM Standard Liters Per Minute of a gas at standard temperature and pressure
STP Standard Temperature and Pressure
TCP/IP Transfer Control Protocol / Internet Protocol, the standard communications protocol
for Ethernet devices
TEC Thermal Electric Cooler
USB
Universal Serial Bus: a standard connection method to establish communication
between peripheral devices and a host controller, such as a mouse and/or keyboard
and a personal computer or laptop
VARS Variables, the variable settings of the instrument
Z/S Zero / Span
06870C DCN6332

A Primer on Electro-Static Discharge T400 Ozone Analyzer Operator’s Manual
316
This page intentionally left blank.
06870C DCN6332

317
INDEX
1
100 VAC, 259, 293
115 VAC, 259, 293, 296
2
230 VAC, 259, 293
5
50 Hz, 293, 296
6
60 Hz, 29, 40, 259, 295, 296
A
AC Power, 27, 295, 296
100 VAC, 259, 293
AC Power 115 VAC, 259, 293, 296
AC Power 230 VAC, 259, 293
AC Power 50 Hz, 293, 296
AC Power 60 Hz, 29, 40, 259, 295, 296
AIN, 125
ANALOG CAL WARNING, 62, 86, 150
Analog Inputs, 125
Analog Outputs, 27, 41, 42, 43, 46, 85, 88, 89, 92,
93, 249, 252, 263, 287
AIN Calibration, 125
Configuration & Calibration, 89, 111, 113, 114, 115,
118, 120, 121, 122, 125
Automatic, 35, 88, 114
Manual-Current Loop, 117, 119
Manual-Voltage, 115
CONVERTING VOLTAGE TO CURRENT OUTPUT, 43
Current Loop, 42
Electrical Connections, 41
Electronic Range Selection, 120
OUTPUT LOOP-BACK, 287
Over-Range Feature, 121
Recorder Offset, 122
Reporting Range, 64, 72, 85, 88
Test Channel, 123, 252, 263, 287
APICOM, 23, 128, 180
and DAS, 153, 155, 156, 159, 164, 166, 167, 168, 169,
170
and Ethernet, 132
and Failure Prediction, 229
Interface Example, 181
Software Download, 170, 181
Approvals, 27
ATIMER, 155, 159, 161
AUTO, 85, 93, 94, 97, 183, 189, 194
AutoCal, 29, 72, 73, 77, 85, 88, 183, 195, 196
B
Beer-Lambert Equation, 23, 275, 278
BOX TEMP, 62, 85, 86, 123, 150, 247, 249, 252,
257
BOX TEMP WARNING, 62, 86, 150, 247, 252
C
CAL Button, 87, 189
CAL_VALVE, 254
CALDAT, 156
Calibration
AIN, 125
Analog Ouputs, 35, 88, 114
Analog Outputs
Current Loop, 117, 119
Voltage, 115
Calibration Gasses
Span Gas, 54, 63, 65, 183, 184, 185, 187, 190, 193,
196, 207, 249, 254, 290, 291
Zero Air, 54, 57, 58, 183, 184, 185, 190, 193, 196, 207,
227, 231, 249, 271
Calibration Mode, 87
CALS Button, 87, 189, 192, 193, 255, 257
CALZ Button, 87, 189, 192, 193, 255, 257
CANNOT DYN SPAN, 62, 86, 247
CANNOT DYN ZERO, 62, 86, 247
CE Mark, 30
Circuit Breaker, 293, 294
CLOCK_ADJ, 103, 105
COMM Ports, 128, 129, 130, 131, 143
COM1, 127, 145
COM2, 51, 127, 128, 132, 145
Communication Modes, 128
Machine ID, 104
Machine ID, 52
06870C DCN6332

Index T400 Ozone Analyzer Operator’s Manual
318
CONC, 156
CONC Button, 105, 264
CONC_PRECISION, 105
CONC1, 159
Concentration Field, 35
CONFIG INITIALIZED, 62, 86
Control Buttons Definition Field, 35
Control Inputs, 45, 46, 72, 73, 77, 183, 195, 265,
287
LOW_SPAN_CAL 1, 265
ZERO_CAL, 265
CPU, 62, 76, 86, 92, 103, 110, 125, 202, 244, 247,
248, 249, 250, 253, 259, 265, 266, 277, 283, 284,
285, 286, 287, 288, 290, 291, 295, 299, 300, 301,
303
Analog to Digital Converter, 62, 86, 110, 264, 286, 287,
298
Status LED’s, 253
Critical flow orifice, 281
Current Loop Outputs, 41, 42, 43, 117, 118, 119
CONVERTING FROM VOLTAGE OUTPUT, 43
Manual Calibration, 117
D
DAS System, 35, 62, 81, 85, 86, 88, 92, 102, 247,
275
and APICOM, 170
Channels
CALDAT, 156
CONC, 156
O3GEN, 156
O3REF, 156
PNUMTC, 156
HOLD OFF, 105, 155, 168
Parameters, 162
CONC1, 159
STABIL, 150, 229, 247, 249
Triggering Events, 161
ATIMER, 155, 159, 161
EXITZR, 161
SLPCHG, 161
DAS_HOLD_OFF, 105
data acquisition. See DAS
DATA INITIALIZED, 62, 86
DB-25M, 25
DB-9F, 25
DC Power, 44, 46, 259, 260, 293
DC Power Test Points, 259, 260
Default Settings
DAS, 155, 156, 157
Ethernet, 137
Hessen Protocol, 146, 150
VARS, 105
DHCP, 136
DIAG AIO, 108
DIAG AOUT, 108
DIAG ELEC, 108
DIAG FCAL, 108
DIAG I/O, 108
DIAG OPTIC, 108
DIAG TCHN, 108
Diagnostic Menu (DIAG), 89, 99, 101, 108, 263
03 GENERATOR CALIBRATION, 108
Accessing, 109
AIN CALIBRATED, 110, 125
ANALOG I/O
AOUT CALIBRATED CONFIGURATION, 110, 113
CONC_OUT_1, 110
CONC_OUT_2, 110
ANALOG I/O CONFIGURATION, 108, 111, 113, 114,
115, 118, 120, 121, 122, 125
ANALOG OUTPUT (Step Test), 108, 263
DARK CALIBRATION, 108, 199
FLOW CALIBRATION, 108
SIGNAL I/O, 108, 250, 251, 253, 257, 258, 261, 264,
265
TEST CHAN OUPTUT, 108
TEST OUTPUT, 110, 287
Display Precision, 105
DUAL, 93, 94, 96, 183, 189, 194
E
EC Compliance, 30
EEPROM
Disk on Module, 164
Electrical Connections
AC Power, 40, 295
Analog Outputs, 41, 42, 93
CURRENT LOOP, 43, 117
Voltage Ranges, 115
Control Inputs, 46, 265
Ethernet, 23, 89, 132
Modem, 177, 266
Electro-Static Discharge, 31, 51, 310
Warning, 312
ENTR Button, 83, 89, 165, 185, 199, 225, 267
Environmental Protection Agency(EPA), 27, 184,
207, 208
Calibration, 55, 63, 73, 87, 183
NIST Traceability, 185, 193, 196, 205, 206, 207
Contact Information, 205, 208, 221
EPA Equivalency, 29
Reference Documents, 205, 207, 221
Ethernet, 24, 81, 132, 136, 173
Configuration, 132–39
Property Defaults, 137
using DHCP, 136
DHCP, 136
HOSTNAME, 139
Exhaust Gas, 38
Exhaust Gas Outlet, 38
EXIT Button, 89, 267
EXITZR, 161
External Pump, 24
F
Final Test and Validation Data Sheet, 32, 63, 229
Flash Chip, 285
Flow Diagram
Basic, 55, 280
IZS, 56
06870C DCN6332

T400 Ozone Analyzer Operator’s Manual Index
319
Reference/Measurement Cycle, 278
Z/S, 73
Front Panel, 33, 234, 302
Buttonpad, 183
Concentration Field, 35
Display, 108, 123, 247, 275
Message Field, 35
Mode Field, 35
ON/OFF Switch, 293
Status LED’s, 154
Status LEDs, 35
Touchscreen Definition Field, 35
G
Gas Inlets, 213, 247, 291
Sample, 38
Span, 38
ZERO AIR, 38
Gas Outlets, 40, 57, 58, 59, 60, 63, 75, 215, 255,
282, 298
Exhaust, 38
H
Hessen Protocol, 128, 142, 143, 144, 145, 146,
147, 148, 149, 150, 151
Default Settings, 146
Status Bits
Default Settings, 150
HOSTNAME, 139
I
I2C, 252, 253, 258, 260, 268, 284, 287, 288, 299,
300
Status LED, 253
Interferents, 279
Internal Zero Air (IZS), 38
Internal Zero/Span Option (IZS), 24, 28, 287
AC Power, 293
AutoCal, 196
Calibration, 63, 71, 183, 191, 202
DIAG Functions, 108
EPA Equivalency, 29
Flow Diagram, 56, 76
Generator, 28, 68, 69, 76, 85, 105, 183, 202, 203, 239,
240, 249, 254, 258, 269, 271, 290
Interferents, 63
Maintenance, 227, 231, 233, 239
O3 Scrubber, 62, 71, 86, 227, 271, 279
Pneumatic Setup, 58
Reference Detector, 70, 240
Span Gas for, 55
Specifications, 28
Test Channel Functions, 123
Test Functions, 85
Troubleshooting, 229, 248, 252, 254, 255, 257, 258,
261, 265, 269, 270, 271
Valve Control, 291
Valve States, 77
Warning Messages, 62, 86
IZS, 54
Reference Feedback Option, 28
L
LAMP DRIVER WARN, 62, 86
LAMP STABIL WARN, 62, 86, 150, 247
Local Area Network (LAN), 132, 136, 137
LOW_SPAN_CAL 1, 265
M
Machine ID, 52, 104
Measure/Reference Valve, 278
Measurement / Reference Cycle, 252, 278
Menu Buttons
CAL, 87, 189
CALS, 87, 189, 192, 193, 255, 257
CALZ, 87, 189, 192, 193, 255, 257
CONC, 105, 264
ENTR, 83, 89, 165, 185, 199, 225, 267
EXIT, 89, 267
MENUS
AUTO, 85, 93, 94, 97, 183, 189, 194
DUAL, 93, 94, 96, 183, 189, 194
SNGL, 64, 72, 93, 94, 95
Message Field, 35
Metal Wool Scrubber, 85, 105, 123, 252, 254, 271,
289, 290, 293, 297
AC Power, 297
Troubleshooting, 257, 261, 271
microcomputer, 283, 303
Mode Field, 35
Modem, 177, 266
Motherboard, 62, 86, 110, 117, 247, 248, 253, 257,
259, 263, 284, 286, 295
Multidrop, 128
O
O3 Detector Output, 286
O3 DRIVE1, 85, 229
O3 GEN LAMP WARN, 62, 86
O3 GEN REF WARNING, 62, 86
O3 GEN TEMP, 249
O3 GEN TEMP WARN, 62, 86, 248
O3 GEN TMP1, 85
O3 GEN2, 85
O3 Generator IZS, 68, 69, 76, 85, 105, 183, 202,
203, 239, 240, 249, 254, 258, 269, 271, 290
O3 MEAS, 85, 249
O3 Option
Relay PCA
Status LED’s, 254
O3 REF, 85, 229, 249, 267
O3 SCRUB TEMP WARN, 62, 86, 150
O3 SCRUB3, 85
O3 Scrubber, 62, 71, 86, 227, 271, 279
O3_GEN_HEATER, 254, 258
O3_GEN_LAMP, 105
O3_GEN_LOW1, 105
O3_GEN_LOW2, 105
06870C DCN6332

Index T400 Ozone Analyzer Operator’s Manual
320
O3_SCRUB_HEATER, 254
O3_SCRUB_SET, 105
O3GEN, 156
O3REF, 156
Offset, 85, 117, 122, 229, 247, 304
OFFSET, 85, 185, 225, 229, 249, 304
ON/OFF Switch, 259, 293, 294
Operating Modes, 108, 229
Calibration Mode, 87, 150
Diagnostic Mode (DIAG), 108
Sample Mode, 35
SAMPLE mode, 81, 83, 105, 195, 255, 291
Secondary Setup, 89
Setup, 88
P
Particulate Filter, 227, 230, 247, 282
PHOTO LAMP, 85, 123, 249, 252, 301
PHOTO REF WARNING, 62, 86, 150, 247
PHOTO TEMP WARNING, 62, 86, 150, 247, 252
PHOTO_LAMP, 105, 254, 258, 264
PHOTO_LAMP_HEATER, 254
PHOTO_REF_VALVE, 254
PHOTOMETER, 235, 293, 298
Absorption Tube, 227, 235, 275, 284
CALIBRATION, 183, 199
Gas Flow, 201
Electronics, 299
Gas Pressure, 301
Layout, 298
Sensor
Flow, 262
PRessure, 262
Status LED’s, 290
Temperature, 301
Theory of Operation, 299
UV Absorption Path, 276, 277, 278
UV detector, 236, 238, 247, 298
UV Lamp, 254, 268, 284, 291, 300
PNUMTC, 156
PRES, 85, 229, 232, 247, 249, 301
Pump
Sample, 85, 231, 247, 256, 259, 290, 296
R
RANGE, 85, 94, 110, 147, 249
RANGE1, 85, 96, 97, 147
RANGE2, 85, 96, 97, 147
REAR BOARD NOT DET, 62, 86, 247
Recorder Offset, 122
REF_4096_MV, 264
REF_GND, 264
Reference Feedback Option (IZS), 28, 70, 240
RELAY BOARD WARN, 62, 86
Relay PCA, 288–93
DC Power Test Points, 260
Status LED’s, 253, 254, 290, 295
CAL_VALVE, 254
O3_GEN_HEATER, 254, 258
O3_SCRUB_HEATER, 254
PHOTO_LAMP_HEATER, 254
PHOTO_REF_VALVE, 254
Troubleshooting, 252, 253, 254, 259, 260, 261
Reporting Range, 64, 72, 88, 92
Configuration, 88
RJ45, 25
RS-232, 24, 49, 50, 51, 53, 72, 73, 76, 77, 81, 89,
132, 154, 155, 167, 168, 173, 176, 180, 209, 286
Troubleshooting, 266
RS-485, 24, 53, 81, 127, 128, 129, 132, 286
S
Safety Messages
Electric Shock, 31, 40, 225, 259, 268, 289
Electro-Static Discharge, 312
General, 31, 39, 40, 54, 75, 117, 232, 235, 236, 238,
243, 298
SAMP FL, 85, 229, 232
SAMPL_FL, 301
Sample Flow Sensor, 85, 247, 282, 286
SAMPLE FLOW WARN, 62, 86, 247, 255
Sample Inlet, 38
Sample Mode, 35
SAMPLE mode, 81, 83, 105, 195, 255, 291
SAMPLE PRESS WARN, 62, 86, 150
Sample Pressure Sensor, 247, 249, 282
SAMPLE TEMP, 62, 85, 86, 123, 150, 249, 252,
301
SAMPLE TEMP WARN, 62, 86, 150, 247
Sample Temperature Sensor, 247
SAMPLE/CAL valve, 291
SAMPLE_FLOW, 264
Sensors
O3 Detector Output, 286
Sample Flow, 85, 247, 282, 286
Sample Pressure, 247, 249, 282
Sample Temperature, 247
Thermistors, 239, 258, 286
Sample Temperature, 247
Thermocouple Inputs, 292
Serial I/O Ports, 27, 72, 73, 76, 77, 245, 247, 284
Modem, 177, 266
Multidrop, 128
RS-232, 24, 51, 72, 73, 76, 77, 81, 89, 154, 155, 167,
168, 180, 209, 286
Troubleshooting, 266
RS-485, 24, 81, 128, 286
Setup MODE, 88
Signal I/O
PHOTO_LAMP, 264
REF_4096_MV, 264
REF_GND, 264
SAMPLE_FLOW, 264
Slope, 85, 229, 247, 304
SLOPE, 85, 185, 225, 229, 249, 304
SLPCHG, 161
SNGL, 64, 72, 93, 94, 95
Span Gas, 38, 54, 63, 65, 183, 184, 185, 187, 190,
193, 196, 207, 249, 254, 290, 291
Span Inlet, 38
06870C DCN6332

T400 Ozone Analyzer Operator’s Manual Index
321
Specifications, 27, 28, 29
EC Compliance, 30
STABIL, 62, 85, 150, 229, 247, 249
Standard Temperature and Pressure, 98, 275
State of California Air Resources Board (CARB)
Contact Information, 208
Status LED’s
CPU, 253
I2C, 253
Relay PCA, 253, 290, 295
CAL_VALVE, 254
O3 Option, 254
O3_GEN_HEATER, 254, 258
O3_SCRUB_HEATER, 254
PHOTO_LAMP_HEATER, 254
PHOTO_REF_VALVE, 254
Watchdog, 253, 260, 290
Status Outputs, 44, 264, 287
ST_CONC_VALID, 264
ST_DIAG, 264
ST_FLOW_ALARM, 264
ST_HIGH_RANGE, 264
ST_PRESS_ALARM, 264
ST_SPAN_CAL, 264, 265
ST_SYSTEM_OK, 264
ST_ZERO_CAL, 264
System
Default Settings, 155, 156, 157
SYSTEM RESET, 62, 86, 150, 248
T
Teledyne Contact Information
Email Address, 274
Fax, 274
Phone, 274
Technical Assistance, 274
Website, 274
Forms, 274
Manuals, 142, 145
Software Downloads, 170, 181
Terminal Mode, 174
Command Syntax, 175
Computer mode, 128, 174
Interactive mode, 174
Test Channel, 123, 252, 263
Test Functions, 63, 84, 85, 123, 227, 229, 236, 248,
249, 255, 263
BOX TEMP, 62, 85, 86, 123, 150, 247, 249, 252, 257
O3 DRIVE1, 85, 229
O3 GEN TEMP, 249
O3 GEN TMP1, 85
O3 GEN2, 85
O3 MEAS, 85, 249
O3 REF, 85, 229, 236, 249, 267
O3 SCRUB3, 85
OFFSET, 85, 185, 225, 229, 249, 304
PHOTO LAMP, 85, 123, 249, 252, 301
PRES, 85, 229, 232, 247, 249, 301
RANGE, 85, 94, 96, 97, 110, 147, 249
RANGE1, 85, 96, 97, 147
RANGE2, 85, 96, 97, 147
SAMP FL, 85, 229, 232
SAMPL_FL, 301
SAMPLE TEMP, 62, 85, 86, 123, 150, 249, 252, 301
SLOPE, 85, 185, 225, 229, 249, 304
STABIL, 62, 85, 86, 150, 229, 247, 249
TEST4, 85
TIME, 85, 196, 249
TEST4, 85
Theory of Operation
Beer-Lambert Equation, 23, 275, 278
Thermistors, 239, 258, 286
Thermocouple Inputs, 292
TIME, 85, 196, 249
U
Ultraviolet Light, 23, 208, 276, 277, 278, 279, 298,
299
Units of Measurement, 64, 72
UV, 268
UV Absorption Path, 276, 277, 278
UV detector, 236, 238, 247, 298
UV Lamp, 268
UV Light, 268
UV Source, 291
O3Generator, 239, 252, 258, 269
Status LED’s, 254
Photometer, 268, 284, 290, 291, 298, 300
Adjustment, 236, 238
Calibration, 199
Power Supply, 293
Replacement, 238
Status LED’s, 254
Troubleshooting, 247, 249, 257, 258
V
Valve Options, 38, 63, 72, 183, 190, 192
Heater Control, 291
Internal Zero/Span Option (IZS), 24, 28, 85, 287
AC Power, 293, 297
AutoCal, 196
Calibration, 63, 71, 183, 191, 202
DIAG Functions, 108
EPA Equivalency, 29
Flow Diagram, 56, 76
Generator, 68, 69, 76, 85, 105, 183, 202, 203, 239,
240, 249, 254, 258, 269, 271, 290
Interferents, 63
Maintenance, 227, 231, 233, 239
O3 Scrubber, 62, 71, 86, 227, 271, 279
Pneumatic Setup, 58
Reference Detector, 70, 240
Span Gas for, 55
Specifications, 28
Test Channel Functions, 123
Test Functions, 85
Troubleshooting, 229, 248, 252, 254, 255, 257, 258,
261, 265, 269, 270, 271
Valve Control, 291
Valve States, 77
VARS, 105
Warning Messages, 62, 86
Status LED’s, 290
06870C DCN6332

Index T400 Ozone Analyzer Operator’s Manual
322
Zero/Span, 72
AND AUTOCAL, 183, 195
Calibration, 63, 190, 193, 194
EPA Equivalency, 29
Flow Diagram, 73
Setup, 74
Troubleshooting, 254, 265
Valve States, 73
with Remote Contact Closure, 195
VARS Menu, 89, 99, 101, 103, 105, 107, 155, 168
Variable Default Values, 105
Variable Names
CLOCK_ADJ, 105
CONC_PRECISION, 105
O3_GEN_LAMP, 105
O3_GEN_LOW1, 105
O3_GEN_LOW2, 105
O3_SCRUB_SET, 105
PHOTO_LAMP, 105, 254, 258
VARS_HOLD_OFF, 105
Ventilation Clearance, 32
W
Warning Messages, 61, 62, 86, 244, 247
ANALOG CAL WARNING, 62, 86, 150
BOX TEMP WARNING, 62, 86, 150, 247, 252
CANNOT DYN SPAN, 62, 86, 247
CANNOT DYN ZERO, 62, 86, 247
CONFIG INITIALIZED, 62, 86
DATA INITIALIZED, 62, 86
LAMP DRIVER WARN, 62, 86
LAMP STABIL WARN, 62, 86, 150, 247
O3 GEN LAMP WARN, 62, 86
O3 GEN REF WARNING, 62, 86
O3 GEN TEMP WARN, 62, 86, 248
O3 SCRUB TEMP WARN, 62, 86, 150
PHOTO REF WARNING, 62, 86, 150, 247
PHOTO TEMP WARNING, 62, 86, 150, 247, 252
REAR BOARD NOT DET, 62, 86, 247
RELAY BOARD WARN, 62, 86
SAMPLE FLOW WARN, 62, 86, 247, 255
SAMPLE PRESS WARN, 62, 86, 150
SAMPLE TEMP WARN, 62, 86, 150, 247
SYSTEM RESET, 62, 86, 150, 248
Watchdog Circuit, 253, 290
Status LED, 253, 260, 290
Z
Zero Air, 54, 57, 58, 183, 184, 185, 190, 193, 196,
207, 227, 231, 249, 271
ZERO AIR Inlet, 38
ZERO/SPAN valve, 195, 291
ZERO_CAL, 265
06870C DCN6332

Teledyne API - Models T400 and 400E (04402F DCN6340) APPENDIX A – Software Version-Specific Documentation
A-1
APPENDIX A – Software Version-Specific Documentation
APPENDIX A-1: Software Menu Trees
APPENDIX A-2: Setup Variables Available Via Serial I/O
APPENDIX A-3: Warnings and Test Measurements Via Serial I/O
APPENDIX A-4: Signal I/O Definitions
APPENDIX A-5: DAS Functions
APPENDIX A-6: MODBUS Register Map
06870C DCN6332

APPENDIX A – Software Version-Specific Documentation Teledyne API - Models T400 and 400E (04402F DCN6340)
A-2
06870C DCN6332
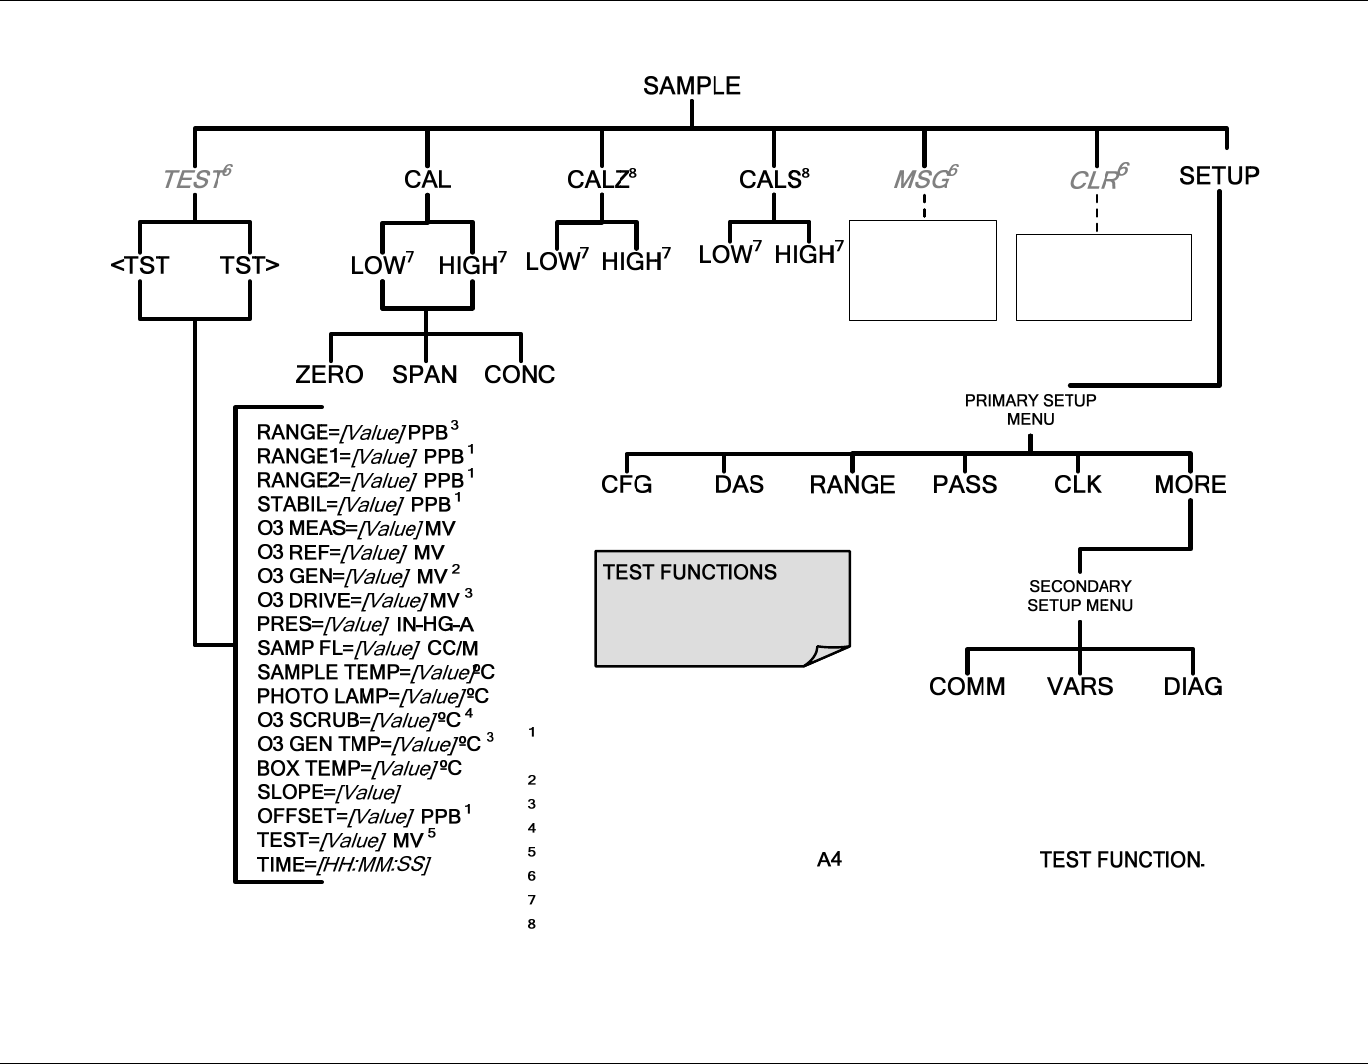
Teledyne API - Models T400 and 400E (04402F DCN6340) APPENDIX A-1: T400 and M400E Software Menu Trees, Revision 1.0.0/E.3
A-3
APPENDIX A-1: T400 and M400E Software Menu Trees, Revision 1.0.0/E.3
Press to cycle
through the
active warning
messages.
Press to clear an
active warning
messages.
This will match the currently selected units of measure for the range being
displayed.
Only appears if IZS reference sensor option is installed.
Only appears if IZS option is installed.
Only appears if metal wool scrubber option is installed.
Only appears if analog output is actively reporting a
Only appears when warning messages are active.
Only appears when reporting ranges are set for either DUAL or AUTO modes.
Only appears when the optional metal wool scrubber is installed.
Viewable by user while
instrument is in SAMPLE
Mode
Figure A-1: Basic Sample Display Menu without Options
06870C DCN6332
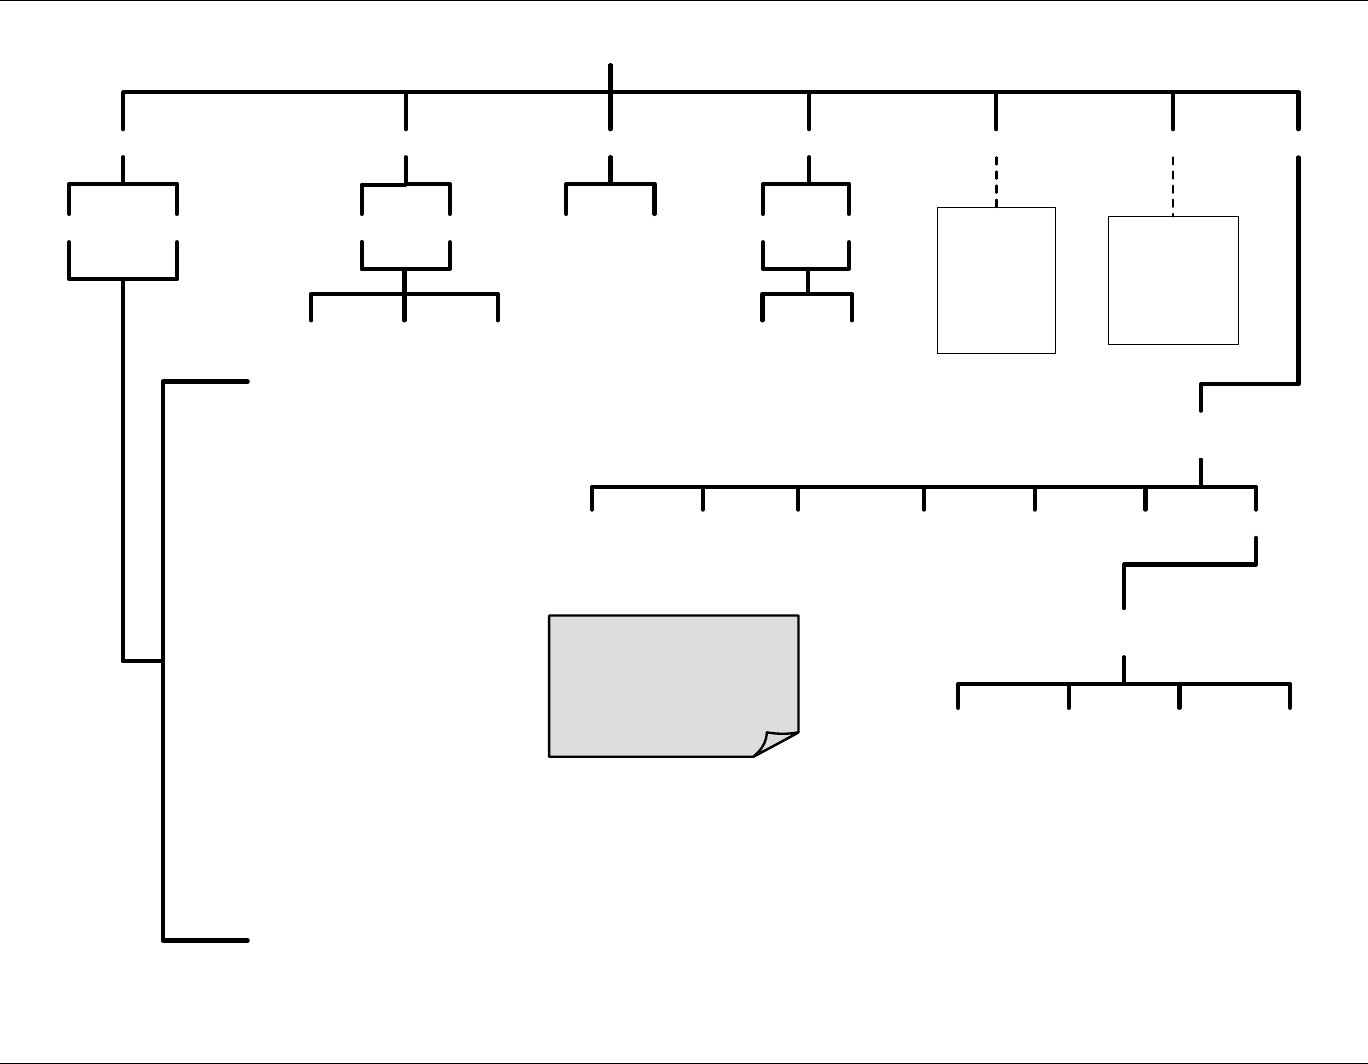
APPENDIX A-1: T400 and M400E Software Menu Trees, Revision 1.0.0/E.3 Teledyne API - Models T400 and 400E (04402F DCN6340)
A-4
PRIMARY SETUP
MENU
SAMPLE
MSG1
CALZ4CALS4CLR1SETUP
<TST TST>
CALTEST1
DASCFG ACAL4CLKRANGE PASS MORE
SECONDARY
SETUP MENU
Press to
cycle
through the
active
warning
messages.
Press to
clear an
active
warning
messages.
DIAGCOMM VARS ALAR5
LOW2HIGH2
CONCZERO SPAN
LOW2HIGH2
CONCSPAN
LOW2HIGH2
RANGE=[Value] PPB
RANGE1=[Value] PPB 2
RANGE2=[Value] PPB 2
STABIL=[Value] PPB
RSP=[Value] SEC
O3 MEAS=[Value] MV
O3 REF=[Value] MV
O3 GEN=[Value] MV 3
O3 DRIVE=[Value] MV 3
PHOTO POWER=[Value] MV
PRES=[Value] IN-HG-A
SAMP FL=[Value] CC/M
SAMPLE TEMP=[Value]ºC
PHOTO LAMP=[Value] ºC
O3 SCRUB=[Value] ºC 4
O3 GEN TMP=[Value] ºC 3
BOX TEMP=[Value] ºC
SLOPE=[Value]
OFFSET=[Value] PPB
TEST=[Value] MV
TIME=[HH:MM:SS]
1 Only appears when warning messages are active.
2Only appears when reporting ranges are set for either DUAL or AUTO modes.
3Only appears if analyzer is equipped with Zero/Span or IZS valve options.
4 Only appears whe the optional metal wool scrubber is installed
5Only appears if the alarm option is installed.
TEST FUNCTIONS
Viewable by user
while instrument is
in SAMPLE Mode
Figure A-1: Basic Sample Display Menu with Options
06870C DCN6332
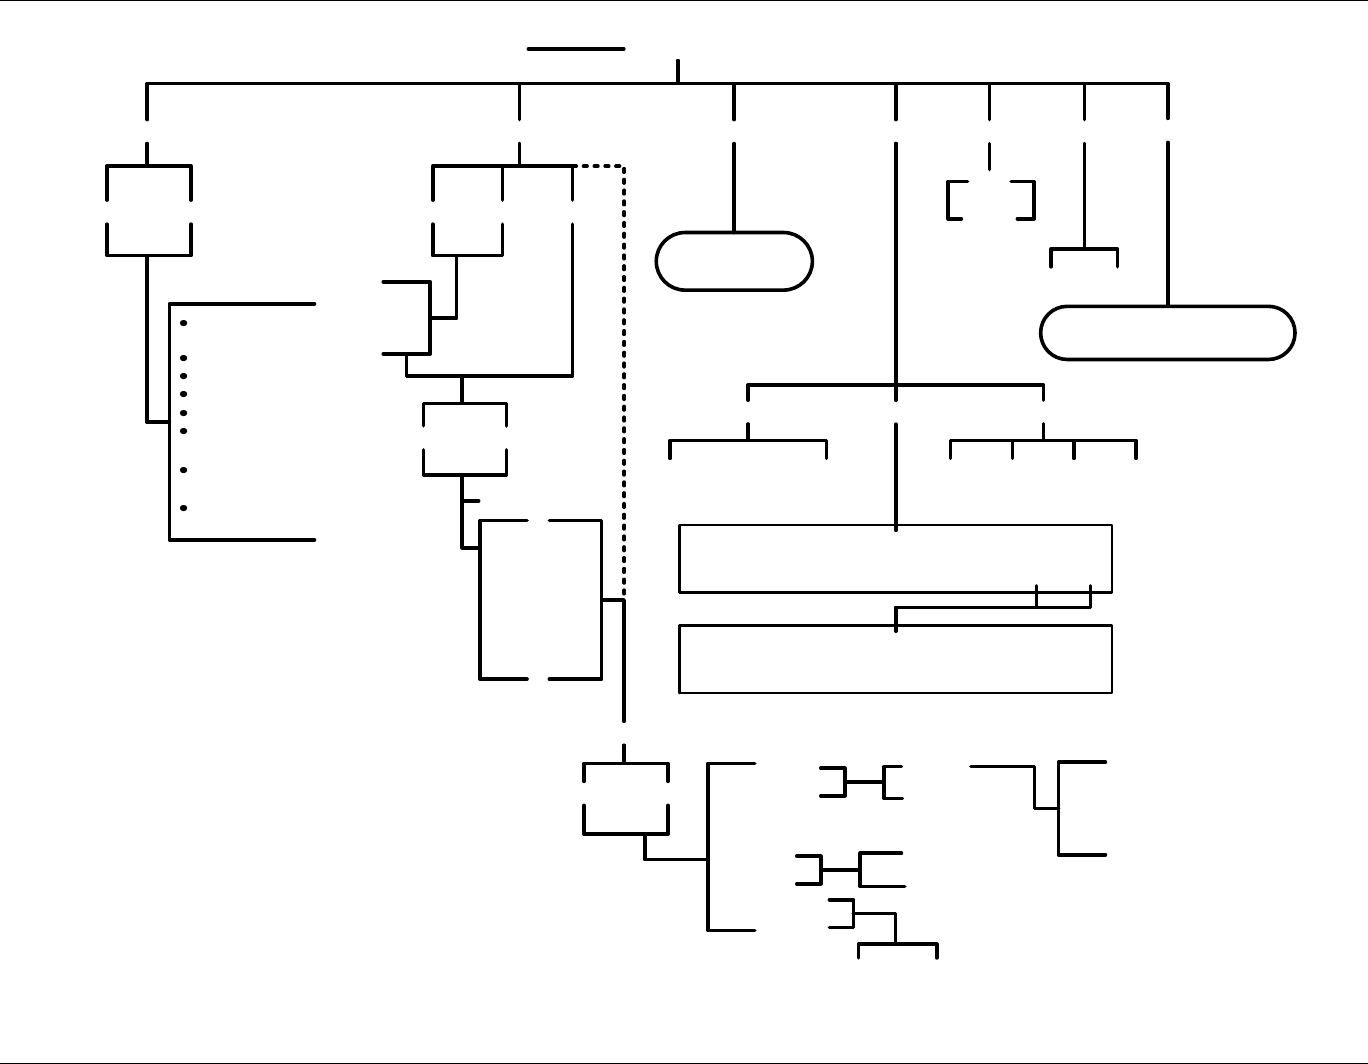
Teledyne API - Models T400 and 400E (04402F DCN6340) APPENDIX A-1: T400 and M400E Software Menu Trees, Revision 1.0.0/E.3
A-5
SETUP
PASS
DAS RNGE CLK MORE
ACAL1
CFG
<TST TST>
MODEL TYPE AND
NUMBER
PART NUMBER
SERIAL NUMBER
SOFTWARE REVISION
LIBRARY REVISION
iCHIP SOFTWARE
REVISION4
CPU TYPE & OS
REVISION4
DATE FACTORY
CONFIGURATION SAVED
Go to DAS
Menu Tree
ON
OFF
PREV MODENEXT
SEQ 1)
SEQ 2)
SEQ 3)
PREV NEXT
DISABLED
ZERO
ZERO-LO
ZERO-HI
ZERO-LO-HI
LO
HI
LO-HI
SET2
<SET SET>
LOW HIGH
RANGE TO CAL3
DURATION
STARTING DATE
STARTING TIME
DELTA DAYS
DELTA TIME
TIMER ENABLE
SAMPLE
1 ACAL menu and its submenus
only appear if analyzer is
equipped with Zero/Span or IZS
valve options.
2Appears whenever the currently
displayed sequence is not set
for DISABLED.
3Only appears when reporting
range is set to AUTO range
mode.
4Applies to E-Series.
Go to SECONDARY SETUP
Menu Tree
CALIBRATE
SET UNITMODE
TIME DATE
PPM UGMPPB MGM
SETUP X.X LOW RANGE:500.0 Conc
00500.0ENTREXIT
SETUP X.X HIGH RANGE:500.0 Conc
00500.0ENTREXIT
OFF
ON
OFF
ON
SNGL DUAL AUTO
Figure A-2: Primary Setup Menu (Except DAS)
06870C DCN6332
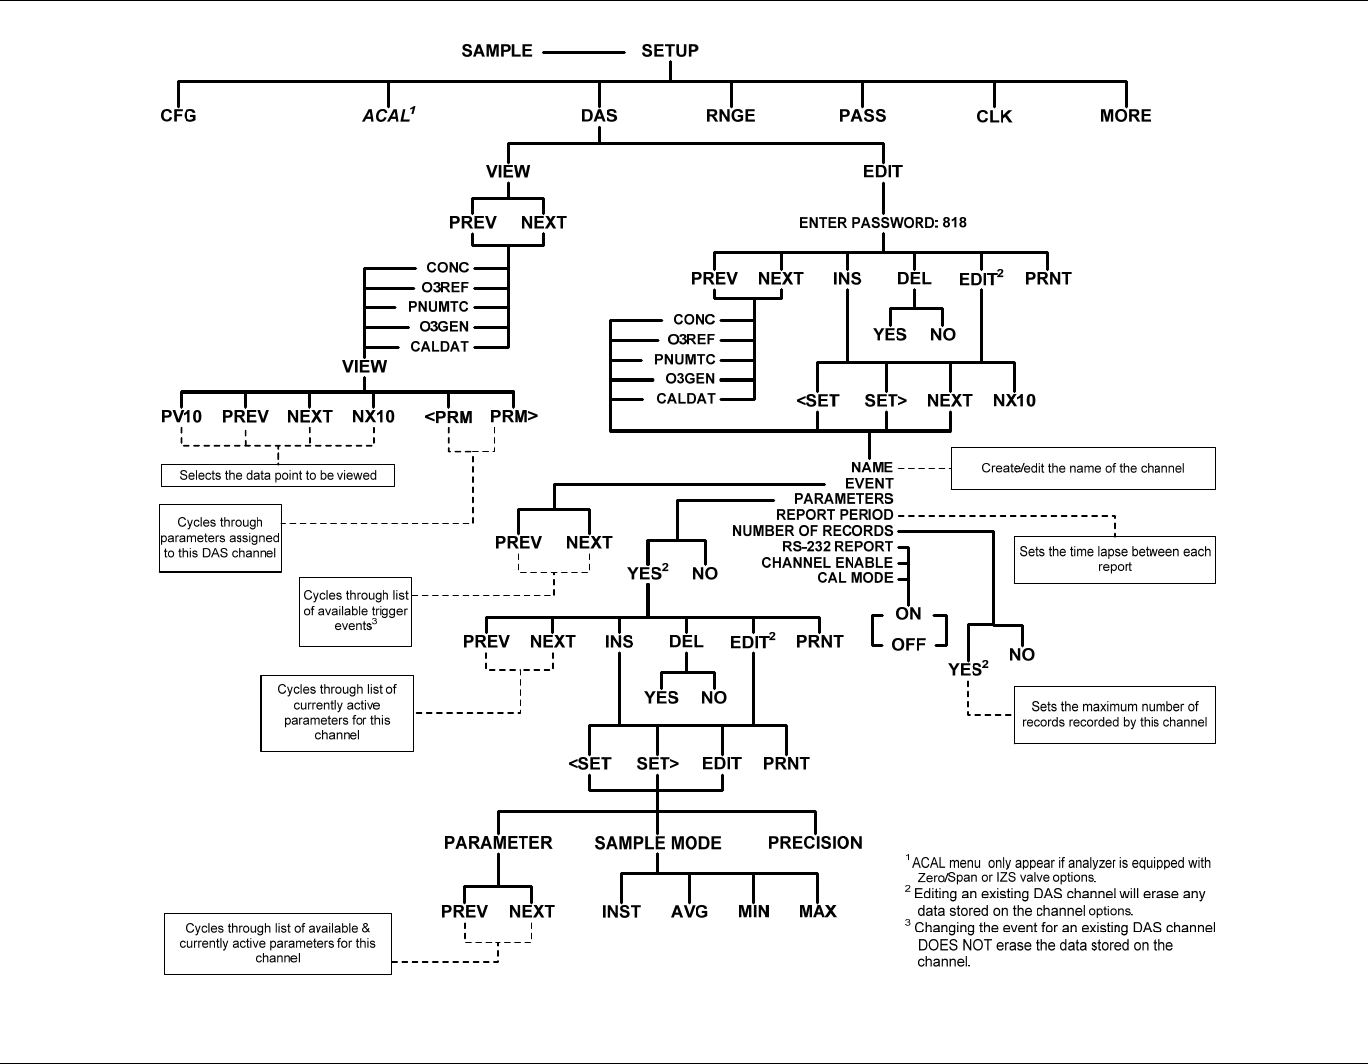
APPENDIX A-1: T400 and M400E Software Menu Trees, Revision 1.0.0/E.3 Teledyne API - Models T400 and 400E (04402F DCN6340)
A-6
Figure A-3: Primary Setup Menu (DAS)
06870C DCN6332
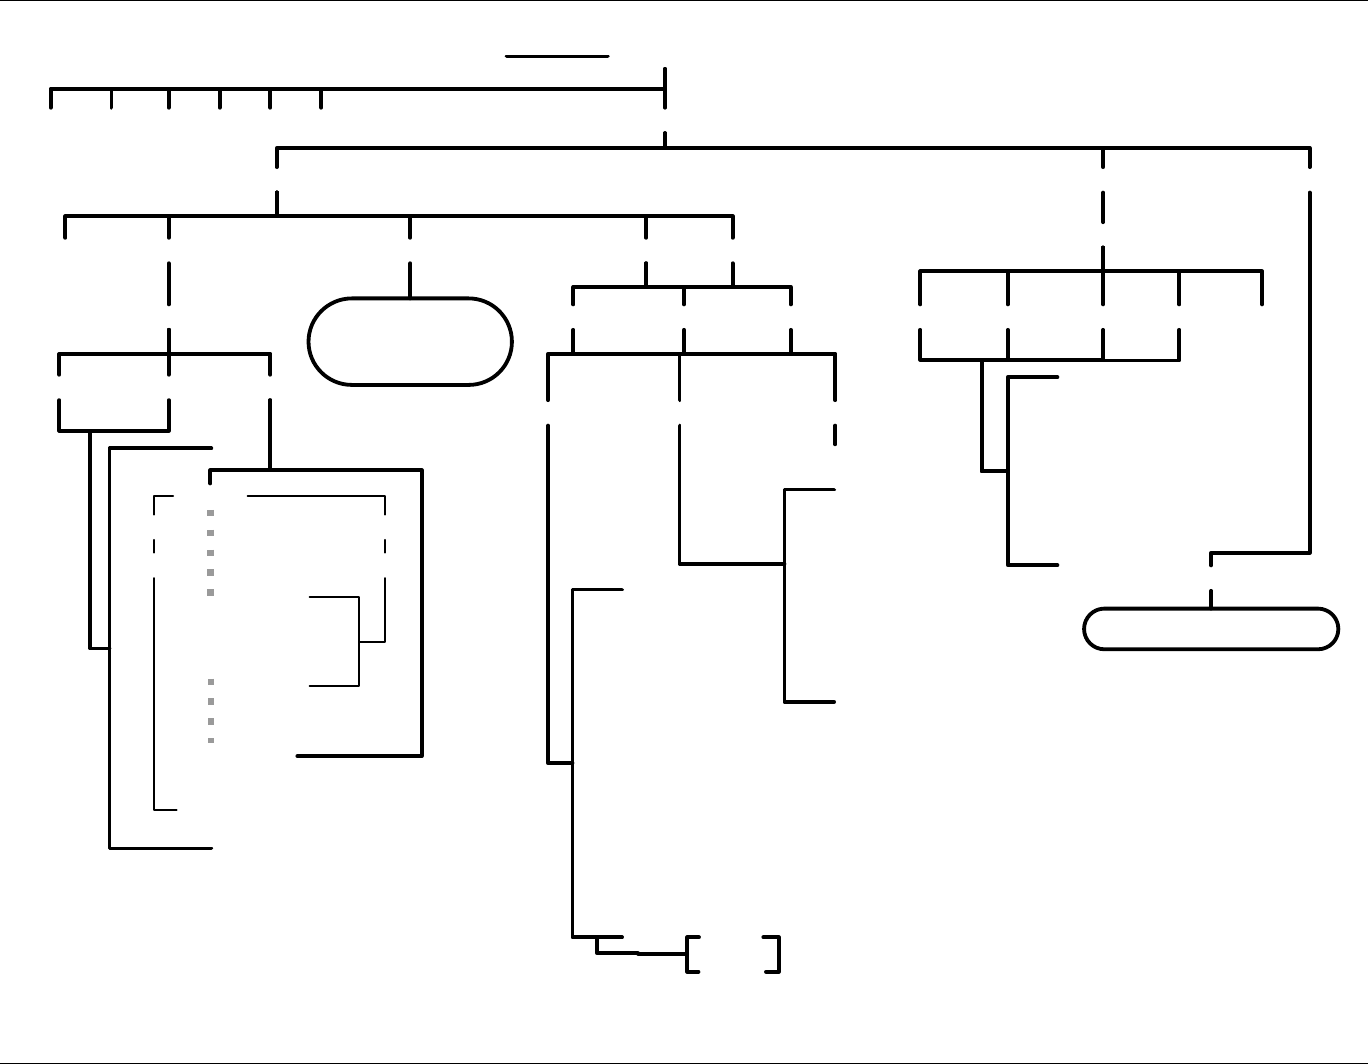
Teledyne API - Models T400 and 400E (04402F DCN6340) APPENDIX A-1: T400 and M400E Software Menu Trees, Revision 1.0.0/E.3
A-7
SETUP
PASSDAS RNGE CLK MORE
ACAL
CFG
SAMPLE
COMM VARS DIAG
EDIT PRNTJUMPNEXTPREV
0) DAS_HOLD_OFF
1) CONC_PRECISION
2) PHOTO_LAMP
3) O3_GEN_LAMP
4) O3_GEN_LOW_1
5) O3_GEN_LOW_2
6) O3_SCRUB_SET
7) CLOCK_ADJ
Go to DIAG Menu Tree
HESN2
INET1
ID
EDITSET><SET
COM1 COM2
TEST PORTBAUD RATEMODE
TEST
300
1200
2400
4800
9600
19200
38400
57600
115200
QUIET
COMPUTER
SECURITY
HESSEN PROTOCOL
E, 8, 2
E, 7, 1
RS-485
SECURITY
MULTIDROP PROTOCOL
ENABLE MODEM
ERROR CHECKING
XON/XOFF HANDSHAKE
HARDWARE HANDSHAKE
HARDWARE FIFO
COMMAND PROMPT
ON
OFF
ENTER PASSWORD: 818
ENTER PASSWORD: 818
Go to
COMM / Hessen
Menu Tree
ENTER PASSWORD: 818
EDITSET><SET
DHCP
ON OFF
INSTRUMENT IP3
GATEWAY IP3
SUBNET MASK3
TCP PORT4
HOSTNAME5
1M400E: Only appears if optional Ethernet PCA is installed;
with that option, the COM2 submenu disappears.
2Only appears if HESSEN PROTOCOL mode is ON (See
COM1 & COM2 – MODE submenu above).
3INSTRUMENT IP, GATEWAY IP & SUBNET MASK are only
editable when DHCP is OFF.
4Although TCP PORT is editable regardless of the DHCP state, do not
change the setting for this property.
5HOST NAME is only editable when DHCP is ON.
EDITEDIT
ONLINE
INITIALIZE INET
Figure A-4: Secondary Setup Menu (COMM & VARS)
06870C DCN6332
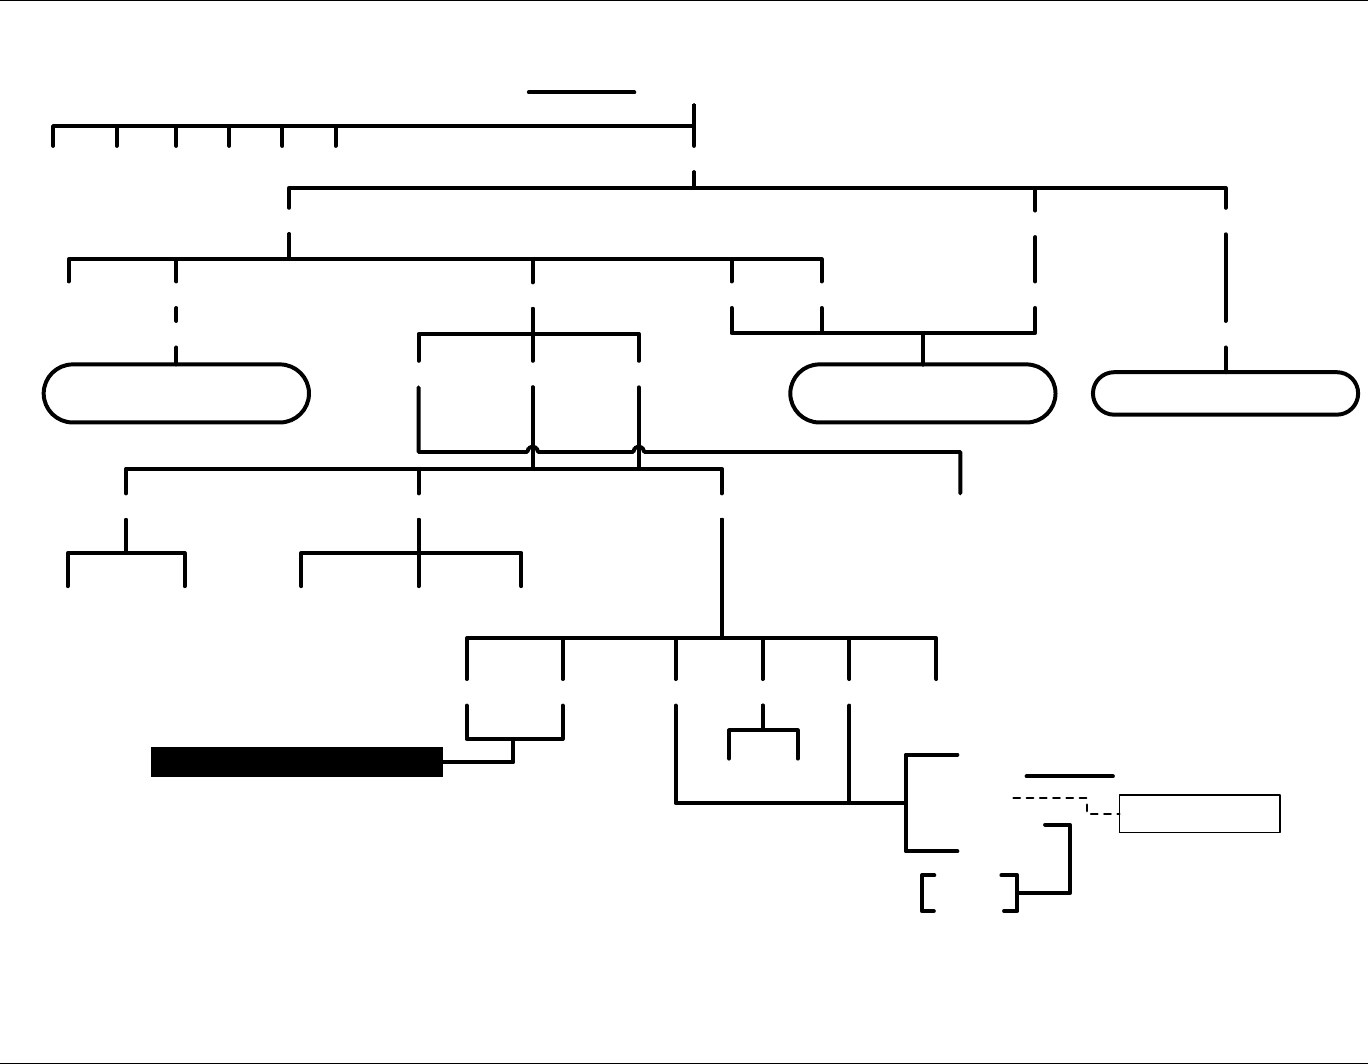
APPENDIX A-1: T400 and M400E Software Menu Trees, Revision 1.0.0/E.3 Teledyne API - Models T400 and 400E (04402F DCN6340)
A-8
SETUP
PASSDAS RNGE CLK MORE
ACAL
CFG
SAMPLE
COMM VARS DIAG
Go to DIAG Menu Tree
HESN2
INET1
ID ENTER PASSWORD: 818
ENTER PASSWORD: 818ENTER PASSWORD: 818
1Only appears if Ethernet Option is installed (M400E).
2Only appears if HESSEN PROTOCOL mode is ON.
Go to COMM / VARS Menu
Tree Go to COMM / VARS Menu
Tree
COM1 COM2
EDITSET><SET
GAS LISTRESPONSE MODEVARIATION STATUS FLAGS
TYPE2TYPE1 CMDTEXTBCC
EDIT PRNTDELINSNEXTPREV
NOYES GAS TYPE
GAS ID
REPORTED
ON
OFF
Set/create unique
gas ID number
O3
O3, 0, 400, REPORTED
Figure A-5: Secondary Setup Menu (HESSEN)
06870C DCN6332
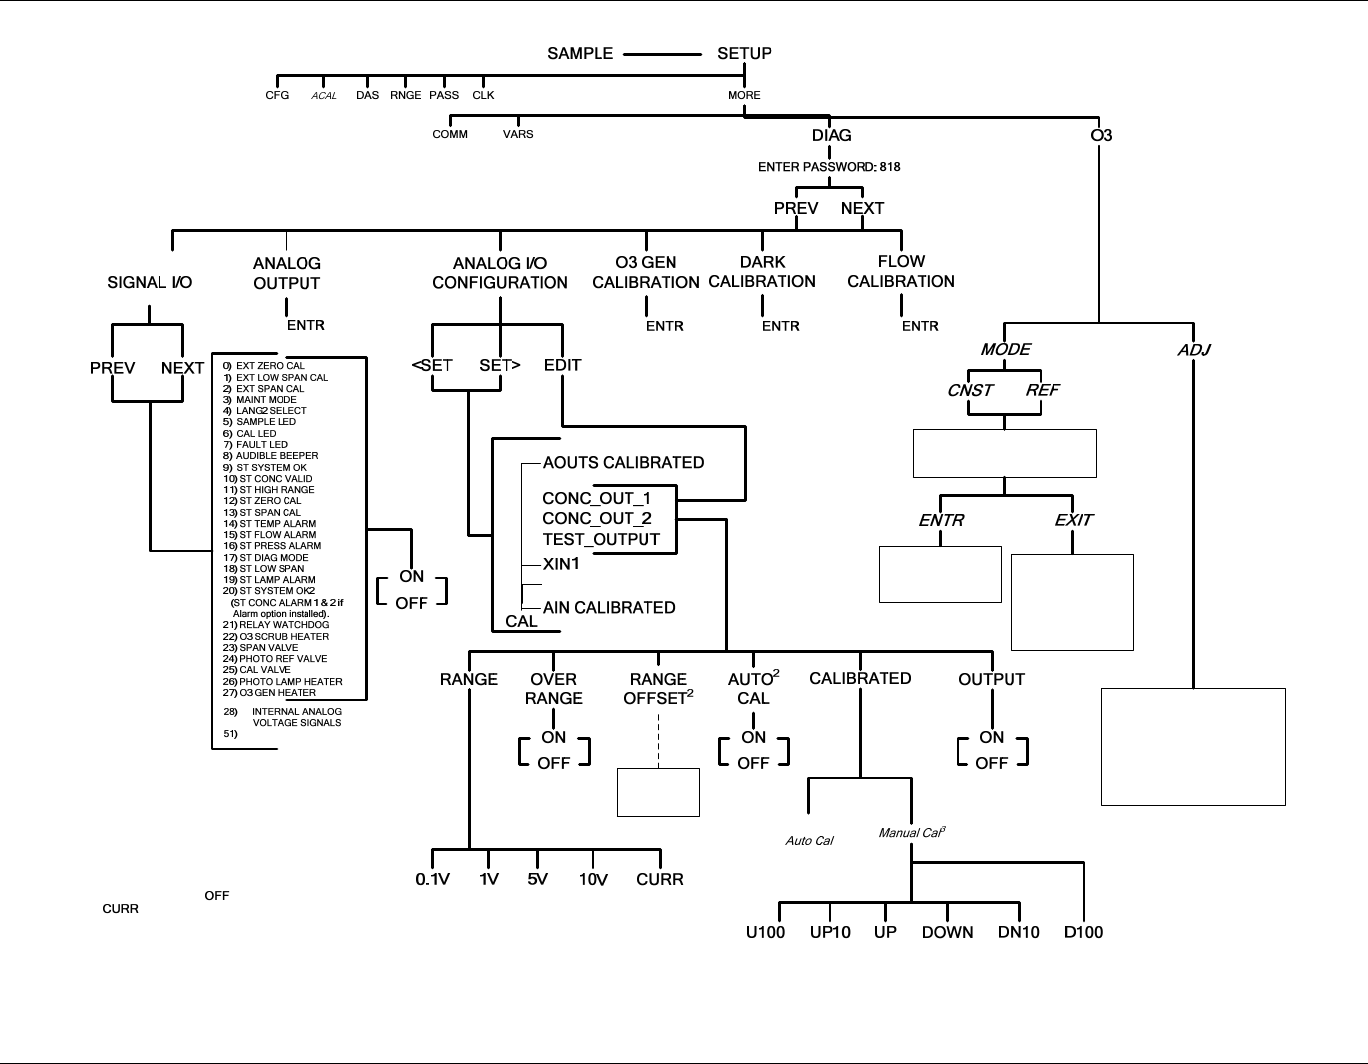
Teledyne API - Models T400 and 400E (04402F DCN6340) APPENDIX A-1: T400 and M400E Software Menu Trees, Revision 1.0.0/E.3
A-9
Press
to start
Calibration
Press
to start test
to
(see Appendix A)
CAL2
Sets the
degree of
offset
1Correspond to analog Output A1 – A4 on back of
analyzer
2Only appears if one of the voltage ranges is selected.
3Manual adjustment menu only appears if either the
Auto Cal feature is or the range is set for
ent.
4For Analog In option, channels 1 through 8, edit
GAIN, OFFSET, UNITS, and DISPLAY.
Press
to start
Calibration
Press
to start
Calibration
Press one of these to select
mode for O3generator.
Accepts selected
O3generator
mode
Leaves O3
generator mode
unchanged and
returns to previous
menu
Causes the drive voltage of
the optional O3generator to
2500 mV. This is used to
manually adjust the position
of the generators UV Lamp.
… through XIN84
Figure A-6: Secondary Setup Menu (DIAG & O3)
06870C DCN6332

APPENDIX A-1: T400 and M400E Software Menu Trees, Revision 1.0.0/E.3 Teledyne API - Models T400 and 400E (04402F DCN6340)
A-10
06870C DCN6332

Teledyne API - Models T400 and 400E (04402F DCN6340) APPENDIX A-2: Setup Variables, Revision 1.0.0/E.3
A-11
APPENDIX A-2: Setup Variables, Revision 1.0.0/E.3
Table A-1: T400 and M400E Setup Variables, Revision 1.0.0/E.3
SETUP VARIABLE NUMERIC
UNITS DEFAULT
VALUE VALUE RANGE DESCRIPTION
Low Access Level Setup Variables (818 password)
DAS_HOLD_OFF Minutes 15 0.5–20
Duration of DAS hold-off period.
CONC_PRECISION — AUTO
AUTO, 0, 1, 2, 3,
4
Number of digits to display to the right of
the decimal point for concentrations on the
display. Enclose value in double quotes (")
when setting from the RS-232 interface.
PHOTO_LAMP ºC
58
Warnings:
57–67
0–100 Photometer lamp temperature set point and
warning limits.
O3_GEN_LAMP ºC
48
Warnings:
43–53
0–100 O3 generator lamp temperature set point
and warning limits.
O3_GEN_LOW1 PPB 100 0–1500
O3 generator low set point for range #1.
O3_GEN_LOW2 PPB 100 0–1500
O3 generator low set point for range #2.
O3_SCRUB_SET ºC
110
Warnings:
100–120
0–200 O3 scrubber temperature set point and
warning limits.
CLOCK_ADJ Sec./Day 0 -60–60
Time-of-day clock speed adjustment.
Medium Access Level Setup Variables (929 password)
LANGUAGE_SELECT — ENGL
0
ENGL,
SECD,
EXTN
Selects the language to use for the user
interface. Enclose value in double quotes
(") when setting from the RS-232 interface.
MAINT_TIMEOUT Hours 2 0.1–100
Time until automatically switching out of
software-controlled maintenance mode.
LATCH_WARNINGS — ON ON, OFF
ON enables latching warning messages;
OFF disables latching
CONV_TIME — 1 SEC
0
33 MS, 66 MS, 133
MS, 266 MS,
533 MS,
1 SEC, 2 SEC
Conversion time for photometer detector
channel. Enclose value in double quotes (")
when setting from the RS-232 interface.
AD_MAX_DELTA 4 mV 1000 1–10000
Maximum reading-to-reading change on
any A/D channel to avoid spike
suppression.
O3_DWELL Seconds 2 0.1–30
Dwell time after switching
measure/reference valve.
O3_SAMPLE Samples 1 1–30
Number of detector readings to sample.
DARK_OFFSET mV 0 -1000–1000
Photometer dark offset for measure and
reference readings.
FILT_SIZE Samples 32 1–100
O3 concentration filter size.
FILT_ASIZE Samples 6 1–100
Moving average filter size in adaptive
mode.
FILT_DELTA PPB 20 1–1000
Absolute concentration difference to trigger
adaptive filter.
FILT_PCT Percent 5 1–100
Percent concentration difference to trigger
adaptive filter.
FILT_DELAY Seconds 60 0–60
Delay before leaving adaptive filter mode.
06870C DCN6332

APPENDIX A-2: Setup Variables, Revision 1.0.0/E.3 Teledyne API - Models T400 and 400E (04402F DCN6340)
A-12
SETUP VARIABLE NUMERIC
UNITS DEFAULT
VALUE VALUE RANGE DESCRIPTION
FILT_ADAPT — ON OFF, ON
ON enables adaptive filter.
OFF disables it.
USER_UNITS — PPB
0 PPB, PPM,
UGM, MGM
Concentration units for user interface.
Enclose value in double quotes (") when
setting from the RS-232 interface.
DIL_FACTOR — 1 0.1–1000
Dilution factor. Used only if is dilution
enabled with FACTORY_OPT variable.
SLOPE_CONST — 1 0.1–10
Slope constant factor to keep visible slope
near 1.
TPC_ENABLE — ON OFF, ON
ON enables temperature/ pressure
compensation; OFF disables it.
O3_GEN_MODE — CNST
0 CNST,
REF
O3 generator control mode. Enclose value
in double quotes (") when setting from the
RS-232 interface.
O3_GEN_SET1 PPB 400 0–1500
O3 generator high set point for range #1.
O3_GEN_SET2 PPB 400 0–1500
O3 generator high set point for range #2.
O3_GEN_DEF PPB 400 0–1500
O3 generator default set point.
O3_MIN_CONC PPB 25 0-100
O3 generator minimum reliable
concentration. Requested concentrations
that are below this are pegged at this value.
REF_DELAY Seconds 60 1–300
Delay before beginning O3 generator
reference feedback control.
REF_FREQ Seconds 12 1–60
O3 generator reference adjustment
frequency.
REF_FSIZE Samples 4 1–10
O3 generator reference filter size.
REF_INTEG — 0.1 0–10
O3 generator reference PID integral
coefficient.
REF_DERIV — 0 0–10
O3 generator reference PID derivative
coefficient.
DRIVE_STABIL mV 10 0.1–100
O3 generator drive stability limit for
concentration cache updates.
CACHE_RESOL PPB 2 0.1–20
O3 generator cache un-normalized
concentration resolution.
O3_LAMP_CYCLE Seconds 2 0.5–30
O3 generator lamp temperature control
cycle period.
O3_LAMP_PROP 1/DegC 0.2 0–10
O3 generator lamp temperature PID
proportional coefficient.
O3_LAMP_INTEG Gain 0.01 0–10
O3 generator lamp temperature PID integral
coefficient.
O3_LAMP_DERIV Gain 0.2 0–10
O3 generator lamp temperature PID
derivative coefficient.
O3_TARG_ZERO1 Conc 0 -100-1000
Target O3 concentration during zero
calibration of range #1.
O3_SPAN1 Conc 400 50–10000
Target O3 concentration during span
calibration for range #1.
O3_SLOPE1 — 1 0.850–1.150
O3 slope for range #1.
O3_OFFSET1 PPB 0 -100–100
O3 offset for range #1.
O3_SPAN2 Conc 400 50–10000
Target O3 concentration during span
calibration for range #2.
O3_SLOPE2 — 1 0.850–1.150
O3 slope for range #2.
O3_OFFSET2 PPB 0 -100–100
O3 offset for range #2.
DYN_ZERO — OFF OFF, ON
ON enables dynamic zero calibration for
contact closures and Hessen protocol.
OFF disables it.
06870C DCN6332

Teledyne API - Models T400 and 400E (04402F DCN6340) APPENDIX A-2: Setup Variables, Revision 1.0.0/E.3
A-13
SETUP VARIABLE NUMERIC
UNITS DEFAULT
VALUE VALUE RANGE DESCRIPTION
DYN_SPAN — OFF OFF, ON
ON enables dynamic span calibration for
contact closures and Hessen protocol.
OFF disables it.
RANGE_MODE — SNGL
0 SNGL, DUAL,
AUTO
Range control mode. Enclose value in
double quotes (") when setting from the RS-
232 interface.
CONC_RANGE1 Conc 500 0.1–20000
D/A concentration range #1.
CONC_RANGE2 Conc 500 0.1–20000
D/A concentration range #2.
RS232_MODE BitFlag 0 0–65535
RS-232 COM1 mode flags. Add values to
combine flags.
1 = quiet mode
2 = computer mode
4 = enable security
16 = enable Hessen protocol 5
32 = enable multi-drop
64 = enable modem
128 = ignore RS-232 line errors
256 = disable XON / XOFF support
512 = disable hardware FIFOs
1024 = enable RS-485 mode
2048 = even parity, 7 data bits, 1 stop bit
4096 = enable command prompt
BAUD_RATE — 115200
0
300, 1200, 2400,
4800, 9600,
19200, 38400,
57600, 115200
RS-232 COM1 baud rate. Enclose value in
double quotes (") when setting from the RS-
232 interface.
MODEM_INIT —
“AT Y0 &D0
&H0 &I0
S0=2 &B0
&N6 &M0 E0
Q1 &W0” 0
Any character in
the allowed
character set. Up
to 100 characters
long.
RS-232 COM1 modem initialization string.
Sent verbatim plus carriage return to
modem on power up or manually.
RS232_MODE2 — 0 0–65535
RS-232 COM2 mode flags.
(Same settings as RS232_MODE.)
BAUD_RATE2 — 115200
0
300, 1200, 2400,
4800, 9600,
19200, 38400,
57600, 115200
RS-232 COM2 baud rate.
MODEM_INIT2 —
“AT Y0 &D0
&H0 &I0
S0=2 &B0
&N6 &M0 E0
Q1 &W0” 0
Any character in
the allowed
character set. Up
to 100 characters
long.
RS-232 COM2 modem initialization string.
Sent verbatim plus carriage return to
modem on power up or manually.
RS232_PASS Password 940331 0–999999 RS-232 log on password.
TCP2_MODE2 — 0 0-99999
Bit Flag
MACHINE_ID ID 400
0–9999 (Hessen:
0–999) Unique ID number for instrument.
COMMAND_PROMPT — “Cmd> ”
0
Any character in
the allowed
character set. Up
to 100 characters
long.
RS-232 interface command prompt.
Displayed only if enabled with
RS232_MODE variable.
06870C DCN6332

APPENDIX A-2: Setup Variables, Revision 1.0.0/E.3 Teledyne API - Models T400 and 400E (04402F DCN6340)
A-14
SETUP VARIABLE NUMERIC
UNITS DEFAULT
VALUE VALUE RANGE DESCRIPTION
TEST_CHAN_ID — NONE
0
NONE,
PHOTO MEAS,
PHOTO REF,
O3 GEN REF,
SAMPLE PRESSURE,
SAMPLE FLOW,
SAMPLE TEMP,
PHOTO LAMP TEMP,
O3 SCRUB TEMP,
O3 LAMP TEMP,
CHASSIS TEMP
Diagnostic analog output ID. Enclose value
in double quotes (") when setting from the
RS-232 interface.
REMOTE_CAL_MODE — LOW
0 LOW, HIGH
Range to calibrate during contact closure or
Hessen calibration. Enclose value in double
quotes (") when setting from the RS-232
interface.
PASS_ENABLE — OFF OFF, ON
ON enables passwords.
OFF disables them.
PHOTO_LAMP_POWER mV 4500 0–5000
Photometer lamp power setting.
LAMP_PWR_ENABLE — OFF OFF, ON
ON enables photometer lamp power
cycling.
OFF disables it.
LAMP_PWR_PERIOD Hours 24 0.01–1000
Photometer lamp power cycling period.
LAMP_OFF_DELAY Seconds 0.1 0.02–5
Length of time photometer lamp is turned
off.
DET_VALID_DELAY Seconds 20 1–300
Delay until valid concentration is computed.
REF_SDEV_LIMIT mV 3 0.1–100
Photometer reference standard deviation
must be below this limit to switch out of
startup mode.
PHOTO_CYCLE Seconds 5 0.5–30
Photometer lamp temperature control cycle
period.
PHOTO_PROP — 0.5 0–10
Photometer lamp temperature PID
proportional coefficient.
PHOTO_INTEG — 0.1 0–10
Photometer lamp temperature PID integral
coefficient.
PHOTO_DERIV — 0 0–10
Photometer lamp temperature PID
derivative coefficient.
O3_SCRUB_CYCLE Seconds 10 0.5–30
O3 scrubber temperature control cycle
period.
O3_SCRUB_PROP — 0.5 0–10
O3 scrubber temperature PID proportional
coefficient.
O3_SCRUB_INTEG — 0.1 0–10
O3 scrubber temperature PID integral
coefficient.
O3_SCRUB_DERIV — 0 0–10
O3 scrubber temperature PID derivative
coefficient.
PATH_LENGTH cm 41.96 0.01–100
Photometer detector path length.
STABIL_FREQ Seconds 10 1–300
Stability measurement sampling frequency.
STABIL_SAMPLES Samples 25 2–40
Number of samples in concentration
stability reading.
SAMP_PRESS_SET In-Hg
29.92
Warnings:
15–35
0–100 Sample pressure set point and warning
limits. Set point is used for T/P
compensation.
06870C DCN6332

Teledyne API - Models T400 and 400E (04402F DCN6340) APPENDIX A-2: Setup Variables, Revision 1.0.0/E.3
A-15
SETUP VARIABLE NUMERIC
UNITS DEFAULT
VALUE VALUE RANGE DESCRIPTION
SAMP_FLOW_SET cc/m
700
Warnings:
500–999.5
0–1200 Sample flow set point and warning limits.
SAMP_FLOW_SLOPE — 1 0.001–100
Slope term to correct sample flow rate.
SAMP_TEMP_SET ºC
30
Warnings:
10.5–49.5
0–100 Sample temperature set point and warning
limits. Set point is used for T/P
compensation.
BOX_SET ºC
30
Warnings:
5–39.5
0–100 Internal box temperature set point and
warning limits.
GAS_STD_TEMP ºC 0 -100–100
Standard temperature for unit conversions.
GAS_STD_PRESS ATM 1 0.1–10
Standard pressure for unit conversions.
GAS_MOL_WEIGHT MolWt 28.890 1–99.999
Molar mass of sample gas for computing
concentrations by weight instead of volume.
Assumed to be 78% Nitrogen (N2, 28.0134)
and 22% Oxygen (O2, 31.9988).
SERIAL_NUMBER — “00000000 ”
0
Any character in
the allowed
character set. Up
to 100 characters
long.
Unique serial number for instrument.
DISP_INTENSITY — HIGH
0 HIGH, MED,
LOW, DIM
Front panel display intensity. Enclose value
in double quotes (") when setting from the
RS-232 interface.
I2C_RESET_ENABLE — ON OFF, ON
I2C bus automatic reset enable.
CLOCK_FORMAT — “TIME=
%H:%M:%S”
Any character in
the allowed
character set. Up
to 100 characters
long.
Time-of-day clock format flags. Enclose
value in double quotes (“) when setting from
the RS-232 interface.
“%a” = Abbreviated weekday name.
“%b” = Abbreviated month name.
“%d” = Day of month as decimal number
(01 – 31).
“%H” = Hour in 24-hour format (00 – 23).
“%I” = Hour in 12-hour format (01 – 12).
“%j” = Day of year as decimal number (001
– 366).
“%m” = Month as decimal number (01 –
12).
“%M” = Minute as decimal number (00 –
59).
“%p” = A.M./P.M. indicator for 12-hour
clock.
“%S” = Second as decimal number (00 –
59).
“%w” = Weekday as decimal number (0 – 6;
Sunday is 0).
“%y” = Year without century, as decimal
number (00 – 99).
“%Y” = Year with century, as decimal
number.
“%%” = Percent sign.
ALARM_TRIGGER 5 Cycles 3 1-100
Number of times concentration must
exceed limit to trigger alarm.
06870C DCN6332

APPENDIX A-2: Setup Variables, Revision 1.0.0/E.3 Teledyne API - Models T400 and 400E (04402F DCN6340)
A-16
SETUP VARIABLE NUMERIC
UNITS DEFAULT
VALUE VALUE RANGE DESCRIPTION
FACTORY_OPT — 0 0–65535
Factory option flags. Add values to combine
options.
1 = enable dilution factor
2 = O3 generator installed 2
4 = O3 generator and reference detector
installed 2
8 = zero and span valves installed
16 = display units in concentration field
32 = enable software-controlled
maintenance mode
64 = enable heated O3 scrubber
128 = enable switch-controlled
maintenance mode
256 = internal zero valve only installed
512 = enable concentration alarms 5
1024 = alternate status output
mapping
2048 = enable Internet option 3
8192 = enable non-zero offset
calibration
16384 = enable external analog inputs 6
0 Enclose value in double quotes (") when setting from the RS-232 interface.
1 Hessen protocol.
2 Must power-cycle instrument for these options to fully take effect.
3 Internet option (applies to E-series).
4 Spike suppression option.
5 Concentration alarm option.
6 T Series external analog input option.
06870C DCN6332

Teledyne API - Models T400 and 400E (04402F DCN6340) APPENDIX A-3: Warnings and Test Functions, Revision 1.0.0/E.3
A-17
APPENDIX A-3: Warnings and Test Functions, Revision 1.0.0/E.3
Table A-2: T400 and M400E Warning Messages, Revision 1.0.0/E.3
NAME MESSAGE TEXT DESCRIPTION REAL
TIME
WSYSRES SYSTEM RESET Instrument was power-cycled or the CPU was reset. Yes 1
WDATAINIT DATA INITIALIZED Data storage was erased. No
WCONFIGINIT CONFIG INITIALIZED Configuration storage was reset to factory configuration or
erased. No
WO3ALARM1 4 O3 ALARM 1 WARN O3 concentration alarm limit #1 exceeded Yes
WO3ALARM2 4 O3 ALARM 2 WARN O3 concentration alarm limit #2 exceeded Yes
WPHOTOREF PHOTO REF WARNING Photometer reference reading less than 2500 mV or greater
than 4999 mV. Yes
WLAMPSTABIL LAMP STABIL WARN Photometer lamp reference step changes occur more than
25% of the time. Yes
WO3GENREF O3 GEN REF WARNING O3 reference detector drops below 50 mV during reference
feedback O3 generator control. Yes
WO3GENINT O3 GEN LAMP WARN O3 concentration below 1000 PPB when O3 lamp drive is
above 4500 mV during O3 generator calibration. Yes
WSAMPPRESS SAMPLE PRESS WARN Sample pressure outside of warning limits specified by
SAMP_PRESS_SET variable. Yes
WSAMPFLOW SAMPLE FLOW WARN Sample flow outside of warning limits specified by
SAMP_FLOW_SET variable. Yes
WSAMPTEMP SAMPLE TEMP WARN Sample temperature outside of warning limits specified by
SAMP_TEMP_SET variable. Yes
WBOXTEMP BOX TEMP WARNING Chassis temperature outside of warning limits specified by
BOX_SET variable. Yes
WO3GENTEMP O3 GEN TEMP WARN O3 generator lamp temperature outside of warning limits
specified by O3_GEN_LAMP variable. Yes
WO3SCRUBTEMP O3 SCRUB TEMP WARN O3 scrubber temperature outside of warning limits specified
by O3_SCRUB_SET variable. Yes
WPHOTOLTEMP PHOTO TEMP WARNING Photometer lamp temperature outside of warning limits
specified by PHOTO_LAMP variable. Yes
WDYNZERO CANNOT DYN ZERO Contact closure zero calibration failed while DYN_ZERO
was set to ON. Yes 2
WDYNSPAN CANNOT DYN SPAN Contact closure span calibration failed while DYN_SPAN
was set to ON. Yes 3
WREARBOARD REAR BOARD NOT DET Rear board was not detected during power up. Yes
WRELAYBOARD RELAY BOARD WARN Firmware is unable to communicate with the relay board. Yes
WLAMPDRIVER LAMP DRIVER WARN Firmware is unable to communicate with either the O3
generator or photometer lamp I2C driver chip. Yes
WFRONTPANEL 5 FRONT PANEL WARN Firmware is unable to communicate with the front panel. Yes
WANALOGCAL ANALOG CAL WARNING The A/D or at least one D/A channel has not been
calibrated. Yes
1 Cleared 45 minutes after power up.
2 Cleared the next time successful zero calibration is performed.
3 Cleared the next time successful span calibration is performed.
4 Concentration alarm option.
5 Applies to E-Series.
06870C DCN6332

APPENDIX A-3: Warnings and Test Functions, Revision 1.0.0/E.3 Teledyne API - Models T400 and 400E (04402F
DCN6340)
A-18
Table A-3: T400 and M400E Test Functions, Revision 1.0.0/E.3
NAME 1 MESSAGE TEXT DESCRIPTION
RANGE RANGE=500.0 PPB 3 D/A range in single or auto-range modes.
RANGE1 RANGE1=500.0 PPB 3 D/A #1 range in dual range mode.
RANGE2 RANGE2=500.0 PPB 3 D/A #2 range in dual range mode.
STABILITY STABIL=0.0 PPB 3 Concentration stability (standard deviation based on
setting of STABIL_FREQ and STABIL_SAMPLES).
RESPONSE 2 RSP=3.11(0.00) SEC
Instrument response. How frequently concentration is
updated. Time in parenthesis is standard deviation.
PHOTOMEAS O3 MEAS=2993.8 MV Photometer detector measure reading.
PHOTOREF O3 REF=3000.0 MV Photometer detector reference reading.
O3GENREF O3 GEN=4250.0 MV O3 generator reference detector reading.
O3GENDRIVE O3 DRIVE=0.0 MV O3 generator lamp drive output.
PHOTOPOWER PHOTO POWER=4500.0 MV Photometer lamp drive output.
SAMPPRESS PRES=29.9 IN-HG-A
Sample pressure.
SAMPFLOW SAMP FL=700 CC/M Sample flow rate.
SAMPTEMP SAMPLE TEMP=31.2 C Sample temperature.
PHOTOLTEMP PHOTO LAMP=52.3 C Photometer lamp temperature.
PHOTOLDUTY 2 PHLMP ON=1.10 SEC Photometer lamp temperature control duty cycle. Portion
of PHOTO_CYCLE time that heater is turned on.
O3SCRUBTEMP O3 SCRUB=110.2 C O3 scrubber temperature.
O3SCRUBDUTY 2 O3 SCRUB ON=2.25 SEC O3 scrubber temperature control duty cycle. Portion of
O3_SCRUB_CYCLE time that heater is turned on.
O3GENTEMP O3 GEN TMP=48.5 C O3 generator lamp temperature.
BOXTEMP BOX TEMP=31.2 C Internal chassis temperature.
SLOPE SLOPE=1.000
Slope for current range, computed during zero/span
calibration.
OFFSET OFFSET=0.0 PPB 2 Offset for current range, computed during zero/span
calibration.
O3 O3=191.6 PPB 2 O3 concentration for current range.
TESTCHAN TEST=2753.9 MV
Value output to TEST_OUTPUT analog output, selected
with TEST_CHAN_ID variable.
XIN1 4 AIN1=37.15 EU
External analog input 1 value in engineering units.
XIN2 4 AIN2=37.15 EU
External analog input 2 value in engineering units.
XIN3 4 AIN3=37.15 EU
External analog input 3 value in engineering units.
XIN4 4 AIN4=37.15 EU
External analog input 4 value in engineering units.
XIN5 4 AIN5=37.15 EU
External analog input 5 value in engineering units.
XIN6 4 AIN6=37.15 EU
External analog input 6 value in engineering units.
XIN7 4 AIN7=37.15 EU
External analog input 7 value in engineering units.
XIN8 4 AIN8=37.15 EU
External analog input 8 value in engineering units.
CLOCKTIME TIME=14:48:01
Current instrument time of day clock.
1 The name is used to request a message via the RS-232 interface, as in “T BOXTEMP”.
2 Engineering software.
3 Current instrument units.
4 External analog input option.
06870C DCN6332

Teledyne API - Models T400 and 400E (04402F DCN6340)APPENDIX A-4: T400 and M400E Signal I/O Definitions, Revision 1.0.0/E.3
A-19
APPENDIX A-4: T400 and M400E Signal I/O Definitions, Revision 1.0.0/E.3
Table A-4: T400 and M400E Signal I/O Definitions, Revision 1.0.0/E.3
SIGNAL NAME BIT OR
CHANNEL
NUMBER DESCRIPTION
Internal inputs, U7, J108, pins 9–16 = bits 0–7, default I/O address 322 hex
0–7 Spare
Internal outputs, U8, J108, pins 1–8 = bits 0–7, default I/O address 322 hex
0–5 Spare
I2C_RESET 6 1 = reset I2C peripherals
0 = normal
I2C_DRV_RST 7 0 = hardware reset 8584 chip
1 = normal
Control inputs, U11, J1004, pins 1–6 = bits 0–5, default I/O address 321 hex
EXT_ZERO_CAL 0 0 = go into zero calibration
1 = exit zero calibration
EXT_LOW_SPAN_CAL 1 1 0 = go into low span calibration
1 = exit span calibration
EXT_SPAN_CAL 1 2 0 = go into span calibration
1 = exit span calibration
3–5 Spare
6–7 Always 1
Control inputs, U14, J1006, pins 1–6 = bits 0–5, default I/O address 325 hex
0–5 Spare
6–7 Always 1
Control outputs, U17, J1008, pins 1–8 = bits 0–7, default I/O address 321 hex
0–7 Spare
Control outputs, U21, J1008, pins 9–12 = bits 0–3, default I/O address 325 hex
0–3 Spare
Alarm outputs, U21, J1009, pins 1–12 = bits 4–7, default I/O address 325 hex
1 = system OK
0 = any alarm condition or in diagnostics mode
ST_SYSTEM_OK2,
MB_RELAY_36 3 4
Controlled by MODBUS coil register
1 = conc. limit 1 exceeded
0 = conc. OK
ST_CONC_ALARM_1 4,
MB_RELAY_37 3 5
Controlled by MODBUS coil register
1 = conc. limit 2 exceeded
0 = conc. OK
ST_CONC_ALARM_2 4,
MB_RELAY_38 3 6
Controlled by MODBUS coil register
1 = high auto-range in use (mirrors ST_HIGH_RANGE
status output)
0 = low auto-range
ST_HIGH_RANGE2 5,
MB_RELAY_39 3 7
Controlled by MODBUS coil register
A status outputs, U24, J1017, pins 1–8 = bits 0–7, default I/O address 323 hex
ST_SYSTEM_OK 0 0 = system OK
1 = any alarm condition
ST_CONC_VALID 1 0 = conc. valid
1 = hold off or other conditions
ST_HIGH_RANGE 2 0 = high auto-range in use
1 = low auto-range
06870C DCN6332

APPENDIX A-4: T400 and M400E Signal I/O Definitions, Revision 1.0.0/E.3Teledyne API - Models T400 and 400E (04402F
DCN6340)
A-20
SIGNAL NAME BIT OR
CHANNEL
NUMBER DESCRIPTION
ST_ZERO_CAL 3 0 = in zero calibration
1 = not in zero
ST_SPAN_CAL 4 0 = in span calibration
1 = not in span
ST_TEMP_ALARM 5 0 = any temperature alarm
1 = all temperatures OK
ST_FLOW_ALARM 6 0 = any flow alarm
1 = all flows OK
ST_PRESS_ALARM 7 0 = any pressure alarm
1 = all pressures OK
A status outputs, alternate status outputs factory option
ST_DIAG_MODE 5 0 = in diagnostic mode
1 = not in diagnostic mode
ST_LOW_SPAN_CAL 6 0 = in low span calibration
1 = not in low span
7 Spare
B status outputs, U27, J1018, pins 1–8 = bits 0–7, default I/O address 324 hex
ST_DIAG_MODE 0 0 = in diagnostic mode
1 = not in diagnostic mode
ST_LOW_SPAN_CAL 1 0 = in low span calibration
1 = not in low span
ST_LAMP_ALARM 2 0 = any lamp alarm
1 = all lamps OK
3–7 Spare
B status outputs, alternate status outputs factory option
ST_TEMP_ALARM 0 0 = any temperature alarm
1 = all temperatures OK
ST_FLOW_ALARM 1 0 = any flow alarm
1 = all flows OK
ST_LAMP_ALARM 2 0 = any lamp alarm
1 = all lamps OK
ST_PRESS_ALARM 3 0 = any pressure alarm
1 = all pressures OK
4–7 Spare
Front panel I2C keyboard, default I2C address 4E hex
MAINT_MODE 5 (input) 0 = maintenance mode
1 = normal mode
LANG2_SELECT 6 (input) 0 = select second language
1 = select first language (English)
SAMPLE_LED 8 (output) 0 = sample LED on
1 = off
CAL_LED 9 (output) 0 = cal. LED on
1 = off
FAULT_LED 10 (output) 0 = fault LED on
1 = off
AUDIBLE_BEEPER 14 (output) 0 = beeper on (for diagnostic testing only)
1 = off
06870C DCN6332

Teledyne API - Models T400 and 400E (04402F DCN6340)APPENDIX A-4: T400 and M400E Signal I/O Definitions, Revision 1.0.0/E.3
A-21
SIGNAL NAME BIT OR
CHANNEL
NUMBER DESCRIPTION
Relay board digital output (PCF8575), default I2C address 44 hex
RELAY_WATCHDOG 0 Alternate between 0 and 1 at least every 5 seconds to keep
relay board active
O3_SCRUB_HEATER 1 0 = O3 scrubber heater on
1 = off
2–5 Spare
SPAN_VALVE 6 0 = let span gas in
1 = let zero gas in
PHOTO_REF_VALVE 7 0 = photometer valve in reference position
1 = measure position
CAL_VALVE 8 0 = let cal. gas in
1 = let sample gas in
9–13 Spare
PHOTO_LAMP_HEATER 14 0 = O3 photometer lamp heater on
1 = off
O3_GEN_HEATER 15 0 = O3 generator lamp heater on
1 = off
Rear board primary MUX analog inputs
PHOTO_DET 0 Photometer detector reading
O3_GEN_REF_DET 1 O3 generator reference detector reading
2 Spare
SAMPLE_PRESSURE 3 Sample pressure
4 Temperature MUX
5 Spare
SAMPLE_FLOW 6 Sample flow
TEST_INPUT_7 7 Diagnostic test input
TEST_INPUT_8 8 Diagnostic test input
REF_4096_MV 9 4.096V reference from MAX6241
10–11 Spare
O3_SCRUB_TEMP 12 O3 scrubber temperature
13 Spare
14 DAC loopback MUX
REF_GND 15 Ground reference
Rear board temperature MUX analog inputs
BOX_TEMP 0 Internal box temperature
SAMPLE_TEMP 1 Sample temperature
PHOTO_LAMP_TEMP 2 Photometer lamp temperature
O3_GEN_TEMP 3 O3 generator lamp temperature
4–5 Spare
TEMP_INPUT_6 6 Diagnostic temperature input
TEMP_INPUT_7 7 Diagnostic temperature input
Rear board DAC MUX analog inputs
DAC_CHAN_1 0 DAC channel 0 loopback
DAC_CHAN_2 1 DAC channel 1 loopback
DAC_CHAN_3 2 DAC channel 2 loopback
DAC_CHAN_4 3 DAC channel 3 loopback
06870C DCN6332

APPENDIX A-4: T400 and M400E Signal I/O Definitions, Revision 1.0.0/E.3Teledyne API - Models T400 and 400E (04402F
DCN6340)
A-22
SIGNAL NAME BIT OR
CHANNEL
NUMBER DESCRIPTION
Rear board analog outputs
CONC_OUT_1 Concentration output #1
DATA_OUT_1 6 0 Data output #1
CONC_OUT_2 Concentration output #2
DATA_OUT_2 6 1 Data output #2
CONC_OUT_3 2 Concentration output #3 (non-step suppression channel,
same range as output #1)
DATA_OUT_3 6 2 Data output #3
TEST_OUTPUT Test measurement output
DATA_OUT_4 6 3 Data output #4
External analog input board, default I2C address 5C hex
XIN1 7 0 External analog input 1
XIN2 7 1 External analog input 2
XIN3 7 2 External analog input 3
XIN4 7 3 External analog input 4
XIN5 7 4 External analog input 5
XIN6 7 5 External analog input 6
XIN7 7 6 External analog input 7
XIN8 7 7 External analog input 8
I2C analog output (AD5321), default I2C address 18 hex
PHOTO_LAMP_DRIVE 0 O3 photometer lamp drive (0–5V)
I2C analog output (AD5321), default I2C address 1A hex
O3_GEN_DRIVE 0 O3 generator lamp drive (0–5V)
1 IZS option.
2 Dual concentration calculation option.
3 MODBUS option.
4 Concentration alarm option.
5 High auto range relay option.
6 User-configurable D/A output option.
5 External analog input option.
06870C DCN6332

Teledyne API - Models T400 and 400E (04402F DCN6340) APPENDIX A-5: T400 and M400E DAS Functions, Revision
1.0.0/E.3
A-23
APPENDIX A-5: T400 and M400E DAS Functions, Revision 1.0.0/E.3
Table A-5: T400 and M400E DAS Trigger Events, Revision 1.0.0/E.3
NAME DESCRIPTION
ATIMER Automatic timer expired
EXITZR Exit zero calibration mode
EXITLS Exit low span calibration mode
EXITHS Exit high span calibration mode
EXITMP Exit multi-point calibration mode
SLPCHG Slope and offset recalculated
EXITDG Exit diagnostic mode
CONC1W 1 Concentration limit 1 exceeded
CONC2W 1 Concentration limit 2 exceeded
PHREFW Photometer reference warning
PHSTBW Photometer lamp stability warning
PHTMPW Photometer lamp temperature warning
O3REFW Ozone generator reference warning
O3LMPW Ozone generator lamp intensity warning
O3TMPW Ozone generator lamp temperature warning
O3SBTW Ozone scrubber temperature warning
STEMPW Sample temperature warning
SFLOWW Sample flow warning
SPRESW Sample pressure warning
BTEMPW Box temperature warning
1 Concentration alarm option.
06870C DCN6332

APPENDIX A-5: T400 and M400E DAS Functions, Revision 1.0.0/E.3 Teledyne API - Models T400 and 400E (04402F
DCN6340)
A-24
Table A-6: T400 and M400E DAS Functions, Revision 1.0.0/E.3
NAME DESCRIPTION UNITS
PHMEAS Photometer detector measure reading mV
PHREF Photometer detector reference reading mV
PHSTB Photometer lamp stability %
SLOPE1 Slope for range #1 —
SLOPE2 Slope for range #2 —
OFSET1 Offset for range #1 PPB
OFSET2 Offset for range #2 PPB
ZSCNC1 Concentration for range #1 during zero/span calibration, just before
computing new slope and offset PPB
ZSCNC2 Concentration for range #2 during zero/span calibration, just before
computing new slope and offset PPB
CONC1 Concentration for range #1 PPB
CONC2 Concentration for range #2 PPB
STABIL Concentration stability PPB
O3REF Ozone generator reference detector reading mV
O3DRIV Ozone generator lamp drive mV
O3TEMP Ozone generator lamp temperature Degrees C
O3STMP Ozone scrubber temperature Degrees C
O3SDTY Ozone scrubber temperature duty cycle Fraction
(1.0 = 100%)
PHTEMP Photometer lamp temperature Degrees C
PHLDTY Photometer lamp temperature duty cycle Fraction
(1.0 = 100%)
SMPTMP Sample temperature Degrees C
SMPFLW Sample flow rate cc/m
SMPPRS Sample pressure Inches Hg
BOXTMP Internal box temperature Degrees C
TEST7 Diagnostic test input (TEST_INPUT_7) mV
TEST8 Diagnostic test input (TEST_INPUT_8) mV
TEMP6 Diagnostic temperature input (TEMP_INPUT_6) Degrees C
TEMP7 Diagnostic temperature input (TEMP_INPUT_7) Degrees C
REFGND Ground reference mV
RF4096 Precision 4.096 mV reference mV
XIN1 1 Channel 1 Analog In
XIN1SLPE 1 Channel 1 Analog In Slope
XIN1OFST 1 Channel 1 Analog In Offset
XIN2 1 Channel 2 Analog In
XIN2SLPE 1 Channel 2 Analog In Slope
XIN2OFST 1 Channel 2 Analog In Offset
XIN3 1 Channel 3 Analog In
XIN3SLPE 1 Channel 3 Analog In Slope
XIN3OFST 1 Channel 3 Analog In Offset
06870C DCN6332

Teledyne API - Models T400 and 400E (04402F DCN6340) APPENDIX A-5: T400 and M400E DAS Functions, Revision
1.0.0/E.3
A-25
NAME DESCRIPTION UNITS
XIN4 1 Channel 4 Analog In
XIN4SLPE 1 Channel 4 Analog In Slope
XIN4OFST 1 Channel 4 Analog In Offset
XIN5 1 Channel 5 Analog In
XIN5SLPE 1 Channel 5 Analog In Slope
XIN5OFST 1 Channel 5 Analog In Offset
XIN6 1 Channel 6 Analog In
XIN6SLPE 1 Channel 6 Analog In Slope
XIN6OFST 1 Channel 6 Analog In Offset
XIN7 1 Channel 7 Analog In
XIN7SLPE 1 Channel 7 Analog In Slope
XIN7OFST 1 Channel 7 Analog In Offset
XIN8 1 Channel 8 Analog In
XIN8SLPE 1 Channel 8 Analog In Slope
XIN8OFST 1 Channel 8 Analog In Offset
1 External Analog In option, T-Series only.
06870C DCN6332

APPENDIX A-6: Terminal Command Designators Teledyne API - Models T400 and 400E (04402F DCN6340)
A-26
APPENDIX A-6: Terminal Command Designators
Table A-7: Terminal Command Designators
COMMAND ADDITIONAL COMMAND SYNTAX DESCRIPTION
? [ID] Display help screen and commands list
LOGON [ID] password Establish connection to instrument
LOGOFF [ID] Terminate connection to instrument
SET ALL|name|hexmask Display test(s)
LIST [ALL|name|hexmask] [NAMES|HEX] Print test(s) to screen
name Print single test
T [ID]
CLEAR ALL|name|hexmask Disable test(s)
SET ALL|name|hexmask Display warning(s)
LIST [ALL|name|hexmask] [NAMES|HEX] Print warning(s)
name Clear single warning
W [ID]
CLEAR ALL|name|hexmask Clear warning(s)
ZERO|LOWSPAN|SPAN [1|2] Enter calibration mode
ASEQ number Execute automatic sequence
COMPUTE ZERO|SPAN Compute new slope/offset
EXIT Exit calibration mode
C [ID]
ABORT Abort calibration sequence
LIST Print all I/O signals
name[=value] Examine or set I/O signal
LIST NAMES Print names of all diagnostic tests
ENTER name Execute diagnostic test
EXIT Exit diagnostic test
RESET [DATA] [CONFIG] [exitcode] Reset instrument
PRINT ["name"] [SCRIPT] Print DAS configuration
RECORDS ["name"] Print number of DAS records
REPORT ["name"] [RECORDS=number] [FROM=<start
date>][TO=<end date>][VERBOSE|COMPACT|HEX]
(Print DAS records)(date format: MM/DD/YYYY(or YY)
[HH:MM:SS]
Print DAS records
D [ID]
CANCEL Halt printing DAS records
LIST Print setup variables
name[=value [warn_low [warn_high]]] Modify variable
name="value" Modify enumerated variable
CONFIG Print instrument configuration
MAINT ON|OFF Enter/exit maintenance mode
V [ID]
MODE Print current instrument mode
DASBEGIN [<data channel definitions>] DASEND Upload DAS configuration
CHANNELBEGIN propertylist CHANNELEND Upload single DAS channel
CHANNELDELETE ["name"] Delete DAS channels
The command syntax follows the command type, separated by a space character. Strings in [brackets] are optional
designators. The following key assignments also apply.
06870C DCN6332

Teledyne API - Models T400 and 400E (04402F DCN6340) APPENDIX A-6: Terminal Command Designators
A-27
Table A-8: Terminal Key Assignments
TERMINAL KEY ASSIGNMENTS
ESC Abort line
CR (ENTER) Execute command
Ctrl-C Switch to computer mode
COMPUTER MODE KEY ASSIGNMENTS
LF (line feed) Execute command
Ctrl-T Switch to terminal mode
06870C DCN6332

APPENDIX A-7: MODBUS Register Map Teledyne API - Models T400 and 400E (04402F DCN6340)
A-28
APPENDIX A-7: MODBUS Register Map
MODBUS
Register Address
(dec., 0-based)
Description Units
MODBUS Floating Point Input Registers
(32-bit IEEE 754 format; read in high-word, low-word order; read-only)
0 Photometer detector measure reading mV
2 Photometer detector reference reading mV
4 Photometer lamp stability %
6 Slope for range #1 —
8 Slope for range #2 —
10 Offset for range #1 PPB
12 Offset for range #2 PPB
14 Concentration for range #1 during zero/span calibration, just before
computing new slope and offset PPB
16 Concentration for range #2 during zero/span calibration, just before
computing new slope and offset PPB
18 Concentration for range #1 PPB
20 Concentration for range #2 PPB
22 Concentration stability PPB
24 Ozone generator reference detector reading mV
26 Ozone generator lamp drive mV
28 Ozone generator lamp temperature °C
30 Ozone scrubber temperature °C
32 Ozone scrubber temperature duty cycle Fraction
(1.0 = 100%)
34 Photometer lamp temperature °C
36 Photometer lamp temperature duty cycle Fraction
(1.0 = 100%)
38 Sample temperature °C
40 Sample flow rate cc/m
42 Sample pressure Inches Hg
44 Internal box temperature °C
46 Diagnostic test input (TEST_INPUT_7) mV
48 Diagnostic test input (TEST_INPUT_8) mV
50 Diagnostic temperature input (TEMP_INPUT_6) °C
52 Diagnostic temperature input (TEMP_INPUT_7) °C
54 Ground reference mV
56 Precision 4.096 mV reference mV
130 4 External analog input 1 value Volts
132 4 External analog input 1 slope eng unit /V
134 4 External analog input 1 offset eng unit
136 4 External analog input 2 value Volts
06870C DCN6332

Teledyne API - Models T400 and 400E (04402F DCN6340) APPENDIX A-7: MODBUS Register Map
A-29
MODBUS
Register Address
(dec., 0-based)
Description Units
138 4 External analog input 2 slope eng unit /V
140 4 External analog input 2 offset eng unit
142 4 External analog input 3 value Volts
144 4 External analog input 3 slope eng unit /V
146 4 External analog input 3 offset eng unit
148 4 External analog input 4 value Volts
150 4 External analog input 4 slope eng unit /V
152 4 External analog input 4 offset eng unit
154 4 External analog input 5 value Volts
156 4 External analog input 5 slope eng unit /V
158 4 External analog input 5 offset eng unit
160 4 External analog input 6 value Volts
162 4 External analog input 6 slope eng unit /V
164 4 External analog input 6 offset eng unit
166 4 External analog input 7 value Volts
168 4 External analog input 7 slope eng unit /V
170 4 External analog input 7 offset eng unit
172 4 External analog input 8 value Volts
174 4 External analog input 8 slope eng unit /V
176 4 External analog input 8 offset eng unit
MODBUS Floating Point Holding Registers
(32-bit IEEE 754 format; read/write in high-word, low-word order; read/write)
0 Maps to O3_TARG_ZERO1 variable; target zero concentration for
range #1 Conc. units
2 Maps to O3_SPAN1 variable; target span concentration for range #1 Conc. units
4 Maps to O3_TARG_ZERO2 variable; target zero concentration for
range #2 Conc. units
6 Maps to O3_SPAN2 variable; target span concentration for range #2 Conc. units
MODBUS Discrete Input Registers
(single-bit; read-only)
0 O3 generator reference detector warning
1 O3 generator lamp intensity warning
2 O3 generator lamp temperature warning
3 O3 scrubber temperature warning
4 Photometer reference warning
5 Photometer lamp stability warning
6 Photometer lamp temperature warning
7 Box temperature warning
8 Sample temperature warning
9 Sample flow warning
06870C DCN6332

APPENDIX A-7: MODBUS Register Map Teledyne API - Models T400 and 400E (04402F DCN6340)
A-30
MODBUS
Register Address
(dec., 0-based)
Description Units
10 Sample pressure warning
11 System reset warning
12 Rear board communication warning
13 Relay board communication warning
14 O3 generator or photometer lamp I2C driver chip communication warning
15 Front panel communication warning
16 Analog calibration warning
17 Dynamic zero warning
18 Dynamic span warning
19 Invalid concentration
20 In zero calibration mode
21 In low span calibration mode
22 In span calibration mode
23 In multi-point calibration mode
24 System is OK (same meaning as SYSTEM_OK I/O signal)
25 3 O
3 concentration alarm limit #1 exceeded
26 3 O
3 concentration alarm limit #2 exceeded
MODBUS Coil Registers
(single-bit; read/write)
0 Maps to relay output signal 36 (MB_RELAY_36 in signal I/O list)
1 Maps to relay output signal 37 (MB_RELAY_37 in signal I/O list)
2 Maps to relay output signal 38 (MB_RELAY_38 in signal I/O list)
3 Maps to relay output signal 39 (MB_RELAY_39 in signal I/O list)
20 1 Triggers zero calibration of O3 range #1 (on enters cal.; off exits cal.)
21 2 Triggers low span calibration of O3 range #1 (on enters cal.; off exits cal.)
22 1 Triggers span calibration of O3 range #1 (on enters cal.; off exits cal.)
23 1 Triggers zero calibration of O3 range #2 (on enters cal.; off exits cal.)
24 2 Triggers low span calibration of O3 range #2 (on enters cal.; off exits cal.)
25 1 Triggers span calibration of O3 range #2 (on enters cal.; off exits cal.)
1 Set DYN_ZERO or DYN_SPAN variables to ON to enable calculating new slope or offset. Otherwise a calibration check
is performed.
2 O
3 generator or zero/span valve factory options must be enabled.
3 Concentration alarm option.
4 External analog input option.
06870C DCN6332

APPENDIX B - Spare Parts
Note
Use of replacement parts other than those supplied by T-API may result in non
compliance with European standard EN 61010-1.
Note
Due to the dynamic nature of part numbers, please refer to the Website or call
Customer Service for more recent updates to part numbers.
06870C DCN6332
B-1
This page intentionally left blank.
B-2
06870C DCN6332

T400 Spare Parts List
PN 06851A DCN5809 08/18/2010
1 of 2 page(s)
Part Numbe
r
Description
000941000 ORIFICE, 13 MIL (SAMPLE FLOW & OZONE GENERATOR)
001760400 ASSY, FLOW CONTROL, 800CC
003290000 ASSY, THERMISTOR
005960000 KIT, EXPENDABLES, ACTIVATED CHARCOAL
006120100 ASSY, UV LAMP, OZONE GENERATOR
006190200 KIT, EXPENDABLES, M400E
009690000 KIT, TFE FILTER ELEMENTS, 5 UM (100)
009690100 AKIT, TFE FLTR (FL6), 47MM, 5UM (30)
016290000 WINDOW, SAMPLE FILTER, 47MM (KB)
016300700 ASSY, SAMPLE FILTER, 47MM
022710000 ABSORPTION TUBE, QUARTZ, (KB)
037340300 ASSY, AIR DRYER, ORANGE SILICA GEL
037860000 ORING, TEFLON, RETAINING RING, 47MM (KB)
040010000 ASSY, FAN REAR PANEL
040030100 PCA, PRESS SENSORS (1X), w/FM4
040660000 ASSY, REPLACEMENT CHARCOAL FILTER
041200000 PCA, DET PREAMP w/OP20
041200200 PCA, DET PREAMP w/OP20
041440000 PCA, DC HEATER/TEMP SENSOR, OPTICAL BENCH
042010000 ASSY, SAMPLE THERMISTOR
042410200 ASSY, PUMP, INT, SOX/O3/IR *
042890100 ASSY, PUMP CONFIG PLUG, 100-115V/60 HZ
042890200 ASSY, PUMP CONFIG PLUG, 100-115V/50 HZ
042890300 ASSY, PUMP CONFIG PLUG, 220-240V/60 HZ
042890400 ASSY, PUMP CONFIG PLUG, 220-240V/50 HZ
043910100 AKIT, EXP KIT, ORANGE SILICA GEL
044730000 IZS ASSY, EXPENDABLES KIT O3
045230100 PCA, RELAY CARD, E SERIES, S/N'S >522
048660000 ASSY, THERMOCOUPLE, AG SCRUBBER
048670000 ASSY, HEATER, FIBER O3 SCRUBBER
049290000 CLIP, THERMISTOR HOLDER
052400000 ASSY, UV LAMP, OPTICAL BENCH (CR)
052910000 ASSY, OPTICAL BENCH
055100200 ASSY, OPTION, PUMP, 240V *
055560000 ASSY, VALVE, VA59 W/DIODE, 5" LEADS
058021100 PCA, E-SERIES MOTHERBD, GEN 5-ICOP (ACCEPTS ACROSSER OR ICOP CPU)
062420200 PCA, SER INTRFACE, ICOP CPU, E- (OPTION) (USE WITH ICOP CPU 062870000)
064130000 ASSY, DC HEATER/THERM PCA, O3 GEN
066970000 PCA, INTRF. LCD TOUCH SCRN, F/P
067240000 CPU, PC-104, VSX-6154E, ICOP *
067300000 PCA, AUX-I/O BD, ETHERNET, ANALOG & USB
067300100 PCA, AUX-I/O BOARD, ETHERNET
067300200 PCA, AUX-I/O BOARD, ETHERNET & USB
067900000 LCD MODULE, W/TOUCHSCREEN
06870C DCN6332
B-3

T400 Spare Parts List
PN 06851A DCN5809 08/18/2010
2 of 2 page(s)
Part Numbe
r
Description
068280100 DOM, w/SOFTWARE, T400 *
068700000 MANUAL, T400, OPERATORS
068810000 PCA, LVDS TRANSMITTER BOARD
069500000 PCA, SERIAL & VIDEO INTERFACE BOARD
072150000 ASSY. TOUCHSCREEN CONTROL MODULE
CN0000073 POWER ENTRY, 120/60 (KB)
CN0000458 CONNECTOR, REAR PANEL, 12 PIN
CN0000520 CONNECTOR, REAR PANEL, 10 PIN
FL0000001 FILTER, SS
FL0000012 SCRUBBER, OZONE, REFERENCE
FM0000004 FLOWMETER (KB)
HW0000005 FOOT, CHASSIS
HW0000020 SPRING
HW0000036 TFE TAPE, 1/4" (48 FT/ROLL)
HW0000453 SUPPORT, CIRCUIT BD, 3/16" ICOP
KIT000219 AKIT, 4-20MA CURRENT OUTPUT
KIT000246 KIT, IZS RETROFIT, O3
KIT000289 AKIT, UV LAMP P/S PCA, 041660100
KIT000290 AKIT, UV LAMP P/S PCA, 041660500
OP0000014 QUARTZ DISC, OPTICAL BENCH
OP0000031 WINDOW, OPTICAL BENCH & OZONE GEN FEEDBACK
OR0000001 ORING, SAMPLE FLOW & OZONE GENERATOR
OR0000025 ORING, AIR DRYER CANISTER
OR0000026 ORING, ABSORPTION TUBE
OR0000039 ORING, OPTICAL BENCH & OZONE GEN FEEDBACK
OR0000048 ORING, OZONE GEN UV LAMP
OR0000089 ORING, OPTICAL BENCH
OR0000094 ORING, SAMPLE FILTER
PU0000022 REBUILD KIT, FOR PU20 & 04241 (KB)
RL0000015 RELAY, DPDT, (KB)
SW0000025 SWITCH, POWER, CIRC BREAK, VDE/CE *
SW0000059 PRESSURE SENSOR, 0-15 PSIA, ALL SEN
WR0000008 POWER CORD, 10A(KB)
B-4
06870C DCN6332
Model T400 Recommended Spare Parts Stocking Levels
(Reference: 07558A DCN6305)
Part Number Description 1 2-5 6-10 11-20 21-30
072150000 ASSY. TOUCHSCREEN CONTROL MODULE 12 3
022710000 ABSORPTION TUBE, QUARTZ, (KB) 12 4 4
040010000 ASSY, FAN REAR PANEL, E SERIES 11 1 2 3
040030100 PCA, PRESS SENSORS (1X), w/FM4 12 3
041200000 PCA, DET PREAMP w/OP20 12
041440000 PCA, DC HTR/TEMP, BENCH 11 2 2 3
KIT000290 AKIT, UV LAMP P/S PCA, 041660500 12 2
042410200** ASSY, PUMP, INT, SOX/O3/IR * 1** 2** 3
052400000 ASSY, BENCH UV LAMP, (BIR), CR * 11
058021100 PCA, MOTHERBD, GEN 5-ICOP 12
055560000 ASSY, VALVE, VA59 W/DIODE, 5" LEADS 11 2 3
067240000 CPU, PC-104, VSX-6154E, ICOP *(KB) 11
KIT000209 KIT, RETROFIT, M400E RELAY 12 2
KIT000253 ASSY & TEST, SPARE PS37 11 2 2
KIT000254 ASSY & TEST, SPARE PS38 11 2 2
066970000 PCA, INTRF. LCD TOUCH SCRN, F/P 12
068810000 PCA, LVDS TRANSMITTER BOARD 12
067900000 LCD MODULE, W/TOUCHSCREEN(KB) 12
041440000 PCA, DC HTR/TEMP, BENCH 11 2 4 8
With IZS, ZS Option
041200200 PCA, DET PREAMP w/OP20 11
KIT000289 AKIT, UV LAMP P/S PCA, 041660100 11 2
055560000 ASSY, VALVE, VA59 W/DIODE, 5" LEADS 12 3
006120100 ASSY,OZ.GEN LAMP (BIR) (OP5) 1 1 2
063110000 PCA, DC HEATER/THERM, 100W 1 1 2 4 8
For 240V operation, use 055100200
Units
**
06870C DCN6332
B-5

T400, M400E Expendables Kit
(Reference 0061902B)
Part Numbe
r
Description Quantit
y
009690100 KIT, TFE FILTER ELEMENTS, 47MM, 5UM (30) 1
FL0000001 FILTER, SS 2
HW0000020 SPRING 2
NOTE01-23 SERVICE NOTE, HOW TO REBUILD THE KNF PUMP 1
OR0000001 ORING, SAMPLE FLOW 4
PU0000022 REBUILD KIT, FOR PU20 & 04084 1
B-6
06870C DCN6332

Part Numbe
r
Description Quantit
y
FL0000001 FILTER, SS 2
040660000 ASSY, REPLACEMENT CHARCOAL FILTER 1
06870C DCN6332
B-7
This page intentionally left blank.
B-8
06870C DCN6332

APPENDIX C
Warranty/Repair Questionnaire
T400, M400E
(04404D, DCN5798)
TELEDYNE INSTRUMENTS CUSTOMER SERVICE
EMAIL: api-customerservice@teledyne.com
PHONE: (858) 657-9800 TOLL FREE: (800) 324-5190 FAX: (858) 657-9816
C-1
CUSTOMER:_______________________________ PHONE: _____________________________________
CONTACT NAME: __________________________ FAX NO. _____________________________________
SITE ADDRESS:____________________________________________________________________________
MODEL TYPE: ______________ SERIAL NO.:_________________ FIRMWARE REVISION: _____________
Are there any failure messages? _______________________________________________________________
_________________________________________________________________________________________
__________________________________________________________________________________________
________________________________________________________________________ (Continue on back if necessary)
PLEASE COMPLETE THE FOLLOWING TABLE:
(Depending on options installed, not all test parameters shown below will be available in your calibrator)
PARAMETER RECORDED VALUE ACCEPTABLE VALUE
RANGE PPB/PPM
1 – 10,000 PPB
STABIL
<= 0.3 PPM WITH ZERO AIR
O3 MEAS mV
2500 – 4800 mV
O3 REF mV
2500 – 4800 mV
O3 GEN1 mV
80 mV. – 5000 mV.
O3 DRIVE1 mV
0 – 5000 mV.
PRES IN-HG-A
~ - 2”AMBIENT ABSOLUTE
SAMPLE FL CM3/MIN
800 ± 10%
SAMPLE TEMP ºC
10 – 50 ºC
PHOTO LAMP ºC
58 ºC ± 1 ºC
O3 GEN TMP1 ºC
48 ºC ± 3 ºC
BOX TEMP ºC
10 – 50 ºC
SLOPE
1.0 ± .15
OFFSET PPB
0.0 ± 5.0 PPB
FOLLOWING VALUES ARE UNDER THE SIGNAL I/O SUBMENU
REF_4096_MV mV 4096mv±2mv and Must be
Stable
REF_GND mV 0± 0.5 and Must be Stable
1 If IZS valve option installed.
Cap the SAMPLE flow inlet and record the flow rate and pressure:
What is sample flow rate _______________ cc/min What is the sample pressure _______________ in-Hg-A
What are the failure symptoms? ________________________________________________________________
_________________________________________________________________________________________
_________________________________________________________________________________________
_________________________________________________________________________________________
06870C DCN6332

APPENDIX C
Warranty/Repair Questionnaire
T400, M400E
(04404D, DCN5798)
C-2
What tests have you done trying to solve the problem? ______________________________________________
__________________________________________________________________________________________
__________________________________________________________________________________________
__________________________________________________________________________________________
__________________________________________________________________________________________
Thank you for providing this information. Your assistance enables Teledyne Instruments to respond faster to the
problem that you are encountering.
OTHER NOTES: ____________________________________________________________________________
__________________________________________________________________________________________
__________________________________________________________________________________________
__________________________________________________________________________________________
__________________________________________________________________________________________
__________________________________________________________________________________________
__________________________________________________________________________________________
__________________________________________________________________________________________
__________________________________________________________________________________________
__________________________________________________________________________________________
__________________________________________________________________________________________
__________________________________________________________________________________________
__________________________________________________________________________________________
_______________________________________________________________________________
_______________________________________________________________________________
_______________________________________________________________________________
_______________________________________________________________________________
_______________________________________________________________________________
_______________________________________________________________________________
_______________________________________________________________________________
_______________________________________________________________________________
_______________________________________________________________________________
_______________________________________________________________________________
_______________________________________________________________________________
_______________________________________________________________________________
_______________________________________________________________________________
_______________________________________________________________________________
06870C DCN6332
APPENDIX D – Wire List and Electronic Schematics
06870C DCN6332
D-1
This page intentionally left blank.
D-2
06870C DCN6332

Interconnect List, T400
(Reference: 069130100A DCN5833)
Revision Description Checked Date DCN
A Initial Release 9/3/10 5833
Cable PN Signal Assembly PN J/P Pin Assembly PN J/P Pin
04105 CBL, KEYBD TO MTHBRD
Kbd Interupt LCD Interface PCA 066970000 J1 7 Motherboard 058021100 J106 1
DGND LCD Interface PCA 066970000 J1 2 Motherboard 058021100 J106 8
SDA LCD Interface PCA 066970000 J1 5 Motherboard 058021100 J106 2
SCL LCD Interface PCA 066970000 J1 6 Motherboard 058021100 J106 6
Shld LCD Interface PCA 066970000 J1 10 Motherboard 058021100 J106 5
04671 CBL, MOTHERBOARD TO XMITTER BD (MULTIDROP OPTION)
GND Motherboard 058021100 P12 2 Xmitter bd w/Multidrop 069500000 J4 2
RX0 Motherboard 058021100 P12 14 Xmitter bd w/Multidrop 069500000 J4 14
RTS0 Motherboard 058021100 P12 13 Xmitter bd w/Multidrop 069500000 J4 13
TX0 Motherboard 058021100 P12 12 Xmitter bd w/Multidrop 069500000 J4 12
CTS0 Motherboard 058021100 P12 11 Xmitter bd w/Multidrop 069500000 J4 11
RS-GND0 Motherboard 058021100 P12 10 Xmitter bd w/Multidrop 069500000 J4 10
RTS1 Motherboard 058021100 P12 8 Xmitter bd w/Multidrop 069500000 J4 8
CTS1/485- Motherboard 058021100 P12 6 Xmitter bd w/Multidrop 069500000 J4 6
RX1 Motherboard 058021100 P12 9 Xmitter bd w/Multidrop 069500000 J4 9
TX1/485+ Motherboard 058021100 P12 7 Xmitter bd w/Multidrop 069500000 J4 7
RS-GND1 Motherboard 058021100 P12 5 Xmitter bd w/Multidrop 069500000 J4 5
RX1 Motherboard 058021100 P12 9 Xmitter bd w/Multidrop 069500000 J4 9
TX1/485+ Motherboard 058021100 P12 7 Xmitter bd w/Multidrop 069500000 J4 7
RS-GND1 Motherboard 058021100 P12 5 Xmitter bd w/Multidrop 069500000 J4 5
06237 CBL ASSY, AC POWER, T SERIES
AC Line Power Entry CN0000073 L Power Switch SW0000025 L
AC Neutral Power Entry CN0000073 N Power Switch SW0000025 N
Power Grnd Power Entry CN0000073 Shield
Power Grnd Power Entry CN0000073 Chassis
AC Line Switched Power Switch SW0000025 L PS2 (+12) 068010000 SK2 1
AC Neu Switched Power Switch SW0000025 N PS2 (+12) 068010000 SK2 3
Power Grnd Power Entry CN0000073 PS2 (+12) 068010000 SK2 2
AC Line Switched Power Switch SW0000025 L PS1 (+5, ±15) 068020000 SK2 1
AC Neu Switched Power Switch SW0000025 N PS1 (+5, ±15) 068020000 SK2 3
Power Grnd Power Entry CN0000073 PS1 (+5, ±15) 068020000 SK2 2
AC Line Switched Power Switch SW0000025 L Relay PCA 045230100 J1 1
AC Neu Switched Power Switch SW0000025 N Relay PCA 045230100 J1 3
Power Grnd Power Entry CN0000073 Relay PCA 045230100 J1 2
06238 CBL ASSY, DC POWER TO MOTHERBOARD, T SER
DGND Relay PCA 045230100 J7 1 Motherboard 058021100 J15 1
+5V Relay PCA 045230100 J7 2 Motherboard 058021100 J15 2
AGND Relay PCA 045230100 J7 3 Motherboard 058021100 J15 3
+15V Relay PCA 045230100 J7 4 Motherboard 058021100 J15 4
AGND Relay PCA 045230100 J7 5 Motherboard 058021100 J15 5
-15V Relay PCA 045230100 J7 6 Motherboard 058021100 J15 6
+12V RET Relay PCA 045230100 J7 7 Motherboard 058021100 J15 7
+12V Relay PCA 045230100 J7 8 Motherboard 058021100 J15 8
Chassis Gnd Relay PCA 045230100 J7 10 Motherboard 058021100 J15 9
06240 CBL, DC power to Relay PCA, E-series
DGND Relay PCA 045230100 P8 1 Power Supply Triple 068010000 SK1 3
+5V Relay PCA 045230100 P8 2 Power Supply Triple 068010000 SK1 1
+15V Relay PCA 045230100 P8 4 Power Supply Triple 068010000 SK1 6
AGND Relay PCA 045230100 P8 5 Power Supply Triple 068010000 SK1 4
-15V Relay PCA 045230100 P8 6 Power Supply Triple 068010000 SK1 5
+12V RET Relay PCA 045230100 P8 7 Power Supply Single 068020000 SK1 3
+12V Relay PCA 045230100 P8 8 Power Supply Single 068020000 SK1 1
06244 CBL, UV LAMP SUPPLY, 400E
SCL Motherboard 058021100 J107 3 Bench Lamp Supply 041660500 P1 3
SDA Motherboard 058021100 J107 5 Bench Lamp Supply 041660500 P1 4
Shield Motherboard 058021100 J107 6 Shield
SCL IZS Lamp Supply 041660100 P1 3 Bench Lamp Supply 041660500 P1 3
SDA IZS Lamp Supply 041660100 P1 4 Bench Lamp Supply 041660500 P1 4
+15V Relay PCA 045230100 J10 4 Bench Lamp Supply 041660500 P1 1
AGND Relay PCA 045230100 J10 3 Bench Lamp Supply 041660500 P1 2
+15V Relay PCA 045230100 J11 4 IZS Lamp Supply 041660100 P1 1
AGND Relay PCA 045230100 J11 3 IZS Lamp Supply 041660100 P1 2
FROM TO
06870C DCN6332
D-3

Interconnect List, T400
(Reference: 069130100A DCN5833)
Cable PN Signal Assembly PN J/P Pin Assembly PN J/P Pin
FROM TO
06245 CBL, PWR & SIGNAL DISTRIBUTION, 400E
Photo Detector Motherboard 058021100 J109 6 UV Det Preamp 041200000 J1 1
AGND Motherboard 058021100 J109 12 UV Det Preamp 041200000 J1 4
Sample Pressure Motherboard 058021100 J109 3 Press/Flow PCA 040030100 J1 2
Sample Flow Motherboard 058021100 J109 1 Press/Flow PCA 040030100 J1 5
IZS Detector Motherboard 058021100 J109 5 UV Det Preamp (IZS) 041200200 J1 1
AGND Motherboard 058021100 J109 11 UV Det Preamp (IZS) 041200200 J1 4
+V15 Relay PCA 045230100 J12 4 UV Det Preamp (IZS) 041200200 J1 2
-15V Relay PCA 045230100 J12 6 UV Det Preamp (IZS) 041200200 J1 3
DGND Relay PCA 045230100 J12 1 LCD Interface PCA 066970000 J14 2
+5V Relay PCA 045230100 J12 2 LCD Interface PCA 066970000 J14 3
DGND Relay PCA 045230100 J3 5 LCD Interface PCA 066970000 J14 2
SDA Relay PCA 045230100 J3 2 LCD Interface PCA 066970000 J14 5
SCL Relay PCA 045230100 J3 1 LCD Interface PCA 066970000 J14 6
+5V Relay PCA 045230100 J9 2 LCD Interface PCA 066970000 J14 1
DGND Relay PCA 045230100 J9 1 LCD Interface PCA 066970000 J14 8
+15V Relay PCA 045230100 J9 4 Press/Flow PCA 040030100 J1 6
AGND Relay PCA 045230100 J9 3 Press/Flow PCA 040030100 J1 3
+15V Relay PCA 045230100 J5 4 UV Det Preamp 041200000 J1 2
-15V Relay PCA 045230100 J5 6 UV Det Preamp 041200000 J1 3
12V Return Relay PCA 045230100 J5 7 Fan 040010000 P1 1
+12V Relay PCA 045230100 J5 8 Fan 040010000 P1 2
06246 CBL, VALVES, 400E
+12V Relay PCA 045230100 J4 1 Zero/Span Vlv 059430000 P1 1
Zero/Span Drv Relay PCA 045230100 J4 2 Zero/Span Vlv 059430000 P1 2
+12V Relay PCA 045230100 J4 5 Samp/Cal Vlv 059430000 P1 1
Samp/Cal Drv Relay PCA 045230100 J4 6 Samp/Cal Vlv 059430000 P1 2
+12V Relay PCA 045230100 J4 3 Meas/Ref Vlv 059430000 P1 1
Shutoff Vlv Relay PCA 045230100 J4 4 Meas/Ref Vlv 059430000 P1 2
06247 CBL, HEATER/THERMISTOR, 400E
+5V Ref Motherboard 058021100 J27 6 Lamp Temp Snsr/Htr 041440000 J1 5
Lamp Temp Motherboard 058021100 J27 13 Lamp Temp Snsr/Htr 041440000 J1 6
+5V Ref Motherboard 058021100 J27 5 O3 Gen Temp Snsr/Htr 041440000 J1 5
O3 Gen Temp Motherboard 058021100 J27 12 O3 Gen Temp Snsr/Htr 041440000 J1 6
+5V Ref Motherboard 058021100 J27 7 Sample Temp Snsr 042010000 P1 1
Sample Temp Motherboard 058021100 J27 14 Sample Temp Snsr 042010000 P1 2
Lamp Heater Relay PCA 045230100 J19 1 Lamp Temp Snsr/Htr 041440000 J1 1
Lamp Heater Relay PCA 045230100 J19 2 Lamp Temp Snsr/Htr 041440000 J1 2
O3 Gen Htr Relay PCA 045230100 J14 1 O3 Gen Temp Snsr/Htr 041440000 J1 1
O3 Gen Htr Relay PCA 045230100 J14 2 O3 Gen Temp Snsr/Htr 041440000 J1 2
06248 CBL, TC, RELAY BD TO MTHRBD, 400E
Therm Out + Relay PCA 045230100 J17 1 Motherboard 058021100 J110 2
AGND Relay PCA 045230100 J17 2 Motherboard 058021100 J110 8
06737 CBL, I2C to AUX I/O (ANALOG IN OPTION)
ATX- Motherboard 058021100 J106 1 Aux I/O PCA 067300000 J2 1
ATX+ Motherboard 058021100 J106 2 Aux I/O PCA 067300000 J2 2
LED0 Motherboard 058021100 J106 3 Aux I/O PCA 067300000 J2 3
ARX+ Motherboard 058021100 J106 4 Aux I/O PCA 067300000 J2 4
ARX- Motherboard 058021100 J106 5 Aux I/O PCA 067300000 J2 5
LED0+ Motherboard 058021100 J106 6 Aux I/O PCA 067300000 J2 6
LED1+ Motherboard 058021100 J106 8 Aux I/O PCA 067300000 J2 8
06738 CBL, CPU COM to AUX I/O (USB OPTION)
RXD CPU PCA 067240000 COM1 1 Aux I/O PCA 0673000 or -02 J3 1
DCD CPU PCA 067240000 COM1 2 Aux I/O PCA 0673000 or -02 J3 2
DTR CPU PCA 067240000 COM1 3 Aux I/O PCA 0673000 or -02 J3 3
TXD CPU PCA 067240000 COM1 4 Aux I/O PCA 0673000 or -02 J3 4
DSR CPU PCA 067240000 COM1 5 Aux I/O PCA 0673000 or -02 J3 5
GND CPU PCA 067240000 COM1 6 Aux I/O PCA 0673000 or -02 J3 6
CTS CPU PCA 067240000 COM1 7 Aux I/O PCA 0673000 or -02 J3 7
RTS CPU PCA 067240000 COM1 8 Aux I/O PCA 0673000 or -02 J3 8
RI CPU PCA 067240000 COM1 10 Aux I/O PCA 0673000 or -02 J3 10
06738 CBL, CPU COM to AUX I/O (MULTIDROP OPTION)
RXD CPU PCA 067240000 COM1 1 Xmitter bd w/Multidrop 069500000 J3 1
DCD CPU PCA 067240000 COM1 2 Xmitter bd w/Multidrop 069500000 J3 2
DTR CPU PCA 067240000 COM1 3 Xmitter bd w/Multidrop 069500000 J3 3
TXD CPU PCA 067240000 COM1 4 Xmitter bd w/Multidrop 069500000 J3 4
DSR CPU PCA 067240000 COM1 5 Xmitter bd w/Multidrop 069500000 J3 5
GND CPU PCA 067240000 COM1 6 Xmitter bd w/Multidrop 069500000 J3 6
CTS CPU PCA 067240000 COM1 7 Xmitter bd w/Multidrop 069500000 J3 7
RTS CPU PCA 067240000 COM1 8 Xmitter bd w/Multidrop 069500000 J3 8
RI CPU PCA 067240000 COM1 10 Xmitter bd w/Multidrop 069500000 J3 10
D-4
06870C DCN6332

Interconnect List, T400
(Reference: 069130100A DCN5833)
Cable PN Signal Assembly PN J/P Pin Assembly PN J/P Pin
FROM TO
06739 CBL, CPU ETHERNET TO AUX I/O
ATX- CPU PCA 067240000 LAN 1 Aux I/O PCA 067300100 J2 1
ATX+ CPU PCA 067240000 LAN 2 Aux I/O PCA 067300100 J2 2
LED0 CPU PCA 067240000 LAN 3 Aux I/O PCA 067300100 J2 3
ARX+ CPU PCA 067240000 LAN 4 Aux I/O PCA 067300100 J2 4
ARX- CPU PCA 067240000 LAN 5 Aux I/O PCA 067300100 J2 5
LED0+ CPU PCA 067240000 LAN 6 Aux I/O PCA 067300100 J2 6
LED1 CPU PCA 067240000 LAN 7 Aux I/O PCA 067300100 J2 7
LED1+ CPU PCA 067240000 LAN 8 Aux I/O PCA 067300100 J2 8
06741 CBL, CPU USB TO FRONT PANEL
GND CPU PCA 067240000 USB 8 LCD Interface PCA 066970000 JP9
LUSBD3+ CPU PCA 067240000 USB 6 LCD Interface PCA 066970000 JP9
LUSBD3- CPU PCA 067240000 USB 4 LCD Interface PCA 066970000 JP9
VCC CPU PCA 067240000 USB 2 LCD Interface PCA 066970000 JP9
06746 CBL, MB TO 06154 CPU
GND Motherboard 058021100 P12 2 Shield
RX0 Motherboard 058021100 P12 14 CPU PCA 067240000 COM1 1
RTS0 Motherboard 058021100 P12 13 CPU PCA 067240000 COM1 8
TX0 Motherboard 058021100 P12 12 CPU PCA 067240000 COM1 4
CTS0 Motherboard 058021100 P12 11 CPU PCA 067240000 COM1 7
RS-GND0 Motherboard 058021100 P12 10 CPU PCA 067240000 COM1 6
RTS1 Motherboard 058021100 P12 8 CPU PCA 067240000 COM2 8
CTS1/485- Motherboard 058021100 P12 6 CPU PCA 067240000 COM2 7
RX1 Motherboard 058021100 P12 9 CPU PCA 067240000 COM2 1
TX1/485+ Motherboard 058021100 P12 7 CPU PCA 067240000 COM2 4
RS-GND1 Motherboard 058021100 P12 5 CPU PCA 067240000 COM2 6
RX1 Motherboard 058021100 P12 9 CPU PCA 067240000 485 1
TX1/485+ Motherboard 058021100 P12 7 CPU PCA 067240000 485 2
RS-GND1 Motherboard 058021100 P12 5 CPU PCA 067240000 485 3
WR256 CBL, XMITTER TO INTERFACE
LCD Interface PCA 066970000 J15 Transmitter PCA 068810000 J1
06870C DCN6332
D-5
This page intentionally left blank.
D-6
06870C DCN6332
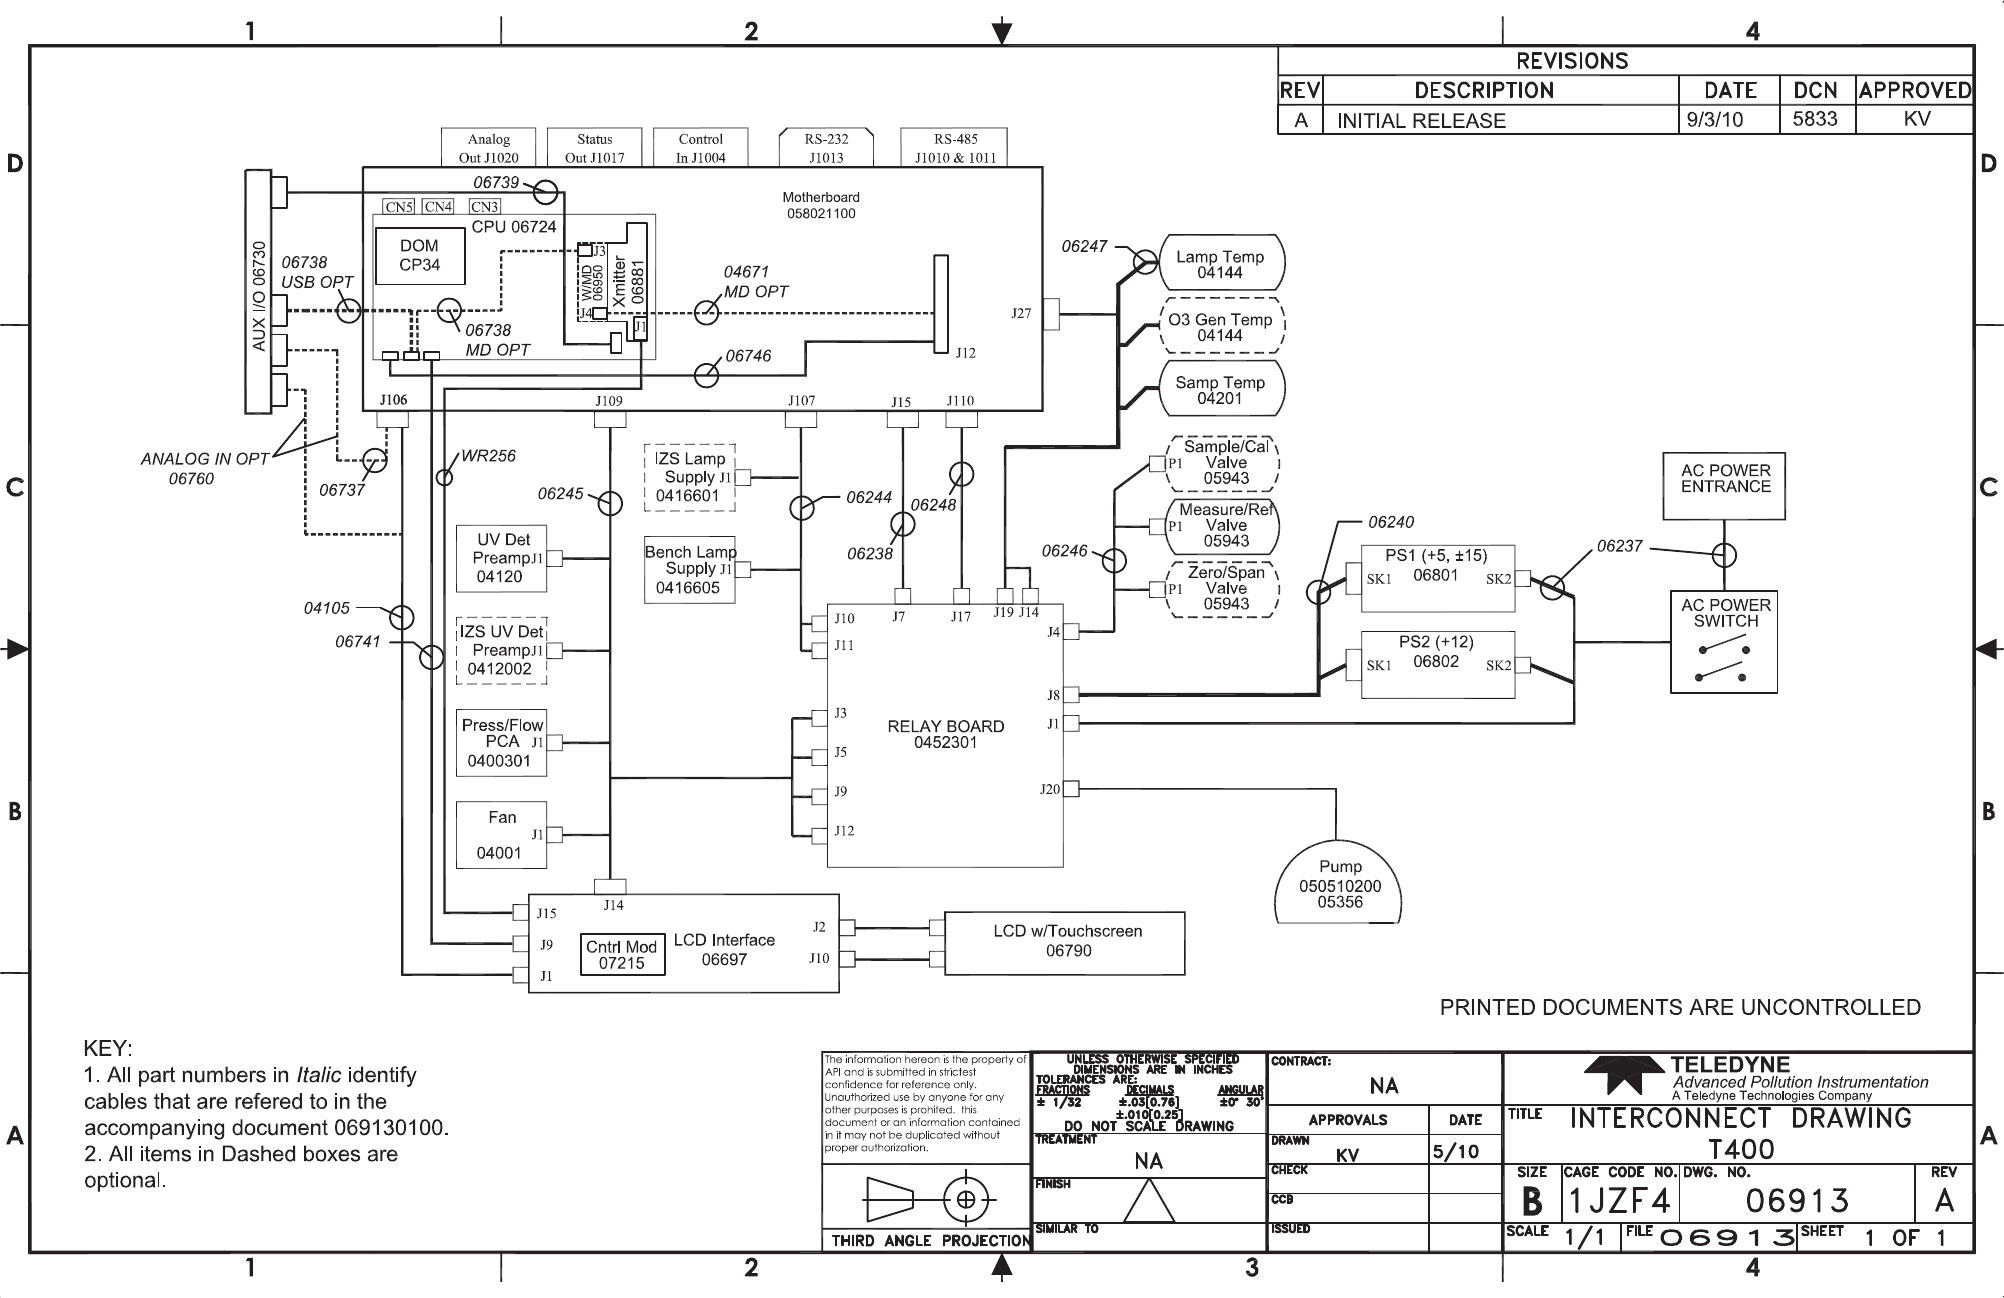
06870C DCN6332
D-7
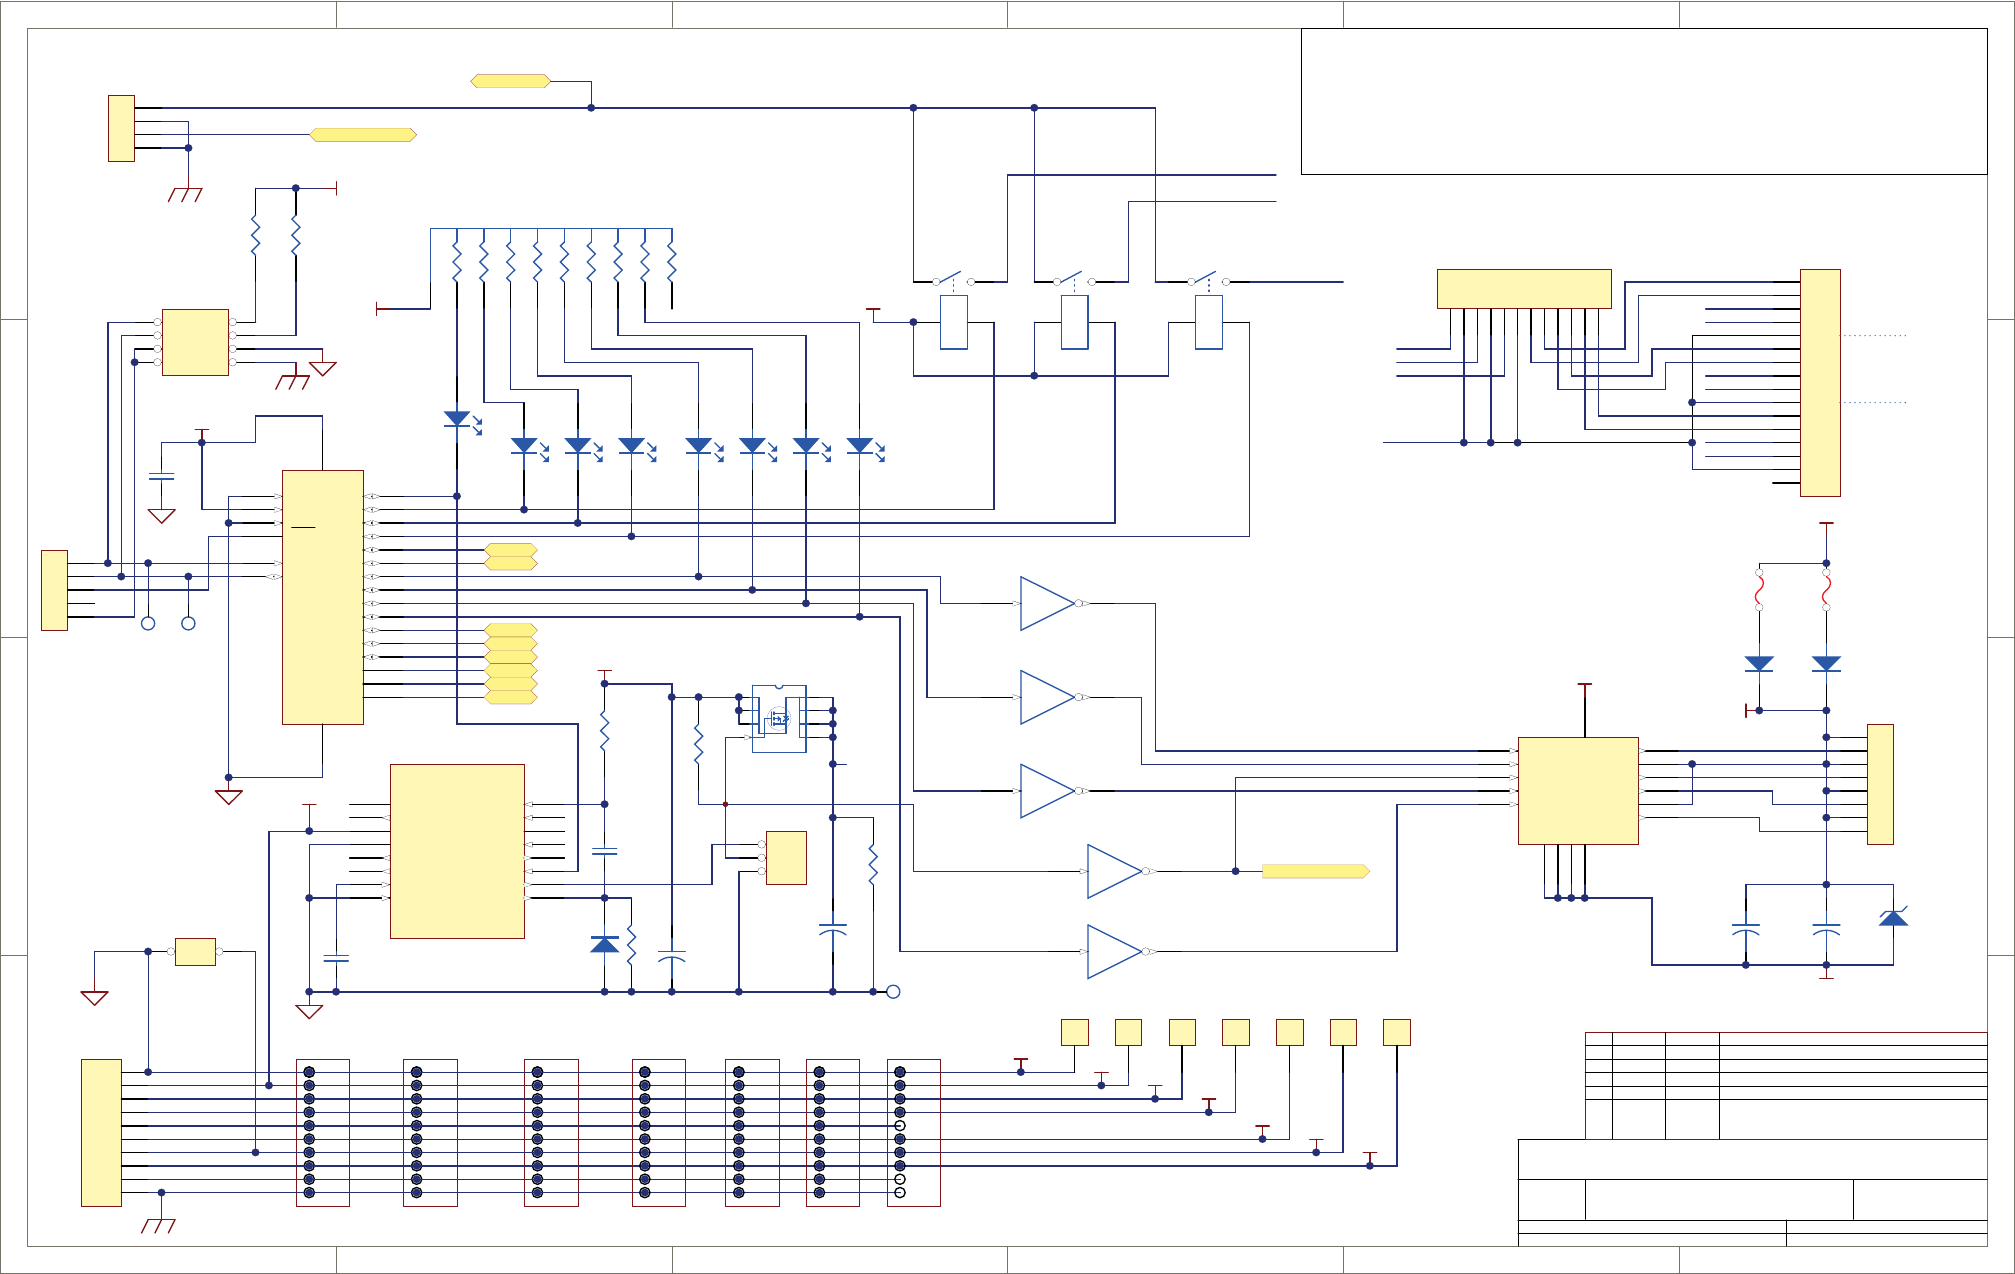
1
1
2
2
3
3
4
4
5
5
6
6
D D
C C
B B
A A
Title
Number RevisionSize
B
Date: 7/11/2011 Sheet of
File: N:\PCBMGR\..\04524-E_p1.schDoc Drawn By:
1 2
U2A
SN74HC04
3 4
U2B
5 6
U2C
11 10
U2E
OUT4 1
K2
OUT 3 3
GND
4GND
5
OUT 2 6
K7
OUT 1 8
IN 1
9IN 2
10
VCC 11
GND
12 GND
13
ENABLE
14 IN 3
15 IN 4
16
U5
UDN2540B(16)
1
2
3
4
5
J3
CON5
VBATT
1
VOUT
2
VCC
3
GND
4
BATT_ON
5
LOW LINE'
6
OSC IN
7
OSC SEL
8
RESET 16
RESET' 15
WDO' 14
CD IN' 13
CD OUT' 12
WDI 11
PFO' 10
PFI 9
U4
MAX693
C2
0.001
VCC
R4
1M
C3
1
A
AKK
D17
DL4148
VCC
D1
RED
2
1
3
4
5
6
7
8
9
10
RN1
330
I2C_Vcc
D2
YEL
D3
YEL
D4
YEL
D7
GRN
D8
GRN
D9
GRN
AA
K
K
D10
GRN
9 8
U2D
VCC
1
2
3
4
5
6
7
8
J4
8 PIN
+12RET
VALVE0
VALVE1
VALVE2
VALVE3
+
C6
2000/25
+12V
1
2
3
4
5
6
7
8
9
10
J5
CON10THROUGH
11
2
3
4
5
6
7
8
9
10
J7
CON10THROUGH
11
2
3
4
5
6
7
8
9
10
J8
CON10THROUGH
11
2
3
4
5
6
7
8
9
10
J9
CON10THROUGH
DGND
VCC
AGND
+15V
AGND
-15V
+12RET
+12V
EGND
CHS_GND
AC_Line
AC_Neutral
I2C_Vcc
1 2
JP3
HEADER 1X2
DC PWR IN KEYBRD MTHR BRD SYNC DEMOD SPARE
1 2
+
3-4
K1
SLD-RLY
1 2
+
3-4
K2
SLD-RLY
1 2
+
3-4
K3
SLD-RLY
I2C_Vcc
1
2
3
JP4
WTCDG OVR
+
C5
10/16
11
2
2
+C4
10/16
C1
0.1
R3
20K
1
2
3
4
J1
4 PIN
1
2
3
4
5
6
7
8
9
10
11
12
13
14
15
16
J2 16 PIN
11
2
3
4
5
6
7
8
9
10
J10
CON10THROUGH
1
TP1
DGND
1
TP2
+5V
1
TP3
AGND
1
TP4
+15V
1
TP5
-15V
1
TP6
+12RT
1
TP7
+12V
General Trace Width Requirements
1. Vcc (+5V) and I2C VCC should be 15 mil
2. Digitial grounds should be at least 20 mils
3. +12V and +12V return should be 30 mils
4. All AC lines (AC Line, AC Neutral, RELAY0 - 4, All signals on JP2) should be 30 mils wide, with 120 mil
isolation/creepage distance around them
5. Traces between J7 - J12 should be top and bottom and at least 140 mils.
6. Traces to the test points can be as small as 10 mils.
Q1
IRF7205
RELAY0 RELAY1 RELAY2
1 2
3 4
5 6
7 8
JP1
HEADER 4X2
R1
2.2K
R2
2.2K
VCC
R6
10K
R5
10K
INT
1
A1
2
A2
3
SCL
22
SDA
23
P10 13
P00 4
P01 5
P02 6
P03 7
P04 8
P05 9
P06 10
P07 11
Vss
12
A0
21
P11 14
P12 15
P13 16
P14 17
P15 18
P16 19
P17 20
Vdd 24
U1
PCF8575
I2C_Vcc
IO3
IO4
IO10
IO11
IO12
IO13
IO14
IO15
AC_Neutral
RELAY0
RELAY1
RELAY2
VLV_ENAB
1
2
3
4
5
6
7
8
9
10
11
12
JP2
Heater Config Jumper
RELAY0
TS0
TS1
TS2
RELAY1
RELAY2
TS0
TS1
TS2
11
2
3
4
5
6
7
8
9
10
J11
CON10THROUGH
11
2
3
4
5
6
7
8
9
10
J12
CON10THROUGH
RELAY0
RELAY1
RELAY2
WDOG
RL0 RL1 RL2 VA0 VA1 VA2 VA3
COMMON0
COMMON1
COMMON2
LOAD0
LOAD1
LOAD2
REV AUTH DATE
B CAC 10/3/02 CE MARK LINE VOLTAGE TRACE SPACING FIX
DD2
15V TVS
+
C16
22 uF
find low ESR electroytic
DD1
6A RECTIFIER
VALVE_POWER
DD4
6A RECTIFIER
4A PTC INTERRUPTOR
F1
4A PTC INTERRUPTOR
F2
11
2
3
4
5
6
7
8
9
10
J13
CON10THROUGH Printed documents are uncontrolled
DRJ 5/16/07 Add alternate thermocouple connectors
+12V
+12RT
-15V
+15V
AGND
+5V
DGND
AC_Line
AC_Neutral
IO10
IO11
IO12
IO13
IO14
IO15
IO3
IO4
E RT 02/15/11 Add C20, C21, C22, TP10, TP11, TP12
TP10 TP11
SCL
SDA
INT
TP12
E
04524
Teledyne API
13
CTRL-0
CTRL-1
CTRL-2
DCN:6161
D-8
06870C DCN6332
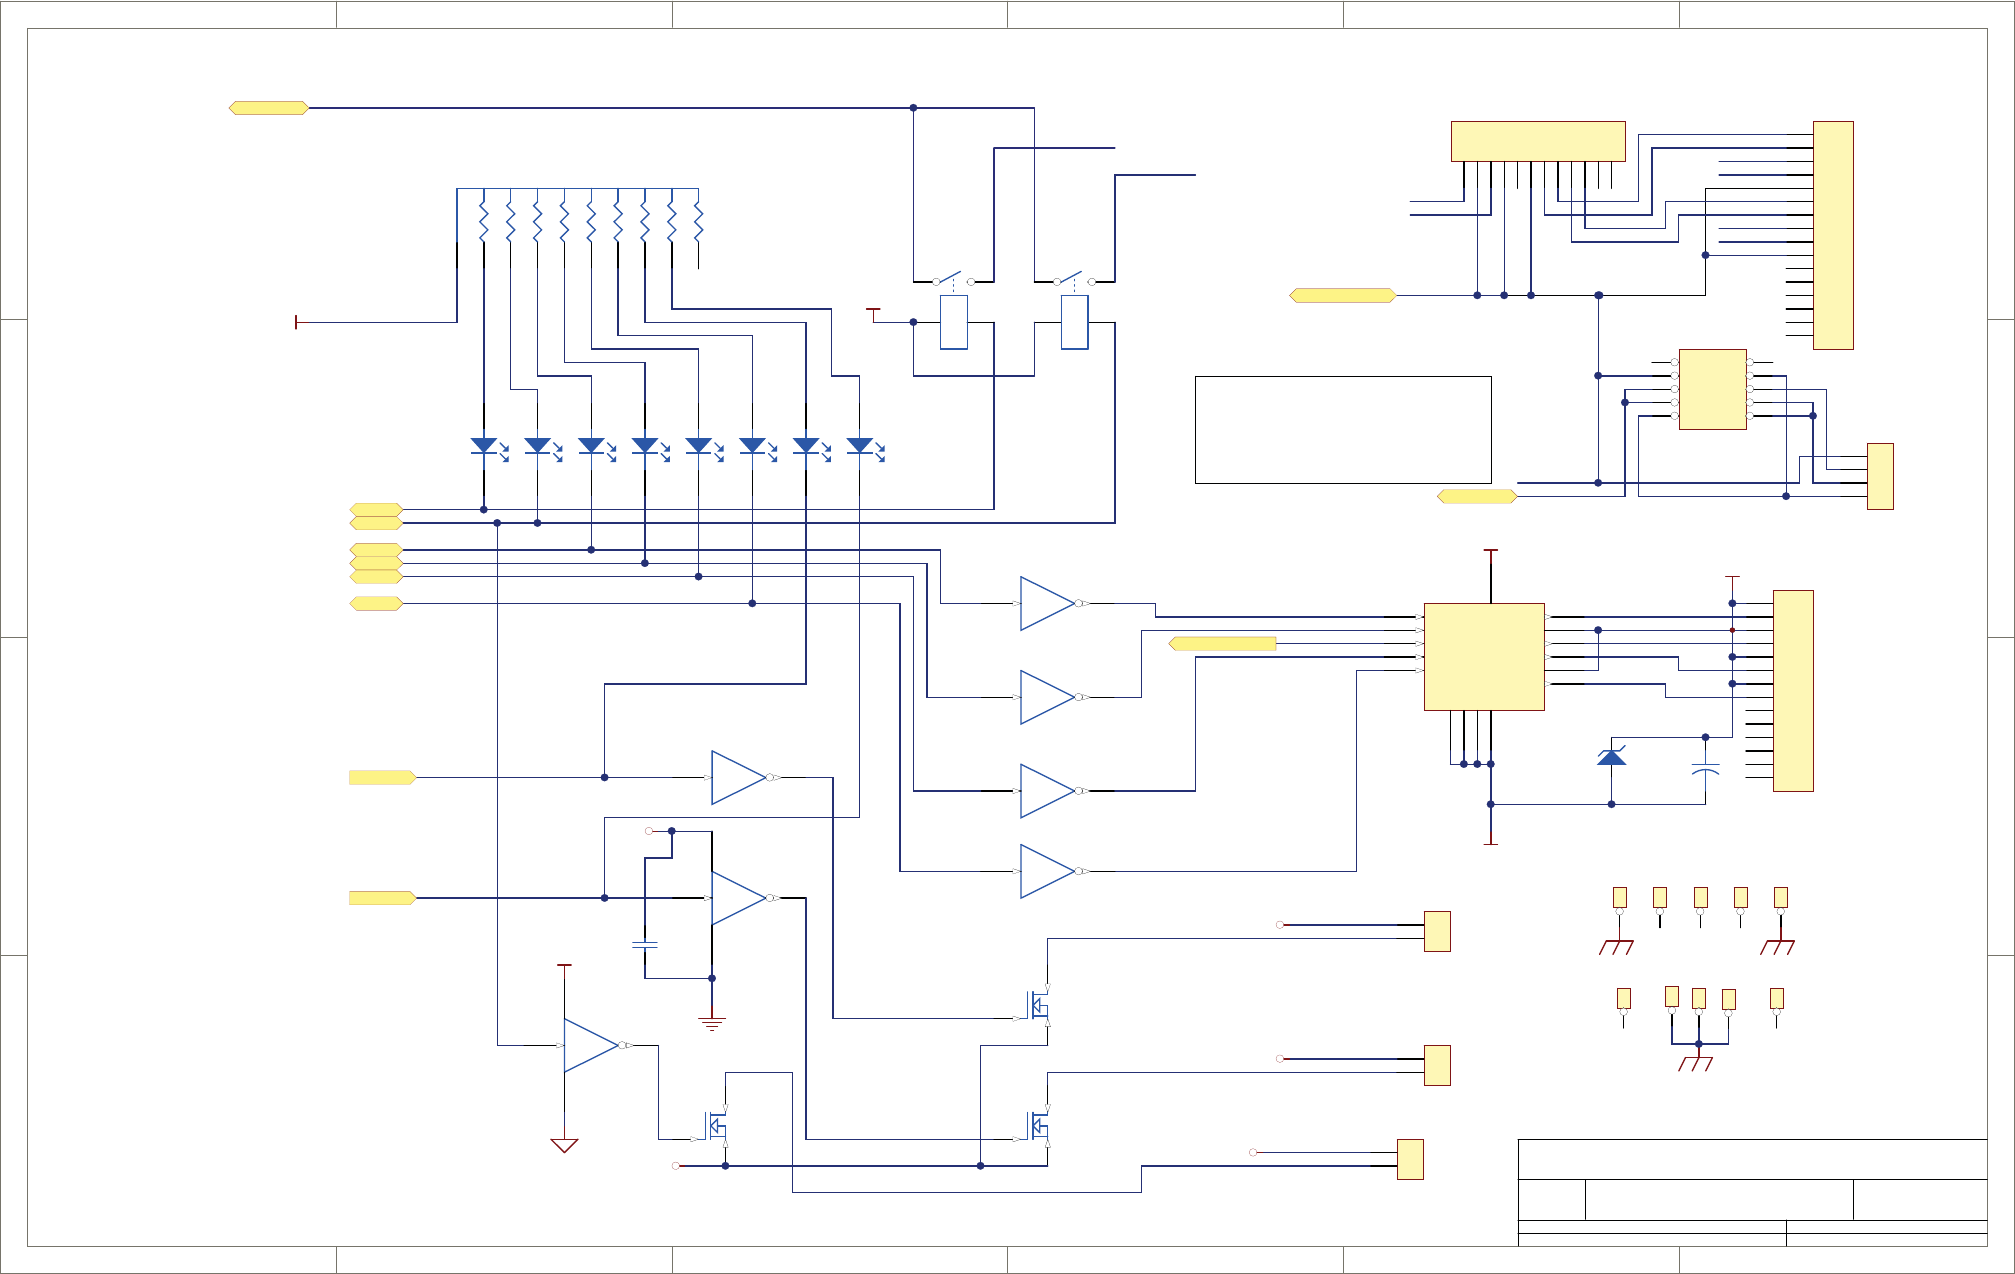
1
1
2
2
3
3
4
4
5
5
6
6
D D
C C
B B
A A
Title
Number RevisionSize
B
Date: 7/11/2011 Sheet of
File: N:\PCBMGR\..\04524-E_p2.schDoc Drawn By:
1 2
U3A
SN74HC04
9 8
U3D
11 10
U3E
OUT4 1
K2
OUT 3 3
GND
4GND
5
OUT 2 6
K7
OUT 1 8
IN 1
9IN 2
10
VCC 11
GND
12 GND
13
ENABLE
14 IN 3
15 IN 4
16
U6
UDN2540B(16)
2
1
3
4
5
6
7
8
9
10
RN2
330
D5
YEL
D6
YEL
D11
GRN
D12
GRN
D13
GRN
D14
GRN
D15
GRN
VCC
1
2
3
4
5
6
7
8
9
10
11
12
13
14
J6
CON14
+12RET
Valve4
Valve5
Valve6
Valve7
I2C_Vcc
1 2
+
3-4
K4
SLD-RLY
1 2
+
3-4
K5
SLD-RLY
I2C_Vcc
RELAY3 RELAY4
IO3
IO4
IO10
IO11
IO12
IO13
13 12
147
U3F
IO14
IO15
AC_Line
Aux Relay Connector
RELAY3
RELAY4
VLV_ENAB
AA
K
K
D16
GRN
3 4
U3B
5 6
U3C
1
2
J19
MINIFIT-2
1
2
J14
MINIFIT-2
VCC
C13
0.1
Q2
IRL3303
Q3
IRL3303
+12V
+12V
+12RET
RL3 RL4 VA4 VA5 VA6 VA7 TR0 TR1
1
2
3
4
5
6
7
8
9
10
11
12
13
14
15
16
J18 16 PIN
AC_Neutral
1
2
3
4
5
6
7
8
9
10
11
12
JP6
Heater Config Jumper
RELAY3
TS3
TS4
RELAY4
TS3
TS4
RELAY3
RELAY4
COMMON3
COMMON4
LOAD3
LOAD4
DD3
15V TVS
VALVE_POWER
+
C17
22 uF
JP7 Configuration
Standard Pumps
60 Hz: 3-8
50 Hz: 2-7, 5-10
World Pumps
60Hz/100-115V: 3-8, 4-9, 2-7
50Hz/100-115V: 3-8, 4-9, 2-7, 5-10
60Hz/220-240V: 3-8, 1-6
50Hz/220-240V: 3-8, 1-6, 5-10 1
2
3
4
J20
1 6
2 7
3 8
4 9
510
JP7
MINI-FIT 10
PUMP
AC_Neutral
AC_Line
13 12
147
U2F
VCC
Q4
IRL3303
1
2
J21
MINIFIT-2
+12V
Use 50 mil traces
Printed documents are uncontrolled
IO14
IO15
AC_Line
AC_Neutral
IO3
IO4
IO10
IO11
IO12
IO13
MF1 MF2 MF3 MT6MT5
X1 X2 X3
MTK1 MTK2
AC_Line
04524 E
23
Teledyne API
CTRL-3
CTRL-4
DCN:6161
06870C DCN6332
D-9
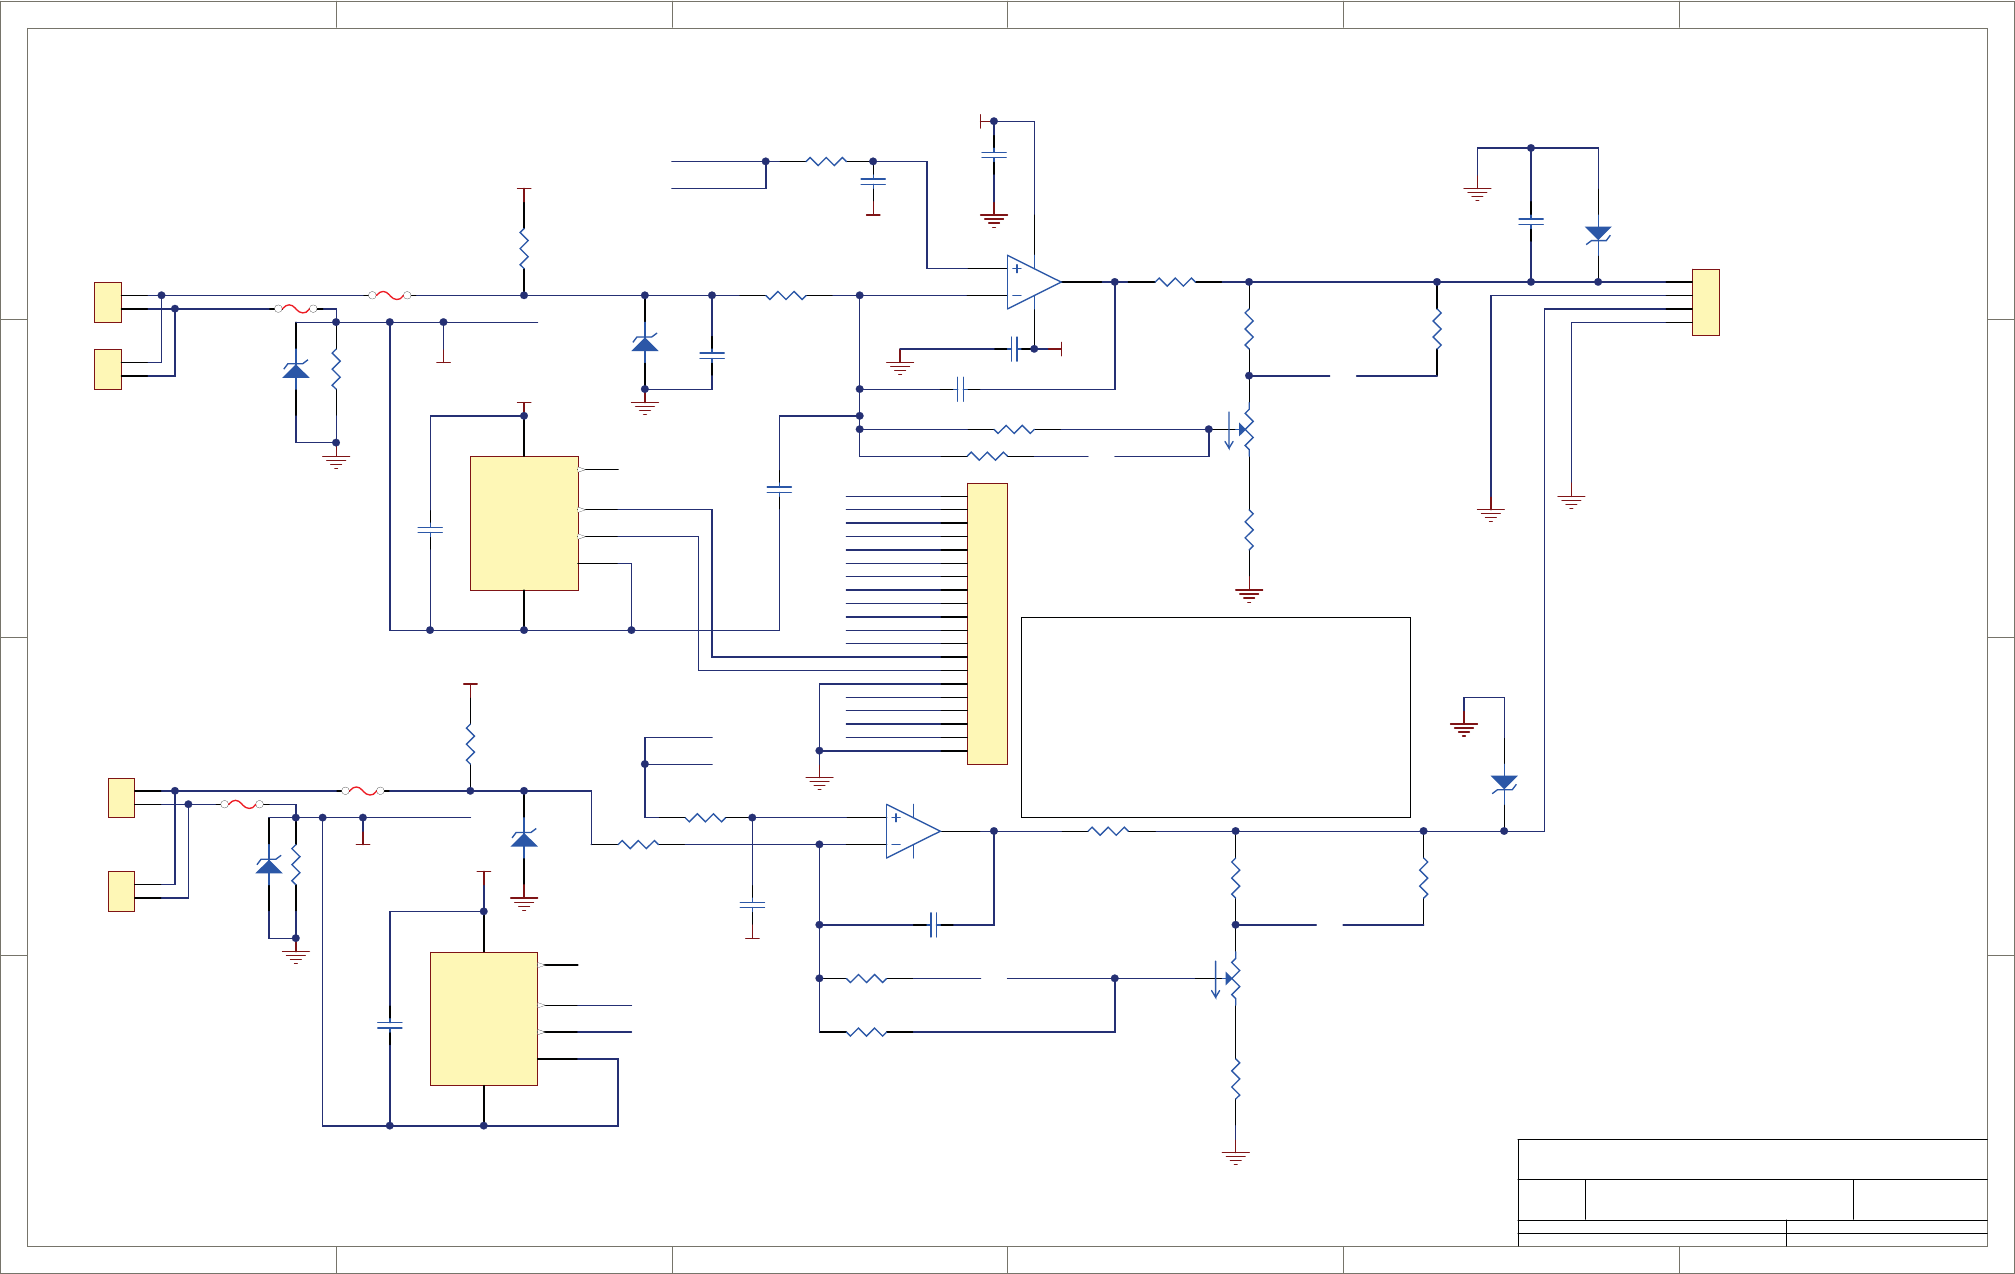
1
1
2
2
3
3
4
4
5
5
6
6
D D
C C
B B
A A
Title
Number RevisionSize
B
Date: 7/11/2011 Sheet of
File: N:\PCBMGR\..\04524-E_p3.schDoc Drawn By:
C7
0.1
-15V
+15V
R11 1M
R9
10K
1
2
J15
THERMOCOUPLE CONNECTOR
C80.01
1
2
3
4
J17
MICROFIT-4
K7
Vin 2
Gnd
4
J8
TOUT 3
R- 5
U10
LT1025
R12
1M
1
2
J16
THERMOCOUPLE CONNECTOR
C11
0.01
+15V
C14
0.1
R14
1M
3
2
1
84
U7A
OPA2277
CW
R17
5K
5
6
7
U7B
OPA2277
AA
K
K
ZR3
4.7V
ZR4
4.7V
R21
1k
R22
1k
+
-
R24
6.81K
C15
0.01
1
2
3
4
5
6
7
8
9
10
11
12
13
14
15
16
17
18
19
20
JP5
MICROFIT-20
TC PROGRAMMING SOCKET
R25
14K
R15
10K
R13
10K
TC1_GND
K7
Vin 2
Gnd
4
J8
TOUT 3
R- 5
U8
LT1025
+15V
R10 1M
R7
20K
TC1_JGAINA TC1_JGAINB
TC1_JGAINB
TC1_JGAINA
C10
0.1
R23
6.81K C12
0.01
TC1_GND
TC1_JCOMPB
TC1_KCOMPB
TC1_JCOMPA
TC2_JCOMPB
TC2_KCOMPB
TC2_KCOMPB
TC2_JCOMPB
TC2_JCOMPA
TC2_5MVA TC2_5MVB
R27
10K
CW
R28
5K
R26
14.3K
TC2_JGAINA
R8
20K
TC2_JGAINB
R16
10K TC2_GND
R18
10K
TC2_JGAINA
TC2_JGAINB
TC2_5MVB
TC2_5MVA
TC1_5MVA TC1_5MVB
R19
3M
R20
3M
TC1_5MVA
TC1_5MVB
TC1_KCOMPA
TC1_KCOMPA
TC2_KCOMPA
TC2_GND
* GROUNDED THERMOCOUPLES ARE EXPECTED BY DEFAULT
No extra connections are necessary for grounded thermocouples
* FOR UNGROUNDED THERMOCOUPLES
short TCX_GNDTCA to TCX_GNDTCB
* FOR K THERMOCOUPLE:
1) Install CN0000156 for thermocouple connector
2) Short only TCX_KCOMPA to TCX_KCOMPB on TC Programming Plug
4) Leave TCX_JCOMPX pins of the plug unconnected
* FOR J THERMOCOUPLE:
1) Install CN0000155 for thermocouple connector
2) Short TCX_JCOMPA to TCXJCOMPB on TC Programming Plug
3) Short TCX_JGAINA to TCX_JGAINB on TC Programming Plug
4) Leave TCX_KCOMPX pins of the plug unconnected
* DEFAULT OUTPUT IS 10 mV PER DEG C
For 5 mV per deg C output, short TCX_5MVA TO TCX_5MVB
TC1_JCOMPA
TC2_KCOMPA
TC2_JCOMPA
C9
0.1
TC2_GNDTCA
TC1_GNDTCA
TC1_GNDTCB
TC2_GNDTCB
TC2_GNDTCA
TC1_GNDTCA
ZR1
3V
ZR6
3V
1/8 AMP FUSE
F6
1/8 AMP FUSE
F4
1/8 AMP FUSE
F3
1/8 AMP FUSE
F5
ZR2
3V
ZR5
3V
+
-
1
2
J15A
THERMOCOUPLE CONNECTOR
+
-
OMEGA
HAMITHERM
1
2
J16A
THERMOCOUPLE CONNECTOR
+
-
HAMITHERM
OMEGA
Printed documents are uncontrolled
C20
0.01
C21
0.01
C22
100pF
-15V
-15V
33
04524 E
Teledyne API
DCN:6161
D-10
06870C DCN6332
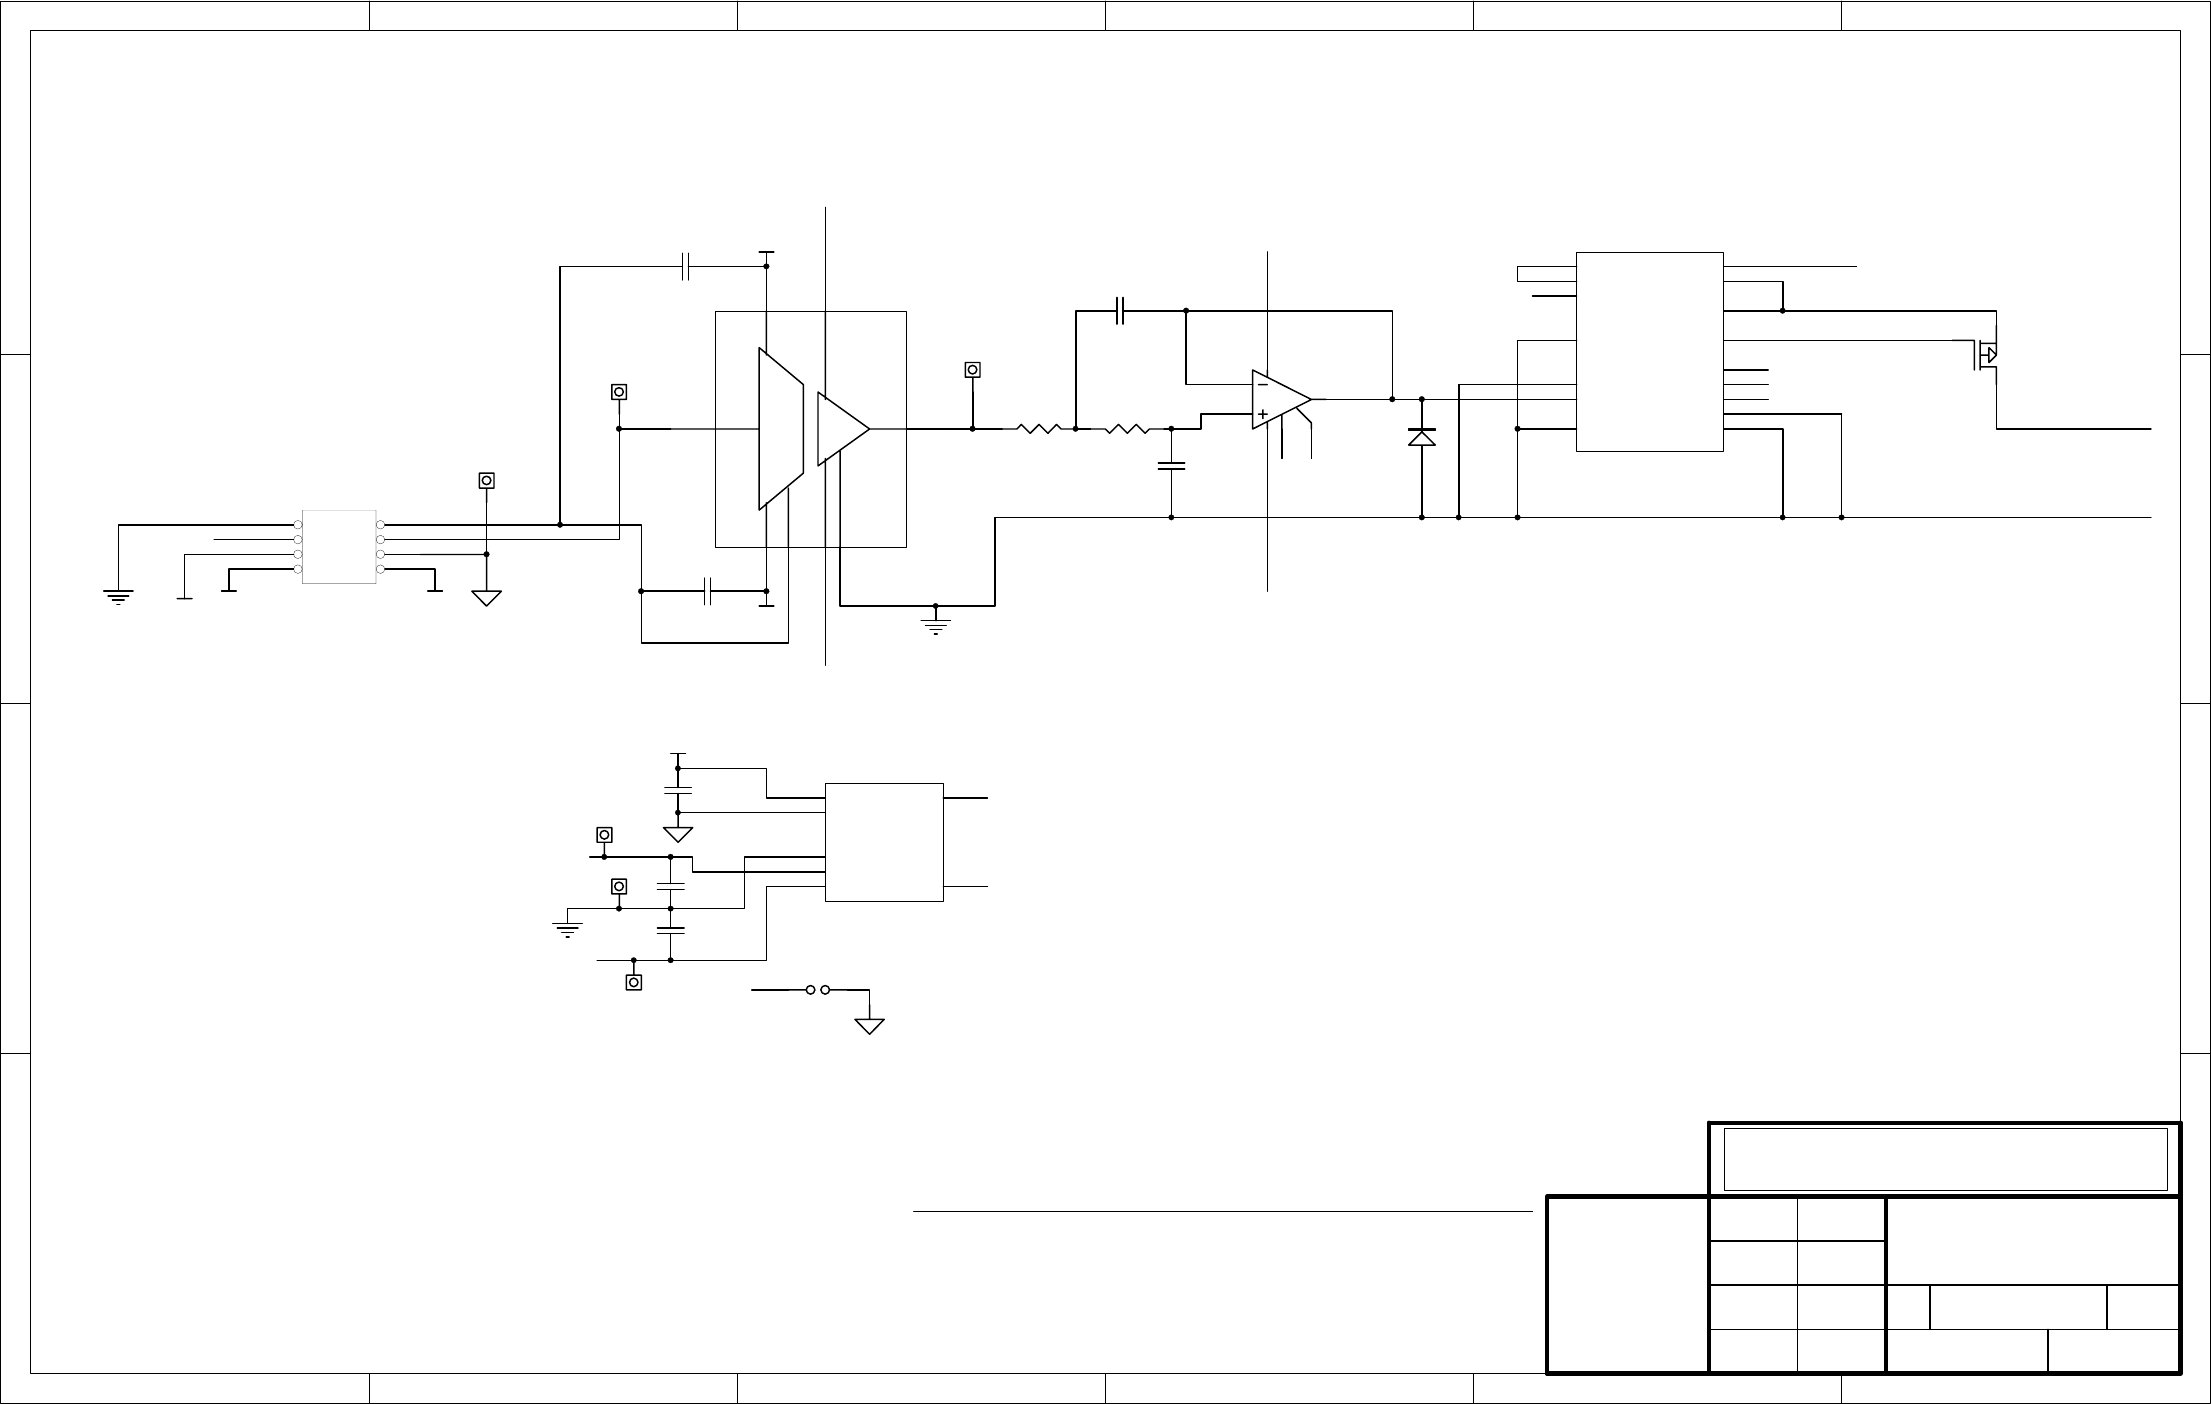
1 2 3 4 56
A
B
C
D
6
54321
D
C
B
A
APPROVALS
DRAWN
CHECKED
APPROVED
DATE
SIZE DRAWING NO. REVISION
SHEET
Error : LOGO.BMP file not found.
The information herein is the
property of API and is
submitted in strictest con-
Unauthorized use by anyone
fidence for reference only.
for any other purposes is
prohibited. This document or
any information contained
in it may not be duplicated
without proper authorization.
PCA 03631, Isolated 0-20ma, E Series
03632 A
1119-Jul-2002
LAST MOD.
B
of
1 2
3 4
5 6
7 8
J1
HEADER 4X2
+15V
+15V
IOUT-
IOUT+
VIN-
VIN+
15 7
9
12
16
10
8
+VS1
-VS1 GND1 -VS2GND2
+VS2
VIN VOUT
U4
ISO124
VIN- JP1
JUMPER2
+12V -12V
+12V
-12V
VS
1
0V
2
0V
5
+VOUT
6
-VOUT
7SOUT 8
SIN 14
U1
DCP010515
C1
0.47
C2
0.47
C3
0.47
ISO_+15V
ISO_GND
ISO_-15V
ISO_-15V ISO_+15V
R1
4.75K
R2
9.76K
3
2
6
1
8
7 4
U2
OPA277
C4
1000PF
C5
220PF
D1
1N914
ISO_+15V ISO_-15V
VREF
15
SENSE
12
VRADJ
11
VIN(10)
4
VREFIN
3
VIN(5V)
5
GND
216MA 9
4MA 10
SPAN 8
OFFADJ 7
GATEDRV 14
SSENSE 13
SR 1
+V 16
OFFADJ 6
U3
XTR110
ISO_+15V
IOUT+
C6
0.1
C7
0.1
Q1
MOSFETP
IOUT-
TP1
TESTPOINT
Date Rev. Change Description Engineer
8/9/00 A INITIAL RELEASE (FROM 03039) KL
TP3
ISO+15
TP2
TESTPOINT
TP4
ISO-15
TP5
ISO_GND
TP6
GND
06870C DCN6332
D-11
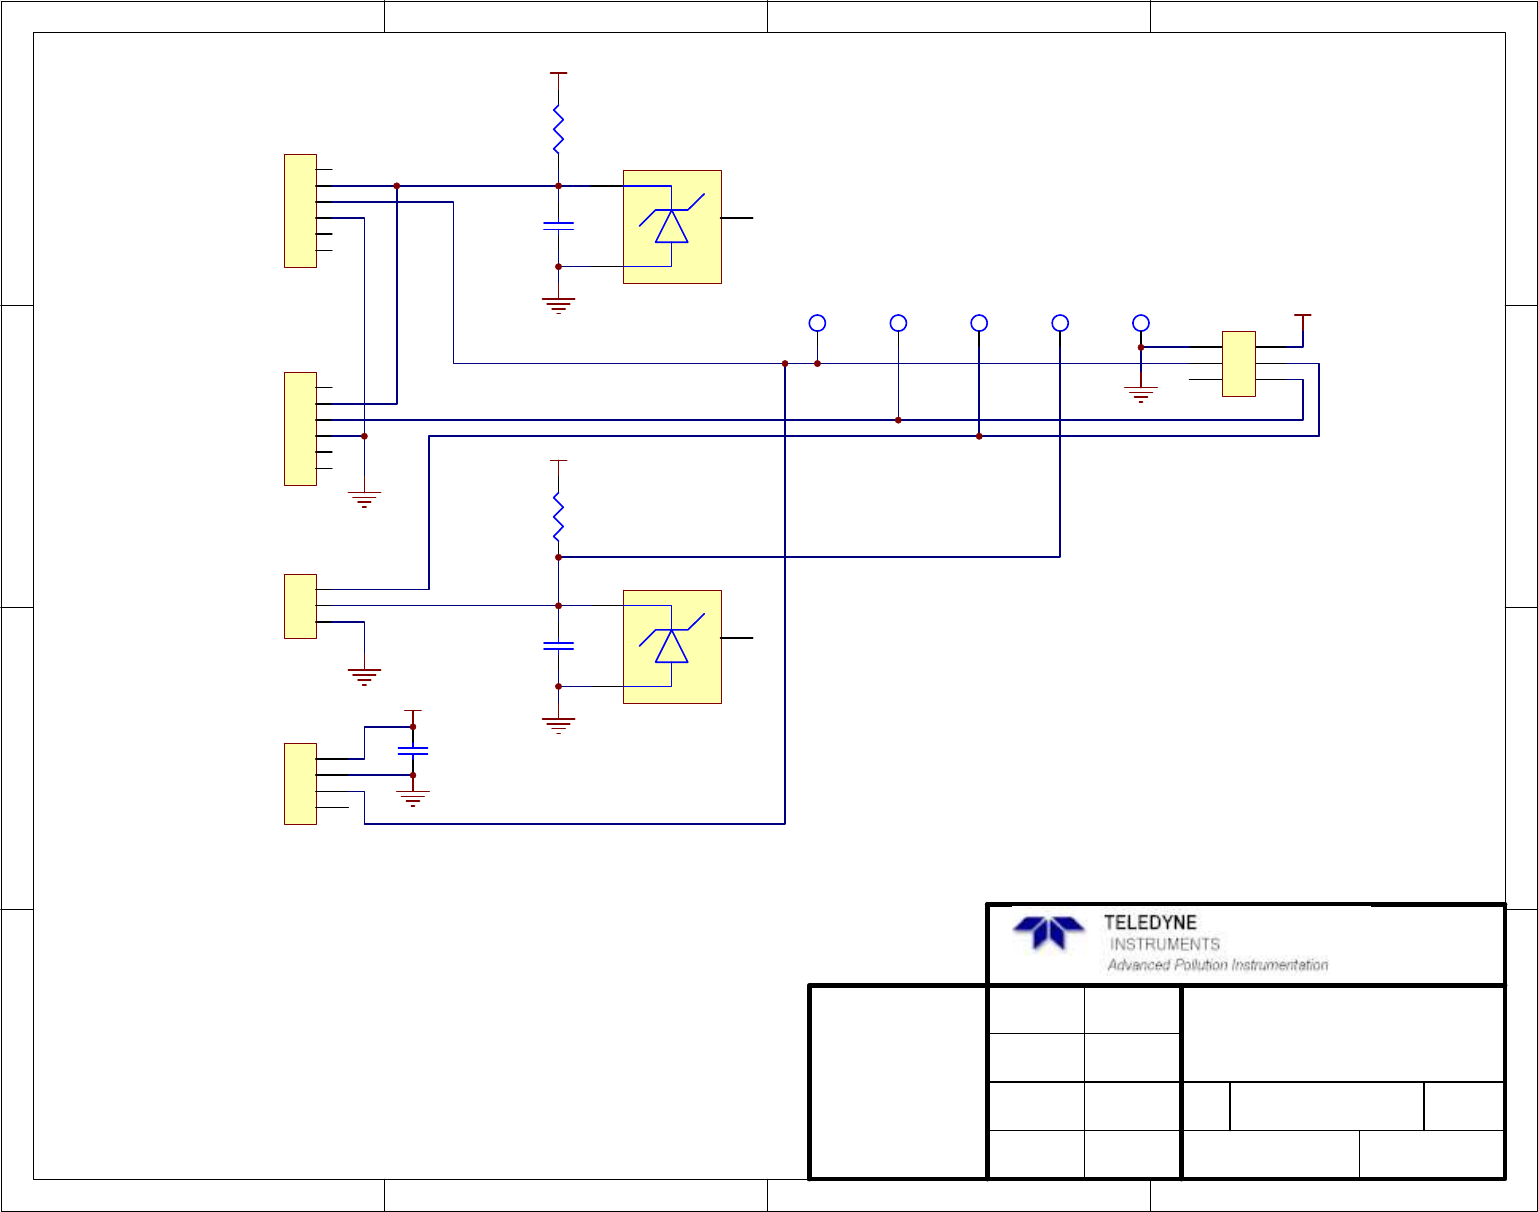
1 2 34
A
B
C
D
4
321
D
C
B
A
APPROVALS
DRAWN
CHECKED
APPROVED
DATE
SIZE DRAWING NO.REVISION
SHEET
The information herein is the
property of API and is
submitted in strictest con-
Unauthorized use by anyone
fidence for reference only.
for any other purposes is
prohibited. This document or
any information contained
in it may not be duplicated
without proper authorization.
SCH, PCA 04003, PRESS/FLOW, 'E' SERIES
04354D
113-Dec-2007
LAST MOD.
B
of
R2
1.1K
+15V
1
2
3
4
5
6
S1
ASCX PRESSURE SENSOR
1
2
3
4
5
6
S2
ASCX PRESSURE SENSOR
1
2
3
S3
FLOW SENSOR
+15V
+15V
TP5
S2_OUT
TP4
S1/S4_OUT
TP2
10V_REF
TP1
GND
TP3
S3_OUT
2
3
1
VR2
LM4040CIZ
2
3
1
VR1
LM4040CIZ
R1
499
1
2
3
4
5
6
J1
MINIFIT6
C1
1.0UF
C2
1.0UF
1
2
3
4
S4
CON4
+15V
C3
1.0
CN_647 X 3
FM_4
D-12
06870C DCN6332
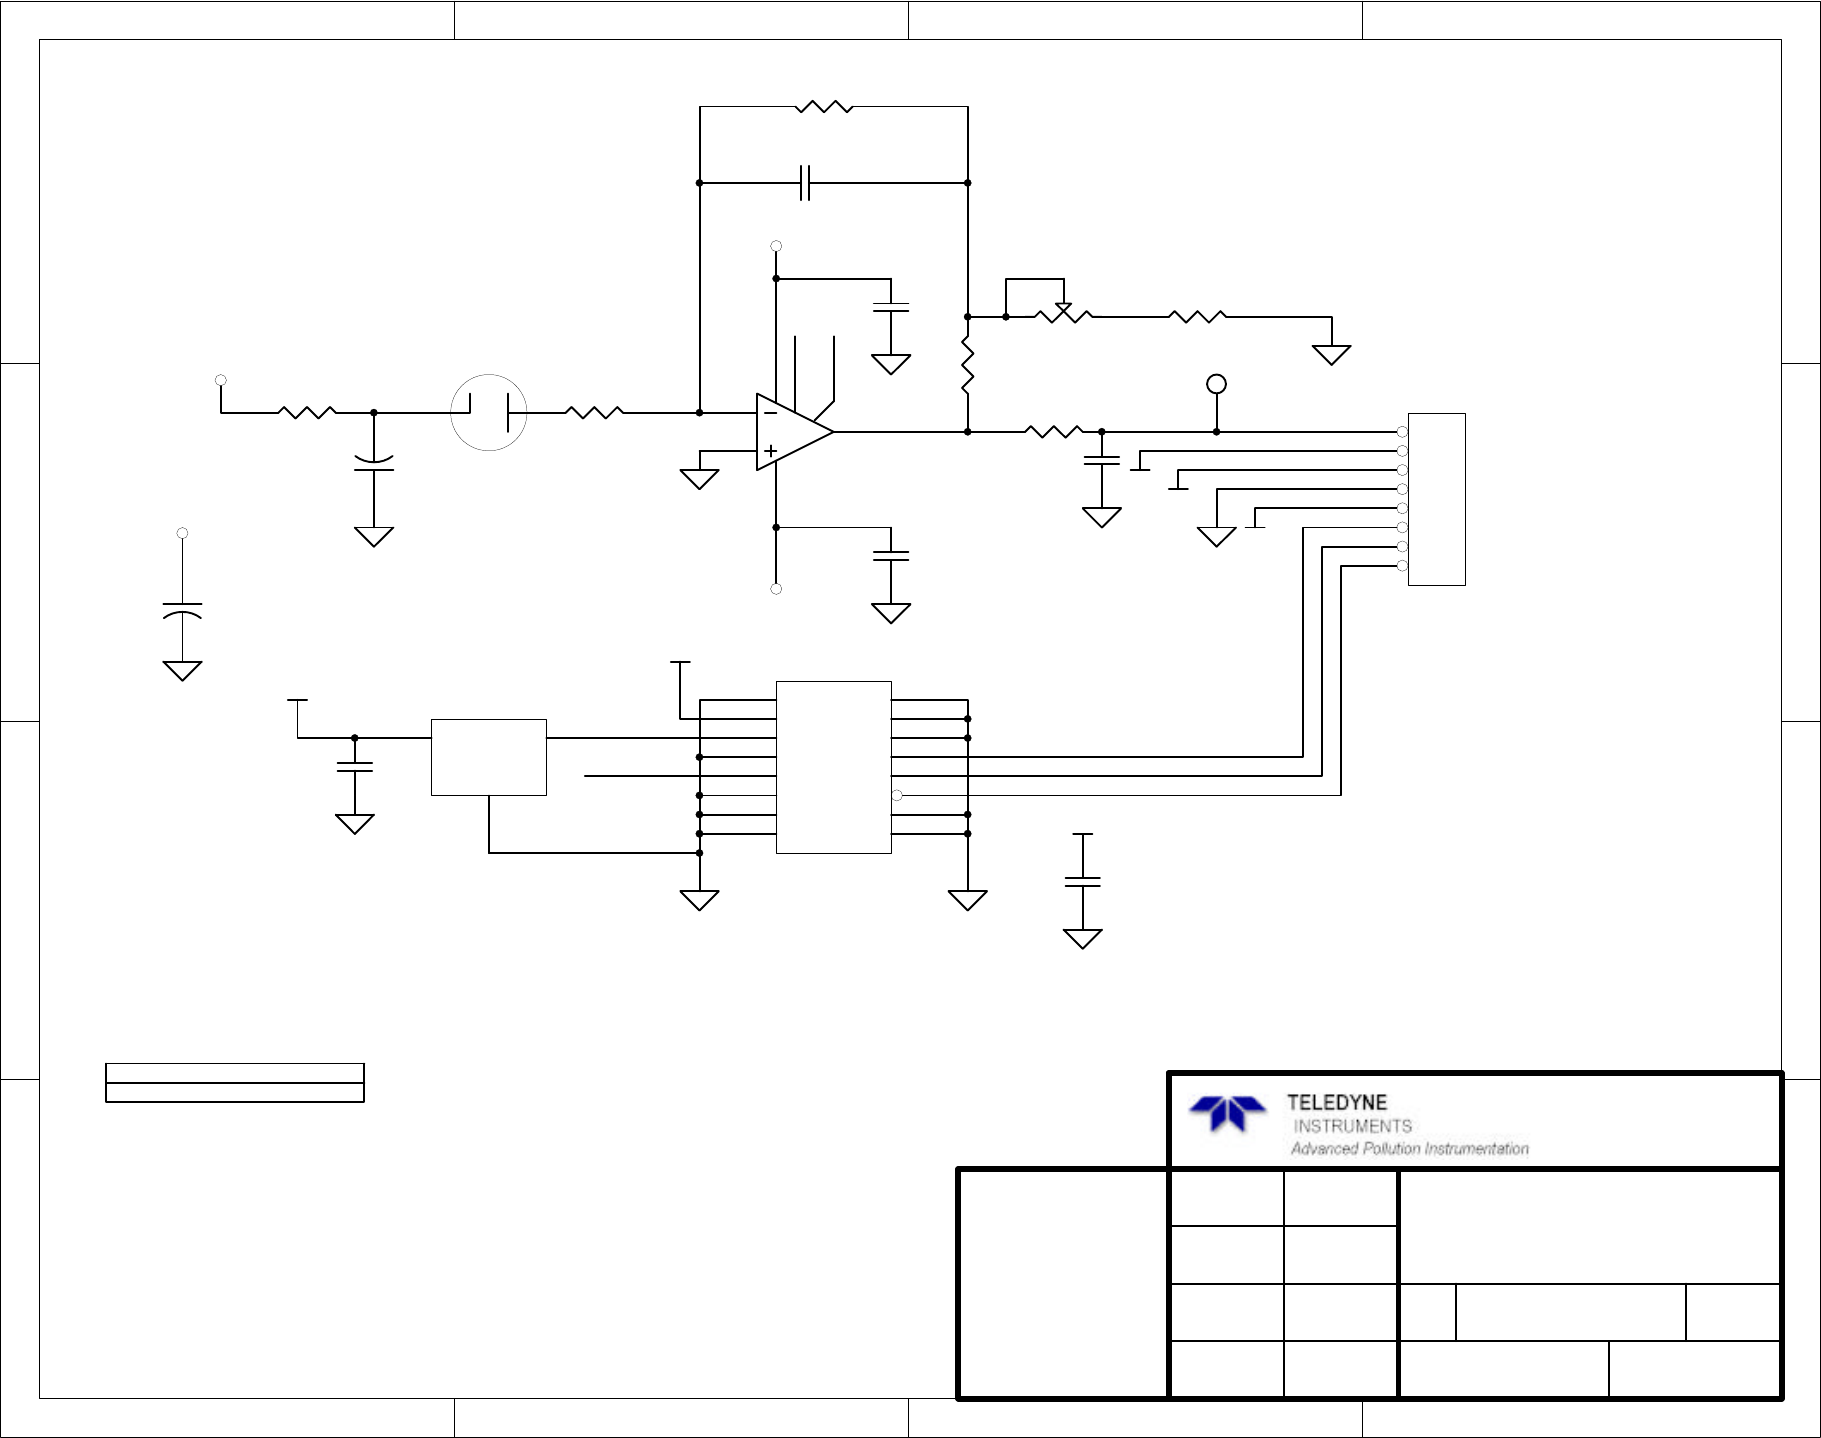
1 2 3 4
A
B
C
D
4321
D
C
B
A
APPROVALS
DRAWN
CHECKED
APPROVED
DATE
SIZE DRAWING NO. REVISION
SHEET
The information herein is the
property of API and is
submitted in strictest con-
Unauthorized use by anyone
fidence for reference only.
for any other purposes is
prohibited. This document or
any information contained
in it may not be duplicated
without proper authorization.
PCA, UV DETECTOR PREAMP
04420 B
1 13-Aug-2004
LAST MOD.
A
of
USA
+15V
D1
PHOTOCELL
R1
SEE TABLE
C1
100pf
-15V
+15V
+C2
1.0uf
C4
0.1uf
C5
0.1uf
-15V
3
26
1
5
7 4
U1
OPA124
R2
1.0K
+
C3
1.0uF
R3
1.0K
R4
5K
VR1
5K
R5
100 1
2
3
4
5
6
7
8
J1
MICROFIT
+15V-15V
GND
1
VCC
2
REF+
3
REF-
4
IN+
5
IN-
6
GND
7
GND
8GND 9
GND 10
CS 11
SDO 12
SCK 13
F0 14
GND 15
GND 16
U2
LTC2413
VCC
IN
1
GND
3
OUT 2
VR2
LT1460S3-2.5
C6
0.1uf
+15V
PHOTO_OUT
PHOTO_OUT
REF_2.5V
C7
N.P.
VCC
R6
1.0K
TP1
TEST_PLUG
C8
0.1
VCC
PCA VERSION TABLE
04120-0000
PCA# R1
4.99M
04120-0200 2.0M
06870C DCN6332
D-13
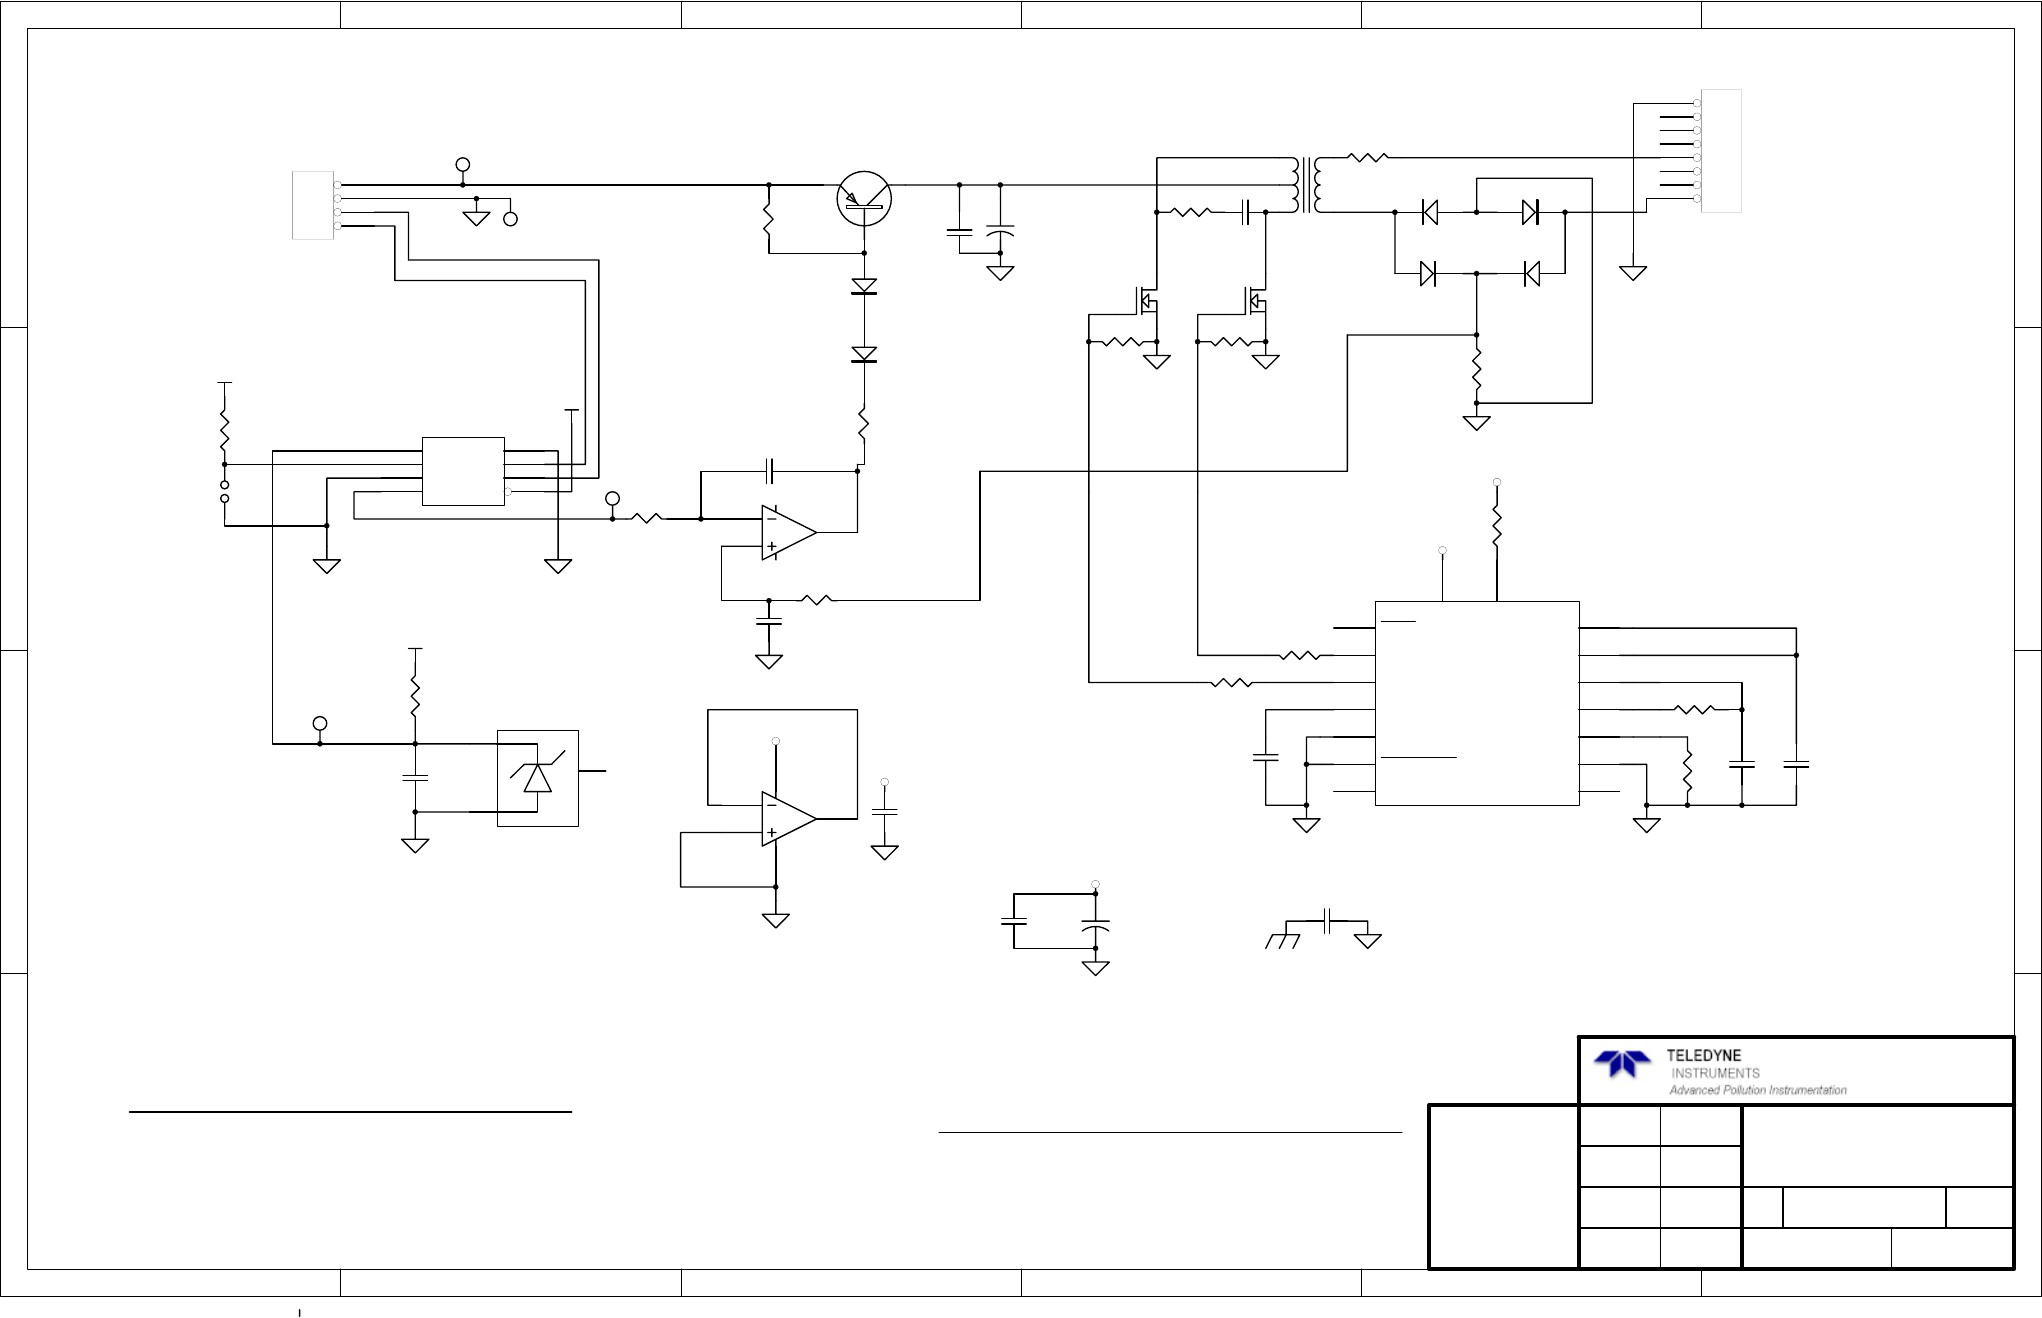
123456
A
B
C
D
6
54321
D
C
B
A
APPROVALS
DRAWN
CHECKED
APPROVED
DATE
SIZE DRAWING NO. REVISION
SHEET
The information herein is the
property of API and is
submitted in strictest con-
Unauthorized use by anyone
fidence for reference only.
for any other purposes is
prohibited. This document or
any information contained
in it may not be duplicated
without proper authorization.
SCH, UV LAMP DRIVER, M450
04421 A
111-Aug-2002
LAST MOD.
B
of
Q1
TIP126
D1
1N4148
D2
1N4148
T1
PE-6196
Q3
IRF520
Q2
IRF520
R2
5.1K
R3
5.1K
R4
100
C4
.01
R12
22
R13
22
R5
4.7K, 2W
+15V
+15V
R14
10
+15V
R16
3.9K
R15
150
C11
.0047
C12
0.1
C9
0.1
3
2
1
84
U1A
LM358
5
6
7
U1B
LM358
C6
.033
C5
.01
+15V
D3
1N4148
D5
1N4148
D4
1N4148
D6
1N4148
R6
330
1
2
3
4
5
6
7
8
P2
LAMP OUTPUT
C2
0.1 +C3
220
+15V
+C1
470
C8
0.1
C10
0.1
KL 3/4/97
C13
0.1
+15V
1 2
RP2A
4.7K
3 4
RP2B
4.7K
5 6
RP2C
4.7K
7 8
RP2D
4.7K
DATE CHANGE DESCRIPTION INITIALREV.
8/1/02 INITIAL RELEASE KLA
Vdd
1
A0
2
A1
3
Vout
4PD 5
SCL 6
SDA 7
GND 8
U3
AD5321-RM8
R1
2.21K
+15V
C7
1.0UF
VCC
VCC
OUTPUT A
11
OUPUT B
14
SOFT START
8
INV. INPUT
1
SHUTDOWN
10 GROUND 12
RT 6
DISCHARGE 7
CT 5
NONINV. INPUT 2
VREF 16
VCC 15
VC 13
SYNC
3
OSC. OUTPUT
4COMP 9
U2
SG3525
3
1
2
VR2
LM4040CIM3
TP1
TEST_PLUG
TP2
TEST_PLUG
TP3
TEST_PLUG
TP4
TEST_PLUG
R7
3.9K
VCC
VREF
1
2
3
4
P1
HEADER 4
JP1
JUMPER2
NOTE: THIS SCHEMATIC APPLIES TO THE FOLLOWING PCA'S:
PCA# NOTE
04166-0000 M400E BENCH AND IZS LAMP SUPPLY
SHUNT INSTALLED IN J1 FOR BENCH SUPPLY
SHUNT NOT INSTALLED IN J1 FOR IZS SUPPLY
CHANGE NOTES
D-14
06870C DCN6332
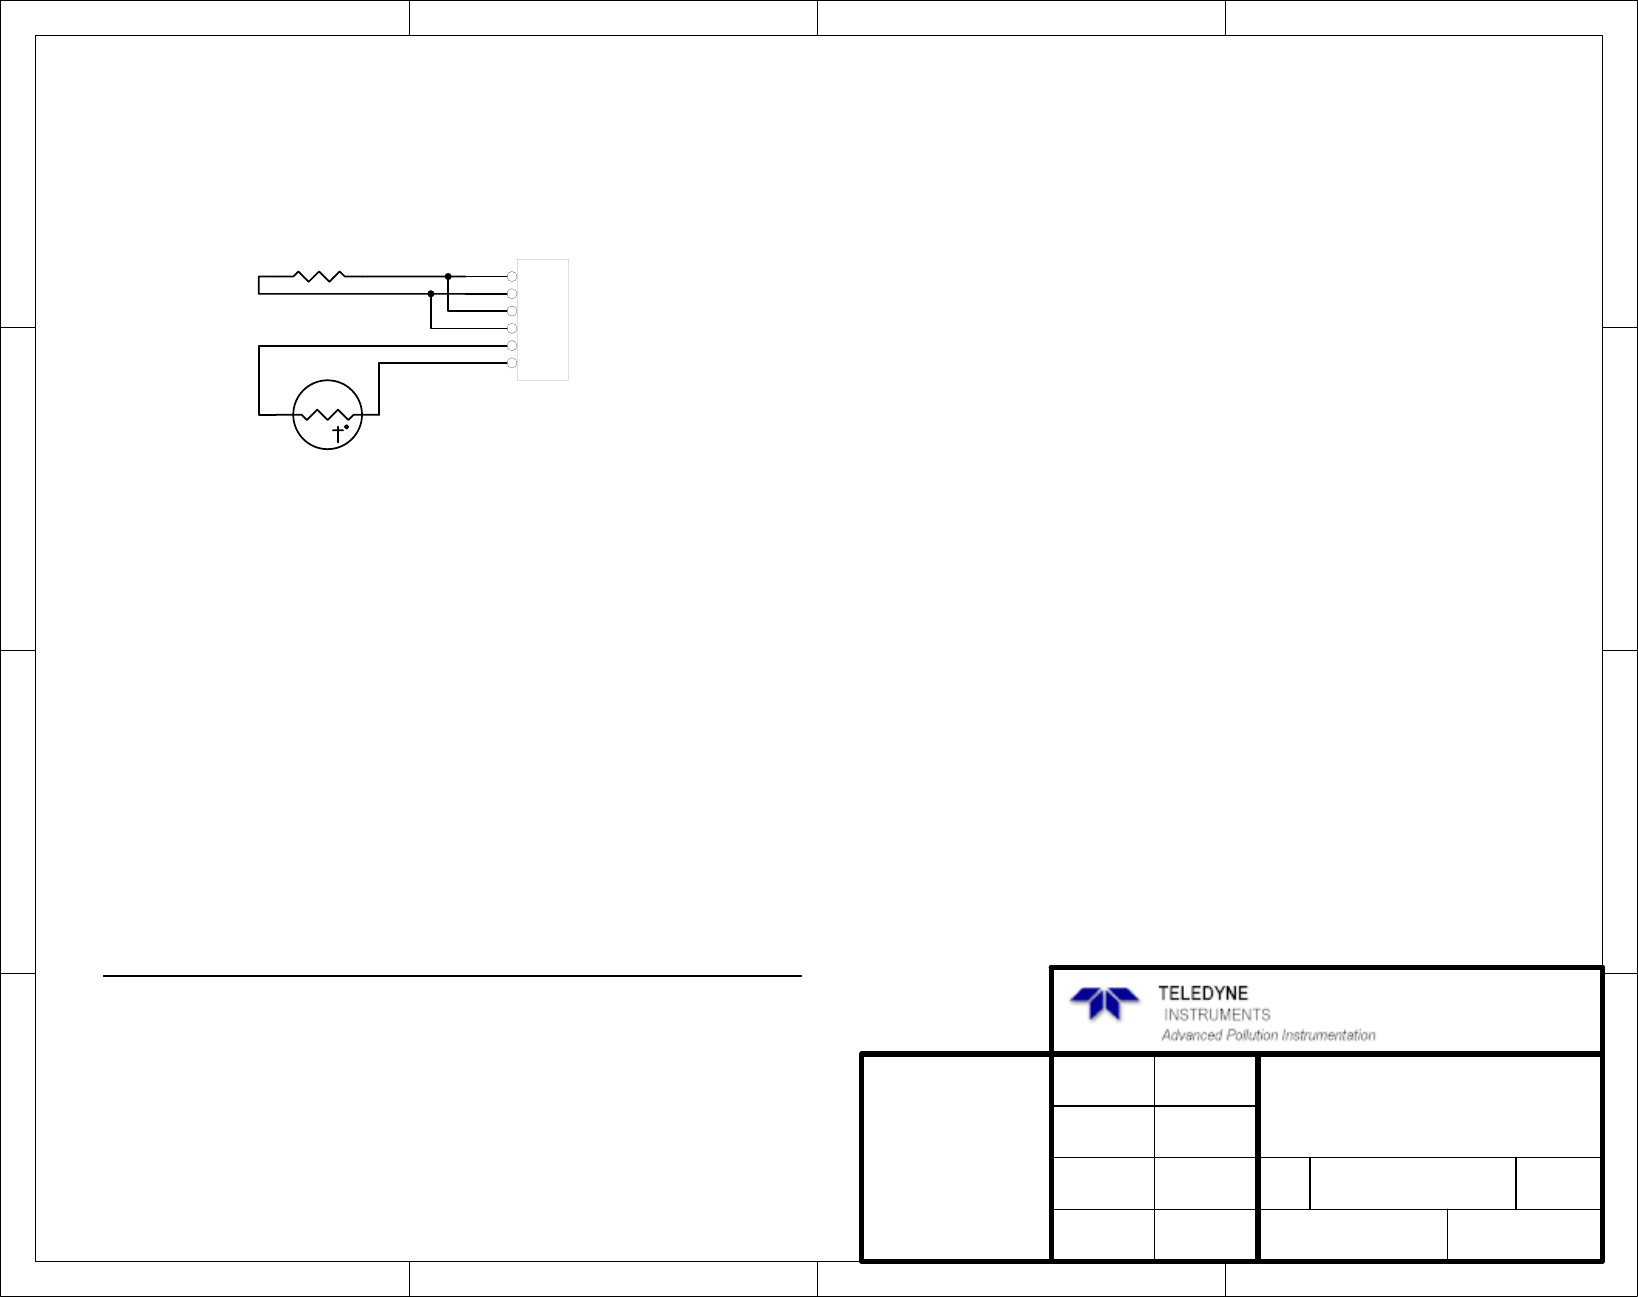
1234
A
B
C
D
4
321
D
C
B
A
APPROVALS
DRAWN
CHECKED
APPROVED
DATE
SIZE DRAWING NO. REVISION
SHEET
The information herein is the
property of API and is
submitted in strictest con-
Unauthorized use by anyone
fidence for reference only.
for any other purposes is
prohibited. This document or
any information contained
in it may not be duplicated
without proper authorization.
SCH, DC HEATER/THERMISTOR
04422 A
111-Aug-2002
LAST MOD.
B
of
R1
30R, 50W
TH1
THERMISTOR
1
2
3
4
5
6
J1
HEADER 6
Rev Date Change Description Eng
A 8/1/02 Initial release for PCA schematic KL
06870C DCN6332
D-15
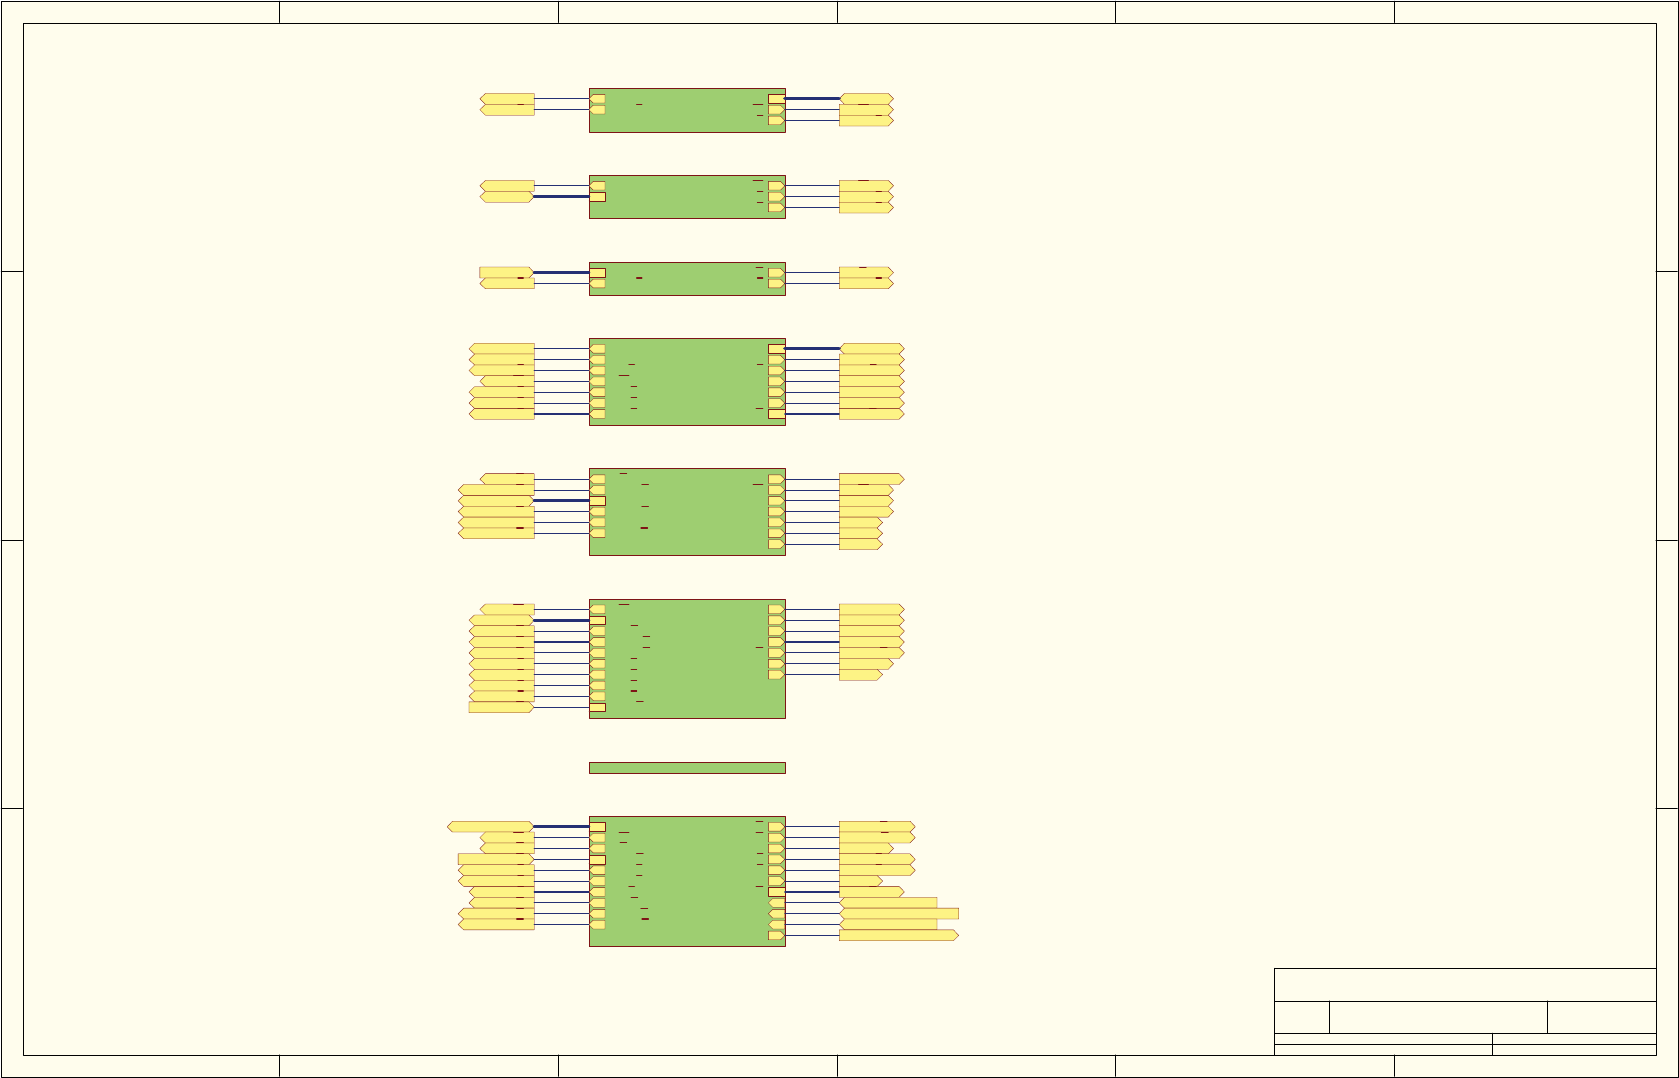
$
%
&
'
'
&
%
$
7LWOH
1XPEHU 5HYLVLRQ6L]H
2UFDG%
'DWH 0D\ 6KHHWRI
)LOH 1?3&%0*5?5-(VHULHV0RWKHUERDUG*HQHUDWLRQ?6RXUFH?EGGE'UDZQ%\
6FKHPDWLFIRU(6HULHV*0RWKHUERDUG3&$31
%
'>@
,2:
,25
6+'$&
',*,2
',*,2
7(03
'$&9
:5'$&
9)352*
&+*$,1
9)5($'
6+'1
',*,2
',*,2
7&
6+'1
,&B5(6(7
,&B'59B567
,&B5(6(7
,&B'59B567
3&,)
E3VFK
'>@ '>@
,2:
,25
6+'$&
',*,2
',*,2
7(03
'$&9
:5'$&
9)352*
&+*$,1
9)5($'
6+'1
',*,2
',*,2
7&
6+'1
,&B5(6(7
,&B'59B567
,&B5(6(7
,&B'59B567
VKHHW
E3VFK
,2:
'>@
'$&9
&6'$&$
&6'$&%
'$&
'$&
'$&
'$&
6+'$&
'$&9
'$&9
'$&9
'$&9
:5'$&
95()
7&
$1$287
E3VFK
,2:
'>@ '>@
'$&9
&6'$&$
&6'$&%
'$&
'$&
'$&
'$&
6+'$&
'$&9
'$&9
'$&9
'$&9
:5'$&
95()
7&
,25
9)5($'
'>@
9)352*
'$&08;
&+*$,1
7(0308;
,2:
6+'1
95()
7&
7&
7&
$1$,1
E3VFK
,25
9)5($'
'>@ '>@
9)352*
'$&08;
&+*$,1
7(0308;
,2:
6+'1
95()
7&
7&
7&
7(0308;
'$&08;
7(03
,2:
'$&
'$&
'$&
'>@
'$&9
'$&
'$&9
'$&9
'$&9
6+'1
6(1625,1
E3VFK
7(0308;
'$&08;
7(03
,2:
'$&
'$&
'$&
'>@
'>@
'$&9
'$&
'$&9
'$&9
'$&9
6+'1
'>@
',*,2
,25
',*,2
',*,1
E3VFK
'>@ '>@
',*,2
,25
',*,2
6+'1
'>@
,2:
',*,2
',*,2
',*287
E3VFK
6+'1
'>@ '>@ ,2:
',*,2
',*,2
6+'1
',*,2
'>@
,2:
',*,2
',*287
E3VFK
6+'1
',*,2
'>@
'>@
,2:
',*,2
D-16
06870C DCN6332
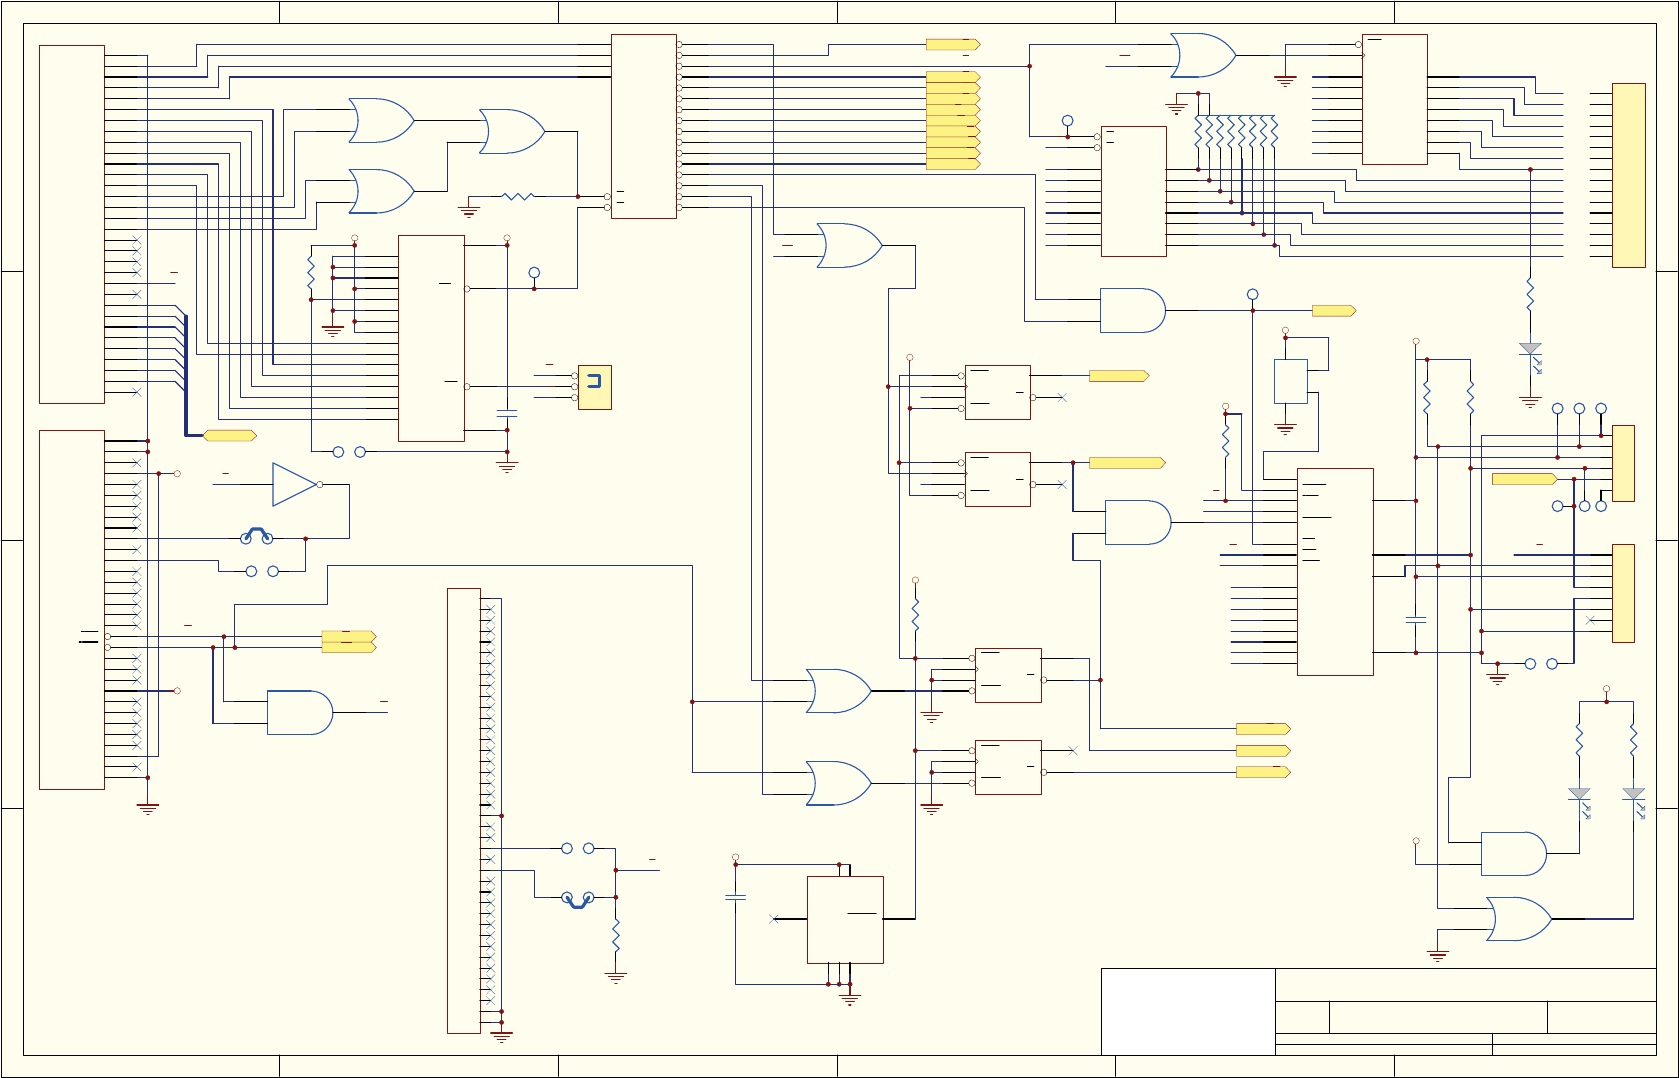
$
%
&
'
'
&
%
$
7LWOH
1XPEHU 5HYLVLRQ6L]H
2UFDG%
'DWH 0D\ 6KHHWRI
)LOH 1?3&%0*5?5-(VHULHV0RWKHUERDUG*HQHUDWLRQ?6RXUFH?EGGE'UDZQ%\
6FKHPDWLFIRU(6HULHV*0RWKHUERDUG3&$31
%
$
$
$
'
'
,2:
$
$
'
,25
6<6&/.
'
'
'
'
'
$
$
$
$
$
$
,17
;(
;'
,2(1
$(1
$
$
$
$
$
$
(1$%
,17
'
'
'
'
'
'
,2:
'
'
,2:
'
'
'
'
'
'
'
'
'
'
,25
'
'
'
,25
'
'
'
',*,2
,54 .%,17
73
$
$
$
$
$
$
$
$
*
*
<
<
<
<
<
<
<
<
8
+&
-
0,&52),7
&
51 .[
'
&/.
4
4
35(
&/5
8%
+&
*1'
$
,2&+(&.
'
'
'
'
'
'
'
'
,2&+5'<
$(1
$
$
$
$
$
$
$
$
$
$
$
$
$
$
$
$
$
$
$
-$
3&
*1'
5(6(7'59
9
,54
9
'54
9
(1';)5
9
.(<
60(0:
60(05
,2:
,25
'$&.
'54
'$&.
'54
5()5(6+
6<6&/.
,54
,54
,54
,54
,54
'$&.
7&
%$/(
9
26&
*1'
*1'
-%
3&
5
N
5
.
$
$
$
$
$
$
$
$
%
%
%
%
%
%
%
%
(1
3 4
9&&
*1'
8 +&
'
'
'
'
'
'
'
'
&/.
2&
4
4
4
4
4
4
4
4
8+&
&
X)FHUDPLF
73
$
%
&
'
*
*
<
<
<
<
<
<
<
<
<
<
<
<
<
<
<
<
8 +&
-3
,'&+($'(5
&
X)FHUDPLF
8$
+&
'
&/.
4
4
35(
&/5
8$ +&
-
3&&'
-3
,'&+($'(5
5
N
8%
+&
,$&.
,17
9&&
$
6'$
966
5'
&6
:5
5(6(7
'%
'%
'%
'%
'%
'%
'%
'%
6&/
&/.
8 3&)
-3 ,'&+($'(5
73
5
.
-
,1/,1(
8'
+&
5
.
9&&
9&&
*1'
*1'
:',
5(6(7
*1'
8
/7&&6
;
-,72'&)2+0
&
X)9
'>@
,2:
,25
6+'$&
',*,2
',*,2
7(03
'$&9
:5'$&
9)352*
&+*$,1
9)5($'
6+'1
',*,2
',*,2
7&
6+'1
,&B5(6(7
,&B5(6(7
,&B'59B567
9&&
9&&
9
9&&
9&&
9&&
9&&
9&&
$''5 ['()$8/7
5
N
5
127,167$//('
'2
'2
'2
'2
'2
'2
'2
',
',
',
',
',
',
',
',
'2
'2
'2
'2
'2
'2
'2
'2
',
',
',
',
',
',
',
',
6&/
6'$
'*1'
-
0,&52),7
.%,17
'
' '
&/.
4
4
35(
&/5
8% +&
'
&/.
4
4
35(
&/5
8$
+&
9&&
'2
,54
5
.
'6
/('5('VPW
8
$+&*8
-3
,'&+($'(5
$''5 [-3,167$//('
$(1
,2(1
,2:
-3
+($'(5'()$8/7('
VKRUWHGVOGUVLGH
-3
VKRUWHGVOGUVLGH
-3
6'$
6&/
'*1'
9&&
1RWHV
7KLVVFKHPDWLFLVIRU3&$
7KLVVFKHPDWLFLVIRU3&%
3LQVVKRUWHGRQ3&%
;&
;)
$
$
$
$
$
$
$
$
$
$
$
$
$
$
$
$
9&&
8&
+&
'6
'6
6&/ 6'$
5
5
9&&
9&&
9&&
''
''
56
,&
,&
%/8( %/8(
6'$
6&/
8'
+&
8&
+&
8'
+&
8$
+&
8$
+&
73
73
73
73
73
73
,&
8%
+&
8&
+&
8'
+&
06870C DCN6332
D-17
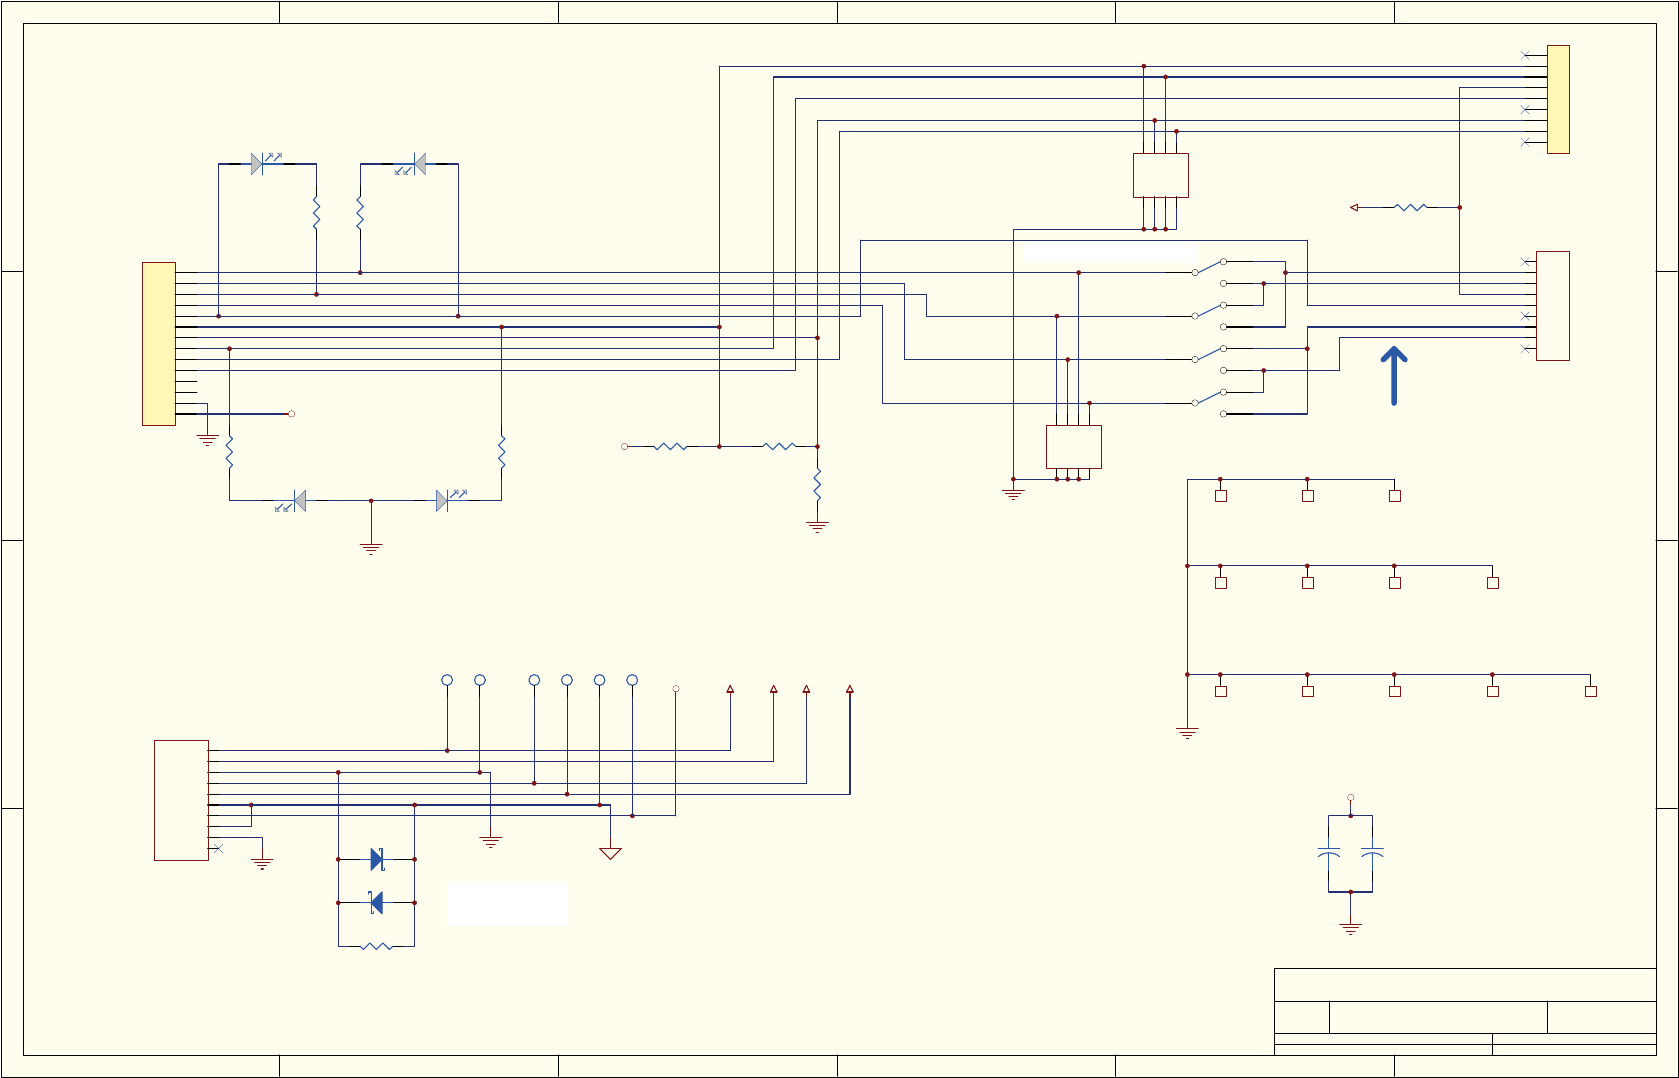
$
%
&
'
'
&
%
$
7LWOH
1XPEHU 5HYLVLRQ6L]H
2UFDG%
'DWH 0D\ 6KHHWRI
)LOH 1?3&%0*5?5-(VHULHV0RWKHUERDUG*HQHUDWLRQ?6RXUFH?EGGE'UDZQ%\
6FKHPDWLFIRU(6HULHV*0RWKHUERDUG3&$31
%
07
02817,1*+2/(
73
9
5(7
'*1'
9
9
$*1'
9
$*1'
(*1'
&+$6*1'
-
02/(;
6:
6:6/,'(3'7
79$55$<
79
60'$/&&
79$55$<
79
60'$/&&
-
,1/,1(
5
.
1&
5;'
7;'
1&
*1'
1&
576
&76
1&
-
'%0
$.
'6
/('*51VPW
5
127,167$//('
$ .
'6
/('5(' 5
N
73
73
5
.
73
5
127,167$//('
5
127,167$//('
73
73
9 99&& 95(79
9
-
'%)(0$/(
7;
&76
56*1'
5;
7;
576
&76
56*1'
5;
576
9&&
07
02817,1*+2/(
07
02817,1*+2/(
07
02817,1*+2/(
07
02817,1*+2/(
07
02817,1*+2/(
07
02817,1*+2/(
07
02817,1*+2/(
07
02817,1*+2/(
'
&
(
V
L
GH
R
I
VZ
L
WF
KL
V
V
L
GH
WRZD
U
GV
S
LQ
7;IRU&RP
5;IRU&RP
9&&
5;
7;
576
&76
56*1'
'7(
&
X)97$17$/80
9&&
&
X)97$17$/80
'
0%56&7
'
0%56&7
5
127,167$//('
''5PXVWEH
ZLWKLQRI-
''B
=
02817,1*+2/(
=
02817,1*+2/(
=
02817,1*+2/(
'6
/('5('
'6
/('*51
5
.
5
.
7;IRU&RP 5;IRU&RP
D-18
06870C DCN6332
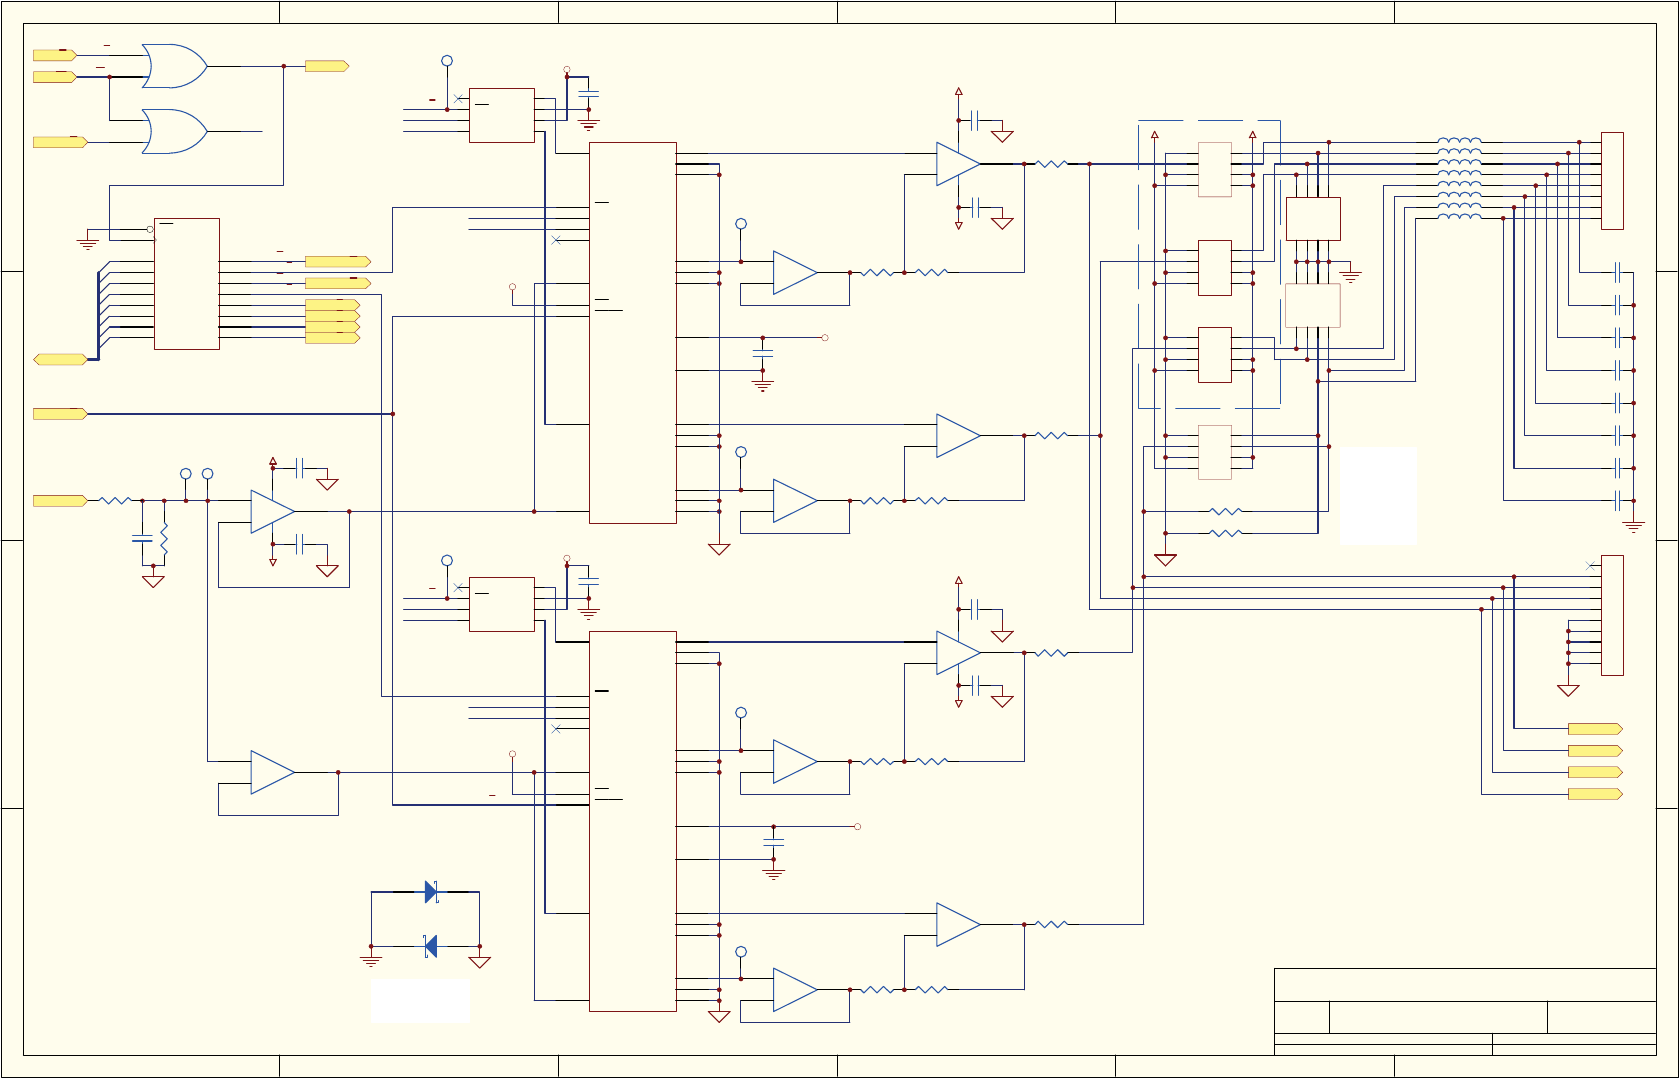
$
%
&
'
'
&
%
$
7LWOH
1XPEHU 5HYLVLRQ6L]H
2UFDG%
'DWH 0D\ 6KHHWRI
)LOH 1?3&%0*5?5-(VHULHV0RWKHUERDUG*HQHUDWLRQ?6RXUFH?EGGE'UDZQ%\
6FKHPDWLFIRU(6HULHV*0RWKHUERDUG3&$31
%
'
&/.
'
&/.
&6'$&$
&
X)FHUDPLF
&/.
',1
92$
*1'
&6
92%
'287
9&&
8 '$&%,7
73
8&
23$8$
:
$*1'
:
$*1'
%
$*1'
$
'*1'
:
$
$
56
$*1'
:
$
%
9&&
%
&/.
6'2
6+'1
&6
%
6',
8 327',*,7$/
73
&
X)FHUDPLF
&
X)FHUDPLF
5
N
5
.
73
5
N
8$
23$8$
&
X)FHUDPLF
8'
23$8$
8%
23$8$
5
.
6+'$&
'$&9
'$&9
9&&
9&&
9
9
'$&
'8$/'$&$
5
5
'
0%56&7
'
0%56&7
'DQG'
0XVWEHORFDWHG
ZLWKLQRI8
'
&/.
6+'$&
'
&/.
&6'$&%
&
X)FHUDPLF
8%
23$8$
8'
23$8$
73
:
$*1'
:
$*1'
%
$*1'
$
'*1'
:
$
$
56
$*1'
:
$
%
9&&
%
&/.
6'2
6+'1
&6
%
6',
8 327',*,7$/
&/.
',1
92$
*1'
&6
92%
'287
9&&
8 '$&%,7
5
N
5
.
&
X)FHUDPLF
8$
23$8$
8&
23$8$
&
X)FHUDPLF
73
&
X)FHUDPLF
5
.
5
N
73
'$&9
'$&9
9
9&&
9&&
9
'$&
'$&
'8$/'$&$
5
5
'$&9
-
,'&
-
,'&
-
,'&
-
0,&52),7
*
*
*
*
-
7(50%/2&.
99
$1$/2*92/7$*(&855(172873876
,62/$7('0$237,21$/%2$5'6
/
/
/
/
)(%($'
/
/
/
)(%($'
&
S)
&
S)
&
S)
&
S)
&
S)
&
S)
&
S)
&
S)
/
'$&9
'$&9
'$&9
9&&
9&&
'$&9
'
'
'
'
'
'
,2:
'
&/.
'
&65$1*(
&65$1*(
8&
+&
8%
+&
,2:
'$&9
:5'$&
7&
'
'
'
'
'
'
'
'
&/.
2&
4
4
4
4
4
4
4
4
8 +&
'>@
'$&5$1*(2))6(7352*5$0
&6'$&$
&6'$&%
'$&
'$&
'$&
'$&
&6'$&%
&6'$&$
&
X)FHUDPLF
&
X)FHUDPLF
&
X)FHUDPLF
5
N
5 .
73
95()
9
9
''B
56
73
8$
23$
8%
23$
62&.(78
62&.(78
-
+($'(5,'&
79$55$<
79
60'$/&&
79$55$<
79
60'$/&&
5
5
,QVWDOO-IRU
P$RQWK
FKDQQHO
,QVWDOO5
5LIP$
RQWKFKDQQHO
QRWXVHG
56
06870C DCN6332
D-19
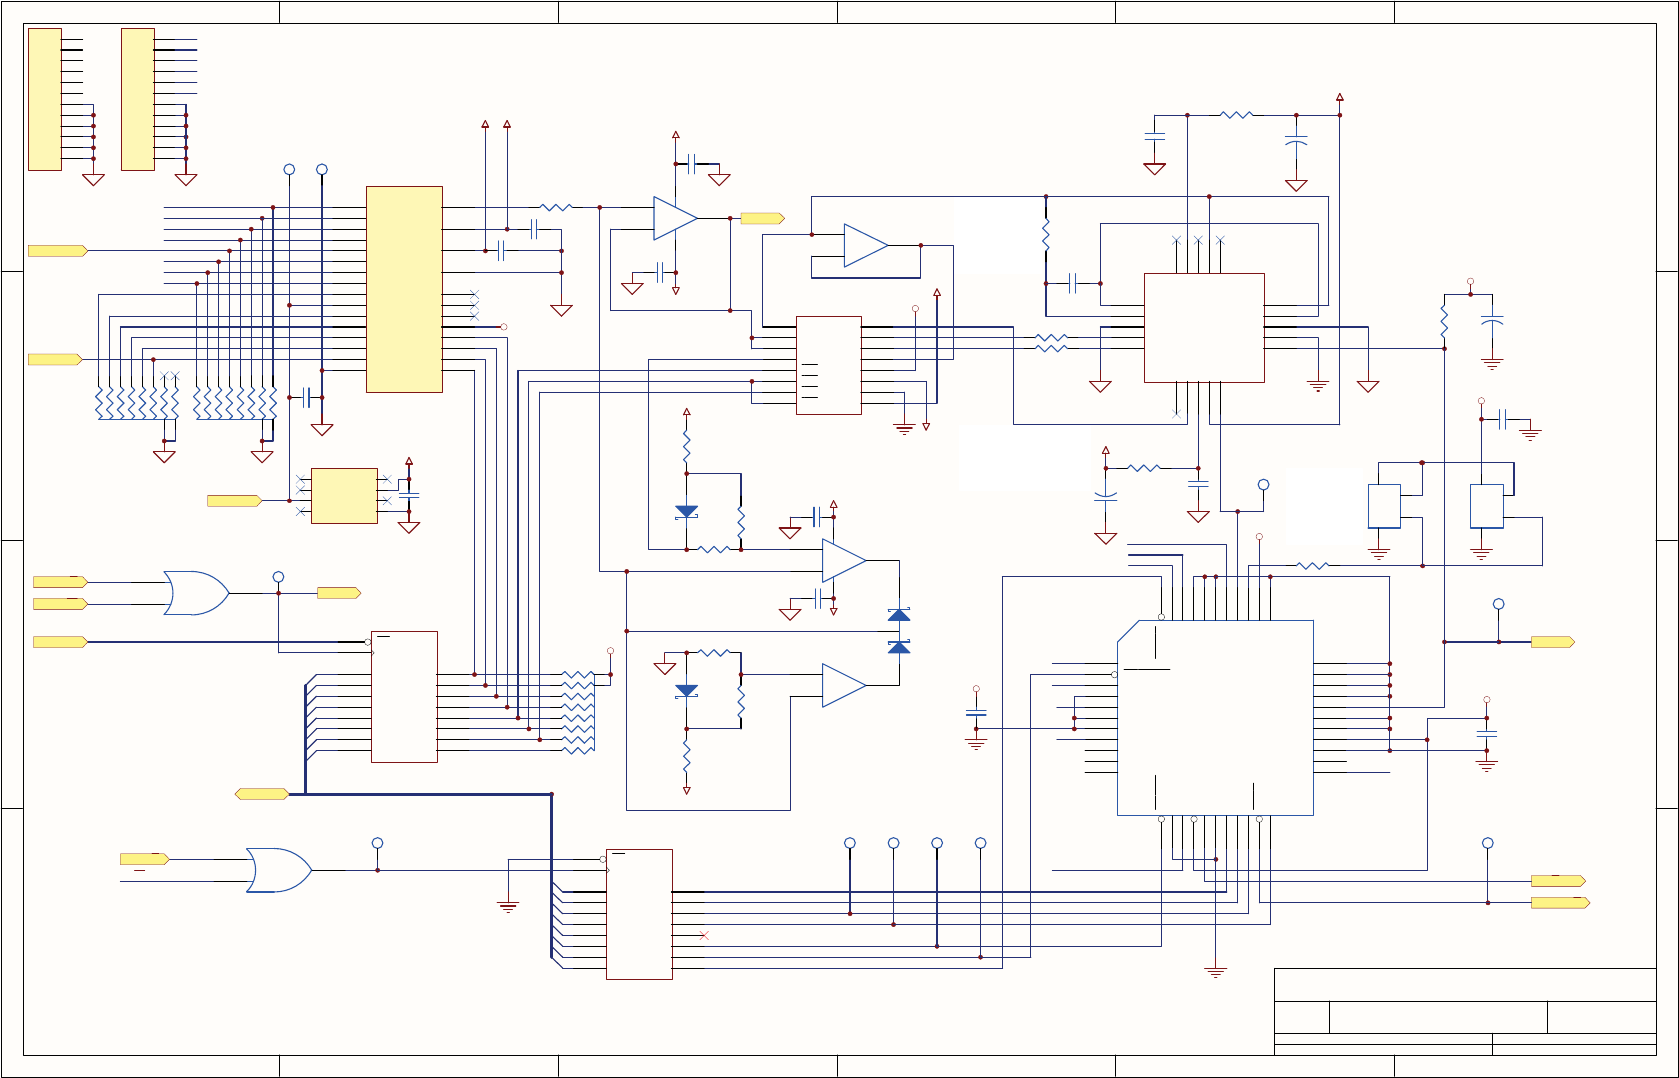
$
%
&
'
'
&
%
$
7LWOH
1XPEHU 5HYLVLRQ6L]H
2UFDG%
'DWH 0D\ 6KHHWRI
)LOH 1?3&%0*5?5-(VHULHV0RWKHUERDUG*HQHUDWLRQ?6RXUFH?EGGE'UDZQ%\
,2:
&+
&+
&+
&+
&+
&+
&+
&+
&+
6%
0,'
6$
6&
06%
'
'
'
'
/6%
67$57
'
6(/
'
6(/
&+
&+
'
'
'
'
'
'
'
'
'
'
'
'
'
'
'
'
'
'
73
;
-,72'&$$(0+=
&
X)97$17$/80
73
-
0,&52),7
&
X)FHUDPLF
& X)FHUDPLF
5
.
&
X)9FHUDPLF
73
,1
,1
,1
,1
,1
,1
,1
,1
,1
1&
966
1&
,1
,1
,1
,1
(1%
$
$
$
$
95()
,1
*1'
,1
966
287
,1
8
$108;
&
X)97$17$/80
73
73
5
1&
9,1
75,0
9287
15
1&
*1'
1&
8
92/7$*(5()
&
X)FHUDPLF
73
&
X)FHUDPLF
&
X)FHUDPLF
&
X)FHUDPLF
&
X)9
'
'
'
'
'
'
'
'
&/.
2(
4
4
4
4
4
4
4
4
8
+&
&
X)FHUDPLF
&
X)9
73
&26
2379
96
&/.
)287
9,
9,
*1'
$*1'
&203
&203
23287
1&
96
23
23
5()
9,
1&
1&
8
$'.3
'
'
'
'
'
'
'
'
&/.
2(
4
4
4
4
4
4
4
4
8
+&
73
5
5
73
-
0,&52),7
5
;
0%+0+=
&
X)97$17$/80
5
0&+,3
&
X)FHUDPLF
7,(
7,(
7,(
7,(
7,(
)5(4
7,(
7,(
*1'
'%
7,(
'%
,&/.
7,(
'%
5'0%<7(
9&&,2
6(/
67$57
7'2
7',
706
7&.
5'06%
9)&/.
'%
'%
7,(
7,(
'%
9&&,17
5'/6%
5($'
6&
6%
*1'
,25
9&&,17
'%
7,(
6$
'%
7,(
*1'
8
;LOLQ[&3/'
&
X)FHUDPLF
&
51
.[
'
6
96
*1'
6
'
,1
,1
6
,1
,1
'
6
96
9&&
'
8
'*'<
,25
9)5($'
'>@
9)352*
'$&08;
&+*$,1
7(0308;
,2:
6+'1
95()
7&
7&
7&
9
9&&
9
9&&
9
9&&
9
9
9
9&&
9
9&&
9&&
9
9&&
9
&
51 .[
&
51 .[
&+
&+
&+
&+
&+
&+
&+
&+
&+
&+
&+
&+
&+
73
95()
73
$*1'
5
3/$&(
2+0
5(6,6725$6
&/26($6
3266,%/(72
;$1';
5LQGXFHVDQ
RIIVHWLQDQDORJ
VLJQDOWRJLYHD
OLYHIRUVHQVRUV
ZLWKRUVOLJKWO\
QHJDWLYHRXWSXW
5DQG5UHGXFHWKHJDLQ
IRUDQDORJLQSXWVE\VR
WKDWZHFDQUHDGVOLJKWO\
DERYHIXOOVFDOHWRSUHYHQW
RYHUIORZRI$'&UHDGLQJ
9&&
6FKHPDWLFIRU(6HULHV*0RWKHUERDUG3&$31
%
,&
23$8$
&
X)
&
X)
9
9
,&
8%
/)
8$
/)
5
.
5
.
5
.
5
.
5
.
5
.
9
'
%$6
9
''
' %$6
' %$6
56
56
5 . $'&95()
95()&/,3
&$B
56
''
56
8$
23$
8%
23$
8$
+&
8%
+&
D-20
06870C DCN6332
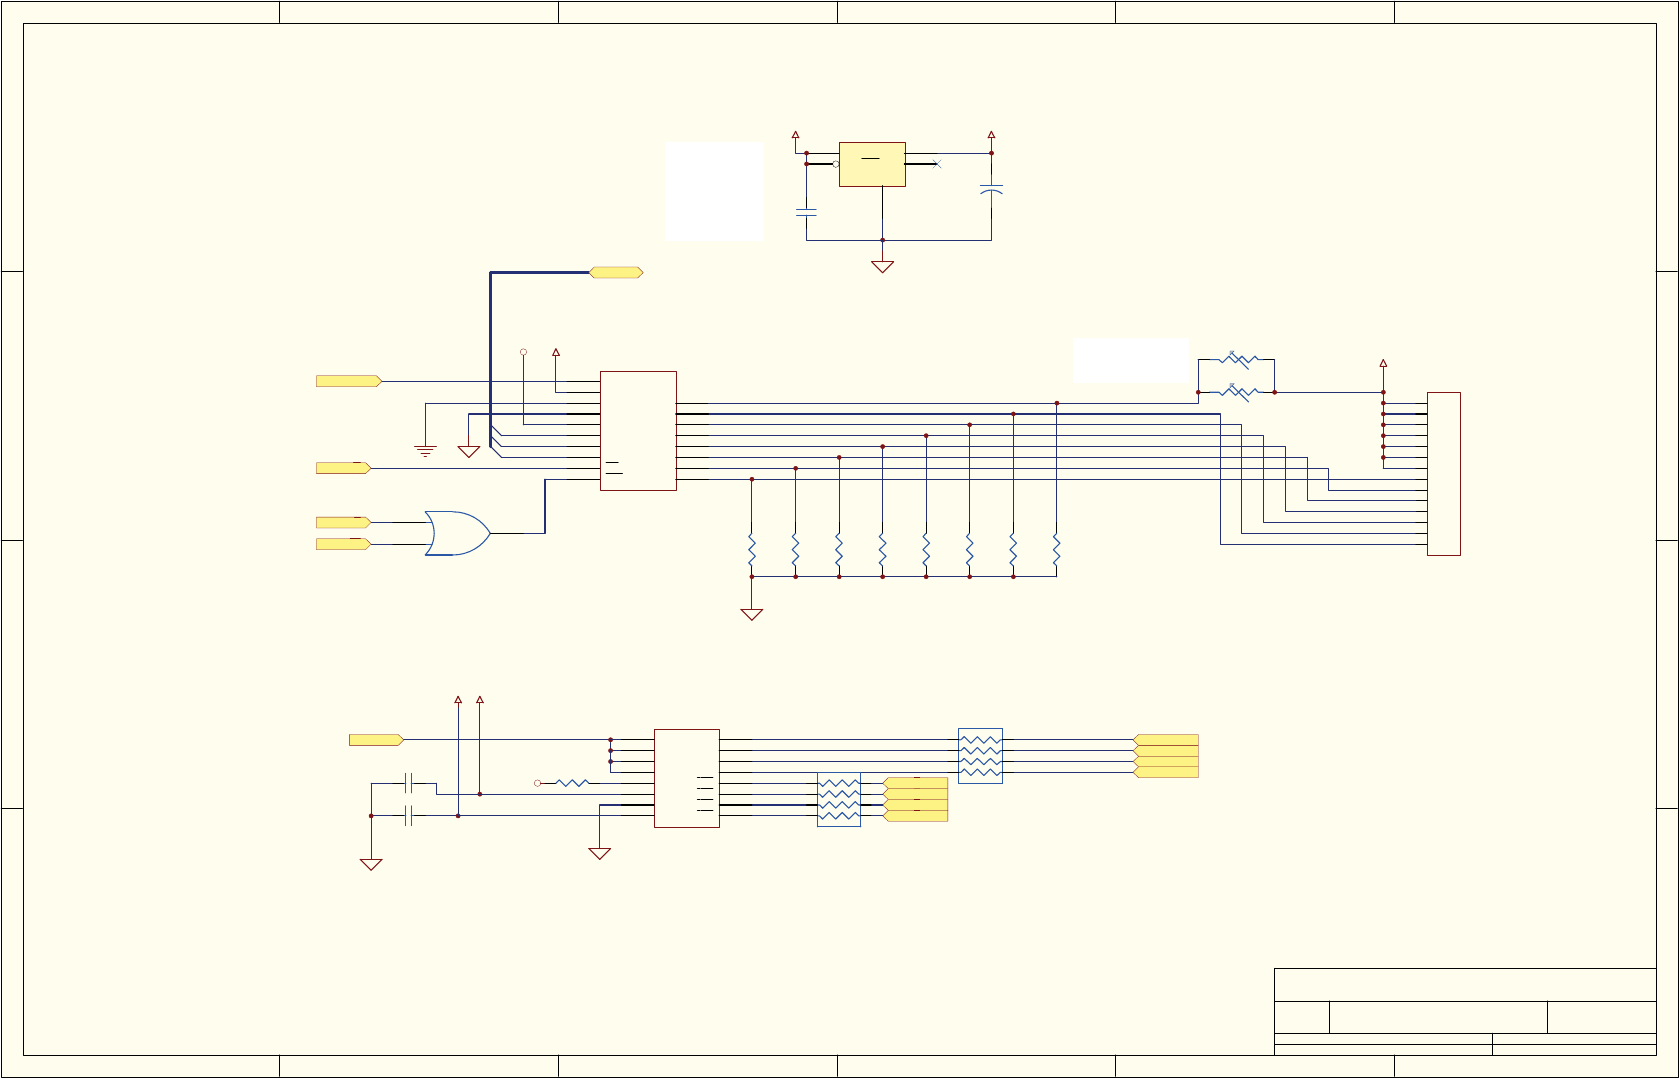
$
%
&
'
'
&
%
$
7LWOH
1XPEHU 5HYLVLRQ6L]H
2UFDG%
'DWH 0D\ 6KHHWRI
)LOH 1?3&%0*5?5-(VHULHV0RWKHUERDUG*HQHUDWLRQ?6RXUFH?EGGE'UDZQ%\
6FKHPDWLFIRU(6HULHV*0RWKHUERDUG3&$31
%
'$&9
'$&9
'$&9
'$&9
'
'
'
& X)FHUDPLF
& X)FHUDPLF
51 .[
$
(1%
9
,1
,1
,1
,1
287
,1
:5
$
*1'
966
,1
,1
,1
$
56
8
0$;&:1
'
6
96
*1'
6
'
,1
,1
6
,1
,1
'
6
96
9&&
'
8
'*'<
-
0,&52),7
;7
7+(50,67(5
7(0308;
'$&08;
7(03
,2:
'$&
'$&
'$&
'>@
'$&9
'$&
'$&9
'$&9
'$&9
6+'1
99
9$1$
9&&
9&& 9
9$1$9
51 .[
5 .
7+(50,67(5
7+(50,67(5
7+(50,67(5
7+(50,67(5
7+(50,67(5
7+(50,67(5
7+(50,67(5
7+(50,67(5
,1
212))
287
1&
*1'
8
/3,0
&
X)
%<3$66&$36
0867%(:,7+,1
2)7+(
5(*8/$725
,1387287387
3,16
&
X)97$17$/80
5
.
56 5
.
5
.
5
.
5
.
5
.
5
.
5
.
7+(50,67(5
7+(50,67(5
7+(50,67(5
7+(50,67(5
7+(50,67(5
7+(50,67(5
7+(50,67(5
7+(50,67(5
8'
+&
;7
7+(50,67(5
,QVWDOO;7WKURXJKKROH
25;760'
EXWQRWERWK
06870C DCN6332
D-21
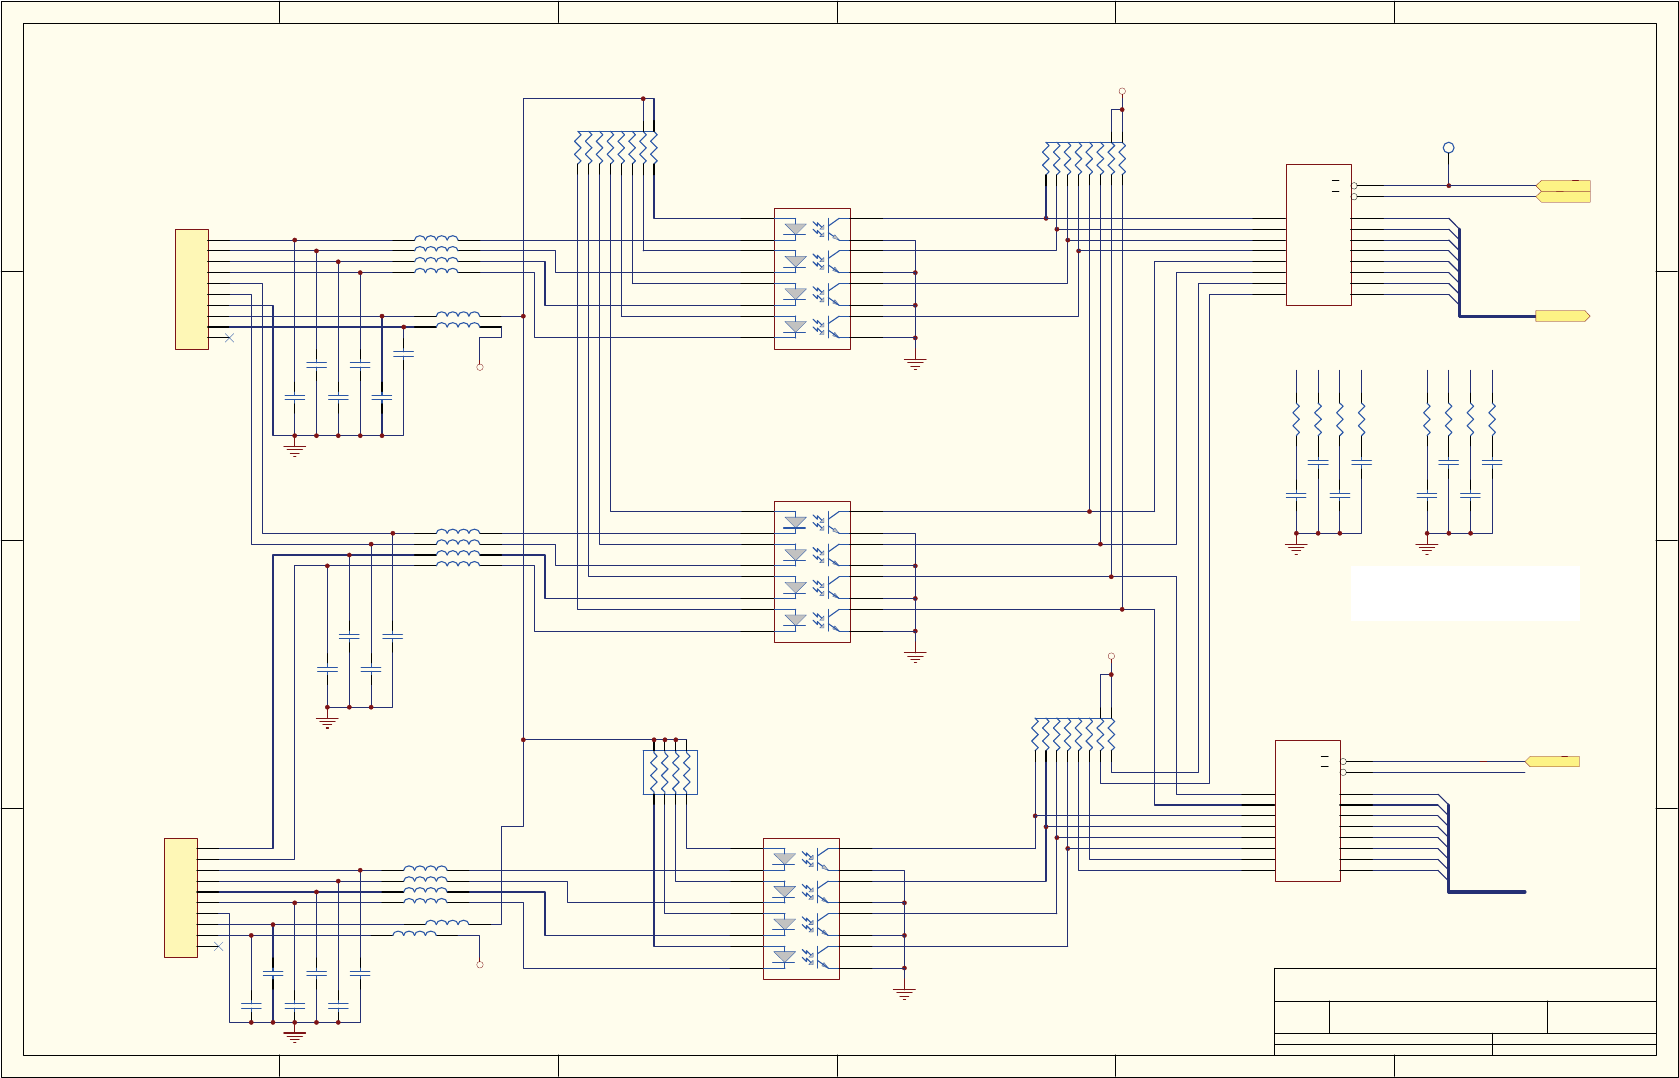
$
%
&
'
'
&
%
$
7LWOH
1XPEHU 5HYLVLRQ6L]H
2UFDG%
'DWH 0D\ 6KHHWRI
)LOH 1?3&%0*5?5-(VHULHV0RWKHUERDUG*HQHUDWLRQ?6RXUFH?EGGE'UDZQ%\
6FKHPDWLFIRU(6HULHV*0RWKHUERDUG3&$31
%
'
'
'
'
'
'
'
'
'>@
,25
'
'
'
'
'
'
'
'
$
$
$
$
$
$
$
$
*
*
<
<
<
<
<
<
<
<
8
+&
-
7(50%/2&.
73
-
7(50%/2&.
51
[
8
36
$
$
$
$
$
$
$
$
*
*
<
<
<
<
<
<
<
<
8
+&
8
36
8
36
'>@
',*,2
,25
',*,2
9&&
9&&
(;7(51$/
&21752/
,1
$
(;7(51$/
&21752/
,1
%
(;7B9B287
(;7B9B287
/
/
/ )(%($'
/
/
/
/)(%($'
/
/
/
/
)(%($'
/
&
S)
&
&
&
S)
&
S)
&
&
&
S)
&
S)
&
&
&
S)
&
51
[
&
51
.[
&
51
.[
&
S)9
&
&
&
S)9
&
S)9
&
&
&
S)9
5
5
5
5
5
5
5
5
'
'
'
'
'
'
'
'
3ODFHWKHVHWHUPLQDWLRQUHVLVWRUVDWWKHHQGRIHDFKGDWD
OLQH(DFKGDWDOLQH
VKRXOGEHODLGRXWDVDGDLV\FKDLQWKHVLJQDOSDVVLQJ
IURPRQH,&WRWKHQH[W
&
&
/
/
&
&
/
/
D-22
06870C DCN6332
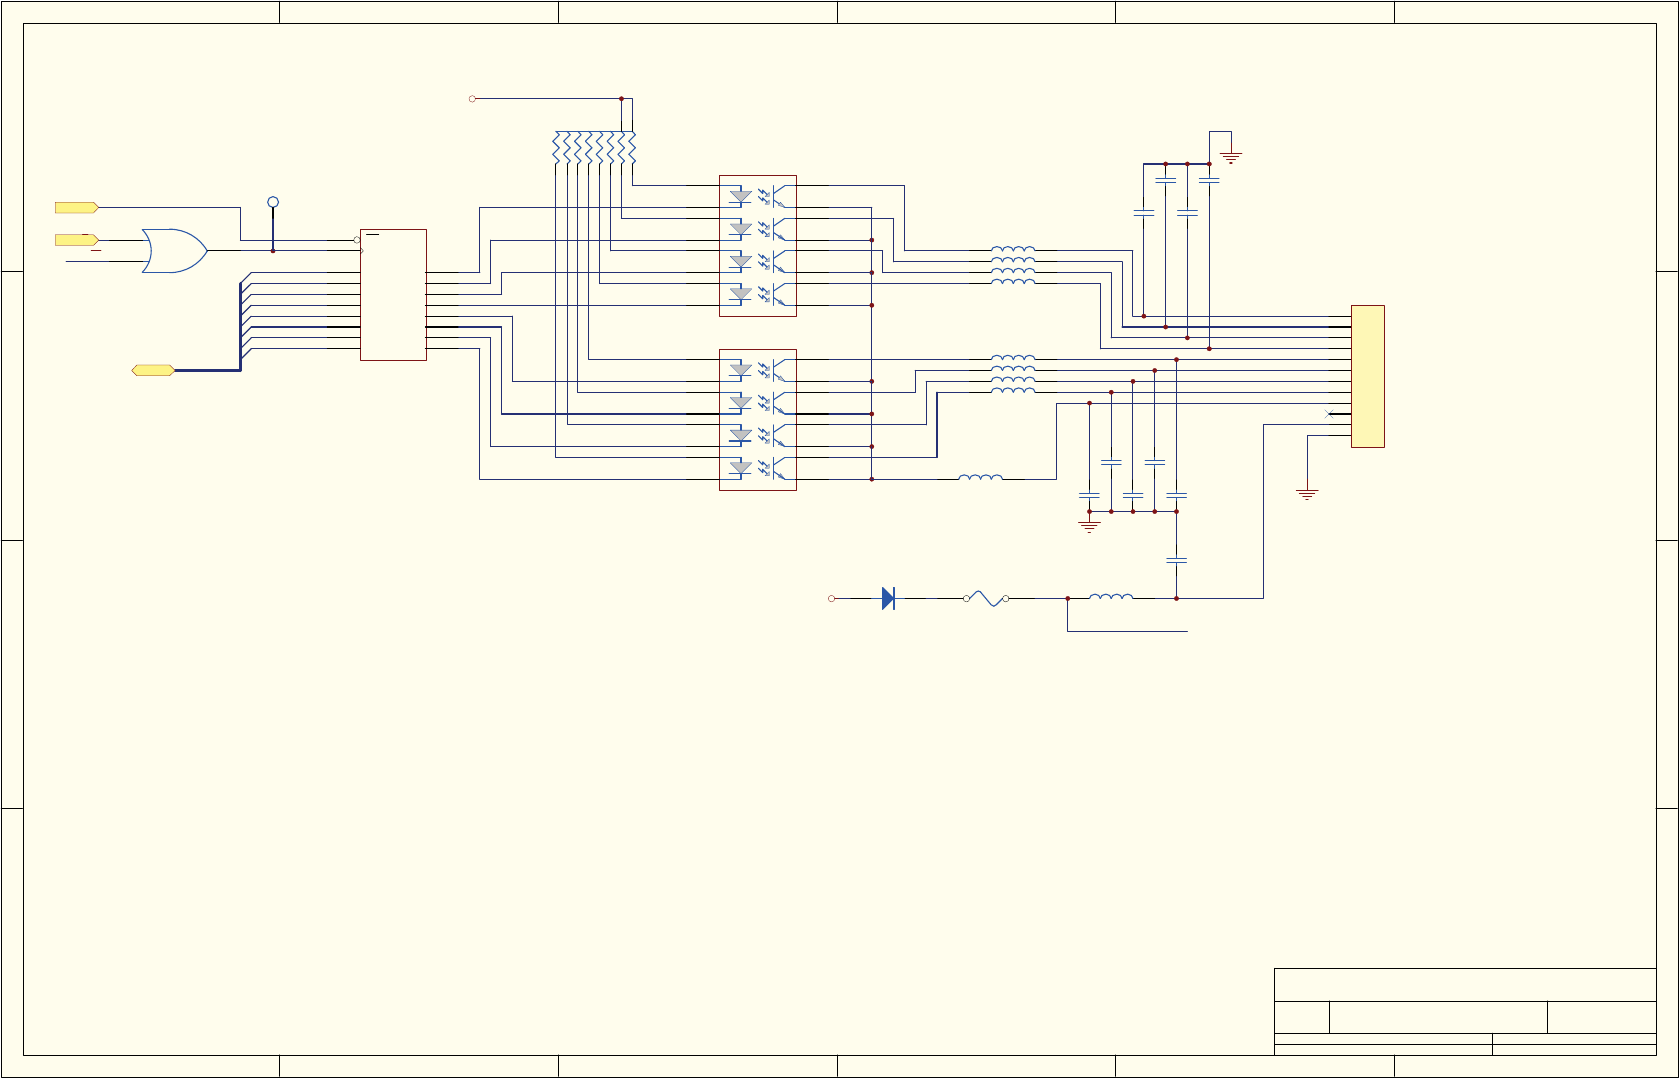
$
%
&
'
'
&
%
$
7LWOH
1XPEHU 5HYLVLRQ6L]H
2UFDG%
'DWH 0D\ 6KHHWRI
)LOH 1?3&%0*5?5-(VHULHV0RWKHUERDUG*HQHUDWLRQ?6RXUFH?EGGE'UDZQ%\
6FKHPDWLFIRU(6HULHV*0RWKHUERDUG3&$31
%
'
'
'
,2:
'
6+'1
'
'
'
'
73
8 36
'
'
'
'
'
'
'
'
&/.
2(
4
4
4
4
4
4
4
4
8
+&
8 36
-
7(50%/2&.
6+'1
'>@
',*,2
9&&
9&&
'
',2'(6&+277.<
)
5(6(77$%/()86($9
/
/
/ )(%($'
/
/
/
/ )(%($'
/
&
S)
&
&
&
S)
&
S)
&
&
&
S)
(;7B9B287
&
51
[
/
)(%($'
/
)(%($'
&
&
8%
+&
06870C DCN6332
D-23
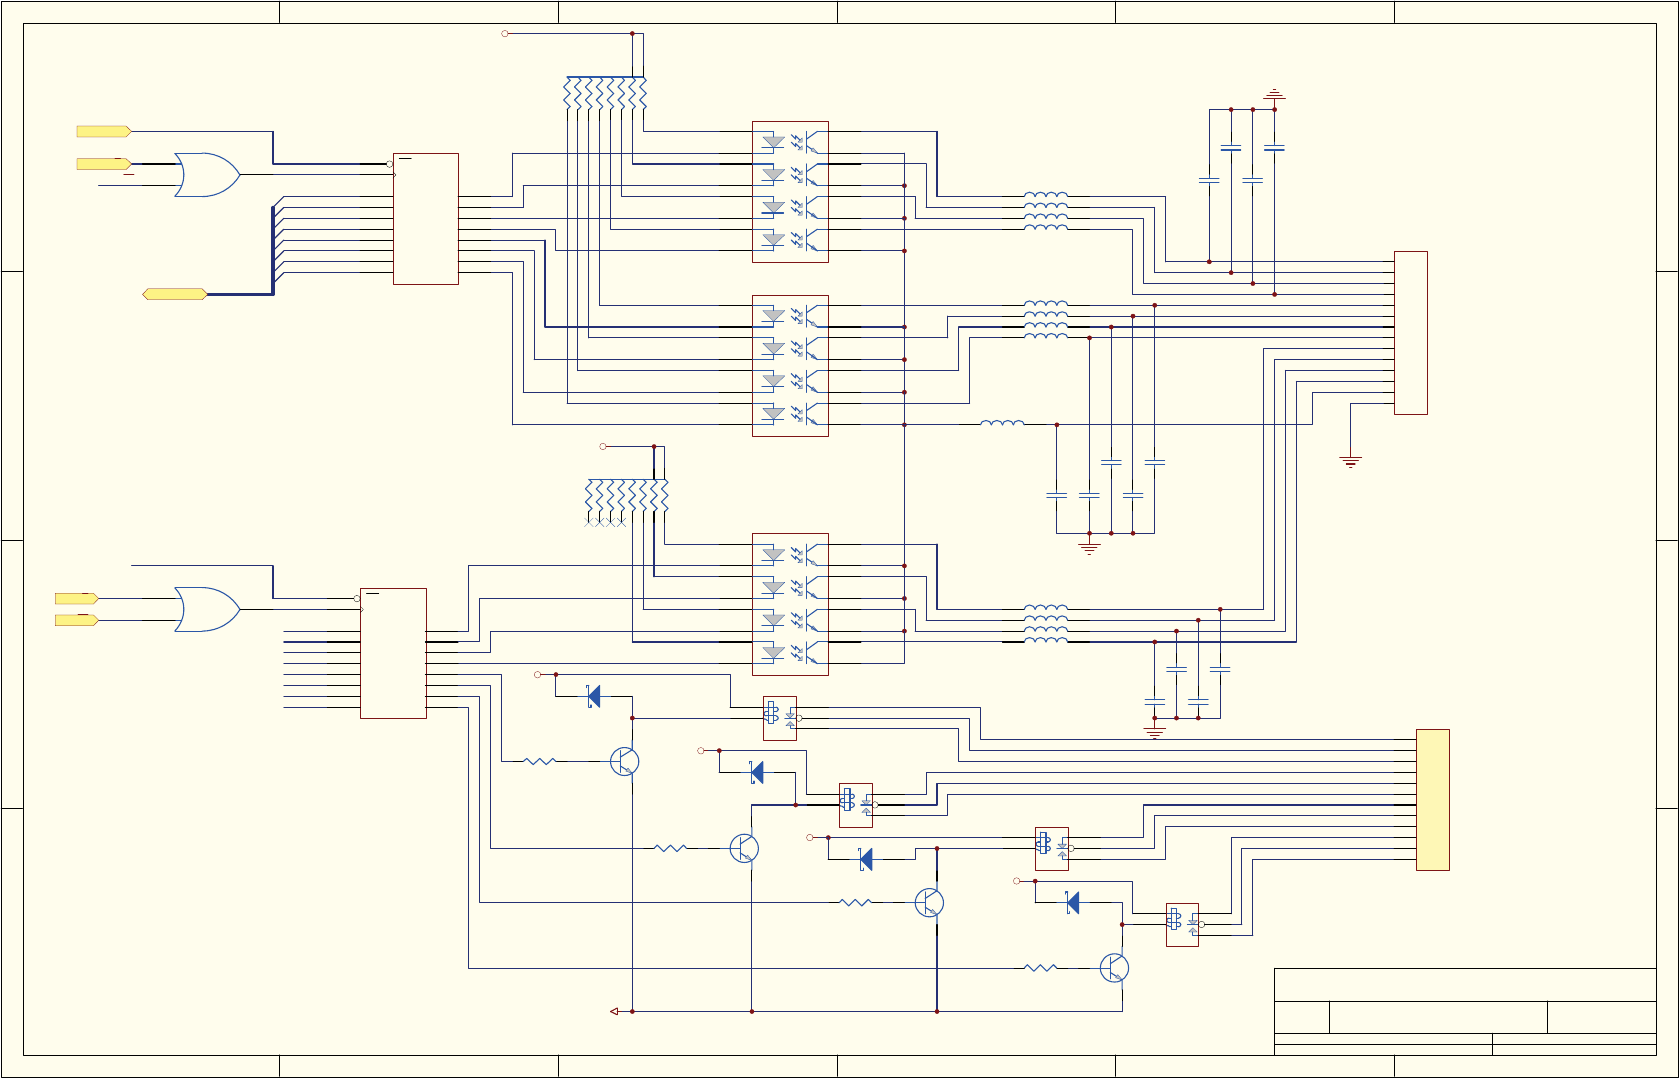
$
%
&
'
'
&
%
$
7LWOH
1XPEHU 5HYLVLRQ6L]H
2UFDG%
'DWH 0D\ 6KHHWRI
)LOH 1?3&%0*5?5-(VHULHV0RWKHUERDUG*HQHUDWLRQ?6RXUFH?EGGE'UDZQ%\
6FKHPDWLFIRU(6HULHV*0RWKHUERDUG3&$31
%
,2:
6+'1
'
'
'
'
'
'
'
'
'
6+'1
'
'
'
'
'
'
'
4
62
5
.
.
5(/$<63'7
5
.
. 5(/$<63'7
-
7(50%/2&.
4
62
5
.
.
5(/$<63'7
'
'
'
'
'
'
'
'
&/.
2(
4
4
4
4
4
4
4
4
8
+&
4
62
8 36
5 .
.
5(/$<63'7
4
62
8 36
'
'
'
'
'
'
'
'
&/.
2(
4
4
4
4
4
4
4
4
8
+&
-
7(50%/2&.
8 36
6+'1
',*,2
'>@
,2:
',*,2
9&&
9&&
9
9
9
9
95(7
(;7(51$/
5($53$1(/
$/$502873876
'
',2'(6&+277.<
'
',2'(6&+277.<
'
',2'(6&+277.<
'
',2'(6&+277.<
/
/
/ )(%($'
/
/
/
/ )(%($'
/
/
/
/ )(%($'
/
&
S)
&
&
&
S)
&
S)
&
&
&
S)
&
S)
&
&
&
S)
&
51
[
&
51
[
/ )(%($'
&
S)
&2B(;7B5(7
8&
+&
8$
+&
D-24
06870C DCN6332
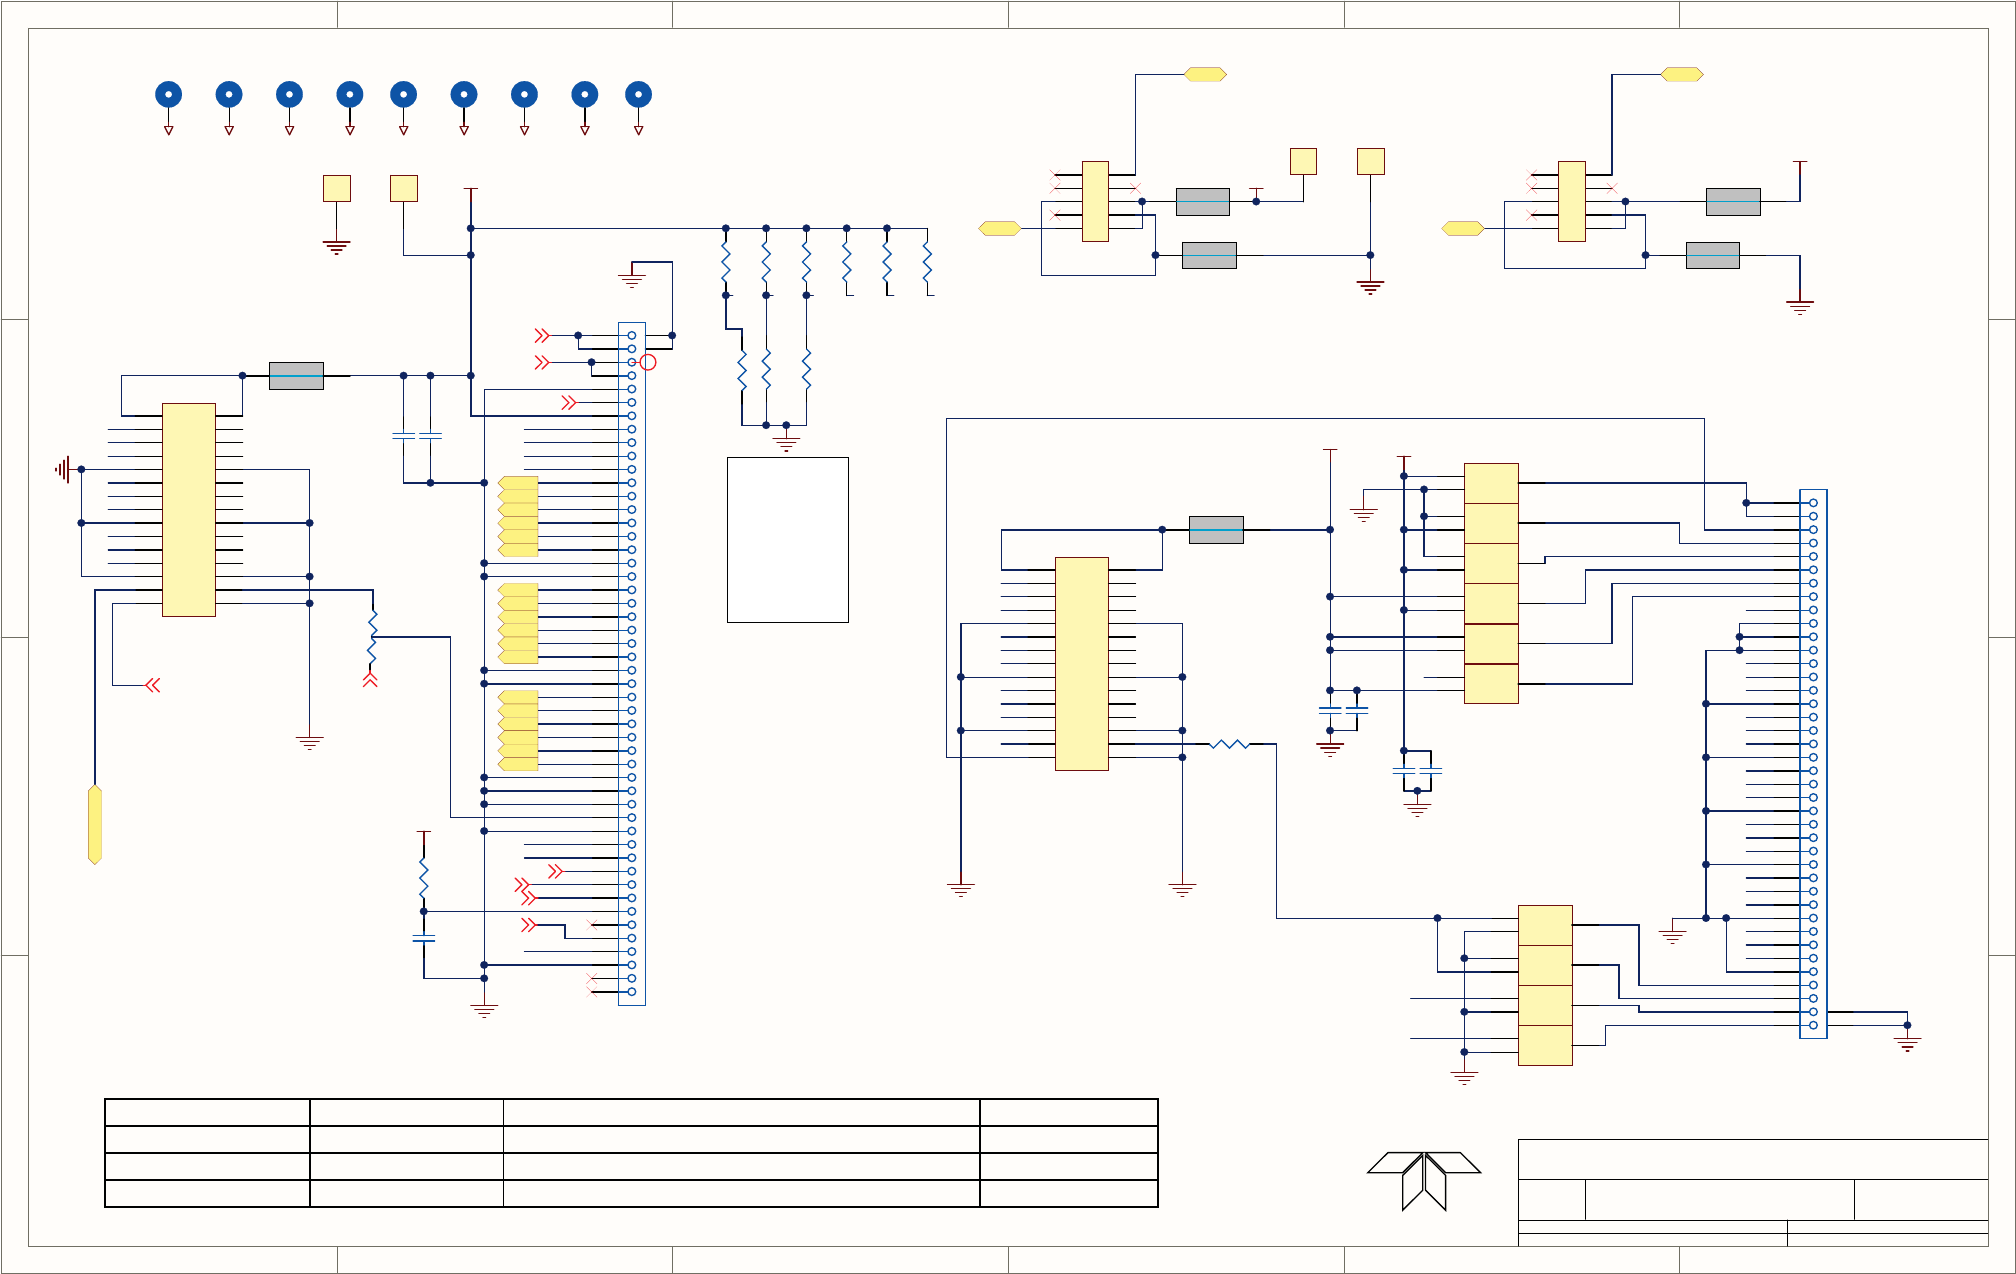
1
1
2
2
3
3
4
4
5
5
6
6
D D
C C
B B
A A
Title
Number RevisionSize
B
Date: 6/24/2010 Sheet of
File: N:\PCBMGR\..\06696.P1.R3.schdoc Drawn By:
GUI Interface
06698 D
14
2
3
4
5
6
7
8
1
51
52
9
10
11
12
13
14
15
16
17
18
19
20
21
22
23
24
25
26
27
28
29
30
31
32
33
34
35
36
37
38
39
40
41
42
43
44
45
46
47
48
49
50
GM800480X-70-TTX2NLW
J2
CL586-0529-2
Mode
aVsync
aHSync
3.3V
100K
R7
L/R
U/D
aReset
DithB
L/RU/DDithB
10K
R1
22uF/6.3V
C1
JMK316BJ226KL 0.0022
CA_112
C2
Mode
aVsync
aHSync
i BackLightDrive
aB7aB6
aB5aB4
aB3aB2
aG7aG6
aG5aG4
aG3aG2
aR6
aR5aR4
aR3aR2
aR7
aDCLK
3.3V
1.0
C7
GMK107BJ105KA
B5B4
B3B2
B1B0
G5G4
G3G2
G1G0
R4
R3R2
R1R0
R5
DEN
2
3
4
5
6
7
8
1
41
42
9
10
11
12
13
14
15
16
17
18
19
20
21
22
23
24
25
26
27
28
29
30
31
32
33
34
35
36
37
38
39
40
NI
J3
CL586-0527-7
B4
B2
B0
G4
G2
G0
R4
R2
R0
B5
B3
B1
G5
G3
G1
R3
R1
R5
DEN
DCLK
L/R
U/D
Mode
3.3V +5V
+5V
5V-GND
1
32
4
65
7
98
10
12 11
JP3
4X3 Jumper
1
32
4
65
7
98
10
12 11
13
15 14
16
18 17
JP2
6X3 Jumper
Bklght+
Bklght-
Vcom
Vgh
AVdd
Vcom
aG1
aG0
aR1
aR0
aB1
aB0
CHASSIS CHASSIS CHASSIS CHASSIS
MT1
TP1
1
2
38
5
7
4
6
10
9
J1
0039300100
1 2
3 4
5 6
7 8
9 10
11 12
13 14
15 16
17 18
19 20
21 22
23 24
25 26
27 28
29 30
B30B-PHDSS (LF)(SN)
J7
1 2
3 4
5 6
7 8
9 10
11 12
13 14
15 16
17 18
19 20
21 22
23 24
25 26
27 28
29 30
B30B-PHDSS (LF)(SN)
NI
J8
FBMH3216HM501NT
FB1
CHASSIS CHASSIS CHASSIS CHASSIS CHASSIS
Vgl
Make Model JP
2
JP
3
FEM A
G
M
800
4
80
W
1
-
2
,4-5,7-
8
,
10
-
11
,
13
-
1
4,
16
-
1
7
1
-
2
,4-5,7-
8
,
10
-
11
Dat a Image F
G0
7
00
A
0
D
S
WB
G01 3
-
2
,
6
-5,
9
-
8
,
12
-
11
,
1
5-
1
4,
18
-
1
7
2
-
3
,5-
6
,
8
-
9
,
11
-
12
United Radiant Tech. UM
S
H-
81
7
3
MD-
1
T
2
-
3
,4
/
5
/6
N
C
,7
/8/9
N
C
,
10
-
11
,
13
-
1
4,
16/ 1
7
/18
N
C2
-
3
,5-
6
,
8
-
9
,
11
-
12
Internal Dithering
0 = Enable
1 = Disable
Scan Direction
U/D L/R Scan Dir.
0 1 UD, LR
1 0 DU, RL
0 0 UD, RL
1 1 DU, LR
(1 = H, 0 = L)
22uF/6.3V
C3
JMK316BJ226KL
22uF/6.3V
C5
JMK316BJ226KL
10K
R2
10K
R3
10K
R4
10K
R5
10K
R6
FBMH3216HM501NT
FB2
FBMH3216HM501NT
FB3
FBMH3216HM501NT
FB4
0.0022
CA_112
C4
0.0022
CA_112
C6
TP3 TP4
R280
MT2 MT3 MT4 MT5 MT6 MT7 MT8 MT9
5V-GND
5V-GND
TP2
BACKL
A
B
R21
jumper
bDCLK
CLK
NI
R48
R47
0
NI
R46
aB6
aB5
aB4
aB3
aB2
aG7
aG6
aG5
aG4
aG3
aG2
aR7
aR6
aR5
aR4
aR3
SCL
SDA
aB7
aR2
aData Enable
aData Enable
aB7
aB6
aB5
aB4
aB3
aB2
aG7
aG6
aG5
aG4
aG3
aG2
aR7
aR6
aR5
aR4
aR3
aR2
aData Enable
Default:R21B
+5V
5V-GND
1
2
38
5
7
4
6
10
9
J14
0039300100
FBMH3216HM501NT
FB16
FBMH3216HM501NT
FB17
SCL
SDA
RT
06870C DCN6332
D-25
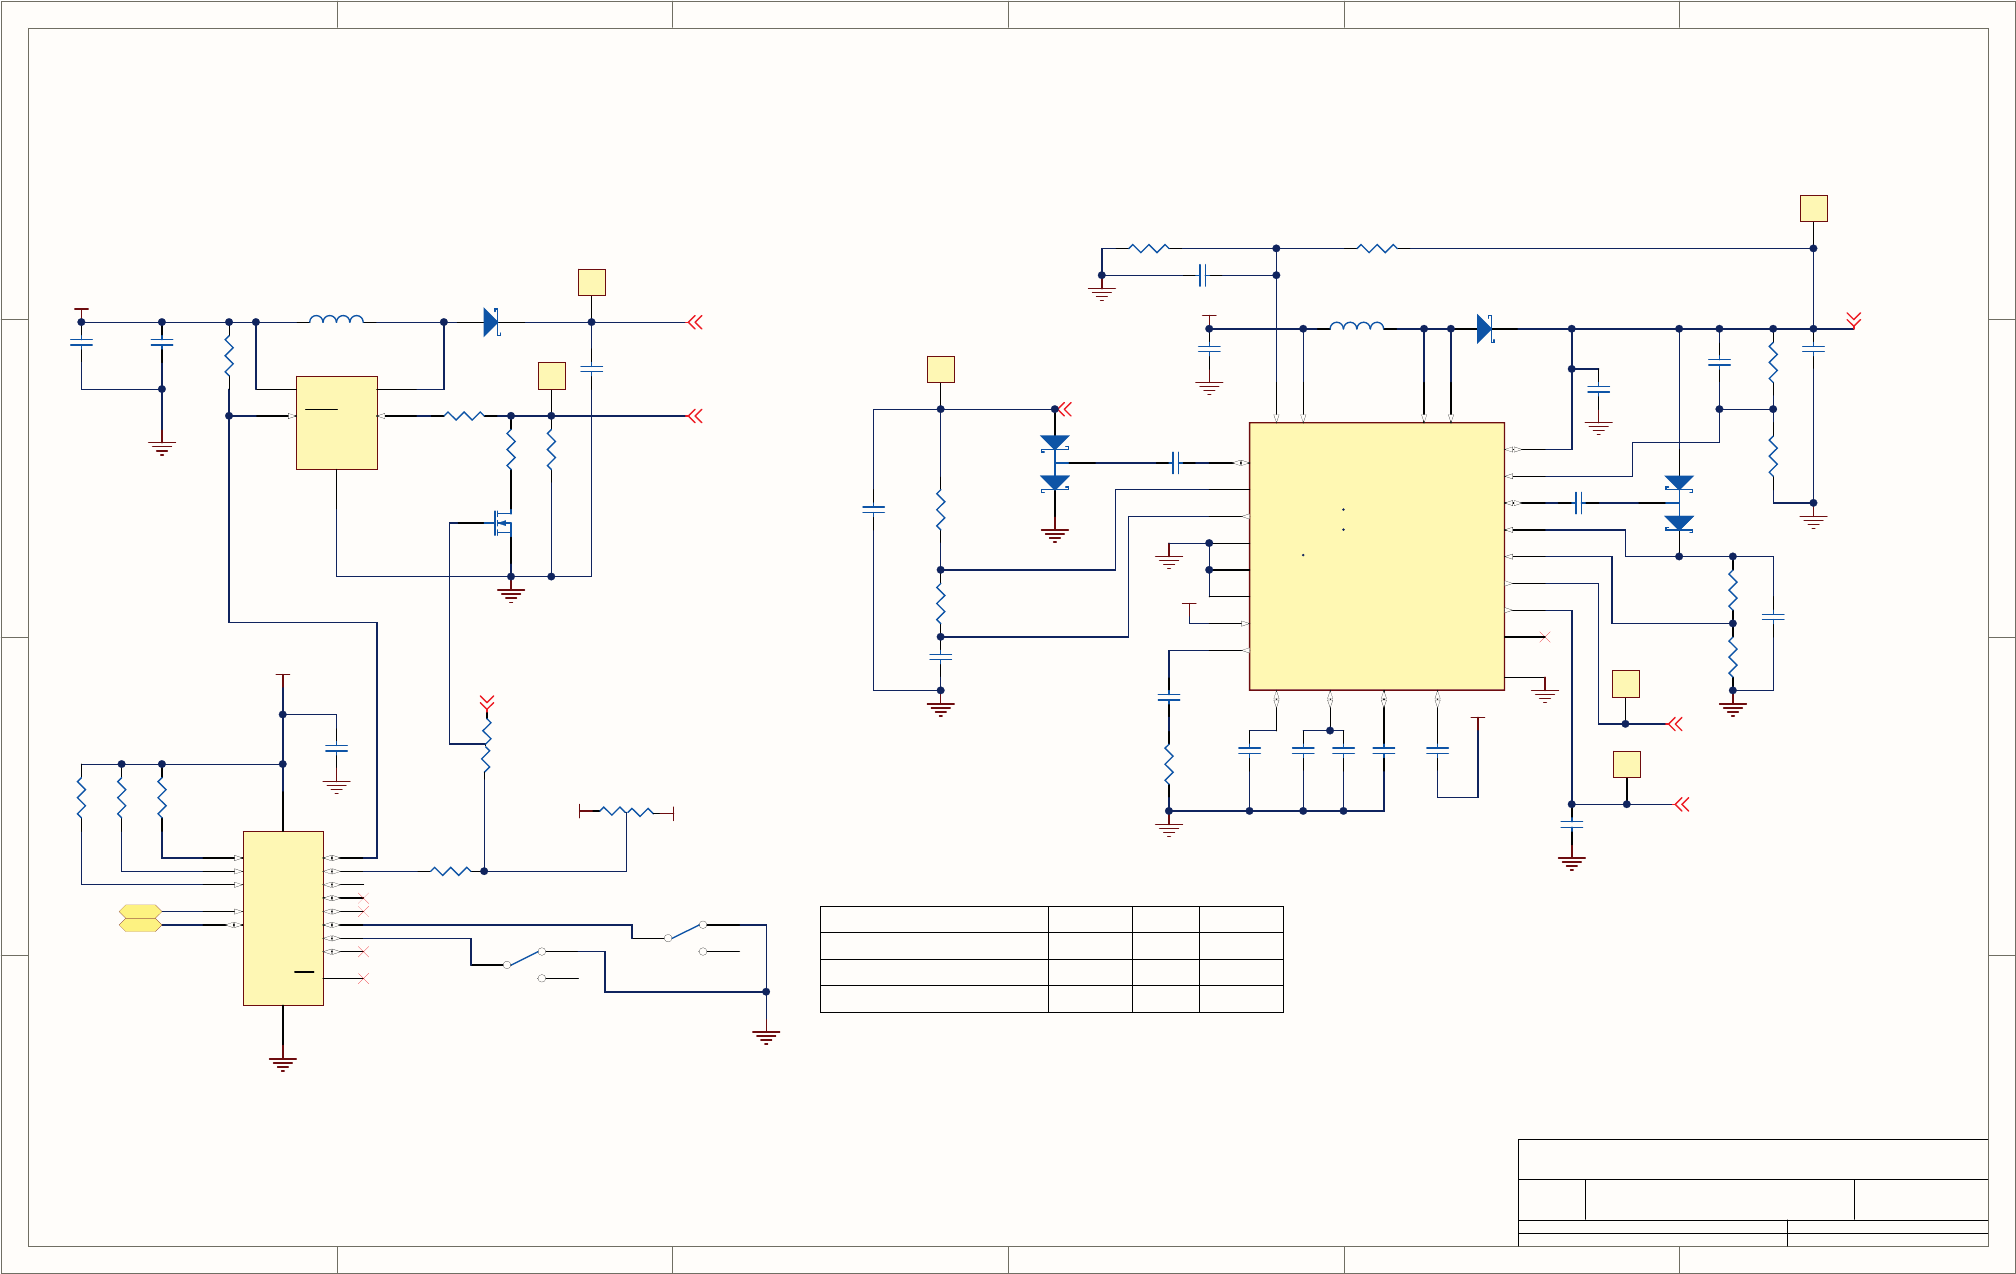
1
1
2
2
3
3
4
4
5
5
6
6
D D
C C
B B
A A
Title
Number RevisionSize
B
Date: 6/24/2010 Sheet of
File: N:\PCBMGR\..\06696.P2.R3.schdoc Drawn By:
06698 D
24
22uH
L1
Vin
5
SHDN
4
SW 1
GND
2
FB 3
U1
CAT4139TD-GT3
4.7uF/16V
C9
1K
R12
2.0
R14
5V-GND
+5V
9.76
R13
3.9uH
L2
487K
R9
309K
R8
80.6K
R18
66.5K
R19
464K
R16
806K
R11
A
2K1
D2
MBRM120LT1G
0.001C8
24pf
C13
0.33
C16
0.220
C20
470pf
C21
22uf/25V
C12
TMK325BJ226MM
0.1
C26
3.3V
33K
R23
43pf
C23
D3
BAT54S
3.3V
Bklght+
Bklght-
Vcom
Vgh
AVdd
3.3V
D3
G
1
S
2
Q1
FDV305N
5V-GND
+5V
Default: NI
R22 jumper
AVdd: +10.4V
TP5
AO
1
A1
2
A2
3
SCL
14
SDA
15
INT 13
P0 4
P1 5
P2 6
P3 7
P4 9
P5 10
P6 11
P7 12
Vdd 16
Vss
8
U3
PCF8574
S2
SW_46
Maint_SW
Lang_Select
5V-GND
5V-GND
+5V
FDLY
24
PGND
8
DRVP 17
PGND
7
DRVN
18
VCOM 10
SUP 9
COMP
22
IN 11
VGH 15
REF
20
GND
19
SW 6
DLY2
3
SW 5
FB 1
DLY1
2
FBP 12
FBN
21
ADJ
14
GD 23
CTRL
13
CPI 16
VIN 4
TPS65150PWP
?
HTSNK 25
U2
D1
CD214A-B140LF
S1
SW_46
Opt. Lang. Sw.
Opt. Main Sw
Vgl
22uF/6.3V
C11
JMK316BJ226KL
1.0
C14
GMK107BJ105KA
1.0
C15
GMK107BJ105KA
1.0
C27
GMK107BJ105KA
24pf
C22
43pf
C24
43pf
C25
10K
R10
10K
R24
10K
R25
10K
R26
100K
R15
806K
R17
0.33
C17
0.33
C18
0.33
C19
D4
BAT54S
4.7uF/16V
C10
Vgh: +16V
TP9
Vcom: +4V
TP10
Vgl: -7V
TP7
TP6
TP8
GUI Interface
C35
0.1
5V-GND AB
R31
10K
3.3V
A
B
R27
jumper
BACKL
SCL
SDA
Default:R27B
Default:R31B
Backlight Brightness Control
Control Mode R22 R27 R31
Remote – Video Port NO A NO
Remote – I2C YES B NO
Fixed Bright (default) NO B B
RT
D-26
06870C DCN6332
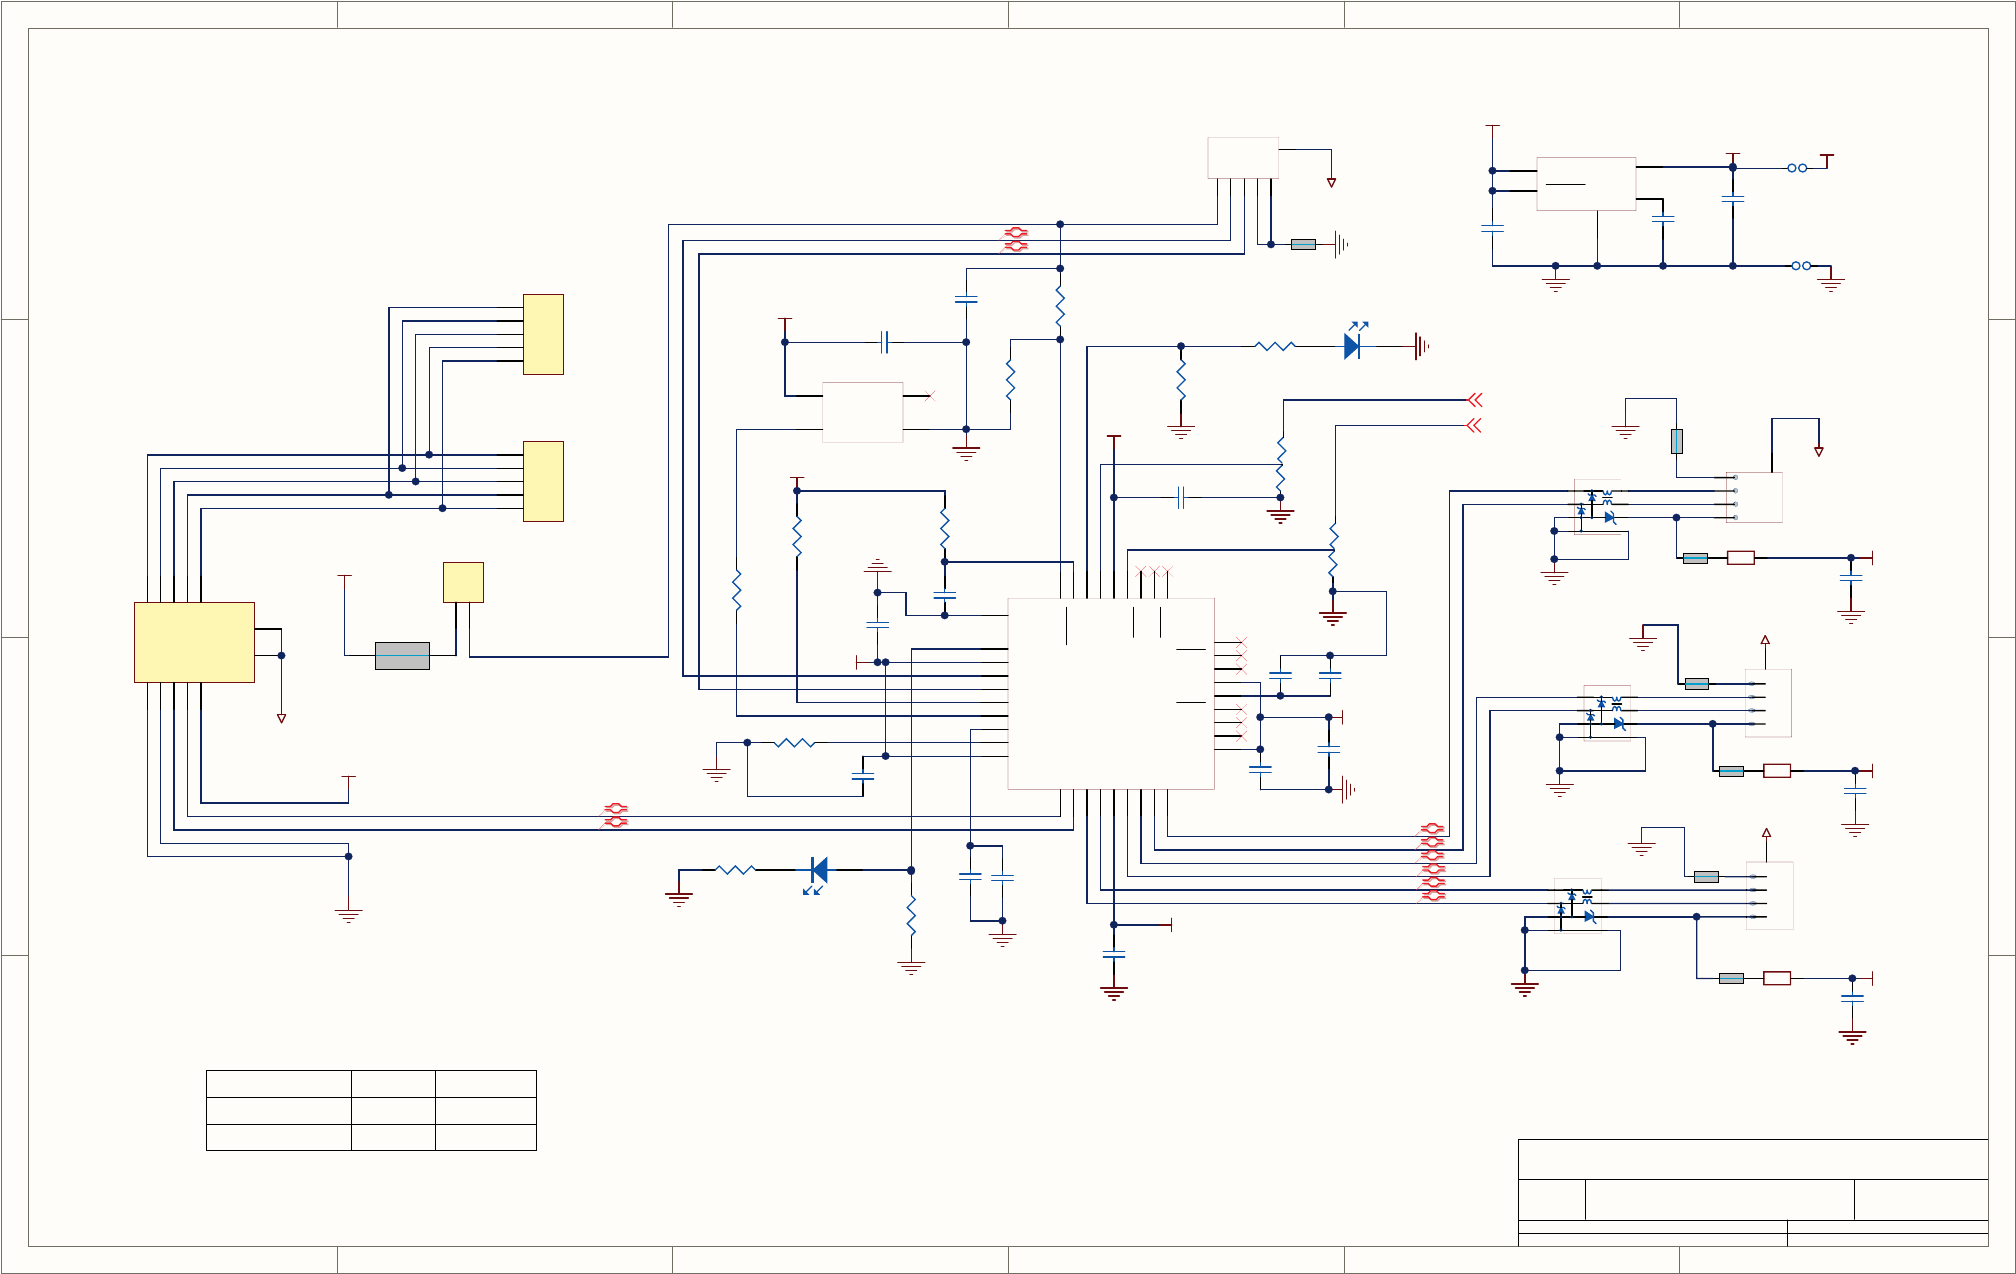
1
1
2
2
3
3
4
4
5
5
6
6
D D
C C
B B
A A
Title
Number RevisionSize
B
Date: 6/24/2010 Sheet of
File: N:\PCBMGR\..\06696.P3.R3.schdoc Drawn By:
06698 D
43
1
2
3
4
5
To old TScreen
70553-004
NI
J11
LL
RL
SD
RT
LT
+5V
CHASSIS
1
2
NI
J12
BUS +5
1
2
3
4
5
To new TScreen
70553-004
J10
LT 1
RT 2
SHLD 3
RL 4
LL 5
GND
6
GND
7
D+
8
D-
9
+5
10
CHS A
CHS B
A1
TSHARC-12C
RT
RL
SD
LL
LT
VBUS
1
D-
2
D+
3
ID
4
GND
5
6
J9
USB-B-MINI
VBUS
CHASSIS
CHASSIS
5V-GND
USB3.3V
SDA
SCL
USB3.3V
USB3.3V
USB3.3V
USB3.3V
USB3.3V
R36
12K
E1
+V
4
-V 2
OUT
3
U5
24MHZ
DS2
GRN
DS1
YEL
SCL
SDA
R37
100K
5V-GND
5V-GND
5V-GND 5V-GND
5V-GND
5V-GND
5V-GND
5V-GND
5V-GND
5V-GND
5V-GND
+5V
5V-GND
C28
1uF
USB3.3V
IN
8
SHTDN
6
GND
2
OUT 1
BP 4
U4
3.3V-REG
R38
1K
F3
0.5A/6V
D1-
1
D1+
2
D2-
3
D2+
4
+3.3V
5
D3-
6
D3+
7
D4-
8
D4+
9
+3.3V 10
TEST 11
PWR1 12
OCS1 13
+1.8V 14
3.3VCR 15
PWR2 16
OCS2 17
PWR3 18
OCS3 19
PWR4 20
OCS4 21
SDA/R1 22
+3.3V 23
SCL/S0 24
HS-IND/S1 25
RESET 26
VBUS-DET 27
SUS/R0
28
+3.3V
29
USB-
30
USB+
31
XTL2
32
CLK-IN
33
1.8VPLL
34
RBIAS
35
+3.3PLL
36
GND
37
U8
USB2514-AEZG
C32
1uF
C44
1uF
5V-GND
+5V
1D-
2D+
3GND
4
5
J4
USB-A_R/A
5V-GND
CHASSIS
CHASSIS
FBMH3216HM501NT
FB5
C34
0.1
C36
0.1uF
C33
0.1uF
C31
0.1uF
R30
100K
R29
1K
F2
0.5A/6V
F1
0.5A/6V
1
2
3
4
5
D+
D-
GND
+5V J5
USB-A_VERT
C29
470pf
C30
1uF
C37 0.01uF
JP4
3.3V
GND
FB7
R20
49.9
FB8
FB9
FB10
FB11
FB12
FB13
GUI Interface
1 8
72
3
4
6
5
U7
1 8
72
3
4
6
5
U9
1 8
72
3
4
6
5
U11
C40
0.1uF
C42
0.1uF
C45
0.1uF
C390.1
C43
0.1uF
C41
0.1
R33
100K
AB
R45
AB
R32
R34
100K
R35
100K
C38
1uF
R39
100K
JP5
C60
0.1uF
C59
0.1
1
2
3
4
5
D+
D-
GND
+5V J6
USB-A_VERT
+5V
D1_N
D1_P D4_P
D4_N
D3_P
D3_N
D2_P
D2_N
D_P
D_N
Configuration Select
Mode R32 R45
Default A A
MBUS B B
Install 100K for A, 0 Ohm for B
+5V
+5V
+5V
5V-GND
5V-GND
5V-GND
5V-GND
5V-GND
5V-GND
5V-GND
5V-GND
5V-GND
RT
06870C DCN6332
D-27
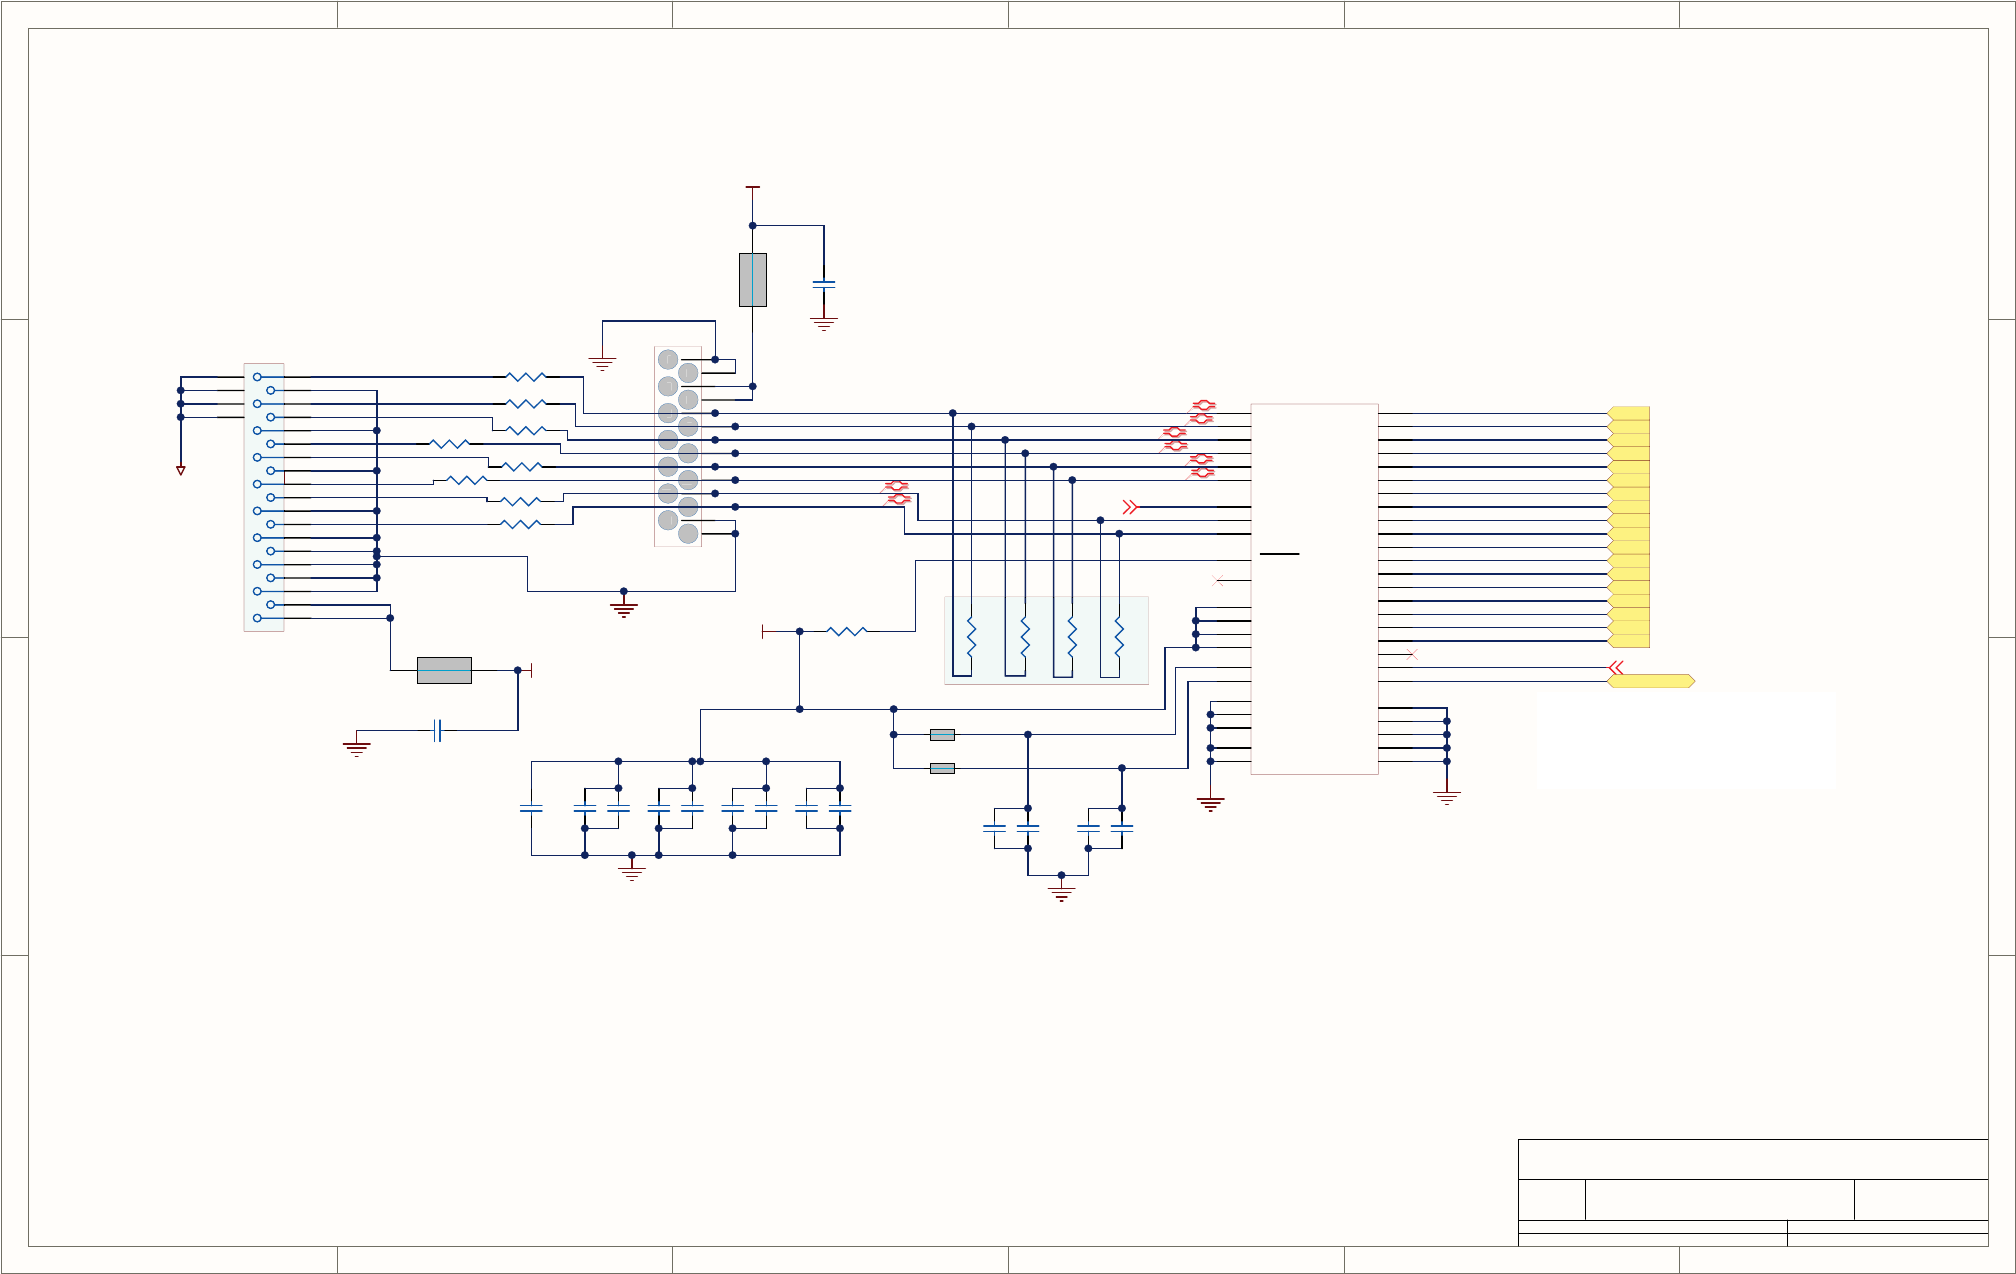
1
1
2
2
3
3
4
4
5
5
6
6
D D
C C
B B
A A
Title
Number RevisionSize
B
Date: 6/24/2010 Sheet of
File: N:\PCBMGR\..\06696.P4.R3.schdoc Drawn By:
06698 D
44
TOUCH SCREEN INTERFACE CIRCUITRY ( TBD)
GUI Interface
R40
10K
Option
CLKOUT_P
CLKOUT_N
3.3V
C49
0.1
R41
100
FB6
FB14
Vcc PIN 28
C47
0.01
22uF/6.3V
C46
JMK316BJ226KL
C50
0.1
C51
0.1
C52
0.1 C55
0.1
C57
0.1
bDCLK
BACKL
NOTE:
To receive backlight control (BACKL) from CPU board
when using ICOP_0096 LVDS Transmitter.
The connection from pin 42 on the TTL video connector
(VSYNC) to U1-23 must be broken and connected to
pin 43.
aB6
aB5
aB4
aB3
aB2
aG7
aG6
aG5
aG4
aG3
aG2
aR7
aR6
aR5
aR4
aR3
aB7
aR2
aData Enable
R42
100
R43
100
R44
100
Vcc PIN 36
C48
0.01
Vcc PIN 42
C53
0.01
Vcc PIN 48
C54
0.01 C56
0.01
C58
0.01
FBMH3216HM501NT
FB15 C61
0.1
1
2
3
4
5
6
7
8
9
10
11
12
13
14
1
2
3
4
5
6
7
8
9
10
11
12
13
14
J13
HEADER-7X2
Y0M
8Y0P
9
Y1M
10 Y1P
11
Y2M
14
Y2P
15
CLKOUT
23
CLKINM
16
CLKINP
17
SHTDN
22
NC
6
VCC
48
VCC
28
VCC
36
VCC
42
LVDS/VCC
12
PLLVCC
20
LVDSGND
7
LVDSGND
13
LVDSGND
18
PLLGND
19
PLLGND
21
D0 24
D1 26
D2 27
D3 29
D4 30
D5 31
D6 33
D7 34
D8 35
D9 37
D10 39
D11 40
D12 41
D13 43
D14 45
D15 46
D16 47
D17 1
D18 2
D19 4
D20 5
GND 3
GND 25
GND 32
GND 38
GND 44
U6
SN75LVDS86A
3.3V
Y0_P
Y0_N
Y1_P
Y1_N
Y2_N
Y2_P
MH3
MH4
2
9
4
5
6
3
8
7MH1
MH2
1
12
11
10
13
14
15
16
17
18
19
J15
G3168-05000202-00
CHASSIS
R490
R500
R510
R520
R530
R540
R550
R560
FBMH3216HM501NT
FB18
C62
0.1
3.3V
Y0_P1
Y0_N1
Y1_P1
Y1_N1
Y2_N1
Y2_P1
CLKOUT_N1
CLKOUT_P1
RT
D-28
06870C DCN6332
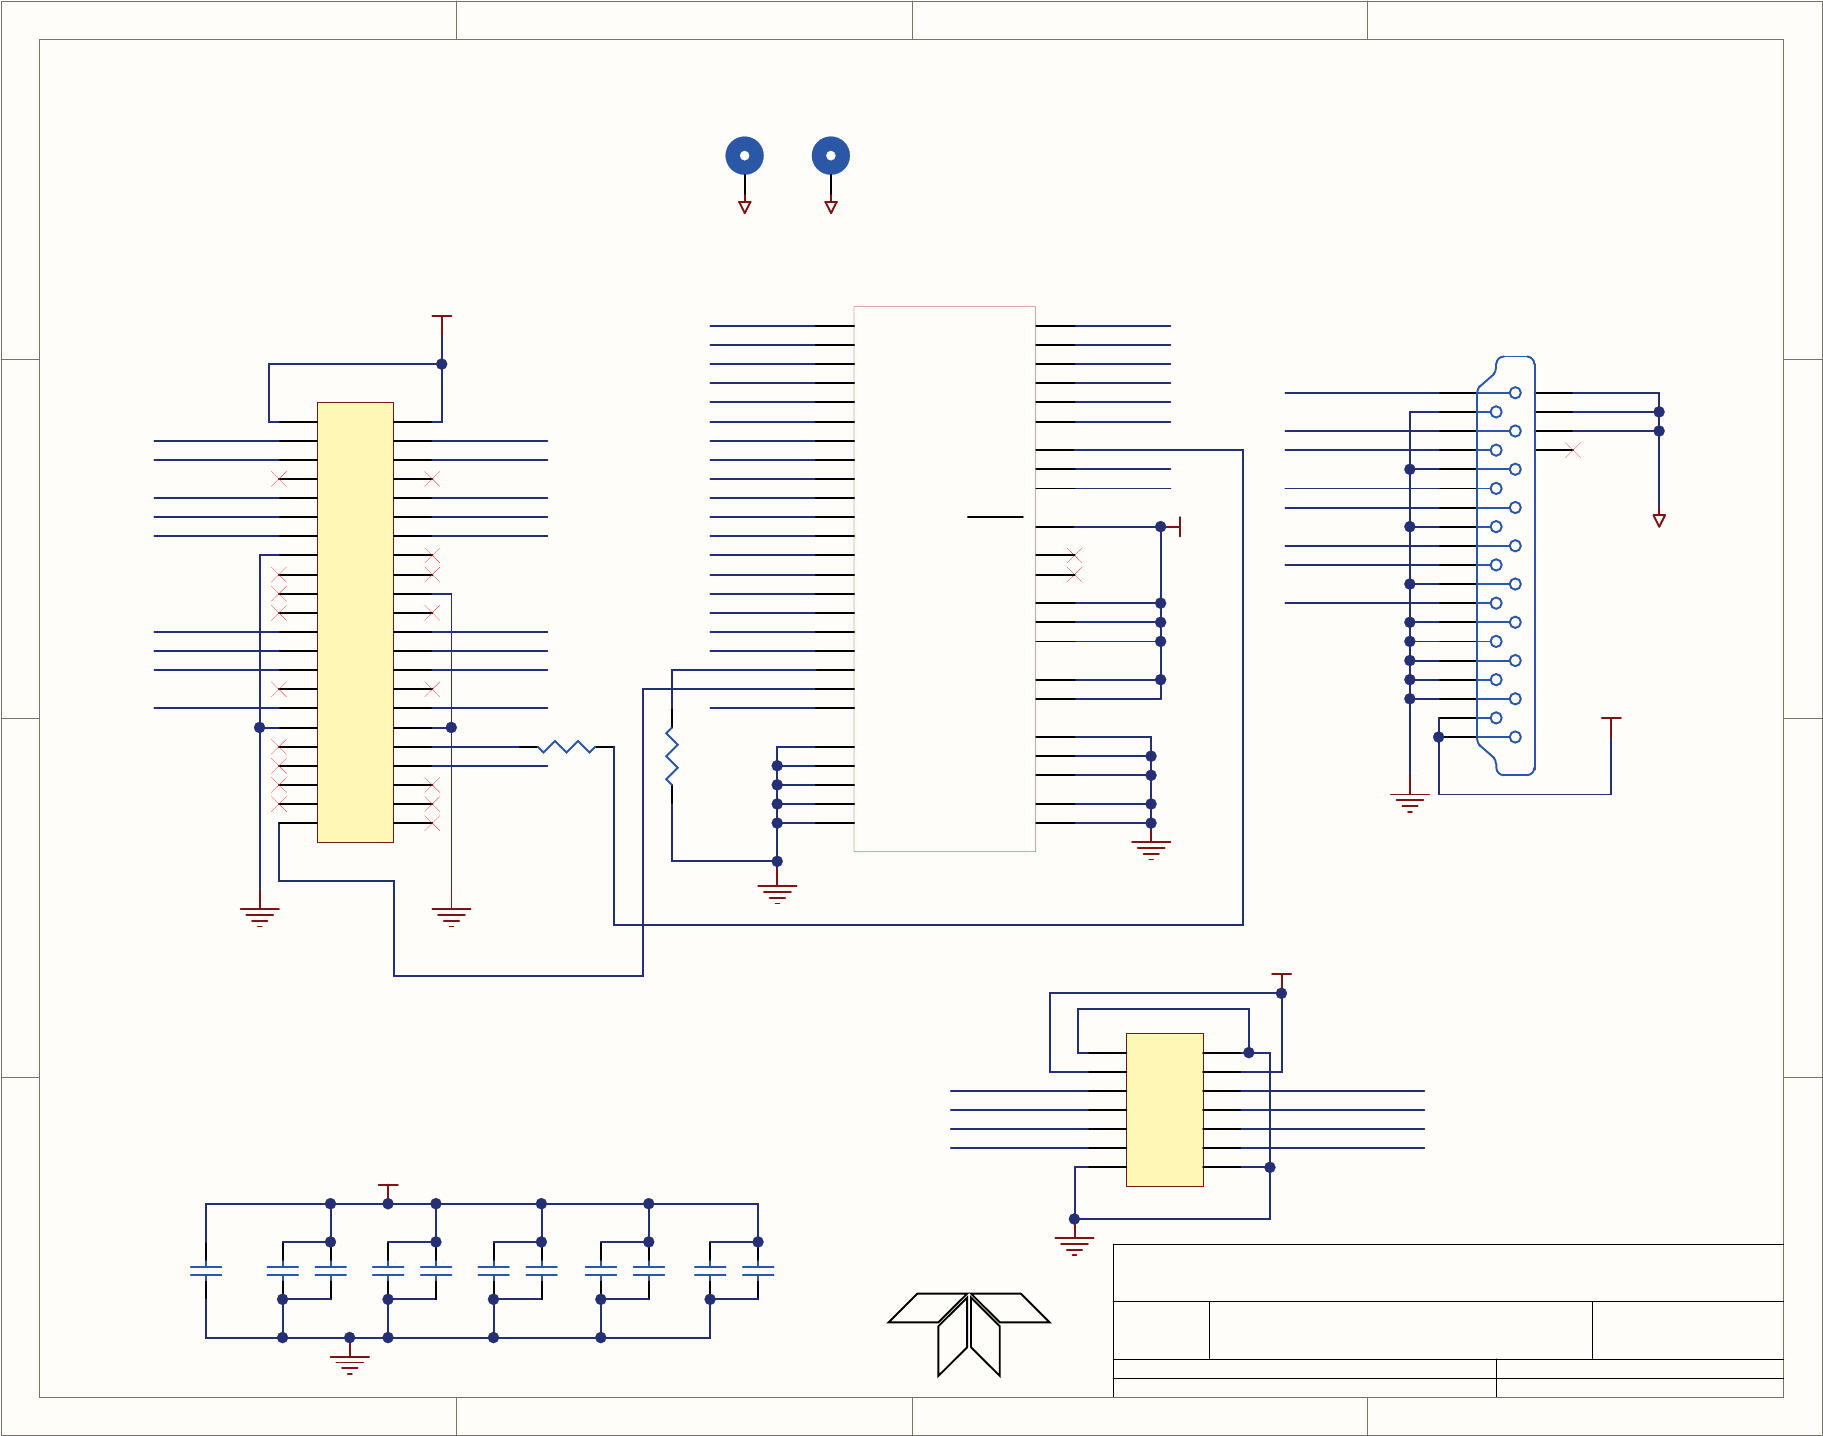
1
1
2
2
3
3
4
4
D D
C C
B B
A A
Title
Number RevisionSize
A
Date: 5/7/2010 Sheet of
File: N:\PCBMGR\..\06882-P1-R0.SchDoc Drawn By:
LVDS, Transmitter Board
B
11
RT
06882
VAD6
VAD7
VAD8
VAD9
VAD10
VAD11
VBD10
VBD11
VAD0
VAD1
VAD2
VAD3
VBD2
VBD3
VBD4
VBD5
VBD6
VBD7
VBDE
Y0_N
Y0_P
Y1_N
Y1_P
Y2_N
Y2_P
CLKOUT_N
CLKOUT_P
R2
22.1
From ICOP CPU To LCD Display
D0
44
D1
45
D2
47
D3
48
D4
1
D5
3
D6
4
D7
6
D8
7
D9
9
D10
10
D11
12
D12
13
D13
15
D14
16
D15
18
D16
19
D17
20
D18
22
D19
23
D20
25
GND
5
GND
11
GND
17
GND
24
GND
46
Y2P 34
Y2M 35
Y1P 38
Y1M 39
Y0P 40
Y0M 41
CLKOUTP 32
CLKOUTM 33
CLKIN 26
SHTDN 27
NC 14
NC 43
VCC 2
VCC 8
VCC 21
LVDSVCC 37
PLLVCC 29
VLDSGND 42
VLDSGND 36
VLDSGND 31
PLLGND 30
PLLGND 28
U1
SN75LVDS84A
CHASSIS-0 CHASSIS
1 2
3 4
5 6
7 8
910
11 12
13 14
15 16
17 18
19 20
21 22
23 24
25 26
27 28
29 30
31 32
33 34
35 36
37 38
39 40
41 42
43 44
J2 Header 22X2
MH3
MH4
2
3
4
5
6
7
8
1MH1
MH2
9
10
11
12
13
14
15
16
17
18
19
J1
G3168-05000101-00
CHASSIS
+3.3V
+3.3V
VAD0 VAD1
VAD2 VAD3
VAD6 VAD7
VAD8 VAD9
VAD10 VAD11
VBD2 VBD3
VBD4 VBD5
VBD6 VBD7
VBD10 VBD11
VBDE
VBGCLK
+3.3V
CLKIN
Y0_N
Y0_P
Y1_N
Y1_P
Y2_N
Y2_P
CLKOUT_N
CLKOUT_P
10K
R1
BACKL
BACKL
C2
0.1
C3
0.01
22uF/6.3V
C1
JMK316BJ226KL
C4
0.1
C6
0.1
C5
0.01
C7
0.01
+3.3V
C8
0.1
C9
0.01
C10
0.1
C11
0.01
1 2
3 4
5 6
7 8
910
11 12
13 14
J3
Header 7X2
+3.3V
Y0_P Y0_N
Y1_P Y1_N
CLKOUT_P
Y2_N
CLKOUT_N
Y2_P
MT1 MT2
06870C DCN6332
D-29
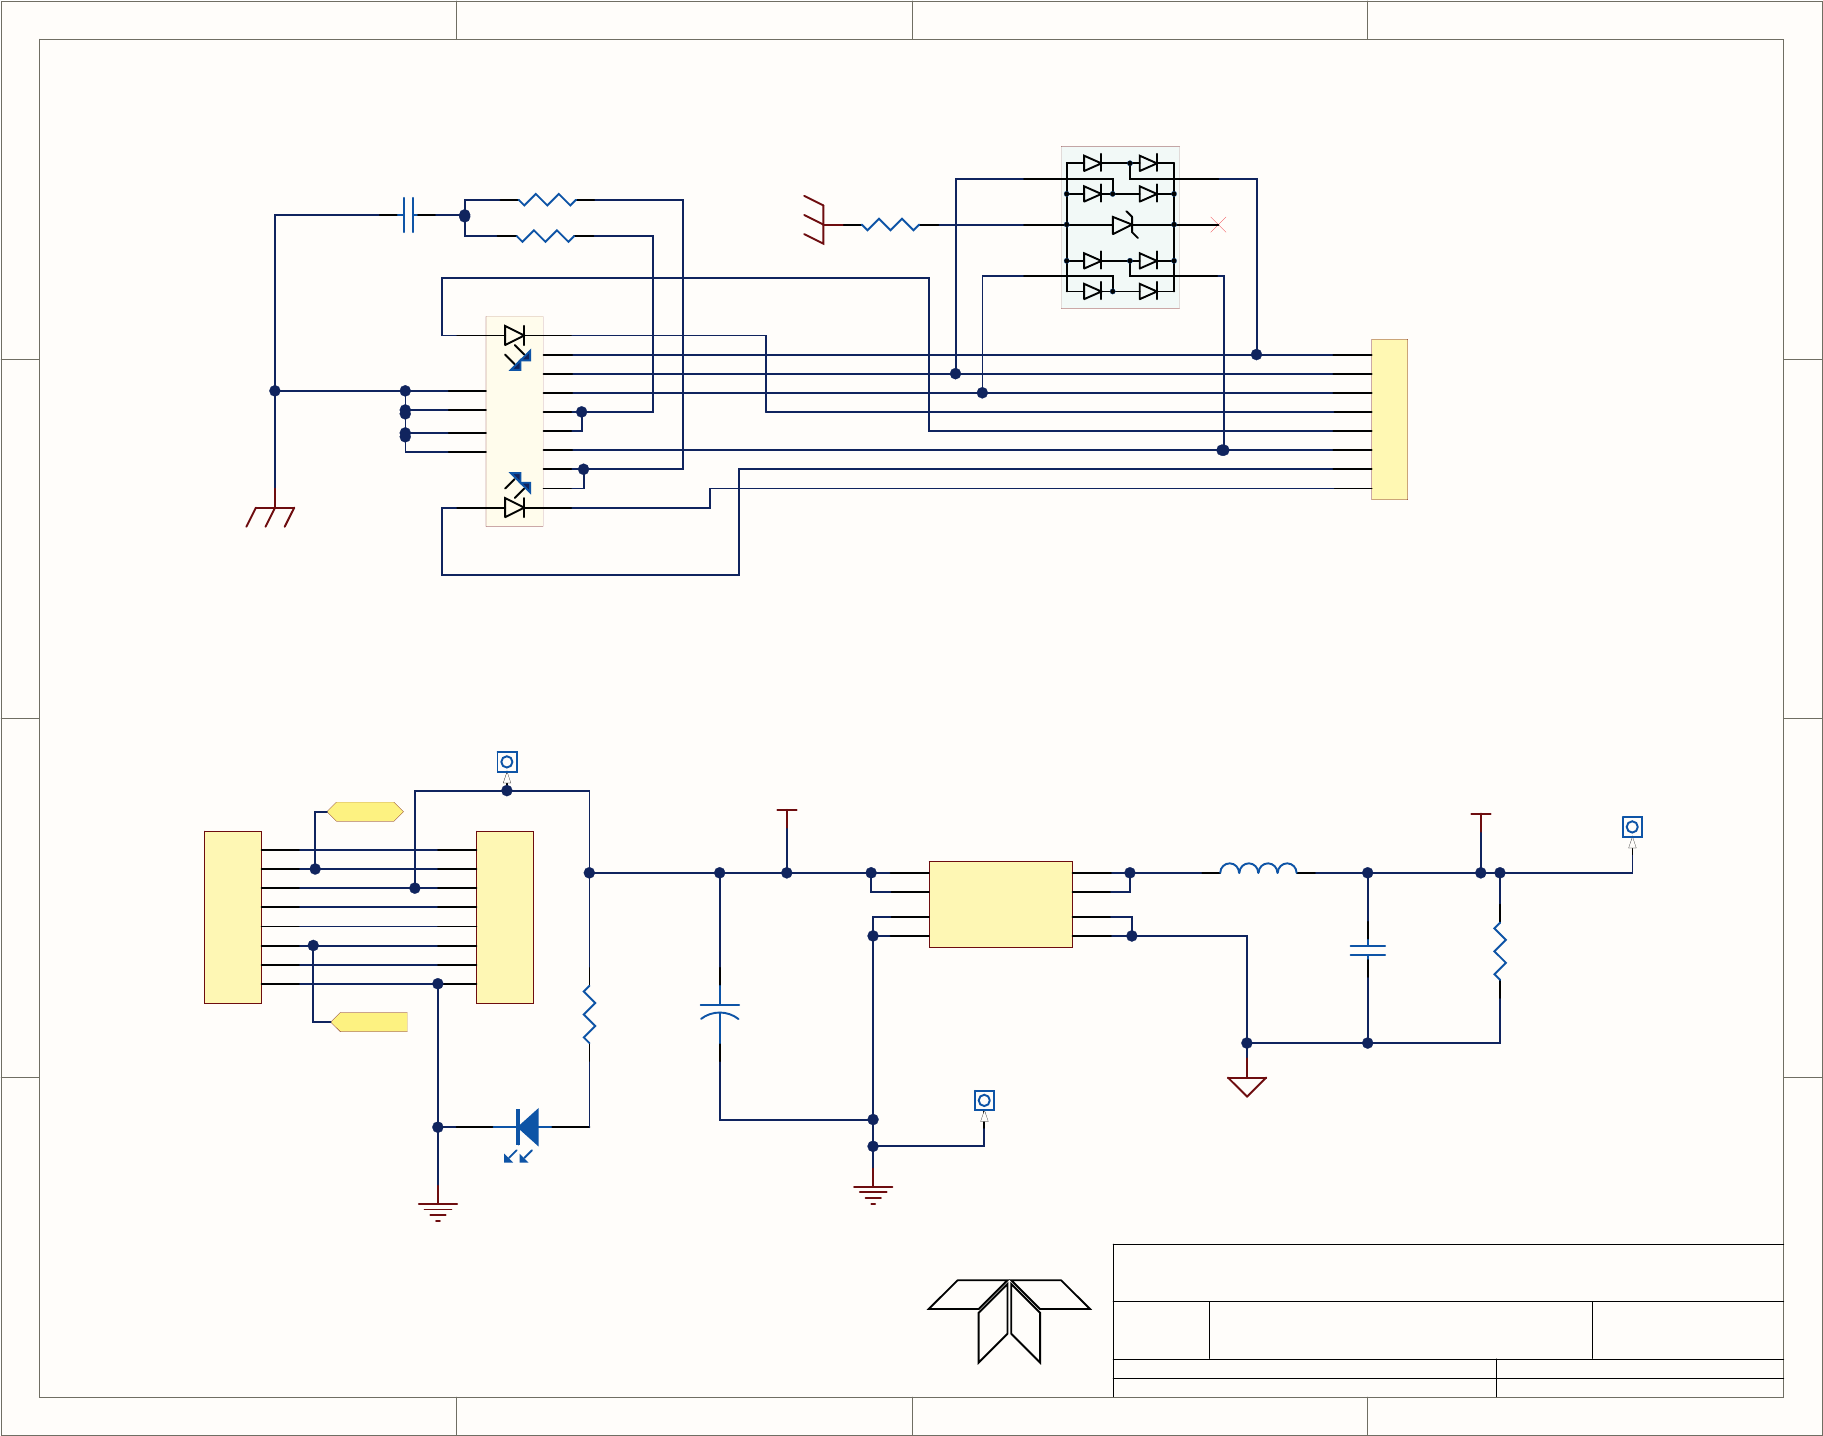
1
1
2
2
3
3
4
4
D D
C C
B B
A A
Title
Number RevisionSize
A
Date: 5/6/2011 Sheet of
File: N:\PCBMGR\..\06731-1_ETHERNET.SchDocDrawn By:
Auxiliary I/O Board (PWR-ETHERNET)
B
31
RT
06731
STRAIGHT THROUGH ETHERNET
GND
+5V
SCL
SDA +5V-ISO
+C17
100uF
GND
DS3
GRN
1
2
3
4
5
6
7
8
P2
Header 8
1
2
3 4
5
6
U6
SP3050
R10
2.2k
L1
47uH
TP1
TP3
TP2
8
2
3
5
7
4
6
1
J2
DF11-8DP-2DS(24)
SDA
SCL
10 9
12 11
1
2
3
4
5
6
7
8
15
16
14
13
J1
CONN_RJ45_LED
+5V-OUT
ISO-GND
C28
4.7uF
R16
1k
ATX+
ATX-
ARX+
ARX-
LED0-
LED0+
LED1+
LED1-
VDD2 5
GND2 7
VDD1
4
GND1
1
12
11
14
13
U8
LME0505
1
2
3
4
5
6
7
8
P3
Header 8
R19
75
C18
.01/2KV R13
0
R20
75
CHASSIS
CHASSIS
PRINTED DOCUMENTS ARE UNCONTROLLED
DCN:6092
D-30
06870C DCN6332
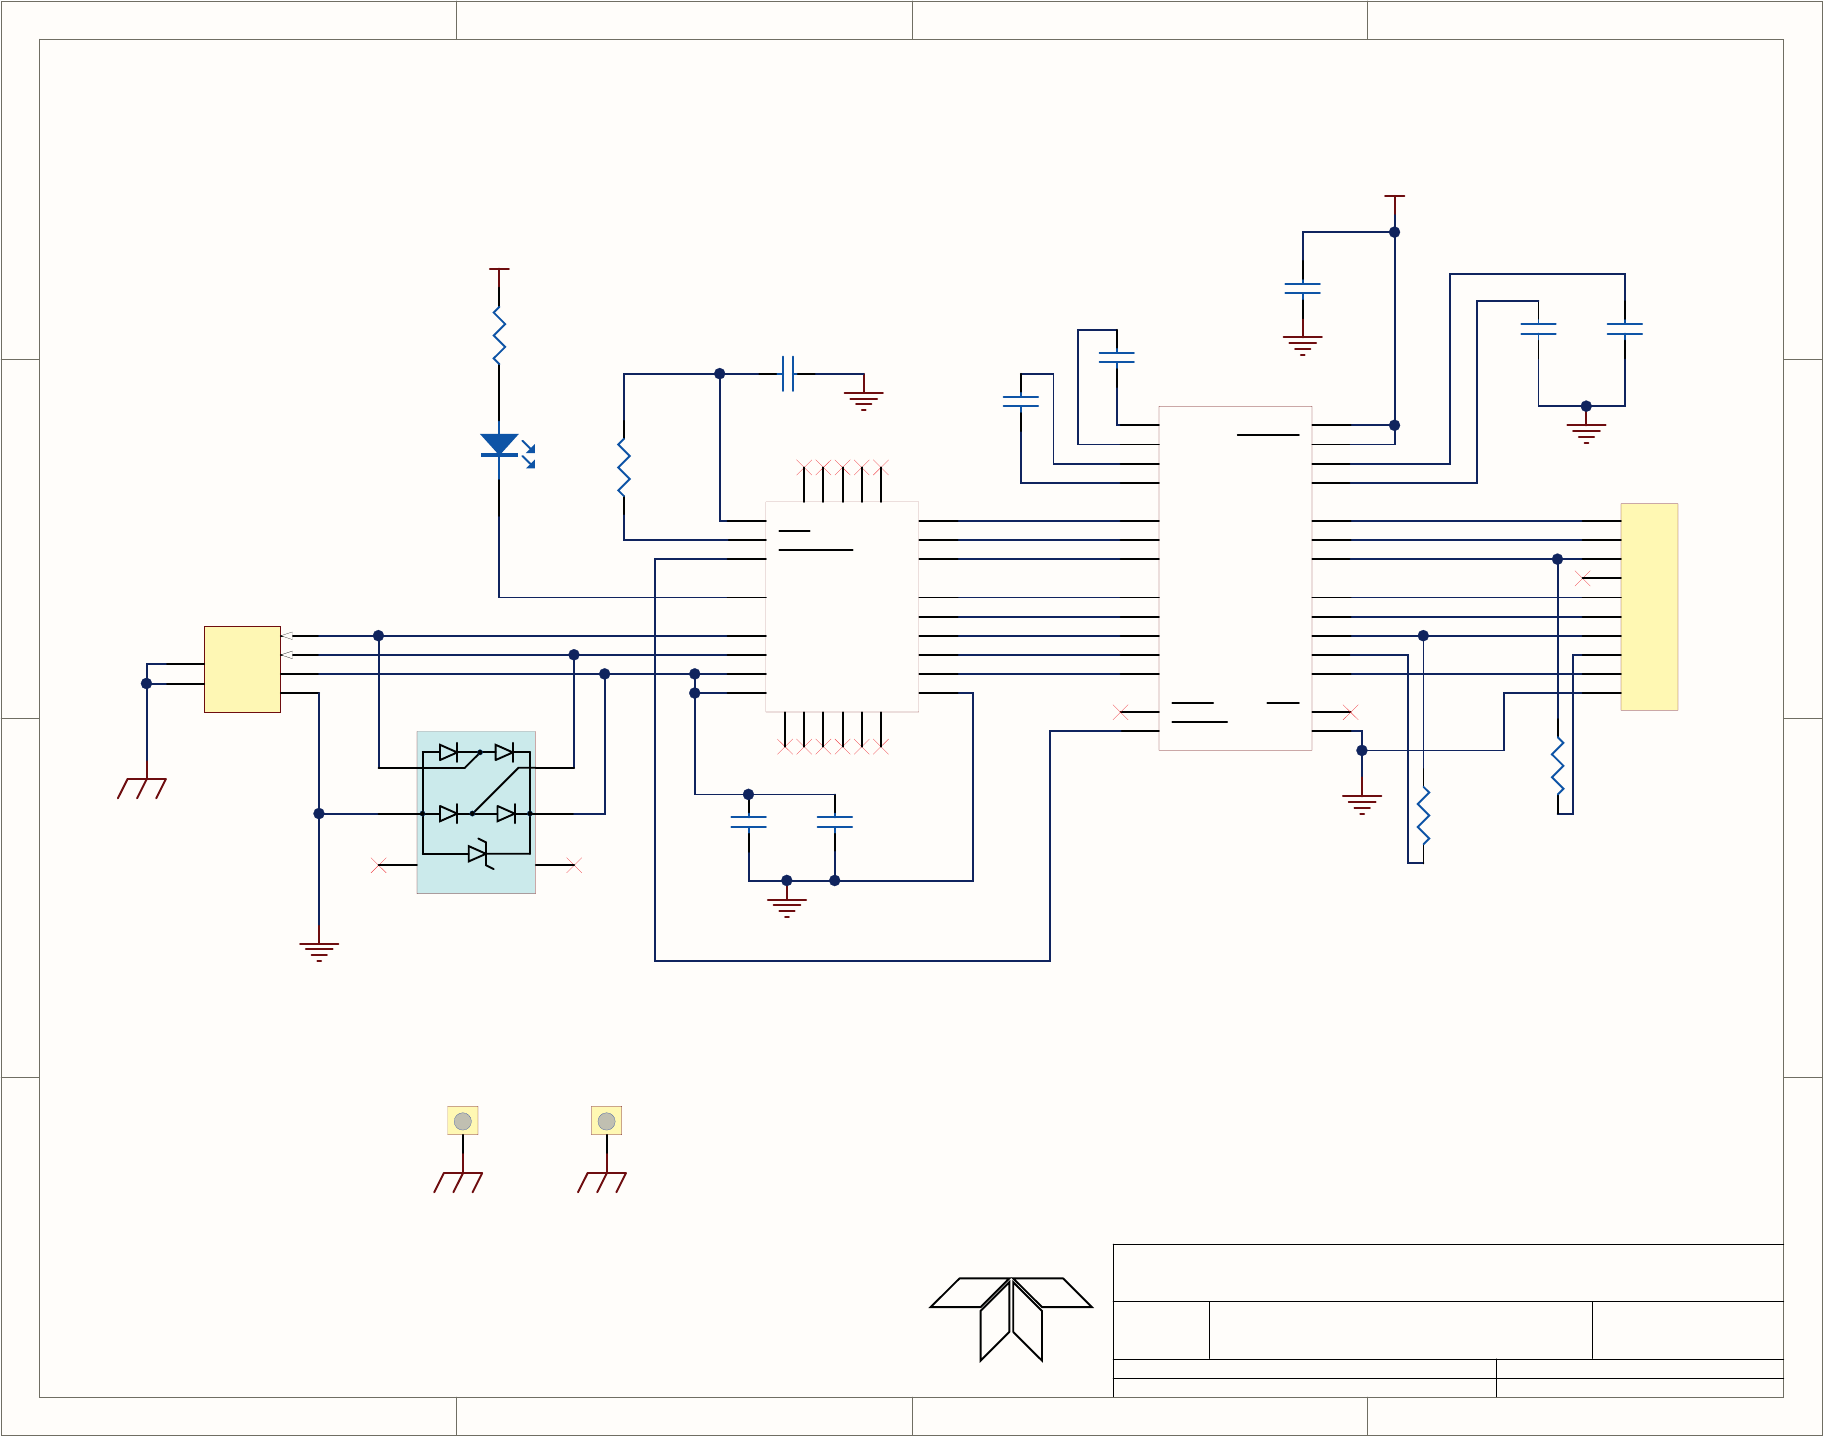
1
1
2
2
3
3
4
4
D D
C C
B B
A A
Title
Number RevisionSize
A
Date: 5/6/2011 Sheet of
File: N:\PCBMGR\..\06731-2_USB.SchDoc Drawn By:
Auxiliary I/O Board (USB)
B
32
RT
06731
TXD-A
RTS-A
DTR-A
RXD-A
CTS-A
DSR-A
DCD-A
RI-A
V-BUS
VBUS 1
D- 2
D+ 3
GND 4
J4
USB
GND
GND
V-BUS
CHASSIS
GND
GND
C1+
28
C1-
24
C2+
1
C2-
2
TI1
14
TI2
13
TI3
12
RI3 6
RI2 5
RI1 4
TO3 11
TO2 10
TO1 9
RO2 20
V- 3
V+ 27
VCC 26
STAT
21
SHTDN
22
RI4 7
RI5 8
ONLINE 23
GND 25
RO1
19
RO2
18
RO3
17
RO4
16
RO5
15
U9
SP3243EU
GND
R12
4.75k
GND
1
2
nc
3nc 4
5
6
U11
NUP2202W1
TXD-B
RXD-B
CTS-B
RTS-B
DSR-B
DTR-B
RI-B
DCD-B
MT1
MT-HOLE
C24
4.7uF
C26
1uF
C25
0.1uF
C22
0.1uF
C23
0.1uF
C19
0.1uF
C20
0.1uF
C21
0.1uF
DS4
GRN
R11
2.2k
CHASSIS
MT2
MT-HOLE
R14
0
R15
0
DCD
2
RXD
1
TXD
4
DTR
3
GND
6
DSR
5
RTS
8
CTS
7
RI
10
N/C
9
J3
DF11-10DP-2DS(24)
V-BUS
22
21
19
18
DCD 1
RI 2
DTR 28
DSR 27
TXD 26
RXD 25
RTS 24
CTS 23
GND 3
16
15
13
10
14 20
17
VBUS
8VREG-I
7D-
5
RST
9
SUSPEND
11
SUSPEND
12
VDD
6
D+
4U10
CP2102
3.3V
D+
D-
CHASSIS
PRINTED DOCUMENTS ARE UNCONTROLLED
DCN:6092
06870C DCN6332
D-31
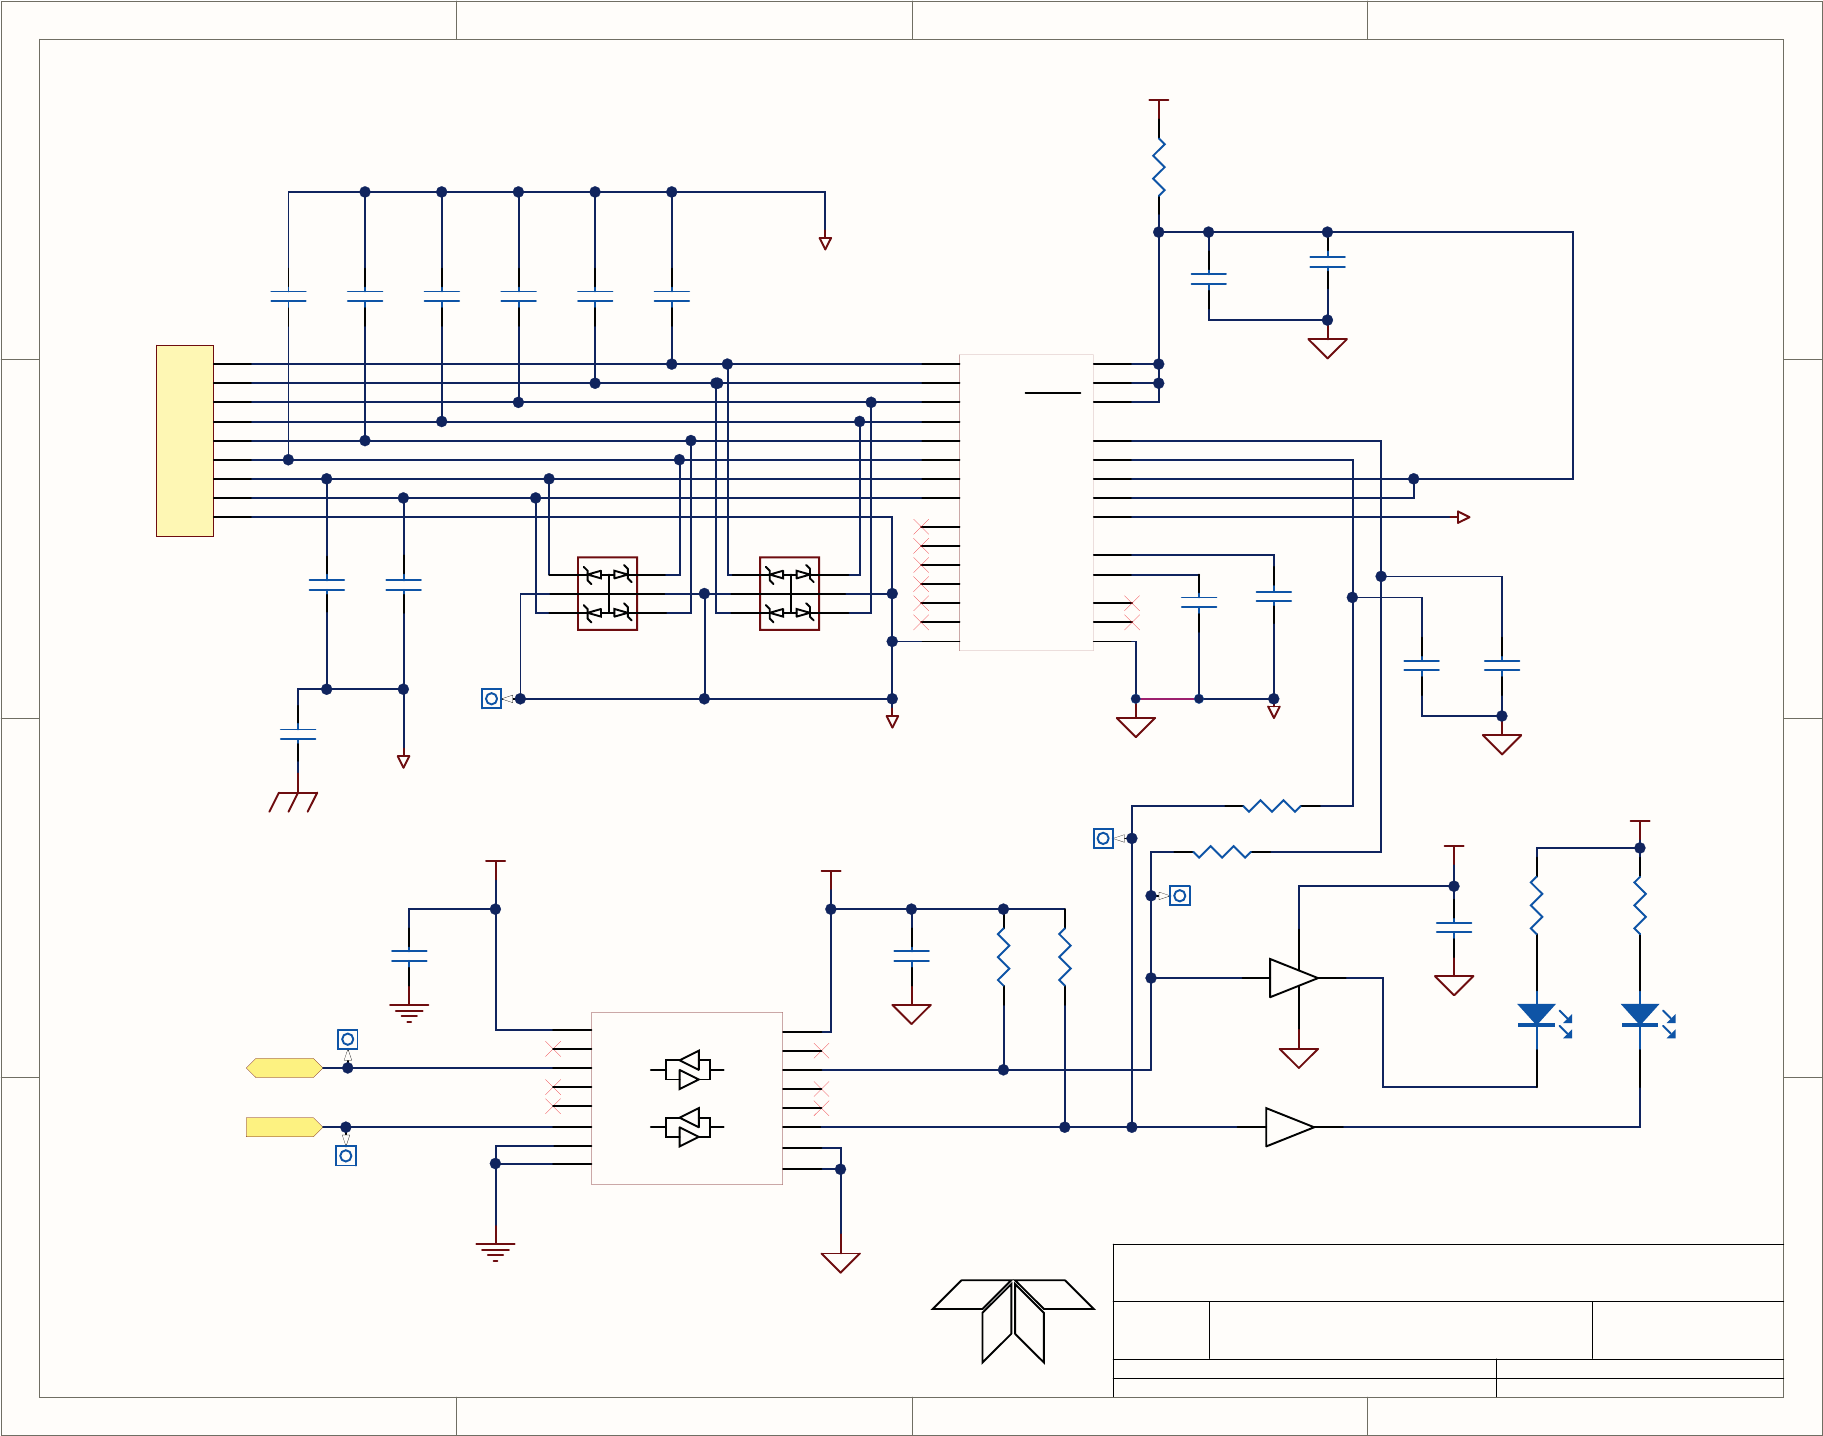
1
1
2
2
3
3
4
4
D D
C C
B B
A A
Title
Number RevisionSize
A
Date: 5/6/2011 Sheet of
File: N:\PCBMGR\..\06731-3_ADC.SchDoc Drawn By:
Auxiliary I/O Board (ADC)
B
33
RT
06731
1
2
3
4
5
6
7
8
9
P1
ANALOG INPUT
+5V-ISO
CH0
15
CH1
16
CH2
17
CH3
18
CH4
19
CH5
20
CH6
21
CH7
23
NC
4
NC
7
SHTDN 13
VDD 2
VDD 1
SDA 9
SCL 5
A2 10
A1 12
A0 6
REF 27
NC
8
AGND
14
REF-AJ 26
DGND 3
NC
22
NC
24 NC 28
NC 25
NC
11
U1
MAX1270BCAI+
+5V
GND
GND
+5V-ISO
SCL
SDA
AGND
ISO-GND
ISO-GND
+5V-ISO
1 6
52
U4A
NC7WZ17P6X
ISO-GND
+5V-ISO
ISO-GND
1
3
2
4
5
6
U2
SMS12
C13
0.1uF
C14
0.1uF
C12
0.1uF
C11
0.01uF
BLU
DS1
SDA
C8
0.1uF C9
0.1uF
C2
0.1uF
C3
0.1uF
C4
0.1uF
C5
0.1uF
C6
0.1uF
C7
0.1uF
C10
4.7uF
AN-CH0
AN-CH1
AN-CH2
AN-CH3
AN-CH4
AN-CH5
AN-CH6
AN-CH7
R9
4.99
C27
4.7uF
+5V-ADC
ISO-GND
ISO-GND
R3
1K
R5
2.2k
R6
2.2k
1
3
2
4
5
6
U3
SMS12
3 4
U4B
NC7WZ17P6X
R4
1K
BLU
DS2
SCL
C15
.01/2KV
GND1 1
NC 2
VDD1 3
NC 4
SDA1 5
SCL1 6
GND1 7
NC 8
GND2
9
NC
15 VDD2
14
NC
13 SDA2
12
SCL2
11
GND2
16
NC
10
U5
ADuM2250
R17
49.9
ISO-GND
TP7
TP8
TP5
TP6
C29
1nF
R18
49.9
C30
1nF
AGND
AGND
C1
0.1uF
TP4 AGND
ISO-GND
CHASSIS
PRINTED DOCUMENTS ARE UNCONTROLLED
DCN:6092
D-32
06870C DCN6332
