Vivosonic V50 VIVOLINK User Manual USER S MANUAL
Vivosonic, Inc. VIVOLINK USER S MANUAL
UserManual.wiki
>
Vivosonic
>
V50 User Manual
>
USERS MANUAL 1
Contents
1.
USERS MANUAL 1
2.
USERS MANUAL 2
USERS MANUAL 1
Navigation menu
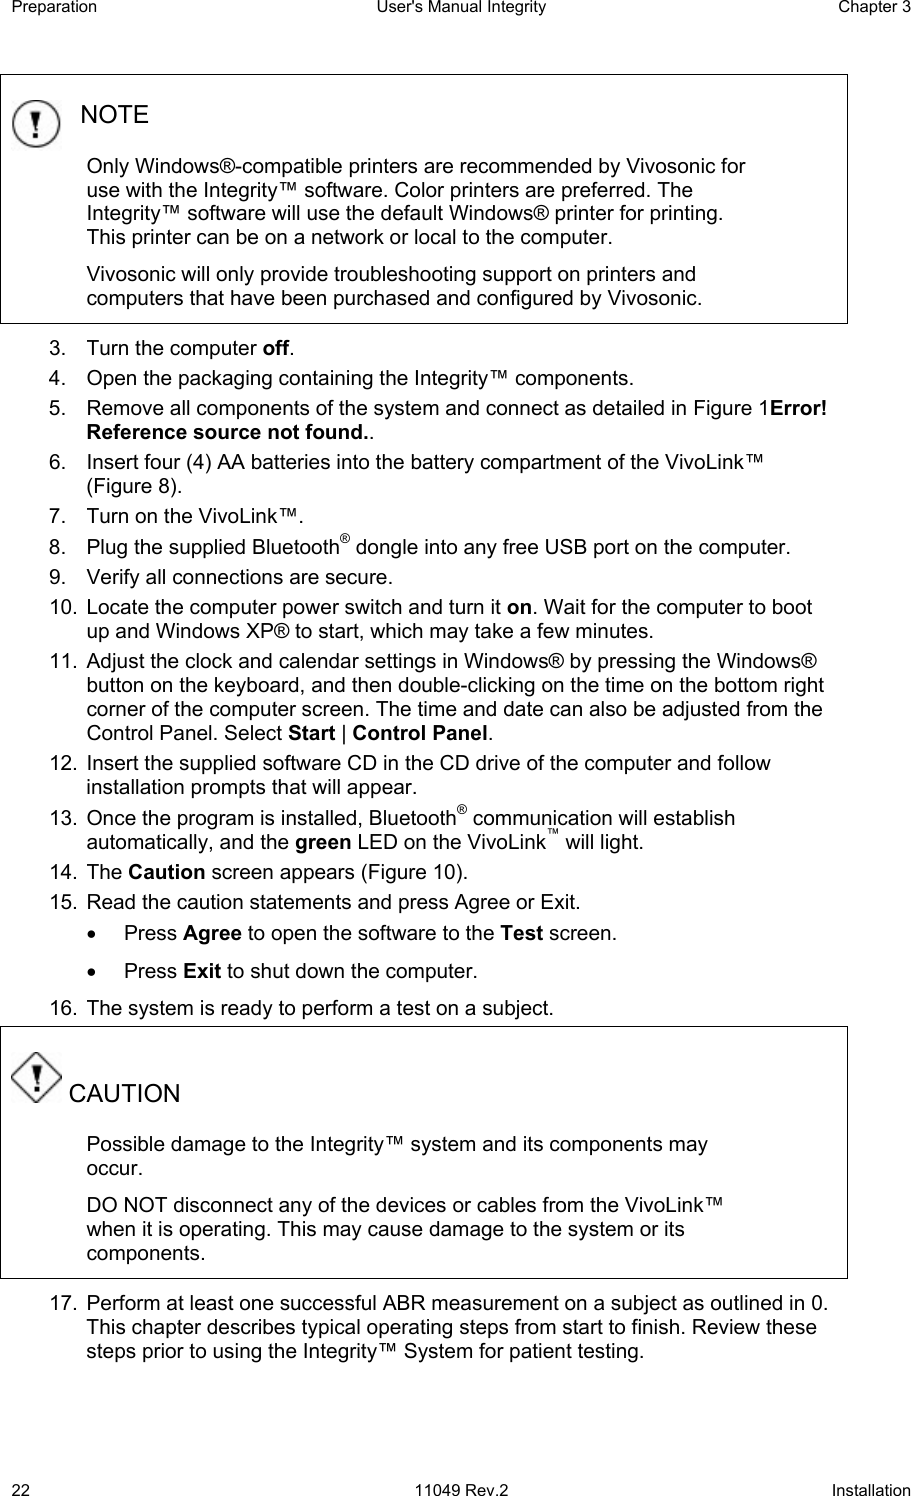
Upload a User Manual
Namespaces
Wiki Guide
HTML
PDF
Info
Views
User Manual
Discussion / Help
Navigation
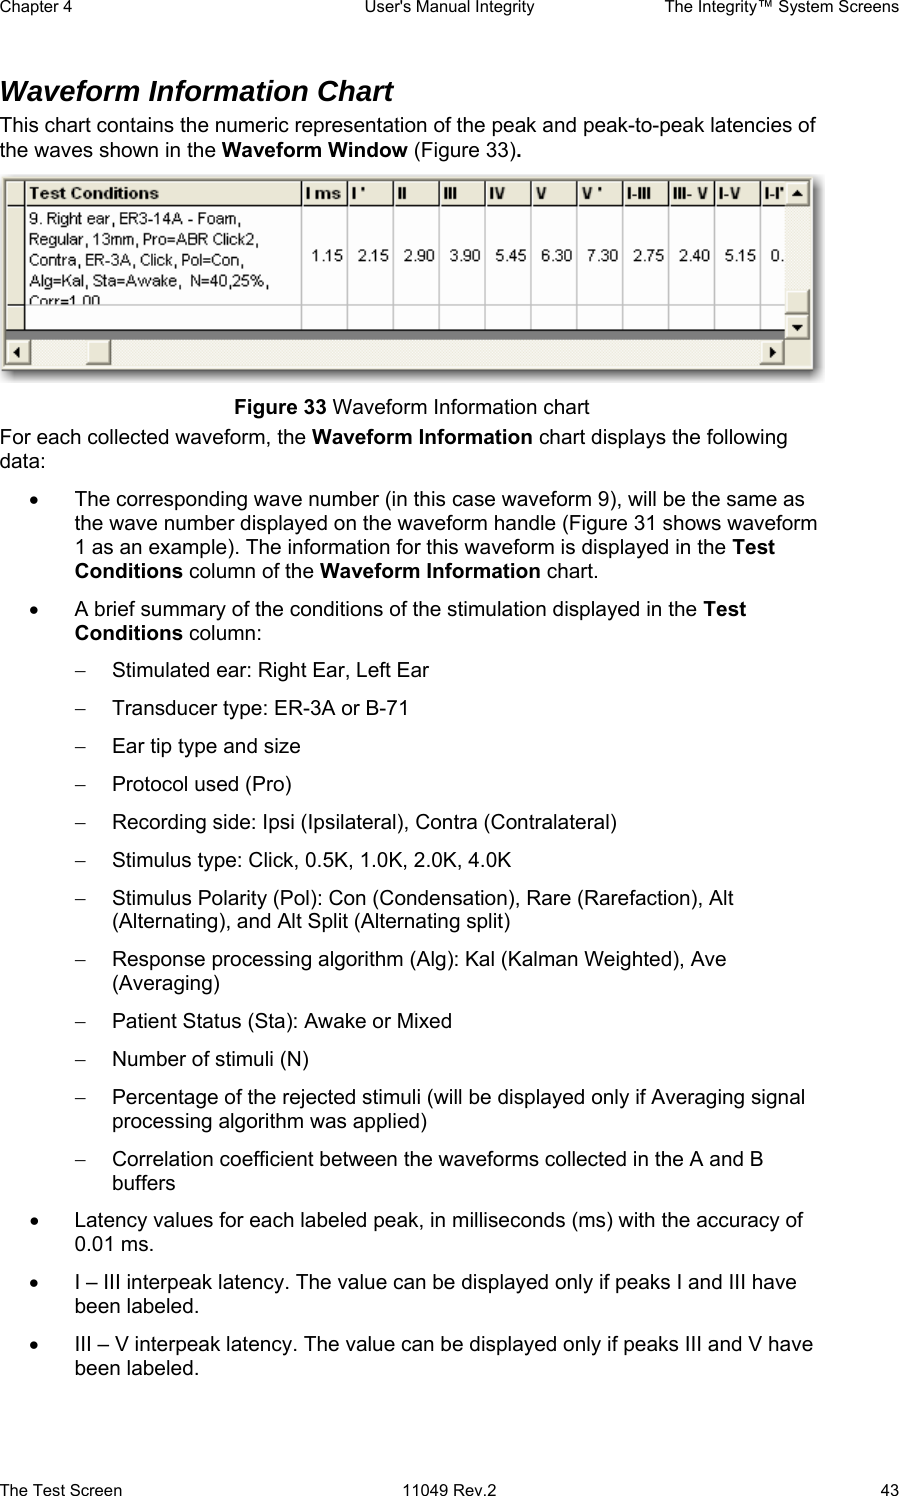
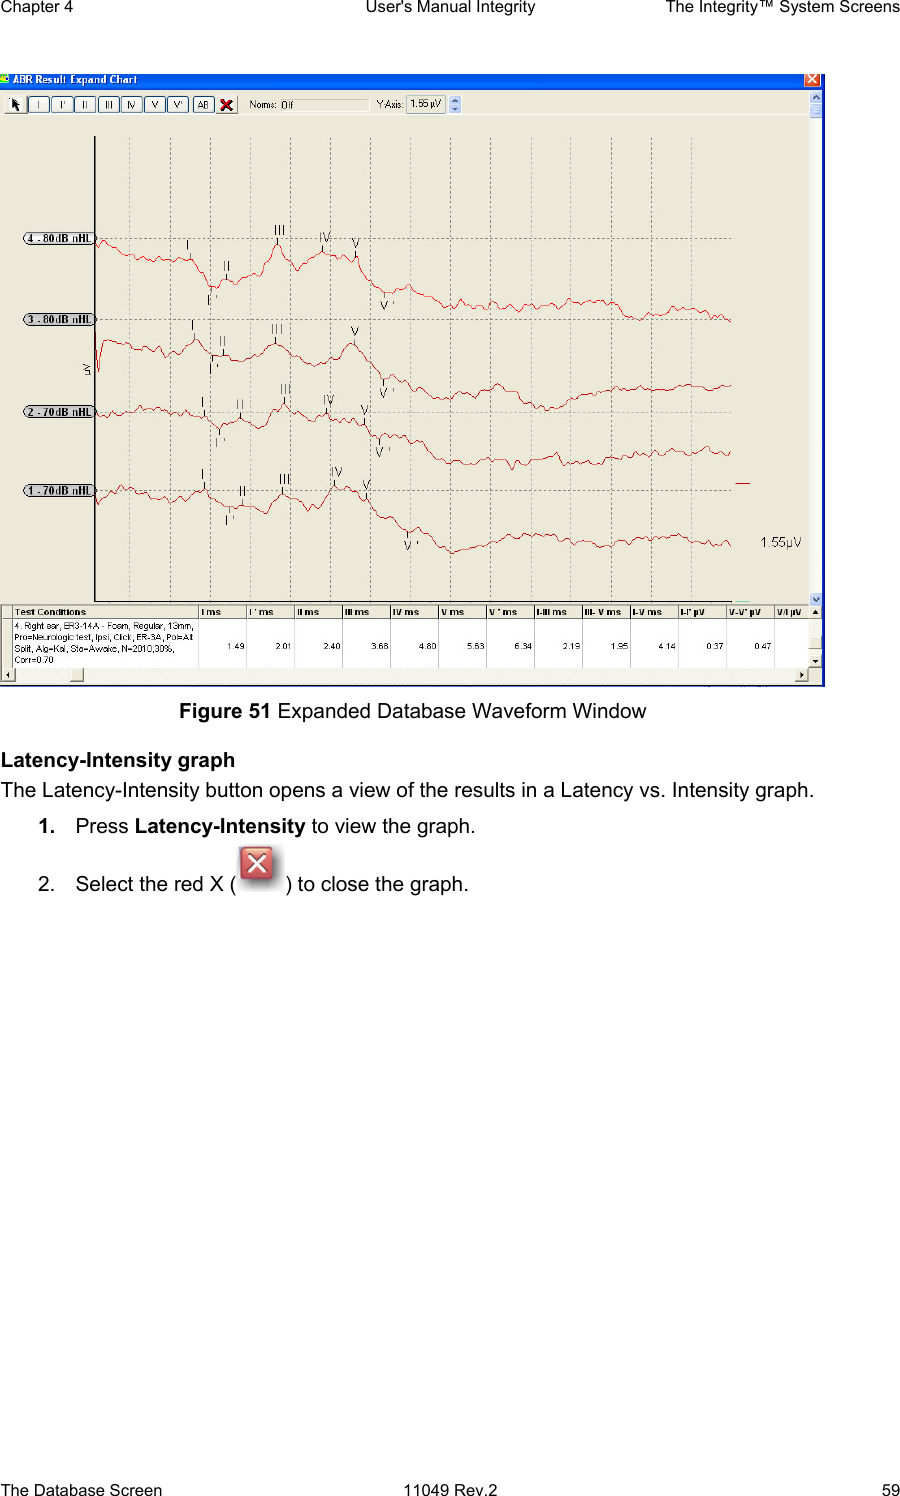
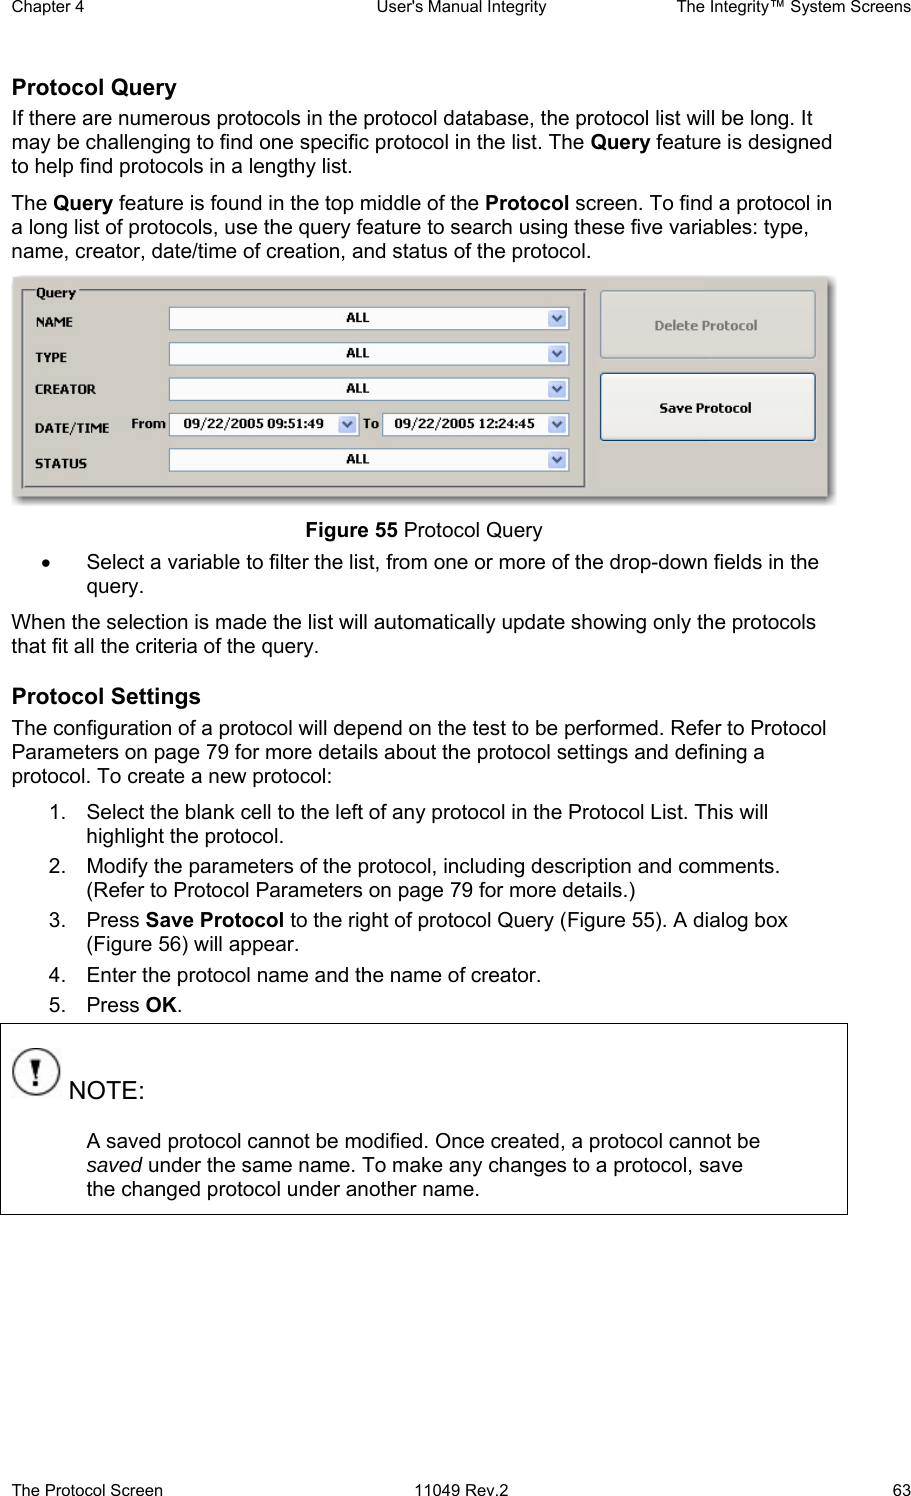
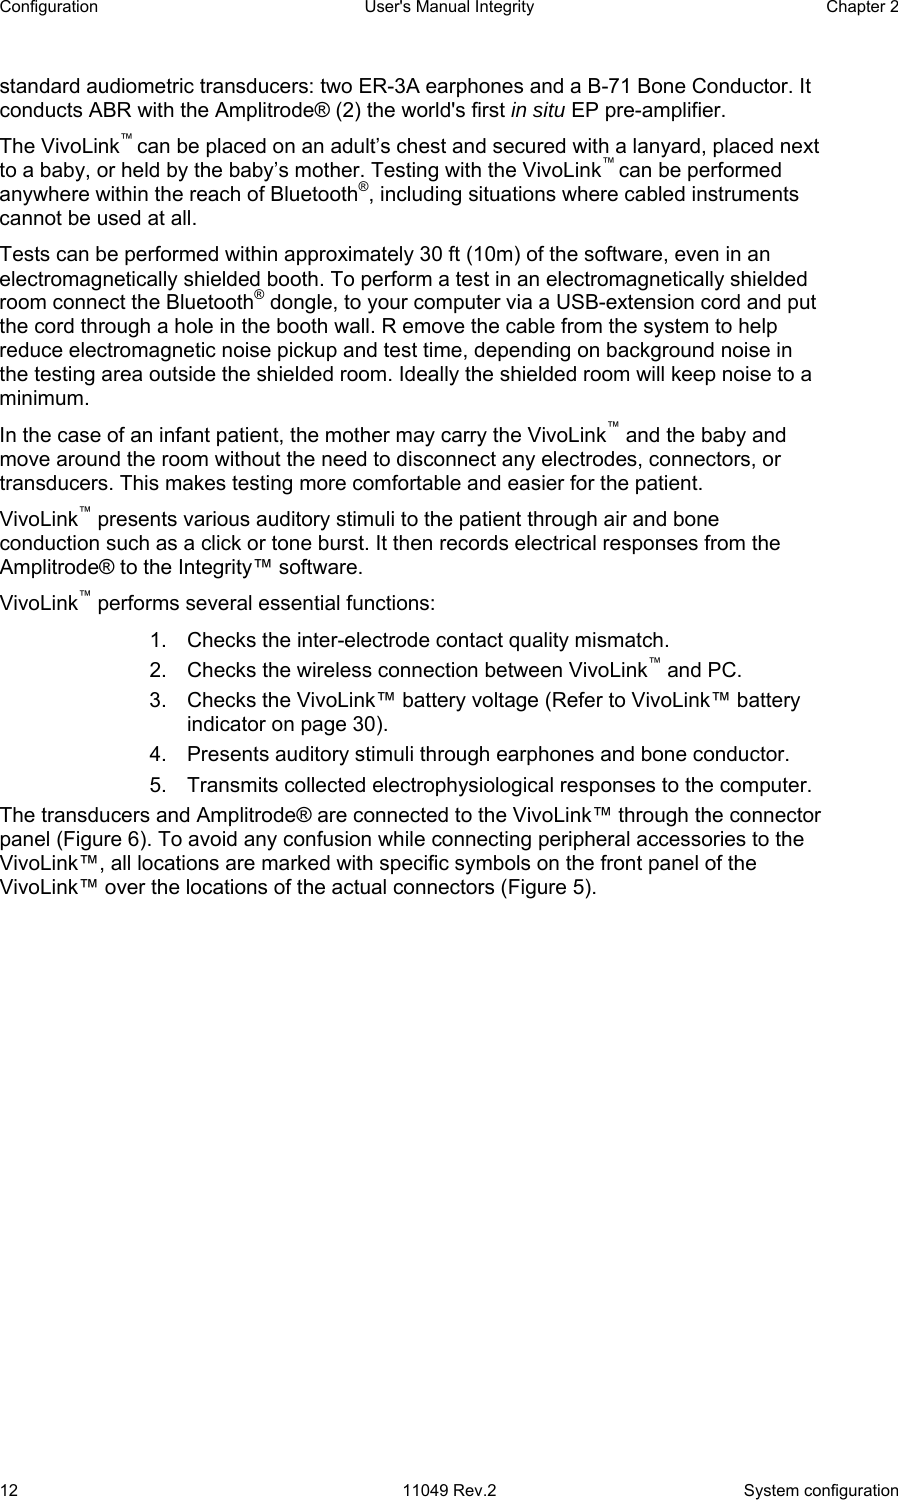
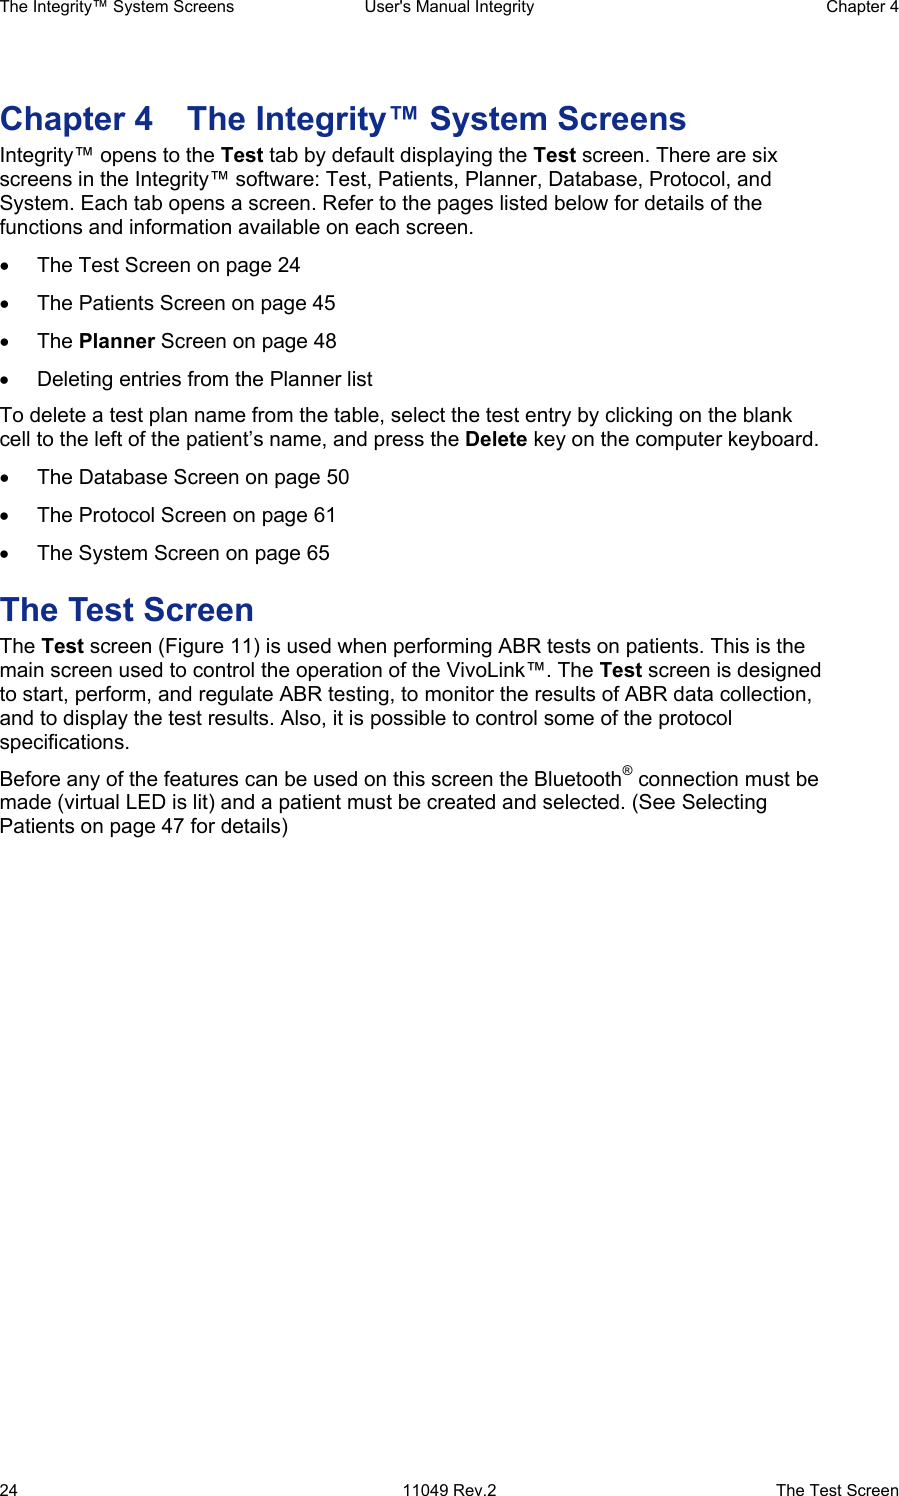
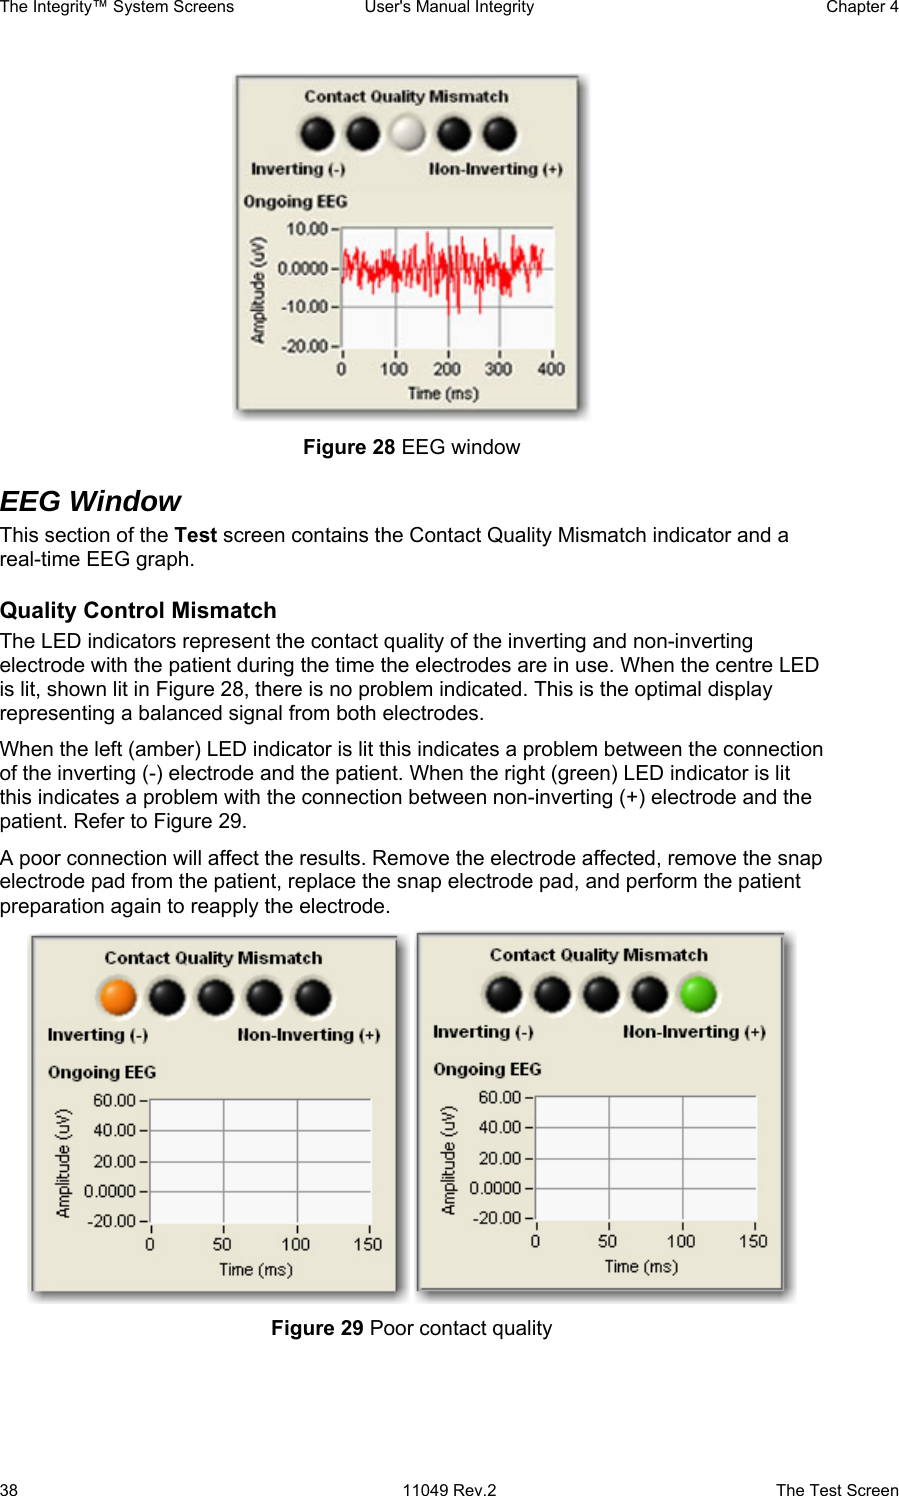
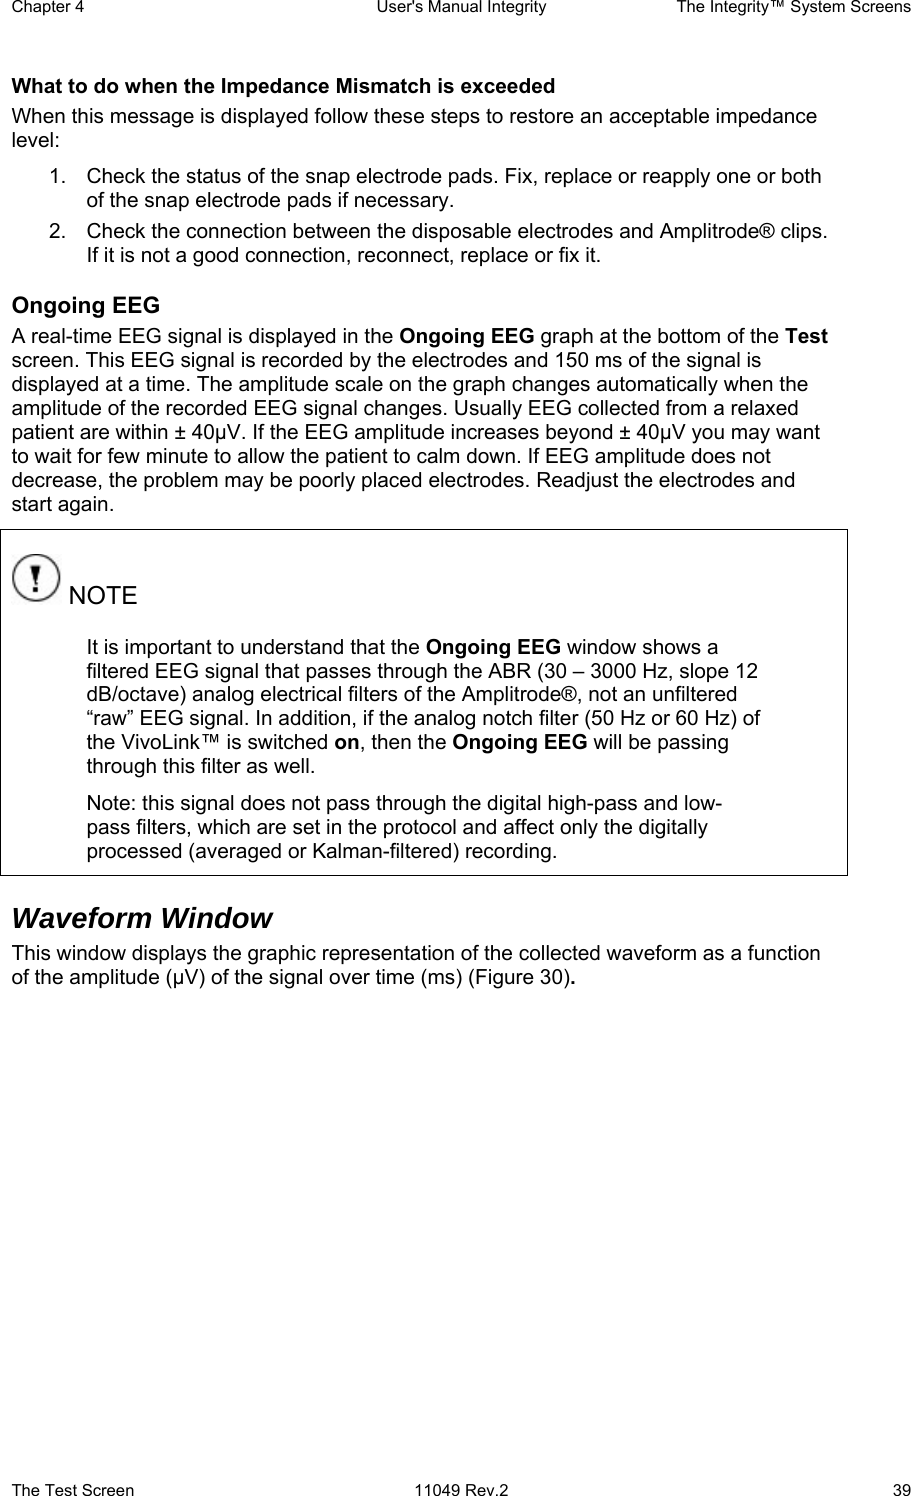
![Table of Figures User's Manual Integrity viii 11049 Rev.2 FIGURE 10 CAUTION SCREEN .............................................................................................................. 21 FIGURE 11 THE TEST SCREEN ............................................................................................................ 25 FIGURE 14 SAVE RESULT CONFIRMATION ............................................................................................ 27 FIGURE 15 DIALOG BOX - ARE YOU SURE YOU WANT TO DISCARD IT? ...................................................... 28 FIGURE 16 PRINT RESULT CONFIRMATION ........................................................................................... 29 FIGURE 18 VIVOLINK™ BATTERY INDICATOR ........................................................................................ 30 FIGURE 19 LOW BATTERY MESSAGE BOX.............................................................................................. 30 FIGURE 20 BLUETOOTH® CONNECTION INDICATOR................................................................................ 31 FIGURE 21 BLUETOOTH CONNECTION FAILED MASSAGE ......................................................................... 31 FIGURE 23 NON-INVERTING (+) ELECTRODE DROP-DOWN LIST SHOWN .................................................... 33 FIGURE 24 LIST OF ELECTRODES AVAILABLE FOR TESTING...................................................................... 34 FIGURE 25 LEVEL (DB PE SPL) BAR. .................................................................................................. 34 FIGURE 26 SIGNAL INFORMATION ........................................................................................................ 35 FIGURE 27 LATENCY-INTENSITY GRAPH (ADULT) [HOOD, 1998].............................................................. 37 FIGURE 28 EEG WINDOW ................................................................................................................... 38 FIGURE 29 POOR CONTACT QUALITY.................................................................................................... 38 FIGURE 30 WAVEFORM WINDOW – COLLECTED DATA FOR ANALYSIS ....................................................... 40 FIGURE 32 WAVEFORM LABELING BUTTONS.......................................................................................... 41 FIGURE 33 WAVEFORM INFORMATION CHART ....................................................................................... 43 FIGURE 34 ARE YOU SURE YOU WANT TO DISCARD THE RECORD(S)?....................................................... 44 FIGURE 35 THE PATIENTS SCREEN...................................................................................................... 45 FIGURE 36 DROP-DOWN CALENDAR..................................................................................................... 47 FIGURE 37 DROP-DOWN CLOCK .......................................................................................................... 47 FIGURE 38 SELECTED PATIENTS IN PATIENTS SCREEN ........................................................................... 48 FIGURE 39 THE PLANNER SCREEN ...................................................................................................... 48 FIGURE 40 PLANNED PATIENT LIST....................................................................................................... 49 FIGURE 41 SELECTED TESTS IN THE PLANNER SCREEN.......................................................................... 50 FIGURE 42 THE DATABASE SCREEN .................................................................................................... 51 FIGURE 43 DATABASE PATIENT LIST – INITIAL VIEW ............................................................................... 53 FIGURE 44 DATABASE PATIENT LIST – OTHER FIELDS SCROLLED RIGHT ................................................... 53 FIGURE 45 DATABASE WAVEFORM WINDOW AND INFORMATION TABLE.................................................... 54 FIGURE 47 TEST REPORT SCREEN ....................................................................................................... 56 FIGURE 48 PRINT TEST RESULT DIALOG BOX ........................................................................................ 56 FIGURE 49 PRINT TEST RESULT DIALOG BOX ........................................................................................ 56 FIGURE 50 EXPORT TEST RESULT....................................................................................................... 57 FIGURE 51 EXPANDED DATABASE WAVEFORM WINDOW........................................................................ 59 FIGURE 52 LATENCY-INTENSITY GRAPH - ADULT NORMS SHOWN............................................................. 60 FIGURE 53 THE PROTOCOL SCREEN ................................................................................................... 61 FIGURE 54 PROTOCOL LIST ................................................................................................................ 62 FIGURE 55 PROTOCOL QUERY ............................................................................................................ 63 FIGURE 56 PROTOCOL DIALOG BOX ..................................................................................................... 64 FIGURE 57 CHANGE PROTOCOL DIALOG BOX ........................................................................................ 64 FIGURE 58 PROTOCOL DELETION DIALOG BOX....................................................................................... 64 FIGURE 59 THE SYSTEM SCREEN ........................................................................................................ 65 FIGURE 60 SAVE RECORDS DIALOG BOX ............................................................................................... 70 FIGURE 61 TYPICAL ELECTRODE PLACEMENT DIAGRAM - FRONT VIEW...................................................... 73 FIGURE 62 TYPICAL ELECTRODE PLACEMENT DIAGRAM - LEFT LATERAL VIEW............................................ 73 FIGURE 63 AMPLITRODE® AND ELECTRODE CLIPS PLACEMENT (SHOWN ON AN INFANT) ........................... 74 FIGURE 64 AMPLITRODE® .................................................................................................................. 75 FIGURE 65 ER-3A EARPHONES (A) AND THEIR FOAM EAR TIP DIMENSIONS (B) .......................................... 77 FIGURE 66 PROTOCOL STIMULUS AND TEST SETTINGS CONTROLS ......................................................... 80 FIGURE 67 BATTERY COMPARTMENT OF THE VIVOLINK™ ...................................................................... 89](https://usermanual.wiki/Vivosonic/V50.USERS-MANUAL-1/User-Guide-624487-Page-8.png)

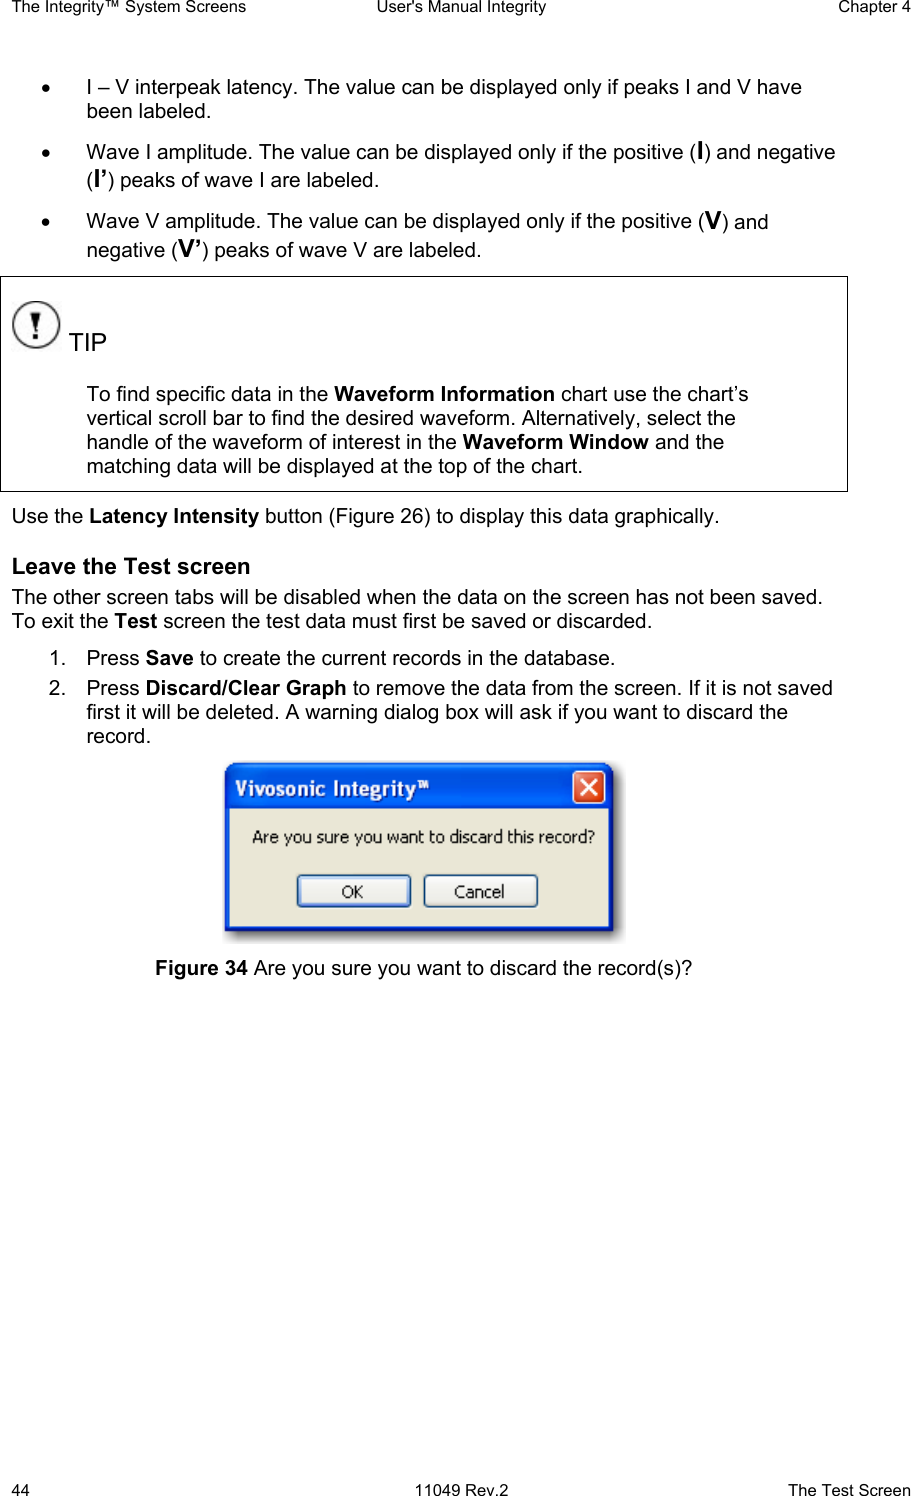
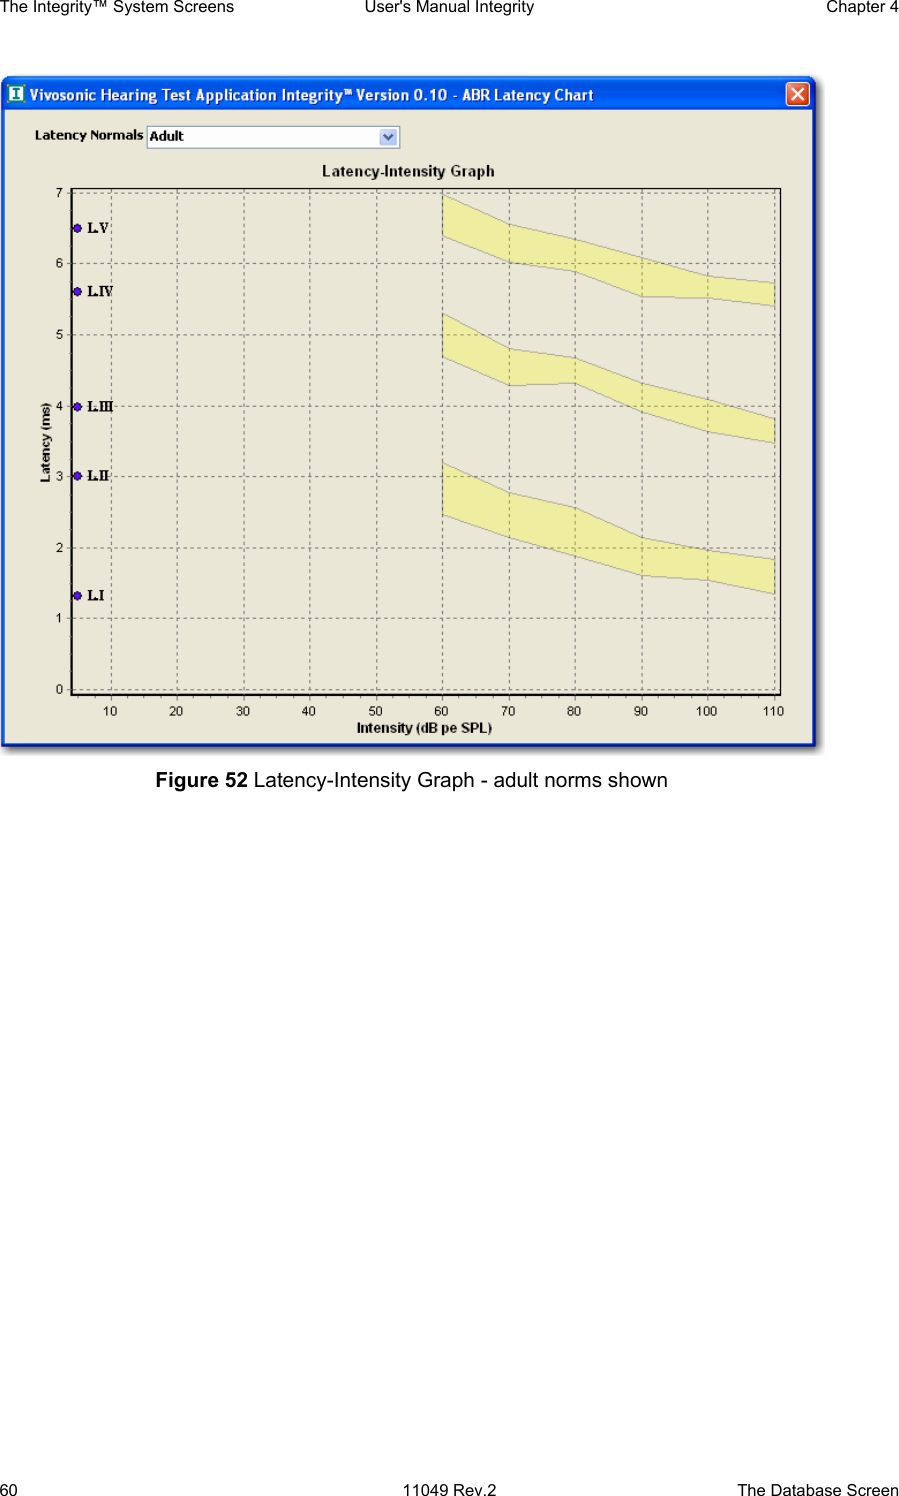
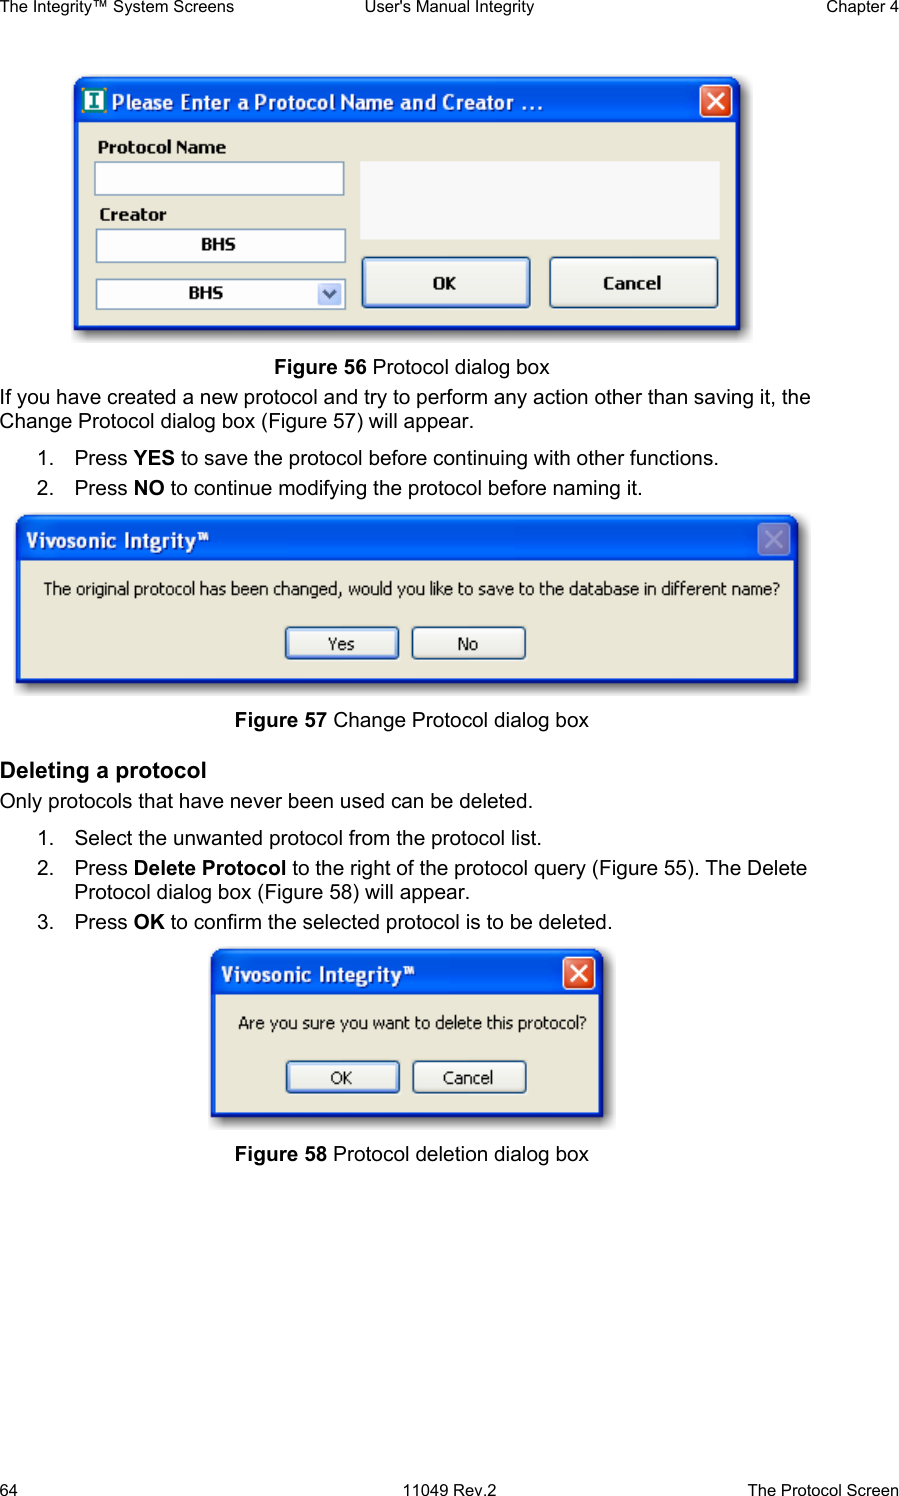
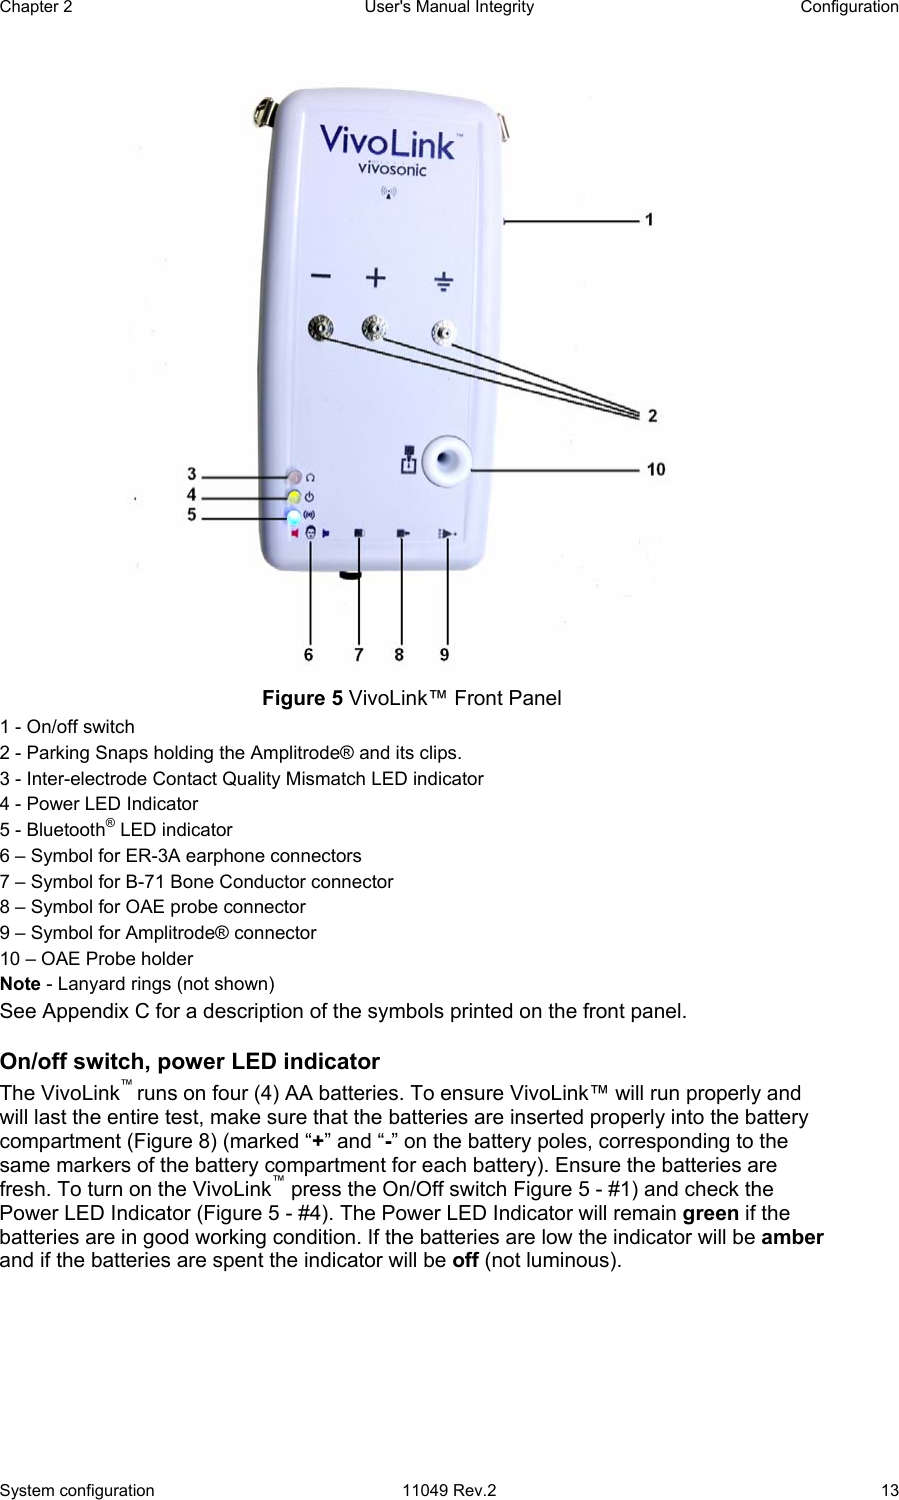
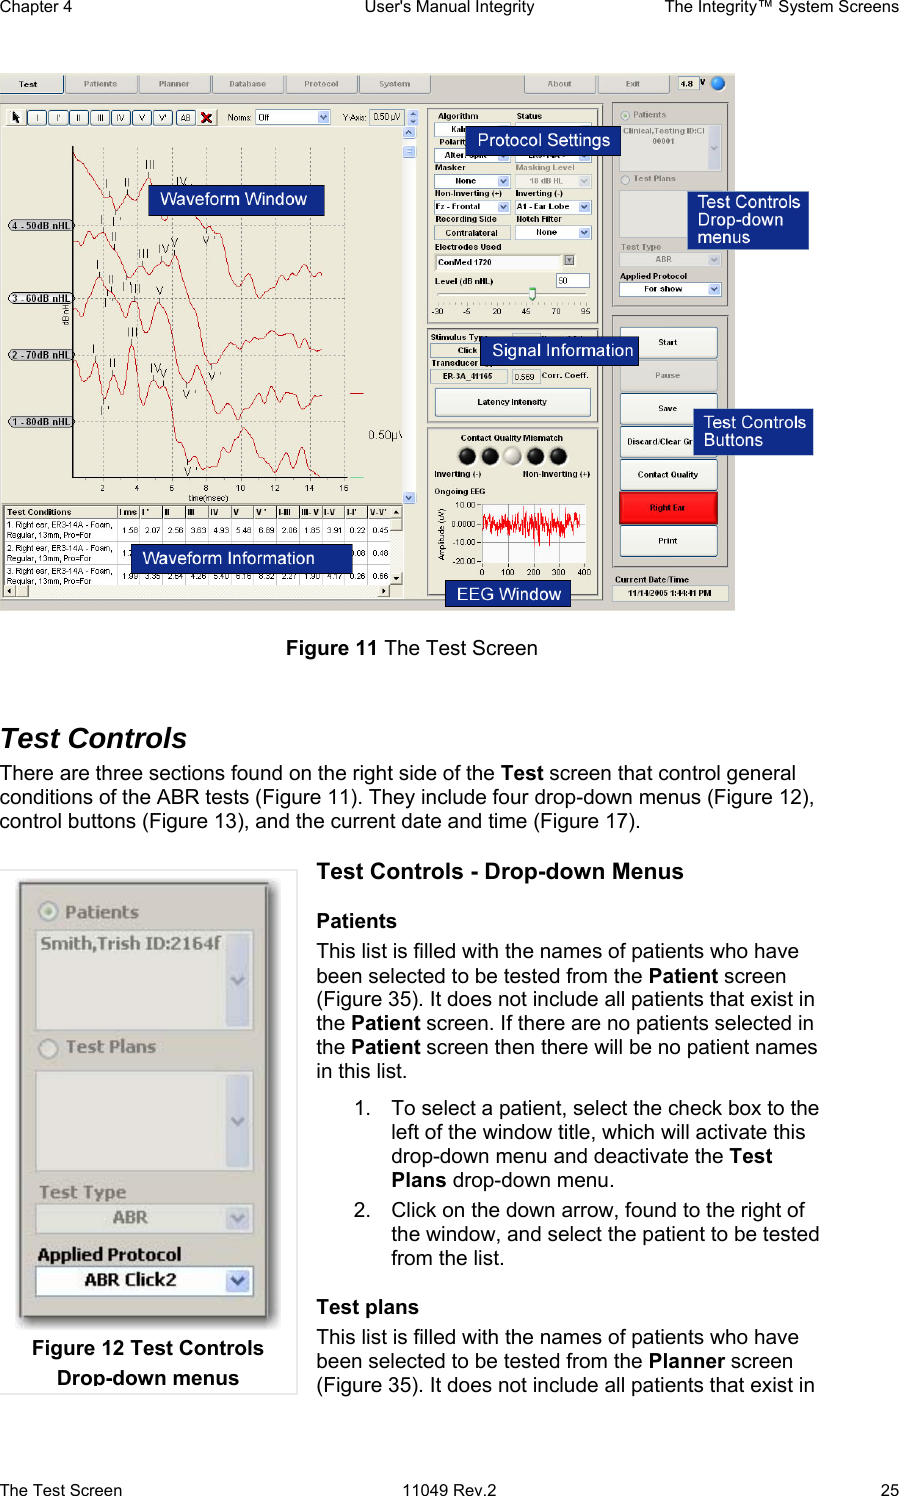
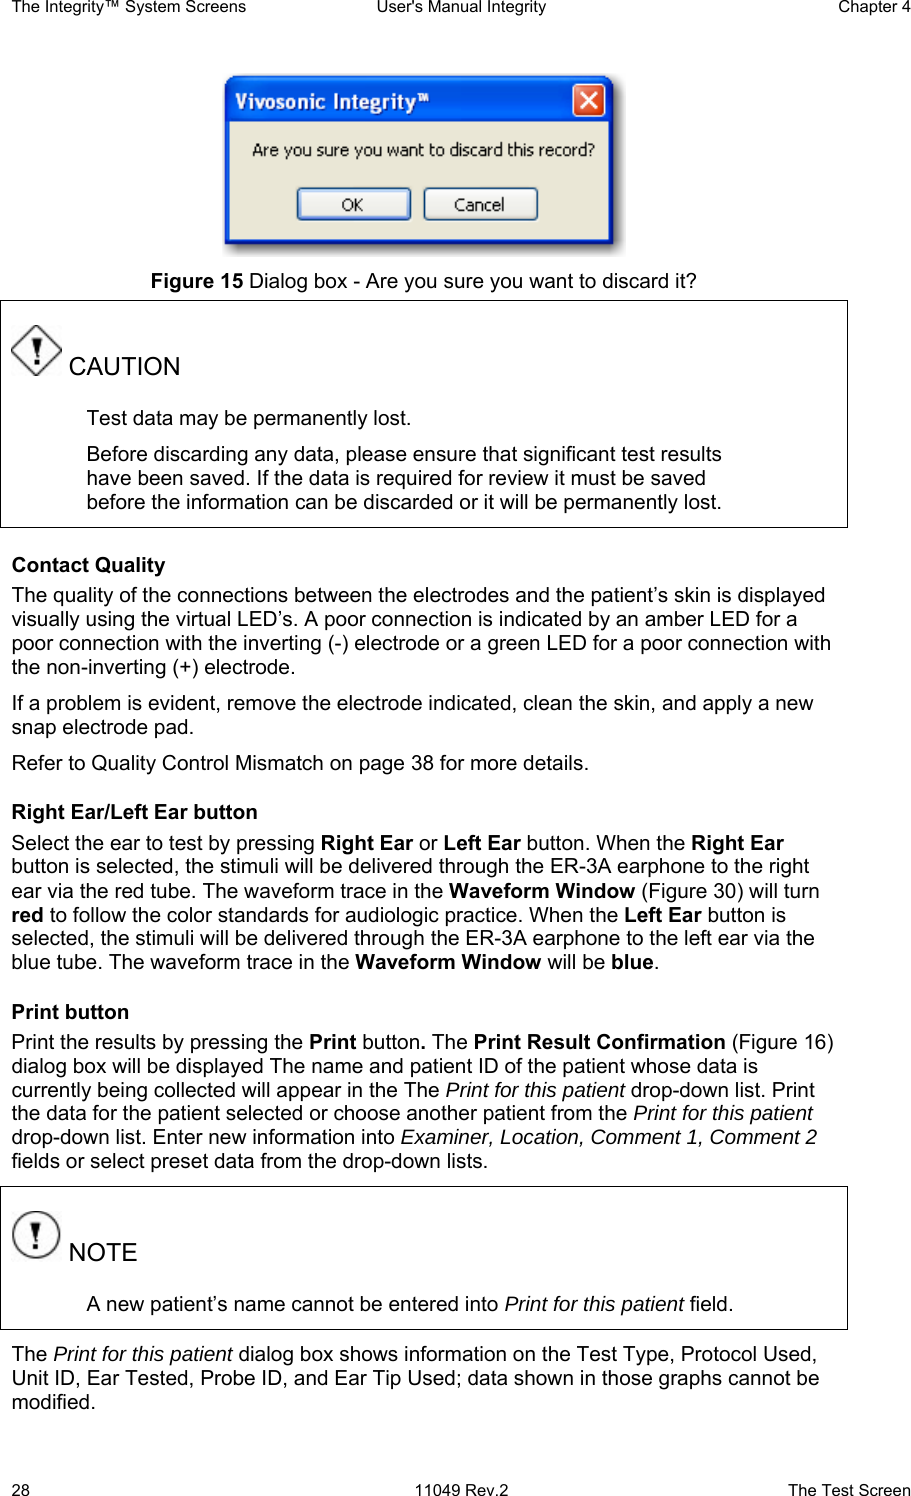
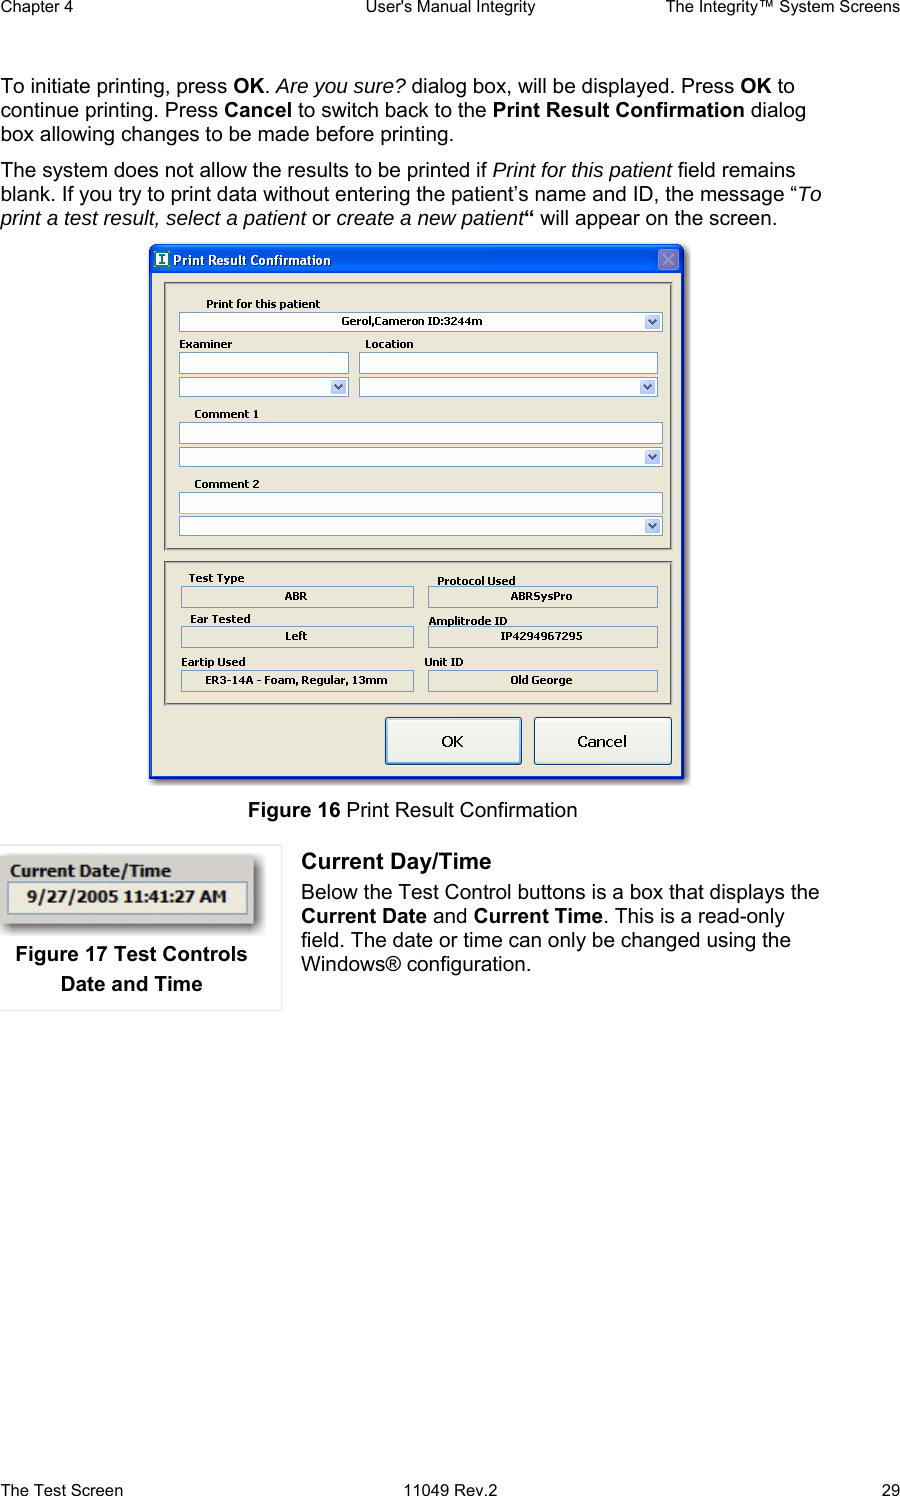
![General Information User's Manual Integrity Chapter 1 4 11049 Rev.2 Introduction Bluetooth® has been implemented in many medical applications making it a natural choice for Auditory Electrophysiology. Vivosonic is first in the world to employ Bluetooth® for this function. More information on Bluetooth® can be found at www.bluetooth.com. Signal-processing algorithms: The system uses a patented digital signal processing technique called the Kalman Filter. The Kalman Filter is a minimum mean-square error filter. [Li, 2002] This technique offers the operator a fast, accurate, reliable, and simple testing process, even in the presence of EMG noise from facial muscles. Other features of the system User friendly: The instrument allows flexible, user-defined test protocols, and provides comprehensive data management and analysis. The protocol screen and test screen both have a similar design, which allows for easy learning. The data-management system keeps a common patient list and combines results from ABR testing which makes finding results, review, and printing reports easy and efficient. Data-management software includes a test planner, the patient database, and test-result database. It provides comprehensive data management suitable for individual offices, clinics, hospitals, research settings, and clinical networks. The Integrity™ system is operated using a Windows XP® based computer and Integrity™ software. Stored measurements can be viewed and evaluated on the computer while running the control program. A summary of the results can also be printed. AEP procedures can be completed in a couple of minutes and then immediately prepared for the next patient. The length of the AEP tests depends on the protocol, auditory function, state of the patient, and the environment. Quality assurance: Information contained in the patient test files allows for traceability and analysis of various factors that may affect the quality of testing. Data integrity, confidentiality, and availability: Test results are password protected and cannot be modified once they have been stored. The results can be backed up using the internal storage means of the computer, or any external USB-connected storage medium such as a RAM drive or CD. Full-page test report: The rest results can be printed to any optional office printer. The report will contain the patient information, unit ID, graphic test results, numeric test results, , and information on the testing facility. User interface: The user interface is very simple and intuitive, and requires a minimum amount of training.](https://usermanual.wiki/Vivosonic/V50.USERS-MANUAL-1/User-Guide-624487-Page-14.png)
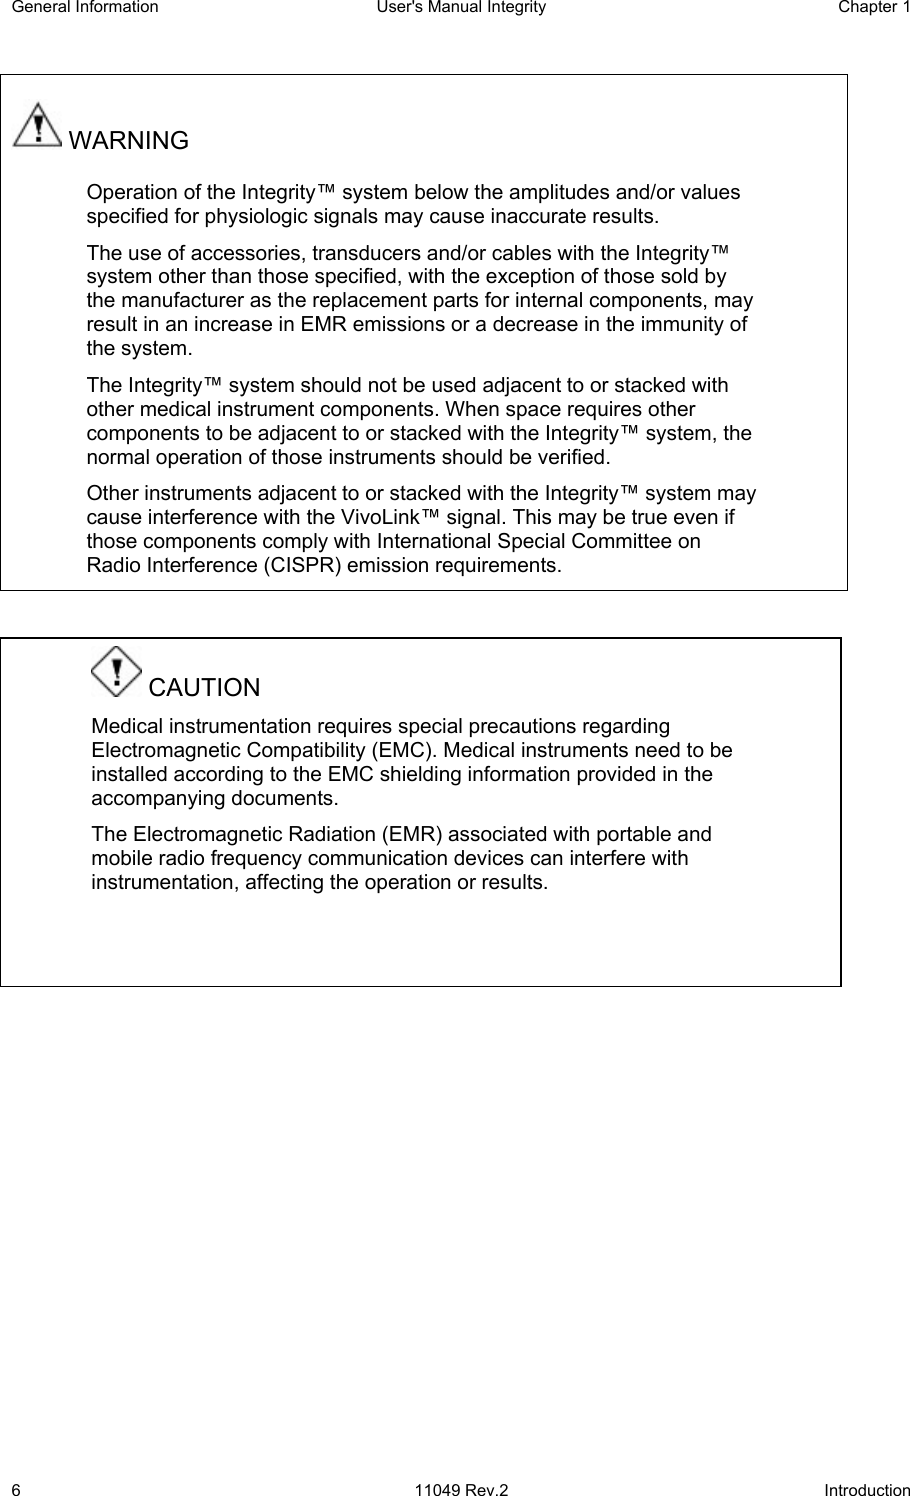
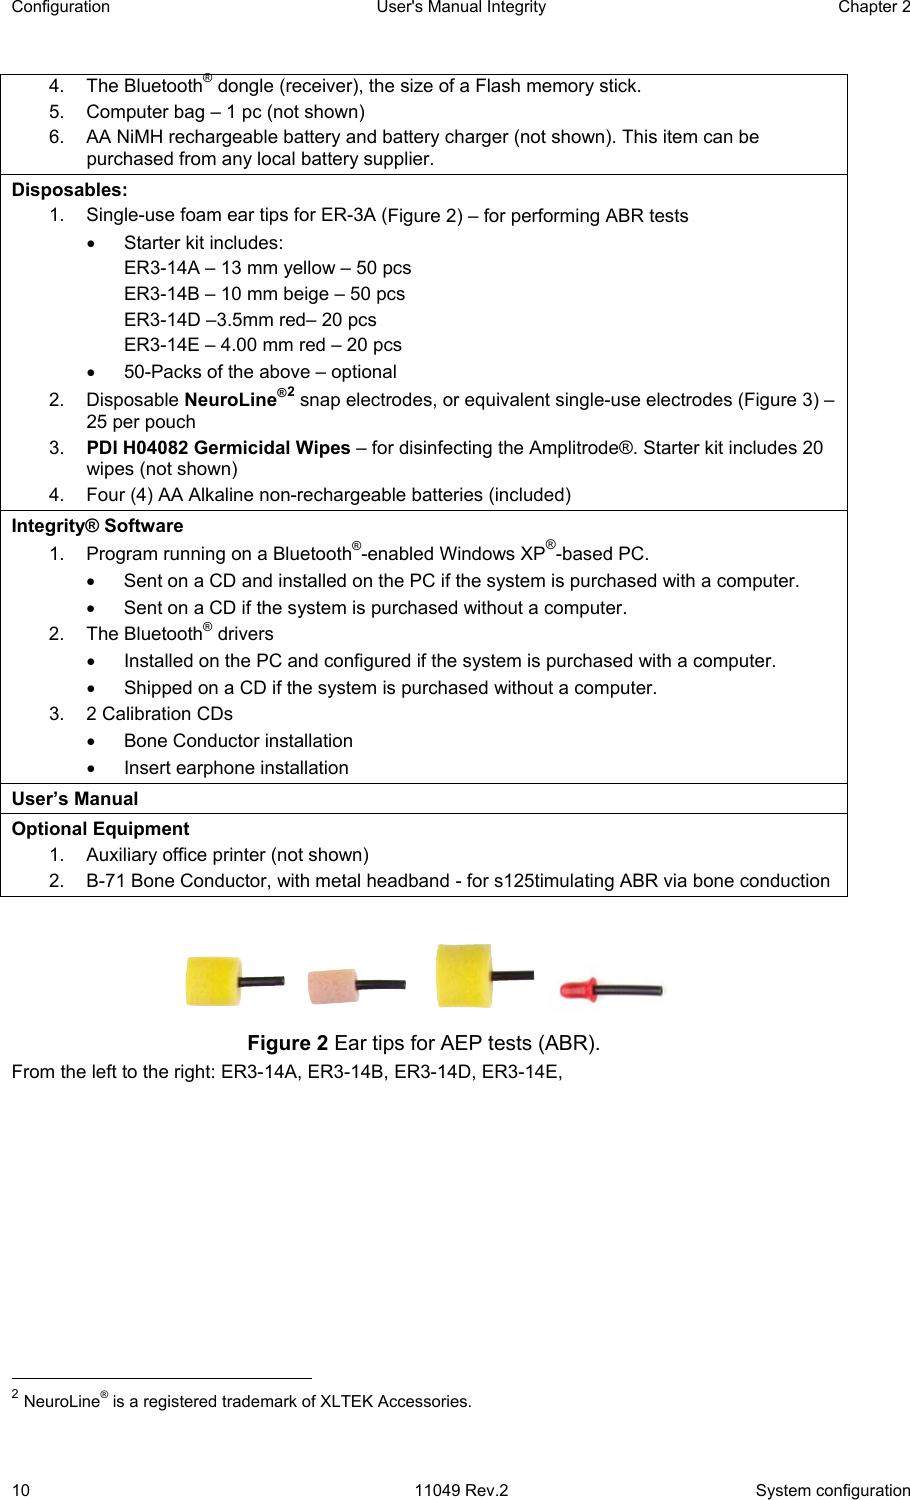
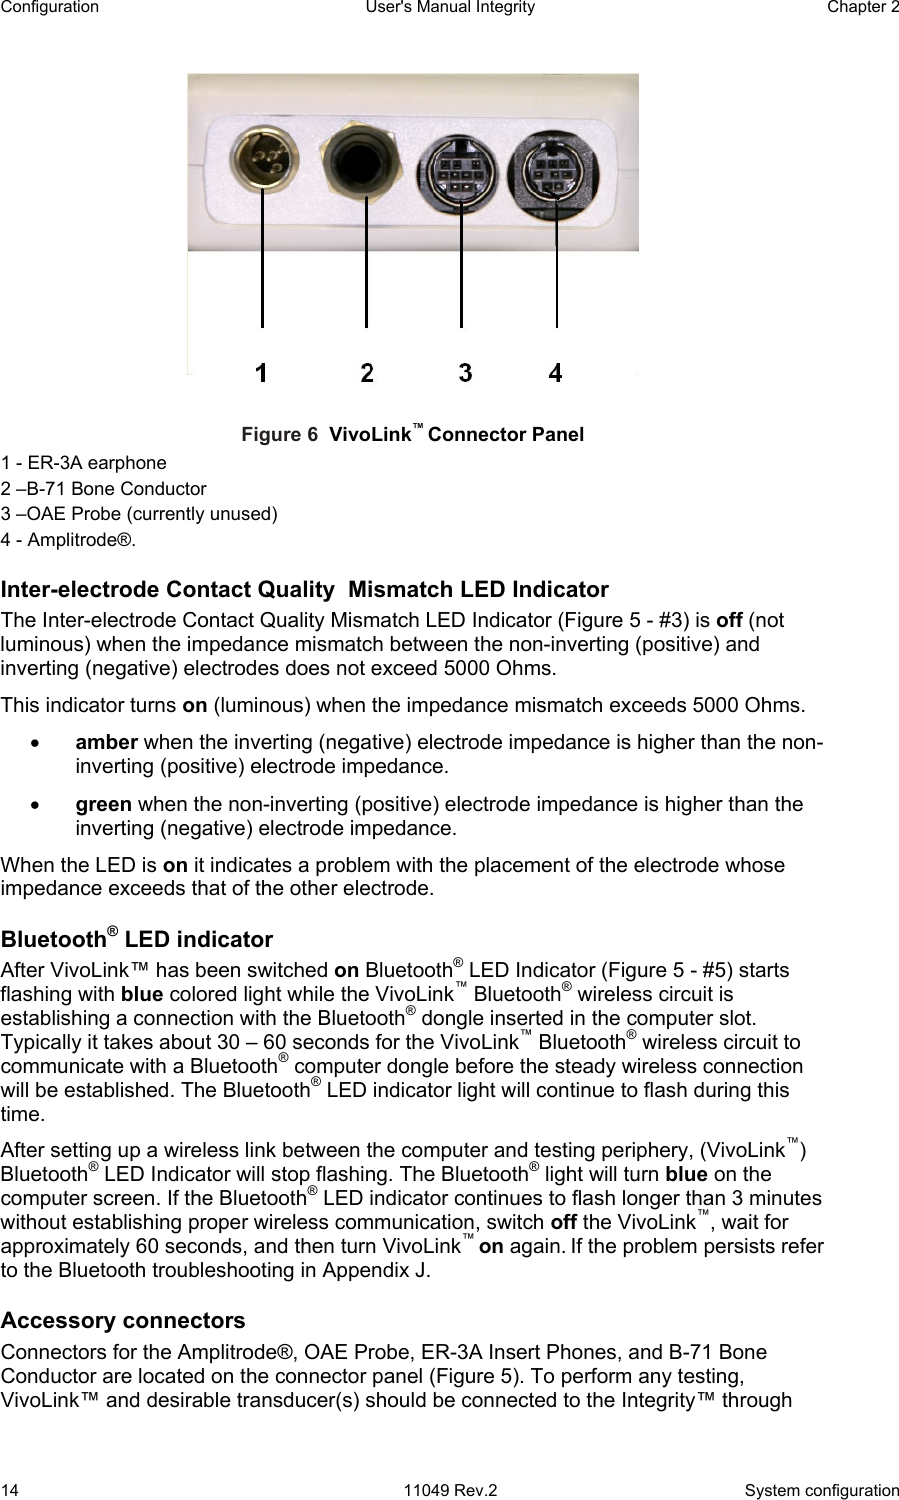
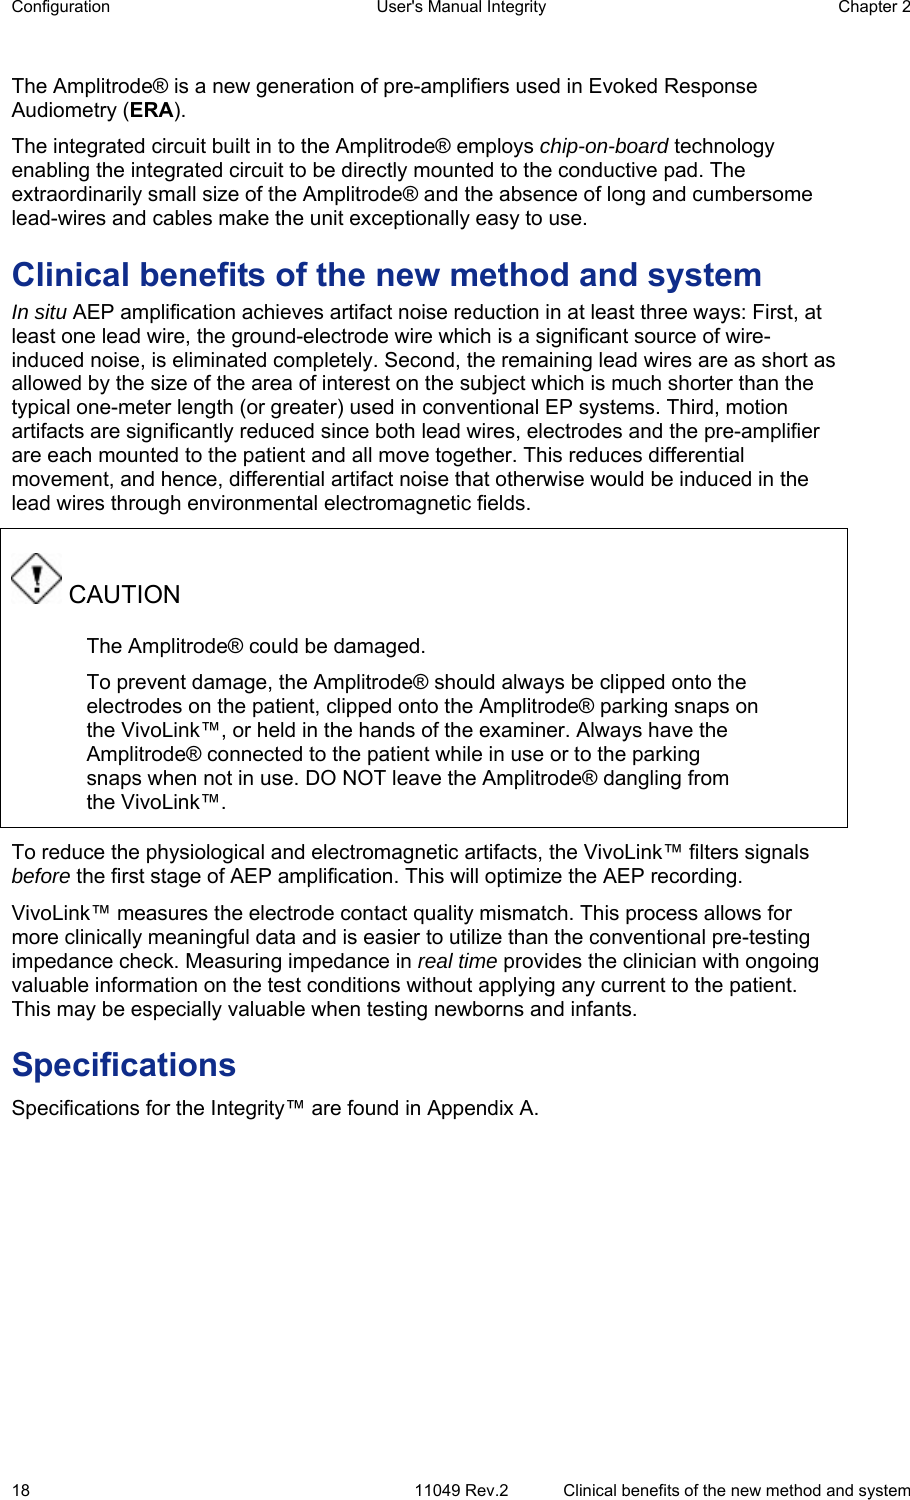
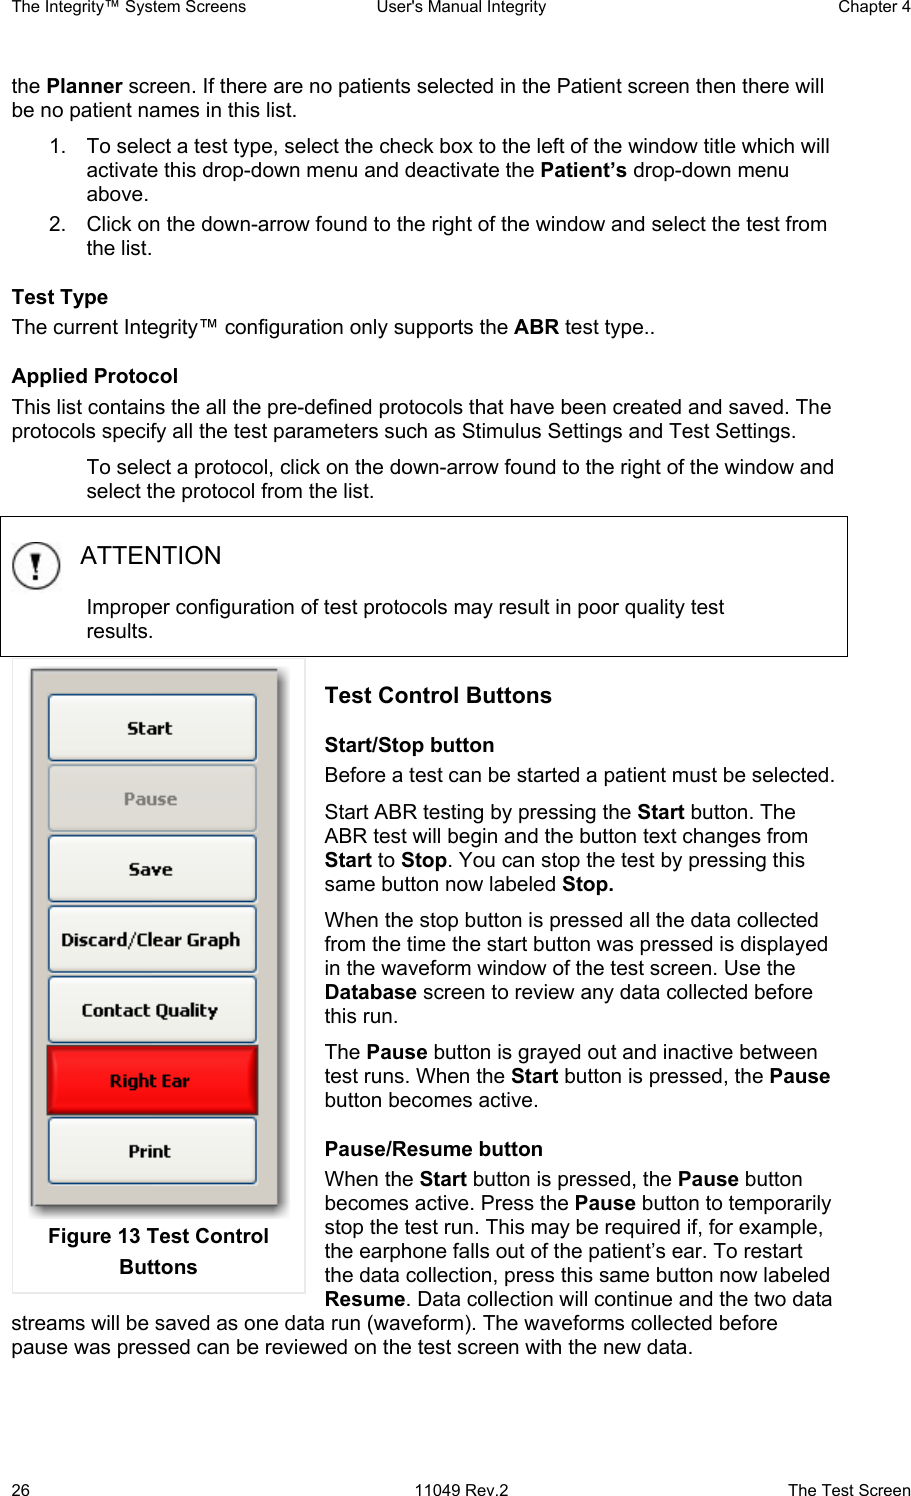
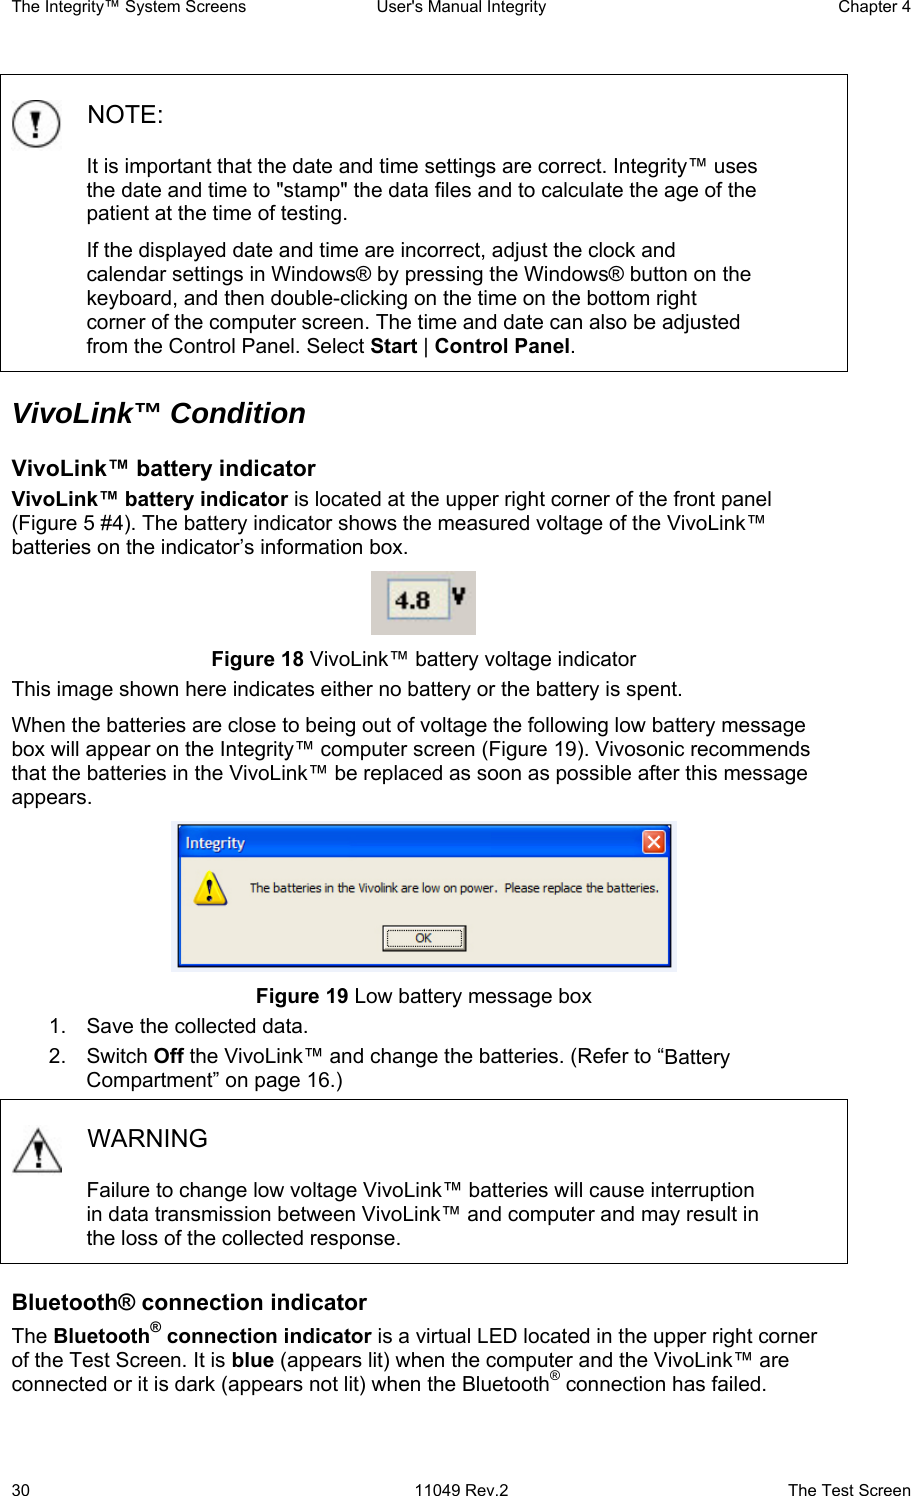
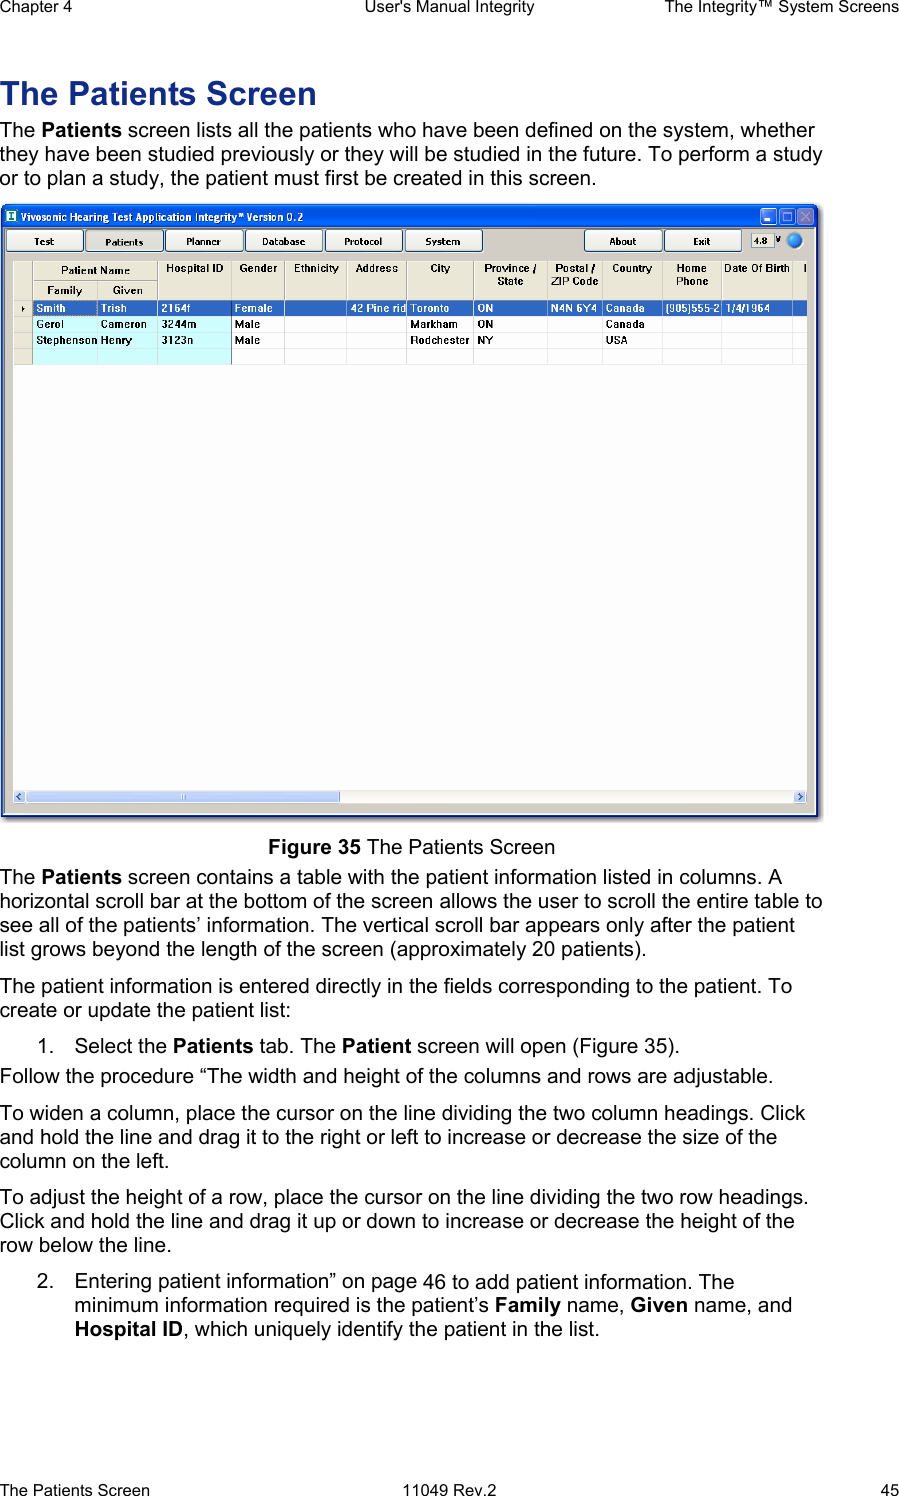
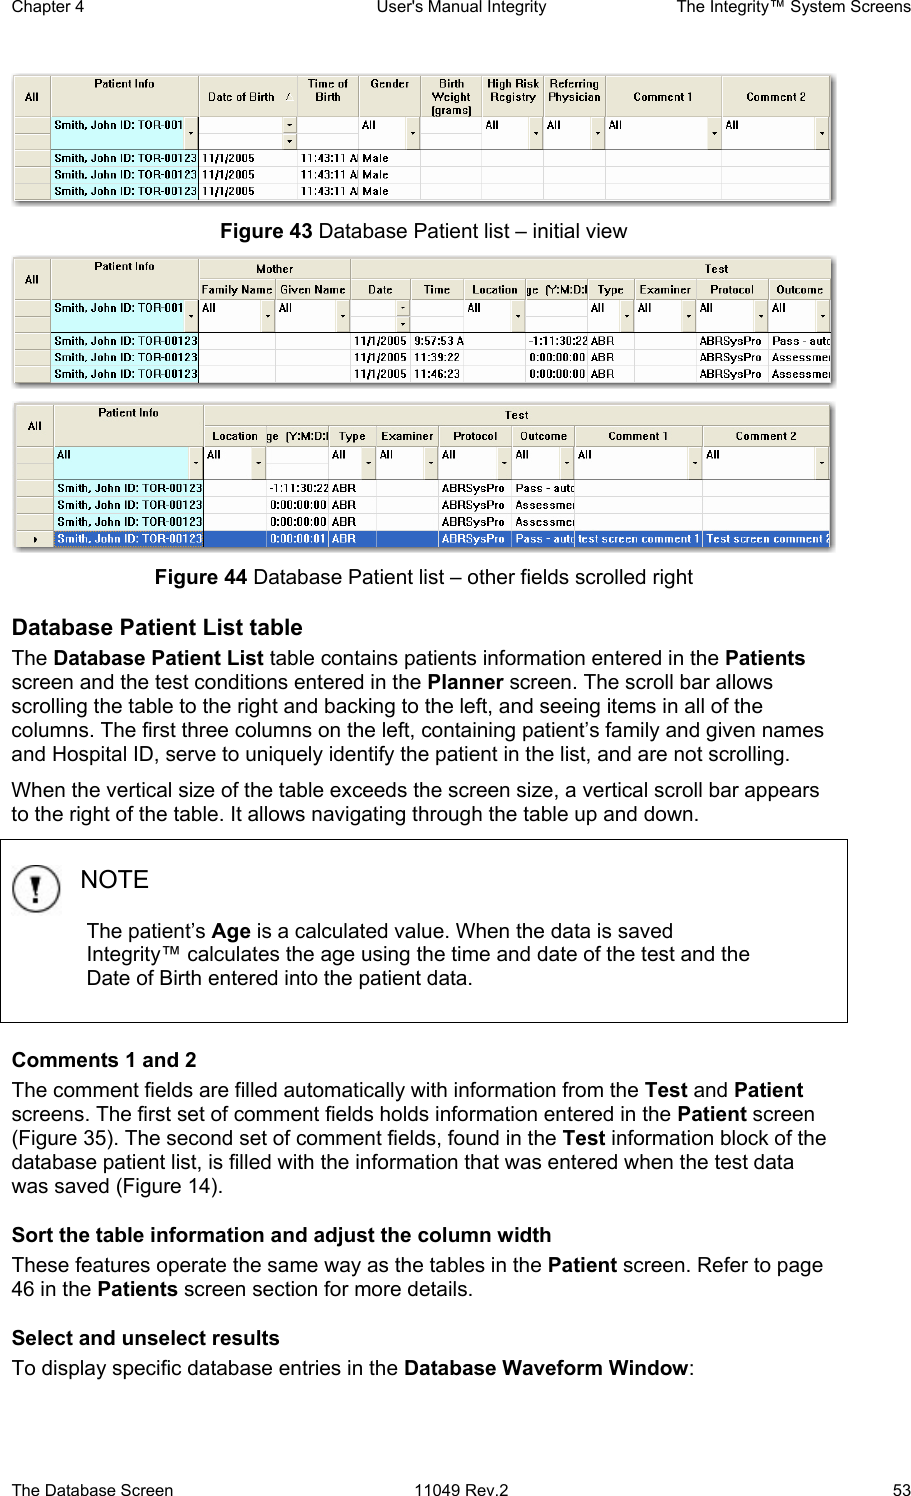
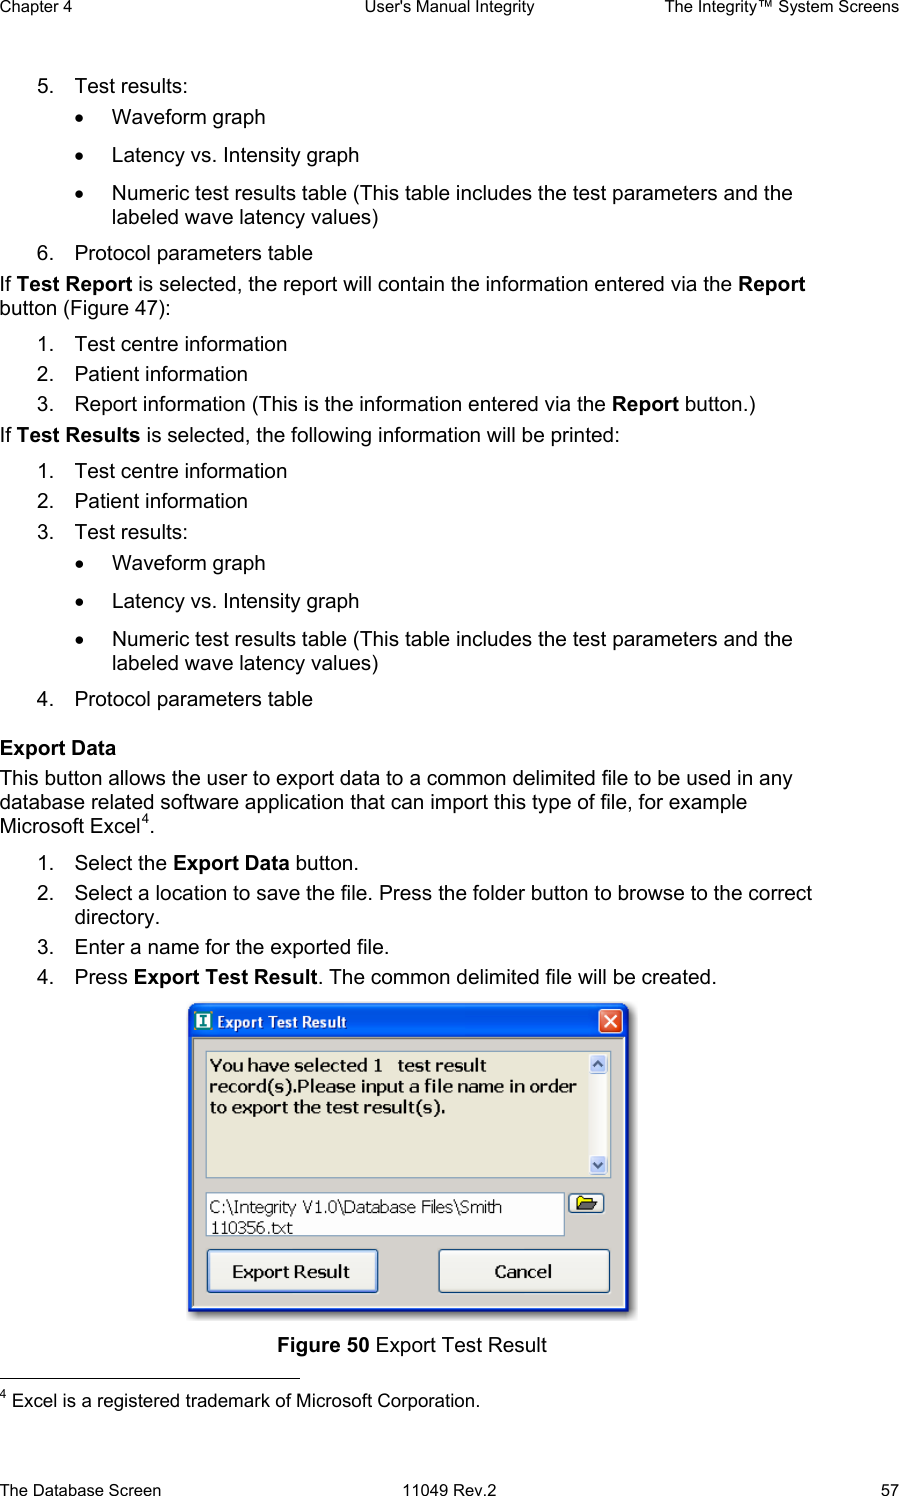
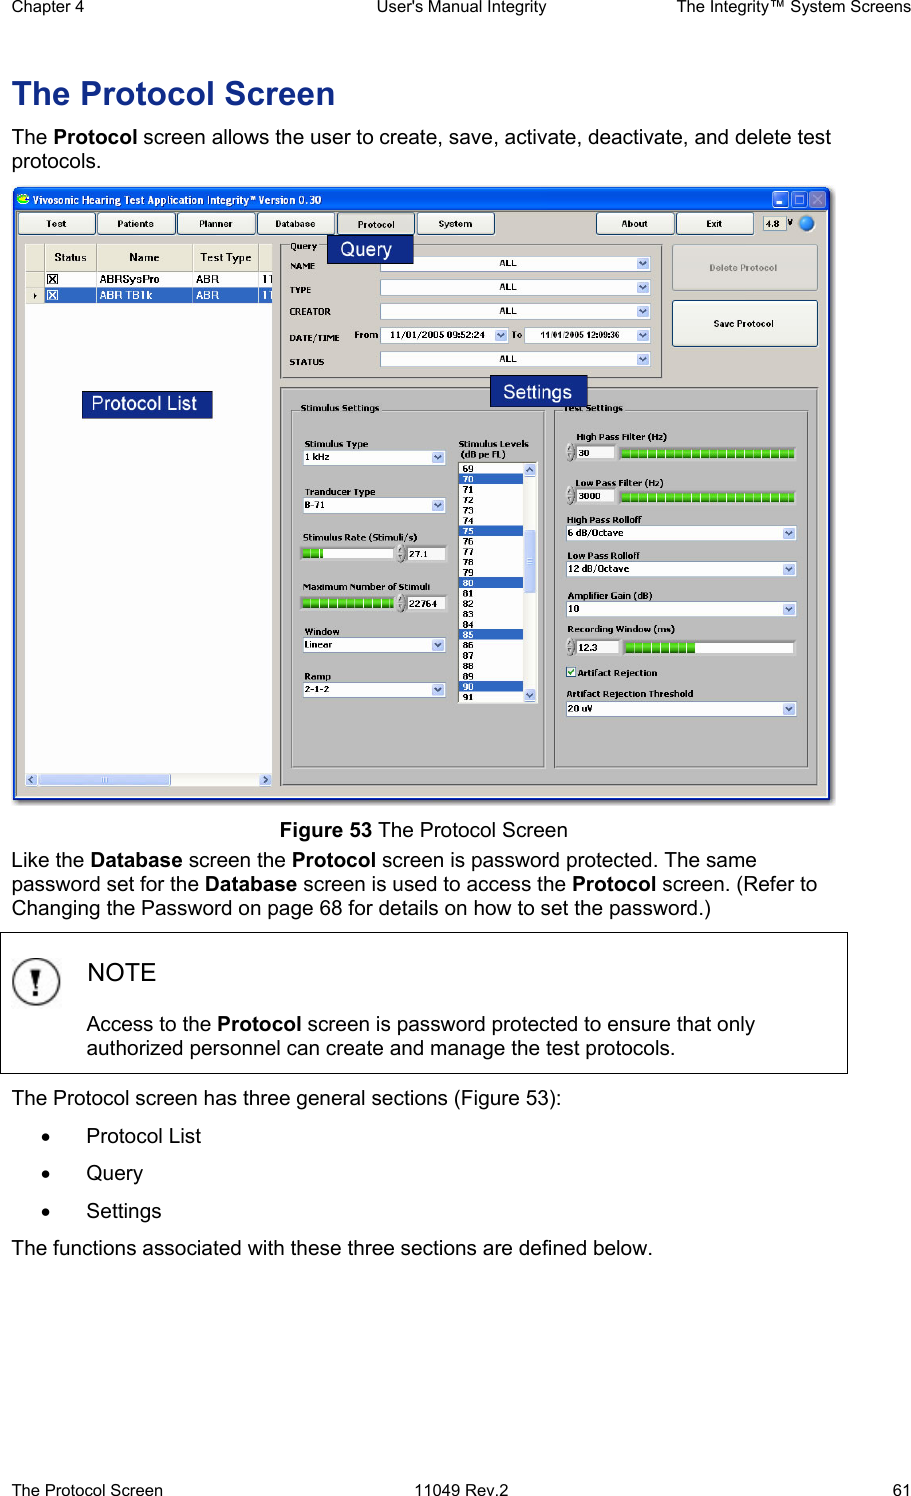
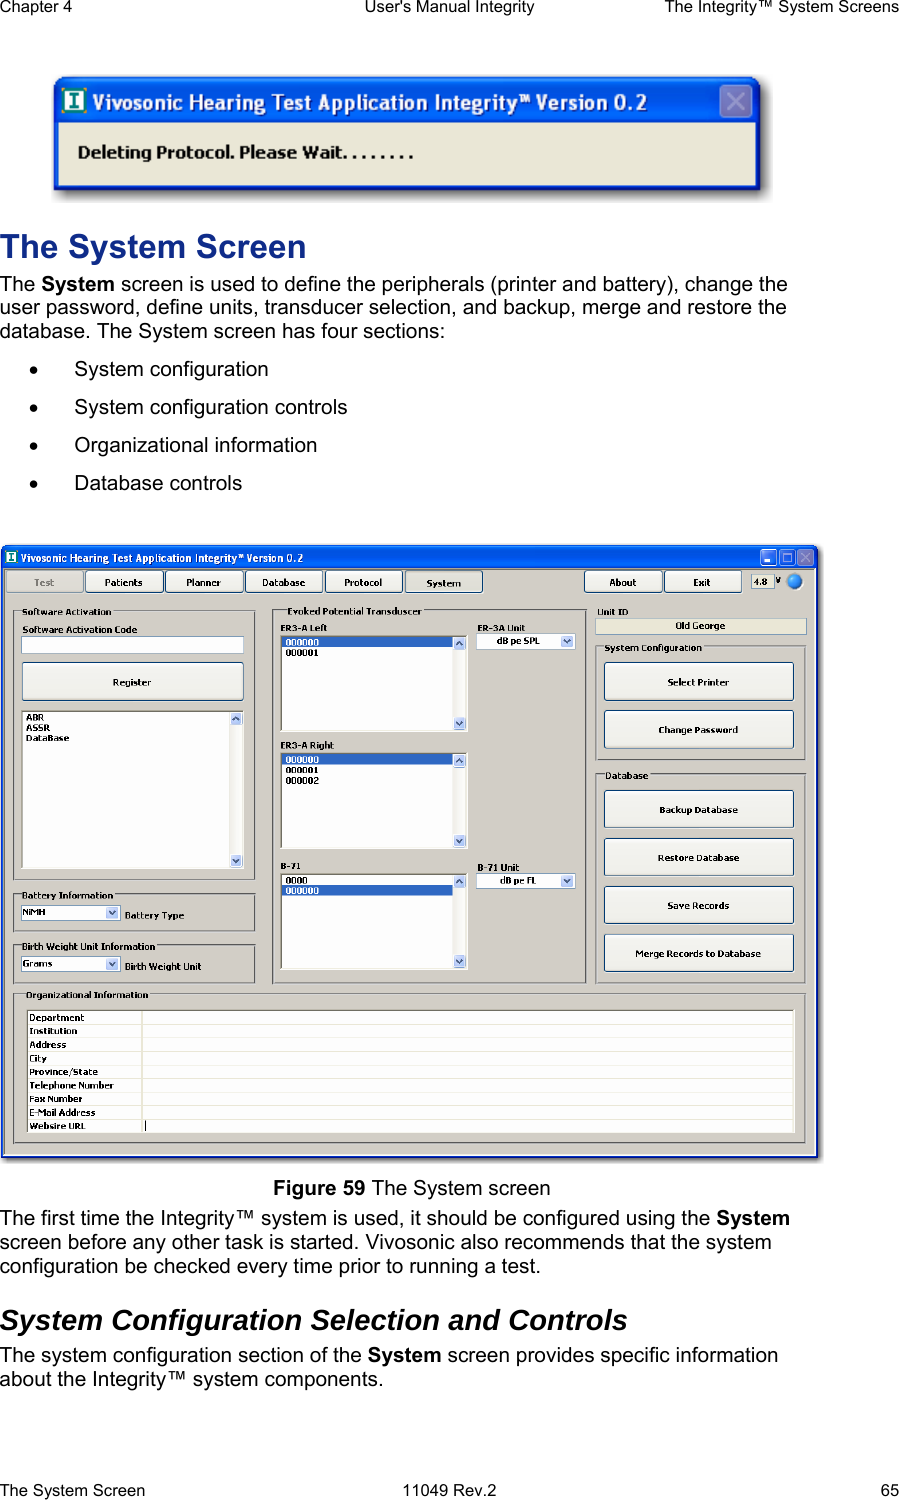
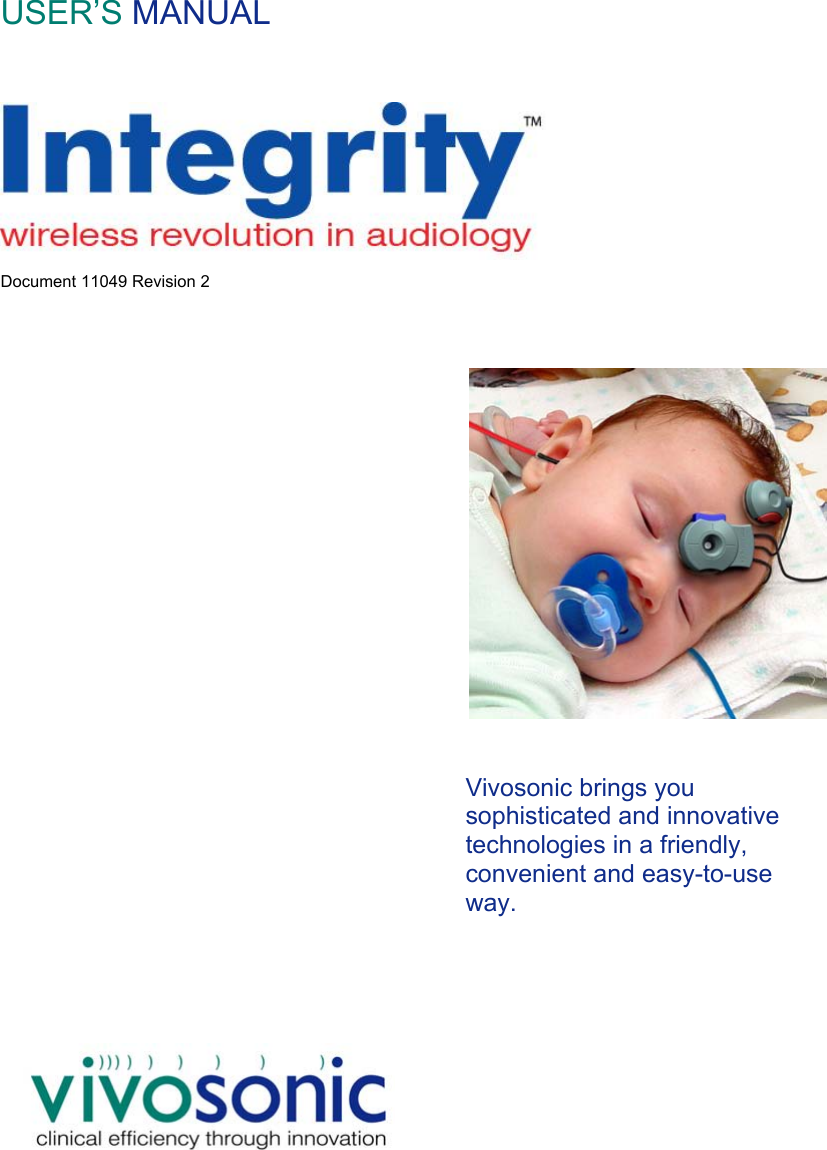
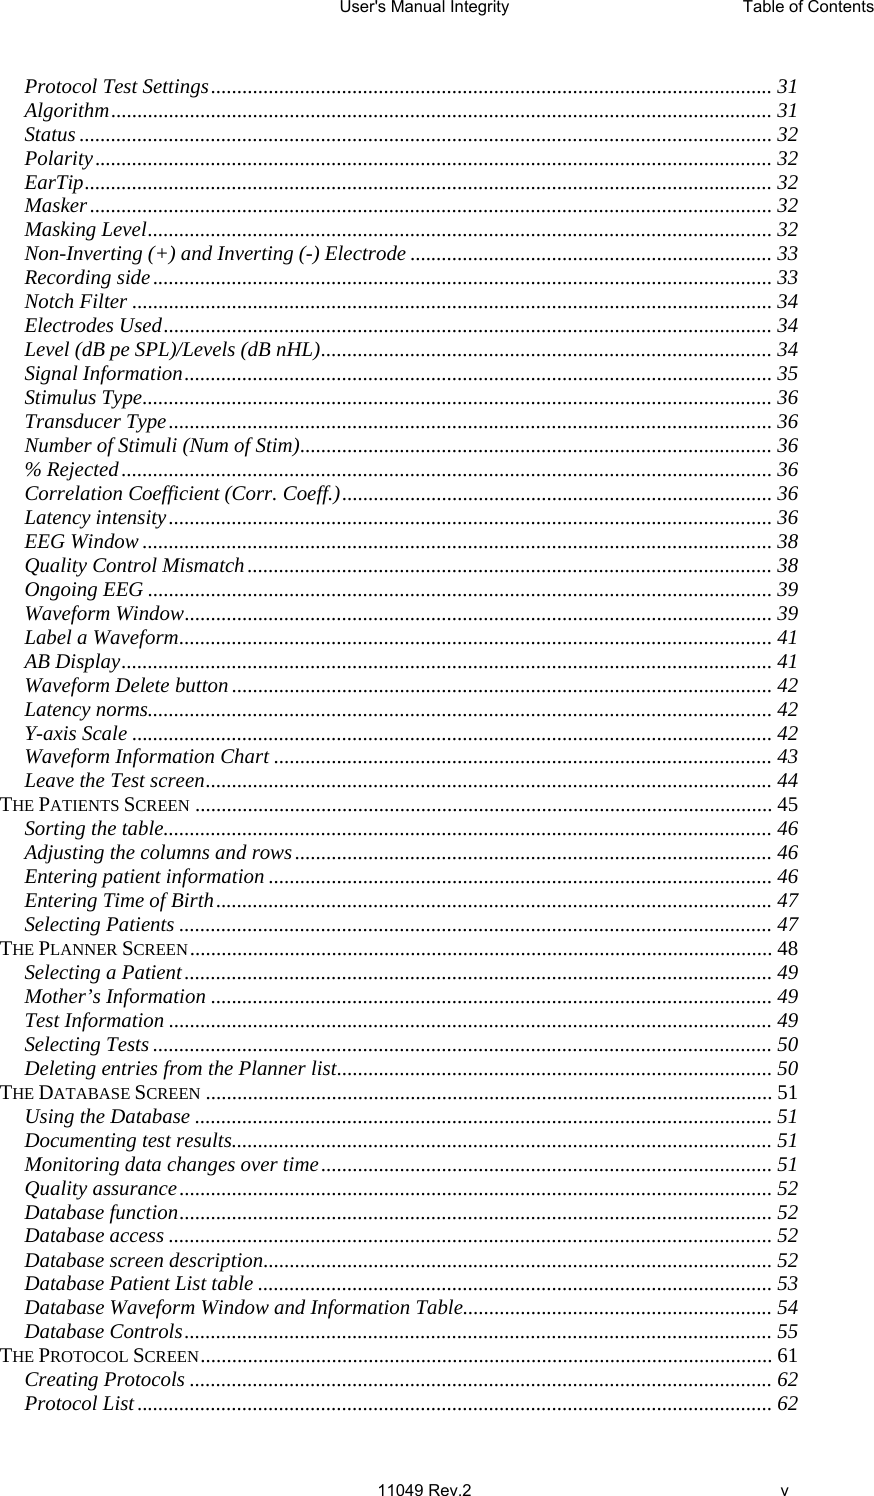
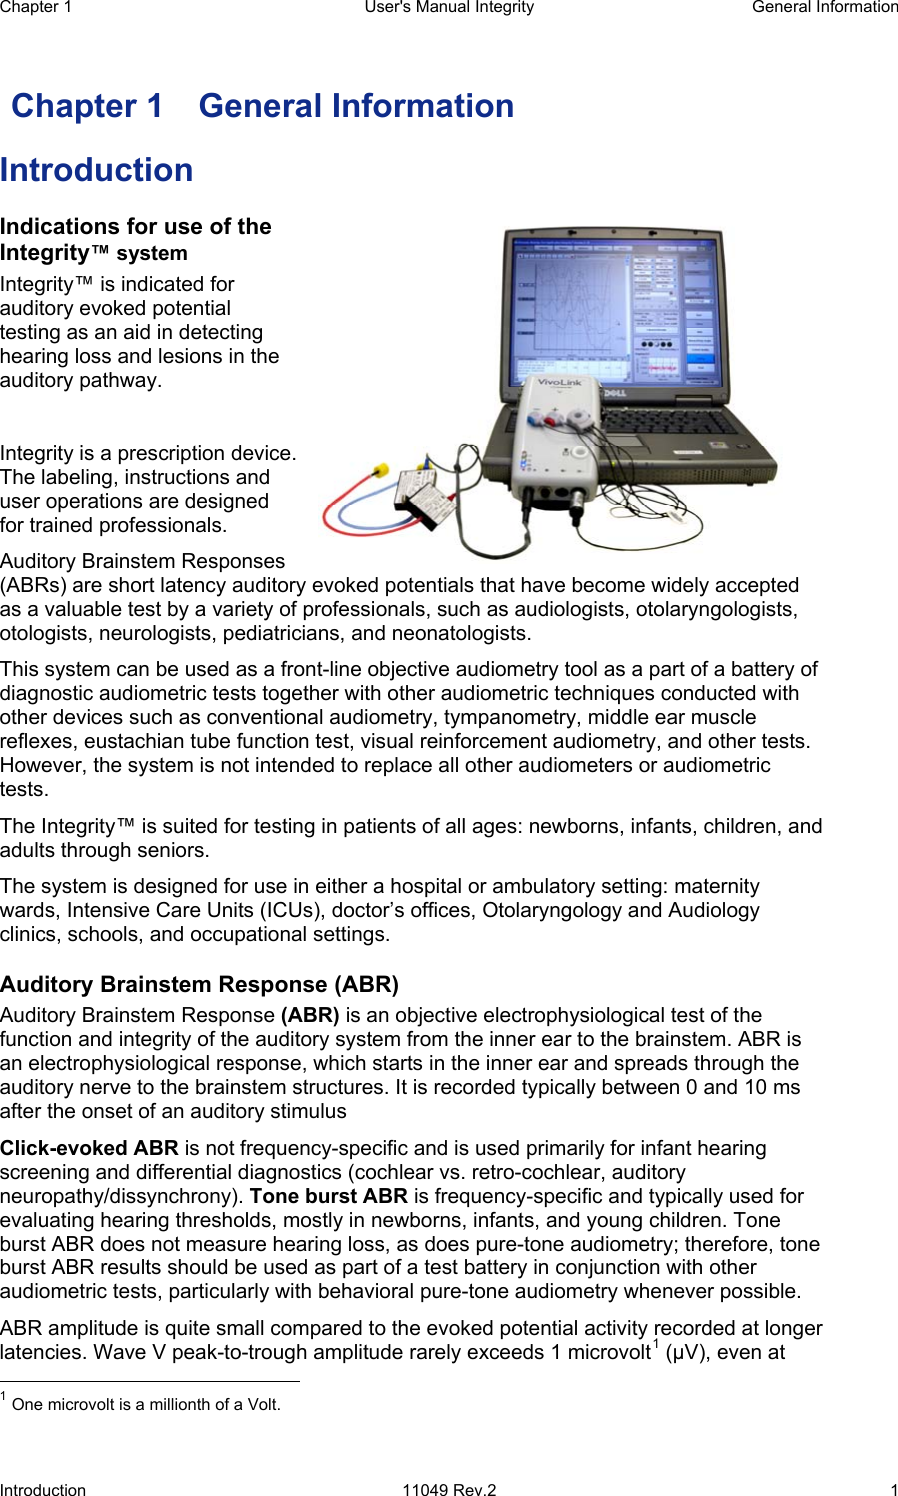
![Chapter 4 User's Manual Integrity The Integrity™ System Screens The Test Screen 11049 Rev.2 31 Figure 20 Bluetooth® connection indicator Bluetooth® connected (lit) Bluetooth® not connected (not lit) The system can establish and maintain a wireless connection only when both the computer and the Bluetooth® dongle are configured correctly. (Refer to System setup for customer installed systems on page 21 for details on configuring the Bluetooth® dongle.) It takes the system approximately 30 seconds to 1 minutes to establish the wireless connection. If the wireless connection is not established a message is displayed stating the connection has failed (Figure 21). This same message will be displayed during data collection if the wireless connection is lost intermittently. Figure 21 Bluetooth connection failed massage If this wireless connection warning message appears, follow the troubleshooting suggestions found in Table 3 on page 91. NOTE The computer on which the Integrity™ operates should be Bluetooth®-enabled and have a Bluetooth® dongle inserted into the computer’s USB port. (Refer to System setup for customer installed systems on page 21 for details on configuring the Bluetooth® dongle.) Protocol Test Settings These Protocol Test Settings are found in the center of the Test screen. Not all of the protocol settings are preset conditions available only from the Protocol screen. Vivosonic™ has developed a set of protocols that can be manipulated during the test procedure [Hall, 1990], [Hall, 1997], [Stapells, 2002]. These settings can be changed at any time between data collection while performing a test. Algorithm This control regulates application of the methods of processing the ABR waveforms. There are two processing algorithms to choose from: Averaging and Kalman Filter. Kalman Filter is the system’s default algorithm. Figure 22 Protocol test settings](https://usermanual.wiki/Vivosonic/V50.USERS-MANUAL-1/User-Guide-624487-Page-41.png)
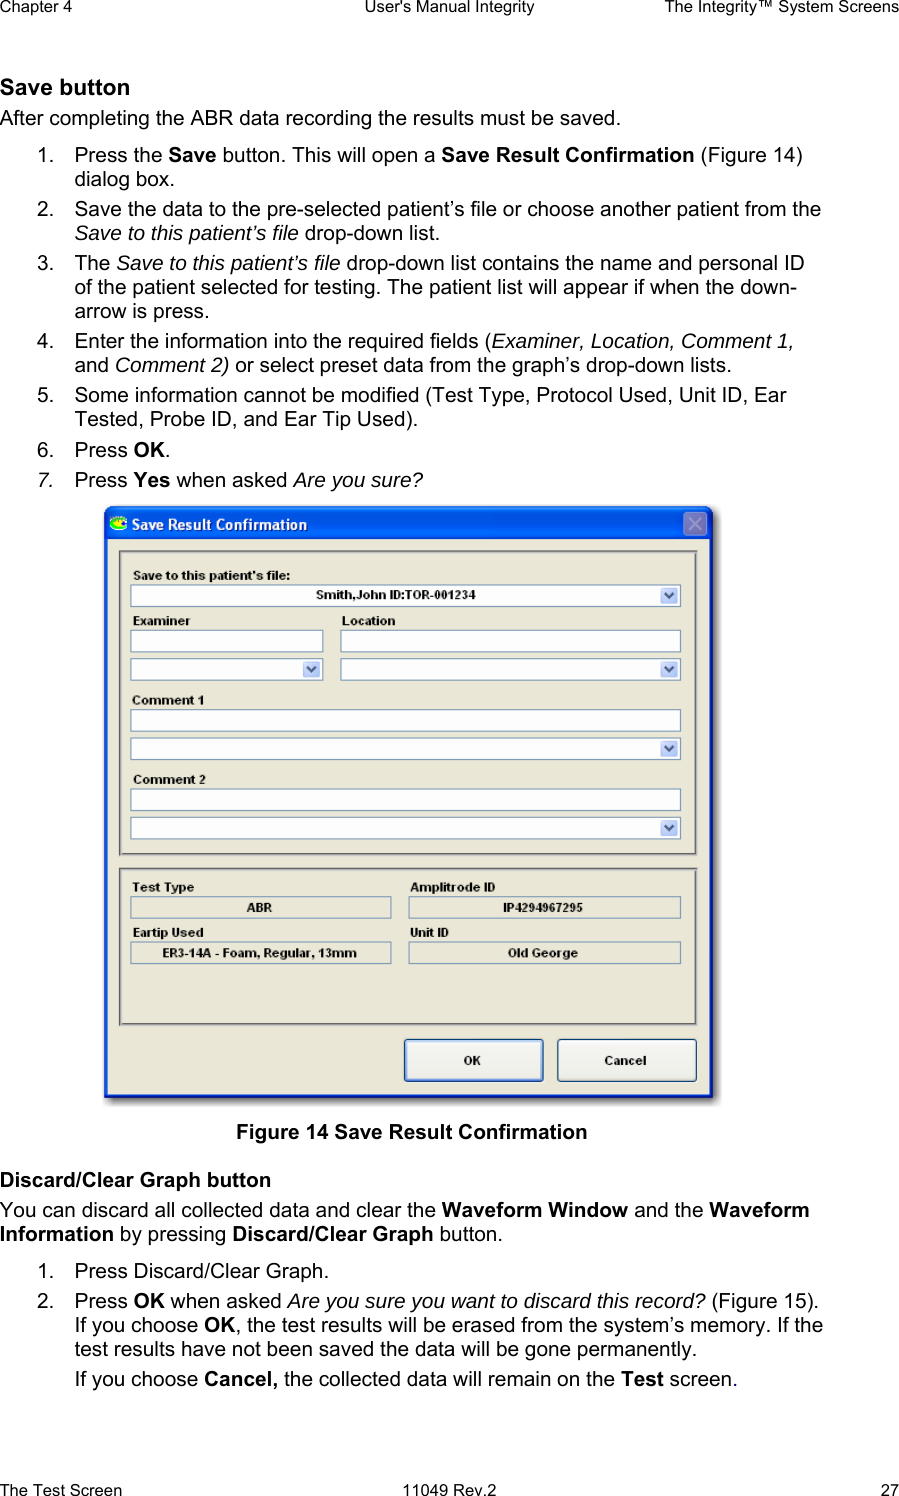
![The Integrity™ System Screens User's Manual Integrity Chapter 4 32 11049 Rev.2 The Test Screen Averaging is a signal processing algorithm, which utilizes the standard time averaging technique so that equal weighting is given to the collected ABR data. Weights are based on the noise in the response. Waveforms contaminated with artifacts above certain Artifact Rejection Thresholds (ART) are excluded from averaging. Kalman Filter is a signal processing algorithm that is used in ABR testing to optimally select the waveform weights. Unlike Averaging, the Kalman Filter technology weights (or a linear minimum mean-square error filter) are inversely proportional to the amount of noise in the collected response. In other words the system gives less weight to the noise-contaminated responses and emphasizes the less noisy responses. This method processes signals in real time without rejecting any time segments, even those containing significant artifacts. [Li 2002] Status Select the patient’s status of arousal from the drop-down menu. The entries are Asleep, Awake, and Mixed. Awake is a default setting. Polarity This control regulates the voltage characteristic of the stimulus. Stimulus polarity selection depends on the goal of the testing. From the drop-down menu select Condensation, Rarefaction, Alternating, or Alternating split. Condensation denotes a polarity as the initial displacement of the stimulus, produced with a positive-voltage electrical signal and an outward movement of the acoustic transducer. Rarefaction denotes a polarity as the initial displacement of the stimulus, produced with a negative-voltage electrical signal and an inward movement of the acoustic transducer. Alternating denotes a polarity as interchangeable, presenting rarefaction and condensation polarity stimuli characteristics. The responses of two consecutive stimuli are sent to one buffer (A) then the responses of the next two consecutive stimuli are sent to the other buffer (B). Thus, each buffer will get the responses from both condensation and rarefaction stimuli. Alternating split denotes a polarity as interchangeable, presenting rarefaction and condensation polarity stimuli characteristics. The polarity alternates which buffer the responses are sent to. Buffer (A) will receive only responses from condensation stimuli and the other buffer (B) will receive only responses from the rarefaction stimuli. Thus, each buffer only receives responses from a specific stimulus. EarTip Select the size of the ear tip from the drop-down menu. Refer to Figure 2 to view the types available. Masker This control regulates the introduction of contralateral wideband masking noise. To apply masking through the ER-3A transducer opposite to the ear which is stimulated with ABR stimuli (clicks or tone bursts) select Wide Band Noise from the control drop-down menu. To test without masking select None (system default). Masking Level The masking level defines the contralateral masking noise (dB HL). When a masking value is selected the VivoLink™ will produce wide-band noise.](https://usermanual.wiki/Vivosonic/V50.USERS-MANUAL-1/User-Guide-624487-Page-42.png)
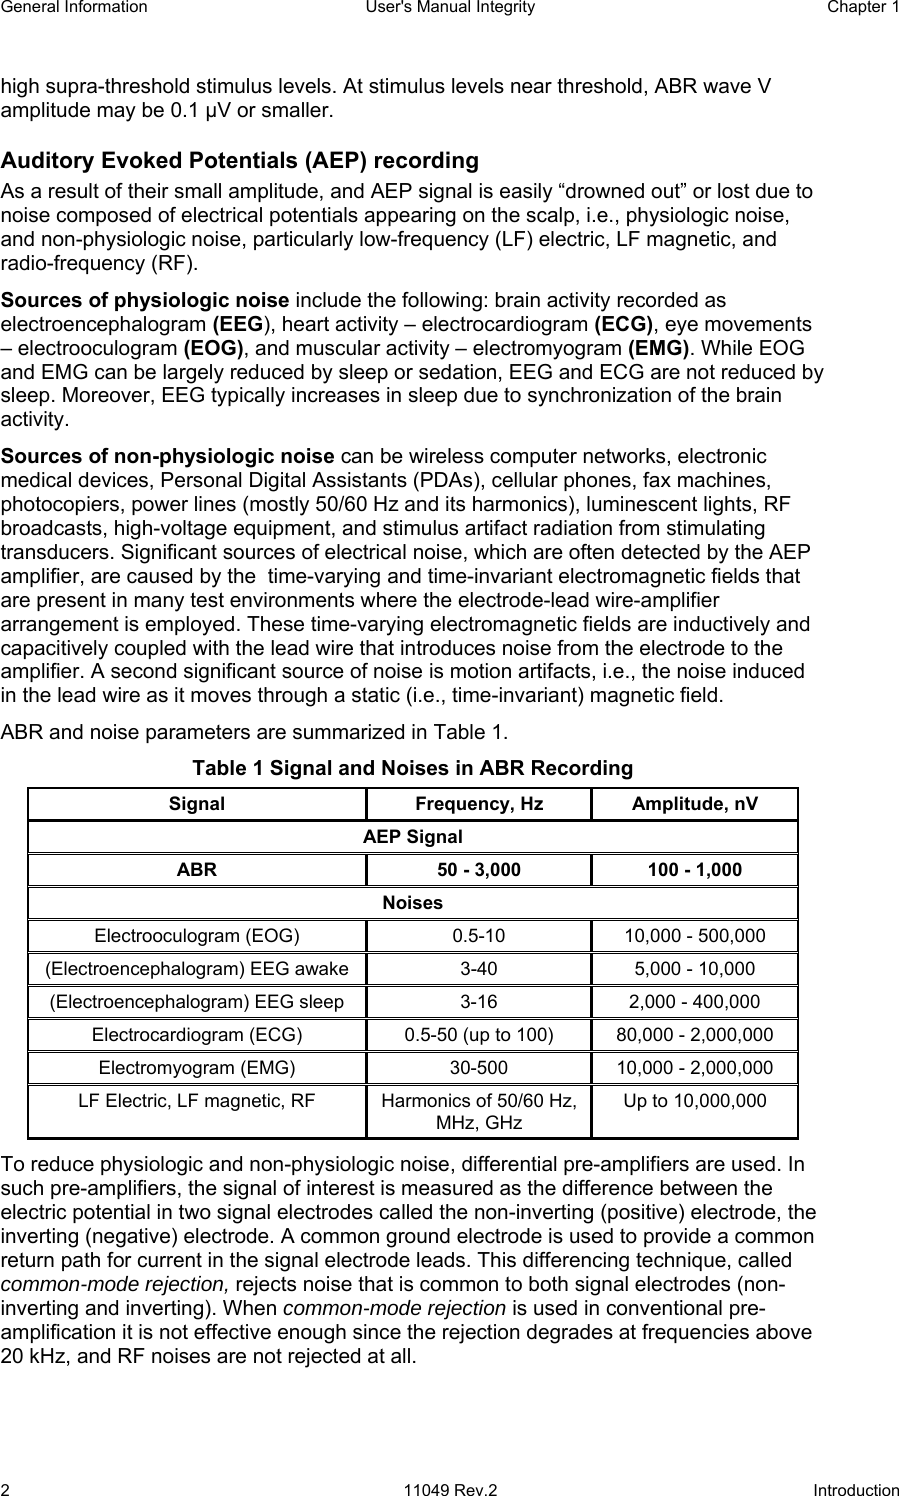
![Chapter 4 User's Manual Integrity The Integrity™ System Screens The Test Screen 11049 Rev.2 33 There are no necessary adjustments to the Reference equivalent threshold sound pressure level (RETSPL) values that accompany narrow-band noise, as per ANSI S3.6-2004, 6.3.1. The conversion from dB HL to dB SPL is based on the RETSPL value for the insert earphones in an occluded ear simulator (Table 7 in ANSI S3.6-2004 manual). The masking dB SPL value is calculated for the root mean spare (rms) of the masking signal. As such, the dB SPL of the overall masking signal will differ with the type of stimulus, such that the rms of the masking signal will match that of the dB HL at the corresponding frequency of the stimulus signal (Click signals are treated as having a frequency of 1 kHz). Select the level from 10 to 110 dB HL in 1 dB increments. Non-Inverting (+) and Inverting (-) Electrode These two fields allow the user to select the location of the Amplitrode® inverting and non-inverting electrodes on the patient. NOTE The Non-Inverting (+) and Inverting (-) field entries provide important information on the condition of data collection and the location of the electrodes during the tests. These settings will not affect the data. The information will be saved with the data and may be used when the data is reviewed. This information cannot be changed after it is saved. Ensure that the information is correct before saving the results. Select the down arrow of the required electrode location and highlight an appropriate entry to define the (+) an (-) electrode locations on the patient. The possible electrode locations available from the drop-down menus are as follows: Figure 23 Non-Inverting (+) electrode drop-down list shown Refer to the location diagram in Figure 61 on page 73. [Hall, 1990], [Hall, 1997], [Stapells, 2001]. Recording side This field is not user-selectable. Its selection is dependant on the non-inverting (+) or inverting (-) electrode selected and the ear chosen for stimulation. It includes: 1. Ipsilateral –the non-inverting electrode is located on the same side of the head as the ear being stimulated. • With the right ear selected for testing any combination of Cz, Fpz, Nz, Oz locations for the non-inverting (+) electrode and A2, M2, EAC2 for the inverting (-) electrode.](https://usermanual.wiki/Vivosonic/V50.USERS-MANUAL-1/User-Guide-624487-Page-43.png)
![The Integrity™ System Screens User's Manual Integrity Chapter 4 34 11049 Rev.2 The Test Screen • With the left ear selected for testing any combination of Cz, Fpz, Nz, Oz locations for the non-inverting (+) electrode and A1, M1, EAC1 for the inverting (-) electrode. 2. Contralateral – the non-inverting electrode is located on the opposite side of the head as the ear being stimulated. • With the right ear selected for testing any combination of Cz, Fpz, Nz, Oz locations for the non-inverting (+) electrode and A1, M1, EAC1 for the inverting (-) electrode. • With the left ear selected for testing any combination of Cz, Fpz, Nz, Oz locations for non-inverting (+) electrode and A2, M2, EAC2 for the inverting (-) electrode. 3. Medial – the non-inverting and inverting electrodes are located along the sagittal plane of the head (any combination of Cz, Fpz, Nz, Oz locations). 4. Horizontal – the non-inverting electrode is located on the stimulus-contralateral mastoid, earlobe or ear canal, while the inverting electrode is located on the stimulus-ipsilateral mastoid, earlobe or ear canal (any combination of A1, A2, M1, M2, EAC1, EAC2 locations). NOTE The Recording Side entries provide important information on the location of data collection with respect to the stimulation location. These settings will not affect the data. The information will be saved with the data and may be used when the data is reviewed. This information cannot be changed after it is saved. Ensure that the information is correct before saving the results. [Hall, 1990], [Hall, 1997], [Stapells, 2001] Notch Filter The notch filter is designed to reduce the interference from electrical activity (power line noise of 50 Hz, 60 Hz). To disable the filter select None from the drop-down menu (system default). Electrodes Used Select the electrode type from the drop-down menu or type the electrode brand into the field. t. Figure 24 List of electrodes available for testing Level (dB pe SPL)/Levels (dB nHL) Figure 25 Level (dB pe SPL) bar.](https://usermanual.wiki/Vivosonic/V50.USERS-MANUAL-1/User-Guide-624487-Page-44.png)
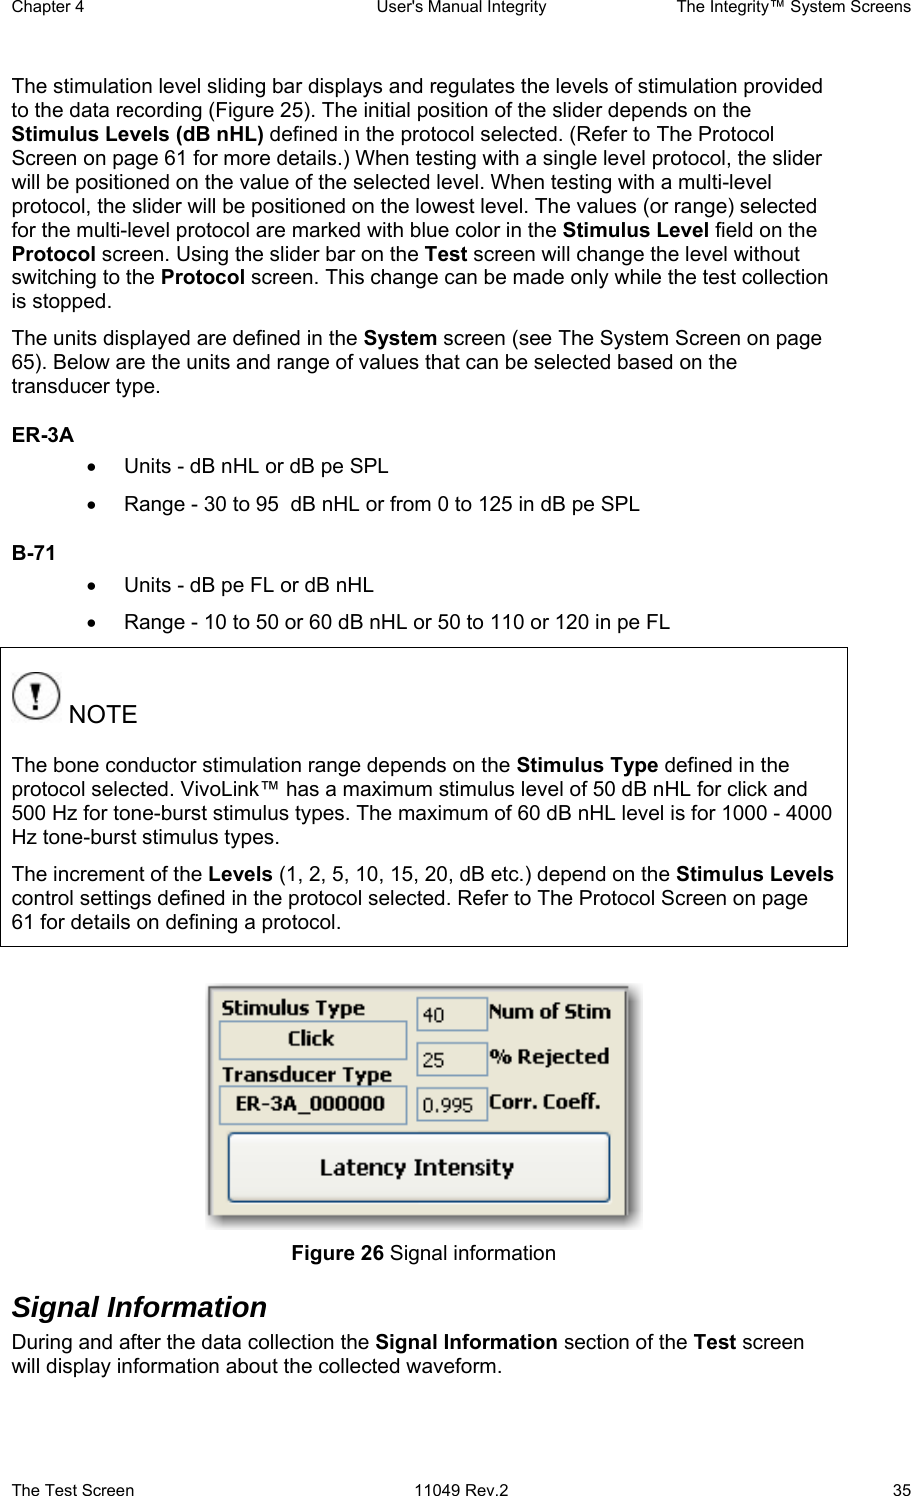
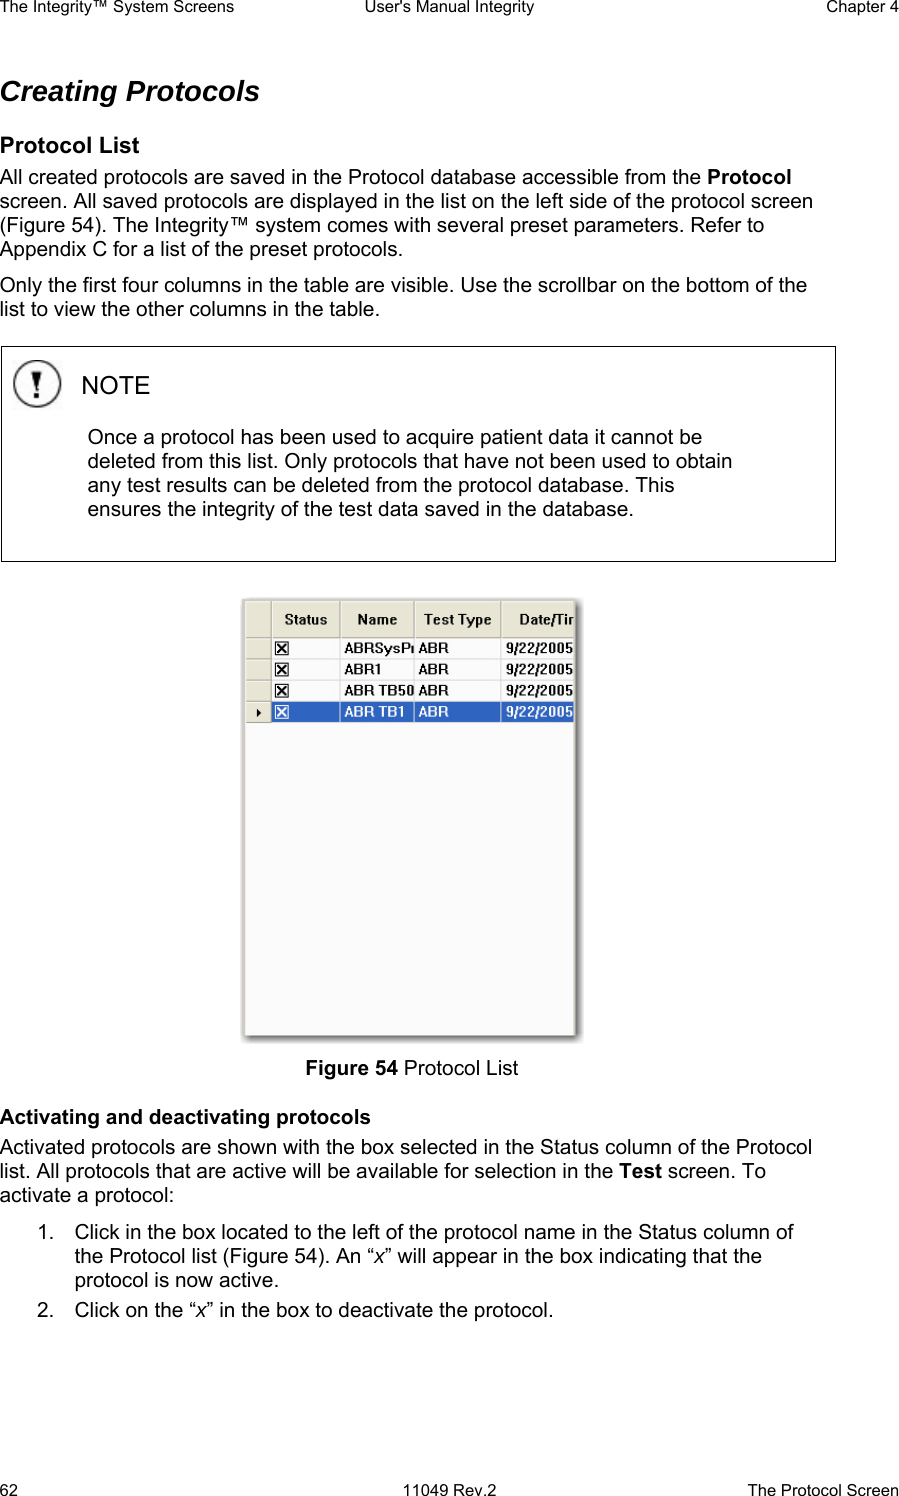
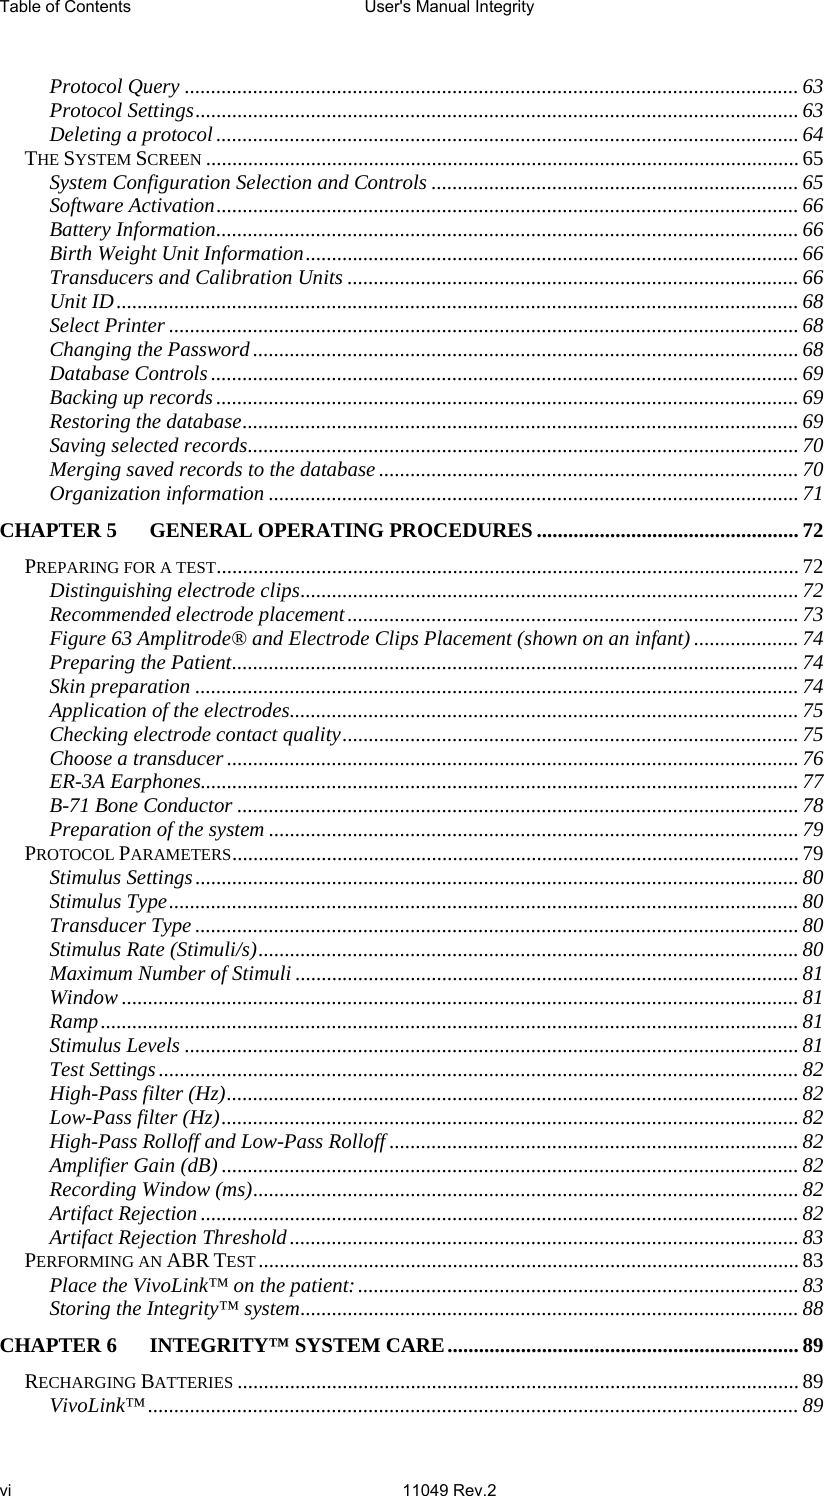
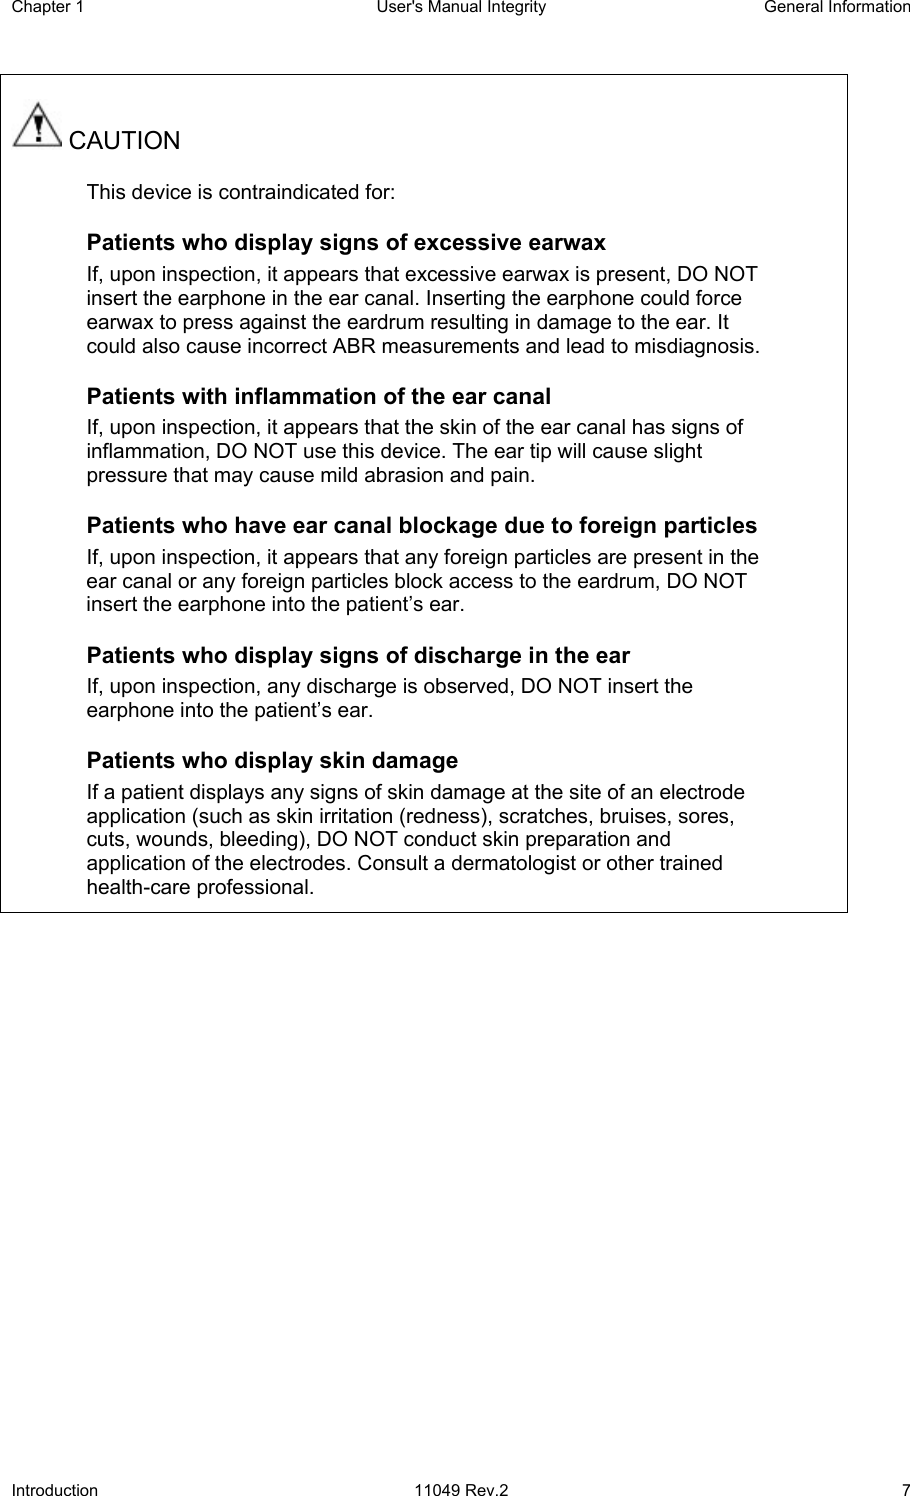
![The Integrity™ System Screens User's Manual Integrity Chapter 4 36 11049 Rev.2 The Test Screen Stimulus Type The Stimulus Type (click or tone-burst frequency) is displayed in this field as a reminder of the main test parameters defined by the protocol selected. Transducer Type The Transducer Type (ER-3A or B-71) is displayed in this field to remind the operator of the main test parameters defined by the protocol selected. This information also includes the transducer serial number. Number of Stimuli (Num of Stim) This information box displays the number of stimuli presented in the test. The value counts up as the test is running. If the test runs to completion, the value should be equal to the value of the maximum Number of Stimuli defined in the protocol selected, otherwise it displays the number of stimuli counted at the time the test was stopped. % Rejected This information box displays the percentage of the rejected ABR responses. Responses are rejected when the amplitude exceeds the preset Artifact Rejection Threshold value defined in the protocol selected. NOTE The system displays the percentage of the rejected stimuli only when Averaging was selected under Algorithm control on the Test screen. Correlation Coefficient (Corr. Coeff.) During the time of testing, two buffers are used to collect the data. The two buffers (A and B) each receive half of the responses. The waveform displayed is an averaged A plus B response (combined waveform). The Correlation Coefficient is a calculated correlation between the curves collected in A and B buffers. The Correlation Coefficient indicates the degree to which the collected waveforms in A and B are repeatable. Latency intensity This button is used to display a graph of the latency versus the intensity values of a patient based on known data defined by the age of the patient. When selected, a window opens displaying the Latency-Intensity Graph (Figure 27). Select the patient age range from the Latency Normals drop-down list to display the data supplied for that age., [Hood, 1998], [Gorga, 1987], [Gorga, 1989], [Zimmerman, 1987]](https://usermanual.wiki/Vivosonic/V50.USERS-MANUAL-1/User-Guide-624487-Page-46.png)
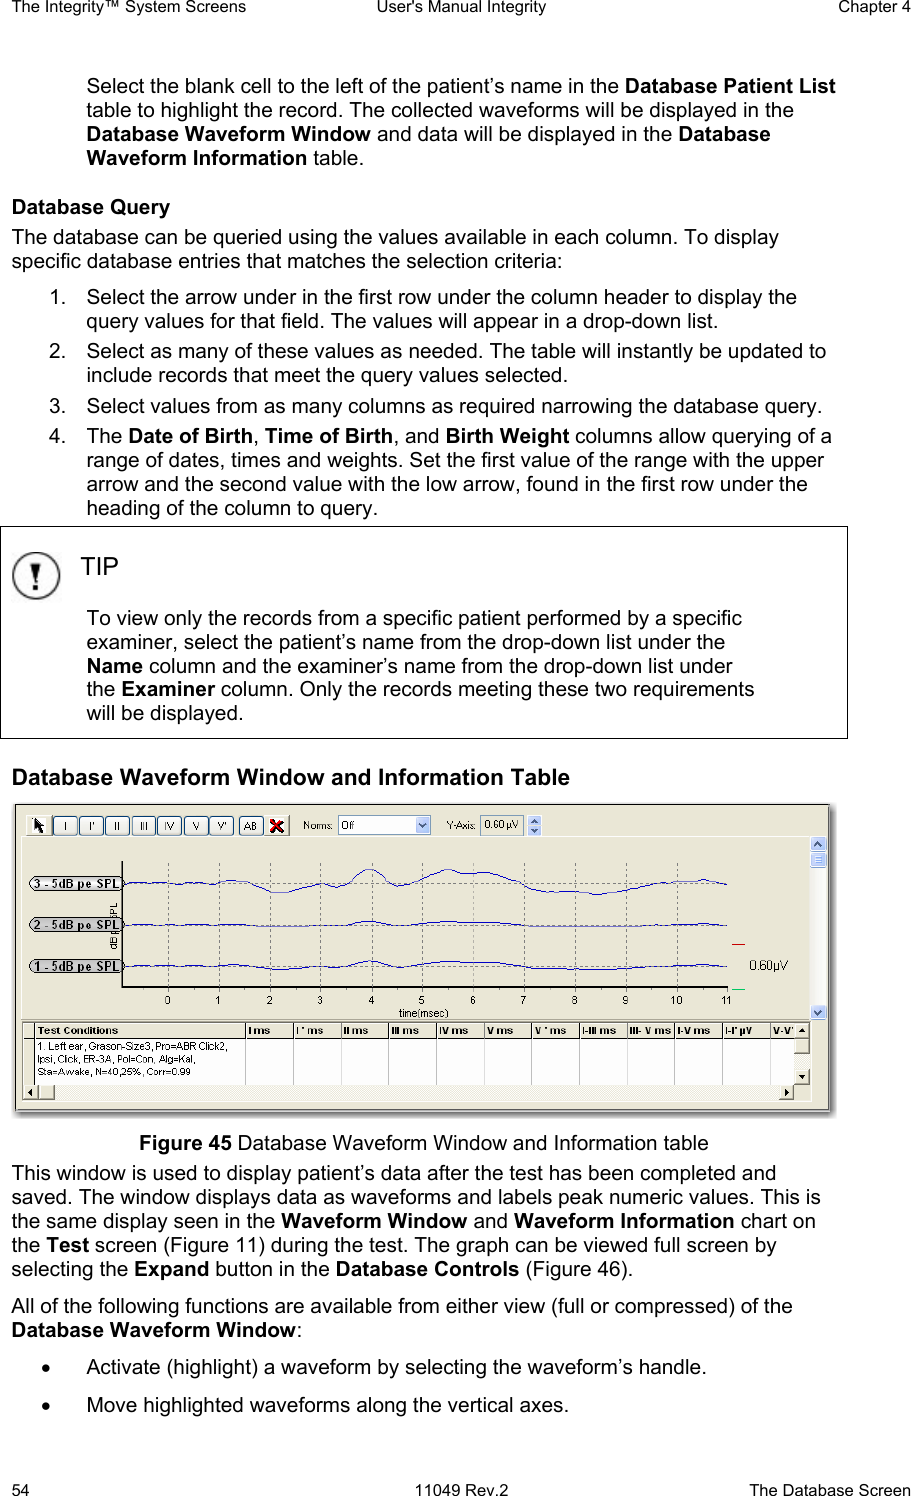
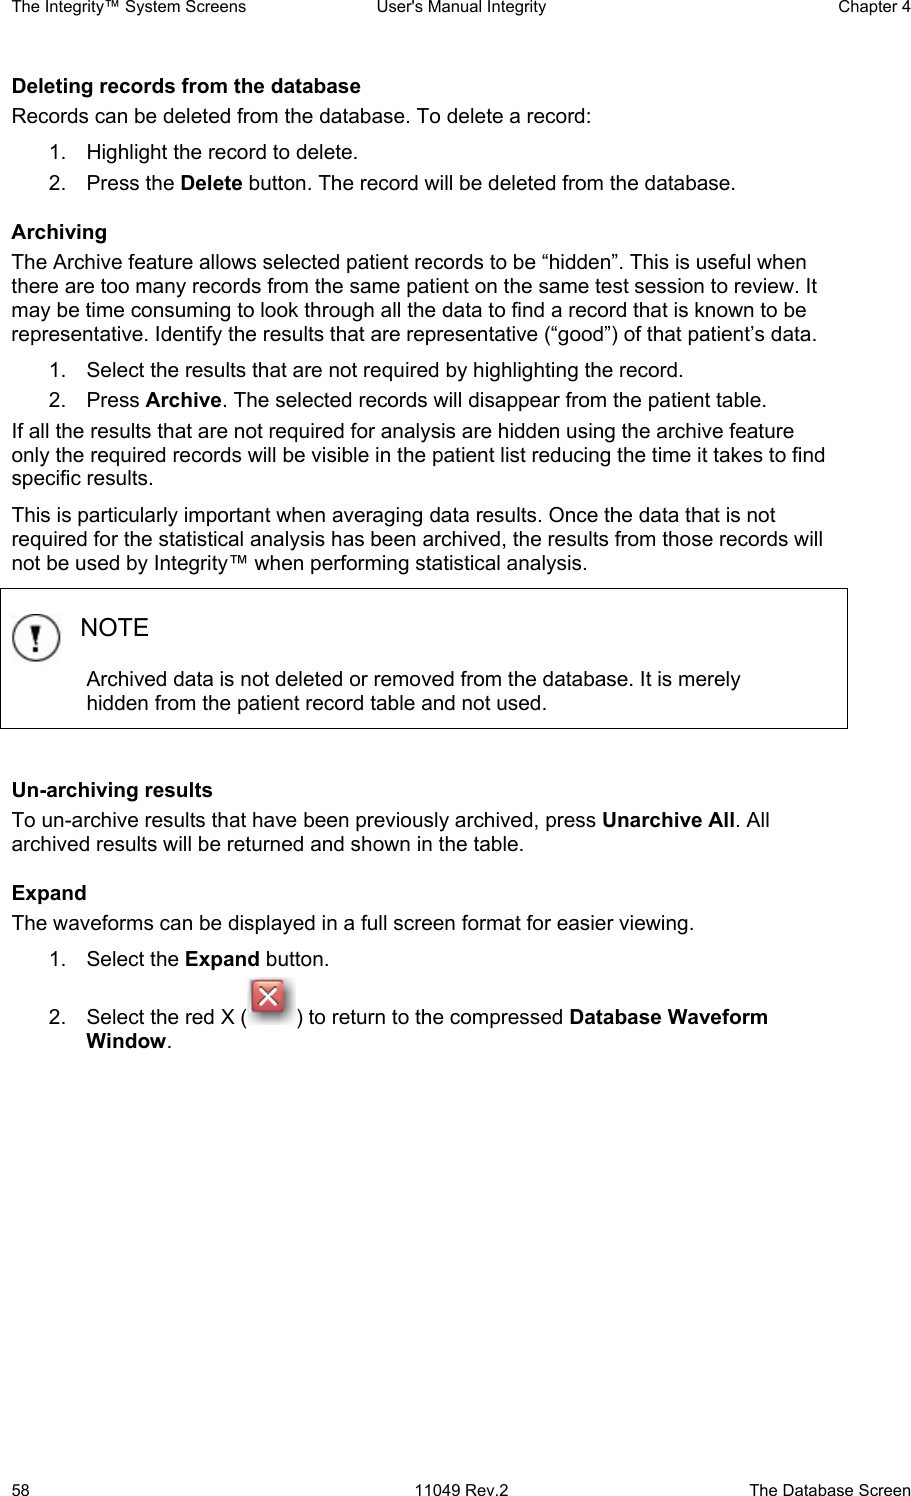
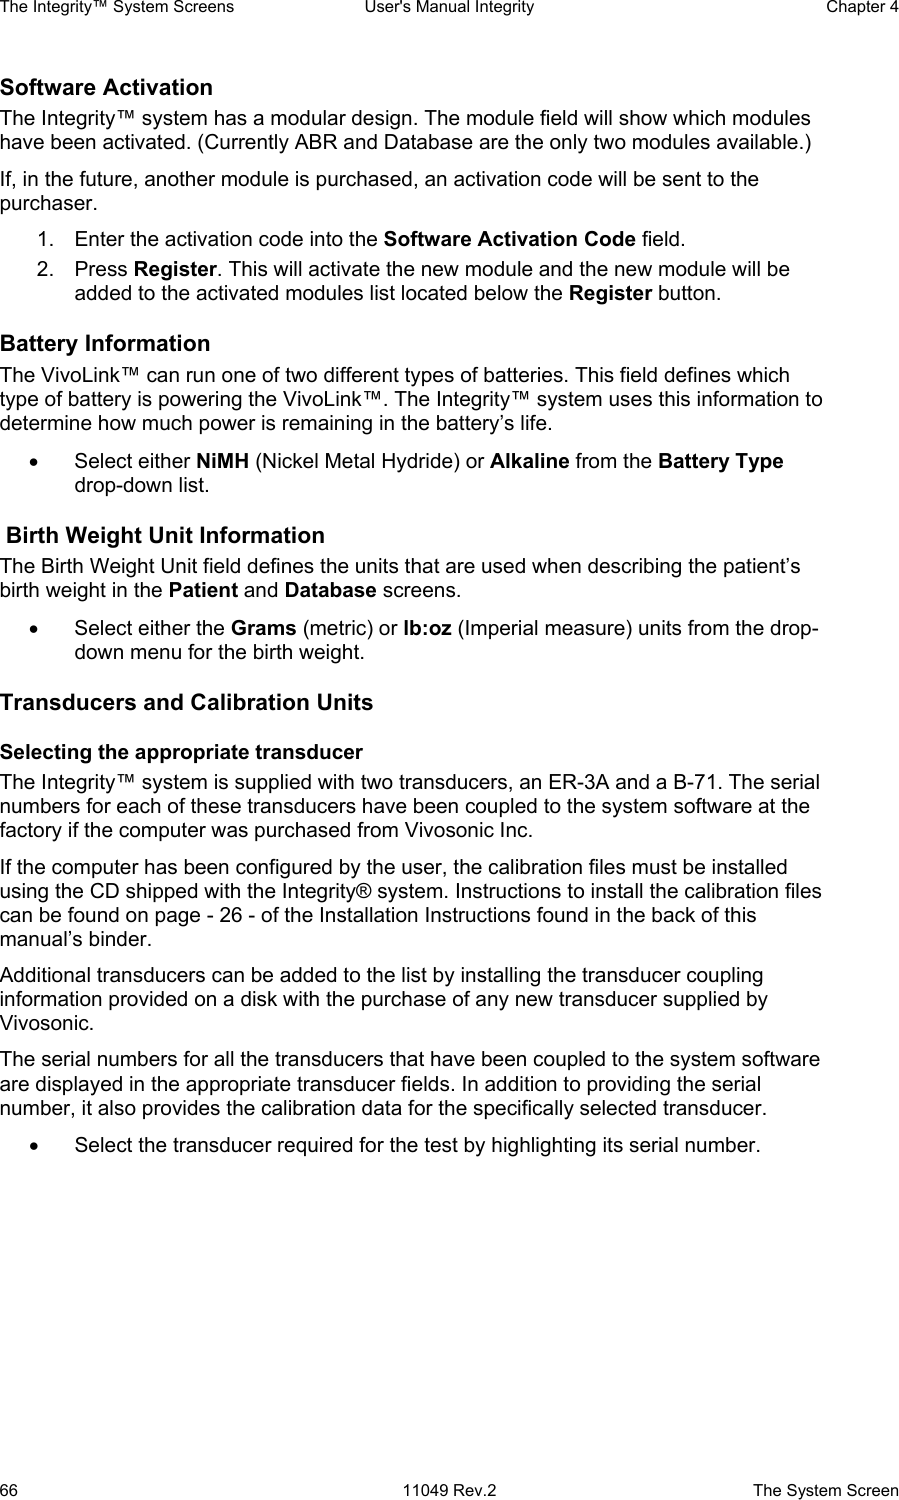
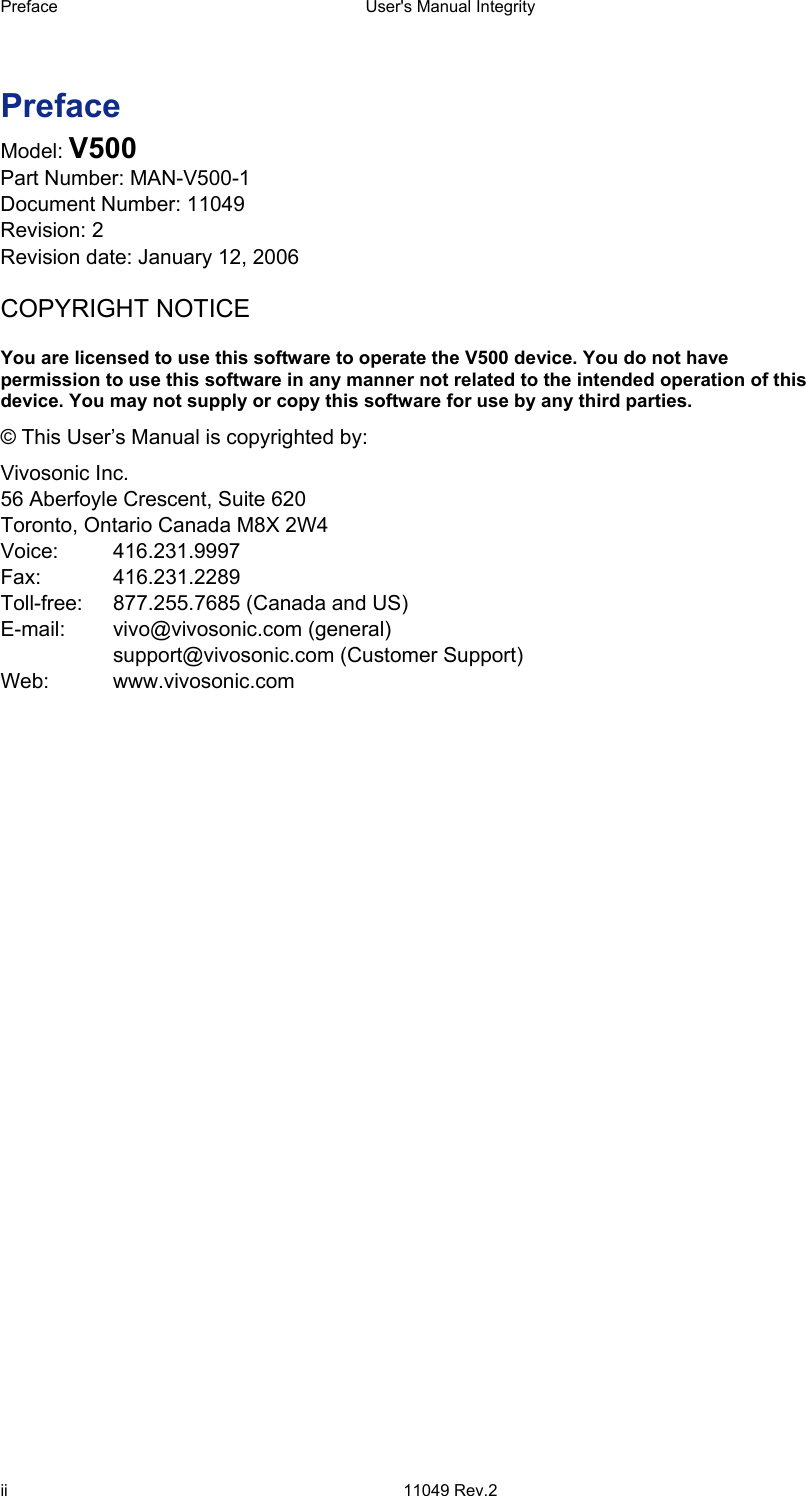
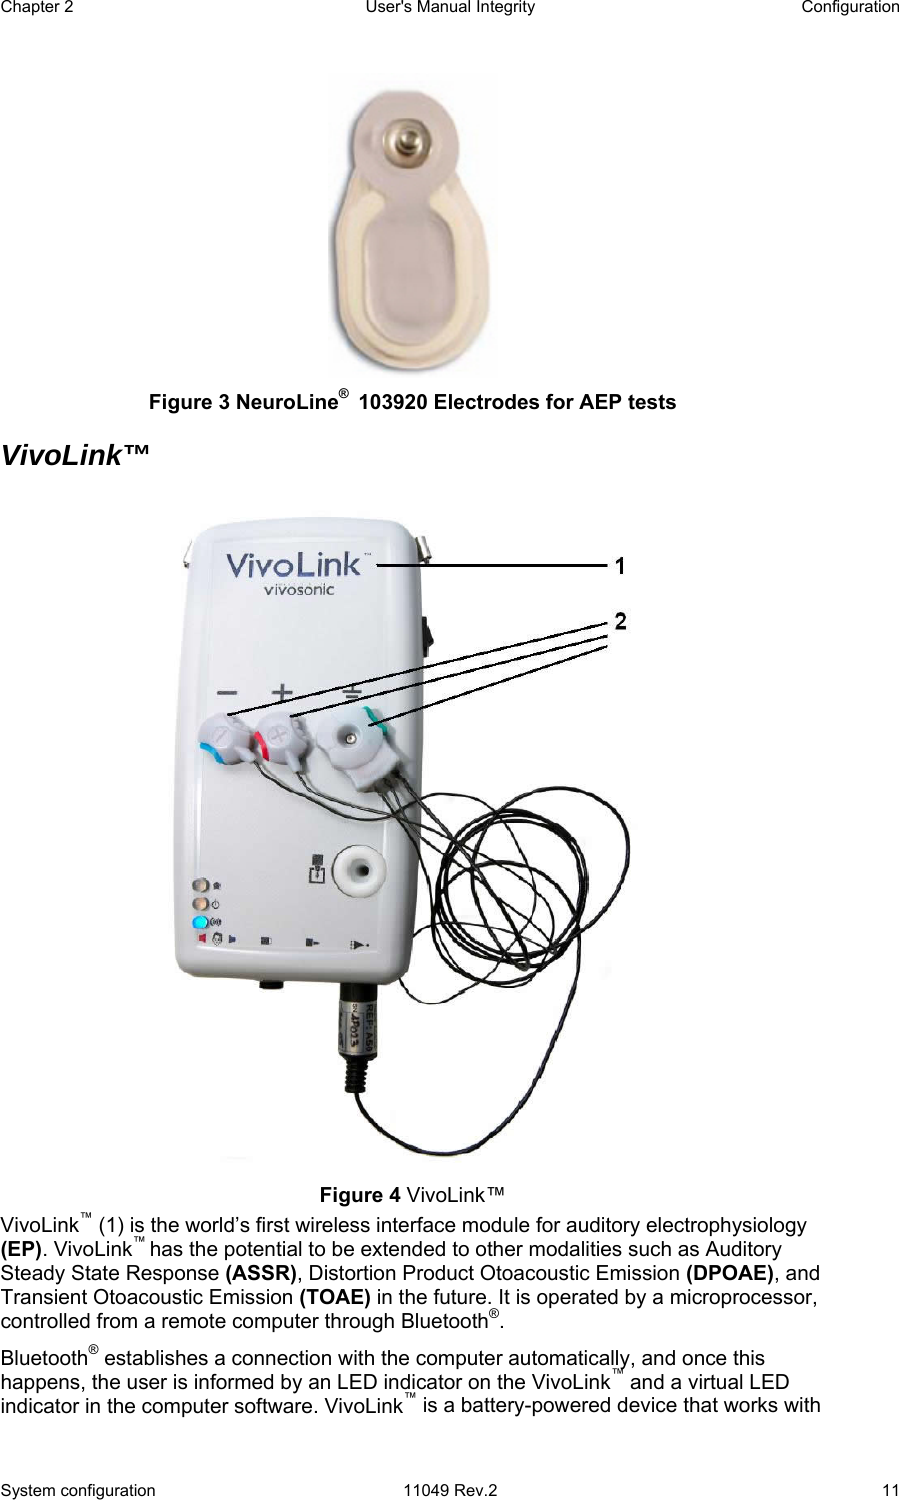
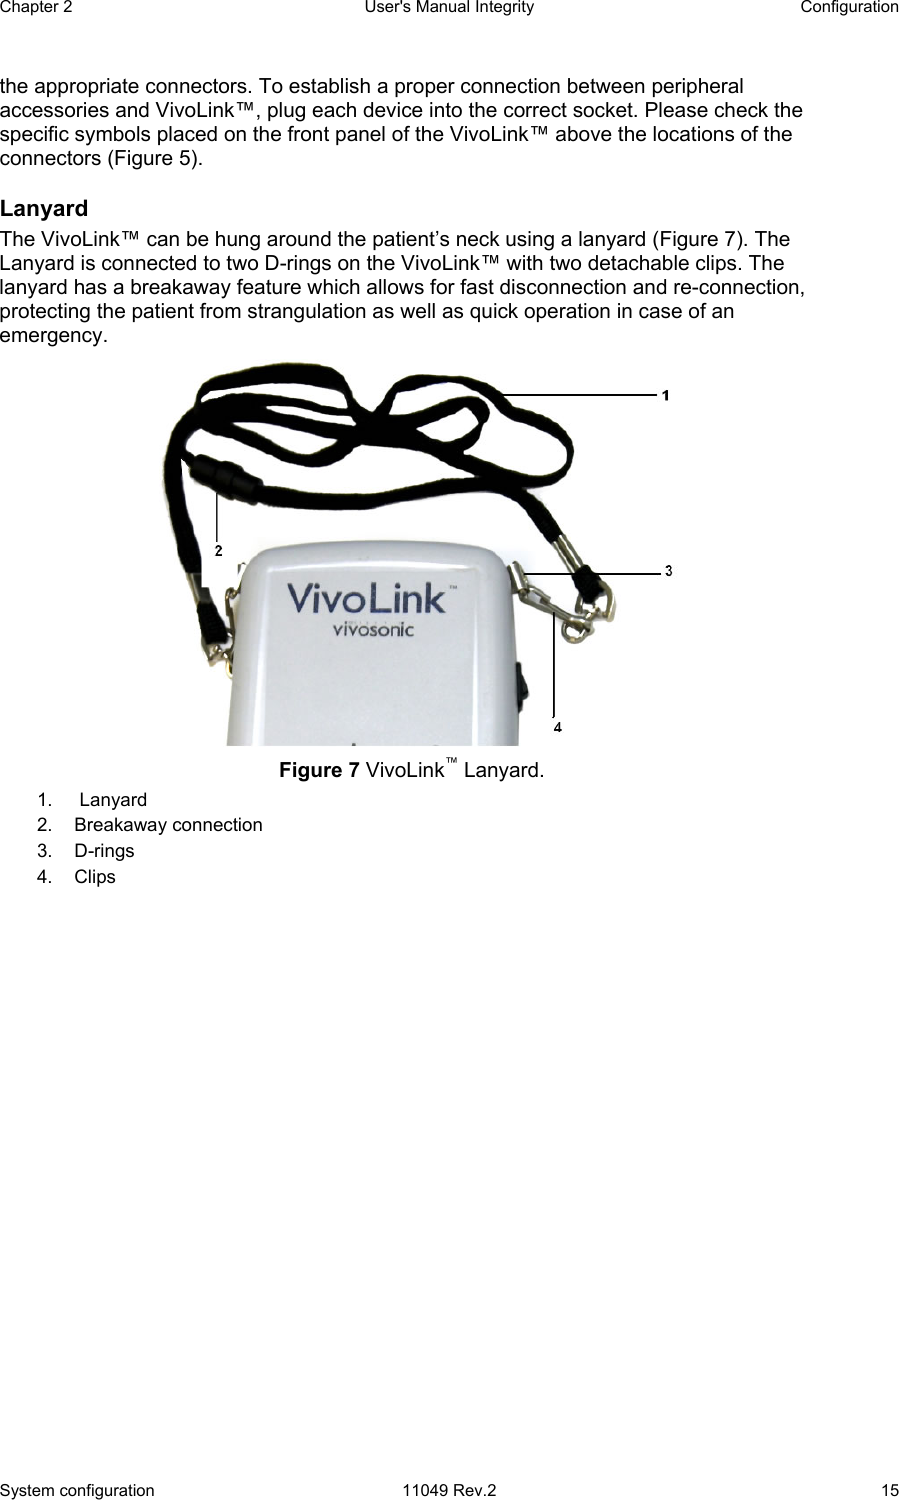
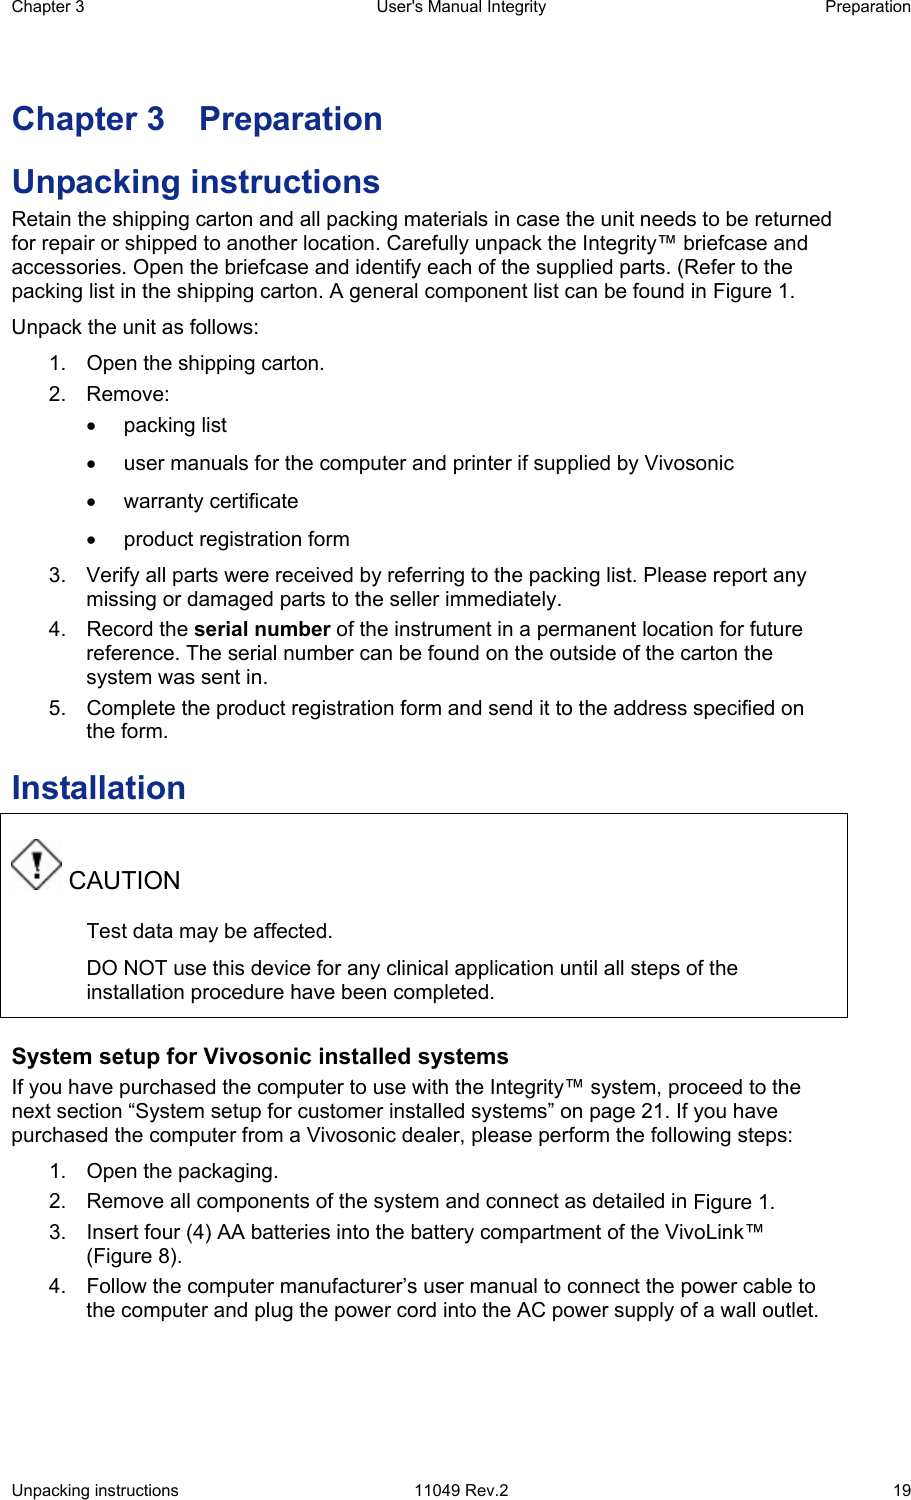
![Chapter 4 User's Manual Integrity The Integrity™ System Screens The Test Screen 11049 Rev.2 37 Figure 27 Latency-Intensity graph (adult) [Hood, 1998] Before the graph can be populated the waves must first be labeled with the I, III, and V wave labels in the Waveform Window. (See Figure 30 for details.) The latency values (in ms) for the I, III, and V waves are plotted against the intensity level. The latency graphs and dots are color coded (red for the right ear and blue for the left). Normative data can be displayed on the Latency-Intensity graph [Hood, 1998], [Gorga, 1987], [Gorga, 1989], [Zimmerman, 1987] as an average value ± 2 STD in the form of vertical bars. To view normative data (raw) go to the following file: C:\INTEGRITY V1.0\ActiveX Controls\LatencyNormals.ini on the Integrity™ system. If more then one waveform was collected for the same ear with the same level of stimulation and the waves were marked with the average latency value, these waves will be displayed on the Latency-Intensity graph.](https://usermanual.wiki/Vivosonic/V50.USERS-MANUAL-1/User-Guide-624487-Page-47.png)
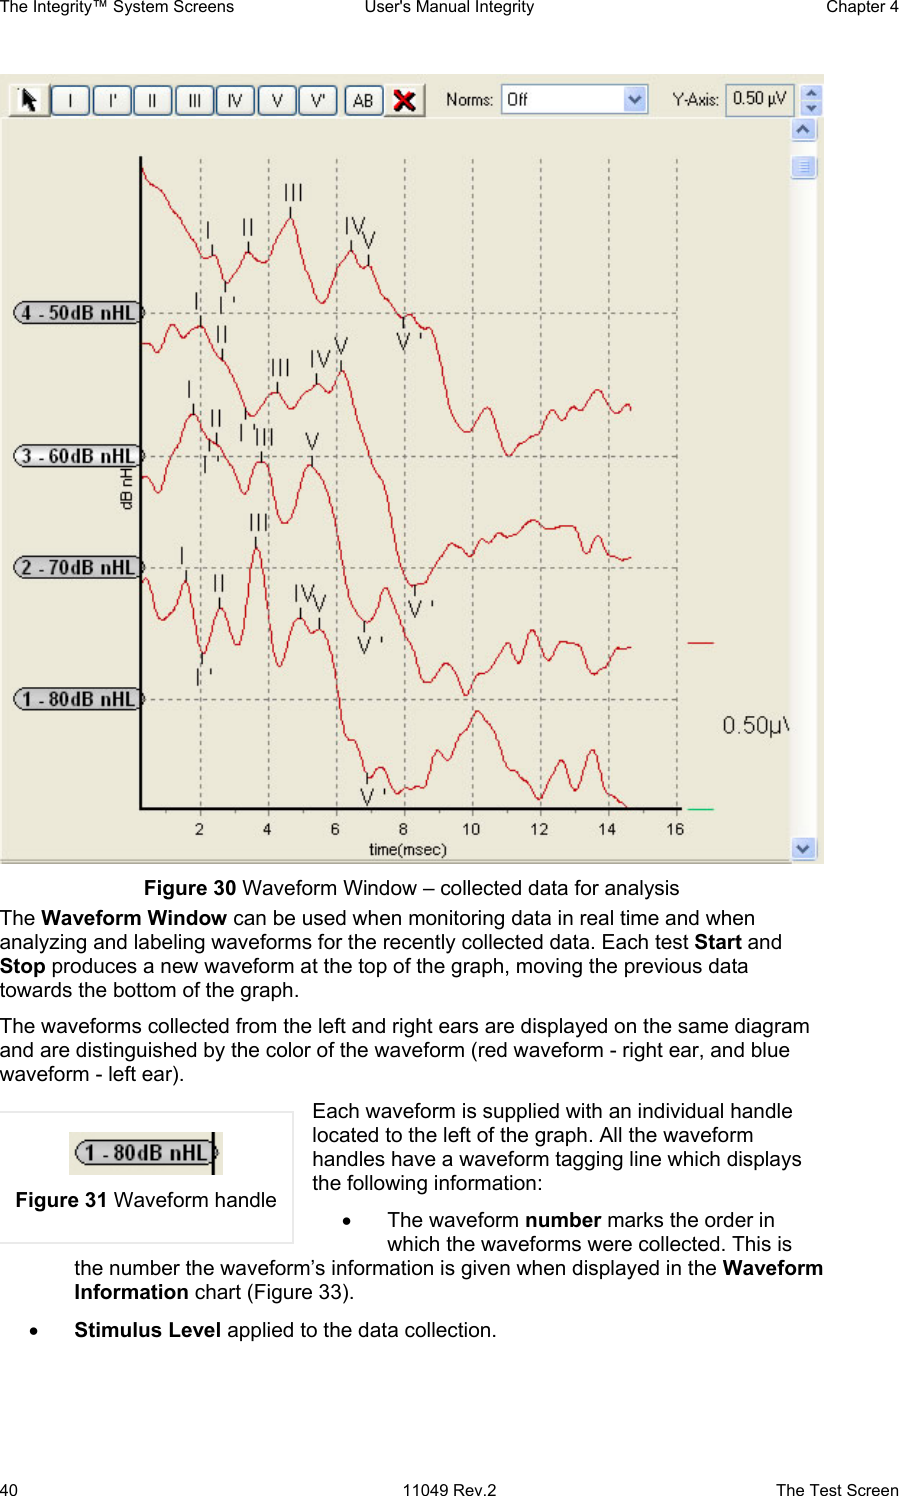
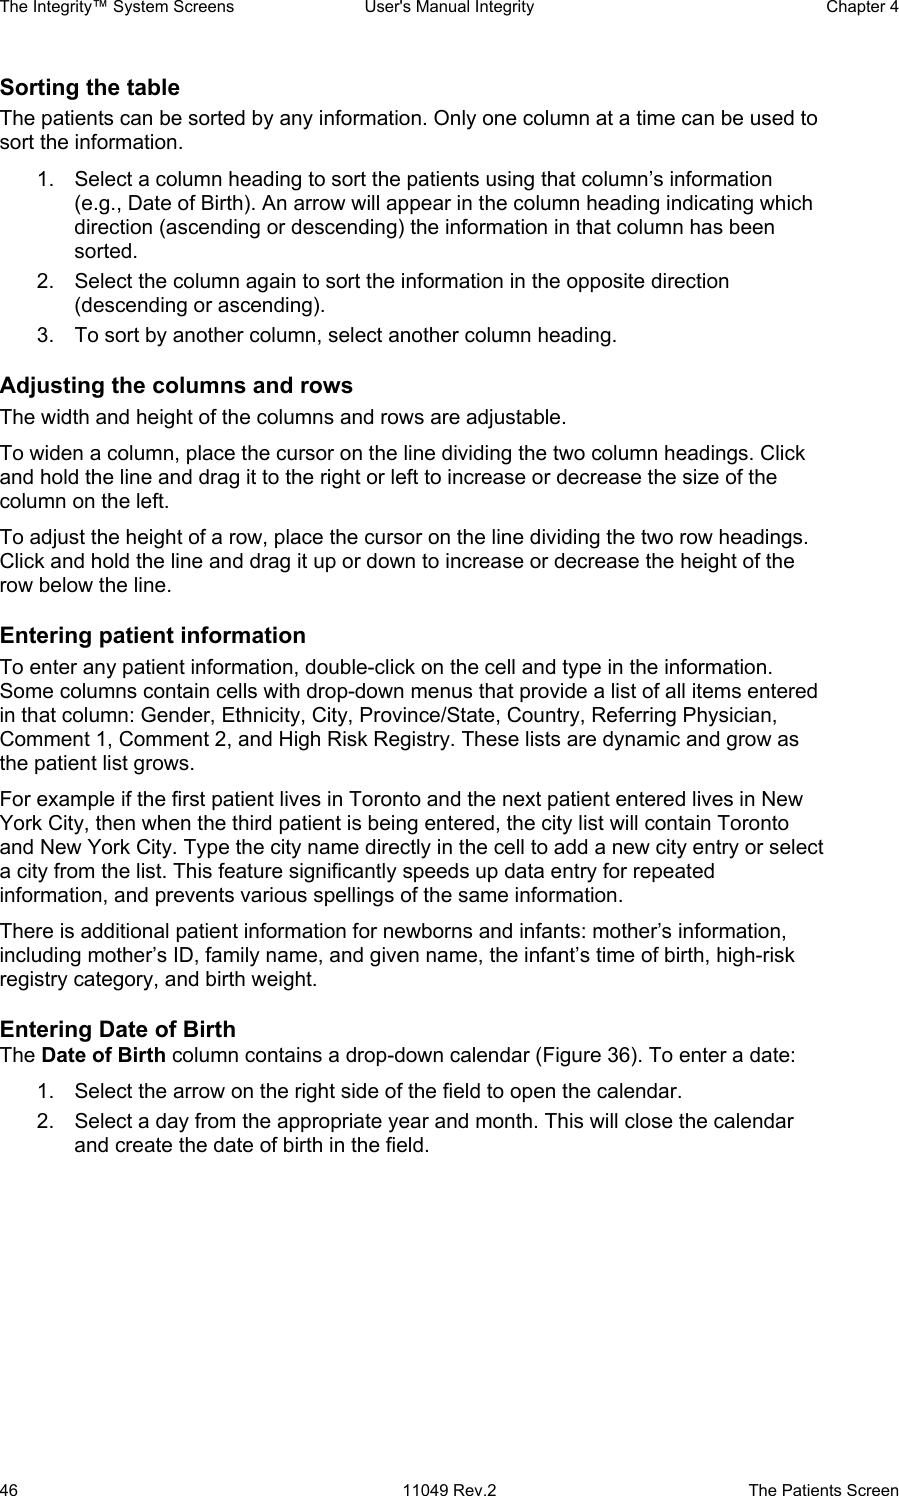
![Chapter 4 User's Manual Integrity The Integrity™ System Screens The Test Screen 11049 Rev.2 41 To highlight any of the waveforms, click on its handle. The highlighted waveform and its handle will become brighter. You can move the highlighted waveform along the vertical axis by dragging it with the handle. Label a Waveform To label a waveform and calculate its latency follow these steps: 1. Select the handle of the wave to be labeled. 2. Select a label from the labeling buttons at the top of the Waveform Window (Figure 30). 3. Place the cursor over the waveform where the label will be placed. Note that the location will jump to the peaks (peak positives) and troughs (peak negatives) of the wave. 4. When the correct peak or valley has been identified, click the mouse to place the label. 5. To move a label, select the label and place it again following the steps above. Once placed on the wave, the label cannot be deleted, only moved. The selected peak will be marked with the chosen wave number and the calculated peak-related latency values [Hood, 1998], [Gorga, 1987], [Gorga, 1989], [Zimmerman, 1987] will appear in the Waveform Information chart (Figure 33). Figure 32 Waveform labeling buttons NOTE Use the “I, II, III, IV, and V” buttons with Roman numerals to label the positive peaks. Use the “I’ and V’” buttons to label the negative peaks of waves I and V. Labeling the negative peaks is essential for calculating the peak-to-peak amplitude. Labeling the negative peaks will not affect the latency calculation. NOTE The arrow button, located first in the label selection, is used to disable the selected label. Once selected, a wave labeling button will remain active until another labeling button is selected or the arrow button is selected. Once a wave label is placed on a wave it cannot be deleted only moved. AB Display The AB display mode is used to change the displayed waveform into the recorded components of the A and B buffered information. 1. Select the waveform desired. 2. Press the AB button located next to the Waveform labeling buttons.](https://usermanual.wiki/Vivosonic/V50.USERS-MANUAL-1/User-Guide-624487-Page-51.png)
![The Integrity™ System Screens User's Manual Integrity Chapter 4 42 11049 Rev.2 The Test Screen The single waveform will split into A and B components. 3. To switch back to the combined waveform, select one of the split waveforms and press AB again. Waveform Delete button To delete a wave from the Waveform Window: 1. Select a waveform handle. 2. Press the button with the X on it. 3. Answer “Yes” when asked if you want to delete the wave. Latency norms Integrity™ provides a graphical presentation of the normative data for Latencies I and V. To view normative latency data for waves I and V, do the following: 1. First label the wave. (See Label a Waveform on page 41 for details.) 2. Select the Latency Norms down arrow to view the normative data list. 3. The normative data graphs for waves I, III, and V latencies will be shown in the Waveform Window in the format of yellow vertical bars. 4. The Waveform Information chart (Figure 33) will display the normative data title and the level of intensities for the latency norms shown. NOTE: Vivosonic recommends that each clinic create its own normative data which reflect the specific character of the tested population and the protocols used for their data collection. The preset normative data can be used to compare the results collected with the same stimulus, recording, and subject parameters. There is no international standardized data available at this time. The Latency Normative file is located at: C:\INTEGRITY V1.0\ActiveX Controls\LatencyNormals.ini Use the same data entry standard as the predefined latency data already in the file to add custom data. Once added, the new data will appear as a selection in the Latency Norms drop-down box. For the source and value of the ABR latency normative data please refer to (Appendix H). [Hood, 1998], [Gorga, 1987], [Gorga, 1989], [Zimmerman, 1987] Y-axis Scale Use the Y-Axis Scale field located at the right upper corner of the Waveform Window (Figure 30) to change the Y-axis scale of the amplitude. The scale can be set to any value between 0.05 µV to 4.0 µV. To change the scale: Select the up or down arrow to the right of the Y-Axis value. Changing the size affects only the display on the screen – it does not influence the recorded data.](https://usermanual.wiki/Vivosonic/V50.USERS-MANUAL-1/User-Guide-624487-Page-52.png)