Vivosonic V50 VIVOLINK User Manual USER S MANUAL
Vivosonic, Inc. VIVOLINK USER S MANUAL
Contents
- 1. USERS MANUAL 1
- 2. USERS MANUAL 2
USERS MANUAL 1

USER’S MANUAL
Document 11049 Revision 2
Vivosonic brings you
sophisticated and innovative
technologies in a friendly,
convenient and easy-to-use
way.
Preface User's Manual Integrity
ii 11049 Rev.2
Preface
Model: V500
Part Number: MAN-V500-1
Document Number: 11049
Revision: 2
Revision date: January 12, 2006
COPYRIGHT NOTICE
You are licensed to use this software to operate the V500 device. You do not have
permission to use this software in any manner not related to the intended operation of this
device. You may not supply or copy this software for use by any third parties.
© This User’s Manual is copyrighted by:
Vivosonic Inc.
56 Aberfoyle Crescent, Suite 620
Toronto, Ontario Canada M8X 2W4
Voice: 416.231.9997
Fax: 416.231.2289
Toll-free: 877.255.7685 (Canada and US)
E-mail: vivo@vivosonic.com (general)
support@vivosonic.com (Customer Support)
Web: www.vivosonic.com

User's Manual Integrity Safety
11049 Rev.2
iii
Safety
To ensure safe operation of the Vivosonic VivoLink™ and the Integrity™ ABR system
please read and comply with the following warning and caution statements.
The following symbols will be used throughout the manual.
WARNING
Messages with this heading indicate serious adverse reactions and potential safety
hazards, limitations in use imposed by them, and steps that should be taken if they occur.
CAUTION
Messages with this heading indicate Include information regarding any special care to be
exercised by the practitioner and/or patient for the safe and effective use of the device.
All precautions should be followed to ensure data and system integrity.
ATTENTION
Messages with this heading indicate a possible loss of data. Follow the procedures to
ensure data integrity.
NOTE
Messages with this heading provide additional information that will increase the
technician’s understanding of the operation of the system.
TIP
Messages with this heading provide tips or alternate instructions for a procedure.
Table of Contents User's Manual Integrity
iv 11049 Rev.2
Table of Contents
PREFACE....................................................................................................................................... 2
SAFETY.......................................................................................................................................... 3
TABLE OF CONTENTS............................................................................................................... 4
TABLE OF FIGURES ................................................................................................................... 7
CHAPTER 1 GENERAL INFORMATION........................................................................... 1
INTRODUCTION............................................................................................................................. 1
Intended use of the Integrity™ system.................................................................................... 1
Auditory Brainstem Response (ABR) ...................................................................................... 1
Auditory Evoked Potentials (AEP) recording......................................................................... 2
AEP electrode impedance....................................................................................................... 3
The Integrity™ system ............................................................................................................ 3
Innovations in the Integrity™ system...................................................................................... 3
Other features of the system.................................................................................................... 4
How the Integrity™ can enhance your practice ..................................................................... 5
Definitions............................................................................................................................... 5
Using This Manual.................................................................................................................. 5
Intended Operator................................................................................................................... 5
Intended Environment............................................................................................................. 5
Indications ...............................................................................Error! Bookmark not defined.
CHAPTER 2 CONFIGURATION........................................................................................... 9
SYSTEM CONFIGURATION ............................................................................................................. 9
General configuration............................................................................................................. 9
VivoLink™............................................................................................................................ 11
On/off switch, power LED indicator..................................................................................... 13
Inter-electrode Contact Quality Mismatch LED Indicator .................................................. 14
Bluetooth® LED indicator..................................................................................................... 14
Accessory connectors............................................................................................................14
Lanyard................................................................................................................................. 15
Battery Compartment............................................................................................................ 16
Amplitrod® ........................................................................................................................... 17
CLINICAL BENEFITS OF THE NEW METHOD AND SYSTEM ............................................................. 18
SPECIFICATIONS ......................................................................................................................... 18
CHAPTER 3 PREPARATION .............................................................................................. 19
UNPACKING INSTRUCTIONS ........................................................................................................ 19
INSTALLATION............................................................................................................................ 19
System setup for Vivosonic installed systems........................................................................ 19
System setup for customer installed systems......................................................................... 21
CHAPTER 4 THE INTEGRITY™ SYSTEM SCREENS................................................... 24
THE TEST SCREEN ...................................................................................................................... 24
Test Controls......................................................................................................................... 25
Test Controls - Drop-down Menus........................................................................................ 25
Test Control Buttons ............................................................................................................. 26
Save button............................................................................................................................ 27
Current Day/Time................................................................................................................. 29
VivoLink™ Condition ........................................................................................................... 30
VivoLink™ battery indicator ................................................................................................ 30
Bluetooth® connection indicator.......................................................................................... 30
User's Manual Integrity Table of Contents
11049 Rev.2
v
Protocol Test Settings........................................................................................................... 31
Algorithm.............................................................................................................................. 31
Status .................................................................................................................................... 32
Polarity................................................................................................................................. 32
EarTip................................................................................................................................... 32
Masker.................................................................................................................................. 32
Masking Level....................................................................................................................... 32
Non-Inverting (+) and Inverting (-) Electrode ..................................................................... 33
Recording side...................................................................................................................... 33
Notch Filter .......................................................................................................................... 34
Electrodes Used.................................................................................................................... 34
Level (dB pe SPL)/Levels (dB nHL)...................................................................................... 34
Signal Information................................................................................................................ 35
Stimulus Type........................................................................................................................ 36
Transducer Type................................................................................................................... 36
Number of Stimuli (Num of Stim).......................................................................................... 36
% Rejected............................................................................................................................ 36
Correlation Coefficient (Corr. Coeff.).................................................................................. 36
Latency intensity................................................................................................................... 36
EEG Window ........................................................................................................................ 38
Quality Control Mismatch.................................................................................................... 38
Ongoing EEG ....................................................................................................................... 39
Waveform Window................................................................................................................ 39
Label a Waveform................................................................................................................. 41
AB Display............................................................................................................................ 41
Waveform Delete button....................................................................................................... 42
Latency norms....................................................................................................................... 42
Y-axis Scale .......................................................................................................................... 42
Waveform Information Chart ............................................................................................... 43
Leave the Test screen............................................................................................................ 44
THE PATIENTS SCREEN .............................................................................................................. 45
Sorting the table.................................................................................................................... 46
Adjusting the columns and rows........................................................................................... 46
Entering patient information ................................................................................................ 46
Entering Time of Birth..........................................................................................................47
Selecting Patients ................................................................................................................. 47
THE PLANNER SCREEN............................................................................................................... 48
Selecting a Patient................................................................................................................ 49
Mother’s Information ........................................................................................................... 49
Test Information ................................................................................................................... 49
Selecting Tests ...................................................................................................................... 50
Deleting entries from the Planner list................................................................................... 50
THE DATABASE SCREEN ............................................................................................................ 51
Using the Database ..............................................................................................................51
Documenting test results....................................................................................................... 51
Monitoring data changes over time...................................................................................... 51
Quality assurance................................................................................................................. 52
Database function................................................................................................................. 52
Database access ................................................................................................................... 52
Database screen description................................................................................................. 52
Database Patient List table .................................................................................................. 53
Database Waveform Window and Information Table........................................................... 54
Database Controls................................................................................................................ 55
THE PROTOCOL SCREEN............................................................................................................. 61
Creating Protocols ............................................................................................................... 62
Protocol List......................................................................................................................... 62
Table of Contents User's Manual Integrity
vi 11049 Rev.2
Protocol Query ..................................................................................................................... 63
Protocol Settings................................................................................................................... 63
Deleting a protocol............................................................................................................... 64
THE SYSTEM SCREEN ................................................................................................................. 65
System Configuration Selection and Controls ...................................................................... 65
Software Activation............................................................................................................... 66
Battery Information............................................................................................................... 66
Birth Weight Unit Information.............................................................................................. 66
Transducers and Calibration Units ...................................................................................... 66
Unit ID.................................................................................................................................. 68
Select Printer ........................................................................................................................ 68
Changing the Password ........................................................................................................ 68
Database Controls ................................................................................................................ 69
Backing up records ............................................................................................................... 69
Restoring the database..........................................................................................................69
Saving selected records.........................................................................................................70
Merging saved records to the database ................................................................................ 70
Organization information ..................................................................................................... 71
CHAPTER 5 GENERAL OPERATING PROCEDURES .................................................. 72
PREPARING FOR A TEST............................................................................................................... 72
Distinguishing electrode clips............................................................................................... 72
Recommended electrode placement...................................................................................... 73
Figure 63 Amplitrode® and Electrode Clips Placement (shown on an infant) .................... 74
Preparing the Patient............................................................................................................ 74
Skin preparation ................................................................................................................... 74
Application of the electrodes................................................................................................. 75
Checking electrode contact quality....................................................................................... 75
Choose a transducer .............................................................................................................76
ER-3A Earphones.................................................................................................................. 77
B-71 Bone Conductor ........................................................................................................... 78
Preparation of the system ..................................................................................................... 79
PROTOCOL PARAMETERS............................................................................................................ 79
Stimulus Settings................................................................................................................... 80
Stimulus Type........................................................................................................................ 80
Transducer Type ................................................................................................................... 80
Stimulus Rate (Stimuli/s).......................................................................................................80
Maximum Number of Stimuli ................................................................................................ 81
Window ................................................................................................................................. 81
Ramp..................................................................................................................................... 81
Stimulus Levels ..................................................................................................................... 81
Test Settings.......................................................................................................................... 82
High-Pass filter (Hz)............................................................................................................. 82
Low-Pass filter (Hz).............................................................................................................. 82
High-Pass Rolloff and Low-Pass Rolloff .............................................................................. 82
Amplifier Gain (dB) .............................................................................................................. 82
Recording Window (ms)........................................................................................................ 82
Artifact Rejection .................................................................................................................. 82
Artifact Rejection Threshold................................................................................................. 83
PERFORMING AN ABR TEST....................................................................................................... 83
Place the VivoLink™ on the patient:.................................................................................... 83
Storing the Integrity™ system............................................................................................... 88
CHAPTER 6 INTEGRITY™ SYSTEM CARE................................................................... 89
RECHARGING BATTERIES ........................................................................................................... 89
VivoLink™............................................................................................................................ 89
User's Manual Integrity Table of Figures
11049 Rev.2
vii
Computer.............................................................................................................................. 89
REPLACING BATTERIES .............................................................................................................. 89
VivoLink™............................................................................................................................ 89
Computer.............................................................................................................................. 90
CHAPTER 7 TROUBLESHOOTING.................................................................................. 91
PROBLEMS, CAUSES AND SOLUTIONS......................................................................................... 91
CHAPTER 8 APPENDICES.................................................................................................. 94
APPENDIX A TECHNICAL SPECIFICATIONS ........................................................... 94
APPENDIX B ITEMS TRACKED IN THE INTEGRITY DATABASE ....................... 97
APPENDIX C ABR PRESET PROTOCOLS ................................................................... 99
APPENDIX D GUIDANCE AND MANUFACTURER’S DECLARATION ............... 108
EMISSIONS................................................................................................................................108
All Equipment and Systems................................................................................................. 108
Equipment and Systems that are NOT life-supporting........................................................ 108
IMMUNITY................................................................................................................................109
All Equipment and Systems................................................................................................. 109
APPENDIX E RECOMMENDED SEPARATION DISTANCE................................... 111
Equipment and Systems that are NOT life-supporting........................................................ 111
APPENDIX F SYMBOLS USED ON THE INSTRUMENT......................................... 112
APPENDIX G OVERVIEW OF CLINICAL APPLICATIONS ................................... 114
GENERAL INFORMATION ON ABR............................................................................................ 114
What is ABR?...................................................................................................................... 114
What are the clinical applications of ABR?........................................................................ 114
APPENDIX H ABR LATENCY NORMATIVE DATA................................................. 115
UCLA School of Medicine Norms for Infants..................................................................... 115
Boys Town Norms for Newborns ........................................................................................ 116
Boys Town Norms for Infants ............................................................................................. 117
Absolute and Interwave Latency Values............................................................................. 118
APPENDIX I REFERENCES .............................................................................................. 119
GLOSSARY OF TERMS.......................................................................................................... 120
APPENDIX J BLUETOOTH® TROUBLESHOOTING................................................... 124
Introduction ........................................................................................................................ 124
INDEX......................................................................................................................................... 125
Table of Figures
FIGURE 1 INTEGRITY™ SYSTEM ............................................................................................................ 9
FIGURE 2 EAR TIPS FOR AEP TESTS (ABR). .........................................................................................10
FIGURE 3 NEUROLINE® 103920 ELECTRODES FOR AEP TESTS .............................................................11
FIGURE 4 VIVOLINK™.........................................................................................................................11
FIGURE 5 VIVOLINK™ FRONT PANEL ...................................................................................................13
FIGURE 6 VIVOLINK™ CONNECTOR PANEL............................................................................................14
FIGURE 7 VIVOLINK™ LANYARD............................................................................................................15
FIGURE 8 BATTERY COMPARTMENT OF THE VIVOLINK™. ........................................................................16
FIGURE 9 AMPLITRODE®.....................................................................................................................17
Table of Figures User's Manual Integrity
viii 11049 Rev.2
FIGURE 10 CAUTION SCREEN .............................................................................................................. 21
FIGURE 11 THE TEST SCREEN ............................................................................................................ 25
FIGURE 14 SAVE RESULT CONFIRMATION ............................................................................................ 27
FIGURE 15 DIALOG BOX - ARE YOU SURE YOU WANT TO DISCARD IT? ...................................................... 28
FIGURE 16 PRINT RESULT CONFIRMATION ........................................................................................... 29
FIGURE 18 VIVOLINK™ BATTERY INDICATOR ........................................................................................ 30
FIGURE 19 LOW BATTERY MESSAGE BOX.............................................................................................. 30
FIGURE 20 BLUETOOTH® CONNECTION INDICATOR................................................................................ 31
FIGURE 21 BLUETOOTH CONNECTION FAILED MASSAGE ......................................................................... 31
FIGURE 23 NON-INVERTING (+) ELECTRODE DROP-DOWN LIST SHOWN .................................................... 33
FIGURE 24 LIST OF ELECTRODES AVAILABLE FOR TESTING...................................................................... 34
FIGURE 25 LEVEL (DB PE SPL) BAR. .................................................................................................. 34
FIGURE 26 SIGNAL INFORMATION ........................................................................................................ 35
FIGURE 27 LATENCY-INTENSITY GRAPH (ADULT) [HOOD, 1998].............................................................. 37
FIGURE 28 EEG WINDOW ................................................................................................................... 38
FIGURE 29 POOR CONTACT QUALITY.................................................................................................... 38
FIGURE 30 WAVEFORM WINDOW – COLLECTED DATA FOR ANALYSIS ....................................................... 40
FIGURE 32 WAVEFORM LABELING BUTTONS.......................................................................................... 41
FIGURE 33 WAVEFORM INFORMATION CHART ....................................................................................... 43
FIGURE 34 ARE YOU SURE YOU WANT TO DISCARD THE RECORD(S)?....................................................... 44
FIGURE 35 THE PATIENTS SCREEN...................................................................................................... 45
FIGURE 36 DROP-DOWN CALENDAR..................................................................................................... 47
FIGURE 37 DROP-DOWN CLOCK .......................................................................................................... 47
FIGURE 38 SELECTED PATIENTS IN PATIENTS SCREEN ........................................................................... 48
FIGURE 39 THE PLANNER SCREEN ...................................................................................................... 48
FIGURE 40 PLANNED PATIENT LIST....................................................................................................... 49
FIGURE 41 SELECTED TESTS IN THE PLANNER SCREEN.......................................................................... 50
FIGURE 42 THE DATABASE SCREEN .................................................................................................... 51
FIGURE 43 DATABASE PATIENT LIST – INITIAL VIEW ............................................................................... 53
FIGURE 44 DATABASE PATIENT LIST – OTHER FIELDS SCROLLED RIGHT ................................................... 53
FIGURE 45 DATABASE WAVEFORM WINDOW AND INFORMATION TABLE.................................................... 54
FIGURE 47 TEST REPORT SCREEN ....................................................................................................... 56
FIGURE 48 PRINT TEST RESULT DIALOG BOX ........................................................................................ 56
FIGURE 49 PRINT TEST RESULT DIALOG BOX ........................................................................................ 56
FIGURE 50 EXPORT TEST RESULT....................................................................................................... 57
FIGURE 51 EXPANDED DATABASE WAVEFORM WINDOW........................................................................ 59
FIGURE 52 LATENCY-INTENSITY GRAPH - ADULT NORMS SHOWN............................................................. 60
FIGURE 53 THE PROTOCOL SCREEN ................................................................................................... 61
FIGURE 54 PROTOCOL LIST ................................................................................................................ 62
FIGURE 55 PROTOCOL QUERY ............................................................................................................ 63
FIGURE 56 PROTOCOL DIALOG BOX ..................................................................................................... 64
FIGURE 57 CHANGE PROTOCOL DIALOG BOX ........................................................................................ 64
FIGURE 58 PROTOCOL DELETION DIALOG BOX....................................................................................... 64
FIGURE 59 THE SYSTEM SCREEN ........................................................................................................ 65
FIGURE 60 SAVE RECORDS DIALOG BOX ............................................................................................... 70
FIGURE 61 TYPICAL ELECTRODE PLACEMENT DIAGRAM - FRONT VIEW...................................................... 73
FIGURE 62 TYPICAL ELECTRODE PLACEMENT DIAGRAM - LEFT LATERAL VIEW............................................ 73
FIGURE 63 AMPLITRODE® AND ELECTRODE CLIPS PLACEMENT (SHOWN ON AN INFANT) ........................... 74
FIGURE 64 AMPLITRODE® .................................................................................................................. 75
FIGURE 65 ER-3A EARPHONES (A) AND THEIR FOAM EAR TIP DIMENSIONS (B) .......................................... 77
FIGURE 66 PROTOCOL STIMULUS AND TEST SETTINGS CONTROLS ......................................................... 80
FIGURE 67 BATTERY COMPARTMENT OF THE VIVOLINK™ ...................................................................... 89
User's Manual Integrity Table of Figures
11049 Rev.2
ix
Table of Figures User's Manual Integrity
x 11049 Rev.2
Chapter 1 User's Manual Integrity General Information
Introduction 11049 Rev.2 1
Chapter 1 General Information
Introduction
Indications for use of the
Integrity™ system
Integrity™ is indicated for
auditory evoked potential
testing as an aid in detecting
hearing loss and lesions in the
auditory pathway.
Integrity is a prescription device.
The labeling, instructions and
user operations are designed
for trained professionals.
Auditory Brainstem Responses
(ABRs) are short latency auditory evoked potentials that have become widely accepted
as a valuable test by a variety of professionals, such as audiologists, otolaryngologists,
otologists, neurologists, pediatricians, and neonatologists.
This system can be used as a front-line objective audiometry tool as a part of a battery of
diagnostic audiometric tests together with other audiometric techniques conducted with
other devices such as conventional audiometry, tympanometry, middle ear muscle
reflexes, eustachian tube function test, visual reinforcement audiometry, and other tests.
However, the system is not intended to replace all other audiometers or audiometric
tests.
The Integrity™ is suited for testing in patients of all ages: newborns, infants, children, and
adults through seniors.
The system is designed for use in either a hospital or ambulatory setting: maternity
wards, Intensive Care Units (ICUs), doctor’s offices, Otolaryngology and Audiology
clinics, schools, and occupational settings.
Auditory Brainstem Response (ABR)
Auditory Brainstem Response (ABR) is an objective electrophysiological test of the
function and integrity of the auditory system from the inner ear to the brainstem. ABR is
an electrophysiological response, which starts in the inner ear and spreads through the
auditory nerve to the brainstem structures. It is recorded typically between 0 and 10 ms
after the onset of an auditory stimulus
Click-evoked ABR is not frequency-specific and is used primarily for infant hearing
screening and differential diagnostics (cochlear vs. retro-cochlear, auditory
neuropathy/dissynchrony). Tone burst ABR is frequency-specific and typically used for
evaluating hearing thresholds, mostly in newborns, infants, and young children. Tone
burst ABR does not measure hearing loss, as does pure-tone audiometry; therefore, tone
burst ABR results should be used as part of a test battery in conjunction with other
audiometric tests, particularly with behavioral pure-tone audiometry whenever possible.
ABR amplitude is quite small compared to the evoked potential activity recorded at longer
latencies. Wave V peak-to-trough amplitude rarely exceeds 1 microvolt1 (μV), even at
1 One microvolt is a millionth of a Volt.

General Information User's Manual Integrity Chapter 1
2 11049 Rev.2 Introduction
high supra-threshold stimulus levels. At stimulus levels near threshold, ABR wave V
amplitude may be 0.1 μV or smaller.
Auditory Evoked Potentials (AEP) recording
As a result of their small amplitude, and AEP signal is easily “drowned out” or lost due to
noise composed of electrical potentials appearing on the scalp, i.e., physiologic noise,
and non-physiologic noise, particularly low-frequency (LF) electric, LF magnetic, and
radio-frequency (RF).
Sources of physiologic noise include the following: brain activity recorded as
electroencephalogram (EEG), heart activity – electrocardiogram (ECG), eye movements
– electrooculogram (EOG), and muscular activity – electromyogram (EMG). While EOG
and EMG can be largely reduced by sleep or sedation, EEG and ECG are not reduced by
sleep. Moreover, EEG typically increases in sleep due to synchronization of the brain
activity.
Sources of non-physiologic noise can be wireless computer networks, electronic
medical devices, Personal Digital Assistants (PDAs), cellular phones, fax machines,
photocopiers, power lines (mostly 50/60 Hz and its harmonics), luminescent lights, RF
broadcasts, high-voltage equipment, and stimulus artifact radiation from stimulating
transducers. Significant sources of electrical noise, which are often detected by the AEP
amplifier, are caused by the time-varying and time-invariant electromagnetic fields that
are present in many test environments where the electrode-lead wire-amplifier
arrangement is employed. These time-varying electromagnetic fields are inductively and
capacitively coupled with the lead wire that introduces noise from the electrode to the
amplifier. A second significant source of noise is motion artifacts, i.e., the noise induced
in the lead wire as it moves through a static (i.e., time-invariant) magnetic field.
ABR and noise parameters are summarized in Table 1.
Table 1 Signal and Noises in ABR Recording
Signal Frequency, Hz Amplitude, nV
AEP Signal
ABR 50 - 3,000 100 - 1,000
Noises
Electrooculogram (EOG) 0.5-10 10,000 - 500,000
(Electroencephalogram) EEG awake 3-40 5,000 - 10,000
(Electroencephalogram) EEG sleep 3-16 2,000 - 400,000
Electrocardiogram (ECG) 0.5-50 (up to 100) 80,000 - 2,000,000
Electromyogram (EMG) 30-500 10,000 - 2,000,000
LF Electric, LF magnetic, RF Harmonics of 50/60 Hz,
MHz, GHz
Up to 10,000,000
To reduce physiologic and non-physiologic noise, differential pre-amplifiers are used. In
such pre-amplifiers, the signal of interest is measured as the difference between the
electric potential in two signal electrodes called the non-inverting (positive) electrode, the
inverting (negative) electrode. A common ground electrode is used to provide a common
return path for current in the signal electrode leads. This differencing technique, called
common-mode rejection, rejects noise that is common to both signal electrodes (non-
inverting and inverting). When common-mode rejection is used in conventional pre-
amplification it is not effective enough since the rejection degrades at frequencies above
20 kHz, and RF noises are not rejected at all.
Chapter 1 User's Manual Integrity General Information
Introduction 11049 Rev.2 3
AEP electrode impedance
Significant care must be taken by the clinician to properly attach AEP electrodes. AEP
voltages are very small, which is why for AEP recording, critical signals (noise) are kept
as low as possible. When the impedance between the skin and the electrodes applied to
the skin is too high, there will be a high input impedance at the AEP pre-amplifier. Non-
physiological noise will be higher, the signal-to-noise ratio will be lower, and the signal
recording and detection will be longer.
In summary, electrodes, lead wires, and cables introduce additional noise and affect AEP
recording.
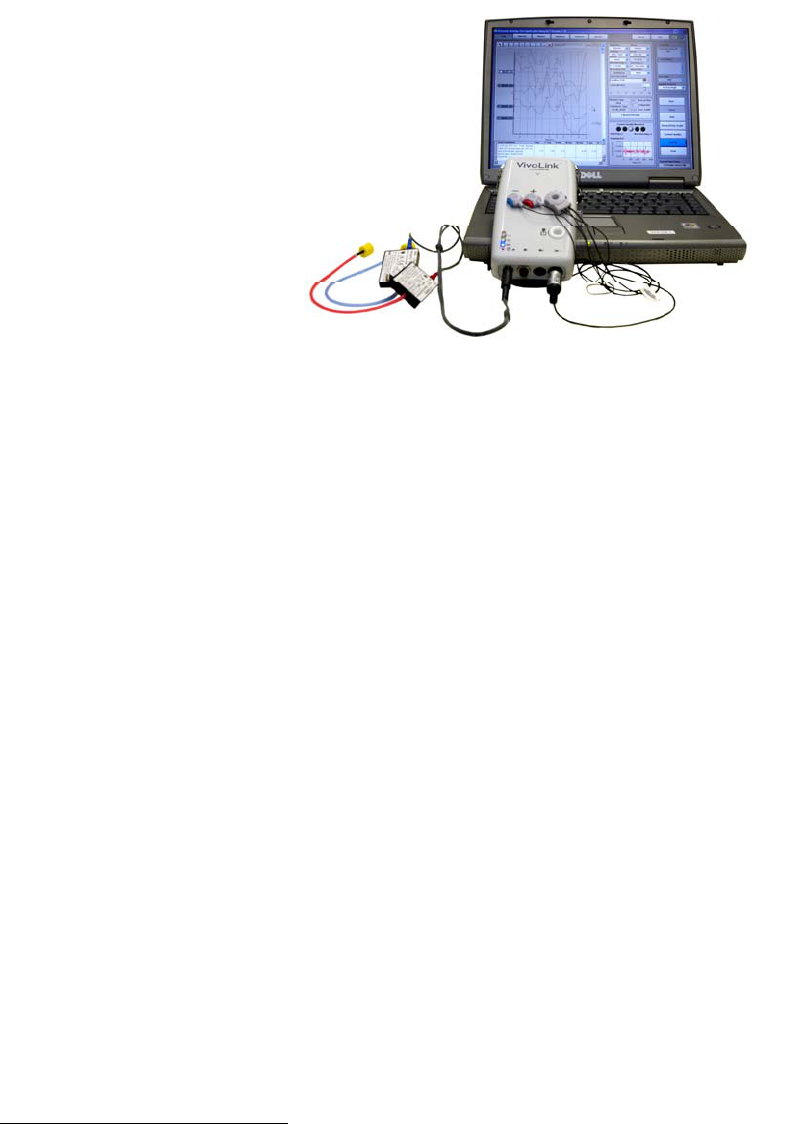
The Integrity™ system
The Integrity™ system is the world’s first wireless ABR recording system. It is multi-
functional and was developed by Vivosonic to offer a solution to overcome AEP-recording
difficulties. Vivosonic’s solutions employed in this system include wireless Bluetooth®
communications between the computer and the data collecting module, in situ
amplification with the Amplitrode®, and a combination of an electrode and a pre-amplifier,
which provide the following benefits:
• Largely reduced physiological and non-physiological noise resulting in fast,
accurate, and clear ABR recordings.
• Mobility for the patient and the user.
• Less attention to electrode impedance due to monitoring of electrode contact
quality mismatch.
• The electrodes can be quickly clipped and unclipped from the patient using easy
release buttons on the electrode clips.
• Shorter lead wires mean fewer inconveniences than experienced with long lead
wires and cables.
• Less risk of electrode-lead misconnection.
Innovations in the Integrity™ system
In situ pre-amplification: For recording ABR, the system employs the Amplitrode®, the
world’s first in situ AEP pre-amplifier that largely reduces physiological noise and
electromagnetic interferences. The system provides fast and reliable results in most
clinical environments, even in those where an electromagnetically shielded room is
unavailable.
Wireless communications: As in most conventional systems, a computer controls all
tests, and then records, displays, and stores the results. An interface module generates
stimuli and processes responses. However, different from all other systems,
communication between the computer and the Interface Module, the VivoLink™, is
wireless using Bluetooth® technology.
Bluetooth®: This wireless communications protocol enables computers and other digital
devices to communicate via a broad radio frequency (RF) band. A Bluetooth® radio signal
does not introduce noise itself because it has very low energy, and yet it is strong enough
to communicate within about 30 ft (10 m), even through walls.
Unlike a radio broadcast, such as FM radio, Bluetooth® does not have a fixed carrier
frequency. Rather, it is a random, noise-like digital signal composed of encoded zeros
and ones. Encoding makes it extremely secure for data exchange, which is important in
medical applications.
General Information User's Manual Integrity Chapter 1
4 11049 Rev.2 Introduction
Bluetooth® has been implemented in many medical applications making it a natural
choice for Auditory Electrophysiology. Vivosonic is first in the world to employ Bluetooth®
for this function. More information on Bluetooth® can be found at www.bluetooth.com.
Signal-processing algorithms: The system uses a patented digital signal processing
technique called the Kalman Filter. The Kalman Filter is a minimum mean-square error
filter. [Li, 2002] This technique offers the operator a fast, accurate, reliable, and simple
testing process, even in the presence of EMG noise from facial muscles.
Other features of the system
User friendly: The instrument allows flexible, user-defined test protocols, and provides
comprehensive data management and analysis. The protocol screen and test screen
both have a similar design, which allows for easy learning. The data-management system
keeps a common patient list and combines results from ABR testing which makes finding
results, review, and printing reports easy and efficient.
Data-management software includes a test planner, the patient database, and test-
result database. It provides comprehensive data management suitable for individual
offices, clinics, hospitals, research settings, and clinical networks.
The Integrity™ system is operated using a Windows XP® based computer and
Integrity™ software. Stored measurements can be viewed and evaluated on the
computer while running the control program. A summary of the results can also be
printed. AEP procedures can be completed in a couple of minutes and then immediately
prepared for the next patient. The length of the AEP tests depends on the protocol,
auditory function, state of the patient, and the environment.
Quality assurance: Information contained in the patient test files allows for traceability
and analysis of various factors that may affect the quality of testing.
Data integrity, confidentiality, and availability: Test results are password protected
and cannot be modified once they have been stored. The results can be backed up using
the internal storage means of the computer, or any external USB-connected storage
medium such as a RAM drive or CD.
Full-page test report: The rest results can be printed to any optional office printer. The
report will contain the patient information, unit ID, graphic test results, numeric test
results, , and information on the testing facility.
User interface: The user interface is very simple and intuitive, and requires a minimum
amount of training.

Chapter 1 User's Manual Integrity General Information
Introduction 11049 Rev.2 5
CAUTION
This device should be used to indicate auditory problems, not diagnose
them.
The Integrity ™ system (Model V500) is an ABR recording system
providing valuable information that allows estimating a hearing loss, and
diagnosing cochlear and retro-cochlear function. While the Integrity ™
system indicates certain auditory problems, it should be used as a part of
a wider audiologic test battery to arrive at an auditory diagnosis. In
addition to these tests the patient must receive additional clinical testing
using other techniques.
Use this device only as specified.
How the Integrity™ can enhance your practice
Integrity uses a database to store and retrieve test data. The database contains the
patient information, the test conditions, and the protocol settings used for the test. The
Integrity™ Database screen (Figure 42) is designed to function like commonly used
spreadsheet applications such as Microsoft Excel, making it very easy to use and
intuitive. From this screen, the health care professional can review and analyze test
results as well as print and export the results.
The database is capable of storing millions of test results (depending on available hard
disk Space) that are then accessible from one place.
Beyond reviewing individual test results, the user can select subsets of the test results
using a multi-query function to print, archive, un-archive, and export the subset data.
Definitions
Definitions for some of the terms used in this manual, as well as terms used in the
software, can be found in The Glossary of Terms.
Using This Manual
This User’s Manual is intended to assist physicians, audiologists, and other trained
health-care professionals in the safe and effective handling of the Integrity™ system. To
use this device properly, the operator must understand the basics of this device’s
performance, and operating instructions. Chapter 1 covers safety features, precautions,
and warnings. The chapters that follow provide the product descriptions, and details on
how to use the Integrity™ system.
Intended Operator
The intended operator is a trained physician, audiologist, or other trained health-care
professional licensed by local authorities to perform hearing assessment. This person
must be trained in the assessment of auditory difficulties. To use this device, the operator
will be required to fit the patient with the ER-3A earphones, affix the B-71 Bone
Conductor and the electrodes to the patient, connect the patient to the VivoLink™, and
conduct the test procedure.
Intended Environment
This device is intended for use in a clinical, ambulatory, or occupational environment
suited to the needs of the patient.
General Information User's Manual Integrity Chapter 1
6 11049 Rev.2 Introduction
WARNING
Operation of the Integrity™ system below the amplitudes and/or values
specified for physiologic signals may cause inaccurate results.
The use of accessories, transducers and/or cables with the Integrity™
system other than those specified, with the exception of those sold by
the manufacturer as the replacement parts for internal components, may
result in an increase in EMR emissions or a decrease in the immunity of
the system.
The Integrity™ system should not be used adjacent to or stacked with
other medical instrument components. When space requires other
components to be adjacent to or stacked with the Integrity™ system, the
normal operation of those instruments should be verified.
Other instruments adjacent to or stacked with the Integrity™ system may
cause interference with the VivoLink™ signal. This may be true even if
those components comply with International Special Committee on
Radio Interference (CISPR) emission requirements.
CAUTION
Medical instrumentation requires special precautions regarding
Electromagnetic Compatibility (EMC). Medical instruments need to be
installed according to the EMC shielding information provided in the
accompanying documents.
The Electromagnetic Radiation (EMR) associated with portable and
mobile radio frequency communication devices can interfere with
instrumentation, affecting the operation or results.

Chapter 1 User's Manual Integrity General Information
Introduction 11049 Rev.2 7
CAUTION
This device is contraindicated for:
Patients who display signs of excessive earwax
If, upon inspection, it appears that excessive earwax is present, DO NOT
insert the earphone in the ear canal. Inserting the earphone could force
earwax to press against the eardrum resulting in damage to the ear. It
could also cause incorrect ABR measurements and lead to misdiagnosis.
Patients with inflammation of the ear canal
If, upon inspection, it appears that the skin of the ear canal has signs of
inflammation, DO NOT use this device. The ear tip will cause slight
pressure that may cause mild abrasion and pain.
Patients who have ear canal blockage due to foreign particles
If, upon inspection, it appears that any foreign particles are present in the
ear canal or any foreign particles block access to the eardrum, DO NOT
insert the earphone into the patient’s ear.
Patients who display signs of discharge in the ear
If, upon inspection, any discharge is observed, DO NOT insert the
earphone into the patient’s ear.
Patients who display skin damage
If a patient displays any signs of skin damage at the site of an electrode
application (such as skin irritation (redness), scratches, bruises, sores,
cuts, wounds, bleeding), DO NOT conduct skin preparation and
application of the electrodes. Consult a dermatologist or other trained
health-care professional.

General Information User's Manual Integrity Chapter 1
8 11049 Rev.2 Introduction
CAUTION
Hazard: The patient experiences discomfort when the ear tip is inserted
into the ear canal.
Remedy: The operator must check whether the ear tip selection was
incorrect and replace with a properly fitting ear tip.
Hazard: Audible levels are uncomfortable for the patient.
Remedy: The operator must immediately select a lower setting for the
stimulus levels. Signal inputs and outputs are intended only in
connection to the specified equipment described in this manual.
Hazard: Skin at the site of the electrode application is damaged, for
example: irritated (red), scratched, bruised, sore, cut, wounded, or
bleeding.
Remedy: Do not conduct skin preparation and electrode application on
areas of damaged skin. Choose another electrode location, wait until
healing is complete, consult a dermatologist, or refer the patient to a
health-care professional who is trained to deal with skin damage.
CAUTION
Please follow these recommendations to ensure the test data is
accurate.
• Substitution of any supplied components with different components may
result in measurement error.
• No other software may be installed onto the computer on which the
Integrity™ software is installed.
• Handle the system with care.
• The system requires calibration of the transducers – ER-3A earphones and
B-71 Bone Conductor – annually on each anniversary from the date of
manufacture, and every time a transducer is dropped, subjected to
mechanical shock, or immersed in a liquid substance. Otherwise, stimuli
presented to the patient as specified may lead to incorrect test results and
misdiagnosis.
• DO NOT force the ear tip into the ear canal.
• Always carry this device with you when traveling to avoid mishandling and
damage of stored or checked luggage.
• DO NOT ship this device for service in packaging other than the packaging
supplied with the system from the manufacturer, or comparable packaging.
Chapter 2 User's Manual Integrity Configuration
System configuration 11049 Rev.2 9
Chapter 2 Configuration
System configuration
General configuration
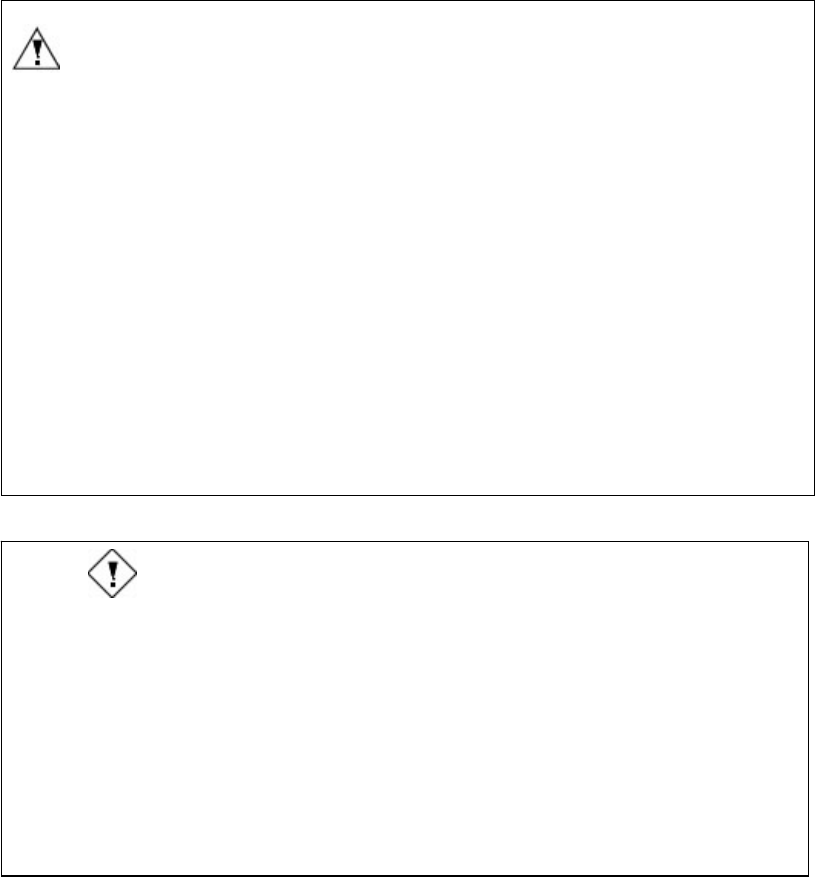
The Integrity™ system is modular (Figure 1), consisting of the components found in
Table 2.
Figure 1 Integrity™ system
1 – Computer with Integrity™ software
2 – Amplitrode®
3 – VivoLink™
4 – ER-3A Earphones (transducers),
5 – B-71 Bone Conductor,
6 – Bluetooth® dongle (installed on back of computer)
7 – Mouse
8 – Probe adapter with Probe holder
Table 2 Components shipped with basic Integrity™ system purchase
VivoLink™
Wireless interface module – 1 pc
Accessories:
1. Amplitrode® – the in situ ABR pre-amplifier – for recording ABR – 1 pc
2. ER-3A earphones – for stimulating ABR and contralateral masking in AEP tests via air
conduction – 1 pair:
• Red, with red silicone tube, ear tip adapter, and clip - for the right ear.
• Blue, with blue silicone tube, ear tip adapter, and clip - for the left ear.
3. B-71 Bone Conductor, with metal headband - for stimulating ABR via bone conduction
(optional)

Configuration User's Manual Integrity Chapter 2
10 11049 Rev.2 System configuration
4. The Bluetooth® dongle (receiver), the size of a Flash memory stick.
5. Computer bag – 1 pc (not shown)
6. AA NiMH rechargeable battery and battery charger (not shown). This item can be
purchased from any local battery supplier.
Disposables:
1. Single-use foam ear tips for ER-3A (Figure 2) – for performing ABR tests
• Starter kit includes:
ER3-14A – 13 mm yellow – 50 pcs
ER3-14B – 10 mm beige – 50 pcs
ER3-14D –3.5mm red– 20 pcs
ER3-14E – 4.00 mm red – 20 pcs
• 50-Packs of the above – optional
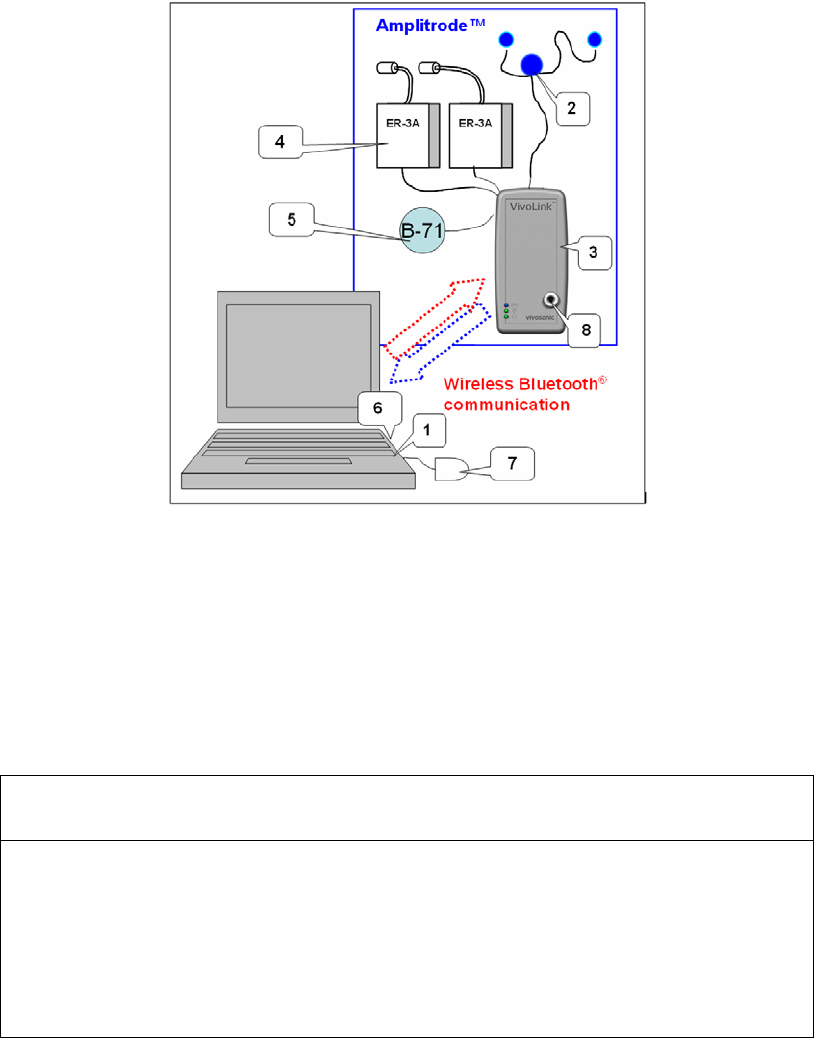
2. Disposable NeuroLine®2 snap electrodes, or equivalent single-use electrodes (Figure 3) –
25 per pouch
3. PDI H04082 Germicidal Wipes – for disinfecting the Amplitrode®. Starter kit includes 20
wipes (not shown)
4. Four (4) AA Alkaline non-rechargeable batteries (included)
Integrity® Software
1. Program running on a Bluetooth®-enabled Windows XP®-based PC.
• Sent on a CD and installed on the PC if the system is purchased with a computer.
• Sent on a CD if the system is purchased without a computer.
2. The Bluetooth® drivers
• Installed on the PC and configured if the system is purchased with a computer.
• Shipped on a CD if the system is purchased without a computer.
3. 2 Calibration CDs
• Bone Conductor installation
• Insert earphone installation
User’s Manual
Optional Equipment
1. Auxiliary office printer (not shown)
2. B-71 Bone Conductor, with metal headband - for s125timulating ABR via bone conduction
Figure 2 Ear tips for AEP tests (ABR).
From the left to the right: ER3-14A, ER3-14B, ER3-14D, ER3-14E,
2 NeuroLine® is a registered trademark of XLTEK Accessories.
Chapter 2 User's Manual Integrity Configuration
System configuration 11049 Rev.2 11
Figure 3 NeuroLine® 103920 Electrodes for AEP tests
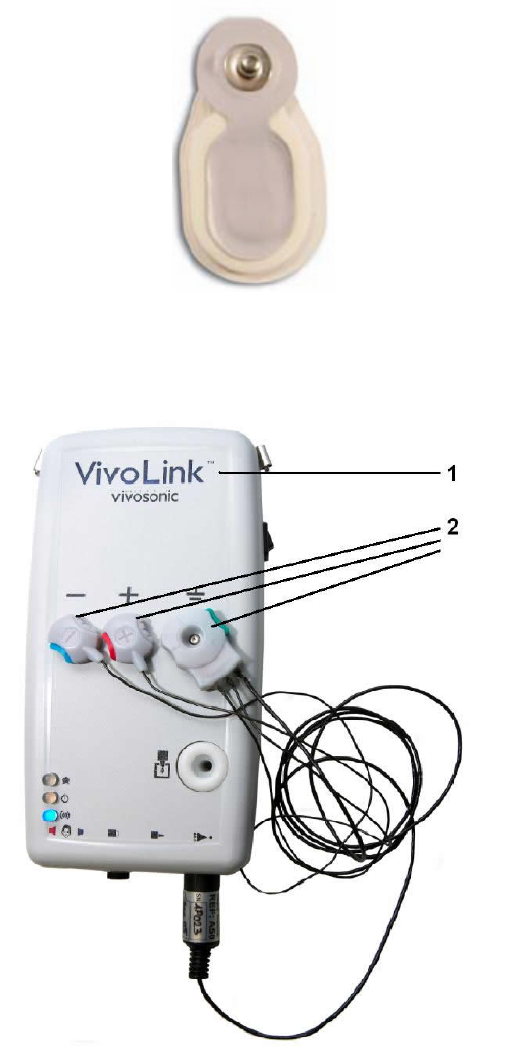
VivoLink™
Figure 4 VivoLink™
VivoLink™ (1) is the world’s first wireless interface module for auditory electrophysiology
(EP). VivoLink™ has the potential to be extended to other modalities such as Auditory
Steady State Response (ASSR), Distortion Product Otoacoustic Emission (DPOAE), and
Transient Otoacoustic Emission (TOAE) in the future. It is operated by a microprocessor,
controlled from a remote computer through Bluetooth®.
Bluetooth® establishes a connection with the computer automatically, and once this
happens, the user is informed by an LED indicator on the VivoLink™ and a virtual LED
indicator in the computer software. VivoLink™ is a battery-powered device that works with
Configuration User's Manual Integrity Chapter 2
12 11049 Rev.2 System configuration
standard audiometric transducers: two ER-3A earphones and a B-71 Bone Conductor. It
conducts ABR with the Amplitrode® (2) the world's first in situ EP pre-amplifier.
The VivoLink™ can be placed on an adult’s chest and secured with a lanyard, placed next
to a baby, or held by the baby’s mother. Testing with the VivoLink™ can be performed
anywhere within the reach of Bluetooth®, including situations where cabled instruments
cannot be used at all.
Tests can be performed within approximately 30 ft (10m) of the software, even in an
electromagnetically shielded booth. To perform a test in an electromagnetically shielded
room connect the Bluetooth® dongle, to your computer via a USB-extension cord and put
the cord through a hole in the booth wall. R emove the cable from the system to help
reduce electromagnetic noise pickup and test time, depending on background noise in
the testing area outside the shielded room. Ideally the shielded room will keep noise to a
minimum.
In the case of an infant patient, the mother may carry the VivoLink™ and the baby and
move around the room without the need to disconnect any electrodes, connectors, or
transducers. This makes testing more comfortable and easier for the patient.
VivoLink™ presents various auditory stimuli to the patient through air and bone
conduction such as a click or tone burst. It then records electrical responses from the
Amplitrode® to the Integrity™ software.
VivoLink™ performs several essential functions:
1. Checks the inter-electrode contact quality mismatch.
2. Checks the wireless connection between VivoLink™ and PC.
3. Checks the VivoLink™ battery voltage (Refer to VivoLink™ battery
indicator on page 30).
4. Presents auditory stimuli through earphones and bone conductor.
5. Transmits collected electrophysiological responses to the computer.
The transducers and Amplitrode® are connected to the VivoLink™ through the connector
panel (Figure 6). To avoid any confusion while connecting peripheral accessories to the
VivoLink™, all locations are marked with specific symbols on the front panel of the
VivoLink™ over the locations of the actual connectors (Figure 5).
Chapter 2 User's Manual Integrity Configuration
System configuration 11049 Rev.2 13
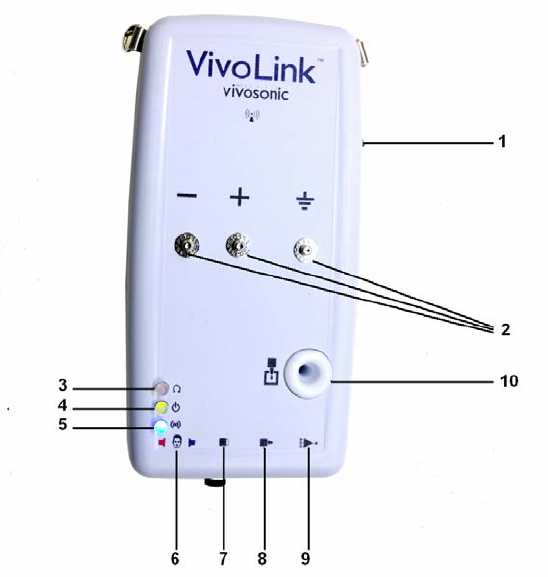
Figure 5 VivoLink™ Front Panel
1 - On/off switch
2 - Parking Snaps holding the Amplitrode® and its clips.
3 - Inter-electrode Contact Quality Mismatch LED indicator
4 - Power LED Indicator
5 - Bluetooth® LED indicator
6 – Symbol for ER-3A earphone connectors
7 – Symbol for B-71 Bone Conductor connector
8 – Symbol for OAE probe connector
9 – Symbol for Amplitrode® connector
10 – OAE Probe holder
Note - Lanyard rings (not shown)
See Appendix C for a description of the symbols printed on the front panel.
On/off switch, power LED indicator
The VivoLink™ runs on four (4) AA batteries. To ensure VivoLink™ will run properly and
will last the entire test, make sure that the batteries are inserted properly into the battery
compartment (Figure 8) (marked “+” and “-” on the battery poles, corresponding to the
same markers of the battery compartment for each battery). Ensure the batteries are
fresh. To turn on the VivoLink™ press the On/Off switch Figure 5 - #1) and check the
Power LED Indicator (Figure 5 - #4). The Power LED Indicator will remain green if the
batteries are in good working condition. If the batteries are low the indicator will be amber
and if the batteries are spent the indicator will be off (not luminous).
Configuration User's Manual Integrity Chapter 2
14 11049 Rev.2 System configuration
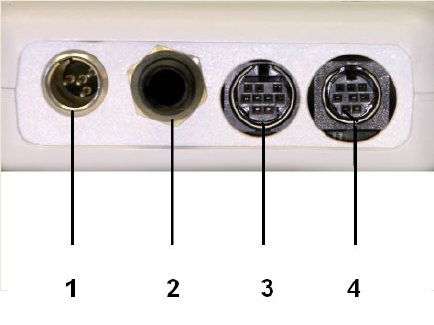
Figure 6 VivoLink™ Connector Panel
1 - ER-3A earphone
2 –B-71 Bone Conductor
3 –OAE Probe (currently unused)
4 - Amplitrode®.
Inter-electrode Contact Quality Mismatch LED Indicator
The Inter-electrode Contact Quality Mismatch LED Indicator (Figure 5 - #3) is off (not
luminous) when the impedance mismatch between the non-inverting (positive) and
inverting (negative) electrodes does not exceed 5000 Ohms.
This indicator turns on (luminous) when the impedance mismatch exceeds 5000 Ohms.
• amber when the inverting (negative) electrode impedance is higher than the non-
inverting (positive) electrode impedance.
• green when the non-inverting (positive) electrode impedance is higher than the
inverting (negative) electrode impedance.
When the LED is on it indicates a problem with the placement of the electrode whose
impedance exceeds that of the other electrode.
Bluetooth® LED indicator
After VivoLink™ has been switched on Bluetooth® LED Indicator (Figure 5 - #5) starts
flashing with blue colored light while the VivoLink™ Bluetooth® wireless circuit is
establishing a connection with the Bluetooth® dongle inserted in the computer slot.
Typically it takes about 30 – 60 seconds for the VivoLink™ Bluetooth® wireless circuit to
communicate with a Bluetooth® computer dongle before the steady wireless connection
will be established. The Bluetooth® LED indicator light will continue to flash during this
time.
After setting up a wireless link between the computer and testing periphery, (VivoLink™)
Bluetooth® LED Indicator will stop flashing. The Bluetooth® light will turn blue on the
computer screen. If the Bluetooth® LED indicator continues to flash longer than 3 minutes
without establishing proper wireless communication, switch off the VivoLink™, wait for
approximately 60 seconds, and then turn VivoLink™ on again. If the problem persists refer
to the Bluetooth troubleshooting in Appendix J.
Accessory connectors
Connectors for the Amplitrode®, OAE Probe, ER-3A Insert Phones, and B-71 Bone
Conductor are located on the connector panel (Figure 5). To perform any testing,
VivoLink™ and desirable transducer(s) should be connected to the Integrity™ through
Chapter 2 User's Manual Integrity Configuration
System configuration 11049 Rev.2 15
the appropriate connectors. To establish a proper connection between peripheral
accessories and VivoLink™, plug each device into the correct socket. Please check the
specific symbols placed on the front panel of the VivoLink™ above the locations of the
connectors (Figure 5).
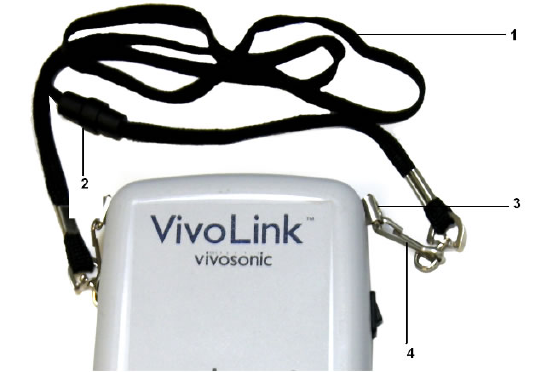
Lanyard
The VivoLink™ can be hung around the patient’s neck using a lanyard (Figure 7). The
Lanyard is connected to two D-rings on the VivoLink™ with two detachable clips. The
lanyard has a breakaway feature which allows for fast disconnection and re-connection,
protecting the patient from strangulation as well as quick operation in case of an
emergency.
Figure 7 VivoLink™ Lanyard.
1. Lanyard
2. Breakaway connection
3. D-rings
4. Clips

Configuration User's Manual Integrity Chapter 2
16 11049 Rev.2 System configuration
Battery Compartment
The VivoLink™ is powered by four (4) AA non-rechargeable Alkaline or Nickel-metal
Hydride (NiMH) rechargeable batteries.3
The battery compartment (Figure 8) is located on the bottom panel of the VivoLink™
marked with an arrow. To open the battery compartment, slide the cover in the direction
of the arrow. The four cells for AA batteries are marked with a “+” and “–” to ensure
proper insertion of the batteries.
Figure 8 Battery compartment of the VivoLink™.
3 Purchase Nickel-metal Hydride rechargeable batteries and charger from any local battery
supplier.
Chapter 2 User's Manual Integrity Configuration
System configuration 11049 Rev.2 17
Amplitrode®
The Amplitrode® is comprised of an integrated pre-amplifier and electrode in a combined
unit that is affixed to the patient. The Amplitrode® (Figure 9) is controlled by VivoLink™
using ABR software modules. Significantly less noise is introduced into the signal
detected by the amplifier as a result of the extremely short connection between the
conductive portion of the electrode and the amplifier. Traditionally this connection could
be as long as a meter or more.
The Amplitrode® amplifies a signal with a much higher signal-to-noise ratio than
conventional electrode-to-lead, wire-to-amplifier arrangements resulting in artifact noise
reduction.
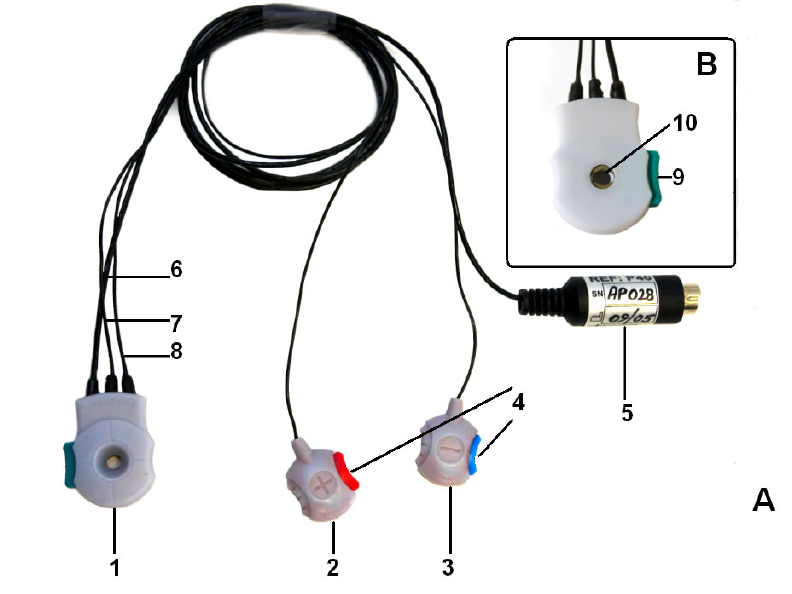
Figure 9 Amplitrode®
View A – General View
View B (insert) bottom view of the pre-amplifier
1. Pre-amplifier combined with ground electrode clip
2. Non-inverting electrode clip
3. Inverting electrode clip
4. Clip buttons
5. Amplitrode® connector with labeled serial number
6. Amplitrode® cord
7. Negative clip cord
8. Positive clip cord
9. Release button
10. Amplitrode® spring

Configuration User's Manual Integrity Chapter 2
18 11049 Rev.2 Clinical benefits of the new method and system
The Amplitrode® is a new generation of pre-amplifiers used in Evoked Response
Audiometry (ERA).
The integrated circuit built in to the Amplitrode® employs chip-on-board technology
enabling the integrated circuit to be directly mounted to the conductive pad. The
extraordinarily small size of the Amplitrode® and the absence of long and cumbersome
lead-wires and cables make the unit exceptionally easy to use.
Clinical benefits of the new method and system
In situ AEP amplification achieves artifact noise reduction in at least three ways: First, at
least one lead wire, the ground-electrode wire which is a significant source of wire-
induced noise, is eliminated completely. Second, the remaining lead wires are as short as
allowed by the size of the area of interest on the subject which is much shorter than the
typical one-meter length (or greater) used in conventional EP systems. Third, motion
artifacts are significantly reduced since both lead wires, electrodes and the pre-amplifier
are each mounted to the patient and all move together. This reduces differential
movement, and hence, differential artifact noise that otherwise would be induced in the
lead wires through environmental electromagnetic fields.
CAUTION
The Amplitrode® could be damaged.
To prevent damage, the Amplitrode® should always be clipped onto the
electrodes on the patient, clipped onto the Amplitrode® parking snaps on
the VivoLink™, or held in the hands of the examiner. Always have the
Amplitrode® connected to the patient while in use or to the parking
snaps when not in use. DO NOT leave the Amplitrode® dangling from
the VivoLink™.
To reduce the physiological and electromagnetic artifacts, the VivoLink™ filters signals
before the first stage of AEP amplification. This will optimize the AEP recording.
VivoLink™ measures the electrode contact quality mismatch. This process allows for
more clinically meaningful data and is easier to utilize than the conventional pre-testing
impedance check. Measuring impedance in real time provides the clinician with ongoing
valuable information on the test conditions without applying any current to the patient.
This may be especially valuable when testing newborns and infants.
Specifications
Specifications for the Integrity™ are found in Appendix A.

Chapter 3 User's Manual Integrity Preparation
Unpacking instructions 11049 Rev.2 19
Chapter 3 Preparation
Unpacking instructions
Retain the shipping carton and all packing materials in case the unit needs to be returned
for repair or shipped to another location. Carefully unpack the Integrity™ briefcase and
accessories. Open the briefcase and identify each of the supplied parts. (Refer to the
packing list in the shipping carton. A general component list can be found in Figure 1.
Unpack the unit as follows:
1. Open the shipping carton.
2. Remove:
• packing list
• user manuals for the computer and printer if supplied by Vivosonic
• warranty certificate
• product registration form
3. Verify all parts were received by referring to the packing list. Please report any
missing or damaged parts to the seller immediately.
4. Record the serial number of the instrument in a permanent location for future
reference. The serial number can be found on the outside of the carton the
system was sent in.
5. Complete the product registration form and send it to the address specified on
the form.
Installation
CAUTION
Test data may be affected.
DO NOT use this device for any clinical application until all steps of the
installation procedure have been completed.
System setup for Vivosonic installed systems
If you have purchased the computer to use with the Integrity™ system, proceed to the
next section “System setup for customer installed systems” on page 21. If you have
purchased the computer from a Vivosonic dealer, please perform the following steps:
1. Open the packaging.
2. Remove all components of the system and connect as detailed in Figure 1.
3. Insert four (4) AA batteries into the battery compartment of the VivoLink™
(Figure 8).
4. Follow the computer manufacturer’s user manual to connect the power cable to
the computer and plug the power cord into the AC power supply of a wall outlet.

Preparation User's Manual Integrity Chapter 3
20 11049 Rev.2 Installation
ATTENTION
Before plugging in the power supply, ensure that the outlet is functioning.
If it is not, the computer will initially run on the battery and then fail to
operate.
5. Plug the supplied Bluetooth® dongle into the USB port on the computer on which
it was installed.
ATTENTION
The Bluetooth dongle shall always be placed in the same USB port on
the computer. Placing the dongle in a different port will cause the
operating system to try to reinstall the Bluetooth® software driver.
6. Turn the computer on.
7. Adjust the clock and calendar settings in Windows® by pressing the Windows®
button on the keyboard, and then double-clicking on the time on the bottom right
corner of the computer screen. The time and date can also be adjusted from the
Control Panel. Select Start | Control Panel.
8. Using the document Integrity Installation, found at the back of this manual’s
binder, follow the instructions to install and configure the Bluetooth drivers.
9. Restart the computer.
10. Verify all connections are secure.
11. If you intend to use an office printer supplied by Vivosonic install the cartridge
and paper as described in its manufacturer’s user guide. If the printer and the
computer where both supplied by Vivosonic the printer driver will already
installed on the computer and fully tested to operate with the system, as part of
assembly procedure at Vivosonic.
ATTENTION
If your computer was purchased from Vivosonic, installation of printer
drivers is NOT recommended. The computer has been tested and
validated to work with the system and will be covered by the warranty to
operate in this state.
Installation of some printer drivers may cause a conflict with the
Integrity™ software and result in error messages and a failure to print.
12. Locate the computer power switch and turn it on. Wait for the computer to boot
up and Windows XP® to start, which may take a few minutes.
13. When you switch the computer On, the Integrity™ program will automatically
start.
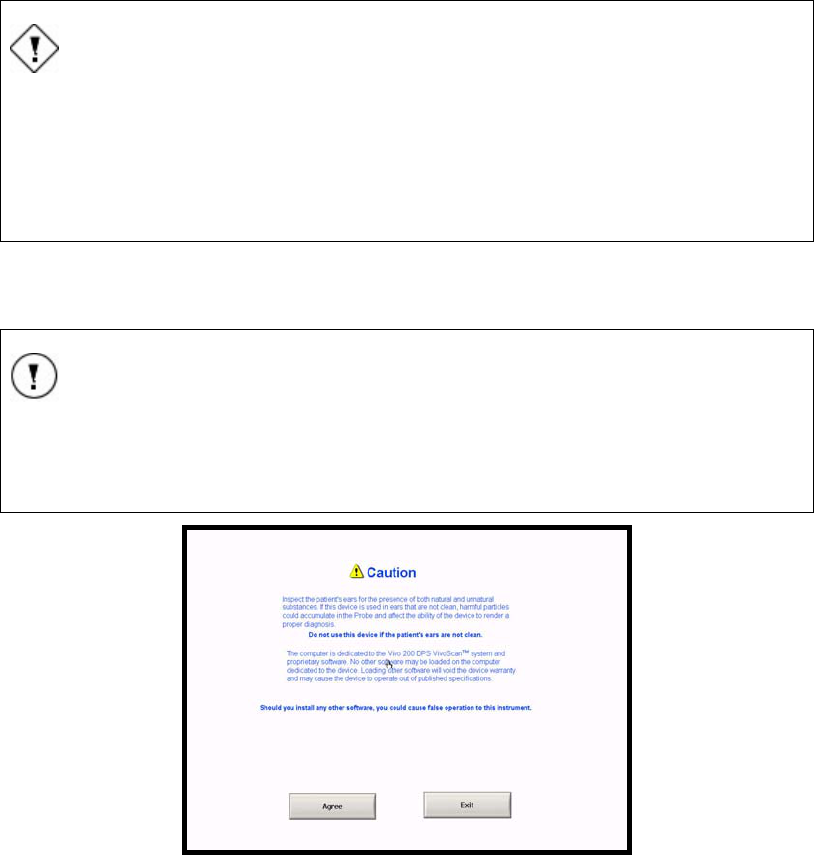
14. Then a screen with two Caution statements appears (Figure 10)).
15. Read the Caution statements and press AGREE or EXIT. Pressing Agree will
open the software to the Test screen. Pressing Exit will shut down the computer.
Chapter 3 User's Manual Integrity Preparation
Installation 11049 Rev.2 21
16. The system is ready to perform a test on a subject.
CAUTION
Possible damage to the Integrity™ system and its components may
occur.
DO NOT disconnect any of the devices or cables from the VivoLink™
when it is operating. This may cause damage to the system or its
components.
17. Perform at least one successful ABR measurement on a subject as outlined in 0.
This chapter describes typical operating steps from start to finish. Review these
steps prior to using the Integrity™ System for patient testing.
ATTENTION
The Integrity™ is supplied with pre-set test protocols. Prior to clinical
use, test-specific protocols must be defined. Pre-set default protocols
recommended in the literature are described in Appendix G.
Figure 10 Caution screen
System setup for customer installed systems
If you did not purchase the computer from a Vivosonic representative and you are
supplying your own computer to run the Integrity™ software, please perform the following
steps:
1. Verify your computer is running before connecting to the Integrity™ System.
2. If you intend to use a printer with the Integrity™ System, use only models that
are recommended by Vivosonic. Install the printer drivers, the cartridge and
paper as described in its manufacturer’s user guide.

Preparation User's Manual Integrity Chapter 3
22 11049 Rev.2 Installation
NOTE
Only Windows®-compatible printers are recommended by Vivosonic for
use with the Integrity™ software. Color printers are preferred. The
Integrity™ software will use the default Windows® printer for printing.
This printer can be on a network or local to the computer.
Vivosonic will only provide troubleshooting support on printers and
computers that have been purchased and configured by Vivosonic.
3. Turn the computer off.
4. Open the packaging containing the Integrity™ components.
5. Remove all components of the system and connect as detailed in Figure 1Error!
Reference source not found..
6. Insert four (4) AA batteries into the battery compartment of the VivoLink™
(Figure 8).
7. Turn on the VivoLink™.
8. Plug the supplied Bluetooth® dongle into any free USB port on the computer.
9. Verify all connections are secure.
10. Locate the computer power switch and turn it on. Wait for the computer to boot
up and Windows XP® to start, which may take a few minutes.
11. Adjust the clock and calendar settings in Windows® by pressing the Windows®
button on the keyboard, and then double-clicking on the time on the bottom right
corner of the computer screen. The time and date can also be adjusted from the
Control Panel. Select Start | Control Panel.
12. Insert the supplied software CD in the CD drive of the computer and follow
installation prompts that will appear.
13. Once the program is installed, Bluetooth® communication will establish
automatically, and the green LED on the VivoLink™ will light.
14. The Caution screen appears (Figure 10).
15. Read the caution statements and press Agree or Exit.
• Press Agree to open the software to the Test screen.
• Press Exit to shut down the computer.
16. The system is ready to perform a test on a subject.
CAUTION
Possible damage to the Integrity™ system and its components may
occur.
DO NOT disconnect any of the devices or cables from the VivoLink™
when it is operating. This may cause damage to the system or its
components.
17. Perform at least one successful ABR measurement on a subject as outlined in 0.
This chapter describes typical operating steps from start to finish. Review these
steps prior to using the Integrity™ System for patient testing.

Chapter 3 User's Manual Integrity Preparation
Installation 11049 Rev.2 23
ATTENTION
The Integrity™ is supplied with pre-set test protocols. Prior to clinical
use, test-specific protocols must be defined. Pre-set default protocols
recommended in the literature are described in Appendix G.
The Integrity™ System Screens User's Manual Integrity Chapter 4
24 11049 Rev.2 The Test Screen
Chapter 4 The Integrity™ System Screens
Integrity™ opens to the Test tab by default displaying the Test screen. There are six
screens in the Integrity™ software: Test, Patients, Planner, Database, Protocol, and
System. Each tab opens a screen. Refer to the pages listed below for details of the
functions and information available on each screen.
• The Test Screen on page 24
• The Patients Screen on page 45
• The Planner Screen on page 48
• Deleting entries from the Planner list
To delete a test plan name from the table, select the test entry by clicking on the blank
cell to the left of the patient’s name, and press the Delete key on the computer keyboard.
• The Database Screen on page 50
• The Protocol Screen on page 61
• The System Screen on page 65
The Test Screen
The Test screen (Figure 11) is used when performing ABR tests on patients. This is the
main screen used to control the operation of the VivoLink™. The Test screen is designed
to start, perform, and regulate ABR testing, to monitor the results of ABR data collection,
and to display the test results. Also, it is possible to control some of the protocol
specifications.
Before any of the features can be used on this screen the Bluetooth® connection must be
made (virtual LED is lit) and a patient must be created and selected. (See Selecting
Patients on page 47 for details)
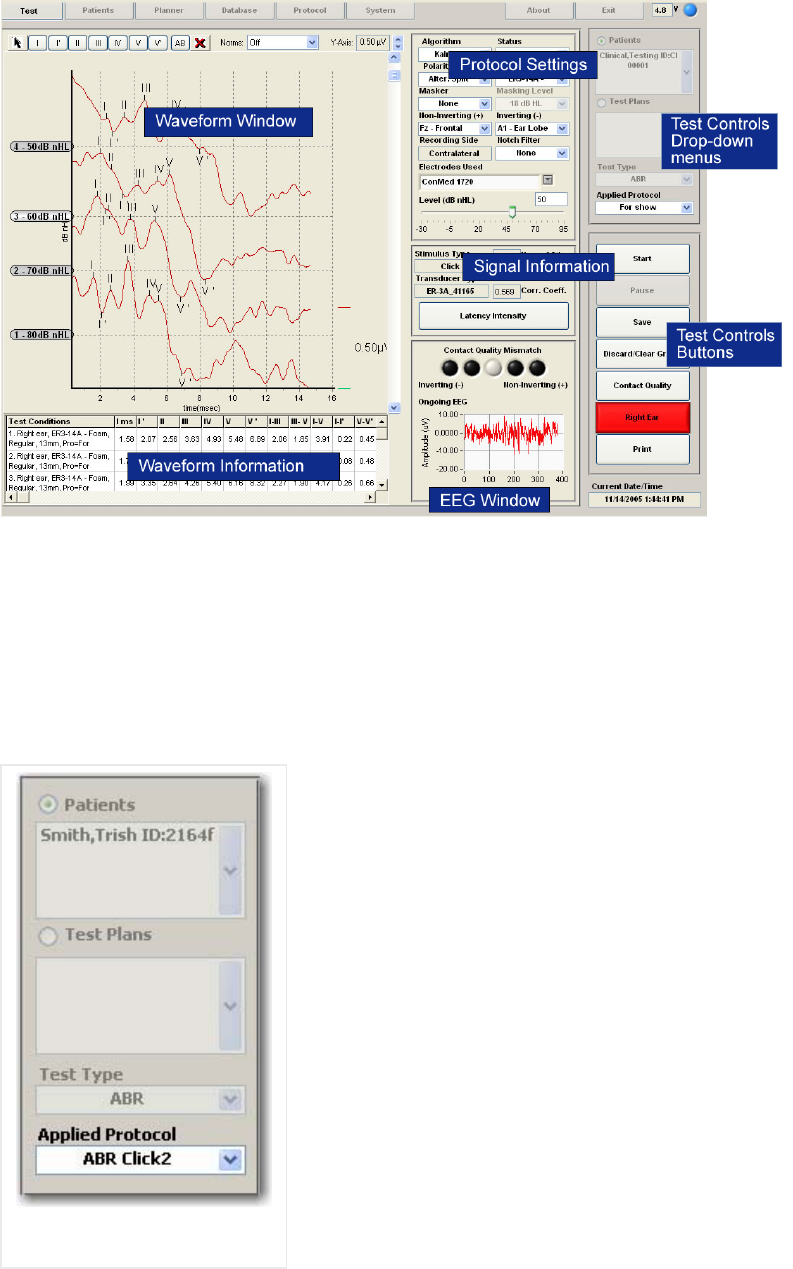
Chapter 4 User's Manual Integrity The Integrity™ System Screens
The Test Screen 11049 Rev.2 25
Figure 11 The Test Screen
Test Controls
There are three sections found on the right side of the Test screen that control general
conditions of the ABR tests (Figure 11). They include four drop-down menus (Figure 12),
control buttons (Figure 13), and the current date and time (Figure 17).
Test Controls - Drop-down Menus
Patients
This list is filled with the names of patients who have
been selected to be tested from the Patient screen
(Figure 35). It does not include all patients that exist in
the Patient screen. If there are no patients selected in
the Patient screen then there will be no patient names
in this list.
1. To select a patient, select the check box to the
left of the window title, which will activate this
drop-down menu and deactivate the Test
Plans drop-down menu.
2. Click on the down arrow, found to the right of
the window, and select the patient to be tested
from the list.
Test plans
This list is filled with the names of patients who have
been selected to be tested from the Planner screen
(Figure 35). It does not include all patients that exist in
Figure 12 Test Controls
Dr
op
-
do
wn m
e
n
us
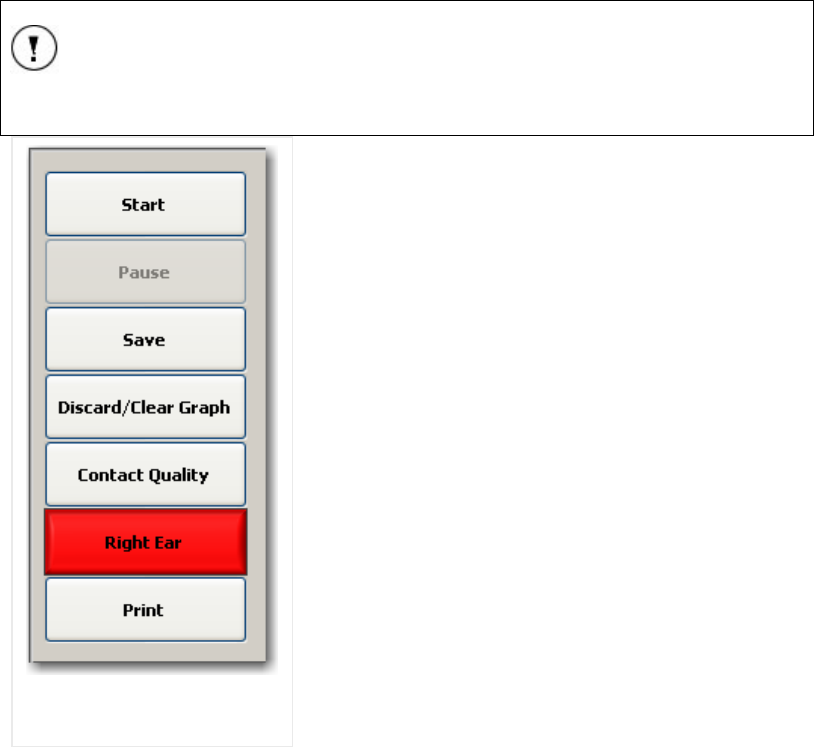
The Integrity™ System Screens User's Manual Integrity Chapter 4
26 11049 Rev.2 The Test Screen
the Planner screen. If there are no patients selected in the Patient screen then there will
be no patient names in this list.
1. To select a test type, select the check box to the left of the window title which will
activate this drop-down menu and deactivate the Patient’s drop-down menu
above.
2. Click on the down-arrow found to the right of the window and select the test from
the list.
Test Type
The current Integrity™ configuration only supports the ABR test type..
Applied Protocol
This list contains the all the pre-defined protocols that have been created and saved. The
protocols specify all the test parameters such as Stimulus Settings and Test Settings.
To select a protocol, click on the down-arrow found to the right of the window and
select the protocol from the list.
ATTENTION
Improper configuration of test protocols may result in poor quality test
results.
Test Control Buttons
Start/Stop button
Before a test can be started a patient must be selected.
Start ABR testing by pressing the Start button. The
ABR test will begin and the button text changes from
Start to Stop. You can stop the test by pressing this
same button now labeled Stop.
When the stop button is pressed all the data collected
from the time the start button was pressed is displayed
in the waveform window of the test screen. Use the
Database screen to review any data collected before
this run.
The Pause button is grayed out and inactive between
test runs. When the Start button is pressed, the Pause
button becomes active.
Pause/Resume button
When the Start button is pressed, the Pause button
becomes active. Press the Pause button to temporarily
stop the test run. This may be required if, for example,
the earphone falls out of the patient’s ear. To restart
the data collection, press this same button now labeled
Resume. Data collection will continue and the two data
streams will be saved as one data run (waveform). The waveforms collected before
pause was pressed can be reviewed on the test screen with the new data.
Figure 13 Test Control
Buttons
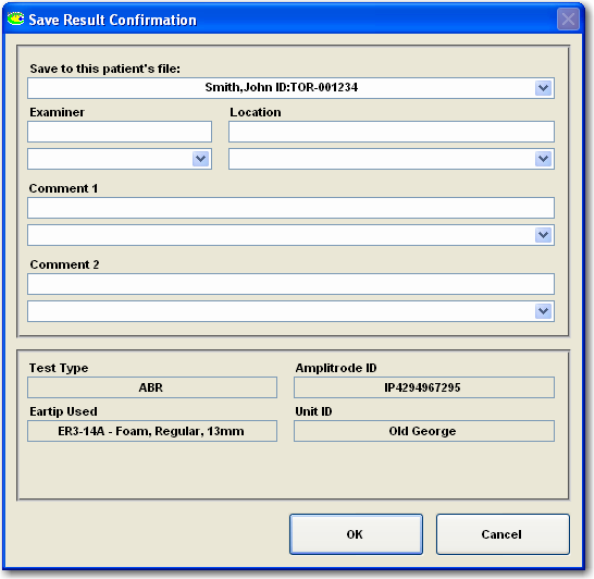
Chapter 4 User's Manual Integrity The Integrity™ System Screens
The Test Screen 11049 Rev.2 27
Save button
After completing the ABR data recording the results must be saved.
1. Press the Save button. This will open a Save Result Confirmation (Figure 14)
dialog box.
2. Save the data to the pre-selected patient’s file or choose another patient from the
Save to this patient’s file drop-down list.
3. The Save to this patient’s file drop-down list contains the name and personal ID
of the patient selected for testing. The patient list will appear if when the down-
arrow is press.
4. Enter the information into the required fields (Examiner, Location, Comment 1,
and Comment 2) or select preset data from the graph’s drop-down lists.
5. Some information cannot be modified (Test Type, Protocol Used, Unit ID, Ear
Tested, Probe ID, and Ear Tip Used).
6. Press OK.
7. Press Yes when asked Are you sure?
Figure 14 Save Result Confirmation
Discard/Clear Graph button
You can discard all collected data and clear the Waveform Window and the Waveform
Information by pressing Discard/Clear Graph button.
1. Press Discard/Clear Graph.
2. Press OK when asked Are you sure you want to discard this record? (Figure 15).
If you choose OK, the test results will be erased from the system’s memory. If the
test results have not been saved the data will be gone permanently.
If you choose Cancel, the collected data will remain on the Test screen.
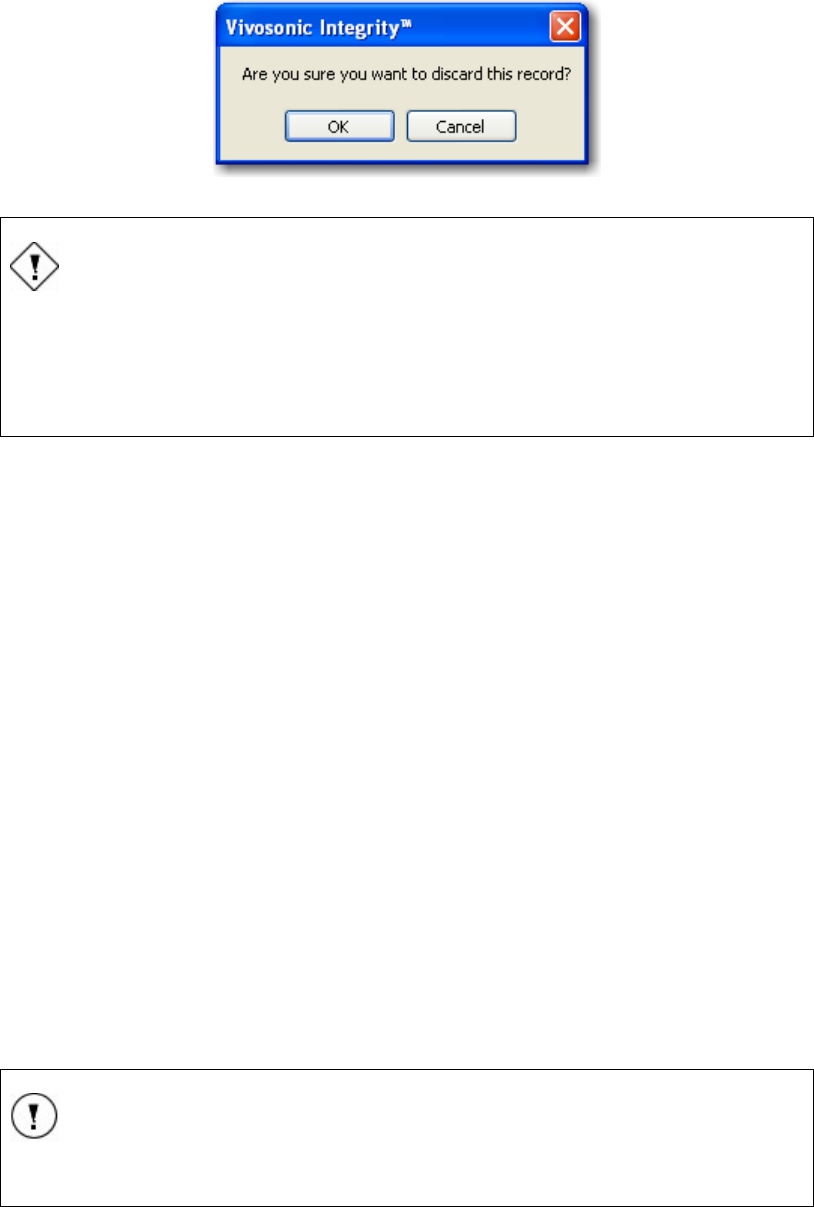
The Integrity™ System Screens User's Manual Integrity Chapter 4
28 11049 Rev.2 The Test Screen
Figure 15 Dialog box - Are you sure you want to discard it?
CAUTION
Test data may be permanently lost.
Before discarding any data, please ensure that significant test results
have been saved. If the data is required for review it must be saved
before the information can be discarded or it will be permanently lost.
Contact Quality
The quality of the connections between the electrodes and the patient’s skin is displayed
visually using the virtual LED’s. A poor connection is indicated by an amber LED for a
poor connection with the inverting (-) electrode or a green LED for a poor connection with
the non-inverting (+) electrode.
If a problem is evident, remove the electrode indicated, clean the skin, and apply a new
snap electrode pad.
Refer to Quality Control Mismatch on page 38 for more details.
Right Ear/Left Ear button
Select the ear to test by pressing Right Ear or Left Ear button. When the Right Ear
button is selected, the stimuli will be delivered through the ER-3A earphone to the right
ear via the red tube. The waveform trace in the Waveform Window (Figure 30) will turn
red to follow the color standards for audiologic practice. When the Left Ear button is
selected, the stimuli will be delivered through the ER-3A earphone to the left ear via the
blue tube. The waveform trace in the Waveform Window will be blue.
Print button
Print the results by pressing the Print button. The Print Result Confirmation (Figure 16)
dialog box will be displayed The name and patient ID of the patient whose data is
currently being collected will appear in the The Print for this patient drop-down list. Print
the data for the patient selected or choose another patient from the Print for this patient
drop-down list. Enter new information into Examiner, Location, Comment 1, Comment 2
fields or select preset data from the drop-down lists.
NOTE
A new patient’s name cannot be entered into Print for this patient field.
The Print for this patient dialog box shows information on the Test Type, Protocol Used,
Unit ID, Ear Tested, Probe ID, and Ear Tip Used; data shown in those graphs cannot be
modified.
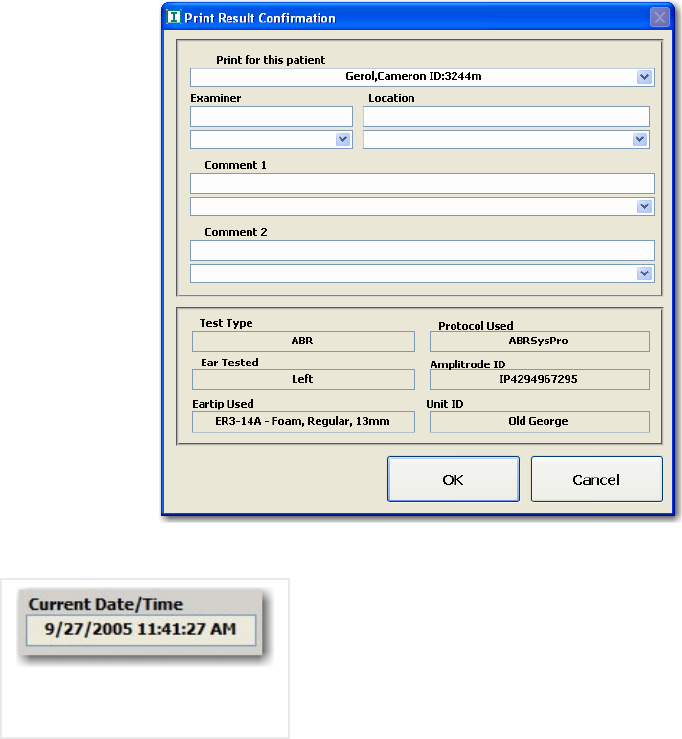
Chapter 4 User's Manual Integrity The Integrity™ System Screens
The Test Screen 11049 Rev.2 29
To initiate printing, press OK. Are you sure? dialog box, will be displayed. Press OK to
continue printing. Press Cancel to switch back to the Print Result Confirmation dialog
box allowing changes to be made before printing.
The system does not allow the results to be printed if Print for this patient field remains
blank. If you try to print data without entering the patient’s name and ID, the message “To
print a test result, select a patient or create a new patient“ will appear on the screen.
Figure 16 Print Result Confirmation
Current Day/Time
Below the Test Control buttons is a box that displays the
Current Date and Current Time. This is a read-only
field. The date or time can only be changed using the
Windows® configuration.
Figure 17 Test Controls
Date and Time
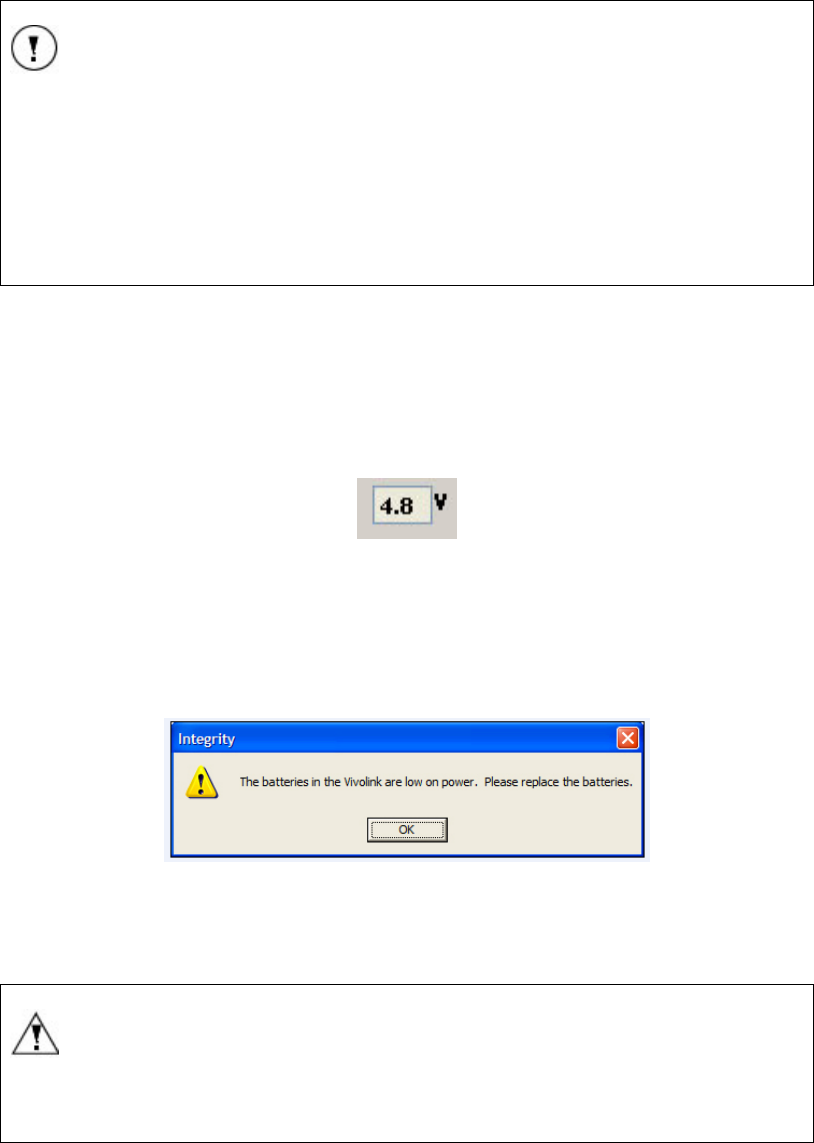
The Integrity™ System Screens User's Manual Integrity Chapter 4
30 11049 Rev.2 The Test Screen
NOTE:
It is important that the date and time settings are correct. Integrity™ uses
the date and time to "stamp" the data files and to calculate the age of the
patient at the time of testing.
If the displayed date and time are incorrect, adjust the clock and
calendar settings in Windows® by pressing the Windows® button on the
keyboard, and then double-clicking on the time on the bottom right
corner of the computer screen. The time and date can also be adjusted
from the Control Panel. Select Start | Control Panel.
VivoLink™ Condition
VivoLink™ battery indicator
VivoLink™ battery indicator is located at the upper right corner of the front panel
(Figure 5 #4). The battery indicator shows the measured voltage of the VivoLink™
batteries on the indicator’s information box.
Figure 18 VivoLink™ battery voltage indicator
This image shown here indicates either no battery or the battery is spent.
When the batteries are close to being out of voltage the following low battery message
box will appear on the Integrity™ computer screen (Figure 19). Vivosonic recommends
that the batteries in the VivoLink™ be replaced as soon as possible after this message
appears.
Figure 19 Low battery message box
1. Save the collected data.
2. Switch Off the VivoLink™ and change the batteries. (Refer to “Battery
Compartment” on page 16.)
WARNING
Failure to change low voltage VivoLink™ batteries will cause interruption
in data transmission between VivoLink™ and computer and may result in
the loss of the collected response.
Bluetooth® connection indicator
The Bluetooth® connection indicator is a virtual LED located in the upper right corner
of the Test Screen. It is blue (appears lit) when the computer and the VivoLink™ are
connected or it is dark (appears not lit) when the Bluetooth® connection has failed.
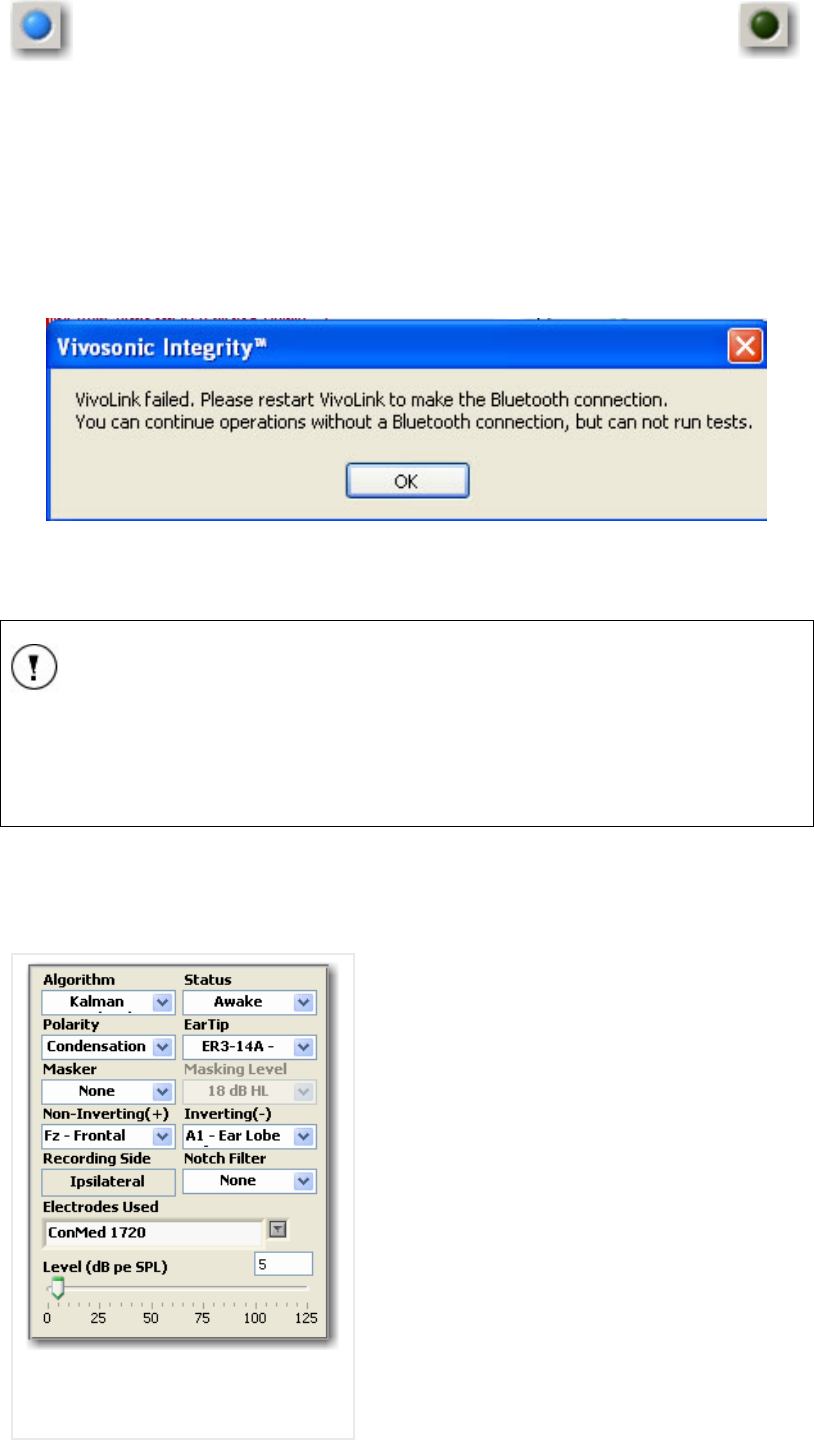
Chapter 4 User's Manual Integrity The Integrity™ System Screens
The Test Screen 11049 Rev.2 31
Figure 20 Bluetooth® connection indicator
Bluetooth® connected (lit) Bluetooth® not connected (not lit)
The system can establish and maintain a wireless connection only when both the
computer and the Bluetooth® dongle are configured correctly. (Refer to System setup for
customer installed systems on page 21 for details on configuring the Bluetooth® dongle.)
It takes the system approximately 30 seconds to 1 minutes to establish the wireless
connection. If the wireless connection is not established a message is displayed stating
the connection has failed (Figure 21).
This same message will be displayed during data collection if the wireless connection is
lost intermittently.
Figure 21 Bluetooth connection failed massage
If this wireless connection warning message appears, follow the troubleshooting
suggestions found in Table 3 on page 91.
NOTE
The computer on which the Integrity™ operates should be Bluetooth®-
enabled and have a Bluetooth® dongle inserted into the computer’s USB
port. (Refer to System setup for customer installed systems on page 21
for details on configuring the Bluetooth® dongle.)
Protocol Test Settings
These Protocol Test Settings are found in the center of the Test screen. Not all of the
protocol settings are preset conditions available only from the Protocol screen.
Vivosonic™ has developed a set of protocols
that can be manipulated during the test
procedure [Hall, 1990], [Hall, 1997], [Stapells,
2002]. These settings can be changed at any
time between data collection while performing a
test.
Algorithm
This control regulates application of the methods
of processing the ABR waveforms. There are
two processing algorithms to choose from:
Averaging and Kalman Filter. Kalman Filter is
the system’s default algorithm.
Figure 22 Protocol test settings
The Integrity™ System Screens User's Manual Integrity Chapter 4
32 11049 Rev.2 The Test Screen
Averaging is a signal processing algorithm, which utilizes the standard time averaging
technique so that equal weighting is given to the collected ABR data. Weights are based
on the noise in the response. Waveforms contaminated with artifacts above certain
Artifact Rejection Thresholds (ART) are excluded from averaging.
Kalman Filter is a signal processing algorithm that is used in ABR testing to optimally
select the waveform weights. Unlike Averaging, the Kalman Filter technology weights
(or a linear minimum mean-square error filter) are inversely proportional to the amount of
noise in the collected response. In other words the system gives less weight to the noise-
contaminated responses and emphasizes the less noisy responses. This method
processes signals in real time without rejecting any time segments, even those containing
significant artifacts. [Li 2002]
Status
Select the patient’s status of arousal from the drop-down menu. The entries are
Asleep, Awake, and Mixed. Awake is a default setting.
Polarity
This control regulates the voltage characteristic of the stimulus. Stimulus polarity
selection depends on the goal of the testing.
From the drop-down menu select Condensation, Rarefaction, Alternating, or
Alternating split.
Condensation denotes a polarity as the initial displacement of the stimulus, produced
with a positive-voltage electrical signal and an outward movement of the acoustic
transducer.
Rarefaction denotes a polarity as the initial displacement of the stimulus, produced with
a negative-voltage electrical signal and an inward movement of the acoustic transducer.
Alternating denotes a polarity as interchangeable, presenting rarefaction and
condensation polarity stimuli characteristics. The responses of two consecutive stimuli
are sent to one buffer (A) then the responses of the next two consecutive stimuli are sent
to the other buffer (B). Thus, each buffer will get the responses from both condensation
and rarefaction stimuli.
Alternating split denotes a polarity as interchangeable, presenting rarefaction and
condensation polarity stimuli characteristics. The polarity alternates which buffer the
responses are sent to. Buffer (A) will receive only responses from condensation stimuli
and the other buffer (B) will receive only responses from the rarefaction stimuli. Thus,
each buffer only receives responses from a specific stimulus.
EarTip
Select the size of the ear tip from the drop-down menu. Refer to Figure 2 to view the
types available.
Masker
This control regulates the introduction of contralateral wideband masking noise. To apply
masking through the ER-3A transducer opposite to the ear which is stimulated with ABR
stimuli (clicks or tone bursts) select Wide Band Noise from the control drop-down menu.
To test without masking select None (system default).
Masking Level
The masking level defines the contralateral masking noise (dB HL). When a masking
value is selected the VivoLink™ will produce wide-band noise.
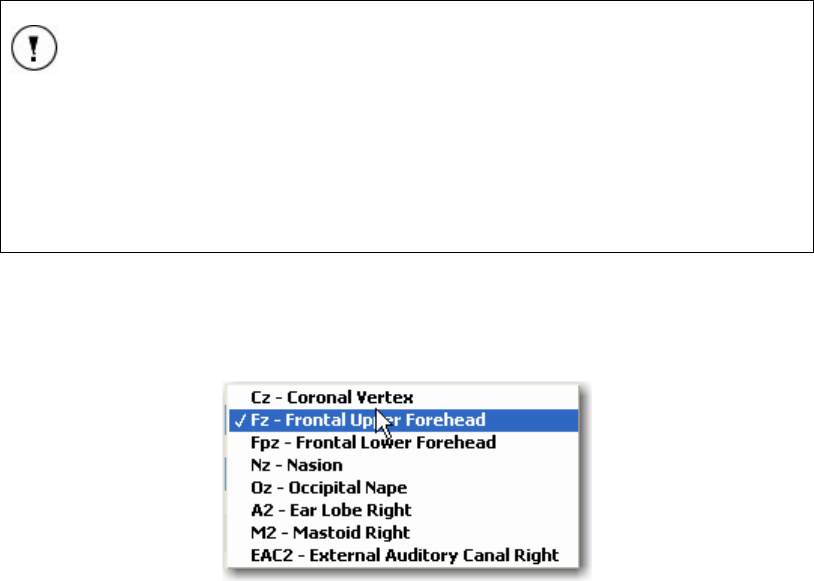
Chapter 4 User's Manual Integrity The Integrity™ System Screens
The Test Screen 11049 Rev.2 33
There are no necessary adjustments to the Reference equivalent threshold sound
pressure level (RETSPL) values that accompany narrow-band noise, as per ANSI S3.6-
2004, 6.3.1. The conversion from dB HL to dB SPL is based on the RETSPL value for the
insert earphones in an occluded ear simulator (Table 7 in ANSI S3.6-2004 manual).
The masking dB SPL value is calculated for the root mean spare (rms) of the masking
signal. As such, the dB SPL of the overall masking signal will differ with the type of
stimulus, such that the rms of the masking signal will match that of the dB HL at the
corresponding frequency of the stimulus signal (Click signals are treated as having a
frequency of 1 kHz).
Select the level from 10 to 110 dB HL in 1 dB increments.
Non-Inverting (+) and Inverting (-) Electrode
These two fields allow the user to select the location of the Amplitrode® inverting and
non-inverting electrodes on the patient.
NOTE
The Non-Inverting (+) and Inverting (-) field entries provide important
information on the condition of data collection and the location of the
electrodes during the tests. These settings will not affect the data. The
information will be saved with the data and may be used when the data
is reviewed. This information cannot be changed after it is saved. Ensure
that the information is correct before saving the results.
Select the down arrow of the required electrode location and highlight an
appropriate entry to define the (+) an (-) electrode locations on the patient.
The possible electrode locations available from the drop-down menus are as
follows:
Figure 23 Non-Inverting (+) electrode drop-down list shown
Refer to the location diagram in Figure 61 on page 73.
[Hall, 1990], [Hall, 1997], [Stapells, 2001].
Recording side
This field is not user-selectable. Its selection is dependant on the non-inverting (+) or
inverting (-) electrode selected and the ear chosen for stimulation. It includes:
1. Ipsilateral –the non-inverting electrode is located on the same side of the head
as the ear being stimulated.
• With the right ear selected for testing any combination of Cz, Fpz, Nz, Oz
locations for the non-inverting (+) electrode and A2, M2, EAC2 for the
inverting (-) electrode.
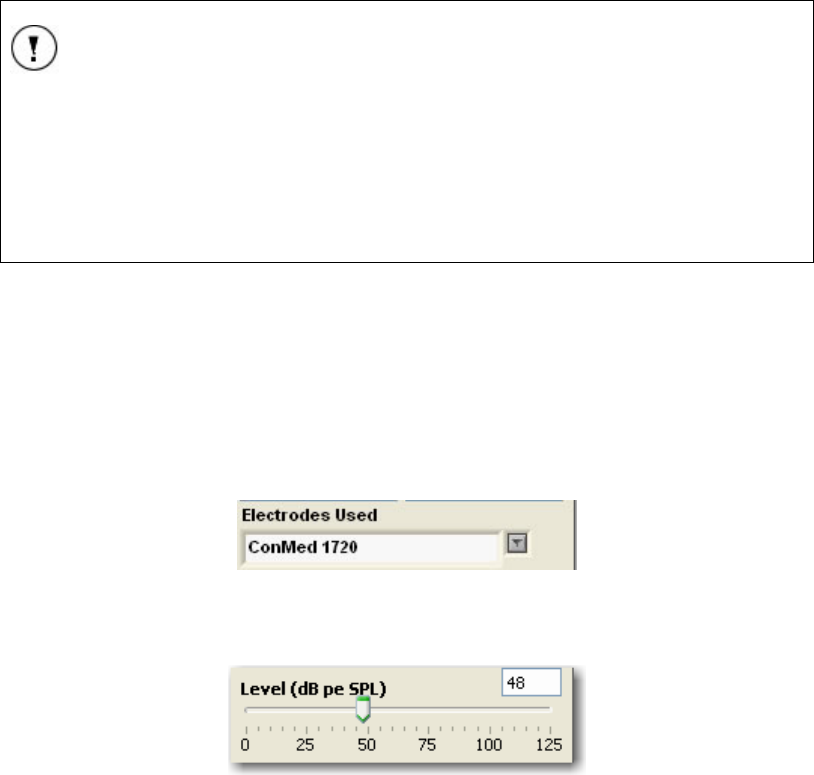
The Integrity™ System Screens User's Manual Integrity Chapter 4
34 11049 Rev.2 The Test Screen
• With the left ear selected for testing any combination of Cz, Fpz, Nz, Oz
locations for the non-inverting (+) electrode and A1, M1, EAC1 for the
inverting (-) electrode.
2. Contralateral – the non-inverting electrode is located on the opposite side of the
head as the ear being stimulated.
• With the right ear selected for testing any combination of Cz, Fpz, Nz, Oz
locations for the non-inverting (+) electrode and A1, M1, EAC1 for the
inverting (-) electrode.
• With the left ear selected for testing any combination of Cz, Fpz, Nz, Oz
locations for non-inverting (+) electrode and A2, M2, EAC2 for the inverting
(-) electrode.
3. Medial – the non-inverting and inverting electrodes are located along the sagittal
plane of the head (any combination of Cz, Fpz, Nz, Oz locations).
4. Horizontal – the non-inverting electrode is located on the stimulus-contralateral
mastoid, earlobe or ear canal, while the inverting electrode is located on the
stimulus-ipsilateral mastoid, earlobe or ear canal (any combination of A1, A2, M1,
M2, EAC1, EAC2 locations).
NOTE
The Recording Side entries provide important information on the
location of data collection with respect to the stimulation location. These
settings will not affect the data. The information will be saved with the
data and may be used when the data is reviewed. This information
cannot be changed after it is saved. Ensure that the information is
correct before saving the results.
[Hall, 1990], [Hall, 1997], [Stapells, 2001]
Notch Filter
The notch filter is designed to reduce the interference from electrical activity (power line
noise of 50 Hz, 60 Hz). To disable the filter select None from the drop-down menu
(system default).
Electrodes Used
Select the electrode type from the drop-down menu or type the electrode brand into the
field. t.
Figure 24 List of electrodes available for testing
Level (dB pe SPL)/Levels (dB nHL)
Figure 25 Level (dB pe SPL) bar.
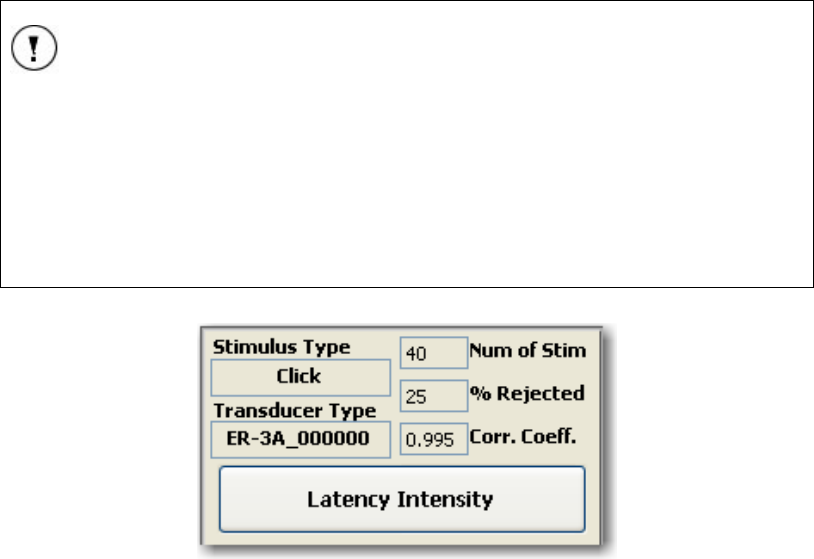
Chapter 4 User's Manual Integrity The Integrity™ System Screens
The Test Screen 11049 Rev.2 35
The stimulation level sliding bar displays and regulates the levels of stimulation provided
to the data recording (Figure 25). The initial position of the slider depends on the
Stimulus Levels (dB nHL) defined in the protocol selected. (Refer to The Protocol
Screen on page 61 for more details.) When testing with a single level protocol, the slider
will be positioned on the value of the selected level. When testing with a multi-level
protocol, the slider will be positioned on the lowest level. The values (or range) selected
for the multi-level protocol are marked with blue color in the Stimulus Level field on the
Protocol screen. Using the slider bar on the Test screen will change the level without
switching to the Protocol screen. This change can be made only while the test collection
is stopped.
The units displayed are defined in the System screen (see The System Screen on page
65). Below are the units and range of values that can be selected based on the
transducer type.
ER-3A
• Units - dB nHL or dB pe SPL
• Range - 30 to 95 dB nHL or from 0 to 125 in dB pe SPL
B-71
• Units - dB pe FL or dB nHL
• Range - 10 to 50 or 60 dB nHL or 50 to 110 or 120 in pe FL
NOTE
The bone conductor stimulation range depends on the Stimulus Type defined in the
protocol selected. VivoLink™ has a maximum stimulus level of 50 dB nHL for click and
500 Hz for tone-burst stimulus types. The maximum of 60 dB nHL level is for 1000 - 4000
Hz tone-burst stimulus types.
The increment of the Levels (1, 2, 5, 10, 15, 20, dB etc.) depend on the Stimulus Levels
control settings defined in the protocol selected. Refer to The Protocol Screen on page
61 for details on defining a protocol.
Figure 26 Signal information
Signal Information
During and after the data collection the Signal Information section of the Test screen
will display information about the collected waveform.

The Integrity™ System Screens User's Manual Integrity Chapter 4
36 11049 Rev.2 The Test Screen
Stimulus Type
The Stimulus Type (click or tone-burst frequency) is displayed in this field as a reminder
of the main test parameters defined by the protocol selected.
Transducer Type
The Transducer Type (ER-3A or B-71) is displayed in this field to remind the operator of
the main test parameters defined by the protocol selected. This information also includes
the transducer serial number.
Number of Stimuli (Num of Stim)
This information box displays the number of stimuli presented in the test. The value
counts up as the test is running. If the test runs to completion, the value should be equal
to the value of the maximum Number of Stimuli defined in the protocol selected,
otherwise it displays the number of stimuli counted at the time the test was stopped.
% Rejected
This information box displays the percentage of the rejected ABR responses. Responses
are rejected when the amplitude exceeds the preset Artifact Rejection Threshold value
defined in the protocol selected.
NOTE
The system displays the percentage of the rejected stimuli only when
Averaging was selected under Algorithm control on the Test screen.
Correlation Coefficient (Corr. Coeff.)
During the time of testing, two buffers are used to collect the data. The two buffers (A and
B) each receive half of the responses. The waveform displayed is an averaged A plus B
response (combined waveform).
The Correlation Coefficient is a calculated correlation between the curves collected in A
and B buffers. The Correlation Coefficient indicates the degree to which the collected
waveforms in A and B are repeatable.
Latency intensity
This button is used to display a graph of the latency versus the intensity values of a
patient based on known data defined by the age of the patient. When selected, a window
opens displaying the Latency-Intensity Graph (Figure 27). Select the patient age range
from the Latency Normals drop-down list to display the data supplied for that age.,
[Hood, 1998], [Gorga, 1987], [Gorga, 1989], [Zimmerman, 1987]
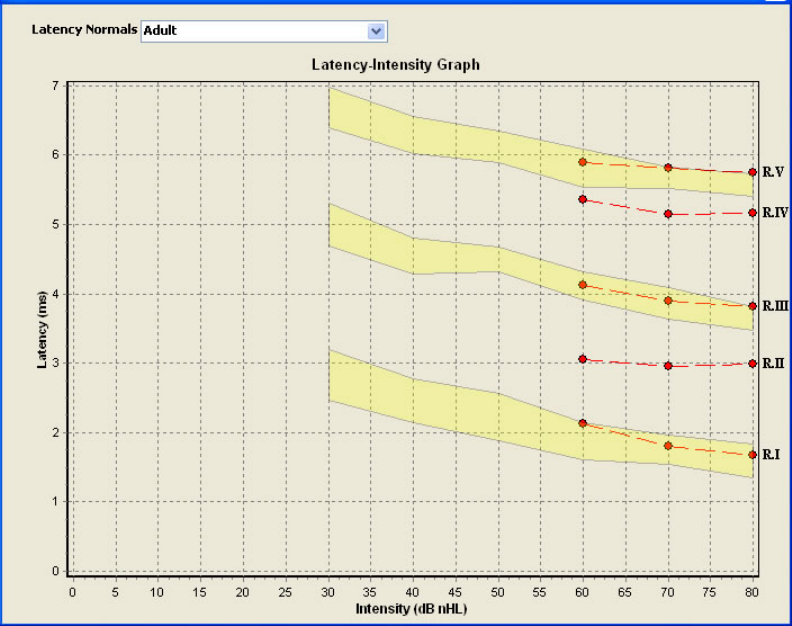
Chapter 4 User's Manual Integrity The Integrity™ System Screens
The Test Screen 11049 Rev.2 37
Figure 27 Latency-Intensity graph (adult) [Hood, 1998]
Before the graph can be populated the waves must first be labeled with the I, III, and V
wave labels in the Waveform Window. (See Figure 30 for details.)
The latency values (in ms) for the I, III, and V waves are plotted against the intensity
level. The latency graphs and dots are color coded (red for the right ear and blue for the
left). Normative data can be displayed on the Latency-Intensity graph [Hood, 1998],
[Gorga, 1987], [Gorga, 1989], [Zimmerman, 1987] as an average value ± 2 STD in the
form of vertical bars. To view normative data (raw) go to the following file:
C:\INTEGRITY V1.0\ActiveX Controls\LatencyNormals.ini
on the Integrity™ system. If more then one waveform was collected for the same ear with
the same level of stimulation and the waves were marked with the average latency value,
these waves will be displayed on the Latency-Intensity graph.
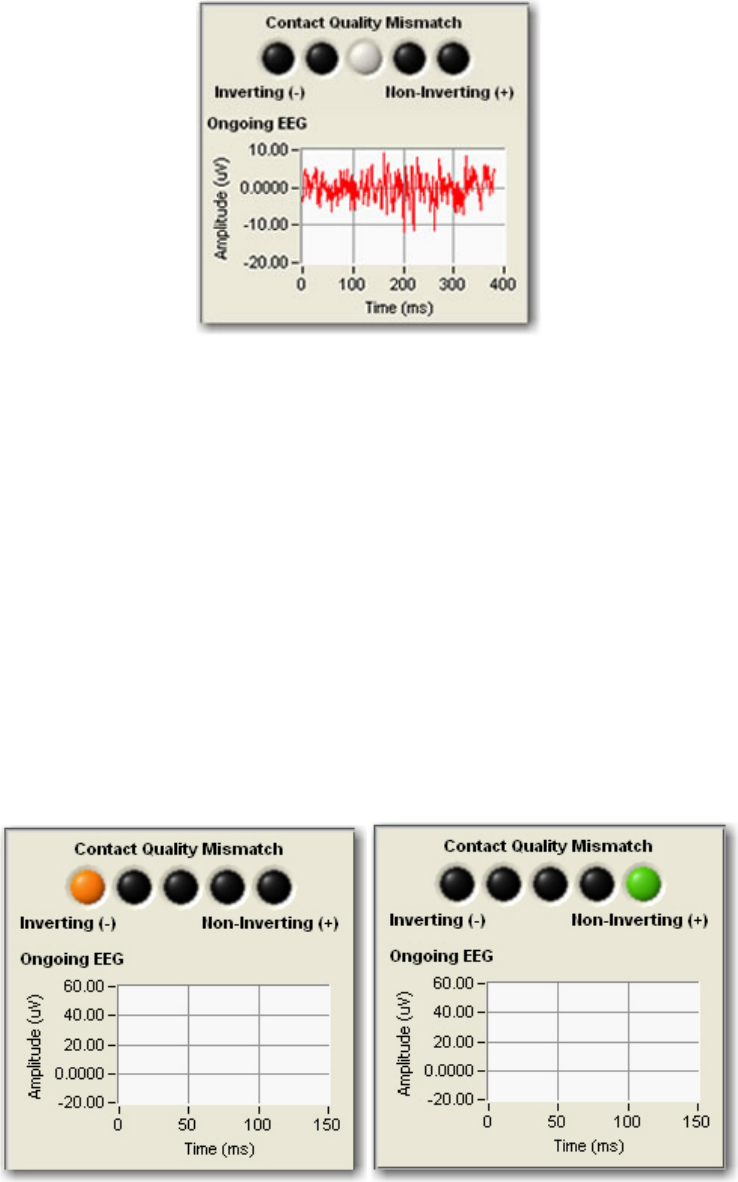
The Integrity™ System Screens User's Manual Integrity Chapter 4
38 11049 Rev.2 The Test Screen
Figure 28 EEG window
EEG Window
This section of the Test screen contains the Contact Quality Mismatch indicator and a
real-time EEG graph.
Quality Control Mismatch
The LED indicators represent the contact quality of the inverting and non-inverting
electrode with the patient during the time the electrodes are in use. When the centre LED
is lit, shown lit in Figure 28, there is no problem indicated. This is the optimal display
representing a balanced signal from both electrodes.
When the left (amber) LED indicator is lit this indicates a problem between the connection
of the inverting (-) electrode and the patient. When the right (green) LED indicator is lit
this indicates a problem with the connection between non-inverting (+) electrode and the
patient. Refer to Figure 29.
A poor connection will affect the results. Remove the electrode affected, remove the snap
electrode pad from the patient, replace the snap electrode pad, and perform the patient
preparation again to reapply the electrode.
Figure 29 Poor contact quality

Chapter 4 User's Manual Integrity The Integrity™ System Screens
The Test Screen 11049 Rev.2 39
What to do when the Impedance Mismatch is exceeded
When this message is displayed follow these steps to restore an acceptable impedance
level:
1. Check the status of the snap electrode pads. Fix, replace or reapply one or both
of the snap electrode pads if necessary.
2. Check the connection between the disposable electrodes and Amplitrode® clips.
If it is not a good connection, reconnect, replace or fix it.
Ongoing EEG
A real-time EEG signal is displayed in the Ongoing EEG graph at the bottom of the Test
screen. This EEG signal is recorded by the electrodes and 150 ms of the signal is
displayed at a time. The amplitude scale on the graph changes automatically when the
amplitude of the recorded EEG signal changes. Usually EEG collected from a relaxed
patient are within ± 40µV. If the EEG amplitude increases beyond ± 40µV you may want
to wait for few minute to allow the patient to calm down. If EEG amplitude does not
decrease, the problem may be poorly placed electrodes. Readjust the electrodes and
start again.
NOTE
It is important to understand that the Ongoing EEG window shows a
filtered EEG signal that passes through the ABR (30 – 3000 Hz, slope 12
dB/octave) analog electrical filters of the Amplitrode®, not an unfiltered
“raw” EEG signal. In addition, if the analog notch filter (50 Hz or 60 Hz) of
the VivoLink™ is switched on, then the Ongoing EEG will be passing
through this filter as well.
Note: this signal does not pass through the digital high-pass and low-
pass filters, which are set in the protocol and affect only the digitally
processed (averaged or Kalman-filtered) recording.
Waveform Window
This window displays the graphic representation of the collected waveform as a function
of the amplitude (µV) of the signal over time (ms) (Figure 30).
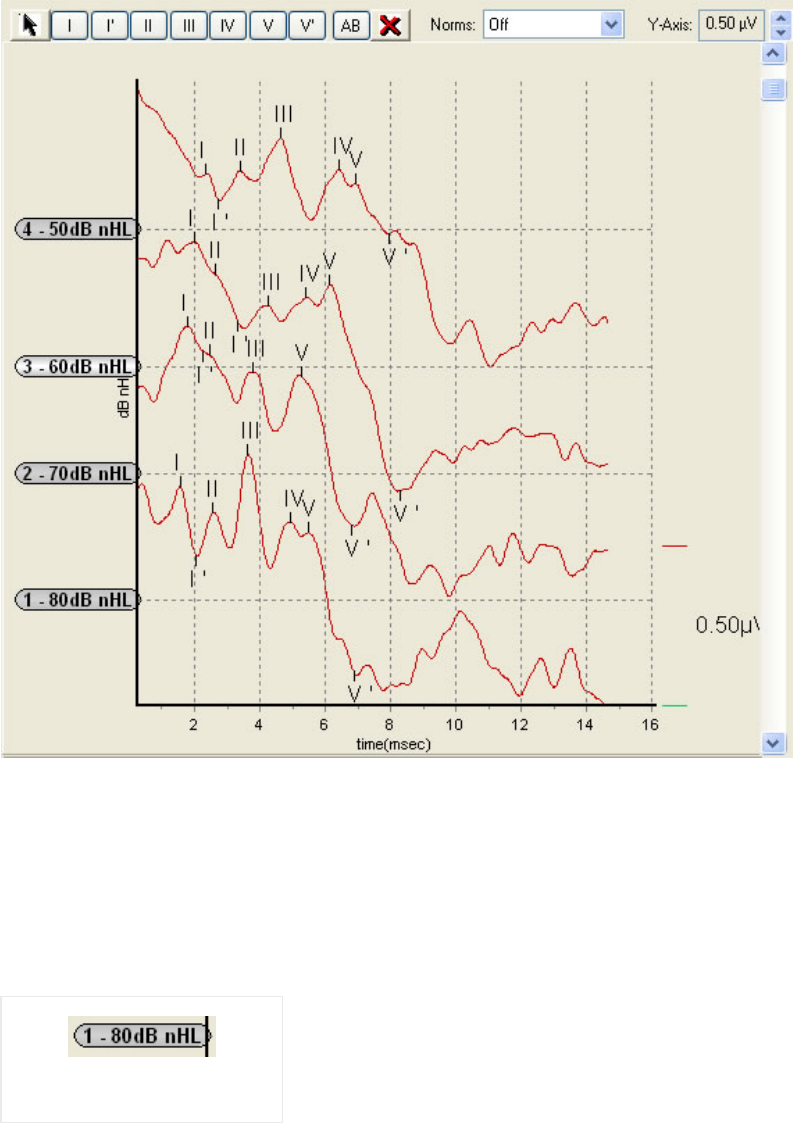
The Integrity™ System Screens User's Manual Integrity Chapter 4
40 11049 Rev.2 The Test Screen
Figure 30 Waveform Window – collected data for analysis
The Waveform Window can be used when monitoring data in real time and when
analyzing and labeling waveforms for the recently collected data. Each test Start and
Stop produces a new waveform at the top of the graph, moving the previous data
towards the bottom of the graph.
The waveforms collected from the left and right ears are displayed on the same diagram
and are distinguished by the color of the waveform (red waveform - right ear, and blue
waveform - left ear).
Each waveform is supplied with an individual handle
located to the left of the graph. All the waveform
handles have a waveform tagging line which displays
the following information:
• The waveform number marks the order in
which the waveforms were collected. This is
the number the waveform’s information is given when displayed in the Waveform
Information chart (Figure 33).
• Stimulus Level applied to the data collection.
Figure 31 Waveform handle
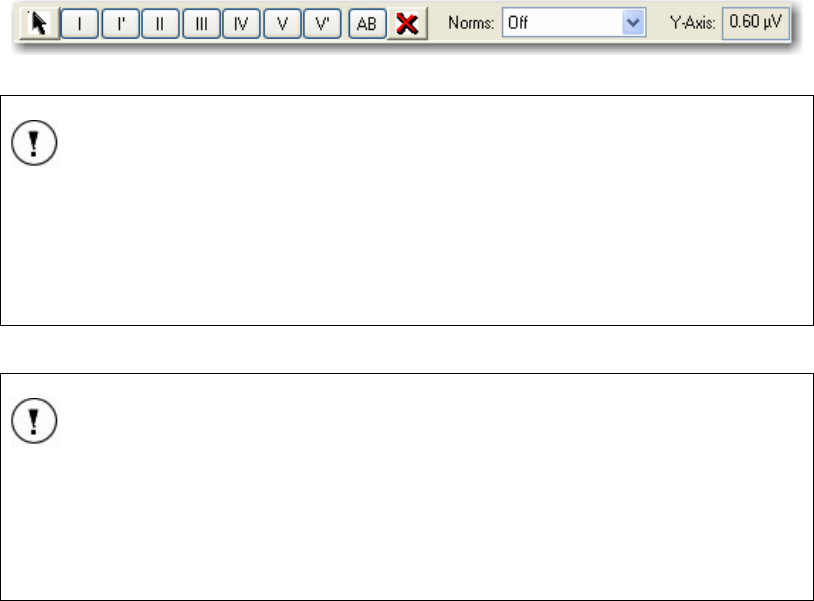
Chapter 4 User's Manual Integrity The Integrity™ System Screens
The Test Screen 11049 Rev.2 41
To highlight any of the waveforms, click on its handle. The highlighted waveform and its
handle will become brighter. You can move the highlighted waveform along the vertical
axis by dragging it with the handle.
Label a Waveform
To label a waveform and calculate its latency follow these steps:
1. Select the handle of the wave to be labeled.
2. Select a label from the labeling buttons at the top of the Waveform Window
(Figure 30).
3. Place the cursor over the waveform where the label will be placed. Note that the
location will jump to the peaks (peak positives) and troughs (peak negatives) of
the wave.
4. When the correct peak or valley has been identified, click the mouse to place the
label.
5. To move a label, select the label and place it again following the steps above.
Once placed on the wave, the label cannot be deleted, only moved.
The selected peak will be marked with the chosen wave number and the calculated peak-
related latency values [Hood, 1998], [Gorga, 1987], [Gorga, 1989], [Zimmerman, 1987]
will appear in the Waveform Information chart (Figure 33).
Figure 32 Waveform labeling buttons
NOTE
Use the “I, II, III, IV, and V” buttons with Roman numerals to label the
positive peaks. Use the “I’ and V’” buttons to label the negative peaks
of waves I and V. Labeling the negative peaks is essential for calculating
the peak-to-peak amplitude.
Labeling the negative peaks will not affect the latency calculation.
NOTE
The arrow button, located first in the label selection, is used to disable
the selected label.
Once selected, a wave labeling button will remain active until another
labeling button is selected or the arrow button is selected.
Once a wave label is placed on a wave it cannot be deleted only moved.
AB Display
The AB display mode is used to change the displayed waveform into the recorded
components of the A and B buffered information.
1. Select the waveform desired.
2. Press the AB button located next to the Waveform labeling buttons.

The Integrity™ System Screens User's Manual Integrity Chapter 4
42 11049 Rev.2 The Test Screen
The single waveform will split into A and B components.
3. To switch back to the combined waveform, select one of the split waveforms and
press AB again.
Waveform Delete button
To delete a wave from the Waveform Window:
1. Select a waveform handle.
2. Press the button with the X on it.
3. Answer “Yes” when asked if you want to delete the wave.
Latency norms
Integrity™ provides a graphical presentation of the normative data for Latencies I and V.
To view normative latency data for waves I and V, do the following:
1. First label the wave. (See Label a Waveform on page 41 for details.)
2. Select the Latency Norms down arrow to view the normative data list.
3. The normative data graphs for waves I, III, and V latencies will be shown in the
Waveform Window in the format of yellow vertical bars.
4. The Waveform Information chart (Figure 33) will display the normative data title
and the level of intensities for the latency norms shown.
NOTE:
Vivosonic recommends that each clinic create its own normative data
which reflect the specific character of the tested population and the
protocols used for their data collection. The preset normative data can be
used to compare the results collected with the same stimulus, recording,
and subject parameters. There is no international standardized data
available at this time.
The Latency Normative file is located at:
C:\INTEGRITY V1.0\ActiveX Controls\LatencyNormals.ini
Use the same data entry standard as the predefined latency data already
in the file to add custom data. Once added, the new data will appear as a
selection in the Latency Norms drop-down box.
For the source and value of the ABR latency normative data please refer to (Appendix H).
[Hood, 1998], [Gorga, 1987], [Gorga, 1989], [Zimmerman, 1987]
Y-axis Scale
Use the Y-Axis Scale field located at the right upper corner of the Waveform Window
(Figure 30) to change the Y-axis scale of the amplitude. The scale can be set to any
value between 0.05 µV to 4.0 µV.
To change the scale:
Select the up or down arrow to the right of the Y-Axis value.
Changing the size affects only the display on the screen – it does not influence the
recorded data.
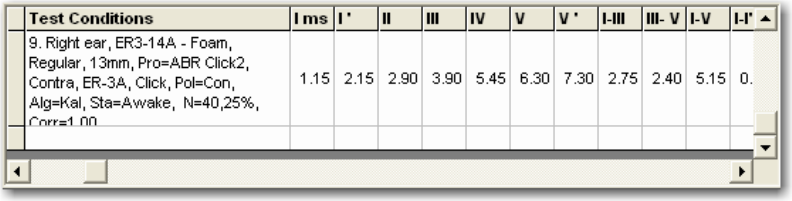
Chapter 4 User's Manual Integrity The Integrity™ System Screens
The Test Screen 11049 Rev.2 43
Waveform Information Chart
This chart contains the numeric representation of the peak and peak-to-peak latencies of
the waves shown in the Waveform Window (Figure 33).
Figure 33 Waveform Information chart
For each collected waveform, the Waveform Information chart displays the following
data:
• The corresponding wave number (in this case waveform 9), will be the same as
the wave number displayed on the waveform handle (Figure 31 shows waveform
1 as an example). The information for this waveform is displayed in the Test
Conditions column of the Waveform Information chart.
• A brief summary of the conditions of the stimulation displayed in the Test
Conditions column:
− Stimulated ear: Right Ear, Left Ear
− Transducer type: ER-3A or B-71
− Ear tip type and size
− Protocol used (Pro)
− Recording side: Ipsi (Ipsilateral), Contra (Contralateral)
− Stimulus type: Click, 0.5K, 1.0K, 2.0K, 4.0K
− Stimulus Polarity (Pol): Con (Condensation), Rare (Rarefaction), Alt
(Alternating), and Alt Split (Alternating split)
− Response processing algorithm (Alg): Kal (Kalman Weighted), Ave
(Averaging)
− Patient Status (Sta): Awake or Mixed
− Number of stimuli (N)
− Percentage of the rejected stimuli (will be displayed only if Averaging signal
processing algorithm was applied)
− Correlation coefficient between the waveforms collected in the A and B
buffers
• Latency values for each labeled peak, in milliseconds (ms) with the accuracy of
0.01 ms.
• I – III interpeak latency. The value can be displayed only if peaks I and III have
been labeled.
• III – V interpeak latency. The value can be displayed only if peaks III and V have
been labeled.
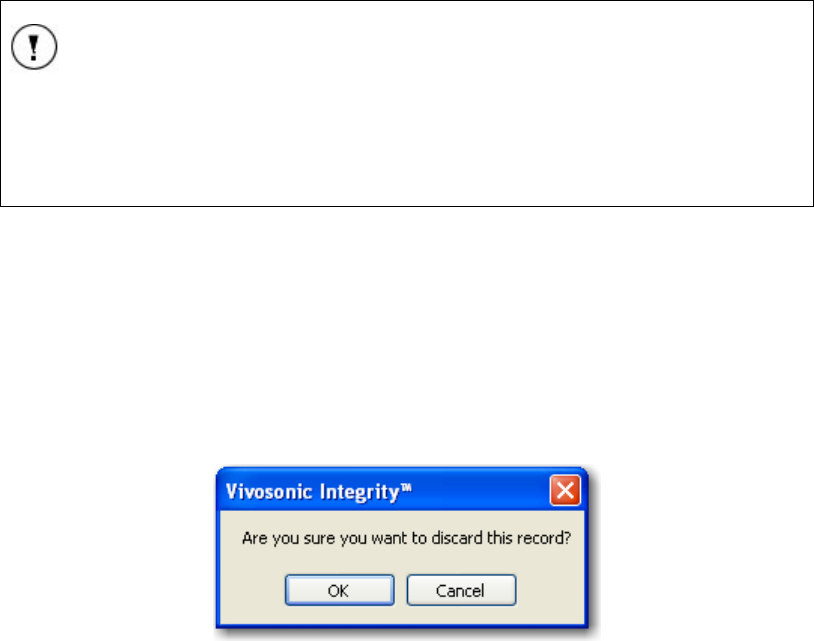
The Integrity™ System Screens User's Manual Integrity Chapter 4
44 11049 Rev.2 The Test Screen
• I – V interpeak latency. The value can be displayed only if peaks I and V have
been labeled.
• Wave I amplitude. The value can be displayed only if the positive (I) and negative
(I’) peaks of wave I are labeled.
• Wave V amplitude. The value can be displayed only if the positive (V) and
negative (V’) peaks of wave V are labeled.
TIP
To find specific data in the Waveform Information chart use the chart’s
vertical scroll bar to find the desired waveform. Alternatively, select the
handle of the waveform of interest in the Waveform Window and the
matching data will be displayed at the top of the chart.
Use the Latency Intensity button (Figure 26) to display this data graphically.
Leave the Test screen
The other screen tabs will be disabled when the data on the screen has not been saved.
To exit the Test screen the test data must first be saved or discarded.
1. Press Save to create the current records in the database.
2. Press Discard/Clear Graph to remove the data from the screen. If it is not saved
first it will be deleted. A warning dialog box will ask if you want to discard the
record.
Figure 34 Are you sure you want to discard the record(s)?
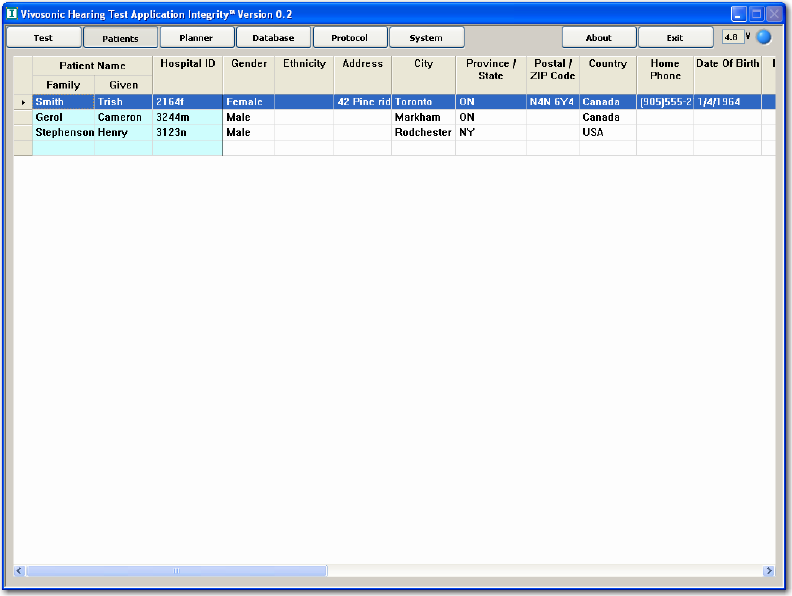
Chapter 4 User's Manual Integrity The Integrity™ System Screens
The Patients Screen 11049 Rev.2 45
The Patients Screen
The Patients screen lists all the patients who have been defined on the system, whether
they have been studied previously or they will be studied in the future. To perform a study
or to plan a study, the patient must first be created in this screen.
Figure 35 The Patients Screen
The Patients screen contains a table with the patient information listed in columns. A
horizontal scroll bar at the bottom of the screen allows the user to scroll the entire table to
see all of the patients’ information. The vertical scroll bar appears only after the patient
list grows beyond the length of the screen (approximately 20 patients).
The patient information is entered directly in the fields corresponding to the patient. To
create or update the patient list:
1. Select the Patients tab. The Patient screen will open (Figure 35).
Follow the procedure “The width and height of the columns and rows are adjustable.
To widen a column, place the cursor on the line dividing the two column headings. Click
and hold the line and drag it to the right or left to increase or decrease the size of the
column on the left.
To adjust the height of a row, place the cursor on the line dividing the two row headings.
Click and hold the line and drag it up or down to increase or decrease the height of the
row below the line.
2. Entering patient information” on page 46 to add patient information. The
minimum information required is the patient’s Family name, Given name, and
Hospital ID, which uniquely identify the patient in the list.
The Integrity™ System Screens User's Manual Integrity Chapter 4
46 11049 Rev.2 The Patients Screen
Sorting the table
The patients can be sorted by any information. Only one column at a time can be used to
sort the information.
1. Select a column heading to sort the patients using that column’s information
(e.g., Date of Birth). An arrow will appear in the column heading indicating which
direction (ascending or descending) the information in that column has been
sorted.
2. Select the column again to sort the information in the opposite direction
(descending or ascending).
3. To sort by another column, select another column heading.
Adjusting the columns and rows
The width and height of the columns and rows are adjustable.
To widen a column, place the cursor on the line dividing the two column headings. Click
and hold the line and drag it to the right or left to increase or decrease the size of the
column on the left.
To adjust the height of a row, place the cursor on the line dividing the two row headings.
Click and hold the line and drag it up or down to increase or decrease the height of the
row below the line.
Entering patient information
To enter any patient information, double-click on the cell and type in the information.
Some columns contain cells with drop-down menus that provide a list of all items entered
in that column: Gender, Ethnicity, City, Province/State, Country, Referring Physician,
Comment 1, Comment 2, and High Risk Registry. These lists are dynamic and grow as
the patient list grows.
For example if the first patient lives in Toronto and the next patient entered lives in New
York City, then when the third patient is being entered, the city list will contain Toronto
and New York City. Type the city name directly in the cell to add a new city entry or select
a city from the list. This feature significantly speeds up data entry for repeated
information, and prevents various spellings of the same information.
There is additional patient information for newborns and infants: mother’s information,
including mother’s ID, family name, and given name, the infant’s time of birth, high-risk
registry category, and birth weight.
Entering Date of Birth
The Date of Birth column contains a drop-down calendar (Figure 36). To enter a date:
1. Select the arrow on the right side of the field to open the calendar.
2. Select a day from the appropriate year and month. This will close the calendar
and create the date of birth in the field.
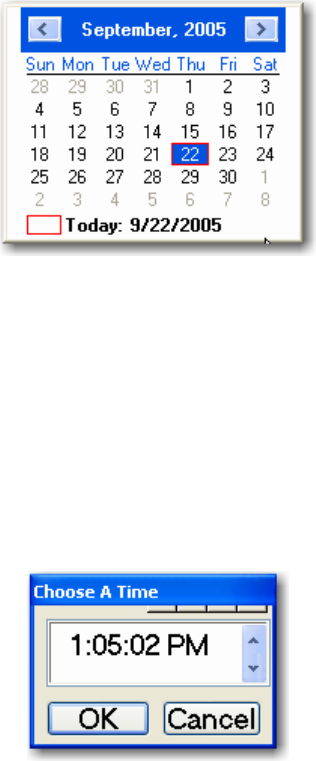
Chapter 4 User's Manual Integrity The Integrity™ System Screens
The Patients Screen 11049 Rev.2 47
Figure 36 Drop-down calendar
Entering Time of Birth
This field will be used most often when the patient is a newborn.
1. Select the appropriate field in the patient Time of Birth column. This will open a
digital clock showing the time in the HH/MM/SS/AM-PM format (Figure 37).
2. Highlight hour and adjust the hour using the up (increase) and down (decrease)
arrows.
3. Highlight the minutes, seconds, AM/PM, and select the correct time using the
arrows.
4. Press OK.
Figure 37 Drop-down clock
Selecting Patients
Select one or more patients who will be tested during a testing session.
Click the row heading to the left of the patient Family name. The entire patient row will be
highlighted (Figure 38).
To select another patient, hold the Ctrl key on the keyboard and click the row heading to
the left of another patient row.
To select several consecutive patients, select the first patient in the required list as stated
above. Hold the Shift key on the keyboard and click the last patient required in the list. All
the patients between the first and last selected will be highlighted.
Only the highlighted patients selected here will appear in the Patients drop-down menu
of the Test screen (Figure 12).
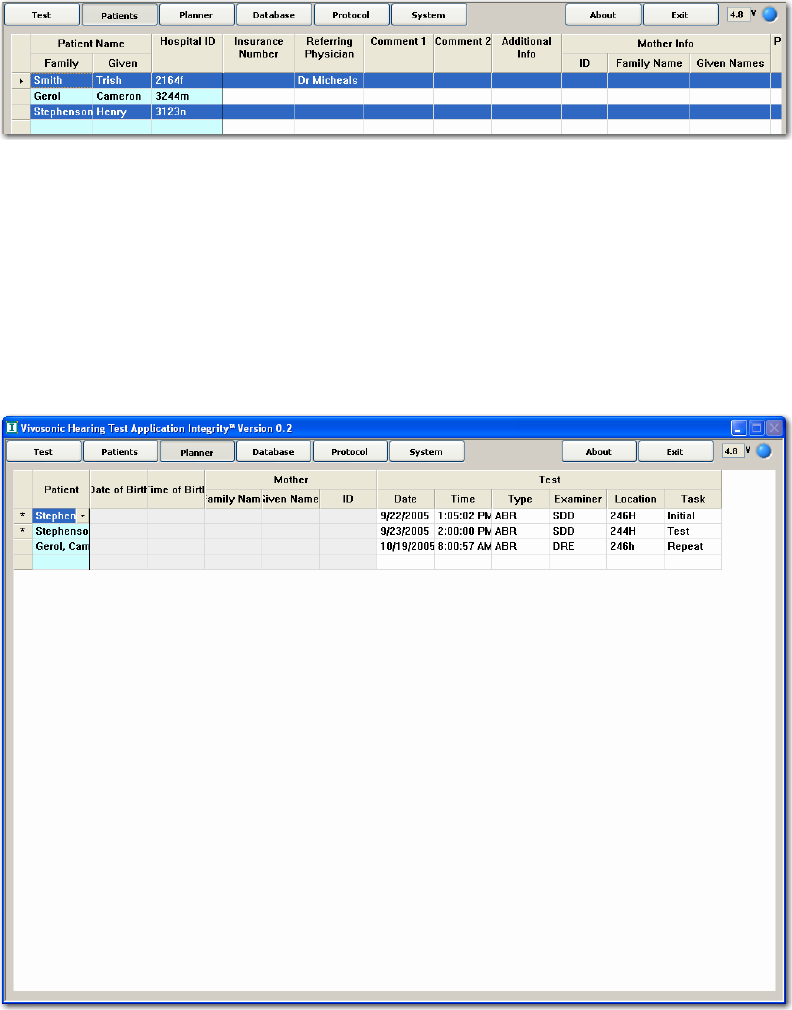
The Integrity™ System Screens User's Manual Integrity Chapter 4
48 11049 Rev.2 The Planner Screen
Figure 38 Selected patients in Patients screen
The Planner Screen
Use the Planner screen to pre-plan tests hours or months in advance of the actual test
(Figure 39). This feature gives the operator the ability to plan upcoming test procedures,
to keep track of patients who need to be tested or re-tested, assign personnel to perform
the tests, and identify the time and location of the tests. This will streamline the testing
process, and reduce the chance of missing a patient, which may be particularly important
in cases after an event that might have affected the hearing system, such as
chemotherapy or other ototoxic treatments.
Figure 39 The Planner Screen
To plan the test schedule, press the Planner tab which opens the Planner screen. It
consists of a table similar to the Patients screen, with two differences: First, you cannot
enter patient information in this table, only select the patients you plan to test from the
patient list, and second, you can add details of the test to the patient information.
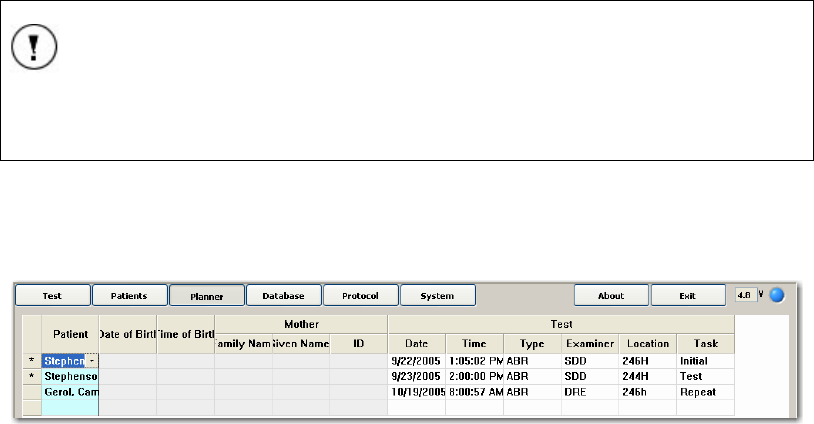
Chapter 4 User's Manual Integrity The Integrity™ System Screens
The Planner Screen 11049 Rev.2 49
NOTE
The test details will be saved with the specific test and not with the
general patient information.
Details that can be added are:
• Mother’s information (Family Name, Given Name, and Hospital ID)
• Test information (Date, Time, Type, Examiner, Location, and Task)
Figure 40 Planned patient list
Selecting a Patient
To add a patient to the planner:
1. Select a blank field in the Patient column. This will open a drop-down list of all
the patients entered in the Patients screen. If the list is too long, a scroll bar
appears on the right side of the drop-down menu.
2. Select the patient from the list. The patient will be added to the planner list.
Patient, Date of Birth, and Time of Birth, as well as Mother’s Family Name, Given
Name, and ID.
Mother’s Information
Family Name, Given Name, and Hospital ID
These three fields are valuable when the patient is a newborn.
Test Information
The Date of Test column contains a drop-down calendar (Figure 36), the same as used
in the Patients screen. To enter a date:
1. Select the arrow on the right side of the Date field. This will open the calendar.
2. Select a day from the appropriate year and month. This will close the calendar
and create the date of birth in the field.
Time of Test
Define the time the test is scheduled by using the following steps.
1. Select the appropriate field in the patient Time column. This will open a digital
clock showing the time in the HH/MM/SS/AM-PM format (Figure 37).
2. Highlight hour and adjust the hour using the up (increase) and down (decrease)
arrows.
3. Highlight the minutes, seconds, AM/PM, and select the correct time using the
arrows.
4. Press OK.
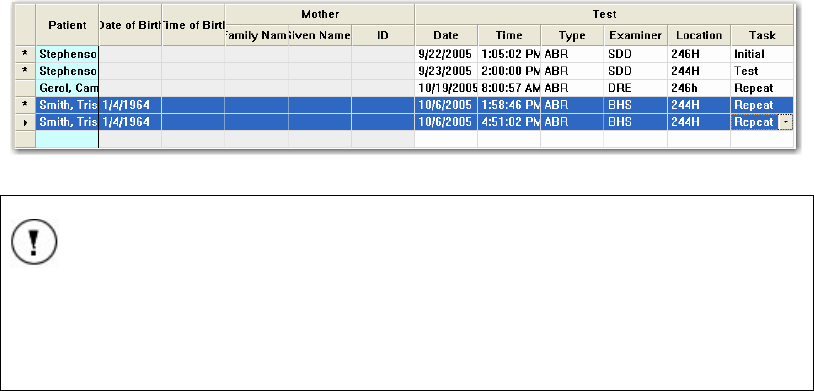
The Integrity™ System Screens User's Manual Integrity Chapter 4
50 11049 Rev.2 The Planner Screen
Type of Test
This column contains a drop-down menu with the available tests on the Integrity™
system.
Click the arrow and select the test required.
Examiner, Location, and Task
These three columns define the test conditions that may affect how test results will be
analyzed. Different examiners may perform tests in different orders, the locations (such
as ICU, maternity wards, and audiology offices) may affect how the data is collected and
the task or goal of the study may change which part of the test is the most important.
These fields contain dynamic drop-down menus. Once a value has been entered it
becomes a choice in the drop-down menu list.
1. Select the arrow of the drop-down menu.
2. Select an item from the list.
3. Alternatively, type a new value into the field.
Selecting Tests
To define a testing schedule, select one or more tests that will be performed in
consecutive order.
To select a test, press the blank grey cell to the left of the patient’s name. This will
highlight the test entry (Figure 41).
To select multiple test entries, hold down the Ctrl key on the keyboard and select all
required patients.
To select patients listed consecutively in this planner screen, select the first patient
required, then hold down the Shift key on the keyboard and select the last patient in the
required list. All of the names will now be highlighted.
Selected test entries will appear in the Test Plans list in the Test screen.
Figure 41 Selected tests in the Planner screen
TIP
Some tests shown in the Planner screen may be denoted by an asterisk to the left of the
patient’s name. This asterisk identifies tests from the past.
To avoid confusion, ensure that the tests selected for current testing have a current date.
Deleting entries from the Planner list
To delete a test plan name from the table, select the test entry by clicking on the blank
cell to the left of the patient’s name, and press the Delete key on the computer keyboard.
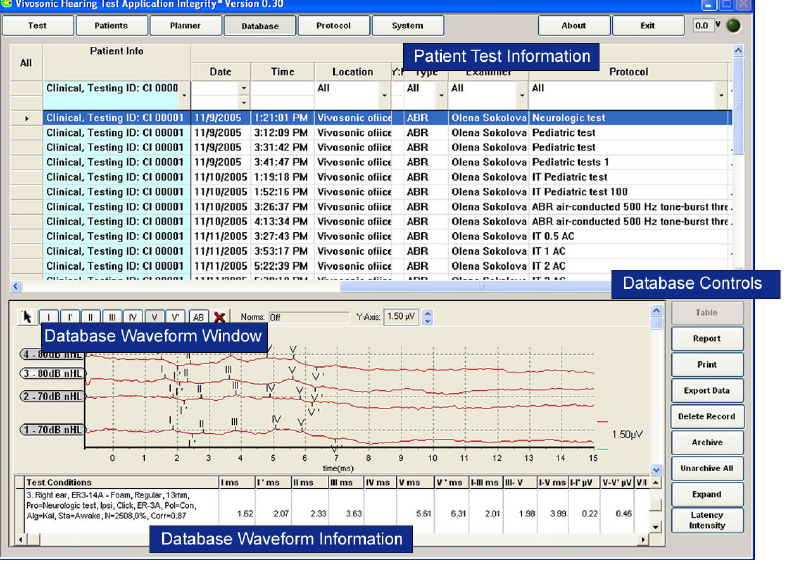
Chapter 4 User's Manual Integrity The Integrity™ System Screens
The Database Screen 11049 Rev.2 51
The Database Screen
The Integrity™ system uses a database to store patient and test data for future analysis.
The Database screen retrieves this data and provides tools to review and analyze a
patient’s test results.
The Database screen is password protected. By default there is no password. Vivosonic
recommends that the entry to this screen be password protected to ensure patient data
privacy. Use the System screen to set a new password. (See Changing the Password on
page 68).
Figure 42 The Database Screen
Using the Database
Documenting test results
A database is a very powerful tool to store and review test results electronically. It
contains records of patient information, as well as information on the test results and test
conditions, including time and location, examiner, protocol used, outcomes, and
comments. The test data is automatically stored in the database. It can be retrieved
through the Database screen as well as exportable to other statistical software packages
for further analysis.
Monitoring data changes over time
It is important to do baseline tests to be able to compare future test data reliably.
Comparability of the results is necessary in order to be able to statistically identify any
changes in a patient’s test results over time. Baseline tests make it possible to accurately
identify the development of conditions such as ototoxicity and noise-induced hearing loss.

The Integrity™ System Screens User's Manual Integrity Chapter 4
52 11049 Rev.2 The Database Screen
Quality assurance
The database can be an essential part of your quality assurance system. To ensure
reliable diagnosis the data analysis must be consistent even when the test conditions are
not, for instance results obtained by different examiners, at different test times, on
different ages of patients, and various test locations.
These variations must be taken into account when analyzing the patient data. When a
variation in a particular condition is affecting the data, changes can be made to correct
the issue, such as relocating tests to an appropriate room, acoustically modifying a test
location, additional personnel training, or strictly enforcing protocol use. These measures
may significantly improve the consistency of data collection, resulting in a reduction of
post test analysis and increasing the reliability of the results.
Database function
Database access
4. To access the test-result in the database and review the stored results, press the
Database tab.
NOTE
The Database screen is password protected. By default there is no
password. Vivosonic recommends that the entry to this screen be
password protected to ensure patient data privacy. Use the System
screen to set a new password. (See on Changing the Password on page
68.)
5. Enter your password and press OK.
NOTE
The password is case-sensitive.
Database screen description
The main Database screen has the following structure (Figure 42):
• Database Patient List table is located at the upper part of the screen. This table
contains patient’s information entered in the Patients screen and the test
conditions entered in the Planner screen.
• Database Waveform Window is positioned at the lower part of the Database
screen. This window displays collected waveforms, waveform peak numeric
values, and conditions of stimulation and recording.
• Database Waveform Information is a table that is located directly below the
waveforms. This table contains the test conditions defined by the protocol
selected, the marked peak values, and the latency calculations.
• Database Controls are located on the right side of the Database screen. The
controls provide post-analysis functions on the data, such as report generation.
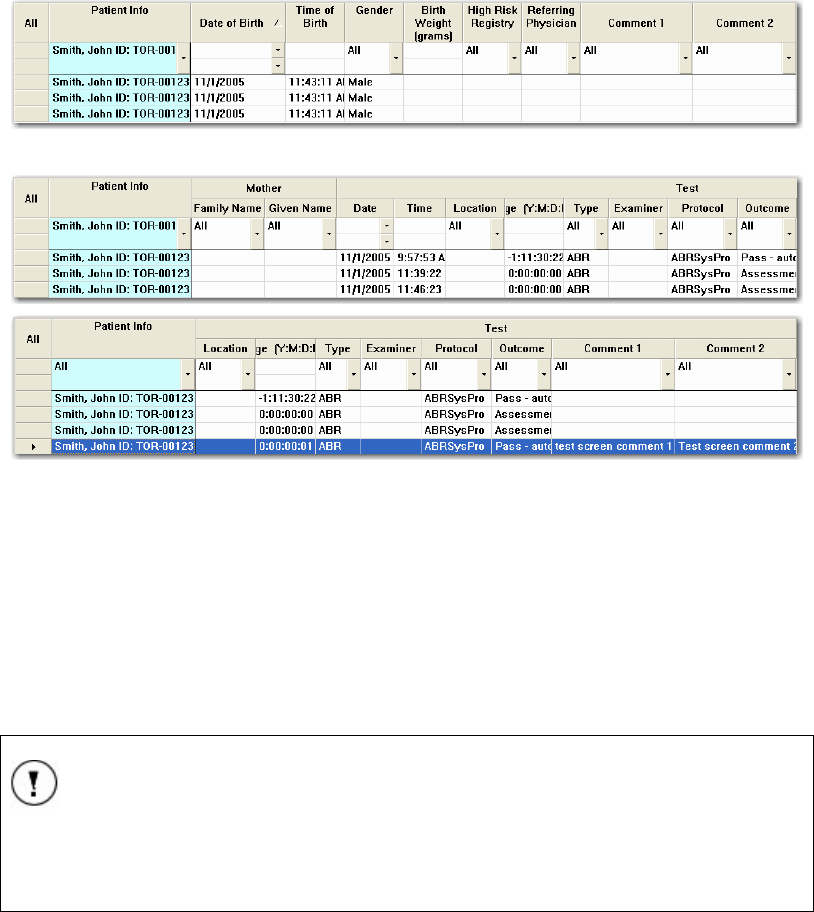
Chapter 4 User's Manual Integrity The Integrity™ System Screens
The Database Screen 11049 Rev.2 53
Figure 43 Database Patient list – initial view
Figure 44 Database Patient list – other fields scrolled right
Database Patient List table
The Database Patient List table contains patients information entered in the Patients
screen and the test conditions entered in the Planner screen. The scroll bar allows
scrolling the table to the right and backing to the left, and seeing items in all of the
columns. The first three columns on the left, containing patient’s family and given names
and Hospital ID, serve to uniquely identify the patient in the list, and are not scrolling.
When the vertical size of the table exceeds the screen size, a vertical scroll bar appears
to the right of the table. It allows navigating through the table up and down.
NOTE
The patient’s Age is a calculated value. When the data is saved
Integrity™ calculates the age using the time and date of the test and the
Date of Birth entered into the patient data.
Comments 1 and 2
The comment fields are filled automatically with information from the Test and Patient
screens. The first set of comment fields holds information entered in the Patient screen
(Figure 35). The second set of comment fields, found in the Test information block of the
database patient list, is filled with the information that was entered when the test data
was saved (Figure 14).
Sort the table information and adjust the column width
These features operate the same way as the tables in the Patient screen. Refer to page
46 in the Patients screen section for more details.
Select and unselect results
To display specific database entries in the Database Waveform Window:
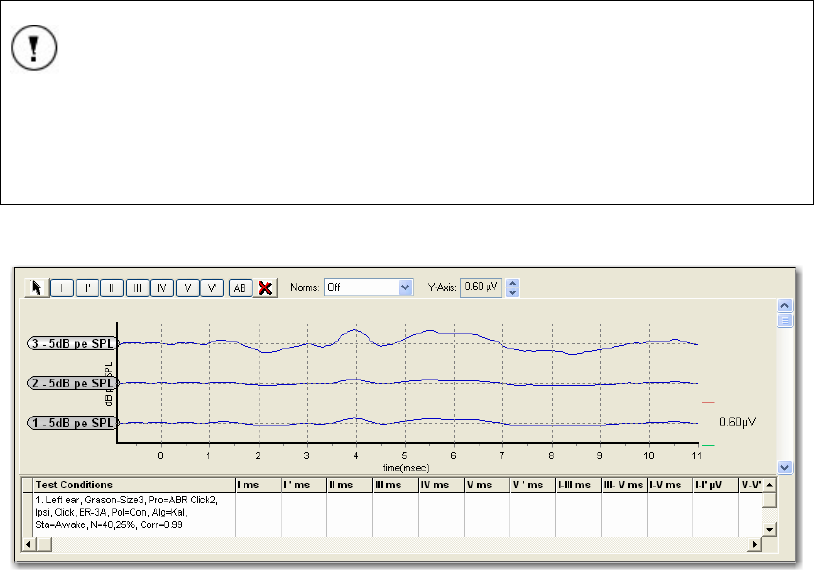
The Integrity™ System Screens User's Manual Integrity Chapter 4
54 11049 Rev.2 The Database Screen
Select the blank cell to the left of the patient’s name in the Database Patient List
table to highlight the record. The collected waveforms will be displayed in the
Database Waveform Window and data will be displayed in the Database
Waveform Information table.
Database Query
The database can be queried using the values available in each column. To display
specific database entries that matches the selection criteria:
1. Select the arrow under in the first row under the column header to display the
query values for that field. The values will appear in a drop-down list.
2. Select as many of these values as needed. The table will instantly be updated to
include records that meet the query values selected.
3. Select values from as many columns as required narrowing the database query.
4. The Date of Birth, Time of Birth, and Birth Weight columns allow querying of a
range of dates, times and weights. Set the first value of the range with the upper
arrow and the second value with the low arrow, found in the first row under the
heading of the column to query.
TIP
To view only the records from a specific patient performed by a specific
examiner, select the patient’s name from the drop-down list under the
Name column and the examiner’s name from the drop-down list under
the Examiner column. Only the records meeting these two requirements
will be displayed.
Database Waveform Window and Information Table
Figure 45 Database Waveform Window and Information table
This window is used to display patient’s data after the test has been completed and
saved. The window displays data as waveforms and labels peak numeric values. This is
the same display seen in the Waveform Window and Waveform Information chart on
the Test screen (Figure 11) during the test. The graph can be viewed full screen by
selecting the Expand button in the Database Controls (Figure 46).
All of the following functions are available from either view (full or compressed) of the
Database Waveform Window:
• Activate (highlight) a waveform by selecting the waveform’s handle.
• Move highlighted waveforms along the vertical axes.
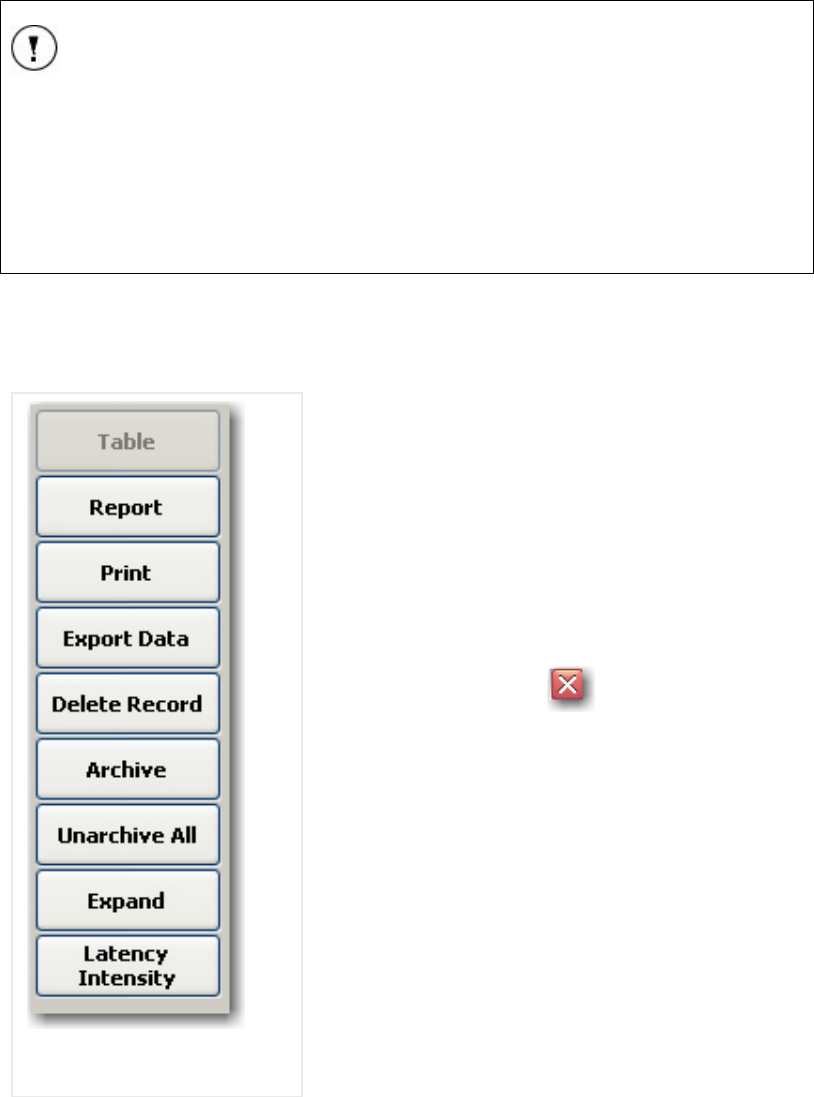
Chapter 4 User's Manual Integrity The Integrity™ System Screens
The Database Screen 11049 Rev.2 55
• Label the peaks of the highlighted waveform using the waveform markers.
• Change waveforms presentation scaling.
• Delete the a highlighted waveforms.
• Introduce or remove latency norms by selecting the appropriate age related
normative values from the Norms list.
• Review the conditions of the stimulation and the waveforms’ numerical values of
the labeled peaks in the Database Waveform Information chart.
NOTE:
All peaks previously labeled on the Test screen during or after the
testing will be stored in the database and displayed at the Database
Waveform Window of the Database screen.
All numeric values of the previously labeled peaks will be displayed in
the Database Waveform Information chart.
Any subsequent peak labeling changes made to the database and saved
will overwrite the previously stored label values.
Database Controls
The database control buttons (Figure 46), located to the right of the Database Waveform
Window, provide options to create reports, print, view, and save the data from the test.
Table
This button is not currently used.
Report
The Report feature allows the user to add comments
about the test results.
1. Select the Report button to open a Report
screen (Figure 47).
2. Write a report for the session and save it in
the database.
3. Select the red X ( ) to save the report
comment to the patient’s record.
Figure 46 Database Controls
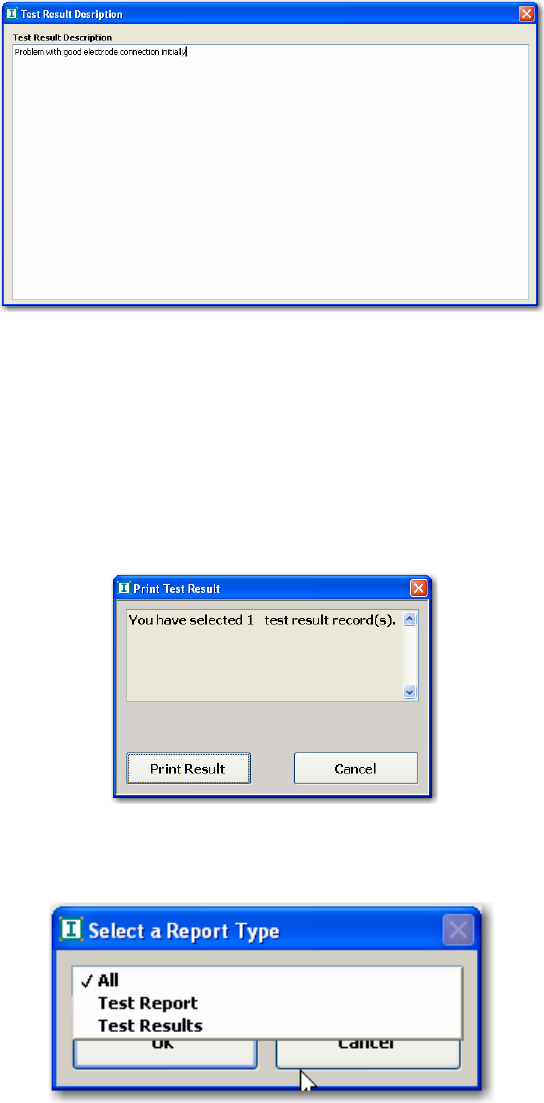
The Integrity™ System Screens User's Manual Integrity Chapter 4
56 11049 Rev.2 The Database Screen
Figure 47 Test report screen
Print
Results, including waveforms, patient information, and comments can be printed as a
report.
1. Select the required patient results to print by highlighting the records.
2. Press Print.
3. A dialog box (Figure 48) will appear. Press Print Test Result to send the report
to the printer.
Figure 48 Print Test Result dialog box
Select a report type from the Select a Report Type drop-down box (Figure 49). There are
three options to choose from: All, Test Report, or Test Results.
Figure 49 Print Test Result dialog box
If All is selected, the following information will be printed:
1. Test centre information
2. Patient information
3. Report information
4. Instrumentation information
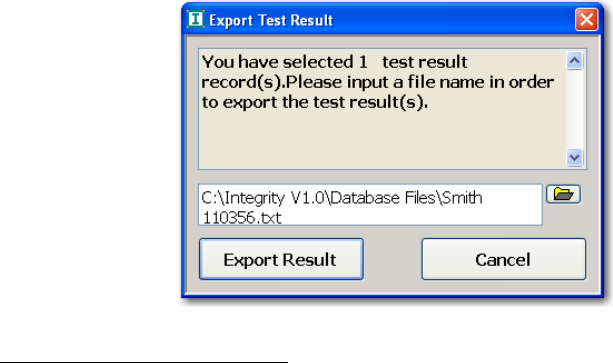
Chapter 4 User's Manual Integrity The Integrity™ System Screens
The Database Screen 11049 Rev.2 57
5. Test results:
• Waveform graph
• Latency vs. Intensity graph
• Numeric test results table (This table includes the test parameters and the
labeled wave latency values)
6. Protocol parameters table
If Test Report is selected, the report will contain the information entered via the Report
button (Figure 47):
1. Test centre information
2. Patient information
3. Report information (This is the information entered via the Report button.)
If Test Results is selected, the following information will be printed:
1. Test centre information
2. Patient information
3. Test results:
• Waveform graph
• Latency vs. Intensity graph
• Numeric test results table (This table includes the test parameters and the
labeled wave latency values)
4. Protocol parameters table
Export Data
This button allows the user to export data to a common delimited file to be used in any
database related software application that can import this type of file, for example
Microsoft Excel4.
1. Select the Export Data button.
2. Select a location to save the file. Press the folder button to browse to the correct
directory.
3. Enter a name for the exported file.
4. Press Export Test Result. The common delimited file will be created.
Figure 50 Export Test Result
4 Excel is a registered trademark of Microsoft Corporation.

The Integrity™ System Screens User's Manual Integrity Chapter 4
58 11049 Rev.2 The Database Screen
Deleting records from the database
Records can be deleted from the database. To delete a record:
1. Highlight the record to delete.
2. Press the Delete button. The record will be deleted from the database.
Archiving
The Archive feature allows selected patient records to be “hidden”. This is useful when
there are too many records from the same patient on the same test session to review. It
may be time consuming to look through all the data to find a record that is known to be
representative. Identify the results that are representative (“good”) of that patient’s data.
1. Select the results that are not required by highlighting the record.
2. Press Archive. The selected records will disappear from the patient table.
If all the results that are not required for analysis are hidden using the archive feature
only the required records will be visible in the patient list reducing the time it takes to find
specific results.
This is particularly important when averaging data results. Once the data that is not
required for the statistical analysis has been archived, the results from those records will
not be used by Integrity™ when performing statistical analysis.
NOTE
Archived data is not deleted or removed from the database. It is merely
hidden from the patient record table and not used.
Un-archiving results
To un-archive results that have been previously archived, press Unarchive All. All
archived results will be returned and shown in the table.
Expand
The waveforms can be displayed in a full screen format for easier viewing.
1. Select the Expand button.
2. Select the red X ( ) to return to the compressed Database Waveform
Window.
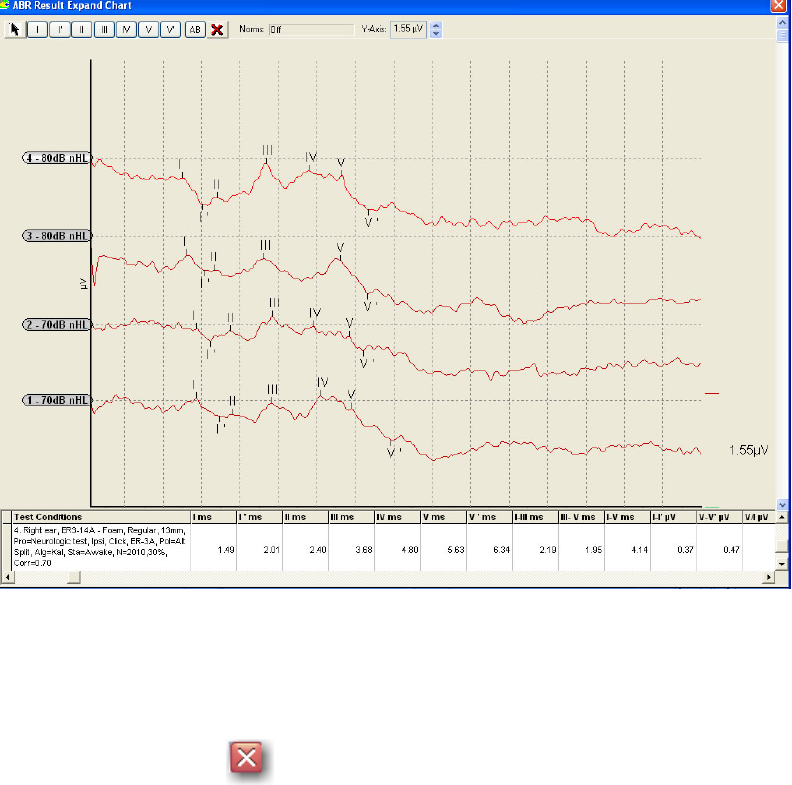
Chapter 4 User's Manual Integrity The Integrity™ System Screens
The Database Screen 11049 Rev.2 59
Figure 51 Expanded Database Waveform Window
Latency-Intensity graph
The Latency-Intensity button opens a view of the results in a Latency vs. Intensity graph.
1. Press Latency-Intensity to view the graph.
2. Select the red X ( ) to close the graph.
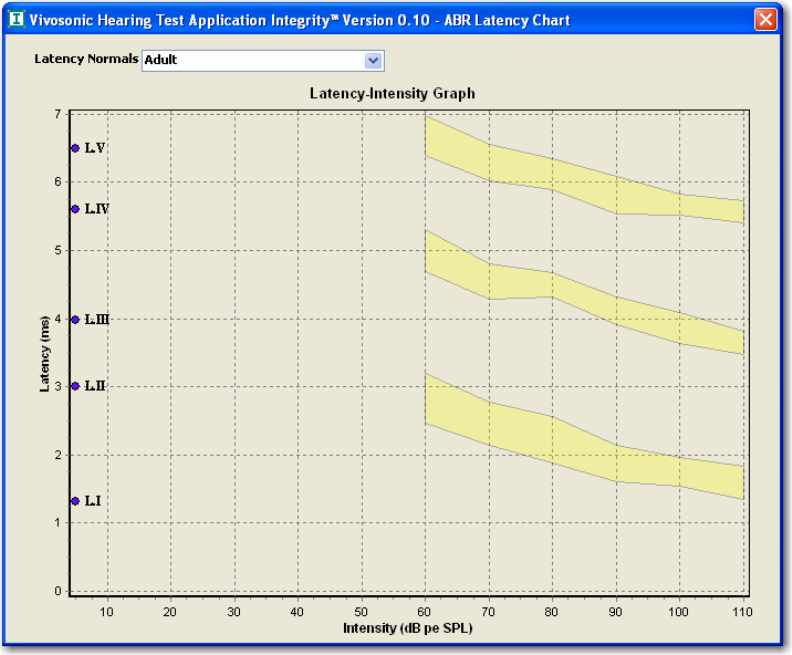
The Integrity™ System Screens User's Manual Integrity Chapter 4
60 11049 Rev.2 The Database Screen
Figure 52 Latency-Intensity Graph - adult norms shown
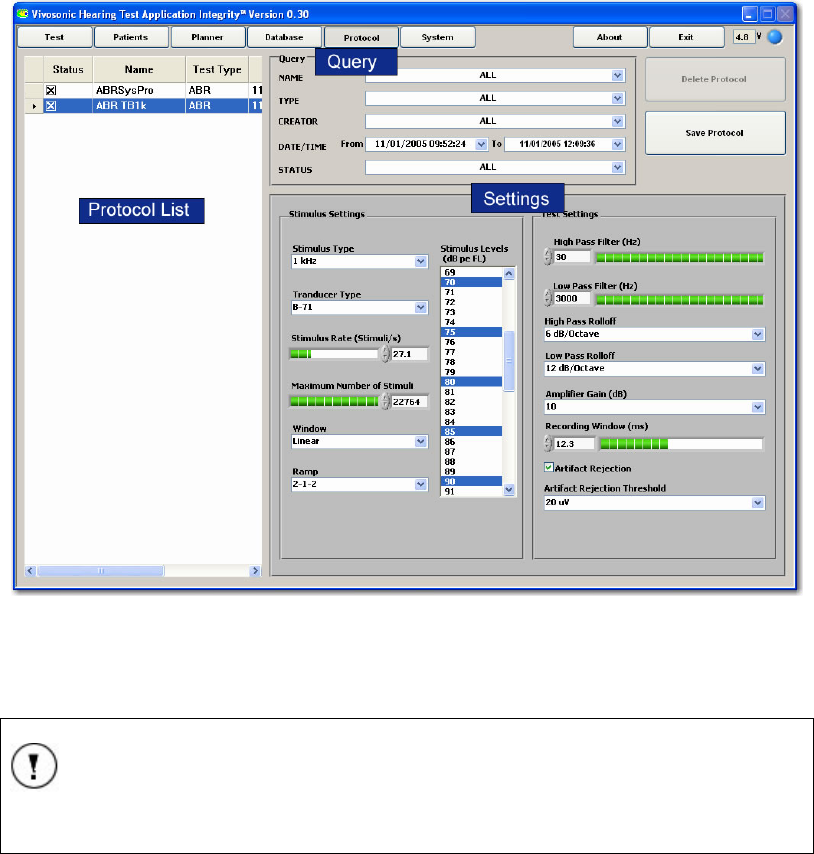
Chapter 4 User's Manual Integrity The Integrity™ System Screens
The Protocol Screen 11049 Rev.2 61
The Protocol Screen
The Protocol screen allows the user to create, save, activate, deactivate, and delete test
protocols.
Figure 53 The Protocol Screen
Like the Database screen the Protocol screen is password protected. The same
password set for the Database screen is used to access the Protocol screen. (Refer to
Changing the Password on page 68 for details on how to set the password.)
NOTE
Access to the Protocol screen is password protected to ensure that only
authorized personnel can create and manage the test protocols.
The Protocol screen has three general sections (Figure 53):
• Protocol List
• Query
• Settings
The functions associated with these three sections are defined below.
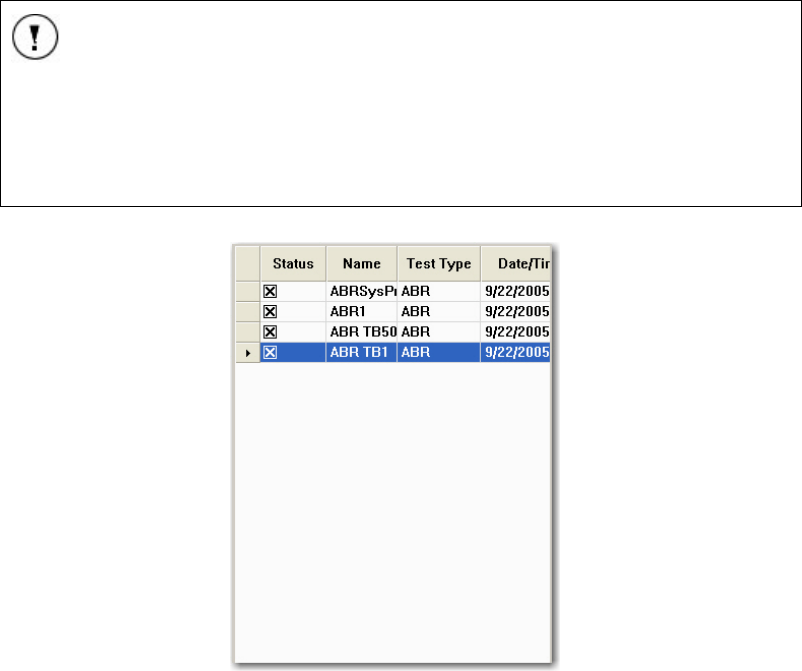
The Integrity™ System Screens User's Manual Integrity Chapter 4
62 11049 Rev.2 The Protocol Screen
Creating Protocols
Protocol List
All created protocols are saved in the Protocol database accessible from the Protocol
screen. All saved protocols are displayed in the list on the left side of the protocol screen
(Figure 54). The Integrity™ system comes with several preset parameters. Refer to
Appendix C for a list of the preset protocols.
Only the first four columns in the table are visible. Use the scrollbar on the bottom of the
list to view the other columns in the table.
Figure 54 Protocol List
Activating and deactivating protocols
Activated protocols are shown with the box selected in the Status column of the Protocol
list. All protocols that are active will be available for selection in the Test screen. To
activate a protocol:
1. Click in the box located to the left of the protocol name in the Status column of
the Protocol list (Figure 54). An “x” will appear in the box indicating that the
protocol is now active.
2. Click on the “x” in the box to deactivate the protocol.
NOTE
Once a protocol has been used to acquire patient data it cannot be
deleted from this list. Only protocols that have not been used to obtain
any test results can be deleted from the protocol database. This
ensures the integrity of the test data saved in the database.
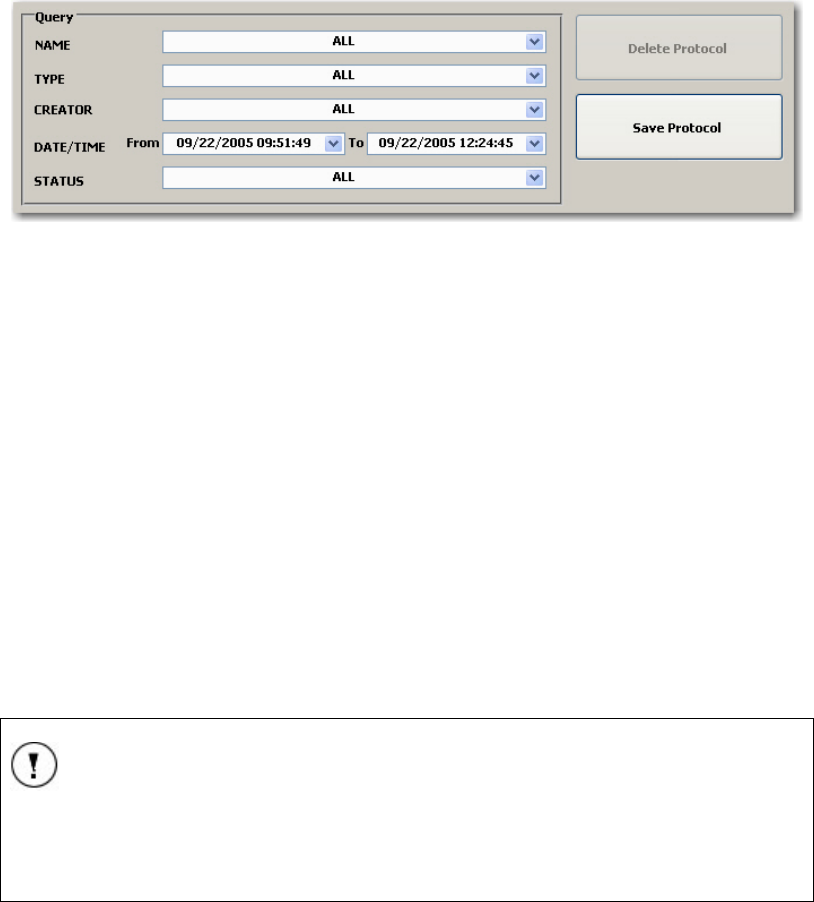
Chapter 4 User's Manual Integrity The Integrity™ System Screens
The Protocol Screen 11049 Rev.2 63
Protocol Query
If there are numerous protocols in the protocol database, the protocol list will be long. It
may be challenging to find one specific protocol in the list. The Query feature is designed
to help find protocols in a lengthy list.
The Query feature is found in the top middle of the Protocol screen. To find a protocol in
a long list of protocols, use the query feature to search using these five variables: type,
name, creator, date/time of creation, and status of the protocol.
Figure 55 Protocol Query
• Select a variable to filter the list, from one or more of the drop-down fields in the
query.
When the selection is made the list will automatically update showing only the protocols
that fit all the criteria of the query.
Protocol Settings
The configuration of a protocol will depend on the test to be performed. Refer to Protocol
Parameters on page 79 for more details about the protocol settings and defining a
protocol. To create a new protocol:
1. Select the blank cell to the left of any protocol in the Protocol List. This will
highlight the protocol.
2. Modify the parameters of the protocol, including description and comments.
(Refer to Protocol Parameters on page 79 for more details.)
3. Press Save Protocol to the right of protocol Query (Figure 55). A dialog box
(Figure 56) will appear.
4. Enter the protocol name and the name of creator.
5. Press OK.
NOTE:
A saved protocol cannot be modified. Once created, a protocol cannot be
saved under the same name. To make any changes to a protocol, save
the changed protocol under another name.
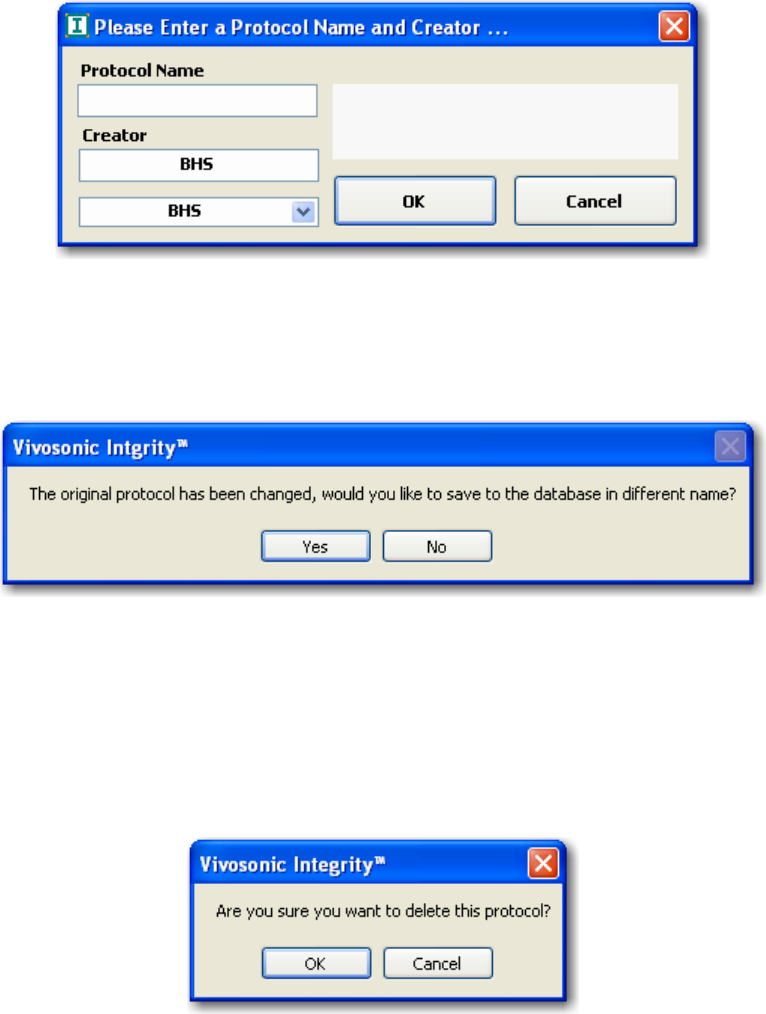
The Integrity™ System Screens User's Manual Integrity Chapter 4
64 11049 Rev.2 The Protocol Screen
Figure 56 Protocol dialog box
If you have created a new protocol and try to perform any action other than saving it, the
Change Protocol dialog box (Figure 57) will appear.
1. Press YES to save the protocol before continuing with other functions.
2. Press NO to continue modifying the protocol before naming it.
Figure 57 Change Protocol dialog box
Deleting a protocol
Only protocols that have never been used can be deleted.
1. Select the unwanted protocol from the protocol list.
2. Press Delete Protocol to the right of the protocol query (Figure 55). The Delete
Protocol dialog box (Figure 58) will appear.
3. Press OK to confirm the selected protocol is to be deleted.
Figure 58 Protocol deletion dialog box
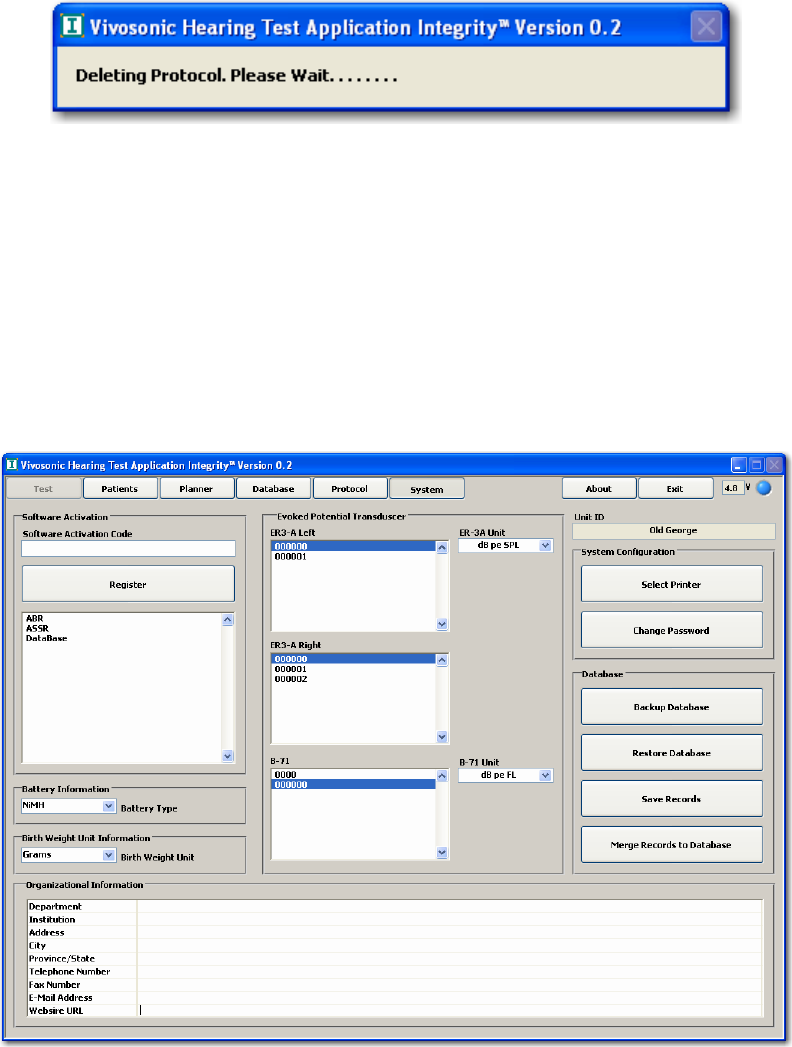
Chapter 4 User's Manual Integrity The Integrity™ System Screens
The System Screen 11049 Rev.2 65
The System Screen
The System screen is used to define the peripherals (printer and battery), change the
user password, define units, transducer selection, and backup, merge and restore the
database. The System screen has four sections:
• System configuration
• System configuration controls
• Organizational information
• Database controls
Figure 59 The System screen
The first time the Integrity™ system is used, it should be configured using the System
screen before any other task is started. Vivosonic also recommends that the system
configuration be checked every time prior to running a test.
System Configuration Selection and Controls
The system configuration section of the System screen provides specific information
about the Integrity™ system components.
The Integrity™ System Screens User's Manual Integrity Chapter 4
66 11049 Rev.2 The System Screen
Software Activation
The Integrity™ system has a modular design. The module field will show which modules
have been activated. (Currently ABR and Database are the only two modules available.)
If, in the future, another module is purchased, an activation code will be sent to the
purchaser.
1. Enter the activation code into the Software Activation Code field.
2. Press Register. This will activate the new module and the new module will be
added to the activated modules list located below the Register button.
Battery Information
The VivoLink™ can run one of two different types of batteries. This field defines which
type of battery is powering the VivoLink™. The Integrity™ system uses this information to
determine how much power is remaining in the battery’s life.
• Select either NiMH (Nickel Metal Hydride) or Alkaline from the Battery Type
drop-down list.
Birth Weight Unit Information
The Birth Weight Unit field defines the units that are used when describing the patient’s
birth weight in the Patient and Database screens.
• Select either the Grams (metric) or lb:oz (Imperial measure) units from the drop-
down menu for the birth weight.
Transducers and Calibration Units
Selecting the appropriate transducer
The Integrity™ system is supplied with two transducers, an ER-3A and a B-71. The serial
numbers for each of these transducers have been coupled to the system software at the
factory if the computer was purchased from Vivosonic Inc.
If the computer has been configured by the user, the calibration files must be installed
using the CD shipped with the Integrity® system. Instructions to install the calibration files
can be found on page - 26 - of the Installation Instructions found in the back of this
manual’s binder.
Additional transducers can be added to the list by installing the transducer coupling
information provided on a disk with the purchase of any new transducer supplied by
Vivosonic.
The serial numbers for all the transducers that have been coupled to the system software
are displayed in the appropriate transducer fields. In addition to providing the serial
number, it also provides the calibration data for the specifically selected transducer.
• Select the transducer required for the test by highlighting its serial number.

Chapter 4 User's Manual Integrity The Integrity™ System Screens
The System Screen 11049 Rev.2 67
CAUTION
Results may be incorrect.
Selecting a serial number that does not match the transducer used may
result in test data that cannot be confirmed or reproduced. The serial
number ensures the correct calibration data, specific to that transducer,
is being used during data collection and analysis.
Selecting the calibration units
The calibration units define whether the data will be reported as:
• dB nHL or dB peSPL for the ER-3A tests, or
• dB nHL or dB peFL for the B-71 tests
These are the units displayed in the Stimulus Levels field on the Protocol screen and
the units of the Level parameters on the Test screen.
• Select the unit from the drop-down list for each transducer type.
Hearing level conversions
It is possible to change the conversion between dBnHL and dBpeSPL. The default
values, rounded to the nearest dB, can be found in Table A, Table B and Table C.
Table A dB nHL conversion for Bone Conductor B-71
Frequency dB peFL at 0 dB nHL
500 Hz 67
1 kHz 54
2 kHz 49
3 kHz 46
4 kHz 41
Click 61
Table B dB HL conversion for Insert Earphone ER-3A
Frequency dB SPL at 0 dB HL
500 Hz 10
1 kHz 6
2 kHz 12
3 kHz 13
4 kHz 15
Click 6
Table C dB nHL conversion for Insert Earphone ER-3A
Frequency dB peSPL at 0 dB nHL
500 Hz 22
1 kHz 25
2 kHz 20
3 kHz 24
4 kHz 26
Click 25

The Integrity™ System Screens User's Manual Integrity Chapter 4
68 11049 Rev.2 The System Screen
To change the values please edit the following text file on the Integrity Windows XP®
computer. Only use a text-only editing application to modify the file and do not change
the formatting of the file. Ensure it is saved with the txt extension after modifying the files:
• Bone Conductor B-71: "ABR B-71 dB nHL to dB pe FL.txt"
• Insert Earphone ER-3A: "ABR ER-3A dB HL to dB SPL.txt"
• Insert Earphone ER-3A: "ABR ER-3A dB nHL to dB pe SPL.txt"
The Files are located in the following directory:
• C:\Integrity V1.0\Conversion File\
Unit ID
Each VivoLink™ has its unique serial number, which will appear at the Unit ID
information control. This is an informational field only and cannot be edited.
Select Printer
The Select Printer button opens a dialog box that is used to define the printer used to
print test reports.
1. Press Select Printer. A dialog box labeled Printer Select will appear.
2. Select the connected system printer from the list.
3. Press OK.
Changing the Password
The password will secure access to the Database and Protocol screens. To change the
password:
1. Press Change Password.
2. Enter the old password. The system is delivered with no set password. Leave
this field blank when configuring the password for the first time.
3. Enter the new password. If this field is left blank the password will be removed.
4. Enter the new password again in the Confirm Password field.
5. Make a note of the new password, and store it in a secure location.
6. Press OK.
7. If the old password was entered incorrectly or the new password confirmation
was entered incorrectly the password will not be changed. Repeat the steps to
attempt to change the password again.
NOTE
The password is case sensitive and can include numbers and letters.
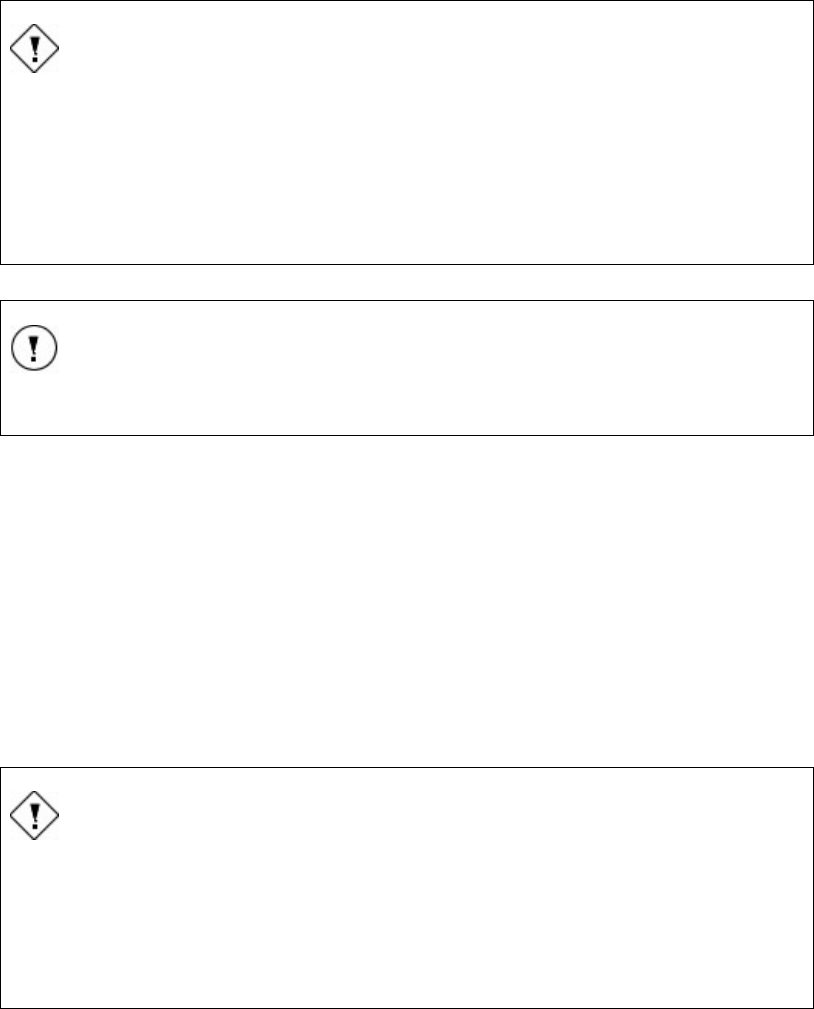
Chapter 4 User's Manual Integrity The Integrity™ System Screens
The System Screen 11049 Rev.2 69
CAUTION
A system without a password may compromise patient confidentiality.
A password is needed to access the Protocols and Database screens.
A password will prevent unauthorized users from having access to the
patient test results stored in the database, as required by local
regulations such as HIPAA in the USA. The password also prevents
unauthorized users from deleting defined protocols.
TIP:
If the password is misplaced or forgotten, please contact customer
support for help.
Database Controls
Backing up records
The Backup Database feature will make a backup copy of the entire database to a
specified file, on the Integrity™ system.
1. Press Backup Database. A dialog box labeled Save As will appear.
2. Select the drive and folder location. Use the button with a folder on it to browse
the network and select a drive.
3. Enter an appropriate file name.
4. Press Save. The file will be saved on the selected drive in a Custom Pattern
format (*.mdb) text file.
CAUTION
Test data may be lost.
To prevent permanent loss of data due to hard drive failure, it is
recommended that the database be backed up regularly. Vivosonic™
recommends a scheduled backup time, for instance once a week, or
after a set number of tests.
Restoring the database
The database can be restored to the Integrity™ system.
1. Press Restore Database. A dialog box labeled Open will appear.
2. Select the required database file from the saved drive and folder location.
3. Press OK.
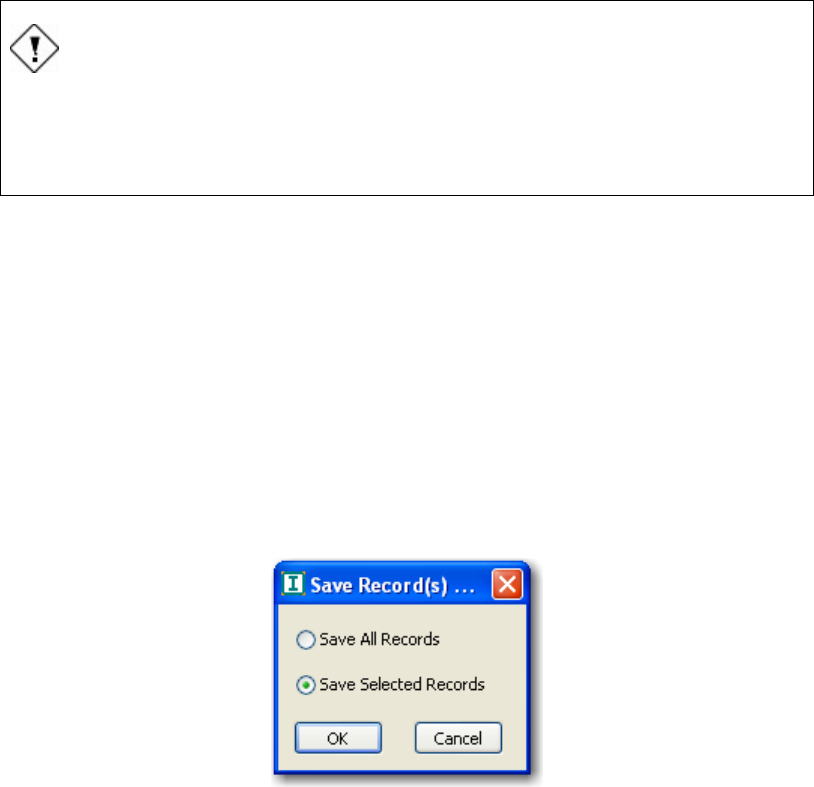
The Integrity™ System Screens User's Manual Integrity Chapter 4
70 11049 Rev.2 The System Screen
CAUTION
Test data may be lost.
When a database is restored it will be permanently replaced with the
database currently on the Integrity™ system.
Saving selected records
The Save Records feature allows a user to save some or all of the patients’ records on
the hard drive of the notebook computer, USB Flash Drive, or any other medium that is
connected to a USB port of the notebook computer.
1. Change to the Database screen.
2. Highlight the required records from the Database Patient List.
3. Select the System tab.
4. Press Save Records. The Save Record(s) dialog box (Figure 60) will appear.
5. Select Save Selected Records to save the highlighted records. (Select Save All
Records to save all test data from the entire patient record list in the Database
screen.)
6. Press OK.
Figure 60 Save records dialog box
Merging saved records to the database
Use the Merge Records to Database feature to integrate records that where saved
using the Save Selected Records function into another Integrity™ system’s database.
1. Press Merge Records to Database. A dialog box labeled Select a File will
appear.
2. Select the file containing the saved records.
3. Press OK.

Chapter 4 User's Manual Integrity The Integrity™ System Screens
The System Screen 11049 Rev.2 71
NOTE
Merge Records to Database feature was created for users who have
more than one Integrity™ system.
Organization information
Enter information about your organization in the appropriate fields. This information will
appear in the patient record printouts.

General Operating Procedures User's Manual Integrity Chapter 5
72 11049 Rev.2 Preparing for a test
Chapter 5 General Operating Procedures
WARNING
Patient injury may occur.
Testing is to be performed by a trained health-care professional licensed
by local authorities.
TIP
There are two ways to access the buttons and text fields on the screen:
1. Press Tab and Shift + Tab on the keyboard to step through the
button and text field options on the page. A button or text field will be
highlighted when it is selected.
2. Move the cursor using a pointing device such as a touchpad or
mouse.
Adjust the values using the up arrow and down arrow keys in the bottom
right corner of the Windows XP® based computer keyboard or type
directly into the fields.
ATTENTION
The Integrity™ system is supplied with default protocols (Appendix C).
Prior to clinical use, an appropriate user-defined protocol must be
created. Refer to Protocol Parameters on page 79.
Before starting a test review the functionality of the Integrity™ system screens (Chapter
4).
Preparing for a test
Distinguishing electrode clips
For the best ABR testing results, it is important to position the electrode clips properly
(Figure 61). The Amplitrode® is designed to significantly reduce the risk of electrode
misplacement. The Amplitrode® is a combination of an electrode and an AEP pre-
amplifier; which is mounted directly on the ground electrode.
The length of the lead to the inverting electrode clip is just long enough to reach from the
nasion to the nape of the neck or mastoid for 99% of the adult population. The lead
between the Amplitrode® and the non-inverting electrode clip is long enough to reach
from the nasion to the hairline for 99% of the adult population.
Refer to the Amplitrode® diagram (Figure 9) for details on the configuration of leads and
electrodes.