Wavetronix SS105V SMARTSENSOR 105 User Manual 2
Wavetronix, LLC SMARTSENSOR 105 Users Manual 2
Contents
- 1. Users Manual 1
- 2. Users Manual 2
Users Manual 2

CHAPTER 3 - Getting Started with SmartSensor Manager
CHAPTER 4 - Communication
CHAPTER 5 - Sensor Settings
CHAPTER 6 - Lane Setup
CHAPTER 7 - Data Collection
CHAPTER 8 - Tools
CHAPTER 9 - Contact Closure Communications
Using SmartSensor Manager
Part II

3
After the SmartSensor is installed, it must be congured to the roadway for
proper operation. The SmartSensor Manager (SSM) software is used to perform
this conguration.
SmartSensor Manager brings increased user-friendliness and improved
functionality to the ITS industry’s only patented auto-conguration and auto-
calibration process. The new features found in SmartSensor Manager 2.2.8
include a redesigned New Connection page, a reorganized menu bar with new
options, and expanded help capabilities to assist you in navigating SmartSensor
Manager and performing basic operations.
Installing SmartSensor Manager
Follow these steps to install SSM on a PC:
To download the install le, go to the Wavetronix website at www.1
wavetronix.com.
Click the 2 Support link near the top of the page. This will bring up a page
with icons from the three dierent Wavetronix product lines.
Click the SmartSensor icon. This will bring up drop-down menus allowing 3
you to select a product by name or part number.
Select SmartSensor 105 or WX-SS-105. A list of links will appear.4
Select the 5 SmartSensor Manager link (it will be near the top) to download
In this Chapter
Installing SmartSensor Manager
About Screen
Table of Contents
Getting Started with SmartSensor Manager
34 CHAPTer 3 o GETTING STARTED WITH SMARTSENSOR MANAGER
the SSM install le.
A File Download window will pop up. Click 6 Save.
In the Save As window, select where you would like the le to be saved, 7
then click Save.
Once you’ve downloaded the le, double-click on it to open SmartSensor 8
Manager.
About Screen
To access information about the version of SmartSensor Manager you are using,
as well as copyright information, go to Help>About SmartSensor Manager (see
Figure 3.1).
About SmartSensor ManagerFigure 3.1 –
Note
The newest version of SSM is always available on the Wavetronix website.
Table of Contents
This user guide presents the features of SmartSensor Manager in the order that
they should be used when seing up and using your sensor. If you’d like to
access information about features organized according to the way the software is
laid out, however, you can use the Table of Contents feature.
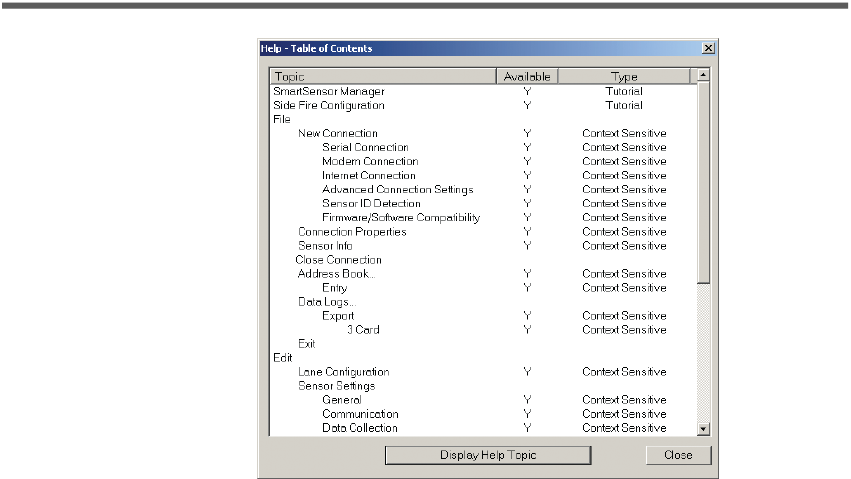
To access the Table of Contents, go to Help>Table of Contents. This will open
the Table of Contents, which is a list of help subjects organized according to the
layout of the SSM menu bar. The list is divided into the following three columns
(see Figure 3.2):
35
CHAPTer 3 o GETTING STARTED WITH SMARTSENSOR MANAGER
Table of Contents PageFigure 3.2 –
Topic –
Lists the available topics according to the setup of the software.
Availability –
Shows whether the information is available. If it is available,
this column will show a Y. If it is not, this column and the one to the right
of it will be blank.
Type –
Shows the type of information contained on the page. Pages marked
Tutorial provide overview information; pages marked Context Sensitive
have information specic to a particular function or operation.
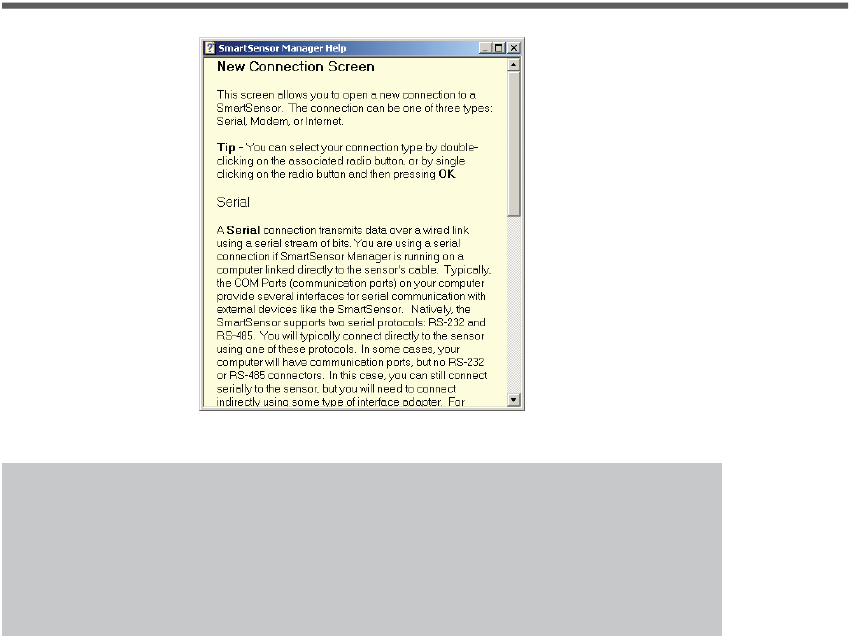
Open the desired information from the Table of Contents by either double-
clicking on the subject in the list, or by highlighting the item and clicking the
Display Help Topic buon (see Figure 3.3).
36 CHAPTer 3 o GETTING STARTED WITH SMARTSENSOR MANAGER
Help ScreenFigure 3.3 –
Note
You can also access the Table of Contents help information for a given page
by pressing the F1 key while on that page. Additionally, some pages have
question marks in the upper right-hand corner that lead to their Table of
Contents help pages.
You can access the Table of Contents page from anywhere in SmartSensor
Manager; an active sensor connection is not needed. This enables you to get help
information at any time, especially if information about connecting to a sensor is
needed.
Release Notes
The last entry in the Table of Contents is Release Notes, which, when selected,
displays information on the current and previous versions of SSM. This
information includes the version number, date of release (in YY/MM/DD format),
and the new features added and issues resolved in each release.

4
In this Chapter
Serial Connection
Modem Connection
Internet Connection
Firmware Upload
Connection Properties
Address Book
Communication Error
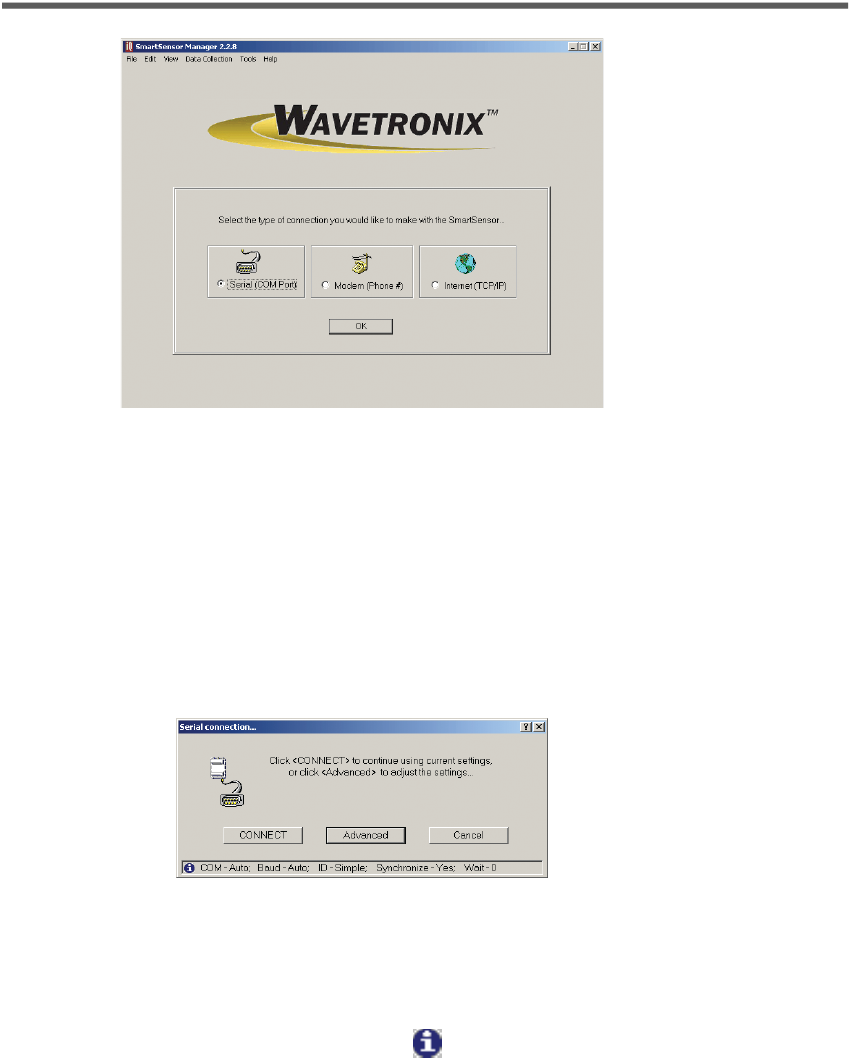
When the SmartSensor Manager application is opened, you will be taken to the
New Connection page, where you will be able to connect using one of three
connection options: serial, modem, or Internet. Choose the desired method of
connection and click OK. The Serial (COM Port) radio buon will be selected by
default (see Figure 4.1).
You can also access the three connection options at any time by going to
File>New Connection.
Note
Selecting a connection type under File>New Connection while you are
already connected will terminate your current connection. You can also
end a connection by going to File>Close Connection.
Communication
38 CHAPTer 4 o COMMUNICATION
New Connection PageFigure 4.1 –
Clicking OK opens a connection page unique to each connection option. Each
connection page contains three function buons: Advanced, Cancel, and one
that allows you to connect or dial. The advanced functions for each connection
option are specic for each option.
Serial Connection
To make a serial connection, click the Serial (COM Port) radio buon and then
OK. The message below will appear (see Figure 4.2):
Serial ConnectionFigure 4.2 –
The three action buons appear near the boom of the page. The CONNECT
buon will aempt to connect to the sensor using the current seings. The
Cancel buon cancels the action and returns you to the New Connection page.
A message bar at the boom, identied by the icon, displays the serial
seings being used for this connection. If the default seings are used, then the
message bar will display the following:
COM - Auto; Baud - Auto; ID - Simple; Synchronize - Yes; Wait - 0
39
CHAPTer 4 o COMMUNICATION
Advanced Serial Settings
Click the Advanced buon to change the Advanced Connection seings (see
Figure 4.3).
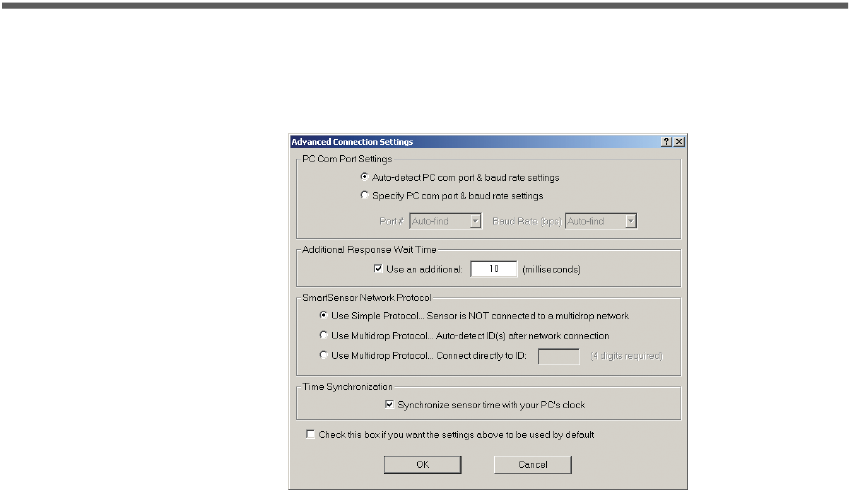
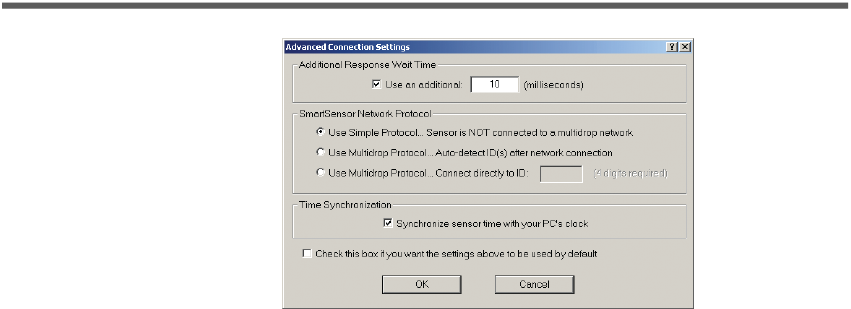
Advanced Connection SettingsFigure 4.3 –
PC Com Port Seings –
By default, SSM is set to automatically detect PC
com port & baud rate seings. To manually congure these seings, click
the Specify PC com port & baud rate seings radio buon. This will
activate the Port # and Baud Rate (bps) drop-down lists.
Additional Response Wait Time –
By default, SmartSensor Manager waits
a few milliseconds to receive a response from the sensor before timing out
and displaying a communication error message. You can add additional
milliseconds to the response wait time to give the program more time to
make a connection. Click the Use an additional: check box to activate the
milliseconds text eld and enter the number of additional milliseconds
SmartSensor Manager should wait for a response from the sensor.
SmartSensor Network Protocol –
These options can be used to identify
sensors that are part of a multi-drop network. The Simple protocol option
refers to sensors that are not part of a multi-drop environment. If the
sensor is part of a multi-drop network, SmartSensor Manager can either
auto-detect the multi-drop ID, or you can enter the four-digit ID. Clicking
the Use Multidrop Protocol… Connect Directly to ID: radio buon will
activate the text box so you can enter the ID number.
Time Synchronization –
Click the check box to have SmartSensor
automatically synchronize with the PC clock.
Click on the check box at the boom of the Advanced Connection Seings page
to use the new seings as default. Click OK to save the new seings or Cancel to
return to default; both buons will return you to the Serial Connection page. The
new seings will be reected in the message bar at the boom of the page.
40 CHAPTer 4 o COMMUNICATION
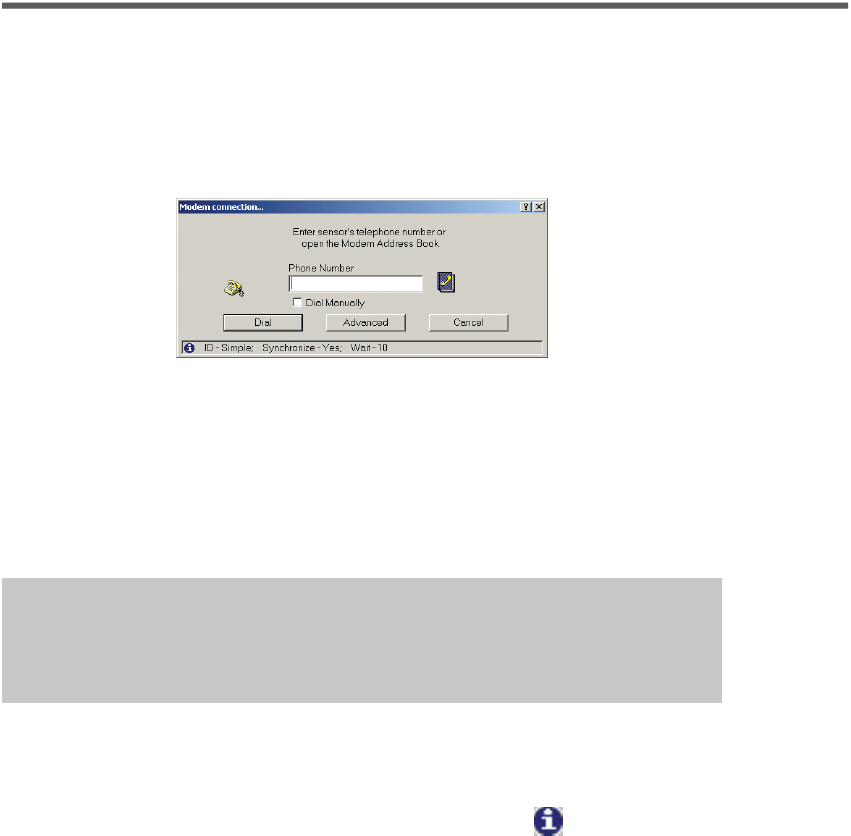
Modem Connection
Clicking the Modem (Phone #) radio buon on the New Connection page and
then clicking OK will allow you to connect to the SmartSensor using a modem.
The Modem Connection page has a text box in which you can enter the phone
number for the sensor’s modem (see Figure 4.4).
Modem ConnectionFigure 4.4 –
The phone book icon to the right of the text eld allows you to browse for
numbers previously saved in the SmartSensor Manager address book (for more
information, see the Address Book section later in this chapter). If you’d prefer
to dial manually, click the Dial Manually check box beneath the text eld, then
click on Dial. At this point you will need to pick up the telephone receiver and
manually dial the phone number.
Note
When this window is rst opened, the modem connection phone number
you used most recently will automatically appear in the text eld.
Once the number is entered, click Dial to make a connection. Click Cancel to
stop the action and return to the New Connection page.
The message bar at the boom of the page, identied by the icon, shows the
modem seings being used. If the default seings are used, the message bar will
display the following:
ID - Simple; Synchronize - Yes; Wait - 0
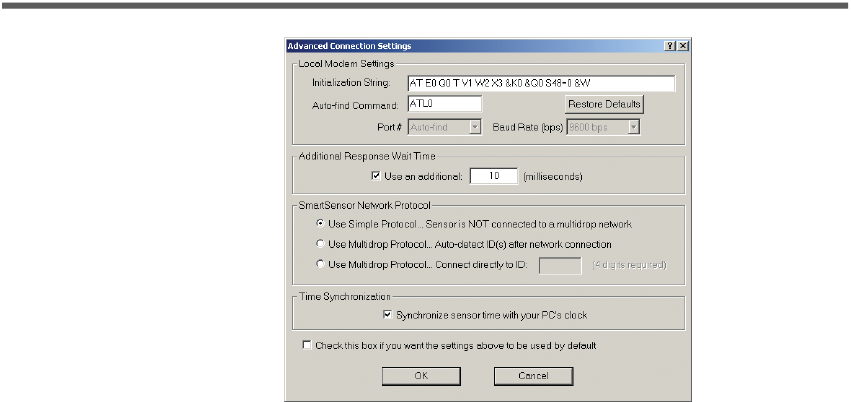
Advanced Modem Settings
The following seings are part of the modem connection’s advanced functions
and can be found by clicking the Advanced buon (see Figure 4.5):
41
CHAPTer 4 o COMMUNICATION
Advanced Modem SettingsFigure 4.5 –
Local Modem Seings –
The initialization string and auto-nd command
can be entered in their respective text elds in the Local Modem Seings
section. The Restore Defaults buon will return these functions to their
default seings. The port number and baud rate will be automatically
detected by SmartSensor Manager, so these seings cannot be changed.
Additional Response Wait Time –
By default, SmartSensor Manager waits
a few milliseconds to receive a response from the sensor before timing out
and displaying a communication error message. You can add additional
milliseconds to the response wait time to give the program more time to
make a connection. Click the Use an additional: check box to activate the
milliseconds text eld and enter the number of additional milliseconds
SmartSensor Manager should wait for a response from the sensor.
SmartSensor Network Protocol –
These options can be used to identify
sensors that are part of a multi-drop network. The Simple protocol option
refers to sensors that are not part of a multi-drop environment. If the
sensor is part of a multi-drop network, SmartSensor Manager can either
auto-detect the multi-drop ID, or you can enter the four-digit ID. Clicking
the Use Multidrop Protocol… Connect Directly to ID: radio buon will
activate the text box so you can enter the ID number.
Time Synchronization –
Click the check box to have SmartSensor
automatically synchronize with the PC clock.
Click the check box near the boom of the Advanced Connection Seings page
to use the new seings as default. The OK buon saves the new seings and
the Cancel buon cancels the changes; both buons return you to the Modem
Connection page. The new seings will be displayed in the message bar at the
boom of the page.
42 CHAPTer 4 o COMMUNICATION
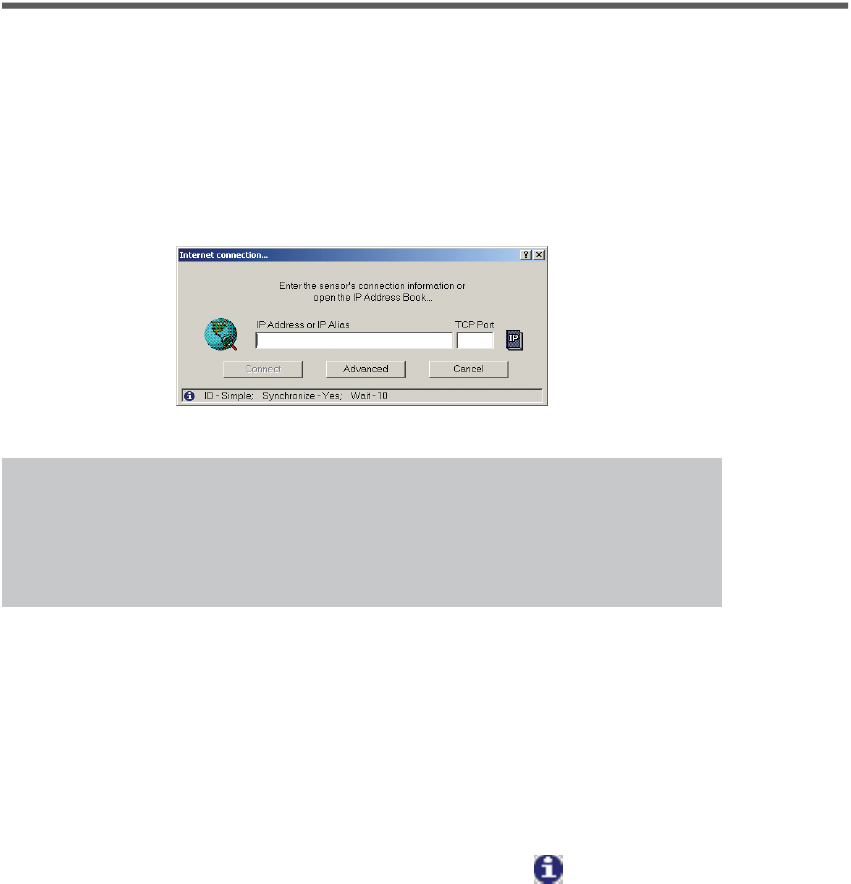
Internet Connection
The Internet (TCP/IP) option will allow you to connect to the SmartSensor
using the sensor’s IP address. The Internet Connection page has two text boxes
in which you can enter the sensor IP address and port number (see Figure 4.6).
The Connect buon does not become active until both the IP address and port
number boxes are lled. You can also establish an Internet connection using a
domain name by entering that domain name in the IP address text eld.
Internet ConnectionFigure 4.6 –
Note
When this window is rst opened, the connection properties for the
Internet connection you used most recently will automatically appear in
the text elds.
The IP icon next to the text elds allows you to browse through previously
saved addresses in the SSM address book, which is especially useful if you are
connecting to more than one sensor using an Internet connection. For more
information, see the Address Book section of this chapter.
Once the IP address and port number are entered, click Connect to make a
connection. Click Cancel to stop the action and return to the New Connection
page.
The message bar at the boom of the page, identied by the icon, shows the
Internet seings being used. If the default seings are used, the message bar will
display the following:
ID - Simple; Synchronize - Yes; Wait - 0
Advanced Internet Settings
The following seings are part of the Internet connection advanced functions
and can be found by clicking the Advanced buon (see Figure 4.7):
43
CHAPTer 4 o COMMUNICATION
Advanced Internet SettingsFigure 4.7 –
Additional Response Wait Time –
By default, SmartSensor Manager waits
a few milliseconds to receive a response from the sensor before timing out
and displaying a communication error message. You can add additional
milliseconds to the response wait time to give the program more time to
make a connection. Click the Use an additional: check box to activate the
milliseconds text eld and enter the number of additional milliseconds
SmartSensor Manager should wait for a response from the sensor.
SmartSensor Network Protocol –
These options can be used to identify
sensors that are part of a multi-drop network. The Simple protocol option
refers to sensors that are not part of a multi-drop environment. If the
sensor is part of a multi-drop network, SmartSensor Manager can either
auto-detect the multi-drop ID, or you can enter the four-digit ID. Clicking
the Use Multidrop Protocol… Connect Directly to ID: radio buon will
activate the text box so you can enter the ID number.
Time Synchronization –
Click the check box to have SmartSensor
automatically synchronize with the PC clock.
Click the check box near the boom of the Advanced Connection Seings page
to use the new seings as default. The OK buon saves the new seings and
the Cancel buon cancels the changes; both buons return you to the Internet
Connection page. The new seings will be displayed in the message bar at the
boom of the page.
Firmware Upload
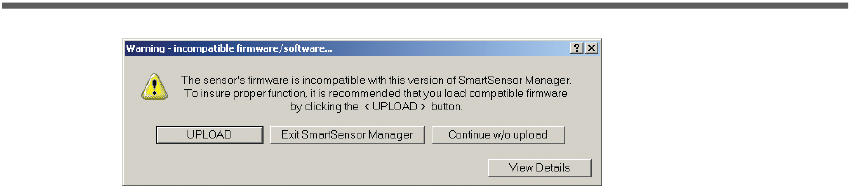
If the rmware installed onboard the SmartSensor is not the same as the
rmware bundled with the SSM software, the Firmware/Software Compatibility
screen may appear after you’ve nished connecting. This screen gives you four
options: Upload, Exit SmartSensor Manager, Continue w/o upload, and View
Details (see Figure 4.8).
44 CHAPTer 4 o COMMUNICATION
Firmware/Software Compatibility ScreenFigure 4.8 –
Upload
Selecting Upload will upload the bundled rmware to the sensor, thereby
eliminating any compatibility problems. The amount of time it takes to complete
the upload depends primarily on your connection speed, but usually varies from
1 to 10 minutes.
During the upload process, you can cancel at any time. However, if the FPGA
rmware was incompatible and the new version was not fully loaded before you
pressed Cancel, the sensor will revert back to a factory-installed version of the
FPGA rmware upon reboot of the sensor. The factory-installed version of the
FPGA rmware may not be the same as the last version you were running on
the sensor. In this case, you will need to re-upload the version of FPGA rmware
you’d like to have on the sensor (see chapter 8 for information on how to do this).
This does not occur when you cancel an upload of DSP rmware.
If the upload completes successfully, the sensor will need to reboot and restart
before the new rmware will take eect. The restart should take about 15 seconds.
Exit SmartSensor Manager
If you are unsure what to do, you should press the Exit SmartSensor Manager
buon. When you have decided what to do, you can reconnect to the sensor.
In some cases, you may have simply connected to the sensor with the wrong
version of SmartSensor Manager. Press the Exit SmartSensor Manager buon
to close your current connection and quit the program. Once you have quit this
version of SmartSensor Manager, you can then connect up with the version you
originally intended.
Continue w/o upload
If you are determined to continue using this version of SmartSensor Manager
to interact with the sensor, but have good reason not to upload the bundled
rmware, you can press the Continue w/o Upload buon. With this choice,
SmartSensor Manager nishes establishing the connection and continues normal
execution. However, depending on the nature of incompatibilities between the
sensor’s rmware and SmartSensor Manager, unexpected errors may result.
View Details
Dierences between the sensor’s rmware and the rmware bundled with
45
CHAPTer 4 o COMMUNICATION
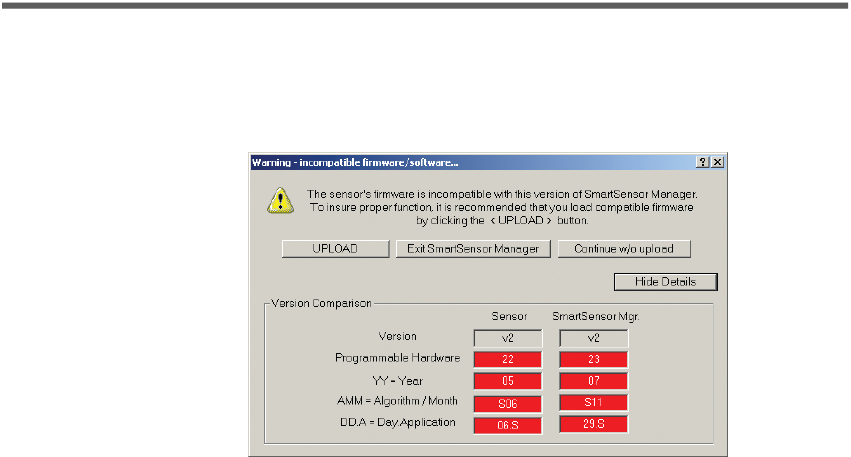
SmartSensor Manager can be viewed by clicking on View Details. The
dierences between the two versions will be highlighted in red. Knowing the
details of the detected dierences may help you make a more informed decision
about how to proceed (see Figure 4.9).
View DetailsFigure 4.9 –
Version –
Shows the software version.
Programmable Hardware –
Shows the FPGA version.
Year –
Shows the year of of the version’s release in YY format.
Algorithm/Month –
Shows the month of the version’s release in MM
format, as well as the operating mode; this will appear as an S for side re
mode and an F for forward re mode.
Day.Application –
Shows the day of the version’s release in DD format as
well as the current application; this will appear as an S for sensor or a D for
diagnostic.
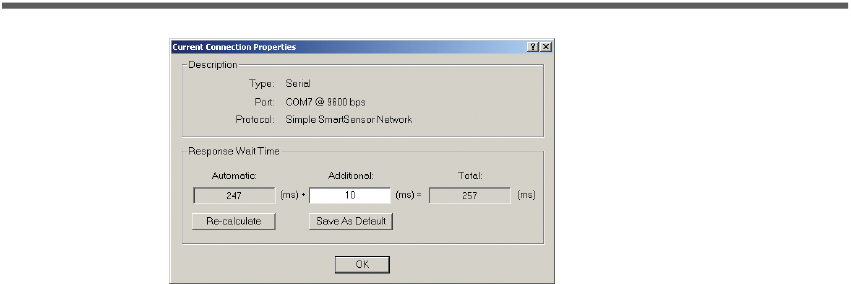
Connection Properties
Information about the current connection can be accessed on the Current
Connection Properties page, which is found under File>Properties (see Figure
4.10).
46 CHAPTer 4 o COMMUNICATION
Current Connection PropertiesFigure 4.10 –
The page shows the following information about your connection:
Type –
Shows the type of connection (serial, modem or Internet). This will
say Disconnected if the software is not currently connected to a sensor.
Port / Phone # / Address –
Displays information about the connection
endpoint. This will vary based on the kind of connection made.
Protocol –
Indicates whether sensor is on a multi-drop network or a simple
sensor network.
Response Wait Time –
Shows the wait time information for each sensor.
The rst box shows the number of milliseconds SmartSensor Manager
will automatically wait for a response from a specic sensor. SmartSensor
Manager determines this number by averaging recent sensor response
times, so this number may uctuate slightly when the Re-calculate buon
is clicked. The second box shows the number of additional seconds you
have added under the Advanced Seings page for your connection; this
number can be changed on this screen. The third box shows the total
number of seconds SSM will wait for a response. Click the Save As Default
buon to save the new seings as default.
Click OK to close the window.
Address Book
The address book can save connection information for both modem and Internet
connections, allowing you to access this information later and connect quickly
without reentering IP addresses, modem numbers and so on.
Accessing the Address Book
The address book can be accessed in two ways:
Go to
File>Address Book. This will give you two options: New and Open.
Selecting New will open a directory box where you can create a new
address book le (.abf). Creating an address book le will not immediately
open the new le.
47
CHAPTer 4 o COMMUNICATION
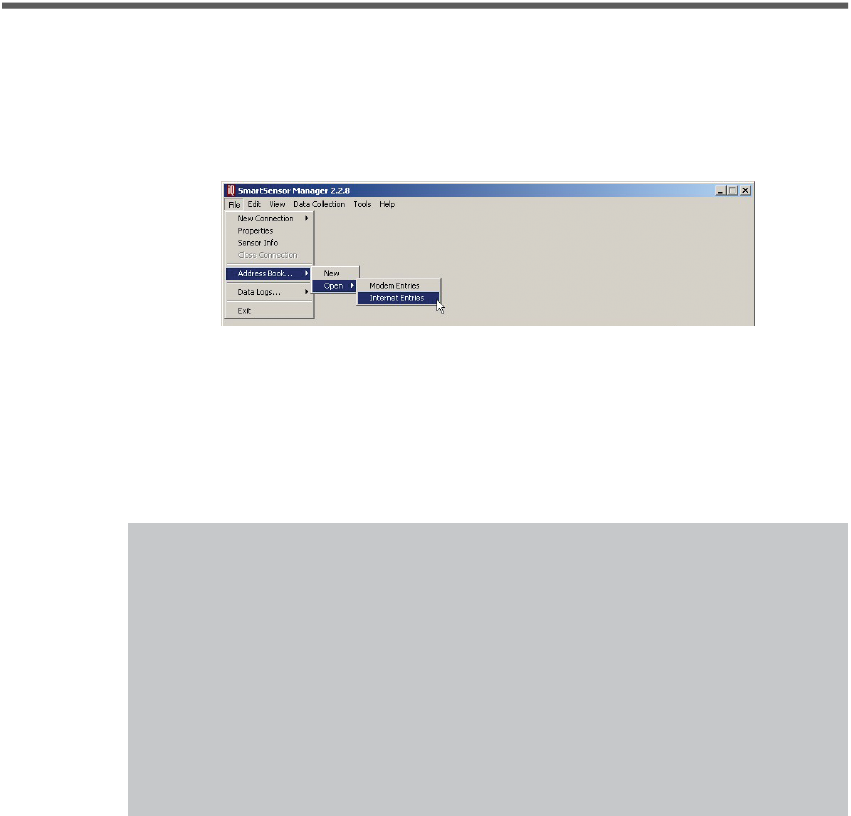
Select Open to access the most recently created or accessed address book
le. This option is divided into two choices, Modem Entries and Internet
Entries (see Figure 4.11). Selecting these will allow you to access all the
modem or Internet entries in the address book. If you have not yet created
an address book le, you will be prompted to do so now.
Accessing Address Book through the Menu BarFigure 4.11 –
Begin to make a new modem or Internet connection, either through
File>New Connection or the New Connection screen. In the connection
screen that comes up, click the book icon next to the text eld. This will
access the address book specic to that type of connection. If you have not
yet created an address book le, you will be asked to do so.
Note
By default, accessing the address book will open the address book le (.abf)
that you most recently had open. As a single .abf can store both modem
and Internet connection information, it will usually not be necessary to
have multiple address book les stored on your computer. If you do have
more than one le, however, you can switch back and forth by going to
File>Address Book>New. Instead of creating a new le, however, select the
le you wish to access and click OK. Now when you go to File>Address
Book>Open or you select the address book icon on a connection screen, it
will default to this most recently opened le.
Using the Address Book
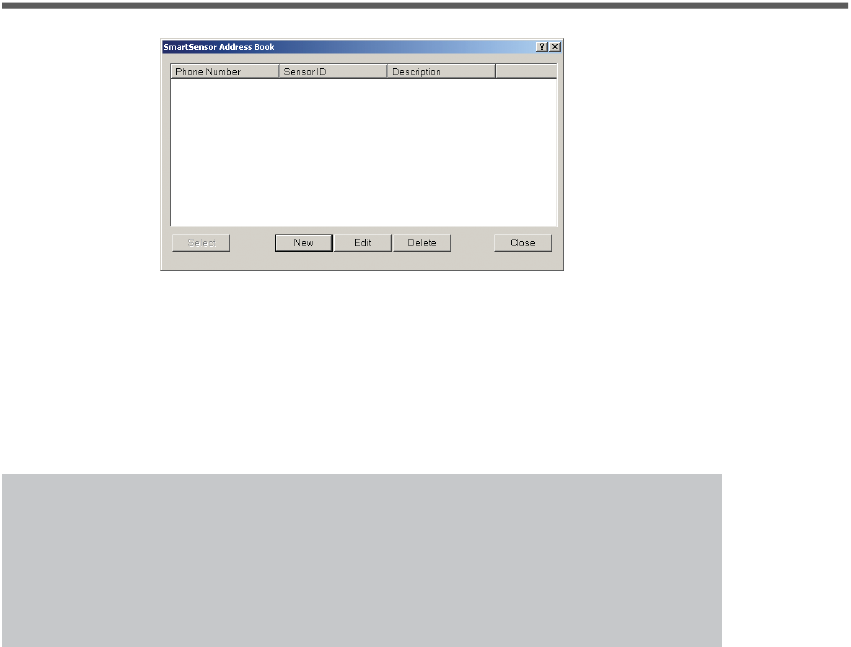
No maer how you access the address book, using it is the same. The
information available and visible will dier, however, based on what kind of
connection you’re making. If you’re looking at modem entries, the screen will
display three columns: Phone Number, Sensor ID and Description (see Figure
4.12). The Internet entries have ve columns: IP Alias, IP Address, TCP Port,
Sensor ID and Description.
48 CHAPTer 4 o COMMUNICATION
Address Book for Modem EntriesFigure 4.12 –
Use the buons in the address book to work with entries and make connections:
Select –
Selects an entry to use to connect. When you have chosen the
entry you would like to use to connect, highlight it in the list and click
Select. This will close the address book and enter the desired information
into the connection page.
Note
When accessing the Address Book screen using the menu options, the
Select buon is disabled. You will be able to edit the address book entries,
but will not be able to connect unless you use the Modem or Internet
Connection Screens.
New –
Creates a new entry. Select New and enter the desired information.
In a modem connection, this is the phone number of the modem, the sensor
ID number and a description of the connection for your own information.
If you are adding an Internet connection entry, you have two options for
the address: an IP address or a domain name. With both options you must
also specify the TCP port number. If you use a domain name, the domain
name must be entered as the IP alias and you should not enter an IP
address, since the domain name may resolve to one or more dynamic IP
addresses. When you enter both an IP address and an IP alias, SmartSensor
Manager will add an entry to the Windows HOSTS le on your computer.
In this case, the IP alias can be a simple text string (or a domain name that
is tied to a xed IP address). You may want to use a simple text string to
help identify IP addresses that do not have a domain name.
Edit –
Allows you to edit the information contained in a highlighted entry.
Delete –
Deletes the selected entry.
Close –
Exits out of the address book.
49
CHAPTer 4 o COMMUNICATION
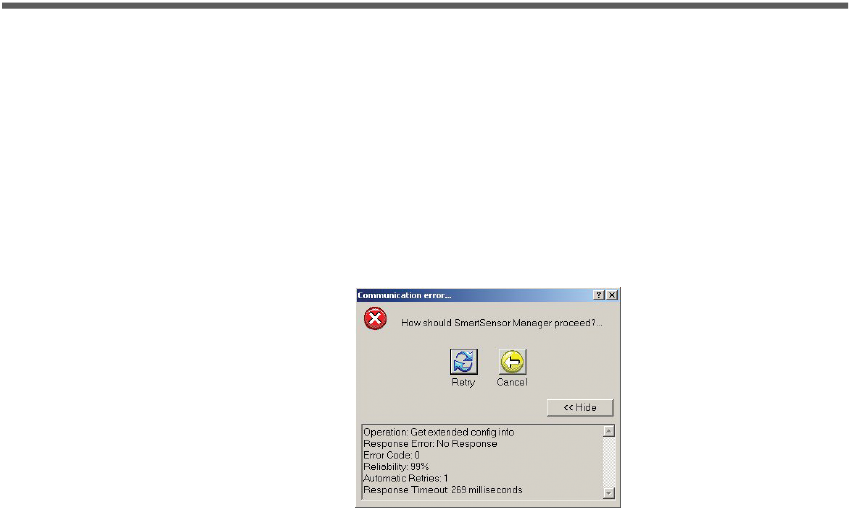
Communication Error
The Communication Error screen will appear if SmartSensor Manager can no
longer communicate with the sensor. If such an error occurs, the Communication
Error screen will give you the following options (see Figure 4.13):
Retry –
Tells SSM to try to communicate with the sensor again.
Cancel –
Stops the current operation as well as other operations that may
be in process.
Details –
Shows error details.
Communication Error with Details ScreenFigure 4.13 –
Clicking the Details buon will access additional information specic to this
problem:
Operation –
Shows the operation SSM is trying to accomplish.
Response Error –
Shows the response error SSM has encountered.
Error Code –
Gives the error code related to the specic error.
Reliability –
Indicates the percentage of communication aempts that
were successfully completed.
Automatic Retries –
Shows the number of times the SSM automatically
aempts to reconnect before showing the communication error screen.
Response Timeout –
Displays the total number of milliseconds that SSM
waited before timing out the requested operation.
If you retry multiple times to communicate with the sensor and it still doesn’t
work, the problem can often be xed by editing the additional response wait time,
found in the Advanced Seings page for your connection.
In this Chapter
Sensor Info
Sensor Settings
Sensor Date & Time
Operating Mode
There are several ways to access and change sensor seings using SSM.
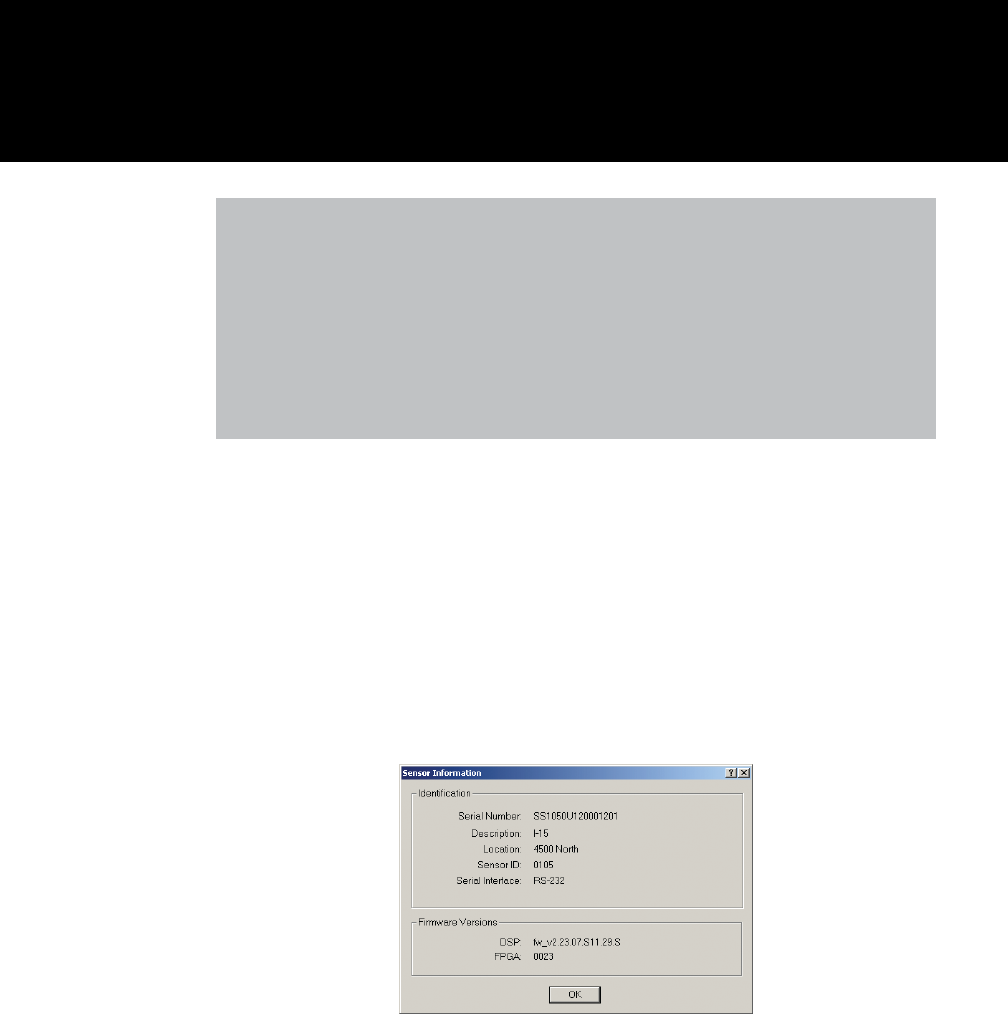
Sensor Info
Going to File>Sensor Info opens the Sensor Information page, which displays
the properties unique to each sensor (see Figure 5.1).
Sensor InformationFigure 5.1 –
Although the information cannot be edited, there must be an active connection
to view the Sensor Information page. The page is divided into two sections,
Identication and Firmware Versions.
5
Sensor Settings

52 CHAPTer 5 o SENSOR SETTINGS
The Identication section information includes the following:
Serial Number –
Shows the 16-digit serial number given to the sensor by
the manufacturer. It can be used to uniquely identify the sensor.
Description –
Shows the 32-character, user-created sensor description as
set using the Sensor Seings screen (for more information, see the Sensor
Seings section later in this chapter). It is used to describe the sensor and/
or the installation site.
Location –
Displays the 32-character, user-created location description as
set using the Sensor Seings screen (for more information, see the Sensor
Seings section later in this chapter). It is used to describe the location of
the sensor.
Sensor ID –
Shows the 4-digit numeric string used to identify the sensor
on a multi-drop network. You can set this ID number using the Sensor
Seings screen (for more information, see the Sensor Seings section later
in this chapter). The SmartSensor Multi-drop protocol uses the sensor ID to
uniquely address sensors on a shared bus.
Serial Interface –
Indicates which of the sensor’s four ports it is using to
communicate. The four ports are RS-232, RS-485, EXP-A, and EXP-B.
Note
The two expansion ports (EXP-A and B) are currently not available for use.
The Firmware Versions section shows on which versions of DSP (Digital Field
Processing) and FPGA (Field Programmable Gain Amplier) the sensor is
operating.
Sensor Settings
You can both view and change certain sensor options and information in the
Sensor Seings page. To access this page, go to Edit>Sensor Seings. If no
sensor connection is active, selecting this will open a directory box, allowing you
to nd SmartSensor conguration (.ssc) les that are saved on your computer.
You can also use this directory box to create a new .ssc le.
The Sensor Seings page is divided into three tabs: General, Communication
and Data Collection. Only the General and Communication tabs will be
discussed here; the Data Collection tab will be discussed in chapter 7.
General Tab
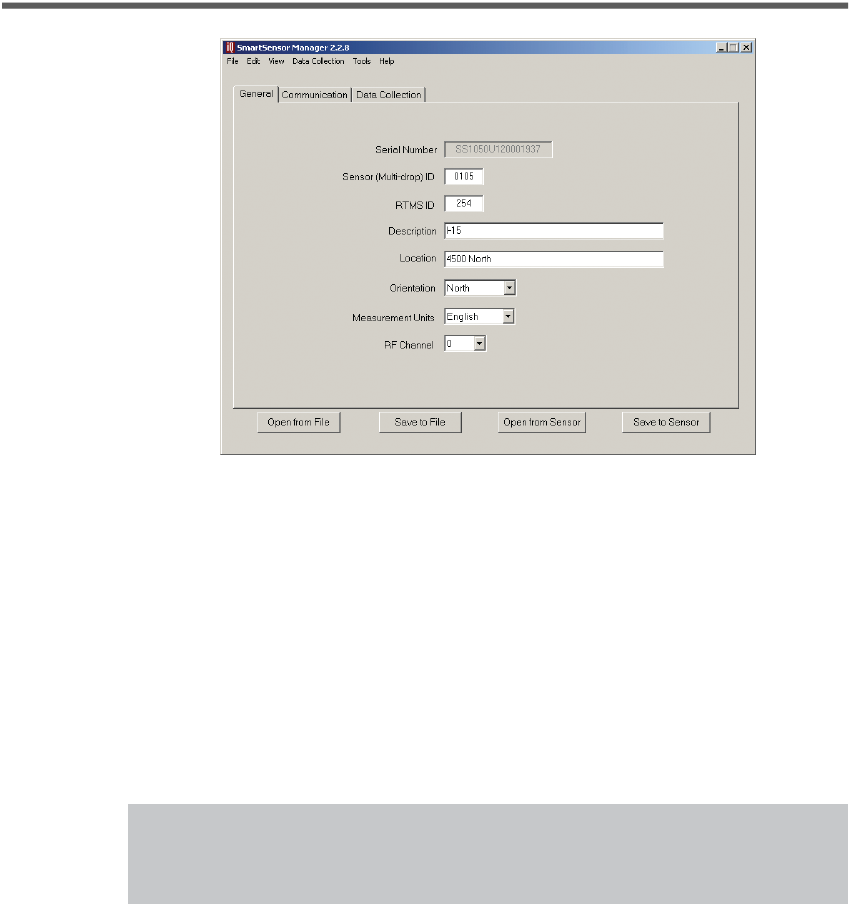
The General tab allows you to edit the following seings (see Figure 5.2):
53
CHAPTer 5 o SENSOR SETTINGS
General TabFigure 5.2 –
Serial Number –
Shows the 16-digit serial number given to the sensor by
the manufacturer, used to uniquely identify the sensor. This is the only
seing on this screen that cannot be edited.
SmartSensor (Multidrop) ID –
Allows you to enter a 4-character ID
number. This number is used to identify the sensor on a multi-drop
network. Each sensor on such a network must have a unique ID number.
This number is referred to on the Sensor Information page as the sensor ID.
RTMS ID –
Lets you change the RTMS ID. The SmartSensor has been
designed to utilize other protocols for those cases when there might
already be a project built around another type of sensor. If you choose to
communicate using the RTMS protocol, all you need is the RTMS ID.
Note
The RTMS ID number 13 cannot be used for polled communications.
Description –
Allows you to create a description of the sensor and/or
installation site for identication purposes. The description may be up to 32
characters long and will be displayed on the Sensor Information page.
Location –
Allows you to enter the location of the sensor for identication
purposes. The location may be up to 32 characters long and will be
displayed on the Sensor Information page.
Orientation –
Lets you select, from a drop-down menu, the direction
the sensor is facing. The orientation does not aect sensor operation or
alignment and is simply for your information.
54 CHAPTer 5 o SENSOR SETTINGS
Measurement Units –
Allows you to choose between English and metric
measurements. Metric units are entered in decimeters so that the metric
and English units can be converted more accurately.
RF Channel –
This allows you to assign specic RF channels to sensors
that are installed in close proximity to each other to prevent the sensors
from interfering with each other.
Communication Tab
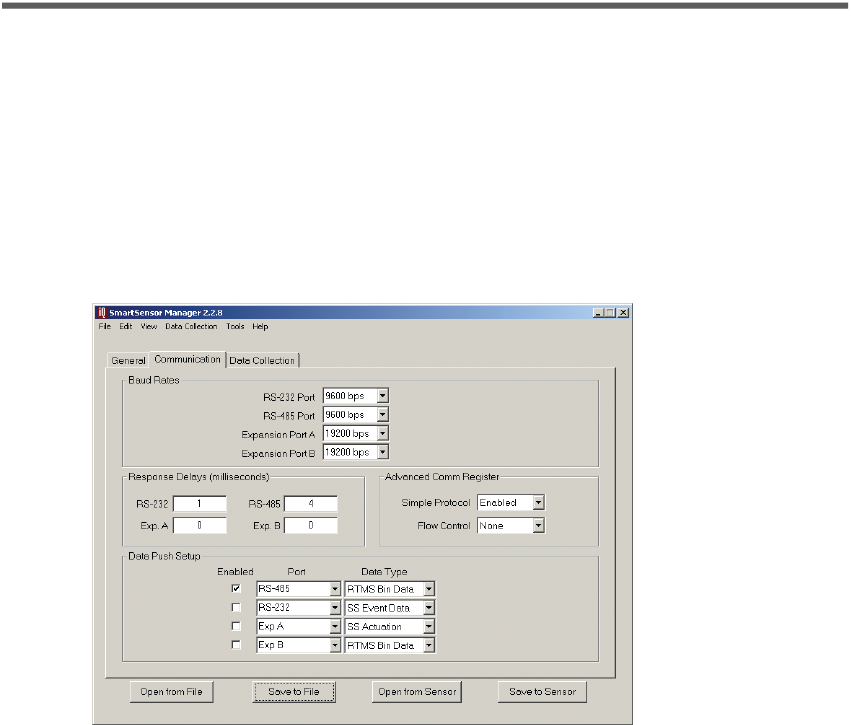
The Communication tab allow you to change the following seings (see Figure
5.3):
Communications TabFigure 5.3 –
Baud Rates –
Allows you to set the baud rate for the each of the sensor’s
four connection ports. To change the baud rate, simply click on the drop-
down menu and select the desired rate. Besides the standard RS-232 and
RS-485 ports, there are also two other expansion ports. These expansion
ports are currently not available for use.
Response Delays (milliseconds) –
Allows you to change the number of
milliseconds that the sensor will delay before responding. This is useful if
you ever aach the sensor to communication equipment that cannot handle
the speed with which the sensor responds to message requests. You can
change the response delay for each of the four connection ports separately
by entering the desired number of milliseconds. If you are not able to
determine the amount of delay required by consulting the communication
equipment’s documentation, you will need to determine this number by
trial and error.

55
CHAPTer 5 o SENSOR SETTINGS
Note
If you increase the response delay, you should also increase the additional
response wait time that SmartSensor Manager uses when communicating
to the sensor.
Advanced Comm Register –
The Advanced Comm Register on the
SmartSensor holds two seings: Simple Protocol and Flow Control.
The rst seing selects whether Simple SmartSensor protocol is enabled
or disabled. By default Simple protocol is enabled. Networks comprised of
simply one sensor can use the Simple protocol. However, if there is more
than one sensor on the network, this protocol can cause communication
messages to be broadcast unintentionally. These messages can result in
collisions and even ongoing chaer between sensors on a multi-drop
network. If you are seing up a multi-drop network of sensors, you should
connect to them one by one and disable Simple protocol. To disable Simple
protocol, select Disabled from the drop-down list. Simple protocol must
also be disabled if you plan on using RTMS protocol.
The second seing selects whether ow control handshaking is enabled
or disabled on the sensor. Flow control is a hardware handshaking
protocol used by some communication equipment. If your communication
equipment requires handshaking, you will need to enable this by selecting
RTS/CTS from the drop down menu.
Note
If you have established a serial connection, enabling RTS/CTS handshaking
will cause you to lose communication with SmartSensor Manager unless
you rst short the RTS/CTS lines on the sensor.
Data Push Setup –
Allows you to enable and congure data push.
SmartSensor communicates trac data in either Data Polled mode or
Data Push mode. By default the SmartSensor is in Data Polled mode. In
Data Polled mode, a trac data collection device must periodically poll
the sensor to retrieve the most recent information. Data Polled mode is
preferred if multiple sensors share the same data bus, so that the data
transmied over the connection will not be corrupted or lost by collisions.
In Data Push mode, the sensor is set up to transmit any new data it
generates automatically (without any prompting by the collection device).
In Data Push mode there is no arbitration of the data bus, and data
messages sent by dierent sensors can collide, causing information to be
56 CHAPTer 5 o SENSOR SETTINGS
lost. However, if there is only one sensor connected to the data bus, there
should be no collisions in data push mode.
Before you change to Data Push mode, select the desired port and data
type from the drop-down lists provided. You can set the sensor up to push
data over more than one port. You can also set it up to push multiple types
of data over the same port. To change to Data Push mode, click on the
Enabled checkbox next to each one of the four ports you wish to enable.
Data Collection Tab
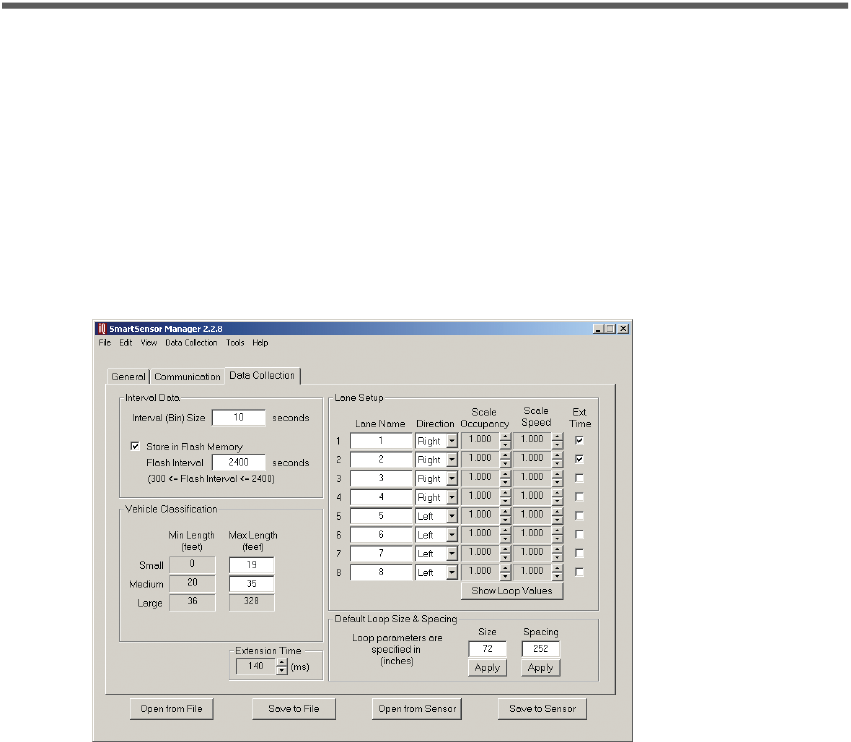
The Data Collection tab allows you to edit the following seings (see Figure 5.7):
Data Collection TabFigure 5.4 –
Interval Data –
Allows you to specify the length of your intervals as
well as how those intervals are stored. The interval refers to the time (in
seconds) that trac data is aggregated (minimum interval is ve seconds).
Interval data is stored directly into the sensor’s SRAM memory, which is
volatile and will not persist after a power cycle. The number of intervals
is limited to 246. You can also tell the sensor to move the data from SRAM
to the sensor’s ash memory by clicking the Store in Flash Memory check
box. This protects the data because ash memory persists after power
cycles. The capacity in ash is about ten times greater than SRAM. If the
Store in Flash Memory box is not checked, the interval data will remain
in SRAM until it is overwrien. Flash storage management features are
explained in greater depth in the Data Collection Setup section of chapter 7.
Vehicle Classication –
Lets you customize vehicle classications by
length. Enter the maximum length amounts for small and medium
class vehicles in the active text boxes and SmartSensor Manager will

57
CHAPTer 5 o SENSOR SETTINGS
automatically determine the minimum lengths.
Lane Setup –
Allows you to change specic lane information such as
lane name and direction of travel, for your own information and for
identication.
You can also change scale occupancy (loop size) and scale speed (loop
spacing). The entry in these columns for each lane represents the manual
scaling applied to the occupancy/duration and speed data. The occupancy
scale factor is the ratio of each lane’s loop size to the default loop size.
The speed scale factor is the ratio of each lane’s loop spacing to that of the
default loop spacing. You can modify the scale factors by clicking on the
arrows to the right of each box.
Note
Interval occupancy is derived from event duration, so the occupancy
scale factor scales both the duration and the occupancy. Additionally, the
length-based event classication is derived from the event duration and
the event speed, so scaling either the speed or the duration will impact the
classication results.
The Show Loop Values buon allows you to toggle quickly between the
loop values and the corresponding scale factors.
Default Loop Size & Spacing –
Lets you enter default values which, when
applied, will automatically update the information for each lane. The terms
“loop size” and “loop spacing” are used since in many cases you will be
using these values to scale the occupancy and speed to match those of dual
loops. The loop size and loop spacing (space between loops) are specied
in inches or centimeters.
Extension Time –
Allows you to increase the time, in milliseconds, on
the countdown timer that the sensor uses in detection. Adding time can
help reduce the occurrence of vehicles with trailers being detected twice.
However, increasing the time also increases the likelihood that one vehicle
being tailgated by another will result in a single detection.
Note
The lane name, lane direction, and interval data seings on this page
can also be changed on other pages. The rest of the seings can only be
changed here.
Saving and Restoring Sensor Settings
Once you have made changes to your seings, use the four buons at the boom
58 CHAPTer 5 o SENSOR SETTINGS
of the screen to save the changes from all three tabs. You can also use these
buons to discard all your changes and return to the old seings.
Save to Sensor –
Saves the changes you’ve just made to the sensor. If you
do not push this buon after making changes, they will be lost when you
navigate away from this page.
Open from Sensor –
Returns all seings to those currently saved on the
sensor.
Save to File –
Saves the seings currently entered in the Sensor Seings
screens to a SmartSensor conguration le (.ssc) on your computer. This
seing can be used to back up your seings; additionally, if you’re not
connected to your sensor, you can change seings, save them to a le, and
use the le to update your sensor once you’re connected again.
Note
Using the Save to File function does not save the changes to your sensor.
If you want to update and then back up your sensor, you need to use both
Save to File and Save to Sensor.
Open from File –
Restores seings from an existing .ssc le. Once the
seings have been restored, you must click Save to Sensor if you want the
sensor updated with the restored seings.
Note
Return to this page to back up your sensor after you’ve completed the steps
to congure your lanes and data collection.
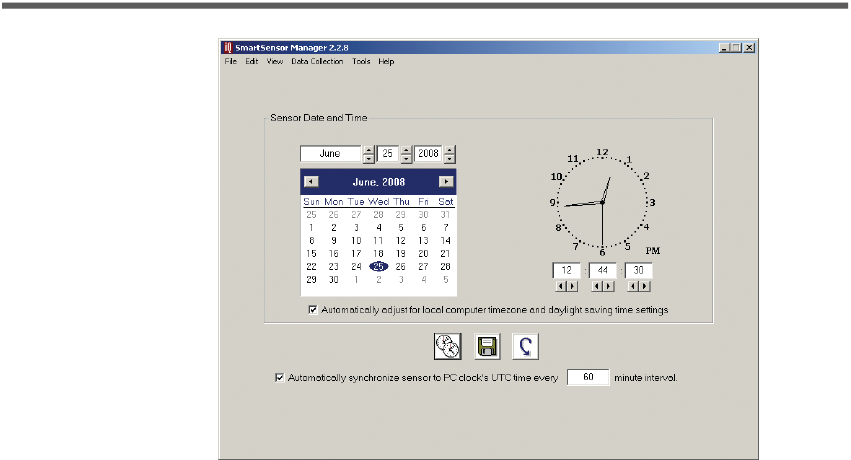
Sensor Date & Time
To ensure that the data collected is timestamped correctly, use the Sensor Date &
Time screen, located at Edit>Sensor Date & Time (see Figure 5.5).
Change the date by selecting the correct date from the drop-down lists (month,
day, and year) or use the calendar to scroll to the correct date. Change the time
by selecting the correct time (hour, minutes, and seconds) from the drop-down
lists.
Click the check box below the calendar to automatically adjust for local computer
time and daylight savings time seings. The check box at the boom of the page
will automatically synchronize sensor to PC UTC time at a certain interval you
can dene in the text eld.
59
CHAPTer 5 o SENSOR SETTINGS
Sensor Date & TimeFigure 5.5 –
The Sensor Date & Time page includes the following three function buons:
Clocks icon –
Performs a one-time synch of the sensor to the PC’s UTC
time.
Disk icon –
Saves the new seings.
Arrow icon –
Undoes the changes.
Operating Mode
Selecting Edit>Operating Mode allows you to switch between Side Fire and
Forward Fire operation modes. While Side Fire mode is standard, Forward Fire
mode allows you to detect trac from a forward-facing position, such as when
the sensor is mounted on a bridge across the road. With this setup, however,
the sensor can only detect one lane at a time and cannot detect cars until after
they’ve passed the mounting location. If you’re interested in a forward-facing
sensor, consider the SmartSensor Advance, which can detect vehicles in multiple
lanes up to 500 ft. (152.4 m) in advance.
If you would like to use the SmartSensor 105 in Forward Fire mode, call
Wavetronix Technical Services at 801-764-0277 for assistance and further
instruction.

In this Chapter
Lane Conguration – Automatic
Lane Conguration – Manual
Verifying Lane Conguration
Seing up lanes is simple in SmartSensor Manager because the software will
do it for you with the click of a buon. Additionally, if SmartSensor Manager is
unable to correctly congure due to barriers, obstacles or irregular lanes, you
can use the Manual Conguration mode to adjust.
Note
Free-owing trac in each lane is required for proper conguration. Light
or sporadic trac may result in slower congurations.
Lane Conguration – Automatic
Follow the steps below to automatically congure lanes in SmartSensor
Manager:
Select 1 Edit>Lane Conguration.
Once the Lane Conguration page opens, click on the 2 Automatic buon.
If you would like to set constraints on the conguration through the 3 Edit
Range Blinders or Manage Gain buons, do so now. For more information
on these options see the sections on them in the following pages.
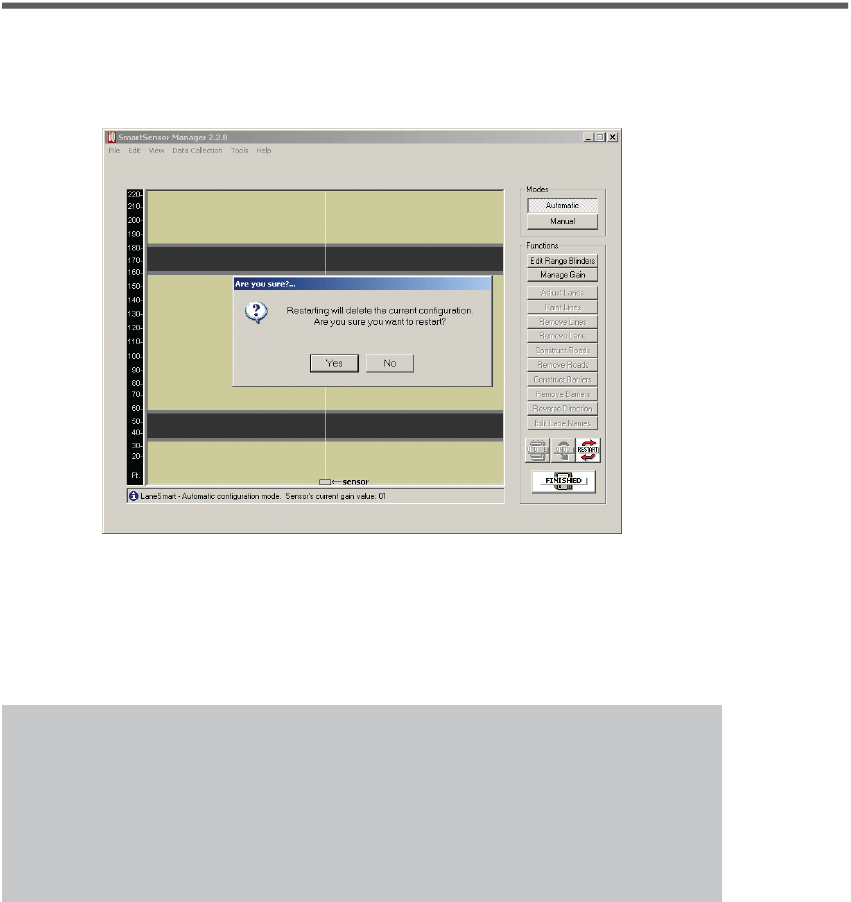
Click the 4 Restart buon at the lower right.
Conrm the conguration restart by clicking 5 Yes in the box that appears
6
Lane Setup
62 CHAPTer 6 o LANE SETUP
(see Figure 6.1). SmartSensor Manager will now automatically begin
detecting and conguring lanes, and the screen will show a visual
depiction of the lanes and vehicle detections in real time.
Conrming Automatic Lane CongurationFigure 6.1 –
After the lanes have been detected and congured correctly, save the 6
conguration by clicking the Finished buon. The time required for
conguration depends on the volume of trac present in the lanes, but is
typically only a few minutes.
Note
After clicking the Finished buon, wait for one minute before turning
o the sensor. During this time the sensor is completing adjustments
of the conguration thresholds. Typically this is not a problem because
verication may be needed in Trac View after clicking Finished. The
verication process will normally be longer than one minute.
Edit Range Blinders
Range blinders are an optional seing available in Automatic mode. Using range
blinders will narrow the search area of the automatic lane conguration process
(range blinders have no eect in Manual Conguration mode), allowing you to
congure faster and avoid conguring undesired lanes such as frontage roads.
Use the steps below to successfully edit the range blinders:
Click the1 Range Blinders buon. Red bars (range blinders) will appear at
the top and boom of the roadway display and any previously displayed
roadways will be cleared.

63
CHAPTer 6 o LANE SETUP
Click on one of the range blinders and drag its edge to the desired range 2
(refer to the range markers on the left side of the screen).
Repeat Step 2 for the other range blinder if necessary.3
Click the4 Restart buon to apply the range blinders. When the range
blinders are applied, they will turn from a red color to a dark khaki color.
To cancel and use the default ranges, or to start over, or click the Range
Blinders buon again.
After the lanes are detected and congured correctly, save the 5
conguration by clicking the Finished buon. After clicking the Finished
buon, the SmartSensor will begin storing vehicle data. The time required
for conguration depends on the volume of trac present in the lanes, but
is typically only a few minutes.
Note
After clicking the Restart buon, detected vehicles (represented by moving
blue rectangles) will be displayed only if a range blinder does not cover
the lane center. If the edge of a range blinder lies between two lanes of the
same road, some manual adjustment of the gray line (usually reserved to
indicate a road shoulder) may need to be made. The edge of the road shown
in the display is really a lane divider.
Manage Gain
Managing gain is an optional seing available in Automatic mode. During the
automatic conguration process, the sensor’s gain is automatically adjusted in
order to best process the radar signal at that particular installation site. In some
locations the reections from vehicles may be stronger than in other locations,
and the gain will need to be lowered in order to optimize detection accuracy.
For the gain to be optimally adjusted by the automatic process, the sensor needs
to be:
Aligned almost exactly perpendicular to all the lanes of the roadway.
Still conguring while several large vehicles (that return strong reections)
pass through the beam in the lanes closest to the sensor.
In some locations, and at particular times of the day, it may be dicult to meet
these two requirements. In these cases, click the Manage Gain buon to change
the starting point of the automatic gain adjustment process. The default starting
point is a gain value of 5. The adjustment process never increases the gain value;
it only decreases it. The starting point is therefore also the maximum gain value.
A new starting point will only be applied after clicking the Restart buon.
During the automatic conguration process, the sensor’s current gain value is
displayed in the status bar at the boom of the screen.
64 CHAPTer 6 o LANE SETUP
No adjustments to the gain can be made once the conguration is saved to the
sensor. However, the detection thresholds congured for the sensor during the
automatic conguration process are based upon the current level of the gain and
will continue to adapt for up to one minute after clicking the Finished buon.
Note
The default starting point of 5 is also the largest starting point allowed. If
you enter a value larger than 5 the default starting point of 5 will be used. If
you are managing the gain, you should generally change the starting point
to a 3 or 4.
Lane Conguration – Manual
If the sensor is unable to automatically congure itself to your satisfaction, you
can manually congure it by adding, removing or adjusting lanes, lane dividers
and lane centers.
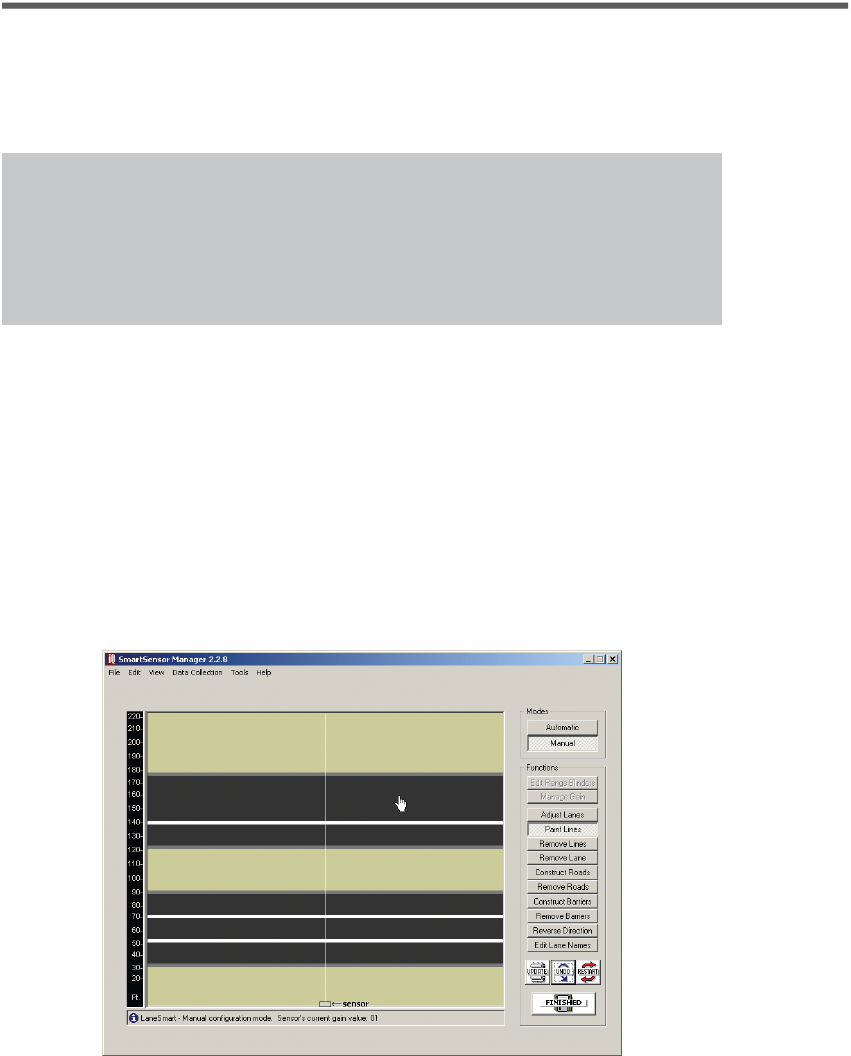
To make changes in Manual mode:
With the Lane Conguration page open, select the 1 Manual buon; the
buons in the toolbar on the right of the screen will change from gray to
black (see Figure 6.2).
Manual Lane CongurationFigure 6.2 –
Selecting a buon in the toolbar will allow you to make changes using the 2
roadview window on the left.
65
CHAPTer 6 o LANE SETUP
Once you’ve made the necessary adjustments, hit 3 Finished to save your
changes.
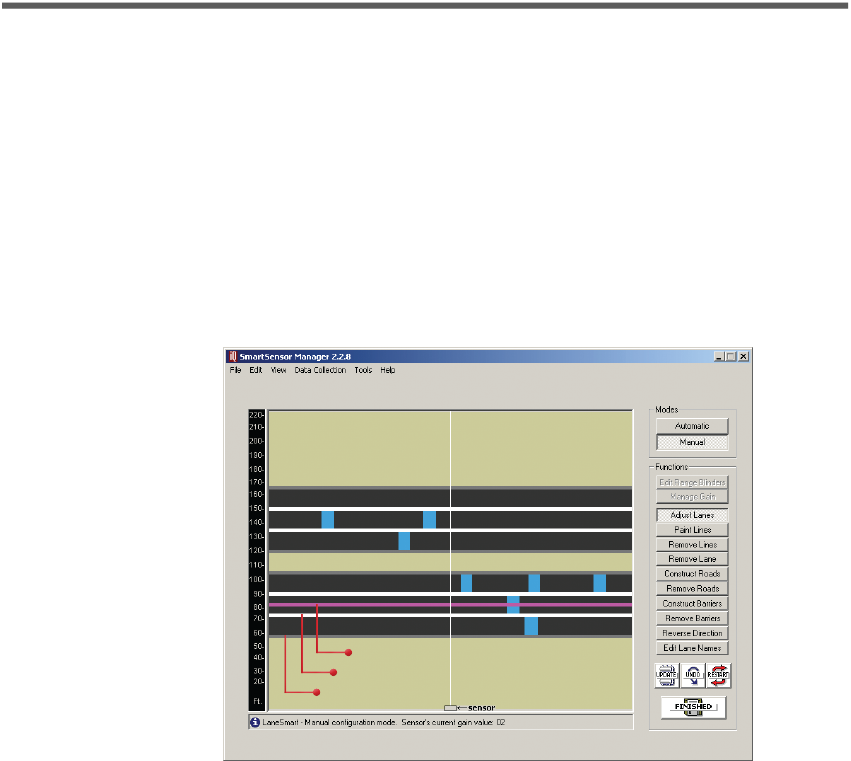
Adjust Lanes
The Adjust Lanes buon allows you to click your cursor on any visible shoulder
(gray line), lane divider (white line) or lane center (pink line) and drag it to the
desired position (see Figure 6.3). The cursor will change from an arrow to a
hand when it is positioned over a “draggable” line. Lane centers (pink lines) only
appear when the cursor is placed directly over them. To adjust the lane center,
click and hold the mouse and move the line up or down on the screen, but only
within the area between the shoulders. Notice that shoulders, dividers, or centers
cannot be dragged past each other.
Shoulder
Lane Divider
Lane Center
Adjusting LanesFigure 6.3 –
Paint and Remove Lines
The Paint Lines buon allows you to add new lanes by inserting lane dividers in
paved (black) areas. SmartSensor Manager allows a maximum of eight lanes.
Again, the cursor will change from an arrow to a hand when it is positioned
directly over a location where it is possible to paint a lane divider. When the
cursor appears as a hand, click and a white line will appear.
To remove a lane divider, click on the Remove Lines buon, select the white line
you want to remove and click the left mouse buon (again, wait for the cursor to
become a hand).
Remove Lane
The Remove Lane buon allows you to remove entire lanes by moving the

66 CHAPTer 6 o LANE SETUP
cursor to the desired lane. When the arrow changes to a hand, click and the
selected lane will disappear.
Construct and Remove Roads
To insert a new road, click on the Construct Roads buon and select a location
anywhere in the background (khaki-colored) area. Make sure the cursor appears
as a hand and then click to draw the road.
Because new roads are initially drawn with an upper shoulder line, a centerline
and a lower shoulder line, you will usually need to adjust your road to the
desired width using the Adjust Lanes function.
To remove an entire road, including all lanes, click on the Remove Roads buon
and click on the road you wish to remove.
Construct and Remove Barriers
Constructing a barrier or median is essentially the act of dividing a single road
into two separate roads. SmartSensor Manager denes a barrier or median as
two adjacent shoulder lines or two shoulder lines with only background (khaki-
colored) areas in between them.
To construct a barrier or median, click on the Construct Barriers buon and
move the cursor to the paved area where you want to insert the barrier. When
the cursor changes from an arrow to a hand, click and the barrier will appear.
Initially, the new barrier is only two shoulder lines wide. To widen the barrier,
use the Adjust Lanes feature as explained earlier.
You may also remove a barrier, or convert two roads into a single road, by
clicking on the Remove Barrier buon and selecting the barrier you wish to
delete.
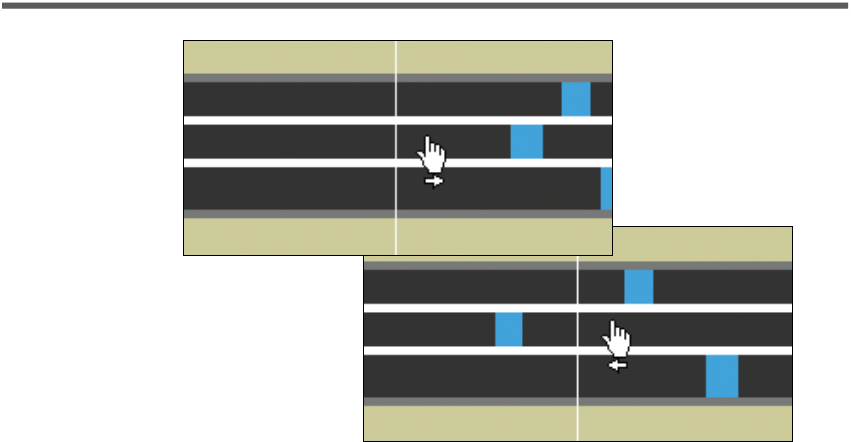
Reverse Direction
Once the conguration process has been completed, you will notice that
SmartSensor Manager shows all detected vehicles moving in the same direction.
The Reverse Direction buon enables you to change the direction of travel
depicted in SmartSensor Manager so that each lane reects the actual direction
traveled by detected vehicles.
To do this, press the Reverse Direction buon and move the cursor over the lane
you wish to change. Once the cursor is in place, the cursor will again change
from an arrow to a hand and a tiny arrow will appear below the hand to indicate
the current direction of that lane (see Figure 6.4).
67
CHAPTer 6 o LANE SETUP
After
Before
Reverse DirectionFigure 6.4 –
Click the mouse, and the arrow will reverse direction to verify the change has
occurred. Using the Reverse Direction buon only aects the SmartSensor
Manager display, not the sensor or any detections, and is useful for verifying
performance.
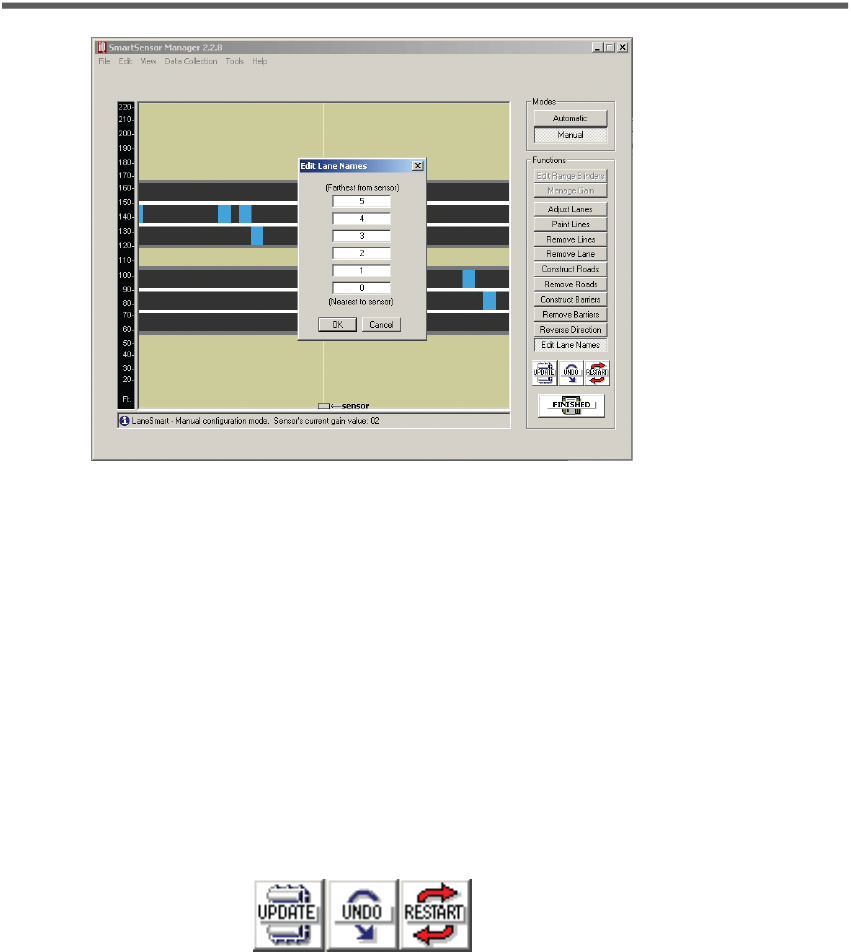
Edit Lane Names
By default, the SmartSensor identies the lanes it congures as lane 1 up to lane
8, where lane 1 is located closest to the sensor. However, you may wish to assign
lane numbers dierently with the Edit Lane Names window (see Figure 6.5).
68 CHAPTer 6 o LANE SETUP
Editing Lane NamesFigure 6.5 –
To do this, click on the Edit Lane Name buon and the Edit Lane Names
window will appear. Highlight the current lane name by double-clicking on it,
then type in the lane’s new alphanumeric identication of up to eight characters.
Lane names can also be changed by going to Sensor Seings and clicking on the
Data Collection tab (see chapter 7 for more information).
Saving the Conguration
Once all congurations are completed, the changes must be updated in the
SmartSensor’s ash memory (lane changes won’t take eect until after the
sensor has been updated). Update all manual changes by clicking the Update
buon located below the manual tool buons (see Figure 6.6). The process of
updating the conguration takes only seconds. Once the process is completed,
SmartSensor Manager will remain on the Lane Conguration page so that any
manual changes made may be viewed and easily changed if needed.
Update, Undo, and Restart ButtonsFigure 6.6 –
Undoing Manual Changes
Unsaved changes may be undone without repeating the manual conguration
process. Click on the Undo buon found below the manual tool buons (see
Figure 6.6). This tool retrieves the last saved conguration from the SmartSensor,
eectively undoing any unsaved changes that were made.
69
CHAPTer 6 o LANE SETUP
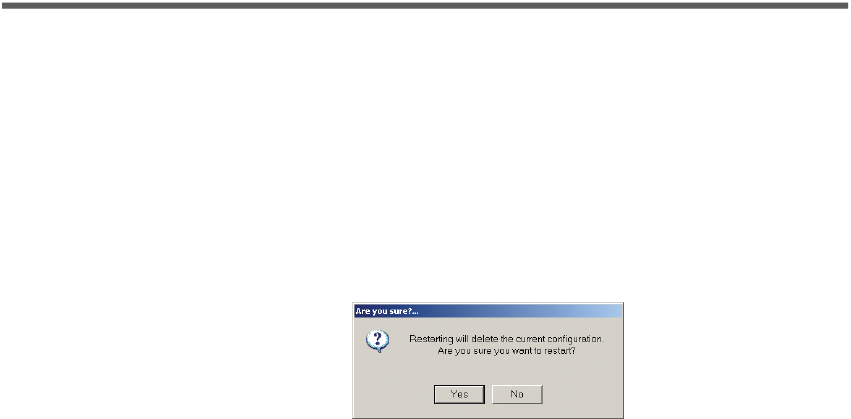
Restarting Lane Congurations
To completely erase the SmartSensor’s current conguration and restart the lane
conguration routine, change from Manual back to Automatic mode by clicking
on the Automatic buon and then clicking on the Restart buon located near the
Update and Undo buons below the Manual toolbar (see Figure 6.6).
This erases all manual changes that have been made, and the SmartSensor
Manager will automatically recongure the road for you. After clicking on the
Restart buon, a window will be displayed asking whether you want to proceed
(see Figure 6.7). Click on Yes to continue or on No to quit this procedure.
Conrmation of RestartFigure 6.7 –
Exiting the Lane Conguration Page
Once all automatic and manual congurations have been completed, you may
perform a nal save and exit the Lane Conguration page by clicking on the
Finished buon located at the boom right of the screen.
A window will appear indicating that the changes are being saved to the
SmartSensor. After the changes have been saved, SmartSensor Manager will
automatically change from Lane Conguration to Trac (Event) Data View mode
so that you can verify lane conguration.
Verifying Lane Conguration
After you click Finished on the Lane Conguration page, SmartSensor Manager
will take you immediately to the View Trac (Event Data) page. Here you can
view your saved lane conguration and see trac in real time, allowing you to
verify that the lanes have been congured correctly.
The other way to view data is the Interval Data screen, which shows numerical
data gathered per lane by the sensor. You can switch back and forth between the
two screens with the toggle buon in the lower right corner of each screen; this
buon will be marked with the name of the screen you’re going to switch to.
The Trac (Event) Data and Interval Data screens can both also be accessed
through the View menu.
70 CHAPTer 6 o LANE SETUP
Note
If the connection’s additional response wait time is greater than 500 ms,
event and actuation information is not displayed on the screen.
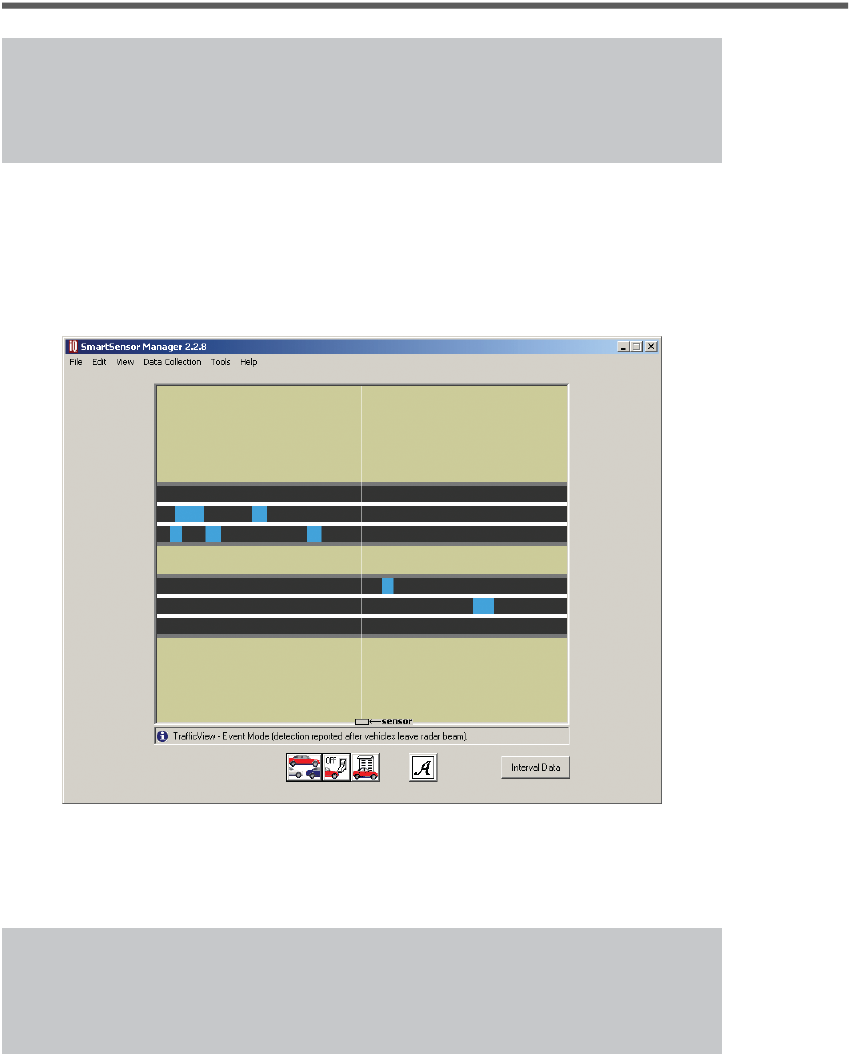
Trafc (Event) Data
In Event mode, this screen allows you to verify the SmartSensor’s conguration
by comparing the trac on the road to event information shown in the window
(see Figure 6.8). In order to keep a record of your verication results, the event
data can also be saved to a log le while you remain on this screen.
View Trafc (Event) DataFigure 6.8 –
The window can also be used to verify true presence information by switching
to Actuation mode (click the A icon).
Note
A status bar below the Trac View window indicates whether you are in
Event mode or Actuation mode.
By default, Trac View launches in Event mode. In Event mode, the vehicles
(represented by the blue rectangles) appear after having passed through the
radar detection zone.
71
CHAPTer 6 o LANE SETUP
The four icons located at the boom of the screen are active in this mode. They
are, from left to right:
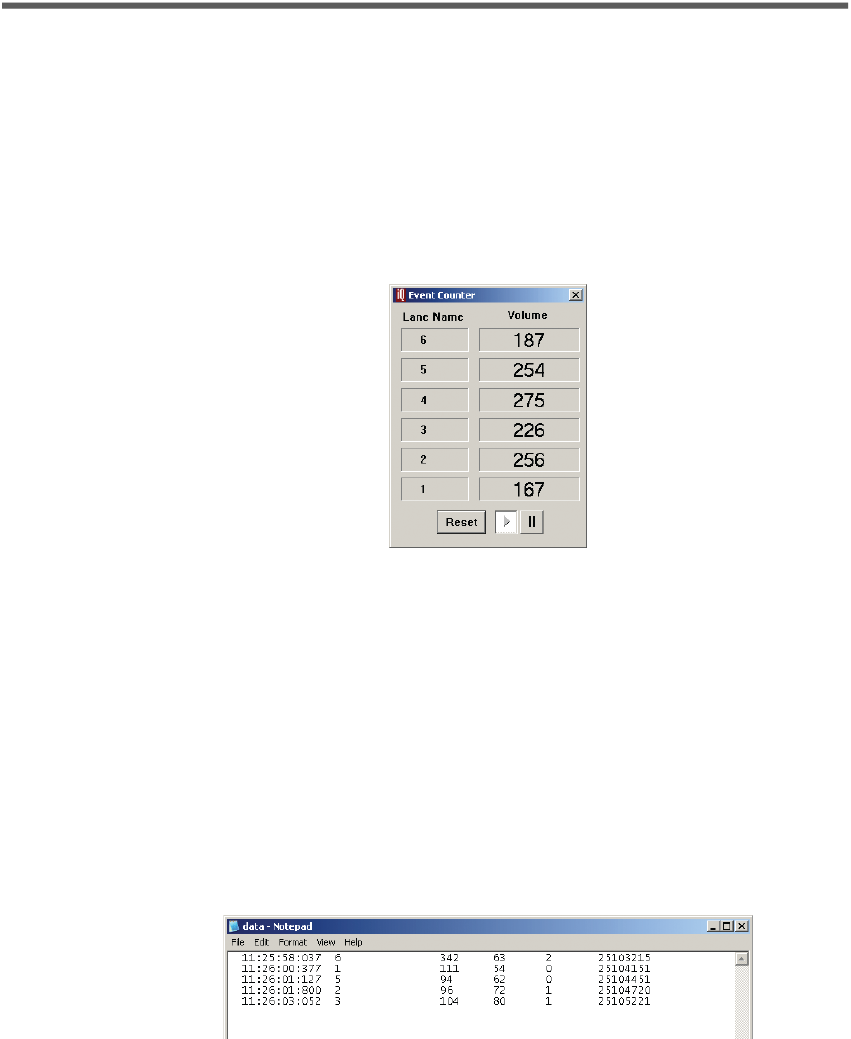
View Event Counter –
Brings up a real-time volume counter lane by lane
(see Figure 6.9). Each time a vehicle enters and leaves the radar detection
zone, the volume for the corresponding lane will increment accordingly.
If counting needs to be paused for any reason, click on the Pause buon;
click the Play buon to resume counting. Any vehicles that were detected
by the SmartSensor while the event counter was paused will not be shown
in Volume. Clicking the Reset buon will clear the volume count and will
begin a fresh count.
Event CounterFigure 6.9 –
Turn Event Logging On and O –
Allows you to log the information
you’re currently seeing. When you switch event logging on, you will be
prompted to create a new log le if there is not already an existing one.
With event logging turned on, all of the event data is wrien to a log le
on the computer that can then be viewed later. To turn event logging
o, click on the icon again. No other visible changes occur while turning
event logging on and o. Event logging remains on as long as you are in
the Trac View screen. If you switch to another screen of SmartSensor
Manager, and then come back to the Trac View window, event logging
will have been turned o.
View Event Log –
Opens the current event log le in a text editor, such as
Notepad (see Figure 6.10).
Event LogFigure 6.10 –
The event log le breaks down each event and reports back the event
Timestamp, Lane Name, Duration, Event Speed, Class, and Count. The

72 CHAPTer 6 o LANE SETUP
timestamp, which is formaed using the local time zone seings on your
computer in hours, minutes, seconds and milliseconds, is the time the
vehicle entered the detection zone. The lane name is a string of eight
alphanumeric characters that describe the lane. The duration is the number
of 2.5ms ticks that elapsed while the vehicle was in the sensor’s detection
zone. The event speed represents the speed of the vehicle, displayed either
in miles per hour (mph) or kilometers per hour (kph). The class indicates
into which one of three length-based classication groupings (0=Small,
1=Medium, and 2=Large) the vehicle ts. The count is the time the vehicle
entered the detection zone encoded as the number of 2.5ms ticks counted
on the sensor since the beginning of the day (UTC time).
Note
Each time the Turn Event Logging On and O buon is pressed, a new
header is created in the log le.
Actuation/Event Toggle –
Changes between Actuation and Event modes.
Clicking on the icon when an “A” is displayed changes the mode from
Event to Actuation. Clicking on the icon when an “E” is displayed changes
the mode from Actuation to Event mode.
In Actuation mode, the three leftmost icons are inactive, and the vehicles are
displayed as long as they are present in the detection zone.
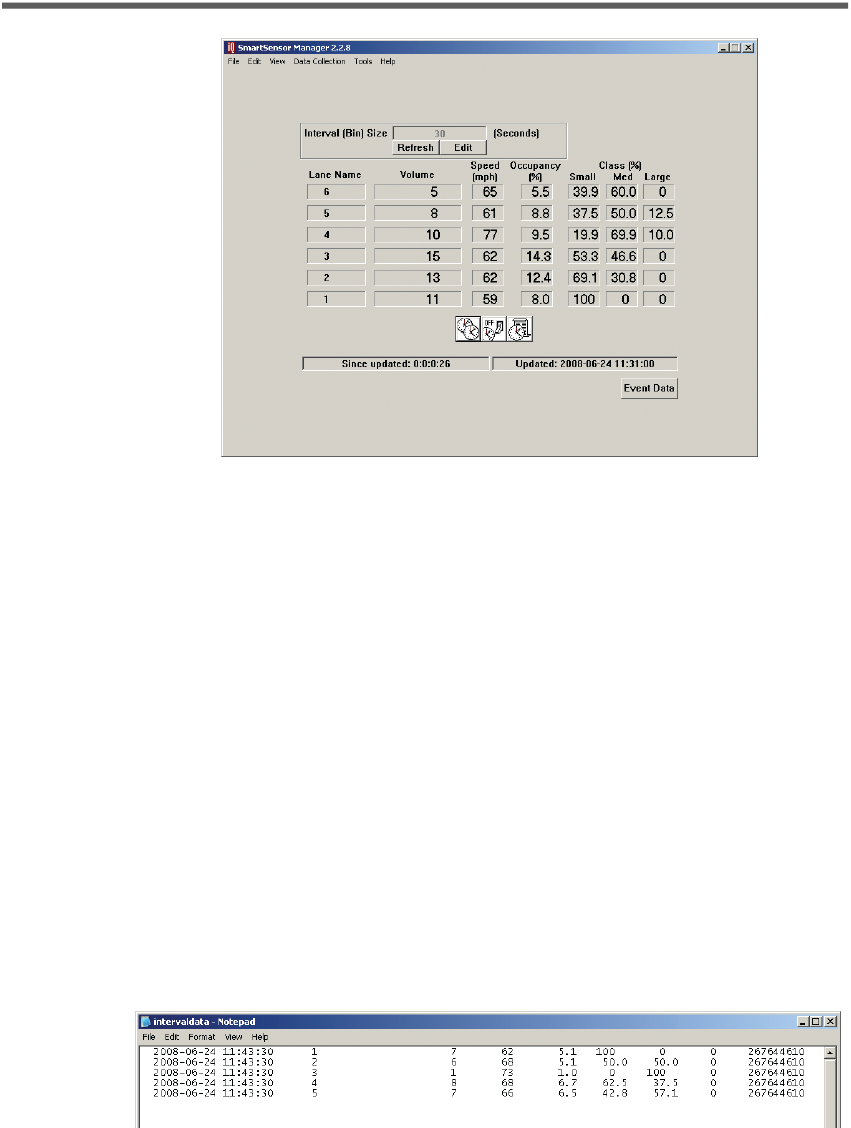
Interval Data
This screen allows you to verify interval data accuracy. The most recent interval
data is displayed on the screen (see Figure 6.11). In order to keep a record of your
verication results, the interval data can also be saved to a log le while you
remain on this screen.
73
CHAPTer 6 o LANE SETUP
View Interval DataFigure 6.11 –
Before interval data verication is performed, do the following:
Specify the desired interval length in the Interval (Bin) Size edit box. To do 1
this, enable the edit box by pressing Edit, then type the desired length of
the interval in seconds and press Submit. The minimum interval allowed
is ve seconds. If you must cancel your changes, press Cancel and Refresh.
Pressing Refresh buon will restore the current interval length.
Synchronize the sensor time to your computer’s UTC time. This will 2
ensure that intervals will begin and end at the expected time. Intervals are
timestamped at the end of the interval. To synchronize the sensor time,
click the Synchronize icon, which shows two overlapping clocks.
The other two icons near the boom of the page are for logging data:
Turn Interval Data Logging On/O –
Turns event logging on and o.
Click on the icon (it shows a clock and light switch) to toggle the switch on
and o. Once you’ve turned it on, you will be prompted to create a new log
le if there is not already an existing one. Now all of the data shown on the
screen will be wrien to a standard text le that can be viewed at any time.
View Interval Data Log –
Opens the log le in a text editor such as
Notepad (see Figure 6.12). The icon shows a clock and paper.
Interval Data LogFigure 6.12 –

74 CHAPTer 6 o LANE SETUP
The interval data in the Interval Data Screen is displayed in a table that contains
the lane name, volume, speed, occupancy, and class. The lane at the top of the
table is the lane closest to the sensor. At the boom of the screen is a status bar
that indicates the time the interval data table was last updated. It also displays
the amount of time that has elapsed since this update.
Lane Name –
Displays the string of eight alphanumeric characters that
describes the lane.
Volume –
Shows the number of events during the interval.
Interval Lane Speed –
Represents the average speed of the lane during the
time of the interval. The speed is displayed either in miles per hour (mph)
or kilometers per hour (kph), depending on your seings.
Occupancy –
Displays the percentage of time vehicles occupied the
sensor’s detection zone during the selected interval.
Class –
Represents the percentage of vehicles detected as ing in one of
three length-based classication groupings (Small, Medium, and Large).
Note
To open data logs from anywhere in the Smart Sensor Manager program,
go to File>Data Logs . . . >Open and select the type of log. This will open
the most recently used log.

In this Chapter
Data Collection Setup
Data Download
Data Logs
Once you’ve set up your sensor and lanes, you can collect data for studies. This
chapter outlines the steps necessary for data collection
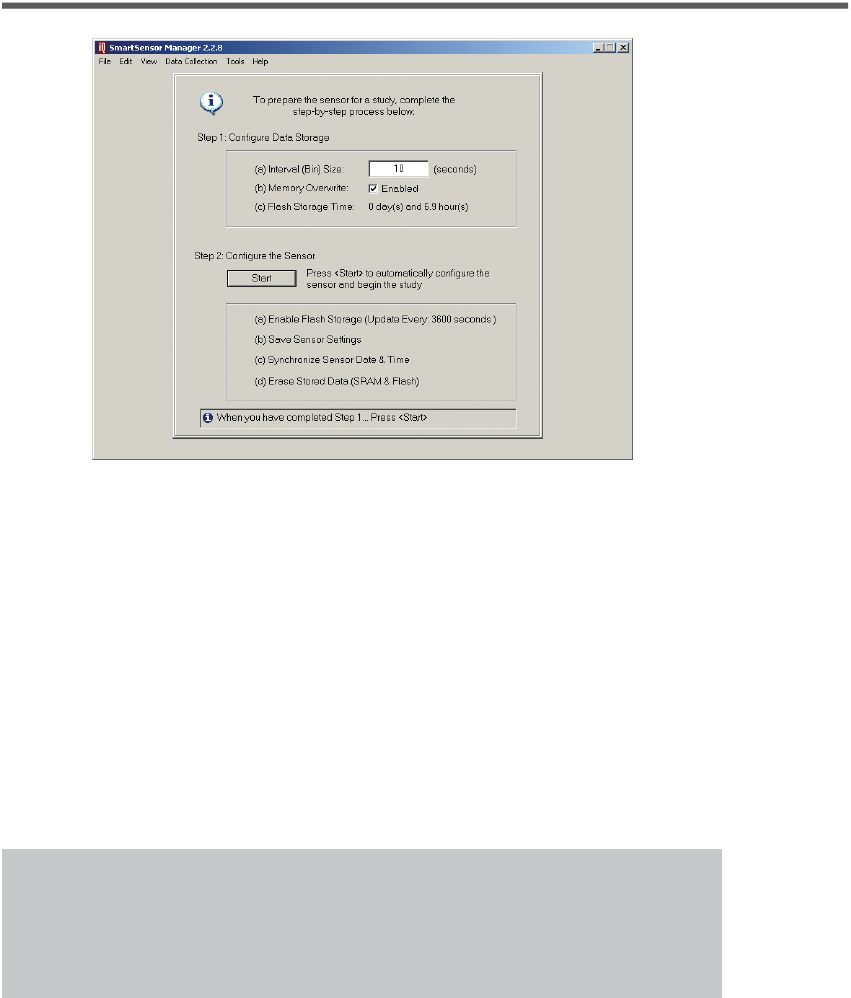
Data Collection Setup
Go to Data Collection>Setup to prepare your sensor for a study. The screen that
appears is divided into two steps: Congure Data Storage and Congure the
Sensor (see Figure 7.1).
7
Data Collection
76 CHAPTer 7 o DATA COLLECTION
Data Collection SetupFigure 7.1 –
Step 1: Congure Data Storage
The Interval (Bin) Size option species the interval of time over which trac
variables like volume, speed, occupancy and classication are aggregated. This
type of data is called interval data. The minimum interval allowed is ve seconds.
By default, the checkbox next to Memory Overwrite is checked. This means that
your study will run indenitely and repeatedly overwrite the ash memory
onboard storage. This means that in order to not lose collected data, you must
download it to a log on your computer before it is overwrien.
Alternatively, you can uncheck the Memory Overwrite checkbox. In this case,
the study will run only until the sensor’s ash memory has been lled with
interval data.
Note
Once the ash memory buer is full, it must be erased before it can be
reused. Before you erase the stored data, you will want to download the
data to a log le on your computer.
The third line under Step 1 displays the Flash Storage Time. This shows the
duration of interval data that a full ash buer holds, calculated for you as
a number of days and hours. Because of the way ash memory is managed,
the Flash Storage Time will vary based on whether or not you have Memory
Overwrite enabled.
77
CHAPTer 7 o DATA COLLECTION
Step 2: Congure the Sensor
When you are ready to begin the study, click on the Start buon to:
Enable ash storage
Save the selected seings to the sensor
Synchronize the sensor date and time
Erase stored data from both SRAM and ash memory
It will take several seconds before the study actually begins. When the study
does begin, the start time will be displayed in the status bar at the boom of the
screen.
Note
If the start time does not coincide directly with the beginning of an
interval, the rst interval in memory will contain a partial aggregation of
data.
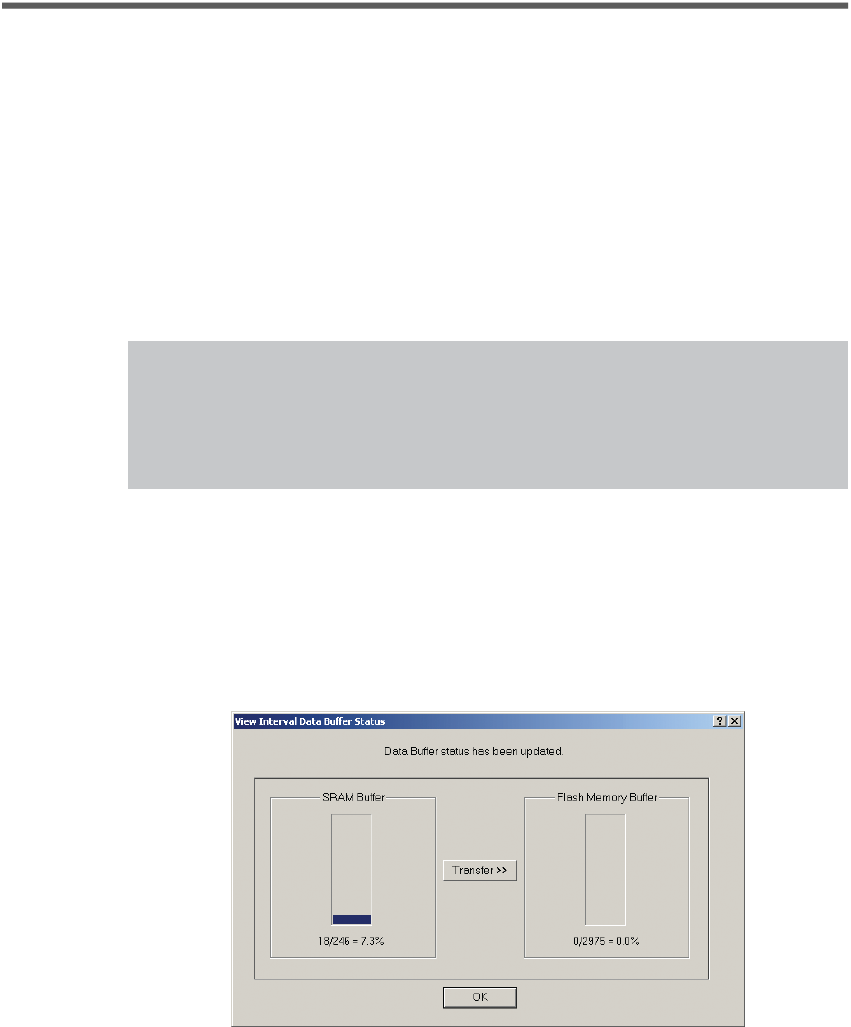
Interval Data Buffer Status
As soon as the study begins, the View Interval Data Buer Status window will
appear. This window shows you how much of the guaranteed onboard storage
space is lled with interval data. If the data collection setup process has just
nished, the storage space should be mostly unused. If you leave this window
open, the status will be updated every 30 seconds. The blue bars indicate the
amount of memory that contains data (see Figure 7.2).
View Interval Data Buffer StatusFigure 7.2 –

78 CHAPTer 7 o DATA COLLECTION
Note
This screen can be accessed via the Data Collection Download screen by
clicking on the View Data Buer Status buon.
The sensor’s SRAM buer contains up to 246 of the most recent interval data
records. This type of storage is temporary because SRAM is volatile—its contents
will be lost if the sensor’s power supply is interrupted. The sensor’s ash
memory buer contains up to 2975 interval data records. This type of storage is
permament because ash memory is nonvolatile—it will retain its contents even
if the sensor’s power supply is interrupted.
Note
The smallest amount of ash memory that can be erased at one time
represents several interval data records. As a result, if you are collecting
data with the Memory Ovewrite feature enabled, you will not typically see
the buer ll up 100%. In fact, you may see the usage fall from near 100% to
something near 80%. This is because as usage approaches 100%, a portion
of the oldest contents are erased in order to make room for newer data.
If you want to force the contents of the sensor’s SRAM buer to be wrien to
ash memory, click the Transfer>> buon.
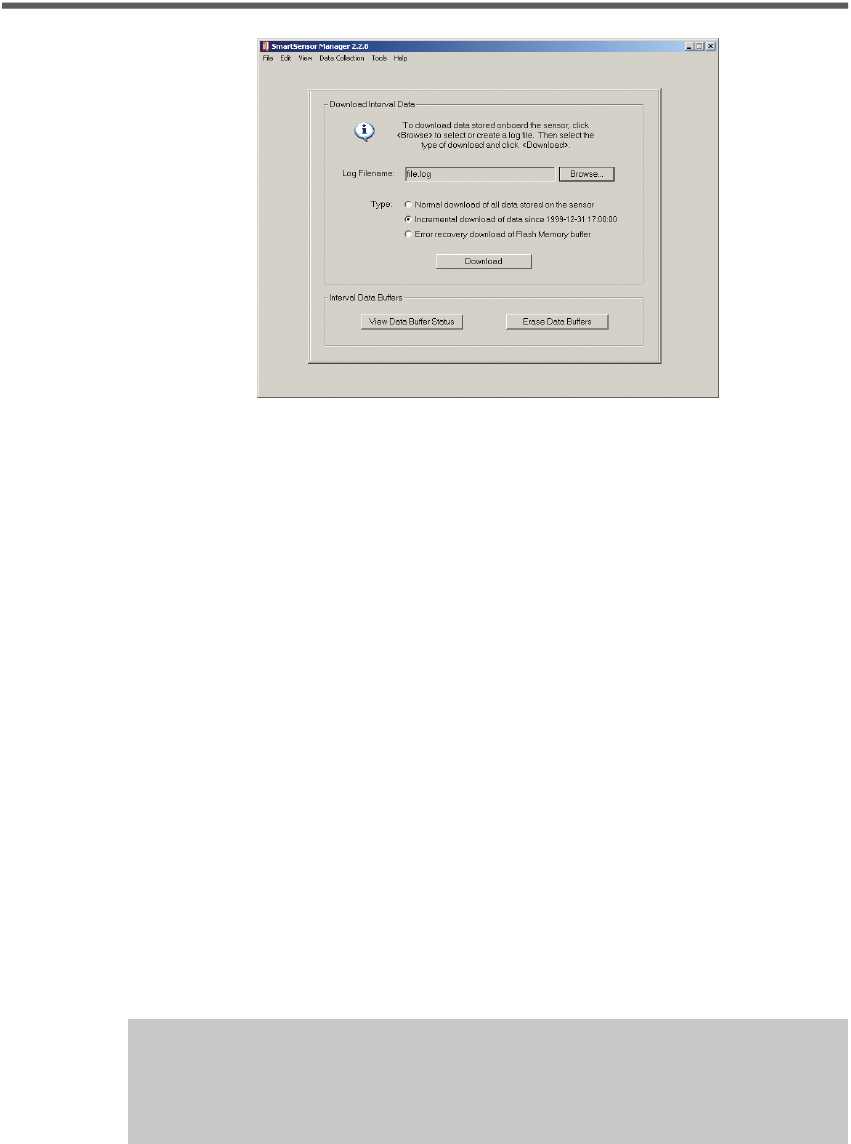
Data Download
To download interval data stored on the sensor in the SRAM and ash memory
buers—such as data collected in a study—go to Data Collection>Download.
The screen that comes up is divided into two sections, Download Interval Data
and Interval Data Buers (see Figure 7.3).
79
CHAPTer 7 o DATA COLLECTION
Data DownloadFigure 7.3 –
Download Interval Data
Under the Download Interval Data section, click the Browse buon. This will
open a directory box where you can either create a new data download le log
or locate an existing download le log. Once you’ve selected an existing le or
entered the name of the new le, select Open.
Next, select the type of download to perform. The following types of download
sessions are available:
Normal –
Retrieves all interval data from the beginning of the study to the
most recent record. The number of lanes per record is determined by the
number of lanes currently congured on the sensor.
Incremental –
Retrieves only the interval data that was recorded after the
indicated date and time. The number of lanes per record is determined by
the number of lanes currently congured on the sensor.
Error Recovery –
Retrieves the entire contents of the ash memory buer.
The ash memory buer contains 2976 records and each record has data
for eight lanes. The contents of SRAM are not retrieved in this mode.
You can perform this type of download to verify the contents of the ash
memory buer in the event that a normal or incremental download does
not retrieve all the data that you expect to receive.
Once you have selected the type of download, click Download.
Note
Each time a data download is performed, a header is inserted into the log
le that indicates the date of the download.

80 CHAPTer 7 o DATA COLLECTION
Data in the SRAM buer contains the most recent information and will be
downloaded rst. If there is any data in the ash buer, it will be downloaded
second. However, before the data is wrien to the log le it will be reordered, so
that the oldest data intervals will be near the top of the le.
If you want to cancel the download or if you only want to download a certain
number of intervals, click the Stop buon as soon as the desired number of
interval data records are downloaded. Once the download process has stopped,
a window is displayed that indicates number of interval data records that were
downloaded.
Note
If your sensor experienced power cycles during the study, it may have
been impossible for SmartSensor Manager to determine the timestamp of
some of your intervals. The timestamp entry for these intervals will appear
blank. If you have detailed knowledge about the length of the study and
when the power cycles occurred (and for how long), you may be able to
reconstruct the unknown timestamps. Periodic connection to the sensor is
recommended in order to resynchronize the sensor time in case of a power
cycle.
Interval Data Buffers
The second section of the download screen is Interval Data Buers. This section
has two options, View Data Buer Status and Erase Data Buers.
Selecting View Data Buer Status takes you to the Interval Data Buer
Status screen; see the Data Collection Setup section of this chapter for more
information.
Note
If you are not sure when your storage space will completely ll up with
data; you can click on the View Data Buer Status buon and monitor
its progress. You can also look at the Flash Storage Time entry on the Data
Collection Setup screen to see how long you have before the ash memory
lls up. Multiply the percentage of remaining storage space by the total
Flash Storage Time to approximate the remaining amount of time before
the storage space will completely ll up.
Selecting Erase Stored Data clears the sensor’s memory and starts fresh. If the
storage space is full, data must be downloaded or erased in order for the study to
continue.

81
CHAPTer 7 o DATA COLLECTION
Note
If intervals expire during (or immediately after) your download, you will
be prompted to download the new intervals before you erase. If you are
presented with the option to download and erase, it is recommended that
you do so in order to prevent losing data.
Data Logs
Going to File>Data Logs . . . allows you to create new data logs, open existing
ones, and export logs into 3 Card format.
Selecting New and then the type of log—Download, Interval or Event—opens a
directory box where you can create a new log. This le will then be used to log
data. If you created an event log, going to View>Trac (Event) Data and turning
logging on will ll the log. If you created an interval log, going to View>Interval
Data and turning logging on will ll the log. If you created a download log,
going to Data Collection>Download and downloading data will ll the log.
Note
If you haven’t created a log le when you go to start logging, the program
will prompt you to create one then.
Selecting Open and then the type of log will open the most recently used log in
a text editor such as Notebook.
Note
You can also open event and interval logs by going to View>Trac (Event)
Data or View>Interval Data and clicking the View Log buon; you can
view download logs by selecting the View data le when this window is
closed buon after downloading.
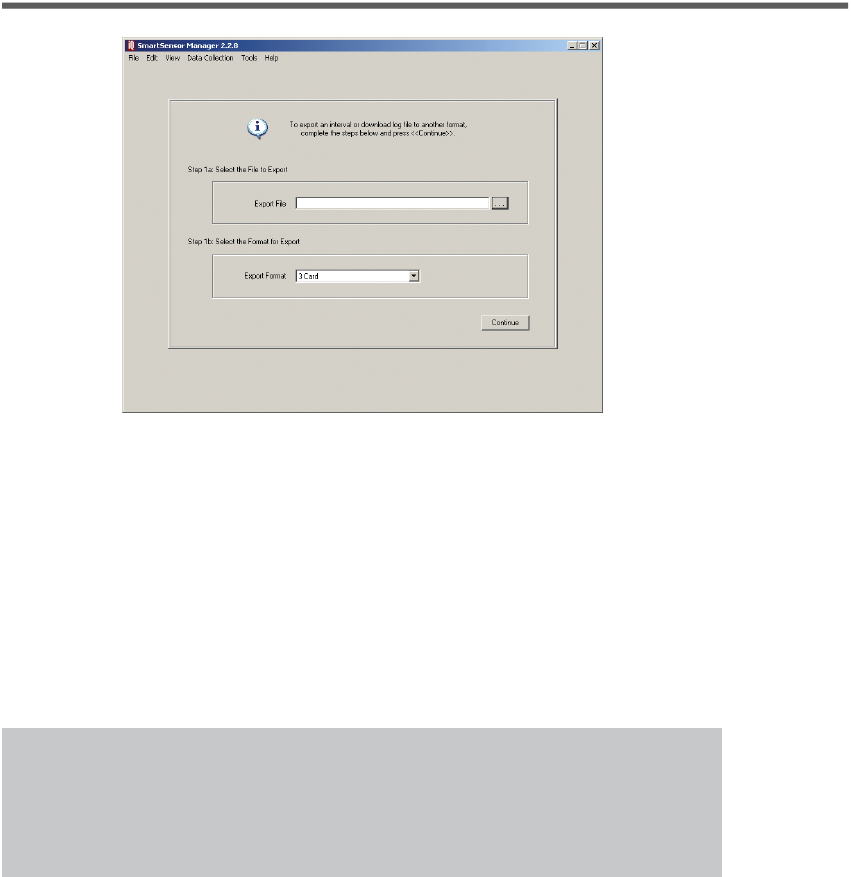
Export
Select File>Data Logs . . . >Export to export an interval log or download log to
another le format (see Figure 7.4).
82 CHAPTer 7 o DATA COLLECTION
Export Data LogsFigure 7.4 –
First, select the le to export by clicking the “. . .” buon next to the Export File
text eld. This will open a directory where you can select the log to be exported.
Next is a spot to select the format for export. Currently the only supported
destination le format is 3 Card (for more information about this format, see the
FH WA’s Trac Monitoring Guide, available from wa.dot.gov). Click Continue.
On the following screen, ll out the requested information, which includes a
starting and ending date, a station ID number, the functional classication of the
sensor site, the state you’re located in, and any restrictions. Click Continue when
you’re done.
Note
The starting date and ending date will generally be the rst and last day of
data in your interval log le. However, you may wish to set your starting
date and ending date so that you export only certain days.
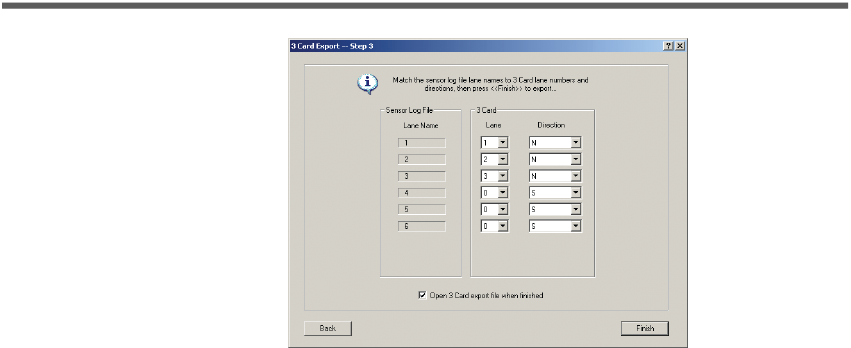
On the third page, specify the lane assignment number and lane direction. So
that you can tell which lane you’re working with, the lanes are numbered under
the Sensor Log File heading, with the lane closest to the sensor at the top of
the list. While multiple lanes may have the same direction, no two lanes may
have both the same direction and number, unless that number is 0. You can call
multiple lanes 0 in order to group them together (see Figure 7.5).
83
CHAPTer 7 o DATA COLLECTION
Step 3 of Export ProcessFigure 7.5 –
Click Finish to create the 3 Card le. (To see the le immediately, click the Open
3 Card export le when nished box.) SmartSensor Manager will take the
entered information and format the le according to 3 Card standards.

In this Chapter
Hyperterminal
Firmware Upload
The Tools menu allows you to view and send messages to and from the sensor,
as well as to upload rmware.
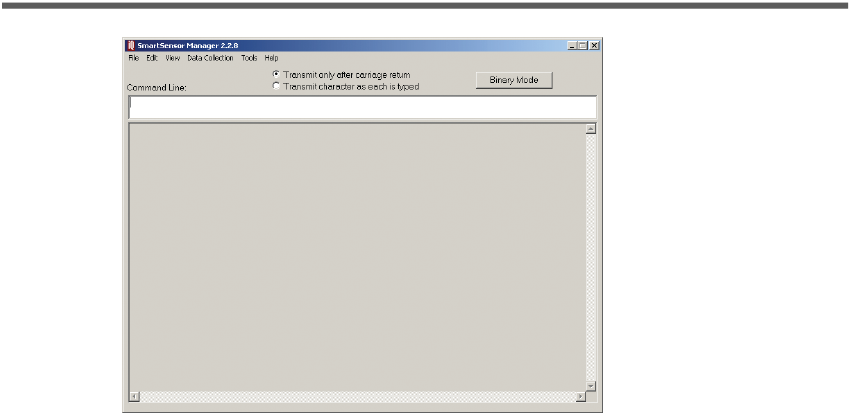
Hyperterminal
Hyperterminal allows you to send message requests and view message
responses for any commands in either Simple or Multi-drop protocols (see Figure
8.1). Enter the request in the text eld marked Command Line located near
the top of the screen. Click on the appropriate radio buon to either transmit
information all at once after you’ve hit Enter on the keyboard or to automatically
transmit each character as it is typed. The message response will be returned in
the gray scrollable area below the Command Line.
You may also use binary mode to verify operation of binary protocols supported
by SmartSensor by clicking the Binary Mode buon.
8
Tools
86 CHAPTer 8 o TOOLS
HyperterminalFigure 8.1 –
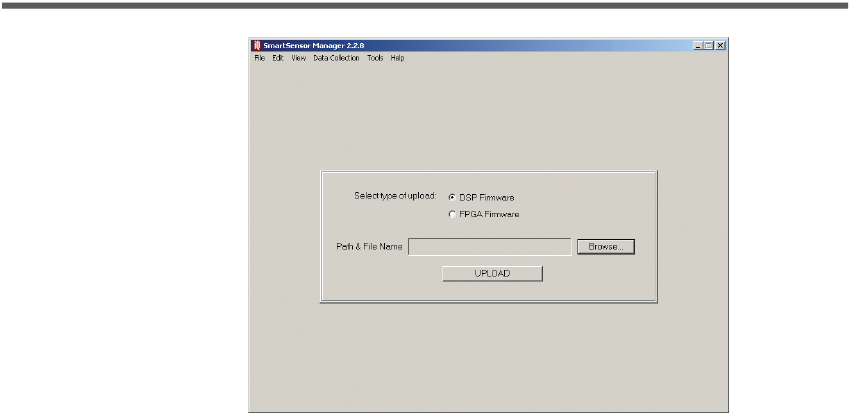
Firmware Upload
When you rst connect, the program will prompt you to update your rmware
if it sees a discrepancy between the software and rmware versions, but you can
also go at any time to Tools>Firmware Upload and select a rmware le (.hex)
stored on your computer to upload to your sensor (see Figure 8.2).
Before using something other than the most current rmware version, please
contact Wavetronix Technical Services for assistance.
To upload rmware, click the appropriate radio buon for either DSP or FPGA
rmware. Click the Browse . . . buon to locate the rmware stored on your
computer; click the UPLOAD buon to transfer the rmware to the sensor.
87
CHAPTer 8 o TOOLS
Firmware UploadFigure 8.2 –

In this Chapter
Selecting the Contact Closure Model
Programming Sensors for Use with Contact Closures
Programming Contact Closures
In many applications, you will not need to use your SmartSensor with contact
closure cards. Often trac data is collected directly from the sensor via a serial,
modem or Internet connection. However, a contact closure module is often
needed to use a SmartSensor with a trac controller, trac data recorder or
other type of data logger.
Selecting the Contact Closure Model
In some applications, all of the contact closure modules listed in Table 9.1 below
could be used, but one model may have major advantages over the others; for
example, the Click! 101 is beer for midblock applications.
Model Number Form Factor Major Advantages
Click! 100 Din rail Screw terminals for easy wiring to automatic trafc
recorders or data loggers
Click! 101 Din rail Collection from multiple sensors
Click! 172/174 Rack card Works with standard ITS and intersection detector
racks (NEMA TS1/TS2, 170, 2070)
Click! 500 Din rail User-programmable contact closure development
platform for virtually any application.
Advantages of Contact Closure ModelsTable 9.1 –
9
Contact Closure Communications
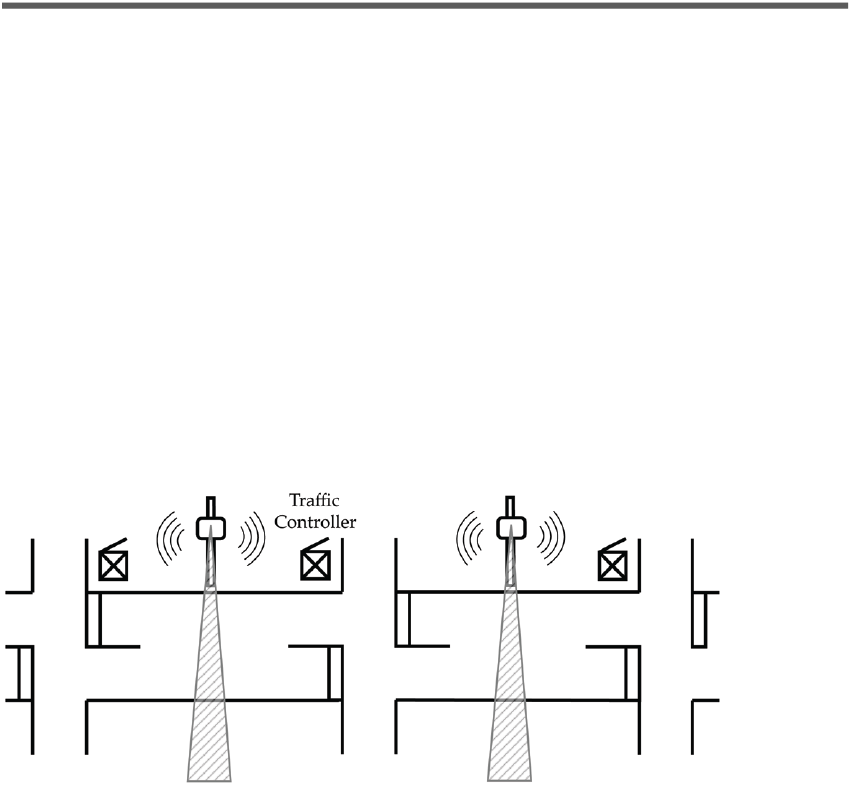
90 CHAPTer 9 o CONTACT CLOSURE COMMUNICATIONS
Click! 100 –
The Click! 100 is a din rail–mounted contact closure that can
be used in cabinets without detector racks and simplies integration into
automatic data recorders and data loggers. The wiring harness of the
automatic data recorders can connect directly to the screw terminals of
the Click! 100. Application notes for wiring to common automatic trac
recorders can be obtained by contacting your authorized Wavetronix
dealer or Wavetronix Technical Services.
Click! 101 –
The Click! 101 has the built-in capability of collecting from
multiple SmartSensor units simultaneously, making it an excellent choice
for midblock applications. This allows one Click! 101 to collect trac data
from all the SmartSensor stations pertaining to an intersection. For arterial
management, the resulting system is very cost-eective and can be rapidly
deployed, especially when wireless communications is included.
Each SmartSensor uses its two communication ports to send real-time
trac data to both cabinets for which it is collecting data (see Figure 9.1).
The real-time data is used to control the intersection using either local
control strategies or closed-loop control systems like ACS-lite.
SmartSensor Sending Real-time Data to Multiple Approaches Using Dual PortsFigure 9.1 –
Click! 172/174 –
The Click! 172/174 are contact closure cards that allow
the SmartSensor to integrate into standard ITS and intersection detector
racks. The Click! 172 has two contact closure outputs and the Click! 174 has
four. The Click! 172/174 are commonly used in legacy ITS cabinets or for
midblock intersection detection. Multiple modules can be daisy-chained
together to collect data from all eight lanes possible with SmartSensor.
Unlike the Click! 101, which actively collects information from multiple
sensors, each Click! 172/174 is dedicated to a single sensor. During
programming, the Click! 172/174 cards transmit conguration information
to SmartSensor to set up the mode of operation. Once the mode is set up,
the rack cards stop transmiing messages and passively listen for data
pushed by the sensor.

91
CHAPTer 9 o CONTACT CLOSURE COMMUNICATIONS
Tip
In many cases, the trac data detected by SmartSensor is valuable to both
operations and planning departments. However, when legacy systems are
used, often there is no mechanism to directly share the data. Even with the
limitations of legacy systems, contact closures can sometimes provide a
way for operations and planning to both get what they need from a single
sensor. For example, the operations department can collect trac data into
a trac controller via a Click! 172/174 over one of the SmartSensor’s two
ports. Then the planning department can use the second port to send data
to an automatic trac data recorder via a Click! 100.
Click! 500 –
The Click! 500 is a user-programmable contact closure
platform for virtually any application. For example, the Click! 500 can be
programmed to activate a contact closure output when vehicles over a
specied speed and length are detected. To accelerate development, the
Click! 500 will provide developers with SmartSensor communication
drivers.
For a full description of each module refer to the Click! quick-start guides, user
manuals and bid specications. Or contact your authorized Wavetronix dealer or
Wavetronix Technical Services for more information.
Programming Sensors for Use with Contact Closures
Click! 100 –
The Click! 100 supports baud rates from 9600 to 57600 bps.
When using a Click! 100, make sure your SmartSensor is set to operate at a
baud rate in this range.
Click! 101 –
The Click! 101 modules support baud rates from 9600 to 115200
bps. The Click! 101 identies each sensor by its sensor ID. Before you
congure the Click! 101, you can retrieve the sensor ID using SmartSensor
Manager over communication link.
Click! 172/174 –
The Click! 172/174 modules support baud rates from 9600
to 57600 bps. When using a Click! 172/174 device, make sure SmartSensor
is set to operate at a baud rate in this range. To select which SmartSensor
lanes are mapped to the Click! 172/174 outputs, the lane names of the
SmartSensor need to be set up correctly using SmartSensor Manager. The
rst character of the lane name should take on the value 0 to 9. The second
character can take on a value R or L to represent the direction trac is
owing. For example, lane names could be 1R (right to left) or 1L (left to
right).

92 CHAPTer 9 o CONTACT CLOSURE COMMUNICATIONS
Note
The SmartSensor default loop size and spacing will change the values of
SmartSensor data. The default loop size is used in the calculation of lane
occupancy, vehicle duration and vehicle length. The default loop spacing
is used in the calculation of vehicle speed and length. The Click! 100 and
172/174 also use these seings to change the duration and spacing of contact
closures signaled on their output pins. If your SmartSensor is connected to
a contact closure device and you are also retrieving data serially, rst adjust
the default loop size and spacing to match the inductive loop setup that
you’re trying to emulate, then adjust the individual lane size and spacing
values used to calculate the per lane scale factors.
Click! 500 –
The Click! 500 modules support baud rates from 9600 to
115200 bps. Any special programming of SmartSensor for an application
running on the Click! 500 will be explained in the documentation for that
application.
Programming Contact Closures
The contact closure modules have several modes of operation explained in their
respective quick-start guides and user manuals. Consult this documentation to
determine the mode appropriate for your application. This documentation will
explain how to program each mode.

In the Appendix
A – Cable Connector Denitions
B – Old Cable Connector Denitions
C – Cable Lengths
D – Direct Serial Connections
Appendix
Appendix A – Cable Connector Denitions
The SmartSensor cable is composed of three groups of wires, each containing color-
coded wires and a drain wire and surrounded by a shield. Table A.1 details the
pinout of the cable and the appropriate connection inside the cabinet for each wire:
Wire Description
Red +DC
Black -DC
Drain GND
Blue -485
White +485
Drain 485 GND
Yellow 232 (TD)
Violet 232 (RD)
Drain GND
Orange RTS
Brown CTS
Gray 232 GND
SmartSensor Cable and Cabinet ConnectionTable A.1 –
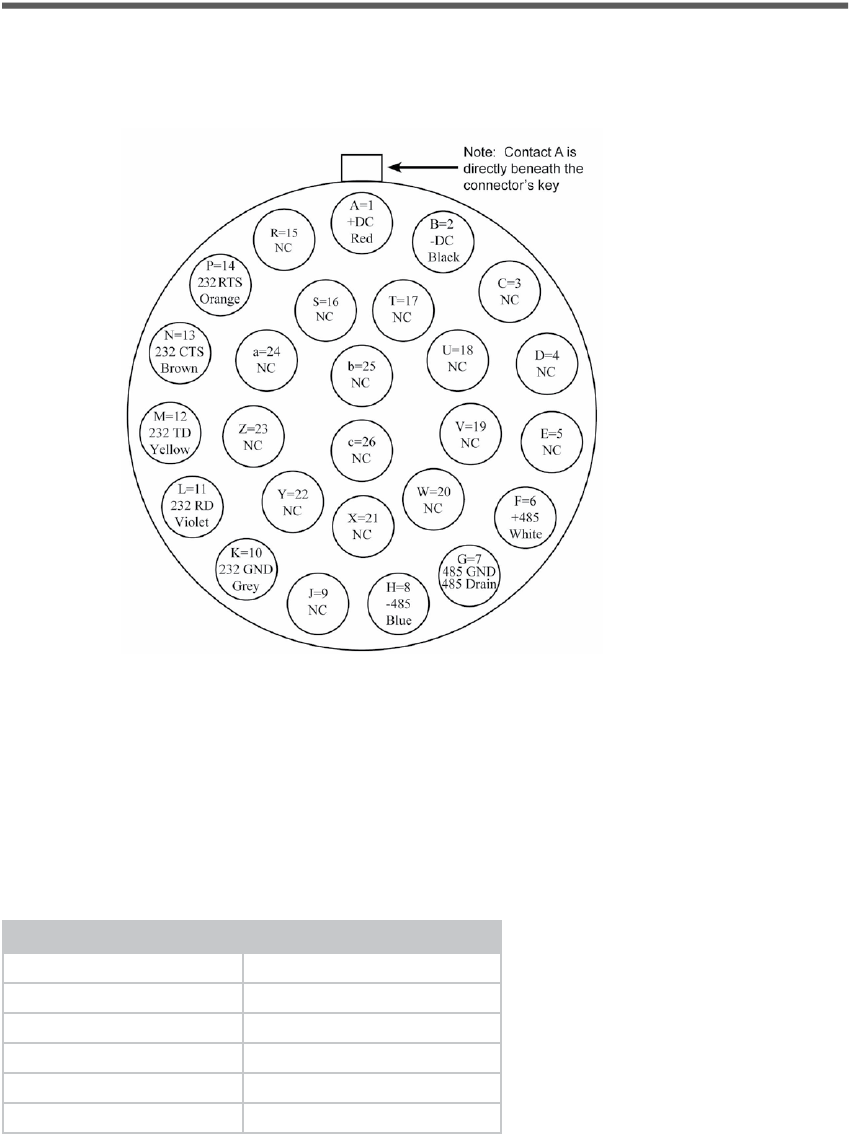
94 APPeNdiX
See Figure A.1 for a diagram of the previously used SmartSensor cable’s 25-pin
socket assignment. The codes listed in the diagram are to be used to solder wires
into the back of the plug where the leers represent the individual solder cups.
SmartSensor 105 Plug Connector Socket AssignmentFigure A.1 –
Appendix B – Old Cable Connector Denitions
The previously used SmartSensor cable is composed of six twisted pairs of wire.
Each pair is composed of a black and a red wire, accompanied by a drain wire
and surrounded by a shield. A numeric label (1 through 6) identies each pair of
black and red wires. Table A.2 details the pinout of the cable and the appropriate
connection inside the cabinet for each wire:
Cable Description
Red 1 +DC
Black 1 -DC
Drain of Pair 1 GND
Red 2 +DC
Black 2 -DC
Drain of Pair 2 GND
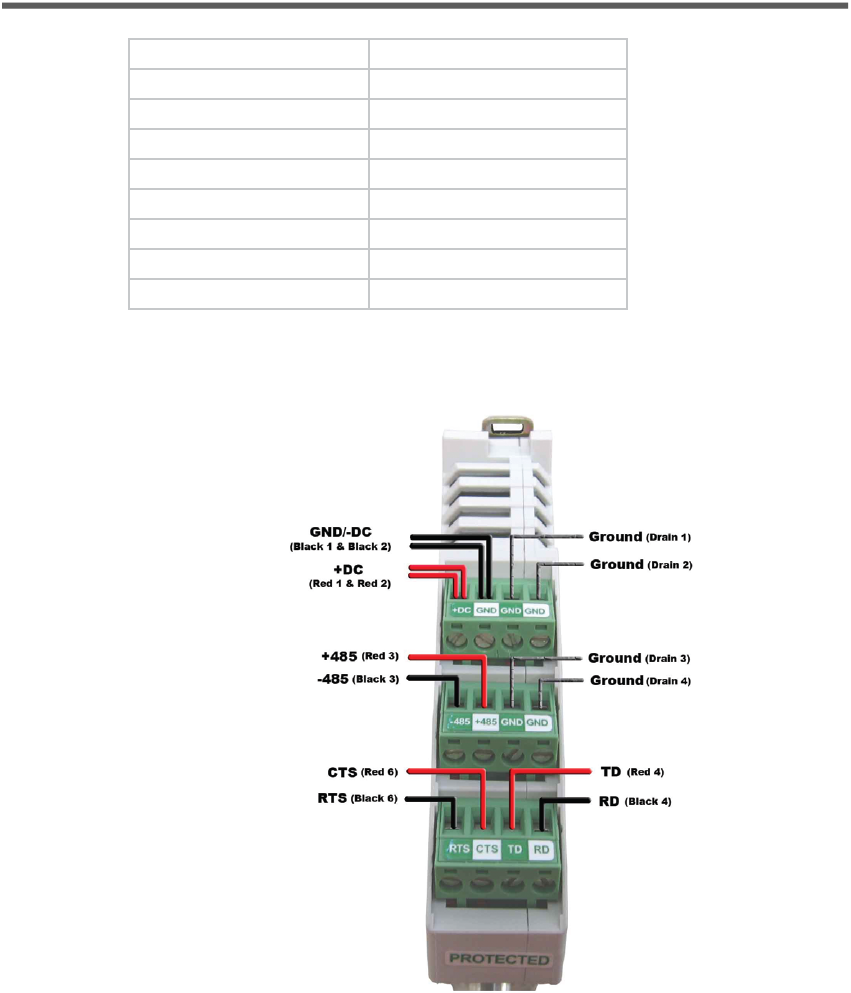
95APPeNdiX
Red 3 +485
Black 3 -485
Drain of Pair 3 485 GND
Red 4 232 (TD) output from sensor
Black 4 232 (RD) input to sensor
Drain of Pair 4 232 GND
Pair 5 Reserved for future use
Red 6 CTS ow for 232
Black 6 RTS ow for 232
Cabinet ConnectionTable A.2 –
Use Figure A.2 below if you are using the old SmartSensor cable:
Click! 200 Wiring (Old)Figure A.2 –
See Figure A.3 below for a diagram of the previously used SmartSensor cable’s
25-pin socket assignment. The codes listed in the diagram are to be used to
solder wires into the back of the plug where the leers represent the individual
solder cups.
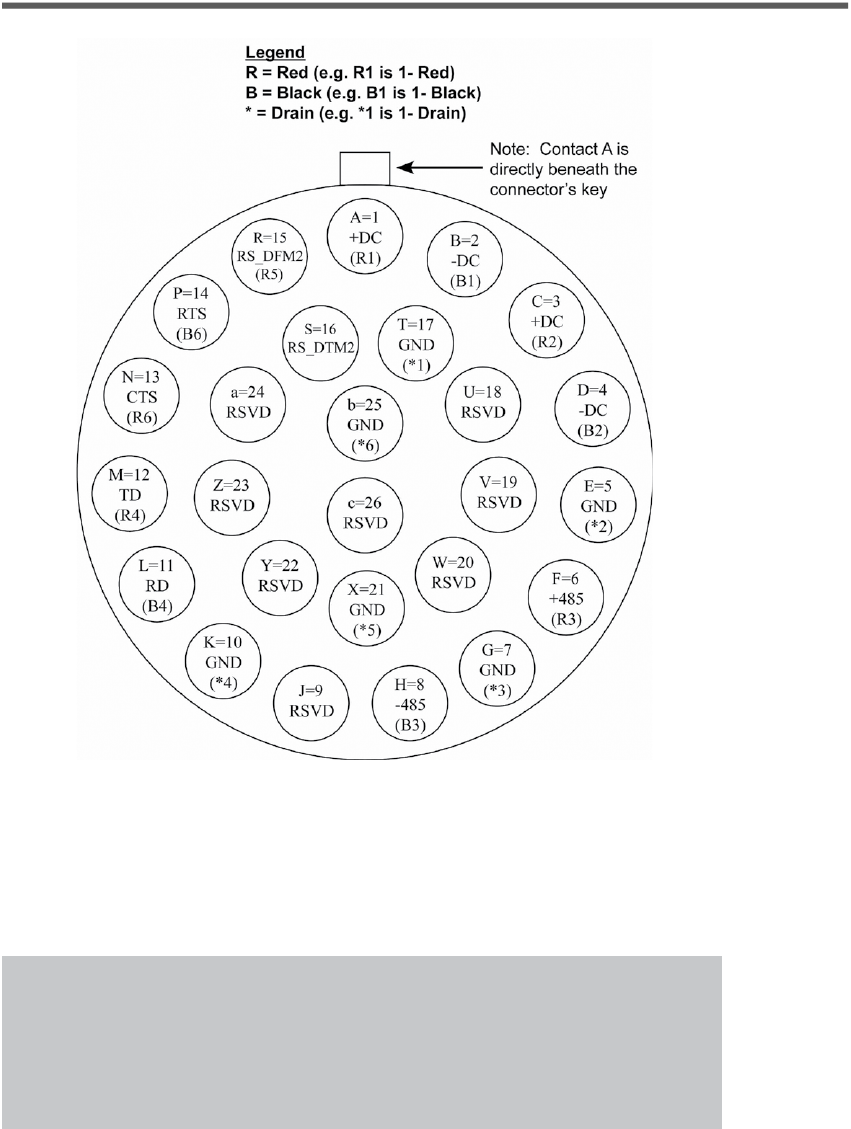
96 APPeNdiX
Old SmartSensor SS105 Plug Connector Socket AssignmentFigure A.3 –
Communication between the SmartSensor and PC can be established using
the RS-232 DTE specications, along with the use of a null modem cable and
the standard 9-pin “D” male connector. Please use the following guidelines for
connecting the SmartSensor cable to the serial connection on a PC or modem
when not using a Click! 200.
Note
The RS-232 pinouts remain the same on the SmartSensor cable regardless
of whether you’re connecting to a PC or a modem. If you’re connecting to
a PC, a null modem cable is required. If you’re connecting to a modem or
other DCE device, then a straight-through serial cable is used.
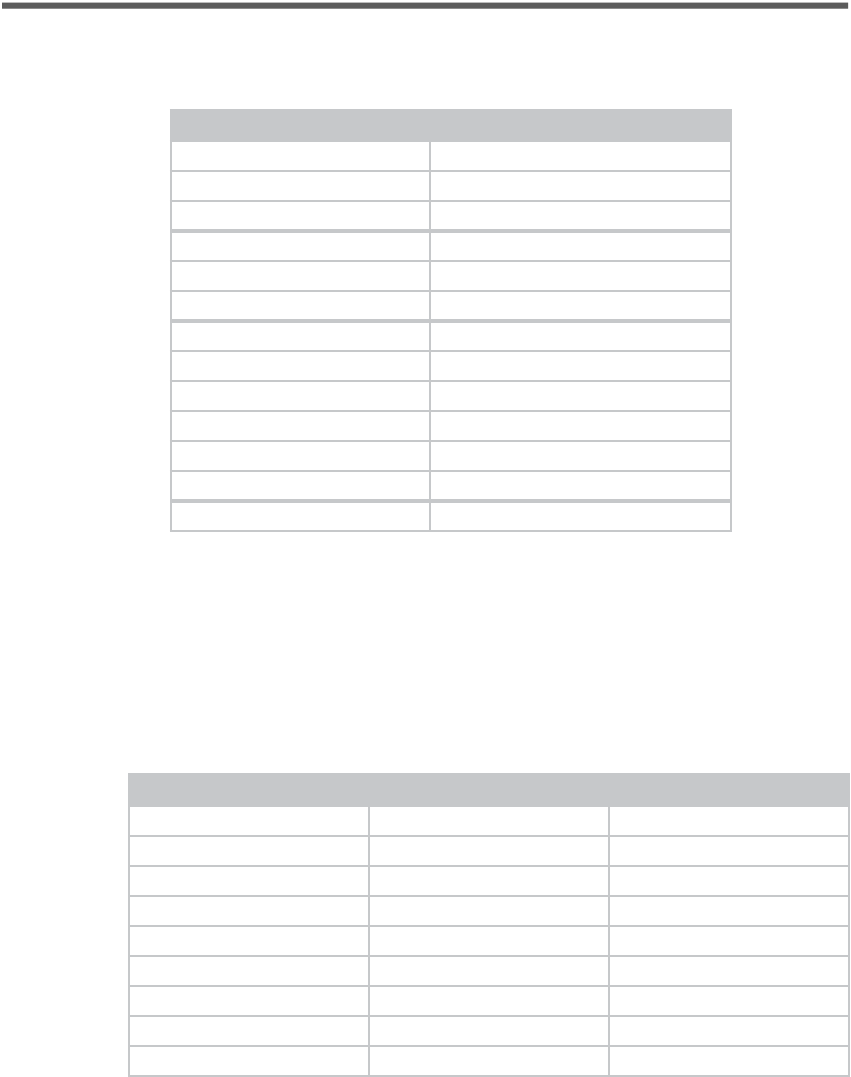
97APPeNdiX
Table A.3 below shows the individual wiring of both the new and old
SmartSensor cables and how they correspond.
Orion Color-Coded Cable Beldin 9331 Cable
Power
Red Red 1, Red 2
Black Black 1, Black 2
Drain None
RS-485
White Red 3
Blue Black 3
Drain Drain 3
RS-232
Yellow Red 4
Violet Black 4
Orange Black 6
Brown Red 6
Gray Drain 4
Drain Drain 4
None Red 5, Black 5, Drain 5, Drain 6
Belden 9331 (Old Cable) ConversionsTable A.3 –
Appendix C – Cable Lengths
The recommendations in Table A.4 below allow you to provide reliable power
to the SmartSensor. The SmartSensor cable’s red and black wires provide a 20
AWG wire pair. The other pairs on the SmartSensor cable are 22 AWG and are
normally used for communication.
Cable Gauge 24 Volts 12 Volts
20 AWG (SS Cable) 600 ft. (182.9 m) 110 ft. (33.5 m)
Additional 22 AWG Add 400 ft. (121.9 m) Add 75 ft. (22.9 m)
22 AWG (Old SS Cable) 400 ft. (121.9 m) 75 ft. (22.9 m)
Additional 22 AWG Add 400 ft. (121.9 m) Add 75 ft. (22.9 m)
14 AWG 2500 ft. (762 m) 450 ft. (137.2 m)
12 AWG 3900 ft. (1188.7 m) 700 ft. (213.4 m)
10 AWG 6000 ft. (1828.8 m) 1050 ft. (320 m)
8 AWG 9900 ft. (3017.5 m) 1750 ft. (533.4 m)
6 AWG 14,000 ft. (4267.2 m) 2500 ft. (762 m)
Maximum Cable Length for PowerTable A.4 –
If the cable length is longer than 600 ft. (182.9 m) when operating at 24 V, it is
98 APPeNdiX
possible to increase the maximum cable length by wiring a pair of lines normally
used for RS-232 communications with the red and black wires.
If the cable length is 200 ft. (61 m) or greater you cannot reliably use RS-232
communications. To add 400 ft. (121.9 m) and achieve a maximum cable length of
1000 ft. (304.8 m), connect the orange wire (normally RTS) to the red wire and the
brown wire (normally CTS) to the black wire.
If your cable run is longer than 1000 ft. (304.8 m), it is possible to sacrice
additional communication pairs to increase the maximum cable length for
power. However, you may desire to communicate to the sensor over two
independent channels, in which case you will need to consider an alternate cable
for power. The AWG for wire pairs that achieve a 2000 ft. (609.6 m) maximum
cable length or greater at 12 and 24 V are listed in Table A.5.
To achieve reliable wired communications, the selected baud rate must be
compatible with the length of the cable run. Table A.5 below shows the cable
length recommendations for wired communications:
Baud Rate (bps) RS-232 RS-485
115200 40 ft. (12.2 m) 300 ft. (91.4 m)
57600 60 ft. (18.3 m) 600 ft. (182.9 m)
38400 100 ft. (30.5 m) 800 ft. (243.8)
19200 140 ft. (42.7 m) 1000 ft. (304.8 m)
9600 200 ft. (61 m) 2000 ft. (609.6 m)
Maximum Cable Length for Wired CommunicationsTable A.5 –
To provide two independent communication channels with a homerun cable
length over 200 ft. (61 m), convert the RS-232 data into RS-485 using a Click! 304
in a pole-mount cabinet mounted next to the sensor. In this case, the homerun
connection establishes one RS-485 channel over the normal white/blue wire
pair and another RS-485 channel over the yellow/violet wire pair. An additional
Click! 304 is needed to convert the data sent over the yellow/violet wire pair back
to RS-232 before connecting to surge protection.
If you elect to use an alternate cable for power, you may also want to select an
alternate cable for RS-485 communications. Some options include the Belden
3105A (Paired – EIA Industrial RS-485 PLTC/CM) or Alpha Wire 6010C 3PR 22
AWG.
There are many reliable options available for wired power and communications
connections (see Table A.6).
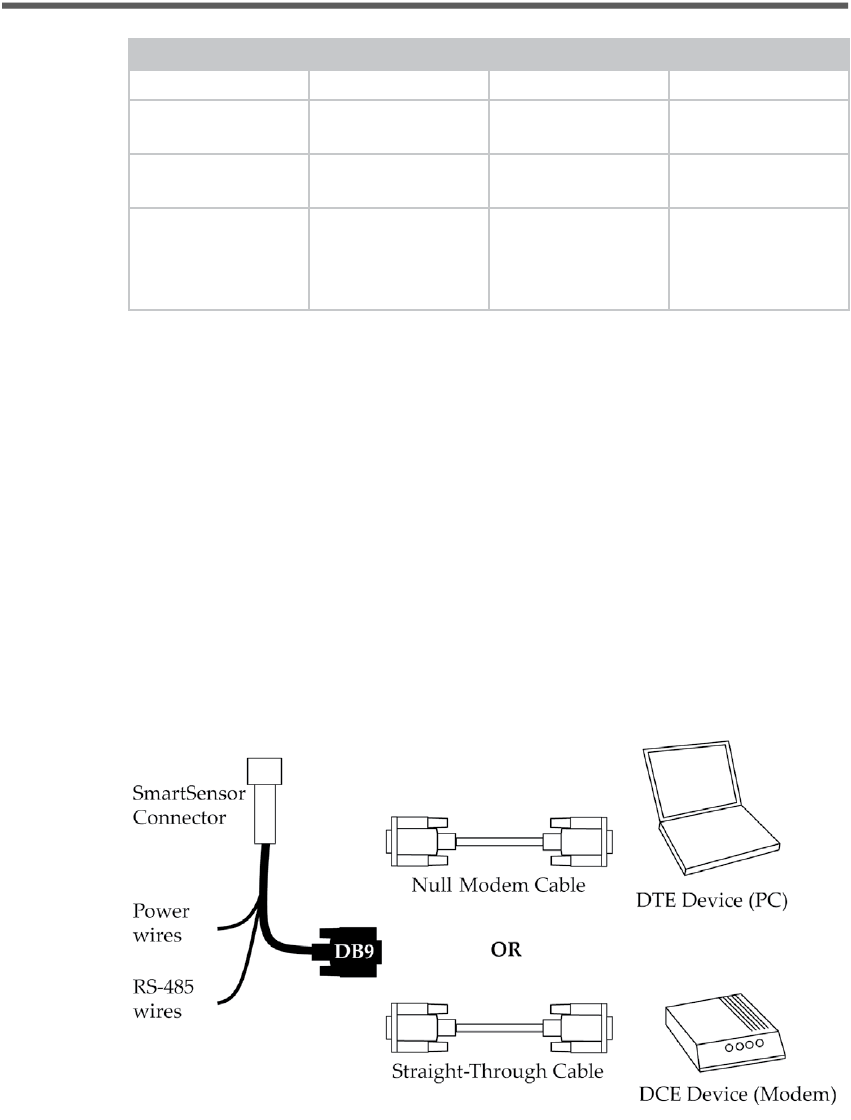
99APPeNdiX
Length Cable Comm. Channel 1 Comm. Channel 2
0–200 ft. (0–61 m) SmartSensor Cable Native RS-485 Native RS-232
200–1000 ft.
(61–304.8 m)
SmartSensor Cable Native RS-485 Click! conversion of
RS-232 to RS-485
1000–1400 ft.
(304.8–426.7 m)
SmartSensor Cable Native RS-485 N/A
1400–2000 ft.
(426.7–609.6 m)
Alternate
power and
communications
cable
Native RS-485 Click! conversion of
RS-485 to RS-232
Cable Length OptionsTable A.6 –
Appendix D – Direct Serial Connections
For most applications, the service end of the SmartSensor cable terminates in a
surge protection device. However, during demonstrations, troubleshooting, and
certain other situations, it is sometimes convenient to bypass surge protection
and connect directly to a personal computer or communications device such as a
modem.
The sensor is congured as an RS-232 DTE device. To connect the SmartSensor
cable’s RS-232 wires directly to another DTE device (such as a PC), you can use
a standard 9-pin “D” connector and a null modem cable. To connect directly to
a DCE device (such as a modem), you will need a straight-through cable. Figure
A.4 illustrates both of these cases.
Direct Serial ConnectionsFigure A.4 –

100 APPeNdiX
Note
If you do not have the right type of RS-232 physical connection you will
not be able to connect using the SmartSensor Manager software. Since null
modem cables and straight-through cables look similar, you may want
to label them. Alternatively, you may want to use a null modem adapter
instead of a null modem cable. If you do, you can turn your straight-
through cable into a null modem cable by aaching the adapter on one end.
If you wish to connect the SmartSensor cable’s RS-485 wires directly to a
PC or modem, this will require that these devices natively support RS-485
communications. Often, modern personal computers do not support RS-485
communications and support USB communications instead. If your computer
only supports USB communications, you may want to use a Click! serial to USB
converter to make a direct connection.