softDSP SDS200A PC BASED DIGITAL OSCILLOSCOPE User Manual MANUAL
softDSP Co., Ltd. PC BASED DIGITAL OSCILLOSCOPE MANUAL
UserManual.wiki
>
softDSP
>
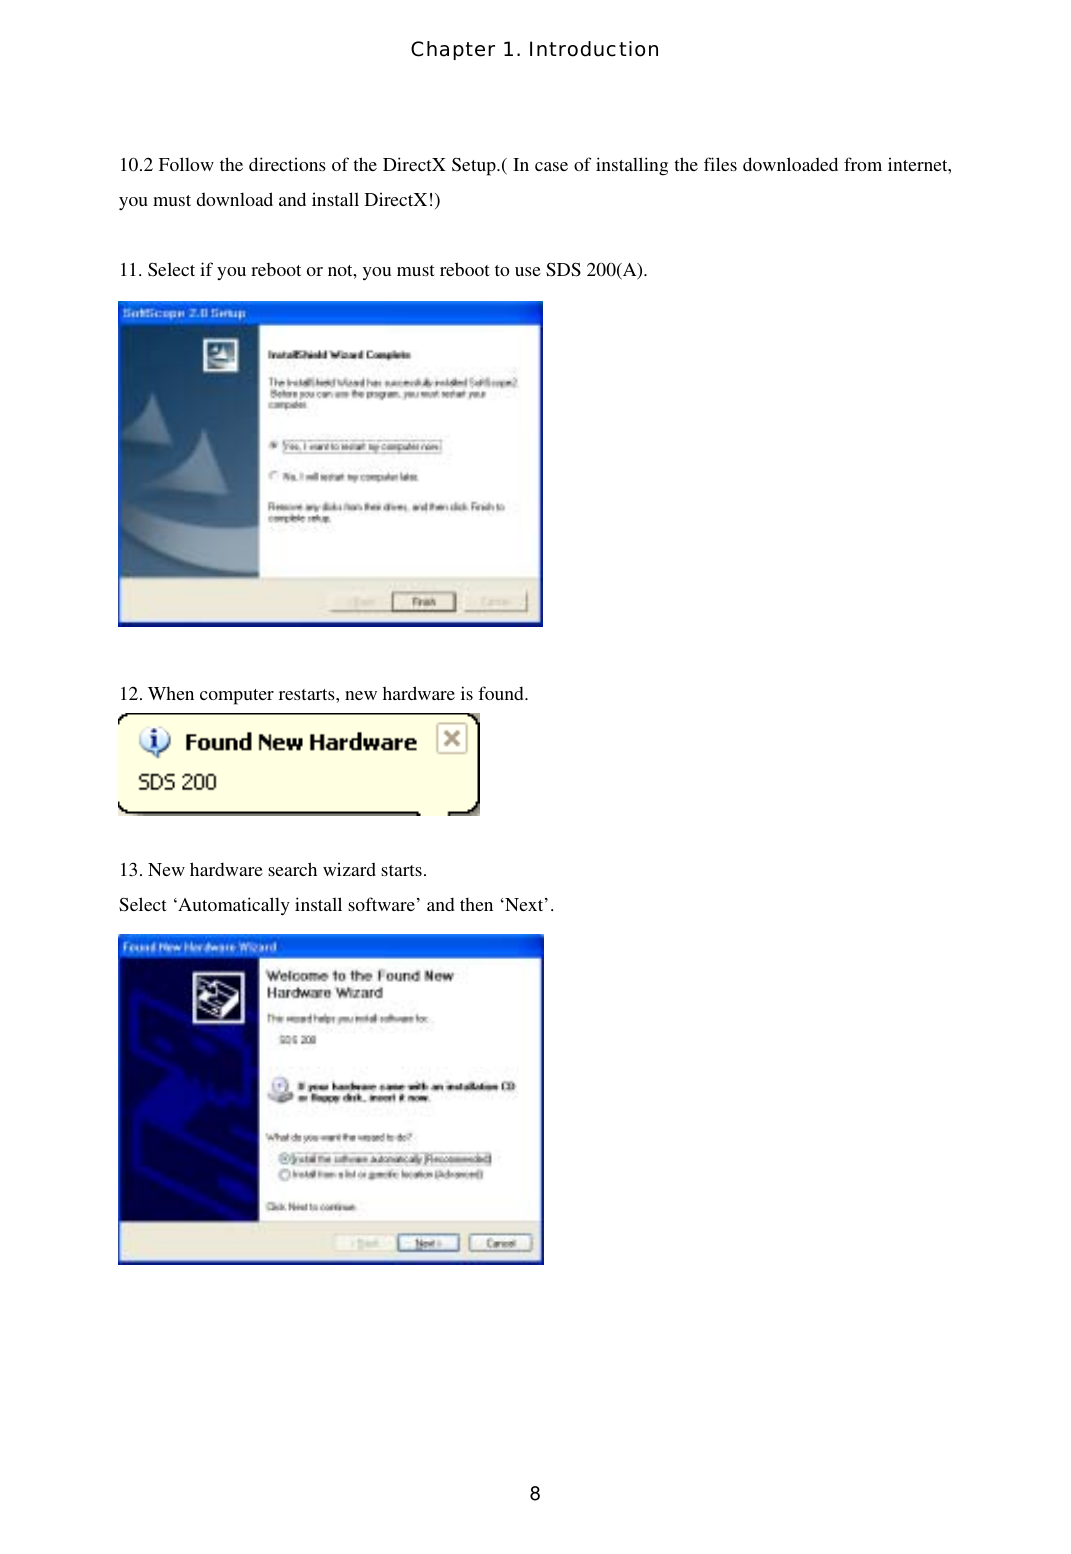
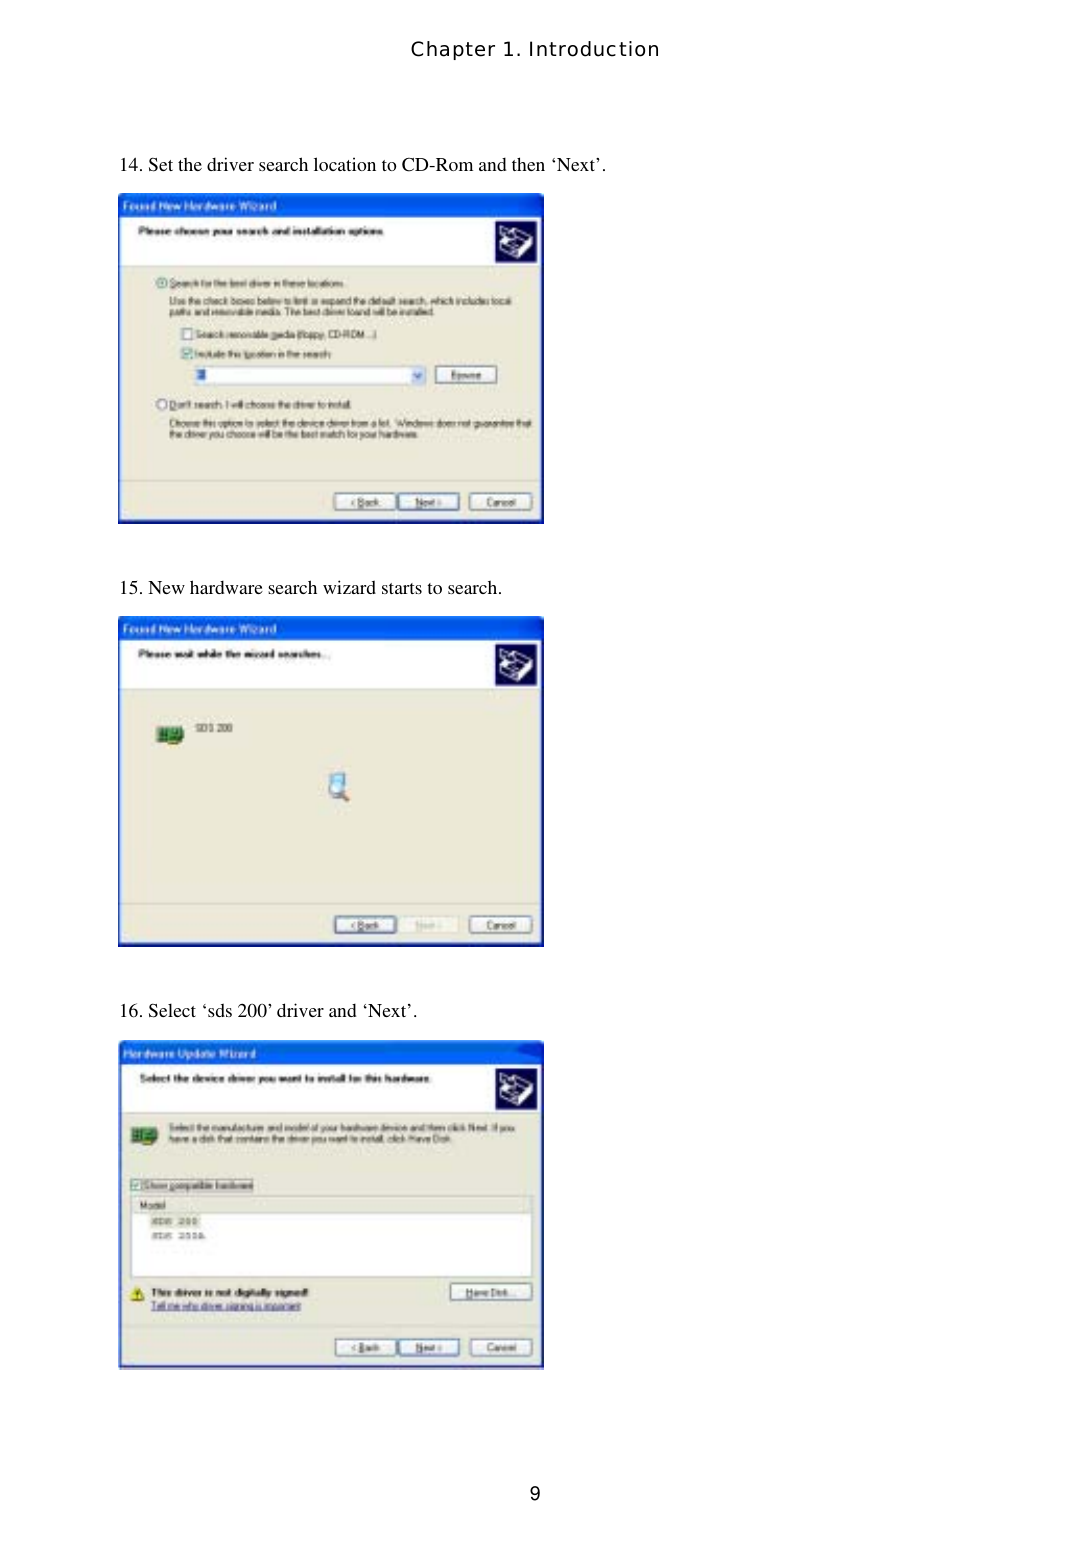
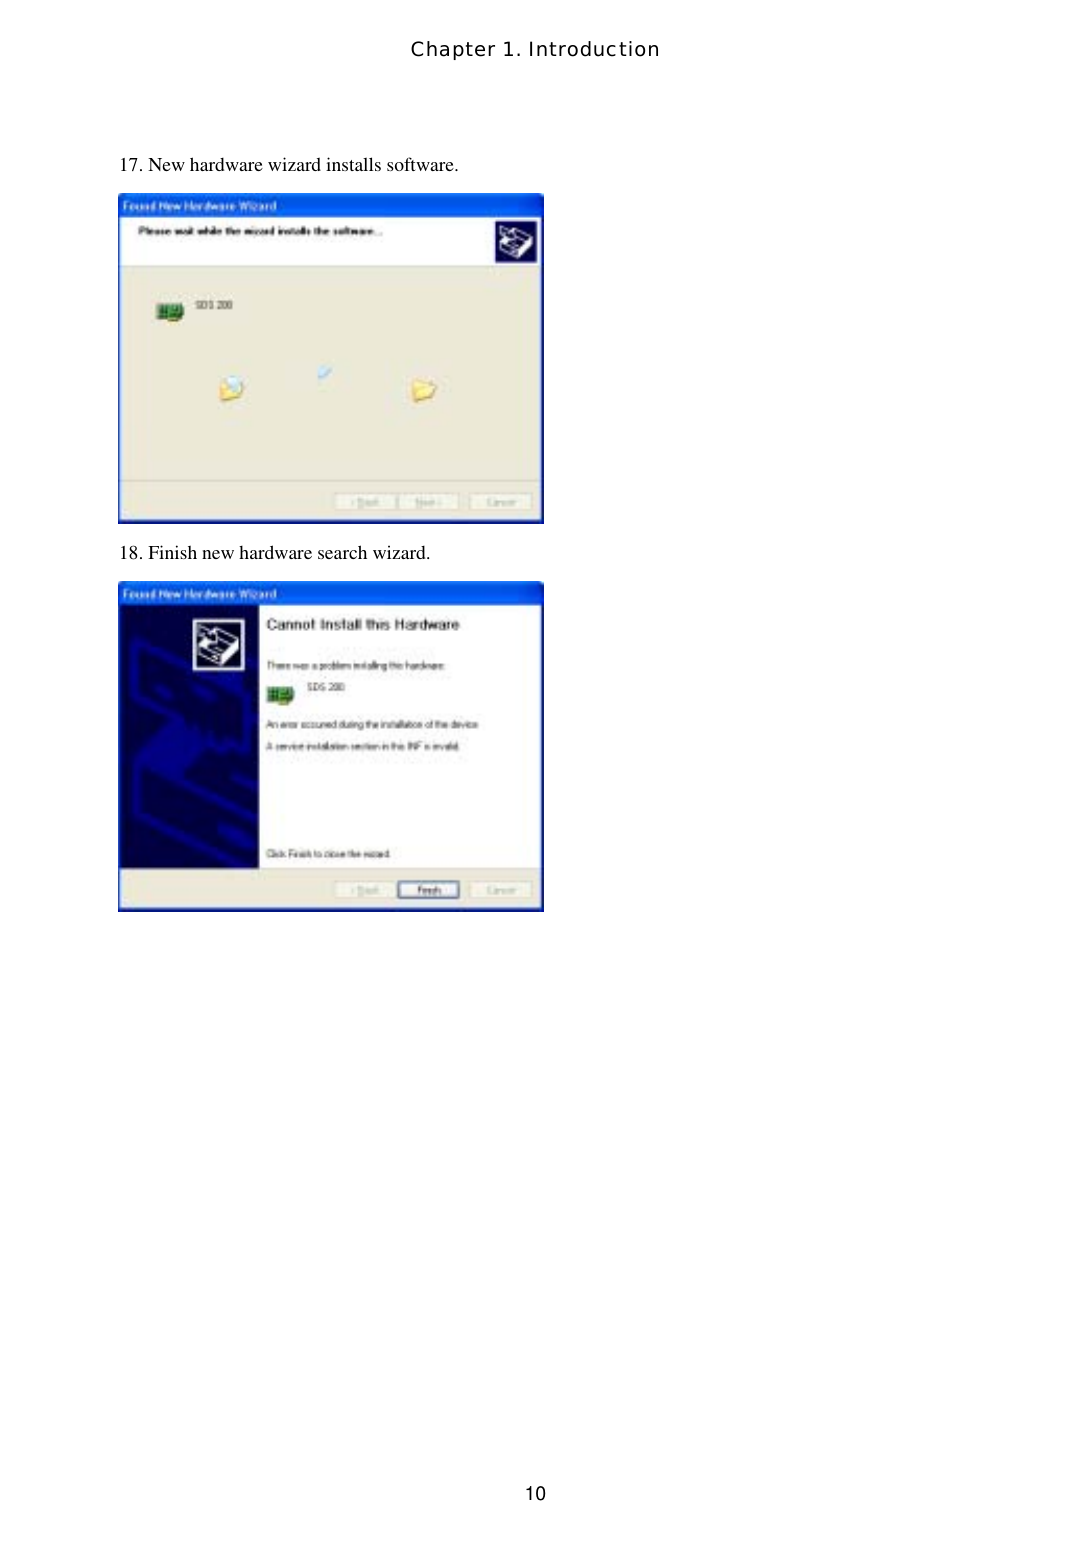
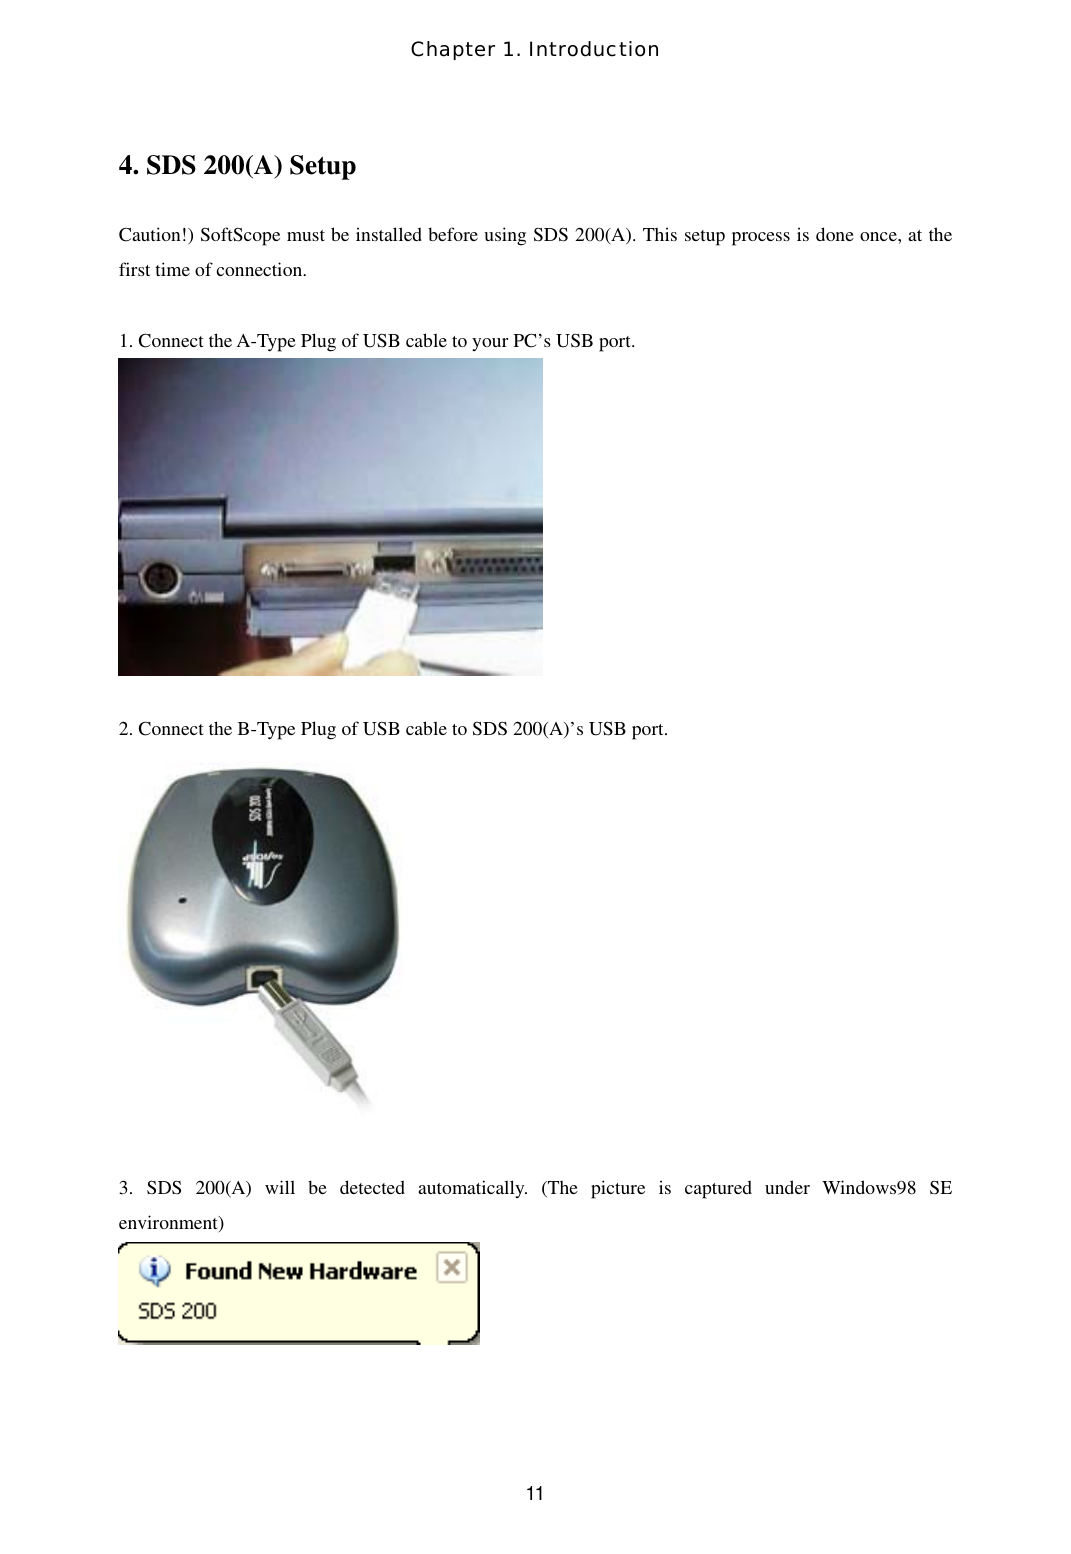
SDS200A User Manual
>
MANUAL
Contents
1.
MANUAL
2.
USERS MANUAL
MANUAL
Navigation menu
Upload a User Manual
Namespaces
Wiki Guide
HTML
PDF
Info
Views
User Manual
Discussion / Help
Navigation
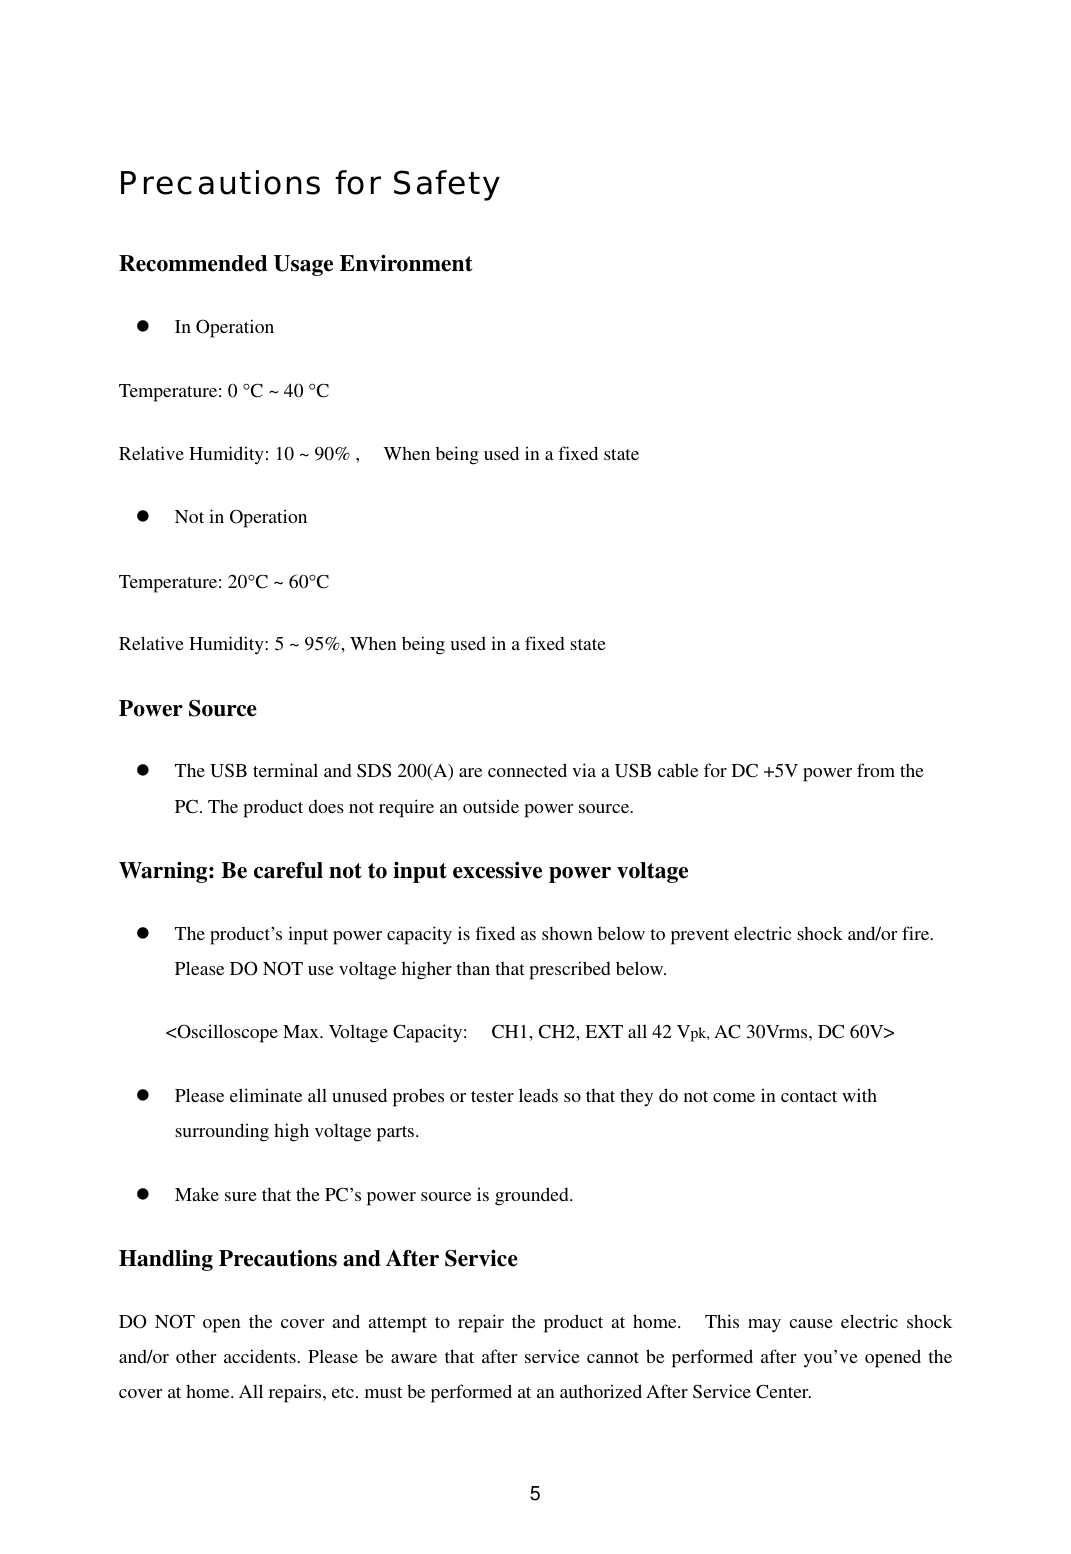
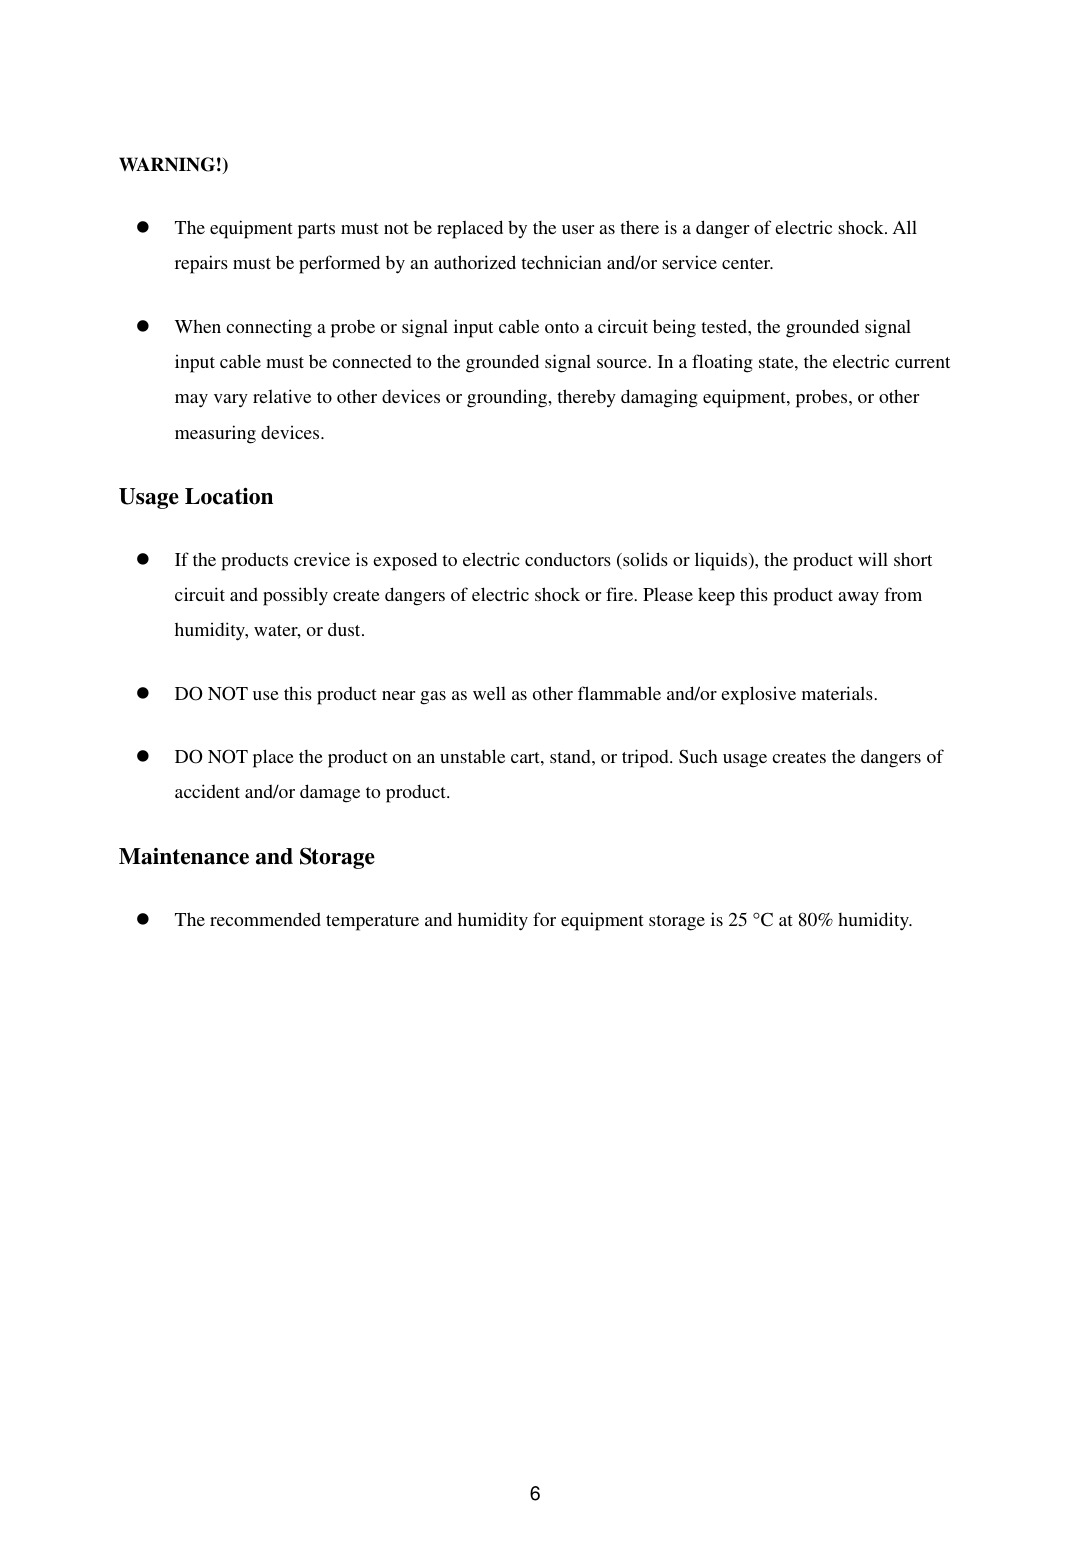
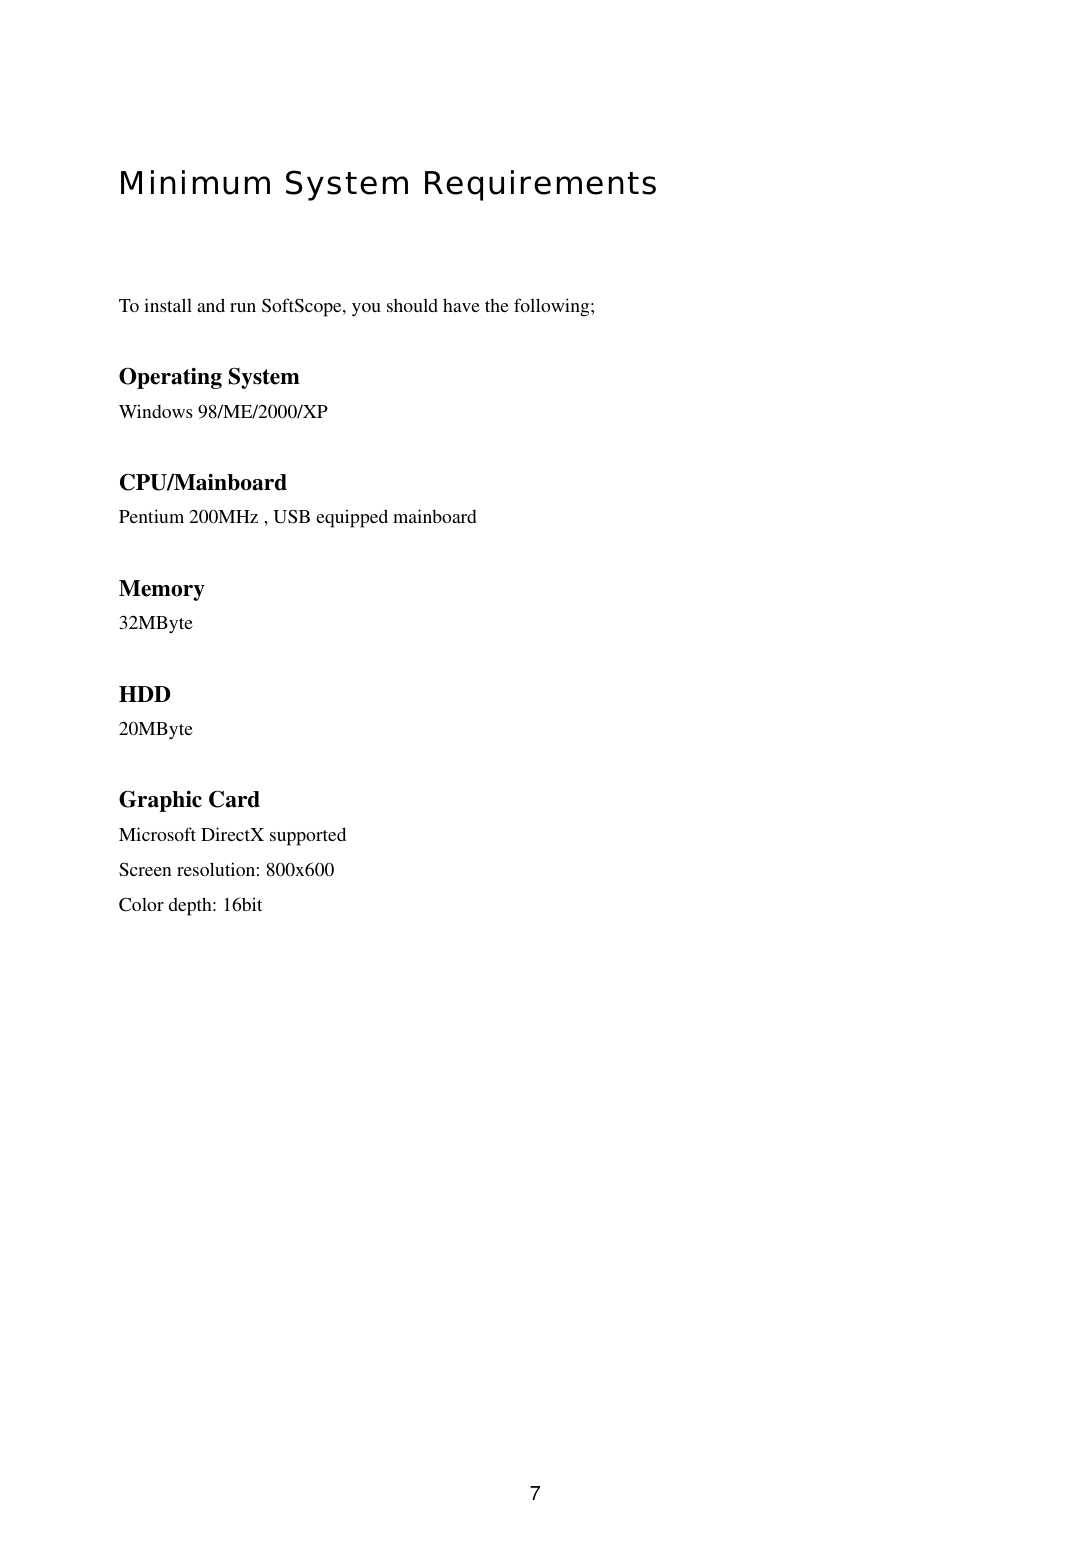
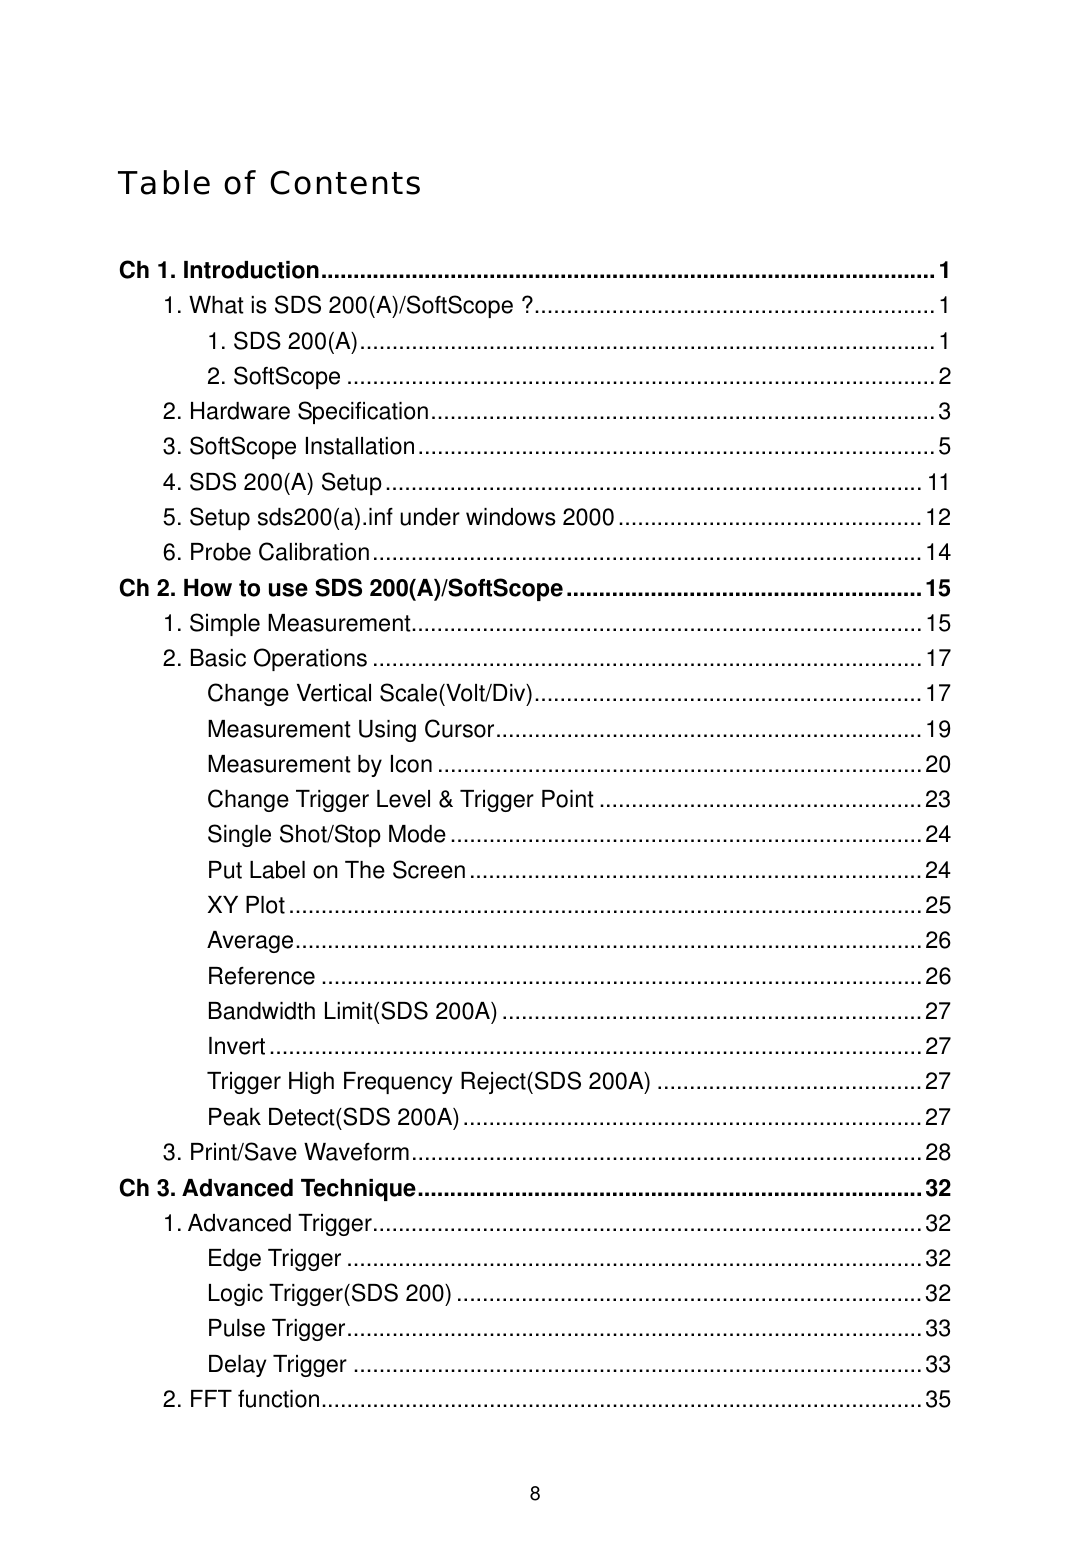
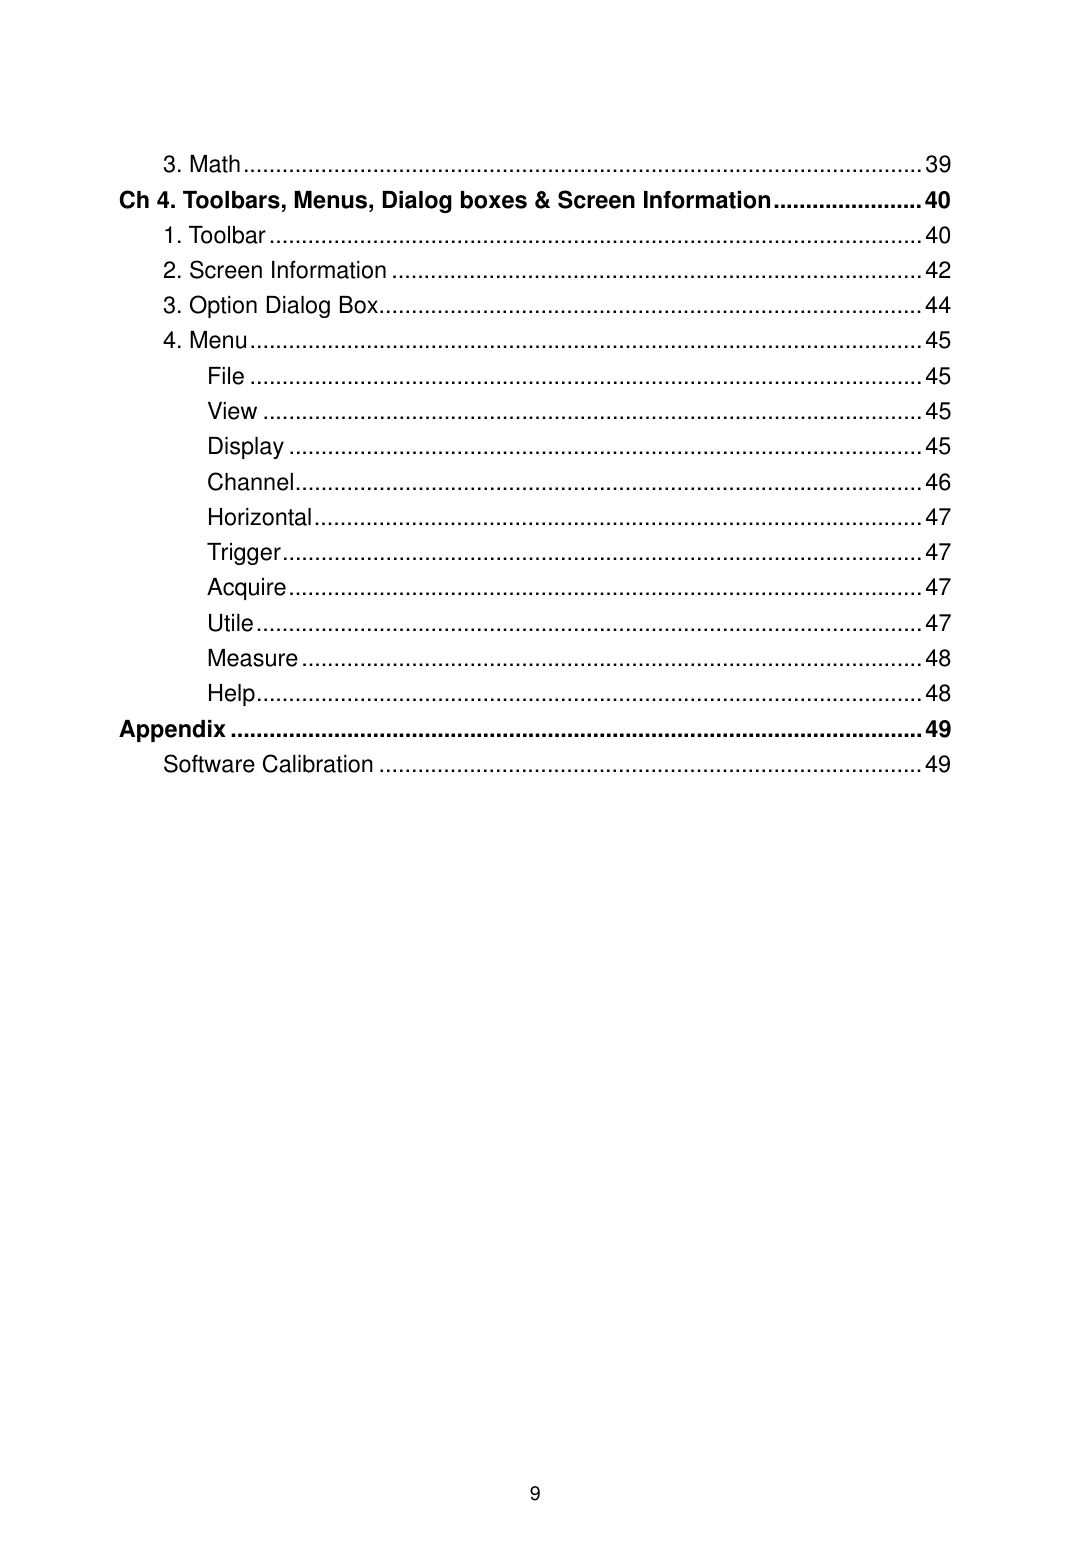
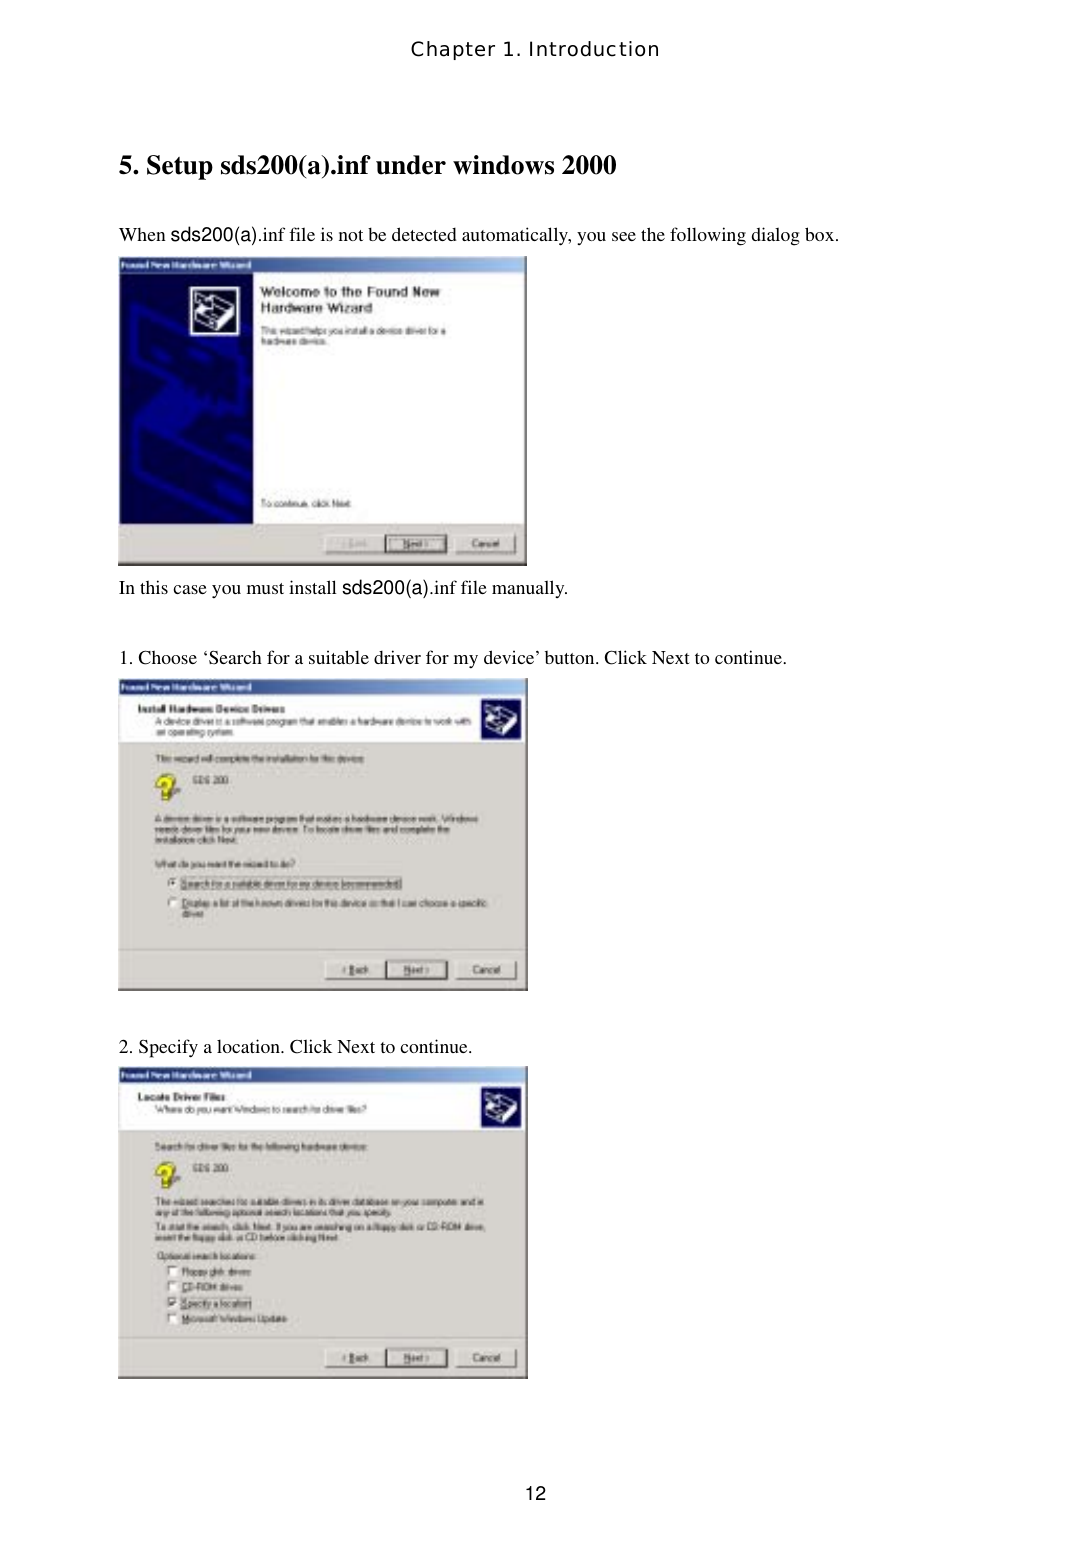

![Chapter 5. Appendix 422. Screen Information SoftScope has the following windows to show the internal states and settings. 1. : Channel 1 Window - Display current probe Attenuation (1:1, 1:10, 1:100, 1:1000). - Display current Volt/Div. - Click mouse to change set up value. 2. Configuration of Channel 2 Window( ) , Math Window( ), Reference Window( ) is same as the Channel 1 window. 3. : Time Window - Display current Time/Div. - Click mouse and change set up value. 4. : Trigger status display window A. When SDS 200(A) is in a delay-on state it shows the current trigger point using time dimension. B. When SDS 200(A) is in a delay-off state it shows the current trigger point using % scale. 5. : Trigger point display window A. The trigger point shows the trigger position in the acquired waveform. B. This line shows the whole acquired waveform. C. You can see the data currently showing using [ ] mark. D. This mark shows the reference point when horizontal scale(time/div) is changed. 6. : Trigger state selection tool bar A. Trigger source selection radio button](https://usermanual.wiki/softDSP/SDS200A.MANUAL/User-Guide-340052-Page-52.png)