softDSP SDS200A PC BASED DIGITAL OSCILLOSCOPE User Manual MANUAL
softDSP Co., Ltd. PC BASED DIGITAL OSCILLOSCOPE MANUAL
softDSP >
Contents
- 1. MANUAL
- 2. USERS MANUAL
MANUAL

User’s Guide
- SDS 200(A) -
- SoftScope-
PC Based Digital Oscilloscope
www.softDSP.com

1
Copyright SOFTDSP CO., LTD.. All rights reserved.
This document is being furnished by SOFTDSP CO., LTD.. for information purposes only to licensed
users of the SDS 200(A) and is furnished on as “AS IS” basis, that is, without any warranties, whatsoever,
expressed or implied.
SDS 200(A) and SoftScope are trademarks of SOFTDSP CO., LTD..
Other brand and product names are trademarks or registered trademarks of the respective holders.
Microsoft is a registered trademark and Windows, the Windows logo are registered trademarks of the
Microsoft Corporation.
Information in this document is subject to change without notice and does not represent a commitment on
the part of SOFTDSP CO., LTD..

2
FCC NOTICE
THIS DEVICE COMPLIES WITH PART 15 OF THE FCC RULES.
OPERATION IS SUBJECT TO THE FOLLOWING TWO CONDITION:
(1) THIS DEVICE MAY NOT CAUSE HARMFUL INTERFERENCE, AND
(2) THIS DEVICE MUST ACCEPT ANY INTERFERENCE RECEIVED,
INCLUDING INTERFERENCE THAT MAY CAUSE UNDERSIRED
OPERATION.
This equipment has been tested and found to comply with the limits for a Class B
digital device, pursuant to part 15 of the FCC Rules. These limits are designed to
provide reasonable protection against harmful interference in a residential installation.
This equipment generates, uses and can radiate radio frequency energy and, if not
installed and used in accordance with the instructions, may cause harmful interference
to radio communication. However, there is no guarantee that interference will not
occur in a particular installation. If this equipment does cause harmful interference to
radio or television reception, which can be determined by turning the equipment off and
on, the user is encouraged to try to correct the interference by one or more of the
following measures :
- Reorient or relocate the receiving antenna.
- Increase the separation between the equipment and receiver.
- Connect the equipment into an outlet on a circuit difference from that to which
the receiver is connected.
- Consult the dealer of an experienced radio/TV technician for help.
NOTE : The manufacturer is not responsible for any radio or TV interference caused by
unauthorized modifications to this equipment. Such modifications could void the user’s
authority to operate the equipment.

3
Certificate of Product Warranty
This product’s warranty, provided by SOFTDSP CO., LTD., covers a period of 1 year from the date of
purchase. All faulty parts and/or functions, resulting despite user’s normal use, will be repaired and/or
replaced at no charge during the warranty period.
However, if any of the malfunctions are caused by user carelessness, inadequate maintenance, or natural
disaster, SOFTDSP will then provide repair and/or replacement services for a fee regardless of warranty
period.
Products covered by this warranty are limited to those that are registered at the SOFTDSP headquarter or
branch offices and repairs, replacements, or refunds will be issued according to manufacturer’s discretion.
When in need of warranty services, the purchaser may visit our headquarter or one of our sales offices
with the product or send the product with a detailed description of services required via postal service to
any of our sales offices (the purchaser will be responsible for packaging, postage, and any postal
insurance). Once repair services are completed, the supplier will return the product to the purchaser
(return postage will be paid by the supplier).
However, if we determined required services to be outside the boundaries of the warranty coverage, we
will first contact the purchaser and provide an estimate of repair costs and obtain authorization to conduct
services before any work is done. In such a case, return postage along with the repair costs will be billed
to the purchaser when the repaired product is returned.
SOFTDSP CO., LTD.. will not be held legally liable for any malfunction resulting from user carelessness,
abnormal use (e.g. ignorance of warning instructions, etc.), and/or natural disaster. Even if SOFTDSP CO.,
LTD. is in receipt of prior notification of such dangers, we will not be held legally liable.

4
Product Warranty Guide
Please read through the “Precautions for Safety” carefully to obtain a long and safe use of this product.
This product has been processed through careful quality control and testing procedures. Any malfunctions
occurring during normal use are covered under the guidelines of the “Certificate of Product Warranty”,
which is included in this Manual.
If you experience product malfunction, please contact our headquarters or any of our sales offices.

5
Precautions for Safety
Recommended Usage Environment
In Operation
Temperature: 0 °C ~ 40 °C
Relative Humidity: 10 ~ 90% , When being used in a fixed state
Not in Operation
Temperature: 20°C ~ 60°C
Relative Humidity: 5 ~ 95%, When being used in a fixed state
Power Source
The USB terminal and SDS 200(A) are connected via a USB cable for DC +5V power from the
PC. The product does not require an outside power source.
Warning: Be careful not to input excessive power voltage
The product’s input power capacity is fixed as shown below to prevent electric shock and/or fire.
Please DO NOT use voltage higher than that prescribed below.
<Oscilloscope Max. Voltage Capacity: CH1, CH2, EXT all 42 Vpk, AC 30Vrms, DC 60V>
Please eliminate all unused probes or tester leads so that they do not come in contact with
surrounding high voltage parts.
Make sure that the PC’s power source is grounded.
Handling Precautions and After Service
DO NOT open the cover and attempt to repair the product at home. This may cause electric shock
and/or other accidents. Please be aware that after service cannot be performed after you’ve opened the
cover at home. All repairs, etc. must be performed at an authorized After Service Center.

6
WARNING!)
The equipment parts must not be replaced by the user as there is a danger of electric shock. All
repairs must be performed by an authorized technician and/or service center.
When connecting a probe or signal input cable onto a circuit being tested, the grounded signal
input cable must be connected to the grounded signal source. In a floating state, the electric current
may vary relative to other devices or grounding, thereby damaging equipment, probes, or other
measuring devices.
Usage Location
If the products crevice is exposed to electric conductors (solids or liquids), the product will short
circuit and possibly create dangers of electric shock or fire. Please keep this product away from
humidity, water, or dust.
DO NOT use this product near gas as well as other flammable and/or explosive materials.
DO NOT place the product on an unstable cart, stand, or tripod. Such usage creates the dangers of
accident and/or damage to product.
Maintenance and Storage
The recommended temperature and humidity for equipment storage is 25 °C at 80% humidity.

7
Minimum System Requirements
To install and run SoftScope, you should have the following;
Operating System
Windows 98/ME/2000/XP
CPU/Mainboard
Pentium 200MHz , USB equipped mainboard
Memory
32MByte
HDD
20MByte
Graphic Card
Microsoft DirectX supported
Screen resolution: 800x600
Color depth: 16bit

8
Table of Contents
Ch 1. Introduction...............................................................................................1
1. What is SDS 200(A)/SoftScope ?..............................................................1
1. SDS 200(A).........................................................................................1
2. SoftScope ...........................................................................................2
2. Hardware Specification..............................................................................3
3. SoftScope Installation................................................................................5
4. SDS 200(A) Setup................................................................................... 11
5. Setup sds200(a).inf under windows 2000...............................................12
6. Probe Calibration.....................................................................................14
Ch 2. How to use SDS 200(A)/SoftScope.......................................................15
1. Simple Measurement...............................................................................15
2. Basic Operations .....................................................................................17
Change Vertical Scale(Volt/Div)............................................................17
Measurement Using Cursor..................................................................19
Measurement by Icon ...........................................................................20
Change Trigger Level & Trigger Point ..................................................23
Single Shot/Stop Mode.........................................................................24
Put Label on The Screen......................................................................24
XY Plot..................................................................................................25
Average.................................................................................................26
Reference .............................................................................................26
Bandwidth Limit(SDS 200A).................................................................27
Invert.....................................................................................................27
Trigger High Frequency Reject(SDS 200A) .........................................27
Peak Detect(SDS 200A).......................................................................27
3. Print/Save Waveform...............................................................................28
Ch 3. Advanced Technique..............................................................................32
1. Advanced Trigger.....................................................................................32
Edge Trigger .........................................................................................32
Logic Trigger(SDS 200) ........................................................................32
Pulse Trigger.........................................................................................33
Delay Trigger ........................................................................................33
2. FFT function.............................................................................................35

9
3. Math.........................................................................................................39
Ch 4. Toolbars, Menus, Dialog boxes & Screen Information.......................40
1. Toolbar.....................................................................................................40
2. Screen Information ..................................................................................42
3. Option Dialog Box....................................................................................44
4. Menu........................................................................................................45
File ........................................................................................................45
View ......................................................................................................45
Display ..................................................................................................45
Channel.................................................................................................46
Horizontal..............................................................................................47
Trigger...................................................................................................47
Acquire..................................................................................................47
Utile.......................................................................................................47
Measure................................................................................................48
Help.......................................................................................................48
Appendix ...........................................................................................................49
Software Calibration ....................................................................................49

Chapter 1. Introduction
1
Ch 1. Introduction
1. What is SDS 200(A)/SoftScope ?
1. SDS 200(A)
SDS 200(A) developed by SOFTDSP CO., LTD. is a portable PC-based Digital Oscilloscope.
High performance
SDS 200(A) has the following features: 200MHz analog bandwidth, 5GS/s equivalent sampling, 100MHz
real-time sampling.
USB connected
SDS 200(A) uses USB that supports plug’n play, with 12Mbps communication speed.
Advanced trigger
SDS 200(A) has advanced trigger circuitry so that it can detect many complex signals.
Best performance for your dollar
SDS 200(A) has many features that is comparable to the high speed stand-alone DSOs. But it costs a
fraction of the price.
No external power required
SDS 200(A) does not need an external power source, because it is bus-powered from USB.

Chapter 1. Introduction
2
2. SoftScope
SoftScope is a Windows software that controls SDS 200(A).
Easy to use
SoftScope is easy to use. It is intuitive and easy to understand.
Big screen
SoftScope uses 500 x 400 screen size.
Various data format processing
SoftScope can save waveform in the following formats: text file, jpg/bmp graphic file, MS excel/word file.
Fast screen update rate
SoftScope uses Microsoft DirectX, so that it gives upto screens per second update rate. (under
Windows98, Pentium II environment)
Many kinds of measurements
SoftScope has 23 measurement functions.
The analog scope effect
SoftScope uses digital persistence and histogram method so that the display resembles an analog
oscilloscope screen.

Chapter 1. Introduction
3
2. Hardware Specification
Input
Max. sample rate Realtime sampling: 100MS/s using one channel, 50MS/s using two
channels
Equivalent sampling: 5GS/s
Channels 2
Bandwidth 200 MHz (-3dB)
Single shot bandwidth:50MHz
20MHz bandwidth limiting function is available(SDS 200A)
Vertical resolution 9 bits/channel
Gain range 10mV ~ 10V/div @ x1 probe
(10mV, 20mV, 50mV, 100mV, 200mV, 500mV, 1V, 2V, 5V, 10V/div
1,2,5 sequence)
100mV ~ 100V/div @ x10 probe
1V ~ 1000V/div @ x100 probe
10V ~ 10kV/div @x1000 probe
Range 8 divisions
Offset level +/-4 divisions
Coupling AC, DC, GND(SDS 200A)
Offset increments 0.02 div
Impedance 1M ohm
DC accuracy +/-3%
Input protection 42Vpk (DC + peak AC < 10 kHz, without external attenuation)
Display Mode Y-T, X-Y
Timebase
Timebase range 2ns/div ~ 10s/div
( 2ns, 4ns, 10ns, 20ns, 40ns, 100ns, 200ns, 400ns, 1us,
2us, 4us, 10us, 20us, 40us, 100us, 200us, 400us, 1ms,
2ms, 4ms, 10ms, 20ms, 40ms, 100ms, 200ms, 400ms, 1s,
2s, 4s, 10s /div 1-2-4 sequence)
Acquisition mode
Equivalent sampling: 2ns/div ~ 4us/div
Realtime sampling: 10us/div ~ 400ms/div
Roll mode: 1s/div ~ 10s/div
Peak detection
Range 10 divisions

Chapter 1. Introduction
4
Pre/Post trigger 0% ~ 1000%
Time resolution 200ps
Buffer size 10K samples
10K ~ 512K samples(SDS 200A)
Trigger
Type Edge trigger: Rising edge, falling edge
Logic trigger: AND, NAND, OR, NOR, XOR, XNOR (SDS 200)
Pulse trigger: Less than width, more than width (10ns ~ 167ms)
Delay trigger: By event (1~16,777,215), by time (10ns ~ 167ms) (SDS
200)
Delay trigger: By event (1~16,777,215), by time (1us ~ 167ms) (SDS
200A)
Mode Auto, Normal and Single
Autoset Yes
Range 10 divisions
Trigger level +/-4 divisions
Settabillity 0.02 div increments
Math
Measurements Vp-p, Vmax, Vmin, Vmean, Vrms, Vamp, Vhigh, Vlow, positive overshoot,
negative overshoot, cycle mean, cycle rms, period, frequency, positive
pulse width, negative pulse width, rise time (10%~90%), fall time
(10%~90%), positive duty cycle, negative duty cycle
Cursor Time/frequency difference, voltage difference
Frequency only in FFT mode
Math Addition, Subtraction, Multiplication, Division
FFT Rectangular, Hanning, Hamming, Blackman Window
Physical
Interface Universal Serial Bus (USB)
Power No external power source required.
Bus-powered from USB
Dimensions 5.1" x 4.4" x 1.5" (130 × 112 × 38mm)
Chapter 1. Introduction
5
3. SoftScope Installation
Caution!) You must install ‘SoftScope’ before using SDS 200(A).
1. While in Windows, insert the installation CD into the CD-ROM drive.
2. The installation should start up automatically. Otherwise in Windows Explorer, switch to the CD-ROM
drive and run Setup.exe.
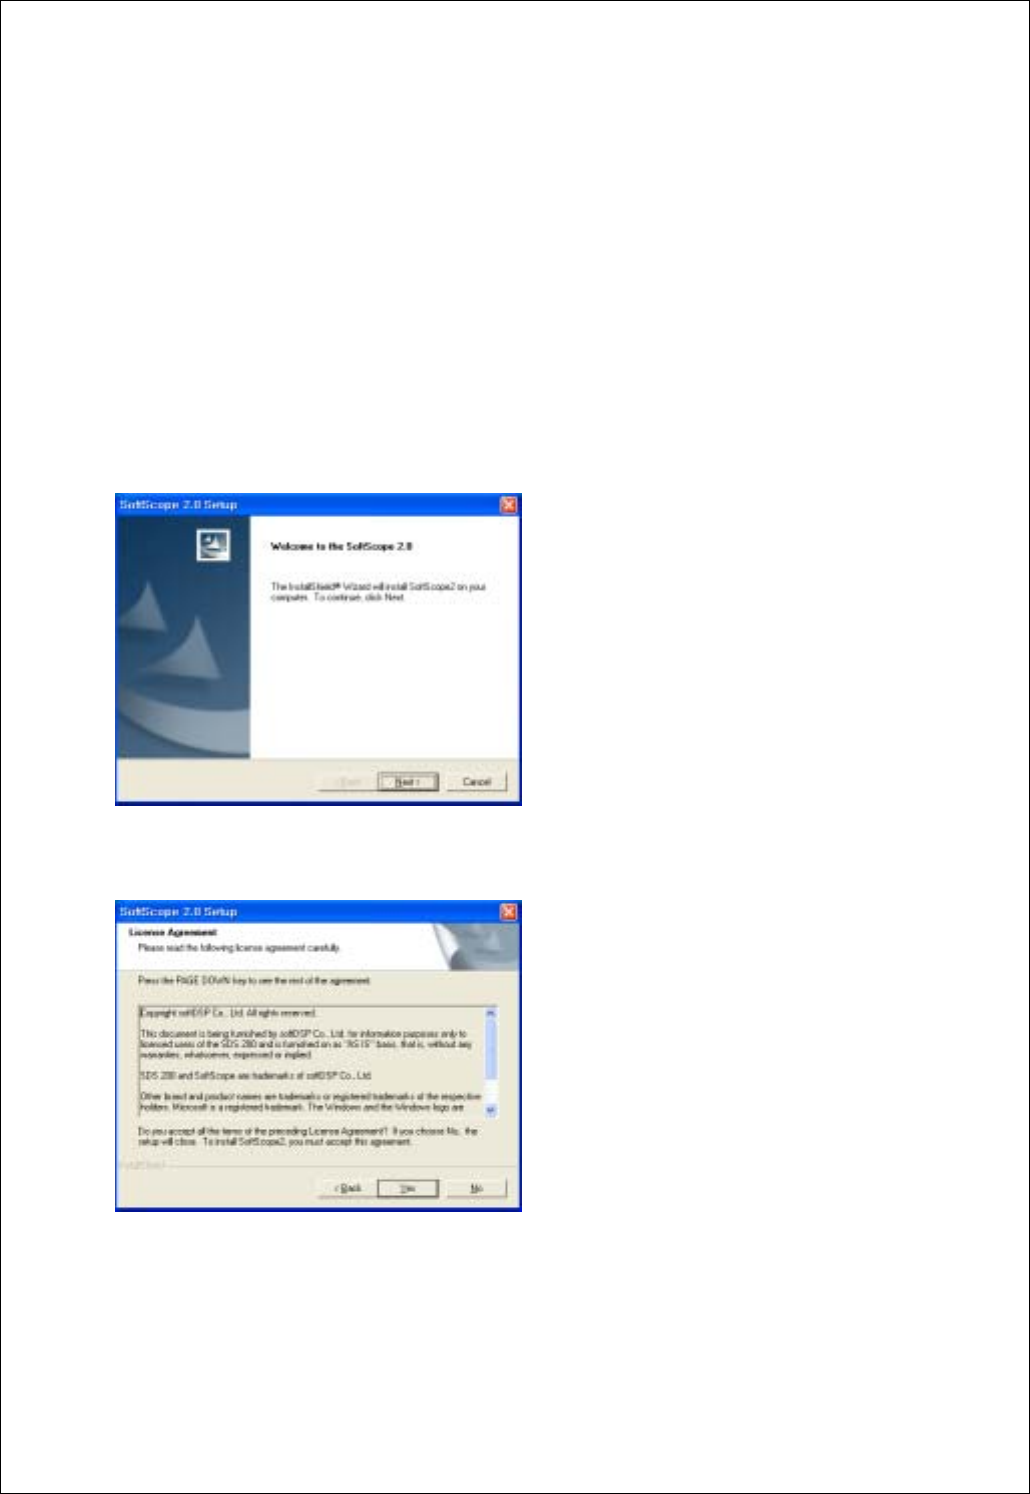
3. The SoftScope Installation is started. Click Next to continue.
4. If you accept the license agreement, click Yes to continue.
Chapter 1. Introduction
6
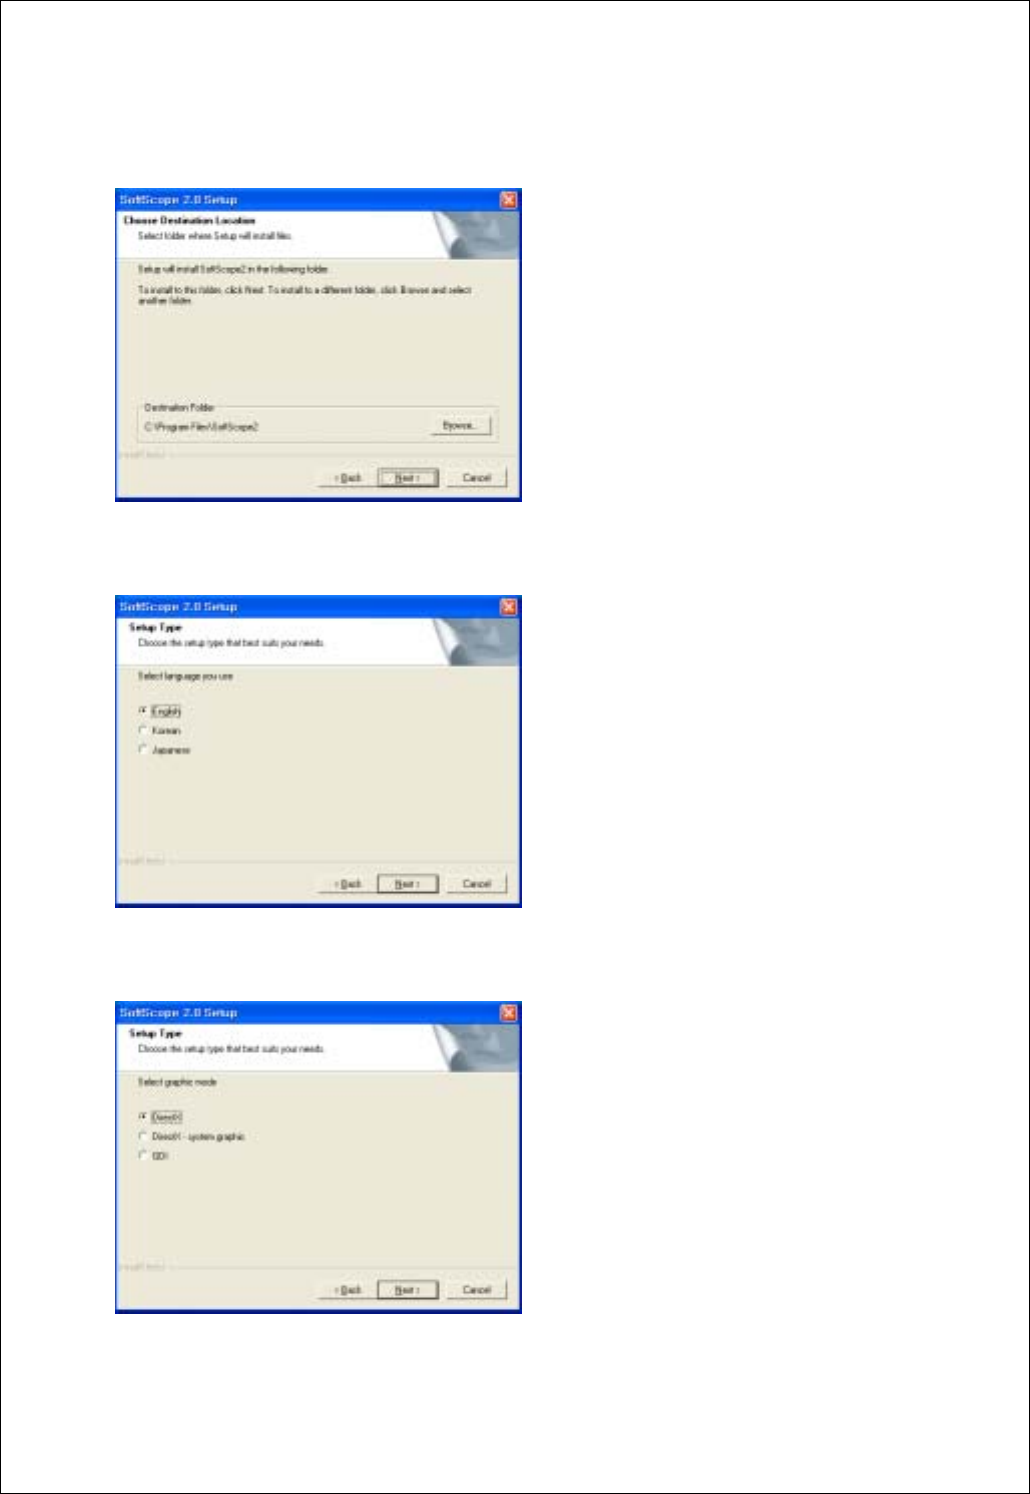
5. Choose a destination directory. Click Next to continue.
6. Select Language you use. Click Next to continue.
7. Select Graph mode. Click Next to continue.
Chapter 1. Introduction
7
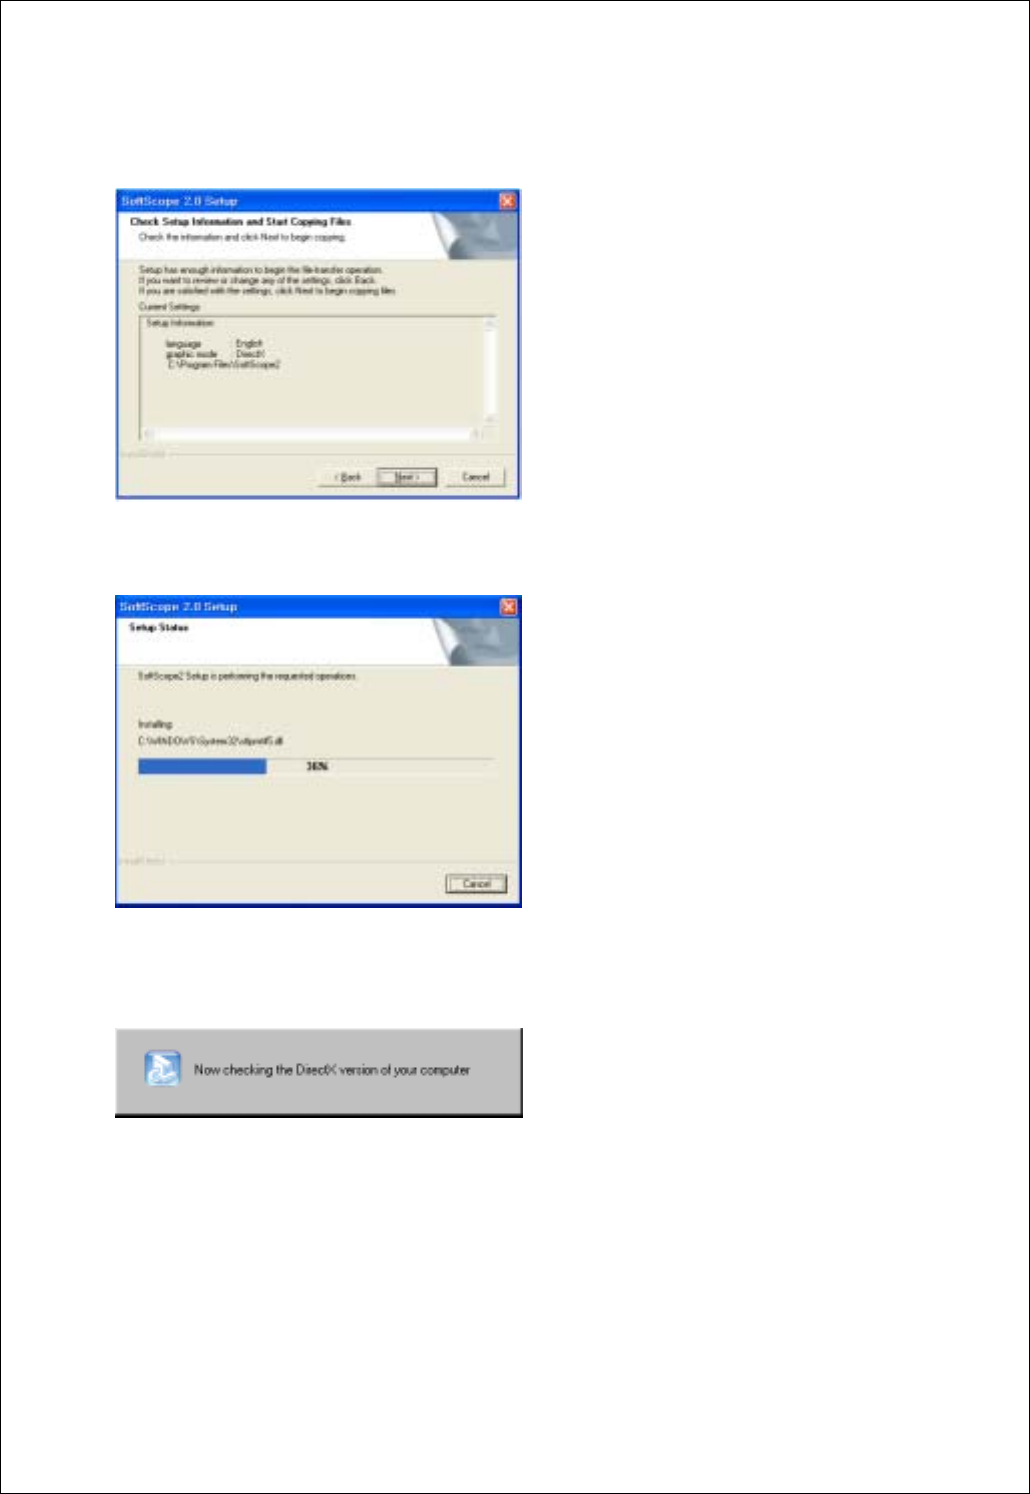
8. Check the setup information. Click Next to start copying of files.
9. This Status dialog is displayed during copying of files.
10. After Installing SoftScope, the installation program will check the DirectX version of your computer.
If it is later than 6.0, the installation program will skip the DirectX Setup.
10.1 If it is earlier than 6.0 or no DirectX installed on your computer, you must reinstall DirectX.
if you install from CD-ROM, DirectX Setup will start up.
If you download SoftScope_with_DirectX.exe, DirectX will be installed automatically.
If you download SoftScope.exe, you must download DirectX also.
Chapter 1. Introduction
8
10.2 Follow the directions of the DirectX Setup.( In case of installing the files downloaded from internet,
you must download and install DirectX!)
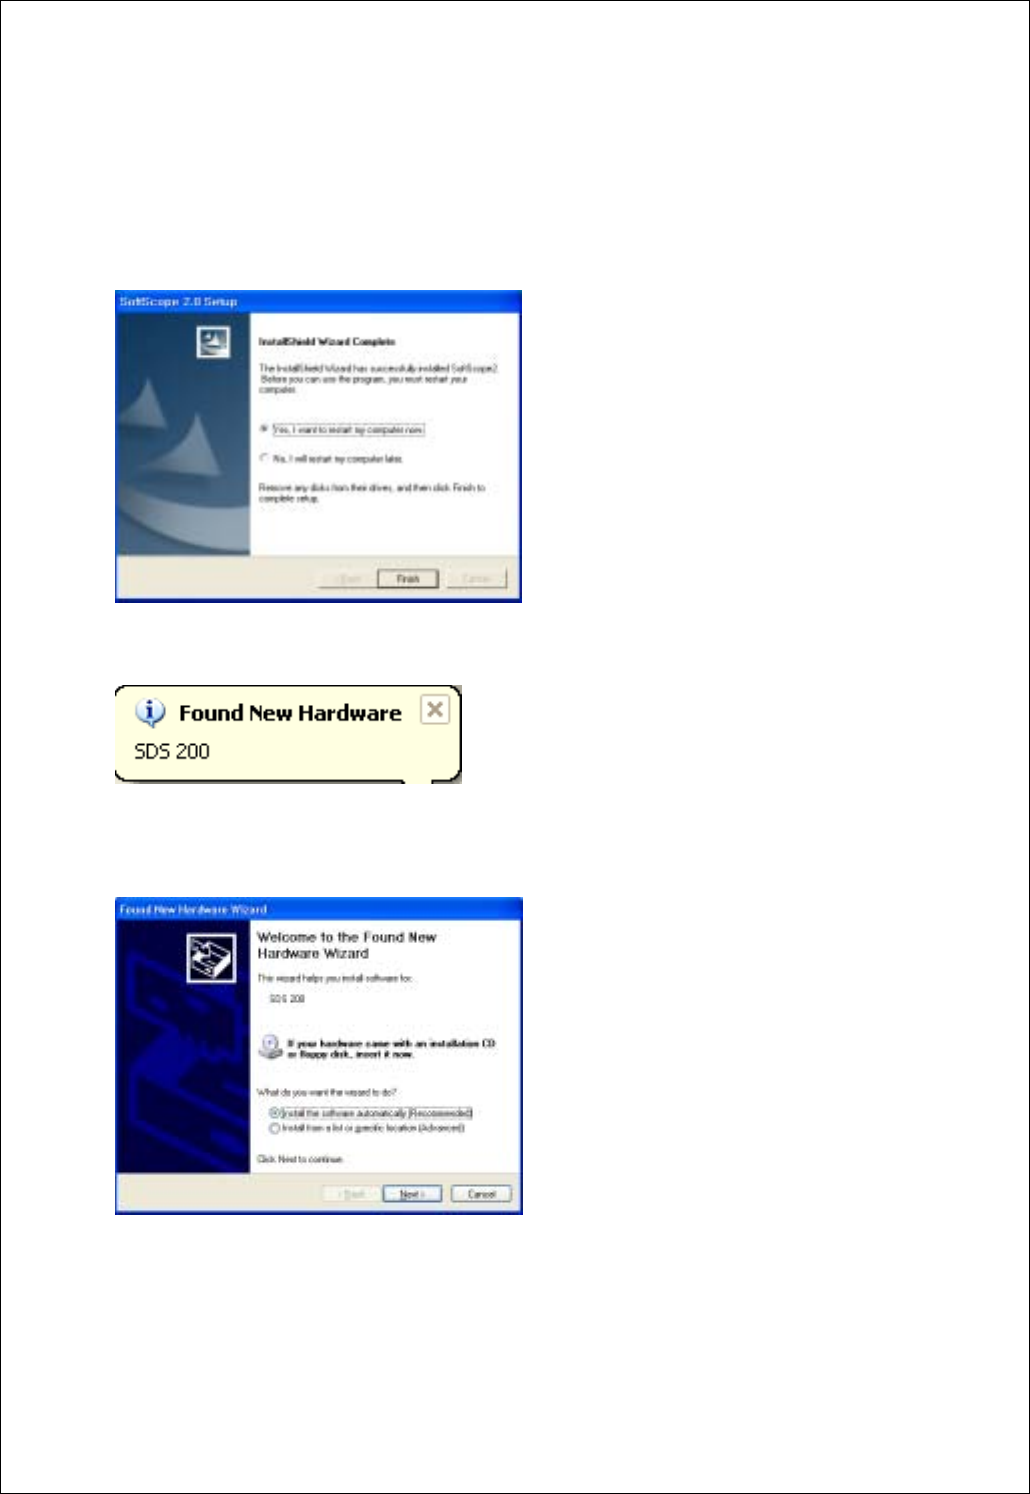
11. Select if you reboot or not, you must reboot to use SDS 200(A).
12. When computer restarts, new hardware is found.
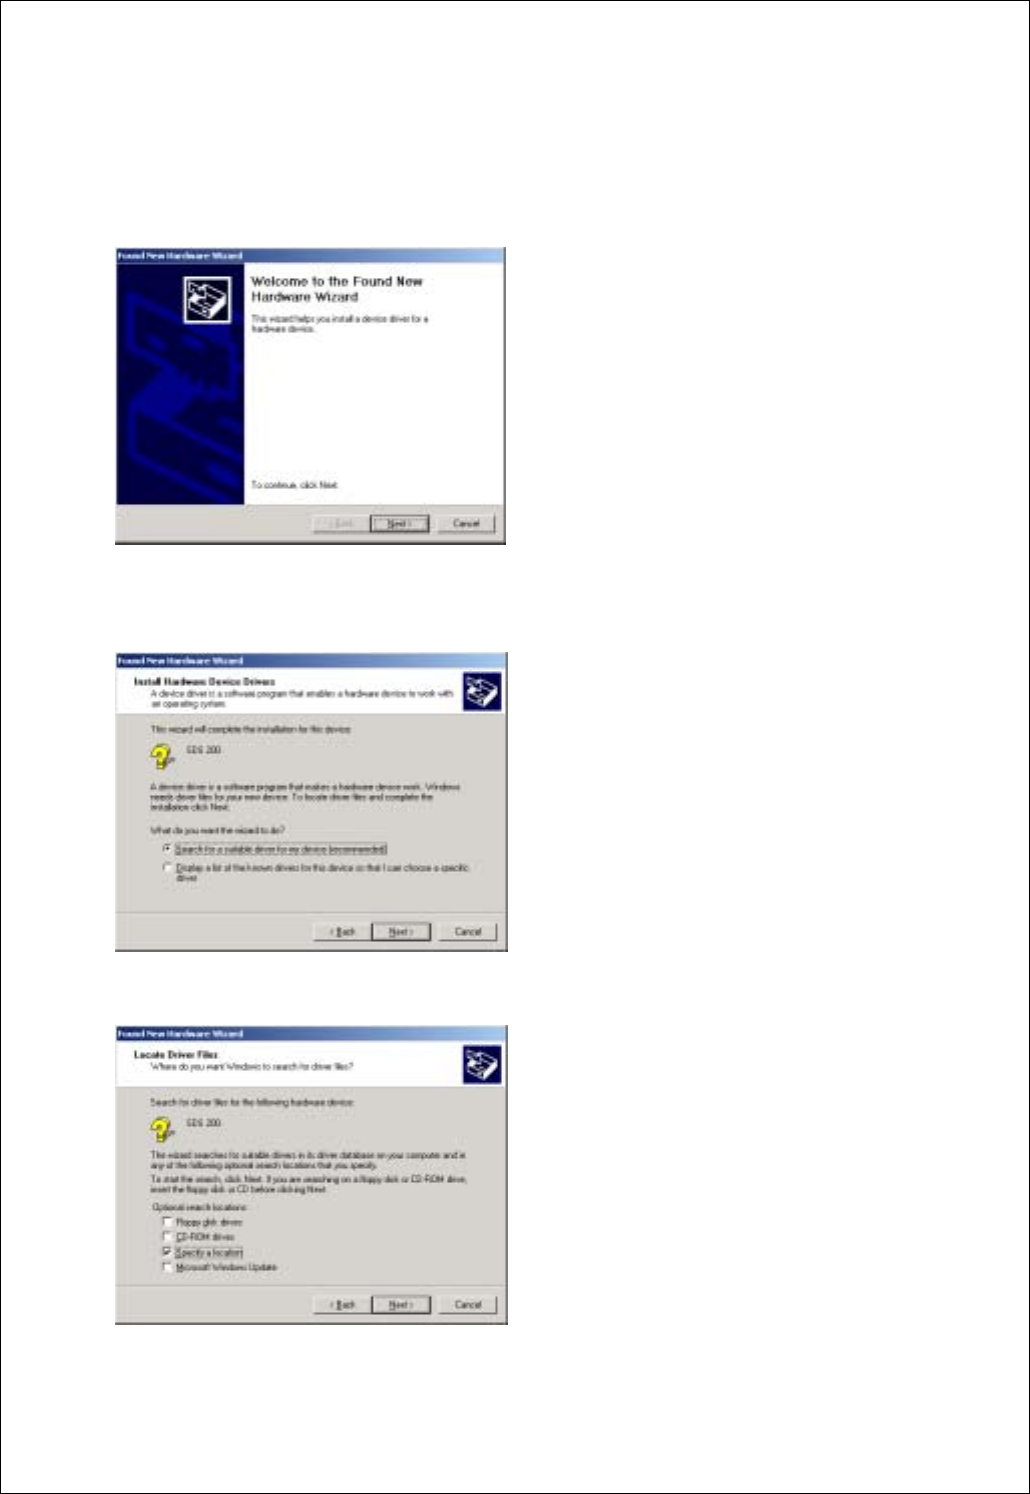
13. New hardware search wizard starts.
Select ‘Automatically install software’ and then ‘Next’.
Chapter 1. Introduction
9
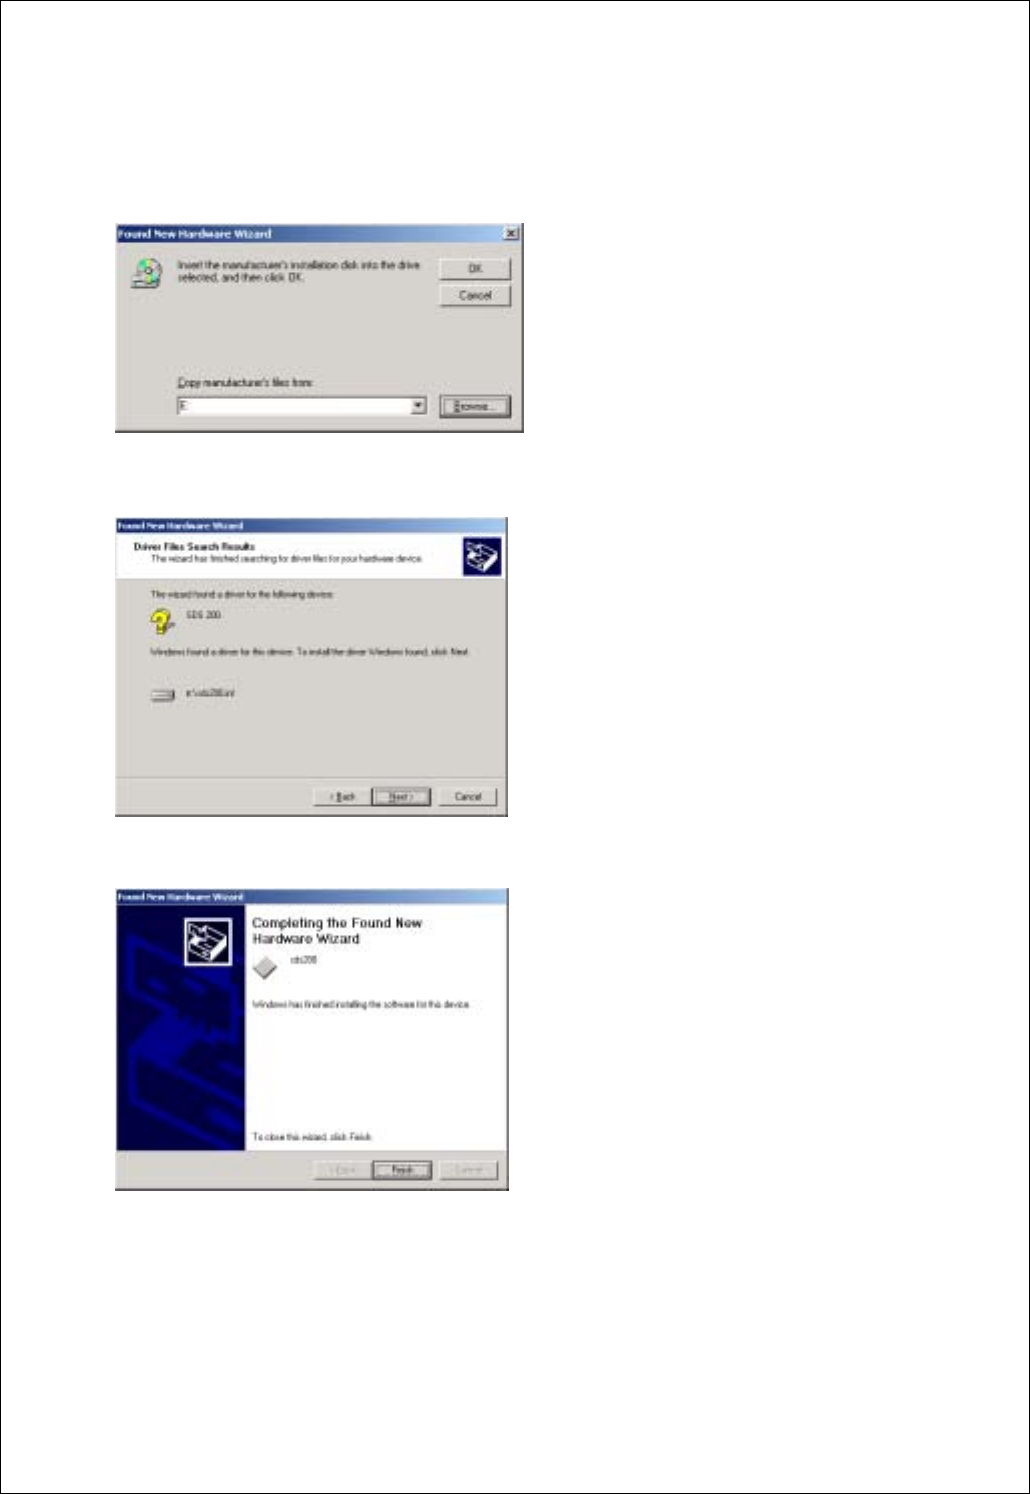
14. Set the driver search location to CD-Rom and then ‘Next’.
15. New hardware search wizard starts to search.
16. Select ‘sds 200’ driver and ‘Next’.
Chapter 1. Introduction
10
17. New hardware wizard installs software.
18. Finish new hardware search wizard.
Chapter 1. Introduction
11
4. SDS 200(A) Setup
Caution!) SoftScope must be installed before using SDS 200(A). This setup process is done once, at the
first time of connection.
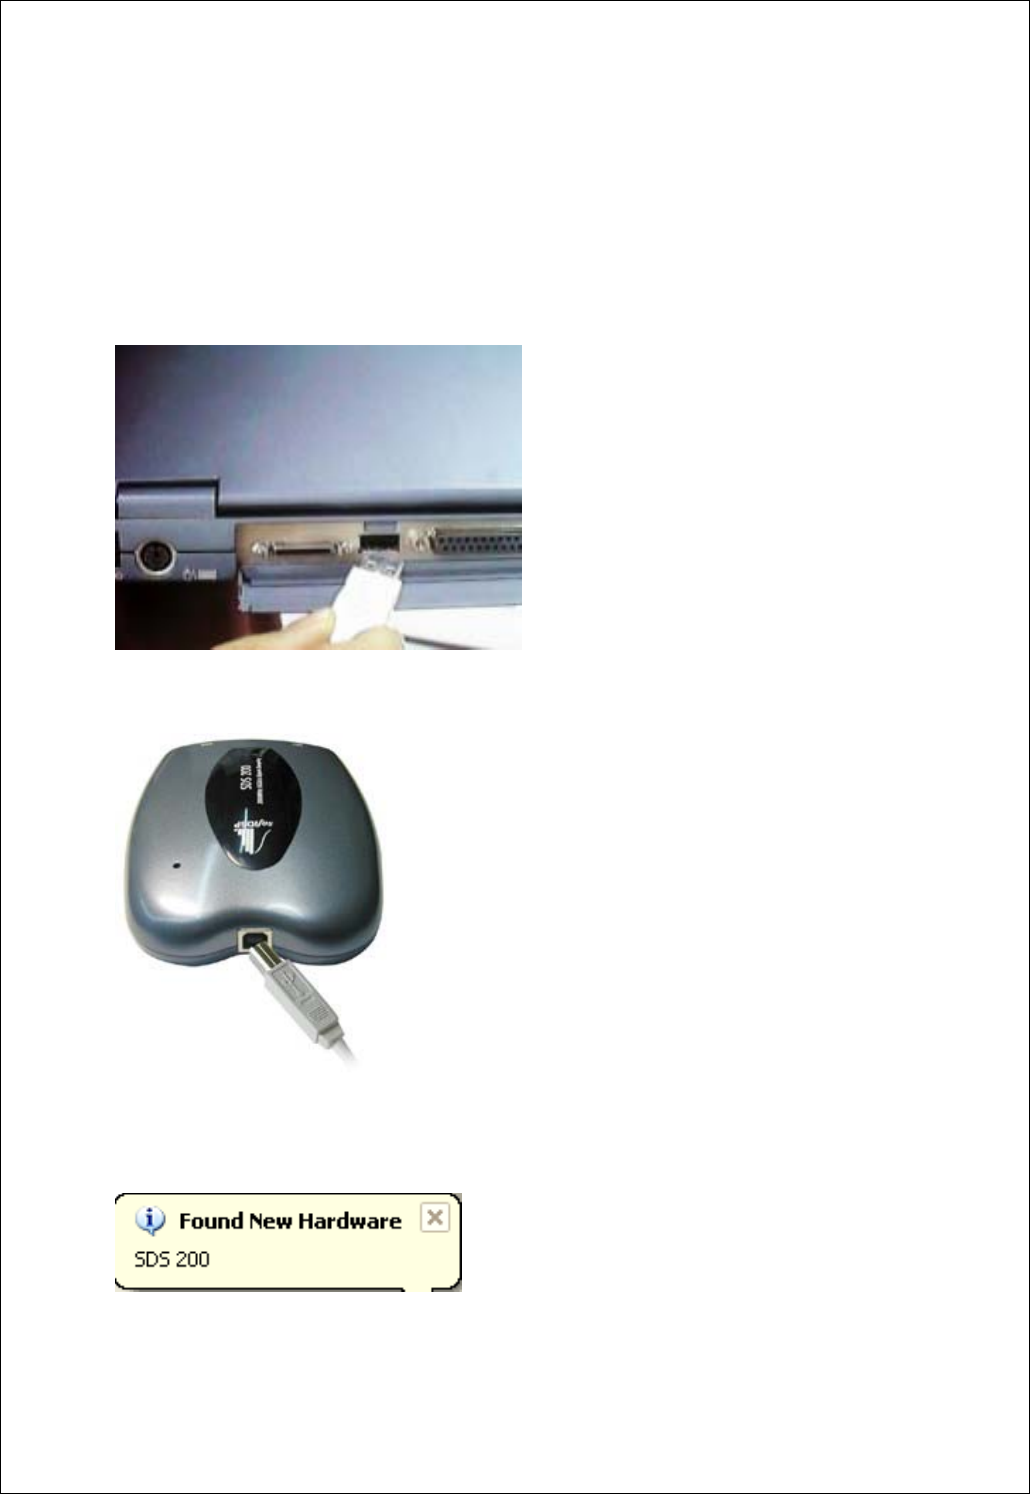
1. Connect the A-Type Plug of USB cable to your PC’s USB port.
2. Connect the B-Type Plug of USB cable to SDS 200(A)’s USB port.
3. SDS 200(A) will be detected automatically. (The picture is captured under Windows98 SE
environment)
Chapter 1. Introduction
12
5. Setup sds200(a).inf under windows 2000
When sds200(a).inf file is not be detected automatically, you see the following dialog box.
In this case you must install sds200(a).inf file manually.
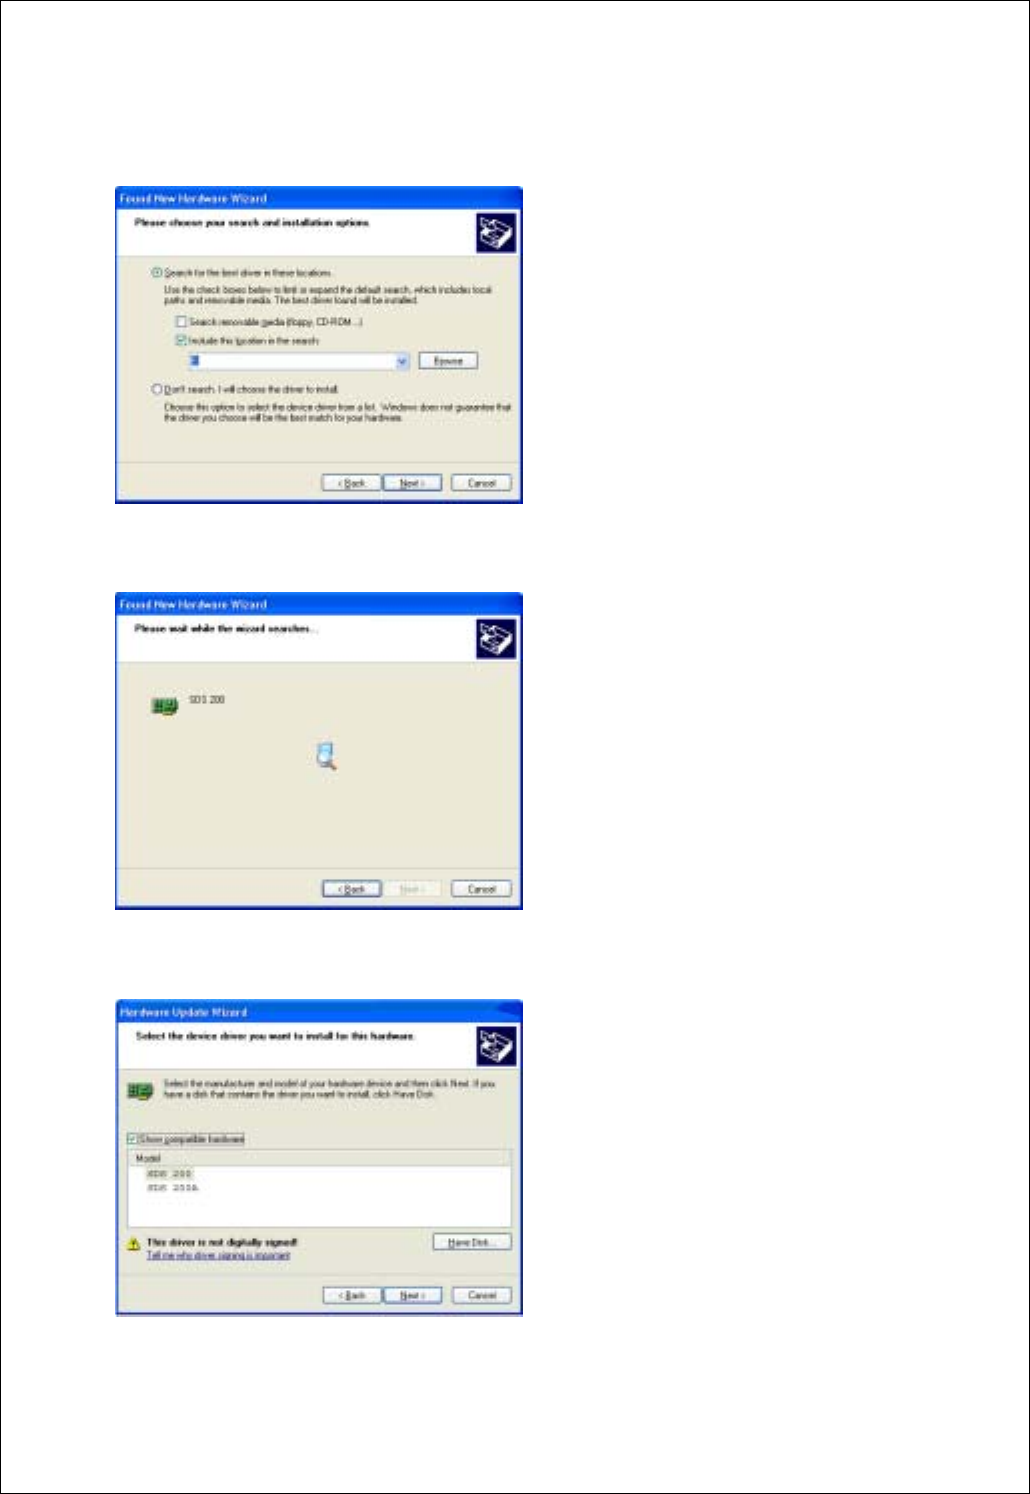
1. Choose ‘Search for a suitable driver for my device’ button. Click Next to continue.
2. Specify a location. Click Next to continue.
Chapter 1. Introduction
13
3. The sds200(a).inf file is located in SoftScope CD-ROM root directory. Specify the location by either
entering or browsing.
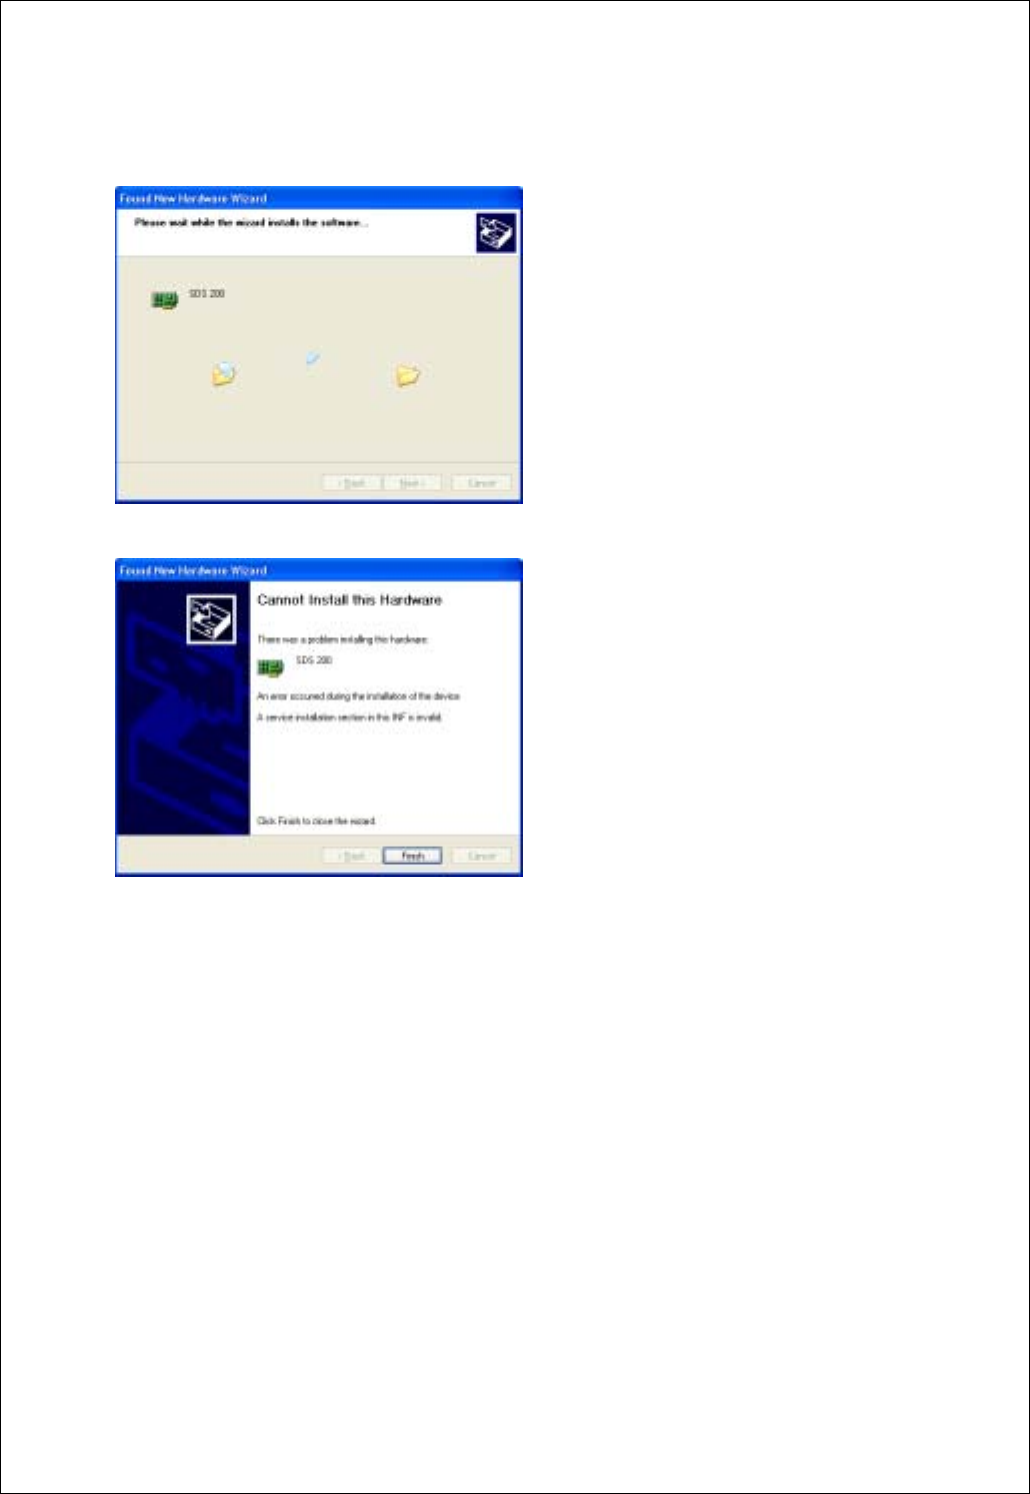
4. sds200(a).inf file is detected automatically. Click Next to continue.
5. Click Finish.
Chapter 1. Introduction
14
6. Probe Calibration
SDS 200(A) calibration
1. When manufactured, SDS 200(A) is calibrated manually to obtain maximum performance.
2. You may calibrate SDS 200(A) 5 or 6 months after purchase.
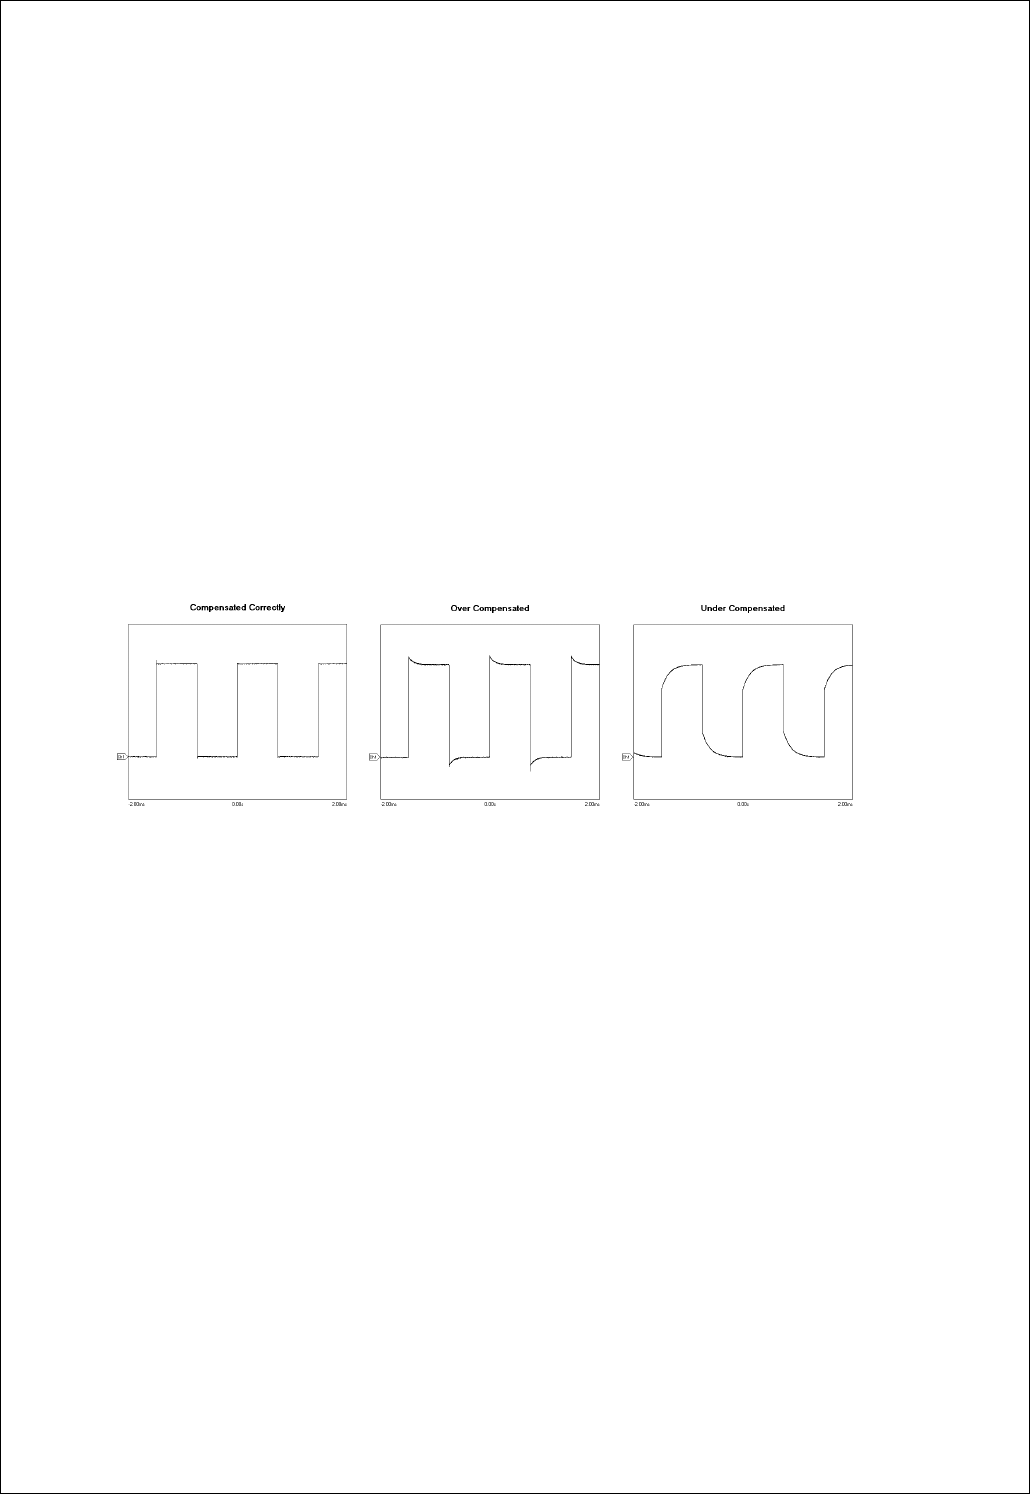
Probe Compensation
1. You must use a probe with more than 200MHz bandwidth to get undistorted signal.
2. Probe should be compensated whenever it is connected for the first time.
3. Connect calibration signal to channel 1, then push AUTOSET.
4. Check the shape of the displayed waveform.
5. Adjust the probe until the displayed waveform is compensated.

Chapter 2. How to use SDS 200/SoftScope
15
Ch 2. How to use SDS 200(A)/SoftScope
1. Simple Measurement
1. Start SoftScope.
2. SoftScope checks the internal state of SDS 200(A), USB communication status and then read
initialization data.
3. Connect channel 1 probe to the calibration terminal.
4. Push the autoset button.
5. SoftScope sets vertical/horizontal scale automatically.
6. Join dots to a solid line.
A. SoftScope displays the data from SDS 200(A) as a dotted line.
B. To see the waveform more clearly, push the line-join icon.

Chapter 2. How to use SDS 200/SoftScope
16
7. Add persistence effect.
A. Persistence effect is analog-scope like effect that remembers the history of displayed waveforms.
With persistence effect, you can see the more frequent line clearer.
B. Change the persistence effect coefficient.
8. Change the intensity of the waveform.
A. Just as in changing the persistence effect, you can change the intensity.
B. By changing the scroll bar in the menu, you can see a more/less distinct line.
Chapter 2. How to use SDS 200/SoftScope
17
2. Basic Operations
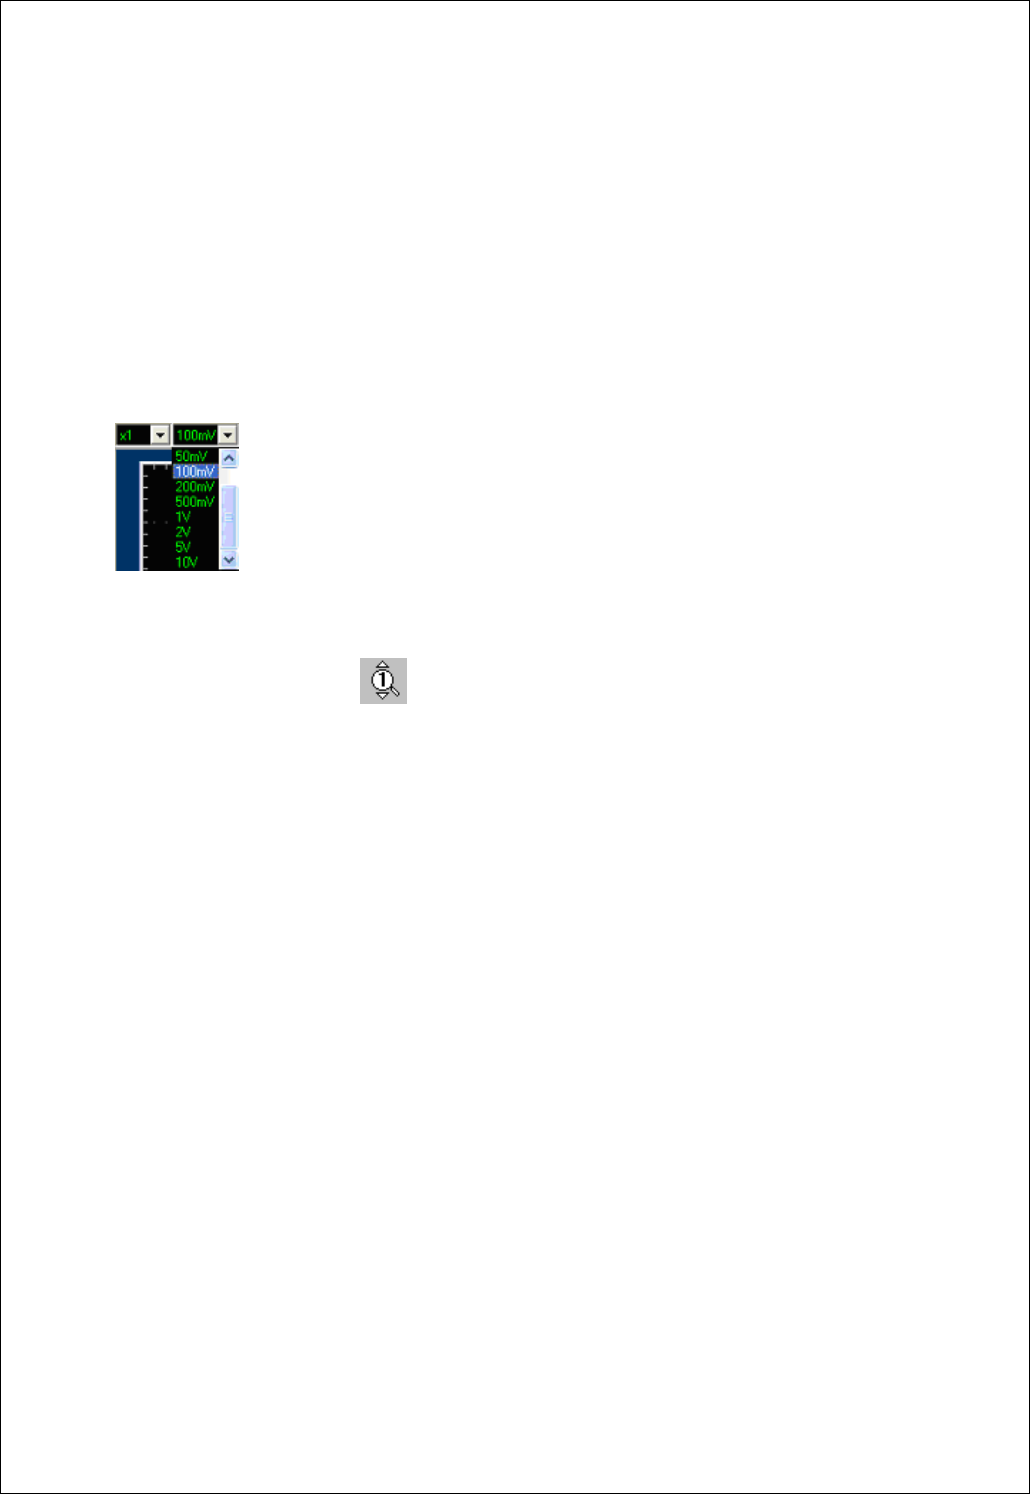
Change Vertical Scale(Volt/Div)
1. Press the voltage change panel in the screen. (Same method to Channel 2, Math, Reference)
- Select Volt/Div to change.
- Voltage per scale is changed.
2. Press voltage change icon .
- Shape of cursor is changed to , meaning Channel 1(When it is a channel 1). (The shape of cursor
differs for each channel.)
: Can measure using horizontal and vertical axis at the same time.
: Can measure using horizontal axis.(Measure Voltage)
: Can measure using vertical axis.(Measure Period and Frequency)
3. Change vertical scale(volt/div) from menu and hot-key.
A. Channel Ch1 Setting Volt Scale
B. Press the appropriate hot-key.
4. Change AC/DC setting.
A. Push the AC/DC icon to change.
B. Push the same button once more to restore.
Chapter 2. How to use SDS 200/SoftScope
18
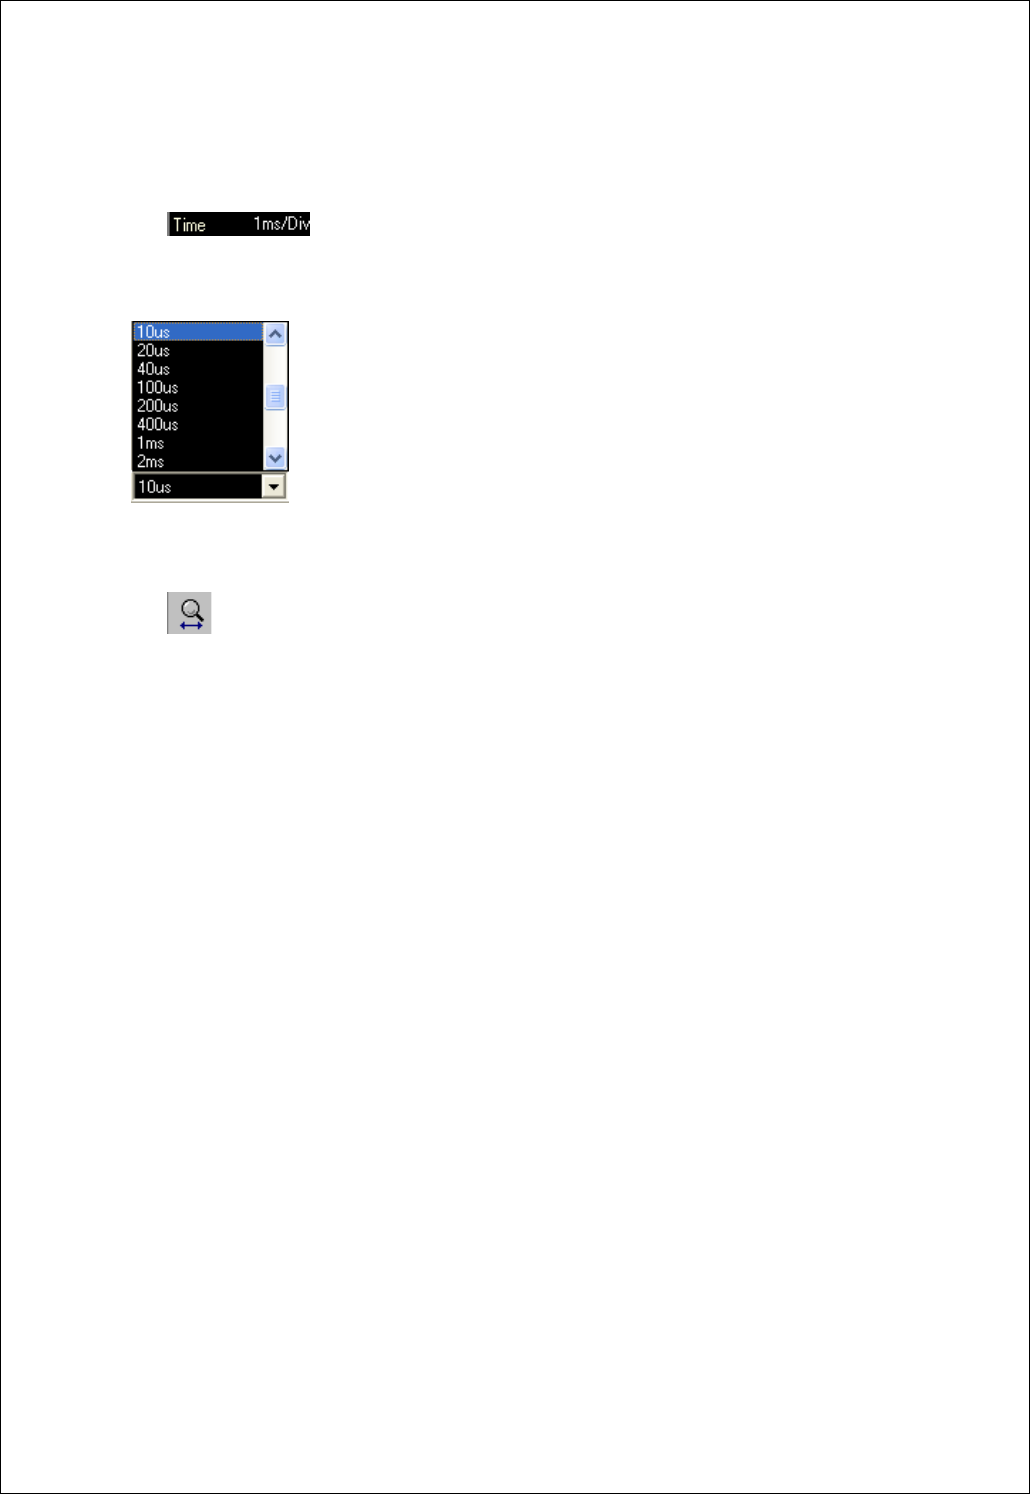
Change Horizontal Scale(Time/Div)
1. Change horizontal scale(time/div) from panel.
A. Push time scale change panel.
B. Set the time/div scale with mouse or keyboard.
C. Horizontal scale is changed.
2. Change horizontal scale(time/div) with mouse button.
A. Push time scale change icon.
B. Cursor is changed to “T”.
C. Push the left/right mouse button to change volt/div.
D. With mouse that supports scroll button, change the trigger point.
3. Change horizontal scale(time/div) from menu and hot-key.
A. Channel Time Scale.
B. Press the appropriate hot-key.
Chapter 2. How to use SDS 200/SoftScope
19
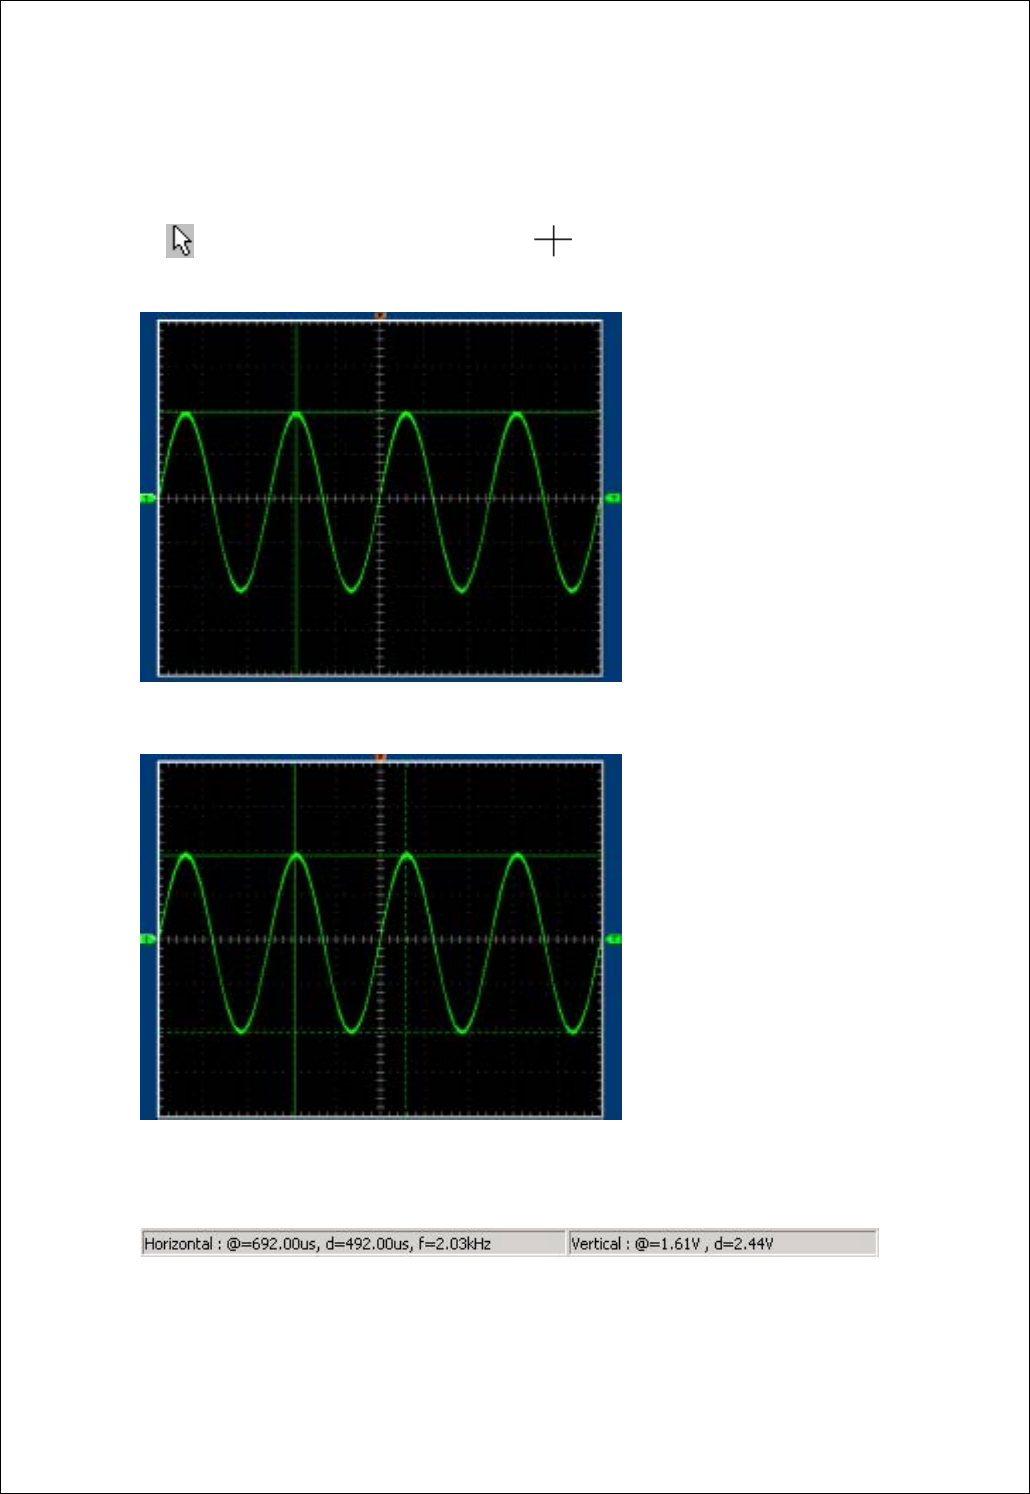
Measurement Using Cursor
Measure voltage and time offset simply using mouse.
A. Push icon and the cursor is changed to cross .
B. Push left mouse button, and the cross lines appear.
C. Drag the mouse button to the point you want to measure.
D. Release the left mouse button, the voltage difference and time difference will be shown at the status
bar.
E. Push right mouse button, and the cross lines disappear.
Chapter 2. How to use SDS 200/SoftScope
20
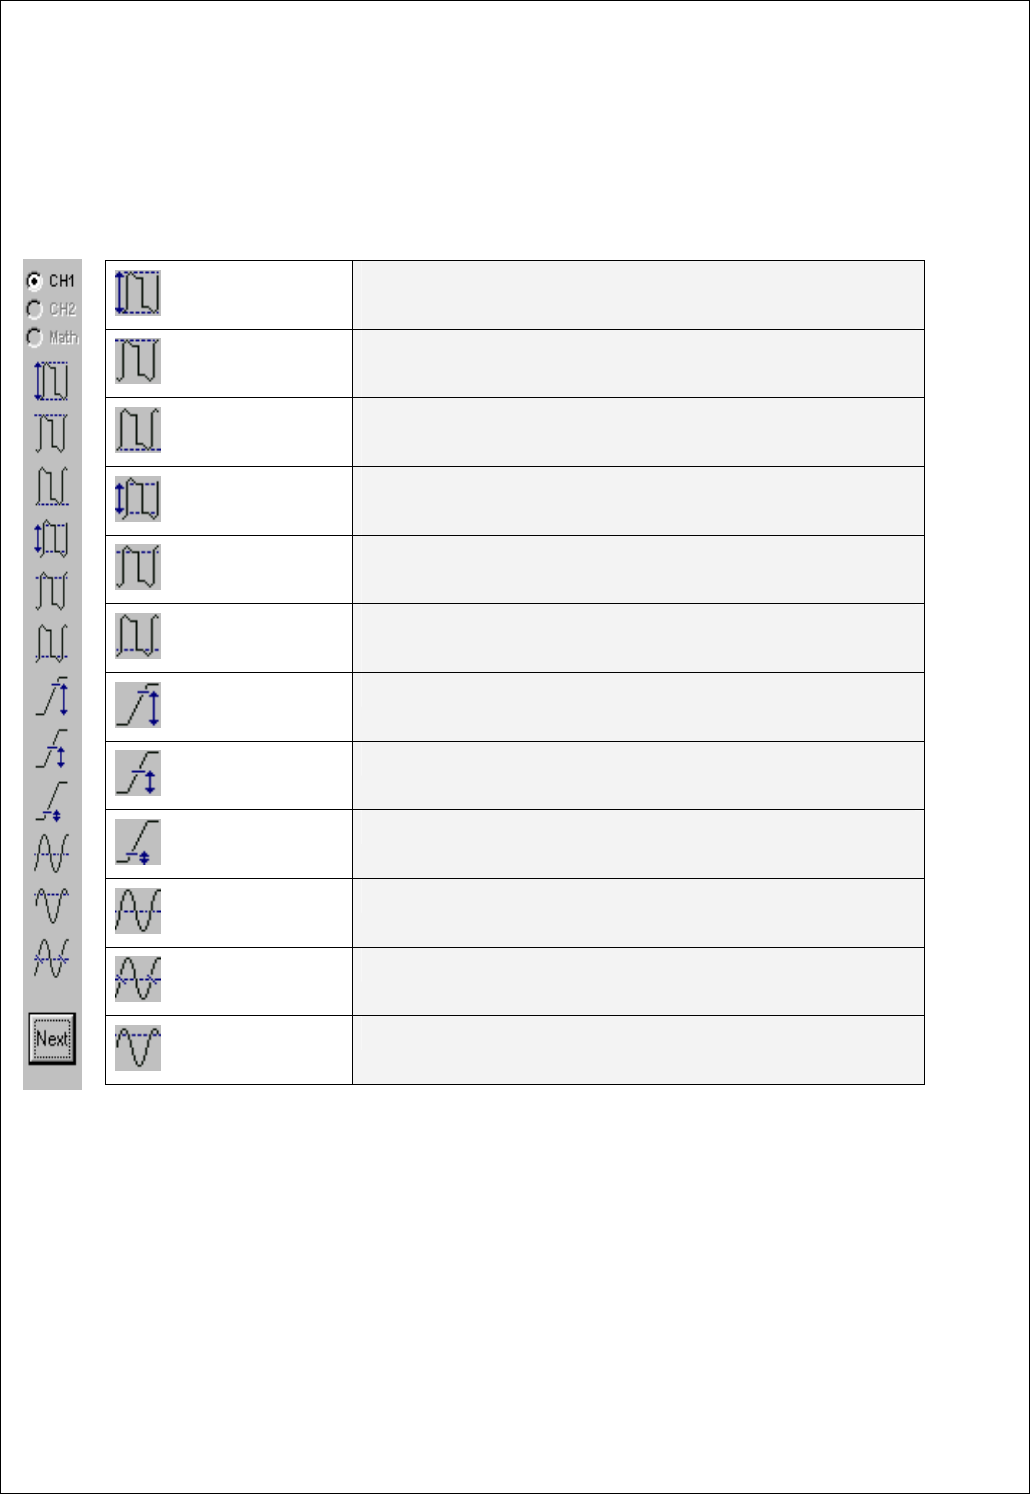
Measurement by Icon
SDS 200(A) has many measurement functions.
Pk-Pk
-Peak-to-peak = Max – Min
-Measured over the entire waveform
Max
-Voltage of the absolute maximum level
-Measured over the entire waveform
Min
-Voltage of the absolute minimum level
-Measured over the entire waveform
Amp
-Amp = Base – Top
-Measured over the entire waveform
Base
-Voltage of the statistical minimum level
-Measured over the entire waveform
Top
-Voltage of the statistical maximum level
-Measured over the entire waveform
Upper threshold
-Voltage of the 90% level from base to top
Middle threshold
-Voltage of the 50% level from base to top
Lower threshold
-Voltage of the 10% level from base to top
Mean
-The arithmetic mean over the entire waveform
Cycle mean
-The arithmetic mean over the first cycle in the waveform
RMS
-The Root Mean Square voltage over the entire waveform
Chapter 2. How to use SDS 200/SoftScope
21
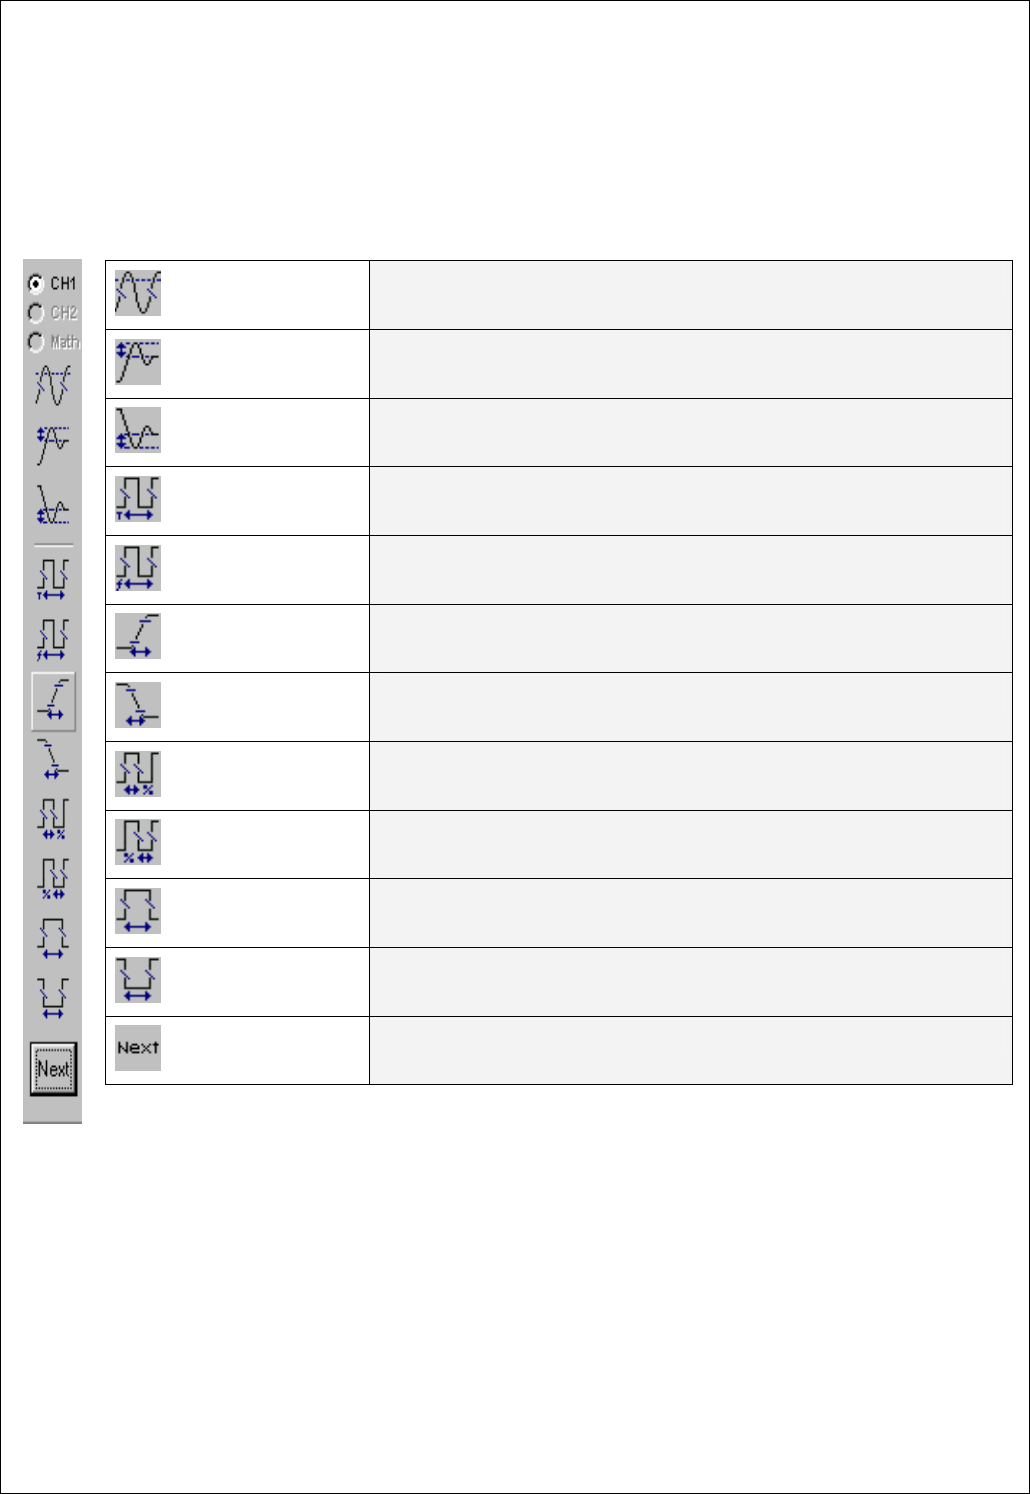
Cycle RMS
- The Root Mean Square voltage over the first cycle in the waveform
Positive Overshoot
- Positive Overshoot = (Max - Top)/Amp x 100 %
- Measured over the entire waveform
Negative Overshoot
- Negative Overshoot = (Base - Min)/Amp x 100 %
- Measured over the entire waveform
Period
- Time to take for the first signal cycle to complete in the waveform
- Measured in seconds
Frequency
- Reciprocal of the period of the first cycle in the waveform
- Measured in Hertz(Hz)
Rise time
- Time taken from lower threshold to upper threshold
Fall time
- Time taken from upper threshold to lower threshold
Positive Duty Cycle
- Positive Duty Cycle = (Positive Pulse Width)/Period x 100%
- Measured of the first cycle in waveform
Negative Duty Cycle
- Negative Duty Cycle = (Negative Pulse Width)/Period x 100%
- Measured of the first cycle in waveform
Positive Pulse Width
- Measured of the first positive pulse in the waveform
- The time between the 50% amplitude points
Negative Pulse Width
- Measured of the first
Next
- View next icons
Chapter 2. How to use SDS 200/SoftScope
22
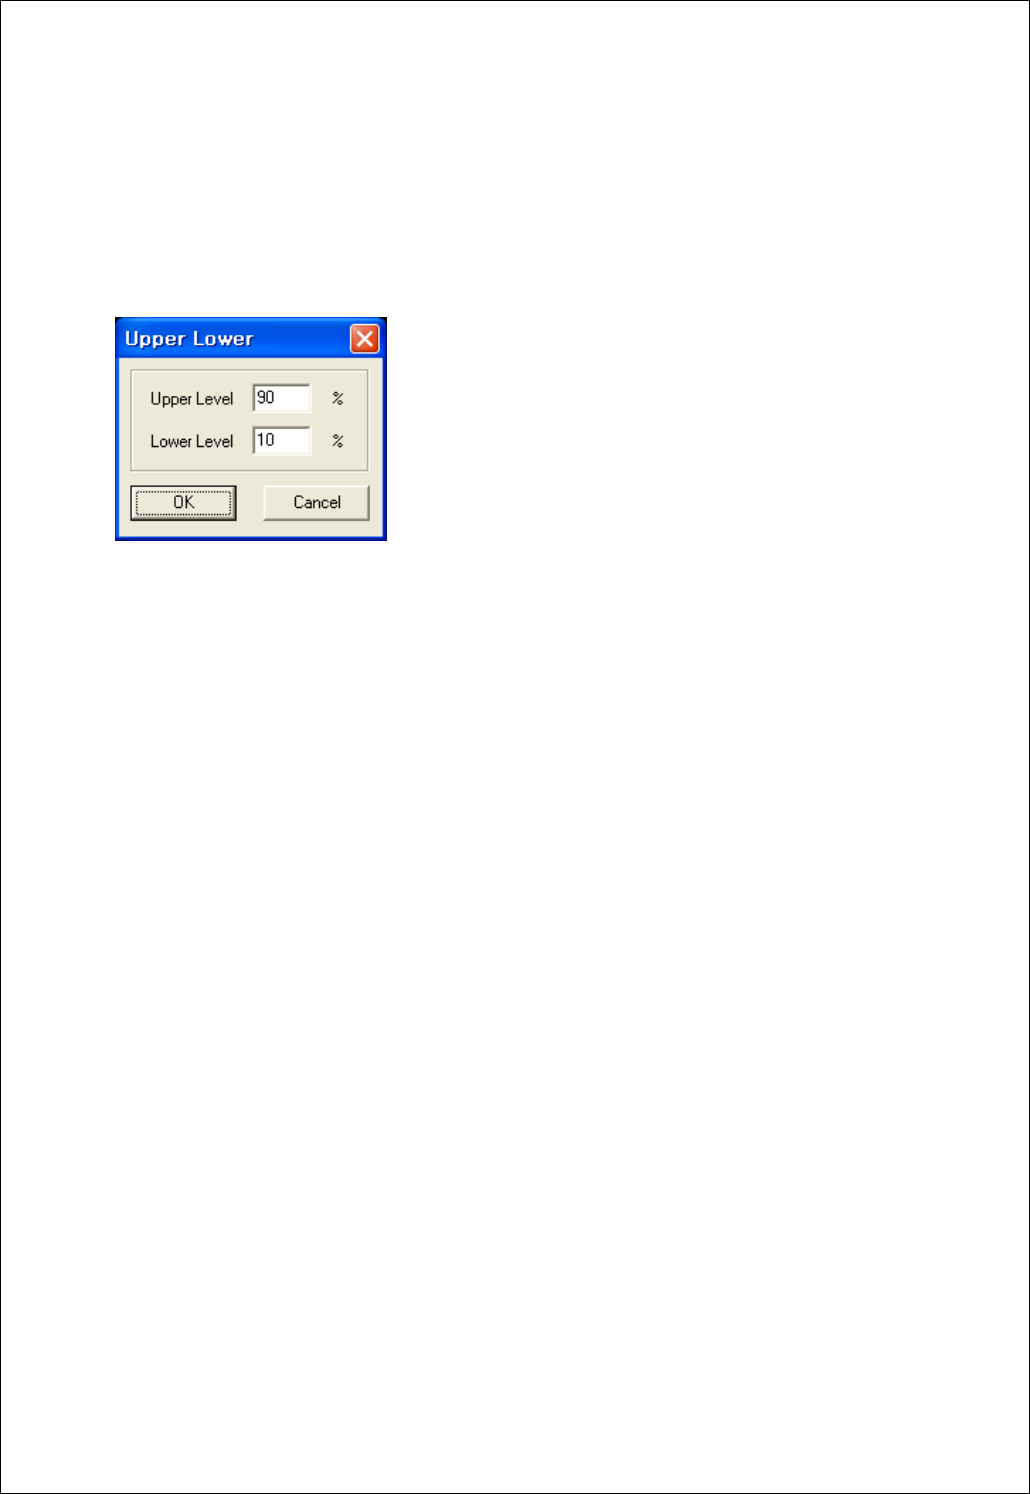
Upper/Lower Level Setting
Set Upper/Lower Ratio
Upper/Lower standard value should be given to obtain Rising Time and Falling Time. Upper/lower ratio
for overall waveform(%) is set using this function and this value is used to calculate Rising/Falling Time
Measurement.
Chapter 2. How to use SDS 200/SoftScope
23
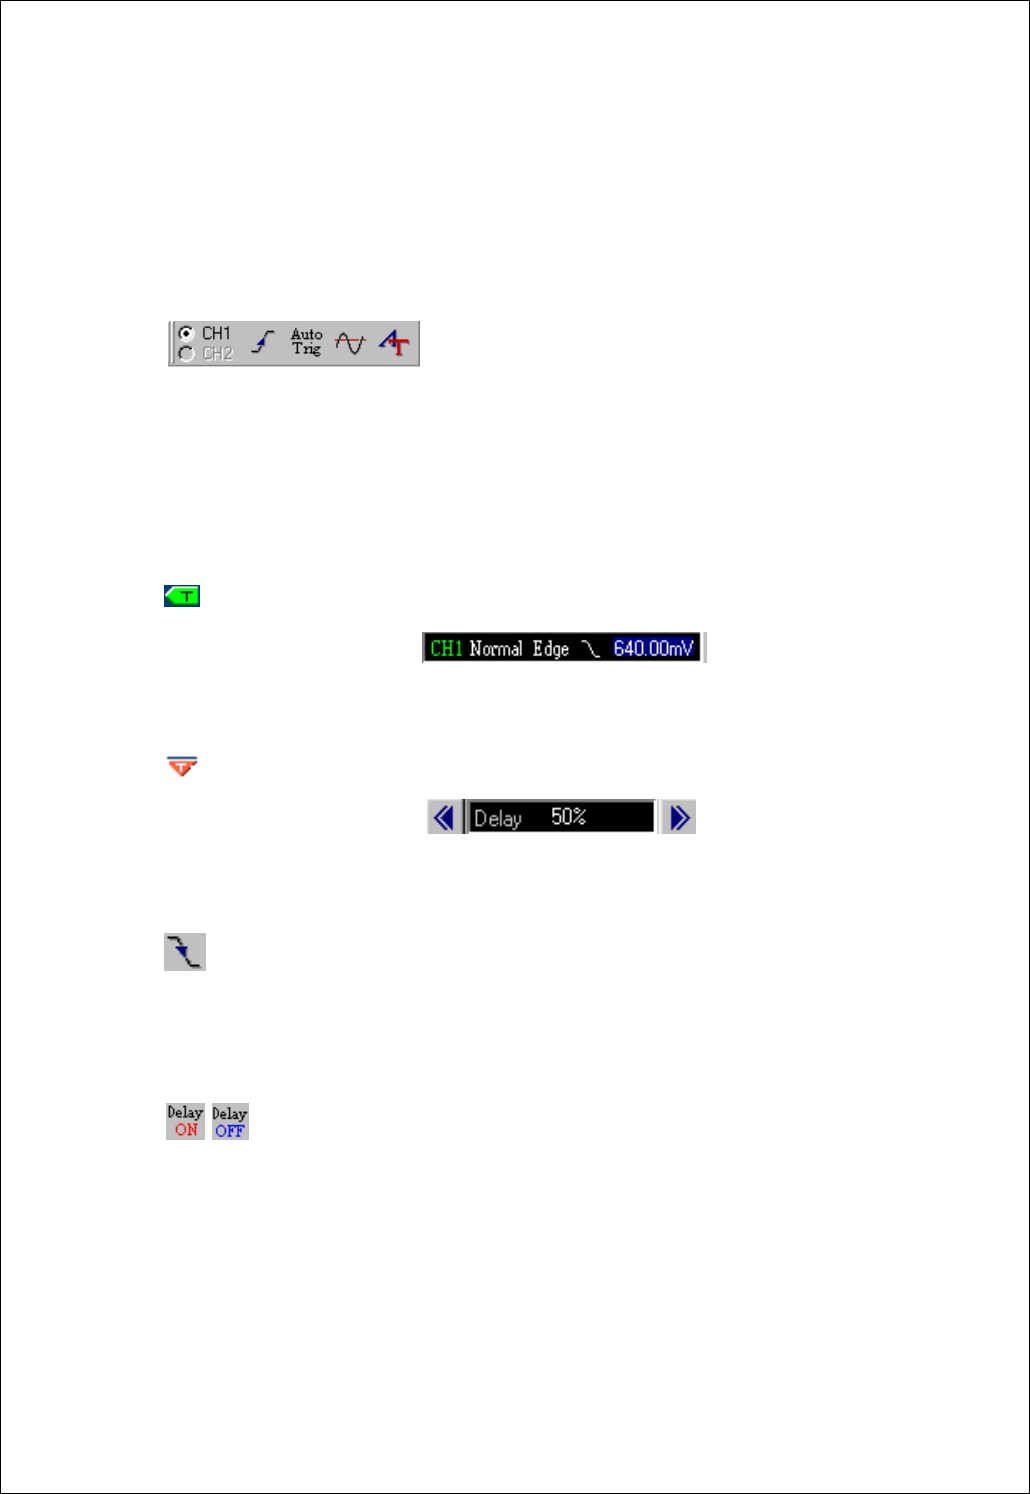
Change Trigger Level & Trigger Point
1.Set the trigger input source.
A. With only one channel on, trigger input source is automatically set to the channel. With 2 channels
on, you can choose trigger input source between the two.
B. Change trigger source from the radio-button.
C. Change trigger source from menu bar.
EX) Trigger Trigger Source CH1 or CH2
D. Change trigger input source using hot key.
2. Change the trigger level.
A. Move the trigger level icon, you can move the trigger level.
B. Input the trigger level from editor
3. Change the trigger point.
A. Move the trigger point icon, you can move the trigger point.
B. Input the trigger point from editor.
4. Change the trigger condition.
A. Push the trigger up/down icon to change trigger condition.
B. Use menu or hot-key. ( Trigger Trigger Up/Down )
5. Set delay on/off.
A. Push the delay button to set delay on or off.
B. When delay on, the trigger point separates from the horizontal expansion point. The horizontal
expansion point stays at the center of the screen.
Chapter 2. How to use SDS 200/SoftScope
24
Single Shot/Stop Mode
1. Change state to stop or single shot.
A. Push the stop button , SDS 200(A) is in stop state.
B. Every operation is the same as in the running state.
2. Single-shot action.
A. Push the single-shot button to acquire only 1 waveform after the trigger condition you set.
B. Single-shot is available only in Real Time mode.
C. Push the single-shot button again to pause, SDS 200(A) waits for the trigger signal again.
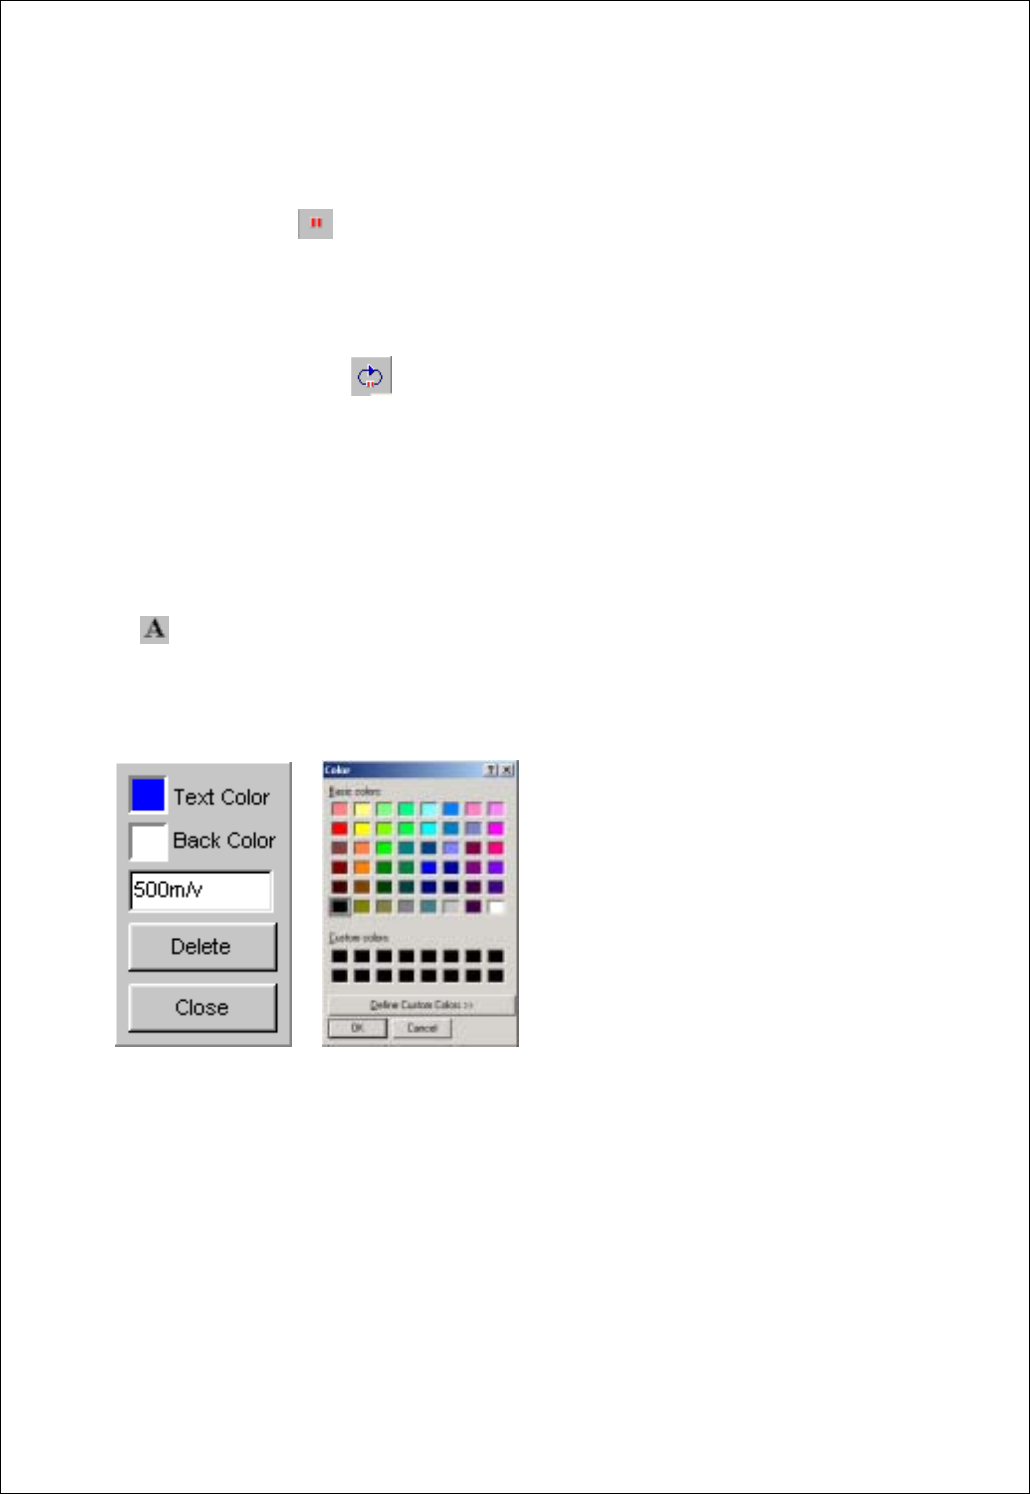
Put Label on The Screen
1. Add a label on the screen.
A. Push the label icon.
B. The mouse cursor is changed to 'I' shape.
C. Push the left mouse button.
D. Input string.
E. Change the text/back color.
F. Push the confirm button to finish.
G. Change the label by clicking the label again.
Chapter 2. How to use SDS 200/SoftScope
25
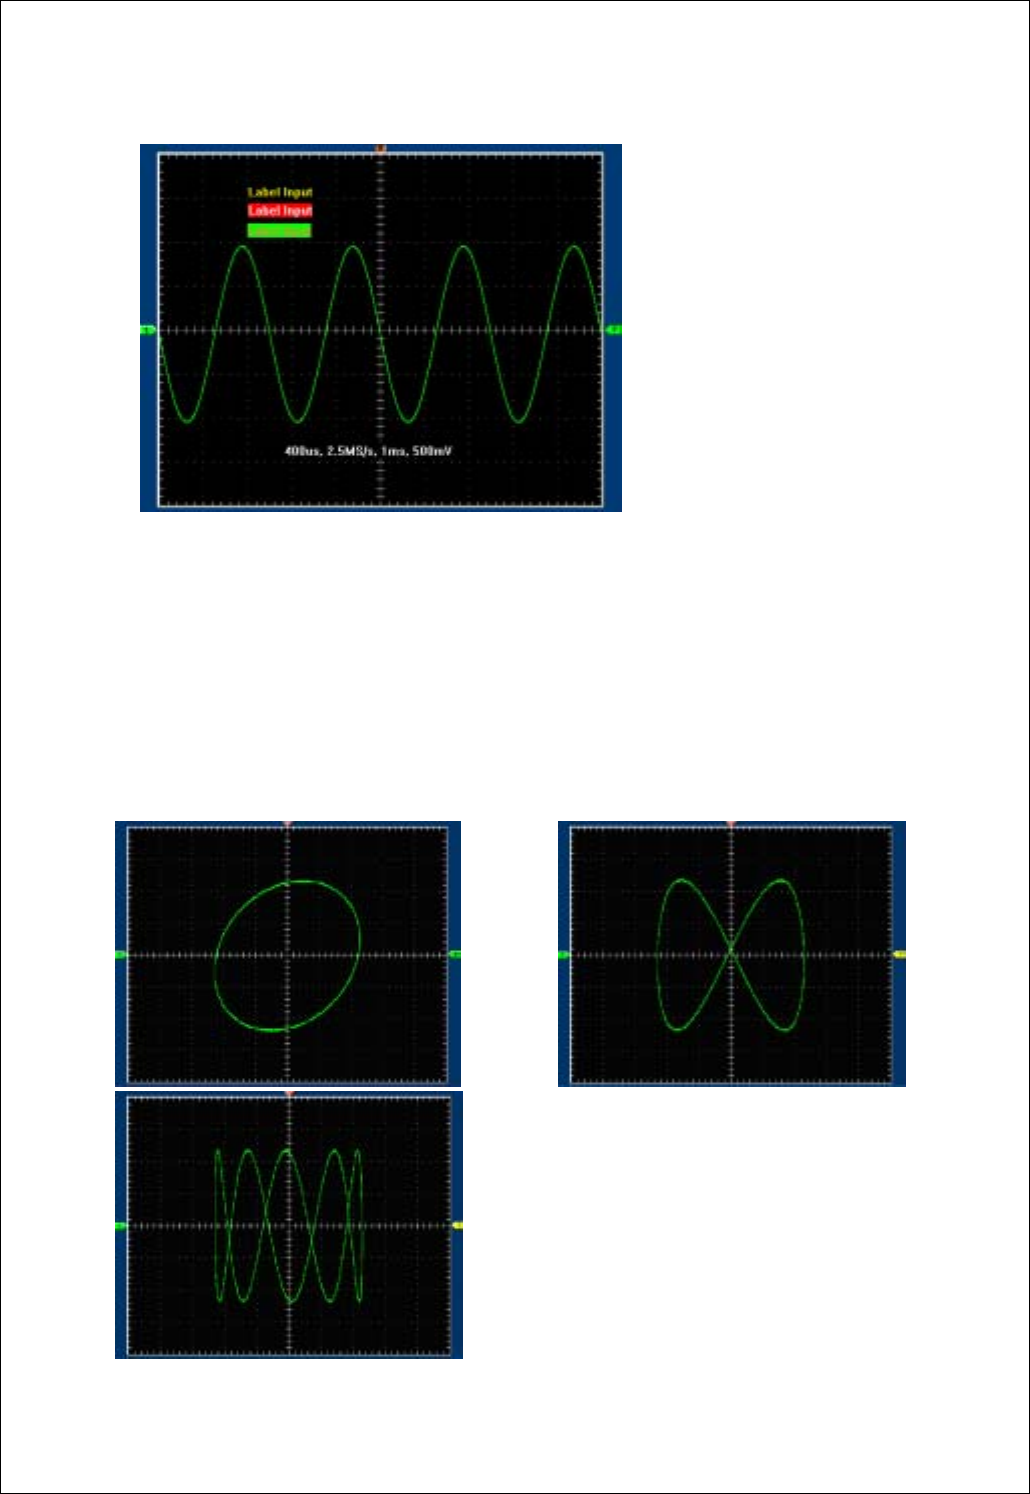
XY Plot
XY Plot acts to analyze correlation of data of two channels. Lissajous diagram is displayed in the screen
when you use XY Plot, which enables to compare frequencies, amplitudes and phases of counterpart
waveform against the reference waveform. This makes it possible to compare and analyze frequency,
amplitude and phase between input and output.
Chapter 2. How to use SDS 200/SoftScope
26
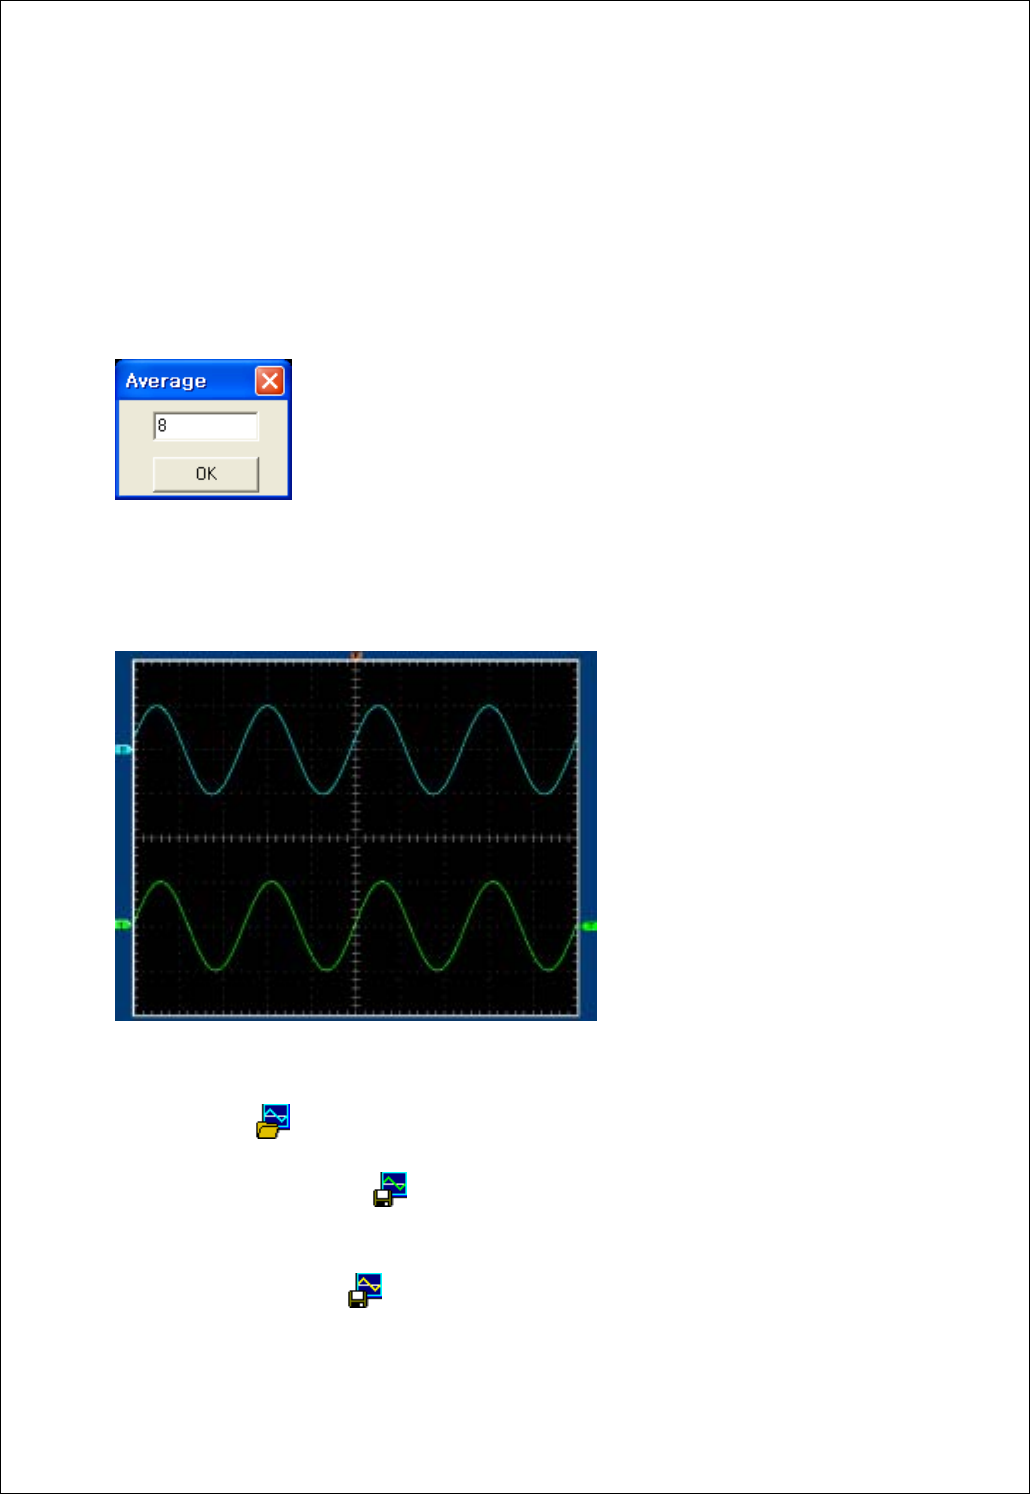
Average
Add acquired waveform as many as the number of average, calculate and display the average.
Perform Moving Average for 2 waves to 256 waves and display it in the screen.
Average function is applied to real time Mode and ETS Mode, and this function can not be used
when role Mode and ETS Mode are turned off.
Reference
Reference waveform can be used after saving the waveforms in the channel 1 or channel 2.
Can work in ‘File’ of menu.
Load Reference( ) : load Reference waveform saved in the form of file.
Save Channel1 As Reference( ) : Save the current channel 1 as Reference waveform and
load it as Reference waveform.
Save Channel1 As Reference( ) : Save the current channel 2 as Reference waveform and load it as
Reference waveform.

Chapter 2. How to use SDS 200/SoftScope
27
Bandwidth Limit(SDS 200A)
Eliminate high-frequency element of input signal.
Signal over 20MHz is not accepted.
Invert
Invert the phase of input signal.
Trigger High Frequency Reject(SDS 200A)
Eliminate high-frequency element of trigger signal.
Signal over 20KHz is not triggered.
Peak Detect(SDS 200A)
In peak detection mode, it accepts minimum and maximum amplitude from 2 continuous
intervals and displays in the screen.
Possibility of aliasing can be removed using peak detection function.
Chapter 2. How to use SDS 200/SoftScope
28
3. Print/Save Waveform
1. Save acquired waveform in the following formats.
A. Text File
B. JPG/BMP File
C. Excel File
D. Word File
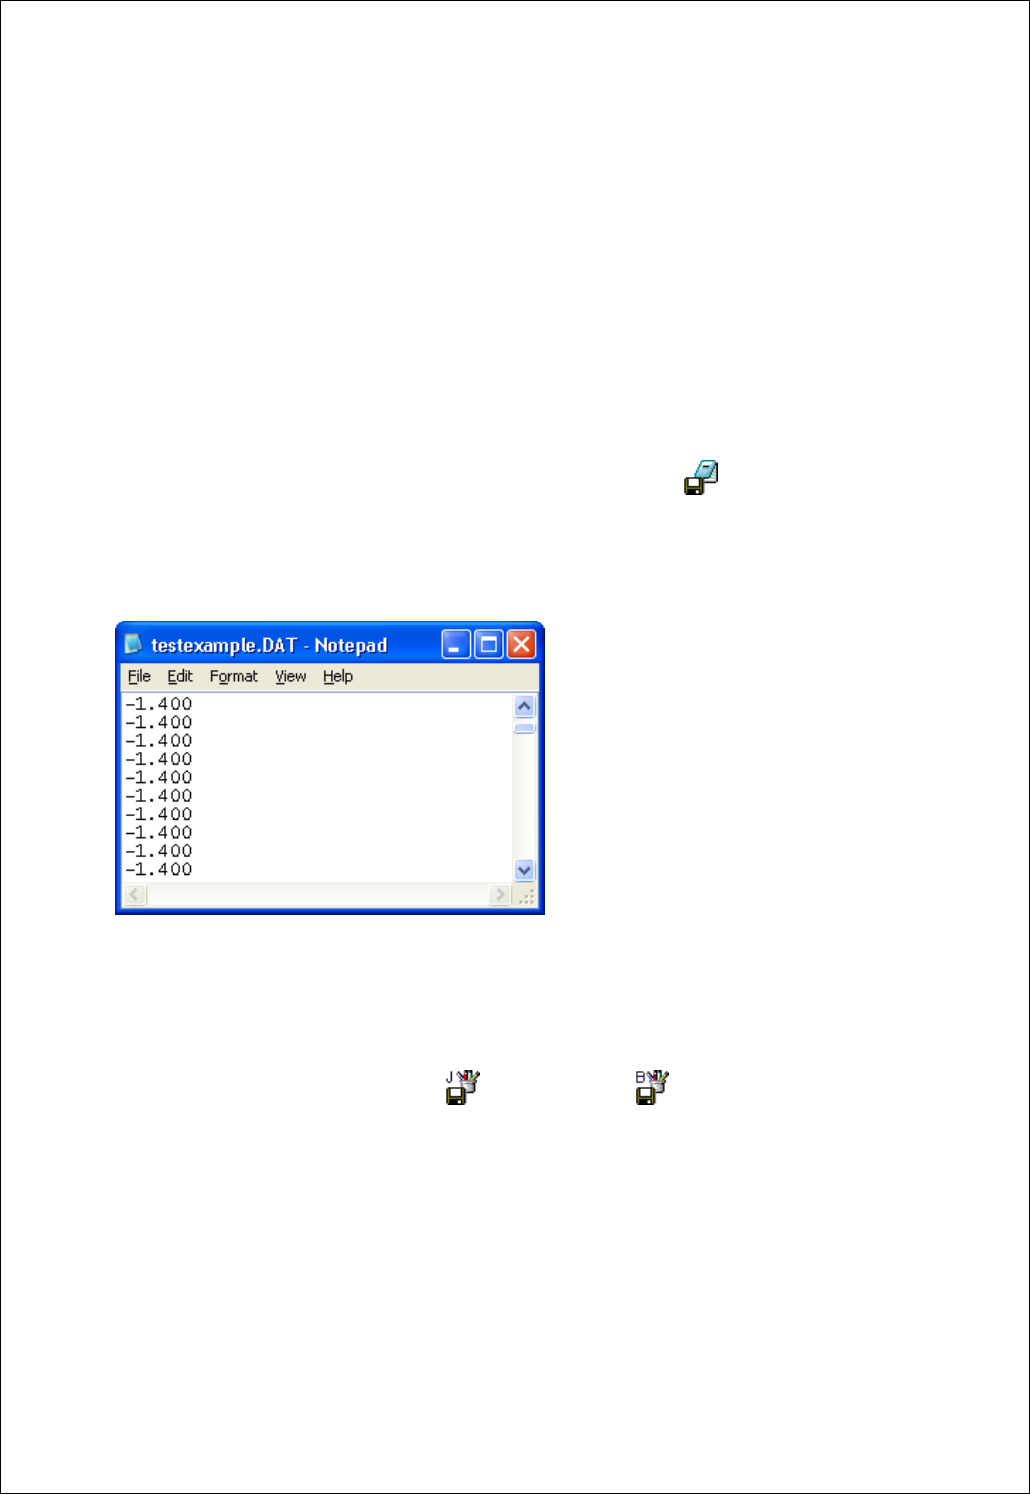
2. Save as text format.
A. In Menu-> File-> ‘Save As DAT’ / Toolbar’, select ‘Save As DAT’ icon( ).
B. Save after selecting the file name and location of saving.
C. When reading the saved file, it appears as follows:
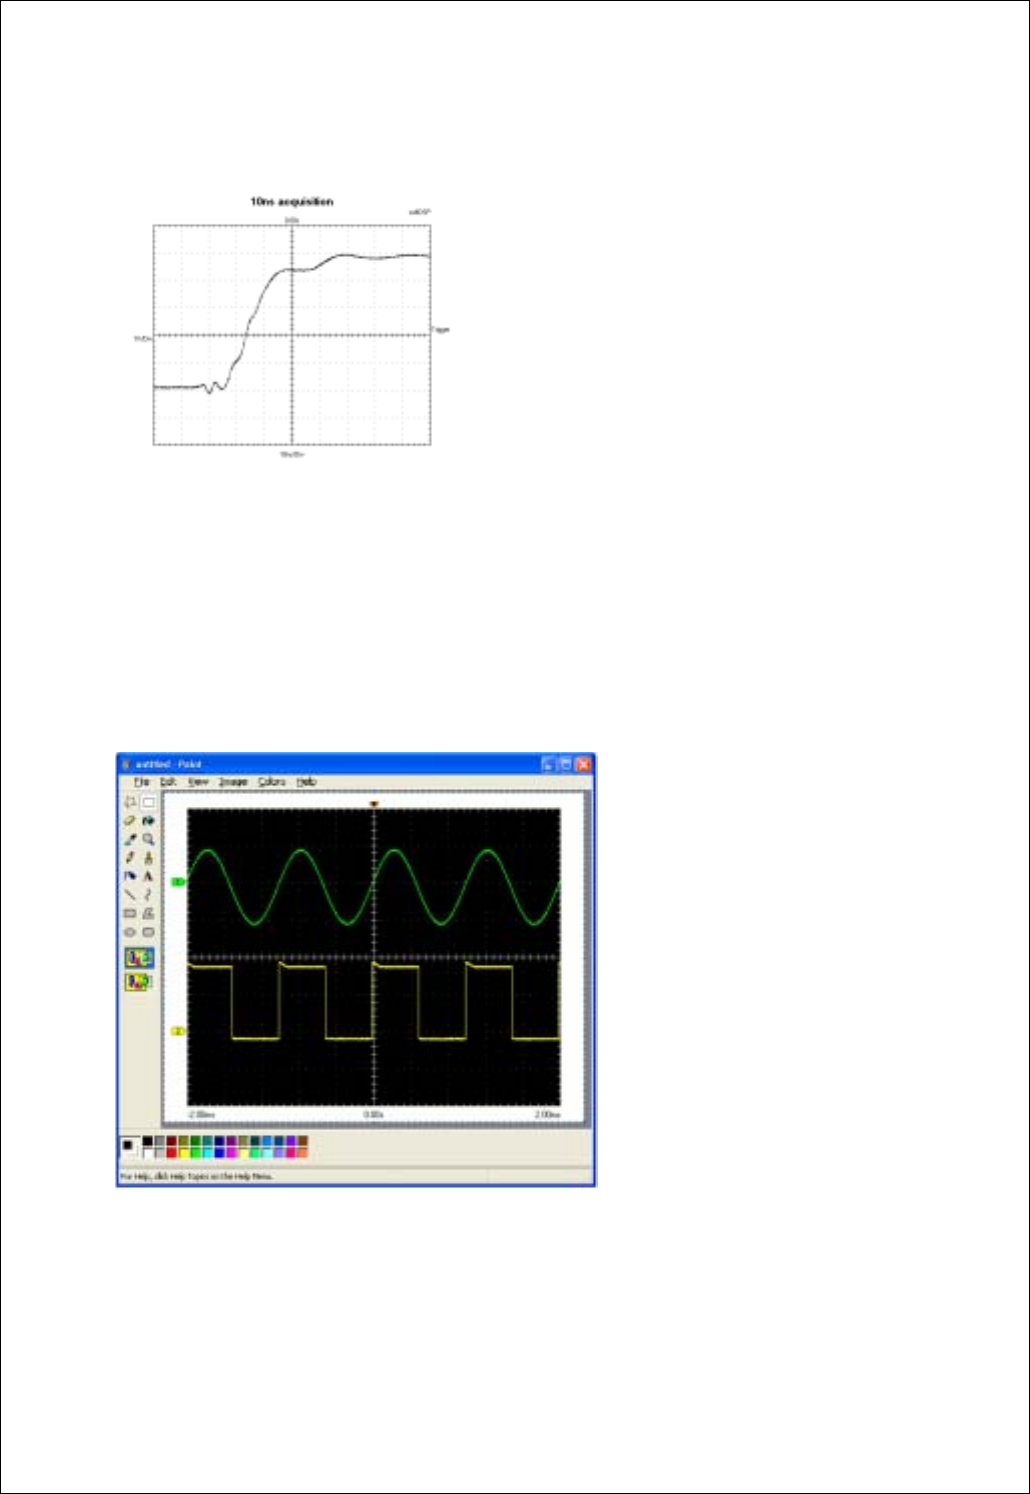
3. Save as JPG/BMP format.
A. In ’Menu’ - ‘File’, select ‘Save As JPG’( ) or ‘Save As BMP’( ).
B. Save after selecting the file name and location of saving.
C. Option for saving of image can be selected in ‘File’ -> ‘Option’.
Chapter 2. How to use SDS 200/SoftScope
29
Example) Saved BMP File
4. Copy the image into clipboard.
A. Select Copy from the File menu.
B. Waveform is copied into clipboard.
C. Paste the image into any program that supports clipboard paste.
Following is the screen for copying the waveform to the image board using clip board.
Chapter 2. How to use SDS 200/SoftScope
30
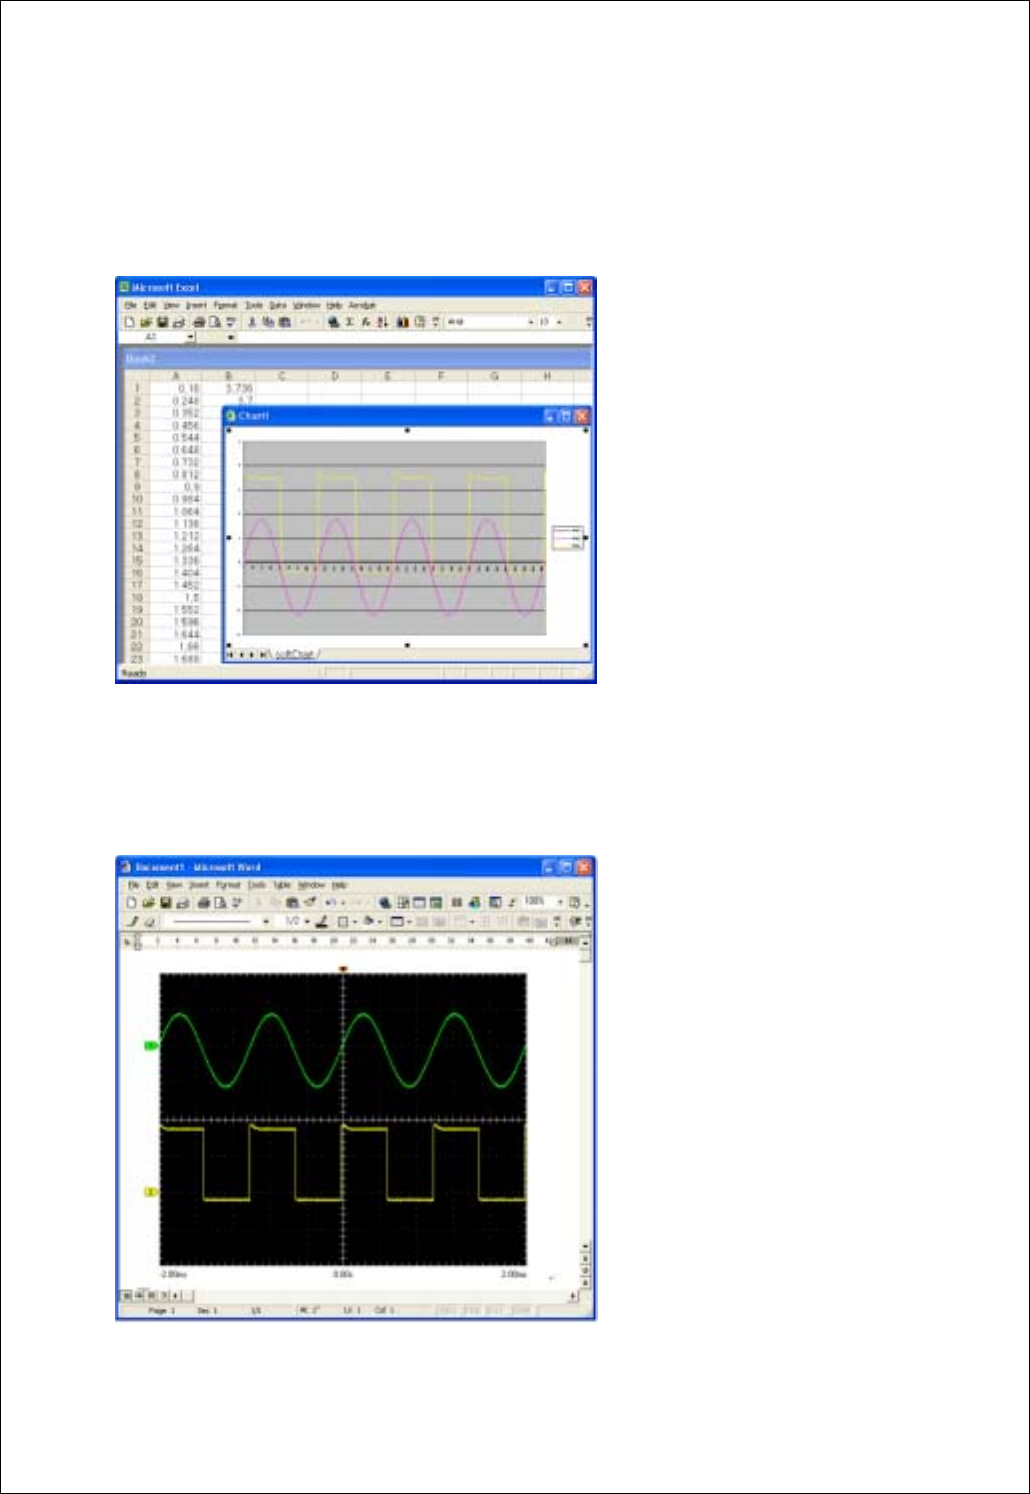
5. Transfer the data to MS Excel using ActiveX automation.
A. Select Copy at the File menu.
B. MS Excel is activated and then data is transferred by using ActiveX.
6. You can save the data to MS Word using ActiveX automation.
A. In ‘Menu’ -> ‘File’, select ‘Save As Word’.
B. MS Word is activated and then data is transferred by using ActiveX.
Chapter 2. How to use SDS 200/SoftScope
31
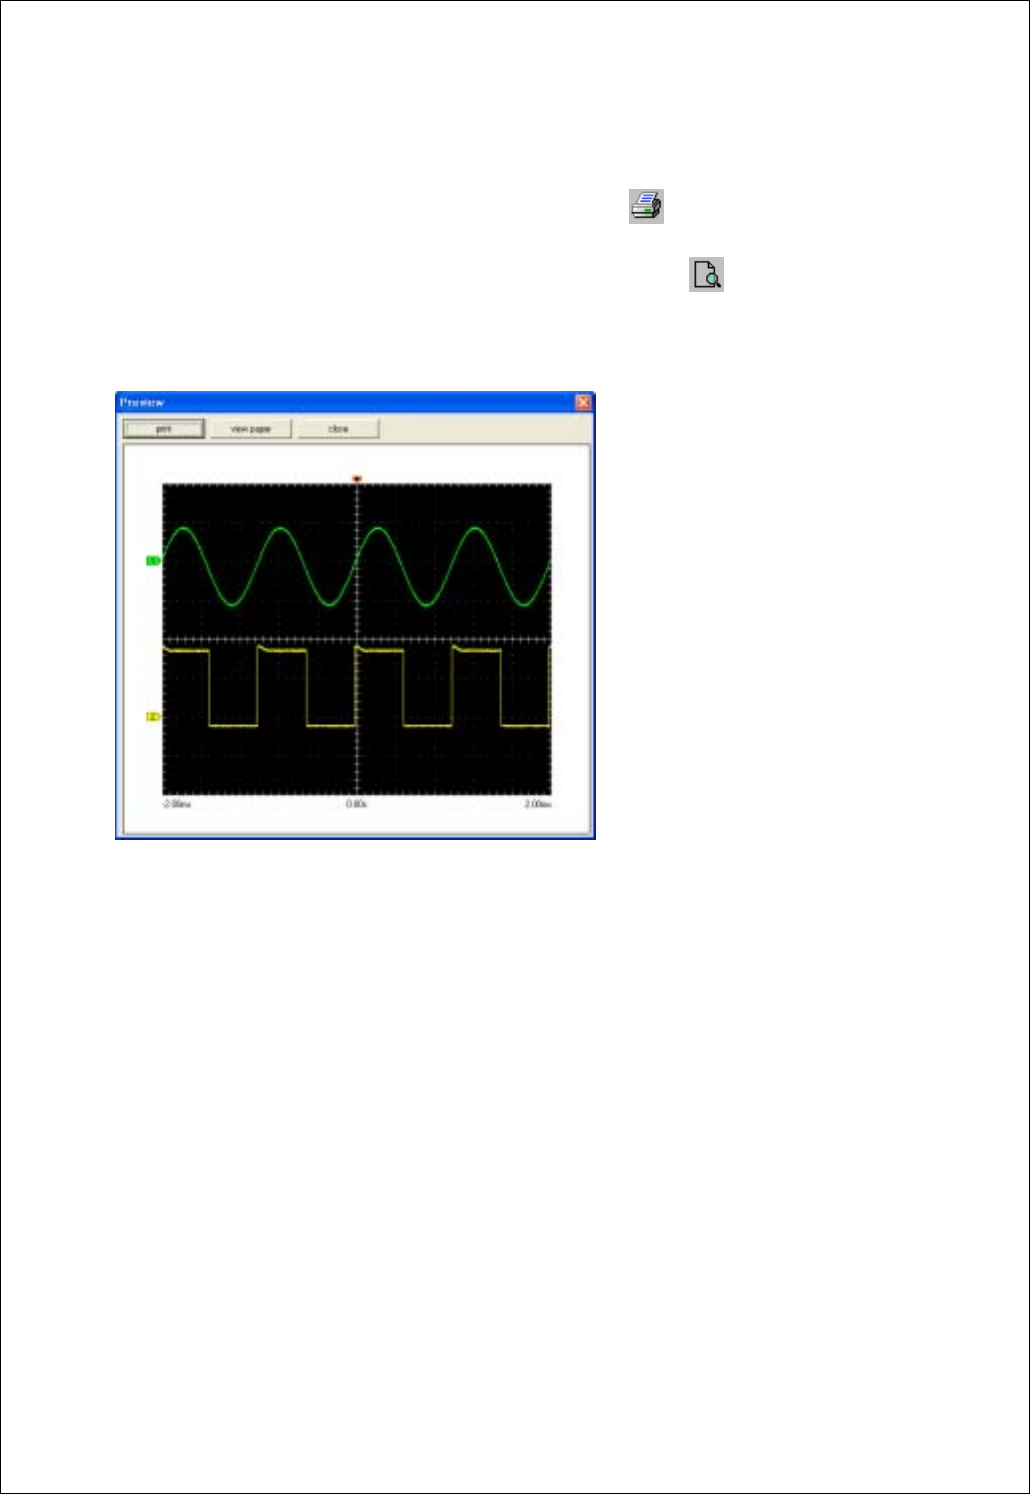
7. Print the waveform.
A. Display the waveform, by selecting ‘Print’ / Toolbar printer icon( ) in ‘Menu’-> ‘File’.
B. Display the screen to print by selecting Preview’ / Toolbar preview icon ( ) in ‘Menu’-> ‘File’->‘.
Example) Preview screen
Chapter 3. Advanced Technique
32
Ch 3. Advanced Technique
1. Advanced Trigger
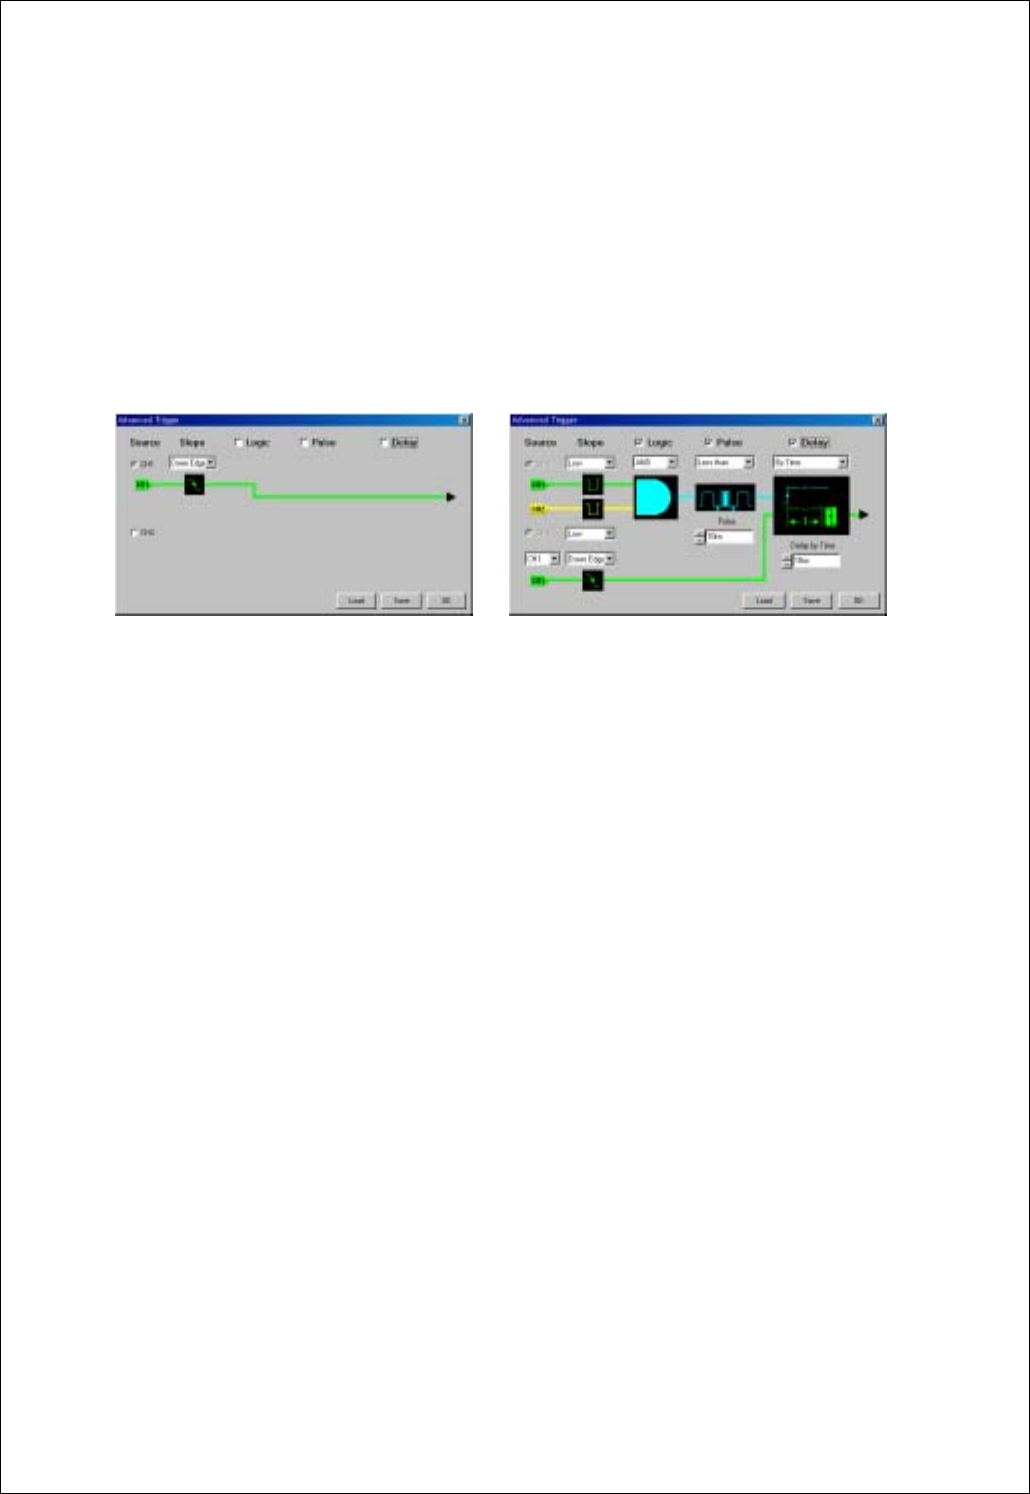
You can return to normal trigger mode by uncheck Logic, Pulse, Delay check box in the advanced trigger
dialog box.
(Normal trigger mode) (Advanced trigger mode)
Edge Trigger
The Edge Trigger generates a trigger when the source signal passes through a specified level in either
positive or negative direction, set by the user. This is the same trigger type found in a conventional analog
oscilloscope. The source, the slope and the level must be set for Edge Trigger operation.
Source: CH1/CH2
-Selects the trigger source.
Slope: Up Edge/Down Edge
-Selects the slope of the source.
Level: +/- 4 vertical screen divisions (Full screen range)
-Selects the level of the input signal where the Edge Trigger is generated. The level is selected by
trigger level pointer at the right-hand side of the display screen and the source is selected from the
tool bar radio button.
Logic Trigger(SDS 200)

Chapter 3. Advanced Technique
33
The Logic Trigger generates a trigger depending on the logical relation between the state of the two input
channels. AND, NAND, OR, NOR, XOR, XNOR Logic Triggers are available and the two input states
can be negated if selected.
Ch1 state: High/Low
-Selects the state of channel 1 signal for Logic Trigger input
Ch2 state: High/Low
-Selects the state of channel 2 signal for Logic Trigger input
Logic type: AND, NAND, OR, NOR, XOR, XNOR
-Selects logic type
Pulse Trigger
The Pulse Trigger generates a trigger if the pulse width of the input signal is either less or more than the
preset time.
Equation: Less than/More than
- Selects whether the trigger is generated when the pulse is less than or more than the preset pulse time
value.
Time: 10ns ~ 167ms
- Selects the pulse width time
Delay Trigger
The Delay Trigger generates a trigger by waiting for a preset time or number of events after a primary
trigger from combination of edge, logic and pulse trigger is generated and when the first trigger from the
secondary trigger source is detected.
Equation: By time/By event
- Selects the delay condition either by time or by event.
Delay condition : By Time(1us~167ms), By Event(1~16,777,215 event)
=> When operating By event, two inputs of Delay trigger is called Primary trigger and Secondary trigger

Chapter 3. Advanced Technique
34
respectively. Due to features of hardware, delay time of 1us exists before first effective input of
Secondary trigger comes after satisfying Delay conditions by input of Primary trigger.
Secondary trigger source: CH1/CH2
- Selects the trigger source of the secondary trigger.
Secondary trigger slope: Rising/Falling
- Selects the slope of the secondary trigger.
Chapter 3. Advanced Technique
35
2. FFT function
FFT(Fast Fourier Transform)
This function analyze the frequency component of current waveform.
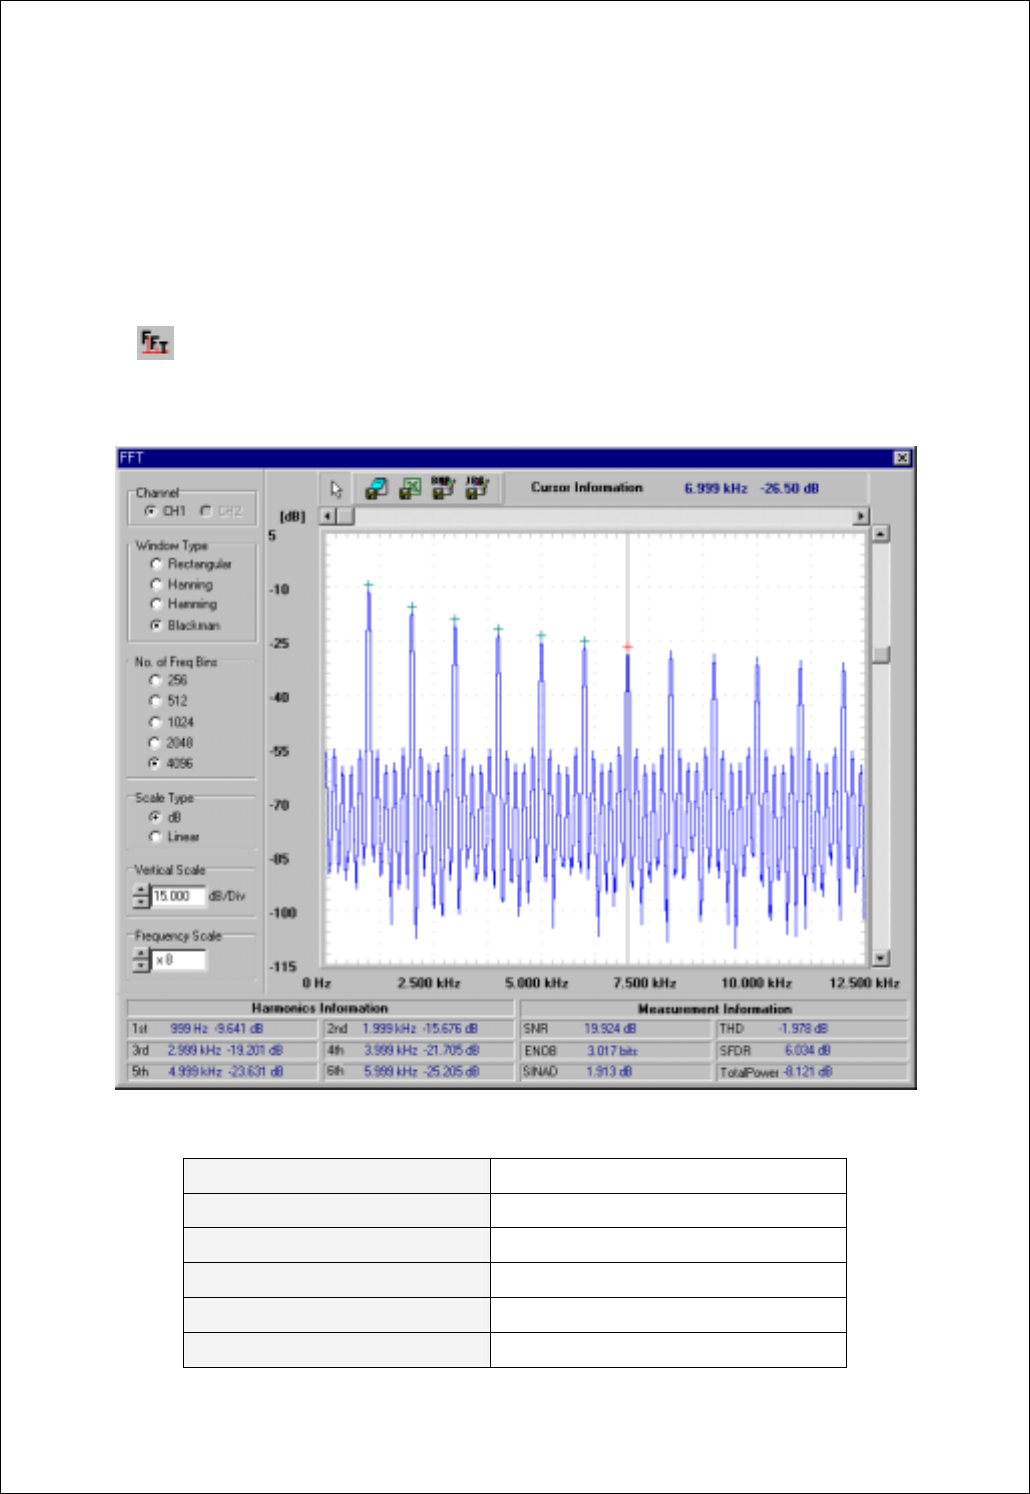
1. Pushing the FFT icon, the FFT dialog box appears.
< The voltage component analyzed using FFT is displayed as Volt unit, and the value transformed as log
scale or by other computation is displayed as rms(root mean square) value.>
2. The left setting menu of the FFT dialog box.
Channel Sets input source for FFT analysis
Window Type Sets digital filter type
No. of Freq Bins Sets size of digital filter
Scale Type Sets y scale type as Linear or Log scale
Vertical Scale Sets vertical scale
Frequency Scale Sets horizontal scale
Chapter 3. Advanced Technique
36
If the information is more than the quantity
displayed to the display window, more
information is displayed by using scroll bar.
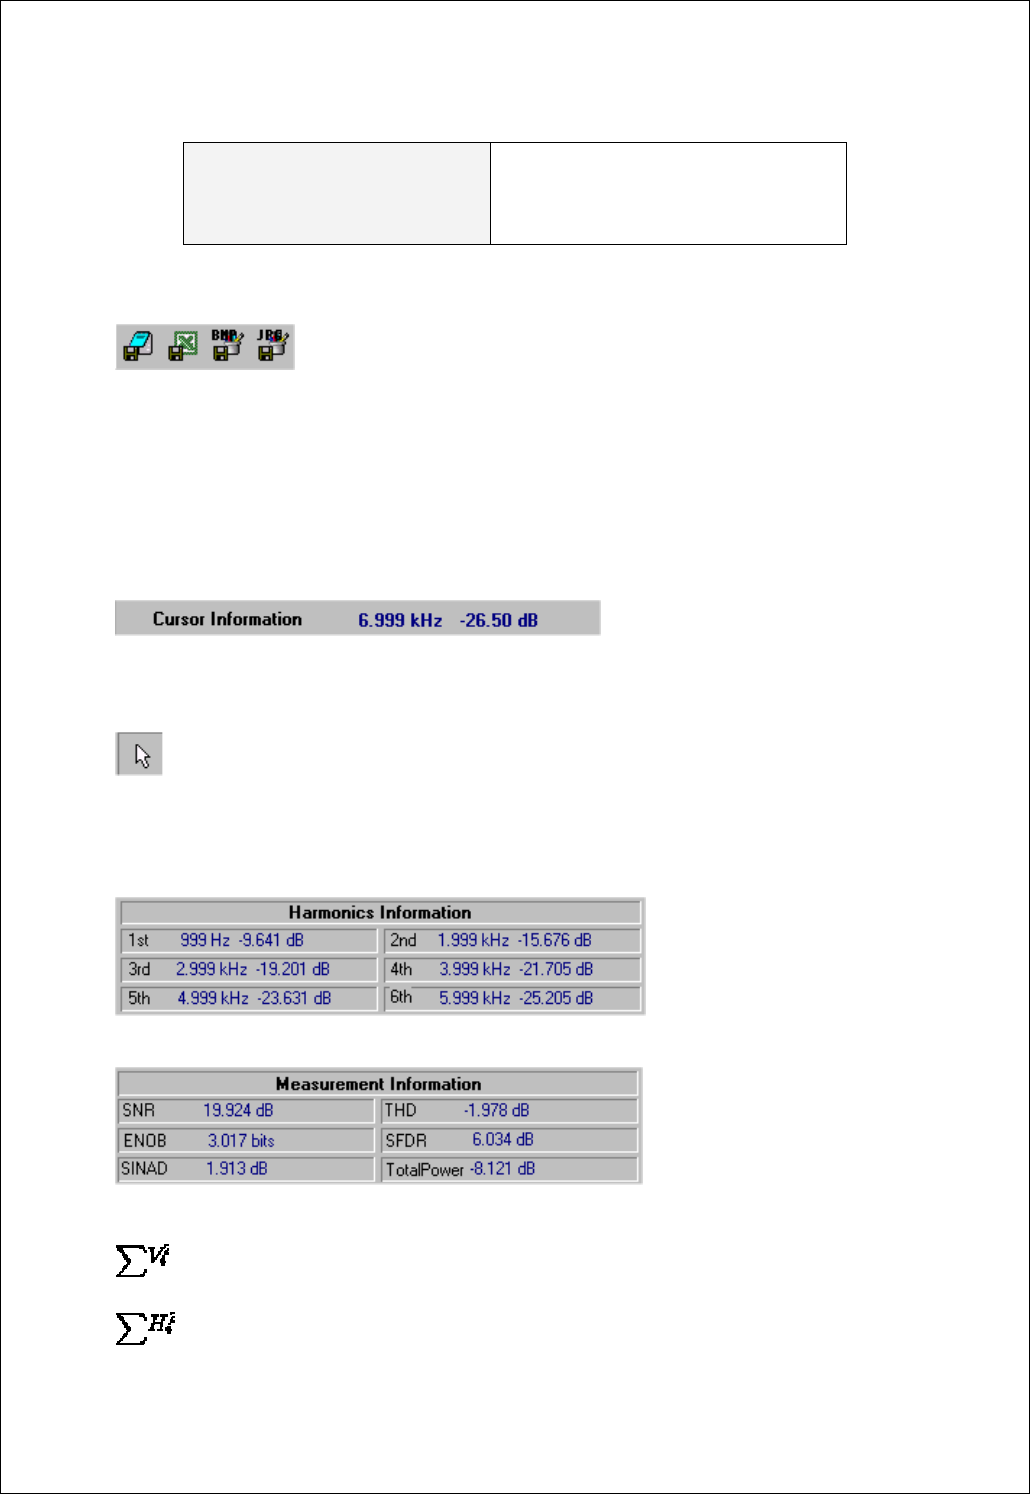
3. The above menu bar of the FFT dialog box
:Save the FFT information as various data type
Save As Text : This Button saves the FFT information as text formation.
Save As Excel : This Button transfers the FFT information to MS Excel using ActiveX
automation.
Save As Bmp : This Button saves the FFT information as Bitmap Image.
Save As Jpg : This Button saves the FFT information as Jpeg Image.
: This shows the information of Cursor.
Example) This means that frequency of cursor point is 3.6MHz and amplitude is 0.029Volts.
:FFT Cursor On/Off
4. The below information window of the FFT dialog box
: This shows the information of Harmonics.
: This shows the information about measurement of FFT.
: Amplitude of the fundamental frequency
: Sum of Amplitude of Harmornic(excluding fundamental frequency)
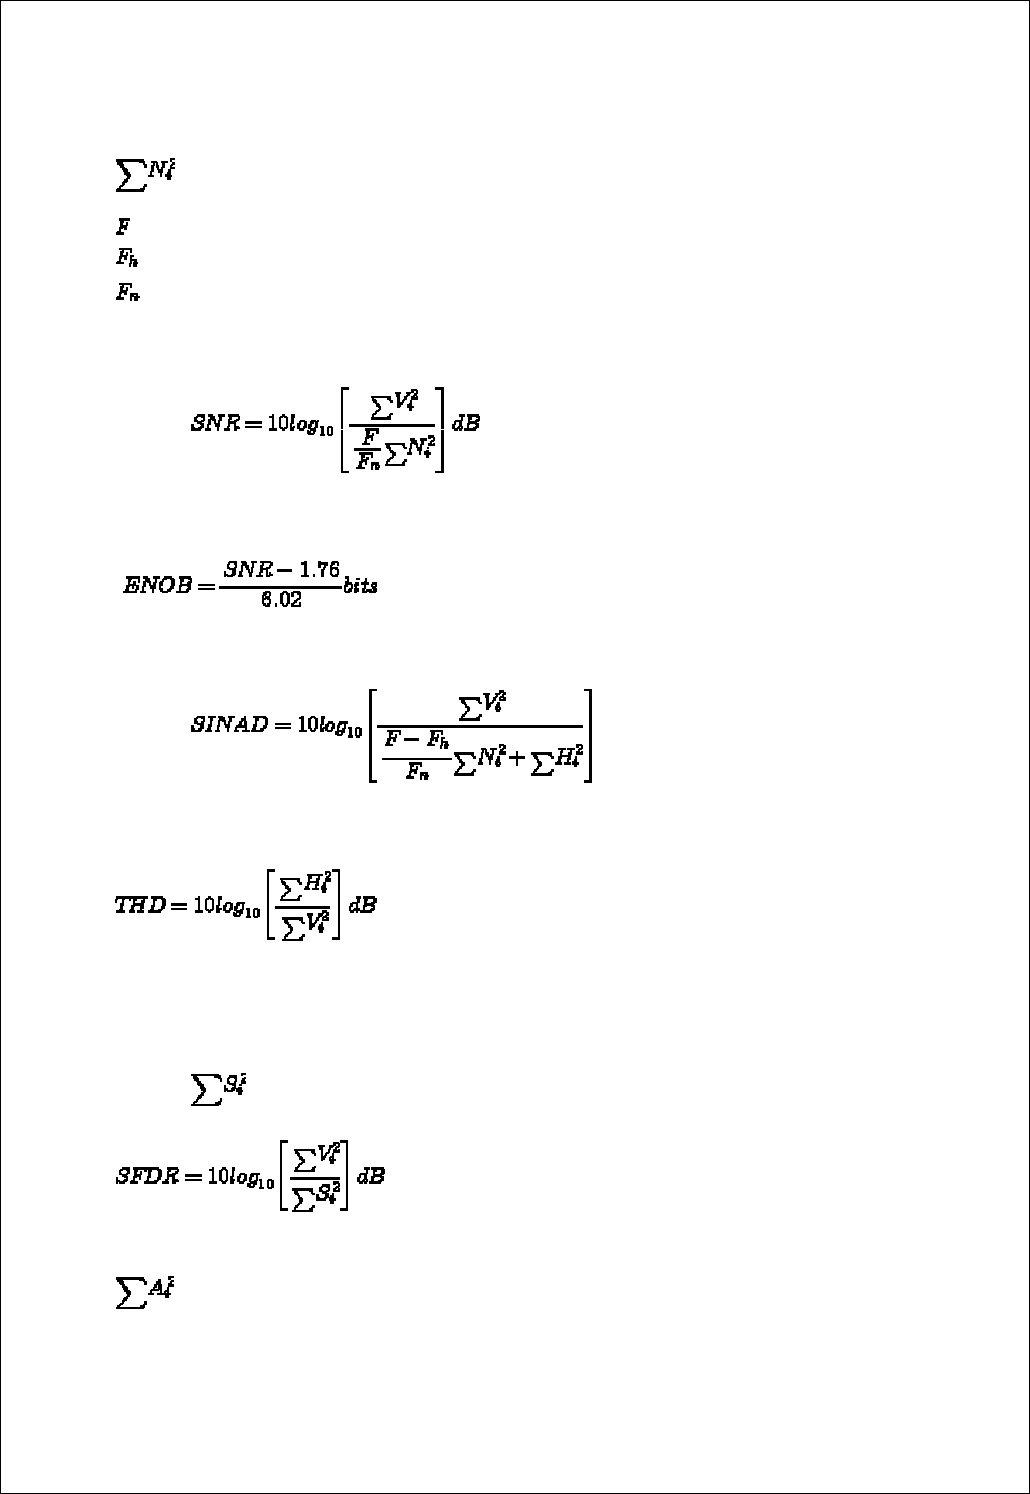
Chapter 3. Advanced Technique
37
: Sum of Noise (excluding fundamental frequency, Harmonics, DC and Nyquist bins)
: Total Number of bins
: Total Number of bins of Harmonic
: Total Number of bins of Noise.
SNR(Signal to Noise Ratio) : The ratio of the amplitude of the fundamental frequency to the
Noise.
ENOB(Effective Number of Bits) : The number of bits in an ideal converter that would be required to
give the same SNR performance.
SINAD(Signal to Noise and Distortion) : The ratio of the amplitude of fundamental frequency
to the Noise, but Noise include Harmonics.
THD(Total Harmonic Distortion) : The ratio of the rms sum of the harmonics to the rms value
of the fundamental.
SFDR(Spurious Free Dynamic Range) The ratio of the rms signal amplitude to the rms value of
the peak spurious spectral component. The peak spurious component may or may not be a
harmonic.
: The rms value of the peak spurious spectral component.
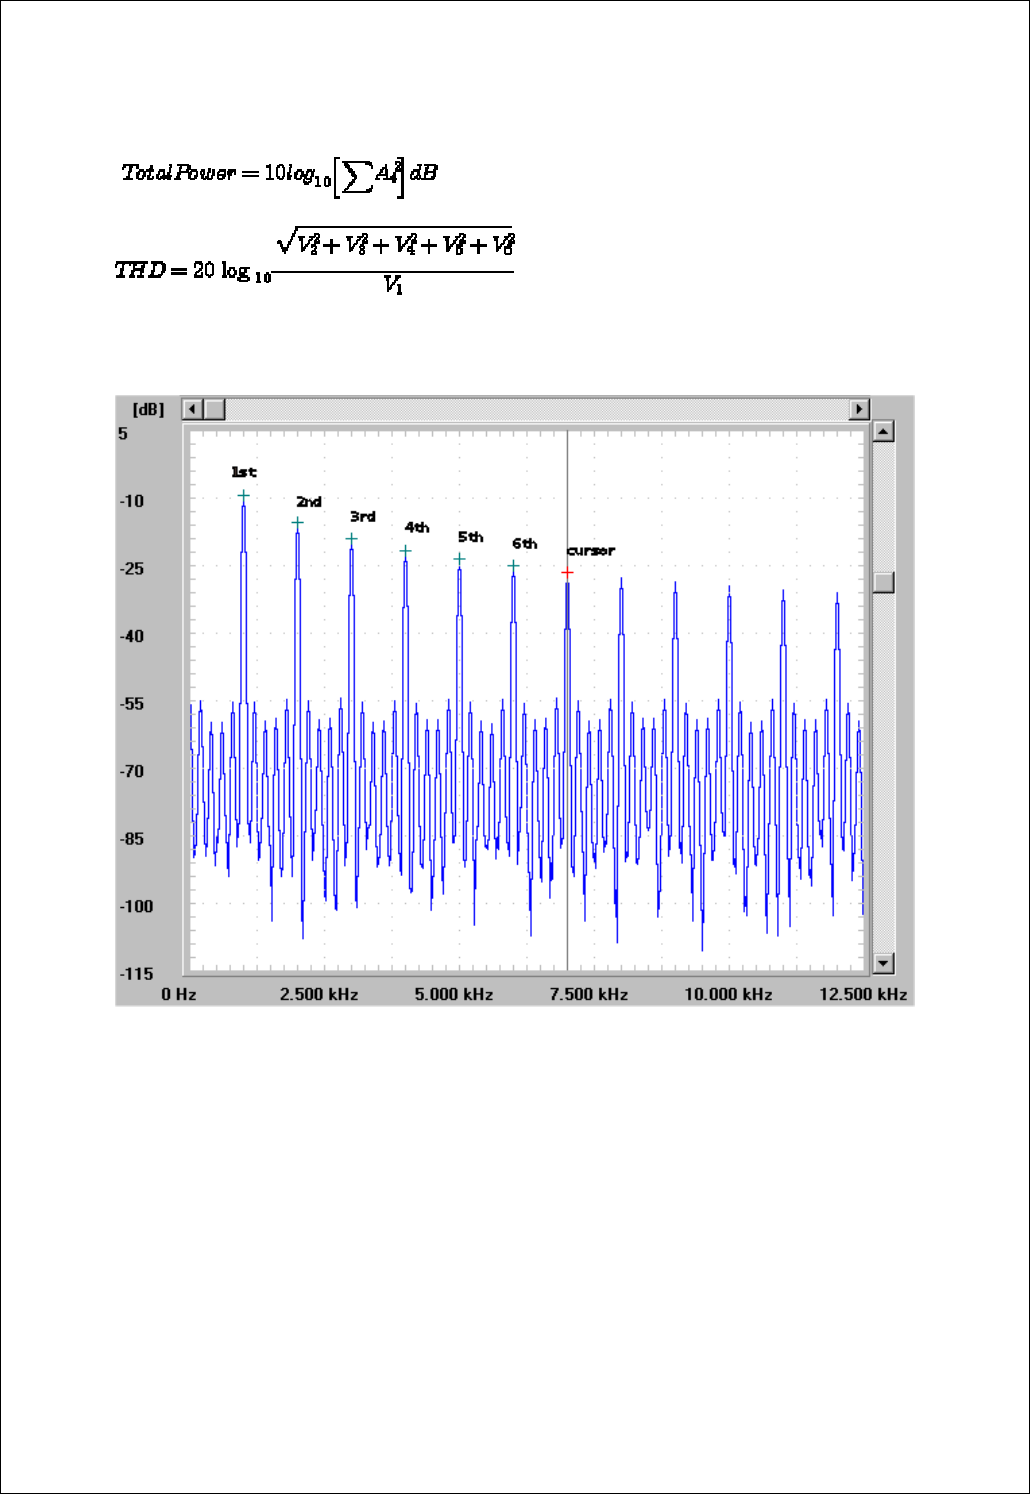
Total Power : The rms value of the sum of all spectral components.
: Sum of Noise excluding DC and Nyquist.
Chapter 3. Advanced Technique
38
5. The FFT display window
:Each green cross points to the Harmonics and red cross points to the cursor.
A coordinate axis of X displays the frequency and a coordinate axis of Y displays the amplitude of the
frequency.
The scrollbar of horizontal and vertical move the base of coordinate axis of X and Y.
Chapter 3. Advanced Technique
39
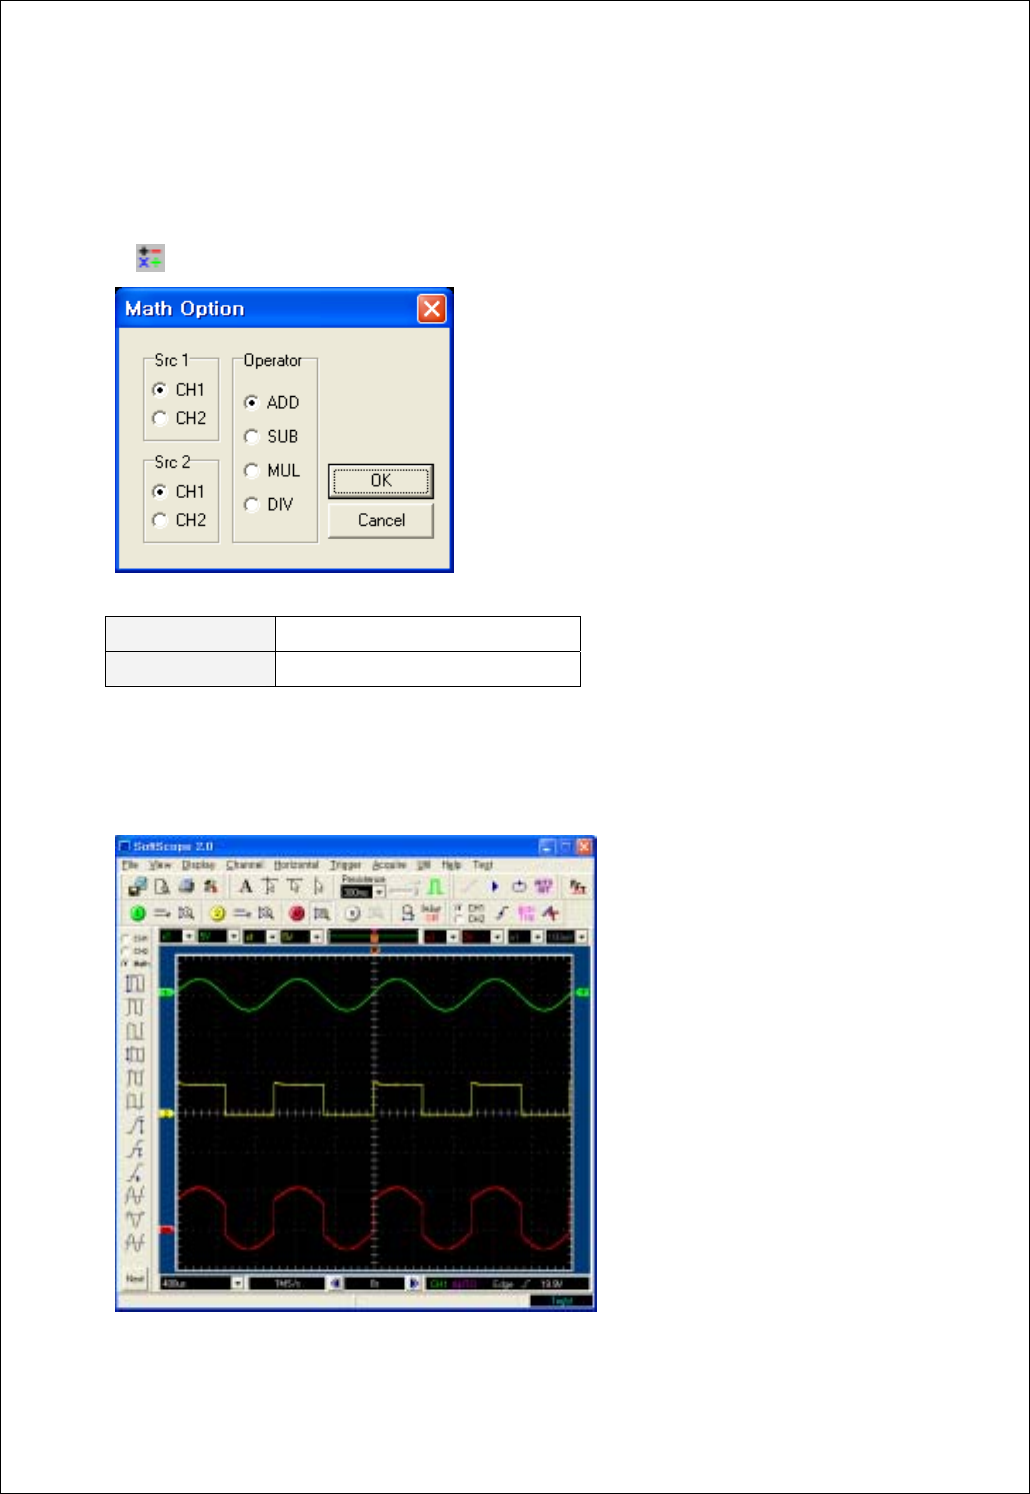
3. Math
Add/Subtract/Multiply/Divide the two waveforms.
1. Push the Math icon.
2. Select source 1, source 2 and operator from the dialog box.
Example) Input1 waveform + Input2 waveform
Src1/Src2 Sets input source.
Operator Sets operation method
Chapter 5. Appendix
40
Ch 4. Toolbars, Menus, Dialog boxes & Screen
Information
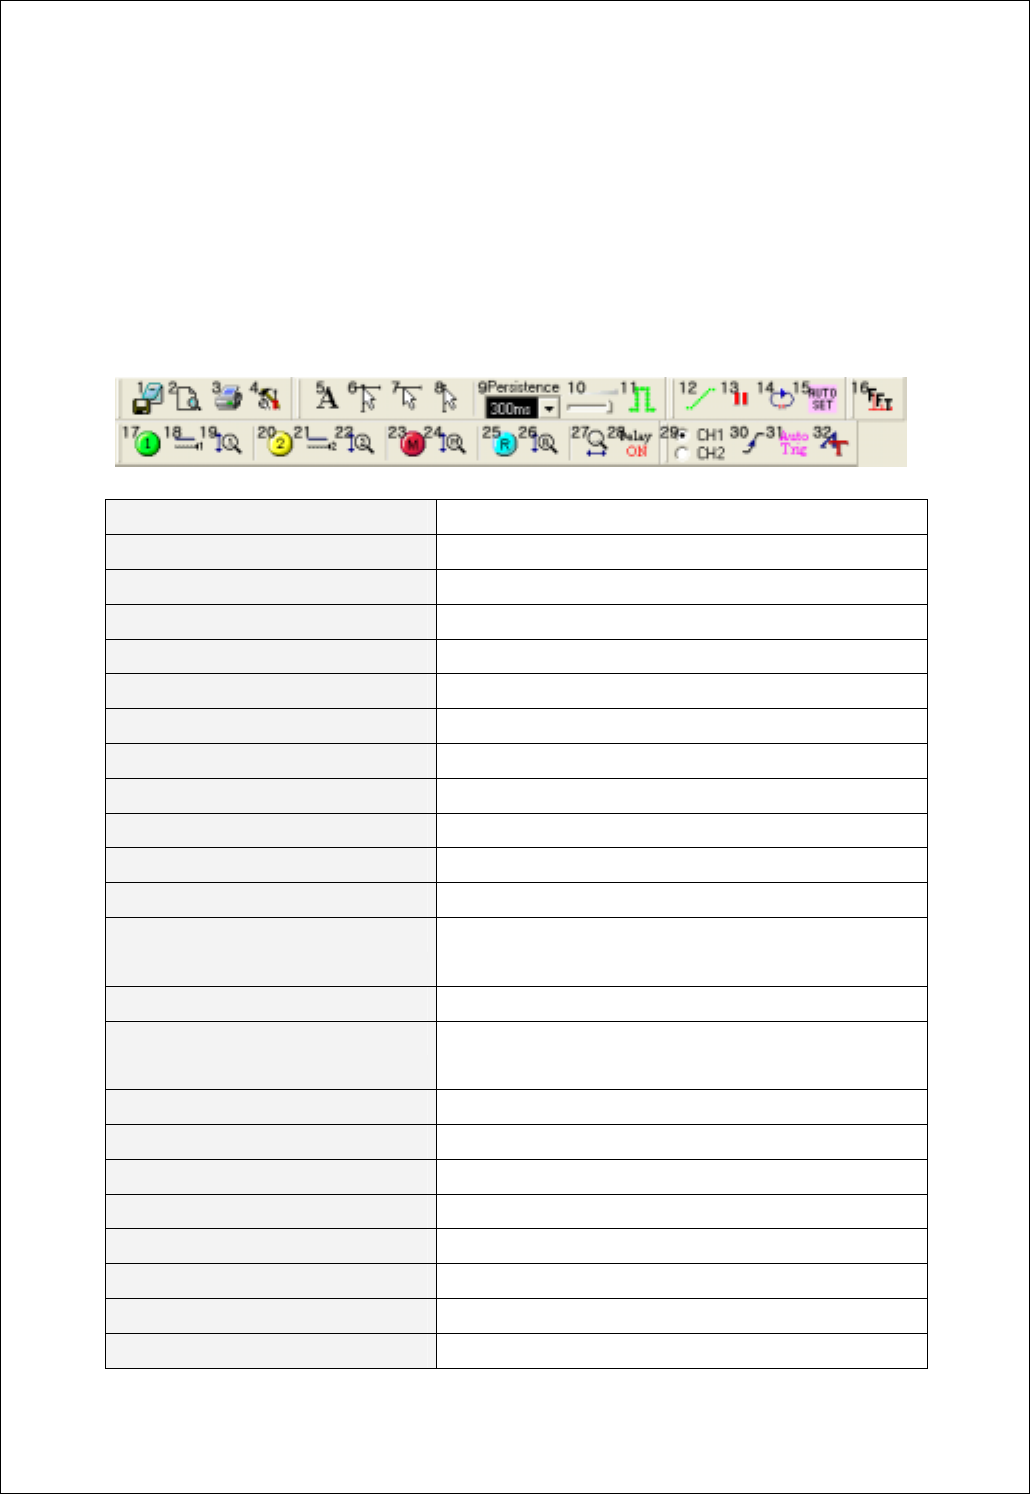
1. Toolbar
1. Save As Dat -Save as “.dat” file
2. Preview -Previews current waveform
3. Print -Prints current waveform
4. Option -Shows option dialog box
5. Label -Shows label on the screen
6. Cross Cursor -On/Off function of Cross Cursor
7. Horizontal Cursor -On/Off function of Horizontal Cursor
8. Vertical Cursor -On/Off function of Vertical Cursor
9. Persistence -Sets persistence time
10. Intensity -Sets intensity of the waveform
11. Line Join -Joins the dots to lines
12. ETS ON/OFF -Sets ETS(Equivalent Time Sampling) On/Off
13. Run/Stop -Starts waveform acquisitions
-Stops waveform acquisitions
14. Single Shot -Executes a single-shot acquisition
15. Auto Shot -Adjusts the vertical, horizontal, and trigger controls for a
usable display automatically
16. FFT -Shows FFT dialog box
17. Channel 1 On/Off -Channel 1 On/Off
18. Channel 1 AC/DC/GND -Select Channel 1 AC/DC/GND
19. Channel 1 Voltage Scale -Adjust Channel 1 Volt/Div
20. Channel 2 On/Off -Channel 2 On/Off
21. Channel 2 AC/DC/GND -Select Channel 2 AC/DC/GND
22. Channel 2 Voltage Scale -Adjust Channel 2 Volt/Div
23. Math On/Off -Math On/Off

Chapter 5. Appendix
41
24. Math Voltage Scale -Adjust Math Volt/Div
25. Reference On/Off -Reference On/Off
26. Reference Voltage Scale -Adjust Reference Volt/Div
27. Time/Div -Adjust Time/Div
28.Delay On/Off -Sets trigger delay on
-Sets trigger delay off
29. Trigger Source -Sets trigger source to a specific channel
30. Trigger Up/Down -Triggers on the rising edge of the signal
-Triggers on the falling edge of the signal
31. Auto/Normal Trigger -Enables free running waveform acquisitions
-Triggers only on valid trigger events
32. Advanced Trigger -Shows advanced trigger dialog box
Chapter 5. Appendix
42
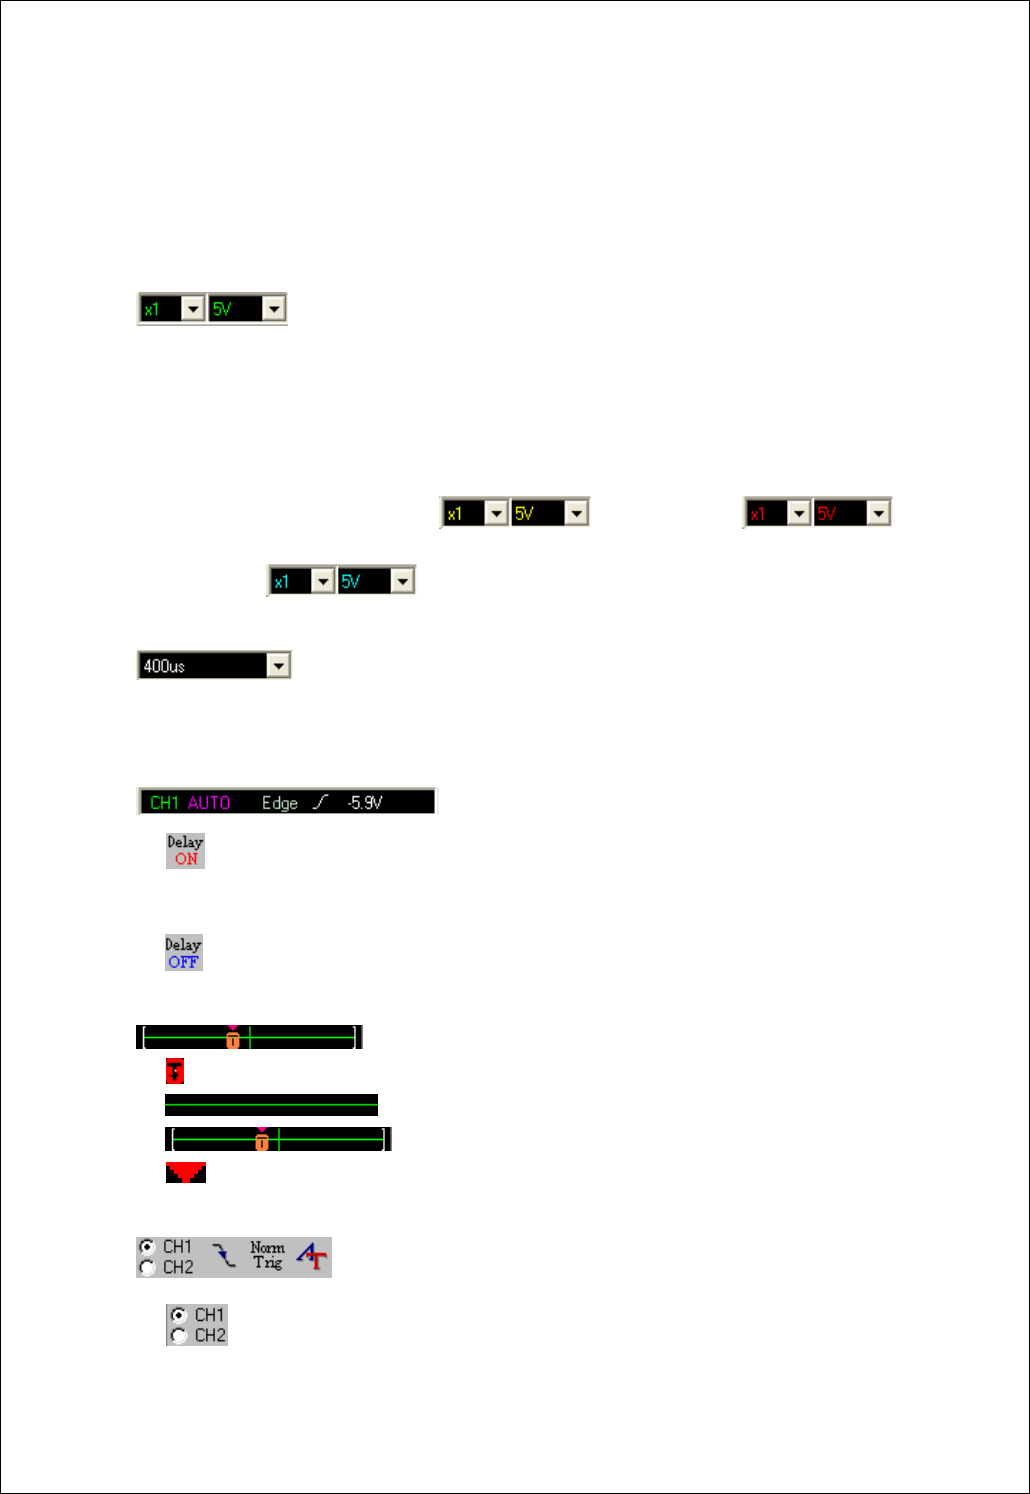
2. Screen Information
SoftScope has the following windows to show the internal states and settings.
1. : Channel 1 Window
- Display current probe Attenuation (1:1, 1:10, 1:100, 1:1000).
- Display current Volt/Div.
- Click mouse to change set up value.
2. Configuration of Channel 2 Window( ) , Math Window( ),
Reference Window( ) is same as the Channel 1 window.
3. : Time Window
- Display current Time/Div.
- Click mouse and change set up value.
4. : Trigger status display window
A. When SDS 200(A) is in a delay-on state it shows the current trigger point using time
dimension.
B. When SDS 200(A) is in a delay-off state it shows the current trigger point using % scale.
5. : Trigger point display window
A. The trigger point shows the trigger position in the acquired waveform.
B. This line shows the whole acquired waveform.
C. You can see the data currently showing using [ ] mark.
D. This mark shows the reference point when horizontal scale(time/div) is changed.
6. : Trigger state selection tool bar
A. Trigger source selection radio button

Chapter 5. Appendix
43
B. Trigger mode (Auto/Normal)
C. Trigger condition (Up edge/Down edge)
D. Triger state display window.
Display trigger source, trigger mode, trigger type, trigger slop and trigger level.
7. : Trigger state of current acquired waveform
A. 'Auto trig'd' - Trigger signal is automatically generated because of no valid triggered signal.
B. Waiting – SDS 200(A) is waiting for the incoming trigger.
C. Trig'd – Acquired waveform is triggered.
Chapter 5. Appendix
44
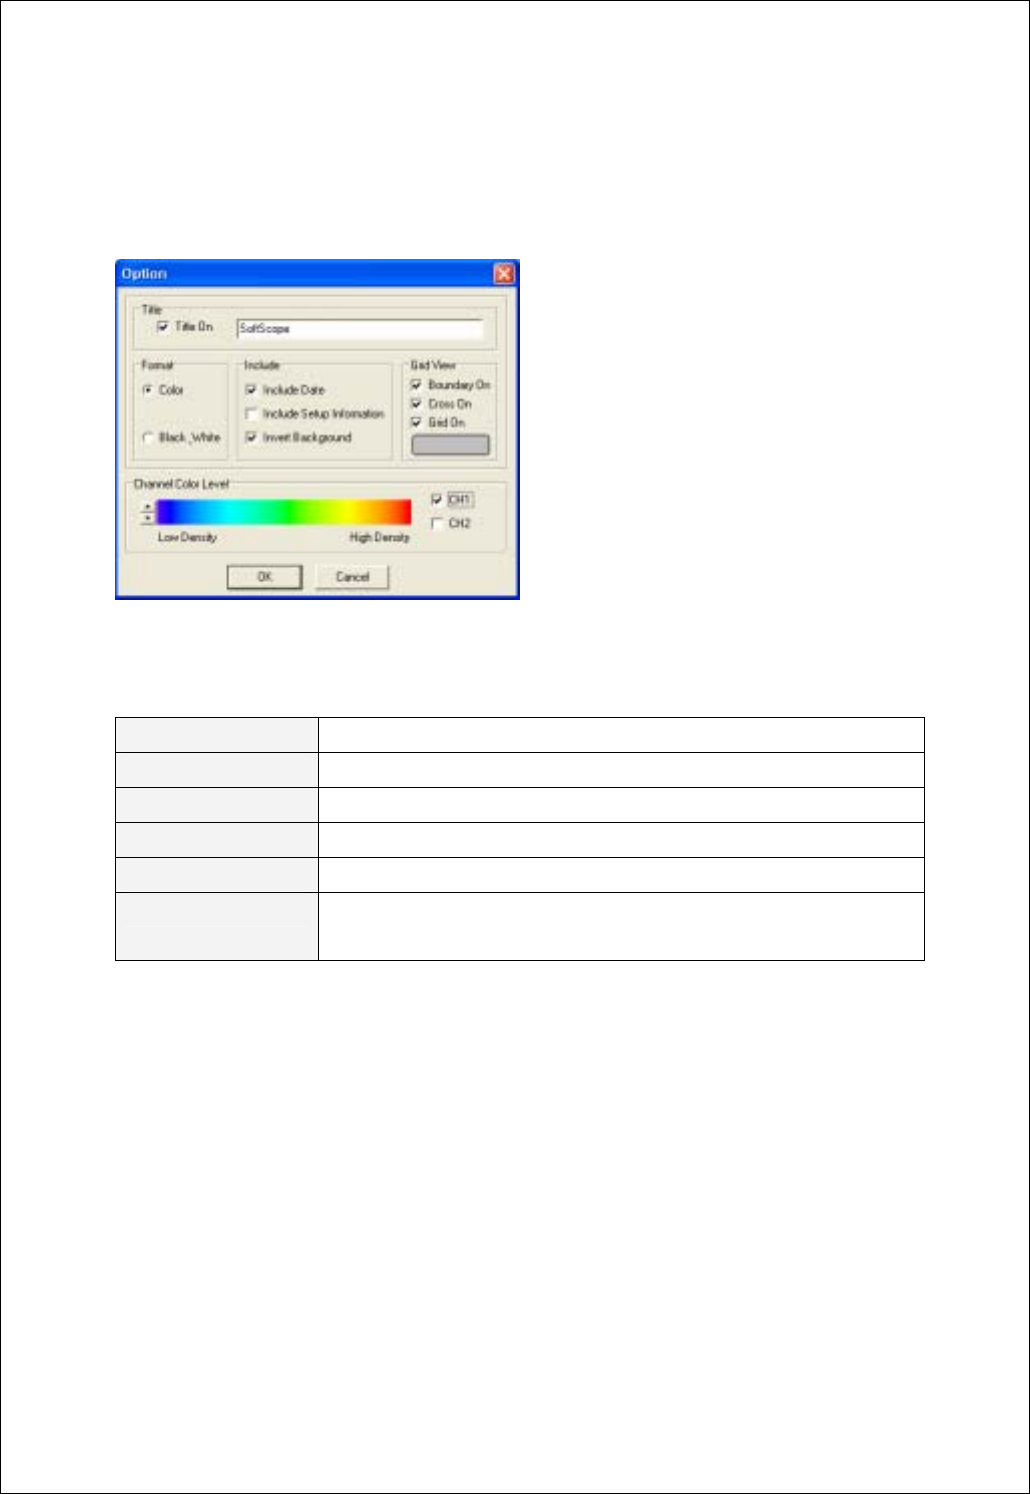
3. Option Dialog Box
Title On -Check to include title on file/print output
Title -Use to set the title on file/print output
Format -Sets color or Black or white type
Include -Check to include information
Grid View -Sets the graticule type
Channel Color Level -Sets color level of waveform
-Check to display waveform in color
Chapter 5. Appendix
45
4. Menu
File
Name Sub Menu Operation Hot-key
Save As DAT Save as DAT File format Ctrl +S
Save As JPG Save as JPG File format
Save As BMP Save as BMP File format
Save As Word Saves waveform as word file F4
Save As Excel Saves waveform as excel file F5
Option Selects the waveform or screen
option
F6
Copy Saves waveform to clipboard Ctrl + C
Load Reference Load Reference file.
Save Channel1 As
Reference
Save and load channel 1 waveform as
Reference waveform
Save Channel2 As
Reference
Save and load channel 1 waveform as
Reference form
Preview Previews the waveform F7
Print Prints the waveform Ctrl + P
Exit Stops the SoftScope and return Ctrl + X
View
Name Sub Menu Operation Hot-key
File Toolbar Shows/Hides File Toolbar Ctrl + F1
Display Toolbar Shows/Hides Display Toolbar Ctrl + F2
Channel Toolbar Shows/Hides Channel Toolbar Ctrl + F3
Run/Stop Toolbar Shows/Hides Run/Stop Toolbar Ctrl + F4
Trigger Toolbar Shows/Hides Trigger Toolbar Ctrl + F5
Utile Toolbar Display/hide Utile Toolbar Ctrl + F6
Display
Name Sub Menu Operation Hot-key
Line Join On/Off Joins the waveform with line Ctrl + J

Chapter 5. Appendix
46
Persistence Changes the persistence effect Ctrl + E
+ Increases intensity of waveform Ctrl + Inc Intensity
_ Decreases intensity of waveform Ctrl + Del
Label Edit On/Off Inserts text to waveform Ctrl + L
Cross Cursor On/Off On/Off Cross Cursor Ctrl + U
Horizontal Cursor On/Off On/Off Horizontal Cursor
Vertical Cursor On/Off On/Off Vertical Cursor
Channel
Name Sub Menu Operation Hot-key
On/Off On/Off Shift + F1
Voltage Change Volt/Div setting Shift + F5
Probe Attenuation Change Probe Attenuation
AC/DC/GND Coupling Change AC/DC/GND Shift + F2
Invert On/Off Change phase of waveform
Channel1
Bandwidth Limit
(SDS 200A)
Bandwidth limit
On/Off On/Off Shift + F7
Voltage Change Volt/Div setting Shift + F11
Probe Attenuation Change Probe Attenuation
AC/DC/GND Coupling Change AC/DC/GND Shift + F8
Invert On/Off Change phase of waveform
Channel2
Bandwidth Limit
(SDS 200A)
Bandwidth limit
On/Off On/Off Ctrl + M
Voltage Change Volt/Div setting
Probe Attenuation Change Probe Attenuation
Math
Math Option Set Option of Math
On/Off On/Off
Voltage Change Volt/Div setting
Reference
Probe Attenuation Change Probe Attenuation

Chapter 5. Appendix
47
Horizontal
Name Sub Menu Operation Hot-key
Time/Div Change Time/Div setting Ctrl + T
Delay On/Off On/Off Delay Ctrl + D
Trigger
Name Sub Menu Operation Hot-key
Trigger Source CH1 Selects CH1 from trigger source Shift+Ctrl+F1
Trigger Source CH2 Selects CH2 from trigger source Shift+Ctrl+F2
Slope Selects Up/Down from Trigger Up/Down Shift+Ctrl+F3
Auto/Normal Selects Normal/Auto from Trigger Normal/Auto Shift+Ctrl+F4
Advanced Trigger Selects Advanced trigger Shift+Ctrl+F5
Trigger High Frequency
Reject On/Off
(SDS 200A)
Eliminate trigger high-frequency
Acquire
Name Sub Menu Operation Hot-key
Run/Stop Starts/Stops acquiring waveform Ctrl + R
Single Shot Begins Single Shot operation Ctrl + H
Auto Set Changes horizontal/vertical scale for waveform Ctrl + A
ETS On/Off On/Off ETS
Average Changes average count number
Peak Detection
(SDS 200A)
Peak Detection On/Off
Utile
Name Sub Name Operation Hot-key
FFT Shows FFT form Ctrl + F
Time - Ctrl + F
Voltage -
Measurement
Upper/Lower Level Upper/Lower
XY plot On/Off On/Off XY plot Ctrl + Y
Calibration Processes Offset calibartion Shift+Ctrl+F6

Chapter 5. Appendix
48
Measure
Name Sub Menu Operation Hot-key
Voltage Peak to Peak
Maximum
Minimum
Amplitude
Top
Base
Upper
Middle
Lower
Mean
Cycle Mean
RMS
Cycle RMS
Positive Overshoot
Negative Overshoot
Measurement of Peak to Peak Voltage
Measurement of Maximum Voltage
Measurement of Minimum Voltage
Measurement of Amplitude Voltage
Measurement of Top Voltage
Measurement of Base Voltage
Measurement of Upper Voltage
Measurement of Middle Voltage
Measurement of Lower Voltage
Measurement of Mean Voltage
Measurement of Cycle Mean Voltage
Measurement of RMS Voltage
Measurement of Cycle RMS Voltage
Measurement of Positive Overshoot Voltage
Measurement of Negative Overshoot Voltage
Ctrl+Alt + P
Ctrl+Alt + X
Ctrl+Alt + N
Ctrl+Alt + A
Ctrl+Alt + T
Ctrl+Alt + B
Ctrl+Alt + U
Ctrl+Alt + M
Ctrl+Alt + L
Ctrl+Alt + E
Ctrl+Alt + C
Ctrl+Alt + R
Ctrl+Alt + Y
Ctrl+Alt + S
Ctrl+Alt + G
Time Period
Frequency
Rise Time
Fall Time
Positive Duty Cycle
Negative Duty Cycle
Positive Pulse Width
Negative Pulse Width
Measurement of Period
Measurement of Frequency
Measurement of Rise Time
Measurement of Fall Time
Measurement of Positive Duty Cycle
Measurement of Negative Duty Cycle
Measurement of Positive Pulse Width
Measurement of Negative Pulse Width
Ctrl+Alt + I
Ctrl+Alt + F
Ctrl+Alt + V
Ctrl+Alt + Z
Ctrl+Alt + J
Ctrl+Alt + D
Ctrl+Alt + W
Ctrl+Alt + H
Upper/Lower
Level
Set Upper/Lower ratio
Help
Name Sub Name Operation Hot-key
Help Shows help file F1
About Displays about Dialog Box F9
Chapter 5. Appendix
49
Appendix
Software Calibration
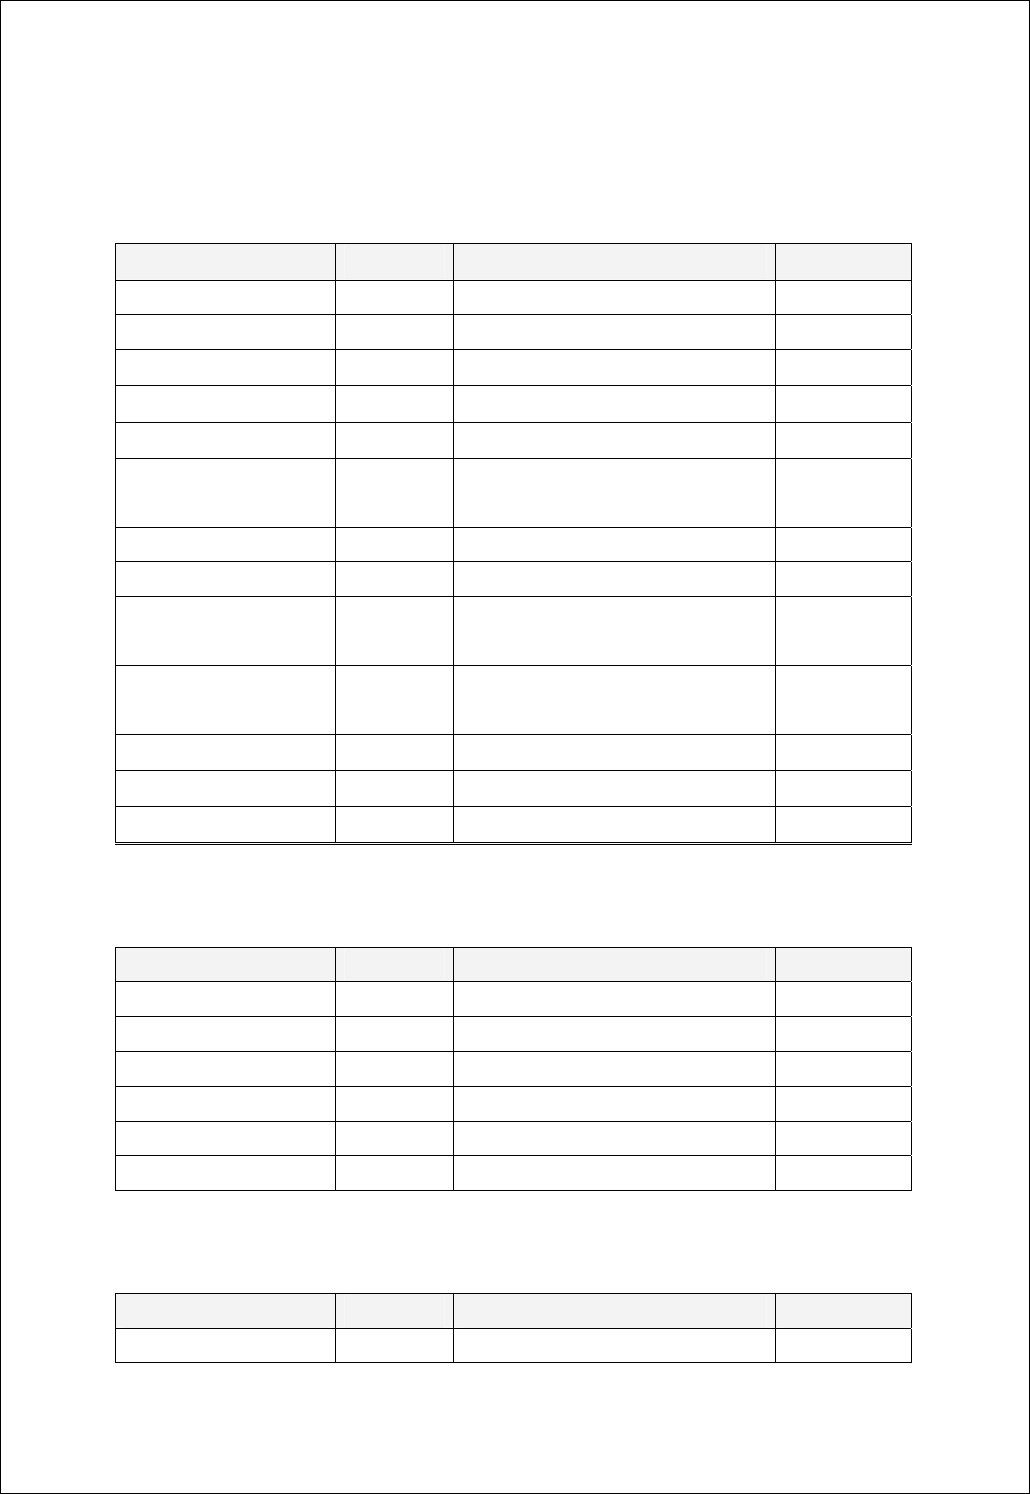
It is necessary for you to calibrate regularly to make the measurements as accurate as possible
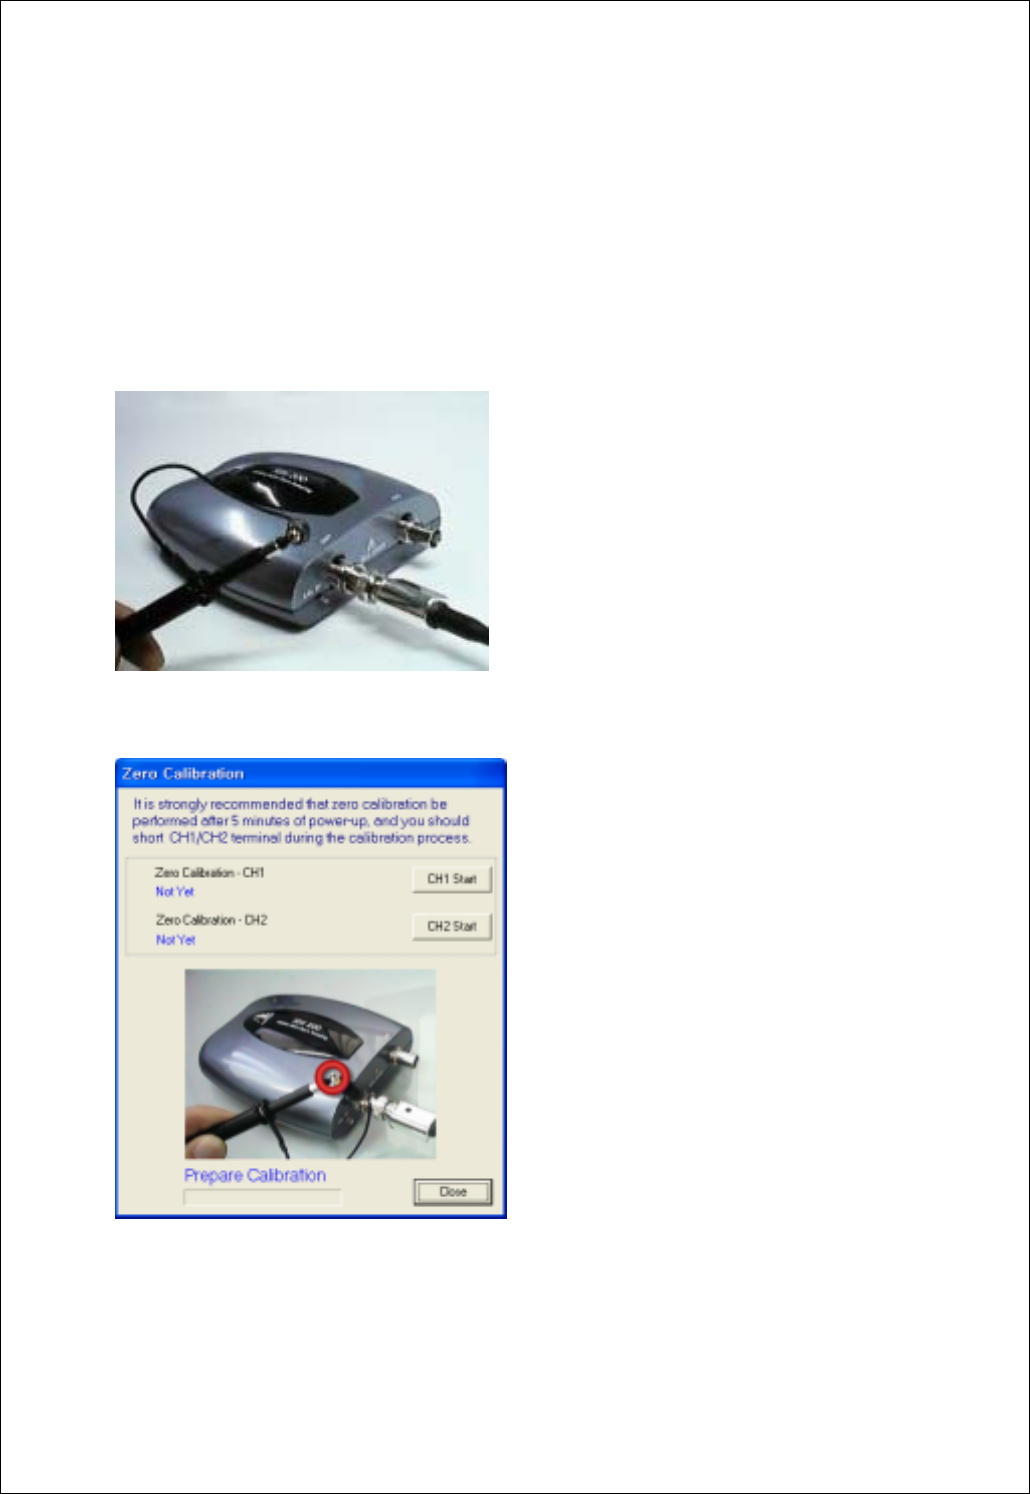
1. Short input signal as shown below.
2. Zero calibration dialog box appears.