Arista Networks SS300ATC60 SpectraGuard Access Point / Sensor User Manual 1
AirTight Networks, Inc. SpectraGuard Access Point / Sensor Users Manual 1
Contents
- 1. Users Manual
- 2. Users Manual-1
- 3. Users Manual-2
- 4. Users Manual-3
- 5. Users Manual-4
- 6. Users Manual-5
- 7. Users Manual-6
- 8. (SS-300AT-C-60) UserMan-Part1_2013.12.11 revised
- 9. (SS-300AT-C-60) UserMan-Part2
- 10. (SS-300AT-C-60) UserMan-Part3
- 11. (SS-300AT-C-60) UserMan-Part4
- 12. (SS-300AT-C-60) UserMan-Part5
- 13. (SS-300AT-C-60) UserMan-Part6
Users Manual-1

User Guide
SpectraGuard® Enterprise
An AirTight® Product
A Comprehensive Wireless IPS and Performance Management Solution
Version 6.7 Update 2
AirTight® Networks, Inc.,
339 N. Bernardo Avenue, # 200,
Mountain View, CA 94043
http://www.airtightnetworks.com
Product documentation is being enhanced continuously based on customer feedback. To obtain a latest copy of this document, visit
http://www.airtightnetworks.com/home/support.html
This page has been intentionally left blank.
SpectraGuard® Enterprise
User Guide

1
END USER LICENSE AGREEMENT
Please read the End User License Agreement before installing SpectraGuard® Enterprise. The End User License
Agreement is available at the following location -.http://www.airtightnetworks.com/fileadmin/pdf/AirTight-
EULA.pdf.
Installing SpectraGuard® Enterprise constitutes your acceptance of the terms and conditions of the End User License
Agreement.
DISCLAIMER
THE INFORMATION IN THIS GUIDE IS SUBJECT TO CHANGE WITHOUT ANY PRIOR NOTICE.
AIRTIGHT® NETWORKS, INC. IS NOT LIABLE FOR ANY SPECIAL, INCIDENTAL, INDIRECT, OR
CONSEQUENTIAL DAMAGES WHATSOEVER (INCLUDING, WITHOUT LIMITATION, DAMAGES FOR LOSS
OF BUSINESS PROFITS, BUSINESS INTERRUPTION, LOSS OF BUSINESS INFORMATION, OR ANY OTHER
PECUNIARY LOSS) ARISING OUT OF THE USE OF OR INABILITY TO USE THIS PRODUCT.
THIS PRODUCT HAS THE CAPABILITY TO BLOCK WIRELESS TRANSMISSIONS FOR THE PURPOSE OF
PROTECTING YOUR NETWORK FROM MALICIOUS WIRELESS ACTIVITY. BASED ON THE POLICY SETTINGS,
YOU HAVE THE ABILITY TO SELECT WHICH WIRELESS TRANSMISSIONS ARE BLOCKED AND, THEREFORE,
THE CAPABILITY TO BLOCK AN EXTERNAL WIRELESS TRANSMISSION. IF IMPROPERLY USED, YOUR
USAGE OF THIS PRODUCT MAY VIOLATE US FCC PART 15 AND OTHER LAWS. BUYER ACKNOWLEDGES
THE LEGAL RESTRICTIONS ON USAGE AND UNDERSTANDS AND WILL COMPLY WITH US FCC
RESTRICTIONS AS WELL AS OTHER GOVERNMENT REGULATIONS. AIRTIGHT IS NOT RESPONSIBLE FOR
ANY WIRELESS INTERFERENCE CAUSED BY YOUR USE OF THE PRODUCT. AIRTIGHT AND ITS
AUTHORIZED RESELLERS OR DISTRIBUTORS WILL ASSUME NO LIABILITY FOR ANY DAMAGE OR
VIOLATION OF GOVERNMENT REGULATIONS ARISING FROM YOUR USAGE OF THE PRODUCT, EXPECT
AS EXPRESSLY DEFINED IN THE INDEMNITY SECTION OF THIS DOCUMENT.
LIMITATION OF LIABILITY
AirTight will not be liable to customer or any other party for any indirect, incidental, special, consequential,
exemplary, or reliance damages arising out of or related to the use of SpectraGuard® Enterprise under any legal
theory, including but not limited to lost profits, lost data, or business interruption, even if AirTight knows of or
should have known of the possibility of such damages. Regardless of the cause of action or the form of action,
AirTight’s total cumulative liability for actual damages arising out of or related to the use of SpectraGuard®
Enterprise will not exceed the price paid for SpectraGuard® Enterprise.
Copyright © 2003–2012 AirTight® Networks, Inc. All Rights Reserved.
AirTight® Networks, The AirTight logo, and SpectraGuard® are registered trademarks of AirTight® Networks. All
other products and services are trademarks, registered trademarks, and service marks or registered service marks of
their respective owners.
This product contains components from Open Source software. These components are governed by the terms and
conditions of the GNU Public License. To read these terms and conditions visit
http://www.gnu.org/copyleft/gpl.html.
This product is protected by one or more of U.S. patent Nos. 7,002,943, 7,154,874, 7,216,365, 7,333,800, 7,333,481,
7,339,914, 7,406,320, 7,440,434, 7,447,184, 7,496,094, 7,536,723, 7,558,253, 7,710,933, 7,751,393, 7,764,648, 7,804,808,
7,856,209, 7,856,656, 7,970,894, 7,971,253, 8,032,939; Australian patent No. 200429804; U.K. patent No. 2410154,
Japanese patent No. 4639195 and any others listed at www.airtightnetworks.com/patents. More patents pending.

i
FEDERAL COMMUNICATIONS COMMISSION INTERFERENCE STATEMENT (Section 15.105)
This equipment has been tested and found to comply with the limits for a Class B digital device, pursuant to part 15 of the
FCC Rules. These limits are designed to provide reasonable protection against harmful interference in a residential installation.
This equipment generates, uses and can radiate radio frequency energy and, if not installed and used in accordance with the
instructions, may cause harmful interference to radio communications. However, there is no guarantee that interference will
not occur in a particular installation. If this equipment does cause harmful interference to radio or television reception, which
can be determined by turning the equipment off and on, the user is encouraged to try to correct the interference by one or
more of the following measures:
-Reorient or relocate the receiving antenna.
-Increase the separation between the equipment and receiver.
-Connect the equipment into an outlet on a circuit different from that to which the receiver is connected.
-Consult the dealer or an experienced radio/ TV technician for help.
CAUTION (Section 15.21)
Any changes or modifications not expressly approved by the guarantee of this device could void the user's authority to
operate the equipment.
Labeling requirements (Section 15.19) (a) (3)
This device complies with Part 15 of the FCC Rules. Operation is subject to the following two conditions: (1) this device may
not cause harmful interference, and (2) this device must accept any interference received, including interference that may
cause undesired operation.
RF exposure warning
This equipment must be installed and operated in accordance with provided instructions and the antenna(s)
used for this transmitter must be installed to provide a separation distance of at least 20 cm from all persons
and must not be co-located or operating in conjunction with any other antenna or transmitter. End-users and
installers must be provide with antenna installation instructions and transmitter operating conditions for
satisfying RF exposure compliance.
This device is operation in 5.15 – 5.25GHz frequency range, then restricted in indoor use only, Outdoor operations in the 5150~5250MHz
is prohibit.
The availability of some specific channels and / or operational frequency bands are country dependent and are firmware programmed at
factory to match the intended destination. The firmware setting is not accessible by the end user.
This device is Master equipment, the transmission is disabled in the 5600-5650MHz band.
Canada, Industry Canada (IC) Notices (RSS-Gen section 7.1.3)
This Class B digital apparatus complies with Canadian ICES-003 and RSS-210.
Operation is subject to the following two conditions: (1) this device may not cause interference, and (2) this device must accept
any interference, including interference that may cause undesired operation of the device.
Radio Frequency (RF) Exposure Information
The radiated output power of the Wireless Device is below the Industry Canada (IC) radio frequency exposure limits. The Wireless Device
should be used in such a manner such that the potential for human contact during normal operation is minimized.
This device has also been evaluated and shown compliant with the IC RF Exposure limits under mobile exposure conditions. (antennas are
greater than 20cm from a person's body).
Canada, avis d'Industry Canada (IC)
Cet appareil numérique de classe B est conforme aux normes canadiennes ICES-003 et RSS-210.
Son fonctionnement est soumis aux deux conditions suivantes : (1) cet appareil ne doit pas causer d'interférence et (2) cet
appareil doit accepter toute interférence, notamment les interférences qui peuvent affecter son fonctionnement.
Informations concernant l'exposition aux fréquences radio (RF)
La puissance de sortie émise par l’appareil de sans fil est inférieure à la limite d'exposition aux fréquences radio d'Industry Canada (IC).

ii
Utilisez l’appareil de sans fil de façon à minimiser les contacts humains lors du fonctionnement normal.
Ce périphérique a également été évalué et démontré conforme aux limites d'exposition aux RF d'IC dans des conditions d'exposition à
des appareils mobiles (les antennes se situent à moins de 20 cm du corps d'une personne).
FCC NOTICE: To comply with FCC part 15 rules in the United States, the system must be professionally installed to ensure
compliance with the Part 15 certification. It is the responsibility of the operator and professional installer to ensure that only
certified systems are deployed in the United States. The use of the system in any other combination (such as co-located
antennas transmitting the same information) is expressly forbidden.
Only the antennas listed below are allowed to be used with the EUT output power.
Antenna List
No.
Manufacturer
Part No.
Peak Gain
Note
1.
JOYMAX
JWX-614XRSXX-361
JWX-614XRSXX-361
JWX-614XRSXX-361
3dBi for 2.4GHz
5dBi for 5.15~5.25GHz
5dBi For 5.25~5.35GHz
5dBi For 5.47~5.725GHz
5dBi for 5.725~5.850GHz
External Antenna
(Dipole)
2.
MAG.LAYERS
MSA-3810-2G4C1-B4
MSA-3810-2G4C1-B3
MSA-3810-2G4C1-A37
4.14dBi for 2.4GHz
3.87dBi for 5.15~5.25GHz
3.87dBi For 5.25~5.35GHz
4.76dBi For 5.47~5.725GHz
5.72dBi for 5.725~5.850GHz
Internal Antenna
(PIFA)
NOTE: There are two different EUT output power for with ground plane antenna and without ground plane antenna.
Under Industry Canada regulations, this radio transmitter may only operate using an antenna of a type and maximum (or lesser) gain
approved for the transmitter by Industry Canada. To reduce potential radio interference to other users, the antenna type and its gain
should be so chosen that the equivalent isotropically radiated power (e.i.r.p.) is not more than that necessary for successful
communication.
En vertu de la réglementation de l'industrie du Canada, cet émetteur de radio ne peuvent fonctionner en utilisant une antenne d'un type
et maximum (ou moins) Gain approuvé pour l'émetteur par Industrie Canada. pour réduire risque d'interférence aux autres utilisateurs,
le type d'antenne et son gain doivent être choisis de sorte que la puissance isotrope rayonnée équivalente (PIRE) ne dépasse pas ce qui
est nécessaire pour la réussite de communication.

Table Of Contents
i
Table Of Contents
Getting Started ............................................................................................................................................................................... 1
Before You Begin ........................................................................................................................................................................ 1
Overview and Organization ..................................................................................................................................................... 1
License Based Features .............................................................................................................................................................. 1
How to get more information ................................................................................................................................................... 1
Contact Information .................................................................................................................................................................. 1
Navigation Bar and Global Functions ......................................................................................................................................... 2
A Quick Tour of the Console .................................................................................................................................................... 2
Navigation Bar ........................................................................................................................................................................... 2
Global Functions ........................................................................................................................................................................ 2
General .................................................................................................................................................................................... 2
Trees ......................................................................................................................................................................................... 2
Dialogs ..................................................................................................................................................................................... 3
Messages ................................................................................................................................................................................. 3
Behavior of SpectraGuard Enterprise Servers managed through SpectraGuard Manager ................................................. 4
Introduction ................................................................................................................................................................................ 4
Inheriting Policies on the Root location of SpectraGuard Enterprise Server ..................................................................... 4
Effect on inherited policies and templates on disassociation from SpectraGuard Manager ........................................... 4
Dashboard Tab ............................................................................................................................................................................... 5
Introduction: Panel Displaying WLAN Snapshot ................................................................................................................. 5
Dashboard Screen ...................................................................................................................................................................... 5
Dashboard: Location Tree ..................................................................................................................................................... 5
Security Dashboard: Sections ............................................................................................................................................... 6
Security Dashboard – Security Scorecard ....................................................................................................................... 6
Security Dashboard – New Events .................................................................................................................................. 8
Security Dashboard – Event Charts ................................................................................................................................. 9
Security Dashboard – Quarantine .................................................................................................................................. 10
Security Dashboard – Sensors ........................................................................................................................................ 12
Security Dashboard – APs .............................................................................................................................................. 13
Security Dashboard – Clients ......................................................................................................................................... 14
Performance Dashboard: Sections ..................................................................................................................................... 17
Performance Dashboard – Performance Summary ..................................................................................................... 17
Performance Dashboard – New Events ........................................................................................................................ 18
Performance Dashboard – Event Charts ....................................................................................................................... 19
Performance Dashboard – Trends ................................................................................................................................. 20
Performance Dashboard – Analysis .............................................................................................................................. 21
Dashboard Tab – User Saved Settings ............................................................................................................................... 23
Events Tab ..................................................................................................................................................................................... 24
Events: Panel Displaying Alerts ............................................................................................................................................. 24
Pagination of Events ............................................................................................................................................................ 24
Events Screen ............................................................................................................................................................................ 24
Events: Location Tree .......................................................................................................................................................... 25
Event Categories, Event Lists, and Table Summary ........................................................................................................ 25
Viewing Events Lists ............................................................................................................................................................... 26
Sorting Events........................................................................................................................................................................... 27
Filtering Events ........................................................................................................................................................................ 28
Working with Events ............................................................................................................................................................... 30
Events Context-Sensitive Menu ......................................................................................................................................... 30
Method for Opening Events Context-Sensitive Menu ................................................................................................ 30
Items in the Events Context-Sensitive Menu ................................................................................................................ 31

Table Of Contents
ii
Event Details Dialog ............................................................................................................................................................ 32
Acknowledging an Event ........................................................................................................................................................ 33
Deleting an Event ..................................................................................................................................................................... 33
Undeleting an Event ................................................................................................................................................................ 34
Toggling an Event’s Contribution to Network Vulnerability ............................................................................................ 34
Viewing Detailed Information for an Event ......................................................................................................................... 34
Tracking the Location of an Event ......................................................................................................................................... 35
Viewing Properties of Devices associated with an Event ................................................................................................... 37
Events Tab: User Saved Settings ............................................................................................................................................ 38
Devices Tab ................................................................................................................................................................................... 39
Devices: Panel Displaying WLAN Devices .......................................................................................................................... 39
Pagination of Devices .......................................................................................................................................................... 39
Devices Screen .......................................................................................................................................................................... 39
Devices: Location Tree......................................................................................................................................................... 40
Device Categories, Device Lists, and Table Summary .................................................................................................... 40
Viewing APs/Clients List ........................................................................................................................................................ 41
Viewing Sensors List ............................................................................................................................................................... 44
Viewing List of Networks Detected by Sensors ................................................................................................................... 45
Sorting a Device List ................................................................................................................................................................ 47
Location Tagging of a Device or Location Tag Assignment ............................................................................................... 48
Automatic Location Tagging (Auto Location Tagging) .................................................................................................. 48
Manual Location Tagging ................................................................................................................................................... 48
Working with Devices ............................................................................................................................................................. 48
AP Context-Sensitive Menu ................................................................................................................................................ 48
Method for Opening AP Context-Sensitive Menu ....................................................................................................... 49
Items in the AP Context-Sensitive Menu ...................................................................................................................... 50
AP Details Dialog ................................................................................................................................................................. 52
Fields in the AP Properties Tab ...................................................................................................................................... 53
Fields in the AP Events Tab ............................................................................................................................................ 57
Fields in the AP Performance Tab ................................................................................................................................. 58
Fields in the AP Troubleshoot Tab ................................................................................................................................ 59
Fields in the AP Locate Tab ............................................................................................................................................ 63
Filtering in APs ................................................................................................................................................................. 64
Client Context-Sensitive Menu .......................................................................................................................................... 66
Method for Opening Client Context-Sensitive Menu ................................................................................................. 66
Items in the Client Context-Sensitive Menu ................................................................................................................. 67
Client Details Dialog ............................................................................................................................................................ 68
Fields in the Client Properties Tab ................................................................................................................................. 69
Fields in the Client Events Tab ....................................................................................................................................... 73
Fields in the Client Performance Tab ............................................................................................................................ 74
Fields in the Client Troubleshoot Tab ........................................................................................................................... 75
Fields in the Client Locate Tab ....................................................................................................................................... 79
Filtering in Clients ............................................................................................................................................................ 80
Smart Device Detection ....................................................................................................................................................... 81
Manually tagging authorized clients as smart devices ............................................................................................... 81
Manually Tagging Guest clients as Smart Devices ...................................................................................................... 86
Removing the smart device tag from guest clients ...................................................................................................... 87
Changing the smart device type .................................................................................................................................... 88
Sensor Context-Sensitive Menu ......................................................................................................................................... 89
Method for Opening Sensor Menu ................................................................................................................................ 89
Items in the Sensor Context-Sensitive Menu ................................................................................................................ 90
Sensor Details Dialog ........................................................................................................................................................... 91
Fields in the Sensor Properties Tab ................................................................................................................................ 91

Table Of Contents
iii
Sensor Events Tab ............................................................................................................................................................ 95
Sensor Performance Tab .................................................................................................................................................. 96
Sensor Spectrum Tab ....................................................................................................................................................... 98
Sensor Troubleshoot Tab ................................................................................................................................................. 99
Filtering in Sensors ........................................................................................................................................................ 103
Network Details Dialog ..................................................................................................................................................... 104
APs tab............................................................................................................................................................................. 104
Changing the location of a network ................................................................................................................................ 106
Deleting a network from Networks Tab ......................................................................................................................... 107
Locating an AP/Client placed on the Floor Map ................................................................................................................ 108
Removing a Device from Quarantine .................................................................................................................................. 111
Moving an AP/Client to a Different Folder ........................................................................................................................ 111
Merging APs ........................................................................................................................................................................... 111
Splitting APs ........................................................................................................................................................................... 112
Devices Tab – User Saved Settings ...................................................................................................................................... 112
Locations Tab.............................................................................................................................................................................. 114
Locations: Panel for Creating Locations ............................................................................................................................. 114
Locations Screen ..................................................................................................................................................................... 114
Working with Location Folders and Location Nodes ....................................................................................................... 115
Adding a New Location .................................................................................................................................................... 115
Moving a Location ............................................................................................................................................................. 117
Renaming a Location ......................................................................................................................................................... 117
Deleting a Location ............................................................................................................................................................ 118
Working with Images ............................................................................................................................................................ 119
Attaching an Image ............................................................................................................................................................ 119
Zooming In/Zooming Out, Opacity Control, Resolution of an Image ........................................................................ 120
Placing Locations on a Location Folder with an Attached Image ............................................................................... 121
Detaching an Image ........................................................................................................................................................... 121
Importing a Planner file into a Location Node............................................................................................................... 122
Creating your Layout ............................................................................................................................................................ 122
Placing APs and Sensors on the Floor map and Viewing Details................................................................................ 123
Setting Coordinates and Deleting Devices from a Floor map ...................................................................................... 124
Resetting your Canvas....................................................................................................................................................... 124
Editing Floor Properties .................................................................................................................................................... 124
Tagging Locations .............................................................................................................................................................. 125
Adding Location Notes to a Floor Map ...................................................................................................................... 125
Editing Location Notes on a Floor Map ...................................................................................................................... 127
Hiding Location Notes shown on a Floor Map .......................................................................................................... 128
Displaying Hidden Location notes shown on a Floor Map ...................................................................................... 129
Deleting Location Notes from Floor Map ................................................................................................................... 130
Printable View ........................................................................................................................................................................ 131
Viewing RF Coverage Maps ................................................................................................................................................. 133
AP Coverage View ............................................................................................................................................................. 133
AP Channel View ............................................................................................................................................................... 134
AP Link Speed View .......................................................................................................................................................... 135
Sensor Coverage View ....................................................................................................................................................... 136
Calibrating RF Views ............................................................................................................................................................. 137
Reports Tab ................................................................................................................................................................................. 139
Reports: Panel for Generating Reports ................................................................................................................................ 139
Reports Screen ........................................................................................................................................................................ 139
Location Tree ...................................................................................................................................................................... 139
Report Panel ....................................................................................................................................................................... 139
List of Reports ................................................................................................................................................................. 140

Table Of Contents
iv
List of Sections ................................................................................................................................................................ 141
Managing Reports .................................................................................................................................................................. 142
Adding a Report ................................................................................................................................................................. 142
Editing a Report ................................................................................................................................................................. 146
Deleting a Report ............................................................................................................................................................... 146
Moving a Report ................................................................................................................................................................ 147
Working with Sections of a Report ...................................................................................................................................... 147
Adding a Section to a Report ............................................................................................................................................ 147
Editing a Section of a Report ............................................................................................................................................ 149
Deleting a Section of a Report .......................................................................................................................................... 149
Scheduling a Report ............................................................................................................................................................... 149
Setting a Report Schedule ................................................................................................................................................. 149
Editing a Report Schedule ................................................................................................................................................ 152
Canceling a Report Schedule ............................................................................................................................................ 152
Generating a Report Instantly .............................................................................................................................................. 152
Sample Report Generation .................................................................................................................................................... 154
Creating a Report ............................................................................................................................................................... 155
Adding a Section ................................................................................................................................................................ 155
Specifying a Section Query ............................................................................................................................................... 155
Saving the Section .............................................................................................................................................................. 155
Generating the Report ....................................................................................................................................................... 155
Forensics Tab .............................................................................................................................................................................. 159
Forensics: Panel for Threat Forensics .................................................................................................................................. 159
Forensics Screen ..................................................................................................................................................................... 159
Forensics: Location Tree .................................................................................................................................................... 159
Forensics: Time Filter, Threat List, and Pie charts ......................................................................................................... 159
Viewing Threats List .............................................................................................................................................................. 160
AP Based Threats ................................................................................................................................................................... 163
AP Based Threat – Association Tab ................................................................................................................................. 163
AP Based Threat – Prevention Tab .................................................................................................................................. 164
AP Based Threat – Admin Tab ......................................................................................................................................... 166
AP Based Threat – DoS ...................................................................................................................................................... 167
AP DoS Threat – Association tab ................................................................................................................................. 167
AP DoS Threat – Prevention tab .................................................................................................................................. 168
AP DoS Threat – Admin Tab ........................................................................................................................................ 168
Client Based Threats .............................................................................................................................................................. 169
Client Based Threat – Association Tab ............................................................................................................................ 170
Client Based Threat – Prevention Tab ............................................................................................................................. 171
Client Based Threat – Admin Tab .................................................................................................................................... 172
Client Based Threat – Ad hoc ........................................................................................................................................... 173
Client Ad hoc Threat – Association tab ....................................................................................................................... 174
Client Ad hoc Threat – Prevention tab ........................................................................................................................ 174
Client Ad hoc Threat – Admin Tab.............................................................................................................................. 175
Forensics Tab – User Saved Settings .................................................................................................................................... 176
Administration Tab ................................................................................................................................................................... 177
Introduction ............................................................................................................................................................................ 177
Administration Screen ........................................................................................................................................................... 177
Global Policies ........................................................................................................................................................................ 178
Event Settings ..................................................................................................................................................................... 178
Vulnerable SSID ............................................................................................................................................................. 178
Regeneration ....................................................................................................................................................................... 179
Hotspot SSIDs ..................................................................................................................................................................... 180
Device Settings ................................................................................................................................................................... 181

Table Of Contents
v
Smart Device Type ......................................................................................................................................................... 181
Import Devices ............................................................................................................................................................... 183
Thresholds ....................................................................................................................................................................... 186
Discovery ........................................................................................................................................................................ 187
Banned AP List ............................................................................................................................................................... 188
Banned Client List .......................................................................................................................................................... 189
User Management .............................................................................................................................................................. 190
Users ................................................................................................................................................................................ 190
LDAP Server Configuration ......................................................................................................................................... 197
RADIUS Server Configuration ..................................................................................................................................... 199
User Authentication ........................................................................................................................................................... 200
Password Policy ............................................................................................................................................................. 204
Account locking.............................................................................................................................................................. 204
User Preferences ............................................................................................................................................................. 205
Location Settings ................................................................................................................................................................ 206
Auto Location Tagging .................................................................................................................................................. 206
Location Tracking .......................................................................................................................................................... 207
Live RF Views ................................................................................................................................................................. 208
RF Propagation ............................................................................................................................................................... 209
System Settings ................................................................................................................................................................... 211
Encoding ......................................................................................................................................................................... 211
Reports............................................................................................................................................................................. 212
Auto-deletion .................................................................................................................................................................. 213
Vendors ........................................................................................................................................................................... 215
SMTP ............................................................................................................................................................................... 216
License ............................................................................................................................................................................. 217
Server ............................................................................................................................................................................... 218
Manage Logs ................................................................................................................................................................... 219
View logs ......................................................................................................................................................................... 220
Upgrade ........................................................................................................................................................................... 221
High Availability............................................................................................................................................................ 225
Login Configuration ...................................................................................................................................................... 227
Wizard ............................................................................................................................................................................. 229
SpectraGuard Manager Configuration ........................................................................................................................ 230
WLAN Integration ............................................................................................................................................................. 231
Aruba Mobility Controllers .......................................................................................................................................... 231
Cisco WLC ...................................................................................................................................................................... 234
Integration with Cisco WLSE ....................................................................................................................................... 238
HiveManager .................................................................................................................................................................. 240
HP MSM Controller ....................................................................................................................................................... 241
Meru................................................................................................................................................................................. 244
ESM Integration ................................................................................................................................................................. 245
ArcSight ESM Server ..................................................................................................................................................... 245
SNMP ............................................................................................................................................................................... 247
Syslog ............................................................................................................................................................................... 250
Integrating with Syslog servers .................................................................................................................................... 250
OPSEC ............................................................................................................................................................................. 252
SpectraGuard SAFE ........................................................................................................................................................... 253
Group Management ....................................................................................................................................................... 253
Adding a SAFE Group Manually ................................................................................................................................. 254
Attaching SAFE Policy to existing SAFE Group ........................................................................................................ 255
Editing a SAFE Group ................................................................................................................................................... 255
Viewing a SAFE Group Policy ..................................................................................................................................... 256

Table Of Contents
vi
Deleting a SAFE Group ................................................................................................................................................. 258
Settings ............................................................................................................................................................................ 258
Manage Clients ............................................................................................................................................................... 259
Local Policies .......................................................................................................................................................................... 263
Local Policies ...................................................................................................................................................................... 263
About Local Policies ...................................................................................................................................................... 263
Policy and Policy Groups .............................................................................................................................................. 264
Customizing v/s Inheriting Policies ............................................................................................................................. 264
Template Based Policies ................................................................................................................................................ 266
Template Availability at Sub-locations ....................................................................................................................... 266
Copying and Pasting of Local Policies ........................................................................................................................ 267
Copying and Pasting a Local Policy Group ................................................................................................................ 268
Wireless Policies-Authorized WLAN Setup ................................................................................................................... 269
Authorized WLAN Setup ............................................................................................................................................. 269
Operating Policies .............................................................................................................................................................. 276
AP auto-classification .................................................................................................................................................... 276
Client auto-classification ............................................................................................................................................... 277
Intrusion Prevention Policy .......................................................................................................................................... 279
Event Settings ..................................................................................................................................................................... 282
Configuration ................................................................................................................................................................. 282
Email Notification .......................................................................................................................................................... 285
Device Settings ................................................................................................................................................................... 286
SSID Profile ..................................................................................................................................................................... 287
Device Template ............................................................................................................................................................. 302
Location Properties ............................................................................................................................................................ 321
Event Activation ............................................................................................................................................................. 321
Intrusion Prevention Activation .................................................................................................................................. 321
Device List Locking ....................................................................................................................................................... 322
Appendix A1:SNMP Interface .................................................................................................................................................. 324
Appendix A2:Syslog Interface .................................................................................................................................................. 325
Glossary of Terms and Icons .................................................................................................................................................... 327
Acronyms ................................................................................................................................................................................ 327
Glossary of Terms .................................................................................................................................................................. 328
Glossary of Icons .................................................................................................................................................................... 330
Navigation Bar Icons ......................................................................................................................................................... 330
General Icons ...................................................................................................................................................................... 331
Dashboard Icons ................................................................................................................................................................. 331
Events Icons ........................................................................................................................................................................ 332
Devices Icons ...................................................................................................................................................................... 333
Locations Icons ................................................................................................................................................................... 337
Reports Icons ...................................................................................................................................................................... 338
Administration Icons ......................................................................................................................................................... 338

Getting Started
SpectraGuard® Enterprise User Guide
1
Getting Started
Before You Begin
Thank you for purchasing SpectraGuard® Enterprise (referred to as ‘system’ hereafter in this document) from
AirTight® Networks, Inc. The system assists you to effectively monitor, troubleshoot, administer, and protect your
wireless network.
Overview and Organization
This user guide gives an overview of the User Interface (referred to as ‘Console’ hereafter in this document) and
helps you familiarize with the following top-level tabs. This guide contains the following chapters.
Navigation Bar and Global Functions: Provides an overview of the various tabs and buttons on
the Console.
Dashboard Tab: Provides wireless vulnerability assessment at-a-glance and displays key findings
about your wireless deployment’s security.
Events Tab: Lists various events generated by the system for your deployment.
Devices Tab: Provides information on wireless devices such as Access Points (APs), Clients,
Sensors, and Network Detectors (NDs) visible to the system.
Locations Tab: Enables you to organize your office locations into a hierarchical tree and displays
live RF maps for each location.
Reports Tab: Enables you to view predefined reports and create customized reports.
Forensic Tab: Enables you to drill down into the details about detected threats for further analysis
of the causes and actions taken.
Administration Tab: Enables you to view and set various policies for your deployment.
License Based Features
Note: If the following licenses are not applied, the user will not be able to view the corresponding features on the Console.
The following features require separate licenses:
1. SpectraGuard SAFE
2. Forensics and Performance Monitoring (both covered under the same license)
3. Wireless Intrusion Detection System (WIDS)
4. Sensor / AP Combo
The number of sensors that can be converted to AP's is based on your license. To view the exact number, go to
Administration->Global->System Settings->Server on your server.
How to get more information
To receive important news on product updates, please visit our website at www.airtightnetworks.com
Contact Information
AirTight® Networks, Inc.
339 N, Bernardo Avenue, Suite #200
Mountain View, CA 94043
Tel: (650) 961-1111
Fax: (650) 963-3388
For technical support, send an email to support@airtightnetworks.com.
Navigation Bar and Global Functions
SpectraGuard® Enterprise User Guide
2
Navigation Bar and Global Functions
A Quick Tour of the Console
The Console consists of the following top-level tabs and additional buttons. This section explains how to use the
Console navigation bar and global functions.
Navigation Bar
The Console navigation bar includes the following tabs: Dashboard, Events, Devices, Locations, Reports, Forensics,
and Administration.
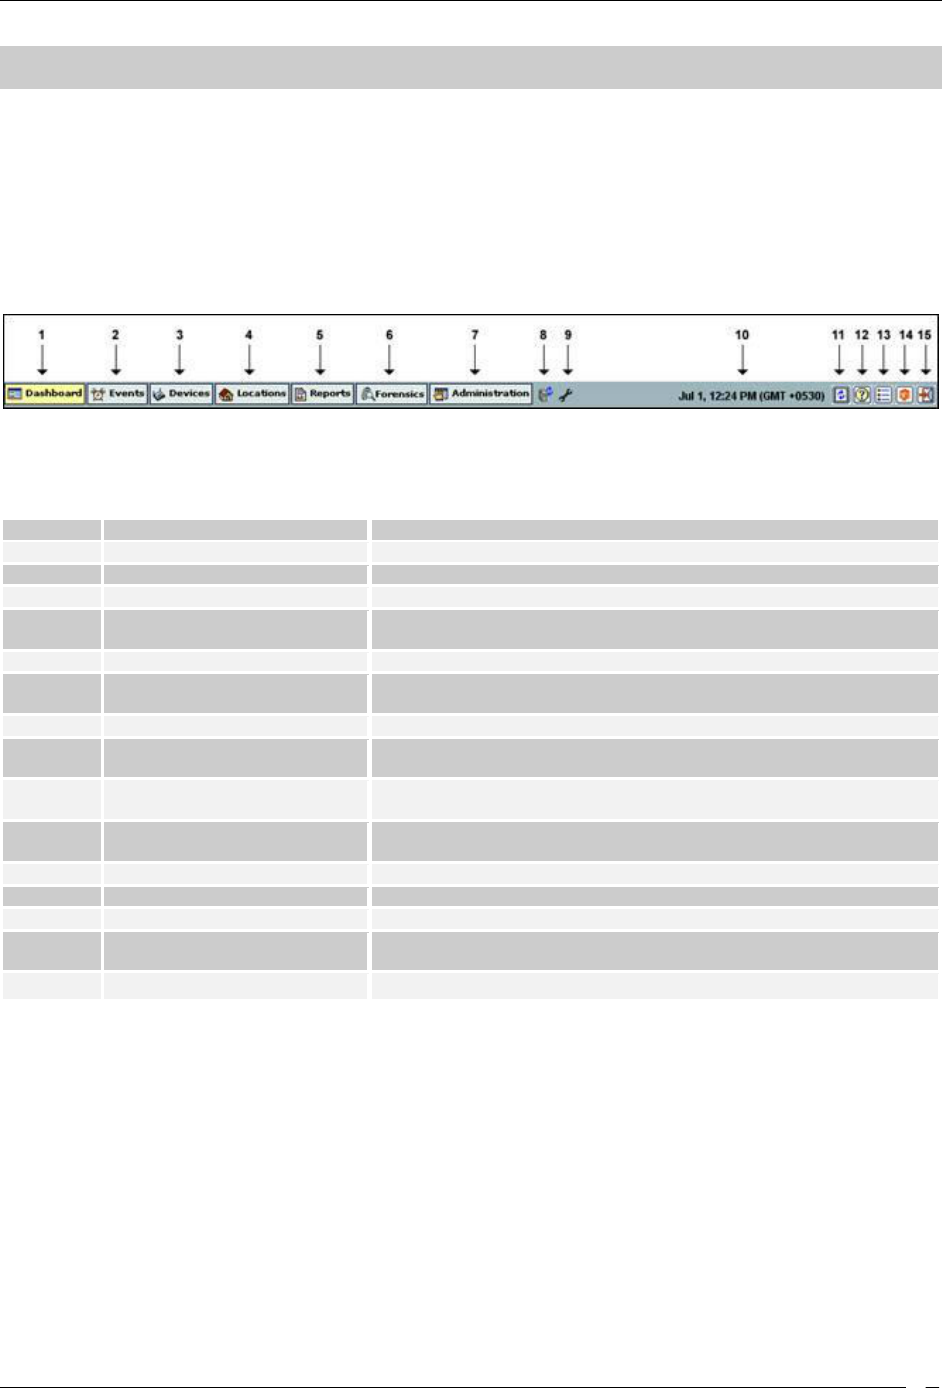
Navigation Bar
The following table describes the items in the navigation bar.
Items in the Navigation Bar
Item No.
Item
Description
1
Dashboard
Provides a summary view of the WLAN environment
2
Events
Lists various Events in the deployed WLAN environment
3
Devices
Provides information on the wireless devices visible to the system
4
Locations
Enables you to organize the network into a list of locations and
displays live RF maps for each location node
5
Reports
Enables you to generate various reports based on 802.11 data
6
Forensics
Enables you to drill down into the details about detected threats for
further analysis of the causes and actions taken
7
Administration
Enables you to perform various administrative activities
8
Upgrade Available
When displayed, alerts you that a newer version of the system is
available
9
Troubleshooting in Progress
When displayed, alerts you that a troubleshooting session is in
progress
10
Current Date and Time
Shows the current date and time in the format: Month Date, Hour:
Minute AM/PM (Time Zone)
11
Refresh
Refreshes all the panels globally
12
Help
Shows the Help file for the system
13
Legend
Describes the icons used in the system
14
About SpectraGuard Enterprise
Shows product version, license information, details of the patents,
and provides access to the license agreement
15
Log Off
Logs out the current user and opens the Login screen
Global Functions
The Console contains several common functions that apply to the Dashboard, Events, Devices, Locations, Reports,
Forensics, and Administration tabs.
General
The following functions apply to all screens in the system. On any screen, you can perform the following:
Resize panes horizontally.
Scroll only if there is data that overflows the screen.
Edit some user-defined fields.
Press the Tab or Enter key to save changes in dialogs.
Trees
The following functions apply to all trees in the system. In any tree, you can perform the following:

Navigation Bar and Global Functions
SpectraGuard® Enterprise User Guide
3
Click to expand the sub nodes.
Click to collapse the sub nodes.
Double-click the node text to either expand or collapse sub nodes.
Dialogs
The following functions apply to all dialogs in the system. Depending on options available in a particular dialog, you
can:
Click OK to save all the changes and close the dialog.
Click Cancel to discard the changes and close the dialog.
Click Apply to save all changes and keep the dialog open.
Click Delete to remove a selected item.
Click Close to close the dialog.
Click Restore Defaults to reset to factory defaults.
Click to view more information. Some screens have more than one such icon. Click each of these icons in
the relevant sections to view information depicted graphically.
Messages
The following functions apply to all message boxes in the system.
The system divides messages into the following classes:
1. Confirmation: Signals an application level event that needs immediate user input.
2. Error: Signals an application level event, indicating failure of user performed action.
3. Warning: Signals an application level event that needs attention.
4. Information: Signals an informational event that may not need immediate action.
For all informational messages, click the button to close the message.
For all messages that require a Yes or No, you can:
Click OK for Yes.
Click Cancel for No.

Behavior of SpectraGuard Enterprise Servers controlled through SpectraGuard Manager
SpectraGuard® Enterprise User Guide
4
Behavior of SpectraGuard Enterprise Servers managed through
SpectraGuard Manager
Introduction
The behavior of the SpectraGuard Enterprise servers that are managed through SpectraGuard Manager, is slightly
different from the SpectraGuard Enterprise servers that are managed individually. Version 6.6 onwards,
SpectraGuard Managed Network Console (SpectraGuard -MNC) has been renamed as SpectraGuard Manager.
SpectraGuard Manager facilitates the centralized management of multiple SpectraGuard Enterprise servers, that
could be placed at different locations of the enterprise.
If you are not using SpectraGuard Manager to manage the SpectraGuard Enterprise servers in your enterprise, you
can ignore this chapter.
Inheriting Policies on the Root location of SpectraGuard Enterprise
Server
When the SpectraGuard Enterprise servers in your enterprise are managed through SpectraGuard
Manager, SpectraGuard Manager pushes the local policies on to the Root location of each of the SpectraGuard
Enterprise servers. The locations under Root location of the SpectraGuard Enterprise server are not affected in any
way.
When a SpectraGuard Enterprise server in the enterprise has been added to a group in SpectraGuard Manager, the
SpectraGuard Manager pushes the local policies defined for that group, to the Root location of the SpectraGuard
Enterprise server. Such policies are said to be inherited by the SpectraGuard Enterprise server from the SpectraGuard
Manager. The inherited policies cannot be edited or deleted from the SpectraGuard Enterprise Console. Such policies
can only be viewed and applied through the SpectraGuard Enterprise Console.
Effect on inherited policies and templates on disassociation from
SpectraGuard Manager
The process of pushing the local policies to a SpectraGuard Enterprise server through SpectraGuard Manager can
happen multiple times. In such cases, the most recently pushed policies would be implemented by or applied on the
SpectraGuard Enterprise servers. The previously inherited local policies that are not in use, would be retained by the
SpectraGuard Enterprise server.
If a SpectraGuard Enterprise server disassociates itself from the SpectraGuard Manager managing it, the inherited
policies and templates that are currently in use, are retained and used by the SpectraGuard Enterprise server. They
can now be edited and deleted from the SpectraGuard Enterprise Console at the Root location, as they are
independent of SpectraGuard Manager. This operation can be performed only by a superuser.
The inherited policies and templates that are no longer in use, will automatically get deleted from SpectraGuard
Enterprise.
Dashboard Tab
SpectraGuard® Enterprise User Guide
5
Dashboard Tab
Introduction: Panel Displaying WLAN Snapshot
The Dashboard screen enables you to view a snapshot of your WLAN security status and performance. The Security
snapshot is provided in terms of overall security status, security events and charts, quarantine activity status and
category-wise device summary. The Performance snapshot presents a summary of performance events based on
severity, performance event charts, and latest trends in factors contributing to performance issues.
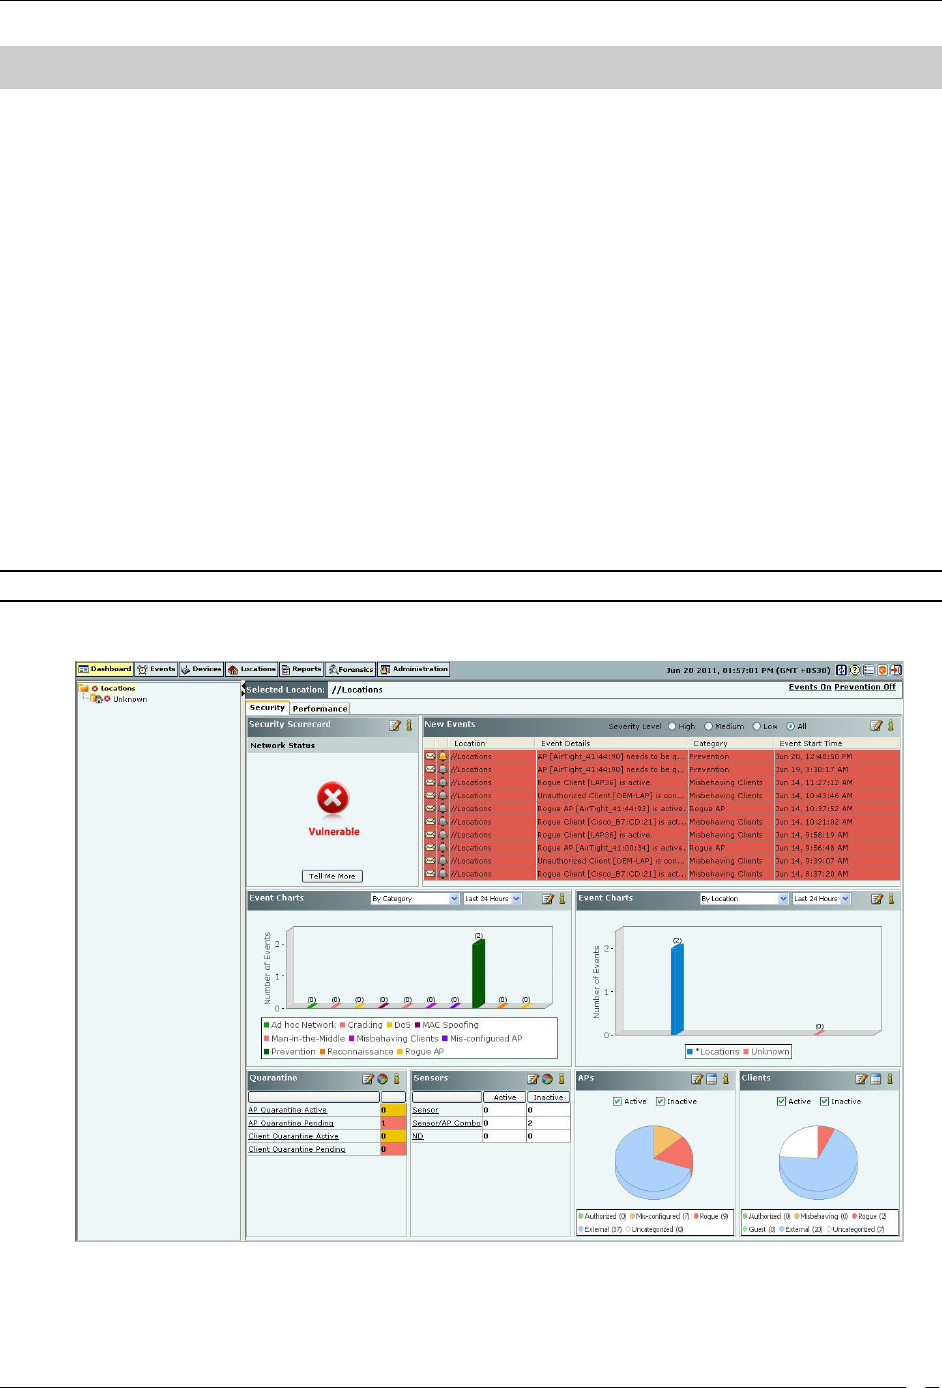
Dashboard Screen
The Dashboard appears by default when you log into the system. You can return to the Dashboard from other
screens by clicking the Dashboard tab.
The Dashboard screen includes two panes:
On the left, the Location tree is seen.
On the right,
Selected Location shows the path for the location selected in the Location tree.
Events On/Off and Prevention On/Off indicate whether Event Generation and Intrusion Prevention have
been turned ON or OFF at a selected location. Clicking Events On/Off opens the Administration->Local-
>Location Properties->Event Activation screen. Clicking Prevention On/Off opens the Administration-
>Local->Location Properties->Intrusion Prevention Activation screen.
Note: Prevention On/Off is not visible if WIDS license is applied.
Security and Performance Dashboard depict a macro view and statistical information of your WLAN
security and performance respectively.
Security Dashboard
Dashboard: Location Tree
Dashboard Tab
SpectraGuard® Enterprise User Guide
6
The Location tree shows the complete list of locations created for your WLAN in the system. Vulnerability status icon
before each location name shows the vulnerabilty status of that location. To view the Dashboard for a particular
location, select the appropriate node in the Location tree.
Security Dashboard: Sections
Security Dashboard screen appears by default when you log into the system. Alternatively, click the Security tab on
the Dashboard screen to view the Security Dashboard. The Security Dashboard consists of the following Information
Widgets.
Security Scorecard
New Events
Security Event Charts
Quarantine
Sensors
APs
Clients
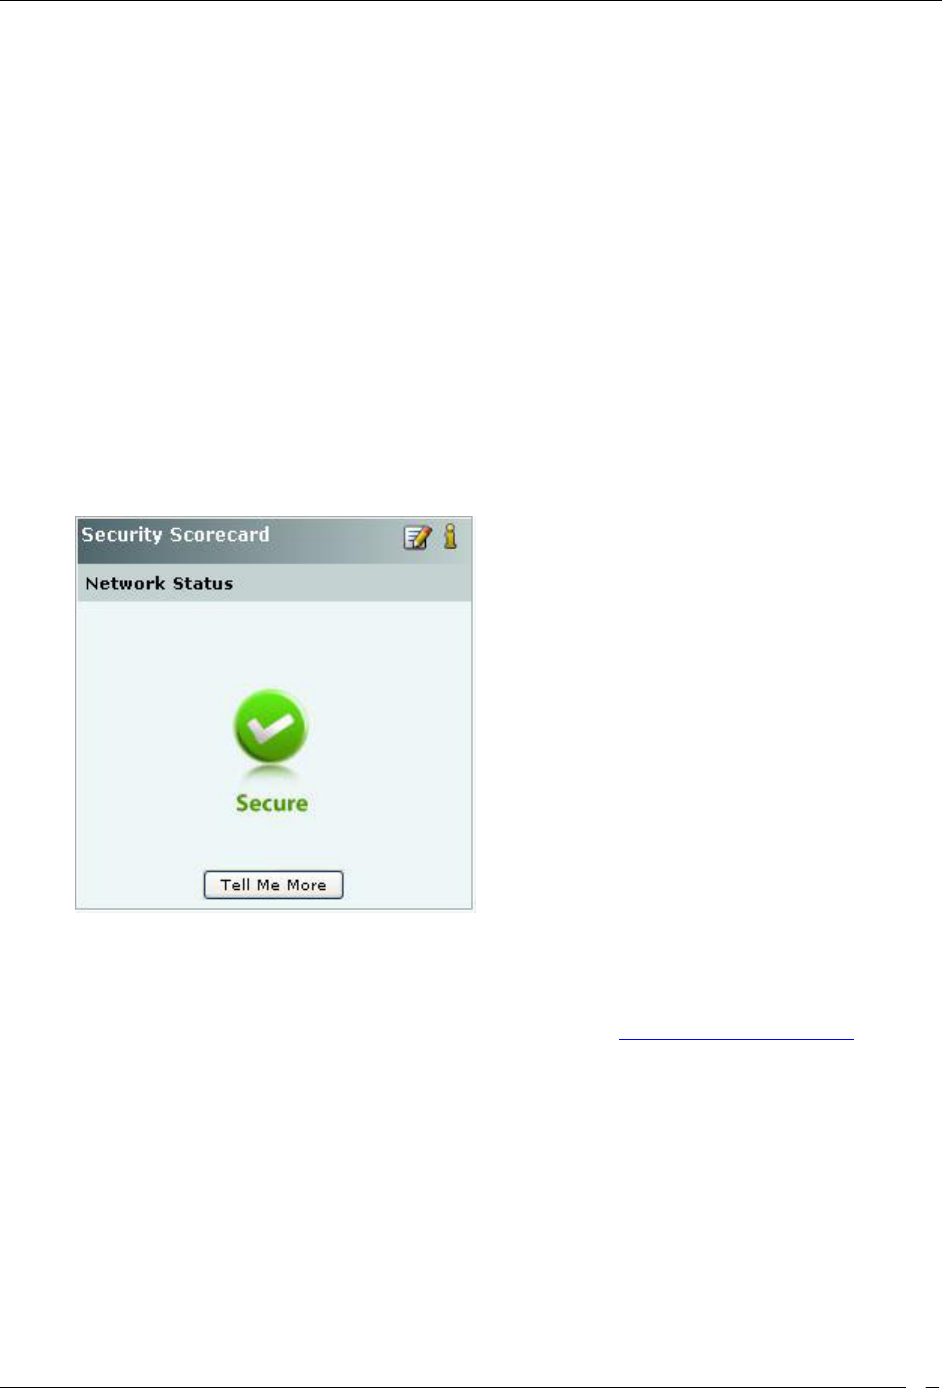
Security Dashboard – Security Scorecard
The Security Scorecard shows the overall security status of the WLAN at the selected location.
Security Dashboard – Security Scorecard Section
Your WLAN can be in either of the following states:
Secure: The selected location is treated as Secure if
No security events are raised at that location and its child locations, or
The Vulnerability checkbox has the following purpose (see Event Settings, Configuration). If the
checkbox is checked, the event type in question will contribute to the security vulnerability check.
To remove a particular instance of an event from the scorecard, the administrator can click
<Remove from Scorecard> and uncheck the Participate from Vulnerability checkbox. Note that
only that instance of the event will stop contributing to the scorecard. All other event instances of
the said event type will continue to contribute to the vulnerability status.
Vulnerable: The selected location is treated as vulnerable if any events, which contribute to vulnerability
status, are raised.
You can customize the list of events that cause the network to be vulnerable by changing the types of events that
contribute to that status. Read/Unread/Acknowledge status of the events do not contribute to the Vulnerability status.
Configuring Security Scorecard View
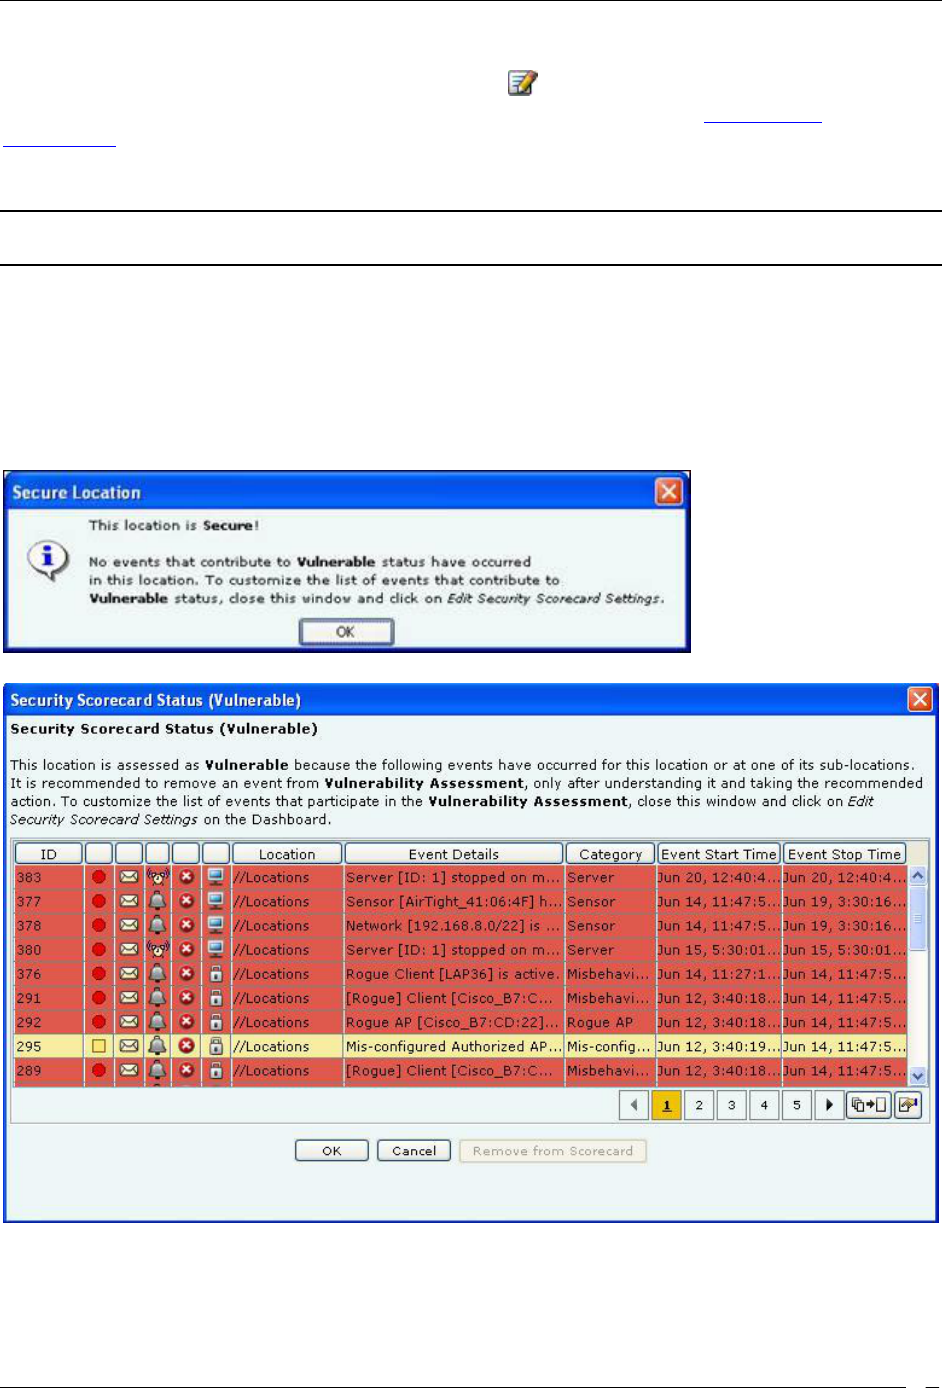
Dashboard Tab
SpectraGuard® Enterprise User Guide
7
To specify the types of events that are considered when determining the Security Scorecard status at a particular
location, select a location in the Location tree and then click the icon to open Administration->Local->Local
Policies->Event Settings->Configuration screen with Security tab selected. Refer to the Event Settings,
Configuration section in the Administration tab for more details. Check/Uncheck the Vulnerability field of the
Security Event Types that you want to be considered/not considered for computation of the vulnerability status of a
location.
Note: Configuring Security Scorecard, New Events, Event Charts, Quarantine, Sensors, APs, and Clients sections are
not visible if WIDS license is applied.
Network Status: Tell Me More
To view more information about the actual events that contributed to the Vulnerable or Secure status of a particular
location, select a location in the Location tree and then click <Tell Me More> in the Security Scorecard. Based on the
security status of the location, a dialog describing the reason for the security status appears as shown below. Secure
Location Dialog appears when a location is Secure, whereas Vulnerable Location Dialog appears when the security
state is Vulnerable.
Secure Location Dialog
Vulnerable Location Dialog
If the location is vulnerable, the Vulnerable Location Dialog shows the actual events that occurred in your network
which contributed to the Vulnerable status of the location. It is possible that you have taken action on the devices
after an event displayed in this list occurred, to address the security vulnerability. In that case, you can select such an
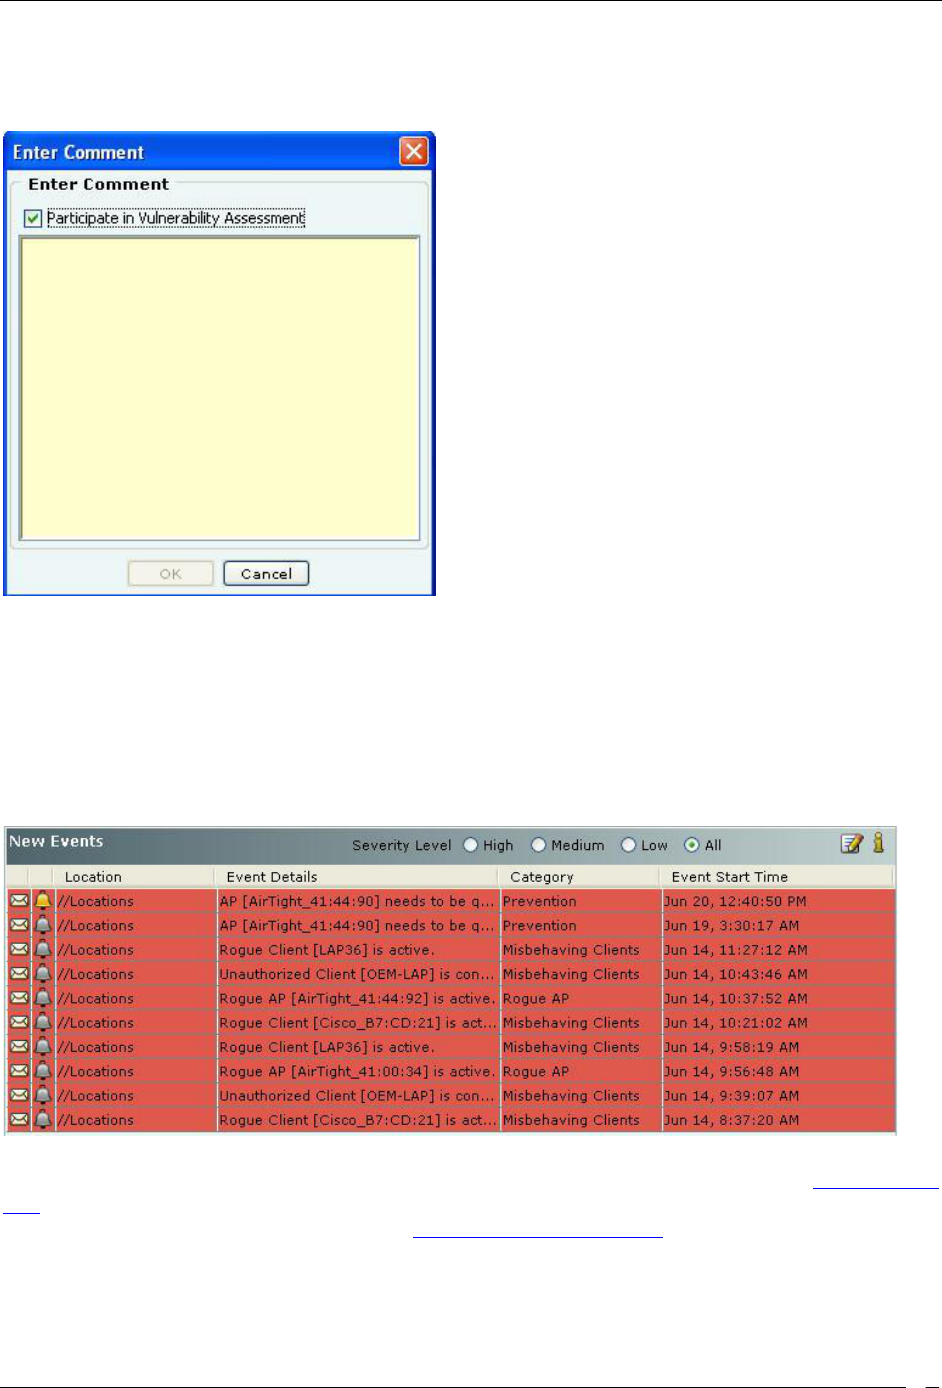
Dashboard Tab
SpectraGuard® Enterprise User Guide
8
event from the Vulnerable Location dialog and click <Remove from Scorecard> to remove it from the consideration
for vulnerability status. The system shows the Remove from Scoreboard dialog which allows you take the removal
action and add a comment to mark that action before removing it from set of events that contributed to vulnerability.
Remove from Scoreboard Dialog
Uncheck the Participate in Vulnerability Assessment check box and enter the text to acknowledge the event, so that
the system does not consider this event occurrence in the future while computing the Vulnerable status.
Security Dashboard – New Events
New Events section lists the ten recent Security events in descending order of start time of the event. This list
includes instantaneous as well as live/expired security events. The events are listed based on the Severity Level
selected: High, Medium, Low, or All.
Security Dashboard – New Events Section
You can select an event row from this list and double-click to see the event details screen. Refer to the Viewing Events
Lists section in the Events tab for more details. Select an event row and right click to open a context sensitive menu of
actions that can be taken on that event. Refer to the Events Context-Sensitive Menu section in the Events tab for more
details.
Configuring New Events View
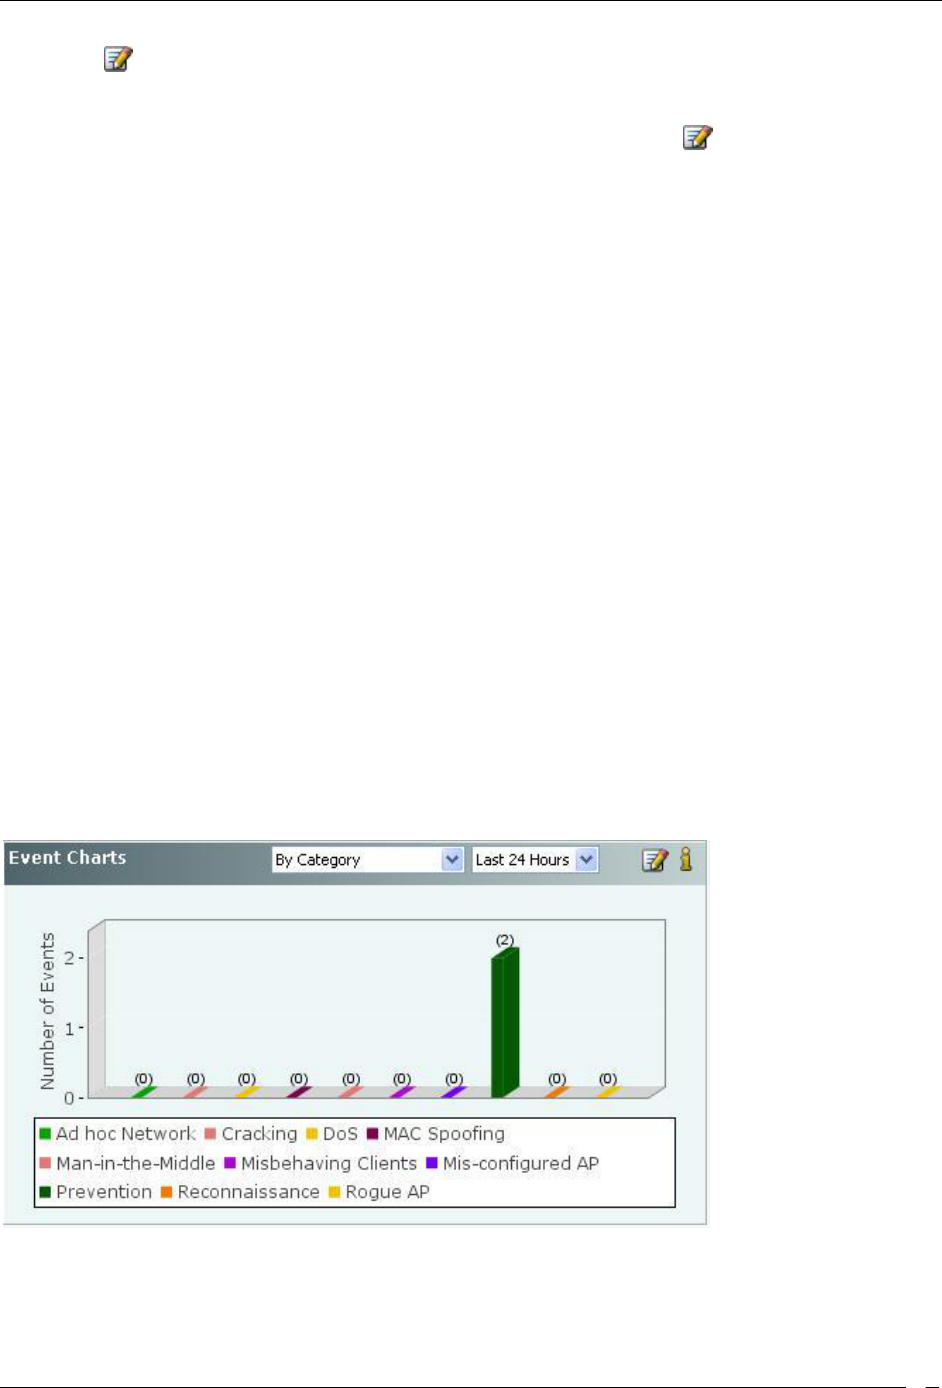
Dashboard Tab
SpectraGuard® Enterprise User Guide
9
Clicking the icon in the New Events section takes you to Administration->Local->Local Policies->Event
Settings->Configuration screen with Security tab selected. This allows you to change the settings of Event types to
control which type security events are displayed at the current location. If you want to change an event configuration
at some other location, then select that location in the Location tree and then click the icon.
Security Dashboard – Event Charts
The system shows two Event Charts on the Security Dashboard. The event drop-down list allows you to focus on
security events (by location or category), or on APs/Wi-Fi Clients having security events. The time period drop-down
list allows you to focus on the last 48 hours or a choice of interval in the last 24 hours. The availability of two charts
on the Security Dashboard improves your ability to efficiently notice and handle security issues, if any.
The details of the charts displayed based on the drop-down list are as follows:
1. The drop-down list of events or devices to show on the chart contains the following:
By Location: Displays a bar chart with a count of Security events for the selected location and its
immediate child locations (The selected location is marked with * in the legend of the chart). In
order to jump to the security events at one of these locations, click on the bar for that location. You
will be taken to the Events ->Security ->All screen for that location and that location will be selected
in the location tree panel as well.
By Category: Displays a bar chart with a count of Security events for each security event category
at the current location. In order to jump to the security events of a specific category, click on the bar
for that category. You will be taken to the Events->Security->Selected category screen.
Top 5 APs by Events: Displays a bar chart for the top 5 APs based on the number of Security
events. On clicking on any bar, the AP Details dialog for the corresponding AP device opens with
the Events tab selected. This allows you to view all the events related to that AP and take
appropriate actions.
Top 5 Clients by Events: Displays a bar chart for the top 5 Clients based on the number of Security
events. On clicking any bar, the Client Details dialog for the corresponding Client device opens
with the Events tab selected. This allows you to view all the events related to that Client device and
take appropriate actions.
2. The drop-down list for time period allows you to control the chart display based on security events that
occurred in the chosen period. The time period choices available are: Last 4 Hours, Last 12 Hours, Last 24
Hours, or Last 48 Hours.
Security Dashboard – Event Charts
Configuring Security Dashboard – Event Charts View
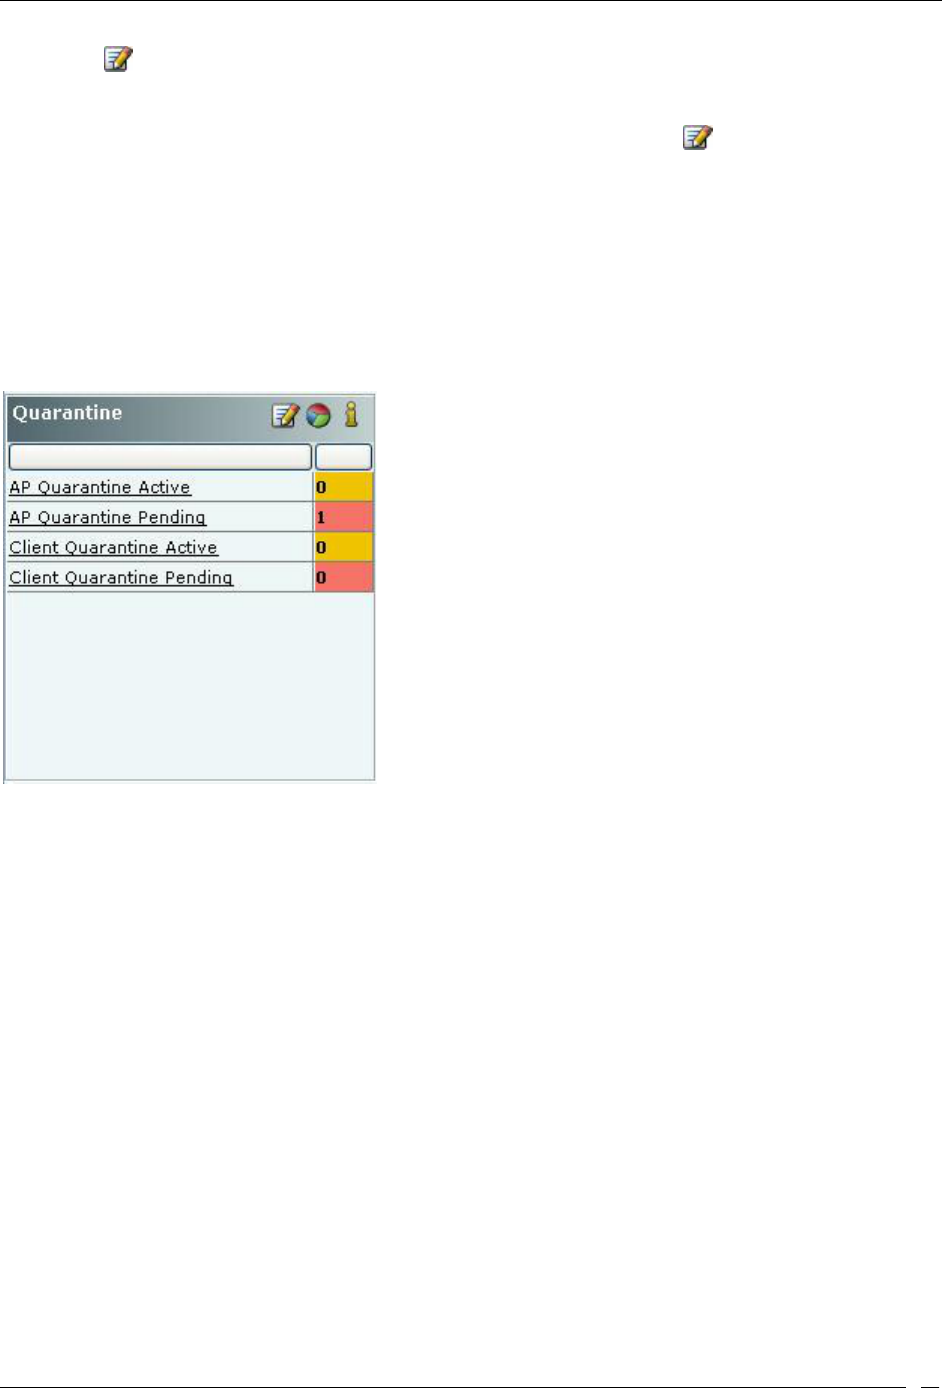
Dashboard Tab
SpectraGuard® Enterprise User Guide
10
Clicking the icon in the Event Charts section takes you to Administration->Local->Local Policies->Event
Settings->Configuration screen with the Security tab selected. This allows you to change the settings of Event types
to control which type security events are displayed at the current location. If you want to change event configuration
at some other location, then select that location in the Location tree and then click the icon.
Security Dashboard – Quarantine
Based on the Intrusion Prevention Policy, the system can proactively block an AP or a Client and automatically
protect the network against various wireless security threats.
The Quarantine section of the Security Dashboard provides a summary of quarantine activities being carried out by
the system. The Quarantine section shows a count of APs (for Merged APs the count of BSSIDs in quarantine are
shown) and Clients that are being blocked, (that is, Quarantined), as well as a count of APs (for Merged APs the
count of BSSIDs in quarantine are shown) and Clients that are identified to be quarantined, but the Quarantine action
has not yet started ( that is, Quarantine Pending).
Security Dashboard – Quarantine Section – Table View
Viewing Quarantined Devices – Table View
To view a list of APs and Clients with status Quarantine Active or Quarantine Pending, click the following
hyperlinked text in the Quarantine section:
AP Quarantine Active
AP Quarantine Pending
Client Quarantine Active
Client Quarantine Pending
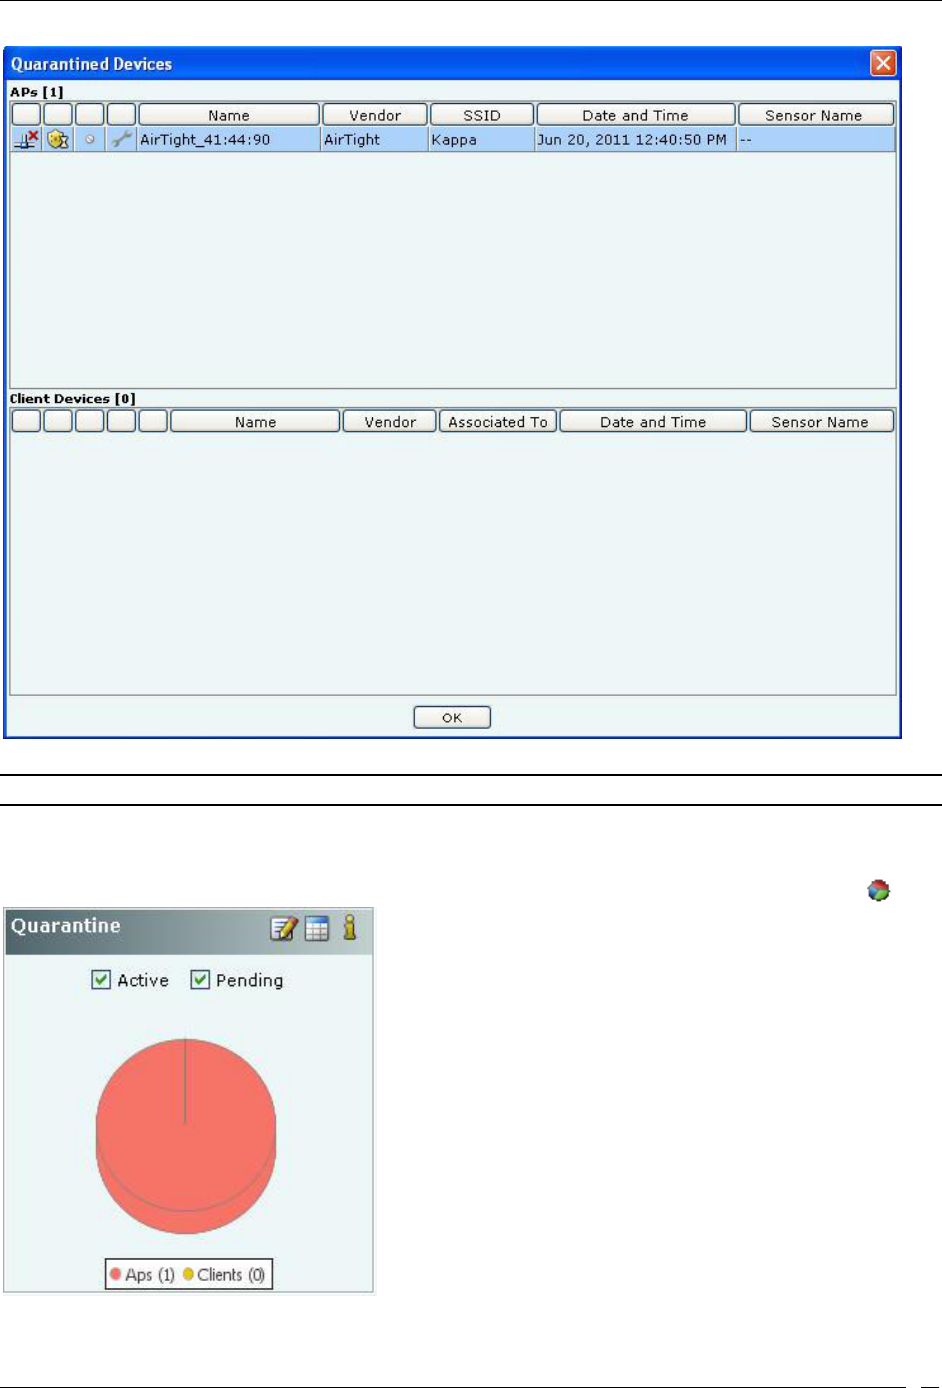
Dashboard Tab
SpectraGuard® Enterprise User Guide
11
List of Quarantined APs and Clients
Note: Viewing Quarantined Devices – Table/Pie Chart View section is not visible if WIDS license is applied.
Viewing Quarantined Devices – Pie Chart View
To view a list of APs and Clients with status Quarantined or Quarantine Pending in pie chart form, click the icon.
Security Dashboard – Quarantine Section – Pie Chart View
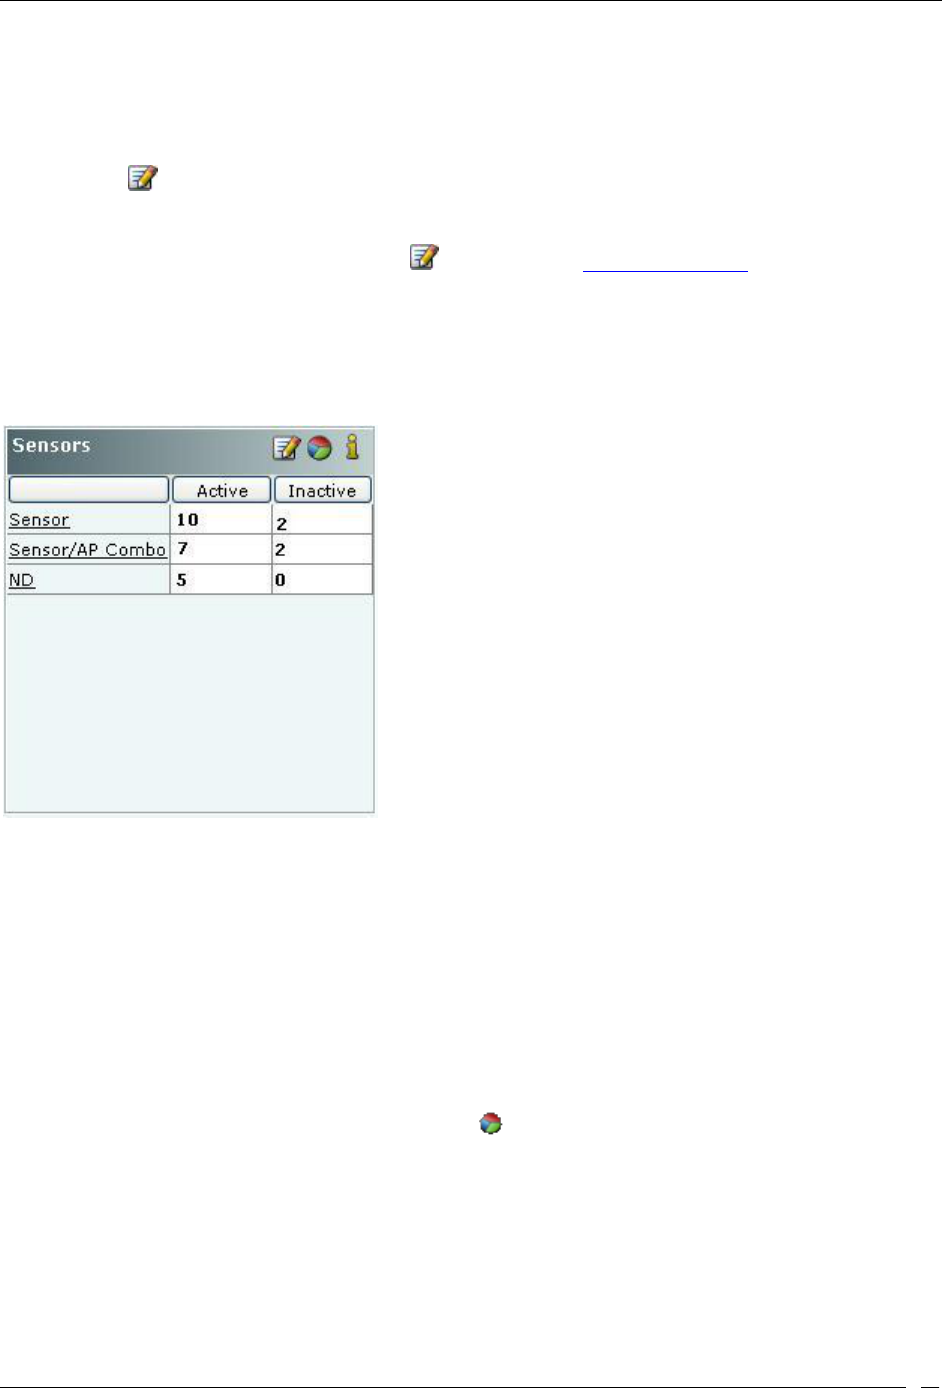
Dashboard Tab
SpectraGuard® Enterprise User Guide
12
Select Active, Pending, or both the checkboxes to control the pie chart contents. Click the area in the pie chart or on
the names that are hyperlinked (appearing in the legends below the pie chart) to see all the quarantine sessions.
Configuring Intrusion Prevention Policy
Clicking on the in the Quarantine section of Security Dashboard opens the Administration->Local->Operating
Policies->Intrusion Prevention screen. This allows you to edit the Intrusion Prevention Policy and the Intrusion
Prevention Level for the selected location. If you want to change this policy for a different location, you can select
that location in the Location tree and then click the icon. Refer to the Intrusion Prevention section in the
Administration tab for more details.
Security Dashboard – Sensors
The Sensors section displays a count of Active and Inactive Sensors, Sensor-AP combo devices(Sensor/AP), and
Network Detectors (ND).
Security Dashboard – Sensors Section – Table View
Viewing Sensors – Table View
To view the details of the Sensor, Sensor/AP combo, or ND devices, click the following hyperlinked text in the
Sensors section:
Sensor
Sensor/AP
ND
Viewing Sensors – Pie Chart View
To view the Sensors information in pie chart form, click the icon.
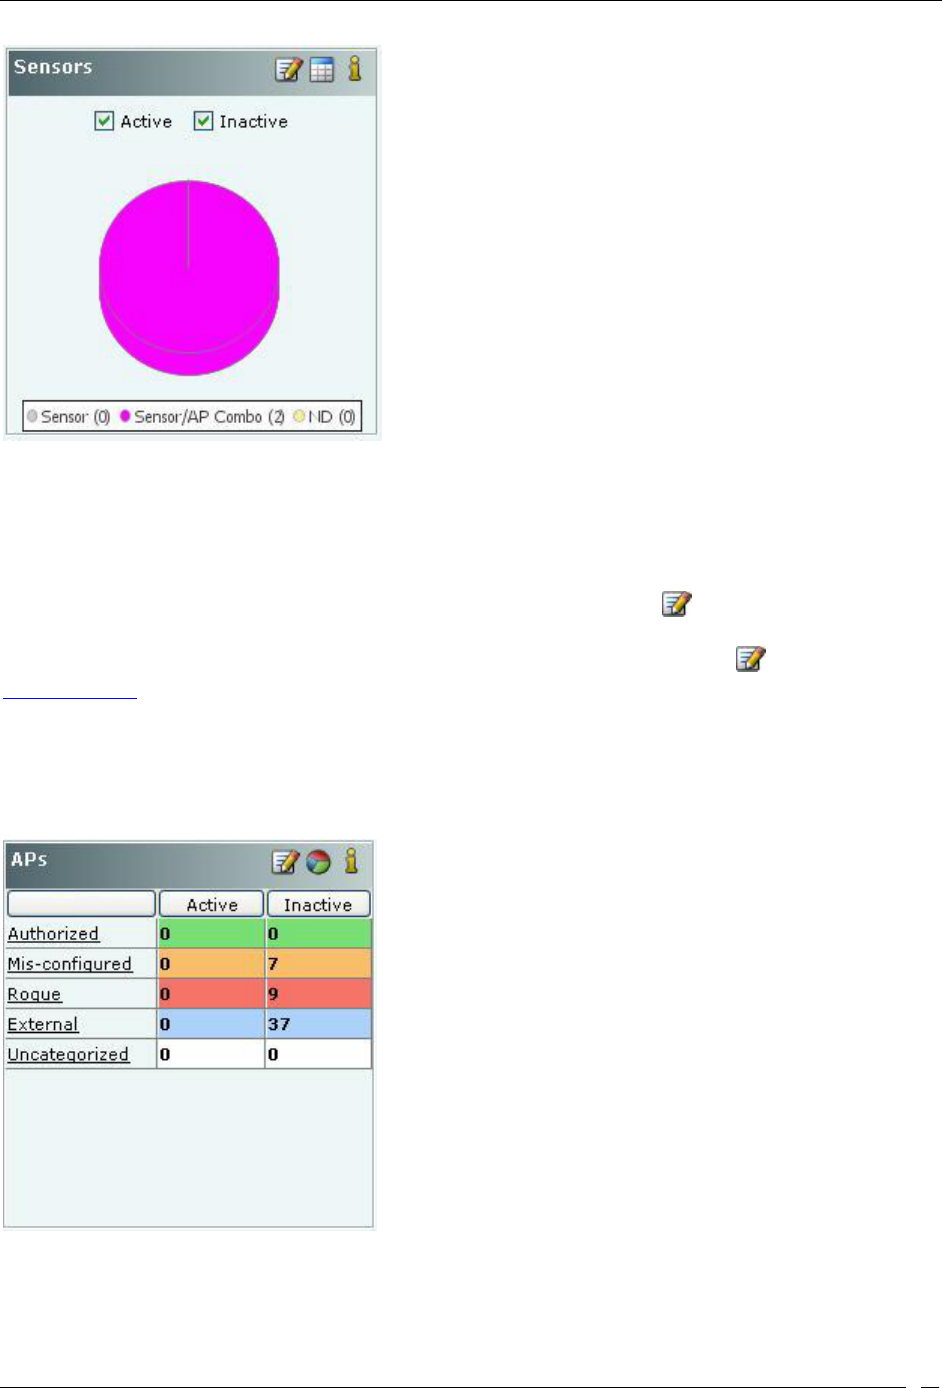
Dashboard Tab
SpectraGuard® Enterprise User Guide
13
Security Dashboard – Sensors Section – Pie Chart View
Select Active, Inactive, or both the checkboxes to view the active/inactive Sensors. Clicking on any area in the pie
chart takes you to the DevicesSensors screen.
Editing Sensor Configuration
To access device Configuration editing functionality from the Dashboard, click the icon to open the
Administration->Local->Local Policies->Device Template screen at the selected location. To edit the device
configuration for another location, select that location in the Location tree and then click the icon. Refer to the
Device Template section in the Administration tab for more details.
Security Dashboard – APs
The APs section enables you to view lists of all the Active and Inactive APs that belong to a certain category
(Authorized, Mis-configured, Rogue, External). APs that do not belong to any category based on their wired status
and AP classification policy are treated as Uncategorized.
Security Dashboard – APs Section – Table View
Entries are color coded according to their classification:
Authorized is denoted by green color
Mis-configured is denoted by orange color
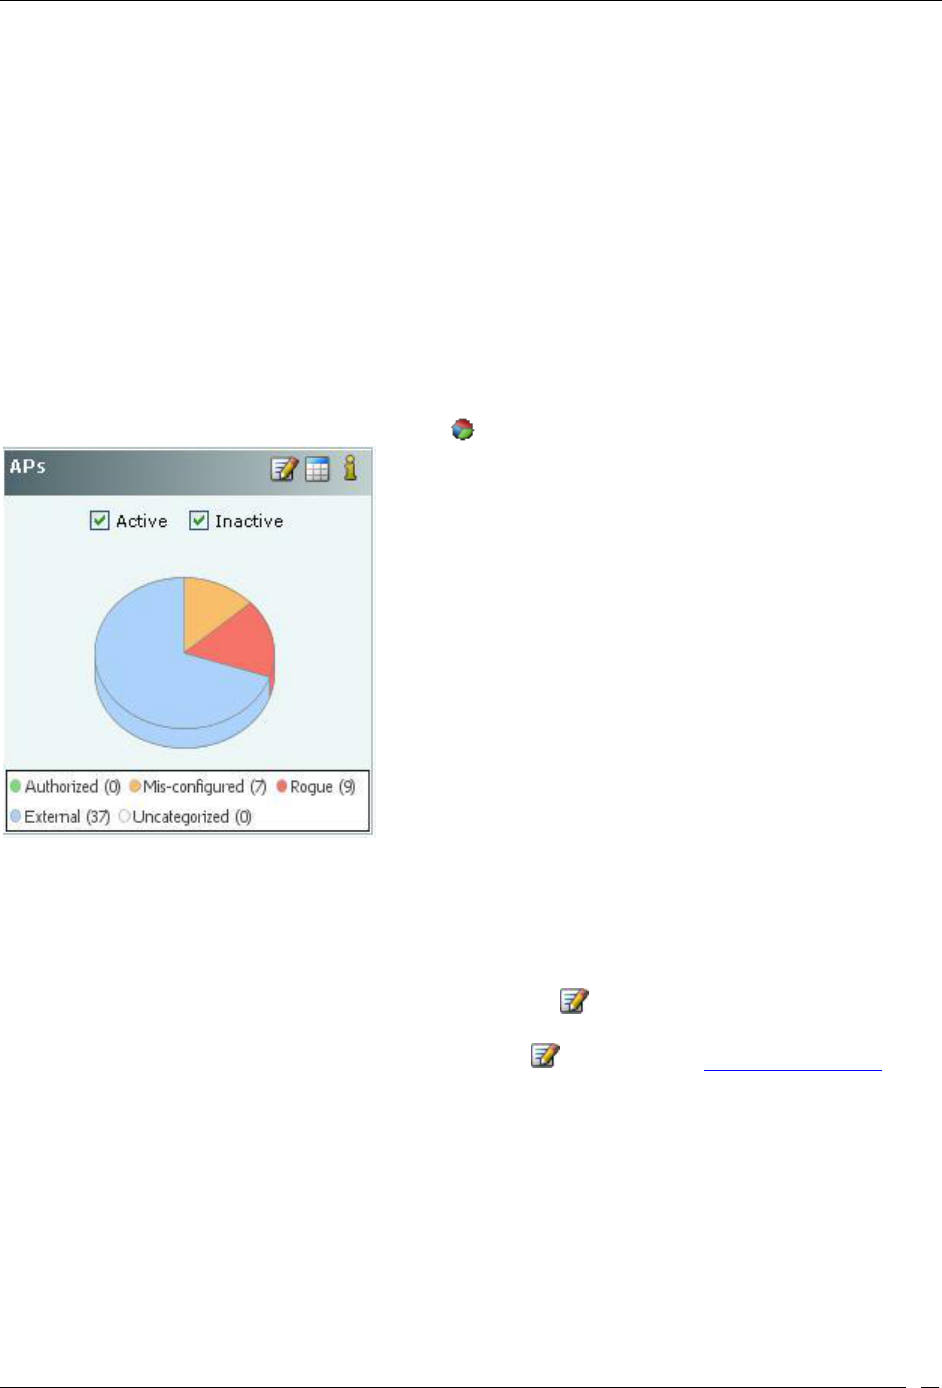
Dashboard Tab
SpectraGuard® Enterprise User Guide
14
Rogue is denoted by red color
External is denoted by blue color
Uncategorized is denoted by white color
Viewing APs – Table View
To view the AP information, click the following hyperlinked text in the APs section:
Authorized: Click on Authorized, the Devices->APs->Categorized->Authorized screen opens.
Mis-configured: Click on Mis-configured, the Devices->AP->Categorized->Authorized screen opens.
Rogue: Click on Rogue, the Devices->APs->Categorized->Rogue screen opens.
External: Click on External, the Devices->AP->Categorized->External screen opens.
Uncategorized: Click on Uncategorized, the Devices->APs->Uncategorized screen opens
Viewing APs – Pie Chart View
To view the APs information in pie chart form, click the icon.
Security Dashboard – APs Section – Pie Chart View
Select Active,Inactive, or both the checkboxes to view the active/inactive APs. Click the area in the pie chart; the
Devices->APs->Selected category screen opens.
Editing AP Auto-classification Policy
To edit the AP Auto-classification policy at selected location, click the icon to open the Administration->Local-
>Local Policies->Operating PoliciesAP Auto-classification screen. To edit the AP classification policy at another
location, select that location in the Location tree and then click the icon. Refer to the AP Auto-classification
section in the Administration tab for more details.
Security Dashboard – Clients
The Clients section enables you to view lists of all the Active and Inactive Clients that belong to a certain category
(Authorized, Misbehaving, Rogue, External, Guest, and Uncategorized).Clients that do not belong to any category
based on their association status and Client classification policy settings are classified as Uncategorized.
The Clients section of Security Dashboard also shows you the Ad hoc networks seen in your environment.
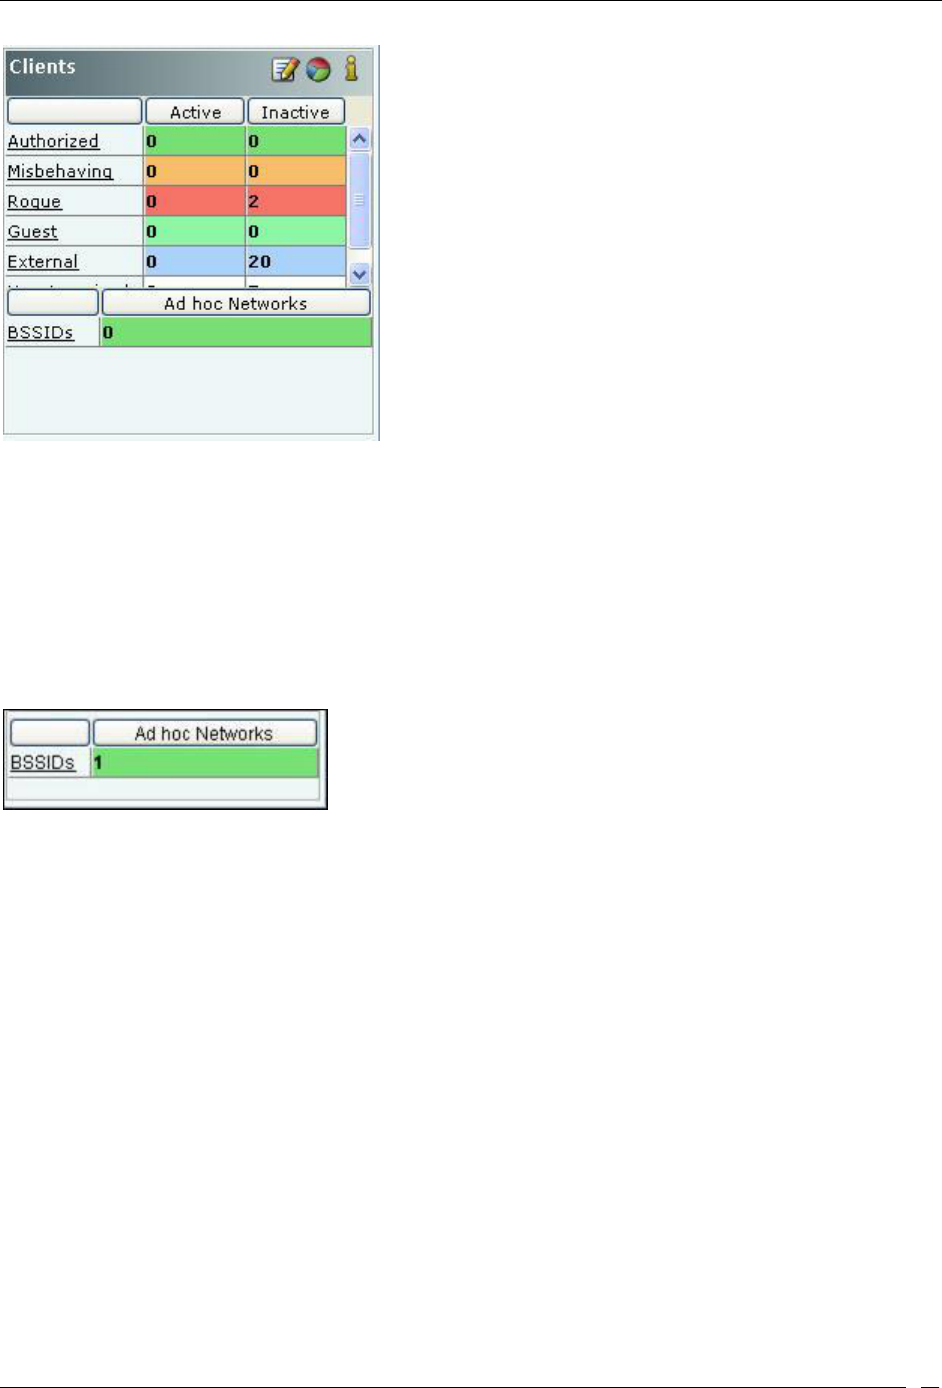
Dashboard Tab
SpectraGuard® Enterprise User Guide
15
Security Dashboard – Clients Section – Table View
Entries are color coded according to the specified classification policies:
Authorized is denoted by green color
Misbehaving is denoted by orange color
Rogue is denoted by red color
Guest is denoted by light green color
External is denoted by blue color
Uncategorized is denoted by white color
The Ad hoc Networks sub-section in the Clients section displays all peer-to-peer wireless, that is, ad hoc connections
between wireless devices in the network.
Clients – Ad hoc Networks Section
Viewing Clients – Table View
To view the Client information, click the following hyperlinked text in the Clients section:
Authorized: Click on Authorized, the Devices->Clients->Categorized->Authorized screen opens.
Misbehaving: Click on Authorized, the Devices->Clients->Categorized->Authorized screen opens.
Rogue: Click on Authorized, the Devices->Clients->Categorized->Rogue screen opens.
Guest: Click on Authorized, the Devices->Clients->Categorized->Guest screen opens.
External: Click on Authorized, the Devices->Clients->Categorized->External screen opens.
Uncategorized: Click on Uncategorized, the Devices->Clients->Uncategorized screen opens. New Clients
that do not belong to any category based on their association status and Client classification policy settings
appear under Clients as Uncategorized Clients. The system cannot determine whether these Clients are
authorized or unauthorized. You should manually inspect and move these Clients to the appropriate Client
folder.
BSSIDs: Click on BSSIDs, list of ad hoc networks and the details of the devices in these ad hoc networks
screen appears.
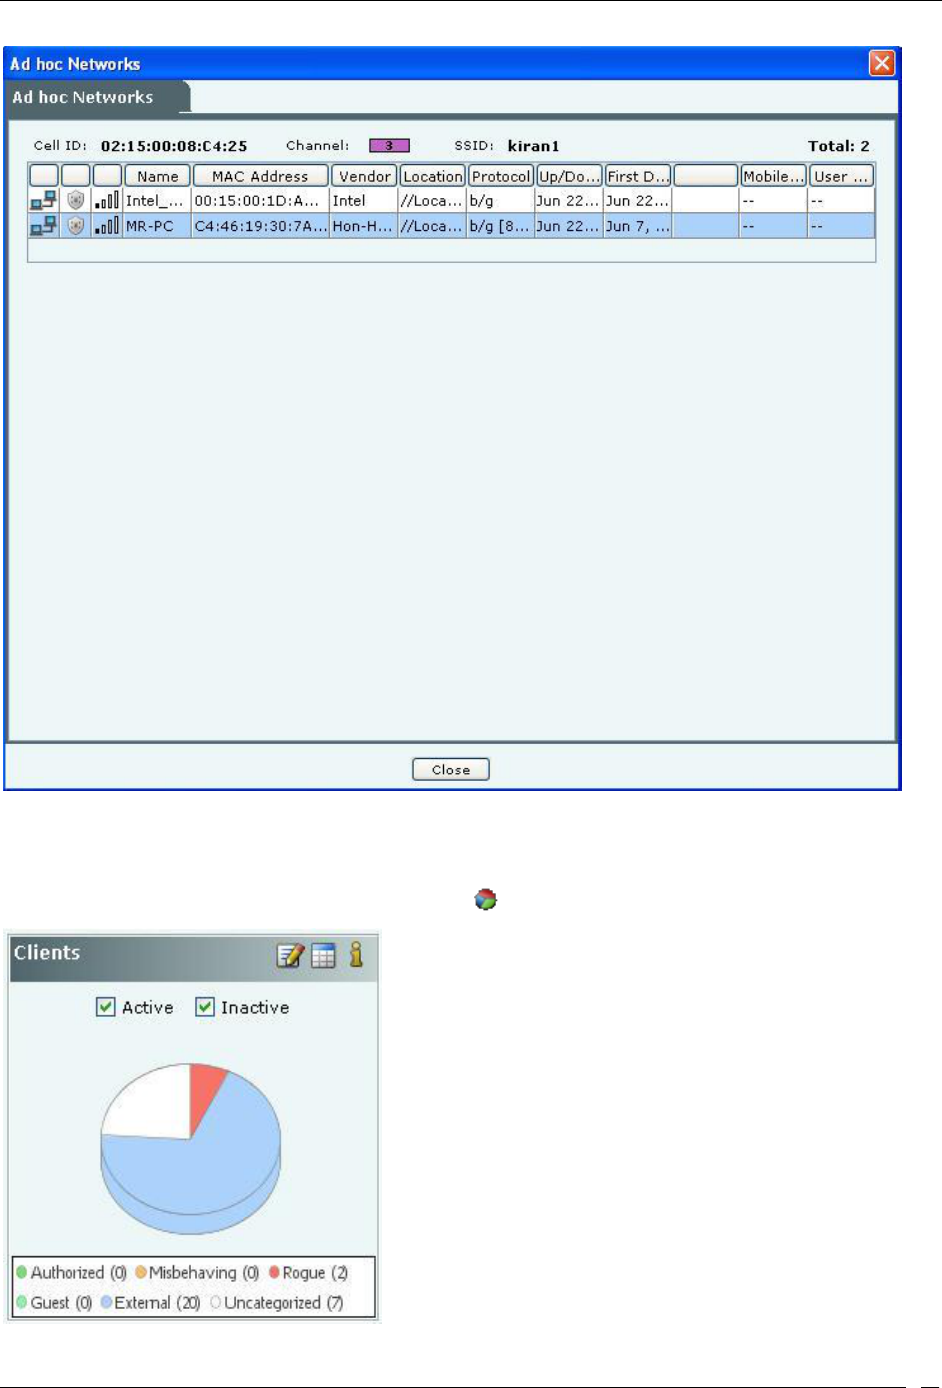
Dashboard Tab
SpectraGuard® Enterprise User Guide
16
List of Ad hoc Connections
Viewing Clients – Pie Chart View
To view the Clients information in pie chart form, click the icon.
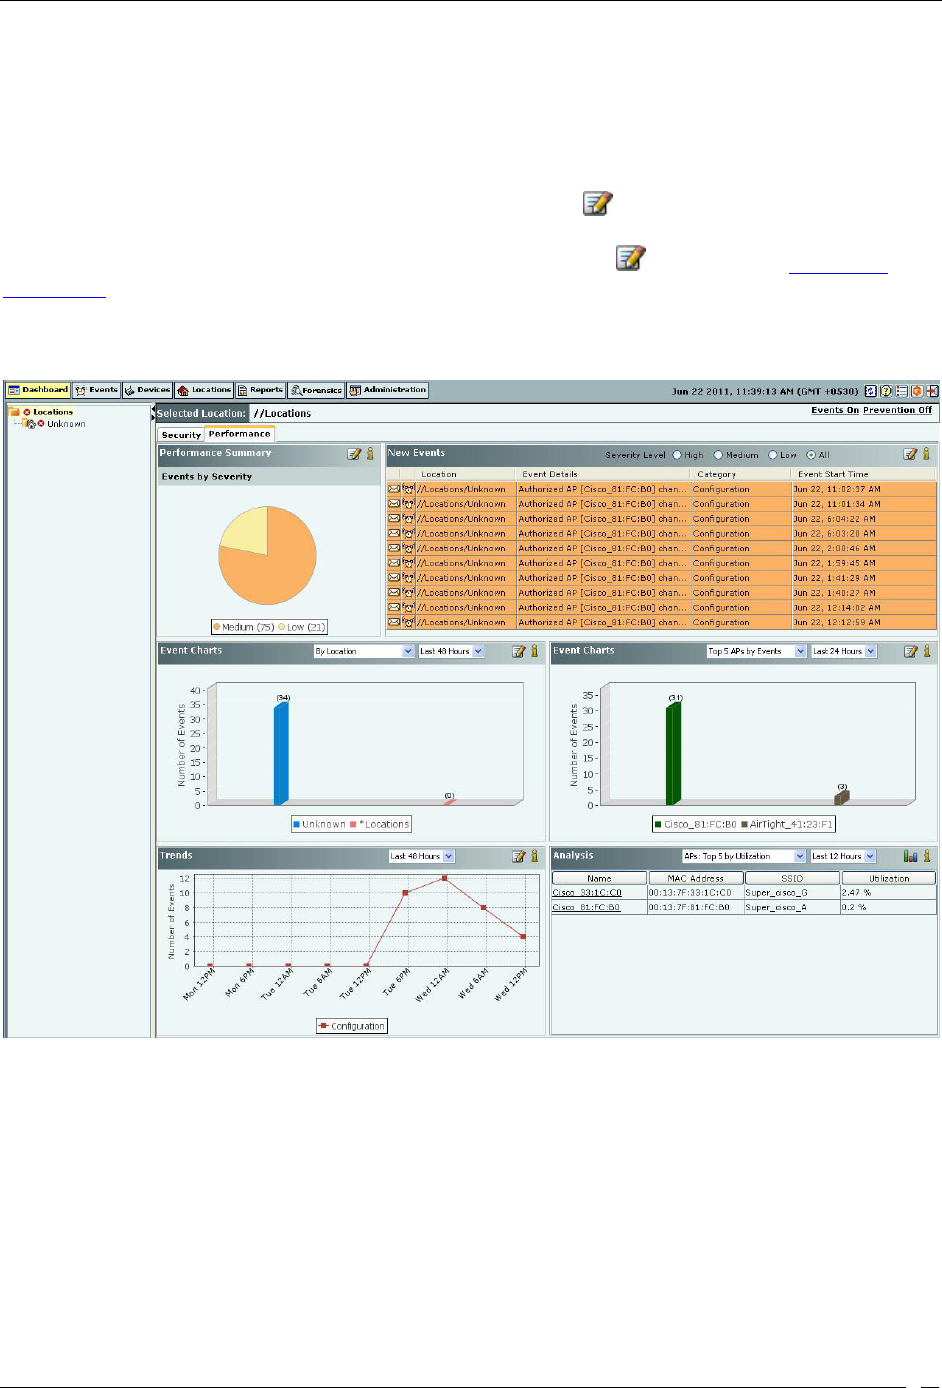
Dashboard Tab
SpectraGuard® Enterprise User Guide
17
Security Dashboard – Clients Section – Pie Chart View
Select Active, Inactive, or both the checkboxes to view the active/inactive Clients. Click the area in the pie chart; the
Devices->Clients->Selected category screen opens.
Editing Client Auto-classification Policy
To edit the Client Auto-classification policy at selected location, click the icon to open the Administration-
>Local->Local Policies->Operating Policies->Client Auto-classification screen. To edit the Client classification policy
at another location, select that location in the Location tree and then click the icon. Refer to the Client Auto-
classification section in the Administration tab for more details.
Performance Dashboard: Sections
The Performance Dashboard screen appears by clicking the Performance tab on the Dashboard screen.
Performance Dashboard
The Performance Dashboard screen consists of the following Information Widgets:
Performance Summary
New Events
Performance Event Charts
Trends
Analysis
Performance Dashboard – Performance Summary
The Performance Summary displays the overall performance information of the Wi-Fi environment at selected
location. This summary is presented as a pie chart of performance related events based on the Severity of these events.
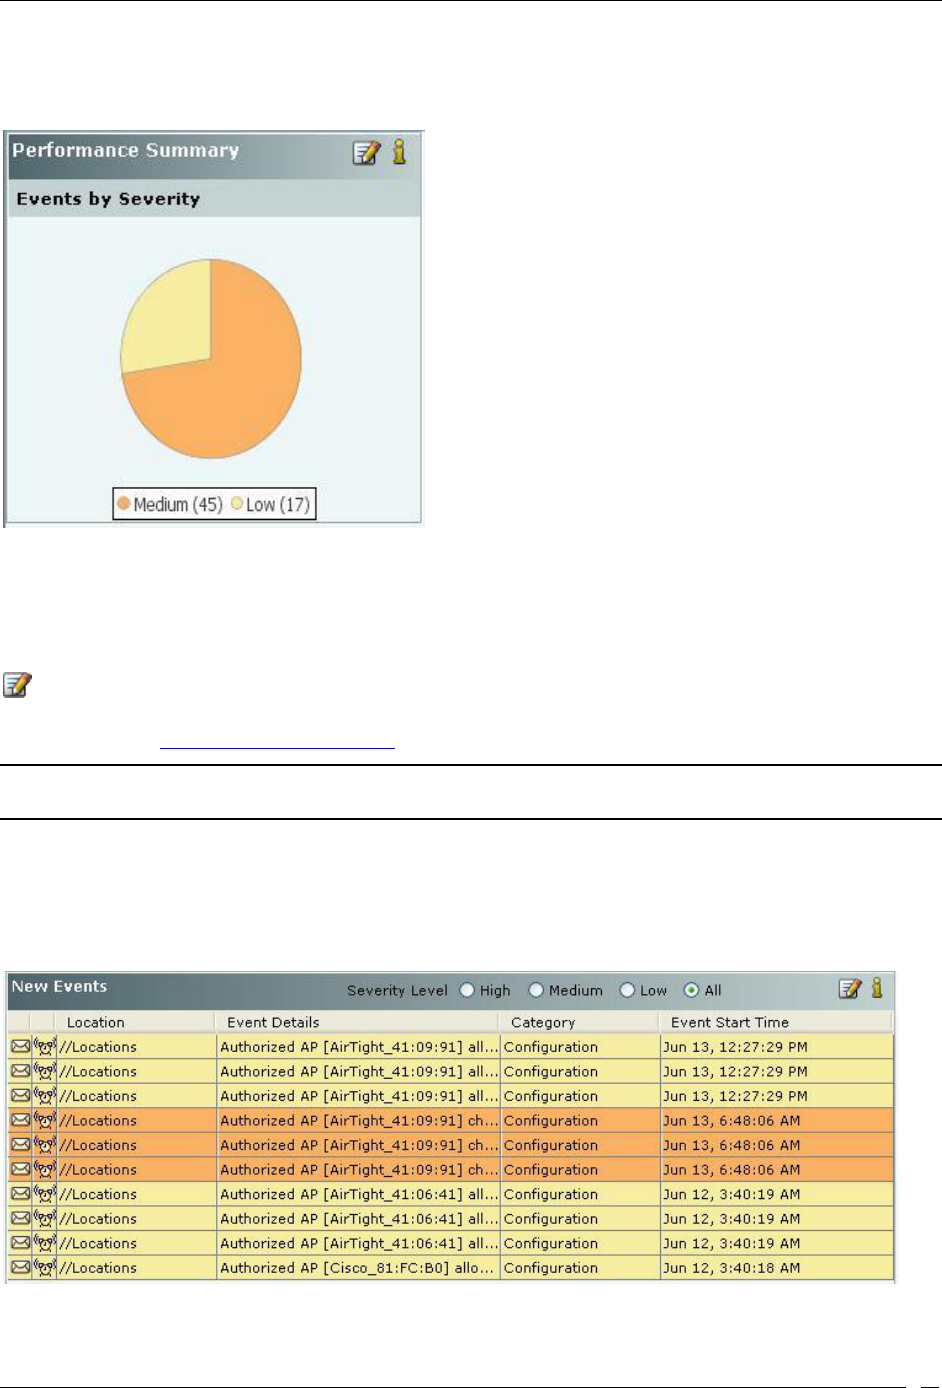
Dashboard Tab
SpectraGuard® Enterprise User Guide
18
While keeping the mouse on an area of the pie chart shows you the number of events of the corresponding category,
Clicking anywhere in the pie chart takes you to the Events->Performance tab screen showing future details of events
at the selected location.
Performance Dashboard – Performance Summary Section
Configuring Performance Dashboard – Performance Summary View
The events considered for showing the pie chart in Performance Summary are those which are selected for Display in
the Event Settings at the selected location. In order to change the Event Settings at the selected location, click the
icon. This will open the Performance tab of the Administration->Local->Local Policies->Event Settings-
>Configuration screen at the selected location where you can directly modify the Display settings of the performance
events. Refer to the Event Settings, Configuration section in the Administration tab for more details.
Note: Configuring Performance Summary, New Events, Events Chart, Trends, and Analysis sections are not visible if WIDS
license is applied.
Performance Dashboard – New Events
The New Events section lists the ten recent Performance events in descending order of the start time of the event.
This list includes instantaneous as well as live/expired performance events. The events are listed based on the
Severity Level selected: High, Medium, Low, or All.
Performance Dashboard – New Events Section

Dashboard Tab
SpectraGuard® Enterprise User Guide
19
You can select an event row from this list and double-click to see the event details screen. Refer to the Viewing Events
Lists section in the Events tab for more details. Select an event row and right click to open a context sensitive menu of
actions that can be taken on that event. Refer to the Events Context-Sensitive Menu section in the Events tab for more
details.
Configuring Performance Dashboard – New Events View
Select a location in the Location tree and then click the icon to open Administration->Local->Local Policies-
>Event Settings->Configuration screen with Performance tab selected.
Performance Dashboard – Event Charts
The system shows two Event Charts on the Performance Dashboard. The event drop-down list allows you to focus
on events (by location or category), or on APs or Wi-Fi Clients experiencing performance issues. The time period
drop-down list allows you to focus on the last 48 hours or a choice of interval in the last 24 hours. The availability of
two charts on the Performance Dashboard improves your ability to efficiently notice and handle performance issues,
if any.
The details of the charts displayed based on the drop-down list are as follows:
1. The drop-down list of events or devices to show on the chart contains the following:
By Location: Displays a bar chart for a count of performance events for the selected location and its
immediate child locations. (The selected location is marked with * in the legend of the chart). In
order to jump to the performance events at one of these locations, click on the bar for that location.
You will be taken to the Events->Performance->All screen for that location and that location will be
selected in the location tree panel as well.
By Category: Displays a bar chart for a count of performance events at the selected location based
on their category. In order to jump to the performance events of a specific category, click on the bar
for that category. You will be taken to the Events->Performance->Selected category screen.
Top 5 APs by Events: Displays bar graph for the top 5 APs based on the number of Performance
events involving these APs. On clicking one of the bars, the AP Details dialog for the
corresponding AP device opens with Events tab selected. This allows you to view all the events
related to that AP and take appropriate actions.
Top 5 Clients by Events: Displays bar graph for the top 5 Clients based on the number of
Performance events involving these Clients. On clicking one of the bars, the Client Details dialog
for the corresponding Client device opens with Events tab selected. This allows you to view all the
events related to that Client device and take appropriate actions.
2. The drop-down list for time period allows you to control the chart display based on performance events that
occurred in the chosen period. The time period choices available are: Last 4 Hours, Last 12 Hours, Last 24
Hours, or Last 48 Hours.
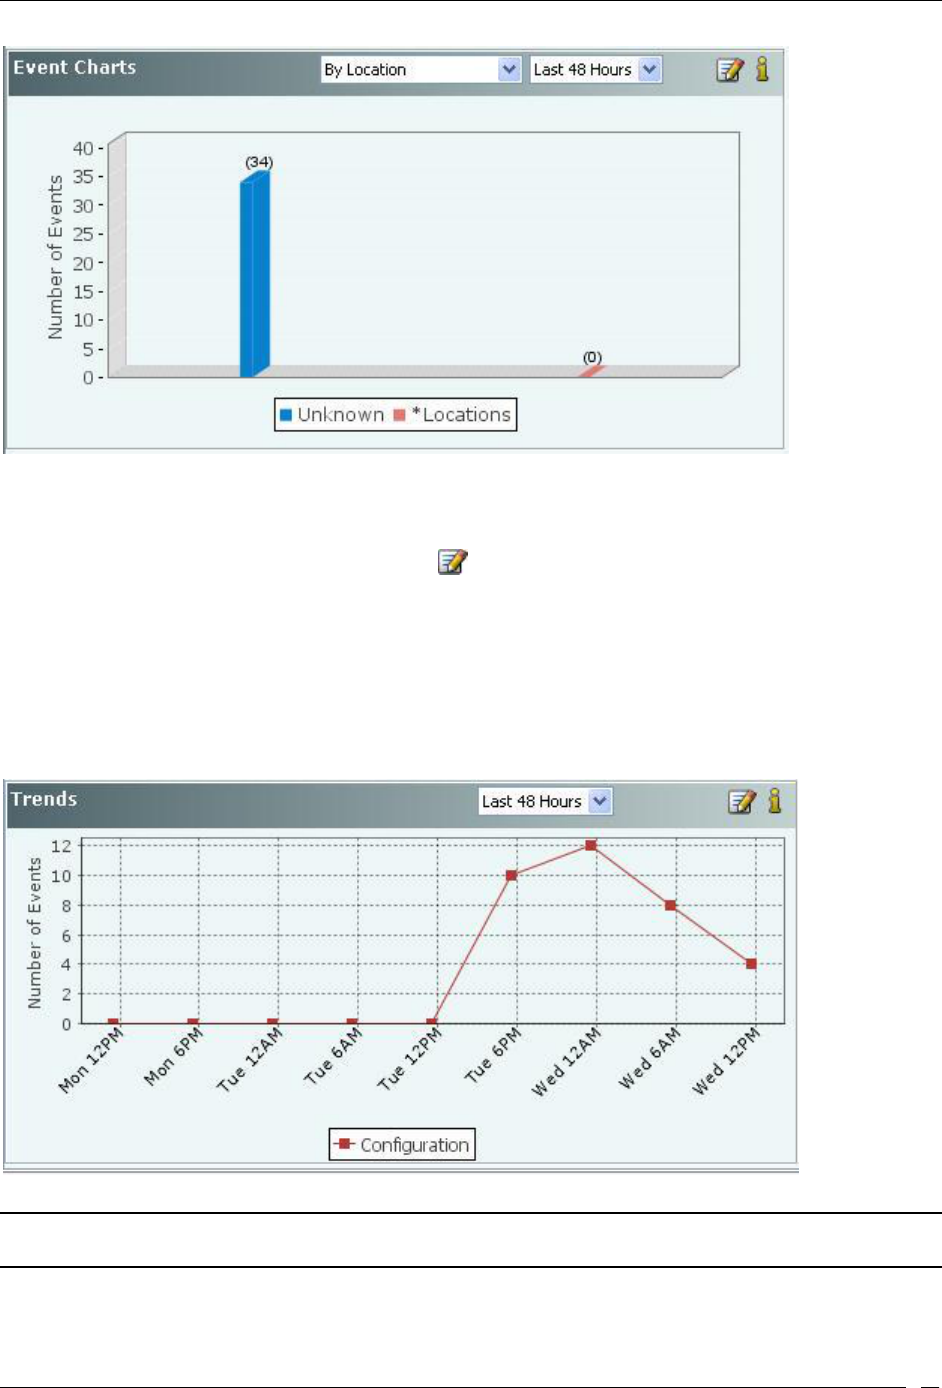
Dashboard Tab
SpectraGuard® Enterprise User Guide
20
Performance Dashboard – Event Charts
Configuring Performance Dashboard – Event Charts View
Select a location in the Location tree and then click the icon to open Administration->Local->Local Policies-
>Event Settings->Configuration screen with Performance tab selected.
Performance Dashboard – Trends
Trends section of the Performance Dashboard displays line charts based on the category of performance events at the
selected location for a chosen period of time. The choices of time period for the chart display are: Last 4 hours, Last
12 hours, Last 24 hours, or Last 48 hours. These choices are available in the form of a drop-down list as shown in the
figure below.
Performance Dashboard – Trends Section
Note: Live events could be counted in multiple time slots that overlap with the event time, whereas Instantaneous events are
counted only in the time slot in which they occurred.
Configuring Performance Dashboard – Trends View
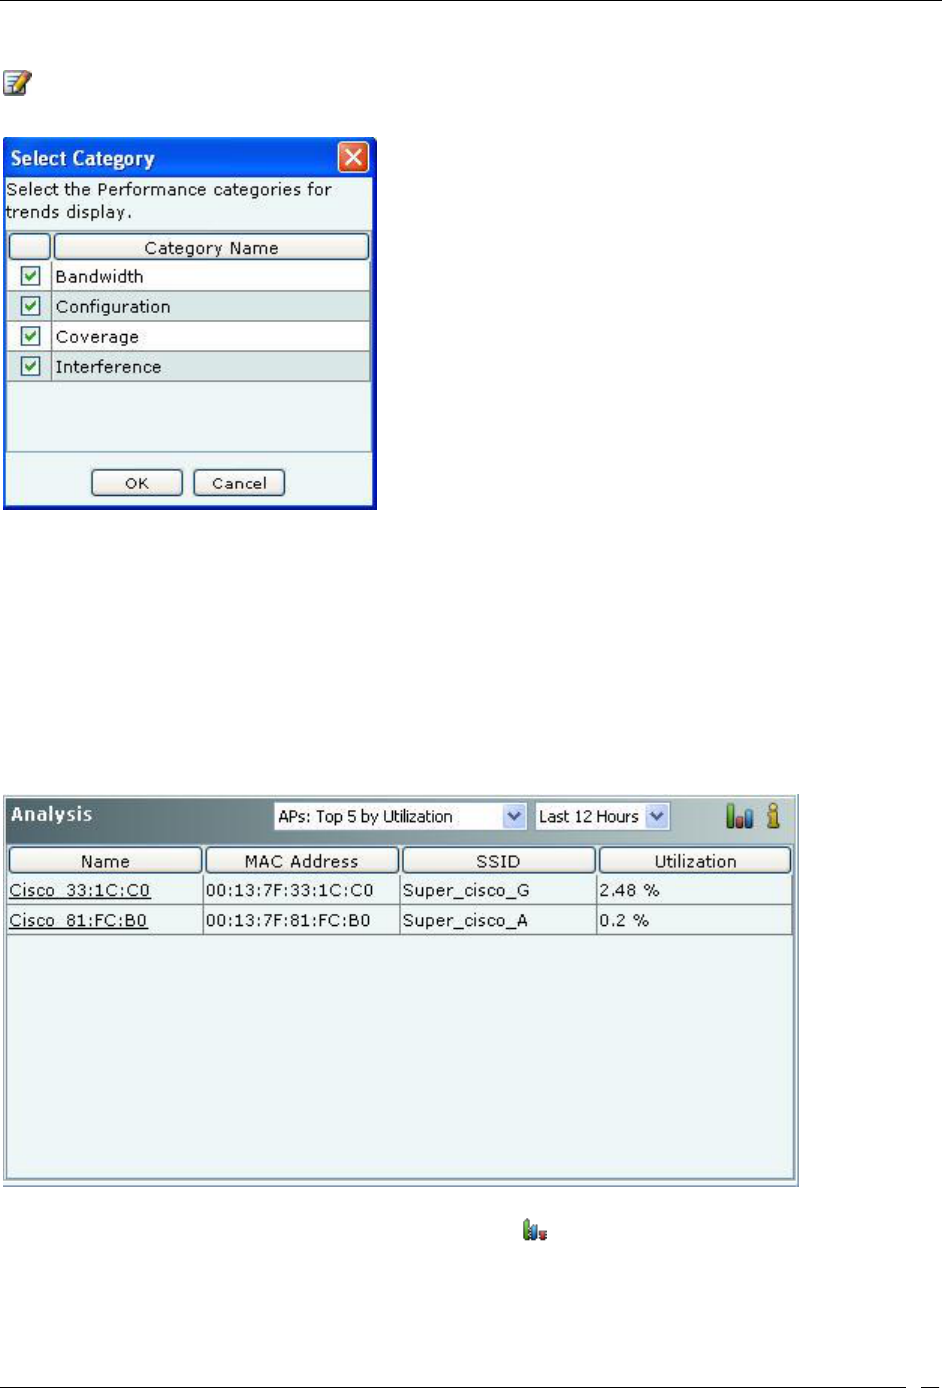
Dashboard Tab
SpectraGuard® Enterprise User Guide
21
To specify the types of performance events that should be shown in the Trends at the selected location, click the
icon in the Trends section. This opens the Select Category dialog shown below. Select the categories to be
displayed by clicking the checkbox next to it in the Select Category dialog and click OK.
Trends – Select Category
Performance Dashboard – Analysis
Top and bottom wireless activity analysis at the selected location is shown here for APs, Clients, and Sensors. Sensor
records various performance parameters in the wireless network and sends performance records to server
periodically for aggregation/correlation. These recorded performance parameters are rendered as Performance
Monitoring Graphs in the Device Details.
The top/bottom analysis is provided based on the performance monitoring graphs described above. The rank of a
device for any performance parameter is computed based on average value of that parameter over the selected time
interval.
Performance Dashboard – Analysis Section – Table View
To view the Analysis information in form of a bar chart, click the icon.
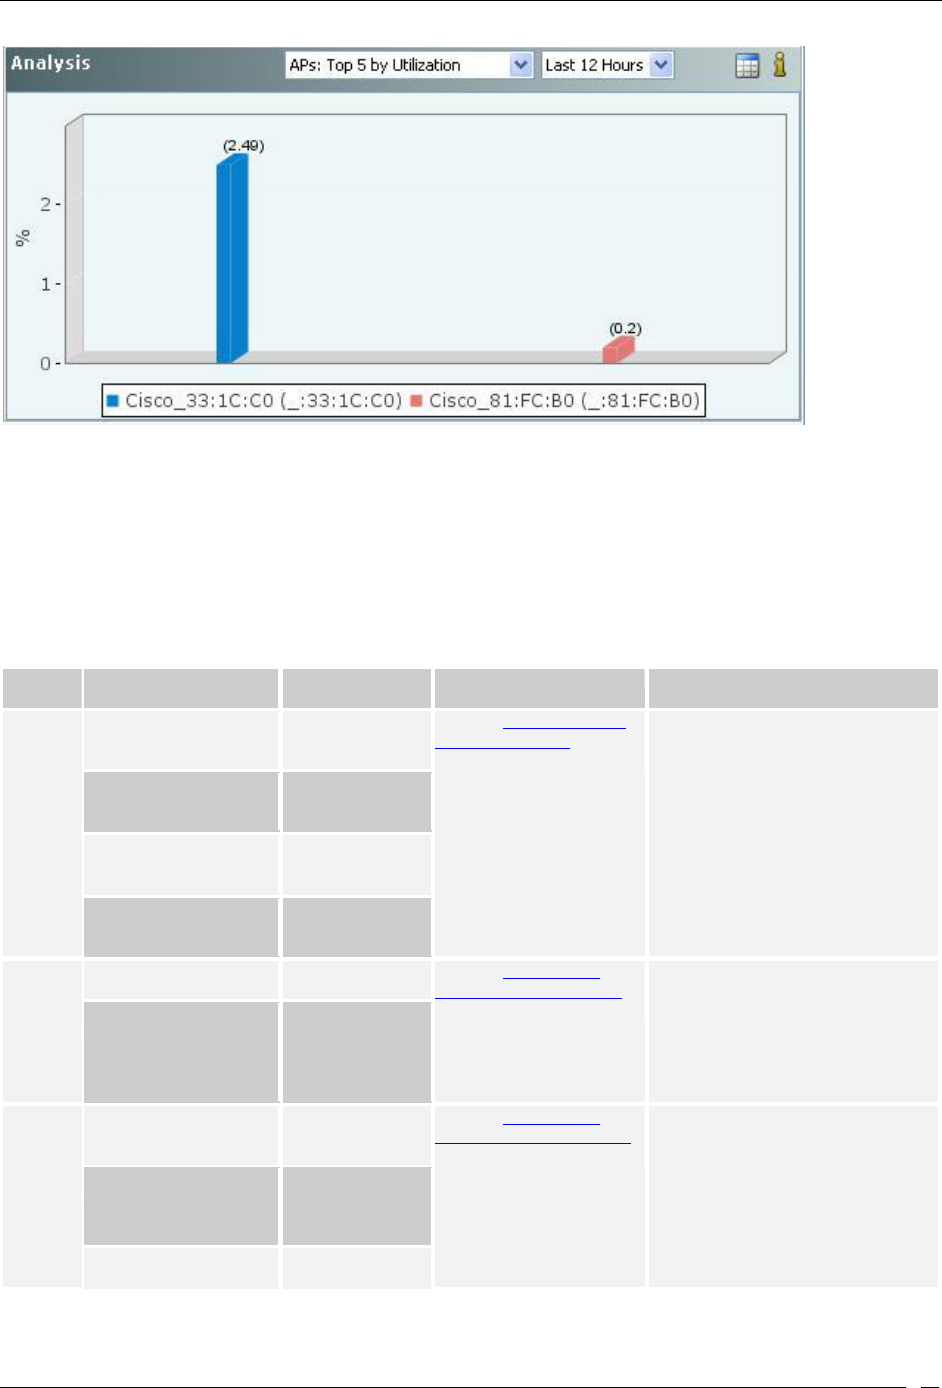
Dashboard Tab
SpectraGuard® Enterprise User Guide
22
Performance Dashboard – Analysis Section – Bar Graph view
Performance parameters are computed based on detections by a channel-rotating Sensor during the time it, samples a
particular channel. Such sampled data is typically well representative of parameters which are averages (for example,
average data rate), ratios (for example, utilization) or slow varying (for example, associated Clients, active APs, active
Clients). For parameters which are absolute values (for example, traffic), the sampled data typically underestimates
the actual value. Time interval of periodic data collection/sampling is 15 minutes.
Details of various parameters in the Analysis section are provided below.
Table 2 Device Type and dropdown available on the Analysis Section
Device
Type
Dropdown Available
Table columns
Description
For details
APs
Top/Bottom 5 by
Associated Clients
Name, MAC
Address, SSID,
Associations
Refer to Fields in the AP
Performance Tab section
for details
Click on the AP Names appearing
in the Name column in the Table
View or click the Bar Graph in the
Bar Graph View, the AP Details
screen opens with Performance
tab selected
Top/Bottom 5 by Data
Rate
Name, MAC
Address, SSID,
Data Rate
Top/Bottom 5 by
Average Traffic
Name, MAC
Address, SSID,
Traffic
Top/Bottom 5 by
Utilization
Name, MAC
Address, SSID,
Utilization
Clients
Top/Bottom 5 by Data
Rate
Name, Data Rate
Refer to Fields in the
Client Performance Tab
section for details
Click on the Client Names
appearing in the Name column in
the Table View or click the Bar
Graph in the Bar Graph View, the
Clients Details screen opens with
Performance tab selected
Top/Bottom 5 by Traffic
Name, Traffic
Sensors
Top/Bottom 5 by Active
APs
Name, Channel
Number,
Bandwidth, APs
Refer to Fields in the
Sensor Performance Tab
section for details
Click on the Sensor Names
appearing in the Name column in
the Table View or click the Bar
Graph in the Bar Graph View, the
Sensor Details screen opens with
Performance tab selected
Top/Bottom 5 by Active
Clients
Name, Channel
Number,
Bandwidth,
Clients
Top/Bottom 5 by
Interference
Name, Channel
Number, dBm

Dashboard Tab
SpectraGuard® Enterprise User Guide
23
Dashboard Tab – User Saved Settings
The following User choices made during browsing of Dashboard Tab are saved by the system:
All the options that the user can select that is, Table/Pie chart, Time Filters, drop-down list, radio buttons, check
boxes for all sections displayed on Performance and Security Dashboard
These settings are saved on log out as well as movement to other tabs on the Console.
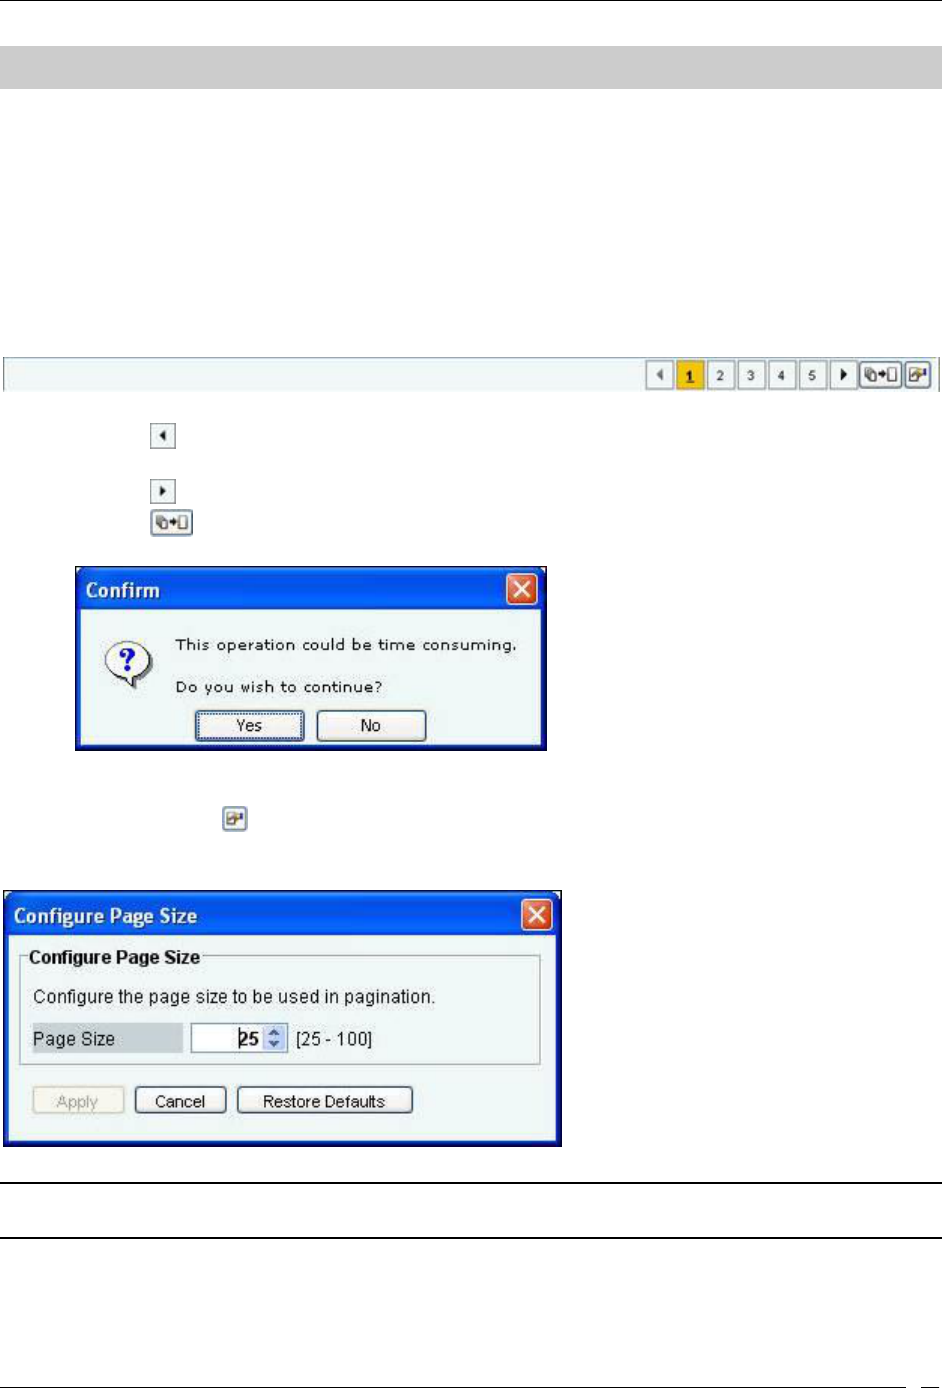
Events Tab
SpectraGuard® Enterprise User Guide
24
Events Tab
Events: Panel Displaying Alerts
The Events screen provides information about events generated by the system. The system classifies events into the
following types: Security, System, and Performance. On this screen, you can view, filter, locate, acknowledge, mark
as read or unread, and toggle the state of the event’s participation in vulnerability computation. The option of Event-
Pagination is also present.
Pagination of Events
You can control the display of events on this screen by choosing to display all the events or display them one page at
a time. The Events screen has a toolbar as shown in the figure below, to configure the Pagination.
Toolbar for Configuring the Pagination of Events
Click the icon, to go to the Previous Page from a Page in the Events screen.
Click on the respective Page number of the Events List. Maximum five Page numbers are displayed.
Click the icon, to go to the Next Page from a Page in the Events screen.
Click the icon, to disable the Paging option. A Confirmation screen appears.
Confirm turning off Pagination
Click Yes to turn off the Pagination of Events.
Click the icon, to Configure Page size of Events as shown in the figure. The Page Size value
selected is the number of Events that will be displayed on every page in the Events screen.
(Minimum: 25; Maximum: 100, Default: 25 Events per Page)
Configure Events Page Size Screen
Note: The Event Pagination feature will appear whenever the Events screen displays (for example, Tell me more from Dashboard,
Events Tab, Events tab in Device Details, and so on.)
The Graphs on the Events screen are based on all the events that have taken place and not on number of events
displayed per page.
Events Screen
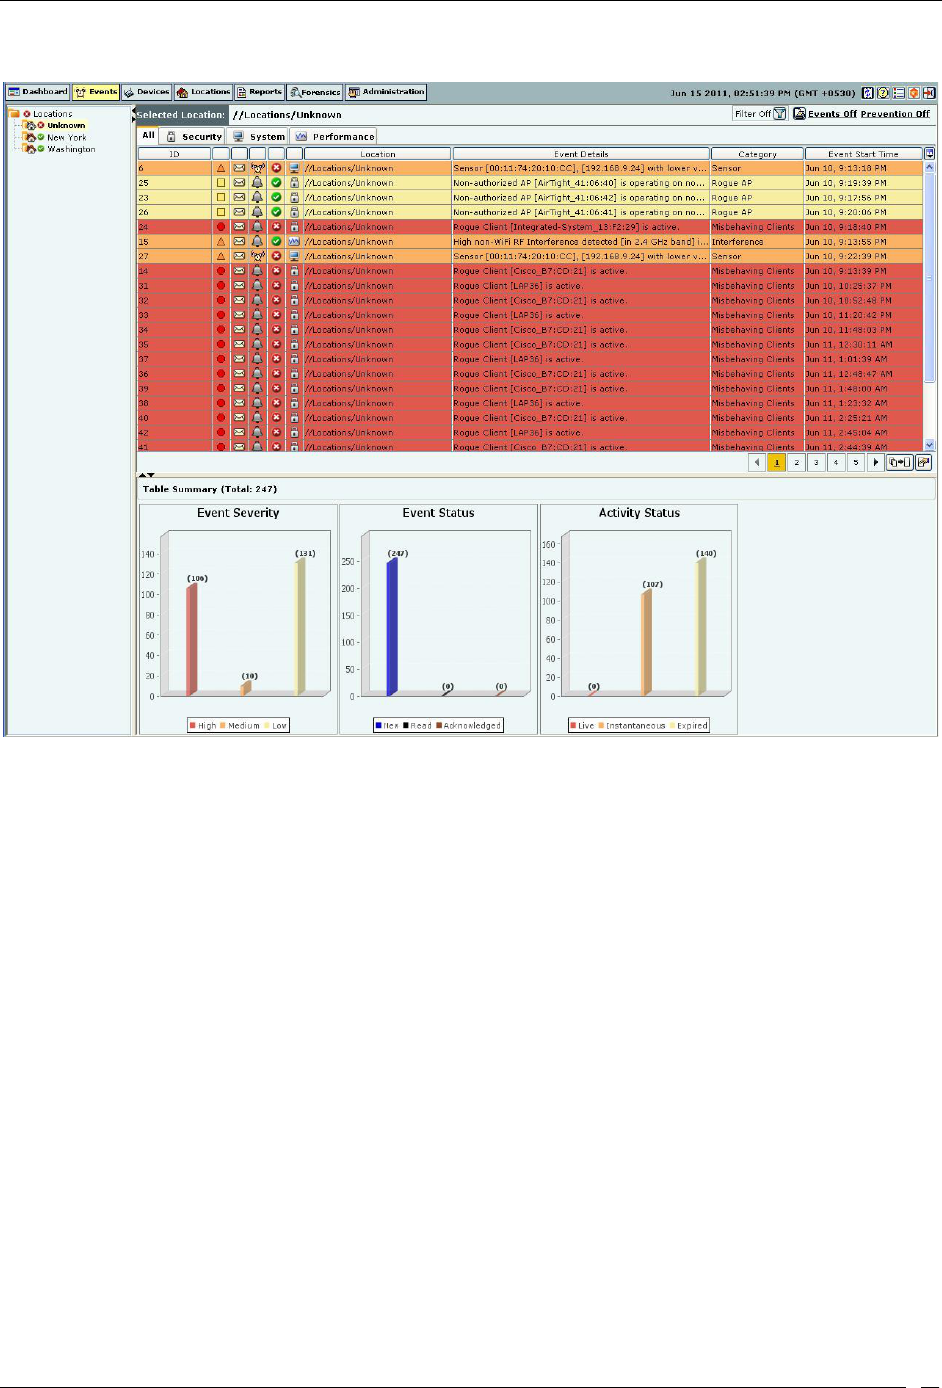
Events Tab
SpectraGuard® Enterprise User Guide
25
To open the Events screen, on the navigation bar, select the Events tab
Events Screen
The Events screen includes two panes:
1. On the left, the Location tree
2. On the right, the event tabs: All, Security, System, and Performance, event list for the selected category of
events, and event charts in the Table Summary.
Events: Location Tree
The Location tree shows the complete list of locations created for your WLAN in the system. The Events shown on
the right are for the currently selected location. To view a list of events for any other location, select that location in
the Location tree, and select an event type in the right pane. A list of events of the selected category that have
occurred at the selected location (and its child locations), appear in the list of events in the right pane.
Event Categories, Event Lists, and Table Summary
This pane shows:
Path of the selected location
List of events that have occurred at that location
You can view the events at the selected location (and its child locations) based on their category. Tabs are provided
for each category:
All: Shows all events
Security: Shows events that indicate security vulnerability or breach in your network
System: Shows events that indicate system health
Performance: Shows events that indicate wireless network performance problems
You can view the following information for all the events on the bar charts under ‘Table Summary’.
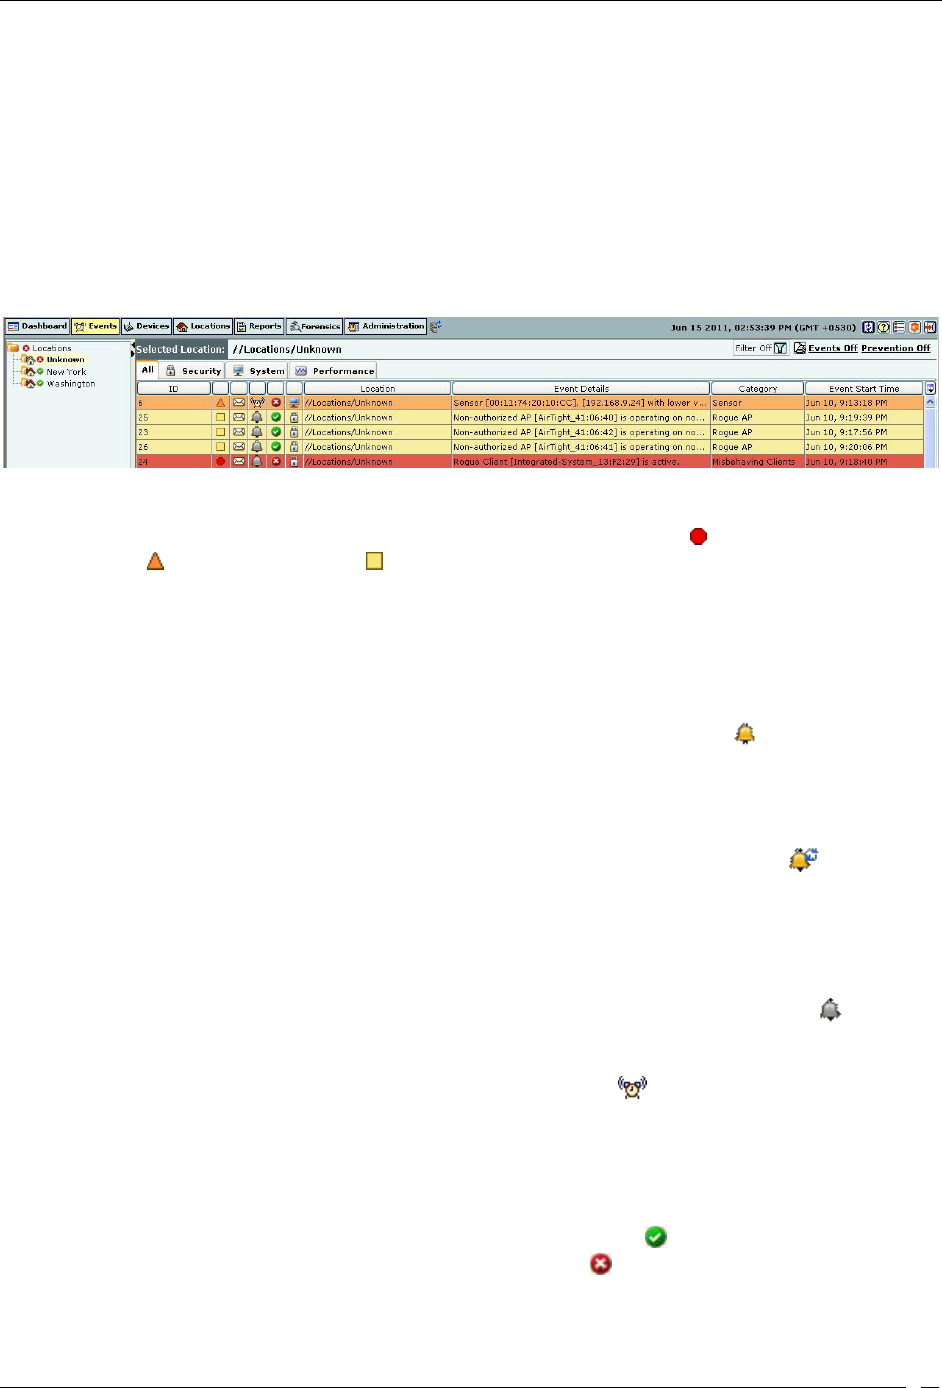
Events Tab
SpectraGuard® Enterprise User Guide
26
Event Severity: High, Medium, or Low. The event rows are highlighted in red, orange, or yellow color
based on the severity level being High, Medium, or Low respectively.
Event Status: New, Read, or Acknowledged
Activity Status: Live, Instantaneous, or Expired
Viewing Events Lists
You must view events in order to take corrective actions. Use the following steps to view an event list:
1. In the Location tree, select a location.
2. In the right pane, select a tab – All, Security, System, or Performance. Event list with following
columns displays:
Events Tab – Column Header
ID: Specifies the unique identification number of the event.
Severity Icon: Specifies the severity of an event as High denoted by icon, Medium denoted by
icon, or Low denoted by icon respectively.
Read Status Icon: Specifies if an event is new (that is, unread), read, or acknowledged, or a
combination of these options.
Activity Status Icon: Specifies if an event is live (in progress), is active and an activity has occurred
since it was last read, or past (already occurred). The system follows a Live Event Architecture
(LEA) where live or instantaneous events are used to classify events based on the duration of their
occurrence as follows:
Live: Have a valid start time stamp and are denoted by the icon. A live event
indicates that the triggers that raised the event are operational or continue to exist. On
expiration, a valid stop time stamp is assigned to it. One or more conditions can
trigger the start and stop of a live event. For example, consider the event ‘Rogue AP is
Live’. This event will have a start and stop time and therefore, it is easy to figure out
that the Rogue AP is still operating. A live event designated by the icon indicates
an event that has been updated, that is, some activity has occurred after the event has
been read.
Expired: Live events are marked as ‘Expired’ once the triggers that caused the events
are no longer operational. For example, once a Rogue AP has been located and
removed by the administrator and is no longer in operation, the event related to the
Rogue AP is marked as ‘Expired’. Expired events are marked with the icon.
Instantaneous: Instantaneous events are the events triggered based on a trigger that
does not have continuity. These events are raised each time the trigger is detected by
the system. These events are indicated by the icon. For example, ‘Change in the
SSID of an Authorized AP’ or ‘Beacon with a large Contention Free Period (CFP)
duration detected’. All offline events (events synchronized from a Sensor that has
reconnected after operating in the Offline mode) are also treated as instantaneous
events.
Contribution to Vulnerability: Indicates if that event occurrence is considered for determining the
network’s vulnerability status on the Security Dashboard. The icon denotes that the event does
not contribute to vulnerability status and is secure. The icon denotes that the event contributes
to vulnerability status and is vulnerable.
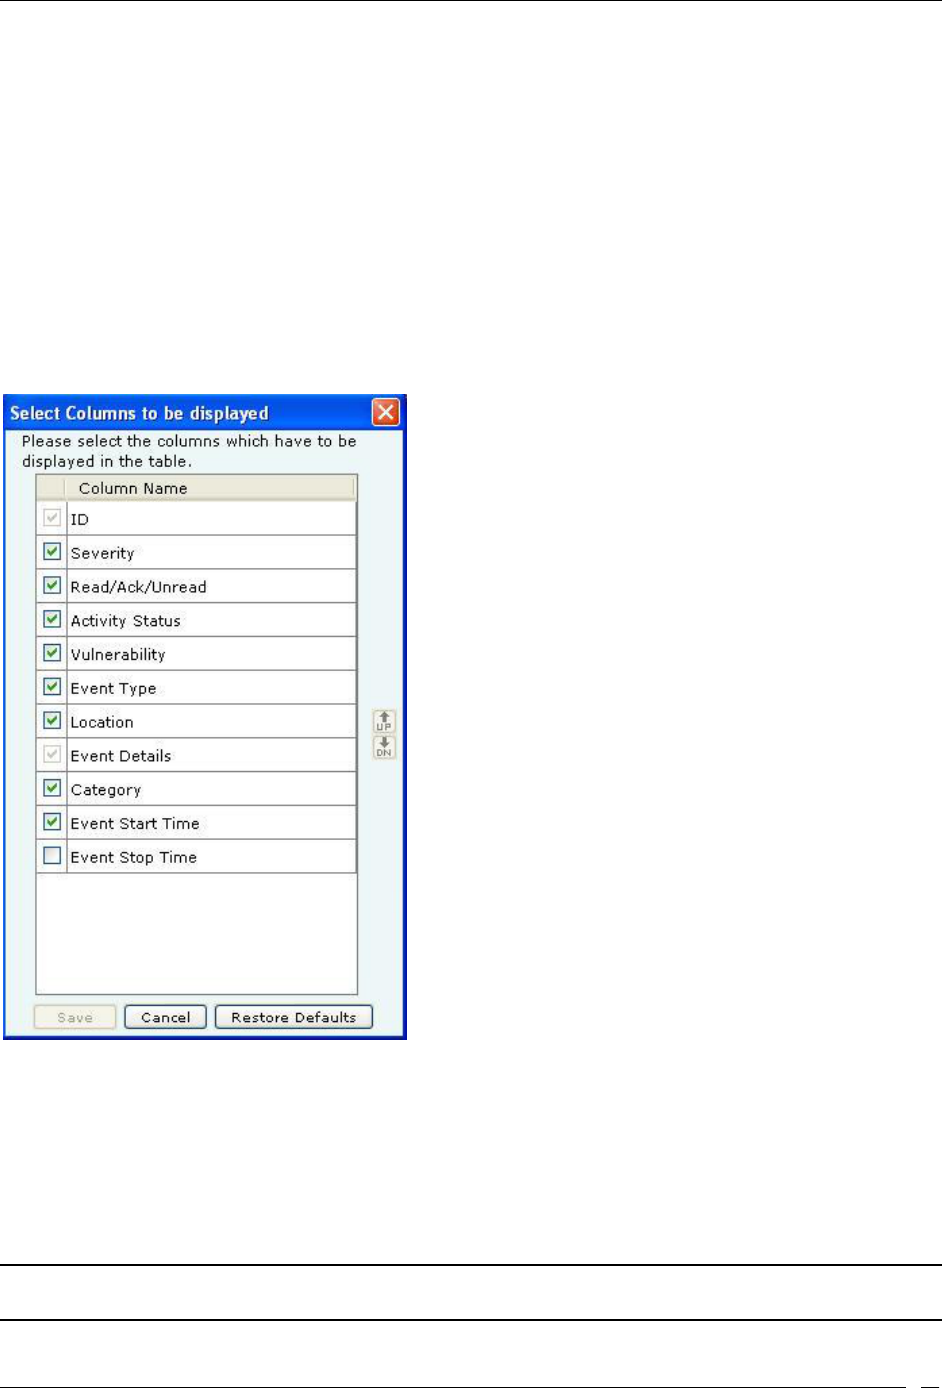
Events Tab
SpectraGuard® Enterprise User Guide
27
Type Icon: Indicates the type of the event – Security, System, or Performance. This column is
visible only if you select the tab All in step 2.
Location: Shows the probable location of the devices participating in the event when the event
occurred.
Event Details: Gives a short description of the event.
Category: Specifies the event’s sub-category within a selected event type. This column is visible
only if you select the tab All in step 2.
Event Start Time: Shows the date and time when the event occurred.
Event Stop Time: Shows the date and time when the event stopped.
Configure Display Columns: Clicking on the Column Visibility icon opens a window showing the
columns available for display and their current selection and display order. You can check/uncheck
the checkbox next to the column name to select/deselect it from Event display. You can change the
display order of a column by selecting the column name and moving it up/down with Up/Down
buttons. Save the display settings by clicking Save button.
Events Tab - Display Columns Screen
Sorting Events
The system enables you to sort events by columns, which helps you arrange information according to your
requirements. Use the following steps to sort events:
1. In the Location tree, select a location.
2. Select an event type tab, for example, Security.
3. Optionally, to drill down further, select an event category tab, for example, Rogue AP.
4. To sort a column, click the column header, for example, Date.
Note: When you sort the list for the first time, the system sorts it in the ascending order. Click a column header again to re-sort
in descending order.
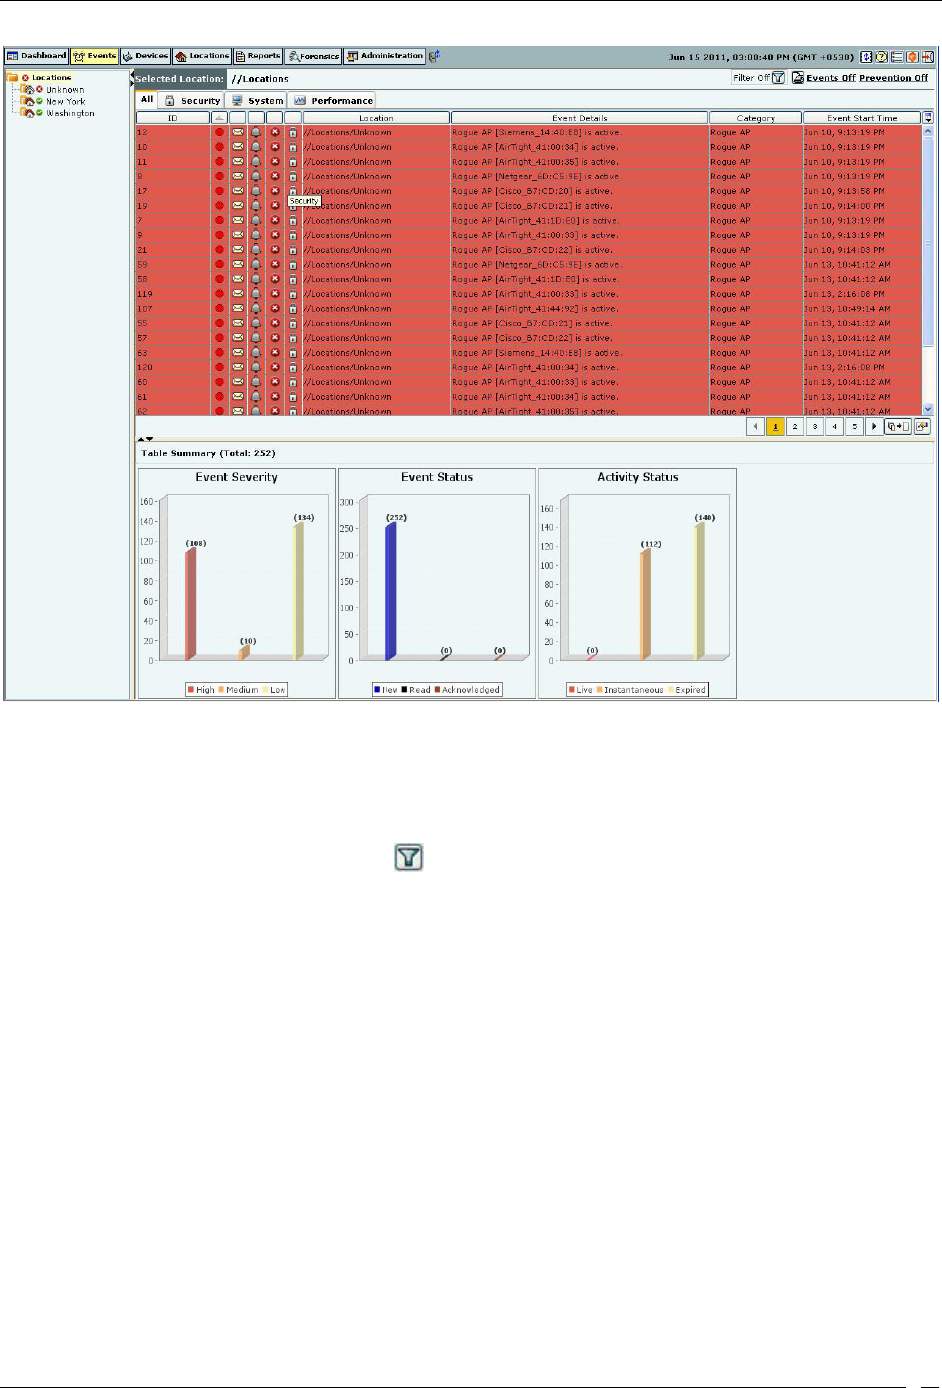
Events Tab
SpectraGuard® Enterprise User Guide
28
Sorted Events List
Filtering Events
To focus your attention to a subset of events based on a filtering criteria (such as events in a particular time period, or
of particular category, and so on) system provides you with the capability to filter events. Use the following steps to
filter events:
1. On the Events screen, click the icon to open the Filter Events dialog.
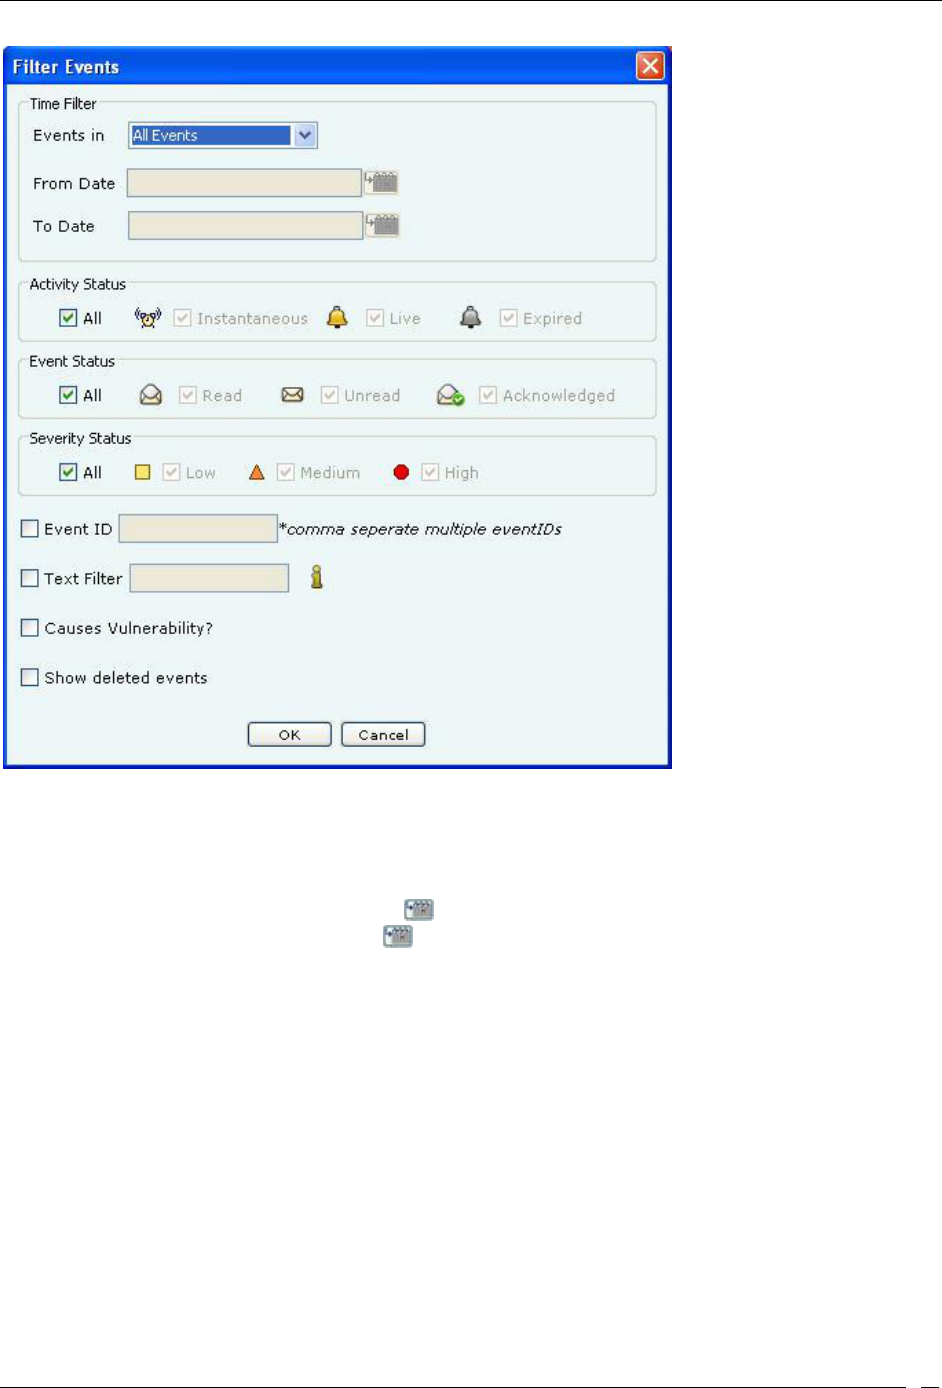
Events Tab
SpectraGuard® Enterprise User Guide
29
Filtering Events
2. In the Time Filter dialog, do one of the following:
Under Events in select the following Events in last 5 Minutes, Events in last 1 Hour, Events in last
1 Day, orCustomize to choose a From and To Date as described below. Default: All Events.
Select Customize under the drop-down menu in Events in and then choose either of the following:
Under From Date, click the icon to specify a start date and time and then click OK.
Under To Date, click the icon to specify an end date and time and then click OK.
3. Under Activity Status, select one or more of the following checkboxes:
All
Instantaneous
Live
Expired
4. Under Event Status, select one or more of the following checkboxes:
All
Read
Unread
Acknowledged
5. Under Severity Status, select one or more of the following checkboxes:
All
Low
Medium
High

Events Tab
SpectraGuard® Enterprise User Guide
30
6. Select the checkbox, Event ID, to enter event IDs manually for searching data related to it.
7. Select the checkbox, Text Filter, to enter search text to select events containing the text in event details.
8. Select the checkbox, Causes Vulnerability?, to select those Events which have been selected to
contribute to Vulnerability.
9. Select the checkbox, Show deleted events, to view deleted events. Event text appears as strikethrough
when you select this checkbox.
10. To save and apply the event filtering criteria, click <OK>. When the filter is applied it is denoted by
Filter On on the Console, if no filter is applied it is denoted by Filter Off on the Console.
Working with Events
Events occur when Sensors detect any unexpected change in the WLAN. The system classifies events into the
following categories:
Security events (for example, Rogue APs and Denial of Service (DoS) attacks)
System events (for example, Sensor connection/disconnection, Server status, or Troubleshooting)
Performance events( for example Bandwidth, Configuration, Coverage, or Interference)
Events Context-Sensitive Menu
Context-sensitive menus for Events enable you to:
View event details
Locate an event
Acknowledge an event
Forensics
Change the location of an event
Delete or undelete an event
Mark an event as
Unread
Read
Toggle Vulnerability
Method for Opening Events Context-Sensitive Menu
To open the Events context-sensitive menu, click the Events tab and then right-click an event row to open the context-
sensitive menu.
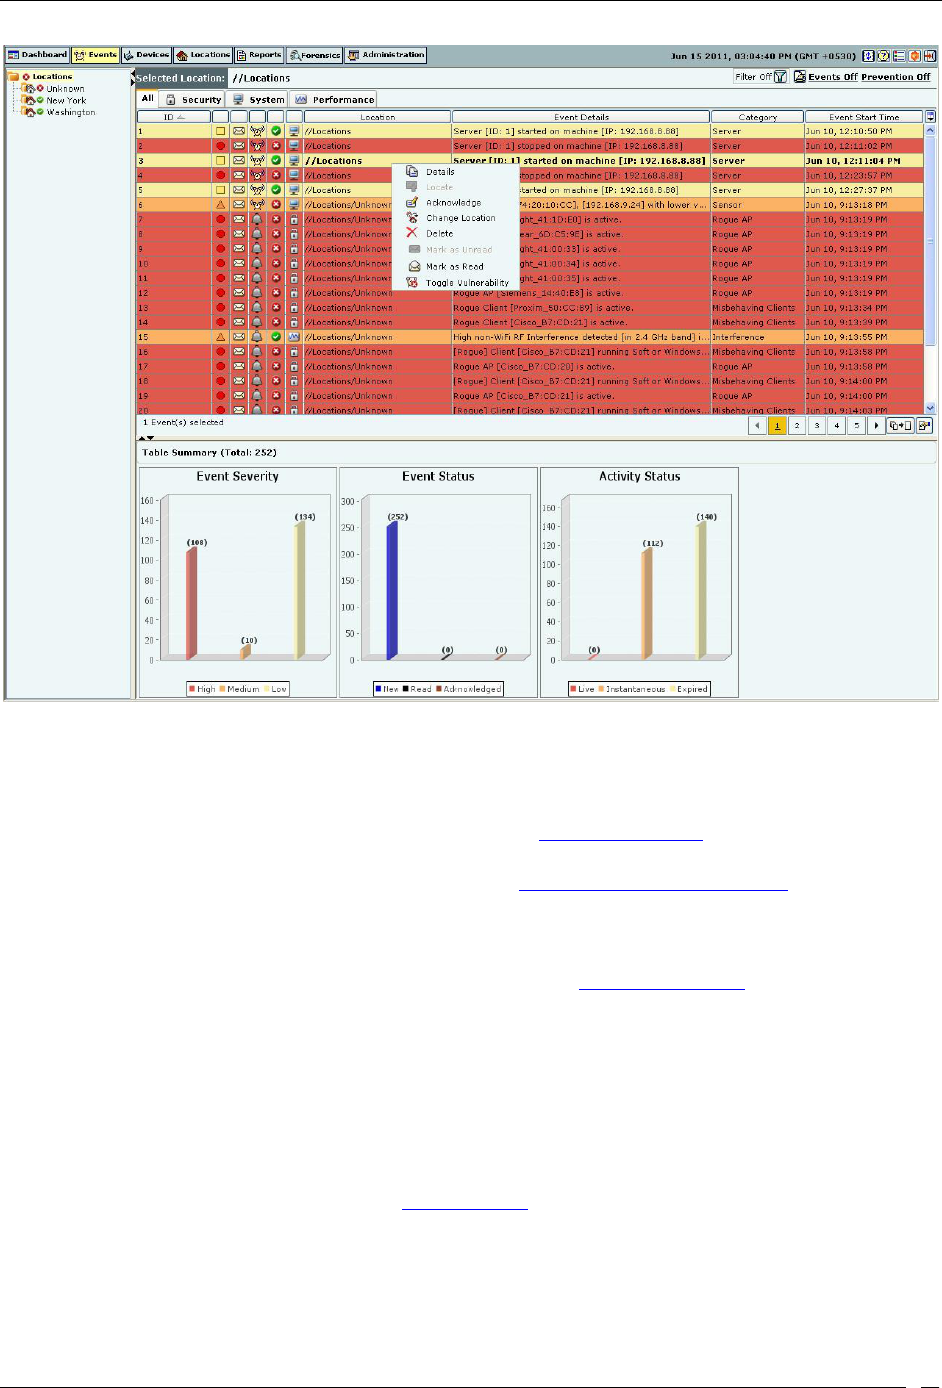
Events Tab
SpectraGuard® Enterprise User Guide
31
Events Context-Sensitive Menu
Items in the Events Context-Sensitive Menu
The Events context-sensitive menu includes the following items.
Details: Opens the Events Details dialog explained in the Event Details Dialog section. This option is
unavailable if you select multiple events.
Locate: Opens the Locate Event dialog explained in the Tracking the Location of an Event section and
enables you to track the location of an event by tracking the location of devices involved in that event.
Acknowledge: Enables you to add comments to an event. These comments serve as a record of actions taken
/ to be taken in response to an event.
Forensics: Opens the Forensics Details dialog explained in the Viewing Threats List section. This menu
option is available for Security events (such as Rogue AP, Mis-configured AP, Honeypot AP, DoS, Banned
AP, Unauthorized Association, Mis-association, Bridging Client, Banned Client, and Ad hoc Networks).
Change Location: Opens the Location Tag dialog that enables you to:
View the complete list of locations
Change the location of the selected event
Delete: Enables you to delete an event. AirTight recommends that you delete an event only after you
have taken the recommended action for that event.
Undelete: Available only if one or more events are deleted and you have checked Show deleted
events check box discussed in the Filtering Events, this option enables you to un-delete event(s).
Mark as Unread: Available only if an event is read; this option enables you to mark an event as a new
event.
Mark as Read: Enables you to mark a new event as read.
Toggle Vulnerability: Enables you select/deselect a checkbox to specify whether this specific event
instance should be considered / not considered for computing the vulnerability status of the network.
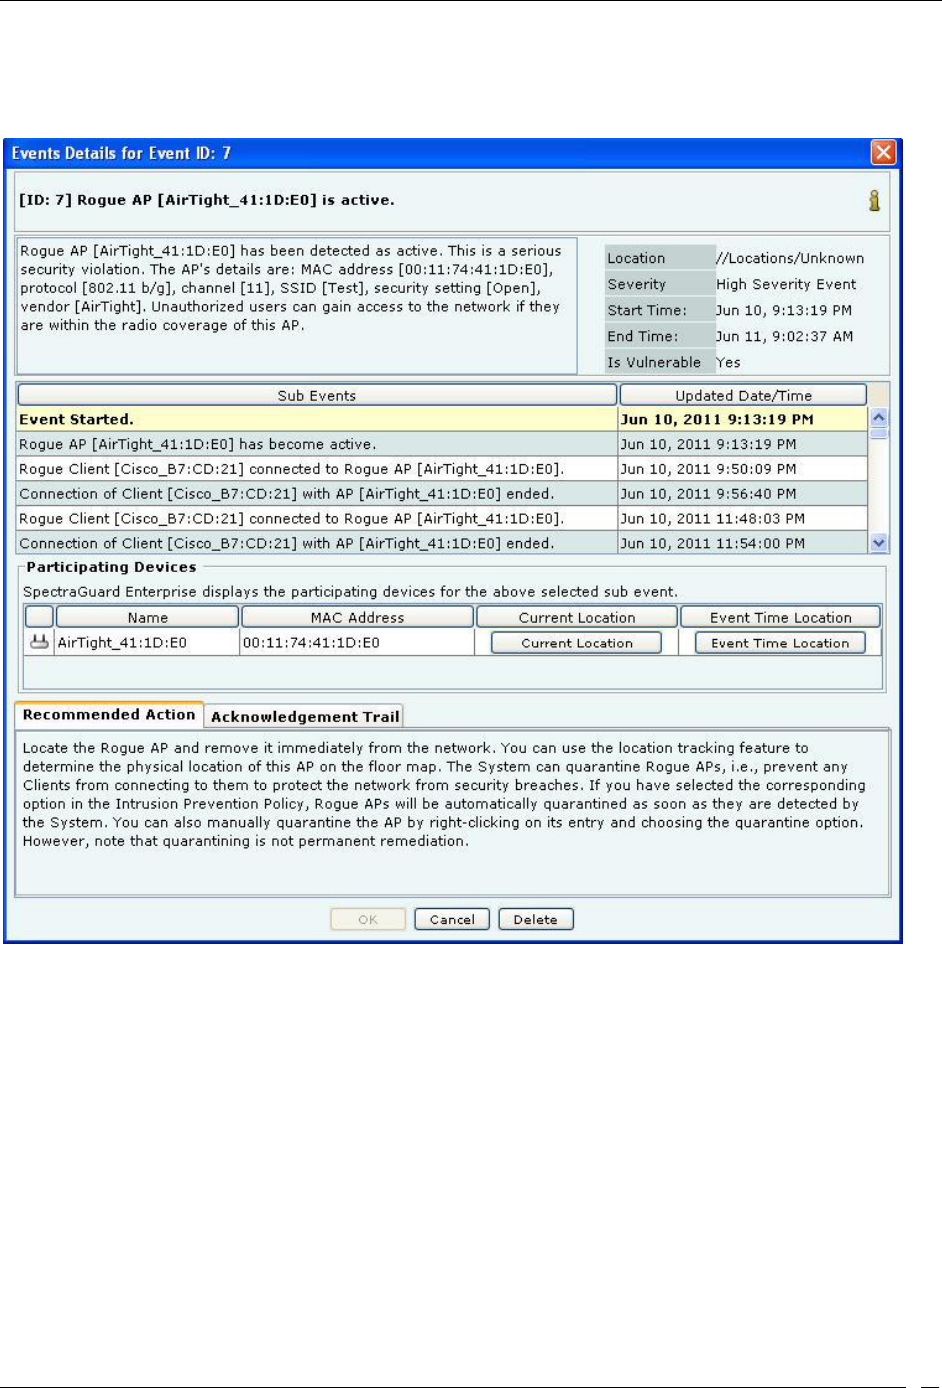
Events Tab
SpectraGuard® Enterprise User Guide
32
Event Details Dialog
To open the Events Details dialog, on the Events screen, double-click an event row.
Events Details Dialog
The Events Details dialog gives information about the selected event, which helps you determine the appropriate
response. The various fields and buttons in this dialog are:
Short Description: Provides a brief description of the event. This is presented as bold text at the top of the dialog.
Event Detailed Description: Gives a detailed description of the event.
Location: Displays the name of the location where the event occurred.
Severity: Displays the severity level of the event.
Start-Time: Shows the date and time when the event started.
End-Time: Shows the date and time (only for expired events) when the event ended.
Is Vulnerable: Indicates if the event contributes to the vulnerability status of the network.
Under Sub Events column, you can view a list of activities or sub-events associated with the event. The sub events
display historic data that varies over time. For example, consider a past event “Rogue AP is Active”; this event
contains an AP’s classification (category) as time varying data. To capture this change in classification, the event will
have sub-events such as:
Event started
Classification of AP changed to Rogue
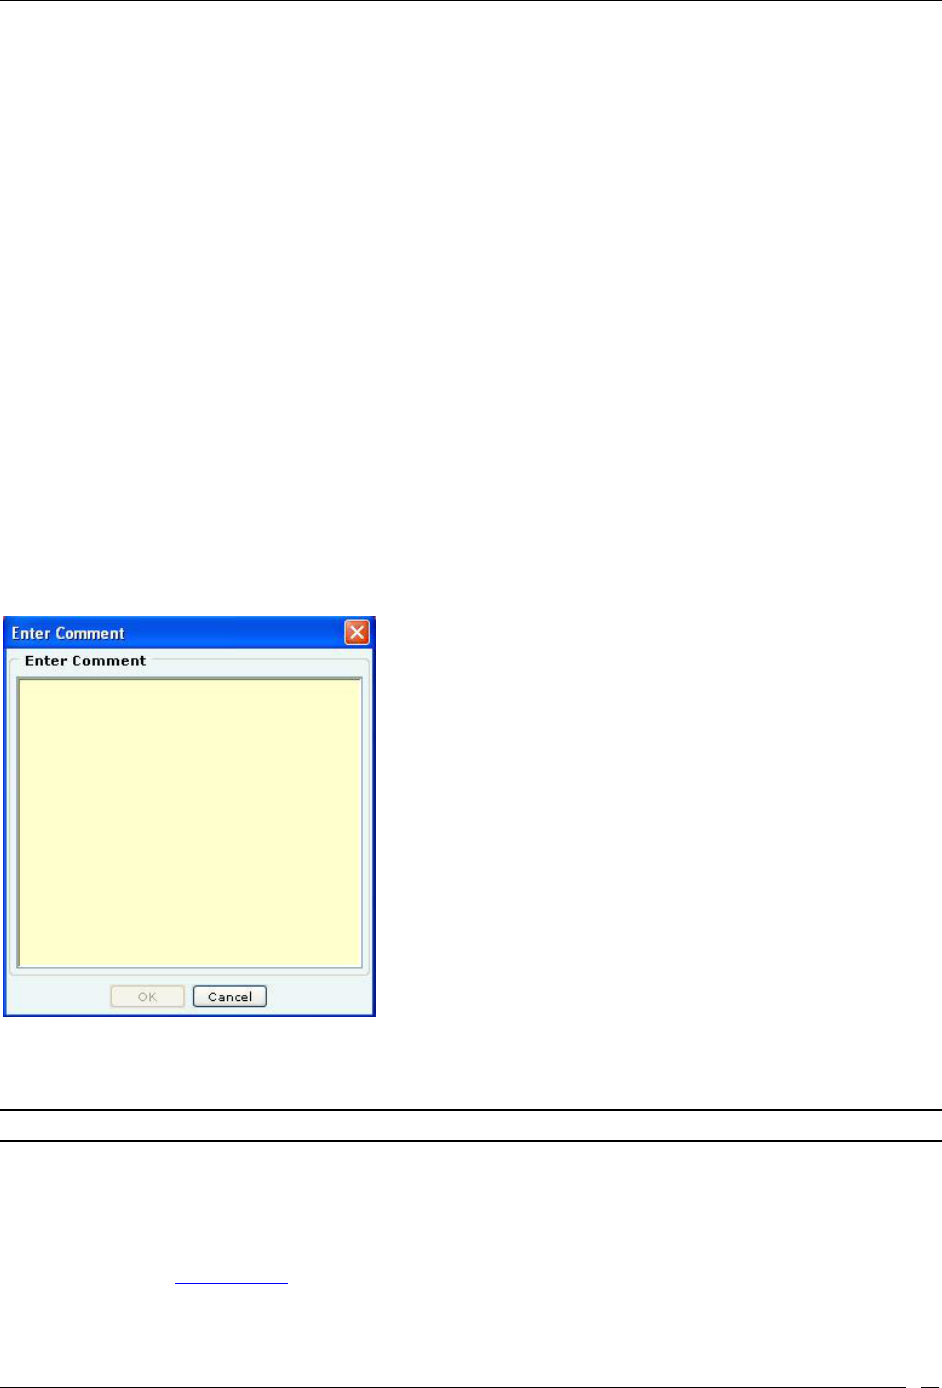
Events Tab
SpectraGuard® Enterprise User Guide
33
AP has become inactive
Event expired
Under Updated Date/Time column, you can view the date and time of generation of the sub-event.
Participating Devices: Displays the following information for each device involved in the sub-event:
Icon
Name
MAC address
Current Location Button (to see the current location of the device involved in the sub-event)
Event Time Location Button (to see the location of the device at the time of occurrence of the
sub-event)
Under Recommended Action tab, the system displays the recommended action that you can take in response to
the event
Under Acknowledgement Trail tab:
Add Comments: Enables you to type acknowledgement notes for the event and acknowledge
the event.
Acknowledgement Notes Trail: Provides a history of acknowledgement notes.
Click Delete to delete the event after confirmation.
Acknowledging an Event
Acknowledge an event so that you can refer to these notes in future. Use the following steps to acknowledge an event:
1. On the Events screen, right-click an event row.
2. From the resulting menu, select Acknowledge.
Event Acknowledgement Dialog
3. In the Enter Comment dialog, under Enter Comment, enter informative text.
4. To save the text click <OK>.
Note: An administrator can read, select, and add comments (acknowledgment notes) for multiple events.
Deleting an Event
When you delete an event manually, the system does not remove it from the system but only marks it as deleted. A
deleted event does not contribute to the vulnerability status for a location. Deleted events are also visible in a report.
Permanent deletion of events from the database happens only automatically based on the configured auto-deletion
policy for events (see Auto Deletion).
Use the following steps to delete an event:
1. On the Events screen, right-click an event row.
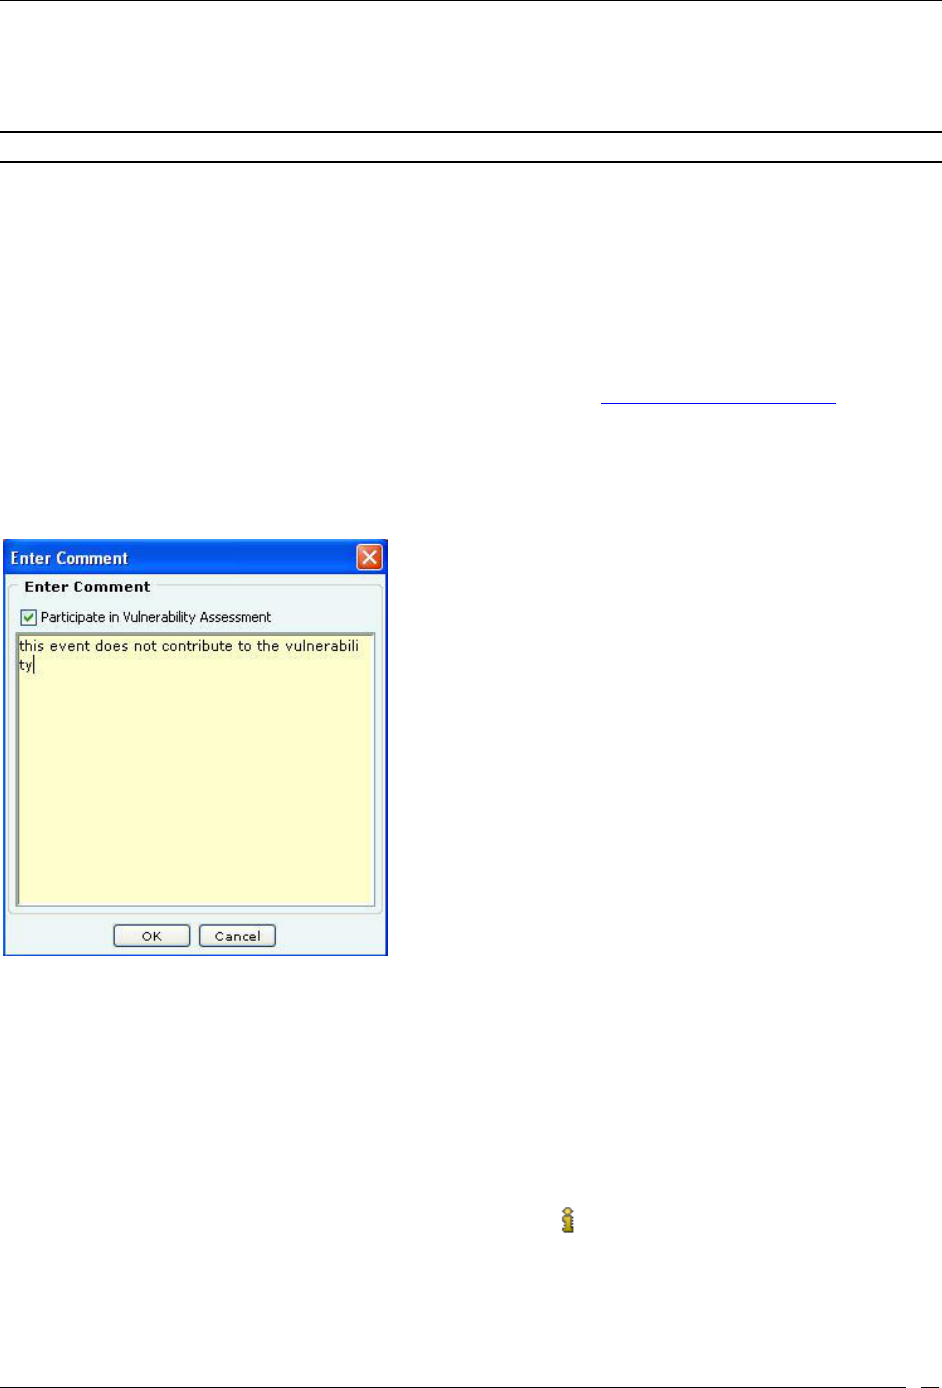
Events Tab
SpectraGuard® Enterprise User Guide
34
2. From the resulting menu, select Delete.
3. In the Confirm dialog, click <Yes> to delete the event. If you have selected the Show deleted
events checkbox on the Filter Events dialog, the text for this deleted event row appears as strikethrough.
Recommended: AirTight recommends that you delete an event only after you view it and have taken the necessary action.
Undeleting an Event
Use the following steps to undelete an event:
1. On the Events screen, right-click an event row that is deleted. The text for this deleted event row
appears as strikethrough.
2. From the resulting menu, select Undelete.
Toggling an Event’s Contribution to Network Vulnerability
As part of system configuration you would have identified certain event types as contributing to vulnerability by
checking the Vulnerable flag in the event configuration. For details refer to Event Settings, Configuration section in
Admin tab. Whenever events of these types occur, they contribute to the vulnerable status of the network. After
taking action on these event occurrences, you can change the vulnerability status of such event occurrences from the
Event Screen. Use the following steps to toggle the vulnerability of an event:
1. On the Events screen, right-click an event row.
2. From the resulting menu, select Toggle Vulnerability.
Toggling Event Vulnerability
3. In the Enter Comment, select/deselect the checkbox Participate in Vulnerability Assessment.
4. In the space provided below the checkbox, enter informative text describing the reason for
changing.
5. To save the changes, click OK.
Viewing Detailed Information for an Event
You can view more information about an event to understand its cause and effect. Use the following steps to view
additional information for an event:
1. On the Events screen, double-click an event row.
2. On the Event Details dialog that appears, click the icon. A dialog that shows more information
for that event type appears.
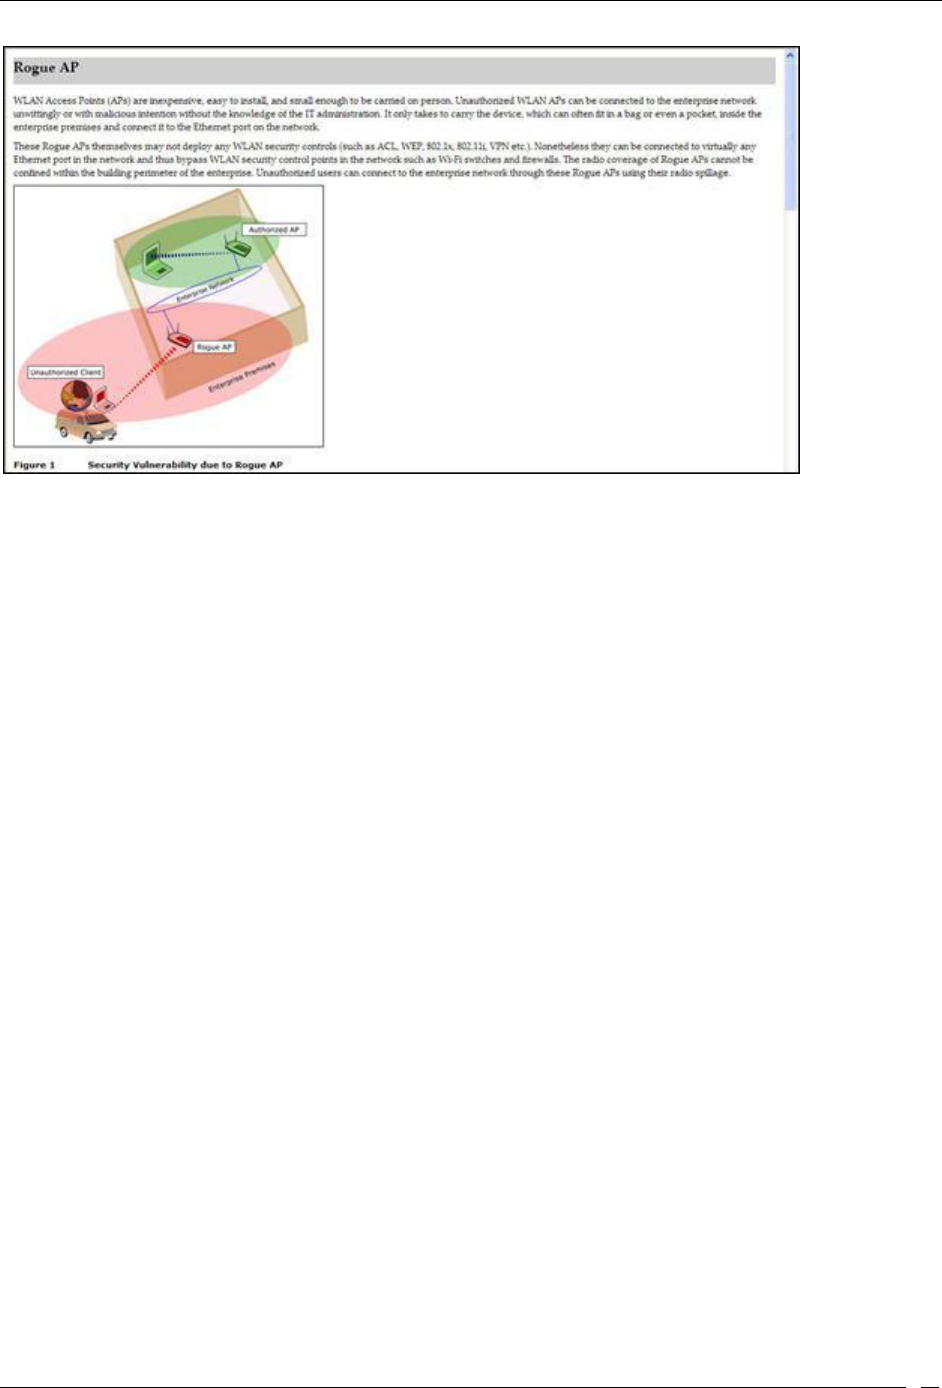
Events Tab
SpectraGuard® Enterprise User Guide
35
Viewing Additional Information about an Event
Tracking the Location of an Event
You can track the location of an event by tracking the location of each participating AP, Client, or attacker device. Use
the following steps to track the location of an event:
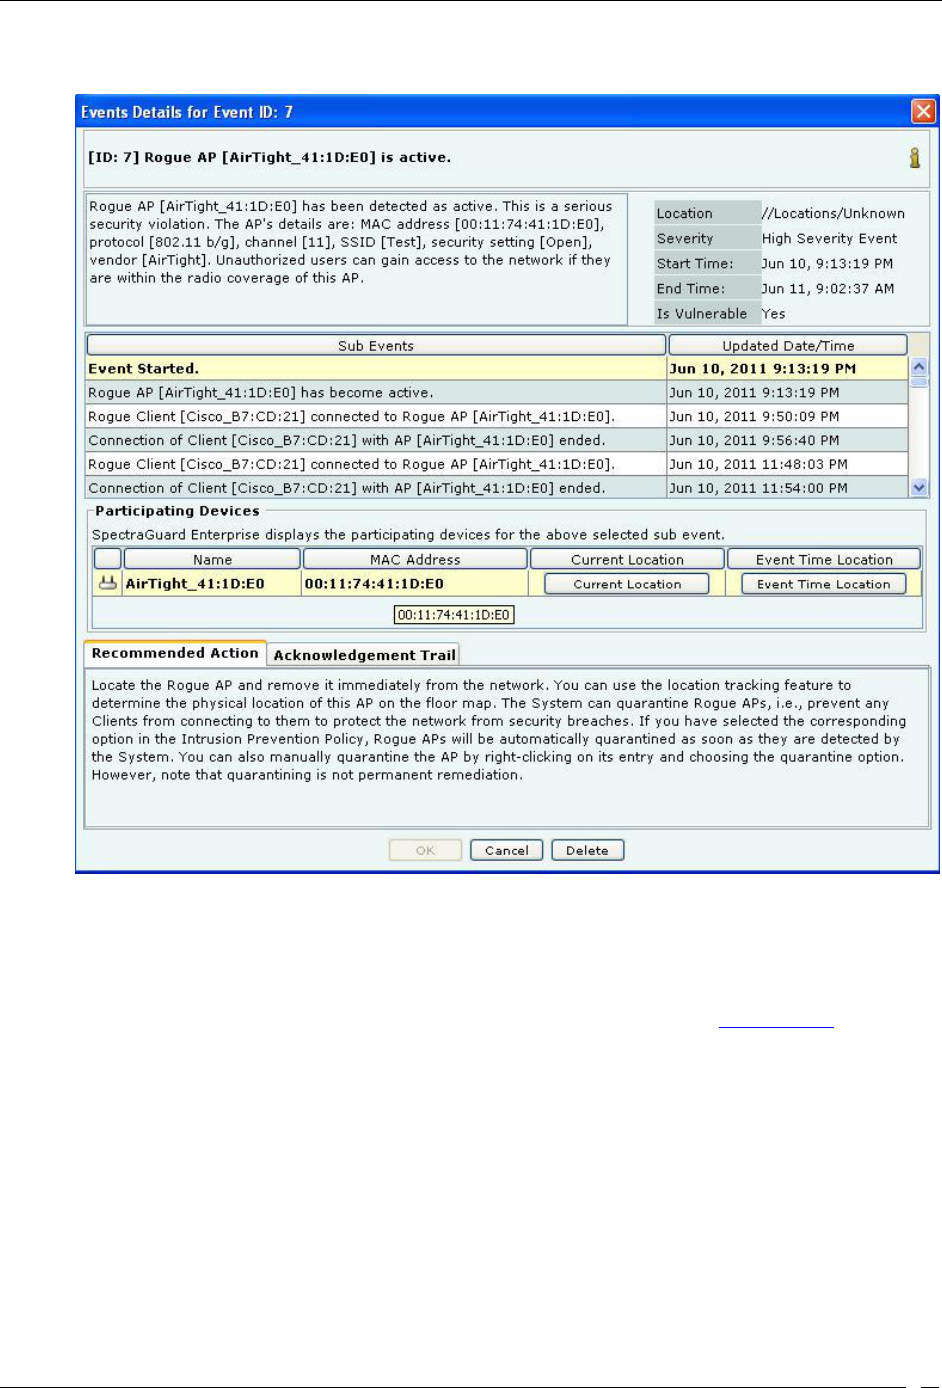
Events Tab
SpectraGuard® Enterprise User Guide
36
1. On the Events screen, right-click an event row and then from the resulting menu, select Locate. This opens
the Event Details dialog as shown below:
Tracking the Location of an Event
2. On the Event Details dialog, perform the following:
Under Sub Events, select a sub-event
Under Participating Devices, select a device participating in the selected sub-event
Click <Current Location> to view the current location of the device. The Device Details dialog
opens with Locate tab selected providing the details of the location (see Device Details).
Click <Event Time Location> to view the location of the device at the time of occurrence of the sub-
event as shown in the figure.
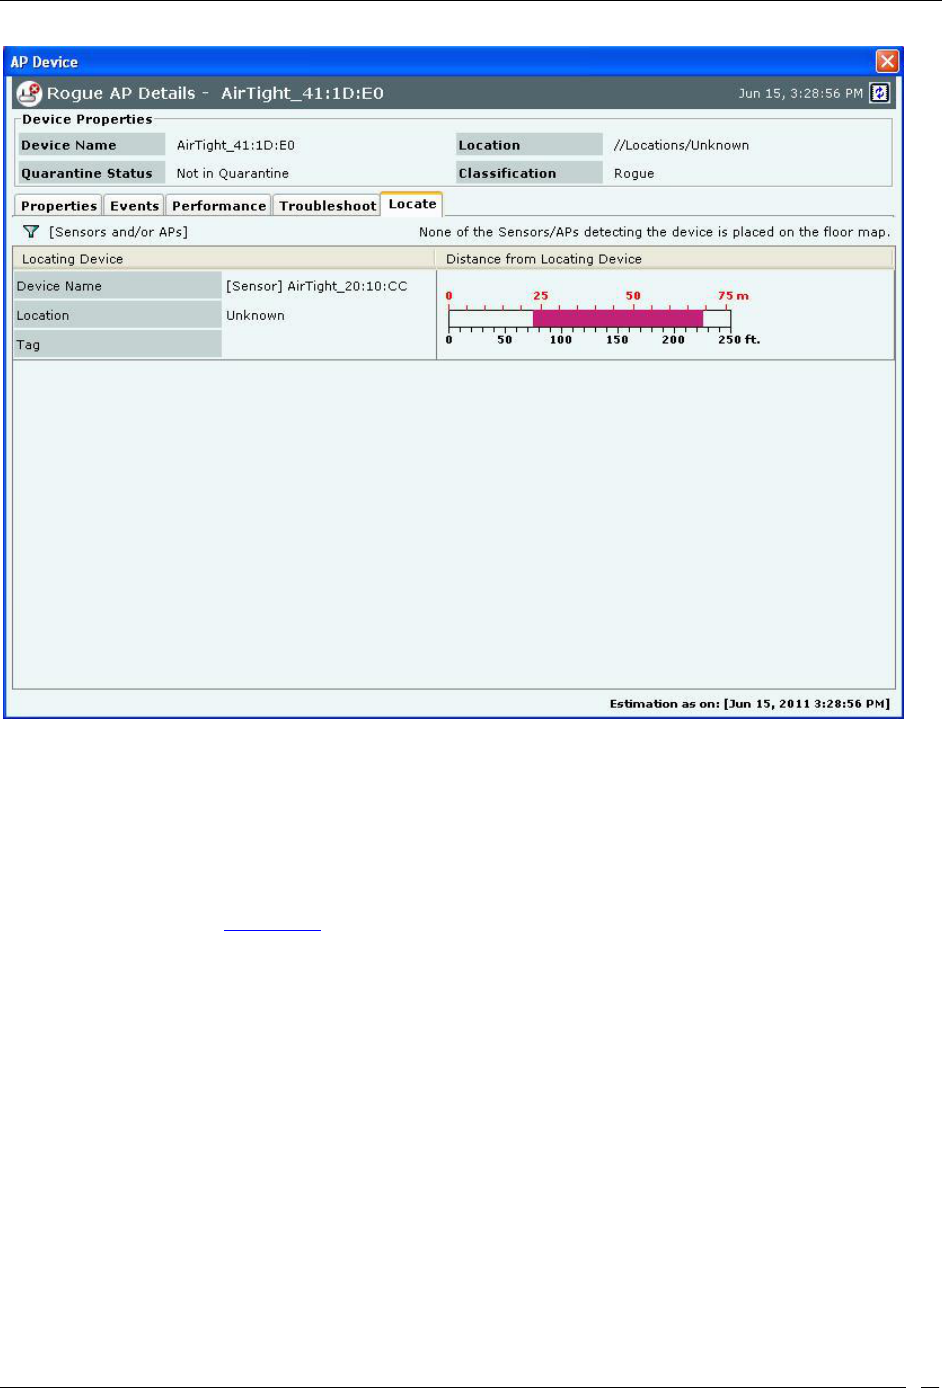
Events Tab
SpectraGuard® Enterprise User Guide
37
Event Time Location dialog
Viewing Properties of Devices associated with an Event
To view/edit the properties of an AP, Client, or Sensor associated with an event use the following steps to access the
corresponding device menu:
1. On the Events screen, double-click an event row.
2. On the Event Details dialog, under Participating Devices, right-click a device row and select
Details from the resulting menu. The right-click options are same as that of Device Details dialog. For more
details refer to the Devices Tab section.
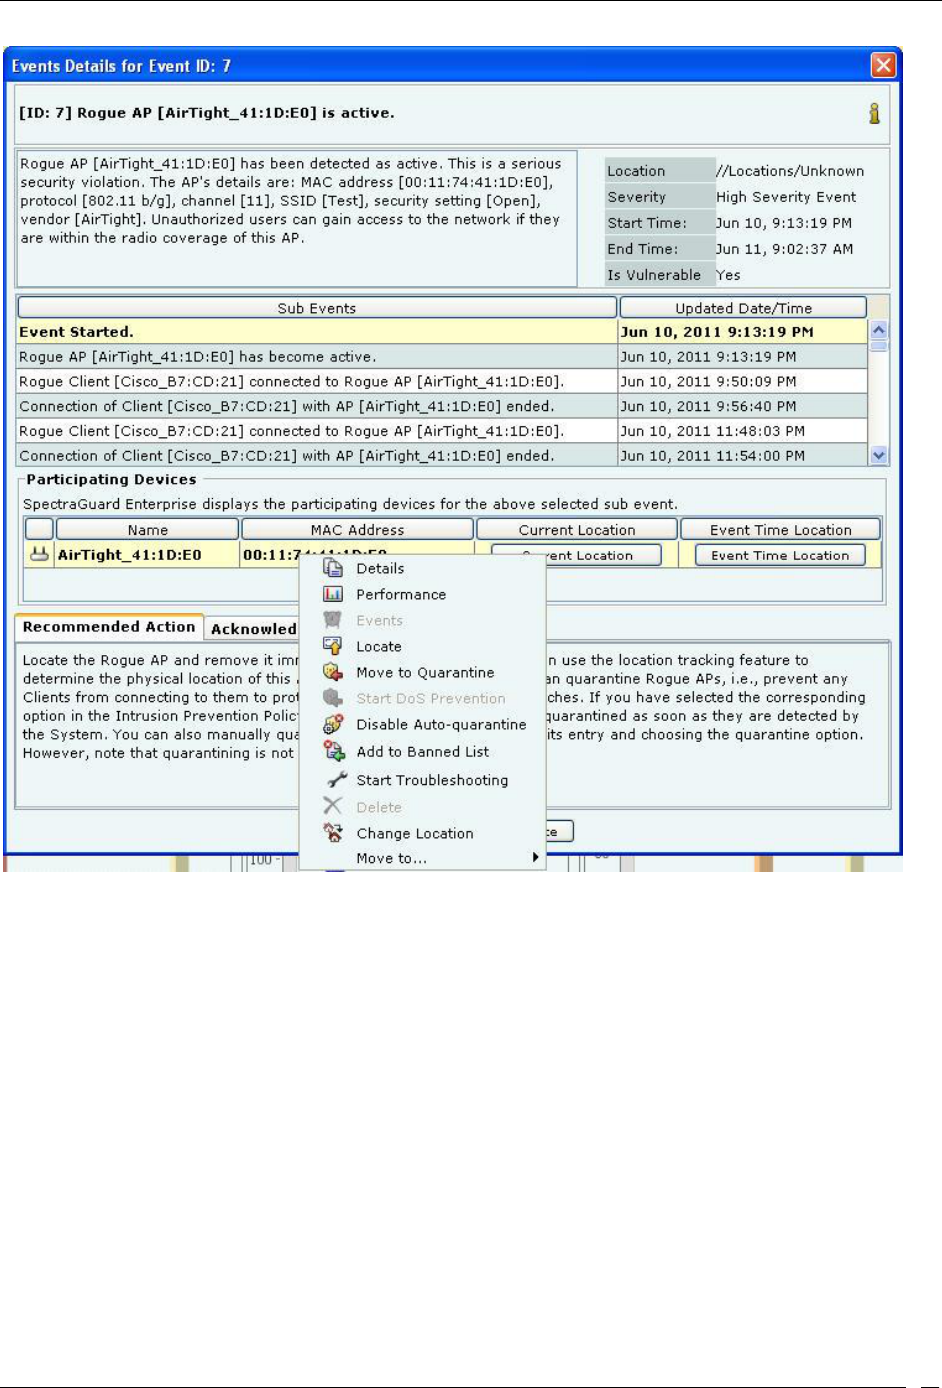
Events Tab
SpectraGuard® Enterprise User Guide
38
Viewing Device Properties from Events Details Dialog
Events Tab: User Saved Settings
The following User choices made during browsing of Events Tab are saved by the system.
Display Columns and their order
Events Filter
Page Size
These settings are saved on log out as well as movement to other tabs on the Console.
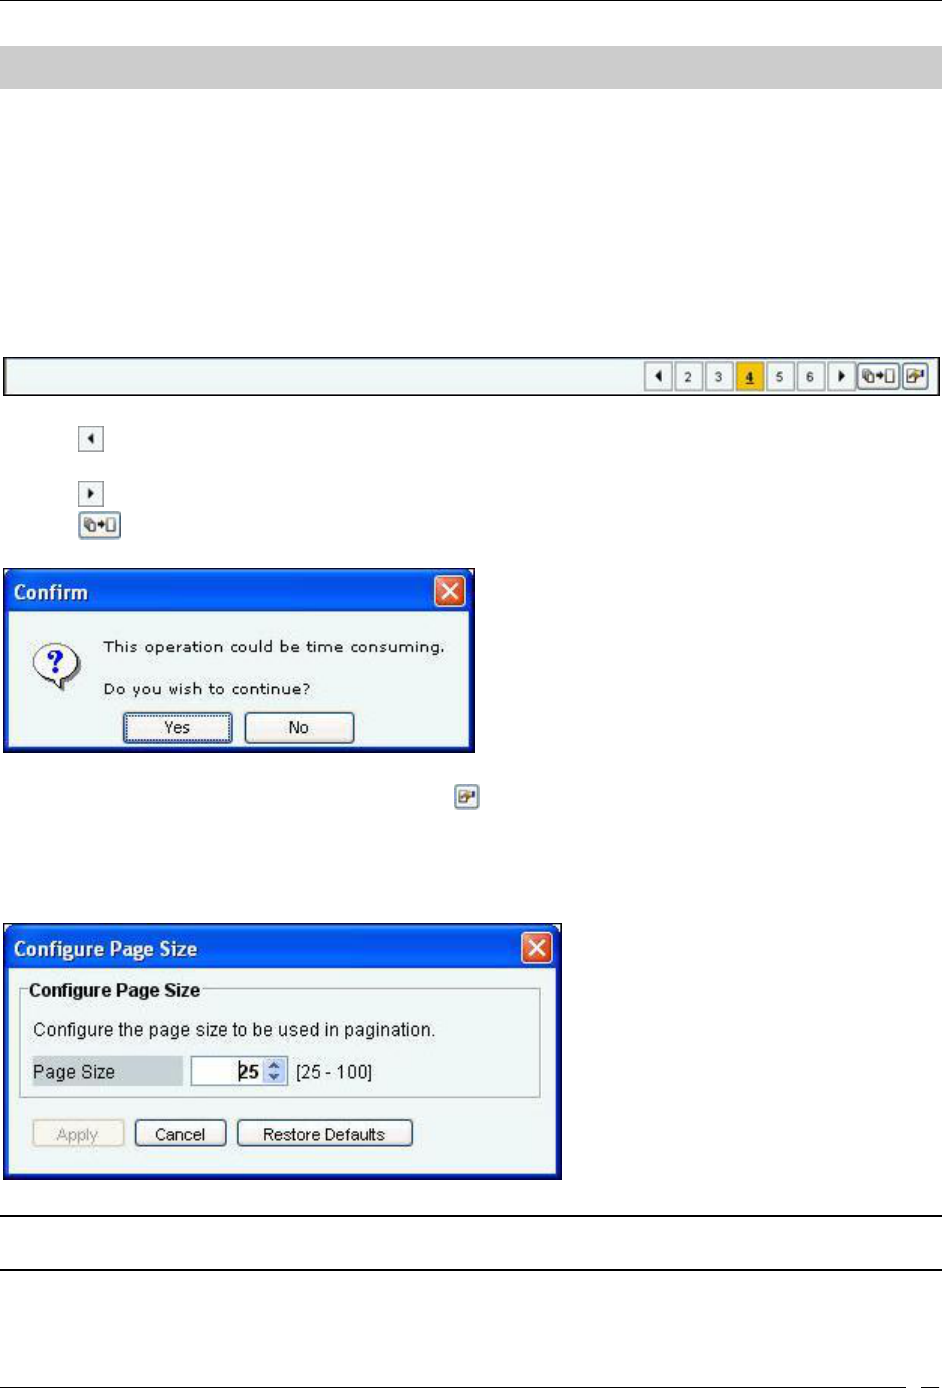
Devices Tab
SpectraGuard® Enterprise User Guide
39
Devices Tab
Devices: Panel Displaying WLAN Devices
The Devices screen provides information about APs, clients, sensors, sensor/AP combos, and networks visible to the
system. On this screen, you can view/edit their details, sort the display based on their properties, carry out a variety
of operations, like changing their location, changing their classification, initiating quarantine activities, and
troubleshooting an AP, a Client, a Sensor or a Sensor/AP Combo.
Pagination of Devices
You can control the display of devices on this screen by choosing to display all the devices or display them one page
at a time. The Devices screen has a new toolbar as shown in the figure below, to configure the Pagination.
Toolbar for Configuring the Pagination of Devices
Click the icon, to go to the Previous Page from a Page in the Devices screen.
Click on the respective Page number of the Devices List. Maximum five Page numbers are displayed.
Click the icon, to go to the Next Page from a Page in the Devices screen.
Click the icon, to disable the Paging option. A Confirmation screen appears.
Confirm turning off Pagination
Click Yes to turn off the Pagination of Devices. Click the icon, to Configure Page size of Devices as shown in the
figure. The Page Size value selected is the number of Devices that will be displayed on every page in the Devices
screen.
(Minimum: 25; Maximum: 100, Default: 25 Events per Page)
Configure Devices Page Size Screen
Note: The Device Pagination feature will appear whenever the Devices screen is displayed (for example, Manage SAFE Clients
screen in Administration tab, and so on.)
Devices Screen
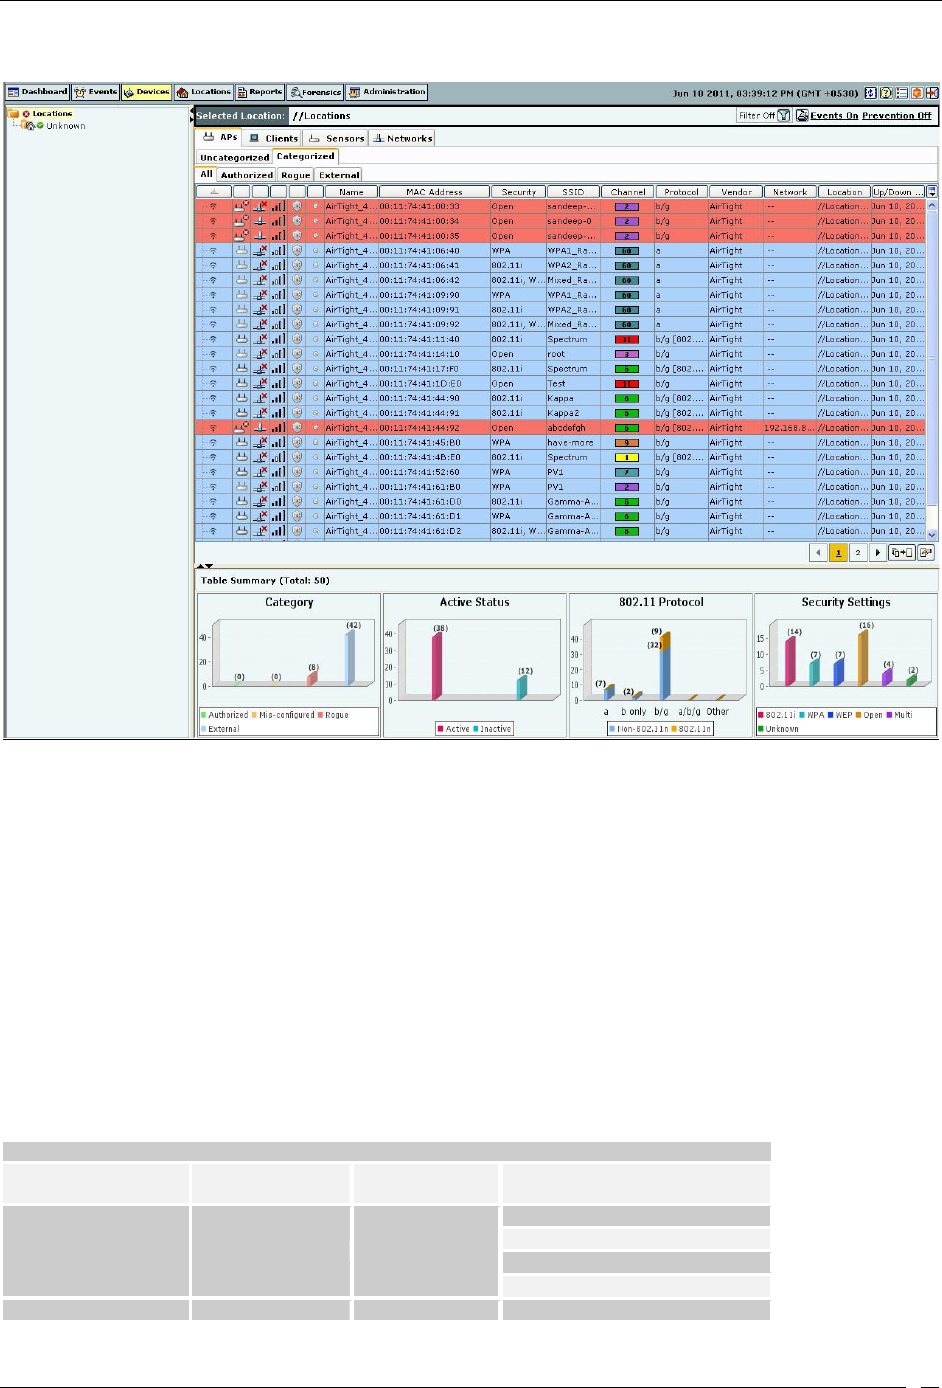
Devices Tab
SpectraGuard® Enterprise User Guide
40
To open the Devices screen, on the navigation bar, select the Devices tab
Devices Screen
The Devices screen includes two panes:
On the left, the Location tree.
On the right, device category tabs, device lists, and table summary.
Devices: Location Tree
The Location tree shows the complete list of locations for your WLAN in the system. The devices at the selected
location are shown in the pane on right. You can choose a Device type (APs, clients, sensors or networks) and
category within the device type tab to see a list of devices of chosen category.
Device Categories, Device Lists, and Table Summary
The right pane of the Devices screen shows a list of devices tagged to the selected location. Tabbed views enable you
to view device lists for Uncategorized and Categorized APs and Clients, a list of all the Sensors and a list of
networks detected by SGE sensors.
The Table Summary displays information about APs, Clients, Sensors, and networks in the network.
APs
Chart Name
Uncategorized
APs
Categorized
APs
Display Information
Potential
Classification
Yes
Potentially Authorized
Potentially Rogue
Potentially External
Indeterminate
Category
Yes
Authorized
Devices Tab
SpectraGuard® Enterprise User Guide
41
Mis-configured
Rogue
External
Network
Connectivity
Yes
Networked
Non-Networked
Indeterminate
Active Status
Yes
Active
Inactive
802.11 Protocol
(with or without
802.11n capability)
Yes
Yes
a
b only
b/g
a/b/g
Other
Security Settings
Yes
Yes
802.11i
Wi-Fi Protected Access (WPA)
Wired Equivalent Privacy (WEP)
Open
Multi
Unknown
Note: The system labels APs that are imported and whose protocol information is not available as Other.
Clients
Chart Name
Uncategorized
Clients
Categorized
Clients
Display Information
Active Status
Yes
Yes
Active
Inactive
Category
Yes
Authorized
Misbehaving
External
Guest
Rogue
Quarantine Status
Yes
Quarantined
Not Quarantined
SAFE Status
Yes
Yes
Active
Inactive
Not Installed
Sensors
Chart Name
Display Information
Sensor Type
Sensor
Sensor/AP Combo
ND
Active Status
Active
Inactive
Networks
Chart Name
Display Information
Monitored Status
Monitored(Yes)
Not Monitored(No)
Viewing APs/Clients List
Use the following steps to open a APs/Clients list:
1. In the Location tree, select a location.
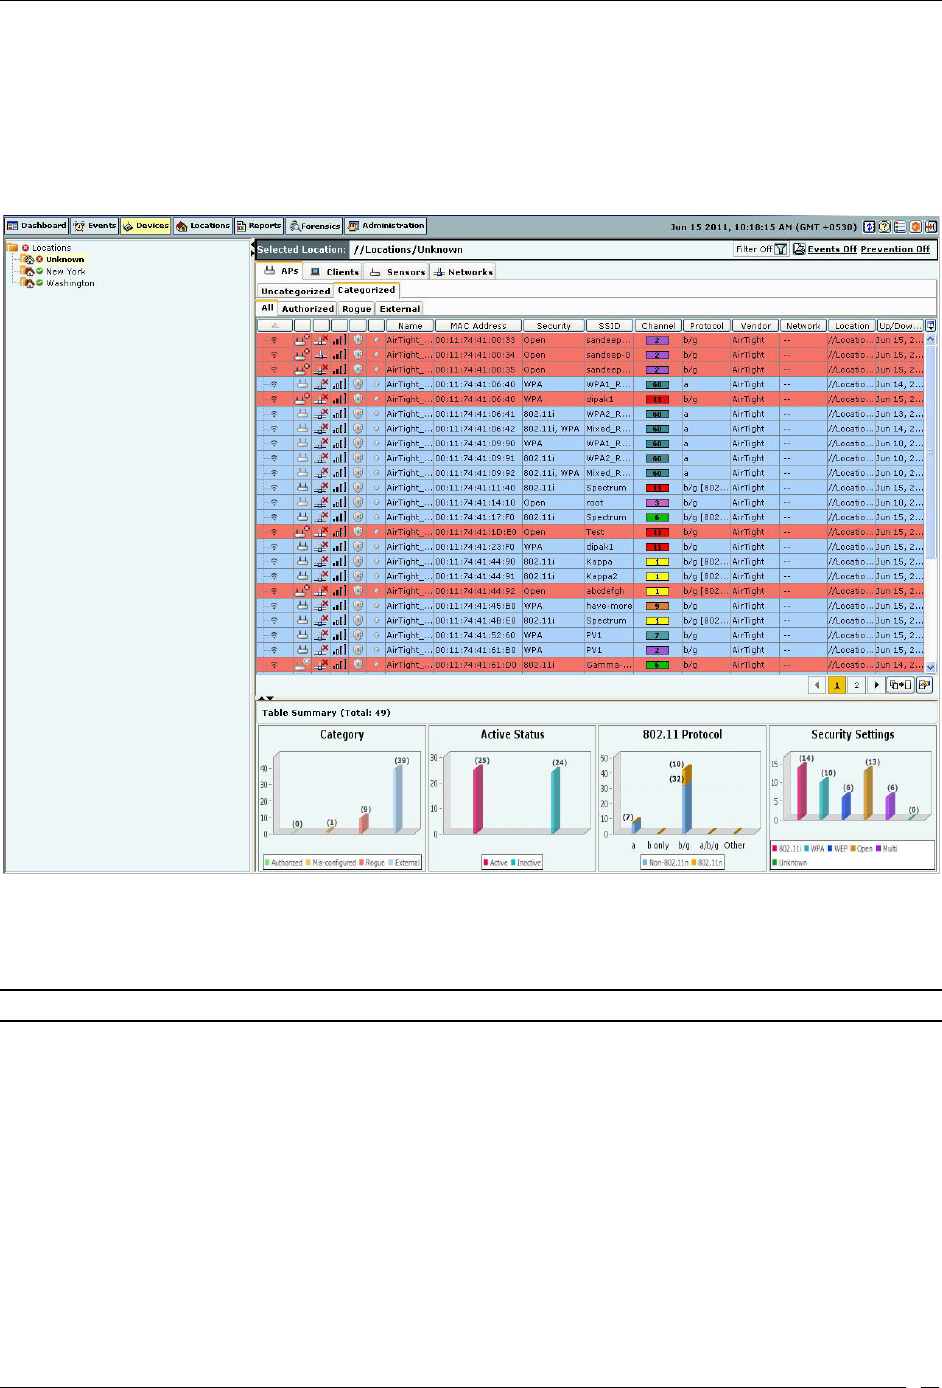
Devices Tab
SpectraGuard® Enterprise User Guide
42
2. On the right, a list of APs/Clients tagged to that location appears; select either the APs or Clients tab.
3. On the header, next to the Search icon, select the Include Inactive APs/Clients check box to view the
inactive APs/Clients in the list.
4. Select either the Uncategorized or Categorized tab under APs or Clients to organize devices. For
Categorized APs, select one of these tabs: All, Authorized, Rogue, or External. For CategorizedClients All,
Authorized, Rogue, Guest, or External
Categorized APs List
The Devices screen shows the following information about APs or Clients.
Expand/Collapse Column: Appears only for Merged or APs with multiple BSSIDs. The Expanded
view shows list of individual BSSIDs with primary AP at the top.
Note: The Expand/Collapse Column appears only in the APs
Categorized
All and Authorized screens.
Device Type and Status Icon: Identifies the type of AP – Rogue, External, Authorized, Indeterminate,
Multiple Radio or the type of Client – Authorized or Rogue/Guest/External (Non-authorized).
Additionally, this icon specifies the status of APs/Clients as – Active/Inactive.
Networked Status Icon: Identifies if the AP is connected to the wired network. This column is not
present for Clients.
Quarantine Status Icon: Identifies the quarantine status of the AP or Client – Quarantined,
Quarantine Pending, or Not in Quarantine. Quarantining an AP or Client utilizes the Sensor’s
computation resources. If no Sensor is currently available to quarantine the AP or Client, this icon
shows Quarantine Pending.
RSSI: Displays the observed RSSI (Received Signal Strength Indicator) value for the AP or Client.
Banned Device Icon: Identifies if the AP or Client is in the Banned AP List or Banned Client List.

Devices Tab
SpectraGuard® Enterprise User Guide
43
Troubleshooting Status Icon: Identifies whether troubleshooting is in progress on the specified AP
or Client, or both.
SpectraGuard Security Agent For Endpoints (SAFE) Status Icon: Identifies the SAFE installation
status – Installed-Active, Installed-Inactive, or Not Installed.
SAFE Risk Level Icon: Identifies the SAFE risk level – High, Medium, or Low.
Smart Device Icon: Identifies the smart device, that is whether the device is an approved smart
device or unapproved smart device.
Name: Specifies the user-defined name for the AP or Client. If SAFE is installed then the hostname
of the Client is displayed.
MAC Address: Specifies the unique 48-bit IEEE format address of the AP or Client assigned to the
network adapter by the manufacturer.
Security: Shows the security settings for the AP, such as Open, WEP, WPA, 802.11i, or Unknown.
Encryption: Specifies the encryption used for unicast communication between the AP and a Client.
MFP/11w: Indicates if the AP implements pre-802.11w standard from Cisco or 802.11w standard, to
mitigate against the DoS attacks against AP.
Authentication: Specifies the procedure used by APs to verify the identity of a Client.
SSID: For an AP, it specifies the operating SSID, which is the unique identity that prospective
Clients use to recognize the network. When several WLANs operate in the same space, SSID helps
Clients in deciding which one to join. However, SSID alone does not provide any meaningful
security. For a Client, it specifies the operating SSID of the AP with which the Client is associated.
Channel: Specifies the channel number on which the AP or Client operates. The channel is shown
as Dual for an AP or Client that operates on both 802.11a and 802.11b/g simultaneously.
Protocol: For an AP, it specifies the 802.11 protocol used – 802.11a, 802.11b only, 802.11b/g, or
802.11a/b/g, with or without 802.11n capability. For a Client, it specifies the 802.11 protocol (with or
without 802.11 n capability) used by the AP with which the Client is associated.
Vendor: Specifies the name of the AP or Client manufacturer. The vendor name is inferred from
the first three bytes of the MAC address.
Network: Shows the Network Tag of the network to which the AP is connected. This value is blank
if the AP is not connected to a network.
Location: Gives the user-defined location name of the AP or Client.
Up/Down Since: Specifies the date and time since the AP or Client is up or down.
# Associated Clients: Specifies the number of Clients associated to the AP.
Group: Displays the SAFE group to which the Client belongs. It denotes the group assigned to the
SAFE Client.
Associated AP: Specifies the name of the AP with which a Client is associated. This is the AP
through which the Client communicates with other Clients and other networked devices.
Cell ID: Specifies an ID for Clients in ad hoc mode. The Cell ID is common for all the Clients that
form a single ad hoc connection.
Smart Device Type Name: Specifies the type of smart device
First Detected At: Specifies the date and time when the AP/Client was first detected by the system.
Configure Display Columns: Clicking on the Column Visibility icon opens a window showing the
columns available for display and their current selection and display order. You can
check/uncheck the checkbox next to the column name to select/deselect it from Device display. You
can change the display order of a column by selecting the column name and moving it up or down
with Up/Down buttons. Save the display settings by clicking the Save button.
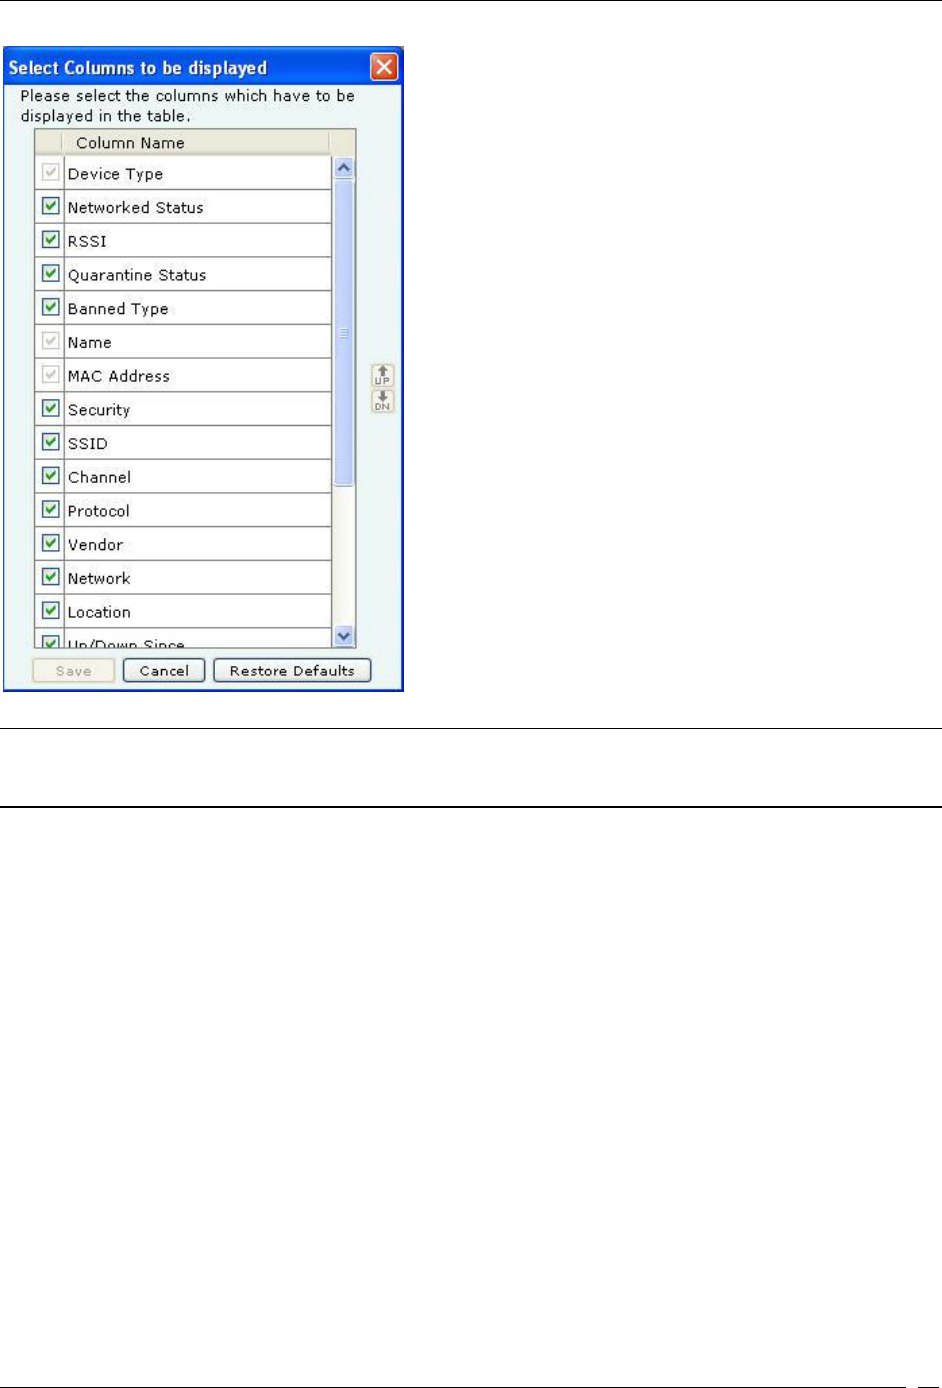
Devices Tab
SpectraGuard® Enterprise User Guide
44
Devices Tab – Display Columns Screen
Note: The columns Network Status Icon, Security, Encryption, 11w/MFP, Authentication, Channel, Network, and
Associated Clients appear only in the APs list. SAFE Status Icon, SAFE Risk Level Icon, Group, Associated AP, and
Cell ID appear only in the Clients list.
Viewing Sensors List
Use the following steps to open a Sensors list.
1. In the Location tree, select a location.
2. On the right, a list of devices tagged to that location appears; select the Sensors tab.
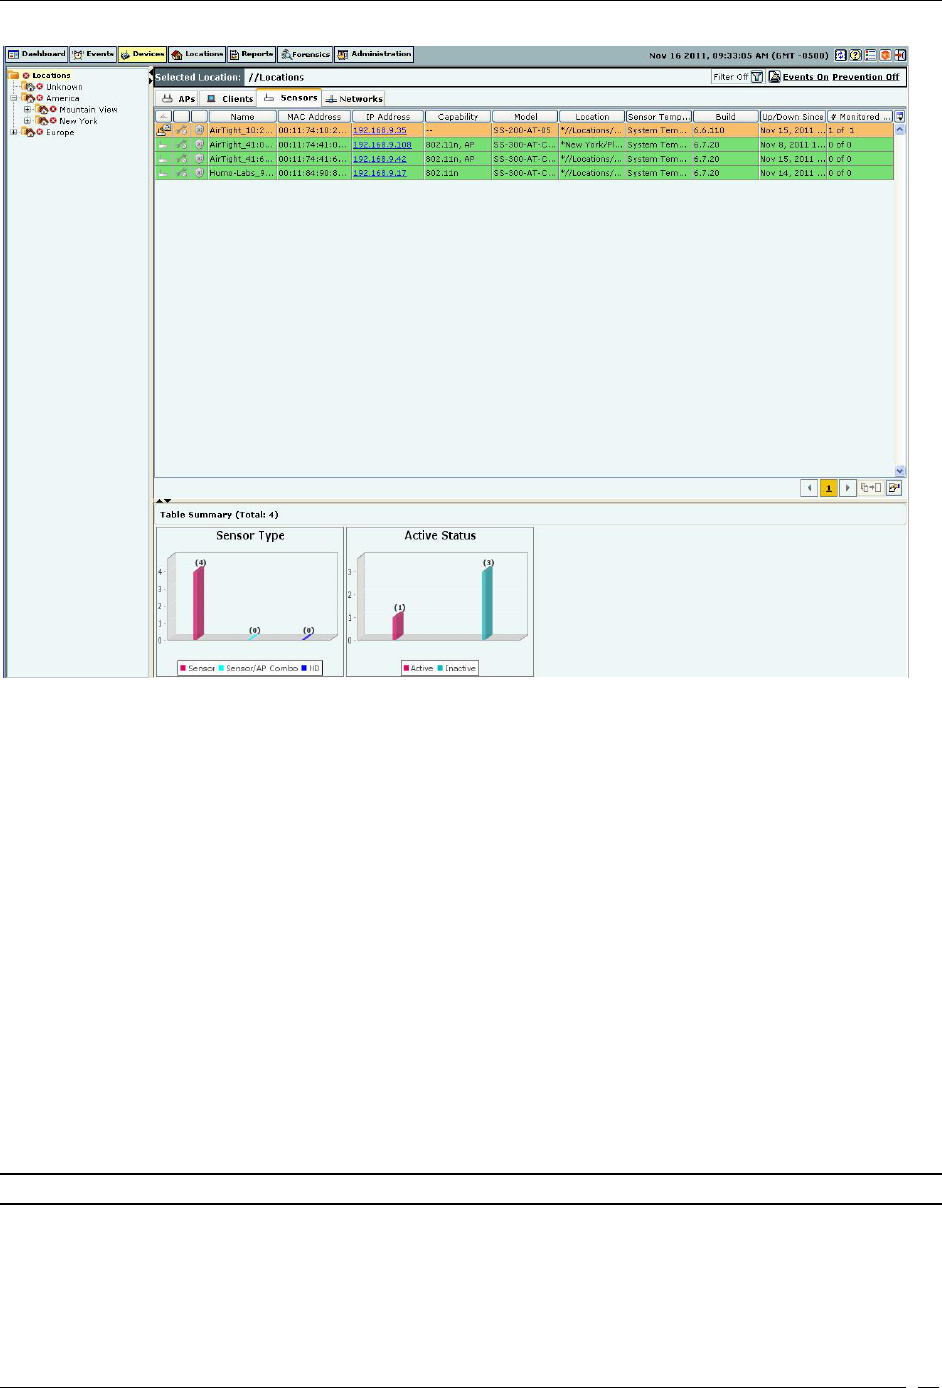
Devices Tab
SpectraGuard® Enterprise User Guide
45
Sensors List
The Devices screen shows the following information about Sensors:
Device Type and Status Icon: Identifies the type of Sensor – Sensor, Sensor/AP combo, ND, and its status –
Active, Inactive, Upgrade Required, or Upgrade in Progress.
Troubleshooting Status Icon: Identifies if troubleshooting is in progress on the specified Sensor.
Name: Specifies the user-defined name for the Sensor.
MAC Address: Specifies the unique 48-bit IEEE format address of the Sensor assigned to the network
adapter by the manufacturer.
IP Address: Specifies the IP Address of the Sensor.
Capability: Specifies if the Sensor has 802.11n capability. Also specifies if the sensor is Sensor/AP combo.
The text AP indicates that the sensor/AP combo device has AP mode enabled.
Model: Specifies the model number of the Sensor
Location: Gives the user-defined location name of the Sensor.
Template: Specifies the Configuration template assigned to the Sensor.
Build: Specifies the build number of the software running on the Sensor.
Up/Down Since: Specifies the date and time since the Sensor is up/down.
# Monitored VLANs: Specifies the number of VLANs monitored by the ND.
AP Mode:Specifies whether the AP mode is enabled or disabled.
AP Template:Specifies the AP template being used by the Sensor/AP combo.
Note: The default mode for Sensor/AP Combo device is the Sensor mode.
Viewing List of Networks Detected by Sensors
Use the following steps to view the list of networks detected by sensors
1. In the Location tree, select a location.
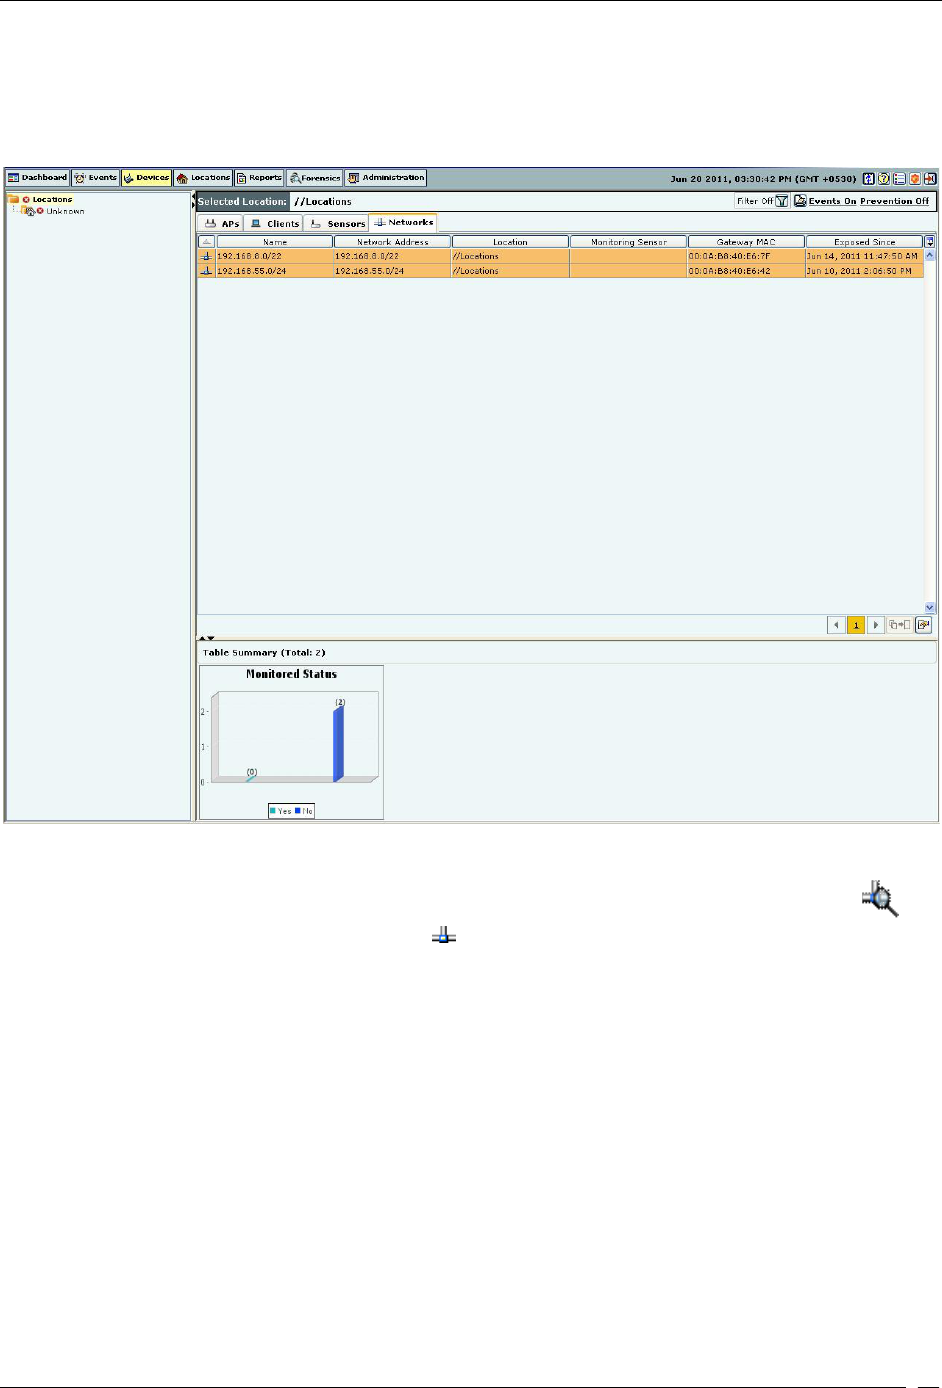
Devices Tab
SpectraGuard® Enterprise User Guide
46
2. On the right, a list of devices, and networks tagged to that location appears; select the Networks
tab.
The following figure displays the Networks tab.
Networks tab
The Networks tab shows the following information about the networks detected by the SGE sensors
Monitored Status:specifies whether the network is monitored or unmonitored by SGE sensor. The icon
indicates that the network is monitored. The icon indicates that the network is unmonitored. This field is
not editable.
Name: specifies the network name of the network, by default. This is an editable field and can be changed
by the user.
Network address: specifies the network address of the network.
Location: specifies the location of the network.
Monitoring sensor: specifies the sensor name of the sensor that has detected this network.
Gateway MAC: specifies the MAC address of the gateway. This field cannot be deselected.
Exposed since: specifies the date and time of exposure. This field is populated if the network is not being
monitored. The date and time when monitoring for the network has stopped, is displayed in this field.
You may configure display columns to view the columns that you want to view. For this, click on the Column
Visibility icon. The following window showing the columns available for display and their current selection and
display order, is opened.
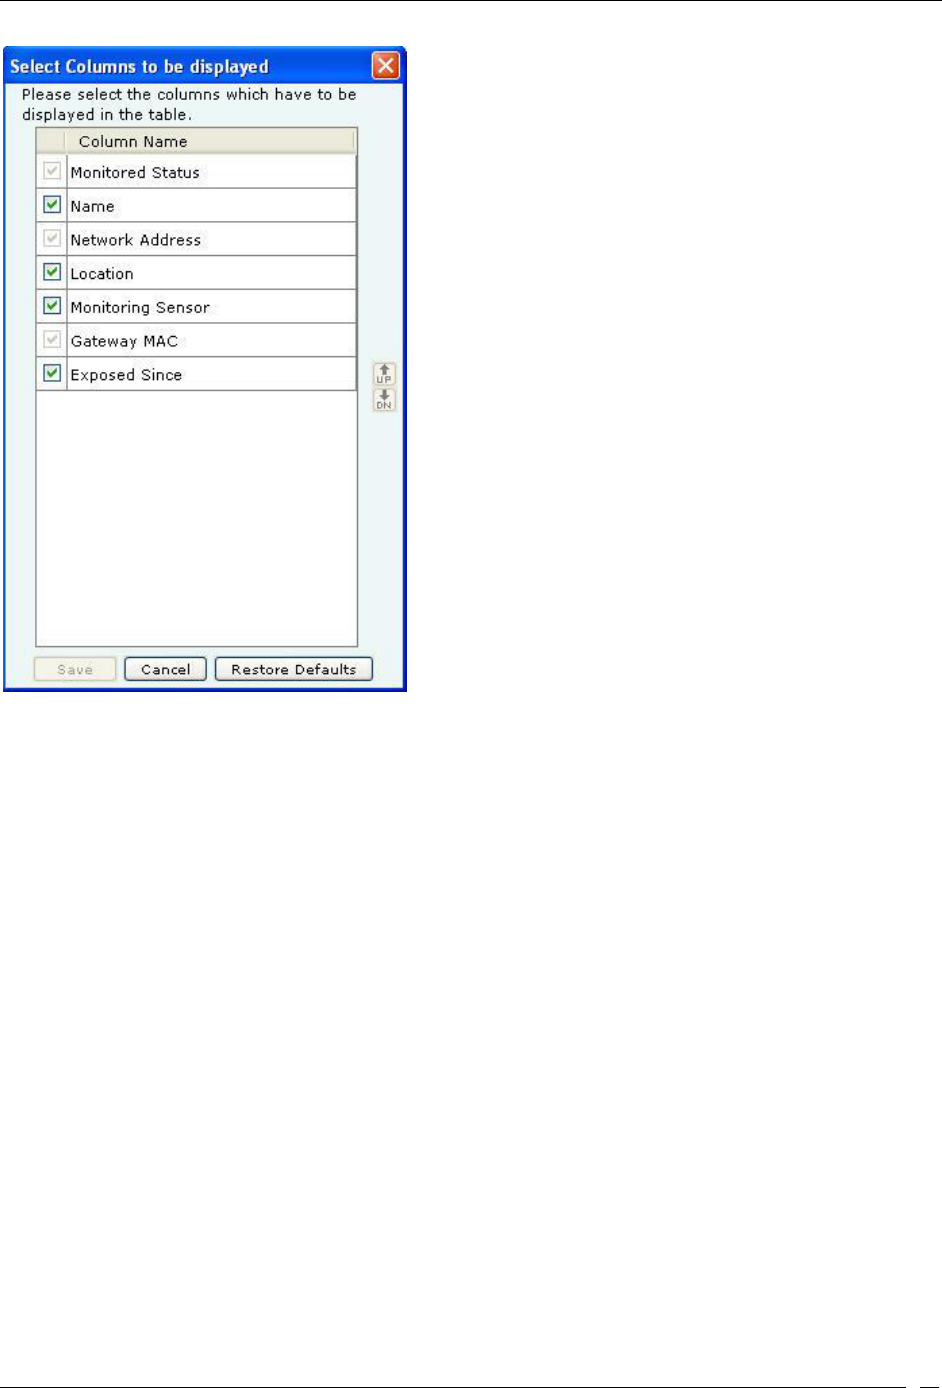
Devices Tab
SpectraGuard® Enterprise User Guide
47
Configure display column list for Networks Tab
You can select/deselect the checkbox next to the column name to view/remove it from Device display. You can
change the display order of a column by selecting the column name and moving it up or down with Up/Down
buttons. Save the display settings by clicking the Save button.
Sorting a Device List
The system enables you to sort a device list so that you can arrange information according to your requirements. Use
the following steps to sort a device list:
1. Open a device list as explained in the Viewing APs/Clients List section.
2. Click a column header to sort the list.
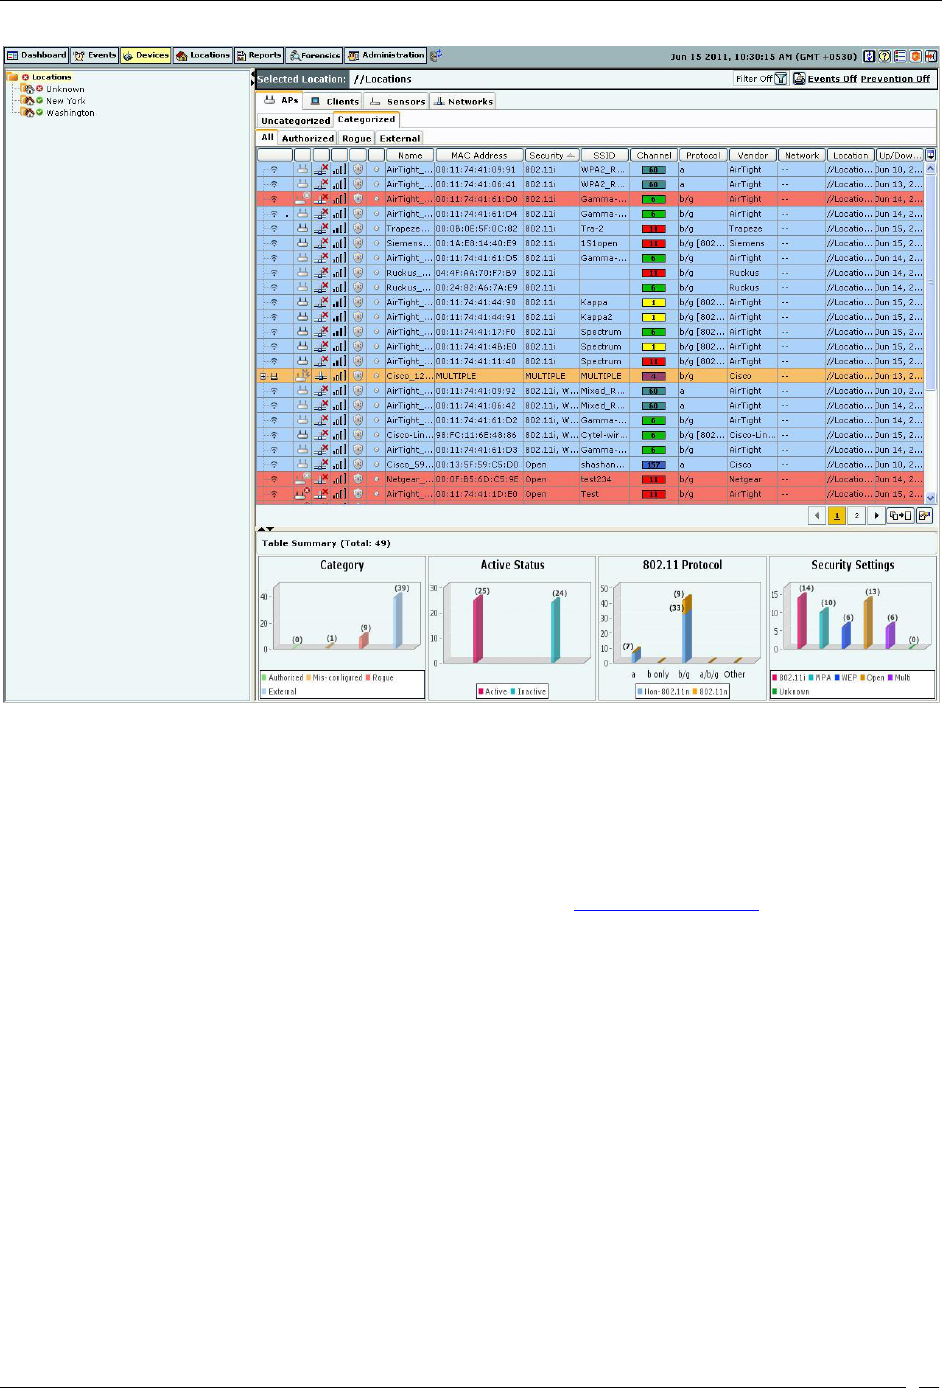
Devices Tab
SpectraGuard® Enterprise User Guide
48
Sorted Device List
Location Tagging of a Device or Location Tag Assignment
Device location tagging refers to the process by which a device obtains the label of a location. Tagging is of two types:
Automatic and Manual.
Automatic Location Tagging (Auto Location Tagging)
The system automatically assigns a location to a device depending on the Automatic Location Tagging policy
selected and the signal strength of the Sensors reporting the device (see Auto Location Tagging). Automatic Location
Tagging of a device depends on the location of the Sensors which are able to see the device. If all the Sensors
reporting a device are tagged to the Unknown location, the device is also tagged to the Unknown location.
Manual Location Tagging
You can change the location tag of a device manually in one of the following ways:
On the Devices screen, right-click the device row and select Change Location.
On the Locations screen, place the Authorized AP on the floor map.
On the AdministrationGlobal tabDevice SettingsImport Devices screen, specify the location to
which the device must be tagged.
If an AP or Client is manually tagged, the system never attempts to auto-tag it again. To re-enable auto-tagging for
that device, you must delete the device and let the system re-discover it.
Working with Devices
This section shows how to access various context-sensitive menus and dialogs associated with the devices in your
network.
AP Context-Sensitive Menu

Devices Tab
SpectraGuard® Enterprise User Guide
49
APs are wireless devices to which wireless Clients (laptops, PDAs, and so on) connect and communicate with other
devices on the Local Area Network (LAN). The context-sensitive menu for APs enables you to:
View
AP Details
Events involving the AP
AP Performance Charts
Edit an AP’s details
Locate an AP
Block Wired Port of an AP
DoS Prevention of an AP
Quarantine an AP
Enable/disable Auto-quarantine on an AP
Troubleshoot an AP
Mark an AP as Known
Delete an AP
Change
AP Location
Category
Move an AP to the following folder
Authorized
Rogue
External
Method for Opening AP Context-Sensitive Menu
To open an AP context-sensitive menu, click the Devices tab and then right-click an AP row to open the context-
sensitive menu.
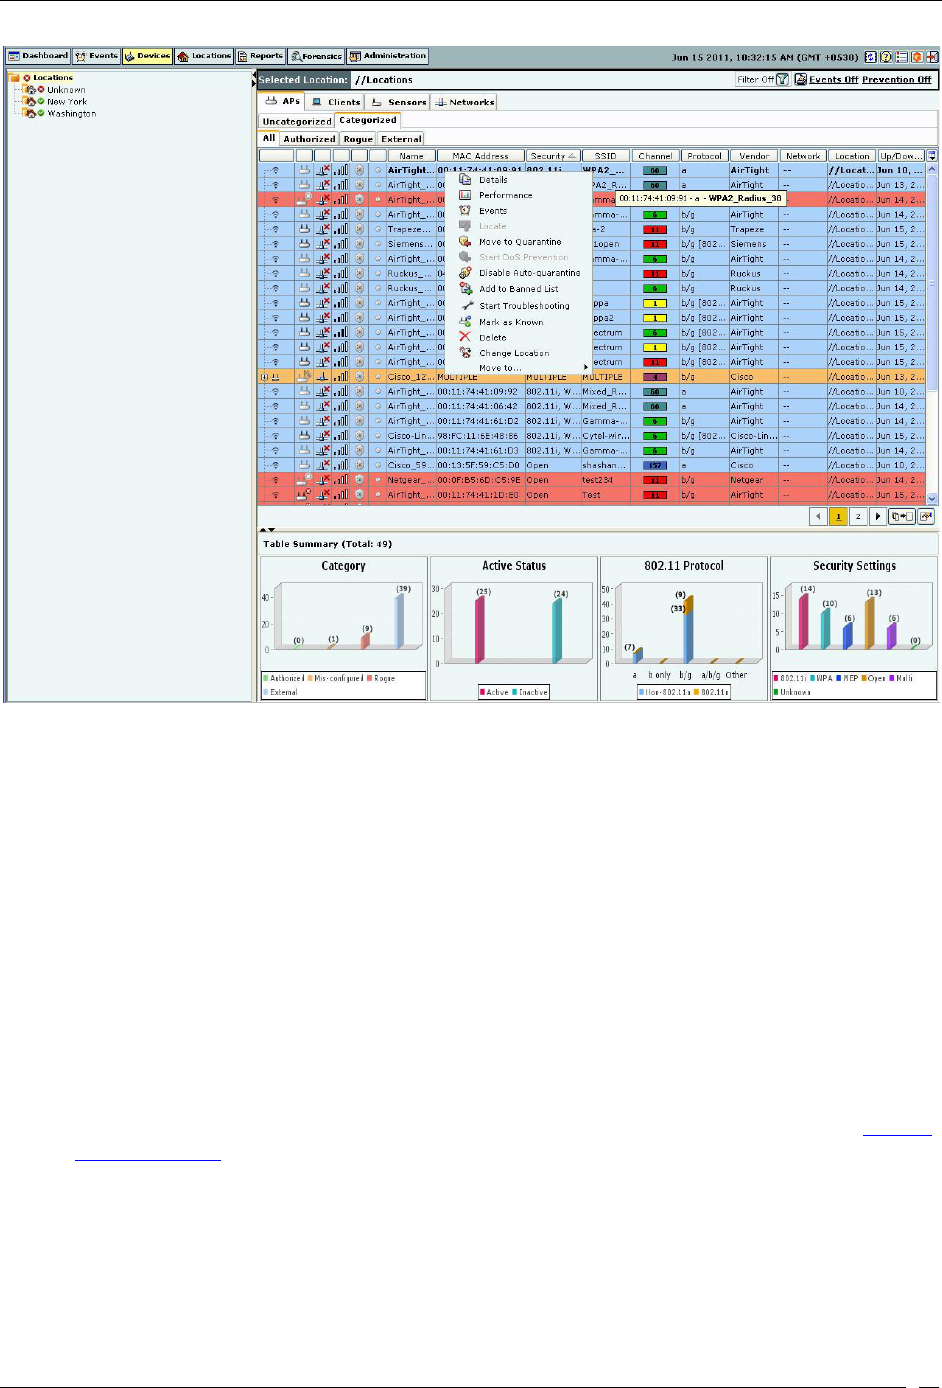
Devices Tab
SpectraGuard® Enterprise User Guide
50
AP Context-Sensitive Menu on Devices Screen
Items in the AP Context-Sensitive Menu
The AP context-sensitive menus include the following items.
Details:Opens the Properties tab of the AP Device dialog, which allows you to:
View/Edit the AP’s name
View/Edit AP’s classification
View/Edit AP’s Device Tag
Assign a user-defined location tag so that you can easily locate the AP; the location of a manually
tagged AP is shown with an asterisk (*) under the Location column
Enables you to view Primary details of the AP Devices seeing the AP and recently associated
Clients.
Performance: Opens the Performance tab of the AP Device dialog, which allows you to view performance
graphs for the AP.
Events: Opens the Events tab of the AP Device dialog, which allows you to view events associated with the
AP, so that you can take the necessary actions.
Locate: Opens the Locate tab of the AP Device dialog, which allows you view the AP Location (see Fields in
the AP Locate Tab).
Block Wired Port: Enables you to disconnect the AP from the network by blocking the wired side Ethernet
port to which the AP is connected using integrated Cisco WLSE APIs.
Mark Port as Unblocked: Available only if the wired port of the AP is Blocked, this option enables you to
connect the AP to the network by unblocking the wired side Ethernet port to which the AP is connected
using integrated Cisco WLSE APIs.
Move to Quarantine: Enables you to block any wireless communication to the AP, that is, quarantine the AP.