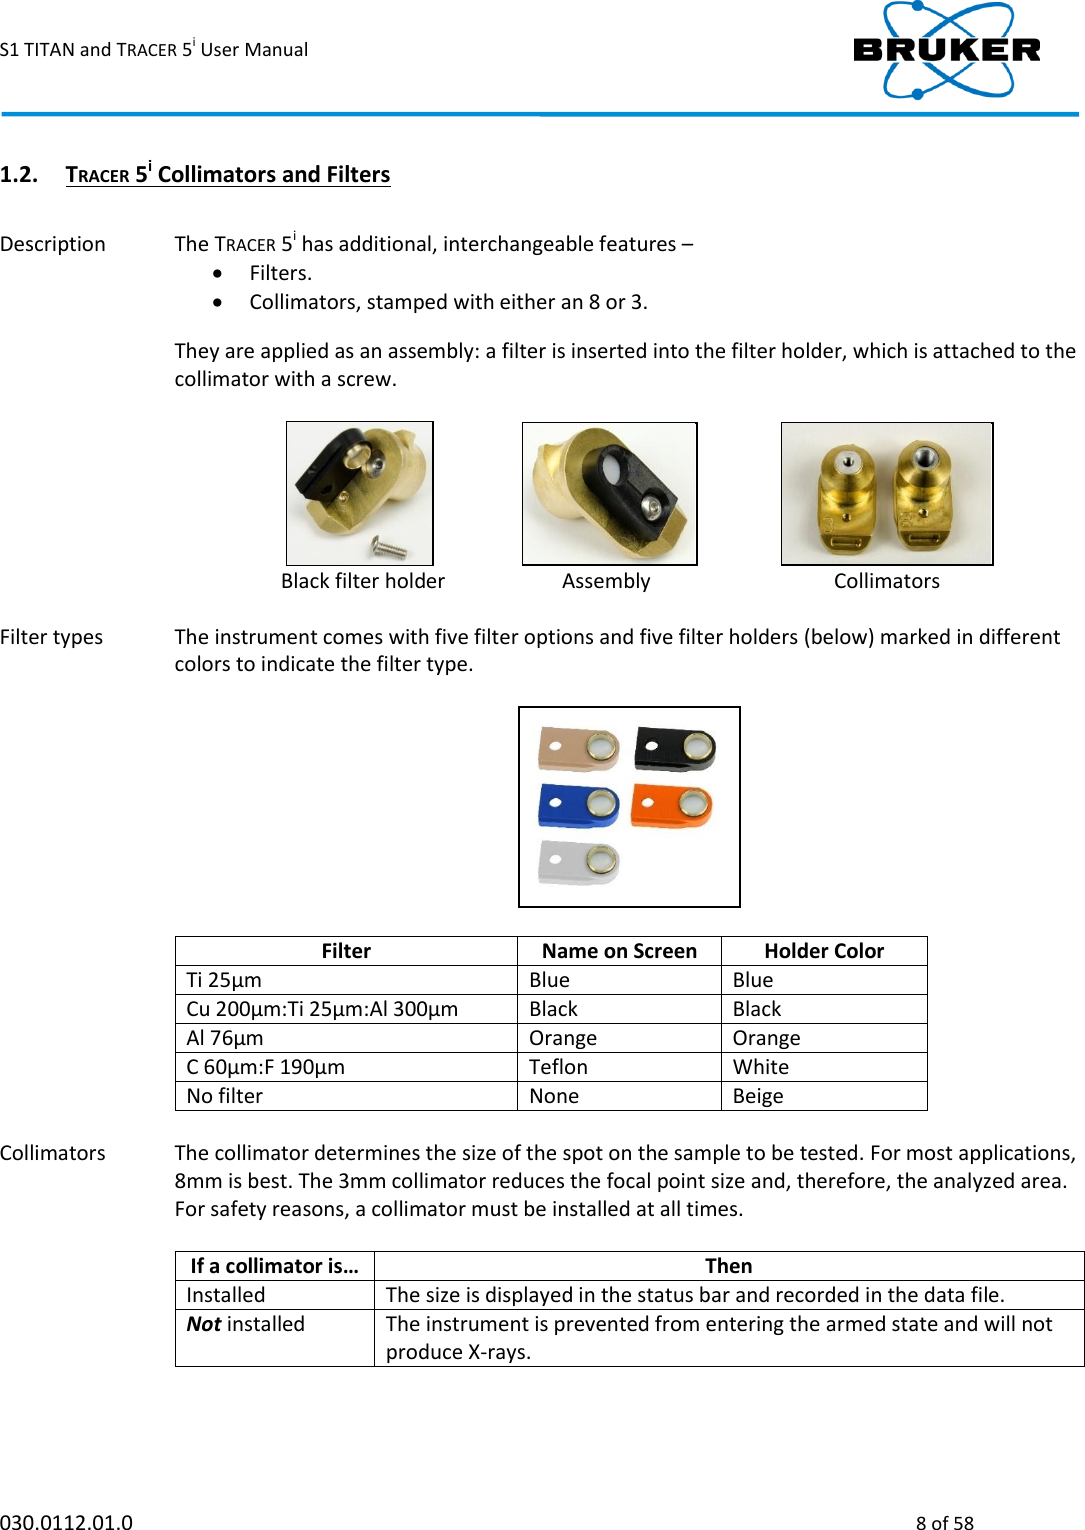
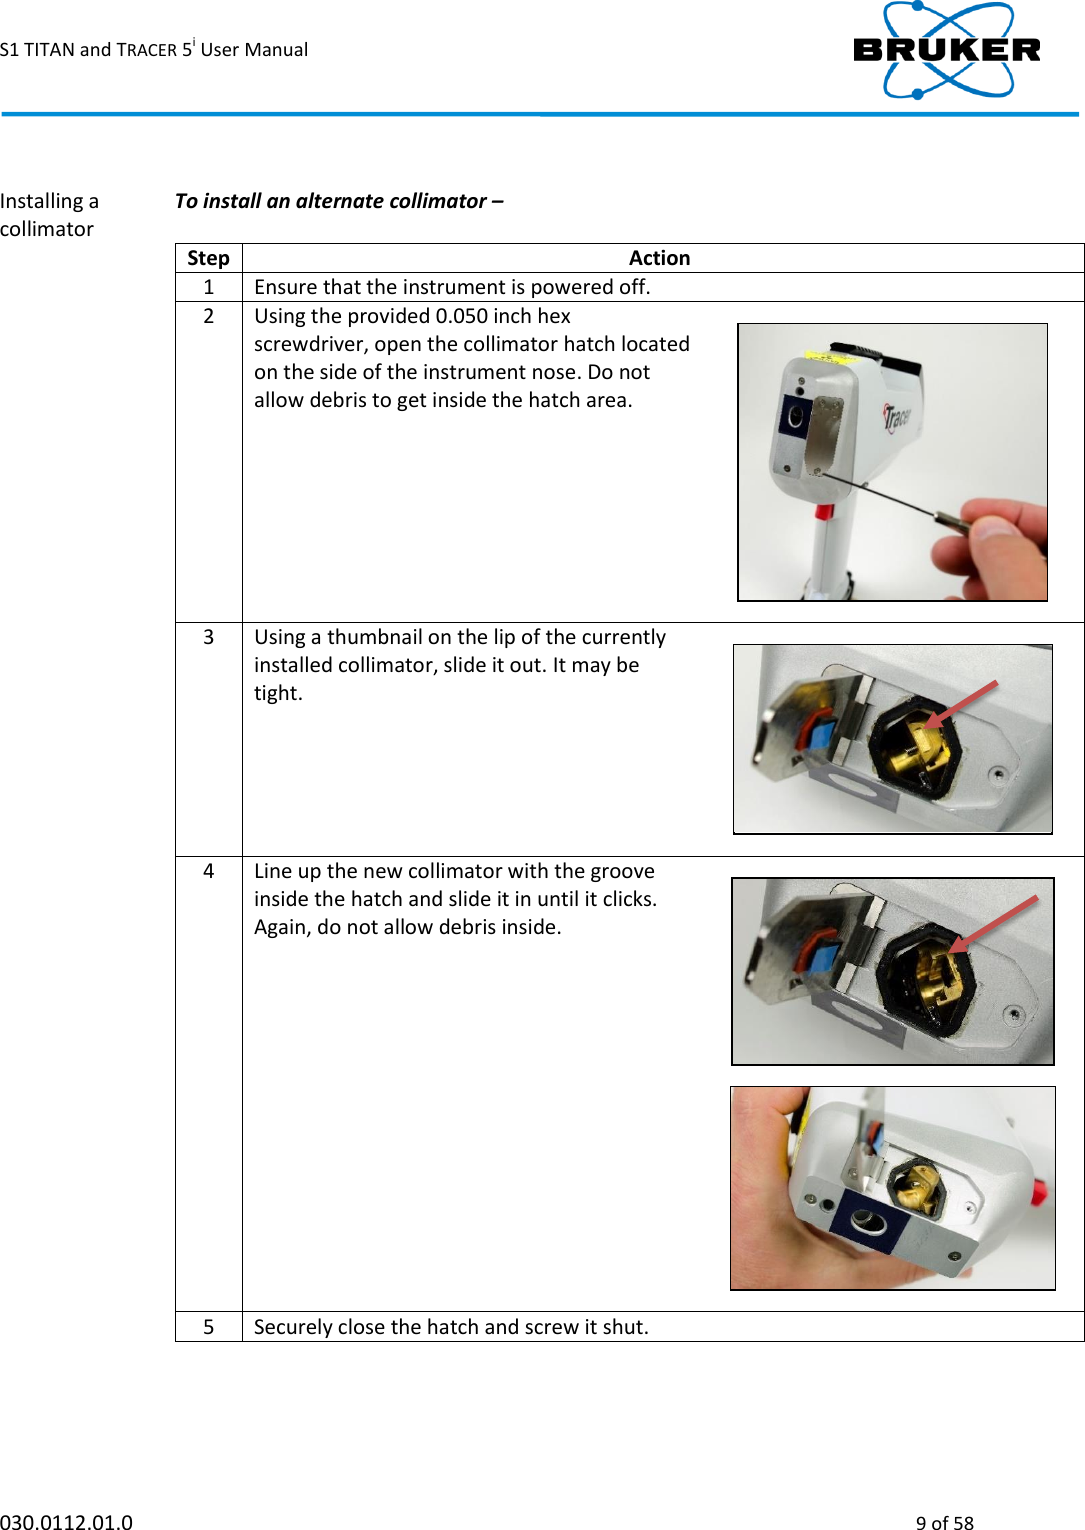
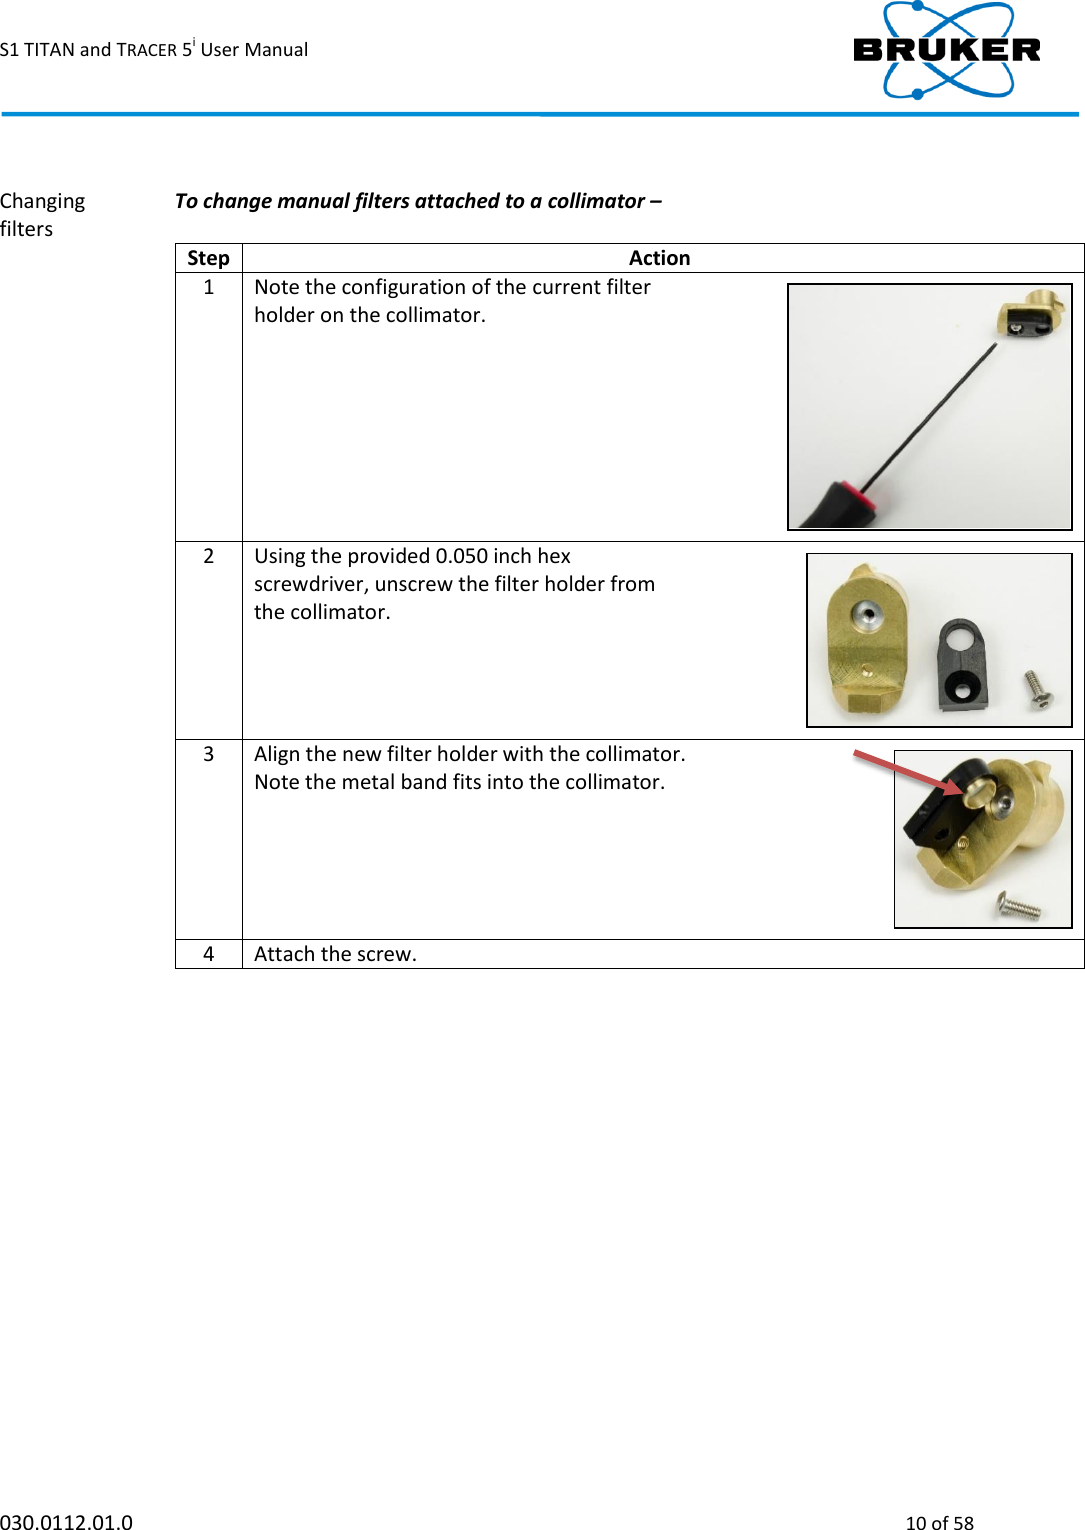
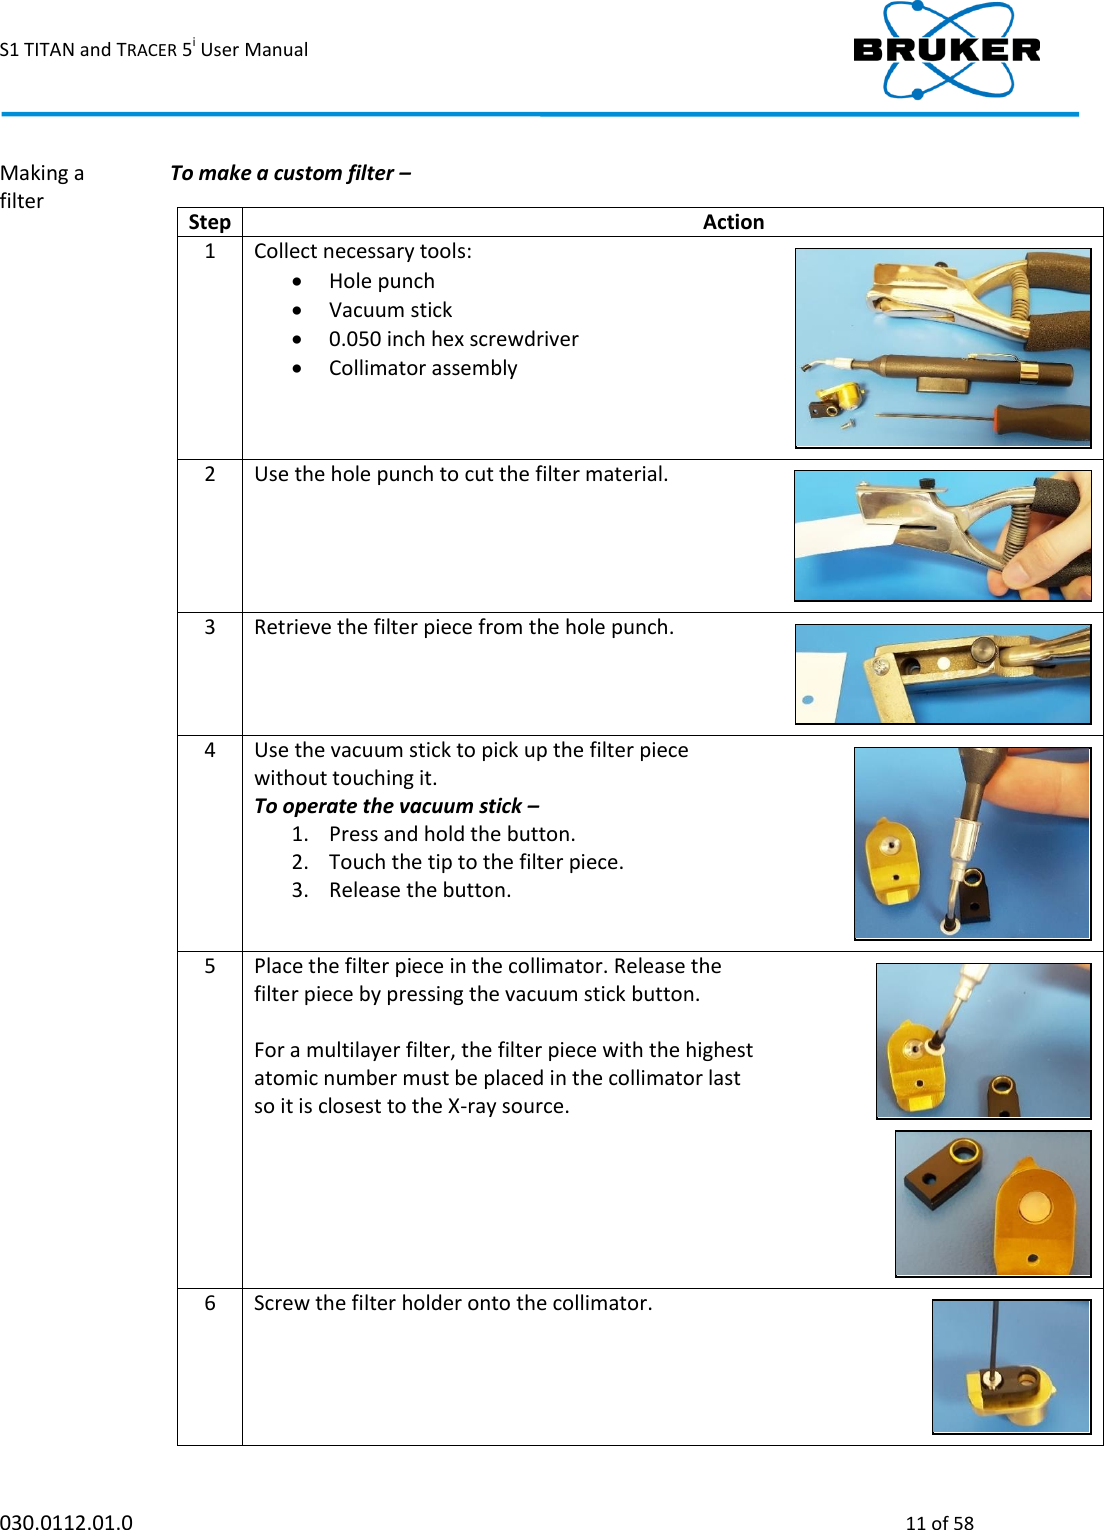
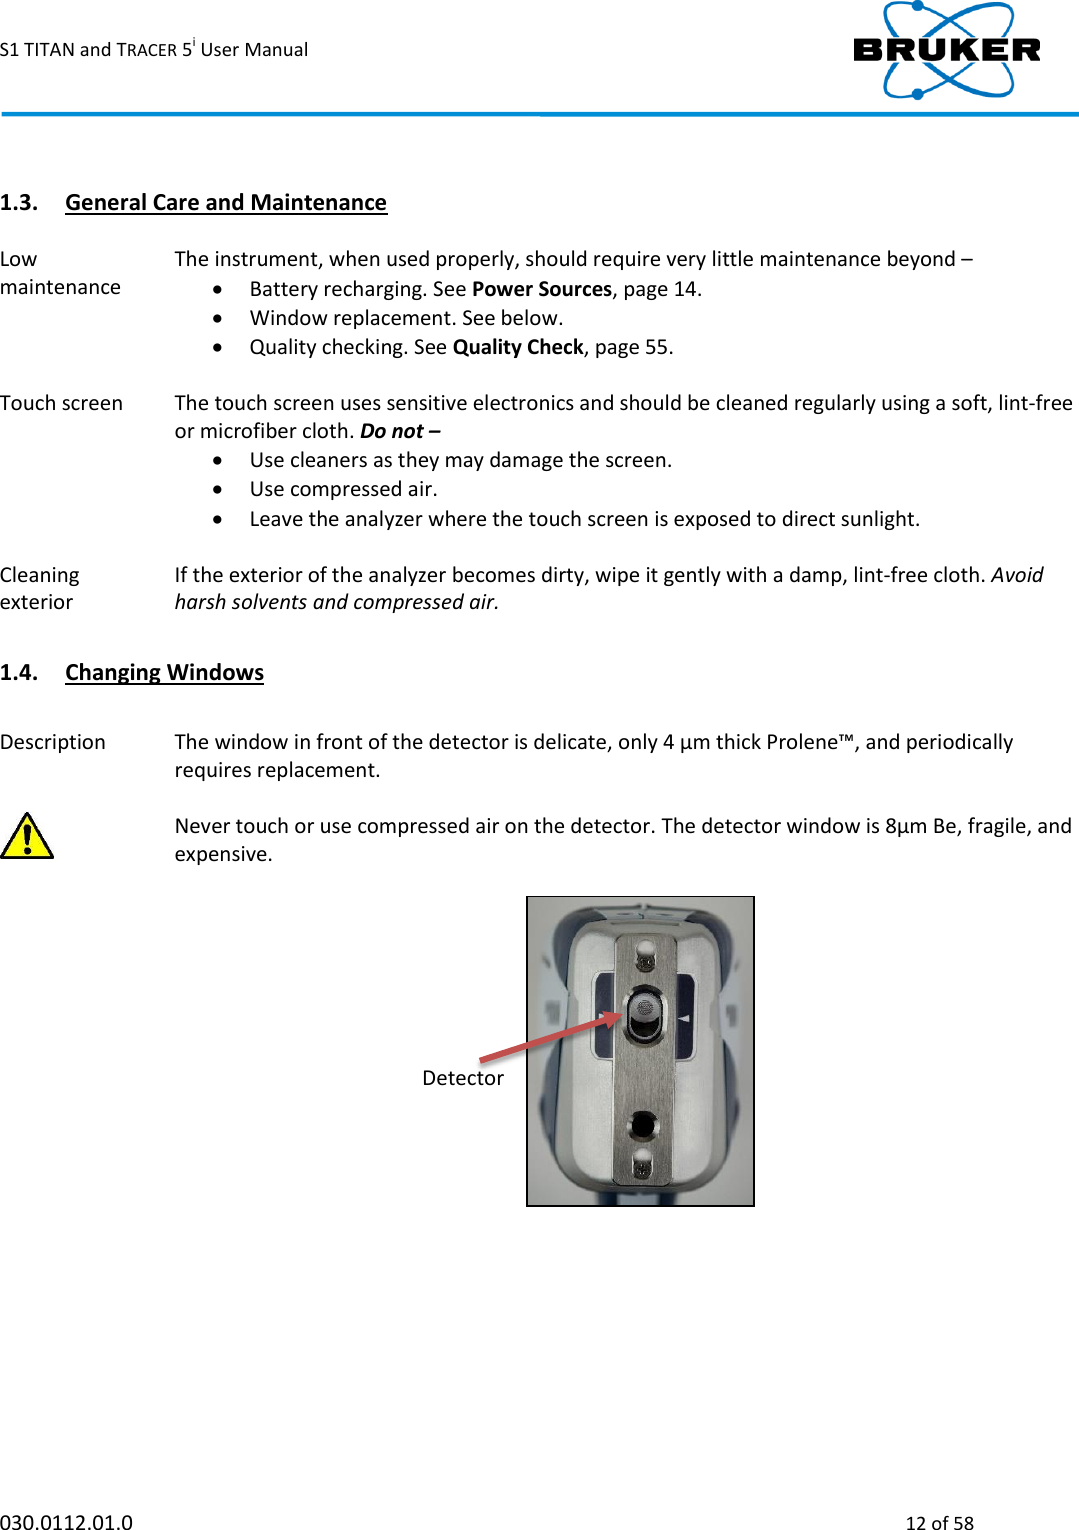
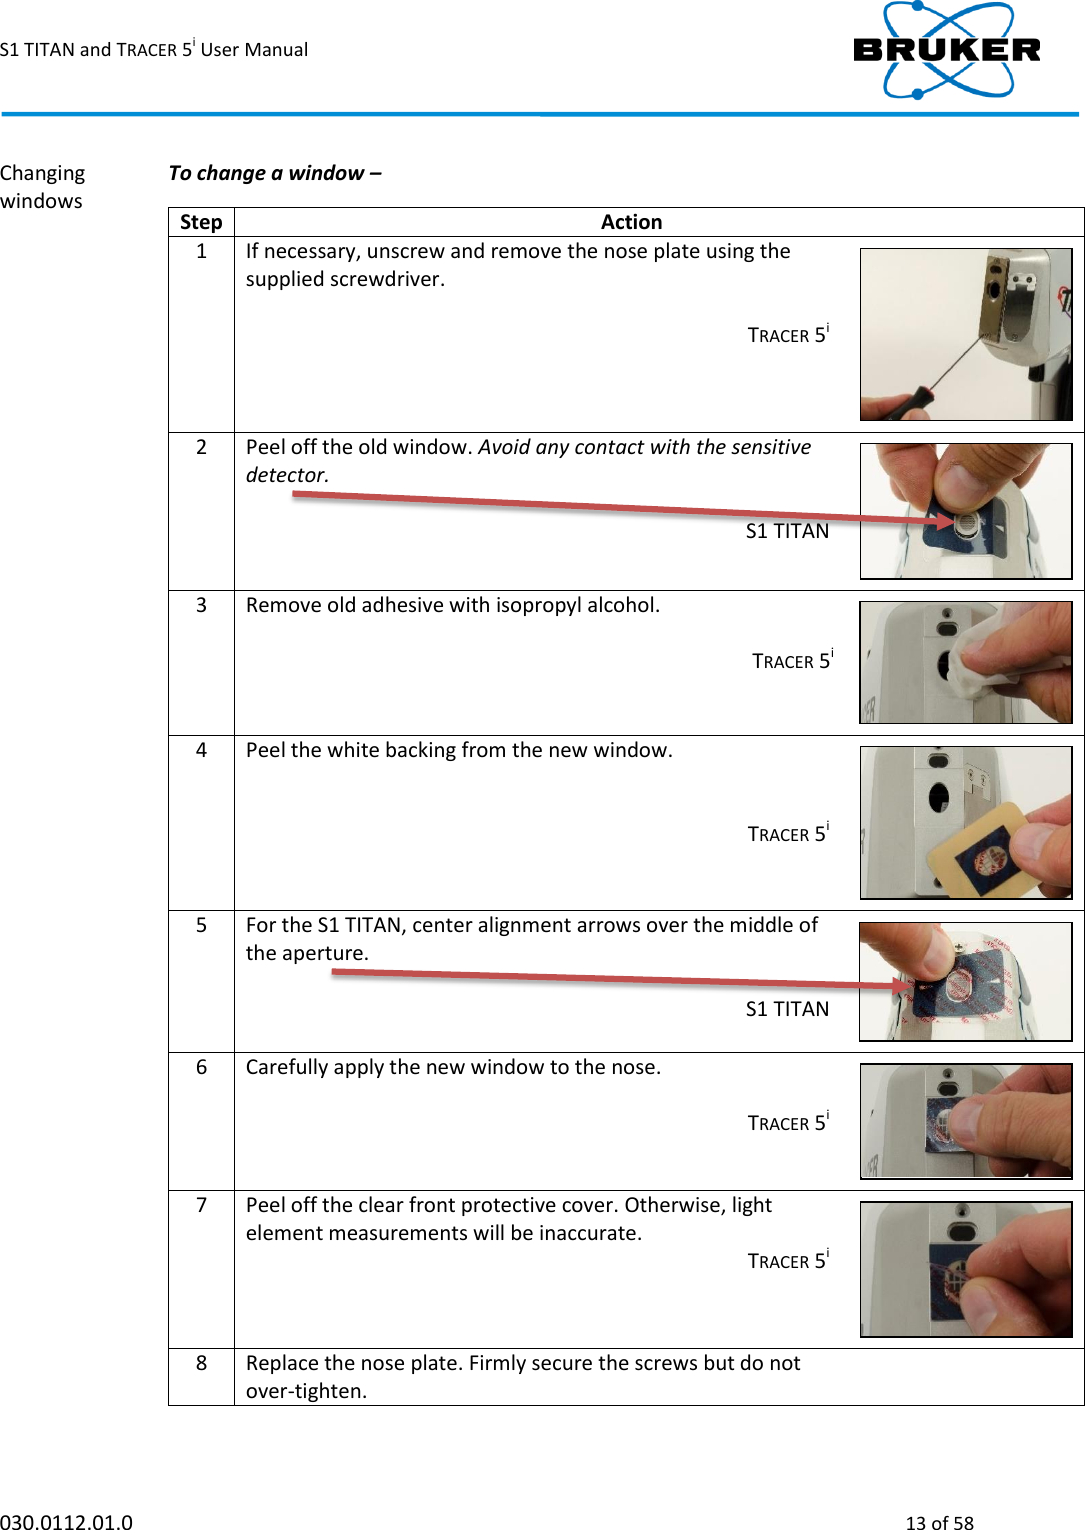
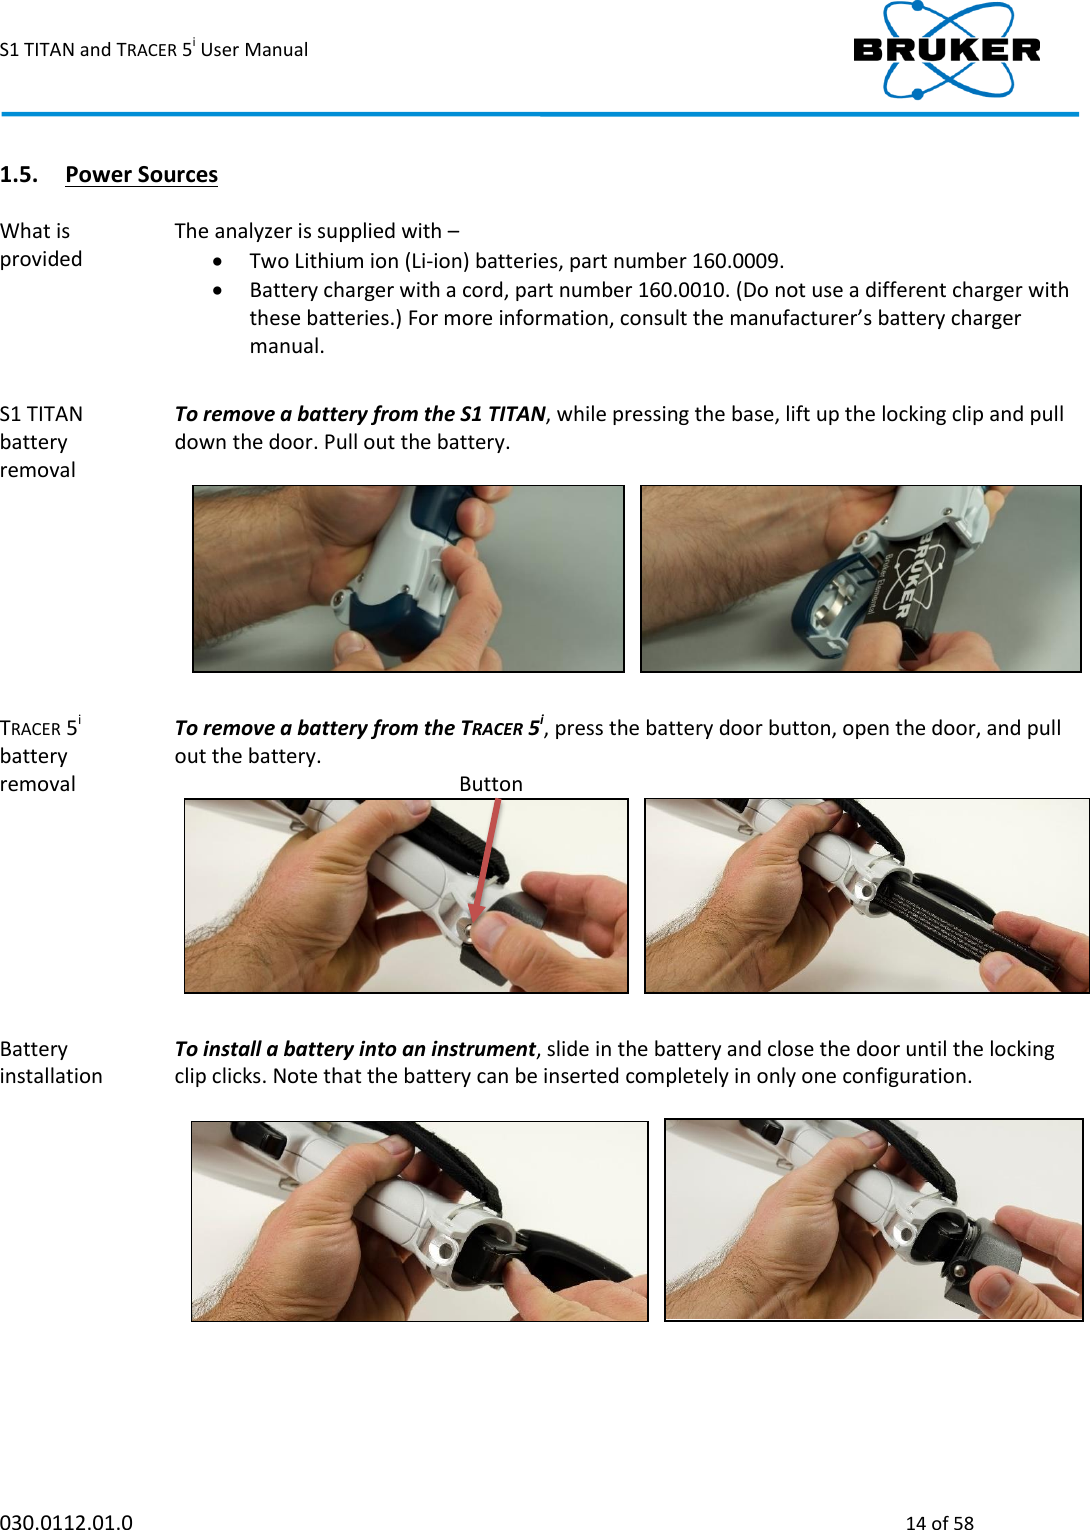
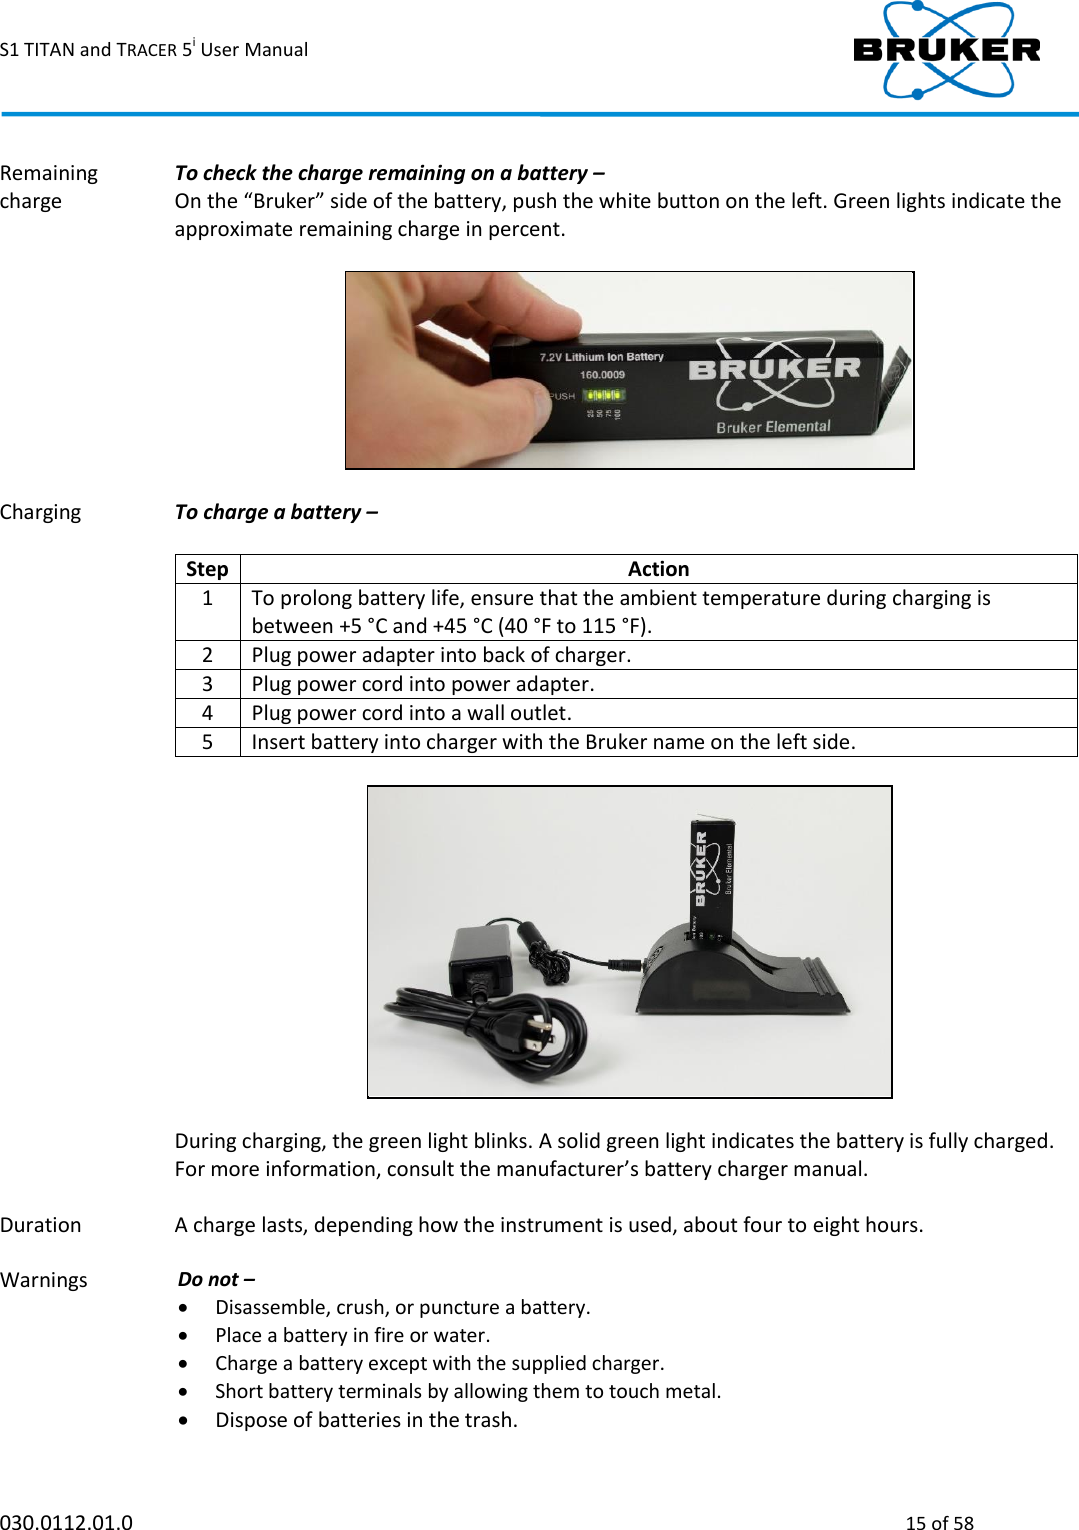
Bruker AXS HMP001 Handheld XRF Spectrometer User Manual
Bruker AXS Handheld XRF Spectrometer
UserManual.wiki
>
Bruker AXS
>
HMP001 User Manual
User Manual
Navigation menu
Upload a User Manual
Namespaces
Wiki Guide
HTML
PDF
Info
Views
User Manual
Discussion / Help
Navigation

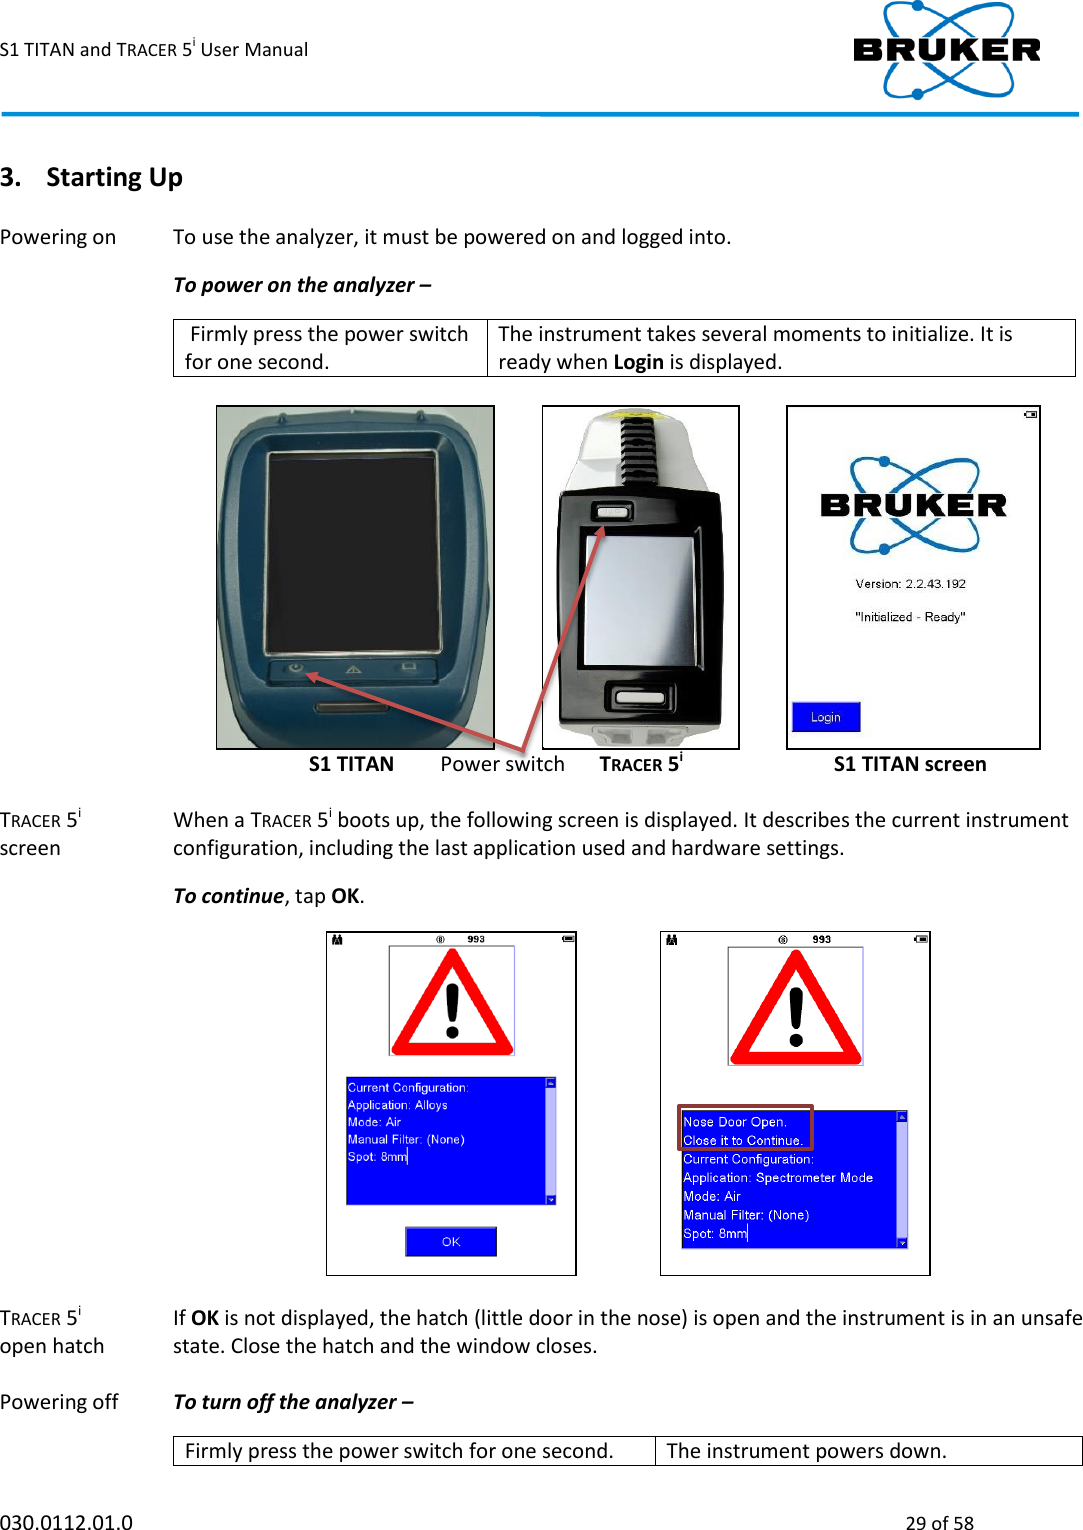
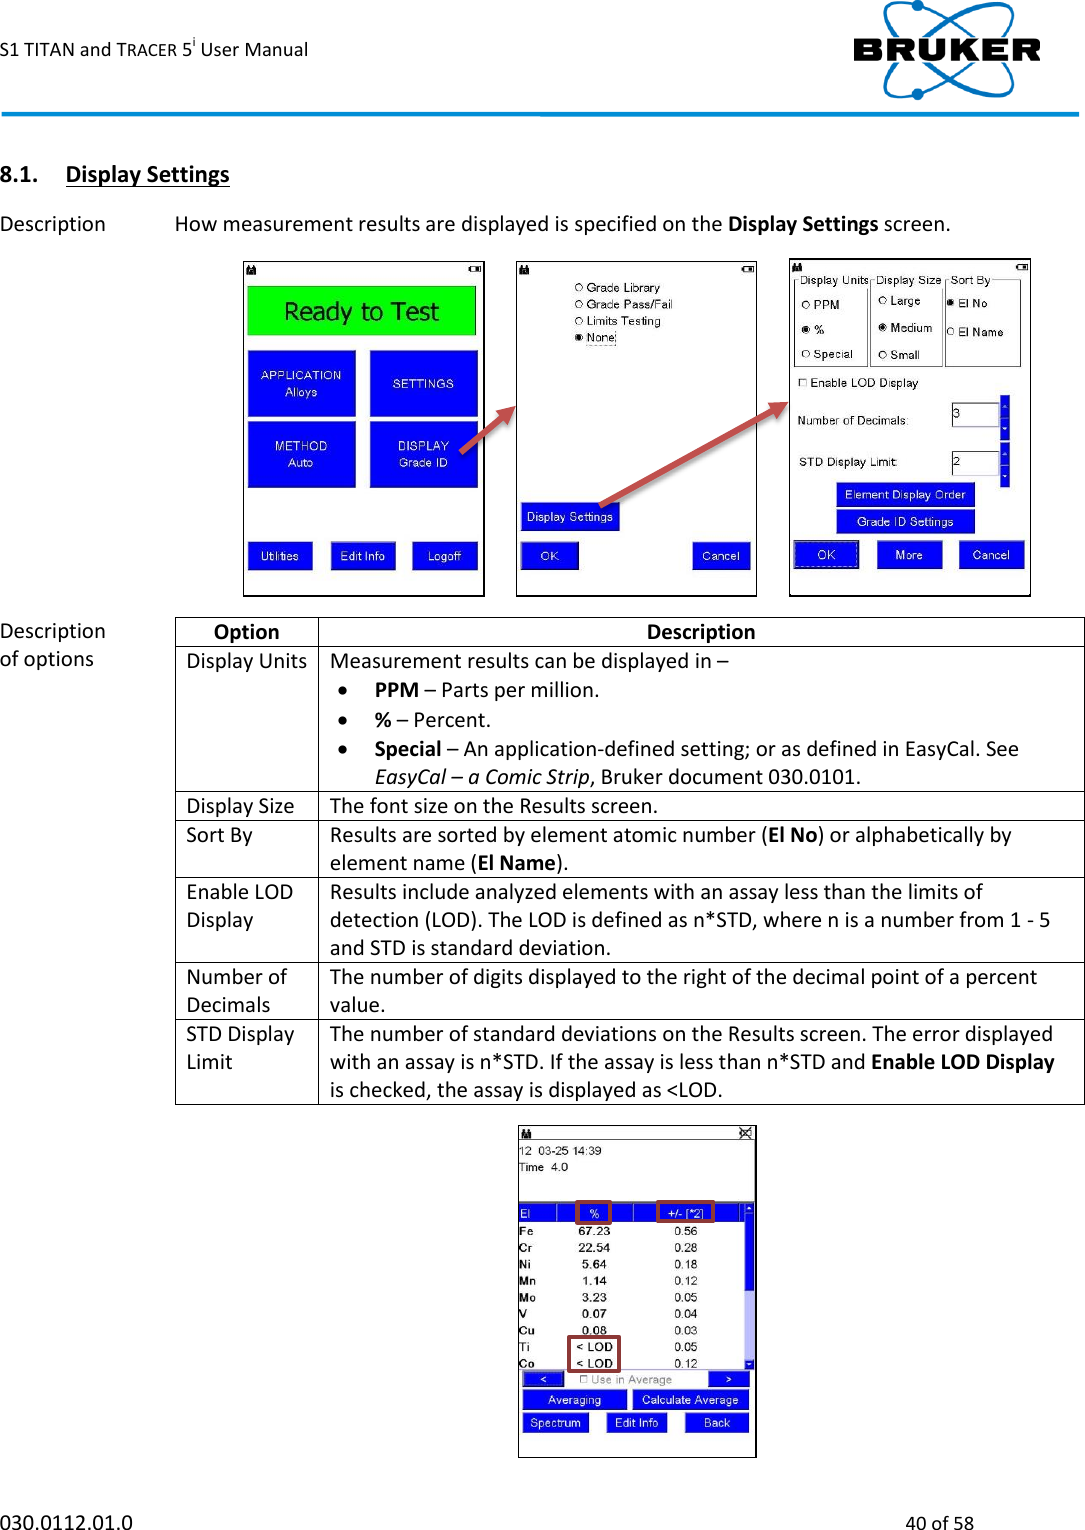
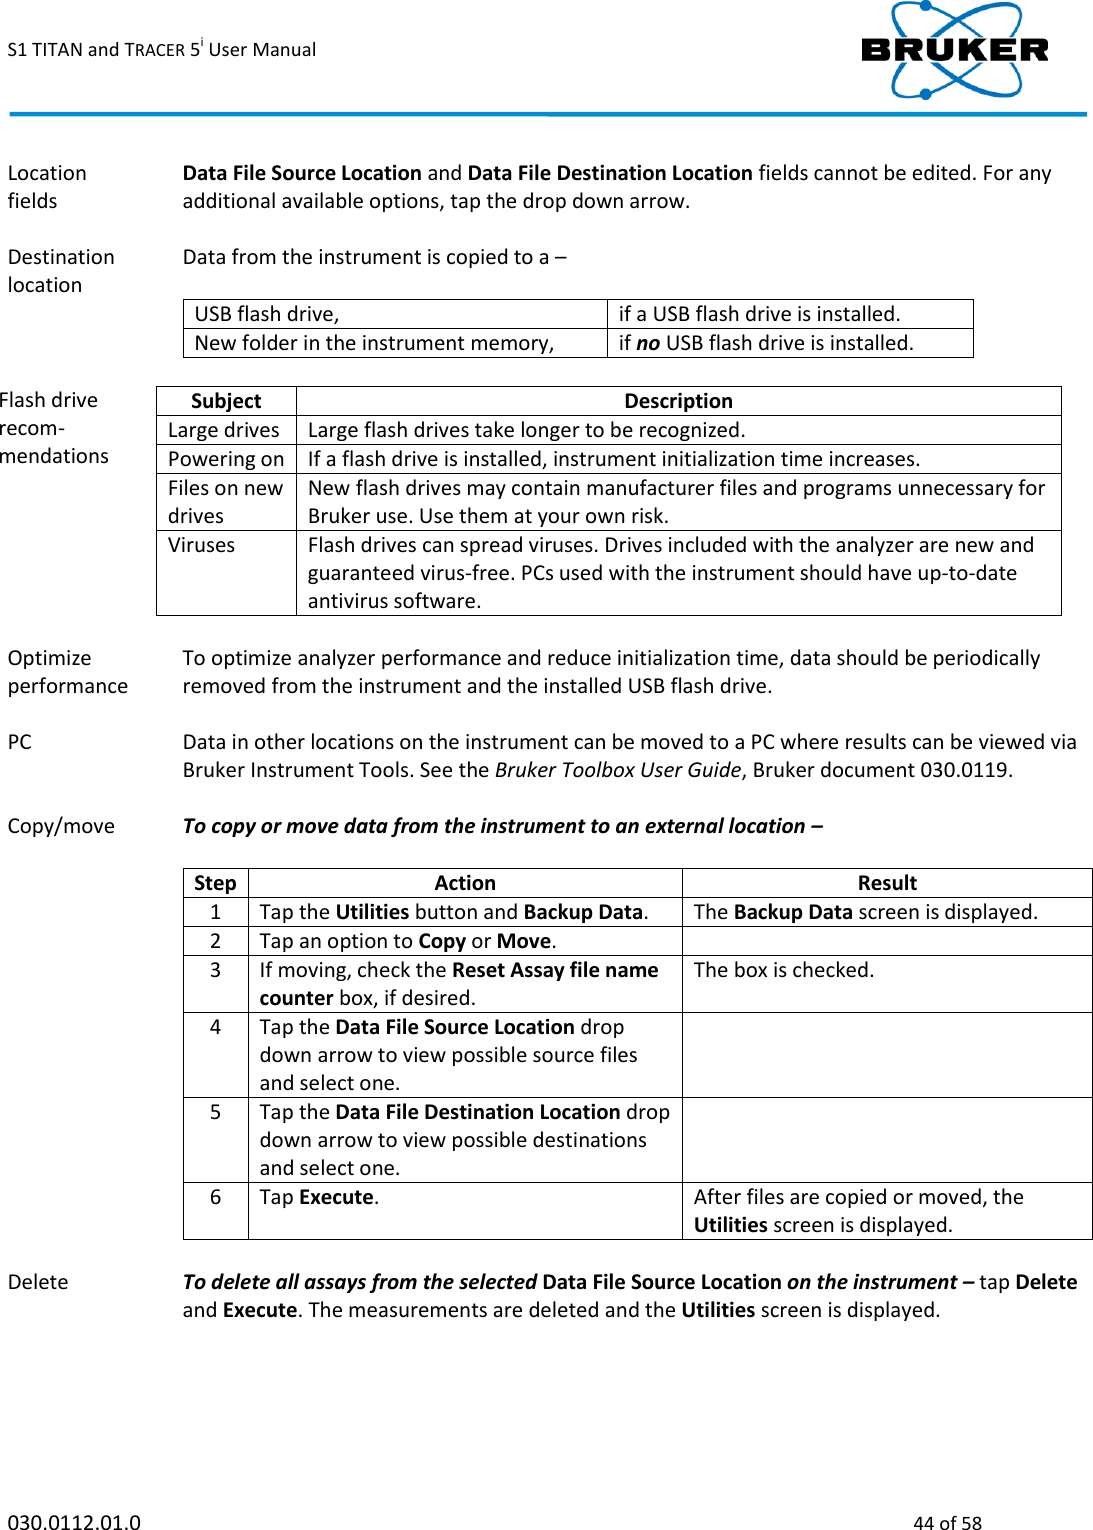
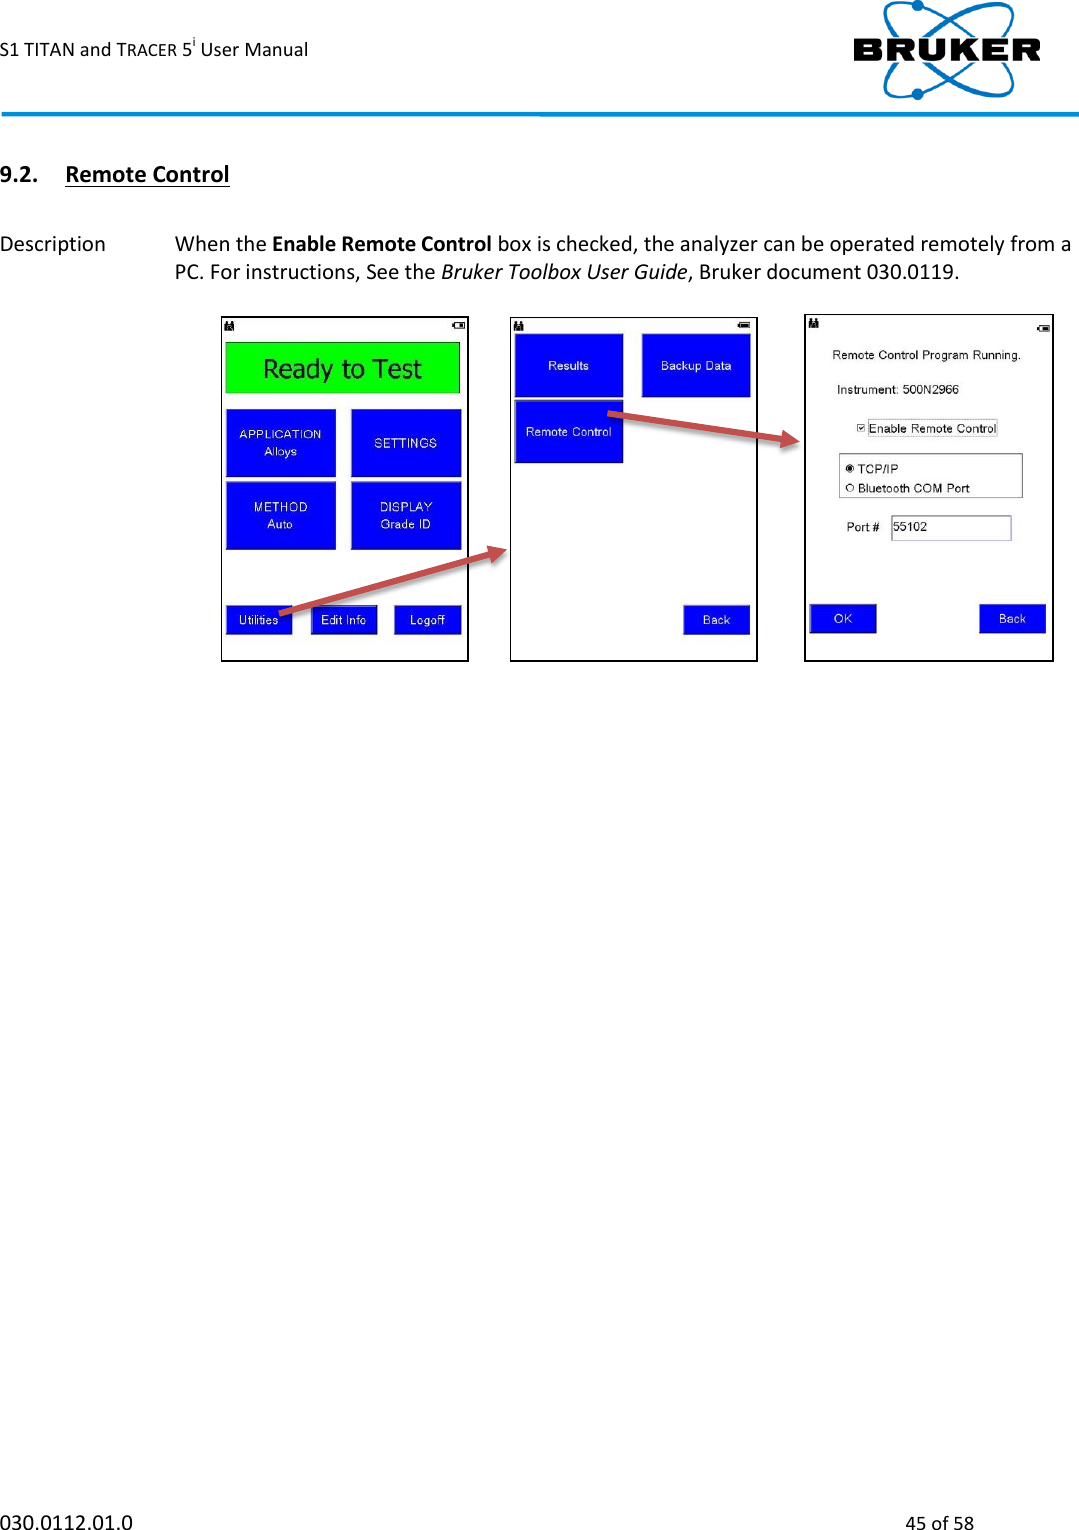
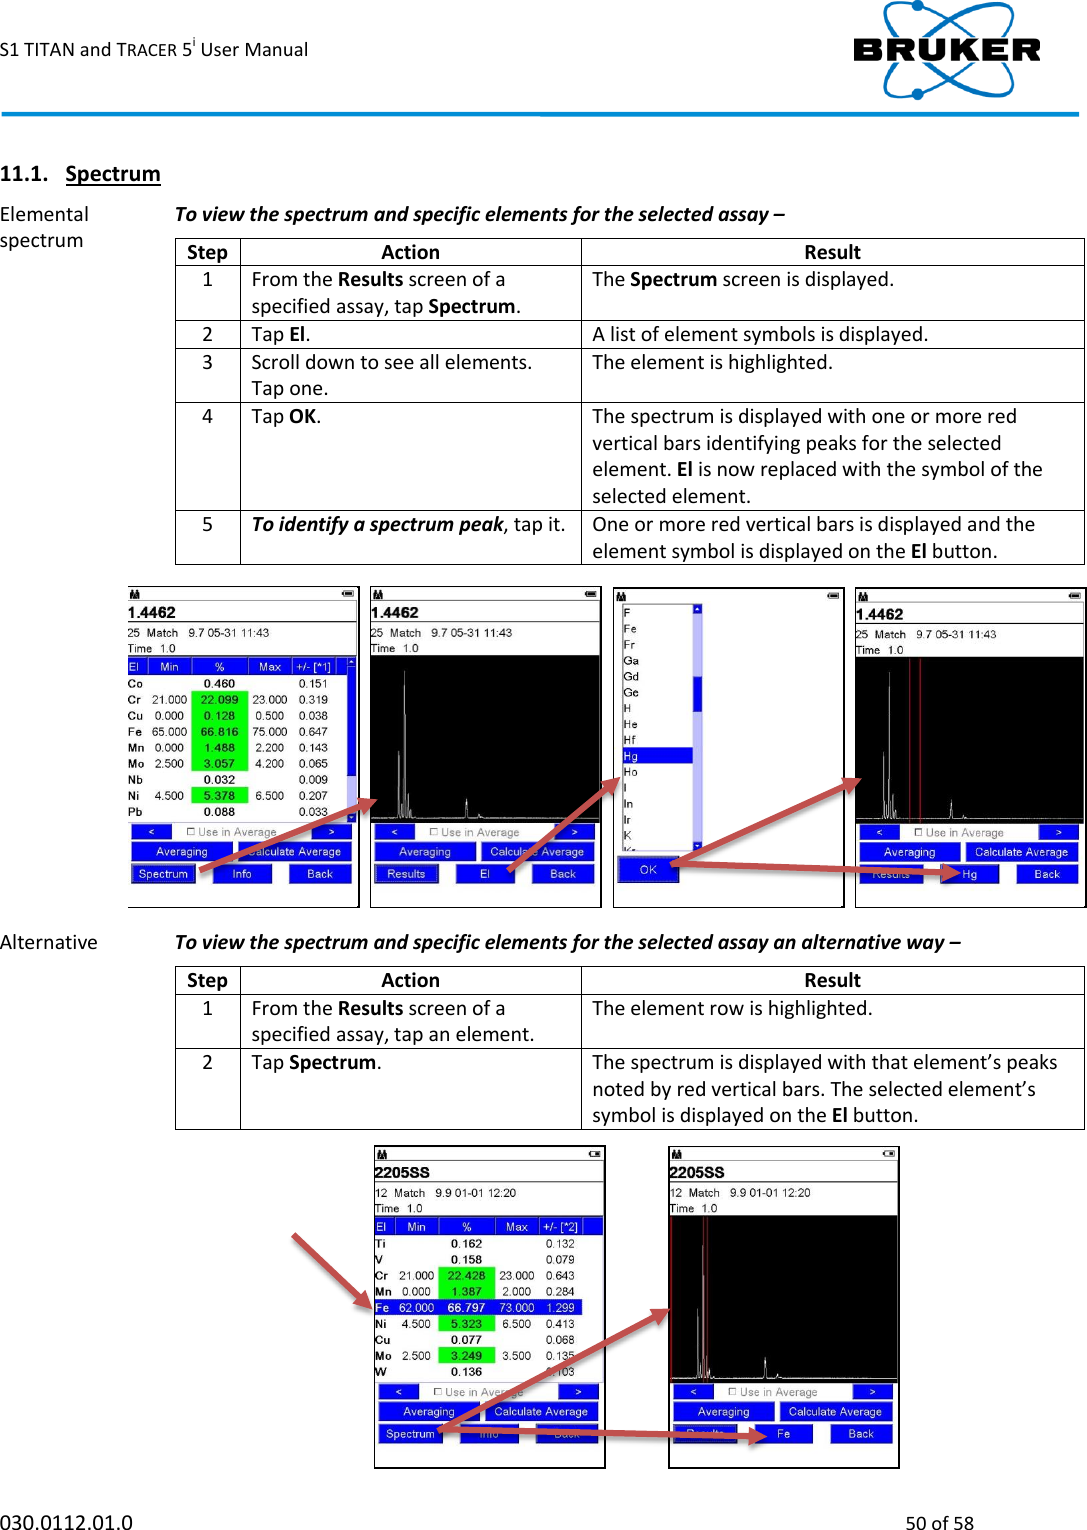
![S1 TITAN and TRACER 5i User Manual 030.0112.01.0 49 of 58 Toolbar displayed Toolbar removed 1. ID match If the sample matches grade IDs in the library, up to three matching IDs are displayed. If not, the application name is displayed. 2. Assay information The following information is provided for quick reference – Index number of the sample. The date and time the assay was measured. Length of the measurement in seconds. If averaging, the index numbers of the selected assays. 3. Columns Column Heading Description El Element symbol. Min and Max Minimum and maximum percent allowed according to the grade library. Note that some applications do not use a grade library and Min and Max are not displayed. %, PPM, or Special Amount of the element in either percent, parts per million, or units defined in EasyCal. See EasyCal – a Comic Strip, Bruker document 030.0101. +/- [*n] Standard deviation. Sorting To sort data in a column in descending or ascending order – tap a column heading. 4. < and > To view different assays ordered by index number – use the back and forward options, < and >. 5. Info To display the assay’s name, ID, and other information, if applicable – tap Info. This information cannot be edited.](https://usermanual.wiki/Bruker-AXS/HMP001/User-Guide-3275034-Page-49.png)