Bruker AXS HMP001 Handheld XRF Spectrometer User Manual
Bruker AXS Handheld XRF Spectrometer
User Manual
User Manual
S1 TITAN/T
RACER
5
I
030.0112.01.0

S1 TITAN and TRACER 5i User Manual
This equipment has been tested and found to comply with the limits for a Class B digital device, pursuant to Part 15 of the FCC Rules. These limits are
designed to provide reasonable protection against harmful interference in a residential installation. This equipment generates uses and can radiate radio
frequency energy and, if not installed and used in accordance with the instructions, may cause harmful interference to radio communications. However,
there is no guarantee that interference will not occur in a particular installation. If this equipment does cause harmful interference to radio or television
reception, which can be determined by turning the equipment off and on, the user is encouraged to try to correct the interference by one of the following
measures:
- Reorient or relocate the receiving antenna.
- Increase the separation between the equipment and receiver.
- Connect the equipment into an outlet on a circuit different from that to which the receiver is connected.
- Consult the dealer or an experienced radio/TV technician for help.
Changes or modifications not expressly approved by the party responsible for compliance could void the user's authority to operate the equipment.
This device complies with part 15 of the FCC Rules. Operation is subject to the following two conditions: (1) This device may not cause harmful
interference, and (2) this device must accept any interference received, including interference that may cause undesired operation.
FCC ID: 2AKJ9HMP001
In order to comply with FCC/ISED/MIC RF Exposure requirements, this device must be installed to provide at least 20 cm
separation from the human body at all times.

S1 TITAN and TRACER 5i User Manual
030.0112.01.0 3 of 58
Table of Contents
1. Instrument Description and Care............................................................................................................................... 5
1.1. Instrument Components .......................................................................................................................................... 6
1.2. TRACER 5i Collimators and Filters............................................................................................................................. 8
1.3. General Care and Maintenance ............................................................................................................................. 12
1.4. Changing Windows ................................................................................................................................................. 12
1.5. Power Sources ........................................................................................................................................................ 14
1.6. Contacting Bruker................................................................................................................................................... 16
2. Radiation Safety ...................................................................................................................................................... 17
2.1. Radiation Profile – S1 TITAN ................................................................................................................................... 17
2.2. Radiation Profile – TRACER 5i ................................................................................................................................. 20
2.3. Precautions ............................................................................................................................................................. 26
2.4. Safety Features ....................................................................................................................................................... 28
3. Starting Up .............................................................................................................................................................. 29
4. APPLICATION Button ............................................................................................................................................... 33
5. METHOD Button ...................................................................................................................................................... 34
6. SETTINGS Button ..................................................................................................................................................... 35
7. SETTINGS Button – Spectrometer Mode .................................................................................................................. 37
8. DISPLAY Button ....................................................................................................................................................... 39
8.1. Display Settings ...................................................................................................................................................... 40
8.2. Element Display Order ........................................................................................................................................... 41
8.3. Grade ID Settings and More ................................................................................................................................... 42
9. Utilities Button ........................................................................................................................................................ 43
9.1. Back up Data........................................................................................................................................................... 43
9.2. Remote Control ...................................................................................................................................................... 45
10. Edit Info Button ................................................................................................................................................... 46
11. Results ................................................................................................................................................................ 48
11.1. Spectrum ................................................................................................................................................................ 50
11.2. Averaging................................................................................................................................................................ 52
12. Quality Check ...................................................................................................................................................... 55
Additional TRACER 5i Radiation Profile Test Results ............................................................................... 56 Appendix A

S1 TITAN and TRACER 5i User Manual
030.0112.01.0 4 of 58
This page is intentionally left blank.

S1 TITAN and TRACER 5i User Manual
030.0112.01.0 5 of 58
1. Instrument Description and Care
Introduction
User documentation for the S1 TITAN and TRACER 5i analyzers is in the form of a suite of Manuals,
each with its own specific purpose. This document, the S1 TITAN and TRACER 5i User Manual,
describes –
Instruments.
Safety precautions.
Safety features.
Basic use.
Complete kit
An instrument comes with the following –
Software and calibrations.
Check samples appropriate to the specific calibrations.
A charger, power cord, and two batteries.
A USB/CD loaded with Bruker Toolbox, all manuals, demonstration software for S1 DATA
TOOLS, and utilities.
Radiation safety video.
Four extra windows.
Screwdriver or Hex driver and two spare nose plate screws.
USB flash drive.
Filters and collimators for TRACER 5i.
Filter making tools for TRACER 5i.
Pelican case.
X-ray use
The S1 TITAN and TRACER 5i are fully field portable analyzers based on energy dispersive X-ray
fluorescence (EDXRF) technology and use an X-ray tube as their excitation source. When
energized, the instruments generate low-energy X-rays.
Calibration
options
The instrument is factory calibrated, based on customer-ordered configuration. Calibrations are
available for various applications, such as:
Alloy analysis.
Mining analysis.
Restriction of Hazardous Substances (RoHS) chemical content.
Lead and other heavy metals in toys and consumer products.
Soil contamination analysis.
Registration
and licensing
For information on how to register and/or license your analyzer, See Registration and Licensing
FAQ, Bruker document 030.0050.
S1 TITAN and TRACER 5i User Manual
030.0112.01.0 6 of 58
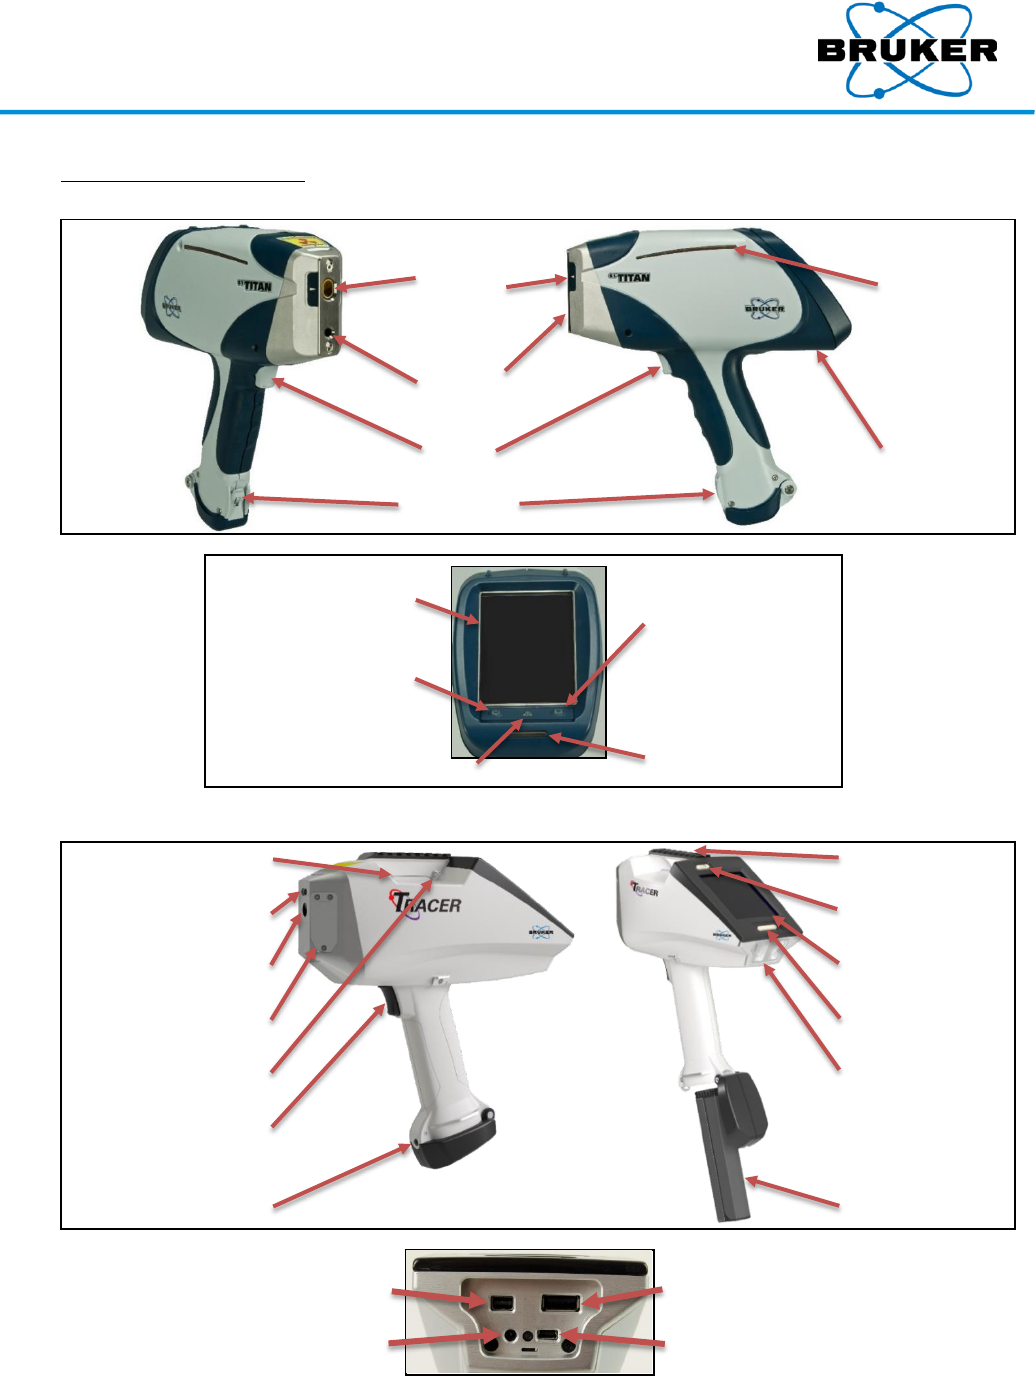
1.1. Instrument Components
S1 TITAN
Examination
Window
Proximity
Sensor
Trigger
Battery Lock
X-ray
warning
light
Ports hatch
Touch screen
Power switch
Armed indicator light
Auxiliary trigger
X-ray warning light
TRACER 5i
X-ray warning light
Proximity sensor
Examination window
Collimator hatch
Hose fitting
Trigger
Battery door lock
Rail
Power switch
Touch screen
Auxiliary trigger
Ports hatch
Battery
Remote
AC power
USB OTG 2.0
USB
S1 TITAN and TRACER 5i User Manual
030.0112.01.0 7 of 58
Descriptions
The following table, in alphabetical order, describes each component:
Component
Description
Armed indicator
Indicates that the instrument is ready to take a measurement.
Auxiliary trigger
Allows dual hand operation as required in certain countries.
Battery
Provides power to the instrument.
Battery door lock
Keeps the battery secure.
Collimator hatch
(TRACER 5i only)
Accesses the collimator/filter assembly.
Examination window
Source location of X-rays.
Hose fitting
(TRACER 5i only)
Provides an attachment location for a vacuum or Helium flush hose.
Ports
Provide connections for USB, remote, USB flash drive, and power.
Power switch
Powers the instrument on and off.
Proximity sensor
Prevents the instrument from activating without a sample in place.
Rail (TRACER 5i only)
Allows accessories to be easily attached.
Touch screen
Controls the instrument through a pressure sensitive user interface.
Using a stylus is helpful.
Trigger
Initiates a measurement.
X-ray warning light
Warns when X-ray is activated.
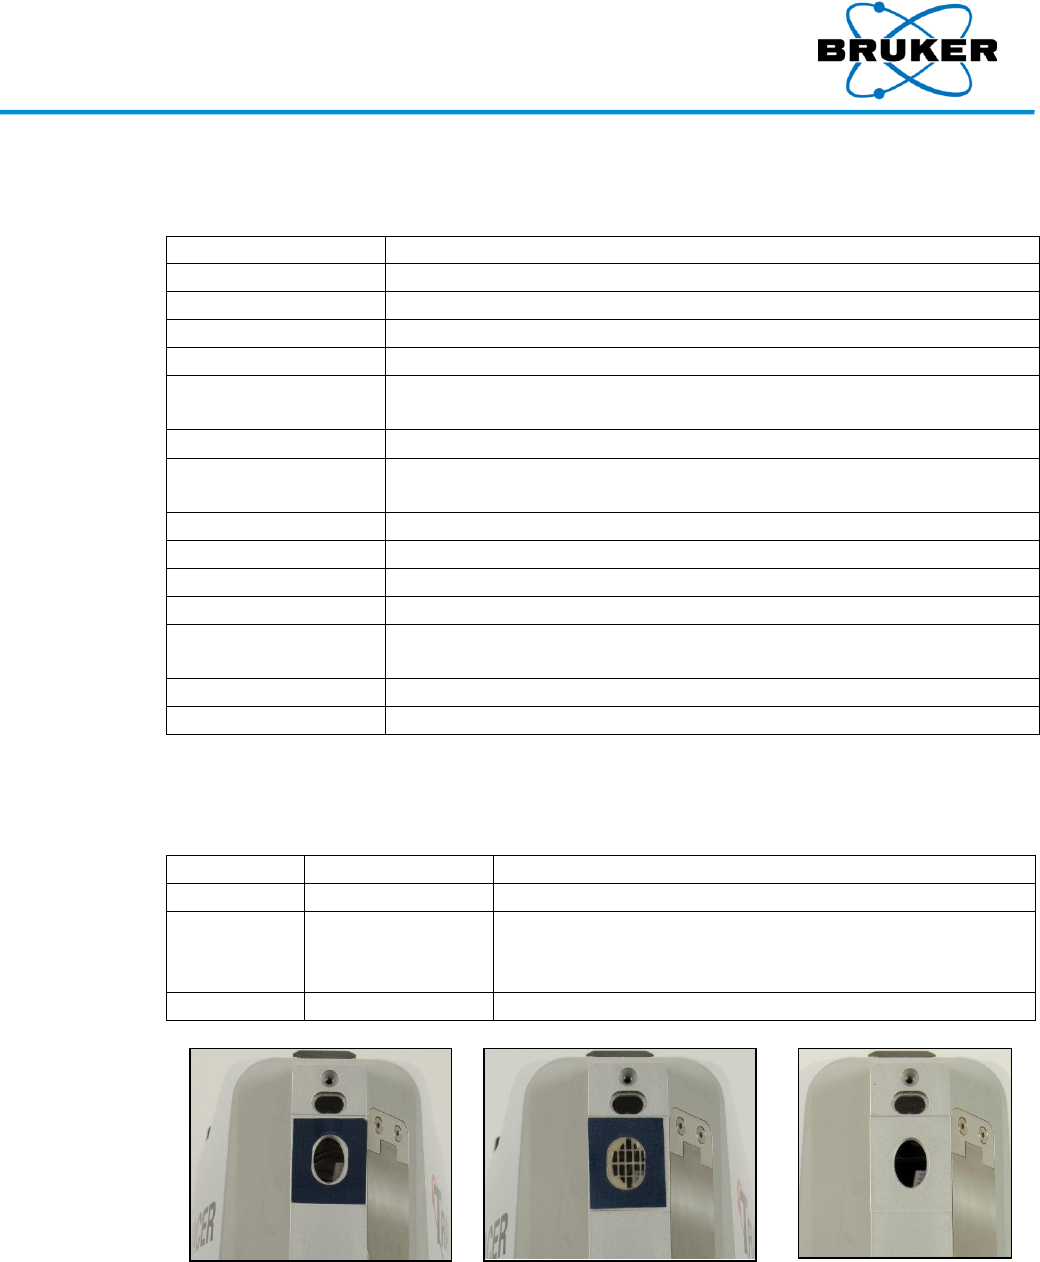
TRACER 5i
windows
Both the S1 TITAN and the TRACER 5i come with a clear examination window but the TRACER 5i has
additional window configurations for different applications.
Application
Configuration
Reason
Normal use
Clear window
The window protects the detector.
Vacuum
Gridded window
The grid reinforces the window against air pressure
during the vacuum. However, during normal use, the grid
interferes with measurements of light elements.
He flush
No window
Allows the Helium flow to escape.
Clear window for normal use
Gridded window for vacuum
No window for He flush
S1 TITAN and TRACER 5i User Manual
030.0112.01.0 8 of 58
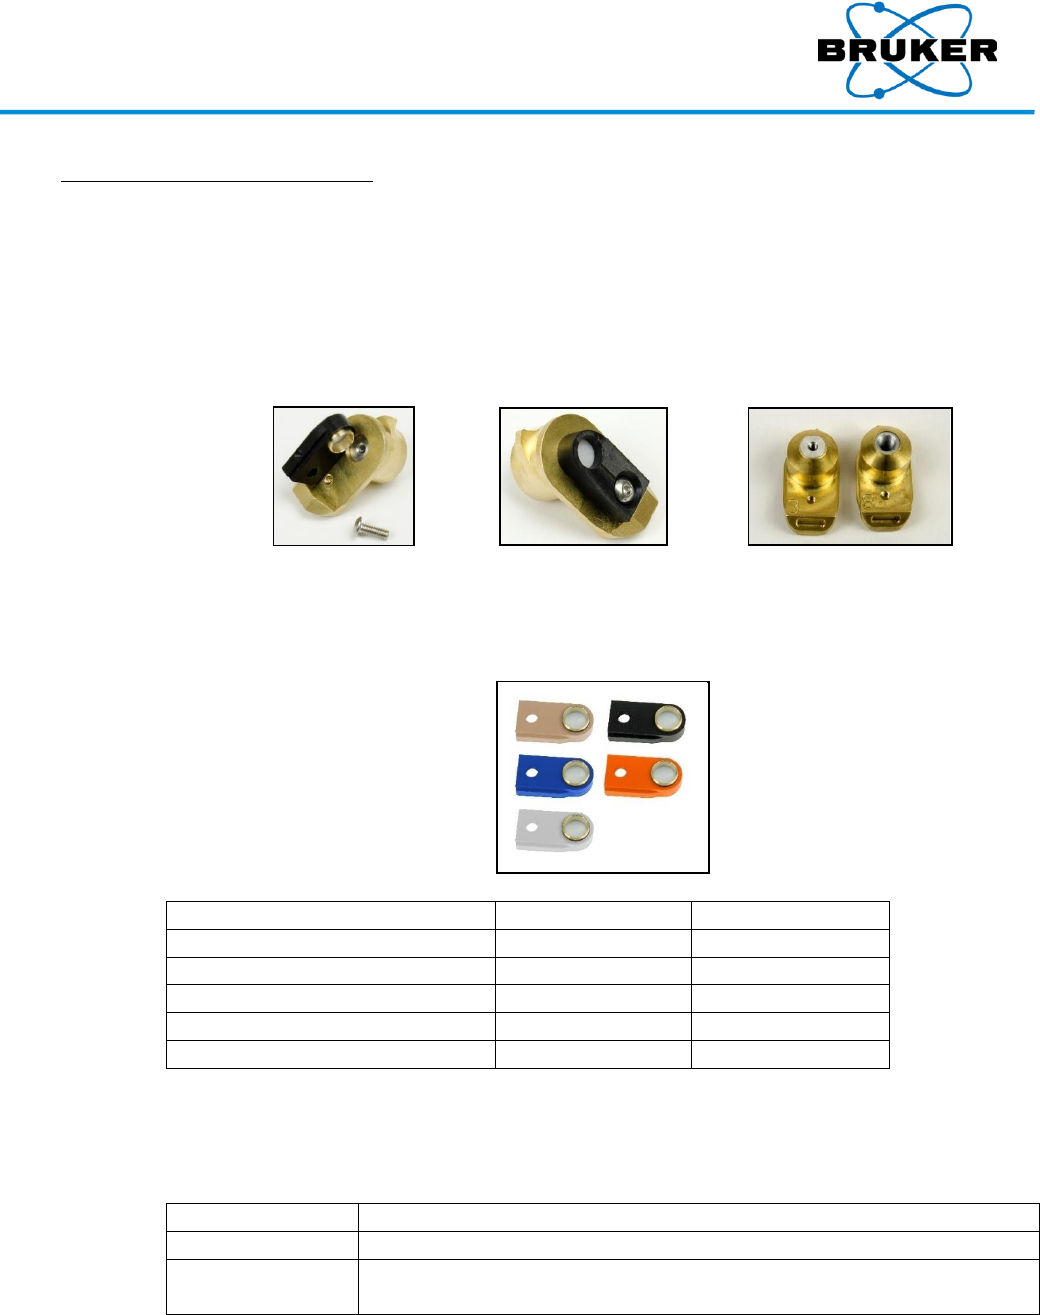
1.2. TRACER 5i Collimators and Filters
Description
The TRACER 5i has additional, interchangeable features –
Filters.
Collimators, stamped with either an 8 or 3.
They are applied as an assembly: a filter is inserted into the filter holder, which is attached to the
collimator with a screw.
Black filter holder Assembly Collimators
Filter types
The instrument comes with five filter options and five filter holders (below) marked in different
colors to indicate the filter type.
Filter
Name on Screen
Holder Color
Ti 25µm
Blue
Blue
Cu 200µm:Ti 25µm:Al 300µm
Black
Black
Al 76µm
Orange
Orange
C 60µm:F 190µm
Teflon
White
No filter
None
Beige
Collimators
The collimator determines the size of the spot on the sample to be tested. For most applications,
8mm is best. The 3mm collimator reduces the focal point size and, therefore, the analyzed area.
For safety reasons, a collimator must be installed at all times.
If a collimator is…
Then
Installed
The size is displayed in the status bar and recorded in the data file.
Not installed
The instrument is prevented from entering the armed state and will not
produce X-rays.
S1 TITAN and TRACER 5i User Manual
030.0112.01.0 9 of 58
Installing a
collimator
To install an alternate collimator –
Step
Action
1
Ensure that the instrument is powered off.
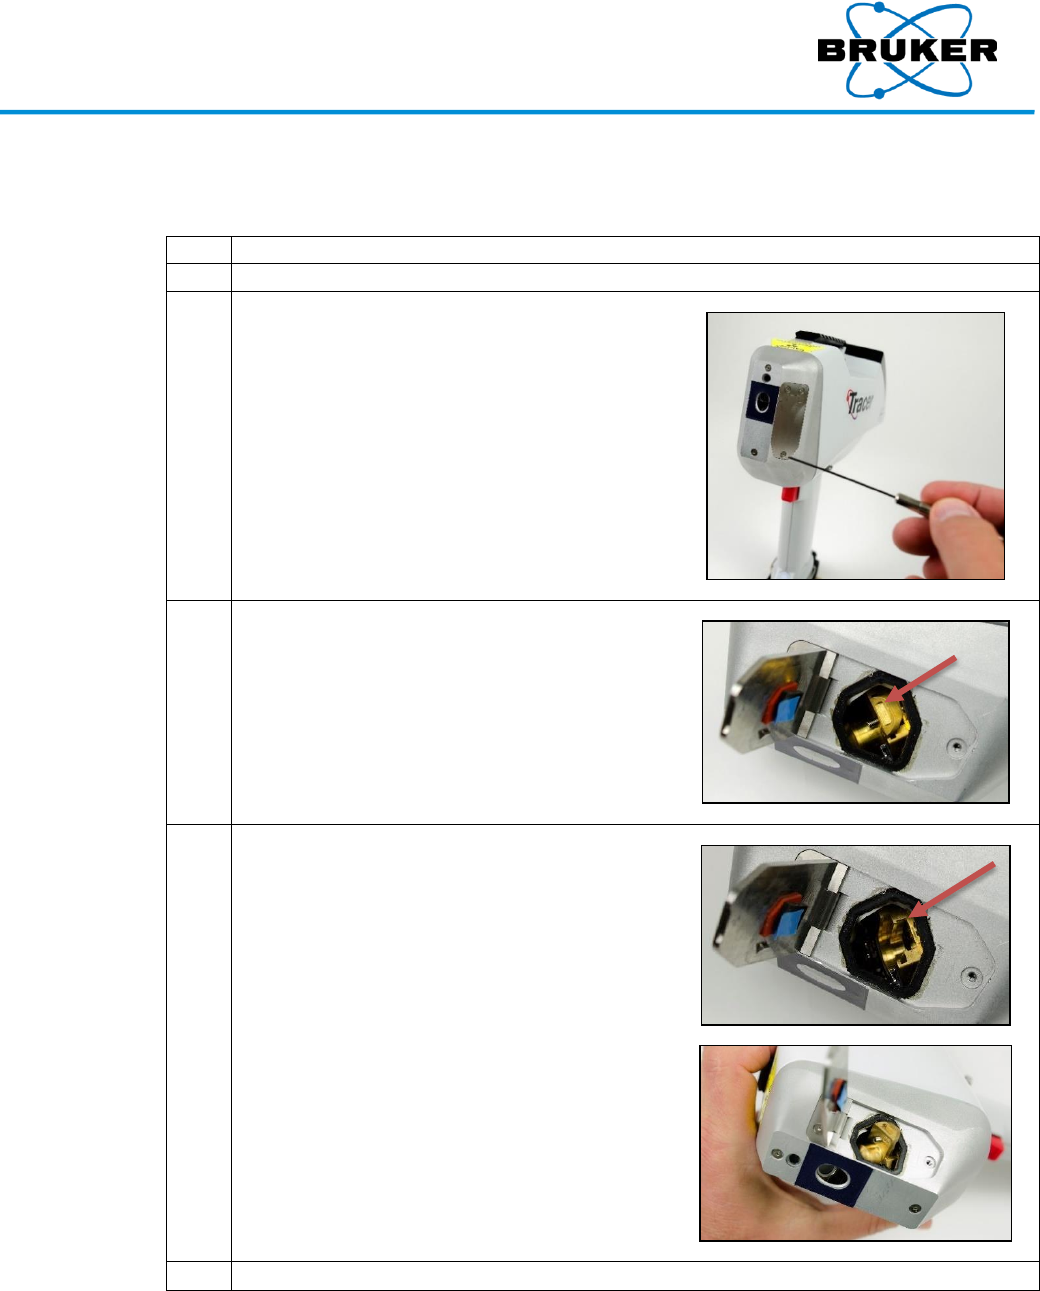
2
Using the provided 0.050 inch hex
screwdriver, open the collimator hatch located
on the side of the instrument nose. Do not
allow debris to get inside the hatch area.
3
Using a thumbnail on the lip of the currently
installed collimator, slide it out. It may be
tight.
4
Line up the new collimator with the groove
inside the hatch and slide it in until it clicks.
Again, do not allow debris inside.
5
Securely close the hatch and screw it shut.
S1 TITAN and TRACER 5i User Manual
030.0112.01.0 10 of 58
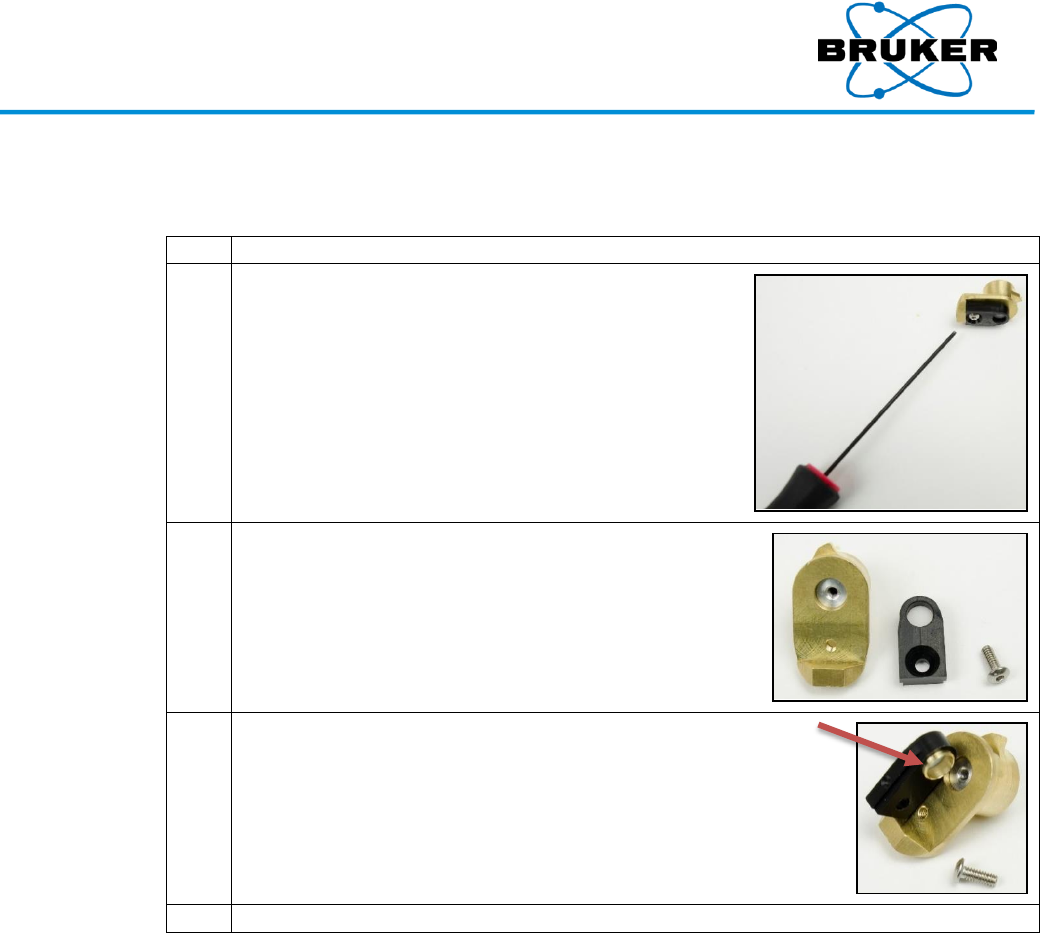
Changing
filters
To change manual filters attached to a collimator –
Step
Action
1
Note the configuration of the current filter
holder on the collimator.
2
Using the provided 0.050 inch hex
screwdriver, unscrew the filter holder from
the collimator.
3
Align the new filter holder with the collimator.
Note the metal band fits into the collimator.
4
Attach the screw.
S1 TITAN and TRACER 5i User Manual
030.0112.01.0 11 of 58
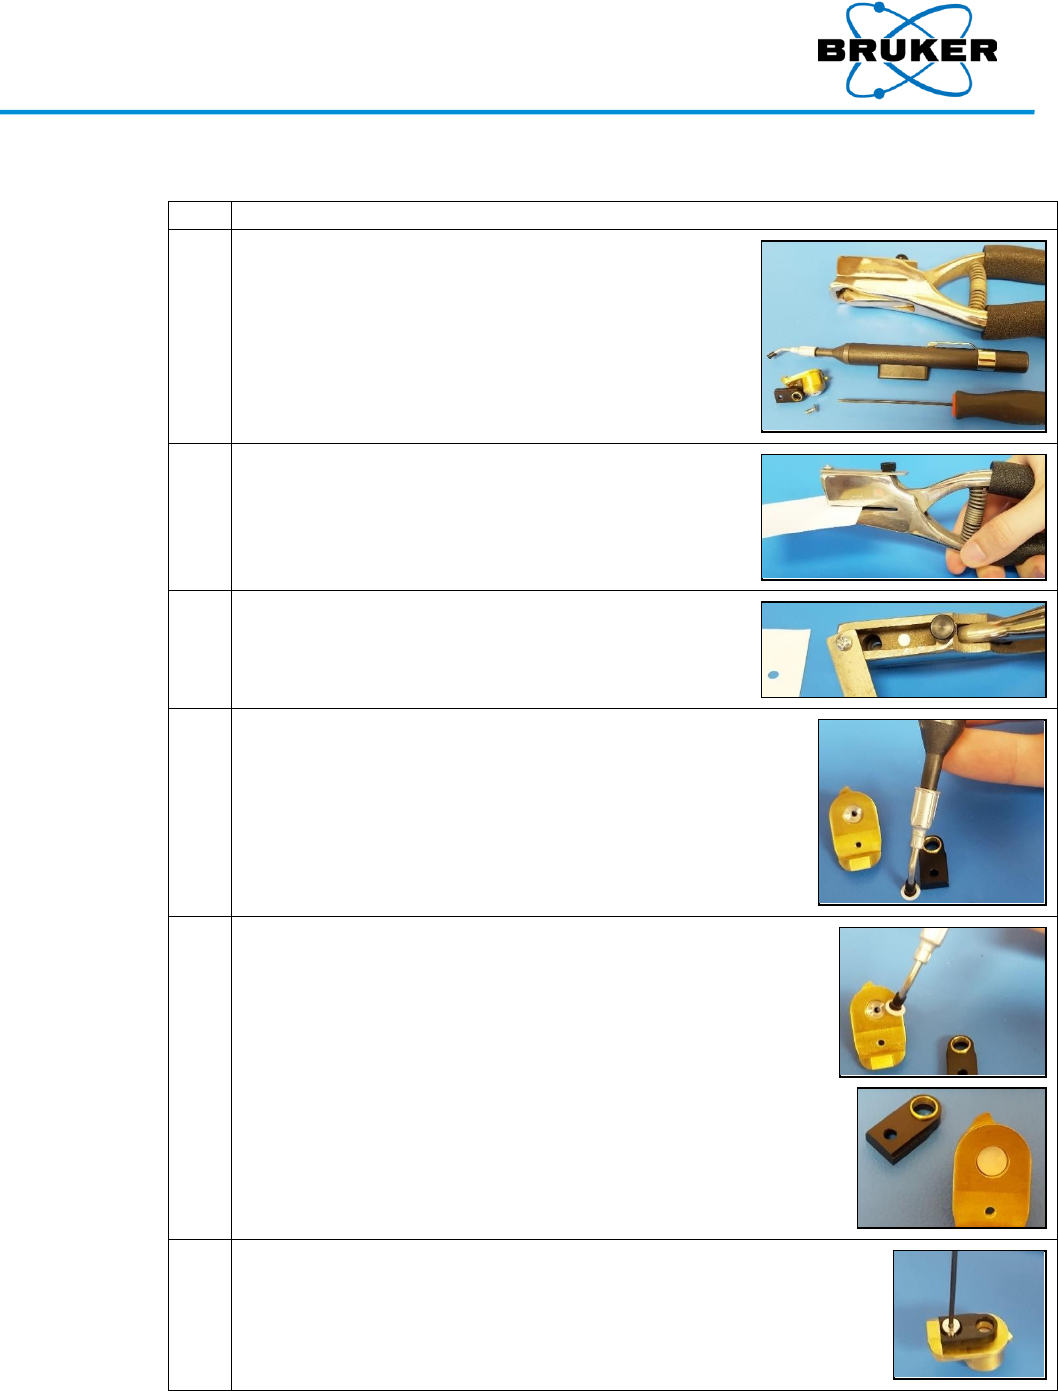
Making a
filter
To make a custom filter –
Step
Action
1
Collect necessary tools:
Hole punch
Vacuum stick
0.050 inch hex screwdriver
Collimator assembly
2
Use the hole punch to cut the filter material.
3
Retrieve the filter piece from the hole punch.
4
Use the vacuum stick to pick up the filter piece
without touching it.
To operate the vacuum stick –
1. Press and hold the button.
2. Touch the tip to the filter piece.
3. Release the button.
5
Place the filter piece in the collimator. Release the
filter piece by pressing the vacuum stick button.
For a multilayer filter, the filter piece with the highest
atomic number must be placed in the collimator last
so it is closest to the X-ray source.
6
Screw the filter holder onto the collimator.
S1 TITAN and TRACER 5i User Manual
030.0112.01.0 12 of 58
1.3. General Care and Maintenance
Low
maintenance
The instrument, when used properly, should require very little maintenance beyond –
Battery recharging. See Power Sources, page 14.
Window replacement. See below.
Quality checking. See Quality Check, page 55.
Touch screen
The touch screen uses sensitive electronics and should be cleaned regularly using a soft, lint-free
or microfiber cloth. Do not –
Use cleaners as they may damage the screen.
Use compressed air.
Leave the analyzer where the touch screen is exposed to direct sunlight.
Cleaning
exterior
If the exterior of the analyzer becomes dirty, wipe it gently with a damp, lint-free cloth. Avoid
harsh solvents and compressed air.
1.4. Changing Windows
Description
The window in front of the detector is delicate, only 4 µm thick Prolene™, and periodically
requires replacement.
Never touch or use compressed air on the detector. The detector window is 8µm Be, fragile, and
expensive.
Detector
S1 TITAN and TRACER 5i User Manual
030.0112.01.0 13 of 58
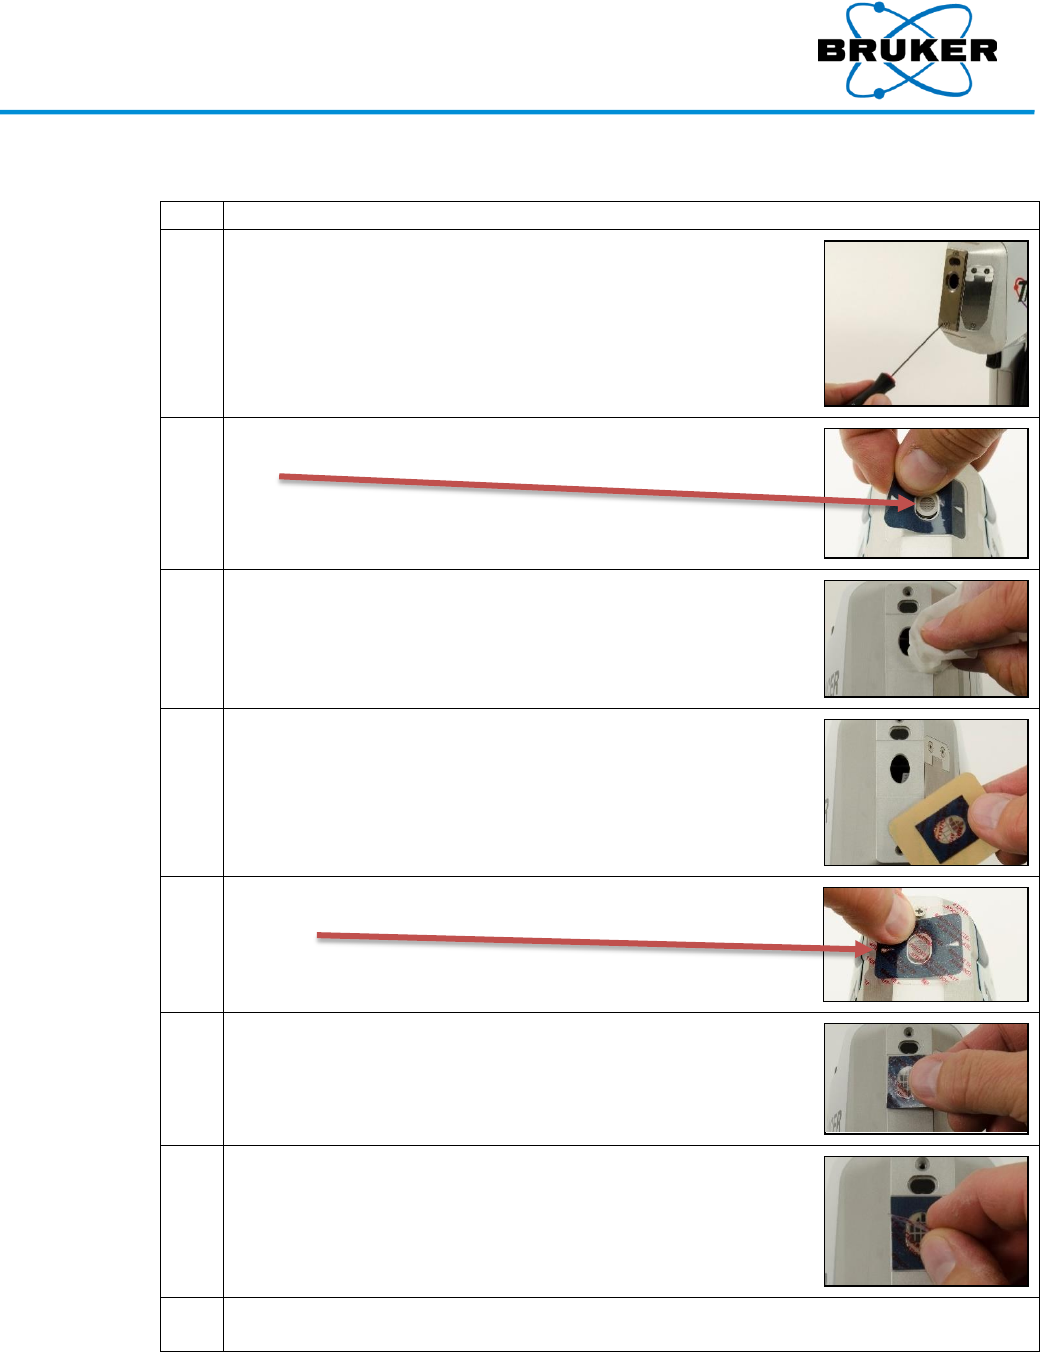
Changing
windows
To change a window –
Step
Action
1
If necessary, unscrew and remove the nose plate using the
supplied screwdriver.
TRACER 5i
2
Peel off the old window. Avoid any contact with the sensitive
detector.
S1 TITAN
3
Remove old adhesive with isopropyl alcohol.
TRACER 5i
4
Peel the white backing from the new window.
TRACER 5i
5
For the S1 TITAN, center alignment arrows over the middle of
the aperture.
S1 TITAN
6
Carefully apply the new window to the nose.
TRACER 5i
7
Peel off the clear front protective cover. Otherwise, light
element measurements will be inaccurate.
TRACER 5i
8
Replace the nose plate. Firmly secure the screws but do not
over-tighten.
S1 TITAN and TRACER 5i User Manual
030.0112.01.0 14 of 58
1.5. Power Sources
What is
provided
The analyzer is supplied with –
Two Lithium ion (Li-ion) batteries, part number 160.0009.
Battery charger with a cord, part number 160.0010. (Do not use a different charger with
these batteries.) For more information, consult the manufacturer’s battery charger
manual.
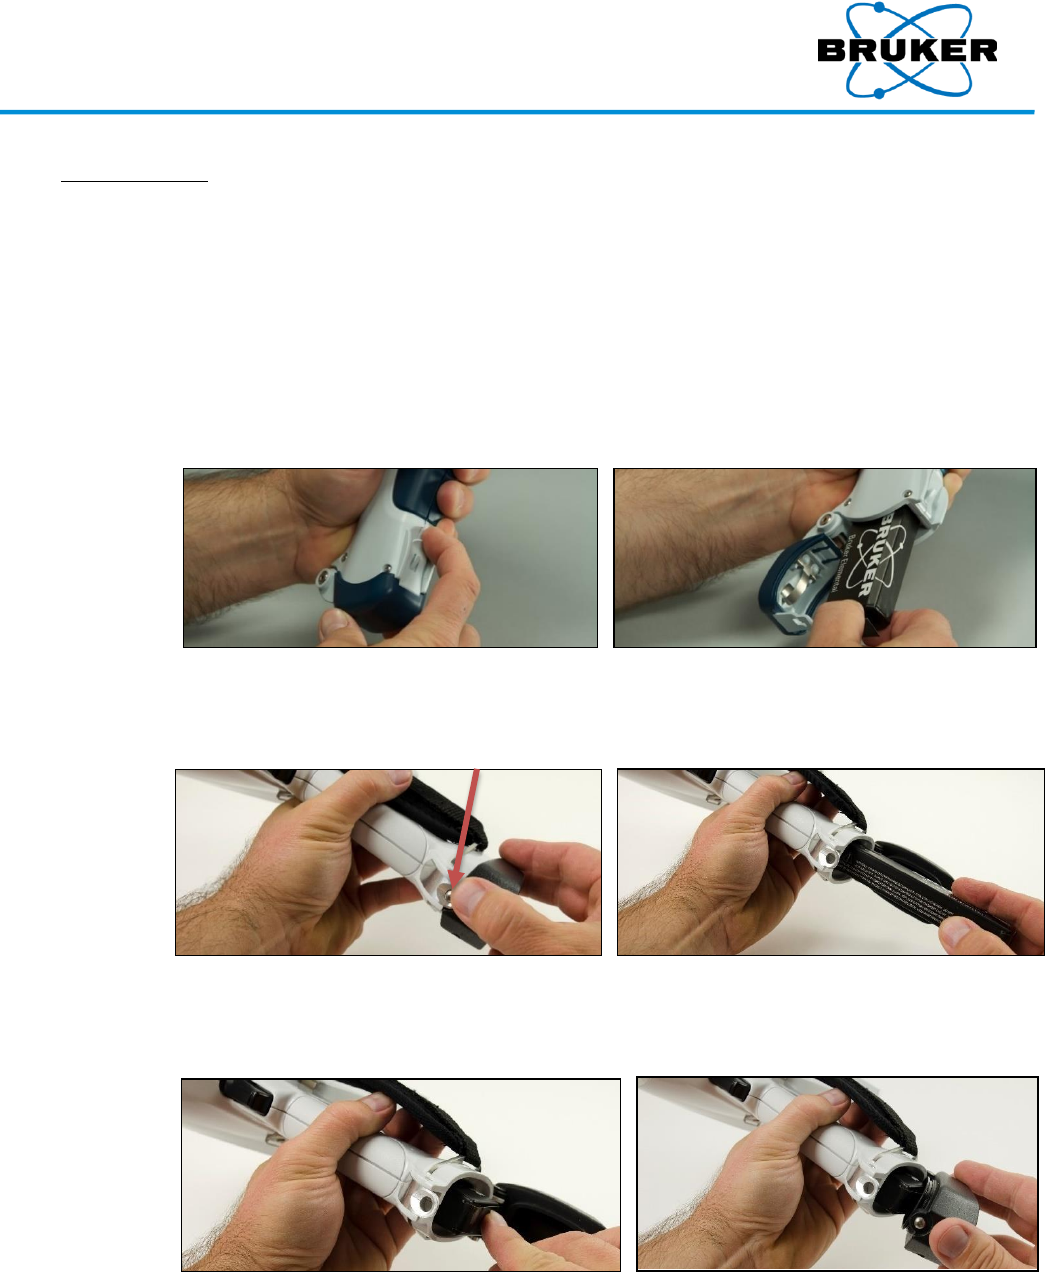
S1 TITAN
battery
removal
To remove a battery from the S1 TITAN, while pressing the base, lift up the locking clip and pull
down the door. Pull out the battery.
TRACER 5i
battery
removal
To remove a battery from the TRACER 5i, press the battery door button, open the door, and pull
out the battery.
Button
Battery
installation
To install a battery into an instrument, slide in the battery and close the door until the locking
clip clicks. Note that the battery can be inserted completely in only one configuration.
S1 TITAN and TRACER 5i User Manual
030.0112.01.0 15 of 58
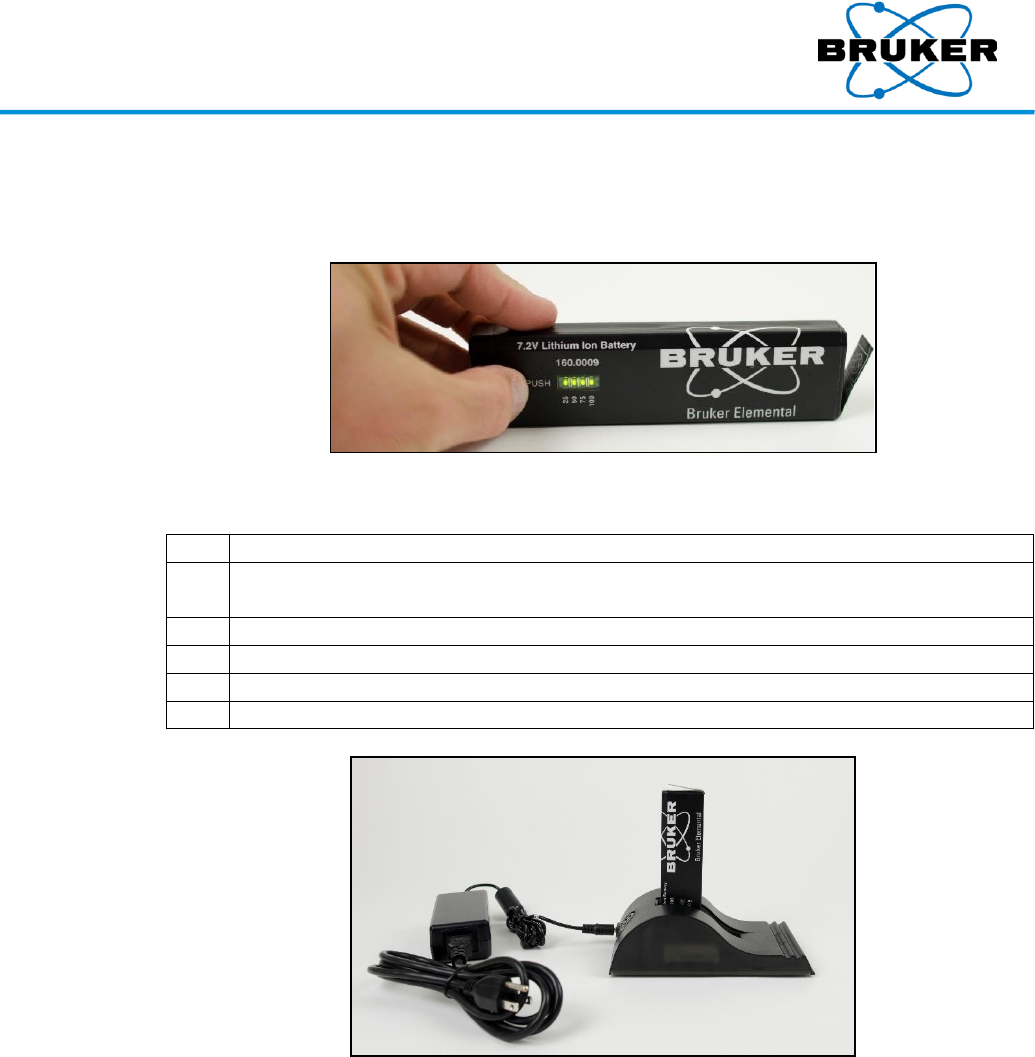
Remaining
charge
To check the charge remaining on a battery –
On the “Bruker” side of the battery, push the white button on the left. Green lights indicate the
approximate remaining charge in percent.
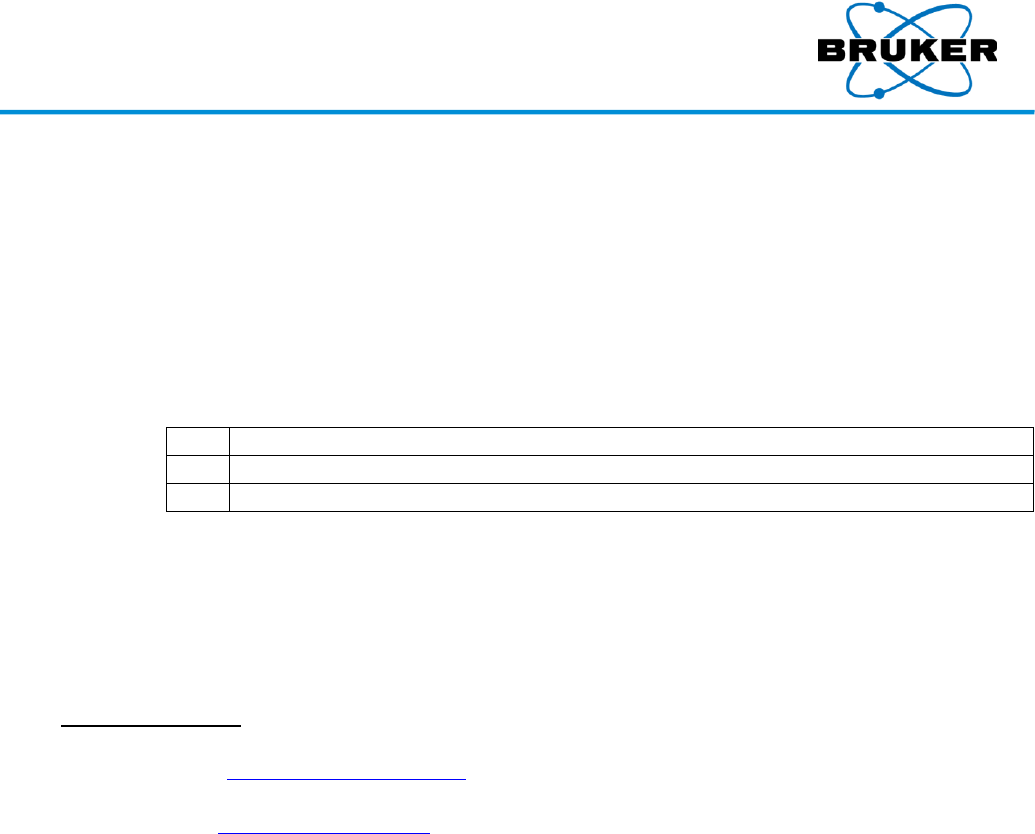
Charging
To charge a battery –
Step
Action
1
To prolong battery life, ensure that the ambient temperature during charging is
between +5 °C and +45 °C (40 °F to 115 °F).
2
Plug power adapter into back of charger.
3
Plug power cord into power adapter.
4
Plug power cord into a wall outlet.
5
Insert battery into charger with the Bruker name on the left side.
During charging, the green light blinks. A solid green light indicates the battery is fully charged.
For more information, consult the manufacturer’s battery charger manual.
Duration
A charge lasts, depending how the instrument is used, about four to eight hours.
Warnings
Do not –
Disassemble, crush, or puncture a battery.
Place a battery in fire or water.
Charge a battery except with the supplied charger.
Short battery terminals by allowing them to touch metal.
Dispose of batteries in the trash.
S1 TITAN and TRACER 5i User Manual
030.0112.01.0 16 of 58
Disposal
To dispose of a battery –
Contact your local waste management company regarding disposal and recycling programs.
If there is no local disposal program, return used Bruker batteries to Bruker. A nominal
shipping charge applies.
If a battery fails to operate normally within the warranty period, return it to Bruker for
evaluation and repair.
Using AC
adapter
Optionally, the instrument may be powered by an AC adapter purchased from Bruker. (This is
different from the battery AC adapter.) To power the analyzer with an AC adapter –
Step
Action
1
With the supplied cord, connect the AC adapter to a 90-240V AC wall outlet.
2
Connect the AC adapter to the analyzer’s power port.
Maintaining
power
The analyzer may be connected to the AC adapter prior to removing the battery so power to the
unit is maintained.
Bruker brand
only
Using another brand of adapter could damage the analyzer and voids the warranty.
1.6. Contacting Bruker
Email: support.hmp@bruker.com
Phone: +1 (509) 783-9850
Web: www.bruker.com/hhxrf
Address: 415 N. Quay Street
Kennewick, WA 99336 USA
S1 TITAN and TRACER 5i User Manual
030.0112.01.0 17 of 58
2. Radiation Safety
Description
This section describes the radiation profiles of the S1 TITAN and TRACER 5i, X-ray warnings, and
safety recommendations.
Proper use
When the instrument is used properly, X-ray radiation from instrument poses no harm to the user
or others. Use the instrument for only its intended use.
Each
instrument
A radiation profile is measured on each instrument before it leaves the factory.
Safe use
Safe use of any XRF device is based on the principles of:
Principle
Description
Time
Managing the amount of time during which X-rays are produced.
Distance
Keeping all parts of the user’s body as far away from the X-ray producing nose
as possible.
Pointing the analyzer away from others.
Keeping others away from the instrument during use.
Shielding
Ensuring that the instrument is mechanically intact and sound.
When measuring small samples that might allow X-ray radiation to escape,
use a benchtop or desktop stand and close the lid.
ALARA
Collectively, these practices are known as “As Low as Reasonably Achievable” (ALARA). Safe
practice is further discussed during user training. For more details, see the Radiation Safety
Manual, Bruker document 030.0011.
Occupational
limits
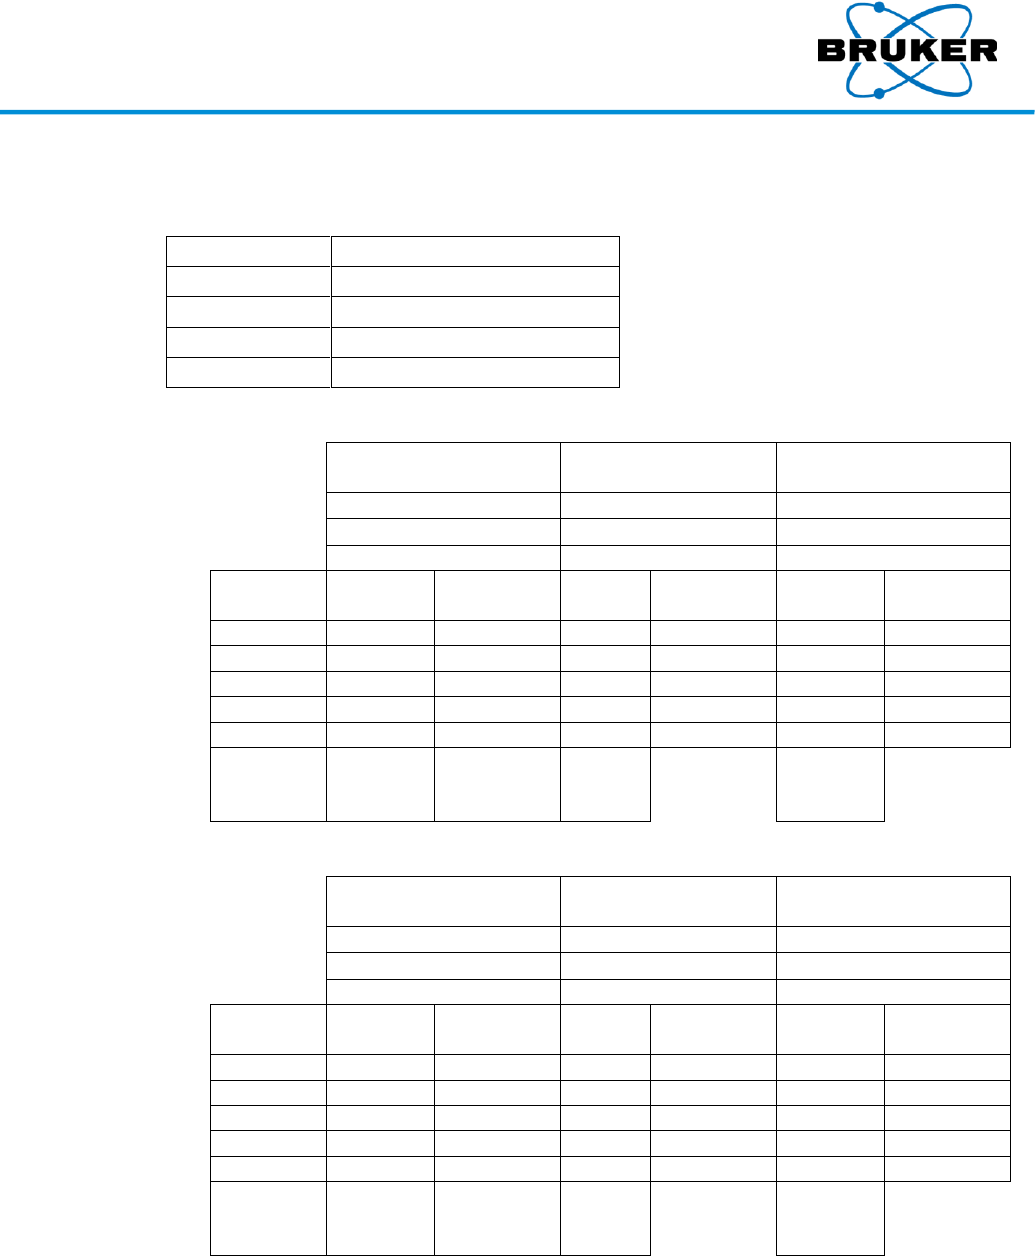
The following table lists the annual exposure limit.
TRACER 5i
Eye
Skin
Rem
15
50
Sieverts
0.15
0.5
2.1. Radiation Profile – S1 TITAN
Testing
standards
The radiation profile reflects the radiological conditions during worst-case (high voltage, high
power) instrument operation.
To establish radiation profiles –
IEC 62495 (2011), Nuclear instrumentation – Portable X-ray fluorescence analysis
equipment utilizing a miniature X-ray tube was used as a guide.
The analyzer was set at the maximum voltage and current established for analysis, with a
standard material sample over the examination window.
Per the guide, measurement of stray radiation (leakage and scatter) was conducted at 10,
30, and 100 centimeter distances from the surface.
Additionally, the geometric size of the X-ray beam and the open beam radiation dose
equivalent rates were recorded at 0, 5, 10, 30, and 100 centimeters.
S1 TITAN and TRACER 5i User Manual
030.0112.01.0 18 of 58
General
testing
conditions
Radiation measurements were conducted –
Using a Thermo micro-rem low energy plastic scintillation radiation survey instrument.
With the survey meter calibrated by the survey meter manufacturer.
Referenced to the center of the detector volume.
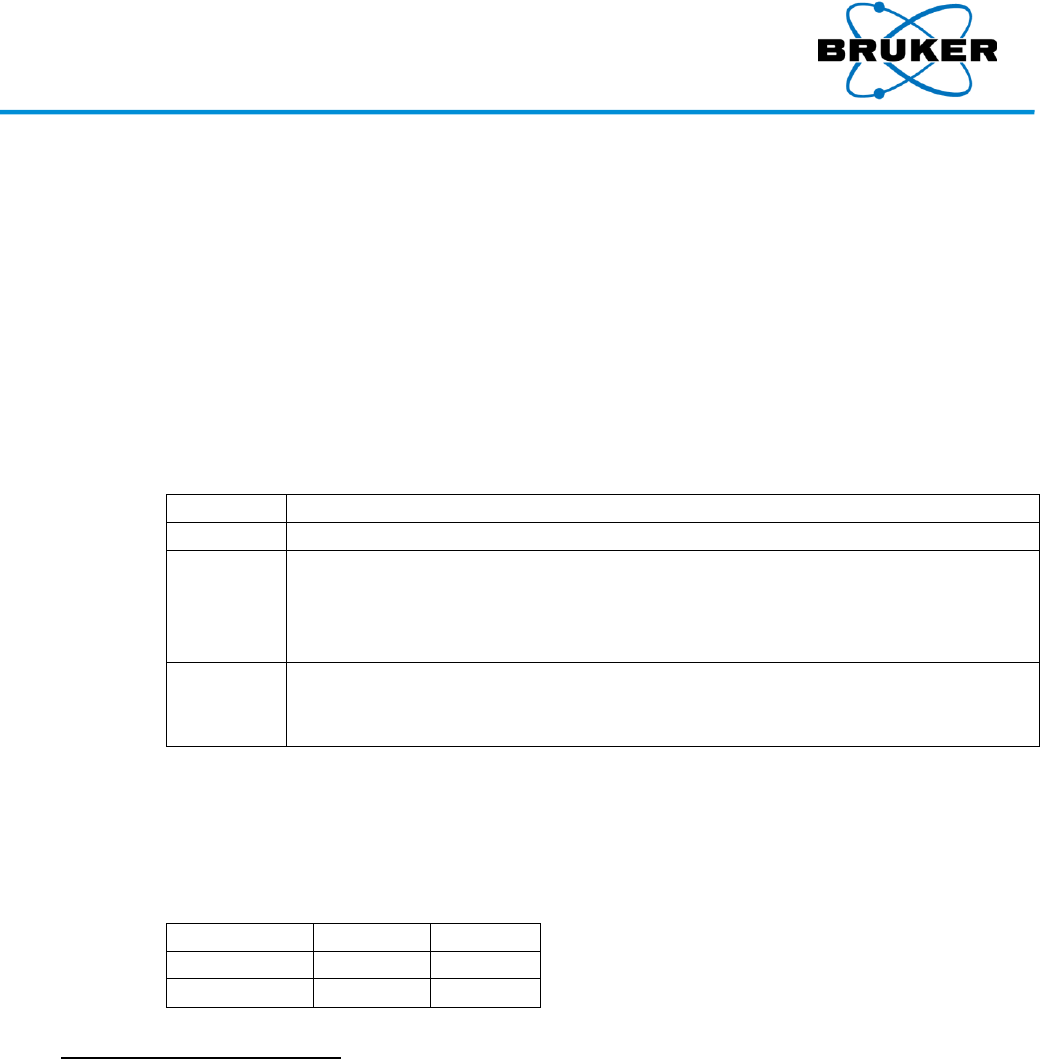
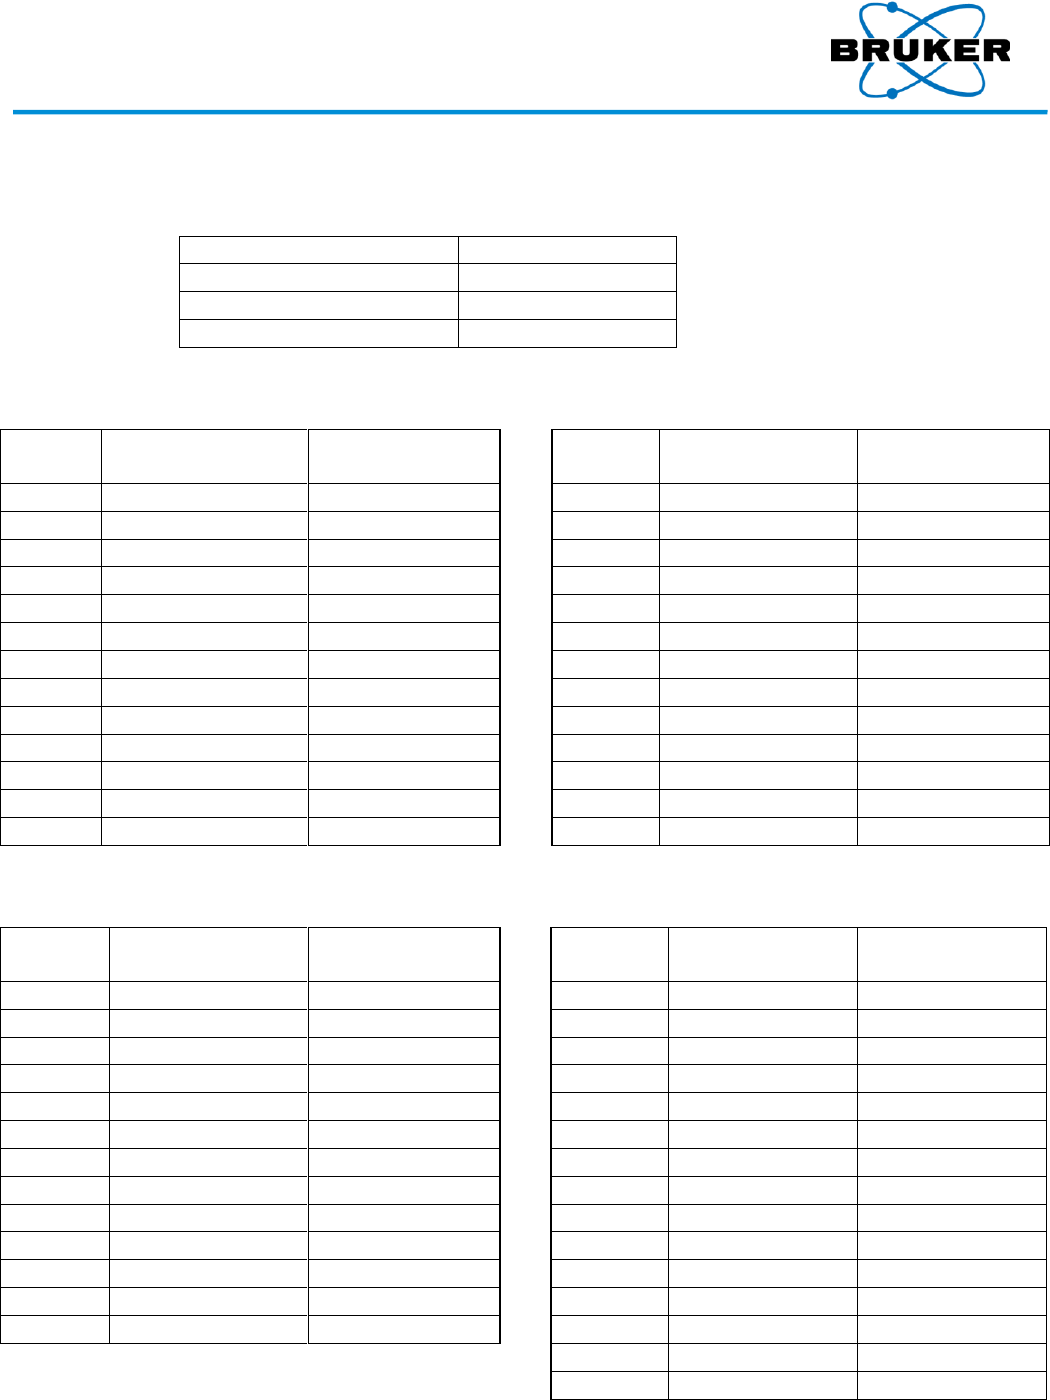
Readings
Readings were taken at 50kV, 39 µA, with a Duplex 2205 sample over the examination window
and rounded up to the nearest 5 µRem/hr value.
Displayed isodistance contours show the maximum value likely to be encountered in x10-6Rem/hr
(rem/hr) or equivalently in x10-8 Sieverts/hr.
Duplex
μrad(μSieverts)/hr
Location
10cm
30cm
100cm
A
≤45(0.45)
≤20(0.20)
≤5(0.05)
B
≤10(0.10)
Background
Background
C
≤5(0.05)
≤5(0.05)
Background
D
Background
Background
Background
E
Background
Background
Background
F
Background
Background
Background
G
Background
Background
Background
H
≤40(0.40)
≤5(0.05)
Background
I
≤40(0.40)
≤5(0.05)
Background
J
≤10(0.10)
Background
Background
K
≤10(0.10)
Background
Background
L
≤5(0.05)
Background
Background
M
≤5(0.05)
Background
Background
S1 TITAN and TRACER 5i User Manual
030.0112.01.0 19 of 58
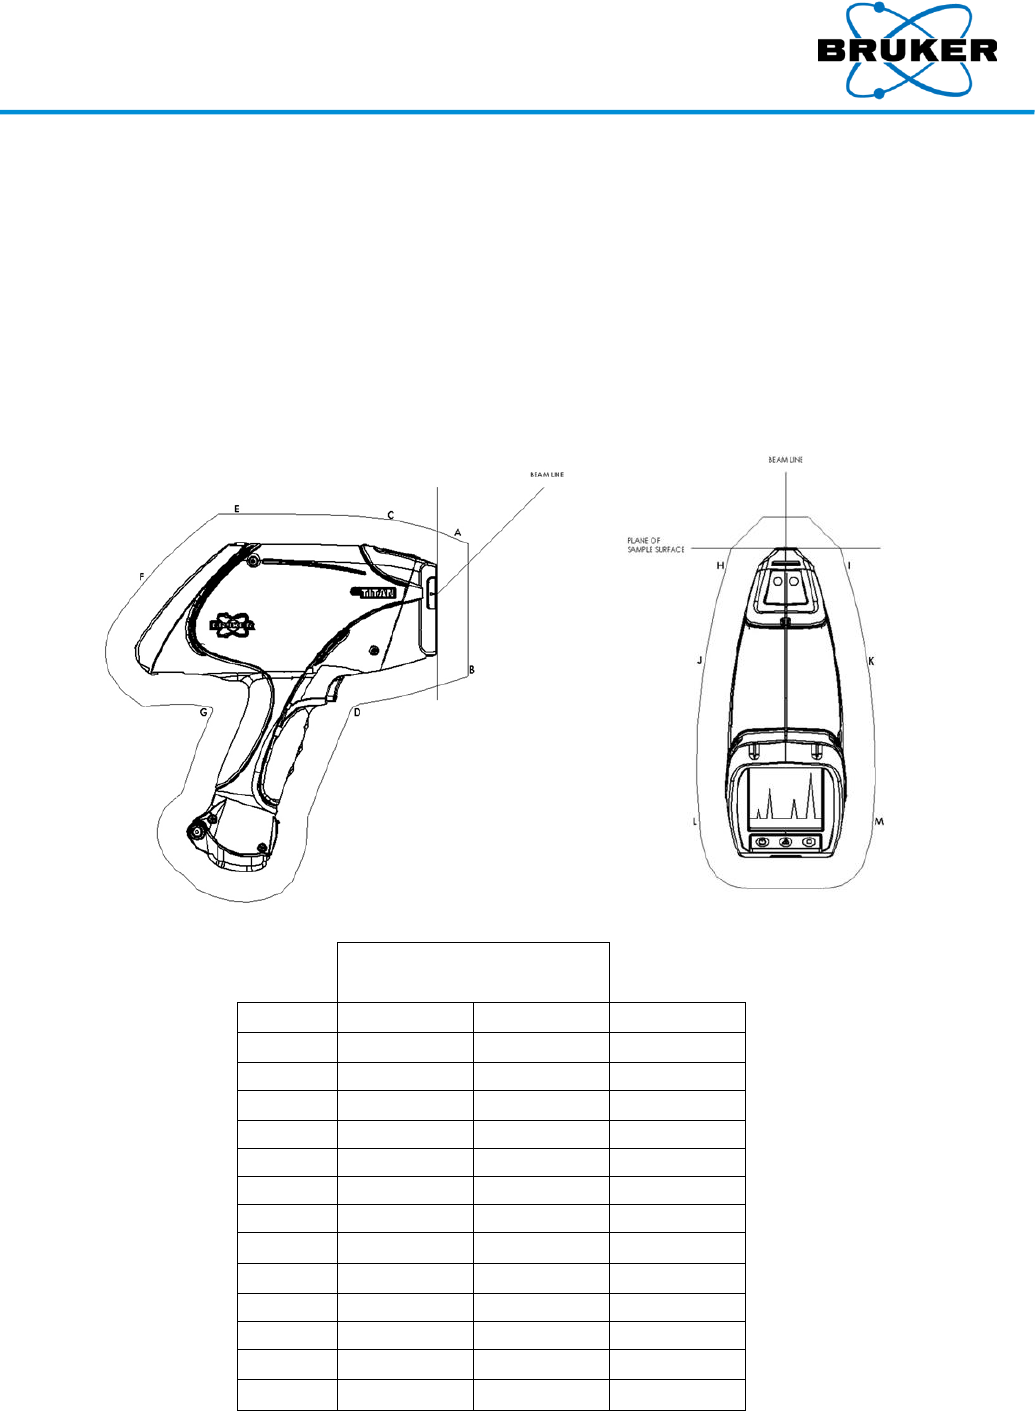
X-ray beam
diameter
The following table provides specific beam diameters at selected distances from the beam port
when no sample is in place.
Beam Port Distance in cm
Beam Diameter in cm
1.50
1.20
5
2.5
10
4.23
30
11.34
100
36.5
Testing
conditions,
open beam
Radiation measurements were conducted –
Using a Thermo RadEye B20-ER meter corrected by results from NanoDots.
With the survey meter calibrated by the survey meter manufacturer.
The dose at the Beam Port for the open beam measurement was extrapolated from the 5cm and
10cm results on a logarithmic scale as described in IEC 62495.
Distance vs.
dose
Worst-Case
50KeV, 39A
Blank, No Filter
Distance
(cm)
Dose
(Rem/hr)
Dose
(Sieverts/hr)
With Duplex
(Rem/hr)
With Duplex
(Sieverts/hr)
Beam Port
223.7
2.237
1300
13.00
5 cm
119.0
1.190
289.0
2.890
10 cm
63.24
0.6324
144.5
1.445
30 cm
19.9
0.199
44.2
0.442
100 cm
1.96
0.0196
Background
Background
Eye / Skin
Time to
Limit
4.02 / 13.4
Minutes
4.02 / 13.4
Minutes
S1 TITAN and TRACER 5i User Manual
030.0112.01.0 20 of 58
2.2. Radiation Profile – TRACER 5i
Testing
standards
The radiation profile reflects the radiological conditions during normal and non-normal
instrument operational conditions.
To establish radiation profiles –
IEC 62495 (2011), Nuclear instrumentation – Portable X-ray fluorescence analysis
equipment utilizing a miniature X-ray tube was used as a guide.
The analyzer was set at three conditions established for normal analysis and two worst-
case conditions with and without a sample over the examination window. For ease in
viewing, three of the settings are shown below.
Per the guide, measurement of stray radiation (leakage and scatter) was conducted at 10,
30, and 100 centimeter distances from the surface, as well as at 5cm.
The geometric size of the X-ray beam and the open beam radiation dose equivalent rates
were recorded at 5, 10, 30, and 100cm and extrapolated back to the surface.
General
testing
conditions
Radiation measurements were conducted –
Using a Thermo RadEye B20-ER meter.
With the survey meter calibrated by the survey meter manufacturer.
Readings
The instrument stray radiation profile was collected –
Operating without a filter.
With the larger 8cm collimator.
At its effective maximum power (40keV and 99uA in the appendix) and maximum voltage
(50keV and 39uA).
At distances of 5, 10, 30, and 100cm.
With and without a sample covering the opening at the nose of the instrument.
Using a duplex (3mm thick) check sample.
Operating at commonly used setting and corresponding filters for 50 (in the appendix),
40, and 15 keV.
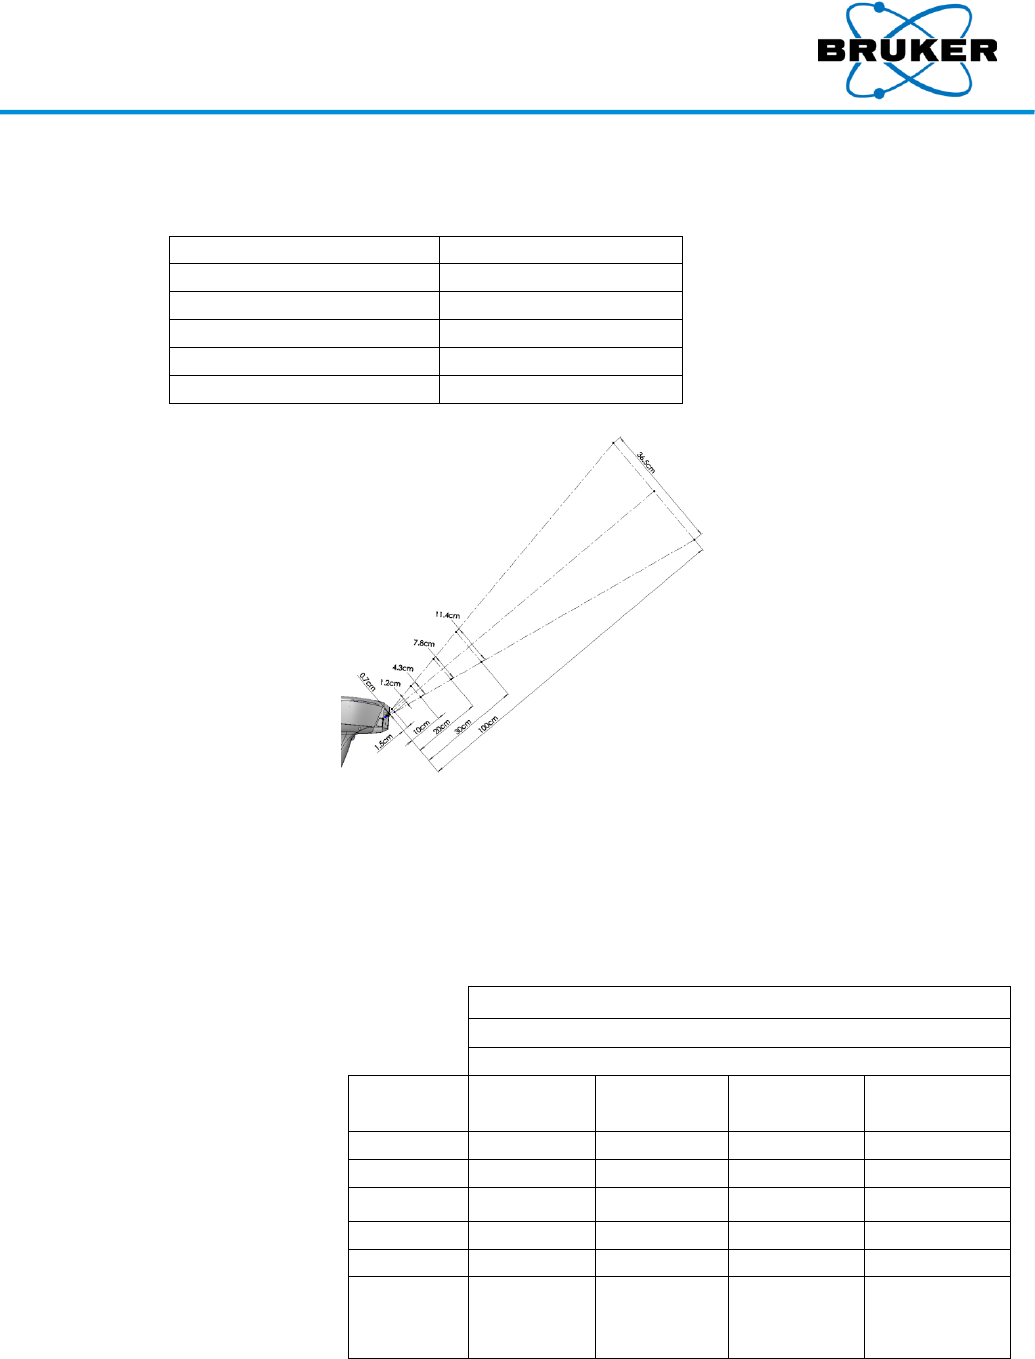
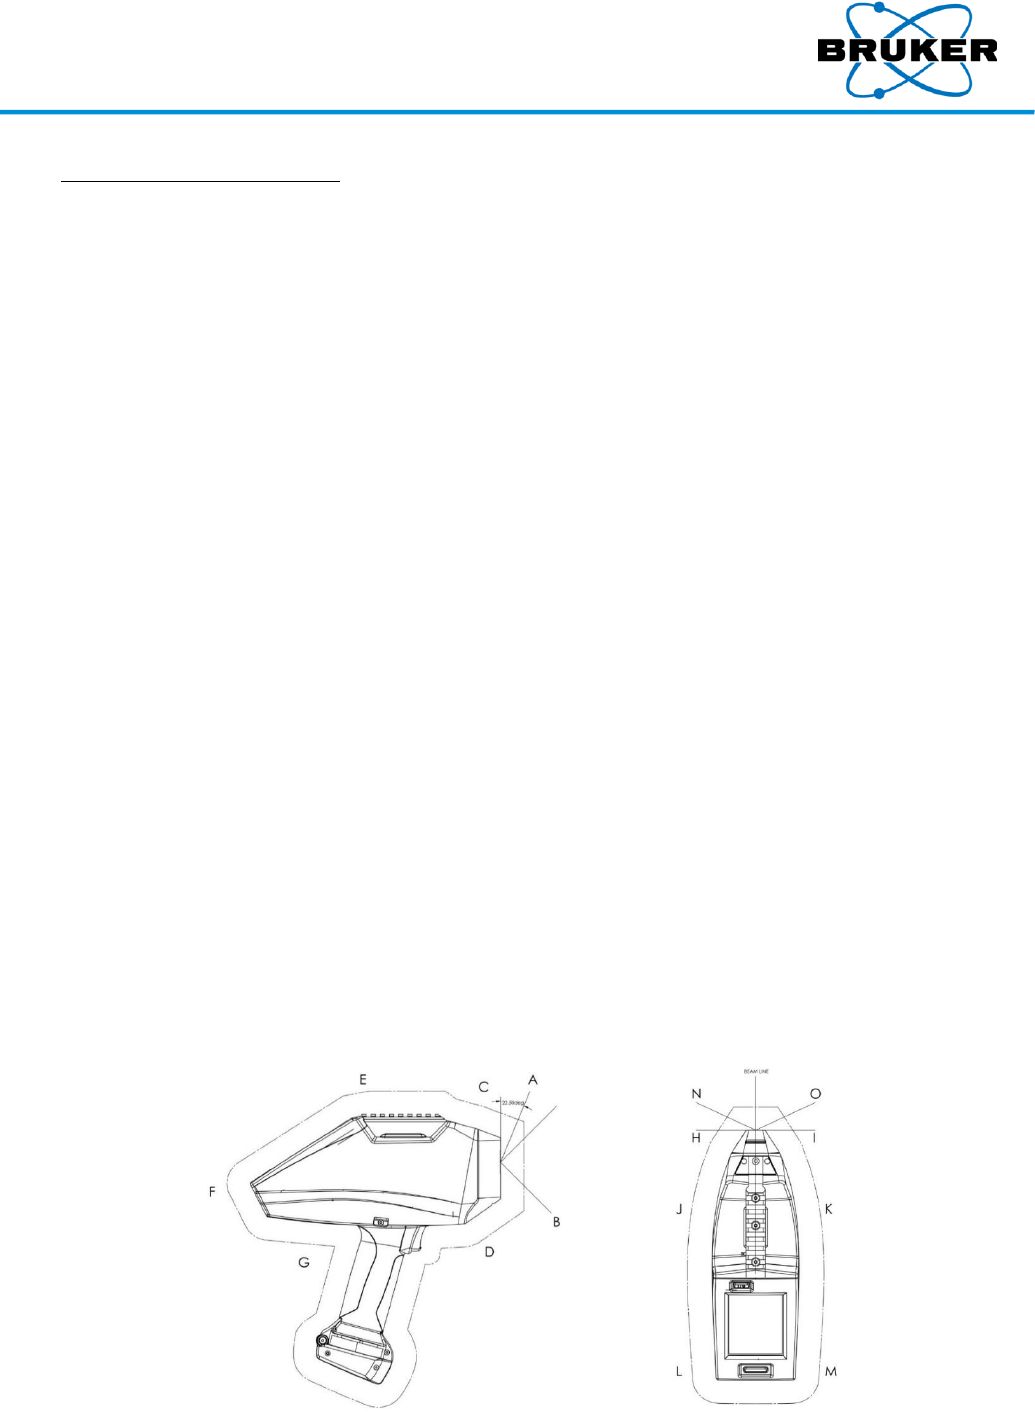
Locations for the stray radiation profiles and results are shown in the figures and tables below,
and the appendix. Correction factors to agree with results from 80 pkV, 2.9mm Al HVL NanoDots
(TLD dosimeters) from Landauer were applied.
S1 TITAN and TRACER 5i User Manual
030.0112.01.0 21 of 58
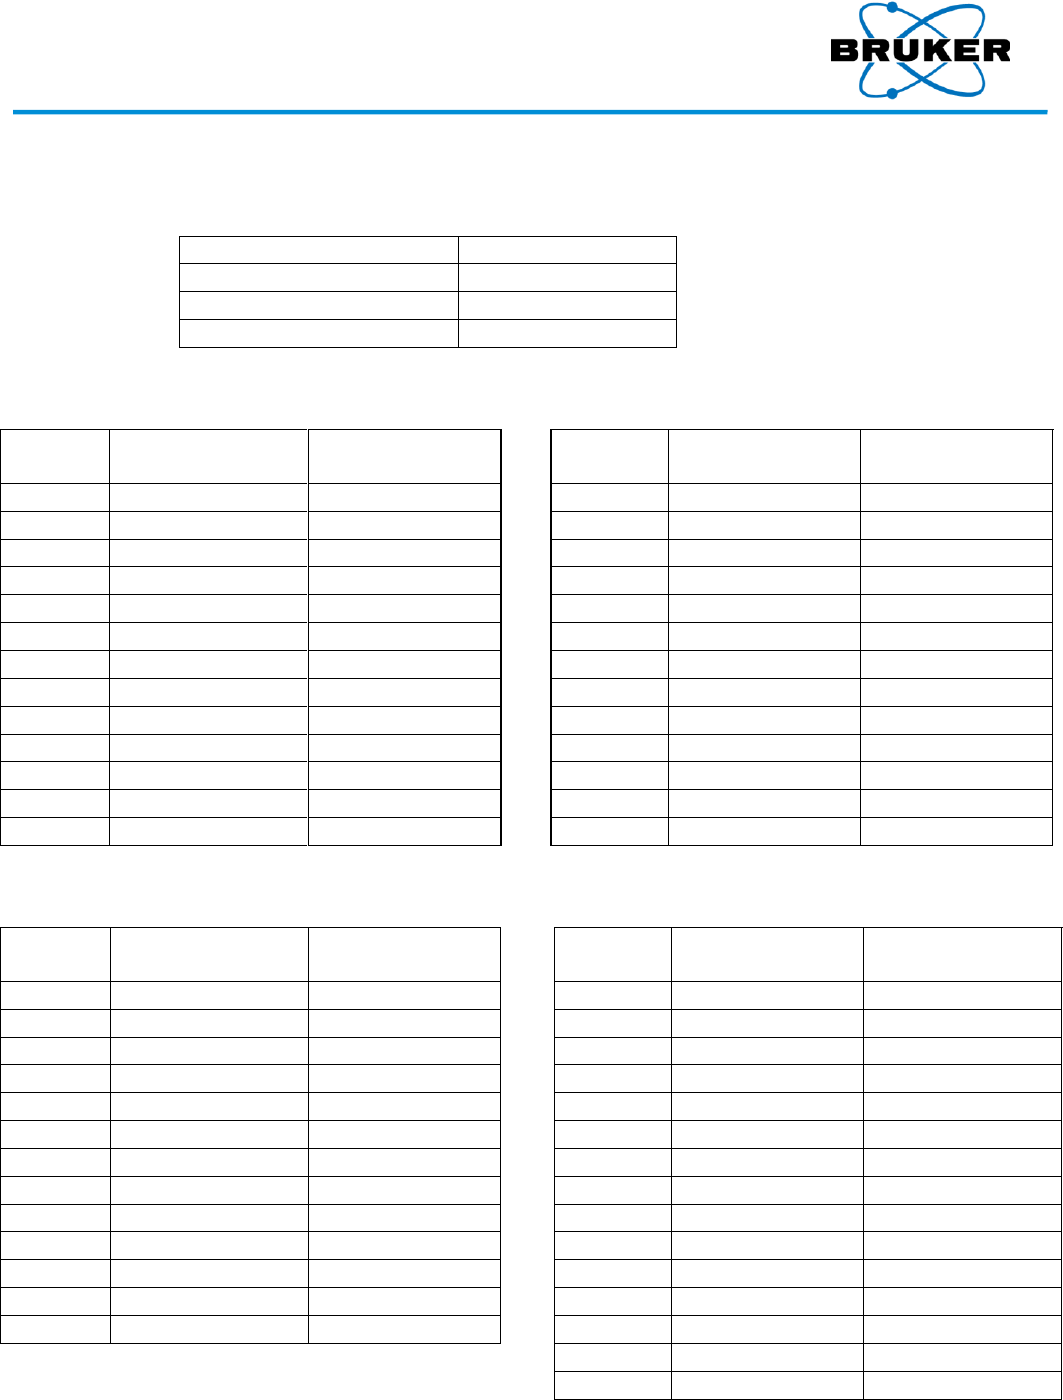
Worst-case 1
highest
energy
Tests were performed with the following settings:
Setting Type
Value
Voltage (keV)
50
Current (μA)
39
Filter
Blank #2
At 5 cm
At 10 cm
Location
Open Beam
μrad(μSieverts)/hr
Duplex
μrad(μSieverts)/hr
Location
Open Beam
μrad(μSieverts)/hr
Duplex
μrad(μSieverts)/hr
A
2781439(27814.39)
83.1(0.831)
A
46204.9(462.049)
Background
B
3272.7(32.727)
Background
B
1556.9(15.569)
Background
C
726.1(7.261)
18.1(0.181)
C
689.9(6.899)
Background
D
1123.4(11.234)
21.7(0.217)
D
942.8(9.428)
Background
E
75.9(0.759)
Background
E
86.7(0.867)
Background
F
256.5(2.565)
Background
F
54.2(0.542)
21.7(0.217)
G
Background
Background
G
Background
Background
H
2351.6(23.516)
112.0(1.120)
H
726.1(7.261)
39.7(0.397)
I
1419.6(14.196)
292.6(2.926)
I
906.7(9.067)
90.3(0.903)
J
191.5(1.915)
47.0(0.470)
J
317.9(3.179)
79.5(0.795)
K
151.7(1.517)
Background
K
292.6(2.926)
68.6(0.686)
L
Background
Background
L
79.5(0.795)
65.0(0.650)
M
Background
Background
M
57.8(0.578)
75.9(0.759)
At 30 cm
At 100 cm
Location
Open Beam
μrad(μSieverts)/hr
Duplex
μrad(μSieverts)/hr
Location
Open Beam
(μrad/hr)
Duplex (μrad/hr)
A
5869.6(58.696)
Background
A
2980.1(29.801)
Background
B
386.2(3.862)
Background
B
128.4(1.284)
Background
C
386.2(3.862)
Background
C
163.5(1.635)
Background
D
386.2(3.862)
Background
D
134.3(1.343)
Background
E
132.7(1.327)
Background
E
99.2(0.992)
Background
F
209.3(2.093)
Background
F
119.7(1.197)
Background
G
Background
Background
G
61.3(0.613)
Background
H
356.7(3.567)
Background
H
61.3(0.613)
Background
I
312.5(3.125)
Background
I
113.8(1.138)
Background
J
312.5(3.125)
Background
J
81.7(0.817)
Background
K
165.1(1.651)
Background
K
61.3(0.613)
Background
L
106.1(1.061)
Background
L
61.3(0.613)
Background
M
59.0(0.590)
Background
M
90.5(0.905)
Background
N
61.3(0.613)
Background
O
131.3(1.313)
Background
S1 TITAN and TRACER 5i User Manual
030.0112.01.0 22 of 58
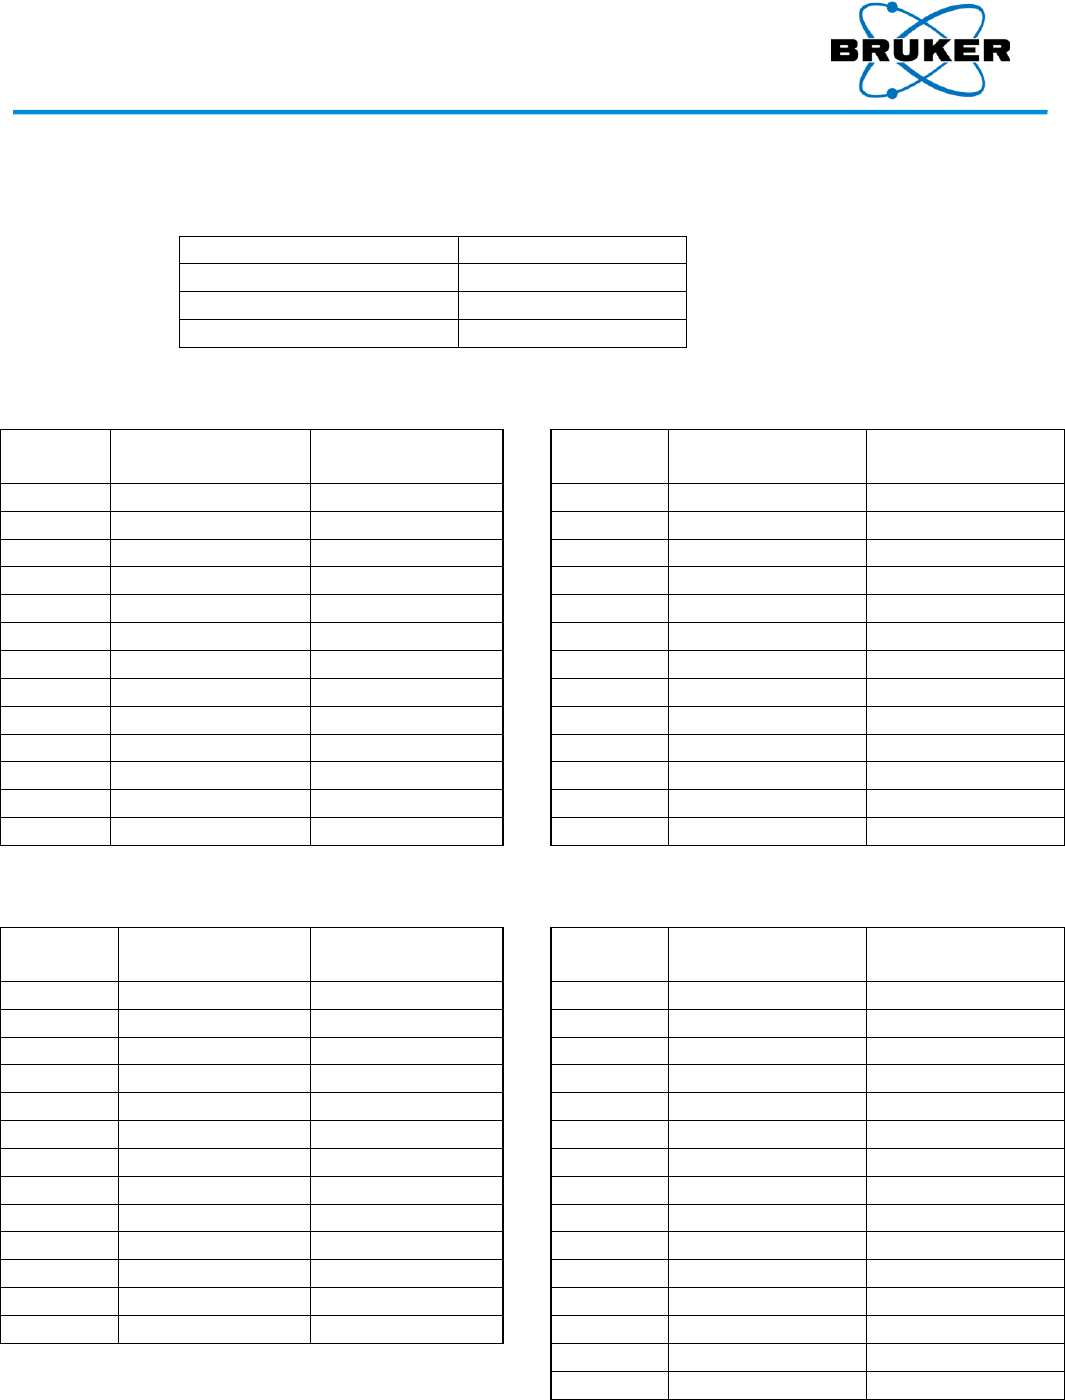
Standard
setting 1
alloy phase 1
Tests were performed with the following settings:
Setting Type
Value
Voltage (keV)
40
Current (μA)
5.2
Filter
Ti25/Al300mm #1
At 5 cm
At 10 cm
Location
Open Beam
μrad(μSieverts)/hr
Duplex
μrad(μSieverts)/hr
Location
Open Beam
μrad(μSieverts)/hr
Duplex
μrad(μSieverts)/hr
A
180582(1805.82)
Background
A
2387.7(23.877)
Background
B
238.4(2.384)
Background
B
39.7(0.397)
Background
C
68.6(0.686)
Background
C
Background
Background
D
75.9(0.759)
Background
D
Background
Background
E
Background
Background
E
Background
Background
F
Background
Background
F
Background
Background
G
Background
Background
G
Background
Background
H
148.1(1.481)
7.2(0.072)
H
18.1(0.181)
Background
I
54.2(0.542)
7.2(0.072)
I
57.8(0.578)
Background
J
Background
Background
J
Background
Background
K
Background
Background
K
Background
Background
L
Background
Background
L
Background
Background
M
Background
Background
M
Background
Background
At 30 cm
At 100 cm
Location
Open Beam
μrad(μSieverts)/hr
Duplex
μrad(μSieverts)/hr
Location
Open Beam
μrad(μSieverts)/hr
Duplex
μrad(μSieverts)/hr
A
268.3(2.683)
Background
A
163.5(1.635)
Background
B
Background
Background
B
Background
Background
C
Background
Background
C
Background
Background
D
Background
Background
D
Background
Background
E
Background
Background
E
Background
Background
F
Background
Background
F
Background
Background
G
Background
Background
G
Background
Background
H
Background
Background
H
Background
Background
I
23.6(0.236)
Background
I
Background
Background
J
Background
Background
J
Background
Background
K
Background
Background
K
Background
Background
L
Background
Background
L
Background
Background
M
Background
Background
M
Background
Background
N
Background
Background
O
Background
Background
S1 TITAN and TRACER 5i User Manual
030.0112.01.0 23 of 58
Standard
setting 2
alloy phase 2
Tests were performed with the following settings:
Setting Type
Value
Voltage (keV)
15
Current (μA)
11.35
Filter
Blank #2
At 5 cm
At 10 cm
Location
Open Beam
μrad(μSieverts)/hr
Duplex
μrad(μSieverts)/hr
Location
Open Beam
μrad(μSieverts)/hr
Duplex
μrad(μSieverts)/hr
A
4374.5(43.745)
Background
A
148.1(1.481)
Background
B
68.6(0.686)
Background
B
28.9(0.289)
Background
C
Background
Background
C
Background
Background
D
Background
Background
D
Background
Background
E
Background
Background
E
Background
Background
F
Background
Background
F
Background
Background
G
Background
Background
G
Background
Background
H
7.2(0.072)
Background
H
Background
Background
I
7.2(0.072)
Background
I
Background
Background
J
3.6(0.036)
Background
J
Background
Background
K
Background
Background
K
Background
Background
L
Background
Background
L
Background
Background
M
Background
Background
M
Background
Background
At 30 cm
At 100 cm
Location
Open Beam
μrad(μSieverts)/hr
Duplex
μrad(μSieverts)/hr
Location
Open Beam
μrad(μSieverts)/hr
Duplex
μrad(μSieverts)/hr
A
53.1(0.531)
Background
A
20.4(0.204)
Background
B
Background
Background
B
Background
Background
C
Background
Background
C
Background
Background
D
Background
Background
D
Background
Background
E
Background
Background
E
Background
Background
F
Background
Background
F
Background
Background
G
Background
Background
G
Background
Background
H
Background
Background
H
Background
Background
I
Background
Background
I
Background
Background
J
Background
Background
J
Background
Background
K
Background
Background
K
Background
Background
L
Background
Background
L
Background
Background
M
Background
Background
M
Background
Background
N
Background
Background
O
Background
Background
S1 TITAN and TRACER 5i User Manual
030.0112.01.0 24 of 58
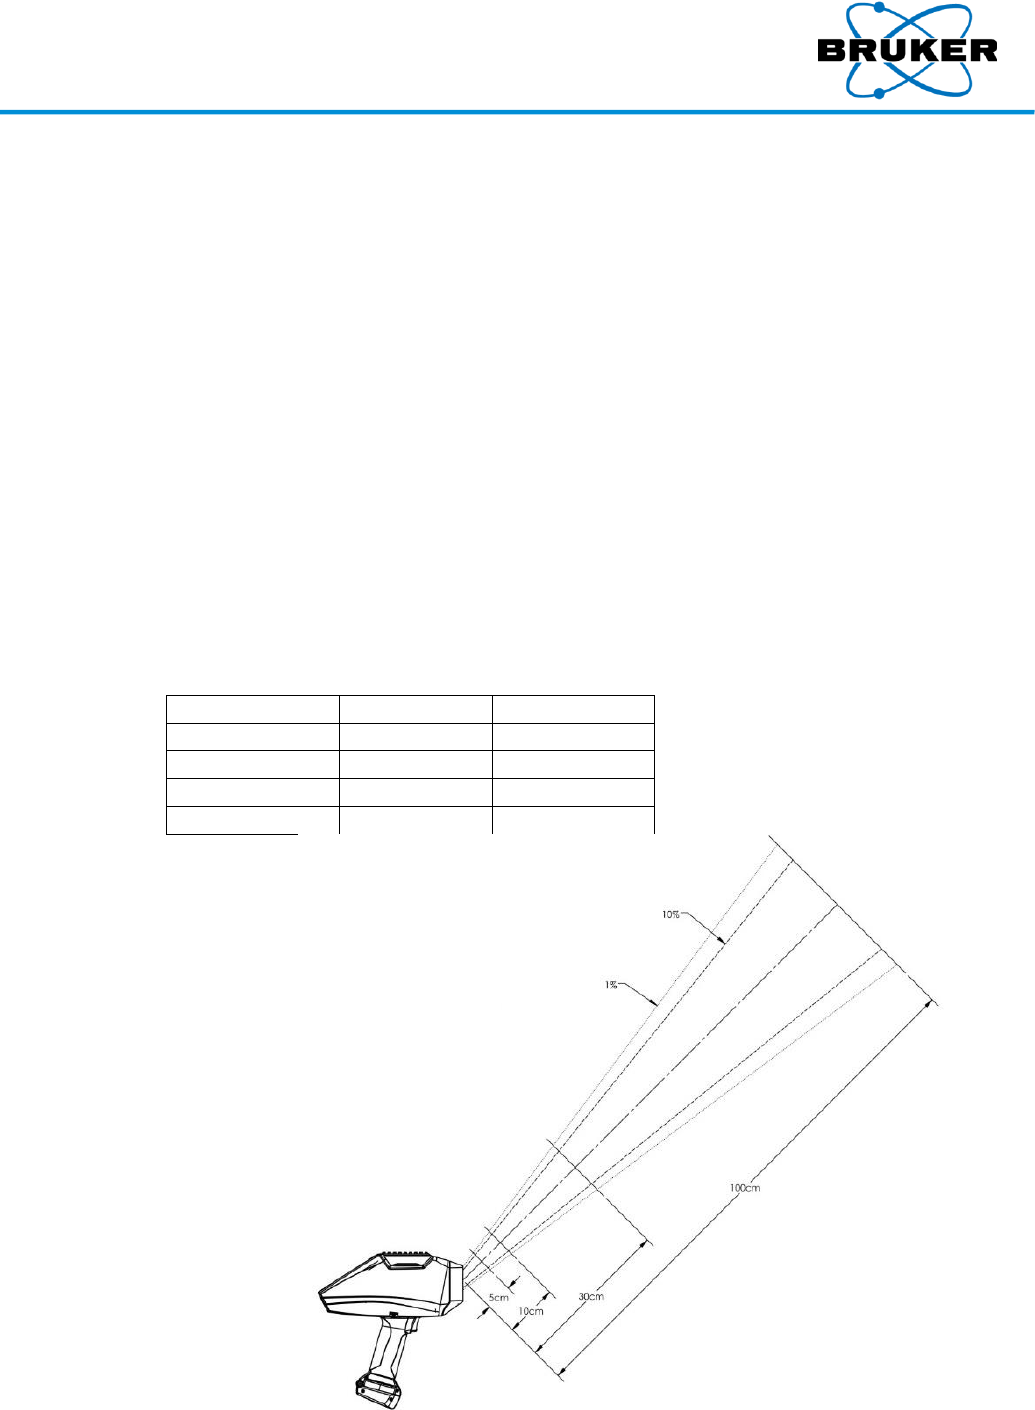
Testing
conditions,
open beam
Measurements of the main beam without a sample (open Beam) were collected at 5, 10, 30, and
100cm. The result at the sample position was extrapolated from measured results using a semi-
log plot as described in IEC 62495. The main beam leaves the front of the instrument going
forward and up at a 45-degree angle. Locations where the intensity of the main beam falls to 10%
and 1% of the intensity at its center were recorded using the “Standard Setting 1 Alloy Phase 1”
only. See the following figure.
RadEye gives instantaneous results but is not accurate over large energy ranges. A second survey
of the main beam was done with 80 pkV, 2.9mm Al HVL NanoDots (TLD dosimeters) from
Landauer with a request to apply the correction factor for NIST H30 that most closely matches
the X-rays in the beam for the setting used.
The NanoDots were exposed at the locations defined with the RadEye at 10, 30 and 100cm
distances from the nose, for a measured time using the Standard Setting 1 Alloy Phase 1.
NanoDots do not give instantaneous results but are more accurate. The RadEye was used to find
the location of the center of the main beam. Its readings at that time were recorded so a
comparison of the results from the NanoDots and RadEye could be made.
X-ray beam
diameter
The following table provides specific beam diameters at selected distances from the beam port
when no sample is in place.
Distance in cm
1% in cm
10% in cm
5
4.5
3.4
10
5.45
4.0
30
10.5
7.9
100
32.0
23.7
S1 TITAN and TRACER 5i User Manual
030.0112.01.0 25 of 58
Correction
factors
During testing, the following correction factors were used:
Distance
Nist H30 Correction Factor
5 cm
3.612
10 cm
3.612
30 cm
2.948
100 cm
2.919
Distance vs.
dose in mRad
In mRad
Worst-Case 1 Highest
Energy
Standard Setting 1
Alloy Phase 1
Standard Setting 2 Alloy
Phase 2
50KeV, 39A
40KeV, 5.2A
15KeV, 11.35A
Blank, No Filter
Ti25/Al300m filter
Blank, No Filter
mRad
mRad
mRad
Distance
(cm)
Open
Beam
With Sample
Open
Beam
With Sample
Open
Beam
With Sample
100
1839
Background
120
Background
34
Background
30
3320
0.027
1126
Background
398
Background
10
143697
0.220
9031
Background
2854
Background
5
163420
0.372
10656
Background
3161
Background
Surface
218936
0.632
14006
4310
Eye / Skin
Time to
Limit
4.2 / 13.7
Minutes
2.7 / 9
Years
66 / 214
Minutes
214 / 696
Minutes
Distance vs.
dose in
mSieverts
In
mSieverts
Worst-case 1 Highest
Energy
Standard Setting 1
Alloy Phase 1
Standard Setting 2 Alloy
Phase 2
50KeV, 39A
40KeV, 5.2A
15KeV, 11.35A
Blank, No Filter
Ti25/Al300m filter
Blank, No Filter
mSieverts
mSieverts
mSieverts
Distance
(cm)
Open
Beam
With Sample
Open
Beam
With Sample
Open
Beam
With Sample
100
18.39
Background
1.197
Background
0.339
Background
30
33.20
0.000265
11.262
Background
3.98
Background
10
1437.0
0.002204
90.308
Background
28.537
Background
5
1634.2
0.003721
106.563
Background
31.608
Background
Surface
2189.4
0.006324
140.06
43.100
Eye / Skin
Time to
Limit
4.2 / 13.7
Minutes
2.7 / 9
Years
66 / 214
Minutes
214 / 696
Minutes
S1 TITAN and TRACER 5i User Manual
030.0112.01.0 26 of 58
2.3. Precautions
Prior to using the instrument, read the Radiation Safety Manual, Bruker document 030.0011.
Improper handling or use could result in radiation exposure.
Do not allow anyone other than trained personnel to operate the analyzer.
Only sell or transfer the analyzer to persons registered to receive it.
Notify your regulatory agency upon the transfer or disposal of the analyzer.
Comply with all instructions and labels provided with the device.
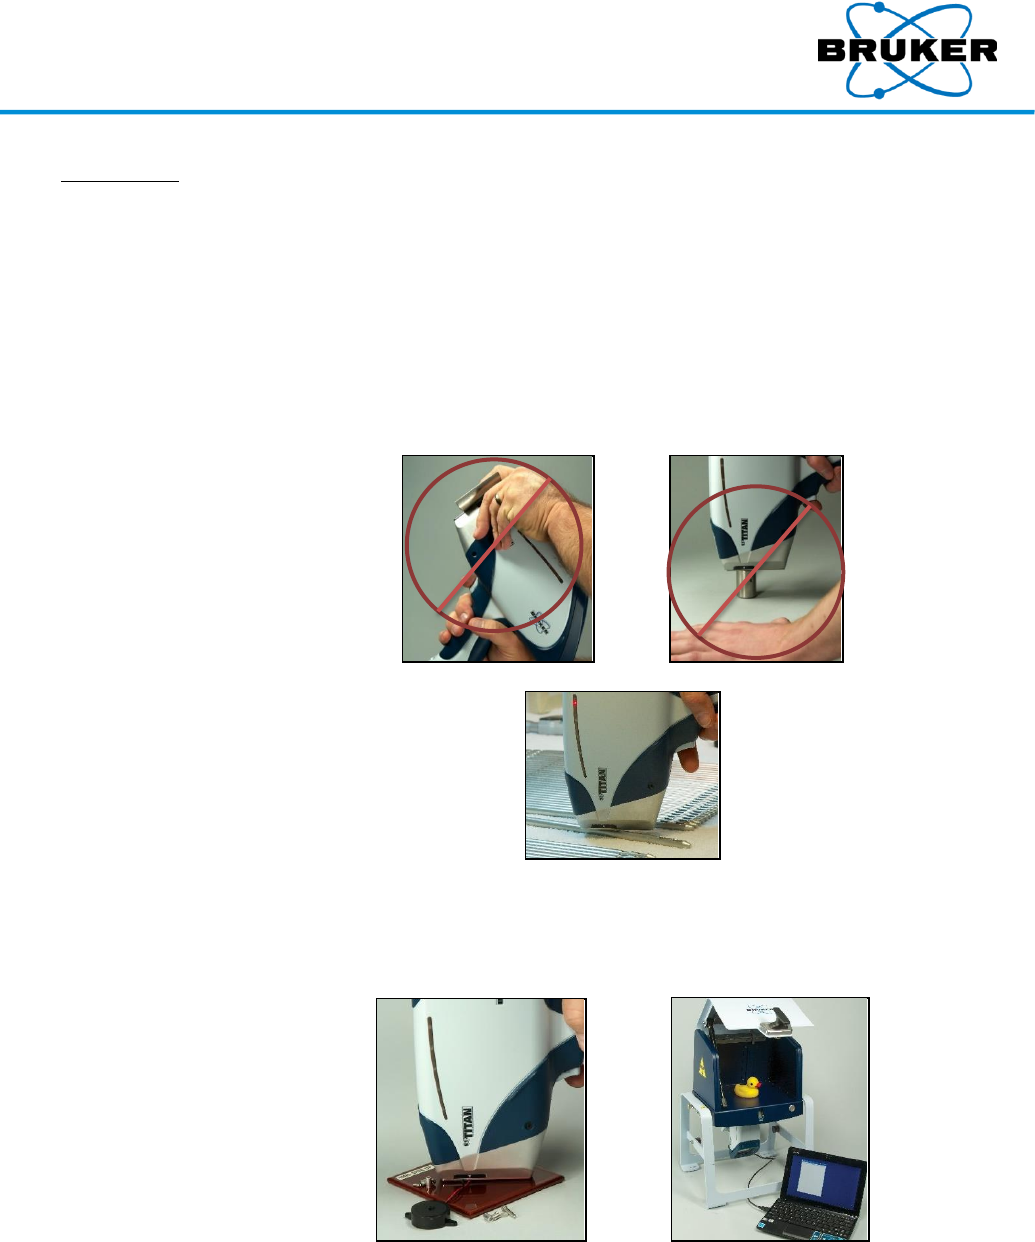
Before pressing the trigger, be aware of the direction the X-rays travel.
While measuring, do not place any part of your body, especially the eyes or hands, near the X-
ray source.
Do not hold a sample by hand to the window for analysis. Hold the window to the sample.
Occasionally, a sample may not be reflective enough to trigger the proximity sensor. Place a
piece of white paper or other reflective material between the sample and sensor. If necessary
and allowed by law, a supervisor can deactivate the proximity sensor.
To test small, thin, or low-density materials, such as plastic, wood, soil, paper, or ceramics,
use the optional background plate, or benchtop or desktop stands.
If required by a regulatory agency, wear an appropriate dosimeter.
When in use, the device should be in the operator's possession at all times.
Always store the instrument in a secure location.
Keep the instrument cool and dry, including during transport.
Know the instrument’s location at all times. Track all instruments, operators assigned to use
them, locations they were used, storage, removal, and transportation.
S1 TITAN and TRACER 5i User Manual
030.0112.01.0 27 of 58
If the analyzer is damaged, even if it remains operational, immediately –
1. Remove the battery pack and disconnect all power sources.
2. Notify Bruker at +1 (509) 783-9850, or support.hmp@bruker.com.
If the analyzer is lost or stolen, immediately notify –
1. The appropriate regulatory agency in the state or country in which the device was located.
2. Local law enforcement authorities.
3. Bruker at +1 (509) 783-9850, or support.hmp@bruker.com.
Never remove labels from the analyzer. This voids regulatory approval of the instrument.
Safety officer
If you have questions, check with your radiation safety officer or a Bruker radiation safety officer
at +1 (509) 783-9850, or support.hmp@bruker.com.

S1 TITAN and TRACER 5i User Manual
030.0112.01.0 28 of 58
2.4. Safety Features
Introduction
The instrument includes a fail-safe electronic control system consisting of primary and secondary
interlocks. The control system is designed to –
Aid in the safe use of the instrument.
Prevent accidental exposure to radiation.
Prevent the instrument from generating radiation in case of damage.
As with any safety control system, it cannot prevent injury from intentional misuse. Never attempt to
disable or otherwise circumvent a safety control.
Power switch
interlock
A push-button main power switch interlock controls power to all components. The switch must be
activated before any other actions can be initiated. When power is activated, X-ray warning lights
flash and, after a few seconds, the touch screen displays.
Password
Once the instrument initializes, a password is requested. The analyzer will neither operate nor
generate X-rays without a valid password.
X-ray warning
Once the password is successfully entered, an X-ray radiation warning is displayed. To continue, press
and release the trigger.
Proximity
sensor
The proximity sensor detects when an object is within range of the examination window. X-rays can
be generated only if the sensor detects an object.
Disabling the
interlock
For some less favorable testing conditions, the proximity sensor interlock may need to be bypassed.
See Supervisor Manual, Bruker document 030.0113. Some locales may not allow this.
When the instrument is logged out or powered off, the interlock is not automatically re-enabled.
Trigger
interlock
X-rays are generated when the trigger is pressed. When using the manual trigger setting (see
SETTINGS Button, page 35), the trigger must be continuously squeezed during measurements. When
the trigger is released, X-ray generation stops.
Auxiliary
trigger
In some countries, both hands are required to be on the instrument when X-rays are generated. The
auxiliary trigger, built into each instrument, is part of that two stage implementation.
Minimum
backscatter
During each measurement, the X-ray count-rate is continuously monitored. If the count-rate drops
below the allowable threshold, as it would in the absence of a sample, X-ray generation discontinues,
minimizing potential exposure.
X-ray warning
lights
When X-rays are generated, red lamps along the instrument’s side and beneath the screen illuminate.
The lamp incorporates redundant LED elements for increased reliability. If more than two red LED
elements fail, X-rays cannot be generated.
Buzzer
In Canada, when the trigger is pressed, an audible alarm indicates X-rays are being generated.
Automatic log
off
If the analyzer remains idle for more than the time specified in Supervisor Mode (default 5 minutes), it
logs off the user. Upon login, the previous session is restored.
Labels
Warning labels identify the analyzer as radiation producing. The manufacturer’s plate underneath
contains regulatory information. Do not tamper with or remove any labels.
TRACER 5i hatch
To generate X-rays, the collimator must be installed and the hatch must be securely closed.
S1 TITAN and TRACER 5i User Manual
030.0112.01.0 29 of 58
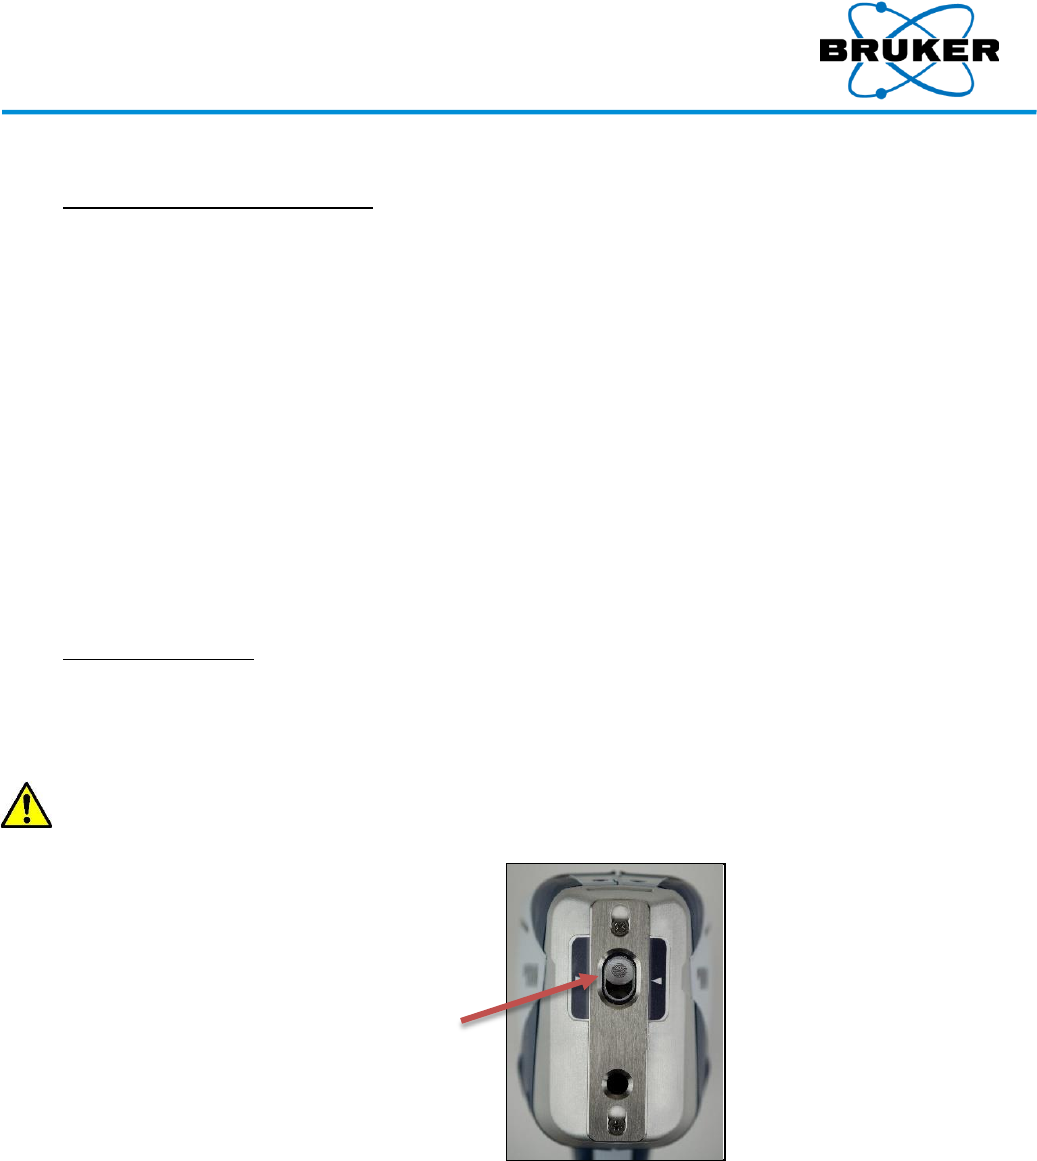
3. Starting Up
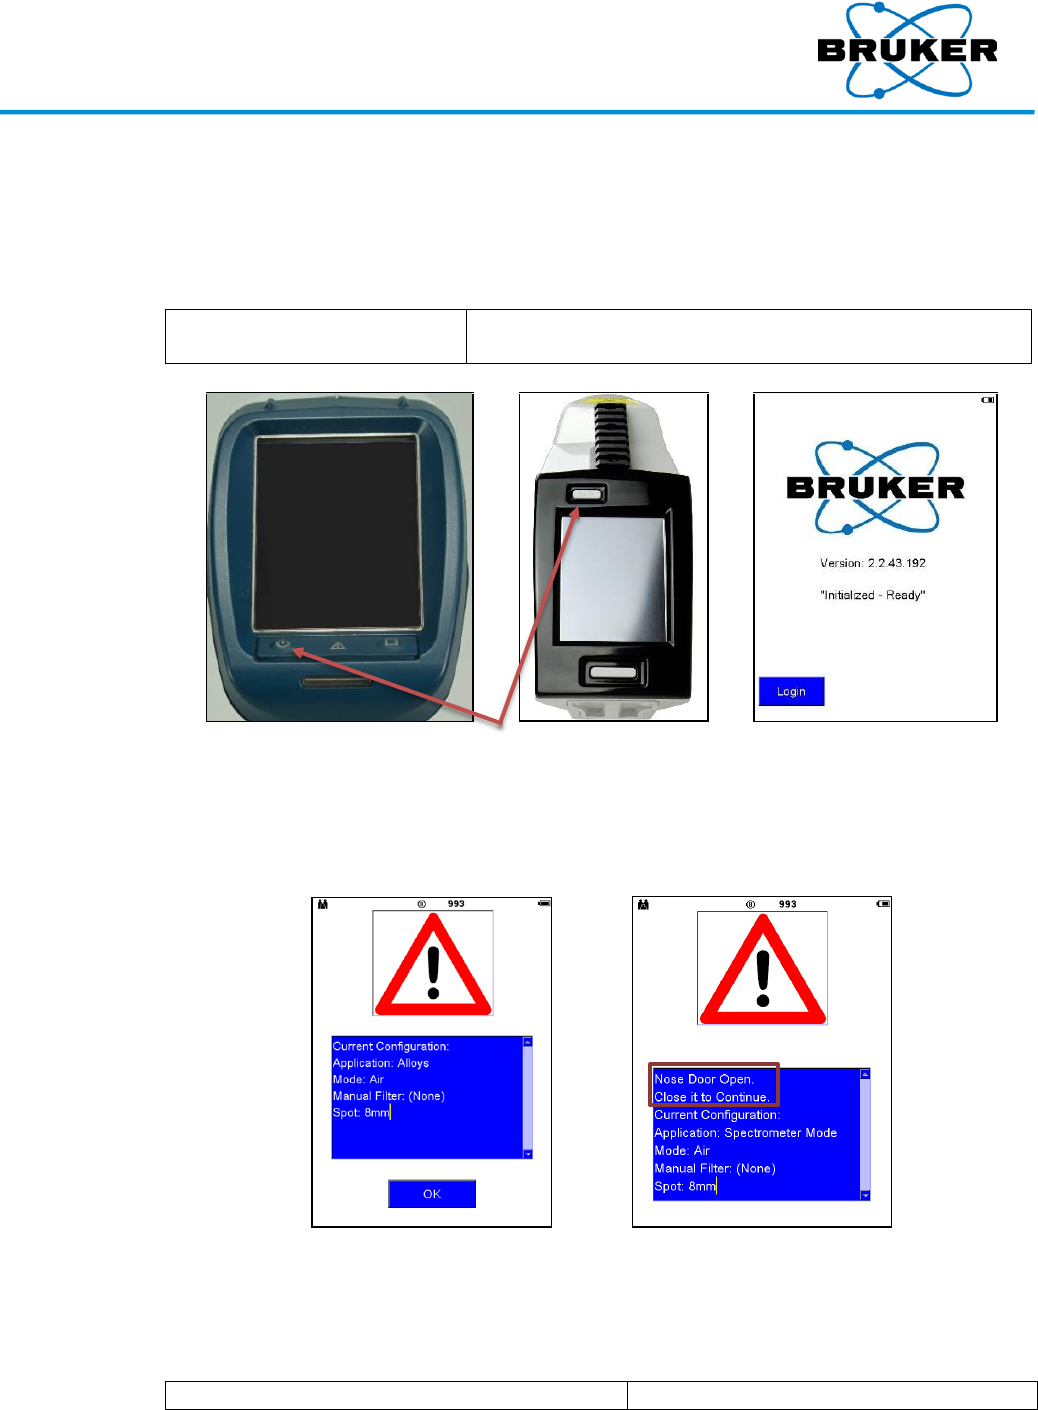
Powering on
To use the analyzer, it must be powered on and logged into.
To power on the analyzer –
Firmly press the power switch
for one second.
The instrument takes several moments to initialize. It is
ready when Login is displayed.
S1 TITAN Power switch TRACER 5i S1 TITAN screen
TRACER 5i
screen
When a TRACER 5i boots up, the following screen is displayed. It describes the current instrument
configuration, including the last application used and hardware settings.
To continue, tap OK.
TRACER 5i
open hatch
If OK is not displayed, the hatch (little door in the nose) is open and the instrument is in an unsafe
state. Close the hatch and the window closes.
Powering off
To turn off the analyzer –
Firmly press the power switch for one second.
The instrument powers down.
S1 TITAN and TRACER 5i User Manual
030.0112.01.0 30 of 58
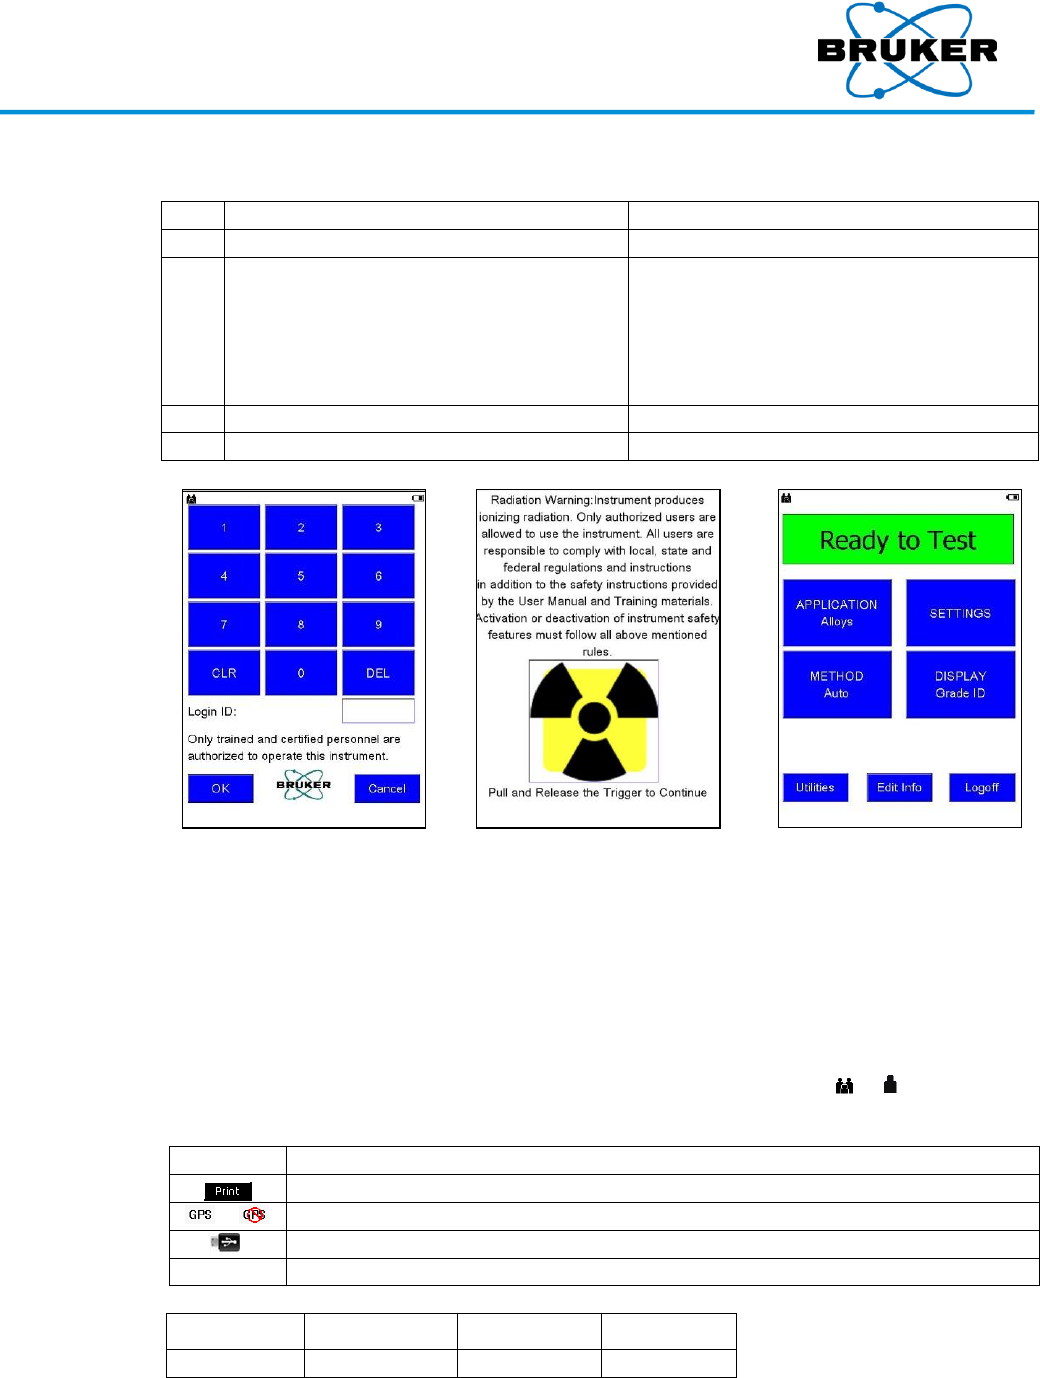
Log in
To log in –
Step
Action
Result
1
After powering on the analyzer, tap Login.
The login screen is displayed.
2
Tap the password. The default is 12345.
To delete one character at a time, from
right to left, tap DEL.
To clear the field entirely, tap CLR.
The field reflects the changes.
3
Tap OK.
The radiation warning screen is displayed.
4
Press and release the trigger.
The Ready to Test screen is displayed.
Log in screen
U.S. Radiation Warning
Ready to Test screen
Wrong
password
If an invalid password is entered, the message Password is invalid OK is displayed. Tap OK to
remove the message and try again.
Screen
description
The Ready to Test screen –
Displays information in the status bar.
Provides access to menu trees from which all analyzer functions can be performed.
Status bar
icons
The status bar, across the top of the screen, always displays the user icon ( or for supervisor),
and power status, but may show additional icons –
Icon
Description
Print. See the Accessories Manual, Bruker document 030.0116.
or
GPS or No GPS. See the Accessories Manual, Bruker document 030.0116.
)
A USB flash drive is installed.
1001
(TRACER 5i only) Pressure in millibars. This is an example value only.
TRACER 5i
collimator
icons
ⓔ
③
⑧
ⓤ
Empty
3mm
8mm
Unknown
S1 TITAN and TRACER 5i User Manual
030.0112.01.0 31 of 58
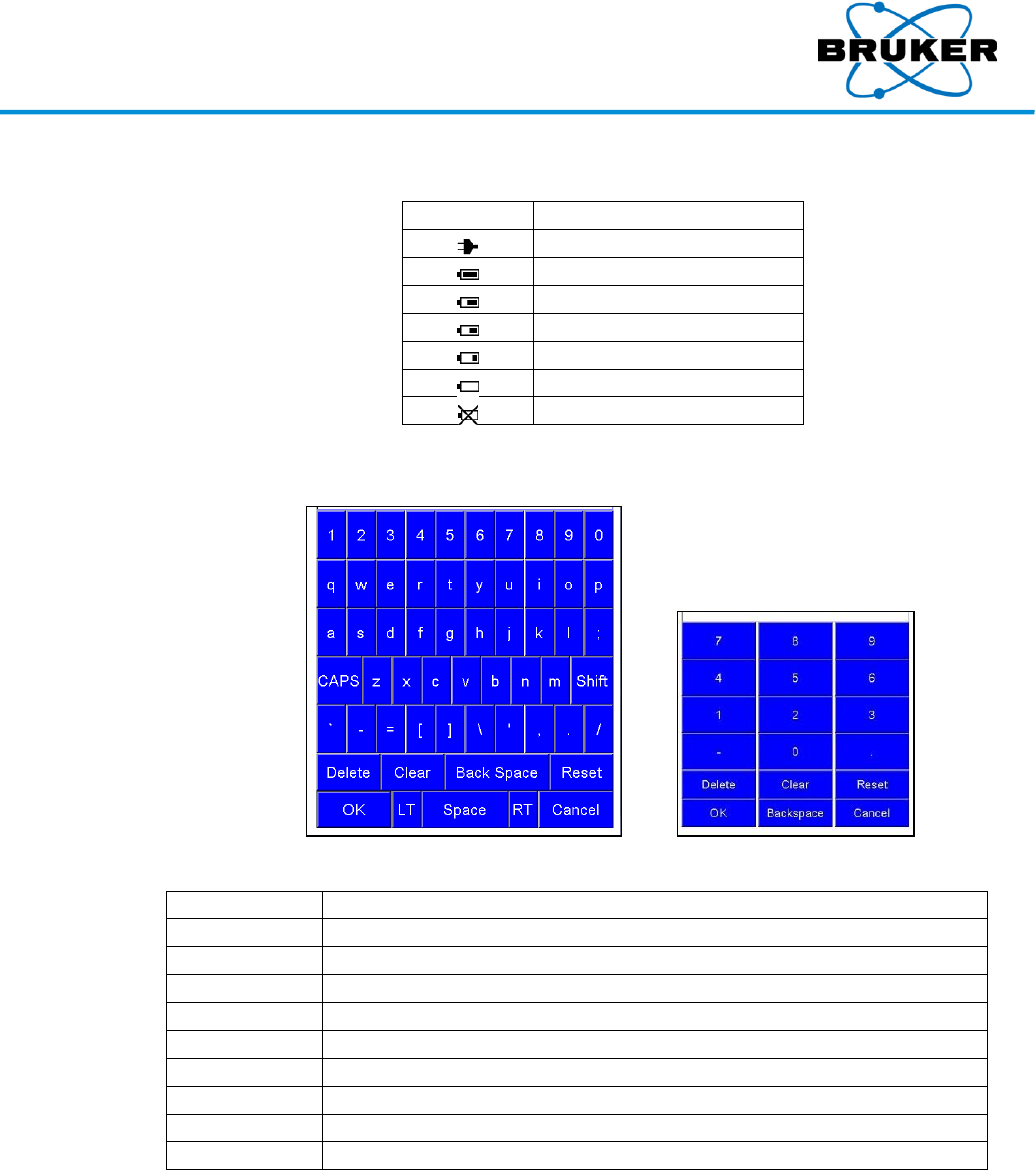
Power status
Power status is displayed in the status bar with one of the following icons –
Icon
Status
External power
Battery at 100%
Battery at 75%
Battery at 50%
Battery at 25%
Empty battery
Error connecting to battery
Keyboards
From several screens an alphanumeric or numeric keyboard may be accessed for data entry.
Alphanumeric keyboard Numeric keyboard
Keys
Key
Function
CAPS
Toggles between all capital letters and all lower case letters.
Shift
Changes the case of only the next letter tapped.
Delete
Removes the character to the right of the cursor.
Clear
Removes all characters from the field.
Backspace
Removes the character to the left of the cursor.
Reset
Restores the field without changes.
OK
Saves changes and closes the keyboard.
LT and RT
Move the cursor left or right in the selected field.
Cancel
Closes without saving changes.
Typical use
Typical use of the analyzer is –
1. Name a sample (optional).
2. Scan the sample.
3. Review the results of the scan.
4. Repeat steps 2-4 as necessary.
5. Back up data.
6. Run report.
S1 TITAN and TRACER 5i User Manual
030.0112.01.0 32 of 58
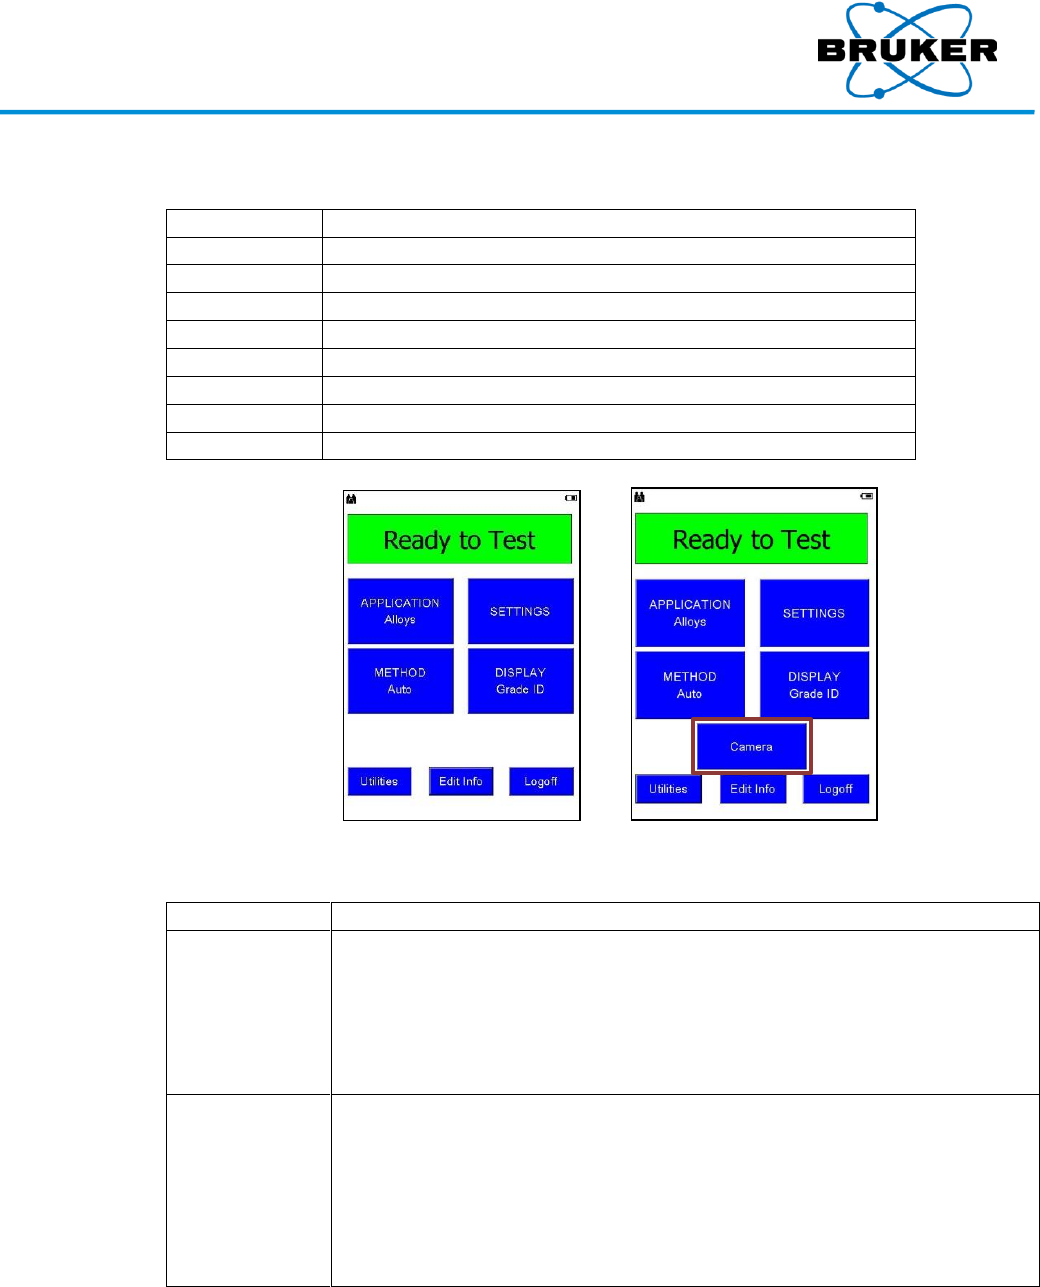
Main
functions
The Ready to Test screen includes seven touch buttons, eight if a camera is installed –
Button name
Purpose
APPLICATION
Specifies the purpose for which the instrument is used.
METHOD
Specifies a calibration applicable to the selected application.
SETTINGS
Specifies trigger behavior and measurement duration.
DISPLAY
Specifies how measurement results are displayed.
CAMERA
If a camera is installed, accesses camera features.
Utilities
Accesses options to display results and back up data.
Edit Info
Allows measurement data to be named and described.
Logoff
Logs off the current user and displays the login screen.
Created files
When a measurement is taken, the following files are created and saved on the instrument:
Data Type
Description
Element
concentrations
Saves measurement data to Results.csv in the Bruker\Data folder,
readable in Excel. What data is saved depends on the selected
application.
Saved data can be viewed on the Results screen or with a Windows
Compatible PC running Bruker Instrument Tools. See the Bruker Toolbox
User Guide, document number 030.0119.
Spectra
Saves data as a .pdz file and can include spectra, element
concentrations, and more.
If copied to a PC, the file can be opened by Bruker Instrument Tools (see
the Bruker Toolbox User Guide, document number 030.0119) to display
spectra or generate a results report with grade IDs, limits results, or
percent concentrations, depending on the selection from the DISPLAY
screen.
S1 TITAN and TRACER 5i User Manual
030.0112.01.0 33 of 58
4. APPLICATION Button
Description
The APPLICATION Button accesses application options. The intended use of the instrument
determines which option to select.
Possible
options
Available applications based on the purchased configuration can include –
Standard alloys.
Restricted materials.
Mining.
Precious metals.
Other custom applications.
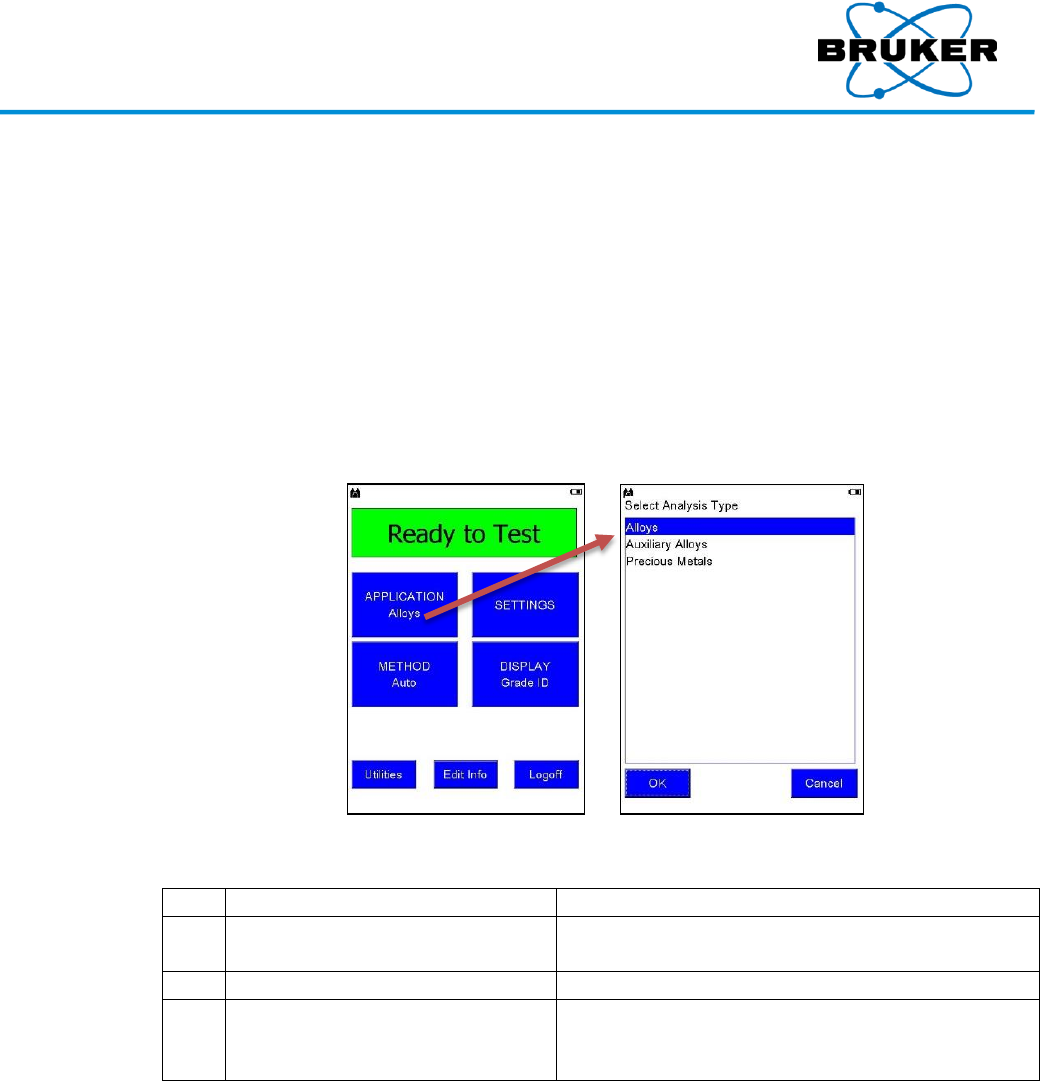
Selecting
application
To select an application –
Step
Action
Result
1
From the Ready to Test screen,
tap APPLICATION.
The Select Analysis Type screen is displayed.
2
Tap an application name.
The application name is highlighted.
3
Tap OK.
The Ready to Test screen is displayed with the
name of the selected application on the
APPLICATION button.
Spectro-
meter mode
Applications have a preset voltage, current, and filter that cannot be changed. Spectrometer
Mode allows those settings to be adjusted within limits. Spectra are recorded, but data are not
analyzed.
Settings
For each application, settings can be defined. Settings include –
Method
Display options
Phase durations (measurement times)
Manual or automatic trigger
Whenever the application is changed, settings are changed to those defined for that application.
S1 TITAN and TRACER 5i User Manual
030.0112.01.0 34 of 58
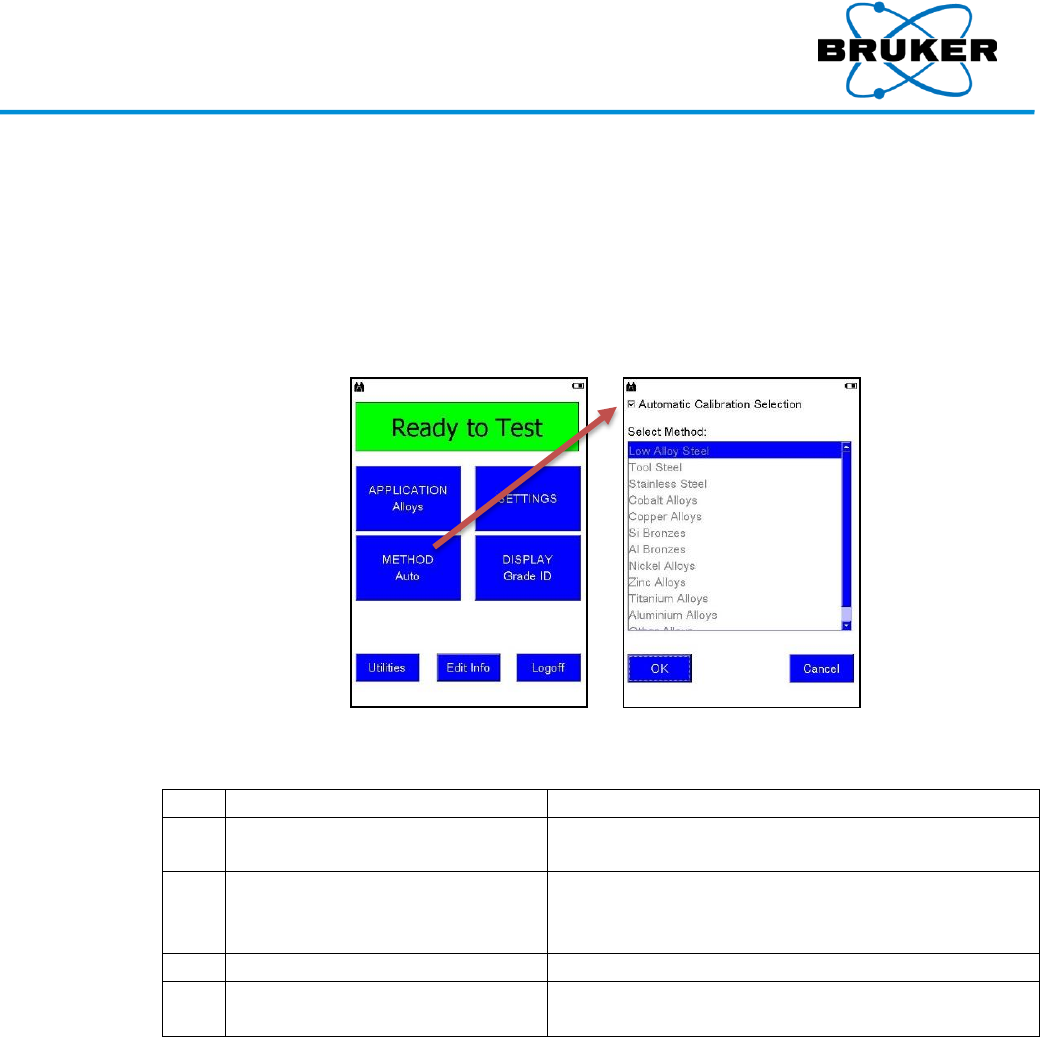
5. METHOD Button
Description
The instrument analyzes a sample using a specifically selected calibration, or method. The
selection can be automatic or user-specified. Automatic is recommended.
The selected application determines available options in METHOD. For more information, see
Applications Module, Bruker document 030.0115.
Selecting a
method
To select a method other than Automatic Calibration Selection –
Step
Action
Result
1
From the Ready to Test screen,
tap METHOD.
The Select Method screen is displayed.
2
Ensure that Automatic
Calibration Selection box is not
checked. If it is checked, tap it.
The box is empty.
3
Tap a method name.
The method name is highlighted.
4
Tap OK.
The Ready to Test screen is displayed with the name
of the selected method on the METHOD button.
S1 TITAN and TRACER 5i User Manual
030.0112.01.0 35 of 58
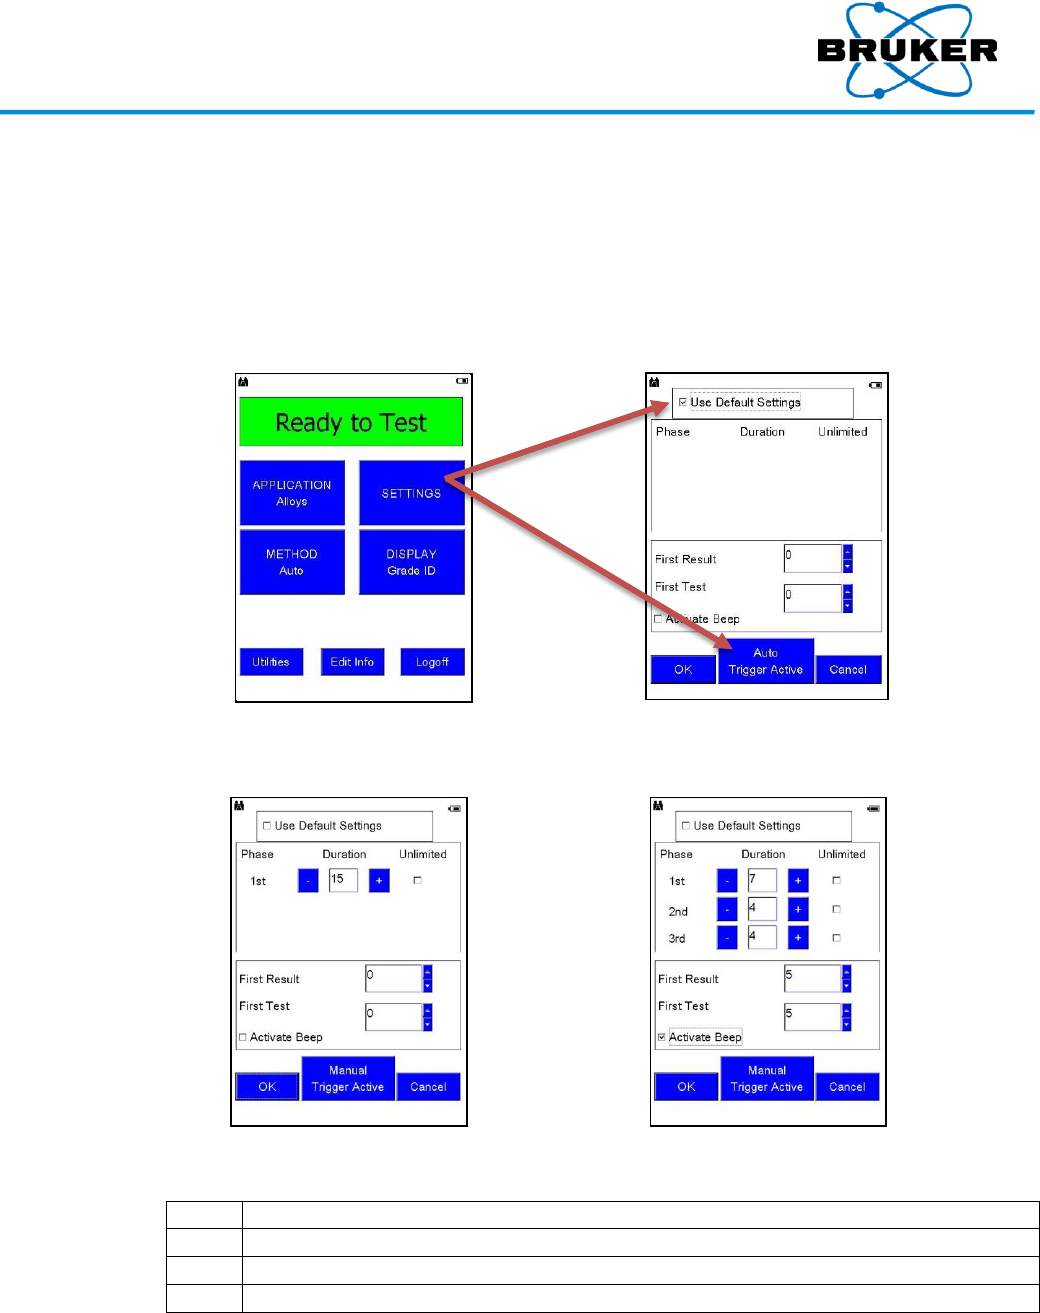
6. SETTINGS Button
Description
The options in SETTINGS define trigger behavior and multiple measurement times, or phases. The
selected application determines available phases. For example, PMI can have one phase; Alloys
has two phases, and Geo Exploration can have three phases.
The following screens are for applications other than Spectrometer Mode. For Spectrometer
Mode, see page 37.
Default
settings
Default settings are set at the factory, or by the supervisor, and determine the length of the
measurement. If Use Default Settings is checked, phase options are not displayed.
Use Default Settings unchecked,
single phase
Use Default Settings unchecked,
multi-phase
Phases
Phase
Description
1st
A quick, high level assay used to refine settings for the subsequent phase.
2nd
A more specific and accurate assay based on first phase information.
3rd
An additional assay available for some applications.
Accuracy
The longer the measurement, the more accurate the results. Every second to several seconds of a
measurement, depending on the application, displayed results are updated.
S1 TITAN and TRACER 5i User Manual
030.0112.01.0 36 of 58
Phase length
To manually set the length of each phase –
Step
Action
Result
1
From the Ready to Test screen, tap SETTINGS.
The SETTINGS screen is displayed.
2
Ensure that Use Default Settings box is not
checked. If it checked, tap it.
Phase options are displayed.
3
Ensure the box below Unlimited is unchecked.
The box is empty and fields previously
grayed out are available.
4
Set each phase duration in seconds by tapping
either the minus sign (-) or the plus sign (+) to
decrease or increase, respectively, the
measurement duration.
OR
Tap the field.
The field reflects the number change.
OR
A numeric keyboard is displayed.
5
On the keyboard, tap a number and OK.
The keyboard is removed and the field
reflects the number change.
6
For subsequent phases, repeat steps 3-5.
To disable subsequent phases, set duration
to 0.
7
Tap OK.
The Settings are saved and the Ready
to Test screen is displayed.
One phase
If a method does not use multiple phases, only one phase is displayed.
Unlimited
Unlimited indicates the measurement continues while the trigger is pressed and ends when the
trigger is released. It is not a timed measurement but is limited to 300 seconds.
If Unlimited is checked for a phase, the instrument will NOT use that phase or additional phases.
First result
The interval in seconds between the start of an assay and when the First Result displays can be
set manually. This assures that results from shorter, less accurate test times are not displayed.
First test
The time can be set manually before the First Test displays and records. Longer test times are
more accurate. First Test settings must always be as long as, or longer, than First Result times.
Results of the first test are compared to the Grade Library and, if a match is found, the grade ID is
displayed.
Activate
beep
This checkbox determines if an audible alarm sounds when a grade match is found.
Trigger
options
Manual Trigger Active – The instrument operates while the trigger is pressed or until safety
criteria are exceeded.
Auto Trigger Active – The measurement begins when the trigger is pressed and released. Analysis
time is controlled by defined phase durations. The measurement can be stopped at any time by
pressing and releasing the trigger again. This option is not available in all markets.
S1 TITAN and TRACER 5i User Manual
030.0112.01.0 37 of 58
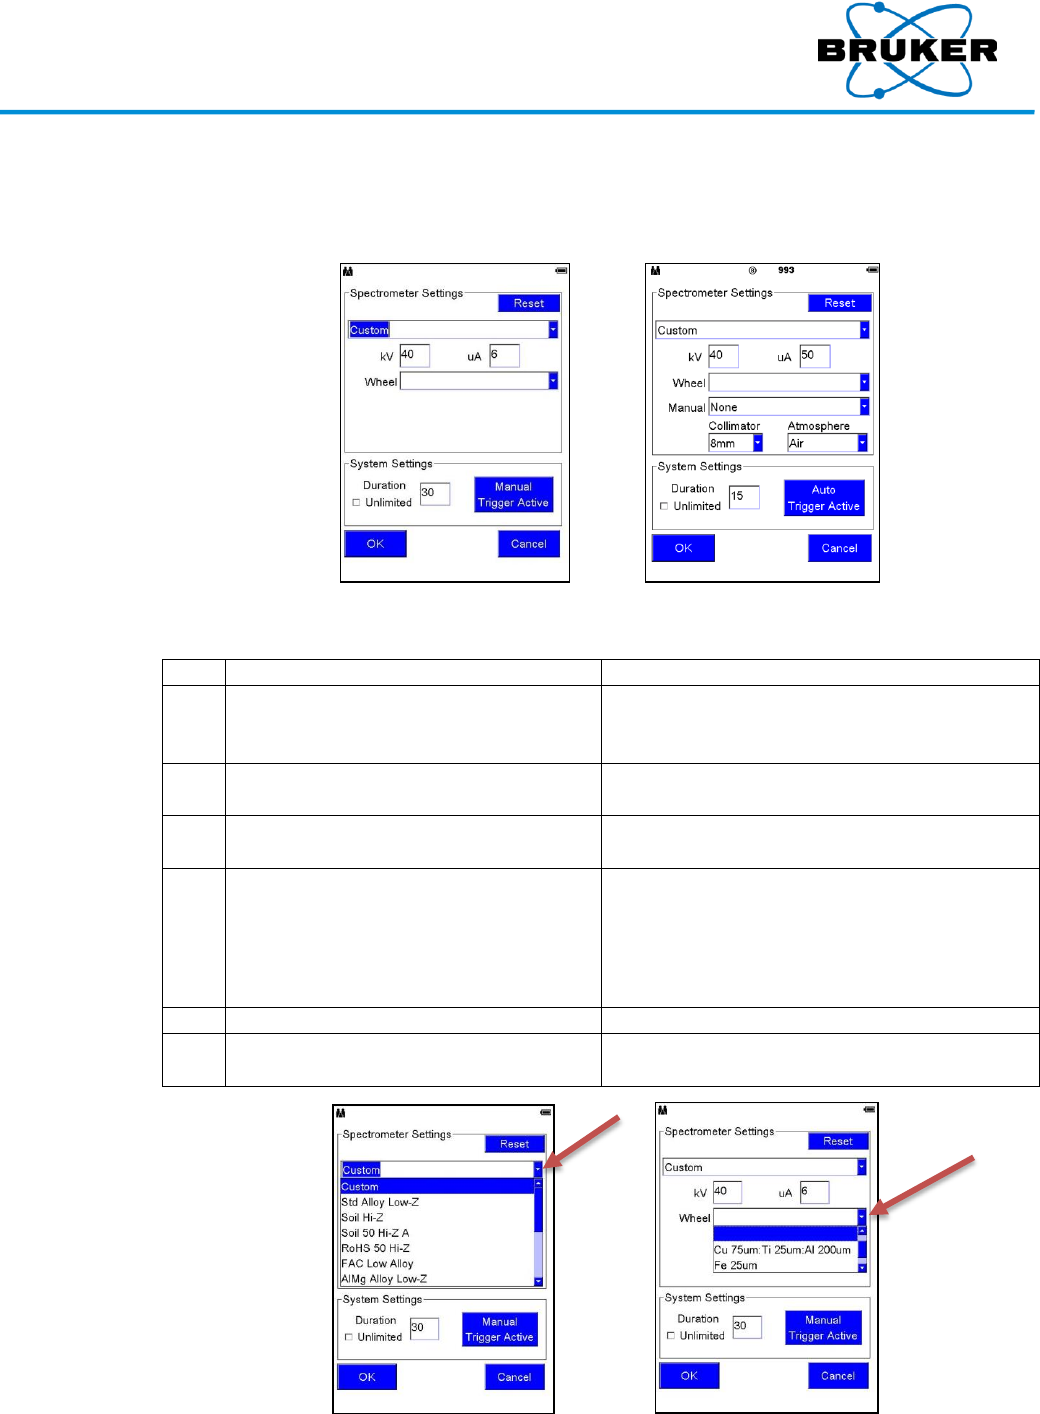
7. SETTINGS Button – Spectrometer Mode
Description
If Spectrometer Mode was selected under APPLICATION, then under SETTINGS one of the following
screens is displayed, depending on instrument type.
S1 TITAN TRACER 5i
Standard
settings
To select a standard spectrometer setting –
Step
Action
Result
1
From the Ready to Test screen with
application Spectrometer Mode
selected, tap SETTINGS.
The Spectrometer Settings screen is displayed.
2
To select a defined setting, tap the down
pointing triangle below Reset.
A dropdown list is displayed.
3
Tap a selection.
The setting name is displayed in the field and
the kV and μA fields reflect appropriate settings.
4
Tap the down pointing triangle to the
right of Wheel, scroll down if necessary,
and tap a filter name.
Note that S1 TITAN models 200 and 500
do not have Wheel displayed.
The filter name is displayed.
5
Define System Settings as necessary.
6
Tap OK.
Settings are saved and the Ready to Test screen
is displayed.
S1 TITAN and TRACER 5i User Manual
030.0112.01.0 38 of 58
Custom
settings
To customize spectrometer settings –
Step
Action
Result
1
From the Spectrometer Settings screen,
tap the field next to kV (kilovolts) or μA
(microamp).
The numeric keyboard is displayed.
2
Tap a value and tap OK.
The keyboard is removed and the field
reflects the change.
3
Repeat steps 1 and 2 for the other field.
Reset
To restore values, tap Reset. Original values are displayed.
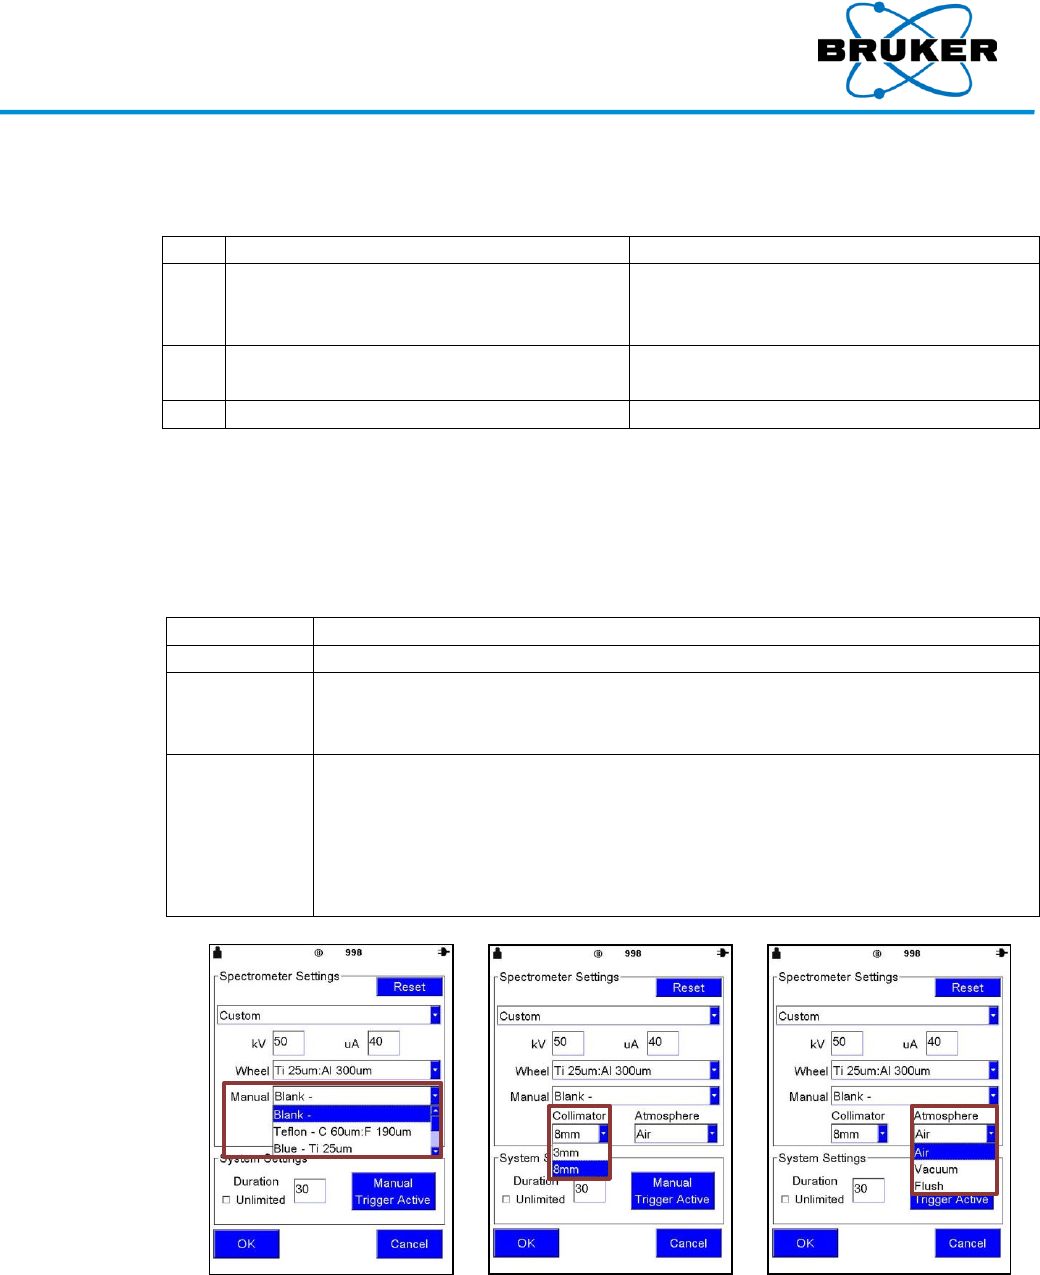
Additional
TRACER 5i
settings
The TRACER 5i has the described setting options plus the following. These settings are required to
tell the instrument which hardware options are installed so the data is recorded in measurement
files.
Option
Lists options for…
Manual
Filters that can be manually installed.
Collimator
Collimators that can be manually installed. (If a collimator is installed but
another is selected here, the installed collimator number in the status bar is
displayed in red instead of black.)
Atmosphere
Atmospheric measurement environments:
Air – normal use.
Vacuum – setting for use with a vacuum pump to eliminate air between the
sample and detector.
Flush – setting for use with a Helium flush to replace air between the sample
and detector.
S1 TITAN and TRACER 5i User Manual
030.0112.01.0 39 of 58
8. DISPLAY Button
Description
How measurement results are displayed is determined by options selected under the DISPLAY
button.
For information on Grade Library and Grade Pass/Fail options, see the Alloy Module, Bruker
document 030.0114.
Limits Testing
Limits Testing displays measurement results against minimum and maximum values. For more
information, see Restricted Materials Screening Application Guide, Bruker document 030.0117
and Soil Application Guide, Bruker document 030.0118.
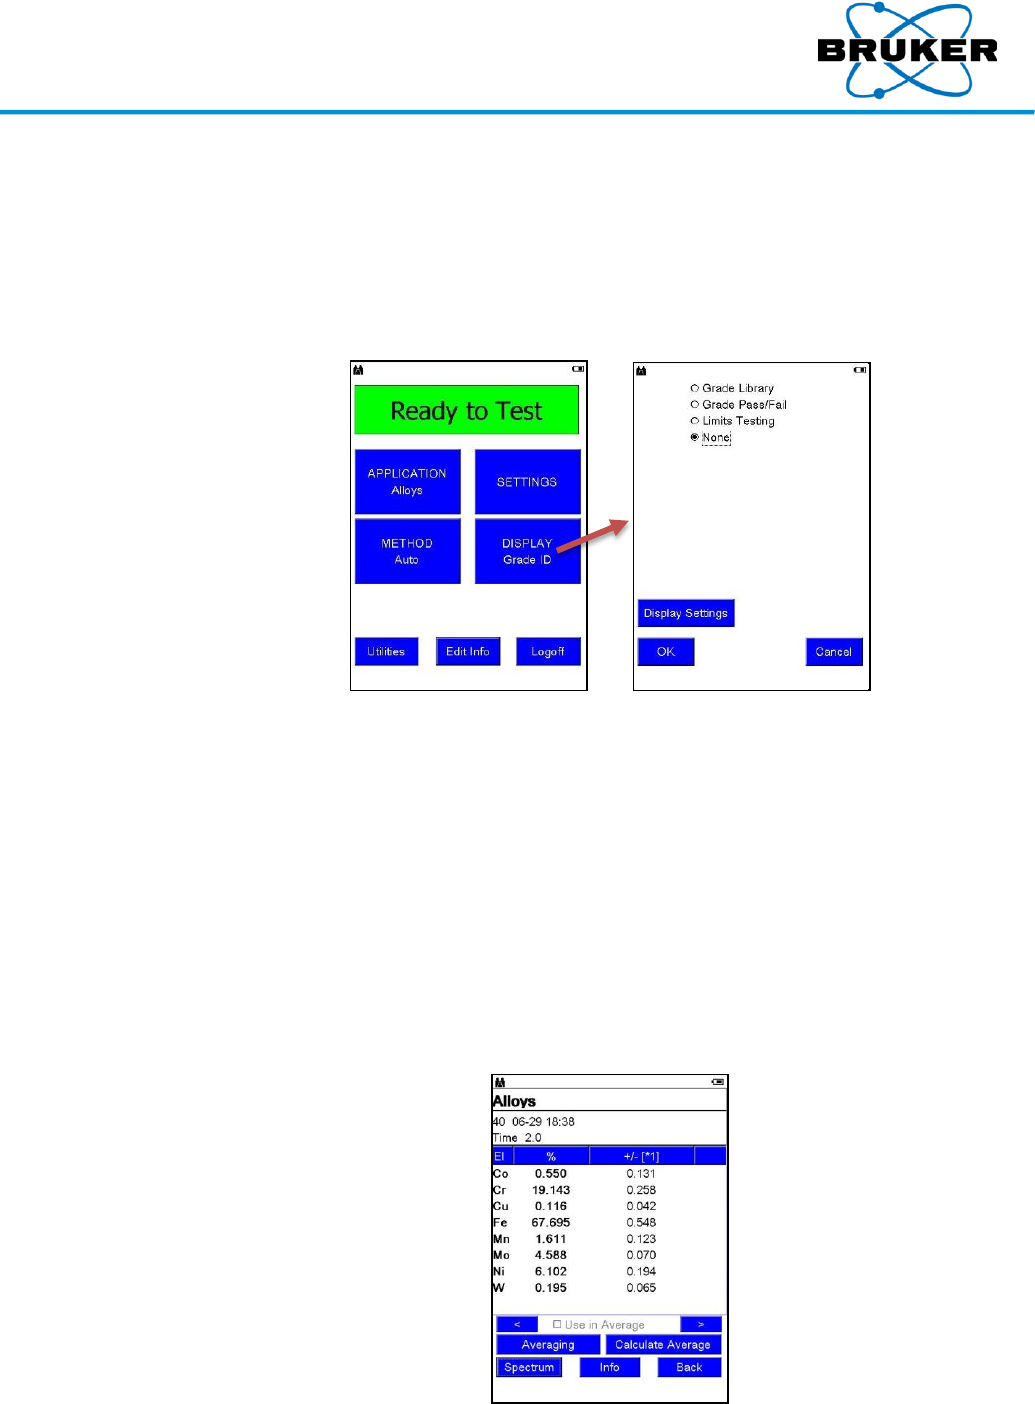
None
Selecting None provides a sample analysis without a comparison to a grade library. The Results
screen displays –
Index number.
Date and time of the assay.
Assay duration in seconds.
Detected elements.
Element percentages or PPM and their statistical +/- error range. (The longer the
measurement, the smaller the +/- error range.)
S1 TITAN and TRACER 5i User Manual
030.0112.01.0 40 of 58
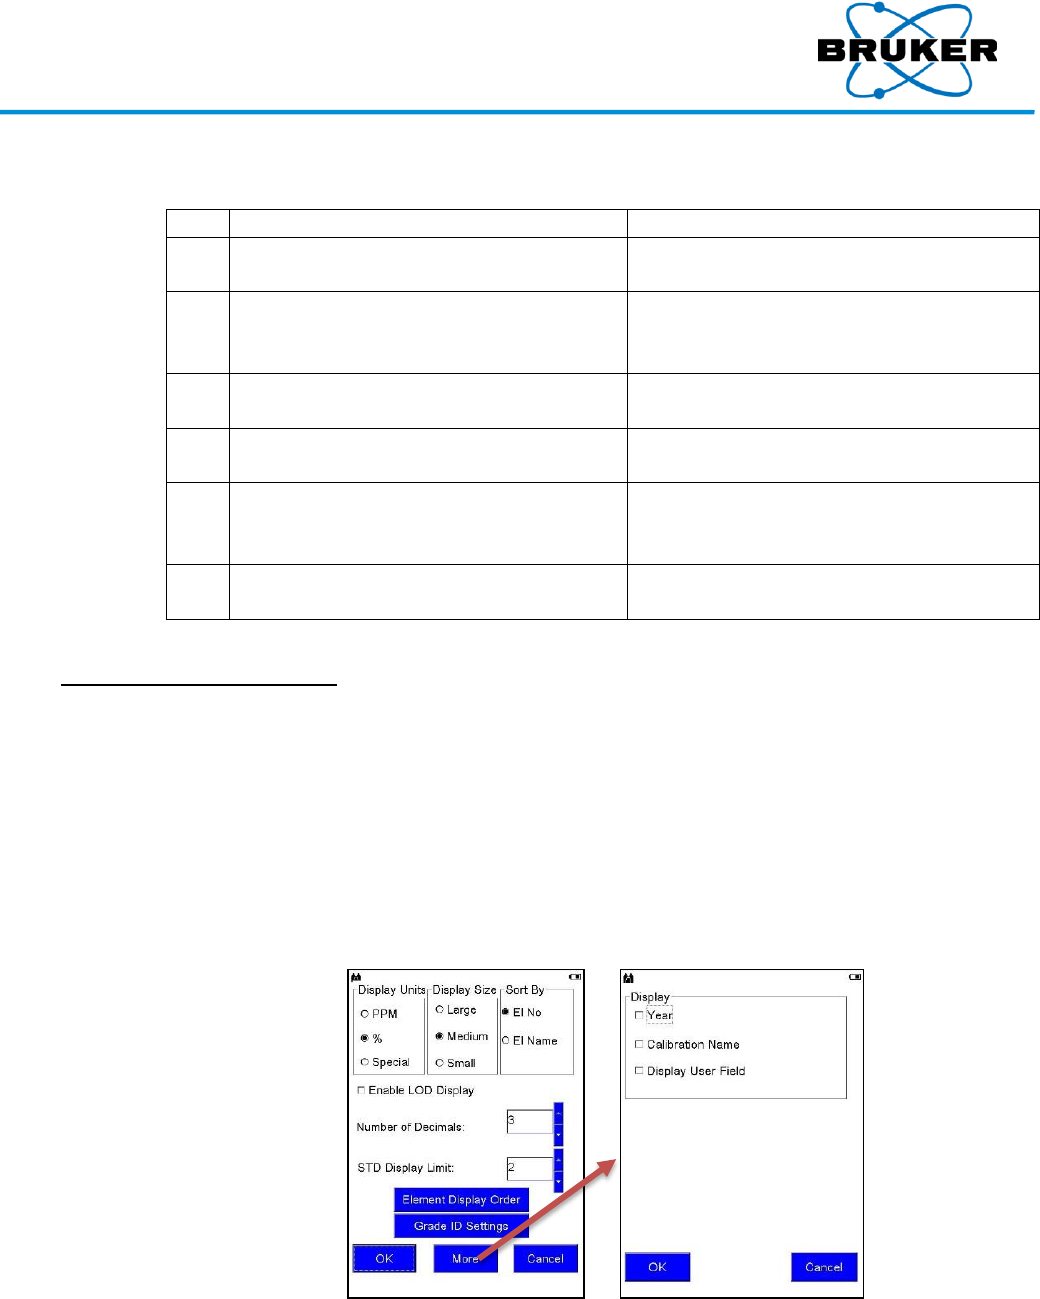
8.1. Display Settings
Description
How measurement results are displayed is specified on the Display Settings screen.
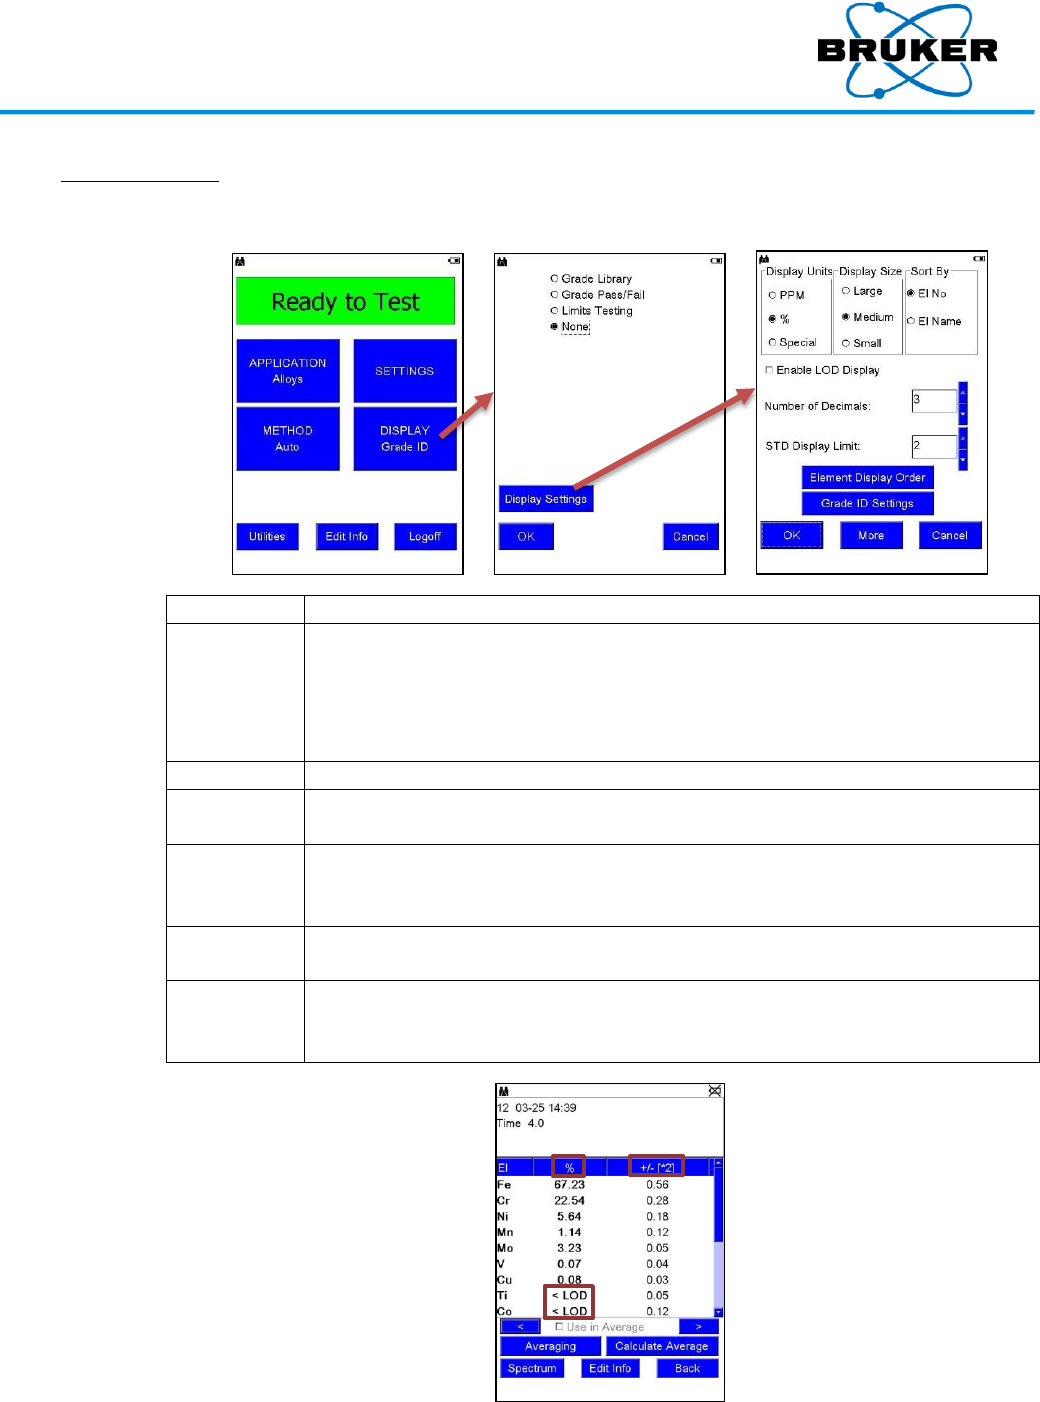
Description
of options
Option
Description
Display Units
Measurement results can be displayed in –
PPM – Parts per million.
% – Percent.
Special – An application-defined setting; or as defined in EasyCal. See
EasyCal – a Comic Strip, Bruker document 030.0101.
Display Size
The font size on the Results screen.
Sort By
Results are sorted by element atomic number (El No) or alphabetically by
element name (El Name).
Enable LOD
Display
Results include analyzed elements with an assay less than the limits of
detection (LOD). The LOD is defined as n*STD, where n is a number from 1 - 5
and STD is standard deviation.
Number of
Decimals
The number of digits displayed to the right of the decimal point of a percent
value.
STD Display
Limit
The number of standard deviations on the Results screen. The error displayed
with an assay is n*STD. If the assay is less than n*STD and Enable LOD Display
is checked, the assay is displayed as <LOD.
S1 TITAN and TRACER 5i User Manual
030.0112.01.0 41 of 58
8.2. Element Display Order
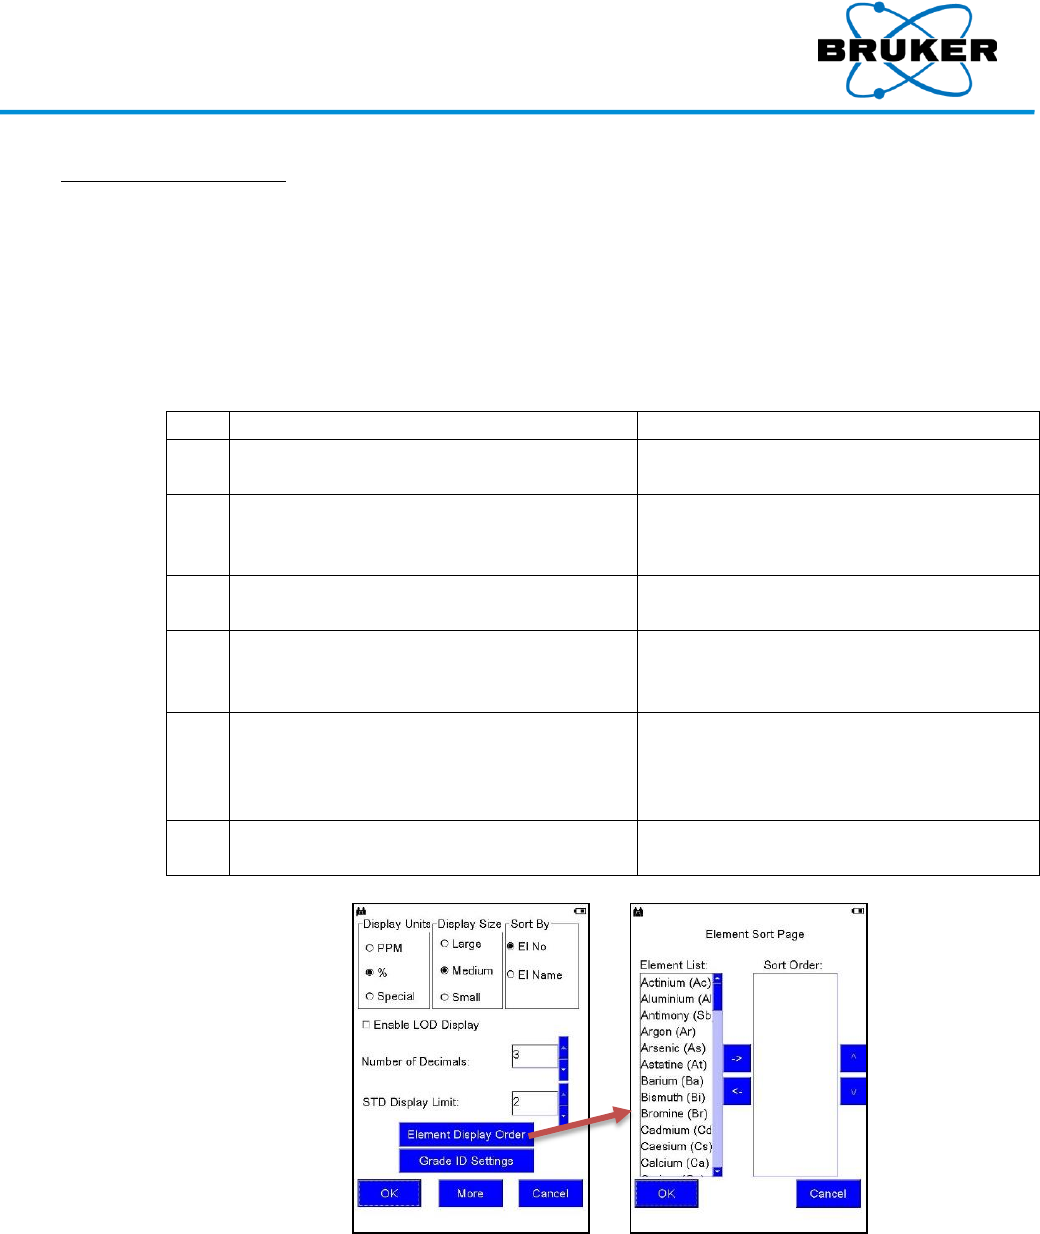
Description
Element order can be customized, rather than sorting by element atomic number or
alphabetically by element name.
Note that results will list only those elements selected.
Sorting one
at a time
To customize the element order on the Results screen one element at a time –
Step
Action
Result
1
Under DISPLAY and then Display Settings,
tap Element Display Order.
The Element Sort Page is displayed.
2
Under the Element List, tap the name of
the first element to be displayed in a result
list.
The selected element name is highlighted.
3
Tap the right pointing arrow.
The selected element name is moved to
the Sort Order list.
4
Populate the Sort Order list with element
names in the desired order by repeating
steps 2 and 3.
The Sort Order list is populated with
element names in the order names are
moved over.
5
To move an element name back to the
Element List on the left, tap the name
under Sort Order and then the left
pointing arrow.
The selected element name is moved back
to the Element List.
6
To save the modified sort order, tap OK.
When assays are taken, results are listed
in this order.
S1 TITAN and TRACER 5i User Manual
030.0112.01.0 42 of 58
Sorting
multiple at a
time
To customize the element order on the Results screen multiple elements at a time –
Step
Action
Result
1
Under DISPLAY and then Display Settings,
tap Element Display Order.
The Element Sort Page is displayed.
2
Under the Element List, tap multiple
element names to be displayed in a result
list.
Selected element names are highlighted.
3
Tap the right pointing arrow.
The selected element names are moved to
the Sort Order list in alphabetical order.
4
To change the order of elements in the
Sort Order column, tap an element name.
The element name is highlighted.
5
To move the element name up or down in
the list, tap the up pointing or down
pointing carat on the right.
The selected element name moves up or
down accordingly.
6
To save the modified sort order, tap OK.
When assays are taken, results are listed in
this order.
8.3. Grade ID Settings and More
Grade ID
Settings
Options on the Grade ID Settings screen affect how measurement results are displayed. See the
Alloy Module, Bruker document 030.0114.
More
To display additional options to customize for the Results screen – from the Display Settings
screen, tap More.
Year – In addition to the date, displays the year of the measurement.
Calibration Name – Displays the name of the method.
Display User Field – Displays the value of the first user field. See Edit Info Button, page 46.
S1 TITAN and TRACER 5i User Manual
030.0112.01.0 43 of 58
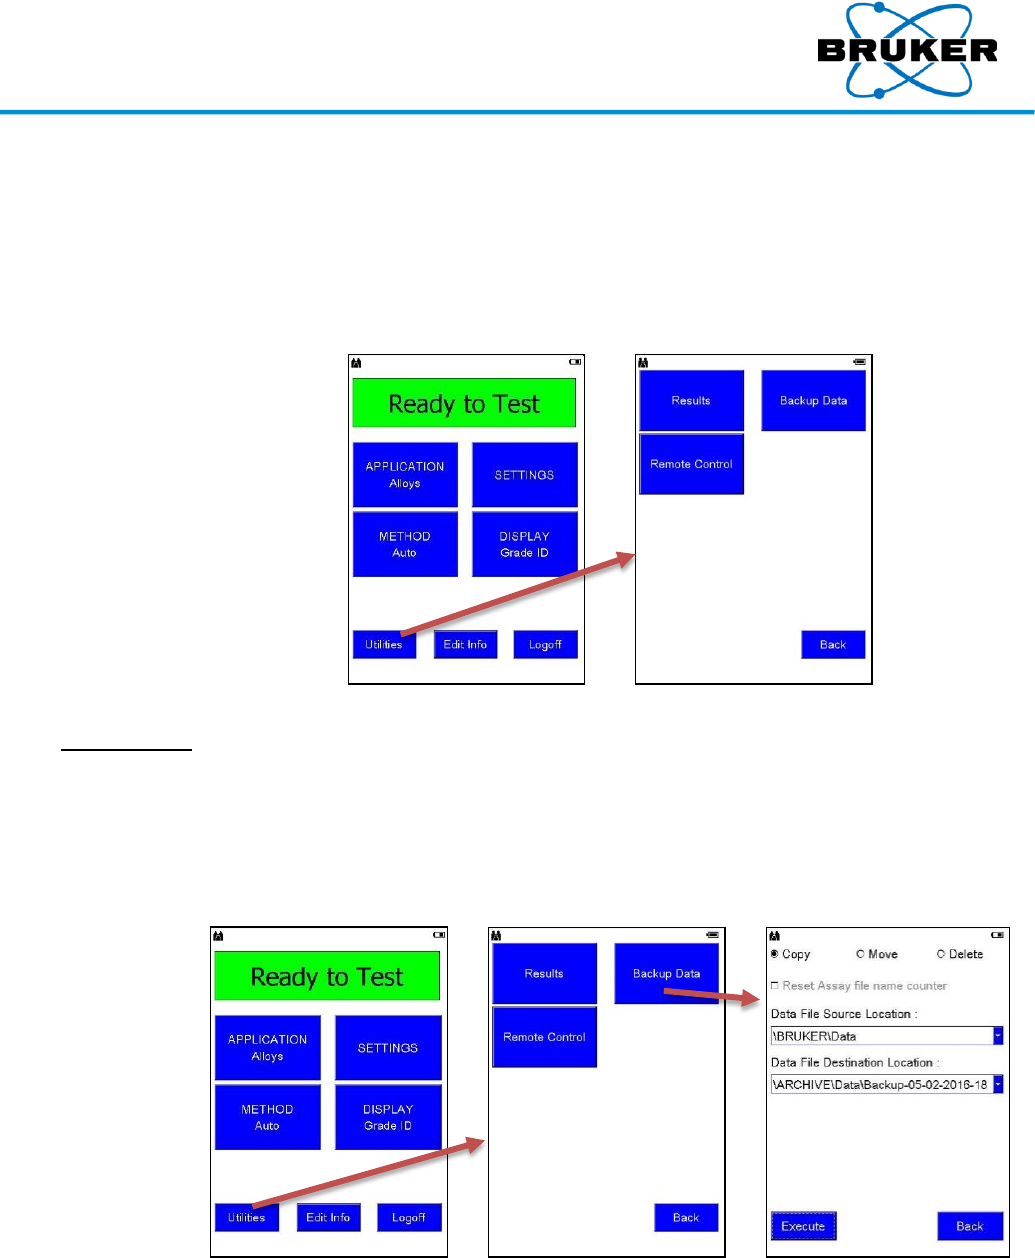
9. Utilities Button
Description
The Utilities button accesses options to –
Display Results of measurements. See Results, page 48.
Back up Data by copying or moving, with the option to delete.
Allow Remote Control of the instrument.
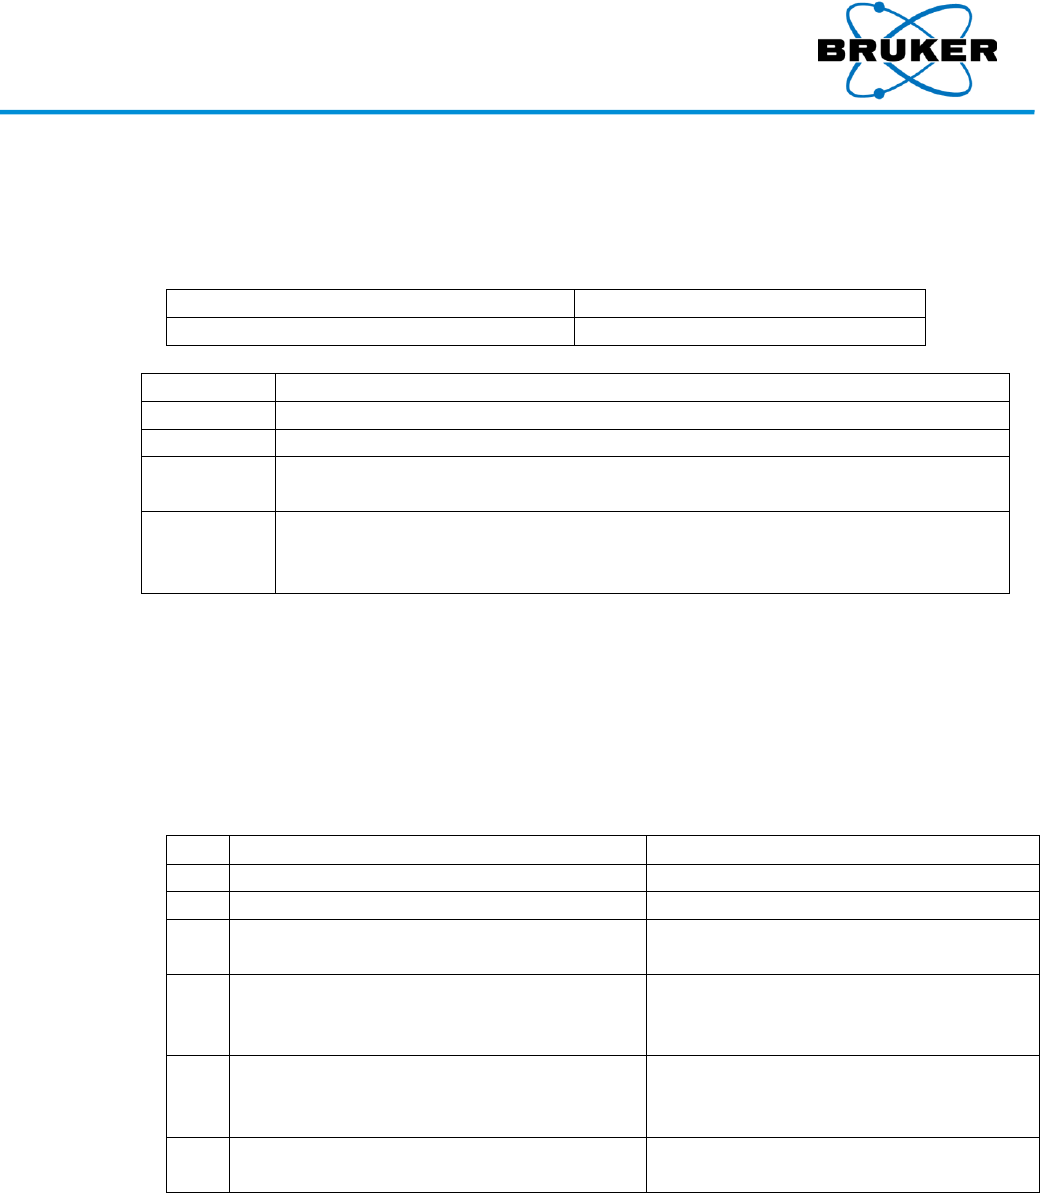
9.1. Back up Data
Description
This option under Utilities provides the ability to –
Copy – copies data to an external location, leaving data in the instrument memory.
Move – copies data to an external location and deletes data stored in the instrument.
Delete – removes data from the instrument memory without copying.
Reset
counter
When the Reset the Assay file name counter box is checked, if data are moved or deleted, the
index counter resets to 1. This function is not available when Copy is selected.
S1 TITAN and TRACER 5i User Manual
030.0112.01.0 44 of 58
Location
fields
Data File Source Location and Data File Destination Location fields cannot be edited. For any
additional available options, tap the drop down arrow.
Destination
location
Data from the instrument is copied to a –
USB flash drive,
if a USB flash drive is installed.
New folder in the instrument memory,
if no USB flash drive is installed.
Flash drive
recom-
mendations
Subject
Description
Large drives
Large flash drives take longer to be recognized.
Powering on
If a flash drive is installed, instrument initialization time increases.
Files on new
drives
New flash drives may contain manufacturer files and programs unnecessary for
Bruker use. Use them at your own risk.
Viruses
Flash drives can spread viruses. Drives included with the analyzer are new and
guaranteed virus-free. PCs used with the instrument should have up-to-date
antivirus software.
Optimize
performance
To optimize analyzer performance and reduce initialization time, data should be periodically
removed from the instrument and the installed USB flash drive.
PC
Data in other locations on the instrument can be moved to a PC where results can be viewed via
Bruker Instrument Tools. See the Bruker Toolbox User Guide, Bruker document 030.0119.
Copy/move
To copy or move data from the instrument to an external location –
Step
Action
Result
1
Tap the Utilities button and Backup Data.
The Backup Data screen is displayed.
2
Tap an option to Copy or Move.
3
If moving, check the Reset Assay file name
counter box, if desired.
The box is checked.
4
Tap the Data File Source Location drop
down arrow to view possible source files
and select one.
5
Tap the Data File Destination Location drop
down arrow to view possible destinations
and select one.
6
Tap Execute.
After files are copied or moved, the
Utilities screen is displayed.
Delete
To delete all assays from the selected Data File Source Location on the instrument – tap Delete
and Execute. The measurements are deleted and the Utilities screen is displayed.
S1 TITAN and TRACER 5i User Manual
030.0112.01.0 45 of 58
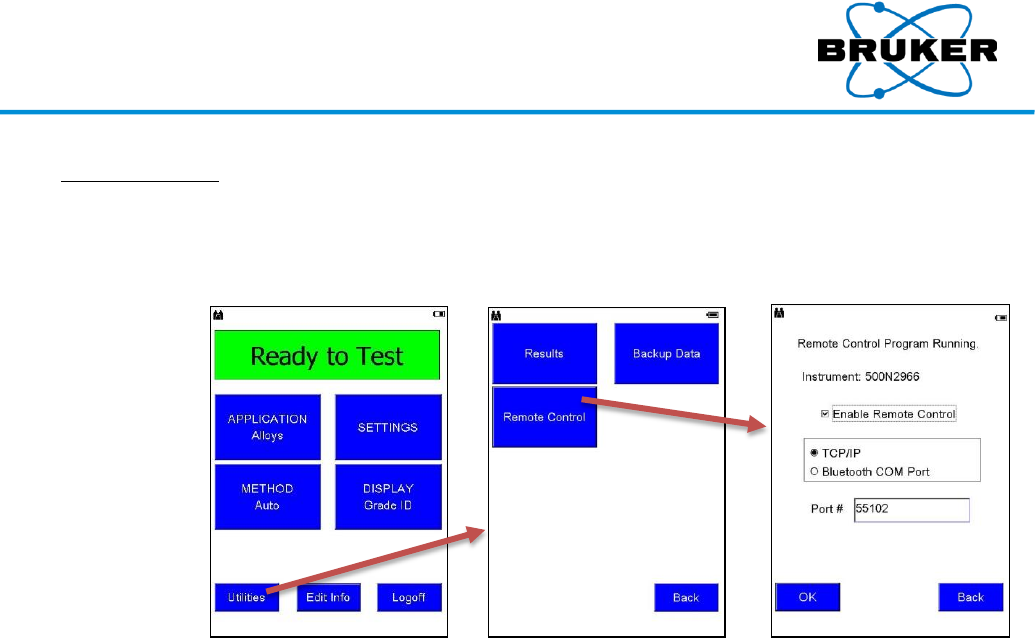
9.2. Remote Control
Description
When the Enable Remote Control box is checked, the analyzer can be operated remotely from a
PC. For instructions, See the Bruker Toolbox User Guide, Bruker document 030.0119.
S1 TITAN and TRACER 5i User Manual
030.0112.01.0 46 of 58
10. Edit Info Button
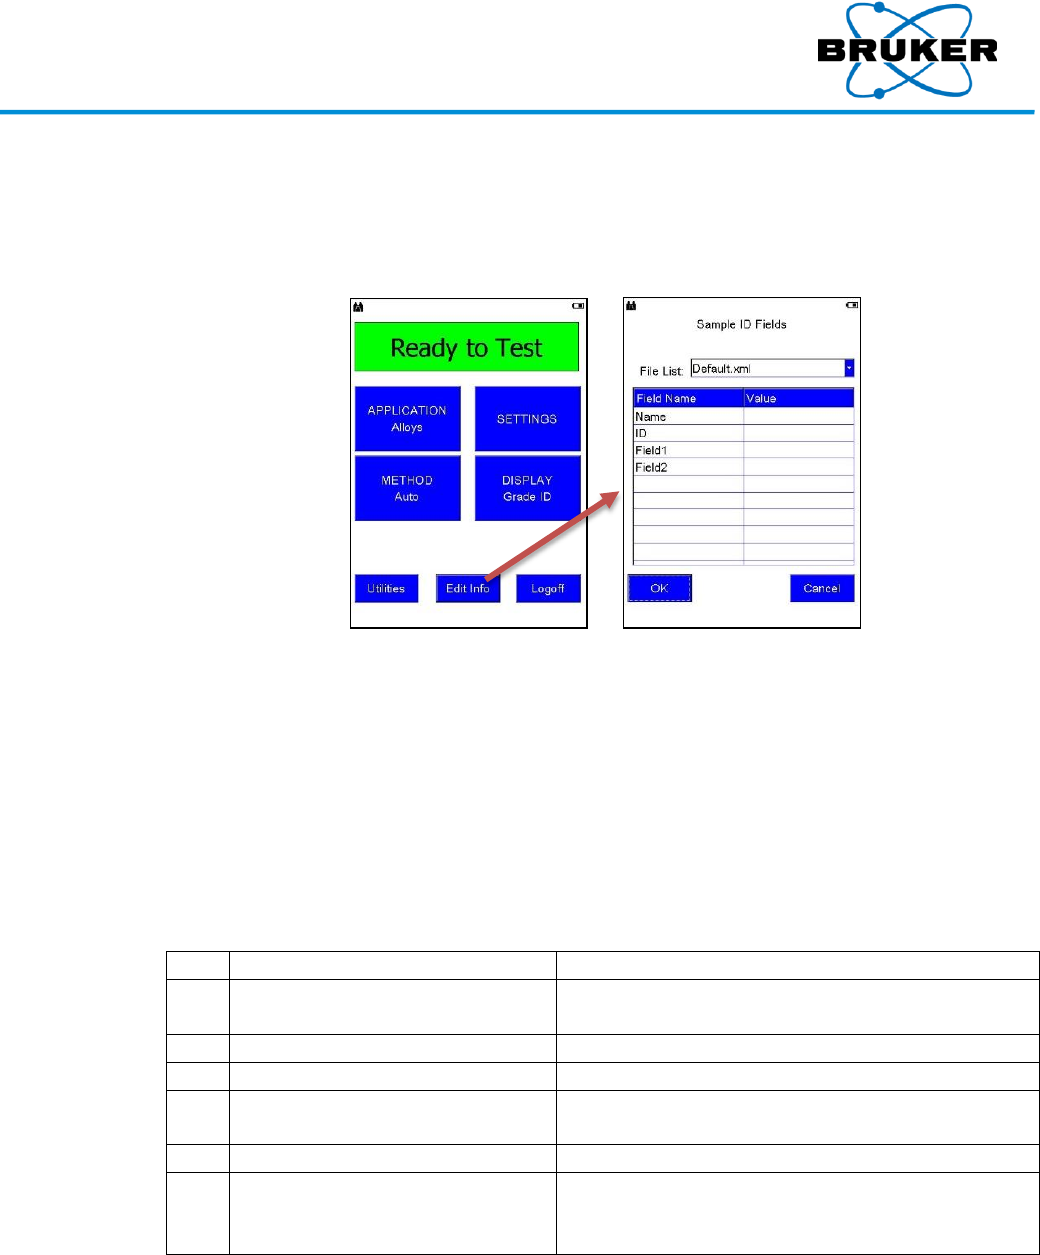
Description
Before a measurement is taken, an assay can be named and described. This information is saved
to the Results.csv file and the <index>-<Application>.pdz (e.g., 00456-Alloys.pdz) spectrum file.
Sample ID
Whatever is entered in the first field under Value is what is displayed in the SampleId field in
Results (and the Name field in Report Generator in Bruker Instrument Tools). If Operator is the
first value, then the second value is used for SampleId.
File List
More than one source file may be available with different or additional Field Names.
To access additional source files, tap the downward pointing arrow to the right of the File List
field. A dropdown list is displayed. Tap a selection.
Labeling an
assay
To label subsequent assays –
Step
Action
Result
1
From the Ready to Test screen,
tap the Edit Info button.
The Sample ID Fields screen is displayed.
2
Double tap a field under Value.*
A keyboard is displayed.
3
Enter appropriate information.
The field reflects the change.
4
Tap OK.
The keyboard is removed and information is saved
in the field.
5
Repeat steps 2 - 4 as necessary.
6
To save changes to the Sample ID
Fields screen, tap OK.
The Ready to Test screen is displayed and
subsequent assays are labeled accordingly until
these settings are changed.
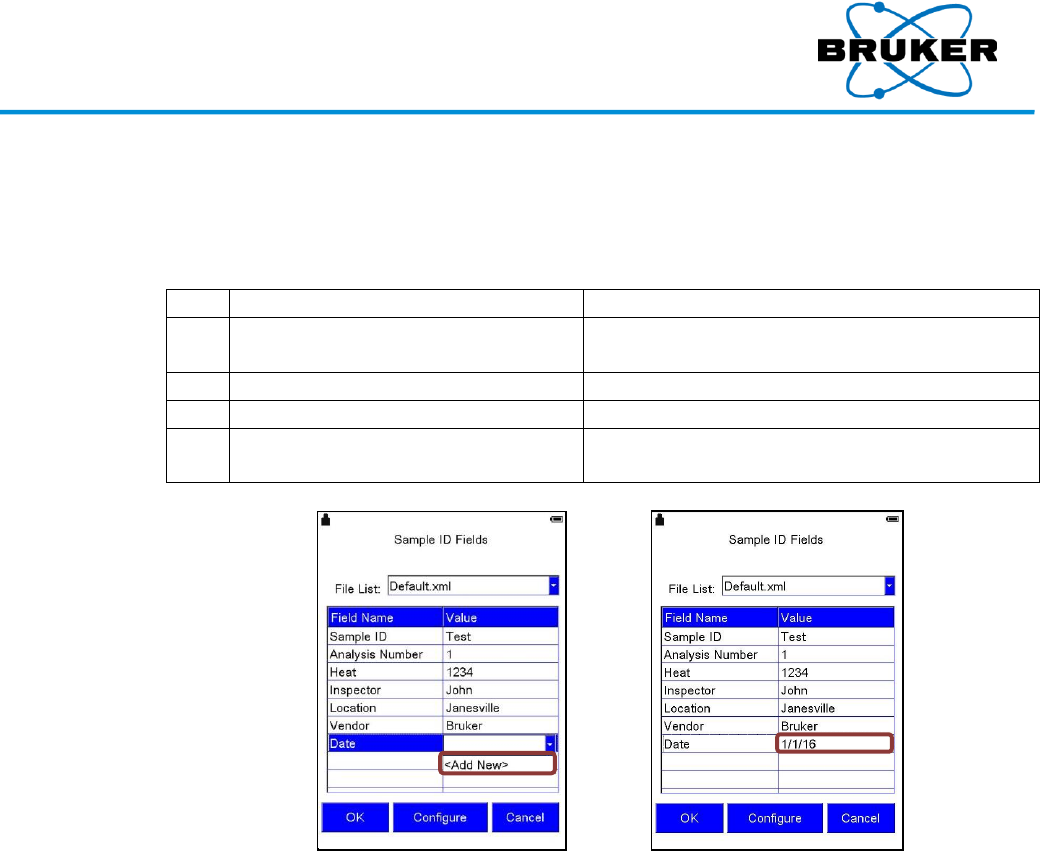
*List option
If the List checkbox, available in Supervisor Mode, is checked for the applicable Field Name, when
a field under Value is tapped once, a dropdown list is displayed, rather than a keyboard. Select
from the list or <Add New>, as described below.
S1 TITAN and TRACER 5i User Manual
030.0112.01.0 47 of 58
Adding
values with
<Add New>
Note that once a value is added, it cannot be removed from the list.
To add values to a dropdown list if the List checkbox available in Supervisor Mode is checked for
the applicable Field Name –
Step
Action
Result
1
From the Sample ID Fields screen,
tap a Value field.
A dropdown list with <Add New> is displayed.
2
Tap <Add New>.
The keyboard is displayed.
3
Enter a value and tap OK.
The new value is displayed in the Value field.
4
Tap OK.
The change is saved and the Ready to Test
screen is displayed.
S1 TITAN and TRACER 5i User Manual
030.0112.01.0 48 of 58
11. Results
Description
Results of a measurement are displayed two ways –
During and immediately after a scan.
Through the Utilities -> Results buttons.
The actual screen configuration varies depending on the selected method and settings defined
under DISPLAY. See DISPLAY Button, page 39.
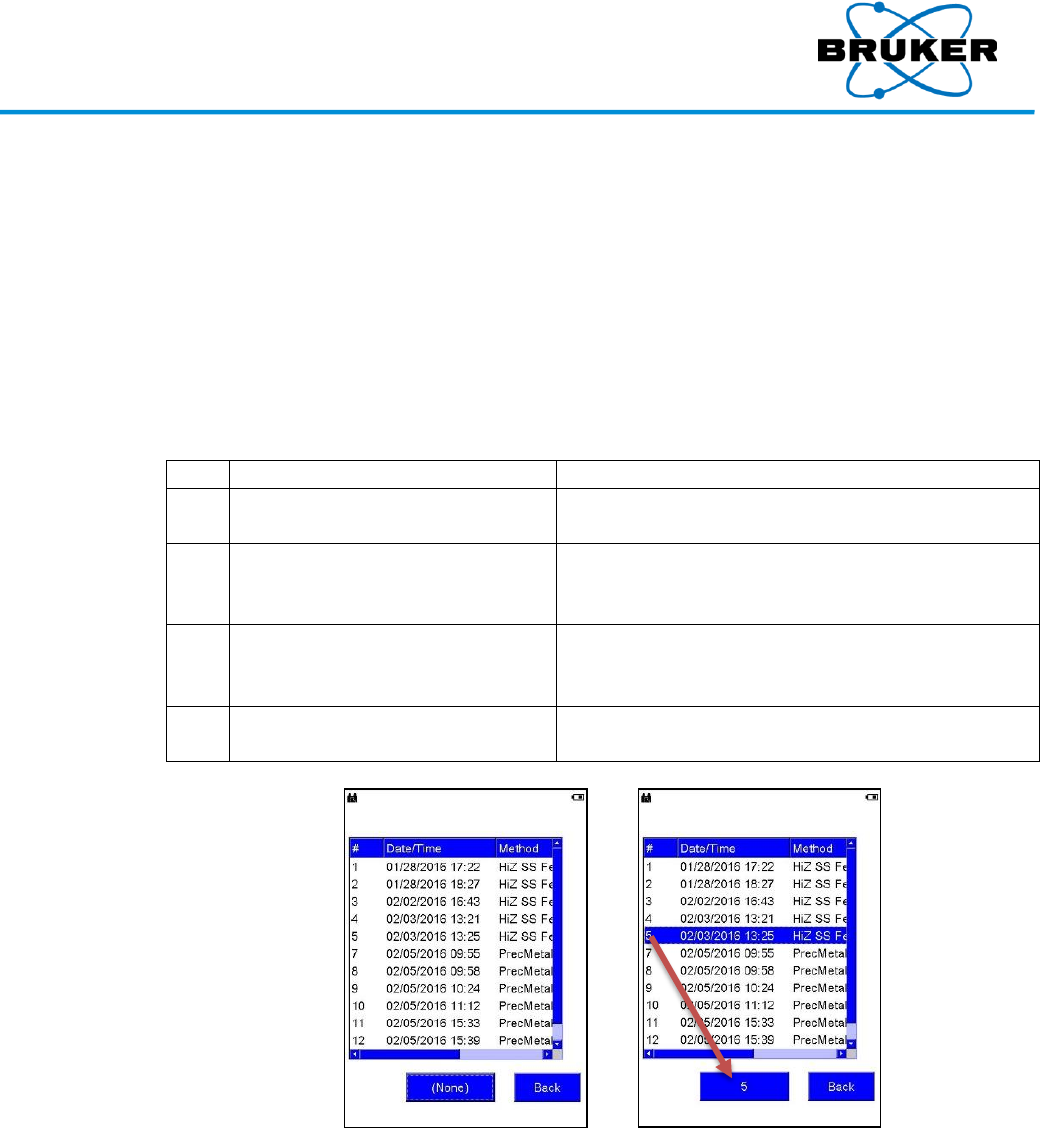
Past results
To review the results of a past analysis –
Step
Action
Result
1
From the Ready to Test screen,
tap the Utilities button.
The Utilities screen is displayed.
2
Tap Results.
A table showing every assay stored in memory, in
reverse order of Index number (most recent
measurement at the top), is displayed.
3
Touch scroll up and down, left
and right, to see all assay names.
Tap a measurement to review.
The sample is highlighted.
4
At the bottom of the screen, tap
the sample’s index number.
Results of the sample’s assay are displayed.
Display
toolbar
To remove the lower toolbar, double tap the center of the screen. To display it again, double tap
again.
S1 TITAN and TRACER 5i User Manual
030.0112.01.0 49 of 58
Toolbar displayed Toolbar removed
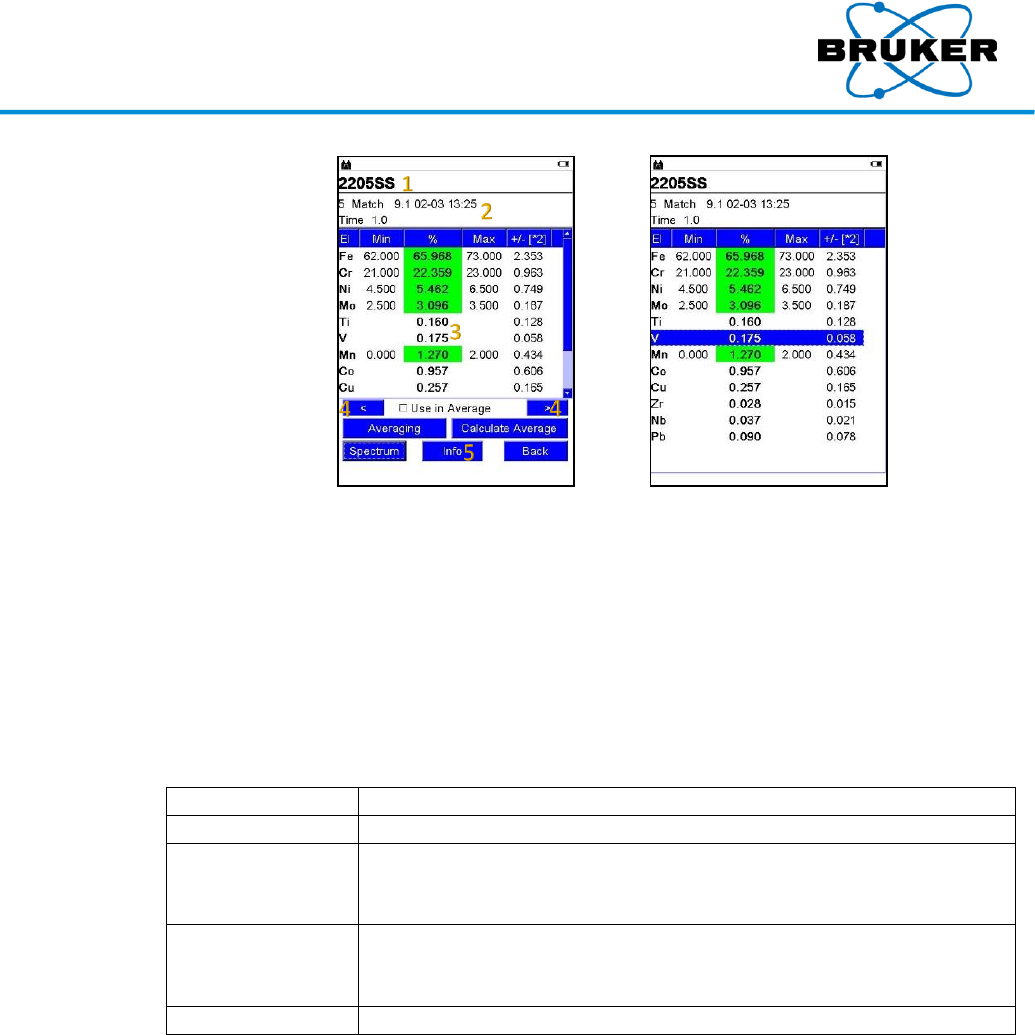
1. ID match
If the sample matches grade IDs in the library, up to three matching IDs are displayed. If not, the
application name is displayed.
2. Assay
information
The following information is provided for quick reference –
Index number of the sample.
The date and time the assay was measured.
Length of the measurement in seconds.
If averaging, the index numbers of the selected assays.
3. Columns
Column Heading
Description
El
Element symbol.
Min and Max
Minimum and maximum percent allowed according to the grade
library. Note that some applications do not use a grade library and Min
and Max are not displayed.
%, PPM, or Special
Amount of the element in either percent, parts per million, or units
defined in EasyCal. See EasyCal – a Comic Strip, Bruker document
030.0101.
+/- [*n]
Standard deviation.
Sorting
To sort data in a column in descending or ascending order – tap a column heading.
4. < and >
To view different assays ordered by index number – use the back and forward options, < and >.
5. Info
To display the assay’s name, ID, and other information, if applicable – tap Info. This information
cannot be edited.
S1 TITAN and TRACER 5i User Manual
030.0112.01.0 50 of 58
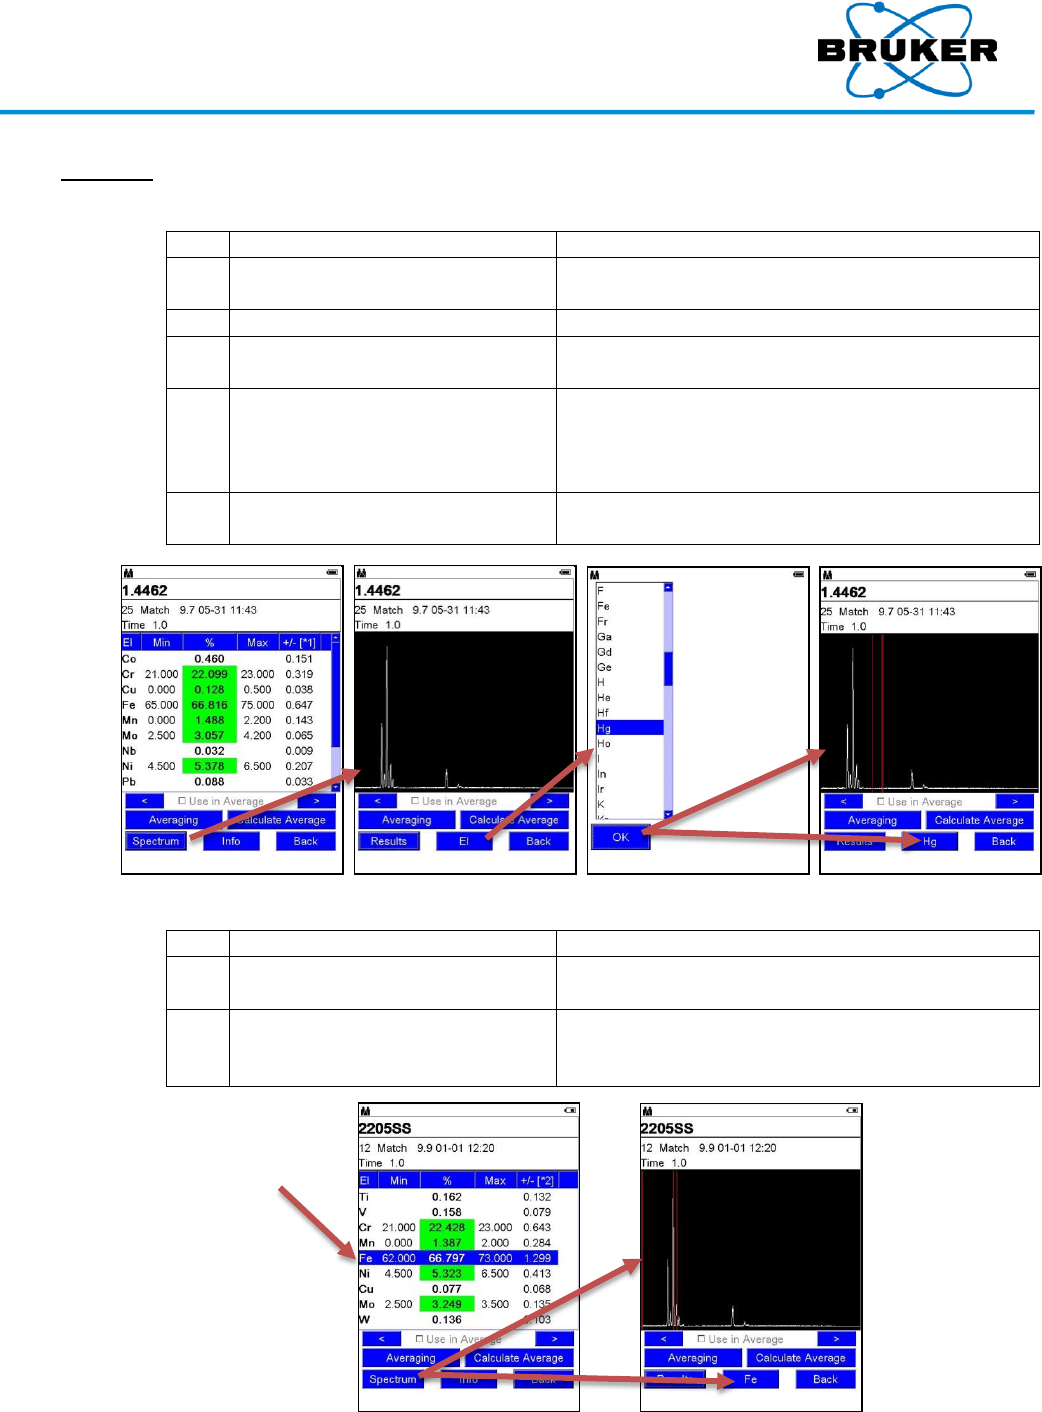
11.1. Spectrum
Elemental
spectrum
To view the spectrum and specific elements for the selected assay –
Step
Action
Result
1
From the Results screen of a
specified assay, tap Spectrum.
The Spectrum screen is displayed.
2
Tap El.
A list of element symbols is displayed.
3
Scroll down to see all elements.
Tap one.
The element is highlighted.
4
Tap OK.
The spectrum is displayed with one or more red
vertical bars identifying peaks for the selected
element. El is now replaced with the symbol of the
selected element.
5
To identify a spectrum peak, tap it.
One or more red vertical bars is displayed and the
element symbol is displayed on the El button.
Alternative
To view the spectrum and specific elements for the selected assay an alternative way –
Step
Action
Result
1
From the Results screen of a
specified assay, tap an element.
The element row is highlighted.
2
Tap Spectrum.
The spectrum is displayed with that element’s peaks
noted by red vertical bars. The selected element’s
symbol is displayed on the El button.
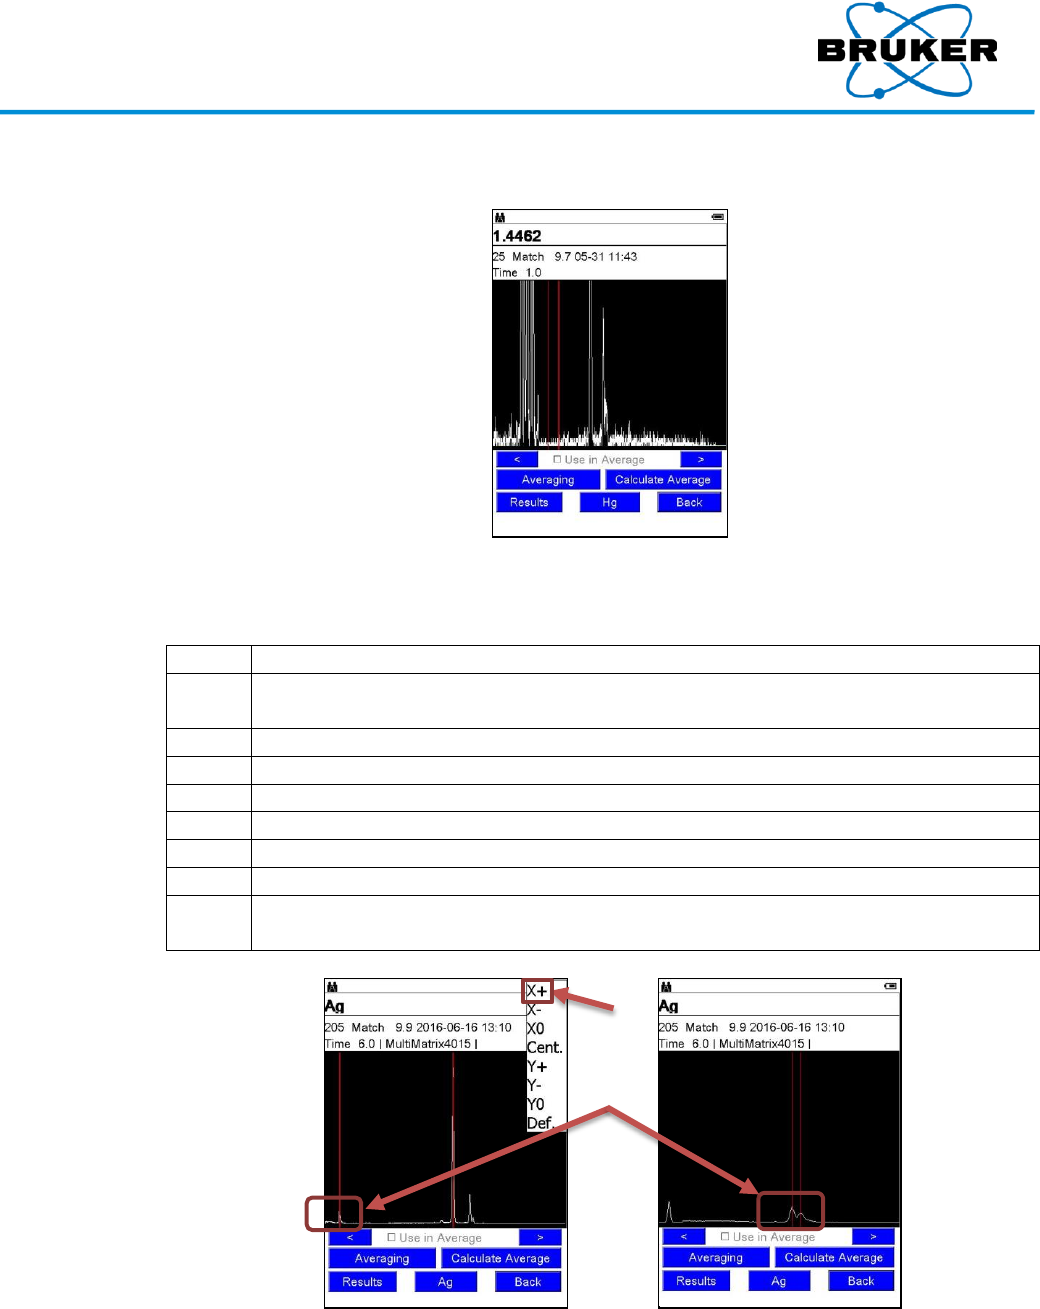
S1 TITAN and TRACER 5i User Manual
030.0112.01.0 51 of 58
Vertical
enhancement
To exaggerate peaks, tap the spectrum and drag upward.
Axis toolbar
The axis toolbar manipulates the spectrum display to better view details. To display it, tap the
screen and hold.
Option
Description
X+
Stretches the x-axis (keV) scale to zoom in on the spectrum. To view the entire
spectrum, tap and drag horizontally.
X-
Compresses the x-axis (keV) scale to zoom out from the spectrum.
X0
Re-centers and returns the spectrum to the original x-axis scale.
Cent.
Re-centers the spectrum on both the x- and y-axes.
Y+
Stretches the y-axis (count rate) scale.
Y-
Compresses the y-axis (count rate) scale.
Y0
Returns the spectrum to the original scale along the y-axis.
Def.
Restores the spectrum to its default setting; the spectrum is re-centered and the
original scale along both axes is restored.
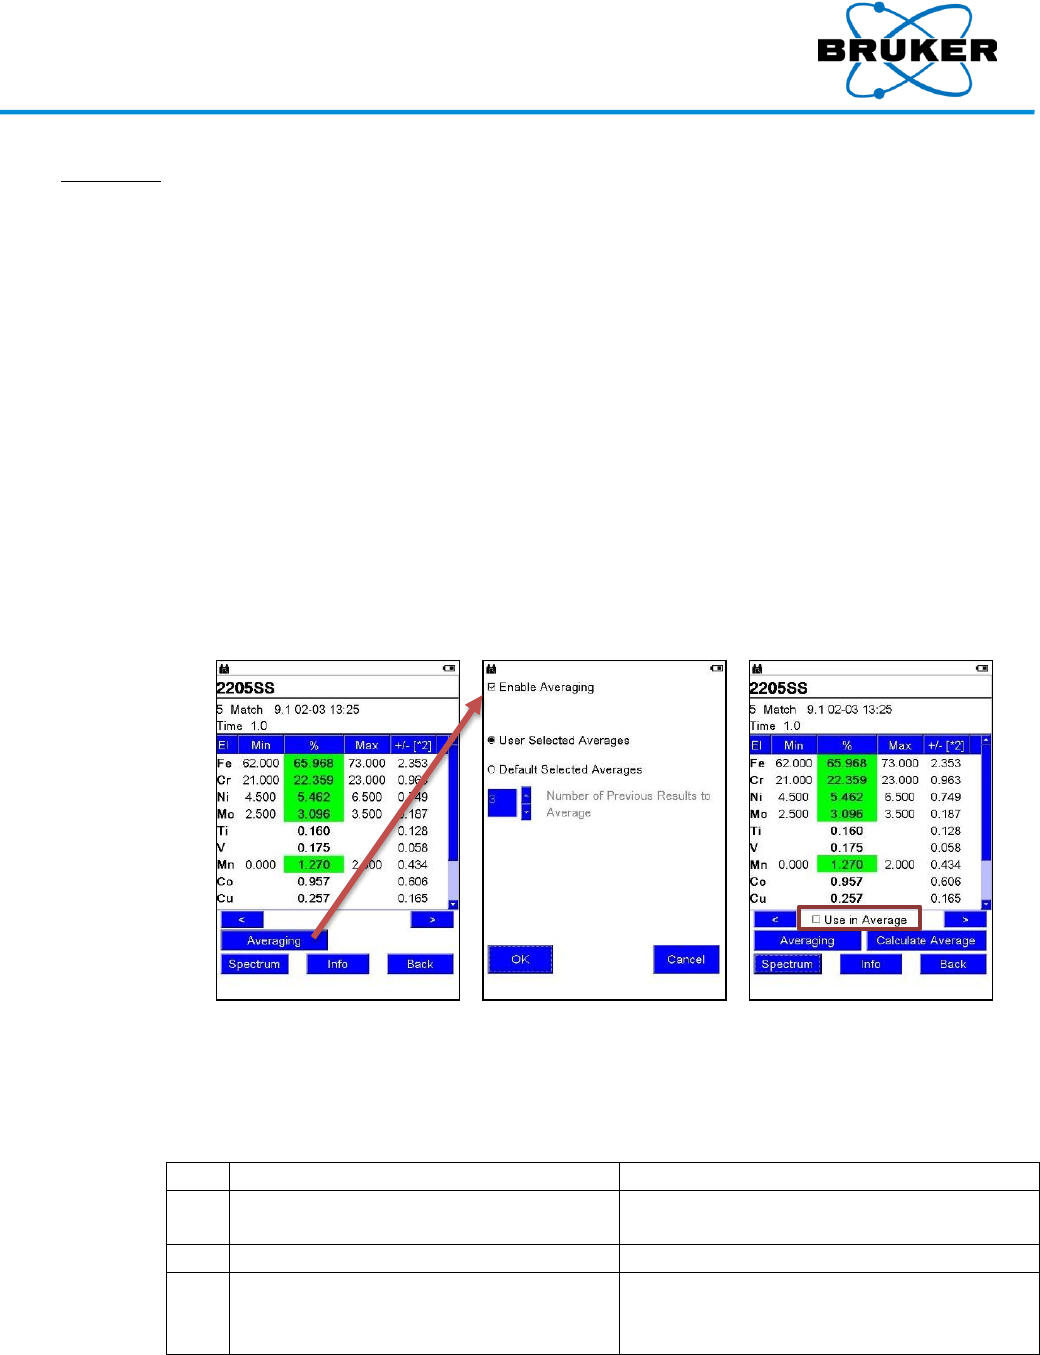
S1 TITAN and TRACER 5i User Manual
030.0112.01.0 52 of 58
11.2. Averaging
Averaging
Values from selected measurements can be averaged. Assays can be selected individually or by
default.
Note: Only assays taken with the same method can be averaged.
Average
results
Average results are –
Calculated for elements and +/- values. If an element is missing from one of the averaged
results, the value is 0. For example, results of three assays are averaged. Al is detected at
60%, 60%, and 0%. The average is 40%.
Analyzed for Grade Matching and Pass/Fail.
Saved in the results list and in Results.csv.
Enable
averaging
When Enable Averaging is checked for an assay –
Averaging is available to all assays stored in the Results.csv file.
The Use in Average and Calculate Average options are displayed on the Results screen.
The ability to average remains in effect until Enable Averaging is unchecked.
Screen options when
Enable Averaging is
unchecked
Screen options when
Enable Averaging is
checked
To enable
To enable assays to be included in an average calculation –
Step
Action
Result
1
If a Results screen does not display Use
in Average, tap Averaging.
The Averaging screen is displayed.
2
Tap the Enable Averaging checkbox.
A checkmark is displayed.
3
Tap OK.
The Results screen is displayed and any
assay stored on the instrument can be used
in an average calculation.

S1 TITAN and TRACER 5i User Manual
030.0112.01.0 53 of 58
User selected
To average multiple user selected assays –
Step
Action
Result
1
From the Results screen, tap Averaging.
The Averaging screen is displayed.
2
Tap User Selected Averages.
The radio button is filled.
3
Tap OK.
The Results screen is displayed and any
assay stored on the instrument can be
used in a user selected average
calculation.
4
Tap the Use in Average checkbox for each
assay included in the average calculation.
To display additional assays to be used in
the average calculation, use < and > to flip
through previous and subsequent assays.
A checkmark is displayed.
5
When all desired assays have checked Use
in Average boxes, tap Calculate Average.
Index numbers of assays used in the
calculation are listed in the status bar
(e.g. AVG 8 9 11 15). Their calculated
average is displayed and stored in
Results.csv.
Default
selected
To average Default Selected assays –
Step
Action
Result
1
Display the assay with the highest index
number of the assays to be part of an average
calculation. For example, to average assays 7 -
9, display index number 9.
2
Tap Averaging.
The Averaging screen is displayed.
3
Tap Default Selected Averages.
The radio button is filled.
4
Set the number of previous assays to be
included in the average calculation by tapping
either the up or down pointing triangle to
increase or decrease, respectively, the value.
OR
Tap the field.
The field reflects the change.
OR
A numeric keyboard is displayed.
5
Tap a number and OK to close the keyboard
and OK to accept the settings.
The selected assay is displayed again.
6
Tap Calculate Average.
The average values of the number of
assays specified is displayed. Assays
part of the average are identified in the
status bar and in Results.csv by index
number. For example, if the Number of
Previous Results to Average is 3 and
the starting index number is 9, AVG 7 8
9 is displayed.

S1 TITAN and TRACER 5i User Manual
030.0112.01.0 54 of 58
Averaged
results
cannot be
averaged
Results of an average calculation cannot be included in a subsequent average calculation. This
means for –
User Selected Averages – The Use in Average option is not available for results of an
average calculation.
Default Selected Averages – A current average does not include values from any
averages falling within the specified range of assays to be averaged.
Example
For example, if –
The Number of Previous Results to Average is 3.
The starting index number is 9.
Index number 7 is a previously average set of results.
The specified range backward skips index number 7 and instead includes index number 6. AVG 6
8 9 is displayed in the status bar.
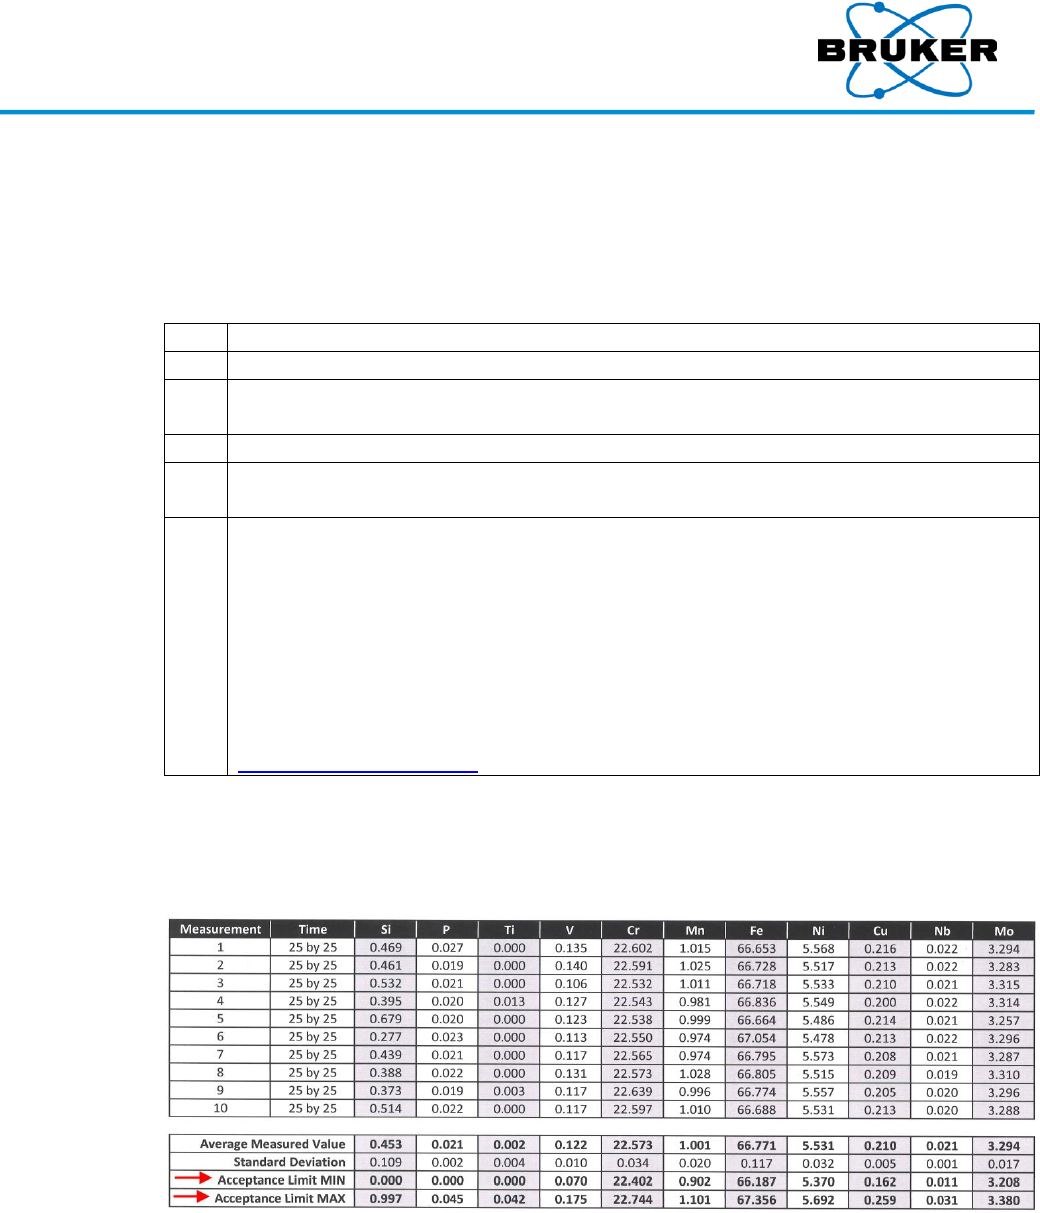
S1 TITAN and TRACER 5i User Manual
030.0112.01.0 55 of 58
12. Quality Check
Description
This test verifies assays measured and recorded on the instrument are accurate.
Process
To verify that your instrument is calibrated correctly –
Step
Action
1
Set APPLICATION to Alloys and Method to Automatic Calibration Selection.
2
From the Ready to Test screen, measure the supplied Duplex 2205 Check Sample 10
times.
3
Average the 10 assays. See Averaging, page 52.
4
Compare the average measured value for each element against the Acceptance Limit
maximum and minimum on the Check Sample Report supplied with your instrument.
5
If all averaged measurements fall within MAX and MIN limits, continue to use the
instrument.
If averages fall outside MAX and MIN limits, with respect to standard deviation, check –
Measurement times
Sample surface
Instrument window
If the instrument does not perform as expected, contact Bruker at
support.hmp@bruker.com, +1 (509) 783-9850.
Individual
reports
The following figure is an example only. When performing a quality check, use the Check Sample
Report included with your instrument. It contains values specific to it as determined during
testing at the factory.
Check Sample Report, example only
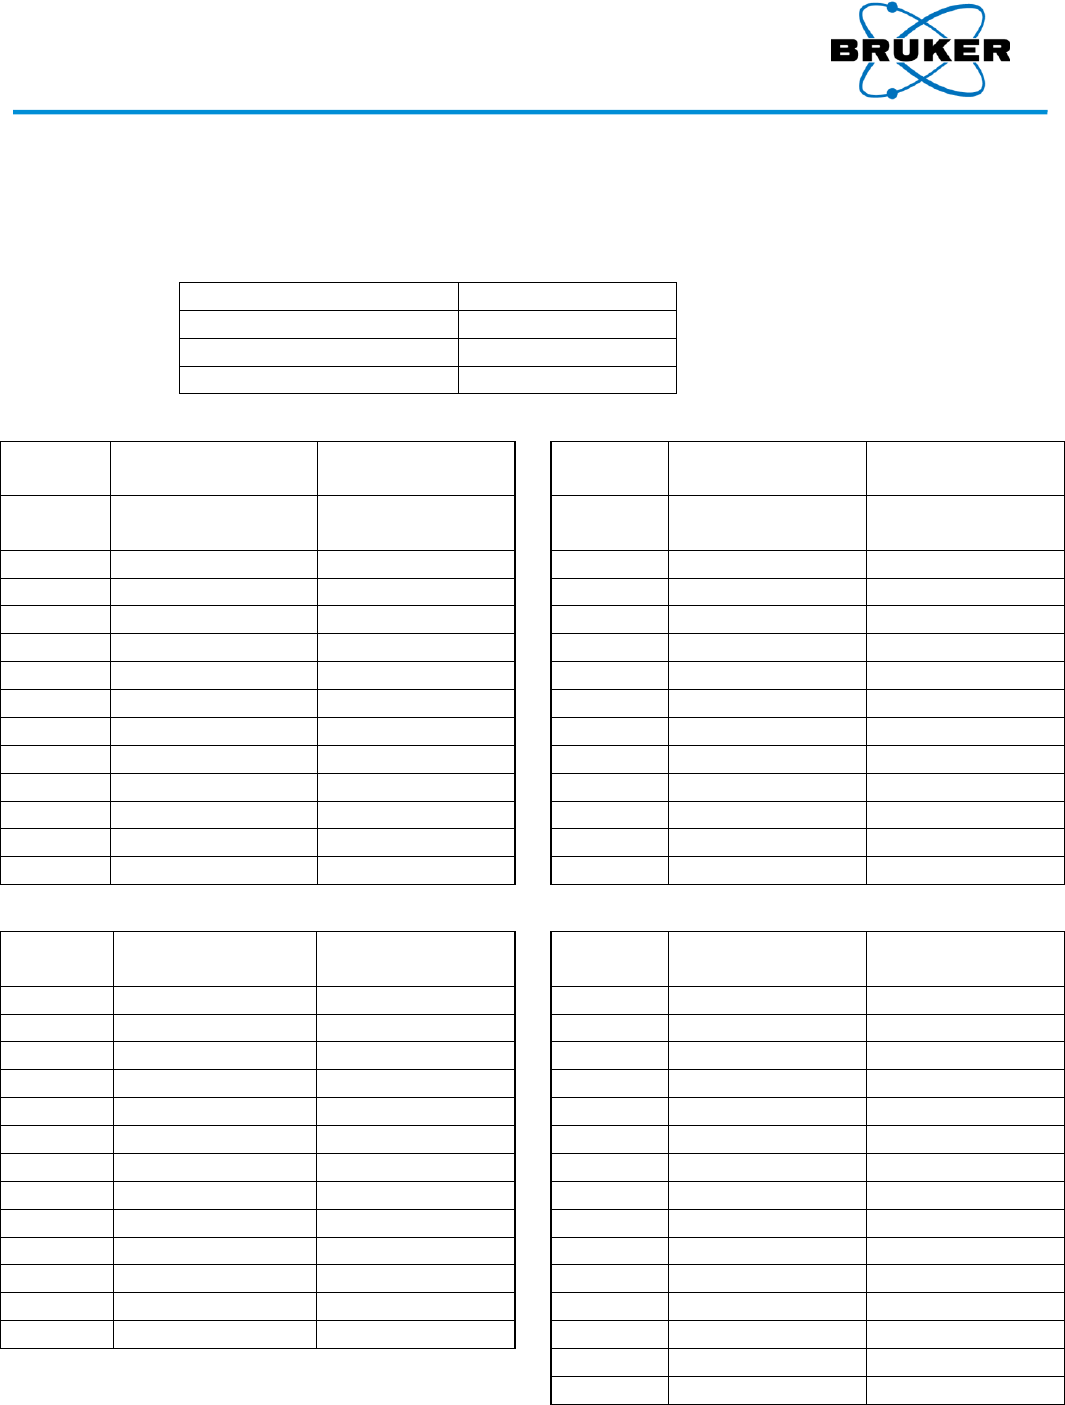
S1 TITAN and TRACER 5i User Manual
030.0112.01.0 56 of 58
Additional TRACER 5i Radiation Profile Test Results Appendix A
Description
To read testing standards and conditions, see Radiation Profile – TRACER 5i on page 20.
Worst-case 2
highest
power
Tests were performed with the following settings:
Setting Type
Value
Voltage (keV)
40
Current (μA)
99
Filter
Blank #2
At 5 cm
At 10 cm
Location
Open Beam
μrad(μSieverts)/hr
Duplex
μrad(μSieverts)/hr
Location
Open Beam
μrad(μSieverts)/hr
Duplex
μrad(μSieverts)/hr
A
458762102(4587621
)
28.9(0.289)
A
81244.2(812.442)
Background
B
6722.5(67.225)
Background
B
2893.5(28.935)
Background
C
1520.8(15.208)
21.7(0.217)
C
1412.4(14.124)
Background
D
2044.6(20.446)
Background
D
2134.9(21.349)
Background
E
198.7(1.987)
Background
E
177.0(1.770)
Background
F
581.6(5.816)
Background
F
516.6(5.166)
Background
G
39.7(0.397)
Background
G
Background
Background
H
4302.2(4.3022)
57.8(0.578)
H
1556.9(15.569)
14.4(0.144)
I
2279.4(22.794)
104.8(1.048)
I
1773.6(17.736)
39.7(0.397)
J
310.7(3.107)
Background
J
610.5(6.105)
39.7(0.397)
K
274.5(2.745)
Background
K
466.0(4.660)
18.1(0.181)
L
Background
Background
L
220.4(2.204)
28.9(0.289)
M
Background
Background
M
93.9(0.939)
14.4(0.144)
At 30 cm
At 100 cm
Location
Open Beam
μrad(μSieverts)/hr
Duplex
μrad(μSieverts)/hr
Location
Open Beam
μrad(μSieverts)/hr
Duplex
μrad(μSieverts)/hr
A
10881.3(108.813)
Background
A
5811.3(58.113)
Background
B
769.4(7.694)
Background
B
207.2(2.072)
Background
C
798.9(7.989)
Background
C
251.0(2.510)
Background
D
798.9(7.989)
Background
D
154.7(1.547)
Background
E
265.3(2.653)
Background
E
198.5(1.985)
Background
F
356.7(3.567)
Background
F
131.3(1.313)
Background
G
Background
Background
G
131.3(1.313)
Background
H
542.4(5.424)
Background
H
201.4(2.014)
Background
I
622.0(6.220)
Background
I
207.2(2.072)
Background
J
415.7(4.157)
Background
J
134.3(1.343)
Background
K
474.6(4.746)
Background
K
157.6(1.576)
Background
L
173.9(1.739)
Background
L
148.9(1.489)
Background
M
259.4(2.594)
Background
M
125.5(1.255)
Background
N
213.1(2.131)
Background
O
236.4(2.364)
Background
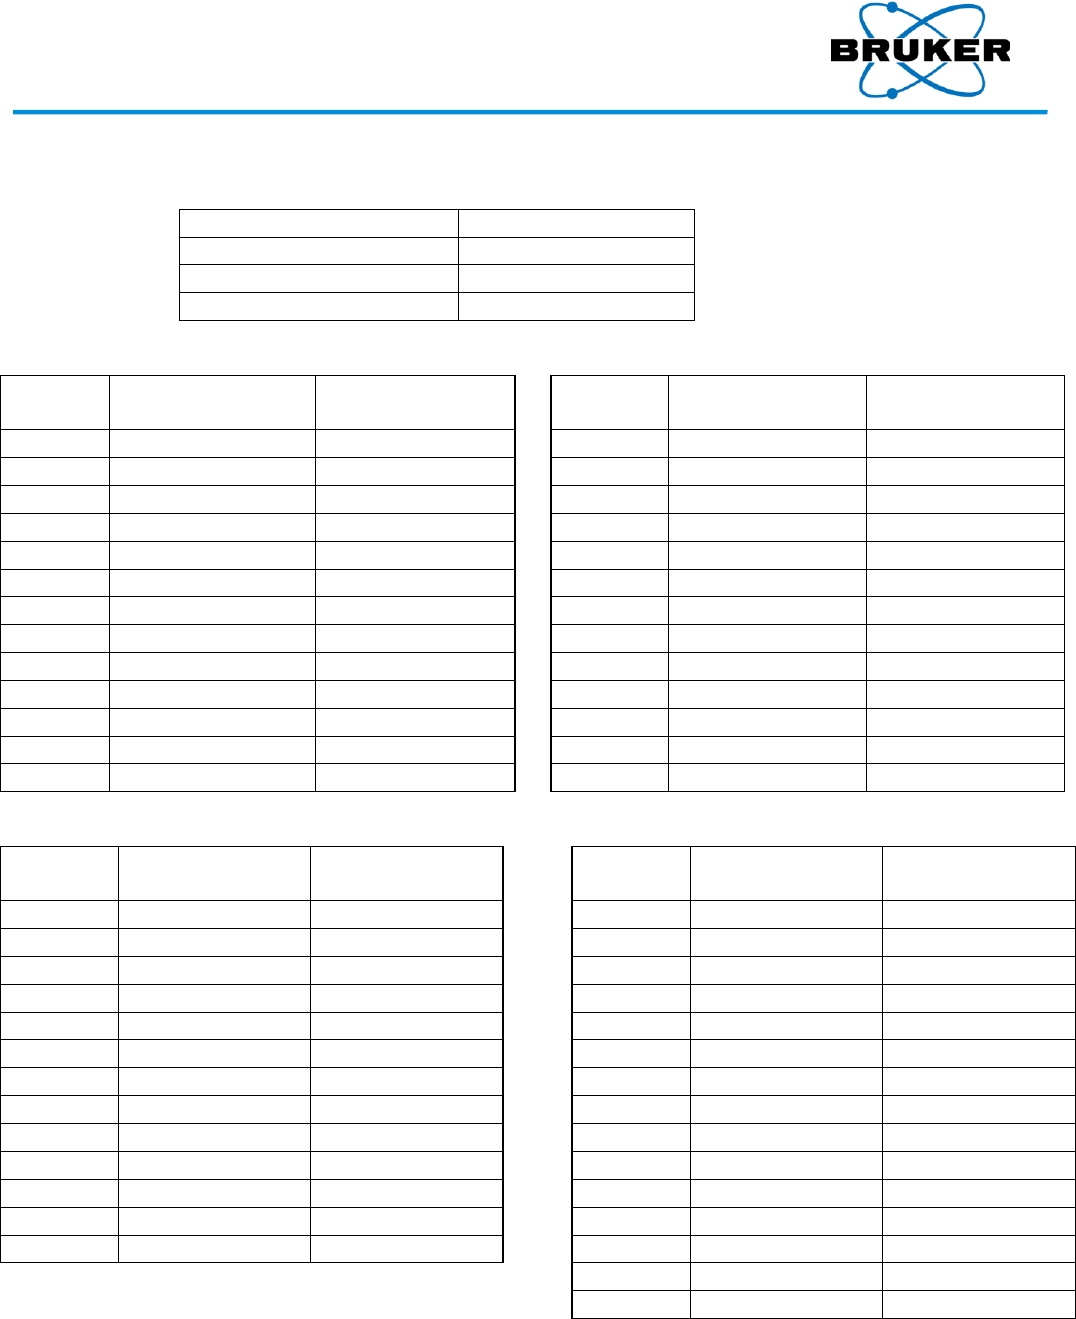
S1 TITAN and TRACER 5i User Manual
030.0112.01.0 57 of 58
Standard
setting 3
high voltage
Tests were performed with the following settings:
Setting Type
Value
Voltage (keV)
50
Current (μA)
9.7
Filter
Cu75,Ti25,Al200mm #3
At 5 cm
At 10 cm
Location
Open Beam
μrad(μSieverts)/hr
Duplex
μrad(μSieverts)/hr
Location
Open Beam
μrad(μSieverts)/hr
Duplex
μrad(μSieverts)/hr
A
288951.5(2889.51)
Background
A
3001.8(30.018)
Background
B
184.2(1.842)
Background
B
68.6(0.686)
Background
C
25.3(0.253)
Background
C
25.3(0.253)
Background
D
65.0(0.650)
Background
D
54.2(0.542)
Background
E
18.1(0.181)
Background
E
Background
Background
F
Background
Background
F
Background
18.1(0.181)
G
Background
Background
G
Background
Background
H
148.1(1.481)
43.3(0.433)
H
25.3(0.253)
18.1(0.181)
I
148.1(1.481)
104.8(1.048)
I
61.4(0.614)
79.5(0.795)
J
Background
Background
J
Background
18.1(0.181)
K
Background
Background
K
Background
18.1(0.181)
L
Background
Background
L
Background
18.1(0.181)
M
Background
Background
M
Background
18.1(0.181)
At 30 cm
At 100 cm
Location
Open Beam
μrad(μSieverts)/hr
Duplex
μrad(μSieverts)/hr
Location
Open Beam
μrad(μSieverts)/hr
Duplex
μrad(μSieverts)/hr
A
445.2(4.452)
Background
A
216.0(2.160)
Background
B
Background
Background
B
Background
Background
C
Background
Background
C
Background
Background
D
26.5(0.265)
Background
D
Background
Background
E
Background
Background
E
Background
Background
F
Background
Background
F
Background
Background
G
Background
Background
G
Background
Background
H
Background
Background
H
Background
Background
I
14.7(0.147)
Background
I
Background
Background
J
Background
Background
J
Background
Background
K
Background
Background
K
Background
Background
L
Background
Background
L
Background
Background
M
Background
Background
M
Background
Background
N
Background
Background
O
Background
Background
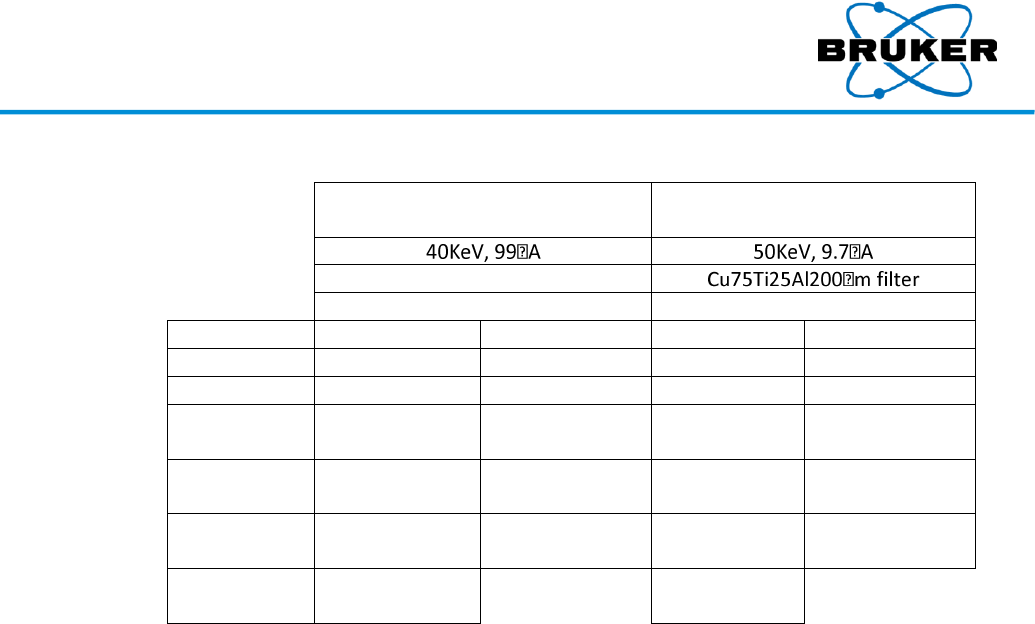
S1 TITAN and TRACER 5i User Manual
030.0112.01.0 58 of 58
Distance
vs. dose
Worst-Case 2
Highest Power
Standard Setting 3
High Voltage
Blank, No Filter
mRad/mSieverts
mRad/mSieverts
Distance (cm)
Open Beam
With Sample
Open Beam
With Sample
100
4057 / 40.571
Background
81 / 0.809
Background
30
28891 / 288.91
Background
766 / 7.665
Background
10
357618 /
3576.18
Background
6141 / 61.409
0.033 /
0.000325
5
395525 /
3955.25
0.054 /
0.000542
7947 / 79.471
0.033 /
0.000325
Surface
541677 /
5416.77
10031 /
100.31
Eye / Skin
Time to Limit
1.7 / 5.54
Minutes
92 / 299
Minutes