COSMED Srl K4B2R-USA TELEMETRY UNIT User Manual User man K4B2 en
COSMED Srl TELEMETRY UNIT User man K4B2 en
UserManual.wiki
>
COSMED Srl
>
K4B2R-USA User Manual
>
Users Manual II
Contents
1.
Users Manual I
2.
Users Manual II
3.
Users Manual III
4.
Users Manual IV
Users Manual II
Navigation menu
Upload a User Manual
Namespaces
Wiki Guide
HTML
PDF
Info
Views
User Manual
Discussion / Help
Navigation


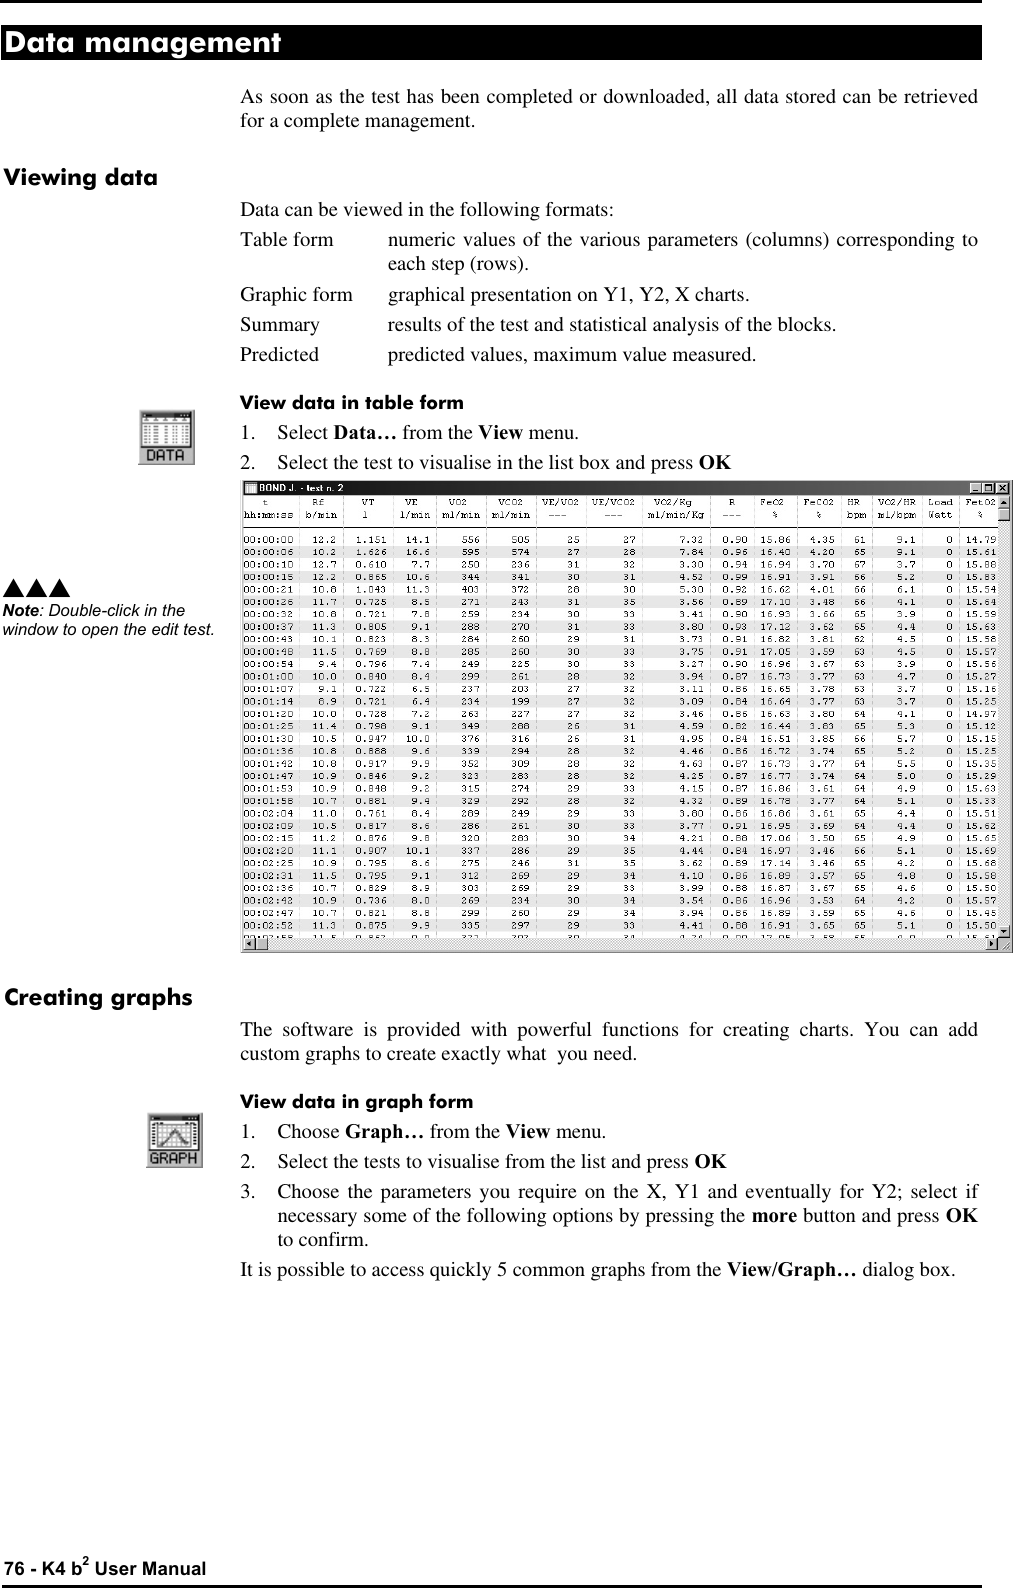
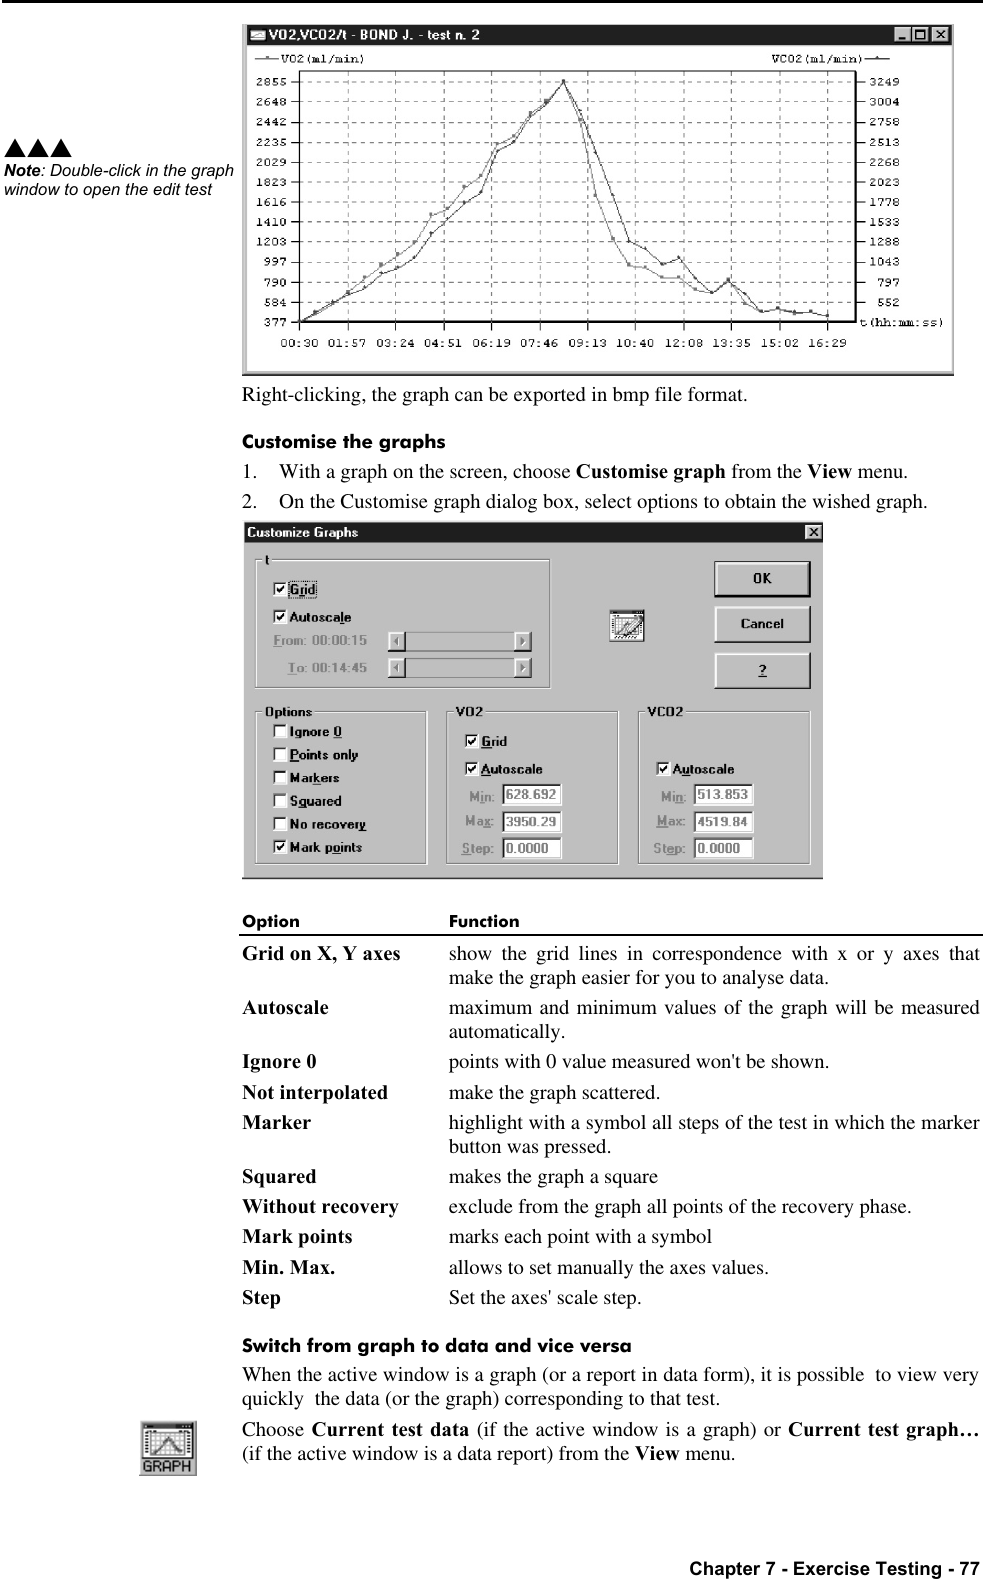
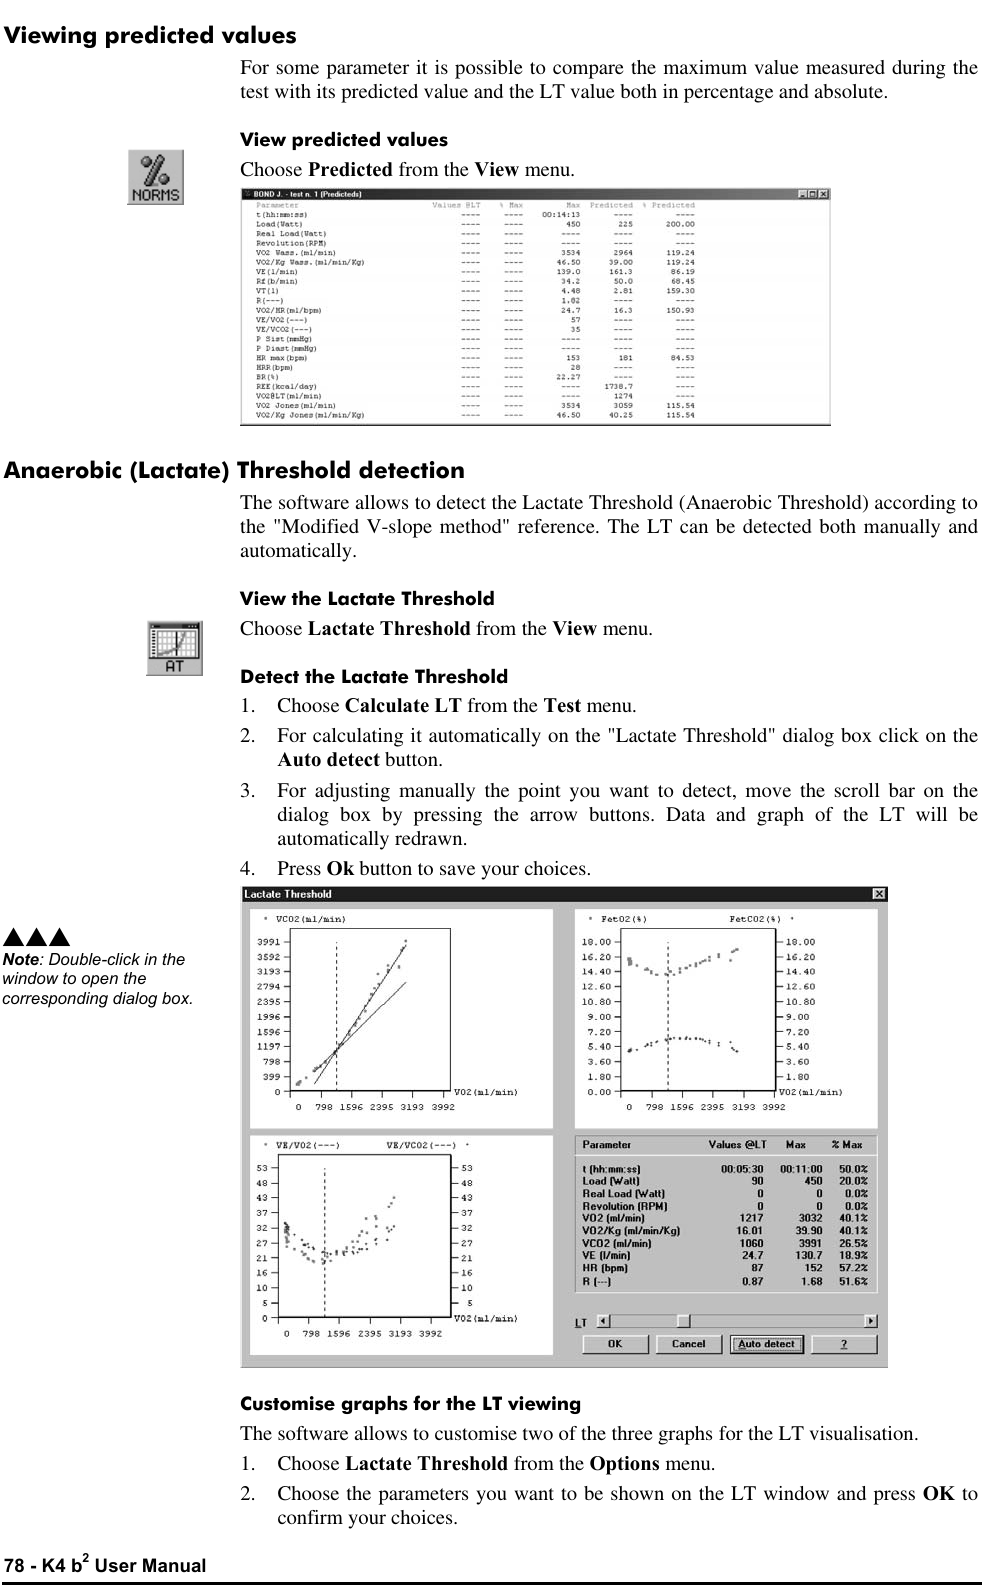
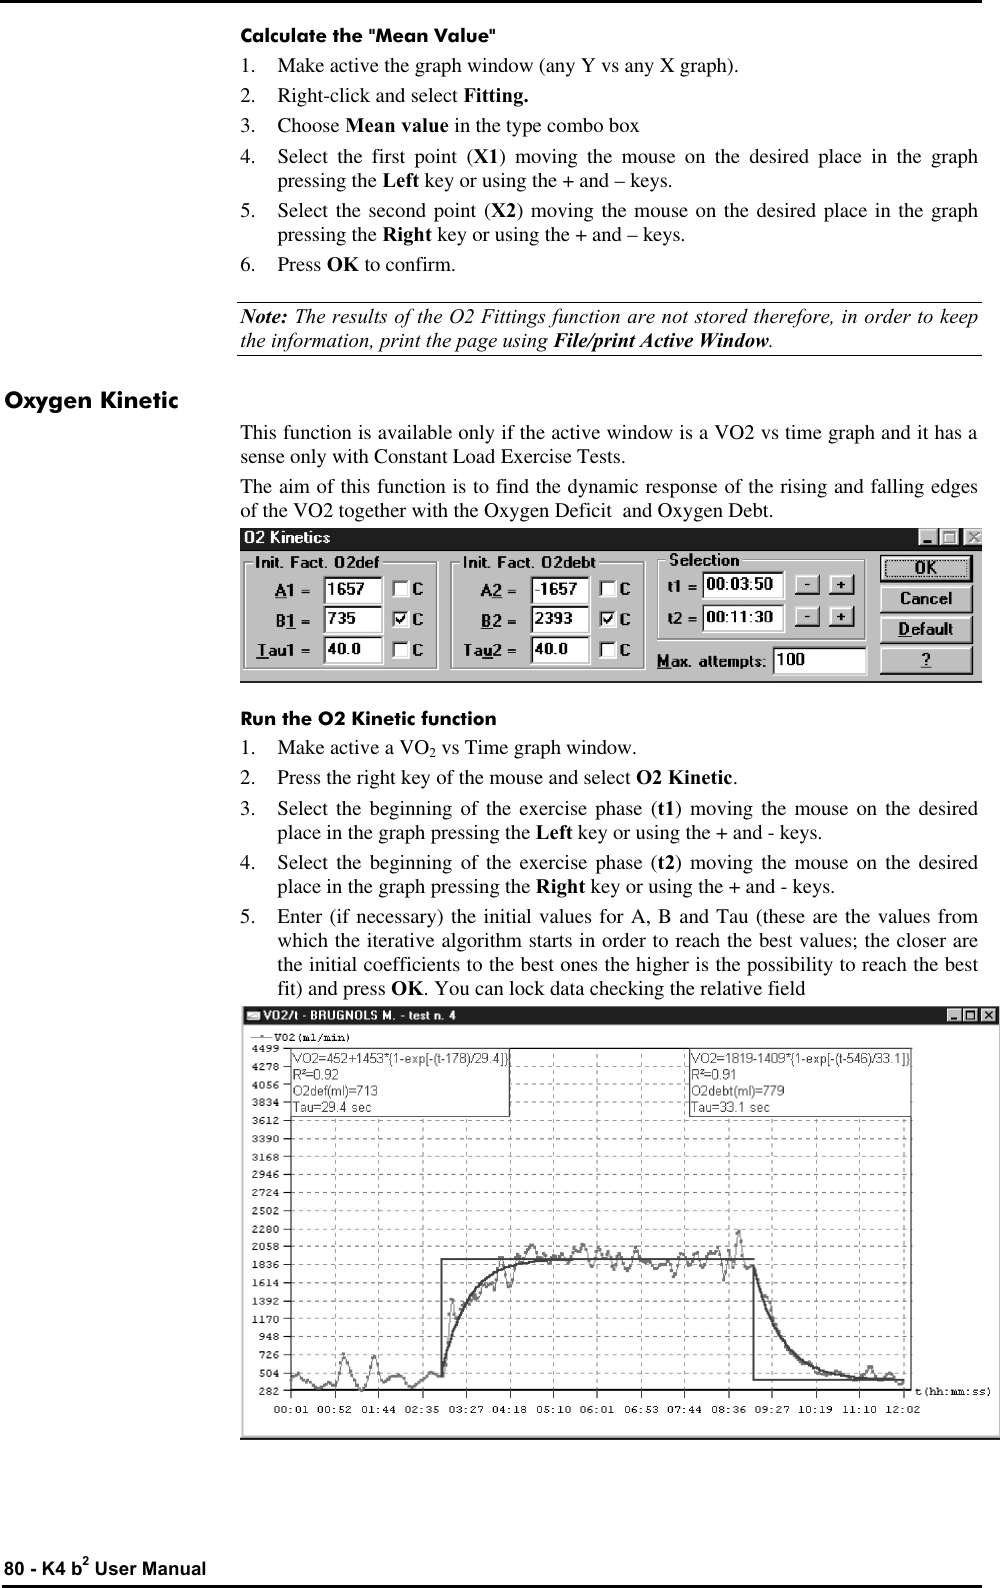
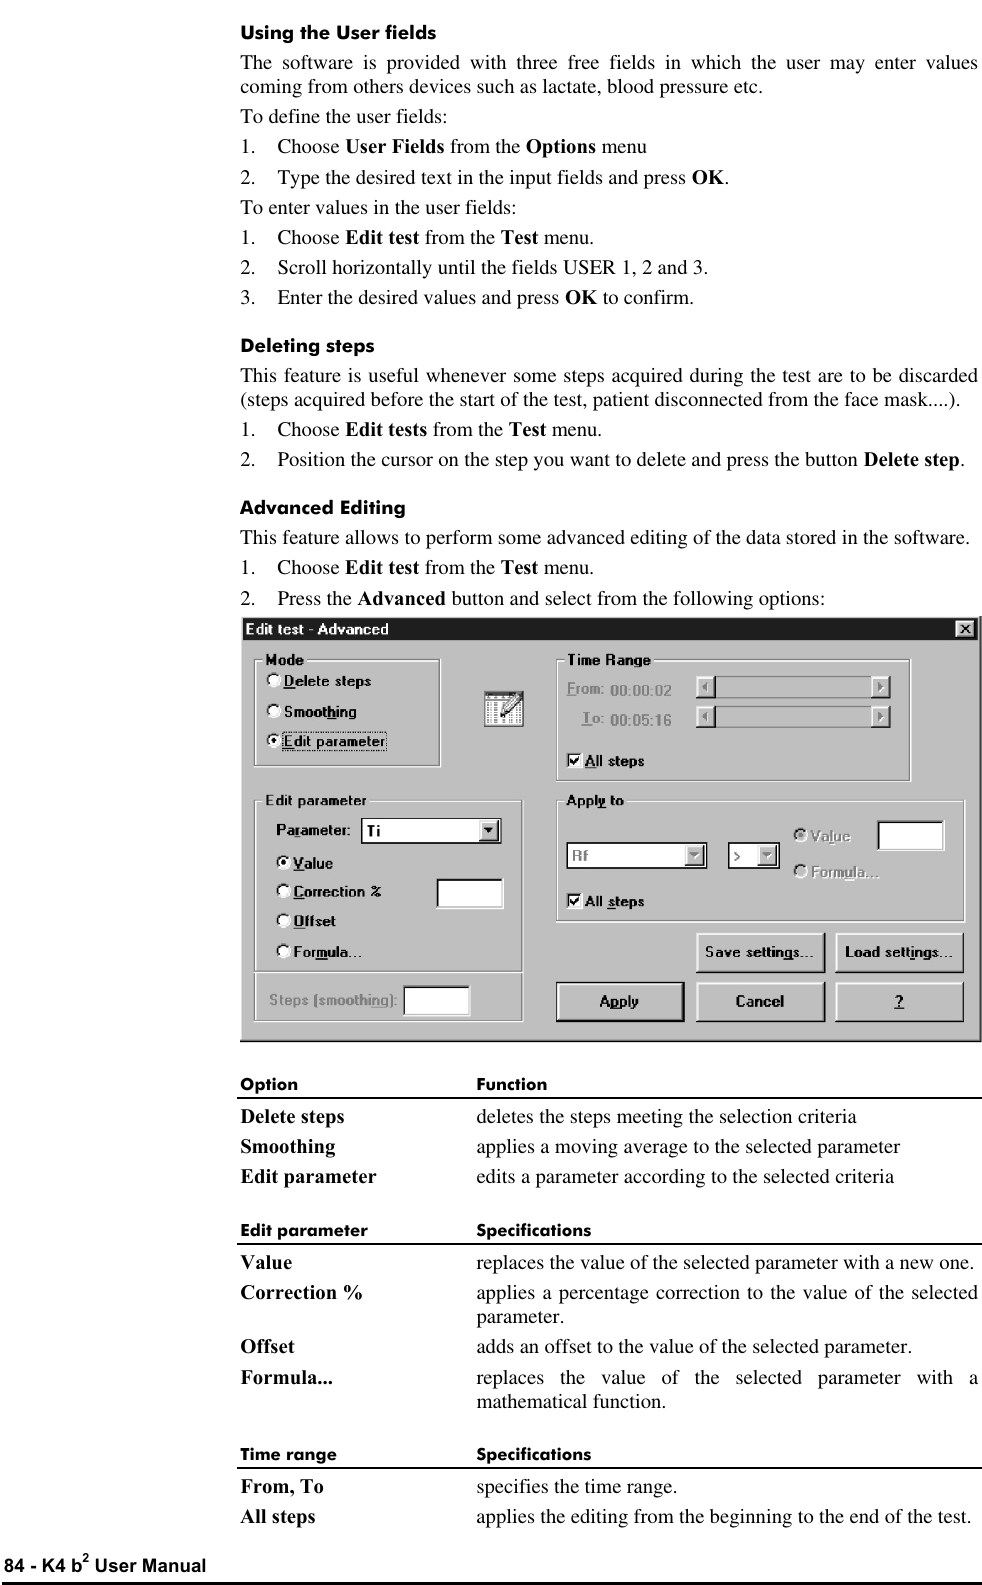
![Chapter 7 - Exercise Testing - 79 Fittings The purpose of the fitting function is to find the function that fits as better as possible the measured data. The software allows to fit data according to 3 different functions: Model Function Algorithm Available for Linear Y=A*X+B Least squares Any Y vs any X graph Mono-Exp Y=A+B*exp[(t-t0)/tau] Levemberg Marquardt Any Y vs Time Graph Mean value This function is available only if the active window is a single Y graph (i.e. VO2 vs time or VO2 vs Load). Fit a graph with a linear regression 1. Make active the graph window (any Y vs any X graph). 2. Right-click and select Fitting. 3. Choose Linear in the type combo box 4. Select the first point (X1) moving the mouse on the desired place in the graph pressing the Left key or using the + and – keys. 5. Select the second point (X2) moving the mouse on the desired place in the graph pressing the Right key or using the + and – keys. 6. Press OK to confirm. Fit a graph with a Mono-exponential regression 1. Make active the graph window (any Y vs any X graph). 2. Right-click and select Fitting. 3. Choose Mono-exponential in the type combo box 4. Select the first point (X1) moving the mouse on the desired place in the graph pressing the Left key or using the + and – keys. 5. Select the second point (X2) moving the mouse on the desired place in the graph pressing the Right key or using the + and – keys. 6. Enter (if necessary) the initial values of A, B and TAU (these are the values from which the iterative algorithm starts in order to reach the best values; the closer are the initial coefficients to the best ones the higher is the possibility to reach the best fit). 7. Press OK to confirm.](https://usermanual.wiki/COSMED-Srl/K4B2R-USA.Users-Manual-II/User-Guide-569366-Page-12.png)