Draeger Medical Systems MS18623 Telemetry Transceiver TeleSmart M300 User Manual TSC f80 en TUVdraft
Draeger Medical, Inc. Telemetry Transceiver TeleSmart M300 TSC f80 en TUVdraft
Contents
- 1. User Manual 1
- 2. User Manual 2
- 3. User Manual 3
- 4. User Manual 4
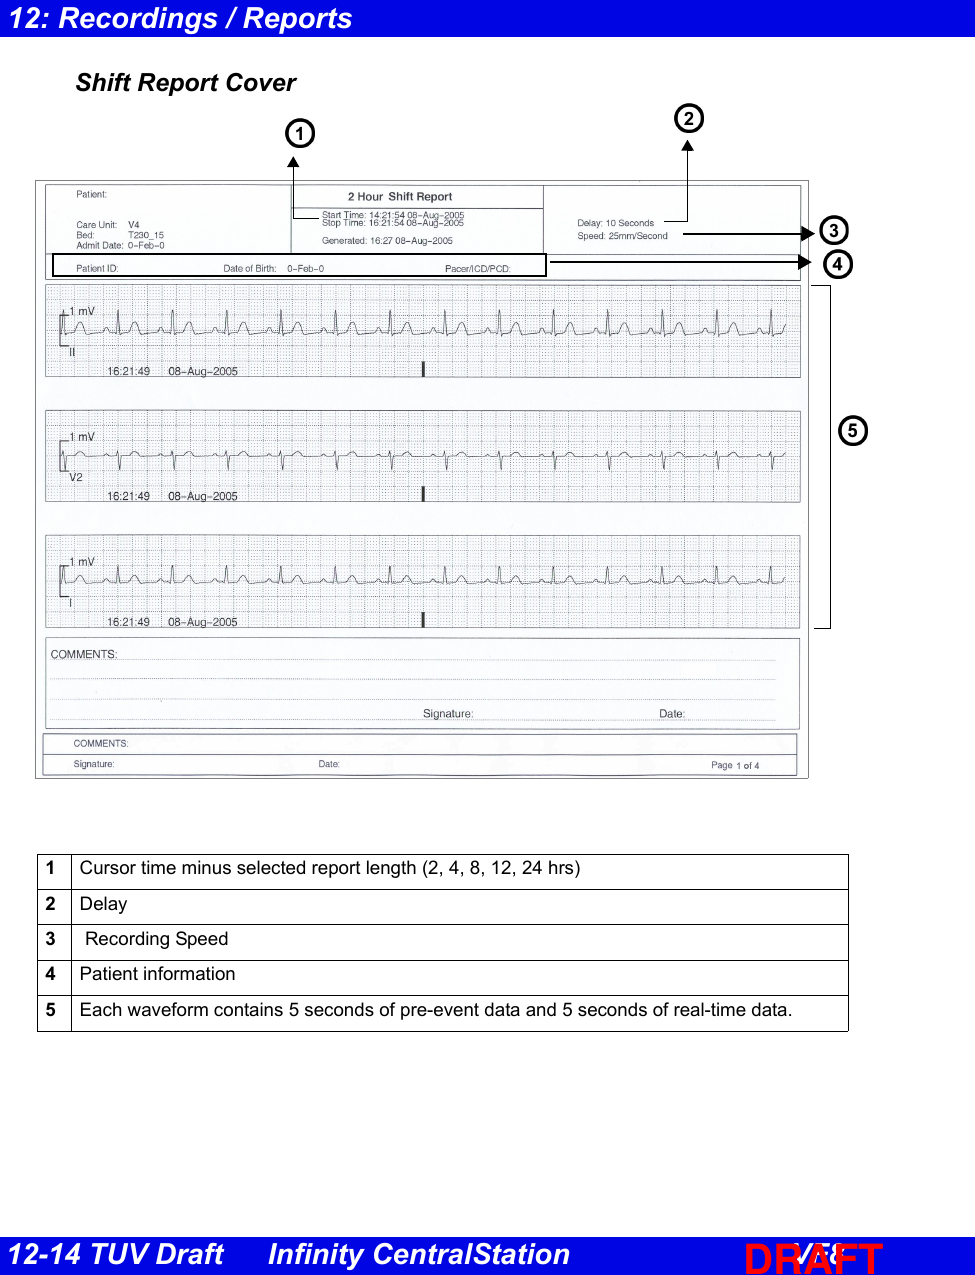
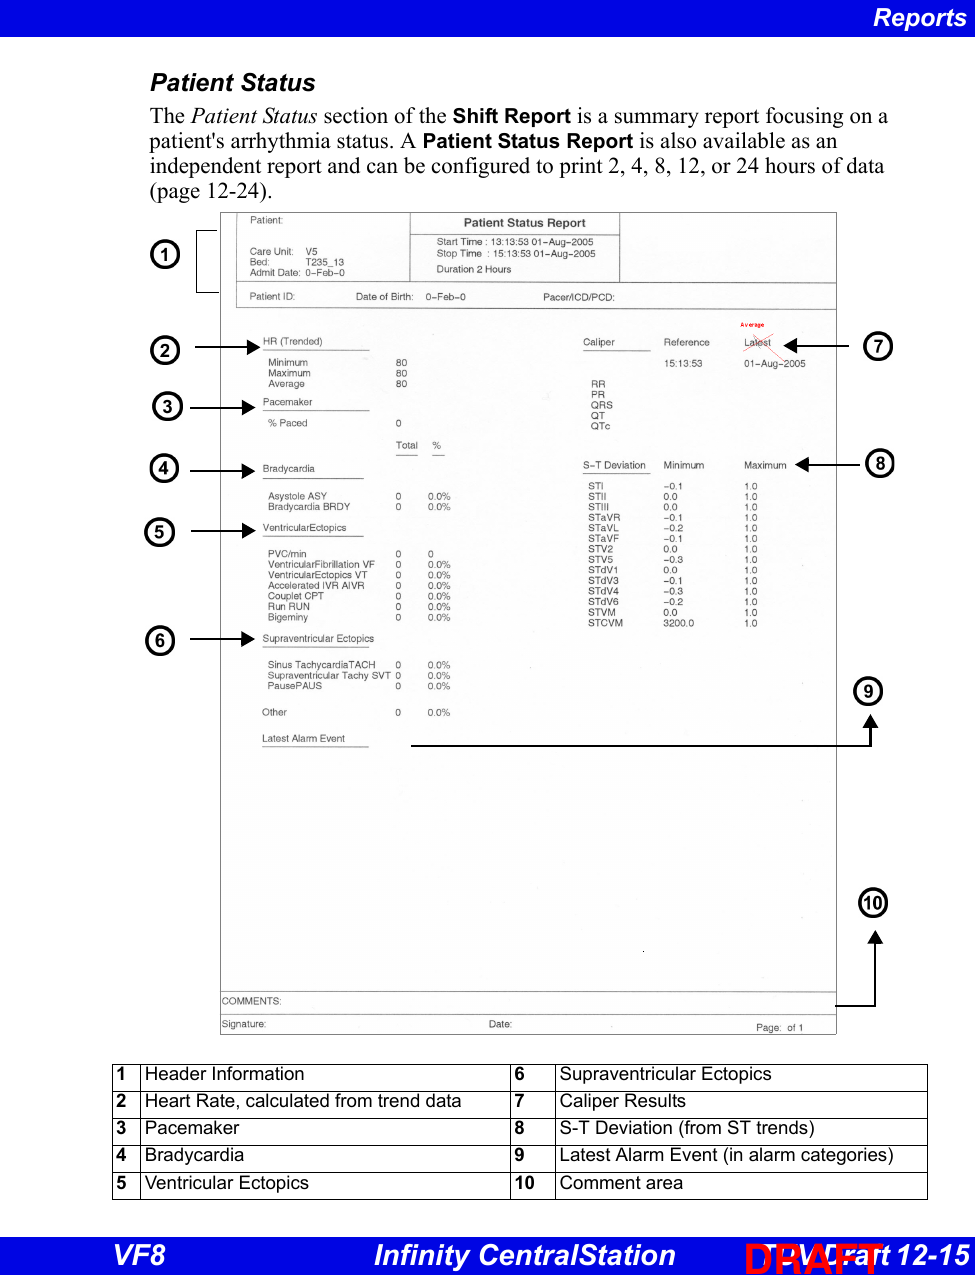
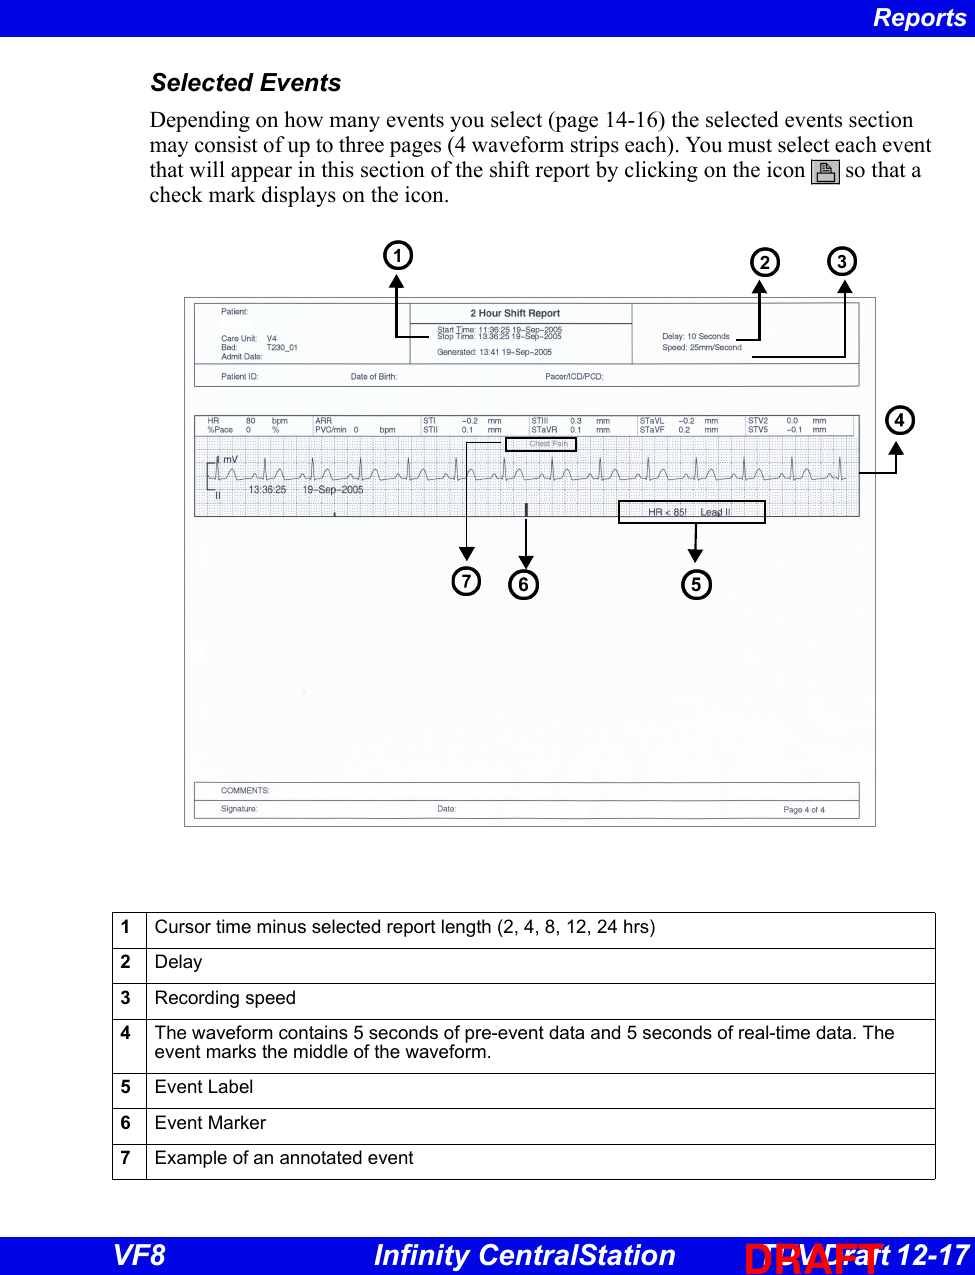
User Manual 3