Draeger Medical Systems MS18623 Telemetry Transceiver TeleSmart M300 User Manual TSC f80 en TUVdraft
Draeger Medical, Inc. Telemetry Transceiver TeleSmart M300 TSC f80 en TUVdraft
Contents
- 1. User Manual 1
- 2. User Manual 2
- 3. User Manual 3
- 4. User Manual 4
User Manual 3
12-14 TUV Draft Infinity CentralStation VF8
12: Recordings / Reports
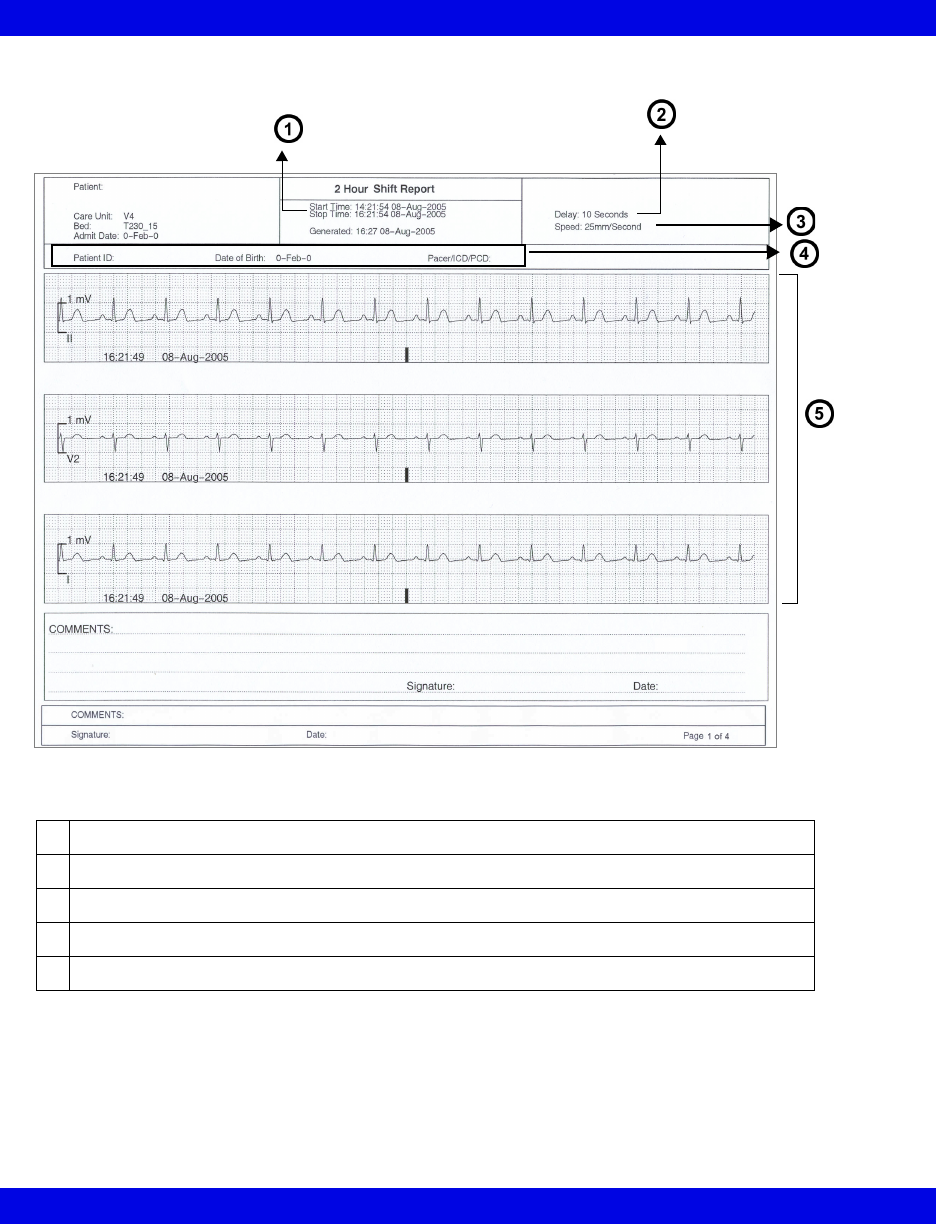
Shift Report Cover
1Cursor time minus selected report length (2, 4, 8, 12, 24 hrs)
2Delay
3 Recording Speed
4Patient information
5Each waveform contains 5 seconds of pre-event data and 5 seconds of real-time data.
DRAFT
Reports
VF8 Infinity CentralStation TUV Draft 12-15
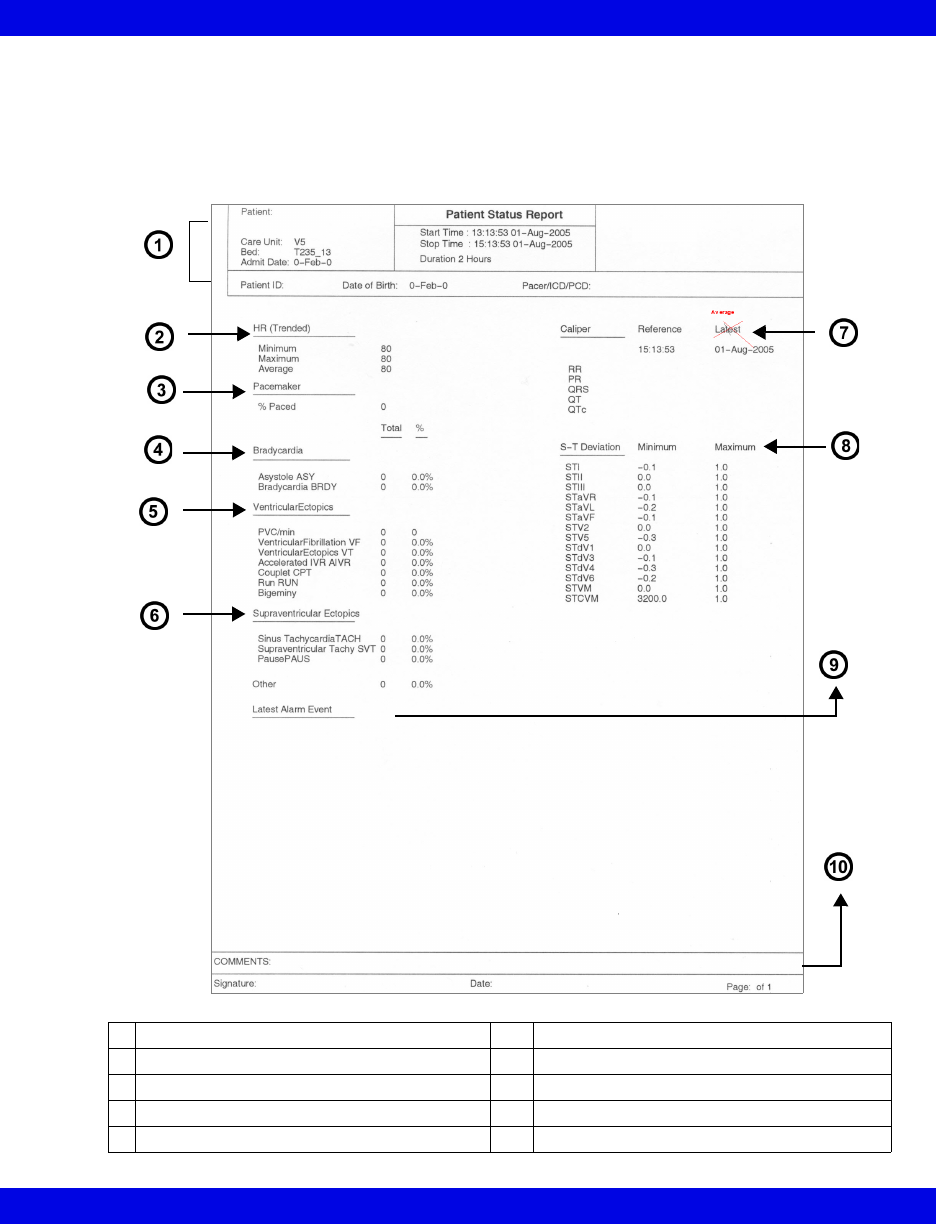
Patient Status
The Patient Status section of the Shift Report is a summary report focusing on a
patient's arrhythmia status. A Patient Status Report is also available as an
independent report and can be configured to print 2, 4, 8, 12, or 24 hours of data
(page 12-24).
1Header Information 6Supraventricular Ectopics
2Heart Rate, calculated from trend data 7Caliper Results
3Pacemaker 8S-T Deviation (from ST trends)
4Bradycardia 9Latest Alarm Event (in alarm categories)
5Ventricular Ectopics 10 Comment area
DRAFT
12-16 TUV Draft Infinity CentralStation VF8
12: Recordings / Reports
Graphical Trends
In the Graphical Trends section of the Shift Report each parameter trend is plotted
according to type.
This section resembles the full version Graphical Trend Report in appearance and
content (page 12-18) but is numbered and labeled as part of the Shift Report.
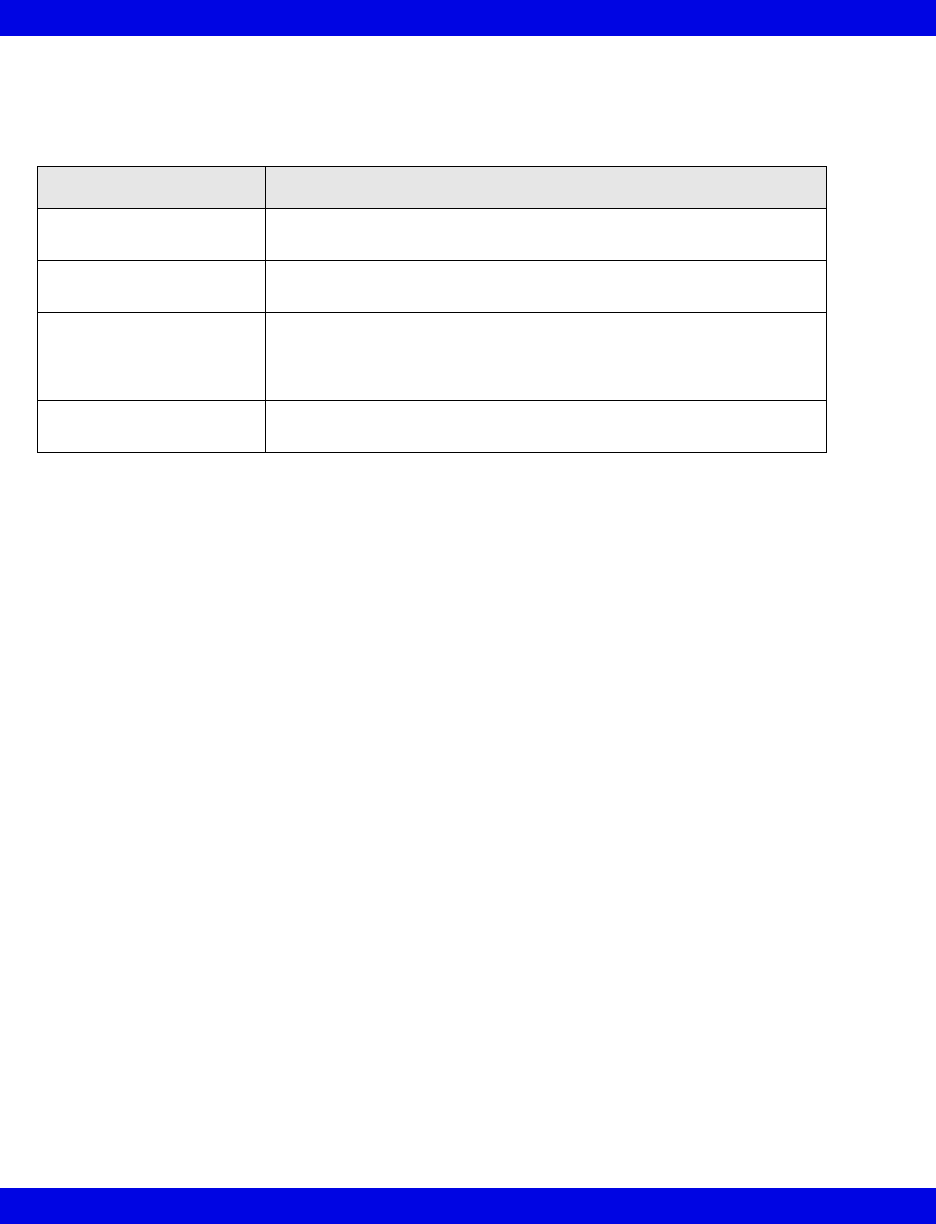
Parameter Type Appearance on Trend Graph
Single-value,
continuous such as HR
Single, continuous line
Single-value,
intermittent such as C.O.
Cross-hairs representing each value
Multi-value,
continuous such as ART
Lines with a dotted line in the center indicating the mean value
e.g., The top and bottom line can represent systolic and diastolic
values.
Multi-value,
intermittent such as NBP
Vertical line with a blank space in the center indicating the mean
value
DRAFT
Reports
VF8 Infinity CentralStation TUV Draft 12-17
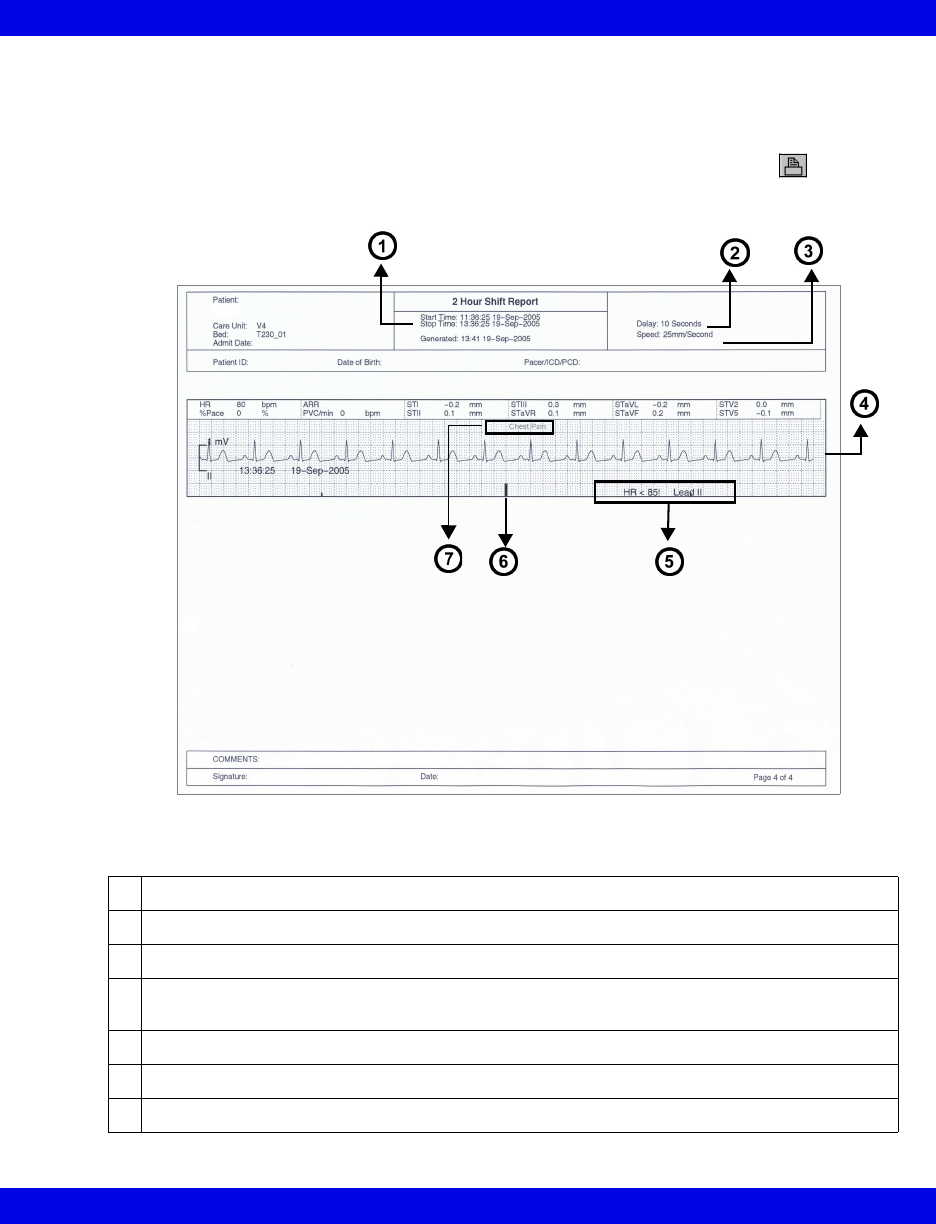
Selected Events
Depending on how many events you select (page 14-16) the selected events section
may consist of up to three pages (4 waveform strips each). You must select each event
that will appear in this section of the shift report by clicking on the icon so that a
check mark displays on the icon.
1Cursor time minus selected report length (2, 4, 8, 12, 24 hrs)
2Delay
3Recording speed
4The waveform contains 5 seconds of pre-event data and 5 seconds of real-time data. The
event marks the middle of the waveform.
5Event Label
6Event Marker
7Example of an annotated event
DRAFT
12-18 TUV Draft Infinity CentralStation VF8
12: Recordings / Reports
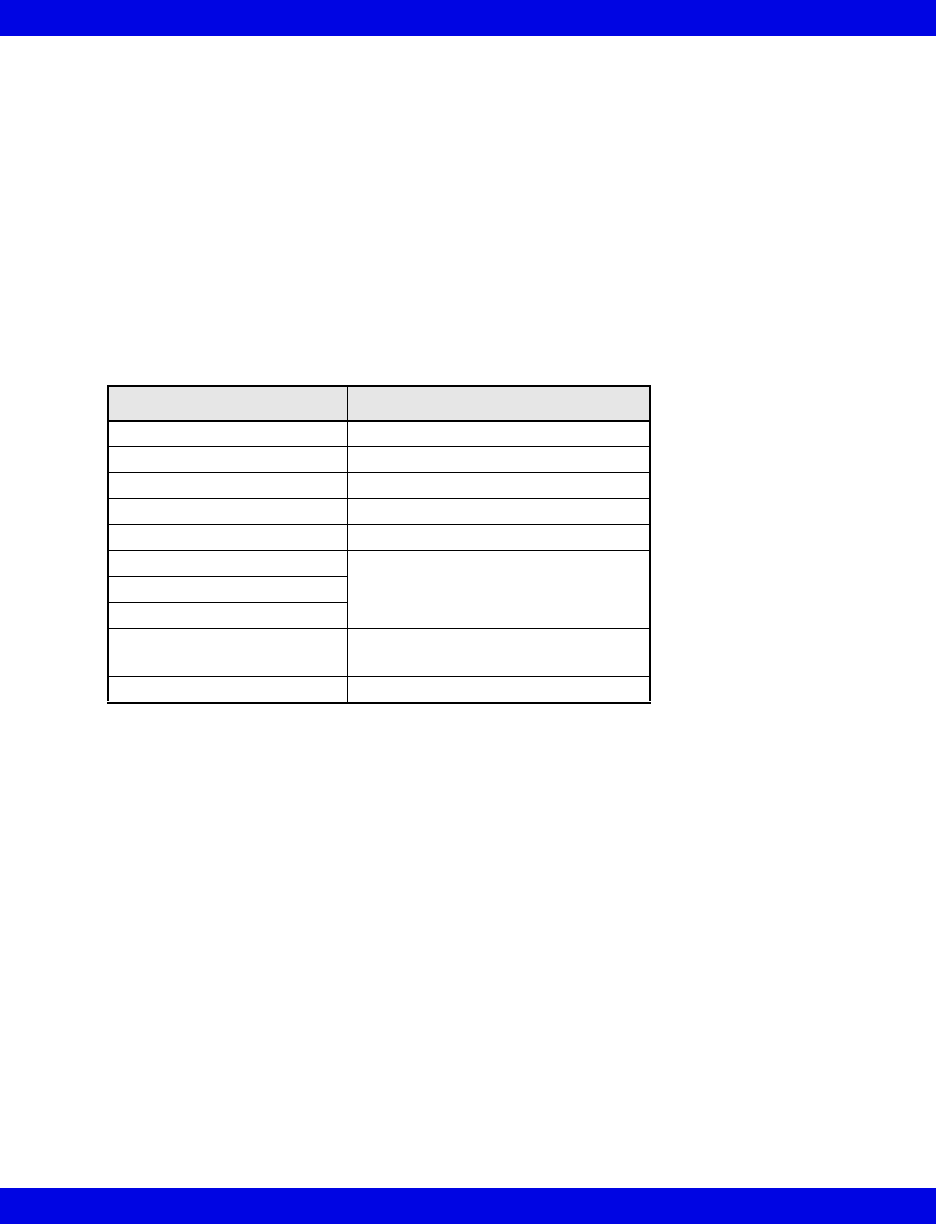
Graphical Trend Report
The Graphical Trend Report is a multi-parameter report containing up to 15 trended
parameters from bedside or telemetry patients. The report can be configured to print 2,
4, 8, 12, or 24 hours of Full or Event Disclosure data. The cursor time represents the
report ‘stop time’; the report ‘start time’ equals ‘stop time’ minus the report length.
You can customize the trend selection per patient (page 12-25) or at system setup
(page 3-4). The trend scale can be a fixed scale or have autoscale values. When you
select Enable Autoscale (page 12-25) in the Trend Order Setup screen, the low and
high scale values are determined by an autoscale factor to the highest and lowest
parameter value over the currently selected trend time. To request a Graphical Trend
Report, see page 12-23.
Selected Strip Report
The Selected Strip Report allows the user to select a waveform of interest within
Full Disclosure and define beginning and ending cursor times (not to exceed one
hour). The report can contain 8 seconds to 1 hour of information (8 second default)
with 8 seconds of waveform data per row. To request this report, see page 12-24.
Selected Events Report
The Selected Events Report may consist of up to six pages (4 event strips per page).
You can select and print the most recent 24 events. Each waveform contains 10
seconds of data, and is annotated with Lead Printed, Lead Processed, Event Cause, 12
of the most recent parameter values, Event End Time, and Event Date. If the lead
processed is stored in the Infinity CentralStation database, it will be printed on the
report. If not, the top lead of the displayed Full Disclosure data will appear.To request
this report, see page 12-24.
Parameter Autoscale Factor (approximate)
HR 10 bpm
PVC/min 10
% Paced 10%
SpO2 10%
PLS 10
ST 1.0 mm
0.10 mV
STVM
STCVM
Pressures (including NBP) 10 mmHg
1 kPa
All others 10
DRAFT