Electronic Controls Design E51-0386-40 Super MOLE® Gold 2 User Manual ECD M O L E MAP Users Help System 3 0 6
Electronic Controls Design Inc Super MOLE® Gold 2 ECD M O L E MAP Users Help System 3 0 6
Contents
- 1. User Manual part 1 of 3
- 2. User Manual part 2 of 3
- 3. User Manual part 3 of 3
User Manual part 3 of 3
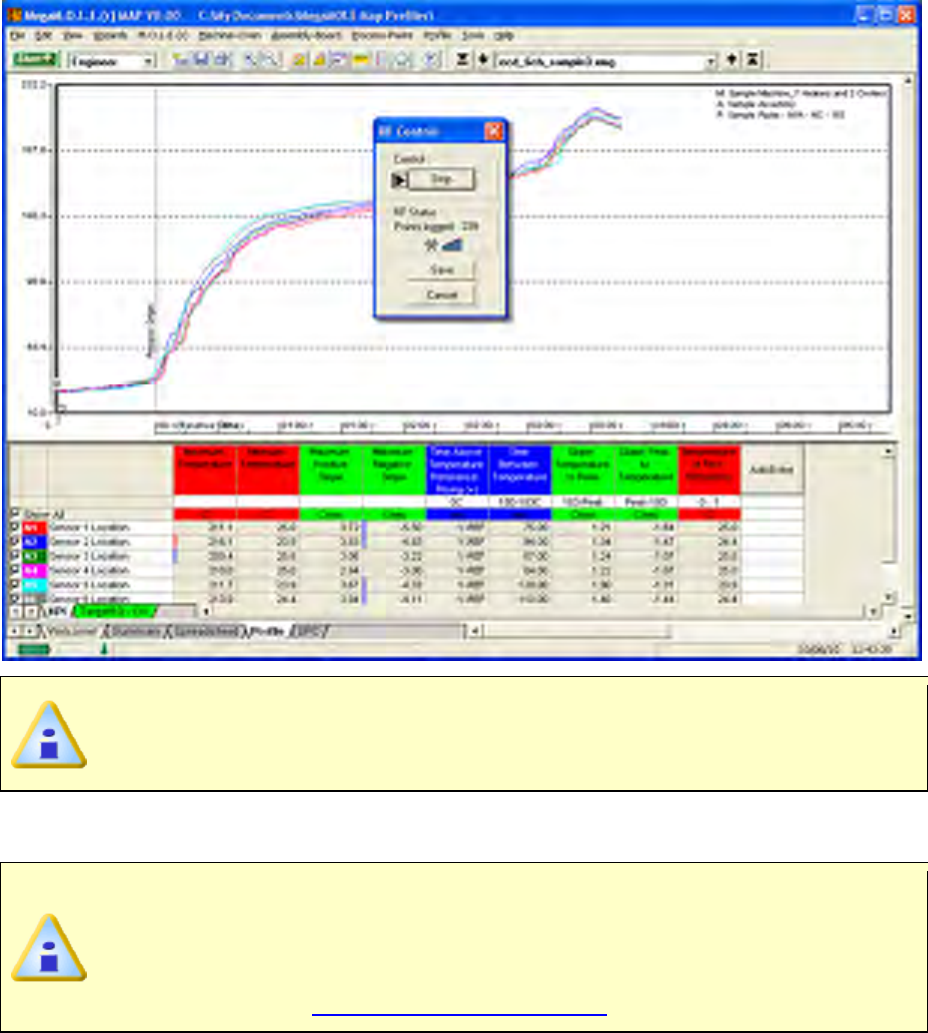
• Internal Temp: Indicates the current internal temperature of the M.O.L.E.
Profiler.
• RF Status: Signal strength indicator with 5 bars indicating relative strength of
the RF signal.
Save:
• Stops the M.O.L.E. Profiler logging real-time data and allows the user to save
that data. If there is not enough data recorded, the software displays a “Not
enough data to profile” message, and it will cancel the data run.
When real-time data is logging using the MEGAM.O.L.E.® or SuperM.O.L.E.®
Gold 2 Profiler, some of the transmitted data may not get logged on the Data
Graph. While transmitting the real-time data the M.O.L.E. Profiler also records
the data run. The software prompts the user to either decide to connect the
M.O.L.E. Profiler to the computer and replace the real-time data with the data
run stored in the M.O.L.E. Profiler, or retain the real-time data and have the
software substitute the gaps with a straight line between missing points.
Cancel:
• Stops the M.O.L.E. Profiler logging real-time data discarding any recorded
real-time RF data.
When real-time data logging has stopped, the software automatically
processes the data. Depending on how long the data run is, it may take a few
moments to complete.
7) Click the Save command to save the data run. The software prompts the user to
specify a file name (*.XMG).
When saving a data run (*.XMG) to a different file directory other than the
current Working directory, the software automatically sets the new file
directory as the current Working Directory. This process does not delete any
data run files in the previously set Working directory and can be quickly
accessed using the Recent Working Directory command on the File menu.
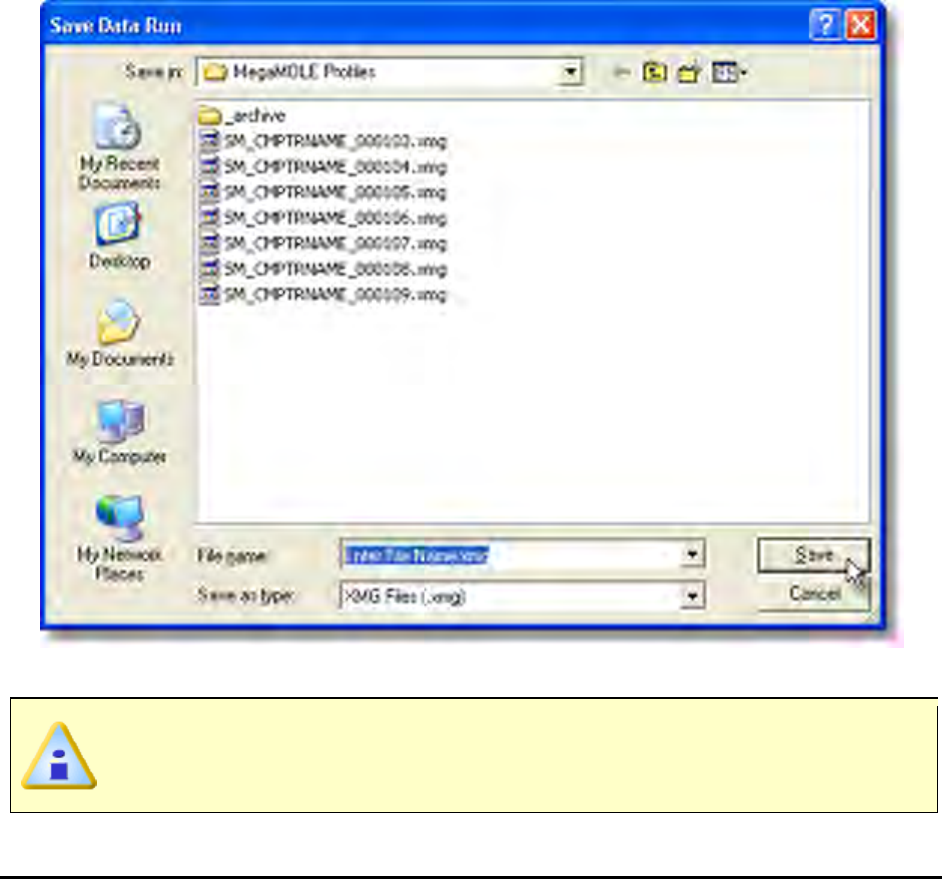
8) When finished, click the Save command button to complete the process.
When using the PTP® VP-8, the PTP® TX power must be turned OFF after
saving the data run by removing the On/Off Male Plug connector from the
Female On/Off Power connector.
Wireless RF communication tips (MEGAM.O.L.E.® & SuperM.O.L.E.® Gold 2):
RF signals come and go as either the M.O.L.E. Profiler moves through the oven or the
Transceiver is moved around like FM radio static as you drive in your car. Moving a few
inches in any direction can turn a low signal strength to high signal strength. This gets
worse as the Transceiver gets further from the M.O.L.E. Profiler, to a point where no
position works.
When setting up the Wireless RF system, the transceiver should be placed as close to
the machine as practical. A standard USB extension cable can be used to move the
Transceiver closer to the machine or up and away from metal or other interference
objects.
Typically if the Transceiver is 3 meters [10 feet] away from the M.O.L.E. Profiler in a
machine any location in the room, reception should be fine. Reception is also often a bit
better when the Transceiver is perpendicular to the direction of travel through the
machine. Metal objects such as carts, walls, or other equipment in the room will impede
transmission.
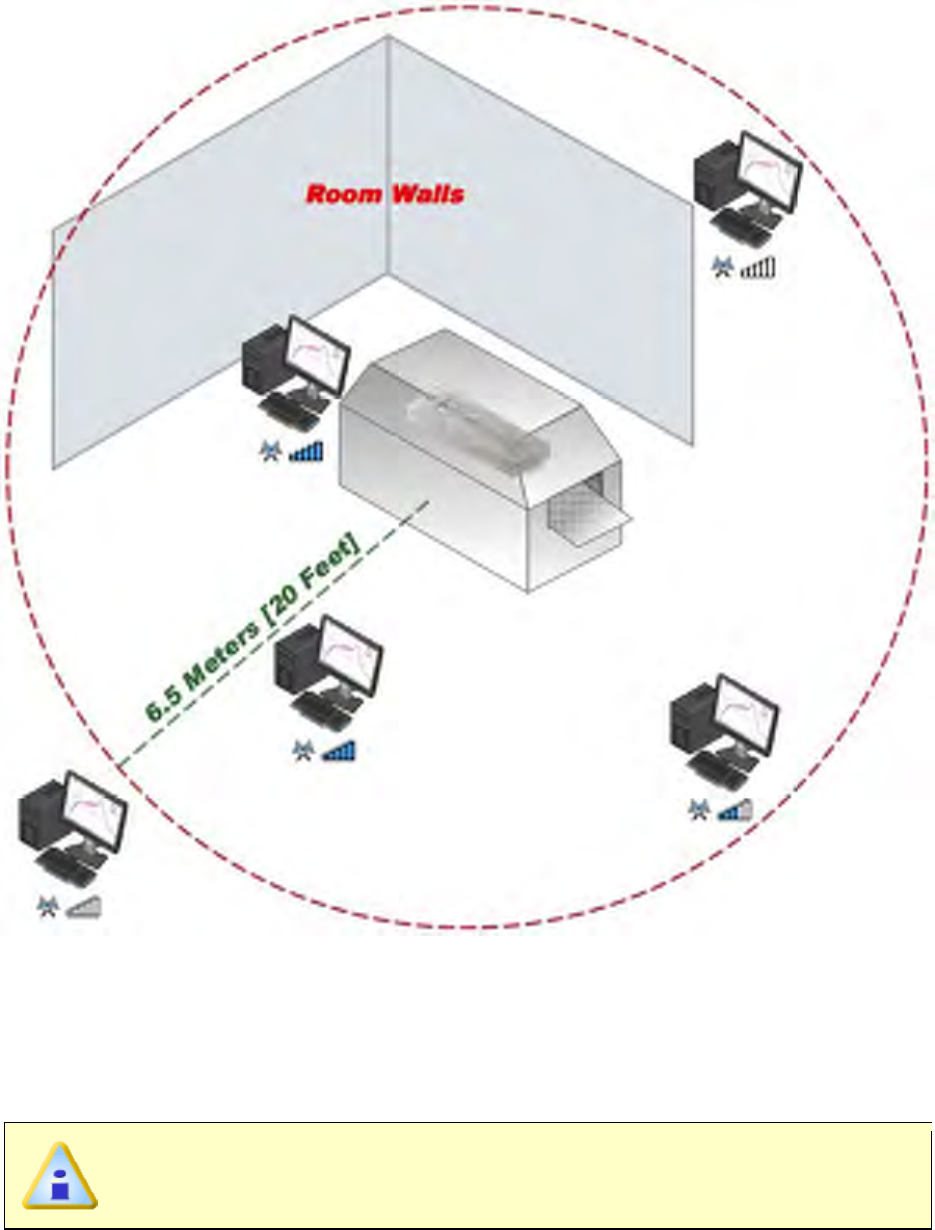
The transmitting Antenna and its proximity to metal can have a big affect. Care should be
taken to make sure the Antenna is not laying on metal parts in the machine or barrier box.
Keeping the Antenna straight is best.
Wireless RF Range
5.5.5.4. Set Recording Parameters
The Set Recording Parameters command configures how the M.O.L.E. profiler records
data during a data run.
This is available when in Engineer Mode.
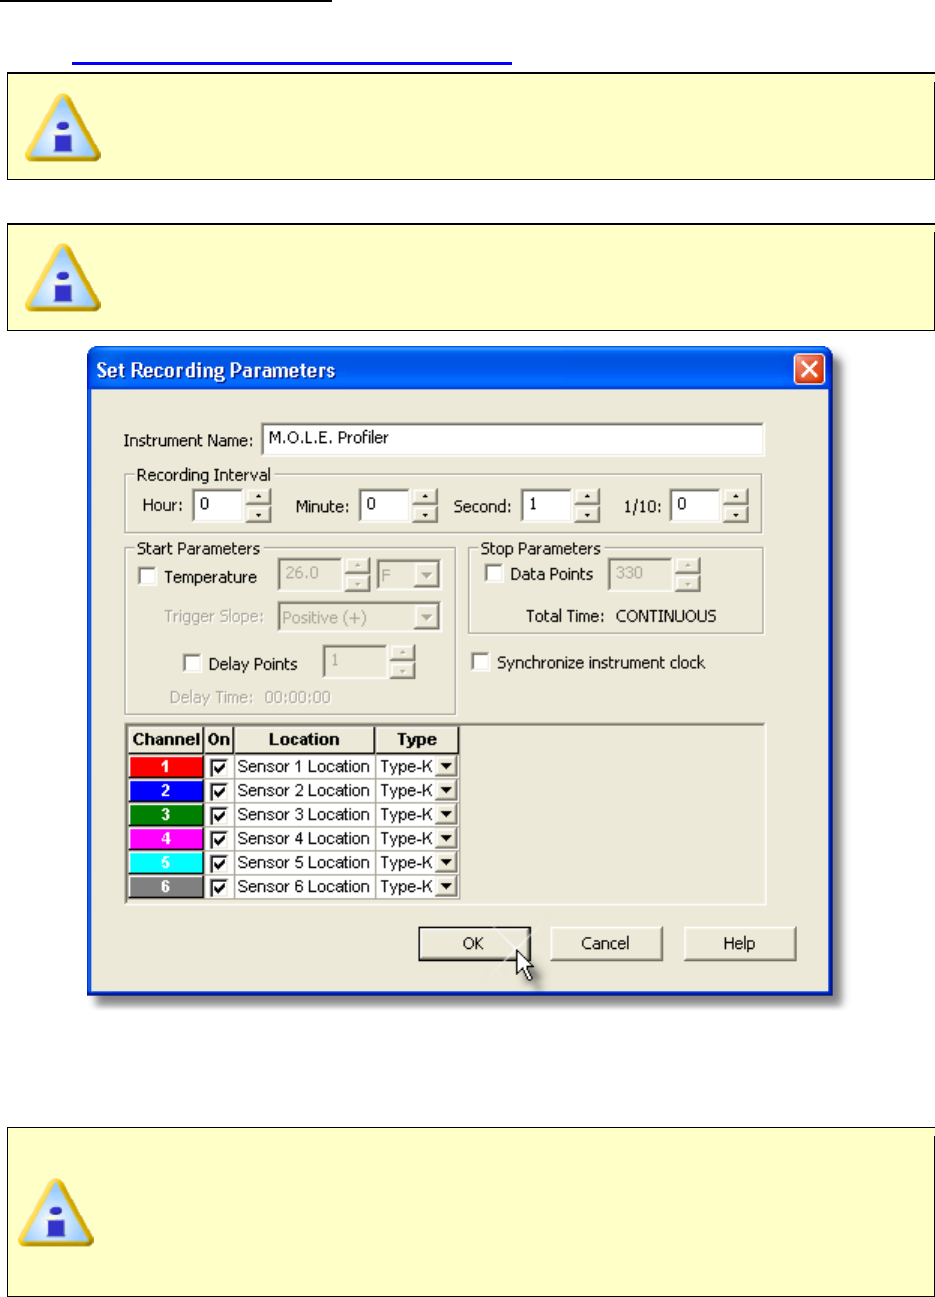
To set recording parameters:
1) Connect the M.O.L.E. Profiler to the computer. Refer to
Basics>Setup>Communications Setup for more information.
If an instrument is not currently connected to the computer, the default
Demonstration MEGAM.O.L.E.® profiler will be displayed.
2) On the M.O.L.E. menu, click Set Recording Parameters.
The Start and Stop Parameters are optional settings and do not require
configuration.
3) In the Instrument Name text box, type a company, operator, or M.O.L.E. Profiler
name.
4) Enter the Recording interval at which the M.O.L.E. profiler records data points.
The maximum interval for a SuperM.O.L.E.® Gold Profiler is 24 hours (one
data point per day) and the minimum interval is 0.3 second (one data point
every three-tenths of a second). When using a SuperM.O.L.E.® Gold Profiler
with the RF Option the minimum interval is 0.5 (one data point every
five-tenths of a second).
5) If desired, configure a Start Parameter such as a threshold temperature or Delay
Points by selecting the associated check box and entering the proper values.
Specifying a threshold temperature “triggers” the recording process when any
active channel reaches the specified temperature and Data Points “trigger” the
M.O.L.E. profiler to start recording when the specified data point is reached in
the process. The actual delay is equal to the Interval times the Pts Dly.
6) If desired, configure a Stop Parameter by selecting the associated check box and
entering the proper value. This parameter is a number of data points the M.O.L.E.
profiler will record during the data run. The maximum number is dependent on the
number of channels turned on. The maximum points the M.O.L.E. Profiler can log
at any recording interval is 5460.
If a no stop parameter is specified, the M.O.L.E. Profiler will log continuously
and will require the user to manually stop the recording process.
7) Configure sensor information by turning the amount of channels ON or OFF, set
the sensor location description and sensor type.
8) Click the OK command button to send the data to the instrument or Cancel to quit
the command.
If the currently selected M.O.L.E. Profiler is a SuperM.O.L.E. Gold, the
sending of data will erase the data currently stored in the M.O.L.E. Profiler.
5.5.5.5. Setup Instrument
This Wizard guides the user through a typical process on how to set a M.O.L.E. Profiler up
for performing a data run.
This is available when in Engineer Mode.
To set an instrument up:
1) Connect the M.O.L.E. Profiler to the computer. Refer to
Basics>Setup>Communications Setup for more information.
2) On the M.O.L.E. menu, click Setup Instrument and the workflow wizard appears.
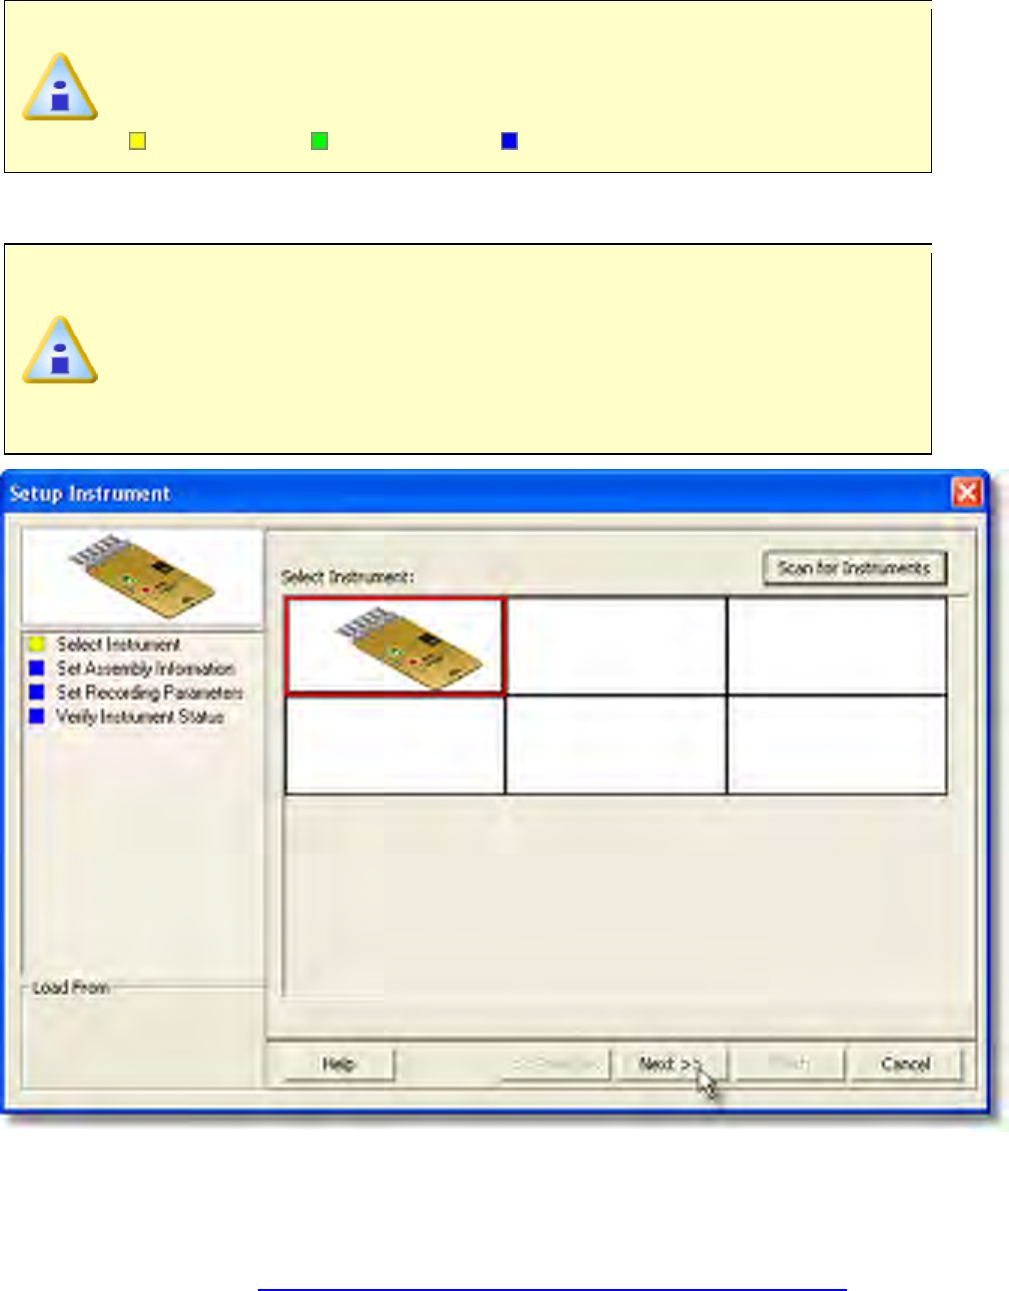
When navigating through the wizard, the step list on the left uses a color key
to inform the user of the current step, steps that have been completed and
remaining steps.
Current Completed Remaining
3) Select the desired instrument from the dialog box. If there is none displayed, select
the Scan for Instruments command button to detect all connected instruments.
If the software does not detect a M.O.L.E. Profiler, using the communication
cable connect it to the computer and click the Scan for Instruments
command button to search again. M.O.L.E.® MAP software allows multiple
instruments to be connected to a computer at one time. Selecting the Scan for
Instruments command button will detect all instruments and display them in
the dialog box. If no instrument is detected the software displays all of the
Demonstration thermal profilers to select from.
4) Select the Next command button.
7) Set Recording Parameters such as the instrument name, recording interval, start
parameters and stop parameters. This step is where the user can also turn a
sensor channel ON or OFF, set the sensor location description and sensor type.
Refer to section Software>Menus>MOLE>Set Recording Parametersfor
detailed information for each setting.
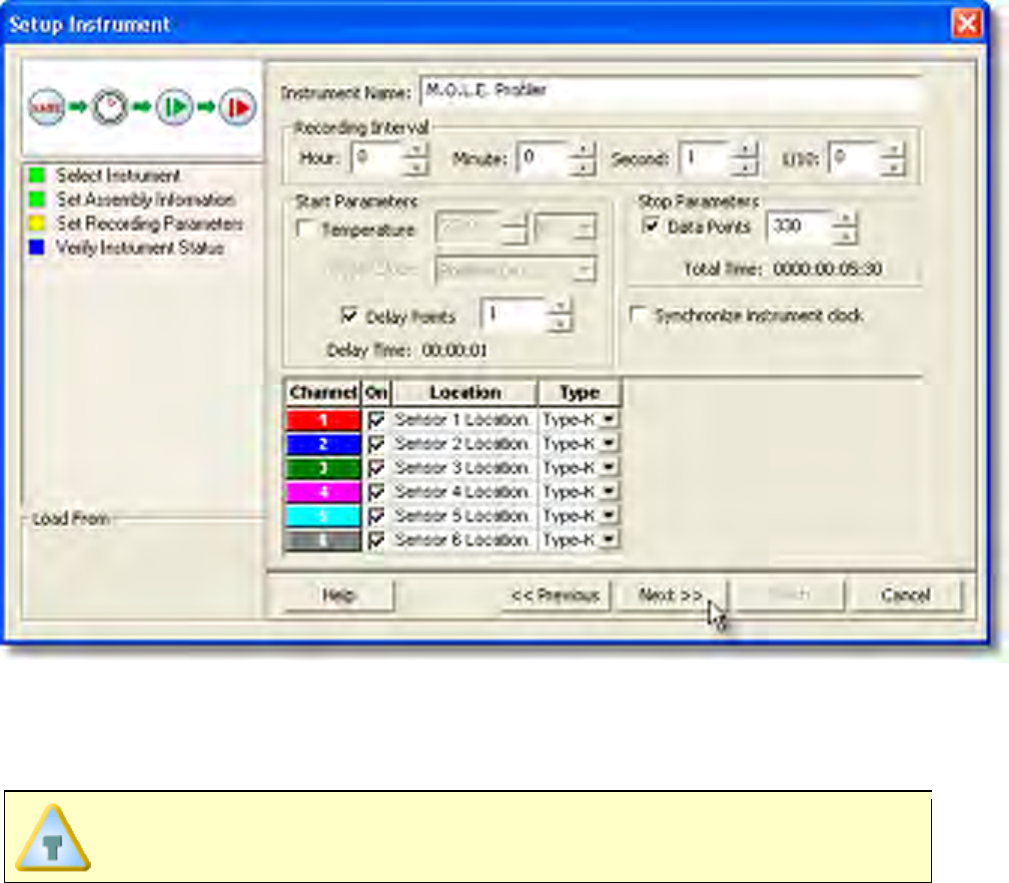
8) Select the Next command button to send the data listed in the dialog box to the
instrument.
If the currently selected M.O.L.E. Profiler is a SuperM.O.L.E. Gold, the
sending of data will erase the data currently stored in the M.O.L.E. Profiler.
9) Verify the instrument status. This dialog box displays the health of the M.O.L.E.
Profiler such as battery charge, internal temperature, thermocouple temperatures.
If the user selects the Show Critical command button the dialog box will only
display items that will prevent the user from completing a successful data run.
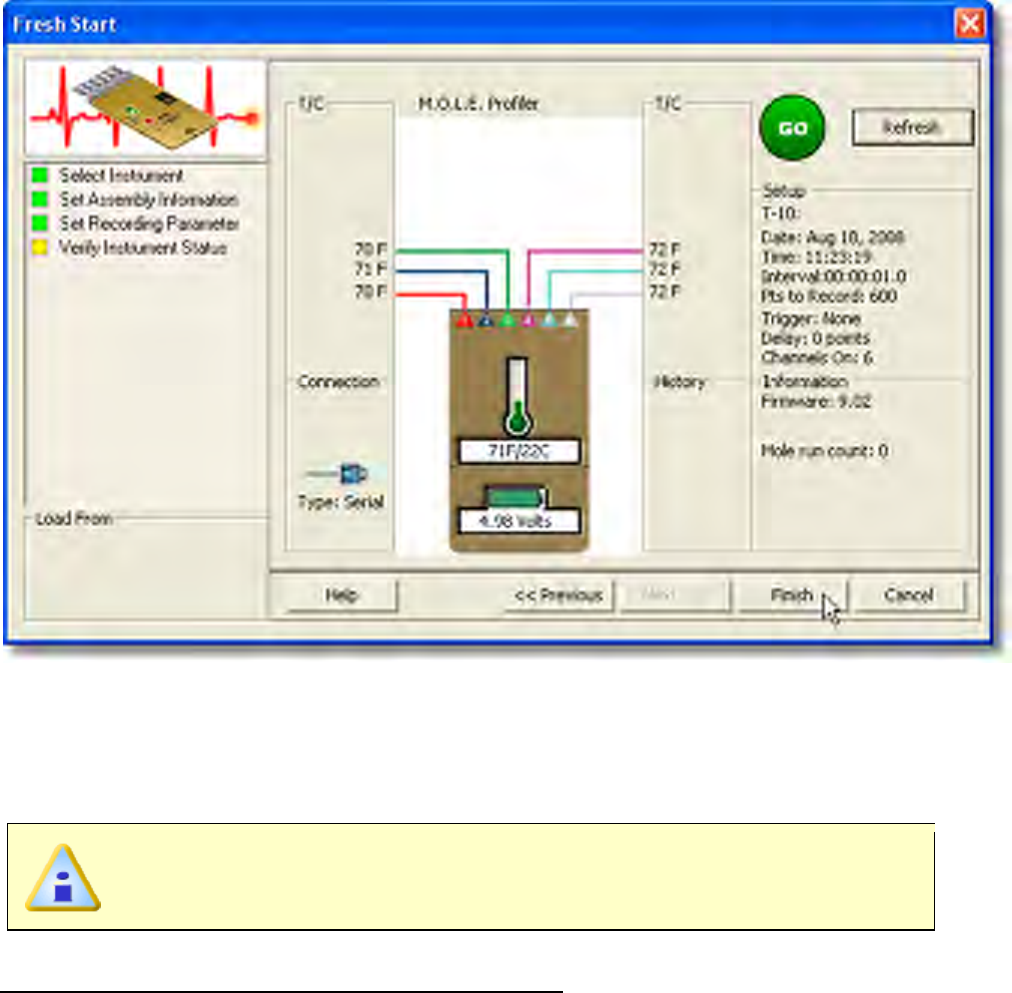
10) Select the Finish command button to complete the Setup Instrument wizard.
5.5.5.6. Show on Profile
M.O.L.E. status information can be displayed or hidden on the Data Graph.
This is available when in Engineer Mode.
To show machine information on the Data Graph:
1) On the M.O.L.E. menu, click Show on Profile.
2) Select or clear the associated machine characteristics to display or hide on the
Data Graph.
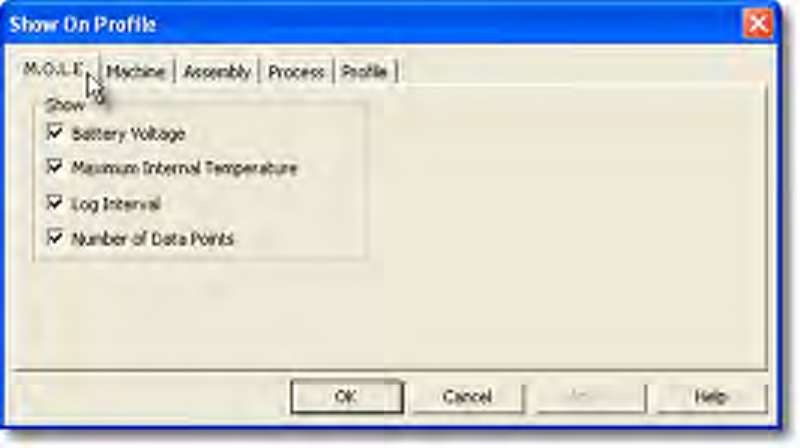
3) Click the OK command button to accept, or Cancel to quit the command.
5.5.6. Machine-Oven Menu
The Machine-Oven menu include options to design specific machine models. Creating an
machine model allows the user to visualize it on the Data Graph along with the associated
data run profile.
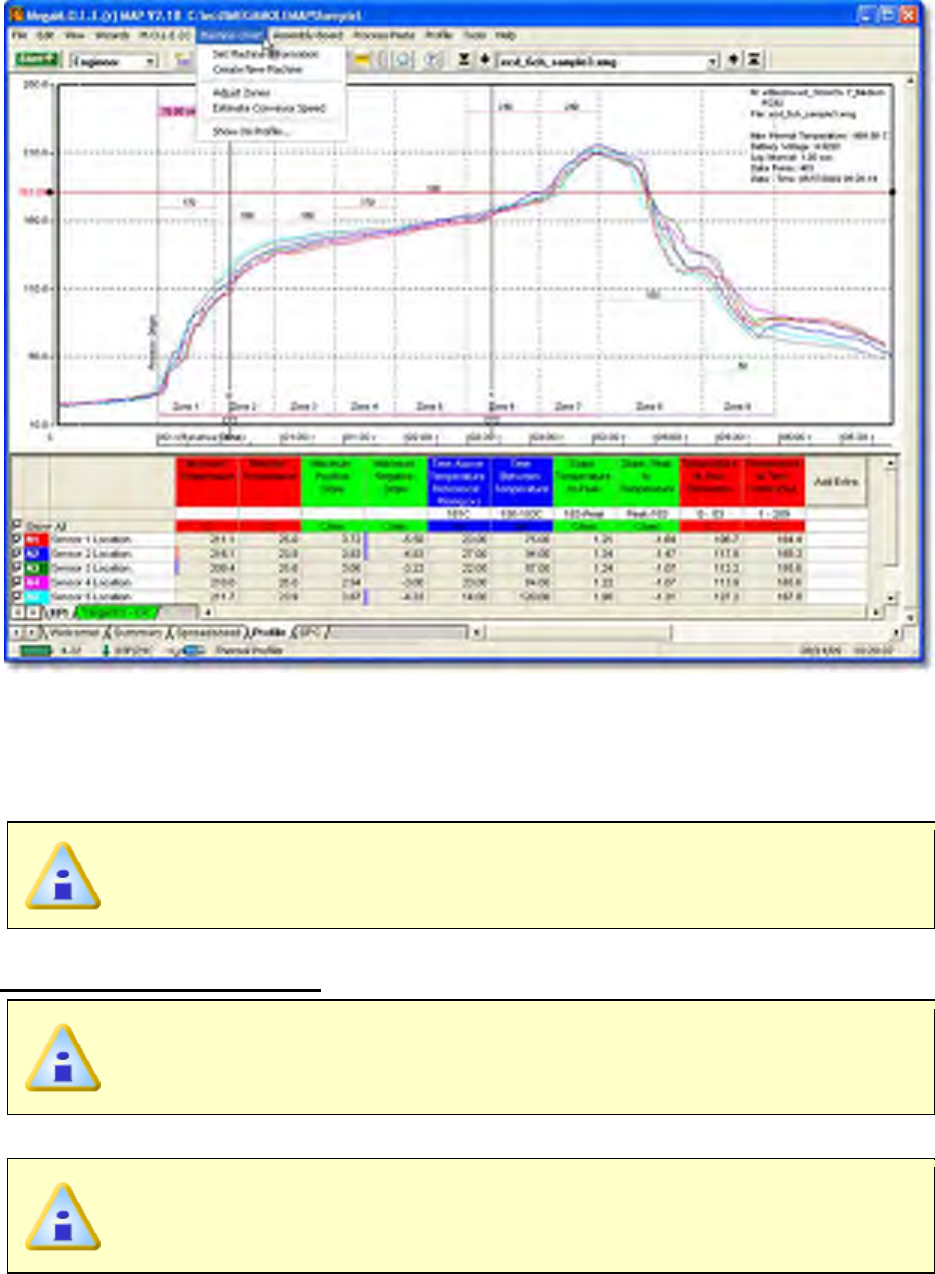
5.5.6.1. Set Machine Information
This command allows the user to set machine information and display it on the Data
Graph so the user can visually see how the data run profile lines up with the machine.
This is available when in Engineer Mode.
To set machine information:
When setting machine information, this data will be applied to the currently
selected data run only. Existing defined machine models may not accurately
reflect your machine and are used as a starting template.
1) On the Machine-Oven menu, click Set Machine Information.
If a setting is already selected for a data run, the software prompts the user to
decide if they wish to modify the current data run. Click the Yes command
button to continue or No to quit the command.
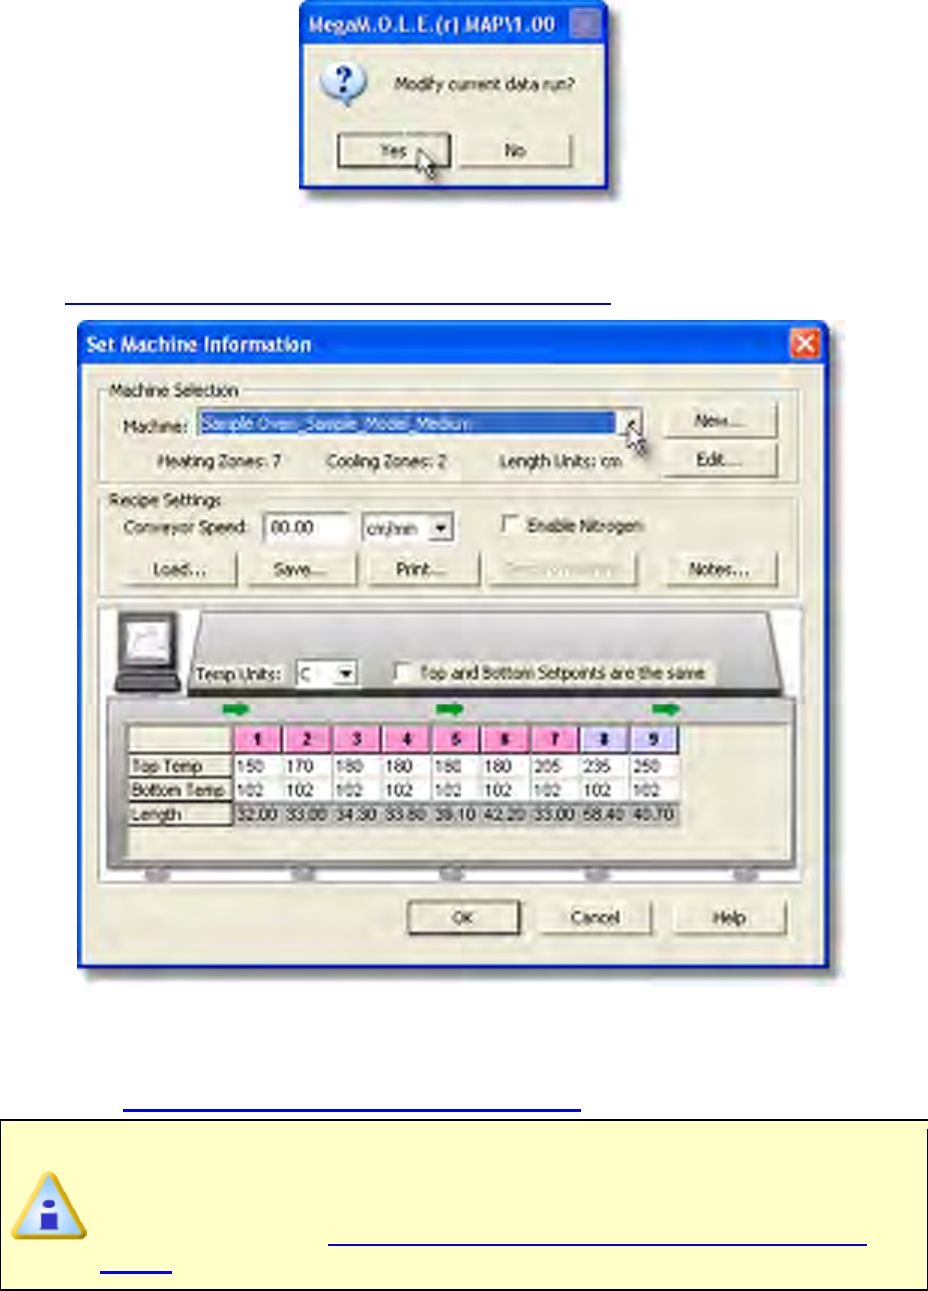
2) Select your machine from the Machine drop down list. If it does not appear in the
list click the New command button to create a new one. Refer to topic
Software>Menus>Machine>Create new Machine for more information.
3) Set the machine conveyor speed. The software uses this value to calculate the
Time (X) Scale values when Distance units are displayed. This number is also
used as the actual conveyor speed when prediction data lines are added. Refer to
topic Software>Menus>Tools>Prediction Tool for more information.
To properly display a machine model on the Data Graph, a conveyor speed
must be set. If you do not know what the conveyor speed is, the software
allows you to estimate it based on the machine information and the data run
profile. Refer to topic Software>Menus>Machine>Estimate Conveyor
Speed for more information.
4) Set the machine temperature units.
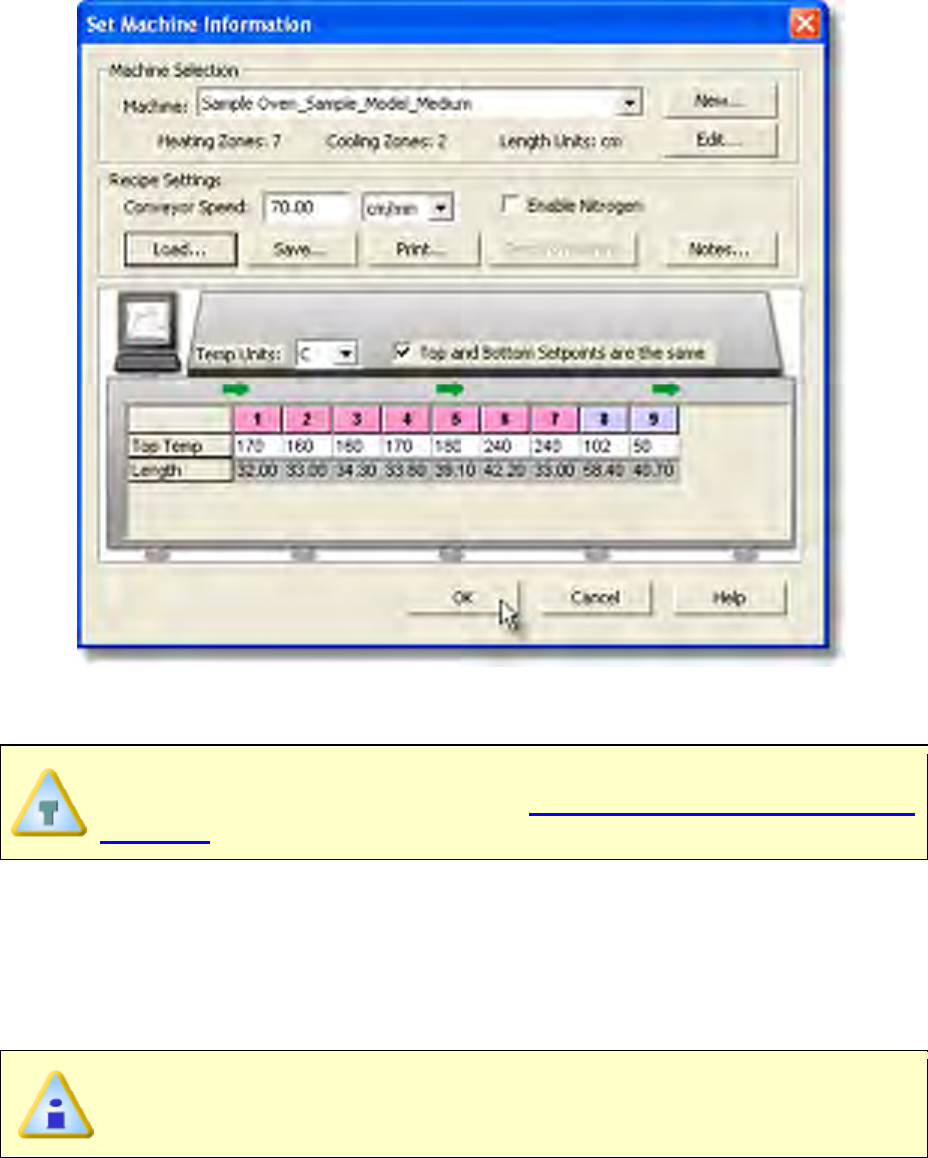
5) Set the Zone Temperatures in the zone matrix. These temperatures could be the
upper and lower thresholds of acceptable temperatures to meet process standards
or temperature settings of upper and lower heat sources. Upper zone
temperatures appear as solid lines and lower zones appear as dotted lines on the
Data Graph.
6) Click the OK command button to set the machine information, or Cancel to quit the
command.
To view the machine information on the Data Graph, the Show on Profile
settings must be enabled. Refer to topic Software>Menus>Machine>Show
on Profile for more information.
5.5.6.2. View Machine Oven
This command allows the user to view machine information displayed on the Data Graph
so the user can visually see how the data run profile lines up with the machine.
This is available when in Verify Mode.
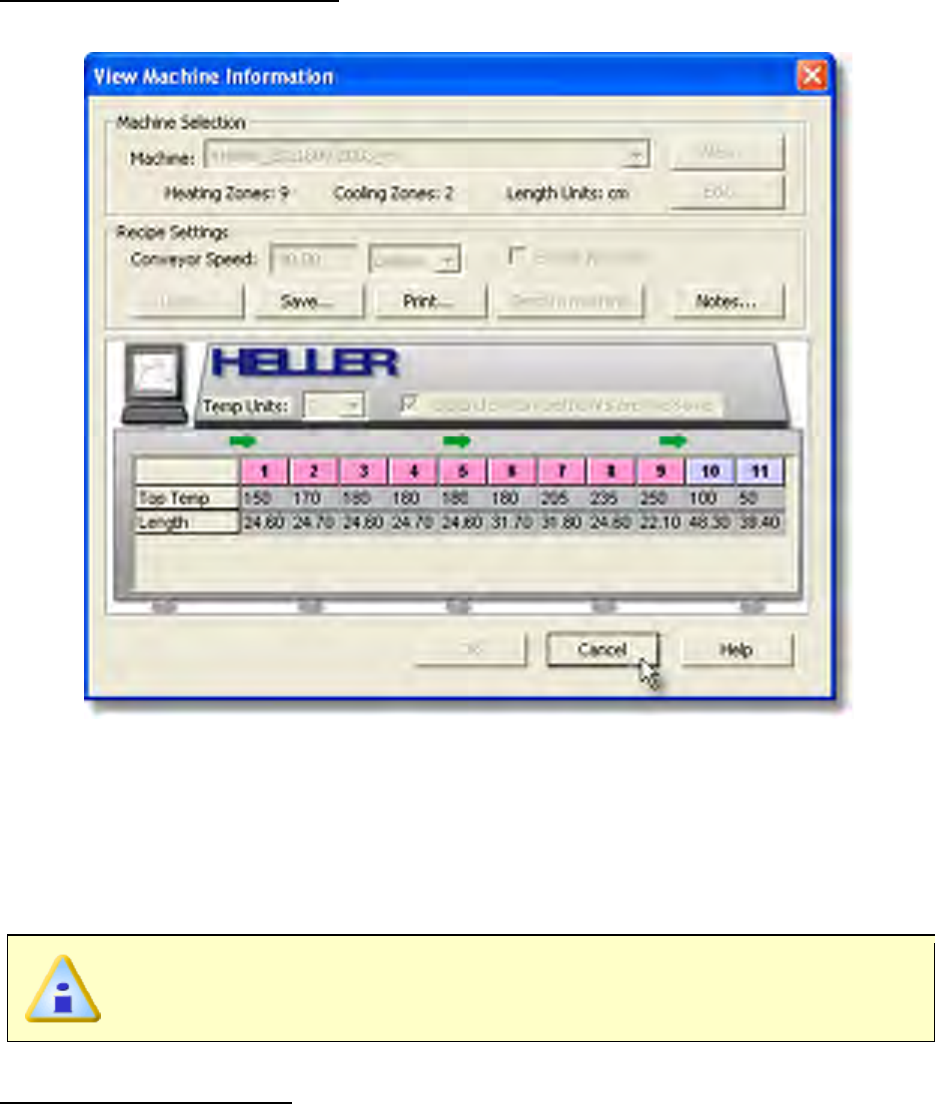
To view machine information:
1) On the Machine-Oven menu, click View Machine Information.
2) Select the Cancel command button to quit the command.
5.5.6.3. Create New Machine
When setting machine information, the user is required to select a machine. The software
includes basic machine models for the user to select from. If your machine model does
not appear in the list the software has the ability for you to create a new machine model.
This is available when in Engineer Mode.
To create a new machine:
1) On the Machine-Oven menu, click Create New Machine.
2) Enter the machine manufacturer and model number.
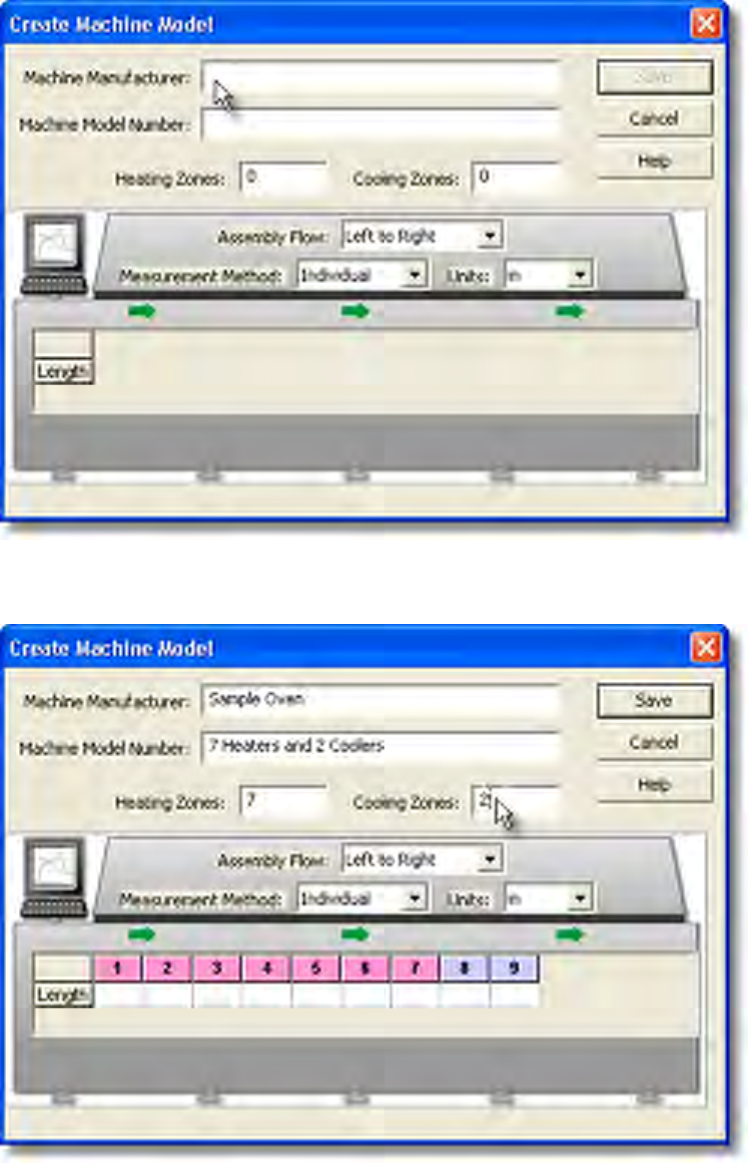
3) Enter the amount of heating and cooling zones. As zones are specified the zone
matrix will automatically grow to allow you to enter zone measurements.
4) Select the assembly flow (left to right or right to left), zone measurement method
(individual or accumulative) and units of measurement. Refer to the illustration
below for proper measurement methods.
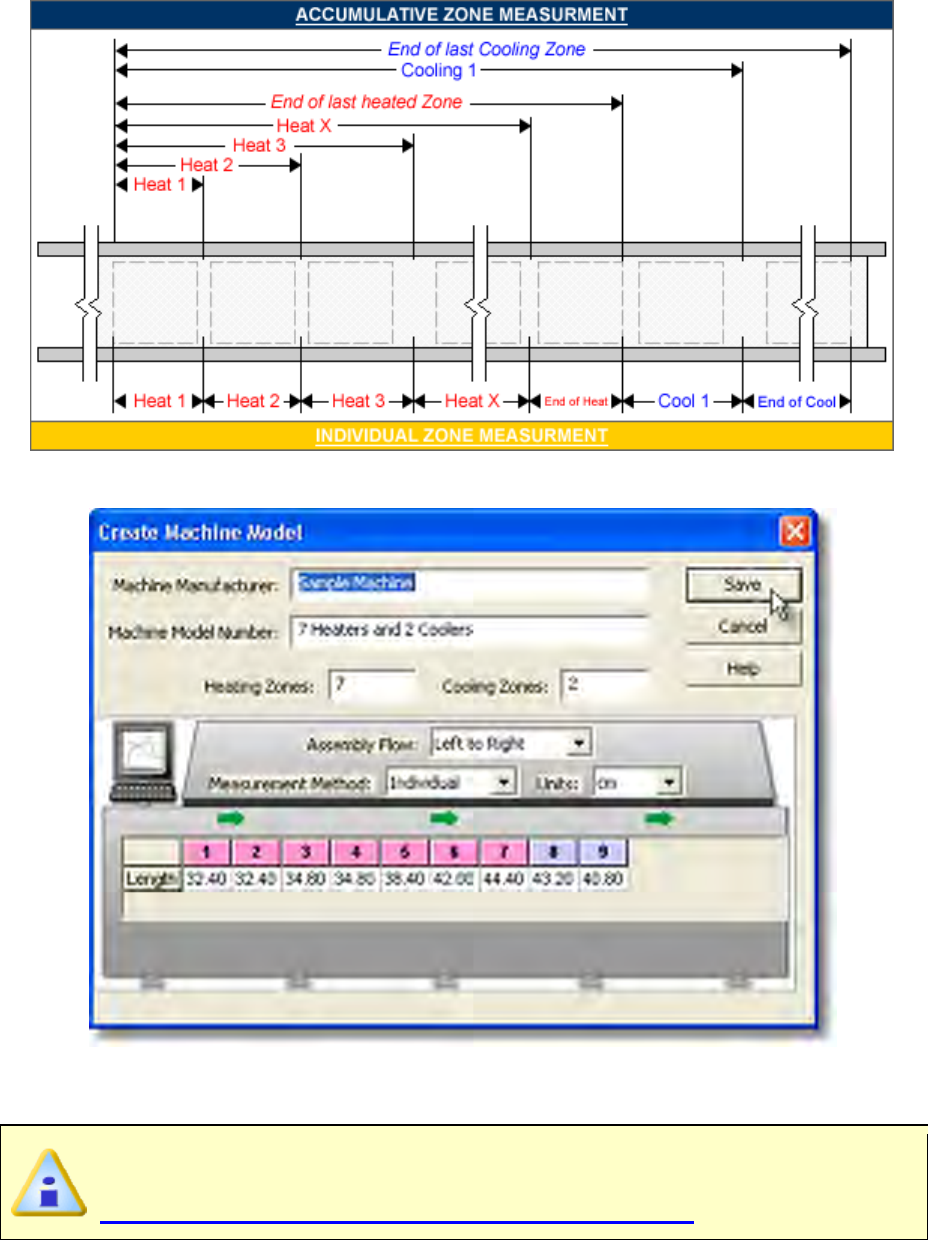
5) Enter the zone measurements in the zone matrix.
6-) Click the Save command button to save the new machine, or Cancel to quit the
command.
The new machine will now appear in the Machine drop-down list on the Set
Machine Information dialog box. Refer to topic
Software>Menus>Machine>Set Machine Information for more information.
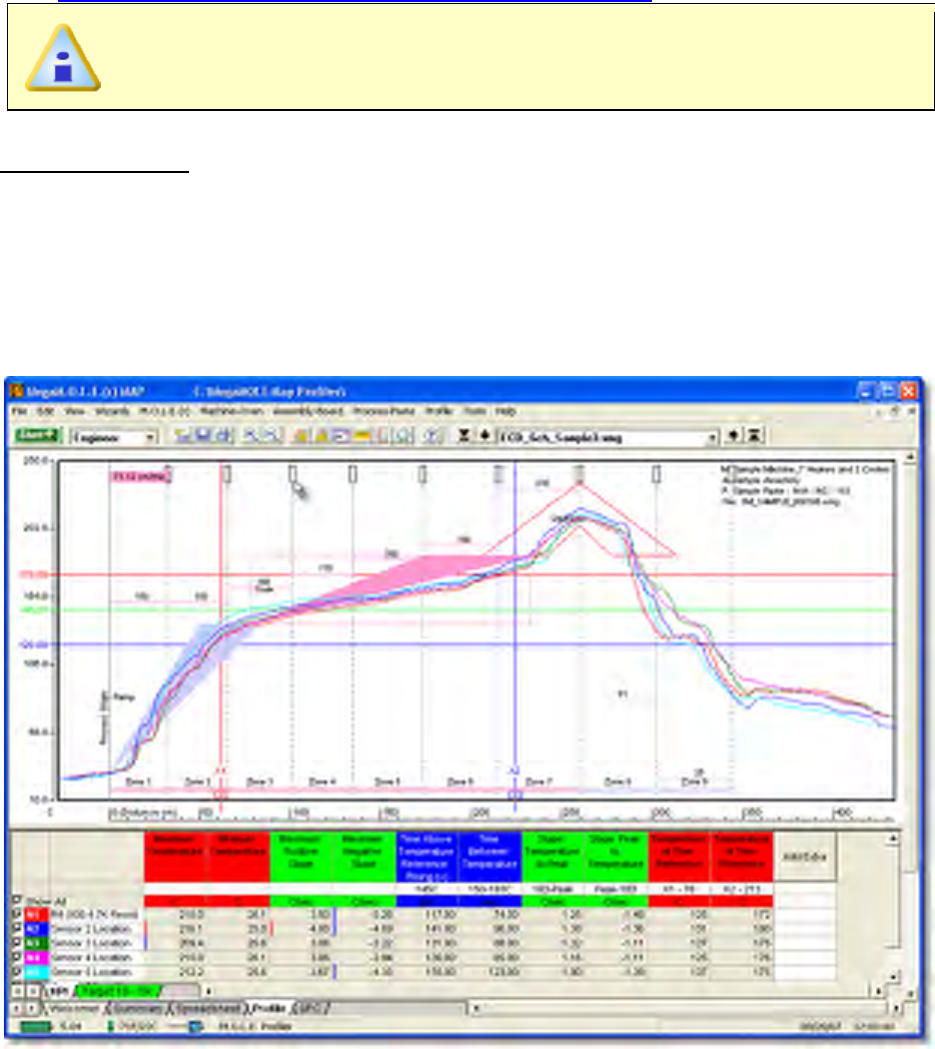
5.5.6.4. Adjust Zones
This command allows the user to manually adjust the displayed machine zones on the
Data Graph. To use this command a machine must be selected and displayed. Refer to
topic Software>Menus>Machine>Set Machine Information.
This is available in both Engineer & Verify Modes.
To adjust zones:
1) One the Machine-Oven menu, click Adjust Zones to activate. A check mark
appears to the left of the command indicating the software is in Adjust Zones
mode.
2) Position the mouse pointer over a desired machine zone line.
3) Click and hold the left mouse button to drag it left or right releasing the mouse
button when the machine zone line is at the desired location.
4) Lock the settings by selecting the Adjust Zones command again. This removes
the check mark next to the command indicating the software is not in Adjust Zones
mode.
5.5.6.5. Estimate Conveyor Speed
To properly display a machine model on the Data Graph, a conveyor speed must be set.
If you do not know what the conveyor speed is when setting machine information, the
software allows you to estimate it based on the machine information and the data run
profile.
This is available when in Engineer Mode.
To estimate conveyor speed:
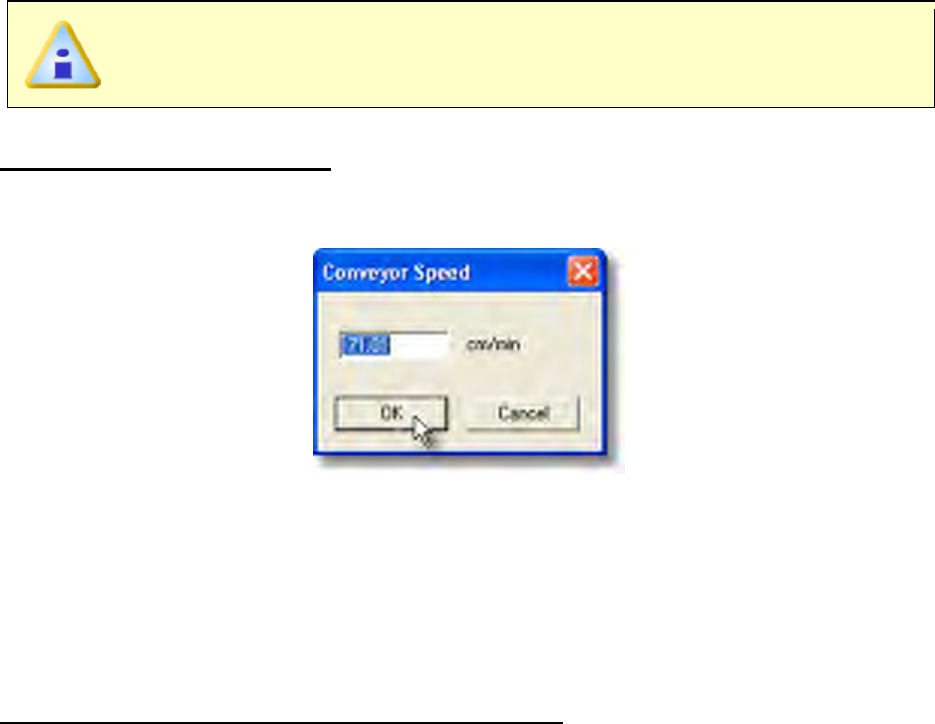
1) On the Machine-Oven menu, click Estimate Conveyor Speed. and the estimated
conveyor speed automatically is displayed in the text box.
2) Click the OK command button to accept the estimated conveyor speed, or Cancel
to quit the command.
5.5.6.6. Show on Profile
Machine information can be displayed or hidden on the Data Graph.
To show machine information on the Data Graph:
1) On the Machine-Oven menu, click Show on Profile.
2) Select or clear the associated machine characteristics to display or hide on the
Data Graph.
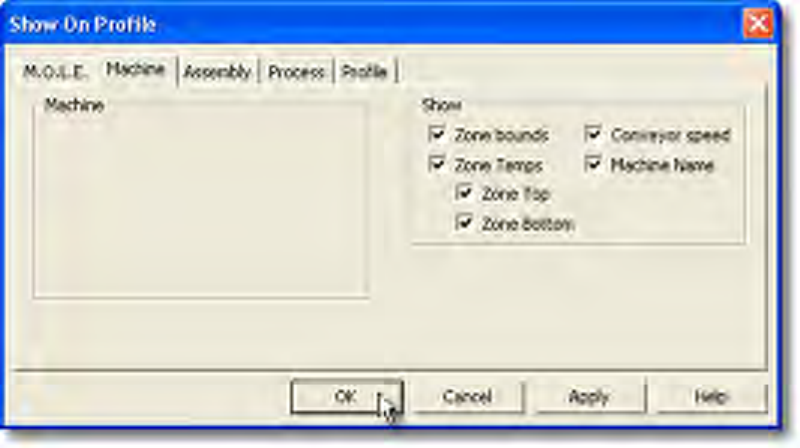
3) Click the OK command button to accept, or Cancel to quit the command.
5.5.7. Assembly-Board Menu
The Assembly-Board menu include commands that enable the user to set and edit
experimental assembly documentation.
5.5.7.1. Set Assembly Information
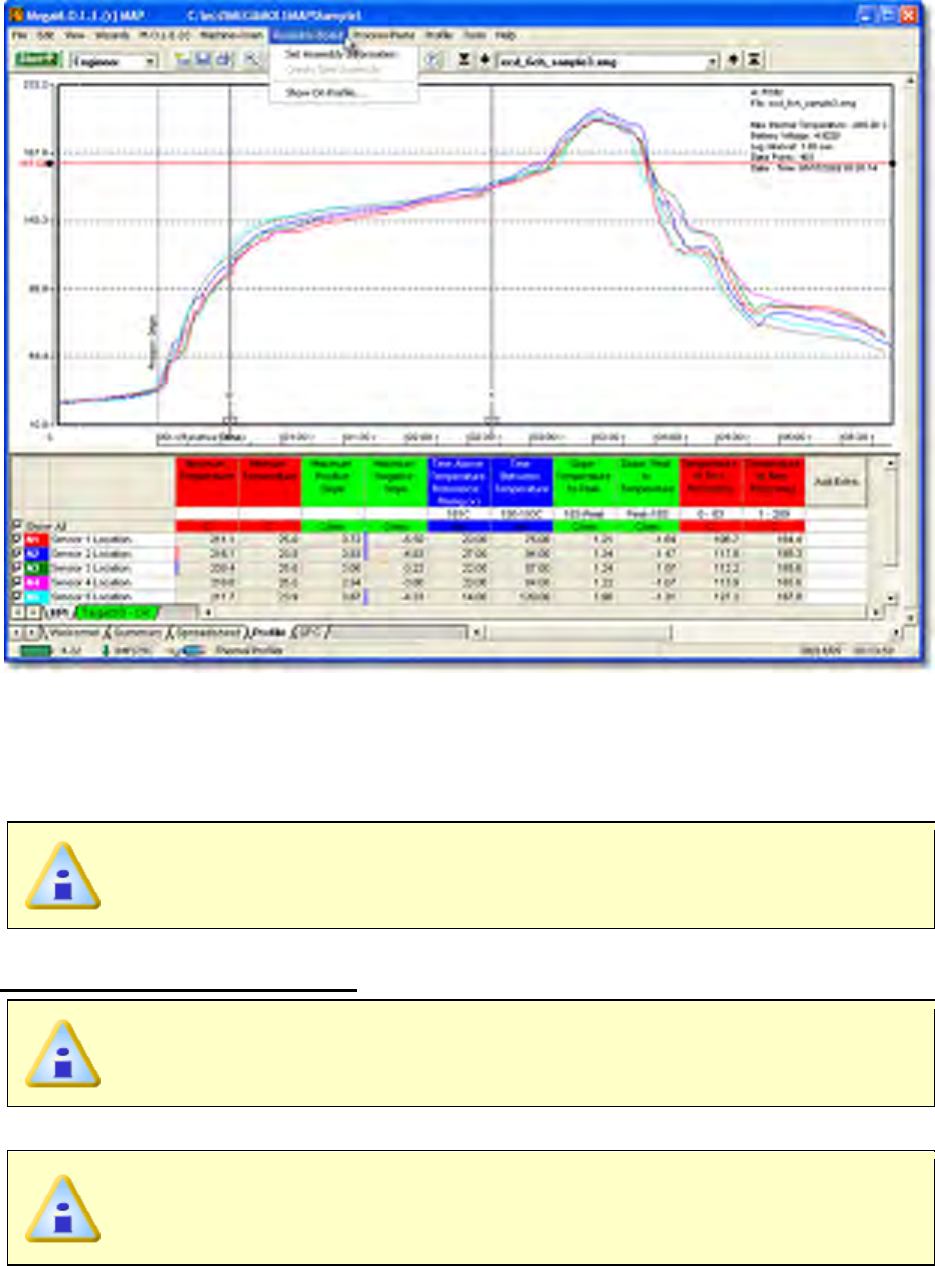
This command allows the user to set assembly information associated with the selected
data run profile.
This is available when in Engineer Mode.
To enter assembly information:
When setting assembly information, this data will be applied to the currently
selected data run only.
1) On the Assembly-Board menu, click Set Assembly Information.
If a setting is already selected for a data run, the software prompts the user to
decide if they wish to modify the current data run. Click the Yes command
button to continue or No to quit the command.
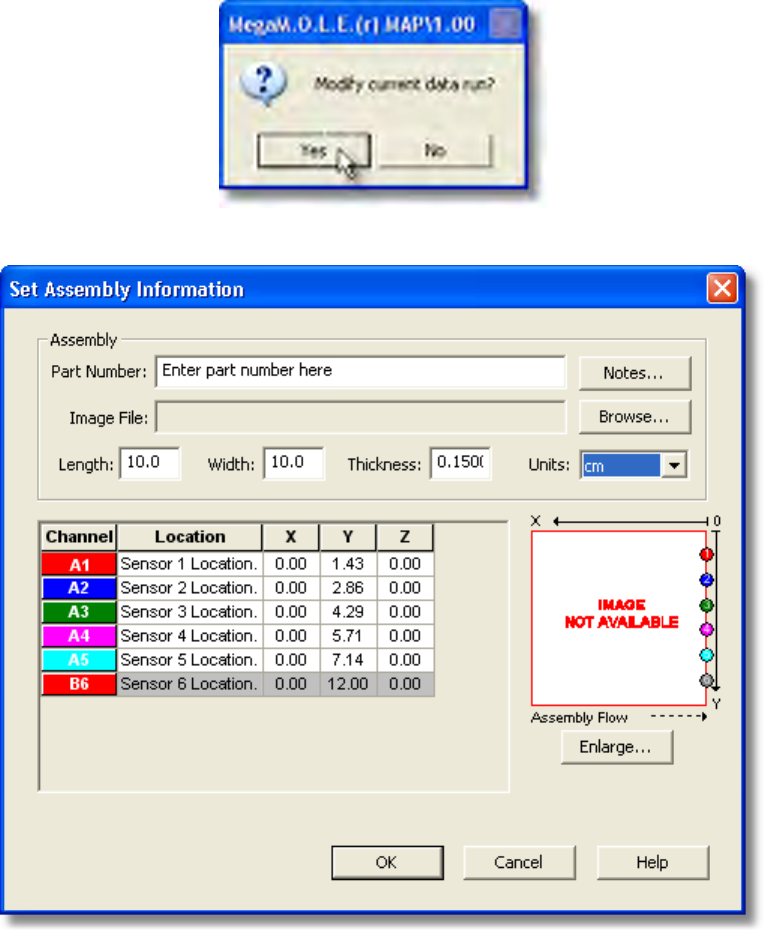
2) Enter an assembly part number.
3) Click the Notes command button if you would like to enter part documentation
about the test assembly being profiled.
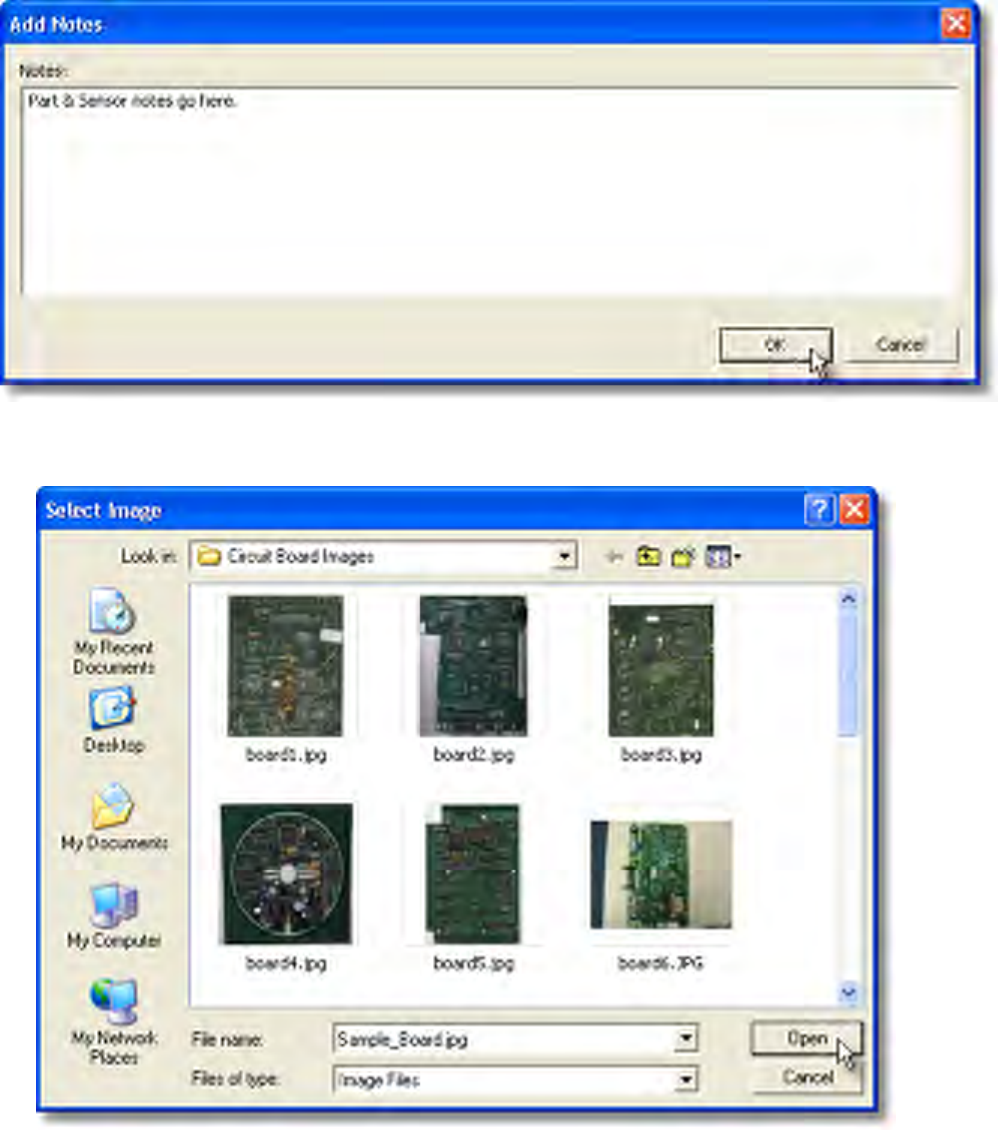
4) Click the image file Browse command button to select a product image. Image
files supported by the software are Jpeg (.jpg), Bitmap (.bmp), and Tiff (.tif).
5) Enter the test assembly board length, width and thickness.
6) Enter the sensor location descriptions. These descriptions can be the location
where each sensor is connected to the test product. The channel color associated
with the description indicates which Data Plot on the Data Graph it represents.
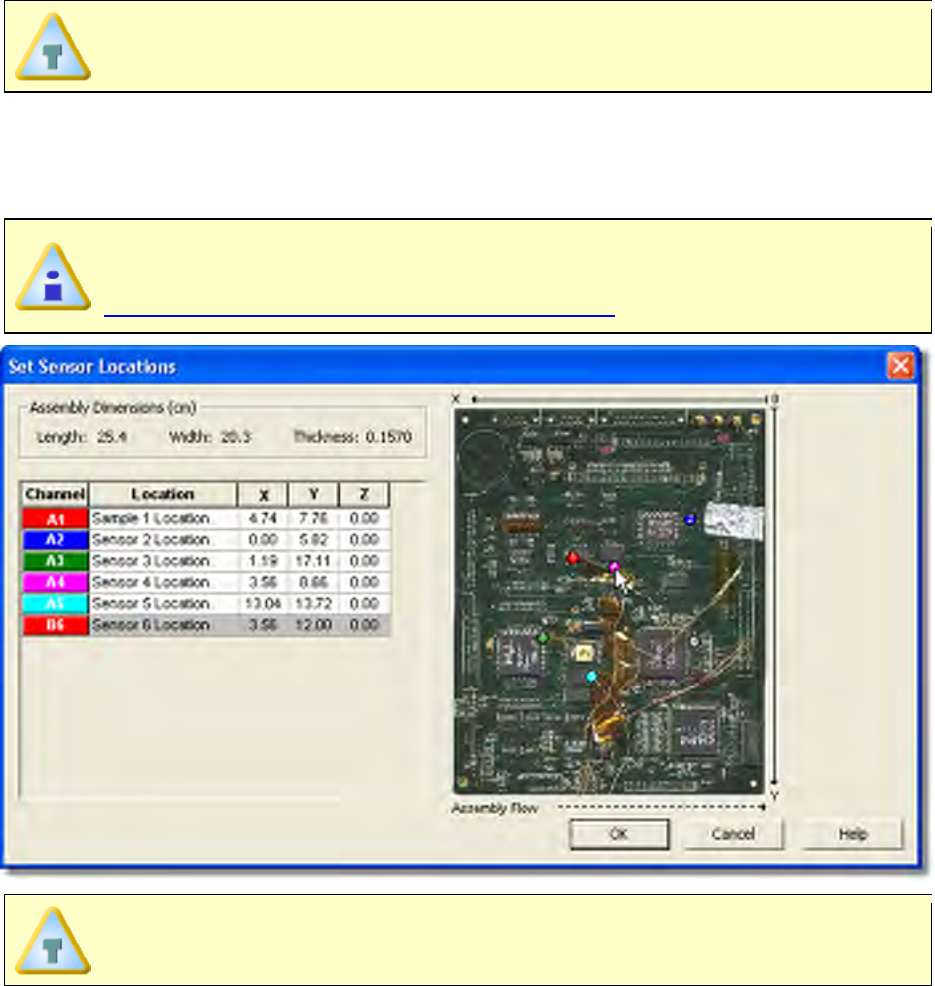
Thermocouple placement information entered in the sensor location matrix are
also displayed as the Sensor Locations in the Data Table.
7) Enter sensor location dimensions. Sensor Locations can also be set by dragging
sensor location markers on the selected image. To move the markers, click the
Enlarge command button below the assembly image and the Set Sensor
Locations dialog box appears.
Specified X-dimensions may be altered when using the Align Profile Peaks
command to align the data run profile lines. Refer to topic
Software>Menus>Profile>Align Profile Peaks for more information.
X-dimensions are measured from the leading (right) edge or the first edge to
enter the process, and Y dimensions are from the top down.
8) Select which sensor channels to display in the Data Table. Excluding a sensor
channel does not delete channel data and can be turned back on at any time. This
is helpful when data has been collected and it may not be beneficial to the data run
profile.
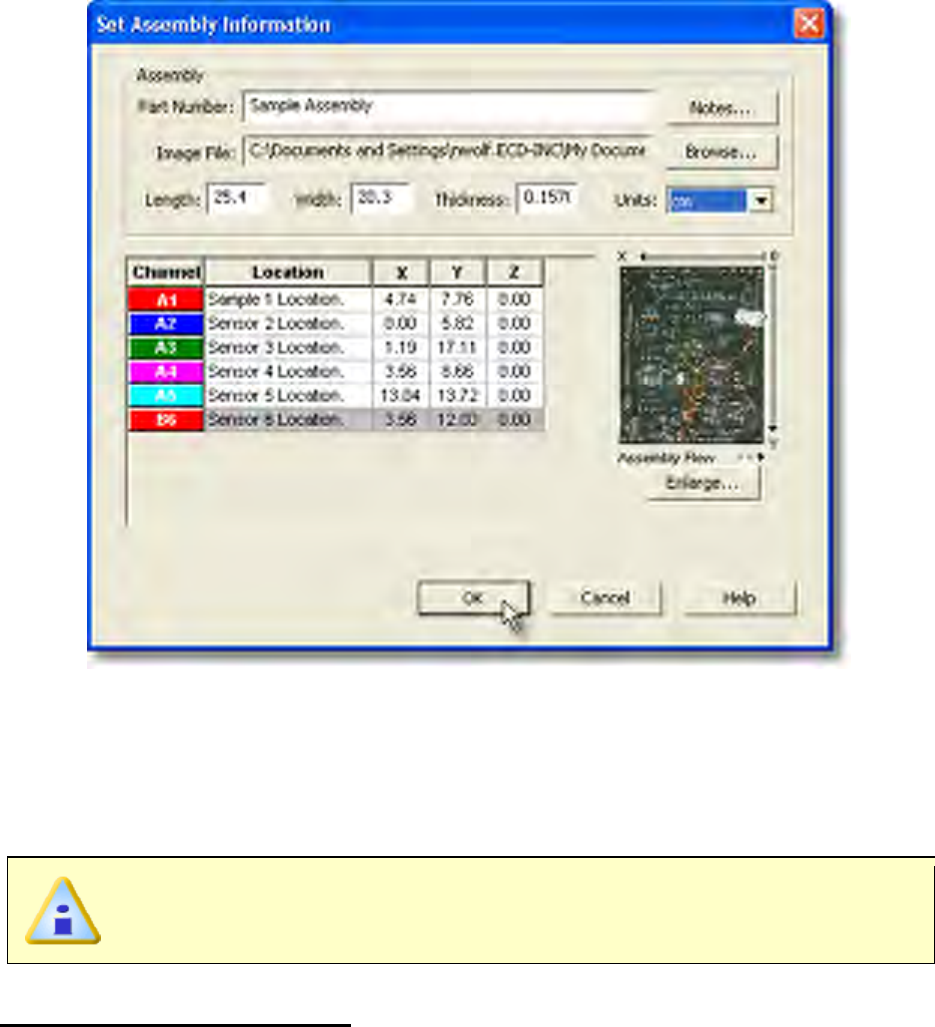
9) Click the OK command button accept or Cancel to quit the command.
5.5.7.2. View Assembly Information
This command allows the user to view assembly information associated with the selected
data run profile.
This is available when in Verify Mode.
To view assembly information:
1) On the Assembly-Board menu, click View Assembly Information.
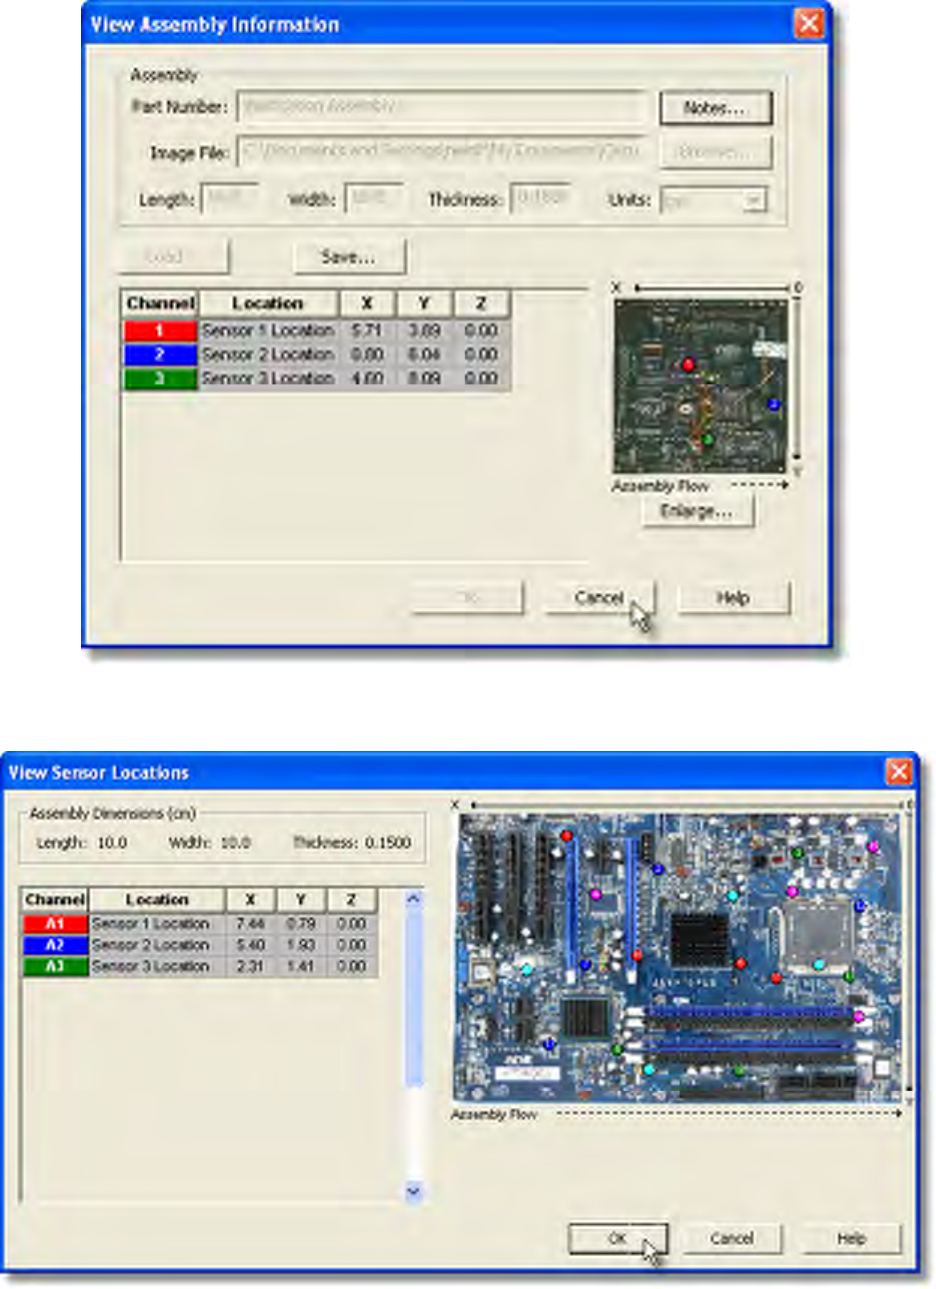
2) For a larger view of the assembly image and sensor locations, click the Enlarge
command and the View Sensor Locations dialog box appears.
3) Select the OK or Cancel command button to close the dialog box.
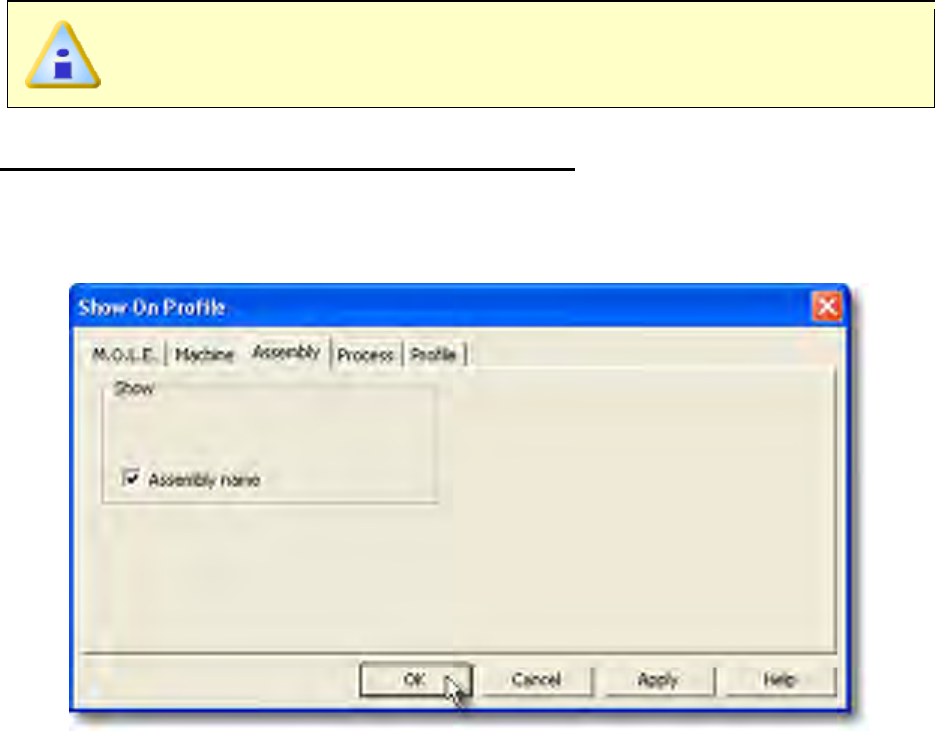
4) Select the Cancel command button to quit the command.
5.5.7.3. Show on Profile
Assembly name can be displayed or hidden on the MAP data section of the Data Graph.
This is available when in Engineer Mode.
To show assembly information on the Data Graph:
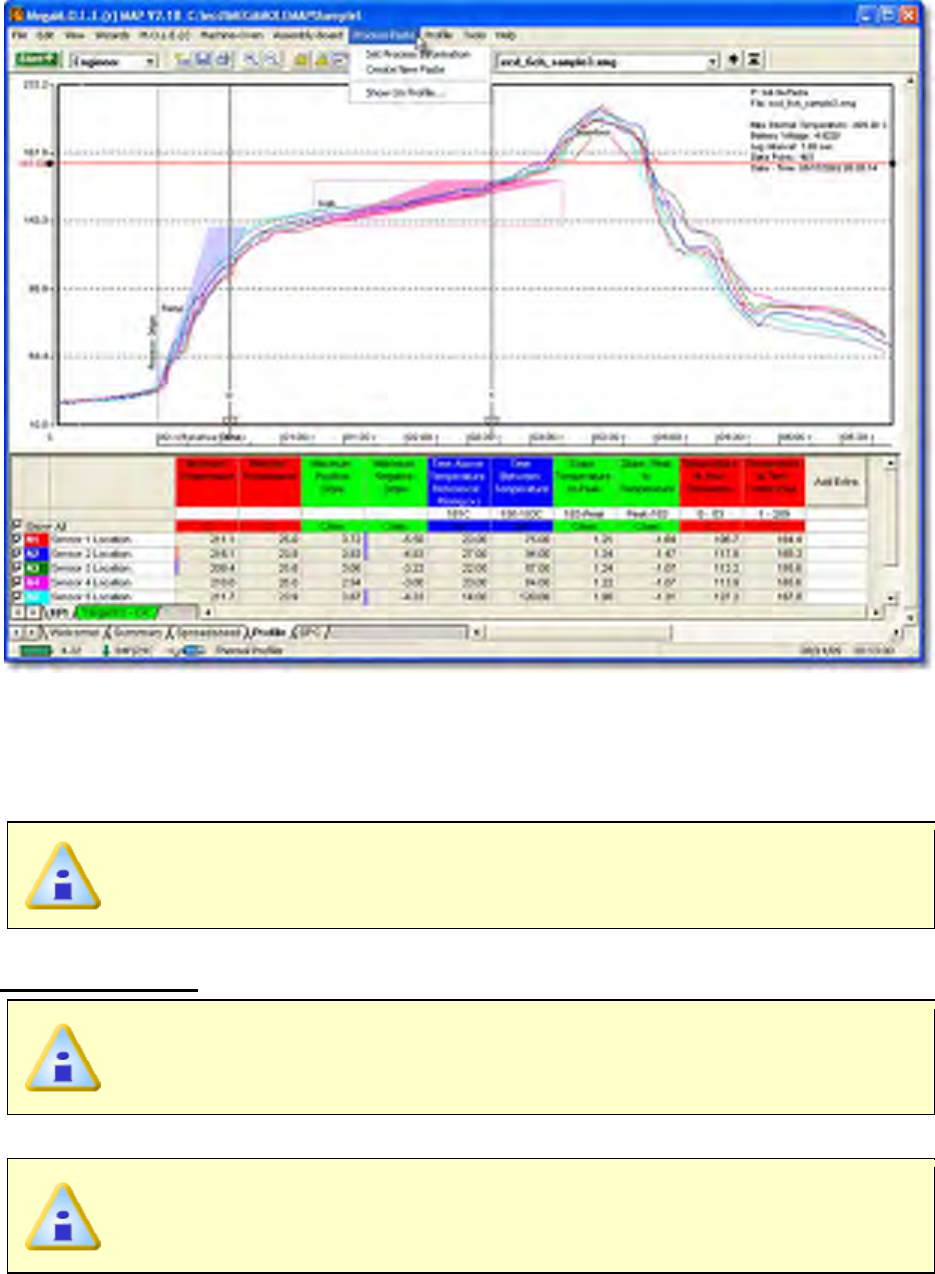
1) On the Assembly-Board menu, click Show on Profile.
2) Select or clear the Assembly name check box to display or hide it on the Data
Graph.
3) Click the OK command button to accept, or Cancel to quit the command.
5.5.8. Process-Paste Menu
The Process-Paste menu include options to select or design a process paste. Creating an
process paste allows the user to visualize it on the Data Graph along with the associated
data run profile.
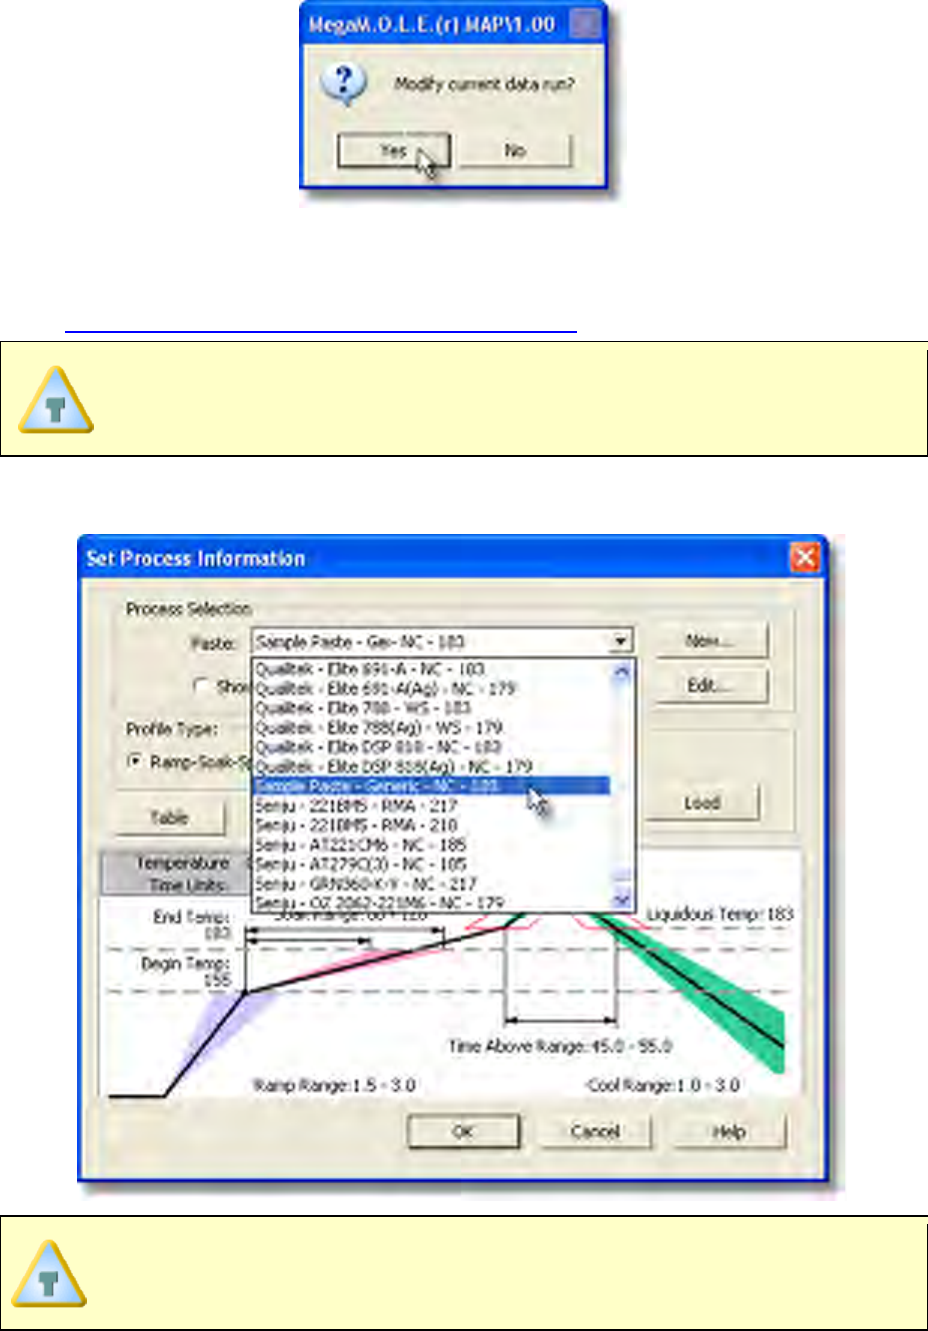
5.5.8.1. Set Process Information
This command allows the user to set a process paste and display it on the Data Graph so
the user can visually see how the data run profile lines up with the process specification.
This is available when in Engineer Mode.
To set a process:
When setting a process, this data will be applied to the currently selected data
run only. Existing defined machine models may not accurately reflect your
machine and are used as a starting template.
1) On the Process-Paste menu, click Set Process.
If a setting is already selected for a data run, the software prompts the user to
decide if they wish to modify the current data run. Click the Yes command
button to continue or No to quit the command.
2) Select your process specification. Select a Paste from the database or previously
created Target 10 Specification. If your Paste does not appear in the database
list click the New command button to create a new one. Refer to topic
Software>Menus>Process>Create new Paste for more information.
When the user selects a paste from the database, they can use the radio
buttons below the drop down box to filter and display only the user created
pastes from paste database.
3) Choose the Profile Type (Ramp-Soak-Spike or Ramp-to-Spike).
Ramp-Soak-Spike profile types are the only type allowed to be edited.
Once a process is selected, the specifications are displayed on the graph. The
software also allows paste specification data to be viewed in a table view by
clicking the Table command button.
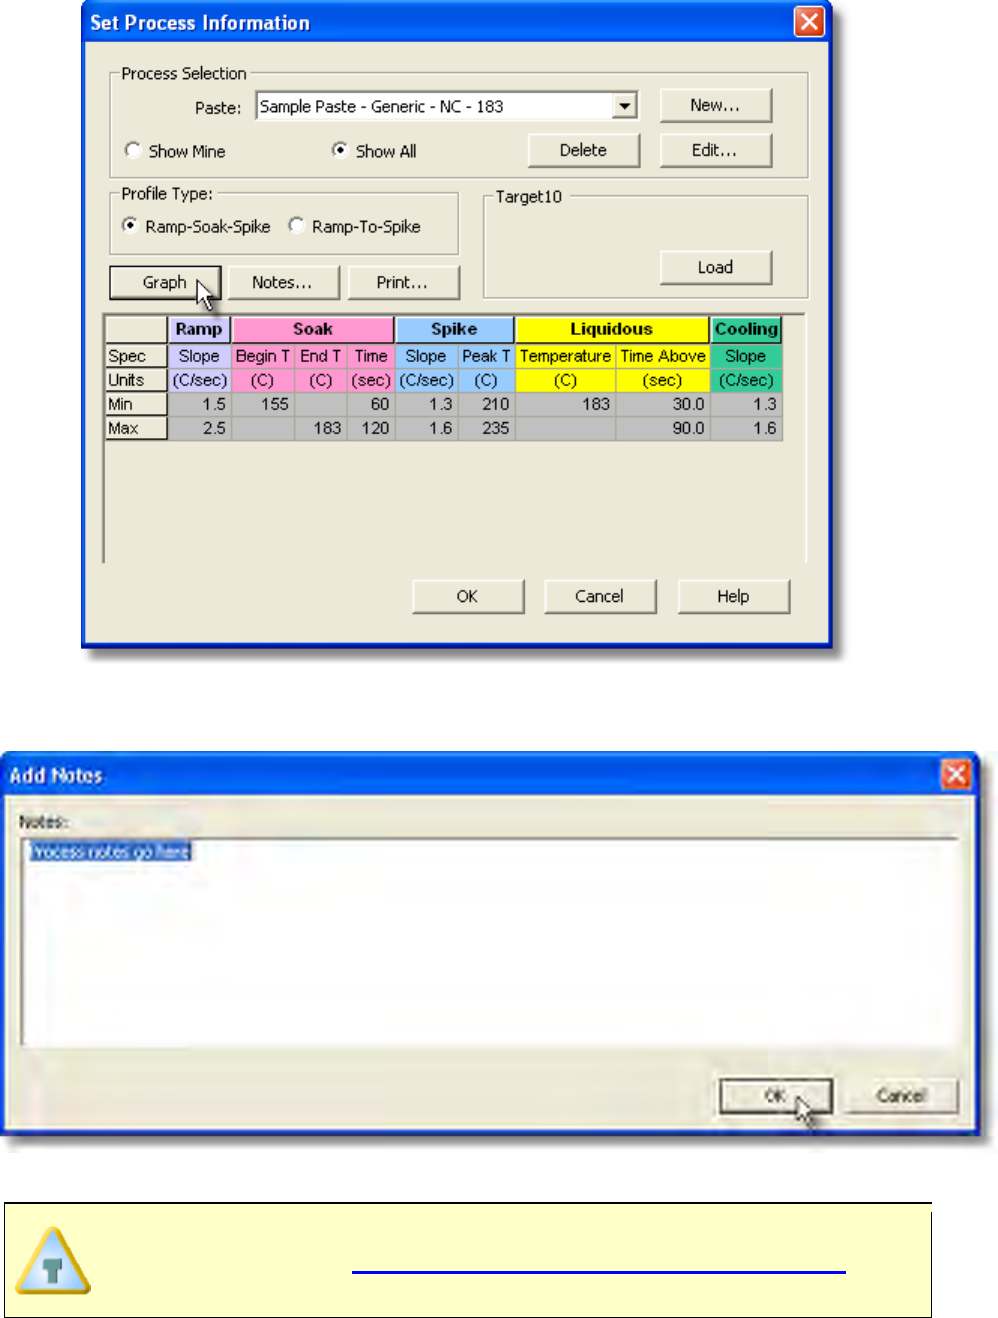
4) Click the Notes command button if you would like to enter process paste
documentation.
5) Click the OK command button to set the process, or Cancel to quit the command.
To view the process on the Data Graph, the Show on Profile settings must be
enabled. Refer to topic Software>Menus>Process>Show on Profile for
more information.
5.5.8.2. View Process
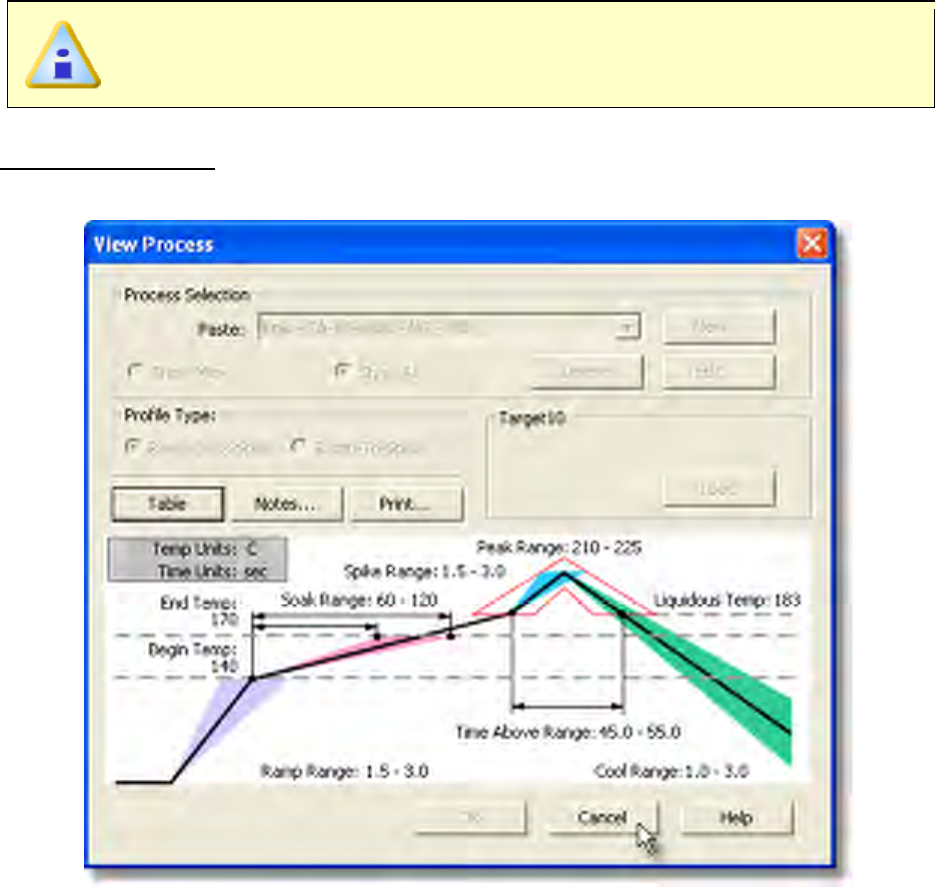
This command allows the user to view process information associated with the selected
data run profile.
This is available when in Verify Mode.
To view a process:
1) On the Process-Paste menu, click View Process.
2) Select the Cancel command button to quit the command.
5.5.8.3. Create New Paste
When setting machine information, the user is required to select a machine. The software
includes basic machine models for the user to select from. If your machine model does
not appear in the list the software has the ability for you to create a new machine model.
This is available when in Engineer Mode.
To create a new paste:
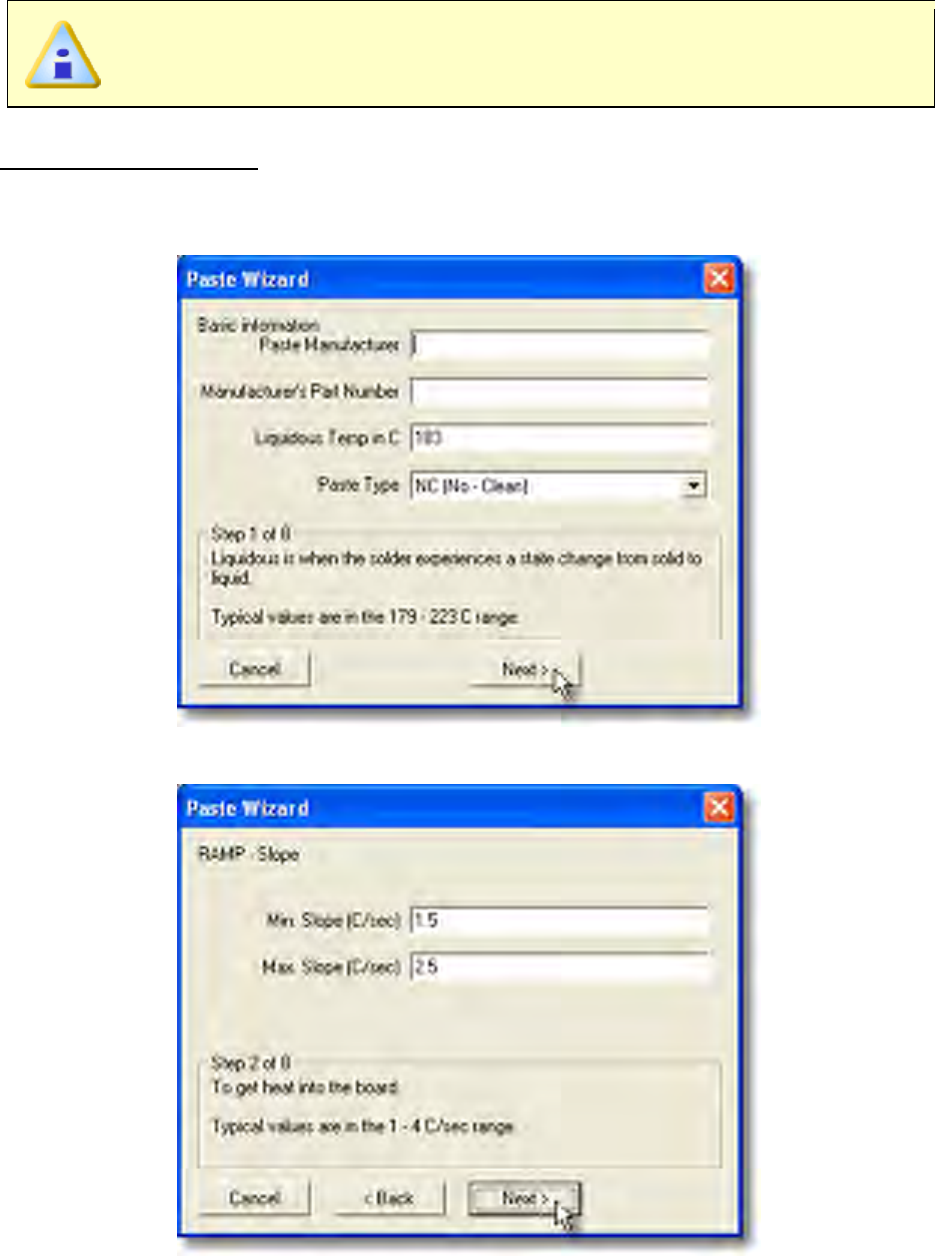
1) On the Process-Paste menu, click Create New Paste.
2) Enter the required information and select the Next button.
3) Enter the RAMP – Slope information and select the Next button.
4) Enter the SOAK –Temperatures information and select the Next button.
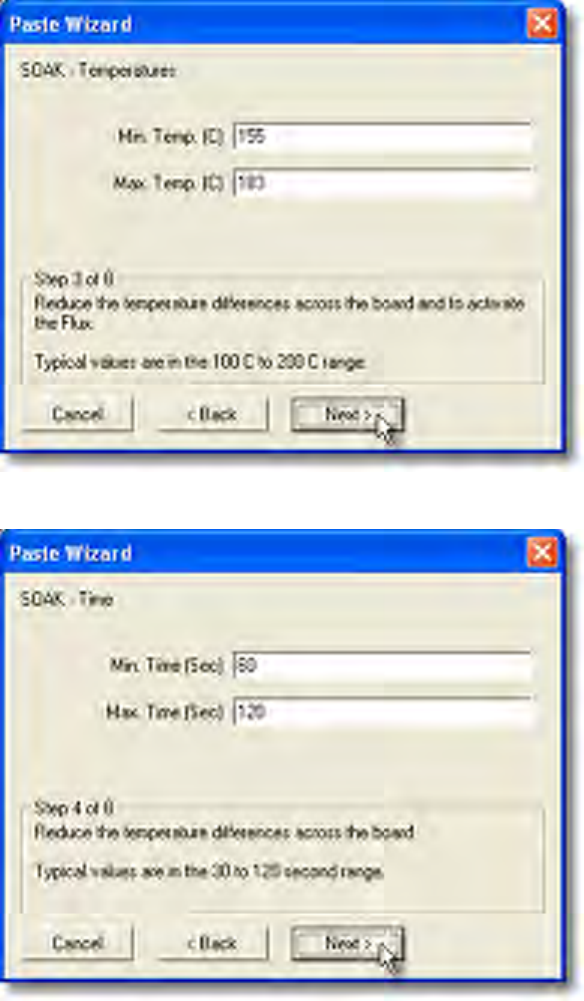
5) Enter the SOAK –Time information and select the Next button.
6) Enter the SPIKE – Ramp Slope information and select the Next button.
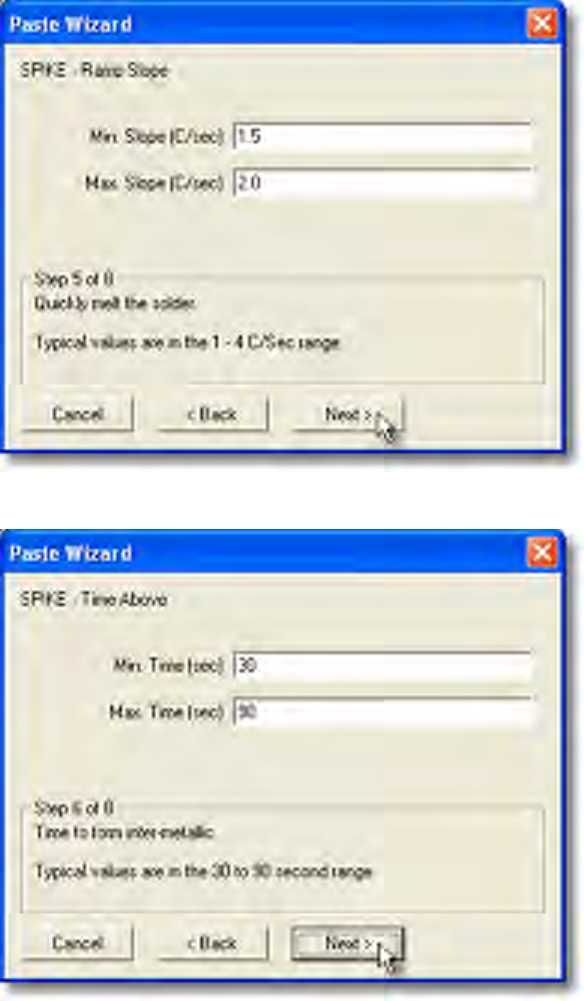
7) Enter the SPIKE – Time Above information and select the Next button.
8) Enter the SPIKE – Peak Temperature information and select the Next button.
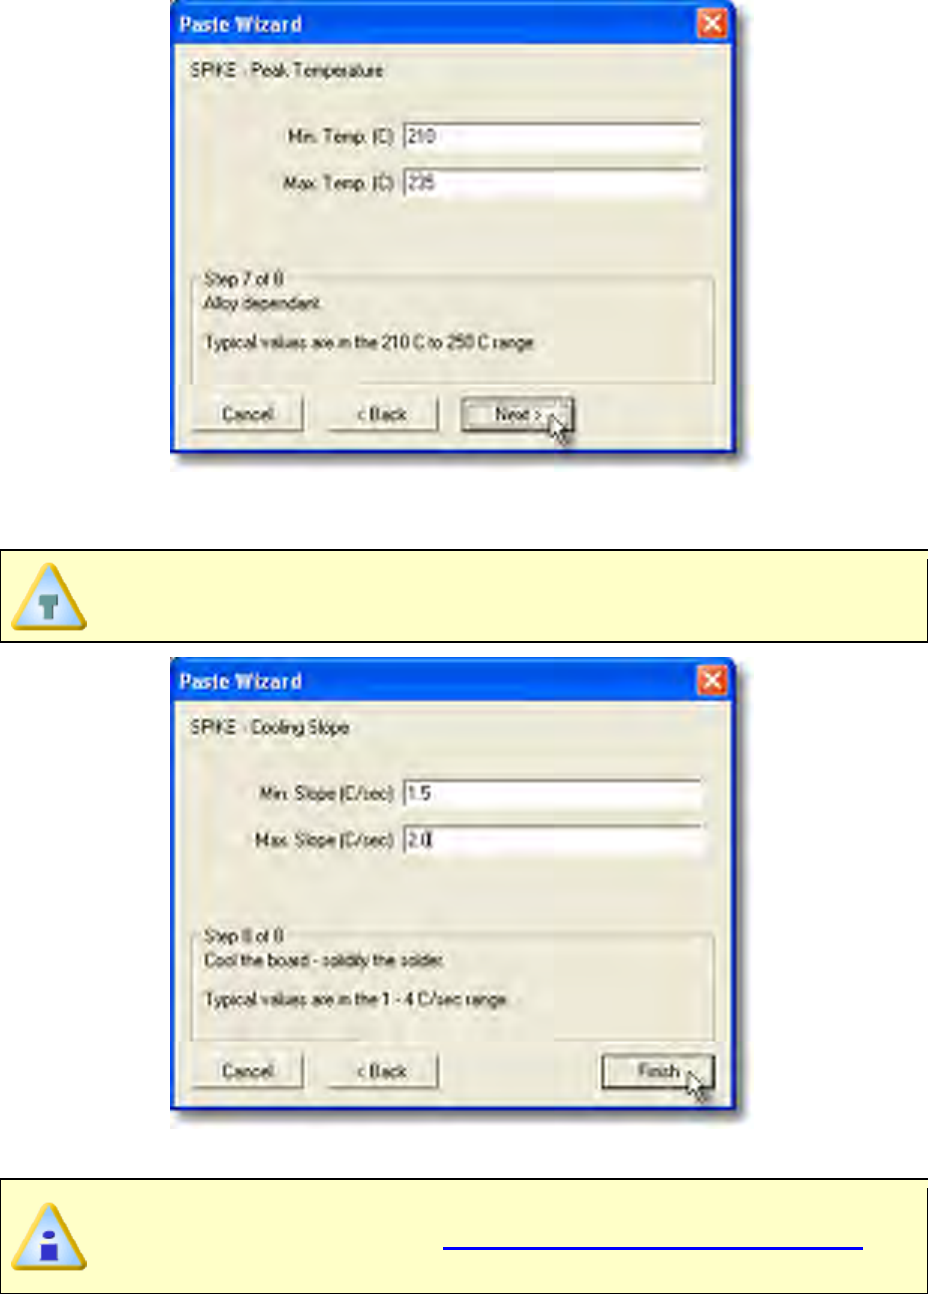
9) Enter the SPIKE – Cooling Slope information and select the Finish button to
create the new paste and return to the Paste Specification database dialog box.
Once the user proceeds to each Step, the Back button can be selected to
confirm or modify previously entered information.
10) Click the Finish command button to accept, or Cancel to quit the command.
The new process paste will now appear in the Paste drop-down list on the Set
Paste dialog box. Refer to topic Software>Menus>Process>Set Paste for
more information.
5.5.8.4. Show on Profile
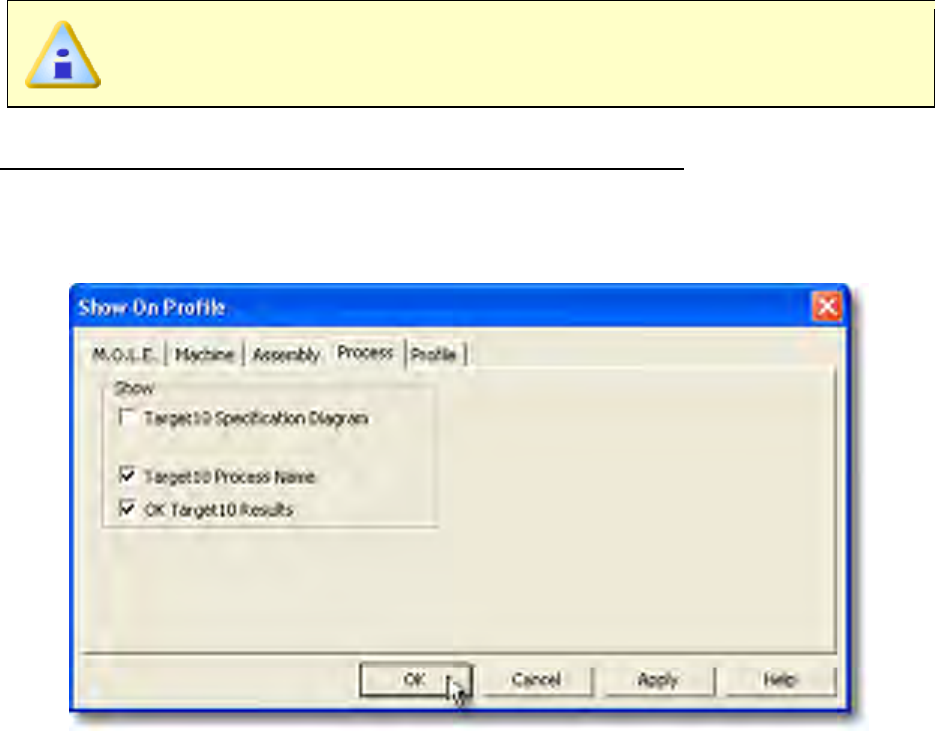
Process Paste specification can be displayed or hidden on the Data Graph.
This is available when in Engineer Mode.
To show the process paste specification on the Data Graph:
1) On the Process-Paste menu, click Show on Profile.
2) Select or clear the associated process paste options to display or hide on the Data
Graph.
3) Click the OK command button to accept, or Cancel to quit the command.
5.5.9. Profile Menu
The Profile menu includes special commands specifically used on the Profile worksheet.
Commands in this menu enable the user to view and edit data run documentation,
change the appearance of the Data Graph and design experiments.
5.5.9.1. Set Temperature (Y) Scale
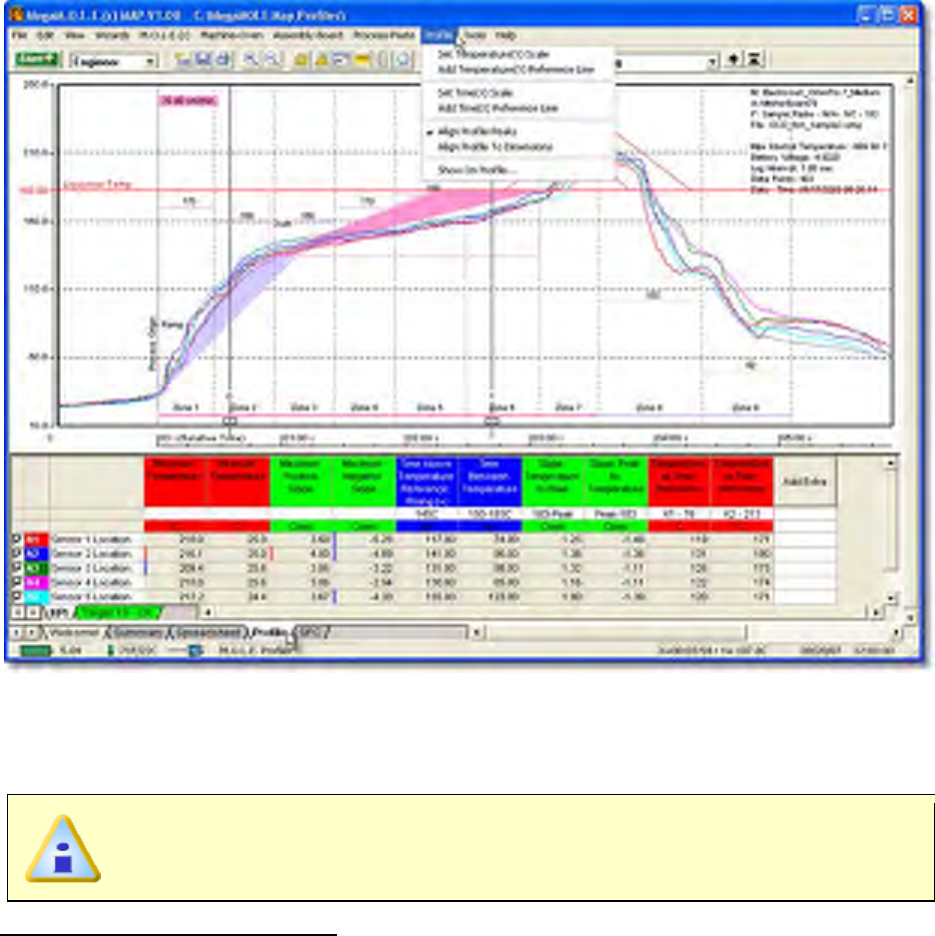
This command controls the scale of the Temperature (Y) axis on the Data Graph.
This is available in both Engineer & Verify Modes.
To use the scaling command:
1) On the Profile menu, click Set Temperature (Y) Scale. This dialog box identifies
the current settings of the displayed units and the maximum and minimum values.
2) Select between Auto or Manual mode. In Auto mode, the software selects the
scale of the Y-Axis to ensure all Data Point values and the highest Zone
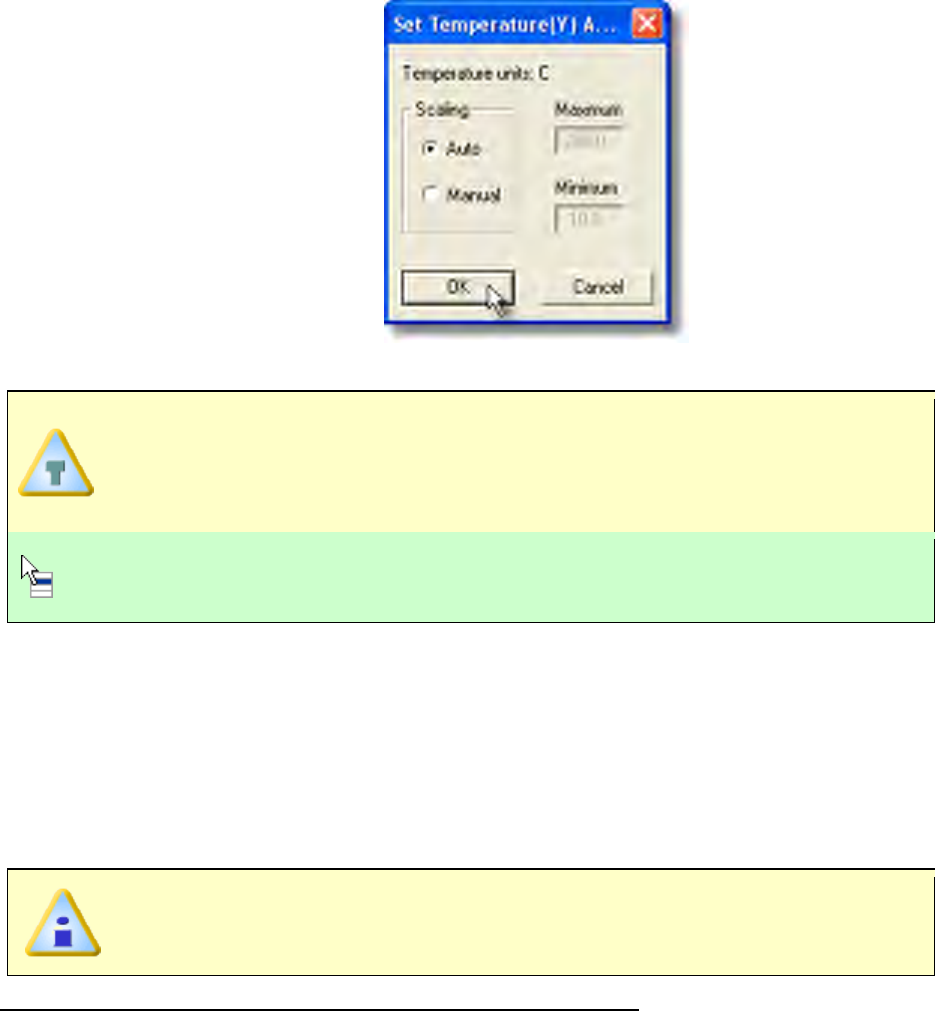
temperature settings are visible in the Data Graph. In Manual mode, the range of
values must be manually set.
3) Click the OK command button to use the settings or Cancel to quit the command.
The software allows the ability to include recipe values when using the
Autoscale feature. Instead of automatic
ally scaling the Data Graph to the data
run profile, it scales it to include the recipe values along with profile so the data
will always be visible and easy to work with.
This command can also be accessed by double-clicking the scale on the Data
Graph.
5.5.9.2. Add Temperature (Y) Reference Lines
Temperature Reference Lines are colored horizontal lines and can be positioned
anywhere within the range of Y-values in the graph.
They are used for analysis when the Temperature (Y) parameter calculations are
displayed in the Data Table.
This is available when in Engineer Mode.
To add Temperature Reference Lines to the Data Graph:
1) On the Profile menu, click Add Temperature (Y) Reference Line.
2) Choose the reference line Type (Fixed and Linked). If Fixed is selected, enter a
fixed Temperature value. If Linked is selected, select a portion of the profile to link
it to.
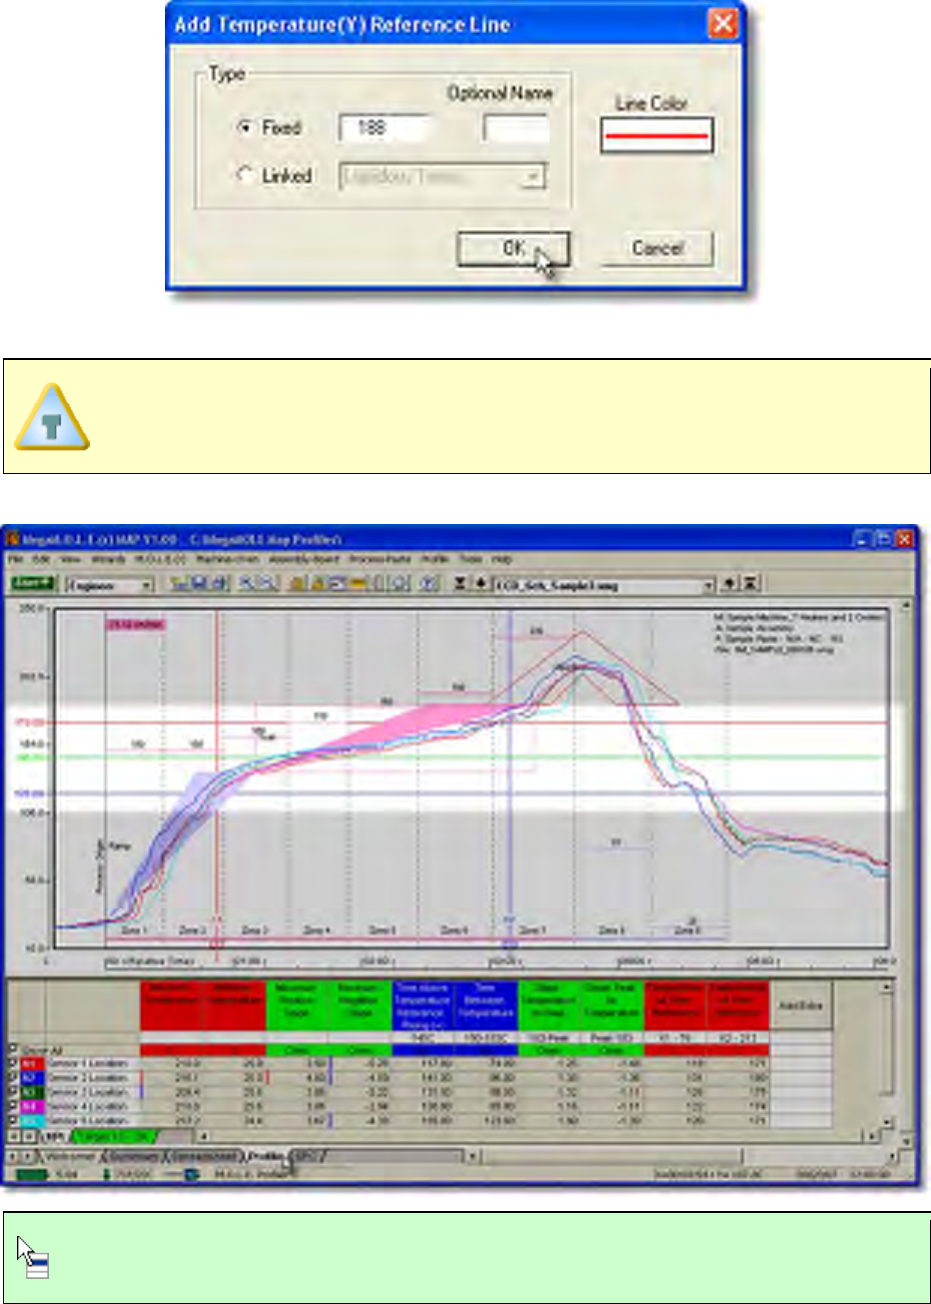
3) Select the line color by clicking the line button below the label.
When an reference line is displayed on the Data Graph, the default label is the
specified temperature. The software allows the user to rename the line by
using the Optional Name text box.
4) Click the OK command to accept the new settings or Cancel to quit the command.
This command can also be accessed by right-clicking the scale on the Data
Graph and select Add Temperature (Y) Scale from the shortcut menu.
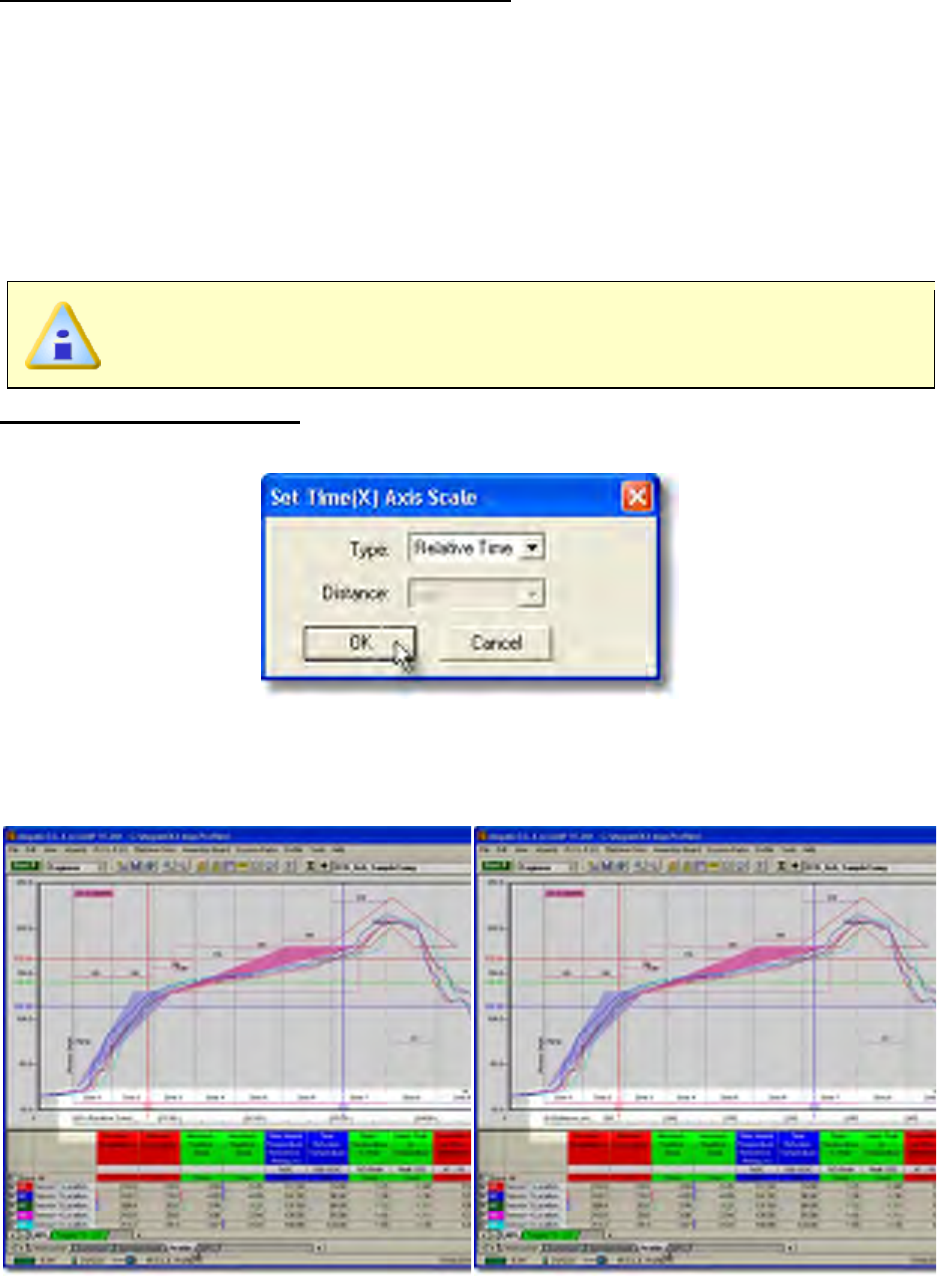
To move an Temperature (Y) Reference Line:
1) Position the mouse pointer over the desired reference line.
2) Double-click the reference line and the Add Temperature (Y) Reference line
dialog box appears.
3) Edit the reference line settings and click the OK command to accept the new
settings or Cancel to quit the command.
5.5.9.3. Set Time (X) Scale
This command controls the scale of the Time (X) axis on the Data Graph.
This is available when in Engineer Mode.
To select a Time (X) scale:
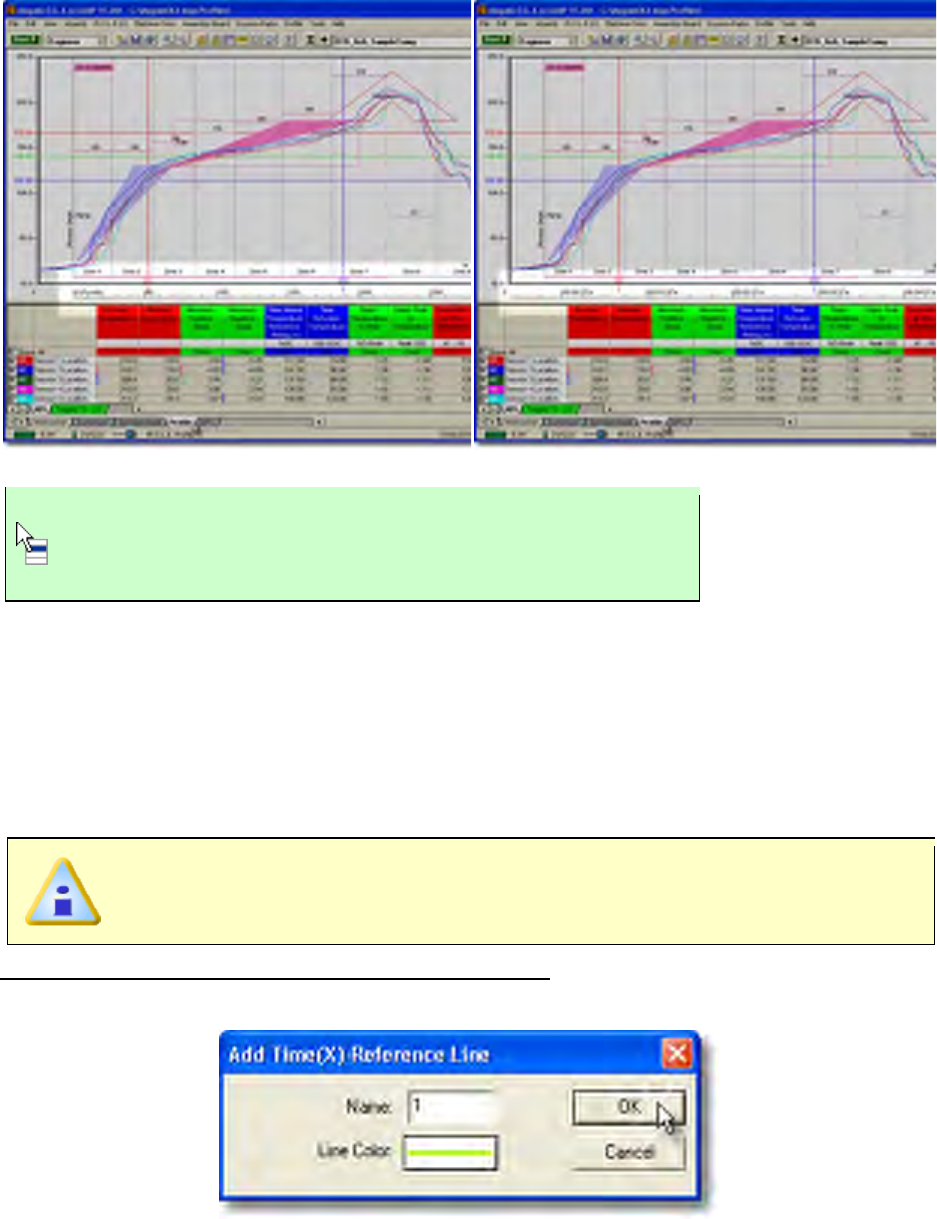
1) On the Profile menu, click Set Time (X) Scale.
2) Select the scale Type and Distance units.
3) Click the OK command button to accept the changes, or Cancel to discard any
changes.
Relative Time Scale
Distance Scale
Points Scale
Absolute Time Scale
This command can also be accessed by right-clicking the
scale on the Data Graph and select Set Time (X) Scale
from the shortcut menu.
5.5.9.4. Add Time (X) Reference Lines
Time Reference Lines are colored vertical lines that can be positioned anywhere within
the range of X-values on the Data Graph.
These reference lines indicate the temperature values at the intersection of a Data Plot
with each displayed reference line.
This is available when in Engineer Mode.
To add Time Reference Lines to the Data Graph:
1) On the Profile menu, click Add Time (X) Reference Line.
2) Select the line color by clicking the line button below the label.
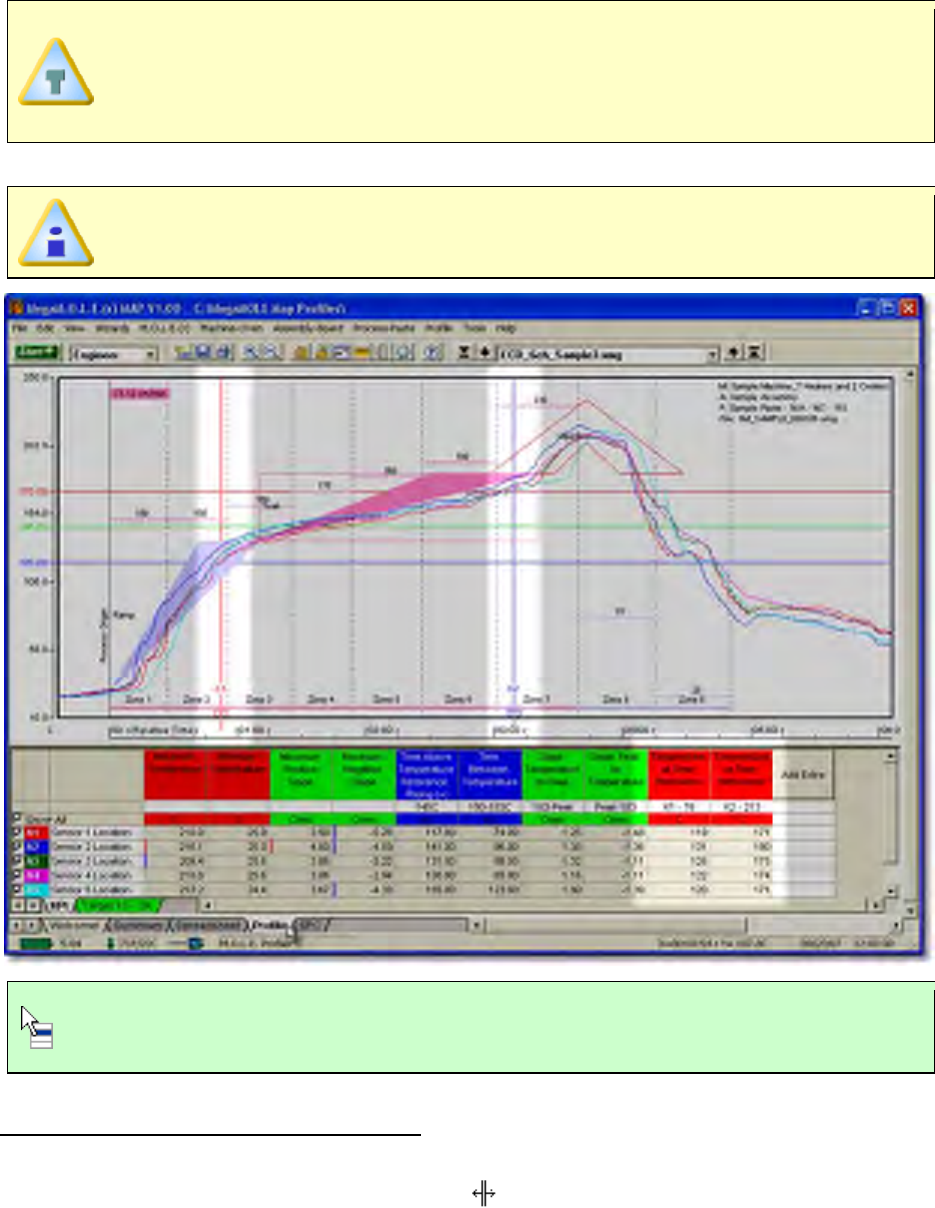
When a reference line is displayed on the Data Graph, the default label is the
next number of reference line. For example if there is two reference lines
displayed, the next default label will be 3. The software allows the user to
rename the line by using the Name text box.
3) Click the OK command to accept the new settings or Cancel to quit the command.
If a reference line is used in a Data Table calculation, the name of the
reference appears in the header along with the parameter value.
This command can also be accessed by right-clicking the scale on the Data
Graph and select Add Time (X) Reference from the shortcut menu.
To move an Time (X) Reference Line:
1) Position the mouse pointer over the a Time (X) Reference line.
2) When the mouse pointer becomes a , click and hold the left mouse button to
drag it left or right releasing the mouse button when the Time (X) Reference line is
at the desired location.
When moving the selected Time (X) Reference line, it can be moved past
other cursors to any location on the Data Graph.
When a Time (X) Reference line is moved to a new position, it snaps to the closest real
Time (X) value. Notice on highly magnified graphs that the line jumps from point to point.
The values in the Data Table are automatically updated to reflect the new position.
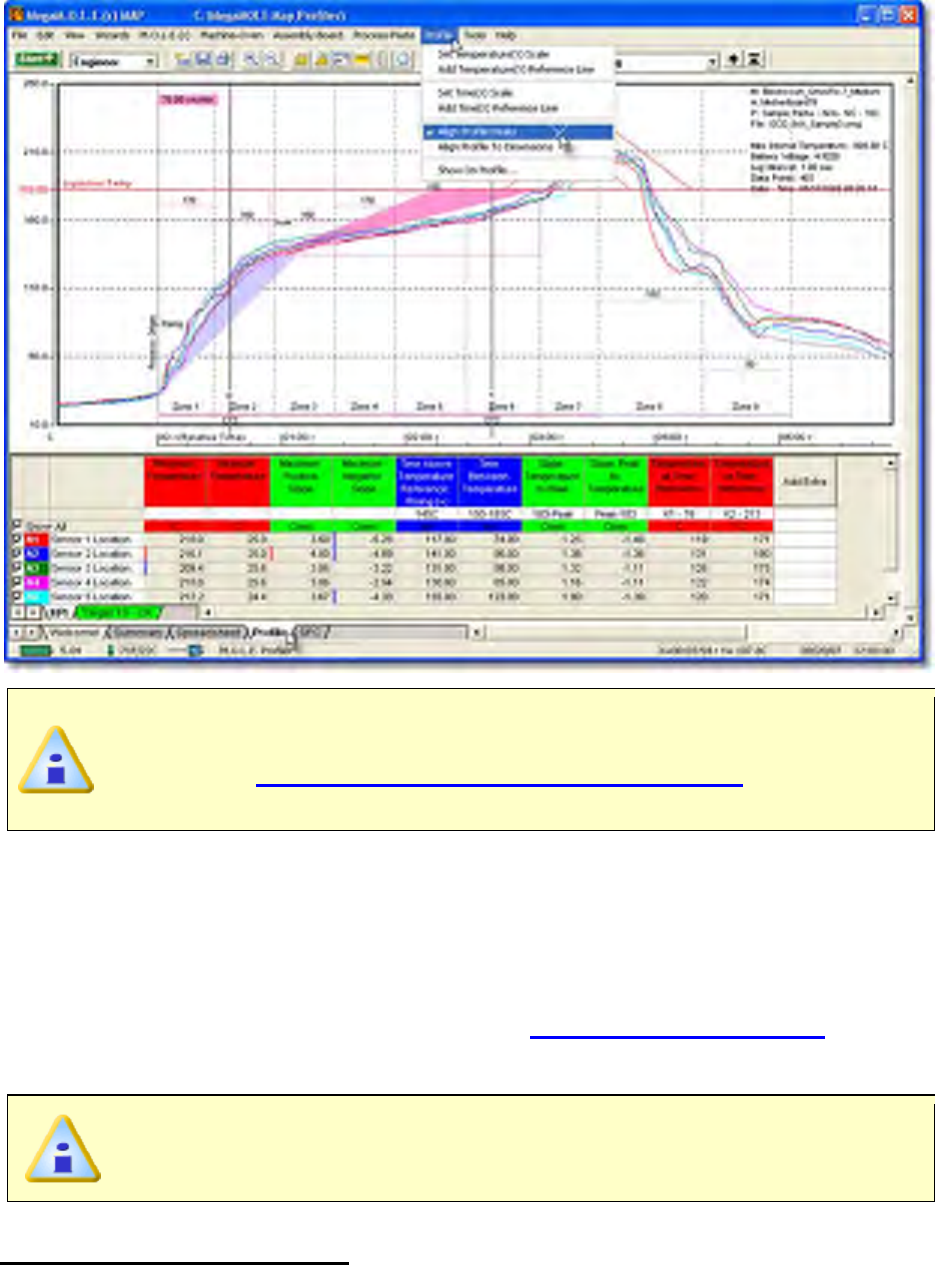
5.5.9.5. Align Profile Peaks
If sensors are placed so they enter and exit machine zones at different times, the resulting
Data Plots lag behind one another. The Align Profile Peaks command automatically
aligns the Time (X) axis maximum peak values for each Data Plot so the results can be
easily compared during analysis.
This is available in both Engineer & Verify Modes.
To align profile peaks:
A conveyor speed must be set to properly use this command. Refer to topic
Software>Menus>Machine>Set Machine Information or Software>Page
Tabs>Profile>Data Graph>Conveyor Speed Indicator for more details.
1) On the Profile menu, click Align Profile Peaks the channel lag values are
automatically calculated, and the Data Plots adjust to reflect them. A check mark
appears to the left of the command indicating the software is in Align Profile Peaks
mode. Repeat this step to disable the command.
When downloading a data run from the M.O.L.E. Profiler, the default sensor
alignment can be specified in the Profile tab of the Preferences dialog box.
Refer to topic Software>Menus>File>Preferences>Profile for more
information.
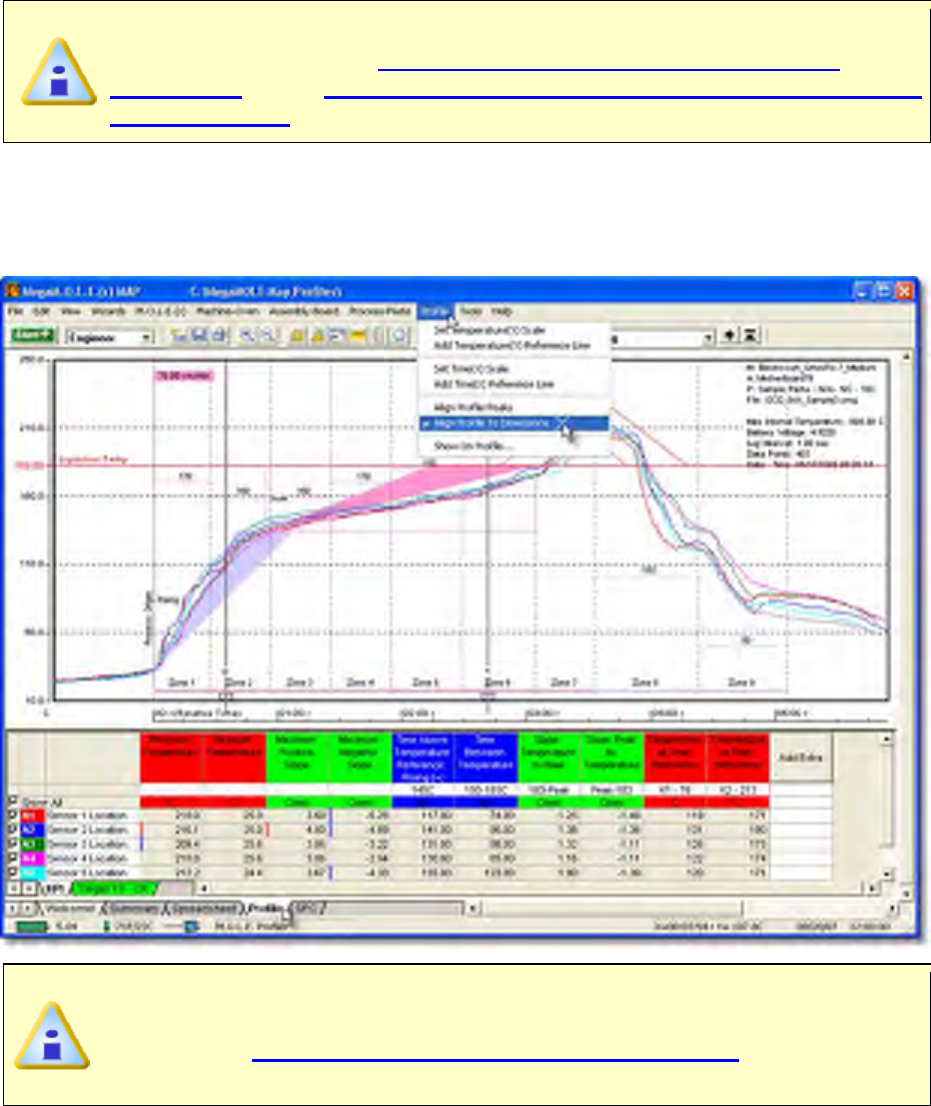
5.5.9.6. Align Profile to Dimensions
If sensors are placed so they enter and exit machine zones at different times, the resulting
Data Plots lag behind one another. The Align Profile To Dimensions command
automatically aligns the (X) values specified in the Set Assembly Information command
for each Data Plot so they are aligned in time so they can be easily compared during
analysis.
This is available in both Engineer & Verify Modes.
To align profile to dimensions:
A conveyor speed and sensor locations must be set to properly use this
command. Refer to topic Software>Menus>Machine>Set Machine
Information and/or Software>Page Tabs>Profile>Data Graph>Conveyor
Speed Indicator for more details.
1) On the Profile menu, click Align Profile To Dimensions the channel lag values
are automatically calculated, and the Data Plots adjust to reflect them. A check
mark appears to the left of the command indicating the software is in Align Profile
To Dimensions mode. Repeat this step to disable the command.
When downloading a data run from the M.O.L.E. Profiler, the default sensor
alignment can be specified in the Profile tab of the Preferences dialog box.
Refer to topic Software>Menus>File>Preferences>Profile for more
information.
5.5.9.7. Show on Profile
The data run file name can be displayed or hidden on the MAP data section of the Data
Graph.
This is available when in Engineer Mode.
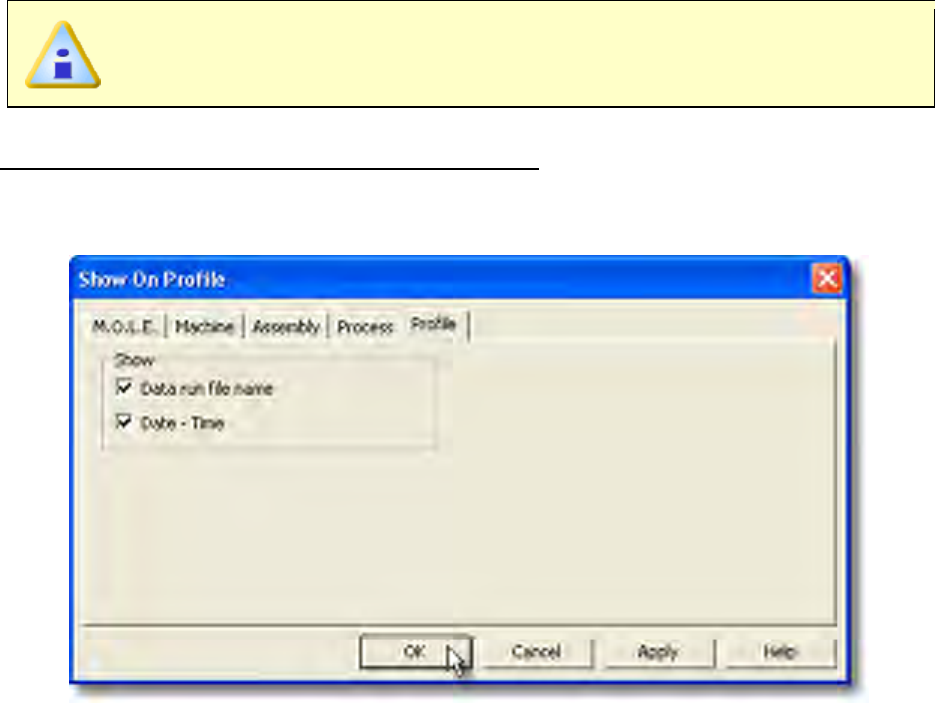
To show profile information on the Data Graph:
1) On the Profile menu, click Show on Profile.
2) Select or clear the File Name check box to display or hide it on the Data Graph.
3) Click the OK command button to accept, or Cancel to quit the command.
5.5.10. Tools Menu
Options in this menu help the user manipulate and analyze the data run profile displayed
on the Data Graph.
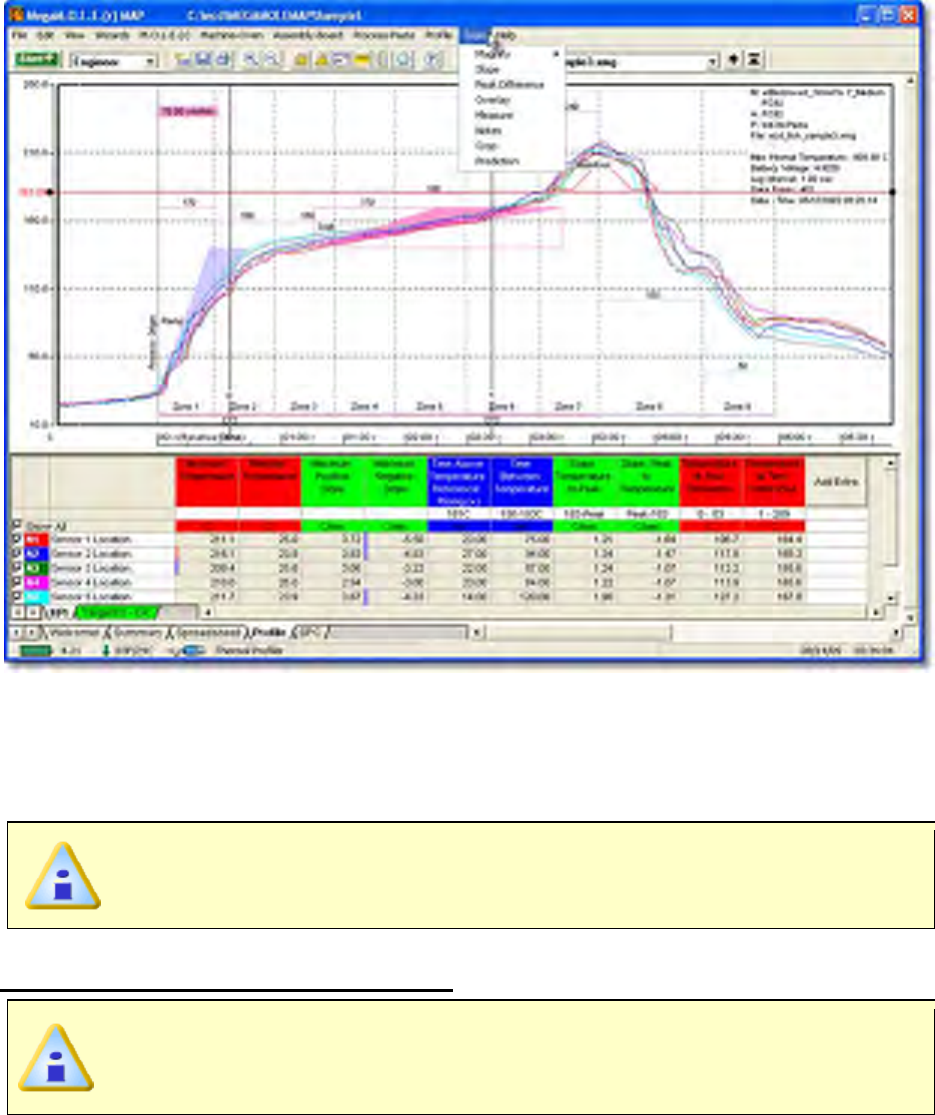
5.5.10.1. Magnify
The Magnify tool enlarges any selected area of the data graph for easy visual
examination.
This is available when in Engineer Mode.
To magnify a portion of the Data Graph:
When a Magnified Window constraint is applied to a parameter in the Data
Table, the Magnify tool is used to enlarge a portion of the Data Graph, and the
values within the magnified area are displayed in the Data Table.
1) On the Tools menu, point to Magnify then select Select Area.
2) Position the mouse pointer on a corner of the area to enlarge.
3) Press the left mouse button and drag the pointer diagonally to the opposite corner
to form a box around the area to be magnified. An outline of the box appears as
you drag.
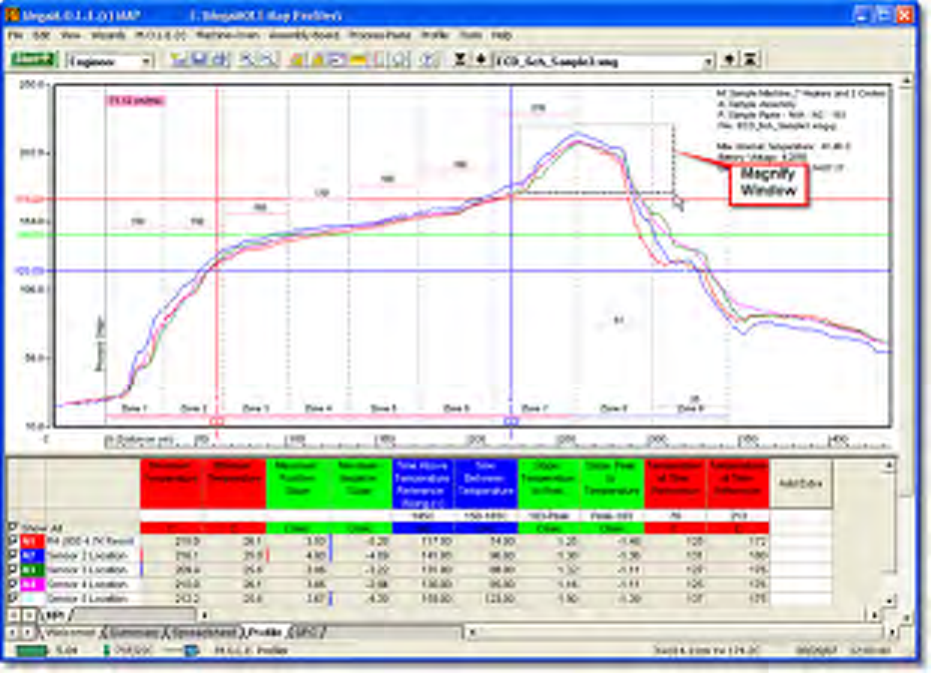
4) Release the left mouse button when the outline of the area to be magnified is
visible. The area inside the box is then magnified to fill the entire Data Graph.
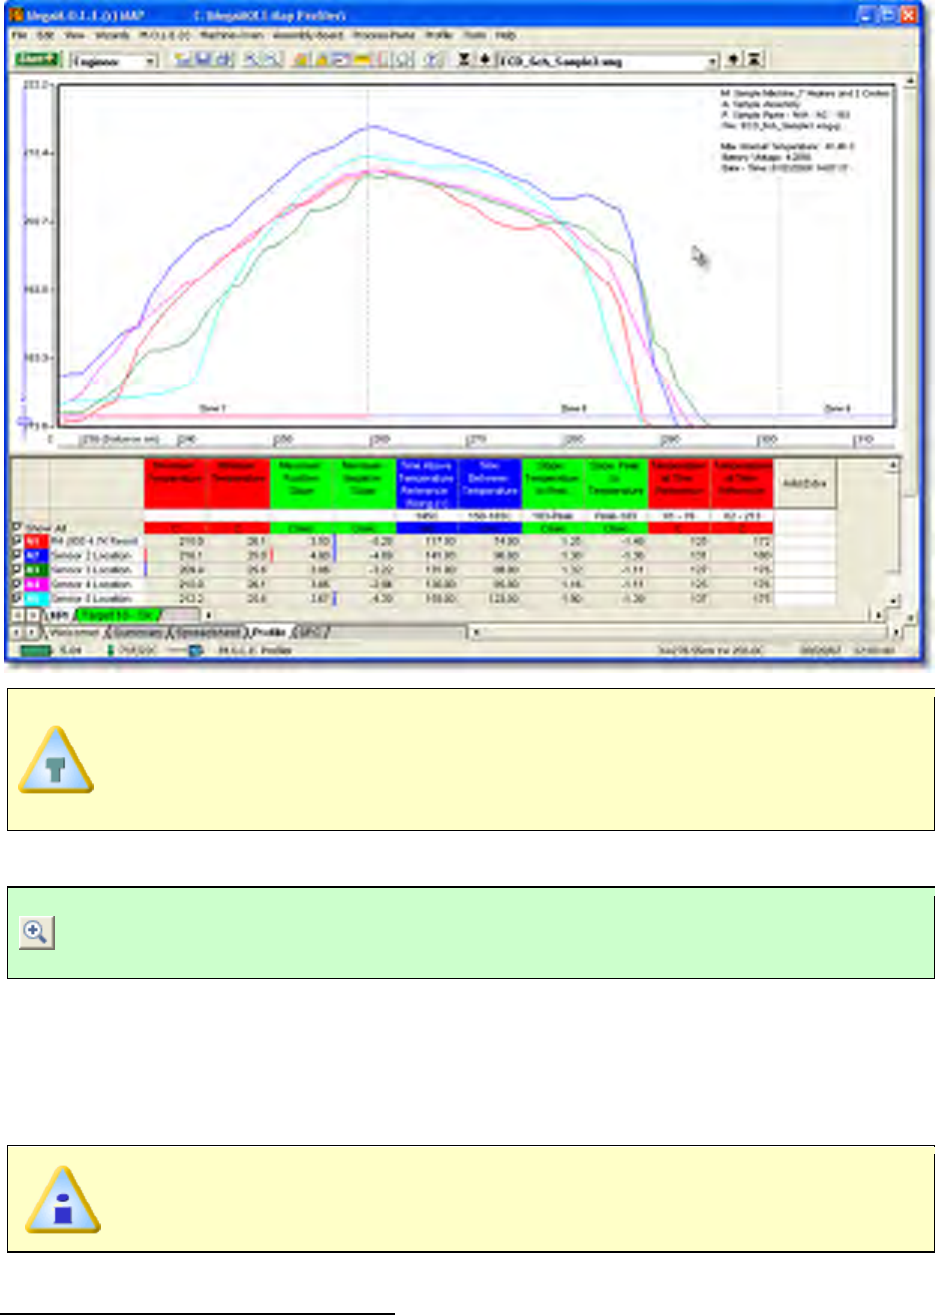
To show even more detail in the Data Graph, Magnify can be performed
multiple times. If the Magnify tool reaches the maximum zoom capability the
software will display a message box informing that the user has “Zoomed to
Tight”.
This command can be accessed on the Toolbar when the Profile Tab is active.
Magnify Button
5.5.10.2. Slope
The Slope tool finds the average slope between any two points in the Data Graph.
This is available when in Engineer Mode.
To find the average slope of a line:
1) On the Tools menu, click Slope.
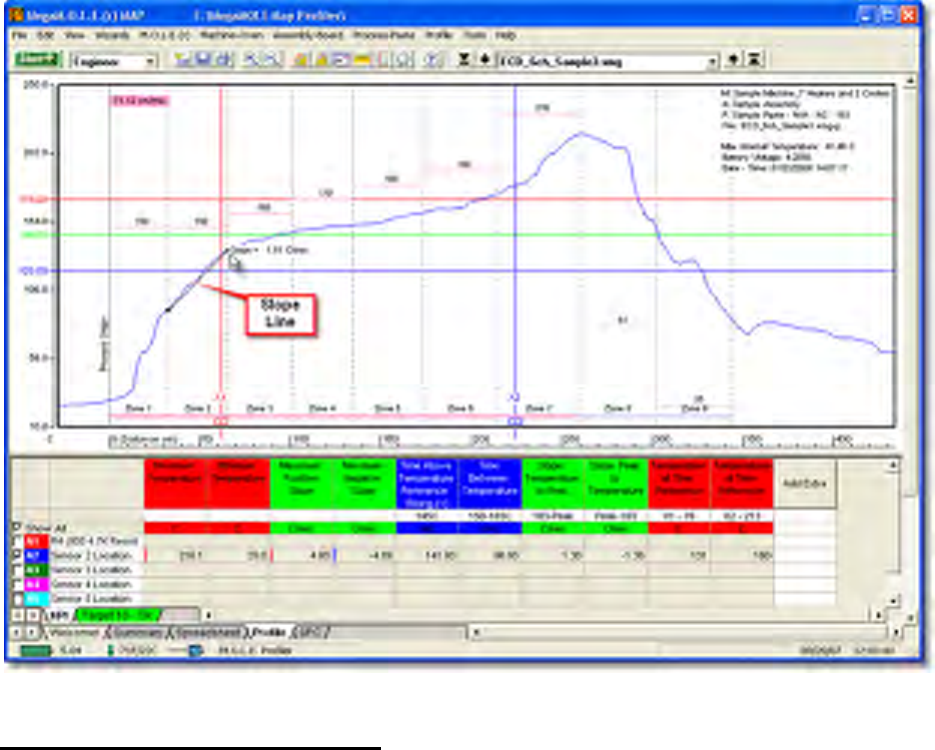
2) Position the mouse pointer at a point on the curve.
3) Press and hold the left mouse button.
4) Drag the pointer to the end of the desired slope line.
5) Release the left mouse button when the pointer is at the desired location. The
software will draw a slope line on the Data Graph, and label the slope value.
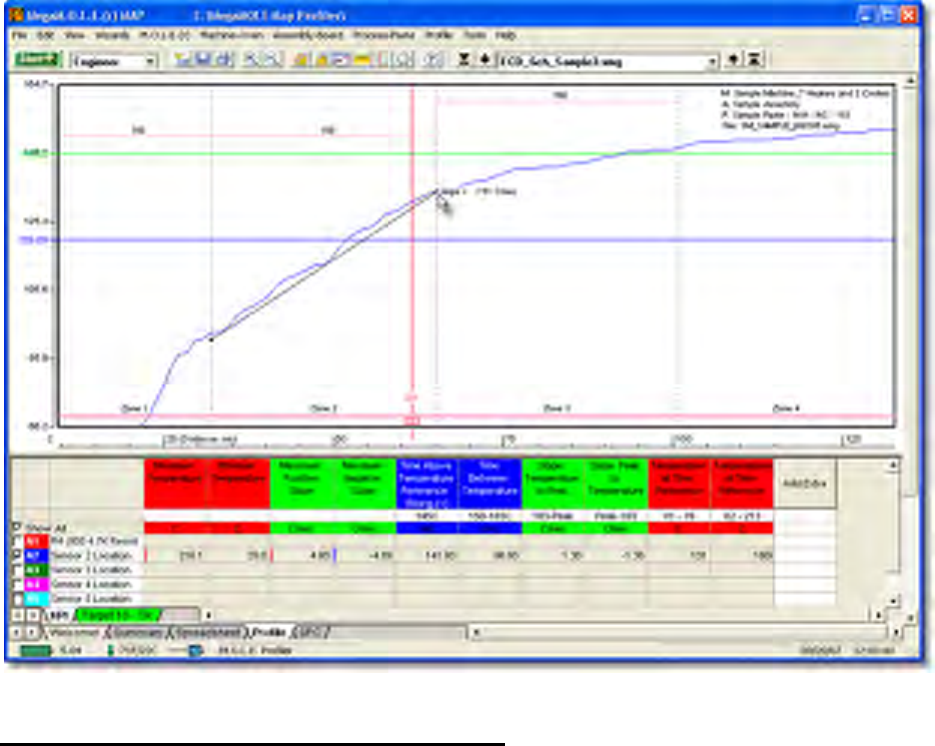
To obtain more accurate slopes:
1) On the Tools menu, click Magnify to magnify a portion of the Data Graph
2) Repeat the Slope command.
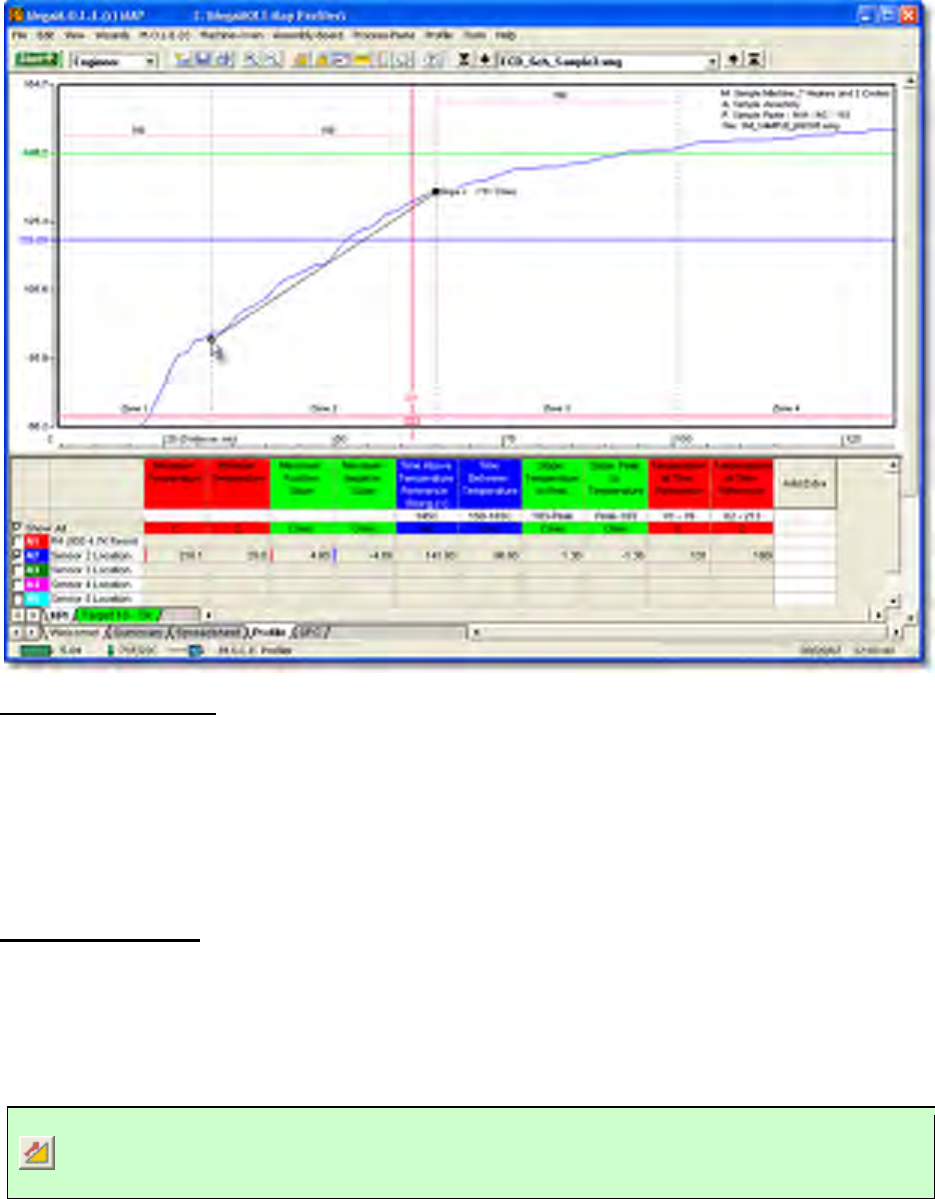
To remove a slope line from the Data Graph:
1) Using the mouse pointer, select the object on the Data Graph by clicking it once.
The object trackers will then become bold indicating that it has been selected.
2) Press the [Delete] key on the keyboard to remove the object.
Slope Applications
• Use the Slope tool to find the average slope between any two points on the graph.
Longer slope lines tend to produce more accurate slope calculations.
• The Slope tool can be used to compare actual data with ideal conditions by
drawing a line with a known slope (to represent the ideal condition) beside a
portion of a Data Plot.
Slope Limitations
• Slope calculations are based on logged points connected by the slope line. Points
occur only at the exact time intervals used to record data.
• The Slope tool cannot measure slopes when the line is vertical.
This command can be accessed on the Toolbar when the Profile Tab is active.
Slope Button
5.5.10.3. Peak Difference
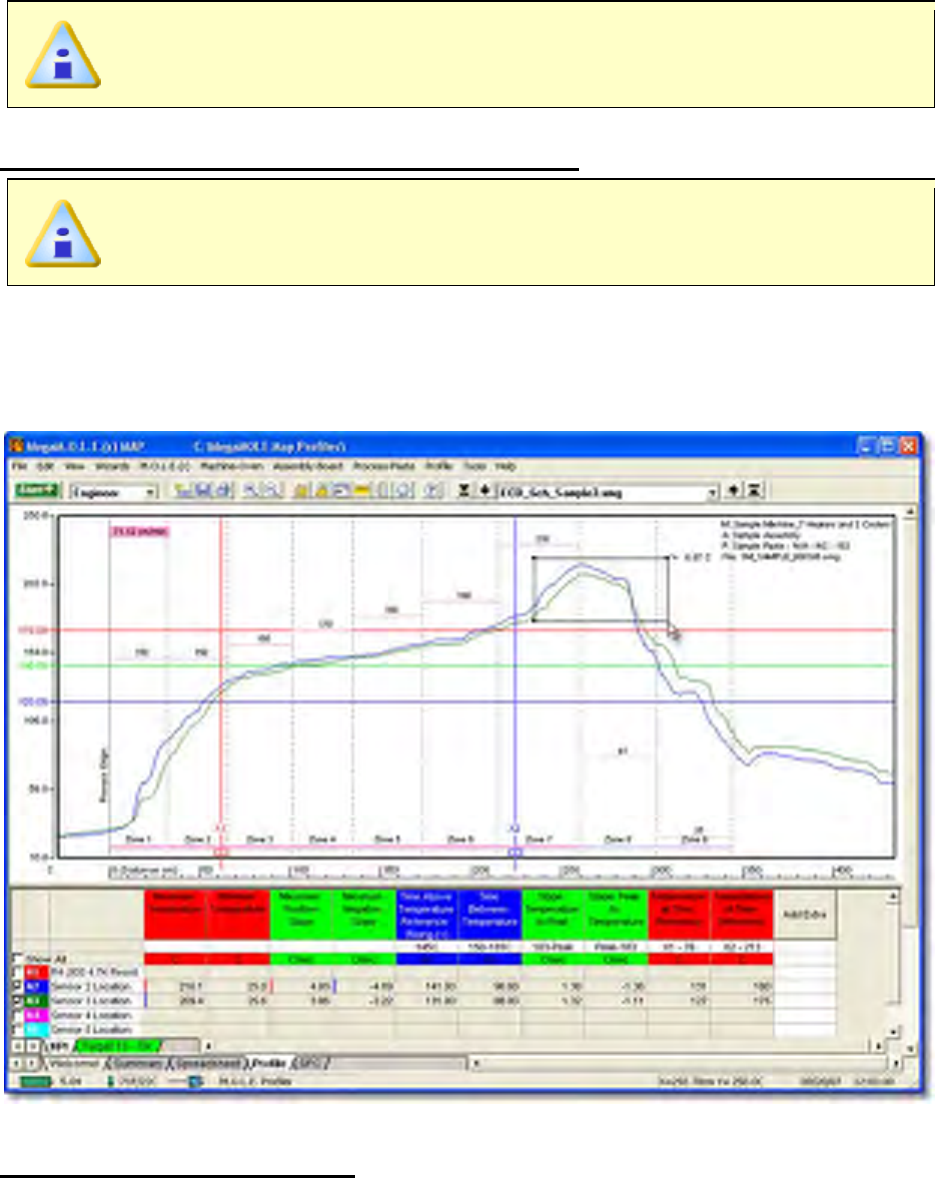
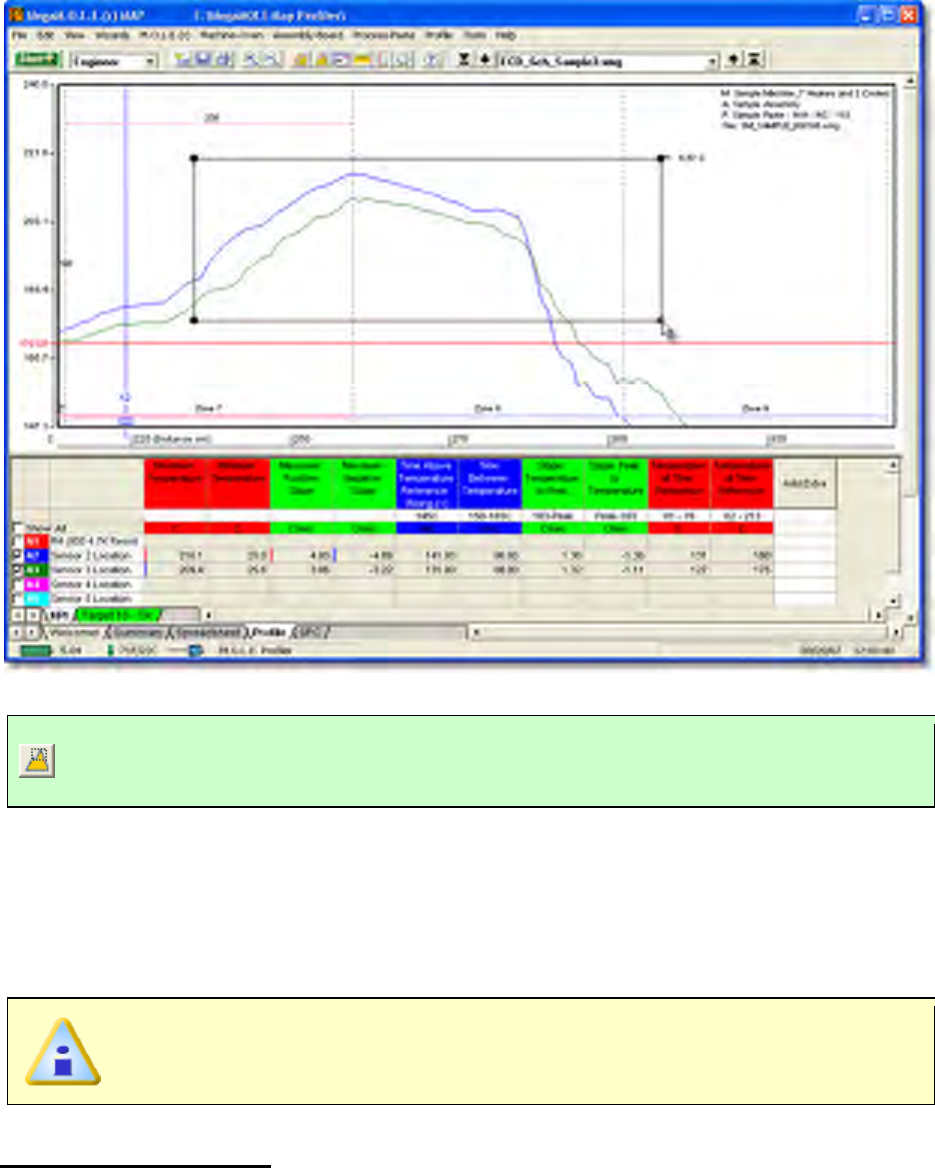
This command displays the difference in value between the peak of the maximum Data
Plot and the peak of the minimum Data Plot in any location of the Data Graph. This
command is especially useful for measuring side-to-side heating differences in a
machine (oven).
This is available when in Engineer Mode.
To display the peak difference between Data Plots:
The peak difference is calculated as the maximum difference between the
highest peak and the lowest peak within the rectangle.
1) On the Tools menu, click Peak Difference.
2) Position the mouse pointer on a corner of the area you want to analyze.
3) Press the left mouse button and drag the pointer diagonally to the opposite corner
to form a Peak difference box. An outline of the box appears as you drag.
To remove the peak difference:
1) Using the mouse pointer, select the object on the Data Graph by clicking it once.
The object trackers will then become bold indicating that it has been selected.
2) Press the [Delete] key on the keyboard to remove the object.
This command can be accessed on the Toolbar when the Profile Tab is active.
Peak Difference Button
5.5.10.4. Overlay
The Overlay tool displays a second data run profile over the currently displayed profile on
the Data Graph for comparison.
This is available when in Engineer Mode.
To overlay two Profiles:
1) On the Tools menu, click Overlay. A list box of data run files (.XMG) in the
currently open working directory appears.
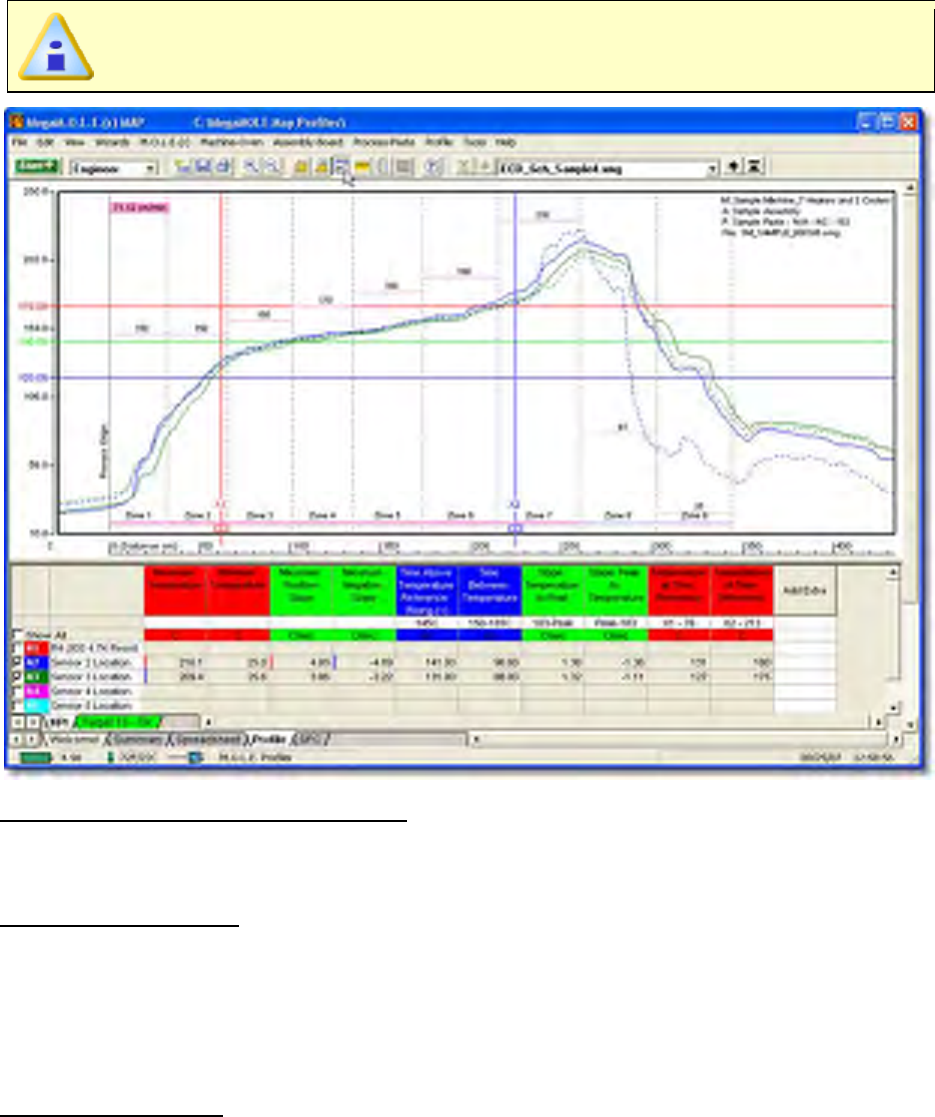
2) Select a data run file (.XMG) to overlay on the original.
The profile will be inserted at the same process origin and automatically scaled to the
same Temperature (Y) axis. The original Data plots remain as solid lines while those
added for comparison are dashed.
The dashed “Overlay” Data Plots are the same color as the original Data Plots.
To remove the overlaid Data Graph:
1) Select the Overlay command again.
Overlay Applications
• The Overlay and Magnify tools can be used together to overlay and compare ideal
reference profiles and magnified portions of the two data files. They can have
different but overlapping Time (X) values (times, point numbers, logging intervals)
or temperatures.
Overlay Limitations
• If the Data Plots are too numerous to clearly see the information of interest, they
can be suppressed by turning the desired channel in one or both files "OFF". This
must be done to the overlaid data run file prior to using the Overlay tool. Save that
data run file and use the Overlay tool again.
This command can be accessed on the Toolbar when the Profile Tab is active.
Overlay Button
5.5.10.5. Measure
The Measure tool is similar to the Slope tool except it measures the distance between any
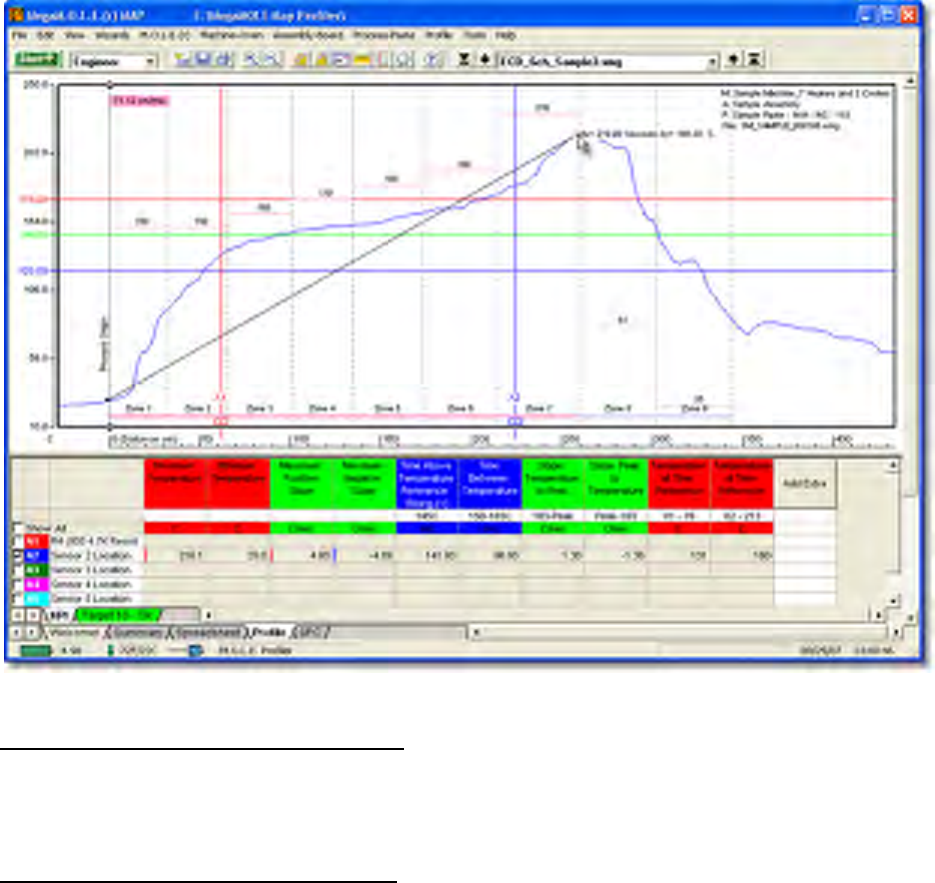
two points on the Profile worksheet Data Graph. This tool adds a line labeled with the
distance values to the graph, and notes the change in X and change in Y (Delta X and
Delta Y) instead of the slope. »
This is available when in Engineer Mode.
To find the distance between two points:
1) On the Tools menu, click Measure.
2) Position the mouse pointer at a point on the curve.
3) Press and hold the left mouse button.
4) Drag the pointer to the end of the desired point on the curve.
5) Release the left mouse button when the pointer is at the desired location and a
slope line labeled with the change in X and Y appears on the Data Graph.
To obtain more accurate distances:
1) Magnify a portion of the Data Graph using the Magnify tool and repeat this
procedure.
To remove the annotated distance:
1) Using the mouse pointer, select the object on the Data Graph by clicking it once.
The object trackers will then become bold indicating that it has been selected.
2) Press the [Delete] key on the keyboard to remove the object.
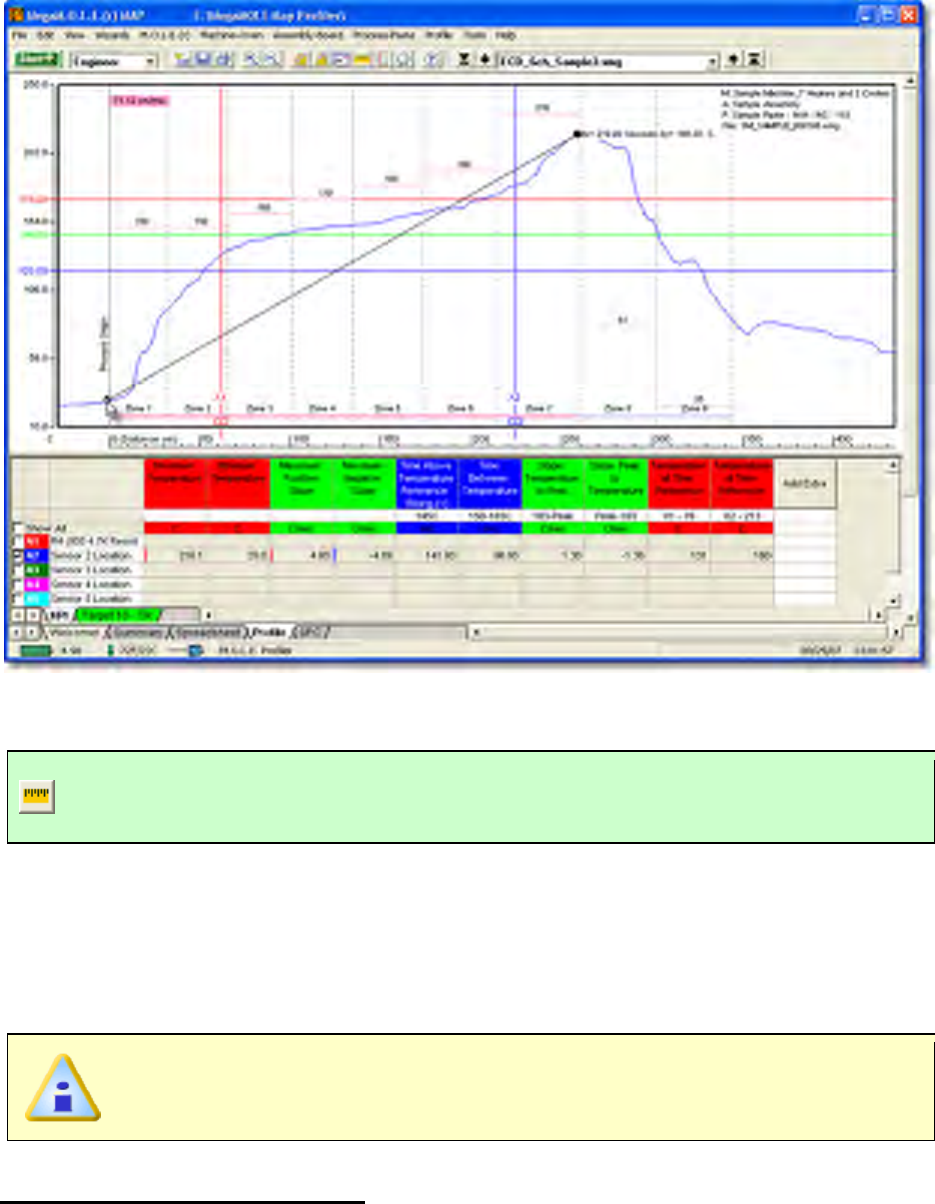
This command can be accessed on the Toolbar when the Profile Tab is active.
Measure Button
5.5.10.6. Notes
The Notes tool adds a leader with text to any portion on the Data Graph to label special
points of interest.
This is available in both Engineer & Verify Modes.
To add notes to the Data Graph:
1) On the Tools menu, click Notes.
2) Position the mouse pointer at the desired location to start the note leader, click and
drag the mouse pointer to the desired location for the note text and release the
mouse button.
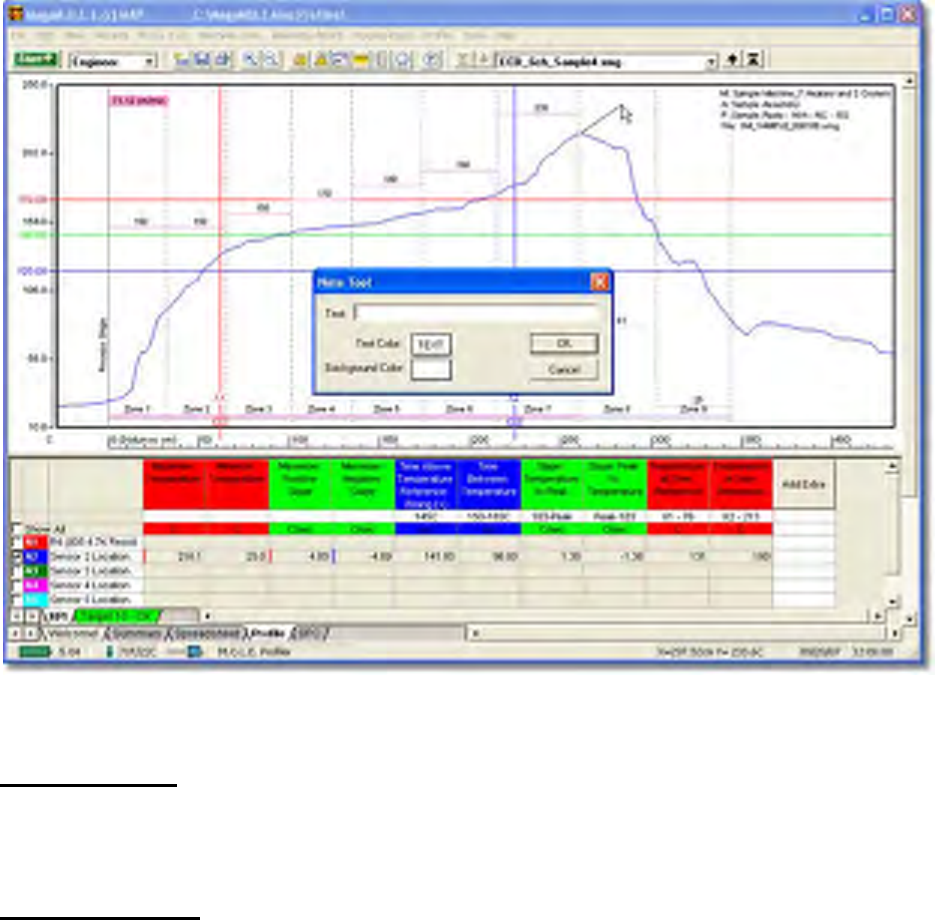
3) A dialog box appears allowing the user to enter a note by typing it in the text box.
There also are options to customize the color and font size.
4) Click the OK command button or Cancel to quit the command.
To move notes:
1) Select a note leader, click and drag the mouse pointer to the desired location for
the note and release the mouse button.
To remove notes:
1) Using the mouse pointer, select the object on the Data Graph by clicking it once.
The object trackers will then become bold indicating that it has been selected.
2) Press the [Delete] key on the keyboard to remove the object.
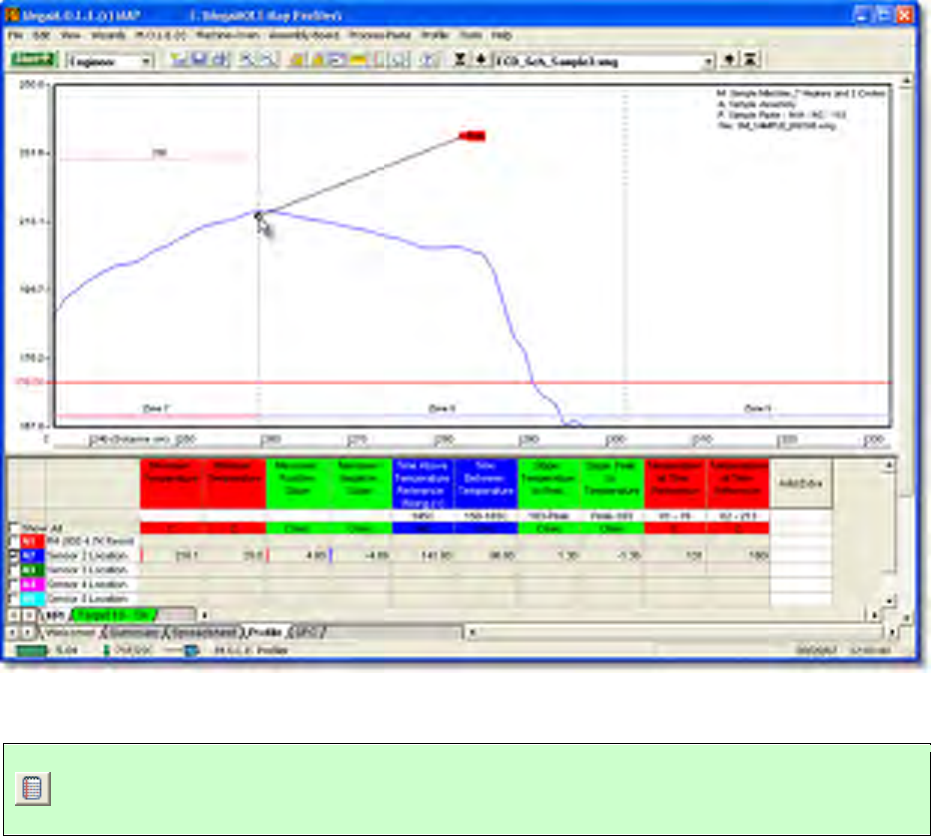
This command can be accessed on the Toolbar when the Profile Tab is active.
Notes Button
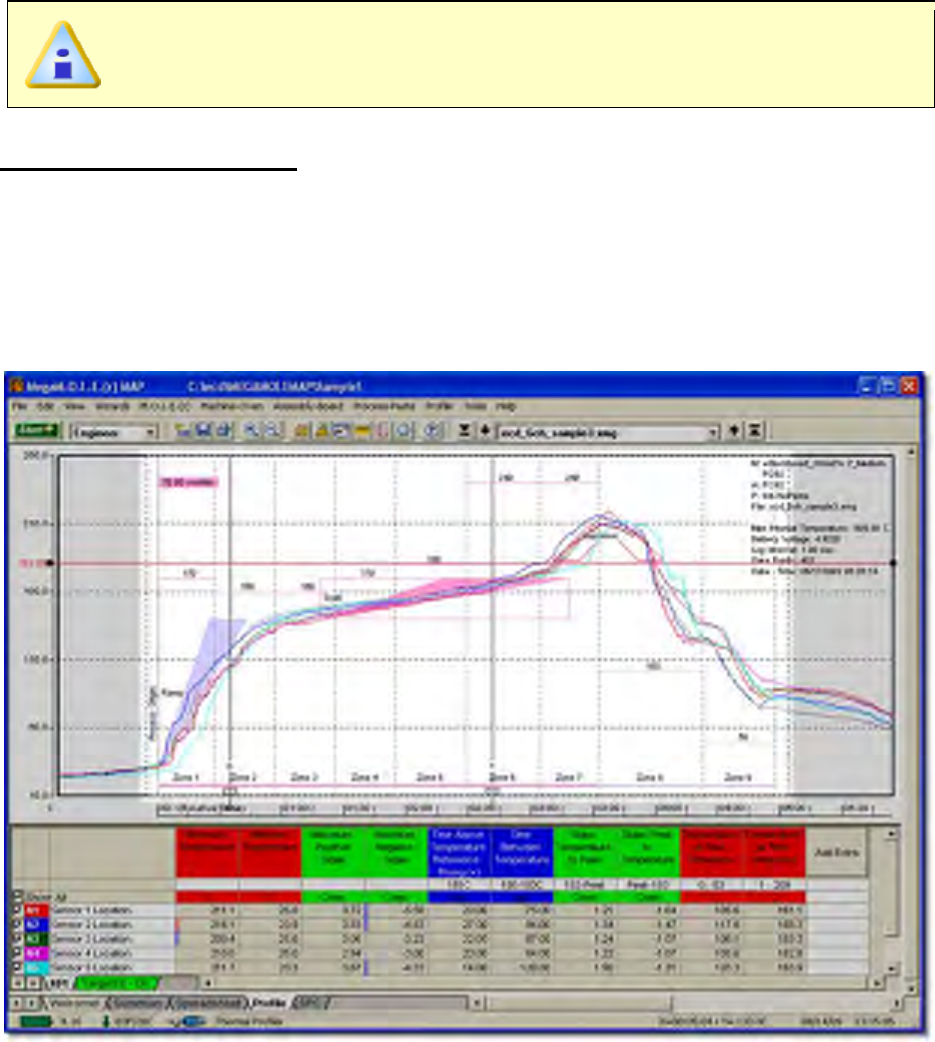
5.5.10.7. Crop
The Crop tool allows the user to save a portion of the data run profile that eliminates
unwanted portions from it. This crop tool only works for the Time (X) Scale which allows
the user the ability to remove portions from the front and back of the data run profile.
This is available when in Engineer Mode.
To crop a data run profile:
1) On the Tools menu, click Crop.
2) Position the mouse pointer on any area of the Data Graph you want to start the
crop.
3) Press and hold the left mouse button down, then drag the pointer horizontally to
the left or right. An outline of the box appears as you drag indicated by dashed line
that appears at the start point.
4) Release the left mouse button when the pointer is at the desired location. The
software prompts the user to save the cropped data run file (.XMG).
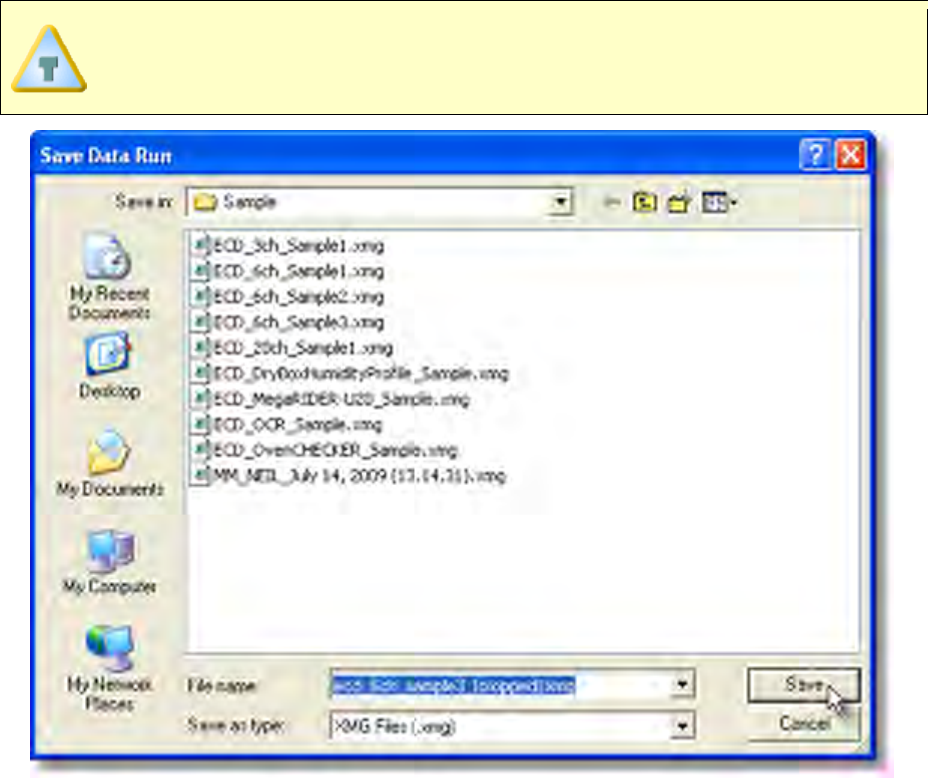
When saving a cropped data run file, the software allows the user to save as
the existing file name or give it a different one. This helps preserve the original
data run.
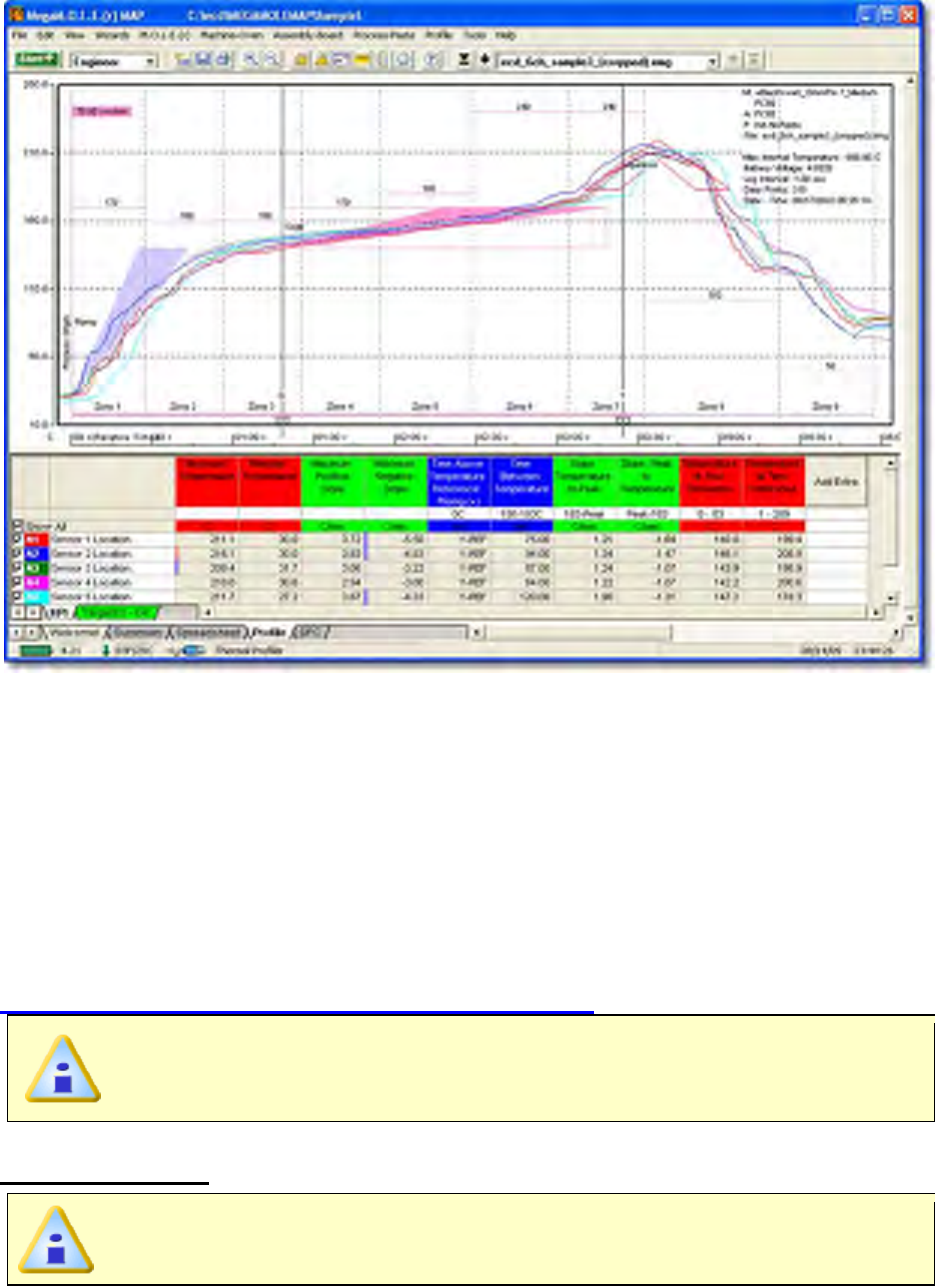
Once the cropped data run has been saved, it Autoscales to properly appear in the Data
Graph.
5.5.10.8. Prediction
One of the most impressive software features is the Prediction tool. This tool enables the
user to change a zone temperature value or the conveyor speed and predict the outcome
of that change. Prediction is easy to use and a valuable command that quickly defines
process parameters.
To use the Prediction Tool machine information must first be set to build an accurate
“model” of an machine (oven) environment. As experience with modeling grows, the first
values selected may need to be modified accurately reflect the process. Refer to topic
Software>Menus>Machine>Set Machine Information.
This is available when in Engineer Mode.
To predict results:
If Zone temperatures are not set, the Prediction tool will not work.
1) On the Tools menu, click Prediction and the Prediction pallet appears.
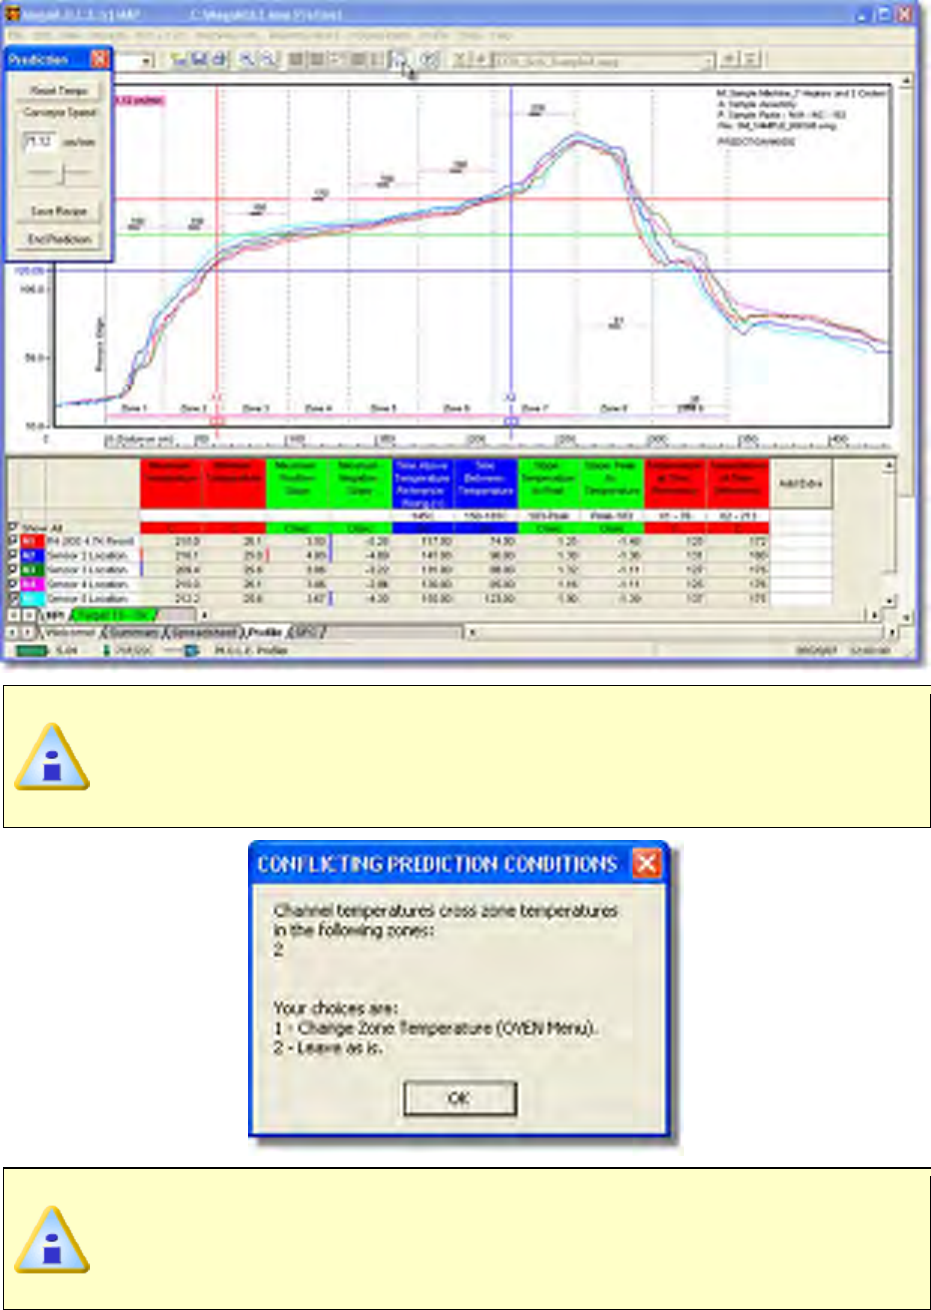
If sensor temperatures are inconsistent with zone temperature settings, a
message box with an explanation appears. The explanation appears only
once for all zones, each time Prediction is used. After that, the software
assumes the user is aware of the potential problem.
The inconsistent setting does not prevent the software from making a
prediction. It makes a rational assumption about what is happening. In addition
to the explanation, several logical ways are displayed to correct the conflicting
conditions at the bottom of the dialog box.
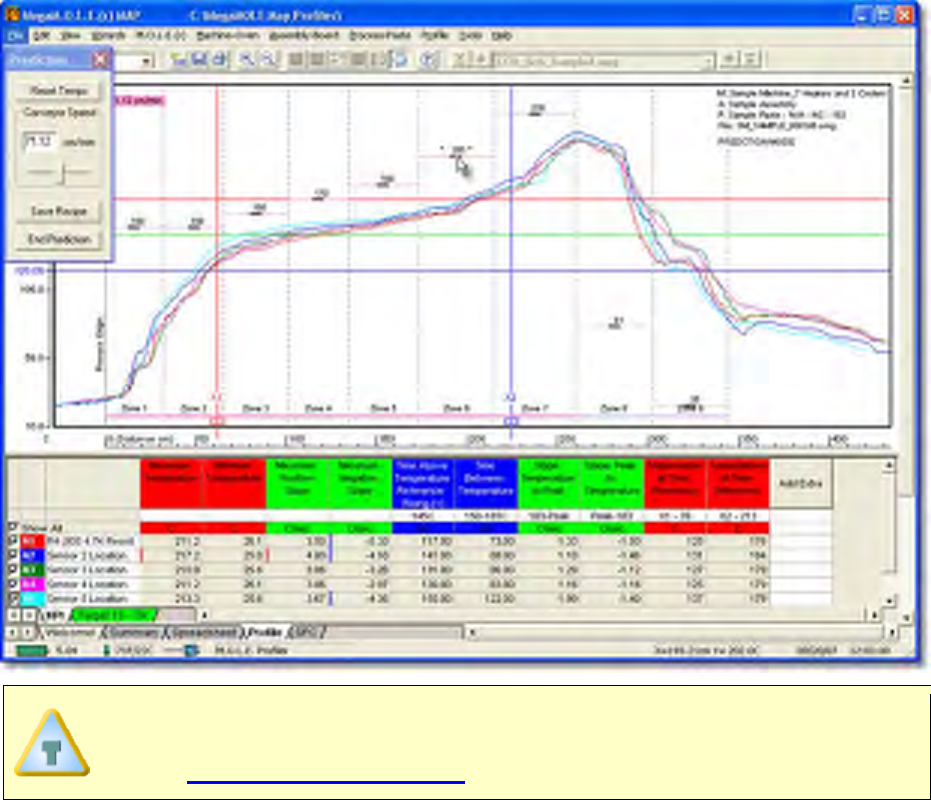
2) Experiment by making “what if” changes to the conveyor speed and sliding Zone
Temperature Prediction Handles up or down to the preferred prediction
temperature.
If the Top and Bottom zone temperature setpoints are different, the software
allows the user to perform predictions by adjusting them independently. Refer
to topic Set Machine Information.
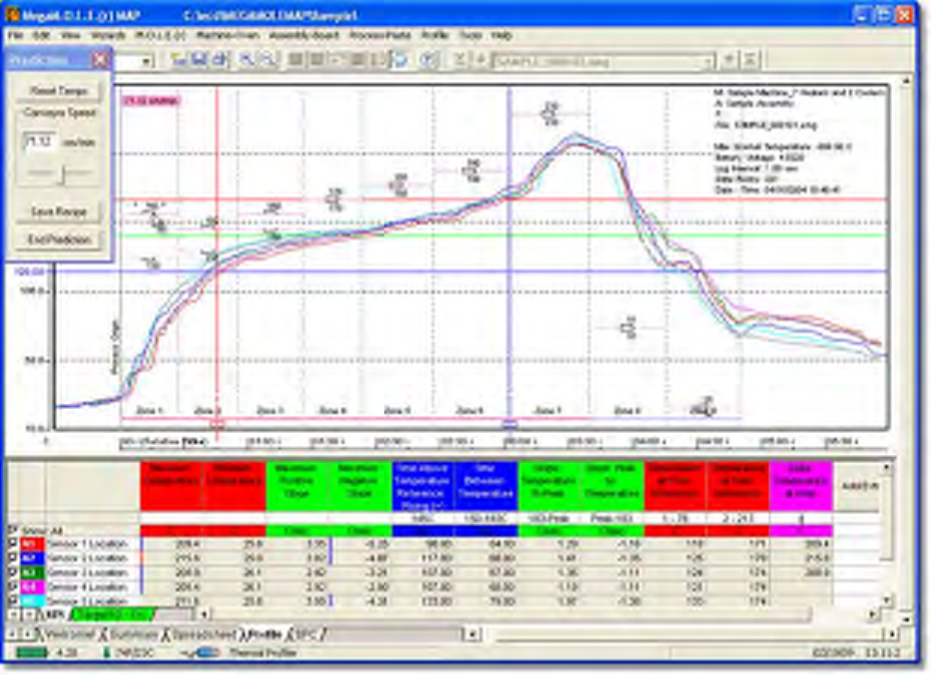
3) Once the predicted machine recipe is at the desired settings, the user can save
them to a recipe file (.XMR) or print them by selecting the Save Recipe command
button.
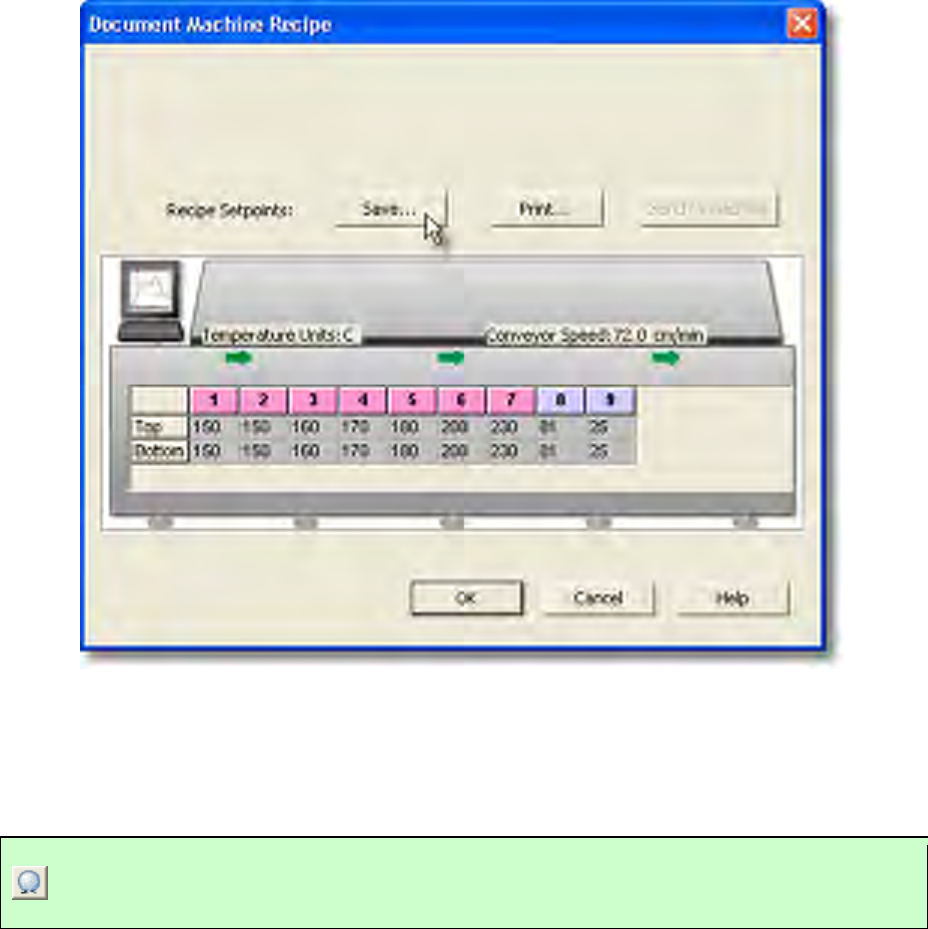
4) Once the machine recipe is saved, set the machine to the final prediction values,
let it stabilize and then perform another data run to check if the process has been
optimized.
This command can be accessed on the Toolbar when the Profile Page Tab is active.
Prediction Button
5.5.11. Help Menu
The Help menu commands are useful when information is needed quickly or when this
Users guide is not available.
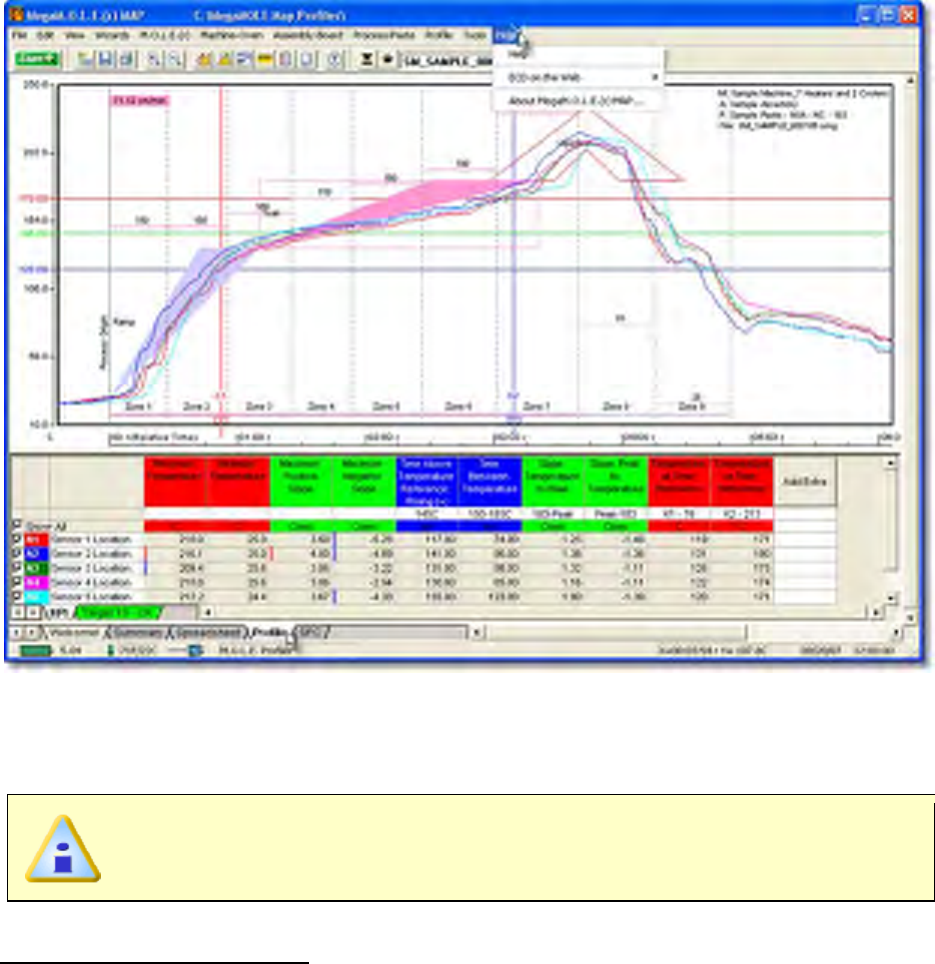
5.5.11.1. Help
The Help Index is a complete reference tool that can be used at any time.
This is available in both Engineer & Verify Modes.
To launch the help system:
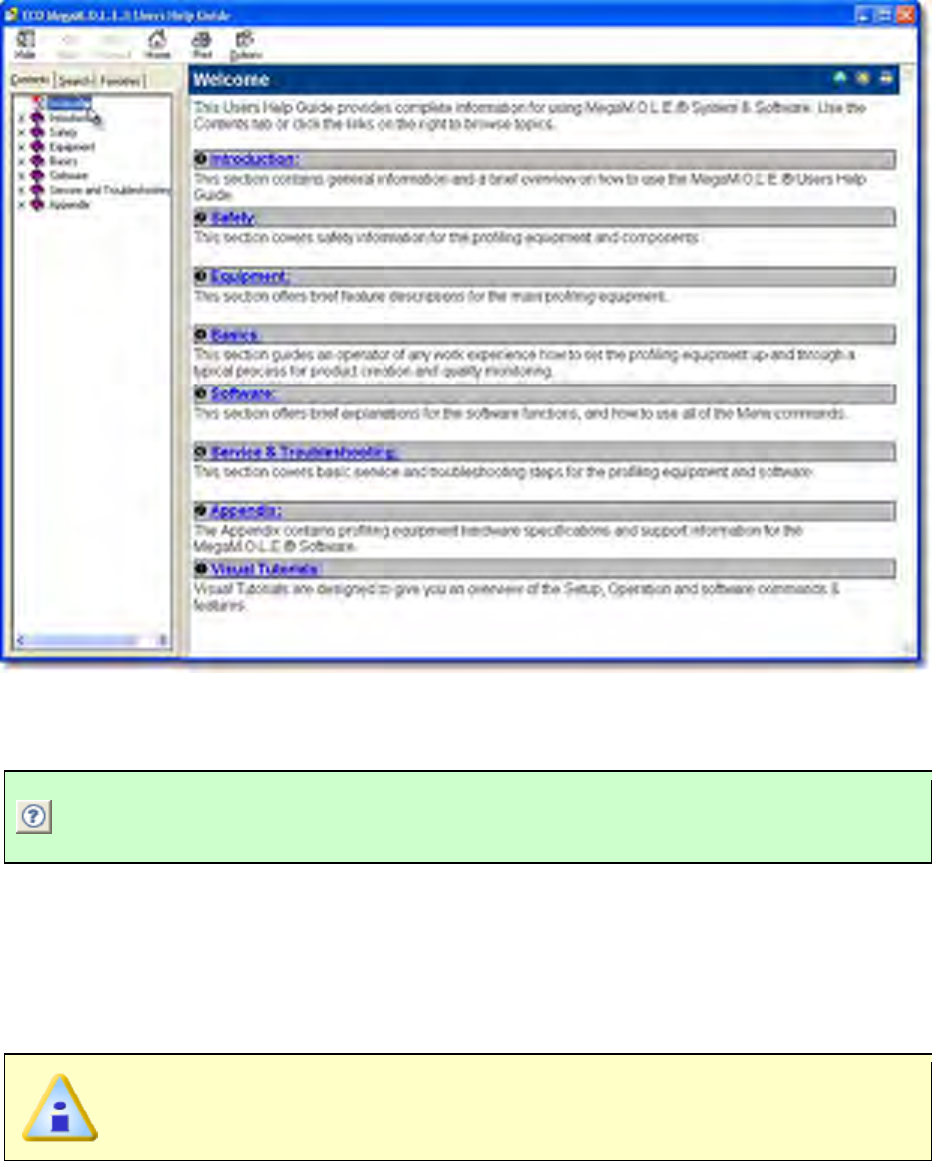
1) On the Help menu, click Help to launch the user’s help guide. You may now
search for the help topic of your choice.
This command can be accessed on the Toolbar and can also be used by pressing the
shortcut key [F1].
Help Button
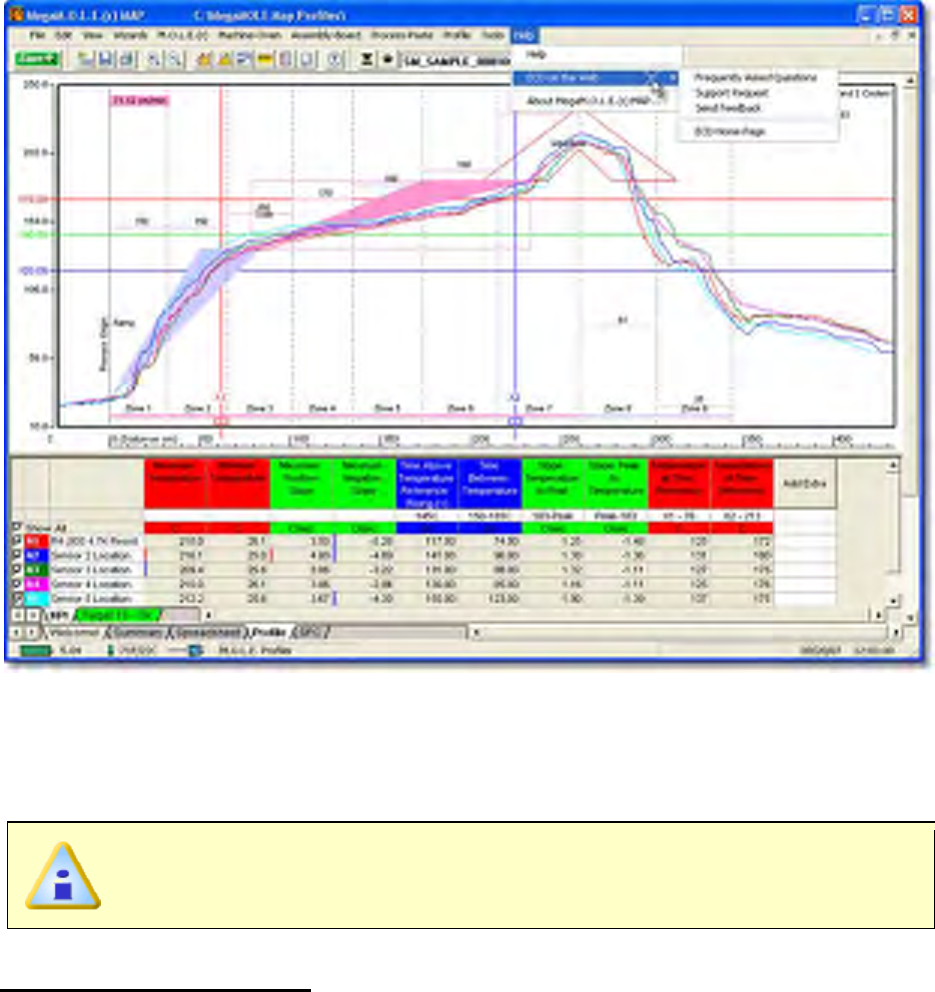
5.5.11.2. ECD on the Web
You can access more help by using ECD web commands. Let us help you by using the
linked commands to the ECD Web site.
This is available when in Engineer Mode.
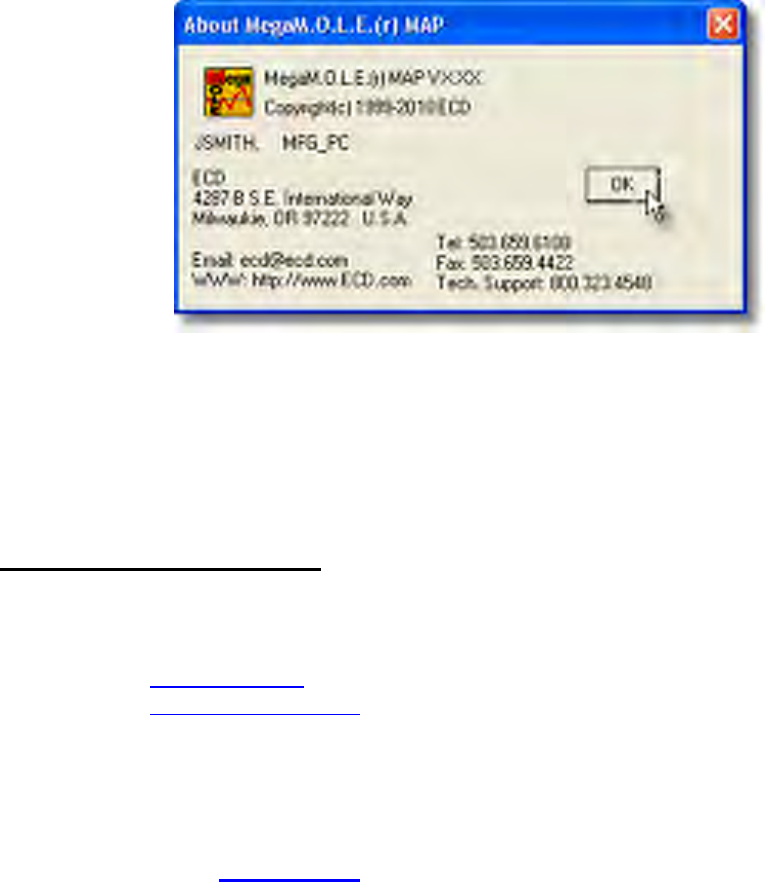
5.5.11.3. About MEGAM.O.L.E.® M.O.L.E.® MAP
The About command displays the software version, release date and company
information.
This is available in both Engineer & Verify Modes.
To view About information:
1) On the Help menu, click About M.O.L.E.® MAP.
6. Optional Accessories
This section covers optional accessories that ECD offers to enhance the use of the
M.O.L.E. Profiler. Contact ECD for complete ordering options and current pricing. You
can also visit the ECD web site for additional information.
Here is how to contact ECD:
Telephone:
(800) 323-4548
(503) 659-6100
FAX:
(503) 654-4422
Email:
ecd@ecd.com
Internet:
http://www.ecd.com
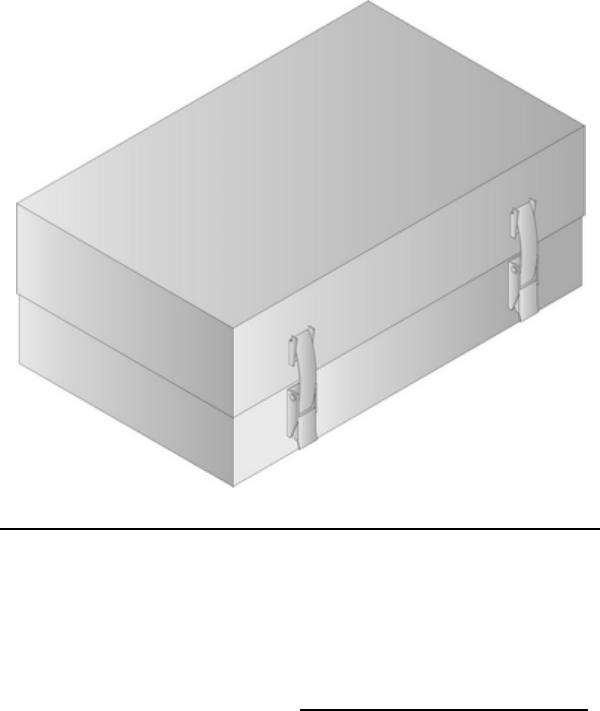
6.1. Thermal Barriers:
The Lead-Free process barriers provide different protection features for the M.O.L.E.
Profiler. Refer to the Armor Chart at the end of this section to determine which is best for
your process.
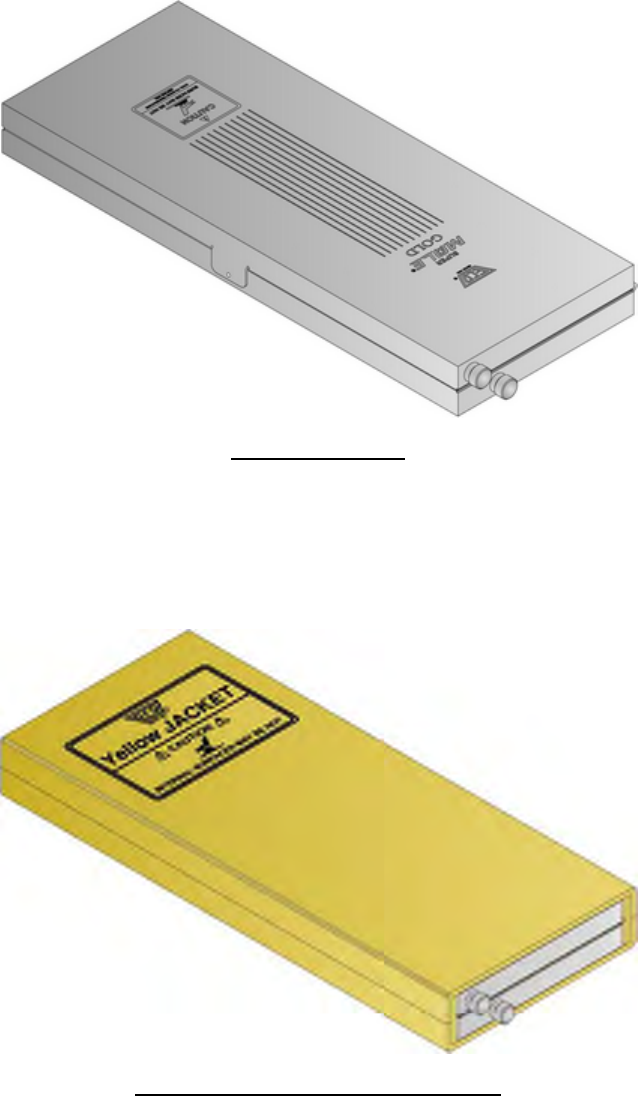
1.0” Uni-barrier
Part Number:
E42-0901-80
Dimensions, Inches:
1.0” 4.1” x 10.62”
Dimensions, Millimeters:
25.4 x 104 x 269.7mm
Weight:
1lb 15oz (0.88kg)
1.0" Uni-Barrier w/Yellow Jacket
Part Number:
E44-0944-80
Dimensions, Inches:
1.28” x 4.53” x 11.28”
Dimensions, Millimeters:
32.5 x 115 x 286.5 mm
Weight:
2.1lbs (0.95kg)
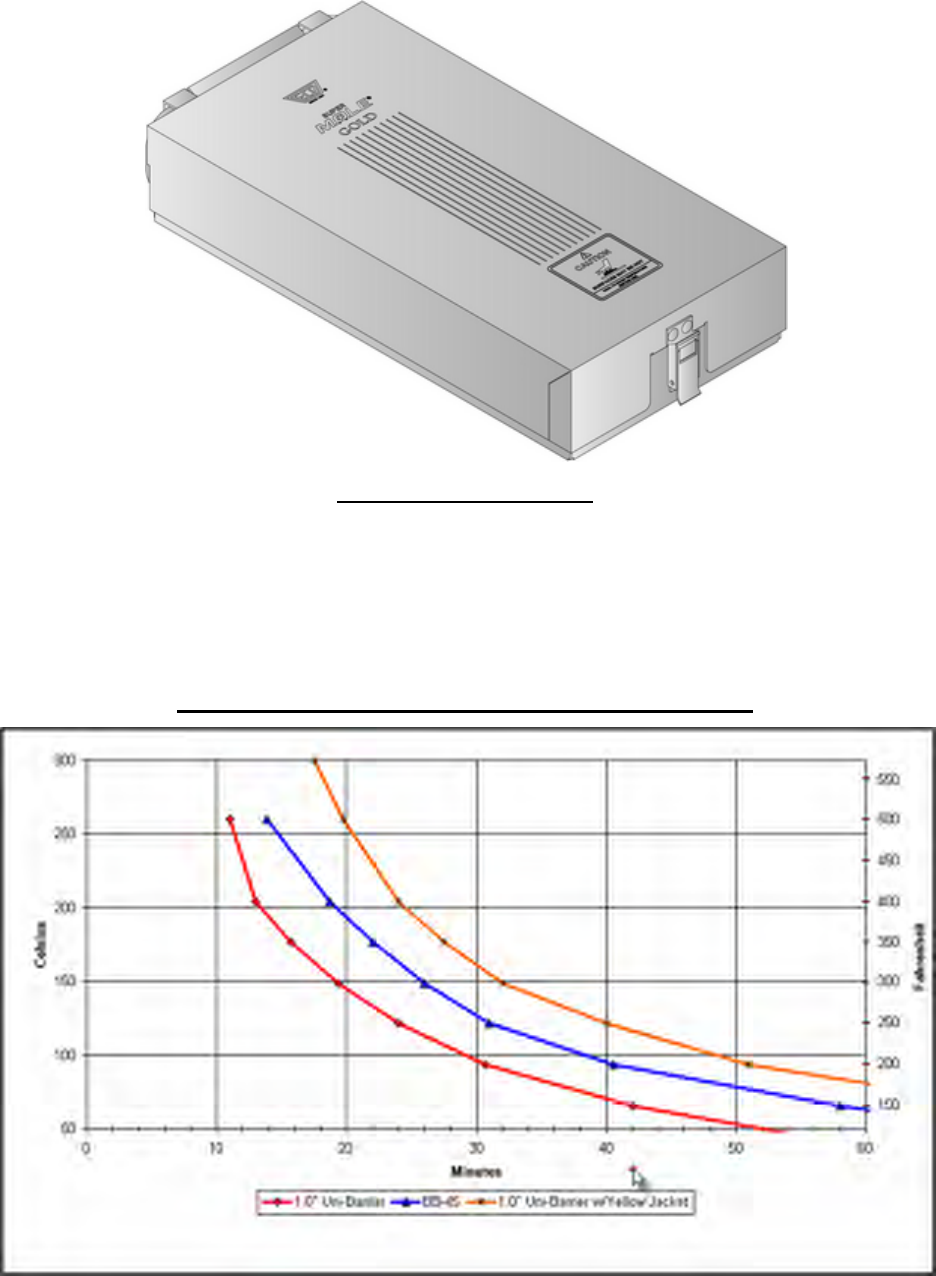
BB-45 Hinged Hot Box
Part Number:
E44-4245-80
Dimensions, Inches:
1.75” x 4.6” x 9.9”
Dimensions, Millimeters:
44.5 x 116.8 x 251.5mm
Weight:
3lbs 9oz (1.62kg)
Lead-Free Process Thermal Barriers - Armor Chart
6.2. Alternate Thermal Barriers:
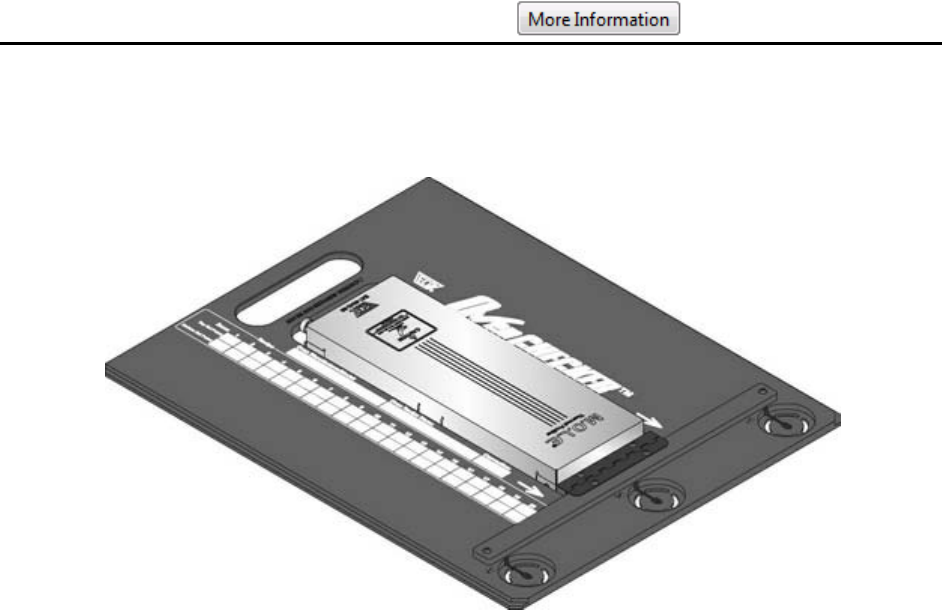
Super HOT BOX (For 450°F 40 minute oven profiling)
Part Number:
E29-2686-90
Dimensions, Inches:
5.25” x 7.9” x 13.0”
Dimensions, Millimeters:
133.4 x 200.7 x 330.2mm
Weight:
11lbs 11oz (5.30kg)
6.3. Products
ECD offers optional products that enable the M.O.L.E. profiler ability to monitor
Temperature and Reflow Analysis. This platform approach ensures the longevity of your
initial investment giving you great flexibility while minimizing training time. The following
section briefly describes the products that can be used in conjunction with the M.O.L.E.
Profiler to monitor and document manufacturing processes. Refer to the beginning of this
topic for contact information.
OvenCHECKER™ Oven Verification System
The OvenCHECKER™ Option is exclusively used with the V-M.O.L.E.® profiler and it
becomes an oven verification system which is the easiest way known to “Verify” a reflow
oven profile. This system allows Engineers-to-Operators “Checking” oven performance
immediately.
The long-life pallet is designed for more than 1,000 reflow runs which includes 3 sensors
and Thermal Barrier.
ECD-exclusive “OK Button” on the V-M.O.L.E.® makes for quick work of assessing profile
to be IN or OUT of specification.
If you…
• Need to verify your oven profile,
• Need to train multiple production operators to profile,
• Need to delegate Go/No-Go decisions to increase your own productivity
… you need OvenCHECKER™
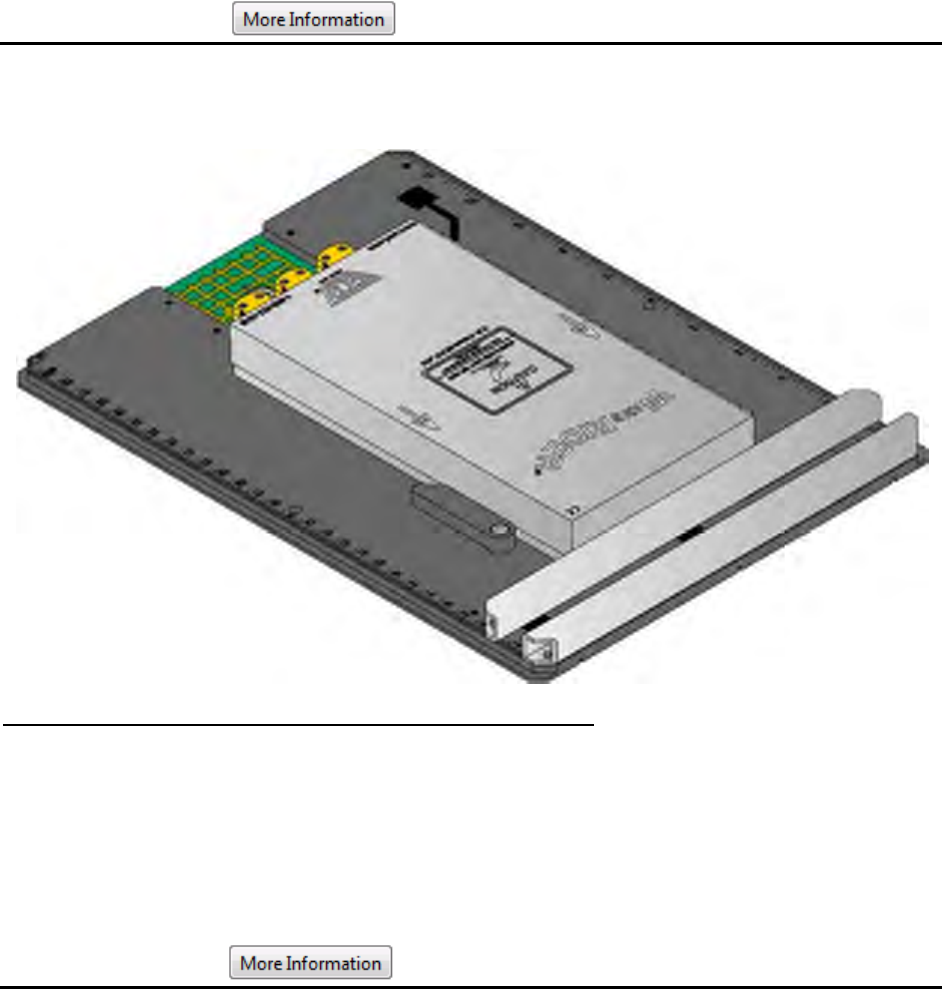
For use with: V-M.O.L.E.® Thermal Profiler
WaveRIDER® NL 2
The WaveRIDER® NL 2 is a self-contained system designed to give the user critical data
on Wave Solder Machine setup and performance parameters. The WaveRIDER® comes
in several standard sizes and is available in custom widths.
Comprehensive SPC software is included featuring:
• X-bar-bar and R SPC Charting
• Measure and track conveyor speed
• Parallelism of the Solder Wave(s)
• Preheat Slopes and Solder depth
For use with: SuperM.O.L.E.® Gold Thermal Profiler
OvenRIDER® NL 2
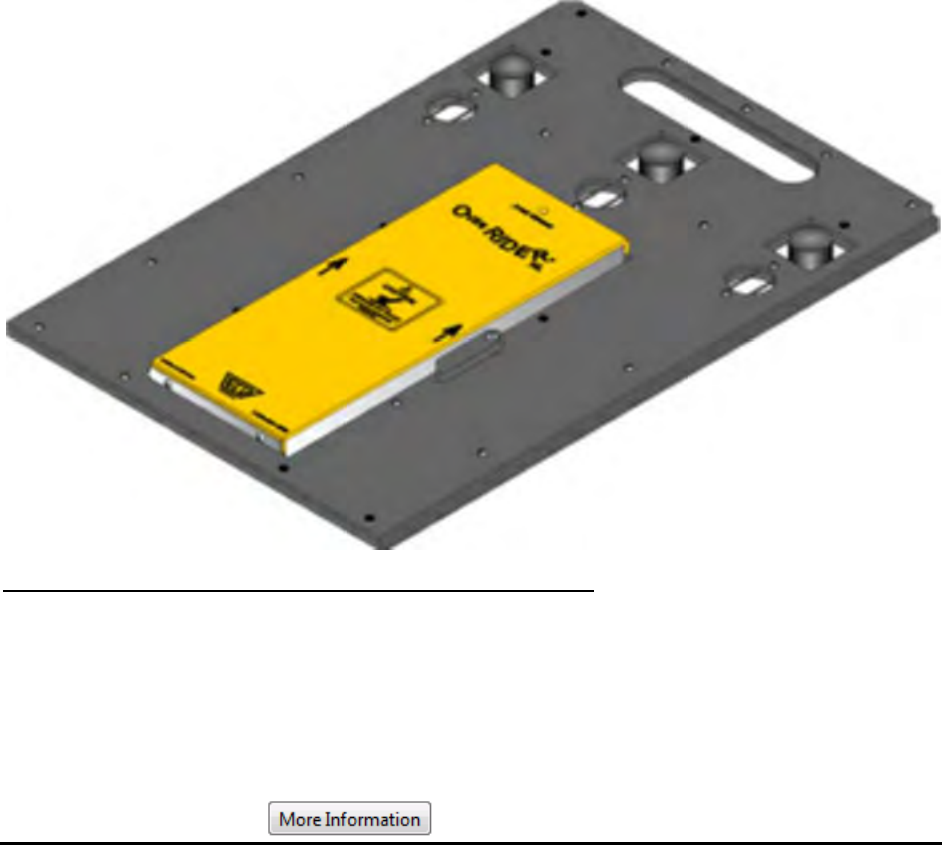
The OvenRIDER® NL 2 is designed exclusively for Reflow solder ovens and provides the
most accurate, easy-to-use monitoring available. Perform diagnostic checks on an oven
process in just minutes with the OvenRIDER®. Reduce scrap and maximize yields
through improved process control. The OvenRIDER® comes in several standard sizes
and is available in custom widths.
Comprehensive SPC software is included featuring:
• X-bar-bar and R SPC Charting
• Measure and track conveyor speed
• Side to Side thermal evenness and heat flow per zone
For use with: SuperM.O.L.E.® Gold Thermal Profiler
AutoM.O.L.E.® Xpert3
The AutoM.O.L.E.® Xpert3 saves you from the laborious, time consuming iterations of
reflow process development that deprive the oven from manufacturing. Instead, work
right at your desk to create a robust lead-free process and oven recipe before actually
running a profile. New, flexible oven Signature creation makes Xpert3 compatible with
virtually any oven, freeing the program from the confines of machine, PC and software
compatibility.
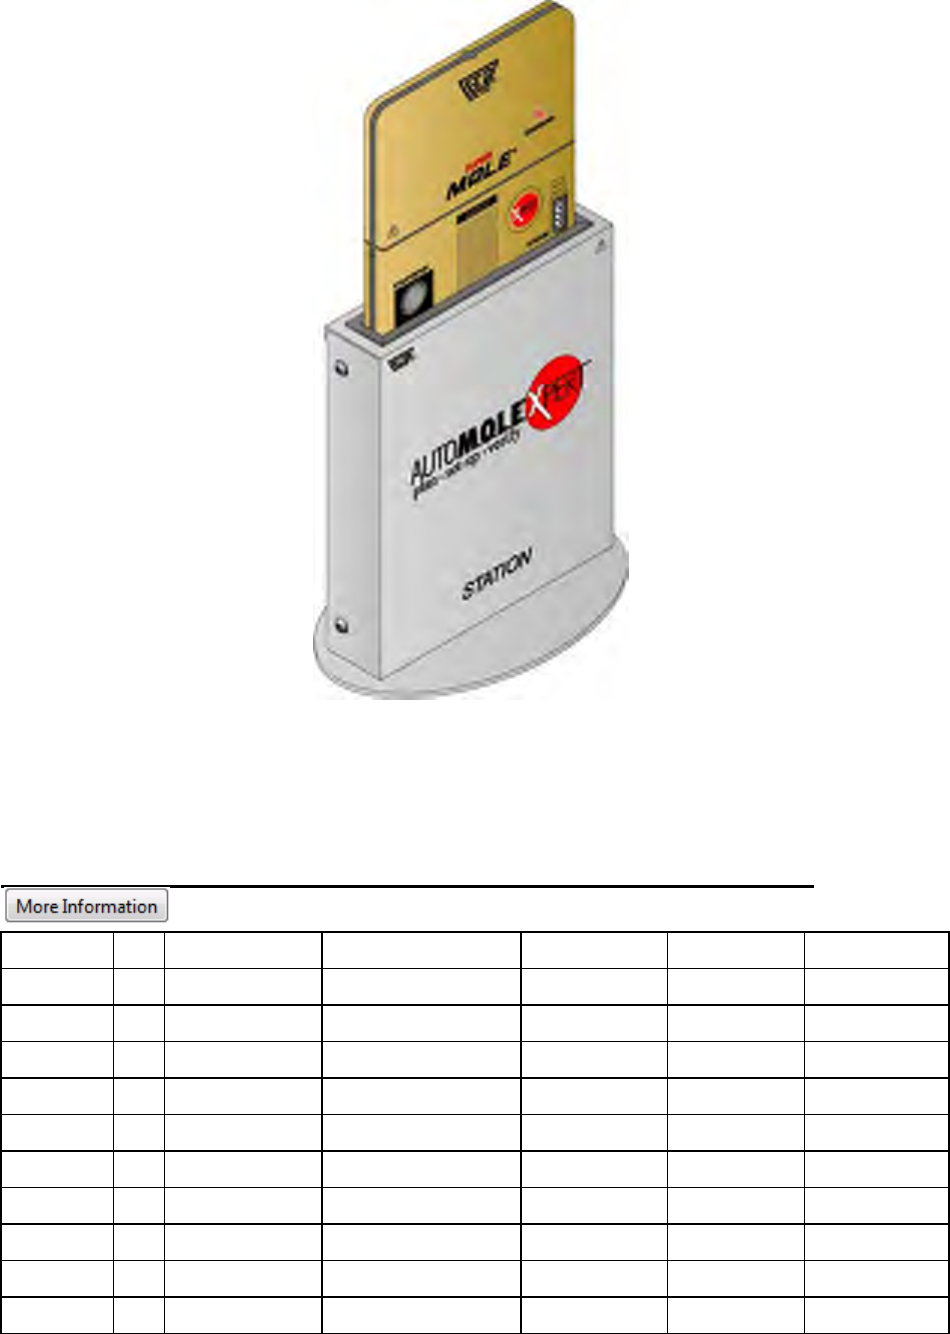
For use with: SuperM.O.L.E.® Gold Thermal Profiler
6.4. Thermocouples & Other
Thermocouples for SuperM.O.L.E.® Gold: (Micro Connector, Type K):
Insulation
Qty
Color
Wire AWG
Length
Max. Temp.
Part Number
Glass
6
Color-Indexed
36 [.005”/.127mm]
3ft/915mm
900F/482C
E44-0944-85
Glass
6
Color-Indexed
30 [.010”/.254mm]
3ft/915mm
900F/482C
E44-0944-81
Glass
6
Brown
36 [.005”/.127mm]
3ft/915mm
900F/482C
E43-0900-85
Glass
6
Brown
30 [.010”/.254mm]
3ft/915mm
900F/482C
E43-0900-89
Glass
6
Brown
40 [.003”/.076mm]
3ft/915mm
900F/482C
E47-0900-83
PFA
6
Color-Indexed
36 [.005”/.127mm]
3ft/915mm
500F/260C
E43-0900-65
PFA
6
Color-Indexed
30 [.010”/.254mm]
3ft/915mm
500F/260C
E43-0900-61
PFA
6
Color-Indexed
30 [.010”/.254mm]
12ft/3658mm
500F/260C
E44-2253-71
PFA
6
Transparent
36 [.005”/.127mm]
3ft/915mm
500F/260C
E31-0900-65
PFA
6
Transparent
30 [.010”/.254mm]
3ft/915mm
500F/260C
E31-0900-61
PFA
6
Transparent
30 [.010”/.254mm]
6ft/1829mm
500F/260C
E31-0900-62
PFA
6
Transparent
36 [.005”/.127mm]
7ft/2134mm
500F/260C
E31-0900-66
PFA
6
Transparent
30 [.010”/.254mm]
7ft/2134mm
500F/260C
E31-0900-71
SSOB
6
-
24 [.021”/ .533mm]
3ft/915mm
900F/482C
E31-0900-86
SSOB
6
-
24 [.021”/ .533mm]
6ft/1829mm
900F/482C
E31-0900-87
Thermocouple Adaptors & Extension Cables:
Part Number
Glass 6-Channel Thermocouple Adapter Set [Mini-Micro] 900F/482C
E44-0944-64
PFA 6-Channel Thermocouple Adapter Set [Mini-Micro] 500F/260C
E31-0900-64
Glass 6-Channel K-Type Extension [Mini-Mini], 15ft/ 4572mm 900F/482C
E42-6672-64
Glass 6-Channel K-Type Extension [Mini-Mini], 20ft/ 6096mm 900F/482C
E42-6672-74
Thermocouples for V-M.O.L.E. ® (Miniature Connector, Type K):
Insulation
Qty
Color
Wire AWG
Length
Max. Temp.
Part Number
Glass
6
Color-Indexed
36 [.005”/.127mm]
3ft/915mm
900F/482C
E47-0248-65
Glass
6
Color-Indexed
30 [.010”/.254mm]
3ft/915mm
900F/482C
E47-0248-61
PFA
6
Color-Indexed
36 [.005”/.127mm]
3ft/915mm
500F/260C
E43-0216-65
PFA
6
Color-Indexed
30 [.010”/.254mm]
3ft/915mm
500F/260C
E43-0216-61
PFA
5
Transparent
36 [.005”/.127mm]
3ft/915mm
500F/260C
Y15-0216-05
PFA
5
Transparent
30 [.010”/.254mm]
3ft/915mm
500F/260C
Y15-0216-10
PFA
5
Transparent
36 [.005”/.127mm]
7ft/2134mm
500F/260C
E29-0180-65
Glass
3
Brown
36 [.005”/.127mm]
3ft/915mm
900F/482C
E48-0509-63
Glass
3
Brown
30 [.010”/.254mm]
3ft/915mm
900F/482C
E48-0509-61
Glass
3
Red/Green/Blue
36 [.005”/.127mm]
3ft/915mm
900F/482C
E48-0509-73
Glass
3
Red/Green/Blue
30 [.010”/.254mm]
3ft/915mm
900F/482C
E48-0509-71
PFA
3
Red/Green/Blue
36 [.005”/.127mm]
3ft/915mm
500F/260C
E48-0509-83
PFA
3
Red/Green/Blue
30 [.010”/.254mm
3ft/915mm
500F/260C
E48-0509-81
Glass
1
Brown
30 [.010”/.254mm]
3ft/915mm
900F/482C
Y15-0224-20
Glass
1
Brown
30 [.010”/.254mm]
15ft/ 4572mm
900F/482C
Y15-0224-30
Glass
1
Brown
30 [.010”/.254mm]
20ft/ 6096mm
900F/482C
Y15-0224-40
Thermocouples for MEGAM.O.L.E.® (Nano Connector, Type K):
Part Number
MEGAM.O.L.E.® 20 Thermocouple Kit
E47-6342-34
Includes: 4 Sets of 5 Glass Color-Indexed 36-gauge [.005”/.127mm], 3ft 900F/482C, Aluminum and Kapton
Tape Strips, High Temp Solder & Organizer Sleeves
Insulation
Qty
Color
Wire AWG
Length
Max. Temp.
Part Number
Glass
5
Color-Indexed
36 [.005”/.127mm]
3ft/915mm
900F/482C
E47-6342-85
[For channel banks A & C]
Glass
5
Color-Indexed
36 [.005”/.127mm]
3ft/915mm
900F/482C
E47-6342-75

[For channel banks B & D]
Glass
1
Red
36 [.005”/.127mm
3ft/915mm
900F/482C
Y15-6342-15
Glass
1
Blue
36 [.005”/.127mm
3ft/915mm
900F/482C
Y15-6342-25
Glass
1
Green
36 [.005”/.127mm
3ft/915mm
900F/482C
Y15-6342-35
Glass
1
Violet
36 [.005”/.127mm
3ft/915mm
900F/482C
Y15-6342-45
Glass
1
Light Blue
36 [.005”/.127mm
3ft/915mm
900F/482C
Y15-6342-55
Thermal Protective Enclosures for SuperM.O.L.E.® Gold, SuperM.O.L.E.® Gold 2 &
RF Option:
Dimensions
Part Number
1” Uni-Barrier
1.0 x 4.2 x 10.5”
E42-0901-80
Yellow Jacket [for Uni-Barrier or 1” Super Survivor]
1.28 x 4.52 x 11.27”
E44-7435-80
1” Uni-Barrier with Yellow Jacket
1.28 x 4.52 x 11.27”
E44-0944-80
SuperM.O.L.E. Boot
1.3 x 5.2 x 9.7”
M30-0200-70
BB-45
1.75 x 4.6 x 9.9”
E44-4245-80
Super Hot Box
5.25 x 7.9 x 13.0”
E29-2686-90
Thermal Protective Enclosures for MEGAM.O.L.E.® & V-M.O.L.E.®:
Dimensions
Part Number
M.O.L.E. Thermal Barrier (stainless steel)
E47-6342-80
M.O.L.E. Yellow Jacket Thermal Barrier Cover
E47-6342-70
Accessories and Value Added Options SuperM.O.L.E.® Gold, SuperM.O.L.E.®
Gold 2:
Part Number
Lead-Free Upgrade Kit-
Hardware that makes your Gold Lead-Free
Compatible
E44-0944-05
For those with an older version of the SuperM.O.L.E. Gold profiling kit.
Includes: 1” Uni-Barrier, Yellow Jacket and 5 & 10-mil sets of color indexed glass thermocouples
Xpert Desktop Download/Charging Station
E40-2875-52
Power Pack Charger, 110V
E31-0900-25
Power Pack Charger, 220V
E31-0900-21
SuperM.O.L.E. Gold Rechargeable Power Pack - RoHS Compliant
E45-7647-30
SuperM.O.L.E. Gold Calendar/Clock Battery
F30-0041-00
SuperM.O.L.E. Gold Pogo Pin [for RF and Xpert dock charging use]
J01-6016-00
SuperM.O.L.E. Gold to PC Interface Cable
Y20-2848-04
USB/RS-232 Serial Adapter
Y23-7782-10
VaporWATCH Humidity Sensor
E44-7423-00
MEGAM.O.L.E. MAP Software (includes CD & Quick Ref Guide)
E47-6342-32
Extended M.O.L.E. warranty; 1 year, includes 1 calibration
A10-0900-00
Accessories and Value Added Options MEGAM.O.L.E.® & V-M.O.L.E.®:
Part Number
MEGAM.O.L.E. Rechargeable Power Pack Battery
E47-6342-30
MEGAM.O.L.E. 20 nano-mini 20-channel adapter
E47-6342-74
MEGAM.O.L.E./V-M.O.L.E. PC USB 2.0 Cable
E47-6342-10
MEGAM.O.L.E./V-M.O.L.E. Battery Charger
E47-6342-20
MEGAM.O.L.E. MAP Software (includes CD & Quick Ref Guide)
E47-6342-32
Extended M.O.L.E. warranty; 1 year, includes 1 calibration
A10-0900-00
Miscellaneous Accessories:
Micro Connector Thermocouple Organizer w/screw lock
M45-0900-60
Micro Thermocouple Connector Set (6 connectors)
E31-0900-60
Micro Thermocouple Connector each (1 connector)
E31-0900-68
Micro Connector Socket, green pin
J31-0252-10
Micro Connector Socket, white pin
J31-0252-15
Micro Thermocouple Connector Crimping Tool
Y25-0312-10
Nano Thermocouple Connector Kit (2 connectors)
E47-6342-68
Nano Thermocouple #0 Phillips Head Screwdriver
G10-0128-10
1 inch Aluminum Tape Roll, 15 feet
G10-7594-18
Aluminum Tape Strips, .50 inch x 1 inch, 10 pieces total
M30-2686-74
Hi Temp Solder, SN10, 6 feet
G10-0041-00
Polyimide Film Tape, 108 feet, 5/8” Kapton
G10-0021-00
Polyimide Tape Strips, 20 pieces total
M30-2686-64
Adhesive Spray Accelerator
G10-0108-00
Clear Instant Adhesive
G10-0107-00
7. Service and Troubleshooting
7.1. General Service Information
This section covers maintaining and troubleshooting a M.O.L.E., Thermocouples, Power
Pack, Software, Wiring, and other parts of the system.
The following service and calibration instructions are for use by qualified
personnel only. Refer to the Safety>Operators Safety Information prior to
performing any service.
Service Troubleshooting:
Decide if the problem is with the M.O.L.E. Profiler Hardware, Communications, or
Software.
• If the problem occurs while attempting to log data, the Hardware may be faulty.
• If the problem occurs while attempting to communicate between M.O.L.E. Profiler
and the computer, the Communications links may be faulty.
• If the problem occurs while attempting to use a software function, the software may
be faulty.
Once it has been determined what item is causing the problem, refer to the appropriate
service section. Start at the top of the list and work your way down. If the problem is still
unresolved go to Service>How to Get Additional Help.
7.2. SuperM.O.L.E.® Gold
This section describes problems that can occur with M.O.L.E. Profiler hardware.
Hardware Problems:
Wrong or erratic temperature readings:

• Open or intermittent thermocouple, cable, or connector: Individual channels
being detected as “Open” on the profile plot will indicate this. Check thermocouple
wires and insulation. Also, check the connectors visually for damage or loose
connections. Tighten all the connections and check with an ohmmeter or millivolt
meter if available or substitute a thermocouple that you know works properly.
• Shorted thermocouple, cable, or connector: This is harder to find. A shorted
thermocouple connector or cable creates a new thermocouple junction at the
location of the short; therefore, actual temperatures are recorded, but not the ones
desired. If the short is intermittent, the recorded temperatures may jump between
that of the thermocouple and that of the shorted location. Visually check for shorts
inside of connectors and for damaged insulation on the wires. Repair or replace
any suspicious components.
• Wrong type thermocouple, connector, or wire: Wrong thermocouple types will
give consistently wrong readings, either always high or always low. Wrong
connectors or wrong wire types (used as an extension) create extra thermocouple
junctions and uncontrolled temperature offsets. Use only Type K thermocouple
wires, and connectors.
• Thermocouple connector wired backwards: Typically causes high
temperatures to read as negative (e.g., -150°F.). Should be Yellow=Ch, Red=Al.
• Low Power Pack charge: Charge the Power Pack.
• Conductive contamination inside the M.O.L.E. Profiler or I/O Module:
Although unlikely, this is known to cause “spikes” (abrupt jumps in value) in the
recorded temperatures. Other kinds of errors are also possible.
• Incorrect calibration: If the recorded temperatures for all of the active channels
are wrong in the same direction (e.g., all too high), then possibly the M.O.L.E.
Profiler has incorrect calibration. Refer to Calibration Information for cautions and
procedures, or return the M.O.L.E. Profiler to ECD for re-calibration.
• Internal temperature effects: If the M.O.L.E. Profiler and it's components has
been subjected to an internal temperature in excess of the published
specifications. Temperatures outside the specified operating range may cause
incorrect readings and shorten Power Pack battery life. Internal temperatures in
excess of the absolute maximum warranteed internal temperature may
cause permanent, irreparable damage to your M.O.L.E. Profiler.
• M.O.L.E. Profiler never turns on, but the software can read and write the
hardware configuration: The start button is possibly defective, return to ECD for
service.
• SuperM.O.L.E.® Gold LED stays on steady (no flashing) when power pack is
replaced:
1) Try a fully charged Power Pack.
2) For MEGAM.O.L.E.® and SuperM.O.L.E.® Gold try removing the Power Pack
waiting a minute before plugging it in again. If the problem is still there, the start
switch is probably damaged. Contact ECD to request an RMA (Return
Merchandise Authorization) to return the M.O.L.E. Profiler for service. Refer to
Service>How to Get Additional Help for contact information.
• The SuperM.O.L.E.® Gold Profiler clock resets itself: Calendar/clock battery
discharged: Replace the calendar/clock battery.
7.2.1. Communications Problems
“SuperM.O.L.E.® Gold not responding” error message:
• Try triggering the M.O.L.E. Profiler with the switch. (Doing this will erase the data in
memory so do this as a last resort). If you cannot get the light to flash, you have a
hardware problem with the M.O.L.E. Profiler itself.
If you can activate the SuperM.O.L.E.® Gold with the switch, check for the
following:
• Wrong computer port: Cable must be connected to which is selected using the
Configuration command in the M.O.L.E.® MAP Software.
• Conflicting use of COM port: Perhaps some other software, such as a mouse
driver, communications programs, or PDA is trying to use the COM Port.
• Computer Interface cable defective: Order spare or replacement cables from
ECD, refer to Service>How to Get Additional Help for contact information.
7.2.2. Calibration Information
Because the SuperM.O.L.E.® Gold Profiler is made with precision components with high
temperature stability and tight tolerances; the analog-to-digital converter remains stable
for years. High quality components together with software algorithms based on the
IPTS-68* standard for Type K thermocouples have been provided to yield specified
accuracy and long-term stability. Each unit has been tested at the factory before it is
shipped.
ECD recommends the M.O.L.E. profiler is factory re-calibrated every 6 months
when it is being
used constantly. If the use is occasional, a period of no greater
than 12 months between calibrations is recommended.
Depending on use, however, temperature accuracy should be periodically verified using a
suitable temperature standard. Any observed inaccuracies are probably not caused by
calibration error but by any one of a number of other sources, primarily the following:
1) Poor thermocouple connectors or open thermocouples.
2) Using a temperature standard that is inaccurate or is not traceable to the National
Institute of Standards and Technology (NIST, formerly the Nation Bureau of
Standards).
• Check the accuracy of your temperature standard and that it is traceable to NIST.
Be sure that you’re using Type K wire connected to the standard. Be sure that your
temperature standard is cold-junction compensated, or use an ice point reference.
3) Extremely low Power Pack charge.
• Recharge the Power Pack. Refer to topic Basics>Setup>Charging the Power
Pack Battery.
4) Sudden changes or excessive ambient temperatures.
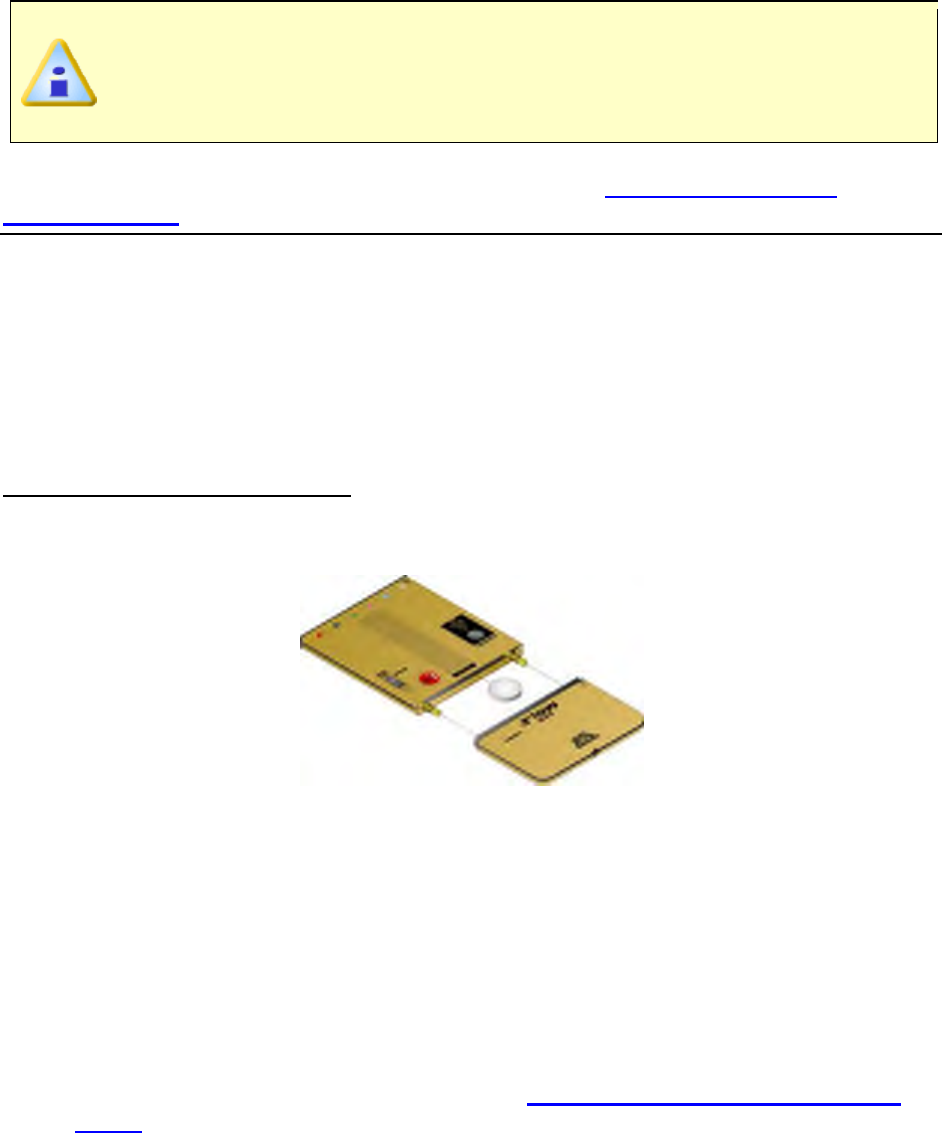
• Allow M.O.L.E. profiler temperature to stabilize for 1/2 hour before calibration.
If after checking these possible sources of inaccuracy the M.O.L.E. profiler still needs to
be calibrated, there are two calibration methods: Using a thermocouple simulator and
another using a voltage reference and an ice point.
Do not attempt to calibrate the M.O.L.E. profiler if you have never used a
thermocouple simulator, or you are unsure of the accuracy of your
thermocouple simulator. (Contact ECD for the proper calibration procedure
P/N A31-0900-05).
If you need to return the M.O.L.E. profiler for re-calibration, contact ECD and request an
RMA (Return Merchandise Authorization). Refer to topic Service>How to Get
Additional Help for contact information.
*IPTS-68 (International Practical Temperature Scale of 1968)
7.2.3. Changing the Calendar/Clock Battery
If the clock is resetting itself, it may be necessary to replace the calendar/clock battery.
(Note that changing this battery resets the hardware configuration parameters stored in
the M.O.L.E. Profiler)
Change the battery as follows:
1) Remove the Power Pack battery by separating the unit. This exposes the clock
battery.
2) Pull the tab to remove the old battery.
3) Insert a new 3V Lithium battery (ECD P/N F30-0041-00), making sure it is oriented
as pictured on the M.O.L.E. Profiler and making sure the tab is tucked in behind the
battery.
4) To help prolong clock battery life, the Power Pack should be replaced so power is
not drawing off the Calendar/Clock battery. The Activity LED blinks rapidly for two
seconds when the Power Pack is first reconnected indicating complete reset has
occurred.
5) Start and then stop the M.O.L.E. Profiler to clear the memory.
6) Reconfigure the M.O.L.E. Profiler Refer to Basics>Setup>Communications
Setup for more information).
7.2.4. Constructing a Thermocouple
The following procedures describe how to construct a thermocouple and a shorting plug.
Thermocouple construction:
The following items will be needed to construct a Thermocouple:
• Thermocouple assembly which includes: 1 Thermocouple housing, 3 Hardware
Screws and 2 female pins (one marked with a green dot and one marked with a
white dot).
• A Thermocouple consisting of one yellow and one red wire. (Maximum T/C wire
size 24 gauge).
• Thermocouple crimping tool
• Phillips (Crosshead) Screwdriver
Construct a thermocouple as follows:
1) Disassemble the Thermocouple housing by unscrewing the 3 Hardware screws.
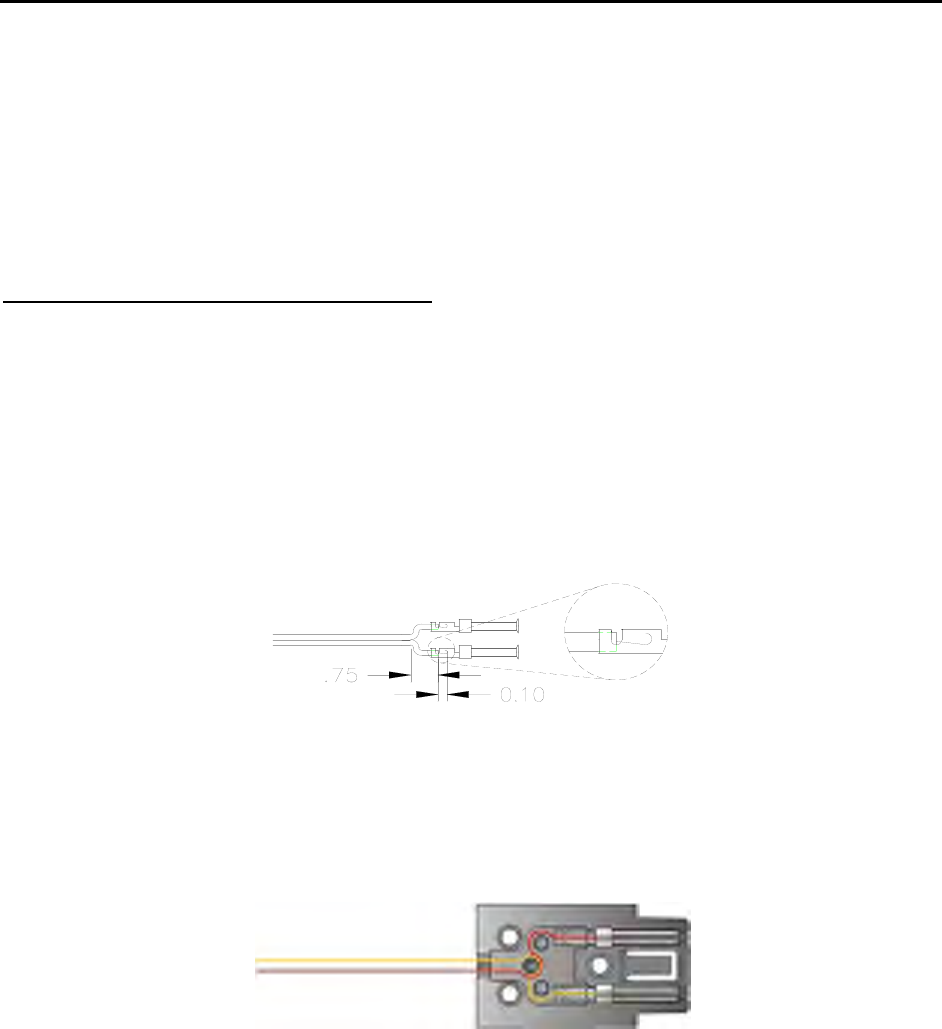
2) Separate the wires on the stripped lead end (opposite junction end) about ¾”.
3) Prep the Red (-) T/C wire stripping the wire casing about 0.10” and curling the bare
wire into a U-shape. Place it into the T/C pin with the green dot and crimp with the
T/C crimping tool. Make sure that the wire covering is clear through the first set of
shoulders and crimped by them. Also, be sure that only wire is crimped by the
second shoulders.
4) Repeat Step 3 for the Yellow (+) wire by placing it into the T/C pin with the white
dot.
5) Place the female pins in the bottom (smaller) half of the Thermocouple housing. Be
careful to place the pins in the proper pin location.
6) Wrap the red and yellow wires around the strain relief posts as shown in the Figure
above.
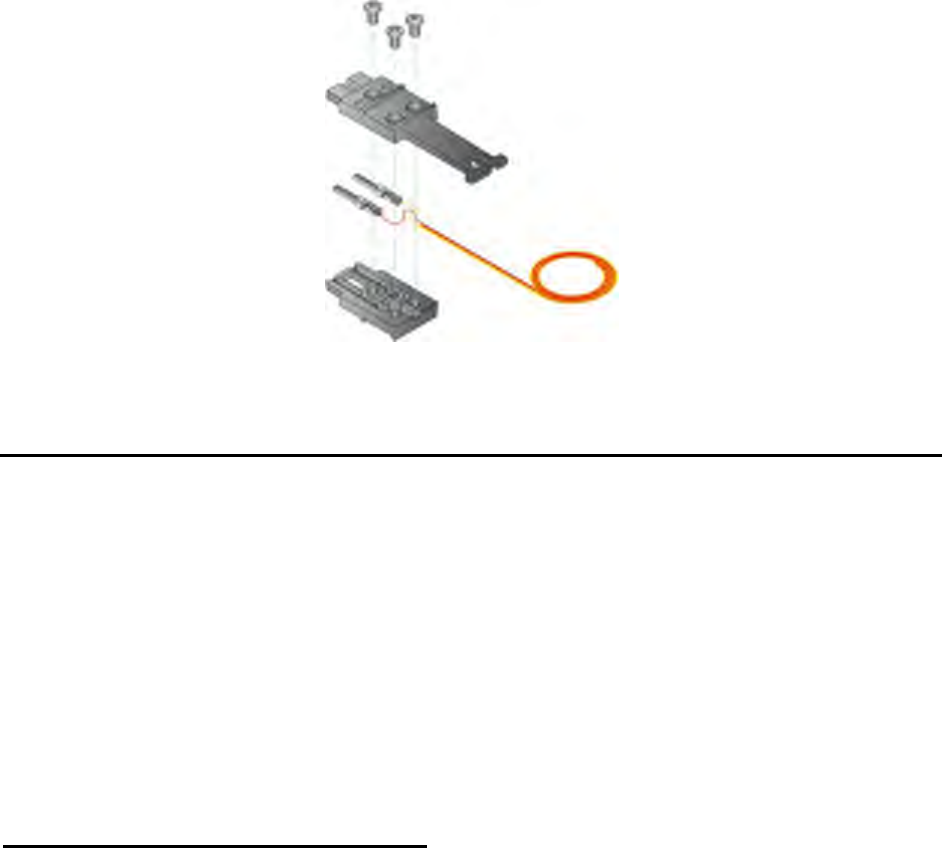
7) Carefully place the two halves of the Thermocouple housing together. Verify that
the wires are not pinched and that the pin and wire positions are correct.
8) Replace the 3 Hardware screws.
Shorting plug construction
If fewer than six sensors are used in your application, a shorting plug may be used for
each of the unused M.O.L.E. Profiler channels.
The following items will be needed to construct a Thermocouple:
• Thermocouple assembly, which includes: Thermocouple housing, 3 Hardware
Screws and 2 female pins (one marked with a green dot and one marked with a
white dot).
• A 1" bare copper buss wire. (Maximum wire size 24 gauge).
• Thermocouple crimping tool.
• Phillips (Crosshead) Screwdriver
Construct a shorting plug as follows:
1) Disassemble the Thermocouple housing by unscrewing the 3 Hardware screws.
2) Place one end of the copper wire into the T/C pin with the green dot and the other
end into the T/C pin with the white dot. Now crimp both pins with the T/C crimping
tool
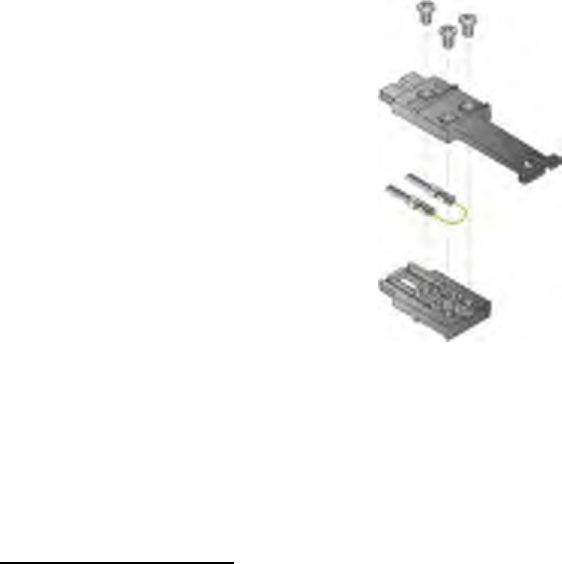
3) Place the female pins in the bottom (smaller) half of the Thermocouple housing. Be
careful to place the pins in the proper pin locations as shown in the Figure below.
4) Carefully place the two halves of the Thermocouple housing together. Verify that
the wire is not pinched and that the pin positions are correct.
5) Replace the 3 Hardware screws.
7.3. SuperM.O.L.E.® Gold 2
This section describes problems that can occur with M.O.L.E. Profiler hardware.
Hardware Problems:
Wrong or erratic temperature readings:
• Open or intermittent thermocouple, cable, or connector: Individual channels
being detected as “Open” on the profile plot will indicate this. Check thermocouple
wires and insulation. Also, check the connectors visually for damage or loose
connections. Tighten all the connections and check with an ohmmeter or millivolt
meter if available or substitute a thermocouple that you know works properly.
• Shorted thermocouple, cable, or connector: This is harder to find. A shorted
thermocouple connector or cable creates a new thermocouple junction at the
location of the short; therefore, actual temperatures are recorded, but not the ones
desired. If the short is intermittent, the recorded temperatures may jump between
that of the thermocouple and that of the shorted location. Visually check for shorts
inside of connectors and for damaged insulation on the wires. Repair or replace
any suspicious components.
• Wrong type thermocouple, connector, or wire: Wrong thermocouple types will
give consistently wrong readings, either always high or always low. Wrong
connectors or wrong wire types (used as an extension) create extra thermocouple
junctions and uncontrolled temperature offsets. Use only Type K thermocouple
wires, and connectors.
• Thermocouple connector wired backwards: Typically causes high
temperatures to read as negative (e.g., -150°F.). Should be Yellow=Ch, Red=Al.
• Low Power Pack charge: Charge the Power Pack.
• Conductive contamination inside the M.O.L.E. Profiler or I/O Module:
Although unlikely, this is known to cause “spikes” (abrupt jumps in value) in the
recorded temperatures. Other kinds of errors are also possible.

• Incorrect calibration: If the recorded temperatures for all of the active channels
are wrong in the same direction (e.g., all too high), then possibly the M.O.L.E.
Profiler has incorrect calibration. Refer to Calibration Information for cautions and
procedures, or return the M.O.L.E. Profiler to ECD for re-calibration.
• Internal temperature effects: If the M.O.L.E. Profiler and it's components has
been subjected to an internal temperature in excess of the published
specifications. Temperatures outside the specified operating range may cause
incorrect readings and shorten Power Pack battery life. Internal temperatures in
excess of the absolute maximum warranteed internal temperature may
cause permanent, irreparable damage to your M.O.L.E. Profiler.
• M.O.L.E. Profiler never turns on, but the software can read and write the
hardware configuration: The start button is possibly defective, return to ECD for
service.
• SuperM.O.L.E.® Gold LED stays on steady (no flashing) when power pack is
replaced:
1) Try a fully charged Power Pack.
2) For MEGAM.O.L.E.® and SuperM.O.L.E.® Gold try removing the Power Pack
waiting a minute before plugging it in again. If the problem is still there, the start
switch is probably damaged. Contact ECD to request an RMA (Return
Merchandise Authorization) to return the M.O.L.E. Profiler for service. Refer to
Service>How to Get Additional Help for contact information.
• The SuperM.O.L.E.® Gold Profiler clock resets itself: Calendar/clock battery
discharged: Replace the calendar/clock battery.
7.3.1. Communications Problems
“Instrument not responding” error message:
• Try triggering the M.O.L.E. Profiler with the switch. If you cannot get the light to
flash, you have a hardware problem with the M.O.L.E. Profiler itself.
If you can activate the M.O.L.E. profiler with the switch, check for the following:
• Wrong computer Communication Port: Cable must be connected to which is
selected using the Select Instruments command in the software.
• Conflicting use of COM Port: Perhaps some other software, such as a mouse
driver, communications programs, or PDA is trying to use the same COM Port.
• Computer Interface cable defective: Order spare or replacement cables from
ECD, refer to Service>How to Get Additional Help for contact information.
The software appears to be locked up when trying to communicate with the
M.O.L.E. Profiler:
• The USB driver may be faulty. Refer to USB Driver information for your M.O.L.E.
Profiler.
•
•
• USB Driver - SuperM.O.L.E.® Gold 2
7.3.1.1. USB Driver
If the installed USB driver for the M.O.L.E.® Profiler is lower than version 5.3.0, it is
recommended that it is updated using the following procedure.
Update USB drivers:
1) Run the driver installation file “CP210x_VCP_Win2K_XP_S2K3.exe” located in
folder: \ECD\MegaMoleMAP\utility.
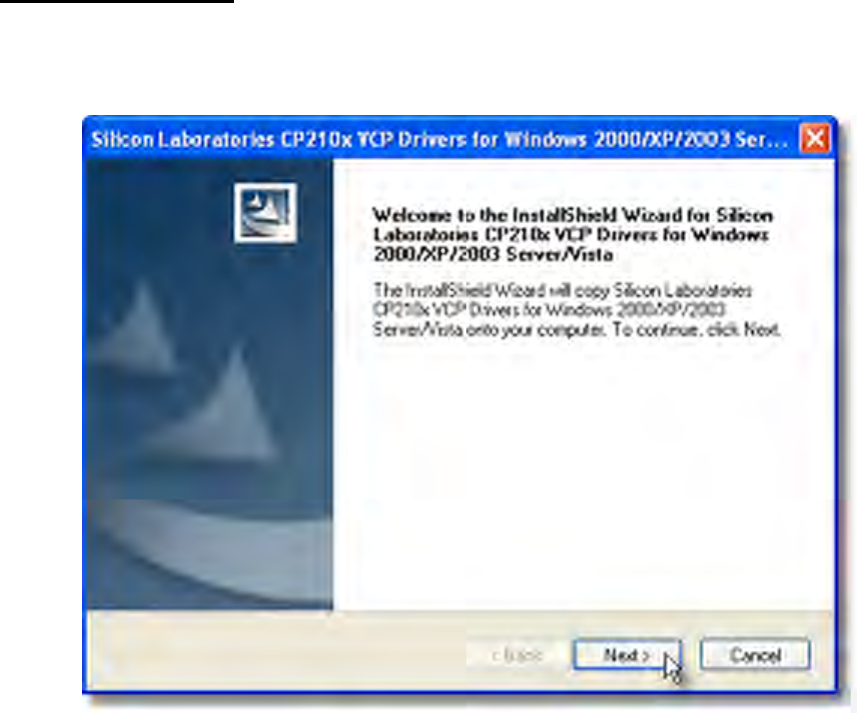
2) Follow the InstallShield wizard steps.
3) Click the Next command button.
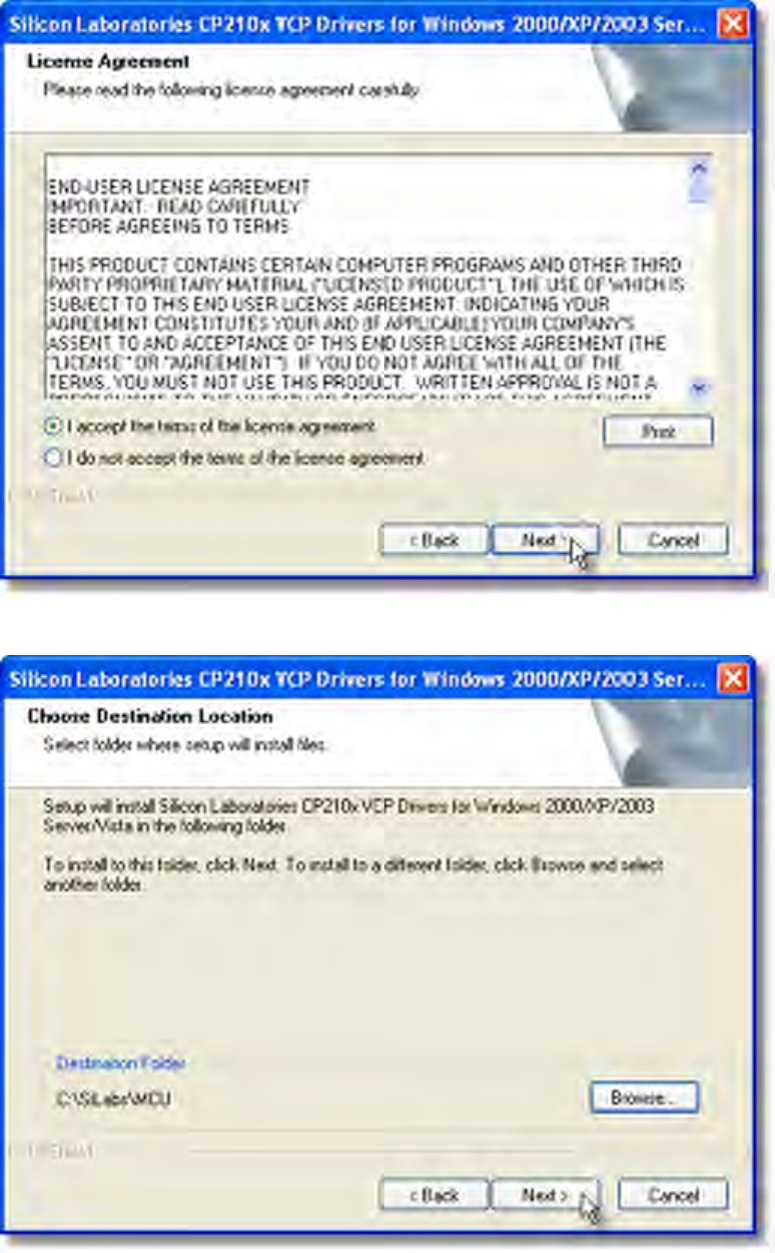
4) Select the Accept radio button then click the Next command button.
5) Click the Next command button to accept the installation folder.
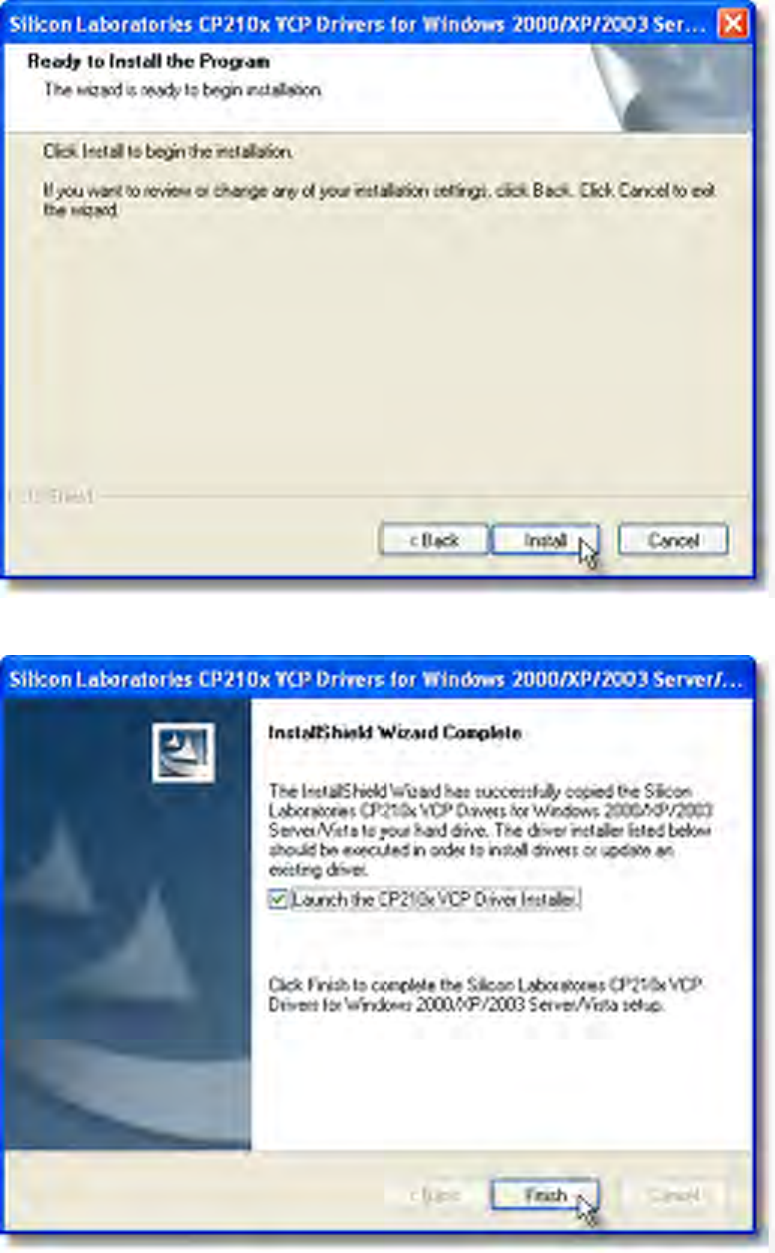
6) Click the Install command button to start the installation.
7) Select the Launch checkbox and then click the Finish command button.
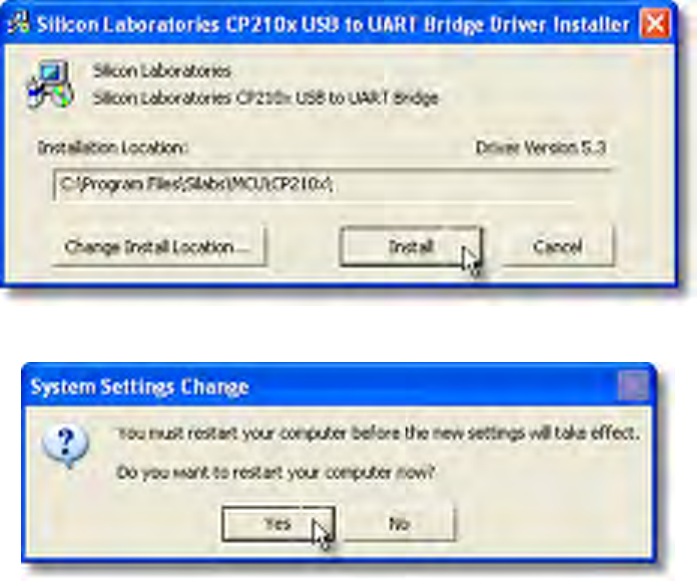
8) Click the Install command button.
9) Restart the computer.
10) Once the computer has restarted, insert the USB computer interface cable into the
Data/Charging Port.
11) Launch the Device Manager. To access, right-click My Computer, click Manage,
and then click Device Manager.
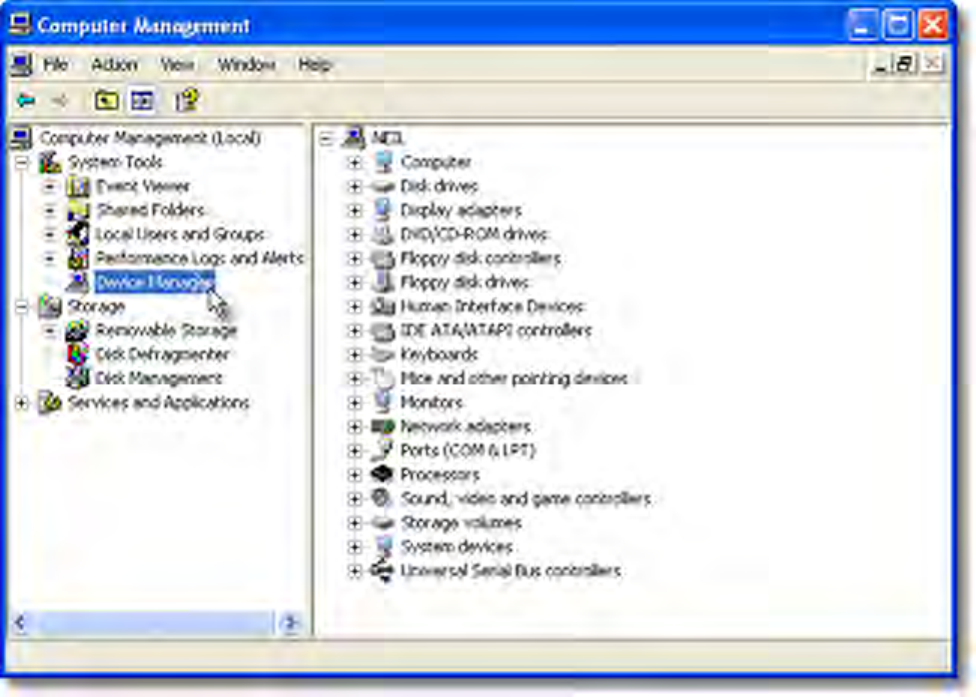
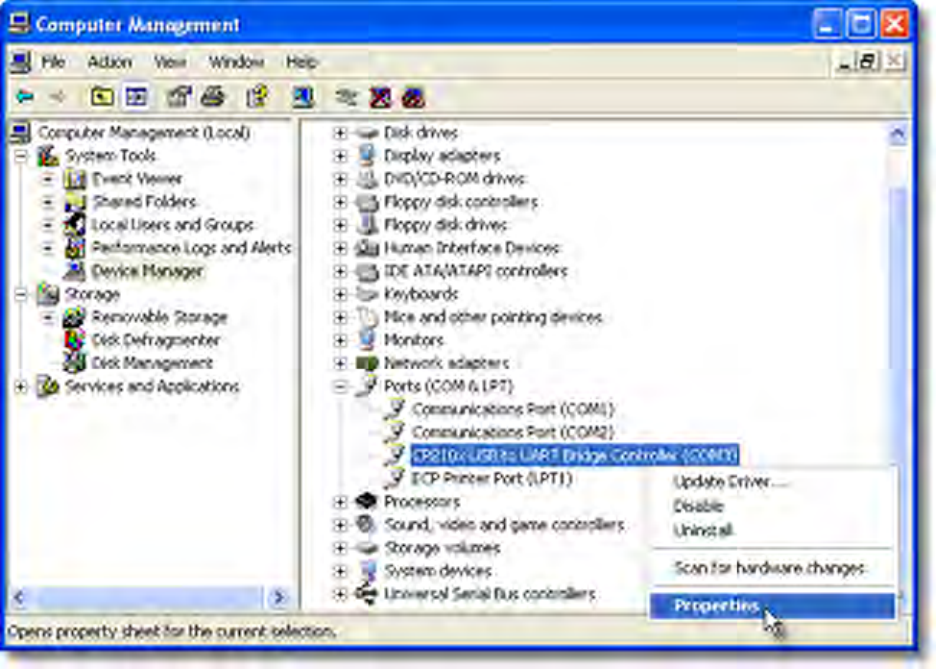
12) Check the driver version by selecting Ports, right-click CP210x USB to UART
Bridge Controller then Properties.
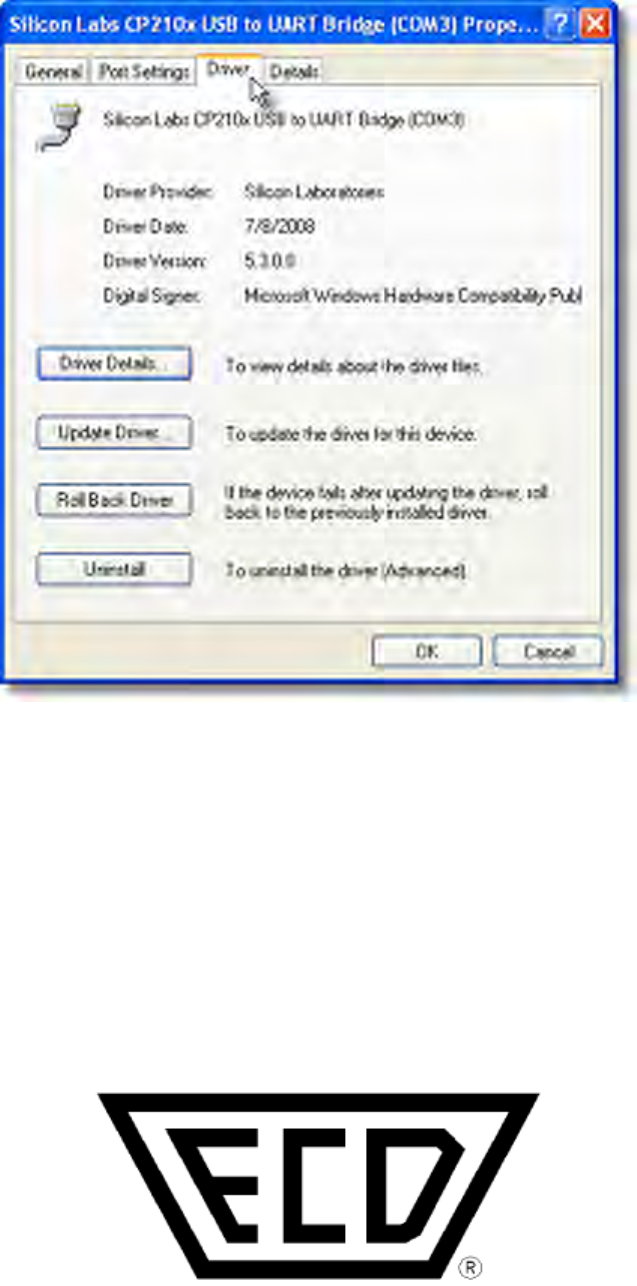
13) Once the driver property manager is displayed, select the Driver tab. If the driver
version is 5.3.0 or greater, the USB driver has been properly updated.
7.3.2. MEGAM.O.L.E.® Series Thermal Profilers
MEGAM.O.L.E.® Series Thermal Profilers
Calibration Procedure
For MEGAM.O.L.E.® 20, V-M.O.L.E.® & SuperM.O.L.E.® Gold 2
SINCE 1964
ECD, Inc.
4287-B S.E. International Way
Milwaukie, Oregon 97222-8825
Telephone: (800) 323-4548
FAX: (503) 659-4422
Technical Support: (800) 323-4548
Email: ecd@ecd.com
Internet: http://www.ecd.com
7.3.3. Calibration Information
Because the M.O.L.E.® Thermal Profiler is made with precision components with high
temperature stability and tight tolerances, the analog-to-digital converter remains stable
for years. High quality components together with software algorithms based on the
IPTS-90* standard for Type K thermocouples have been provided to yield the specified
accuracy and long-term stability. Each unit has been tested at the factory before it is
shipped.
ECD recommends the M.O.L.E.® Thermal Profiler is factory re-calibrated
every 6 months when it is being used constantly. If the use is occasional, a
period of no greater than 12 months between calibrations is recommended.
Good thermal quality programs require periodic calibration to show the Thermal Profiler
continues to remain in calibration using a temperature standard. Any observed
inaccuracies are probably not caused by calibration error but by any one of a number of
other sources, primarily the following:
1. Poor thermocouple connections or open thermocouples.
2. Using a standard that is inaccurate or one not traceable to the National Institute of
Standards and Technology.
• Check the accuracy of your standard and that it is traceable to NIST. Be sure
that you're using Type K special limits of error wire connected to the standard.
Be sure that your standard is cold-junction compensated, or use an ice-point
reference.
• Make sure that IPTS-90 tables are being used.
3. Extremely low Power Pack charge.
• Recharge the Power Pack. Refer to M.O.L.E.® MAP User Help System for
details.
4. Sudden changes in ambient temperature.

• Allow the M.O.L.E.® Thermal Profiler to stabilize for 1/2 hour before calibration.
If after checking these possible sources of inaccuracy and the M.O.L.E.® Thermal Profiler
still needs to be calibrated, proceed as directed.
* IPTS-90 - International Practical Temperature Scale of 1990
7.3.3.1. Equipment Required
Equipment Required:
1. Voltage reference and an ice point reference.
• Resolution: 1µV or better
• Accuracy: 5µV or better
• Output Imp: =10ohms
---------- OR ----------
Thermocouple Simulator
• Resolution: 0.1°C
• Accuracy: 0.25°C
• Output Imp: =10ohms
2. Thermocouple harness (special limits of error)
3. Thermal Isolation Box (Thermal Barrier)
4. Thermocouple Simulator software program
• Hyperterminal (Windows)
5. USB computer interface cable
7.3.3.2. Setup
The equipment you use for the calibration determines the setup procedure. The number
of thermocouples vary depending on the M.O.L.E.® Thermal Profiler. These examples
display the use of 6 channels.
Voltage reference and ice point reference:
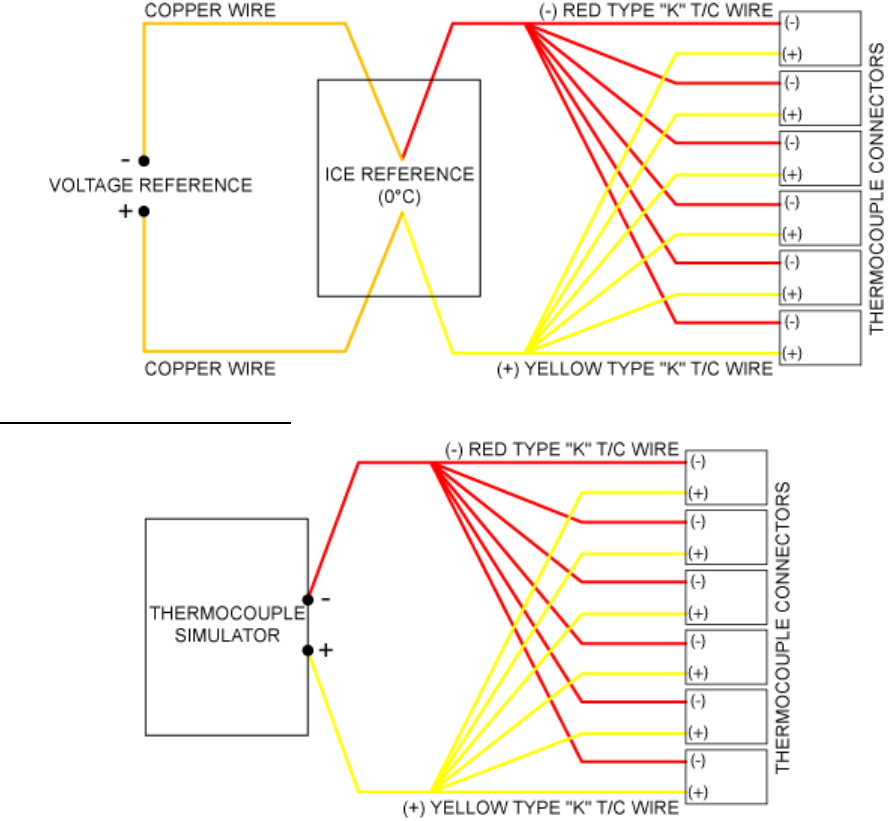
Thermocouple Simulator:
7.3.3.3. Procedure
1. Connect the M.O.L.E.® Thermal Profiler to calibration standard.
2. Connect the M.O.L.E.® to a USB port with the USB computer interface cable.
3. Insert the M.O.L.E.® into the Thermal Isolation Box.
4. Start Hyperterminal.
5. Enter any Name for the Connection Description.
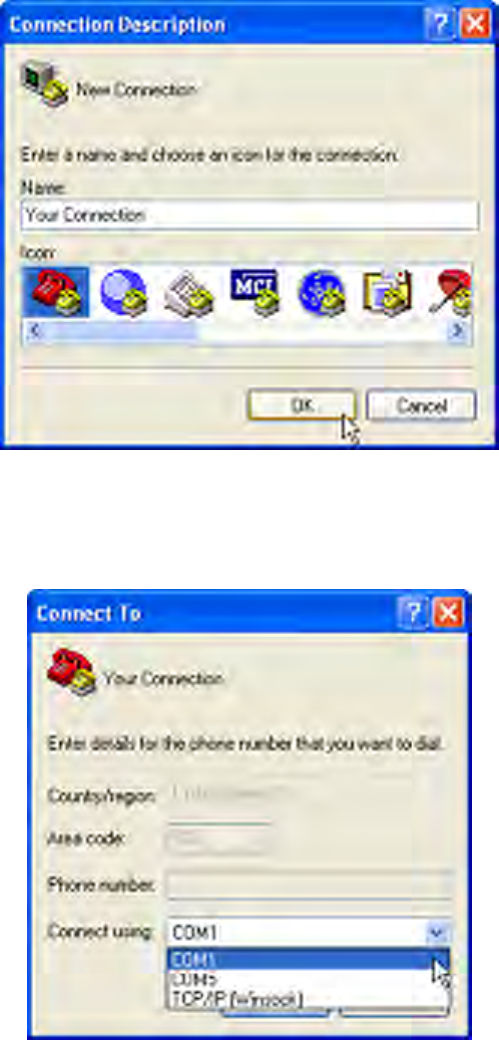
6. Select the COM port number that the operating system assigned to the USB
port that the M.O.L.E.® is connected to. The Connect Using drop down list
displays all of the available COM ports so it may require a few attempts to
determine the correct port.
7. Enter the COM Port Properties as shown.
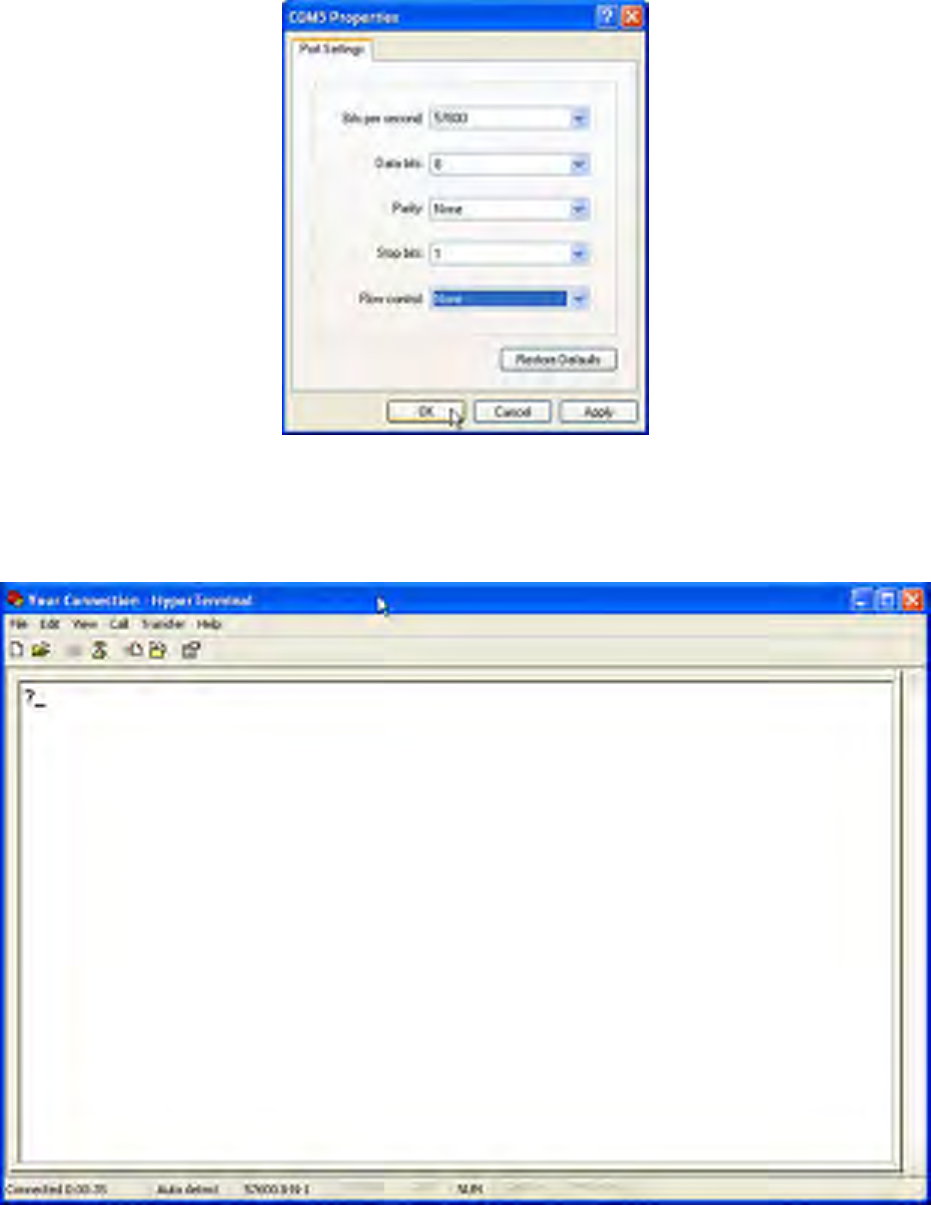
8. When finished select the OK command button and Hyperterminal displays a
blank screen to enter commands directly to the M.O.L.E.®.
9. Hit Enter to display a “?_”. If Hyperterminal does not display a “?_”, that means
the correct COM Port was not selected in Step 7.
10. Enter: ^OC1. This starts the calibration and the M.O.L.E.® replies with
instructions:
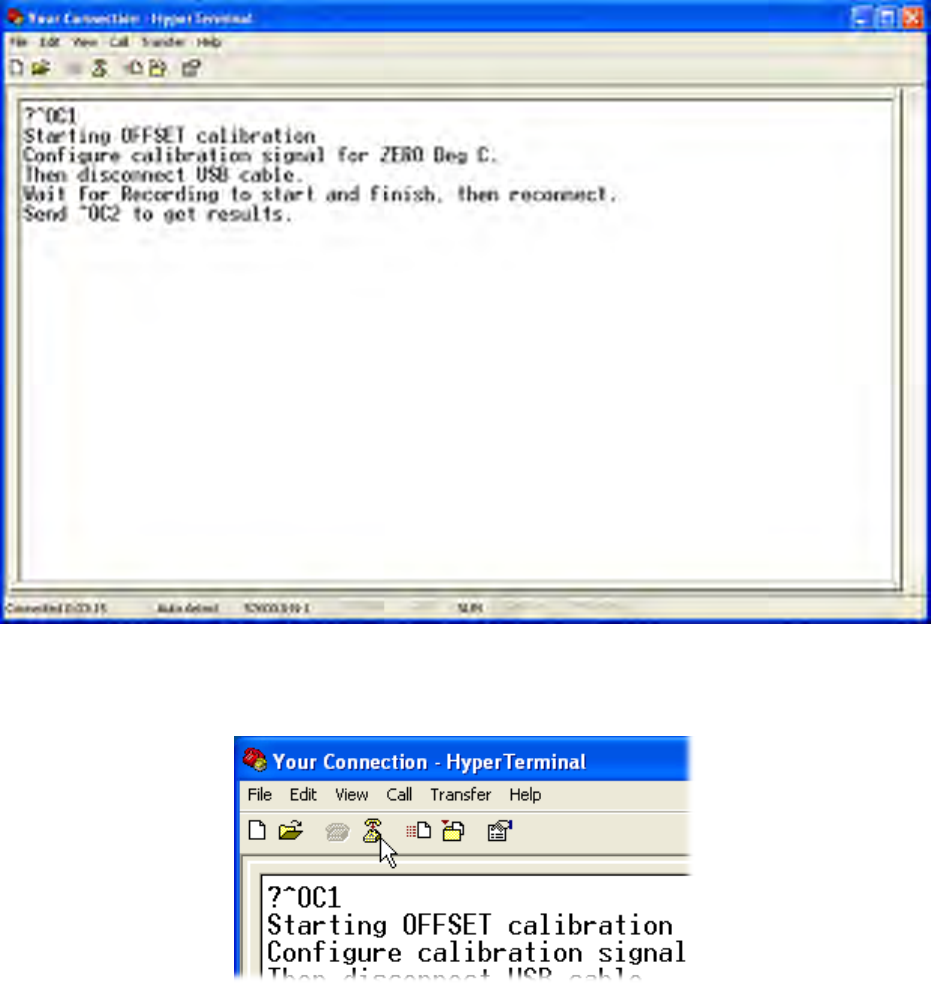
11. Set the standard to 0.0°C, disconnect the M.O.L.E.® from the computer and
then select Disconnect on the Hyperterminal Toolbar. The M.O.L.E.® records
for about 20 seconds and stops.
12. Connect the M.O.L.E.® to the computer again and select Call on the
Hyperterminal Toolbar.
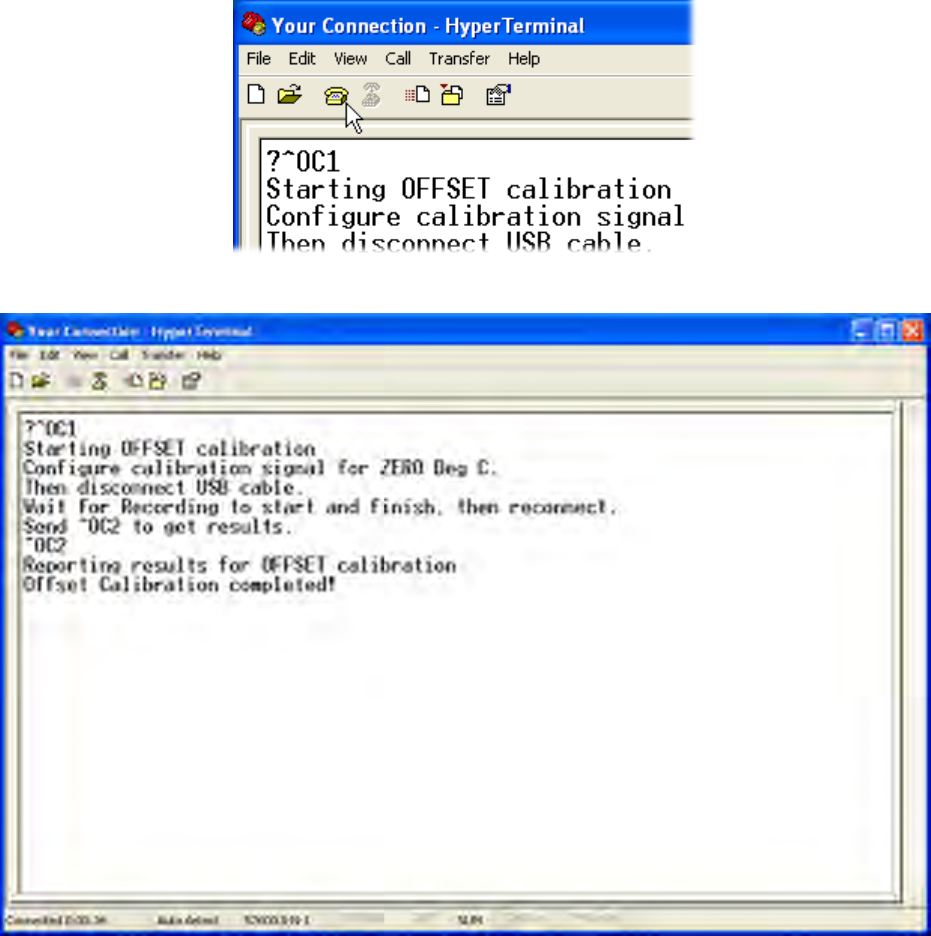
13. Enter: ^OC2.
14. The M.O.L.E.® reports success or failure. If successful, Hyperterminal dispays:
Offset Calibration completed! then enter: ^OC3. If failure, repeat ^OC1 as
directed in Step 10.
15. The M.O.L.E.® replies with instructions:
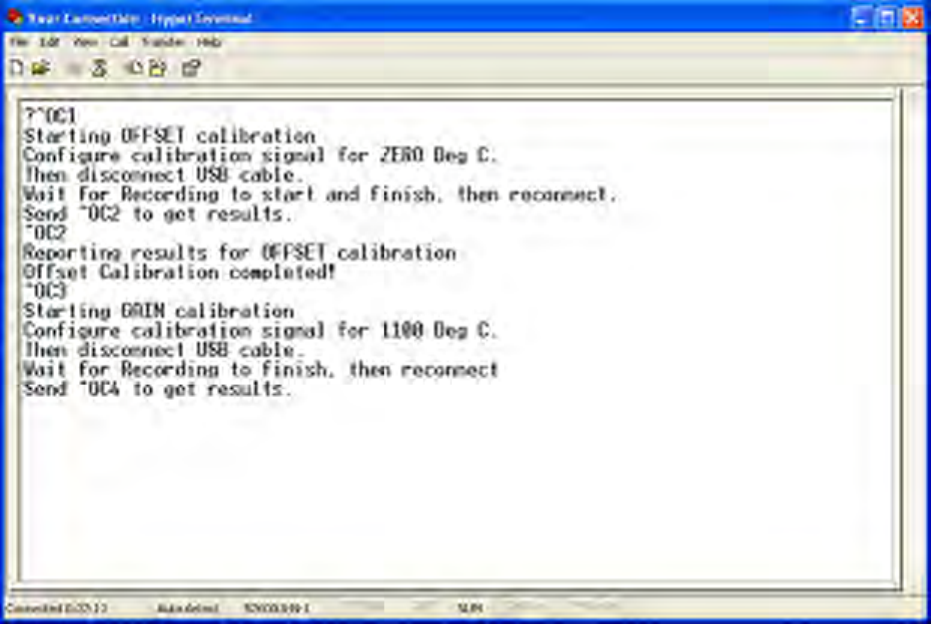
16. Set the standard to 1100.0°C, disconnect the M.O.L.E.® from the computer
and then select Disconnect on the Hyperterminal Toolbar. The M.O.L.E.®
records for about 20 seconds and stops.
17. Connect the M.O.L.E.® to the computer again and select Call on the
Hyperterminal Toolbar.
18. Enter: ^OC4.
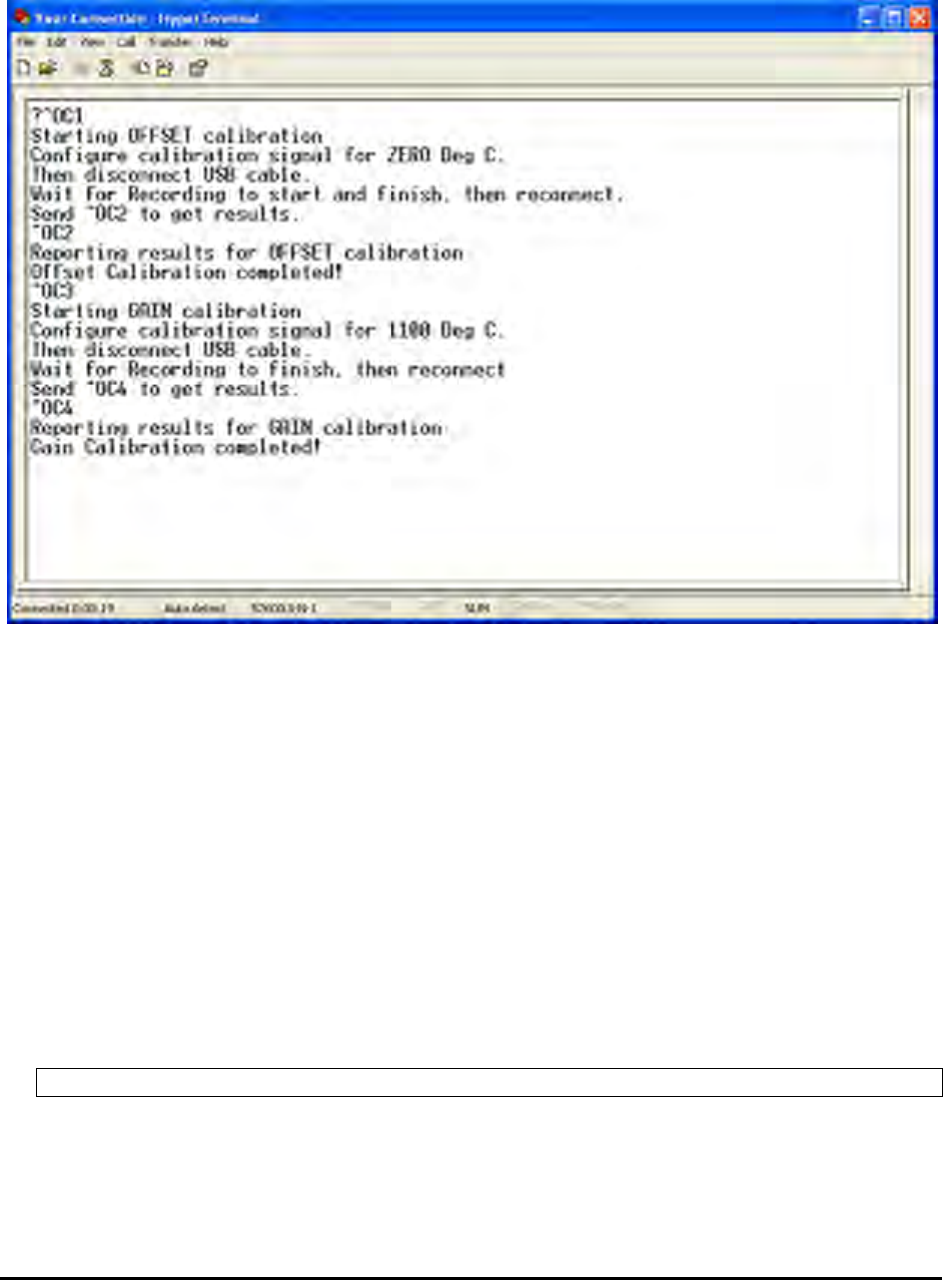
19. The M.O.L.E.® reports success or failure. If successful, Hyperterminal dispays:
Gain Calibration completed! then hit the Enter key which displays the “?_”. If
failure, repeat ^OC3 as directed in Step 14.
20. Now perform a calibration confirmation. Select Disconnect on the
Hyperterminal Toolbar, disconnect the M.O.L.E.® from the computer and
record several temperature values downloading them into M.O.L.E.® MAP
software to see if they are within the ECD specification. If acceptable, connect
the M.O.L.E.® to the computer again and select Call on the Hyperterminal
Toolbar. Enter: ^OCD then ^OCA.
Manufacturer Specification: +/- 1ºC of reading
Those commands set the calibration date and stores the calibration constants
as archive values:
Your M.O.L.E.® Thermal Profiler is now calibrated.
7.3.4. Constructing a Thermocouple
The following procedures describe how to construct a thermocouple and a shorting plug.
Thermocouple construction:
The following items will be needed to construct a Thermocouple:
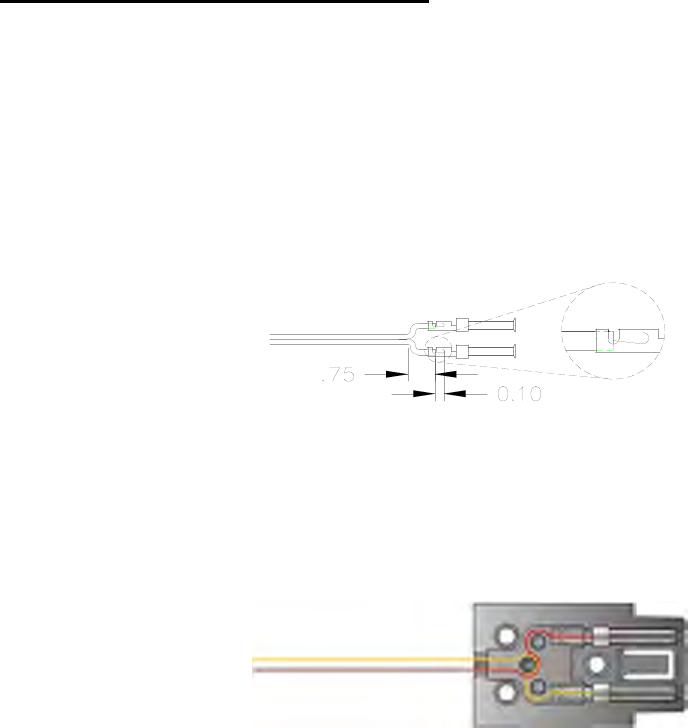
• Thermocouple assembly which includes: 1 Thermocouple housing, 3 Hardware
Screws and 2 female pins (one marked with a green dot and one marked with a
white dot).
• A Thermocouple consisting of one yellow and one red wire. (Maximum T/C wire
size 24 gauge).
• Thermocouple crimping tool
• Phillips (Crosshead) Screwdriver
Construct a thermocouple as follows:
1) Disassemble the Thermocouple housing by unscrewing the 3 Hardware screws.
2) Separate the wires on the stripped lead end (opposite junction end) about ¾”.
3) Prep the Red (-) T/C wire stripping the wire casing about 0.10” and curling the bare
wire into a U-shape. Place it into the T/C pin with the green dot and crimp with the
T/C crimping tool. Make sure that the wire covering is clear through the first set of
shoulders and crimped by them. Also, be sure that only wire is crimped by the
second shoulders.
4) Repeat Step 3 for the Yellow (+) wire by placing it into the T/C pin with the white
dot.
5) Place the female pins in the bottom (smaller) half of the Thermocouple housing. Be
careful to place the pins in the proper pin location.
6) Wrap the red and yellow wires around the strain relief posts as shown in the Figure
above.
7) Carefully place the two halves of the Thermocouple housing together. Verify that
the wires are not pinched and that the pin and wire positions are correct.

8) Replace the 3 Hardware screws.
Shorting plug construction
If fewer than six sensors are used in your application, a shorting plug may be used for
each of the unused M.O.L.E. Profiler channels.
The following items will be needed to construct a Thermocouple:
• Thermocouple assembly, which includes: Thermocouple housing, 3 Hardware
Screws and 2 female pins (one marked with a green dot and one marked with a
white dot).
• A 1" bare copper buss wire. (Maximum wire size 24 gauge).
• Thermocouple crimping tool.
• Phillips (Crosshead) Screwdriver
Construct a shorting plug as follows:
1) Disassemble the Thermocouple housing by unscrewing the 3 Hardware screws.
2) Place one end of the copper wire into the T/C pin with the green dot and the other
end into the T/C pin with the white dot. Now crimp both pins with the T/C crimping
tool
3) Place the female pins in the bottom (smaller) half of the Thermocouple housing. Be
careful to place the pins in the proper pin locations as shown in the Figure below.
4) Carefully place the two halves of the Thermocouple housing together. Verify that
the wire is not pinched and that the pin positions are correct.
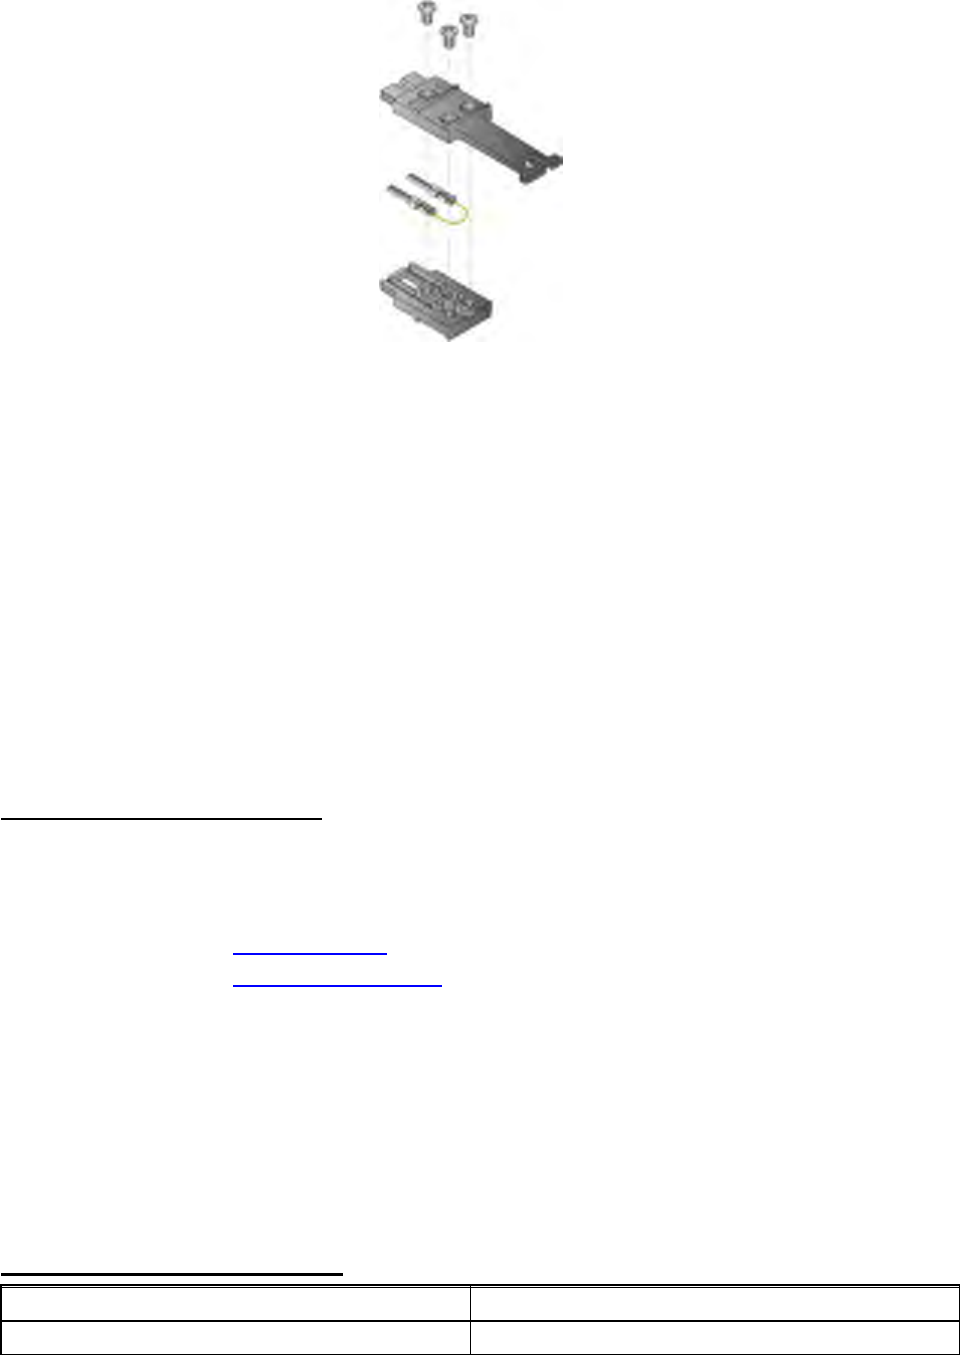
5) Replace the 3 Hardware screws.
7.4. How to Get Additional Help
If you still have problems, let us help you. We offer many ways to service your problems.
You can call our Service/Test technicians, visit our web site to view our FAQ section
(Frequently asked Questions) or send us e-mail explaining your problem in detail.
When calling our Service/Test technicians or sending us e-mail, please include the
following information:
• Product Description (i.e. SuperM.O.L.E.® Gold 2)
• Product Serial Number
• Software Version
Here is how to contact ECD:
Telephone:
+(1) 800.323.4548
+(1) 503.659.6100
FAX:
+(1) 503.659.4422
Email:
ecd@ecd.com
Internet:
http://www.ecd.com
8. Appendix
8.1. A: Specifications
SuperM.O.L.E.® Gold Profiler:
INPUTS:
Up to 6 type K ECD Micro-Thermocouples
PHYSICAL DIMENSIONS:
3.5" x 6" x 0.37"
TEMPERATURE MEASUREMENT RANGE:
-129°C to +1250°C (200°F to +2282°F)
INTERNAL OPERATING TEMPERATURE RANGE:
0°C to 65°C (32°F to 150°F)
Absolute Maximum Warranteed Internal
Temperature:
82°C (180°F)* SuperM.O.L.E.® Gold automatically
stops monitoring when the internal temperature
exceeds 80°C (176°F)
*WARNING: Exceeding this temperature may permanently damage the equipment!
ACCURACY:
Within ± 0.1%+1°C. at –73, 100, 250 and 1000°C.
Channel to channel compliance within 1°C.
PROGRAMMABLE SAMPLING PERIOD:
0.1 seconds to 24 hours
HARDWARE REAL-TIME CLOCK/CALENDER:
±1 minute/month at 25°C
OPEN THERMOCOUPLE DETECTION.
All six channels
NUMBER OF SAMPLES PER CHANNEL
5460 total for six channels
Power Pack:
POWER PACK CHARGE:
Typical 50 ten-minute profiles.
CHARGE TIME:
14 hours.
EXPECTED POWER PACK LIFE:
300-400 charging cycles.
OPERATING RANGE:
5.1V to 4.9V (the unit may become unreliable below
4.5V).
Power Pack Charger Model Specifications:
NORTH AMERICA:
ECD Part No. E31-0900-25
Input: 120 V, AC, 50/60 Hz, 2.8 VA Output: 9V DC, 120-200mA, 1.08VA
CONTINENTAL EUROPE:
ECD Part No. E31-0900-21
Input: 230 V, AC, 50/60 Hz, 2.8 VA Output: 9V DC, 120-200mA, 1.08VA
Thermocouple Specifications:
Thermocouples: Type K, Micro-Connector, Glass insulated. (Other insulation types available)
THERMOCOUPLE RESPONSE TIME
Wire Size
Still Air
800/100°F
60 Ft./Sec. Air
800/100°F
Still H2O
200/100°F
.001 in.
.005 in.
.015 in.
0.05 sec.
1.0 sec.
10.0 sec.
0.004 sec.
0.08 sec.
0.80 sec.
0.002 sec.
0.04 sec.
0.40 sec.
Environmental Limitation Specifications:
• Altitude up to 2000 meters
• Maximum relative humidity 80% RH from 0°C to 31°C, decreasing linearly to 17% RH at 50°C.
•
Pollution Degree 2 (Normally only dry pollution, but with temporary conductivity caused by condensation)
Power Pack Charger Only:
• Mains Voltage Fluctuations + 10%
• Mains Transient Overvoltage Installation Category II (Per IEC 664)
•
Pollution Degree 2 (Normally only dry pollution, but with temporary conductivity caused by condensation)
NOTE:Tests have shown that because of the sensitive nature of the measurement and logic circuits, the
following precautions must be observed:
• Minimize exposure to ESD Events. If the M.O.L.E. Profiler or one of the thermocouples receives an 8kV
electrostatic discharge during the data collection sequence, the M.O.L.E. Profiler may switch itself “OFF”.
To retrieve the data, simply upload the data that was recorded prior to the event. If a new data collection
sequence is started without uploading first, the existing data stored in the M.O.L.E. Profiler will be lost.
• Keep strong electromagnetic fields away. The thermocouple wires serve as an antenna for
electromagnetic radiation. If field strength of 3 volts per meter is present (usually due to close proximity
of
radio transmitters) while the M.O.L.E. Profiler is collecting data, the accuracy of the data may be
compromised. This interference is compounded by using long thermocouple wires, as well as the effect of
the thermocouple wires acting as a “tuned” antenna.
SuperM.O.L.E.® Gold 2 Profiler
INPUTS:
Up to 6 type K ECD Micro-Thermocouples
PHYSICAL DIMENSIONS:
9.41mm x 89mm x 152.4mm (0.37in. x 3.5in. x 6in.)
TEMPERATURE MEASUREMENT RANGE:
-200°C to +1271°C (-328°F to +2322°F)
INTERNAL OPERATING TEMPERATURE RANGE:
-40°C to 85°C (-40°F to 185°F)
Absolute Maximum Warranteed Internal
Temperature:
87°C (188.6°F)* SuperM.O.L.E.® Gold 2 Profiler
automatically stops operating when the internal
temperature exceeds 85°C (185°F)
*WARNING: Exceeding this temperature may permanently damage the equipment!
ACCURACY:
±1°C. Channel to channel compliance within 1°C.
PROGRAMMABLE SAMPLING PERIOD:
0.1 seconds to 24 hours
HARDWARE REAL-TIME CLOCK/CALENDAR:
±1 minute/month at 25°C
OPEN THERMOCOUPLE DETECTION.
All 6 channels
NUMBER OF SAMPLES PER CHANNEL
250,000 total for 6 channels
Internal Power Pack:
POWER PACK CHARGE:
Typical 50 ten-minute profiles.
CHARGE TIME:
8 hours (a 15 min. charge allows one 10min. data run)
EXPECTED POWER PACK LIFE:
300-400 charging cycles.
OPERATING RANGE:
4.2V to 3.0V
Internal Power Pack Charger:
INPUT:
Voltage Rating: 100 to 240 VAC
Current: 200mA(RMS) max. @ 115VAC
80mA(RMS) max. @ 230VAC
Frequency: 50/60Hz
OUTPUT:
5V DC, Load 0A MIN. 1A MAX.
Mains Voltage Fluctuations:
+ 10%
Wireless RF Option:
This equipment has been tested and found to comply with the limits for a Class A digital device, pursuant to
Part 15 of the FCC Rules. These limits are designed to provide reasonable protection against harmful
interference in a residential installation. This equipment generates, uses and can radiate radio frequency
energy and, if not installed and used in accordance with the instructions, may cause harmful interference to
radio communications. However, there is no guarantee that interference will not occur in a particular
installation. If this equipment does cause harmful interference to radio or television reception, which can be
determined by turning the equipment off and on, the user is encouraged to try to correct the interference by
one or more of the following measures:
• Reorient or relocate the receiving antenna.
• Increase the separation between the equipment and receiver.
• Connect the equipment into an outlet on a circuit different from that to which the receiver is connected.
•
Consult the dealer or an experienced radio/TV technician for help.
SuperM.O.L.E.® Gold 2 Radio:
Type:
IEEE 802.15.4 ZigBee™ two way
Frequency:
2.45 gHz
Power:
1mW (0dbm)
Range:
6.5 meters (20ft)*
Wireless Antenna:
Temperature:
250ºC (500ºF)
Exposed Material:
Teflon insulation
Connector:
MMCX Right Angle
USB Transceiver:
Type:
IEEE 802.15.4 ZigBee™ two way
Antenna:
Internal fractal chip
* The range of the SuperM.O.L.E.® Gold 2 RF system varies with the RF environment. Under ideal
conditions, the range may be 6.5 meters [20 feet] and in some situations it may only be a few meters. Refer to
topic Basics>Wireless RF Option Setup
Thermocouple Specifications:
Thermocouples: Type K, Mini-Connector, Glass insulated. (Other insulation types available.)
THERMOCOUPLE RESPONSE TIME
Wire Size
Still Air
800/100°F
60 Ft./Sec. Air
800/100°F
Still H2O
200/100°F
.005 in.
1.0 sec.
0.08 sec.
0.04 sec.
Environmental Limitation Specifications:
SuperM.O.L.E.® Gold 2 Profiler:
• Maximum relative humidity 80% RH from 0°C to 31°C, decreasing linearly to 17% RH at 50°C.
•
Pollution Degree 2 (Normally only dry pollution, but with temporary conductivity caused by condensation)
Power Pack Charger:
• Temperature: (Operation) 0 to +45°C (32 to 113°F)
• Temperature: (Non-Operation) -20 to +75°C (-4 to 167°F)
•
Humidity: (Operation) 20 to 90%
NOTE:Tests have shown that because of the sensitive nature of the measurement and logic circuits, the

following precautions must be observed:
• Minimize exposure to ESD Events. If the M.O.L.E. Profiler or one of the thermocouples receives an 8kV
electrostatic discharge during the data collection sequence, the M.O.L.E. Profiler may switch itself “OFF”.
To retrieve the data, simply upload the data that was recorded prior to the event. If a new data collection
sequence is started without uploading first, the existing data stored in the M.O.L.E. Profiler will be lost.
•
Keep strong electromagnetic fields away.
The thermocouple wires serve as an antenna for
electromagnetic radiation. If field strength of 3 volts per meter is present (usually due to close proximity
of
radio transmitters) while the M.O.L.E. Profiler is collecting data, the accuracy of the data may be
compromised. This interference is compounded by using long thermocouple wires, as well as the effect of
the thermocouple wires acting as a “tuned” antenna.
8.2. B: Statistical Process Control (SPC) Background Information
This appendix deals with the subset of SPC that is incorporated into M.O.L.E.® MAP
Software. It does not address general SPC principals. A working knowledge of general
statistical principals and SPC terms is assumed and is not addressed here. There are
many good basic SPC books where this information may be obtained.
Reflow and Wave Solder operators, engineers and production managers are expected to
understand their soldering process so as to deliver quality products cost effectively. This
is a continuous process.
First, the machine must be checked for consistency. A standard or typical set up should
be routinely checked prior to any process set point determinations, or actual production
run machine checks. Only after the machine has been determined to be operating
correctly and not experiencing abnormal variation, should data from the machine be
utilized. SPC is all about identifying common or normal variation from abnormal variation.
Second, the correct process set points must be determined for a particular product.
Utilizing the M.O.L.E. Profiler, the correct set points for a particular product may be
determined. These set points, if selected correctly and followed, should deliver the
maximum throughput of quality product.
Third, the machine must consistently deliver the correctly determined set points. SPC will
help identify common or normal variation from abnormal variation. Checking the machine
using your M.O.L.E. Profiler and the M.O.L.E.® MAP Software with its SPC capability will
help ensure that the machine is consistently performing to its set points and your
expectations.
Fourth, repeat the above three steps. Continuous improvement is a never-ending cycle.
Check the long-term variation of the machine by graphing typical set point samples. Using
the M.O.L.E. Profiler, recheck/adjust part number specific set points to maximize your
quality throughput. Check the machine during a part number run to control the machine
variation from that part number’s actual ideal set points.
While SPC had its start in high volume repetitive operations, SPC is applicable to many
other types of operations as well. However, SPC can be difficult to apply to short runs.
Short runs may be runs that take a long time to process, runs in which multiple samples
are difficult to collect, and runs where samples are difficult to place into subgroups or runs
where small quantities are run.
The M.O.L.E.® MAP Software charts will be more meaningful to the user if SPC charts
are generated based on data sets that have the same set points each time.
There are several basic short run SPC techniques:
1. Nominals Charts
2. Individuals/Moving Range Charts
3. Moving Average/Moving Range Charts
4. Standardized Formula Charts
The Moving Average/Moving Range Chart technique is particularly well suited for
situations where control information is desired as soon as possible and there is a
relatively long time between sample collections. After considering the nature of solder
operations and the machine sampling process, the Moving Average/Moving Range Chart
technique was incorporated into M.O.L.E.® MAP Software.
Moving Average/Moving Range Chart Technique:
M.O.L.E.® MAP Software utilizes the standard Moving Average/Moving Range Charting
technique with a subgroup size of 2-6 that is selected by the user. The following steps and
figure illustrates the Moving Average/Moving Range calculations (using a group size of
two) that are used to construct the SPC chart.
Steps for Creating a Moving Average Moving Range Control Chart:
1. Select the key variable to monitor.
2. Select the moving average group size. (We will use two in our example.)
3. Obtain your first sample and record it as sample 1 (X1).
4. Obtain your second sample and record it as sample 2 (X2).
5. Determine the x-bar and R values.
Moving Average formulas:
6. Plot this value on the chart as subgroup 1.
7. Carry forward sample 2 into subgroup 2’s calculation. Obtain your third sample and
record it as sample 3. The averages of sample 2 and sample 3 form subgroup 2.
8. Plot this value on the chart as subgroup 2.
9. Repeat for all the samples.
10. Calculate control limits using standard x-bar and R formulas for the appropriate
sample sizes. M.O.L.E.® MAP Software uses range-based calculations for LCL
and UCL.
X
1
+ X
2
2
X =
(Range)R=X - X
H
L
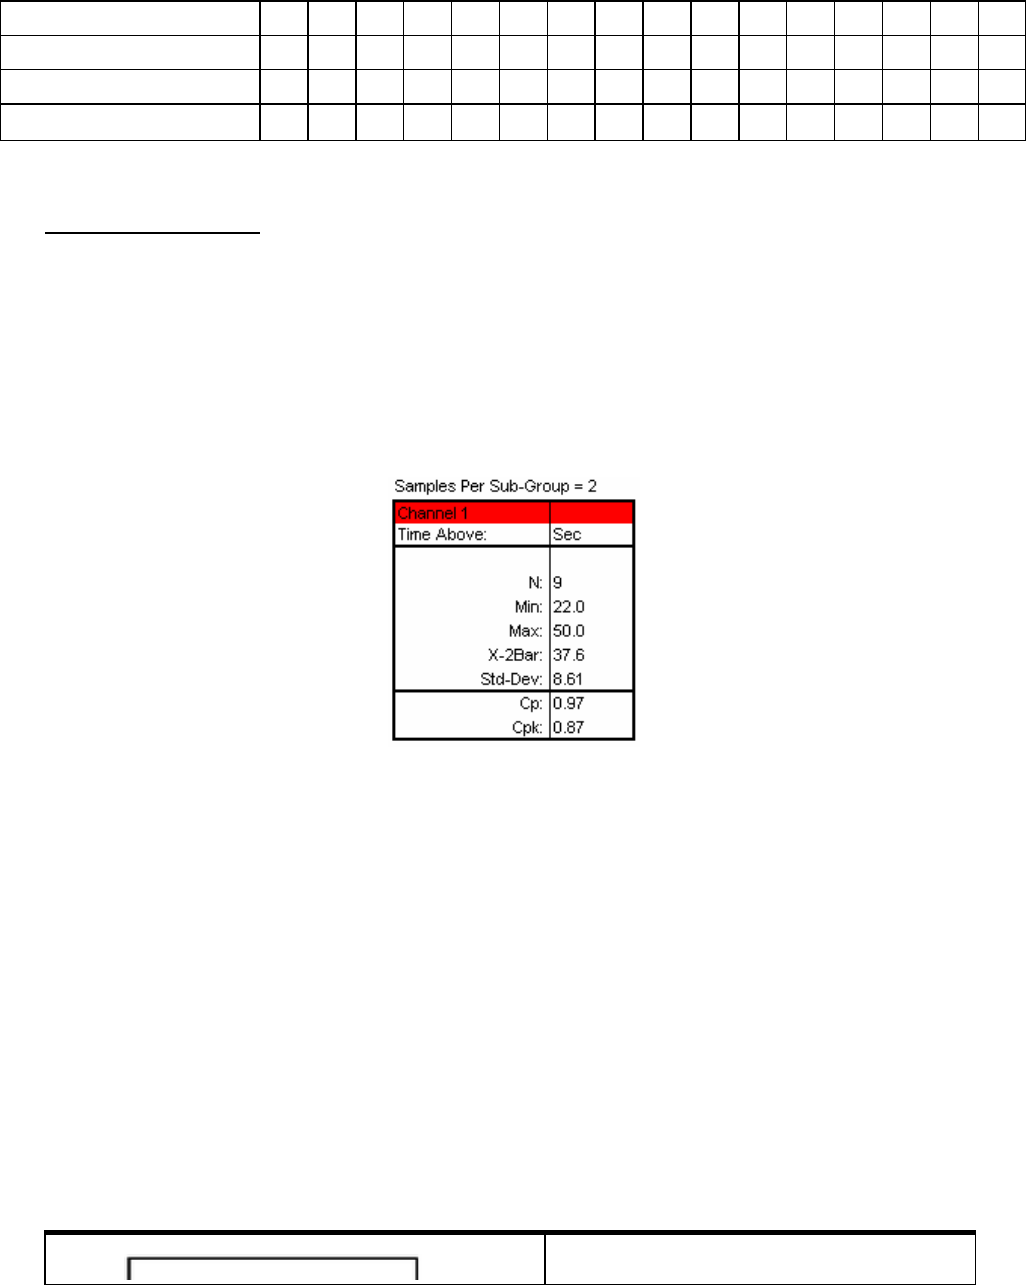
11. Continue monitoring the process.
SAMPLE #
1
2
3
4
5
6
7
8
9
10
11
12
13
14
15
16
SAMPLE MEASUREMENTS
3
4
5
3
2
9
5
2
6
8
4
8
5
6
3
3
SUBGROUP VALUE
x
3.5
4.5
4
2.5
5.5
7
3.5
4
7
6
6
6.5
5.5
4.5
3
R 1 1 2 1 7 4 3 4 2 4 4 3 1 3 0
Moving Average/Moving Range Subgroup Size 2 Calculations Chart
Process Capability
A process capability index is a standard measure of how a process compares with its
specification limits—how a process is performing relative to how it is supposed to
perform. As opposed to the control chart, which shows detailed information about how the
data compares with control limits, a capability index is a summary of how the data
compares with the specification limits.
Two common capability indicators are Cp and Cpk. These values are shown in the
Statistics Box on the SPC Page Tab.
For both of the index values, the data used to determine them is dictated by the subgroup
size (N) chosen by the user. In the case where N=1, individual data is used—for N>1,
average data is used (x bar).
The charts on the next page give a graphical representation of the concept of Cp and Cpk.
Notice that in each graph, the same upper and lower specification limits (USL, LSL) are
used. The values of Cp and Cpk will differ according to the data that is compared with
those specifications.
Depending on the particular process being monitored, the desired value for Cp and Cpk
may differ. In general, however, a Cp and Cpk of 1.33 or above is desired. This assures
that the process is not only capable of meeting the required specification limits, but also
has a built-in margin for error that may be needed in special circumstances. In addition to
targeting a certain minimum Cp and Cpk, it is also desirable to have these two values
equal one another. This indicates that the process is well-centered between the
specification limits.
Cp
≥
1.33: Data tightly distributed.

Cpk
≥
1.33: Data well inside spec limits.
Cp = 1.00: Data fills entire spec range.
Cpk = 1.00: Data fills entire spec range.
Cp > 1.00: Data tightly distributed. If it
were centered between the spec limits,
no data would lie beyond those limits.
Cpk < 1.00: Some data is outside the
spec limits.
Cp < 1.00: Data not tightly distributed. If it
were centered between the spec limits,
some data would still lie outside those
limits.
Cpk < 1.00: Some data is outside the
spec limits.
The equations used to calculate the index values are as follows:
O
R
, whichever is less
As can be interpreted from the above equations, Cp gives an indication of how narrow the
data distribution is relative to the width of the specification limits. Essentially, it indicates
how well the process would be able to stay within the specified limits if the data were
perfectly centered between those limits.
Cpk compares the widest half of the data distribution to the appropriate specification limit.
It indicates whether the process is capable of meeting the specification as indicated by
.).(*6 DevStd
LSLUSL
Cp −
=
.).(*3 DevStd
xUSL
Cpk −
=
.).(*3 DevStd
LSLx
Cpk −
=
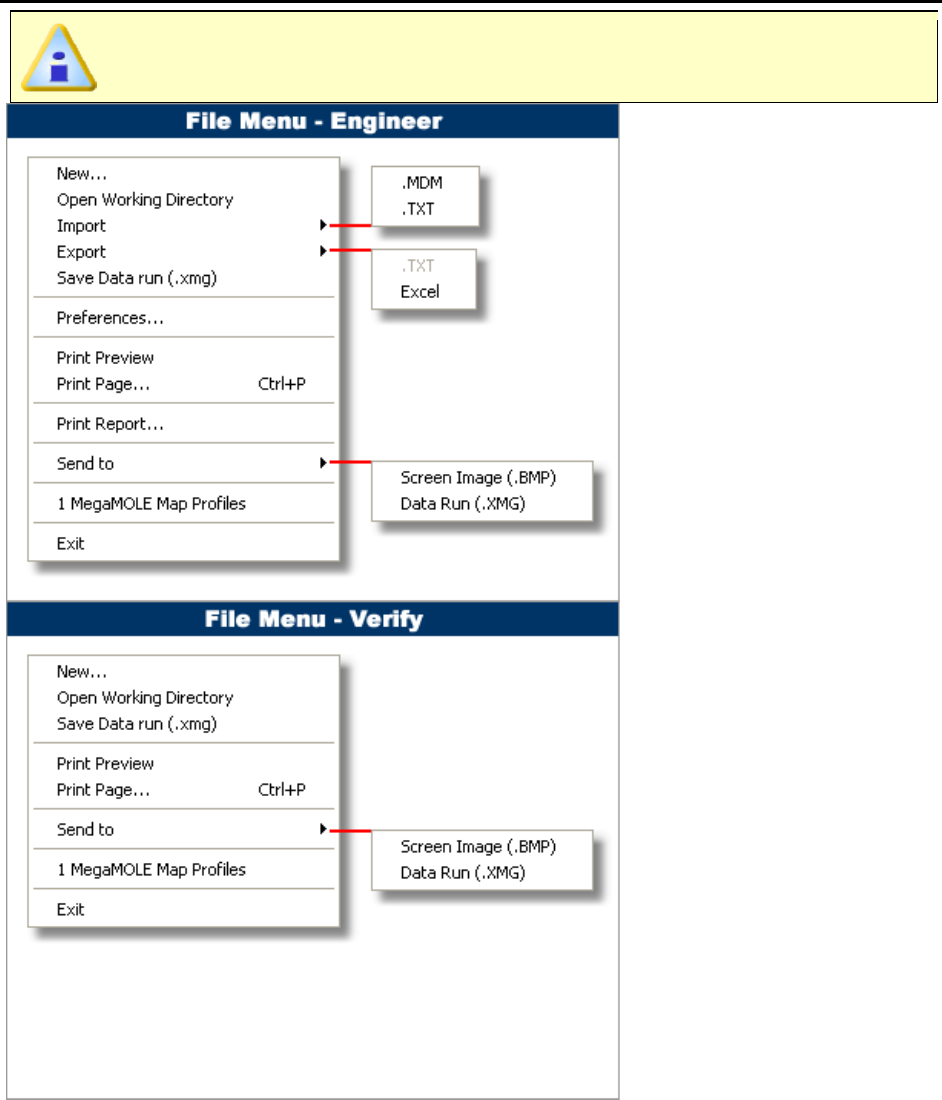
the “worst half” of the measurements. Unlike Cp, the Cpk index measures process
capability without assuming the data is well-centered.
8.3. C: Pull Down Menus & Toolbar Buttons
Menus:
The dimmed menu commands are used in other Page Tabs.
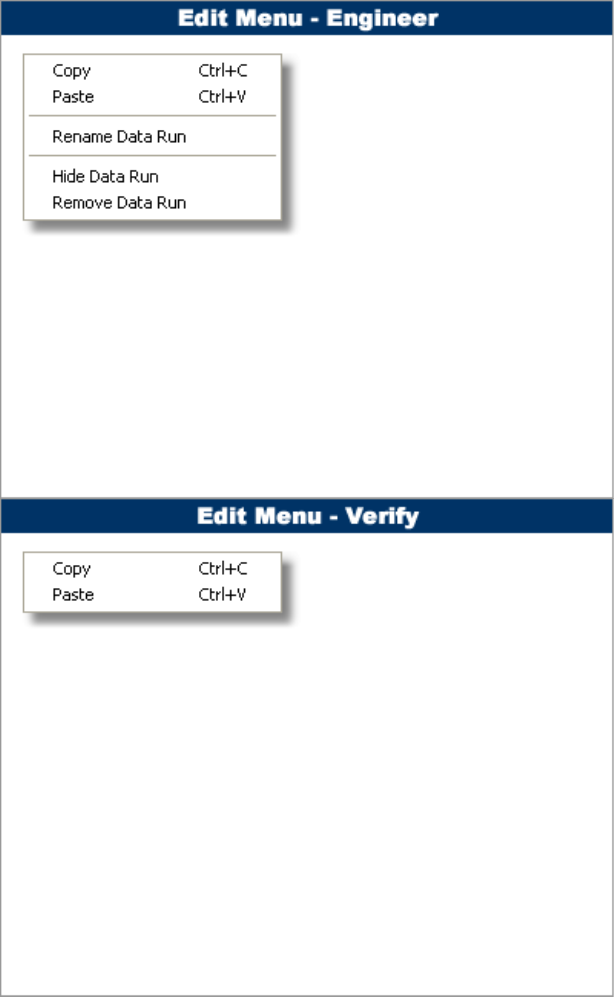
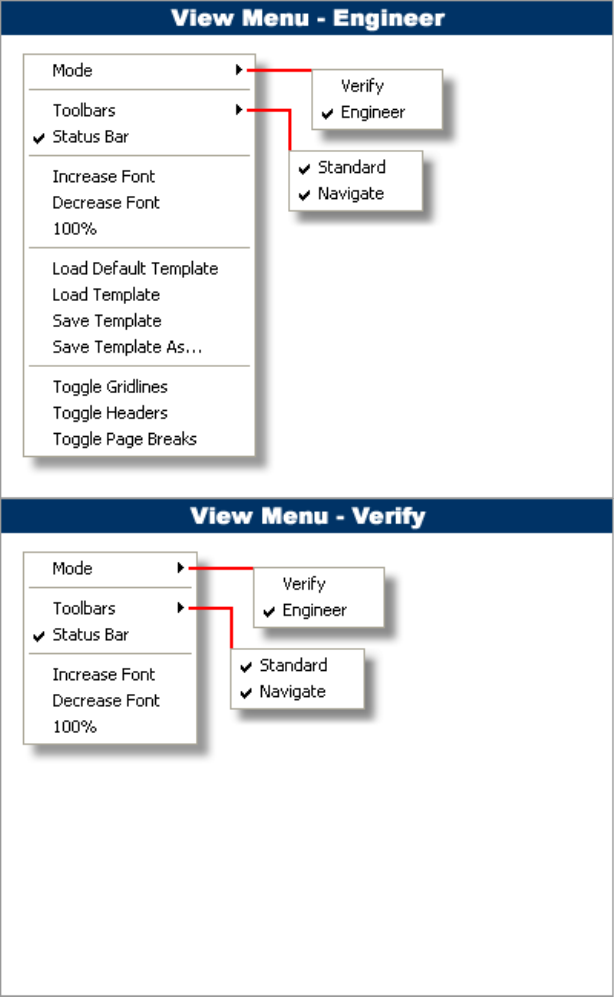
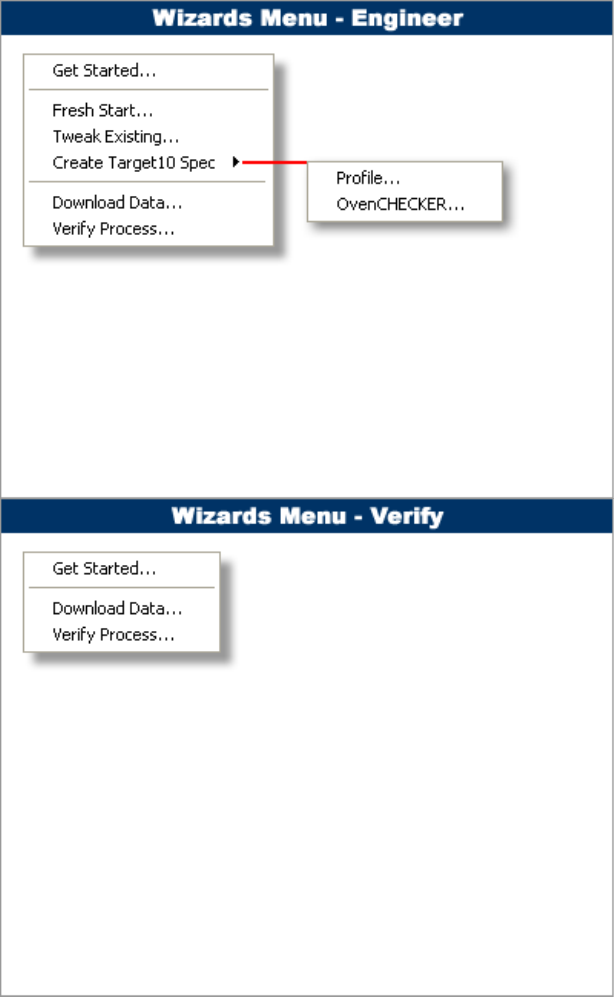
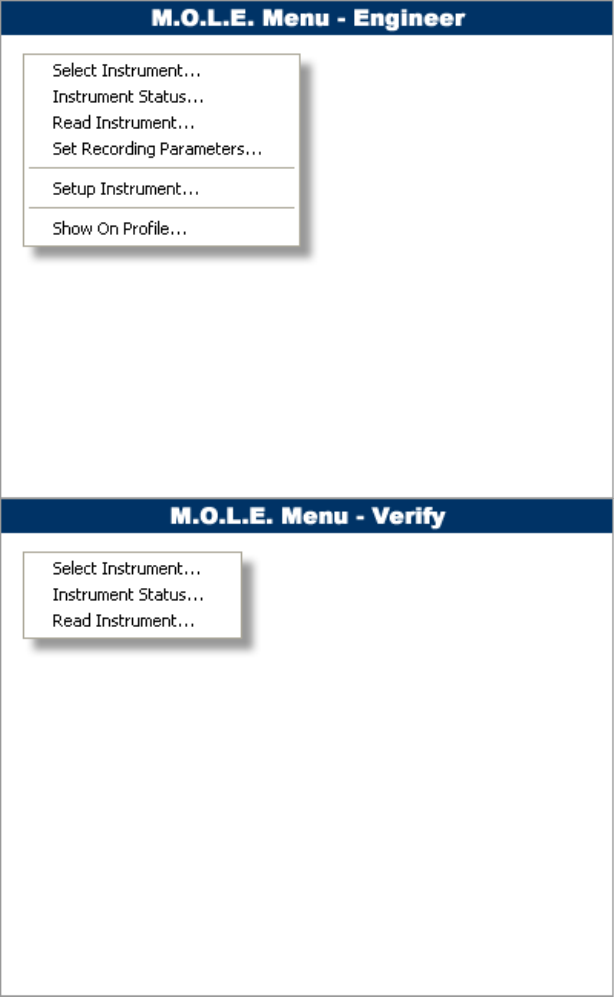
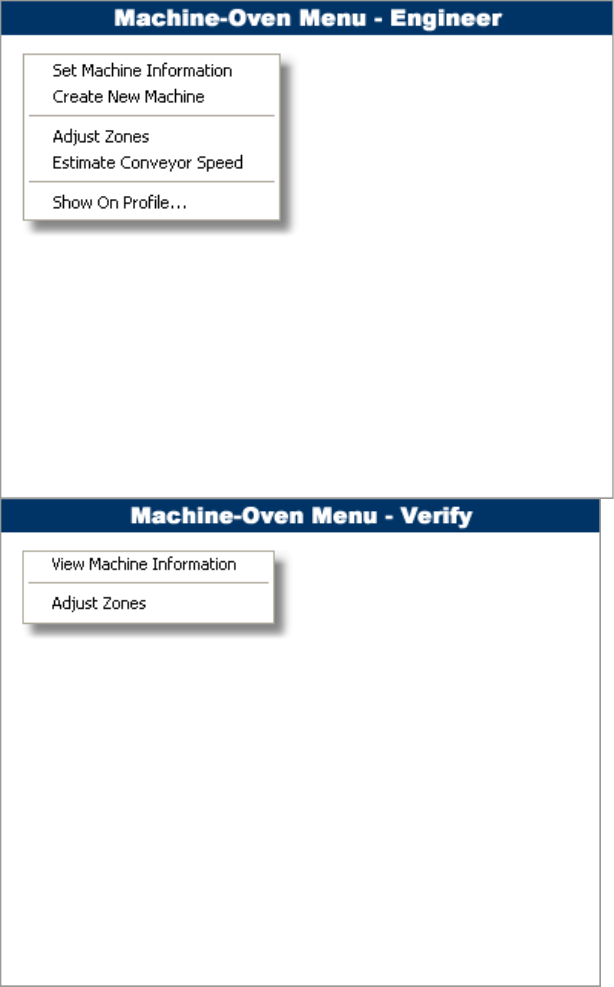
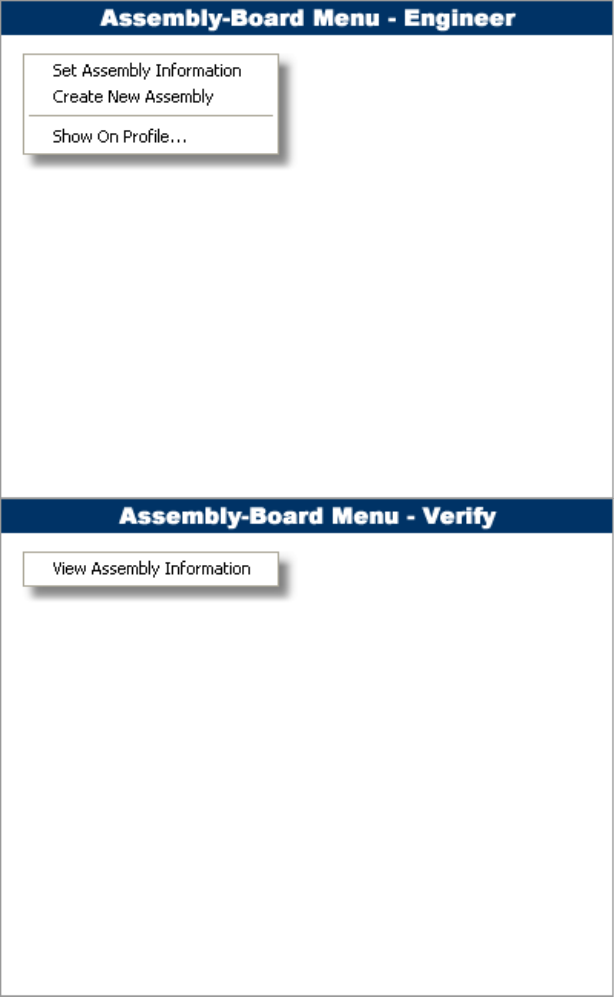
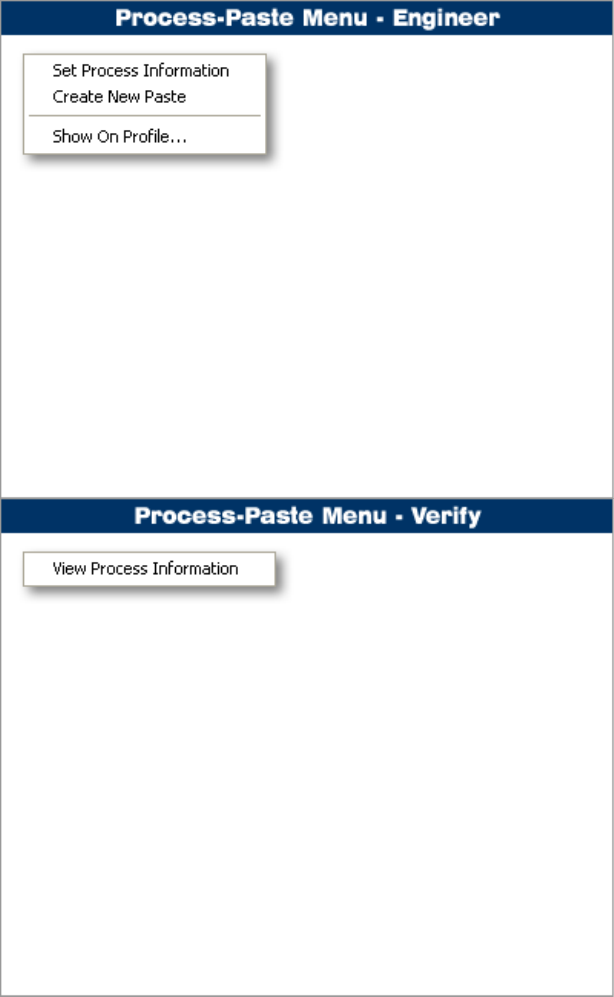
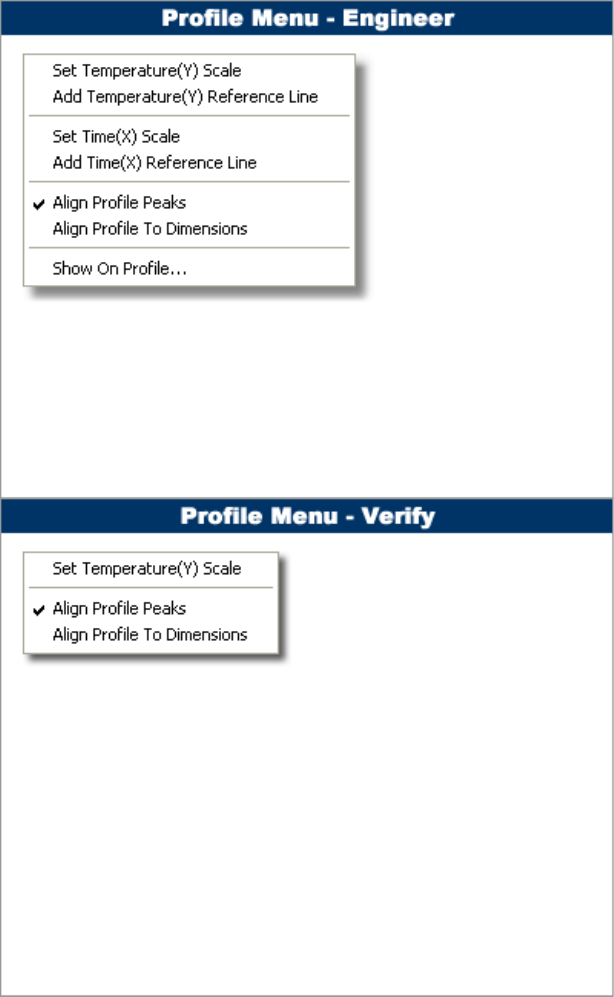
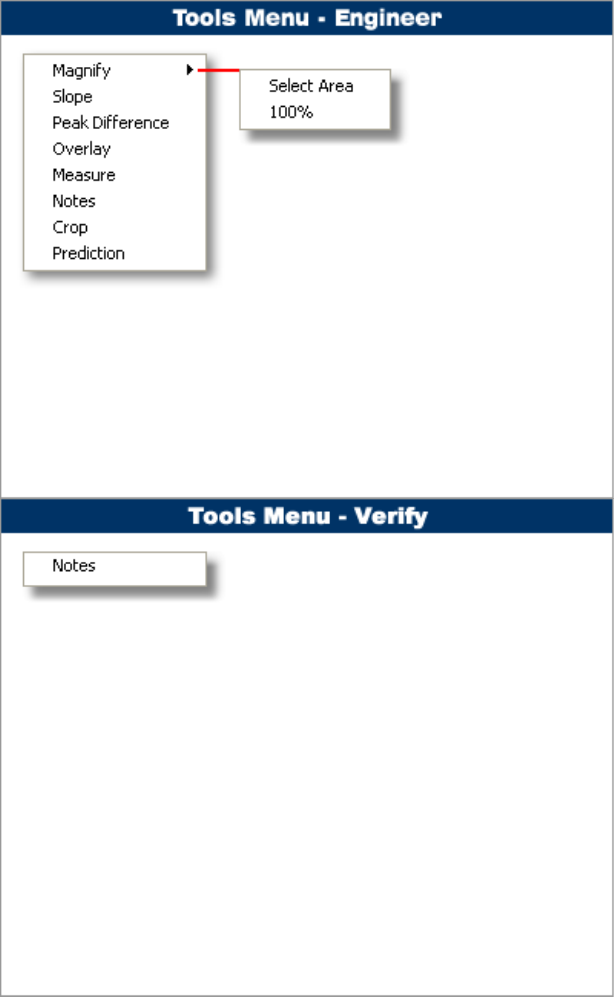
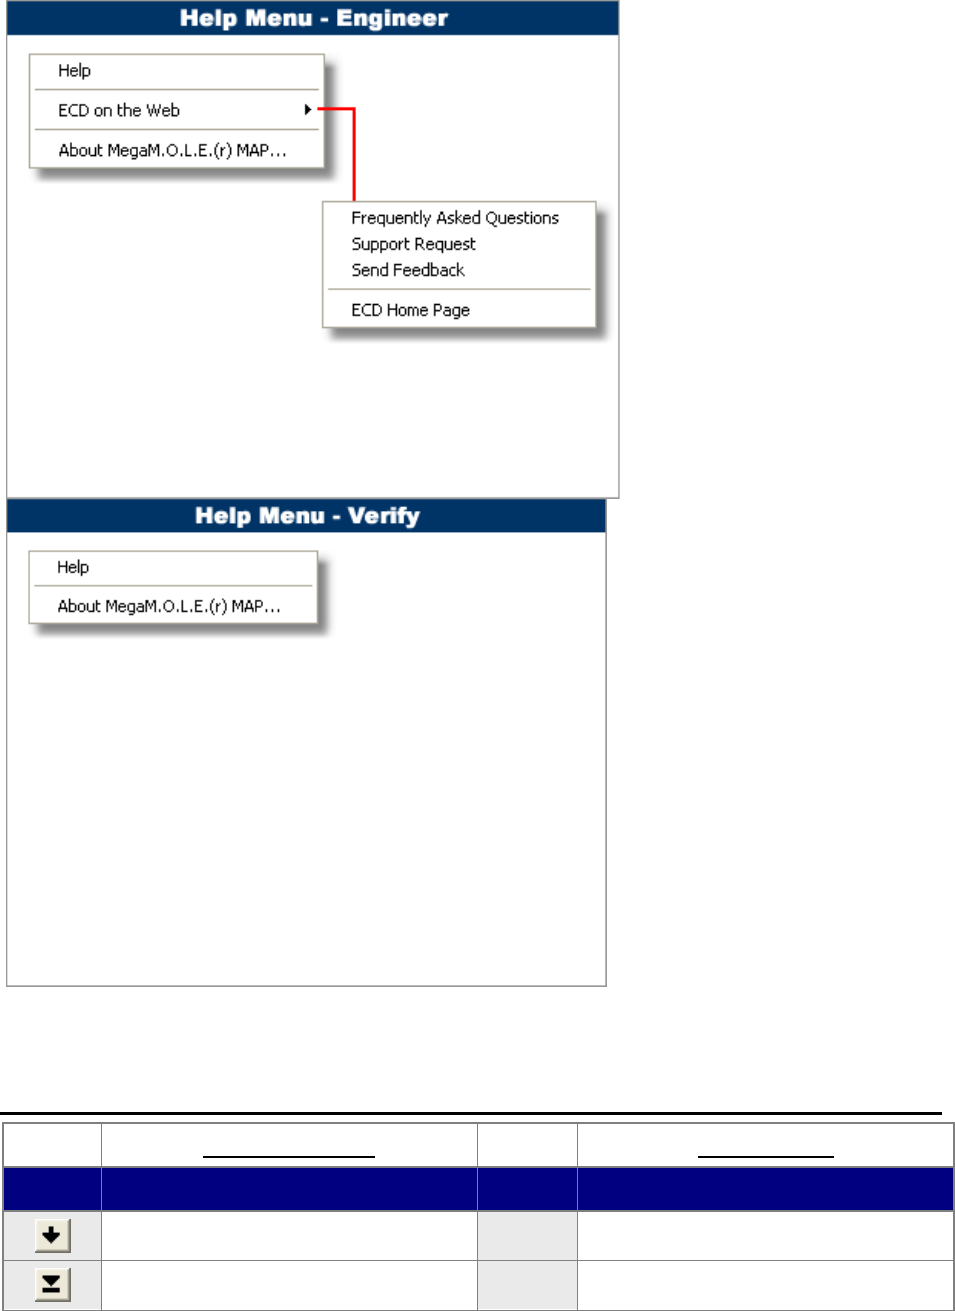
Menus (Verify Mode):
Toolbar buttons:
Engineer Mode
Verify Mode
Button
Command
Button
Command
Back (To Previous Data Run)
First (Data Run)
Help
Help
Last (Data Run)
Magnify Window
Magnify 100%
Measure
Next (Data Run)
Notes
Notes
Open Working Directory
Open Working Directory
Overlay
Peak Difference
Print Page Tab
Print Page Tab
Prediction
Save Data Run
Save Data Run
Slope
Start/New
Start/New
Your index page goes here...
In MS-Word, select INDEX AND CONTENTS from the INSERT menu.
Select INDEX and click OK.