Embeded Designs BS KIC Base Station User Manual KIC 2000
Embeded Designs KIC Base Station KIC 2000
UserManual.wiki
>
Embeded Designs
>
BS User Manual
>
Manual Part 2
Contents
1.
Manual Part 1
2.
Manual Part 2
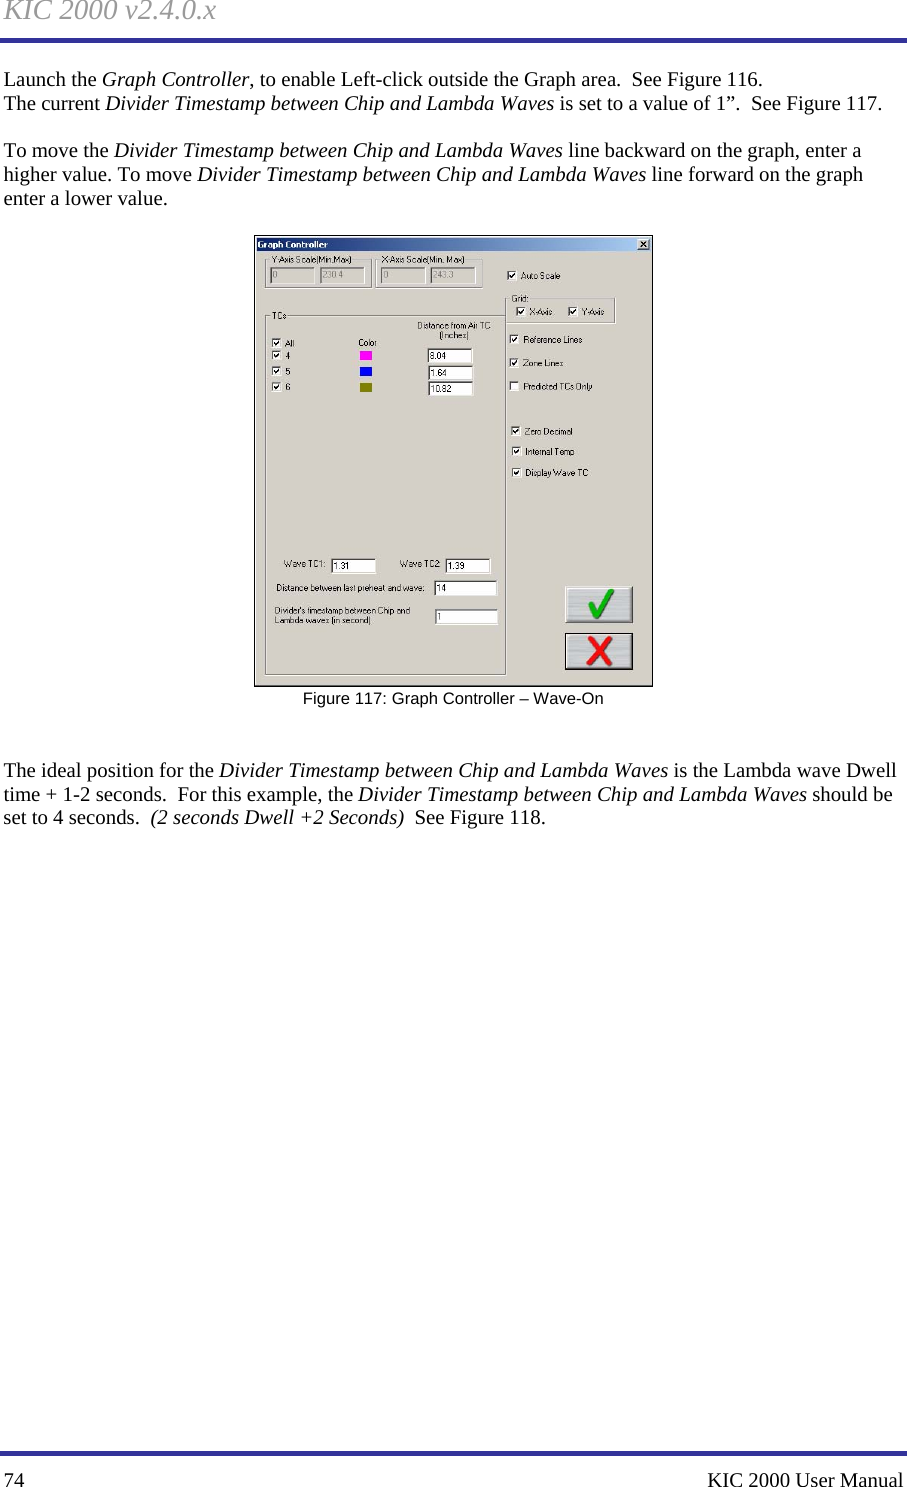
Manual Part 2
Navigation menu
Upload a User Manual
Namespaces
Wiki Guide
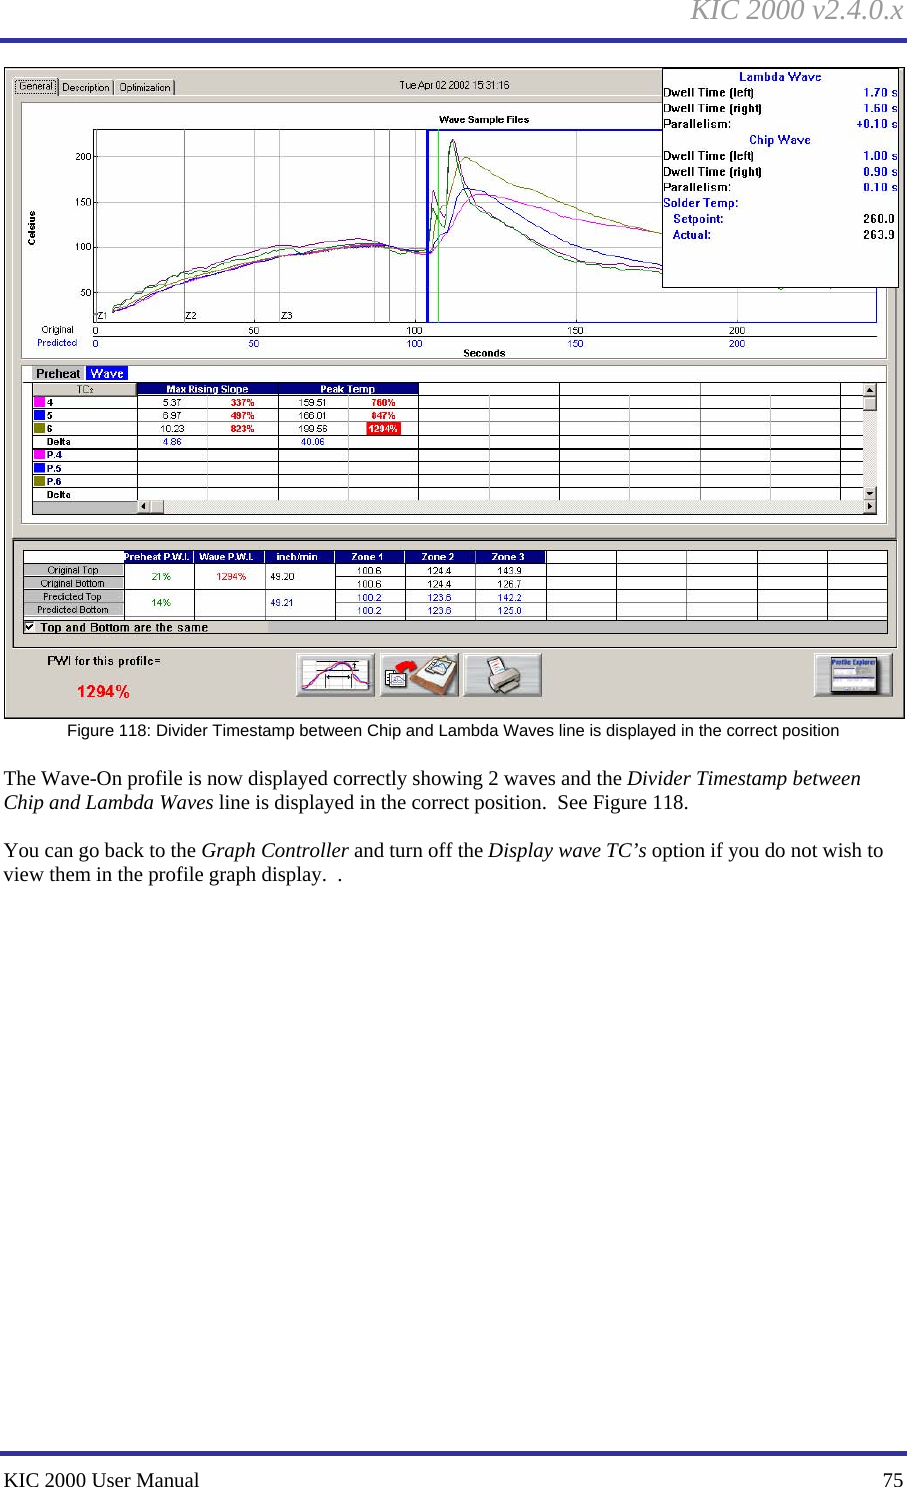
HTML
PDF
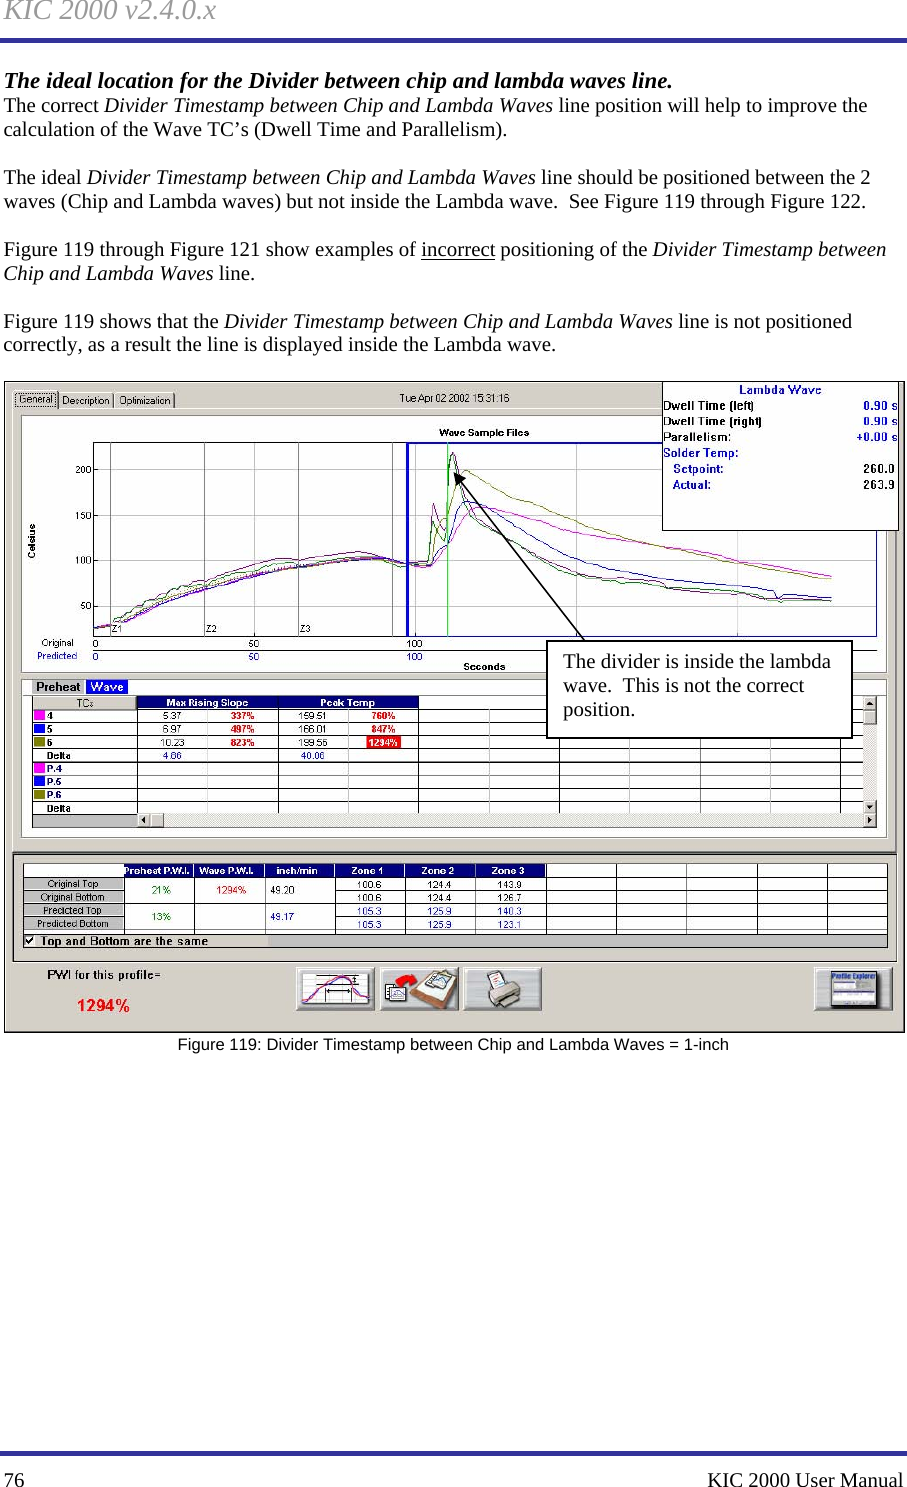
Info
Views
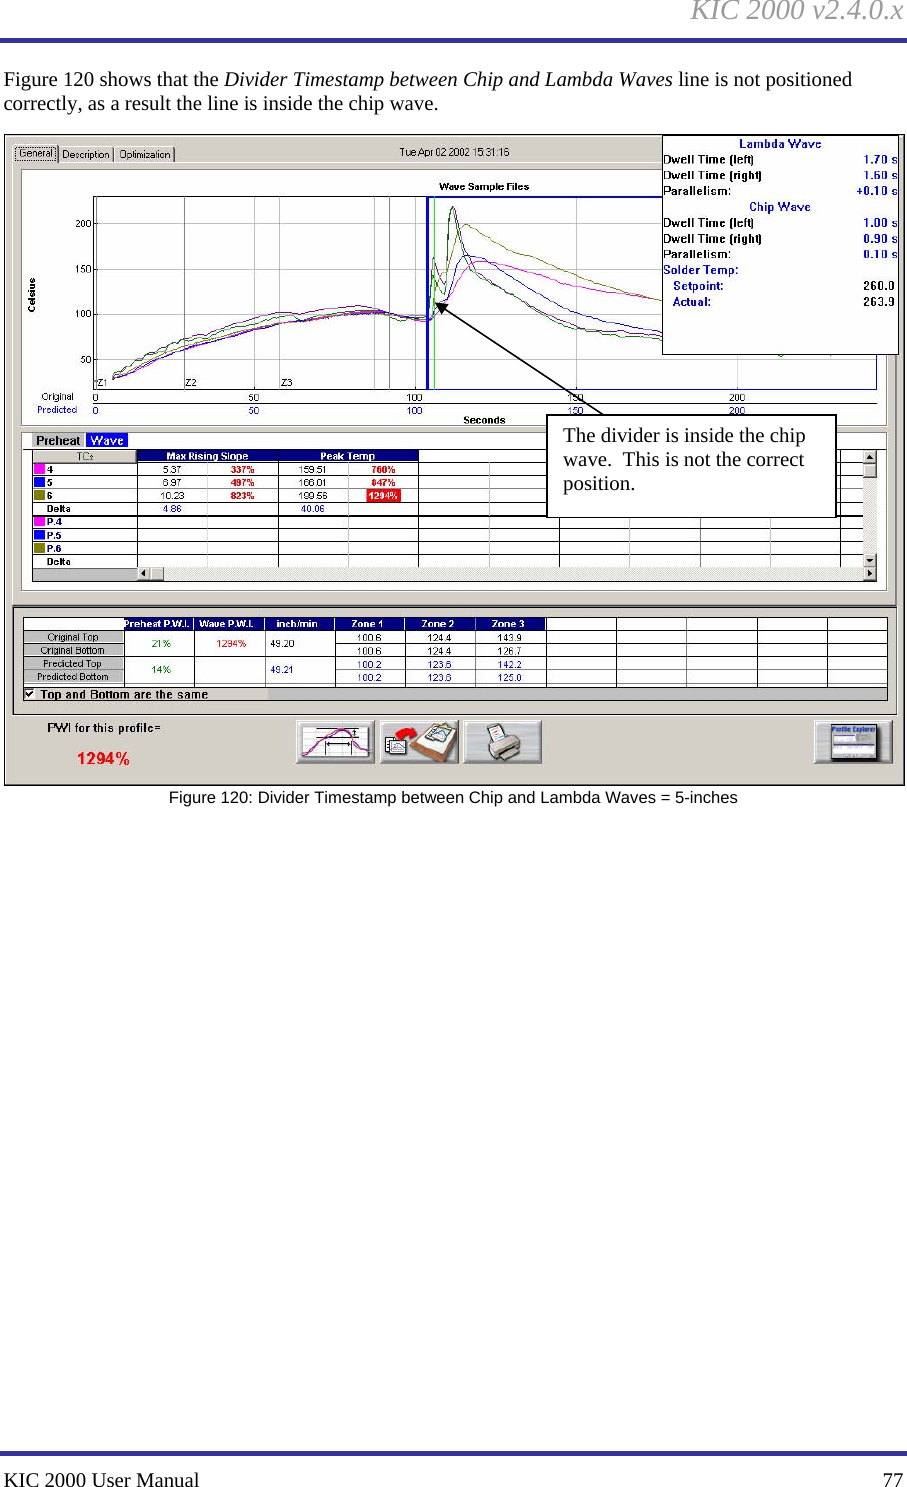
User Manual
Discussion / Help
Navigation
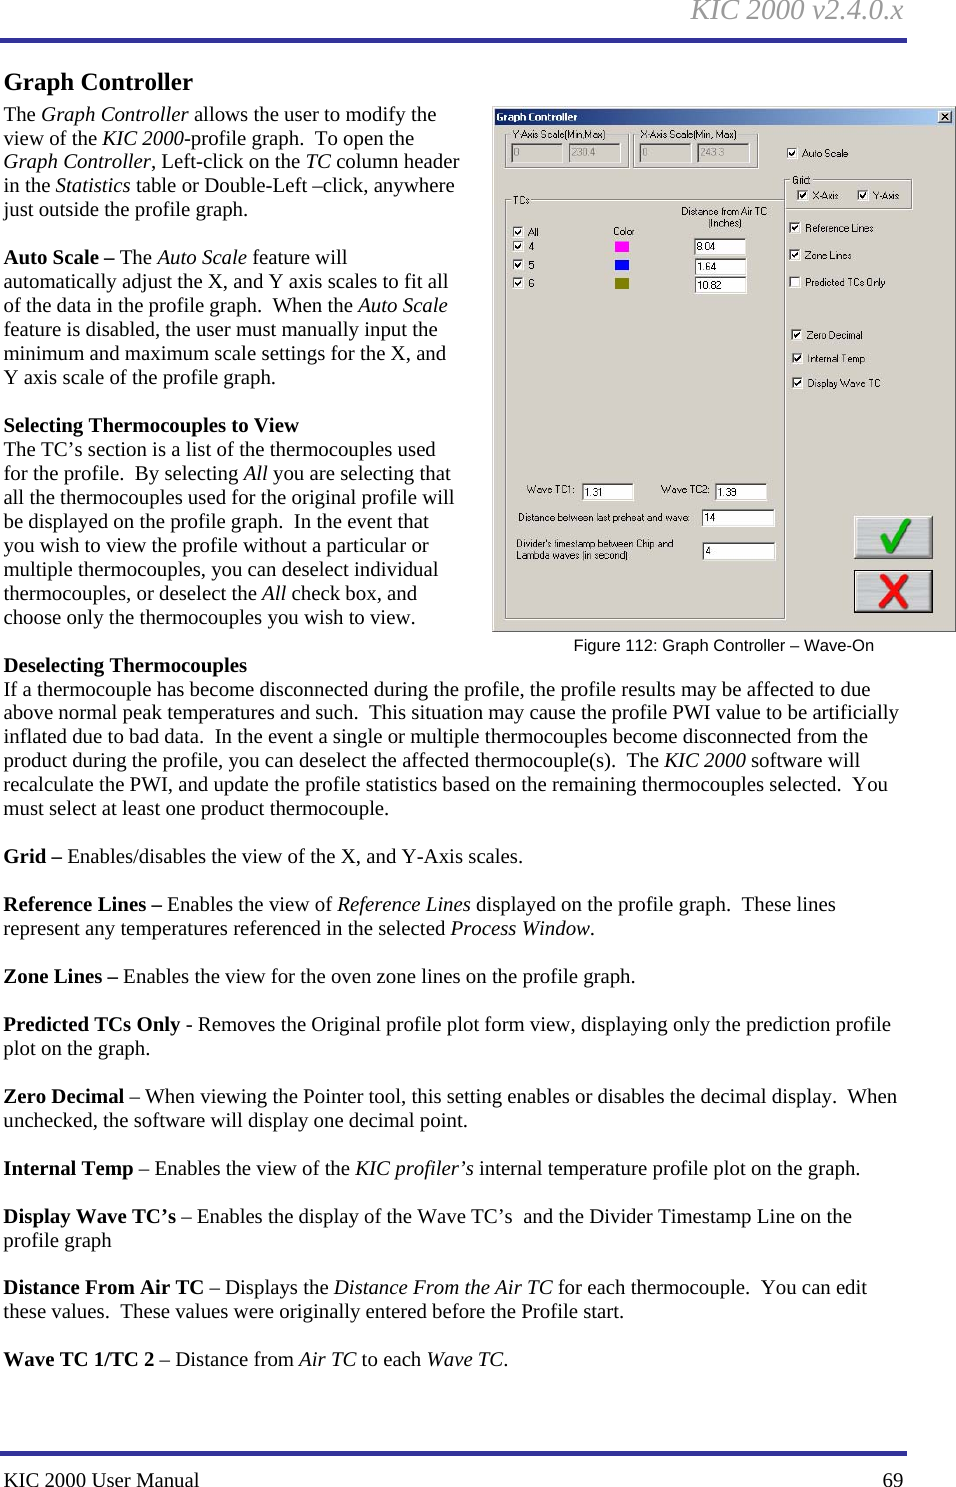
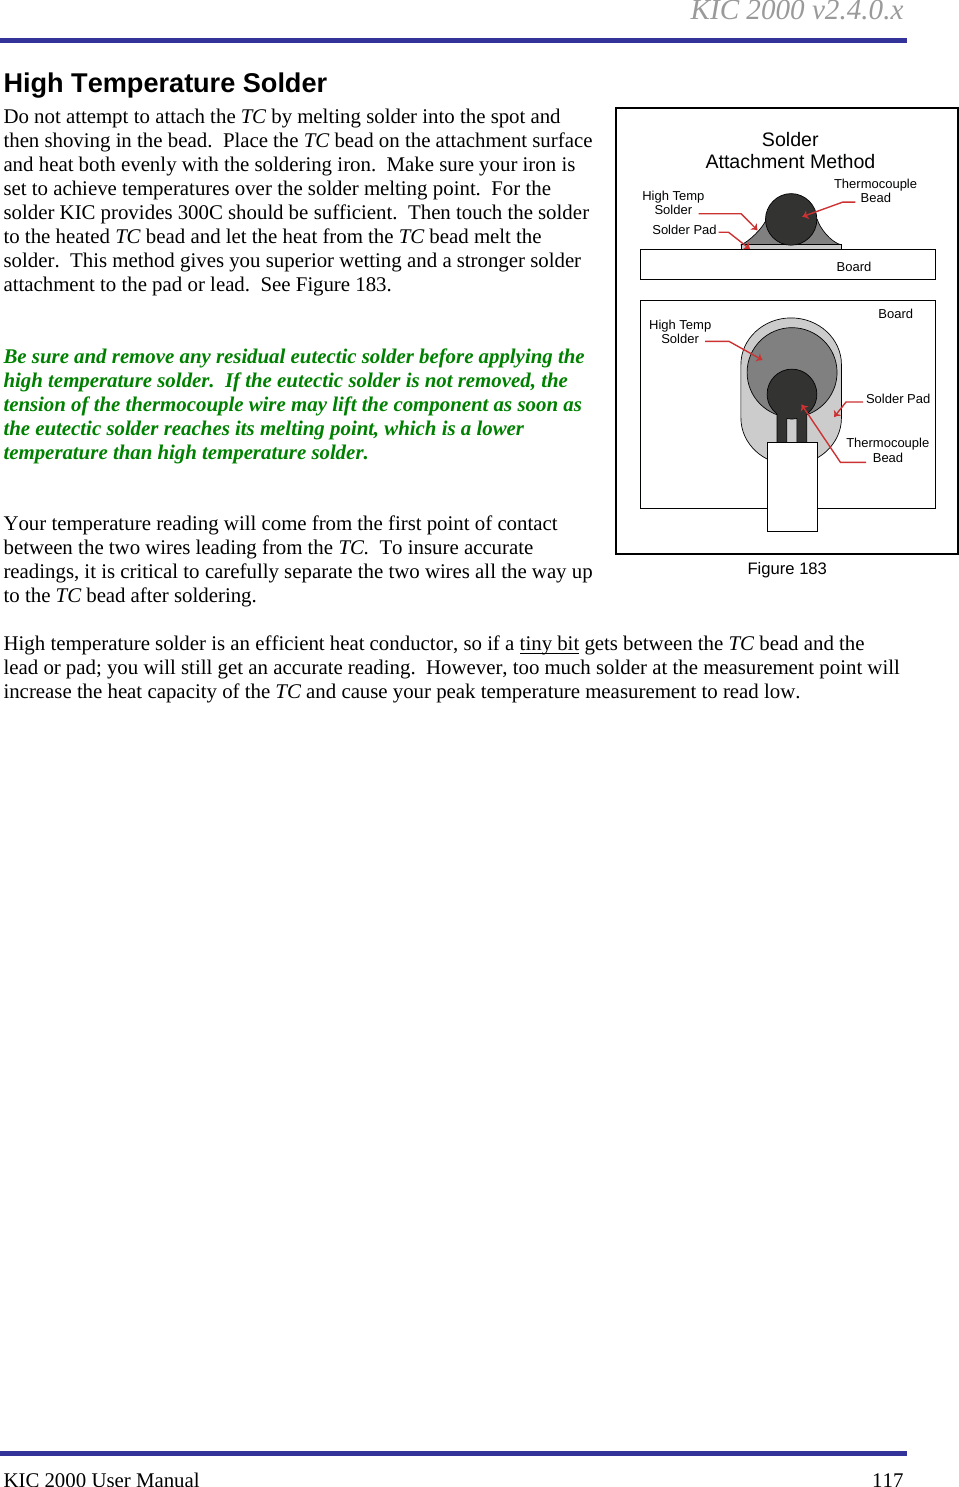
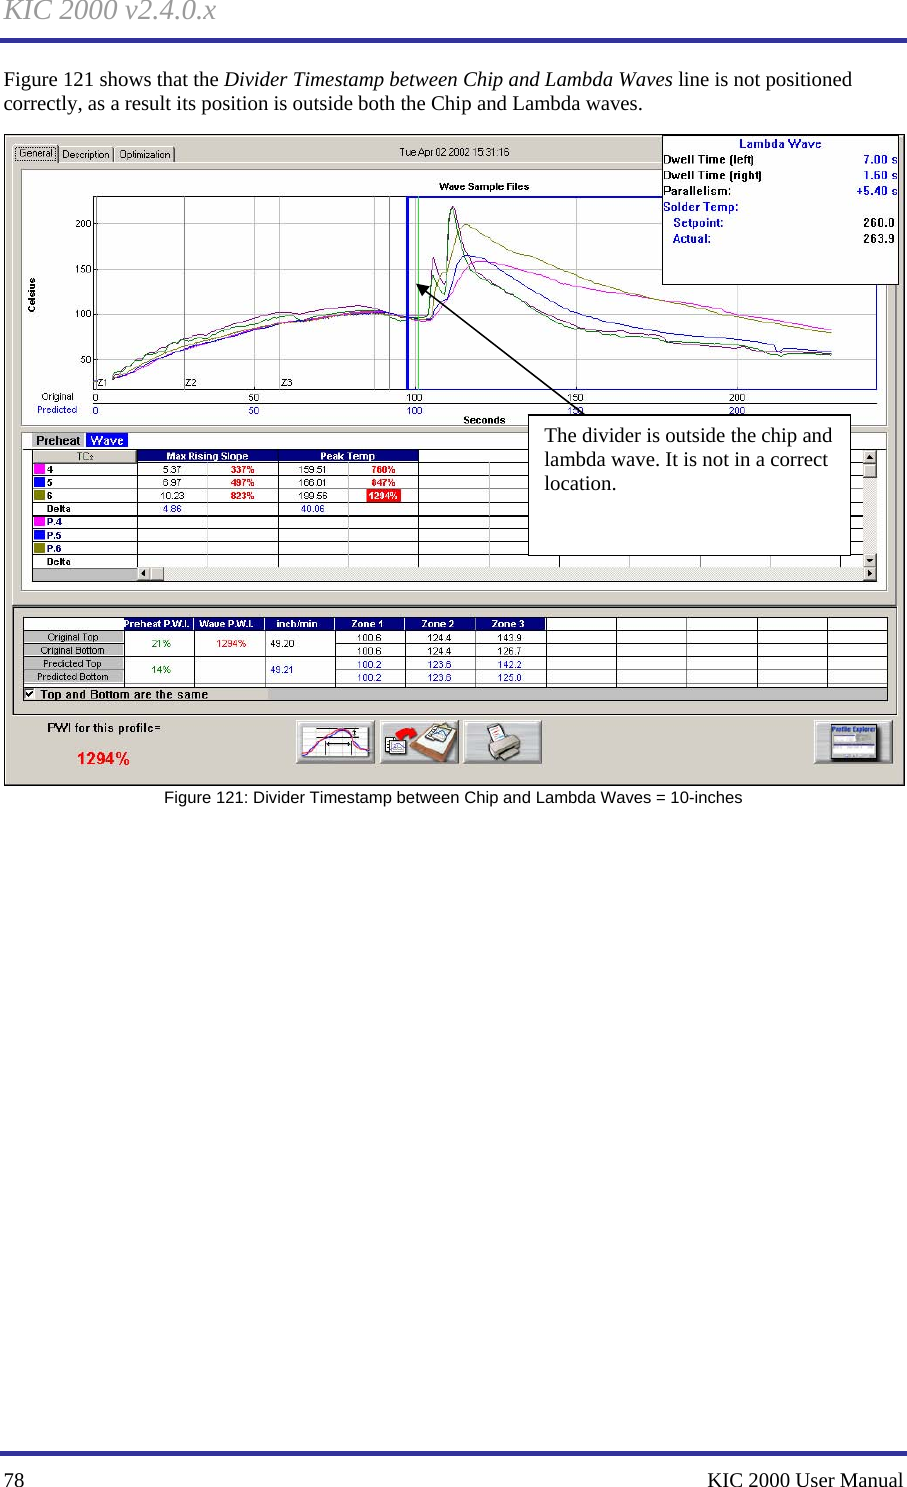
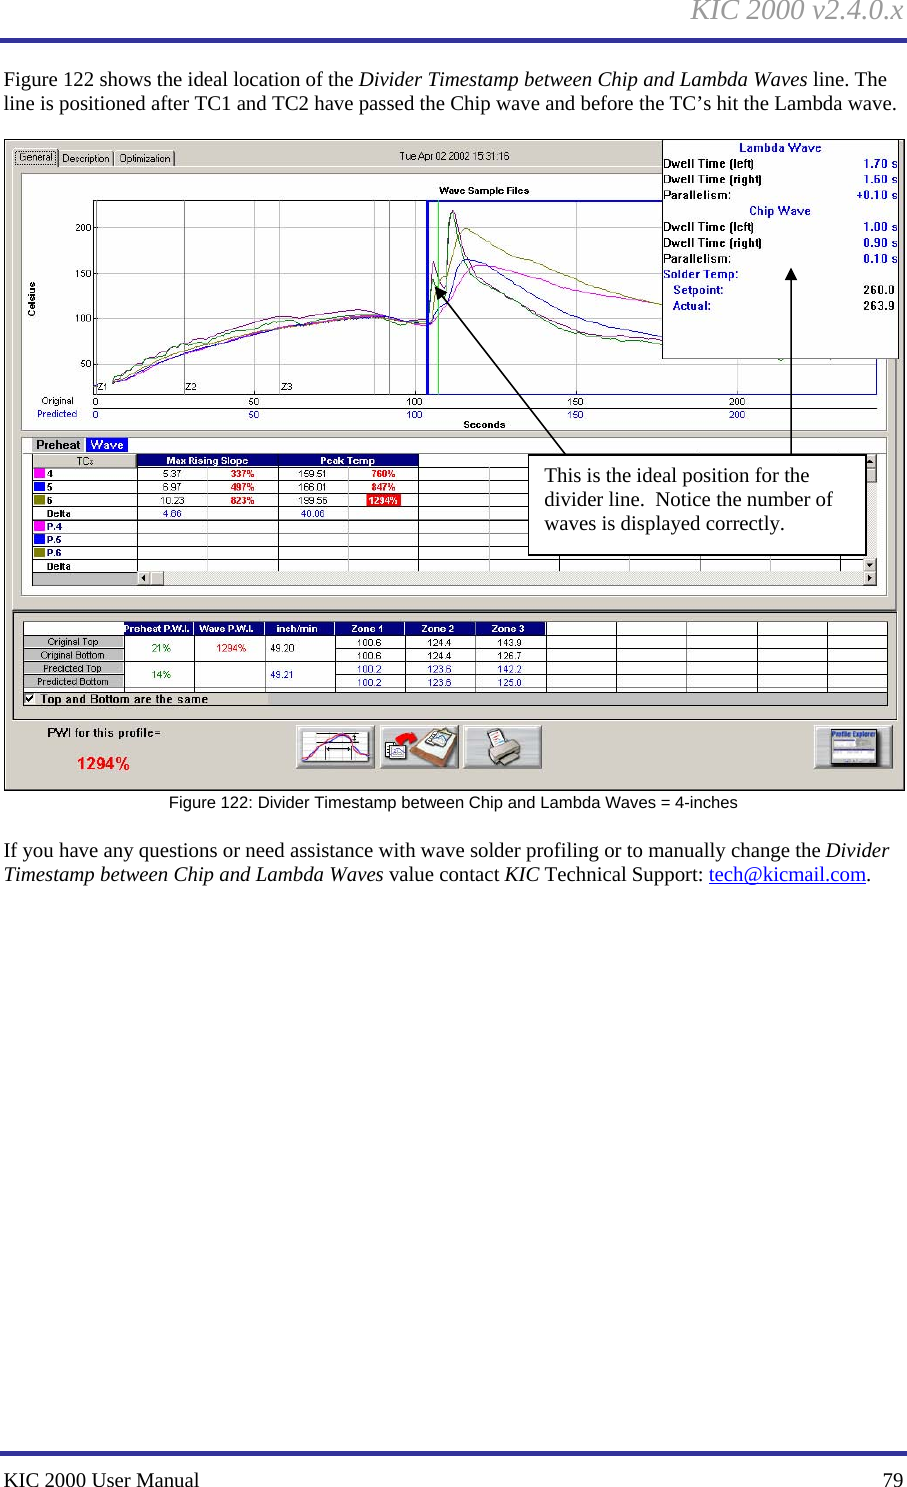
![KIC 2000 v2.4.0.x KIC 2000 User Manual 71 In order for the KIC 2000 software to display the Wave-On profiles correctly, the user can manually enter the Wave Machine measurements in the Oven configuration file. See Figure #1 for details of each required measurement. File Name to edit: C:\KIC Profiler 2000\Ovens\yourwaveovenname.kiccfg: 1. Enter the measurements for the required items listed below: See Figure 113 for details of each required measurement. [HOST] LambdaLength= ChipLength= fChipLambdaDistance= UnitsEnumForWave=0 (0=Inches, 1=Centimeters) 2. After the measurements have been input, save the file and then close it. From this point-forward all profiles run using this same oven name will be displayed using the values input in the previous step.](https://usermanual.wiki/Embeded-Designs/BS.Manual-Part-2/User-Guide-857736-Page-7.png)
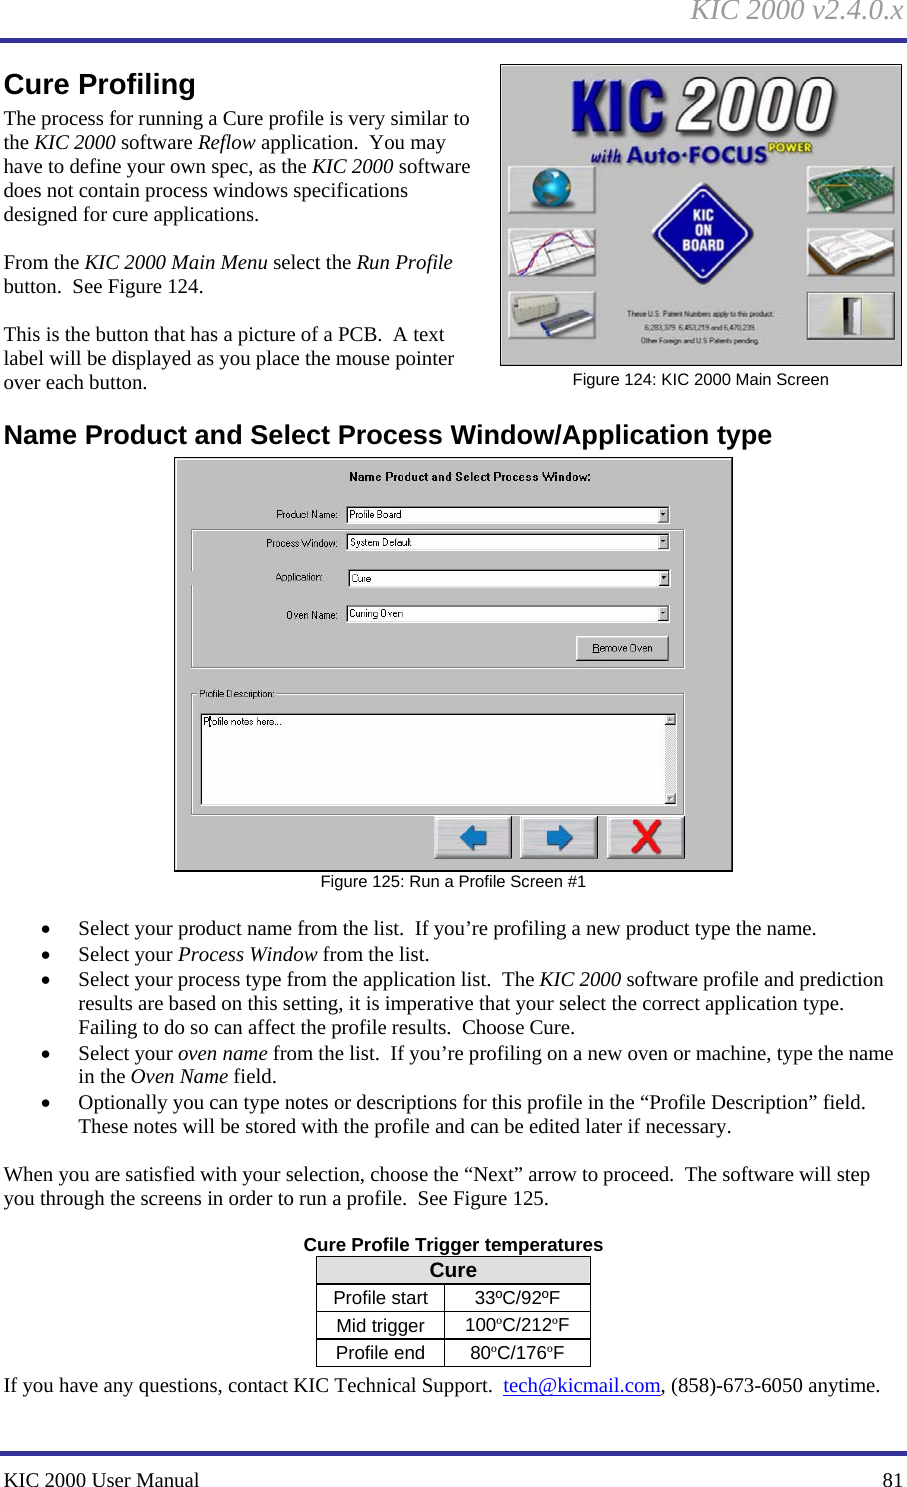


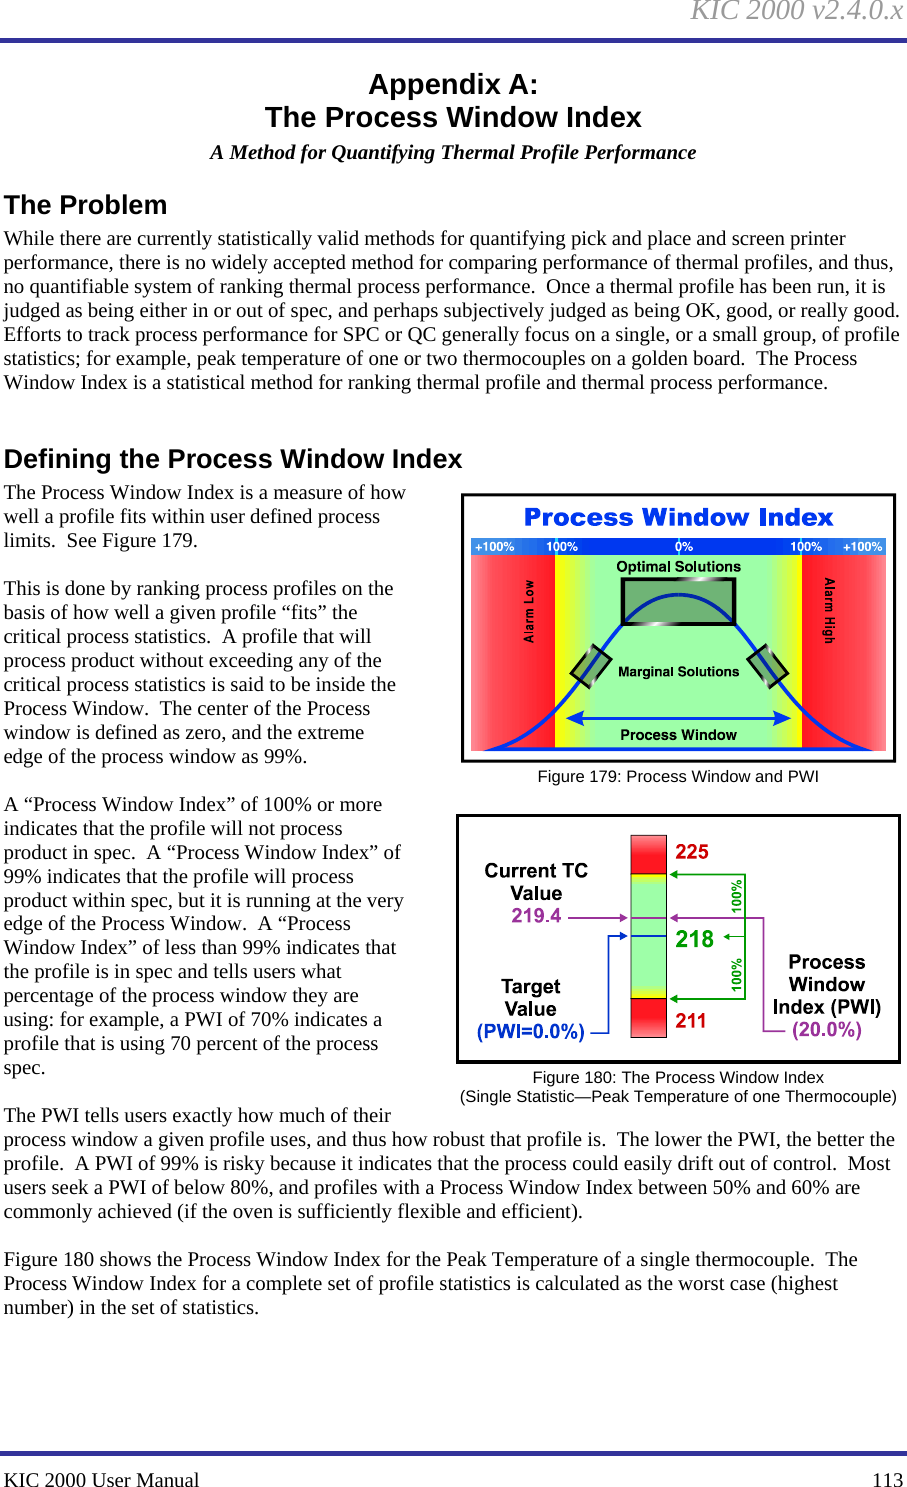
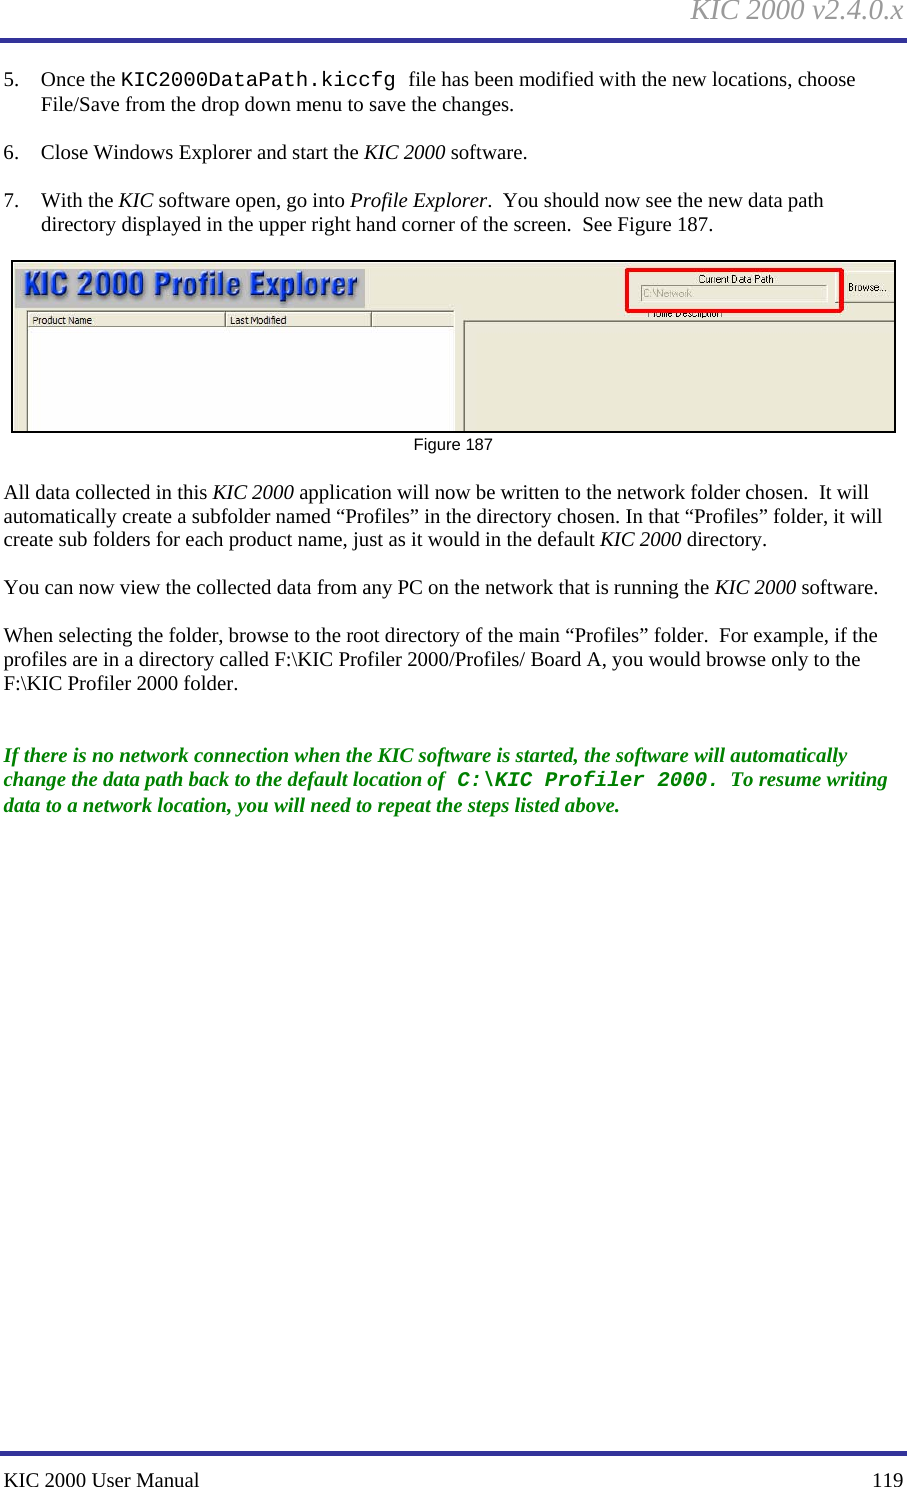
![KIC 2000 v2.4.0.x 114 KIC 2000 User Manual For example: if a profile is run with six thermocouples, and four profile statistics are logged for each thermocouple, then there will be a set of twenty-four statistics for that profile, and the PWI will be the worst case (highest number expressed as a percentage) in that set of profile statistics. Note that Figure 181 shows the user designated critical statistics for a single thermocouple. 100%80%60%40%20%0%-20%-40%-60%-80%-100%705540PWI SecTime Above183oC100%80%60%40%20%0%-20%-40%-60%-80%-100%225223221219217215213211209207205PWI Temp oCPeakTemperature100%80%60%40%20%0%-20%-40%-60%-80%-100%9086827874706662585450PWI SecSoak Time Between140oC ~ 170oC02.03.0100%80%60%40%20%0%-20%-40%-60%-80%-100%PWI oC/SecSlopePWI = 0% PWI = 20%PWI = 60%PWI = -40%PWI = 60%Typical Leaded Process WindowHow Process Window Index (PWI) is Determined Figure 181: The Process Window Index (Multiple Statistics for a Single Thermocouple and Final PWI Calculation) Calculating the PWI To calculate the Process Window Index: i=1 to N (number of thermocouples); j=1 to M (number of statistics per thermocouple); measured_value[i,j] is the [i,j]th statistic’s value; average_limits[i,j] is the average of the [i,j]th statistic’s high and low limits; and range[i,j] is the [i,j]th statistic’s high limit minus the low limit. ( measured_value[i,j] average_limits[i,j] )( range[i,j] 2 )i,j=1N,M= 100 MAXPWI Table 3: Process Window Index Formula Thus, the PWI calculation includes all thermocouple statistics for all thermocouples. The profile PWI is the worst case profile statistic (maximum, or highest percentage of the process window used), and all other values are less. Benefits of Ranking Thermal Profile Performance The analysis of thermal profiles with the Process Window Index offers four significant benefits. The first is that profiles can be easily compared, and users can be confident that they are using the best profile their process can achieve. Before the PWI was available for profile analysis, comparing profiles was subjective, and users could never be certain they had the best profile for their product. The PWI provides an excellent opportunity for process improvement and its use is a significant step towards Zero-defect Production. The second benefit is that the PWI greatly simplifies the profiling process. When used in advanced profiling tools, all profile statistics are reduced to a single number (the PWI) that even the most inexperienced operator can understand. This means significant savings in terms of training costs and a reduction in defects caused by operator error. It further means that in a few minutes, an inexperienced operator can setup an oven with the optimal profile, a job that formerly could take an experienced engineer hours.](https://usermanual.wiki/Embeded-Designs/BS.Manual-Part-2/User-Guide-857736-Page-50.png)