Furuno USA 9ZWRTR060 Marine Radar User Manual operators manual
Furuno USA Inc Marine Radar operators manual
UserManual.wiki
>
Furuno USA
>
9ZWRTR060 User Manual
operators manual
Navigation menu
Upload a User Manual
Namespaces
Wiki Guide
HTML
PDF
Info
Views
User Manual
Discussion / Help
Navigation
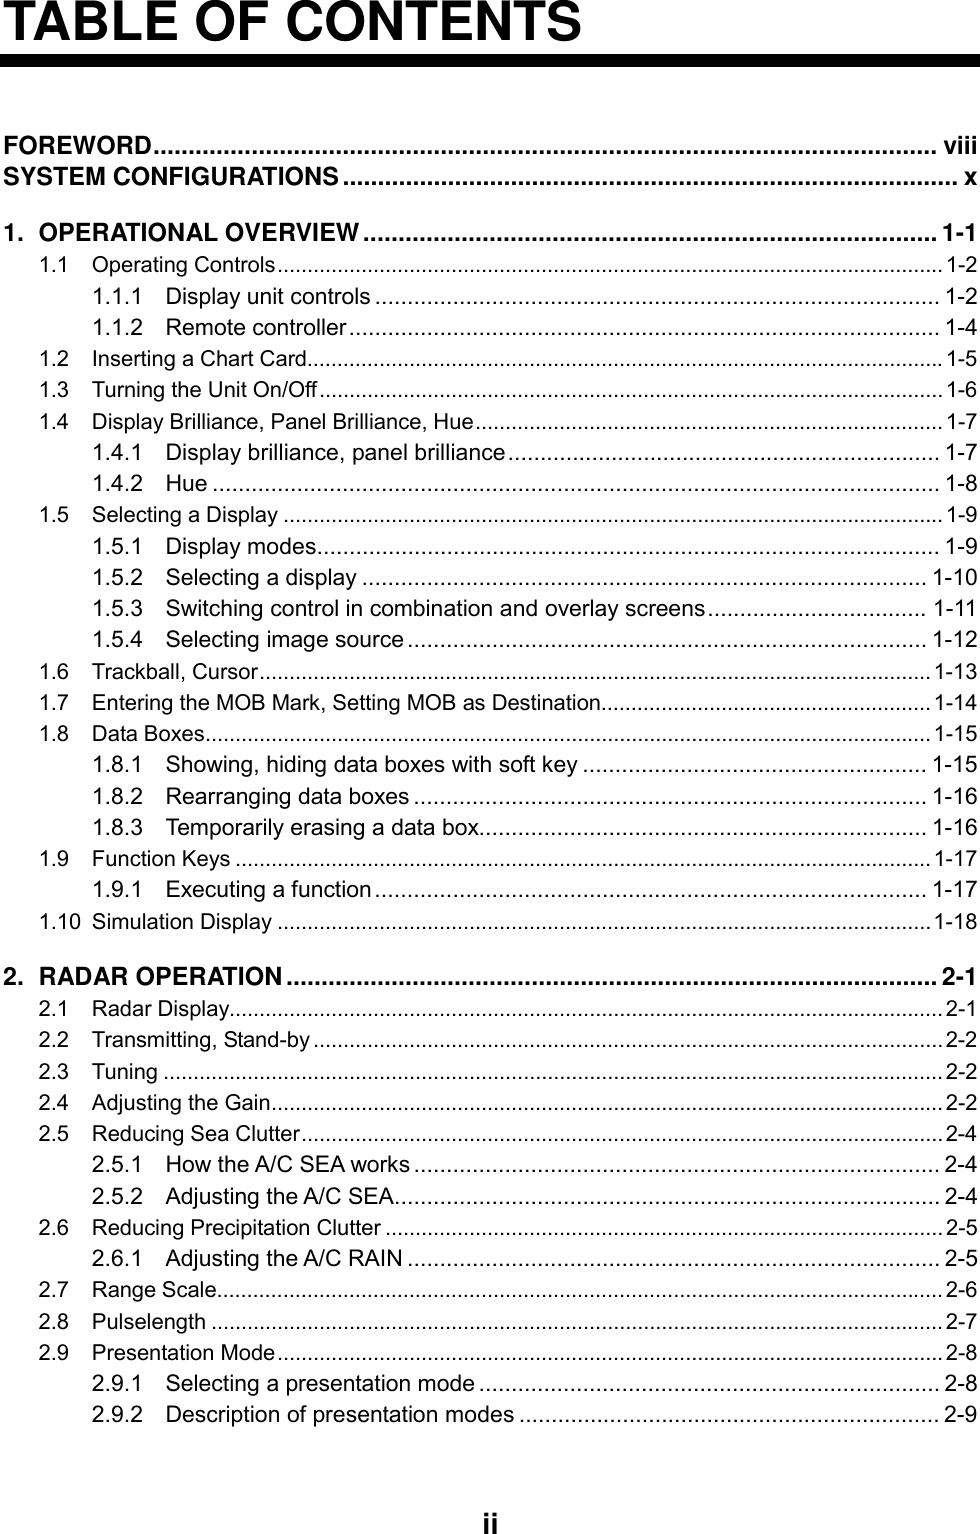
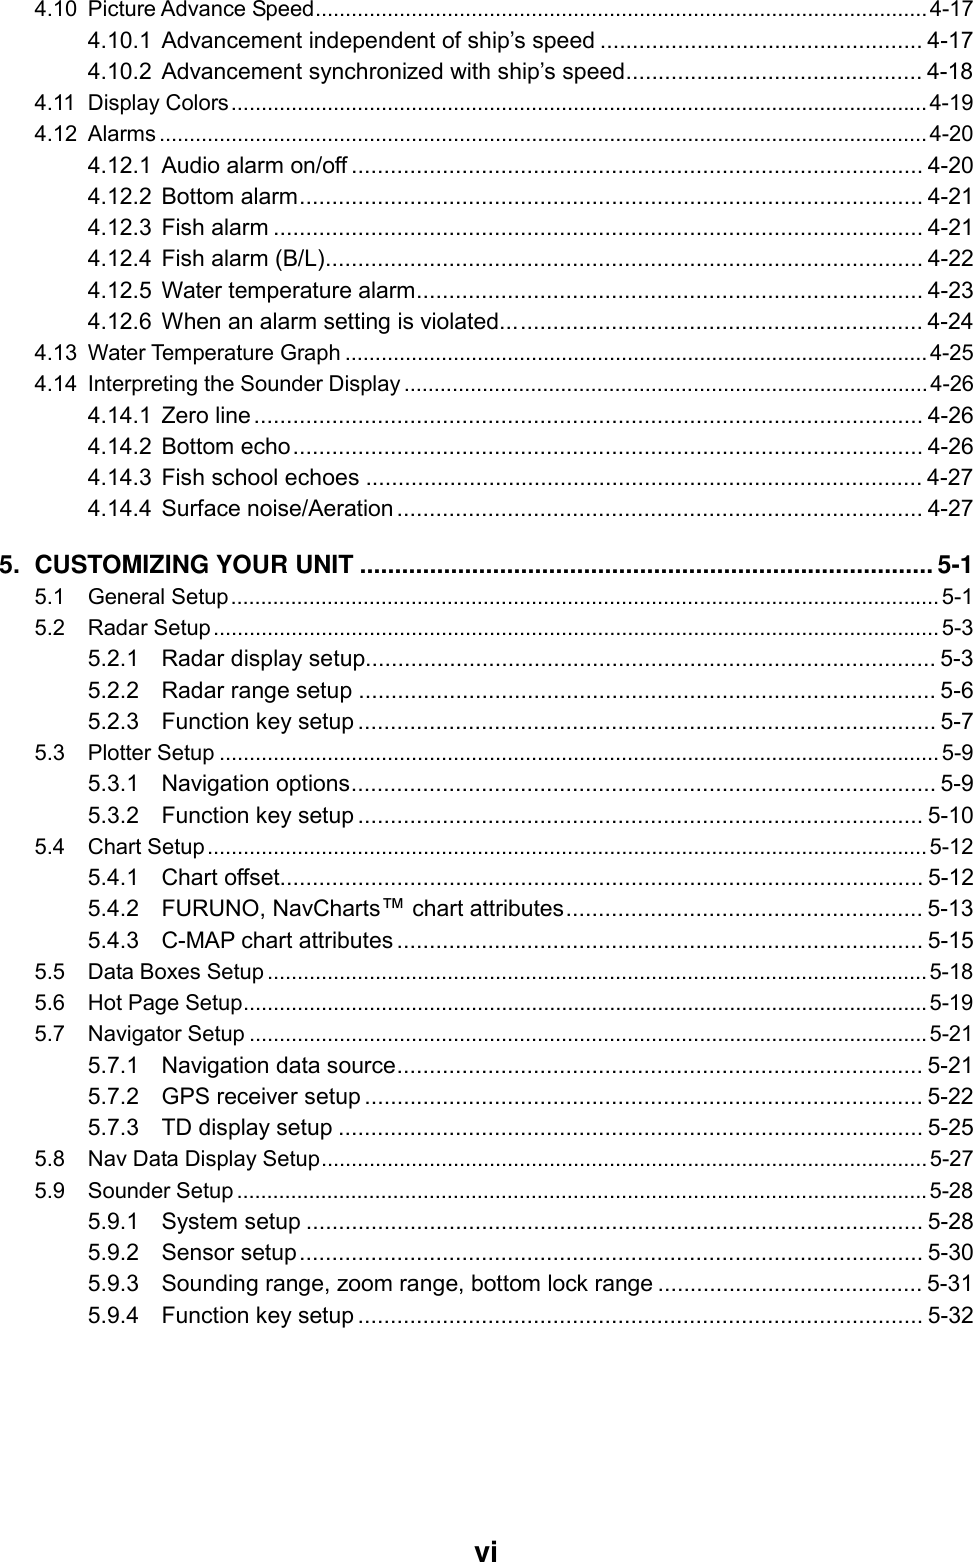
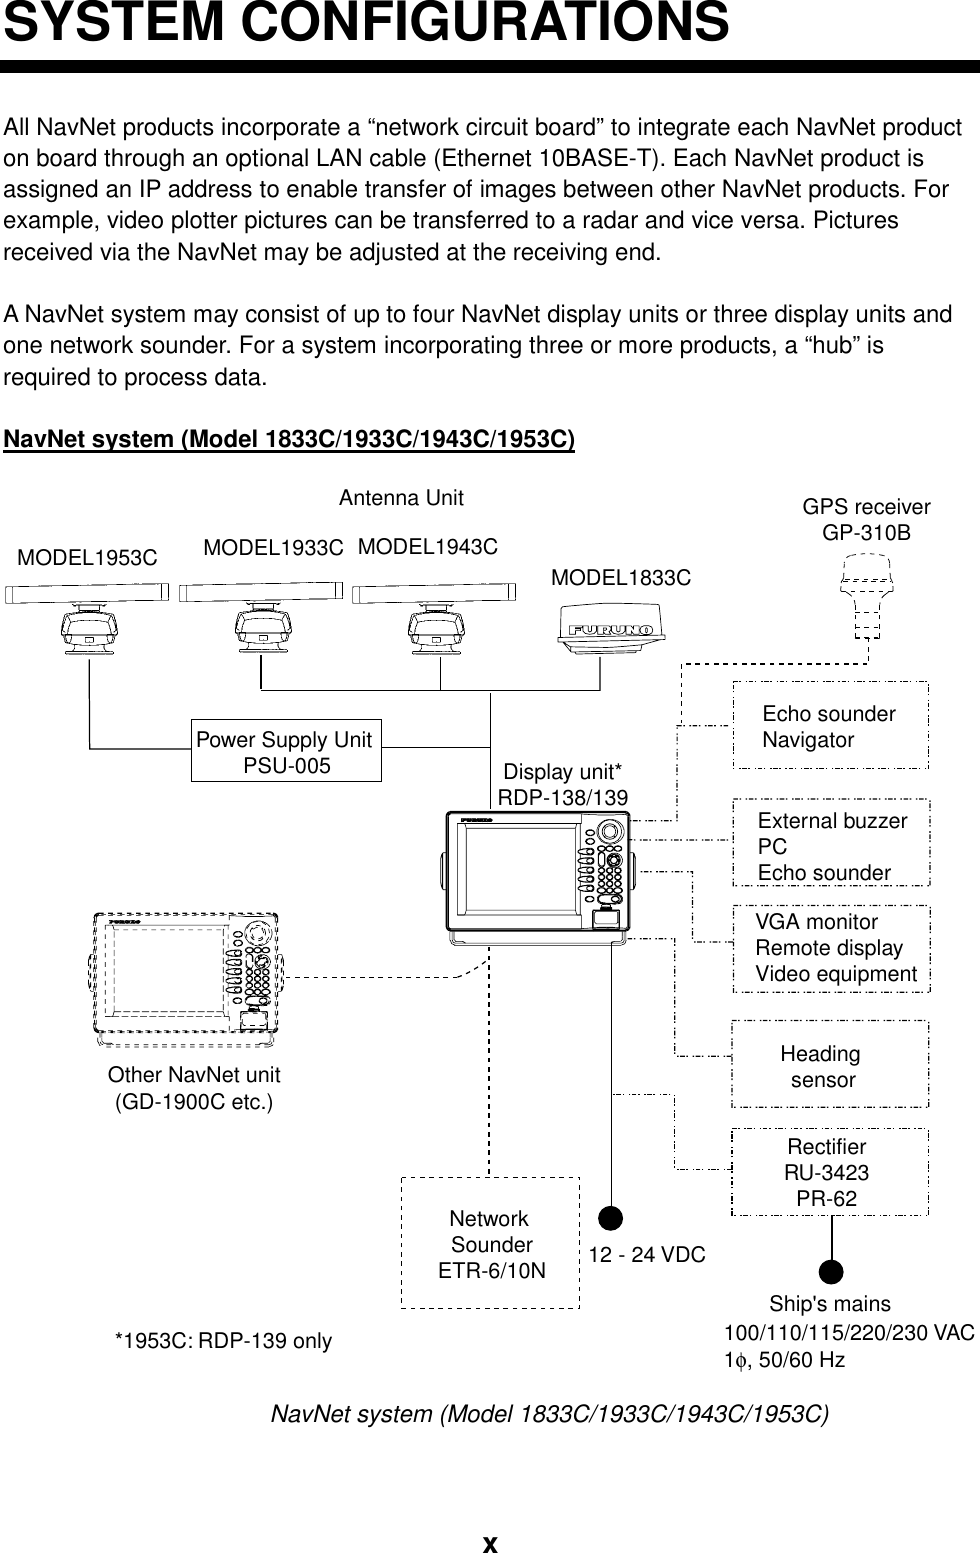
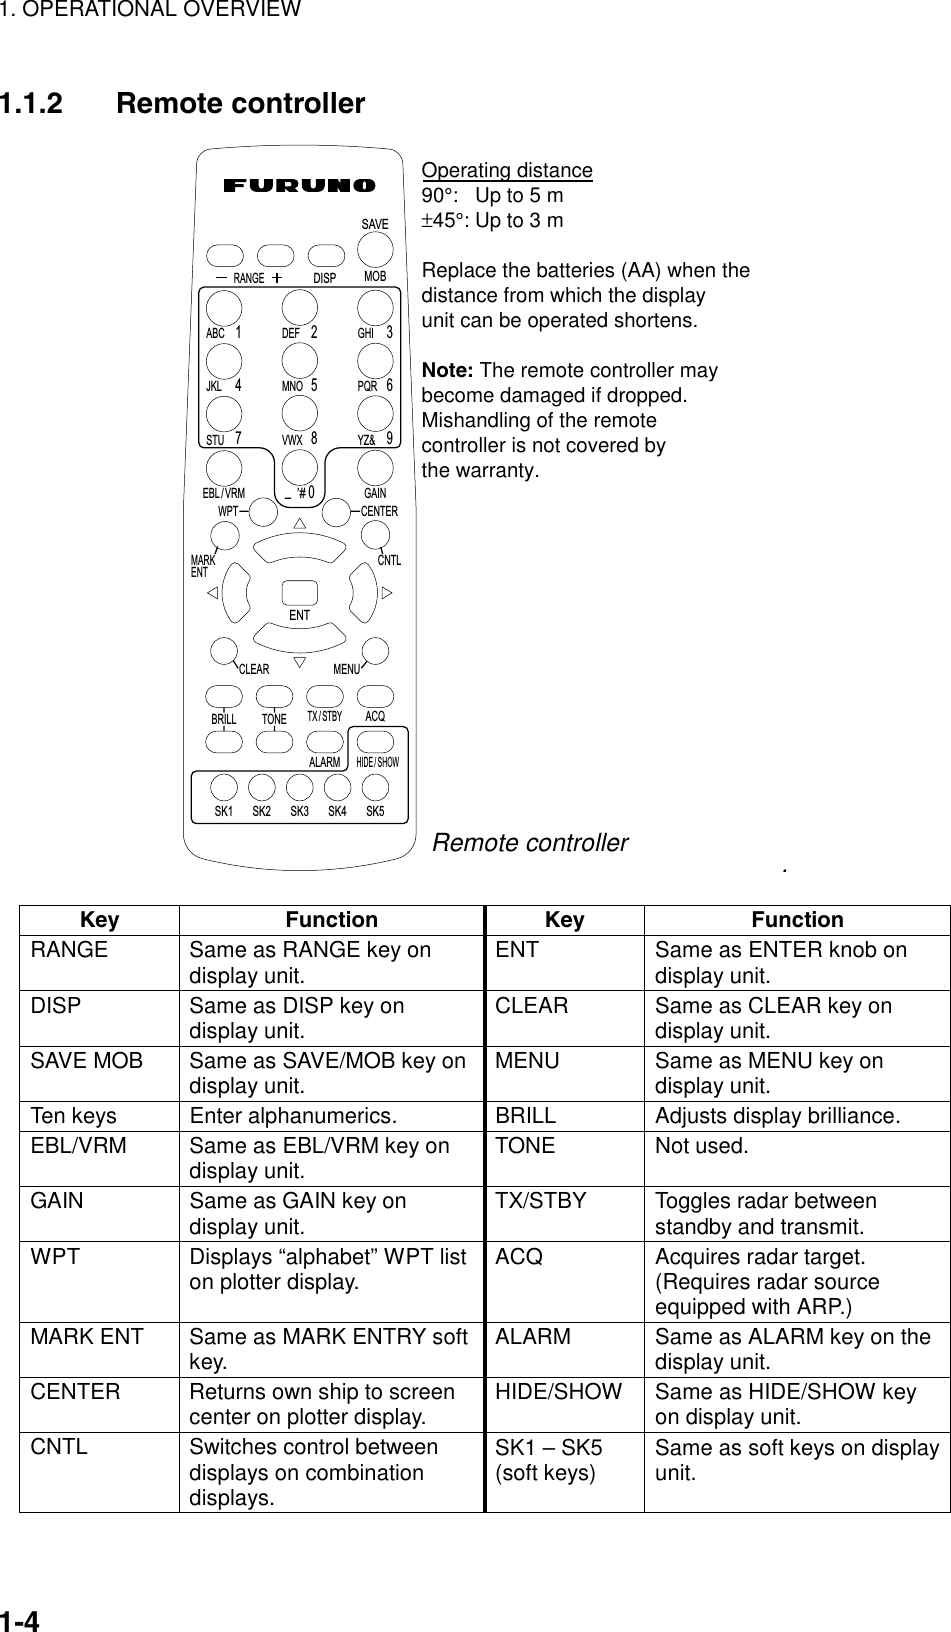
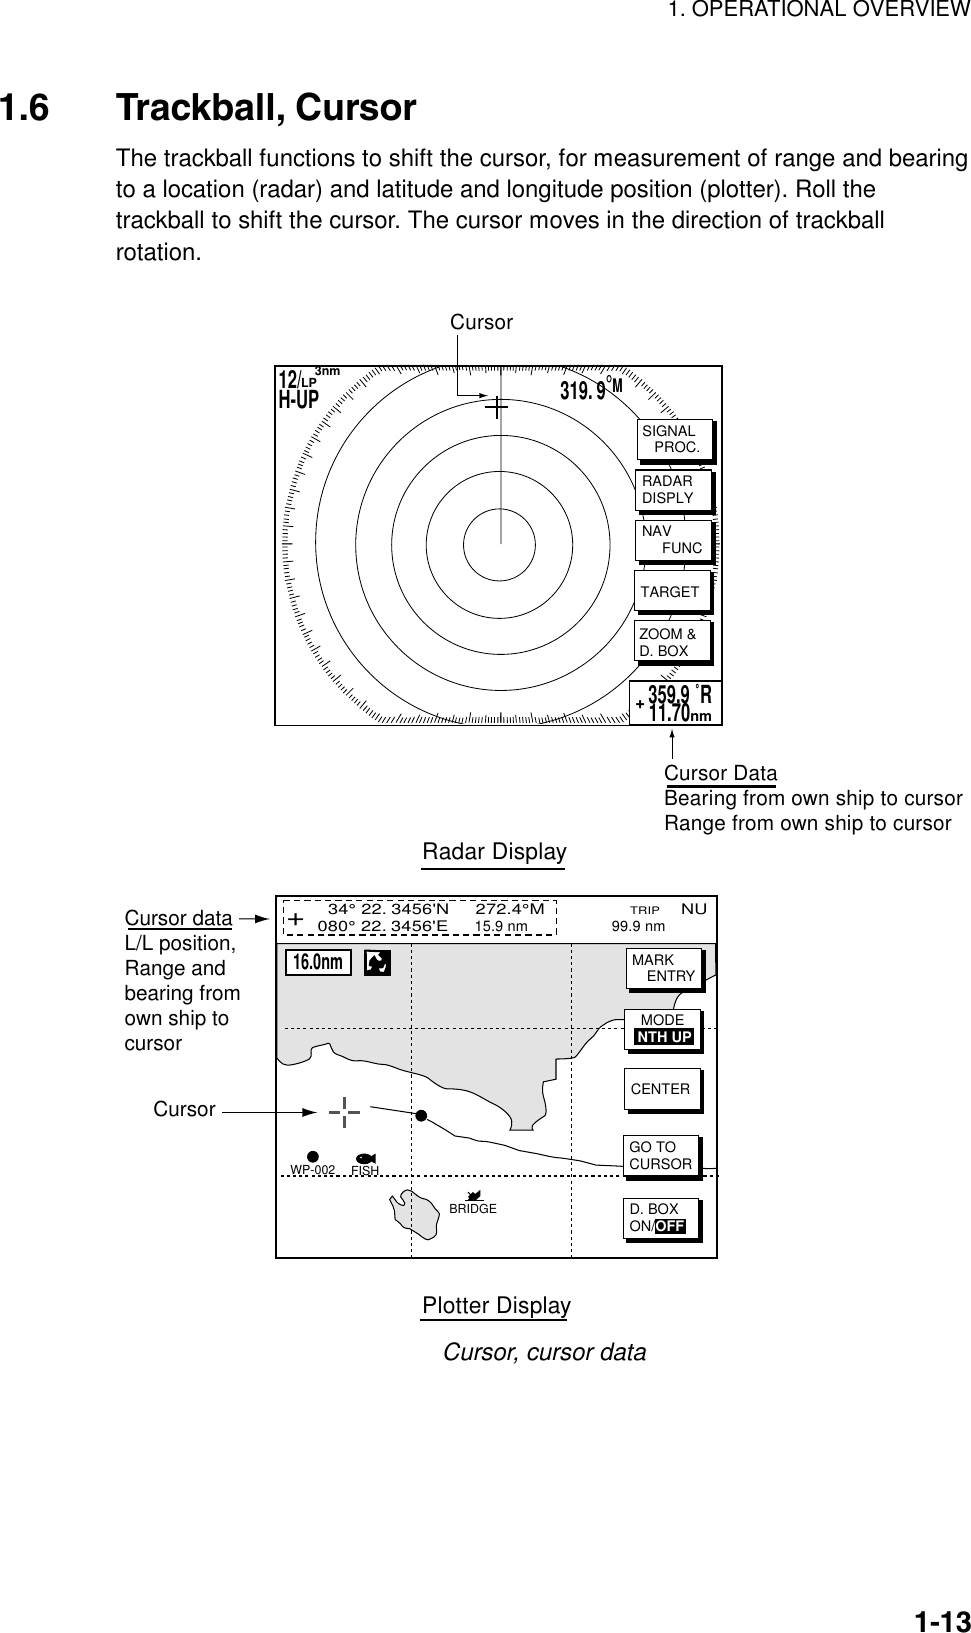
![1. OPERATIONAL OVERVIEW 1-2 1.1 Operating Controls 1.1.1 Display unit controls Overview of display unit controls The radar, video plotter, sounder and chart systems are operated with the controls of the display unit (and the remote controller). Ten keys are labeled and they provide the function shown on their labels. The five soft keys provide various functions according to current operating mode. The [ENTER] knob mainly functions to register selections on the menu and adjust the EBL, VRM and gain. The trackball’s main function is to move the cursor across the screen. When you correctly execute an operation, the unit generates a beep. Invalid operation causes the unit to emit three beeps. TrackballShifts cursor EBL/VRM andcursor; selects menu items and options.Displays the modeselection window.Soft keysMomentary press:Registers own ship’s position as a waypoint.Press three seconds:Marks man overboard position.Opens/closes the main menu.Radar: Displays the soft keys for adjustment ofgain, A/C SEA, A/C RAIN and FTC (Model 1700series radar only).Sounder: Adjusts gain.Long press: Turns power off.Momentary press: Turns the power on;opens the display for adjustment of brilliance and hue; shows RADAR STBY/TX soft key.ENTER knobPush: Registers setting. Rotate: Adjusts, gain, VRM, EBL, etc.;selects menu items and options. May alsobe used to enter alphanumeric data.Clears data; erases selected mark.Opens/closes the alarm menu.Shows or hides the softkeys, function keys,nav data alternately.Chart driveSelects a range.EBLVRM GAINABC1JKL4STU7DEF2MNO5VWX8_'#0GHI3PQR6YZ&9Enter alphanumeric data.Displays soft keys for EBL/VRM. Control panel](https://usermanual.wiki/Furuno-USA/9ZWRTR060/User-Guide-228449-Page-16.png)
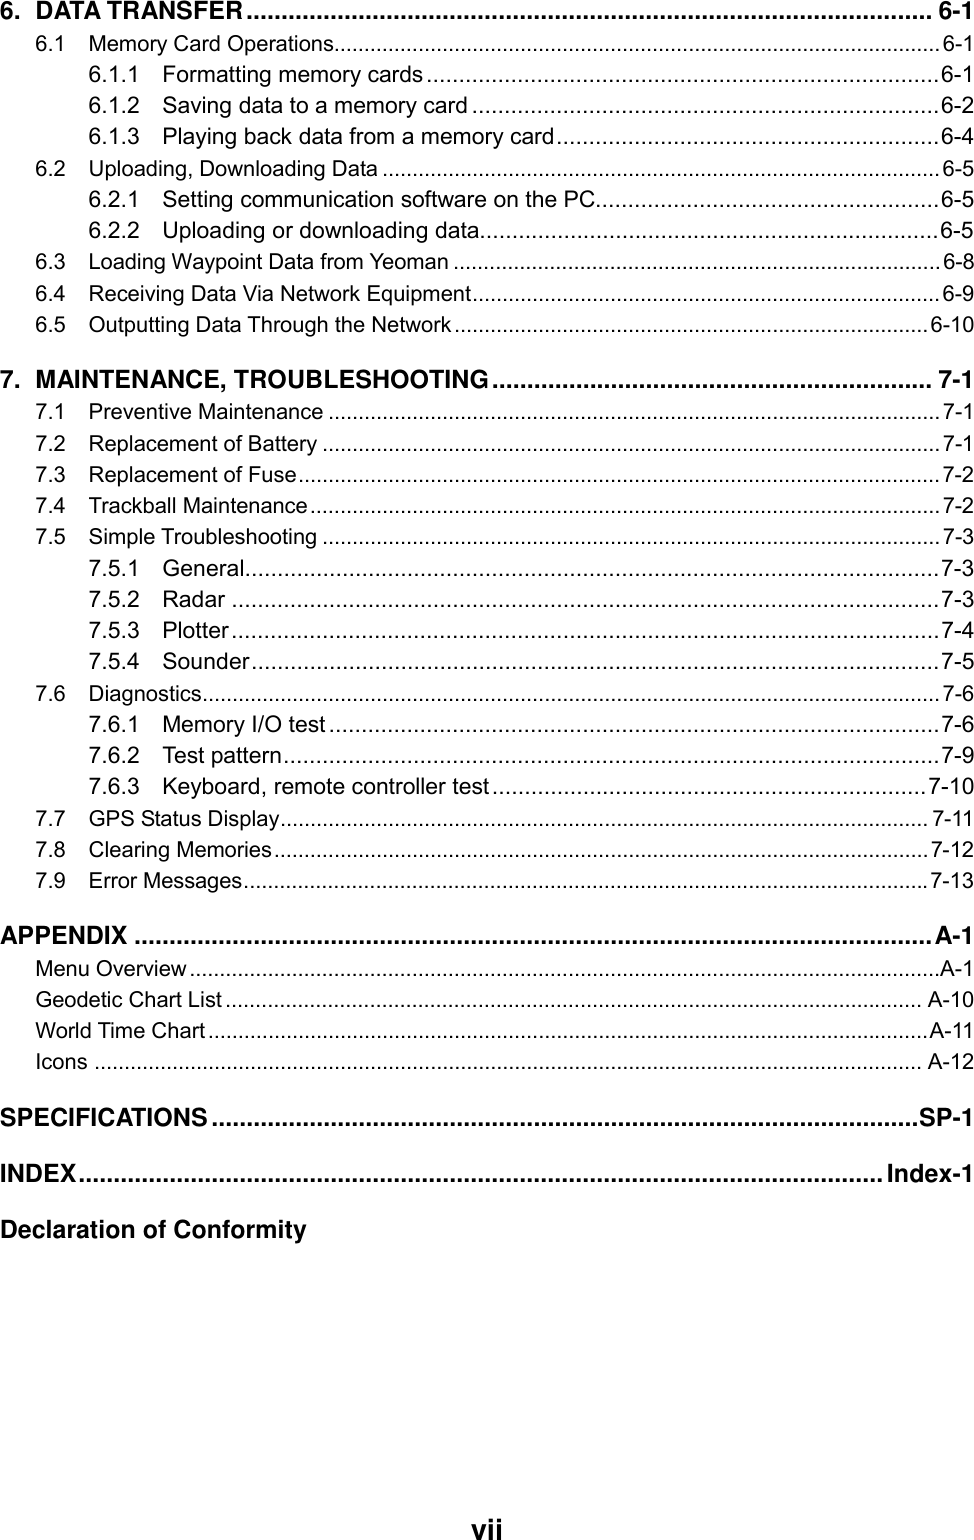
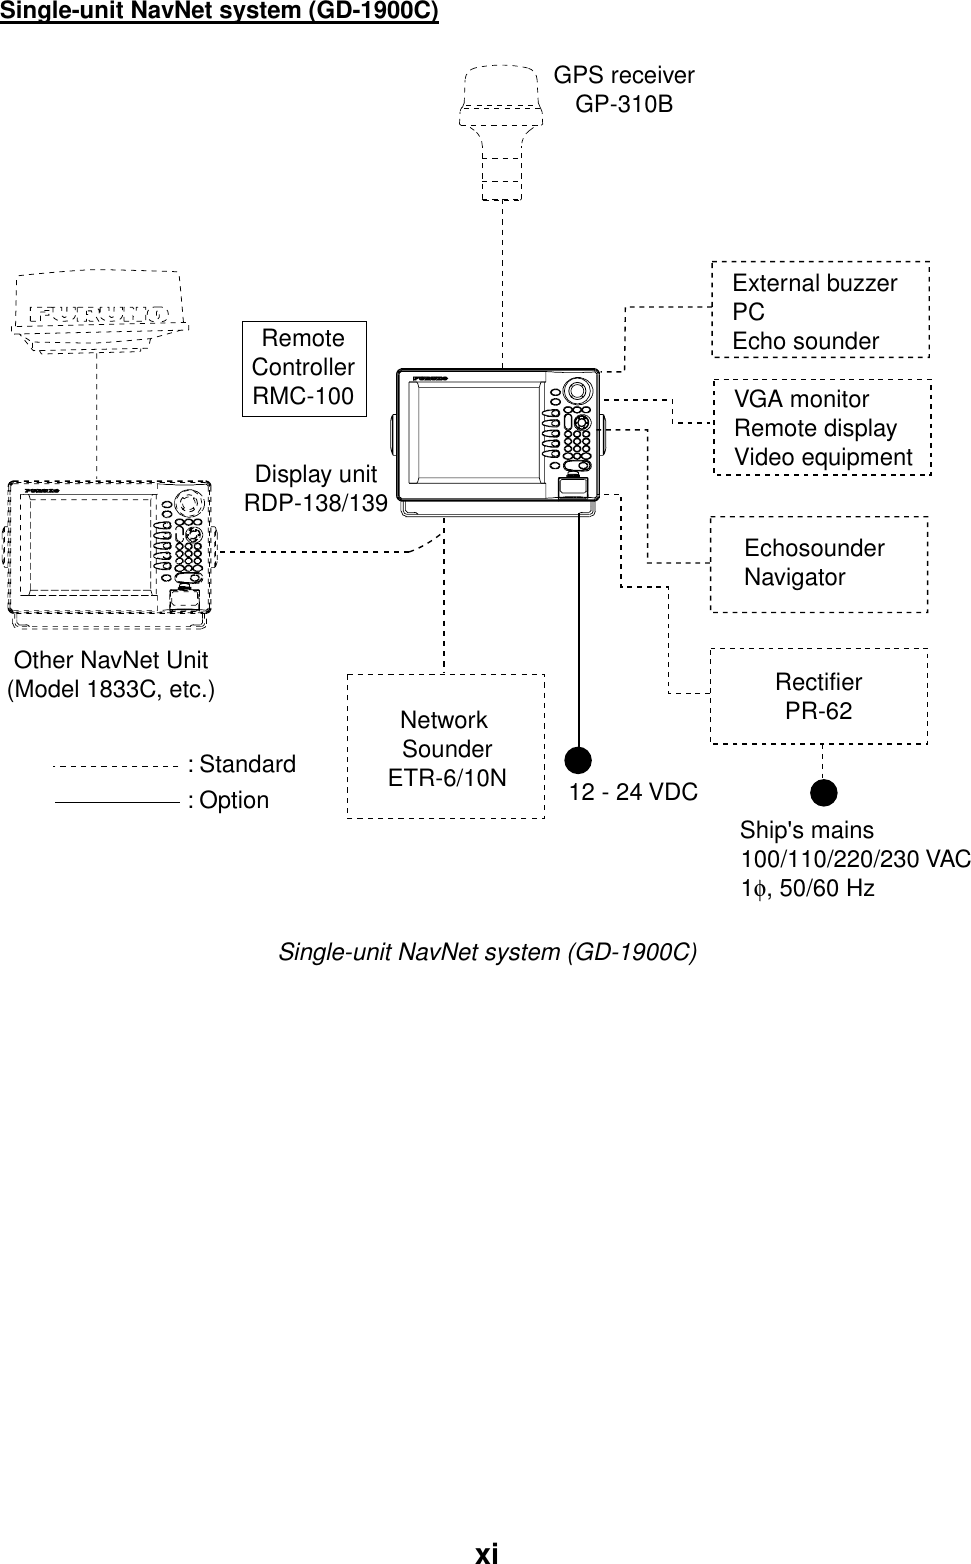
![1. OPERATIONAL OVERVIEW 1-3Soft keys The function of the five soft keys changes according to the operation. Their labels for their current functions are shown on the screen to the left of the keys. To hide or show the soft keys, press the [HIDE/SHOW] key. Each press of the key shows preset soft keys, user function keys or turns off navigation information (at the top of the screen). SOFTKEYS Display unit Some soft keys show the current station of the soft key function in reverse video as shown below. BRIDGEFISHWP-002 34° 22. 3456'N 359.9°M TRIP NU080° 22. 3456'E 19.9 kt 99.9 nmMARKENTRYMODENTH UPNAVPOSCurrent option shown in reverse videoRadar Display Plotter Display 16.0nmD. BOXON/OFF359.9 ˚R 11.70nm+319. 9°M12/ H-UP 3nmLPTRAILRETURNTRAILON /OFFTRAIL TIMETRAIL COLORGRADSINGLE Radar and plotter displays](https://usermanual.wiki/Furuno-USA/9ZWRTR060/User-Guide-228449-Page-17.png)
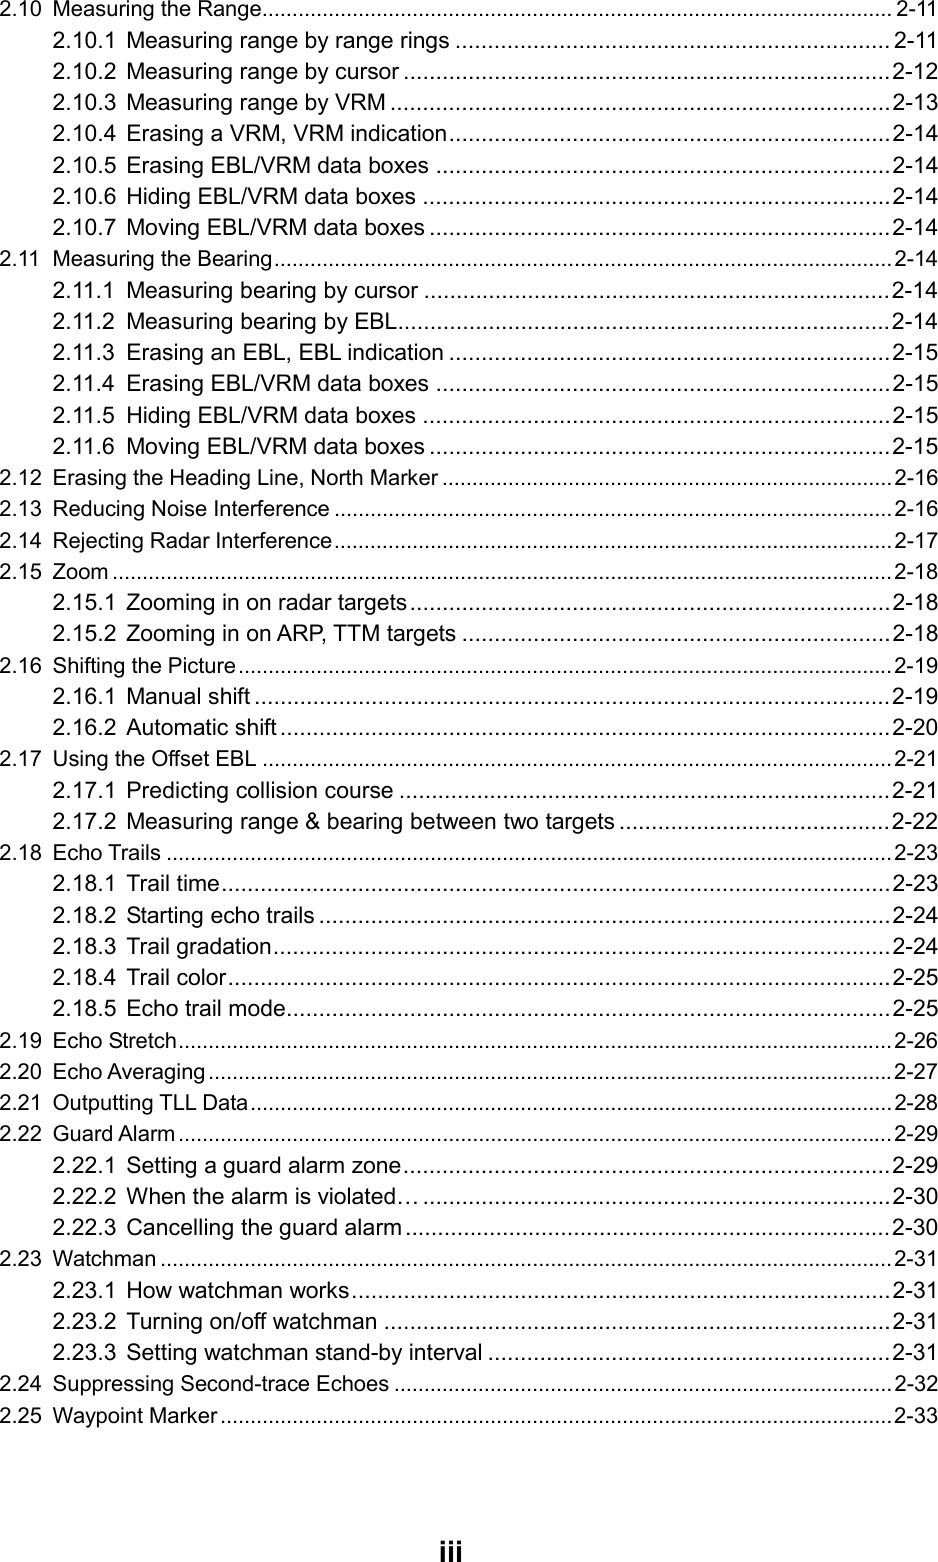
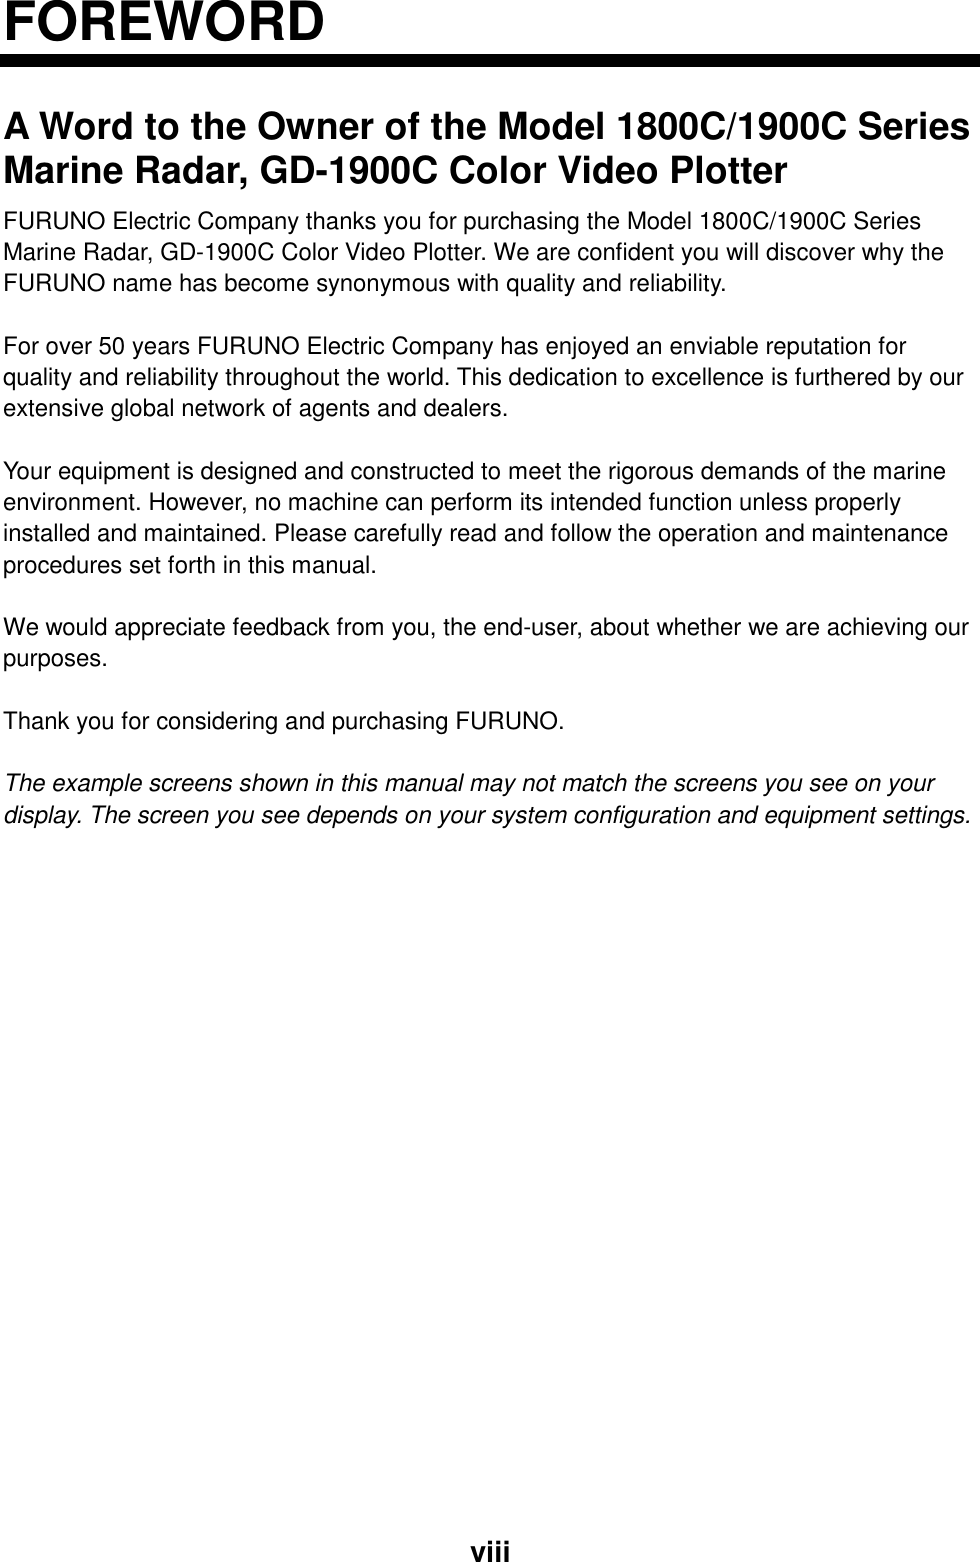
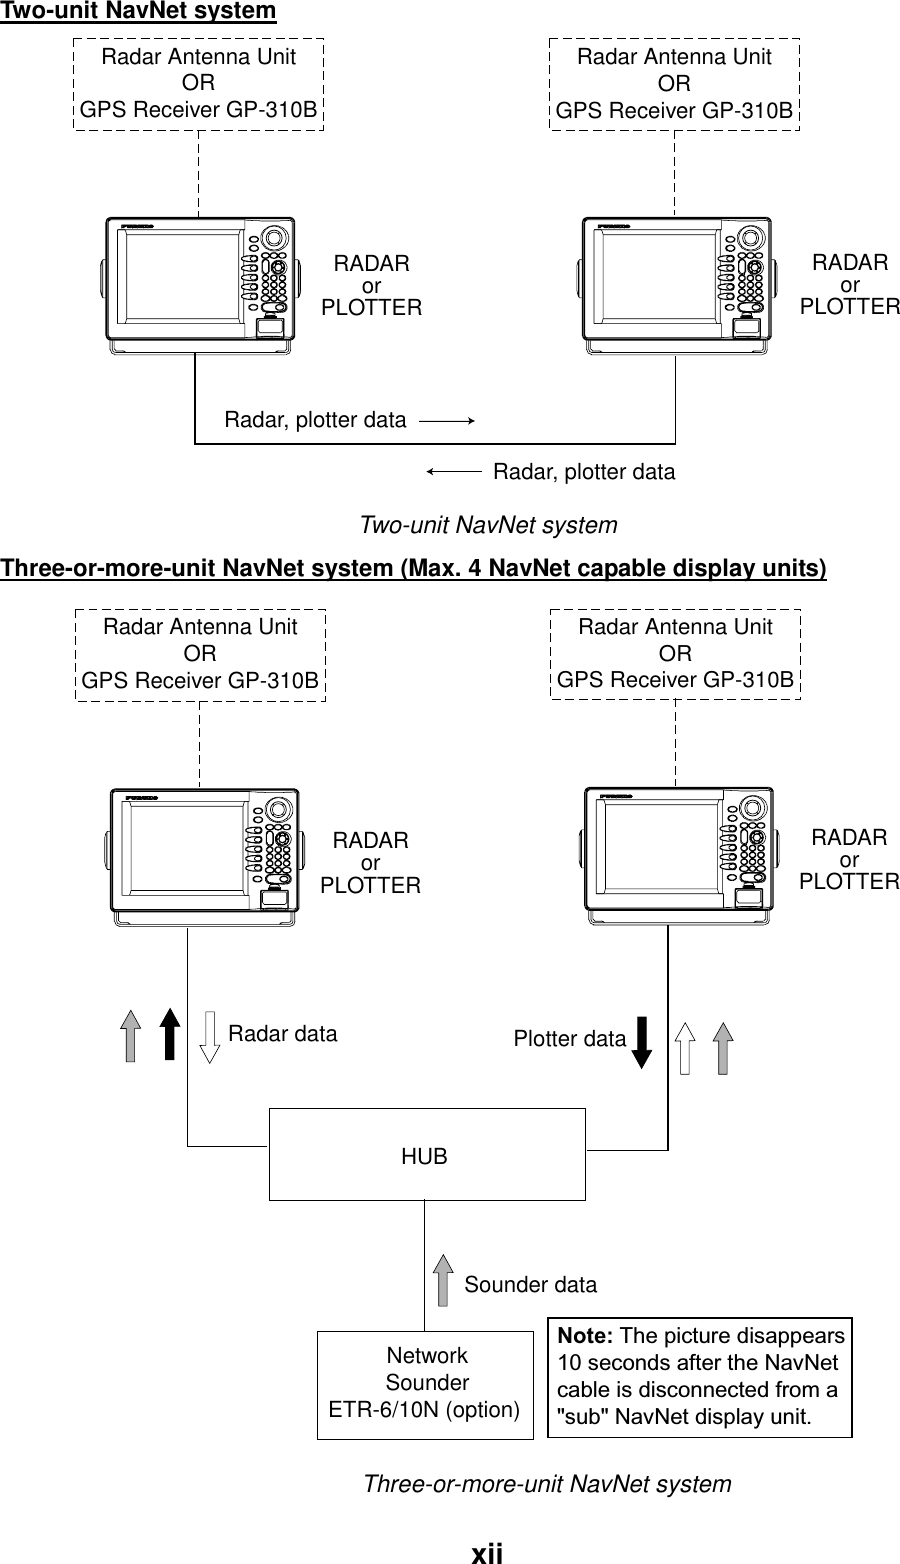
![1. OPERATIONAL OVERVIEW 1-61.3 Turning the Unit On/Off Press the [POWER/BRILL] key to turn the unit on. A beep sounds and the equipment proceeds in the sequence shown below, displaying product information, startup test results and the chart usage disclaimer. The startup test checks the ROM, RAM, internal battery and backup data for proper operation, displaying the results for each as OK or NG (No Good). If NG appears an appropriate message appears on the screen. For any NG, try to press any key to go to the chart disclaimer screen, then perform the diagnostic test as shown in the paragraph “7.6 Diagnostics.” RADAR PLOTTER* STATION NAME: RADAR#FURUNO ELECTRIC CO., LTD.CHARTS AVAILABLELICENSE NO. STARTUP TESTROM OKRAM OKINTERNAL BATTERY OKBACKUP DATA OKHost NameChart ListNO NATIONAL HYDROGRAPHICOFFICE HAS VERIFIED THEINFORMATION IN THISCOASTLINE DATA CARD AND NONEACCEPT LIABILITY FOR THE ACCURACY OF REPRODUCTION ORANY MODIFICATIONS MADE THEREAFTER. THIS PRODUCT WITHTHIS COASTLINE DATA CARDDOES NOT REPLACE THE REQUIREMENT TO USE THEAPPROPRIATE PRODUCTS FORNAVIGATION ACCORDING TONATIONAL AND INTERNATIONALREGULATIONS.PROGRAM No. 19500020XX**** = Program version no. forFURUNO/NAVIONICSmodel. 19500010XX for C-MAP model.XX = program version no.* = "GD-1900C Plotter" for GD-1900C#= Name determined at installation. Startup sequence For start up with the radar display, the magnetron takes from one minute to two minutes and thirty seconds (depending or radar model) to warm up before the radar can be operated. The time remaining for warm up of the magnetron is counted down at the center of the display. You may press any key at the chart disclaimer screen to show the last-used display, or wait several seconds to let the equipment do it for you. To turn the unit off, press and hold down the [POWER/BRILL] key until the screen goes dark (approx. 3 sec.). To protect the LCD attach the hard cover. Note that the network sounder will be turned off approx. three minutes after turning off the power. Note: The first time you turn on the power (or any time the power is applied after a memory reset), you are asked if you want to start the simulation mode, which provides simulated operation of the equipment. Push the [ENTER] knob to start the simulation mode, or press the [CLEAR] key to start normal operation. For further details about the simulation mode, see the paragraph “1.10 Simulation Display.”](https://usermanual.wiki/Furuno-USA/9ZWRTR060/User-Guide-228449-Page-20.png)
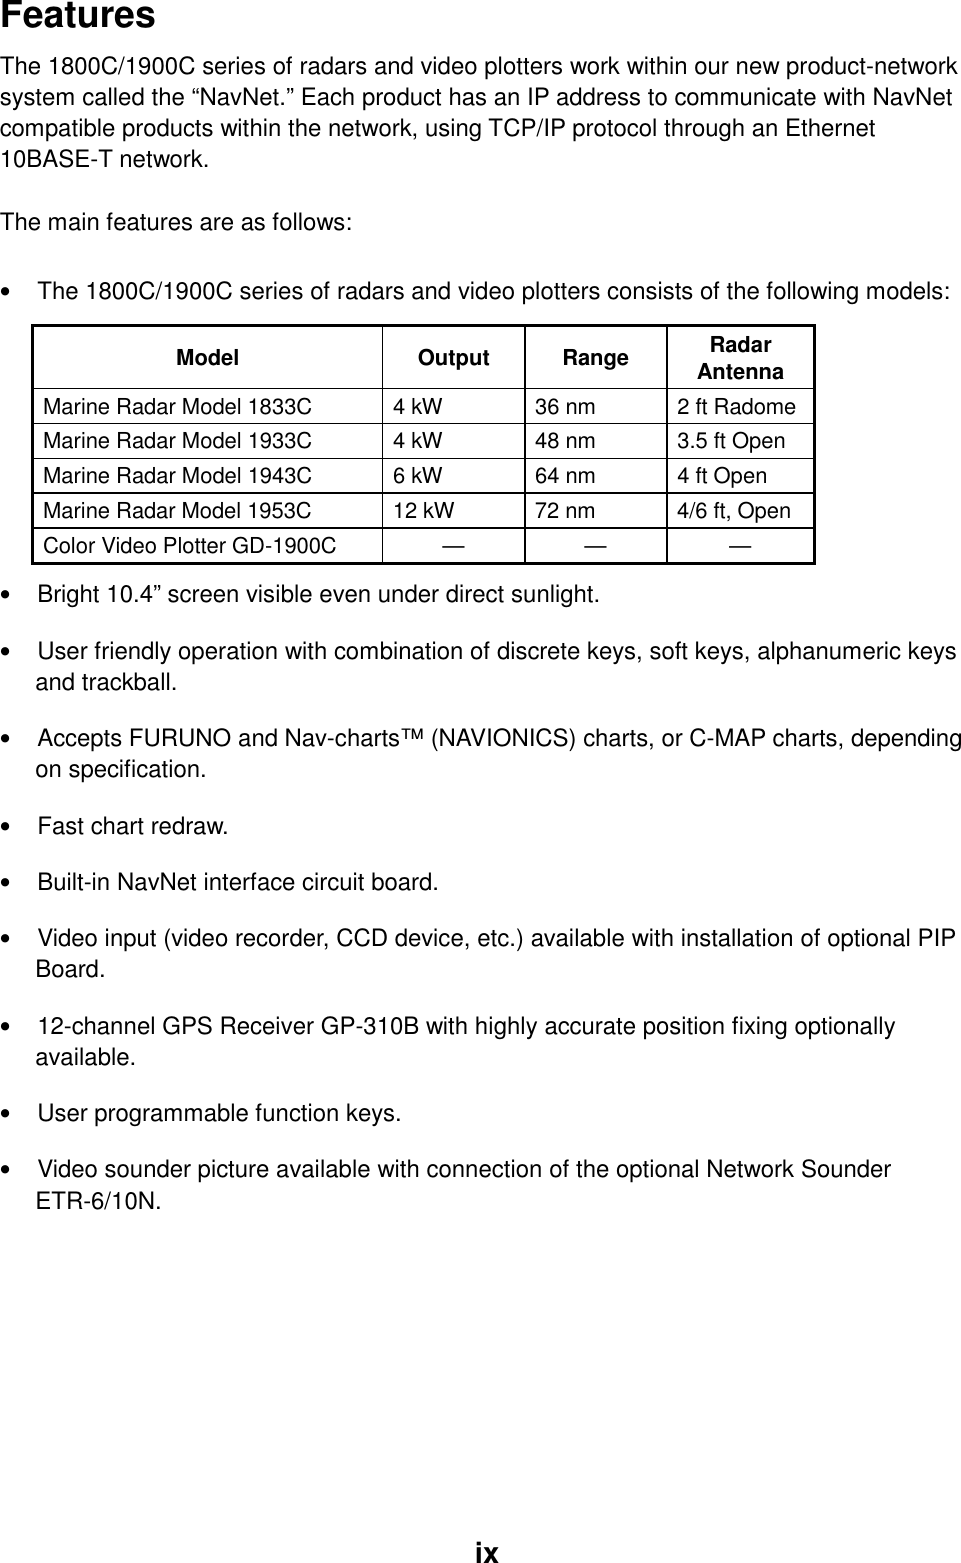
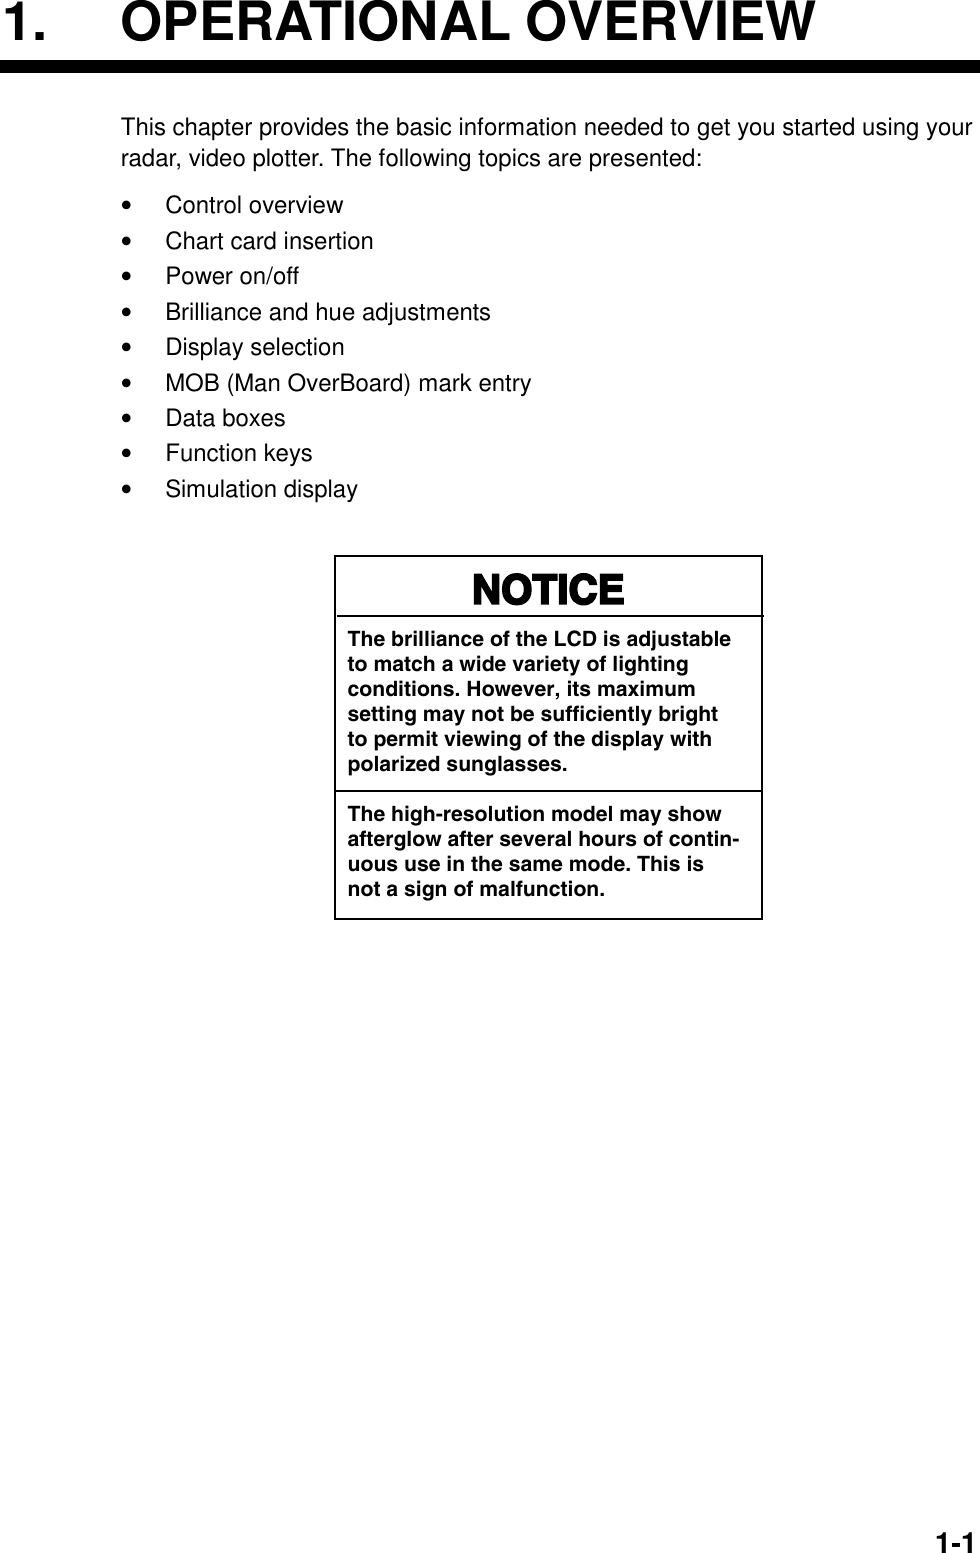
![1. OPERATIONAL OVERVIEW 1-71.4 Display Brilliance, Panel Brilliance, Hue You can adjust display brilliance, panel brilliance and hue as shown below. 1.4.1 Display brilliance, panel brilliance 1. Press the [POWER/BRILL] key momentarily. A set of soft keys for adjustment of brilliance and hue appear. BRIDGEFISHWP-002 34° 22. 3456'N 359.9°M TRIP NU080° 22. 3456'E 19.9 kt 99.9 nmDISPLAY BRILLIANCE8PANEL BRILLHUERETURNBRILLCONTST12/H-UP 3nmLP319. 9°M359.9 ˚R 11.70nm+PANEL BRILLHUERETURNRADARSTBYRadar Display Plotter DisplayDISPLAY BRILLIANCE8BRILLCONTST 16.0nmDISPLYBRILLDISPLYBRILLActive soft key is highlighted.RADARSTBY Brilliance adjustment soft keys 2. Press the DISPLY BRILL or PANEL BRILL soft key as appropriate. An adjustment window appears at the bottom of the screen. This window shows the name of the item selected for adjustment plus current brilliance level, by bar graph. DISPLAY BRILLIANCE8PANEL BRILLIANCE8Display brilliance Panel brilliance Display brilliance and panel brilliance windows 3. Adjust the [ENTER] knob, clockwise to raise the setting or counterclockwise to decrease it. You may also use the soft key pressed at step 2. Eight levels of display brilliance and panel brilliance are available. 4. Hit the RETURN soft key to finish. Note 1: If the unit is turned off with minimum brilliance, the screen will be dark at the next power-up. Press the [POWER/BRILL] key consecutively to adjust the brilliance. Note 2: This equipment does not have a contrast control.](https://usermanual.wiki/Furuno-USA/9ZWRTR060/User-Guide-228449-Page-21.png)
![1. OPERATIONAL OVERVIEW 1-8 1.4.2 Hue You may select the colors for the radar, plotter and overlay displays as below. 1. Press the [POWER/BRILL] key momentarily. 2. Press the HUE soft key to show the hue setting window. HUE▲ DAYNIGHTTWILIGHTMANUAL SET▼ Hue window 3. Operate the trackball to select hue desired, referring to the table below. MANUAL SET follows the color settings on the CHART DETAILS menu for the plotter and the RADAR DISPLAY SETUP menu for the radar. Night Day Twilight Characters Red Black Green Radar ring Red Green* Green* Radar echo Orange Red Yellow Background Black White Blue Landmass (plotter) Light-Yellow Yellow Light-Yellow * = Red on C-MAP display unit. 4. Hit the RETURN soft key to finish. Note: When using the overlay screen, the own ship track will be hidden if the radar background and own ship track are blue and the “MANUAL SET” hue setting is used. In this case, set HUE to other position and then return to “MANUAL” to show the own ship track in black.](https://usermanual.wiki/Furuno-USA/9ZWRTR060/User-Guide-228449-Page-22.png)
![1. OPERATIONAL OVERVIEW 1-10 1.5.2 Selecting a display 1. Press the [DISP] key to show the display selection window. The icons of modes not available are marked with an “X.” HOTPAGE 1-HOTPAGE 6 are user-arrangeable displays called “hot pages,” which you can configure as you like. For further details, see the paragraph “5.6 Hot Page Setup.” RADAR PLOTTER SOUNDER NAV DATA OVERLAY EXT VIDEO · TURN KNOB TO SELECT MODE AND PUSH KNOB TO ENTER.· PUSH ANY SOFT KEY TO SELECT IMAGE SOURCE.Basic displayscreensHot pagesSelecteditemHOTPAGE 1 HOTPAGE 2 HOTPAGE 3 HOTPAGE 4 HOTPAGE 5 HOTPAGE 6 Display screen selection window 2. Rotate the [ENTER] knob to select a basic display screen or a hot page screen. 3. Push the [ENTER] knob. 4. If you selected a basic display screen, a group of appropriate combination displays appear. In the example below, the radar combination screens are shown. PUSH ENTER KNOB. Radar combination screen selection window 5. Rotate the [ENTER] knob to select display desired. 6. Push the [ENTER] knob to finish.](https://usermanual.wiki/Furuno-USA/9ZWRTR060/User-Guide-228449-Page-24.png)
![1. OPERATIONAL OVERVIEW 1-12 1.5.4 Selecting image source When more than one network radar or network sounder is connected to the equipment, you may select an image source for each as shown below. This is not necessary when only one network radar or network sounder is connected. 1. Press the [DISP] key. 2. Press any soft key to show the following display. ▲SELECTSOURCEEDITRETURNIF THERE IS MORE THANONE NETWORK RADAR ORECHO SOUNDER, YOU MAYSELECT THE IMAGESOURCES FOR DISPLAY.RADAR SOURCE RADAR - - - SOUNDER SOURCE SOUNDER- IP ADDRESS 172.031.003.003HOST NAME RADAR - - - Select source menu 3. Use the trackball to select RADAR SOURCE or SOUNDER SOURCE as appropriate, then press the EDIT key. RADAR SOURCE SOUNDER SOURCE Radar source Sounder sourceRADAR - - - SOUNDER- Radar source and sounder source windows 4. Use the trackball and alphanumeric keys to enter source name: Adjust the trackball to select location and enter character with the alphanumeric keys. 5. Push the [ENTER] knob to set. 6. Press the [DISP] key to finish. 7. Turn the power off and on again. Note: Source names are determined at installation. For example, the source names for radars in a two radar system might be “RADAR” and “RADAR1”.](https://usermanual.wiki/Furuno-USA/9ZWRTR060/User-Guide-228449-Page-26.png)
![1. OPERATIONAL OVERVIEW 1-141.7 Entering the MOB Mark, Setting MOB as Destination The MOB (Man Overboard) mark functions to mark man overboard position. You can inscribe this mark from any mode, except while playing back data or conducting any test. Note that this function requires position data. Manoverboad Range, bearingCurrentpositionMOBmarkMOB Data BoxBearing and range to MOB positionM(MOB)MOB162.5°M 0.49 nm MOB concept 1. Press and hold down the [SAVE/MOB] key for about three seconds when someone falls overboard. The display shows the waypoint number being saved (youngest empty waypoint number, 001-999) followed by the MOB confirmation window. MAN OVER BOARD!GO TO MOB? YES ... PUSH ENTER KNOB NO ... PUSH CLEAR KEY WAYPOINT SAVED! XXXWPT CONTINUE PUSHING FOR MOB!After severalsecondsXXX = Waypoint number MOB mark messages 2. Push the [ENTER] knob to select the MOB position as the destination, or press the [CLEAR] key to only mark current ship’s position as a waypoint. If you select the MOB position as destination; • A full-screen radar, plotter or overlay appears depending on the display in use. • The MOB mark “MOB” appears at the MOB position and a light-blue line runs between it and current position. This line shows the shortest course to the MOB position. • Range and bearing to the MOB position are shown in the MOB data box. To erase an MOB mark from the plotter display, you must first erase its corresponding waypoint. Place the cursor on the MOB mark, then press the [CLEAR] key followed by pushing the [ENTER] knob to erase the waypoint. Then, repeat to erase the MOB mark.](https://usermanual.wiki/Furuno-USA/9ZWRTR060/User-Guide-228449-Page-28.png)
![1. OPERATIONAL OVERVIEW 1-161.8.2 Rearranging data boxes You may select the location for data boxes as follows: 1. Using the trackball, place the cursor inside the data box you wish to move. As the cursor enters the box it changes to a hand. Push the [ENTER] knob, and the hand changes to a fist, meaning the box is correctly selected. 2. Use the trackball to move the data box to the location desired, then push the [ENTER] knob. 1.8.3 Temporarily erasing a data box If a data box is obscuring a desired object you may temporarily erase the box. Use the trackball to place the cursor inside the data box you wish to erase, then press the [CLEAR] key. To redisplay the box, press the D. BOX soft key twice to display it.](https://usermanual.wiki/Furuno-USA/9ZWRTR060/User-Guide-228449-Page-30.png)
![1. OPERATIONAL OVERVIEW 1-171.9 Function Keys The function keys provide for one-touch execution of a desired function. The default function key settings are as shown in the table below. Default Setting, Key Label Function Key Radar Plotter Sounder #1 Heading line on/off, HL Track on/off, TRK TLL output, TLL #2 Rings on/off, RNG Edit mark/line, EML Clutter, CLT #3 Echo trail, TRL Ruler, RUL Signal level, SLV #4 Offcenter, SFT Add new waypoint, ADD Noise limiter, NL #5 Radar source, RSR Waypoint alphanumeric list, ALP Picture advance, PA 1.9.1 Executing a function 1. Press the [HIDE/SHOW] key to replace the preset soft key labels with the function key labels. HLRNGTRLSFTRSRPlotter Display Function keys 34° 22. 3456'N 359.9°M TRIP NU080° 22. 3456'E 19.9 kt 99.9nm BRIDGEFISH002WPRadar Display12/H-UP 3nmLP319. 9°M359.9 ˚R 11.70nm+Functionkeys 16.0 nmTRKEMLRULADDALP Function keys](https://usermanual.wiki/Furuno-USA/9ZWRTR060/User-Guide-228449-Page-31.png)
![1. OPERATIONAL OVERVIEW 1-18 2. Press function key desired. Note: Function keys can be individually programmed for the plotter, radar and sounder displays. For further details see the following: Radar: paragraph 5.2.3 Plotter: paragraph 5.3.2 Sounder: paragraph 5.9.4 1.10 Simulation Display The simulation display, for use by service technicians for demonstration purposes, provides simulated operation to help acquaint you with the many features your unit has to offer. It allows you to view and control a simulated plotter, radar and sounder picture, without position-fixing equipment, network radar or a network sounder. Most controls are operative, thus you may practice setting destination, enter waypoints, measure range and bearing to a target, etc. The simulation icon (S I M ) appears when any simulation mode is active. To start the simulation display; 1. Press the [MENU] key. 2. Press the SYSTEM CONFIGURATION, SYSTEM SETUP and SIMULATION SETUP soft keys in that order. SIM SETUPEDITRETURNRADAR LIVEPLOTTER LIVESOUNDER LIVESPEED 00.0ktCOURSE 000.0°LATITUDE 45°35.000’NLONGITUDE 125°00.000’WSTART DATE & TIME 00:00 01.APR.00RADAR SIMULATION DATA NO Simulation setup menu 3. Follow appropriate procedure on the next several pages.](https://usermanual.wiki/Furuno-USA/9ZWRTR060/User-Guide-228449-Page-32.png)
![1. OPERATIONAL OVERVIEW 1-19Radar NavNet display unit-generated echoes 1. Select RADAR, then press the EDIT soft key. RADAR▲SIMULATION 1SIMULATION 2LIVE▼ 2. Select SIMULATION 1, then push the [ENTER] knob. 3. Press the [MENU] key to close the menu. NavNet radar antenna-generated echoes (not available with the GD-1900C) 1. Select RADAR SIMULATION DATA, then press the EDIT soft key. 2. Select YES, then push the [ENTER] knob to erase simulation data and get new data. The message “Now getting demo data. Do not turn off display unit.” appears while the unit is receiving radar data. Note: If the network radar could not be found “Radar source is not found. Cannot get demo data.” appears. And if the radar is not active, the message “Radar is not active. Cannot get demo data.” is displayed. Check that the radar is plugged in and its signal cable is firmly fastened. 3. Select RADAR, then press the EDIT soft key. 4. Select SIMULATION 2, then push the [ENTER] knob. 5. Press the [MENU] key to close the menu. Plotter 1. Select PLOTTER, then press the EDIT soft key. PLOTTER▲SIMULATION LIVE▼ 2. Select SIMULATION, then push the [ENTER] knob. 3. Select SPEED, then press the EDIT soft key. 4. Enter speed (setting range, 0-99 kt, default speed, 0 kt) with the alphanumeric keys, then push the [ENTER] knob. 5. Select COURSE, then press the EDIT key. 6. Select “8 FIGURE” to trace the simulated ship’s track in a figure-eight course, or enter your own course at DIRECTION. To enter course, use the trackball to select digit, and enter value with the alphanumeric keys. 7. Press the ENTER soft key. 8. Select LATITUDE, then press the EDIT soft key. 9. Enter latitude (setting range, 85°N-85°S, default setting, 45°35.000’N), then push the [ENTER] knob. 10. Select LONGITUDE, then press the EDIT soft key.](https://usermanual.wiki/Furuno-USA/9ZWRTR060/User-Guide-228449-Page-33.png)
![1. OPERATIONAL OVERVIEW 1-20 11. Enter longitude (setting range, 180°E-180°W, default setting, 125°00.000’W), then push the [ENTER] knob. 12. Select START DATE & TIME, then press the EDIT soft key. 13. Enter start date and time, then push the [ENTER] knob. 14. Press the [MENU] key to close the menu. Sounder 1. Select SOUNDER, then press the EDIT soft key. SOUNDER▲SIMULATION 1SIMULATION 2LIVE▼ 2. Select SIMULATION 1 (internally generated echoes) or SIMULATION 2 (network sounder-generated echoes), then push the [ENTER] knob. Note 1: If the network sounder could not be found “Sounder source is not found. Cannot get simulation data.” appears. And if the sounder is not active, the message “Sounder is not active. Cannot get simulation data.” is displayed. Check that the sounder is plugged in and its signal cable is firmly fastened. Note 2: The gain, shift, range and mode of the SIMULATION 1 mode picture cannot be adjusted. 3. Press the [MENU] key to close the menu.](https://usermanual.wiki/Furuno-USA/9ZWRTR060/User-Guide-228449-Page-34.png)
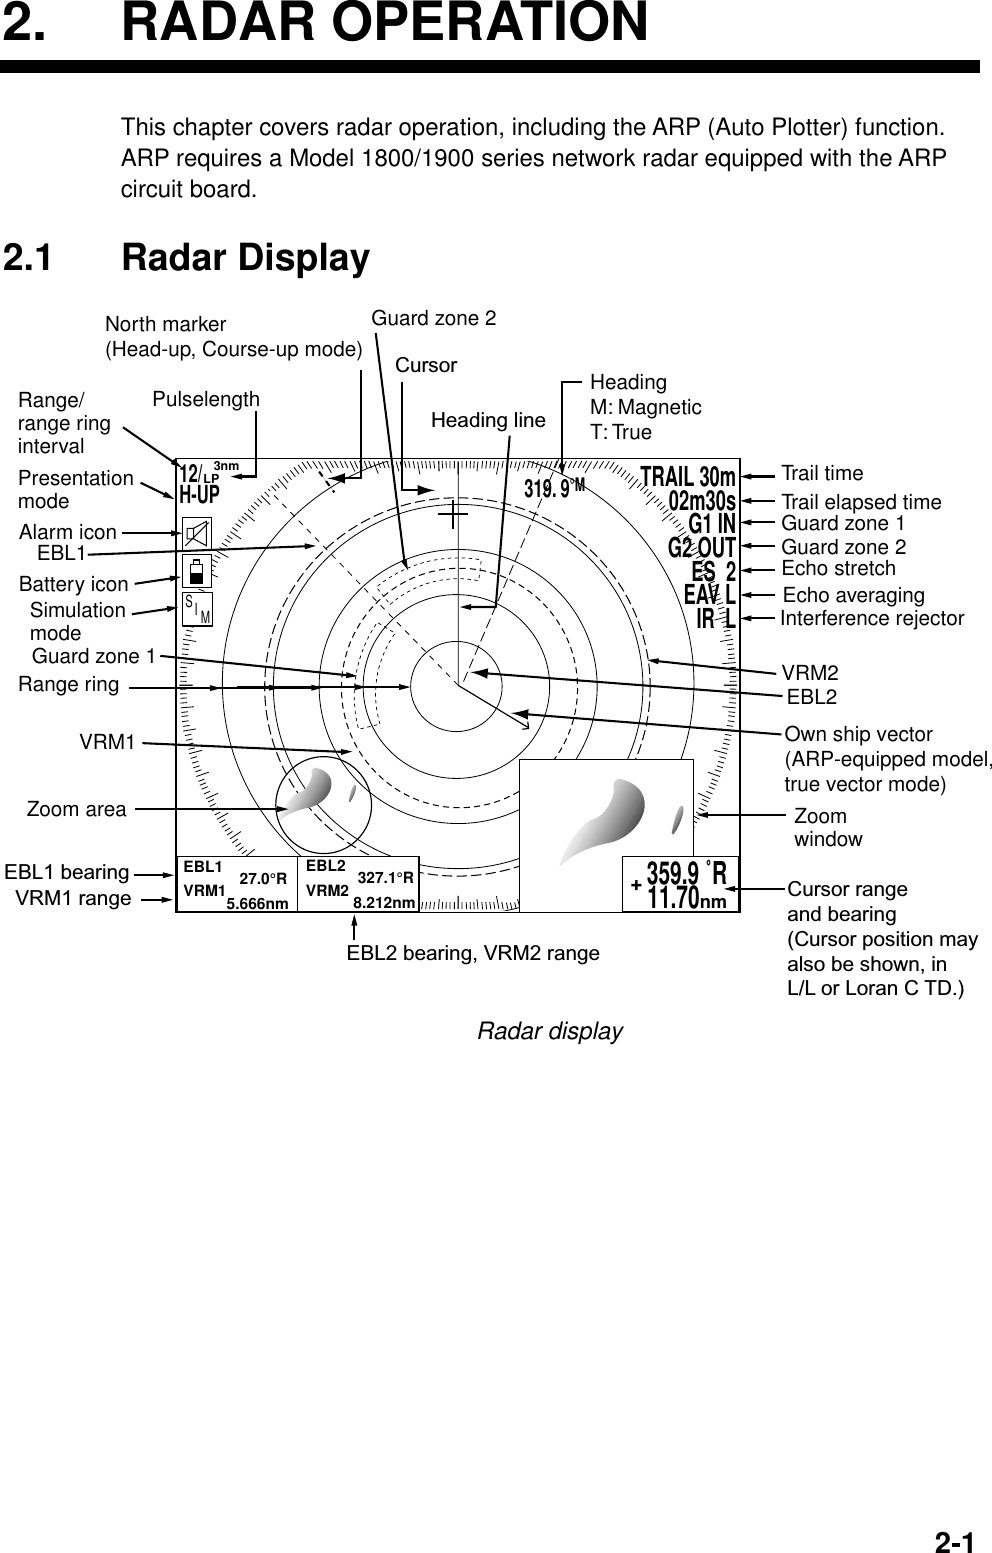
![2. RADAR OPERATION 2-22.2 Transmitting, Stand-by 1. Confirm that the network radar is plugged in. 2. Press the [DISP] key to select a radar display. 3. Press the [POWER/BRILL] key momentarily. 4. Press the RADAR STBY soft key to highlight TX on its label. 5. Press the RETURN soft key. When the radar picture is not required, but you want keep it in a state of readiness, press the RADAR TX soft key to highlight STBY on its label. 2.3 Tuning The radar receiver can be tuned automatically or manually, and the default tuning method is automatic. If you require manual tuning, do the following: 1. Press the [MENU] key to display the main menu. 2. Press the RADAR DISPLAY SETUP soft key. 3. Select TUNING, then press the EDIT soft key. AUTOMANTUNINGTuning bar Tuning window 4. Choose MAN. 5. Adjust the [ENTER] knob until the tuning bar is at its longest position. 6. Press the [MENU] key to close the menu. Note: If the auto setting does not provide satisfactory tuning, ask your dealer how to re-adjust tuning. 2.4 Adjusting the Gain The [GAIN] key adjusts the gain sensitivity of the radar receiver. It works in a manner similar to that of volume control of a broadcast receiver, which amplifies received signals. The proper setting is such that the background noise is just visible on the screen. If your gain setting is too low, weak echoes may be missed. On the other hand, excessive gain yields too much background noise; strong targets may be missed because of the poor contrast between desired echoes and the background noise on the display. To adjust the receiver sensitivity, transmit on long range, and then do the following:](https://usermanual.wiki/Furuno-USA/9ZWRTR060/User-Guide-228449-Page-36.png)
![2. RADAR OPERATION 2-31. Press the [GAIN] key to show the “gain adjustment” soft keys, and the last-used adjustment window appears. The example below shows the gain sensitivity adjustment window. The gain soft keys shown depend on radar source as shown below. Model 1800/1900 seriesGAINADJUSTGAINRETURN319. 9°M359.9 ˚R 11.70nm+Model 1700 seriesGAINADJUSTGAINRETURN12/ H-UP 3nmLP359.9 ˚R 11.70nm+A/C SEAA/C RAINFTCA/C SEAA/C RAINA/C ATON /OFF12/ H-UP 3nmLP319. 9°MGAIN SENSITIVITY AUTO ROUGH AUTO MODERATE AUTO CALM MAN 0GAIN SENSITIVITY AUTO ROUGH AUTO MODERATE AUTO CALM MAN 0 Gain adjustment soft keys 2. Press the GAIN soft key to show the gain sensitivity setting window. GAIN SENSITIVITY AUTO ROUGH AUTO MODERATE AUTO CALM MAN0 Gain sensitivity window 3. Use the trackball to select AUTO ROUGH, AUTO MODERATE, AUTO CALM, or MAN (manual) as appropriate. Select an AUTO option according to the sea state. 4. For manual adjustment, rotate the [ENTER] knob to adjust, while observing the radar echo. The range of adjustment is 0-100. 5. Press the [GAIN] key on the front panel or the RETURN soft key to finish. Adjusting the FTC (When the radar source is the 1700 series radar) To suppress rain clutter from heavy storms or scattered rain clutter, adjust the FTC. In addition to reducing clutter, the FTC can be used in fine weather to clarify the picture when navigating in confined waters. However, with the circuit active the receiver is less sensitive. Therefore, turn off the FTC, by setting it for “0”, when its function is not required. 1. Press the [GAIN] key. 2. Press the FTC soft key to show the FTC window. 3. Rotate the [ENTER] knob to adjust. The range of adjustment is 0-100(%). Do not overadjust the FTC – weak target echoes may be missed. 4. Press the [GAIN] key on the front panel or RETURN soft key to finish.](https://usermanual.wiki/Furuno-USA/9ZWRTR060/User-Guide-228449-Page-37.png)
![2. RADAR OPERATION 2-42.5 Reducing Sea Clutter 2.5.1 How the A/C SEA works Echoes from waves can be troublesome, covering the central part of the display with random signals known as “sea clutter”. The higher the waves and the higher the antenna above the water, the further the clutter will extend. Sea clutter may affect radar performance because real targets are sometimes hidden by the echoes of small waves. (See the left-hand figure in the figure below.) When sea clutter masks the picture, adjust the A/C SEA to reduce the clutter. The A/C SEA reduces the amplification of echoes at short ranges (where clutter is the greatest) and progressively increases amplification as the range increases, so amplification will be normal at those ranges where there is no sea clutter. A/C SEA adjusted;sea clutter suppressedSea clutter atscreen center Effect of A/C SEA 2.5.2 Adjusting the A/C SEA A/C SEA should be adjusted so that the clutter is broken up into small dots, and small targets become distinguishable. 1. Press the [GAIN] key. 2. Press the A/C SEA soft key to show the A/C SEA setting window. A/C SEA AUTO ROUGH AUTO MODERATE AUTO CALM MANModel 1700 series radarA/C SEAModel 1800/1900 series radar00 A/C SEA setting window 3. When the radar source is the Model 1700 series, use the trackball to select AUTO ROUGH, AUTO MODERATE, AUTO CALM, or MAN (manual) as appropriate. Select an AUTO option according to the sea state. 4. For manual adjustment, rotate the [ENTER] knob to adjust. The range of adjustment is 0-100. Do not overadjust – weak echoes may be missed.](https://usermanual.wiki/Furuno-USA/9ZWRTR060/User-Guide-228449-Page-38.png)
![2. RADAR OPERATION 2-55. When the radar source is the Model 1800/1900 series, A/C SEA and A/C RAIN can be automatically adjusted. Press the A/C AT ON/OFF soft key to select ON or OFF as appropriate. When turned on, it overrides A/C SEA and A/C RAIN settings. 6. Press the [GAIN] key on the front panel or RETURN soft key to finish. 2.6 Reducing Precipitation Clutter The vertical beamwidth of the antenna is designed to see surface targets even when the ship is rolling. However, by this design the unit will also detect precipitation clutter (rain, snow, hail, etc.) in the same manner as normal targets. Precipitation clutter shows as random dots on the screen. 2.6.1 Adjusting the A/C RAIN When echoes from precipitation mask solid targets, adjust the A/C RAIN to split up these unwanted echoes into a speckled pattern, making recognition of solid targets easier. 1. Press the [GAIN] key. 2. Press the A/C RAIN soft key to show the A/C RAIN window. A/C RAIN0 A/C RAIN setting window 3. Rotate the [ENTER] knob to adjust the A/C RAIN. The current level is shown on the A/C RAIN level bar in the A/C RAIN window, and the range of adjustment is 0 to 100(%). Do not overadjust – weak echoes may be missed. 4. Press the [GAIN] key on the front panel or RETURN soft key to finish.](https://usermanual.wiki/Furuno-USA/9ZWRTR060/User-Guide-228449-Page-39.png)
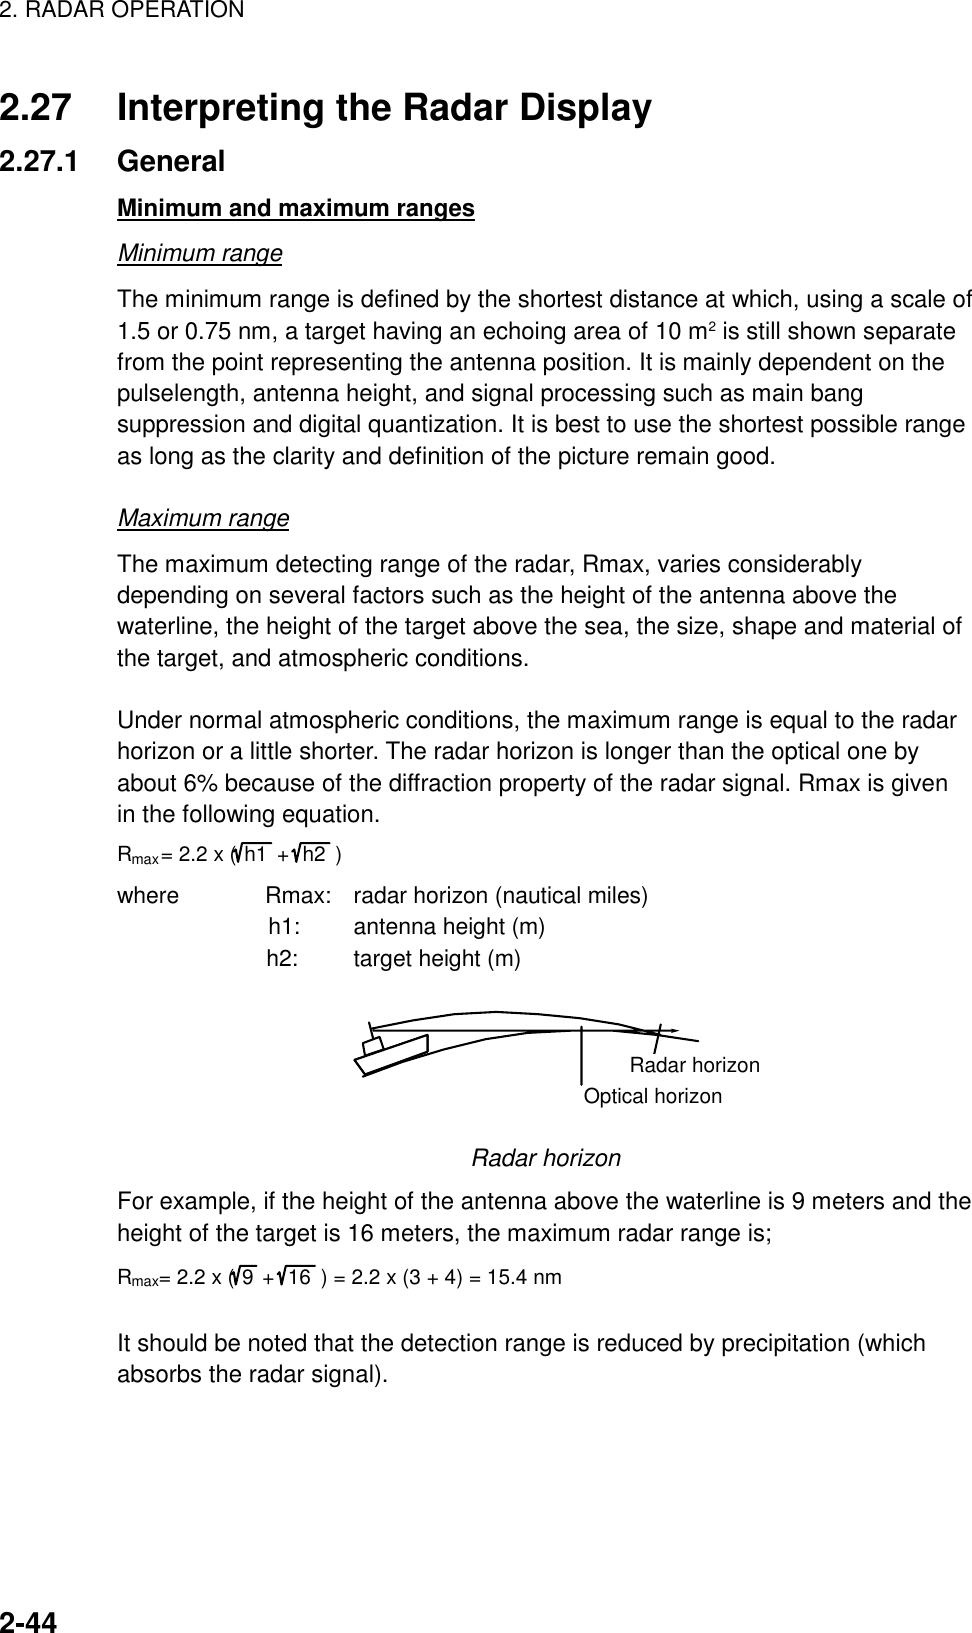
![2. RADAR OPERATION 2-62.7 Range Scale The range setting determines the size of the area (in nautical miles) that will appear on your display. In addition, the range setting will also automatically adjust the range ring interval so that accurate range measurements may be made while operating on any range setting. The range, range ring interval and pulselength appear at the top left-hand corner of the display. Press the [RANGE (+ or -)] key to change the range scale. Range scales (nm, sm) Range 0.125 0.25 0.5 0.75 1 1.5 2 3 4 6 8 12 16 24 36 48 64 72Ring Interval 0.0625 0.125 0.125 0.25 0.25 0.5 0.5 1 1 2 2 3 4 6 12 12 16 18No. of Rings 2 2 4 3 4 3 4 3 4 3 4 4 4 4 3 4 4 4 Range scales (km) Range 0.25 0.5 0.75 1 1.5 2 3 4 6 8 12 16 24 36 48 64 72 Ring Interval 0.125 0.25 0.25 0.25 0.5 0.5 1 1 2 2 3 4 6 12 12 16 18 No. of Rings 2 2 3 4 3 4 3 4 3 4 4 4 4 3 4 4 4 Note 1: Maximum range depends on the network radar as shown below. Model 1722/1722C: 24 nm Model 1732/1732C/1742/1742C/1833/1833C: 36 nm Model 1762/1762C/1933/1933C: 48 nm Model 1943/1943C: 64 nm Model 1953C: 72 nm Note 2: You may choose which ranges to use from the RADAR RANGE SETUP menu. For details see paragraph 5.2.2. This function is not available with the GD-1900C.](https://usermanual.wiki/Furuno-USA/9ZWRTR060/User-Guide-228449-Page-40.png)
![2. RADAR OPERATION 2-72.8 Pulselength The pulselength in use is displayed at the upper left corner of the display. Appropriate pulselengths are preset to individual range scales. Therefore, you are not usually required to select them. If you are not satisfied with the current pulselength setting, however, it is possible to change it for the ranges shown below. Generally, select a longer pulse for longer detection range and shorter pulse for better range discrimination. 1.5 nm, 1.5 sm, 3 km: Short pulse, medium pulse 3 nm, 3 sm, 6 km: Medium pulse, long pulse 1. If not displayed, press the [HIDE/SHOW] key to show the radar soft keys. 2. Press the SIGNAL PROC. soft key. Shown when radar source is the Model1800/1900 seriesradar. Not shownotherwise.SIGNALPROCESSRETURN359.9 ˚R 11.70nm+I. REJOFFE. AVGOFFPULSEE. STROFF12/ H-UP 3nmLP319. 9°M Signal process soft keys 3. Choose the 1.5 nm or 3 nm with the RANGE key. 4. Press the PULSE soft key to select the pulselength setting. SHORT or MEDIUM for 1.5 nm, 1.5 sm, 3 km and MEDIUM or LONG for 3 nm, 3 sm, 6 km. 5. Press the RETURN soft key to finish.](https://usermanual.wiki/Furuno-USA/9ZWRTR060/User-Guide-228449-Page-41.png)
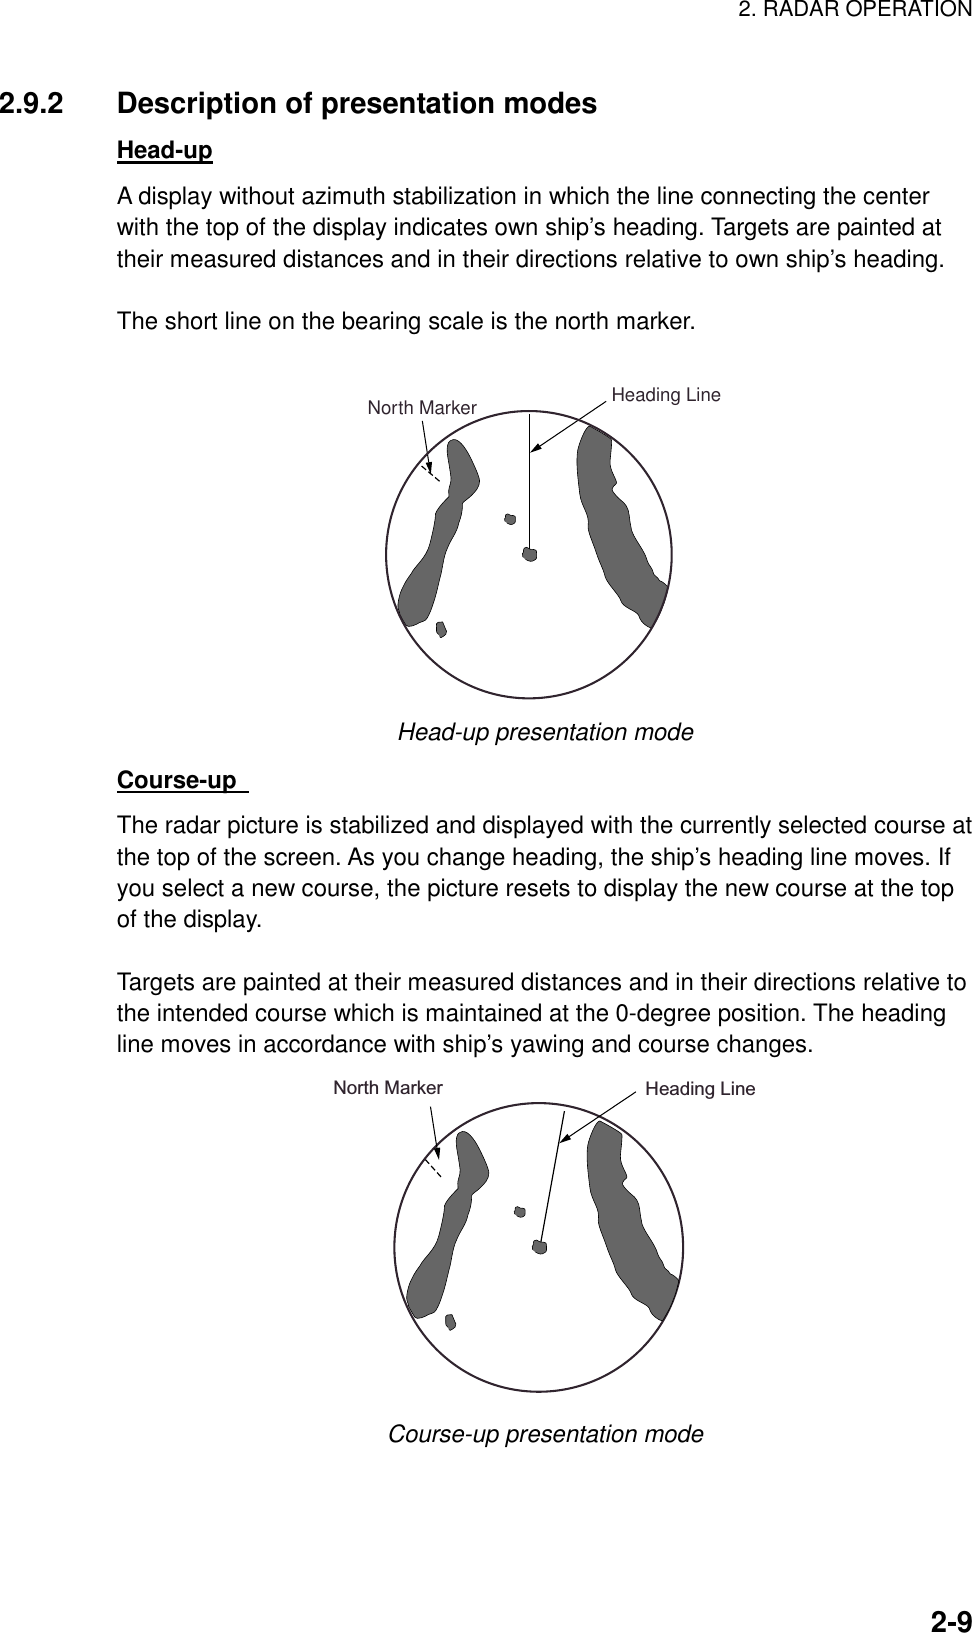
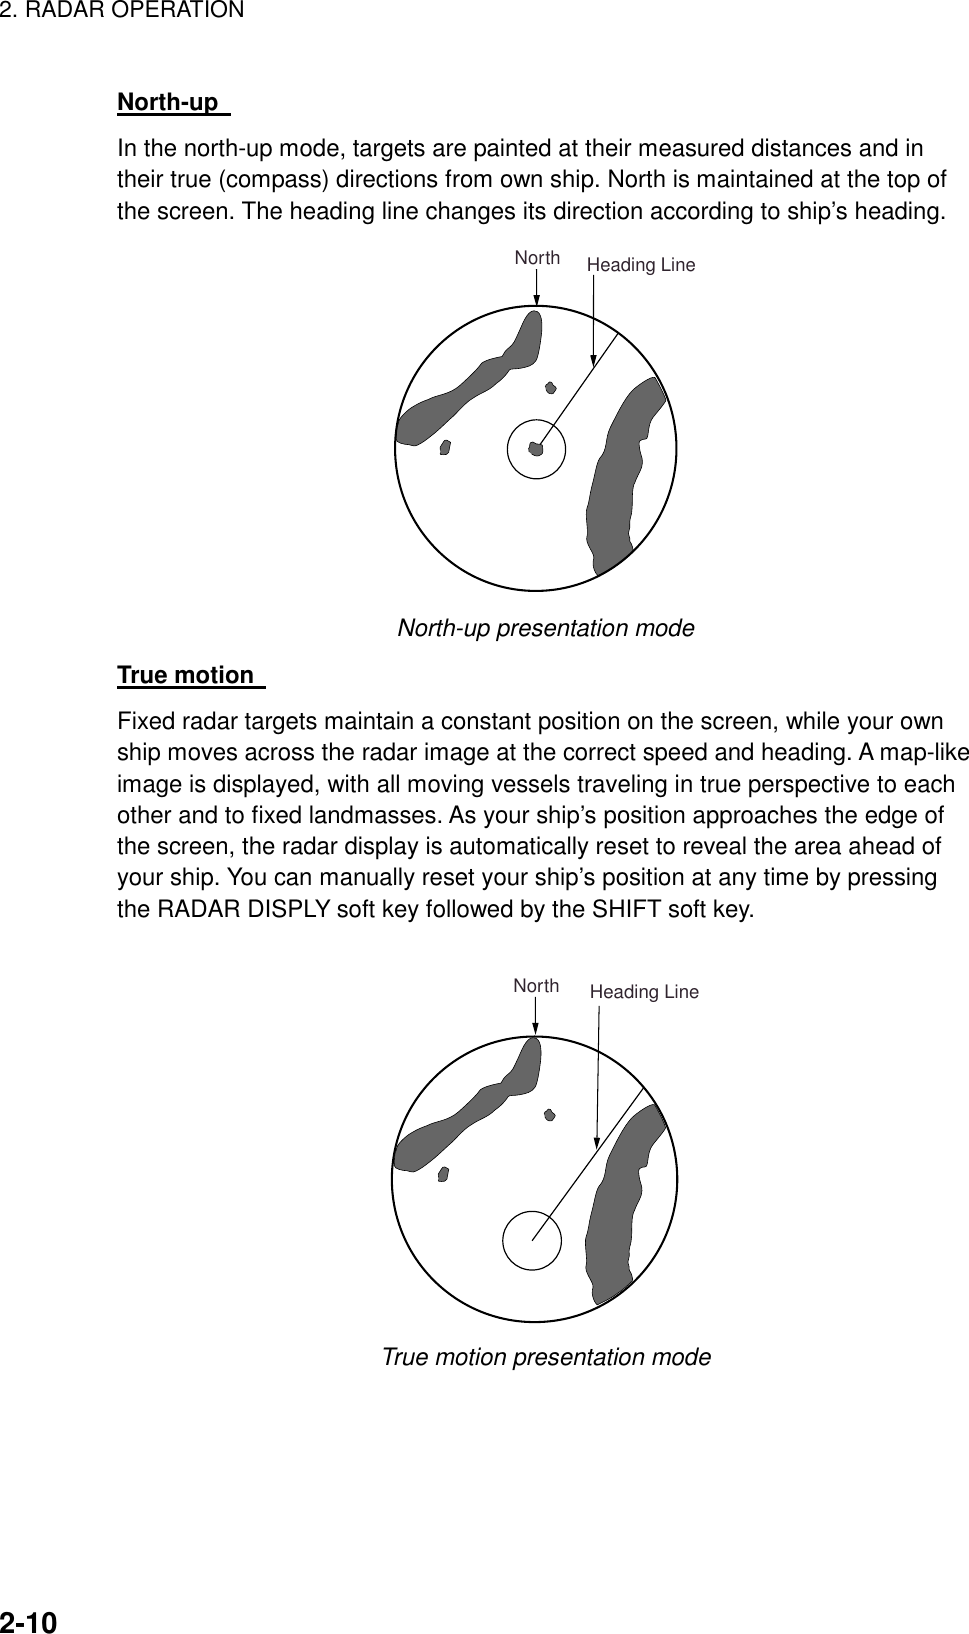
![2. RADAR OPERATION 2-82.9 Presentation Mode This unit provides four radar presentation modes: head-up, course-up, north-up and true motion. Heading data is required for modes other than head-up. 2.9.1 Selecting a presentation mode 1. If not displayed, press the [HIDE/SHOW] key to show the radar soft keys. 2. Press the RADAR DISPLY soft key to show the RADAR DISPLAY soft keys. RADARDISPLAYRETURN359.9 ˚R 11.70nm+MODEHD UPSHIFTHL OFFRINGS HIGH12/ H-UP 3nmLP319. 9°M Radar display soft keys 3. Press the MODE soft key. Each pressing of the key changes the presentation mode and the presentation mode indication in the sequence of North-up, True Motion, Head-up, and Course-up. Function Indicator on display Soft key label North-up N-UP NTH UP True Motion TR-M TRUE M Head-up H-UP HD UP Course-up C-UP CSE UP 4. Press the RETURN soft key to finish. Note: When heading data is lost, the presentation mode automatically goes to head-up, the heading indication at the screen top shows “- - -.-°” and the audio alarm sounds. Press the [ALARM] key to acknowledge the alarm. The message “HEADING DATA MISSING” appears. Restore compass signal to show heading indication. Use the MODE soft key to select presentation mode if necessary. The audio alarm may be silenced with the [CLEAR] key.](https://usermanual.wiki/Furuno-USA/9ZWRTR060/User-Guide-228449-Page-42.png)
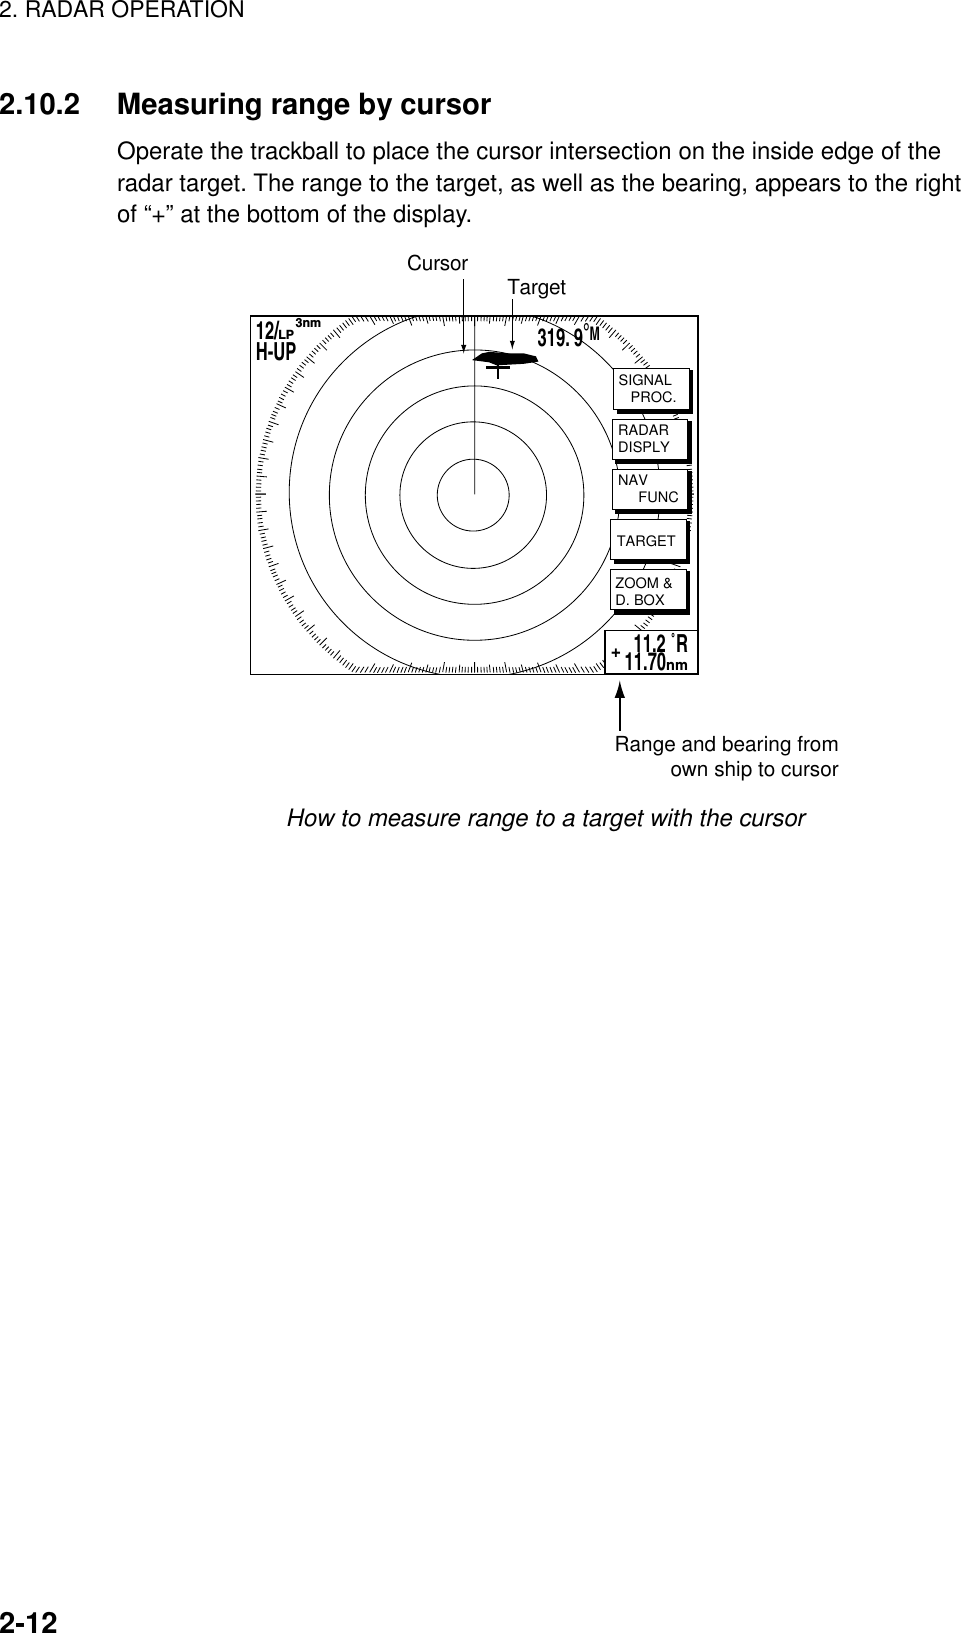
![2. RADAR OPERATION 2-112.10 Measuring the Range You can measure the range to a radar target three ways: by the range rings, by the cursor, and by the VRM (Variable Range Marker). 2.10.1 Measuring range by range rings Count the number of rings between the center of the display and the target. Check the range ring interval and judge the distance of the echo from the inner edge of the nearest ring. To turn the range rings on, do the following: 1. If not displayed, press the [HIDE/SHOW] key to show the radar soft keys. 2. Press the RADAR DISPLY soft key. RADARDISPLAYRETURN359.9 ˚R 11.70nm+MODEHD UPSHIFTHL OFFRINGS HIGH12/ H-UP 3nmLP319. 9°M Radar display soft keys 3. Press the RINGS soft key to turn the rings on and select desired brilliance. 4. Press the RETURN soft key to finish.](https://usermanual.wiki/Furuno-USA/9ZWRTR060/User-Guide-228449-Page-45.png)
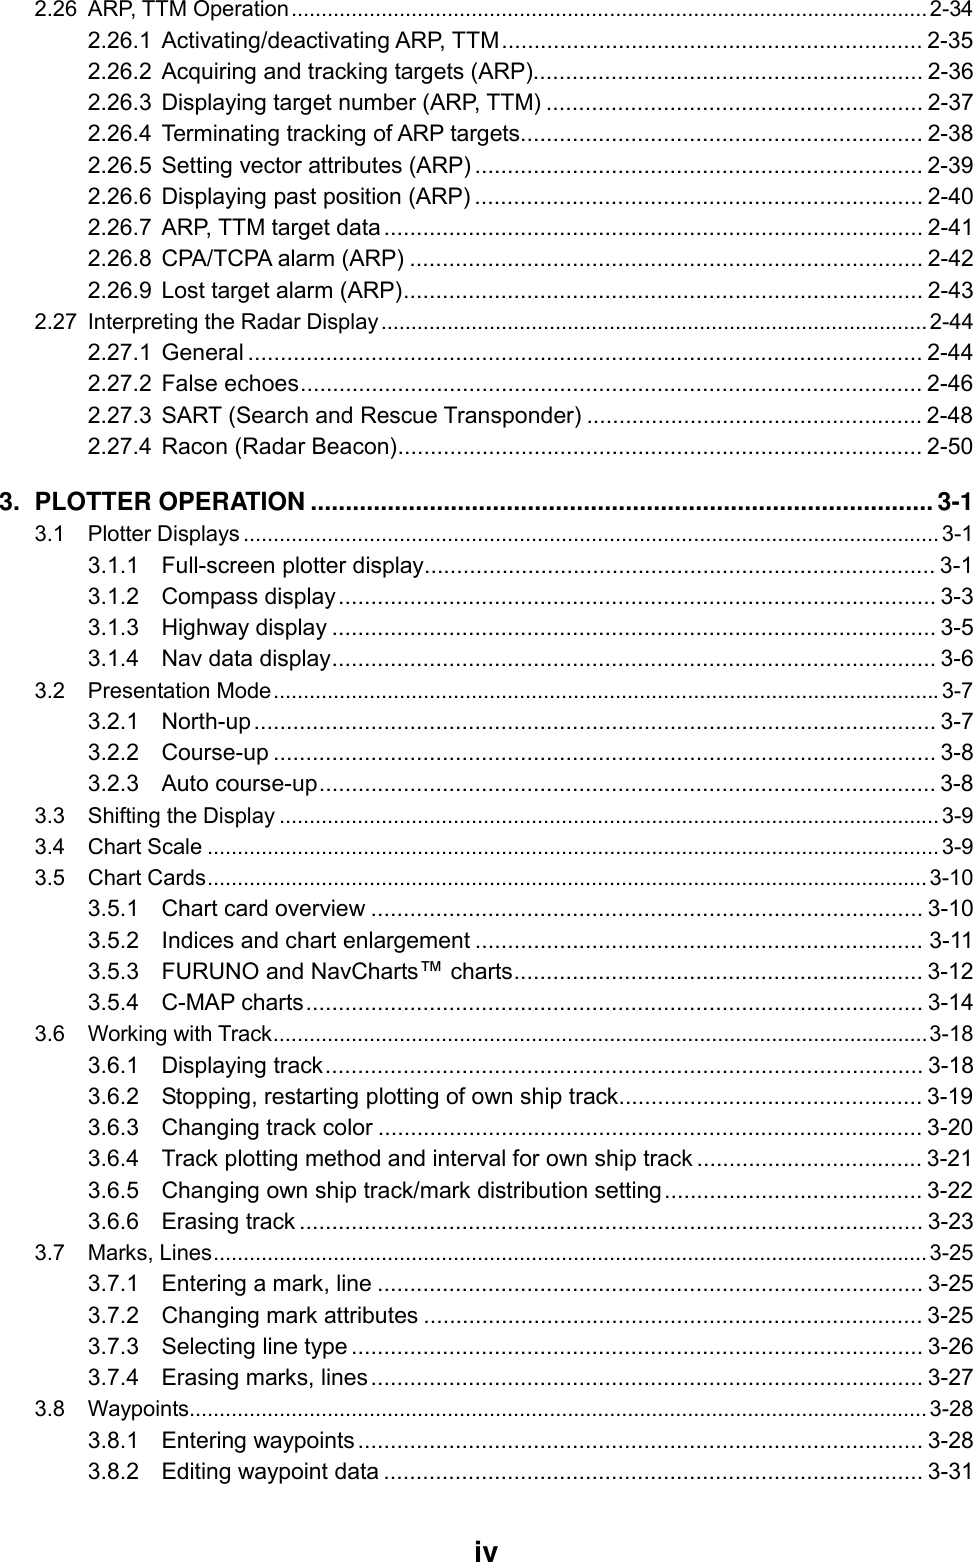
![2. RADAR OPERATION 2-132.10.3 Measuring range by VRM 1. Press the [EBL/VRM] key to display the EBL/VRM soft keys. EBLVRMEBL1 ONVRM2 ON359.9 ˚R 11.70nm+VRM1 ONOFFSETEBL2 ON319. 9°M12/ H-UP 3nmLP EBL/VRM soft keys 2. Press the VRM1 ON (dotted ring VRM) or VRM2 ON (dashed ring VRM) soft key to select the desired VRM. The selected VRM’s indication, at the bottom of the screen, is highlighted. 3. Rotate the [ENTER] knob the place the VRM on the inside edge of a radar target. Read the VRM indication to find range to the target. EBLVRMEBL1 ON359.9 ˚R 11.70nm+VRM1(Dotted line)VRM2(Dashed line)VRM1 rangeActive VRM is highlighted. OFFSETEBL2 ONVRM1 ONVRM2 ONEBL1 ---.-°RVRM1 3.123nmEBL2 ---.-°RVRM2 9.343nmVRM2 range319. 9°M12/ H-UP 3nmLP 4. You may hide the EBL/VRM soft keys by pressing the [EBL/VRM] key. How to measure range with the VRM](https://usermanual.wiki/Furuno-USA/9ZWRTR060/User-Guide-228449-Page-47.png)
![2. RADAR OPERATION 2-142.10.4 Erasing a VRM, VRM indication Press appropriate VRM soft key, then press the [CLEAR] key. The VRM is erased and its indication becomes blank. 2.10.5 Erasing EBL/VRM data boxes Press the EBL or VRM soft key associated with the EBL/VRM data box you wish to erase. Press the [CLEAR] key once or twice to erase the data box. 2.10.6 Hiding EBL/VRM data boxes Press the ZOOM & D. BOX and D. BOX ON/OFF soft keys to show or hide the EBL/VRM data boxes. 2.10.7 Moving EBL/VRM data boxes When an EBL/VRM data box is obscuring a target you want to see, you can move it to another location as shown below. This cannot be done when the EBL/VRM soft keys are shown. 1. Press the [EBL/VRM] key to turn off the EBL/VRM soft keys. 2. Using the trackball, place the cursor inside the data box you wish to move. As the cursor enters the box it changes to a “hand.” Push the [ENTER] knob, and the hand changes to a fist, meaning the box is correctly selected. 3. Use the trackball to move the data box to the location desired, then push the [ENTER] knob. 2.11 Measuring the Bearing There are two ways to measure the bearing to a target: by the cursor, and by the EBL (Electronic bearing Line). 2.11.1 Measuring bearing by cursor Use the trackball to place the cursor at the center of the target. The bearing to the target appears in the range and bearing box at the bottom right-hand corner on the screen. 2.11.2 Measuring bearing by EBL 1. Press the [EBL/VRM] key. 2. Press the EBL1 ON (dotted line EBL) or EBL2 ON (dashed line EBL) soft key to select the desired EBL. The selected EBL’s indication, at the bottom of the screen, is highlighted. 3. Rotate the [ENTER] knob to bisect the radar target with the EBL. Read the EBL indication to find the bearing to the target.](https://usermanual.wiki/Furuno-USA/9ZWRTR060/User-Guide-228449-Page-48.png)
![2. RADAR OPERATION 2-15EBLVRMEBL1 ONVRM2 ON359.9 ˚R 11.70nm+EBL1(Dotted line)EBL2(Dashed line)EBL2 bearingActive marker is highlighted.EBL1 bearingVRM1 ONOFFSETEBL2 ONEBL1 330.1°RVRM1 -.---nmEBL2 234.1˚RVRM2 -.---nm12/H-UP 3nmLP319. 9°M How to measure bearing with the EBL 4. You may hide the EBL/VRM soft keys by pressing the [EBL/VRM] key. Note: The bearing to a target may be shown relative to own ship’s heading (Relative) or True bearing (requires heading data). This may be done with “EBL REFERENCE,” which is in the RADAR DISPLAY SETUP menu. 2.11.3 Erasing an EBL, EBL indication Press appropriate EBL soft key, then press the [CLEAR] key. The EBL is erased and its indication becomes blank. 2.11.4 Erasing EBL/VRM data boxes Press the EBL or VRM soft key associated with the EBL/VRM data box you wish to erase. Press the [CLEAR] key once or twice to erase the data box. 2.11.5 Hiding EBL/VRM data boxes Press the ZOOM & D. BOX and D. BOX ON/OFF soft keys to show or hide the EBL/VRM data boxes. 2.11.6 Moving EBL/VRM data boxes When an EBL/VRM data box is obscuring a target you want to see, you can move it to another location as shown below. This cannot be done when the EBL/VRM soft keys are shown. 1. Press the [EBL/VRM] key to turn off the EBL/VRM soft keys. 2. Using the trackball, place the cursor inside the data box you wish to move. As the cursor enters the box it changes to a “hand.” Push the [ENTER] knob, and the hand changes to a fist, meaning the box is correctly selected. 3. Use the trackball to move the data box to the location desired, then push the [ENTER] knob.](https://usermanual.wiki/Furuno-USA/9ZWRTR060/User-Guide-228449-Page-49.png)
![2. RADAR OPERATION 2-162.12 Erasing the Heading Line, North Marker The heading line indicates the ship's heading in all presentation modes. It is a line from the own ship position to the outer edge of the radar display area and appears at zero degrees on the bearing scale in head-up mode; it changes its orientation in the north-up, course-up and true motion modes with ship’s movement. The north marker appears as a short dashed line. In the head-up and course-up modes the north marker moves around the bearing scale as the ship’s heading moves. To temporarily erase the heading line and north marker, press the RADAR DISPLY soft key followed by the HL OFF soft key. Release the key to redisplay the markers. (If the radar soft keys are not shown, hit the [HIDE/SHOW] key to display them.) 2.13 Reducing Noise Interference Noise, appearing on the displays as random “speckles,” can be reduced as follows: 1. Press the [MENU] key to open the menu. 2. Press the RADAR DISPLAY SETUP soft key. 3. Select NOISE REJECTION, then press the EDIT soft key. 4. Select OFF, LOW or HIGH as appropriate. 5. Press the ENTER soft key. 6. Press the [MENU] key to close the menu.](https://usermanual.wiki/Furuno-USA/9ZWRTR060/User-Guide-228449-Page-50.png)
![2. RADAR OPERATION 2-172.14 Rejecting Radar Interference Radar interference may occur when near another shipborne radar that is operating in the same frequency band as your radar. Its on-screen appearance looks like many bright dots either scattered at random or in the form of dotted lines extending from the center to the edge of the display. Interference effects are distinguishable from normal echoes because they do not appear in the same place on successive rotations of the scanner. Be sure to turn off the interference rejector when no interference exists – weak targets may be missed. Radar interference 1. If not displayed, press the [HIDE/SHOW] key to show the radar soft keys. 2. Press the SIGNAL PROC. soft key. Shown when radar source is the Model1800/1900 seriesradar. Not shownotherwise.SIGNALPROCESSRETURN359.9 ˚R 11.70nm+I. REJOFFE. AVGOFFPULSEE. STROFF12/ H-UP 3nmLP319. 9°M SIGNAL PROCESS soft keys 3. Press the I. REJ soft key successively to choose the interference rejection level desired; LOW, MED, HIGH or OFF. 4. Press the RETURN soft key to finish. The display shows IR L (Low), IR M (Medium) or IR H (High) when the interference rejector is on.](https://usermanual.wiki/Furuno-USA/9ZWRTR060/User-Guide-228449-Page-51.png)
![2. RADAR OPERATION 2-182.15 Zoom The zoom feature allows you to double the size of the area selected with the “zoom circle.” It is available on any range but is inoperative in true motion and when the display is shifted. 2.15.1 Zooming in on radar targets 1. If not displayed, press the [HIDE/SHOW] key to show the radar soft keys. 2. Use the trackball to set the cursor where you want to zoom. 3. Press the ZOOM & D. BOX soft key to show ZOOM & D. BOX soft keys. 4. Press the ZOOM ON/OFF soft key to select ON. A solid circle, called the “zoom circle,” appears on the display. 5. To release the cursor, press the CURSOR FLOAT soft key. (The solid circle changes to a dashed one.) To relocate the zoom circle, select location with the trackball, then press the CURSOR LOCK key. 6. To quit the zoom function, press the ZOOM ON/OFF soft key to select OFF. ZOOM &D. BOX12/HU 3nmLP319. 9°MZoom circleZoom windowRequires optionalARP Board inModel 1800/1900 seriesnetwork radar.Not shown otherwise.RETURN359.9 ˚R 5.727nm+ZOOMON /OFFCURSORFLOATD. BOXON/ OFFARP TGT ZM Zoom 2.15.2 Zooming in on ARP, TTM targets You may zoom in on TTM (Tracked Target Message) and ARP targets. TTM targets can come from a NavNet connected radar, or from other ARP radar that is outputting the TTM message. (TTM is a NMEA 0183 data sentence that is an available output from some ARP capable radar.) Target numbers must be turned on to use this function. This can be done by enabling the target ID number option in the ARP SETUP menu. 1. If not displayed, press the [HIDE/SHOW] key to show the radar soft keys. 2. Press the ZOOM/D. BOX soft key to show ZOOM & D. BOX soft keys. 3. Press the ZOOM ON/OFF soft key to select ZOOM ON.](https://usermanual.wiki/Furuno-USA/9ZWRTR060/User-Guide-228449-Page-52.png)
![2. RADAR OPERATION 2-194. Press the ARP TGT ZM soft key. ▲▼1SELECT TARGET NO. Target no. selection window 5. Use the [ENTER] knob to select number (1-10), then push the [ENTER] knob. If the target number does not exist several beeps sound and the zoom function is cancelled. . To cancel, press the CURSOR LOCK soft key. Note: The zoom window blends in with the background when the background color for the radar picture is white. If the window is difficult to see, change the background color. 2.16 Shifting the Picture Own ship position, or sweep origin, can be displaced manually or automatically to expand the view field without switching to a larger scale. 2.16.1 Manual shift The sweep origin can be shifted in any presentation mode to a point specified by the cursor by up to 50% of the range in use in any direction. 1. Locate the cursor anywhere within the effective radius of the display. 2. If not displayed, press the [HIDE/SHOW] key to show the radar soft keys. 3. Press the RADAR DISPLY soft key. 4. Press the SHIFT soft key. 5. Press the MANUAL soft key to shift. The heading line shifts to the cursor location. SHIFT appears at right-hand corner of the display. 6. To cancel shift, press the RADAR DISPLY, SHIFT and OFF soft keys. CursorPlace cursorwhere desired. Press the MANUAL soft key.SHIFT Shifting the picture manually](https://usermanual.wiki/Furuno-USA/9ZWRTR060/User-Guide-228449-Page-53.png)
![2. RADAR OPERATION 2-202.16.2 Automatic shift The amount of automatic shift is calculated according to ship’s speed, and the amount of shift is limited to 50% of the range in use. For example, if you set the shift speed setting for 15 knots and the ship is running at 10 knots the amount of shift will be about 34%. The formula for determining shift amount is as shown below. Ship's speed Shift speed setting X 0.5 = Amount of shift(%) Automatic shift mode is only available in the head-up mode. Setting automatic shift maximum speed 1. If not displayed, press the [HIDE/SHOW] key to show the radar soft keys. 2. Press the RADAR DISPLY soft key. 3. Press the SHIFT soft key to show the shift soft keys. 4. Press the AUTO S.SPD soft key to display the auto ship speed setting window. AUTO SHIP SPEED 15 Auto ship speed setting window 5. Adjust the trackball or [ENTER] knob to set the maximum speed of your vessel, and then push the [ENTER] knob or the ENTER soft key to set. The setting range is 1-999 kt and the default setting is 15 kt. Automatic shift Press the AUTO key to automatically shift the sweep origin. To cancel shift, press the RADAR DISPLY, SHIFT and OFF soft keys.](https://usermanual.wiki/Furuno-USA/9ZWRTR060/User-Guide-228449-Page-54.png)
![2. RADAR OPERATION 2-212.17 Using the Offset EBL The offset EBL can be used to predict a potential collision course. It can also be used to measure the range and bearing between two targets. 2.17.1 Predicting collision course The procedure below may be used to check if a radar target is on a potential collision course with your vessel. 1. Press the [EBL/VRM] key to show the EBL/VRM soft keys. 2. Press the EBL1 ON soft key to turn on the EBL1. 3. Press the OFFSET soft key. The origin of EBL1 moves to the cursor position, which is marked with an “X.” 4. Use the trackball to place the cursor on the radar target which looks like it might be on a collision course with own ship. 5. Push the [ENTER] knob to fix the origin position. 6. After waiting for a few minutes (at least three minutes), rotate the [ENTER] knob so the EBL bisects the target at the new position. If the target tracks along the EBL towards the center of the display (your ship’s position), the target may be on a collision course with your vessel. 7. To cancel the offset EBL, press the OFFSET soft key. EBLVRMVRM1 ONVRM2 ON359.9 ˚R 11.70nm+Initial targetpositionTarget trackedhereOFFSETEBL2 ONEBL1 45.0˚RVRM1 -.---nmEBL1 ON12/H-UP 3nmLP319. 9°M Predicting collision course with the offset EBL](https://usermanual.wiki/Furuno-USA/9ZWRTR060/User-Guide-228449-Page-55.png)
![2. RADAR OPERATION 2-222.17.2 Measuring range & bearing between two targets The procedure which follows shows how to measure the range and bearing between two targets, using the targets “A” and “B” in the figure below as an example. 1. Operate the trackball to place the cursor on the target “A.” 2. Press the [EBL/VRM] key to show the EBL/VRM soft keys. 3. Press the EBL1 ON soft key to turn on the EBL1. 4. Press the OFFSET soft key. The origin of EBL1 moves to the cursor position, which is marked with an “X.” 5. Rotate the [ENTER] knob so the EBL bisects the target “B.” 6. Push the [ENTER] knob, then press the VRM1 ON soft key. 7. Rotate the [ENTER] knob to place the VRM1 on the inner edge of the target “B.” 8. Look at the indications for VRM1 and EBL1 to find the range and bearing between the two targets. 9. To cancel the offset EBL, press the OFFSET key. EBLVRMEBL1 ONVRM2 ON359.9 ˚R 11.70nm+Target ATarget BBearing and rangebetween target Aand target BVRM1 ONOFFSETEBL2 ONEBL1 45.0°RVRM1 7.121nm12/ H-UP 3nmLP319. 9°M Measuring range and bearing between two targets](https://usermanual.wiki/Furuno-USA/9ZWRTR060/User-Guide-228449-Page-56.png)
![2. RADAR OPERATION 2-232.18 Echo Trails Echo trails are simulated afterglow of target echoes that represent their movements relative or true to own ship. This function is useful for alerting you past possible collision situations. Echo trail Sample echo trails 2.18.1 Trail time 1. If not displayed, press the [HIDE/SHOW] key to show the radar soft keys. 2. Press the TARGET soft key. 3. Press the TRAIL soft key. TRAILRETURN359.9 ˚R 11.70nm+TRAILON /OFFTRAIL TIMETRAIL COLORGRADSINGLE12/ H-UP 3nmLP319. 9°M Trail soft keys 4. Press the TRAIL TIME soft key to show the trail time window. TRAIL TIME▲15 seconds30 seconds1 minute 3 minutes6 minutes15 minutes30 minutesCONTINUOUS▼ Trail time window 5. Use the trackball to select time desired. 6. Press the ENTER soft key. 7. Press the RETURN soft key twice to finish.](https://usermanual.wiki/Furuno-USA/9ZWRTR060/User-Guide-228449-Page-57.png)
![2. RADAR OPERATION 2-242.18.2 Starting echo trails 1. If not displayed, press the [HIDE/SHOW] key to show the radar soft keys. 2. Press the TARGET soft key. 3. Press the TRAIL soft key. 4. Press the TRAIL ON/OFF soft key to select ON. 5. Press the RETURN soft key twice to finish. “TRAIL,” the echo trail time selected and elapsed time appear at the top right-hand corner of the display. Then, afterglow starts extending from all targets. Trails are restarted when the range or mode is changed and zoom or shift is turned on. For continuous trails, the maximum continuous trail time is 99 minutes and 59 seconds. When the elapsed time clock counts up to that time, the elapsed time display resets to zero and trails begin again. To turn off echo trail, press the TRAIL ON/OFF soft key to select OFF at step 4 in the above procedure. 2.18.3 Trail gradation The echo trails can be shown in single or multiple gradations. Multiple gradation paints the trails thinner with time, like the afterglow on an analog PPI radar. 1. If not displayed, press the [HIDE/SHOW] soft key to show the radar soft keys. 2. Press the TARGET and TRAIL soft keys. 3. Press the GRAD soft key to select SINGLE or MULTI as appropriate. 4. Press the RETURN soft key twice to finish. Multitone Monotone Multitone and monotone trails](https://usermanual.wiki/Furuno-USA/9ZWRTR060/User-Guide-228449-Page-58.png)
![2. RADAR OPERATION 2-252.18.4 Trail color Trails may be shown target trails in blue, yellow, green or white. 1. If not displayed, press the [HIDE/SHOW] key to show the radar soft keys. 2. Press the TARGET, TRAIL and TRAIL COLOR soft keys in that order. TRAIL COLOR▲BLUEYELLOWGREEN WHITE▼ Trail color window 3. Use the trackball to select the color desired, then press the ENTER soft key. 4. Press the RETURN soft key twice. 2.18.5 Echo trail mode Echo trails can be shown in Relative or True motion. (True trails require heading and speed inputs.) 1. Press the [MENU] key. 2. Press the RADAR DISPLAY SETUP key. 3. Choose TRAIL MODE, then press the EDIT soft key. TRAIL MODE▲TRUE RELATIVE▼ Trail mode window 4. Select TRUE or RELATIVE as appropriate, then press the ENTER soft key. 5. Press the [MENU] key to close the menu.](https://usermanual.wiki/Furuno-USA/9ZWRTR060/User-Guide-228449-Page-59.png)
![2. RADAR OPERATION 2-262.19 Echo Stretch Normally, the reflected echoes from long range targets appear on the display as weaker and smaller blips even though they are compensated by the radar’s internal circuitry. The echo stretch function magnifies these small blips in all ranges. Two types of echo stretch are available: ES LOW which stretches echoes in bearing direction and ES HIGH which stretches them in both range and bearing directions. "LOW" Echo stretch "HIGH" Echo stretchBearingdirection BearingdirectionRangedirection Echo Stretch OFFTarget Types of echo stretch This function magnifies not only targets but also sea clutter and radar interference. For this reason, be sure sea clutter and radar interference are properly suppressed before activating the echo stretch. 1. If not displayed, press the [HIDE/SHOW] key to show the radar soft keys. 2. Press the SIGNAL PROC. soft key. 3. Press the E. STR soft key to select HIGH, LOW or OFF as appropriate. 4. Press the RETURN soft key to finish. The display shows ES H (High) or ES L (Low) when the echo stretch is on.](https://usermanual.wiki/Furuno-USA/9ZWRTR060/User-Guide-228449-Page-60.png)
![2. RADAR OPERATION 2-272.20 Echo Averaging The echo average feature, which requires a Model 1800/1900 series network radar, effectively suppresses sea clutter. Echoes received from stable targets such as ships appear on the screen at almost the same position during every rotation of the antenna. On the other hand, unstable echoes such as sea clutter appear at random positions. To distinguish real target echoes from sea clutter, echo average performs scan-to-scan correlation. Correlation is made by storing and averaging echo signals over successive picture frames. If an echo is solid and stable, it is presented in its normal intensity. Sea clutter is averaged over successive scans resulting in the reduced brilliance, making it easier to discriminate real targets from sea clutter. To properly use the echo average function, it is recommended to first suppress sea clutter with the A/C SEA control and then do the following: 1. If not displayed, press the [HIDE/SHOW] key to display the radar soft keys. 2. Press the SIGNAL PROC. soft key. 3. Press the E. AVG soft key to select desired echo averaging. OFF: No averaging LOW: Helps distinguish targets from sea clutter and suppresses brilliance of unstable echoes. MED: Distinguishes small stationary targets such as navigation buoys. HIGH: Stably displays distant targets. 4. Press the RETURN soft key to finish. The display shows EAV L, EAV M or EAV H when echo averaging is on. (a) Echo average OFF (b) Echo average ON Effect of echo averaging](https://usermanual.wiki/Furuno-USA/9ZWRTR060/User-Guide-228449-Page-61.png)
![2. RADAR OPERATION 2-282.21 Outputting TLL Data Target position data can be output to units of the network and shown on their plotter screen with the TTL mark (X). This function requires position and heading data. 1. Operate the trackball to place the cursor on the target whose position you wish to output. 2. If not displayed, press the [HIDE/SHOW] key to display the radar soft keys. 3. Press the TARGET soft key. Requires ARP circuit boardin Model 1800/1900 seriesNavNet radar. Not shownotherwise.TARGETTRAILTLLOUTPUTACQTARGET INFORETURN359.9 ˚R 11.70nm+12/ H-UP 3nmLP319. 9°M TARGET soft keys 4. Press the TLL OUTPUT soft key to output target position data. The TTL mark appears on the plotter screen at the target’s position the moment the TLL OUTPUT soft key was pressed. Further, that position is recorded as a waypoint on all NavNet units, under the youngest empty waypoint number on each NavNet unit. 5. Press the RETURN soft key to finish. Note: The screen of the TLL recipient may be temporarily interrupted when receiving TLL from another NavNet display unit. Press any key to restore normal operation.](https://usermanual.wiki/Furuno-USA/9ZWRTR060/User-Guide-228449-Page-62.png)
![2. RADAR OPERATION 2-292.22 Guard Alarm The guard alarm allows the operator to set the desired range and bearing for a guard zone. When ships, islands, landmasses, etc. violate the guard zone, an audio alarm sounds and the offending target blinks to call the operator’s attention. CAUTION• The alarm should not be relied upon as the sole means for detecting possible collision situations.• A/C SEA, A/C RAIN and GAIN controls should be properly adjusted to be sure the alarm system does not overlook target echoes. 2.22.1 Setting a guard alarm zone To set a guard alarm zone, set the radar to transmit and do the following: 1. Press the [ALARM] key. 2. Use the trackball to set the cursor on the top left corner (or top right corner) of the guard zone you want to set, then press the SET GUARD1 or SET GUARD2 soft key, depending on which guard zone you want to set. 3. Use the trackball to set the cursor on the bottom right corner (or top left corner) of the guard zone area, then push the [ENTER] knob. 4. Press the RETURN soft key to finish. (1) Drag cursor to top (or bottom) cornerfor guard zone and press the SETGUARD1 or SET GUARD2 soft key. (2) Drag cursor diagonally to bottom (or top) corner for guard zone and press the [ENTER]knob. 12/H-UP 3nmLP319. 9°M317.2 ˚R 11.60nm+SETGUARD1RETURN12/H-UP 3nmLP39.9 ˚R 8.800nm+NO ALARMERASEGUARD1SETGUARD2SETGUARD1RETURNALARM ALARMGUARD 1319. 9°M1MOVE +CURSOR TOANOTHER CORNER OFGUARD1 AND PUSHKNOB TO SET.SETGUARD22 How to set a guard alarm zone](https://usermanual.wiki/Furuno-USA/9ZWRTR060/User-Guide-228449-Page-63.png)
![2. RADAR OPERATION 2-30The equipment then searches for targets inside the guard zone to determine guard alarm type. If a target is found inside the guard zone, the guard zone type becomes an “Outward guard alarm,” and any target exiting the guard zone will trigger the audio alarm. If no target is found, the guard zone type becomes an “Inward guard alarm,” and any targets entering the guard zone will trigger the audio alarm. The guard alarm type is shown as G1(G2) IN or G1(G2) OUT. Note 1: When the radar range is less than the guard zone range, the audio alarm sounds and the alarm icon appears (in red). Press the [CLEAR] key to silence the alarm. Press the [ALARM] key and the message “GUARD1(2) IS OUTSIDE RADAR RANGE” appears. Reselect appropriate range. Note 2: If the network radar is set to standby while the guard alarm is active, the guard alarm is cancelled. The guard alarm is redisplayed when the radar is set to transmit again. Note 3: If the network radar is set to standby while the radar picture is not displayed, the alarm icon appears in red and the alarm sounds. Press the [ALARM] key and the message “STBY MODE HAS BEEN SELECTED. GUARD/WTCHMN CANCELED.” or “GUARD/WATCHMAN CANCELED. STBY/TX SELECTED.” appears. 2.22.2 When the alarm is violated… Any radar target violating the guard zone will flash, the audio alarm sounds, and the alarm icon appears in red. Additionally the message “TARGET ENTERED INTO GUARD1(GUARD2)” or “TARGET LEFT FROM GUARD1(GUARD2)” is displayed at the bottom of the screen. Press the [CLEAR] key to silence the alarm. When this is done, the color of the speaker icon changes to background color and “G1(G2) ACK” replaces G1(G2) IN(OUT) at the top right corner of the display. This means the alarm is temporarily deactivated. To reactivate the alarm, press the SET GUARD1 or SET GUARD2 soft key as appropriate. 2.22.3 Cancelling the guard alarm 1. Press the [ALARM] key to show the ALARM menu. 2. Press the ERASE GUARD1 or ERASE GUARD2 soft key as appropriate. 3. Press the RETURN soft key to finish.](https://usermanual.wiki/Furuno-USA/9ZWRTR060/User-Guide-228449-Page-64.png)
![2. RADAR OPERATION 2-312.23 Watchman 2.23.1 How watchman works The watchman function periodically transmits radar pulses for one minute to check for targets in a guard zone. If a target is found in the zone, watchman is cancelled, the audio alarm sounds and the radar continues transmitting. If no target is found the radar goes into standby for the number of minutes specified on the RADAR DISPLAY SETUP menu. This feature is useful when you do not need the radar’s function continuously but want to be alerted to radar targets in a specific area. “WTCH” appears at the top left corner when Watchman is active. ST-BY5,10or20 min Tx1 min Tx1 minWatchmanstarts5,10or20 minST-BY*** Beeps emitted just before radar transmits. How watchman works 2.23.2 Turning on/off watchman 1. Set a guard zone. (See the paragraph 2.22.) 2. If not displayed, press the [HIDE/SHOW] key to display the radar soft keys. 3. Press the NAV FUNC soft key. 4. Press the W. MAN ON/OFF soft key to select ON or OFF as appropriate. 5. Press the RETURN soft key to finish. Note: When the watchman is activated and no guard zone is active, the message “PLEASE SET GUARD ZONE. PUSH ANY KEY TO CONTINUE.” appears. Press any key and then set a guard zone. 2.23.3 Setting watchman stand-by interval The watchman standby interval, that is, the number of minutes the radar is in standby, can be set to 5, 10 or 20 minutes as follows: 1. Press the [MENU] key. 2. Press the RADAR DISPLAY SETUP soft key. 3. Select WATCHMAN TIME, then press the EDIT soft key. WATCHMAN TIME5 minutes10 minutes20 minutes Watchman window 4. Select time desired, then press the ENTER soft key. 5. Press the [MENU] key to close the menu.](https://usermanual.wiki/Furuno-USA/9ZWRTR060/User-Guide-228449-Page-65.png)
![2. RADAR OPERATION 2-322.24 Suppressing Second-trace Echoes In certain situations, echoes from very distance targets may appear as false echoes (second-trace echoes) on the screen. This occurs when the return echo is received one transmission cycle later, or after a next radar pulse has been transmitted. Second-traceechoTx repetitionActual rangeFalse echorange Second-trace echoes To activate or deactivate the second-trace echo rejector do the following: 1. Press the [MENU] key. 2. Press the RADAR DISPLAY SETUP soft key. 3. Use the trackball to select 2ND ECHO REJECTION, then press the EDIT soft key. 4. Choose ON or OFF as appropriate, then press the ENTER soft key. 5. Press the [MENU] key to close the menu.](https://usermanual.wiki/Furuno-USA/9ZWRTR060/User-Guide-228449-Page-66.png)
![2. RADAR OPERATION 2-332.25 Waypoint Marker A waypoint marker, showing the location of the destination waypoint set on the plotter, may be inscribed on the radar display. NAV FUNCRETURN12/HU L 3nmSP319. 9°M359.9 ˚R 11.70nm+W. MANON/ OFFWPT MKON /OFFWaypoint marker Waypoint marker 1. If not already shown, press the [HIDE/SHOW] key to display the radar soft keys. 2. Press the NAV FUNC soft key. 3. Press the WPT MK ON/OFF soft key to select ON or OFF as appropriate. 4. Press the RETURN soft key to finish.](https://usermanual.wiki/Furuno-USA/9ZWRTR060/User-Guide-228449-Page-67.png)
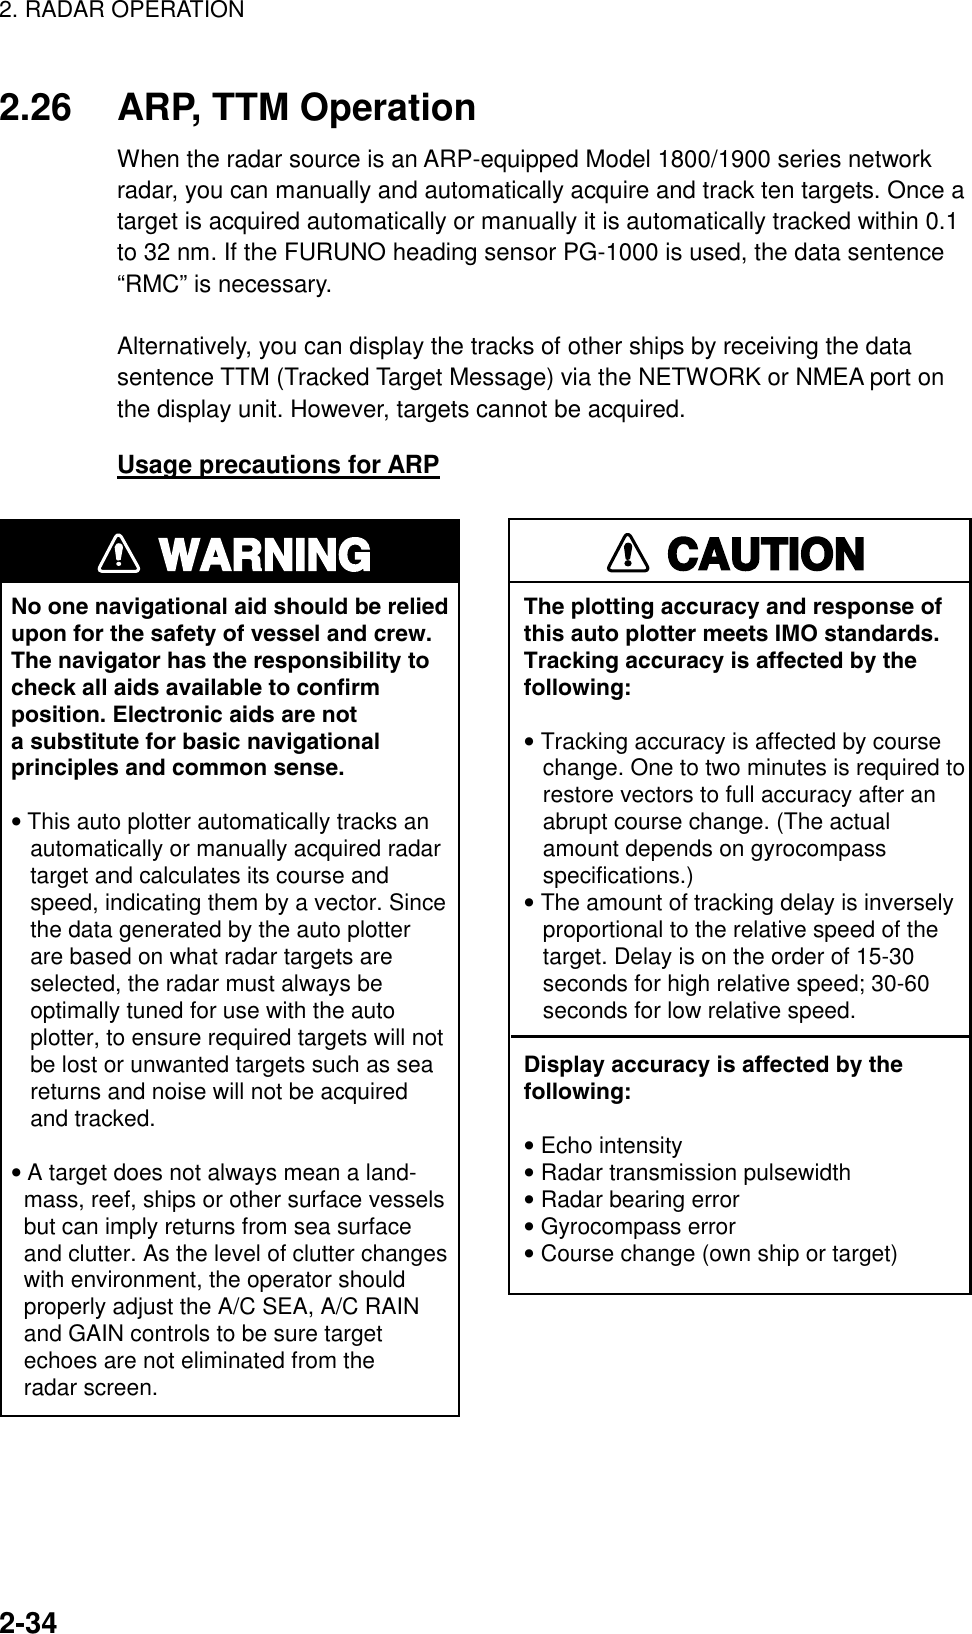
![2. RADAR OPERATION 2-352.26.1 Activating/deactivating ARP, TTM 1. Press the [MENU] key followed by the ARP SETUP soft key to show the ARP SETUP menu. EDITRETURNARP SETUPARP TARGET INFO INTERNAL ARPCANCEL ALL TARGETS NOARP VECTOR MODE TRUEARP VECTOR TIME 30 minutesHISTORY INTERVAL OFFCPA OFFTCPA 30 secondsAUTO ACQUISITION AREA OFFTARGET ID NUMBER OFF ARP setup menu 2. Select ARP TARGET INFO, then press the EDIT soft key to show the ARP target info window. ARP TARGET INFO▲▼INTERNAL ARPEXTERNAL ARPOFF ARP target info window 3. Select INTERNAL ARP, EXTERNAL ARP or OFF as appropriate. INTERNAL ARP: The radar source must be an ARP-equipped Model 1800/1900 series NavNet radar. Select this item also for a NavNet unit being fed ARP targets. EXTERNAL ARP: Receive TTM data sentence via NMEA or NETWORK port. Target tracks are shown but targets cannot be acquired. OFF: Turns off the ARP or TTM display. 4. Press the ENTER soft key. 5. Press the [MENU] key to close the menu.](https://usermanual.wiki/Furuno-USA/9ZWRTR060/User-Guide-228449-Page-69.png)
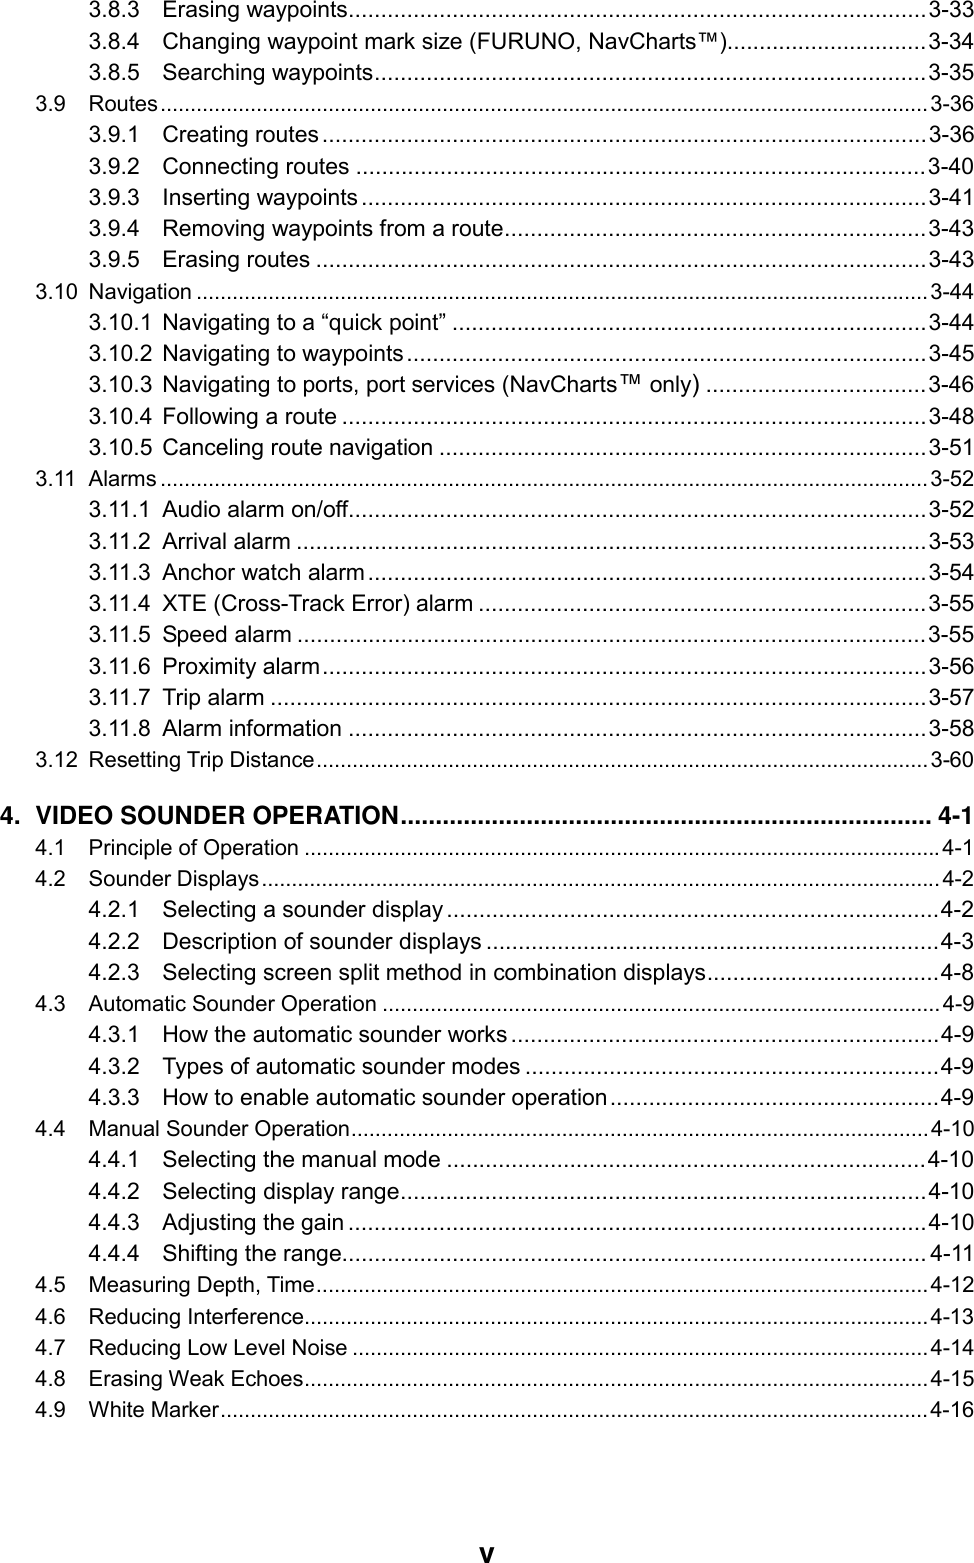
![2. RADAR OPERATION 2-362.26.2 Acquiring and tracking targets (ARP) Ten targets may be acquired and tracked manually and automatically. When you attempt to acquire an 11th target, the message “ARP FULL – ALREADY TRACKING 10 TARGETS!” appears for five seconds. To acquire another target, terminate tracking of an unnecessary target as shown in the paragraph “2.26.4 Terminating tracking of ARP targets.” Manual acquisition 1. If not already shown, press the [HIDE/SHOW] key to show the radar soft keys. 2. Press the TARGET soft key. 3. Place the cursor on the target to acquire. 4. Press the ACQ soft key. 5. Press the RETURN soft key to finish. The plot symbol changes over time as below. A vector appears about one minute after acquisition, indicating the target’s motion trend. At acquisition 1 min. afteracquisition3 min. afteracquisition01* 01* 01*Vector* = Target number shown when TARGET ID NUMBER is turned on in the ARP SETUP menu.Target Number ARP plot symbols Automatic acquisition The ARP can acquire up to ten targets automatically by setting an automatic acquisition area. When automatic acquisition is selected after acquiring targets manually, only the remaining capacity for targets may be automatically acquired. For example, if seven targets have been manually acquired, three targets may be automatically acquired. 1. Press the [MENU] key to show the main menu. 2. Press the ARP SETUP soft key to show the ARP SETUP menu. 3. Operate the trackball to select AUTO ACQUISITION AREA. 4. Press the EDIT soft key to show the automatic acquisition area window. AUTO ACQ. AREA▲▼ONOFF Automatic acquisition area window 5. Select ON, then press the ENTER soft key.](https://usermanual.wiki/Furuno-USA/9ZWRTR060/User-Guide-228449-Page-70.png)
![2. RADAR OPERATION 2-376. Press the [MENU] key to close the menu. An acquisition area of 2.0 to 2.5 miles in range and ±45º on either side of the heading line in bearing appears. Note: Targets being tracked in automatic acquisition are continuously tracked when switching to manual acquisition. Automatic acquisition area45° port 45° starboard2.0 - 2.5 nm Automatic acquisition area 2.26.3 Displaying target number (ARP, TTM) Target number can be shown for ARP and TTM targets as below. TARGETTRAILTLLOUTPUTTARGET INFORETURN359.9 ˚R 11.70nm+ACQARPTargetNumber0112/H-UP 3nmLP319. 9°T ARP target number 1. Press the [MENU] key. 2. Press the ARP SETUP soft key. 3. Select TARGET ID NUMBER. 4. Press the EDIT soft key. 5. Select ON or OFF as appropriate. 6. Press the ENTER soft key. 7. Press the [MENU] key to close the menu.](https://usermanual.wiki/Furuno-USA/9ZWRTR060/User-Guide-228449-Page-71.png)
![2. RADAR OPERATION 2-382.26.4 Terminating tracking of ARP targets When ten targets have been acquired, no more acquisition occurs unless targets are cancelled. If you need to acquire additional targets, you must first cancel one or more individual targets, or all targets, using one of the procedures below. Terminating tracking of selected targets 1. Place the cursor on the target to terminate tracking. 2. Press the [CLEAR] key to terminate tracking and erase the target. Terminating tracking of all targets 1. Press the [MENU] key followed by the ARP SETUP soft key. 2. Select CANCEL ALL TARGETS. 3. Press the EDIT soft key. CANCEL ALL TARGETS▲▼YESNO Cancel all targets window 4. Select YES. 5. Press the ENTER soft key. 6. Press the RETURN soft key followed by the [MENU] key to close the menu.](https://usermanual.wiki/Furuno-USA/9ZWRTR060/User-Guide-228449-Page-72.png)
![2. RADAR OPERATION 2-392.26.5 Setting vector attributes (ARP) What is a vector? A vector is a line extending from a tracked target which shows estimated speed and course of the target. The vector tip shows an estimated position of the target after the selected vector time elapses. It can be useful to extend the vector length (time) in order to evaluate the risk of collision with any target. Vector Vector Vector reference, vector time You may reference the vectors to North (True, requires heading and speed data) or ship’s heading (relative) as desired. Vector time can be set to 30 seconds, 1, 3, 6, 15 or 30 minutes. 1. Press the [MENU] key followed by the ARP SETUP soft key to show the ARP SETUP menu. 2. Operate the trackball to select ARP VECTOR MODE. 3. Press the EDIT soft key to show the ARP vector mode window. ARP VECTOR MODERELATIVETRUE ARP vector mode window 4. Select TRUE or RELATIVE as appropriate. 5. Press the ENTER soft key. 6. Select ARP VECTOR TIME, then press the EDIT soft key to show the ARP vector time window. ▲▼30 seconds1 minute3 minutes6 minutes15 minutes30 minutesARP VECTOR TIME ARP vector time window 7. Operate the trackball to select vector time among 30 sec, 1 min, 3 min, 6 min, 15 min and 30 min. 8. Press the ENTER soft key. 9. Press the [MENU] key to close the menu.](https://usermanual.wiki/Furuno-USA/9ZWRTR060/User-Guide-228449-Page-73.png)
![2. RADAR OPERATION 2-402.26.6 Displaying past position (ARP) This ARP can display time-spaced dots (maximum ten dots) marking the past positions of any targets being tracked. You can evaluate a target’s actions by the spacing between dots. Below are examples of dot spacing and target movement. (a) Ship turning (b) Ship running straight(c) Ship reduced speed(d) Ship increased speed Past position displays To turn the past position display on or off: 1. Press the [MENU] key followed by the ARP SETUP soft key. 2. Operate the trackball to select HISTORY INTERVAL. 3. Press the EDIT soft key to show the history interval window. HISTORY INTERVAL▲▼OFF30 seconds1 minute3 minutes6 minutes History interval window 4. Operate the trackball to select history interval among 30 sec, 1 min, 3 min and 6 min, or select OFF to turn off the past position display. 5. Press the ENTER soft key. 6. Press the [MENU] key to close the menu.](https://usermanual.wiki/Furuno-USA/9ZWRTR060/User-Guide-228449-Page-74.png)
![2. RADAR OPERATION 2-412.26.7 ARP, TTM target data You can show motion trends (range, bearing, course, speed, CPA and TCPA) for ARP or TTM targets. Note that TARGET ID NUMBER, in the ARP SETUP menu, must be turned on to display this data. 1. Place the cursor on the target whose data you want to see. 2. If not already displayed, press the [HIDE/SHOW] key to show the radar soft keys. 3. Press the TARGET and TARGET INFO soft keys. The data of the selected target appears at the bottom left-hand corner of the display. (If an EBL/VRM data box is displayed the ARP (TTM) data box will be under it.) 4. Press the RETURN soft key to finish. 5. To erase ARP/TTM target data, select the corresponding target with the cursor, then press the [CLEAR] key. TARGETTRAILTLLOUTPUTTARGET INFORETURN359.9 ˚R 11.70nm+No.01 VECTOR TRUE 15minCSE 359.9˚T SPD 12.5ktCPA 2.21nm TCPA 12:35ARPTargetCPA and TCPACourse and SpeedTarget No., Vector Reference (True), Vector TimeCursor01ACQ12/ H-UP 3nmLP319. 9°T ARP target data](https://usermanual.wiki/Furuno-USA/9ZWRTR060/User-Guide-228449-Page-75.png)
![2. RADAR OPERATION 2-422.26.8 CPA/TCPA alarm (ARP) When the predicted CPA of any target becomes smaller than a preset CPA alarm range or its predicted TCPA less than a preset TCPA alarm limit, an audio alarm sounds and the speaker icon appears (in red). In addition, the target plot symbol of the offending target changes to a triangle and flashes together with its vector. You may silence the audio alarm with the [CLEAR] key. Press the [ALARM] key and the message “COLLISION ALARM” appears. Press the CLEAR ALARM soft key to acknowledge the alarm. The flashing of the triangle plot symbol continues until you intentionally terminate tracking of the target. The ARP continuously monitors the predicted range at the Closest Point of Approach (CPA) and predicted time to CPA (TCPA) of each track to own ship. This feature helps alert you to targets which may be on a collision course with own ship. However, it is important that gain, A/C SEA, A/C RAIN and other radar controls are properly adjusted and the ARP is set up so that it can track targets effectively. CPA/TCPA alarm ranges must be set up properly taking into consideration the size, tonnage, speed, turning performance and other characteristics of own ship. CAUTIONThe CPA/TCPA alarm should never berelied upon as the sole means for detect-ing the risk of collision. The navigator isnot relieved of the responsibility to keepvisual lookout for avoiding collisions,whether or not the radar or other plottingaid is in use. Follow the steps shown below to set the CPA/TCPA alarm range: 1. Press the [MENU] key followed by the ARP SETUP soft key. 2. Operate the trackball to select CPA. 3. Press the EDIT soft key to show the CPA window. CPA▲▼OFF0.5nm1nm2nm3nm5nm6nm CPA window 4. Select a CPA limit desired from 0.5 nm, 1 nm, 2 nm, 3 nm, 5 nm and 6 nm with the trackball. 5. Press the ENTER soft key. The ARP SETUP menu reappears. 6. Operate the trackball to select TCPA. 7. Press the EDIT soft key to show the TCPA window.](https://usermanual.wiki/Furuno-USA/9ZWRTR060/User-Guide-228449-Page-76.png)
![2. RADAR OPERATION 2-43 TCPA▲▼30 seconds1 minute2 minutes3 minutes4 minutes5 minutes6 minutes12 minutes TCPA window 8. Select a TCPA limit from 30 sec, 1 min, 2 min, 3 min, 4 min, 5 min, 6 min and 12 min. 9. Press the ENTER soft key. 10. Press the [MENU] key to close the menu. 2.26.9 Lost target alarm (ARP) When the system detects a lost target, the target symbol becomes a diamond and tracking is discontinued after one minute. 01 Lost target mark Canceling a lost target 1. Place the cursor on the target. 2. Press the [CLEAR] key.](https://usermanual.wiki/Furuno-USA/9ZWRTR060/User-Guide-228449-Page-77.png)
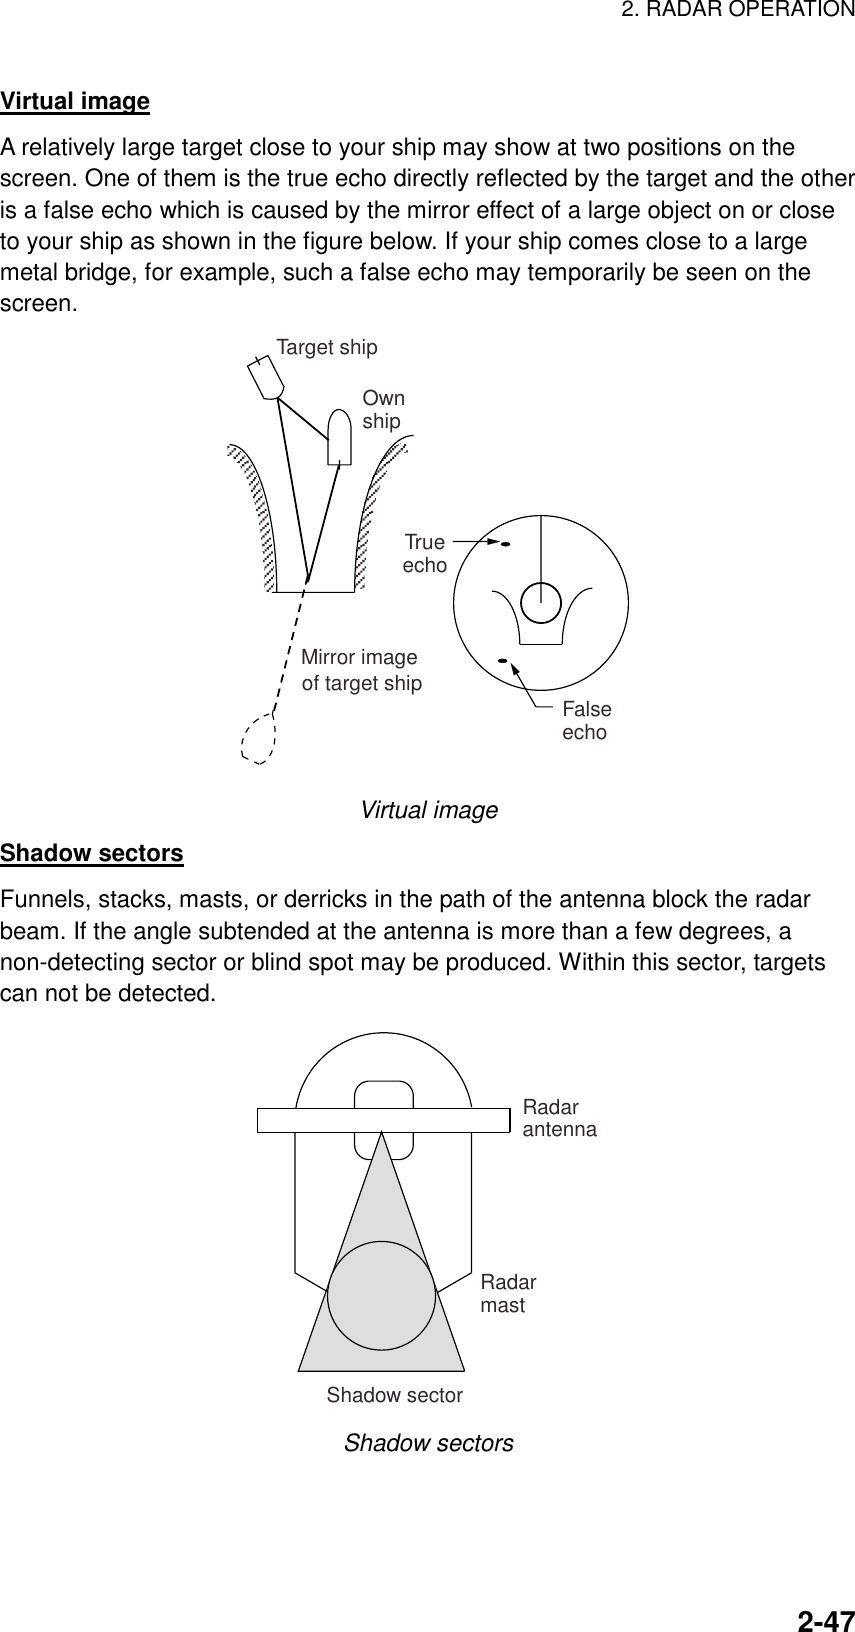
![2. RADAR OPERATION 2-462.27.2 False echoes Occasionally echo signals appear on the screen at positions where there is no target or disappear even if there are targets. False target situations may be recognized, however, if you understand why they are displayed. Typical false echoes are shown below. Multiple echoes Multiple echoes occur when a transmitted pulse returns from a solid object like a large ship, bridge, or breakwater. A second, a third or more echoes may be observed on the display at double, triple or other multiples of the actual range of the target as shown below. Multiple reflection echoes can be reduced and often removed by decreasing the gain (sensitivity) or properly adjusting the [A/C SEA] control. Own shipTargetTrueechoMultiple echo Multiple echoes Sidelobe echoes Every time the radar pulse is transmitted, some radiation escapes on each side of the beam. This stray RF is called a “sidelobe.” If a target exists where it can be detected by the sidelobes as well as the main lobe, the side echoes may be represented on both sides of the true echo at the same range. Sidelobes show usually only on short ranges and from strong targets. They can be reduced through careful reduction of the gain or proper adjustment of the A/C SEA control. Target B(True)Target B(Spurious)Target A Sidelobe echoes](https://usermanual.wiki/Furuno-USA/9ZWRTR060/User-Guide-228449-Page-80.png)
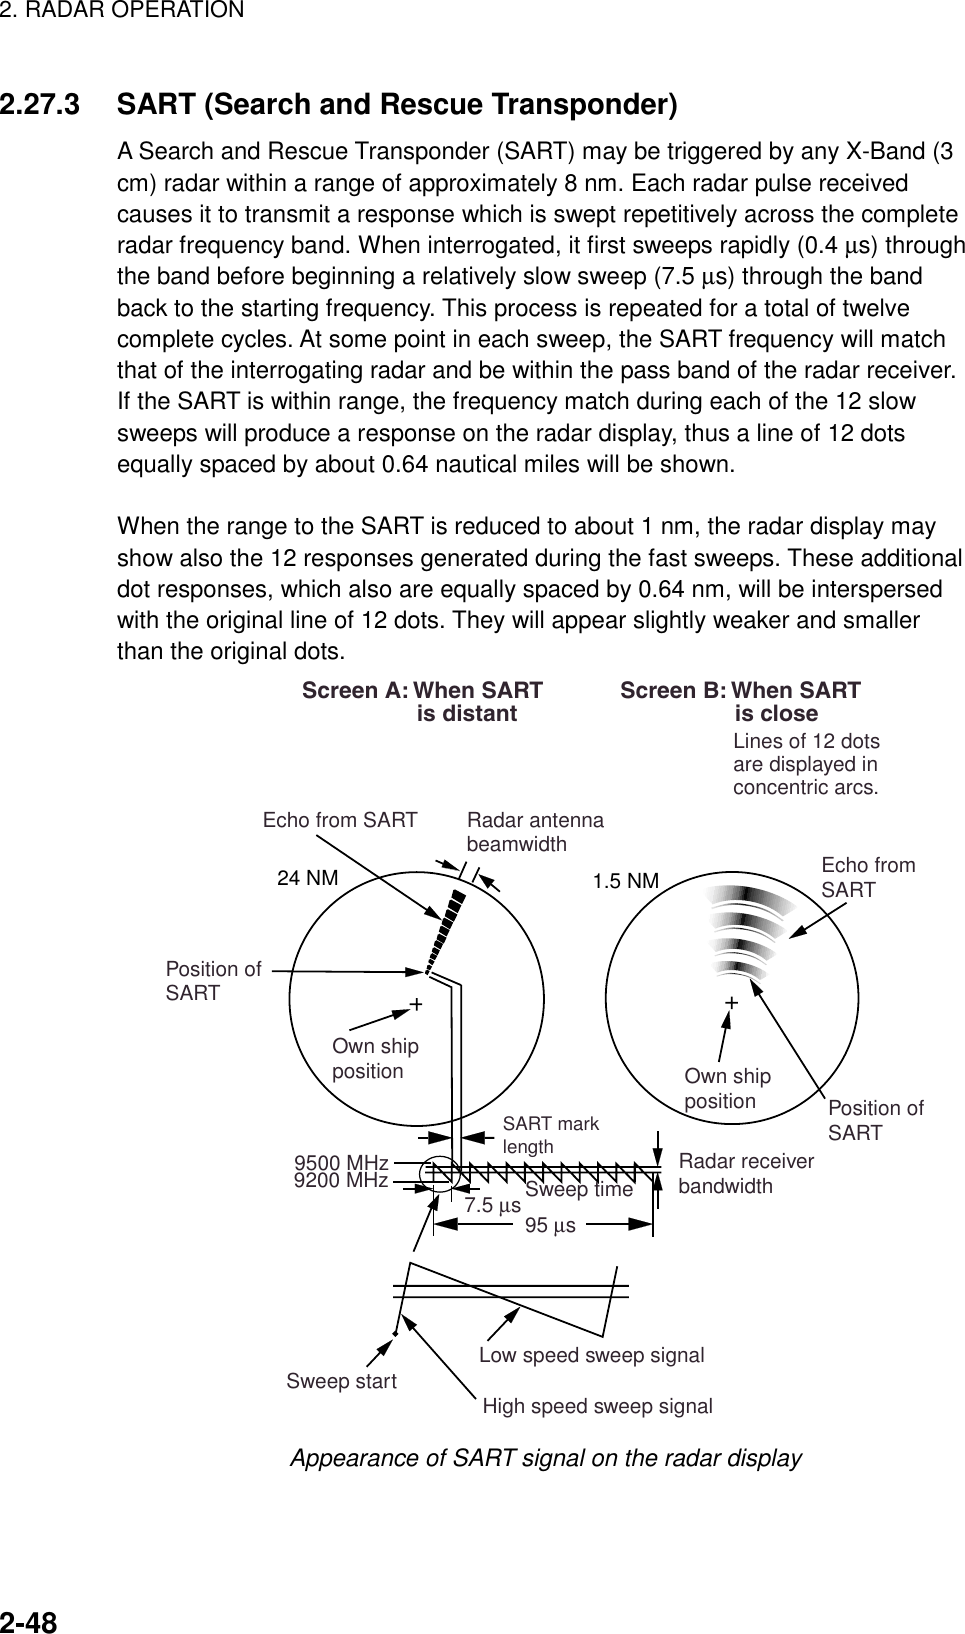
![2. RADAR OPERATION 2-49General procedure for detecting SART response 1. Use the range scale of 6 or 12 nm as the spacing between the SART responses is about 0.6 nm (1125 m) to distinguish the SART. 2. Turn off the automatic clutter suppression (if applicable). 3. Turn off the Interference Rejector. General remarks on receiving SART SART range errors When responses from only the 12 low frequency sweeps are visible (when the SART is at a range greater than about 1 nm), the position at which the first dot is displayed may be as much as 0.64 nm beyond the true position of the SART. When the range closes so that the fast sweep responses are seen also, the first of these will be no more than 150 meters beyond the true position. Radar bandwidth This is normally matched to the radar pulselength and is usually switched with the range scale and the associated pulselength. Narrow bandwidths of 3-5 MHz are used with long pulses on long range and wide bandwidths of 10-25 MHz with short pulses on short ranges. Any radar bandwidth of less than 5 MHz will attenuate the SART signal slightly, so it is preferable to use a medium bandwidth to ensure optimum detection of the SART. Radar sidelobes As the SART is approached, sidelobes from the radar antenna may show the SART responses as a series of arcs or concentric rings. These can be removed by the use of the [A/C SEA] control although it may be operationally useful to observe the sidelobes as they may be easier to detect in clutter conditions and also they will confirm that the SART is near to the ship. Gain For maximum range SART detection the normal gain setting for long range detection should be used, that is, with background noise speckle visible.](https://usermanual.wiki/Furuno-USA/9ZWRTR060/User-Guide-228449-Page-83.png)