Japan Radio NJJ-200 Handy Search User Manual NJJ 95A
Japan Radio Co Ltd. Handy Search NJJ 95A
UserManual.wiki
>
Japan Radio
>
NJJ-200 User Manual
>
Users Manual 2
Contents
1.
Users Manual 1
2.
Users Manual 2
3.
Users Manual 3
4.
Instruction of testing sample
Users Manual 2
Navigation menu
Upload a User Manual
Namespaces
Wiki Guide
HTML
PDF
Info
Views
User Manual
Discussion / Help
Navigation
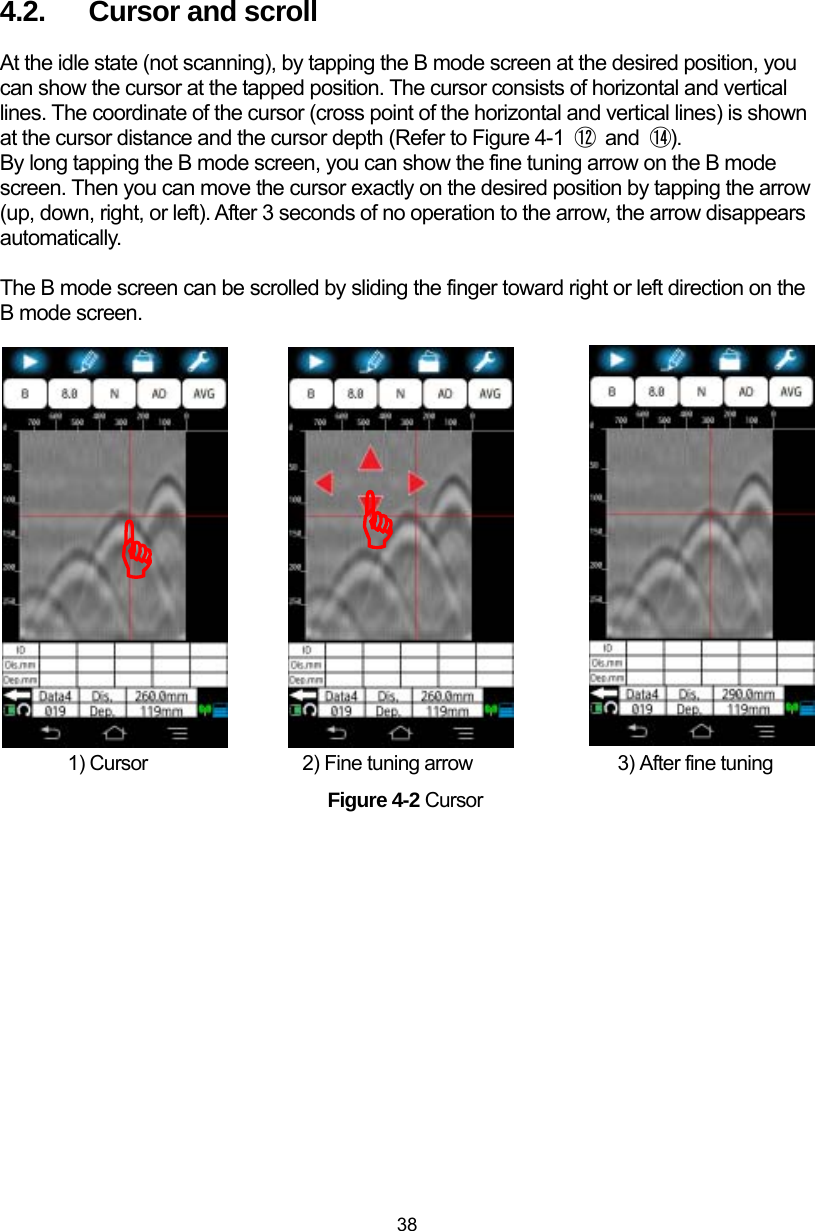
![35 4. NJJ-200 application functions Here is a screen-by-screen description of all functions of NJJ-200 application. 4.1. Main screen Figure 4-1 shows the name of each part which appears on the main screen of NJJ-2000 application. Figure 4-1 Main screen of NJJ-200 application ①[Start] icon ②[Mark] icon ③[File/Print] icon ④[Parameter] icon ⑤[Image processing] icon ⑥[Sensitivity] icon ⑦[View range] icon ⑧[Relative permittivity] icon⑨[Display mode] icon ⑩Marker list ⑪Folder ⑫Cursor distance ⑬Sensor unit battery capacity ⑭Cursor depth ⑮Data number ⑯Distance scale ⑰Depth scale ⑱Smartphone battery capacity](https://usermanual.wiki/Japan-Radio/NJJ-200.Users-Manual-2/User-Guide-2182937-Page-1.png)
![36 Table 4-1 Functions of the main screen (1/2) Ref# Name Function① [Start] icon Tapping this icon start or stop the scan. ② [Mark] icon By tapping this icon, you can place an antenna mark or a marker on the main screen. For this detail, refer to Section 4.3 [Mark] icon. Also by long tapping this icon you can access to the marker operation screen. For this detail, refer to Section 4.13 Marker operation. ③ [File/Print] icon By tapping this icon, you can save the scan result into a file or to print out the scan result to the external printer. For this detail, refer to Section 4.4 [File/Print] icon. Also by long tapping this icon you can access to the external output setup screen. For this detail, refer to Section 5 External output. ④ [Parameter] icon By tapping this icon, you can set the color and unit displayed on the main screen. For this details, refer to Section 4.5 [Parameter] icon. Also by long tapping this icon, you can access the parameter setup screen. For this details, refer to Section 4.11 Parameter setup. ⑤ [Image Processing] icon Shows the current setting of the image processing. By tapping this icon, you can access the image processing screen. For this detail, refer to Section 4.10 [Image processing] icon. For the the image processing used during the scan, refer to Section 4.11.4 Device setting: [Image processing] menu. ⑥ [Sensitivity] icon Shows the current setting of the sensitivity. By tapping this icon, you can set the sensitivity. For this detail, refer to 4.9 [Sensitivity] icon. For the sensitivity used during the san, refer to Section 4.11.2 Device setting: [Sensitivity] menu. ⑦ [View range] icon Show the current setting of the view range. By tapping this icon, you can set the view range. For this detail, refer to Section 4.8 [View range] icon. For the view range used during the scan, refer to Section 4.11.3 Device setting: [View range] menu. ⑧ [Relative permittivity] icon Shows the current setting of the relative permittivity. By tapping this icon, you can set the relative permittivity. For this detail, refer to Section 4.7 [Relative permittivity] icon. For the relative permittivity used during the scan, refer to Section 4.11.1 Device setting: [Relative permittivity] menu. ⑨ [Display mode] icon Shows the current setting of the display mode. By tapping this icon, you can set the display mode. For this detail, refer to Section 4.6 [Display mode] icon.](https://usermanual.wiki/Japan-Radio/NJJ-200.Users-Manual-2/User-Guide-2182937-Page-2.png)
![37 Table 4-1 Functions of Main screen (2/2) Ref# Name Function ⑩ Maker list Shows the coordinate of each registered marker. For this detail, refer to Section 4.3.3 Marker list. ⑪ Folder Shows the current setting of the folder. The file operation (saving and recalling) are performed for the file under the selected folder. For this detail, refer to Section 4.12.3 [Select Folder] menu. ⑫ Cursor distance Shows the distance coordinate of the cursor. ⑬ Sensor unit battery capacity Shows the remained capacity of the sensor unit’s battery roughly. ⑭ Cursor depth Shows the depth coordinate of the cursor. ⑮ Data number Shows the current setting of the data number. The scan result is saved into the file whose name is decided by the data number. For this detail, refer to Section 4.12.4 [Data number setting] menu. ⑯ Distance scale Is the moving distance scale. Antenna markers and the line marker of the image processing are shown on this scale. ⑰ Depth scale Is the depth scale. This scale changes in accordance with the depth calibration (relative permittivity setting). For the depth calibration, refer to Sections 4.7 [Relative permittivity] icon and 4.11.1 Device setting: [Relative permittivity] menu. ⑱ Smartphone battery capacity Shows the remained capacity of Smartphone’s battery roughly.](https://usermanual.wiki/Japan-Radio/NJJ-200.Users-Manual-2/User-Guide-2182937-Page-3.png)
![39 4.3. [Mark] icon At the idle state (not scanning), by tapping [Mark] icon (refer to Figure 4-1 ②), you can add or delete a marker at the cursor position (cross point of the cursor’s horizontal and vertical lines). Added markers can be grouped into three marker groups. You can register maximum 99 markers in one marker group. For the procedure to set the marker group, refer to Section 4.13.6 [Marker group setting] menu. 4.3.1. Marker addition You can add a marker with the following procedure. (1) Tap a position on the B mode screen nearby the position where you want to place a marker. Then the cursor appears at the tapped position. (2) Long tap B mode screen anywhere to show fine tuning arrow. Then move the cursor at the desired position on the B mode screen by tapping the fine tuning arrow. (3) Tap [Mark] icon. Then you can place a marker at the desired position (cursor position). 1)Tap B mode screen 2)Long tap B mode screen 3)Tap [Mark] icon Figure 4-3 Marker addition )))](https://usermanual.wiki/Japan-Radio/NJJ-200.Users-Manual-2/User-Guide-2182937-Page-5.png)
![40 4.3.2. Marker deletion You can delete the selected marker by the following procedure. (1) Tap the marker to be deleted on the B mode screen or in the marker list. Then the cursor appears on the tapped marker. Then tap [Mark] icon. (2) A message “Group:x IDx Marker delete? “ [Cancel] [OK] appears. Tap [OK] to delete the selected marker. To cancel the marker deletion, tap [Cancel]. Then the message disappears automatically, and the screen returns to the main screen. 1)Tap the marker to be deleted 2)Tap [OK] 3)After deleting the marker Figure 4-4 Marker deletion ))))](https://usermanual.wiki/Japan-Radio/NJJ-200.Users-Manual-2/User-Guide-2182937-Page-6.png)
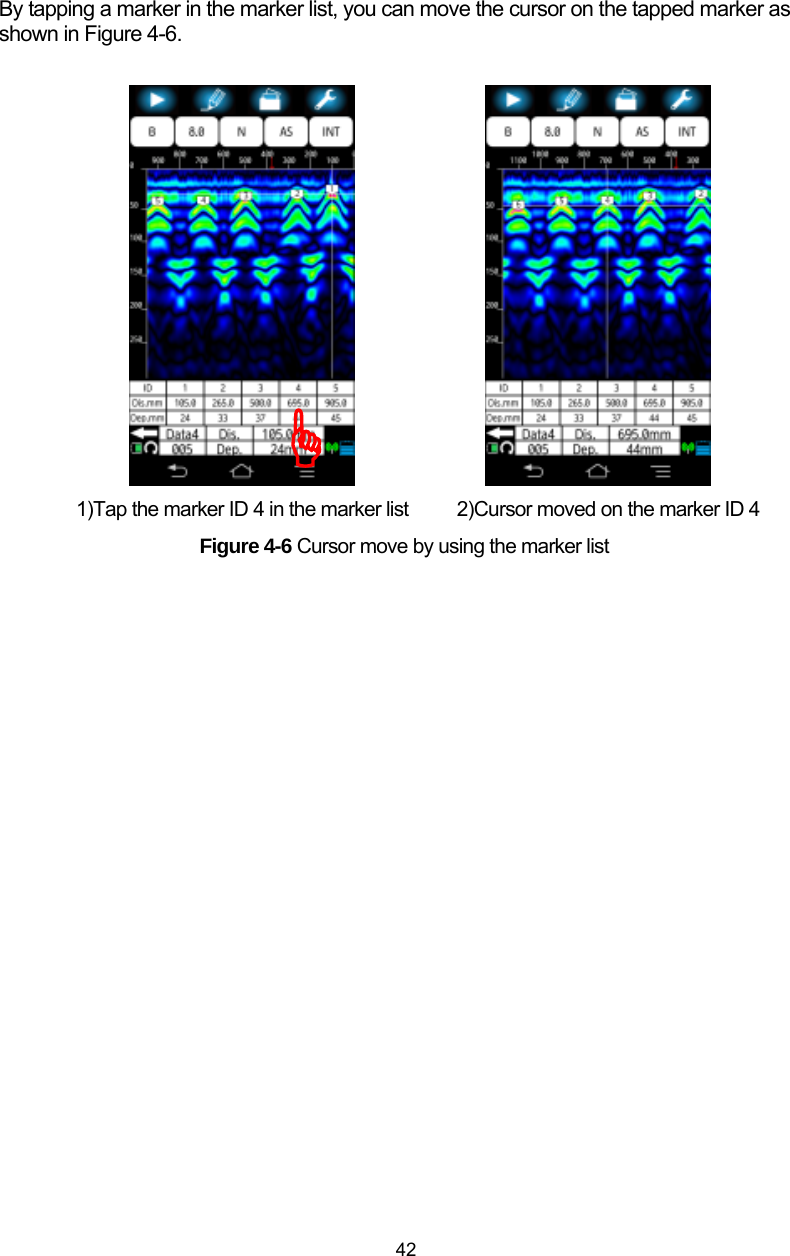
![41 4.3.3. Marker list You can show the marker list below B mode screen which displays the marker ID number, distance coordinate, and depth coordinate of all added markers. The mark list can be hidden. For the detail, refer to Section 4.13.2 [Show marker list] menu. For the unit of the distance and depth coordinate, refer to Section 4.5.2 [Unit] menu. The marker list displays 5 markers in one screen. You can scroll the marker list as shown in Figure 4-5 Marker list scroll. 1)Scroll right hand side 2)Marker list displayed from ID5 Figure 4-5 Marker list scroll )](https://usermanual.wiki/Japan-Radio/NJJ-200.Users-Manual-2/User-Guide-2182937-Page-7.png)
![43 4.4. [File/Print] icon By tapping [File/Print] icon, you can output the scan result to the file or the external printer in accordance with the output destination setting. The icon shape of [File/Print] icon indicates the current output destination setting: Folder symbol (Figure 4-7 1)) shows the destination being set to the file (binary or ASCII) and Printer symbol (Figure 4-7 2)) shows the destination being set to the printer. For the detail to set the output destination, refer to Section 5 External output. The factory setting (initialized by [Initial setting] menu. Refer to 4.11.21 Other: [Initial setting] menu) of the output destination is set to the file of binary under the folder “data 1” in Smartphone memory card. 1) Folder symbol 2)Printer symbol Figure 4-7 [File/Print] icon indication ))](https://usermanual.wiki/Japan-Radio/NJJ-200.Users-Manual-2/User-Guide-2182937-Page-9.png)
![44 4.5. [Parameter] icon By tapping [Parameter] icon at the idle state (not scanning), you can change the display color and unit settings of B mode screen. (The setting made by this icon is valid only for the scan result image displayed at the idle state. After starting a new scan, the setting for the measurement called as the device setting are restored. For the setting as the device setting, refer to Sections 4.11.5 Device setting: [Color] menu and 4.11.7 Device setting: [Unit] menu.) This section describes the procedure to set color and unit by using [Parameter] icon at the idle state. 4.5.1. [Color] menu [Color] menu allows you to set the color and gradation of the scan image on the main screen. You can set the color and gradation with the following procedure. (1) Tap [Parameter] icon at the main screen, then the display setup screen appears. (2) Tap [Color] menu, then the color setup screen appears. The mark ● shows the current setting. (3) Tap a desired color. Then confirm the mark ● attached to the selected setting. (4) Tap [OK] to return to the main screen. To cancel the setting change, tap [Cancel], then you can return to the main screen without the setting change. 1) Tap [Parameter] icon. 2) Display setup screen 3) Color setup screen Figure 4-8 Display color setting (1/2) )))](https://usermanual.wiki/Japan-Radio/NJJ-200.Users-Manual-2/User-Guide-2182937-Page-10.png)
![45 4) Tap [OK]. 5) Main screen after the color setup. Figure 4-8 Display color setting (2/2) )](https://usermanual.wiki/Japan-Radio/NJJ-200.Users-Manual-2/User-Guide-2182937-Page-11.png)
![46 4.5.2. [Unit] menu [Unit] menu allows you to set the unit of both depth and distance scales on the main result. You can set the unit with the following procedure. (1) Tap [Parameter] icon at the main screen, then the display setup screen appears. (2) Tap [Unit] menu, then the unit setup screen appears. The mark ● shows the current setting. (3) Tap a desired unit for distance and depth scales, respectively. Then confirm the mark ● attached to the selected setting. (4) Tap [OK] to return to the main screen. To cancel the setting change, tap [Cancel], then you can return to the main screen without the setting change. 1) Parameter icon 2) Display setup screen 3) Unit setup screen Figure 4-9 Unit setting (1/2) ))))](https://usermanual.wiki/Japan-Radio/NJJ-200.Users-Manual-2/User-Guide-2182937-Page-12.png)
![47 4) Tap [OK]. 5) Main screen after the unit setup Figure 4-9 Unit setting (2/2) )](https://usermanual.wiki/Japan-Radio/NJJ-200.Users-Manual-2/User-Guide-2182937-Page-13.png)
![48 4.6. [Display mode] icon At the idle state (not scanning), you can switch the display mode by tapping [Display mode] icon. This product supports two display modes. One is B-mode which displays only the vertical cross section. The other is BA-mode which displays both the vertical cross section and the reflected waveform. The current setting is shown on the label of the icon. When B-mode is selected, the label is displayed as shown in Figure 4-10 1). To change the display mode, tap [Display mode] icon. Then the display mode can be changed between BA mode and B-mode. A mode waveform shown in BA mode shows the received signal waveform (reflected from the object) at the B-mode cursor position. 1) B mode 2) BA mode Figure 4-10 Display mode setting y You can change the display mode between BA-mode and B-mode after the scan. The scan result scanned in B-mode can be displayed in BA-mode and vice versa by switching the display mode after the scan. Note ))](https://usermanual.wiki/Japan-Radio/NJJ-200.Users-Manual-2/User-Guide-2182937-Page-14.png)
![49 4.7. [Relative permittivity] icon [Relative permittivity] icon allows you to set the relative permittivity (dielectric constant) of the scanned concrete for the scan result at the idle state and to perform the depth calibration. (The setting made by this icon is valid only for the scan result image displayed at the idle state. After starting a new scan, the setting for the measurement is restored to the original device setting. For more details on device setting, refer to Section 4.11.1 Device setting: [Relative permittivity] menu.) The available range of the relative permittivity is from 2.0 to 20.0. (Refer to Section 4.7.1 Relative permittivity.) The current setting is shown on the label of the icon. Figure 4-11 shows the example of the icon label of the relative permittivity setting 8.0. You can set the relative permittivity with the following procedure. (1) Tap [Relative permittivity] icon. The relative permittivity setup screen appears (Figure 4-11) which shows the current setting. (2) Tap the current setting (8.0 in Figure 4-11), then a list of available values appears. (3) Scroll the list, tap the desired value, and confirm the selected value shown as current setting. (4) Tap [OK] to return to the main screen. To cancel the setting change, tap [Cancel], then you can return to the main screen without the setting change. To reflect the selected value to the setting as the device setting, tap [□ Applies to the measurement] in the relative permittivity setup screen, then confirm that 9is attached in [□]. Then tap [OK] to return to the main screen. 1) Tap [Relative permittivity] icon 2) Relative permittivity setup screen Figure 4-11 Relative permittivity setup screen ))](https://usermanual.wiki/Japan-Radio/NJJ-200.Users-Manual-2/User-Guide-2182937-Page-15.png)
![50 4.7.1. Relative permittivity and depth calibration The relative permittivity is an object-specific coefficient showing the relationship between the electromagnetic propagation speed in the air and scanned medium. This product measures the time between the time of transmitting the signal and the time receiving the signal reflected at the embedded object, then calculates the depth of the embedded object by using the measured time and electromagnetic propagation speed determined by the relative permittivity of the scanned medium Depending upon the relative permittivity entered, this product can correct the depth scale on the scan screen. Therefore setting the appropriate value to the relative permittivity is the key factor to get the accurate depth of the detected object. For the theory of operation, refer to 8 Theory. Depth calibration is performed by estimating the relative permittivity of the scanned concrete and setting the value to the relative permitivity. When the relative permittivity of the scanned concrete is known, enter the known value to the relative permittivity. For the setting procedure, refer to Sections 4.7 [Relative permittivity] icon and 4.11.1 Device setting: [Relative permittivity] menu. To reduce depth error when the relative permittivity of the scanned concrete is unknown, perform the depth calibration before the scanning with the following procedure. (1) Scan the object whose actual depth is known (Ex. the rebar with a known depth or a wall with the known width) and detect the depth of the object. (2) Adjust the relative permittivity value so that the depth displayed in the scan result matches with the known depth. When the object with a known depth is not avaialble and the relative dielectric constant of the concrete is unclear, it is recommended to set 8.0 (+0) as the relative permittivity. y The relative permittivity depends on the condition (such as moisture content) of the concrete being scanned. Therefore the more difference between the actual relative dielectric constant of the concrete and the entered value, the more the depth error. Set an appropriate value to this parameter to get the accurate depth. Note](https://usermanual.wiki/Japan-Radio/NJJ-200.Users-Manual-2/User-Guide-2182937-Page-16.png)
![51 4.8. [View range] icon [View range] icon allows you to change the view range for the scan result displayed at the idle state. (The setting made by this icon is valid only for the scan result image displayed at the idle state. After starting a new scan, the setting for the measurement is restored to the original device setting. For the setting as the devie setting, refer to Section 4.11.3 Device setting: [View range] menu.) The view range specifies the displayed range of depth and distance in B mode screen. Select the adequate range matched with the depth of the scan target as follows. The available settings are Shallow, Normal, Deep, Shallow Wide, Normal Wide, and Deep Wide. Depth of the scan target 30 cm or less: Deep or Deep Wide Depth of the scan target20 cm or less: Normal or Normal Wide Depth of the scan target10cm or less: Shallow or Sallow Wide The current setting is shown on the label of the icon. Figure 4-12 shows the label of the icon displayed for the current setting: N (Normal). You can set the view range with the following procedure. (1) Tap [View range] icon, then the view range setup screen shown in Figure 4-12 appears. The mark ● shows the current setting. (2) Tap the desired setting, and confirm the mark ● attached to the selected setting. (3) Tap [OK] to return to the main screen. To cancel the setting change, tap [Cancel], then you can return to the main screen without the setting change. 1) Tap [View range] icon 2) View range setup screen Figure 4-12 View range setting ))](https://usermanual.wiki/Japan-Radio/NJJ-200.Users-Manual-2/User-Guide-2182937-Page-17.png)
![52 4.9. [Sensitivity] icon [Sensitivity] icon allows you to change the sensitivity (display gain) of the received wave for the scan result image displayed at the idle state. (The setting made by this icon is valid only for the scan result dispayed at the idle state. After starting a new scan, the setting for the measurement is restored to the original device setting. For the setting as the device setting, refer to Section 4.11.2 Device setting: [Sensitivity] menu.) The available settings are -2S (-2, shallow), -1S (-1, shallow), AS (A, shallow), +1S (+1, shallow), +1S (+1, shallow ), +2S (+2, shallow), -2D (-2, deep), -1D (-1, deep), AD (A, deep), +1D ( +1, deep), +2D (+2, deep). The current setting is shown on the label of the icon. Figure 4-13shows the label of the icon displayed for the current setting: AS . You can set the sensitivity with the following procedure. Tap [Sensitivity] icon, then the sensitivity setup screen shown in Figure 4-13 (1) Figure 4-13 appears. The mark ● shows the current setting. (2) Tap the desired setting, and confirm the mark ● attached to the selected setting. (3) Tap [OK] to return to the main screen. To cancel the setting change, tap [Cancel], then you can return to the main screen without the setting change. 1) Tap [Sensitivity] icon 2) Sensitivity setup screen Figure 4-13 Sensitivity setup screen ))](https://usermanual.wiki/Japan-Radio/NJJ-200.Users-Manual-2/User-Guide-2182937-Page-18.png)
![53 4.9.1. Sensitivity The first letter A of the setting name AS indicates the overall sensitivity, and the second letter S (Shallow) indicates the sensitivity by the depth. The overall sensitivity consists of five levels: -2 , -1 , A , +1 , +2 . The A setting is the middle of all overall sensitivity settings and is used normally. Use the +side (+1 and +2) to increase the sensitivity and the –side (-2 and -1) to reduce the sensitivity. The sensitivity by the depth consists of two levels: S (shallow) and D (deep). Select shallow when scanning the object at a depth less than 10 cm and deep when scannning the object at a depth of 10 cm or more. The setting AS (A Shallow) is appropriate for scanning the steel bar at the depth less than 10 cm in the normal concrete. The initial sensitivity setting (default) at the factory shipment is AS (A Shallow). y The setting made by [Sensitivity] icon is valid only for the scan result displayed at the idlestate. After starting a new scan, the setting for the measurement is restored to the original device setting.. For the setting as the device setting, refer to Section 4.11.2 Device setting: [Sensitivity] menu. y When NJJ-200 application boots up, the sensitivity setting is set to the same as the settings of the device setting. Note](https://usermanual.wiki/Japan-Radio/NJJ-200.Users-Manual-2/User-Guide-2182937-Page-19.png)
![54 4.10. [Image processing] icon [Image processing] allows you to set the image processing for the scan result displayed at the idle state. (The setting made by this icon is valid only for the scan result dispayed at the idle state. After starting a new scan, the setting for the measurement is restored to the original device setting.. For the setting as the devie setting, refer to Section 4.11.4 Device setting: [Image processing] menu.) For the available image processing, refer to Section 4.10[Image processing] icon. The current setting is shown on the label of the icon. Figure Figure 4-14 shows the label of the icon displayed for the current setting: Fixed Surface Wave Image Processing. You can set the image processing with the following procedure. Tap [Image processing] icon, then the image processing setup screen shown in Figure 4-14 (1) Figure 4-14appears. The mark ● shows the current setting. (2) Tap the desired setting, and confirm the mark ● attached to the selected setting. (3) Tap [OK] to return to the main screen. To cancel the setting change, tap [Cancel], then you can return to the main screen without the setting change. For the details of the image processing, refer to Sections 4.10.1 to 4.10.8. 1) Tap [Image processing] icon 2) Image processing setup screen Figure 4-14 Image processing setup screen ))](https://usermanual.wiki/Japan-Radio/NJJ-200.Users-Manual-2/User-Guide-2182937-Page-20.png)
![55 4.10.1. Image processing The original scan data includes always unnecessary reflected signals (for example, the reflection wave from the concrete surface (surface reflection wave) or reflection wave from the boundary of concrete layers) which is commonly distributed over the scan image. These unnecessary reflection waves make the image decoding difficult. Image processing aims to remove or reduce the unnecessary reflection waves by data processing (subtraction, averaging, and so on) and to provide easy deciphering of objects that are being probed from the scan result. This product supports the image processing listed in Table 4-2. Three image processing can be performed in real time during scanning. The other image processing are applicable to the scan result only at the idle state. Peak processing is applied to the image data obtained by an image processing. Table 4-2 shows which image processing is applicable in real-time during scanning and can be combined with the peak processing. For the image processing applicable at the idle state, refer to Section 4.10 [Image processing] icon. For the image processing applicable in real-time during scanning, refer to Section 4.11.4 Device setting: [Image processing] menu. This section describes the details of each image processing. Table 4-2 Image processing Image processing Applicable in the scan Combination with Peak processing applicable Users Guide (Reference) Fixed surface processing ✔ ✔ 4.10.2 Fixed surface processing User surface processing ✔ ✔ 4.10.3 User surface processing Subtraction processing ✔ 4.10.4 Subtraction Manual surface processing ✔ 4.10.5 Manual surface processing Average processing ✔ 4.10.6 Averaging Peak processing 4.10.7 Peak processing Original image ✔ ✔ 4.10.8 Original image](https://usermanual.wiki/Japan-Radio/NJJ-200.Users-Manual-2/User-Guide-2182937-Page-21.png)
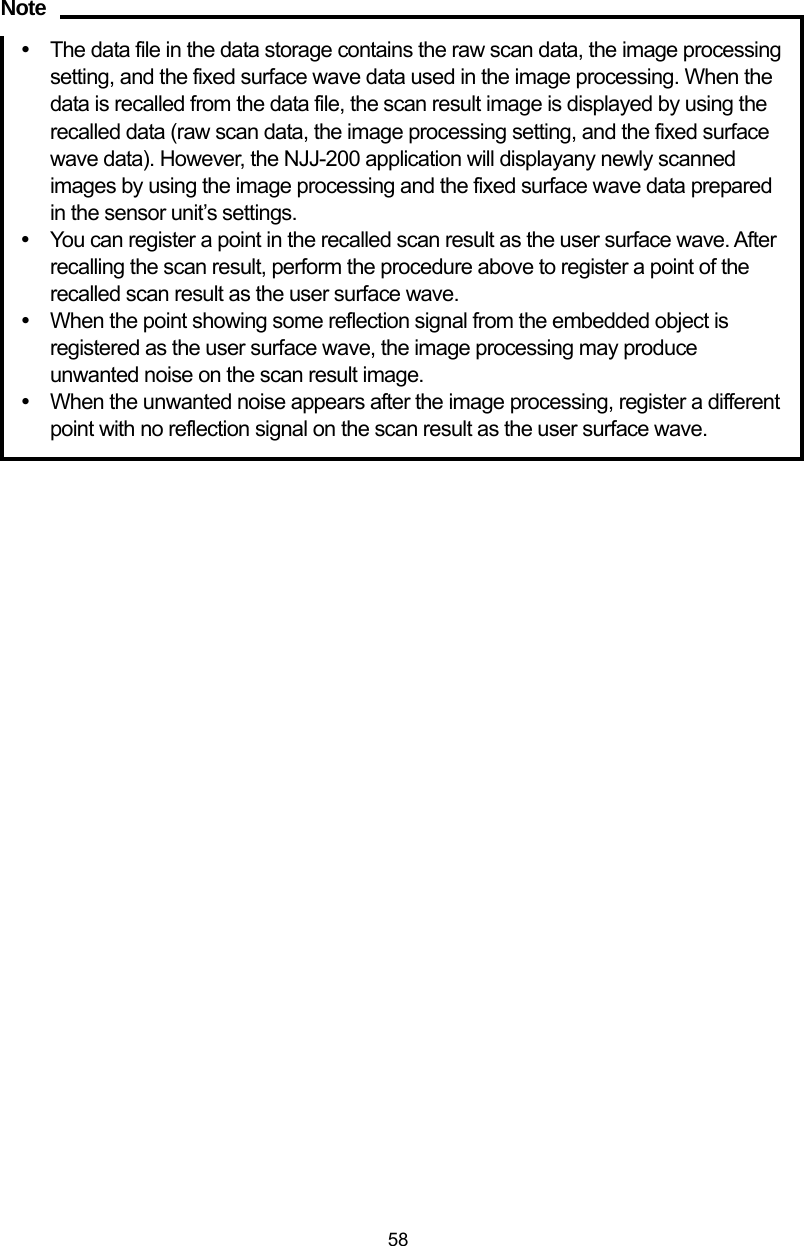
![56 4.10.2. Fixed surface processing This image processing subtracts the predefined data of the typical concrete surface reflection wave from the displayed scan data. Usually it can reduce the concrete surface reflection wave to provide easy image decoding. The predefined data used in this image processing is called the fixed surface reflection wave which is generated at the factory by using typical concrete and is stored in the non-volatile memory of the sensor unit. y The scan result file stored into the data storage contains the raw scan data, the information about the selected image processing, and the fixed surface wave data used for the image processing. When the data is recalled from the file, NJJ-200 application displays the scan image by using the recalled data (raw scan data, the image processing setting, and the fixed surface wave data). After scanning, NJJ-200 application displays the scan image obtained by performing the selected image processing and the fixed surface wave data prepared in the sensor unit. 4.10.3. User surface processing This image processing subtracts the user defined surface reflection wave from the raw scan data. The user defined surface reflection wave is registered by selecting a point in the actual scan data. Then this image processing subtracts the actual reflection wave selected in the scan data, so that it can reduce the affection (noise) of the concrete surface reflection wave more accurately than the fixed surface wave processing. The user surface reflection wave can be defined and registered by the following procedure. (1) Scan the concrete. After the scan completed, the scan result image is displayed on the screen. (2) Move the cursor to the area on the scan result image where you want to do the processing. Make sure not to put the cursor directly on the point with a reflection signal (echo) from any embedded objects. (3) Tap [Image processing] icon. Then the image processing setup screen appears. (4) Tap User surface processing and confirm that the mark ● is attached to the selected setting. Then tap [□Processed at the current cursor.] and confirm that a mark 9is displayed in the [□]. (5) Tap [OK]. Then a message “Are you sure to update the user surface wave data?” [Cancel] [OK] appears. Tap [OK]. (6) A message “Saving user surface wave data completed” appears. Then tap [OK] to return to the main screen. Note](https://usermanual.wiki/Japan-Radio/NJJ-200.Users-Manual-2/User-Guide-2182937-Page-22.png)
![57 Here the registration of a user surface wave data has been completed. The label of [Image processing] icon shows USER as the current setting. 1) Complete a scan 2)Select a position 3) Image processing setup screen 4)Select user surface wave 5) Tap [OK]. 6) Tap [OK]. Image processing Figure 4-15 User surface wave registration )))))](https://usermanual.wiki/Japan-Radio/NJJ-200.Users-Manual-2/User-Guide-2182937-Page-23.png)
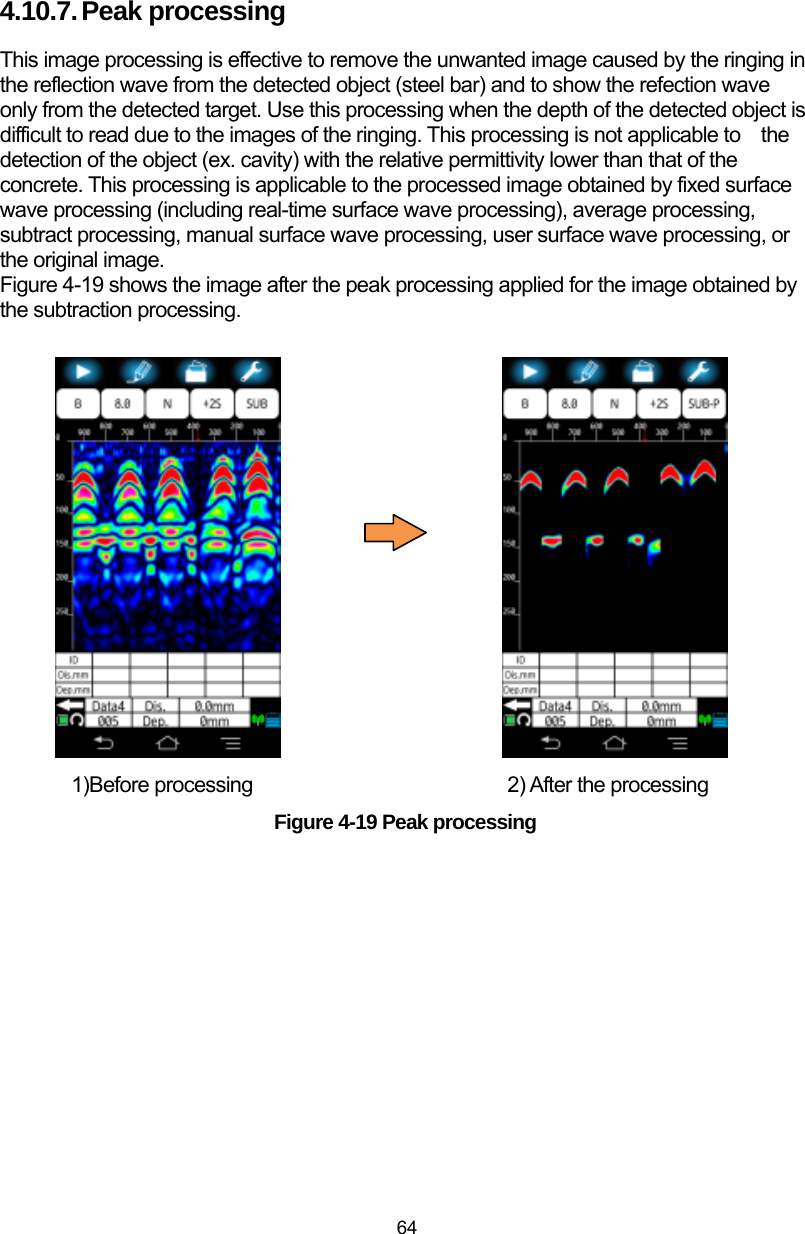
![59 4.10.4. Subtraction This image processing is used to reduce the horizontal band noise of the reflection wave appearing at the depth more than 20 cm as shown Figure 4-16 1). You can use this image processing with the procedure below. (1) Scan the concrete. After the scan completed, the scan image is displayed on the main screen. (2) Move the cursor to the area on the scan result image where you want to do the processing. Make sure not to put the cursor directly on the point with a reflection signal (echo) from any embedded objects. (3) Tap [Image processing] icon. Then the image processing setup screen appears. (4) Tap [Subtraction] and confirm that the mark ● is attached to the selected setting. Then tap [□Processed at the current cursor.] and confirm that the mark 9is displayed in the [□]. (5) Tap [OK] to return to the main screen. Here NJJ-200 application executes the subtraction processing by using the data specified at the step (2) above and shows the image after the processing. (The label of [Image processing] icon shows SUB.) The mark È is shown at the point selected as the subtraction data on the distance scale. 1) Complete a scan 2)Select a position 3) Image processing setup screen Figure 4-16 Subtraction (1/2) ))))](https://usermanual.wiki/Japan-Radio/NJJ-200.Users-Manual-2/User-Guide-2182937-Page-25.png)
![60 4) Tap [OK]. 5) Image after processing Figure 4-16 Subtraction (1/2) y When tapping [OK] without the mark 9 at [□Processed at the current cursor] at the step 4) above, a message “No processing point defined” appears and the processing is canceled. y When re-executing the manual surface wave processing or the subtraction processing (including real-time manual subtraction processing) without the mark 9 at [□Processed at the current cursor], the processing is executed by using the reflection wave data previously registered and shown by the cursor mark È on the distance scale. To change the reflection wave data used for the processing, perform the steps 2) to 4) above. y For the real-time subtraction processing, refer to Section 3.4 Interpreting the scan result. y The processing of the manual surface processing is almost same as that of the subtraction processing. The difference is that the manual surface processing subtracts the surface reflection wave data from the scan result only for the depth range of 0 mm to 200 mm. The subtraction processing subtracts the surface reflection data from the scan result over all depth range. y The subtraction processing may remove the reflection wave from the opposite side of the concrete wall. y For the manual surface processing, refer to Section 4.10.5 Manual surface processing. y When the registered surface reflection wave contains some signal reflected from the embedded object, the processing may produce the unwanted noise. Note )](https://usermanual.wiki/Japan-Radio/NJJ-200.Users-Manual-2/User-Guide-2182937-Page-26.png)
![61 4.10.5. Manual surface processing This image processing is used to reduce the remained noise even after an image processing (Refer to Figure 4-17 1)) . This image processing subtracts the registered surface reflection wave from the scan result only for the depth range of 0 mm to 200 mm. You can perform this image processing with the following procedure. (1) Scan the concrete. After the scan completed, the scan image is displayed on the main screen. (2) Move the cursor to the area on the scan result image where you want to do the processing. Make sure not to put the cursor directly on the point with a reflection signal (echo) from any embedded objects. (3) Tap [Image processing] icon. Then the image processing setup screen appears. (4) Tap Manual surface processing and confirm that the mark ● is attached to the selected setting. Then tap [□Processed at the current cursor.] and confirm that the mark 9is displayed in the [□] . (5) Tap [OK] to return to the main screen. Here NJJ-200 application executes the manual surface processing by using the reflection wave data specified at the step (2) above and shows the image obtained by the processing. The label of [Image processing] icon shows MNL. The mark È is shown at the point selected as the subtraction data on the distance scale. 1) Complete a scan 2)Select a position 3) Image processing setup screen Figure 4-17 Manual surface processing (1/2) ))))](https://usermanual.wiki/Japan-Radio/NJJ-200.Users-Manual-2/User-Guide-2182937-Page-27.png)
![62 4) Tap [OK]. 5) Image after processing Figure 4-17 Manual surface processing (1/2) y When tapping [OK] without the mark 9 at [□Processed at the current cursor] at the step 4) above, a message “No processing point defined” appears and the processing is canceled. y When re-executing the manual surface processing or subtraction processing (including real-time manual subtraction processing) without the mark 9 at [□Processed at the current cursor], the processing is executed by using the reflection wave data previously registered and shown by the cursor mark È on the distance scale. To change the reflection wave data used for the processing, perform the steps 2) to 4) above. y For the real-time subtraction processing, refer to Section 3.4 Interpreting the scan result. y The processing of the manual surface processing is almost same as that of the subtraction processing. The difference is that the manual surface processing subtracts the surface reflection data from the scan image only for the depth range of 0 mm to 200 mm. The subtraction processing subtracts the surface reflection data from the scan result over all depth range. y The subtract processing may remove the reflection wave from the opposite side of the concrete wall. y For the manual surface wave processing, refer to Section 4.10.5 Manual surface processing. y When the registered surface reflection wave contains some signal reflected from the embedded object, the processing may produce the unwanted noise. )Note](https://usermanual.wiki/Japan-Radio/NJJ-200.Users-Manual-2/User-Guide-2182937-Page-28.png)
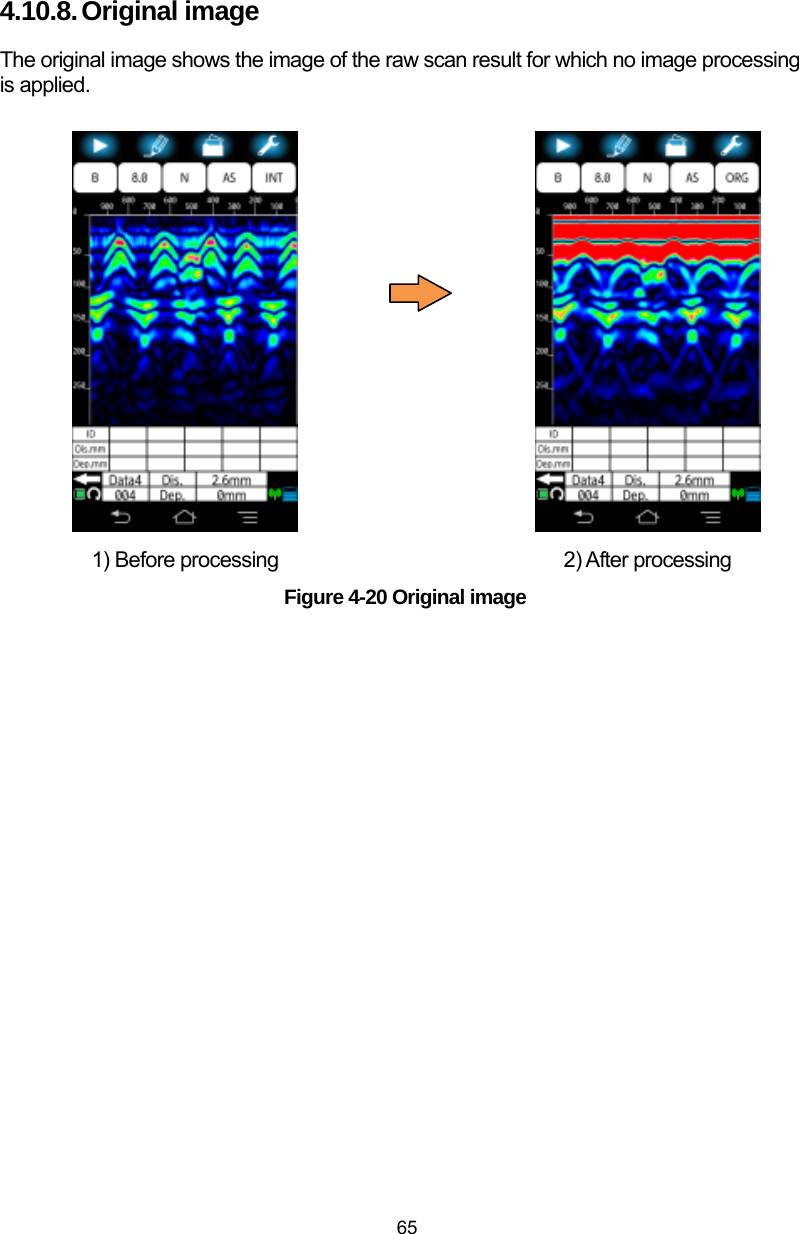
![63 4.10.6. Averaging This image processing is effective to reduce the horizontal line noise appearing uniformly over the scan result. It subtracts the averaged wave of all scan points from the scan result and displays the processed image. This processing may remove the continuous reflection signal appearing at the constant depth like the reflection from the opposite side of the concrete wall. Use this processing by considering this point. You can perform the average processing by the following procedure. (1) Scan the concrete. After the scan completed, the scan image is displayed on the main screen. (2) Tap [Image processing] icon. Then the image processing setup screen appears. (3) Tap Averaging and confirm that the mark ● is attached to the selected setting. (4) Tap [OK] to return to the main screen. Here NJJ-200 application executes the average processing and shows the image obtained by the processing. The label of [Image processing] icon shows AVG. 1) Complete a scan 2) Image processing setup screen 3) Image after processing Figure 4-18 Average processing y This processing reduces the horizontal line noise appearing uniformly over the scan result, so that it may remove the similar image of the continuous reflection signal appearing uniformly at the constant depth like the reflection from the opposite side of the concrete wall. )))Caution](https://usermanual.wiki/Japan-Radio/NJJ-200.Users-Manual-2/User-Guide-2182937-Page-29.png)
![66 4.11. Parameter setup screen The parameter setup screen allows you to set various conditions: relative permittivity and sensitivity used in the scanning, and so on. To access the parameter setup screen, long tap [Parameter] icon (Figure 4-1 ④) at the idle state (not scanning). Then the parameter setup screen shown in Figure 4-21 appears on the screen. Scroll the screen and tap a desired setting menu, then you can access each setup screen. After completing the setting, you can return to the main screen by tapping [Return to the main screen]. Figure 4-21 Parameter setup screen )](https://usermanual.wiki/Japan-Radio/NJJ-200.Users-Manual-2/User-Guide-2182937-Page-32.png)
![67 4.11.1. Device setting: [Relative permittivity] menu Device setting: [Relative permittivity] menu (Figure 4-22) in the parameter setup screen (Figure 4-21) allows you to set the relative permittivity of the scanned medium (ex. concrete) used for the scan. (The relative permittivity used for the scan result image at the idle state, refer to Section 4.7 [Relative permittivity] icon.) The menu shows the current setting at the right hand. Figure 4-22 shows the case of the current setting: 8.0. Figure 4-22 Device setting: [Relative permittivity] menu The available range of the relative permittivity is from 2.0 to 20.0. You can change the setting with the following procedure. (1) Tap Device setting: [Relative permittivity] menu. Then the relative permittivity setup screen (Figure 4-23) appears. The current setting is shown in the screen. Figure 4-23 Relative permittivity setup screen (2) Tap the setting value (8.0 shown in Figure 4-23). Then the list of the available setting values appears. (3) Scroll the list and tap a desired value as the relative permittivity. (4) Confirm the selected value is shown in the screen as the current setting. (5) Tap [OK] to return to the parameter setup screen. To cancel the setting change, tap [Cancel], then the screen returns to the parameter setup screen without setting change. (6) Tap [Return to the main window] to return to the main screen.](https://usermanual.wiki/Japan-Radio/NJJ-200.Users-Manual-2/User-Guide-2182937-Page-33.png)
![68 4.11.2. Device setting: [Sensitivity] menu Device setting: [Sensitivity] menu (Figure 4-24) in the parameter setup screen (Figure 4-21) allows you to set the sensitivity used for the scan. (The sensitivity used for the scan result image at the idle state, refer to Section 4.9 [Sensitivity] icon.) The menu shows the current setting at the right hand. Figure 4-24 shows the case of the current setting: A Shallow. Figure 4-24 Device setting: [Sensitivity] menu The available settings are -2S (-2, shallow), -1S (-1, shallow), AS (A, shallow), +1S (+1, shallow), +1S (+1, shallow ), +2S (+2, shallow), -2D (-2, deep), -1D (-1, deep), AD (A, deep), +1D ( +1, deep), +2D (+2, deep). For the details about each setting, refer to 4.9.1 Sensitivity. You can change the setting with the following procedure. (1) Tap Device setting: [Sensitivity] menu. Then the sensitivity setup (device) screen Figure 4-25) appears. The mark ● shows the current setting. (2) Tap a desired setting, and confirm the mark ● is moved to the selected setting. (3) Tap [OK] to return to the parameter setup screen. To cancel the setting change, tap [Cancel], then the screen returns to the parameter setup screen without setting change. (4) Tap [Return to the main window] to return to the main screen. Figure 4-25 Sensitivity setup screen](https://usermanual.wiki/Japan-Radio/NJJ-200.Users-Manual-2/User-Guide-2182937-Page-34.png)
![69 4.11.3. Device setting: [View range] menu Device setting: [View range] (Figure 4-26) in the parameter setup screen (Figure 4-21) allows you to set the view range used for the scan. (The view range used for the scan result image at the idle state, refer to Section 4.8 [View range] icon.) The menu shows the current setting at the right hand. Figure 4-26 shows the case of the current setting: N (Normal). Figure 4-26 Device setting: [View range] menu The available settings are Shallow, Normal, Deep, Shallow Wide, Normal Wide, and Deep Wide. For the detail about each setting, refer to Section 4.8 [View range] icon. You can change the setting with the following procedure. (1) Tap Device setting: [View range] menu. Then the view range setup (device) screen (Figure 4-27) appears. The mark ● shows the current setting. (2) Tap a desired setting, and confirm the mark ● is moved to the selected setting. (3) Tap [OK] to return to the parameter setup screen. To cancel the setting change, tap [Cancel], then the screen returns to the parameter setup screen without setting change. (4) Tap [Return to the main window] to return to the main screen. Figure 4-27 View range setup screen](https://usermanual.wiki/Japan-Radio/NJJ-200.Users-Manual-2/User-Guide-2182937-Page-35.png)
![70 4.11.4. Device setting: [Image processing] menu Device setting: [Image processing] menu (Figure 4-28) in the parameter setup screen (Figure 4-21) allows you to set the image processing performed real time during the scan. (The image processing applied for the scan result at the idle state, refer to Section 4.10 [Image processing] icon.) The menu shows the current setting at the right hand. Figure 4-28 shows the case of the current setting: FIX (Fixed surface wave processing). Figure 4-28 Device setting: [Image processing] menu The available settings are Fixed surface processing, User surface processing, and Original image. y For more information about the image processing listed above , refer to the following sections. 4.10.2 Fixed surface processing 4.10.3 User surface processing 4.10.8 Original image You can change the setting with the following procedure. (1) Tap Device setting: [Image processing] menu. Then the image processing setup screen (Figure 4-29) appears. The mark ● shows the current setting. (2) Tap a desired setting, and confirm the mark ● is moved to the selected setting. (3) Tap [OK] to return to the parameter setup screen. To cancel the setting change, tap [Cancel], then the screen returns to the parameter setup screen without setting change. (4) Tap [Return to the main window] to return to the main screen. Figure 4-29 Image processing setup screen Note](https://usermanual.wiki/Japan-Radio/NJJ-200.Users-Manual-2/User-Guide-2182937-Page-36.png)
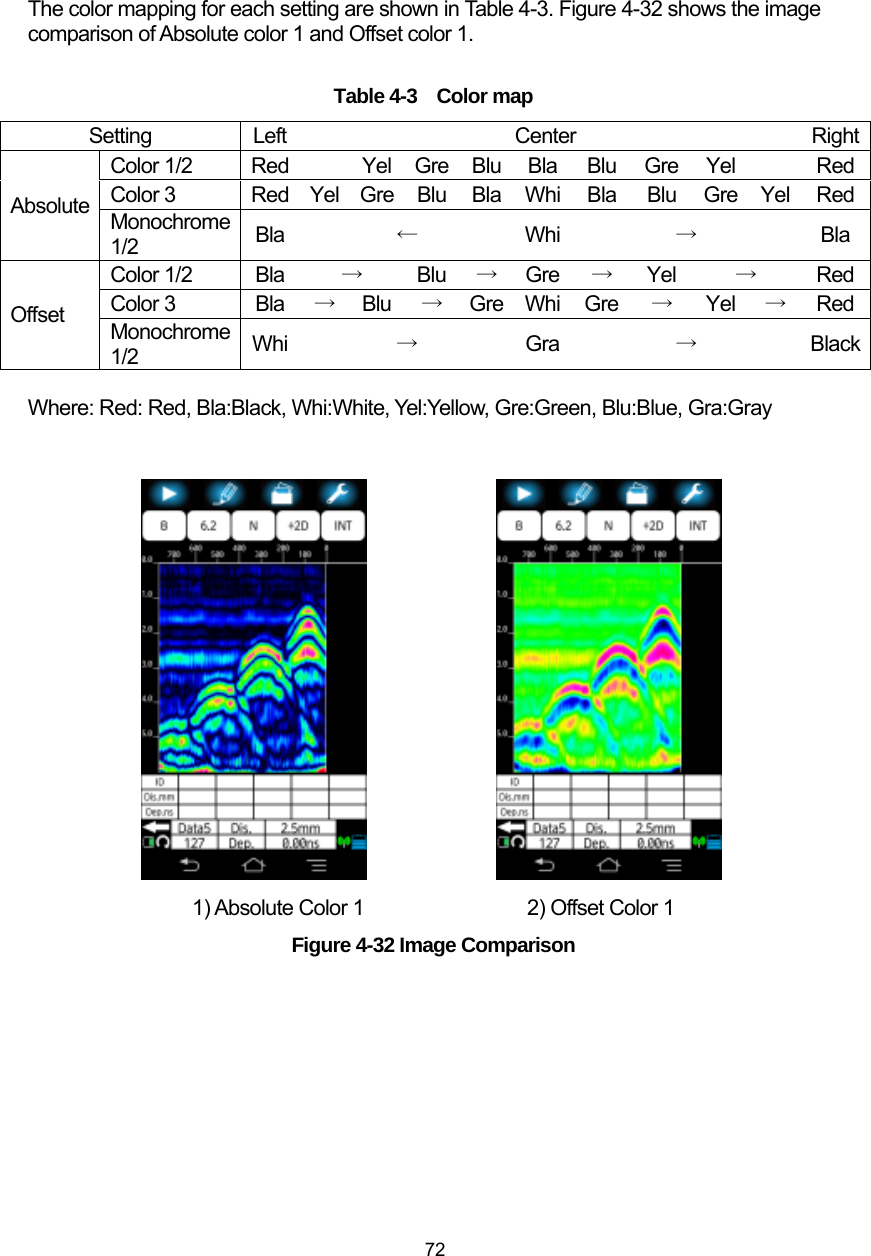
![71 4.11.5. Device setting: [Color] menu Device setting: [Color] menu (Figure 4-30) in the parameter setup screen (Figure 4-21) allows you to set the display color applied to the scan result image during the scanning. (The view range applied for the scan result at the idle state, refer to Section 4.5.1 [Color] menu.) The menu shows the current setting at the right hand. Figure 4-30 shows the case of the current setting: Color 1 Abs (Color 1 Absolute). Figure 4-30 Device setting: [Color] menu The available settings are listed below. The color mapping for each setting are provided at the end of this section. y Absolute gradation: Color 1, Color 2, Color 3, Monochrome 1, and Monochrome 2 y Offset gradation: Color 1, Color 2, Color 3, Monochrome 1, and Monochrome 2 You can change the setting with the following procedure. (1) Tap Device setting: [Color] menu. Then the display color screen (Figure 4-31) appears. The mark ● shows the current setting. (2) Tap a desired setting, and confirm the mark ● is moved to the selected setting. (3) Tap [OK] to return to the parameter setup screen. To cancel the setting change, tap [Cancel], then the screen returns to the parameter setup screen without setting change. (4) Tap [Return to the main window] to return to the main screen. Figure 4-31 Color setup screen](https://usermanual.wiki/Japan-Radio/NJJ-200.Users-Manual-2/User-Guide-2182937-Page-37.png)
![73 4.11.6. Device setting: [Device orientation setting] menu Device setting: [Device orientation setting] menu (Figure 4-33) in the parameter setup screen (Figure 4-21) allows you to set the distance scale direction for the device moving orientation. The menu shows the current setting at the right hand. Figure 4-33 shows the case of the current setting: Left. Figure 4-33 Device setting: [Device orientation] setting menu The available settings are Left and Right. Table 4-4 shows the relation between the device moving orientation and distance scale. Table 4-4 Device moving orientation and distance scale direction Item Distance scale direction Device moving orientation Device orientation setting: Left Device orientation setting: Right Forward From left to right on the screen From right to left on the screen Backward From right to left on the screen From Left to right on the screen You can change the setting with the following procedure. (1) Tap Device setting: [Device orientation setting] menu. Then the setting alternates between Left and Right. (2) Confirm the selected setting shown as the current setting in the menu. (3) Tap [Return to the main window] to return to the main screen.](https://usermanual.wiki/Japan-Radio/NJJ-200.Users-Manual-2/User-Guide-2182937-Page-39.png)
![74 4.11.7. Device setting: [Unit] menu Device setting: [Unit] menu (Figure 4-34) in the parameter setup screen (Figure 4-21) allows you to set the unit of the distance scale (horizontal direction) and the depth scale (vertical direction) displayed during the scan. (The unit setting of scales displayed at the idle state, refer to Section 4.5.2 [Unit] menu.) The menu shows the current setting at the right hand. Figure 4-34 shows the case of the current setting: distance scale (shown as X) of mm and depth scale (shown as Y) of mm. Figure 4-34 Device setting: [Unit] menu The available settings are mm, cm, m, inch, nSec. Where nSec is applicable only to the depth scale. You can change the setting with the following procedure. (1) Tap Device setting: [Unit] menu. Then the unit setup screen (Figure 4-35) appears. The mark ● shows the current setting for the distance and depth scales, respectively. (2) Tap a desired setting, and confirm the mark ● is moved to the selected setting. (3) Tap [OK] to return to the parameter setup screen. To cancel the setting change, tap [Cancel], then the screen returns to the parameter setup screen without setting change. (4) Tap [Return to the main window] to return to the main screen. Figure 4-35 Unit setup screen](https://usermanual.wiki/Japan-Radio/NJJ-200.Users-Manual-2/User-Guide-2182937-Page-40.png)
![75 4.11.8. Device setting: [Location notification] menu Device setting: [Location notification] menu (Figure 4-36) in the parameter setup screen (Figure 4-21) allows you to turn the rebar detection assist function on and off. The menu shows the current setting at the right hand. Figure 4-36 shows the case of the current setting: OFF. Figure 4-36 Device setting: [Location notification] menu The rebar detection assist function helps you to detect the rebar easily. It detects automatically rebars in the scan result and places a marker on the detected rebar. Also it notifies the rebar position by blinking the LED of the front or rear panel of the sensor unit and beeping when the fixed cursor (showing the position of the front or rear edge of the sensor unit) superposes one of markers of the detected rebars. For details of the rebar detection assist function, refer to Section 6.4 Location notification function. You can change the setting with the following procedure. (1) Tap Device setting: [Location notification] menu. Then the setting alternates between ON and OFF. (2) Confirm the selected setting is shown as the current setting in the menu. (3) Tap [Return to the main window] to return to the main screen. 4.11.9. Device setting: [Sound] menu Device setting: [Sound] menu (Figure 4-37) in the parameter setup screen allows you to turn the sound of Smartphone on and off. The menu shows the current setting at the right hand. Figure 4-37 shows the case of the current setting: ON. Figure 4-37 Device setting: [Sound] menu You can change the setting with the following procedure. (1) Tap Device setting: [Sound] menu. Then the setting alternates between ON and OFF. (2) Confirm the selected setting is shown as the current setting in the menu. (3) Tap [Return to the main window] to return to the main screen. y When the ”Manner” mode of Smartphone is set to On, Smartphone does not beep even when the sound setting is set to ON. y When the touch tone setting of Smartphone is set to On, Smartphone beeps each touch of the operation even when the sound setting is set to OFF. Note](https://usermanual.wiki/Japan-Radio/NJJ-200.Users-Manual-2/User-Guide-2182937-Page-41.png)
![76 4.11.10. Preferred setting: [Relative permittivity] menu Preferred setting: [Relative permittivity] menu (Figure 4-38) in the parameter setup screen (Figure 4-21) allows you to specify which relative permittivity setting of the file or device setting is used to display the scan result image when recalling the scan result data from the file. The menu shows the current setting at the right hand. Figure 4-38 shows the case of the current setting: File. Figure 4-38 Preferred setting: [Relative permittivity] menu The available settings are below. Device: uses Device setting: Relative permittivity setting to display the scan image. File: uses the relative permittivity setting recalled from the file to display the scan image. You can change the setting with the following procedure. (1) Tap Preferred setting: [Relative permittivity] menu. Then the setting alternates between Device and File. (2) Confirm the selected setting is shown as the current setting in the menu. (3) Tap [Return to the main window] to return to the main screen. 4.11.11. Preferred setting: [Sensitivity] menu Preferred setting: [Sensitivity] menu (Figure 4-39) in the parameter setup screen allows you to specify which sensitivity setting of the file or device setting is used to display the scan result image when recalling the scan result data from the file. The menu shows the current setting at the right hand. Figure 4-39 shows the case of the current setting: File. Figure 4-39 Preferred setting: [Sensitivity] menu The available settings are below. Device: uses Device setting: Sensitivity setting to display the scan image. File: uses the sensitivity setting recalled from the file to display the scan image. You can change the setting with the following procedure. (1) Tap Preferred setting: [Sensitivity] menu. Then the setting alternates between Device and File. (2) Confirm the selected setting is shown as the current setting in the menu. (3) Tap [Return to the main window] to return to the main screen.](https://usermanual.wiki/Japan-Radio/NJJ-200.Users-Manual-2/User-Guide-2182937-Page-42.png)
![77 4.11.12. Preferred setting: [Range] menu Preferred setting: [View range] menu (Figure 4-40) in the parameter setup screen (Figure 4-21) allows you to specify which view range setting of the file or device setting is used to display the scan result image when recalling the scan result from the file. The menu shows the current setting at the right hand. Figure 4-40 shows the case of the current setting: File. Figure 4-40 Preferred setting: [View range] menu The available settings are below. Device: uses Device setting: View range setting to display the scan image. File: uses the view range setting recalled from the file to display the scan image. You can change the setting with the following procedure. (1) Tap Preferred setting: [View range] menu. Then the setting alternates between Device and File. (2) Confirm the selected setting is shown as the current setting in the menu. (3) Tap [Return to the main window] to return to the main screen. 4.11.13. Preferred setting: [Color] menu Preferred setting: [Color] menu (Figure 4-41) in the parameter setup screen (Figure 4-21) allows you to specify which display color setting of the file or device setting is used to display the scan result image when recalling the scan result data from the file. The menu shows the current setting at the right hand. Figure 4-41 shows the case of the current setting: File. Figure 4-41 Preferred setting: [Color] menu The available settings are below. Device: uses Device setting: Display color setting to display the scan image. File: uses the display color setting recalled from the file to display the scan image. You can change the setting with the following procedure. (1) Tap Preferred setting: [Color] menu. Then the setting alternates between Device and File. (2) Confirm the selected setting is shown as the current setting in the menu. (3) Tap [Return to the main window] to return to the main screen.](https://usermanual.wiki/Japan-Radio/NJJ-200.Users-Manual-2/User-Guide-2182937-Page-43.png)
![78 4.11.14. Preferred setting: [Unit] menu Preferred setting: [Unit] menu (Figure 4-42) in the parameter setup screen (Figure 4-21) allows you to specify which unit setting of the file or device setting is used to display the scan result image when recalling the scan result from the file. The menu shows the current setting at the right hand. Figure 4-42 shows the case of the current setting: File. Figure 4-42 Preferred setting: [Unit menu] menu The available settings are below. Device: uses Device setting: Unit setting to display the scan image. File: uses the unit setting recalled from the file to display the scan image. You can change the setting with the following procedure. (1) Tap Preferred setting: [Unit] menu. Then the setting alternates between Device and File. (2) Confirm the selected setting is shown as the current setting in the menu. (3) Tap [Retrun to the main window] to return to the main screen.](https://usermanual.wiki/Japan-Radio/NJJ-200.Users-Manual-2/User-Guide-2182937-Page-44.png)
![79 4.11.15. Sensor setting: [Measurement mode] menu Sensor setting: [Measurement mode] menu (Figure 4-43) in the parameter setup screen (Figure 4-21) allows you to set the measurement mode to Distance or Time. The menu shows the current setting at the right hand. Figure 4-43 shows the case of the current setting: Distance. Figure 4-43 Sensor setting: [Measurement mode] menu The available settings are below. Distance: performs a scan per every 2.5 mm movement of the sensor unit and displays the image on the distance scale. Time: performs a scan every 50 ms and displays the image on the time scale. You can change the setting with the following procedure. (1) Tap Sensor setting: [Measurement mode] menu. Then the setting alternates between Distance and Time. (2) Confirm the selected setting is shown as the current setting in the menu. (3) Tap [Return to the main window] to return to the main screen. y .測定方式設定:時間送りは、探査開始後にセンサー本体のスタートボタンを約 8秒はなすと自動的に探査を終了します。探査を継続するには、センサー本体のスタートボタンを押し続けてください。探査終了はスマートフォンのスタートアイコンをタップもしくはセンサー本体のマーカボタンを長押ししてください。 Note](https://usermanual.wiki/Japan-Radio/NJJ-200.Users-Manual-2/User-Guide-2182937-Page-45.png)
![80 4.11.16. Sensor setting: [LED] menu Sensor setting: [LED] menu (Figure 4-44) in the parameter setup screen (Figure 4-21) allows you to set LEDs of the senor unit to on and off. (For the location of LED on the sensor unit, refer to Figure 1-2 ⑪、⑫、⑰ and ⑱). The menu shows the current setting at the right hand. Figure 4-44 shows the case of the current setting: ON. Figure 4-44 Sensor setting: [LED] menu The available settings are ON (turn on) and OFF (turn off). You can change the setting with the following procedure. (1) Tap Sensor setting: [LED] menu. Then the setting alternates between ON and OFF. (2) Confirm the selected setting is shown as the current setting in the menu. (3) Tap [Return to the main window] to return to the main screen. 4.11.17. Sensor setting: [Distance correction] menu Sensor setting: [Distance correction] menu (Figure 4-45) in the parameter setup screen (Figure 4-21) allows you to correct the distance error caused by the tire wear of the sensor unit. For the details of the distance correction, refer to Section 6.8 Distance error correction. The menu shows the current setting at the right hand. Figure 4-45 shows the case of the current setting: 0. Figure 4-45 Sensor setting: [Distance correction] menu The available setting range is from -20 to +20. You can change the setting with the following procedure. (1) Tap Sensor setting: [Distance correction] menu. Then the distance correction screen (Figure 4-46) appears and shows the current setting. (2) Tap the current setting (+0 in Figure 4-46), then the list of available correction values appears. (3) Scroll the list and tap the desired correction value. (4) Confirm the selected setting is shown as the current setting in the screen. (5) Tap [OK] to return to the parameter setup screen. To cancel the setting change, tap [Cancel], then the screen returns to the parameter setup screen without setting change. (6) Tap [Return to the main window] to return to the main screen. Figure 4-46 Distance correction screen](https://usermanual.wiki/Japan-Radio/NJJ-200.Users-Manual-2/User-Guide-2182937-Page-46.png)
![81 4.11.18. Sensor setting: [Channel] menu Sensor setting: [Channel] menu (Figure 4-47) in the parameter setup screen (Figure 4-21) allows you to set the channel used for the WiFi communication between Smartphone and the sensor unit. For the details of the channel setting procedure, refer to Section 6.7 Communication channel setup. The menu shows the current setting at the right hand. Figure 4-47 shows the case of the current setting: 0. Figure 4-47 Sensor setting: Channel menu The available settings are range is from 0 to 11. You can change the setting with the following procedure. (1) Tap Sensor setting: [Channel] menu. Then the channel setup screen (Figure 4-48) appears and shows the current setting. (2) Tap the channel setting value (0 in Figure 4-48), then the list of available channels appears. (3) Scroll the list and tap the desired channel. (4) Confirm the selected setting is shown as the current setting in the screen. (5) Tap [OK] to return to the parameter setup screen. To cancel the setting change, tap [CANCEL]. Then the screen returns to the parameter setup screen without setting change. (6) Tap [Return to the main window] to return to the main screen. Figure 4-48 Channel setup screen](https://usermanual.wiki/Japan-Radio/NJJ-200.Users-Manual-2/User-Guide-2182937-Page-47.png)
![82 4.11.19. Other: [Sensor select] menu Other: [Sensor select] menu (Figure 4-49) in the parameter setup screen (Figure 4-21) allows you to select a sensor unit for which the Smartphone establishes the WiFi communication. For more details, refer to Section 6.7 Communication channel setup. The menu shows the current setting at the right hand. Figure 4-49 shows the case of the sensor unit SENSOR-12345 connected. Figure 4-49 Other: [Sensor select] menu You can change the setting with the following procedure. (1) Tap Other: [Sensor select] menu. Then the sensor select screen (Figure 4-50) appears and shows the current setting and lists SSIDs of available sensor units which is located near and detected by Smartphone. (2) Tap a SSID to establish the communication with Smartphone. Then the screen returns to the main screen. And Smartphone establish the communication with the selected sensor unit. The color of the antenna mark shown at the right bottom of the main screen changes from Red to Greed after the communication established. (3) In step (2), tap [Cancel] to cancel the setting change, then the screen returns to the parameter setup screen without setting change. (4) Tap [Return to the main window] to return to the main screen. Figure 4-50 Sensor select screen](https://usermanual.wiki/Japan-Radio/NJJ-200.Users-Manual-2/User-Guide-2182937-Page-48.png)
![83 4.11.20. Other: [Version] menu Other: [Version] menu (Figure 4-51) in the parameter setup screen (Figure 4-21) allows you to show the version information of NJJ-200 application and the firmware of the sensor unit and to update the firmware of the sensor unit. Figure 4-51 Version menu To confirm the software version, tap Other: [Verson] menu. Then the version screen shown as Figure 4-52 appears. When the communication is not established between Smartphone and the sensor unit, the screen shown as Figure 4-52 1) appears and shows only the version of NJJ-200 application. When the communication has been established between Smartphone and the sensor unit, the screen shown as Figure 4-52 2) appears and shows both of the version of NJJ-200 application and the firmware version of the sensor unit. To update the firmware of the sensor unit, tap [Update]. To cancel the update, tap [Cancel], then the screen returns to the parameter setup screen. For the procedure to update the firmware of the sensor, refer to Section 6.9.2 Software version up for Sensor unit. 1) No communication with the sensor 2) Active communication with the sensor Figure 4-52 Version display screen](https://usermanual.wiki/Japan-Radio/NJJ-200.Users-Manual-2/User-Guide-2182937-Page-49.png)
![84 4.11.21. Other: [Initial setting] menu Other: [Initil setting] menu (Figure 4-53) in the parameter setup screen (Figure 4-21) allows you to restore the initial values (settings at the factory shipment) to all settings. Figure 4-53 Other: [Initial setting] menu You can restore the initial settings with the following procedure. (1) Tap Other: [Initial setting] menu. Then the initial setting conformation screen (Figure 4-54) appears. (2) Tap [OK], then the initial setting are restored to all settings, then the screen returns to the parameter setup screen. To cancel the initialization, tap [Cancel], then the screen returns to the parameter setup screen without restoring the initial values. Figure 4-54 Initial setting confirmation](https://usermanual.wiki/Japan-Radio/NJJ-200.Users-Manual-2/User-Guide-2182937-Page-50.png)
![85 4.12. File operation screen File operation screen (Figure 4-55) allows you to perform several file operations: saving/recalling the scan result data to/from the file, the folder setup, and the data number setup. You can access the file operation screen by long tapping the [File/Print] icon. This section describes file operations available in the file operation screen. Figure 4-55 File operation screen )Ling tap the File/Print icon](https://usermanual.wiki/Japan-Radio/NJJ-200.Users-Manual-2/User-Guide-2182937-Page-51.png)
![86 4.12.1. [Open] menu [Open] menu shown in File operation screen (Figure 4-55) allows you to show the list of the scan result files stored in Smartphone, to read the scan result data from the file, and to delete the selected file. Tap [Open] menu, then the file list screen as shown in Figure 4-56 appears. To read the data from the selected file, perform the following steps. (1) Tap the desired file. Then the background of the tapped file become blue and the thumbnail of the selected file is shown at the bottom of the screen. (2) Tap [Read], then the data are read from the file and are shown on the main screen. To delete the selected file, perform the following steps. (1) Tap the desired file. Then the background of the tapped file become blue and the thumbnail of the selected file is shown at the bottom of the screen. (2) Tap [Delete], then a message “Delete confirmation?” appears. (3) Tap [OK], then the file is deleted and the screen returns to the file list screen. To cancel the file deletion, tap [Cancel], then the screen returns to the file list screen. To delete all files in a folder, perform the following steps. (1) tap Delete all data in this folder at the right upper side on the file list screen. Then a message Delete confirmation? appears. (2) Tap OK, the the file is deleted and the screen is return to the file list screen. Tap [Cancel] to cancel to delete all files, then the screen returns to the file list screen. You can return to the main screen by tapping [Cancel] in the file list screen. For the details of File open screen, refer to Sections from 5.3 and 5.7. Figure 4-56 File open screen )Tap a file name.](https://usermanual.wiki/Japan-Radio/NJJ-200.Users-Manual-2/User-Guide-2182937-Page-52.png)
![87 4.12.2. [save/print] menu [save/print] menu (Figure 4-57) in the file operation screen (Figure 4-55) allows you to select the output destination of the scan result data. The menu shows the current setting at the right hand side. Figure 4-57 shows the case of the current setting: Save (Binary). Figure 4-57 [Save/Print] menu The available settings are below. Save (Binary): outputs the data into the file with the binary formart. Save (Text): outputs the data into the file with the text format. Print: outputs the data to the external printer. You can change the setting with the following procedure. (1) Tap [Save/Print] menu. Then the file/print setup screen (Figure 4-58) appears. The mark ● shows the current setting. (2) Tap a desired setting, and confirm the mark ● is moved to the selected setting. (3) Tap [OK] to return to the file operation screen. To cancel the setting change, tap [CANCEL], then the screen returns to the file operation screen without setting change. (4) Tap [Return to the main window] to return to the main screen. Figure 4-58 File/Print setup screen For the details of the file output, refer to Section 5 External output.](https://usermanual.wiki/Japan-Radio/NJJ-200.Users-Manual-2/User-Guide-2182937-Page-53.png)
![88 4.12.3. [Select Folder] menu [Select folder] menu (Figure 4-59) in the file operation screen (Figure 4-55) allows you to select the folder under which the scan data are stored in the memory card of Smartphone. The menu shows the current setting at the right hand. Figure 4-59 shows the case of the current setting: Data1. Figure 4-59 [Select Folder] menu The available settings are from 1 to 10. You can change the setting with the following procedure. (1) Tap [Select folder] menu. Then Select Folder screen (Figure 4-60) appears. The mark ● shows the current setting. (2) Tap a desired setting, and confirm the mark ● is moved to the selected setting. (3) Tap [OK] to return to the file operation screen. To cancel the setting change, tap [Cancel], then the screen returns to the file operation screen without setting change. Figure 4-60 Folder select screen y The folders from Folder 1 to Folder 10 are automatically created into the memory card of Smartphone when booting up NJJ-200 application. y For the procedure to read/save the scan data, refer to Section 5 External output. Note](https://usermanual.wiki/Japan-Radio/NJJ-200.Users-Manual-2/User-Guide-2182937-Page-54.png)
![89 4.12.4. [Data number setting] menu [Data number setting] menu (Figure 4-61) in the file operation screen (Figure 4-55) allows you to set the data number of the file into which the scan data is stored. The menu shows the current setting at the right hand side. Figure 4-61 shows the case of the current setting: Data number 001. Figure 4-61 Data number menu The available settings are from 0 to 999. The data number is used as a part part of the file name and is increased with one every when the data is stored into the file. You can change the setting with the following procedure. (1) Tap [Data number setting] menu. Then Data No. screen (Figure 4-62) appears and shows the current setting. (2) Tap the current setting (001 in Figure 4-62), then the list of available data numbers appears. (3) Scroll the list and tap the desired number. (4) Confirm the desired channel is shown as the current setting in the Data No. screen. (5) Tap [OK] to return to the file operation screen. To cancel the setting change, tap [Cancel], then the screen returns to the file operation screen without setting change. (6) Tap [Return to the main window] to return to the main screen. Figure 4-62 Data No. setup screen y When you want to re-scan the data, changing the data number makes the data file management easier. Note](https://usermanual.wiki/Japan-Radio/NJJ-200.Users-Manual-2/User-Guide-2182937-Page-55.png)
![90 4.13. Marker operation Marker operation screen (Figure 4-63) allows you several marker operations: hide markers, Show marker list, Marker details, sort marker, AutoMark, and so on. You can access Marker Operation screen by long tapping the Marker Icon. This section describes operations available in the marker operation screen. Figure 4-63 Marker operation screen 4.13.1. [Hide markers] menu [Hide markers] menu (Figure 4-64) in the marker operation screen (Figure 4-63) allows you to hide all markers displayed on the scan result image. To hide all markers, tap [Hide markers] menu. To redisplay hidden markers, tap any position of B mode screen or the marker list. This function is helpful to see and confirm the part of the scan result image hidden by the displayed markers. Figure 4-64 [Hide markers] menu ) Long tap [Mark] icon.](https://usermanual.wiki/Japan-Radio/NJJ-200.Users-Manual-2/User-Guide-2182937-Page-56.png)
![91 4.13.2. [Show marker list] menu [Show marker list] / [Hide marker list] menu (Figure 4-65) in the marker operation screen (Figure 4-63) allows you to show/hide the marker list. When you want to see the scan result in the large screen, hide the marker list. When you want to confirm the coordinates of markers, show the marker list. To show the marker list, tap [Show marker list] menu as shown in Figure 4-65 1), then the screen returns to the main screen. To hide the marker list, tap [Hide marker list] menu, then the screen returns to the main screen as shown in Figure 4-65 2). 1) Show marker list 2) Hide maker list Figure 4-65 Show/Hide marker list )Tap [Show marker list] menu. )Tap [Hide marker list] menu.](https://usermanual.wiki/Japan-Radio/NJJ-200.Users-Manual-2/User-Guide-2182937-Page-57.png)
![92 4.13.3. [Marker details] menu [Marker details] menu in the marker operation screen (Figure 4-63) allows you to show the marker details screen (Figure 4-66) which shows the detailed information (statistic, distance and depth of each marker, pitch between neighboring markers) of all markers registered in each marker group. To show the marker details screen, tap [Marker detail] menu. To return to the main screen, tap [OK]. When tapping [Marker details] menu when no marker registered, a message shown in Figure 4-67 appears. In this case, tap [OK] to return to the main screen. The details of each information on the marker details screen are provided below. Figure 4-66 Marker details screen Figure 4-67 Message of no marker (1) Group selection(2) Marker statistic table (3) Marker coordinates table (4)[Delete all markers in a group] button (5) [OK] button](https://usermanual.wiki/Japan-Radio/NJJ-200.Users-Manual-2/User-Guide-2182937-Page-58.png)
![93 (1) Group selection Group selection allows you to select the marker group to show the detailed information in the marker details screen. Tap a desired marker group. Then the mark ● is displayed at the selected marker group, then the detailed information of the selected marker group is shown in the marker details screen. (2) Marker statistic table The marker statistic table shows the number of registered markers, average, minimum and maximum of depth and pitch (distance between neighboring markers). When only one marker is registered, “-“ is shown at the pitch. (3) Marker coordinate table The marker coordinate table shows the distance and depth of each registered marker and each pitch between two neighboring markers. The pitch is the absolute distance between two markers of ID n and ID n+1 (N= 1,2,3…). You can scroll the marker coordinate table vertically. (4) [Delete all marker in a group button] button [Delete all marker in a group] button located at the right upper side of the marker details screen allows you to delete all markers registered in the selected group. To delete all markers, tap [Delete all marker in a group] button, then a message “Deleting all the markers in the group” (Figure 4-68) appears. Tap [OK] to delete all markers. To cancel to delete the markers, tap [Cancel], then the screen returns to the marker details screen. Figure 4-68 Delete all markers in group (5) [OK] button [OK] button closes the marker details screen. Tap [OK] to return to the main screen.](https://usermanual.wiki/Japan-Radio/NJJ-200.Users-Manual-2/User-Guide-2182937-Page-59.png)
![94 4.13.4. [Sort marker] menu [Sort marker] menu in the marker operation screen (Figure 4-63) allows you to re-number the ID numbers of the registered markers as ascending or descending order. For more details of [Sort marker] menu, refer to 6.6 Sort marker. The following sortings are available. y Ascending order: renumbers the ID number of markers from the scan start position (distance 0) to the scan end point. y Descending order: renumbers the ID numner of Markers from the scan end poistion to the scan start position. You can sort the marker ID numbers with the following procedure. (1) Tap [Sort marker] menu. Then the sort marker screen (Figure 4-69) appears. The mark ● shows the current setting. (2) Tap a desired setting, and confirm the mark ● is attached to the selected setting. (3) Tap [OK] to sort the ID numbers of markers, then the screen return to the main screen. To cancel the sort marker, tap [Cancel], then the screen returns to the main screen without sorting the marker IDs. Figure 4-69 Sort marker screen 4.13.5. [AutoMark] menu [AutoMark] menu in the marker operation screen (Figure 4-63) allows you to execute the AutoMark function which automatically analyzes the scan data, detects the embedded object, and adds the marker on the detected object. For more details of AutoMark function, refer to Section 6.3 AutoMark function. You can specify the direction of the detection processing: Search from the start or Search from the end. You can execute the AutoMark function with the following procedure. (1) Tap [AutoMark] menu. Then AutoMark screen (Figure 4-70) appears. The mark ● shows the current setting. (2) Tap a desired setting: [Search from the start] or [Search from the end], and confirm the mark ● is attached to the selected setting. (3) Tap [OK] to execute the AutoMark function, then the screen return to the main screen. To cancel the AutoMark function, tap [Cancel], then the screen returns to the main screen without executing the AutoMark function. Figure 4-70 AutoMark screen](https://usermanual.wiki/Japan-Radio/NJJ-200.Users-Manual-2/User-Guide-2182937-Page-60.png)
![95 4.13.6. [Marker group setting] menu [Marker group setting] menu in the marker operation screen (Figure 4-63) allows you to select a marker group into which newly added markers are registered. The available marker group are Group 0 to 2. The marker IDs of 1 to 99 are allocated to Marker group 0, the IDs of 101 to 199 to Marker group 1, and the IDs of 201 to 299 to Marker group 2. You can specify the marker group with the following procedure. (4) Tap [Marker group setting] menu. Then the marker group setup screen (Figure 4-71) appears. The mark ● shows the current setting. (5) Tap a desired setting: [Group 0], [Group 1], or [Group 2], and confirm the mark ● is attached to the selected setting. (6) Tap [OK] to return to the main screen. To cancel the Marker group setting, tap [Cancel], then the screen returns to the main screen without changing the Marker group setting. Figure 4-71 Marker group setup screen](https://usermanual.wiki/Japan-Radio/NJJ-200.Users-Manual-2/User-Guide-2182937-Page-61.png)
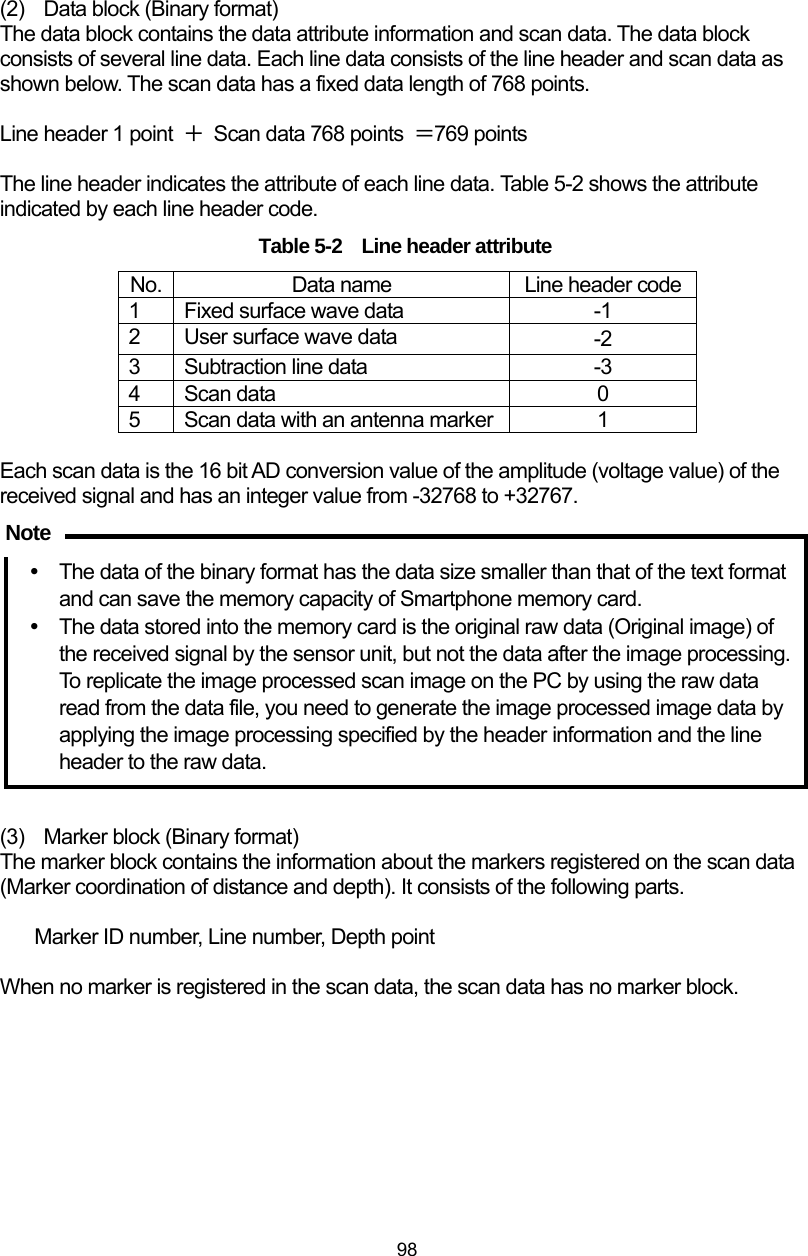
![99 5.1.2. Text format The data structure of the text format is same as that of the binary format. The difference from the binary format is that all data is represented by using ASCII code. (1) Header block The header block structure of the text format is same as that of the binary format. For the details of the header structure, refer to Section 5.1.1 (1) Header block (Binary format). (2) Data block The data block structure of the text format is same as that of the binary format. The difference is that each data is represented by ASCII code in place of the binary data and the terminator [0x0D][0x0A](CR,LF) is added at the end of each data point. For the details of the data block structure, refer to Section 5.1.1 (2) Data block (Binary format). Note y The data of the binary format has the data size smaller than that of the text format and can save the memory capacity of Smartphone memory card. y The data stored into the memory card is the original raw data (Original image) of the received signal by the sensor unit, but not the data after the image processing. (3) Marker block The marker block structure of the text format is same as that of the binary format. For the marker block structure, refer to Section 5.1.1 (3) Marker block (Binary format). Note](https://usermanual.wiki/Japan-Radio/NJJ-200.Users-Manual-2/User-Guide-2182937-Page-65.png)
![100 5.2. Saving the scan data This section describes the procedure to save the scan data into the memory card mounted on Smartphone. (1) Set the data format of saving the scan data Long tap [File/Print] icon. Then the file operation screen appears. Tap [Save/Print] menu. Then the save/print screen appears. Tap [Binary] or [Text] to select the data format. For more details, refer to Section 4.12.2 [save/print] menu. (2) Set the folder to which the scan data file is saved Long tap [File/Print] icon, tap [Select Folder] menu, then tap one of [Data1] to [Data10] to select a data folder. For more details, refer to Section 4.12.3 [Select Folder] menu. (3) Set the data number Long tap [File/Print] icon, tap [Data number setting] menu, then tap the displayed data number, then scroll the list of the data number and tap the desired data number. The data number is incremented each time when a scan data is saved into the file. For more details, refer to Section 4.12.4 [Data number setting] menu. (4) Save the scan data Tap [File/Print] icon after completing a scan. Then the scan data is saved into the file under the folder specified in Step (2) above which is located under the folder “NJJ-200” in the memory card of Smartphone. The file of the scan data is named automatically as described below. B01011345_001.HSD File extension for the data file of Handysearch Data number Date/Time of scan execution Data format: Binary format: [B], Text format : [T]](https://usermanual.wiki/Japan-Radio/NJJ-200.Users-Manual-2/User-Guide-2182937-Page-66.png)
![101 (5) Confirm the saved scan data Long tap [File/Print] icon, tap [Open] menu, then tap the file name to which the scan data is saved. Then the thumbnail image of the selected scan data file is shown at the bottom of the screen. By checking the thumbnail image, confirm that the scan data is saved correctly. For more details, refer to Sections 5.4 to 5.7. Figure 5-1 Confirmation of the saved data y When attempting to save data to a remaining memory capacity less than 2 Mbytes, a message “Saving not possible”[OK] appears, and the data saving is canceled. In this case, delete the unnecessary files or mount the memory card with the remained capacity more than 2 Mbytes, then perform the data saving. y The maximum number of the files stored under one folder is 21800 each. When attempting to save data beyond the maximum number of the files, a message “Data saving not possible” appears and the data saving is cancelled. In this case, delete the unnecessary files, then try to save the data again.. )Caution](https://usermanual.wiki/Japan-Radio/NJJ-200.Users-Manual-2/User-Guide-2182937-Page-67.png)
![102 y This product has no limitation of the scan distance. The scan data shown on Smartphone screen and saved into the file is maximum 15 m of the latest scan data from the scan stop point. y The scan data saved into the memory card contains the scan conditions displayed on the screen when performing the data save. 5.3. Data file operation You can perform data file operations: displaying the thumbnail image of the data file, reading the scan result from the data file, and deleting the data file by using the file open screen shown in Figure 5-2. To access the file open screen, long tap the [File/Print] icon and [Open] menu. This section describes each procedure of data file operations. y When a lot of files are saved into the current folder, it may take a lot of time to access to the screen to open the file. During this time, “Creating file list・・・”[Cancel] appears. (The transient time depends on the memory card performance and will be around 1 minute for the folder having 1000 pieces of files and 7 minutes for the folder having 21844 files.) Figure 5-2 File open screen ))Note Caution](https://usermanual.wiki/Japan-Radio/NJJ-200.Users-Manual-2/User-Guide-2182937-Page-68.png)
![103 5.4. Displaying thumbnail image of the data file You can display the thumbnail image of the data file by tapping the file name on the file open screen. After tapping a file name, the background color of the tapped file name changes to blue. Then the thumbnail image of the scan data saved in the selected file appears at the bottom of the screen. By using the thumbnail image, you can quickly confirm that the scan result is saved correctly or confirm that it is what you would like to read. The color of the thumbnail image is decided by the settings of Sections 4.5.1 [Color] menu and 4.11.5 Device setting: [Color] menu. Figure 5-3 Thumbnail image of the save scan data y The thumbnail image shows a part of the scan data image. (Distance: 1 m, Depth: Normal, Image processing: Fixed surface wave processing. Thumbnail )Caution](https://usermanual.wiki/Japan-Radio/NJJ-200.Users-Manual-2/User-Guide-2182937-Page-69.png)
![104 5.5. Reading the scan data from the data file You can read the scan data from the data file with the following procedure. (1) Tap a file name on the file open screen. Then the background color of the tapped file name changes to blue. And the thumbnail image of the scan data in the selected file appears at the bottom of the screen. (2) Tap [Read] button to read the scan data from the file. Then a message “Reading the data from the file….” appears. When the message disappears, the data reading ends. To cancel the data reading, tap [Cancel], then the screen returns to the main screen without reading the data from the file. (3) In the step 2, if the scan data displayed on the main screen has not been saved yet into the file, a message “Measurement data not saved disappears.” To continue the data reading, tap [OK], then the screen returns to the main screen. To cancel the data reading, tap [Cancel], then the screen returns to the File open screen. (Refer to Figure 5-4.) Figure 5-4 Reading the scan data from the file When the scan result on the main screen has not been saved. When the scan result on the main screen has been saved. )Tap [Read]. Tap [OK]. )](https://usermanual.wiki/Japan-Radio/NJJ-200.Users-Manual-2/User-Guide-2182937-Page-70.png)
![105 The scan data read from the file is displayed by using either of the settings read from the file or the settings of the sensor unit. For the settings used to display the scan data read from the file, refer to Sections 4.11.11 Preferred setting: [Sensitivity] menu to 4.11.14 Preferred setting: [Unit] menu. y On the fIle open screen, when tapping [Read] without tapping a file, a message “File not selected.” In this case, tap [OK] to return to the File open screen. y You can register the user surface wave data in the scan data read from the file. When you do this, the user surface wave data is memorized in the sensor unit and is applied to the next scanning. For the procedure to register the user surface wave, refer to Section 4.10.3 User surface processing. 5.6. Deleting the data file You can delete data files with the following procedure. (1) Tap a file name on the File open screen. Then the background color of the tapped file name changes to blue. (2) Tap [Delete]. Then a message “Delete confirmation? [OK] [CANCEL]” appears. Then tap [OK] to continue to delete the file, then the screen returns to the File open screen. To cancel to delete the file, tap [Cancel], then the screen returns to the File open screen. Figure 5-5 Deleting the data file )Tap [Delete]. )Tap [OK]. Note](https://usermanual.wiki/Japan-Radio/NJJ-200.Users-Manual-2/User-Guide-2182937-Page-71.png)
![106 5.7. Delete all files under the folder You can delete all data files with the following procedure. (3) Tap [Delete all data in this folder] on the file open screen. Then a message “Datax: Delete confirmation? [CANCEL] [OK]” appears. (4) Tap [OK] to continue to delete all files, then the screen returns to the file operation screen. To cancel to delete all files, tap [Cancel], then the screen returns to the file open screen. Figure 5-6 Deleting all file under a folder y Tapping [Delete all data in this folder] deletes all files under the folder. y When you check the file list on the Smartphone by connecting the PC and Smartphone in MTP mode after you deleted a file, you may see the deleted file on the PC screen due to the cached data on the memory of Smartphone. In this case, clear all cached data of Smartphone (An example of Smartphone operation: Tap [Settings], [Device settings], [Storage], [Cached data], and [OK]) or connect Smartphone to the PC in the card reader mode. )Tap [Delete all data in this folder]. )Tap [OK]. Caution](https://usermanual.wiki/Japan-Radio/NJJ-200.Users-Manual-2/User-Guide-2182937-Page-72.png)
![107 5.8. Printer output You can print out the scan data to the external printer (Option) by connecting the external printer to Smartphone via Bluetooth communication. To get Bluetooth communication between the printer and Smartphone, you need to perform the settings for both before running NJJ-200 application. This section describes the procedure of these settings and printing the scan data to the printer. y Cautions on Bluetooth communication y Some devices operate using the same frequency bands adopted by this product. Equipment such as microwave ovens and other home electronics, radios and equipment used in various types of radio stations including Amateur Radio stations, and devices that operate on industrial, scientific, or medical frequency bands may experience interference from this product. 1. In case any harmful radio interference occurred, immediately stop to use this product. Then contact to one of our contact points described in Section 14 or the distributor from which you purchased this product to get consultation about the solution. 2. For the other unclear points, contact to our contact points described in Section 14 or the distributor from which you purchased this product to get consultation about the solution. 5.8.1. Preparation for the printer You need to configure software switch setting inside the printer to connect it to Smartphone via Bluetooth communication. The procedure of the switch configuration is described below. (1) Boot up the printer in the menu setting mode and print out the current setup Set the paper to the printer, keep pushing the [MENU] button down, and turn on the printer. Here the ERROR LED turns on. Then wait for ERROR LED to turn off , then release the [MENU] button. The printer starts the printing after POWER LED and STATUS LED light changes to green. Then press [FEED] (NO) button, as printing the printer setup is not required. PD-24 menu printer setup print out YES:MENU button NO:FEED button EXIT:MENU+FEED button Do you print out the printer setup? YES (M) NO (F) Caution](https://usermanual.wiki/Japan-Radio/NJJ-200.Users-Manual-2/User-Guide-2182937-Page-73.png)
![108 (2) Printer initialization: No The following message is printed out. Press [FEED] button, because no initialization is required. Do you initialize the printer? Press YES for three seconds. YES (M) NO(F) (3) Printer setup change: Do The following message is printed out. Press [MENU] (YES) button to execute the setup change. Do you change the printer setup? YES(M) NO(F) (4) Printer setup change: No The following message is printed out. Press [FEED] (NO) button, because no printer setup change is required. Printer setup YES(M) NO(F) EXIT(M+F) (5) System setup change: No The following message is printed out. Press [FEED] (NO), because no system setup change is required. System setup YES(M) NO(F) EXIT(M+F) (6) Interface setup change: Do The following message is printed out. Press [MENU] (YES), because the interface setup change is required. Interface setup YES(M) NO(F) EXIT(M+F)](https://usermanual.wiki/Japan-Radio/NJJ-200.Users-Manual-2/User-Guide-2182937-Page-74.png)
![109 (7) Interface selection The following message is printed out. Press [MENU] (YES) to select the Bluetooth. Interface setup Bluetooth YES(M) NO(F) (8) Cable automatic recognition setup The following message is printed out. Press [MENU] (YES) button tentatively to proceed, because the cable interface is not used between the printer and Smartphone, as this setup is not applicable Cable automatic recognition Active YES(M) NO(F) (9) Cable baud rate The following message is printed out. Press [MENU] (YES) button tentatively to proceed, because the cable interface is not used between the printer and Smartphone, as this setup is not applicable. Cable baud rate 9600 YES(M) NO(F) (10) Cable data length The following message is printed out. Press [MENU] (YES) button tentatively to proceed, because the cable interface is not used between the printer and Smartphone, as this setup is not applicable. Cable data length 8bit YES(M) NO(F) (11) Cable parity The following message is printed out. Press [MENU] (YES) button tentatively to proceed, because the cable interface is not used between the printer and Smartphone, as this setup is not applicable. Cable parity None YES(M) NO(F)](https://usermanual.wiki/Japan-Radio/NJJ-200.Users-Manual-2/User-Guide-2182937-Page-75.png)
![110 (12) Cable stop bit The following message is printed out. Press [MENU] (YES) button tentatively to proceed, because the cable interface is not used between the printer and Smartphone, as this setup is not applicable. Cable stop bit 1Bit YES(M) NO(F) (13) Cable flow control The following message is printed out. Press [MENU] (YES) button tentatively to procced, because the cable interface is not used between the printer and Smartphone, as this setup is not applicable. Cable flow control XON/OFF YES(M) NO(F) (14) IrCZ baud rate The following message is printed out. Press [MENU] (YES) button tentatively, because the IrCZ interface is not used between the printer and Smartphone, as this setup is not applicable. IrCZ baud rate 9600 YES(M) NO(F) (15) IrCZ stop bit The following message is printed out. Press [MENU] (YES) button tentatively, because the IrCZ interface is not used between the printer and Smartphone, as this setup is not applicable. IrCZ stop bit 1Bit YES(M) NO(F) (16) Bluetooth communication mode The following message is printed out. Press [MENU] (YES) button to set the Bluetooth communication mode to BOND. Bluetooth communication node BOND YES(M) NO(F)](https://usermanual.wiki/Japan-Radio/NJJ-200.Users-Manual-2/User-Guide-2182937-Page-76.png)
![111 (17) BOND log deletion The following message is printed out. Press [FEED] (NO) button to change the BOND log deletion setting to ON. BOND log deletion OFF YES(M) NO(F) The following message is printed out. Press [MENU] (YES) button to turn on the BOND log deletion. BOND log deletion ON YES(M) NO(F) (18) Bluetooth Inquiry The following message is printed out. Press [MENU] (YES) button to set Discoverable to the Bluetooth inquiry. Bluetooth Inquiry Discoverable YES(M) NO(F) (19) Bluetooth pass key The following message is printed out. Press [MENU] (YES) button to use the default value for the Bluetooth pass key. Bluetooth pass key Default YES(M) NO(F) (20) Printer setup EXIT The following message is printed out. Press both of [MENU] and [FEED] down at the same time to exit from the printer setup mode. Printer setup YES(M) NO(F) EXIT(M+F)](https://usermanual.wiki/Japan-Radio/NJJ-200.Users-Manual-2/User-Guide-2182937-Page-77.png)
![112 (21) Printer setting update The following message is printed out. Press [MENU] (YES) button to update the printer setup. Then the STATUS LED changes to light in red. Do you update the printer setup? YES(M) NO(F) (22) Printing of the printer setup The STATUS LED changes to light in green. Then following message is printed out. Press [MENU] (YES) button to print the printer setup. Do you print the printer setup? YES(M) NO(F) The following printer setup is printed out, then the printer is turned off. Make sure to record the trailing 4 digit of [*BD address], because these 4 digits are used as pass key to establish the Bluetooth communication between Smartphone and the printer. (In the following example, “E874” is the pass key.) PD-24 setup information ROM Version :CP00-0701 2007-09-25 Boot version :CPBT-0002 2005-02-14 Firm version :CP00-07XX 2007-09-25 Font version :CP00XX01 2004-06-04 Interfce :Bluetooth & Cable Select *BD address :00:01:90:E1:E8:74 ・Printer setup Paper setup Thermal paper Ink volume ±0 Print pitch 10CPI Character code set カタカナ International Character Japan Text O ff QRsplit mode Mode 1 Edit speed Normal ・System setup Power saving time 10 minutes Link off Off Marker detection function Off Response control On ・Interface setup Interface selection Bluetooth Cable automatic detection On Cable baud rate 9600 Cable data length 8Bit Bluetooth Pass key](https://usermanual.wiki/Japan-Radio/NJJ-200.Users-Manual-2/User-Guide-2182937-Page-78.png)
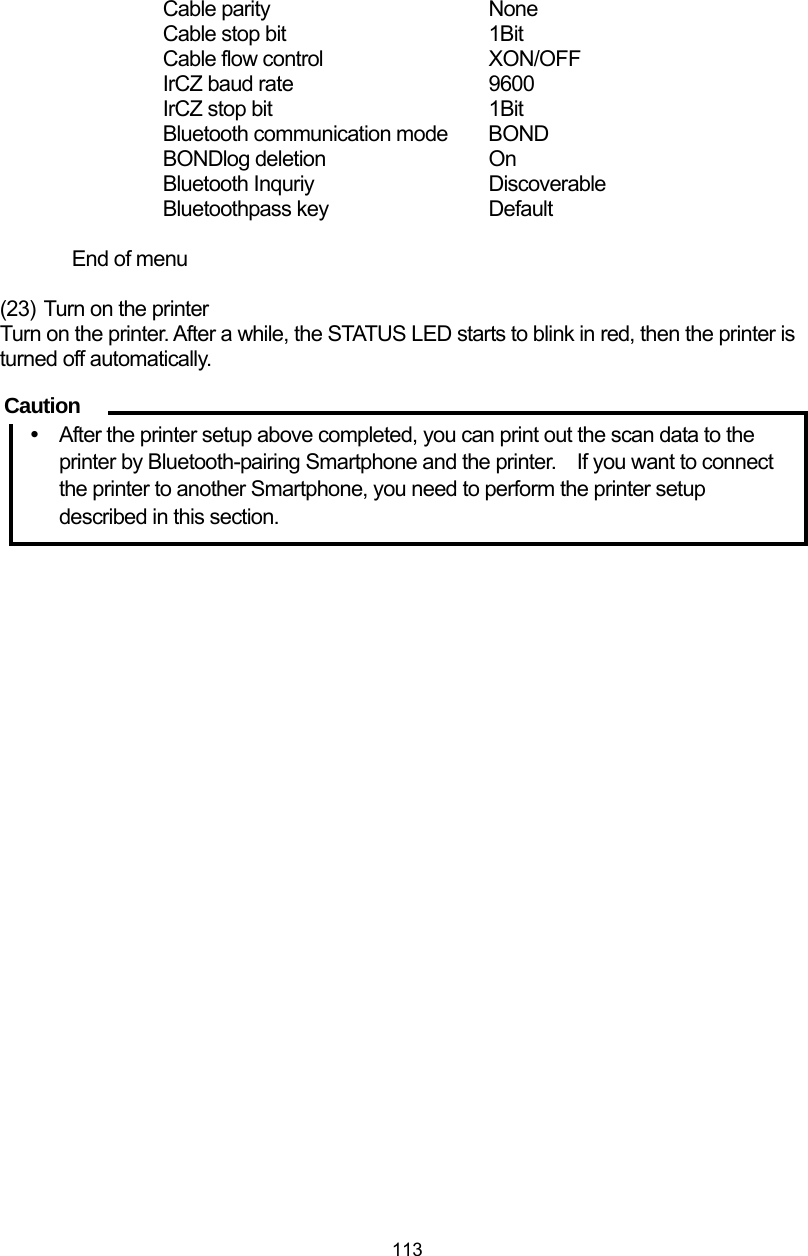
![114 5.8.2. Bluetooth pairing Smartphone communicates with the external printer by using Bluetooth communication. For this Bluetooth communication, you need to turn the Bluetooth function of Smartphone on and to execute the pairing of the Smartphone and the printer. For the details of the procedure to pair Smartphone and the printer, refer to the manual attached to Smartphone. An example of the pairing procedure is provided below. (1) Turn on the printer. (2) On Smartphone, tap [Settings] , then [Device settings]. Then the device settings screen appears. Figure 5-7 Device settings screen ))](https://usermanual.wiki/Japan-Radio/NJJ-200.Users-Manual-2/User-Guide-2182937-Page-80.png)
![115 (3) Tap [Bluetooth] button and [OFF/ON] button to turn Bluetooth on. Figure 5-8 Bluetooth setup screen (4) Tap [CITIZEN SYSTEMS] in the device list displayed in the screen. Then Bluetooth pairing request screen shown in Figure 5-10 appears. Figure 5-9 Device selection )))](https://usermanual.wiki/Japan-Radio/NJJ-200.Users-Manual-2/User-Guide-2182937-Page-81.png)
![116 (5) In accordance with the instruction shown in Bluetooth pairing request screen, enter the pass key recorded in 5.8.1 (22). Figure 5-10 Pass key setup (6) Tap [OK], then you can complete to paring Smartphone and the printer. Figure 5-11 Pairing execution (7) Tap [Home] button to return the home screen. )))))))](https://usermanual.wiki/Japan-Radio/NJJ-200.Users-Manual-2/User-Guide-2182937-Page-82.png)
![117 )5.8.3. Printing scan data You can print out the scan data by tapping[File/Print] icon. Before printing out, you need to select the printer in [Save/Print ] menu accessed by long tapping [File/Print] icon. (The shape of the [Save/Print] icon becomes a printer when the printer is selected.) After tapping [File/Print] icon, NJJ-200 application searches the available printer and after detecting a printer, it starts to print out. Then a message “Printing…” [Cancel] appears. Here you can cancel the print out by tapping [Cancel] . After completing the print out, the message disappears. The printed scan data is from the scan image displayed on the main screen from the start point of the scan data. When you want to print out all of the scan data, scroll the scan data to the end of the scan data and then start the print out. Figure 5-12 Scan data printing](https://usermanual.wiki/Japan-Radio/NJJ-200.Users-Manual-2/User-Guide-2182937-Page-83.png)
![118 When the Smartphone cannot detect an available printer (ex. When the printer is not turned on.), a message “Could not establish the communication with a printer.” [OK] appears. In this case, confirm that the printer is turned on. When Bluetooth pairing of the Smartphone and the printer is not completed, a message “The printer is not paired. I will finish printing.” [OK] appears. In this case, shut down NJJ-200 application and perform Bluetooth pairing in accordance with Section 5.8.2 Bluetooth pairing. 1)Printer turned off 2)Bluetooth pairing not made Figure 5-13 Example of printing failure y Before printing out, the printer setup is required. Make sure to complete the printer setup described in Section 5.8.1 Preparation for the printer. y The printer is dedicated to NJJ-200 Handy Search. It is not applicable to the any other Handy Search model. y Make sure one Smartphone is paired to only one printer for Bluetooth pairing. Smartphone does not allow you to select one from some available printers. The scan data is printed out to the printer detected by Smartphone first of all. y The print out is made in monochrome of 16 gradation). The printed image is not the same as that of the scan image displayed on Smartphone. y The print out of the scan data is compressed to fit for printing. Although the position of the cursor and marker may be slightly moved on the print out, however, the coordinate information of the cursor and marker is not changed. y Make sure to use the recommended print paper. Caution](https://usermanual.wiki/Japan-Radio/NJJ-200.Users-Manual-2/User-Guide-2182937-Page-84.png)
![119 y For detailed information about the printer, refer to the printer manual. The range of printing is from the scan start point (0 m) to the scan image displayed on the main screen. To print out all the scan data, scroll the main screen to the end of the scan position and print out the scan data. y The direction of printing depends on the scan direction (forward or backward). y The speed of printing slows down in accordance with the battery voltage of the printer. Change the battery as soon as possible when the speed of printing out is slowing down. y When a message “Low printer battery voltage. “ [OK] during printing or at the start of printing appears, it means that the battery voltage of the printer is dropping. Turn off the printer and change the battery with a fully charged one. y When a message “No print paper. Turn off the printer and supply the paper to the printer.“ [OK] during printing or at the start of printing, the printer is in out of paper. Turn off the printer and supply the print paper. (If the paper was supplied when the printer is turned on, the next print out will not be executed correctly. In this case, cancel the print out, and cycle the power of the printer.) y For the scan data of the distance more than 10 m scanned with the distance correction ≥ 13, when printing it in Wide (“W”) view range (Shallow W, Normal W, Depth W), the printed image may be difficult to recognize. Note](https://usermanual.wiki/Japan-Radio/NJJ-200.Users-Manual-2/User-Guide-2182937-Page-85.png)