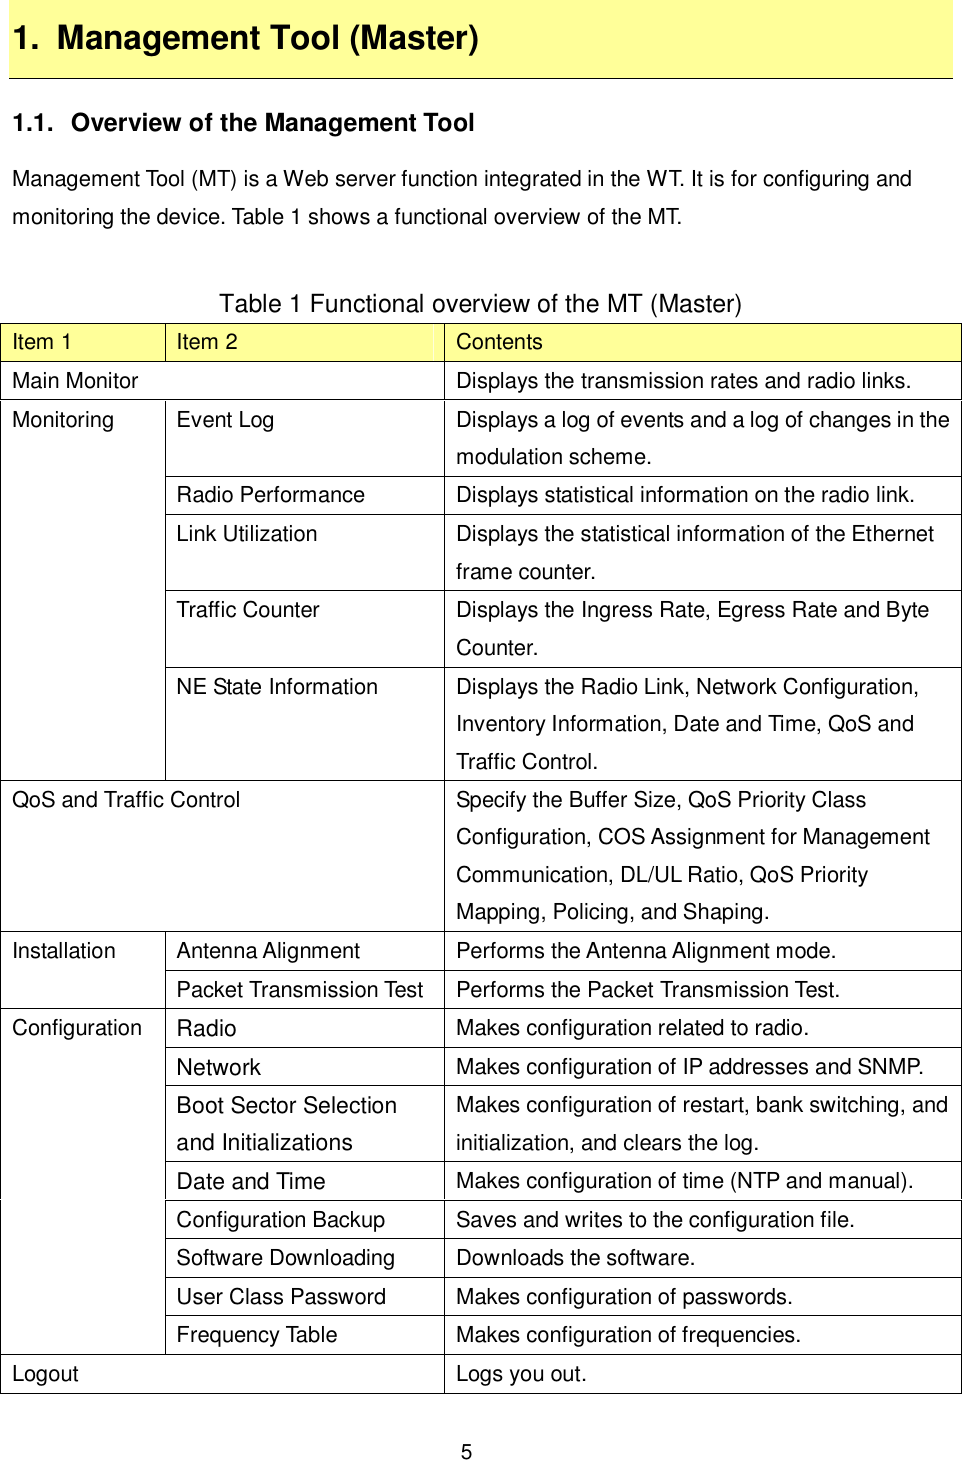
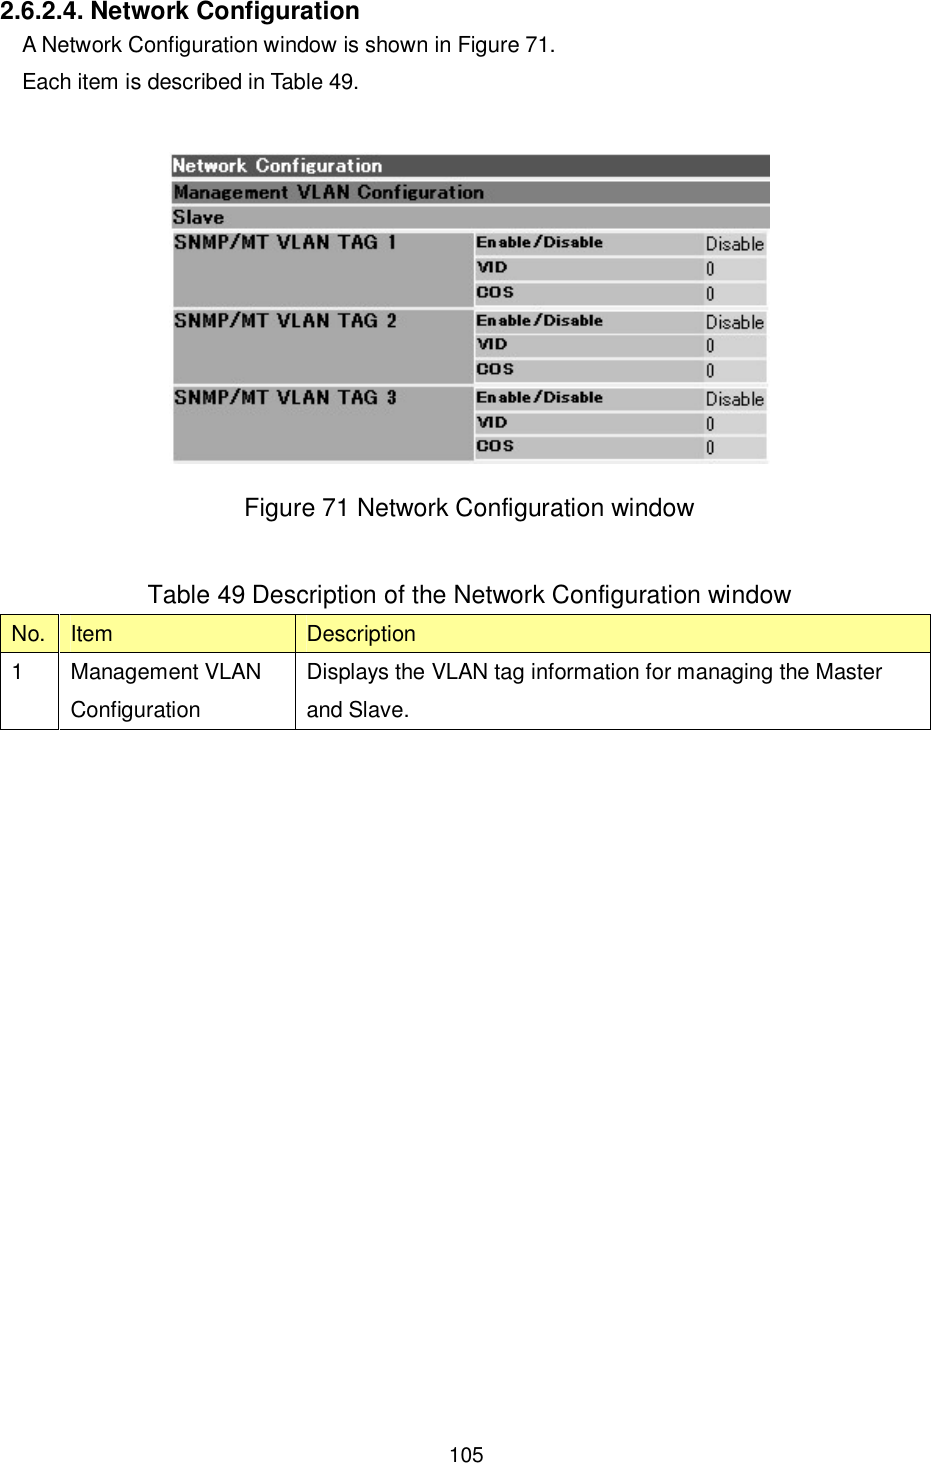
Japan Radio NTG525-EUL Wireless Access System User Manual Managenment ToolInstruction manual
Japan Radio Co Ltd. Wireless Access System Managenment ToolInstruction manual
Contents
- 1. Instruction manual
- 2. Managenment ToolInstruction manual
Managenment ToolInstruction manual

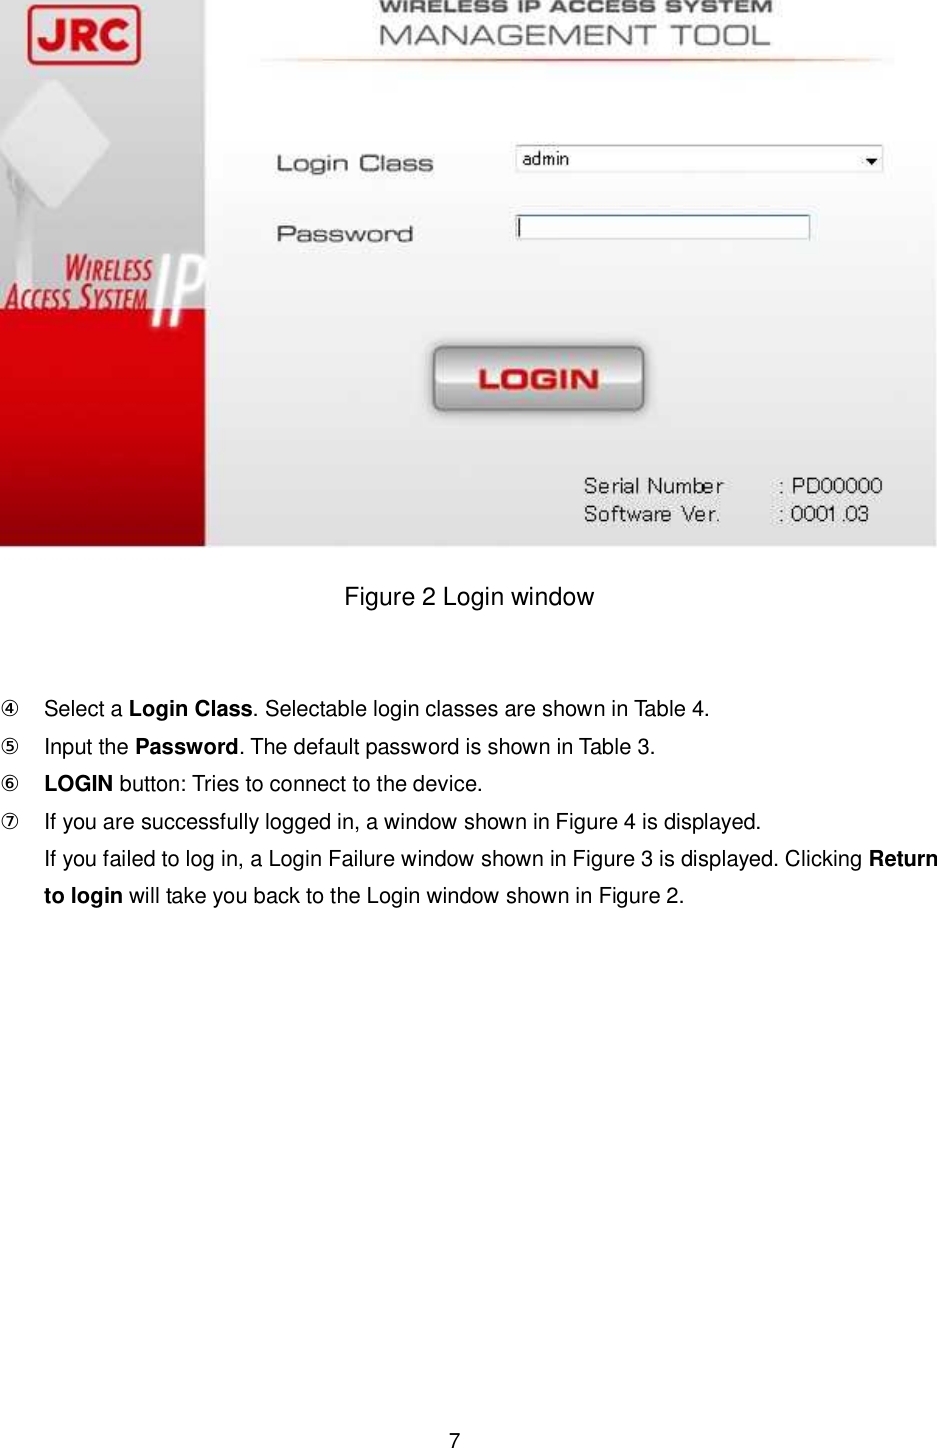
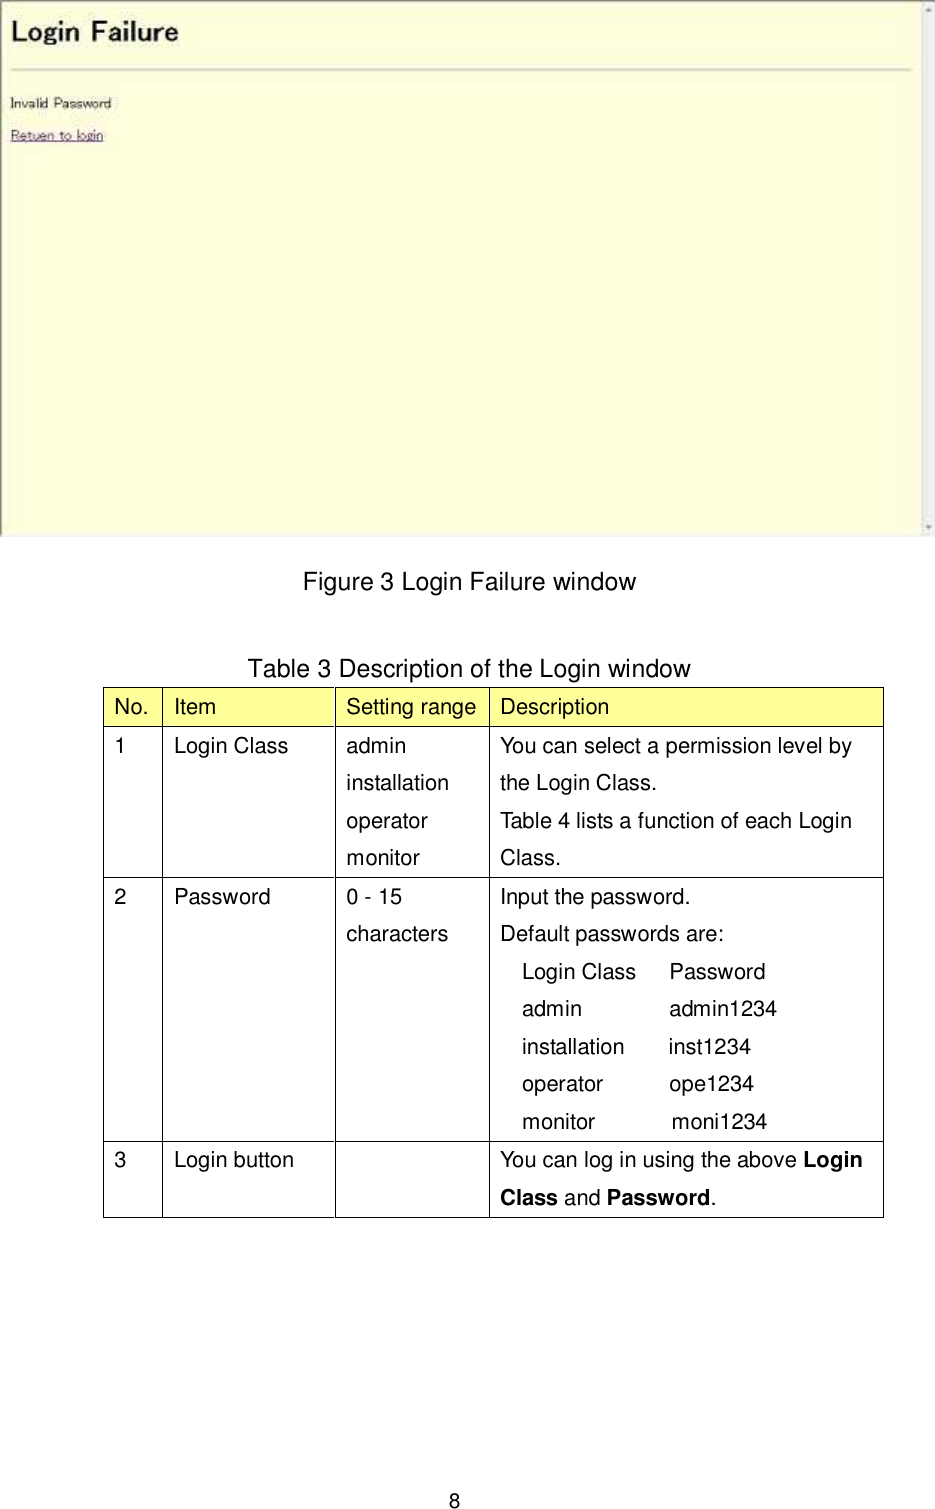
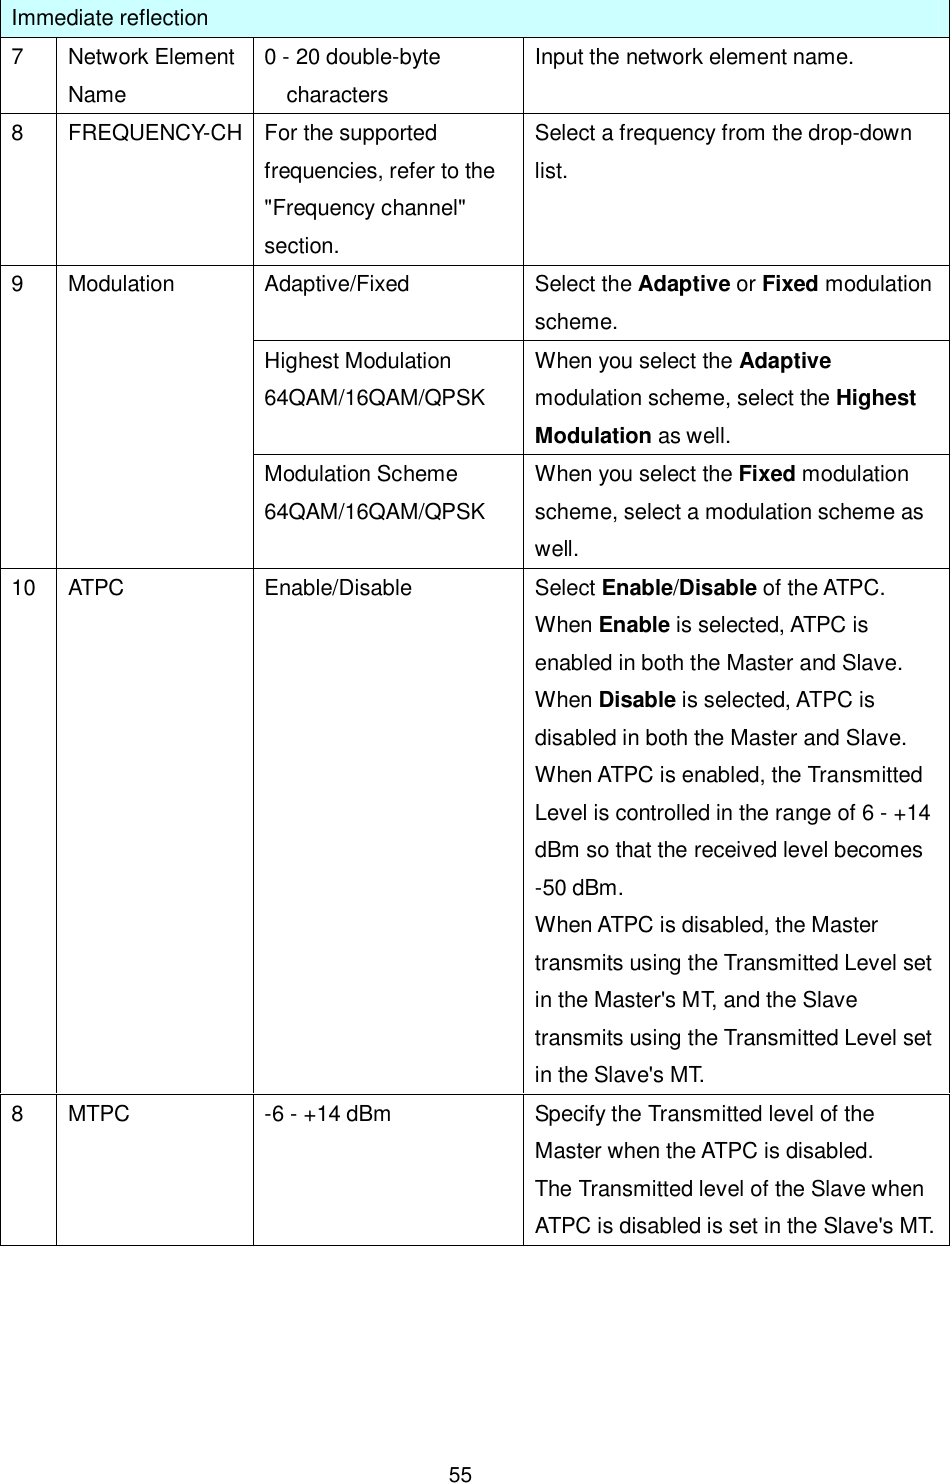
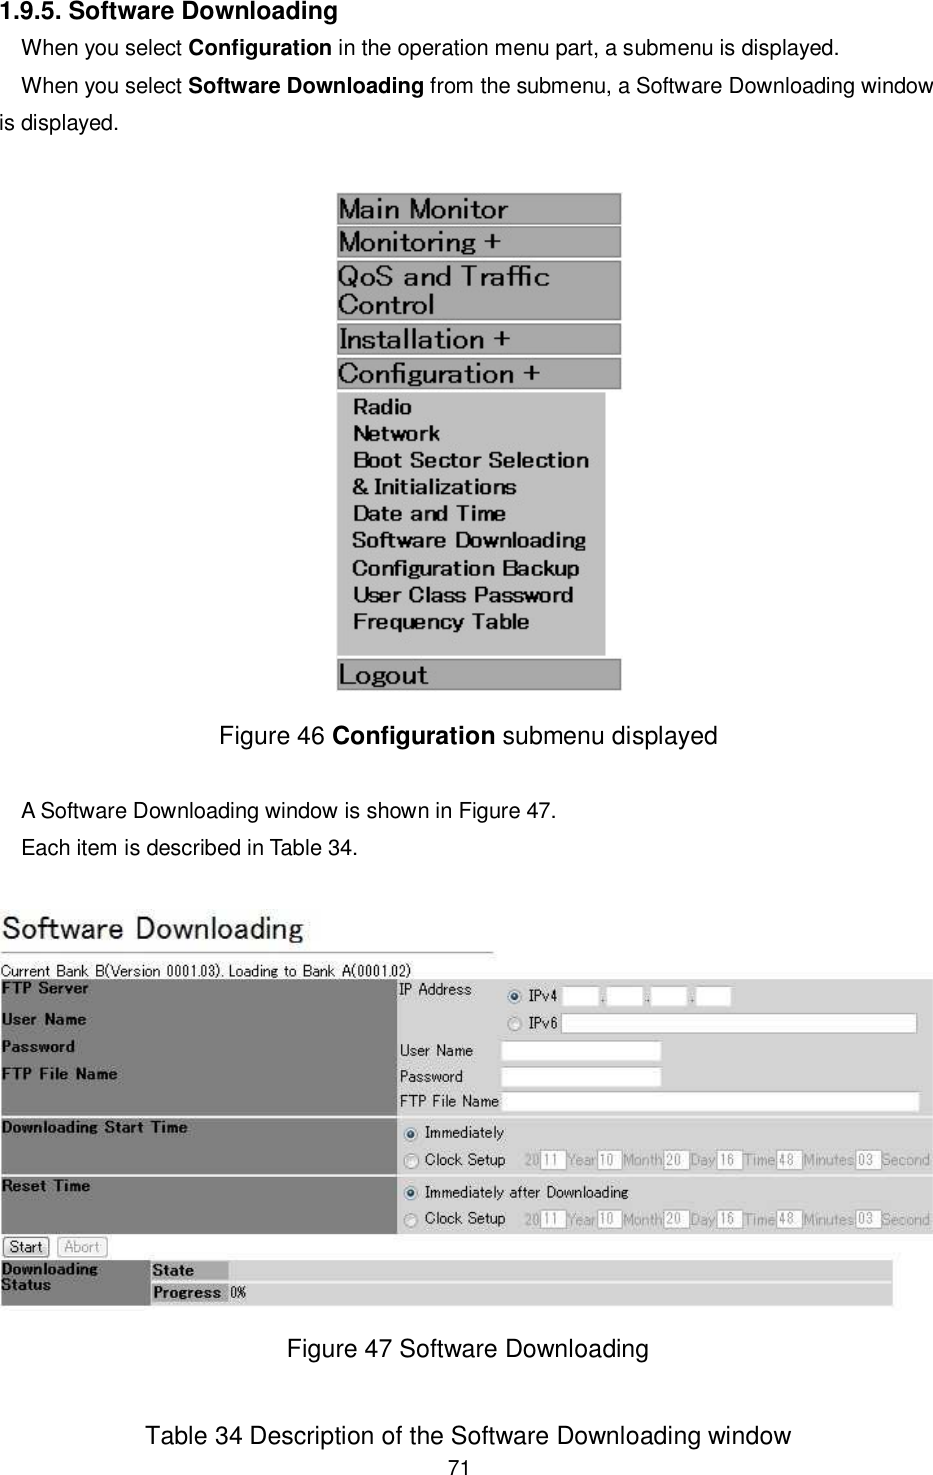
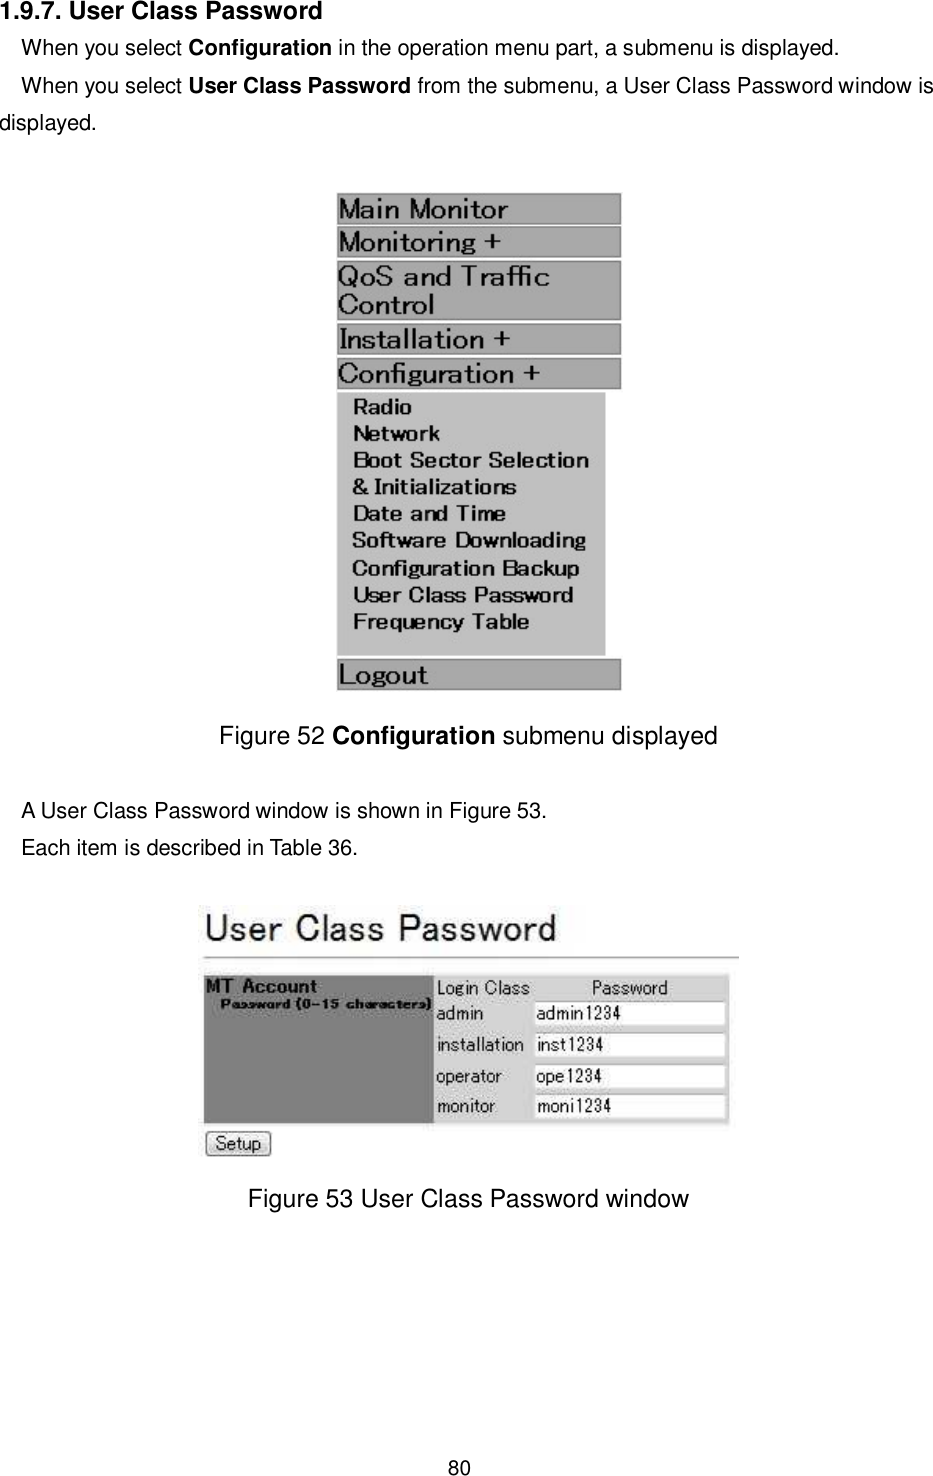
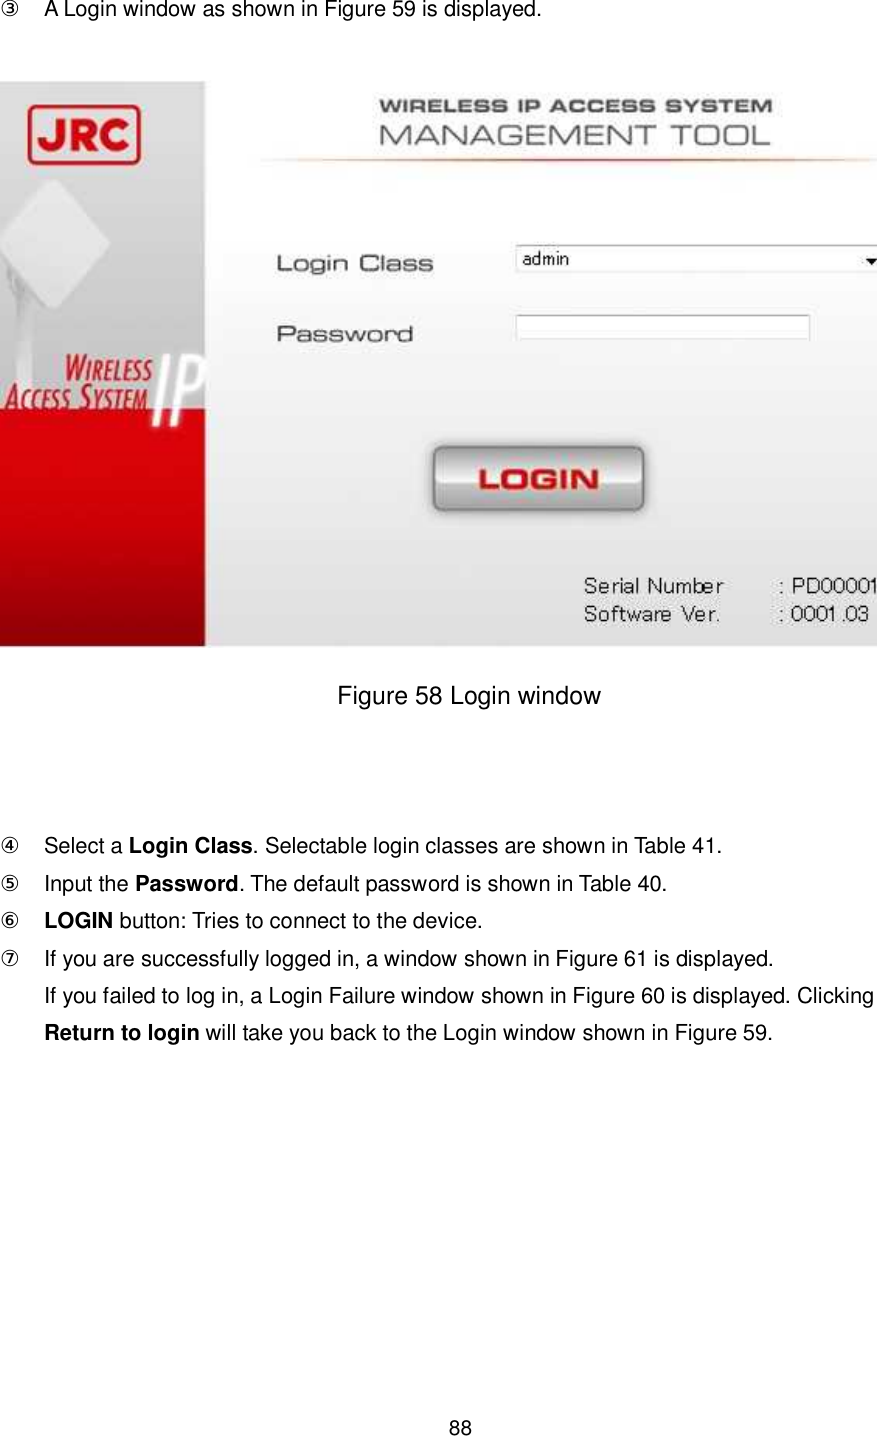
![6 1.2. Logging In [Operation] ① Connects the MT operation PC and the device over the LAN. Table 2 shows an recommended environment for the PC. Table 2 Recommended environment for the MT operation PC No. Item Specifications Remarks 1 Web browser Windows Internet Explorer Version 8 or higher 2 Monitor size 1024*768 ② Input the IP address of the device as the URL in the Windows Internet Explorer. The factory default IP address is "192.168.1.100". Figure 1 Inputting the IP address to the Internet Explorer ③ A Login window as shown in Figure 2 is displayed.](https://usermanual.wiki/Japan-Radio/NTG525-EUL.Managenment-ToolInstruction-manual/User-Guide-1684777-Page-6.png)
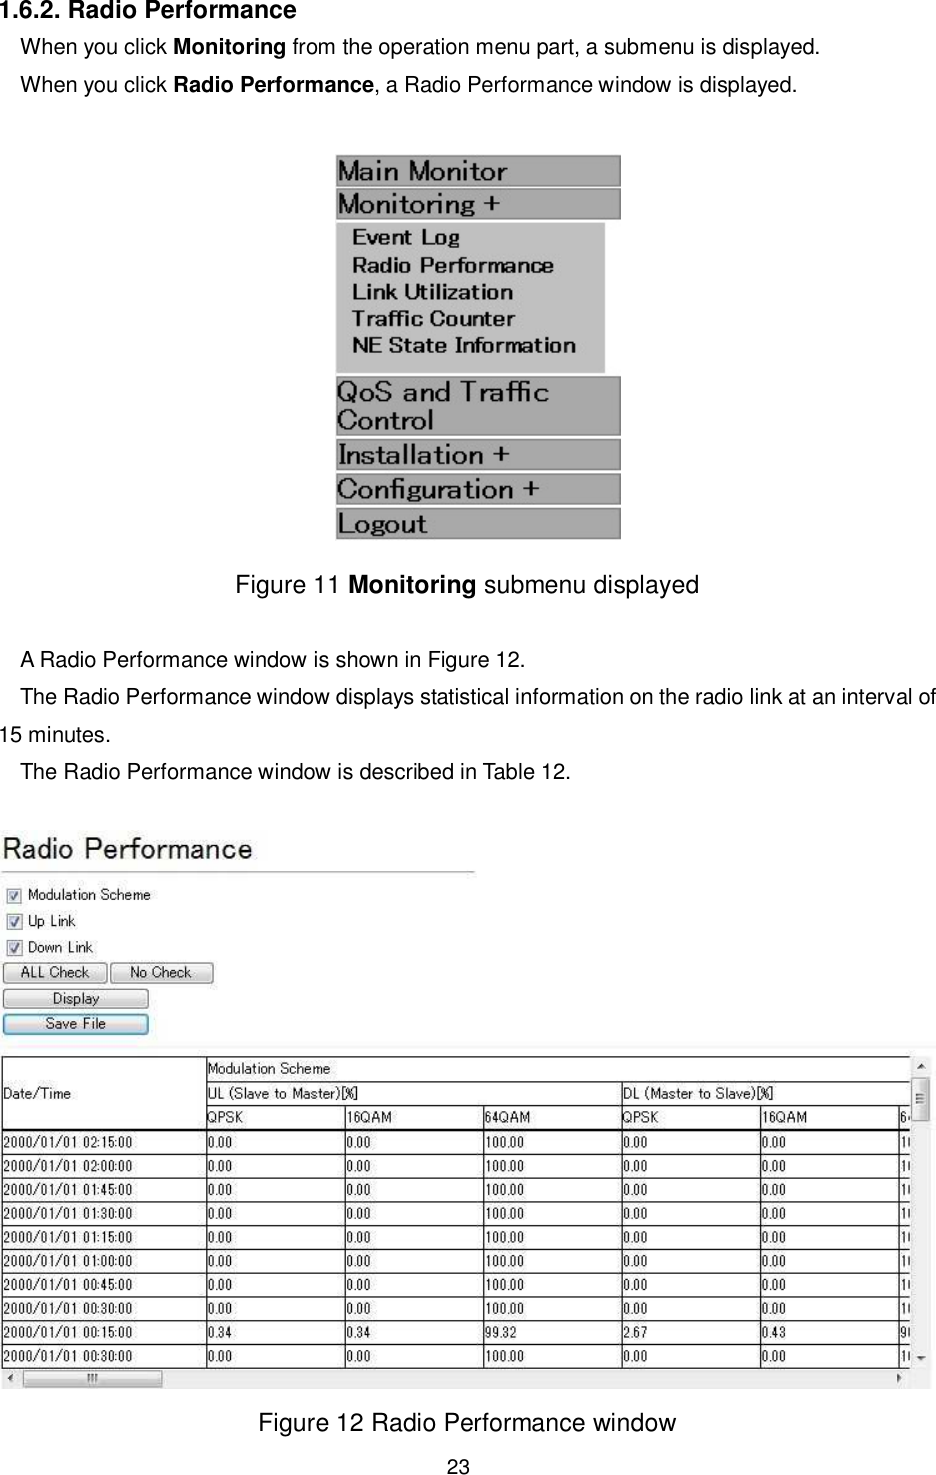
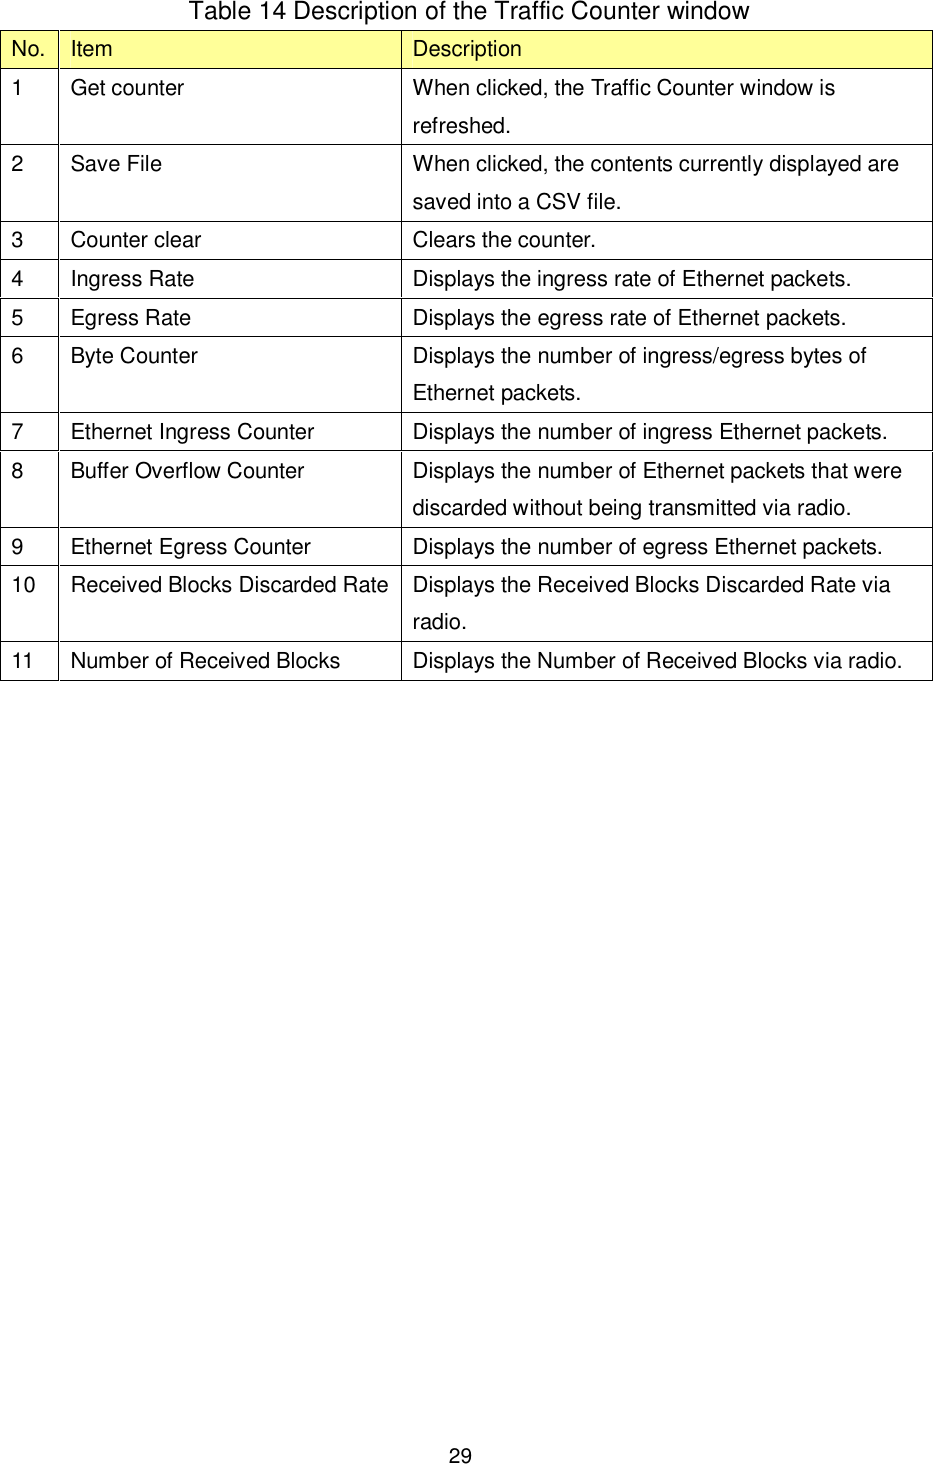
![24 Table 12 Description of the Radio Performance window No. Item Contents 1 Check box Only the items with their check boxes selected are displayed. [Modulation Scheme] Down Link: QPSK/16QAM/64QAM: Each occupancy is displayed in %. Up Link: QPSK/16QAM/64QAM: Each occupancy is displayed in %. [Up Link/Down Link] Transmitted Level: MIN/MAX Received Level: MIN/MAX Receive CNR: MIN/MAX Received Blocks Discarded Rate: QPSK/16QAM/64QAM Number of Received Blocks: QPSK/16QAM/64QAM 2 ALL Check Selects all the check boxes. 3 No Check Clears all the check boxes. 4 Display Refreshes the statistical information. 5 Save File When clicked, a dialog to specify the destination and file name is displayed to store the contents in a file. The file format is CSV.](https://usermanual.wiki/Japan-Radio/NTG525-EUL.Managenment-ToolInstruction-manual/User-Guide-1684777-Page-24.png)
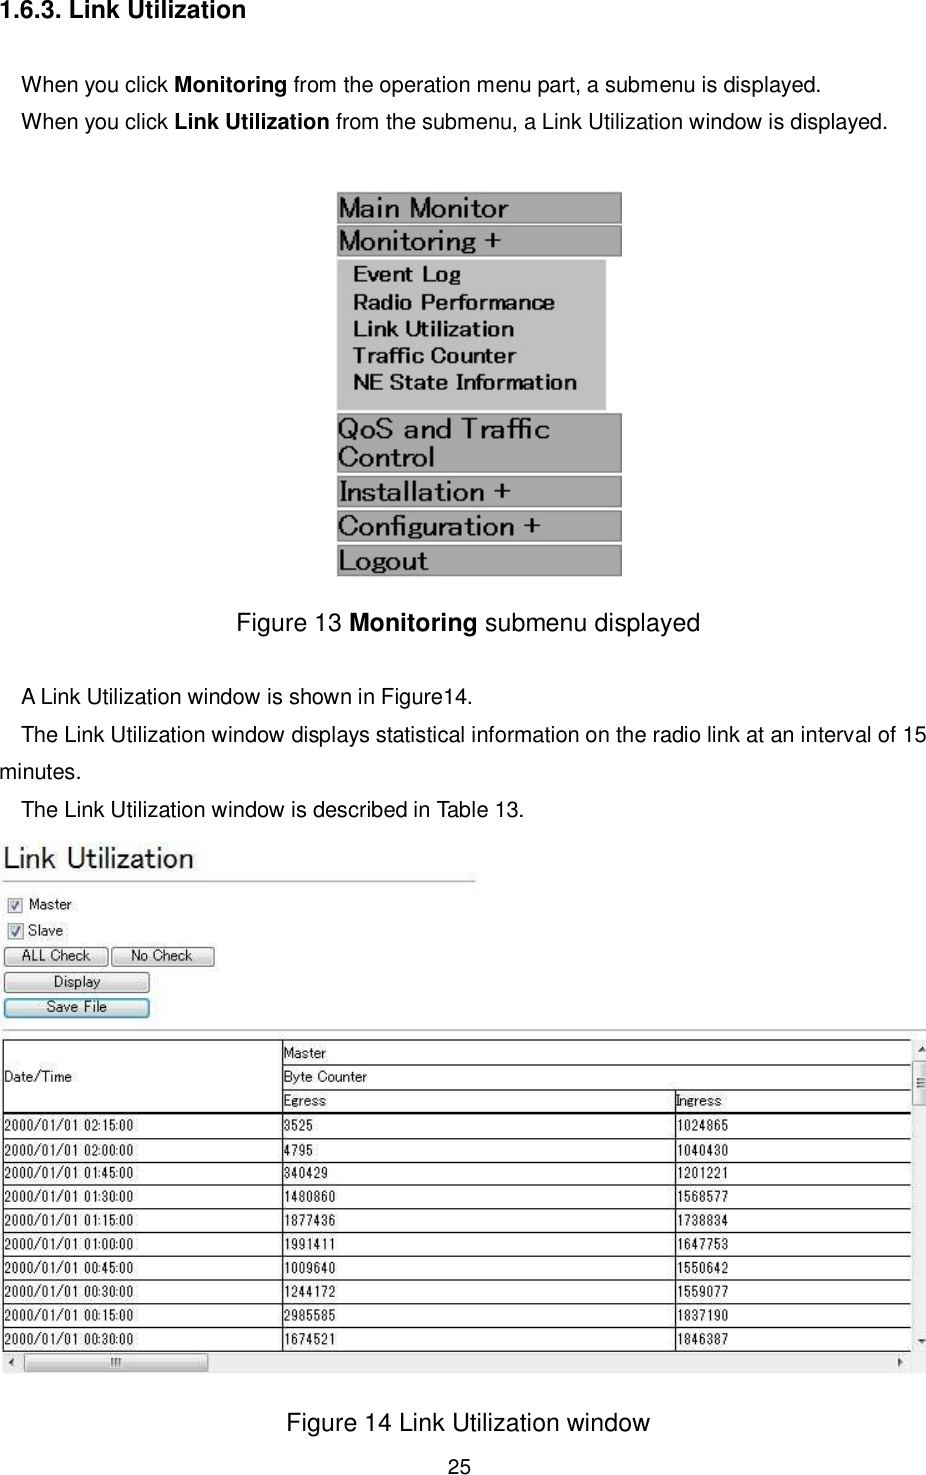
![26 Table 13 Description of the Link Utilization window No. Item Contents 1 Check box Only the items with their check boxes selected are displayed. [Counter window] [Master/Slave] - Byte Counter Egress: Total value of the eight classes is displayed. Ingress: Total value of the eight classes is displayed. - Ethernet Frame Counter Ingress: Total value of the eight classes is displayed. Egress: Total value of the eight classes is displayed. Buffer Overflow Counter: Total value of the eight classes is displayed. 2 ALL Check Selects all the check boxes. 3 No Check Clears all the check boxes. 4 Display Refreshes the statistical information. 5 Save File When clicked, a dialog to specify the destination and file name is displayed to store the contents in a file. The file format is CSV.](https://usermanual.wiki/Japan-Radio/NTG525-EUL.Managenment-ToolInstruction-manual/User-Guide-1684777-Page-26.png)
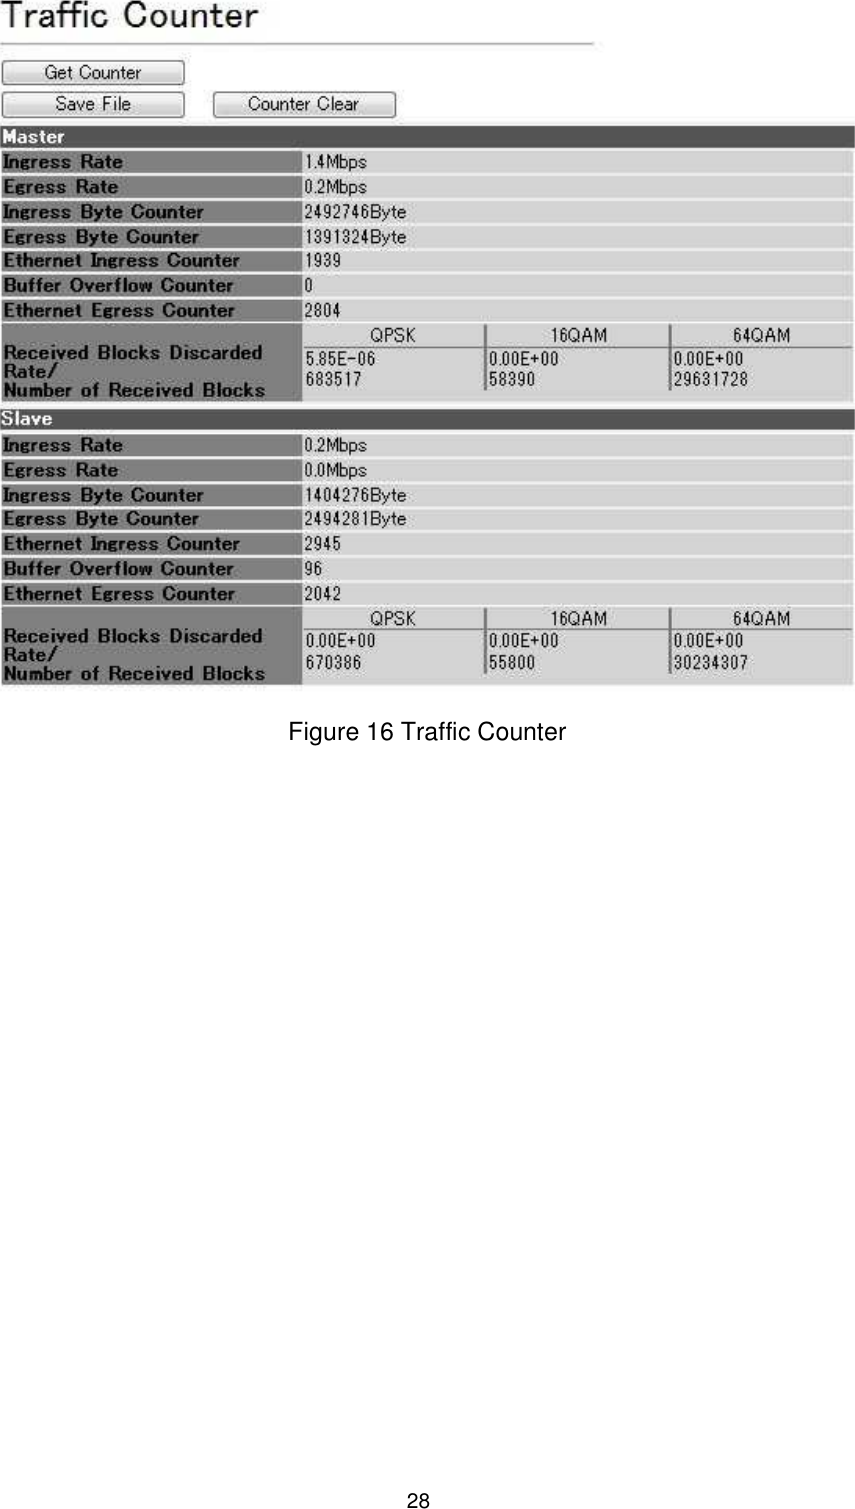
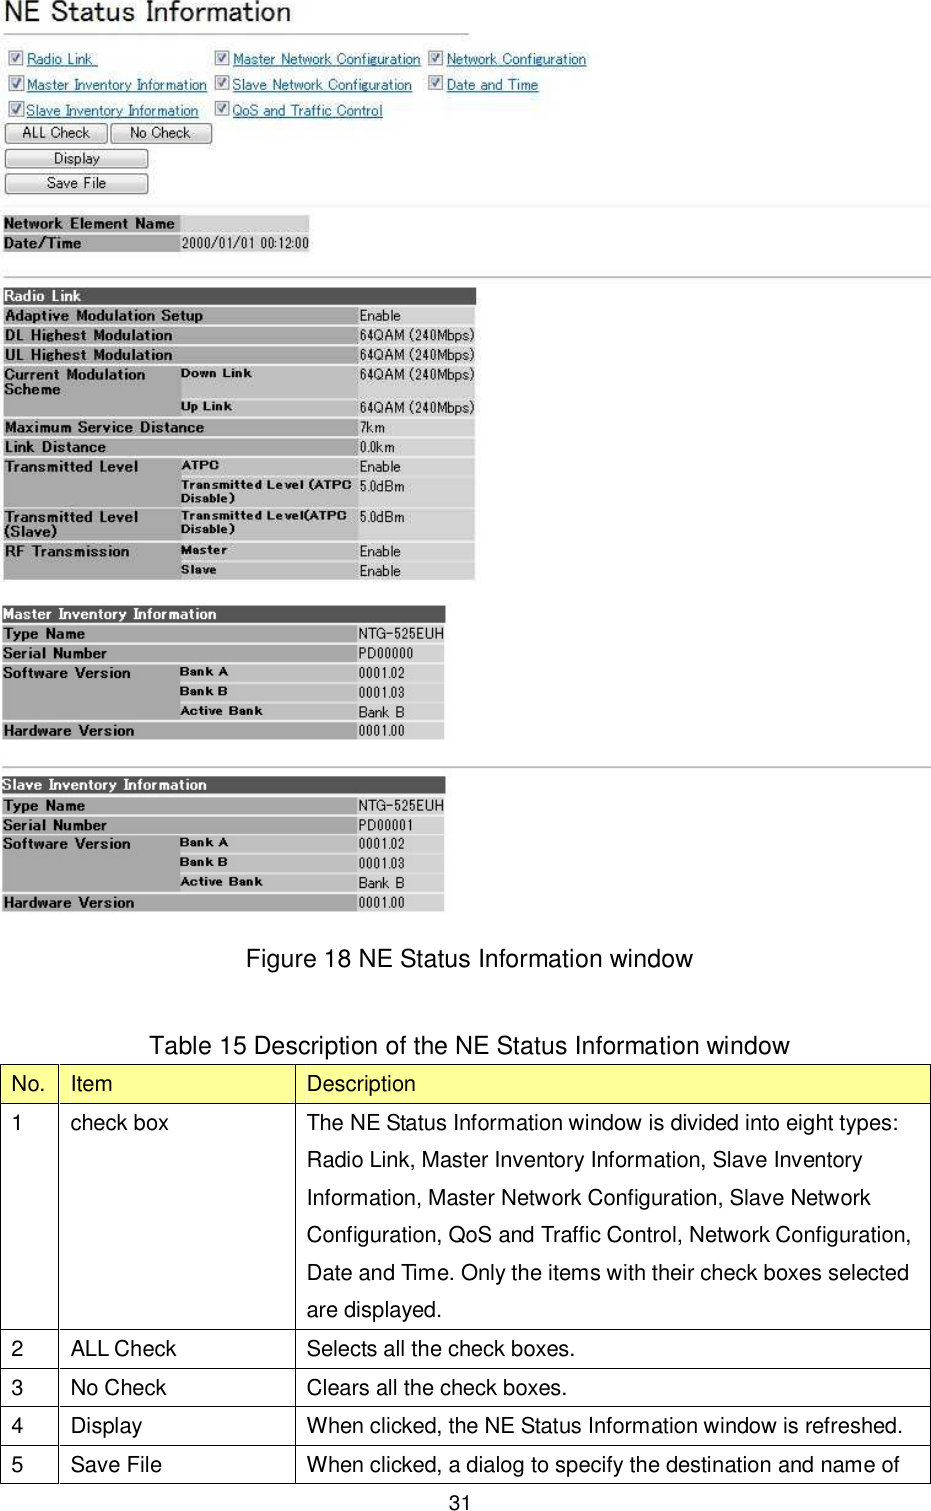
![32 the file is displayed to store NE Status Information. Following information will be saved in addition to the displayed items. [Mode] [Symbol Rate] [Frequency] [CH] [Frame ID] [Status] [Radio Link] [Authentication] [Manag. Com.] 6 Network Element Name Displays the network element name. 7 Date/Time Displays the time of the device when the window is displayed. 8 Radio Link [Adaptive Modulation Setup] [DL Highest Modulation] [UL Highest Modulation] [Current Modulation Scheme: Down Link] [Current Modulation Scheme: Up Link] [Maximum Service Distance] [Link Distance] [Transmitted Level] [RF Transmission] 9 Master inventory Information [Type Name] [Serial Number] [Software Version: Bank A/Bank B/Active Bank] [Hardware Version] 10 Slave inventory Information [Type Name] [Serial Number] [Software Version: Bank A/Bank B/Active Bank] [Hardware Version]](https://usermanual.wiki/Japan-Radio/NTG525-EUL.Managenment-ToolInstruction-manual/User-Guide-1684777-Page-32.png)
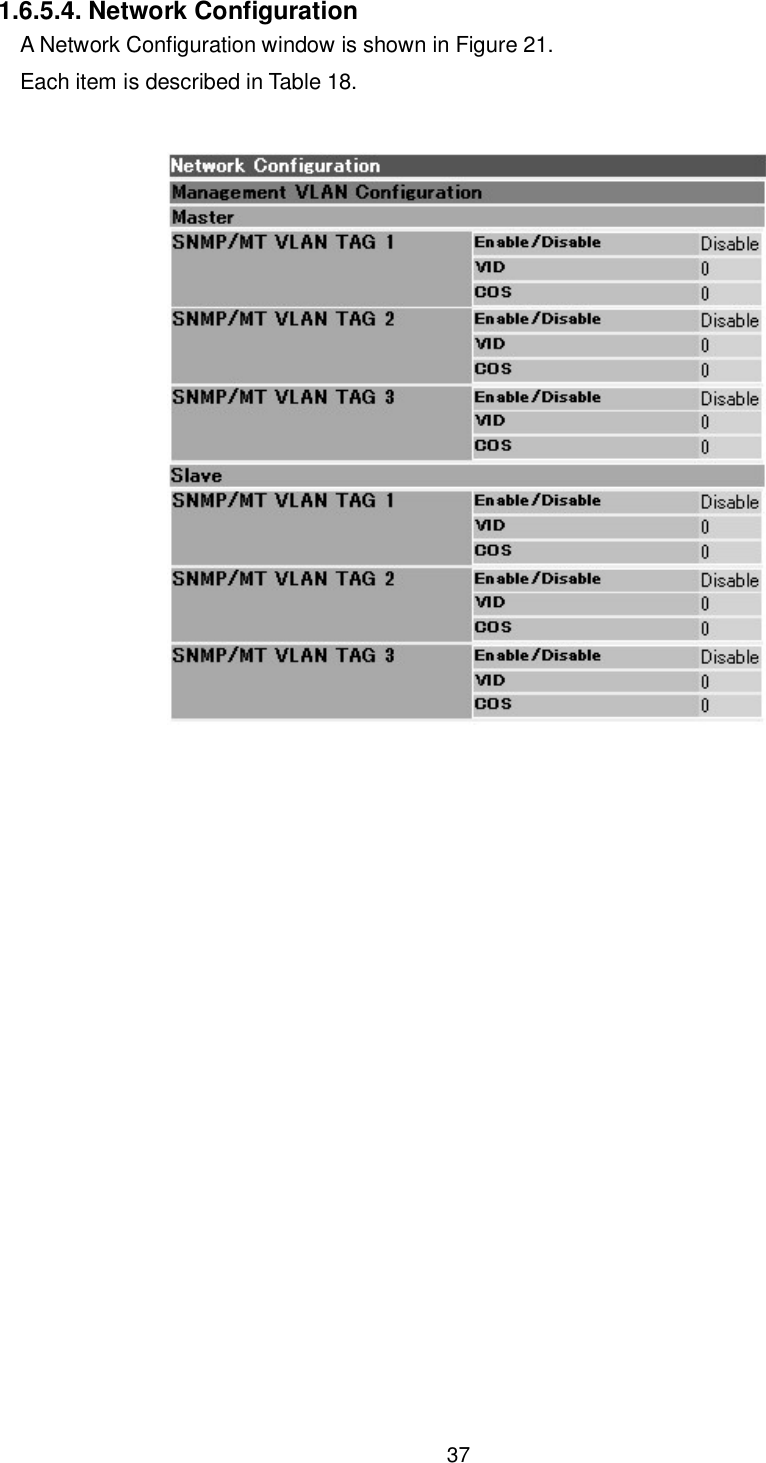
![33 1.6.5.2. Master/Slave Network Configuration A Master/Slave Network Configuration window is shown in Figure 19. Each item is described in Table 16. Figure 19 Master/Slave Network Configuration Table 16 Items of the Master/Slave Network Configuration window No. Item Description 1 Ethernet Configuration [Setup] The setting value is displayed. [Status] Displays the Ethernet link status at the time it is displayed. 2 IPv4 [IP Address] [Subnet Mask] [Default Gateway] 3 IPv6 [Enable/Disable] [IP Address] [Default Gateway] 4 MAC address The MAC address is displayed.](https://usermanual.wiki/Japan-Radio/NTG525-EUL.Managenment-ToolInstruction-manual/User-Guide-1684777-Page-33.png)
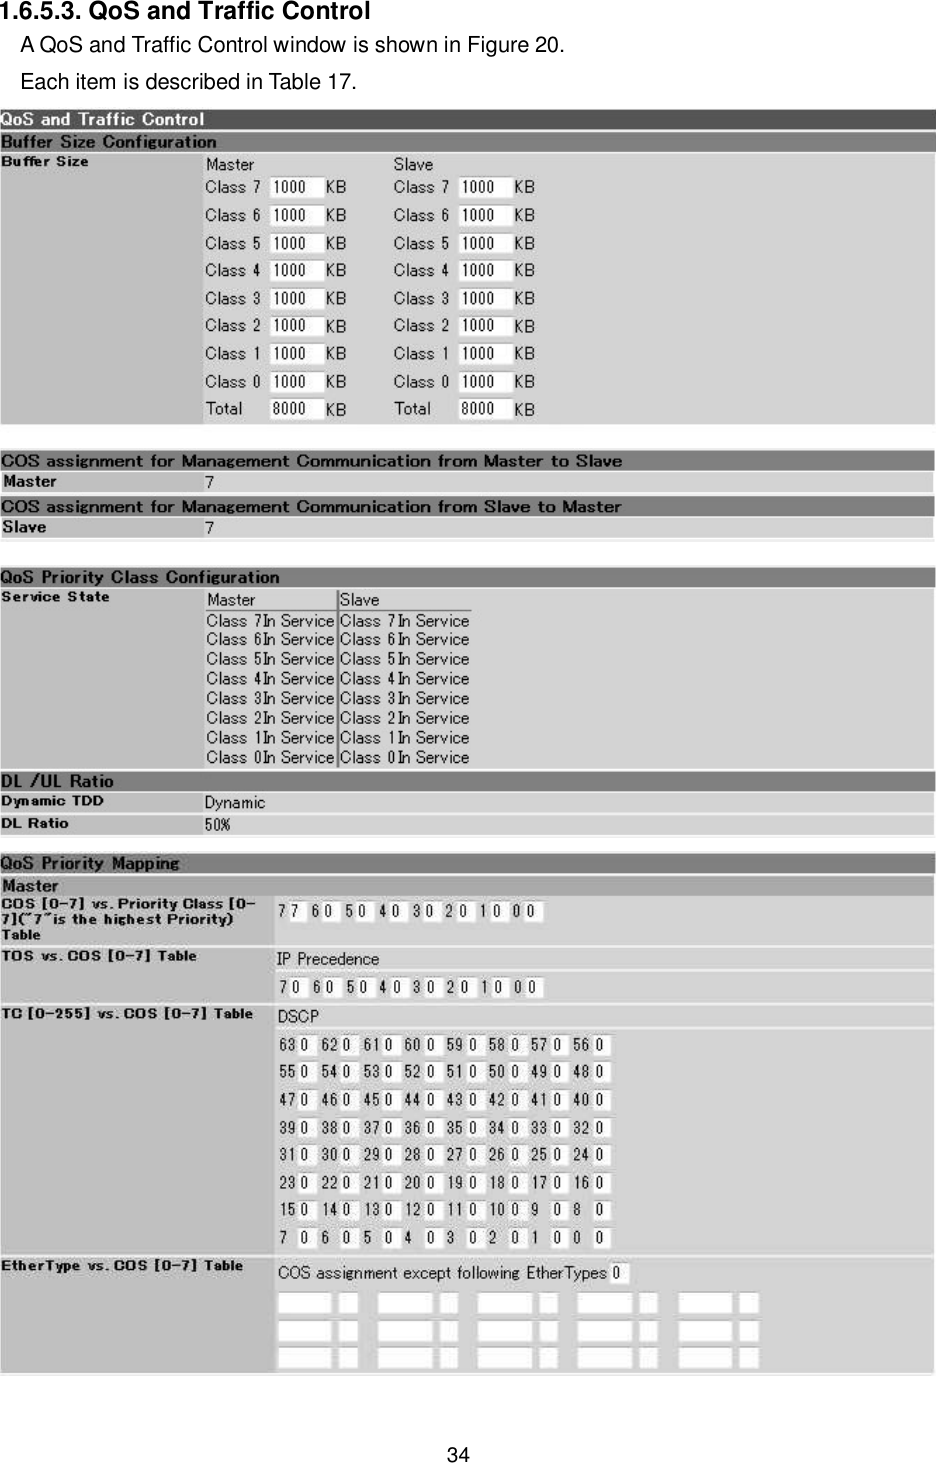
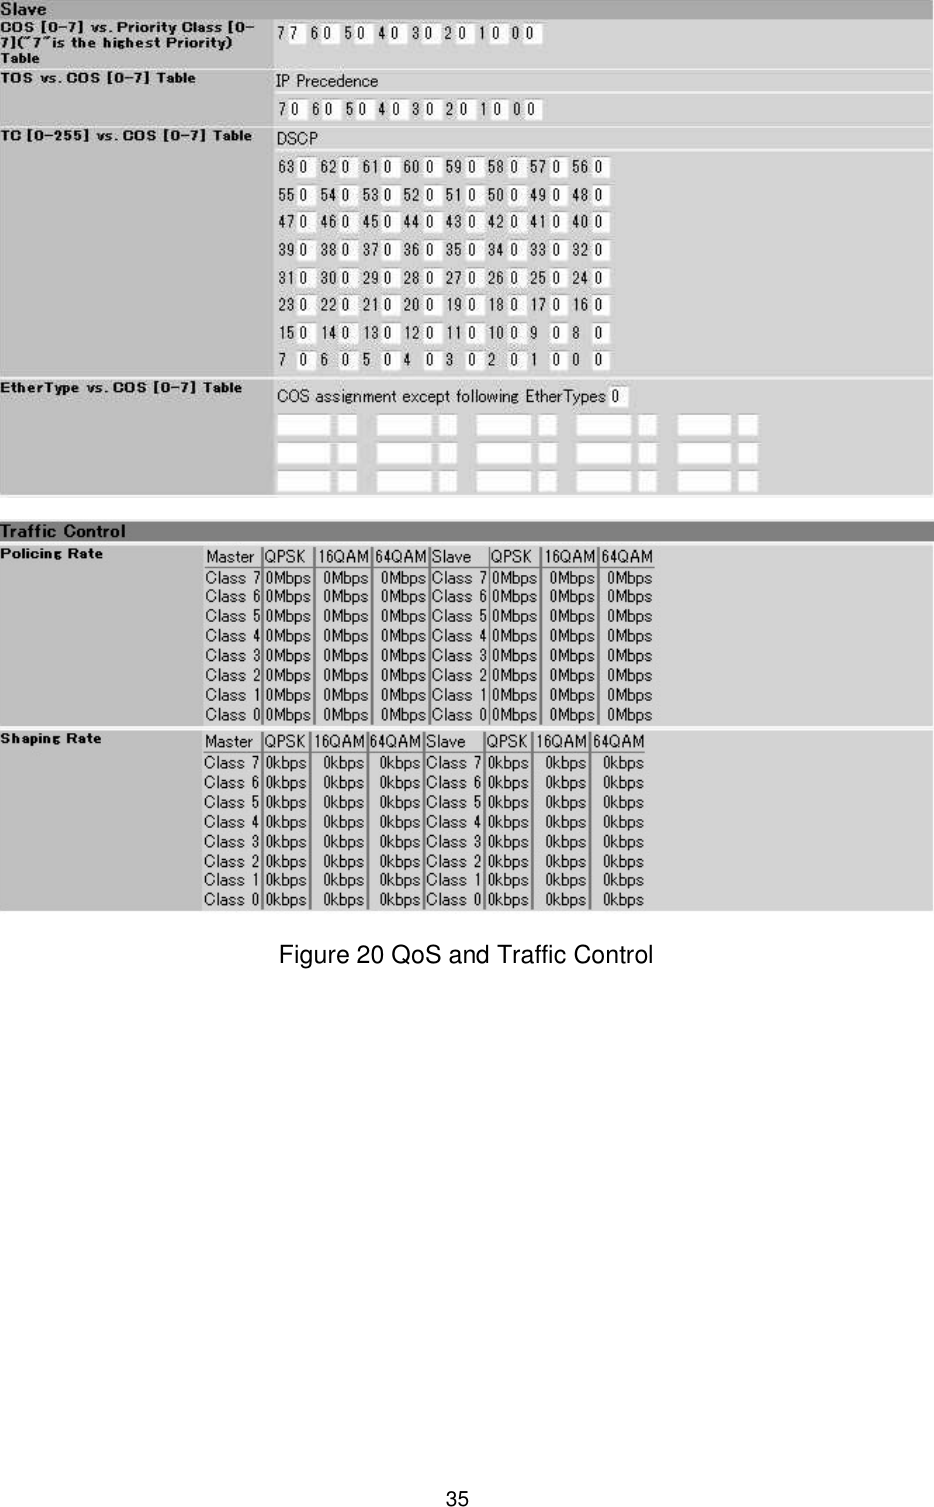
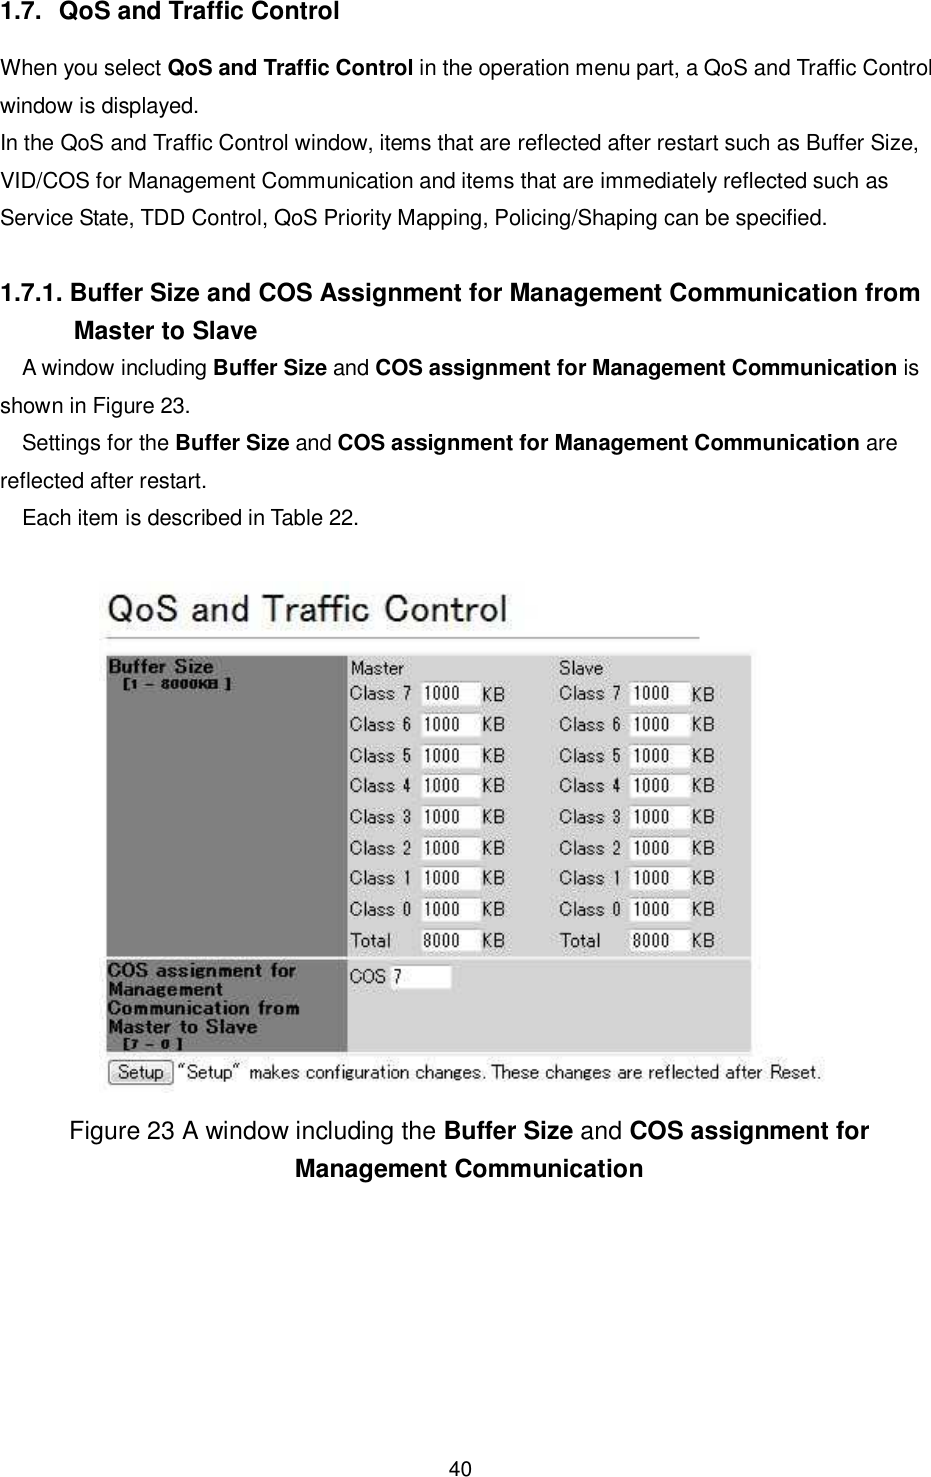
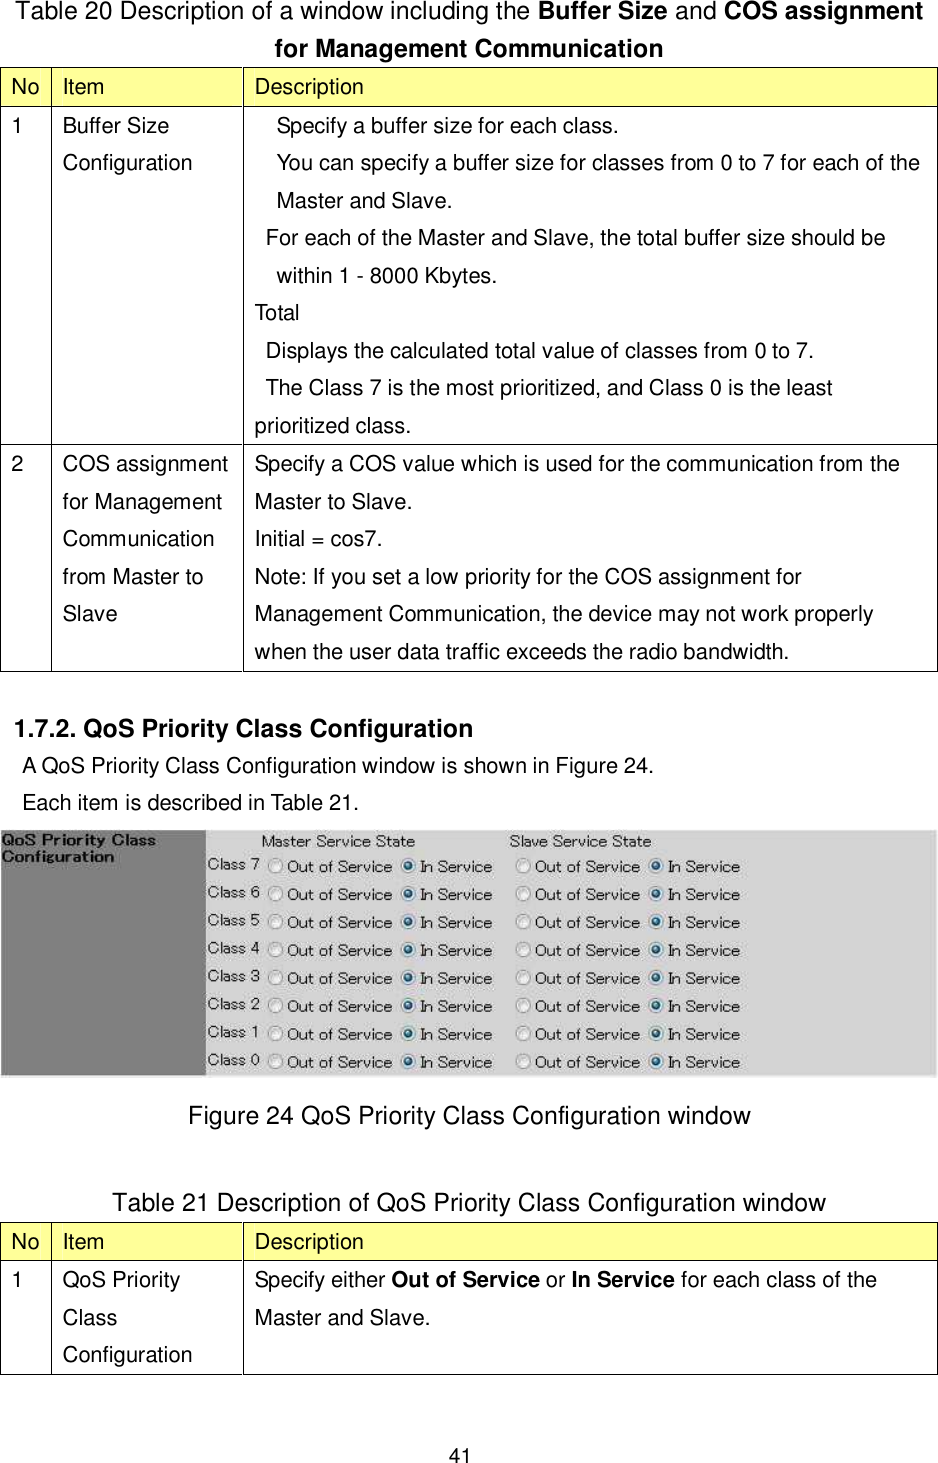
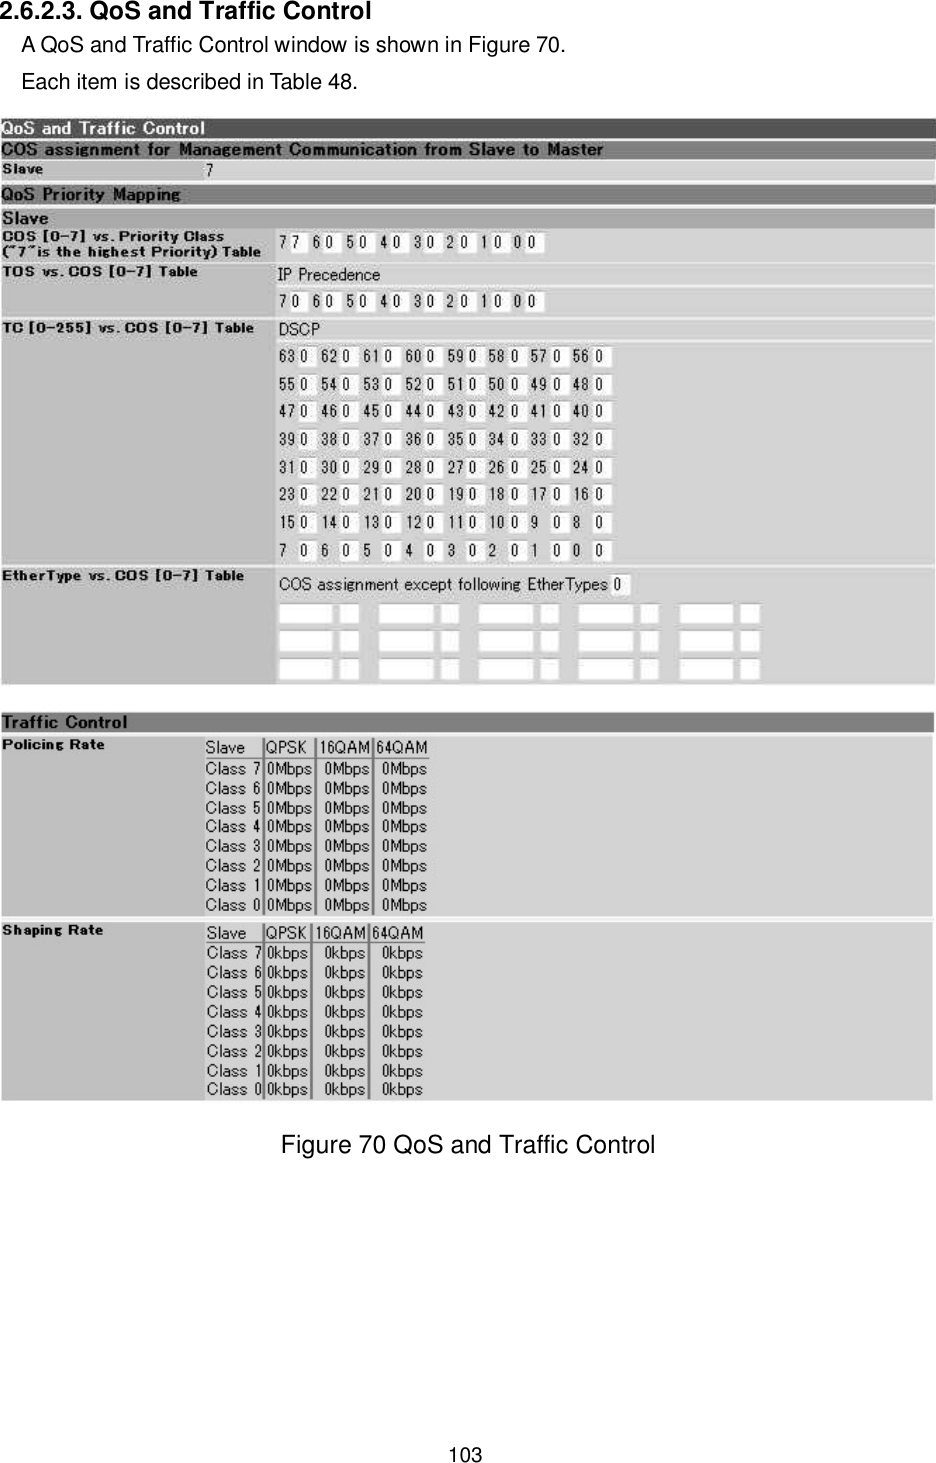
![36 Table 17 Description of the QoS and Traffic Control window No. Item Description 1 Buffer Size Configuration Displays a buffer size for each class of Master and Slave. 2 COS assignment for Management Communication Displays a COS assignment value for communication between Master and Slave devices. 3 QoS Priority Class Configuration Displays a service state for each class of Master and Slave. 4 DL/UL Ratio Displays a dynamic TDD mode and setting value of the DL Ratio. 5 QoS Priority Mapping Following values are displayed for the Master and Slave. Displays the setting value at the time it is displayed. COS [0-7] vs. Priority Class ("7"is the highest Priority) Table TOS vs. COS [0-7] Table TC [0-255] vs. COS [0-7] Table EtherType vs. COS [0-7] Table For TOS vs. COS [0-7] Table, IP Precedence or DSCP, either of which has been selected, is displayed. 6 Traffic control Policing Rate Displays permitted policing rates of the Master and Slave. These are displayed for each class and each modulation scheme. 7 Traffic control Shaping Rate Displays permitted policing rates of the Master and Slave. These are displayed for each class and each modulation scheme.](https://usermanual.wiki/Japan-Radio/NTG525-EUL.Managenment-ToolInstruction-manual/User-Guide-1684777-Page-36.png)
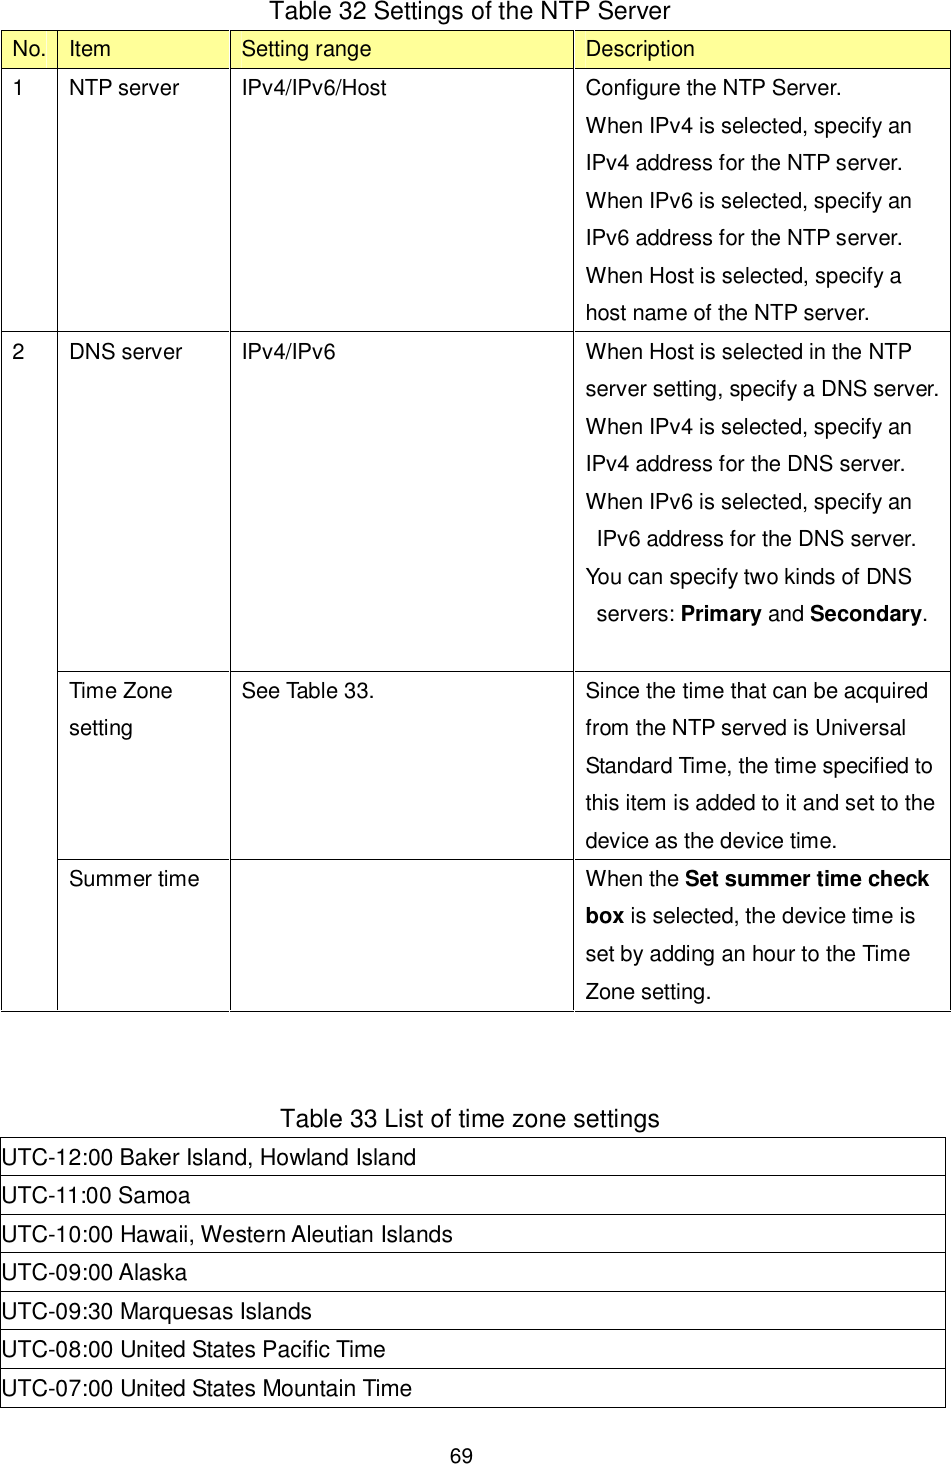
![39 1.6.5.5. Date and Time A Date and Time window is shown in Figure 22. Each item is described in Table 19. Figure 22 Date and Time window Table 19 Description of the Date and Time window No. Item Description 1 Date and Time [Clock Setting Mode] Displays the specified item. [NTP Server, IP Address] When the connection is successful, a destination IP Address is displayed. When the connection failed, "-" is displayed. [DNS Server, IP Address] When the connection is successful, a destination IP Address is displayed. When the connection failed or when it is not set, "----" is displayed. [Time Zone] Displays the specified Time Zone.](https://usermanual.wiki/Japan-Radio/NTG525-EUL.Managenment-ToolInstruction-manual/User-Guide-1684777-Page-39.png)
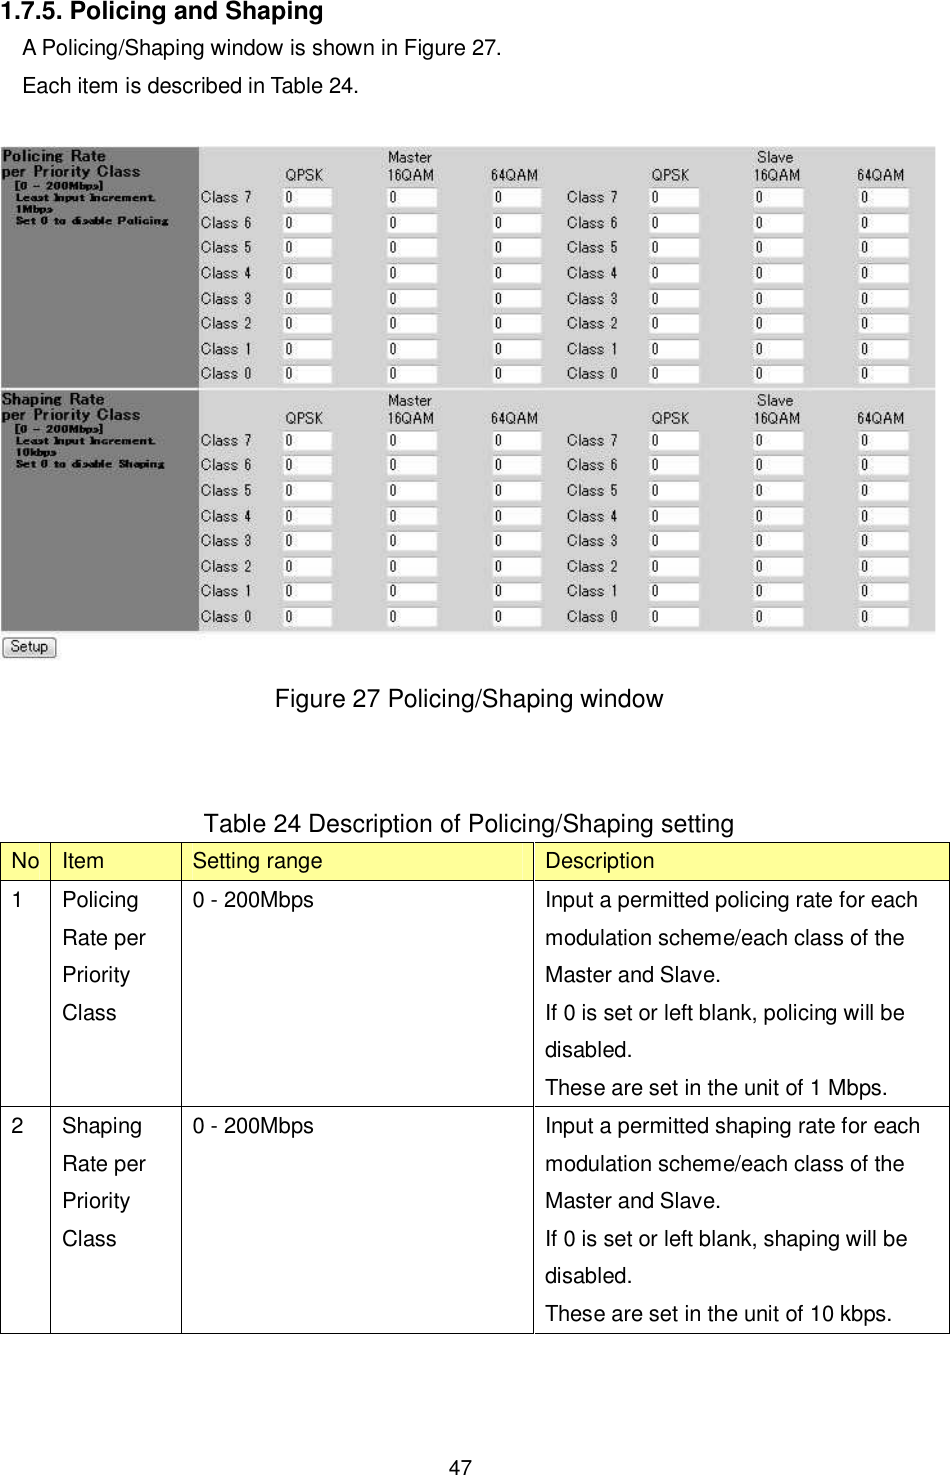
![42 1.7.3. TDD Control A TDD Control window is shown in Figure 25. Each item is described in Table 22. Figure 25 TDD Control window Table 22 Description of TDD Control window No Item Setting range Description 1 TDD Control Fixed/Dynamic Specify an operation method for TDD control. Fixed: Regardless of the uplink and downlink traffic, communication is always performed using a fixed percent of radio bandwidth. Dynamic: Communication is performed by atomically assigning the extra bandwidth generated by changes in the uplink and downlink traffic to the other communication bandwidth. 2 DL Ratio[Fixed] DL Arbitration Ratio[Dynamic] 1 - 99% Specify a value corresponding to the percent of downlink bandwidth in total bandwidth in 1% - 99%. Note: Setting a value from 10% to 90% is recommended in order to perform communication between devices such as authentication and key updates.](https://usermanual.wiki/Japan-Radio/NTG525-EUL.Managenment-ToolInstruction-manual/User-Guide-1684777-Page-42.png)
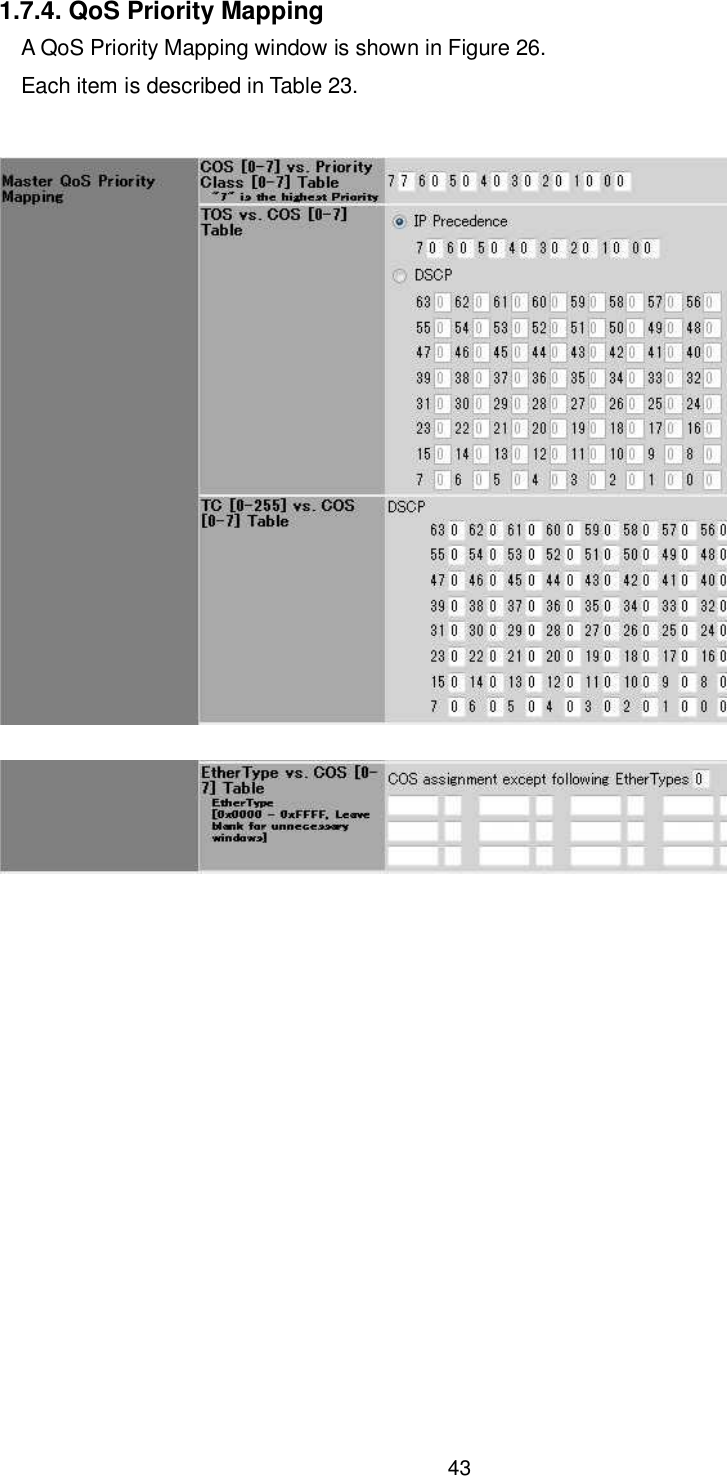
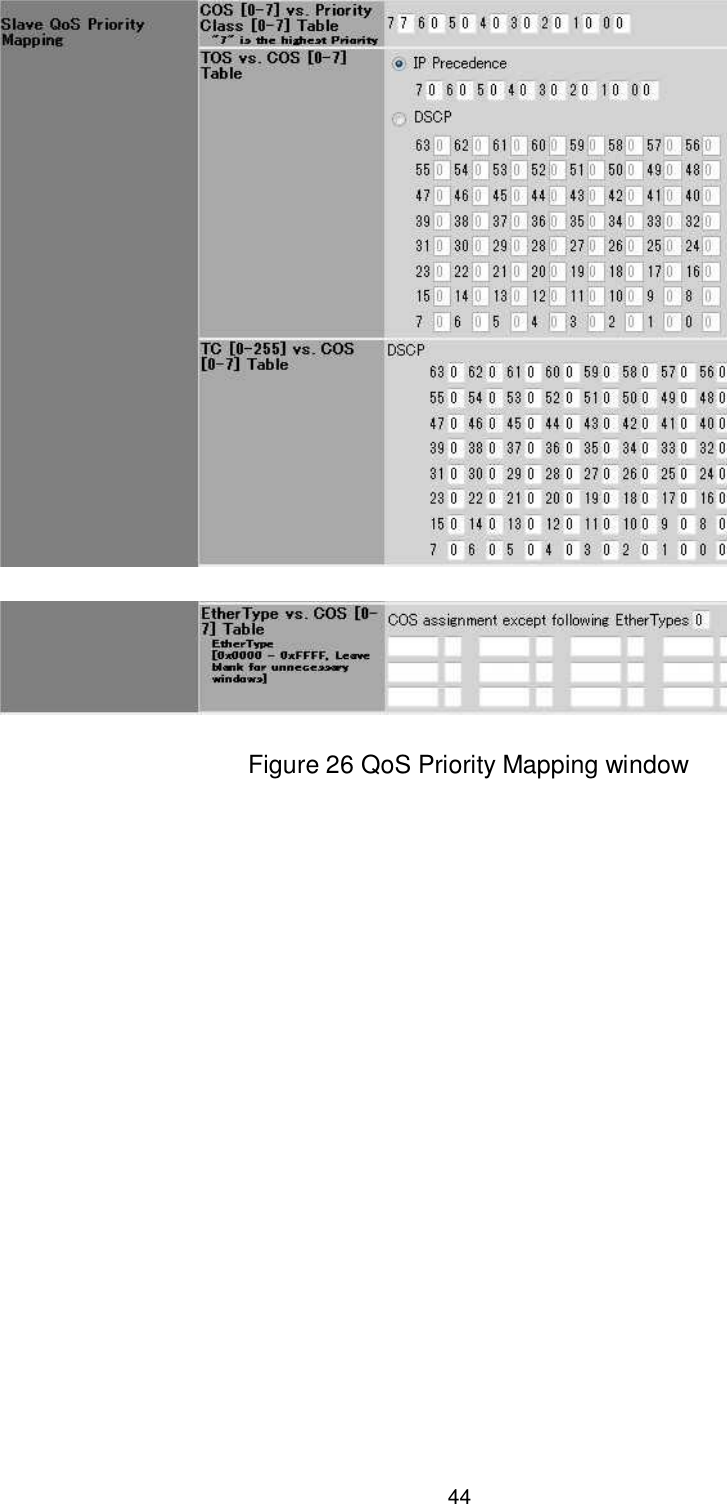
![45 Table 23 Description of the QoS Priority Mapping window No Item Setting range Description 1 Master COS [0-7] vs. Priority Class [0-7] Table 0 - 7 The Class 7 is the most prioritized, and Class 0 is the least prioritized class. 2 Master TOS vs. COS [0-7] Table [Selection of input format] IP Precedence/DSCP [COS value] 0 - 7 [Selection of input format] Select either the IP Precedence radio button or DSCP radio button. [Input format] Input a COS value to each TOS value. [Bit string for each mode] ・IP Precedence Bit[7:5]: Priority Bit[4:0]: Reserved ・DSCP Bit[7:2]: DSCP (63 types) Bit[1:0]: Reserved [Setting example] If COS=7 is assigned for IP Precedence = 1, COS value=7 is set to TOS: 0x20 - 0x3F. That is, the reserved part is filled with the same COS value. 3 Master TC [0-63] vs. COS [0-7] Table [COS value] 0 - 7 Input a COS value for TC values from 0 to 63. 4 Master EtherType vs. COS [0-7] Table [COS value] 0 - 7 [EtherTypes] 0x0000 - 0xFFFF Input combinations of 15 types of EtherTypes and CoS values. Also input a CoS value in COS assignment except following EtherTypes for unspecified EtherTypes. 5 Slave COS [0-7] vs. Priority Class [0-7] Table 0 - 7 The Class 7 is the most prioritized, and Class 0 is the least prioritized class. 6 Slave TOS vs. COS [0-7] Table [Selection of input format] IP Precedence/DSCP [Selection of input format] Select either the IP Precedence radio button or DSCP radio button.](https://usermanual.wiki/Japan-Radio/NTG525-EUL.Managenment-ToolInstruction-manual/User-Guide-1684777-Page-45.png)
![46 [COS value] 0 - 7 [Input format] Input a COS value to each TOS value. [Bit string for each mode] ・IP Precedence Bit[7:5]: Priority Bit[4:0]: Reserved ・DSCP Bit[7:2]: DSCP (63 types) Bit[1:0]: Reserved [Setting example] If COS=7 is assigned for IP Precedence = 1, COS value=7 is set to TOS: 0x20 - 0x3F. That is, the reserved part is filled with the same COS value. 7 Slave TC [0-255] vs. COS [0-7] Table 0 - 7 Input a COS value for TC values from 0 to 63. 8 Slave EtherType vs. COS [0-7] Table [COS value] 0 - 7 [EtherTypes] 0x0000 - 0xFFFF Input combinations of 15 types of EtherTypes and CoS values. Also input a CoS value in COS assignment except following EtherTypes for unspecified EtherTypes.](https://usermanual.wiki/Japan-Radio/NTG525-EUL.Managenment-ToolInstruction-manual/User-Guide-1684777-Page-46.png)
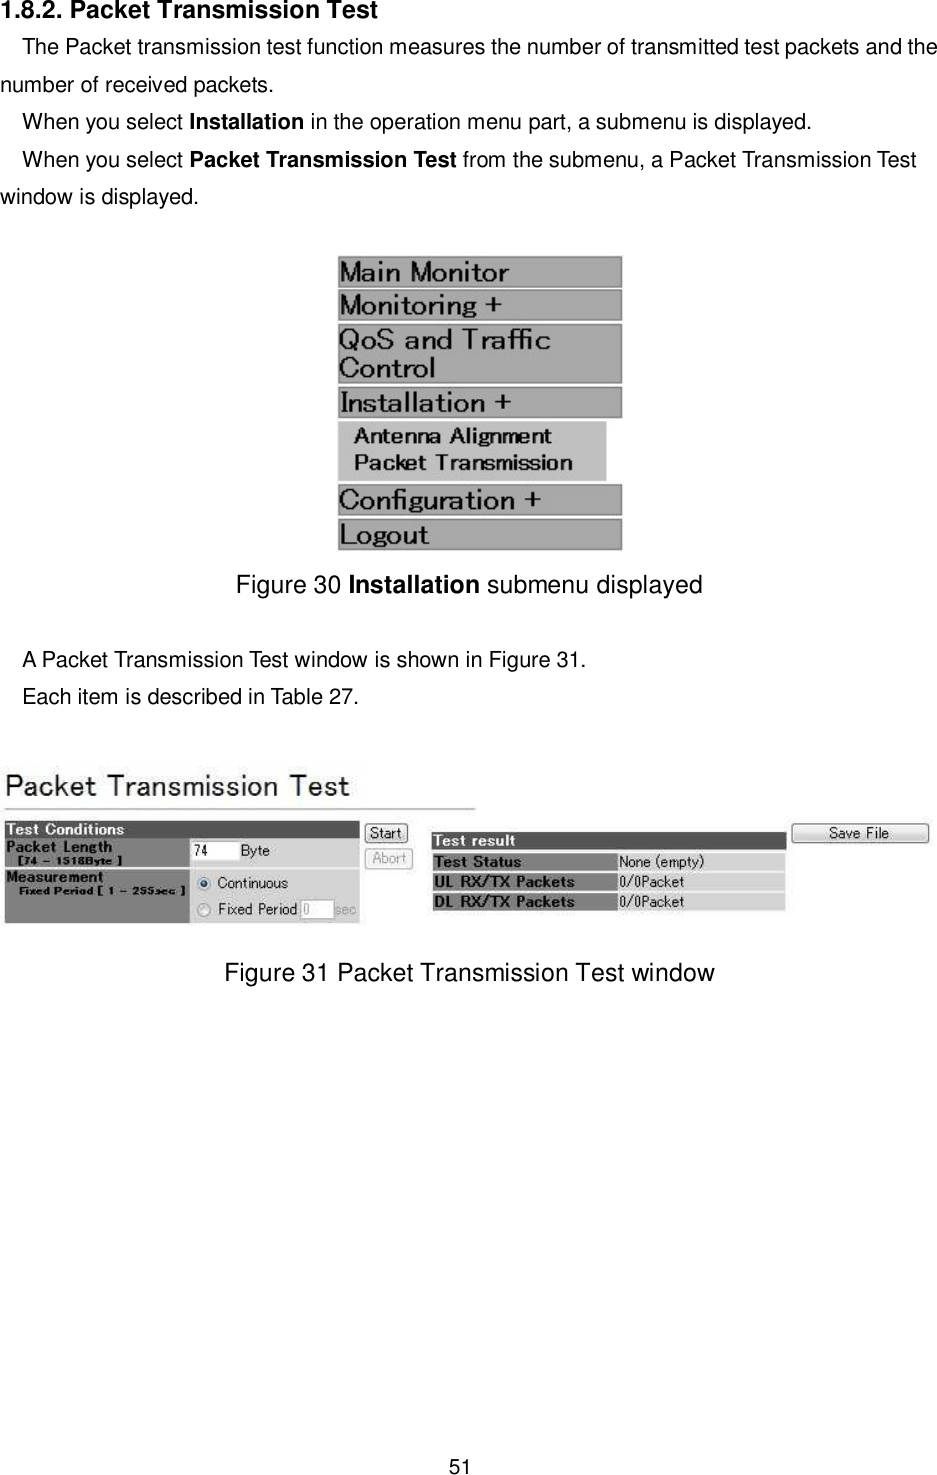
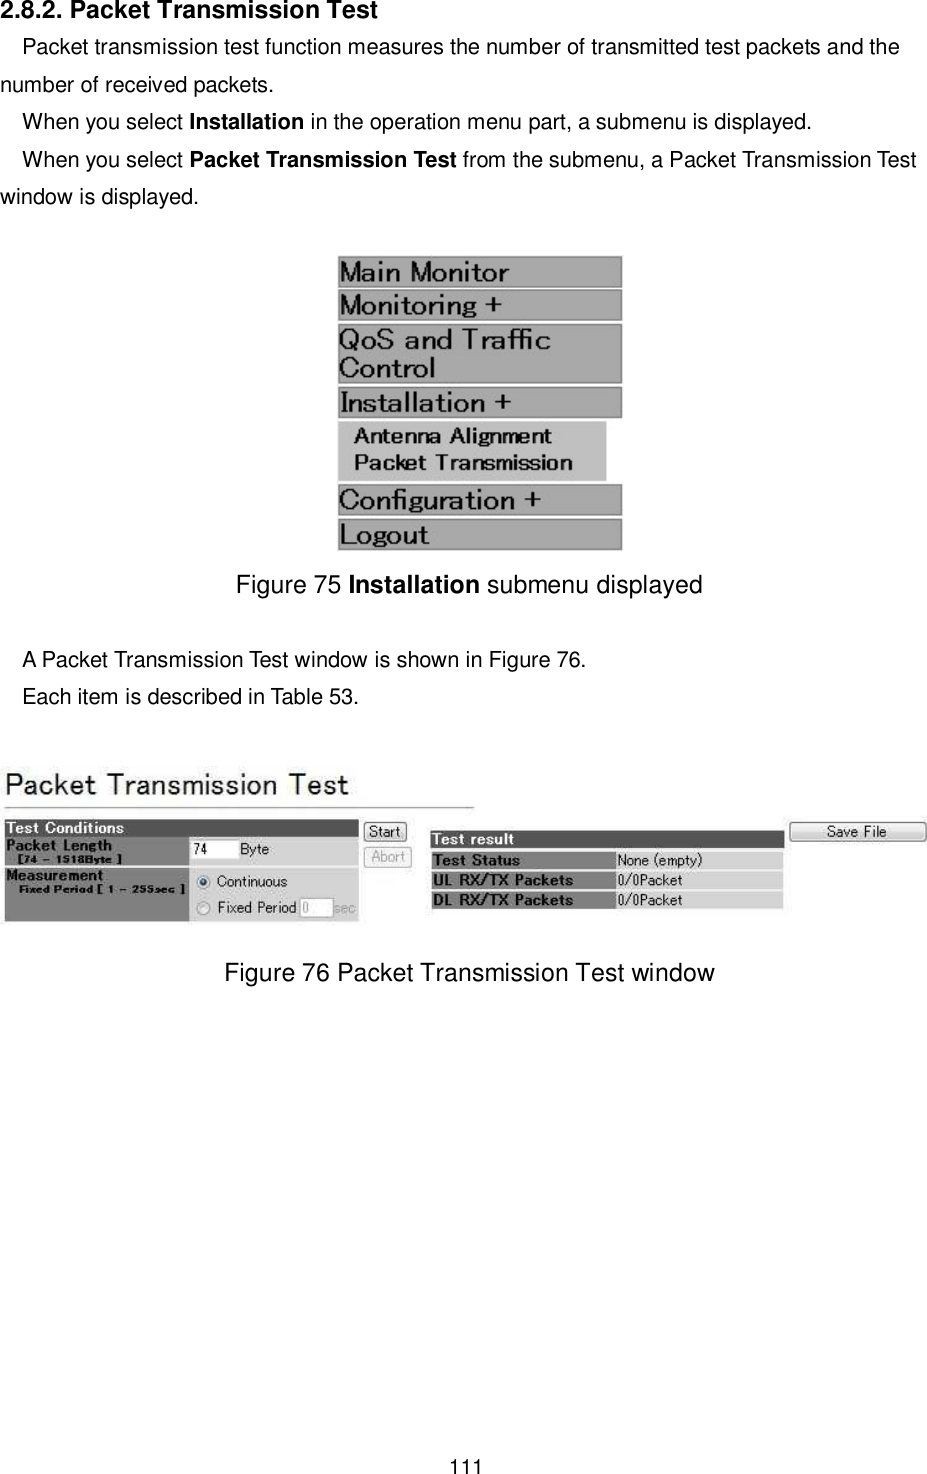
![52 Table 27 Description of the Packet Transmission Test window No. Item Setting range Description 1 Packet Length 74 - 1518 Specify the length of the test packet. 2 Measurement Continuous/Fixed Period Fixed Period 1 - 255 seconds Select either Continuous or Fixed Period. When you select Fixed Period, input the measurement time. 3 Start / Abort Start button starts a test. Abort button stops the test. 4 Test result Displays the Test Status, UL RX/TX Packets, and DL RX/TX Packets. UL RX/TX Packets is displayed as a fraction of the uplink [number of received packets/number of transmitted packets]; the DL RX/TX Packets is displayed as a fraction of the downlink [number of received packets/number of transmitted packets]. Note: As the priority of the test packets is lower than the packets for communication between the devices, the test packets can be lost. 5 Save File When clicked, a dialog to specify the destination and name is displayed to store the test results. Notes: (1) When the test is performed continuously, it is recorded as Fixed Period "0". (2) When the packet transmission test is performed by specifying the measurement time, the measurement time will not be saved in the network element, which is not the device on which the Start button is pressed. (3) The Test Status will not be saved.](https://usermanual.wiki/Japan-Radio/NTG525-EUL.Managenment-ToolInstruction-manual/User-Guide-1684777-Page-52.png)
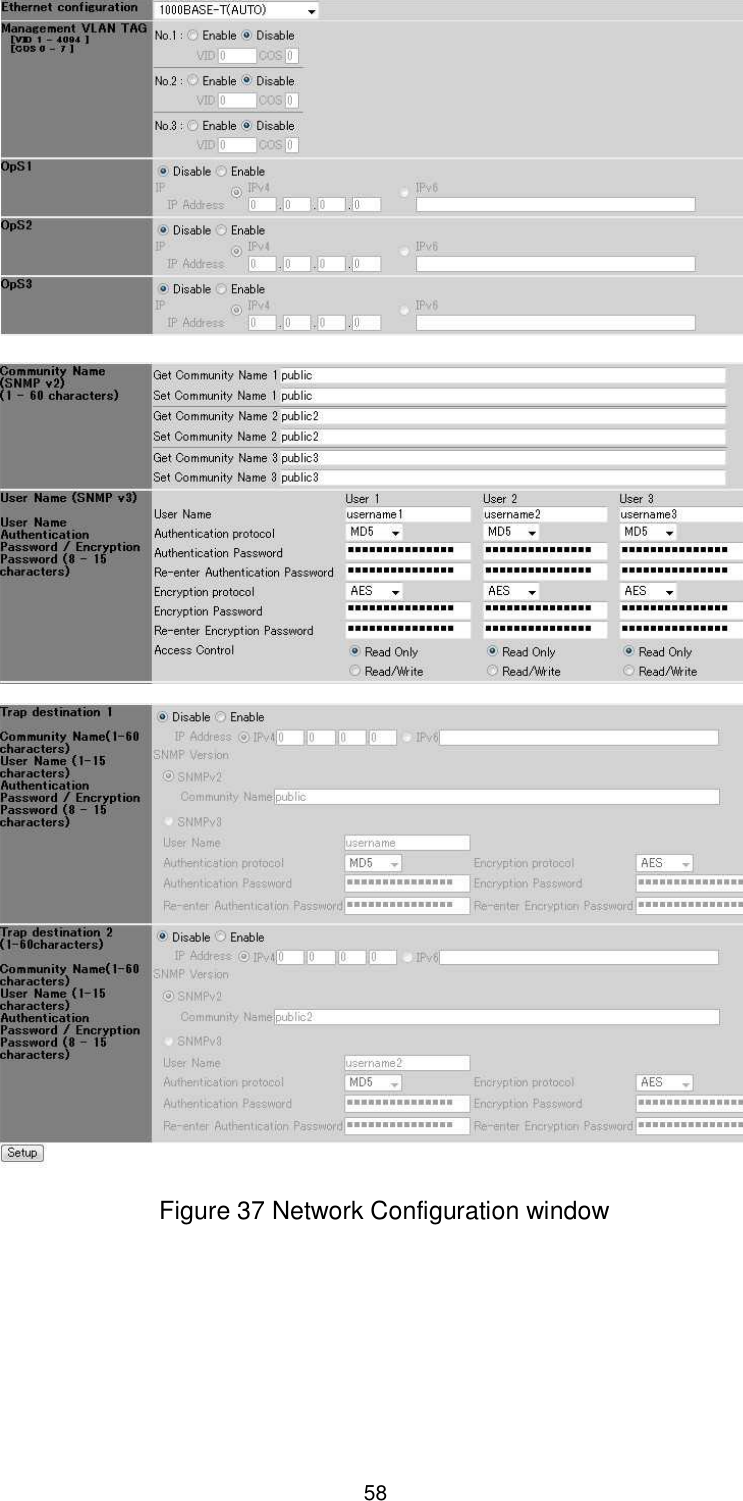
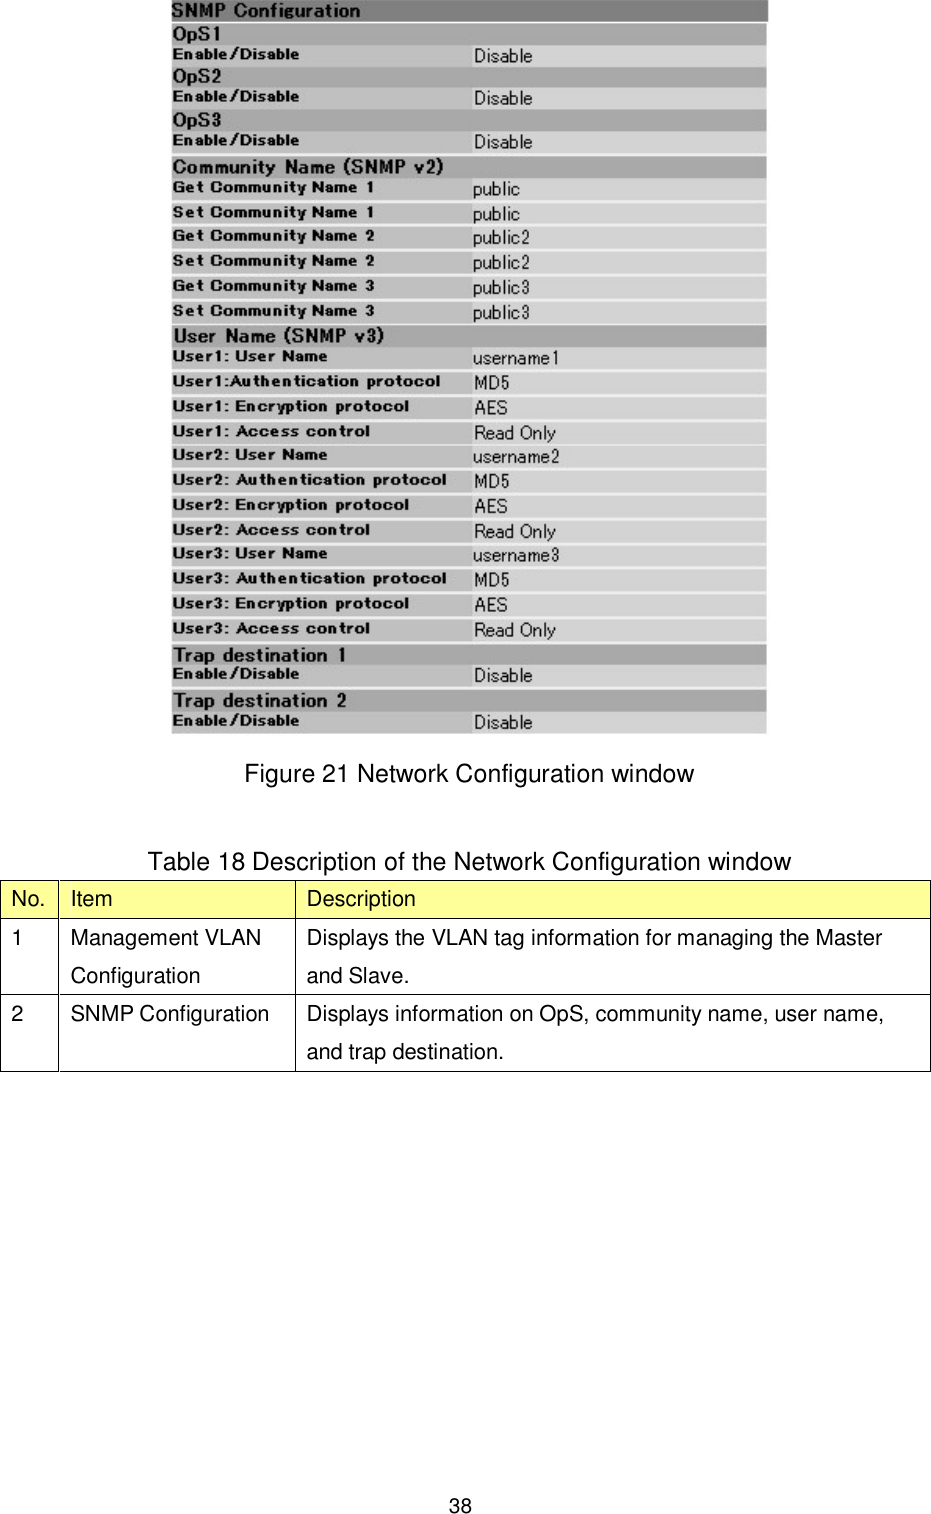
![60 IP setting IPv4/IPv6 When Enable is selected, input the IP setting as well. [IP setting] Select IPv4 or IPv6. Input the IP Address in the selected format. 7 Community Name (SNMPv2) Up to 60 single-byte characters Register a SNMPv2 Get/Set community name. You can register up to three types of community names. User Name 1 - 15 single-byte characters Register a SNMPv3 user name. You can register up to three users. Authentication protocol: NONE/MD5/SHA Password: 8 - 15 single-byte characters Select an authentication protocol. When you select MD5/SHA, input a password as well. Encryption protocol: NONE/DES/AES Password: 8 - 15 single-byte characters Select an encryption protocol. When you select DES/AES, input a password as well. 8 User Name (SNMPv3) Access Control Read Only Read/Write Select an access control. 9 Trap destination 1/2 Disable/Enable You can specify up to two kinds of trap destinations. Select Enable/Disable for each type of trap destination. If Enable is selected, when communication to the trap destination becomes available, a trap is transmitted for each upcoming event. VLAN tag of the trap: For each destination without a VLAN tag and with the management VLAN tag, a trap is transmitted to a destination where there was an ARP response.](https://usermanual.wiki/Japan-Radio/NTG525-EUL.Managenment-ToolInstruction-manual/User-Guide-1684777-Page-60.png)
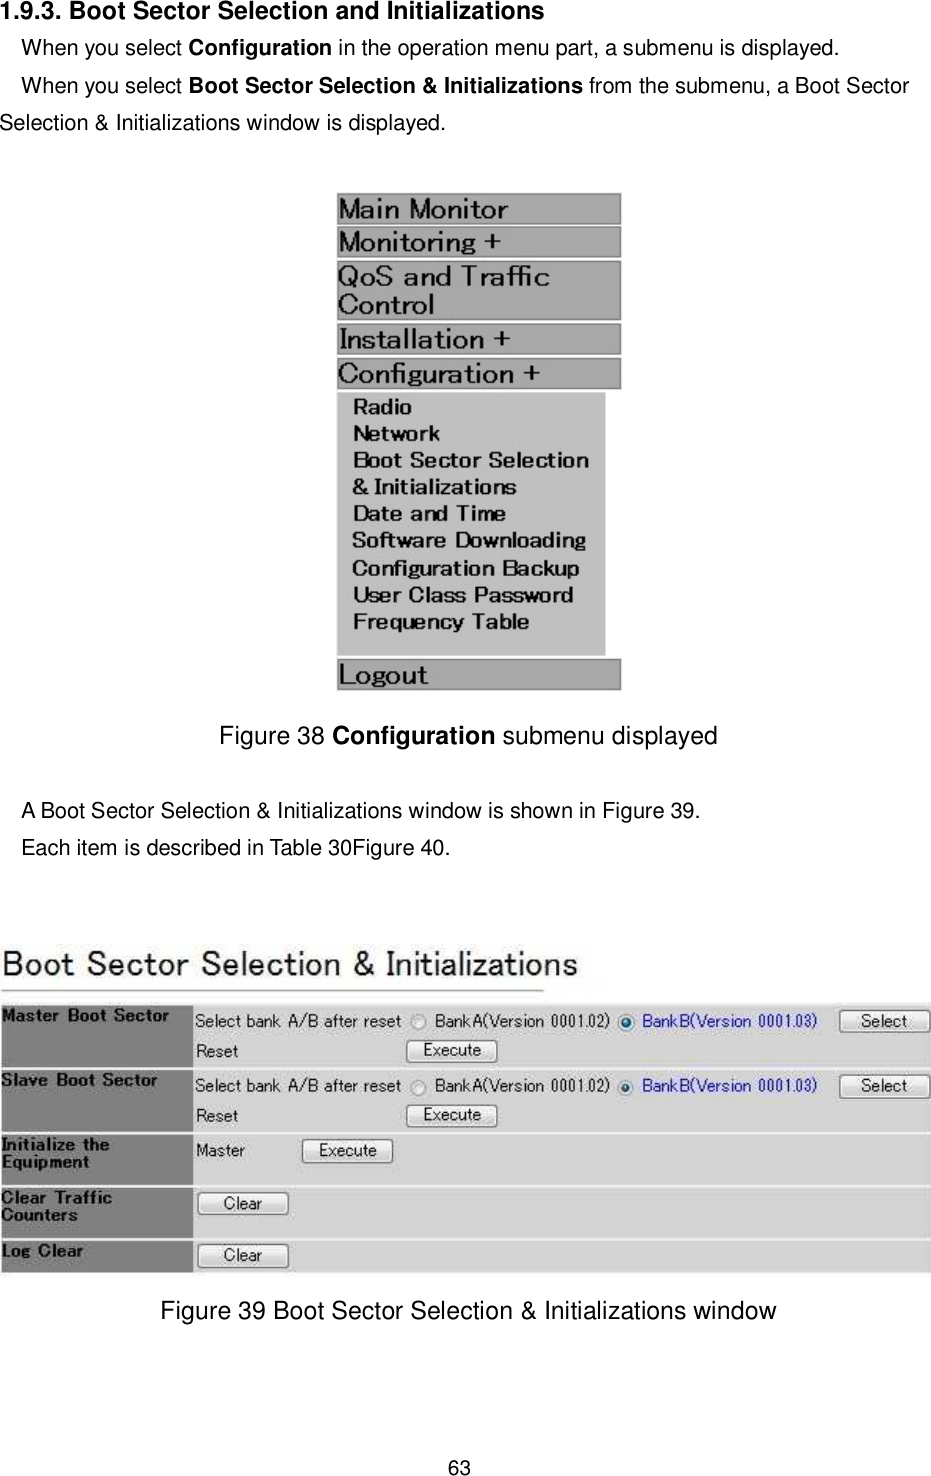
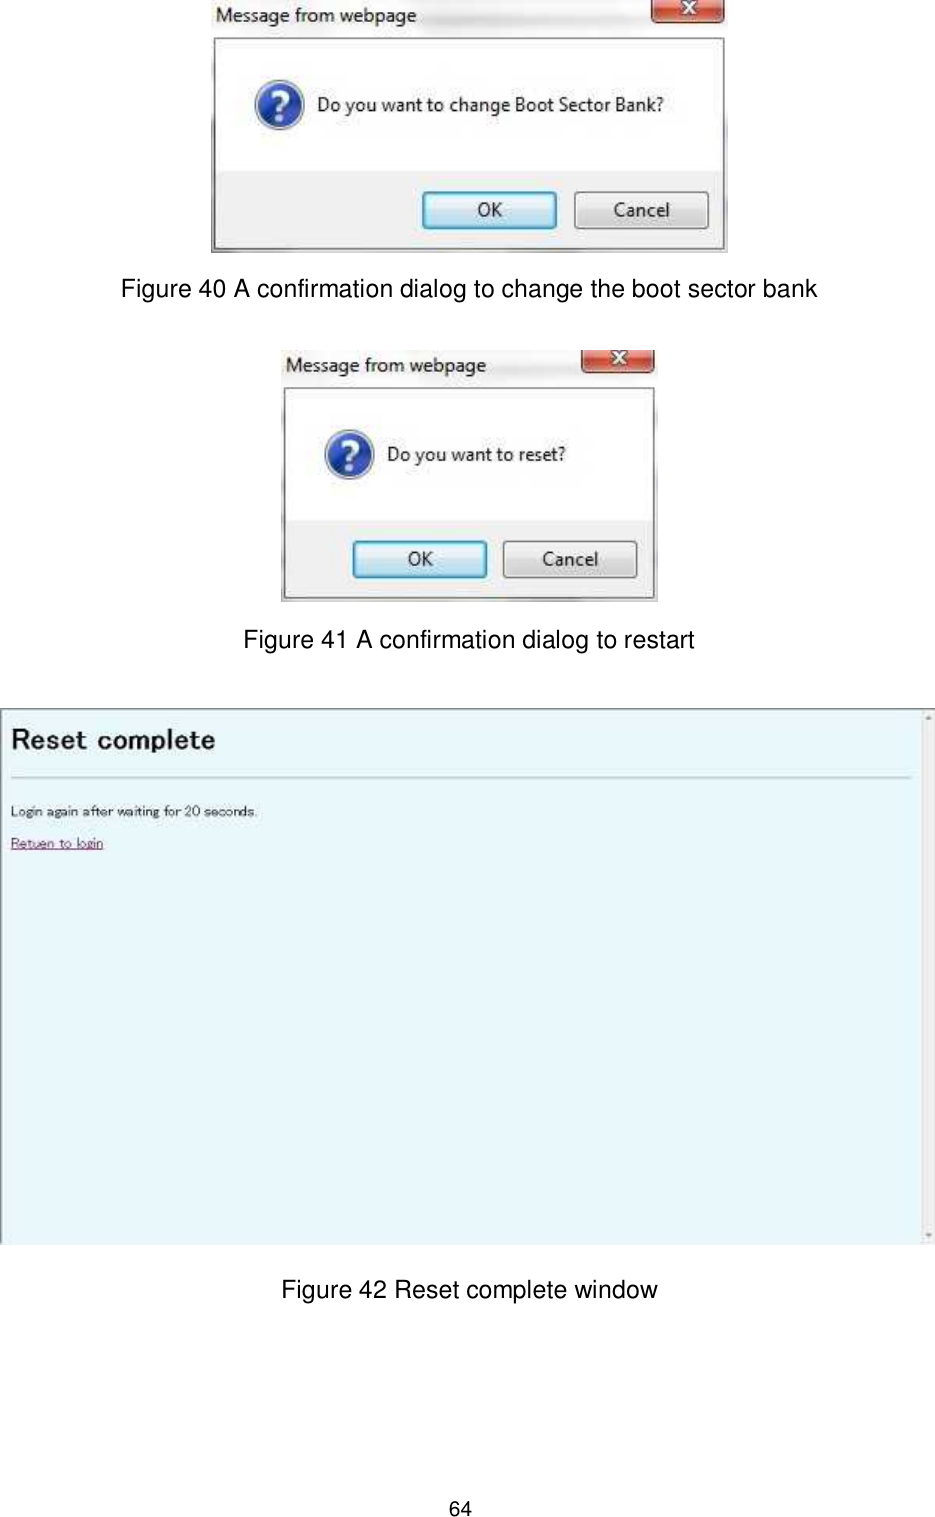
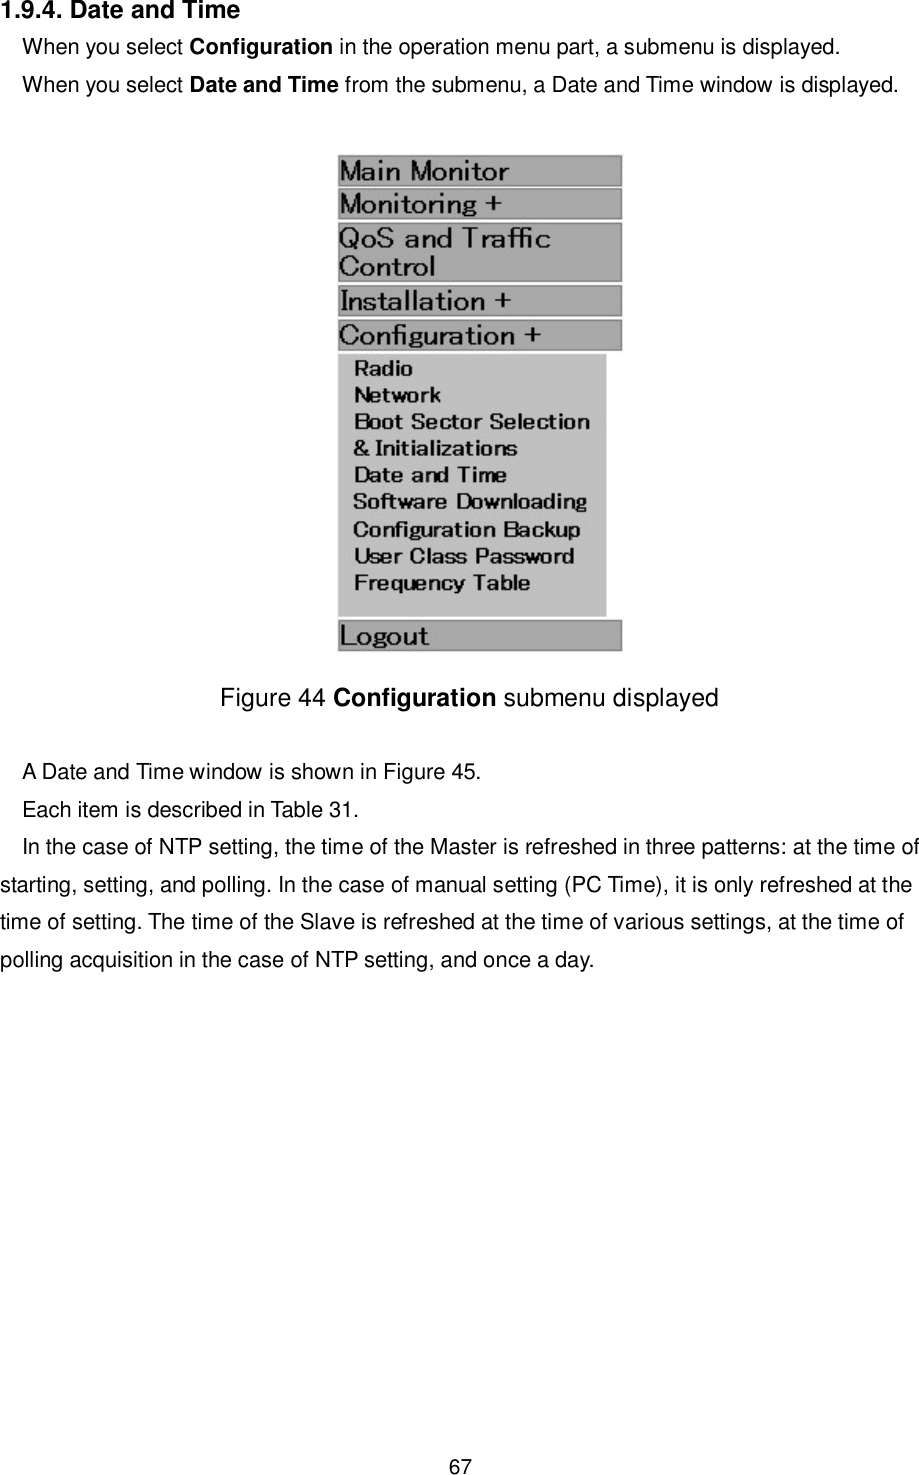
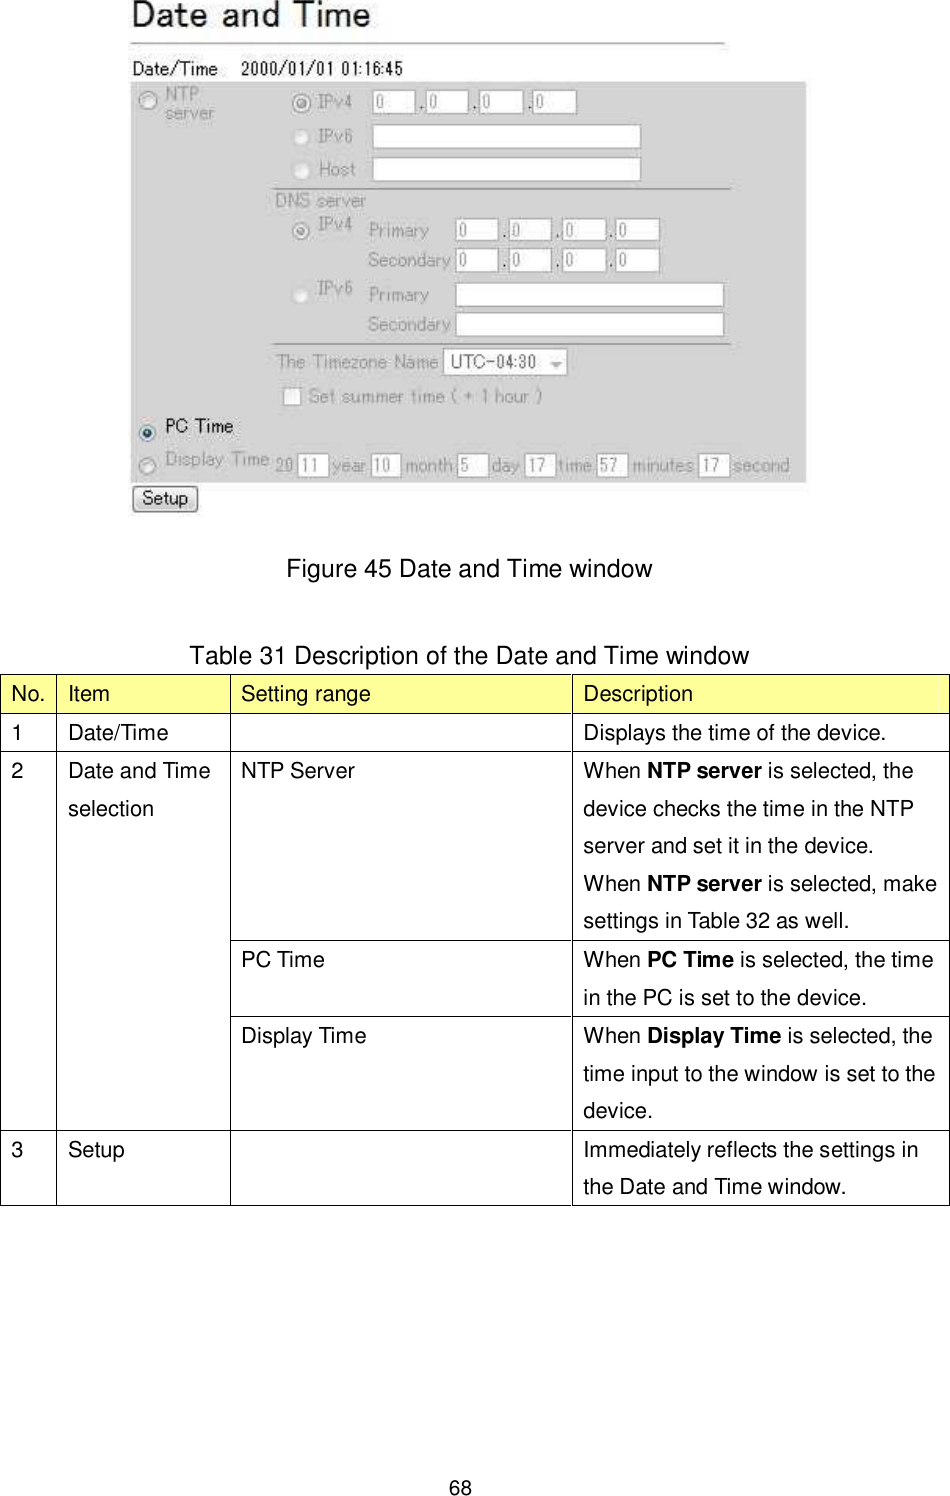
![65 Figure 43 A confirmation dialog to initialize Table 30 Description of the Boot Sector Selection & Initializations window No. Item Setting range Description [Select bank A/B after reset] Bank A/Bank B Specify the start bank. The currently stored version is displayed next to the button. [Select] Performs the bank change. When the Select button is clicked, a confirmation dialog in Figure 40 appears. OK changes the bank, and Cancel closes the dialog without setting. 1 Master Boot Sector [Reset] Restarts the device. When the Execute button is clicked, a confirmation dialog in Figure 41 appears. OK restarts the device, and Cancel closes the dialog without restarting. After the restart is finished, a Reset complete window shown in Figure 42 is displayed. When Return to login is clicked, it will go back to the Login window shown in Figure 2. 2 Slave Boot Sector Performs the same operation as Master Boot Sector Selection & Initializations. 3 Initialize the Equipment [Execute] When the Execute button is clicked, a confirmation dialog shown in Figure 43 appears. OK initializes the device, and Cancel closes the dialog without initialization.](https://usermanual.wiki/Japan-Radio/NTG525-EUL.Managenment-ToolInstruction-manual/User-Guide-1684777-Page-65.png)
![66 Note: Do not turn off the device during initialization. 4 Clear Traffic Counters [Clear] When the Clear button is clicked, a confirmation dialog to clear the statistical information appears. OK clears the statistical information, and Cancel closes the dialog without clearing. Note: Do not turn off the device while clearing the statistical information. 5 Log Clear [Clear] When the Clear button is clicked, a confirmation dialog to clear the log information appears. OK clears the log information, and Cancel closes the dialog without clearing. Note: Do not turn off the device while clearing the log information.](https://usermanual.wiki/Japan-Radio/NTG525-EUL.Managenment-ToolInstruction-manual/User-Guide-1684777-Page-66.png)
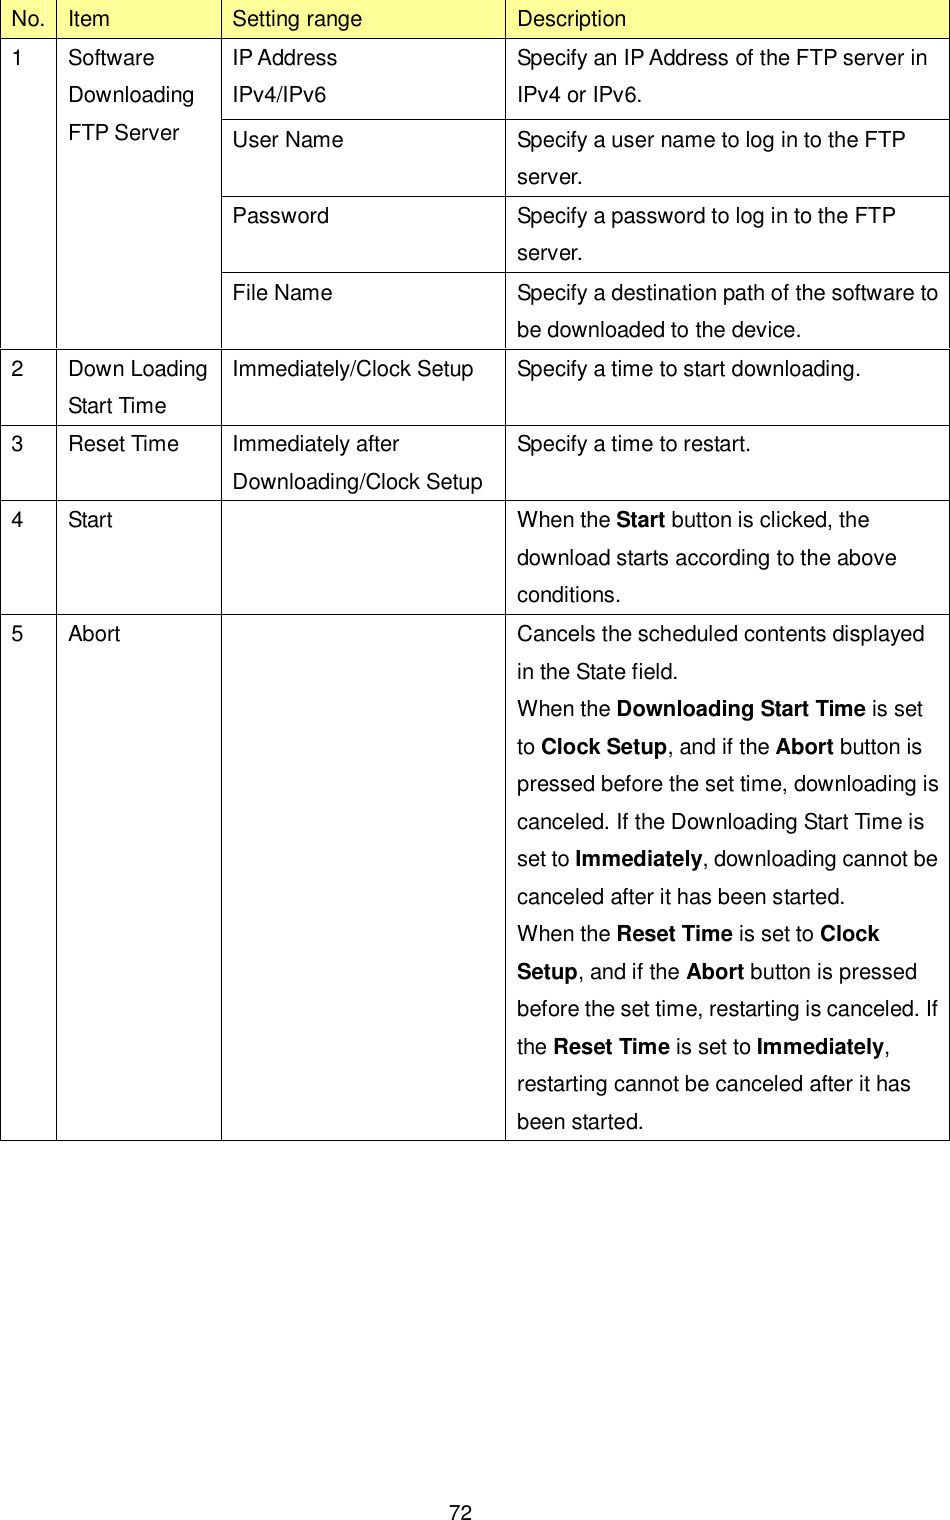
![73 State Displays the progress of software downloading or updating, or scheduled download. Downloading on Master: Indicates that the Master is during a software download process. Updating on Master: Indicates that the Master is during a software update process. Downloading on Slave: Indicates that the Slave is during a software download process. Updating on Slave: Indicates that the Slave is during a software update process. Displayed scheduled contents are: ・Downloading Start Time ・Reset Time ・FTP server address ・Bank to be loaded 6 Downloading Status Progress Displays the download progress in percent. 1.9.5.1. Operation Procedure (1) Configuring a FTP server If you use the Software Downloading function, you need a server from which update files are downloaded. Please configure the FTP server setting as follows: FTP mode : PASV mode FTP access port number : 21 ports fixed User Name : (1 - 15 in single-byte characters) Password : (8 - 15 in single-byte characters) [Available characters] A-Z, a-z, 0-9, ! # $ % ' ( ) * + , - . / : ; = ? @ [ ] ^ _ ` { | } ~](https://usermanual.wiki/Japan-Radio/NTG525-EUL.Managenment-ToolInstruction-manual/User-Guide-1684777-Page-73.png)
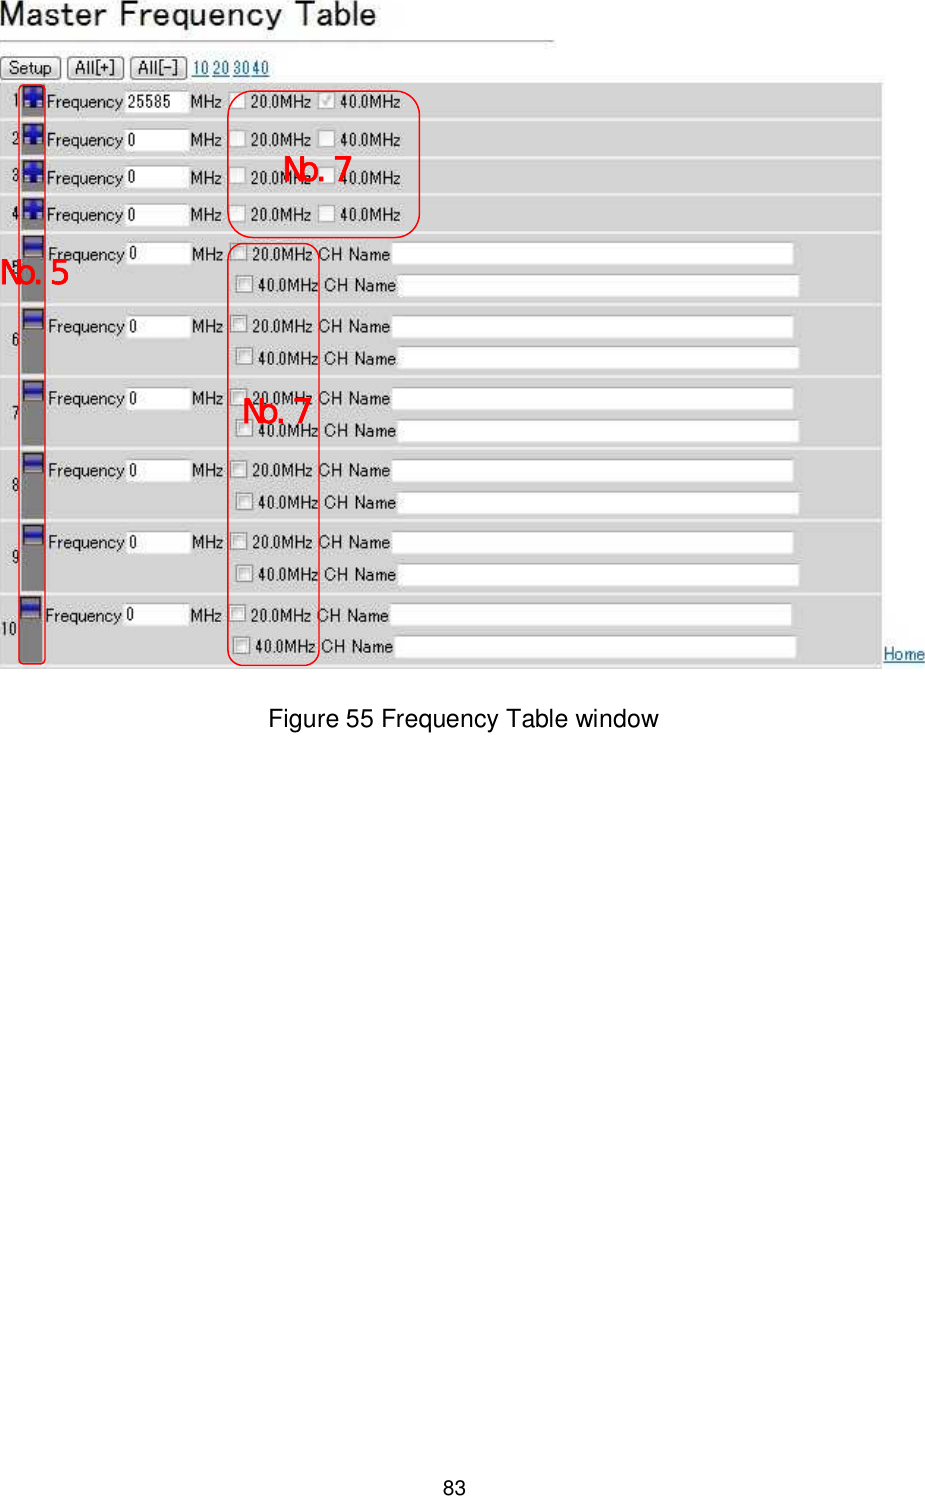
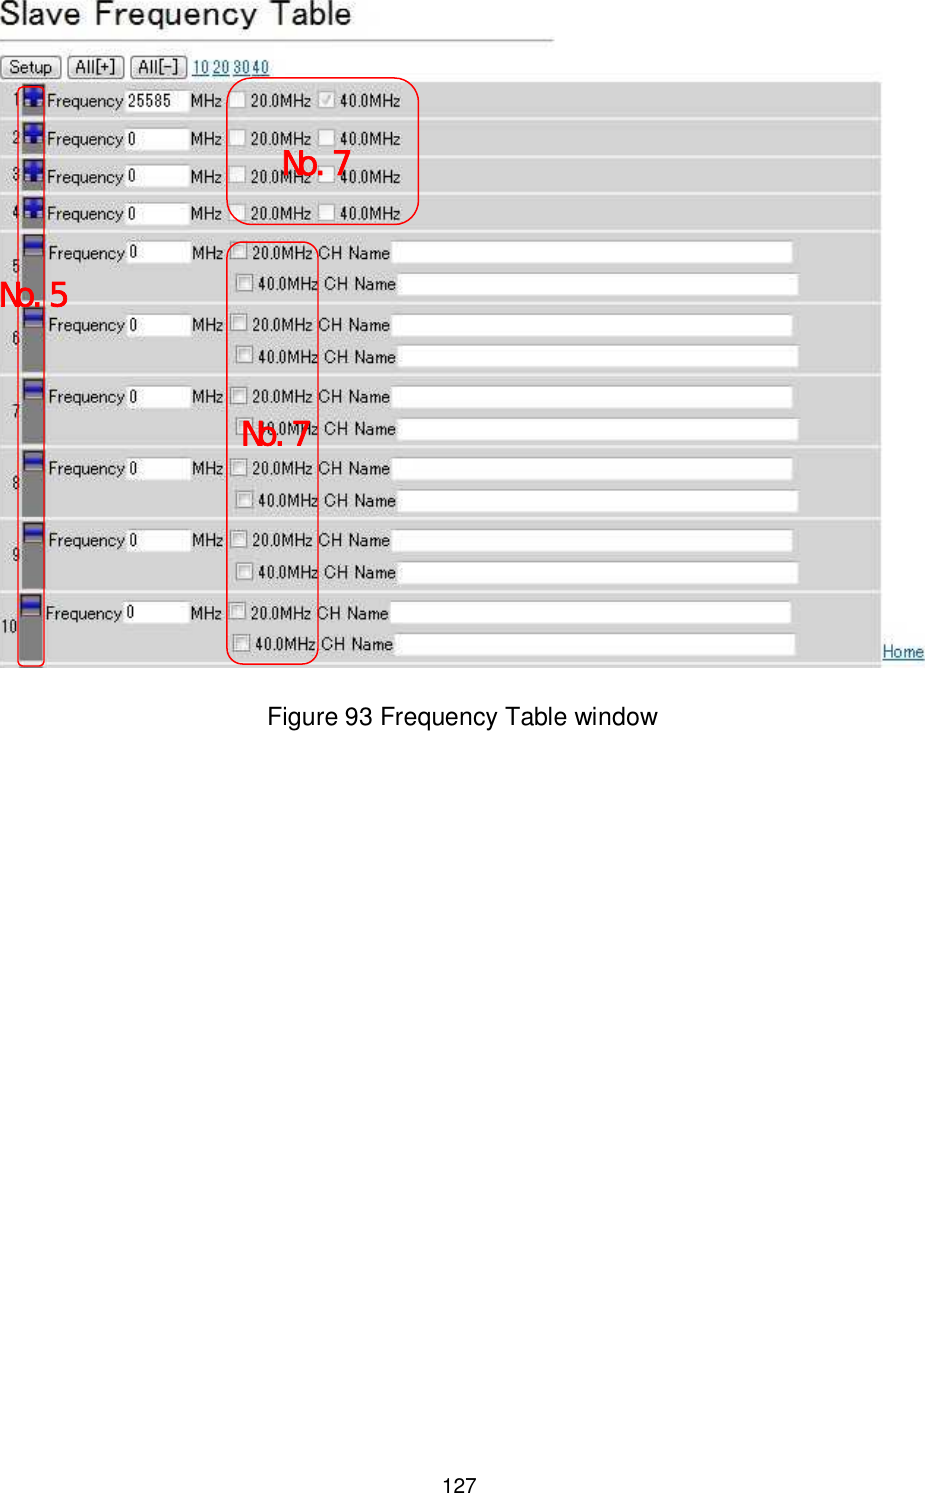
![84 Table 37 Description of the Frequency Table No. Item Setting range Description 1 Setup Sets all the items specified in this page to the Flash ROM. The setting will be reflected after the restart. 2 All[+] Sets all the following frequency setting items to [+] so that the list of frequencies can be viewed. 3 All[−] Sets all the following frequency setting items to [-] so that the list of CH names can be viewed. 4 10 20 30 40 Move to the specified number. 5 Select display method [+] [-] In the case of [+], the CH Name is omitted and the enable/disable status of the frequency and each symbol rate is displayed. In this case, the enable/disable status of the symbol rate cannot be changed. In the case of [-], the enable/disable status of the symbol rate aligns vertically, and each CH Name can be configured. 6 Frequency _____MHz See the "Frequency channel" section. Displays and configures frequencies. 7 Symbol Rate See the "Frequency channel" section. Displays and configures the enable/disable status of the symbol rate. If the display method is [+], the enable/disable status of the symbol rate cannot be changed. 8 Home When clicked, it will move to the top.](https://usermanual.wiki/Japan-Radio/NTG525-EUL.Managenment-ToolInstruction-manual/User-Guide-1684777-Page-84.png)
![87 2.2. Logging In [Operation] ① Connects the MT operation PC and the device over the LAN. Table 39 shows an recommended environment for the PC. Table 39 Recommended environment for the MT operation PC No. Item Specifications Remarks 1 Web browser Windows Internet Explorer Version 8 or higher 2 Monitor size 1024*768 ② Input the IP address of the device as the URL in the Windows Internet Explorer. The factory default IP address is "192.168.1.100". Figure 57 Inputting the IP address to the Internet Explorer](https://usermanual.wiki/Japan-Radio/NTG525-EUL.Managenment-ToolInstruction-manual/User-Guide-1684777-Page-87.png)

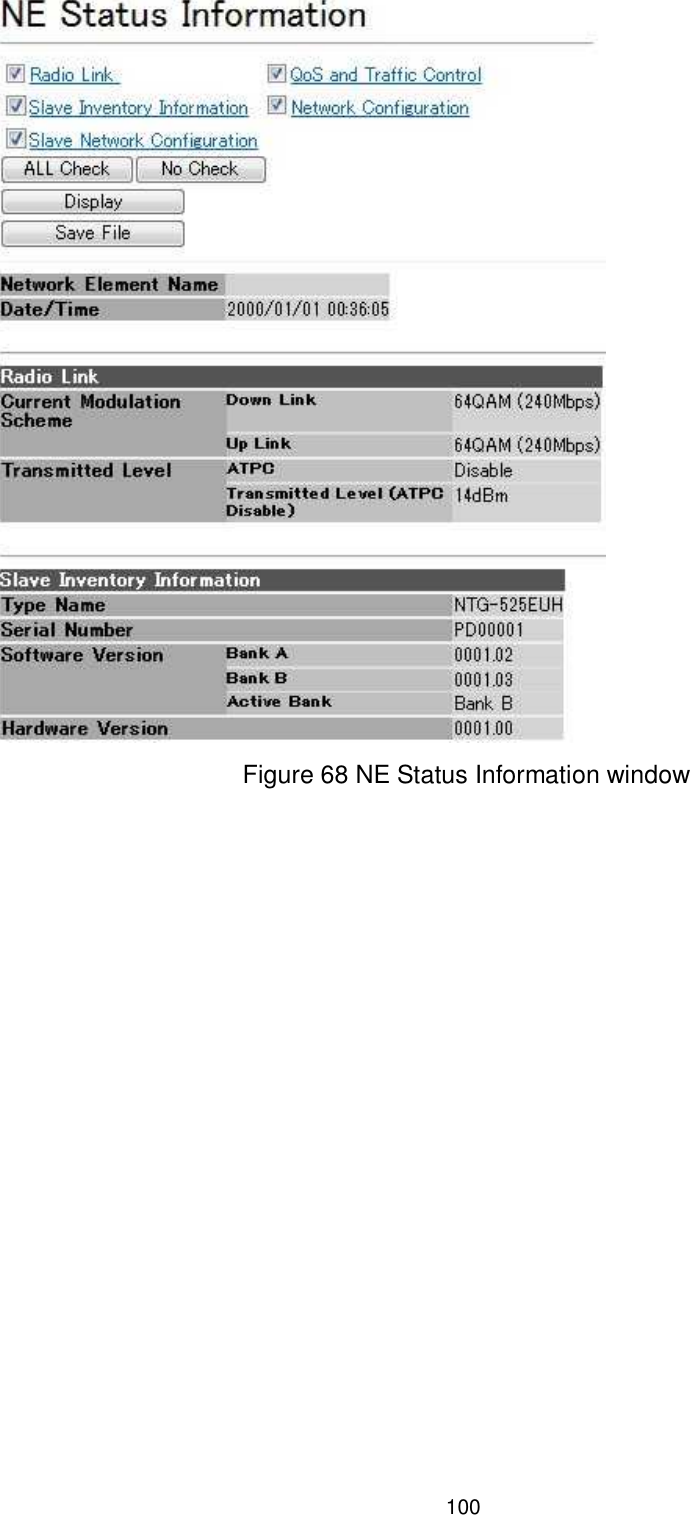
![101 Table 46 Description of the NE Status Information window No. Item Description 1 check box The NE Status Information window is divided into five types: Radio Link, QoS and Traffic Control, Slave Inventory Information, Network Configuration, Slave Network Configuration. Only the items with their check boxes selected are displayed. 2 ALL Check Selects all the check boxes. 3 No Check Clears all the check boxes. 4 Display When clicked, NE State Information is refreshed. 5 Save File When clicked, a dialog to specify the destination and name of the file is displayed to store NE Status Information. In the Radio Link, following information will be saved in addition to the displayed items. [Mode] [Symbol Rate] [Frequency] [CH] [Frame ID] [Status] [Radio Link] [Authentication] 6 Network Element Name Displays the network element name. 7 Date/Time Displays the time of the device when the window is displayed. 8 Radio Link [Current Modulation Scheme: Down Link] [Current Modulation Scheme: Up Link] [Transmitted Level] 9 Slave inventory Information [Type Name] [Serial Number] [Software Version: Bank A/Bank B/Active Bank] [Hardware Version]](https://usermanual.wiki/Japan-Radio/NTG525-EUL.Managenment-ToolInstruction-manual/User-Guide-1684777-Page-101.png)
![102 2.6.2.2. Slave Network Configuration A Slave Network Configuration window is shown in Figure 69. Each item is described in Table 47. Figure 69 Slave Network Configuration Table 47 Items of Slave Network Configuration window No. Item Description 1 Ethernet Configuration [Setup] Displays the setting value at the time it is displayed. [Status] Displays the Ethernet link status at the time it is displayed. 2 IPv4 [IP Address] [Subnet Mask] [Default Gateway] Displays the setting value at the time it is displayed. 3 IPv6 [Enable/Disable] [IP Address] [Default Gateway] Displays the setting value at the time it is displayed. 4 MAC address Displays the MAC address at the time it is displayed.](https://usermanual.wiki/Japan-Radio/NTG525-EUL.Managenment-ToolInstruction-manual/User-Guide-1684777-Page-102.png)
![104 Table 48 Description of the QoS and Traffic Control window No. Item Description 1 COS assignment for Management Communication Displays a COS assignment value for communication between Master and Slave devices. 2 QoS Priority Mapping Following values are displayed for the Slave. Displays the setting value at the time it is displayed. COS [0-7] vs. Priority Class ("7"is the highest Priority) Table TOS vs. COS [0-7] Table TC [0-255] vs. COS [0-7] Table EtherType vs. COS [0-7] Table For TOS vs. COS [0-7] Table, IP Precedence or DSCP, either of which has been selected, is displayed. 3 Policing Rate Displays permitted policing rates of the Master and Slave. These are displayed for each class and each modulation scheme. 4 Shaping Rate Displays permitted policing rates of the Master and Slave. These are displayed for each class and each modulation scheme.](https://usermanual.wiki/Japan-Radio/NTG525-EUL.Managenment-ToolInstruction-manual/User-Guide-1684777-Page-104.png)
![112 Table 53 Description of the Packet Transmission Test window No. Item Setting range Description 1 Packet Length 74 - 1518 Specify the length of the test packet. 2 Measurement Continuous/Fixed Period Fixed Period 1 - 255 seconds Select either Continuous or Fixed Period. When you select Fixed Period, input the measurement time. 3 Start / Abort Start button starts a test. Abort button stops the test. 4 Test result Displays the Test Status, UL RX/TX Packets, and DL RX/TX Packets. UL RX/TX Packets is displayed as a fraction of the uplink [number of received packets/number of transmitted packets]; the DL RX/TX Packets is displayed as a fraction of the downlink [number of received packets/number of transmitted packets]. Note: As the priority of the test packets is lower than the packets for communication between the devices, the test packets can be lost. 5 Save File When clicked, a dialog to specify the destination and name is displayed to store the test results. Notes: (1) When the test is performed continuously, it is recorded as Fixed Period "0". (2) When the packet transmission test is performed by specifying the measurement time, the measurement time will not be saved in the network element, which is not the device on which the Start button is pressed. (3) The Test Status will not be saved.](https://usermanual.wiki/Japan-Radio/NTG525-EUL.Managenment-ToolInstruction-manual/User-Guide-1684777-Page-112.png)
![121 Table 56 Description of the Reset & Initializations window No. Item Setting range Description 1 Slave Control [Reset] Restarts the device. When the Execute button is clicked, a confirmation dialog in Figure 41 appears. OK restarts the device, and Cancel closes the dialog without restarting. After the restart is finished, the Reset complete window shown in Figure 42 is displayed. When Return to login is clicked, it will go back to the Login window shown in Figure 2. 3 Initialize the Equipment [Execute] When the Execute button is clicked, a confirmation dialog shown in Figure 43 appears. OK initializes the device, and Cancel closes the dialog without initialization. Note: Do not turn off the device during initialization. 4 Log Clear [Clear] When the Clear button is clicked, a confirmation dialog to clear the log information appears. OK clears the log information, and Cancel closes the dialog without clearing. Note: Do not turn off the device while clearing the log information.](https://usermanual.wiki/Japan-Radio/NTG525-EUL.Managenment-ToolInstruction-manual/User-Guide-1684777-Page-121.png)
![128 Table 59 Description of the Frequency Table No. Item Setting range Description 1 Setup Sets all the items specified in this page to the Flash ROM. The setting will be reflected after a restart. 2 All[+] Sets all the following frequency setting items to [+] so that the list of frequencies can be viewed. 3 All[−] Sets all the following frequency setting items to [-] so that the list of CH names can be viewed. 4 10 20 30 40 Move to the specified number. 5 Display method selection [+] [-] In the case of [+], the CH Name is omitted and the enable/disable status of the frequency and each symbol rate is displayed. In this case, the enable/disable status of the symbol rate cannot be changed. In the case of [-], the enable/disable status of the symbol rate aligns vertically, and each CH Name can be configured. 6 Frequency _____MHz See the "Frequency channel" section. Displays and configures frequencies. 7 Symbol Rate See the "Frequency channel" section. Displays and configures the enable/disable status of the symbol rate. If the display method is [+], the enable/disable status of the symbol rate cannot be changed. 8 Home When clicked, it will move to the top.](https://usermanual.wiki/Japan-Radio/NTG525-EUL.Managenment-ToolInstruction-manual/User-Guide-1684777-Page-128.png)