Japan Radio NTG525-EUL Wireless Access System User Manual Managenment ToolInstruction manual
Japan Radio Co Ltd. Wireless Access System Managenment ToolInstruction manual
Contents
- 1. Instruction manual
- 2. Managenment ToolInstruction manual
Managenment ToolInstruction manual

1
WIPAS2
WT Management Tool
Instruction Manual
(Point to Point)
Rev. 1.0
13/Nove./2011
2
CONTENTS
CONTENTS ....................................................................2
1. Management Tool (Master)....................................................5
1.1. Overview of the Management Tool ............................................ 5
1.2. Logging In ................................................................. 6
1.3. Configuration of Main Window .............................................. 10
(1) Status display part (Equipment status) .............................. 10
(2) Operation menu part ................................................. 10
(3) Operation window part ............................................... 10
1.4. Reflecting the Setting Values (immediate reflection and reflection after restart)
13
1.5. Main Monitor .............................................................. 15
1.6. Monitoring ................................................................ 17
1.6.1. Event Log.............................................................................................................17
1.6.2. Radio Performance...............................................................................................23
1.6.3. Link Utilization......................................................................................................25
1.6.4. Traffic Counter......................................................................................................27
1.6.5. NE State Information ............................................................................................30
1.6.5.1. Radio Link and Inventory Information............................. 30
1.6.5.2. Master/Slave Network Configuration............................... 33
1.6.5.3. QoS and Traffic Control.......................................... 34
1.6.5.4. Network Configuration............................................ 37
1.6.5.5. Date and Time.................................................... 39
1.7. QoS and Traffic Control ................................................... 40
1.7.1. Buffer Size and COS Assignment for Management Communication from Master to Slave
40
1.7.2. QoS Priority Class Configuration...........................................................................41
1.7.3. TDD Control .........................................................................................................42
1.7.4. QoS Priority Mapping ...........................................................................................43
1.7.5. Policing and Shaping............................................................................................47
1.8. Installation .............................................................. 48
1.8.1. Antenna Alignment................................................................................................48
1.8.2. Packet Transmission Test .....................................................................................51
1.9. Configuration ............................................................. 53
1.9.1. Radio ...................................................................................................................53
1.9.2. Network................................................................................................................57
1.9.2.1. Input Range for IP Addresses..................................... 61
3
(1) IPv4................................................................ 61
(2) IPv6................................................................ 61
1.9.3. Boot Sector Selection and Initializations ...............................................................63
1.9.4. Date and Time......................................................................................................67
1.9.5. Software Downloading..........................................................................................71
1.9.5.1. Operation Procedure.............................................. 73
(1) Configuring a FTP server ............................................ 73
(2) Immediate update of software ........................................ 74
(3) Scheduled update of the software .................................... 74
(4) Canceling the software update ....................................... 76
1.9.6. Configuration Backup ...........................................................................................77
1.9.7. User Class Password ...........................................................................................80
1.9.8. Frequency Table...................................................................................................82
1.10. Logout .................................................................... 85
2. Management Tool (Slave)....................................................86
2.1. Overview of the Management Tool (Slave).................................... 86
2.2. Logging In ................................................................ 87
2.3. Configuration of Main Window .............................................. 91
(1) Status display part (Equipment status) .............................. 91
(2) Operation menu part ................................................. 91
(3) Operation window part ............................................... 91
2.4. Reflecting the Setting Values (immediate reflection and reflection after restart)
93
2.5. Main Monitor .............................................................. 95
2.6. Monitoring ................................................................ 97
2.6.1. Event Log.............................................................................................................97
2.6.2. NE State Information ............................................................................................99
2.6.2.1. Radio Link and Inventory Information............................. 99
2.6.2.2. Slave Network Configuration..................................... 102
2.6.2.3. QoS and Traffic Control......................................... 103
2.6.2.4. Network Configuration........................................... 105
2.7. QoS and Traffic Control .................................................. 106
2.7.1. COS Assignment for Management Communication from Slave to Master............106
2.8. Installation ............................................................. 107
2.8.1. Antenna Alignment..............................................................................................107
2.8.2. Packet Transmission Test ................................................................................... 111
2.9. Configuration ............................................................ 113
2.9.1. Radio ................................................................................................................. 113
2.9.2. Network.............................................................................................................. 116
4
2.9.2.1. Input Range for IP Addresses.................................... 118
(1) IPv4............................................................... 118
(2) IPv6............................................................... 118
2.9.3. Reset and Initialization........................................................................................ 119
2.9.4. Configuration Backup .........................................................................................122
2.9.5. User Class Password .........................................................................................124
2.9.6. Frequency Table.................................................................................................126
2.10. Logout ................................................................... 129

5
1. Management Tool (Master)
1.1. Overview of the Management Tool
Management Tool (MT) is a Web server function integrated in the WT. It is for configuring and
monitoring the device. Table 1 shows a functional overview of the MT.
Table 1 Functional overview of the MT (Master)
Item 1 Item 2 Contents
Main Monitor Displays the transmission rates and radio links.
Event Log Displays a log of events and a log of changes in the
modulation scheme.
Radio Performance Displays statistical information on the radio link.
Link Utilization Displays the statistical information of the Ethernet
frame counter.
Traffic Counter Displays the Ingress Rate, Egress Rate and Byte
Counter.
Monitoring
NE State Information Displays the Radio Link, Network Configuration,
Inventory Information, Date and Time, QoS and
Traffic Control.
QoS and Traffic Control Specify the Buffer Size, QoS Priority Class
Configuration, COS Assignment for Management
Communication, DL/UL Ratio, QoS Priority
Mapping, Policing, and Shaping.
Antenna Alignment Performs the Antenna Alignment mode. Installation
Packet Transmission Test Performs the Packet Transmission Test.
Radio Makes configuration related to radio.
Network Makes configuration of IP addresses and SNMP.
Boot Sector Selection
and Initializations
Makes configuration of restart, bank switching, and
initialization, and clears the log.
Date and Time Makes configuration of time (NTP and manual).
Configuration Backup Saves and writes to the configuration file.
Software Downloading Downloads the software.
User Class Password Makes configuration of passwords.
Configuration
Frequency Table Makes configuration of frequencies.
Logout Logs you out.

6
1.2. Logging In
[Operation]
① Connects the MT operation PC and the device over the LAN. Table 2 shows an
recommended environment for the PC.
Table 2 Recommended environment for the MT operation PC
No. Item Specifications Remarks
1 Web browser Windows Internet Explorer
Version 8 or higher
2 Monitor size 1024*768
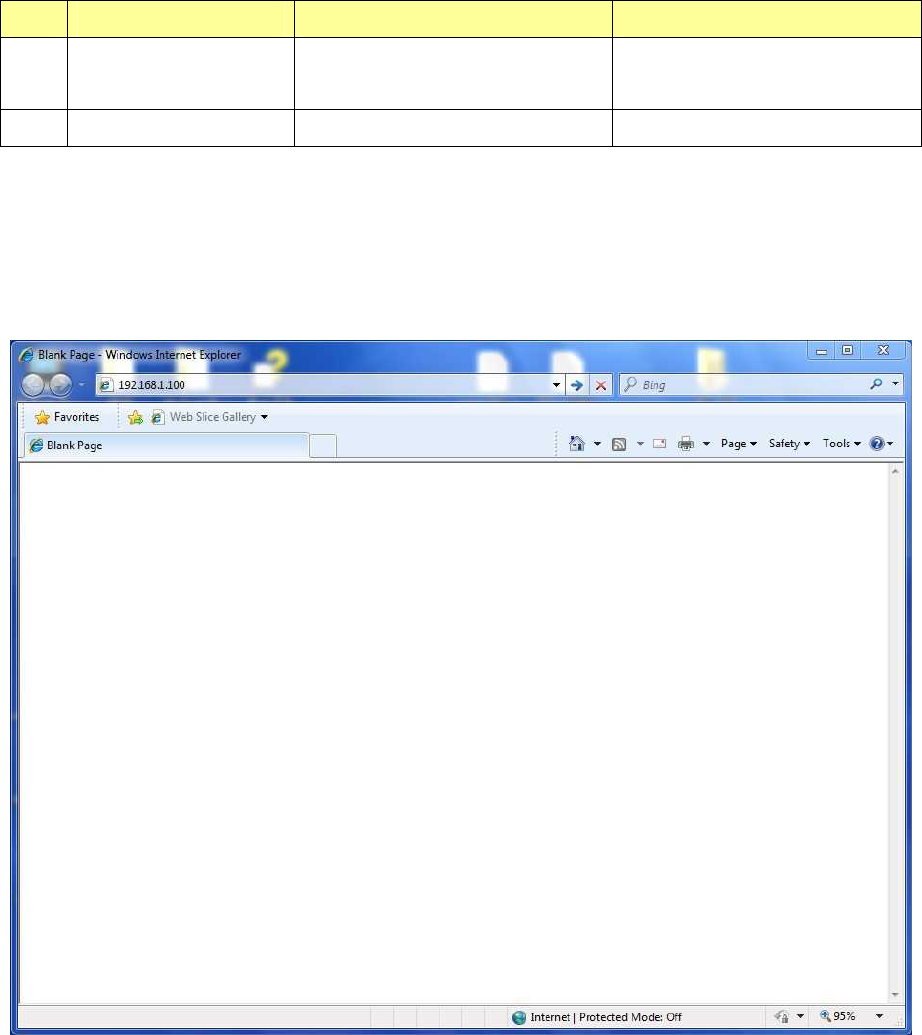
② Input the IP address of the device as the URL in the Windows Internet Explorer. The factory
default IP address is "192.168.1.100".
Figure 1 Inputting the IP address to the Internet Explorer
③ A Login window as shown in Figure 2 is displayed.

7
Figure 2 Login window
④ Select a Login Class. Selectable login classes are shown in Table 4.
⑤ Input the Password. The default password is shown in Table 3.
⑥ LOGIN button: Tries to connect to the device.
⑦ If you are successfully logged in, a window shown in Figure 4 is displayed.
If you failed to log in, a Login Failure window shown in Figure 3 is displayed. Clicking Return
to login will take you back to the Login window shown in Figure 2.

8
Figure 3 Login Failure window
Table 3 Description of the Login window
No.
Item Setting range
Description
1 Login Class admin
installation
operator
monitor
You can select a permission level by
the Login Class.
Table 4 lists a function of each Login
Class.
2 Password 0 - 15
characters
Input the password.
Default passwords are:
Login Class Password
admin admin1234
installation inst1234
operator ope1234
monitor moni1234
3 Login button You can log in using the above Login
Class and Password.

9
Table 4 Function of each Login Class
Login Class (permission level High ... Low)
Monitor admin installation operator
monitor
Main Monitor Yes No Yes Yes
Monitoring Yes No Yes Yes
QoS and Traffic
Control Yes No Yes No
Installation Yes Yes No No
Configuration Yes No No No
Logout Yes Yes Yes Yes
・If an upper or equivalent level user newly logs in while a user is logged in, the user previously
logged in will be forced to log out.
・You can check a user who have logged in by selecting a Login Class drop-down list in the Login
window.
10
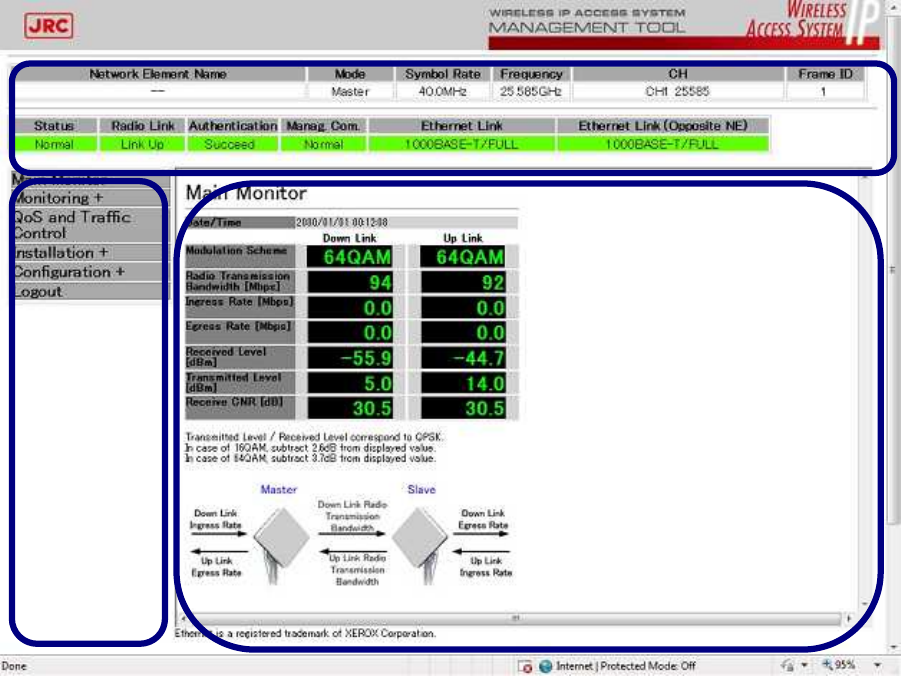
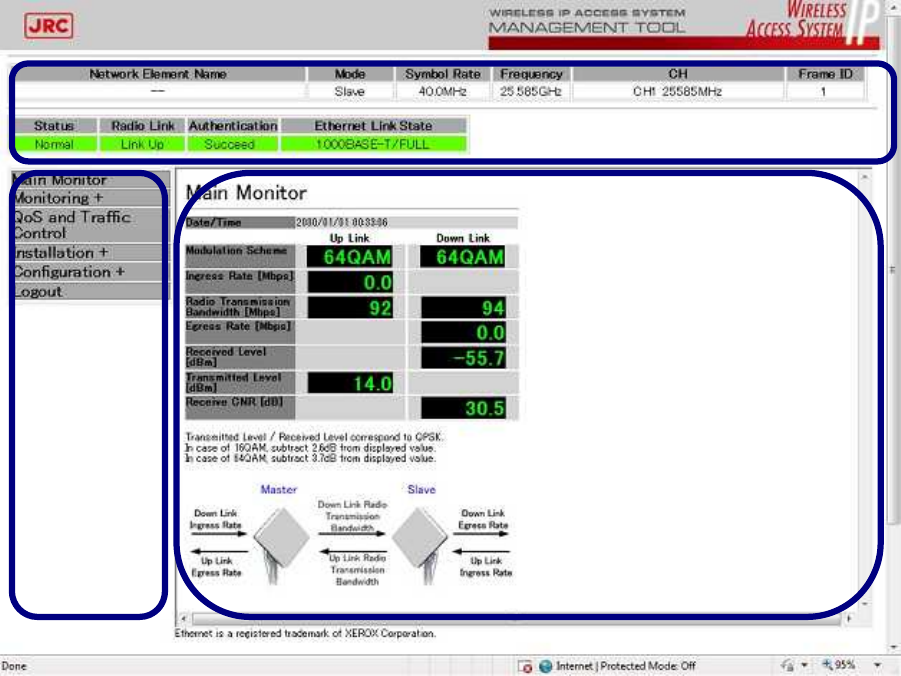
1.3. Configuration of Main Window
After the login, a main window shown in Figure 4 is displayed. The main window includes a
status display part, operation menu part, and operation window part.
(1) Status display part (Equipment status)
This part displays the status of the device. The status display part displays settings
(Mode/Symbol Rate/Frequency/CH/Frame ID) in the upper row, and statuses (Status/Radio
Link/Authentication/Manag. Com./Ethernet Link/Ethernet Link (Opposite NE) in the lower row.
Anomalies in the status are displayed after evaluating Normal or Failed by ORing each anomaly
shown in Table 6.
Table 7 lists causes of anomalies of Manag. Com.
(2) Operation menu part
This part lets you select each function listed in Table 1.
(3) Operation window part
This part displays a window for each function selected in the operation menu part.
Figure 4 Window after the login
Status display part
Operation menu part
Operation window part

11
Table 5 Status display list
Status Display
Network Element Name Displays the Network Element Name.
Mode MASTER/SLAVE
Symbol Rate Displays the symbol rate name set in the NE data.
Frequency
During the carrier sense, "----" is displayed. When
the carrier sense is completed and the frequency
is determined, the radio frequency channel set in
the configuration information is displayed.
CH
During the carrier sense, "-" is displayed. When
the carrier sense is completed and the frequency
is determined, the channel name set in the
configuration information is displayed.
Frame ID
The frame ID set in the configuration information
is displayed.
Status Normal/Failure
Radio Link Link Up/Link Down
Authentication Succeed/Failure
Manag. Com. Normal/Failure
Ethernet Link
Link Down
10BASE-T/HALF
10BASE-T/FULL
100BASE-TX/HALF
100BASE-T/FULL
1000BASE-T/HALF
1000BASE-T/FULL
Ethernet Link (Opposite
NE)
Same as in the local station

12
Table 6 Causes of status anomalies
Item
RF Carrier Unlock
IF Carrier Unlock
TDD SW Failure
PA Failure
PLL Unlock
Device start is abnormal
SPI Failure
Table 7 Causes of anomalies in Manag. Com.
Item
Health check timeout
Modem Synchronization Un-synchronized
13
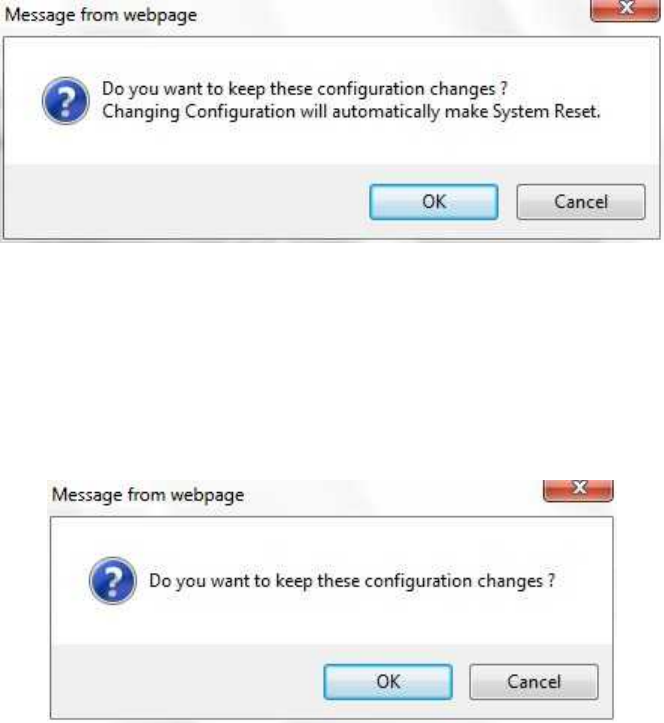
1.4. Reflecting the Setting Values (immediate reflection and reflection after
restart)
Each window has two kinds of Setup buttons. One kind is "reflection after restart" which requires
a restart to reflect the setting, and the other kind is "immediate reflection" which does not need a
restart to reflect the setting values.
・Reflection after restart
The value is reflected to the Flash ROM at the time the Setup button is pressed. The pop-up
message to notify that the value is reflected after restart and prompt you to restart is
displayed. You can select from OK or Cancel. If you press OK, the device is restarted, and if
you press Cancel, the device will go back to the previous window without restarting.
Figure 5 Reflection after restart message
・Immediate reflection
A pop-up message that notifies you that the values are immediately reflected will be
displayed (Figure 6). If you click OK, the value is immediately reflected. If you click Cancel,
the device will return to the previous window without reflecting the value.
Figure 6 Immediate reflection message
・When the input value exceeds the setting range in the case of direct input, a message as shown
in Figure 7 is displayed.

14
Figure 7 Input value error message
15
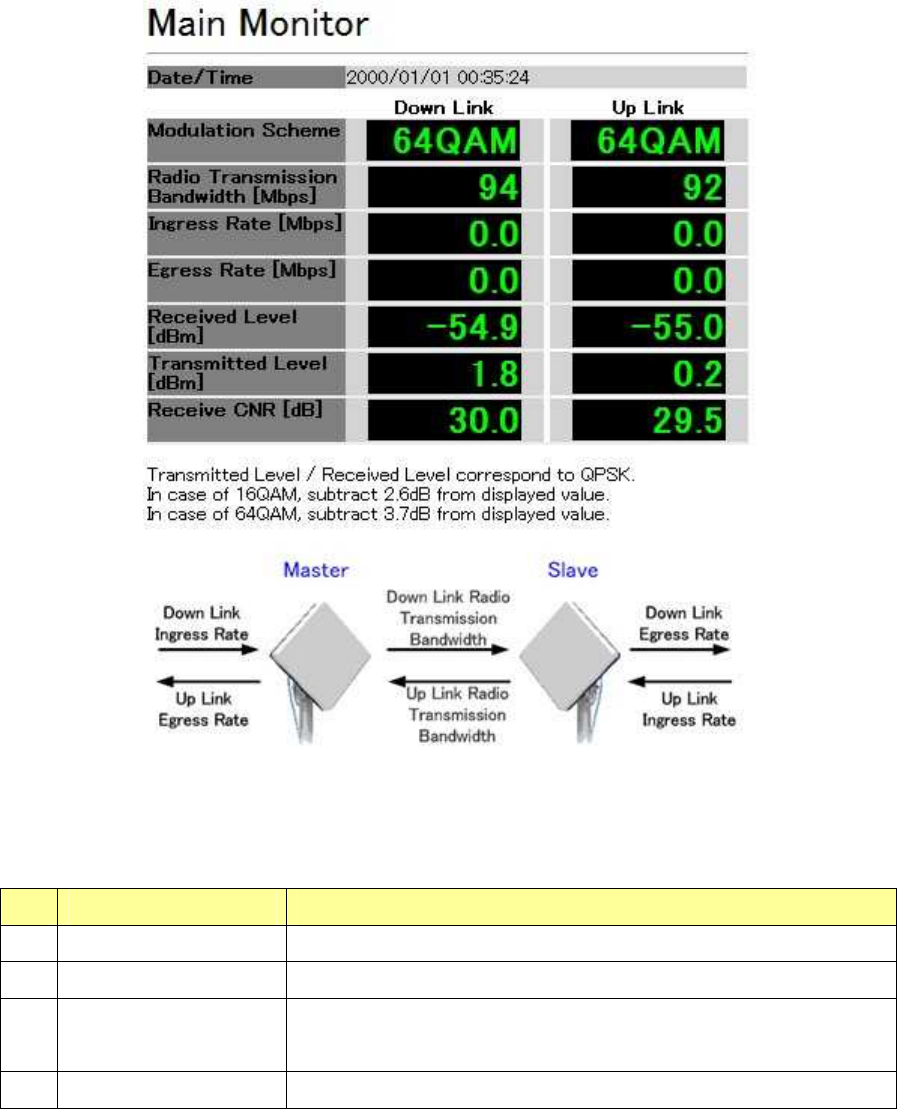
1.5. Main Monitor
When you select the Main Monitor from the operation menu part, a Main Monitor window is
displayed.
The Main Monitor window displays the transmission rates and radio links.
A Main Monitor window is shown in Figure 8. The description of each item is shown in Table 8.
Figure 8 Main Monitor window
Table 8 Description of the Main Monitor window
No.
Item Description
1 Date/Time Displays the time in the device.
2 Modulation Scheme Displays the current Modulation Scheme.
3 Radio Transmission
Bandwidth
Displays the current radio transmission bandwidth.
4 Ingress Rate Displays the current ingress rate of Ethernet packets.

16
5 Egress Rate Displays the current egress rate of Ethernet packets.
6 Received Level Displays the current receiving level.
During Link Down, "-" is displayed.
7 Transmittied Level Displays the current transmission level.
During Link Down:
"-" is displayed, but if the ATPC is set to Enable, it is
transmitted at the highest transmission level; if the ATPC is
set to Disable, it is transmitted at the set transmission level.
8 Receive CNR Displays the current receiving CNR.
During Link Down, "-" is displayed.
17
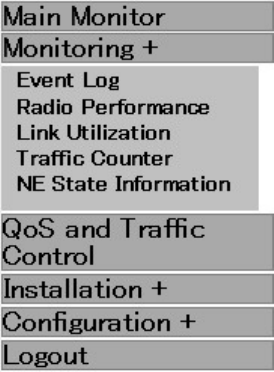
1.6. Monitoring
1.6.1. Event Log
When you click Monitoring from the operation menu part, a submenu is displayed.
When you select the Event Log in the submenu, an Event Log window is displayed.
Figure 9 Monitoring submenu displayed
18
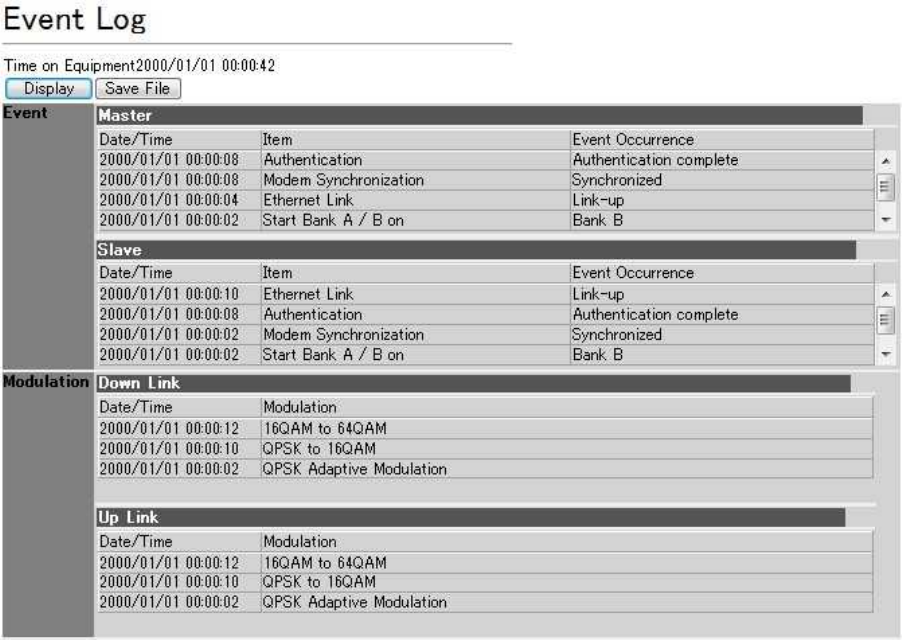
An Event Log window is shown in Figure 10.
The Event Log window displays a log of events and a log of changes in the modulation scheme.
Each item is described in Table 9.
The event logs are listed in Table 10. The log of modulation scheme is listed in Table 11.
Figure 10 Event Log window

19
Table 9 Description of the Event Log window
No.
Item Description
1 Display When clicked, the Event Log window is refreshed.
2 Save File When clicked, a dialog to specify the file destination and name
is displayed to store the log in a file. The file format is CSV.
3 Event Displays a log of events.
4 Modulation Displays a log of changes in the modulation scheme.

20
Table 10 List of event logs
Item Event Occurrence
RF Carrier Unlock Occurred
IF Carrier Unlock Occurred
TDD SW Failure Occurred
Ethernet Link Link-up Link-down
Management Communication Failure Cleared Occurred
Remote Downloading Success Failed
Power Turn On
Device restoration trigger Executed
PA Failure Occurred
PLL Unlock Occurred
Ethernet Link Speed is asymmetry
between Master and Slave
Occurred
Device start is abnormal Occurred
Modem Synchronization Un-synchronized Synchronized
Frame ID Error Occurred
Radio Link Quality Failure Cleared Occurred
SPI Failure Occurred
Authentication Authentication Failure Authentication
complete
Get Time Success
(Recorded only once
when succeeded)
Failed
Remote Downloading Start Set Up Time Remote
Download
Immediate Remote
Download
Remote Downloading Failed to Master
from FTP
Detected
Remote Downloading Failed to Slave
from FTP
Detected
File Check Failed on Master Detected
File Check Failed on Slave Detected
Reset after Downloading Executed
Not received : Notice of update start
receiving reply
Detected
Not received : Notice of update complete
Detected

21
Not received : Notice of update
completion receiving reply
Detected
Not received : Cancellation instructions
receiving reply
Detected
Start Bank A / B on Bank A Bank B
Software Check Failure Bank A Failed Bank B Failed
Change Login Password
RF Transmission Disable Enable
Service State Out of Service In Service
Initialize Execute Initial
Equipment
Select Bank A / B Bank A Bank B
Reset Occurred

22
Table 11 List of modulation scheme log
Description
No.
Modulation scheme
log During normal operation
mode
During Antenna Alignment
mode
1 64QAM Fixed Modulation Fixed, 64QAM
2 16QAM Fixed Modulation Fixed, 16QAM
3 QPSK Fixed Modulation Fixed, QPSK
4 QPSK Adaptive
Modulation Modulation Adaptive, QPSK
5 QPSK to 16QAM
Modulation Adaptive,
transition from QPSK to
16QAM
Changes from QPSK to
16QAM.
6 16QAM to 64QAM
Modulation Adaptive,
transition from 16QAM to
64QAM
Changes from 16QAM to
64QAM.
7 64QAM to 16QAM
Modulation Adaptive,
transition from 64QAM to
16QAM
Changes from 64QAM to
16QAM.
8 16QAM to QPSK
Modulation Adaptive,
transition from 16QAM to
QPSK
Changes from 16QAM to
QPSK.
9 QPSK Antenna
Alignment
Displayed when starting the
Antenna Alignment mode.
QPSK
23
1.6.2. Radio Performance
When you click Monitoring from the operation menu part, a submenu is displayed.
When you click Radio Performance, a Radio Performance window is displayed.
Figure 11 Monitoring submenu displayed
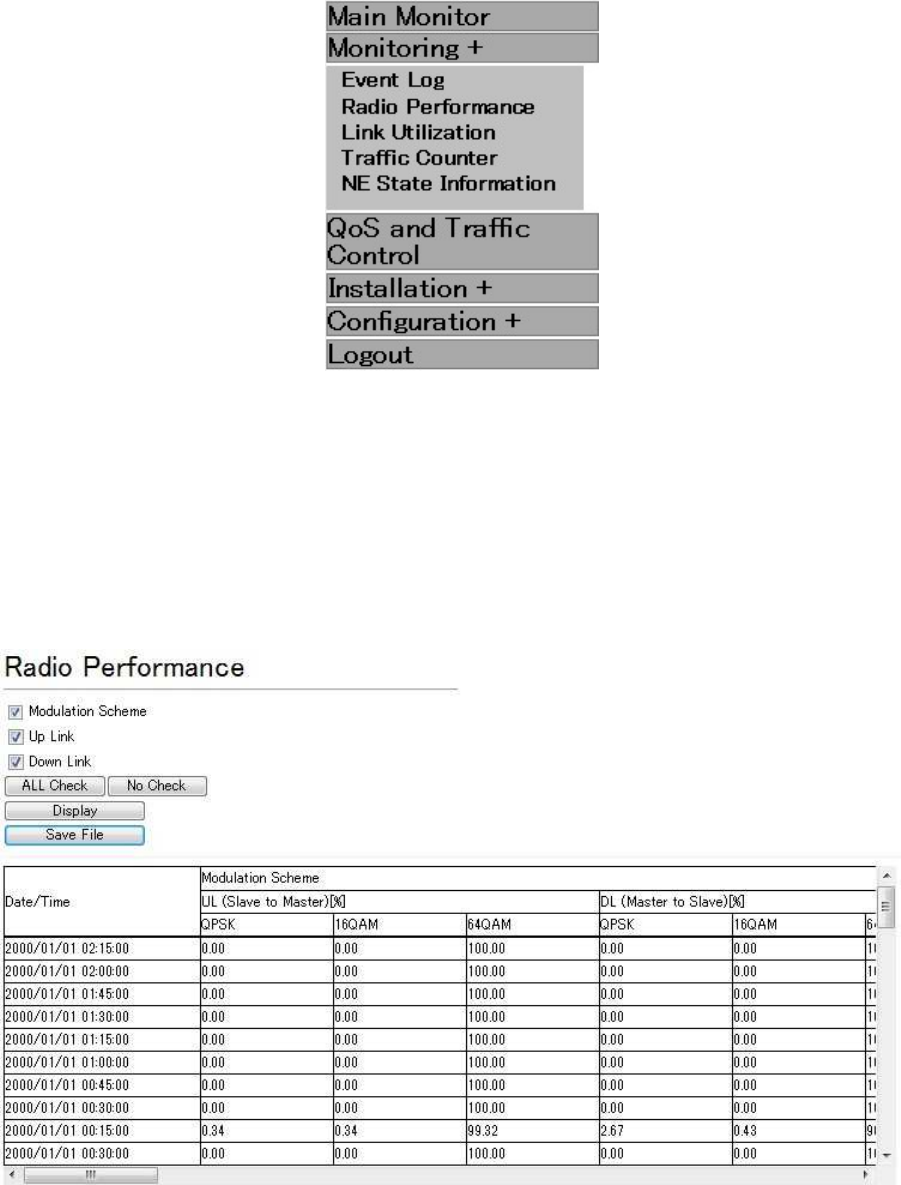
A Radio Performance window is shown in Figure 12.
The Radio Performance window displays statistical information on the radio link at an interval of
15 minutes.
The Radio Performance window is described in Table 12.
Figure 12 Radio Performance window

24
Table 12 Description of the Radio Performance window
No.
Item Contents
1 Check box Only the items with their check boxes selected are displayed.
[Modulation Scheme]
Down Link: QPSK/16QAM/64QAM: Each occupancy is
displayed in %.
Up Link: QPSK/16QAM/64QAM: Each occupancy is
displayed in %.
[Up Link/Down Link]
Transmitted Level: MIN/MAX
Received Level: MIN/MAX
Receive CNR: MIN/MAX
Received Blocks Discarded Rate: QPSK/16QAM/64QAM
Number of Received Blocks: QPSK/16QAM/64QAM
2 ALL Check Selects all the check boxes.
3 No Check Clears all the check boxes.
4 Display Refreshes the statistical information.
5 Save File When clicked, a dialog to specify the destination and file name
is displayed to store the contents in a file. The file format is
CSV.
25
1.6.3. Link Utilization
When you click Monitoring from the operation menu part, a submenu is displayed.
When you click Link Utilization from the submenu, a Link Utilization window is displayed.
Figure 13 Monitoring submenu displayed
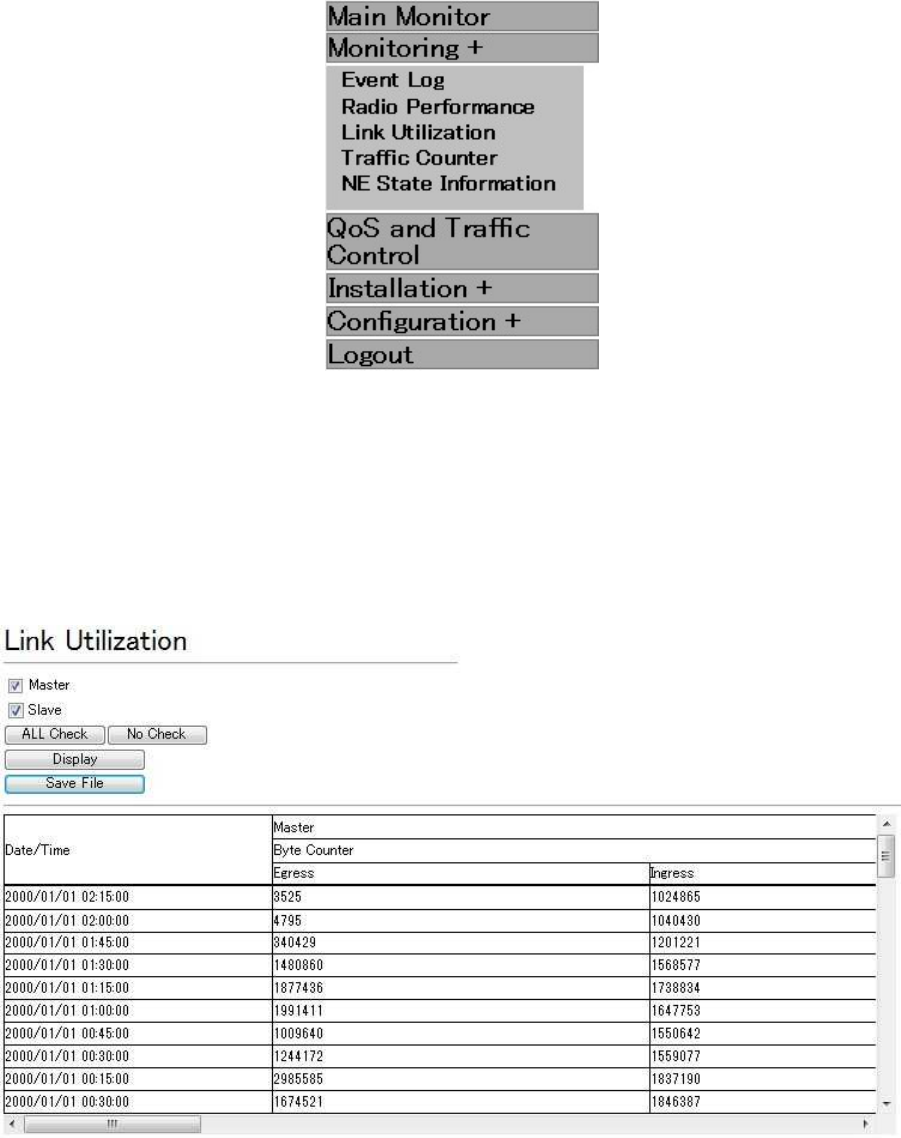
A Link Utilization window is shown in Figure14.
The Link Utilization window displays statistical information on the radio link at an interval of 15
minutes.
The Link Utilization window is described in Table 13.
Figure 14 Link Utilization window

26
Table 13 Description of the Link Utilization window
No.
Item Contents
1 Check box Only the items with their check boxes selected are displayed.
[Counter window]
[Master/Slave]
- Byte Counter
Egress: Total value of the eight classes is displayed.
Ingress: Total value of the eight classes is displayed.
- Ethernet Frame Counter
Ingress: Total value of the eight classes is displayed.
Egress: Total value of the eight classes is displayed.
Buffer Overflow Counter: Total value of the eight classes is
displayed.
2 ALL Check Selects all the check boxes.
3 No Check Clears all the check boxes.
4 Display Refreshes the statistical information.
5 Save File When clicked, a dialog to specify the destination and file name
is displayed to store the contents in a file. The file format is
CSV.

27
1.6.4. Traffic Counter
When you click Monitoring from the operation menu part, a submenu is displayed.
When you select Traffic Counter, a Traffic Counter window is displayed.
Figure 15 Monitoring submenu displayed
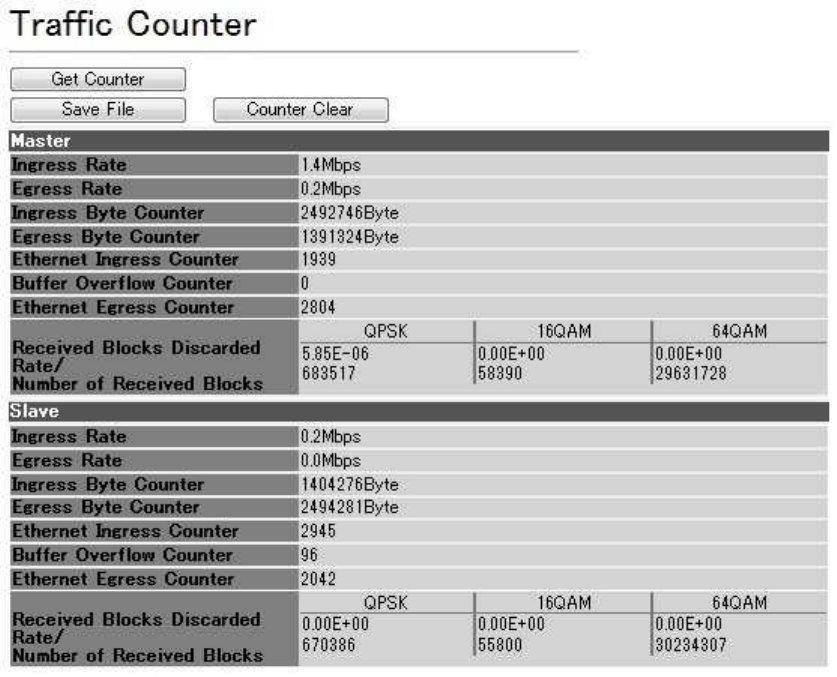
A Traffic Counter window is displayed in Figure 16.
The Traffic Counter window displays Ingress Rate, Egress Rate, Byte Counter, etc.
Unlike statistical information in the Radio Performance or Link Utilization window, the Traffic
Counter window displays the information at the time Get Counter button is clicked.
Each item on the Traffic Counter window is described in Table 14.
28
Figure 16 Traffic Counter

29
Table 14 Description of the Traffic Counter window
No.
Item Description
1 Get counter When clicked, the Traffic Counter window is
refreshed.
2 Save File When clicked, the contents currently displayed are
saved into a CSV file.
3 Counter clear Clears the counter.
4 Ingress Rate Displays the ingress rate of Ethernet packets.
5 Egress Rate Displays the egress rate of Ethernet packets.
6 Byte Counter Displays the number of ingress/egress bytes of
Ethernet packets.
7 Ethernet Ingress Counter Displays the number of ingress Ethernet packets.
8 Buffer Overflow Counter Displays the number of Ethernet packets that were
discarded without being transmitted via radio.
9 Ethernet Egress Counter Displays the number of egress Ethernet packets.
10 Received Blocks Discarded Rate
Displays the Received Blocks Discarded Rate via
radio.
11 Number of Received Blocks Displays the Number of Received Blocks via radio.

30
1.6.5. NE State Information
When you click Monitoring from the operation menu part, a submenu is displayed.
When you click NE State Information from the submenu, a NE Status Information window is
displayed.
Figure 17 Monitoring submenu displayed
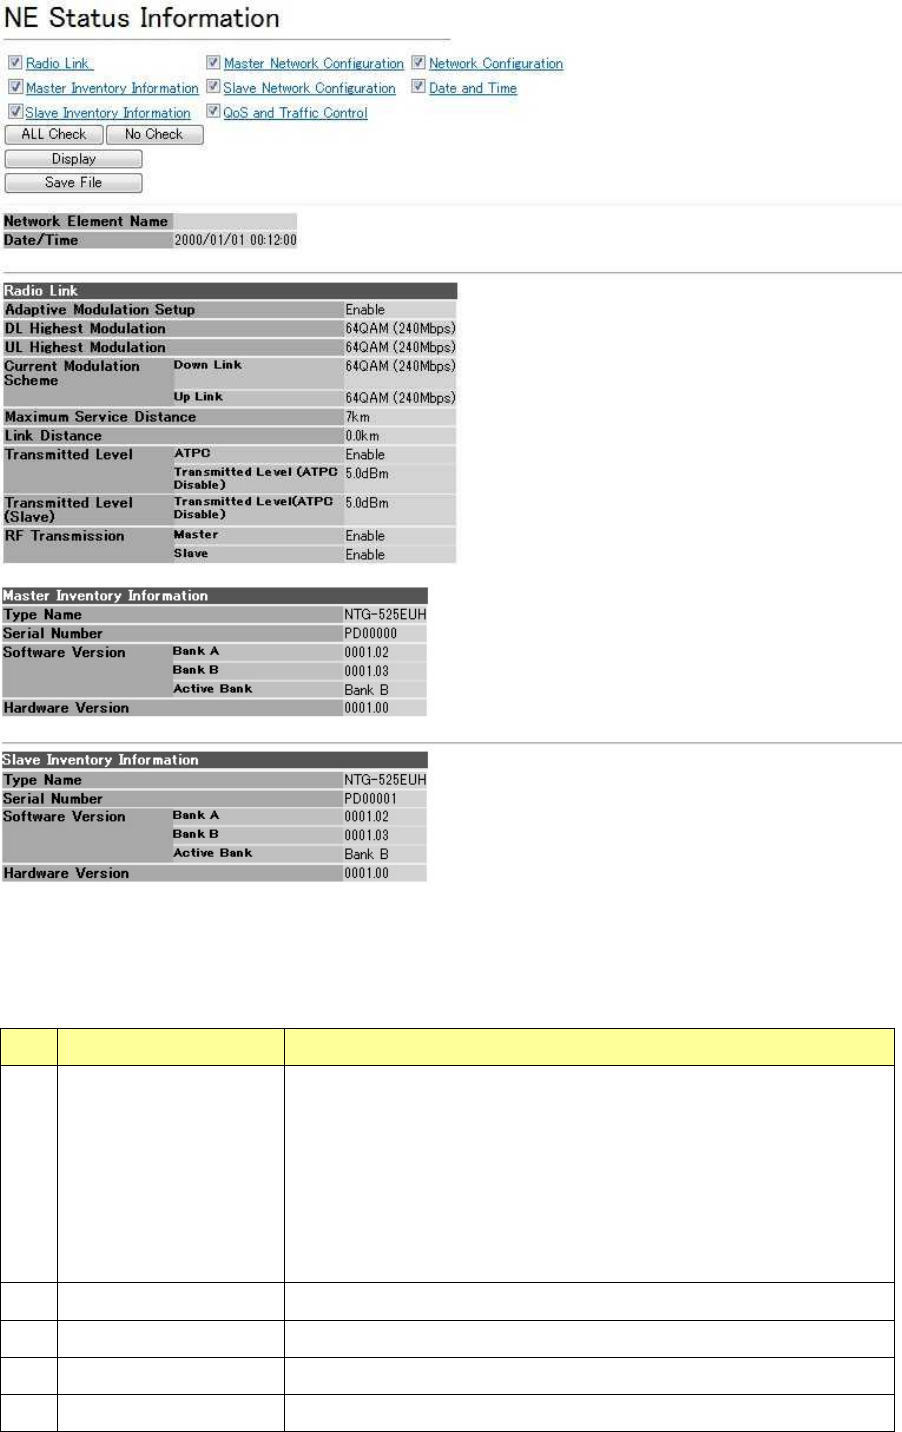
1.6.5.1. Radio Link and Inventory Information
Figure 18 shows the NE Status Information window including radio link and inventory
information.
Each item is described in Table 15.
31
Figure 18 NE Status Information window
Table 15 Description of the NE Status Information window
No.
Item Description
1 check box The NE Status Information window is divided into eight types:
Radio Link, Master Inventory Information, Slave Inventory
Information, Master Network Configuration, Slave Network
Configuration, QoS and Traffic Control, Network Configuration,
Date and Time. Only the items with their check boxes selected
are displayed.
2 ALL Check Selects all the check boxes.
3 No Check Clears all the check boxes.
4 Display When clicked, the NE Status Information window is refreshed.
5 Save File When clicked, a dialog to specify the destination and name of

32
the file is displayed to store NE Status Information.
Following information will be saved in addition to the displayed
items.
[Mode]
[Symbol Rate]
[Frequency]
[CH]
[Frame ID]
[Status]
[Radio Link]
[Authentication]
[Manag. Com.]
6 Network Element
Name
Displays the network element name.
7 Date/Time Displays the time of the device when the window is displayed.
8 Radio Link [Adaptive Modulation Setup]
[DL Highest Modulation]
[UL Highest Modulation]
[Current Modulation Scheme: Down Link]
[Current Modulation Scheme: Up Link]
[Maximum Service Distance]
[Link Distance]
[Transmitted Level]
[RF Transmission]
9 Master inventory
Information
[Type Name]
[Serial Number]
[Software Version: Bank A/Bank B/Active Bank]
[Hardware Version]
10 Slave inventory
Information
[Type Name]
[Serial Number]
[Software Version: Bank A/Bank B/Active Bank]
[Hardware Version]
33
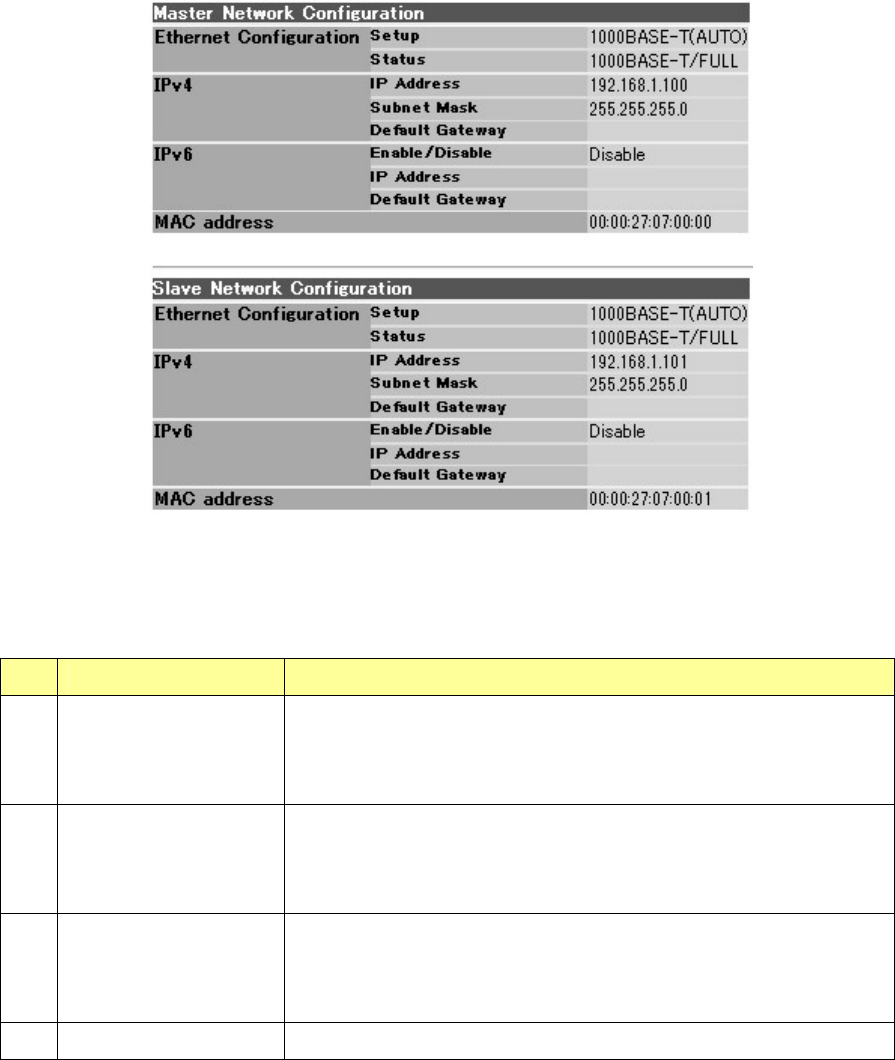
1.6.5.2. Master/Slave Network Configuration
A Master/Slave Network Configuration window is shown in Figure 19.
Each item is described in Table 16.
Figure 19 Master/Slave Network Configuration
Table 16 Items of the Master/Slave Network Configuration window
No.
Item Description
1 Ethernet
Configuration
[Setup] The setting value is displayed.
[Status] Displays the Ethernet link status at the time it is
displayed.
2 IPv4 [IP Address]
[Subnet Mask]
[Default Gateway]
3 IPv6 [Enable/Disable]
[IP Address]
[Default Gateway]
4 MAC address The MAC address is displayed.
34
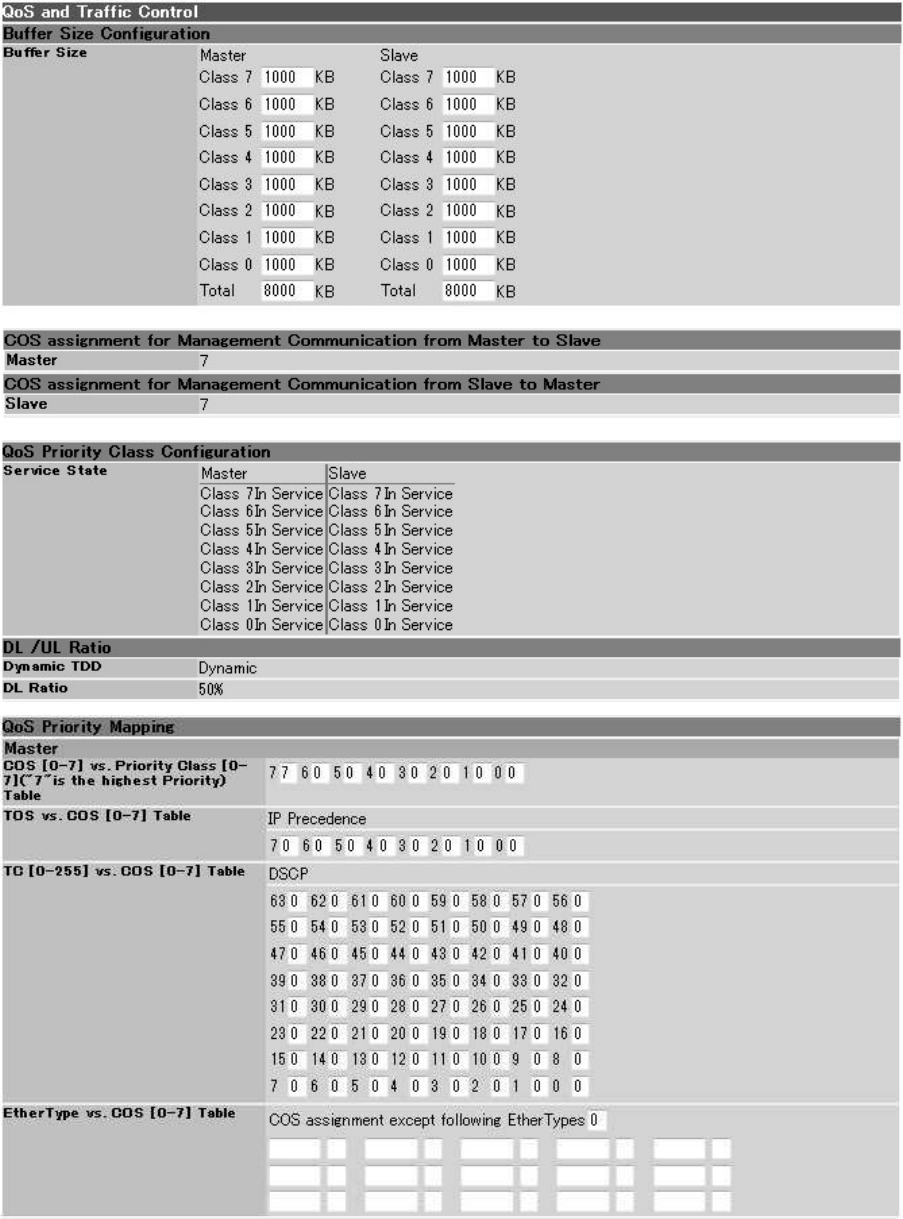
1.6.5.3. QoS and Traffic Control
A QoS and Traffic Control window is shown in Figure 20.
Each item is described in Table 17.
35
Figure 20 QoS and Traffic Control

36
Table 17 Description of the QoS and Traffic Control window
No.
Item Description
1 Buffer Size
Configuration
Displays a buffer size for each class of Master and Slave.
2 COS assignment for
Management
Communication
Displays a COS assignment value for communication between
Master and Slave devices.
3 QoS Priority Class
Configuration
Displays a service state for each class of Master and Slave.
4 DL/UL Ratio Displays a dynamic TDD mode and setting value of the DL
Ratio.
5 QoS Priority Mapping
Following values are displayed for the Master and Slave.
Displays the setting value at the time it is displayed.
COS [0-7] vs. Priority Class ("7"is the highest Priority)
Table
TOS vs. COS [0-7] Table
TC [0-255] vs. COS [0-7] Table
EtherType vs. COS [0-7] Table
For TOS vs. COS [0-7] Table, IP Precedence or DSCP, either
of which has been selected, is displayed.
6 Traffic control
Policing Rate
Displays permitted policing rates of the Master and Slave.
These are displayed for each class and each modulation
scheme.
7 Traffic control
Shaping Rate
Displays permitted policing rates of the Master and Slave.
These are displayed for each class and each modulation
scheme.
37
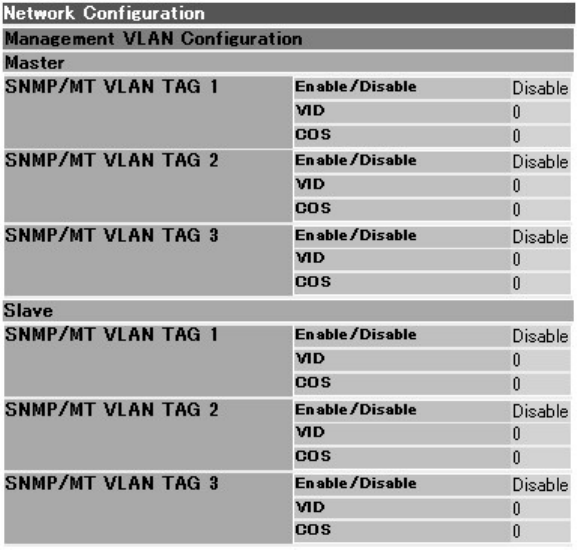
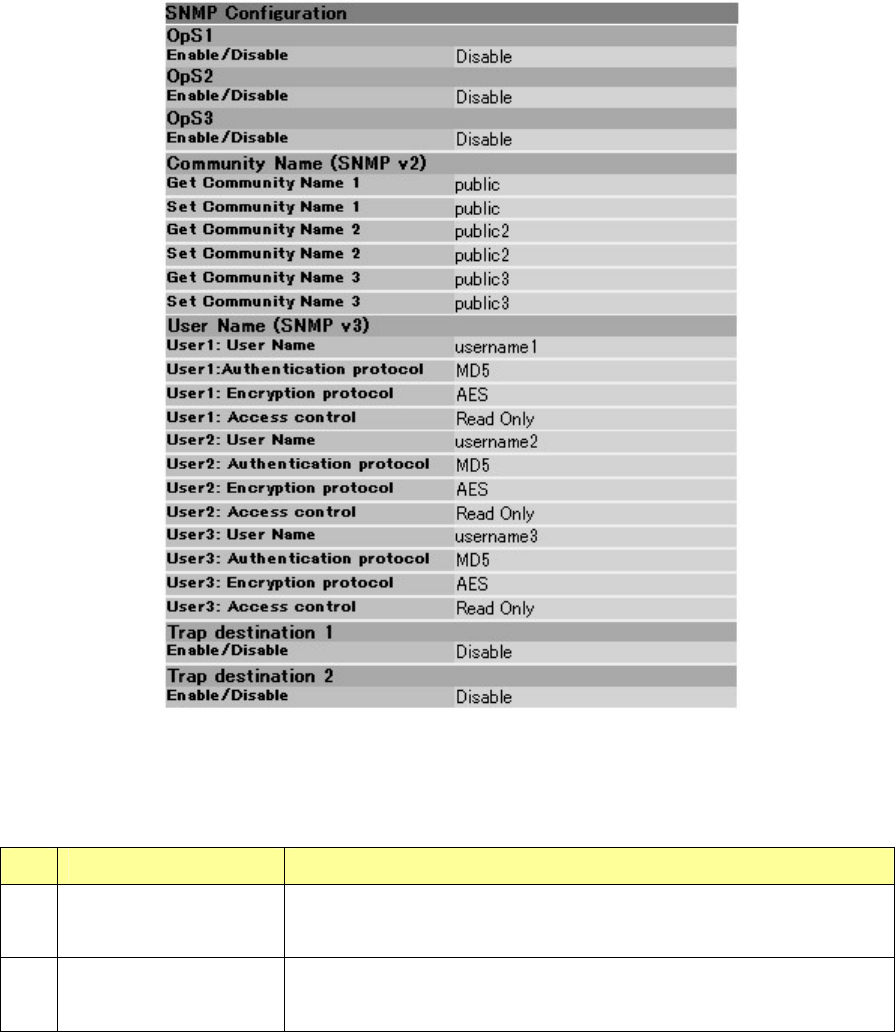
1.6.5.4. Network Configuration
A Network Configuration window is shown in Figure 21.
Each item is described in Table 18.
38
Figure 21 Network Configuration window
Table 18 Description of the Network Configuration window
No.
Item Description
1 Management VLAN
Configuration
Displays the VLAN tag information for managing the Master
and Slave.
2 SNMP Configuration Displays information on OpS, community name, user name,
and trap destination.
39
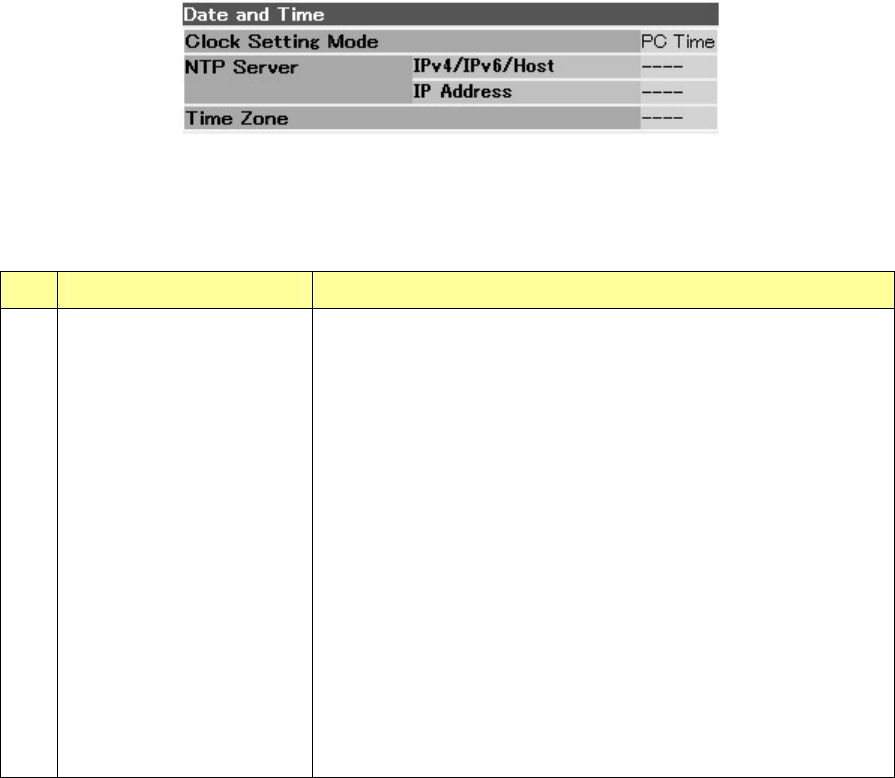
1.6.5.5. Date and Time
A Date and Time window is shown in Figure 22.
Each item is described in Table 19.
Figure 22 Date and Time window
Table 19 Description of the Date and Time window
No.
Item Description
1 Date and Time [Clock Setting Mode]
Displays the specified item.
[NTP Server, IP Address]
When the connection is successful, a destination IP
Address is displayed.
When the connection failed, "-" is displayed.
[DNS Server, IP Address]
When the connection is successful, a destination IP
Address is displayed.
When the connection failed or when it is not set, "----" is
displayed.
[Time Zone]
Displays the specified Time Zone.
40
1.7. QoS and Traffic Control
When you select QoS and Traffic Control in the operation menu part, a QoS and Traffic Control
window is displayed.
In the QoS and Traffic Control window, items that are reflected after restart such as Buffer Size,
VID/COS for Management Communication and items that are immediately reflected such as
Service State, TDD Control, QoS Priority Mapping, Policing/Shaping can be specified.
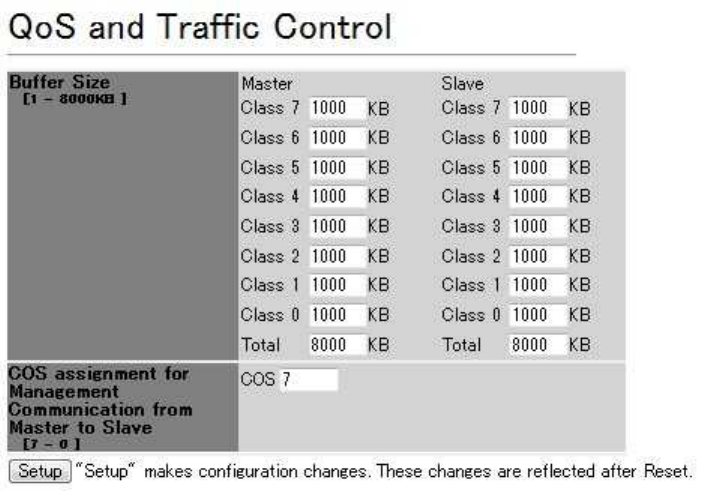
1.7.1. Buffer Size and COS Assignment for Management Communication from
Master to Slave
A window including Buffer Size and COS assignment for Management Communication is
shown in Figure 23.
Settings for the Buffer Size and COS assignment for Management Communication are
reflected after restart.
Each item is described in Table 22.
Figure 23 A window including the Buffer Size and COS assignment for
Management Communication
41
Table 20 Description of a window including the Buffer Size and COS assignment
for Management Communication
No
Item Description
1 Buffer Size
Configuration
Specify a buffer size for each class.
You can specify a buffer size for classes from 0 to 7 for each of the
Master and Slave.
For each of the Master and Slave, the total buffer size should be
within 1 - 8000 Kbytes.
Total
Displays the calculated total value of classes from 0 to 7.
The Class 7 is the most prioritized, and Class 0 is the least
prioritized class.
2 COS assignment
for Management
Communication
from Master to
Slave
Specify a COS value which is used for the communication from the
Master to Slave.
Initial = cos7.
Note: If you set a low priority for the COS assignment for
Management Communication, the device may not work properly
when the user data traffic exceeds the radio bandwidth.
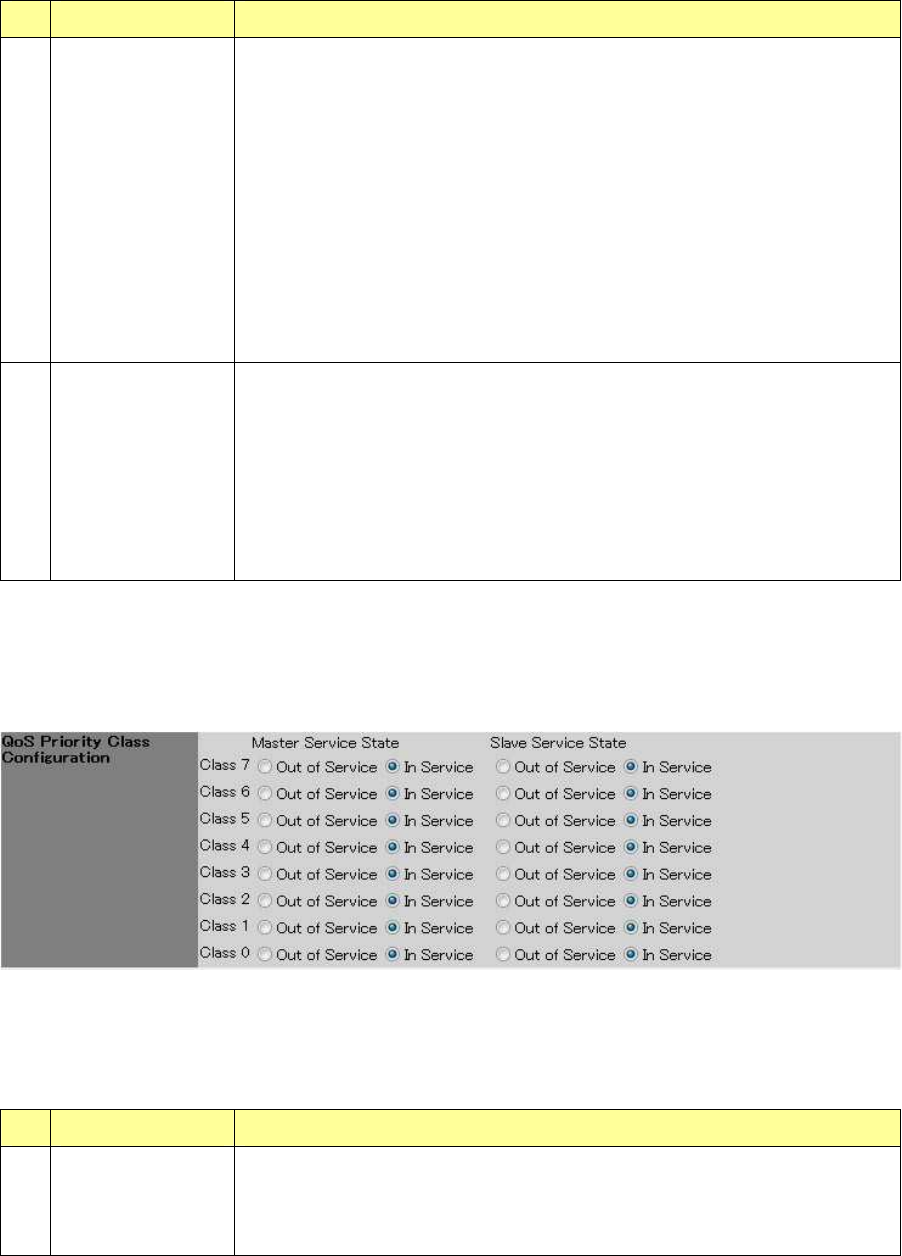
1.7.2. QoS Priority Class Configuration
A QoS Priority Class Configuration window is shown in Figure 24.
Each item is described in Table 21.
Figure 24 QoS Priority Class Configuration window
Table 21 Description of QoS Priority Class Configuration window
No
Item Description
1 QoS Priority
Class
Configuration
Specify either Out of Service or In Service for each class of the
Master and Slave.
42
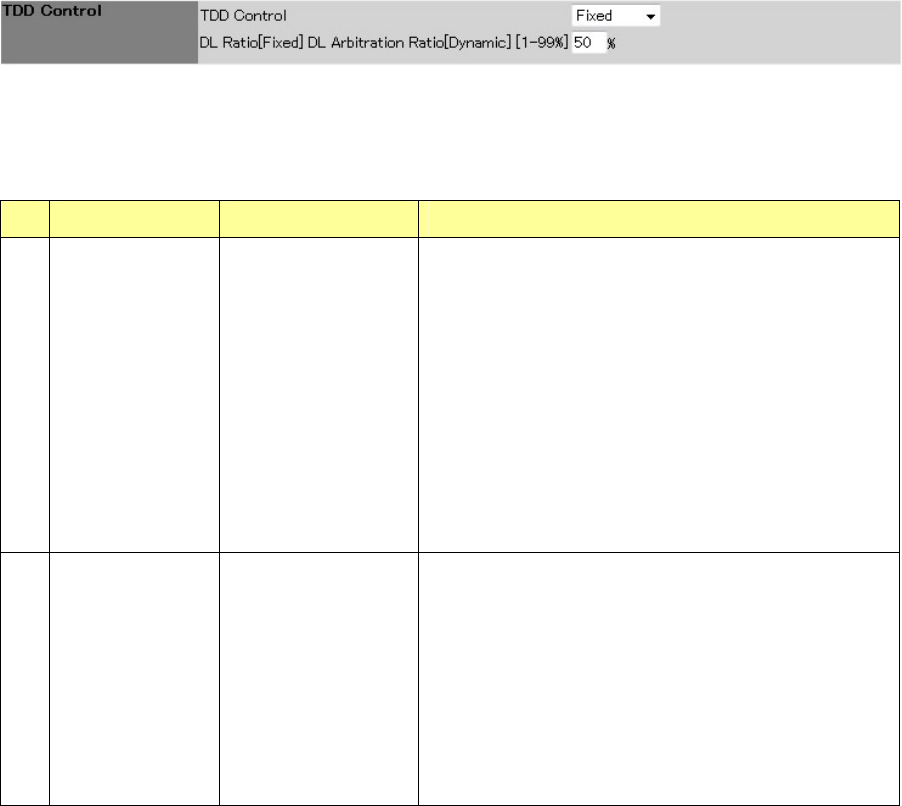
1.7.3. TDD Control
A TDD Control window is shown in Figure 25.
Each item is described in Table 22.
Figure 25 TDD Control window
Table 22 Description of TDD Control window
No
Item Setting range Description
1 TDD Control Fixed/Dynamic Specify an operation method for TDD control.
Fixed:
Regardless of the uplink and downlink traffic,
communication is always performed using a
fixed percent of radio bandwidth.
Dynamic:
Communication is performed by atomically
assigning the extra bandwidth generated by
changes in the uplink and downlink traffic to the
other communication bandwidth.
2 DL Ratio[Fixed]
DL Arbitration
Ratio[Dynamic]
1 - 99% Specify a value corresponding to the percent of
downlink bandwidth in total bandwidth in 1% -
99%.
Note: Setting a value from 10% to 90% is
recommended in order to perform communication
between devices such as authentication and key
updates.
43
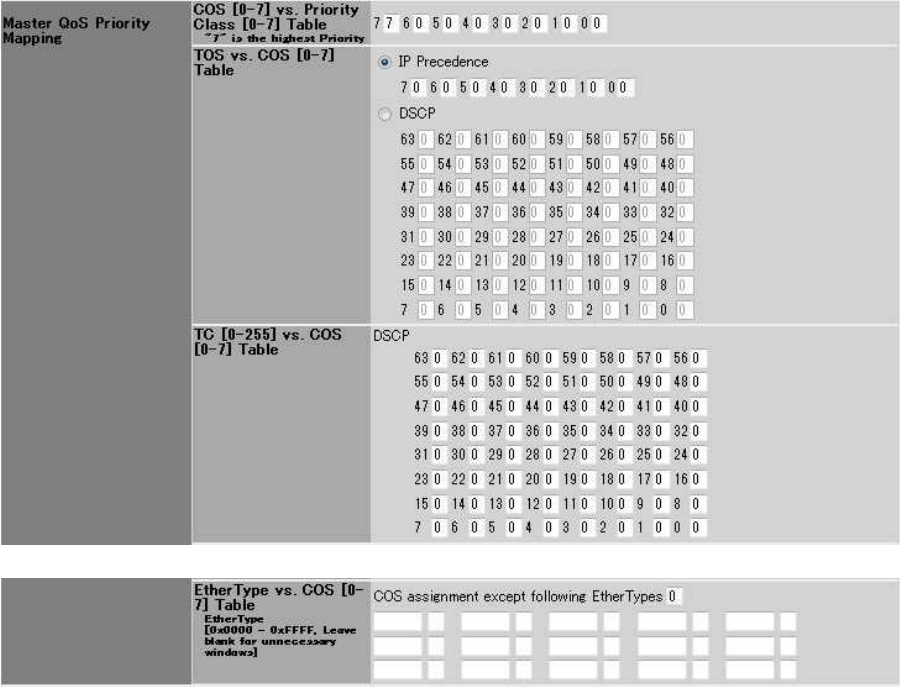
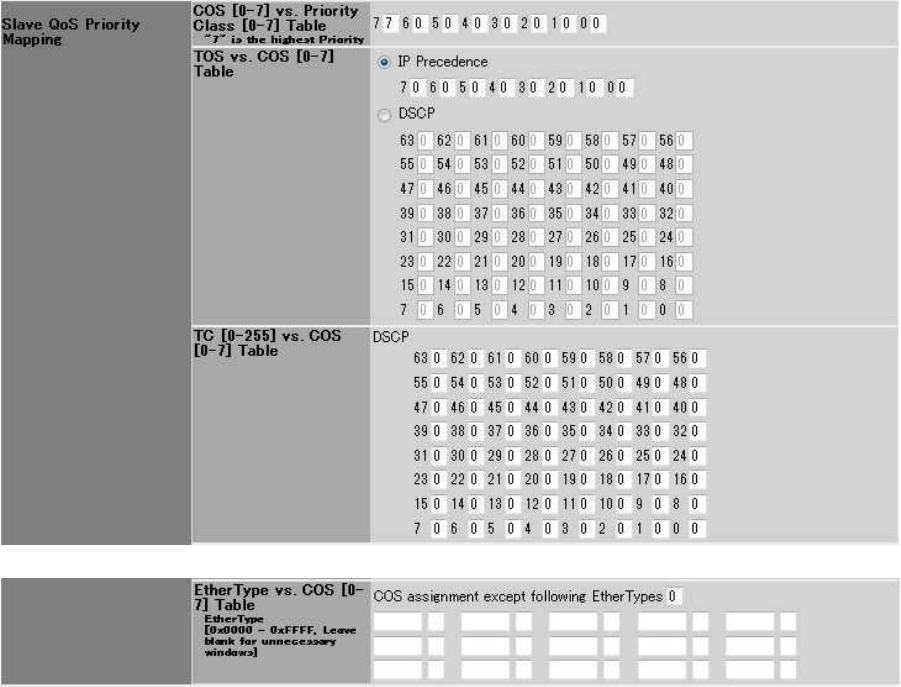
1.7.4. QoS Priority Mapping
A QoS Priority Mapping window is shown in Figure 26.
Each item is described in Table 23.
44
Figure 26 QoS Priority Mapping window

45
Table 23 Description of the QoS Priority Mapping window
No
Item Setting range Description
1 Master
COS [0-7] vs.
Priority Class
[0-7] Table
0 - 7
The Class 7 is the most prioritized, and
Class 0 is the least prioritized class.
2 Master
TOS vs. COS
[0-7] Table
[Selection of input
format]
IP Precedence/DSCP
[COS value] 0 - 7
[Selection of input format]
Select either the IP Precedence radio
button or DSCP radio button.
[Input format]
Input a COS value to each TOS value.
[Bit string for each mode]
・IP Precedence
Bit[7:5]: Priority
Bit[4:0]: Reserved
・DSCP
Bit[7:2]: DSCP (63 types)
Bit[1:0]: Reserved
[Setting example]
If COS=7 is assigned for IP Precedence = 1,
COS value=7 is set to TOS: 0x20 - 0x3F.
That is, the reserved part is filled with the
same COS value.
3 Master
TC [0-63] vs.
COS [0-7] Table
[COS value] 0 - 7 Input a COS value for TC values from 0 to
63.
4 Master
EtherType vs.
COS [0-7] Table
[COS value] 0 - 7
[EtherTypes]
0x0000 - 0xFFFF
Input combinations of 15 types of
EtherTypes and CoS values. Also input a
CoS value in COS assignment except
following EtherTypes for unspecified
EtherTypes.
5 Slave
COS [0-7] vs.
Priority Class
[0-7] Table
0 - 7
The Class 7 is the most prioritized, and
Class 0 is the least prioritized class.
6 Slave
TOS vs. COS
[0-7] Table
[Selection of input
format]
IP Precedence/DSCP
[Selection of input format]
Select either the IP Precedence radio
button or DSCP radio button.

46
[COS value] 0 - 7
[Input format]
Input a COS value to each TOS value.
[Bit string for each mode]
・IP Precedence
Bit[7:5]: Priority
Bit[4:0]: Reserved
・DSCP
Bit[7:2]: DSCP (63 types)
Bit[1:0]: Reserved
[Setting example]
If COS=7 is assigned for IP Precedence = 1,
COS value=7 is set to TOS: 0x20 - 0x3F.
That is, the reserved part is filled with the
same COS value.
7 Slave
TC [0-255] vs.
COS [0-7] Table
0 - 7 Input a COS value for TC values from 0 to
63.
8 Slave
EtherType vs.
COS [0-7] Table
[COS value] 0 - 7
[EtherTypes]
0x0000 - 0xFFFF
Input combinations of 15 types of
EtherTypes and CoS values. Also input a
CoS value in COS assignment except
following EtherTypes for unspecified
EtherTypes.
47
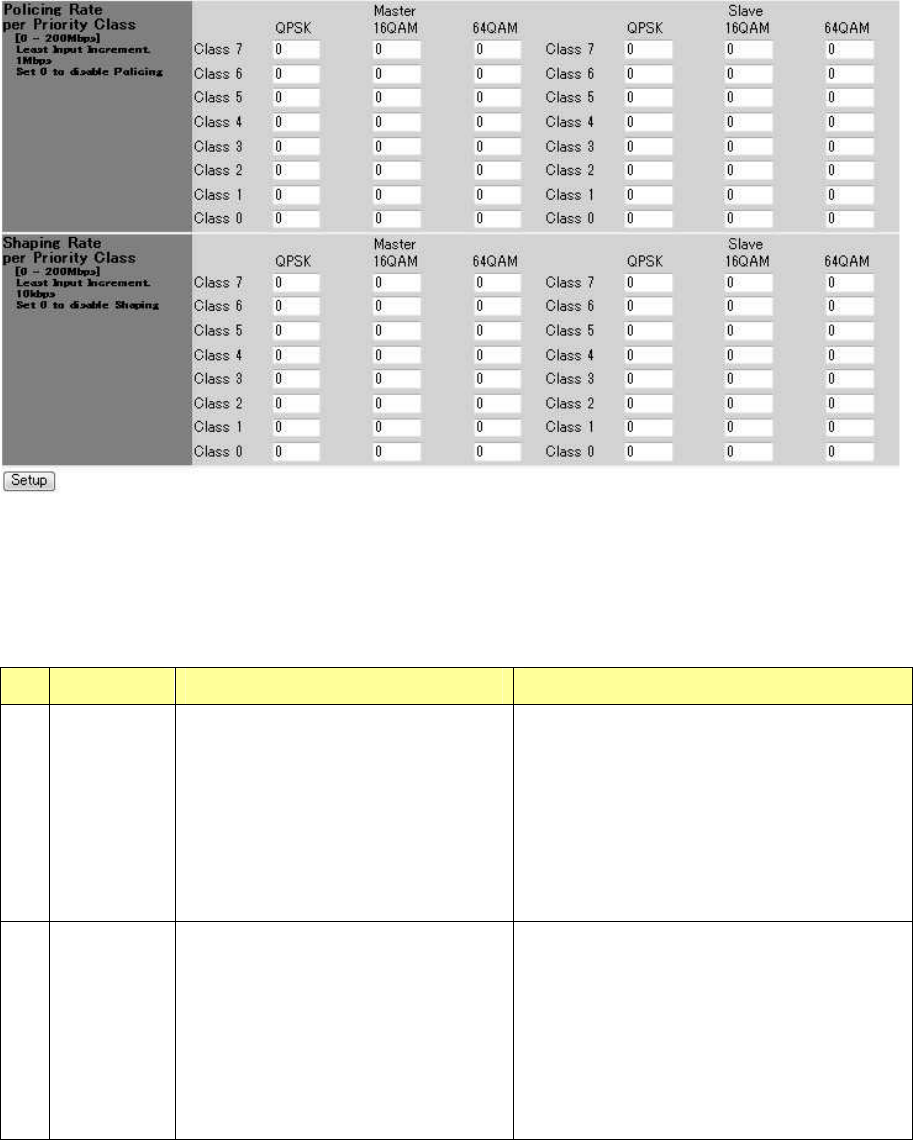
1.7.5. Policing and Shaping
A Policing/Shaping window is shown in Figure 27.
Each item is described in Table 24.
Figure 27 Policing/Shaping window
Table 24 Description of Policing/Shaping setting
No
Item Setting range Description
1 Policing
Rate per
Priority
Class
0 - 200Mbps Input a permitted policing rate for each
modulation scheme/each class of the
Master and Slave.
If 0 is set or left blank, policing will be
disabled.
These are set in the unit of 1 Mbps.
2 Shaping
Rate per
Priority
Class
0 - 200Mbps Input a permitted shaping rate for each
modulation scheme/each class of the
Master and Slave.
If 0 is set or left blank, shaping will be
disabled.
These are set in the unit of 10 kbps.
48
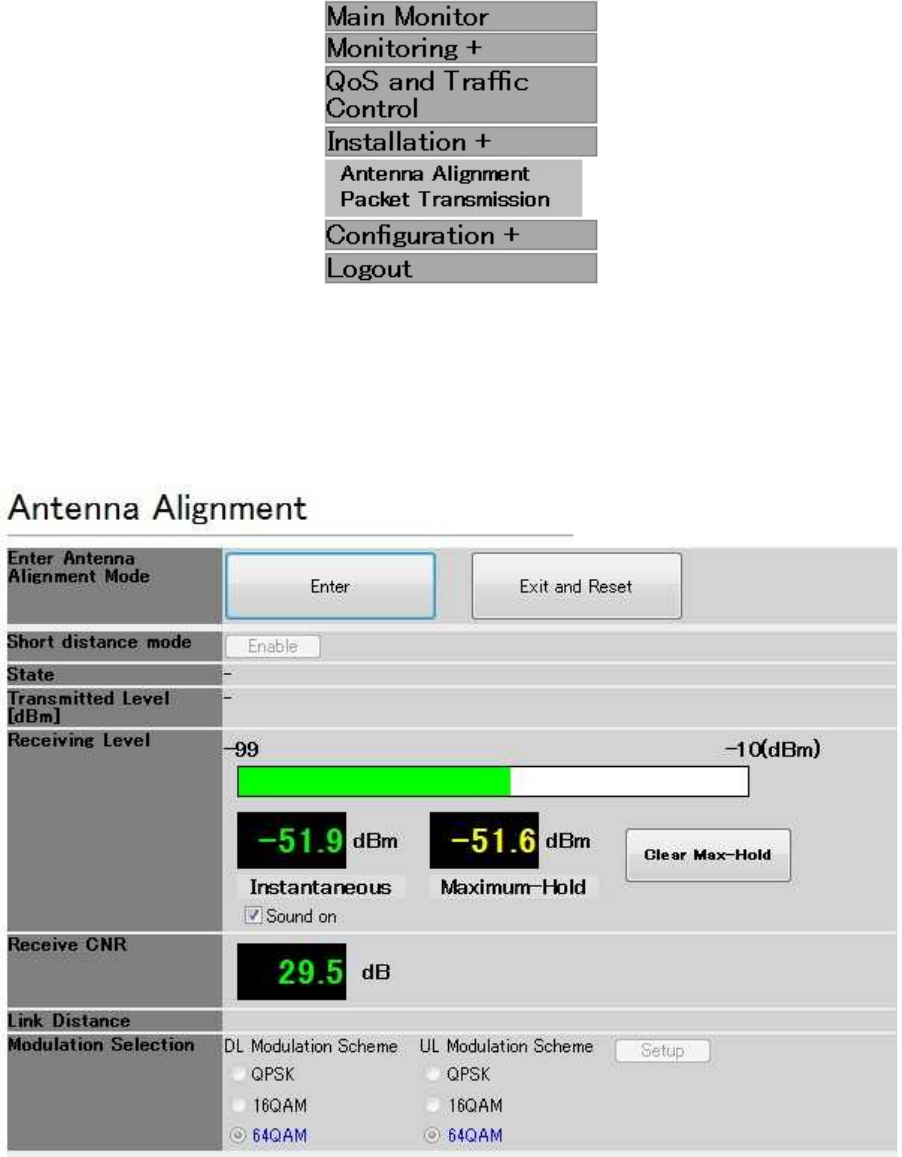
1.8. Installation
1.8.1. Antenna Alignment
When you select Installation in the operation menu part, a submenu is displayed.
When you select Antenna Alignment from the submenu, an Antenna Alignment window is
displayed.
Figure 28 Installation submenu displayed
An Antenna Alignment window is shown in Figure 29.
Each item is described in Table 25. Also, the displayed status is described in Table 26.

49
Figure 29 Antenna Alignment window
Table 25 Description of the Antenna Alignment window
Item Description
1 Enter Antenna
Alignment Mode
Clicking the Enter button switches the device into the Antenna
Alignment mode.
Clicking the Exit and Reset button will restart the device,
exiting from the Antenna Alignment mode.
Notes:
. To switch the device from the Antenna Alignment mode back
to the normal mode, a restart is required.
. Transition between pages is disabled during the Antenna
Alignment mode.
2 Short distance mode When the button is clicked while it is marked as Enable, the
Transmitted Level is decreased by 20 dB.
When the button is clicked while it is marked as Disable, the
Transmitted Level is returned to the original value.
3 State Displays the current status. Table 26 lists the displayed
contents.
4 Transmitted Level Displays the transmission level.
5 Receiving Level Displays the current receiving level with a bar and values.
The maximum value is shown by figures.
Clicking the Clear Max-Hold button will clear the maximum
value.
When the Sound on check box is selected, a sound
corresponding to the current value is emitted. The sound
function is supported only in Windows XP.
6 Receive CNR Displays the receiving CNR.
7 Link Distance Displays the distance between the Master and the Slave.
8 Modulation Selection Selects uplink and downlink modulation schemes.
Clicking the Setup button will switch the device into the
selected modulation scheme.

50
9 Radio Link Status Displays the Discarded Received Blocks and Number of
Received Blocks and Received Blocks Discarded Rate.
Clicking the Clear button will clear the counters.
Table 26 Displayed status
No. Displayed status Description
1 Over Receiving Level. Enable Short
distance mode of opposite NE.
Displayed when the Received Level is over
input (-30 dBm or more).
2 Frame ID Error Displayed when the device has received a radio
wave with a Frame ID different from the Frame
ID set for the Master.
It occurs when the Master receives a radio wave
of other opposite sets.
51
1.8.2. Packet Transmission Test
The Packet transmission test function measures the number of transmitted test packets and the
number of received packets.
When you select Installation in the operation menu part, a submenu is displayed.
When you select Packet Transmission Test from the submenu, a Packet Transmission Test
window is displayed.
Figure 30 Installation submenu displayed
A Packet Transmission Test window is shown in Figure 31.
Each item is described in Table 27.
Figure 31 Packet Transmission Test window

52
Table 27 Description of the Packet Transmission Test window
No.
Item Setting range Description
1 Packet Length 74 - 1518 Specify the length of the test packet.
2 Measurement Continuous/Fixed
Period
Fixed Period
1 - 255 seconds
Select either Continuous or Fixed Period.
When you select Fixed Period, input the
measurement time.
3 Start / Abort Start button starts a test. Abort button stops the
test.
4 Test result Displays the Test Status, UL RX/TX Packets,
and DL RX/TX Packets.
UL RX/TX Packets is displayed as a fraction of
the uplink [number of received packets/number
of transmitted packets]; the DL RX/TX Packets
is displayed as a fraction of the downlink
[number of received packets/number of
transmitted packets].
Note: As the priority of the test packets is lower
than the packets for communication between
the devices, the test packets can be lost.
5 Save File When clicked, a dialog to specify the destination
and name is displayed to store the test results.
Notes:
(1) When the test is performed continuously, it is
recorded as Fixed Period "0".
(2) When the packet transmission test is
performed by specifying the measurement time,
the measurement time will not be saved in the
network element, which is not the device on
which the Start button is pressed.
(3) The Test Status will not be saved.
53
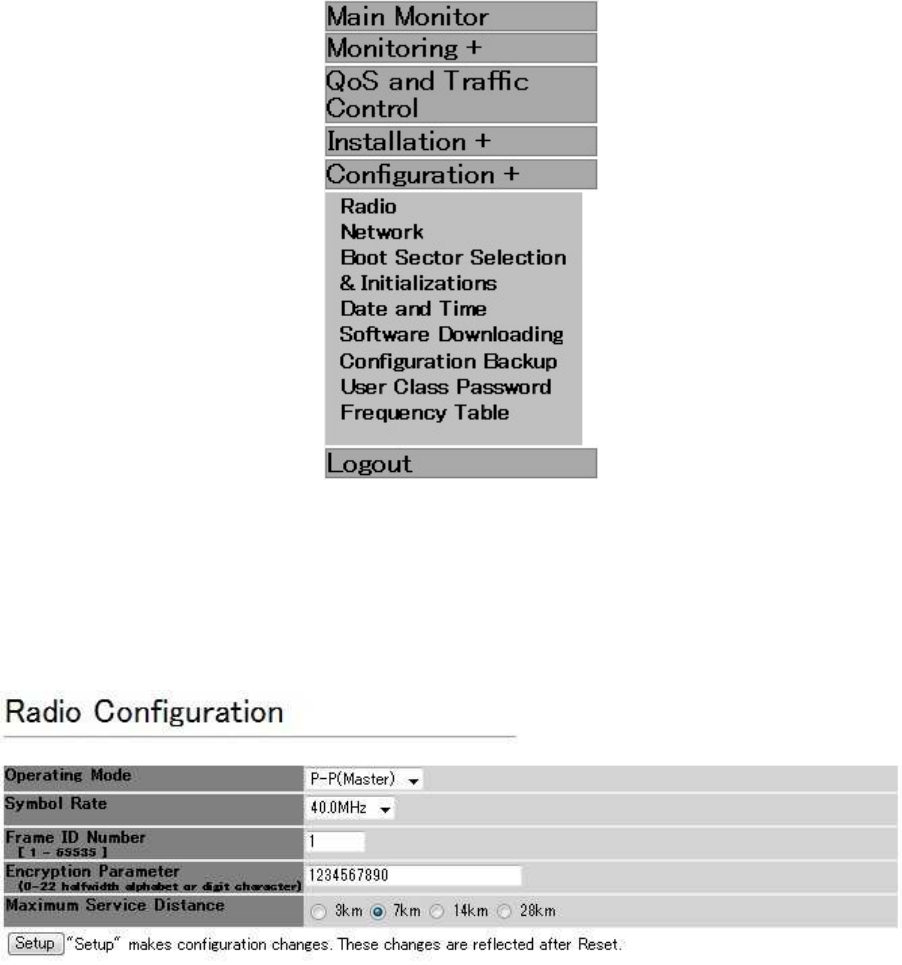
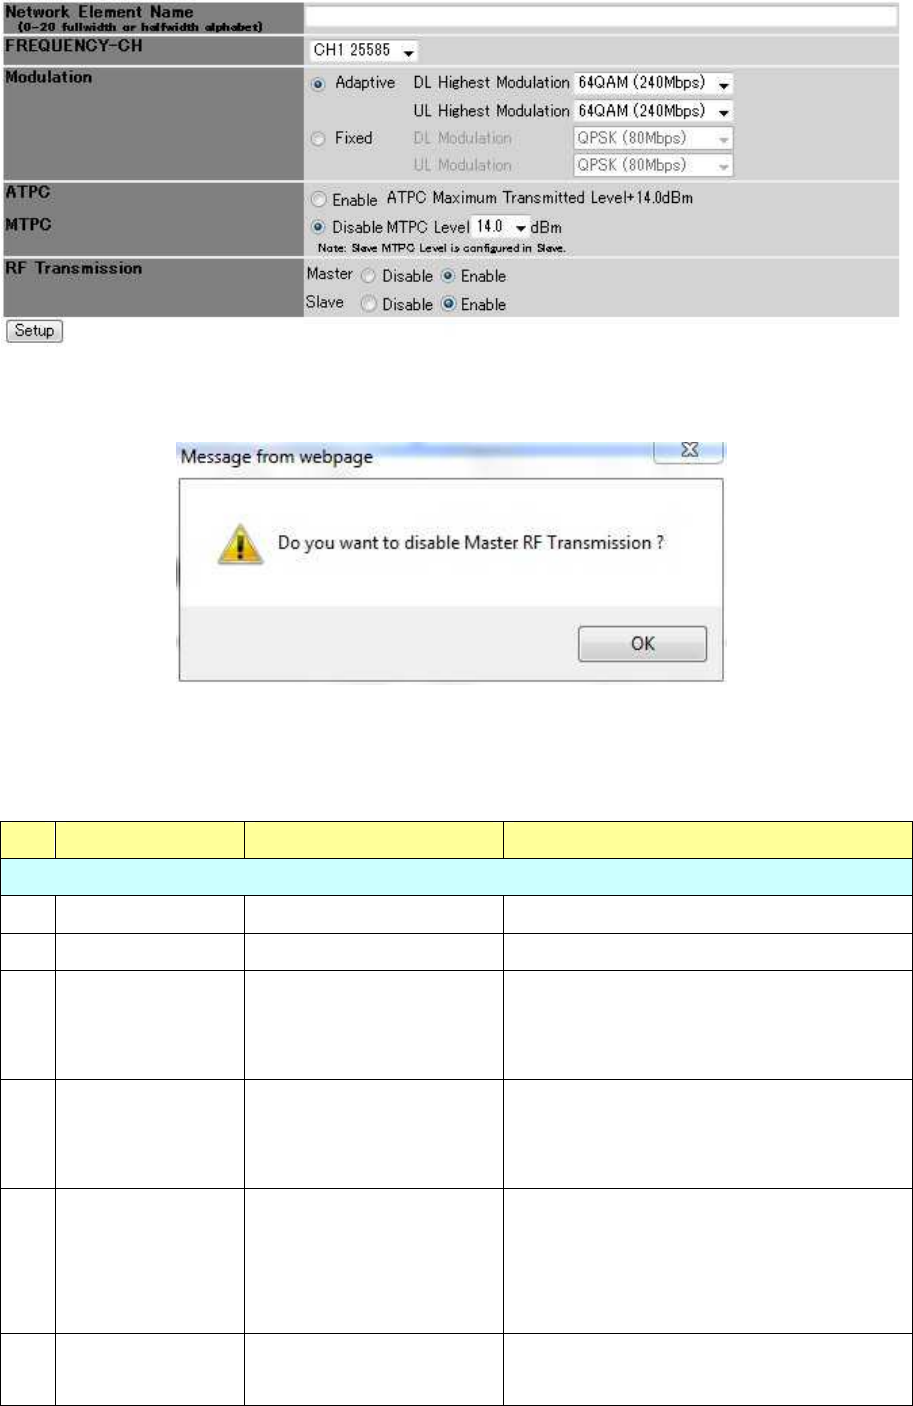
1.9. Configuration
1.9.1. Radio
When you select Configuration in the operation menu part, a submenu is displayed.
When you select Radio from the submenu, a Radio Configuration window is displayed.
Figure 32 Configuration submenu displayed
A Radio Configuration window is shown in Figure 33 and Figure 34.
Each item is described in Table 28.
Figure 33 Radio Configuration window (reflection after restart)
54
Figure 34 Radio Configuration window (immediate reflection)
Figure 35 Confirmation dialog to disable RF transmission
Table 28 Description of Radio Configuration window
No.
Item Setting range Contents
Reflection after restart
1 Operating Mode Master/Slave Select Master or Slave.
2 Symbol Rate 20.0MHz/40.0MHz Select a symbol rate.
3 Frame ID Number
1 - 65535 Input a Frame ID.
Input the same Frame ID value for local
NE and opposite NE.
4 Encryption
Parameter
0 - 22 characters Input an encryption parameter.
Input the same encryption parameter
value for local and opposite NE.
5 Maximum Service
Distance
3/7/14/28 km Select a maximum service distance to the
opposite NE.
Select a value longer than the actual
distance.
6 Setup Restarts the device and reflect the setting
values.

55
Immediate reflection
7 Network Element
Name
0 - 20 double-byte
characters
Input the network element name.
8 FREQUENCY-CH
For the supported
frequencies, refer to the
"Frequency channel"
section.
Select a frequency from the drop-down
list.
Adaptive/Fixed
Select the Adaptive or Fixed modulation
scheme.
Highest Modulation
64QAM/16QAM/QPSK
When you select the Adaptive
modulation scheme, select the Highest
Modulation as well.
9 Modulation
Modulation Scheme
64QAM/16QAM/QPSK
When you select the Fixed modulation
scheme, select a modulation scheme as
well.
10 ATPC Enable/Disable Select Enable/Disable of the ATPC.
When Enable is selected, ATPC is
enabled in both the Master and Slave.
When Disable is selected, ATPC is
disabled in both the Master and Slave.
When ATPC is enabled, the Transmitted
Level is controlled in the range of 6 - +14
dBm so that the received level becomes
-50 dBm.
When ATPC is disabled, the Master
transmits using the Transmitted Level set
in the Master's MT, and the Slave
transmits using the Transmitted Level set
in the Slave's MT.
8 MTPC -6 - +14 dBm Specify the Transmitted level of the
Master when the ATPC is disabled.
The Transmitted level of the Slave when
ATPC is disabled is set in the Slave's MT.

56
11 RF Transmission RF Transmission
Disable/RF Transmission
Enable
Specify RF Transmission Disable and RF
Transmission Enable for the Master and
Slave.
When you perform RF Transmission
Disable of the Master/Slave, a
confirmation dialog in Figure 35 will
appear. Click OK.
12 Setup Performs immediate reflection.
57
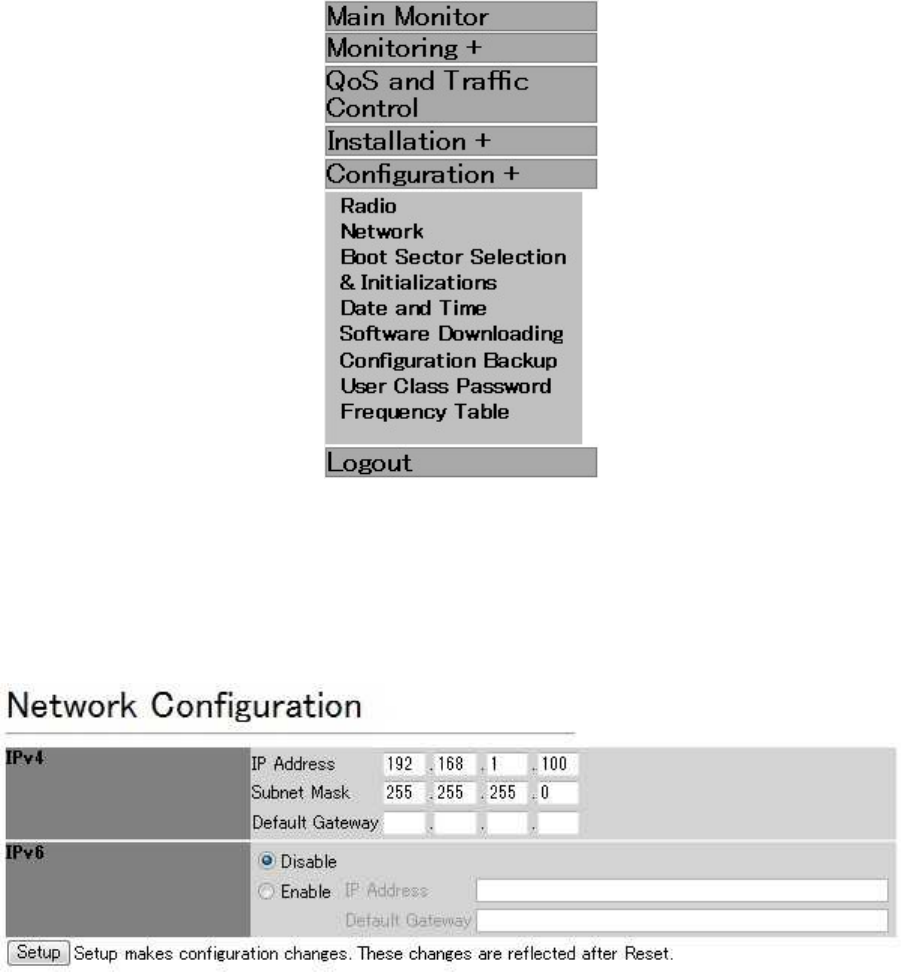
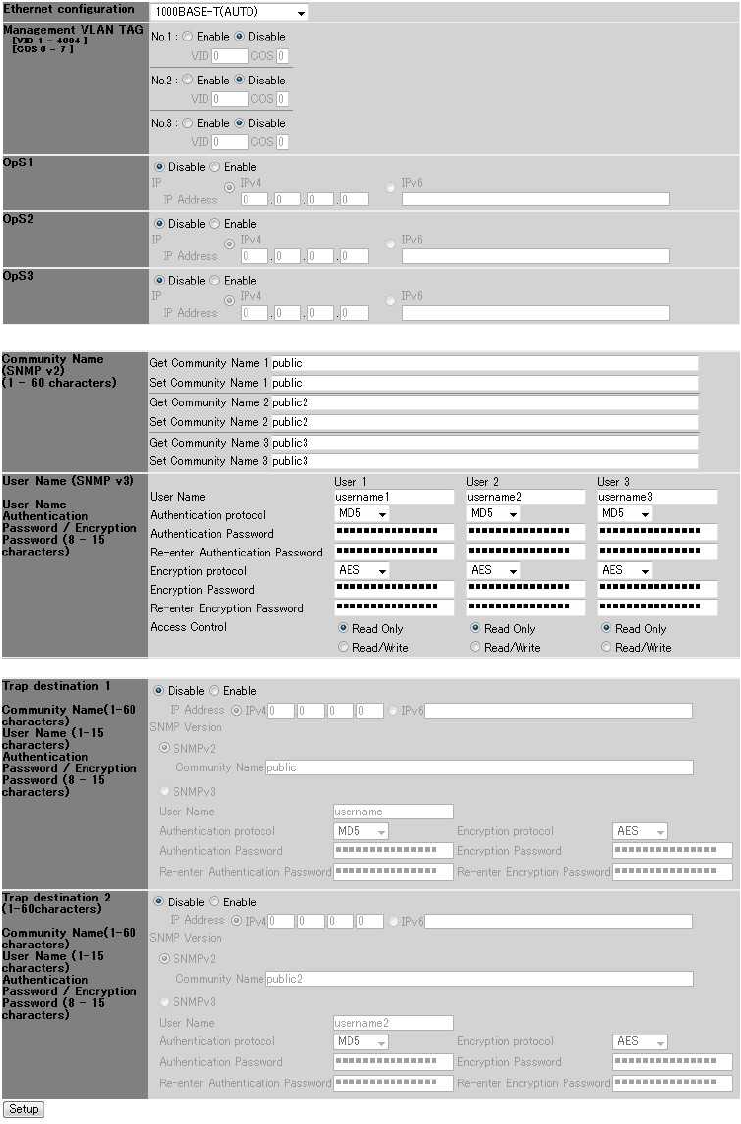
1.9.2. Network
When you select Configuration in the operation menu part, a submenu is displayed.
When you select Network Configuration from the submenu, a Network Configuration window is
displayed.
Figure 36 Configuration submenu displayed
A Network Configuration window is shown in Figure 37.
Each item is described in Table 29.
58
Figure 37 Network Configuration window

59
Table 29 Description of the Network Configuration window
No.
Item Setting range Description
Reflection after restart
1 IPv4 0 - 255
See 1.9.2.1(1).
Specify an IPv4 address.
Enable/Disable 2 IPv6
See 1.9.2.1(2).
Select Enable to use IPv6. When
enabled, specify an IP Address and
Default Gateway.
3 Setup Restarts the device and reflect the setting
values.
Immediate reflection
4 Ethernet
Configuration
1000BASE-T(AUTO)
1000BASE-T(Fixed)
100BASE-TX FULL(Fixed)
100BASE-TX FULL(AUTO)
100BASE-TX HALF(Fixed)
Select an Ethernet setting.
Enable/Disable
You can register three types of VLAN tags
for the MT.
Specify Enable/Disable for each type of
VLAN tag.
You can disable all the VLAN tag settings.
About SNMP Trap destination: A total of
four ARPs with VLAN tags and without
management VLAN tags are transmitted,
and a trap is transmitted to a destination
where there was an ARP response.
5 Management
VLAN TAG
VID range 1 - 4094
COS value range 0 - 7
When Enable is selected, input a VID and
COS value as well.
6 OpS1/2/3 Enable/Disable You can set three types of OpS.
Select Enable/Disable for each type of
OpS.

60
IP setting IPv4/IPv6 When Enable is selected, input the IP
setting as well.
[IP setting]
Select IPv4 or IPv6.
Input the IP Address in the selected
format.
7 Community
Name
(SNMPv2)
Up to 60 single-byte
characters
Register a SNMPv2 Get/Set community
name. You can register up to three types
of community names.
User Name
1 - 15 single-byte characters
Register a SNMPv3 user name. You can
register up to three users.
Authentication
protocol: NONE/MD5/SHA
Password: 8 - 15 single-byte
characters
Select an authentication protocol.
When you select MD5/SHA, input a
password as well.
Encryption
protocol: NONE/DES/AES
Password: 8 - 15 single-byte
characters
Select an encryption protocol.
When you select DES/AES, input a
password as well.
8 User Name
(SNMPv3)
Access Control
Read Only
Read/Write
Select an access control.
9 Trap
destination
1/2
Disable/Enable You can specify up to two kinds of trap
destinations.
Select Enable/Disable for each type of
trap destination.
If Enable is selected, when
communication to the trap destination
becomes available, a trap is transmitted
for each upcoming event.
VLAN tag of the trap:
For each destination without a VLAN
tag and with the management VLAN
tag, a trap is transmitted to a
destination where there was an ARP
response.

61
IP Address IPv4/IPv6 When Enable is selected, input the IP
setting as well.
Select IPv4 or IPv6.
Input the IP Address in the selected
format.
SNMP Version
SNMPv2/SNMPv3
Select a SNMP Version.
Community Name
Up to 60 single-byte
characters
When SNMPv2 is selected, input a
Community Name as well.
User Name, Authentication
protocol, Authentication
Password, Encryption
protocol, Encryption
Password
When SNMPv3 is selected, input User
Name, Authentication protocol,
Authentication Password, Encryption
protocol, Encryption Password as well.
See section 8 for the setting range for
each item.
10 Setup Performs immediate reflection.
1.9.2.1. Input Range for IP Addresses
IP addresses that can be input are limited as follows.
(1) IPv4
IP Address
・ Values of 0 and 255 cannot be specified for the most significant bit and the least significant
bit.
・ The range from 127.0.0.0 to 127.255.255.255 cannot be specified.
・ Addresses higher than 223.255.255.254 cannot be specified.
Subnet Mask
・ An address 0.0.0.0 cannot be specified.
・ An address with dropped bits (0 bit) cannot be specified.
Default Gateway
・ The bit area of the subnet mask must match the subnet mask of the IP Address.
(2) IPv6
IP Address
・ An address 0:0:0:0:0:0:0:0 cannot be specified.
62
・ An address 0:0:0:0:0:0:0:1 cannot be specified.
・ Addresses higher than feff:ffff:ffff:ffff:ffff:ffff:ffff:ffff cannot be specified.
Default Gateway
・ The address cannot be specified if the most significant 64bits are different from that of the
IP Address.
63
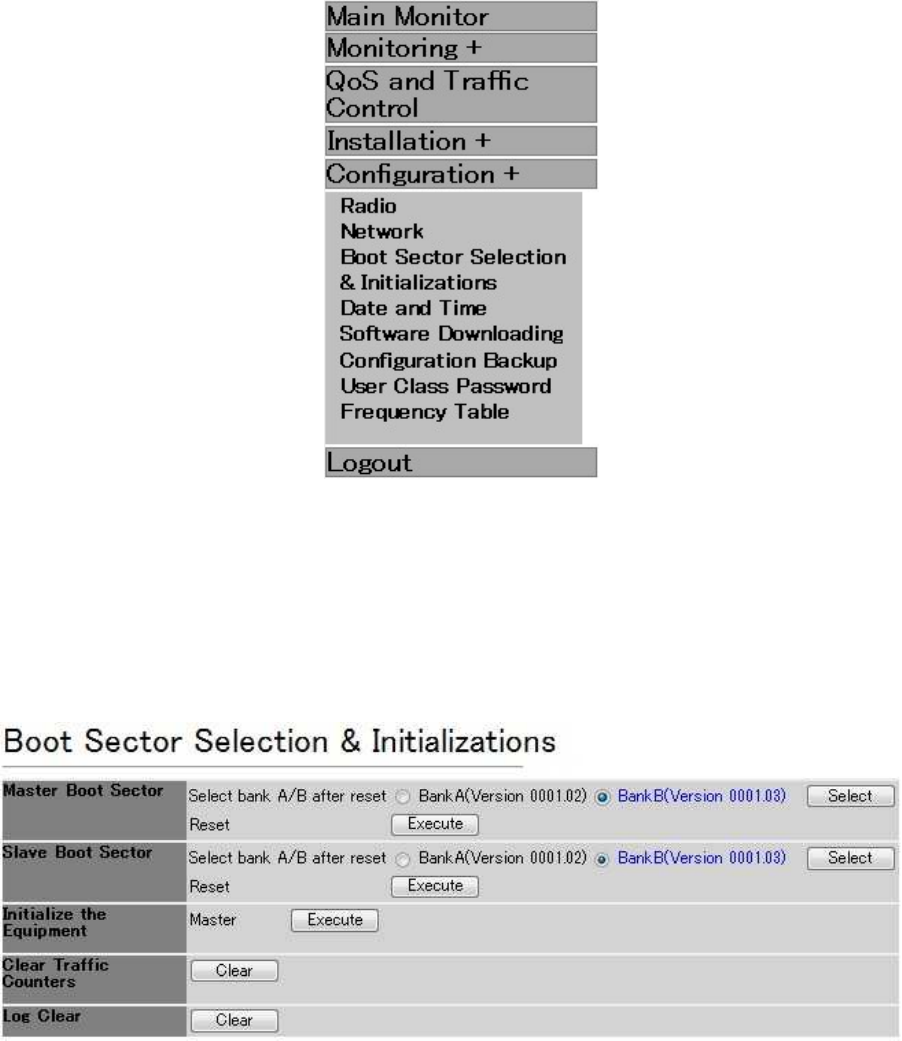
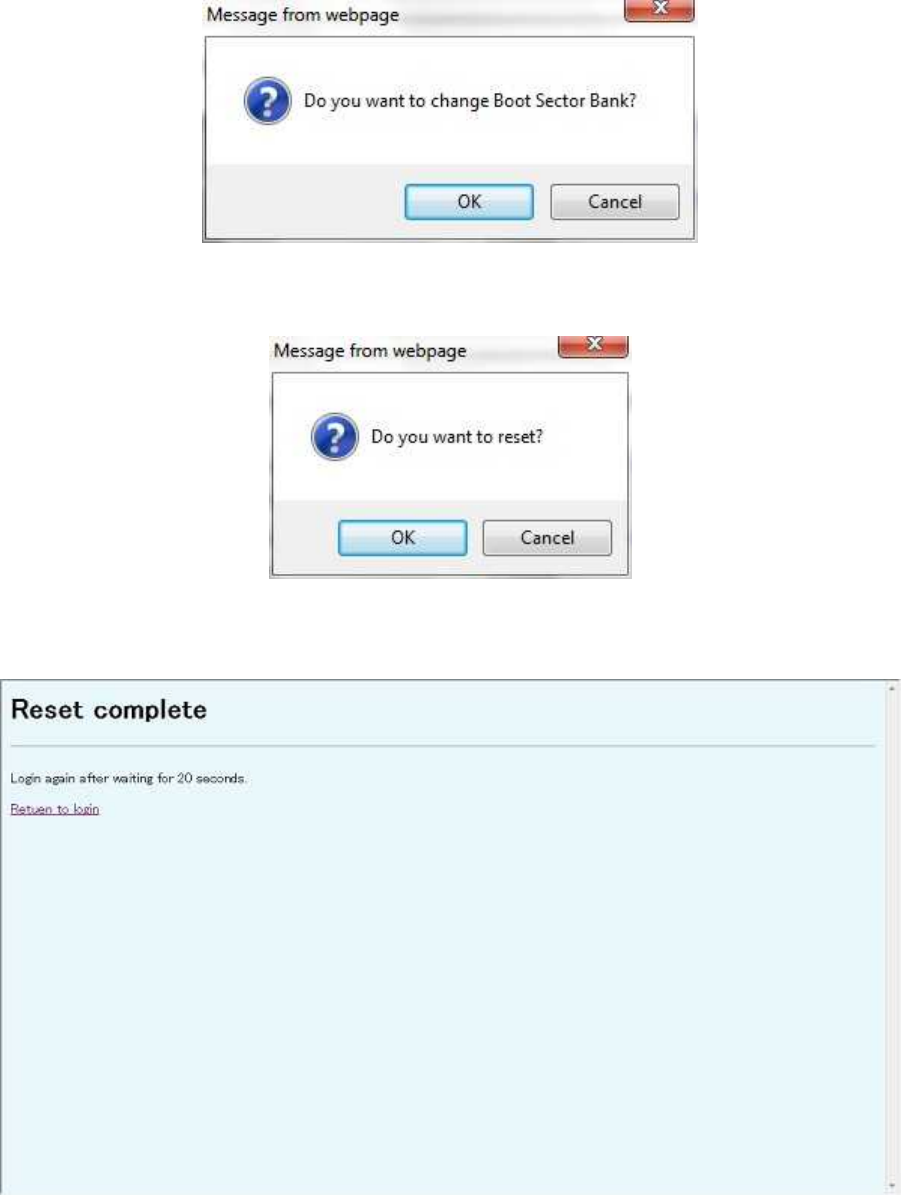
1.9.3. Boot Sector Selection and Initializations
When you select Configuration in the operation menu part, a submenu is displayed.
When you select Boot Sector Selection & Initializations from the submenu, a Boot Sector
Selection & Initializations window is displayed.
Figure 38 Configuration submenu displayed
A Boot Sector Selection & Initializations window is shown in Figure 39.
Each item is described in Table 30Figure 40.
Figure 39 Boot Sector Selection & Initializations window
64
Figure 40 A confirmation dialog to change the boot sector bank
Figure 41 A confirmation dialog to restart
Figure 42 Reset complete window

65
Figure 43 A confirmation dialog to initialize
Table 30 Description of the Boot Sector Selection & Initializations window
No.
Item Setting range Description
[Select bank A/B after reset]
Bank A/Bank B
Specify the start bank.
The currently stored version is
displayed next to the button.
[Select]
Performs the bank change.
When the Select button is clicked, a
confirmation dialog in Figure 40
appears. OK changes the bank, and
Cancel closes the dialog without
setting.
1 Master Boot
Sector
[Reset] Restarts the device.
When the Execute button is clicked,
a confirmation dialog in Figure 41
appears. OK restarts the device, and
Cancel closes the dialog without
restarting.
After the restart is finished, a Reset
complete window shown in Figure
42 is displayed. When Return to
login is clicked, it will go back to the
Login window shown in Figure 2.
2 Slave Boot
Sector
Performs the same operation as
Master Boot Sector Selection &
Initializations.
3 Initialize the
Equipment
[Execute] When the Execute button is clicked,
a confirmation dialog shown in
Figure 43 appears. OK initializes the
device, and Cancel closes the
dialog without initialization.

66
Note: Do not turn off the device
during initialization.
4 Clear Traffic
Counters
[Clear] When the Clear button is clicked, a
confirmation dialog to clear the
statistical information appears. OK
clears the statistical information, and
Cancel closes the dialog without
clearing.
Note: Do not turn off the device
while clearing the statistical
information.
5 Log Clear [Clear] When the Clear button is clicked, a
confirmation dialog to clear the log
information appears. OK clears the
log information, and Cancel closes
the dialog without clearing.
Note: Do not turn off the device
while clearing the log information.
67
1.9.4. Date and Time
When you select Configuration in the operation menu part, a submenu is displayed.
When you select Date and Time from the submenu, a Date and Time window is displayed.
Figure 44 Configuration submenu displayed
A Date and Time window is shown in Figure 45.
Each item is described in Table 31.
In the case of NTP setting, the time of the Master is refreshed in three patterns: at the time of
starting, setting, and polling. In the case of manual setting (PC Time), it is only refreshed at the
time of setting. The time of the Slave is refreshed at the time of various settings, at the time of
polling acquisition in the case of NTP setting, and once a day.
68
Figure 45 Date and Time window
Table 31 Description of the Date and Time window
No.
Item Setting range Description
1 Date/Time Displays the time of the device.
NTP Server
When NTP server is selected, the
device checks the time in the NTP
server and set it in the device.
When NTP server is selected, make
settings in Table 32 as well.
PC Time When PC Time is selected, the time
in the PC is set to the device.
2 Date and Time
selection
Display Time When Display Time is selected, the
time input to the window is set to the
device.
3 Setup Immediately reflects the settings in
the Date and Time window.

69
Table 32 Settings of the NTP Server
No.
Item Setting range Description
1 NTP server IPv4/IPv6/Host Configure the NTP Server.
When IPv4 is selected, specify an
IPv4 address for the NTP server.
When IPv6 is selected, specify an
IPv6 address for the NTP server.
When Host is selected, specify a
host name of the NTP server.
DNS server IPv4/IPv6 When Host is selected in the NTP
server setting, specify a
DNS server.
When IPv4 is selected, specify an
IPv4 address for the DNS server.
When IPv6 is selected, specify an
IPv6 address for the DNS server.
You can specify two kinds of DNS
servers: Primary and Secondary.
Time Zone
setting
See Table 33. Since the time that can be acquired
from the NTP served is Universal
Standard Time, the time specified to
this item is added to it and set to the
device as the device time.
2
Summer time When the Set summer time check
box is selected, the device time is
set by adding an hour to the Time
Zone setting.
Table 33 List of time zone settings
UTC-12:00 Baker Island, Howland Island
UTC-11:00 Samoa
UTC-10:00 Hawaii, Western Aleutian Islands
UTC-09:00 Alaska
UTC-09:30 Marquesas Islands
UTC-08:00 United States Pacific Time
UTC-07:00 United States Mountain Time

70
UTC-06:00 United States Central Time
UTC-05:00 United States Eastern Time
UTC-04:30 Venezuela
UTC-04:00 Canada Atlantic Time, Brazil (Amazon time)
UTC-03:30 Canada (Newfoundland)
UTC-03:00 Brazil (Brazil time), Argentina, Greenland
UTC-02:00 Brazil (Fernando de Noronha Island)
UTC-01:00 Azores islands, Cape Verde
UTC United Kingdom, Ireland, Portugal, Western Africa
UTC+01:00 Central European Time, West Africa Time
UTC+02:00 Eastern European Time, Central Africa Time, South Africa
UTC+03:00 Russia (Kaliningrad), East Africa Time
UTC+03:30 Iran
UTC+04:00 Russia (Moscow), Azerbaijan, United Arab Emirates
UTC+04:30 Afghanistan
UTC+05:00 Pakistan
UTC+05:30 India
UTC+05:45 Nepal
UTC+06:00 Russia (Yekaterinburg), Kazakhstan, Bangladesh
UTC+06:30 Myanmar, Cocos Islands
UTC+07:00 Russia (Omsk), Mongolia, Thailand, Vietnam, Jakarta
UTC+08:00 China, Mongolia, Australia (Western Australia)
UTC+08:45 Australia (Eucla)
UTC+09:00 Japan, Russia (Irkutsk), South Korea
UTC+09:30 Australia (Northern Territory, South Australia)
UTC+10:00 Russia (Yakutsk), Guam, Australian Eastern Time
UTC+10:30 Russia (Vladivostok), Australia (Lord Howe Island)
UTC+11:00 Russia (Magadan), Solomon Islands, New Caledonia
UTC+11:30 Norfolk Island
UTC+12:00 New Zealand, Fiji, Kiribati (Gilbert Islands)
UTC+12:45 New Zealand (Chatham Islands)
UTC+13:00 Tonga, Kiribati (Phoenix Islands)
UTC+14:00 Kiribati (Line Islands)
71
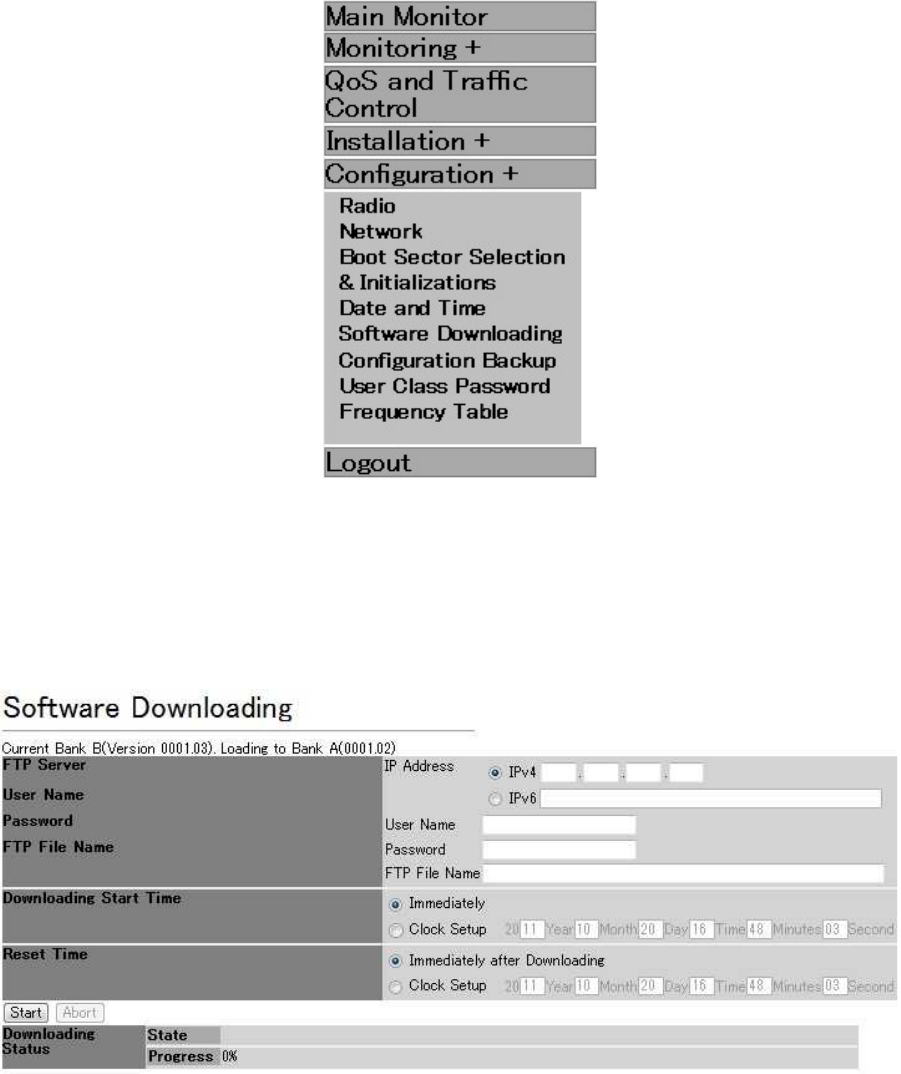
1.9.5. Software Downloading
When you select Configuration in the operation menu part, a submenu is displayed.
When you select Software Downloading from the submenu, a Software Downloading window
is displayed.
Figure 46 Configuration submenu displayed
A Software Downloading window is shown in Figure 47.
Each item is described in Table 34.
Figure 47 Software Downloading
Table 34 Description of the Software Downloading window

72
No.
Item Setting range Description
IP Address
IPv4/IPv6
Specify an IP Address of the FTP server in
IPv4 or IPv6.
User Name Specify a user name to log in to the FTP
server.
Password Specify a password to log in to the FTP
server.
1 Software
Downloading
FTP Server
File Name Specify a destination path of the software to
be downloaded to the device.
2 Down Loading
Start Time
Immediately/Clock Setup Specify a time to start downloading.
3 Reset Time Immediately after
Downloading/Clock Setup
Specify a time to restart.
4 Start When the Start button is clicked, the
download starts according to the above
conditions.
5 Abort Cancels the scheduled contents displayed
in the State field.
When the Downloading Start Time is set
to Clock Setup, and if the Abort button is
pressed before the set time, downloading is
canceled. If the Downloading Start Time is
set to Immediately, downloading cannot be
canceled after it has been started.
When the Reset Time is set to Clock
Setup, and if the Abort button is pressed
before the set time, restarting is canceled. If
the Reset Time is set to Immediately,
restarting cannot be canceled after it has
been started.

73
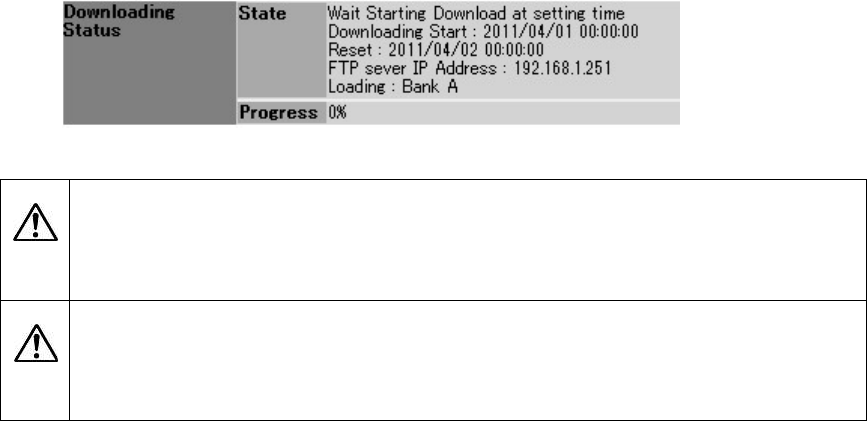
State Displays the progress of software
downloading or updating, or scheduled
download.
Downloading on Master:
Indicates that the Master is during a
software download process.
Updating on Master:
Indicates that the Master is during a
software update process.
Downloading on Slave:
Indicates that the Slave is during a
software download process.
Updating on Slave:
Indicates that the Slave is during a
software update process.
Displayed scheduled contents are:
・Downloading Start Time
・Reset Time
・FTP server address
・Bank to be loaded
6 Downloading
Status
Progress Displays the download progress in percent.
1.9.5.1. Operation Procedure
(1) Configuring a FTP server
If you use the Software Downloading function, you need a server from which update files
are downloaded.
Please configure the FTP server setting as follows:
FTP mode : PASV mode
FTP access port number : 21 ports fixed
User Name : (1 - 15 in single-byte characters)
Password : (8 - 15 in single-byte characters)
[Available characters]
A-Z, a-z, 0-9, ! # $ % ' ( ) * + , - . / : ; = ?
@ [ ] ^ _ ` { | } ~
74
(2) Immediate update of software
Step 1 Log in to the MT as admin, and select Configuration in the operation menu part, and
select Software Downloading from the submenu to display the window.
Step 2 Specify the FTP server information from which the software is downloaded in the
Software Downloading FTP Server section.
File name of the downloaded software:
WT_dwldxxxx.xx.mot (xxxx.xx is a version number.)
Select the Immediately radio button in the Downloading Start Time section.
Step 3 Select the Immediately after Downloading radio button in the Reset Time section.
Step 4 Click the Start button.
(3) Scheduled update of the software
Step 1 Log in to the MT as admin and select Main Monitor in the operation menu part to
display the window.
Step 2 Check that the time in the Date/Time item is correct.
If it is not correct, refer to Section 1.9.4 and adjust the date and time.
Step 3 Select Configuration in the operation menu part, and select Software Downloading
from the submenu to display the window.
75
Step 4 Specify the FTP server information from which the software is downloaded in the
Software Downloading FTP Server section.
File name of the downloaded software:
WT_dwldxxxx.xx.mot (xxxx.xx is a version number.)
Set the File Name as the following according to the save location in the server.
<If the file is at the root of the home directory>
WT_dwldxxxx.xx.mot (Only the file name.)
<If the file is in a subdirectory under the home directory>
Software¥Master¥WT_dwldxxxx.xx.mot
(1)~~~~~~ (2)~~~~ (3)~~~~~~~~~~~~~
* Folder name ((1), (2))+File Name ((3))
* Input ¥ or / as separating characters except for the top level folder name.
* If the file is in a hierarchy not in the home directory of the server, input a
relative path from the home directory.
Specify the time to start downloading in the Downloading Start Time section.
Step 5 Select either the Immediately after Downloading or Clock Setup radio button in the
Reset Time section.
If Clock Setup is selected, specify a time after the time set in the Downloading Start
Time section.
Step 6 Click the Start button.
During the update process, the contents of the State section are updated as the
process proceeds.
When the reservation process is started, in an idle time when the device is not
downloading, updating, nor restarting, the following scheduled contents are displayed
in the State section.
If you perform schedule setting, set the correct date and time in the device in
advance. If the device time is wrong, the process will not be performed at the
specified time.
If the restart process is set with the Clock Setup, and when the specified time has
passed when the downloading is finished, downloading process will be processed
as Immediately.

76
(4) Canceling the software update
If you want to abort the update midway, click the Abort button in the Software
Downloading window.
When the Abort button is clicked, the scheduled contents and restart process for the
update process is canceled. The process being performed while downloading and
updating will be continued. Therefore if you want to perform the update again, continue
the work after the State section turns to idle state.
In addition, if you perform the following operations, the software update process is aborted
and the State section turns to idle state.
・After clicking the Start button in the Software Downloading window and before the
download is started, if you click the Start button in the Antenna Alignment window on
the LMT, the Software Downloading process is canceled.
・After the performing the software download and while waiting for the device to restart, if
you click the Start button in the Antenna Alignment window, the restart process is
canceled.
Do not turn off or restart the device during a software update process. The device
may be broken.
The Abort button is designed to cancel the scheduled contents and restart process
for the update process. It is not possible to stop the download or update process.
77
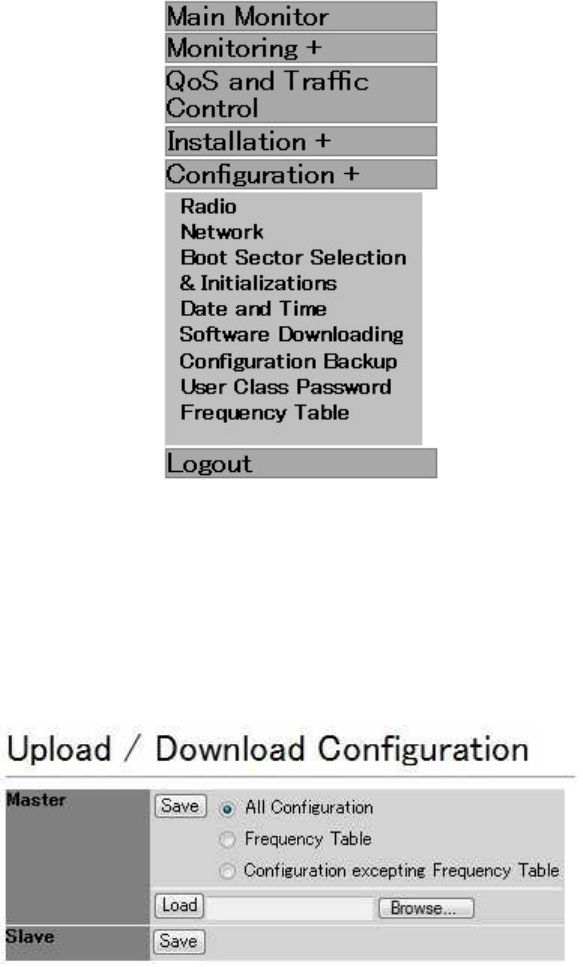
1.9.6. Configuration Backup
When you select Configuration in the operation menu part, a submenu is displayed.
When you select Configuration Backup from the submenu, a Configuration Backup window is
displayed.
Figure 48 Configuration submenu displayed
A Configuration Backup window is shown in Figure 49.
Each item is described in Table 35.
Figure 49 Configuration Backup window
78
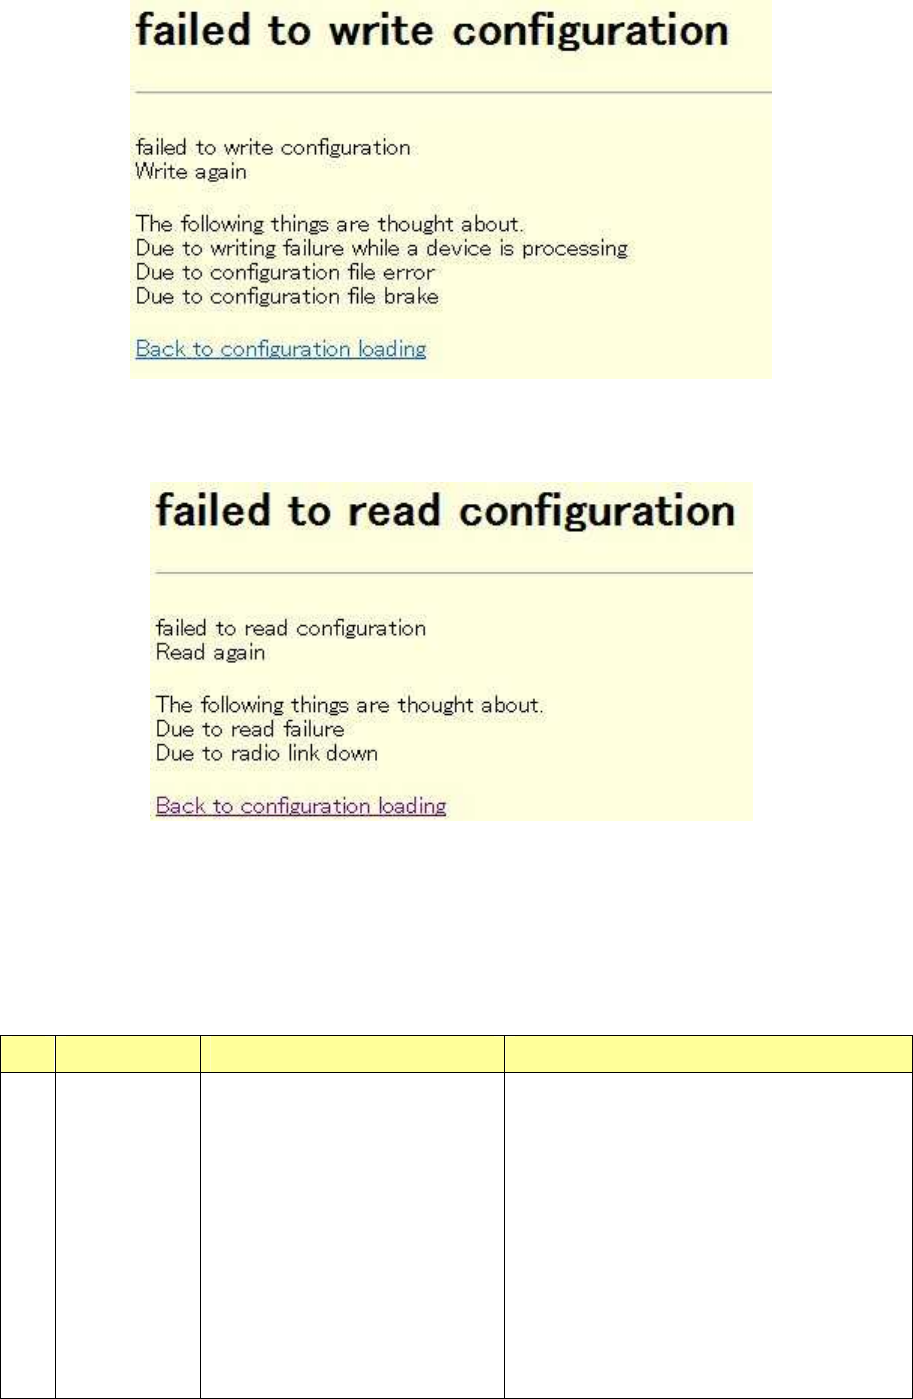
Figure 50 Failed to write configuration window
Figure 51 Setting save error window
(An example when tried to save the configuration of the Slave
in the Master when no radio connection is established)
Table 35 Description of the Configuration Backup window
No.
Item Setting range Contents
1 Master
Save
In the Master field, specify
configuration information to be
saved.
All Setting : Entire
configuration information
Frequency Info: Only
frequency information
Setting Info : Configuration
Saves the specified configuration
information.
When the Save button is clicked, a dialog
to specify a save destination and name is
displayed.

79
information except for
frequency information
2 Master
Load
When the Browse button is clicked, a
dialog for selecting a file is displayed.
When the Load button is clicked, a popup
window confirming the writing and reset is
displayed. YES performs the writing and
reset. NO closes the popup window
without writing.
3 Slave
Save
When saving the configuration
information in the Slave,
specify, in the Master field, the
configuration information to be
saved.
All Setting : Entire
configuration information
Frequency Info: Only
frequency information
Setting Info : Configuration
information except for
frequency information
Saves the specified configuration
information.
When the Save button is clicked, a dialog
to specify a save destination and name is
displayed.
4 Error When the writing failed, a window shown
in Figure 50 is displayed. When the
saving failed, a window shown in Figure
51 is displayed. In both cases, you can go
back to the Configuration Backup window
by clicking Back to configuration
loading.
80
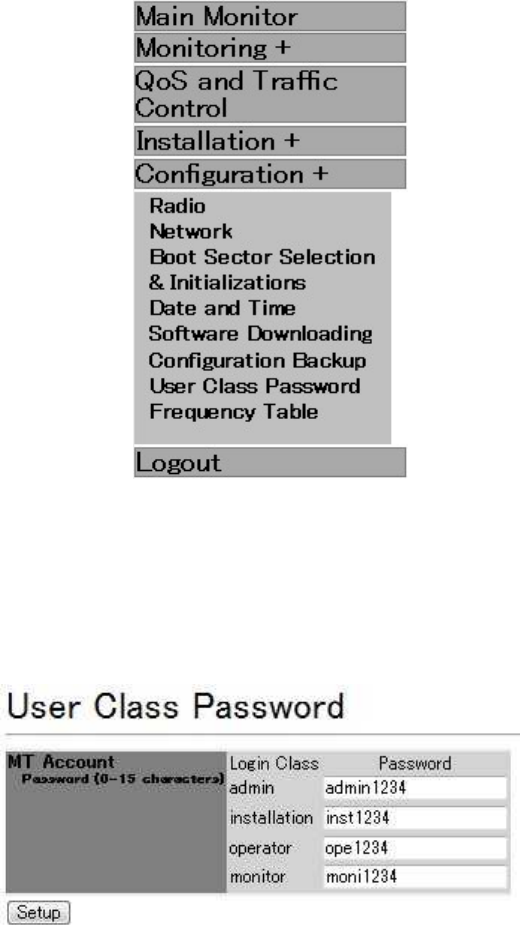
1.9.7. User Class Password
When you select Configuration in the operation menu part, a submenu is displayed.
When you select User Class Password from the submenu, a User Class Password window is
displayed.
Figure 52 Configuration submenu displayed
A User Class Password window is shown in Figure 53.
Each item is described in Table 36.
Figure 53 User Class Password window

81
Table 36 Description of the User Class Password window
No.
Item Setting range Description
1 MT
account
Password
0 - 15 characters
No password in the case of 0
character.
Specify passwords for the four types
of accounts. Each account is
described in Table 4.
2 Setup When the Setup button is clicked, the
setting is immediately reflected.

82
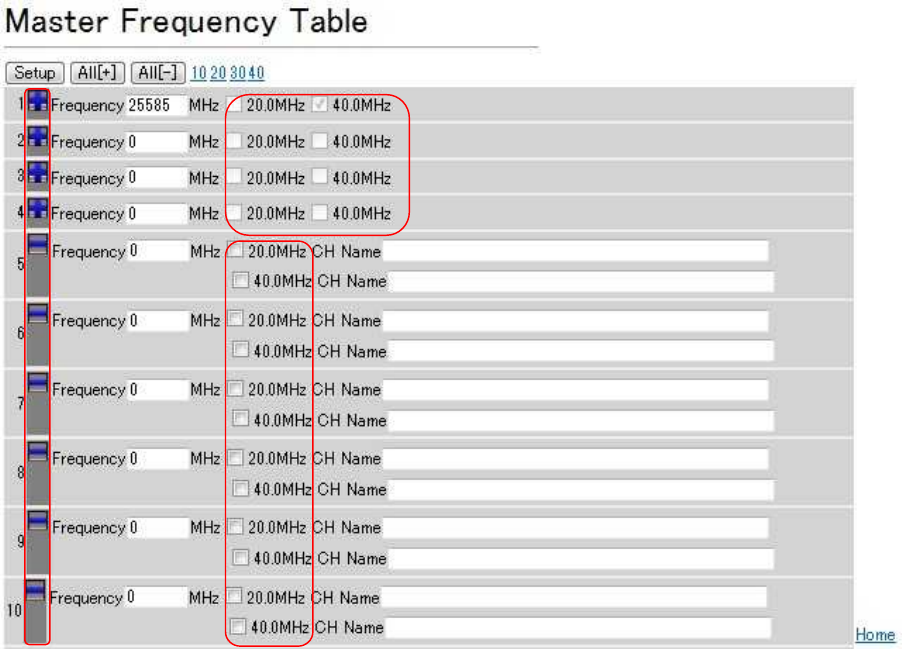
1.9.8. Frequency Table
When you select Configuration in the operation menu part, a submenu is displayed.
When you select Frequency Table from the submenu, a Frequency Table window is displayed.
Figure 54 Configuration submenu displayed
A Frequency Table window is shown in Figure 55. Each item is described in Table 37.
83
Figure 55 Frequency Table window
No.5
No.7
No.7

84
Table 37 Description of the Frequency Table
No. Item Setting range Description
1 Setup Sets all the items specified in this page to the Flash
ROM.
The setting will be reflected after the restart.
2 All[+] Sets all the following frequency setting items to [+] so
that the list of frequencies can be viewed.
3 All[−] Sets all the following frequency setting items to [-] so
that the list of CH names can be viewed.
4 10 20 30 40 Move to the specified number.
5 Select display
method
[+]
[-]
In the case of [+], the CH Name is omitted and the
enable/disable status of the frequency and each
symbol rate is displayed. In this case, the
enable/disable status of the symbol rate cannot be
changed.
In the case of [-], the enable/disable status of the
symbol rate aligns vertically, and each CH Name can
be configured.
6 Frequency
_____MHz
See the
"Frequency
channel"
section.
Displays and configures frequencies.
7 Symbol Rate See the
"Frequency
channel"
section.
Displays and configures the enable/disable status of
the symbol rate. If the display method is [+], the
enable/disable status of the symbol rate cannot be
changed.
8 Home When clicked, it will move to the top.
85
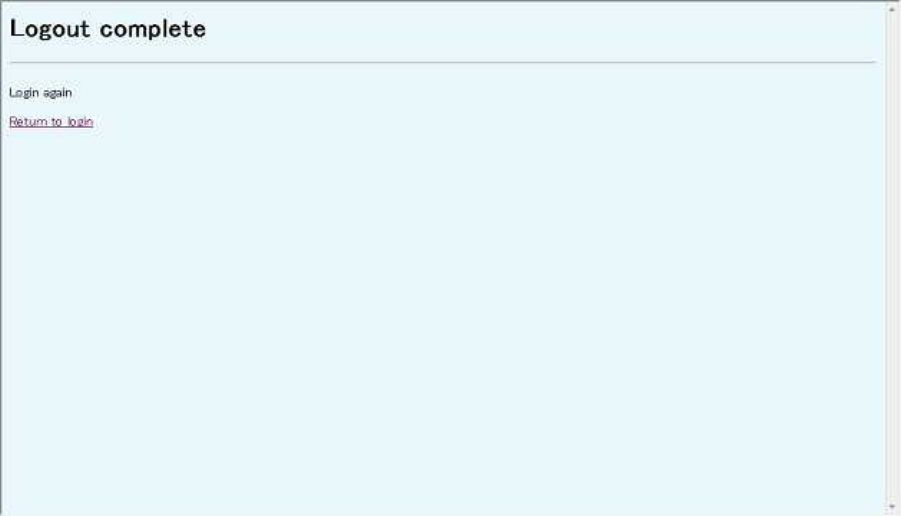
1.10. Logout
After clicking Logout in the operation menu part, select OK. A Logout complete window as
shown in Figure 56 appears.
Clicking Return to login will display a Login window shown in Figure 2.
Figure 56 Logout complete window

86
2. Management Tool (Slave)
2.1. Overview of the Management Tool (Slave)
The Management Tool (MT) is a Web server function integrated in the device. It is for configuring
and monitoring the device. Table 38 shows a functional overview of the MT.
Table 38 Functional overview of the MT (Slave)
Item 1 Item 2 Contents
Main Monitor Displays the transmission rates and radio links.
Event Log Displays a log of events. Monitoring
NE State Information Displays the Radio Link, QoS and Traffic Control,
Inventory information, and Network Configuration.
QoS and Traffic Control Performs COS assignment for Management
Communication.
Antenna Alignment Performs the Antenna Alignment mode. Installation
Packet Transmission Test Performs the Packet Transmission Test.
Radio Makes configuration related to radio.
Network Makes configuration of IP addresses.
Reset and Initializations Makes configuration of restart and initialization, and
clears the log.
Configuration Backup Saves and writes to the configuration file.
User Class Password Makes configuration of passwords.
Configuration
Frequency Table Makes configuration of frequencies.
Logout Logs you out.
87
2.2. Logging In
[Operation]
① Connects the MT operation PC and the device over the LAN. Table 39 shows an
recommended environment for the PC.
Table 39 Recommended environment for the MT operation PC
No. Item Specifications Remarks
1 Web browser Windows Internet Explorer
Version 8 or higher
2 Monitor size 1024*768
② Input the IP address of the device as the URL in the Windows Internet Explorer. The factory
default IP address is "192.168.1.100".
Figure 57 Inputting the IP address to the Internet Explorer

88
③ A Login window as shown in Figure 59 is displayed.
Figure 58 Login window
④ Select a Login Class. Selectable login classes are shown in Table 41.
⑤ Input the Password. The default password is shown in Table 40.
⑥ LOGIN button: Tries to connect to the device.
⑦ If you are successfully logged in, a window shown in Figure 61 is displayed.
If you failed to log in, a Login Failure window shown in Figure 60 is displayed. Clicking
Return to login will take you back to the Login window shown in Figure 59.

89
Figure 59 Login Failure window
Table 40 Description of the Login window
No.
Item Setting range
Description
1 Login Class admin
installation
operator
monitor
You can select a permission level by
the Login Class.
Table 4 lists a function of each Login
Class.
2 Password 0 - 15
characters
Input the password.
Default passwords are:
Login Class Password
admin admin1234
installation inst1234
operator ope1234
monitor moni1234
3 Login button You can log in using the above Login
Class and Password.

90
Table 41 Function of each Login Class
Login Class (permission level High ... Low)
Monitor admin installation operator
monitor
Main Monitor Yes No Yes Yes
Monitoring Yes No Yes Yes
QoS and Traffic
Control Yes No Yes No
Installation Yes Yes No No
Configuration Yes No No No
Logout Yes Yes Yes Yes
・If an upper or equivalent level user newly logs in while a user is logged in, the user previously
logged in will be forced to log out.
・You can check a user who have logged in by selecting a Login Class drop-down list in the Login
window.
91
2.3. Configuration of Main Window
After the login, a main window shown in Figure 61 is displayed. The main window includes a
status display part, operation menu part, and operation window part.
(1) Status display part (Equipment status)
This part displays the status of the device. The status display part displays settings
(Mode/Symbol Rate/Frequency/CH/Frame ID) in the upper row, and statuses (Status/Radio
Link/Authentication/Manag. Com./Ethernet Link/Ethernet Link (Opposite NE) in the lower row.
Anomalies in the status are displayed by evaluating Normal or Failed by ORing each anomaly
shown in Table 43.
(2) Operation menu part
This part lets you select each function listed in Table 38.
(3) Operation window part
This part displays a window for each function selected in the operation menu part.
Figure 60 Window after the login
Status display part
Operation menu part
Operation window part

92
Table 42 Status display list
Status Display
Network Element Name Displays the Network Element Name.
Mode MASTER/SLAVE
Symbol Rate Displays the symbol rate name set in the NE data.
Frequency
During the carrier sense, "----" is displayed. When
the carrier sense is completed and the frequency
is determined, the radio frequency channel set in
the configuration information is displayed.
CH
During the carrier sense, "-" is displayed. When
the carrier sense is completed and the frequency
is determined, the channel name set in the
configuration information is displayed.
Frame ID
The frame ID set in the configuration information
is displayed.
Status Normal/Failure
Radio Link Link Up/Link Down
Authentication Succeed/Failure
Ethernet Link Link Down
10BASE-T/HALF
10BASE-T/FULL
100BASE-TX/HALF
100BASE-T/FULL
1000BASE-T/HALF
1000BASE-T/FULL
Table 43 Causes of Status anomalies
Item
RF Carrier Unlock
IF Carrier Unlock
TDD SW Failure
PA Failure
PLL Unlock
Device start is abnormal
SPI Failure
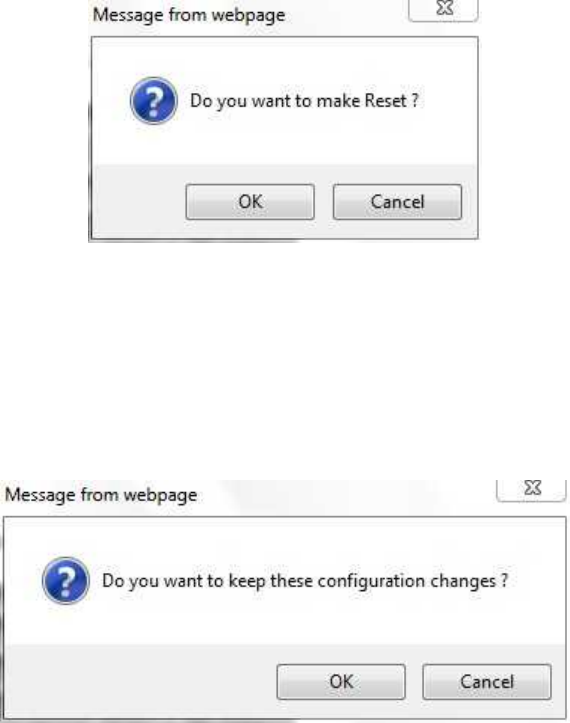
93
2.4. Reflecting the Setting Values (immediate reflection and reflection after
restart)
Each window has two kinds of Setup buttons. One kind is "reflection after restart" which requires
a restart to reflect the setting, and the other kind is "immediate reflection" which does not need a
restart to reflect the setting values.
・Reflection after restart
The value is reflected to the Flash ROM at the time the Setup button is pressed. The pop-up
message to notify that the value is reflected after the restart and prompt you to restart is displayed.
You can select from OK or Cancel. If you press OK, the device is restarted, and if you press
Cancel, the device will go back to the previous window without restarting.
Figure 61 Reflection after restart message
・Immediate reflection
A pop-up message that notifies you that the values are immediately reflected will be displayed
(Figure 62). If you click OK, the value is immediately reflected. If you click Cancel, the device
will return to the previous window without reflecting the value.
Figure 62 Immediate reflection message

94
・When the input value exceeds the setting range in the case of direct input, a message as
shown in Figure 63 is displayed.
Figure 63 Input value error message
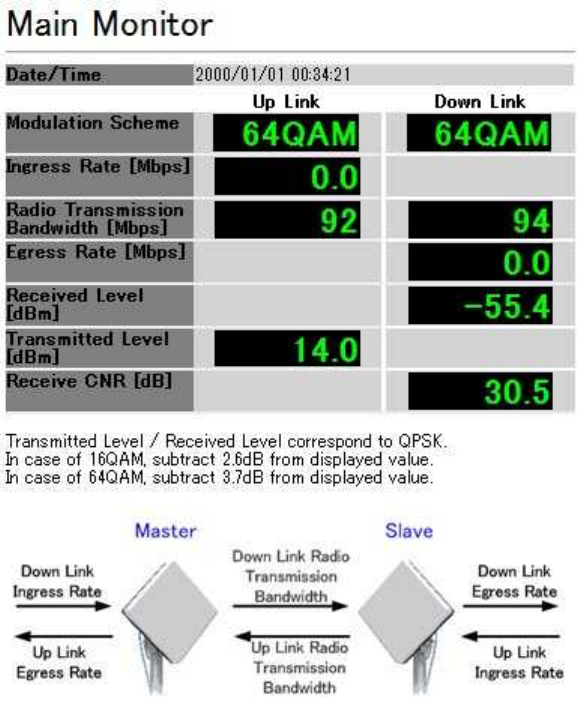
95
2.5. Main Monitor
When you select the Main Monitor from the operation menu part, a Main Monitor window is
displayed.
A Main Monitor window displays the transmission rates and radio links.
A Main Monitor window is shown in Figure 64. The description of each item is shown in Table 44.
Figure 64 Main Monitor window

96
Table 44 Description of the Main Monitor window
No.
Item Description
1 Date/Time Displays the time in the device.
2 Modulation Scheme Displays the current Modulation Scheme.
3 Radio Transmission
Bandwidth
Displays the current radio transmission bandwidth.
4 Ingress Rate Displays the current ingress rate of Ethernet packets.
Only the uplink ingress rate is displayed.
5 Egress Rate Displays the current egress rate of Ethernet packets.
Only the downlink egress rate is displayed.
6 Received Level Displays the current receiving level.
Only the downlink is displayed.
During Link Down, "-" is displayed.
7 Transmittied Level Displays the current transmission level.
Only the uplink is displayed.
During Link Down, "-" is displayed.
8 Receive CNR Displays the current receiving CNR.
Only the downlink is displayed.
During Link Down, "-" is displayed.
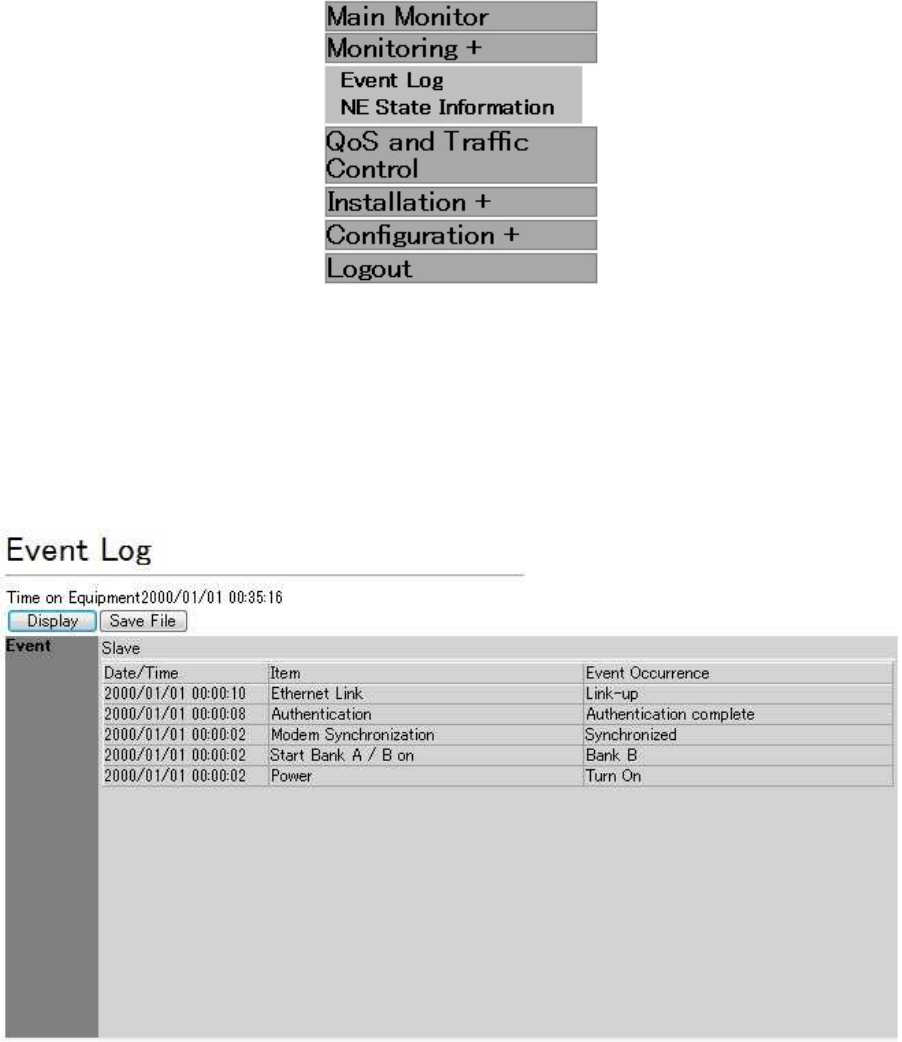
97
2.6. Monitoring
2.6.1. Event Log
When you click Monitoring from the operation menu part, a submenu is displayed.
When you select the Event Log in the submenu, an Event Log window is displayed.
Figure 65 Monitoring submenu displayed
An Event Log window is shown in Figure 66.
The Event Log window displays a log of events and a log of changes in the modulation scheme.
Each item is described in Table 45.
Figure 66 Event Log window

98
Table 45 Description of the Event Log window
No.
Item Description
1 Display When clicked, the Event Log window is refreshed.
2 Save File When clicked, a dialog to specify the file destination and name
is displayed to store the log in a file. The file format is CSV.
3 Event Displays a log of events.
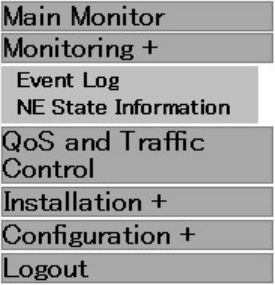
99
2.6.2. NE State Information
When you click Monitoring from the operation menu part, a submenu is displayed.
When you select NE State Information from the submenu, an NE Status Information window is
displayed.
Figure 67 Monitoring submenu displayed
2.6.2.1. Radio Link and Inventory Information
Figure 68 shows the NE Status Information window including radio link and inventory
information.
Each item is described in Table 46.
100
Figure 68 NE Status Information window

101
Table 46 Description of the NE Status Information window
No.
Item Description
1 check box The NE Status Information window is divided into five types:
Radio Link, QoS and Traffic Control, Slave Inventory
Information, Network Configuration, Slave Network
Configuration. Only the items with their check boxes selected
are displayed.
2 ALL Check Selects all the check boxes.
3 No Check Clears all the check boxes.
4 Display When clicked, NE State Information is refreshed.
5 Save File When clicked, a dialog to specify the destination and name of
the file is displayed to store NE Status Information.
In the Radio Link, following information will be saved in
addition to the displayed items.
[Mode]
[Symbol Rate]
[Frequency]
[CH]
[Frame ID]
[Status]
[Radio Link]
[Authentication]
6 Network Element
Name
Displays the network element name.
7 Date/Time Displays the time of the device when the window is displayed.
8 Radio Link [Current Modulation Scheme: Down Link]
[Current Modulation Scheme: Up Link]
[Transmitted Level]
9 Slave inventory
Information
[Type Name]
[Serial Number]
[Software Version: Bank A/Bank B/Active Bank]
[Hardware Version]
102
2.6.2.2. Slave Network Configuration
A Slave Network Configuration window is shown in Figure 69.
Each item is described in Table 47.
Figure 69 Slave Network Configuration
Table 47 Items of Slave Network Configuration window
No.
Item Description
1 Ethernet
Configuration
[Setup] Displays the setting value at the time it is displayed.
[Status] Displays the Ethernet link status at the time it is
displayed.
2 IPv4 [IP Address]
[Subnet Mask]
[Default Gateway]
Displays the setting value at the time it is displayed.
3 IPv6 [Enable/Disable]
[IP Address]
[Default Gateway]
Displays the setting value at the time it is displayed.
4 MAC address Displays the MAC address at the time it is displayed.
103
2.6.2.3. QoS and Traffic Control
A QoS and Traffic Control window is shown in Figure 70.
Each item is described in Table 48.
Figure 70 QoS and Traffic Control

104
Table 48 Description of the QoS and Traffic Control window
No.
Item Description
1 COS assignment for
Management
Communication
Displays a COS assignment value for communication between
Master and Slave devices.
2 QoS Priority Mapping
Following values are displayed for the Slave.
Displays the setting value at the time it is displayed.
COS [0-7] vs. Priority Class ("7"is the highest Priority)
Table
TOS vs. COS [0-7] Table
TC [0-255] vs. COS [0-7] Table
EtherType vs. COS [0-7] Table
For TOS vs. COS [0-7] Table, IP Precedence or DSCP, either
of which has been selected, is displayed.
3 Policing Rate Displays permitted policing rates of the Master and Slave.
These are displayed for each class and each modulation
scheme.
4 Shaping Rate Displays permitted policing rates of the Master and Slave.
These are displayed for each class and each modulation
scheme.
105
2.6.2.4. Network Configuration
A Network Configuration window is shown in Figure 71.
Each item is described in Table 49.
Figure 71 Network Configuration window
Table 49 Description of the Network Configuration window
No.
Item Description
1 Management VLAN
Configuration
Displays the VLAN tag information for managing the Master
and Slave.
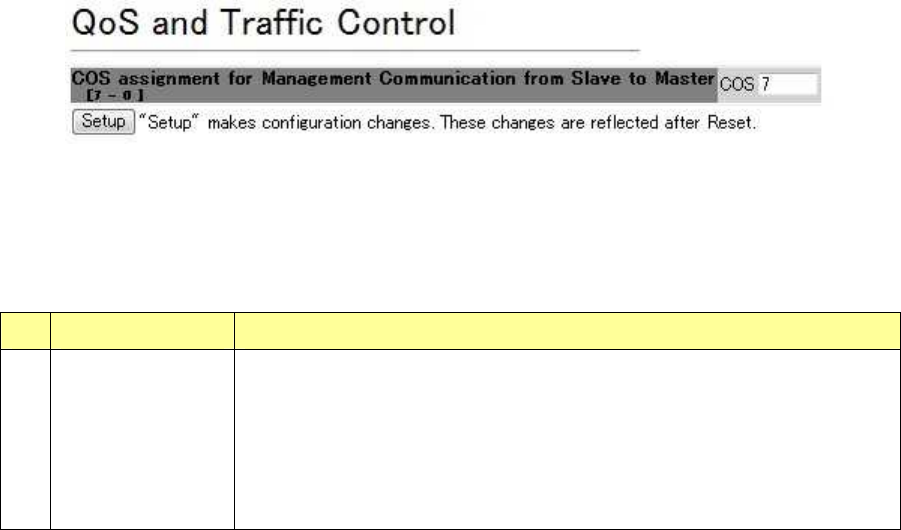
106
2.7. QoS and Traffic Control
When you select QoS and Traffic Control in the operation menu part, a QoS and Traffic Control
window is displayed.
In the QoS and Traffic Control window, you can set VID/COS for Management Communication.
2.7.1. COS Assignment for Management Communication from Slave to Master
A window for assigning COS for Management Communication is shown in Figure 72.
The settings in this window are reflected after a restart.
Each item is described in Table 50.
Figure 72 A window for assigning COS for Management Communication
Table 50 Description of a window for assigning COS for Management
Communication
No
Item Description
1 COS assignment
for Management
Communication
from Slave to
Master
Specify a COS value used during communication from the Slave to
the Master.
Note: If you set a low priority for the COS assignment for
Management Communication, the device may not work properly
when the user data traffic exceeds the radio bandwidth.
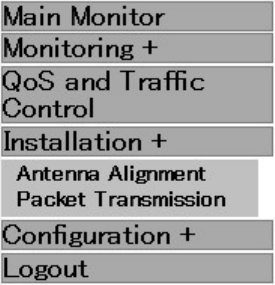
107
2.8. Installation
2.8.1. Antenna Alignment
When you select Installation in the operation menu part, a submenu is displayed.
When you select Antenna Alignment from the submenu, an Antenna Alignment window is
displayed.
Figure 73 Installation submenu displayed
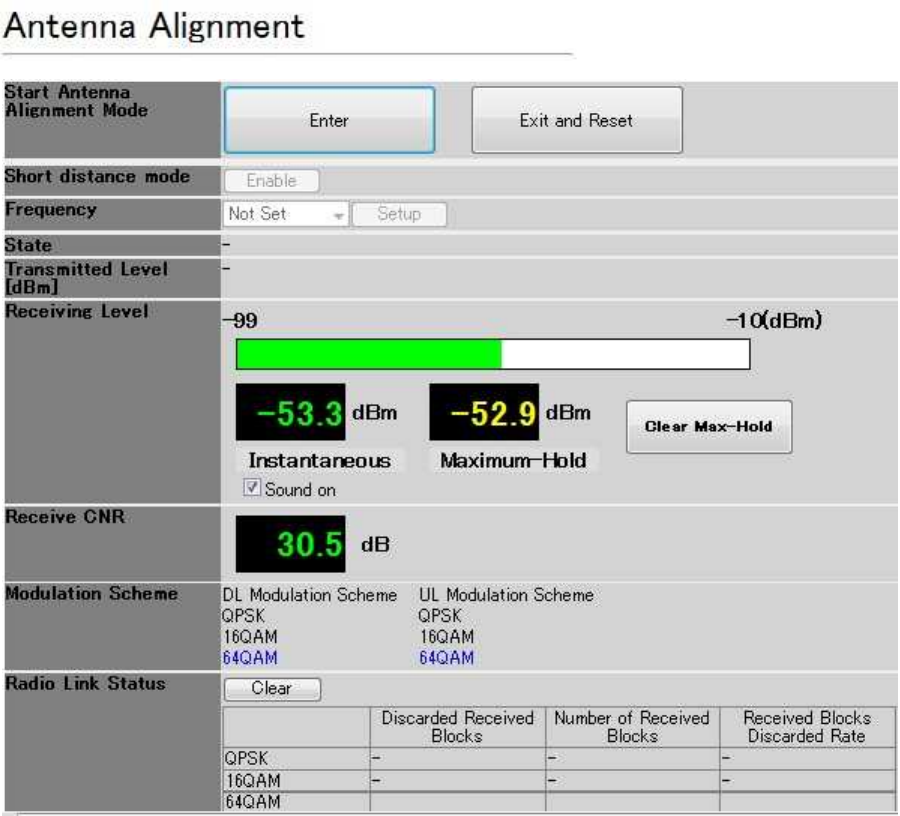
108
An Antenna Alignment window is shown in Figure 74.
Each item is described in Table 51. Also, the displayed status is described in Table 52.
Figure 74 Antenna Alignment window

109
Table 51 Description of the Antenna Alignment window
No.
Item Description
1 Enter Antenna
Alignment Mode
Clicking the Enter button switches the device into the Antenna
Alignment mode.
Clicking the Exit and Reset button will restart the device,
exiting from the Antenna Alignment mode.
Notes:
. To switch the device from the Antenna Alignment mode back
to the normal mode, a restart is required.
. Transition between pages is disabled during the Antenna
Alignment mode.
2 Short distance mode When the button is clicked while it is set to Enable, the
Transmitted Level is decreased by 20 dB.
When the button is clicked while it is set to Disable, the
Transmitted Level is returned to the original value.
3 Frequency Specify the frequency. Specify according to the Frequency in
the master NE.
"Not Set" is shown immediately after starting the Antenna
Alignment mode, and it is operating with a frequency displayed
in the status display part.
4 State Displays the current status. Table 26 lists the displayed
contents.
5 Transmitted Level Displays the transmission level.
6 Receiving Level Displays the current receiving level with a bar and values.
The maximum value is shown by figures.
Clicking the Clear Max-Hold button will clear the maximum
value.
When the Sound on check box is selected, a sound
corresponding to the current value is emitted. The sound
function is supported only in Windows XP.
7 Receive CNR Displays the receiving CNR.
9 Modulation Selection Displays the modulation scheme selected in the Master NE.
10 Radio Link Status Displays the Discarded Received Blocks and Number of
Received Blocks.
Clicking the Clear button will clear the counters.
Table 52 Displayed status

110
No.
Displayed status Description
1 Over Receiving Level. Enable Short
distance mode of opposite NE.
Displayed when the Received Level is over
input (-30 dBm or more).
2 Frame ID Error Displayed when the device has received a radio
wave with a Frame ID different from the Frame
ID set to for Slave.
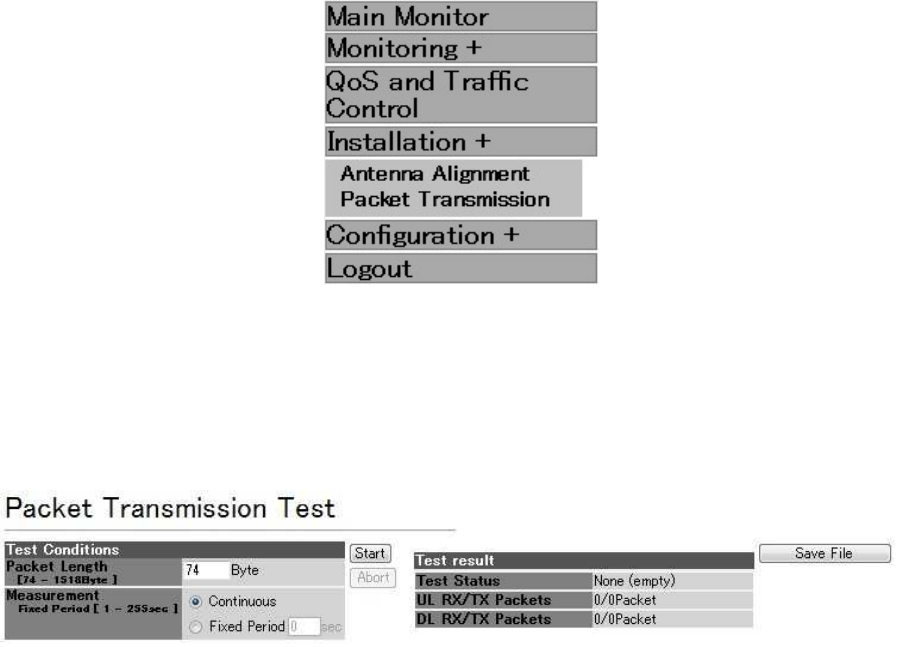
111
2.8.2. Packet Transmission Test
Packet transmission test function measures the number of transmitted test packets and the
number of received packets.
When you select Installation in the operation menu part, a submenu is displayed.
When you select Packet Transmission Test from the submenu, a Packet Transmission Test
window is displayed.
Figure 75 Installation submenu displayed
A Packet Transmission Test window is shown in Figure 76.
Each item is described in Table 53.
Figure 76 Packet Transmission Test window

112
Table 53 Description of the Packet Transmission Test window
No.
Item Setting range Description
1 Packet Length 74 - 1518 Specify the length of the test packet.
2 Measurement Continuous/Fixed
Period
Fixed Period
1 - 255 seconds
Select either Continuous or Fixed Period.
When you select Fixed Period, input the
measurement time.
3 Start / Abort Start button starts a test. Abort button stops the
test.
4 Test result Displays the Test Status, UL RX/TX Packets,
and DL RX/TX Packets.
UL RX/TX Packets is displayed as a fraction of
the uplink [number of received packets/number
of transmitted packets]; the DL RX/TX Packets
is displayed as a fraction of the downlink
[number of received packets/number of
transmitted packets].
Note: As the priority of the test packets is lower
than the packets for communication between
the devices, the test packets can be lost.
5 Save File When clicked, a dialog to specify the destination
and name is displayed to store the test results.
Notes:
(1) When the test is performed continuously, it is
recorded as Fixed Period "0".
(2) When the packet transmission test is
performed by specifying the measurement time,
the measurement time will not be saved in the
network element, which is not the device on
which the Start button is pressed.
(3) The Test Status will not be saved.
113
2.9. Configuration
2.9.1. Radio
When you select Configuration in the operation menu part, a submenu is displayed.
When you select Radio from the submenu, a Radio Configuration window is displayed.
Figure 77 Configuration submenu displayed
Radio Configuration windows are shown in Figure 78 and Figure 79.
Each item is described in Table 54.
Figure 78 Radio Configuration window (reflection after restart)
114
Figure 79 Radio Configuration window (immediate reflection)
Table 54 Description of the Radio Configuration window
No.
Item Setting range Contents
Reflection after restart
1 Operating Mode Master/Slave Select Master or Slave.
2 Symbol Rate 20.0MHz/40.0MHz Select a symbol rate.
3 Frame ID Number
1 - 65535 Input a Frame ID.
Input the same Frame ID value for local
NE and opposite NE.
4 Encryption
Parameter
0 - 22 characters Input an encryption parameter.
Input the same encryption parameter
value for local and opposite NEs.
5 Setup Restarts the device and reflect the setting
values.
Immediate reflection
6 Network Element
Name
0 - 20 characters in
double-byte characters
Input the network element name.
FIXED/SEARCH
Select either to set a fixed frequency or
search the frequency.
7 FREQUENCY-CH
START/END
START CH/END CH
For the corresponding
frequencies, refer to the
"Frequency channel"
section.
If SEARCH is selected, specify START
CH and END CH as well.
The default value is the minimum (START
CH) and the maximum (END CH) channel
among the valid frequency channels for
the related symbol rate.
If the symbol rate is changed, or the mode
is changed, it will be returned to the
default value.
8 MTPC -6 - +14 dBm Specify the Transmitted Level in the case

115
ATPC is disabled. Enable or Disable of
the ATPC is selected in the Master. When
Enable is selected, ATPC is enabled in
both the Master and Slave. When Disable
is selected, ATPC is disabled in both the
Master and Slave.
9 Setup Performs immediate reflection.
116
2.9.2. Network
When you select Configuration in the operation menu part, a submenu is displayed.
When you select Network Configuration from the submenu, a Network Configuration window
is displayed.
Figure 80 Configuration submenu displayed
A Network Configuration window is shown in Figure 81.
Each item is described in Table 55.

117
Figure 81 Network Configuration window
Table 55 Description of the Network Configuration
No.
Item Setting range Description
Reflection after restart
1 IPv4 0 - 255
See 0.
Specify an IPv4 address.
Enable/Disable 2 IPv6
See 2.9.2.1(2).
Select Enable to use IPv6. When
enabled, specify an IP Address and
Default Gateway.
3 Setup Restarts the device and reflect the
setting values.
Immediate reflection
4 Ethernet
Configuration
1000BASE-T(AUTO)
1000BASE-T(Fixed)
00BASE-TX FULL(Fixed)
100BASE-TX FULL(AUTO)
100BASE-TX HALF(Fixed)
Select an Ethernet setting.
Enable/Disable
You can register three types of VLAN
tags for the MT.
Specify Enable/Disable for each type of
VLAN tag.
You can disable all the VLAN tag
settings.
5 Management
VLAN TAG
VID range1 - 4094
COS value range 0 - 7
When Enable is selected, input a VID
and COS value as well.
10 Setup Performs immediate reflection.
118
2.9.2.1. Input Range for IP Addresses
IP Addresses that can be input are limited as follows.
(1) IPv4
IP Address
・ Values of 0 and 255 cannot be specified for the most significant bit and the least significant
bit.
・ The range from 127.0.0.0 to 127.255.255.255 cannot be specified.
・ Addresses higher than 223.255.255.254 cannot be specified.
Subnet Mask
・ An address 0.0.0.0 cannot be specified.
・ An address with dropped bits (0 bit) cannot be specified.
Default Gateway
・ The bit area of the subnet mask must match the subnet mask of the IP Address.
(2) IPv6
IP Address
・ An address 0:0:0:0:0:0:0:0 cannot be specified.
・ An address 0:0:0:0:0:0:0:1 cannot be specified.
・ Addresses higher than feff:ffff:ffff:ffff:ffff:ffff:ffff:ffff cannot be specified.
Default Gateway
・ The address cannot be specified if the most significant 64 bits are different from that of the
IP Address.
119
2.9.3. Reset and Initialization
When you select Configuration in the operation menu part, a submenu is displayed.
When you select Reset & Initializations from the submenu, a Reset & Initializations window is
displayed.
Figure 82 Configuration submenu displayed
A Reset & Initializations window is shown in Figure 83.
Each item is described in Table 56.
Figure 83 Reset & Initializations
120
Figure 84 Restart confirmation dialog
Figure 85 Reset Complete window
Figure 86 Initialization confirmation dialog

121
Table 56 Description of the Reset & Initializations window
No.
Item Setting range Description
1 Slave Control [Reset] Restarts the device.
When the Execute button is clicked,
a confirmation dialog in Figure 41
appears. OK restarts the device, and
Cancel closes the dialog without
restarting.
After the restart is finished, the
Reset complete window shown in
Figure 42 is displayed. When
Return to login is clicked, it will go
back to the Login window shown in
Figure 2.
3 Initialize the
Equipment
[Execute] When the Execute button is clicked,
a confirmation dialog shown in
Figure 43 appears. OK initializes the
device, and Cancel closes the
dialog without initialization.
Note: Do not turn off the device
during initialization.
4 Log Clear [Clear] When the Clear button is clicked, a
confirmation dialog to clear the log
information appears. OK clears the
log information, and Cancel closes
the dialog without clearing.
Note: Do not turn off the device
while clearing the log information.
122
2.9.4. Configuration Backup
When you select Configuration in the operation menu part, a submenu is displayed.
When you select Configuration Backup from the submenu, a Configuration Backup window is
displayed.
Figure 87 Configuration submenu displayed
A Configuration Backup window is shown in Figure 88.
Each item is described in Table 57.
Figure 88 Configuration Backup window

123
Figure 89 Failed to write configuration window
Table 57 Description of the Configuration Backup window
No.
Item Setting range Contents
1 Save Specify the range of
configuration information to be
saved.
All Setting: Entire
configuration information
Frequency Info: Only
frequency information
Setting Info : Configuration
information except for
frequency information
Saves the specified configuration
information.
When the Save button is clicked, a dialog
to specify a save destination and name is
displayed.
2 Load When the Browse button is clicked, a
dialog for selecting a file is displayed.
When the Load button is clicked, a popup
window confirming the writing and reset is
displayed. YES performs the writing and
reset. NO closes the popup window
without writing.
3 Error When the writing failed, a window shown
in Figure 89 is displayed. When you click
Back to configuration loading, it will
return to the Configuration Backup
window.
124
2.9.5. User Class Password
When you select Configuration in the operation menu part, a submenu is displayed.
When you select User Class Password from the submenu, a User Class Password window is
displayed.
Figure 90 Configuration submenu displayed
A User Class Password window is shown in Figure 91.
Each item is described in Table 58.
Figure 91 User Class Password window

125
Table 58 Description of the User Class Password
No.
Item Setting range Description
1 MT
account
Password
0 - 15 characters
No password in the case of 0
character.
Specify passwords for the four types
of accounts. Each account is
described in Table 41.
2 Setup When the Setup button is clicked, the
setting is immediately reflected.
126
2.9.6. Frequency Table
When you select Configuration in the operation menu part, a submenu is displayed.
When you select Frequency Table from the submenu, a Frequency Table window is displayed.
Figure 92 Configuration submenu displayed
A Frequency Table window is shown in Figure 55. Each item is described in Table 37.
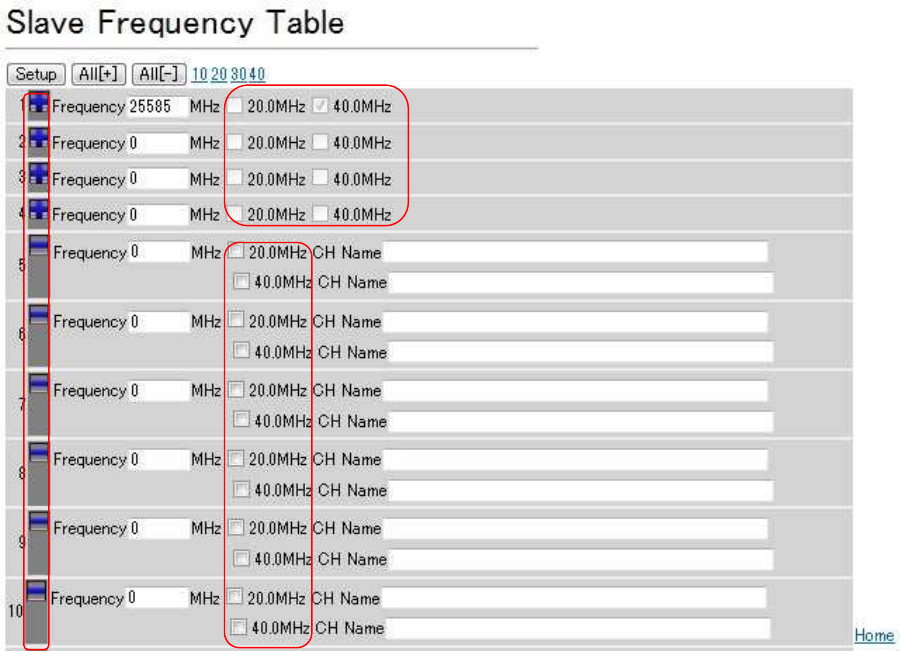
127
Figure 93 Frequency Table window
No.5
No.7
No.7

128
Table 59 Description of the Frequency Table
No. Item Setting range Description
1 Setup Sets all the items specified in this page to the Flash
ROM.
The setting will be reflected after a restart.
2 All[+] Sets all the following frequency setting items to [+] so
that the list of frequencies can be viewed.
3 All[−] Sets all the following frequency setting items to [-] so
that the list of CH names can be viewed.
4 10 20 30 40 Move to the specified number.
5 Display
method
selection
[+]
[-]
In the case of [+], the CH Name is omitted and the
enable/disable status of the frequency and each
symbol rate is displayed. In this case, the
enable/disable status of the symbol rate cannot be
changed.
In the case of [-], the enable/disable status of the
symbol rate aligns vertically, and each CH Name can
be configured.
6 Frequency
_____MHz
See the
"Frequency
channel"
section.
Displays and configures frequencies.
7 Symbol Rate See the
"Frequency
channel"
section.
Displays and configures the enable/disable status of
the symbol rate. If the display method is [+], the
enable/disable status of the symbol rate cannot be
changed.
8 Home When clicked, it will move to the top.

129
2.10. Logout
After clicking Logout in the operation menu part, select OK. A Logout complete window as
shown in Figure 94 appears.
Clicking Return to login will display the Login window shown in Figure 58.
Figure 94 Logout complete window

130
Ethernet is a registered trademark of XEROX Corporation.
 ̄ ̄ ̄ ̄ ̄ ̄ ̄ ̄ ̄ ̄ ̄ ̄ ̄ ̄ ̄ ̄ ̄ ̄ ̄ ̄ ̄ ̄ ̄ ̄
WIPAS2
WT Management Tool
Instruction Manual
H-7YZCM5109
Rev. 1.0
13/Nove./2011
 ̄ ̄ ̄ ̄ ̄ ̄ ̄ ̄ ̄ ̄ ̄ ̄ ̄ ̄ ̄ ̄ ̄ ̄ ̄ ̄ ̄ ̄ ̄ ̄