Landis Gyr Technology EC6R1S2 Electronic Endpoint Module User Manual 12 0296 Exhibit Cover
Landis+Gyr Technology, Inc. Electronic Endpoint Module 12 0296 Exhibit Cover
UserManual.wiki
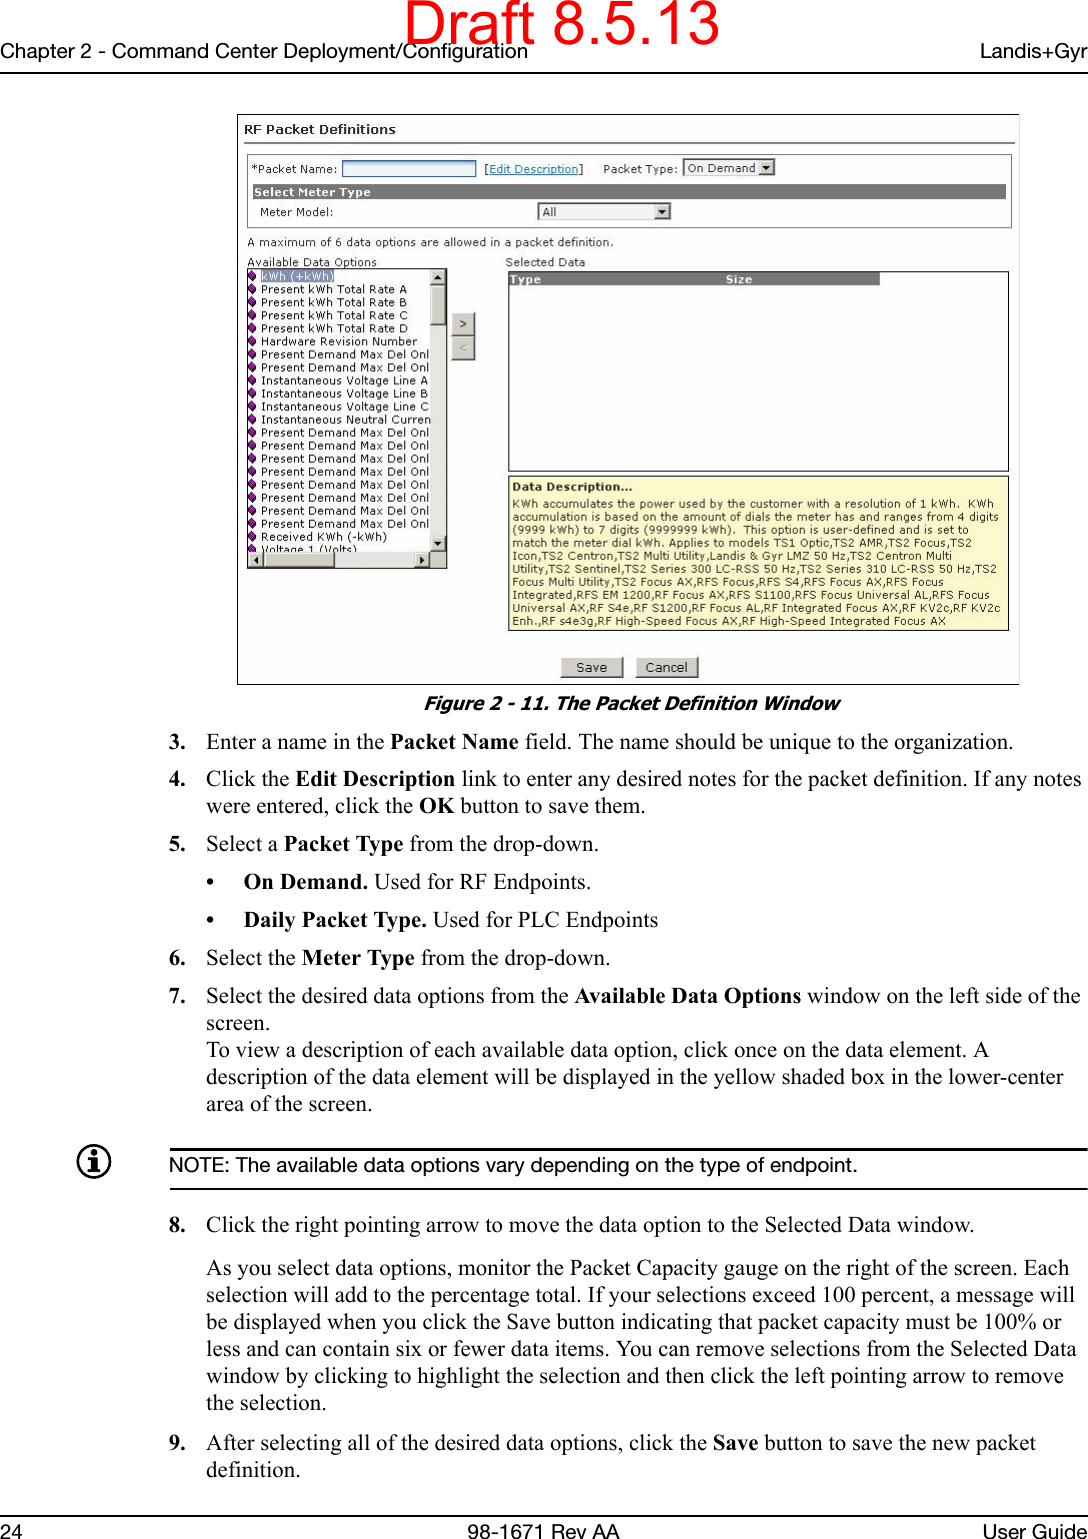
>
Landis Gyr Technology
>
EC6R1S2 User Manual
Manual
Navigation menu
Upload a User Manual
Namespaces
Wiki Guide
HTML
PDF
Info
Views
User Manual
Discussion / Help
Navigation

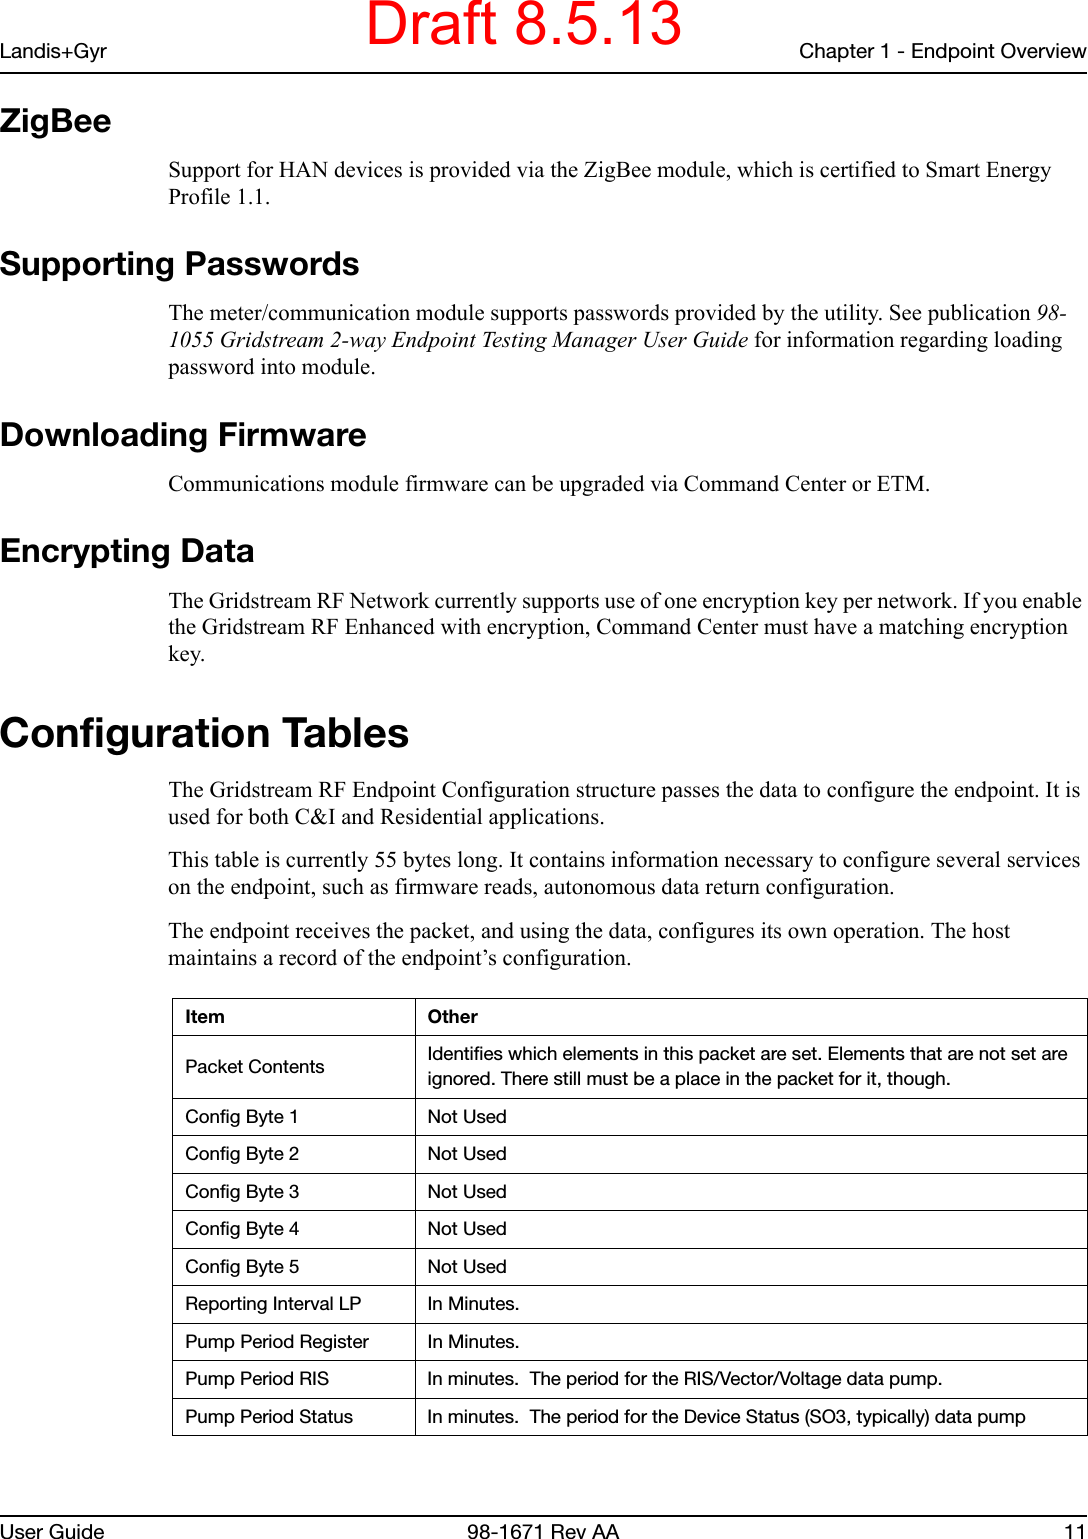
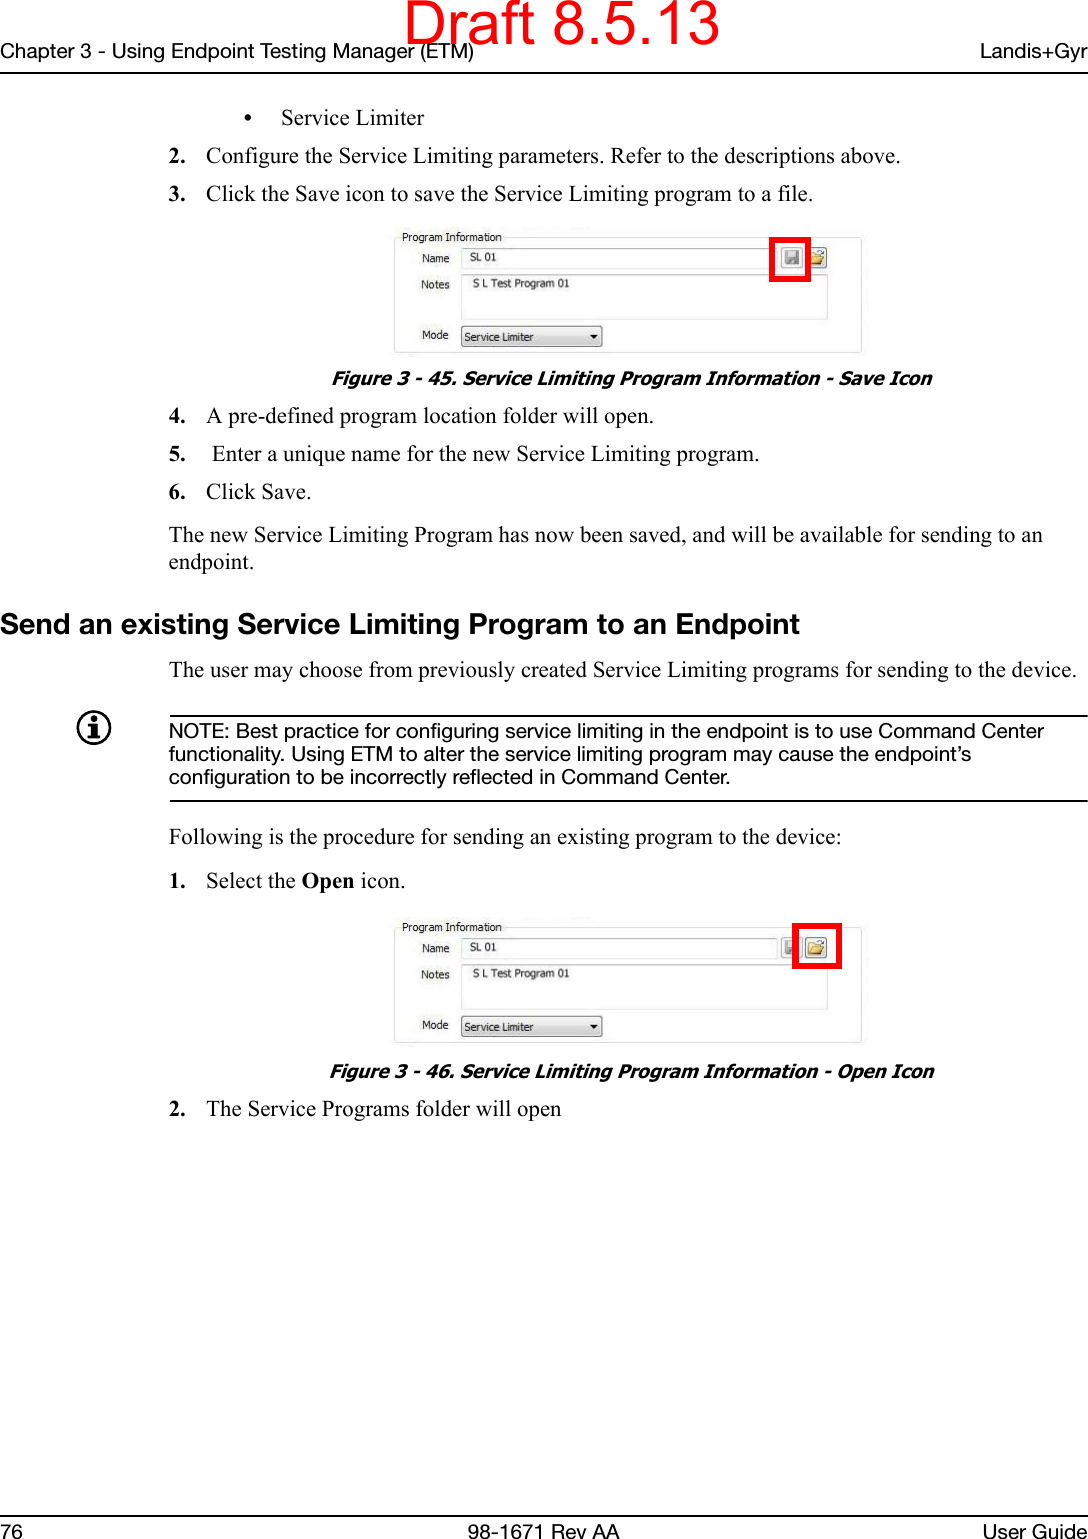
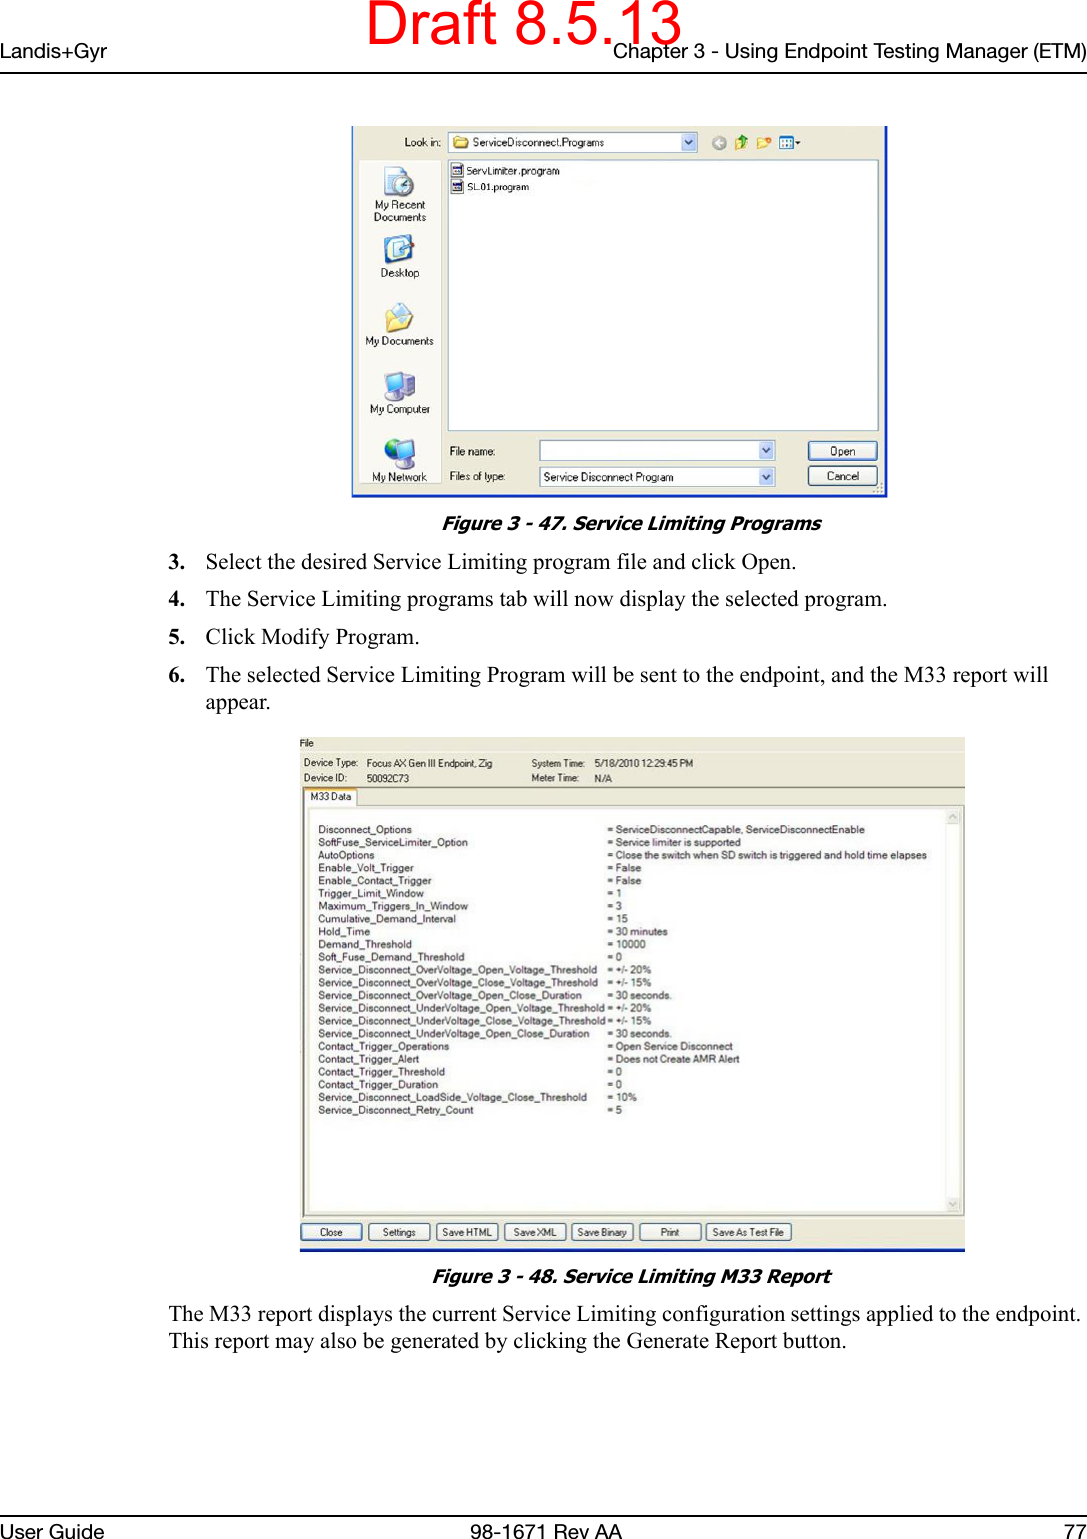
![Landis+Gyr Chapter 3 - Using Endpoint Testing Manager (ETM)User Guide 98-1671 Rev AA 75NOTE: The recommended closure prevention setting is 25 - 40%•Threshold Percent of Nominal Voltage. Enter the desired threshold. Legal Values: 0 to 60% of Nominal Voltage when enabled. A value of 0 will disable the check.Fused Settings•Amps at Nominal Voltage. This setting is a number between 0 and 60 that sets a threshold beyond which the switch will be opened.•Cumulative Demand same as Demand Interval [checked]. If this box is checked, this automatically sets the interval to the same interval used elsewhere in Command Center for automatic meter reads. •Cumulative Demand same... box [not checked]. If this box is not checked, the user must select an interval from the Interval button drop-down menu. The options are: 1, 5, 10, 15, 30, and 60 minutes.Open Options•Open Time. If instantaneous power (measured in watts) reaches a (programmable) threshold value, the switch will open for a configurable period of time, generally 0 - 30 minutes. •After Open Time Expires. Select the operation to be performed when the Open Time has expired. The switch can either be Closed, or the switch will Arm itself. When Armed, the switch will remain Open until the Reconnect button is pressed.•Limited Repeated Triggers. Limit Repeated Triggers, when enabled, causes the service disconnect switch to remain Open for an extended period if a number of Soft Fuse operations occur within a time window. For example, if a meter is programmed to allow no more than two operations within a 24-hour period, after the switch was triggered for the third time in 24 hours, the meter would remain open for 24 hours. At the end of that time, it would perform the operation it was configured to perform when the Open Time expired. Legal Values: 1 to 48 operations within a 1 to 24-hour window.Create a Service Limiting ProgramNew Service Limiting Programs may be created and saved to file for future application to meters. Following is the procedure for creating a new service limiting program.1. Enter the following Program Information:• Program Name: The program name identifies the Service Limiting program. Best practice for naming is to provide a functionality descriptive of the program. The name field is limited to fifty characters and must be unique to the organization. This field must be changed when creating a new Service Limiting program, or the existing Service Limiting program will be overwritten when the file is saved.•Notes: This is an optional file that allows for including up to 255 characters of additional information about the new Service Limiting program.•Mode: Select from the following modes:•Manual or Comm OnlyDraft 8.5.13](https://usermanual.wiki/Landis-Gyr-Technology/EC6R1S2/User-Guide-2034802-Page-76.png)