Landis Gyr Technology EC6R1S2 Electronic Endpoint Module User Manual 12 0296 Exhibit Cover
Landis+Gyr Technology, Inc. Electronic Endpoint Module 12 0296 Exhibit Cover
Manual

5015 B.U. Bowman Drive Buford, GA 30518 USA Voice: 770-831-8048 Fax: 770-831-8598
Certification Exhibit
FCC ID: R7PEC6R1S2
IC: 5294A-EC6R1S2
FCC Rule Part: 15.247
IC Radio Standards Specification: RSS-210
ACS Project Number: 12-0296
Manufacturer: Landis+Gyr Technology, Inc.
Model: Gridstream RF Enhanced A3
Manual

LANDIS+GYR CONFIDENTIAL INFORMATION
Gridstream RF
Enhanced Series IV
Elster A3 Endpoint
User Guide
Publication: 98-1671 Rev AA
Draft 8.5.13

Limitation on Warranties and Liability
Information in this document is subject to change without notice. This manual or any part of it thereof may not be re-
produced in any form unless permitted by contract or by written permission of Landis+Gyr.
In no event will Landis+Gyr be liable for any incidental, indirect, special, or consequential damages (including lost prof-
its) arising out of or relating to this publication or the information contained in it, even if Landis+Gyr has been advised,
knew, or should have known of the possibility of such damages.
© 2013 Landis+Gyr, Inc. All Rights Reserved
Gridstream RF Enhanced Series IV Elster A3 Endpoint User Guide
Publication: 98-1671 Rev AA
Revision History
Modification Date Revision Description Author
08/05/2013 AA Draft Kim Utesch
Landis+Gyr
6436 County Road 11
Pequot Lakes, MN 56472
Website: www.landisgyr.com
E-mail: solutionsupport.na@landisgyr.com
Technical Support: 1-888-390-5733
© 2013 Landis+Gyr
All rights reserved.
Draft 8.5.13

User Guide 98-1671 Rev AA 3
Table of Contents
Chapter 1: Endpoint Overview . . . . . . . . . . . . . . . . . . . . . . . . . . . . . . . . . . . . . . . . . . . . . . . . . . . . . . . . 7
Gridstream RF Enhanced Series IV Elster A3 Endpoint . . . . . . . . . . . . . . . . . . . . . . . . . . . . . . . . . . . . . . . . . . 7
Endpoint Usage . . . . . . . . . . . . . . . . . . . . . . . . . . . . . . . . . . . . . . . . . . . . . . . . . . . . . . . . . . . . . . . . . . . 7
Required Software . . . . . . . . . . . . . . . . . . . . . . . . . . . . . . . . . . . . . . . . . . . . . . . . . . . . . . . . . . . . . . . . . 8
Labels . . . . . . . . . . . . . . . . . . . . . . . . . . . . . . . . . . . . . . . . . . . . . . . . . . . . . . . . . . . . . . . . . . . . . . . . . . . 8
Features and Functions . . . . . . . . . . . . . . . . . . . . . . . . . . . . . . . . . . . . . . . . . . . . . . . . . . . . . . . . . . . . . . . . . . . . 8
Communicating via Meter to Endpoint Connection . . . . . . . . . . . . . . . . . . . . . . . . . . . . . . . . . . . . . . . 8
Auto-Registration . . . . . . . . . . . . . . . . . . . . . . . . . . . . . . . . . . . . . . . . . . . . . . . . . . . . . . . . . . . . . . . . . . 9
Retrieving Data . . . . . . . . . . . . . . . . . . . . . . . . . . . . . . . . . . . . . . . . . . . . . . . . . . . . . . . . . . . . . . . . . . . 9
Demand Reset . . . . . . . . . . . . . . . . . . . . . . . . . . . . . . . . . . . . . . . . . . . . . . . . . . . . . . . . . . . . . . . . . . . 10
Time Synchronization . . . . . . . . . . . . . . . . . . . . . . . . . . . . . . . . . . . . . . . . . . . . . . . . . . . . . . . . . . . . . 10
Power Outage/Restoration . . . . . . . . . . . . . . . . . . . . . . . . . . . . . . . . . . . . . . . . . . . . . . . . . . . . . . . . . . 10
ZigBee . . . . . . . . . . . . . . . . . . . . . . . . . . . . . . . . . . . . . . . . . . . . . . . . . . . . . . . . . . . . . . . . . . . . . . . . . 11
Supporting Passwords . . . . . . . . . . . . . . . . . . . . . . . . . . . . . . . . . . . . . . . . . . . . . . . . . . . . . . . . . . . . . 11
Downloading Firmware . . . . . . . . . . . . . . . . . . . . . . . . . . . . . . . . . . . . . . . . . . . . . . . . . . . . . . . . . . . 11
Encrypting Data . . . . . . . . . . . . . . . . . . . . . . . . . . . . . . . . . . . . . . . . . . . . . . . . . . . . . . . . . . . . . . . . . . 11
Configuration Tables . . . . . . . . . . . . . . . . . . . . . . . . . . . . . . . . . . . . . . . . . . . . . . . . . . . . . . . . . . . . . . . . . . . . . 11
Theory of Operation . . . . . . . . . . . . . . . . . . . . . . . . . . . . . . . . . . . . . . . . . . . . . . . . . . . . . . . . . . . . . . . . . . . . . 13
FCC and Industry Canada Compliance . . . . . . . . . . . . . . . . . . . . . . . . . . . . . . . . . . . . . . . . . . . . . . . . . . . . . . . 13
FCC Class B . . . . . . . . . . . . . . . . . . . . . . . . . . . . . . . . . . . . . . . . . . . . . . . . . . . . . . . . . . . . . . . . . . . . . 13
RF Exposure . . . . . . . . . . . . . . . . . . . . . . . . . . . . . . . . . . . . . . . . . . . . . . . . . . . . . . . . . . . . . . . . . . . . . 14
Industry Canada . . . . . . . . . . . . . . . . . . . . . . . . . . . . . . . . . . . . . . . . . . . . . . . . . . . . . . . . . . . . . . . . . . 14
Chapter 2: Command Center Deployment/Configuration . . . . . . . . . . . . . . . . . . . . . . . . . . . . . . . . . . 15
Deployment . . . . . . . . . . . . . . . . . . . . . . . . . . . . . . . . . . . . . . . . . . . . . . . . . . . . . . . . . . . . . . . . . . . . . . . . . . . . 15
Auto Registration . . . . . . . . . . . . . . . . . . . . . . . . . . . . . . . . . . . . . . . . . . . . . . . . . . . . . . . . . . . . . . . . . 15
Endpoint Status . . . . . . . . . . . . . . . . . . . . . . . . . . . . . . . . . . . . . . . . . . . . . . . . . . . . . . . . . . . 16
Meter Manufacturer Data . . . . . . . . . . . . . . . . . . . . . . . . . . . . . . . . . . . . . . . . . . . . . . . . . . . . . . . . . . . 16
Import Installation File . . . . . . . . . . . . . . . . . . . . . . . . . . . . . . . . . . . . . . . . . . . . . . . . . . . . . . . . . . . . . 17
Import Information File CSV Format requirements . . . . . . . . . . . . . . . . . . . . . . . . . . . . . . . 19
Time Zone . . . . . . . . . . . . . . . . . . . . . . . . . . . . . . . . . . . . . . . . . . . . . . . . . . . . . . . . . . . . . . . 19
Tracking and Deployment . . . . . . . . . . . . . . . . . . . . . . . . . . . . . . . . . . . . . . . . . . . . . . . . . . . . . . . . . . . . . . . . . 20
Deployment Status . . . . . . . . . . . . . . . . . . . . . . . . . . . . . . . . . . . . . . . . . . . . . . . . . . . . . . . . . . . . . . . . 20
RF Installation Status . . . . . . . . . . . . . . . . . . . . . . . . . . . . . . . . . . . . . . . . . . . . . . . . . . . . . . . . . . . . . . 21
Endpoint Configuration . . . . . . . . . . . . . . . . . . . . . . . . . . . . . . . . . . . . . . . . . . . . . . . . . . . . . . . . . . . . . . . . . . . 23
Packet Definitions . . . . . . . . . . . . . . . . . . . . . . . . . . . . . . . . . . . . . . . . . . . . . . . . . . . . . . . . . . . . . . . . 23
Alarm Definitions . . . . . . . . . . . . . . . . . . . . . . . . . . . . . . . . . . . . . . . . . . . . . . . . . . . . . . . . . . . . . . . . 25
Meter Configuration Groups . . . . . . . . . . . . . . . . . . . . . . . . . . . . . . . . . . . . . . . . . . . . . . . . . . . . . . . . 26
Add Meters to a Meter Configuration Group . . . . . . . . . . . . . . . . . . . . . . . . . . . . . . . . . . . . . . . . . . . .28
HAN Setup Process Overview . . . . . . . . . . . . . . . . . . . . . . . . . . . . . . . . . . . . . . . . . . . . . . . . . . . . . . . . . . . . . 29
HAN: Initialization . . . . . . . . . . . . . . . . . . . . . . . . . . . . . . . . . . . . . . . . . . . . . . . . . . . . . . . . . . . . . . . 30
Provisioning HAN Devices . . . . . . . . . . . . . . . . . . . . . . . . . . . . . . . . . . . . . . . . . . . . . . . . . . . . . . . . . 31
Application Summary . . . . . . . . . . . . . . . . . . . . . . . . . . . . . . . . . . . . . . . . . . . . . . . . . . . . . . 33
Remove HAN Devices . . . . . . . . . . . . . . . . . . . . . . . . . . . . . . . . . . . . . . . . . . . . . . . . . . . . . . . . . . . . . 33
Management and Troubleshooting . . . . . . . . . . . . . . . . . . . . . . . . . . . . . . . . . . . . . . . . . . . . . . . . . . . . 34
Meter Swap Out Process using Decommission HAN . . . . . . . . . . . . . . . . . . . . . . . . . . . . . . 34
Draft 8.5.13

Table of Contents Landis+Gyr
4 98-1671 Rev AA User Guide
Commission HAN Network for Channel Control . . . . . . . . . . . . . . . . . . . . . . . . . . . . . . . . . 34
Meter LCD Screen for ZigBee Alerts . . . . . . . . . . . . . . . . . . . . . . . . . . . . . . . . . . . . . . . . . . 35
Confirm HAN Radio in Meter is Communicating or HAN is set-up. . . . . . . . . . . . . . . . . . . 35
Get information for a specific device . . . . . . . . . . . . . . . . . . . . . . . . . . . . . . . . . . . . . . . . . . . 35
Get Firmware version for the HAN radio. . . . . . . . . . . . . . . . . . . . . . . . . . . . . . . . . . . . . . . . 35
Confirm that a HAN device can communicate with the meter . . . . . . . . . . . . . . . . . . . . . . . 36
Chapter 3: Using Endpoint Testing Manager (ETM) . . . . . . . . . . . . . . . . . . . . . . . . . . . . . . . . . . . . . . . .37
How To Use ETM . . . . . . . . . . . . . . . . . . . . . . . . . . . . . . . . . . . . . . . . . . . . . . . . . . . . . . . . . . . . . . . . . . . . . . .37
Access to Endpoint Test Manager . . . . . . . . . . . . . . . . . . . . . . . . . . . . . . . . . . . . . . . . . . . . . . . . . . . . . . . . . . .37
Setting Up Access to the Command Center Server . . . . . . . . . . . . . . . . . . . . . . . . . . . . . . . . . . . . . . .37
Adding a New Server . . . . . . . . . . . . . . . . . . . . . . . . . . . . . . . . . . . . . . . . . . . . . . . . . . . . . . . . . . . . . .38
Selecting an alternate existing server . . . . . . . . . . . . . . . . . . . . . . . . . . . . . . . . . . . . . . . . . . . . . . . . . .38
Modify an existing server . . . . . . . . . . . . . . . . . . . . . . . . . . . . . . . . . . . . . . . . . . . . . . . . . . . . . . . . . . .39
Delete an existing server . . . . . . . . . . . . . . . . . . . . . . . . . . . . . . . . . . . . . . . . . . . . . . . . . . . . . . . . . . . .39
Add additional servers . . . . . . . . . . . . . . . . . . . . . . . . . . . . . . . . . . . . . . . . . . . . . . . . . . . . . . . . . . . . .39
After Login: Setup Cautions . . . . . . . . . . . . . . . . . . . . . . . . . . . . . . . . . . . . . . . . . . . . . . . . . . . . . . . . . . . . . . .40
Certificate Attributes . . . . . . . . . . . . . . . . . . . . . . . . . . . . . . . . . . . . . . . . . . . . . . . . . . . . . . . . . . . . . .40
Request MAT Certificate . . . . . . . . . . . . . . . . . . . . . . . . . . . . . . . . . . . . . . . . . . . . . . . . . . . . . . . . . . .41
ETM Sign In . . . . . . . . . . . . . . . . . . . . . . . . . . . . . . . . . . . . . . . . . . . . . . . . . . . . . . . . . . . . . . . . . . . . . . . . . . .42
Using the Bar-code Scanner . . . . . . . . . . . . . . . . . . . . . . . . . . . . . . . . . . . . . . . . . . . . . . . . . . . . . . . . .43
Navigating the Software . . . . . . . . . . . . . . . . . . . . . . . . . . . . . . . . . . . . . . . . . . . . . . . . . . . . . . . . . . . .44
Configuring a New Gridstream IWR Radio . . . . . . . . . . . . . . . . . . . . . . . . . . . . . . . . . . . . . . . . . . . . .44
Meter Shop Best Practices Use Case - Proper IWR Configuration . . . . . . . . . . . . . . . . . . . . 45
Authentication Server Connection . . . . . . . . . . . . . . . . . . . . . . . . . . . . . . . . . . . . . . . . . . . . . . . . . . . .46
Connecting to a Collector . . . . . . . . . . . . . . . . . . . . . . . . . . . . . . . . . . . . . . . . . . . . . . . . . . . . . . . . . . .46
Connection Tab . . . . . . . . . . . . . . . . . . . . . . . . . . . . . . . . . . . . . . . . . . . . . . . . . . . . . . . . . . . . . . . . . . . . . . . . .47
Baud Rate Selection . . . . . . . . . . . . . . . . . . . . . . . . . . . . . . . . . . . . . . . . . . . . . . . . . . . . . . . . . . . . . . .48
Connecting to an Endpoint . . . . . . . . . . . . . . . . . . . . . . . . . . . . . . . . . . . . . . . . . . . . . . . . . . . . . . . . . .49
Head End Radio Tab . . . . . . . . . . . . . . . . . . . . . . . . . . . . . . . . . . . . . . . . . . . . . . . . . . . . . . . . . . . . . . . . . . . . .50
Device Test Tab . . . . . . . . . . . . . . . . . . . . . . . . . . . . . . . . . . . . . . . . . . . . . . . . . . . . . . . . . . . . . . . . . . . . . . . . .52
High Speed (115200 bps) Enable . . . . . . . . . . . . . . . . . . . . . . . . . . . . . . . . . . . . . . . . . . . . . . . . . . . . .55
Multiple Meter Test Mode . . . . . . . . . . . . . . . . . . . . . . . . . . . . . . . . . . . . . . . . . . . . . . . . . . . . . . . . . .56
Enabling Multiple Meter Test Mode . . . . . . . . . . . . . . . . . . . . . . . . . . . . . . . . . . . . . . . . . . . 56
Editing Multiple Meter Test Configuration . . . . . . . . . . . . . . . . . . . . . . . . . . . . . . . . . . . . . . 57
Firmware Download Tab . . . . . . . . . . . . . . . . . . . . . . . . . . . . . . . . . . . . . . . . . . . . . . . . . . . . . . . . . . . . . . . . . .58
Battery End Point Firmware Download . . . . . . . . . . . . . . . . . . . . . . . . . . . . . . . . . . . . . . . . . . . . . . . .60
Module Tab . . . . . . . . . . . . . . . . . . . . . . . . . . . . . . . . . . . . . . . . . . . . . . . . . . . . . . . . . . . . . . . . . . . . . . . . . . . .60
Optical Lockout . . . . . . . . . . . . . . . . . . . . . . . . . . . . . . . . . . . . . . . . . . . . . . . . . . . . . . . . . . . . . . . . . .61
Reporting Tab . . . . . . . . . . . . . . . . . . . . . . . . . . . . . . . . . . . . . . . . . . . . . . . . . . . . . . . . . . . . . . . . . . . . . . . . . .62
Demand Reset . . . . . . . . . . . . . . . . . . . . . . . . . . . . . . . . . . . . . . . . . . . . . . . . . . . . . . . . . . . . . . . . . . . .63
Enabling Demand Reset . . . . . . . . . . . . . . . . . . . . . . . . . . . . . . . . . . . . . . . . . . . . . . . . . . . . . 64
Demand Reset Lockout . . . . . . . . . . . . . . . . . . . . . . . . . . . . . . . . . . . . . . . . . . . . . . . . . . . . . 64
Performing a Demand Reset. . . . . . . . . . . . . . . . . . . . . . . . . . . . . . . . . . . . . . . . . . . . . . . . . . 64
Command Scheduler Tab . . . . . . . . . . . . . . . . . . . . . . . . . . . . . . . . . . . . . . . . . . . . . . . . . . . . . . . . . . . . . . . . .65
Event Mask . . . . . . . . . . . . . . . . . . . . . . . . . . . . . . . . . . . . . . . . . . . . . . . . . . . . . . . . . . . . . . . . . . . . . .67
Command Schedule . . . . . . . . . . . . . . . . . . . . . . . . . . . . . . . . . . . . . . . . . . . . . . . . . . . . . . . . . . . . . . .68
HAN Tab . . . . . . . . . . . . . . . . . . . . . . . . . . . . . . . . . . . . . . . . . . . . . . . . . . . . . . . . . . . . . . . . . . . . . . . . . . . . . .69
Universal Event Log Tab . . . . . . . . . . . . . . . . . . . . . . . . . . . . . . . . . . . . . . . . . . . . . . . . . . . . . . . . . . . . . . . . . .71
Service Limiting Tab . . . . . . . . . . . . . . . . . . . . . . . . . . . . . . . . . . . . . . . . . . . . . . . . . . . . . . . . . . . . . . . . . . . . .72
Draft 8.5.13

Landis+Gyr Table of Contents
User Guide 98-1671 Rev AA 5
Service Limiting Modes . . . . . . . . . . . . . . . . . . . . . . . . . . . . . . . . . . . . . . . . . . . . . . . . . . . . . . . . . . . . 73
Read Program . . . . . . . . . . . . . . . . . . . . . . . . . . . . . . . . . . . . . . . . . . . . . . . . . . . . . . . . . . . . . . . . . . . . 74
Service Limiting options . . . . . . . . . . . . . . . . . . . . . . . . . . . . . . . . . . . . . . . . . . . . . . . . . . . . 74
Create a Service Limiting Program . . . . . . . . . . . . . . . . . . . . . . . . . . . . . . . . . . . . . . . . . . . . . . . . . . . 75
Send an existing Service Limiting Program to an Endpoint . . . . . . . . . . . . . . . . . . . . . . . . . 76
Groups Tab . . . . . . . . . . . . . . . . . . . . . . . . . . . . . . . . . . . . . . . . . . . . . . . . . . . . . . . . . . . . . . . . . . . . . . . . . . . . 78
Chapter 4: Specifications . . . . . . . . . . . . . . . . . . . . . . . . . . . . . . . . . . . . . . . . . . . . . . . . . . . . . . . . . . . 79
Enhanced Series IV Elster A3 Specs . . . . . . . . . . . . . . . . . . . . . . . . . . . . . . . . . . . . . . . . . . . . . . . . . . . . . . . . 79
Draft 8.5.13
Draft 8.5.13
User Guide 98-1671 Rev AA 7
1
Endpoint Overview
Gridstream RF Enhanced Series IV Elster A3 Endpoint
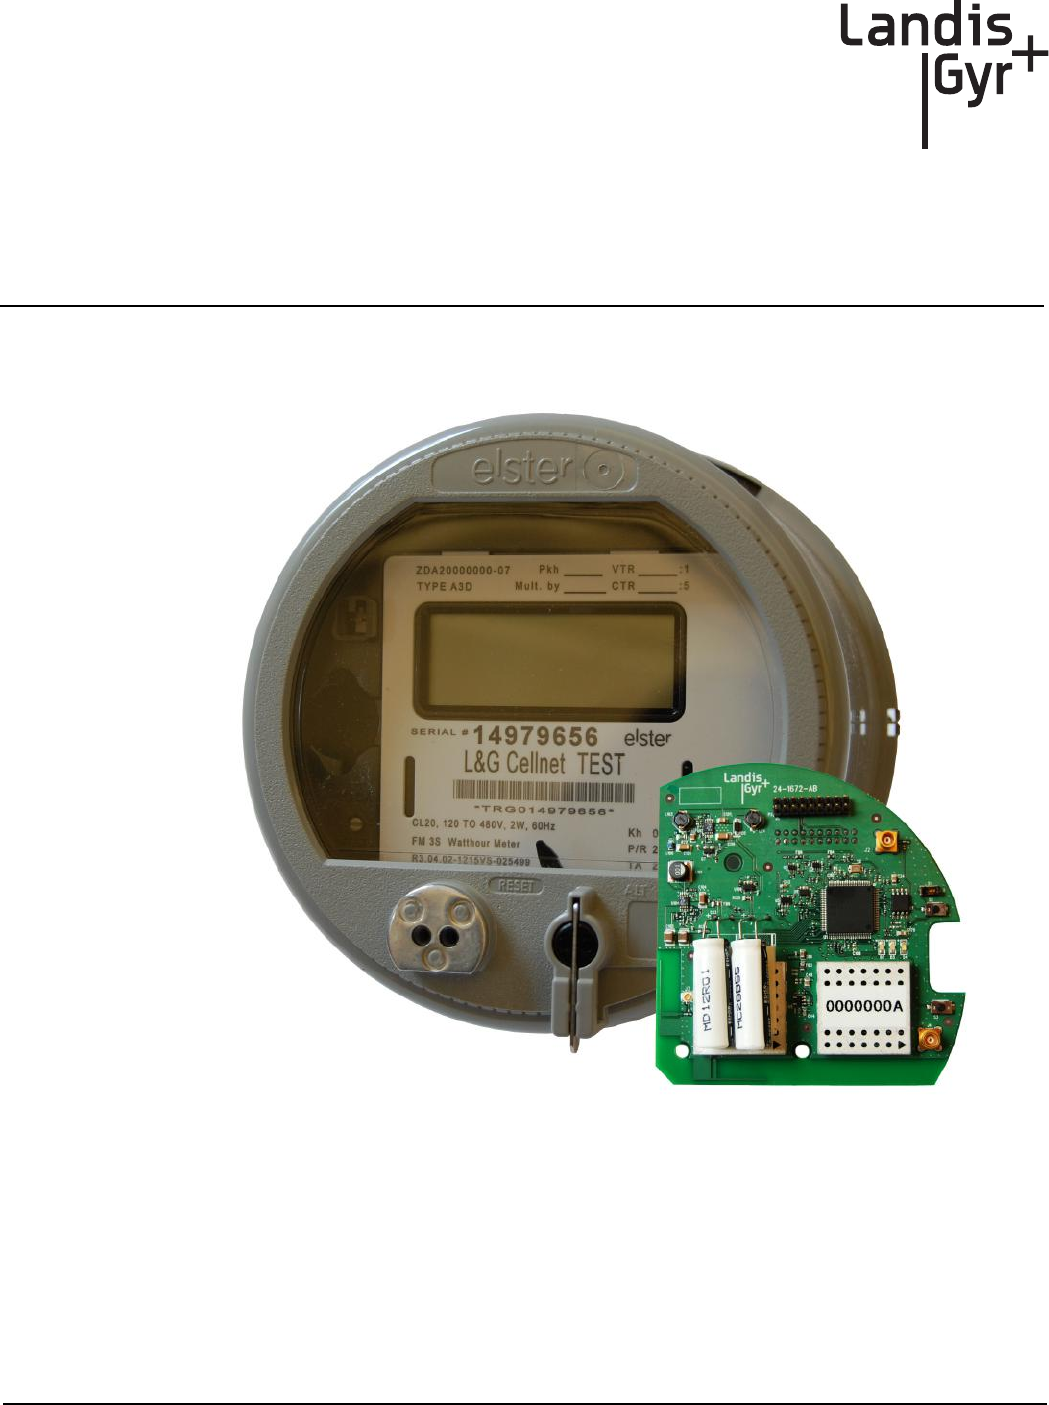
Figure 1 - 1. Gridstream RF Enhanced Series IV Elster A3 Meter and Module
Endpoint Usage
The Gridstream RF Enhanced Series IV Elster A3 endpoint will be used for commercial and
industrial metering applications.
The Gridstream RF Enhanced Series IV Elster A3 communication module requires professional
installation by qualified personnel.
Draft 8.5.13

Chapter 1 - Endpoint Overview Landis+Gyr
8 98-1671 Rev AA User Guide
Required Software
To work with the endpoint, you need one of the following software tools:
•Command Center version 5.7 or later.
•RadioShop version 5.4 or later.
•Endpoint Testing Manager version 5.7 or later.
Labels
The endpoint includes the following label.
Figure 1 - 2. Label Identification
1. LAN ID, includes programmed module part number (printed and barcoded)
NOTE: The LAN ID is a unique identifier for each endpoint. It always displays in hex. Landis+Gyr
provides the LAN address. You cannot change the LAN ID of a radio.
2. Product ID (printed and bar-coded)
3. FCC ID:R7PEC6R1S2
4. IC ID: 5294A-EC6R1S2
Features and Functions
Using the Elster A3 Meter with the Gridstream RF Enhanced Communication Module, you can:
•Integrate the endpoint into all forms, classes and voltages of the Elster A3 meter.
•Communicate via serial connection between the endpoint and the meter through the meter's
provided interface.
•Support all levels of meter passwords.
•Download radio firmware.
Communicating via Meter to Endpoint Connection
The serial connection is a 26-pin header that contains:
•Full duplex serial connection. The baud rate is 9600, 8 bits, 1 stop bit, no hardware hand-
shaking.
•Power fail indication signal from the meter that tells the endpoint to disconnect from
drawing power from the meter.
•DC power line which supplies power to the module from the meter.
CONTAINS IC: 5294A-EC6R1S2
CONTAINS FCC ID: R7PEC6R1S2
MODULE MODEL: GRIDSTREAM RF ENHANCED A3
SERIES IV
XXXXXXXX
Draft 8.5.13

Landis+Gyr Chapter 1 - Endpoint Overview
User Guide 98-1671 Rev AA 9
•Signal pass through between meter and Elster option board.
Auto-Registration
Endpoint firmware version 7.59 or later and module Device Control Word (DCW) 7.55 or later is
required for auto-registration. After the meter/endpoint is installed in the field it will automatically
register with the Head End System. No special tools are needed during installation as the normal
Utility meter swap process can be utilized.
The meter automatically sends in the registration information containing items on how the meter/
communication module is configured so the host can properly interpret the incoming data. Some of
the items contained in this are as follows:
•Default Gridstream RF Collector destination
•Reporting interval for Register Data
•Reporting interval for Interval Data
•Meter's AMR-level security password
•Time Synchronization parameters
•GMT offset
•Periodic Register Data reporting
•Periodic LP Data reporting
•Meter configuration information
Once this information has been sent the meter/communication module starts collecting and sending
based on the default configuration loaded during manufacturing.
Retrieving Data
The communication module performs data retrieval from the meter on request (ORR) or
autonomously (periodically reported).
Availability of the following features depends on meter configuration. On Request Reads (ORR)
available with this communication module are:
•Register Data (Standard Table 23) which includes consumption, demand and TOU values.
•Load Profile or Interval Data (Standard Table 64).
•Revenue Integrity Services which includes instantaneous measurements related to line
voltage, current and phase angle.
Availability of the following features depends on meter configuration. Options for periodically
reported data with this module include:
•Register Data & Status Flags (Standard Tables 23 & 3) which includes consumption,
demand, TOU values and meter status.
•Load Profile or Interval Data & Status Flags (Standard Tables 64 & 3) which includes
interval data and meter status.
Draft 8.5.13

Chapter 1 - Endpoint Overview Landis+Gyr
10 98-1671 Rev AA User Guide
Demand Reset
When Command Center delivers a Demand Reset command, the communication module passes the
command to the meter, which performs the Demand Reset on the meter. The meter/communication
module then passes the previous demand data captured by the meter (Standard Table 25) to
Command Center for processing.
Time Synchronization
Time syncronization is the process of keeping the meter time synchronized with the Gridstream RF
network time within a configurable limit. The communication module automatically keeps its time
synchronized with the Gridstream RF network via periodic background process. The communication
module reads the meter date/clock table (Standard Table 52) periodically, determined by its
configuration. If the time drift between the meter and communication module exceeds the
configured threshold, it sends a time synchronization alert message to Command Center. Command
Center schedules a time change event for the meter and sends it to the communication module. The
time of the change is determined such that the meter’s data integrity is maintained. At the scheduled
time, the communication module executes the standard procedure to change date/time on the meter.
Power Outage/Restoration
When an outage occurs, the meter uses an early power failure signal to alert the communication
module to disconnect from the meter's power immediately. The communication module saves
critical module data to non-volatile memory and creates and sends a power outage message. This
message includes the following information:
•LAN ID
•Outage time
•Reboot count.
The communication module sends the message, then assists with routing other packets until the
back-up energy source can no longer keep the radio alive. The time that this energy source is
available varies with several factors, including amount of data packets being routed, environmental
conditions and age of meter/communication module. Generally, a hold-up time of ~120 seconds is
typical.
At restoration, the communication module first acquires network connectivity. With network
communications restored, the communication module sends a power restoration message that
includes details such as:
•LAN ID
•Outage time
•Restoration time
•Reboot count.
The communications module stores a history of up to the last five power outage and restoration
event pairs. Command Centercan request this data.
Draft 8.5.13

Landis+Gyr Chapter 1 - Endpoint Overview
User Guide 98-1671 Rev AA 11
ZigBee
Support for HAN devices is provided via the ZigBee module, which is certified to Smart Energy
Profile 1.1.
Supporting Passwords
The meter/communication module supports passwords provided by the utility. See publication 98-
1055 Gridstream 2-way Endpoint Testing Manager User Guide for information regarding loading
password into module.
Downloading Firmware
Communications module firmware can be upgraded via Command Center or ETM.
Encrypting Data
The Gridstream RF Network currently supports use of one encryption key per network. If you enable
the Gridstream RF Enhanced with encryption, Command Center must have a matching encryption
key.
Configuration Tables
The Gridstream RF Endpoint Configuration structure passes the data to configure the endpoint. It is
used for both C&I and Residential applications.
This table is currently 55 bytes long. It contains information necessary to configure several services
on the endpoint, such as firmware reads, autonomous data return configuration.
The endpoint receives the packet, and using the data, configures its own operation. The host
maintains a record of the endpoint’s configuration.
Item Other
Packet Contents Identifies which elements in this packet are set. Elements that are not set are
ignored. There still must be a place in the packet for it, though.
Config Byte 1 Not Used
Config Byte 2 Not Used
Config Byte 3 Not Used
Config Byte 4 Not Used
Config Byte 5 Not Used
Reporting Interval LP In Minutes.
Pump Period Register In Minutes.
Pump Period RIS In minutes. The period for the RIS/Vector/Voltage data pump.
Pump Period Status In minutes. The period for the Device Status (SO3, typically) data pump
Draft 8.5.13

Chapter 1 - Endpoint Overview Landis+Gyr
12 98-1671 Rev AA User Guide
Pump Period Snap Read
Snap Reads will be delivered at a pseudo-random time, which will occur in
the first X hours of each day. X is the value that is provided here. It will default
to 2. The process is: this value, which is in hours, will be converted to
minutes. The LAN ID will be mod-ed with this minute value, and the result will
be the minute of the day that the self read is transmitted.
User ID 2 byte User ID used while running ANSI Logon Service
Logon User 10 byte User Name that is used while running the ANSI Logon Service
Security Password The full 20 bytes are required.
Sustained Outage
Duration
Defines the number of seconds after which an outage will be classified as
sustained. If less than this amount, the outage is momentary. A value of zero
will cause all outages to be considered "sustained".
Max Meter Time Drift The number of seconds that the meter clock can drift from the radio clock,
after which an alarm is triggered.
Meter Time Read Period The number of seconds that the meter clock can drift from the radio clock,
after which an alarm is triggered.
GMT Offset The GMT Offset in 15 minute increments. Signed.
Item Other
Draft 8.5.13
Landis+Gyr Chapter 1 - Endpoint Overview
User Guide 98-1671 Rev AA 13
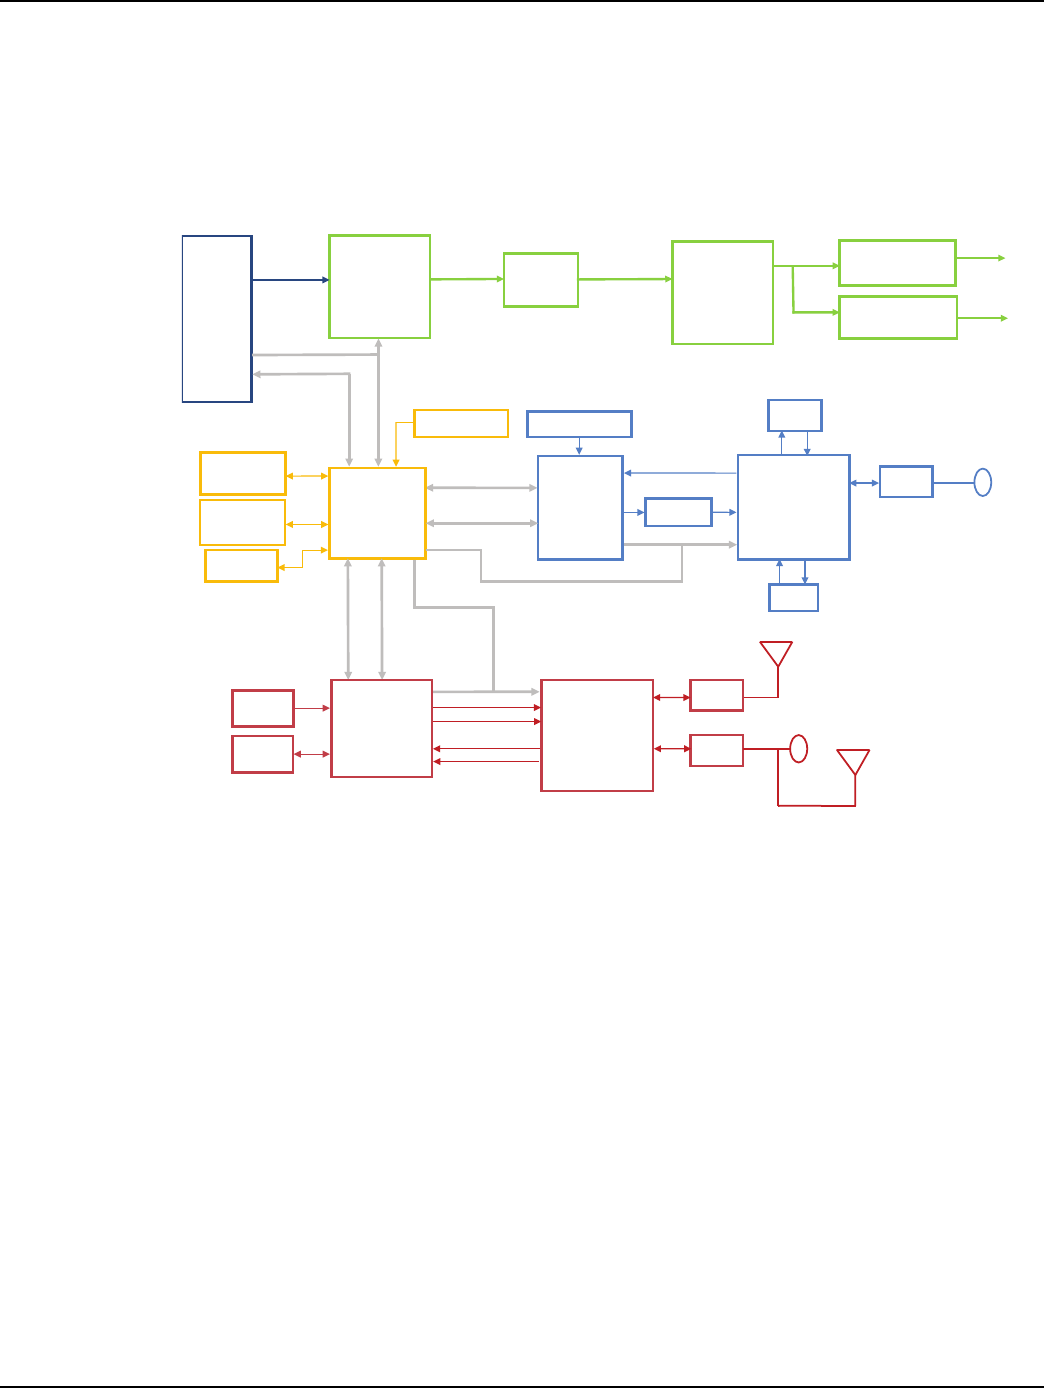
Theory of Operation
The Gridstream RF Elster A3 module is an electric endpoint with 900MHz Gridstream and ZigBee
communications on a single PCB. This product will be integrated into the Elster A3 C&I meter. The
following figure shows the high-level block diagram of the module. Each functional block is
described in the following sections.
Figure 1 - 3. Block Diagram
FCC and Industry Canada Compliance
FCC Class B
This device complies with Part 15 of the FCC rules. Operation is subject to the following two condi-
tions:
1. This device may not cause harmful interference, and
2. This device must accept any interference received, including interference that may cause
undesired operation.
This equipment has been tested and found to comply with the limits for a Class B digital device, pur-
suant to Part 15 of the FCC Rules. These limits are designed to provide reasonable protection against
harmful interference in a residential installation. This equipment generates, uses, and can radiate radio
frequency energy and, if not installed and used in accordance with the Instructions, may cause harmful
interference to radio communications. However, there is no guarantee that interference will not occur
in a particular installation. If this equipment does cause harmful interference to radio or television re-
UART
Semtech
Transceiver
SX1232
LDO
(LP3985IM5-3.3)
LDO
(LP3985IM5-3.3)
DC-DC Buck-
Boost
Regulator
(LTC3530EMS)
Supercap
5F
DC-DC
Converter
Constant
Current
(LT1618EMS)
Elster A3
Meter
Interface
11V ч Vin ч 14V
100 mA max 4.5V 1.8V to 4.5V
3.6V
3.3V
3.3V
900MHz FEM
PA+LNA+RF
switch
SiGe SE2435L
SAW
Filter
Renesas
R5F3650TDFB
768K Flash
47K RAM
Data Flash
4MB
Supervisor
+ Watchdog
GPIO
SPI
UART
GPIO
GPIO
GPIO
SPI
/PFAIL
Ember
EM357
192K Flash
12K RAM
24 MHz
2.4GHz FEM
PA+LNA+RF
switch
SiGe SE2432L
Filter
Filter
UART
ZB ANT 1
32.1 MHz TCXO
RF connector
(3.9V when
temp>65°C)
10dB Pad
14.7456 MHz Filter
RFVCC
DVCC
DiīerenƟal Tx
DiīerenƟal Rx
/RESET
RX
TX
JTAG
JTAG
RF connector
ZB ANT 2
Draft 8.5.13

Chapter 1 - Endpoint Overview Landis+Gyr
14 98-1671 Rev AA User Guide
ception, which can be determined by turning the equipment off and on, the user is encouraged to try
to correct the interference by one or more of the following measures:
•Reorient or relocate the receiving antenna.
•Increase the separation between the equipment and receiver.
•Consult Landis+Gyr or an experienced radio technician for help
UWARNING: Changes or modifications to this device not expressly approved by Landis+Gyr
could void the user’s authority to operate the equipment.
RF Exposure
This equipment complies with FCC radiation exposure limits set forth for an uncontrolled
environment. This equipment should be installed and operated with minimum distance 20 cm
between the radiator and your body. This transmitter must not be co-located or operating in
conjunction with any other antenna or transmitter.
Industry Canada
This device complies with Industry Canada license-exempt RSS standard(s). Operation is subject to
the following two conditions: (1) this device may not cause interference, and (2) this device must
accept any interference, including interference that may cause undesired operation of the device.
Le présent appareil est conforme aux CNR d'Industrie Canada applicables aux appareils radio
exempts de licence. L'exploitation est autorisée aux deux conditions suivantes : (1) l'appareil ne doit
pas produire de brouillage, et (2) l'utilisateur de l'appareil doit accepter tout brouillage
radioélectrique subi, même si le brouillage est susceptible d'en compromettre le fonctionnement.
Under Industry Canada regulations, this radio transmitter may only operate using an antenna of a
type and maximum (or lesser) gain approved for the transmitter by Industry Canada. To reduce
potential radio interference to other users, the antenna type and its gain should be so chosen that the
equivalent isotropically radiated power (e.i.r.p.) is not more than that necessary for successful
communication.
Conformément à la réglementation d'Industrie Canada, le présent émetteur radio peut fonctionner
avec une antenne d'un type et d'un gain maximal (ou inférieur) approuvé pour l'émetteur par
Industrie Canada. Dans le but de réduire les risques de brouillage radioélectrique à l'intention des
autres utilisateurs, il faut choisir le type d'antenne et son gain de sorte que la puissance isotrope
rayonnée équivalente (p.i.r.e.) ne dépasse pas l'intensité nécessaire à l'établissement d'une
communication satisfaisante.
This radio transmitter (5294A-EC6R1S2) has been approved by Industry Canada to operate with the
antenna types listed below, with the maximum permissible gain and required antenna impedance for
each antenna type indicated. Antenna types not included in this list, having a gain greater than the
maximum gain indicated for that type, are strictly prohibited for use with this device.
Le présent émetteur radio (5294A-EC6R1S2) a été approuvé par Industrie Canada pour fonctionner
avec les types d'antenne énumérés ci-dessous et ayant un gain admissible maximal et l'impédance
requise pour chaque type d'antenne. Les types d'antenne non inclus dans cette liste, ou dont le gain
est supérieur au gain maximal indiqué, sont strictement interdits pour l'exploitation de l'émetteur.
Approved Antenna: Elster P/N 1B12150H01, +1dBi Gain, 50 ohms
Draft 8.5.13

User Guide 98-1671 Rev AA 15
2
Command Center
Deployment/Configuration
Deployment
Auto Registration
Landis+Gyr RF radio is Plug & Play; meters equipped with Landis+Gyr endpoints arrive from the
factory in operational mode, ready to be installed at a service location. Along with the meters, a
Meter Manufacturer File is provided to the utility. This file contains meter number/serial number
combinations; the file must be uploaded into Command Center prior to installation of endpoints in
the field.
A meter installer installs the endpoint at the service location.
Once installed, the endpoint will begin the following auto-registration process:
1. The endpoint listens for RF traffic and evaluates its neighbors, searching for the best possible
path to the collector. The best path is the one with the fewest hops to the Collector and through
an endpoint with the highest Receive Signal Strength Indicator (RSSI) (RSSI is the receive
signal strength from the node. It is a rough indicator of how strong the signal is from the radio).
2. Having identified the best path, the endpoint will transmit the following two packets:
• RF Registration Packet: The RF Registration Packet identifies for the Collector the return
path to the endpoint. This is achieved by each intermediary endpoint adding its LAN address
to the endpoint’s RF Registration Packet as it travels to the Collector. Once the RF
Registration Packet is received, the endpoint will transition to Discovered in Command
Center. The RF Registration will continue to be sent until the SetWAN command is received
from Command Center.
•Init Push: The Init Push packet contains configuration information about the meter, that
allows Command Center to understand the configuration of the meter. The Init Push is
transmitted until the SetWAN command is received from Command Center.
3. Once the RF Registration Packet and Init Push are received, Command Center will validate the
configuration and, if validated, begin accepting readings from the endpoint. The endpoint will
remain in Discovered status until the SetWAN command is received by the endpoint.
4. The SetWAN command is issued to the endpoint when Command Center receives latitude and
longitude information AND the endpoint’s closest neighbor has a WAN address. The SetWAN
command provides the endpoint with its WAN address. The WAN address is the radio’s physical
location (Latitude and Longitude) expressed in degree, minutes and seconds. The SetWAN
command achieves two way communication with the endpoint. The SetWAN tells the endpoint
that we have received your configuration information and it is OK to stop sending it in.
Draft 8.5.13

Chapter 2 - Command Center Deployment/Configuration Landis+Gyr
16 98-1671 Rev AA User Guide
NOTE: If Installation Data is received before an Init Push has been received, the installation record
will be stored awaiting the Init Push from the device.
Endpoint Status
Endpoints will move from one status to another during the deployment process. The following are
various endpoint statuses:
•Installed. Endpoints in the Installed status have been deployed in the field, but Command
Center has not received the RF Registration packet.
• Discovered. Endpoints in the Discovered status have transmitted an RF Registration Packet.
The RF Registration Packet identifies for the Collector the return path to the endpoint. This
is achieved by each intermediary endpoint adding its LAN address to the endpoint’s RF
Registration Packet as it travels to the Collector.
•Normal. Endpoints in the Normal status have transmitted an Init Push packet containing
configuration information AND have acknowledged a SetWAN command from Command
Center. The SetWAN command provides the endpoint with its WAN address. The WAN
address is the radio’s physical location (Latitude and Longitude) expressed in degree,
minutes and seconds.
•Lost. Endpoints in the Lost status have reported an outage event. When the endpoint loses
power, it will transmit a “Power Outage Event” to Command Center. Once power has been
restored, the endpoint transmits a “Power Restore Event”. The endpoint will then transition
back to Normal status.
• Configure. Endpoints in the Configure status are endpoints that have been recently added to
a new configuration group and have not yet confirmed the receipt of configuration
commands.
• Failed. Endpoints and/or meters in the Failed status have failed a re-configuration attempt or
have failed a work flow process. Work flow processing will determine if configuration
changes such as time zone updates, reconfiguring of endpoints, meter change programs have
been successful. Endpoints must be manually removed from the Failed status, generally by
attempting the work process again.
•Archive. Endpoints in Archive status are no longer in use within the Mesh System, for
example, damaged endpoints. Endpoints must be manually entered into Archive status.
•Inventory. Endpoints in Inventory status have not yet been deployed in the field. These may
be recently purchased meters or meters that have been removed from the field and are
awaiting redeployment.
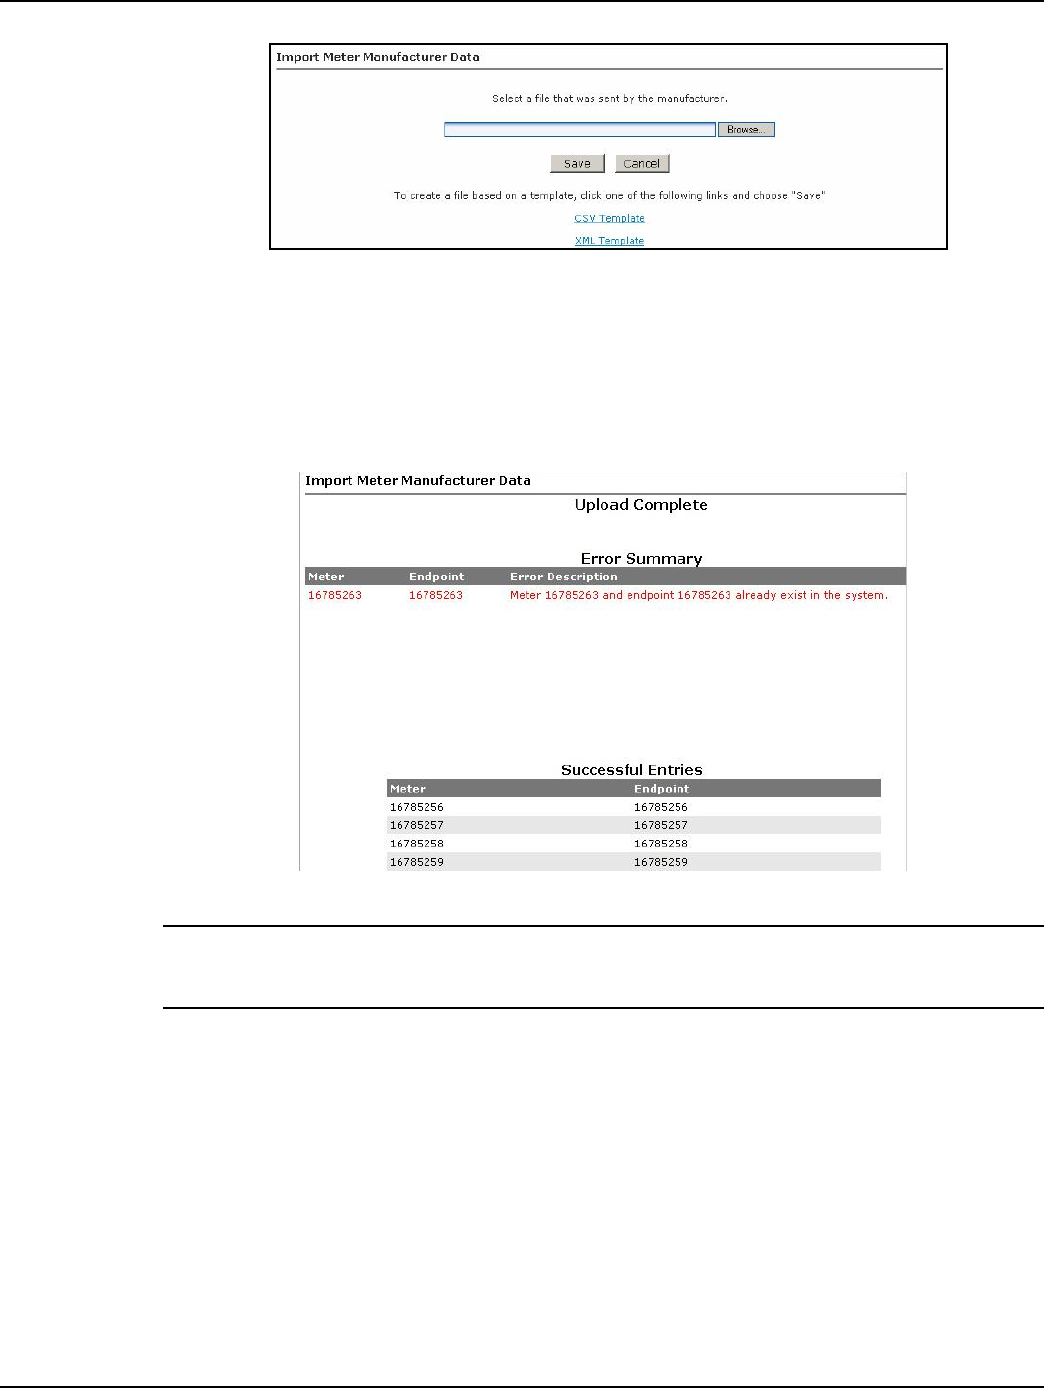
Meter Manufacturer Data
The Meter Manufacturer Data screen allows the user to import an XML or CSV file supplied by the
meter manufacturer so the utility does not have to key in meters and endpoints by hand.
1. Click Operations > Import > Meter Manufacturer Data to display the Import Meter
Manufacturer Data screen.
Draft 8.5.13
Landis+Gyr Chapter 2 - Command Center Deployment/Configuration
User Guide 98-1671 Rev AA 17
Figure 2 - 1. Import Meter Manufacturer Data
2. Click the Browse button to navigate to, and select, a file that was sent by the meter
manufacturer.
3. Click the Save button to import the file into the database.
The Meter Manufacturer Data Import (Upload Complete) window will appear displaying the Error
Summary (if applicable) and Successful Entries.
Figure 2 - 2. Upload Complete Window
NOTE: Any entries under Error Summary will be red text. The usual reason for an entry under Errors
is that the endpoint already exists in the system. If file parsing errors or other file-related errors
occur, contact the meter manufacturer that supplied the file.
4. Successful entries will be added to inventory and will be displayed on the dashboard as
Inventory status.
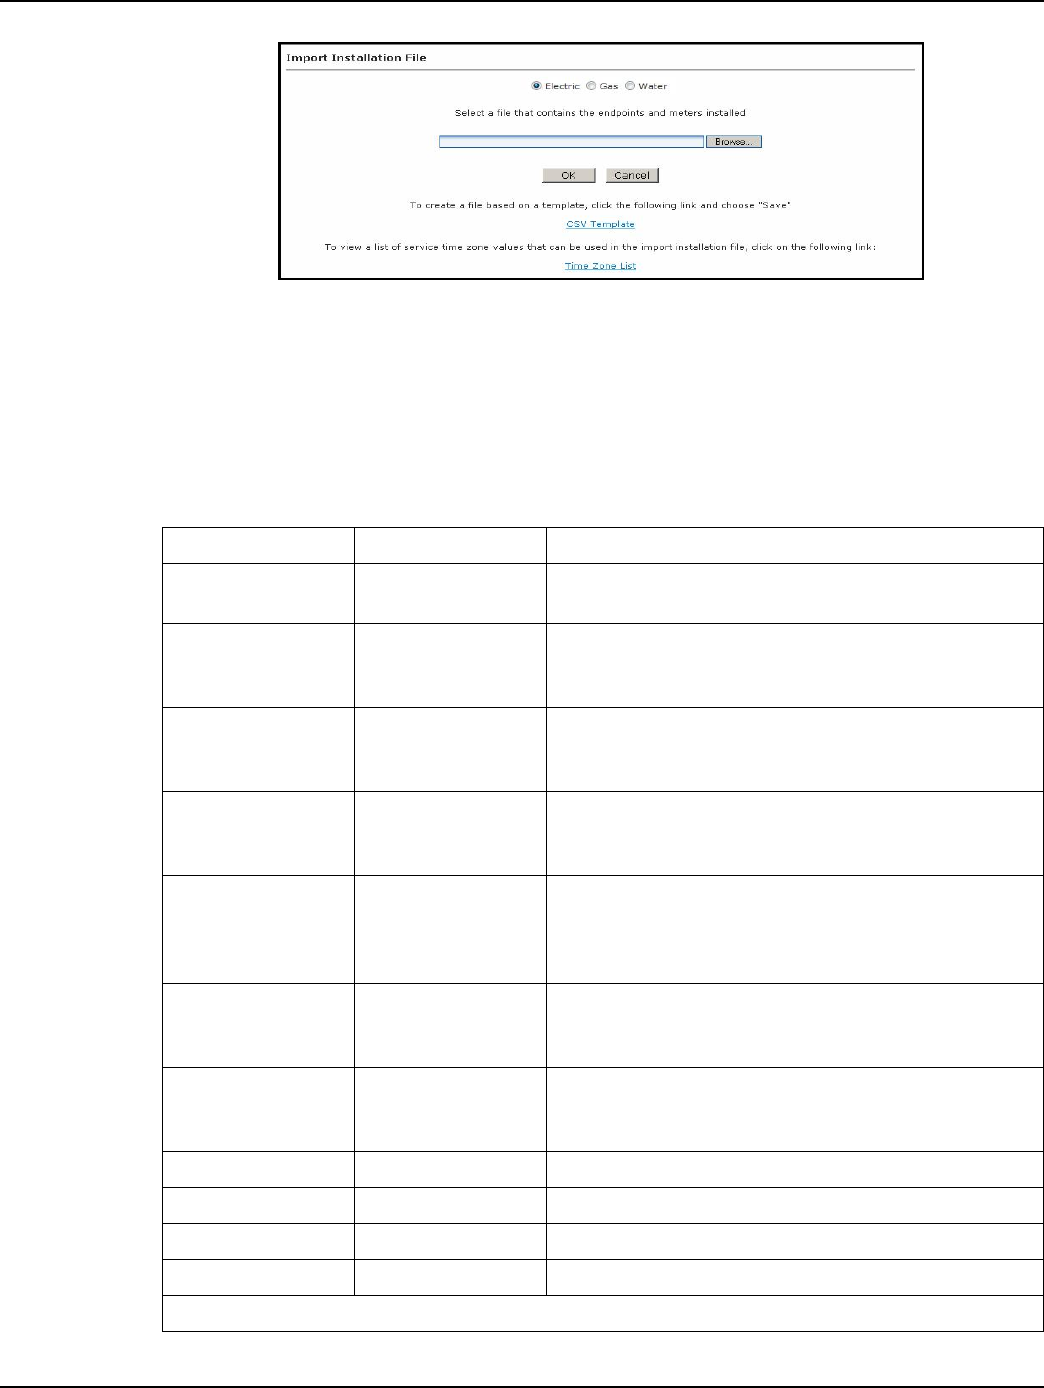
Import Installation File
Meter deployment details can be imported by use of an Installation File provided by the installer.
Following is the procedure for importing the installation file.
1. Click Operations > Import > Import Installation File to display the Import Installation File
screen.
Draft 8.5.13
Chapter 2 - Command Center Deployment/Configuration Landis+Gyr
18 98-1671 Rev AA User Guide
Figure 2 - 3. Import Installation File Screen
2. Enter the Path to the file.
...or...
3. Click the Browse button to navigate to, and select, a file containing the endpoint information.
4. Click OK to upload the file. The information imported via the Installation File:
Table 2 - 1. Installation File Fields
Data Format Format/Description
User ID* AlphaNum (30) Login assigned by the utility for the installer. Utility may
elect to use “1” for System usage.
Installation Date*
Date
MM/DD/YYYY
12/26/2009
Actual date the meter was installed. This date is used in
various Command Center reports to track deployment
statistics.
Installation Time* T i m e H H M M A M / P M
11:12 AM
Actual time the meter was installed. This date is used in
various Command Center Reports to track deployment
statistics.
Change Out meter
number AlphaNum (20)
The meter being replaced with a new meter. Meter change
out information is displayed in the notes section of the
endpoint information screen.
Change Out meter
kWh AlphaNum (20)
The kWh reading on the meter being replaced Meter
change out kWh information is displayed in the notes
section of the endpoint information screen. Variable
Character.
Installed Meter
Number* AlphaNum (20)
Meter number of the new meter being installed. This meter
must exist in Command Center prior to importing the
Import Installation File. Must parse to Decimal format.
Installed Endpoint
Serial Number* Decimal (9)
The serial number of the new meter being installed. Note:
Endpoint serial numbers must be converted from Hex to
Decimal.
Installed Meter kWh Decimal (9) Initial reading of the new meter.
Service Latitude Decimal (12,8) GPS latitude.
Service Longitude Decimal (12,8) GPS longitude.
Service Location AlphaNum (100) Meter service location.
* Indicates a required field.
Draft 8.5.13
Landis+Gyr Chapter 2 - Command Center Deployment/Configuration
User Guide 98-1671 Rev AA 19
Import Information File CSV Format requirements
ACAUTION: Required fields are UserID, Installed Date, InstalledTime, InstalledMeterNo, and
InstalledEndpointSN. If these fields are not populated, the file will not be processed. Service
Location is required if the Latitude and Longitude fields are populated. Command Center will
ignore the latitude and longitude values if Service Location is not provided.
The Import Installation File window provides a CSV template link. Click this link to view the format
requirements for the file. This template can be saved to a network location or local machine and
provided to the installer.
The Installation file must be of the following format:
•The first line must be a header.
•A comma is required to separate each item even if no data exists.
•A Service location is required if the service latitude and longitude are provided.
Time Zone
In order to report reading time correctly, the endpoint must be programmed with the appropriate time
zone; this is achieved by sending commands to the endpoint that indicates the time zone in which the
endpoint is installed and whether Daylight Savings Time (DST) is observed in the given time zone.
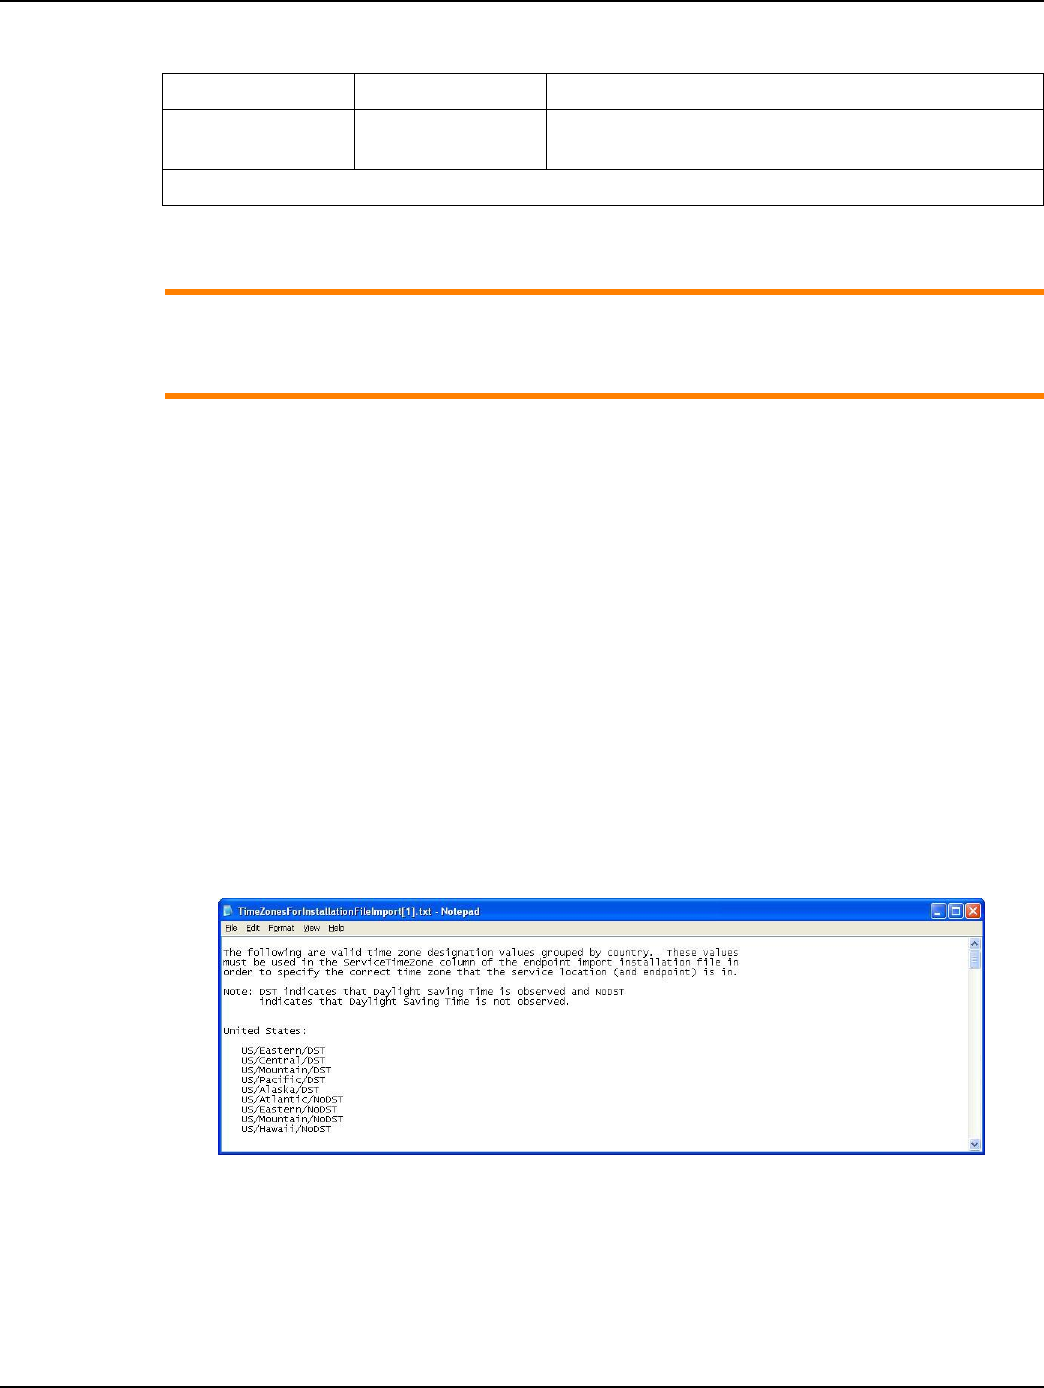
The Installation File should include the endpoint time zone. Clicking the Time Zone List link will
open a document that displays a list of valid time zone designations by country.
Figure 2 - 4. Time Zones
Service Time Zone See formatting
below.
The service time zone may be entered to specify the
correct time zone for the service location.
Table 2 - 1. Installation File Fields (Continued)
Data Format Format/Description
* Indicates a required field.
Draft 8.5.13
Chapter 2 - Command Center Deployment/Configuration Landis+Gyr
20 98-1671 Rev AA User Guide
Tracking and Deployment
Deployment Status
Deployment Status enables users to monitor the find process when endpoints are being deployed on
a system.
1. Click Network > Deployment Status to display the Deployment Status Report screen.
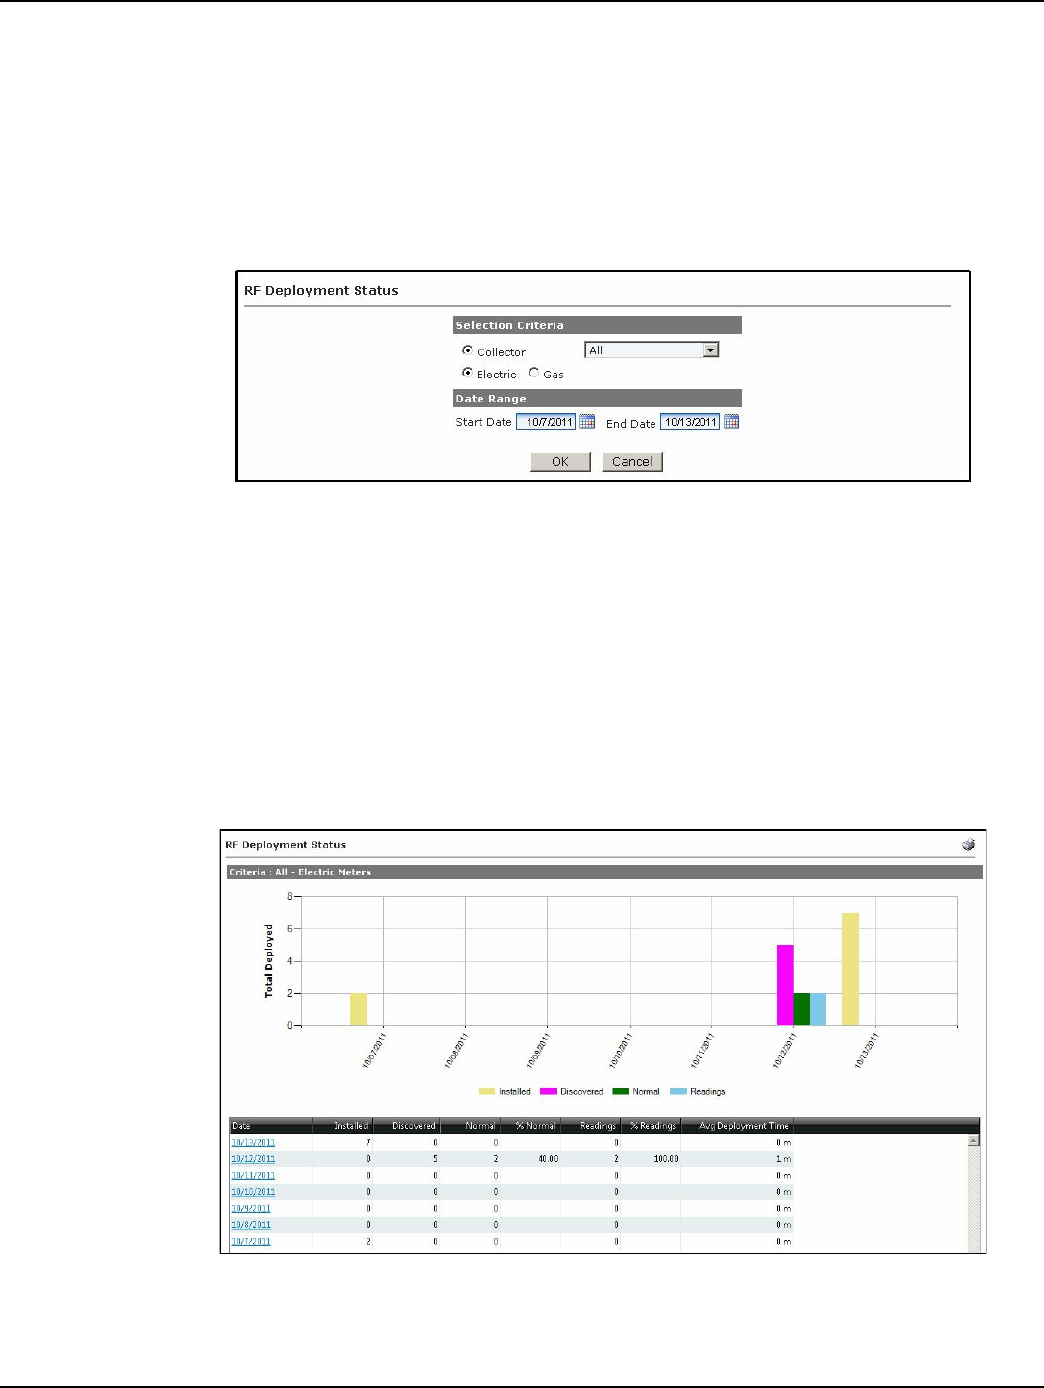
Figure 2 - 5. RF Deployment Status Screen
2. Choose the Selection Criteria:
A. All
...or...
B. Collector. Select the desired collector from the drop-down menu.
3. Select a Date Range:
A. Start Date. Click the calendar icon, and then click on the desired start date.
B. End Date. Click the calendar icon and then click the desired end date.
4. Click the OK button to display the RF Deployment Status Report.
Figure 2 - 6. RF Deployment Status Report
The RF Deployment Status Report displays a graph representing 14 days of installation statistics and
a chart. Time periods longer than 14 days may be selected, but will not be presented on the graph due
Draft 8.5.13
Landis+Gyr Chapter 2 - Command Center Deployment/Configuration
User Guide 98-1671 Rev AA 21
to space limitations. By clicking on a specific date, each endpoint registering that day displays
installation, registered, normal and reading status for this date. Information on the report is updated
as the information is received by Command Center on a rolling seven day basis. Installation
information is populated from the RF Installation File Import process. Registered and Normal status
updates are based on receipt of the two registration requests from the endpoints. Readings are based
on the first reading received from the endpoint. Average deployment time is based on the time it
takes to go from installed to normal.
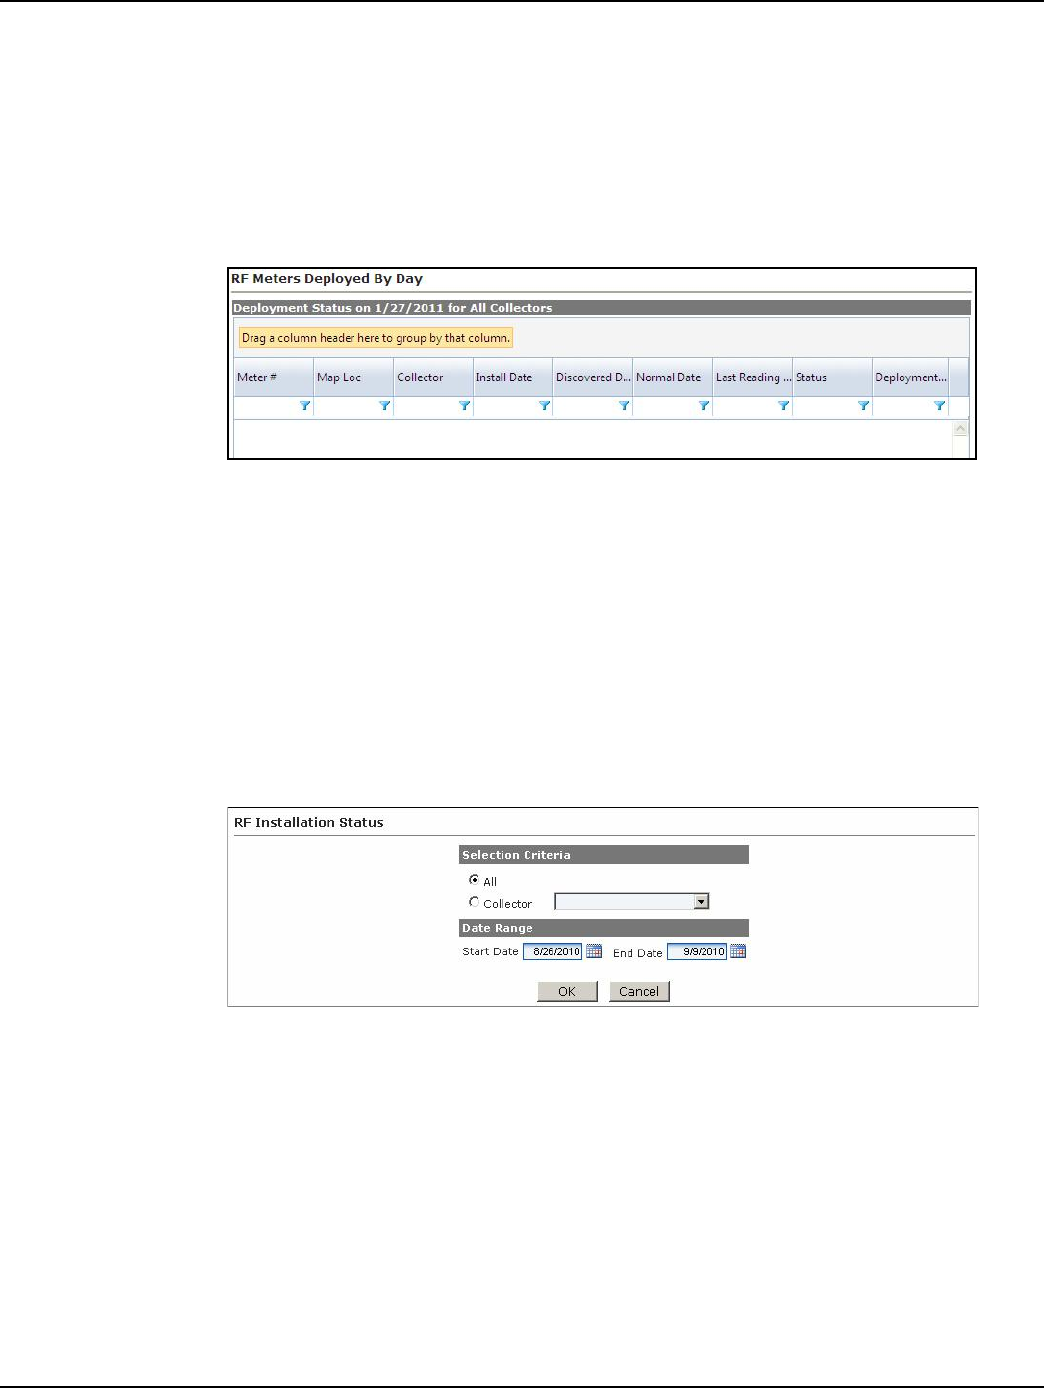
5. Click on the Date link to display the Gridstream Meters Deployed By Day report.
Figure 2 - 7. RF Meters Deployed by Day
RF Installation Status
The RF Installation Status Report is intended to be used by utilities during mass deployment. It can
be used as an installation tool to determine how many meters have been installed over a specified
time frame and of those meters how many have been discovered, how many have moved to normal
status, how many are sending readings, and how many have sent readings in the past 24 hours.
Following is the procedure for viewing the RF Installation Status report:
1. From Command Center, select Network > RF Installation Status. The RF Installation Status
window will open.
Figure 2 - 8. RF Installation Status
2. Selection Criteria. Select All to view results for all collectors in the system
...or...
Select the desired collector from the drop down box to view results for only that collector.
3. Date Range. Enter a Start Date and End Date. Select the Calendar icon to view a calendar and
make date selections if needed.
4. Click OK. The RF Installation Status report will be displayed, shown in Figure 2 - 9.
Draft 8.5.13
Chapter 2 - Command Center Deployment/Configuration Landis+Gyr
22 98-1671 Rev AA User Guide
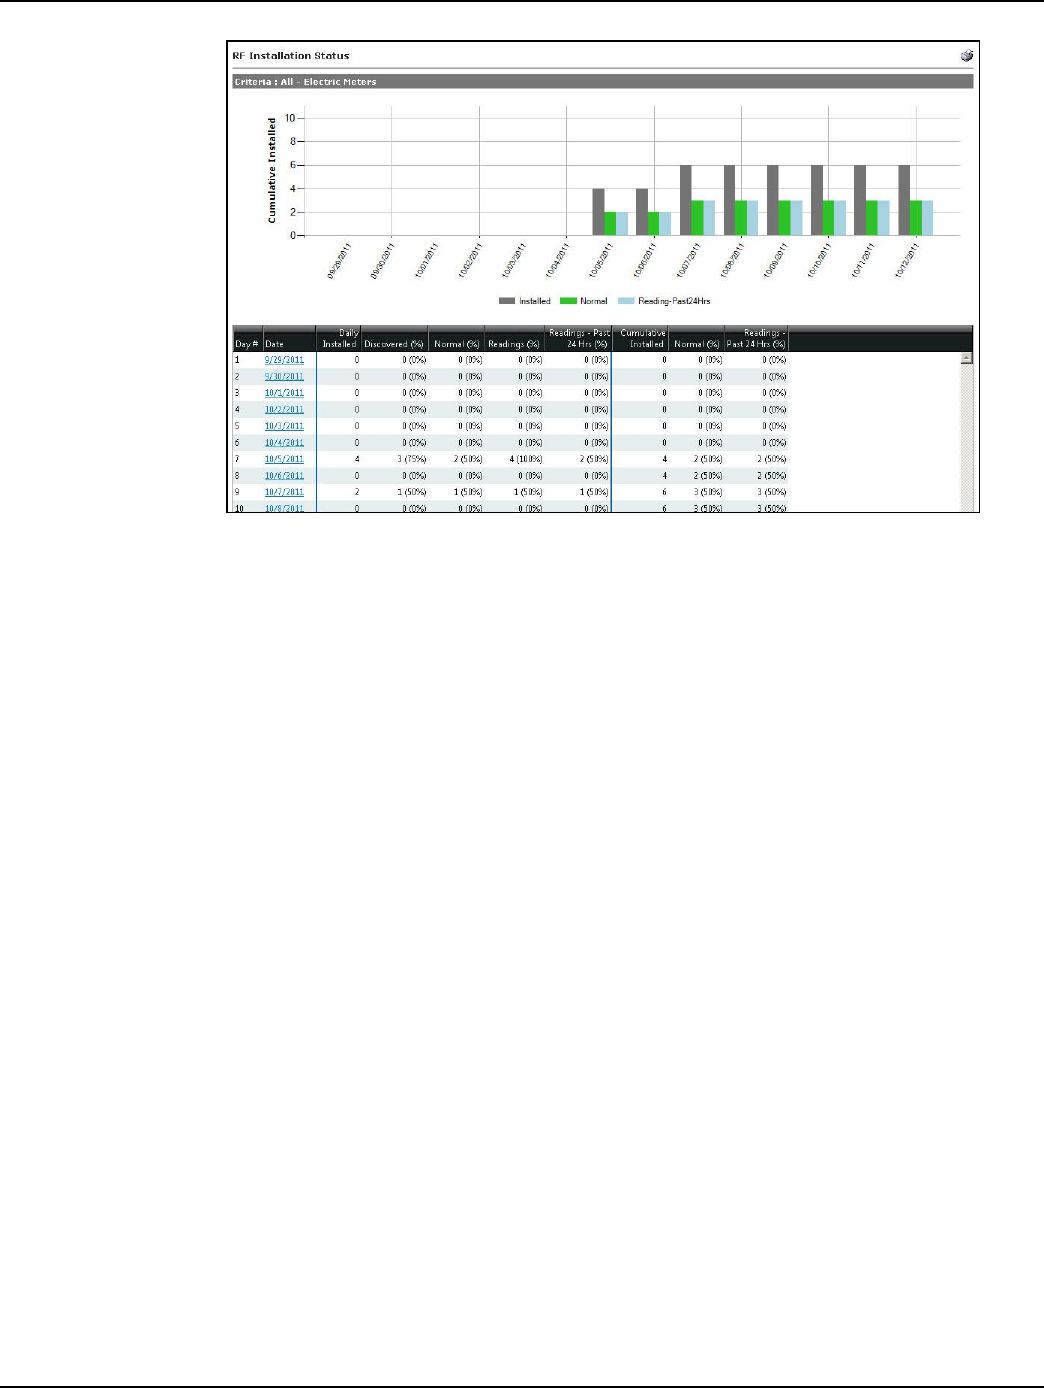
Figure 2 - 9. RF Installation Status Report
The following information is displayed in the report:
•Day. This number will increment for each day the used has selected to display.
•Date. This will display the dates selected in generation of the report. Click the date link to
view a list of all meters deployed on the selected date.
• Daily Installed. This will display the number of endpoints installed for that particular day.
The daily installed data is imported into Command Center via the Installation File.
• Discovered. Of the total number of meters installed on the summary date, the total number
of those that have transitioned into a Discovered state and the percentage
(Discovered meters/Installed meters).
•Normal. Of the number of meters installed on the summary date, the total of those meters
that have transitioned to a normal state at that point in time and the percentage (Normal
meters/Installed meters).
• Readings. Of the total number of meters installed on that day, the number of those meters
that have sent in a billable reading packet, and the percentage (meters that have sent a
billable reading packet/total meters installed on that day).
• Readings past 24 Hours. Of the meters that were installed on that day, the total number of
meters that sent in a billable readings packet in the last 24 hours (from the point the report
was generated) and the percentage (meters that sent in a billable readings packet in the last
24 hours/total meters installed on that day).
• Cumulative installed. The total number of meters that have been installed up to that date.
•Normal. The total cumulative number of meters that have transitioned to Normal status up
to that date.
The color-coded bar graph displays the following deployment information:
•Cumulative number of meters installed for each date (Grey).
•Current number of meters that have transitioned to Normal status (Green).
Draft 8.5.13
Landis+Gyr Chapter 2 - Command Center Deployment/Configuration
User Guide 98-1671 Rev AA 23
•Number of installed meters that have sent in a billable reading in the last 24 hours (Blue).
Endpoint Configuration
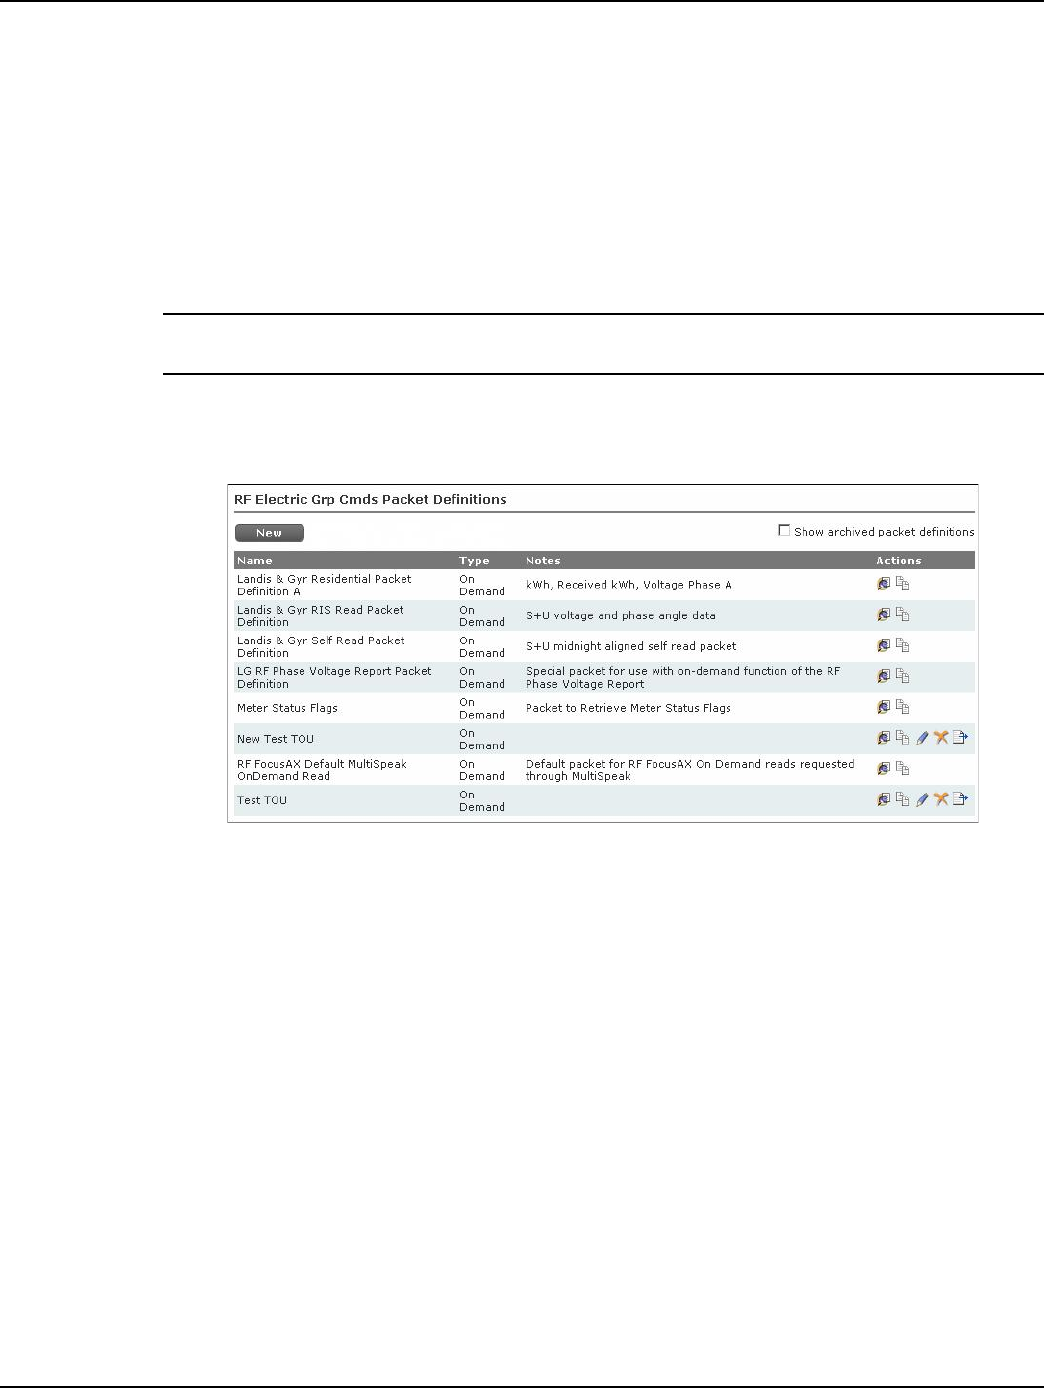
Packet Definitions
Creating a packet definition is necessary to reconfigure the packet payload of an endpoint. Packet
definitions can contain several different user-configurable data elements.
NOTE: RF endpoints allow a user to return up to 6 registers. However, the more registers returned,
the greater the strain on the network.
1. Click Setup > Packet Definitions > RF Residential
The Packet Definitions screen will be displayed.
Figure 2 - 10. Packet Definitions Screen
2. In the Packet Definitions screen (above) click the New button to display the Packet Definition
window.
Draft 8.5.13
Chapter 2 - Command Center Deployment/Configuration Landis+Gyr
24 98-1671 Rev AA User Guide
Figure 2 - 11. The Packet Definition Window
3. Enter a name in the Packet Name field. The name should be unique to the organization.
4. Click the Edit Description link to enter any desired notes for the packet definition. If any notes
were entered, click the OK button to save them.
5. Select a Packet Type from the drop-down.
•On Demand. Used for RF Endpoints.
• Daily Packet Type. Used for PLC Endpoints
6. Select the Meter Type from the drop-down.
7. Select the desired data options from the Available Data Options window on the left side of the
screen.
To view a description of each available data option, click once on the data element. A
description of the data element will be displayed in the yellow shaded box in the lower-center
area of the screen.
NOTE: The available data options vary depending on the type of endpoint.
8. Click the right pointing arrow to move the data option to the Selected Data window.
As you select data options, monitor the Packet Capacity gauge on the right of the screen. Each
selection will add to the percentage total. If your selections exceed 100 percent, a message will
be displayed when you click the Save button indicating that packet capacity must be 100% or
less and can contain six or fewer data items. You can remove selections from the Selected Data
window by clicking to highlight the selection and then click the left pointing arrow to remove
the selection.
9. After selecting all of the desired data options, click the Save button to save the new packet
definition.
Draft 8.5.13
Landis+Gyr Chapter 2 - Command Center Deployment/Configuration
User Guide 98-1671 Rev AA 25
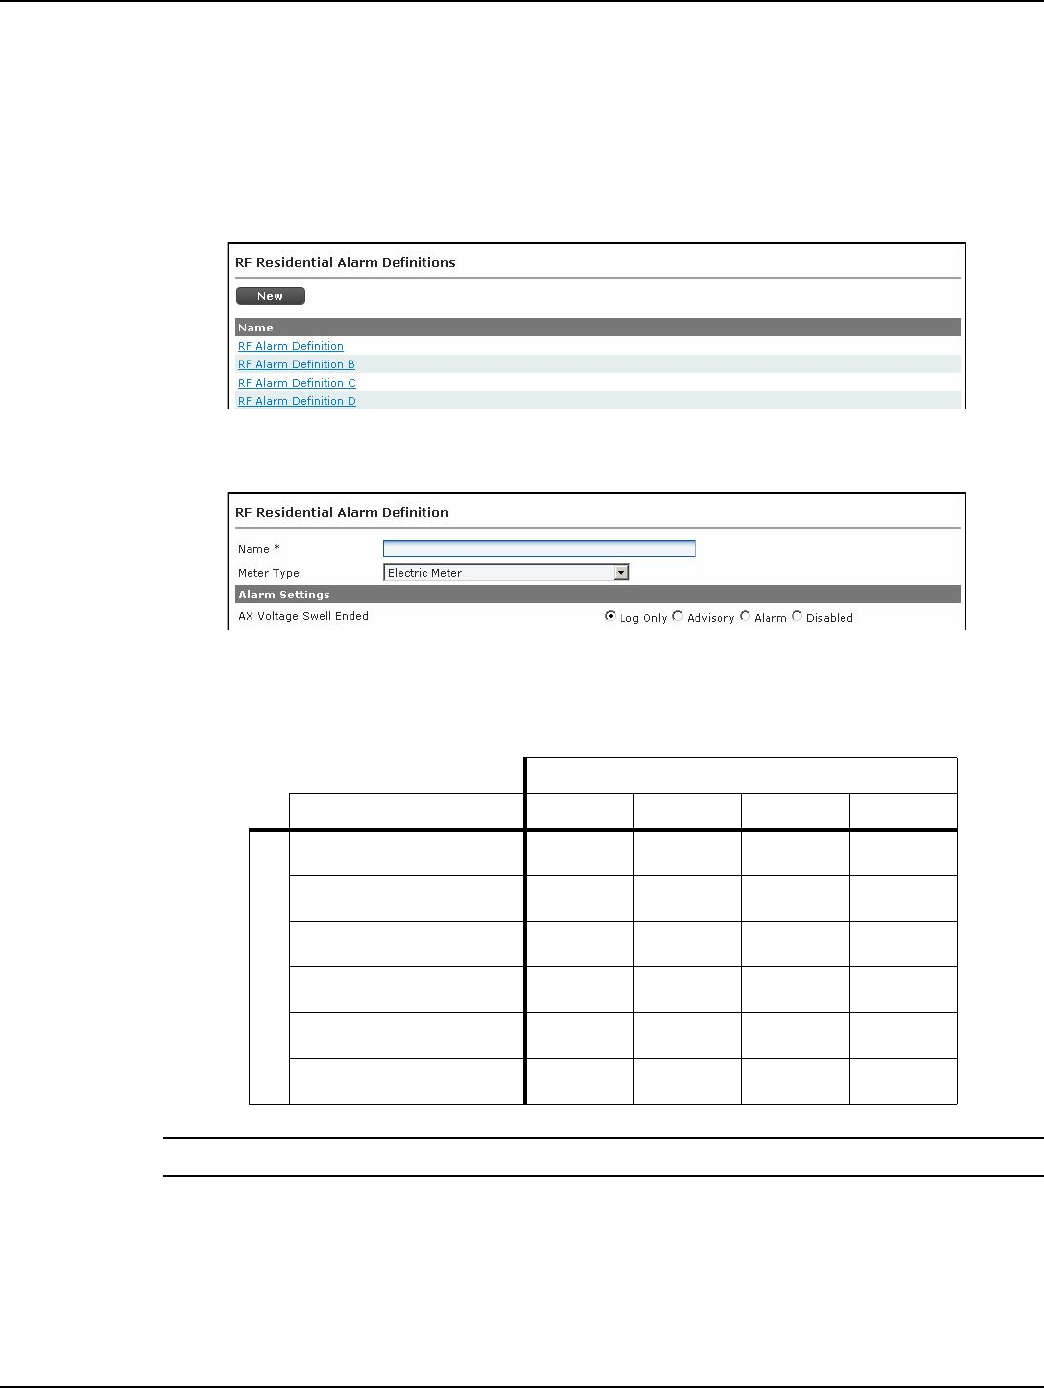
Alarm Definitions
Alarm Definitions determine what type of response the given Events will trigger, including
Dashboard Alerts and Email Alerts. Alarm Definitions must be created prior to Meter Configuration
Groups in order to be programmed to a module.
1. Click Setup > Alarm Definitions and select the appropriate endpoint type to display the Alarm
Definitions screen.
Figure 2 - 12. Alarm Definitions screen
2. Click the New button to display the Alarm Definition screen.
Figure 2 - 13. Alarm Definition screen
3. Enter an Alarm Definition name in the Name field.
4. Choose the desired setting for each event. See below for setting descriptions.
NOTE: The default Alarm Definition settings represent the recommendation of Landis+Gyr.
5. Click the Save button.
An Alarm Definition can only be edited if it is not already part of an existing Configuration Group.
Available Settings
Result Disabled Log Only Advisory Alarm
Event is:
Logged in module
Available via request
Included in next
Transmitted immediately
Flagged on Dashboard
Included in E-mail Alerts
Draft 8.5.13
Chapter 2 - Command Center Deployment/Configuration Landis+Gyr
26 98-1671 Rev AA User Guide
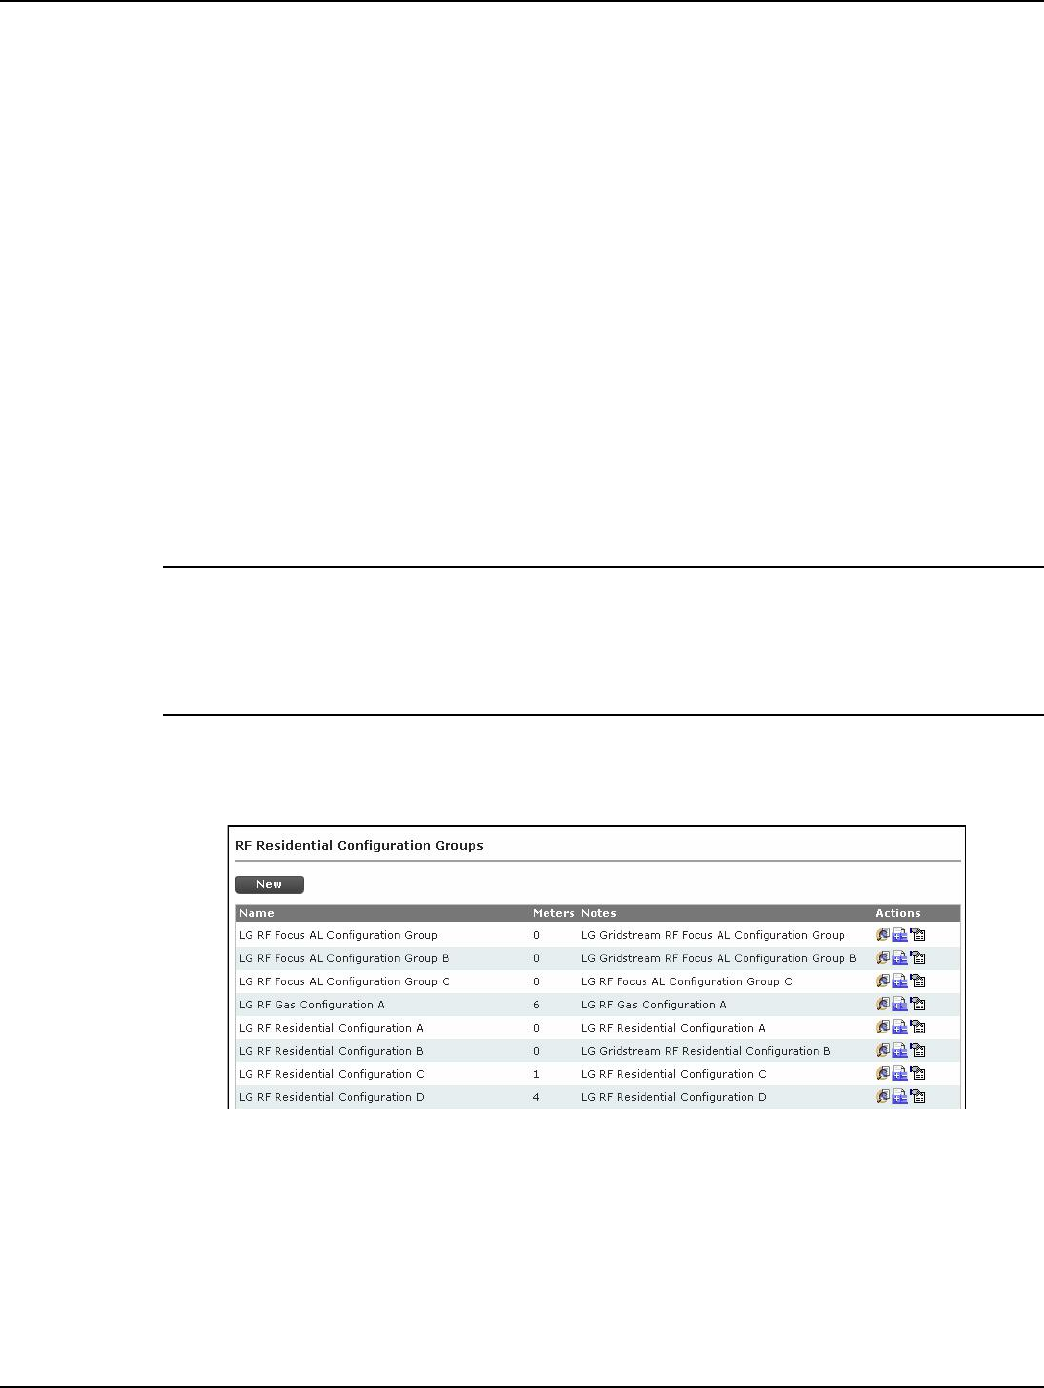
Meter Configuration Groups
A Configuration Group is a type of Command Addressing Group. A meter can be a member of only
one configuration group. All members of a configuration group must be assigned the same
configuration settings. Configuration groups are used to drive group-based reconfigurations for
multiple endpoints.
Each endpoint type is manufactured with a default configuration group.
The data transmitted by an RF module, how frequently the data is sent, and how the module
responds to conditions in the field, is dictated by the endpoint’s Configuration Group.
An RF Endpoint configuration consists of the following:
• Packet Definitions that are built for various data elements to be captured by the endpoint.
• Alarm Definitions that establish the priority associated with events that occur in the RF
endpoints.
• RF Network Settings that establish the outage wait and time synchronization settings.
•A schedule that includes the commands and packet definitions, along with time settings and
frequency settings associated with data transmission, that are stored in the endpoint.
NOTE: During the Auto-registration process, the module transmits an Init Push packet which
indicates its configuration. This enables Command Center to associate the endpoint with the
appropriate configuration group. If the configuration transmitted does not match an existing
configuration in Command Center, a new configuration group may be auto-generated to which the
endpoint will be assigned. For this process to occur, the Auto Generate Meter Configuration Groups
setting must be enabled in System Settings.
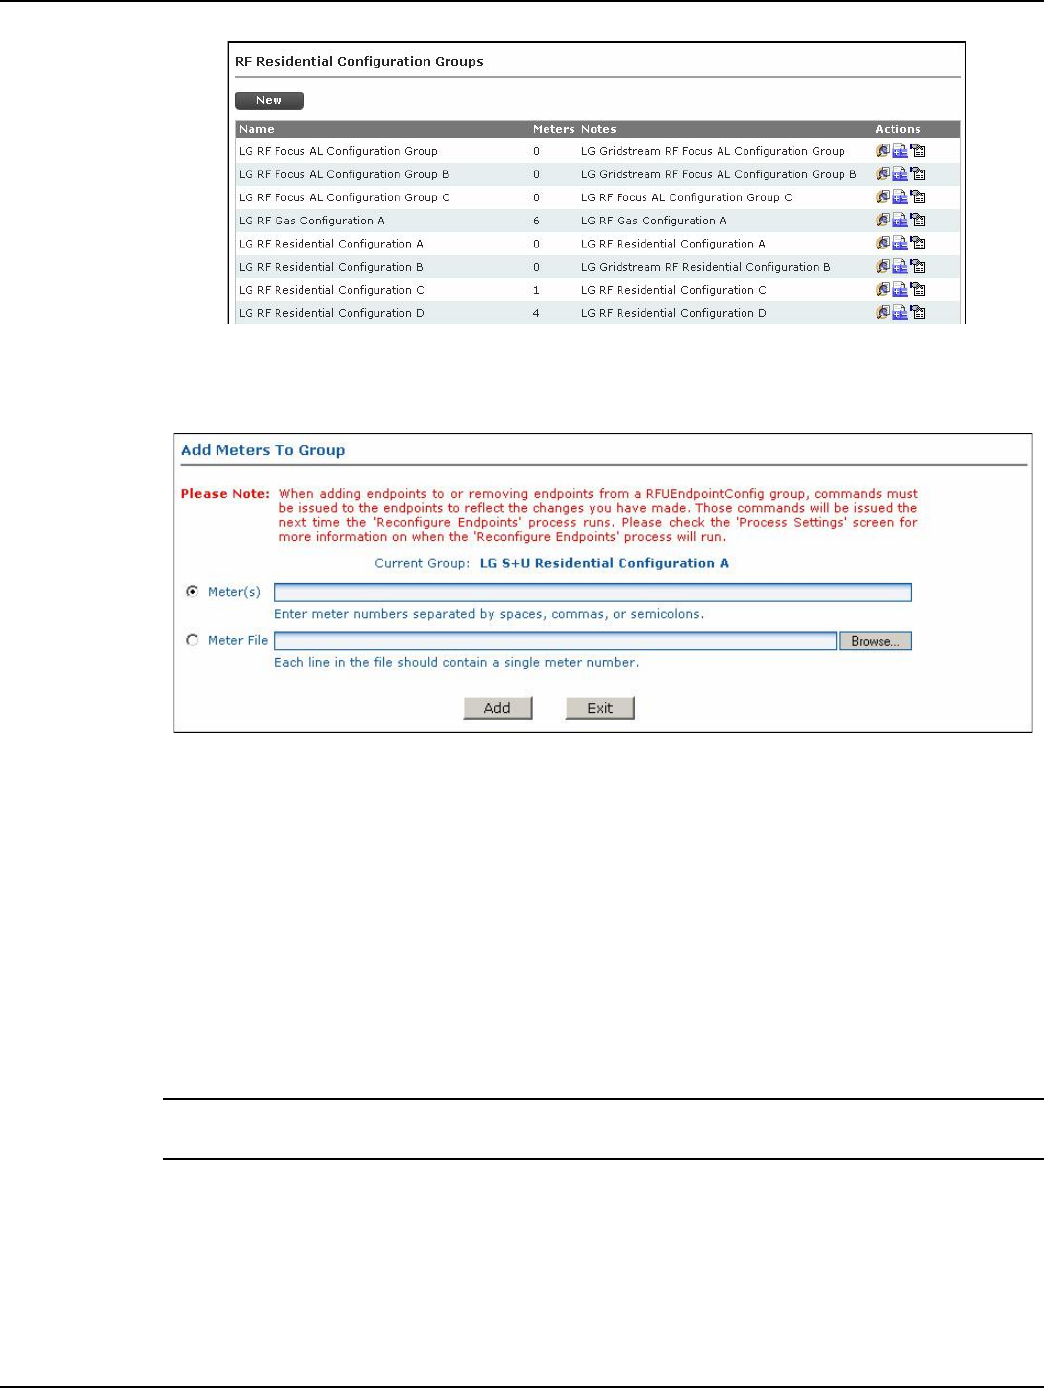
1. Click Setup > Groups > Meter Configuration Groups and select the endpoint type.
The Configuration Group screen will be displayed.
Figure 2 - 14. Configuration Groups Window
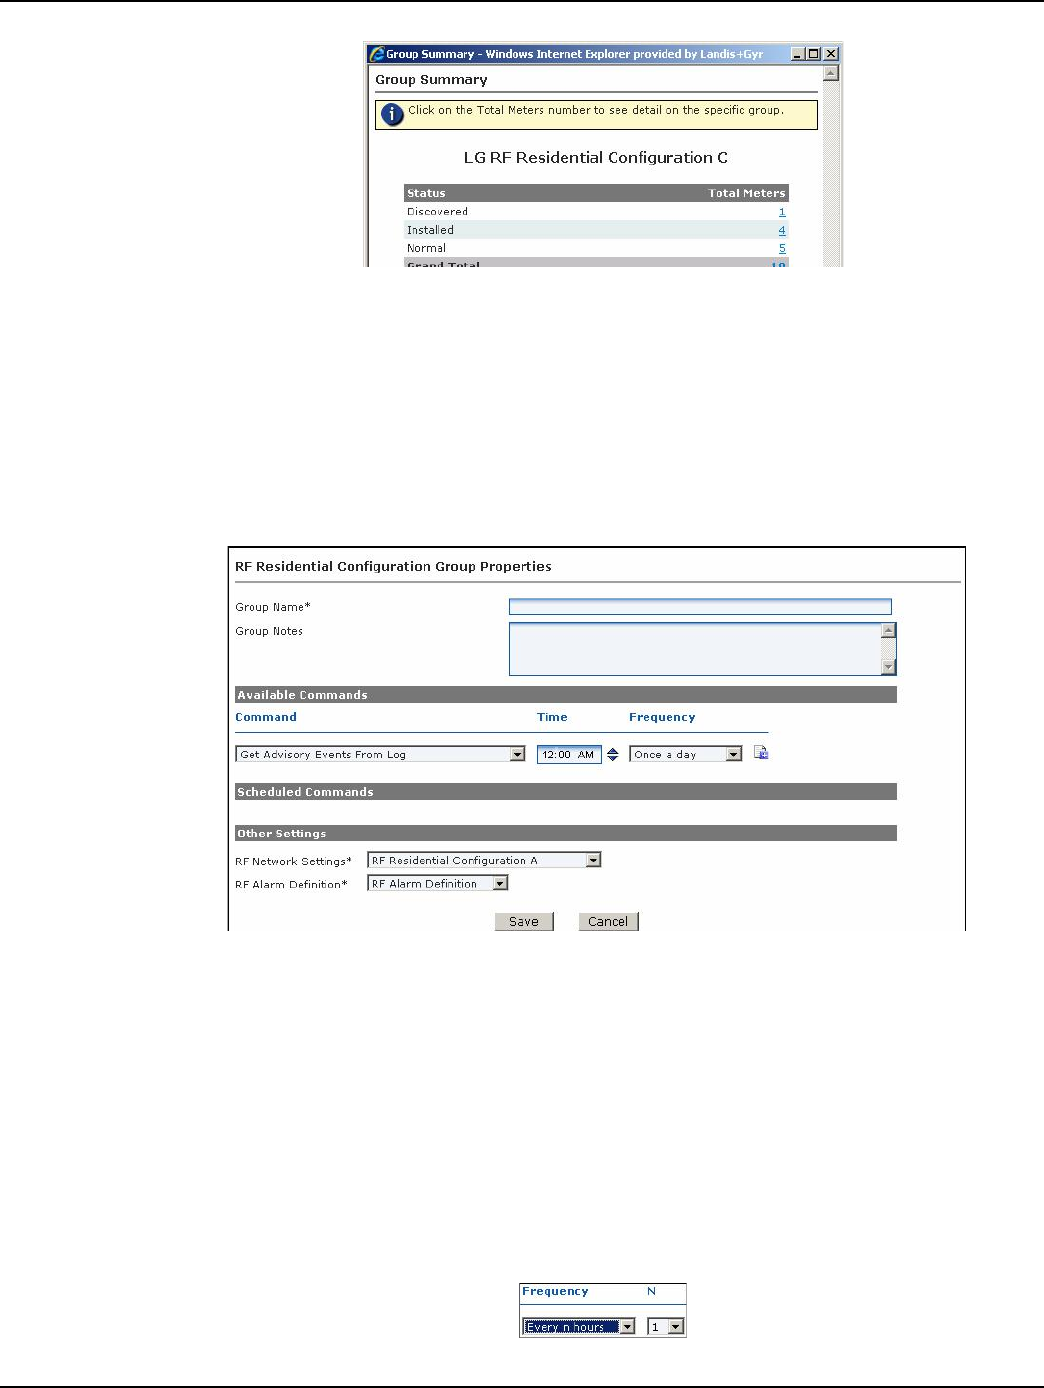
If you wish to view the details of an existing configuration group, perform the following steps.
A. In the Configuration Group window click the View Meters icon for the Configuration
Group you want to view to display the Group Summary window.
Draft 8.5.13
Landis+Gyr Chapter 2 - Command Center Deployment/Configuration
User Guide 98-1671 Rev AA 27
Figure 2 - 15. Group Summary Window
The group membership list window displays the following categories:
• Status. Status is the current status of the meter.
•Total Meters. Displays the total number of meters in each status.
B. Click any of the meter number links to view the Endpoint Properties window for the
selected meter.
2. In the Configuration Groups window click the New button to display the Configuration Group
Properties window.
Figure 2 - 16. Configuration Group Properties Window
3. Enter a Group Name. The name must be unique within the organization.
4. Enter any desired Group Notes.
5. To set up Scheduled Commands use the following steps:
A. Select the desired packet definition from the Command drop-down.
B. Select the Time at which the reading will be taken from the meter. Adjust the time by
clicking on either the hours, minutes, or AM/PM and then using the up or down arrow.
C. Select the Frequency with which the reading will be taken from the meter.
If either Every n minutes or Every n hours is selected, an additional field, N, will be
displayed.
Figure 2 - 17. Frequency Interval
Draft 8.5.13
Chapter 2 - Command Center Deployment/Configuration Landis+Gyr
28 98-1671 Rev AA User Guide
•Select the desired interval from the Frequency drop-down.
D. Click the Schedule Command icon to add the command to the Scheduled Commands list.
Figure 2 - 18. Scheduled Commands
E. (Gridstream endpoints only) Select the Delayed check-box for a command.
6. Repeat step 5 for any additional commands.
7. Select the Endpoint Transmit Interval from the drop-down. This setting determines how often
the endpoint will transfer its readings to Command Center.
8. Select the appropriate RF Network Settings from the drop-down.
9. Select an RF Alarm Definition from the drop-down.
10. Click the Save button to save the new configuration group.
Add Meters to a Meter Configuration Group
Adding meters to a configuration group initiates the configuration process.
1. Click Setup > Groups > Meter Configuration Groups and select the endpoint type.
The Configuration Group screen will be displayed.
Table 2 - 2. RF Network Settings Parameters
Default RF Collector
Configuration
Hunt RFS Residential
Configuration A
Hunt RFS S4
Configuration A
Hunt RFS Gas
Configuration
RF Residential
Configuration A
LG AU Residential
Network
Configuration A
LG RF Commercial
Configuration A
Parameter
Outage Wait Value* 6 6 6 30
Tamper Threshold** 10 0 0 0 30 0 10
Time Synchronization
(X, Y)† 1,1 20, 60 20, 60 20, 60 20, 360 20, 60 20, 1
*Outage Wait Value
The length of time (in seconds) that an endpoint will wait during a power
outage situation before sending an outage notification to Command Cen-
ter.
**Tamper Threshold The number of reverse pulses of -kWh an endpoint must see within an
interval before triggering a "Tamper Alert".
†Time Synchronization
The number of seconds that the meter time may drift before an automated
time synchronization must be performed (X), or an alert must be gener-
ated and sent to Command Center (Y).
Draft 8.5.13
Landis+Gyr Chapter 2 - Command Center Deployment/Configuration
User Guide 98-1671 Rev AA 29
Figure 2 - 19. Configuration Group Window
2. Click the Add Meters icon for the Configuration Group to which you want to add meters in
order to display the Add Meters to Group window.
Figure 2 - 20. Add Meters to Group Window
3. Click the Meter(s) radio button and enter individual meter numbers separated by spaces,
commas, or semi-colons.
...or...
4. Click the Meter File radio button and then the Browse button to browse for a .csv file
containing all the necessary meter numbers.
5. Click the Add button and then the Exit button to save the additions.
After clicking the Add button, the user will receive feedback on how many meter numbers were
successfully and/or unsuccessfully added. The reason for an unsuccessful message is that the
meter number does not exist.
NOTE: If a meter is already in a configuration group, the meter will be removed from the original and
added to the new configuration group.
HAN Setup Process Overview
Pre-requisite:
•Meters must be ZigBee-enabled and in Normal status before any of the following HAN
functionality commands are usable.
Draft 8.5.13

Chapter 2 - Command Center Deployment/Configuration Landis+Gyr
30 98-1671 Rev AA User Guide
1. Send the HAN: Initialization command to the ZigBee-enabled meter, if not already completed
during 5.6 (or later) Gridstream System Release upgrade.
2. Provision HAN Devices
3. Provisioned devices can utilize the following HAN applications:
A. Usage/Metering Information.
B. Text Messaging.
C. Load Control.
D. Pricing/Rate Information.
4. Remove HAN Devices from Home Area Network:
A. HAN: Delete Device.
B. HAN: Clear Devices.
C. Decommission HAN.
5. Management & Troubleshooting:
A. Meter Swap out process using Decommission HAN.
B. Commission HAN Network for Channel Control.
C. Meter LCD Screen for ZigBee Alerts.
D. Confirm HAN Radio in Meter is Communicating or HAN is set-up.
E. Get information for a specific device.
F. Get FW version for the HAN radio.
G. Confirm that a HAN device can communicate with the meter.
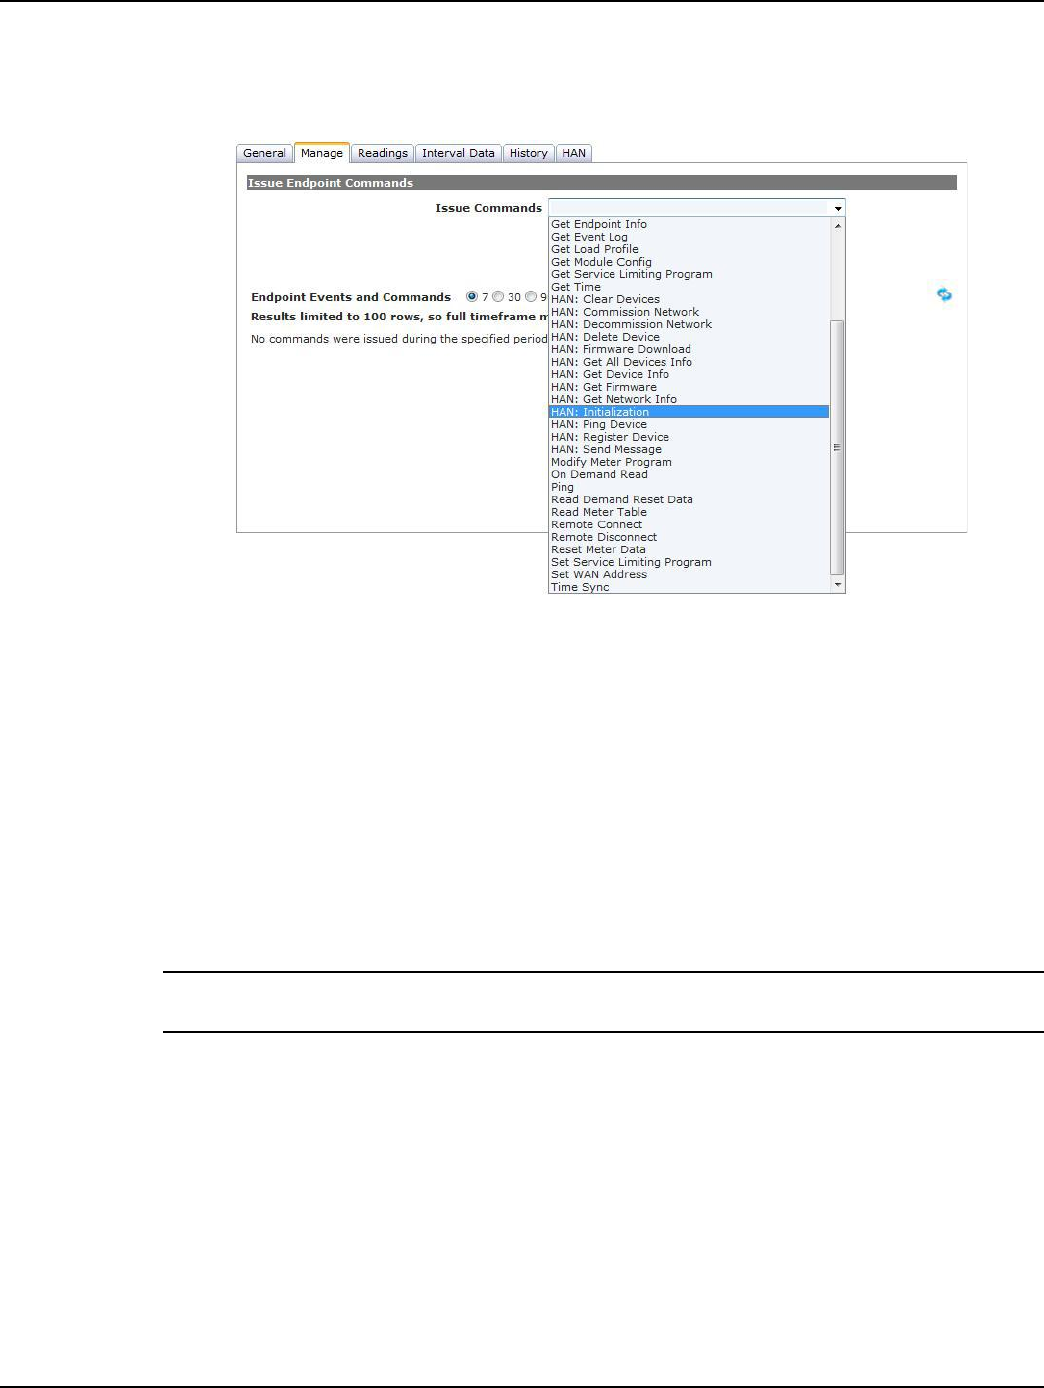
HAN: Initialization
The HAN: Initialization command provides the meter with key information that the Home Area
Network will need to properly communicate metering information to HAN devices. This process
allows the module firmware to flexibly adjust its meter information collection process to work with
any meter or meter program.
NOTE: The HAN: Initialization command is new to Gridstream with System Release 5.6, and
required to be sent to all existing or new Home Area Networks.
Please see publication 98-1188: HAN Initialization and Firmware Transition Guide for more
details on the HAN Initialization process. This document includes the full process, as well as
expected results or potential issues. It is expected that users will leverage this document in parallel to
this user guide.
NOTE: If a HAN command is sent to a meter before the HAN: Initialization command has been
successfully sent to a meter, the HAN command will fail and the HAN: Initialization command will be
sent to the meter in its place. Once the initialization process is complete, the original HAN
command, which was failed, will need to be retried by the user or 3rd party system.
Under the Manage Tab on the Endpoint Information Window, select the HAN: Initialization
command from the drop-down menu and press Send. This will cause the meter to change from a
Draft 8.5.13
Landis+Gyr Chapter 2 - Command Center Deployment/Configuration
User Guide 98-1671 Rev AA 31
status of Normal to a status of Configure. This status change indicates that the HAN initialization
process is underway. Once the meter status changes from Configure to Normal the HAN
initialization process is complete.
Figure 2 - 21. HAN: Initialization
Provisioning HAN Devices
Provisioning a HAN device (such as a display, smart thermostat, or direct load control unit) securely
joins a specific ZigBee-enabled HAN device with a specific meter so that they can communicate
across their meter's Home Area Network.
When the first HAN device for a meter is provisioned, a Home Area Network is automatically
commissioned. This involves Gridstream assigning a Channel (from a list of preferred channels) and
HAN ID. If there is a need to specifically assign the Channel and or the HAN ID, use the HAN:
Commission Network Command, as described under the Management and Troubleshooting section
below.
NOTE: Up to 5 devices may be provisioned to a single Non-Enhanced meter and up to 10 devices,
8 of which may be DRLC devices, for a single Enhanced Meter.
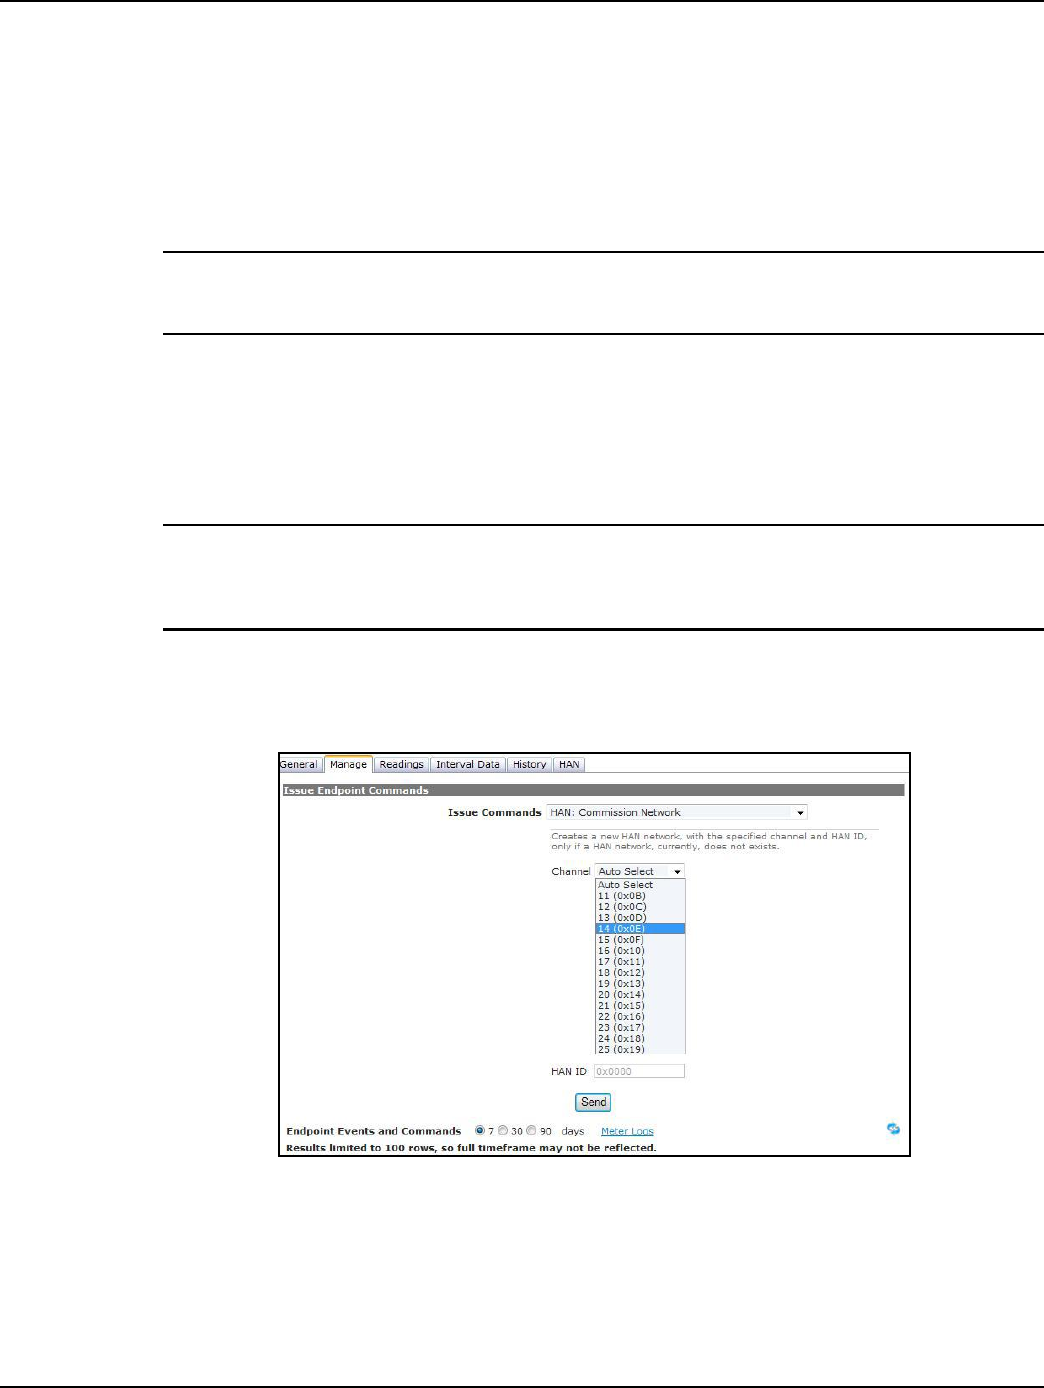
A device can be provisioned in two ways from Command Center: either 1) HAN Tab or 2) Manage
Tab on the Endpoint Information Window:
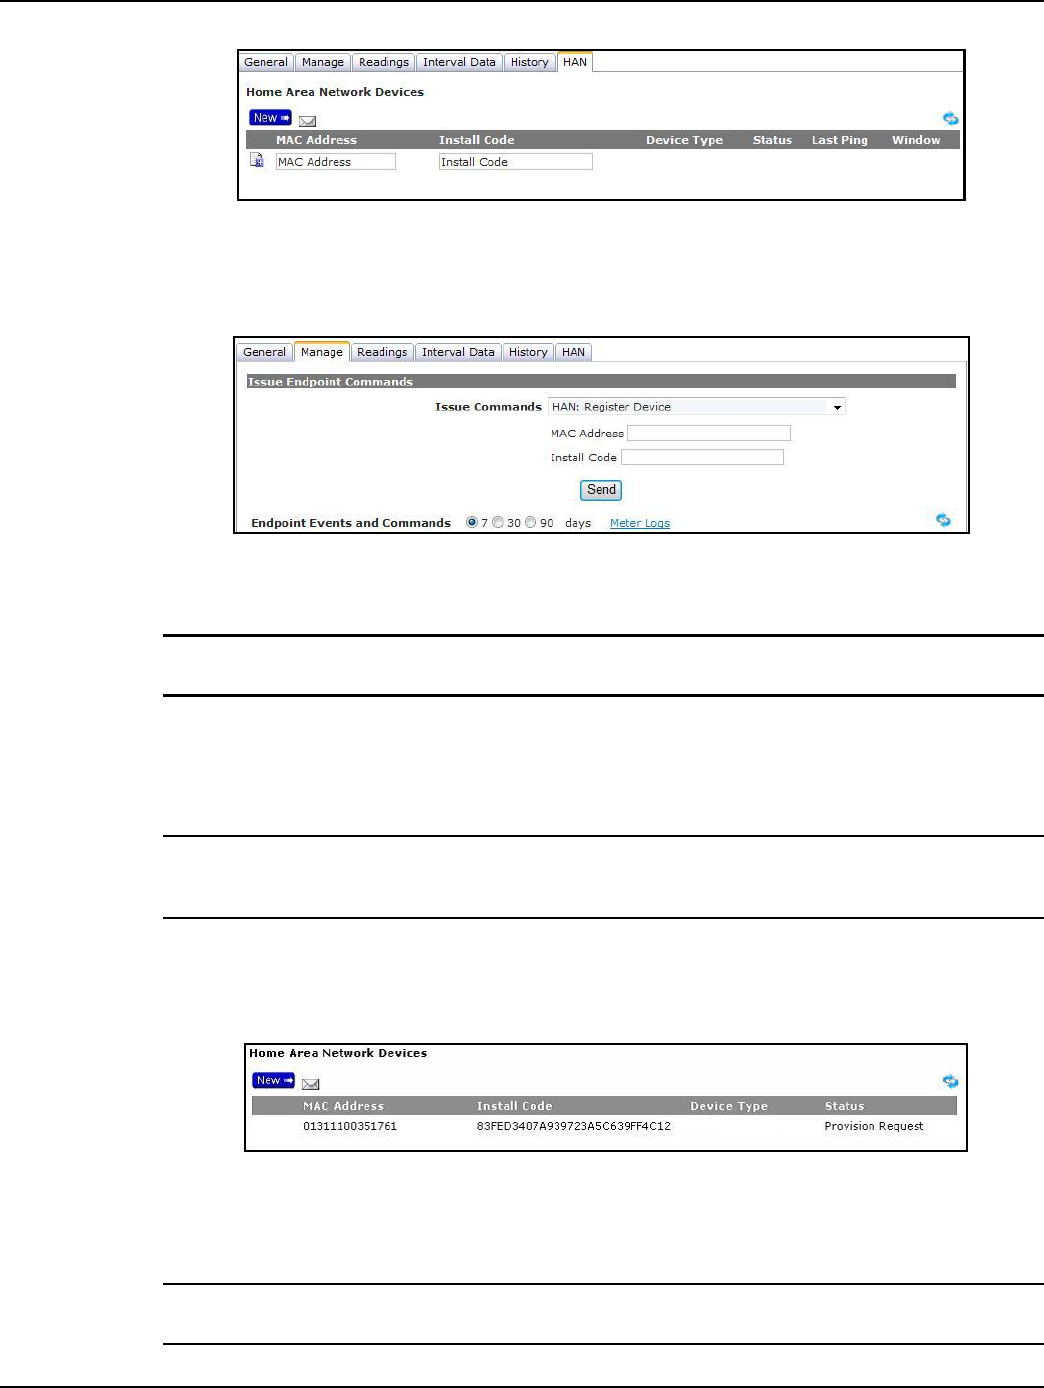
1. On the Endpoint Information Window, select the HAN tab.
Click the New button to display the new device fields shown below.
Draft 8.5.13
Chapter 2 - Command Center Deployment/Configuration Landis+Gyr
32 98-1671 Rev AA User Guide
Figure 2 - 22. HAN Tab
...or...
2. On the Endpoint Information Window, select the Manage Tab.
Figure 2 - 23. Manage Tab
A. Enter the MAC Address. (Listed either on the HAN device or HAN device packaging.)
NOTE: A Media Access Control address (MAC address) is a unique identifier assigned to most
network adapters or network interface cards (NICs) by the manufacturer for identification.
B. Enter the Install Code. (Listed either on the HAN device or HAN device packaging)
C. Click the Send button. This will notify the Meter to open a Join Window for the specified
HAN device.
NOTE: The window of time during which the customer may complete registration is determined by
the user configuration setting in the Organization Information screen and must be set to a value of
between 1 to 30 days.
3. The HAN or Manage Tab will be updated with a device status of Provision Request, which
indicates that the Meter has opened a Join Window for the specified device. The MAC Address
and Install Code for the specified device will be shown in the updated window as well.
Figure 2 - 24. MAC Address
4. Once initial contact with the specified device has been made, the device status will update to
Find Pending.
NOTE: You may need to click the Refresh icon periodically to determine if the device has entered
the Find Pending status.
Draft 8.5.13

Landis+Gyr Chapter 2 - Command Center Deployment/Configuration
User Guide 98-1671 Rev AA 33
5. When the device is in the Find Pending status, the customer (end device user in premise) may
need to complete registration by joining or accepting the HAN network; if needed, this is often
accomplished simply by pressing a button on the device. This is not always necessary because
some HAN devices have completely automated this process, requiring no user interaction. This
process can vary by HAN device; please consult the device user's guide or manual for details.
6. Once the device joins the HAN network, the Status will change to Normal and the Device Type
field will be populated. The HAN Device is now joined and ready for use.
Application Summary
For provisioned HAN devices, the following functionality/communication may be possible,
depending on what is supported by that device. Gridstream's support of these applications is further
detailed in the Command Center User Manual, as well as the Integration Suite SDK.
• Usage Information: Once provisioned, HAN devices can receive usage information, such
as kWh and kW, as values are updated by the meter.
NOTE: The usage information available to the HAN devices from the meter will depend on the type
of meter, as well as the Smart Energy version of the HAN device.
• Text Messaging: Character-based text messages can be sent to in-home displays from either
Command Center or via Integration Suite.
• Load Control: Direct load control commands such as thermostat temperature adjustments
and load-based duty cycling can be sent via Integration Suite.
• Pricing Information: Energy rate information for both flat or Time-of-Use structured
pricing can be sent via Integration Suite.
Remove HAN Devices
Removing (de-provisioning) a HAN device from the Home Area Network can be accomplished in
three ways:
•If the user wishes to remove a single HAN device and leave the HAN Network
Commissioned, use the HAN: Delete Device command under the Manage Tab on the
Endpoint Information Screen.
•If the user wishes to remove ALL HAN devices but leave the HAN Network Commissioned,
use the HAN: Clear Devices command under the Manage Tab on the Endpoint
Information Screen.
•If a user wishes to remove a single or all HAN devices and decommission the Home Area
Network, use the HAN: Decommission Network command under the Manage Tab on the
Endpoint Information Screen and click Send.
NOTE: If a HAN Network has been decommissioned, when the HAN Network is re-commissioned it
will setup new trust center encryption keys and will reassign a random Channel and HAN ID if not
specifically assigned through the HAN: Commission Network command. It will be necessary to re-
provision any HAN devices since this will be a new unique HAN Network.
Draft 8.5.13
Chapter 2 - Command Center Deployment/Configuration Landis+Gyr
34 98-1671 Rev AA User Guide
Management and Troubleshooting
Meter Swap Out Process using Decommission HAN
For management and troubleshooting of the HAN Network and associated HAN devices, the
following commands can be used: Commission Network, Get Network Info, Get Device Info, Get
Firmware, and Ping.
NOTE: If a meter needs to be swapped out, the HAN must be decommissioned, or at very least, all
the HAN devices must be removed. Removing these devices will allow them to be re-provisioned
on the replacement meter.
Commission HAN Network for Channel Control
The HAN: Commission Network command is used to commission a HAN network with a specific
Channel and HAN ID. This command can be used to troubleshoot scenarios in which there may be
channel interference or spotty communication with a HAN device.
NOTE: A HAN Network will be automatically commissioned by provisioning a HAN device to a
meter if no HAN network is present. The automatic process will randomly assign the Channel from a
list of preferred channels as well as the HAN ID. See the section "Provisioning HAN Devices" for
details on adding/provisioning a HAN device to a meter.
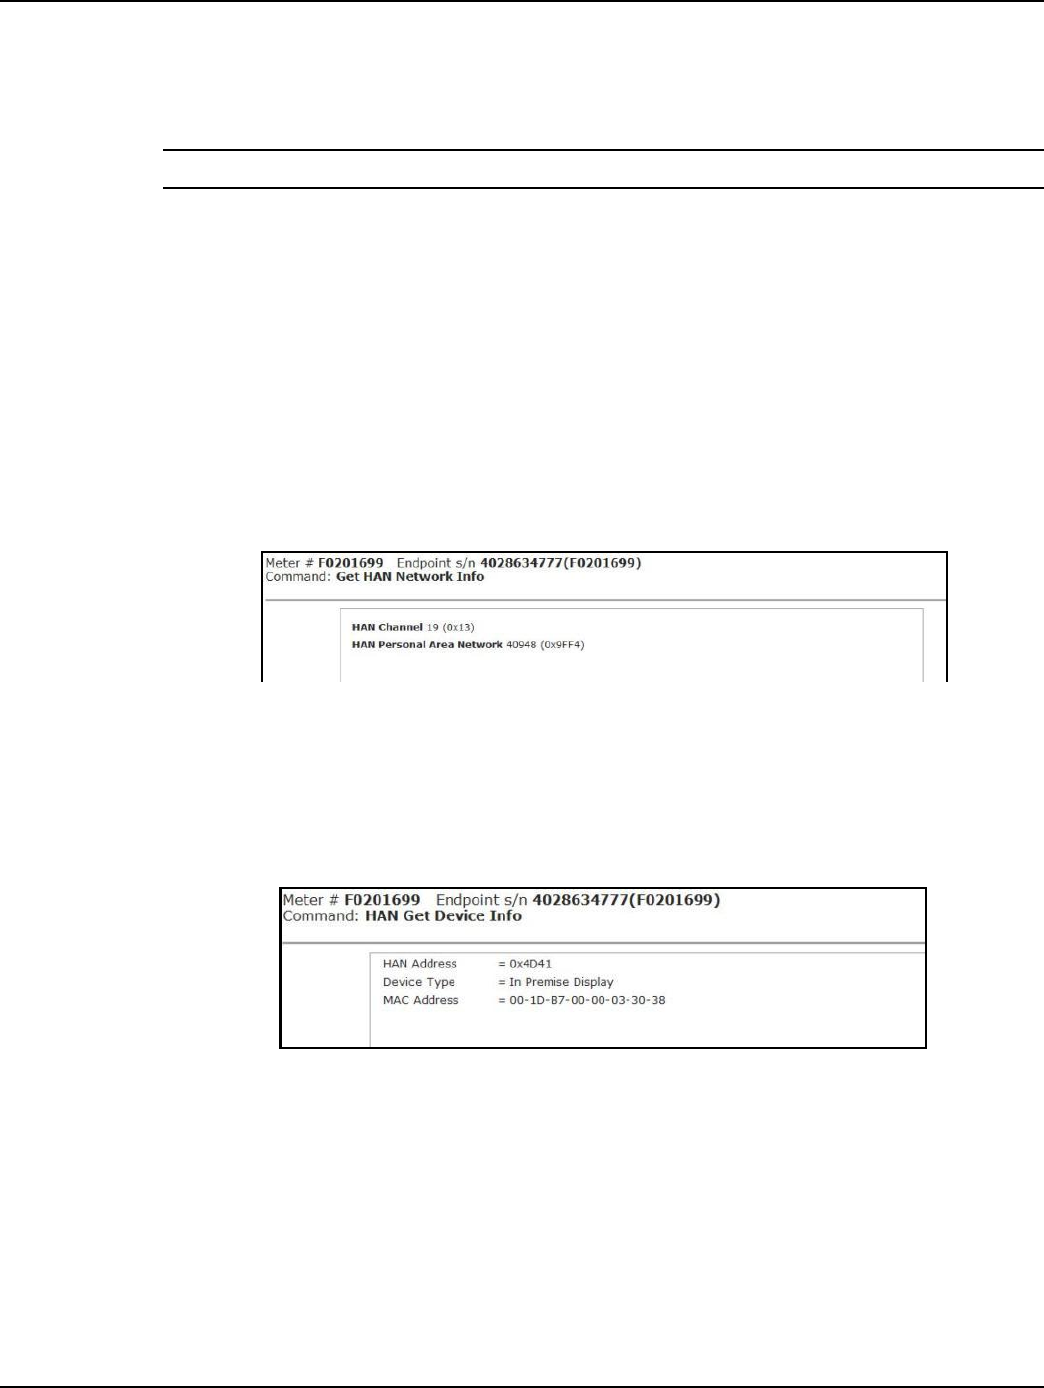
1. On the Endpoint Information Window, select the Manage tab. Select HAN: Commission
Network from the Issue Commands drop-down menu. The user will need to select the
Channel and HAN ID.
Figure 2 - 25. Commission HAN Network
2. For Channel, choose Auto Select which will randomly select a SEP preferred channel
...or...
3. Select a specific channel 11-25.
HAN ID field will display the selected HAN ID.
Draft 8.5.13
Landis+Gyr Chapter 2 - Command Center Deployment/Configuration
User Guide 98-1671 Rev AA 35
4. Click Send.
Meter LCD Screen for ZigBee Alerts
NOTE: After installation, the meter display will flash Z/B under the following conditions:
No network commissioned: The ZigBee module will request the time from the Gridstream radio
every 30 seconds after power up and every 15 minutes once it has received the time from the radio.
HAN Network is commissioned: When HAN is present, regardless of any devices present, the
ZigBee module will read the meter data every 30 seconds in anticipation of HAN devices needing
that information.
Confirm HAN Radio in Meter is Communicating or HAN is set-up
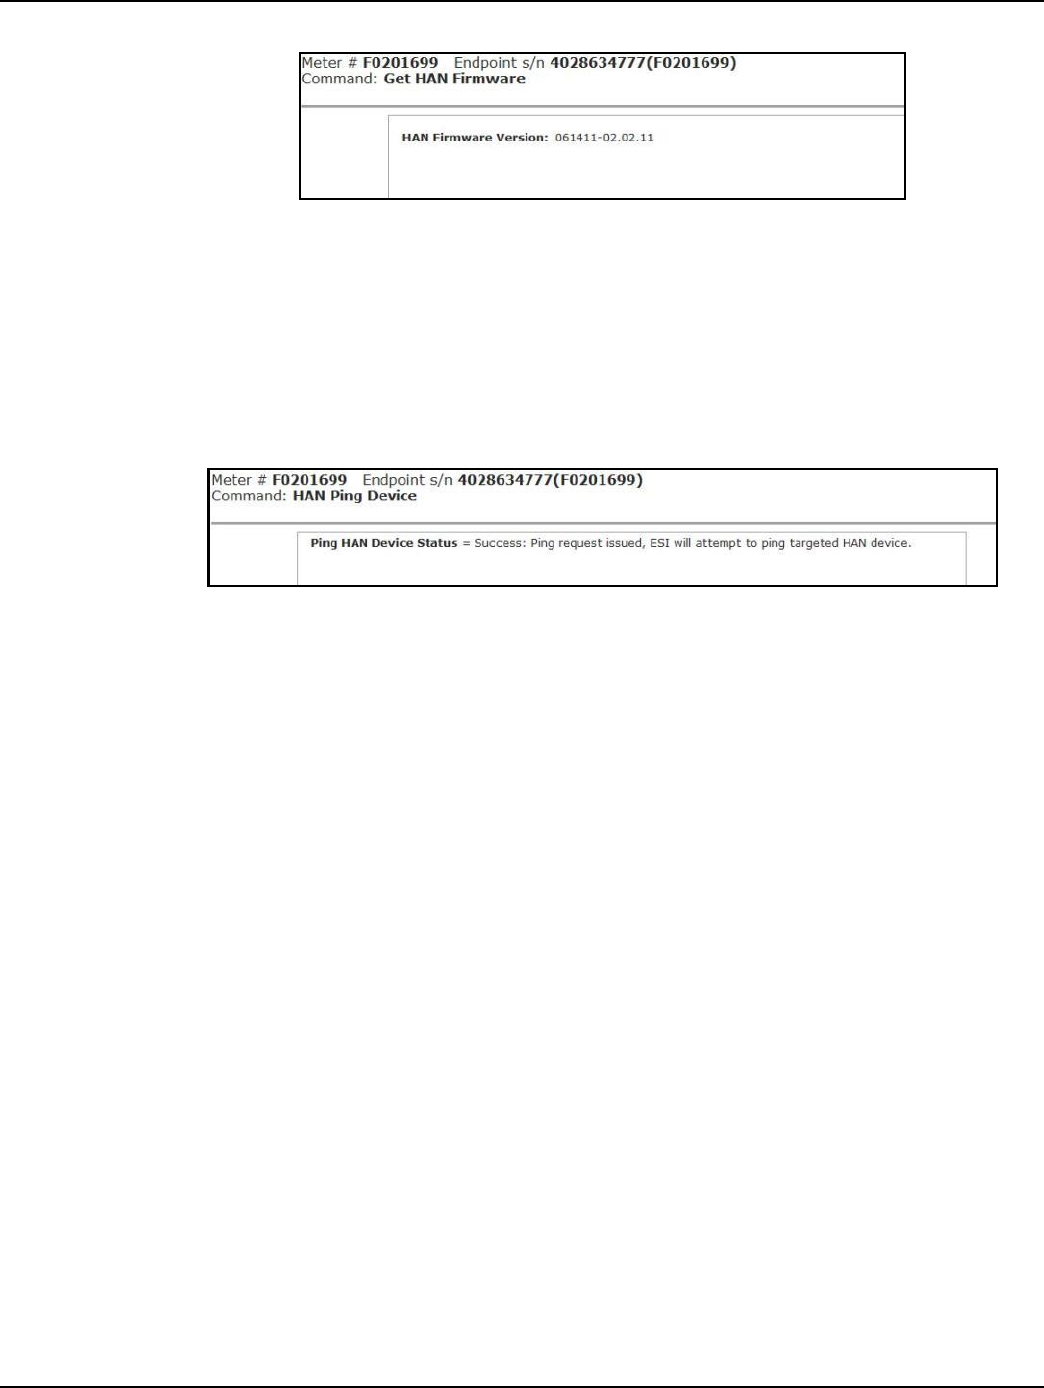
To confirm the existence of a HAN Network or to gather details on the HAN Network, issue the
HAN: Get Network Info command.
It will return the Channel and HAN ID.
Figure 2 - 26. HAN Network Info
Get information for a specific device
To confirm device details issue the HAN: Get Device Info command. It will return the MAC
Address, the Installation Code, and Device Type i.e: In Premise Display, Programmable Controllable
Thermostat.
Figure 2 - 27. HAN Device Info
Get Firmware version for the HAN radio
To confirm which firmware the HAN module in the meter is using issue the HAN: Get Firmware
command. This will return the ZigBee Firmware version number which will allow the user to figure
out if the meter is running the proper ZigBee Firmware.
Draft 8.5.13
Chapter 2 - Command Center Deployment/Configuration Landis+Gyr
36 98-1671 Rev AA User Guide
Figure 2 - 28. HAN Firmware Info
Confirm that a HAN device can communicate with the meter
To confirm if Command Center can communicate with a HAN device or whether a HAN device is
still in communication with its meter, issue the HAN: Ping command. The Ping HAN Device Status
will be returned notifying the user that the Ping Command was issued. To verify that the device was
Pinged, check the history on the Manage Tab as the response from the device will be logged in the
device history.
Figure 2 - 29. HAN Ping Device
Draft 8.5.13
User Guide 98-1671 Rev AA 37
3
Using Endpoint Testing
Manager (ETM)
How To Use ETM
Endpoint Testing Manager (ETM) software provides the user with the ability to verify accurate
module-to-meter, meter-to-module, module-to-network, and network-to-module communications.
This chapter provides detailed instructions for navigating the software.
Access to Endpoint Test Manager
With the release of Command Center 5.0, ETM users must be authenticated into Command Center
prior to accessing the ETM application and communicating with devices in the network. The
designated Security Administrator for the utility is responsible for configuring the connection to the
Command Center server, and for providing log in credentials (including user names and passwords)
for those who will require access to the software.
Setting Up Access to the Command Center Server
Before launching the ETM software, a link to the Command Center server must be created. Follow
the steps below to create the link to the Command Center server.
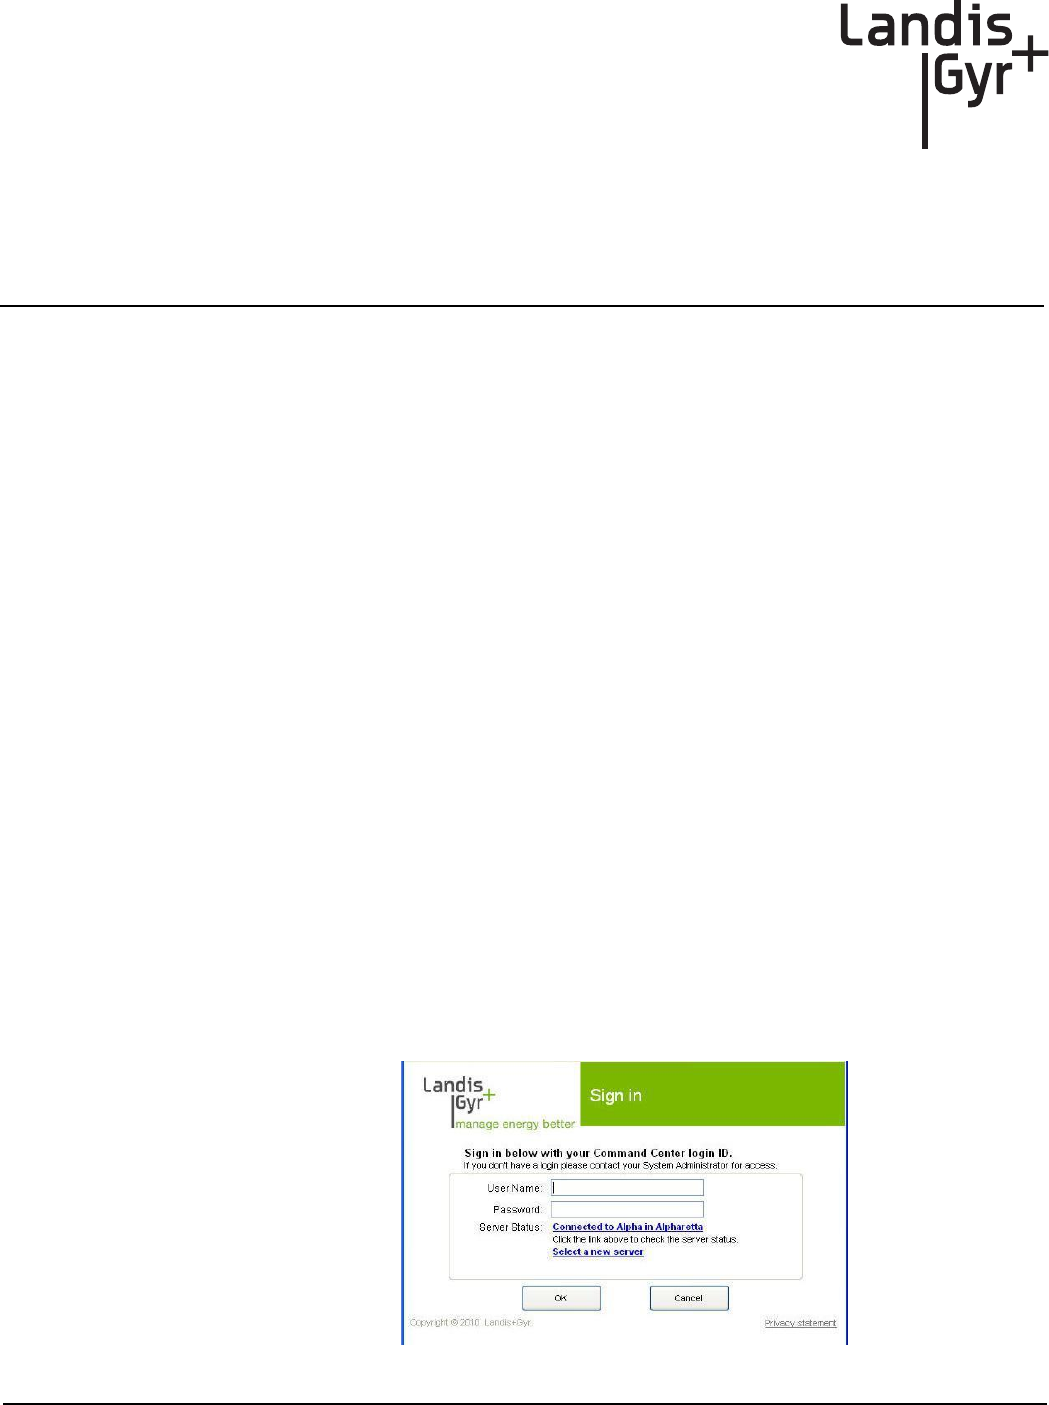
•Launch ETM software. The ETM Sign in screen will open. On an initial launch of ETM, the
ETM user must be authenticated with the Command Center server. The Command Center
server connection places an authentication token on the user’s computer. This token is valid
for a time specified by the Command Center Administrator. On succeeding launches, the
Server Name field may display Offline, and may display Offline during future logins. Users
may login to ETM without Command Center server connection, as long as their
authentication token is valid.
Figure 3 - 1. Endpoint Testing Manager - Sign In
Draft 8.5.13
Chapter 3 - Using Endpoint Testing Manager (ETM) Landis+Gyr
38 98-1671 Rev AA User Guide
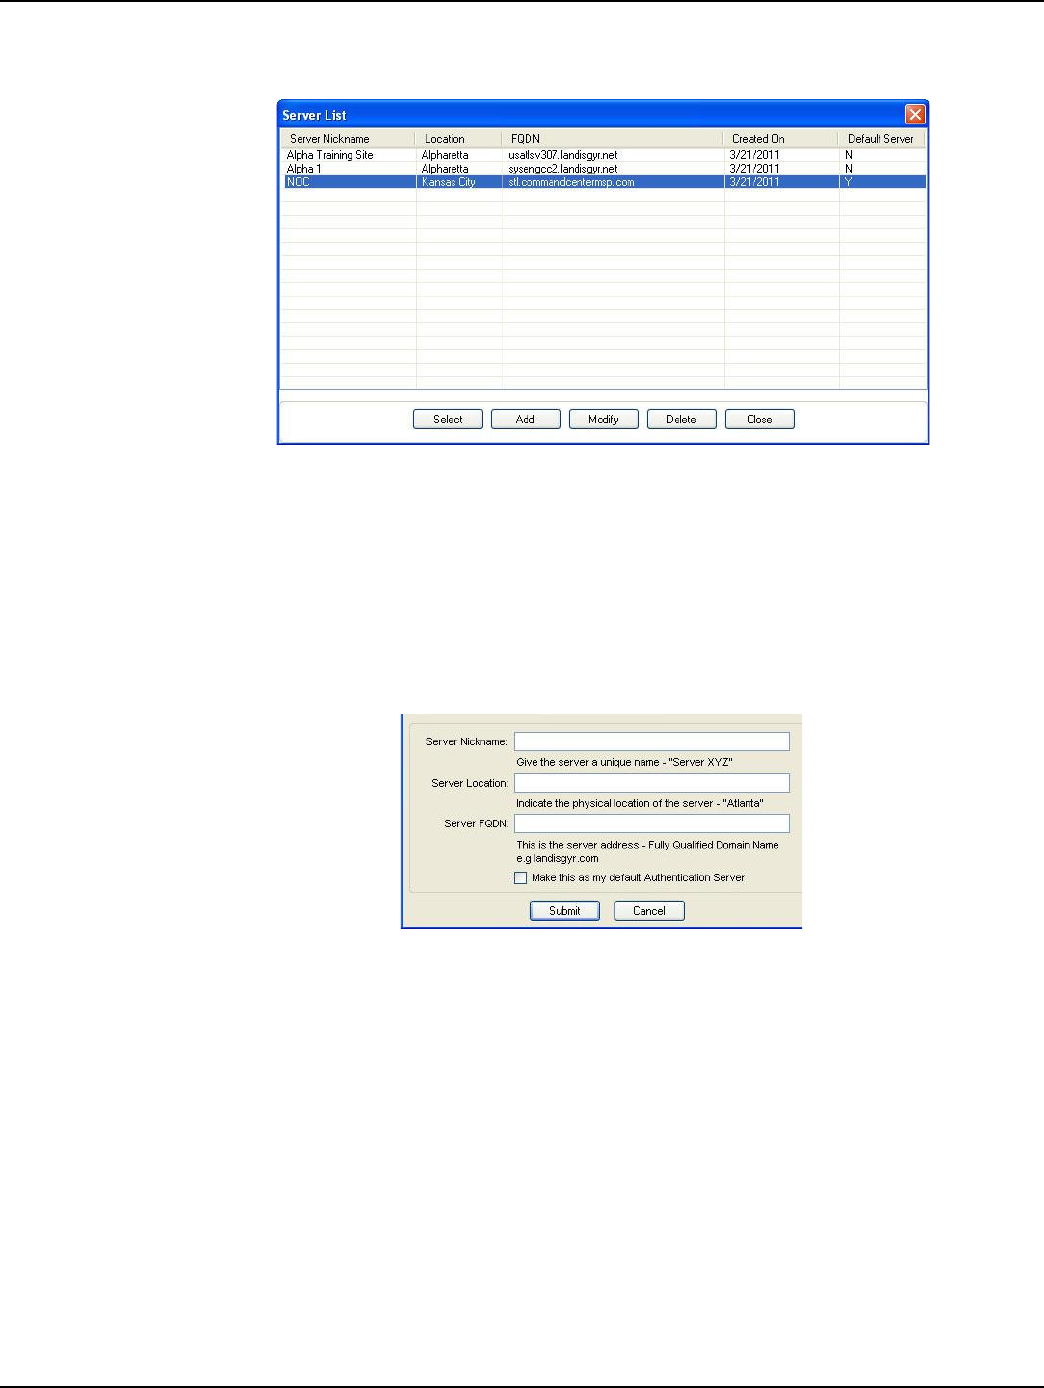
•If this launch of ETM is not connected to a server, click the Select a new server link. The
Server List will appear.
Figure 3 - 2. Server List
•Click the name of the desired server in the Server column to highlight it.
•Click Select. The Server List window will close and the selected server will be displayed on
the ETM log in screen.
Adding a New Server
Click Add on the Server List. The New Server window will open.
Figure 3 - 3. Endpoint Testing Manager - New Server
• Server Nickname: Enter a user-defined name for this server.
• Server Location: Enter the physical location of the server.
• Server FQDN: Enter the fully qualified domain name for the server. (see example in the
New Server display).
• Make this my default Authentication Server. Enable this setting to connect to this server
each time this instance of ETM starts.
•Click Submit to add the new server.
Selecting an alternate existing server
An ETM instance may have multiple servers associated to it. When ETM is first started, the server
that has been selected by default will be displayed on the log in screen. The user may choose a
different server, if necessary.
Draft 8.5.13

Landis+Gyr Chapter 3 - Using Endpoint Testing Manager (ETM)
User Guide 98-1671 Rev AA 39
Following is the procedure for selecting an alternate server:
From the ETM log-in screen, select the Select a new server link. The Server List window will
appear.
•Click the name of the desired server in the Server column.
•Click Select. The Server List window will close and if ETM can connect to that server, the
selected server will be displayed on the ETM login screen.
Modify an existing server
If it is necessary to make modifications to an existing server, this task may be performed in the
Server List window, shown previously in Figure 3 - 2.
From the ETM log-in screen, click the Select a new server link. In the Server List window, click the
name of the server to be modified.
•Select the Modify button. The New Server window will open.
•Make desired changes.
•Click Save to apply changes.
•Click Close to close the Server List window and return to the ETM login screen.
Delete an existing server
If it is necessary to delete an existing server, this task may be performed in the Server List window.
In the Server List window, click the name of the server to be deleted.
•Select the Delete button. The selected server will be removed from the Server List.
•Click Close to close the Server List window and return to the ETM login screen.
Add additional servers
If it is necessary to add additional servers, this task may be performed in the Server List window.
In the Server List window, click the Add button. The New Server window will open.
• Server Nickname: Enter a user-defined name for this server.
• Server Location: Enter the physical location of the server.
• Server FQDN: Enter the fully qualified domain name for the server. (see example in the
New Server display)
• Make this my default Authentication Server. Enable this setting to connect to this server
each time this instance of ETM starts.
•Click Submit to add the new server.
•Click Close to close the Server List window and return to the ETM login screen.
Draft 8.5.13
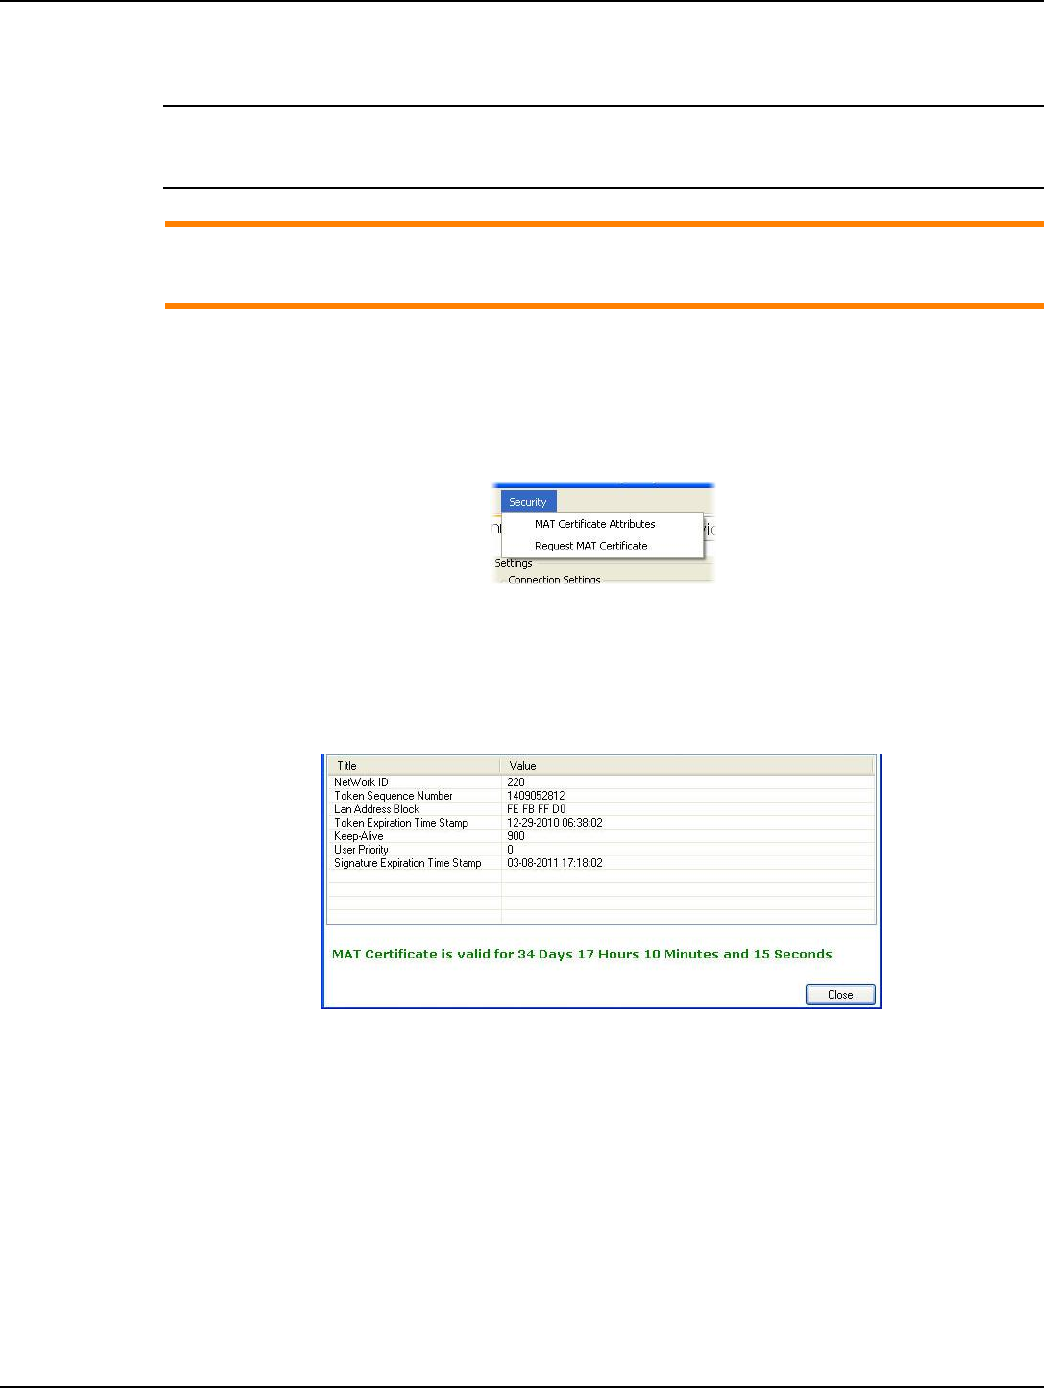
Chapter 3 - Using Endpoint Testing Manager (ETM) Landis+Gyr
40 98-1671 Rev AA User Guide
After Login: Setup Cautions
NOTE: When ETM is first launched, view the Connection tab. Click the checkboxes for both
Display Scrolling Status and Enable Test Reports, and then click Save Settings. Until changed,
these settings will remain the default each time the ETM application opens.
ACAUTION: Upon launch, ETM will attempt connection to the computer’s first available serial
port. If an Integrated WAN Radio (IWR) is not connected to that serial port, ETM will time out.
After ETM times out, click the Connection tab to select the serial port connected to the IWR.
Certificate Attributes
The current status of the Mobile Admin Tool (MAT) Certificate can be viewed in the Security
display.
Figure 3 - 4. Security Menu Options
From the menu options, select Security > MAT Certificate Attributes.
The Token Attributes displays the current status of the MAT Certificate received from
Command Center.
Figure 3 - 5. Token Attributes
• NetWork ID. The Network ID is the utility’s unique Network Identifier. (For endpoints with
v6.x firmware, this parameter cannot be changed in ETM)
• Token Sequence Number. The Certificate Sequence number uniquely identifies the
certificate issued for the MAT session.
• Lan Address Block. The LAN Address Block displays the set of LAN Addresses that the
MAT has been provided to use to communicate with endpoints. LAN Address block consists
of 16 addresses, and are provided each time a certificate is requested from Command Center.
• Token Expiration Time Stamp. Indicates the date and time that the MAT certificate will
expire. The default value is 1440 minutes (one day) and is established in Command Center
Organization Information settings.
Draft 8.5.13
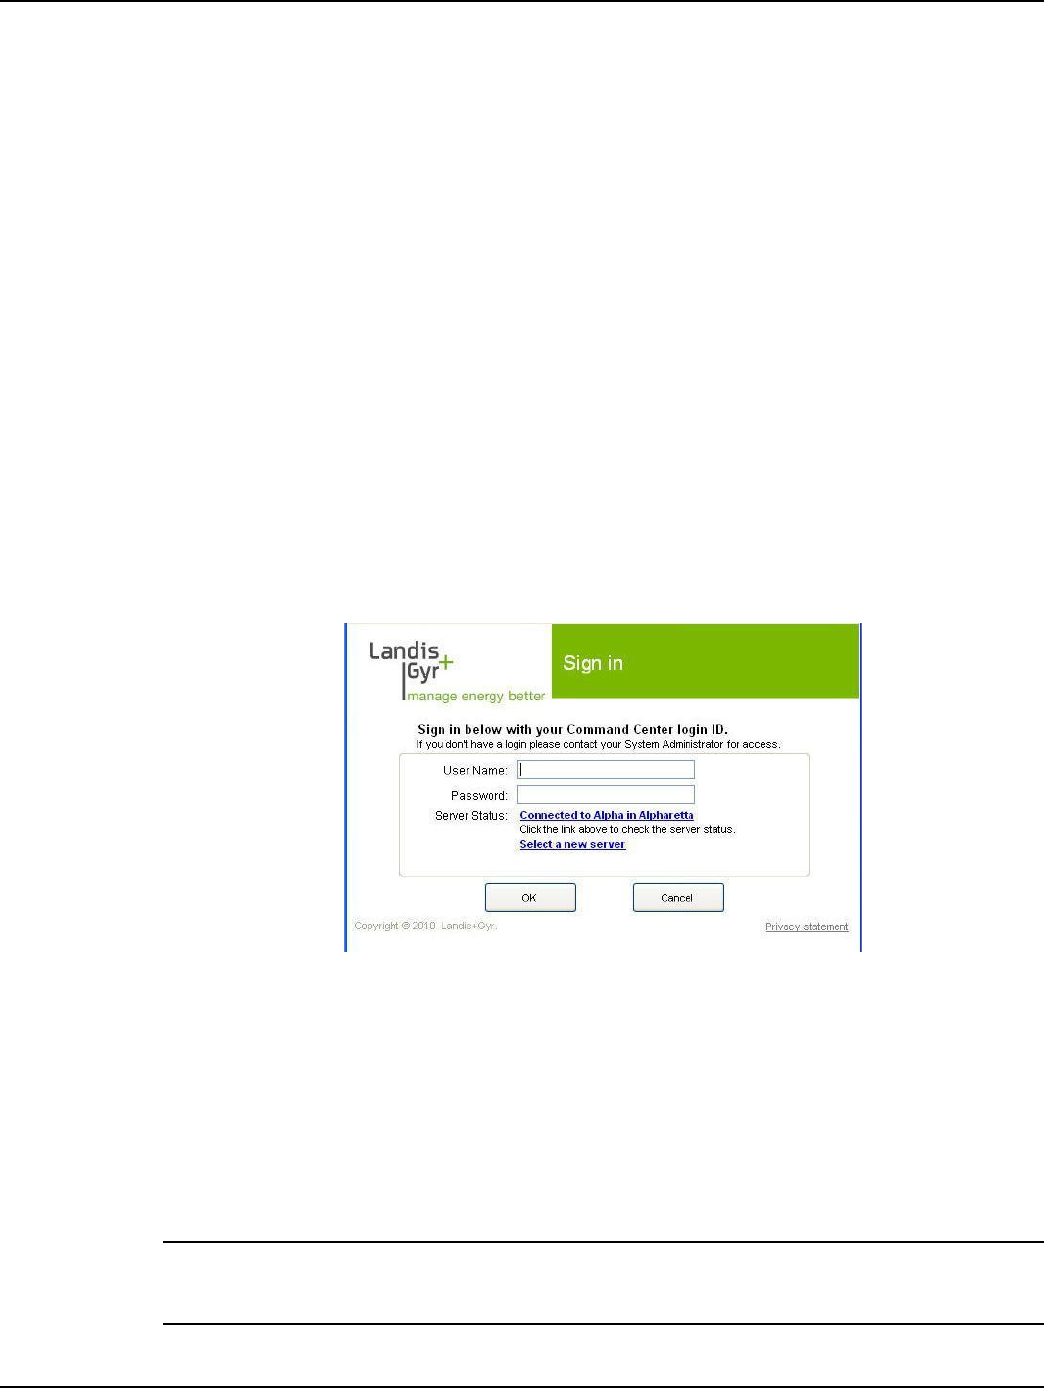
Landis+Gyr Chapter 3 - Using Endpoint Testing Manager (ETM)
User Guide 98-1671 Rev AA 41
• Keep Alive. This value specifies the amount of time that a session between a MAT and an
endpoint can be inactive before the endpoint closes the session. The default value is 15
minutes.
• User Priority. The user priority field allows a user of a higher or equal priority to preempt
an existing MAT Certificate. Users with a lower priority cannot gain access if a higher
priority is engaged with the endpoint device. This also provides a method for the system to
lockout a rogue user if a problem is detected on the endpoint.
• Signature Expiration Time Stamp. This indicates the signature expiration for the MAT
Certificate. It is set to three times the MAT Certificate expiration interval by default. This
allows the MAT user to attempt to access an endpoint using the certificate and get a response
back from the MAT rather than no response for a reasonable period of time before the
certificate expires. A signed certificate is only required when endpoints are in ECC mode.
Request MAT Certificate
In the event that a MAT Certificate is reaching its expiration time, a new MAT Certificate may be
requested from Command Center by selecting the MAT Certificate option from the Security sub-
menu.
From the Menu options, select Security > Request MAT Certificate. The Log-in window will
open.
Figure 3 - 6. ETM Login screen
• User Name: Enter utility-provided user name.
•Password: Enter utility-provided password.
• Server Name: The Server name field will display the server to which ETM will connect by
default.
•Click OK. If the user is successfully authenticated by Command Center, and the user has the
proper privileges (Access and Certificate Authorization), Command Center will issue a
MAT Certificate consistent with the level of security that the utility is using.
NOTE: If a user’s session is nearing expiration, the user may also log out of ETM and log back in to
get a new Certificate. If the ETM either has no Certificate, or the current MAT Certificate expiration
is less than 50% of the original time interval, the MAT requests a new MAT Certificate.
Draft 8.5.13
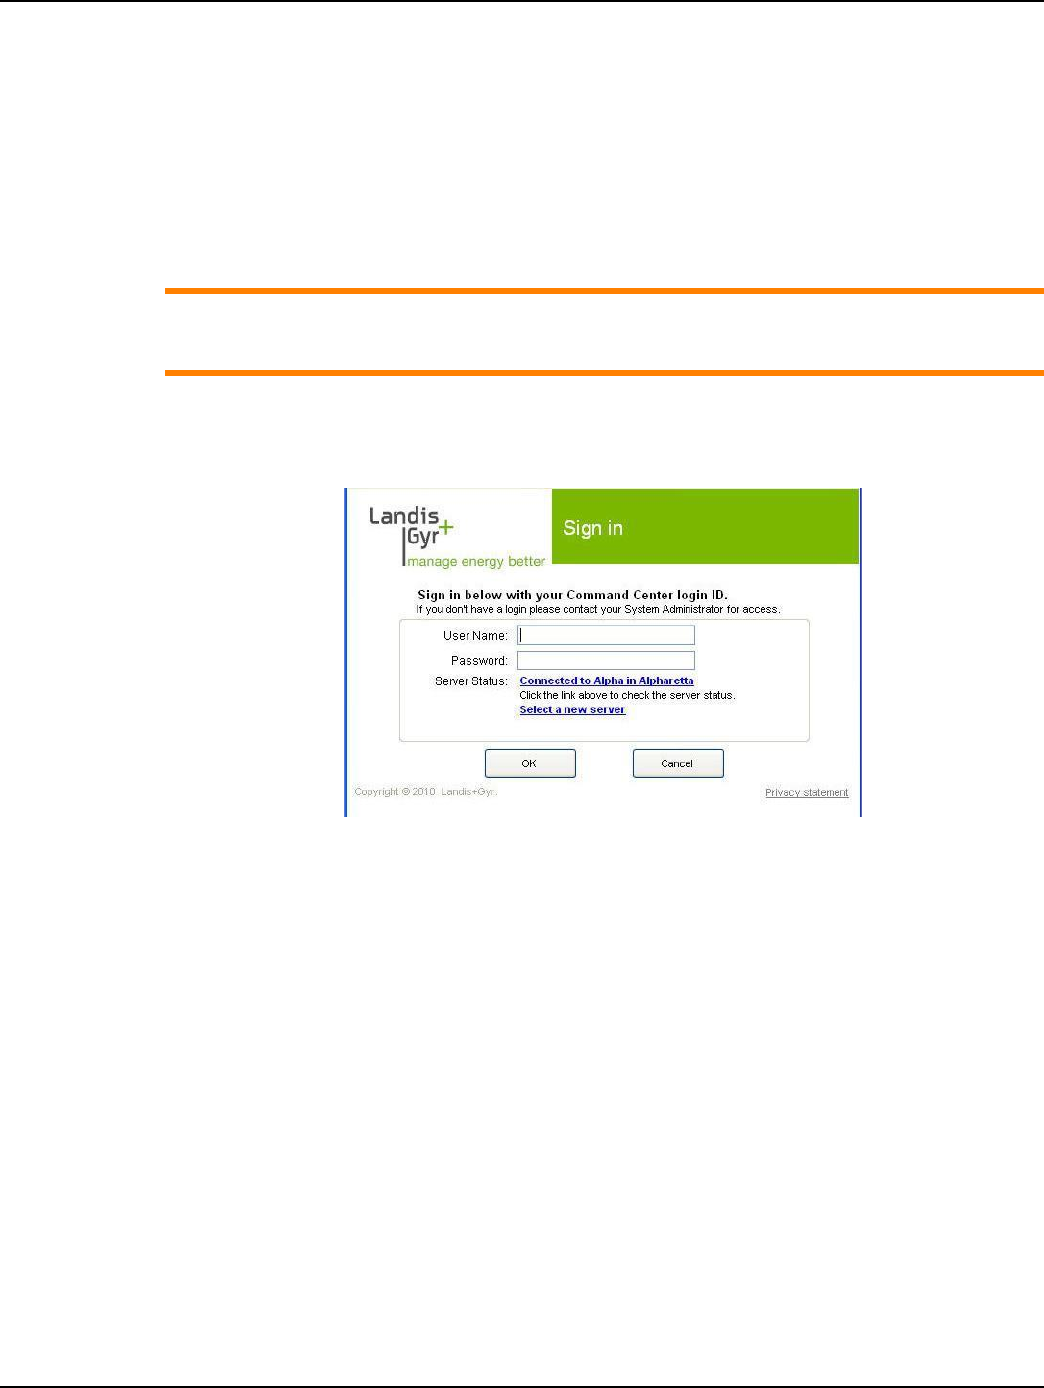
Chapter 3 - Using Endpoint Testing Manager (ETM) Landis+Gyr
42 98-1671 Rev AA User Guide
ETM Sign In
The ETM user and the ETM tool must 1) be known to and 2) authenticated by Command Center. The
user must have been provided privileges and user credentials in order to access the ETM software. If
the user has not been provided with credentials, the user must contact the utility-designated Security
Administrator.
The process of authenticating with Command Center provides the user with a Mobile Admin Tool
(MAT) Certificate. The MAT Certificate confirms and certifies ETM’s identity to the endpoints.
ACAUTION: ETM login has two modes: one with and one without server access (off-line). In
off-line environments, ETM users must go on-line and successfully authenticate themselves
to Command Center once every seven days.
Below is the procedure for logging into ETM:
Launch ETM. The Login to ETM screen will open.
Figure 3 - 7. Endpoint Test Manager - Sign In
• User Name: Enter utility provided your User Name.
•Password: Enter utility provided password
• Server Name: The Server name field will display the server to which ETM will connect by
default. If needed, click the Select a new server link to connect to a different server, as
described above.
•Click OK. If the user is properly authenticated by Command Center and the user has the
proper privileges (Access and Certificate Authorization), Command Center will issue a
MAT Certificate consistent with the level of security the utility is using.
If the user name and/or password is not authenticated, a warning dialog box will appear. The
user may attempt to log in a total of five times with incorrect credentials before being locked out
of the system. The Security Administrator will need to clear the locked out status via Command
Center.
Draft 8.5.13
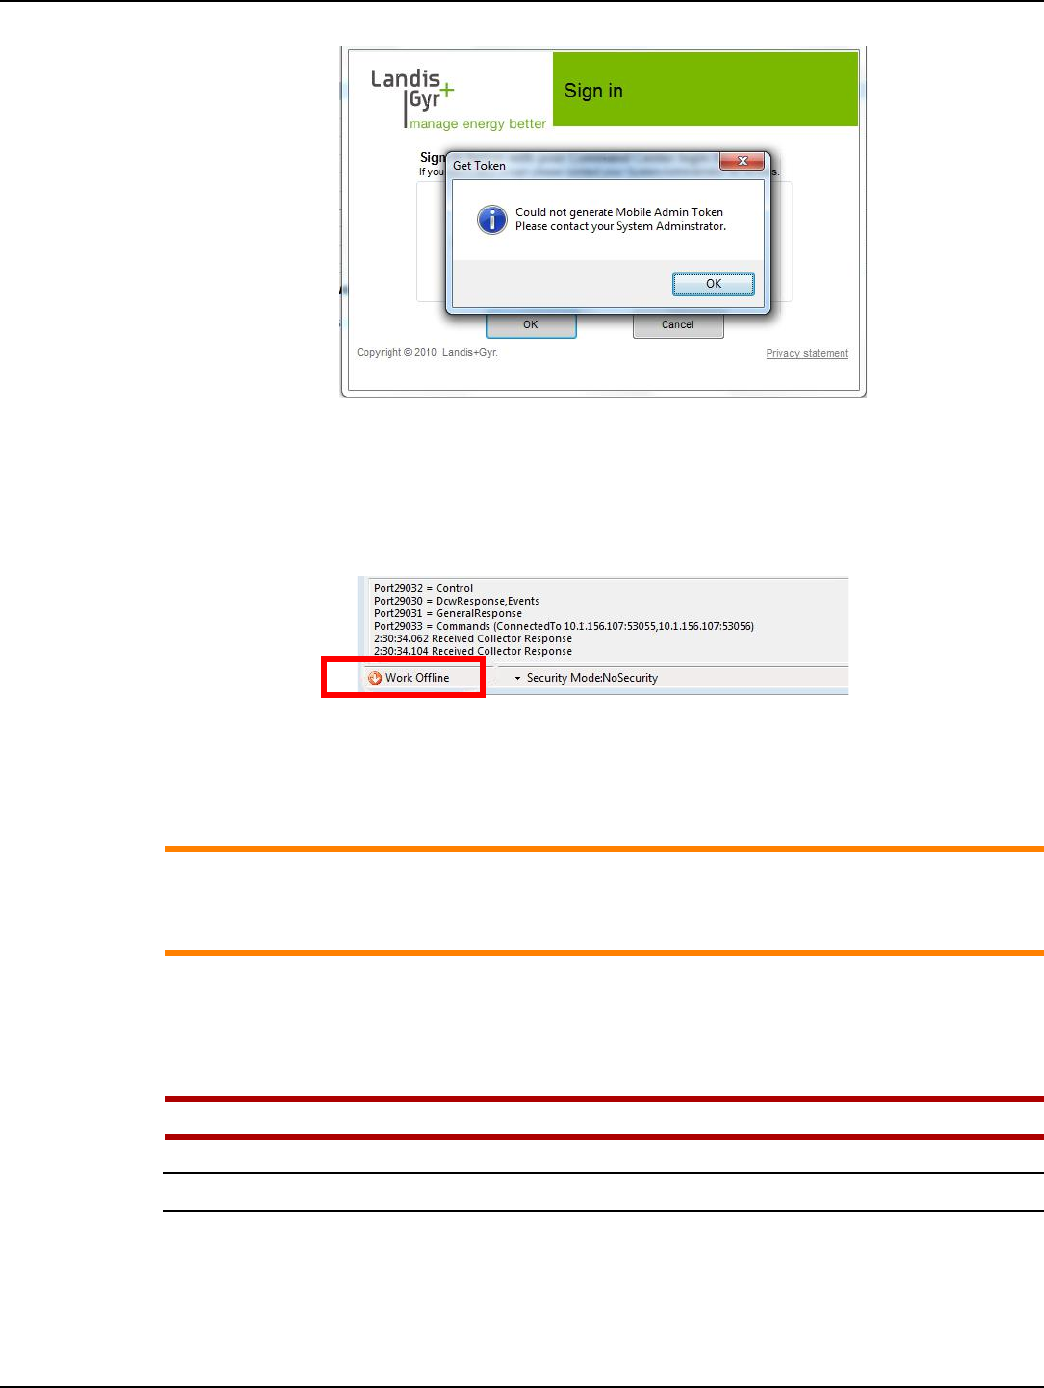
Landis+Gyr Chapter 3 - Using Endpoint Testing Manager (ETM)
User Guide 98-1671 Rev AA 43
Figure 3 - 8. Login Validation
Even though the user may have certificate privileges, this message indicates that certificate server is
not properly set up. (Possible reasons include: the server might be down or the signing utility might
not be set up). If the user clicks OK, ETM will launch and they will be able to communicate to
meters that are not in ECC mode.
Figure 3 - 9. Login Validation
The authentication process provides the user with the required MAT Certificate. The length of time
that the MAT certificate is valid is configured by the utility in the Organization Information settings,
with the default being 1440 minutes.
ACAUTION: If a MAT Certificate is nearing expiration, the user may log out of ETM and log
back in to get a new Certificate. If the ETM instance either has no Certificate, or the current
MAT Certificate expiration is less than 50% of the original time interval, the MAT requests a
new MAT Certificate.
Using the Bar-code Scanner
Please read the following information before using the barcode scanner to scan meter information.
UWARNING: The bar-code scanner contains a laser light. Do not stare directly into the beam.
NOTE: Ensure that the bar-code scanner beam covers the length of the bar-code.
The figure below illustrates the proper method for scanning a bar-code.
Draft 8.5.13
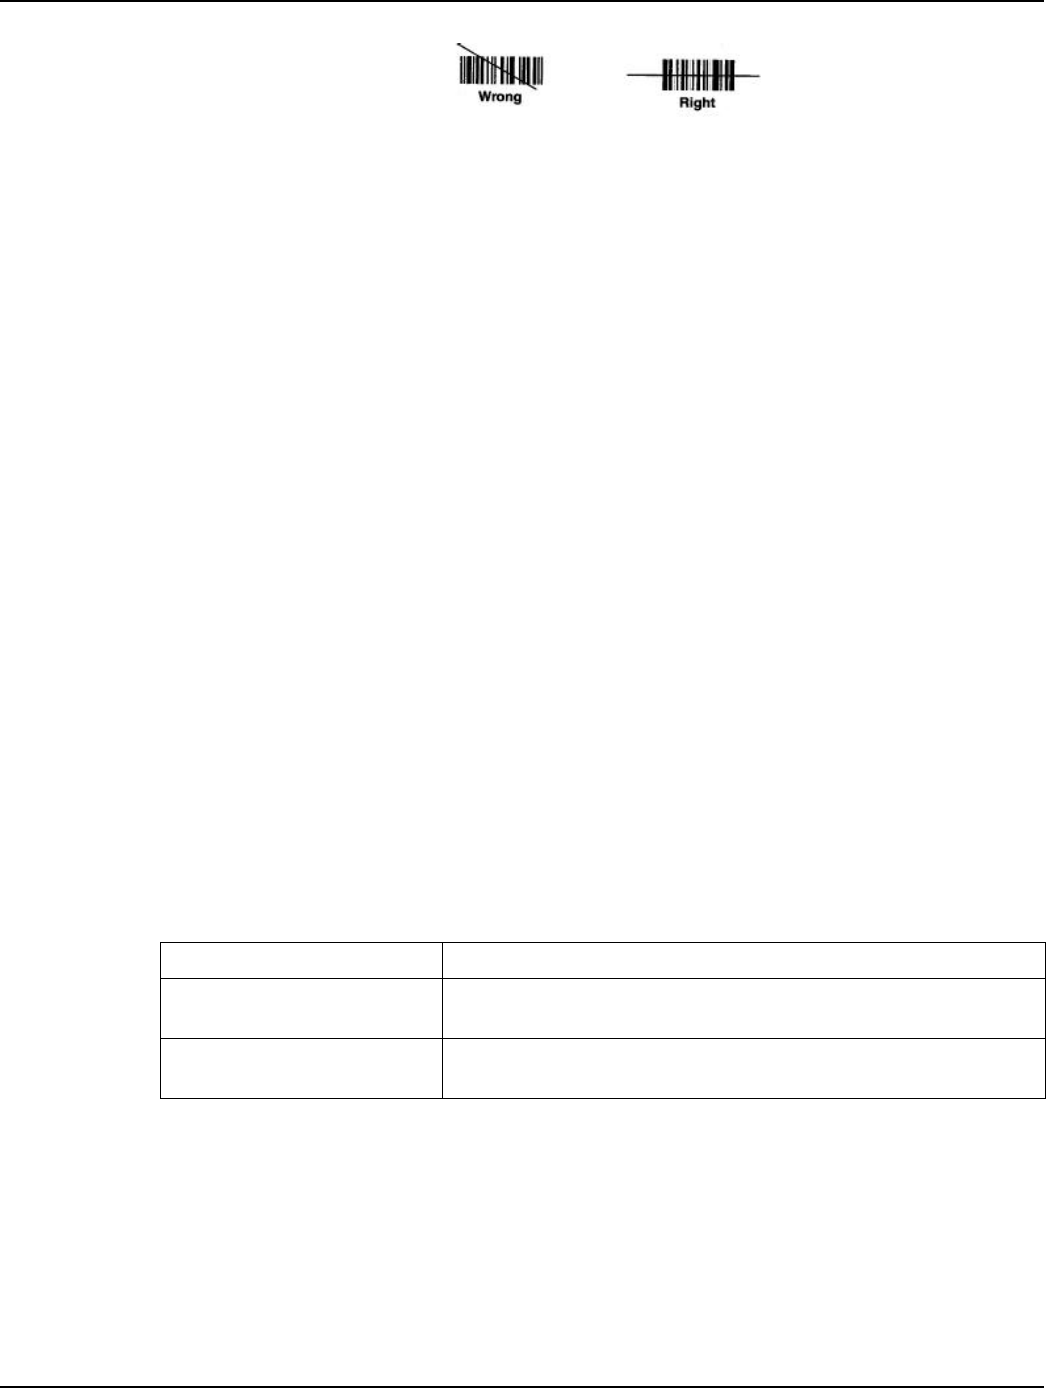
Chapter 3 - Using Endpoint Testing Manager (ETM) Landis+Gyr
44 98-1671 Rev AA User Guide
Figure 3 - 10. Using the Bar-code Scanner
Navigating the Software
ETM is an easy-to-use software application that allows you to perform specific configuration,
verification, and testing procedures. The application is comprised of an upper menu bar, the tabs
listed below, and a Security Status line at the bottom of the display that describes the server
connection and displays the connected endpoint’s security status.
•Connection
•Head End Radio
•Device Test
•Firmware Download
•Module
•Reporting
•Command Scheduler
•HAN (ONLY appears when a compatible endpoint is connected)
•Universal Event Log
•Service Limiting (ONLY appears when a compatible endpoint is connected)
•Groups
•RF Gas/Water (ONLY appears when the appropriate key is added to the Settings.XML file)
•Collector (ONLY appears when ETM is connected to a Collector)
Use the upper menu bar for exiting ETM, File > Exit, or to display or request Security details (as
specified in the following section).
ETM can also be configured to display an Activity Log at the bottom of each screen that allows the
user to view communication activities between the tool and the endpoint.
Configuring a New Gridstream IWR Radio
These parameters can be set via the Head End Radio tab. To configure a new Gridstream IWR
radio:
1. Connect the IWR to the PC
Table 3 - 1. Upper Menu Bar Security Details
Field Description
MAT Certificate Attributes Displays details about the Mobile Admin Tool certificate received from
Command Center.
Request MAT Certificate Sends a request to Command Center for a Mobile Admin Tool
Certificate. Login permissions will vary access to this feature.
Draft 8.5.13

Landis+Gyr Chapter 3 - Using Endpoint Testing Manager (ETM)
User Guide 98-1671 Rev AA 45
2. Select the Head End Radio tab
3. Click the Modify button
4. Change the radio's Network ID to match the utility-specified Network ID (for endpoints with
firmware version v6.x and higher, this parameter is managed by Command Center and cannot be
changed by ETM)
5. Disable the router bit
6. Disable the timekeeper bit
7. Enable the head-end bit
8. Enable the operational bit
9. Set the baud rate to 38400
10. Enter the Latitude and Longitude in the LPP Address field
11. Click Apply to save changes.
NOTE: If only the CRC and baud rate are to be changed, a new Gridstream IWR can be configured
using ETM’s Head-end management. Command Center is used to manage the CRC for endpoints
with firmware v6.x and higher.
Meter Shop Best Practices Use Case - Proper IWR Configuration
This procedure describes proper configuration for IWR radios being used by any technician where
the radio is on a production network.
Do not:
•Set up your IWR as a router. This will only slow down process actions as the IWR will be
busy routing packets unnecessarily. On a production network this will interfere with the
local mesh when the radio is turned off.
•Set up your IWR as a head-end. This will cause significant problems with the production
mesh network.
•Set up your IWR set as a timekeeper. This is will pass the time of your computer to other
network devices.
Using RadioShop, confirm the following settings.
NOTE: For information on RadioShop see RadioShop® Getting Started Guide, Landis+Gyr
publication 98-1054.
•Control Byte 1 - 69 is correct for a mobile IWR. The best way to change Control byte 1 is by
setting WAN address under configure. As you change from a Mobile IWR to Fixed IWR
CB1 changes from 69 > 49.
•Control byte 2 should be HEX 48.
•Control byte 3 should be HEX 50.
ACAUTION: Control byte 3 is important. It prevents your radio from advertising a path to the
Collector and from trying to register with Command Center every time it is powered on or
reset.
Draft 8.5.13
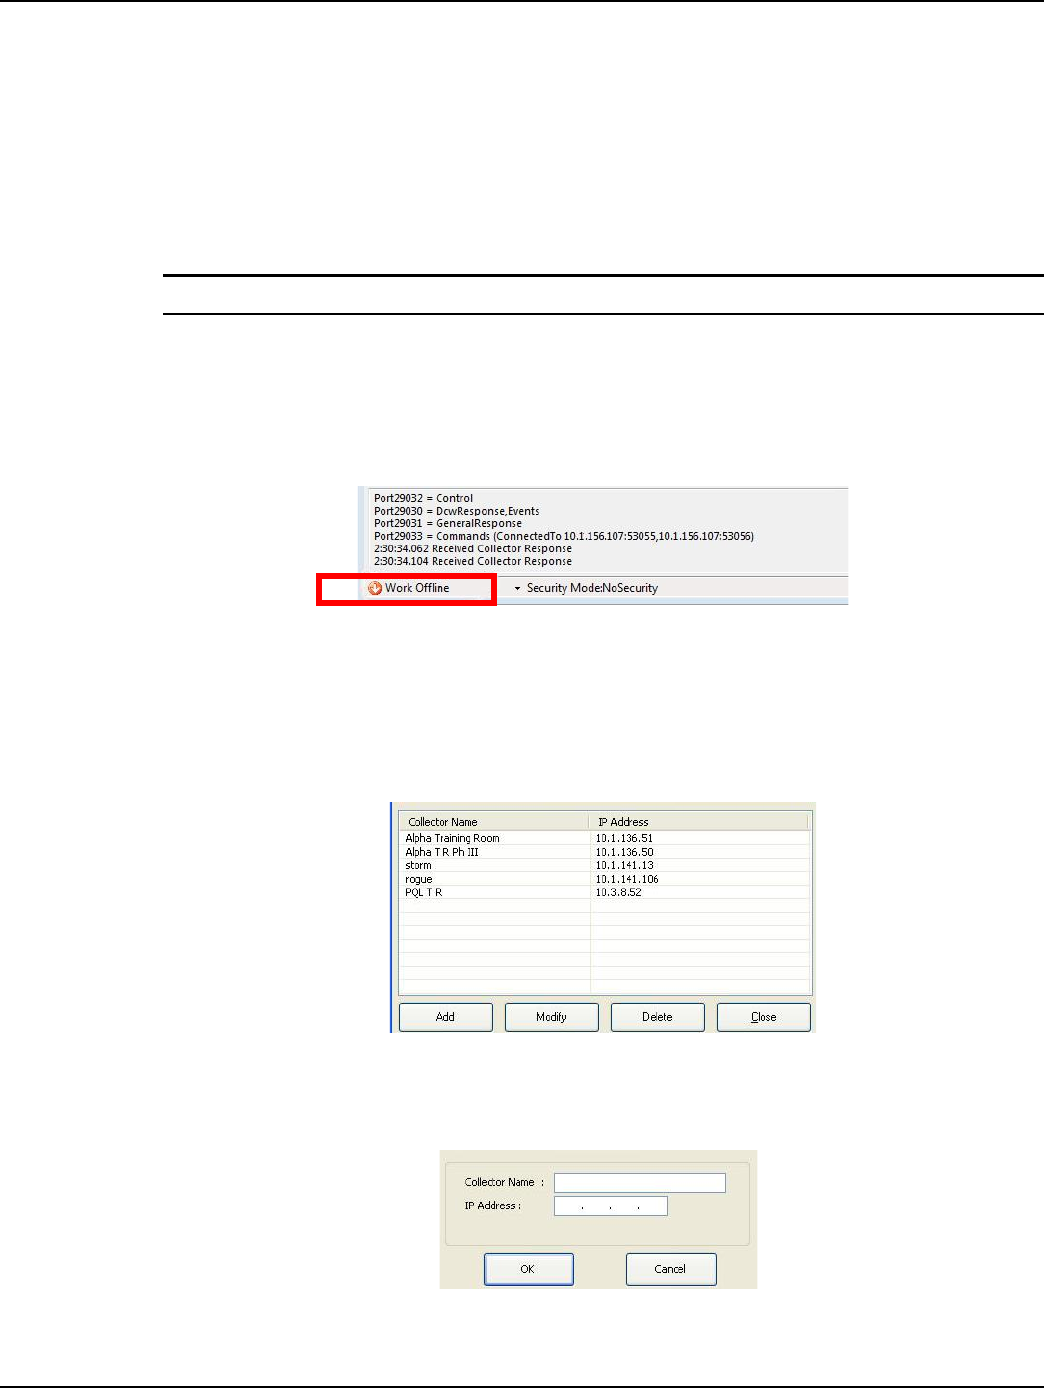
Chapter 3 - Using Endpoint Testing Manager (ETM) Landis+Gyr
46 98-1671 Rev AA User Guide
•Control byte 4 should be HEX 69.
•Control Byte 4 with RF Filter enabled and wide mode enabled should be HEX 29.
•Control Byte 4 with RF Filter disabled and wide mode enabled should be HEX 28.
•Max LAN Nodes could be set to 28 or 86 depending on your environment. If you are on a
deployed Normal meter network, 28 would be the best setting. If you are working in a
LARGE meter shop environment handling meter returns, sample testing, and First Article
Testing Max LAN Nodes value 56 (hex 86) would be best.
NOTE: Series IV radios appear in Command Center by default.
Authentication Server Connection
If the current instance of ETM is not connected to the Authentication Server, ETM will display
Work Offline in the status bar.
Figure 3 - 11. Login Validation
Connecting to a Collector
On the Connection tab, click the Collector Settings button to add a Collector. The Collector List
dialog box will appear.
Figure 3 - 12. Collector List Dialog
1. When adding a Collector to the Collector List, click the Add button. The Collector dialog will
appear.
Figure 3 - 13. Collector Dialog
2. Type a unique name into the Collector Name field.
Draft 8.5.13

Landis+Gyr Chapter 3 - Using Endpoint Testing Manager (ETM)
User Guide 98-1671 Rev AA 47
3. Type the Collector IP address into the IP Address field with the numbers between the periods.
4. Click the OK button to add the Collector.
The added Collector will appear in the Host: drop down box, located on the Connection tab.
5. To connect to the Collector, click Use Collector from the drop-down box.
6. In the Host: drop down box, highlight the name of the Collector you would like to connect to.
7. Click Connect.
When the connection is successful, the Collector tab will appear in the tab group, ETM will
navigate to the Device Test tab, and your radio will be set to field mode.
Use the Disconnect button on the Connection tab to break communications with the Collector
and return to standard head-end radio communications using the COM port.
Connection Tab
The Connection tab allows the user to view and change the connection information for the radio or
Collector connected to the meter being tested. The table below describes the fields on the
Connection tab.
Table 3 - 2. Connection Tab
Field Description
Connection Settings
<connected to a radio>
<Connect/Disconnect> - Use
COM1 - at <baud rate> drop-
down arrow
This button allows the user to Connect or Disconnect, contains a drop
down menu that allow the user to choose a COM port or Collector to
interface with your radio, and contains another drop down menu (Figure
3 - 14.) to select connection speed for the COM port. The available baud
rates are:
9,600
19,200
38,400 (default)
115,200 (for Series IV IWRs)
RadioShop can identify the COM port and baud rate of the radio you are
using.
<connected to a Collector>
<Connect/Disconnect> - Use
Collector drop-down arrow -
choose Host drop-down arrow
This button provides for Connect or Disconnect, selecting the Collector
to connect with, and uses a drop-down menu to list collectors available
to host the connected module. When ETM is connected to a Collector, a
tab labeled “Collector” appears.
Host Allows testing meters in the field by displaying available collectors in the
drop down box.
Collector Settings <button> Allows the user to point Endpoint Testing Manager to a specific
Collector using the IP address for the desired Collector.
Application Settings
Display Scrolling Status check-
box
Allows the user to choose the amount of detail displayed in the Activity
Log at the bottom of each screen.
Enable Test Reports check-box Determines whether test results are saved to the Test Reports file on
your PC.
Draft 8.5.13

Chapter 3 - Using Endpoint Testing Manager (ETM) Landis+Gyr
48 98-1671 Rev AA User Guide
Baud Rate Selection
The Baud Rate drop-down menu sets connection communications speed.
Enable Field Mode check-box
Checking this box will allow the user to change the mode of the meter
being tested. Unchecking this box allows the user to ensure that meters
are not accidentally put into field mode during a meter test and will hide
the buttons on the Device Test tab.
AMR Password (Utility) drop
down box
This drop down box determines which AMR password is set when the
test is run and the DCW is sent to the meter. Clicking the Setup AMR
Passwords button allows the user to manage the AMR passwords that
are available in this drop down box.
Polling Interval (Secs) drop
down box
Determines how often ETM polls the meter for data. Available intervals
are:
5 seconds (default)
10 seconds
15 seconds
20 seconds
25 seconds
30 seconds
This parameter is also used (and multiplied according to command
choice) for meter response time-out settings, except for WECO actions.
Log Trace Level drop down box
Enables the user to specify the level of information that is logged. The
choices are:
Off: no logging
Error: only logs critical exceptions
Warning: logs all exceptions
Info: logs all messages on a high level
Verbose: logs all activity (default)
Current Encryption Key drop
down box Lists available Encryption Key choices.
Timeout Period (Sec) drop
down box Configures the timeout setting parameter for the WECO library.
Import Security Key <button>
Allows the user to import an encryption security key from RadioShop
and tell ETM what encryption key is used to encrypt/decrypt the meters
tested.
Setup AMR Passwords
<button>
If the meter tested supports AMR passwords, the utility can use this
feature to give the Gridstream module the same AMR password as the
meter so the two can communicate.
Save Settings <button> This button activates saving connection settings so that next time ETM
is launched, the saved settings are restored.
Activity Log
Insert Comment <button> Allows a user to insert comments into the Activity Log. These comments
will also post to the Log file.
Table 3 - 2. Connection Tab
Field Description
Draft 8.5.13
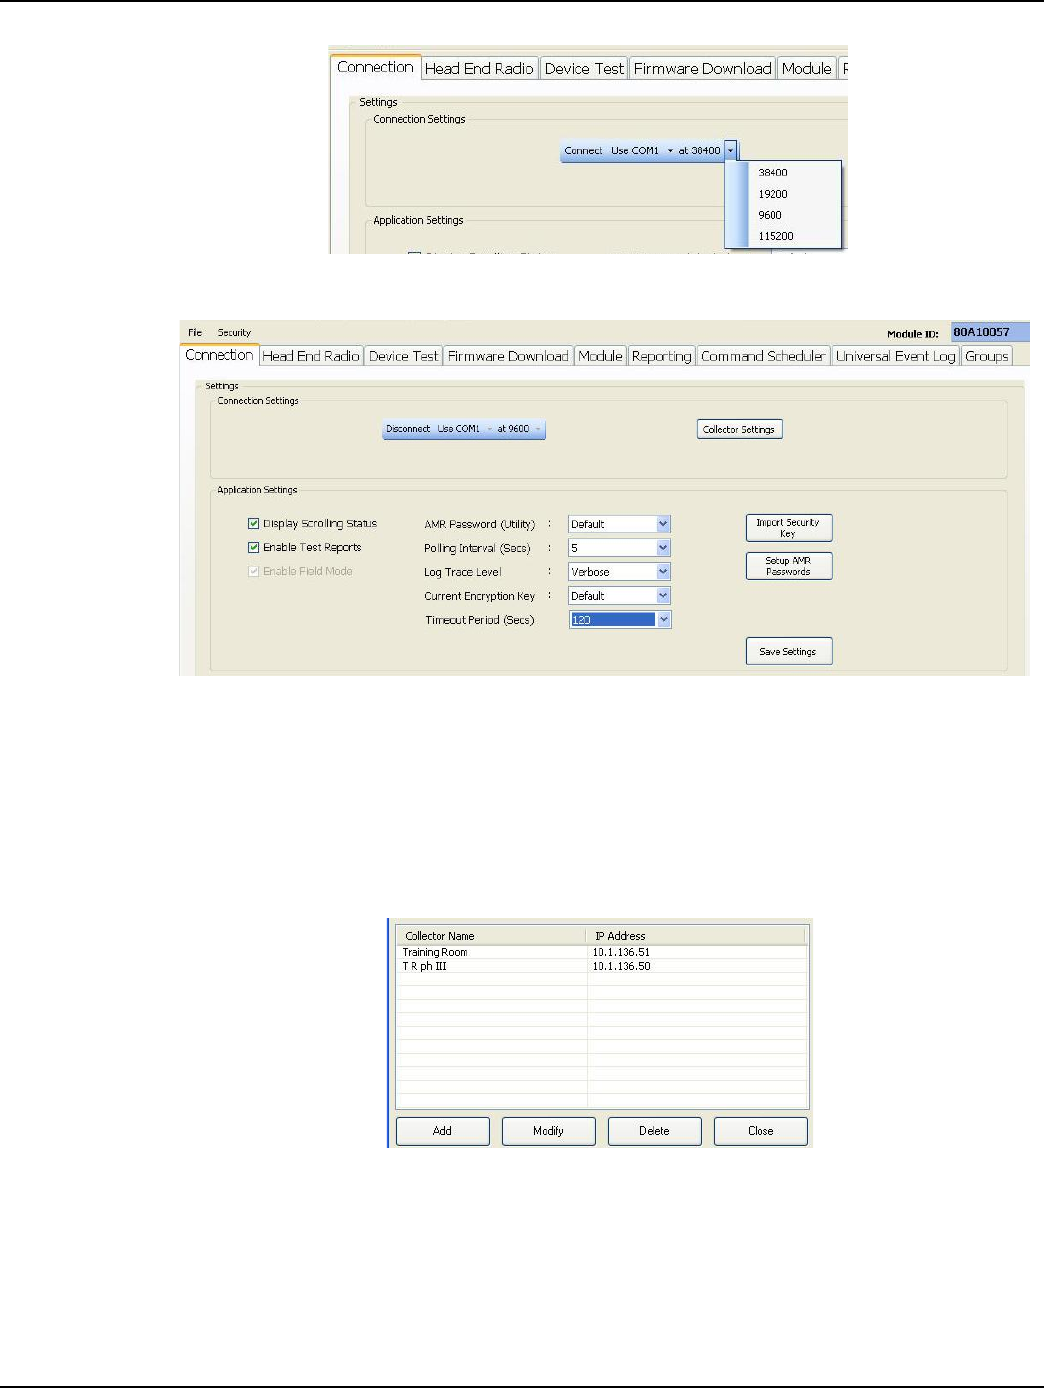
Landis+Gyr Chapter 3 - Using Endpoint Testing Manager (ETM)
User Guide 98-1671 Rev AA 49
Figure 3 - 14. Connection Baud Rate Option Select Drop-down Menu
Figure 3 - 15. Connection Tab Connected to a Radio
Connecting to an Endpoint
The user can connect to an endpoint either through the computer’s COM port or through a Collector.
The Collector Settings button is separate from the endpoint selection process, and enables operator
entry of Collector endpoint connection parameters by using the dialog buttons to fill in or edit table
information.
Figure 3 - 16. Connection Tab Collector Settings dialog
When connecting to any endpoint, the user clicks the Use... drop-down and selects either Collector
or the computer’s COM port.
Draft 8.5.13
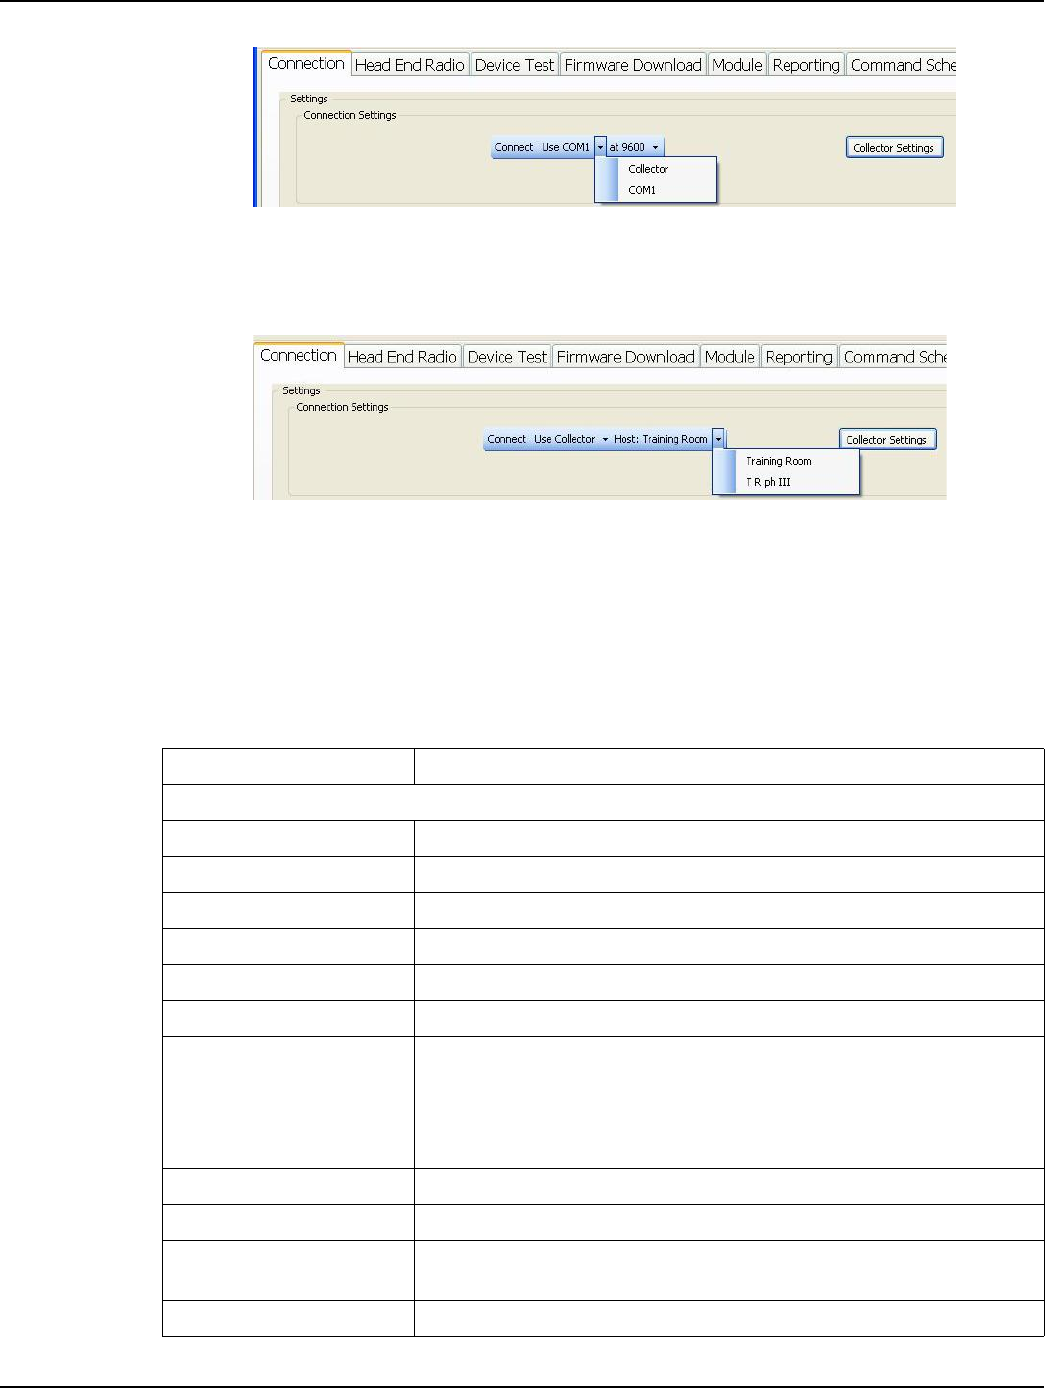
Chapter 3 - Using Endpoint Testing Manager (ETM) Landis+Gyr
50 98-1671 Rev AA User Guide
Figure 3 - 17. Connection Selection drop-down
After Collector has been selected, the endpoint drop-down populates with the previous connected
endpoint’s identifier. To select a different Collector, click the drop-down arrow.
Figure 3 - 18. Choosing a Collector
Head End Radio Tab
The Head End Radio tab displays information about the head end radio currently in use. The Head
End Radio tab can also be used to configure Head End radio settings..
Table 3 - 3. Head End Radio Tab
Field Description
Collector / Integrated WAN Radio
Radio: Displays radio type.
Encryption: Displays whether encryption is enabled or disabled.
Head-end Can be Enabled or Disabled.
Firmware Version: Firmware version for the head-end radio being tested.
Routing: Displays whether routing is enabled or disabled.
Operational: Displays Operational Bit status as enabled or disabled.
LPP Address:
WAN and LAN address for the radio used in the test. After Modify is clicked,
clicking in this field opens the Configure WAN Address dialog (Figure 3 -
20) and permits the user to specify radio WAN Address parameters. If the
radio is a mobile unit, Routing, Time Keeper, and Collector Bit values
cannot be changed.
Network ID: Network ID for the radio being tested.
Baud Rate: Displays the baud rate of the communications channel.
Type: Displays whether Endpoint Testing Manager is connected to a Serial Radio
or a Collector.
Time Keeper: Enables or disables setting the radio as the timekeeper for the network
Draft 8.5.13
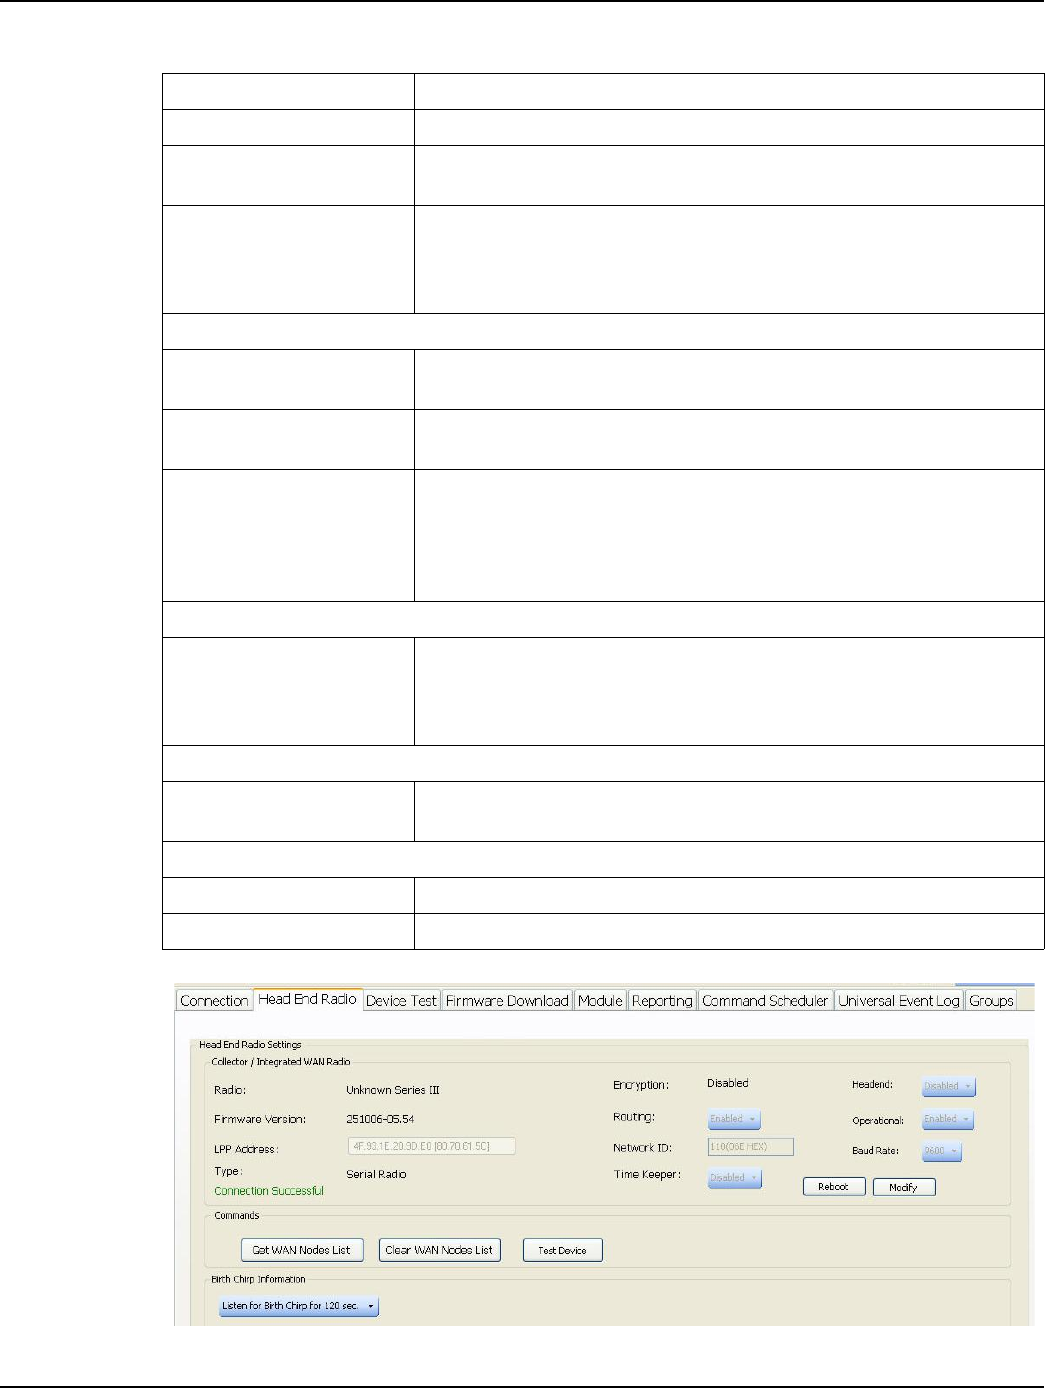
Landis+Gyr Chapter 3 - Using Endpoint Testing Manager (ETM)
User Guide 98-1671 Rev AA 51
Figure 3 - 19. Head End Radio Tab
Reboot <button> Clicking this button restarts the radio’s main board.
Modify <button> According to radio type, clicking this button allows the user to edit radio
parameters.
<Connection Status>
Displays the connection status. The different statuses are:
Connection Successful
Not Supported Meter Device
Failed Connection
Commands
Get WAN Nodes List
<button>
Queries the radio for a list of neighbors and displays these statistics in a
dialog box.
Clear WAN Nodes List
<button>
Deletes all entries from the current WAN Nodes List so that the radio can
refresh the roster of neighbor radios.
Test Device <button>
Allows users to test the head-end radio (whether it's a serial head-end or
Collector head-end radio), after connecting to the head-end using the
Connection tab. This button will test the link to the connected head-end.
After the connection is confirmed, the user can perform other tasks with it
i.e. FW/DCW downloads.
Birth Chirp Information (only available if head-end radio is in field mode)
Listen for Birth Chirp for
<secs> <button>
Allows you to power up a meter and test to see if your head end radio can
communicate with the meter. If so, the Network ID and mode will be
displayed to ensure accurate testing. Use this button to discover a meter’s
CRC and operational mode.
Activity Log
Insert Comment <button> Allows a user to insert comments into the Activity Log. These time-stamped
comments will also list in the Log file.
Status Bar
Connected to... Identifies Authentication Server connection and Security Mode.
MAT Certificate Countdown Displays a time-remaining countdown for the current MAT Certificate.
Table 3 - 3. Head End Radio Tab
Field Description
Draft 8.5.13
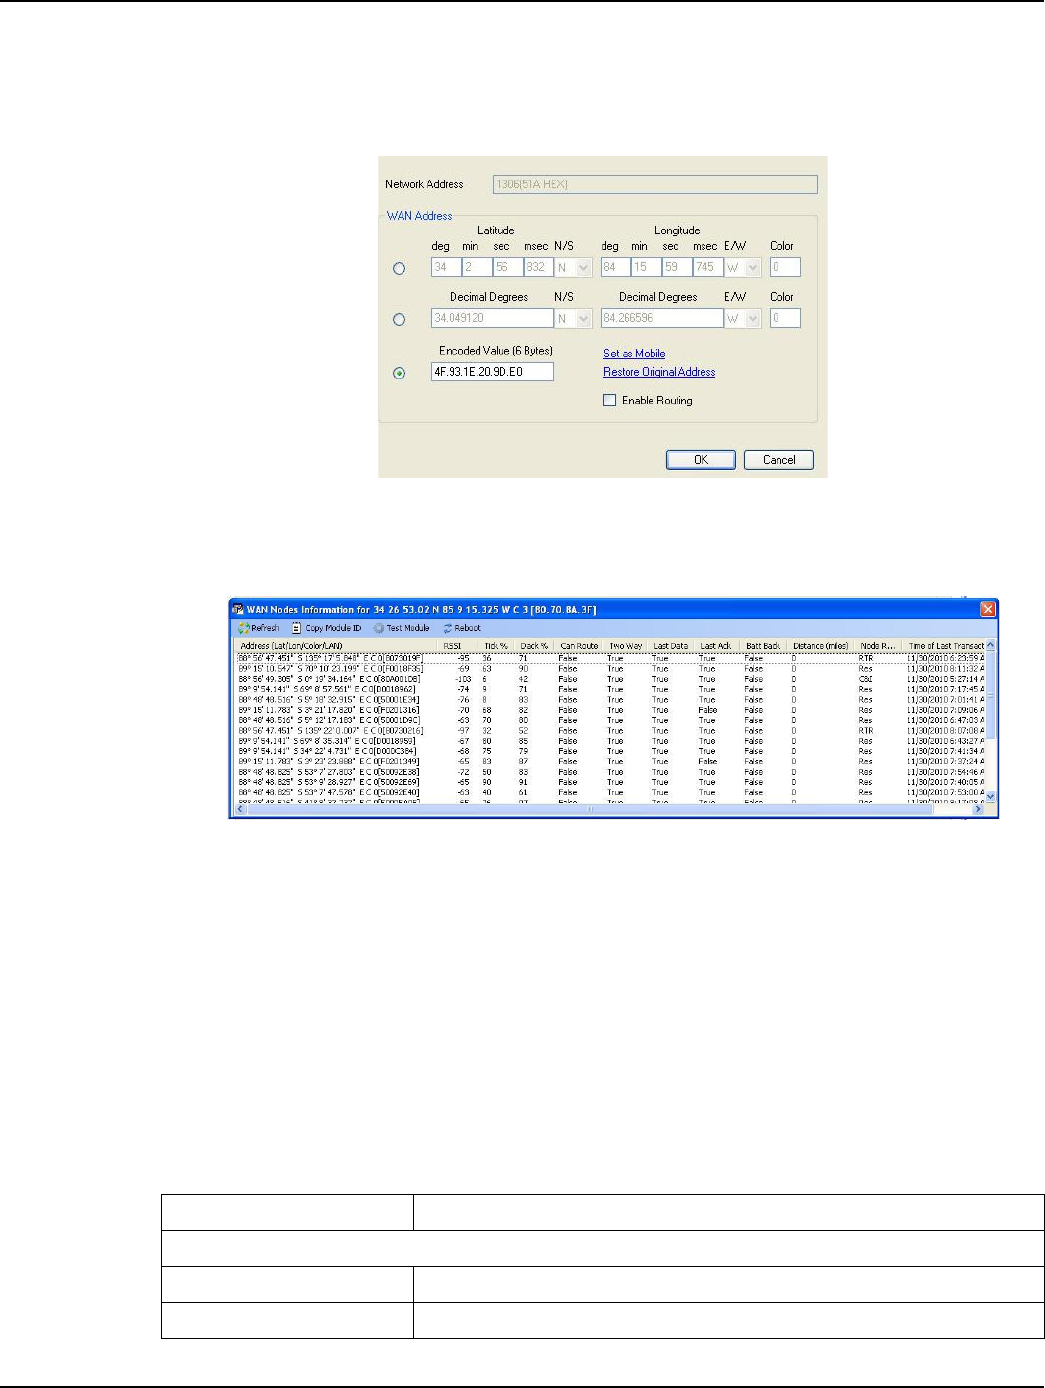
Chapter 3 - Using Endpoint Testing Manager (ETM) Landis+Gyr
52 98-1671 Rev AA User Guide
Clicking the Modify button activates access to many configuration settings and options on this tab.
Entering changes and clicking Apply will provision the radio’s configuration settings with the
entered changes. The radio may also be Rebooted after the Modify button has been clicked.
Clicking the Cancel button closes access to these settings without making any changes.
Figure 3 - 20. Configure WAN Address Dialog
Clicking the Get WAN Nodes List button opens a window that lists neighboring endpoints and
various parameters of those endpoints.
Figure 3 - 21. Get WAN Nodes List
Right-clicking on any radio listed in the WAN Nodes Information table offers the choice of Copy
Module ID To Clipboard (for continuing multiple reference), Test This Module (for immediate
Device Test launch of that specific radio), or Reboot.
Device Test Tab
The Device Test tab provides options for running a test on a meter. The table below describes the
fields located in the Device Test tab. Note that many of these fields are not populated until after a test
on a meter has successfully concluded.
Table 3 - 4. Device Test tab
Field Description
Identifiers
Scan Module ID Scan or manually enter the module ID of the meter that is to be tested.
Scan Serial Number Scan or manually enter the serial number of the meter to be tested.
Draft 8.5.13

Landis+Gyr Chapter 3 - Using Endpoint Testing Manager (ETM)
User Guide 98-1671 Rev AA 53
Scan Meter ID Scan or manually enter the meter ID of the meter to be tested.
“Find device” <>
Opens the Find device dialog for entering the Network Address and used to
locate a device that is a neighbor of the head-end. This function looks at the
neighboring devices of the head-end radio to see if there is one device that
has the same WAN address. If found, the function pulls the module ID of
that device and displays it in the Scan Module ID box.
Start Test <button> Click this button to begin a meter test.
Reset Test <button> Clicking this button resets the input fields.
Module Test Results (these fields will only be populated after the tested endpoint has passed the test and
communicated parameters to ETM)
Endpoint Type of meter that is currently under test.
Firmware Version Module, HAN, and meter firmware versions for the endpoint that has been
successfully tested.
LPP Address The WAN and LAN address for the module of the meter tested.
Encryption Displays module encryption status as either enabled or disabled.
Routing Displays whether module routing is enabled or disabled.
Network ID Network ID for the connected module in both decimal and hexadecimal
formats.
Take Out Point Address for the Take Out Point associated with the tested module.
Mode Settings <Current
Mode>
Displays the current mode of the module. Will be displayed as either Shop,
Field, or Installation.
Shop Mode is a special test mode, used while in manufacturing and
diagnostic troubleshooting, that is turned off at the end of the manufacturing
line. (not available for Concentrators)
Field Mode is for working with installed modules, and sets the module to
listen on the Network ID displayed on the Head End radio tab.
Installation Mode is a temporary state that initiates the first network
synchronization, and the auto registration process.
Meter
Meter Serial Number Serial number for the meter tested.
Meter ID Meter ID for the meter tested.
Disconnect Switch (only visible when the tested meter has an integrated switch)
Status Displays the status of the disconnect switch.
Switch Displays the switch state: either Connected or Disconnected.
Armed Status Displays the armed state. May also display N/A, according to meter and
firmware version.
Utility Voltage Voltage that the utility is providing to the meter.
Customer Voltage If service is connected, will be the same as the Utility Voltage. If
disconnected, will be near zero.
Table 3 - 4. Device Test tab(Continued)
Field Description
Draft 8.5.13

Chapter 3 - Using Endpoint Testing Manager (ETM) Landis+Gyr
54 98-1671 Rev AA User Guide
Mode Settings
Current Mode
Current mode of the IWR connected to the meter under test. The user may
change the mode as needed.
(If you are connected through a Collector, your IWR is always in Field Mode.)
Go to <Mode> <button> Sets the radio to Shop Mode or Field Mode
Set Endpoint to <Mode>
<buttons>
Sets the endpoint to either Shop Mode, Field Mode, or Installation Mode
(if Firmware version is 421 or above), depending on the current state.
With v6.x firmware, Set to Installation is the only enabled mode. Setting an
endpoint to Shop mode is only enabled by a key provided by Landis+Gyr.
Endpoint Settings
Set
AMR Password <button> This button allows you to set the AMR password for endpoints being tested.
Configure Encryption
<button>
This button opens a dialog used to enable or disable encryption on the
meter tested.
Disable Routing <button> This button disables routing through the meter being tested.
Service Connect/Disconnect (only visible when the tested meter has an integrated switch)
Connect <button> Closes the switch (energizes).
Arm <button> Prepares the switch to be closed.
Disconnect <button> Opens the switch (deenergizes).
Get Status <button> Populates the Disconnect Switch section.
Activity Log
Insert Comment <button> Allows a user to insert comments into the Activity Log. These time-stamped
comments will also appear in the Log file.
Table 3 - 4. Device Test tab(Continued)
Field Description
Draft 8.5.13
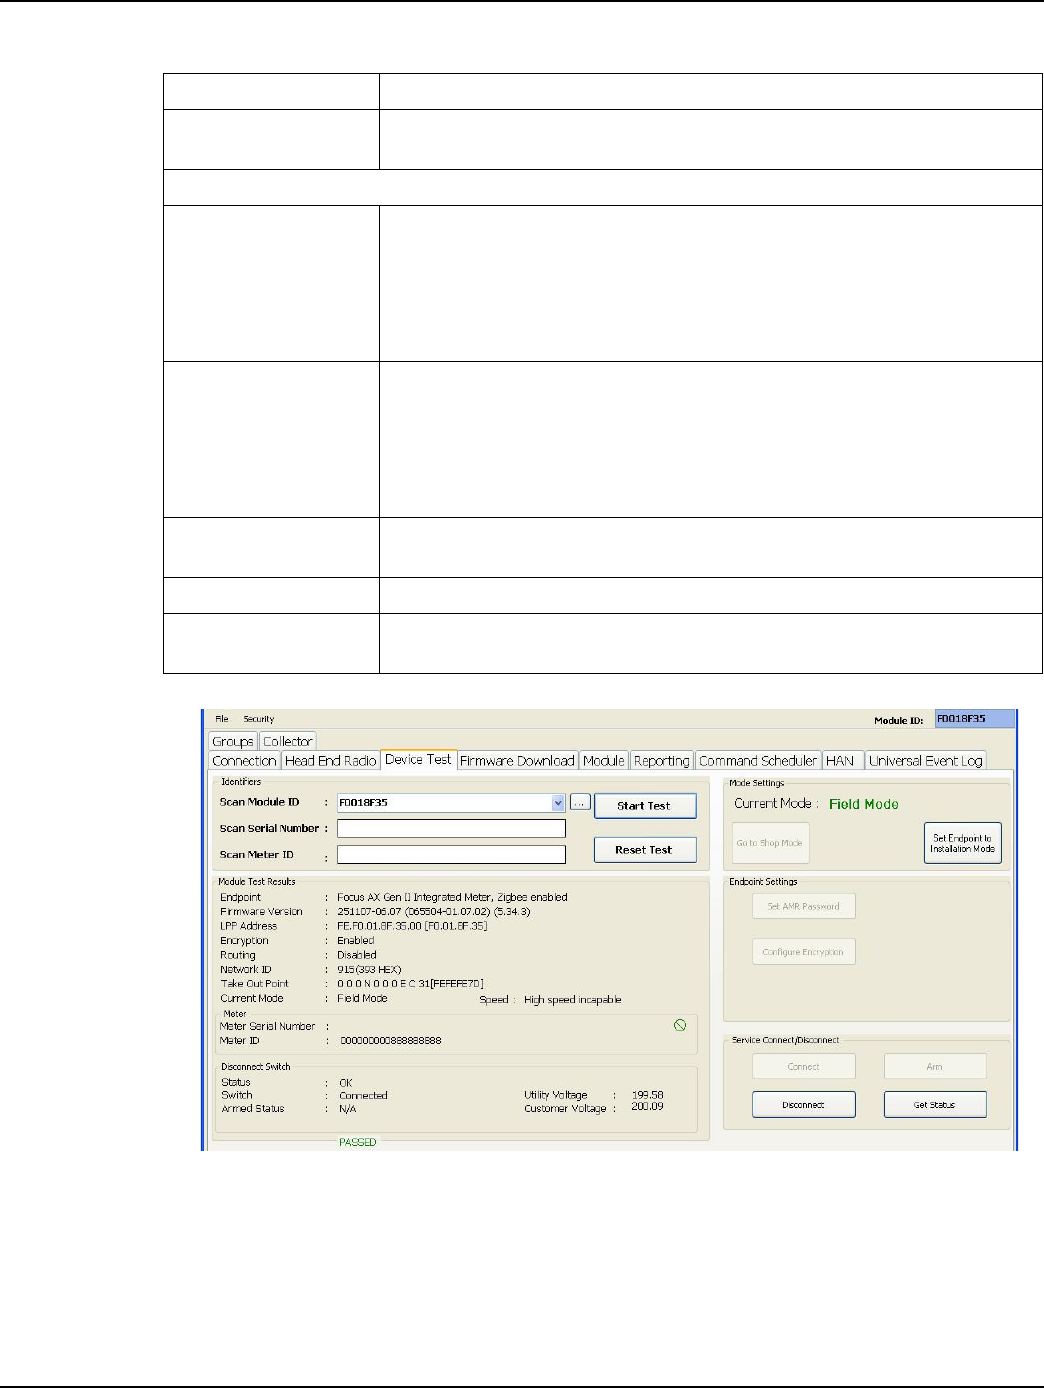
Landis+Gyr Chapter 3 - Using Endpoint Testing Manager (ETM)
User Guide 98-1671 Rev AA 55
Figure 3 - 22. Device Test Tab with Endpoint and Service Settings active
High Speed (115200 bps) Enable
High Speed operation (also referred to as Wide Channel Mode) refers to configuring
communications for 115200 bits-per-second data transmission.
Table 3 - 5. “Find Device” Dialog Parameter Details
Field Description
Network Address The ID number, in decimal and hex formats, of the network that the radio under
test is currently connected to.
WAN Address
Latitude
The latitude of the radio, expressed in:
deg — Degrees
min — Minutes
sec — Seconds
msec — Milliseconds
N/S — North or South
Longitude
The longitude of the radio, expressed in:
deg — Degrees
min — Minutes
sec — Seconds
msec — Milliseconds
N/S — North or South
Color The parameter that differentiates multiple radios installed at one location (that is,
sharing one WAN address).
Decimal Degrees The WAN address of the radio, expressed in decimal degrees.
Encoded Value (six
bytes)
The same WAN address as that specified by the Latitude, Longitude, and Color
values.
Draft 8.5.13
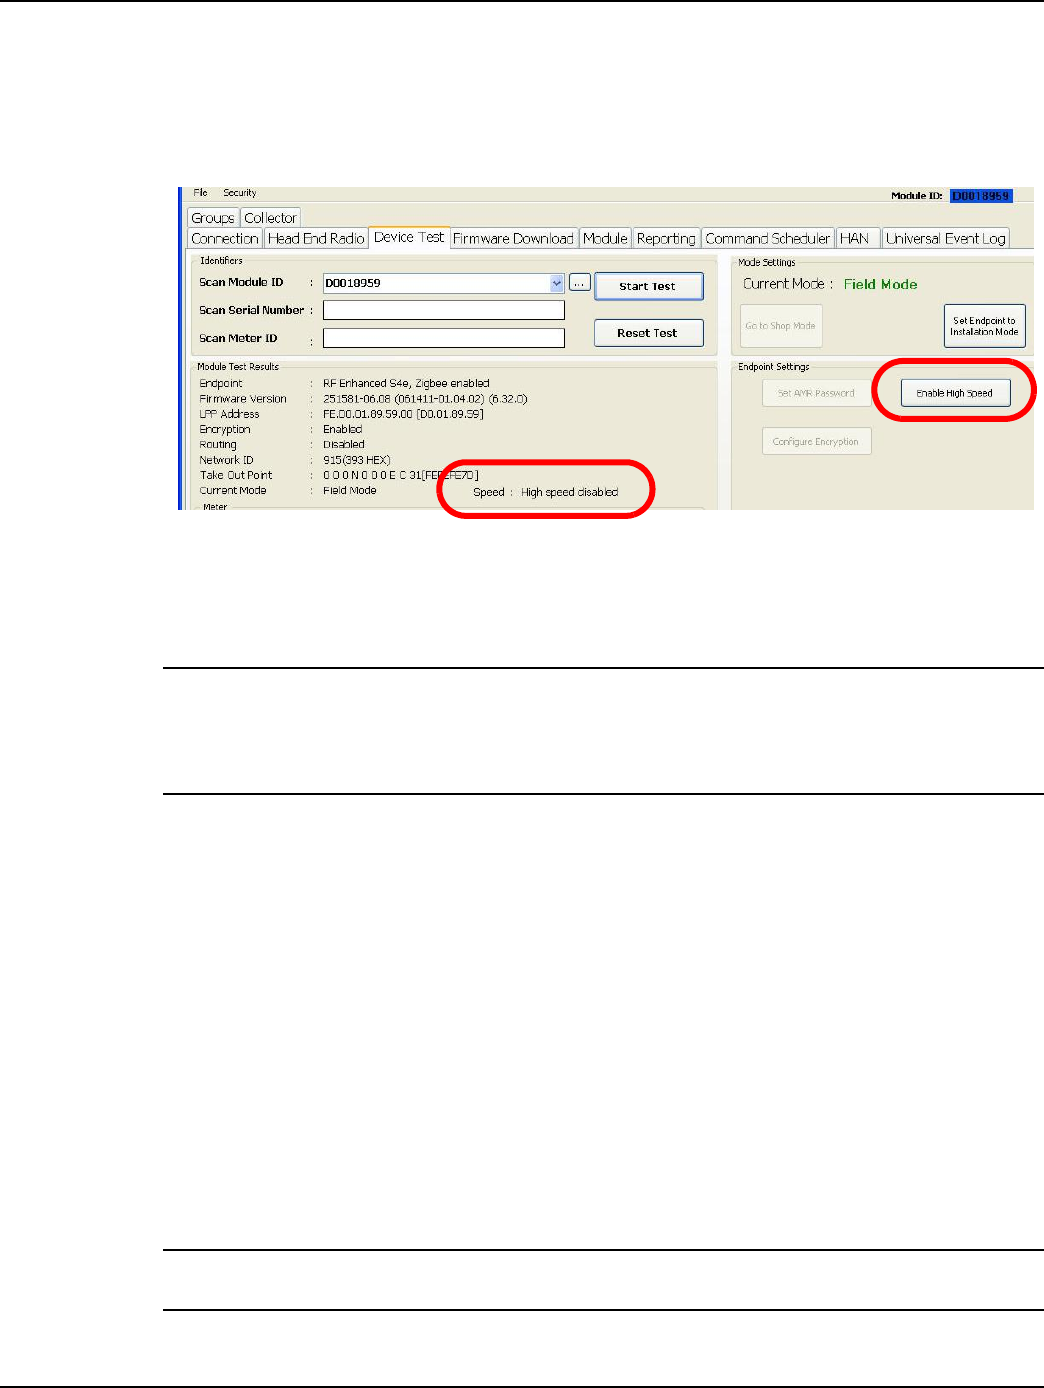
Chapter 3 - Using Endpoint Testing Manager (ETM) Landis+Gyr
56 98-1671 Rev AA User Guide
For high speed-capable endpoints an indication will appear on ETM’s Device Test tab when the
endpoint is connected, as seen in the following figure. Endpoints that do not support high speed
functionality will display High speed incapable in the Speed: call out. The user has the option to
enable high speed operation in a compatible endpoint by clicking the Enable High Speed button in
the Endpoint Settings section of the Device Test tab.
Figure 3 - 23. High Speed Status
After High Speed is enabled, the Speed: call out will display High speed enabled and the Enable
High Speed button label will change to “Disable High Speed.” Clicking the Disable High Speed
button will reset the endpoint to function in standard (“Narrow Channel”) mode.
NOTE: If an endpoint is put into high speed (or “wide channel”) mode, then any other radios that are
running firmware earlier than v5.56 will not be able to communicate with the high speed endpoint
directly. Endpoints that function in standard (“narrow channel”) mode can only communicate with
radios operating in high speed mode as long as the standard mode radios are running firmware
v5.56 or higher.
Multiple Meter Test Mode
Once enabled, the Multiple Meter Test Mode supports a single ETM instance testing a large number
of meters in one session.
Enabling Multiple Meter Test Mode
To enable Multiple Meter Test Mode, you must use Windows Notepad (or your preferred text editor)
to add a special key (provided by your Landis+Gyr Program Advisor) to the Settings.XML file
located at:
•C:\ProgramData\Landis+Gyr\Gridstream\Tool Settings\Settings.XML on Vista or Win7
systems.
•C:\Documents and Settings\All Users\Application Data\Landis+Gyr\Gridstream\Tool
Settings\Settings.XML on WinXP systems.
NOTE: The Landis+Gyr program advisor can provide the key required to activate the Multiple Meter
Test Mode feature.
Draft 8.5.13
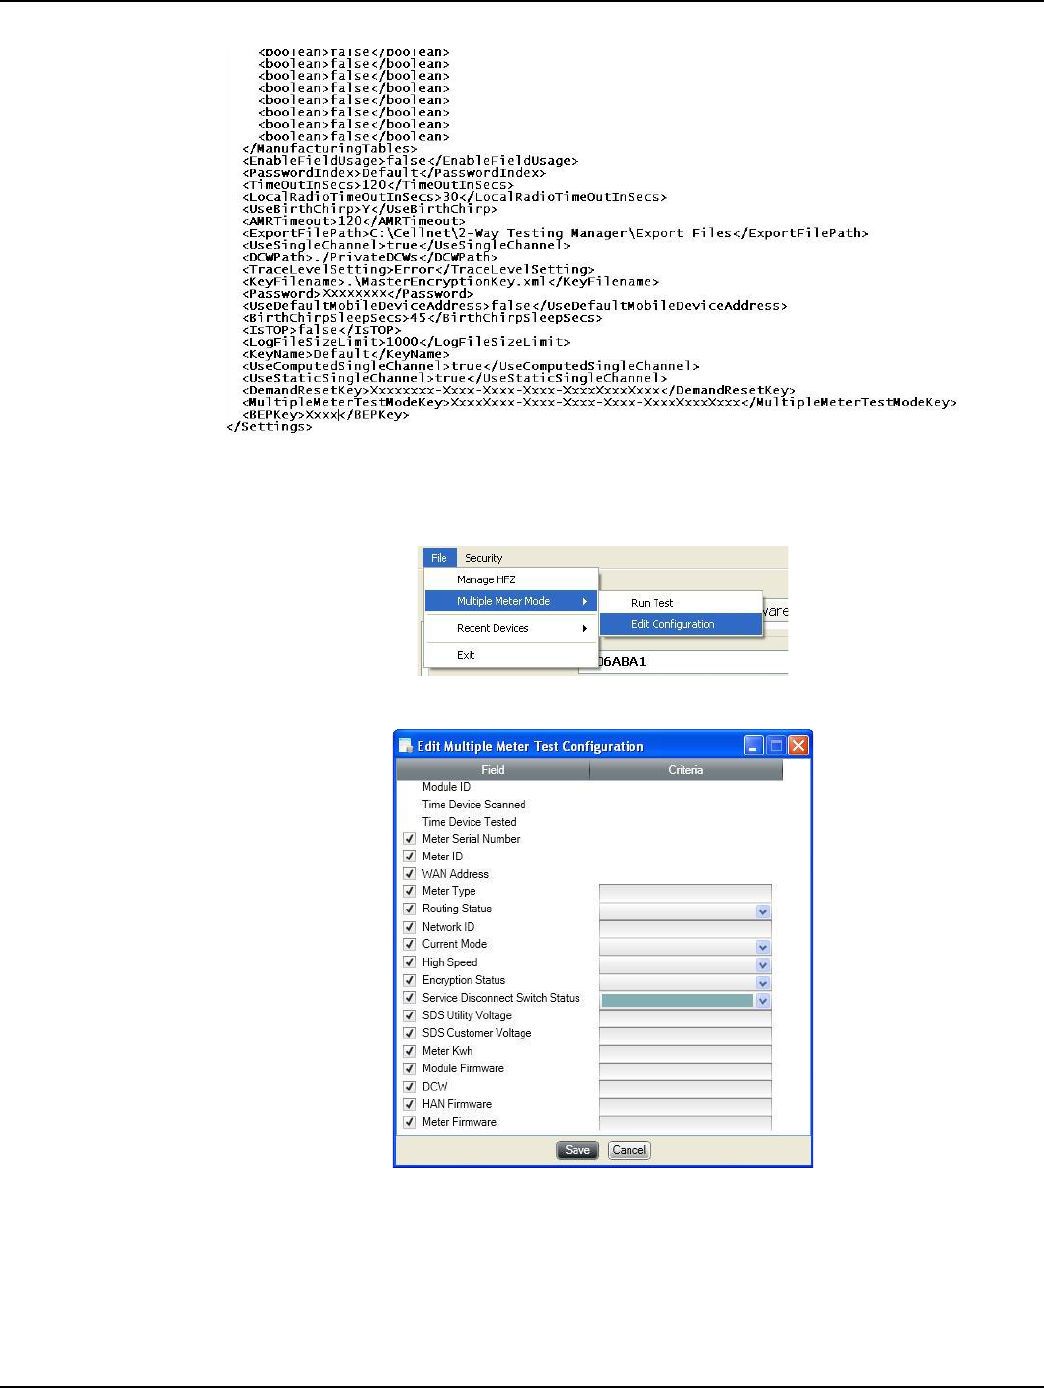
Landis+Gyr Chapter 3 - Using Endpoint Testing Manager (ETM)
User Guide 98-1671 Rev AA 57
Figure 3 - 24. Settings.XML File Detail
Editing Multiple Meter Test Configuration
Figure 3 - 25. Accessing Multiple Meter Test Configuration
Figure 3 - 26. Edit Multiple Meter Test Configuration Dialog
The Edit Multiple Meter Mode Test Configuration dialog allows users to select the fields that will
appear on the Multiple Device Test Results screen. The Edit Multiple Meter Mode Test
Configuration dialog also supports data filtering by allowing users to specify values to test against
for a selected field.
Draft 8.5.13
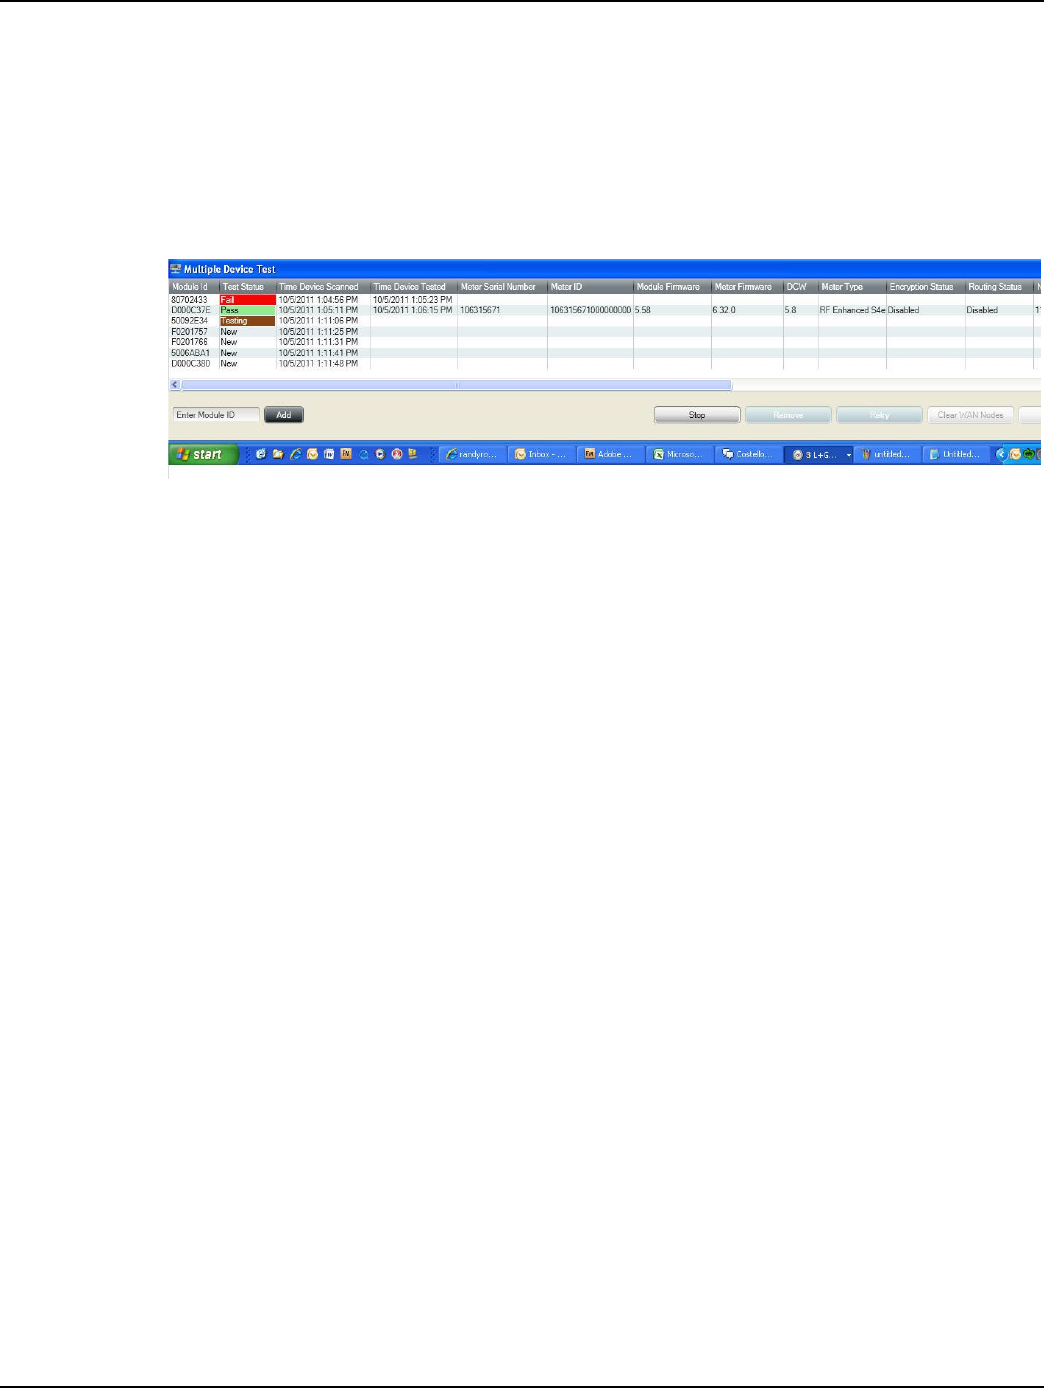
Chapter 3 - Using Endpoint Testing Manager (ETM) Landis+Gyr
58 98-1671 Rev AA User Guide
For example, if the user wants testing to confirm that the module firmware version is 07.06, this
parameter can be specified in the Module Firmware field of the Edit Multiple Meter Mode Test
Configuration dialog. When the test is run, ETM will read the module firmware version from the
meter and compare it with the user-specified value. If these values do not match, an error will
display.
Clicking File | Multiple Meter Mode | Run Test will open the Multiple Device Test Results
screen. Meters to be tested are entered using the Add button at the lower left of that screen.
Figure 3 - 27. Multiple Device Test Results Screen
When the Multiple Device Test screen opens, ETM waits for a device ID to be entered so that it can
begin testing. Testing can be halted by clicking the Stop button. After a Module ID is added, testing
begins on the first device in the list, continuing through the entire list.
Devices that pass testing will populate the columns with data selected on the Edit Multiple Meter
Test Configuration dialog. Modules that fail testing will display Fail in a red-highlighted cell in the
Test Status column. If the user hovers their cursor over the Fail indication, the reason for the failure
will appear.
The user can Retry testing on the selected module by clicking that button. Pressing the Ctrl+A keys
selects all modules in the list.
When testing is not active, the user can use the buttons at lower right to Clear WAN Nodes in the
test, and Close the Multiple Device Test screen.
After testing concludes, a log file is created and placed under the Multiple Meter Testing folder in
the ETM installation directory.
Firmware Download Tab
The Firmware Download tab allows you to view the current firmware on the module and download
a new firmware.
For Modular Focus AX meters running 5.13 module firmware and above, ETM now supports
metrology firmware download over the air. This action functions in a manner similar to Module/
HAN firmware download.
For Integrated Focus AX meters, only the Module Firmware option appears. The metrology
firmware upgrade occurs automatically within the build.
Draft 8.5.13

Landis+Gyr Chapter 3 - Using Endpoint Testing Manager (ETM)
User Guide 98-1671 Rev AA 59
The table below describes the fields on the Firmware Download tab.
NOTE: Field visibility on the Firmware Download tab will vary according to current module firmware
version. There may be limits on firmware administration access with endpoints running module
firmware previous to v6.x.
Table 3 - 6. Firmware Download Tab
Field Description
Download Status
Firmware Download Progress Displays the percentage status of a firmware download after the Start
Download button is clicked.
Module: Version <Firmware Version Number>
Upgrade To: Drop Down Box
Displays the module firmware upgrade versions that are available to and
supported by the endpoint tested.
The current firmware version is displayed in the title of the field. For
example, Module: Version 251581-06.08
Download Delay Rate (In
Secs) Drop Down Box
Specifies the delay (in seconds) between sending firmware packets. For
large files, you can break up the firmware information that is sent between
the radio and the module and ensure that network bandwidth is not
overwhelmed.
Start Download <button> Clicking this button will begin downloading the firmware version specified
in the Upgrade To: drop down box to the module.
Meter: Version <Firmware Version Number>
Upgrade To: Drop Down Box
Displays the meter upgrade firmware versions that are supported by the
endpoint tested, and a list of the minimum and maximum meter firmware
versions that the connected meter must be running in order to download
the metrology firmware.
The current firmware version is displayed in the title of the field. For
example, Meter: Version 5.34.3
Download Delay Rate (In
Secs) Drop Down Box
Specifies the delay (in seconds) between sending firmware packets as
described in Module <F/W Version #> above.
Start Download <button> Clicking this button will begin downloading the firmware version specified
in the Upgrade To: drop down box.
ZigBee: Version <Version Number> (displays when connected to a ZigBee-capable meter)
Upgrade To: Drop Down Box
Displays the module ZigBee versions that are supported by the endpoint
tested.
The current version is displayed in the title of the field. For example,
ZigBee: Version 061411-01.04.02
Activity Log
Insert Comment <button> Allows a user to insert comments into the Activity Log. These time-
stamped comments will also post to the Log file.
Draft 8.5.13
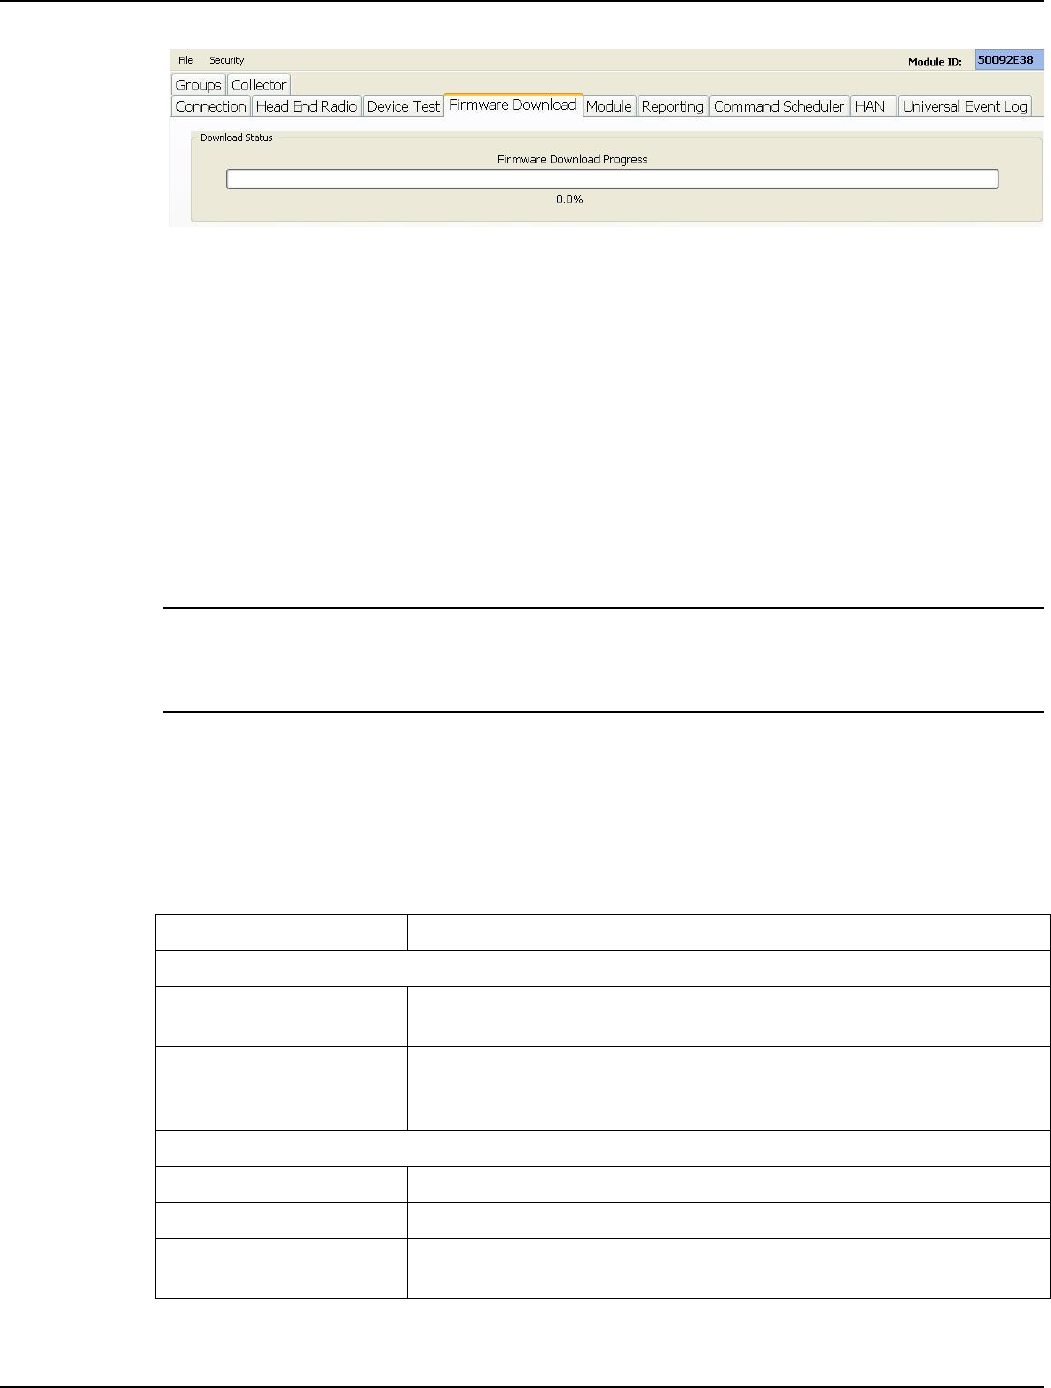
Chapter 3 - Using Endpoint Testing Manager (ETM) Landis+Gyr
60 98-1671 Rev AA User Guide
Figure 3 - 28. Firmware Download Tab Connected to an Endpoint with v6.x Firmware
Battery End Point Firmware Download
No meter specifics will be displayed on this tab when ETM is connected to a battery end point.
Module version will be displayed, and firmware unique to the connected (battery end point) module
will be found on the drop-down menu.
Select the firmware for download by highlighting and click the Start Download button to launch the
event.
Module Tab
NOTE: Due to the differences in meter setup with integrated Focus AX meters, only the Module
Firmware option appears on the Module tab when ETM connects to an integrated Focus AX meter.
Metrology firmware upgrades occur automatically within the build; other fields on this screen are
not necessary for endpoint configuration.
The Module tab is comprised of the DCW Information, Timing, Current Time, Set Time, and
Command fields. The fields on this tab are only enabled if a meter has been run with a status of
Passed.
The table below describes the fields on the Module tab.
Table 3 - 7. Module Tab
Field Description
DCW Information
Get DCW Information
<button> Provides the most current DCW information of the endpoint tested.
Install DCW <button>
Allows you to load a DCW on the endpoint tested.
The DCW available for download will be limited to the latest specified DCW
for the firmware version on the meter.
Timing
Module Time (GMT) Displays the current module time.
Meter Time (GMT) Displays the current meter time.
Get Time Delta <button> Generates a report that displays the difference between the module time and
the meter time. Closing the report enables the Sync Meter and Module button
Draft 8.5.13
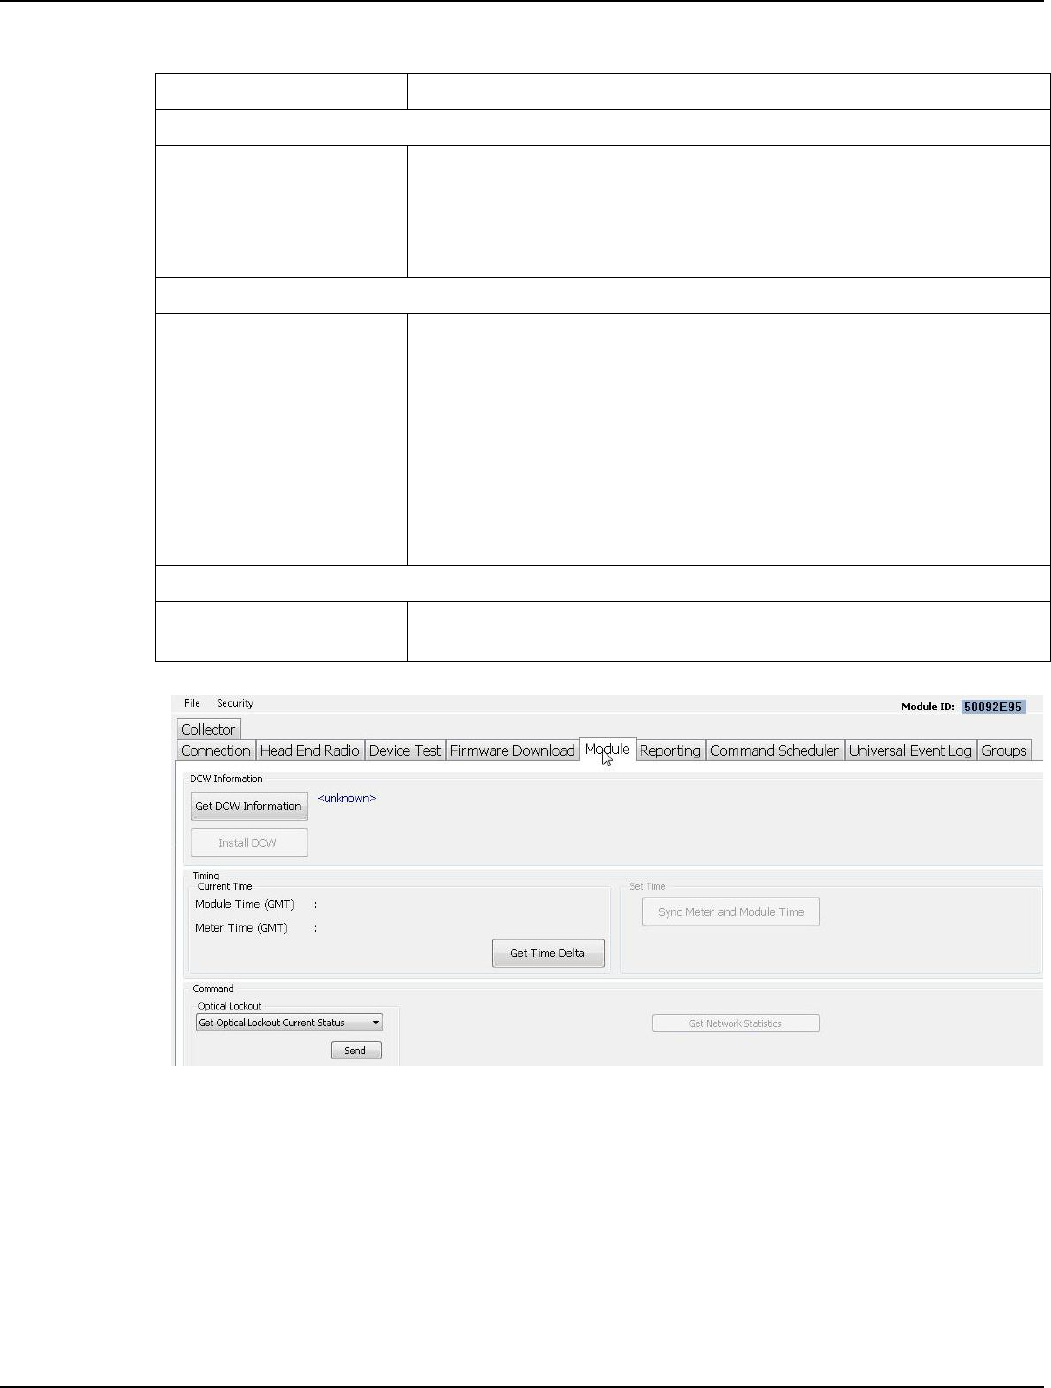
Landis+Gyr Chapter 3 - Using Endpoint Testing Manager (ETM)
User Guide 98-1671 Rev AA 61
Figure 3 - 29. Module Tab
Optical Lockout
For compatible endpoints (FOCUS AX with metrology version 5.36 or higher, etc.), a section that
appears on ETM’s Module tab is active, as seen in the previous figure. (Endpoints that do not
support this feature will display this function, but it will be “grayed out” to represent connection to
an incompatible endpoint).
This setting includes options to:
•Get current status
Set Time
Sync Meter and Module
Time <button>
On connected meters with applicable firmware, this button is enabled after
the Get Time Delta button is clicked and the resulting report is closed. Once
enabled, clicking this button synchronizes meter time with module time. After
Meter and Module Time are synchronized, “Time Sync Completed” will
display in the Set Time box.
Command
Optical Lockout
When connected to compatible meters with applicable firmware, allows the
user/tester to configure the meter’s Optical Lockout parameter. This setting
includes options to:
Get current status
Lock the port indefinitely
Unlock the port for <user-specified> minutes
Unlock the port indefinitely
There is also a button to Send the command to the connected meter.
When the time parameter command is used, a data entry field appears for
entering the Minutes parameter.
Activity Log
Insert Comment <button> Allows a user to insert comments into the Activity Log. These time-stamped
comments will also post to the Log file.
Table 3 - 7. Module Tab(Continued)
Field Description
Draft 8.5.13
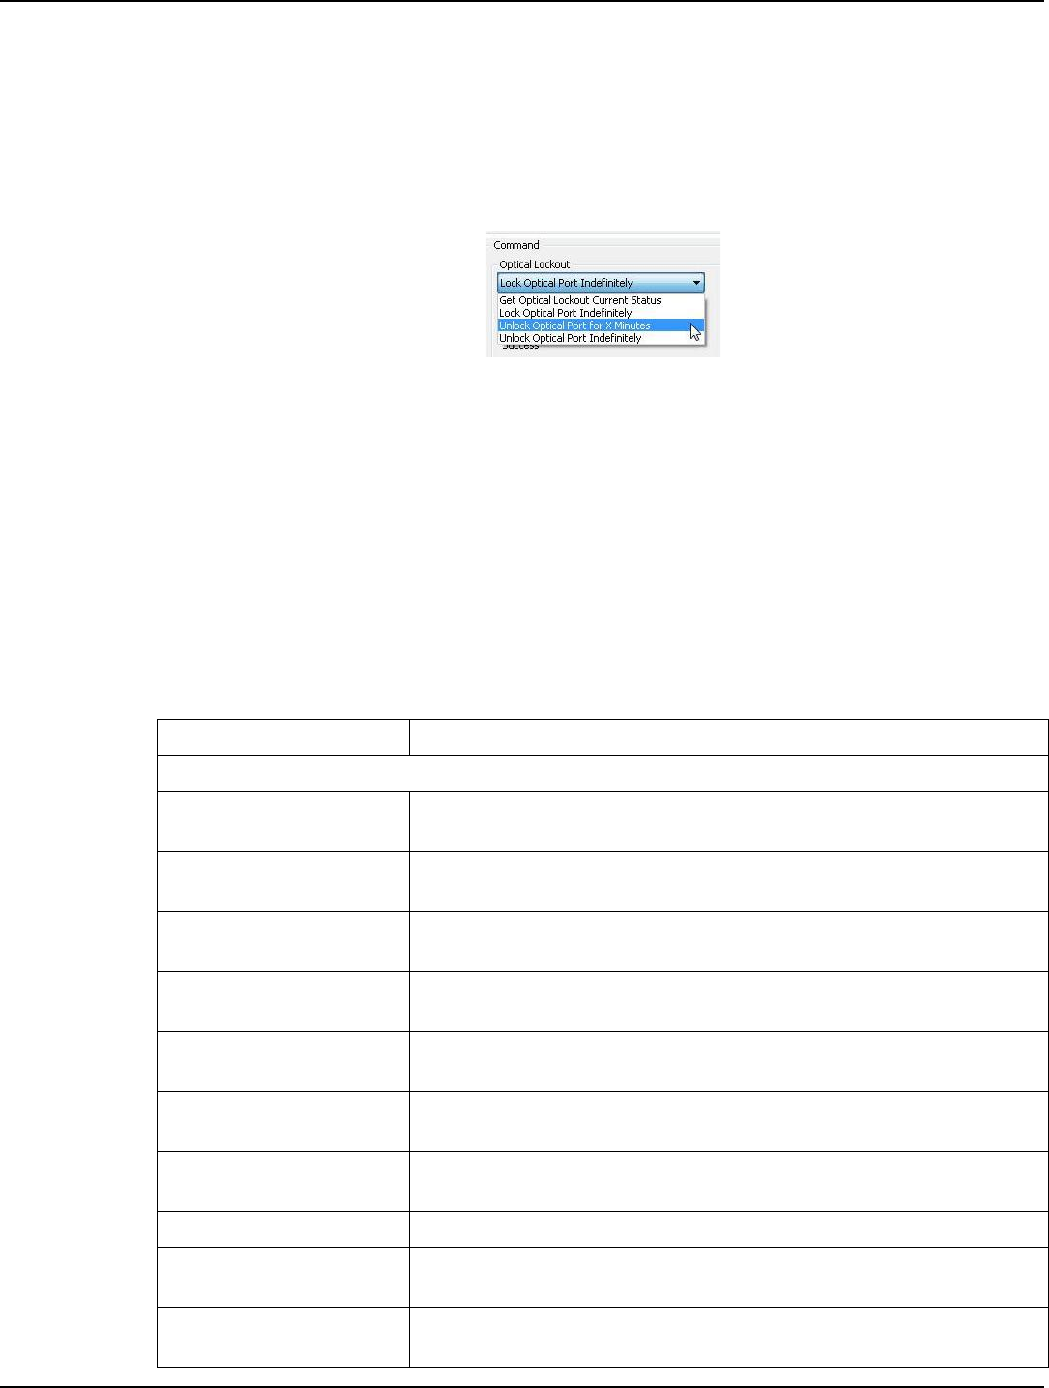
Chapter 3 - Using Endpoint Testing Manager (ETM) Landis+Gyr
62 98-1671 Rev AA User Guide
•Lock the port indefinitely
•Unlock the port for <user-specified> minutes
•Unlock the port indefinitely
After a choice has been selected from the drop-down menu, the Send button executes the command.
An illustration for the available Optical Lockout functions appears below.
Figure 3 - 30. Optical Lockout Drop-down Menu
For the “X Minutes” selection, a data entry field appears for the user to enter the desired value, after
which pressing the Send button, as with the other options, executes the command.
Reporting Tab
The Reporting tab is comprised of the Meter Information, ANSI Tables and Reports fields. The
fields on this tab are only enabled if a meter test has been run and has a status of Passed.
The table below describes the fields on the Reporting tab.
Table 3 - 8. Reporting Tab
Field Description
Meter Information
Meter Configuration Check-
box
Loads tables to display meter specific configuration parameters (e.g. load
profile, interval length, channel selection).
“Landis+Gyr Meter
Configuration” Check-box
Loads information about proprietary configuration parameters (time sync
configuration, etc.).
LP Data Check-box Loads tables that display the last two blocks of load profile data (interval
data).
Energy and Demand / TOU
Check-box Loads Time-Of-Use tables for meter register data.
Demand Reset Data / TOU
Check-box Loads Time-Of-Use tables for meter demand data.
Meter History Log Data
Check-box Loads tables that displays the meter history.
Latest Snap Read Check-
box Loads tables for meter time-of-use data.
Vector Data Check-box Loads tables containing instantaneous meter data.
Meter Event Log Data
Check-box Loads tables that display the meter events that have occurred.
Status Summary Check-box Loads a table that displays disconnect switch status and meter time sync
information.
Draft 8.5.13
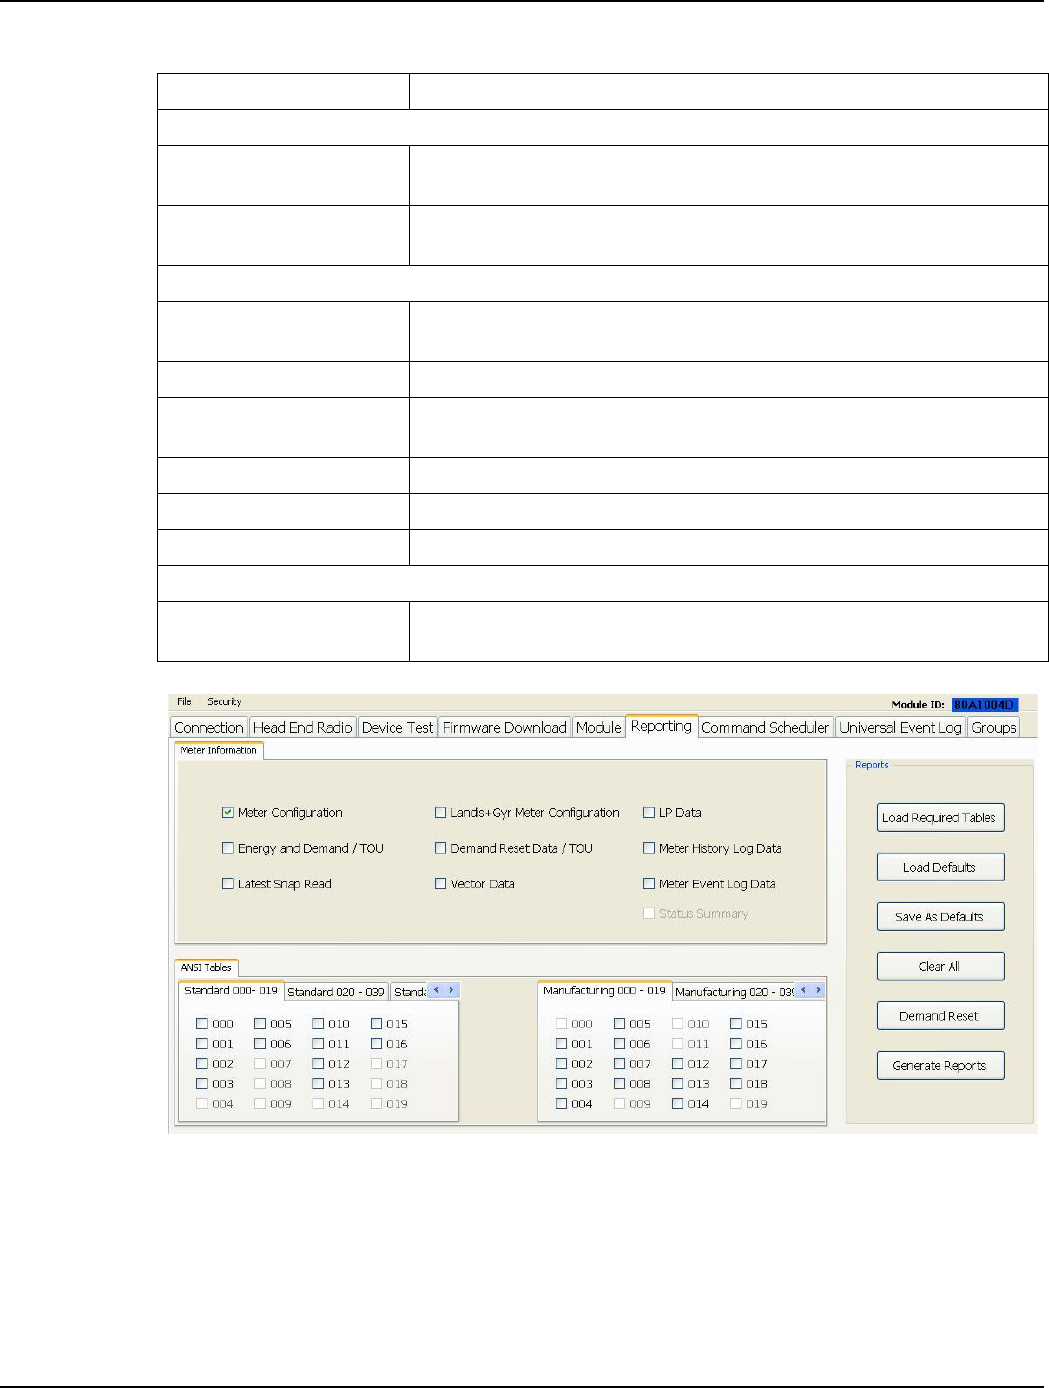
Landis+Gyr Chapter 3 - Using Endpoint Testing Manager (ETM)
User Guide 98-1671 Rev AA 63
Figure 3 - 31. Reporting Tab
Demand Reset
Demand Reset is a function performed on the meter. The meter stores peak demand information. A
demand peak is determined by taking the kWh (kilo-watt hours) used over a configured demand
window and converting it to kW (kilo-watts). This is done by multiplying the kWh by 60 and
dividing that number by the window length. This information is used to bill the utility customer.
ANSI Tables
Standard 000 - 099 Selecting specific check-boxes will load the corresponding ANSI Standard
tables.
Manufacturing 000 - 099 Selecting specific check-boxes will load the corresponding ANSI
Manufacturing tables.
Reports
Load Required Tables
<button> Loads the tables that are required to run a report.
Load Defaults <button> Loads any tables that have been saved as default.
Save As Defaults <button> Clicking this button will save currently selected tables as defaults that will be
brought up at a later time by clicking the Load Defaults button.
Clear All <button> Clears any check-boxes that are selected.
Demand Reset <button> Launches the function. See details in the Demand Reset heading below.
Generate Reports <button> Generates reports for the tables selected.
Activity Log
Insert Comment <button> Allows a user to insert comments into the Activity Log. These time-stamped
comments will also post to the Log file.
Table 3 - 8. Reporting Tab
Field Description
Draft 8.5.13

Chapter 3 - Using Endpoint Testing Manager (ETM) Landis+Gyr
64 98-1671 Rev AA User Guide
Demand Reset is determined by taking the difference of the peak demand value between the current
time and the time of the last Demand Reset.
The purpose of the Demand Reset is to capture peak demand values and the times at which those
values were recorded since the last time the Demand Reset procedure was executed. The Demand
Reset takes a snapshot of the current instantaneous values, along with the demand readings, and
stores that information in a holding place on the endpoint. As part of this process, the five highest
demand readings are reset to zero.
NOTE: The program administrator can provide the key required to enable and configure Demand
Reset features.
The Demand Reset action can only be activated after the Meter Configuration report has been
retrieved. Select (click the checkbox beside) the Meter Configuration report option and click the
Generate Report button. Once this report is obtained, the Demand Reset button will be enabled.
Enabling Demand Reset
To enable the Demand Reset feature, you must use Windows Notepad (or your preferred text editor)
to add a special key (provided by your Landis+Gyr Program Advisor) to the Settings.XML file
located at:
•C:\ProgramData\Landis+Gyr\Gridstream\Tool Settings\Settings.XML on computers using
either the Vista or Win7 operating systems.
•C:\Documents and Settings\All Users\Application Data\Landis+Gyr\Gridstream\Tool
Settings\Settings.XML on computers using the WinXP operating system.
Demand Reset Lockout
The Demand Reset feature is limited by the lockout window parameter. The lockout window is a
safety feature to ensure that Demand Reset data will not be lost by accidentally executing too many
demand resets.
Some meters have a meter-enforced lockout period. During this lockout period, the meter will return
an error code and no Demand Reset will be performed.
By default, the Demand Reset lockout window is set to 24 hours. If a different value is preferred,
locate the Demand Reset Lockout parameter in the Settings file mentioned above and change the
number to set the hour value for the desired Demand Reset lockout window parameter.
Performing a Demand Reset
Clicking the Demand Reset button on the Reports tab launches a Demand Reset action. The Activity
Log will display Waiting for Demand Reset Response, followed by progressive communication
events.
For a successful action, Demand Reset response received and then Demand Reset Status: Success
will display in the ETM Activity Log.
Draft 8.5.13
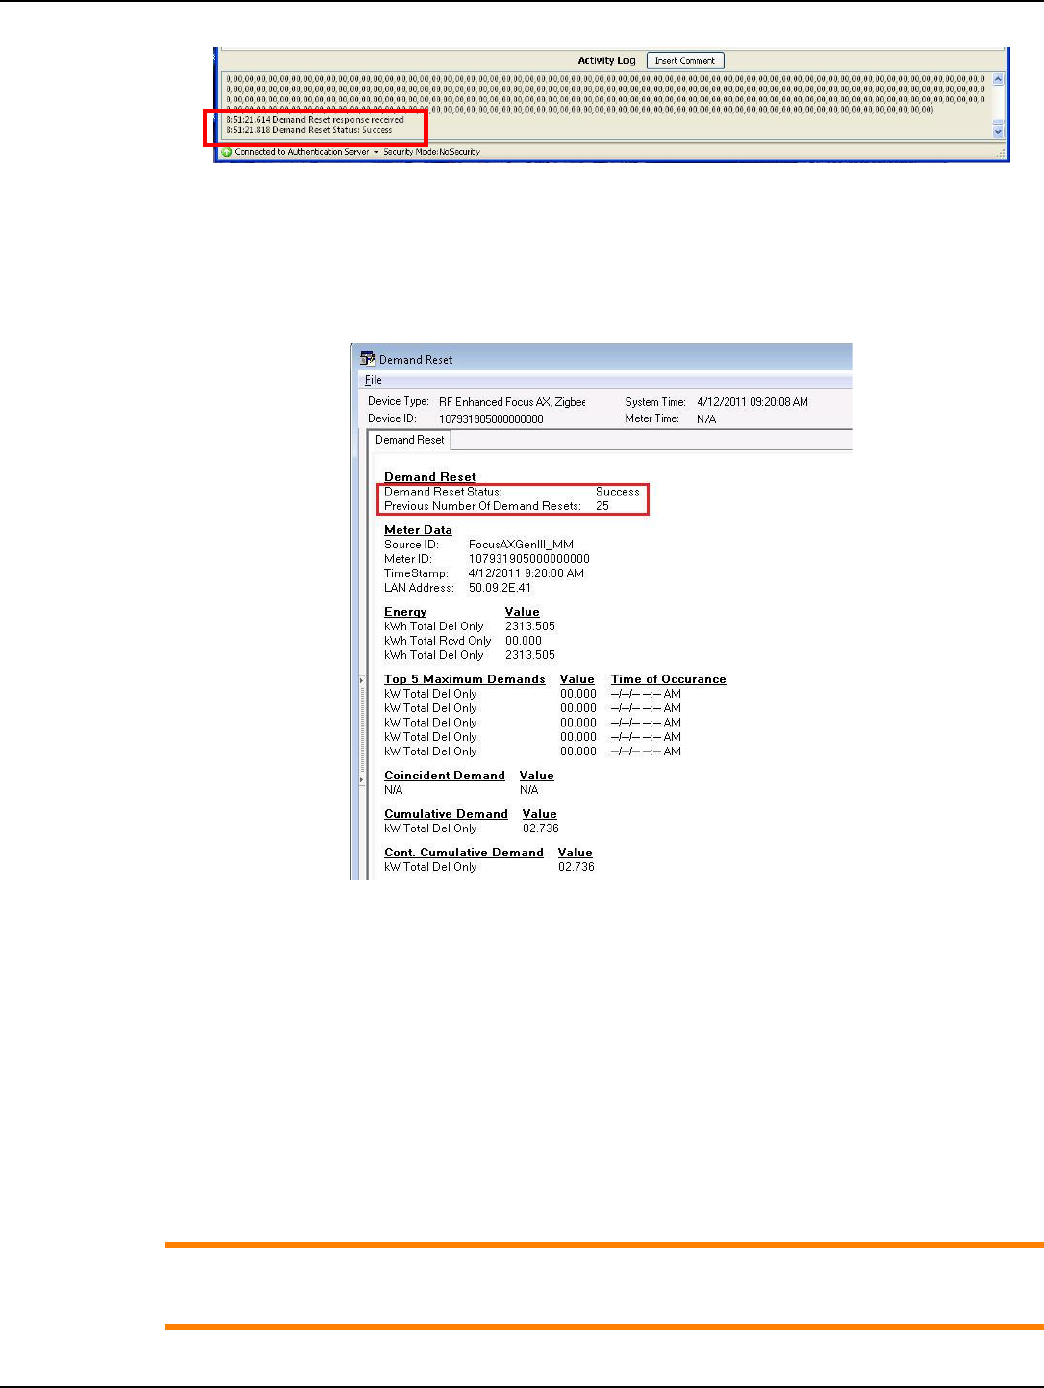
Landis+Gyr Chapter 3 - Using Endpoint Testing Manager (ETM)
User Guide 98-1671 Rev AA 65
Figure 3 - 32. Demand Reset Status: Success
Simultaneously, a Demand Reset report will display. This report is similar to the Demand Reset
Data/TOU report output, except that it shows the status of the Demand Reset operation as
highlighted below. The Demand Reset report also lists the previous number of demand resets
reported by the meter. A portion of that report is shown below.
Figure 3 - 33. Demand Reset Report
The Demand Reset Report’s File menu offers options to Print a hard copy or to Save the report in
XML or HTML formats, along with a Page Setup choice.
Demand Reset Restriction
A Demand Reset Action may only be performed once every 24 hours.
Command Scheduler Tab
The Command Scheduler tab, as shown in Figure 3 - 34, is comprised of the Event Mask, Command
Schedule, and Activity Log fields.
ACAUTION: When an endpoint is hosted by Command Center, all schedules are managed by
Command Center. Endpoint Testing Manager should not be used to make changes to this
command schedule.
Draft 8.5.13

Chapter 3 - Using Endpoint Testing Manager (ETM) Landis+Gyr
66 98-1671 Rev AA User Guide
The table below describes the fields on the Command Scheduler tab.
Table 3 - 9. Command Scheduler Tab
Field Description
Event Mask: over 100 choices are available for notification scheduling. Choices for event masking include:
Disabled, Log Only, Advisory, and Alarm.
Erase Control
EraseZero Always the best choice for this screen. This option makes no changes to
existing parameters.
EraseAll Never to be used unless a start-from-zero meter commissioning action is in-
process.
EraseCommands Clears commands that have been entered into the Command section of the
Command Scheduler tab.
Command Schedule
<Command Type>
Cached Reads /
Passthru PDU command /
Interval Data Pump /
Snap Read Pump /
Advisory Events /
Init Push Message /
Meter Events /
Radio Virtual Memory Read
(Short) /
WAN Node Information
Read /
Predefined Memory Read
Command chosen by the user for implementation and notification.
Start Time Displays the user-selected date and time for launching the specified
command.
<Period Type>
Run Minute based /
Run Day based
User-programmed test parameter types for command launch intervals.
<Test Interval Setting>
Cached Read /
Run Randomized /
Normal
User-programmed test parameter intervals for command launch.
Period display The user-defined data field that displays the test interval.
Accept / Cancel Clicking this button sets the changed parameter for the command being
configured or cancels the change.
<Buttons>
Get Scheduled Commands Polls the meter to refresh the scheduled commands.
Display Scheduled
Commands Report Displays a report of the scheduled commands.
Set Scheduled Commands
Loads all new commands into the meter. The user MUST click Get
Scheduled Commands to verify that the new commands have loaded.
Confirmation does not appear in the Activity Log.
Draft 8.5.13
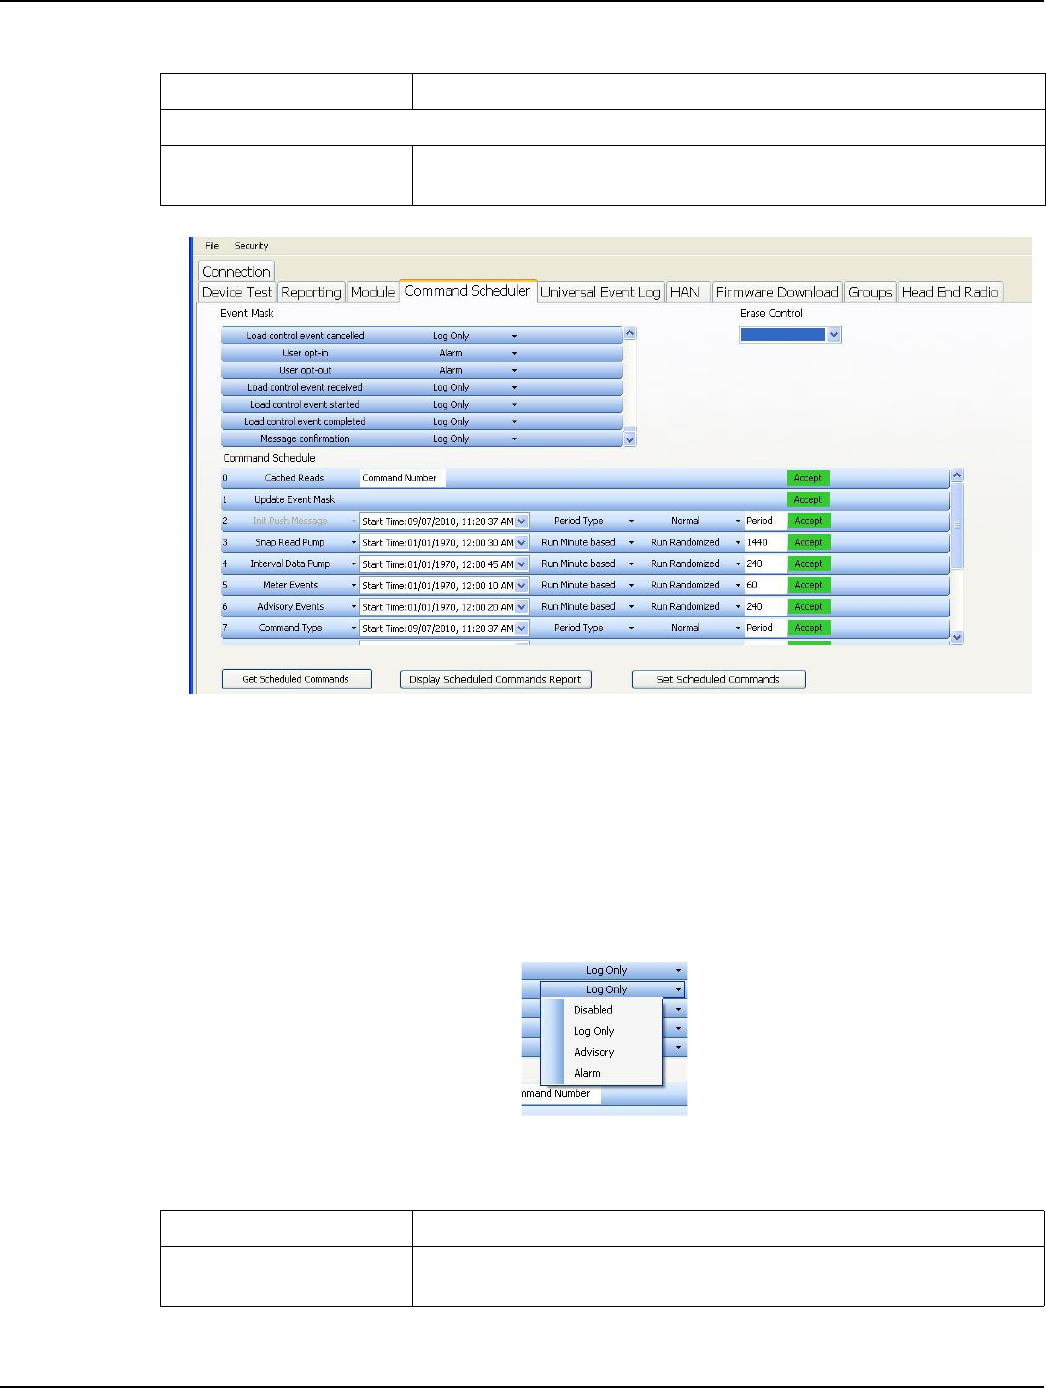
Landis+Gyr Chapter 3 - Using Endpoint Testing Manager (ETM)
User Guide 98-1671 Rev AA 67
Figure 3 - 34. Command Scheduler Tab
Event Mask
The Event Mask interface of the Command Scheduler tab supports user notification for specified
events. These events include Primary Power Down, Primary Power Up, Procedure invoked, Table
Written To, Event log cleared, Rate Change, and many others. There are over 90 Event Mask choices
available for notificatio.To view currently-loaded meter commands and their status, click the Get
Scheduled Commands button.
Figure 3 - 35. Command Scheduler Event Mask Notification Options
Activity Log
Insert Comment <button> Allows a user to insert comments into the Activity Log. These time-stamped
comments will also post to the Log file.
Table 3 - 9. Command Scheduler Tab(Continued)
Field Description
Table 3 - 10. Event Mask Events
Event Mask Field Description
Disabled No notification when the specified event occurs; the event is not stored and
will not be reported.
Draft 8.5.13
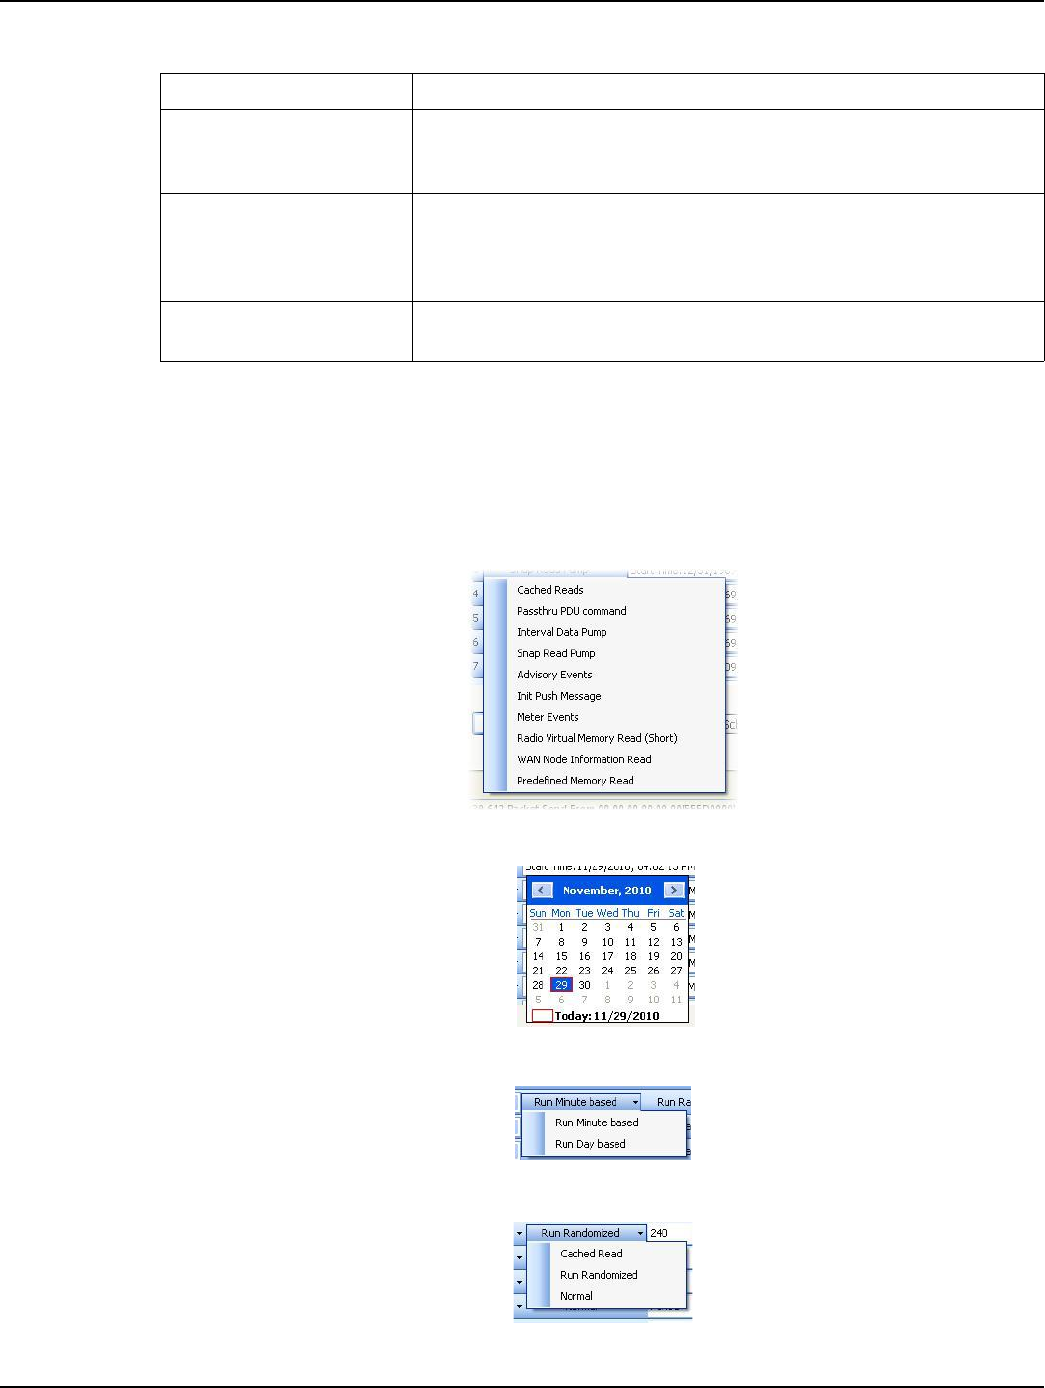
Chapter 3 - Using Endpoint Testing Manager (ETM) Landis+Gyr
68 98-1671 Rev AA User Guide
Command Schedule
The Command Schedule interface provides the user with the ability to schedule up to 12 specific
commands, stipulate parameters for the scheduled commands, and set the Erase Control (this value
must be set before sending any command). Drop-down arrows next to each parameter allow these
commands to be programmed for specific dates and times and set to function in varying ways.
Figure 3 - 36. Some Command Scheduler Command Types
Figure 3 - 37. Command Scheduler Calendar
Figure 3 - 38. Command Scheduler Test Interval Types
Figure 3 - 39. Command Scheduler Test Interval Settings
Log Only
The event will be stored in the event log; it will not be reported in alarm/alert
messages; only an on-request read of the event log will retrieve these
events.
Advisory
An advisory message is generated when the specified event occurs; the
event will be stored in the event log and will only be reported the next time a
periodic push is transmitted; the periodic push will track the last event
pushed to the host and will only send events that have not yet been pushed.
Alarm The event will be stored in the event log and an immediate alert message
will be transmitted.
Table 3 - 10. Event Mask Events (Continued)
Event Mask Field Description
Draft 8.5.13

Landis+Gyr Chapter 3 - Using Endpoint Testing Manager (ETM)
User Guide 98-1671 Rev AA 69
NOTE: Some test interval options do not apply to all command choices
HAN Tab
The HAN (Home Area Network) tab makes use of ZigBee protocols to enable home user interaction
with power managing and monitoring devices. When connected to a compatible endpoint, Endpoint
Testing Manager accesses the following ZigBee functions:
•Access and display ZigBee network information
•Enable registration into an active Home Area Network
•Remove an active Home Area Network
Additional associated functions and data are available on this screen, including displays for Zigbee
Network Channel and HAN ID. A data field on this screen displays the HAN Device List. Near this
data field are buttons to Get Device Details and Delete HAN Device.
Sub-tabs on the HAN tab provide options for the user to check Device Provisioning, supervise Load
Control, view Event History, manage Messaging, coordinate Troubleshooting, and run a FAT Test.
The MAC Address of the HAN (Home Area Network) module is displayed on the HAN tab, along
with a button immediately adjoining the display that provides a means to Get Device Details.
Table 3 - 11. HAN Tab
Field Description
Zigbee Network Details
Channel: Displays the channel that ZigBee is currently using. This number will be
between 11 and 25.
HAN ID: Displays the Network ID that ZigBee is currently using. The number will be
between 1 and 65334.
Commands and Displays
Network Info <button> Sends a request to the network for ZigBee Network Information.
Commission HAN <button> Creates the ZigBee (HAN) network.
Decommission HAN
<button> Closes the active ZigBee (HAN) network.
Refresh HAN Device List
<button>
Displays an updated list of ZigBee devices that currently exist on the HAN
network.
Get Device Details <button> Queries the highlighted HAN device for configuration parameters and
displays the information in the Activity Log window.
Delete HAN Device
<button> Deletes the highlighted HAN device.
MAC Address Displays the MAC address of the Home Area Network module.
Device Class
Defined in the ZigBee Smart Energy Profile Specification and refers to
particular devices, e.g. Range Extenders, Metering Devices, Smart
Appliances, etc.
Draft 8.5.13

Chapter 3 - Using Endpoint Testing Manager (ETM) Landis+Gyr
70 98-1671 Rev AA User Guide
Client Cluster A bitmap that indicates which clusters are supported as clients on the HAN
device. This Landis+Gyr proprietary design optimizes HAN communication.
HAN sub-tabs
Device Provisioning
Use this tab to associate (pair, or marry) a HAN device to the meter. This
step is required to enable communication exchanges between HAN
devices.
Load Control
Use this tab to send load adjustment commands to HAN devices, including
thermostats, other energy-consuming appliances, or load control devices.
(load control devices adjust temperature, or cycle devices on and off).
Event History Displays HAN settings that have been made or changed.
Publish Price (this tab only
appears for meters running
HAN firmware v1.5.x and
higher)
This Gridstream command (defined by Landis+Gyr, not the ZigBee Smart
Energy Profile Specification) is the proprietary method by which Gridstream
makes pricing information available to the customer.
Messaging Enables sending a text message to the remote HAN device.
Troubleshooting Provides simple testing options, including configuration queries, for the
internal ZigBee module. Also provides for custom HAN settings.
FAT Test
As a quick way to test a ZigBee module, this test is used for meter shop
sample testing to verify proper RF and HAN communication capability.
The First Article Test can only be run without an active HAN. This function is
used in combination with either “black box” equipment or by using a
ZigBee-enabled device (such as the ecoMeter) to test the communications
channel via the “join and un-join” action.
In order to use the HAN functionality within ETM, a HAN Initialization
Command must be successfully completed via Command Center before
ETM can be used to operate and manage the HAN. Please see Customer
Service Update 98-1217 for more details.
Activity Log
Insert Comment <button> Allows a user to insert comments into the Activity Log. These time-stamped
comments will also post to the Log file.
Table 3 - 11. HAN Tab(Continued)
Field Description
Draft 8.5.13
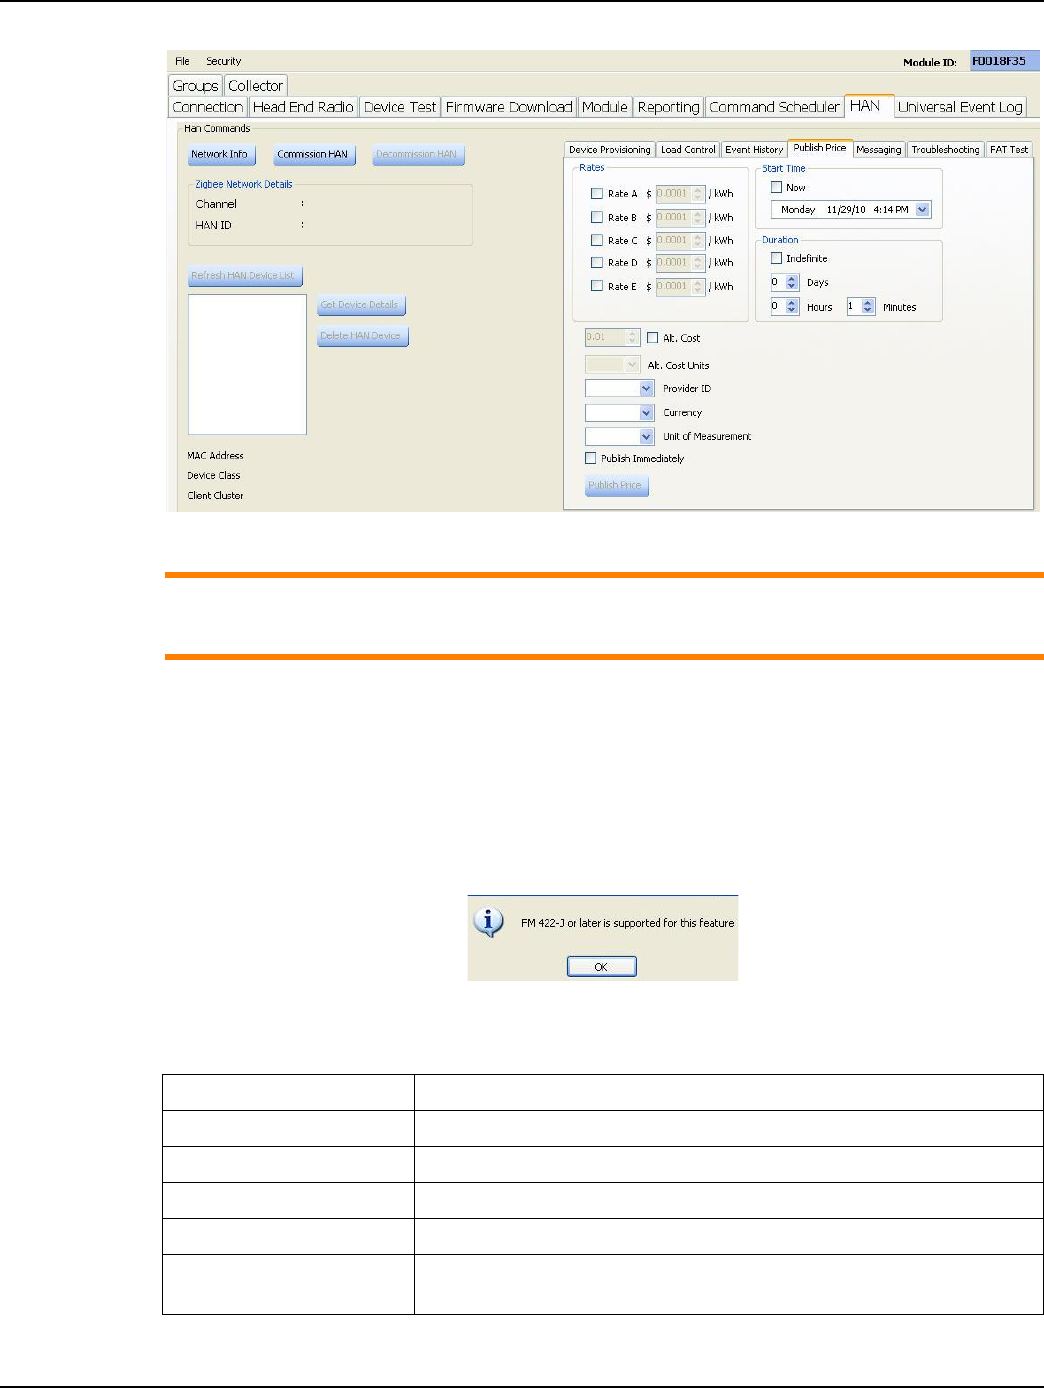
Landis+Gyr Chapter 3 - Using Endpoint Testing Manager (ETM)
User Guide 98-1671 Rev AA 71
Figure 3 - 40. Fully-Populated HAN Tab - “Publish Price” sub-tab displayed
ACAUTION: View the Connection tab. Click the check-boxes for both Enable Field Mode and
Display Scrolling Status. Click Save Settings. These settings will continue to be the default
setting each time ETM is launched.
Universal Event Log Tab
The Universal Event Log tab, shown in Figure 3 - 42, is only enabled on meters with version 422-J
or higher software. This tab enables user-programmable log activities that result from meter events.
This feature is not supported by endpoints with firmware versions prior to 422-J. Endpoints with
earlier firmware will return the message below when the Universal Event Log tab is clicked.
Figure 3 - 41. Universal Event Log Tab Support Message
Table 3 - 12. Universal Event Log Tab
Field Description
Start Date The user-programmable start date parameter.
Start Event ID This parameter can be set from 1 to 254.
End Date The user-programmable end date parameter.
End Event ID This parameter can be set from 1 to 254.
Event Report Type Set by the user to specify either Log Only, Advisory Only, or Alarm Only
Report Types for meter events.
Draft 8.5.13
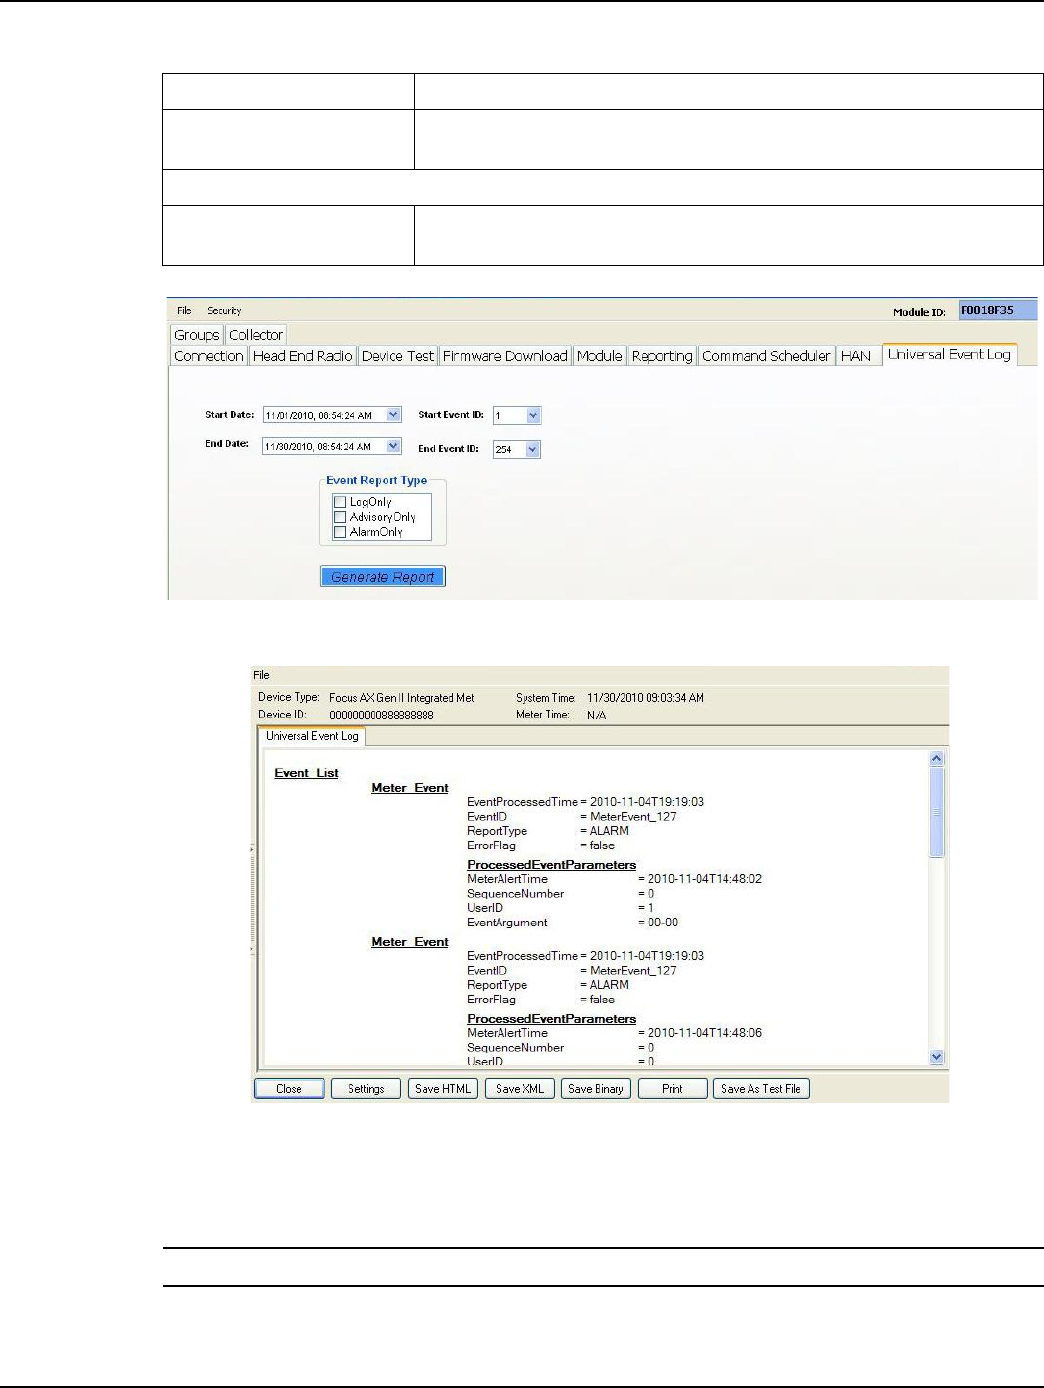
Chapter 3 - Using Endpoint Testing Manager (ETM) Landis+Gyr
72 98-1671 Rev AA User Guide
Figure 3 - 42. Universal Event Log Tab
Figure 3 - 43. Generate Report Data View
Service Limiting Tab
NOTE: The Service Limiting option is only available for Focus AX meters.
Service Limiting functionality allows the utility to place a limit on the power used on certain
accounts during a time period when they cannot disconnect power completely. As an example, to
Generate Report <button> Generates a report based on meter events, with options for setting up
report appearance and saving these reports.
Activity Log
Insert Comment <button> Allows a user to insert comments into the Activity Log. These time-stamped
comments will also list in the Log file.
Table 3 - 12. Universal Event Log Tab(Continued)
Field Description
Draft 8.5.13
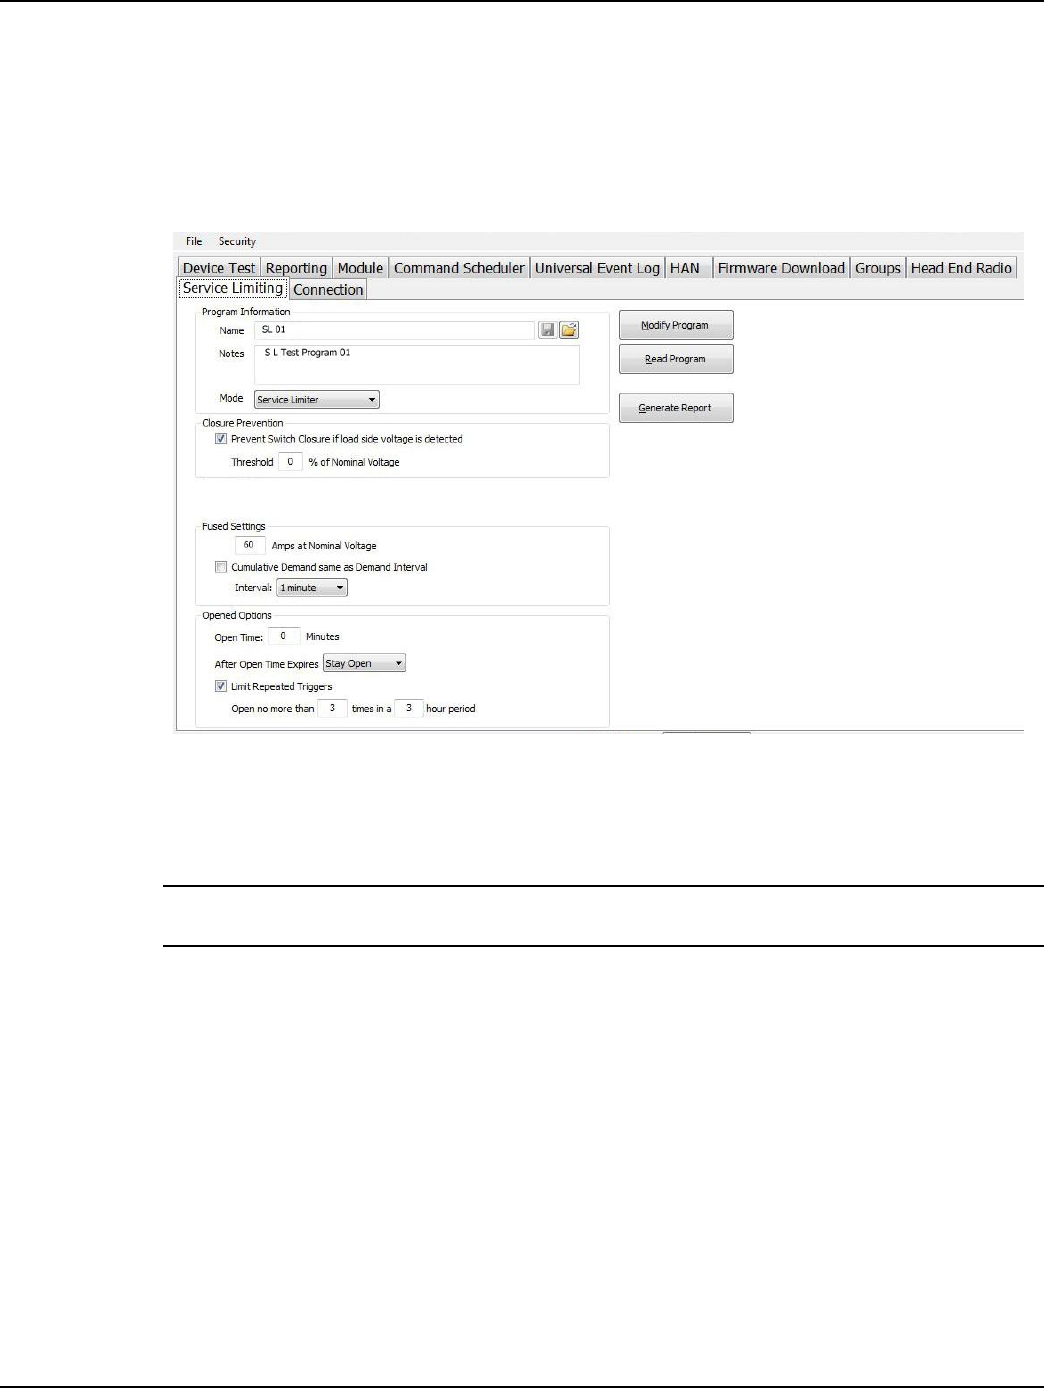
Landis+Gyr Chapter 3 - Using Endpoint Testing Manager (ETM)
User Guide 98-1671 Rev AA 73
avoid customer hazard during freezing weather, some localities prohibit utilities from completely
disconnecting service.
When ETM connects to an endpoint, the application will verify whether or not Service Limiting is
available with the connected endpoint. Service Limiting can only be enabled after Landis+Gyr
supplies a proprietary key to the endpoint. If ETM has the required validation, the Service Limiting
tab will appear.
Figure 3 - 44. Service Limiting
From the Service Limiting tab, the user has the ability to read the Service Limiting Program for
which the endpoint is currently configured, modify the existing program, and create a report of the
service limiting program.
NOTE: During the meter testing process, if the endpoint is not capable of remote connect/
disconnect, the Service Limiting tab will be visible, but disabled.
Service Limiting Modes
The following modes are available for service limiting programs:
•Manual or Comm Only. This mode provides the user with the ability to create a Service
Limiting Program that will configure the endpoint’s switch so that the switch will only be
operated via communications from either an AMR device or software application.
•Service Limiter. If “Service Limiter” is selected, the switch will also open when a
configured load threshold is exceeded at the end of the sample interval. In Service Limiter
mode, the trigger is an average value measured over a configured interval.
Draft 8.5.13

Chapter 3 - Using Endpoint Testing Manager (ETM) Landis+Gyr
74 98-1671 Rev AA User Guide
Read Program
Read Program allows the user to view the current Service Limiting control settings of the meter
being tested:
Select the Read Program button. The Service Limiting screen will refresh, displaying the endpoint’s
Service Limiting Program.
NOTE: If the meter has no service limiting program applied, the result will be Manual or Comm Only.
Program Information.
•Program Name. The program name identifies the service limiting program.
•Notes. This is an optional field that allows for providing further information about the new
program.
•Mode.
•Manual or Comm Only.
•Service Limiter
Service Limiting options
Service Limiting parameters will vary depending on the mode selected.
A. Manual or Comm Only.
Closure prevention.
•Prevent Switch Closure if load side voltage is detected. When selected, the meter will
reject commands to close the service disconnect switch when load side voltage exceeds
the configured percentage of nominal voltage.
•If the closure prevention is enabled and the configured threshold is set to 25% of
nominal voltage (in this case, 240V), the meter will reject a command to close if it
detects a load side voltage in excess of 60V.
NOTE: The recommended closure prevention setting is 25 - 40%
•Threshold Percent of Nominal Voltage. Enter the desired threshold. Legal Values: 0 to
60% of Nominal Voltage when enabled. A value of 0 will disable the check.
B. Service Limiter
If “Service Limiter” is selected, the switch will also open when a configured load threshold
is exceeded at the end of the sample interval. In Service Limiter mode, the trigger is an
average value measured over a configured interval.
Closure prevention
•Prevent Switch Closure if load side voltage is detected. When selected, the meter will
reject commands to close the service disconnect switch when load side voltage exceeds
the configured percentage of nominal voltage.
•If the closure prevention is enabled and the configured threshold set to 25% of nominal
voltage (in this case, 240V), the meter will reject a command to close if it detects in
excess of 60V of load side voltage.
Draft 8.5.13

Landis+Gyr Chapter 3 - Using Endpoint Testing Manager (ETM)
User Guide 98-1671 Rev AA 75
NOTE: The recommended closure prevention setting is 25 - 40%
•Threshold Percent of Nominal Voltage. Enter the desired threshold. Legal Values: 0 to
60% of Nominal Voltage when enabled. A value of 0 will disable the check.
Fused Settings
•Amps at Nominal Voltage. This setting is a number between 0 and 60 that sets a
threshold beyond which the switch will be opened.
•Cumulative Demand same as Demand Interval [checked]. If this box is checked, this
automatically sets the interval to the same interval used elsewhere in Command Center
for automatic meter reads.
•Cumulative Demand same... box [not checked]. If this box is not checked, the user must
select an interval from the Interval button drop-down menu. The options are: 1, 5, 10,
15, 30, and 60 minutes.
Open Options
•Open Time. If instantaneous power (measured in watts) reaches a (programmable)
threshold value, the switch will open for a configurable period of time, generally 0 - 30
minutes.
•After Open Time Expires. Select the operation to be performed when the Open Time has
expired. The switch can either be Closed, or the switch will Arm itself. When Armed,
the switch will remain Open until the Reconnect button is pressed.
•Limited Repeated Triggers. Limit Repeated Triggers, when enabled, causes the service
disconnect switch to remain Open for an extended period if a number of Soft Fuse
operations occur within a time window.
For example, if a meter is programmed to allow no more than two operations within a 24-
hour period, after the switch was triggered for the third time in 24 hours, the meter would
remain open for 24 hours. At the end of that time, it would perform the operation it was
configured to perform when the Open Time expired. Legal Values: 1 to 48 operations within
a 1 to 24-hour window.
Create a Service Limiting Program
New Service Limiting Programs may be created and saved to file for future application to meters.
Following is the procedure for creating a new service limiting program.
1. Enter the following Program Information:
• Program Name: The program name identifies the Service Limiting program. Best practice
for naming is to provide a functionality descriptive of the program. The name field is limited
to fifty characters and must be unique to the organization. This field must be changed when
creating a new Service Limiting program, or the existing Service Limiting program will be
overwritten when the file is saved.
•Notes: This is an optional file that allows for including up to 255 characters of additional
information about the new Service Limiting program.
•Mode: Select from the following modes:
•Manual or Comm Only
Draft 8.5.13
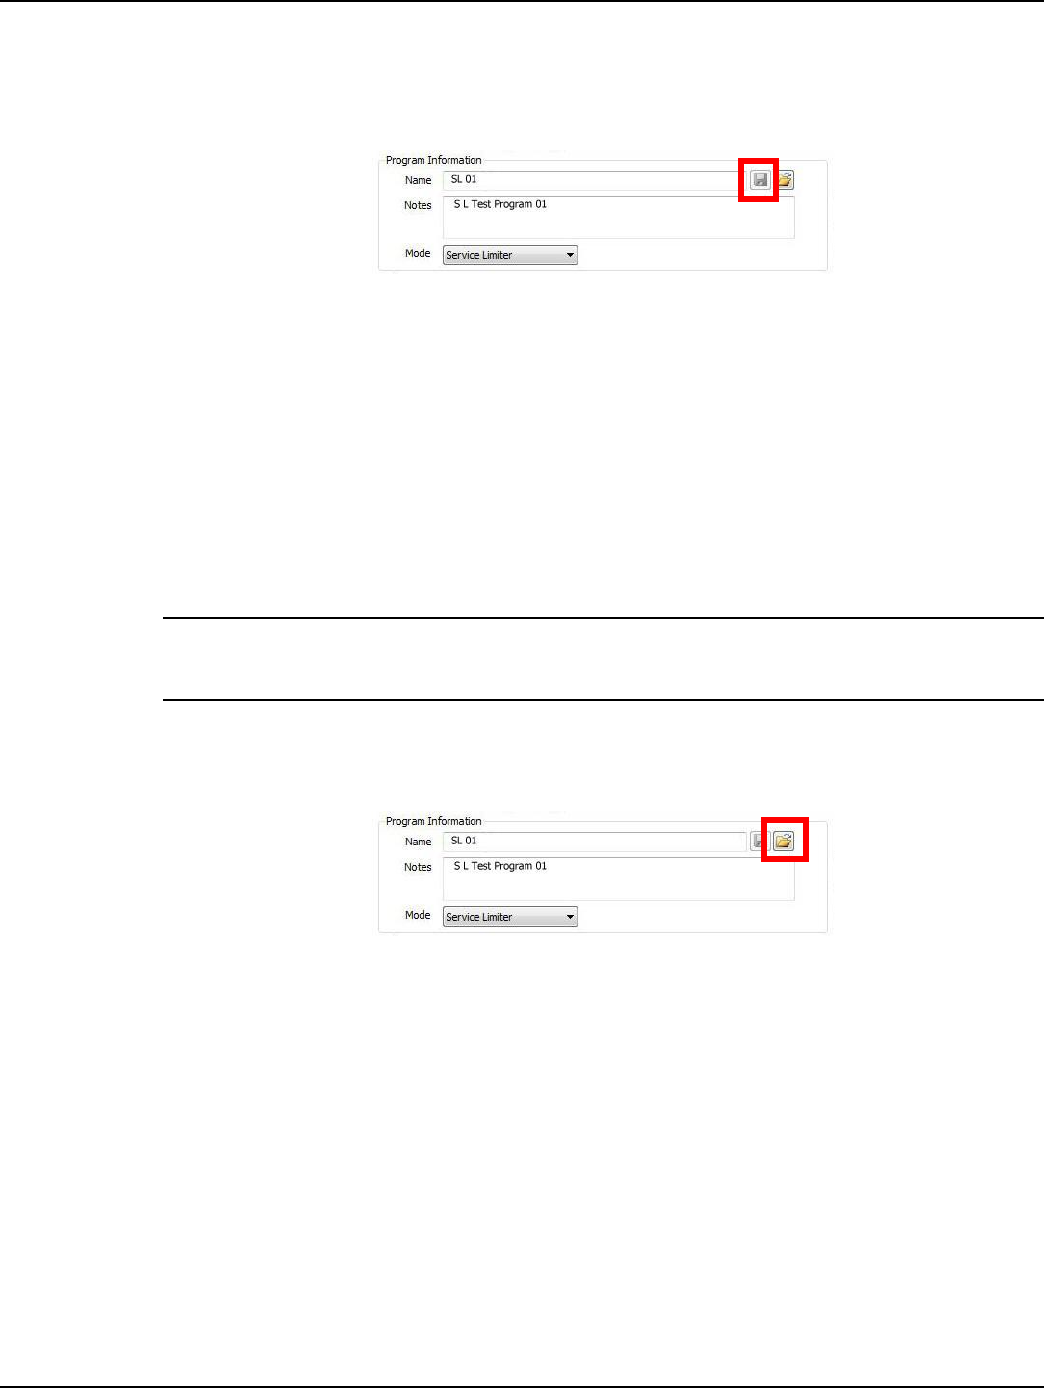
Chapter 3 - Using Endpoint Testing Manager (ETM) Landis+Gyr
76 98-1671 Rev AA User Guide
•Service Limiter
2. Configure the Service Limiting parameters. Refer to the descriptions above.
3. Click the Save icon to save the Service Limiting program to a file.
Figure 3 - 45. Service Limiting Program Information - Save Icon
4. A pre-defined program location folder will open.
5. Enter a unique name for the new Service Limiting program.
6. Click Save.
The new Service Limiting Program has now been saved, and will be available for sending to an
endpoint.
Send an existing Service Limiting Program to an Endpoint
The user may choose from previously created Service Limiting programs for sending to the device.
NOTE: Best practice for configuring service limiting in the endpoint is to use Command Center
functionality. Using ETM to alter the service limiting program may cause the endpoint’s
configuration to be incorrectly reflected in Command Center.
Following is the procedure for sending an existing program to the device:
1. Select the Open icon.
Figure 3 - 46. Service Limiting Program Information - Open Icon
2. The Service Programs folder will open
Draft 8.5.13
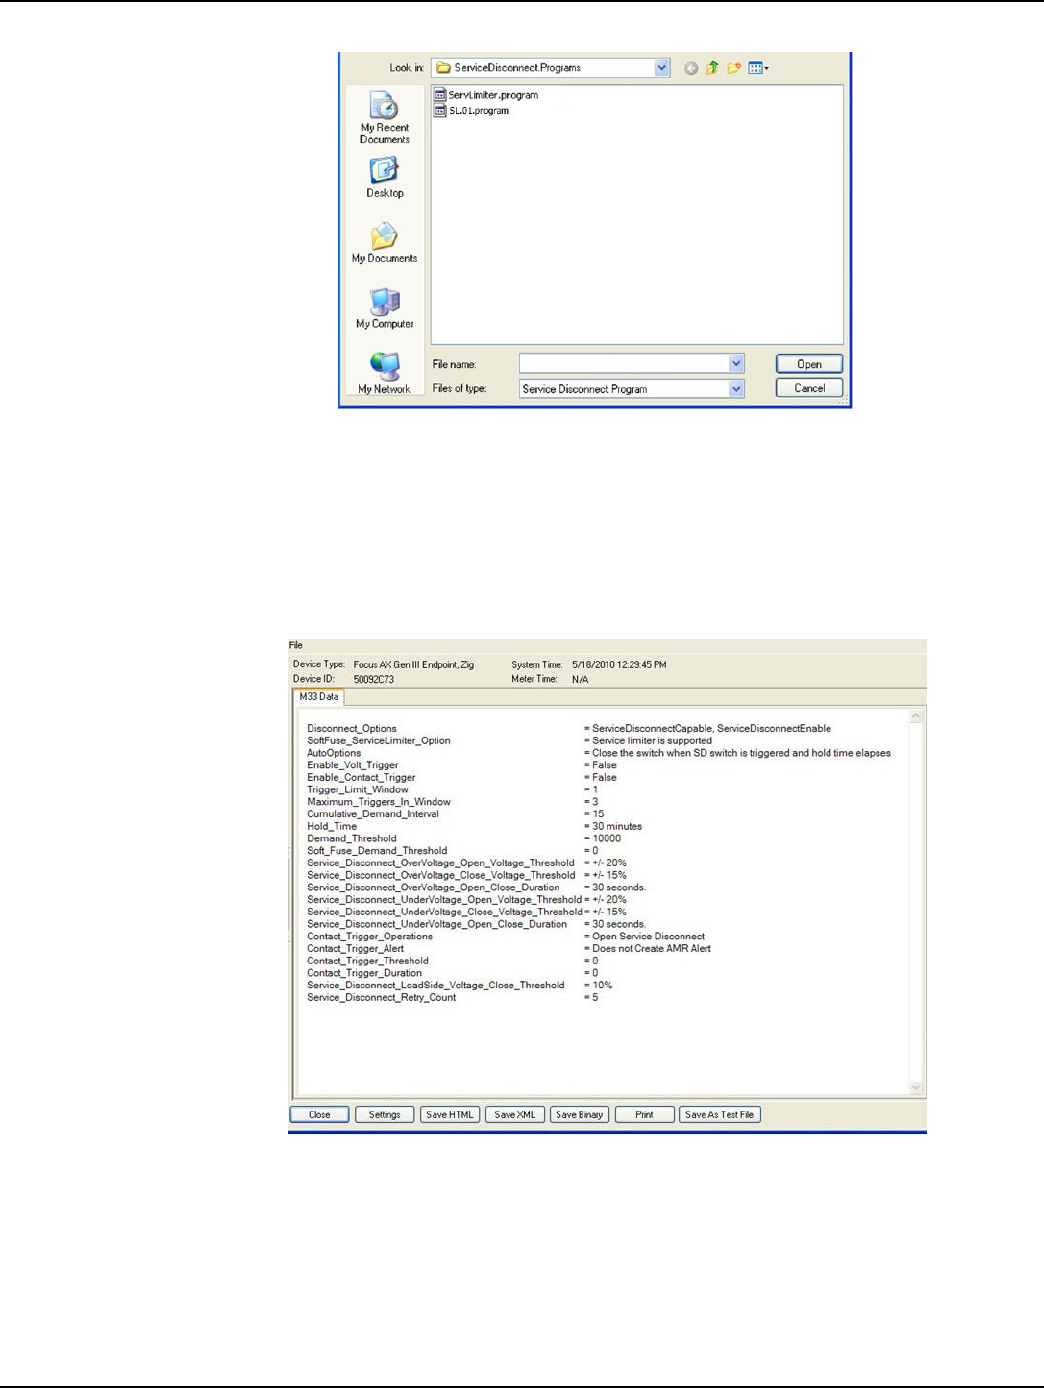
Landis+Gyr Chapter 3 - Using Endpoint Testing Manager (ETM)
User Guide 98-1671 Rev AA 77
Figure 3 - 47. Service Limiting Programs
3. Select the desired Service Limiting program file and click Open.
4. The Service Limiting programs tab will now display the selected program.
5. Click Modify Program.
6. The selected Service Limiting Program will be sent to the endpoint, and the M33 report will
appear.
Figure 3 - 48. Service Limiting M33 Report
The M33 report displays the current Service Limiting configuration settings applied to the endpoint.
This report may also be generated by clicking the Generate Report button.
Draft 8.5.13
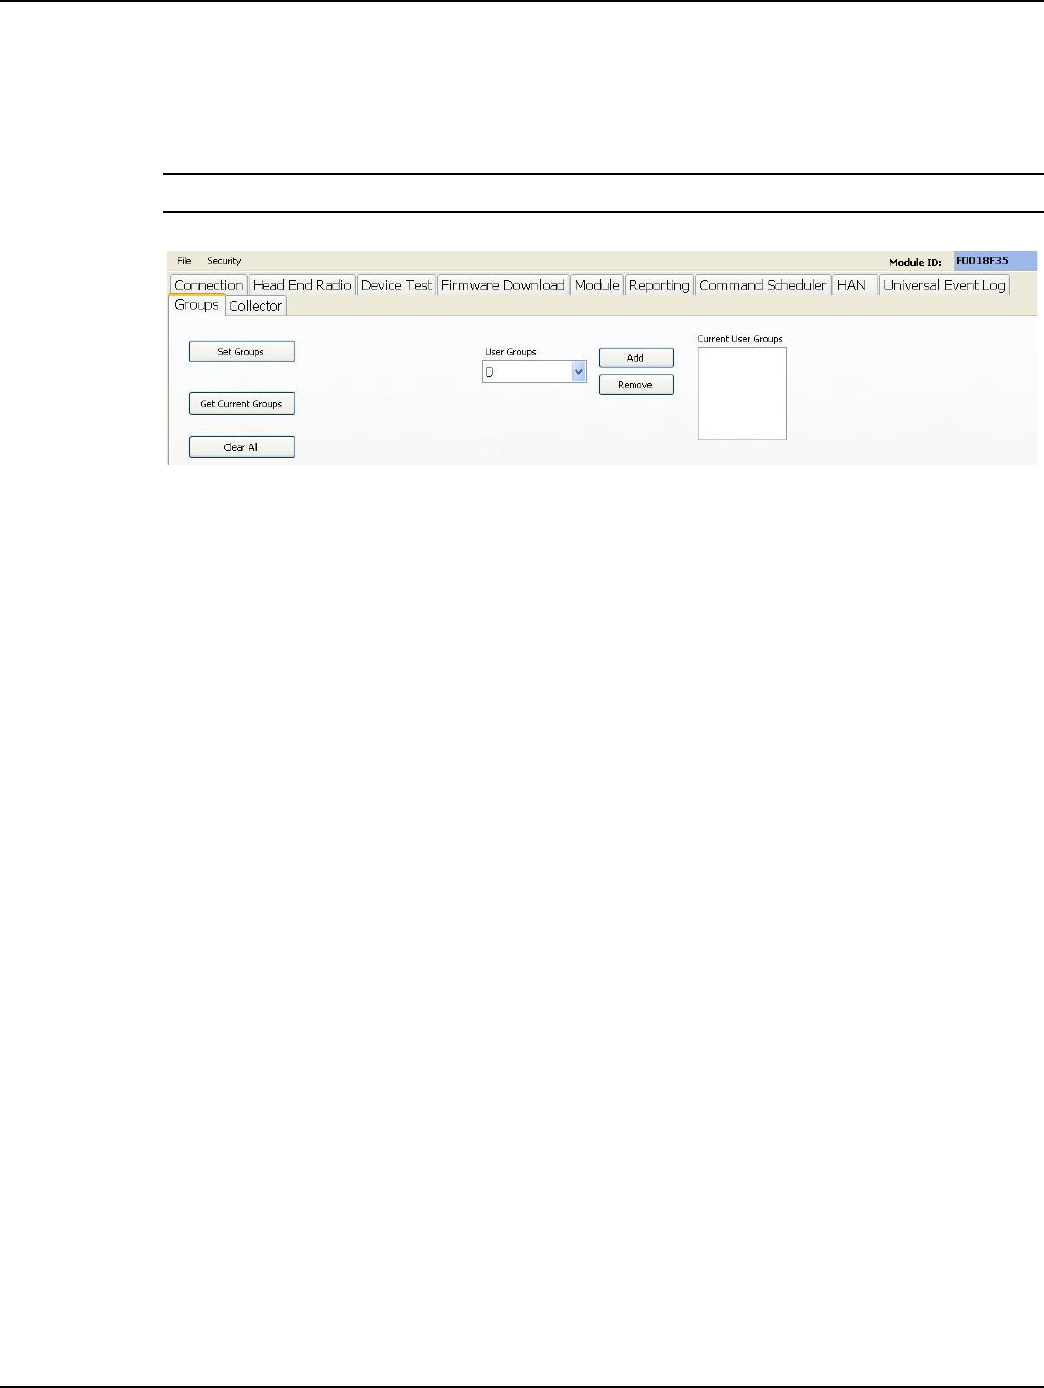
Chapter 3 - Using Endpoint Testing Manager (ETM) Landis+Gyr
78 98-1671 Rev AA User Guide
Groups Tab
The Groups tab is only enabled on meters with version 422 or higher firmware. This tab allows
organizing meters into groups so as to enable actions and activities that are group-based.
NOTE: A meter can belong to no more than eight groups.
Figure 3 - 49. Groups Tab
Draft 8.5.13

User Guide 98-1671 Rev AA 79
4
Specifications
Enhanced Series IV Elster A3 Specs
Table 4 - 1. Specifications
Category Specification Value or Range
Compatible
Meters Elster Supported Meter Forms
Form Voltage Class
3S - -
16S - -
10A - -
Electrical
Voltage 11.0-14.0V (from the meter’s power supply)
Power Max: 2.5W
Typical: 0.5W
RF 900 MHz
Output Power +26 dBm +/-1 dBm
Adjacent Channel Power 39 dBc Nominal (9600 bps)
Transmit Frequency 902.2 to 927.9 MHz ISM unlicensed (FCC Part 15)
Communication Protocol Gridstream Protocol for Command Center
Receive Sensitivity -108 dBm minimum
RF ZigBee
Output Power 19 dBm Max
Adjacent Channel Power 40 dBc Minimum
Transmit Frequency 2405 to 2475 MHz
Communication Protocol ZigBee Protocol
Receive Sensitivity -101 dBm minimum, -104dBm typical
Draft 8.5.13

Chapter 4 - Specifications Landis+Gyr
80 98-1671 Rev AA User Guide
Standards
Compliance
FCC Title 47 CFR Part 15 Radiated and Conducted Emissions (incl. intentional
radiators)
IEC 61000 4-2,3,4,5,11,12 Electromagnetic Compatibility
ANSI C12.19 Compatible with Utility Industry End Device Tables
ANSI C12.20 National Standard for Electricity Meters - 0.2 and 0.5
Accuracy Classes
ANSI C12.1 Code for Electricity Metering
ANSI C37.90.1 (1989) Standard Surge Withstand Capability (SWC) Tests
ANSI C12.22 Transport of ANSI C12.19 Over Network
Transmissions
Environmental
General Environmental Outdoor, rain-protected, sunlight-exposed
Operating Temperature Range -40 to +85 C (under meter cover)
Humidity 0 to 85% relative humidity, non-condensing
Table 4 - 1. Specifications (Continued)
Category Specification Value or Range
Draft 8.5.13