Mini Mitter AWR1 ACTIREADER User Manual USERES MANUAL 2
Mini Mitter Co. Inc. ACTIREADER USERES MANUAL 2
Contents
- 1. USERS MANUAL 1
- 2. USERES MANUAL 2
- 3. USERS MANUAL 3
USERES MANUAL 2

5015 B.U. Bowman Drive Buford, GA 30518 USA Voice: 770-831-8048 Fax: 770-831-8598
Certification Exhibit
FCC ID: JIAAWR1
IC: 6041A-AWR1
FCC Rule Part: 15.209
IC Radio Standards Specification: RSS-210
ACS Report Number 08-0085 - 15C
Manufacturer: Mini Mitter Company, Inc.
Model(s): ActiReader
Manual
(Part 2 of 3)

2-1
S
ECTION
2
WARNING! Actiware / Actiware-CT is for use only in a clinical, research,
or home care provider setting.
G
ETTING
S
TARTED
The workspace of the Actiware program is similar to many software applications.
Dockable windows give the user direct access to the Actiwatch or subjectdata
stored in the selected database. They also provide control over analysis viewing
and exports.
The Database Viewer and the Properties Viewer are docked at the left side of the
main Actiware window by default. The Actogram View toolbar is shown on the
right side of the main Actiware window.
Actiwaredatabasesareorganizedinahierarchicalfashion.Thetoplevelisthe
subjectlevel.ThesecondlevelistheActiwatchdataforthatsubject.Thethird
level is for saved analyses of the Actiwatch data. You can navigate through this
hierarchy by clicking on the + (plus sign) or – (minus sign) buttons to the left of
thesubjectorActiwatchdataicons.
•SubjectsaresortedbysubjectID.
• Actiwatch Data entries are sorted by data collection start time.
• Analyses are sorted by saved name.
2-2 Getting Started
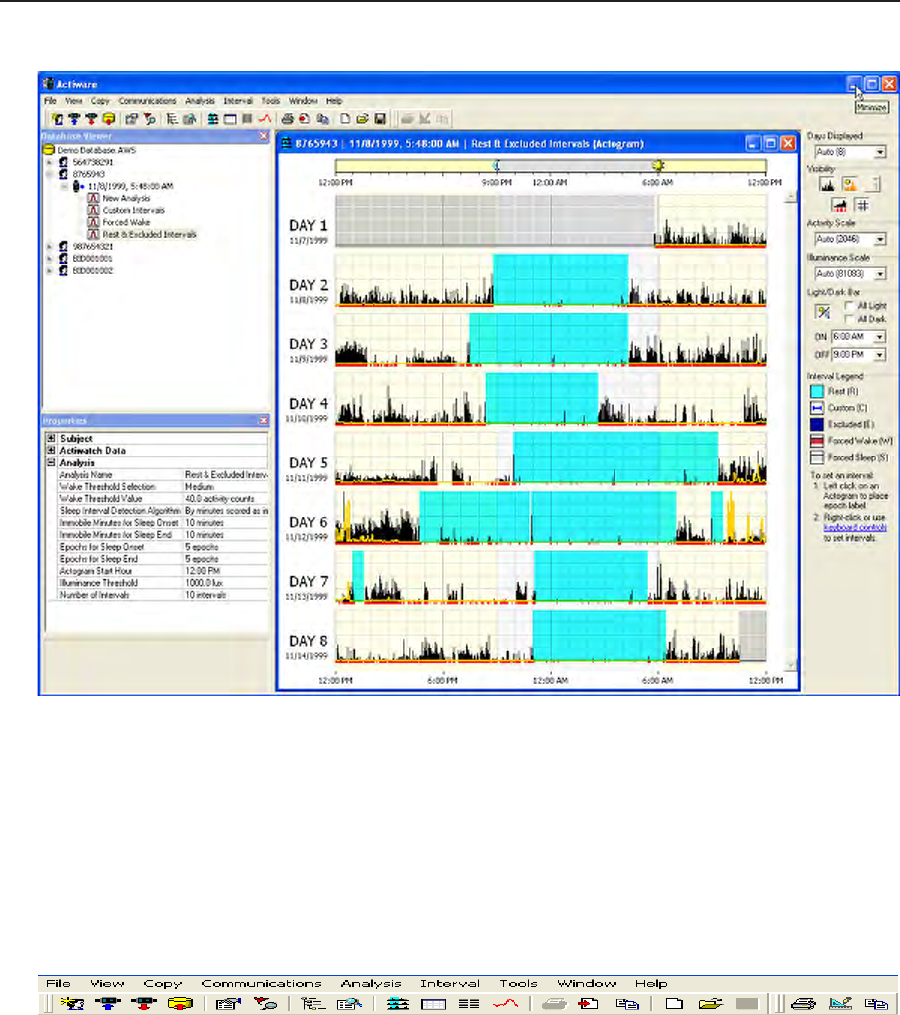
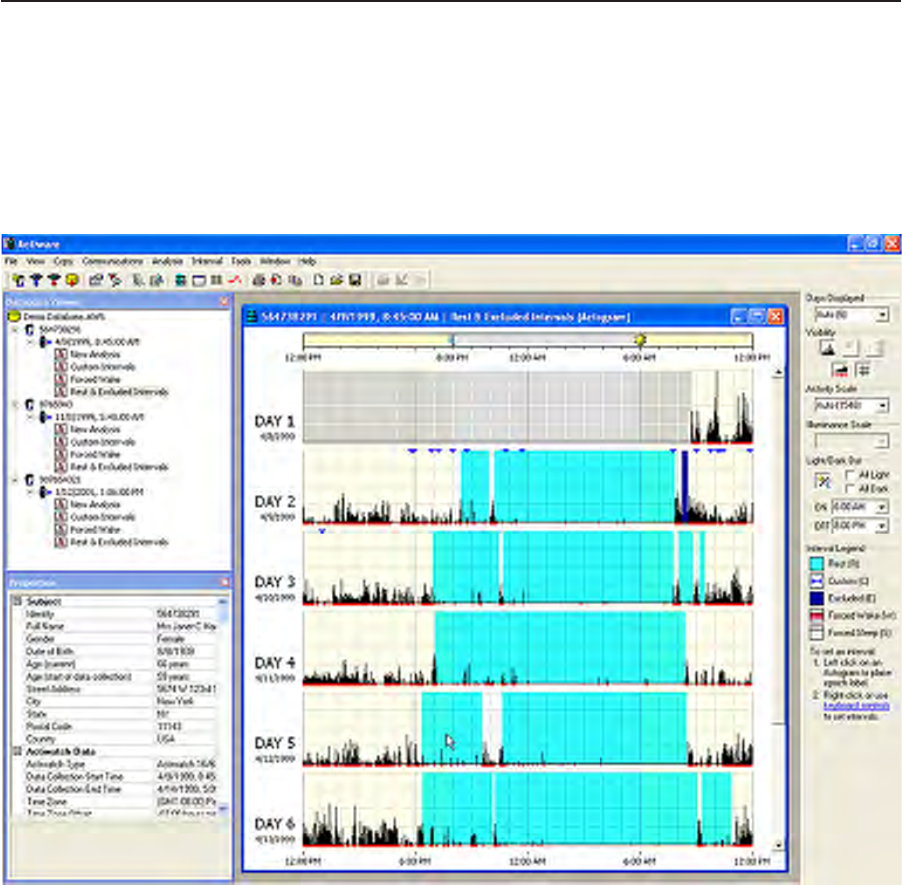
Main Window
Actiware workspace, full-window
The main Actiware window can be broken into three main sections:
• Toolbars
• Database Viewer
• Properties viewer
Toolbars
The Menu Bar is similar to most software applications. Keyboard shortcuts,
actuated by pressing the ALT key plus the hotkey letter, (identified by an
underscore) can be used to navigate through the toolbar menus.
2-3
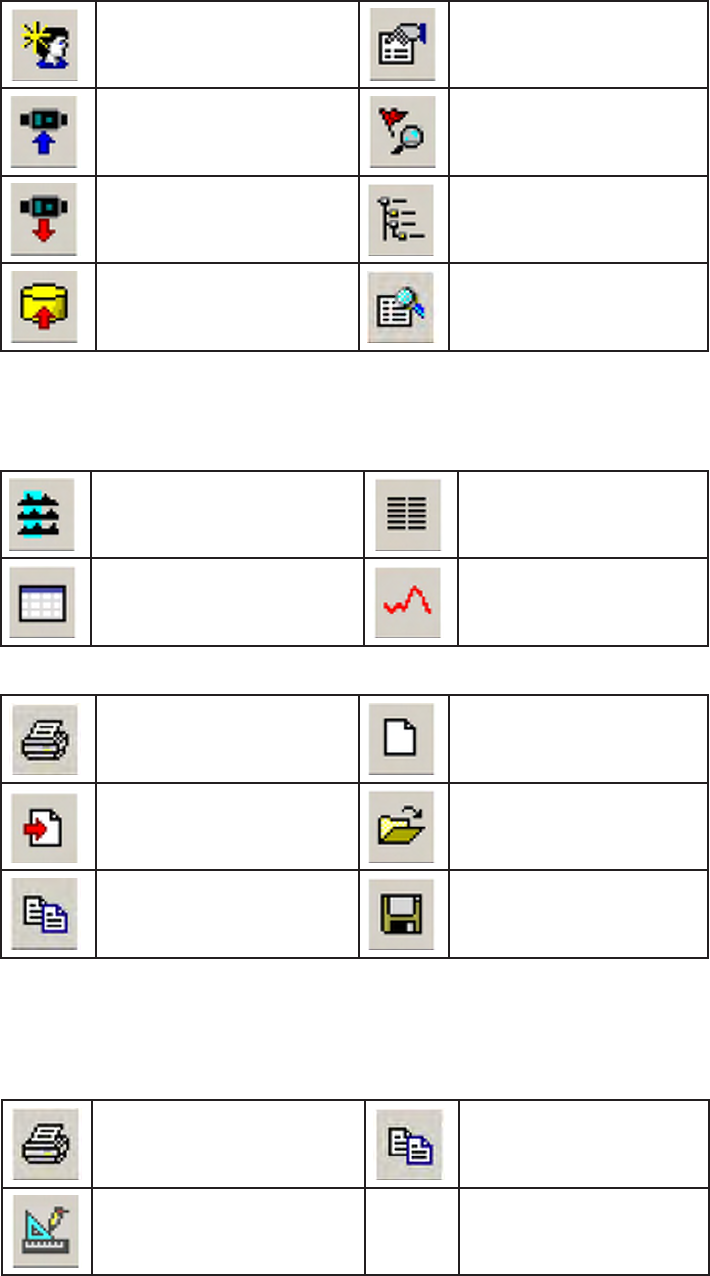
TheStandardtoolbar,justbelowtheMenu Bar, includes shortcuts to associated
functions within the Actiware software program. Hover your mouse over the icon
for a short text description.
Standard Toolbar Icons
Create A New Subject Edit Subject, Data, or Analysis
Configure My Actiwatch Show Audit Trail
Retrieve Data from My Actiwatch Open the Database Viewer
Import an .awd File Open the Properties Viewer
The following four icons determine how the data are shown in the Analysis
window.
Display Data as an Actogram Display the Data List
Display Statistics within an Interval Display Data as a Graph
Print an Actiware Report Create a New Analysis File
Export a Data File Open an Analysis File
Copy Export Text to the Clipboard Save an Analysis File
The Graph toolbar provides access to functions that are available only when
viewing a graph.
Print a Graph Copy Graph to the Clipboard
Edit the Graph Display Properties
2-4 Getting Started
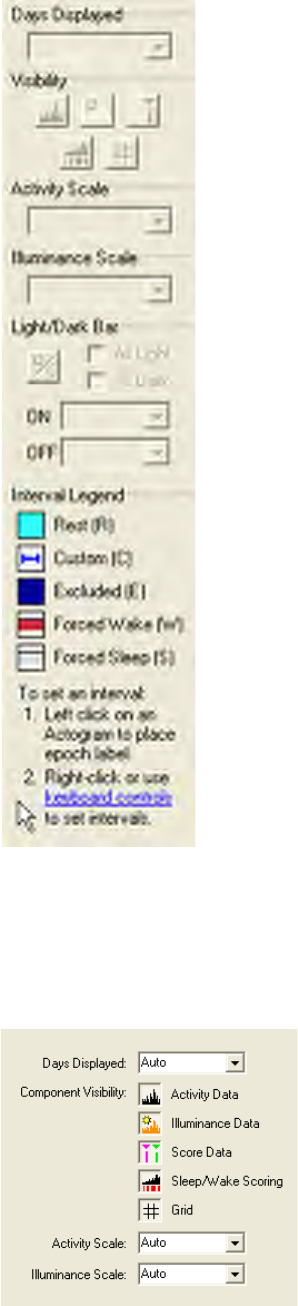
The Actogram Viewtoolbarisusedforadjustingtheviewing properties of an
Actogram, and is available only when an Actogram is present. Changes made to
this toolbar are immediately visible in the currently selected Actogram.
• Days Displayed: controls how many days are displayed in the visible part
of the Actogram window. Use the scroll bar on the right of the Actogram to
see the remaining days. Pull down or type directly into this control to set the
number of days.
• Visibility: these buttons hide and show the data items in the Actogram:
Actogram View Toolbar
2-5
• ActivityScale:adjuststhemaximumvalueofactivitycountsdisplayedon
the Actogram. Pull down or type directly into this control to set the activity
scale.
• IlluminanceScale:adjuststhemaximumilluminance value displayed on the
Actogram. Pull down or type directly into this control to set the scale.
• Light/Dark Bar: use these controls to show or hide the bar at the top of the
Actogram, to set the light on/light off time, or to set the light to all on (24
hours of light) or all off (24 hours of dark).
• Interval Legend: provides a convenient reminder of the color scheme used
for displayed intervals. Click the keyboard controls link to display quick
reminders on how to set intervals. See Setting Intervals later in this section.
To save your current Actogram View settings as default settings, click View >
Save Current Actogram View as My Default View. Or, to restore your default
view settings, click View > Restore My Default Actogram View.
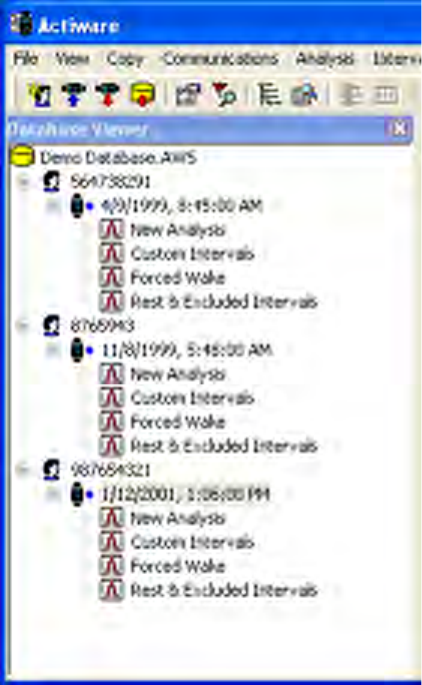
Database Viewer
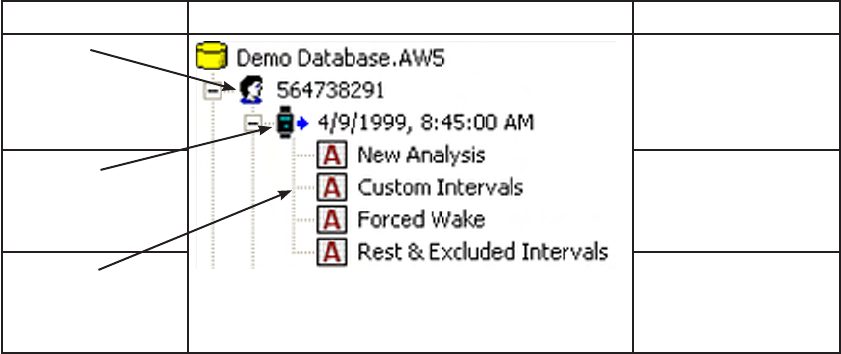
The Database Viewer is used to provide a hierarchical tree view of the data
in your currently selected database. Below is an example view from the
Demonstration Database that is provided with Actiware.
Database Viewer
2-6 Getting Started
Subjects,Actiwatchdata,andAnalysesareshownasindicatedbelow:
Commonly used functions can be accessed by right-clicking on an item in the
Database Viewer and using the popup menu.
Actiware automatically loads the last used database or when run for the first time,
the Demonstration Database. To create a new database, click File > Database >
New and use the Windows file selection to select a filename and location. Other
database functions (such as Open, Save As, Backup, and Export) can be accessed
from the File > Database menu.
The Database Viewer can be undocked or docked by clicking and dragging the
windowtitlebar.Inaddition,itcanberesizedorclosed.Toshowagain,usethe
View > Database Viewer menu.
Level Content
1st Level
(Subject)
SubjectIdentity
(Sorted
Alphabetically or
Numerically)
2nd Level
(Actiwatch Data) Local Start Time
(Sorted by Date)
3rd Level
(Analysis) Analysis Name
(Sorted
Alphabetically)
2-7
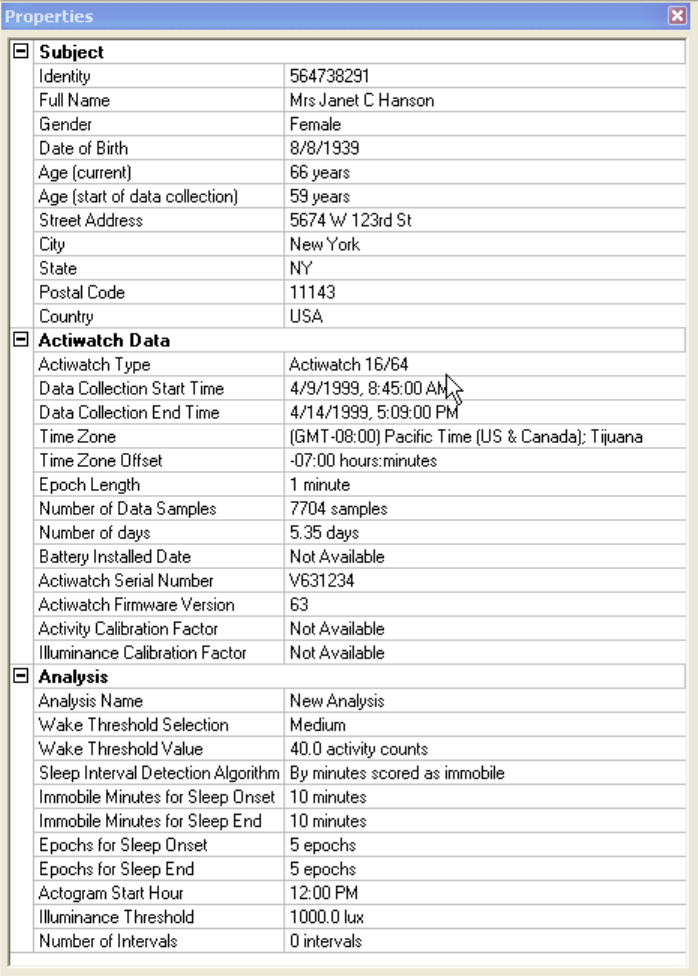
Properties Viewer window
Items in the Properties Viewer can be edited by double-clicking the item.
The Properties Viewer can be undocked or docked by clicking and dragging the
windowtitlebar.Inaddition,itcanberesizedorclosed.Toshowagain,usethe
View > Properties Viewer menu.
Properties Viewer
The Properties Viewer displays information for the database item that is currently
selected in the Database Viewer; hence the Database Viewer and Properties Viewer
are linked.
Clickthe+or–nexttotheSubject,ActiwatchData,orAnalysistoexpandor
collapse the properties related to that database item. Left-click on an item to see
a description of the property in the notes area at the bottom of the window. For
instance, the properties related to the Rest & Excluded Intervals analysis are
desplayed.NotethattheSubjectandActiwatchdatapropertiesarealsodisplayed.
2-8 Getting Started
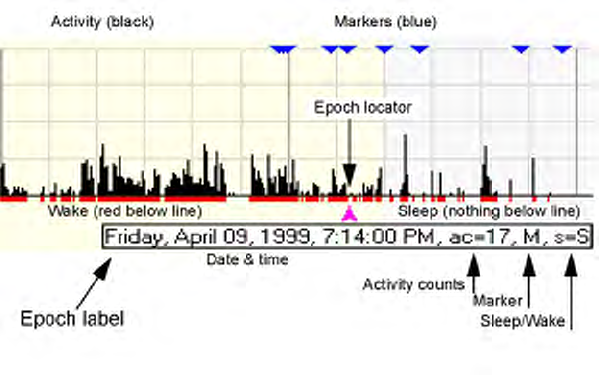
An Actogram is a graphic view of the rest/activityhistoryofasubject.Dataare
displayed in stackable 24-hour periods which allow the user to immediately
determine sleep/wake patterns.
The Actogram provides the ability to select periods of time, known as intervals,
and to provide statistics for these times of interest. (See Setting Intervals later in
this section.)
Actogram
There are multiple ways to open an Actogram. The most direct way is:
1. In the DatabaseViewer,clickthe+signnexttoaSubjecttoexpand.
2. Click the + sign next to the Actiwatch Data record to expand.
3. Double-click on New Analysis. An Actogram will be displayed.
This process can be repeated for any analysis (such as Custom Intervals) shown
in the Database Viewer.
2-9
You can also open an Actogram by clicking the View > Actogram menu, or by clicking
the icon on the Standard toolbar at the top of the window.
UsetheActogramViewtoolbar(displayedontherightsideofthewindow)toadjustthe
view settings for the Actogram.
Note: The sleep/wake scoring algorithm is applied automatically to the activity in
the entire data set. Epochs scored as wake are indicated by a red mark below the
X axis, whereas epochs scored as sleep have no mark below the X axis.
2-10 Getting Started
Setting Intervals
Adding an Interval Selection to an Actogram
An interval is a user-defined selection of time that allows you to graphically
selectandanalyzedataforstatisticalcalculations.Forcalculationofstatisticsfor
specific periods of time, it is necessary to select intervals and assign an interval
type to them. The Interval feature in Actiware provides a robust data selection,
exclusion and quantitative tool. The interval types that are available:
• Rest – user defined
• Sleep – automatically determined from Rest intervals
• Active – automatically determined from Rest intervals
• Excluded – user defined
• Forced Wake Score – user defined
• Forced Sleep Score – user defined
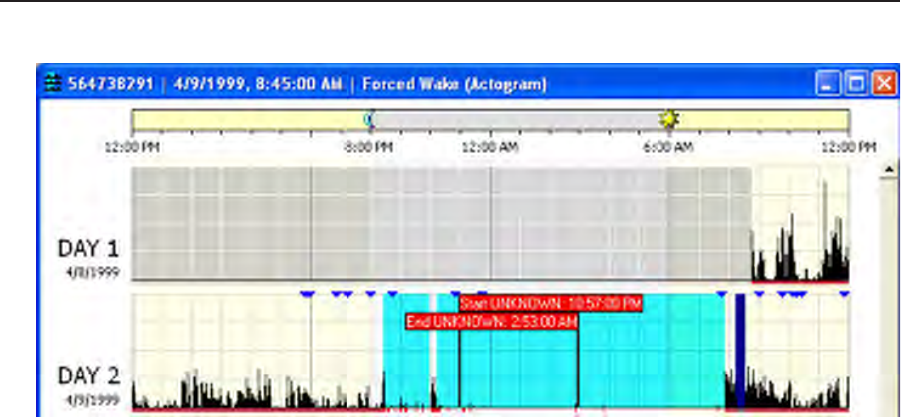
Rest intervals
Theseareintervalsofdatathatcontainperiodsoftimewhenthesubjectactivity
islowandthesubjectislikelytobeatrest.Theymustbesetbytheuserandare
indicated on the Actogram by light blue shading. Typically this will be used for
the In Bed Period. By setting a Rest Interval you are directing the program to
apply the Sleep Interval Detection algorithm for generating Sleep Periods.
This algorithm will use the first data point in the rest interval as the Bed Time
and the last data point as the Get up Time. From these points, the Sleep Onset
and Sleep End will be set using the Analysis parameter values that are indicated
on the Analysis tab of the Tools > Options window. Once you have set a Rest
Interval, a Sleep Interval will automatically be created within it.

2-11
Sleep Intervals
Data in these intervalsrepresentperiodsoftimeinwhichthesubjectislikelyto
be asleep. These intervals are created automatically by the program once a Rest
Interval has been set. They represent the period of time between Sleep Onset and
Sleep End but are not indicated by any shading.
Active Intervals
Dataintheseintervalsrepresentperiodsoftimeinwhichsubjectactivity
indicates that they are alert and engaged in physical activity. These intervals
contain all those data that are outside of Rest Intervals. Active Intervals are
created automatically when Rest Intervals are set. No shading is used to indicate
these intervals.
Excluded Intervals
Data in these intervals are excluded from all analytical calculations. These
intervalsaredesignedforusewhensubjectsremovetheActiwatchorforother
invalid periods of data. These must be set by the user and are indicated by dark
blue shading.
Custom Intervals
These are intervals of data that are of some interest for any reason. Typically
these are used for illuminance calculations when using an Actiwatch-L or
numerical rating scale values when using the Actiwatch Score. They may also be
used for assessing activity during specific periods of the day. They are indicated
on the Actogram by a blue bar above the activity data, and must be set by the
user.
Forced Wake
These intervals are periods of time for which the Sleep/Wake score has been
forcedbytheusertoWake.Thisistypicallyusedifthesubjectisknowntobe
awake, but very inactive, or as an alternative to excluding data. Epochs included
in this type of interval are indicated by a magenta mark below the X axis of the
Actogram.
Forced Sleep
These intervals are periods of time for which the Sleep/Wake score has been
forcedbytheusertoSleep.Thistypicallyisusedifthesubjectisknownto
be sleeping but there is significant movement. Epochs included in this type of
interval are indicated by a gray mark below the X axis of the Actogram.
Note: Custom, Excluded, Forced Wake and Forced Sleep intervals can
be overlapped. However, due to the automatic creation of Sleep intervals,
Rest intervals cannot be overlapped. If you attempt to overlap Rest
intervals, they will be combined into one interval.
2-12 Getting Started
There are three ways to set intervals. The quick method uses the mouse and
hotkey combinations:
Quick Method
1. Hold down the CTRL key on the keyboard.
2. Click the left mouse button where you want the start of the interval to be.
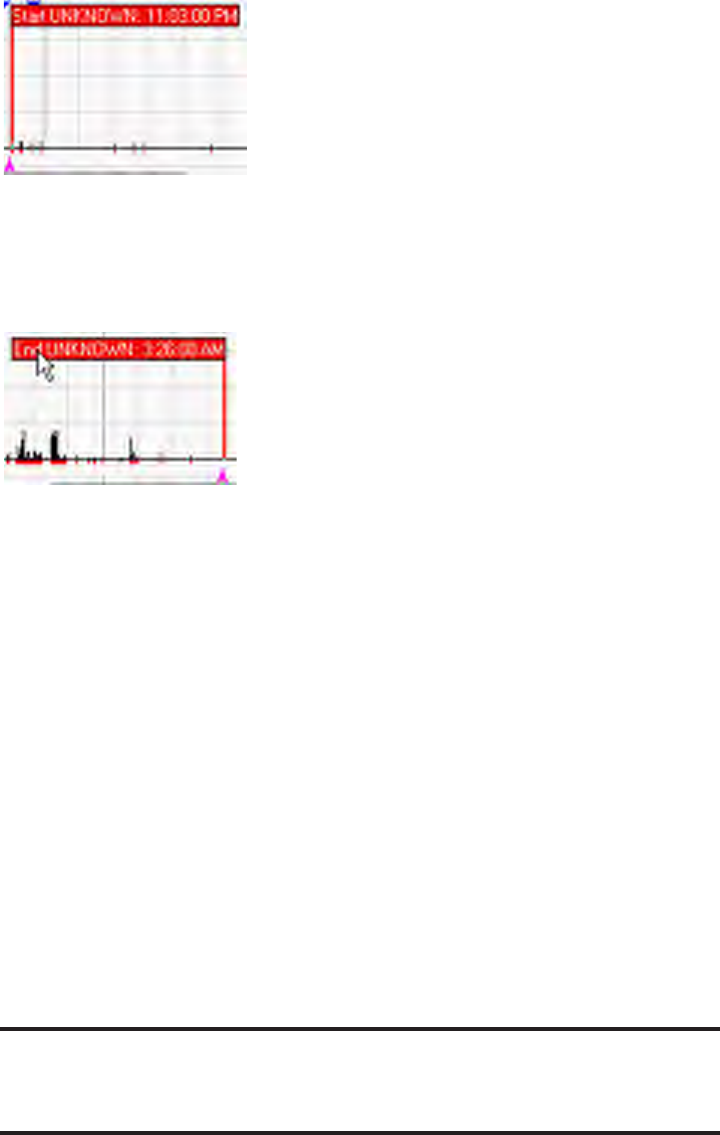
Interval Start Time
If you set an interval flag in the wrong location and want to move it,
repeat the above process. Also, by holding down the CTRL key and the
mouse button, you can drag the flag to the precise location you want.
4. Using one of the following hotkey combinations, set the type of interval
you want:
CTRL + R Insert REST interval
CTRL + C Insert CUSTOM interval
CTRL + E Insert EXCLUDED interval
CTRL + W Insert Forced WAKE interval
CTRL + S Insert Forced SLEEP interval
The new interval will be automatically drawn in the Actogram display. See the
legend on the right side of the window (on the Actogram View toolbar) to see
how the intervals are indicated on the Actogram.
Interval End Time
3. While still holding down the CTRL key, click the right mouse button
where you want the end of the interval.
Note: During the interval creation process you can press the keyboard
Escape key to clear the markers.
2-13
Fine Control Method
To set your intervals graphically to the nearest epoch, use the following
procedure:
1. Click the left mouse button on the Actogram to place the epoch label.
2. Usethekeyboardarrowkeys(←,→,↑,↓)tomovetheepochlabelto
the desired interval start time.
Close-up of Interval Markers on Actogram
3. To place the interval start marker, press one of the following keys based
on the interval type you want to create:
R Set REST interval start
C Set CUSTOM interval start
E Set EXCLUDED interval start
W Set Forced WAKE interval start
S Set Forced SLEEP interval start
4. Once again, click the left mouse button on the Actogram to place the
epoch label, and use the arrow keys to place the epoch label at the
desired interval end time.
5. To place the interval end marker, press one of the following hotkey
combinations based on the interval type you’re creating:
SHIFT + R Set REST interval end
SHIFT + C Set CUSTOM interval end
SHIFT + E Set EXCLUDED interval end
SHIFT + W Set Forced WAKE interval end
SHIFT + S Set Forced SLEEP interval end
If you set an interval flag in the wrong location and want to move it, repeat the
above process.

2-14 Getting Started
6. As with the Quick Method above, use one of the following hotkey
combinations to set the type of interval you want:
CTRL + R Insert REST interval
CTRL + C Insert CUSTOM interval
CTRL + E Insert EXCLUDED interval
CTRL + W Insert Forced WAKE interval
CTRL + S Insert Forced SLEEP interval
Note: During the interval creation process you can press the keyboard
Escape key to clear the markers.
Menu and Sleep Diary Methods
If you prefer to type in the date and time values for the interval start and end
times, such as if you have a patient sleep diary, use the following procedure:
1. Click Interval > Add Interval.
This will launch the Add Interval window.
2. Select the Interval Type
• Rest
• Excluded
• Custom
• Forced Sleep
• Forced Wake
3. Set the Interval Start Time (date and time).
You can type in the date or use the interactive calendar to select the date.
You can type in the time or use the arrows to scroll to the appropriate
time
4. Set the Interval End Time (date and time).
Note: If you want to create this interval for all days, check the Repeat for
all days check box. This will create an interval every 24 hours starting
with the interval start time, with the duration equal to the congured
interval.
2-15
5. Click the Add Interval(s) button to add the interval, or Close to cancel.
You can repeat steps 2 through 5 for each interval without closing the Add
Interval window.
Note: You can also click the right mouse button in the Actogram, or use
other sub-menus under the Interval main menu to set interval markers or
insert intervals.
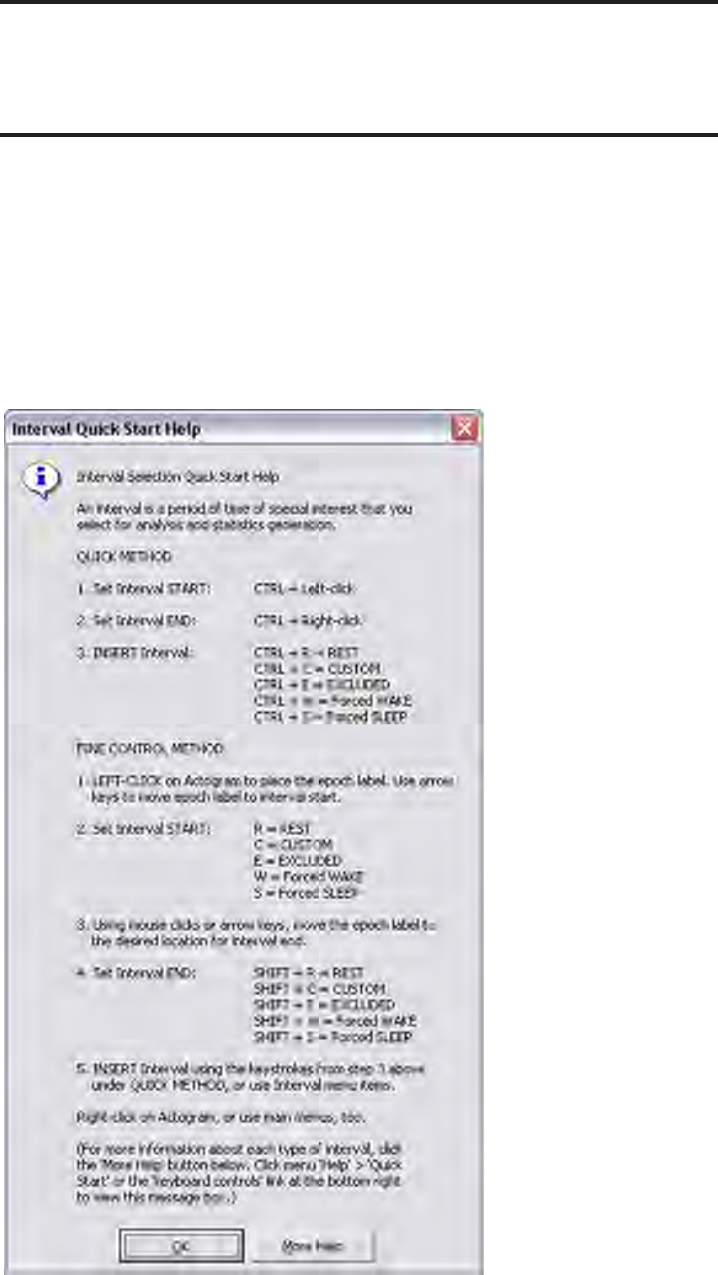
Interval Quick Start Help
The Interval Quick Start Help message provides an overview of the interval
functions. To display this message, click the keyboard controls link on the
bottom of the Actogram View toolbar, or click Help > Quick Start > Interval
Selection.
Interval Quick Start pop-up message. To access, Help > Quick Start > Interval Selection
2-16 Getting Started
Removing Intervals
To remove a single interval simply click the left mouse button in the interval you
want to delete, then press the Delete key.
To remove all intervals, right click on the Actogram and select Clear All
Intervals (also accessible from the Interval menu)
To remove all intervals of a specific interval type, use the Interval menu, or the
corresponding keyboard shortcuts (such as CTRL + ALT + C to clear all custom
intervals).
2-17
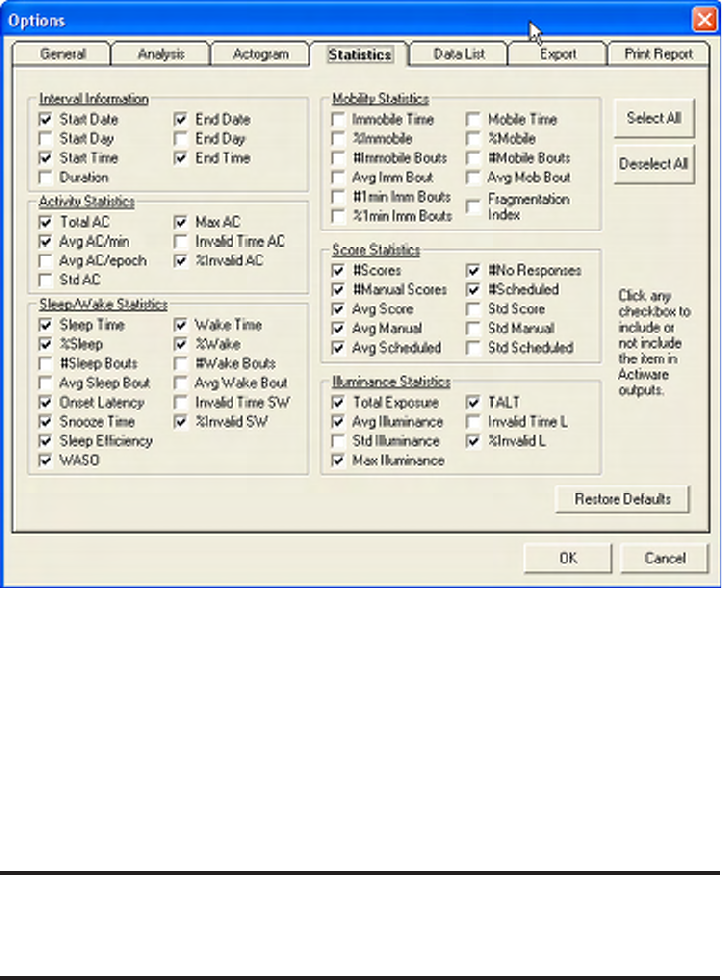
Controlling the Content of the Statistics Table
1. Tools > Options
This will launch the Options pop-up window.
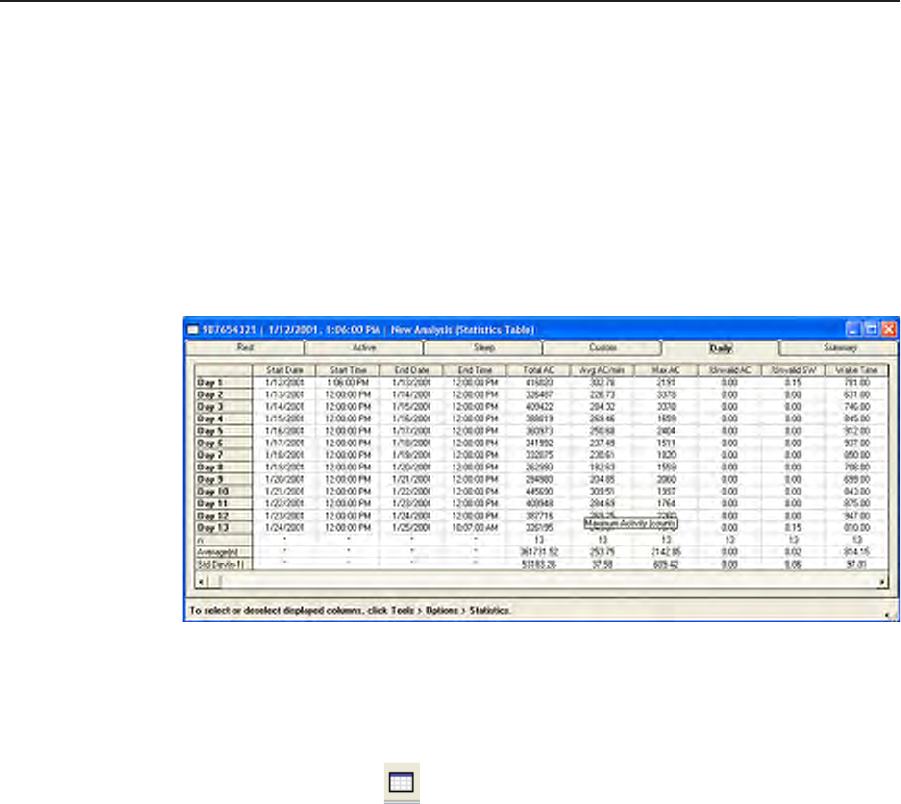
Viewing Statistics
Statistics Table
The Statistics Table is one of two main ways to display the calculated sleep/wake
output. Interval, activity, mobility, sleep, illuminance, and score statistics are
automatically calculated for intervals that are set by the user.
1. View > Statistics Table
Click on the tabs at the top of the window to view calculated statistics for
different types of intervals. Use the scrolling tools to move through the list of
intervals or to view different columns of statistics.
2-18 Getting Started
2. Statistics
Select the Statistics tab (mouse-click) to view the available statistic properties.
Check those statistics that you want to include. Actiware includes Select All,
Deselect All, and Restore Defaults buttons for ease of use.
3. Click OK to save your selections or Cancel to unaccept.
Your selections will appear in the Statistics Table and be included in exported and
printed data.
Tools > Options > Statistics
See Advanced Usage in Section 4 for statistic definitions.
Note: The selections that you make here will impact the content of
exported les and printed reports.

2-19
Exporting Data
Once you have added intervalsandanalyzedyourdata,youcanexportthe
retrieved raw data or statistical results to a text file that can be easily loaded into
Microsoft Excel, FAST, or a database program of your choice.
There are three types of export files that can be created using Actiware:
Standard Individual Export File
This is a comma delimited ASCII text file (.csv) that can be opened directly by
Microsoft Excel. It contains the data and analysis results for one analysis.
To create this file, click File > Export menu or click the button on the
Standard toolbar. You will be prompted for a file name using the standard
Windows dialog box.
Note: The contents of the export le can be customized using the Tools >
Options window. Use the Statistics, Data List and Export tabs to select
what content you would like in the export le.
Instead of creating a file, you can copy the file contents directly to the Windows
clipboard by clicking Copy > Export Text. Then paste into your program of
choice using the Clipboard paste function (commonly CTRL + V keyboard
hotkey).
FAST™ Export File1
This is a tab delimited ASCII text file (.txt) designed specifically for importing
into the Fatigue Avoidance Scheduling Tool™ Software. A short header, sleep/
wake scores, and per epoch time stamps for the currently selected analysis are
included in this export file.
To create this file, click File > FAST Export. You will be prompted for a file
name using the standard Windows dialog box.
1 FAST™ is a trademark of NTI, Inc.

2-20 Getting Started
Combined Export File
This is a comma delimited ASCII text file (.csv) that can be opened directly
by Microsoft Excel. It contains the data and analysis results for intervals
from multipleanalyses.Theseanalysescanbefromanynumberofsubjectsor
Actiwatch data records in the currently opened database.
UsetheTextFileExportBatchWizard,accessiblefromtheTools > Text File
Export Batch menu to create this file (or many Standard Individual Export
Files).
See Batch Export in Advanced Usage, Section 4, for details.
Note: Actiware-CT does not allow Copy > Export Text or File > FAST
Export because these are unsecured outputs that do not contain an
electronic or digital signature.
2-21
Print Report
You can generate a printed report of your Actogram and statistical results for the
currently selected analysis.
To generate the report, click File > Print Report, or click the button on the
Standard toolbar. You will be presented with a Windows printer dialog where you
can select the printer, number of copies, and paper orientation (such as Portrait or
Landscape).
Note: The contents of the printed report can be customized using the Tools
> Options window. Use the Statistics and Print Report tabs to select what
content you would like for the printed report.

2-22 Getting Started
New Subject
Once a databaseexistsitcanbepopulatedwithsubjectsandsubjectcollected
data.Toaddoreditasubject,firstopenthedatabase.Select File > Database >
Open, as described on the previous page.
Toaddanewsubjecttoadatabase,dothefollowing:
1. Click File > New Subject.
ThiswillopenaNewSubjectwindowtoallowforthecaptureofdemographic
data.
2. Fill in the three required fields: Identity, Date of Birth and Gender
ForIdentity,wesuggestusingablinddescriptorornicknameofthesubject.
Notice that Age is automatically computed.
Important! Because you can import subjects from other databases,
Actiware allows more than one subject with the same ID. Therefore, you
need to be sure you choose a subject ID that does not already exist in the
currently open database.
3. If you desire, fill in the remaining fields.
For HIPAA considerations, these fields are optional.
When USA or Canada is entered into the Country field, a dropdown list for the
State/Province area will become available. Additionally, the Phone field will be
optimizedforthe(###)###-####format.Toenteranon-USornon-Canadian
state code or phone number, enter the Country first.

2-23
Deleting/Hiding Subjects
Forpurposesofdatatracking,youcannotdeletesubjectsfromadatabase.You
can hide them by checking the Hide Subjectbox.Oncehidden,asubjectwillnot
appear in the DatabaseViewer.Hiddensubjectsmayberevealedbyrightclicking
in the Database Viewer and selecting View Hidden Subjects.
2-24 Getting Started

3-1
S
ECTION
3
The Actiware software is used to configure the Actiwatch device and retrieve
data from the Actiwatch through the use of the ActiReader.
To set up the ActiReader, see Installation and Setup in Section 1 of this manual.
C
OMMUNICATIONS
Overview
ThiswizardwillconfigureanActiwatchfordatacollection.Thiswizardassumes
that the ActiReader or Actiwatch Reader is connected to the computer and the
appropriate COM port is selected. Please refer to Section 1 of this manual for
setting up the ActiReader and selecting a COM port.
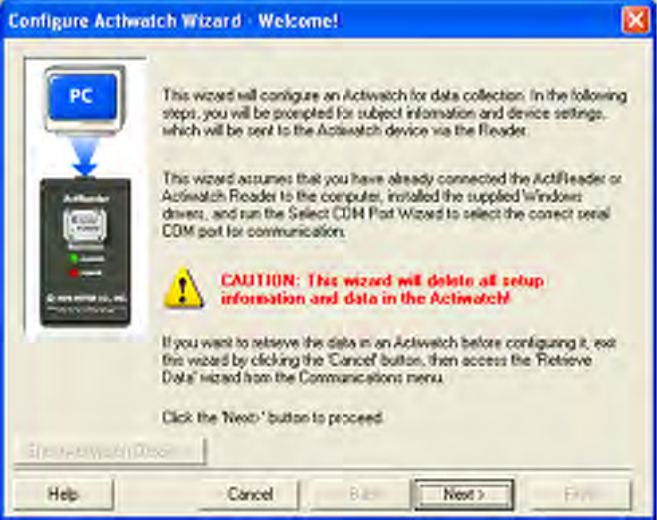
The Configure Actiwatch Wizard will guide you through several windows. As
withotherActiwarewizards,youcanmakechangesateachwindow.Youcan
also travel between windows using the Back and Next buttons, or Cancel to
closethewizard.
Use the Show/Hide Actiwatch Details button to view additional information
associated with the watch.
Congure Actiwatch
CAUTION! The Congure Actiwatch wizard will delete all setup
information and data stored in the Actiwatch. To stop this wizard, select
the Cancel button. To retrieve data, proceed to Retrieve Data from
Actiwatch later in this section.
3-2 Communications
Congure
Actiwatch
Congure Actiwatch
1. Communications > Configure Actiwatch
ThiswilllaunchtheConfigureActiwatchWizard.
2. Remove the wrist/foot bands from the Actiwatch (optional).
The bands may interfere with proper Actiwatch placement.
3. Place the Actiwatch on the reader.
The green dot on the metal side of the Actiwatch must align with the green dot
on the ActiReader. Verify that the metal side is facing up, the green dots are
adjacentandthegreenLED‘ALIGNED’lightison.
4. Click Next to continue.
ThewizardwillchecktheActiwatchserialnumberandbatterylife.IfaLow
Battery Warning appears, please choose one of the three options from the pop-
up window. If the warning does not appear, proceed to step 6.
• ChangeBattery—wizardwillguideyouthroughthebatteryreplacement
process (see Actiwach Battery Replacement later in this manual).
•ChangedBattery,update—wizardwillupdatethedatabase with the new
battery information.
•Ignore—wizardwillignoretheLowBatteryWarning.
5. Click Next to continue.
Configure Actiwatch Wizard Welcome window
3-3
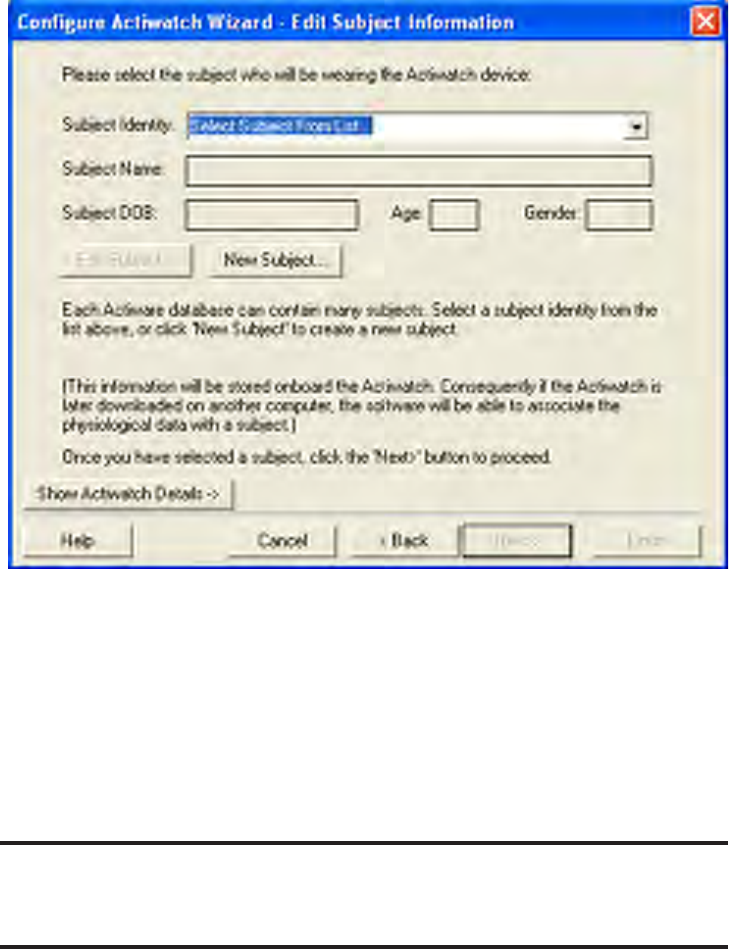
6. SelectacurrentsubjectfromthedropdownlistandthenclickEdit Subject
to make updates.
Whenanexistingsubjectisselectedfromthedropdownmenu,theareasbelow
(SubjectName,SubjectDOB,Age,andGender)willpre-populatewiththe
information stored in the database.
Note: The subject must be in the current data le to be accessible from the
dropdown menu.
Select subject from the dropdown list or use the ‘New Subject’ button to add a new subject to the
database.
Click New SubjecttoconfigureActiwatchforanewsubject.
7. Click Nextwhenyouhavecompletedediting/addingsubjectinformation.
Edit Subject Information
3-4 Communications
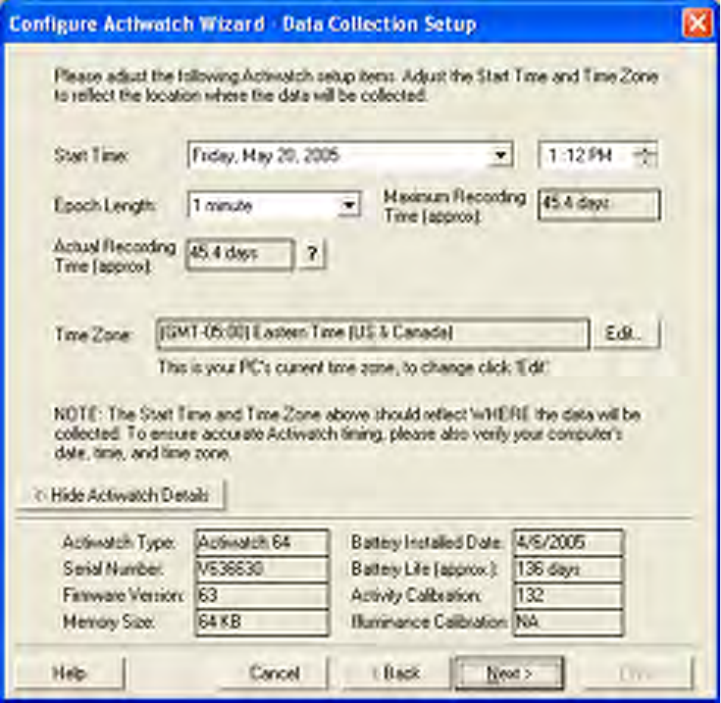
Expanded window displaying the Actiwatch Details.
Epoch length
The period of time Actiwatch will accumulate activity counts before saving the
sample to memory. Select the epoch length by clicking in this field. The choices
will appear sequentially.
When selecting epoch length:
• If actual recording time is in red, then the battery may need to be changed.
•Timezoneselectionshouldbewherethedatawillbecollected,notthe
currenttimezoneofthecomputerlocation.
• When configuring the Actiwatch for sleep analysis, use an epoch length of
2 minutes or less, otherwise sleep analysis statistics will not be calculated.
Data Collection Setup
During the Data Collection Setup, you can configure the Actiwatch setup items,
includingstarttime,epochlength,andtimezonewithasimplemouseclick.
3-5
Recording Time
Displays the time at which the activity monitor will fill its memory with samples
based on the epoch length selected.
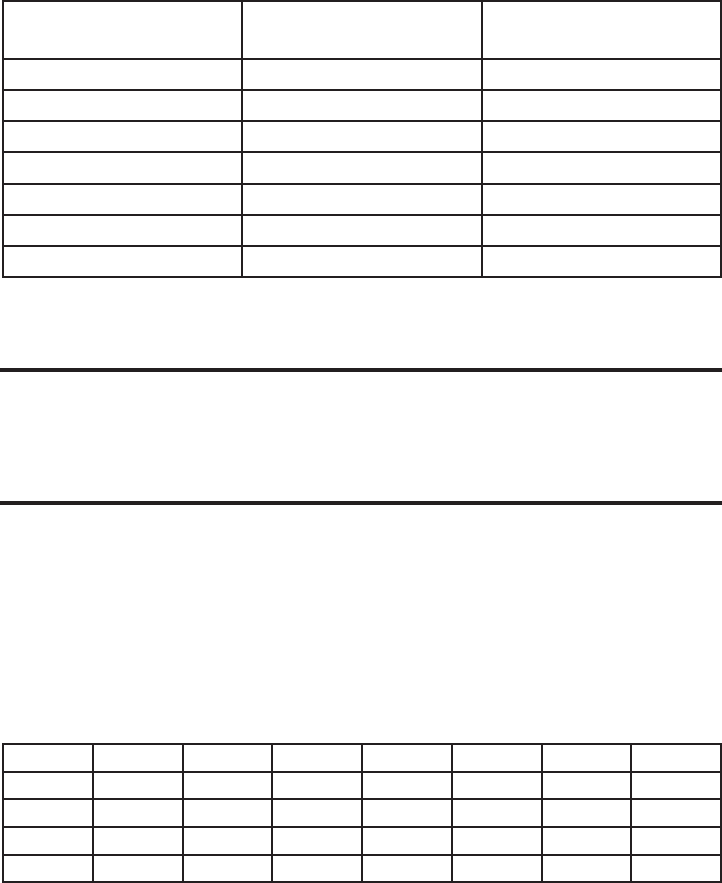
Recording Time Table (for epochs > 0.25 minutes)
Memory 0.25 min 0.5 min 1 min 2 min 5 min 10 min 15 min
AW-16K 2.8 5.6 11.2 22.5 56.4 112.8 169.3
AW-64K 11.3 22.7 45.4 90.8 227 454 681
AW-L 3.7 7.5 15.1 30.2 75.7 151 225
AW-Score 5.6 11.2 22.4 44.9 112 224 336
NOTE: AW-L devices manufactured before July 1st, 1999 have 32K memory and shorter recording
times.
NOTE: Maximum battery life is 180 days for AW16, AW64, and AW-L, and 90 days for AW-Score.
Epoch Length Number of
Epochs per Day Maximum Delay
in Start Time
15 seconds 5760 5 days
30 seconds 2880 11 days
1 minute 1440 22 days
2 minutes 670 49 days
5 minutes 288 114 days
10 minutes 144 228 days
15 minutes 96 342 days
Note: For sleep analysis it is recommended you select an interval of one
minute or less. Data with sampling epochs of greater than two minutes
cannot be analyzed using Actiware-Sleep analysis.
8. Click Next when you have completed editing/adding data collection
information.
If you are configuring an Actiwatch-Score, continue below. If configuring an
Actiwatch-16/64 or Actiwatch-L, skip ahead to step 10.
Actiwatch-Score
If you are configuring an Actiwatch-Score, a Score Range window will appear
and you will now be required to set the minimum and maximum score ranges.
Set the ranges by typing in the numeric value (0-15) or use the scroll arrows.
9. Click Next to continue.
3-6 Communications
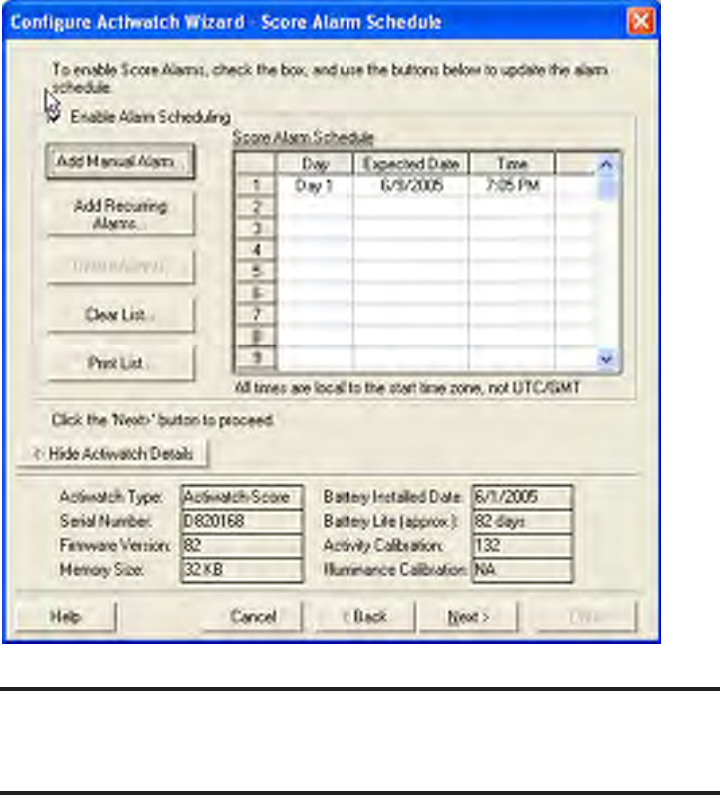
Actiwatch-Score Alarm
Click the Enable Alarm Scheduling box and format the Score Alarms with the
following actions.
• Add Manual Alarm
• Add Recurring Alarm
• Delete Alarms (select item in list)
• Clear List
• Print List
After establishing the Actiwatch-Score Alarm schedule, you can print a listing.
10. Click Next to continue.
The Configure Actiwatch process is in operation. When prompted, remove the
Actiwatch.
11. Click FinishtocompletetheConfigureActiwatchWizard.
CAUTION! Do not remove the Actiwatch from the ActiReader during the
Congure Actiwatch Wizard process until instructed to do so.
Actiwatch-Score Alarm window
3-7
Overview
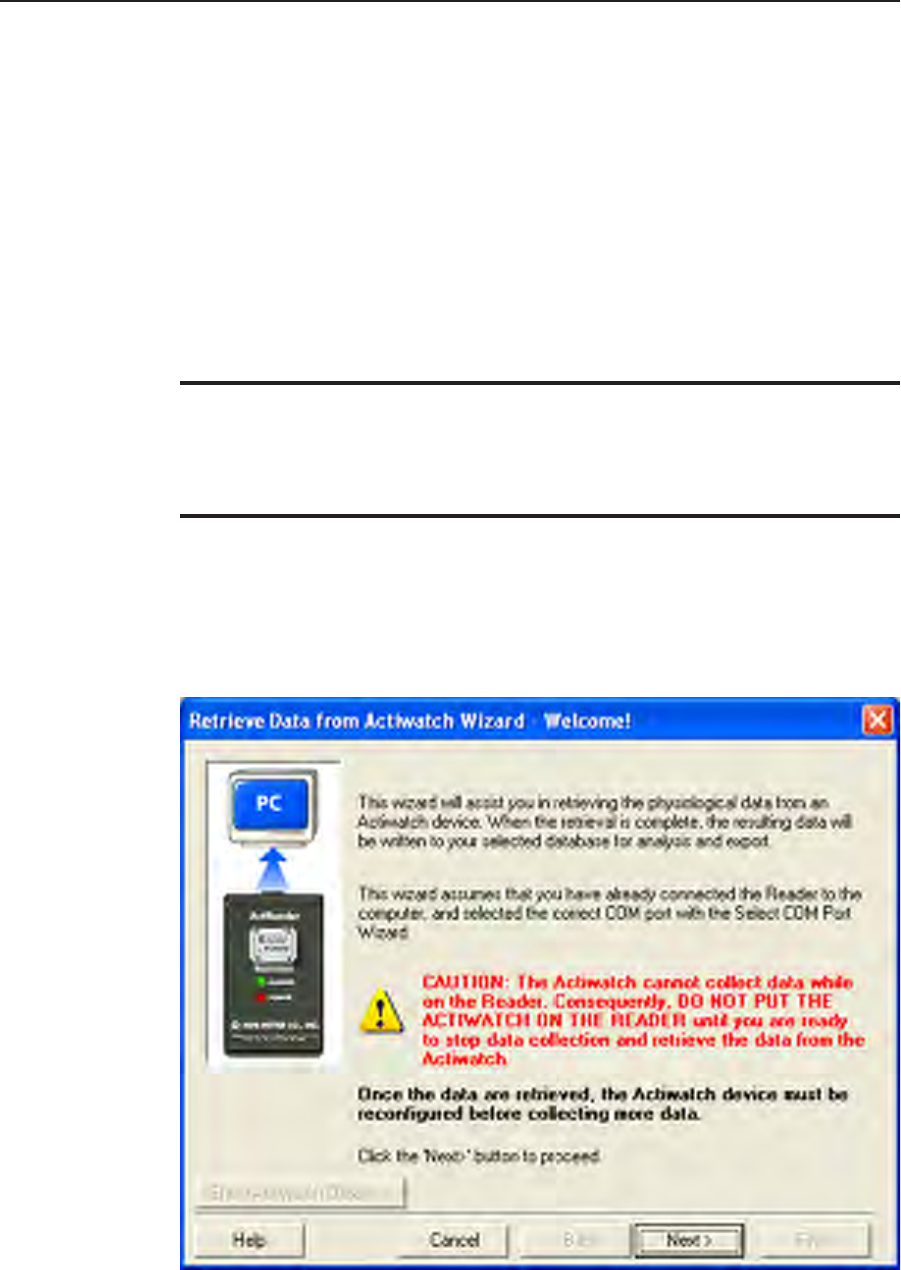
ThiswizardwillassistyouinretrievingthephysiologicaldatafromanActiwatch
device. When the retrieval process is complete, the resulting data will be written
to your selected database for analysis and export.
ThiswizardassumesthattheActiReaderorActiwatch Reader is connected to the
computer and the appropriate COM port is selected. Please refer to Installation
and Setup in Section 1 of this manual.
Retrieve Data from Actiwatch
CAUTION! The Actiwatch cannot collect data while on the reader.
Consequently, do not put the Actiwatch on the reader until you are ready
to stop data collection and retrieve the data from the Actiwatch.
Retrieve Data from Actiwatch Wizard Welcome window
3-8 Communications
Retrieve Data from Actiwatch
1. Communications > Retrieve Data from Actiwatch.
StarttheRetrieveDatafromActiwatchWizard.ClickNext to continue.
2. Remove the wrist/foot bands from the Actiwatch (optional).
The bands may interfere with proper Actiwatch placement.
3. Place the Actiwatch on the reader.
The green dot on the metal side of the Actiwatch must align with the green dot
on the ActiReader. Verify that the metal side is facing up, the green dots are
adjacentandthegreenLED‘ALIGNED’lightison.
4. Click Next to continue.
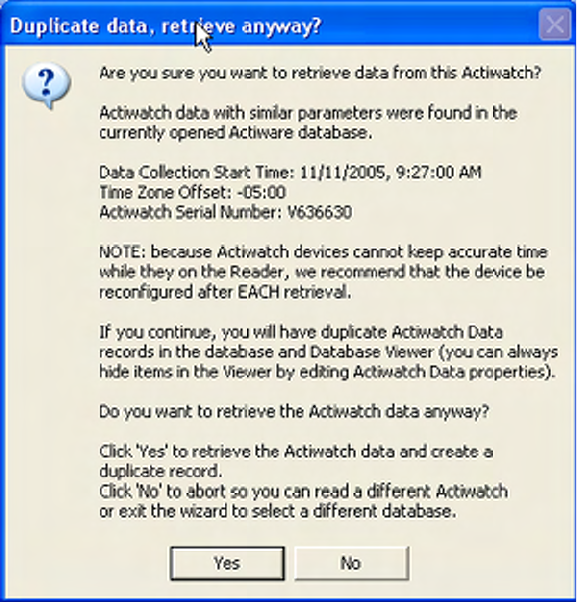
Actiware will communicate with the Actiwatch device and retrieve the data. If
you receive a Duplicate data, retrieve anyway message, you have the option to
abort the retrieve process by selecting the No button, or create a duplicate record
by selecting the Yes button and continue retrieving the data.
Retrieve
Data from
Actiwatch
Duplicate data window
3-9
Note: Actiware-CT requires the user to ‘Sign and Save’ the data by using a
Windows or Network username and password. Please contact your local
administrator with any issues or questions.
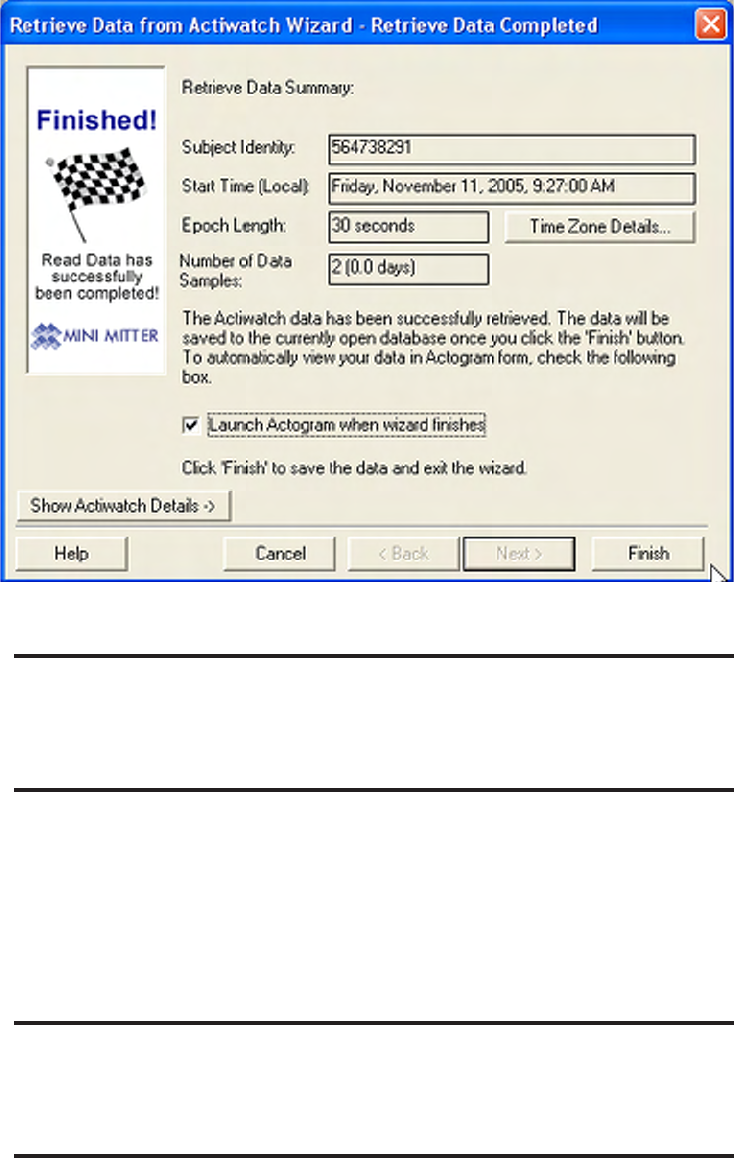
5. When the Retrieval Successful! message appears, click the OK button.
6. Check the Launch Actogram when the wizard finishes box to view the
Actogram data immediately.
7. Click the Finishbuttontoexitthewizard.
Note: Actiwatch-Score may occasionally make a short “chirping” sound
during communications. This is normal. DO NOT remove the device from
the reader until instructed.
Retrieve Data Complete window
3-10 Communications
4-1
S
ECTION
4
A
DVANCED
U
SAGE
Actiware provides greater flexibility to researchers and clinicians when viewing
andanalyzingdata.AdvanceduserscantakeadvantageoftheActiwareToolbars
to manipulate how the data is viewed and exported.
Items covered in this section:
• Program Options (Tools > Options)
• Data List
• Batch Export
• Import AWD files
• Graph
Your input is vital to us. Please explore the program fully and give us your
feedback. Please feel free to contact us with any questions or comments on this
software.
4-2 Advanced Usage
Program Options
Tools > Options
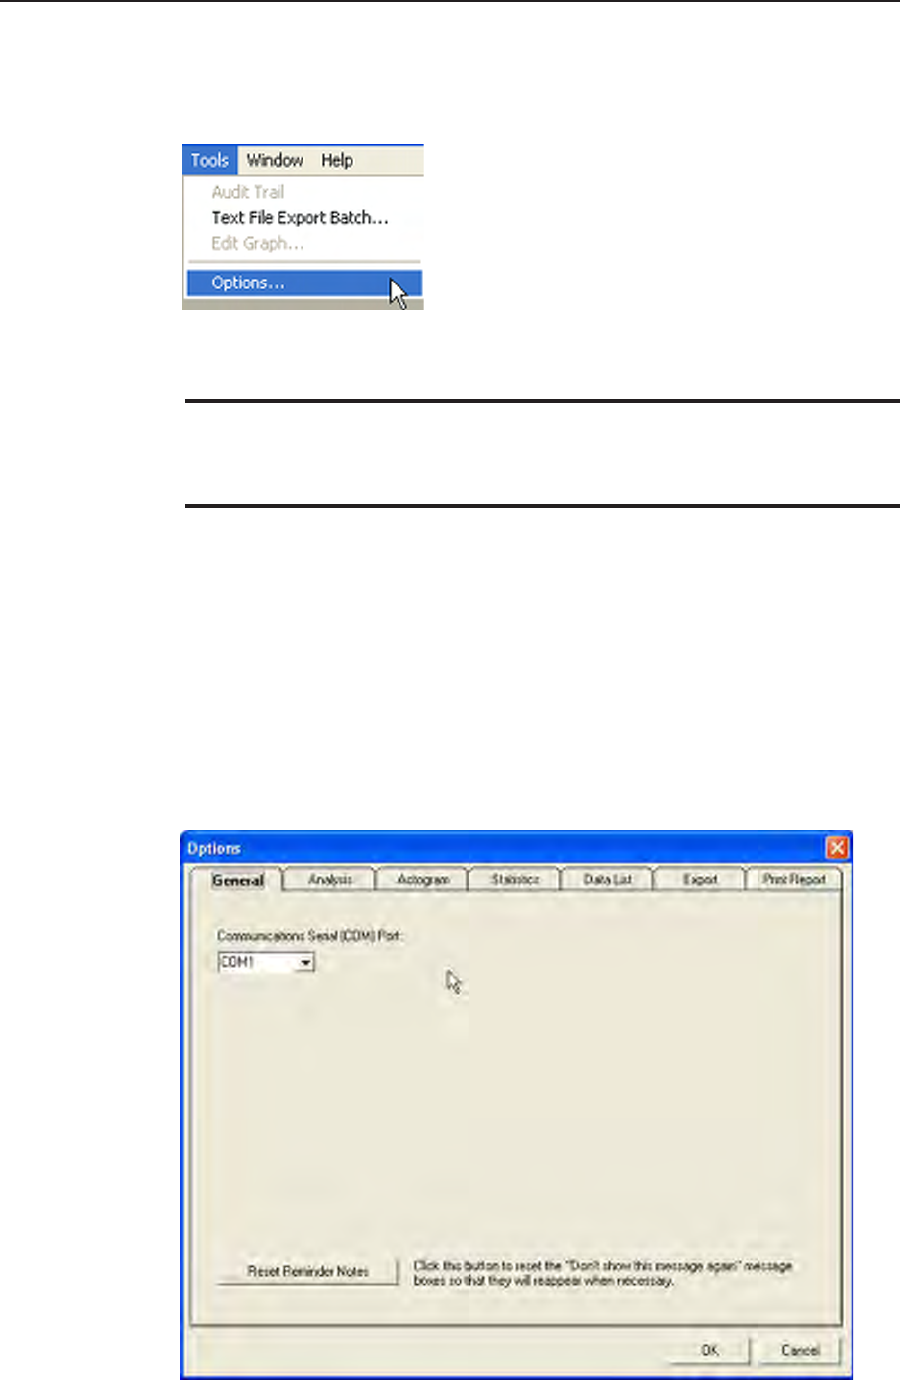
General Tab (Tools > Options > General)
Select the COM port from the dropdown menu. To reset all Help Window
reminders, check the Reset Reminder Notes button.
CustomizetheActiwaresoftwareanddatapropertiesthroughtheprogram
options window. Select Tools > Options from the main menu bar to access the
option tabs.
Note: After you have nished making all of your changes in the options
window, click OK to accept or Cancel to not accept.
Tools > Options > General
4-3
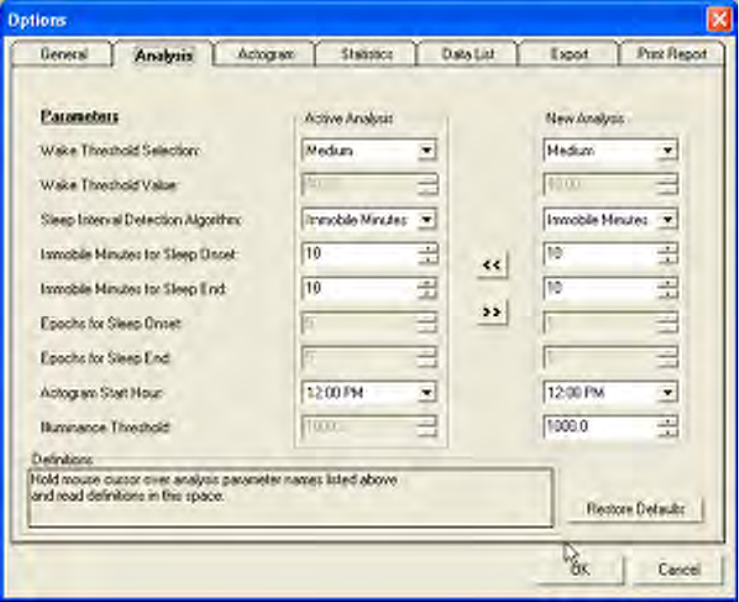
Analysis Tab (Tools > Options > Analysis)
An analysis includes parameter settings and interval settings as inputs. Use the
Analysis tab for setting parameter values (see Section 2 for how to set intervals).
Definitions of each analysis parameter are given on the next few pages. You can
also see the definitions of each parameter on screen when running the Actiware
software by holding your mouse cursor over the parameter names on the left side
of the Analysis tab.
Active Analysis refers to the currently selected analysis, so the analysis parameter
settings shown in the Active Analysis frame are those of the currently selected
analysis.
New Analysis refers to a newly created analysis, so the analysis parameter settings
shown in the New Analysis frame are default values. These default values are
unique to each Windows logon username and are used each time a New Analysis
window is opened.
Click the << button to set Active Analysis parameter settings equal to New
Analysis parameter settings.
Click the >> button to set New Analysis parameter settings equal to those of the
Active Analysis.
Click the Restore Defaults button to reset to the factory released parameter
settings.
Tools > Options > Analysis

4-4 Advanced Usage
Wake Threshold Selection
Selected level or method of setting the Wake Threshold. If Automatic is selected, the
Wake Threshold will be computed automatically based on activity data.
Wake Threshold Value
Thenumberofactivitycountsusedtodenewake.Detail:Levelofactivitythatis
compared to a value (x) generated by the Actiware sleep algorithm for each epoch. If
(x) is above the Wake Threshold, then the epoch is scored as wake. The higher the Wake
Threshold, the fewer the number of epochs scored as wake (See Appendix A for further
information).
Sleep Interval Detection Algorithm
Thisdeterminesthebasisforcalculatingsleeponsetandsleepend.Therstoption
uses the number of minutes scored as immobile. By selecting this option, the parameter
settings for epochs for sleep onset and sleep end can be edited. The second option uses
a number of epochs scored as sleep. By selecting this option, the parameter settings for
immobile minutes for sleep onset and epochs for sleep end can be edited. Note: This is a
means of automatically setting sleep onset and sleep end intervals, not rest intervals.
Immobile Minutes for Sleep Onset
After the start of each rest interval, the start of each sleep interval will be automatically
settotherstepochoftherstsectionofconsecutiveepochs“THIS”manyminutes
long with all but one epoch in the section scored as immobile. Note: This parameter is
only applied if the Immobile Minutes option is selected as the sleep interval detection
algorithm.
Immobile Minutes for Sleep End
Prior to the end of each rest interval, the end of each sleep interval will be automatically
set to the last epoch of the last section of consecutive epochs “THIS” many minutes
long with all but one epoch in the section scored as immobile. Note: This parameter is
only applied if the Immobile Minutes option is selected as the sleep interval detection
algorithm.
Epochs for Sleep Onset
After the start of each rest interval, the start of each sleep interval will be automatically
settotherstepochoftherstsectionofconsecutiveepochsscoredassleep“THIS”
many epochs long. Note: This parameter is only applied if the Sleep Epochs option is
selected as the sleep interval detection algorithm.
Epochs for Sleep End
Prior to the end of each rest interval, the end of each sleep interval will be automatically
set to the last epoch of the last section of consecutive epochs scored as sleep “THIS”
many epochs long. Note: This parameter is only applied if the Sleep Epochs option is
selected as the sleep interval detection algorithm.
Actogram Start Hour
The hour at which Actogram rows and daily intervals begin. This setting affects daily
interval statistics.
Illuminance Threshold
Level of illuminance, in lux, that is compared to the intensity of illumination the
Actiwatch-L is exposed to, for the purpose of calculating the Time Above Illuminance
Threshold statistic for given time intervals (Actiwatch-L only).
Analysis Parameter Denitions
4-5
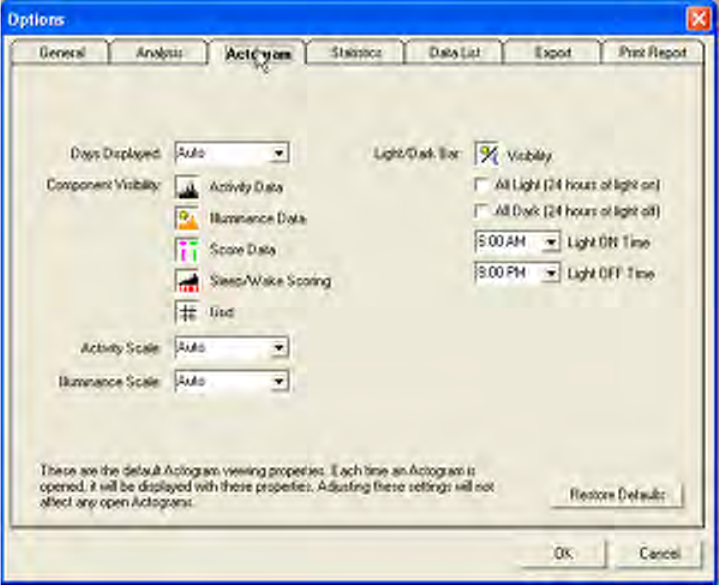
Actogram Tab (Tools > Options > Actogram)
These are the default Actogram viewing properties. Each time an Actogram is
opened,itwillbedisplayedwiththeseproperties.Adjustingtheseproperties
will not affect any open Actograms. To view the changes, close and reopen the
Actogram.
Click the Restore Defaults button to reset to the factory released settings.
Tools > Options > Actogram
4-6 Advanced Usage
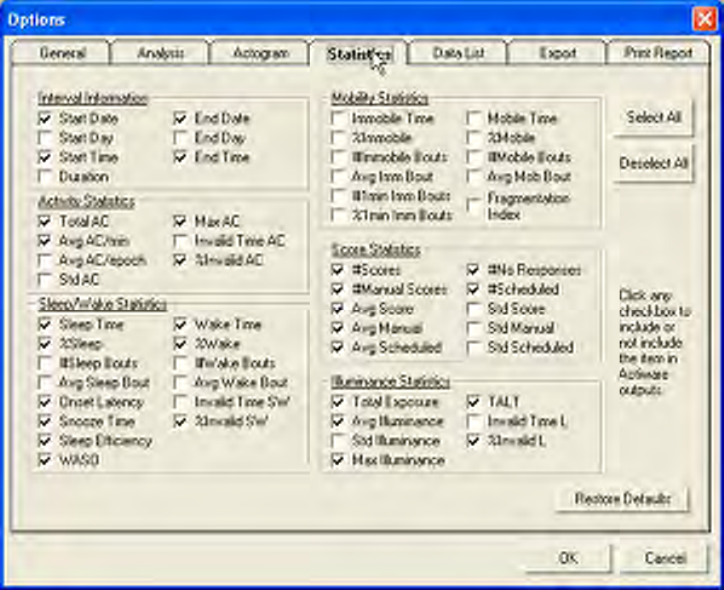
Tools > Options > Statistics
Statistics Tab (Tools > Options > Statistics)
Select the items of data displayed from the analysis. Changes made here will
impact exported and printed data, and the statistics table window contents. Place
your cursor over an item to get a brief definition of that item.
Click Select All to include all items in your statistical analysis. Click Deselect
All to remove all items from your statistical analysis. Click the Restore Defaults
button to reset to the factory released settings.
See Appendix B for a definition of each statistic.
4-7
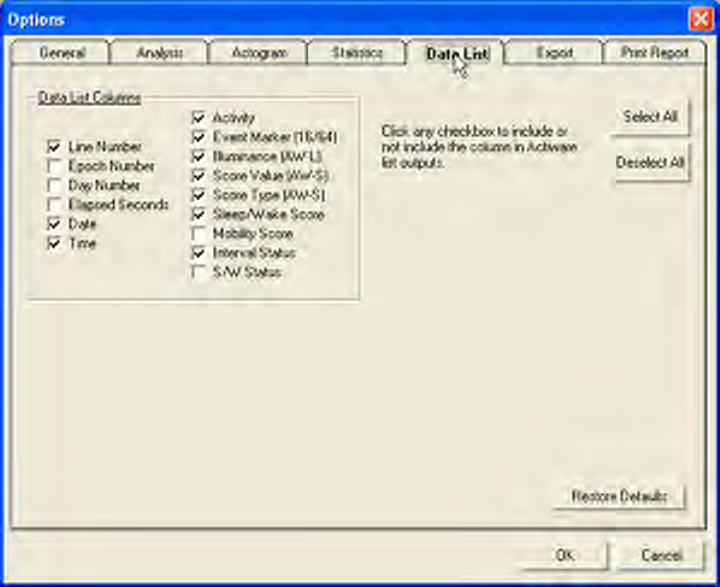
Data List Tab (Tools > Options > Data List)
Select the columns to be displayed in the Data List window. Changes made on
this tab will impact the content of exported files and printed reports.
Click Select All to include all items in the Data List. Click Deselect All to
remove all items from the Data List. Click Restore Defaults to return the settings
to the factory presets.
Changes made in the Tools > Options > Data List window will be immediately
displayed in the View > Data List window.
Tools > Options > Data List
4-8 Advanced Usage
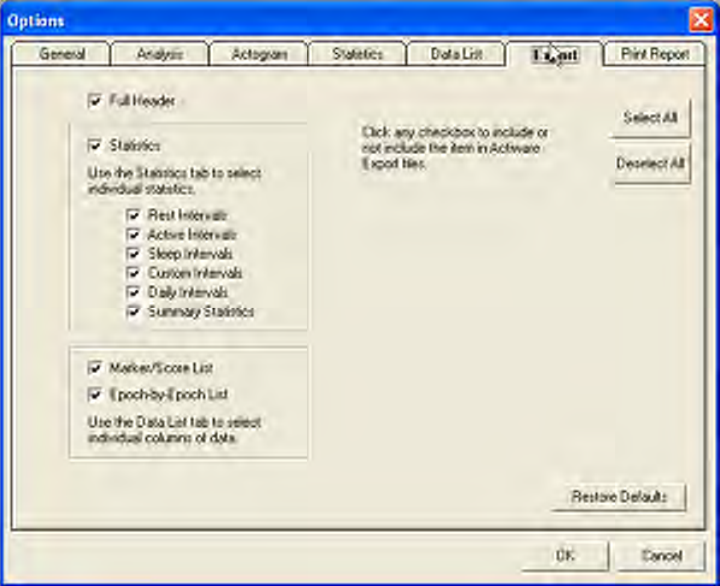
Tools > Options > Export
Export Tab (Tools > Options > Export)
Select the items you want to include in your export file (also applies to the Copy
> Export Text to windows clipboard function in the non-CT version of Actiware).
Use the Statistics tab to select individual statistics. Use the Data List tab to
select individual columns of data.
Click Select All to select all of the types of data. Click Deselect All to uncheck
all of the types of data. Click Restore Defaults to return the settings to the
factory presets.
4-9
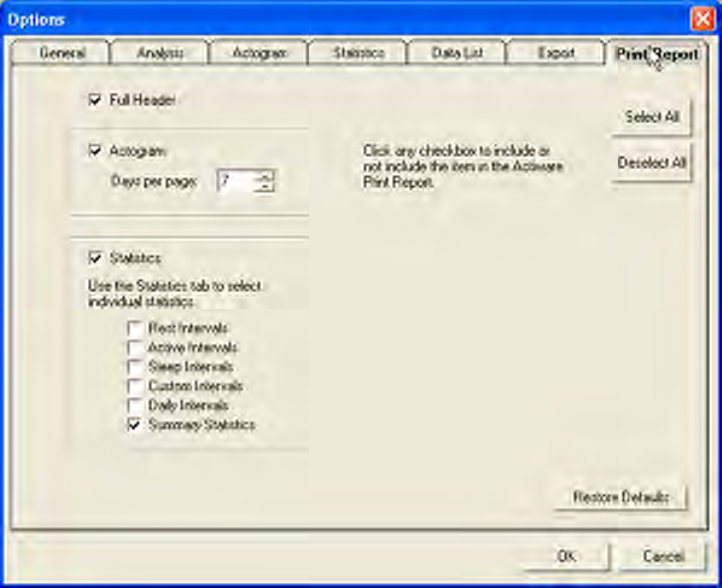
Tools > Options > Print Report
Print Report Tab (Tools > Options > Print Report)
Select the items you want to include in your printed report. Click the Full
Header box to include a first page of header information (recommended). Click
the Actogram box to include the Actogram graphic in the report. You can select
the number of Actogram days to print per page. Click the Statistics box (and sub-
boxes) to include statistics for various types of intervals (by default the report
will include Summary Statistics only). Use the Statistics tab to select individual
statistics.
Click Select All to select all of the types of data. Click Deselect All to uncheck
all of the types of data. Click Restore Defaults to return the settings to the
factory presets.
4-10 Advanced Usage
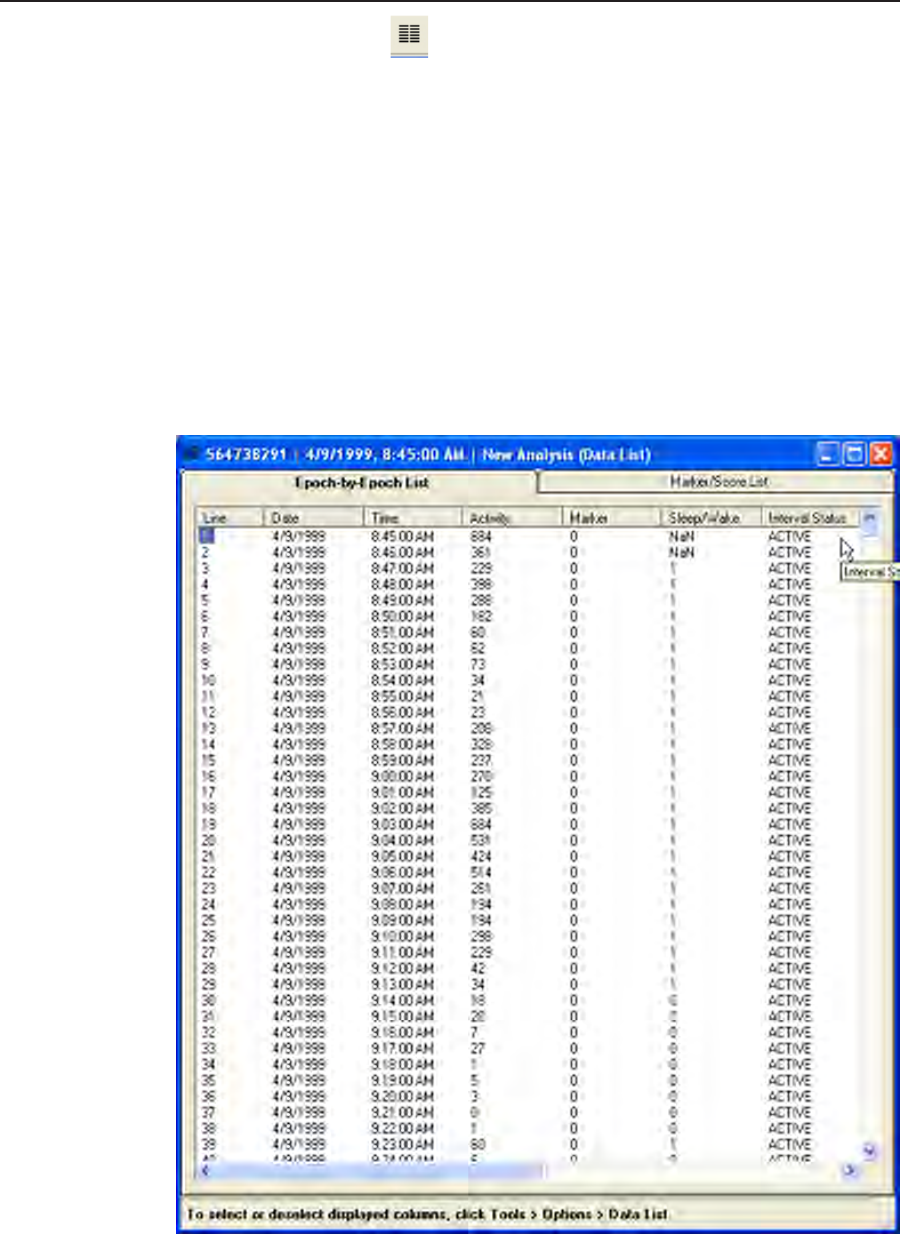
View > Data List
1. View > Data List
You have selected to view a listing of the currently active data as a function of
time (epoch-by-epoch).
2. Click the Epoch-by-Epoch List tab or the Marker/Score List tab to view
the data list for that type.
Use the scroll bars to move up and down each List and to pan across data
columnsasnecessary.Youmaywanttomaximizethewindowsizebyclicking
the‘Maximize’buttonintheupperrightcorner.
Data List
4-11
This option is used when you want to export data from multiple analyses for the
currently open database. You can elect to send these data to individual text files
or to the same composite file.
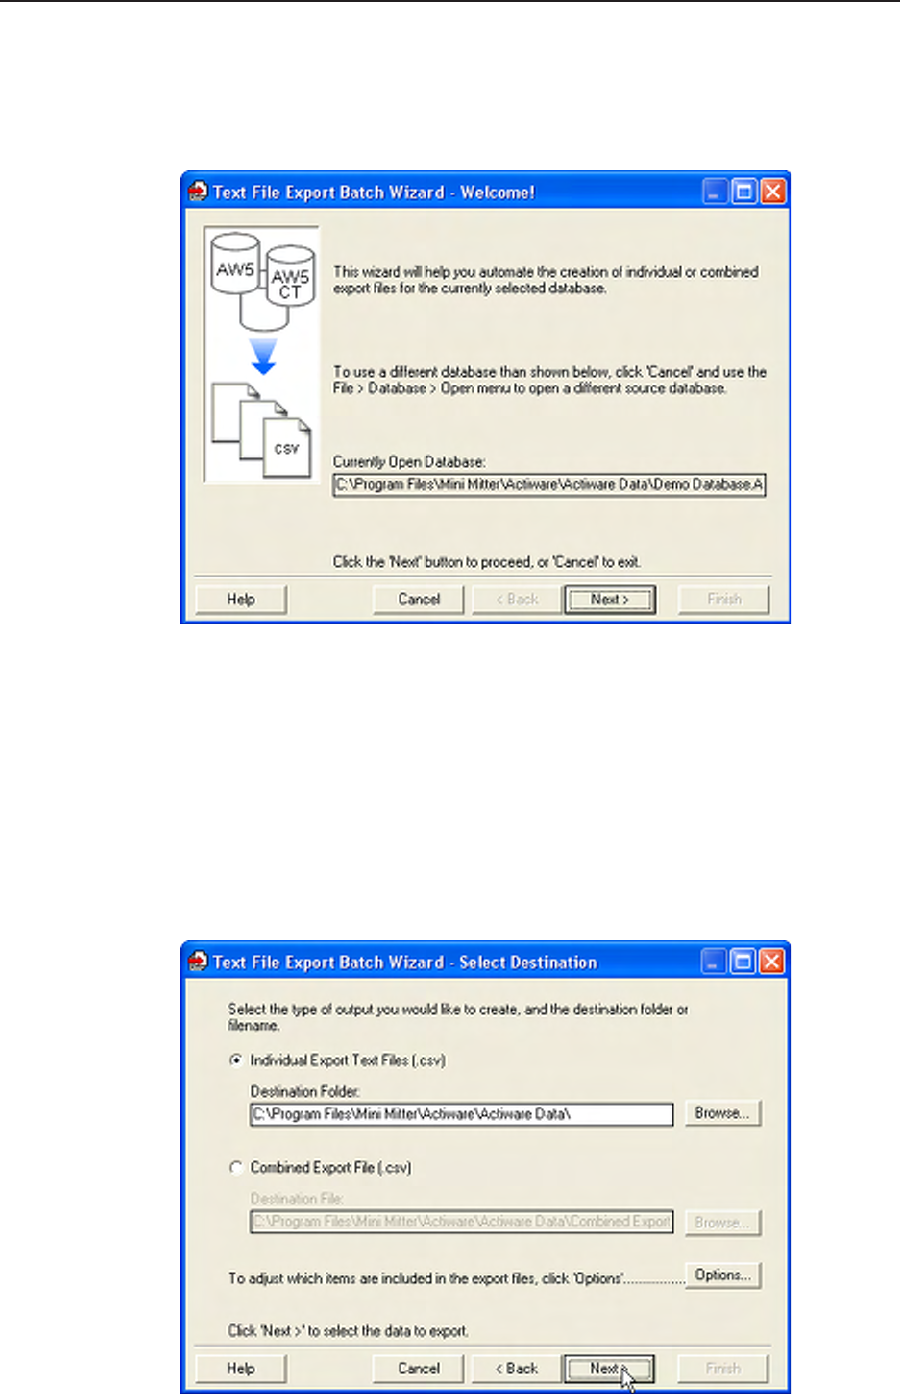
1. Tools > Text File Export Batch
ThiswilllaunchtheExportBatchWizard.Confirmthatthecurrentlyactive
database is the one you want to export from.
2. Click Next.
Select the type of output you require (individual files for each analysis, or a
combined file for multiple analyses).
Text File Batch Export
Text File Export Batch Wizard Welcome window
Select destination of the exported data
4-12 Advanced Usage
3. Click Browse.
Use this button to determine the destination for any export output using the
Browse button and the Windows File Dialog.
4. Click the Options button to make any changes.
5. Click Next.
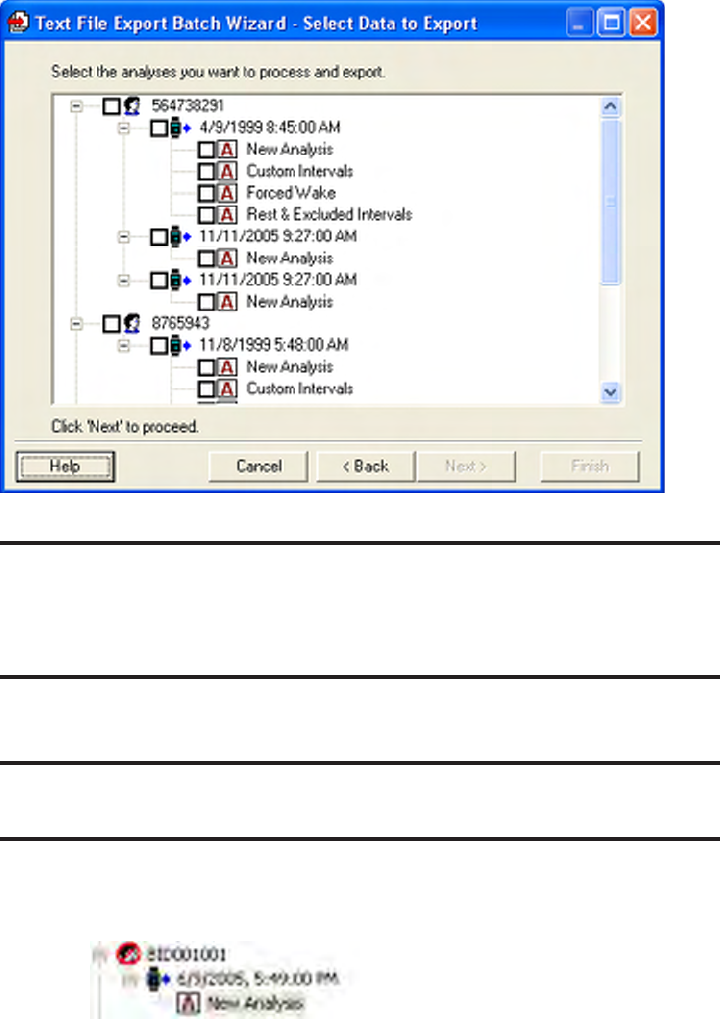
6. Select the data that you want to include in the export file by checking the
boxes.
Note: The controls for this window are hierarchical. If you select a
subject, or Actiwatch data entry all analyses associated with that subject
or Actiwatch data set will be included in the export le.
Note: Hidden subjects are shown in the display.
Hidden data is indicated by the red circle and the diagonal line.
Select data to export
4-13
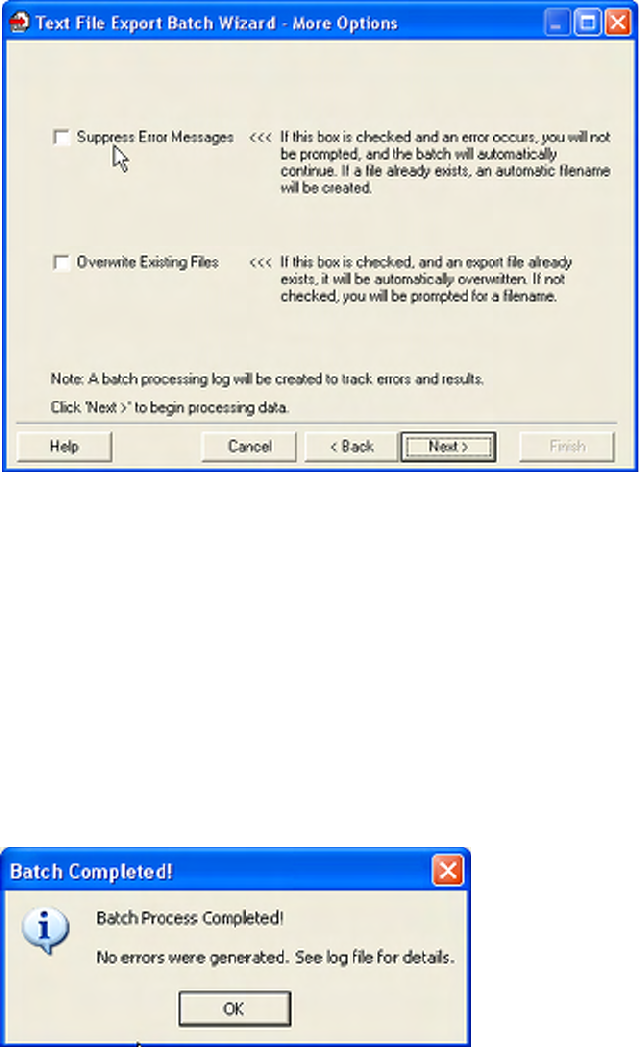
10. Click OK when the batch process is completed.
If any errors occur, you have the option to view the log file for details. You can
also Restart the batch process. If you restart the process you may choose to
overwrite the existing file or rename the file.
11. Click FinishtocompletetheExportBatchWizard.
Batch Completed! pop-up window
7. Suppress Errors Messages box.
When this box is checked, you will not be prompted if an error occurs during the
batch process. If a file alrady exists, an automatic filename will be created.
8. Overwrite Existing Files box.
Indicate if you want to overwrite existing export file(s) without being prompted.
9. Click Next to process your data and create the export.
More options are available when using the Text File Export Batch Wizard
4-14 Advanced Usage
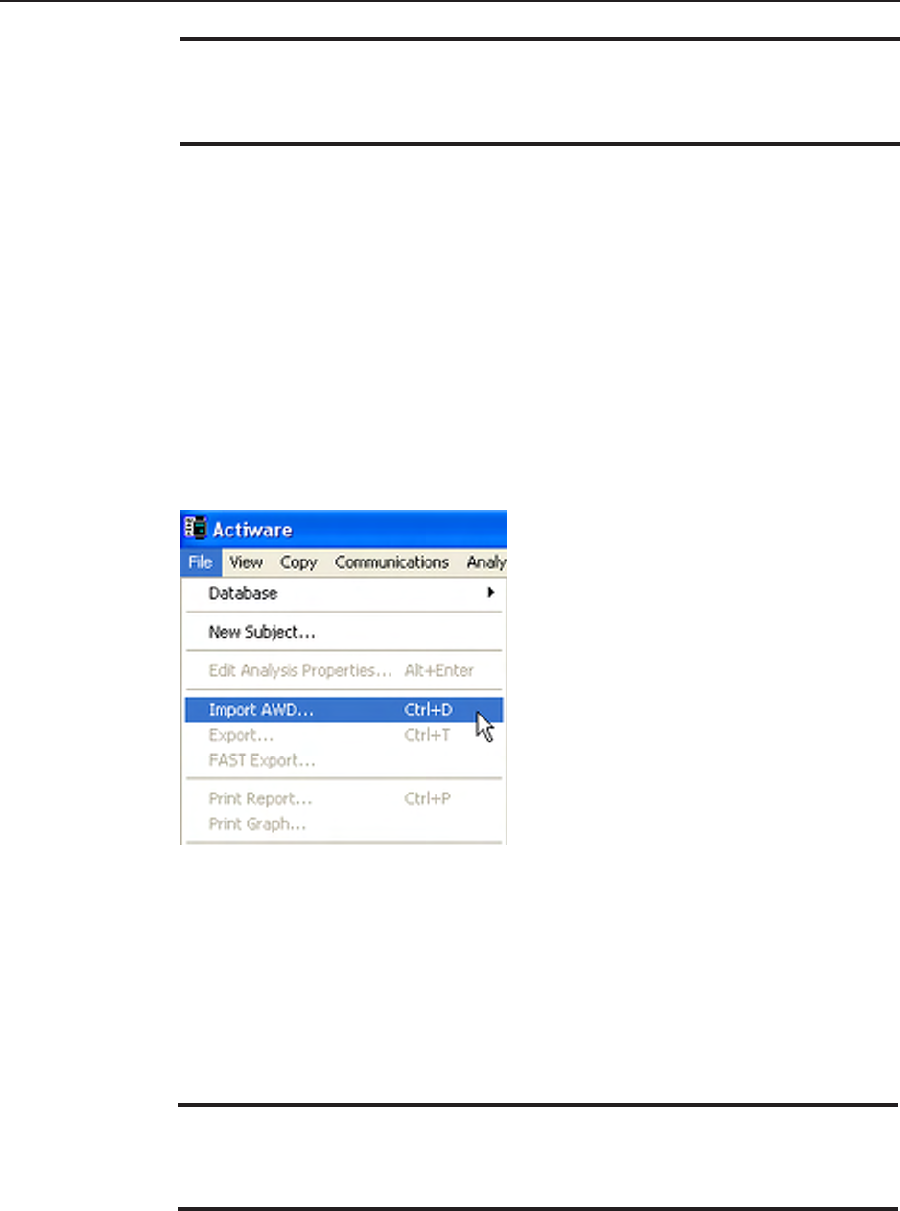
Import AWD Files
File > Import AWD
Import AWD
You can import data files collected with previous versions of Actiware (Actiware-
Sleep/Rhythm v3.4 and earlier).
1. LeftmouseclicktohighlightthesubjectyouwanttoimporttheAWDfileto.
Ifyoudonotalreadyhaveasubjectcreated,useFile > New Subject menu.
2. Click File > Import AWD.
Note: .AWS les cannot be imported. Only .AWD (Actiwatch) les can be
imported.
Note: The identity from the AWD le is not imported. You must select or
create the correct subject when importing.
3. Use Windows File Dialog to Browse to the location of the AWD files.
Select the file and click OK to import. When the file is successfully imported
a pop-up window will appear.
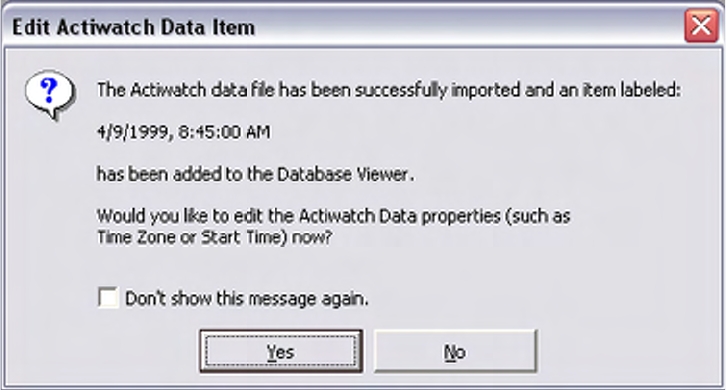
4-15
4. Click Yes to edit the Actiwatch Data properties or click No to bypass.
5. The data is ready for analysis.
Edit Actiware Data
4-16 Advanced Usage
View
Graph
View
The Actiware toolbars provide many new features to assist you with the data.
Graph
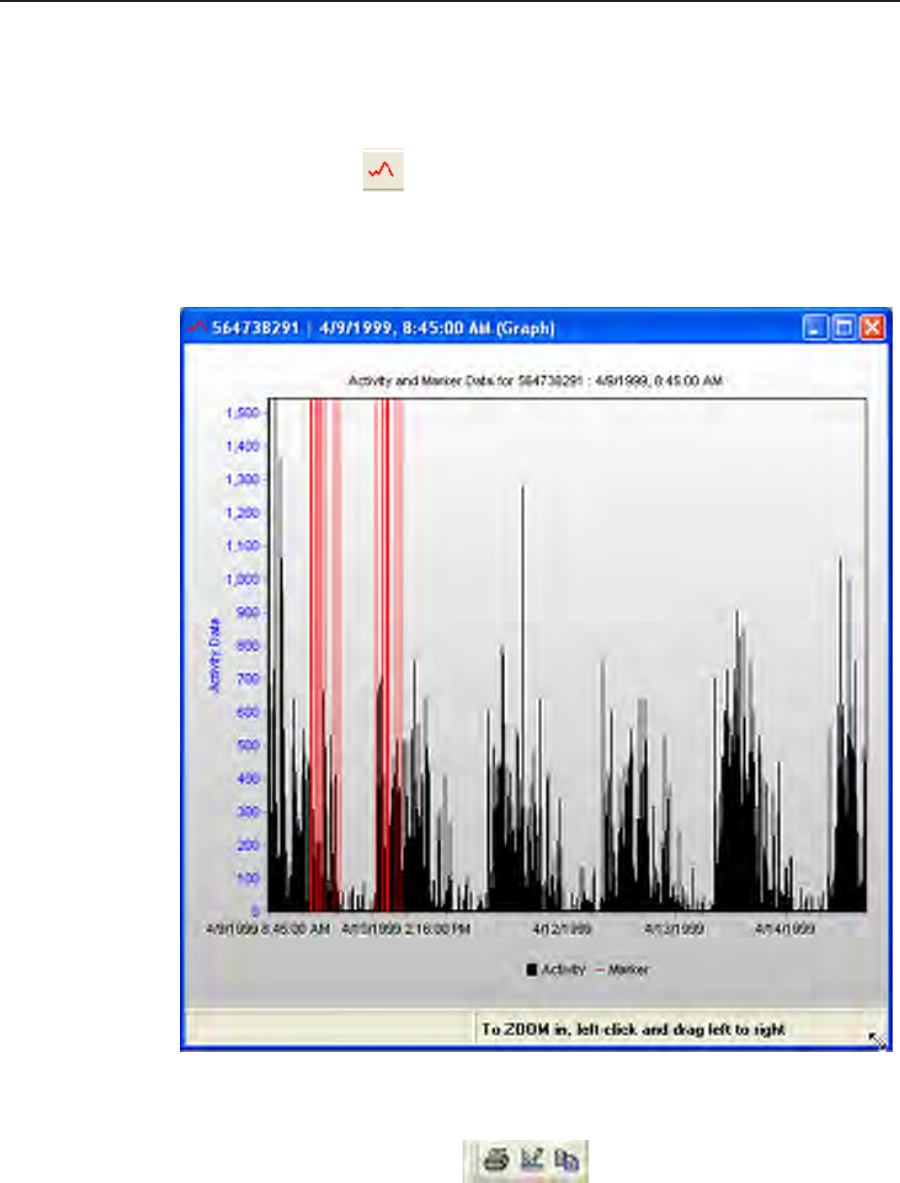
1. View > Graph
This is the Graph window for viewing Actiwatch data along a single axis.
View > Graph
Graph Icons
2. View > Toolbars > Graph
When viewing a graph, the Graph Icons are available in the standard toolbar.
These icons allow you to
1. Print the graph.
2. Edit Graph Display Properties.
3. Copy a picture of the graph to the Windows Clipboard.
4-17
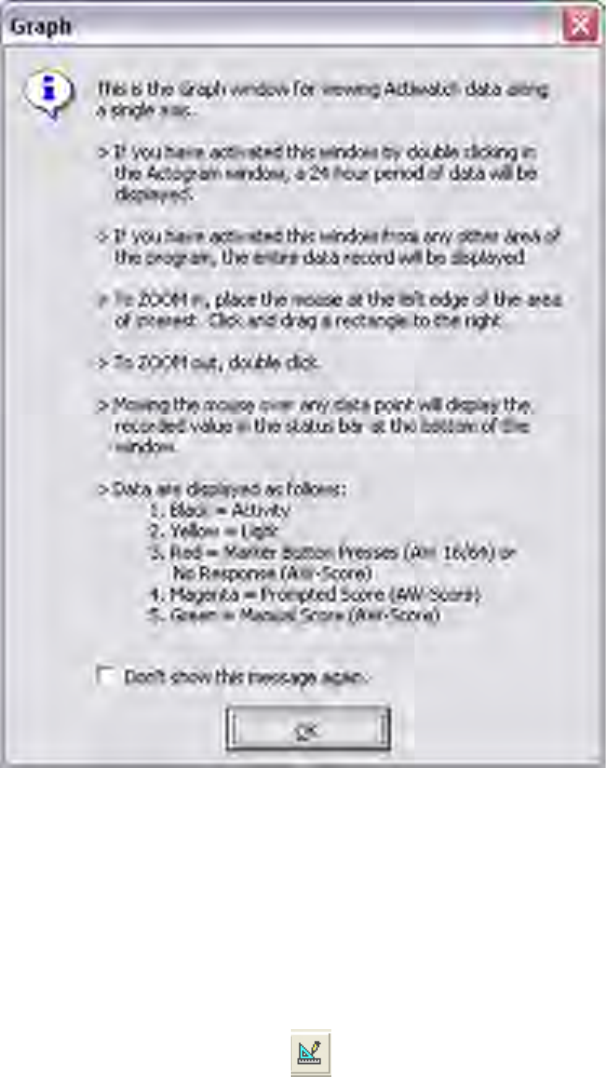
The Graph Help window provides useful information when using the Graph
view.
Edit Graph Display Properties
1. Tools > Edit Graph
This more advanced feature allows you to edit the Graph GUI, display and
printing features, and plotting parameters of the graph.
Graph Help
4-18 Advanced Usage