Norav Medical 1200WR WIRELESS ECG RECORDING SYSTEM User Manual PCECG1200WR Revised UserMan
Norav Medical Ltd. WIRELESS ECG RECORDING SYSTEM PCECG1200WR Revised UserMan
Contents
- 1. USERS MANUAL 1
- 2. USERS MANUAL 2
- 3. USERS MANUAL 3
USERS MANUAL 2
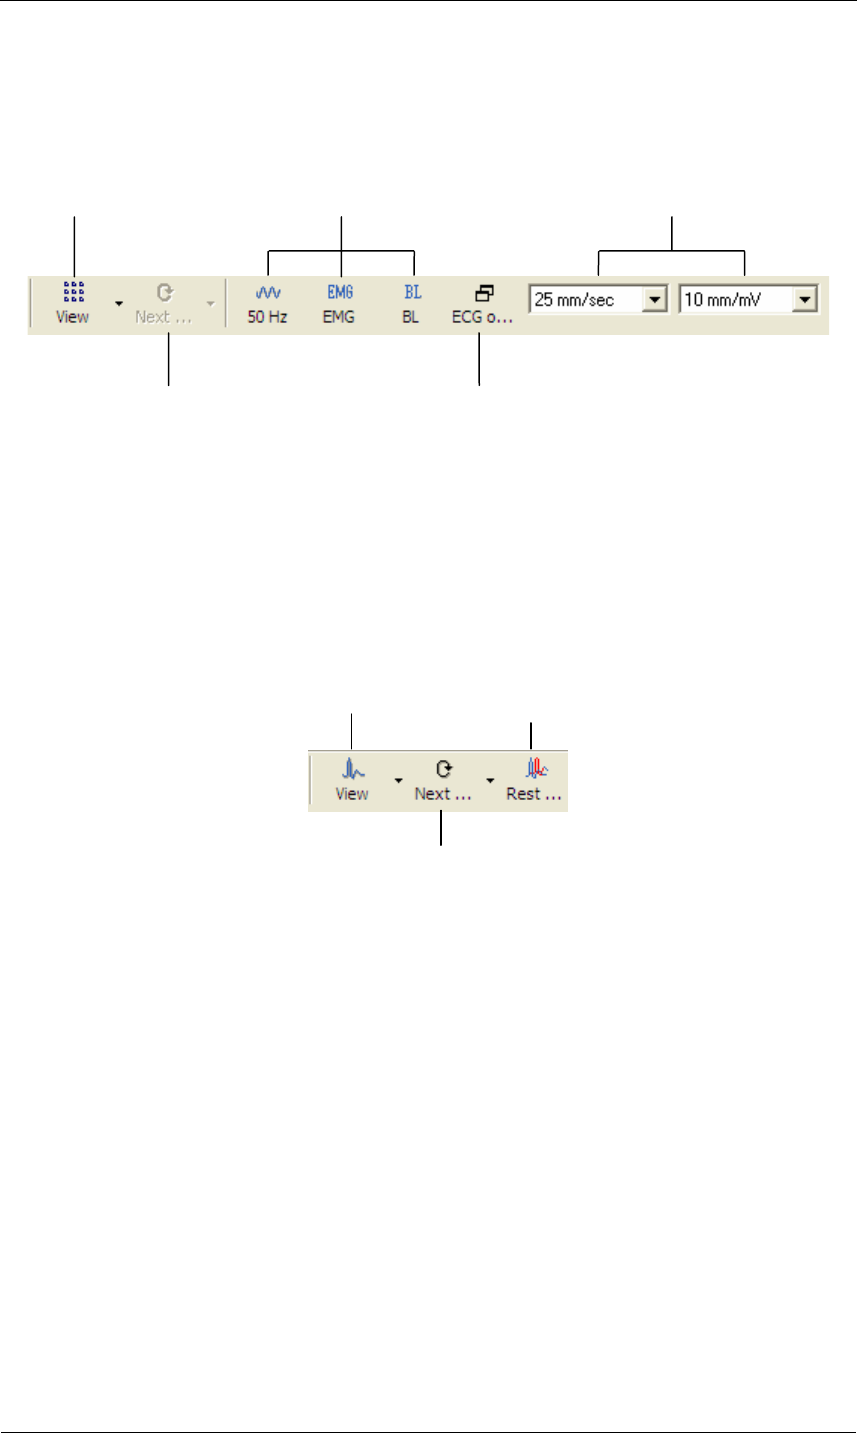
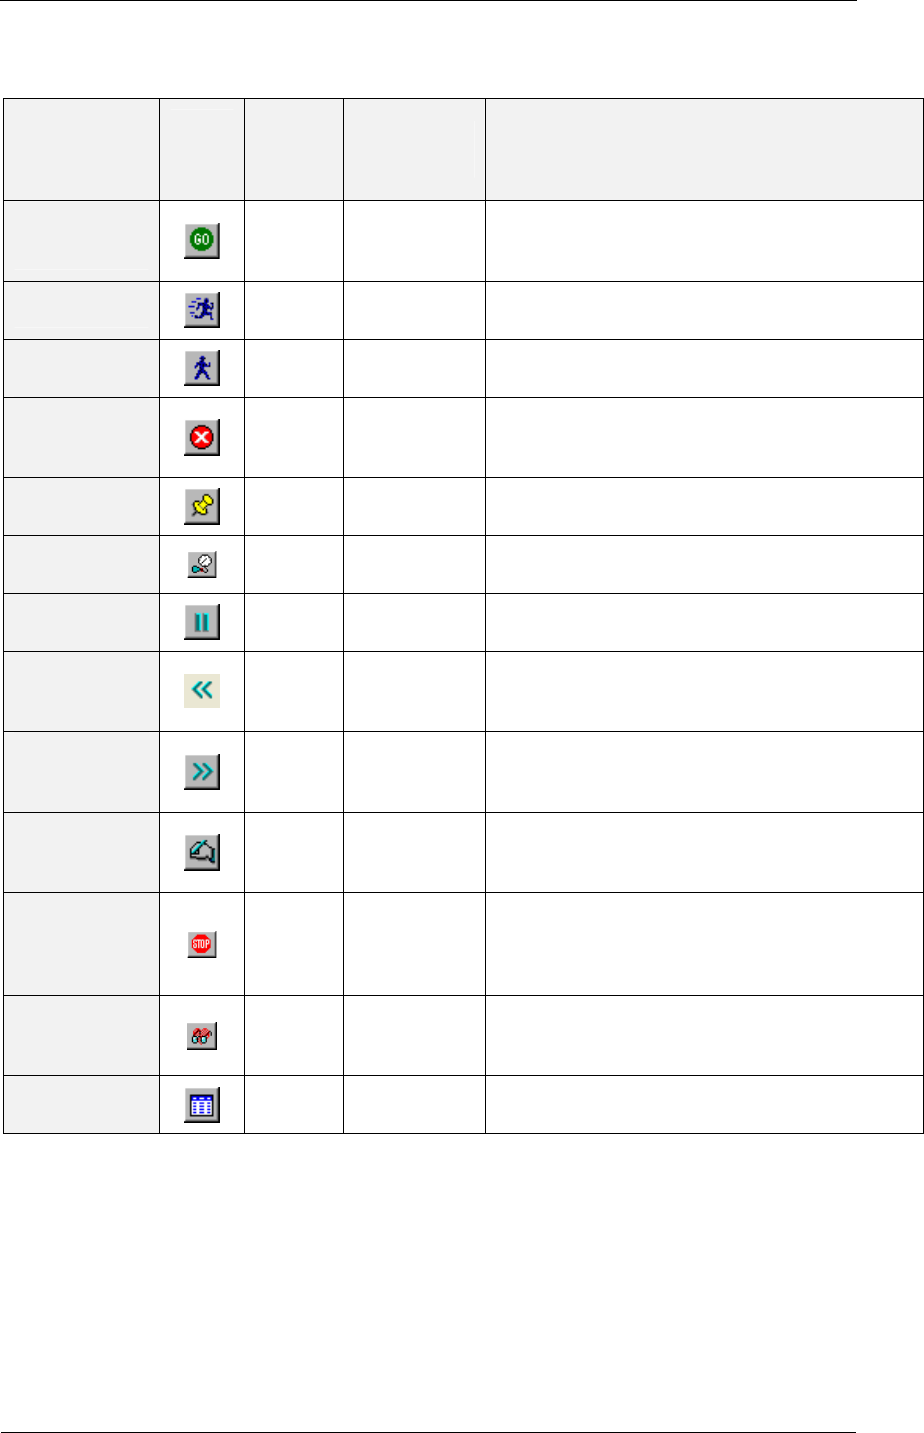
Resting ECG
NV-54/PCECG1200W
39
To do this
Click
this
icon
Or use
this
short-
cut key
Or select this
menu Description
Scroll between
displays from
different leads
—
View > Leads
Format > Next
leads
Double function:
Scrolls for all leads in the 3X1 display
Points to the requested lead
Start/stop ECG
F2 ECG >
Start/Stop Controls start and stop of ECG recording.
Record a 10
second
segment
F3 ECG > 10 Sec Start 10-sec timer for recording ECG data.
Start/stop
50/60 Hz filter
— ECG > Filters
> 50/60 Hz
ON/OFF for line interference filter. Set Options for 50
or 60 Hz prior to operation.
Start/stop
EMG filter
— ECG > Filters
> EMG ON/OFF for muscle noise filter.
Compare
View >
Compare Tests
Select two or more Rest tests from the Database
interface and click Compare. This option is only
available when you check Setup > ECG Recording >
Use ECG Database.
Click Compare again to end Compare mode and display
the Rest test.
* ECG data can be set up as limited amplitude or unlimited amplitude, which can cause one lead data to
overlap a neighboring lead.
Table 8: Recording Resting ECG
Using the Matlab Feature within PC-ECG 1200
1. Record a rest study and apply the MATLAB function under the File
menu.
A file with extension LIB is created in the default data folder.
The file has the following structure:
10,000 bytes X 12 Leads (I, II, III, AVR, AVL, AVF, V1, V2, V3, V4,
V5, V6);
1sec = 1000 bytes = 500 samples.
2. Start Matlab (not included in PC-ECG software) and perform the
required operation.

Instructions for Use and Technical Description
Norav Medical Ltd.
40
Example of ECG Display with MATLAB
1. Open a file: handle = fopen('c:\default_\ patient_name.lib,'r')
2. Choose from which lead and which second to display the ECG:
fseek(handle, (Lead-1) * 10000 + (Sec-1) * 500,-1)
where Lead (1,2,3,...,12) and Sec (1,2,3,...10)
For example, if lead AVR (number 4) from the second 3 is requested:
fseek(handle,3*10000+2*500,-1)
t = fread(handle, [sec * 500 ,1], 'int16')
where sec(1,2,3,4,...,10)
3. Type: plot(t)
The graph is displayed.
Stress ECG
NV-54/PCECG1200W
41
CHAPTER 8: STRESS ECG
(This option is available with S0, S1, and S2 licenses)
Figure 8: Stress ECG Results Screen
To Customize the Display
Click and drag the separating bar between two sections with the mouse cursor.
To Lock Screen Window Borders
If you want to keep the display in its present format:
1. Click Setup > View tab.
2. Check Lock Splitter.
Multiple lead
display
Selected display: ST trends, 12
averages, Single QRS (current)
Numerical
display
HR/BP
trend
Separating
bars
Current
protocol
Enter blood
pressure

Instructions for Use and Technical Description
Norav Medical Ltd.
42
Quick Start
To Perform a New Test
1. Click F1 (or the New button on the toolbar).
2. Insert patient details in the dialog box.
3. Click OK.
The preliminary Rest phase begins.
4. Click F3 (or Stress button) to start the Stress phase.
5. Insert blood pressure and/or remarks (if relevant) in the dialog box and
click OK.
6. Click F5 (or Recovery button) to begin the Recovery phase.
7. Enter blood pressure and/or remarks (if relevant) in the dialog box and
click OK.
8. Click F4 (or Stop button) to stop the test.
To Print an ECG
1. Select Print ECG from File menu.
2. Select Current Stage\Entire Study from the Print ECG submenu.
3. Select the printer from the print dialog box.
4. Click OK to close the dialog box and start printing.
To Print a Report
1. Click Print on the toolbar.
2. Select the report/s to print.
3. Click OK to start printing to the default printer.
Or
1. Select Print Reports item from the File menu.
2. Select the report.
3. Define the printer in the Print dialog box.
4. Click OK to start printing the report.
For an example of a printed report, see Appendix C: page 111.
Stress ECG
NV-54/PCECG1200W
43
Leads Placement
You can place the leads on the patient in various ways. The usual method is to place
the leads in the standard positions on the chest (V1-V6). To identify the placement of
the leads, the channels are renamed. One option for standard lead placement is V7-V9.
Another is the Right chest Lead system.
To Define the Lead System
1. Click Setup > Lead.
2. Select the lead system to use (the default is Standard).
Operation with Function Keys
F1 New recording
F2 Run/stop pre-test monitoring
F3 Begin stress test
F4 Stop test
F5 Begin Recovery phase
F6 Set Event
F7 Freeze stage
F8 Next stage
F9 Manual control
F10 Previous stage
F11 Open saved study
F12 Stop treadmill or ergometer in emergency
Table 9: Stress Function Keys
Note
Before using the stress test package define preferred parameters in Setup.
Otherwise the program will operate according to the factory setup.
Instructions for Use and Technical Description
Norav Medical Ltd.
44
Toolbar Overview
Main Toolbar (Easy Toolbars Mode)
This toolbar is displayed at startup. Use it to open an existing test or to begin a new
one.
Figure 9: Main Stress Toolbar
Stress Test Commands
This toolbar is displayed at the start of a new test.
Figure 10: Stress Test Commands Toolbar
New Change
protocol
A
bou
t
Open saved
study
Setup
Add
remarks
Run/stop
pre-test
monitoring
Begin
recovery
Set event
Previous
stage
Manual
control
Zoom heart
rate
Setup Begin
stress test
Stop test Freeze
stage
Next stageEmergency
stop treadmill
Stress ECG
NV-54/PCECG1200W
45
Views and Filters Toolbar
The toolbar controlling views filters appears beneath the main toolbar.
Figure 11: Stress ECG Views and Filters Toolbar
Average Viewer Toolbar
The toolbar displaying various post processing views appears to the right of the Views
and Filters toolbar.
Figure 12: Stress ECG Post Processing Display Toolbar
Select leads
to display Select filters
Select
horizontal/vertical
scale
Display next
leads
Display
ECG only
Select leads
to display
Select next
leads
Display
QRS
Instructions for Use and Technical Description
Norav Medical Ltd.
46
Post Processing Options Toolbar
When the test is complete you can review it using the Post Processing Options
Toolbar.
Figure 13: Stress ECG Playback Toolbar
Open saved
study Print results Add
remarks
Display next
leads
Display ECG
test in new
window Play current
event
Save results Show
patient
details
Setup Display
stages/events
as table
Skip to
previous
event
Skip to next
event
Stress ECG
NV-54/PCECG1200W
47
Stress ECG Setup
Printer Definition:
Printer definition is very important because of the high data rate during real time
printing. If the printer has about 8–10 MB RAM, set the graphic resolution at 600 dpi.
If the printer has about 2 MB RAM, reduce the resolution to 300 dpi.
Click Setup on the Toolbar to access the following parameters:
Tab & Secondary
Tab Option Description
ECG Recording Default filters Defines the filter’s initial status in ECG recording.
Save format Defines the amount of data to be saved on the disk.
Auto Save
Select this option to save the ECG test automatically at the end of
the test. The test will be saved into the defined directory or to the
database (if used).
Save
Options
Set File
Name by
To add the Patient ID or Patient Last Name to the file name,
select the required option.
Simulator ECG
When cleared (default), ECG recording is performed from the
PC-ECG unit.
When checked, the ECG recording is performed from the demo
file included in the software package. In this case, the recording
unit is not needed.
Alert Signal OFF
There is an alert (beep) when reach the target\warning zone of
HR. If this option is marked, there is no alert.
Beep on QRS When marked, beep is heard every time QRS is detected.
ECG Leads
When using the standard 12 lead patient cable, select the “12
Leads” option to read and display up to 12 leads (default). When
using a 6 lead cable, select the “6 Leads” option to read and view
up to 6 leads.
Use ECG Database
Select this option to connect to the default ECG database. If this
option is selected (checked) the ECG tests are saved in the
database.
Data Directory
Allows the user to define a directory for saved ECG recordings (if
ECG database is not used).
Use a secondary hard disk, if one is available.
Lead Systems Default 3 leads Define the 3 leads that are displayed as default when using 3x1
view format.
Default 6 leads Define the 6 leads that are displayed as default when using 6x1 or
3x2 view format.
Strip Lead 10 sec lead to appear in 4x3 and 6x2 formats.
View Count Recovery Time
Separately from Stress
Check this option to have separate times for the Stress phases and
the Recovery phases.
Clear this option to have the time displayed on screen (in Real
time and in Review Screen) as the overall test time including the
Stress and the Recovery phases.
Instructions for Use and Technical Description
Norav Medical Ltd.
48
Tab & Secondary
Tab Option Description
Default Colors To define the default colors for background, traces, grid, light
grid, text, and base average, click the appropriate button and
select the color from the color palette.
To restore the default colors click Restore Default in the frame.
Default ECG View Select the default on screen lead display from the list in the
combo box. When “6 Leads” is defined in the ECG Recording
tab, the maximum view is 6 leads.
Easy Toolbar mode Check this option to display fewer icons.
Text Labels Check this option to add text labels to the toolbar buttons.
Separate Leads Check this option to have the leads separated by borders.
Clear this option to have the leads not separated by borders.
Draw over Leads Border Check this option to have high signals (exceeding the channel
display) drawn beyond the lead border.
Clear this option to have high signals cut off.
Draw Grid Check to display grid lines. Uncheck to hide gridlines.
Cabrera Display Check this option when using a Cabrera lead system. When using
the standard LEDs system, clear this option.
Lock Splitter When this option is checked, the splitters cannot be moved and
the sections in the viewer cannot be resized. To resize the
different sections in the viewer, clear this option.
Horizontal scale Sets the default value for the horizontal scale window on screen
(mm/sec).
Vertical scale Sets the default value for the vertical scale window on screen
(mm/mV).
Ergometer METS/Watt Applies to an Ergometer test. The selected units (METS or
WATT) are displayed for the Workload on the Review Screen
(post-processing).
Installation Saves user data (hospital and physician). This data is recorded on
any print out and sent as email.
Measurement Standard Define whether measurements are calculated according to the
metric or the USA standard. The default is metric.
Magnetic Card Reader Select this option to use a magnetic card with bar-code to insert
patient details. Select the magnetic card type.
Environment Connection If an automatic blood pressure monitor (Tango) is to be
connected to the system, checks for the appropriate COM port.
Display Size Choose between 14/15-inch screen (default) and 17-inch screen.
This setting is required in order to display the ECG and grid in
the correct scale.
Measure BP by Automatic
Device
If a blood pressure monitor is used, define whether automatic
measurements should be performed in addition to manual
measurements.
Automatic BP COM Port Set the COM Port that the BP device (optional) is connected to.
Exercise Device COM Port Select the COM port that the exercise device is connected to from
the list.
Stress ECG
NV-54/PCECG1200W
49
Tab & Secondary
Tab Option Description
Advance Cards R wave trigger (requires D1-t board) should be ticked if a blood
pressure monitor is used or if external synchronization is needed.
If analog out (requires D/A board) for metabolic or exercise
device control is needed, select the appropriate options.
The software is compatible with a metabolic chart manufactured
by Ganshorn, Germany.
USB Check R wave trigger option (when using USB connection with
BNC output) if a blood pressure monitor is used or if external
synchronization is needed. Select the required R-wave trigger
width from the option list.
Check ECG option for analog ECG signal.
Use Transfer file “Trnsf.txt”Check this option to use Trnsf.txt file (see page 58).
Exercise device Type Set up for PC-ECG connection, the external device (treadmill or
ergometer) connection, and type. The factory default setup for the
external device type is "None". In this mode, the software does
not control an external device. Define the type of ergometer or
treadmill that is being used.
Exercise Device Default protocol Valid for S1, S2 options.
Choose one of the available protocols or define your own
protocol.
Exercise Device Speed unit Set up for MPH or KPH. This option refers to treadmills only.
Exercise Device Emergency STOP Select the procedure for Emergency STOP.
Select “Immediately” for abrupt stop of the treadmill or “Slow
Down” for gradually slowing down the treadmill until final stop.
Metabolic Card
Control
Metabolic Card Control Check this option to control an external metabolic testing device
for blood gas content. If this option is cleared (default) no
communication is made with the metabolic testing device.
Metabolic Card
Manufacturer Select the metabolic card manufacturer from the list.
Auto Print (Print Report) Check this option to print the metabolic test report automatically
at the end of the test.
Printouts Auto Print Default Reports
on End Test
Check this option to automatically print the default reports at the
end of each test.
Default Reports Define the default reports.
Paper Size for ECG PrintingSet paper size, either conventional printer or 4-inch thermal
printer.
Use Large fonts for
Remarks Enables large font for user entered free text.
Shadow/Frame for Area of
Interest
Allows the user to choose between shadow and frame to highlight
the area of interest .
Load Printer Drivers Ahead Check this option to save time by reading the driver before
sending the print action.
ECG Line Define the line width in the printouts, either Normal or Bold.
Event Format Set Event format for printout to either 3 lead or 12 leads format.
Instructions for Use and Technical Description
Norav Medical Ltd.
50
Tab & Secondary
Tab Option Description
Tabular Results Format Check this option to print out results in a tabular format.
Graph Paper When set to On, prints 1mm and 5 mm squares on printouts.
Regular Grid works with any printer.
Improved Grid shows a fine grid but may not work on some
printers.
Color printout Select this option for colored printouts.
Blending out ST values Select this option to print results without ST values.
GDT/BDT
Format
Automatic Options Setup automatic options for saving and/or importing files in
GDT/BDT format.
File Format Select the file format: GDT or BDT.
Import Codepage 437 Check this option to import Code page 437.
Export Codepage 437 Check this option to export Code page 437.
Edit Labels Click this button to open a dialog box with an editable list of the
field labels used in the GDT and BDT files.
GDT/BDT Data Directory Define the directory path where the GDT/BDT files should be
maintained.
Token for PCECG The default is PEKG.
Token for Practice EDP The default is EDV1.
Text File Auto Save Test Data in Text
File
Check this option to save the test data automatically to a text file
at the end of the test (according to the naming and directory
defined in this tab).
Set Text File Name by Define the naming convention of the text file, created
automatically or on demand.
Text File Data Directory Define the directory where the text files will be maintained.
Target
HR/METS
Target HR Set the maximum male and female HR for to be allowed for use
in the Target HR equation . The target HR is affected by the age
of the patient.
Target HR warning zone % Set the percentage of target HR for warning. Above this level, the
HR trend is displayed in a different color. If the percentage value
is reached during the test and “Switch to Recovery when reaches
HR Warning zone” option is checked, the stress test stops
automatically and recovery phase begins.
Stop Stress and start
Recovery
Check this option to stop stress test when HR reaches the target
HR or warning zone and start the recovery phase. When “Switch
to Recovery when reaches HR Warning Zone" is cleared, the
Stress test continues according to the test protocol.
METS/VO2 Formula
selection
Set the formula to calculate the METS/VO2 values:
• To use a single formula check “single formula for
any speed”.
• To use one formula for speed up to 3.7 m/h and a
second formula above that speed, set the option
“Two formulas (Up to and from 3.7 m/h)”.
Stress ECG
NV-54/PCECG1200W
51
Tab & Secondary
Tab Option Description
METS/VO2 Updating
Method
Select the method for updating the METS/VO2 values.
The values can:
• remain constant through the entire stage
• switch to the current METS value 1 or 2 minutes
after the stage begun
• have values vary during the stage (at every quarter
of the stage time).
ST.VPB Options ST Measurements After J Choose the number of milliseconds after the J point at which the
ST is measured. The factory set up is 60 Ms.
Detect ST Event Define the mm level for elevation and depression. This option
also allows the user to save only deteriorated ST episodes.
Real Time Printing Set the events to print (including ST/VPB/SVPB). Any checked
event will be printed. Cleared events will not be printed (9 events).
Show Dialog Check events to display a dialog box at the beginning.
Clear events to prevent display of dialog box.
Print Page Format Check the required option for printout format.
Print Scale Format Select the scale for printout format.
St, Slope Printing Select this option to print the ST and ST slope values.
Clear to prevent printing.
Switch to Review
Automatically
Check this option to switch automatically to the Review screen at
the end of the test. When cleared, the realtime screen remains
Remarks Defines statements that can be entered during the test. It is
divided into five sets of statements used during real time and post
processing.
Remote View Valid for option S2. Enables viewing a study that takes place in
any of the network stations, across the whole network. Enables a
physician to view a study remotely.
Table 10: Stress ECG Setup Options
Instructions for Use and Technical Description
Norav Medical Ltd.
52
Toolbar and Menus: Main
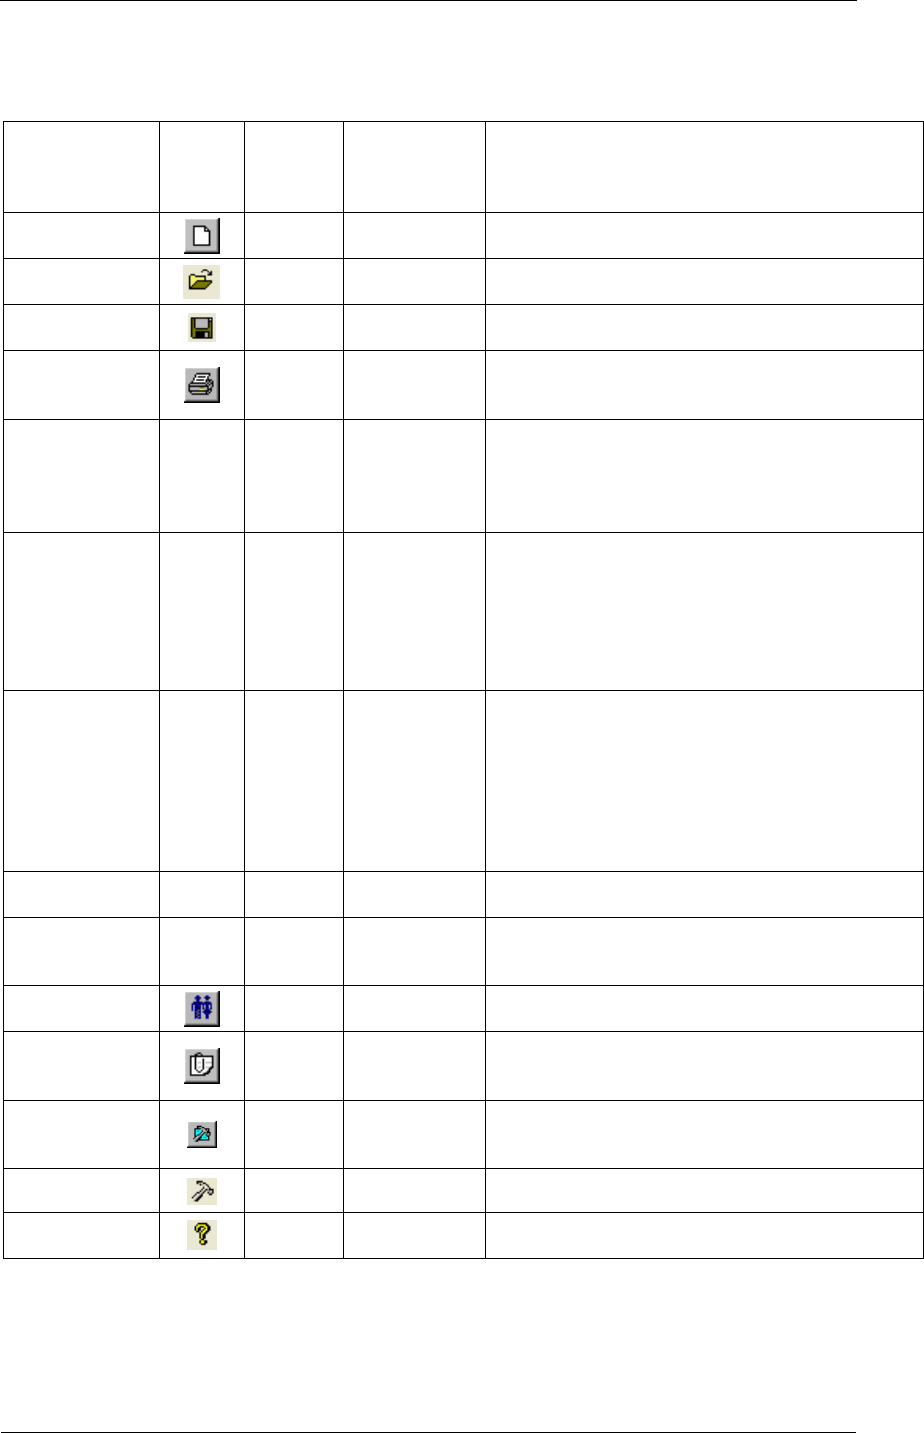
To do this
Click
this
icon
Or use
this
short-cut
key
Or select this
menu Description
Start a new
study
F1 File > New Creates a new study
Open an
existing study F11 File > Open Opens an existing study
Save a
recording Ctrl+S File > Save Saves the active study
Print results
Ctrl+P
File > Print
Report or Print
ECG
Prints the active study
Recover file to
Monitoring
format
File >
Recovery File
to Monitoring
Format
Enables saving and viewing data if the Stress
application crashes. Select this option in the main
frame. In the dialog box, provide a name and path for
the file (*.TMP). To view the ECG open this file with
the Monitoring application (main frame menu).
Import
demographic
data from HIS
to PC-ECG
File >
GDT/BDT
Format
For details see
Import from
GDT/BDT,
page 105
This file always contains the last patient data.
Export the
GDT/BDT file
from PC-ECG
to HIS
File >
GDT/BDT
Format
For details see
Save Test in
GDT/BDT
page 105
This file always contains the last patient data.
Create a text
file
File > Create
Text File Saves ECG data in text format.
Restore default
window size
View > Set
Default
Window Size
Restores the default window size of the sections in
the window. (Available in realtime)
Set/change
patient data
View > Patient Sets or changes patient data
Add/view
remarks
Ctrl+R View >
Remarks
Allows you type free text during or after the ECG
recording. It is printed and saved together with the
ECG traces.
Select a
different
protocol
View >
Change current
protocol
Changes the protocol
Set preferences
Ctrl+T View > Setup Displays the setup dialog box
To display
information
Help > About
Stress…
Displays program information, version number, and
copyright
Table 11: Main Stress Toolbar and Menus
Stress ECG
NV-54/PCECG1200W
53
Toolbar and Menus: Stress Test Commands
To do this
Click
this
icon
Or use
this
short-cut
key
Or select this
menu Description
Start/stop
monitoring
F2
Test >
Run/stop
monitoring
Runs/stops monitoring
Start stress test
F3 Test > Stress
test begin Starts stress test
Start recovery
phase
F5 Test >
Recovery begin Starts recovery phase
Stop
test/recovery
phase
F4 Test > Stop
test Stops stress test or recovery phase
Set an event
F6 Test > Set
event Sets events and prints according to options
Measure blood
pressure
Test >
Measure BP Activates the blood pressure monitor
Freeze the
current stage
F7 Test > Freeze
stage Freezes the current protocol stage
Return to the
previous
protocol stage
F10 Test >
Previous stage Returns to the next protocol stage
Advance to the
next protocol
stage
F8 Test > Next
stage Advances to the next protocol stage
Control the
exercise device
manually
F9 Test > Manual
management Manually controls the exercise device
Stop the
treadmill or
ergometer in an
emergency
F12 Test > Stop
exercise device Emergency stop for treadmill or ergometer
Display
enlarged heart
rate
Ctrl+H View > Zoom
up heart rate Enlarges display of heart rate window
Display study
results
Test > Review Displays study results
Table 12: Stress Test Commands
Instructions for Use and Technical Description
Norav Medical Ltd.
54
Toolbar and Menus: Average Viewer
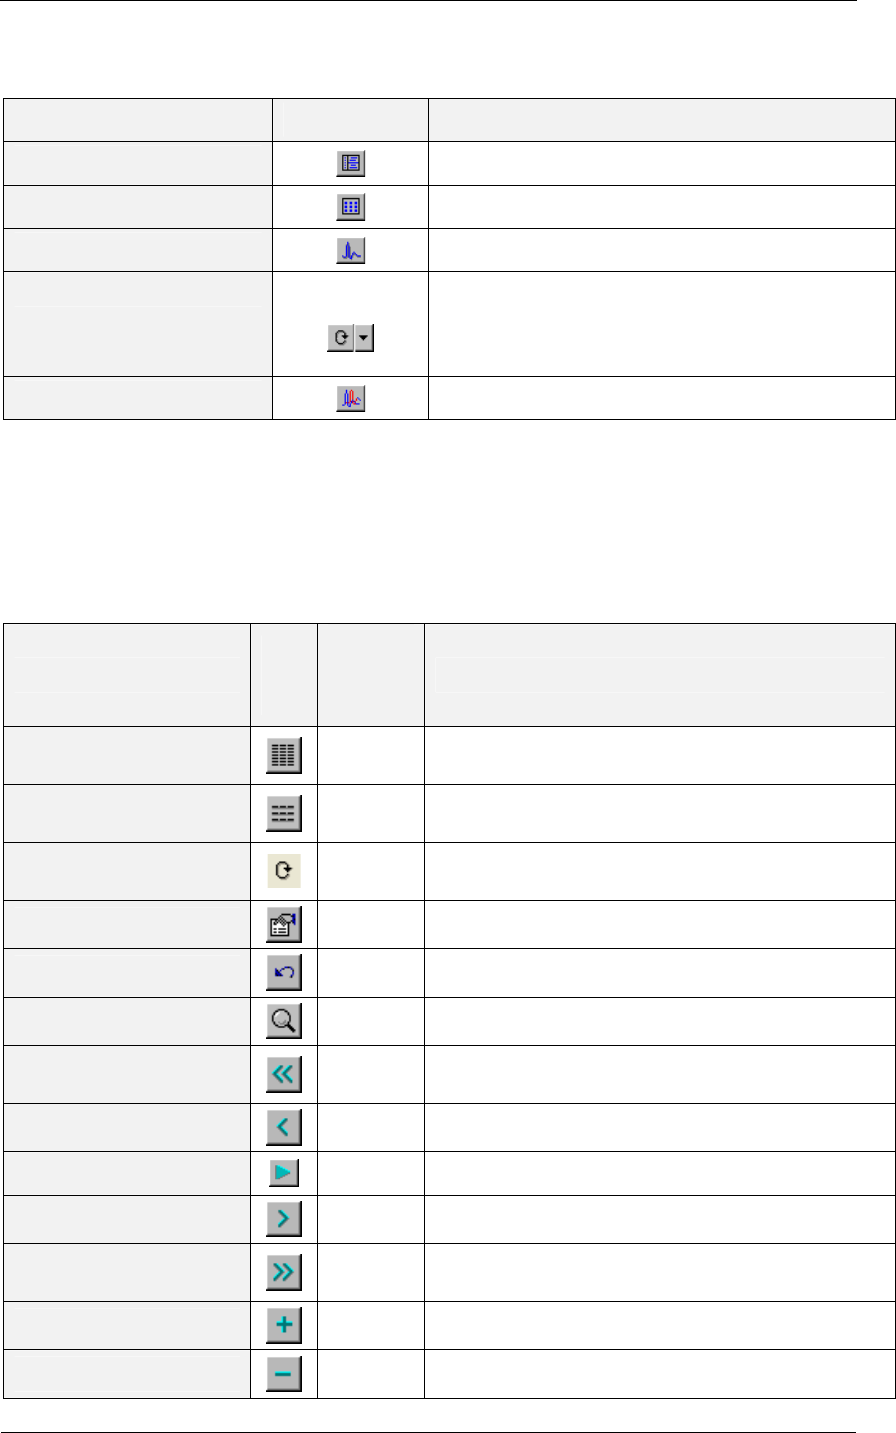
To do this Click this icon Description
Display 3 lead average
Averages of 3 leads and ST trends
Display 12 lead average
12 leads averages
Display single QRS
Single QRS
Scroll between lead displays
Double function:
a) scroll for all leads in the 3X1 display
b) point to the requested lead
Display QRS
Base line QRS in white and current QRS in yellow
Table 13: Average Viewer Toolbar
Toolbar and Menus: Post Processing
(Right hand side of tool bar)
To do this
Click
this
icon
Or use
this
short-cut
key
Or select this menu
View 12 leads ST trends
results View > 12 Leads ST
View 3 leads ST trends
results View > 3 Leads ST
View next ST trends
Triplet View > Next ST Leads
View numerical results Ctrl+V View > Properties
Undo the last action Ctrl+Z
View ECG 10 sec data Enter View > Open ECG Data (requires I1 or I2 license).
Move marker to previous
event Ctrl+ View > Event > Previous Event
Move marker left 10 sec View > Event > Left
Play back results View > Play ECG Data
Move marker right 10 sec View > Event > Right
Move marker to next
event Ctrl+ View > Event > Next Event
Add (create) a new event View > Add New Event
Delete the current event View > Delete Current Event
Stress ECG
NV-54/PCECG1200W
55
To do this
Click
this
icon
Or use
this
short-cut
key
Or select this menu
Set preferences Ctrl+T View > Setup
Print the study File/Print
ECG This enables you to print the entire study or a single stage
Position the ST marker View/Rec
alculate ST
This enables you to position the ST marker for the entire
study
Table 14: Post Processing Toolbar and Menus
To Start the Stress Recording Program
Double click the stress icon.
The initial screen is displayed.
To Start a New Test
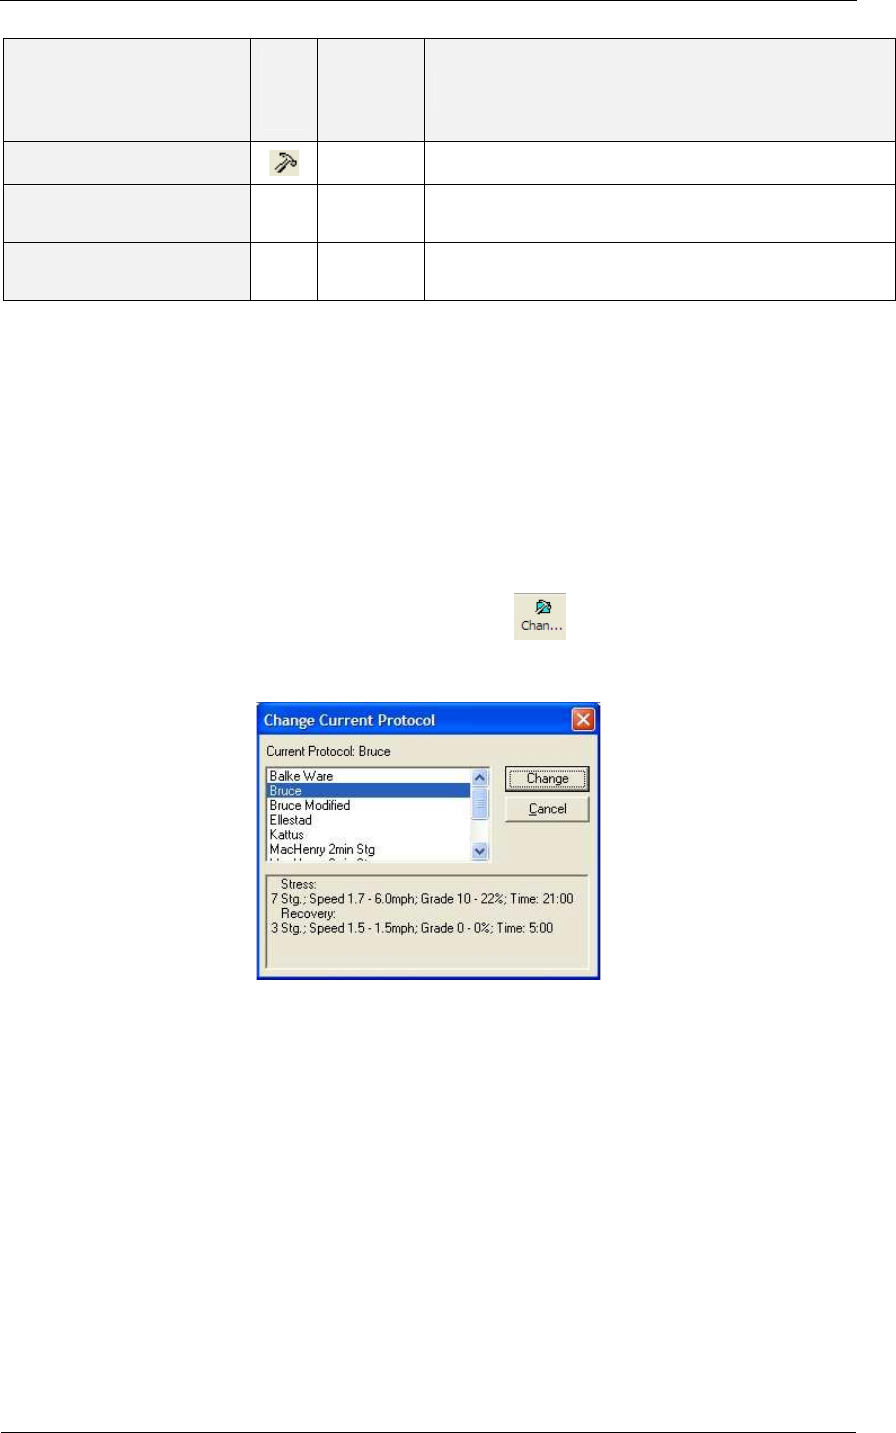
1. Define the exercise machine (Treadmill/Ergometer). (See page 49.)
2. If necessary, click the Change Protocol icon to select a test
protocol.
Figure 14: Change Test Protocol
3. Click the white page icon.
The Stress working screen and patient data entry screen are displayed.
Instructions for Use and Technical Description
Norav Medical Ltd.
56
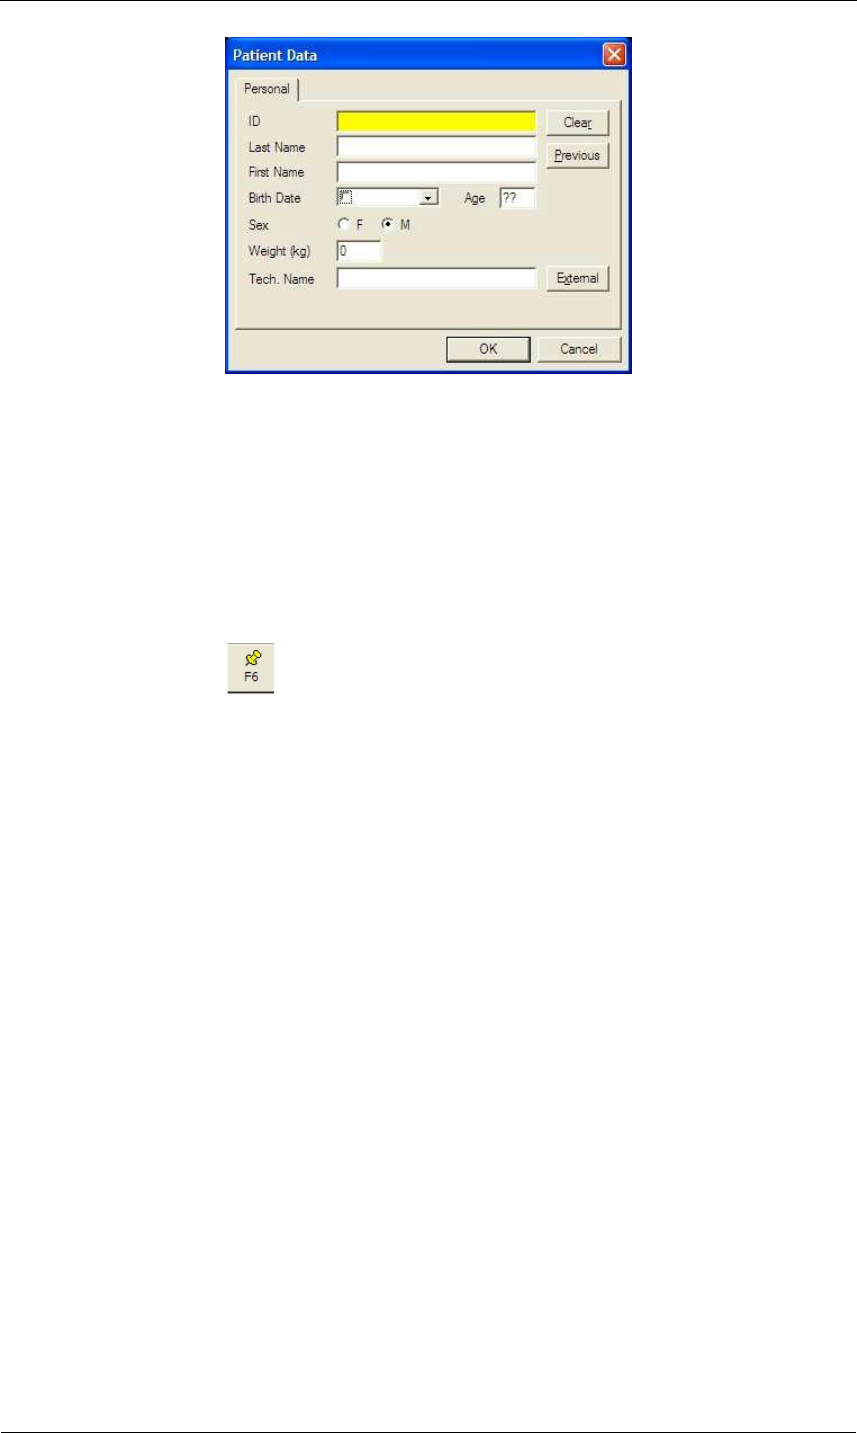
Figure 15: Patient Data Entry
4. Enter patient data and click OK.
Monitoring of 12 leads begins. After about 15 sec the average QRS is
displayed.
5. Inspect the protocol label in the lower right hand corner. To choose
another protocol, click the Change Protocol icon (or select View >
Change Protocol), select the requested protocol, and click Change.
6. Enter blood pressure for rest. You can print a Rest printout using the
EVENT icon without starting the Stress program. This enables
multiple Rest printouts.
7. To start the stress session, click the Stress icon (running man). The
stress time is displayed in the lower left-hand corner.
The following options are available:
◊ Define events
◊ Go to Manual
◊ Freeze Stage
◊ Advance Stage
◊ Go to Recovery phase.
Recovery Phase
When you switch to recovery phase, the recovery phase elapsed time is counted as
well as the total elapsed time. Wait for recovery phase to finish according to
protocol or stop it using the stop icon. Both TEST time and RECOVERY time
are fixed. Patient monitoring continues. Click and disable Go to stop it.
Viewing Results
There are two options for completing a stress test.
• Display the post-processing data screen (Review Screen) automatically
• Remain in ECG display.

Stress ECG
NV-54/PCECG1200W
57
To View Study Results
Click the Post Processing icon.
This enables display and printout of the entire study. Note that before saving the
study to disk, the entire ECG is kept for review.
To Display the Review Screen Automatically
In Setup, click the Real-Time tab and check Switch to Review Automatically.
At the end of the test protocol, or after clicking F4, the display switches automatically
to the Review Screen, and the post-processing information is displayed.
To Display the Review Screen Manually
If Switch to Review Automatically is not enabled:
1. Click F4
The test (exercise device) stops but the ECG signal continues to run.
2. Click F2
The ECG signal stops and a Review button is displayed on the tool bar.
(The Review button is not displayed if Switch to Review
Automatically is enabled).
3. To review the post-processing information, click Review.
The Review Screen is displayed with the post processing data. It
provides the following options:
◊ Print reports automatically.
◊ Save and display ORIGINAL Data with real time filters (with removal
option).
◊ Print All Events in REVIEW.
◊ Print on an additional page if necessary.
◊ Print ST Measurements optionally.
To Save Study Results
1. Click Setup > ECG Recording.
2. Select options for saving the study and click OK.
3. Click File > Save, define the file name and path, and click OK.

Instructions for Use and Technical Description
Norav Medical Ltd.
58
Metabolic Stress Estimation (METS)
A very important feature of the software is the estimation of Metabolic Equivalency
(METS). This estimates how many ml of oxygen the body produces for every kg of
weight per minute. The results are shown in units of METS or VO2 Max. (One unit of
VO2 is 3.5 units of METS.)
1 METS corresponds to a person at rest.
A higher METS indicates a higher fitness level.
Transfer File “Trnsf.txt”
Use this option when the PC-ECG 1200 shares the same PC with another application
in real time.
To Transfer a File
1. Click Setup > Environment.
2. Click the Advance tab.
3. Check Use transfer file “TRNST.TXT”
A transfer file is created in the directory containing the Stress application file. The
default is C:\Program Files\Pc-ecg. The transfer file receives real time data from the
Stress application, such as: current Heart Rate, Workload, Speed, and Grade of
external device. It is a text file, updated every 5 seconds.
The format is as follows: Each text line starts with a descriptive header and a
parameter that always starts at character number 13. The value of each parameter may
change during the study.
Parameter Current
Value
Range (not included in text
file)
HR : 86
(0-200)
Speed(mph): 3.3
(0- 25)
Grade(%) : 1.0
(0 – 30)
Workload : 10.1
(0 – 1000)
Table 15: Transfer File Format
Note
A Sharing Violation error may occur if the file is read while the Stress
Application is updating it. Wait until updating is completed (a second or two).

Stress ECG
NV-54/PCECG1200W
59
Additional Features
To Define Max. HR
1. Open a test in a Review Screen (post processing).
2. Click Properties on the toolbar
The Properties dialog box is displayed.
3. Select the cell with the highest HR value.
4. Click Define Max HR.
The cell is highlighted and the background color of the cell is changed.
To Define Worst ST
1. Open a test in a Review Screen (post processing).
2. Click Properties on the toolbar
The Properties dialog box is displayed.
3. Select a cell in one of the channels with the worst ST.
4. Click Define Worst ST.
The cells in the 12 channels of the same event are highlighted and the
background color is changed.

Instructions for Use and Technical Description
Norav Medical Ltd.
60
RS232 Controlled Treadmill Types
Vendor Model Vendor’s Fax RS232
Connector on
the TM
RS232 Wiring Type
Trackmaster TM425 +1-316-283-3350 D-9 female Straight
Trackmaster TMX425 +1-316-283-3350 D-9 female Straight
Parker PM +1-334-8213221 D-9 female Straight
RAM 770 +39-049-8703388 D-9 female Straight
Woodway PPS55-MED D-9 male Crossed
Powerjog GM, J +44-121-4333035
System Biomedical +91-22-4963147
HP COSMOS All models +49-8669-864249
QUINTON TM-55 D-9 female Straight
QUINTON ST-55 D-9 female
(RS422)
Q422*
D-9 female
(RS422)
M422* Marquette 2000 series
DIN 5 pin
female
Tx –5
Rx – 4
GND - 2
KIP Machines KIP Series +5411-4327-2963
+54341-464-7302
+54341-463-7919
DB9 Male Lines: RX, TX, GND
standard place in DB9
Male connector
BONTE
MACHINEFABRI
EK B.V.
+ 31 038-4554030 DB9, crossed Treadmill (SUB-D 25)
<----> PC (SUB-D 25)
2 ---------- 3
3 ---------- 2
7 ---------- 7
* Requires a special adaptor, supplied by Norav Medical
Table 16: Controlled Treadmills

Stress ECG
NV-54/PCECG1200W
61
RS232 Controlled Bicycle Ergometers
Vendor Model Vendor’s Fax RS232
Connector on
the Ergometer
RS232 Wiring
Type
Ergoline ER900 +49-7431-989427 DIN 5 pin
SECA CT100 +49-40-20000050 D-9 male Crossed
Dimeq 770 +49-30-72376240
LODE EXCALIBER
ELMED
Table 17: Controlled Ergometers
Late Potential Signal Averaging
NV-54/PCECG1200W
63
CHAPTER 9: LATE POTENTIAL SIGNAL
AVERAGING
(This option is available with the L1 license)
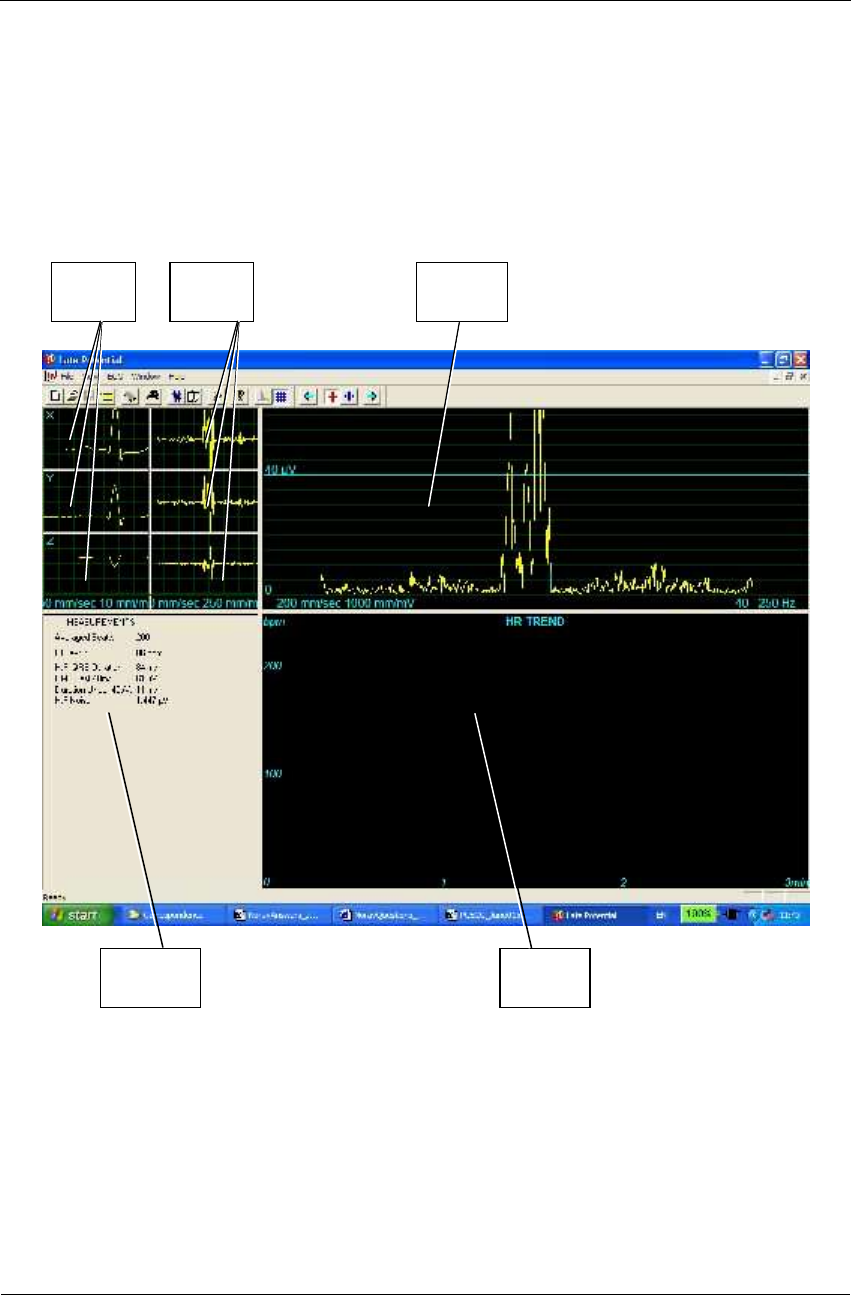
Figure 16: Late Potential Signal Averaging Screen
Signal
averages
Filtered
averages
Vector
magnitude
Numerical
results
Heart
trends

Instructions for Use and Technical Description
Norav Medical Ltd.
64
Quick Start
To Start a New Test
1. Click F1 (or the New button on the tool bar).
2. Insert patient details in the dialog box.
3. Click OK.
4. Click F3 or F4 to start the LP averaging test.
5. Enter the interval name and/or remarks as appropriate in the dialog box
and click OK.
6. Click F3 or F4 (or Start/Stop Averaging button) to stop the LP
averaging test (or wait until it terminates).
To Print
1. Click F6, or select Print item from the File menu.
2. Select the printer from the Print dialog box.
3. Click OK to close the dialog box and print the display (the LP averaging
report or the ECG test).
Late Potential Signal Averaging
NV-54/PCECG1200W
65
Operation with Function Keys
F1 New recording
F3/F4 Start/stop
F6 Print
F11 Open saved study
Table 18: LP Signal Averaging Function Keys
For an example of a printed report, see Appendix C:, page 111.
Leads
Recording is performed for leads X, Y, and Z (orthogonal) using the regular 12 lead
cable. Arrange the leads as follows:
12 Lead Orthogonal Lead (position)
V2 X+ left side of the chest
V1 X- right side of the chest
V4 Y+ lower side of the chest
V3 Y- upper side of the chest
V6 Z+ middle of the chest
V5 Z- middle of the back
RA,LA,LL,RL Same position as in 12 leads
Table 19: LP Signal Averaging Leads Placement
Instructions for Use and Technical Description
Norav Medical Ltd.
66
LP Signal Averaging Setup
Click Setup on the Toolbar to access the following parameters:
Tab Option Description
ECG
Recording
Auto Save(Save Options) When Auto Save is ON, the file is stored by Last name or
by ID.
When Auto Save is OFF, the program requests a filename.
Set File Name by (Save
Options)
Set the naming convention for saving files (by Patient Last
Name or ID)
Simulator ECG When cleared (default), ECG recording is performed from
the PC-ECG unit.
If checked, the ECG recording is performed from the
demo file included in the software package. The recording
unit is not required.
Stop to confirm QRS When ON, the user can choose the Normal QRS.
When OFF, the program chooses the Normal QRS
automatically.
Template Correlation Defines the QRS percentage match during signal averaging.
A higher number corresponds to a better match.
Target Number of Beats Number of typical heartbeats that will be counted during
the averaging stage.
Use ECG Database Check this option to connect to the default ECG database.
ECG tests are saved in the database.
Data Directory Defines the directory for saved ECG recordings.
View ECG’s Colors To modify the ECG colors, click the appropriate button
and select the color from the color palette.
Averages Color To modify the colors in the Averages window, click the
appropriate button and select the color from the color
palette.
HR Trend’s Color To modify the colors in the HR Trend’s window, click the
appropriate button and select the color from the color
palette.
Restore Defaults Click to restore the default factory colors
Installation Saves hospital and physician data. This data is included in
print out and email.
Measurement Standard Define whether measurements will be calculated according
to the metric or the USA standard. The default is metric.
Magnetic Card Reader Select this option to use a magnetic card with bar-code to
insert patient details. Select the magnetic card type.

Late Potential Signal Averaging
NV-54/PCECG1200W
67
Tab Option Description
Environment Connection Use the option button (COM port/USB) to select the port
for device connection.
If COM port is selected, select the serial input for the PC-
ECG unit from the COM port list.
If the USB connection is selected, the COM PC-ECG
selection list is disabled. (Default at installation is USB).
Graph paper If ON, prints 1mm and 5 mm squares on printouts.
Regular grid prints from all printers.
Improved grid shows a fine grid but may not work on
some printers.
Use Large Fonts for
Remarks Enlarges font for free typed text.
Color printouts Clear this option to force B/W printing on color printer.
Display Size Choose between 14/15-inch screen (default) and 17-inch
screen. This setting is required in order to display the ECG
and grid in correct scale.
GDT/BDT
Format
Automatic Options Define automatic options for saving and/or importing files
in GDT/BDT format.
File Format Select the file format: GDT or BDT
Import Codepage 437 Check this option to import Code page 437.
Export Codepage 437 Check this option to export Code page 437.
Edit Labels Click this button to open a dialog box with an editable list
of the field labels used in the GDT and BDT files.
GDT/BDT Data directory Define the directory path where the GDT/BDT files will
be maintained.
Token for PCECG Default is PEKG.
Token for Practice EDP Default is EDV1.
Holter File
Path
Download Flash Card
Program Define the path for the flash card program directory.
Download Directory Define the directory to maintain the downloaded Holter
files.
Table 20: LP Signal Averaging Setup
Instructions for Use and Technical Description
Norav Medical Ltd.
68
Toolbar and Menus
To do this
Click
this
icon
Or use
this
short-cut
key
Or select
this menu Description
Start a new
study
F1 File > New
Starts a new XYZ recording. The patient’s demographic
data can be entered prior to ECG recording (optional).
The three channels are displayed on the screen for quality
assurance. If the results are unsatisfactory, check skin
preparation and disposable electrode contacts. Then click
Start/Stop Averaging.
Open an
existing study F11 File > Open Opens an existing study
Save a
recording Ctrl+S File > Save Saves recording to disk (default file name: REST).
Send data via
email
File >Send... Sends recording data via email, if present on the
computer.
Print results
F6 File > Print Prints the active study
Import
demographic
data from HIS
to PC-ECG
File >
GDT/BDT
Format
For details
see Import
from
GDT/BDT,
page 105
This file always contains the last patient data.
Export the
GDT/BDT file
from PC-ECG
to HIS
File >
GDT/BDT
Format
For details
see Save
Test in
GDT/BDT
page 105
This file always contains the last patient data.
Set/change
patient data
View >
Patient Data
Adds this data to the recording. It is printed together
with the ECG traces. If the recording is saved, then the
PATIENT DATA is saved together with the ECG
traces. Use the Previous option if the same patient
undergoes a second study.
Add/view
remarks
View >
Remarks
Allows you type free text during or after the ECG
recording. It is printed and saved together with the ECG
traces.
Late Potential Signal Averaging
NV-54/PCECG1200W
69
To do this
Click
this
icon
Or use
this
short-cut
key
Or select
this menu Description
Set preferences
Ctrl+T View >
Setup
Displays the setup dialog box and allows the user to
tailor operation preferences.
To display
information
Help >
About…
Displays software version number (which should be
quoted on any inquiry regarding the software). Also
displays memory size and disk free space.
Start/Stop
Averaging
F3/F4
ECG >
Start/Stop
Averaging
Allows the user to start the averaging period. The
averaging period default is 200 beats. It can be changed
in OPTIONS, ECG RECORDING, and TARGET
NUMBER
Display/Hide
the grid
View > Grid Optional display of 5mm raster. Print outs are always
with 1mm raster.
Start
monitoring.
F2
ECG >
Start/Stop
Monitoring
Starts monitoring.
Stop
monitoring
F2
ECG >
Start/Stop
Monitoring
Stops monitoring.
Activate Onset
Marker
Ctrl+ ECG Onset
marker
Allows the user to move the Onset Marker using the
direction arrow icons.
Activate Offset
Marker
Ctrl+ ECG Offset
marker
Allows the user to move the Offset Marker using the
direction arrow icons.
Move the On
and Off
markers
/
Allows the user to move the ON/OFF markers.
Table 21: LP Signal Averaging Toolbar and Menus
Instructions for Use and Technical Description
Norav Medical Ltd.
70
Interpreting Results
When the signal-averaging phase is complete, the result screen is displayed:
Figure 17: LP Signal Averaging Review Screen
Numerical
results

Late Potential Signal Averaging
NV-54/PCECG1200W
71
Numerical Results
Averaged Beats Displays the number of averaged normal beats captured during the study.
HR Average in beat/min
High Frequency QRS
Duration in Milliseconds
from ONSET to OFFSET
Displays the width of the filtered QRS containing only high frequencies. A
higher number indicates higher patient risk.
RMS LASTS 40 milli-
seconds in Microvolts
Displays the total activity for the last (40ms) portion of the QRS. A lower
number indicates higher patient risk.
DURATION UNDER 40
Microvolts in Milliseconds
Shows the period in ms from offset of the QRS till the first point of 40uV
activity. A higher number indicates higher patient risk.
H.F. Noise: in Microvolts Quality assurance. A lower number corresponds to higher result accuracy.
The maximum number should not exceed 1 µV.
Table 22: LP Signal Averaging Numerical Results
The results are calculated automatically. You can overrule the automatic positioning
of the ONSET/OFFSET markers with the direction keys.

Instructions for Use and Technical Description
Norav Medical Ltd.
72
Monitoring
NV-54/PCECG1200W
73
CHAPTER 10: MONITORING
(This option is available with the M1 license)
This option enables long-term recording and storage to disk. The user decides which
leads and at which sample rate to monitor on screen and save to disk. During the
study, you can print in real time on a thermal printer.
Figure 18: Monitoring Screen
Horizontal scale
(mm/sec)
Vertical scale
(mm/mV)
Toolbars
Heart rate
(beats/min)
Slider time Total study time

Instructions for Use and Technical Description
Norav Medical Ltd.
74
Quick Start
To Start a New Test
1. Click F1 (or the New button on the tool bar).
2. Insert patient details in the dialog box.
3. Click OK.
4. Click F2 (or Start/Stop button) to stop data collection or wait until end
time.
To Print
1. Click F6, or select Print item from the File menu.
2. Select the printer from the Print dialog box.
3. Click OK to close the dialog box and print the display.
Print Study (print a selected time range and leads)
1. Click Print Study on the toolbar or select Print Study Item from the
File menu.
2. Define the time range and select the leads to print from the dialog box.
3. Click OK to acknowledge selection and close the dialog box.
4. Select the printer in the Print dialog box.
5. Click OK to start printing.
Monitoring ECG Setup
Click Setup on the Toolbar to access the following parameters:
Tab Option Description
Sample
Rate\Leads
Selection
Leads Allows the user to select leads. To select all leads, click Select
All. To deselect all leads click Unselect.
Sample rate Allows the user to choose requested samples per second per
channel.
X,Y,Z
Check this option to monitor X, Y, and Z axis. Clear the option
to select the other leads to be displayed and monitored on
screen. With this option, monitoring other leads is not possible
(default is cleared).
Monitoring
NV-54/PCECG1200W
75
Tab Option Description
12 Leads View Default 3 leads This function is available only if 12 lead monitoring is selected. 3
leads appear if 3X1 format is used.
Strip Lead 10 sec. lead appears in 4X3 and 6X2 formats.
ECG recording Filter 50/60Hz
When checked, the default status of 50/60Hz filter is ON
(according to the checked frequency 50 or 60). Default is
cleared.
EMG Filter When checked, the default status of the EMG filter is ON.
Default is cleared.
Baseline filter When checked, the default status of the Baseline filter is ON.
Default is cleared.
Save options If Auto Save is ON the file is stored by last name or by ID.
If Auto Save is OFF the program requests a filename.
Simulator ECG
If cleared (default), ECG recording is performed from PC-ECG
unit.
If checked, ECG recording is performed from the demo file
included in the software package. The recording unit is not
needed.
ECG
Recording time
(h:m)
Determines study duration in minutes.
Data Directory Defines the directory for saved ECG recordings. Use secondary
hard disk if available.
View Draw Over
Lead Borders
If checked (default), does not limit the extreme high amplitude
ECG pulses from exceeding the borders.
If cleared, chops the pulses at the borders.
Horizontal
Scale
Sets the default value for the Horizontal scale window on the
screen.
Vertical Scale Sets the default value for the Vertical scale window on the
screen.
Slider step size Off line function. Sets the default value for slider steps when
moved by mouse or arrow keys.
Colors Allows the user to choose colors.
Restore
Defaults Restores factory defaults.
Installation Saves hospital and physician data. This data is included in print
out mail.
Measurement
Standard
Define whether measurements will be calculated according to
the metric or the USA standard. The default is metric.
Instructions for Use and Technical Description
Norav Medical Ltd.
76
Tab Option Description
Magnetic Card
Reader
Select this option to use a magnetic card with bar-code to insert
patient details. Select the magnetic card type.
Environment Connection
Select the option button (COM port/USB) to choose the port
for device connection.
If the COM port option is selected, select the serial input for the
PC-ECG unit from the COM port list.
Disabled if the USB connection is selected. (Default at
installation – USB)
Display Size
Choose between 14/15-inch screen (default) and 17-inch screen.
This setting is required to display the ECG and grid in correct
scale.
Graph paper
If set to On, it prints 1mm and 5 mm squares on printouts.
Regular Grid is guaranteed to fit any printer.
Improved Grid shows a fine grid but may not work on some
printers.
Large Remarks
font Enlarges printed text.
Color Printout Forces B/W printing on color printer.
Thermal Plotter Sets LPT port for optional thermal paper.
GDT/BDT
Format
Automatic
options
Setup automatic options for saving and/or importing files in
GDT/BDT format.
File Format Select the file format: GDT or BDT
Import
Codepage 437 Check this option to import Code page 437.
Export
Codepage 437 Check this option to export Code page 437.
Edit Labels Click this button to open a dialog box with an editable list of the
field labels used in the GDT and BDT files.
GDT/BDT
Data directory
Define the directory path where the GDT/BDT files will be
maintained.
Token for
PCECG Default is PEKG.
Token for
Practice EDP Default is EDV1.
Table 23: Monitoring Setup Options
Monitoring
NV-54/PCECG1200W
77
Toolbar and Menus
To do this
Click
this
icon
Or use
this
short-cut
key
Or select this
menu Description
Start a new
study
F1 File > New
Test
Starts a new monitoring session. Patient data can
be entered prior to ECG recording (optional).
The recording time is set in SETUP for ECG
RECORDING. The user can stop recording by
clicking the GO/STOP icon.
Open an
existing study F11 File > Open Shows recordings saved on disk.
Save a
recording Ctrl+S File > Save Saves recording to disk.
Print results
F6 File > Print
Off line printing. Determine the time range to be
printed. The acquired ECG is printed in miniature
format horizontal: 6.25mm/sec and vertical: 2.5
mm/mV.
Export to Rest
File > Export
to Rest
A 10 sec segment containing original leads
I,II,V1-V6 and calculated leads III, aVR, aVL,
aVF is transferred into Rest format (up to 12
leads 10 sec). Calculated leads are performed only
if I and II are acquired.
Export to
MATLAB
File > Export
to MATLAB
A 10 sec segment containing acquired leads is
transferred into MATLAB format.
Import from
ISHNE
File > Import
from ISHNE
Long-term high resolution ECG recorded on
Holter can be transferred into a monitoring study
Plot in real
time
Real time printing on a thermal printer. Can print
continuously while monitoring up to 8 leads.
Set/change
patient data
View > Patient
data Displays patient demographic information.
Add/view
remarks
View >
Remarks
Allows the user to enter free text during or after
the ECG recording. This is printed and saved
together with ECG traces.
Set preferences
Allows the user to tailor operation preferences.
To display
information
Help >
About…
Software version number. Quote this for any
software inquiry. Also shows memory size and
free disk space. The HASP ID number is the ID
of existing software keys. This ID number is used
for adding software options.
Instructions for Use and Technical Description
Norav Medical Ltd.
78
To do this
Click
this
icon
Or use
this
short-cut
key
Or select this
menu Description
Display/Hide
the grid
View > Grid Optional display of 5mm raster.
Start ECG
Recording.
F2 ECG >
Start/Stop Starts ECG recording.
Stop ECG
Recording
F2 ECG >
Start/Stop Stops ECG recording.
Display 3X4
Leads
Ctrl+1
View > Leads
format >
Windows
Classical format. Displays 12 lead ECG of 2.5sec
ECG + 10sec trace.
*
Display 12X1
Leads
Ctrl+2
View > Leads
format > All
leads
Displays 12 lead ECG of 10sec ECG.
*
Display 3X1
Leads
Ctrl+3
View > Leads
format > Lead
group
Displays 3 lead ECG of 10sec ECG.
*
Display the
next leads
Ctrl+0
View > Leads
format > Next
leads
Allows the user to scroll through all leads in the
3X1 display
Set 50/60 Hz
filter
ECG > Filters
> 50/60 Hz
ON/OFF for line interference filter. Set
OPTIONS for 50 or 60 Hz prior to operation
Set EMG filter
ECG > Filters
> EMG ON/OFF for muscle noise filter
Set base line
filter
ECG > Filters
> BaseLine ON/OFF for baseline filter on ECG data
Table 24: Monitoring Toolbar and Menus
*
ECG data can be set up as limited amplitude or unlimited amplitude, which can cause one lead data to
overlap a neighboring lead.
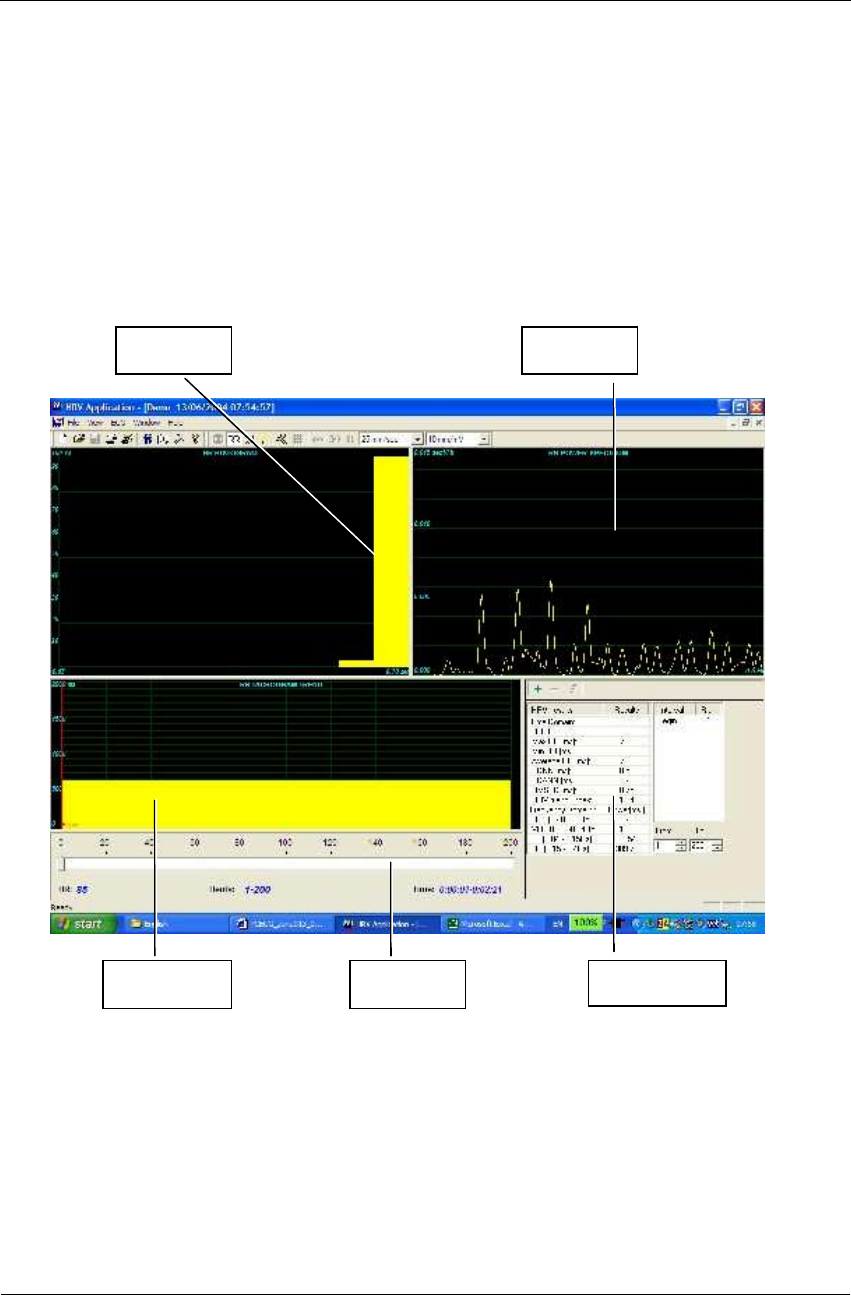
Heart Rate Variability (HRV)
NV-54/PCECG1200W
79
CHAPTER 11: HEART RATE VARIABILITY
(HRV)
(This option is available with the H1 license)
Time and frequency domain analysis is designed for short studies in which one or
more time segments are measured, as in a Tilt study.
Measured/reported parameters are according to NASPE/ESC Guidelines.
Histogram P.S.D.
Tachogram Slider HRV results

Instructions for Use and Technical Description
Norav Medical Ltd.
80
Key:
Histogram The histogram relates to the active part (yellow) of the tachogram
P.S.D. The power spectrum distribution
Tachogram
The tachogram trend shows all intervals. Each beginning of an interval is
checked with a red line followed by the interval’s name. To activate an
interval, click it. To activate several neighboring segments, press SHIFT and
move the slider.
Slider
Use the slider at the bottom to:
• Define new intervals
• Change interval duration, and
• Activate several intervals
HRV results The HRV results pane displays the results in numerical format.
Table 25: HRV Screen
Quick Start
To Start a New Test
1. Click F1 (or the New button on the tool bar).
2. Insert patient details in the dialog box.
3. Click OK.
4. Click F3 or F4 to start the HRV test.
5. Enter the interval name and/or remarks as appropriate in the dialog box
and click OK.
6. Click F3 or F4 (or the Start/Stop HRV button) to stop the HRV test
(or wait until it ends).
To Print an HRV Report
1. Click Print on the toolbar or select Print from the file menu.
2. Select the printer from the print dialog box.
3. Click OK and the report is printed.
For an example of a printed report, see Appendix C:, page 111.
Heart Rate Variability (HRV)
NV-54/PCECG1200W
81
To Print an ECG
1. Click the Print ECG button on the toolbar or select Print ECG from
the file menu.
2. Select the beats and leads to print from the dialog box and click OK.
3. Select the printer from the print dialog box.
4. Click OK to close the dialog and print the ECG.
HRV Setup
1. Click the HRV icon.
The HRV window is displayed.
2. Click the Setup icon (hammer).
The following folders are displayed:
Tab Option Description
Sample
Rate\Leads
Selection
Leads Choose leads and sampling rate. Select up to four neighboring leads for
calculations.
ECG
Recording Filters Set filters as active.
Test Duration
Define the test duration either by target number of beats or by the ECG
recording time. Select the preferred parameter and define the value for the test
duration.
Save Options
Set the Preferred saving options:
To save test automatically at the end of the test, check the Auto Save option.
When this option is cleared, the test is saved only on demand.
Define the saving format either as No ECG Data or Full Disclosure.
Define the file naming convention of the saved files, either by Patient Last
Name or ID.
Use ECG
Database
Select this option to connect to the default ECG database. When this option
is checked, the ECG tests are saved in the database.
Data Directory Define a directory for saved ECG recordings (if ECG database is not used).
Use a secondary hard disk, if one is available.
Simulator ECG
When cleared (default), ECG recording is performed from the PC-ECG unit.
When checked, the ECG recording is performed from the demo file included
in the software package. In this case, the recording unit is not needed.
View Change default colors for ECG and for graphs.
Instructions for Use and Technical Description
Norav Medical Ltd.
82
Tab Option Description
Restore
Defaults Restores factory default color definitions for ECG display and graphs.
Installation Saves hospital and physician data. This data is included in print out and mail.
Measurement
Standard
Define whether measurements will be calculated according to the metric or
USA standard. The default is metric.
Magnetic Card
Reader
Select this option to use a magnetic card with bar-code to insert patient
details. Select the magnetic card type.
Environment Connection
Select the option button (COM port/USB) to choose the port for device
connection.
If the COM port option is selected, select the serial input for the PC-ECG
unit from the COM port list.
The option is disabled if the USB connection is selected. Default at
installation is USB.
Display Size Choose between 14/15-inch screen (default) and 17-inch screen. This setting
is required to display the ECG and grid in correct scale.
Graph Paper
(Print options)
When set to On, prints 1mm and 5 mm squares on printouts.
Regular Grid works with any printer.
Improved Grid shows a fine grid but may not work on some printers.
Large Remarks
Font Enlarges font for free typed text.
Color Printout Clear the check-box to force B/W printing on color printer.
GDT/BDT
Format
Automatic
Options
Define automatic options for saving and/or importing files in GDT/BDT
format.
File Format Select the file format: GDT or BDT
Import
Codepage 437 Check this option to import Code page 437.
Export
Codepage 437 Check this option to export Code page 437.
Edit Labels Click to open a dialog box with an editable list of the field labels used in the
GDT and BDT files.
GDT/BDT
Data directory Define the directory path where the GDT/BDT files will be maintained.
Token for
PCECG Default is PEKG.
Token for
Practice EDP Default is EDV1.

Heart Rate Variability (HRV)
NV-54/PCECG1200W
83
Starting a Study
1. Click New.
2. Enter patient data in the Patient Data field.
The ECG leads are monitored on the screen for quality check.
If you are satisfied with the quality check, click the R-R icon. The
display comprises three sections:
◊ The ECG leads are displayed on the upper part of the screen
◊ The tachogram trend display is built up in the middle strip.
◊ A slider shows the study status and time at the bottom
During the study, define a new time segment (interval) by clicking the flag icon
(interval). Name each interval during the study to retain it as a valid interval.
When all predefined beats are completed, or if terminated by clicking the R-R
icon, the HRV screen is displayed:
To Add or Subtract an Interval
1. Select the interval with the slider.
2. Click
+
or
–
at the top of the HRV results pane.
To Edit Interval Names
Use the pencil icon.
To Import or Save GDT/BDT Format
See Import from GDT/BDT and Save Test in GDT/BDT, page 105.
Instructions for Use and Technical Description
Norav Medical Ltd.
84
Results Display
The AVERAGE HEART RATE is displayed in the lower left side.
All results are for the chosen segment (check the yellow selection or the From-To bits
number).
Other results are shown in the right hand side as follows:
RR no. Number of beats in the active interval
max RR Longest R-R period
min RR Shorter R-R period
Average RR Average of interval in active interval
SDNN Standard deviation of all R-R periods in interval
SDANN Standard deviation of the averages of R-R periods in all 5 min
segments of the active interval
RMSSD The square root of the mean of the sum of the squares of
differences between adjacent NN intervals
Time
Domain
HRV triangular
Index
Total number of all R-R intervals divided by the height of the
histogram of all R-R intervals measured on a discrete scale
ULF Power of the ultra low frequency range
VLF Power of the very low frequency range
LF Power of the low frequency range
Frequency
Domain
HF Power of the high frequency range
Figure 19: HRV Results
HRV Interval Measurement
A QRS detector measures the interval between any two valid beats. It calculates a
sliding N-N average and compares each interval to it. When a significant change
occurs, the current beat is either a premature beat (as in PVC) or a prolonged one,
which may indicate either a compensatory pause following a PVC or a missing beat. A
premature interval and a following prolonged interval (compensatory pause) timed in
the range of twice the current N-N interval are averaged. This methodology maintains
a consistent time axis in the presence of PVCs. If a prolonged interval follows a
normal interval, but at twice the current N-N interval, it indicates the presence of a
missing beat. Accordingly, the missing beat is computed as present. This last event is
very rare, because the recording is made in rest condition and the software detects the
QRS efficiently under such conditions.
Measurements/ Interpretation
NV-54/PCECG1200W
85
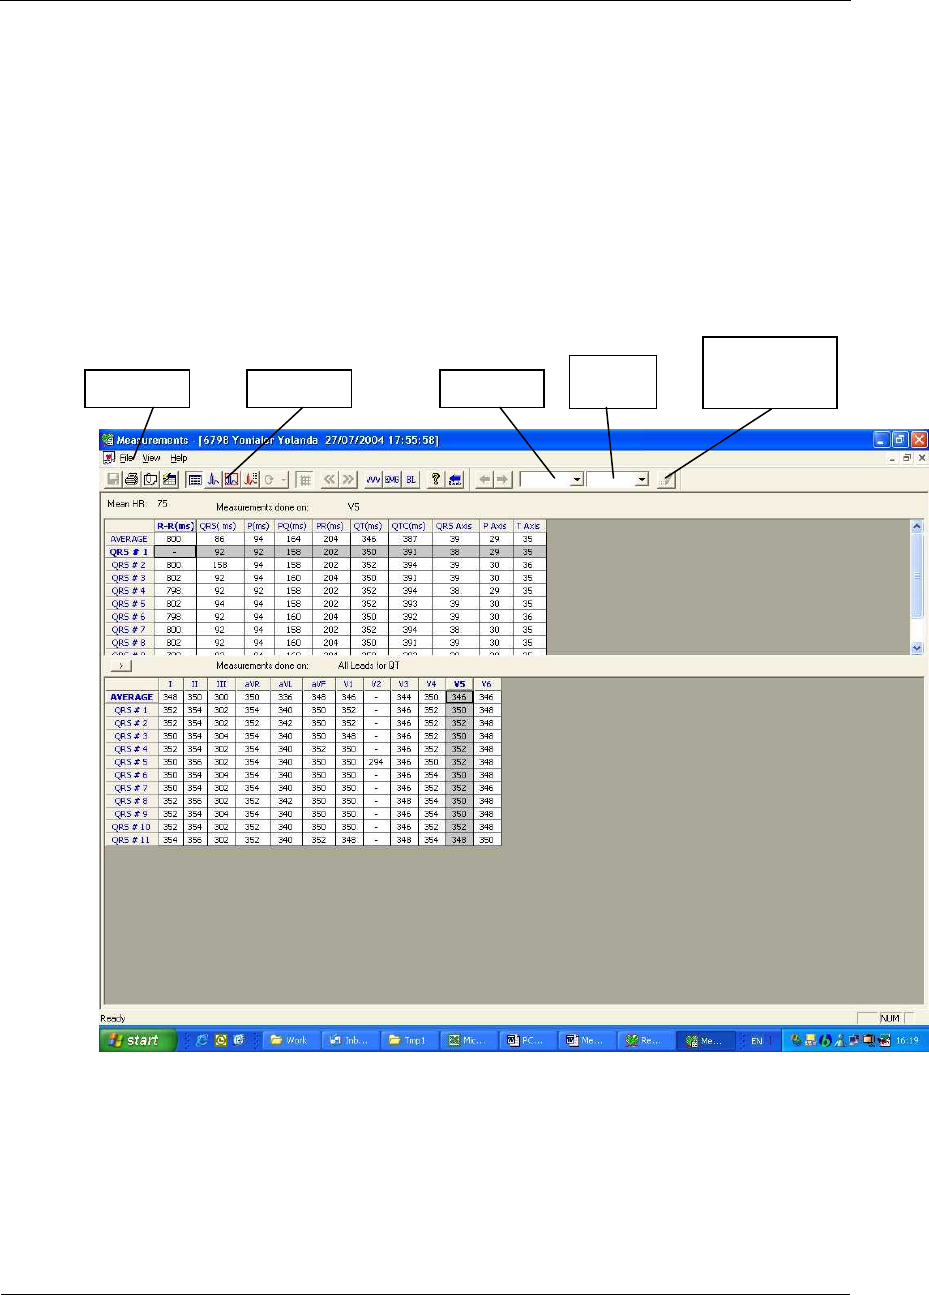
CHAPTER 12: MEASUREMENTS/
INTERPRETATION
(This option is available with the I1 or I2 license)
Measurements is not an autonomous
application. The Measurements application is
used for calculations of QRSs and interpretation of the ECG signal. The user can
manually change the QRS identification parameters. 10 seconds of data are calculated.
Figure 20: Measurements—Tabular Screen
Menu bar Toolbar Wave type Marker
name
Add/Remove
ECG Wave
Markers

Instructions for Use and Technical Description
Norav Medical Ltd.
86
Quick Start
To Start Measurements
Click the ruler icon in the Rest, Stress, and Monitoring applications,
or click View > Measurements
The application has four view formats:
• Measurements Table (default display)
• ECG Averages
• QRS Signal
• Caliper
To Print Reports
1. Click the printer icon or select File > Print Reports.
2. Select the reports to print and click OK.
Performing Changes in Calculations
To Move the QRS Marker
(Averages and QRS views only)
1. Click and drag the marker to the required position (between the
previous and next markers).
2. The calculations are modified accordingly.
To Add or Remove a Wave Marker
1. Click the Add/Remove ECG Wave Markers icon on the toolbar
(or select File > Add/Remove ECG Wave Markers).
2. Check or clear wave markers in the dialog box displayed.
3. Click OK to save the selection, close the dialog box, and display the
change.

Measurements/ Interpretation
NV-54/PCECG1200W
87
To Move the Wave Marker
(Caliper view only)
1. Select a wave from the wave list on the left hand side of the viewer (or
from the Wave Type combo box).
2. Select the marker from the Marker Name combo box in the toolbar or
by clicking the marker.
3. Use the Left/Top/Right/Bottom arrows on the toolbar or drag & drop
the marker to the required position.
The calculations are modified accordingly.
Features
View all calculated parameters on every QRS, on every channel and average
calculations in tabular format.
The upper table displays measurements for a channel.
The lower table displays measurements values for a QRS.
To View the Measurements on a QRS
Select a QRS from the upper table and view the results on the lower table.
To View the Measurements on a Channel
Select a channel from the lower table and view the values on the upper table.
To View the Measurements on All Channels for QT
Click “>” (between the two tables) to view measurements for All Leads for QT on
the lower table.
Tabular Screen
The Tabular screen (see page 85) displays calculations of the QRS parameters in all
the leads in a tabular format. Original calculations or changes performed in the other
screens (Averages, QRS, or Caliper) are displayed in a tabular format and can be
printed out.
Instructions for Use and Technical Description
Norav Medical Ltd.
88
Averages Display
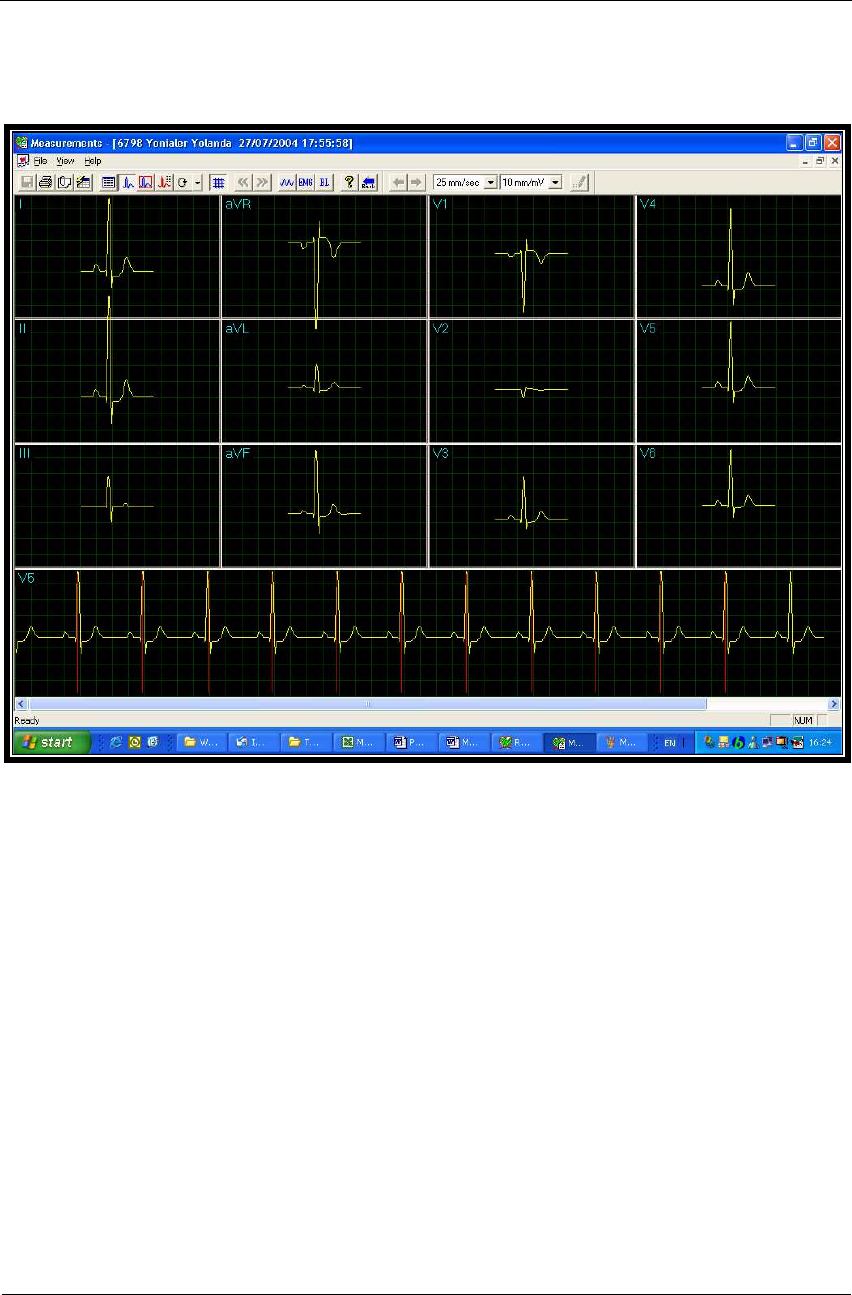
Figure 21: Measurements—Averages Display
The Averages screen displays the average QRS in each of the leads and the average
ECG of the Strip lead. Each QRS identified is marked with a red marker in the strip
lead (The marker actually marks the R wave of every QRS). The QRS markers can be
moved to the left and right (between the previous and the next marker). Changes in
marker positions are recalculated and displayed in the tabular screen and the QRS
screen.