Norav Medical 1200WR WIRELESS ECG RECORDING SYSTEM User Manual PCECG1200WR Revised UserMan
Norav Medical Ltd. WIRELESS ECG RECORDING SYSTEM PCECG1200WR Revised UserMan
UserManual.wiki
>
Norav Medical
>
1200WR User Manual
>
USERS MANUAL 2
Contents
1.
USERS MANUAL 1
2.
USERS MANUAL 2
3.
USERS MANUAL 3
USERS MANUAL 2
Navigation menu
Upload a User Manual
Namespaces
Wiki Guide
HTML
PDF
Info
Views
User Manual
Discussion / Help
Navigation
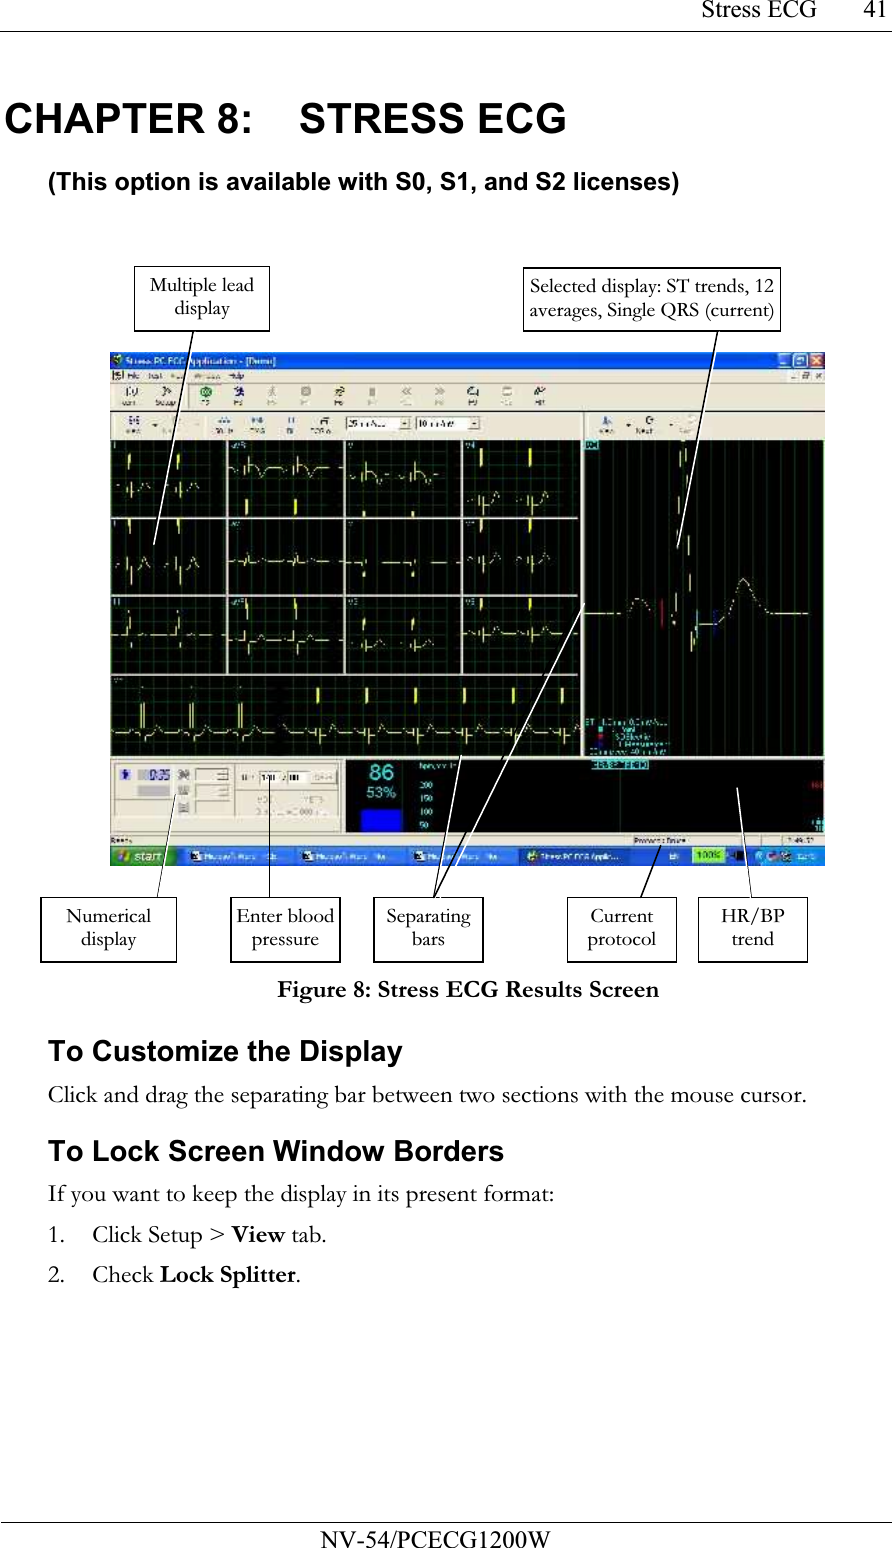
![Instructions for Use and Technical Description Norav Medical Ltd. 40Example of ECG Display with MATLAB 1. Open a file: handle = fopen('c:\default_\ patient_name.lib,'r') 2. Choose from which lead and which second to display the ECG: fseek(handle, (Lead-1) * 10000 + (Sec-1) * 500,-1) where Lead (1,2,3,...,12) and Sec (1,2,3,...10) For example, if lead AVR (number 4) from the second 3 is requested: fseek(handle,3*10000+2*500,-1) t = fread(handle, [sec * 500 ,1], 'int16') where sec(1,2,3,4,...,10) 3. Type: plot(t) The graph is displayed.](https://usermanual.wiki/Norav-Medical/1200WR.USERS-MANUAL-2/User-Guide-918322-Page-2.png)