Canadian Health Measures Survey (CHMS) CHMS User Guide Cycle3 E
User Manual: Pdf
Open the PDF directly: View PDF ![]() .
.
Page Count: 154 [warning: Documents this large are best viewed by clicking the View PDF Link!]
- 1. Introduction
- 2. Important notes related to this document
- 3. Canadian Health Measures Survey (CHMS) background and objectives
- 4. Survey approval
- 5. Survey content
- 6. Sample design
- 6.1 Target population
- 6.2 Sample size and allocation
- 6.3 Sampling frames and sampling strategy
- 6.3.1 Sampling of collection sites
- 6.3.2 Dwelling sampling
- 6.3.3 Respondent sampling
- 6.3.4 Activity monitor subsample
- 6.3.5 Blood and urine subsamples
- 6.3.5.1 Fasted subsampling
- 6.3.5.2 Red blood cell fatty acids subsample
- 6.3.5.3 Urine fluoride subsample
- 6.3.5.4 Blood volatile organic compounds (VOCs) subsample
- 6.3.5.5 Blood acrylamide subsample
- 6.3.5.6 Blood methyl mercury subsample
- 6.3.5.7 Urine environmental contaminants subsample
- 6.3.5.8 Urine NNK metabolites subsample
- 6.3.6 Tap water household subsamples
- 7. Data collection
- 7.1 Preparation for collection
- 7.2 Collection
- 7.3 Minimizing non-response
- 7.4 Physical measures protocols
- 7.5 Laboratory measures protocols (blood and urine)
- 8. Data processing
- 9. Weighting
- 9.1 Selection weights for collection sites
- 9.2 Selection weights for dwellings
- 9.3 Removal of out-of-scope units
- 9.4 Household non-response
- 9.5 Creation of the person weight
- 9.6 Non-response at the questionnaire level
- 9.7 Non-response at the MEC level
- 9.8 Winsorization
- 9.9 Calibration
- 9.10 Bootstrap weights
- 9.11 Weighting for selected subsamples
- 10.1 Response rates
- 10.2 Errors in surveys
- 10.3 Quality assurance and control
- 10.3.1 Training of household interviewers and Mobile Examination Centre (MEC) staff
- 10.3.2 Household component
- 10.3.2.1 Monitoring – Household interview
- 10.3.3 Mobile examination centre (MEC) component
- 10.3.3.1 Equipment selection
- 10.3.3.2 Protocols and procedures
- 10.3.3.3 Mobile examination centre (MEC) environment
- 10.3.3.4 Adherence to pre-testing guidelines
- 10.3.3.5 Equipment monitoring
- 10.3.3.6 Data entry verification
- 10.3.3.7 MEC – data collection monitoring
- 10.3.3.8 Spirometry data review
- 10.3.3.9 Data validation
- 10.3.3.10 Activity monitor data review
- 10.3.3.11 Replicate testing
- 10.3.3.11.1 Anthropometry replicate testing
- 10.3.3.11.2 Laboratory replicate testing
- 10.3.3.12 Mobile examination centre (MEC) laboratory
- 10.3.3.13 Proficiency testing
- 10.3.3.14 Processing and storage of blood and urine samples
- 10.3.3.15 Shipping
- 10.3.3.16 Field blanks
- 10.3.3.17 Tap water blanks
- 10.3.3.18 Hearing data review
- 10.3.4 Head office
- 10.3.4.2 Red blood cell folate data
- 11. File Usage
- 11.1 Description of data files
- 11.1.1 Household full sample file
- 11.1.2 Clinic full sample file
- 11.1.3 Postal code file
- 11.1.4 Climate and air quality file
- 11.1.5 Activity monitor subsample file
- 11.1.6 Non-environmental lab full sample file
- 11.1.7 Fasted subsample file
- 11.1.8 Red blood cell fatty acids subsample file
- 11.1.9 Hearing full sample file
- 11.1.10 Fluoride household level subsample file (in tap water)
- 11.1.11 Volatile organic compounds household level subsample file (in tap water)
- 11.1.12 Fluoride person level subsample file (in urine and tap water)
- 11.1.13 Volatile organic compounds person level subsample file (in blood and tap water)
- 11.1.14 Environmental lab blood and urine full sample file
- 11.1.15 Acrylamide (environmental blood subsample) file
- 11.1.16 Methyl mercury (environmental blood subsample) file
- 11.1.17 NNK metabolites (environmental urine subsample) file
- 11.1.18 Environmental urine (main subsample) file
- 11.2 Key variables for linking data files
- 11.3 Key variables and definitions
- 11.4 Use of age and sex variables
- 11.5 Use of weight variables
- 11.6 Variable naming convention
- 11.7 Access to data files
- 11.1 Description of data files
- 12. Guidelines for tabulation, analysis and release
- 12.1 Guidelines for tabulation
- 12.2 Guidelines for statistical analysis
- 12.3 Guidelines for releasing data
- 13. References and end notes
- Appendix 1 - Acronyms and Abbreviations
- Appendix 2 - List of other Canadian Health Measures Survey (CHMS) documents available
- Appendix 3 - List of Collection Sites for Cycle 3
- Appendix 4 - Pre-testing Guidelines
- Appendix 5 - Exclusion Criteria
- Appendix 6 - Medication Classification Systems
- Appendix 7 - Response Rates
- Appendix 7A - CHMS Cycle 3 Full Sample Response Rates by age group and sex
- Appendix 7B - CHMS Cycle 3 Activity Monitor Response Rates by age group and sex
- Appendix 7C - CHMS Cycle 3 Blood Draw and Urine Response Rates by age group and sex
- Appendix 7D - CHMS Cycle 3 Fasted Subsample Response Rates by age group and sex
- Appendix 7E - CHMS Cycle 3 Red Blood Cell Fatty Acids Subsample Response Rates by age group and sex
- Appendix 7F - CHMS Cycle 3 Tap water fluoride subsample household response rates by household size
- Appendix 7G - CHMS Cycle 3 Urine fluoride subsample person response rates by age group and sex
- Appendix 7H - CHMS Cycle 3 Tap water VOCs subsample household response rates by household size
- Appendix 7I - CHMS Cycle 3 Blood VOCs subsample person response rates by age group and sex
- Appendix 7J - CHMS Cycle 3 Acrylamide Subsample Response Rates by age group and sex
- Appendix 7K - CHMS Cycle 3 Methyl Mercury Subsample Response Rates by age group and sex
- Appendix 7L - CHMS Cycle 3 Urine environmental contaminants Subsample Response Rates by age group and sex
- Appendix 7M - CHMS Cycle 3 Urine NNK metabolites subsample response rates by age group and sex
- Appendix 8 - Activity Monitor Research
- Appendix 9 – Changes to Wave 1 Variables
- Appendix 10 – Changes to Wave 2 Variables

Canadian Health Measures Survey (CHMS)
Data User Guide: Cycle 3
July 2015

Canadian Health Measures Survey (CHMS) Data User Guide: Cycle 3
1
TABLE OF CONTENTS
1. INTRODUCTION ........................................................................................................................................................ 8
2. IMPORTANT NOTES RELATED TO THIS DOCUMENT .................................................................................................. 9
2.1 ACRONYMS AND ABBREVIATIONS ........................................................................................................................................ 9
2.2 REFERENCES AND END NOTES ............................................................................................................................................. 9
2.3 SURVEY DOCUMENTATION ................................................................................................................................................. 9
2.4 UPDATES TO CHMS DOCUMENTATION .............................................................................................................................. 10
2.4.1 User guide ........................................................................................................................................................... 10
3. CANADIAN HEALTH MEASURES SURVEY (CHMS) BACKGROUND AND OBJECTIVES ................................................. 20
3.1 CHMS BACKGROUND ..................................................................................................................................................... 20
3.2 CHMS OBJECTIVES ........................................................................................................................................................ 20
4. SURVEY APPROVAL ................................................................................................................................................. 21
4.1 AUTHORITY .................................................................................................................................................................. 21
4.2 ETHICAL PROTOCOLS AND PRIVACY STANDARDS .................................................................................................................... 21
5. SURVEY CONTENT ................................................................................................................................................... 22
6. SAMPLE DESIGN ..................................................................................................................................................... 23
6.1 TARGET POPULATION ...................................................................................................................................................... 23
6.2 SAMPLE SIZE AND ALLOCATION ......................................................................................................................................... 23
6.3 SAMPLING FRAMES AND SAMPLING STRATEGY ..................................................................................................................... 23
6.3.1 Sampling of collection sites ................................................................................................................................. 23
6.3.2 Dwelling sampling ............................................................................................................................................... 24
6.3.3 Respondent sampling .......................................................................................................................................... 26
6.3.4 Activity monitor subsample ...................................................................................................................................... 26
6.3.5 Blood and urine subsamples ..................................................................................................................................... 27
6.3.5.1 Fasted subsampling .............................................................................................................................. 27
6.3.5.2 Red blood cell fatty acids subsample .................................................................................................... 27
6.3.5.3 Urine fluoride subsample ...................................................................................................................... 27
6.3.5.4 Blood volatile organic compounds (VOCs) subsample .......................................................................... 27
6.3.5.5 Blood acrylamide subsample ................................................................................................................. 28
6.3.5.6 Blood methyl mercury subsample ......................................................................................................... 28
6.3.5.7 Urine environmental contaminants subsample .................................................................................... 28
6.3.5.8 Urine NNK metabolites subsample ........................................................................................................ 28
6.3.6 Tap water household subsamples ............................................................................................................................ 28
7. DATA COLLECTION .................................................................................................................................................. 30
7.1 PREPARATION FOR COLLECTION ........................................................................................................................................ 30
7.1.1 The Canadian Health Measures Survey (CHMS) team ........................................................................................ 30
7.1.1.1 Field team ............................................................................................................................................. 30
7.1.1.2 Mobile examination centre (MEC) team .............................................................................................. 30
7.1.1.3 Head office staff .................................................................................................................................... 30
7.1.2 The mobile examination centre (MEC) ................................................................................................................ 31
7.1.3 Informatics environment ..................................................................................................................................... 31
7.1.4 Questionnaire design .......................................................................................................................................... 32
7.1.4.1 Household questionnaire...................................................................................................................... 32
7.1.4.2 Clinic questionnaire .............................................................................................................................. 32
7.1.4.3 Tap Water Questions ............................................................................................................................ 33
7.1.4.4 Hearing Questions ................................................................................................................................ 33
7.1.4.5 Sun Exposure Questions ....................................................................................................................... 33
7.1.4.6 Indoor Air Questions ............................................................................................................................. 33

Canadian Health Measures Survey (CHMS) Data User Guide: Cycle 3
2
7.1.4.7 Fish and Shellfish Consumption ............................................................................................................ 33
7.2 COLLECTION ................................................................................................................................................................. 33
7.2.1 Collection – Household interview ........................................................................................................................ 34
7.2.2 Collection – MEC.................................................................................................................................................. 34
7.3 MINIMIZING NON-RESPONSE ........................................................................................................................................... 35
7.3.1 Minimizing non-response – Household interview ............................................................................................... 35
7.3.1.1 Introductory material ........................................................................................................................... 35
7.3.1.2 Initiating contact ................................................................................................................................... 36
7.3.1.3 Refusal procedures ............................................................................................................................... 36
7.3.1.4 Language barriers ................................................................................................................................. 36
7.3.1.5 Youth respondents................................................................................................................................ 36
7.3.1.6 Proxy interviews ................................................................................................................................... 37
7.3.2 Minimizing non-response – MEC ......................................................................................................................... 37
7.3.2.1 Non-response follow-up ....................................................................................................................... 37
7.3.2.2 Flexible MEC hours ............................................................................................................................... 37
7.3.2.3 Refusal procedures ............................................................................................................................... 38
7.3.2.4 Language barriers ................................................................................................................................. 38
7.3.2.5 Youth respondents................................................................................................................................ 38
7.4 PHYSICAL MEASURES PROTOCOLS ...................................................................................................................................... 38
7.4.1 Anthropometry .................................................................................................................................................... 38
7.4.1.1 Standing height ..................................................................................................................................... 39
7.4.1.2 Sitting height ......................................................................................................................................... 39
7.4.1.3 Weight .................................................................................................................................................. 39
7.4.1.4 Waist circumference ............................................................................................................................. 39
7.4.1.5 Hip circumference ................................................................................................................................. 39
7.4.2 Skin pigmentation .............................................................................................................................................. 39
7.4.3 Heart rate and blood pressure ............................................................................................................................ 40
7.4.4 Lung health.......................................................................................................................................................... 40
7.4.4.1 Spirometry ........................................................................................................................................... 40
7.4.4.2 Fractional Exhaled Nitric Oxide (FENO) ................................................................................................. 40
7.4.5 Grip strength ....................................................................................................................................................... 40
7.4.6 Hearing ................................................................................................................................................................ 40
7.4.6.1 Otoscopy ............................................................................................................................................... 40
7.4.6.2 Tympanometry ..................................................................................................................................... 41
7.4.6.3 Distortion Product Otoacoustic Emissions ............................................................................................ 41
7.4.6.4 Audiometry ............................................................................................................................................ 41
7.4.7 Activity monitor ................................................................................................................................................... 41
7.4.8 Tap water ............................................................................................................................................................ 41
7.4.9 Indoor air sampler ............................................................................................................................................... 41
7.5 LABORATORY MEASURES PROTOCOLS (BLOOD AND URINE) ..................................................................................................... 42
7.5.1 Sample collection ................................................................................................................................................ 42
7.5.1.1 Blood collection .................................................................................................................................... 42
7.5.1.2 Urine collection ..................................................................................................................................... 42
7.5.2 Analysis of CBC performed at the mobile examination centre (MEC) ................................................................. 42
7.5.3 Processing and storage of the blood and urine samples ..................................................................................... 42
7.5.4 Shipment of the blood and urine samples ........................................................................................................... 43
8. DATA PROCESSING ................................................................................................................................................. 44
8.1 VERIFICATION ............................................................................................................................................................... 44
8.2 MARK-ALL-THAT-APPLY QUESTIONS .................................................................................................................................. 44
8.3 CODING ....................................................................................................................................................................... 45
8.4 EDITING ....................................................................................................................................................................... 46
8.5 CREATION OF DERIVED VARIABLES ..................................................................................................................................... 47
8.6 ANALYTICAL RANGE ........................................................................................................................................................ 47

Canadian Health Measures Survey (CHMS) Data User Guide: Cycle 3
3
9. WEIGHTING.................................................................................................................................................................. 48
9.1 SELECTION WEIGHTS FOR COLLECTION SITES ........................................................................................................................ 48
9.2 SELECTION WEIGHTS FOR DWELLINGS ................................................................................................................................. 48
9.3 REMOVAL OF OUT-OF-SCOPE UNITS ................................................................................................................................... 49
9.4 HOUSEHOLD NON-RESPONSE ........................................................................................................................................... 49
9.5 CREATION OF THE PERSON WEIGHT.................................................................................................................................... 49
9.6 NON-RESPONSE AT THE QUESTIONNAIRE LEVEL .................................................................................................................... 49
9.7 NON-RESPONSE AT THE MEC LEVEL .................................................................................................................................. 50
9.8 WINSORIZATION ............................................................................................................................................................ 51
9.9 CALIBRATION ................................................................................................................................................................ 51
9.10 BOOTSTRAP WEIGHTS ........................................................................................................................................... 51
9.11 WEIGHTING FOR SELECTED SUBSAMPLES........................................................................................................................... 52
9.11.1 Weighting for activity monitor data ....................................................................................................................... 52
9.11.2 Weighting for blood and urine data ...................................................................................................................... 52
9.11.2.1 Weighting for the fasted subsample .......................................................................................................... 52
9.11.2.2 Weighting for the red blood cell fatty acids subsample ........................................................................ 53
9.11.2.3 Weighting for the urine fluoride subsample .......................................................................................... 54
9.11.2.4 Weighting for the blood volatile organic compounds (VOCs) subsample ............................................. 55
9.11.3 Weighting for the tap water subsamples ............................................................................................................... 60
9.11.3.1 Weighting for the tap water fluoride subsample (household-level weights) ........................................ 60
9.11.3.2 Weighting for the tap water VOCs subsample (household-level weights) ............................................ 60
10. DATA QUALITY ........................................................................................................................................................ 62
10.1 RESPONSE RATES .................................................................................................................................................. 62
10.1.1 Household and MEC response rates ............................................................................................................... 62
10.1.2 Activity monitor response rates ...................................................................................................................... 65
10.1.3 Blood draw and urine response rates ............................................................................................................. 66
10.1.4 Response rates for blood and urine subsamples ............................................................................................ 67
10.1.4.1 Fasted subsample response rates.......................................................................................................... 67
10.1.4.2 Red blood cell fatty acids subsample response rates ............................................................................ 69
10.1.5 Fluoride subsamples response rates ............................................................................................................... 74
10.1.5.1 Tap water fluoride subsample household response rates ..................................................................... 74
10.1.5.2 Urine fluoride subsample person response rates .................................................................................. 74
10.1.6 VOCs subsamples response rates ................................................................................................................... 76
10.1.6.1 Tap water VOCs subsample household response rates ......................................................................... 76
10.1.6.2 Blood VOCs subsample person response rates ..................................................................................... 77
10.2 ERRORS IN SURVEYS .............................................................................................................................................. 79
10.2.1 Non-sampling errors ....................................................................................................................................... 79
10.2.2 Sampling errors .............................................................................................................................................. 80
10.3 QUALITY ASSURANCE AND CONTROL......................................................................................................................... 81
10.3.1 Training of household interviewers and Mobile Examination Centre (MEC) staff .......................................... 81
10.3.1.1 Initial training ......................................................................................................................................... 81
10.3.1.2 Dress rehearsal ...................................................................................................................................... 82
10.3.1.3 Ongoing training – Dry run day .............................................................................................................. 83
10.3.1.4 Annual retraining ................................................................................................................................... 83
10.3.2 Household component .................................................................................................................................... 83
10.3.2.1 Monitoring – Household interview ................................................................................................................. 83
10.3.2.2 Household questionnaire response rates .............................................................................................. 83
10.3.2.3 Validation of questionnaire responses .................................................................................................. 83
10.3.3 Mobile examination centre (MEC) component .............................................................................................. 84
10.3.3.1 Equipment selection .............................................................................................................................. 84
10.3.3.2 Protocols and procedures ...................................................................................................................... 84
10.3.3.3 Mobile examination centre (MEC) environment ................................................................................... 85
10.3.3.4 Adherence to pre-testing guidelines ..................................................................................................... 85

Canadian Health Measures Survey (CHMS) Data User Guide: Cycle 3
4
10.3.3.5 Equipment monitoring ........................................................................................................................... 85
10.3.3.6 Data entry verification ........................................................................................................................... 85
10.3.3.7 MEC – data collection monitoring ......................................................................................................... 85
10.3.3.8 Spirometry data review ......................................................................................................................... 86
10.3.3.9 Data validation ....................................................................................................................................... 86
10.3.3.10 Activity monitor data review ................................................................................................................. 87
10.3.3.11 Replicate testing .................................................................................................................................... 87
10.3.3.11.1 Anthropometry replicate testing ........................................................................................................... 87
10.3.3.11.2 Laboratory replicate testing .................................................................................................................. 87
10.3.3.12 Mobile examination centre (MEC) laboratory ....................................................................................... 87
10.3.3.13 Proficiency testing ................................................................................................................................. 88
10.3.3.14 Processing and storage of blood and urine samples ............................................................................. 88
10.3.3.15 Shipping ................................................................................................................................................. 88
10.3.3.16 Field blanks ............................................................................................................................................ 88
10.3.3.17 Tap water blanks .................................................................................................................................... 89
10.3.3.18 Hearing data review ............................................................................................................................... 89
10.3.4 Head office ..................................................................................................................................................... 90
10.3.4.1 Correcting for bias ................................................................................................................................. 90
10.3.4.2 Red blood cell folate data ............................................................................................................................... 90
11. FILE USAGE ............................................................................................................................................................. 91
11.1 DESCRIPTION OF DATA FILES ................................................................................................................................... 91
11.1.1 Household full sample file .............................................................................................................................. 94
11.1.2 Clinic full sample file ....................................................................................................................................... 94
11.1.3 Postal code file ............................................................................................................................................... 95
11.1.4 Climate and air quality file ............................................................................................................................. 95
11.1.5 Activity monitor subsample file ............................................................................................................................. 96
11.1.6 Non-environmental lab full sample file.................................................................................................................. 96
11.1.7 Fasted subsample file ............................................................................................................................................ 96
11.1.8 Red blood cell fatty acids subsample file ................................................................................................................ 96
11.1.9 Hearing full sample file ........................................................................................................................................... 96
11.1.10 Fluoride household level subsample file (in tap water) ........................................................................................ 97
11.1.11 Volatile organic compounds household level subsample file (in tap water) ........................................................ 97
11.1.12 Fluoride person level subsample file (in urine and tap water) .............................................................................. 97
11.1.13 Volatile organic compounds person level subsample file (in blood and tap water) .................................... 97
11.1.14 Environmental lab blood and urine full sample file ..................................................................................... 97
11.1.15 Acrylamide (environmental blood subsample) file ...................................................................................... 97
11.1.16 Methyl mercury (environmental blood subsample) file .............................................................................. 98
11.1.17 NNK metabolites (environmental urine subsample) file ............................................................................. 98
11.1.18 Environmental urine (main subsample) file ................................................................................................. 98
11.2 KEY VARIABLES FOR LINKING DATA FILES .................................................................................................................... 98
11.3 KEY VARIABLES AND DEFINITIONS ............................................................................................................................. 98
11.4 USE OF AGE AND SEX VARIABLES ............................................................................................................................ 100
11.5 USE OF WEIGHT VARIABLES .................................................................................................................................. 100
11.6 VARIABLE NAMING CONVENTION ........................................................................................................................... 100
11.6.1 Position 4: Place Holder or Variable Type ..................................................................................................... 101
11.6.2 Positions 5-8: Question reference ................................................................................................................. 101
11.7 ACCESS TO DATA FILES ......................................................................................................................................... 102
12. GUIDELINES FOR TABULATION, ANALYSIS AND RELEASE ...................................................................................... 103
12.1 GUIDELINES FOR TABULATION ...................................................................................................................................... 103
12.1.1 Tabulation of categorical and quantitative estimates ......................................................................................... 103
12.1.1.1 Categorical estimates .......................................................................................................................... 103
12.1.1.2 Quantitative estimates ........................................................................................................................ 104

Canadian Health Measures Survey (CHMS) Data User Guide: Cycle 3
5
12.1.2 Imputation of household income .......................................................................................................................... 105
12.1.3 Other missing data and lab results outside the analytical range ......................................................................... 106
12.2 GUIDELINES FOR STATISTICAL ANALYSIS .......................................................................................................................... 107
12.2.1 Precise variances or coefficients of variation ....................................................................................................... 107
12.2.2 Some recommendations for doing analysis with data from cycle 3 of the CHMS ................................................ 107
12.2.3 Data comparability over time ............................................................................................................................... 108
12.2.3.1 Normative scales ................................................................................................................................. 108
12.2.3.2 Activity monitor data for 3 to 5 year olds ............................................................................................ 108
12.2.3.3 Vitamin B12 data ................................................................................................................................. 108
12.2.3.4 Vitamin D data ..................................................................................................................................... 109
12.2.3.5 Ferritin data ......................................................................................................................................... 109
12.2.3.6 Red blood cell folate data .................................................................................................................... 109
12.2.3.7 Limits of detection ............................................................................................................................... 109
12.2.3.8 Significant digits ................................................................................................................................... 109
12.2.4 Combining multiple cycles of CHMS data ............................................................................................................. 110
12.2.5 Software packages available ................................................................................................................................ 110
12.3 GUIDELINES FOR RELEASING DATA ................................................................................................................................. 111
12.3.1 Sample size and coefficient of variation ............................................................................................................... 111
12.3.2 Rounding guidelines ............................................................................................................................................. 111
13. REFERENCES AND END NOTES .............................................................................................................................. 113
APPENDIX 1 - ACRONYMS AND ABBREVIATIONS ........................................................................................................... 116
APPENDIX 2 - LIST OF OTHER CANADIAN HEALTH MEASURES SURVEY (CHMS) DOCUMENTS AVAILABLE ...................... 117
APPENDIX 3 - LIST OF COLLECTION SITES FOR CYCLE 3 ................................................................................................... 119
APPENDIX 4 - PRE-TESTING GUIDELINES ........................................................................................................................ 120
APPENDIX 5 - EXCLUSION CRITERIA ............................................................................................................................... 122
APPENDIX 6 - MEDICATION CLASSIFICATION SYSTEMS .................................................................................................. 125
APPENDIX 7 - RESPONSE RATES ..................................................................................................................................... 126
APPENDIX 7A - CHMS CYCLE 3 FULL SAMPLE RESPONSE RATES BY AGE GROUP AND SEX ................................................................ 126
APPENDIX 7B - CHMS CYCLE 3 ACTIVITY MONITOR RESPONSE RATES BY AGE GROUP AND SEX ........................................................ 128
APPENDIX 7C - CHMS CYCLE 3 BLOOD DRAW AND URINE RESPONSE RATES BY AGE GROUP AND SEX ............................................... 129
APPENDIX 7D - CHMS CYCLE 3 FASTED SUBSAMPLE RESPONSE RATES BY AGE GROUP AND SEX ....................................................... 131
APPENDIX 7E - CHMS CYCLE 3 RED BLOOD CELL FATTY ACIDS SUBSAMPLE RESPONSE RATES BY AGE GROUP AND SEX ......................... 133
APPENDIX 7F - CHMS CYCLE 3 TAP WATER FLUORIDE SUBSAMPLE HOUSEHOLD RESPONSE RATES BY HOUSEHOLD SIZE .......................... 135
APPENDIX 7G - CHMS CYCLE 3 URINE FLUORIDE SUBSAMPLE PERSON RESPONSE RATES BY AGE GROUP AND SEX ................................. 136
APPENDIX 7H - CHMS CYCLE 3 TAP WATER VOCS SUBSAMPLE HOUSEHOLD RESPONSE RATES BY HOUSEHOLD SIZE ............................. 138
APPENDIX 7I - CHMS CYCLE 3 BLOOD VOCS SUBSAMPLE PERSON RESPONSE RATES BY AGE GROUP AND SEX ...................................... 139
APPENDIX 7J - CHMS CYCLE 3 ACRYLAMIDE SUBSAMPLE RESPONSE RATES BY AGE GROUP AND SEX ................................................. 141
APPENDIX 7K - CHMS CYCLE 3 METHYL MERCURY SUBSAMPLE RESPONSE RATES BY AGE GROUP AND SEX ........................................ 143
APPENDIX 7L - CHMS CYCLE 3 URINE ENVIRONMENTAL CONTAMINANTS SUBSAMPLE RESPONSE RATES BY AGE GROUP AND SEX ........... 145
APPENDIX 7M - CHMS CYCLE 3 URINE NNK METABOLITES SUBSAMPLE RESPONSE RATES BY AGE GROUP AND SEX .............................. 147
APPENDIX 8 - ACTIVITY MONITOR RESEARCH ................................................................................................................ 149
APPENDIX 9 – CHANGES TO WAVE 1 VARIABLES............................................................................................................ 150
CHANGES TO THE HOUSEHOLD FULL SAMPLE FILE ..................................................................................................................... 150
Aboriginal status ............................................................................................................................................................. 150
Education ......................................................................................................................................................................... 150
CHANGES TO THE CLINIC FULL SAMPLE FILE .............................................................................................................................. 150
Fasting status .................................................................................................................................................................. 150
APPENDIX 10 – CHANGES TO WAVE 2 VARIABLES .......................................................................................................... 152

Canadian Health Measures Survey (CHMS) Data User Guide: Cycle 3
6
CHANGES TO THE ACTIVITY MONITOR FULL SAMPLE FILE ............................................................................................................. 152
CHANGES TO THE ACTIVITY MONITOR SUBSAMPLE FILE .............................................................................................................. 153
CHANGES TO THE ACTIVITY MONITOR SUBSAMPLE WEIGHT FILE ................................................................................................... 153
CHANGES TO THE ACTIVITY MONITOR DERIVED VARIABLE DOCUMENTATION................................................................................... 153
Canadian Health Measures Survey (CHMS) Data User Guide: Cycle 3
7

Canadian Health Measures Survey (CHMS) Data User Guide: Cycle 3
8
1. Introduction
The Canadian Health Measures Survey (CHMS) is a comprehensive, direct health measures survey,
developed to address important data gaps and limitations in existing health information. It is conducted
by Statistics Canada in partnership with Health Canada (HC) and the Public Health Agency of Canada
(PHAC). The results will provide comprehensive health information to advance health surveillance and
research in Canada.
This document will help users work with and understand data from cycle 3 of the CHMS, which was
obtained through the collection of directly measured indicators of health and wellness from January 2012
to December 2013 on a representative sample of 5,785 Canadians aged 3 to 79 years. The survey
consisted of an in-home general health interview followed by a visit to a mobile examination centre
(MEC), sometimes referred to as a mobile clinic. Reference laboratories and the MEC laboratory
analyzed biological specimens for indicators of general health, chronic disease, infectious disease,
nutritional status and environmental biomarkers. Indoor air samples were also taken from the home to
measure for a number of airborne substances. Tap water samples were taken from randomly-selected
households for the purpose of detecting the presence of volatile organic compounds (VOCs) and fluoride.
This document also provides data users with information on the complexity of the data and any
limitations that could have an impact on their use. It explains the methods and concepts used to collect
the data at the household and the MEC. Subsequent sections of the document contain information about
data processing and the creation of derived variables1. Content regarding sampling and weighting
methodology, and guidelines for the creation of tabulations have also been included to assist the data
user. Quality assurance and quality control information is provided to describe characteristics of the data
which might limit their usefulness or interpretation. The document concludes with a series of appendices
which provide supporting information that will be helpful to users of the CHMS data files.

Canadian Health Measures Survey (CHMS) Data User Guide: Cycle 3
9
2. Important notes related to this document
2.1 Acronyms and abbreviations
Throughout this document, acronyms and abbreviations for terms associated with the Canadian Health
Measures Survey (CHMS) are spelled out the first time they appear in a chapter, with the
acronym/abbreviation put in brackets immediately afterwards. The next time that term appears in the
chapter, only the acronym/abbreviation is used. A full list of these acronyms and abbreviations can be
found in Appendix 1.
2.2 References and end notes
Background information such as references for research articles, definitions and procedural information
is cited frequently throughout this document so that the user can find additional information related to the
text. When this occurs, a small superscript number is put at the end of the text and users can consult the
corresponding number in Chapter 13 – References and end notes, for additional information.
2.3 Survey documentation
Extensive documentation on the CHMS is available to all data users and the general public on the
Statistics Canada website. A description of the CHMS, basic methodological information, links to the
household and mobile examination centre (MEC) questionnaires and the CHMS bibliography can be
accessed through the following link:
http://www23.statcan.gc.ca:81/imdb/p2SV.pl?Function=getSurvey&SDDS=5071&lang=en&db=imdb&a
dm=8&dis=2
In addition, Appendix 2 provides a list of documents that are available upon request. References to the
documents in this list are made throughout the User Guide in order to help users identify which
documents are related to a particular topic.
Chapters of significant importance in this User Guide are Chapter 11- File usage, which outlines when
each data file and its corresponding documentation are released as well as describes how to work with the
data files, and Chapter 12 – Guidelines for tabulation, analysis and release.
Users wanting to obtain copies of the documents in the list or to obtain further information about the
survey can contact Statistics Canada’s Statistical Information Service (toll-free 1-800-263-1136; 514-
283-8300; infostats@statcan.gc.ca; teletypewriter (TTY) 1-800-363-7629).

Canadian Health Measures Survey (CHMS) Data User Guide: Cycle 3
10
2.4 Updates to CHMS documentation
2.4.1 User guide
There are expected to be five different versions of the User Guide, corresponding to the five main data
release dates. Version 1, was released on October 29th, 2014, version 2 was initially released on
December 16th, 2014, and an update version was released on January 29th, 2015, version 3 was released
on April 15th, 2015, the current version, version 4 was released on July 15th, 2015, and the final version,
Version 5 is scheduled to be released on September 16th, 2015. In order to keep track of content changes
amongst the different versions, a summary of the type of information changed and location where the
change was made will be provided in a table below. Version 5 is expected to be the final version of the
cycle 3 User Guide. If this is not the case, more information will be provided here as it becomes
available.
Type of
Change
Section#
Content Description
Version#
(where
change first
appears)
Changed
content in
section
2.4.1 – User guide
Updated information in order to reflect
the fact that the current version of the
User Guide is Version 4.
4
Added section
2.4.2 – Data files
Describes updates made to CHMS
data files and refers to more detailed
information in Appendix 9.
2
Added section
6.3.4 – Activity
monitor subsamples
Provides information on the activity
monitor subsamples.
2
Added section
6.3.5 – Blood and
urine subsamples
Provides general information on blood
and urine subsamples.
2
Added section
6.3.5.1 – Fasted
subsampling
Provides information on the fasted
subsample.
2
Added section
6.3.5.2 – Red blood
cell fatty acids
subsample
Provides information on the red blood
cell fatty acids subsample.
2
Added section
6.3.5.3 – Urine
fluoride subsample
Provides information on the urine
fluoride subsample.
3
Added section
6.3.5.4 – Blood
volatile organic
compounds (VOCs)
subsample
Provides information on the blood
volatile organic (VOCs) subsample.
3
Added section
6.3.5.5 – Blood
acrylamide subsample
Provides information on the blood
acrylamide subsample
4
Added section
6.3.5.6 – Blood
methyl mercury
subsample
Provides information on the blood
methyl mercury subsample
4
Added section
6.3.5.7 – Urine
environmental
contaminants
subsample
Provides information on the urine
environmental contaminants
subsample
4
Added section
6.3.5.8 – Urine NNK
Provides information on the urine
4

Canadian Health Measures Survey (CHMS) Data User Guide: Cycle 3
11
metabolites subsample
NNK metabolites subsample
Added section
6.3.6 – Tap water
household subsamples
Provides information on the tap water
household subsamples.
3
Changed
content in
section
7.4.5 – Grip strength
Removed information regarding
screen-outs as this information is
provided in Appendix 5.
3
Changed
content in
section
7.4.6 – Hearing
Added information pertaining to
hearing testing eligibility.
3
Removed
content in
section
7.4.6.1 - Otoscopy
Removed information regarding
screen-outs as this information is
provided in 7.4.6.
3
Removed
content in
section
7.4.6.4 – Audiometry
Removed the reference to audiometry
being used to monitor changes in an
individual’s hearing over time as this
function of audiometry is not
applicable to the CHMS.
3
Added content
7.4.7 – Activity
monitor
Added information to indicate that
activity monitors not only provide
information on levels of physical
activity but on sedentary behaviours as
well.
2
Applied
corrections to
content in
section
7.4.8 – Tap water
Corrected information regarding the
objective of the measure and the
laboratory used to analyse the data.
3
Changed
content in
section
7.5.1.1 – Blood
collection
Updated the list of volume of blood
collected from respondents based on
their age.
2
Added content
8.6 – Analytical range
Provided more details in the
description of the analytical range
4
Added section
9.11.1 – Weighting
for activity monitor
data
Describes how data was weighted for
activity monitor data.
2
Added section
9.11.2 – Weighting
for blood and urine
data
Introduces weighting for blood and
urine data.
2
Added section
9.11.2.1 – Weighting
for the fasted
subsample
Describes how data was weighted for
the fasted subsample.
2
Added section
9.11.2.2 – Weighting
for the red blood cell
fatty acids subsample
Describes how data was weighted for
the red blood cell fatty acids
subsample.
2
Added section
9.11.2.3 – Weighting
for the urine fluoride
subsample
Describes how data was weighted for
the urine fluoride subsample.
3
Added section
9.11.2.4 – Weighting
for the blood volatile
organic compounds
Describes how data was weighted for
the blood volatile organic compounds
(VOCs) subsample.
3

Canadian Health Measures Survey (CHMS) Data User Guide: Cycle 3
12
(VOCs) subsample
Added section
9.11.2.5 – Weighting
for the acrylamide
subsample
Describes how data was weighted for
the acrylamide subsample.
4
Added section
9.11.2.6 – Weighting
for the methyl
mercury subsample
Describes how data was weighted for
the methyl mercury subsample.
4
Added section
9.11.2.7 – Weighting
for the urine
environmental
contaminants
subsample
Describes how data was weighted for
the urine environmental contaminants
subsample.
4
Added section
9.11.2.8 – Weighting
for the NNK
metabolites subsample
Describes how data was weighted for
the NNK metabolites subsample.
4
Added section
9.11.3.1 – Weighting
for the tap water
fluoride subsample
(household-level
weights)
Describes how data was weighted for
the tap water fluoride subsample
(household-level weights).
3
Added section
9.11.3.2 – Weighting
for the tap water
VOCs subsample
(household-level
weights)
Describes how data was weighted for
the tap water VOCs subsample
(household-level weights)
3
Added section
10.1.2 – Activity
monitor response rates
Provides a description of how activity
monitor response rates were calculated
and refers to a table of the rates in
Appendix 7B.
2
Applied
corrections to
content in
section
10.1.2 – Activity
monitor response rates
Adjusted the number of respondents
with the appropriate number of days of
valid entries to be included in the AM
subsample file to reflect the
corrections made to the wave 2
release.
2 (Revised)
Added section
10.1.3 – Blood draw
and urine response
rates
Provides a description of how blood
draw and urine response rates were
calculated and refers to a table of the
rates in Appendix 7C.
2
Added section
10.1.4 – Response
rates for blood and
urine subsamples
Introduces response rates for blood
and urine subsamples.
2
Added section
10.1.4.1 – Fasted
subsample response
rates
Provides a description of how fasted
subsample response rates were
calculated and refers to a table of the
rates in Appendix 7D.
2
Added section
10.1.4.2 – Red blood
Provides a description of how red blood
2

Canadian Health Measures Survey (CHMS) Data User Guide: Cycle 3
13
cell fatty acids
subsample response
rates
cell fatty acids subsample response rates
were calculated and refers to a table of
the rates in Appendix 7E.
Added section
10.1.4.3 – Acrylamide
subsample response
rates
Provides a description of how
acrylamide subsample response rates
were calculated and refers to a table of
the rates in Appendix 7J.
4
Added section
10.1.4.4 – Methyl
mercury subsample
response rates
Provides a decription of how methyl
mercury subsample response rates
were calculated and refers to a table of
the rates in 7K.
4
Added section
10.1.4.5 - Urine
environmental
contaminants
subsample response
rates
Provides a description of how urine
environmental contaminants
subsample response rates are
calculated and refers to a table of the
rates in Appendix 7L.
4
Added section
10.1.4.6 – NNK
metabolites subsample
response rates
Provides a description of how NNK
metabolites subsample response rates
are calculated and refers to a table of
the rates in Appendix 7M.
4
Added section
10.1.5.1 – Tap water
fluoride subsample
household response
rate
Provides a description of how tap
water fluoride subsample household
response rates were calculated and
refers to a table of the rates in
Appendix 7F.
3
Added section
10.1.5.2 – Urine
fluoride subsample
person response rate
Provides a description of how urine
fluoride subsample person response
rates were calculated and refers to a
table of the rates in Appendix 7G.
3
Added section
10.1.6.1 – Tap water
VOCs subsample
household response
rates
Provides a description of how tap
water VOCs subsample household
response rates were calculated and
refers to a table of the rates in
Appendix 7H.
3
Added section
10.1.6.2 – Tap water
VOCs subsample
person response rates
Provides a description of how tap
water VOCs subsample person
response rates were calculated and
refers to a table of the rates in
Appendix 7I.
3
Added section
10.3.3.10 – Activity
monitor data review
Describes the activity monitor data
review process.
2
Added section
10.3.3.11 – Replicate
testing; 10.3.3.11.1 –
Anthropometry
replicate testing
Describes the anthropometry replicate
testing procedures.
2
Added section
10.3.3.11 – Replicate
testing; 10.3.3.11.2 –
Laboratory replicate
testing
Describes the laboratory replicate
testing procedures.
2

Canadian Health Measures Survey (CHMS) Data User Guide: Cycle 3
14
Added section
10.3.3.12 – Mobile
examination centre
(MEC) laboratory
Describes the procedures put into
place in order to quickly detect errors
related to the MEC laboratory CBC
analysis.
2
Added section
10.3.3.13 –
Proficiency testing
Describes the quality control
requirements/procedures for all CHMS
reference laboratories.
2
Added section
10.3.3.14 – Processing
and storage of blood
and urine samples
Describes the processing and storage
procedures followed for blood and
urine samples collected at the MEC.
2
Added section
10.3.3.15 – Shipping
Comments on the biological sample
shipping procedures followed at the
MEC.
2
Added section
10.3.3.16 – Field
blanks
Describes the field blank testing
performed at the MEC to ensure that
urine and blood samples were not
being contaminated by the MEC
laboratory environment and processes.
2
Added section
10.3.3.17 – Tap water
blanks
Introduces tap water blank testing.
3
Added section
10.3.3.17.1 – Tap
water travel blanks
Describes the tap water travel blank
testing performed to ensure that
shipping and storage conditions were
not a source of contamination for the
tap water VOC bottles.
3
Added section
10.3.3.17.2 – Tap
water blind blanks
Describes the tap water blind blank
testing performed to ensure that
shipping and storage conditions were
not a source of contamination for the
tap water VOC bottles.
3
Added section
10.3.3.18 – Hearing
data review
Describes the hearing data review
process.
3
Added section
10.3.4.2 – Red blood
cell folate data
Describes the limitations of the red
blood cell folate data.
2
Applied
corrections to
content in
section
11.1 – Description of
data files
Updated the information to reflect a
name change to one of the files –
NNAL and glucuronides
(environmental urine subsample) to
NNK metabolites (environmental
urine subsample).
4
Changed
content in
section
11.1.1 – Household
full sample file
Updated the information to include the
release of revised data files and to
reflect new release dates.
3
Changed
content in
section
11.1.2 – Clinic full
sample file
Updated the information to include the
release of revised data files and to
reflect new release dates
3
Added section
11.1.5 – Activity
monitor subsample
Provides the exact number of records
in file (4,271) and information on
2

Canadian Health Measures Survey (CHMS) Data User Guide: Cycle 3
15
file
variable naming.
Added section
11.1.6 – Non-
environmental lab full
sample file
Provides the exact number of records
in file (5,785) and information on the
number and type of lab measures.
2
Added section
11.1.7 – Fasted
subsample file
Provides the exact number of records
in file (2,571) and information on the
respondent characteristics and
variables specific to this subsample.
2
Added section
11.1.8 – Red blood
cell fatty acids
subsample file
Provides the exact number of records
in file (1,984) and information on the
respondent characteristics and
variables specific to this subsample.
2
Added section
11.1.9 – Hearing full
sample file
Provides the exact number of records
in file (5,785) and information on the
respondent characteristics and
variables specific to this subsample.
3
Added section
11.1.10 – Fluoride
household level
subsample file (in tap
water)
Provides the exact number of records
in file (2,188) and information on the
respondent characteristics and
variables specific to this subsample.
3
Added section
11.1.11 – Volatile
organic compounds
household level
subsample file (in tap
water)
Provides the exact number of records
in file (2,650) and information on the
respondent characteristics and
variables specific to this subsample.
3
Added section
11.1.12 – Fluoride
person level
subsample file (in
urine and tap water)
Provides the exact number of records
in file (2,671) and information on the
respondent characteristics and
variables specific to this subsample.
3
Added section
11.1.13 – Volatile
organic compounds
person level
subsample file (in
blood and tap water)
Provides the exact number of records
in file (2,527) and information on the
respondent characteristics and
variables specific to this subsample.
3
Added section
12.2.3.2 – Activity
monitor data for 3 to 5
year olds
Comments on comparability of
activity monitor data for 3 to 5 year
olds between cycles 2 and 3 of the
CHMS.
2
Added section
12.2.3.3 – Vitamin
B12 data
Comments on comparability of
vitamin B12 data between cycle 3 and
previous cycles of the CHMS.
2
Added section
12.2.3.4 – Vitamin D
data
Comments on comparability of
vitamin D data between cycle 3 and
previous cycles of the CHMS.
2
Added section
12.2.3.5 – Ferritin
data
Comments on comparability of ferritin
data between cycle 3 and previous
cycles of the CHMS.
2
Added section
12.2.3.6 – Red blood
cell folate data
Comments on comparability of red
blood cell folate data between cycle 3
2

Canadian Health Measures Survey (CHMS) Data User Guide: Cycle 3
16
and previous cycles of the CHMS.
Added section
12.2.3.7 – Limits of
detection
Comments on the differences in the
limits of detection between cycles.
2
Added content
12.2.3.8 – Significant
digits
Added details regarding rounding and
displaying results in significant digits.
4
Added content
12.3.2 – Rounding
guidelines
Added details regarding the
calculation of estimates for
environmental lab data (except indoor
air)
4
Added content
13 – References and
end notes
Added references related to
environmental lab data
4
Applied
corrections to
content in
appendix
Appendix 5 –
Exclusion criteria
Applied corrections to the screen-outs
for blood pressure, activity monitor
and hearing.
3
Added appendix
Appendix 7B –
CHMS Cycle 3
Activity Monitor
Response Rates by
age group and sex
CHMS cycle 3 activity monitor (AM)
response rates by age group and sex.
2
Applied
corrections to
content in
appendix
Appendix 7B –
CHMS Cycle 3
Activity Monitor
Response Rates by
age group and sex
Adjusted the response rates to reflect
the corrections made to the wave 2
release.
2 (Revised)
Added appendix
Appendix 7C –
CHMS Cycle 3 Blood
Draw and Urine
Response Rates by
age group and sex
CHMS cycle 3 blood draw and urine
response rates by age group and sex.
2
Applied
corrections to
content in
appendix
Appendix 7C –
CHMS Cycle 3 Blood
Draw and Urine
Response Rates by
age group and sex
Corrected response rates.
2 (Revised)
Added appendix
Appendix 7D –
CHMS Cycle 3 Fasted
Subsample Response
Rates by age group
and sex
CHMS cycle 3 fasted subsample
response rates by age group and sex.
2
Applied
corrections to
content in
appendix
Appendix 7D –
CHMS Cycle 3 Fasted
Subsample Response
Rates by age group
and sex
Corrected response rates.
2 (Revised)
Added appendix
Appendix 7E –
CHMS Cycle 3 Red
Blood Cell Fatty
Acids Subsample
CHMS cycle 3 red blood cell fatty
acids subsample response rates by age
group and sex.
2

Canadian Health Measures Survey (CHMS) Data User Guide: Cycle 3
17
Response Rates by
age group and sex
Added appendix
Appendix 7F – CHMS
Cycle 3 Tap Water
Fluoride Subsample
Household Response
Rates by household
size
CHMS cycle 3 tap water fluoride
subsample Household response rates
by household size.
3
Added appendix
Appendix 7G –
CHMS Cycle 3 Urine
Fluoride Subsample
Person Response
Rates by age group
and sex
CHMS cycle 3 urine fluoride
subsample person response rates by
age group and sex.
3
Added appendix
Appendix 7H –
CHMS Cycle 3 Tap
Water VOCs
Subsample Household
Response Rates by
household size
CHMS cycle 3 tap water VOCs
subsample household response rates
by household size.
3
Added appendix
Appendix 7I – CHMS
Cycle 3 Blood VOCs
Subsample Person
Response Rates by
age group and sex
CHMS cycle 3 blood VOCs
subsample person response rates by
age group and sex.
3
Added appendix
Appendix 7J – CHMS
Cycle 3 Acrylamide
subsample response
rates by age group and
sex
CHMS Cycle 3 acrylamide subsample
response rates by age group and sex
4
Added appendix
Appendix 7K –
CHMS Cycle 3
Methyl Mercury
subsample Response
Rates by age group
and sex
CHMS Cycle 3 methyl mercury
ssubsample response rates by age
group and sex.
4
Added appendix
Appendix 7L –
CHMS Cycle 3 Urine
Environmental
Contaminants
subsample response
rates by age group and
sex
CMHS Cycle 3 urine environmental
contaminants subsample response
rates by age group and sex
4
Added appendix
Appendix 7M –
CHMS Cycle 3 Urine
NNK metabolites
subsample response
rates by age group and
CHMS Cycle 3 urine NNK
metabolites subsample response rates
by age group and sex
4

Canadian Health Measures Survey (CHMS) Data User Guide: Cycle 3
18
sex
Added content
Appendix 8 – Activity
Monitor Research
Updated information to reflect most
recent research regarding physical
activity data collection in preschool
aged children and how this has led to
the collection of activity monitor data
in 15 second epochs rather than 60
second epochs for 3 to 5 year olds in
cycle 3.
4
Added appendix
Appendix 9 –
Changes to wave 1
variables
Lists the changes that were made to
the variables on the household and
clinic full sample files between the
cycle 3 wave 1 release (Oct 29, 2014)
and the wave 2 release (Dec 16, 2014)
2
Added appendix
Appendix 10 –
Changes to wave 2
variables
Lists the changes that were made to
the variables on the activity monitor
full sample and activity monitor
subsample files between the cycle 3
wave 2 release (Dec 16, 2014) and the
corrected wave 2 release (Jan 29,
2015).
2 (Revised)
Canadian Health Measures Survey (CHMS) Data User Guide: Cycle 3
19
2.4.2 Data files
Some errors were discovered in the wave 1 household full sample file as well as the clinic full sample file
released on October 29th, 2014. These errors were corrected in the updated files released on December
16th, 2014. Documentation of the changes made to the wave 1 variables to address the errors can be
found in Appendix 9.
Some errors were discovered in the wave 2 activity monitor full sample file as well as the activity
monitor subsample file released on December 16th, 2014. These errors were corrected in the updated files
released on January 29th, 2015. Documentation of the changes made to the wave 2 variables to address
the errors can be found in Appendix 10.
Only the most recent household and clinic full sample files and their corresponding data dictionaries
should be used.
Canadian Health Measures Survey (CHMS) Data User Guide: Cycle 3
20
3. Canadian Health Measures Survey (CHMS) background and
objectives
3.1 CHMS background
Policy makers, researchers and health professionals from many fields have expressed a need for an on-
going national and comprehensive source of accurate health measures to assist them in addressing the
health needs of all Canadians.
In 2003, Health Canada (HC) and the Public Health Agency of Canada (PHAC) supported Statistics
Canada in obtaining funding for a direct measures health survey to address longstanding limitations
within Canada’s health information system. This support was announced in the 2003 Budget as part of an
extension of the Health Information Roadmap Initiative and permanent funding was secured in the 2008
Budget.
Collection for cycle 1 of the survey took place from March 2007 to February 2009, with dissemination of
the main results occurring from January 2010 until April 2011.Collection for cycle 2 of the survey took
place from August 2009 to November 2011, with dissemination of the main results occurring from
September 2012 until April 2013. Cycle 3 collection occurred from January 2012 until December 2013.
The main changes between the cycles 2 and 3 are summarized in Chapter 5.
The information collected will create national baseline data on the extent of such major health concerns
as obesity, hypertension, cardiovascular disease, exposure to infectious diseases, and exposure to
environmental contaminants. In addition, the survey will provide indications about illness and the extent
to which many diseases may be undiagnosed among Canadians. Data from the CHMS will enable us to
determine relationships between health status and risk factors, and to explore emerging public health
issues.
3.2 CHMS objectives
The main objectives of the CHMS are to:
• explore emerging public health issues and new measurement technologies
• establish national baseline data on major health concerns
• determine relationships among risk factors, protection practices and health status
• assess the validity of self- and proxy-reported information
• assemble a nationally representative sample for storage in a biobank

Canadian Health Measures Survey (CHMS) Data User Guide: Cycle 3
21
4. Survey approval
4.1 Authority
The 2008 Budget provided on-going funding for the Canadian Health Measures Survey (CHMS) to be
conducted by Statistics Canada in partnership with Health Canada (HC) and the Public Health Agency of
Canada (PHAC).
The survey falls under the authority of the federal Statistics Act. Statistics Canada may only collect
health information for statistical research purposes and may not use or disclose individual participant
information for any other purpose without the written consent of participants.
4.2 Ethical protocols and privacy standards
The CHMS was conducted in cooperation with provincial and municipal officials, with the support of
health professional associations, and with the highest regard to Canadians’ health and safety.
All processes of the CHMS were reviewed and approved by the HC and PHAC Research Ethics Board to
ensure that internationally recognized ethical standards for human research were met and maintained. In
addition, protocols were developed through extensive consultation with recognized experts and were
performed by accredited health professionals in conformance with universal precautions.
Several meetings were also held with the Office of the Privacy Commissioner of Canada and with
provincial privacy commissioners regarding CHMS protocols to ensure that participants’ privacy rights
were protected. A full Privacy Impact Assessment (PIA) was completed for the CHMS and reviewed
through the Office of the Privacy Commissioner of Canada—the authority that continues to provide
oversight to the CHMS as well as a complaint route and redress mechanism for CHMS participants. This
assessment is updated regularly to reflect any changes in the CHMS.
Participation in this survey was voluntary. The voluntary nature of the survey was stated in the
introductory letter, brochure, video, Information and Consent Booklet, and on the Statistics Canada
website (www.statcan.gc.ca\chms). The documents also emphasized the safety and standards used in all
tests. CHMS staff answered any questions respondents had regarding the risks of participating in the tests
and the use of their data in an interactive consent process throughout the household health interview and
the visit to the mobile examination centre.
Canadian Health Measures Survey (CHMS) Data User Guide: Cycle 3
22
5. Survey content
Consultation on proposed content, data requirements and operational considerations has been on-going
with many groups, individuals and agencies such as Health Canada (HC), the Public Health Agency of
Canada (PHAC), and several internal and external expert advisory groups and committees.
Cycle 3 was made up of a household interview and a visit to a mobile examination centre (MEC). The
household interview included general demographic information and an in-depth health questionnaire. The
MEC visit included not only physical measure tests but also the collection of blood and urine samples
from respondents. Some samples were analyzed in a laboratory at the MEC, such as the complete blood
count (CBC), which includes platelets, red blood cell count and white blood cell count. The remaining
samples were analyzed at seven external reference laboratories. Respondents were also asked to wear an
activity monitor and to place an indoor air sampler in their home for the seven days following their visit
to the MEC.
The CHMS aims to keep content fairly consistent between a pair of cycles to allow for more
opportunities to combine the data, providing a larger sample size to work with and more precise
estimates for small prevalence. As such, the content for cycles 1 and 2 is quite similar and the content for
cycles 3 and 4 is quite similar. More significant changes were made to the survey content between cycles
2 and 3 in order to obtain data on some new measures of public health interest.
The main changes between cycle 2 and 3 were the withdrawal of several physical fitness tests (sit and
reach, partial curl-ups and mCAFT), the addition of tap water sampling at the household interview and
the addition of questionnaires on sun exposure, noise exposure and hearing ability as well as physical
measure skin pigmentation, fractional exhaled nitric oxide (FENO) and hearing tests at the mobile
examination center.
Tap water samples were collected to test for the presence of volatile organic compounds (VOCs) and
fluoride. Skin pigmentation was measured using a colormeter and results will be used to evaluate the
relationship between skin pigmentation, sun exposure and vitamin D status. Respondents were asked to
blow into a FENO sensor to measure the concentration of exhaled nitric oxide which is a direct measure
of airway inflammation, a factor in the causal pathway of asthma and other possible lung diseases. They
were also asked to participate in a series of hearing tests (audiometry, otoacoustic emissions, otoscopy
and tympanometry) to evaluate hearing acuity.
Other changes to the survey between the two cycles included the removal of the weight change, housing
characteristics, health utility index, physical activities and maternal breastfeeding questions, the addition
of the international physical activity and time spent outdoors questions as well as the removal of skinfold
and neck circumference measurements. There were also a large number of new and changed laboratory
measures, particularly in relation to cardiovascular health markers and environmental exposures.
A content summary document for cycles 1 to 8 of the CHMS is available upon request.

Canadian Health Measures Survey (CHMS) Data User Guide: Cycle 3
23
6. Sample design
6.1 Target population
The CHMS covers the population 3 to 79 years of age living in the ten provinces. Excluded from the
survey's coverage are: persons living in the three territories; persons living on reserves and other
Aboriginal settlements in the provinces; full-time members of the Canadian Forces; the institutionalized
population and residents of certain remote regions. Altogether these exclusions represent approximately
4% of the target population.
6.2 Sample size and allocation
To produce reliable estimates at the national level by age group and sex, it was determined that this
survey must be carried out on a sample of at least 5,700 persons over a two-year period to allow
estimates for the following 11 groups: ages 3 to 5 (both sexes combined), ages 6 to 11 (males and
females), 12 to 19 (males and females), 20 to 39 (males and females), 40 to 59 (males and females) and
60 to 79 (males and females).
6.3 Sampling frames and sampling strategy
To meet the requirements of the CHMS, a multistage sampling strategy was used. An overview of the
sampling strategy is provided below; for further information about the sampling strategy refer to Labrecque
and Quigley (2014)2.
6.3.1 Sampling of collection sites
The sample of dwellings is selected within collection sites in such a way that respondents are able to
travel to the MEC within a reasonable period of time. A collection site is a geographic area with a
population of at least 10,000 and a maximum respondent travel distance of 50 kilometres in urban areas
and 75 kilometres in rural areas. Areas not meeting these criteria were excluded. Using Census
geography, 360 collection sites were created. The geographic units used to define the sites were also
grouped with respect to provincial boundaries, census metropolitan-area boundaries, health regions and
population density criteria.
Although only national estimates were required, the collection sites were stratified into five regions to
ensure that the allocation of the sample was spread across the country. The regions identified, based on
Statistics Canada’s standard regional boundaries, were British Columbia, the Prairies (Alberta, Manitoba
and Saskatchewan), Ontario, Quebec and the Atlantic provinces (Newfoundland and Labrador, Prince
Edward Island, Nova Scotia and New Brunswick).
A large number of collection sites (with few respondents) would be the recommended sampling strategy
because it would help to optimize the precision of the estimates. However, the logistical and cost
constraints associated with the use of a MEC restricted the number of collection sites to 16. The number
of sites selected by region is provided in Table 6.1.
Canadian Health Measures Survey (CHMS) Data User Guide: Cycle 3
24
Table 6.1 Selection of collection sites for the CHMS, by region – Cycle 3
Region Estimated target population,
ages 3 to 79, 2011 Census Number of
sites in region Number of
sites allocated
Atlantic
2,162,905
56
2
Quebec
7,305,955
75
4
Ontario 11,917,605 90 6
Prairies
5,439,415
92
2
British Columbia
4,079,435
47
2
Total
30,905,315
360
16
Within each region, the collection sites were sorted according to whether they belonged to a census
metropolitan area (CMA), and then by the size of the population before the selection took place. A CMA
is an area consisting of one or more adjacent municipalities centering on a large urban area (known as an
urban core). The urban core must have a population of at least 100,000 to form a CMA. In the Atlantic
and Prairies regions, the sites were first sorted by province, then CMA and finally size of the population.
The collection sites were then sampled systematically with a probability of selection proportional to the
size of their population. While not every province would have a collection site, the CHMS sites were
chosen to represent the Canadian population, east to west, with larger and smaller population densities.
Data collection at the 16 sites was carried out sequentially over two years. The sites were ordered to take
into account seasonality and the temporal effect, subject to operational and logistical constraints. The
temporal effect was corrected by distributing uniformly the number of sites per region between the first
and the second year.
The specific collection sites by city/municipality are listed in Appendix 3. Note that as each cycle of the
CHMS was designed to produce national estimates only, it is not recommended to do analysis at lower
geographic levels for a single survey cycle as it could result in either extreme sampling variability or
unstable estimates of the sampling variability.
6.3.2 Dwelling sampling
Several options were examined to determine how best to obtain the required number of participants by
age group. The option chosen used the 2011 Census as a sampling frame. The household composition of
dwellings as of May 2011 was available and could be used to develop a design to meet the sample
requirements for each age group. Prior to selecting the sample, the household composition from the
Census was updated with more recent information from administrative files. To reduce under-coverage,
new dwellings constructed since the 2011 Census or dwellings that were missed were added to the frame
from the Address Register, a list of dwelling addresses across Canada compiled by Statistics Canada.

Canadian Health Measures Survey (CHMS) Data User Guide: Cycle 3
25
Within each collection site, dwellings with known household composition at the time of sample selection
were stratified by the occupants’ age at the time of the survey. Age was determined based on the starting
date of data collection at each site. Six age-group strata3 were created, corresponding to the six CHMS
age groups (3 to 5, 6 to 11, 12 to 19, 20 to 39, 40 to 59 and 60 to 79 years) as follows:
• 3 to 5 stratum dwellings where at least one 3-to-5-year-old is present, else,
• 6 to 11 stratum: dwellings where at least one 6-to-11-year-old is present, else,
• 12 to 19 stratum: dwellings where at least one 12-to-19-year-old is present, else,
• 60 to 79 stratum: dwellings where at least one 60-to-79-year-old is present, else,
• 20 to 39 stratum: dwellings where at least one 20-to-39-year-old is present, else,
• 40 to 59 stratum: dwellings where at least one 40-to-59-year-old is present, else,
• “Other” stratum: dwellings not included in the above-mentioned strata, such as vacant dwellings
at the time of sampling or dwellings with people outside the CHMS age ranges based on
household composition at the time of sampling.
Each stratum had a high probability of having dwellings inhabited by persons in the desired age groups,
whether they were the same occupants or were replaced by a similar household. Within each site, a
simple random sample of dwellings was selected in each stratum. The sample size was allocated in each
stratum so that, combined with the strategy for sampling participants in the survey, an equal number of
respondents by age group would be obtained. Each selected dwelling was contacted to draw up a current
list of the members of the household, and this list was then used to select survey respondents.
Table 6.2 shows the distribution of the number of dwellings selected per site. In all, 8,815 dwellings were
selected, with an average of 550 dwellings per site.
Table 6.2 CHMS cycle 3 — Number of dwellings selected per site
Site
Number of
dwellings
1
525
2
520
3
525
4
590
5
563
6
597
7
610
8
520
9
500
10
580
11
530
12
575
13
465
14
585
15
560
16
570
TOTAL
8,815
Canadian Health Measures Survey (CHMS) Data User Guide: Cycle 3
26
6.3.3 Respondent sampling
Different selection probabilities by age group and sex were used to ensure that the sampling targets at the
MEC were attained. This was a modification from cycle 2, when only the age group was used in
assigning person-level selection factors to eligible members of the dwelling. The sampling factors shown
in Table 6.3 were used for the first site in cycle 3. Changes were made to these sampling factors
throughout the cycle to modify the number of people selected by age group and sex. It was necessary to
update the factors to react to how collection was going for each group. The dwellings selected were
contacted to obtain a list of current household members. In each dwelling, one or two people were
selected, depending on the household composition. Two people were selected from households with
children aged 3 to 11: one child randomly selected from those aged 3 to 11 and a second person aged 12
to 79. If no 3 to 11 year olds were living in the household, only one person was selected from the
household members aged 12 to 79. The sampling factors for the selection of people aged 12 to 79 were
designed to avoid large person-sampling weights. Since some age groups have a weight that is up to 7.5
times higher than that of other age groups, it is possible that a selected person would have a very high
sampling weight when there are many household members in a dwelling. Therefore when a specified
minimum number of people aged 12 to 79 are living in a household, the weight for each person is reset to
1. In such cases, each household member has an equal chance of being selected. A careful balance of the
parameters required for the respondent sampling strategy was obtained through studies and simulations.
Table 6.3 CHMS cycle 3 – Selection weight multiplicative factors for the person-level sampling
strategy, by sex and age group
Age group
Sex
3 to 5
6 to 11
12 to 19
20 to 39
40 to 59
60 to 79
Male
4.00
1.60
5.70
1.30
0.90
4.75
Female
4.00
1.60
6.00
0.80
0.85
4.25
6.3.4 Activity monitor subsample
Separate subsample data and weight files were created for the activity monitor data. This is not a true
subsample as respondents were not selected to participate in the measurements. All respondents were
given an activity monitor to wear for 7 days. The activity monitor data is released as a subsample file as
analysis could only be performed on the records1 where there was a minimum of 4 valid days of data
entries (3 valid days for youths 3 to 5 years old). Due to the high volume of non-response meeting this
criterion, a separate weight was created for the valid observations (see Section 9.11.1). Creating a weight
for the subsample corrects for potential bias due to differences between respondents who had valid data
and those that did not.
Canadian Health Measures Survey (CHMS) Data User Guide: Cycle 3
27
6.3.5 Blood and urine subsamples
Subsamples of the survey respondents are selected for different laboratory tests on the blood and urine
specimens collected. As some blood lipid tests require that the respondents fast, approximately half of the
respondents are asked to fast prior to their MEC appointment and are usually scheduled to attend the
MEC in the morning. Some environmental chemicals are also measured on subsamples of survey
respondents due to the high cost of performing these tests on the entire sample. All of the blood and urine
subsamples were selected independently; that is, without consideration of who was selected for the other
subsamples. This means that a specific respondent can be selected for any number of subsamples. The
CHMS content summary document indicates which tests have been done on each subsample.
6.3.5.1 Fasted subsampling
Each sampled dwelling was randomly flagged to indicate whether a respondent should fast prior to the
MEC appointment. It required that respondents fast for at least 10 hours, whereas shorter eating
restrictions were imposed on those with non-fasted appointments. Pregnant women, people with diabetes,
youth less than 6 years old and other special cases were not asked to fast, even if the dwelling was
flagged to be fasted. This random allocation reduced the potential for bias, which could occur if
respondents were given the option to fast. During collection, the sampling rates were adjusted to obtain
approximately half of the sample where respondents were selected to fast and were actually fasted prior
to the MEC appointment.
6.3.5.2 Red blood cell fatty acids subsample
Respondents aged 20 to 79 attending the MEC were randomly selected to be included or excluded from
the fatty acids subsample. The targeted subsample size was 2,000 respondents; 333 respondents by sex
for the following age groups: 20 to 39, 40 to 59 and 60 to 79.
6.3.5.3 Urine fluoride subsample
Respondents aged 3 to 79 attending the MEC were randomly selected to be included or excluded from
the urine fluoride subsample. The selection of each respondent was done based on age, sex and the
number of persons selected from the household to participate in the CHMS. A MEC respondent could be
selected for the subsample only if tap water was collected at his dwelling to measure fluoride in tap water
(see section 6.3.6). The targeted subsample sizes were 500 respondents for 3 to 5 year olds, 250
respondents by sex from each of the following age groups: 6 to 11 and 12 to 19 and a total of 1,000
respondents equally distributed by sex and age groups for the following age groups (20 to 39, 40 to 59
and 60 to 79). The goal was to have a total subsample of 2,500 respondents.
6.3.5.4 Blood volatile organic compounds (VOCs) subsample
Respondents aged 12 to 79 attending the MEC were randomly selected to be included or excluded from
the blood VOCs subsample. The selection of each respondent was done based on age, sex and the
number of persons selected from the household to participate in the CHMS. A MEC respondent could be
selected for the subsample only if tap water was collected at his dwelling to measure VOCs in tap water
(see section 6.3.6). The targeted subsample sizes were 375 respondents by sex for the 12 to 19 age group
and a total of 1,750 respondents by sex for the other age groups (20 to 39, 40 to 59 and 60 to 79). The
goal was to have a total subsample of 2,500 respondents.
Canadian Health Measures Survey (CHMS) Data User Guide: Cycle 3
28
6.3.5.5 Blood acrylamide subsample
Respondents aged 3 to 79 attending the MEC were randomly selected to be included or excluded from
the acrylamide subsample. The targeted subsample sizes were 250 respondents by sex for the following
age groups: 3 to 5, 6 to 11, 12 to 19 as well as 500 respondents by sex for the 20 to 79 years old, for a
total of 2,500 respondents.
6.3.5.6 Blood methyl mercury subsample
Respondents aged 20 to 79 attending the MEC were randomly selected to be included or excluded from
the methyl mercury subsample. The targeted subsample size was 1,000 respondents; 500 respondents by
sex for the age group 20 to 79.
6.3.5.7 Urine environmental contaminants subsample
Respondents aged 3 to 79 attending the MEC were randomly selected to be included or excluded from
the urine environmental contaminants subsample. The targeted subsample sizes were 250 respondents by
sex for the following age groups: 3 to 5, 6 to 11, 12 to 19 as well as 500 respondents by sex for the 20 to
79 years old, for a total of 2,500 respondents.
6.3.5.8 Urine NNK metabolites subsample
Respondents aged 12 to 79 attending the MEC were randomly selected to be included or excluded from
the urine NNAL (4-(methylnitrosoamino)-1-(3-pyridyl)-1-butanol) subsample. The selection of each
respondent was done based on age, sex and smoker type (smoker, non-smoker exposed to smoke and non-
smoker non-exposed to smoke). The targeted subsample sizes were 500 respondents by sex for the non-
smokers exposed to smoke, for a total of 1,000 respondents, 250 respondents by sex for the non-smokers
exposed to smoke, for a total of 500 respondents and all smokers were selected for the subsample. The
goal was to have a total of 2,500 respondents for the subsample. Since the number of non-smokers
exposed to smoke was much smaller than expected, all the non-smokers exposed to smoke were included
in the subsample.
6.3.6 Tap water household subsamples
Two subsamples of respondent households were selected for tap water collection to measure the fluoride
and/or the VOCs in tap water. Each of those subsamples are related to the corresponding person-level
subsample for urine fluoride or blood VOCs in the sense that a respondent could only be selected for the
urine fluoride subsample, or blood VOCs subsample if tap water was collected at the dwelling to measure
fluoride, or VOCs, in tap water. The selection of each household, for each subsample, was done based on
the number of persons selected from the household to participate in the CHMS.
All households with a member in the 3 to 5 age group participating in the survey were selected to have
the level of fluoride measured in their tap water. A little over half of the households with a member in the
6 to 11 age group participating in the survey were selected to have the level of fluoride measured in their
tap water. For the other CHMS respondent households having only one person selected to participate in
the CHMS, the probability of selection was set in order to reach the targeted number of respondents for
the urine fluoride subsample (see section 6.3.5.3).
Canadian Health Measures Survey (CHMS) Data User Guide: Cycle 3
29
A little over 60% of the households with two persons selected to participate in the CHMS, were selected
to have the level of VOCs measured in their tap water. For the other CHMS respondent households
having only one person selected for the CHMS, the probability of selection was set in order to reach the
targeted number of respondents for the blood VOCs subsample (see section 6.3.5.4).
Canadian Health Measures Survey (CHMS) Data User Guide: Cycle 3
30
7. Data collection
7.1 Preparation for collection
7.1.1 The Canadian Health Measures Survey (CHMS) team
The CHMS team is a diverse, well-trained, experienced group of individuals. The group can be
subdivided into three sub-teams: field team, mobile examination centre (MEC) team, and head office
staff. Each of these three sub-teams was responsible for specific portions of the survey.
7.1.1.1 Field team
The CHMS field team was comprised of Statistics Canada household interviewers and an interviewer
manager. The household interviewers were primarily responsible for contacting selected households,
conducting the household interview, explaining the MEC portion of the survey to respondents and
attempting to secure their participation at the MEC. The CHMS interviewers were supervised by an
interviewer manager who was responsible for conducting data quality assurance activities for the
household component, overseeing the non-response follow-up and monitoring the household collection
rates.
7.1.1.2 Mobile examination centre (MEC) team
The CHMS MEC team consisted of health professionals responsible for various components of the
physical measures testing and a site manager who oversaw the day-to-day operation of the MEC. The
health measures specialists were responsible for performing the majority of physical measures tests on
respondents (e.g., blood pressure, anthropometry, fitness testing, spirometry). The laboratory
technologists/phlebotomists conducted the specimen collection (blood and urine), performed the
complete blood count (CBC) analysis and processed the biological samples for storage and shipment to
the reference labs. In addition to the health professionals, the MEC team also consisted of administrative
staff who worked at the reception desk and the appointment booking desk, as well as a site logistics
officer who took care of the maintenance of the trailers.
7.1.1.3 Head office staff
The CHMS staff at head office processed data, monitored data collection response rates and data quality,
provided human resource support and conducted periodic site visits to ensure staff were following correct
protocols. In addition, head office staff prepared and mailed the respondent’s report of selected
laboratory tests, and provided information about the survey to respondents, the public and the media.
Finally, a medical advisor followed-up with respondents about critical or sensitive results.
Canadian Health Measures Survey (CHMS) Data User Guide: Cycle 3
31
7.1.2 The mobile examination centre (MEC)
Two sets of trailers were acquired in order to conduct the physical measures and laboratory components
of the CHMS. Each MEC was comprised of two trailers, the administrative trailer and the clinic trailer.
The trailers had several different rooms including a reception area, restrooms, an administrative office, a
fitness testing area, a hearing testing area, a screening area, an anthropometry area, a phlebotomy area
and a laboratory.
Using MECs provided several benefits over a fixed examination centre site (e.g., an examination centre
set up in an office building or hospital). They provided a standardized collection environment (equipment
set up, room size, etc.) that was designed to meet Statistics Canada security and confidentiality policies
as well as the flexibility of locating the MEC near the selected respondents’ homes.
7.1.3 Informatics environment
Computer assisted interviewing (CAI) was used to capture the responses for the household, physical
measure and laboratory components of the CHMS. CAI allowed for custom interviews for every
respondent based on their individual characteristics and survey responses. This included:
• Questions that were not applicable to the respondent were skipped automatically.
• Edits to check for inconsistent answers or out-of-range responses were applied automatically and
on-screen prompts were shown when an invalid entry was recorded. Immediate feedback was
given to the respondent and the interviewer was able to correct any inconsistencies.
• Question text, including reference periods and pronouns, was customised automatically based on
factors such as the age and sex of the respondent, the date of the interview and answers to
previous questions.
In order to perform computerized data capture within the MEC, a unique data capture architecture had to
be developed as there was a requirement for multiple users in different MEC rooms to access a single
respondent’s case file. This required the development of a complex, fully customized data capture
application that used components of the computer assisted telephone interview (CATI) environment.
To reduce data entry errors, increase efficiency of data collection and reduce the need for double entry
and data entry verification, the CHMS MEC data capture system was developed to accept direct input
from other electronic testing equipment. This included communication (both one and two-way) between
the application and the measurement devices (e.g., automated blood pressure cuff, weight scale). In cases
where the direct input was not functioning and manual entry was required, the data were entered twice.
In order to support the electronic capture of physical measures data and to support the operational and
administrative needs, the MEC was equipped with its own computer server. After each session at the
MEC, encrypted data were transmitted from the trailer server via a dedicated out-going phone line to
Statistics Canada headquarters. Encryption software was used to ensure the confidentiality of the data
during transmissions between the MEC and headquarters.

Canadian Health Measures Survey (CHMS) Data User Guide: Cycle 3
32
7.1.4 Questionnaire design
7.1.4.1 Household questionnaire
http://www23.statcan.gc.ca/imdb/p3Instr.pl?Function=getInstrumentList&Item_Id=136650&UL=1V&
The household questionnaire content was developed with input from stakeholders (Health Canada and
the Public Health Agency of Canada) and from external experts who participated as members of various
advisory committees. Much of the cycle 3 household questionnaire was identical to the cycle 2
questionnaire.
Prior to finalizing the questions, one-on-one qualitative test interviews were conducted to look at specific
questionnaire content, particularly the content new to cycle 3. As a result of this testing, improvements
were made to questionnaire wording and instructions and to the flow of questions.
Some of the main modifications to the household questionnaire between cycle 2 and 3 of the survey
included the following:
• Addition of questions on time spent outdoors for 3 to 14 year olds. This information is used to
help assess the physical activity of children, in conjunction with the activity monitor data.
• Replacement of the cycle 2 physical activities questionnaire module with the international
physical activities module, a more widely used and standardized set of questions.
• Cycling out of questions due to changes in physical measure and lab content. This includes the
health utility index and maternal breastfeeding questions.
• Cycling out of questions deemed to be of lower priority related to weight change.
• Increase in age range for strengths and difficulties and human papilloma virus questions in order
to obtain more comprehensive data (from 6-17 to 4-17 for strengths and difficulties and from 9-39
to 9-59 for human papilloma virus)
• Cycling in questions due to new physical measure or lab content. This includes new questions for
chronic conditions, food frequency and water consumption.
• Replacement of selected questions or sets of questions to conform with Statistics Canada
Harmonized Content. This includes socio-demographic topics such as immigration, aboriginal
persons, population group and language as well as education, income and labour force.
7.1.4.2 Clinic questionnaire
http://www23.statcan.gc.ca/imdb/p3Instr.pl?Function=getInstrumentList&Item_Id=136651&UL=1V&
Development of the clinic questionnaire (sometimes referred to as the clinic questionnaire) proceeded in
much the same way as that of the household questionnaire. Content was determined through a
comprehensive consultation process and multiple iterations of the collection application were generated.
Each iteration was assessed on flow within the MEC for the respondent and the staff, and the quantity
and quality of data collected.
The clinic questionnaire consisted of several modules new to cycle 3: tap water, hearing (ability and
noise exposure) and sun exposure. Several modules were repeated from cycle 2: indoor air, fish and
shellfish consumption, medication use as a follow-up to similar questions asked at the household
interview, and screening of respondents for eligibility in physical measures tests (see Appendix 5).
Canadian Health Measures Survey (CHMS) Data User Guide: Cycle 3
33
Grooming product questions were dropped from the survey.
7.1.4.3 Tap Water Questions
The tap water questions are associated to behaviours and habits which can affect the respondent’s
exposure to certain VOCs (volatile organic compounds) as well as their exposure to fluoride. This
information can later be linked to the analysis of tap water samples which are collected at the
respondent’s household.
7.1.4.4 Hearing Questions
The hearing ability and noise exposure questions are asked to evaluate the respondent’s current
perception of their hearing ability and to assess the respondent’s exposure to potentially harmful levels of
noise. This information can later be linked to the results from the quantitative hearing evaluation.
7.1.4.5 Sun Exposure Questions
The sun exposure questions are used to quantify the respondent’s recent exposure to sunlight as well as
evaluate which parts of the body receive the most sun exposure. These questions can be used in
conjunction with the skin pigmentation measures and blood samples to evaluate a possible relationship
between skin pigmentation, sun exposure and levels of blood vitamin D.
7.1.4.6 Indoor Air Questions
The indoor air block was administered verbally to all respondents who took an indoor air sampler (one
per household). Respondents were asked questions about their home environment and housing
characteristics (e.g., presence of garage, parking facilities etc.) and certain behaviours and habits which
would help determine a possible link to indoor volatile compound (VOC) levels. Their answers will help
researchers to better understand the results from the indoor air sampler.
7.1.4.7 Fish and Shellfish Consumption
The fish and shellfish component gathered information on the respondent’s consumption of fish and
shellfish within the previous month and was used to help better understand the respondent’s blood and
urine test results. The fish questions in the component allow for in-depth analysis of sources regarding
possible exposure to biomarkers such as mercury, cadmium, vitamin D and vitamin B12.
7.2 Collection
Cycle 3 data collection took place between January 5, 2012 and December 17, 2013 and included 16
collection sites spread across Canada from Halifax, Nova Scotia to Victoria-Saanich, British Columbia
(see Appendix 3). While one set of trailers was being used for collection, the second set would be moved
to the next location and began the rigorous set of procedures required to prepare for collection.
Canadian Health Measures Survey (CHMS) Data User Guide: Cycle 3
34
7.2.1 Collection – Household interview
One to two weeks prior to the start of household interviews at each collection site, introductory material
was mailed to the dwellings selected for the survey informing them that they would be contacted to
participate in the survey. Interviewers called or drove to each dwelling to book an interview. Once
contact was made with the household, the interviewer introduced the survey by outlining the basic steps
of the survey and informing the person that participation was voluntary and that any information
provided would be kept confidential under the authority of the Statistics Act.
Based on the demographic information collected, one or two persons in the household were selected to
participate in the survey. A selection algorithm was used to try and reach an equal distribution of people
among the different age groups. If two persons were selected in a household, one person was always 3 to
11 years old and the other 12 to 79 years old.
Prior to commencing the interview, the respondent was informed about the survey and was shown a brief
four minute introductory video. For respondents between the ages of 3 and 11, an adult/guardian was
present during the interview to answer questions with assistance from the child. All respondents aged 12
to 79 years who were able to answer questions on their own were asked to do so.
In some cases, the interviewer then collected tap water samples from the home (see Section 7.4.8 Tap
water for more details).
At the end of the interview the interviewer provided the respondent with an information package,
explaining the MEC portion of the survey, information about the tests performed at the MEC and general
information about the survey. The interviewer briefly reviewed the material in the information package
and answered any questions. At that time, the interviewer informed the respondents that he/she had been
assigned to a fasting or non-fasting appointment at the MEC. The fasting appointments required
respondents 6 to 79 years of age to fast for 12 hours in preparation for specific laboratory tests. See
Appendix 4 for a list of the pre-testing guidelines provided to respondents during the household
interview.
At the end of the household interview, if possible, the interviewer sets up an appointment at the MEC for
the respondent. In some cases, the respondent or parent of the respondent sets up an appointment on their
own at a later time. At the end of each day, the interviewers transmitted all completed cases back to
Statistics Canada using encryption software to ensure the confidentiality of the data during the
transmission.
7.2.2 Collection – MEC
Upon arrival at the MEC, the respondent’s information was logged into the database at the reception
desk. The MEC staff verified that the respondent’s name, sex, date of birth and official language
(collected during the household interview) were correct. Adherence to the pre-testing guidelines was
verified and documented within the application.
Canadian Health Measures Survey (CHMS) Data User Guide: Cycle 3
35
Prior to beginning the physical measures tests, the respondent had to provide their consent to participate
in the MEC portion of the survey. Parents or guardians gave consent on behalf of children aged 3 to 13
while each child provided their assent to participate.
After the consent module, the respondent (or parent/guardian of younger respondents) was asked some
screening questions. Parents or guardians completed the screening questions on behalf of children aged 3
to 13. Depending on the fasting status, the age of the respondent and the responses to the screening
questions, some respondents were excluded from certain measures or laboratory tests (see Appendix 5 –
Exclusion Criteria).
Respondents then performed all measures or provided biospecimens for laboratory tests for which they
were eligible. For the activity monitor and indoor air measures, respondents were provided instructions to
follow when they returned home.
Every respondent could, at any time, refuse to participate in a measure or test. The order of the measures
and blood tests was set in such a way that the effects of a certain measure (e.g., increased blood pressure
from spirometry) did not affect the results of another measure (e.g., resting blood pressure).
After the blood and urine samples were collected from survey respondents, they were processed,
analyzed for the CBC and temporarily stored in fridges and freezers within the MEC laboratory. An
initial DNA extraction step was carried out at the MEC prior to shipping. Stored samples were sent
weekly to reference laboratories in Ottawa, Quebec City, Burlington, Edmonton, Toronto and Winnipeg
for additional analyses related to general health, nutrition, chronic disease, volatile organic compounds
(VOCs), and environmental exposure as well as infectious diseases and for storage in the CHMS biobank
in Winnipeg.
Prior to leaving the MEC, the respondent received a report of their measurements, and a letter for their
health care provider if it was required (e.g., extremely high or low blood pressure). A few months after
the visit to the MEC, a report of laboratory tests containing most of the respondent’s blood and urine test
results, hearing results, spirometry results and results for their household’s tap water was sent to them.
Respondents 14 years of age or older received their laboratory, hearing and spirometry reports, while
parents of respondents 3 to 13 years old received their child’s reports.
Although no home visits took place during cycle 3, they were available upon respondent request.
7.3 Minimizing non-response
7.3.1 Minimizing non-response – Household interview
To ensure the best possible response rate at the household, many practices were used to minimize non-
response.
7.3.1.1 Introductory material
Before the start of each collection period, introductory materials were sent to the selected households,
explaining the different steps of the survey and emphasizing the importance of the survey by providing
examples of how CHMS data would be used.
Canadian Health Measures Survey (CHMS) Data User Guide: Cycle 3
36
7.3.1.2 Initiating contact
Interviewers were instructed to make all reasonable attempts to obtain interviews. When the timing of the
interviewer's visit was inconvenient, an appointment was made to come back at a more convenient time.
If no one was home on first visit, a notice that a CHMS interviewer had stopped by their home was left at
the door. Numerous personal visits were made at different times on different days until potential
respondents were home and available to do the interview. If interviewers were unable to make contact
with anyone at the household, they tried phoning to arrange for a personal visit. In some cases a phone
number was not available for the case and the interviewers had to research to find a name and number,
using directory listings, neighbours, superintendents, and management/rental offices.
7.3.1.3 Refusal procedures
The interviewer tried to convince the respondent of the importance and potential benefits of participating
in the survey. If the individual refused to participate in the survey, a refusal letter was sent and they were
then contacted a second time by either another interviewer or the senior interviewer who, again, stressed
the importance of the survey and the household's participation in it.
7.3.1.4 Language barriers
Some of the introductory materials (the introductory letter and the CHMS brochure) were available in
English, French, and Mandarin. Respondents were interviewed in the official language of their choice
(English or French). To remove language as a barrier to conducting interviews, where possible, the
CHMS team recruited interviewers with some competencies in a language other than the two official
languages. When necessary, cases were transferred to an interviewer or external interpreter with the
appropriate language competency so that questions/instructions could be translated for the respondent.
If, no one with a certain language competency could be found, it was also acceptable for a household
member who was willing and able to translate for the respondent to do so. Note that this was not
considered a proxy interview. The household member was simply translating the questions and the
respondent’s answers directly to the interviewer, not answering for the respondent.
7.3.1.5 Youth respondents
Interviewers were obliged to obtain verbal permission from parents/guardians to interview youths
between the ages of 12 and 17 who were selected for the survey. Several measures were taken to alleviate
potential parental concerns and to ensure a completed interview. Interviewers provided the parent or
guardian with a copy of the Information and Consent Booklet which contained a section dedicated to
parents and guardians. This document explained the purpose of collecting information from youth, listed
the subjects to be covered in the survey and explained the need to respect a youth's right to privacy and
confidentiality.
When interviewing respondents 12 to 17 years of age, interviewers ensured that the parent was in the
home but that the interview took place outside of parents/siblings earshot, unless permission was
obtained from the youth for a parent to be present. If the selected youth could not be interviewed in a
private setting, the interviewer read the questions out loud with a parent or guardian in the room. The
youth then answered the questions directly onto the computer. If privacy and confidentiality could not be
respected, the case was coded as a refusal with a permanent note indicating that privacy/confidentiality
could not be respected.
Canadian Health Measures Survey (CHMS) Data User Guide: Cycle 3
37
If parents asked to know more about the type of questions asked in the survey, interviewers first directed
them to the topics listed in the Information and Consent Booklet. If they asked to see the actual questions,
interviewers showed them the content section of the Interviewer's Manual. For those parents who
requested a copy of the questions, a copy was available through the Data Collection Manager, as well as
at Statistics Canada’s head office in Ottawa.
7.3.1.6 Proxy interviews
In the CHMS, parents/guardians answered questions about their children aged 3 to 11. This included all
household modules that were applicable to children. Children assisted in responding to some questions
for which the parents may not have known the answers (e.g., participation in activity during school
hours).
In cases where the selected respondent 12 years of age or over was, for reasons of physical or mental
limitations, incapable of completing an interview at the household, another knowledgeable member of
the household supplied information about the selected respondent. While these proxy respondents were
able to provide accurate answers to most of the survey questions, the more sensitive or personal questions
were beyond their scope of knowledge. This resulted in some questions from the proxy interview being
unanswered. Every effort was taken to keep proxy interviews to a minimum. The variable “PROXY” on
the data set indicates whether or not a household interview was completed by proxy.
In cycle 3, 28% of the interviews were proxy, compared to 27% in cycle 2.Of the proxy interviews,
98.7% of the respondents were under 12 years of age and 1.3% were 12 years of age or older.
7.3.2 Minimizing non-response – MEC
Approximately 78.8% of respondents who completed a household interview in cycle 3 agreed to go to the
MEC. Some of the main practices used to obtain this high level of participation are described below.
7.3.2.1 Non-response follow-up
MEC staff was responsible for following up with any respondents who did not book an appointment at
the end of their household interview and did not call the MEC booking desk to set up an appointment
within a few days after their household interview. The staff members followed similar refusal procedures
as household interviewers.
7.3.2.2 Flexible MEC hours
Strategies specific to the MEC included the creation of MEC opening hours and appointment times that
provided maximum flexibility to the respondent. The MEC staff tried to accommodate as many
respondents as possible at each site.
Canadian Health Measures Survey (CHMS) Data User Guide: Cycle 3
38
7.3.2.3 Refusal procedures
To minimize the non-response to the CHMS clinic component, the MEC staff was instructed to make all
reasonable attempts to convince respondents who participated in the household interview to attend the
MEC. The appointment booking desk staff, who had received specific training in handling refusal
conversions, followed-up with respondents who refused to participates in the MEC portion of the survey.
If they were unsuccessful in booking an appointment, the MEC site manager or senior HMS would call
one final time to attempt to book an appointment. Respondents who could not be contacted (e.g., no
answer at the home phone number) were sent a “No Contact Letter” asking them to phone the MEC to
book an appointment.
7.3.2.4 Language barriers
Mobile examination centre (MEC) staff handled language barriers in the same way as household
interviewers. CHMS staff, external interpreters or family members with knowledge of the third language
were used to help the respondent understand instructions and forms in order to complete the visit at the
MEC.
7.3.2.5 Youth respondents
As with the household interview, parents/guardians answered all questions about their children aged 3 to
11. Since the age of consent for the MEC portion of the CHMS was 14 years of age, parents/guardians
also answered these questions for their 12 and 13 year old youths, though the youths usually assisted.
Youths aged 14 and over were responsible for signing their own consent form and answering all
questions although parents/guardians were in some cases present during their visit at the MEC and able to
assist on difficult questions. To maximize efficiency at the MEC, the selected child or youth usually did
the physical measure tests with one CHMS staff member while their selected parent was doing tests with
another CHMS staff member.
In cases where the selected respondent 14 years of age or over was, for reasons of physical or mental
limitations, incapable of answering questions and completing the consent form at the MEC, the
parent/guardian assisted.
7.4 Physical measures protocols
Major changes to the MEC visit for cycle 3 include the withdrawal of several physical fitness tests (sit
and reach, partial curl-ups and mCAFT) and the addition of skin pigmentation, fractional exhaled nitric
oxide (FENO) and hearing test measures.
All physical measures protocols were done at the MEC except for the activity monitor which was worn
by respondents once they returned home, the indoor air sampler which respondents deployed in their
home and the tap water samples which were taken at the respondent’s home by the interviewer, A brief
description of the physical measures protocols can be found below, with information on exclusion criteria
provided in Appendix 5.
7.4.1 Anthropometry
The anthropometry component consisted of five main physical measure tests: standing and sitting height,
weight as well as waist and hip circumference. All tests were done on eligible respondents aged 3 to 79
Canadian Health Measures Survey (CHMS) Data User Guide: Cycle 3
39
years old. Respondents having one or more acute or chronic conditions which could affect the results of
an anthropometry test result were excluded from participating in that particular test.
7.4.1.1 Standing height
Standing height is an assessment of the maximum vertical size of the respondent. This measure was taken
on all the respondents who were able to stand unassisted. Standing height was measured with a fixed
stadiometer with a vertical backboard and a moveable headboard using a procedure based on the
Canadian Physical Activity, Fitness and Lifestyle Approach (CPAFLA) 3rd Edition.5 A self-reported
height was captured for respondents who were not eligible because of an acute or chronic condition (e.g.,
in a wheelchair) or who refused to have their height measured.
7.4.1.2 Sitting height
Sitting height is an assessment of maximum vertical size when the respondent is sitting. It was measured
on respondents who were able to sit unassisted. Sitting height was measured with a fixed stadiometer
with a vertical backboard and a moveable headboard. The respondent’s sitting height was measured,
following the International Society for the Advancement of Kinanthropometry (ISAK) protocol. 6
7.4.1.3 Weight
The respondent’s weight was taken on a Mettler Toledo digital scale, following the CPAFLA protocol.5
7.4.1.4 Waist circumference
Waist circumference provides an indication of abdominal fat distribution and is an important indicator of
the health risks associated with obesity. Waist measurements were taken on respondents using the
National Institute of Health (NIH) protocol.7
7.4.1.5 Hip circumference
Hip circumference is the maximal circumference measured at the hips or buttocks region (whichever is
larger). It is used to calculate the waist-to-hip ratio (waist circumference divided by hip circumference)
and is a simple method of determining body fat pattern. The protocol for hip circumference was based on
the Canadian Standardized Test of Fitness (3rd Edition).8
7.4.2 Skin pigmentation
The skin pigmentation measure assesses several characteristics of an individual’s skin colour. This can be
used to evaluate the relationship between skin pigmentation (as an absolute, independent variable), sun
exposure and vitamin D status. The measurements were done on eligible respondents aged 3 to 79 years
old.
Canadian Health Measures Survey (CHMS) Data User Guide: Cycle 3
40
7.4.3 Heart rate and blood pressure
The respondent’s resting heart rate and blood pressure (BP) were measured following a new protocol
created by the CHMS using information from the report “Hypertension Surveillance in Canada:
Minimum Standards for Assessing Blood Pressure in Surveys”.9 This report was published by an expert
committee consisting of members of the Canadian Hypertension Society, the Canadian Coalition for
High Blood Pressure Prevention and Control and the Heart and Stroke Foundation of Canada.
Heart rate and blood pressure measurements were taken on all eligible respondents aged 6 to 79 years old
using an oscillometric blood pressure measurement device. A series of blood pressure and heart rate
measurements were taken at one minutes intervals following a five minute rest period. The last five
measurements were used to determine the average resting heart rate and blood pressure. A 2nd series of
measurement was only performed when required.
7.4.4 Lung health
7.4.4.1 Spirometry
Spirometry was used to assess respondents’ lung function. The measurement was taken on all eligible
respondents aged 6 to 79 years old, following the 1994 Update of the Standardization of Spirometry
article, published by the American Thoracic Society.10 Reasons for being excluded from doing this test
include heart attacks, chest or abdominal surgeries within the last 3 months, eye surgery within the last 6
weeks, tuberculosis, use of certain medications and pregnancy >27 weeks.
7.4.4.2 Fractional Exhaled Nitric Oxide (FENO)
FENO was used to assess the levels of inflammation in the upper airways. This measure was
administered to all respondent’s aged 6 to 79 years old. Respondents who possessed a stoma were
excluded from the test.
7.4.5 Grip strength
The grip strength component provides information on the muscular strength of all eligible respondents
aged 6 to 79 years old. Grip strength is heavily linked to general health and independence.
7.4.6 Hearing
The hearing component consisted of four physical measure tests: Otoscopy, Tymponometry, Distortion
Product Otoacoustic Emissions (DPOAE) and Audiometry. Otoscopy, tympanometry and DPOAE were
done on eligible respondents aged 3 to 79 years old. Audiometry was done on eligible respondents 6 to
79 years of age. Exclusions for hearing tests are listed in Appendix 5.
7.4.6.1 Otoscopy
An otoscopic examination is the visual, non-diagnostic examination of the outer ear (including the pinna
and ear canal) using an otoscope. The purpose of the otoscopic examination is to identify any gross
abnormalities such as: impacted/excessive ear wax or pus and/or the presence of blood, a foreign object
or a growth or tumor in the ear canal.
Canadian Health Measures Survey (CHMS) Data User Guide: Cycle 3
41
7.4.6.2 Tympanometry
Tympanometry is a test designated to evaluate the mobility of the ear drum, located in the middle ear.
7.4.6.3 Distortion Product Otoacoustic Emissions
The distortion product otoacoustic emissions (DPOAE) test is carried out to obtain an objective
evaluation of cochlear (inner ear) function. This test measures outer hair cell movement within the
cochlea in response to the simultaneous delivery of two pure tone frequencies in the respondent’s ear.
7.4.6.4 Audiometry
The purpose of performing audiometry (also called audiometric evaluation) is to determine whether
hearing loss is present.
7.4.7 Activity monitor
An Actical physical activity monitor was given to all eligible respondents aged 3 to 79, along with an
adjustable belt, an XPRESSPOST envelope, and an information sheet. Respondents were asked to wear
an activity monitor for 7 days following their visit to the MEC. Activity monitors provide key
information on the wearer’s level of physical activity, including intensity, timing (day and time),
frequency and duration as well as information on sedentary behaviour (excluding sleep). Respondents in
wheelchairs were excluded from this measure.
7.4.8 Tap water
A subsample of respondent households was chosen for tap water collection. The interviewer ran the
kitchen tap for five minutes before taking the cold water samples – one sample was taken using a tube to
test for fluoride and the other taken using a glass bottle to test for selected volatile organic compounds
(VOCs). The objective of tap water collection is to determine the prevalence and characterize the
distribution of exposures to certain VOCs and fluoride found in tap water. Interviewers sent the tubes
once a week via courier to the Laboratoire de santé publique du Québec (LSPQ) in Sainte-Anne-de-
Bellevue, Quebec for fluoride analysis and the bottles twice a week to the Health Canada – Water lab in
Ottawa for VOC analysis.
7.4.9 Indoor air sampler
Indoor air samplers are small cylindrical devices that were placed in each household in order to establish
national baselines for indoor air concentrations of several volatile organic compounds (VOCs). These
samplers were distributed to respondents in order to measure a number of airborne substances, including
benzene, methane and ethanol within their homes for seven days following the MEC visit.
After the seven day collection period was over, respondents sent their samplers directly to Cassen
laboratory in Toronto for VOC analysis. A pre-addressed envelope was provided to all respondents.
Canadian Health Measures Survey (CHMS) Data User Guide: Cycle 3
42
7.5 Laboratory measures protocols (blood and urine)
A brief description of the laboratory measures protocols used for the CHMS can be found below.
Additional supporting documentation is available upon request.
7.5.1 Sample collection
Blood and urine samples were collected from all eligible respondents at the MEC in order to obtain
nationally representative information on a variety of biomarkers (nutrition, chronic and infectious
diseases, environmental exposure, etc.).
7.5.1.1 Blood collection
The blood was collected by a phlebotomist using a standardized venipuncture technique. The amount of
blood taken from respondents depended on their age:
• 3 to 5 years: 25.0 ml
• 6 to 11 years: 38.0 ml
• 12 to 13 years: 64.0 ml
• 14 to 19 years: 82.0 ml
• 20 to 79 years: 94.0 ml
A deviation from the order of blood collection tubes typically done in a clinical setting was made to
accommodate the priority of the test(s) being measured.
7.5.1.2 Urine collection
Respondents were asked to provide urine to conduct all the tests for which they were eligible.
7.5.2 Analysis of CBC performed at the mobile examination centre (MEC)
The CBC was analyzed in the MEC laboratory by a technologist and performed for all respondents from
whom a sample was collected. Results from any unsuitable samples (e.g., severe lipemia or clot in tube)
were not reported.
7.5.3 Processing and storage of the blood and urine samples
It was important to process the specimens as soon as possible because the quality and integrity of the
blood and urine specimens would deteriorate over time. Blood was centrifuged at 20°C for 15 minutes at
3000 to 3400 revolutions per minute to separate plasma and serum and to allow for the aliquoting into
smaller tubes. The urine was also aliquoted into smaller tubes. These tubes were placed in shipping trays
and stored in the MEC laboratory in either the refrigerator or the freezer depending on the test. All
specimens were stored as soon as processing was complete to ensure the quality of the samples’ integrity.
A four hour ceiling from the point of collection was placed on the time for blood samples to be processed
and stored. For most samples, however, processing and storage was achieved within two hours from the
time of collection.
Canadian Health Measures Survey (CHMS) Data User Guide: Cycle 3
43
7.5.4 Shipment of the blood and urine samples
The shipping of the blood and urine aliquots was done once a week to the reference laboratory on pre-
assigned shipping days. All packages were sent to one of the seven blood and urine reference labs: 1.
Health Canada-Nutrition in Ottawa for biomarkers related to chronic disease, general health (chemistry
panel) and nutrition, 2. Health Canada-Environment in Ottawa for blood Volatile Organic Compounds
(VOCs) 3. Institut National de Santé Publique du Québec (INSPQ) in Quebec City for environmental
biomarkers plus urine creatinine (environmental adjustments and kidney health), 4. , National
Microbiology Laboratories NML in Winnipeg for infectious disease related analyses and the CHMS
biobank, 5. ALS-Global in Edmonton for parabens and organophosphate insecticides, 6. ALS-
Environment in Burlington for organohalogens, and 7. Ontario Region Health Canada in Toronto for
acrylamide.
Shipments were packaged according to the International Air Transport Association (IATA) and Transport
of Dangerous Goods regulations for biological specimens. All shipments were sent by overnight delivery
using a courier company certified to handle dangerous goods and were scheduled to arrive at the
reference laboratory only on weekdays. A specimen tracking system was also used in order to allow staff
to determine the status of every tube shipped to the reference laboratory. In addition, the temperature of
refrigerated shipments was monitored using pre-programmed devices that took the temperature every 30
minutes during shipping. This provided assurance that the samples received by the reference labs were
maintained at an adequate temperature to preserve the sample integrity during shipping.
There were some occurrences where shipments were delayed and the condition of the samples required
assessment. If it was determined that the shipment conditions had been inadequate, the affected results
were removed to ensure that only the highest quality of data was reported to the CHMS by the reference
laboratories.
Canadian Health Measures Survey (CHMS) Data User Guide: Cycle 3
44
8. Data processing
8.1 Verification
One of the unique features of the Canadian Health Measures Survey (CHMS) is that three different sets
of data are collected for the same respondent: household interview data, physical measures data, and
laboratory results data. Each set of data has to be processed on its own, yet they cannot be completely
separated from each other because at various points during processing the three sets of data have to be
used together.
The processing of the household interview data was performed in a manner similar to that of other health
surveys at Statistics Canada. The data are validated first at the record level and then at the individual
variable level, followed by detailed top-down editing. During data collection, processing takes place on a
daily basis. The household interview responses have to be processed quickly in order for the data to be
available at the mobile examination centre (MEC) in time for the respondent’s visit to the MEC.
Similarly, the processing of the physical measures data begins with the data being validated first at the
record level and then at the individual variable level, followed by detailed top-down editing. Also,
because the laboratory tests are determined based on responses received at the MEC, the MEC data are
used to generate a file containing a list of the tests for which laboratory results are expected to be
received. This laboratory “control” file is used in processing the laboratory results data.
The processing of the laboratory data involves significant file manipulation due to the fact that several
different file types are received from the MEC and the various reference laboratories. As with the
household and the physical measures data, the laboratory data are validated at the record level and at the
individual variable level, and several new variables are then derived. The laboratory data are processed as
quickly as possible so that any critical results that have been identified at the reference laboratories and
the MEC are immediately available for reporting to respondents.
8.2 Mark-all-that-apply questions
During the initial phase of data processing, mark-all-that-apply questions are expanded, with each
response category in the original question becoming a series of separate questions with a yes or no
response. In the example below, the respondent selected both 2 and 3 as answers to the original question.
The answers to the new questions are based on answers from the original question.
Original question:
CCC_Q96 What type of hepatitis do you have?
INTERVIEWER: Read categories to respondent. Mark all that apply.
1 Hepatitis A
2 Hepatitis B
3 Hepatitis C
2
3

Canadian Health Measures Survey (CHMS) Data User Guide: Cycle 3
45
Final questions / responses:
CCC_96A What type of hepatitis do you have? - Hepatitis A
1 Yes
No
Don’t Know, Refused
CCC_96B What type of hepatitis do you have? - Hepatitis B
Yes
2 No
Don’t Know, Refused
CCC_96C What type of hepatitis do you have? - Hepatitis C
Yes
2 No
Don’t Know, Refused
8.3 Coding
As in previous cycles, pre-coded answer categories were supplied for all suitable variables, and the
interviewers and health measures specialists (HMS) were trained to assign a respondent’s answer to the
appropriate category. In the event that a respondent’s answer could not be easily assigned to an existing
category, several questions also allowed the interviewer to enter a long-answer text in the “Other-
specify” category. All such questions were closely examined at head office during processing. For some
household questions, the long answers were coded into one of the existing listed categories. If this was
not possible, the response was coded as ‘Other’. For the MEC responses, long answers were reviewed
and some responses were coded to existing categories. For the remaining ‘Other-specify’ answers at both
the household and the MEC, some new categories were created when there was a sufficient number of
responses. The remaining responses were coded as ‘Other’. For all questions, the “Other-specify”
responses will be taken into account when refining the answer categories for future cycles.
Statistics Canada is not permitted to release drug names. As a result, this information, while collected, is
not available on the data files. Instead, coded variables representing information about these responses
are placed on the data file. Codes representing specific drug names were put on the medication file (see
Appendix 6 for information on the medical classification systems used).
2
1
1
Canadian Health Measures Survey (CHMS) Data User Guide: Cycle 3
46
As in previous cycles, certain data were collected as long answers and had codes assigned. This included
medication and other health product names and dosages, and job description information. For
medications, databases of standard descriptions were available in the computer-assisted interviewing
(CAI) applications, and a code could be assigned at the time of collection based on a search of the
appropriate database. Any description without a code was extracted during processing and coded
manually. Over the course of the full survey, there were 530 medications and other health products that
were manually assigned a Drug Identification Number (DIN), Natural Health Product Number (NPHN),
Homeopathic Medicine Number (DIN-IM) or Exemption Number (EN). For the assignment of industry
and occupation codes, 3,187 records with data in the job description fields were extracted and sent for
coding. The North American Industry Classification System (NAICS) 2012 and National Occupational
Classification – Statistics (NOC) 2011 codes were used. In addition, to maintain consistency with the
coding systems used for cycles 1 and 2, the job description responses were also coded using the North
American Industry Classification System (NAICS) 2002 and the National Occupational Classification -
Statistics (NOC-S) 2001.
More information about the classification systems for job descriptions can be found at:
http://www.statcan.gc.ca/subjects-sujets/standard-norme/naics-scian/2012/index-indexe-eng.htm
http://www.statcan.gc.ca/subjects-sujets/standard-norme/noc-cnp/2011/index-indexe-eng.htm
http://www.statcan.gc.ca/subjects-sujets/standard-norme/naics-scian/2002/naics-scian-02index-eng.htm
and http://www.statcan.gc.ca/subjects-sujets/standard-norme/soc-cnp/2001/noc2001-cnp2001-eng.htm.
8.4 Editing
Most editing of the data was performed at the time of the interview by the CAI application. It was not
possible for interviewers/HMS to enter out-of-range values and flow errors were controlled through
programmed skip patterns. For example, CAI ensured that questions that did not apply to the respondent
were not asked. Edits requiring corrective action were incorporated in the CAI application to deal with
inconsistent responses. In addition, warnings not requiring corrective action were also included to
identify unusual (i.e., improbable rather than impossible) values as a means of catching potential errors
and allowing correction at source.
At head-office, the data underwent a series of processing steps that resulted in some of the data being
adjusted. As a final validation step, the CAI edits were re-applied to the processed data. As a result, the
final data were complete and contained reserve codes for responses of “less than limit of detection”, “not
applicable”, “don’t know”, “refusal” and “not stated”.
Table 8.1 Reserve code of responses
Reserve Code label
Reserve code
Less than limit of detection
9.5, 99.5 etc.
Not Applicable
6, 96, 99.6 etc.
Don’t Know
7, 97, 99.7 etc.
Refusal
8, 98, 99.8 etc.
Not Stated
9, 99, 99.9 etc.
Information on imputation of household income and the treatment of other missing data can be found in
Sections 12.1.2 and 12.1.3.

Canadian Health Measures Survey (CHMS) Data User Guide: Cycle 3
47
8.5 Creation of derived variables
Derived variables (DV) are created to facilitate data analysis and to minimize the risk of errors. The three
most common types of DVs are created by: collapsing data from one variable into groups; combining the
data from one or more survey questions for a single respondent; or combining data from more than one
respondent. DVs generally have a "D" (derived) or "G" (grouped) in the fourth character of the variable
name.
Three other types of DVs can be found on the CHMS data file: converting responses given in various
time units (days, weeks, months or a year) into one type of unit such as yearly; calculation of body mass
index (BMI); and the creation of the Health Utility Index which is based on responses from a series of
questions.
Specifications were received providing details on how to create each derived variable. Cycle 3 of the
CHMS has over 500 DVs. Many of these DVs were created within the capture application in order to be
able to provide initial results to the respondents at the end of their visit to the MEC, while others were
created after the completion of data processing.
All derived variables underwent a validation process after creation in order to ensure that the output
provided the requested data. Modifications to the specifications were necessary if, during validation by
subject matter experts, the output from the derived variables was determined to be flawed. Complete
documentation for all derived variables is available upon request.
8.6 Analytical range
Laboratory data are obtained from the analysis of blood, urine, air and tap water samples. The pre-
analytical conditions (e.g., sample volume, specimen processing procedures, etc.) and methods used by
laboratories determine the analytical range within which an analyte can reliably be measured.
The low end of the analytical range is identified as the limit of detection (LOD). The LOD is defined as
the lowest concentration at which the analyte’s analytical response is measured to be greater than the
noise. The LOD for the environmental measures were evaluated using the United States Environmental
Protection Agency’s methodology32 or a similar method. The upper limit of the analytical range is
determined by the highest standard concentration that produces a linear analytical response. Another
value that is of interest is the limit of quantification (LOQ). The LOQ is the minimal concentration that
can be quantified to a pre-defined level of reliability for a specific method.
Laboratories are unable to determine the concentration of the analyte outside the analytical range. When
laboratory results for analytes measured in blood, urine, air and tap water fall below or above the
analytical range, the laboratory does not report a value and therefore the data are assigned a reserve code
ending in 5 for results less than LOD (e.g.; 99.5) or ending in 7 for results above the upper analytical
range (e.g.; 99.7). A full listing of the analytical ranges including LOD and LOQ values can be found in
the analytical ranges document (available upon request).

Canadian Health Measures Survey (CHMS) Data User Guide: Cycle 3
48
9. Weighting
In order for estimates produced from survey data to be representative of the population covered and not
merely of the sample itself, users must incorporate weighting factors (survey weights) into their
calculations. A survey weight is assigned to each person included on the final dataset, that is, in the
sample of persons who responded to the entire survey. This weight corresponds to the number of people
represented by the respondent in the population as a whole.
The survey weight is calculated as the inverse of the probability that the respondent was selected for the
survey. As described in Chapter 6 (Sample design), the Canadian Health Measures Survey (CHMS) is a
multi-stage sample that uses two sampling frames for selecting its sample; an area frame of geographic
units (clusters) for constructing and selecting collection sites, and a list frame of the dwellings within
each site. The probability of selection for the survey is determined by multiplying the probability of
selection at each stage.
In accordance with the weighting strategy, the selection weights for collection sites are multiplied by the
selection weights for dwellings (households) and adjusted for non-response. Following the conversion of
household weights into person weights, the latter are adjusted for non-response at the interview stage and
the mobile examination centre (MEC) stage, and with several other adjustments, this weight becomes the
final survey weight. The steps of the weighting process are outlined in Sections 9.1 to 9.9.
9.1 Selection weights for collection sites
The first step is to calculate the selection weight for each collection site. For each site, this weight is
calculated as follows within each region12:
Selection weight of a collection site within a given region13 =
Sum of persons in all sites contained within the region
(Number of persons in the site) x (Number of the sites selected within the region)
There is no adjustment for non-response at the level of the collection sites, since all sites participated in
the survey.
9.2 Selection weights for dwellings
For each collection site selected, a list of all dwellings was obtained from the sample frame which is
based on the 2011 Census and updated with other administrative files. These dwellings were stratified
into seven groups corresponding to the six age group strata and one other stratum, using household
composition as specified in the Section 6.3.2 (Dwelling sampling). The sample of dwellings was
allocated among these strata.
For a given dwelling, the selection weight is equal to the inverse of the probability of selection of the
dwelling within the stratum to which it belongs.
stratathe from samplethe in dwellings all of Count
Count strata in the dwellings all of
This weight is then multiplied by the collection site selection weight.

Canadian Health Measures Survey (CHMS) Data User Guide: Cycle 3
49
9.3 Removal of out-of-scope units
Among all the dwellings sampled, a proportion is identified during collection as being outside the scope
of the survey. Examples of out-of-scope cases for the CHMS are: demolished dwellings, dwellings under
construction, vacant, seasonal or secondary dwellings, institutions, and dwellings in which all household
members are under 3 or over 79 years of age or are full-time members of the Canadian Forces. These
dwellings are simply removed from the sample, leaving only dwellings in the scope of the survey. The
dwellings that remain in the sample retain the same weight as at the previous stage.
9.4 Household non-response
During collection, a proportion of the households sampled inevitably resulted in a non-response. This
usually occurs when the household refuses to participate in the survey, provides unusable data or cannot
be reached to conduct the interview. The weight of non-respondent households is redistributed to
respondents within homogeneous response groups (HRGs). In order to create these HRGs, the score
method based on logistic regression is used.14 First a logistic regression model is created to estimate the
response probability, and then these probabilities are used to divide the sample into groups with similar
response properties. The logistic regression models are created from the limited amount of information
available for all households. This includes data from the frame such as the strata, and geographic
location, and paradata about the data collection such as the number of attempts to contact the household
and the elapsed time between the first and last contact. An adjustment factor was then calculated within
each HRG as follows:
Sum of weights for all dwellings (households)
Sum of weights for all respondent households
The weight of respondent households is multiplied by this adjustment factor to produce the adjusted
household weight. Non-respondent households are eliminated from the weighting process starting at this
point.
9.5 Creation of the person weight
Since the final sampling unit for the CHMS is the person, the adjusted household weight up to this point
must be converted into a person weight. This is obtained by multiplying the adjusted household weight
by the inverse of the probability of selection of the person selected in the household. It should be kept in
mind that the probability of a person being selected changes depending on the number of persons in the
household and their ages (see Section 6.3.3, Respondent sampling for more details).
9.6 Non-response at the questionnaire level
The CHMS has a three-stage collection process. First, the interviewer obtains the complete list of persons
living in the household, then he or she interviews the person(s) selected in the household, and finally, the
selected person or persons report to the CHMS MEC.

Canadian Health Measures Survey (CHMS) Data User Guide: Cycle 3
50
In some cases, interviewers succeed in completing only the first step, either because they cannot contact
the person(s) selected, or because the person or persons selected refuse to be interviewed. Such cases are
defined as non-responses at the questionnaire level, and an adjustment factor must be applied to the
weights of respondent persons to compensate for this non-response. Just as for non-response at the
dwelling (household) level, the adjustment is applied within classes defined by the score method using
response probabilities from a logistic regression model. The model is based on the characteristics
available for all respondents and non-respondents, which includes all the characteristics collected when
the members of the household are listed, such as the number of persons in the household, in addition to
geographic information and paradata. An adjustment factor is calculated within each class, as follows:
irequestionna the to respondingpersonsselectedllaorfsweightof Sum
personsselectedllaorfsweightof Sum
Thus, the weight of respondent persons is multiplied by this adjustment factor. Persons not responding to
the questionnaires are removed from weighting starting at this point.
9.7 Non-response at the MEC level
Respondents to the questionnaire are then invited to go to the CHMS MEC for physical measurements. In
some cases, people refuse to participate or do not keep their appointment at the MEC. Such cases are
defined as non-responses at the MEC level, and to compensate for this non-response, an adjustment
factor must be applied to the weights of the MEC participants. Just as for non-response at the dwelling
(household) and questionnaire levels, the adjustment is applied within classes defined by their probability
of attending the MEC. This probability is obtained from a logistic model using the characteristics
available for respondents and non-respondents. All the characteristics collected on the questionnaire
during the interview (such as income class, whether or not the respondent is employed, general health
status, and frequency of smoking), in addition to geographic information and paradata, were made
available to create the non-response models. An adjustment factor is calculated within each class as
follows:
MECthe at ingparticipatpersonsallforeightswof Sum
irequestionna the to respondingpersonsallforweightsofSum
The weights of the persons participating at the MEC were accordingly multiplied by this adjustment
factor. Persons who did not report to the MEC are removed from the weighting process starting at this
point.

Canadian Health Measures Survey (CHMS) Data User Guide: Cycle 3
51
9.8 Winsorization
Note that following a series of adjustments applied to the weights, it is possible that some units will have
weights that stand out from the other weights to the point of being aberrant. Some respondents may
actually represent an abnormally high proportion in their group and therefore strongly influence both the
estimates and the variance. To avoid this situation, a respondent weight that contributes aberrantly to the
age-sex group is adjusted downward using a method known as “winsorization.” In this process,
respondent weights that are considered to be outliers are replaced by the highest non-outlier weight for
that age and sex group. All of the weights are then adjusted to redistribute the surplus weight (the part of
the weight that is higher than the highest non-outlier weight). This is done by multiplying the non-outlier
weights by an adjustment factor to create the winsor adjusted weights. The adjustment factor is calculated
as:
weightsoutliernon of Sum
weightsfinal original of Sum
−
9.9 Calibration
The last step required to obtain the final CHMS weight is calibration. This procedure is applied to ensure
that the sum of the final weights corresponds to the estimates of populations defined at the scale of the
five Canadian geographic regions12, for each of the 12 age-sex groups of interest, the six age groups 3 to
5, 6 to 11, 12 to 19, 20 to 39, 40 to 59 and 60 to 79 for each sex. An additional criterion was used to
calibrate the 20 to 39 age group to compensate for the fact that persons in this age group living with kids
have a greater chance of being selected than those living without kids. In households where there was at
least one person aged 3 to 11, a second person aged 12 to 79 was selected for the survey. The second
person selected was usually a parent aged 20 to 39. To compensate for any potential bias caused by the
selection method the 20 to 39 age group was split into those living with and without children aged 3 to
11.
The population estimates are based on the most recent census counts, as well as on counts of births,
deaths, immigration and emigration since then. The calibration was carried out using the mean of the
monthly estimates (covering the survey period) for each cross-tabulation of standard regional boundaries
and age-sex groups. The population estimate for the 20 to 39 age group in each region was split into
those living with and without kids aged 3 to 11 based on the estimated ratio of 20 to 39 year olds living
with and without kids from the sampling frame for cycles 1, 2 and 3.
After calibration, the weight adjustment was obtained. The resulting weight is the final CHMS weight
found in the data file bearing the variable name WGT_FULL.
9.10 Bootstrap weights
The CHMS uses a complex sampling design to select the sample and there are no simple formulas that
can be used to calculate the variance of the survey estimates. Instead, a re-sampling approach known as
the bootstrap method is used to approximate the sample variance. The bootstrap method involves creating
subsamples of the full sample by randomly selecting « n-1 » collection sites with replacement among the
« n » collection sites in each region.15 An adjusted weight is then calculated for each respondent in the
selected subsample. This is repeated 500 times to create the bootstrap weights. To calculate the variance
of a point estimate (such as the mean), the estimate for each of the 500 replicates is calculated using the
bootstrap weight. The variability among the 500 estimates gives the variance estimate. The bootstrap
weights are provided on the final CHMS weight file with the names BSW1-BSW500. Refer to Section
11.5 on the use of the weight variable and Section 12.2.5 on available software for more information.

Canadian Health Measures Survey (CHMS) Data User Guide: Cycle 3
52
9.11 Weighting for selected subsamples
9.11.1 Weighting for activity monitor data
A separate weight was created for the analysis of the activity monitor data, even though all respondents
were asked to wear the activity monitor for one week following the MEC appointment. For this reason
the activity monitor data is not a true subsample. Analysis could only be performed for respondents who
had at least 4 days of valid data (3 days of valid data for youths 3 to 5 year old) on the activity monitor.
To compensate for any bias due to a difference in the respondents who had the required number of valid
days of data and those that did not, a separate weight was created for the activity monitor data.
The weighting steps described in Sections 9.1 to 9.7 were carried out and then an additional adjustment
was made to account for respondents who did not have the required number of valid days of data. Cases
where there were not at least 4 valid days of data (3 days of valid data for youths 3 to 5 year old) were
treated as non-respondents to the activity monitor. The weights of the persons with the required number
of valid days were multiplied by an adjustment factor to account for non-response. Similar to the non-
response adjustment at the collection site, household and MEC levels, the adjustment is applied within
homogeneous response classes. The classes are created based on the probability of response from a
logistic model using the characteristics available for all respondents and non-respondents. All of the
characteristics collected during the interview and at the MEC, in addition to geographic information and
paradata, were available to create the non-response models. The “score” method is then used to define the
classes. The adjustment factor within each class is calculated as follows:
id entriesays of valumber of drequired n with the ll personsghts for aSum of wei
e MECting at th participall personsghts for aSum of wei
The weights of the persons who have the required number of days of valid entries were multiplied by this
adjustment factor. Persons who did not have the required number of days of valid entry were removed
from the weighting process. The final three steps, winsorization, calibration, and bootstrap weights (see
Sections 9.8 to 9.10) were then applied to the respondents. After calibration, the weight adjustment was
obtained. The resulting activity monitor subsample weight is called WGT_ACMO and the corresponding
bootstrap weights are labelled as BSW1-BSW500.. They are available on the activity monitor subsample
weight file.
9.11.2 Weighting for blood and urine data
Subsamples were selected during the sample collection. For each of the subsamples, a sample weight was
created that accounts for this extra step in the sample selection process. As the selection for each
subsample was done independently, a separate weight is calculated for each of these subsamples.
9.11.2.1 Weighting for the fasted subsample
The fasted subsample was selected when the sample of dwellings were selected, and thus occurred prior
to completion of the household questionnaire. To create the fasted subsample weights, the steps described
in Sections 9.1 to 9.4 remain the same and then at the person weight creation step (see Section 9.5) the
subsample flags that were assigned to the dwellings were attributed to the selected person(s). Before
adjusting for non-response at the questionnaire level (see Section 9.6), the person weight of those selected
for the fasted subsample was adjusted to incorporate the subsample sampling weight. An adjustment
factor was derived by collection site and stratum as follows:

Canadian Health Measures Survey (CHMS) Data User Guide: Cycle 3
53
subsamplehe fasted cted for trsons seleghts of peSum of wei
sonslected perghts of seSum of wei
The weights of the persons selected for the subsample were accordingly multiplied by this adjustment
factor. Persons who were not selected for the fasted subsample were removed from the weighting process.
An additional step was required to adjust for persons who were selected for the subsample but who did
not fast or did not provide blood. Such cases were defined as non-respondents to the fasted subsample and
to compensate for this non-response an adjustment factor was applied to the weights of the persons with a
valid measure. Just as for non-response at the collection site, dwelling (household) and MEC levels, the
adjustment is applied within homogeneous response classes. The classes are defined using the score
method with logistic regression based on the characteristics available for all respondents and non-
respondents. All the characteristics collected on the questionnaire during the interview and measures taken
at the MEC, in addition to geographic information and paradata, were available for creating the
homogeneous response classes. An adjustment factor was calculated within each class as follows for the
fasted subsample:
d measurehad a valiasted and who were f selected ll personsghts for aSum of wei
he MECating at td participto fast an selected ll personsghts for aSum of wei
The weight of the persons who were selected for the subsample who had a valid measure was
accordingly multiplied by this adjustment factor. Persons who did not have a valid measure were
removed from the weighting process.
The final three steps, winsorization, calibration, and generating bootstrap weights (see sections 9.8 to
9.10) were then applied to the fasted subsample. After calibration, the weight adjustment was obtained.
The resulting fasted subsample weight is called WGT_FAST and the corresponding bootstrap weights
are labelled BSW1-BSW500. They are available on the fasted subsample weight file.
9.11.2.2 Weighting for the red blood cell fatty acids subsample
Respondents were selected for the fatty acids subsample when they attended the MEC appointment, so
the non-response adjustments that are applied to the full sample weights remain the same for the roster,
household questionnaire and MEC levels (steps 9.1 to 9.7). Three additional adjustments were applied to
the weights from step 9.7 to adjust for respondents not selected for the subsample and to account for non-
response to the subsample. First, the weight of the respondents not selected for the subsample was
redistributed to the weights of the selected respondents using the following adjustment factor within each
combination of site, age group and sex:
ee subsamplted for th and selecat the MECicipating rsons partghts of peSum of wei
e MECting at th participall personsghts for aSum of wei
The weights of the persons selected for the subsample were then accordingly multiplied by this
adjustment factor. Persons who were not selected for the subsample were removed from the weighting
process.
The next two adjustments were applied on weights to account for non-response to the subsample, which

Canadian Health Measures Survey (CHMS) Data User Guide: Cycle 3
54
occurred when a respondent did not provide blood or a valid measure could not be obtained on at least
one of the laboratory tests.
Among the fatty acids non-respondents, it was noticed that for 27 cases in site 10, the blood was not
analyzed for fatty acids because the integrity of a shipment sent to the laboratory was suspect (length of
time to arrive to the laboratory / temperature of blood sample). Because the non-availability of results
was not a non-response behaviour that could be explained through modelling but a collection error, their
weights were redistributed to all other selected person in the sub-sample using the adjustment factor:
1027 s in site respondent nonse ght of thesum of weiSOWSS
SOWSS
−−
where SOWSS = (sum of weight of persons selected for the subsample).
All other non-respondents are adjusted through modelling. The adjustment is applied within
homogeneous non-response classes, similar to the other non-response adjustments at the collection site,
household and MEC levels. The classes are defined using the score method with logistic regression based
on the characteristics available for all respondents and non-respondents after excluding the 27 site 10
cases. All the characteristics collected on the questionnaire during the interview and measures taken at
the MEC, in addition to geographic information and paradata, were available for creating the
homogeneous response classes. An adjustment factor was calculated within each class as follows for the
fatty acids subsample:
asurea valid mee and had e subsamplted for thrson selecghts of peSum of wei
ee subsamplted for thsons selecght of perSum of wei
This adjustment factor is multiplied by the weight of all the respondents selected for the subsample who
had a valid measure. Persons who did not have a valid measure were removed from the weighting
process.
The weights are then winsorized and calibrated and the bootstrap weights are generated following the
steps described in Sections 9.8 to 9.10. The resulting fatty acids subsample weight is called WGT_FTA
and the corresponding bootstrap weights are labelled BSW1-BSW500. They are available on the fatty
acids subsample weight file.
9.11.2.3 Weighting for the urine fluoride subsample
In order to create the urine fluoride subsample weights, the steps described in Sections 9.1 to 9.4 are
followed. Once those are completed, two adjustments to the household weights are applied to take into
account the fact that a respondent could only be selected for the urine fluoride subsample if tap water was
collected at the dwelling. First, the weights of the households selected for the tap water fluoride
subsample were adjusted to incorporate the subsample sampling weight. An adjustment factor was
derived by collection site, by the age of the persons selected in the household and by the number of
respondents selected for the CHMS from the household as follows:
𝑆𝑢𝑚 𝑜𝑓 𝑤𝑒𝑖𝑔ℎ𝑡𝑠 𝑜𝑓 𝑟𝑒𝑠𝑝𝑜𝑛𝑑𝑒𝑛𝑡 ℎ𝑜𝑢𝑠𝑒ℎ𝑜𝑙𝑑𝑠 𝑓𝑜𝑟 𝑡ℎ𝑒 𝐶𝐻𝑀𝑆
𝑆𝑢𝑚 𝑜𝑓 𝑤𝑒𝑖𝑔ℎ𝑡𝑠 𝑜𝑓 𝑠𝑒𝑙𝑒𝑐𝑡𝑒𝑑 ℎ𝑜𝑢𝑠𝑒ℎ𝑜𝑙𝑑𝑠 𝑓𝑜𝑟 𝑤𝑎𝑡𝑒𝑟 𝑓𝑙𝑢𝑜𝑟𝑖𝑑𝑒 𝑠𝑢𝑏𝑠𝑎𝑚𝑝𝑙𝑒

Canadian Health Measures Survey (CHMS) Data User Guide: Cycle 3
55
Secondly, an adjustment was made to the household weights to account for tap water fluoride non-
response. The adjustment is applied within homogeneous non-response classes, similar to the other non-
response adjustments. The classes are defined using the score method with logistic regression based on
the characteristics available for all respondents and non-respondents. All characteristics collected during
the interview in addition to geographic information and paradata were available for creating
homogeneous response classes. An adjustment factor for tap water fluoride non-response was calculated
within each class as follows:
𝑆𝑢𝑚 𝑜𝑓 𝑤𝑒𝑖𝑔ℎ𝑡𝑠 𝑜𝑓 𝑠𝑒𝑙𝑒𝑐𝑡𝑒𝑑 ℎ𝑜𝑢𝑠𝑒ℎ𝑜𝑙𝑑𝑠 𝑓𝑜𝑟 𝑡ℎ𝑒 𝑤𝑎𝑡𝑒𝑟 𝑓𝑙𝑢𝑜𝑟𝑖𝑑𝑒 𝑠𝑢𝑏𝑠𝑎𝑚𝑝𝑙𝑒
𝑆𝑢𝑚 𝑜𝑓 𝑤𝑒𝑖𝑔ℎ𝑡𝑠 𝑜𝑓 ℎ𝑜𝑢𝑠𝑒ℎ𝑜𝑙𝑑 𝑟𝑒𝑠𝑝𝑜𝑛𝑑𝑒𝑛𝑡𝑠 𝑡𝑜 𝑡ℎ𝑒 𝑤𝑎𝑡𝑒𝑟 𝑐𝑜𝑙𝑙𝑒𝑐𝑡𝑖𝑜𝑛 𝑓𝑜𝑟 𝑡ℎ𝑒 𝑓𝑙𝑢𝑜𝑟𝑖𝑑𝑒 𝑠𝑢𝑏𝑠𝑎𝑚𝑝𝑙𝑒
Household weights were converted to person weights (see section 9.5) and the person weights were
adjusted for questionnaire and MEC non-response (see sections 9.6 and 9.7).
Weights for respondents selected for the urine fluoride subsample were adjusted to incorporate the
subsample sampling weight. An adjustment factor was derived by collection site, number of persons
selected to participate from the household and age and sex as follows:
𝑆𝑢𝑚 𝑜𝑓 𝑤𝑒𝑖𝑔ℎ𝑡𝑠 𝑜𝑓 𝑀𝐸𝐶 𝑟𝑒𝑠𝑝𝑜𝑛𝑑𝑒𝑛𝑡𝑠 𝑓𝑜𝑟 𝑡ℎ𝑒 𝐶𝐻𝑀𝑆 𝑤𝑖𝑡ℎ 𝑤𝑎𝑡𝑒𝑟 𝑐𝑜𝑙𝑙𝑒𝑐𝑡𝑒𝑑 𝑎𝑡 𝑡ℎ𝑒 𝑑𝑤𝑒𝑙𝑙𝑖𝑛𝑔
𝑆𝑢𝑚 𝑜𝑓 𝑤𝑒𝑖𝑔ℎ𝑡𝑠 𝑜𝑓 𝑠𝑒𝑙𝑒𝑐𝑡𝑒𝑑 𝑝𝑒𝑟𝑠𝑜𝑛𝑠 𝑓𝑜𝑟 𝑢𝑟𝑖𝑛𝑒 𝑓𝑙𝑢𝑜𝑟𝑖𝑑𝑒 𝑠𝑢𝑏𝑠𝑎𝑚𝑝𝑙𝑒
The weights were then adjusted for non-response to the fluoride measure in urine. The adjustment is
applied within homogeneous non-response classes, similar to the other non-response adjustments. The
classes are defined using the score method with logistic regression based on the characteristics available
for all respondents and non-respondents. All characteristics collected during the interview and measures
taken at the clnic in addition to geographic information and paradata were available for creating
homogeneous response classes. An adjustment factor for urine the urine fluoride subsample was
calculated within each class as follows:
𝑆𝑢𝑚 𝑜𝑓 𝑡ℎ𝑒 𝑤𝑒𝑖𝑔ℎ𝑡𝑠 𝑜𝑓 𝑠𝑒𝑙𝑒𝑐𝑡𝑒𝑑 𝑝𝑒𝑟𝑠𝑜𝑛𝑠 𝑓𝑜𝑟 𝑡ℎ𝑒 𝑢𝑟𝑖𝑛𝑒 𝑓𝑙𝑢𝑜𝑟𝑖𝑑𝑒 𝑠𝑢𝑏𝑠𝑎𝑚𝑝𝑙𝑒
𝑆𝑢𝑚 𝑜𝑓 𝑡ℎ𝑒 𝑤𝑒𝑖𝑔ℎ𝑡𝑠 𝑜𝑓 𝑝𝑒𝑟𝑠𝑜𝑛𝑠 𝑤𝑖𝑡ℎ 𝑣𝑎𝑙𝑖𝑑 𝑚𝑒𝑎𝑠𝑢𝑟𝑒 𝑜𝑓 𝑢𝑟𝑖𝑛𝑒 𝑓𝑙𝑢𝑜𝑟𝑖𝑑𝑒
The weights are then winsorized and calibrated and the bootstrap weights are generated following the
steps described in sections 9.8 to 9.10. The resulting urine fluoride subsample weight is called
WGT_FLP and the corresponding bootstrap weights are labelled BSW1-BSW500. They are available on
the urine fluoride subsample weight file.
9.11.2.4 Weighting for the blood volatile organic compounds (VOCs) subsample
In order to create the blood VOCs subsample weights, the steps described in Sections 9.1 to 9.4 are
followed. Once those are completed, two adjustments to the household weights are applied to take into
account the fact that a respondent could only be selected for the blood VOCs subsample if tap water was
collected at the dwelling. First, the weights of the households selected for the tap water VOCs subsample
were adjusted to incorporate the subsample sampling weight. An adjustment factor was derived by
collection site, by the age of the persons selected in the household and by the number of respondents
selected for the CHMS from the household as follows:
𝑆𝑢𝑚 𝑜𝑓 𝑤𝑒𝑖𝑔ℎ𝑡𝑠 𝑜𝑓 𝑟𝑒𝑠𝑝𝑜𝑛𝑑𝑒𝑛𝑡 ℎ𝑜𝑢𝑠𝑒ℎ𝑜𝑙𝑑𝑠 𝑓𝑜𝑟 𝑡ℎ𝑒 𝐶𝐻𝑀𝑆
𝑆𝑢𝑚 𝑜𝑓 𝑤𝑒𝑖𝑔ℎ𝑡𝑠 𝑜𝑓 𝑠𝑒𝑙𝑒𝑐𝑡𝑒𝑑 ℎ𝑜𝑢𝑠𝑒ℎ𝑜𝑙𝑑𝑠 𝑓𝑜𝑟 𝑤𝑎𝑡𝑒𝑟 𝑉𝑂𝐶𝑠 𝑠𝑢𝑏𝑠𝑎𝑚𝑝𝑙𝑒

Canadian Health Measures Survey (CHMS) Data User Guide: Cycle 3
56
Secondly, an adjustment was made to the household weights for tap water VOCs non-response. The
adjustment is applied within homogeneous non-response classes, similar to the other non-response
adjustments. The classes are defined using the score method with logistic regression based on the
characteristics available for all respondents and non-respondents. All characteristics collected during the
interview in addition to geographic information and paradata were available for creating the
homogeneous response classes. An adjustment factor for tap water VOCs non-response was calculated
within each class as follows:
𝑆𝑢𝑚 𝑜𝑓 𝑤𝑒𝑖𝑔ℎ𝑡𝑠 𝑜𝑓 𝑠𝑒𝑙𝑒𝑐𝑡𝑒𝑑 ℎ𝑜𝑢𝑠𝑒ℎ𝑜𝑙𝑑𝑠 𝑓𝑜𝑟 𝑡ℎ𝑒 𝑤𝑎𝑡𝑒𝑟 𝑉𝑂𝐶𝑠 𝑠𝑢𝑏𝑠𝑎𝑚𝑝𝑙𝑒
𝑆𝑢𝑚 𝑜𝑓 𝑤𝑒𝑖𝑔ℎ𝑡𝑠 𝑜𝑓 ℎ𝑜𝑢𝑠𝑒ℎ𝑜𝑙𝑑 𝑟𝑒𝑠𝑝𝑜𝑛𝑑𝑒𝑛𝑡𝑠 𝑡𝑜 𝑡ℎ𝑒 𝑤𝑎𝑡𝑒𝑟 𝑐𝑜𝑙𝑙𝑒𝑐𝑡𝑖𝑜𝑛 𝑓𝑜𝑟 𝑡ℎ𝑒 𝑉𝑂𝐶𝑠 𝑠𝑢𝑏𝑠𝑎𝑚𝑝𝑙𝑒
Household weights were converted to person weights (see section 9.5) and the person weights were
adjusted for questionnaire and MEC non-response (see sections 9.6 and 9.7).
Weights for respondents selected for the blood VOCs subsample were adjusted to incorporate the
subsample sampling weight. An adjustment factor was derived by collection site, number of respondents
selected to participate from the household and age and sex as follows:
𝑆𝑢𝑚 𝑜𝑓 𝑤𝑒𝑖𝑔ℎ𝑡𝑠 𝑜𝑓 𝑀𝐸𝐶 𝑟𝑒𝑠𝑝𝑜𝑛𝑑𝑒𝑛𝑡𝑠 𝑓𝑜𝑟 𝑡ℎ𝑒 𝐶𝐻𝑀𝑆 𝑤𝑖𝑡ℎ 𝑤𝑎𝑡𝑒𝑟 𝑐𝑜𝑙𝑙𝑒𝑐𝑡𝑒𝑑 𝑎𝑡 𝑡ℎ𝑒 𝑑𝑤𝑒𝑙𝑙𝑖𝑛𝑔
𝑆𝑢𝑚 𝑜𝑓 𝑤𝑒𝑖𝑔ℎ𝑡𝑠 𝑜𝑓 𝑠𝑒𝑙𝑒𝑐𝑡𝑒𝑑 𝑝𝑒𝑟𝑠𝑜𝑛𝑠 𝑓𝑜𝑟 𝑏𝑙𝑜𝑜𝑑 𝑉𝑂𝐶𝑠 𝑠𝑢𝑏𝑠𝑎𝑚𝑝𝑙𝑒
The weights were then adjusted for non-response to the VOC measures in blood. The adjustment is
applied within homogeneous non-response classes, similar to the other non-response adjustments. The
classes are defined using the score method with logistic regression based on the characteristics available
for all respondents and non-respondents. All characteristics collected during the interview and measures
taken at the clinic, in addition to geographic information and paradata, were available for creating the
homogeneous response classes. An adjustment factor for blood VOCs subsample was calculated within
each class as follows:
𝑆𝑢𝑚 𝑜𝑓 𝑡ℎ𝑒 𝑤𝑒𝑖𝑔ℎ𝑡𝑠 𝑜𝑓 𝑠𝑒𝑙𝑒𝑐𝑡𝑒𝑑 𝑝𝑒𝑟𝑠𝑜𝑛𝑠 𝑓𝑜𝑟 𝑡ℎ𝑒 𝑏𝑙𝑜𝑜𝑑 𝑉𝑂𝐶𝑠 𝑠𝑢𝑏𝑠𝑎𝑚𝑝𝑙𝑒
𝑆𝑢𝑚 𝑜𝑓 𝑡ℎ𝑒 𝑤𝑒𝑖𝑔ℎ𝑡𝑠 𝑜𝑓 𝑝𝑒𝑟𝑠𝑜𝑛𝑠 𝑤𝑖𝑡ℎ 𝑣𝑎𝑙𝑖𝑑 𝑚𝑒𝑎𝑠𝑢𝑟𝑒 𝑜𝑓 blood VOCs
The weights are then winsorized and calibrated and the bootstrap weights are generated following the
steps described in sections 9.8 to 9.10. The resulting VOCs subsample weight is called WGT_VOCP and
the corresponding bootstrap weights are labelled BSW1-BSW500. They are available on the blood VOCs
subsample weight file.
9.11.2.5 Weighting for the acrylamidee subsample
Respondents were selected for the acrylamide subsample when they attended the MEC, therefore the
non-response adjustments applied to the full sample weights remain the same at the roster, household
questionnaire and MEC levels (steps 9.1 to 9.7). Two additional adjustments were applied to the weights
following step 9.7 to adjust for respondents not selected for the subsample and to account for non-
response in those selected. To adjust for those not selected for the subsample, the weight of each
respondent not selected was redistributed to the weights of the selected respondents using the following
adjustment factor within each combination of site, age group and sex:
ee subsamplted for th and selecat the MECicipating rsons partghts of peSum of wei
e MECting at th participall personsghts for aSum of wei

Canadian Health Measures Survey (CHMS) Data User Guide: Cycle 3
57
Note: age groups 20 to 39, 40 to 59 and 60 to 79 were grouped together to compensate for 20 to 39 year
old males not being sampled in site 15.
The weight of each respondent selected for the subsample was then multiplied by this adjustment factor.
Respondents not selected for the subsample were removed from the weighting process.
A second adjustment was applied to the weights of the respondents selected for the subsample to account
for non-response, which occurred when a respondent did not provide blood or a valid measure could not
be obtained for at least one of the laboratory tests.The adjustment is applied within homogeneous non-
response classes, similar to the other non-response adjustments at the collection site, household and MEC
levels. The classes are defined using the score method with logistic regression based on the
characteristics available for all respondents and non-respondents. Characteristics collected during the
household interview and at the MEC, in addition to geographic information and paradata were available
to create the homogeneous response classes. An adjustment factor for the acrylamide subsample was
calculated within each class as follows:
asurea valid mee and had e subsamplted for thrson selecghts of peSum of wei
ee subsamplted for thsons selecght of perSum of wei
The weight of each respondent selected for the subsample and having a valid result for this measure was
multiplied by this adjustment factor. Respondents that did not have a valid measure were removed from
the weighting process.
The weights are then winsorized and calibrated and the bootstrap weights are generated following the
steps described in Sections 9.8 to 9.10. The resulting acrylamide subsample weight is called
WGT_ACRY and the corresponding bootstrap weights are labelled BSW1-BSW500. They are available
on the acrylamide subsample weight file.
The calibration of the weights is done differently for this subsample. To be coherent with the first weight
adjustment (see note above), age groups 20 to 39, 40 to 59 and 60 to 79 were grouped together to
improve variance estimation efficiency. Calibration for the 20 to 79 age group is done by sex but there
are no supplementary adjustments for 20 to 39 year olds living with or without kids.
9.11.2.6 Weighting for the methyl mercury subsample
Respondents were selected for the methyl mercury subsample when they attended the MEC, therefore the
non-response adjustments applied to the full sample weights remain the same at the roster, household
questionnaire and MEC levels (steps 9.1 to 9.7). Two additional adjustments were applied to the weights
following step 9.7 to adjust for respondents not selected for the subsample and to account for non-
response in those selected. To adjust for those not selected for the subsample, the weight of each
respondent not selected was redistributed to the weights of the selected respondents using the following
adjustment factor within each combination of site, age group and sex:
ee subsamplted for th and selecat the MECicipating rsons partghts of peSum of wei
e MECting at th participall personsghts for aSum of wei
The weight of each respondent selected for the subsample was then multiplied by this adjustment factor.

Canadian Health Measures Survey (CHMS) Data User Guide: Cycle 3
58
Respondents not selected for the subsample were removed from the weighting process.
A second adjustment was applied on the weights of the respondents selected for the subsample to account
for non-response, which occurred when a respondent did not provide blood or a valid measure could not
be obtained for at least one of the laboratory tests. The adjustment is usually applied within homogeneous
non-response classes similar to the other non-response adjustments at the collection site, household and
MEC levels in which the classes are defined using the score method with logistic regression based on the
characteristics available for all respondents and non-respondents. However, there was so little non-
response in the methyl mercury subsample (12 non-respondents), no characteristics obtained from the
household interview, measures at the clinic or geographic information and paradata could help produce a
satisfactory non-response model. Therefore the weights of non-respondents were redistributed to the
weights of the subsample respondents using the following adjustment factor calculated for each age
group and sex level:
asurea valid mee and had e subsamplted for thrson selecghts of peSum of wei
ee subsamplted for thsons selecght of perSum of wei
The weight of each respondent selected for the subsample and having a valid result for this measurewas
multiplied by this adjustment factor. Respondents that did not have a valid measure were removed from
the weighting process.
The weights are then winsorized and calibrated and the bootstrap weights are generated following the
steps described in Sections 9.8 to 9.10. The resulting methyl mercury subsample weight is called
WGT_MEHG and the corresponding bootstrap weights are labelled BSW1-BSW500. They are available
on the methyl mercury subsample weight file.
9.11.2.7 Weighting for the urine environmental contaminants subsample
Respondents were selected for the urine environmental contaminants subsample when they attended the
MEC, therefore the non-response adjustments to the full sample weights remain the same for the roster,
household questionnaire and MEC levels (steps 9.1 to 9.7). Two additional adjustments were applied to
the weights from step 9.7 to adjust for respondents not selected for the subsample and to account for non-
response in those selected. To adjust for those not selected for the subsample, the weight of each
respondents not selected was redistributed to the weights of the selected respondents using the following
adjustment factor within each combination of site, age group and sex:
ee subsamplted for th and selecat the MECicipating rsons partghts of peSum of wei
e MECting at th participall personsghts for aSum of wei
Note: age groups 20 to 39, 40 to 59 and 60 to 79 year old were grouped together to compensate for 20 to
39 year old males not being sampled in site 15.
The weight of each respondent selected for the subsample was then multiplied by this adjustment factor.
Respondents not selected for the subsample were removed from the weighting process.
A second adjustment was applied on the weights of the respondents selected for the subsample to account
for non-response, which occurred when a respondent did not provide urine or a valid measure could not
be obtained on at least one of the laboratory tests.

Canadian Health Measures Survey (CHMS) Data User Guide: Cycle 3
59
The adjustment is applied within homogeneous non-response classes, similar to the other non-response
adjustments at the collection site, household and MEC levels. The classes are defined using the score
method with logistic regression based on the characteristics available for all respondents and non-
respondents. Characteristics collected during the household interview and at the MEC, in addition to
geographic information and paradata were available to create the homogeneous response classes. An
adjustment factor for the urine environmental contaminants subsample was calculated within each class
as follows for the urine environmental contaminants subsample:
asurea valid mee and had e subsamplted for thrson selecghts of peSum of wei
ee subsamplted for thsons selecght of perSum of wei
The weight of each respondent selected for the subsample and having a valid result for this measure was
multiplied by this adjustment factor. Respondents that did not have a valid measure were removed from
the weighting process.
The weights are then winsorized and calibrated and the bootstrap weights are generated following the
steps described in Sections 9.8 to 9.10. The resulting urine environmental contaminants subsample
weight is called WGT_EU and the corresponding bootstrap weights are labelled BSW_1-BSW500. Thay
are available on the urine environmental contaminants subsample weight file. The calibration of the
weights is done differently for this subsample. To be coherent with the first weight adjustment (see note
above), age groups 20 to 39, 40 to 59 and 60 to 79 were grouped together to improve the variance
estimation efficiency. Calibration for the 20 to 79 age group is done by sex but there is not
supplementary adjustments for 20 to 39 years old living with or without kids.
9.11.2.8 Weighting for the NNK metabolites subsample
in order to create the urine NNK metabolites subsample weights, the steps described in Sections 9.1 to 9.7
are followed. The weights of the respondents selected for the urine NNK metabolites subsample were
adjusted to incorporate the subsample sampling weight. An adjustment factor was derived by collection
site, age, sex and smoker type as follows:
𝑆𝑢𝑚 𝑜𝑓 𝑤𝑒𝑖𝑔ℎ𝑡𝑠 𝑜𝑓 𝑀𝐸𝐶 𝑟𝑒𝑠𝑝𝑜𝑛𝑑𝑒𝑛𝑡𝑠 𝑓𝑜𝑟 𝑡ℎ𝑒 𝐶𝐻𝑀𝑆
𝑆𝑢𝑚 𝑜𝑓 𝑤𝑒𝑖𝑔ℎ𝑡𝑠 𝑜𝑓 𝑠𝑒𝑙𝑒𝑐𝑡𝑒𝑑 𝑝𝑒𝑟𝑠𝑜𝑛𝑠 𝑓𝑜𝑟 𝑢𝑟𝑖𝑛𝑒 𝑁𝑁𝐴𝐿 𝑠𝑢𝑏𝑠𝑎𝑚𝑝𝑙𝑒
The weights were then adjusted for non-response for the NNK metabolites measures in urine. The
adjustment is applied within homogeneous non-response classes, similar to the other non-response
adjustments. The classes are defined using the score method with logistic regression based on the
characteristics available for all respondents and non-respondents. All characteristics collected during the
interview and measures taken at the clinic, in addition to geographic information and paradata, were
available for creating the homogeneous response classes. An adjustment factor was calculated within
each class as follows:
𝑆𝑢𝑚 𝑜𝑓 𝑡ℎ𝑒 𝑤𝑒𝑖𝑔ℎ𝑡𝑠 𝑜𝑓 𝑠𝑒𝑙𝑒𝑐𝑡𝑒𝑑 𝑝𝑒𝑟𝑠𝑜𝑛𝑠 𝑓𝑜𝑟 𝑡ℎ𝑒 𝑢𝑟𝑖𝑛𝑒 𝑁𝑁𝐾 𝑠𝑢𝑏𝑠𝑎𝑚𝑝𝑙𝑒
𝑆𝑢𝑚 𝑜𝑓 𝑡ℎ𝑒 𝑤𝑒𝑖𝑔ℎ𝑡𝑠 𝑜𝑓 𝑝𝑒𝑟𝑠𝑜𝑛𝑠 𝑤𝑖𝑡ℎ 𝑣𝑎𝑙𝑖𝑑 𝑚𝑒𝑎𝑠𝑢𝑟𝑒 𝑜𝑓 urine NNK
The weights are then winsorized and calibrated and the bootstrap weights are generated following the
steps described in sections 9.8 to 9.10. The resulting NNK metabolites subsample weight is called
WGT_NNAL and the corresponding bootstrap weights are labelled BSW1-BSW500. They are available
on the urine NNK metabolites subsample weight file.

Canadian Health Measures Survey (CHMS) Data User Guide: Cycle 3
60
9.11.3 Weighting for the tap water subsamples
9.11.3.1 Weighting for the tap water fluoride subsample (household-level weights)
In order to create the household-level weights for the tap water fluoride subsample, the steps described in
Sections 9.1 to 9.4 are followed. However, the person design weights (i.e. the inverse of the probability
of selecting the chosen respondent from the household) are not considered for the household weights.
The weights of the households selected for the tap water fluoride subsample were adjusted to incorporate
the subsample sampling weight. An adjustment factor was derived by collection site, by age of the
persons selected in the household and the number of respondents selected for the CHMS as follows:
𝑆𝑢𝑚 𝑜𝑓 𝑤𝑒𝑖𝑔ℎ𝑡𝑠 𝑜𝑓 𝑟𝑒𝑠𝑝𝑜𝑛𝑑𝑒𝑛𝑡 ℎ𝑜𝑢𝑠𝑒ℎ𝑜𝑙𝑑𝑠 𝑓𝑜𝑟 𝑡ℎ𝑒 𝐶𝐻𝑀𝑆
𝑆𝑢𝑚 𝑜𝑓 𝑤𝑒𝑖𝑔ℎ𝑡𝑠 𝑜𝑓 𝑠𝑒𝑙𝑒𝑐𝑡𝑒𝑑 ℎ𝑜𝑢𝑠𝑒ℎ𝑜𝑙𝑑𝑠 𝑓𝑜𝑟 𝑡𝑎𝑝 𝑤𝑎𝑡𝑒𝑟 𝑓𝑙𝑢𝑜𝑟𝑖𝑑𝑒 𝑠𝑢𝑏𝑠𝑎𝑚𝑝𝑙𝑒
The household-level weights were adjusted for tap water fluoride subsample non-response (tap water
collection and valid lab data for the tap water fluoride) as well as questionnaire and MEC non-response.
At least one respondent selected from a given household must provide consent to the request to share
data asked at the clinic in order for that household to be included in the subsample. As is the case for the
person-level weights and the urine fluoride subsample weights (see section 9.11.2.3), non-response
adjustments are again done using the score method with logistic regression. However, in regards to the
household-level tap water fluoride subsample weights, the models consider whether or not at least one
person responded for the household rather than looking at each individual person if two people were
selected from the same household. In order to do this, one person was chosen to represent the household
for the non-response models in households where two people were selected because whether or not a
person chooses to respond to each level of the survey is in part dependent on the characteristics of the
individual selected. The variables used in the non-response model at each level are a combination of the
household level and person level characteristics available for all respondents and non-respondents.
The calibration of the final weights is done at the household level so that the weighted estimate reflects
all dwellings in Canada that are not an institution. After the calibration, the sum of the final household
weights corresponds to the estimates of the number of dwellings in each of the five Canadian geographic
regions12 for households of size 1, 2 and 3 or more persons. The household counts are based on the most
recent census counts available, with updates to account for births, deaths, immigration and emigration.
The values used for calibration were the mean of the monthly estimates (covering the survey period) for
each cross-tabulation of household size and geographic region minus an estimate of the number of
households with only persons aged over 79 or that are institutions as they are not part of the CHMS target
population. The proportion of households where all occupants are over the age of 79 was estimated from
the dwelling sampling frame of CHMS cycles 1, 2 and 3.
The final tap water fluoride household weights were obtained after calibration. The weights are labelled
as WGT_FLH and the bootstrap weights, for variance estimation, were created as described in Section
9.10 and are labelled BSW1-BSW500.
9.11.3.2 Weighting for the tap water VOCs subsample (household-level weights)
In order to create the household-level weights for the tap water fluoride subsample, the steps described in
Sections 9.1 to 9.4 are followed. However, the person design weights (i.e. the inverse of the probability
of selecting the chosen respondent from the household) are not considered for the household weights.
The weights of the households selected for the tap water VOCs subsample were adjusted to incorporate
the subsample sampling weight. An adjustment factor was derived by collection site, by age of the

Canadian Health Measures Survey (CHMS) Data User Guide: Cycle 3
61
persons selected in the household and the number of respondents selected for the CHMS from the
household as follows:
𝑆𝑢𝑚 𝑜𝑓 𝑤𝑒𝑖𝑔ℎ𝑡𝑠 𝑜𝑓 𝑟𝑒𝑠𝑝𝑜𝑛𝑑𝑒𝑛𝑡 ℎ𝑜𝑢𝑠𝑒ℎ𝑜𝑙𝑑𝑠 𝑓𝑜𝑟 𝑡ℎ𝑒 𝐶𝐻𝑀𝑆
𝑆𝑢𝑚 𝑜𝑓 𝑤𝑒𝑖𝑔ℎ𝑡𝑠 𝑜𝑓 𝑠𝑒𝑙𝑒𝑐𝑡𝑒𝑑 ℎ𝑜𝑢𝑠𝑒ℎ𝑜𝑙𝑑𝑠 𝑓𝑜𝑟 𝑡𝑎𝑝 𝑤𝑎𝑡𝑒𝑟 𝑉𝑂𝐶𝑠 𝑠𝑢𝑏𝑠𝑎𝑚𝑝𝑙𝑒
The household-level weights were adjusted for the tap water VOCs subsample non-response (tap water
collection and valid lab data for the tap water VOCs) as well as questionnaire and MEC non-response. At
least one respondent selected from a given household must provide consent to the request to share data
asked at the clinic in order for that household to be included in the subsample. As it is the case for the
person-level weights, or the blood VOCs subsample weights (see section 9.11.2.4), the non-response
adjustments are again done using the score method with logistic regression. However, in regards to the
blood VOCs subsample weights, the models consider whether or not at least one person responded for
the household rather than looking at each individual person if two people were selected from the same
household. In order to do this, one person was chosen to represent the household for the non-response
models in households where two people were selected because whether or not a person chooses to
respond to each level of the survey is in part dependent on the characteristics of the individual selected.
The variables used in the non-response model at each level are a combination of the household level and
person level characteristics available for all respondents and non-respondents.
The calibration of the final weights is done at the household level so that the weighted estimate reflects
all dwellings in Canada that are not an institution. After the calibration, the sum of the final household
weights corresponds to the estimates of the number of dwellings in each of the five Canadian geographic
regions12 for households of size 1, 2 and 3 or more persons. The household counts are based on the most
recent census counts available, with updates to account for births, deaths, immigration and emigration.
The values used for calibration were the mean of the monthly estimates (covering the survey period) for
each cross-tabulation of household size and geographic region minus an estimate of the number of
households with only persons aged over 79 or that are institutions as they are not part of the CHMS target
population. The proportion of households where all occupants are over the age of 79 was estimated from
the dwelling sampling frame of CHMS cycles 1, 2 and 3.
The final tap water COVs household weights were obtained after calibration. The weights are labelled as
WGT_VOCH and the bootstrap weights, for variance estimation, were created as described in Section
9.10 and are labelled BSW1-BSW500.

Canadian Health Measures Survey (CHMS) Data User Guide: Cycle 3
62
10. Data quality
10.1 Response rates
One of the most important ways to ensure that the survey data collected are truly representative of the
Canadian population is to maximize participation of selected respondents in all parts of the survey.
Response rates are very useful data quality indicators that help to measure success in achieving this goal.
The following section describes how response rates are derived for the full sample and subsamples.
10.1.1 Household and MEC response rates
In all, 8,120 dwellings were selected within the scope of the Canadian Health Measures Survey
(CHMS).16 Of these dwellings, 6,017 agreed to provide information on the composition of the
household, for a household response rate of 74.1%. From these respondent households, 8,302 persons
were selected (one or two persons per household) to participate in the survey, of whom 7,339 responded
to the questionnaire, for a response rate of 88.4%. Of these persons, 5,785 then reported to the CHMS
mobile examination centre (MEC) for physical measurements, for a response rate of 78.8%. At the
Canadian level, a combined response rate of 51.7% was observed for cycle 3 of the CHMS. It is
important to note that the combined response rate is not obtained by multiplying the response rates at the
person and household levels (or questionnaire level and the MEC level), since two persons were selected
in some households. Appendix 7A shows the combined response rates and the relevant information for
calculating them for the given age groups and gender.
Below is a description of how the different components of the equation must be used to calculate
combined response rates correctly.
Response rate at the household level
HR =
R =
S
# of respondent households
# of households within the scope of the survey
Response rate at the person level among households where one person was selected (questionnaire)
PQ1=
Q1 =
PS1
# of respondents to the questionnaire among households
where one person was selected
# of persons selected among households where one person
was selected

Canadian Health Measures Survey (CHMS) Data User Guide: Cycle 3
63
Response rate at the person level among households where two persons were selected
(questionnaire)
PQ2 =
Q2 =
PS2
# of respondents to the questionnaire among households where
two persons were selected
# of persons selected among households where two persons
were selected
Response rate at the person level among households where one person was selected (MEC)
PC1 =
C1 =
Q1
# of participants at the MEC among households where one
person was selected
# of respondents to the questionnaire among households where
one person was selected
Response rate at the person level among households where two persons were selected (MEC)
PC2 =
C2 =
Q2
# of participants at the MEC among households where two
persons were selected
# of respondents to the questionnaire among households where
two persons were selected
Ratio for households where one person was selected
RR1 =
R1 =
R
# of respondent households among those where one person
was selected
# of respondent households
Ratio for households where two persons were selected
RR2 =
R2 =
R
# of respondent households among those where two persons
were selected
# of respondent households
Note: The “# of respondent households” (R) is the sum of “# of respondent households among those
where one person was selected” (R1) and the “# of respondent households among those where two
persons were selected” (R2).
Once all the above components have been calculated, a user can calculate the combined response rate
(COMBRR) using the following formula:
COMBRR = HR * [ (RR1 * PQ1 * PC1) + (RR2 * PQ2 * PC2) ]
The household response rate (HR) is determined by the total number of respondent households (6,017)
and the households in scope of the survey (8,120). The households in scope cannot be calculated
separately for each age group and sex. For this reason, the household response rate is not included in
Appendix 7A.
Canadian Health Measures Survey (CHMS) Data User Guide: Cycle 3
64
HR =
R =
S
# of respondent households
# of households within the scope of the survey
HR =
6,017
= 0.741
8,120
= 74.1%
Below you will find an example of calculating the combined response rate for Canada using the
information provided in Appendix 7A.
PPQ1 =
Q1
=
3,287
=
0.881
PS1
3,732
PPC1 =
C1
=
2,612
=
0.795
Q1
3,287
PPQ2 =
Q2
=
4,052
=
0.887
PS2
4,570
PPC2 =
C2
=
3,173
=
0.783
Q2
4,052
R = R1 + R2 = 3,732 + 2,285 = 6,017
PRR1 =
R1
=
3,732
=
0.620
R
6,017
PRR2 =
R2
=
2,285
=
0.380
R
6,017
COMBRR=
0.741 * [ (0.620 * 0.881 * 0.795) + (0.380 * 0.887 * 0.783) ]
= 0.517
= 51.7%

Canadian Health Measures Survey (CHMS) Data User Guide: Cycle 3
65
10.1.2 Activity monitor response rates
Of the 5,785 participants who reported to the CHMS mobile examination centre (MEC) for physical
measurements, 5,632 participants were offered an activity monitor. Of these persons, 4,264 returned the
activity monitor with at least four days of valid entries for 6-79 year olds or at least 3 days of valid
entries for 3-5 year olds. The combined response rate (COMBRR) for the activity monitor was 38.8%. It
is important to note that the combined response rate is not obtained by multiplying the response rates by
the person and household scales, since two persons were selected in some households. Appendix 7B
shows the combined response rates and the relevant information for calculating them for the given age
groups by gender.
Below is a description of how the different components of the equation must be manipulated to calculate
combined response rates correctly. Two additional response rates are required to derive the activity
monitor combined response rates:
Response rate at the person level among households where one person was selected (activity
monitor)
AM1=
V1 =
OF1
# of persons who returned the activity monitor with the required
number of days of valid entries among MEC participants
where one person was selected
# of participants at the MEC who were offered an activity monitor
among households where one person was selected
Response rate at the person level among households where two persons were selected (activity
monitor)
AM2 =
V2 =
OF2
# of persons who returned the activity monitor with the required
number of days of valid entries among MEC participants
where two persons were selected
# of participants at the MEC who were offered an activity monitor
among households where two persons were selected
Activity monitor combined response rate (AMCBRR)
AMCBRR = HR * [ (RR1 * PQ1 * PC1 * AM1 ) + ( RR2 * PQ2 * PC2 * AM2 ) ]
where HR, RR1, PQ1, PC1, RR2, PQ2 and PC2 are described in Section 10.1.1.
Below is an example of calculating the activity monitor combined response rate for Canada using the
information provided in Appendices 7A and 7B and the calculations in Section 10.1.1.
AM1 =
V1
=
1,870
=
0.735
OF1
2,544
AM2 =
V2
=
2,394
=
0.775
OF2
3,088

Canadian Health Measures Survey (CHMS) Data User Guide: Cycle 3
66
AMCBRR=
0.741 * [ (0.620 * 0.881 * 0.795 * 0.735) + ( 0.380 * 0.887 * 0.783 * 0.775) ]
= 0.388
= 38.8%
10.1.3 Blood draw and urine response rates
Although the file with the laboratory data includes all MEC participants, some laboratory analysis could
not be performed because the respondents did not or could not provide blood or urine. Of the 5,785
participants who reported to the CHMS MEC for physical measurements, 5,609 participants provided
blood and 5,711 provided urine. The combined response rate for blood draw was 50.4% whereas the
combined response rate for urine was 51.1%. It is important to note that the combined response rate is
not obtained by multiplying the response rates at the person and household levels, since two persons were
selected in some households. Appendix 7C shows the combined response rates and the relevant
information for calculating them for the given age groups by gender.
Below is a description of how the different components of the equation must be manipulated to calculate
combined response rates correctly. Four additional response rates are required to derive the blood draw
and the urine combined response rates:
Response rate at the person level among households where one person was selected (blood draw)
BC1 =
B1 =
C1
# of persons who provided blood among households where
one person was selected
# of participants at the MEC among households where
one person was selected
Response rate at the person level among households where two persons were selected (blood draw)
BC2 =
B2 =
C2
# of persons who provided blood among households where
two persons were selected
# of participants at the MEC among households where
two persons were selected
Response rate at the person level among households where one person was selected (urine)
UC1 =
U1 =
C1
# of persons who provided urine among households where
one person was selected
# of participants at the MEC among households where
one person was selected

Canadian Health Measures Survey (CHMS) Data User Guide: Cycle 3
67
Response rate at the person level among households where two persons were selected (urine)
UC2 =
U2 =
C2
# of persons who provided urine among households where two
persons were selected
# of participants at the MEC among households where
two persons were selected
Blood draw combined response rate (BCOMBRR)
BCOMBRR = HR * [ (RR1 * PQ1 * PC1 * BC1 ) + ( RR2 * PQ2 * PC2 * BC2 )]
Urine combined response rate (UCOMBRR)
UCOMBRR = HR * [ (RR1 * PQ1 * PC1 * UC1 ) + ( RR2 * PQ2 * PC2 * UC2) ]
where HR, RR1, PQ1, PC1, RR2, PQ2 and PC2 are described in Section 10.1.1.
10.1.4 Response rates for blood and urine subsamples
As described in Section 6.3.5, subsamples of the survey respondents were selected. A combined response
rate for each of the subsamples can be obtained by modifying the response rate calculations shown in
Section 10.1.1. The fasting subsample response rate is calculated differently to account for the difference
in selection for the subsamples. Dwellings are selected for the fasted subsample prior to the
questionnaire, whereas individual respondents are selected at the MEC for most of the other subsamples.
10.1.4.1 Fasted subsample response rates
From the 6,017 respondent households, 3,425 were selected for the fasted subsample. In these
households, 4,271 persons 6 to 79 years of age were selected (one or two persons per household) to
participate in the fasted subsample, of whom 3,773 responded to the questionnaire, for a response rate of
88.3%. Of these persons, 2,981 then reported to the CHMS MEC for physical measurements, for a
response rate of 79.0%. Of these persons, 2,571 were actually fasted and had a valid measure on at least
one of the laboratory tests. At the Canadian scale, a combined response rate of 45.2% was observed,
using the formula given below. It is important to note that the combined response rate is not obtained by
multiplying the response rates at the person and household level, since two persons were selected in some
households. Appendix 7D shows the fasted subsample combined response rates and the relevant
information for calculating them for the given age groups by gender.
Response rate to the questionnaire at the person level among households where one person was
selected for the fasted subsample
SSQ1=
SQ1 =
SPS1
# of respondents to the questionnaire among households
where one person was selected for the subsample
# of persons selected for the subsample among households
where one person was selected for the subsample

Canadian Health Measures Survey (CHMS) Data User Guide: Cycle 3
68
Response rate to the questionnaire at the person level among households where two persons were
selected for the fasted subsample
SSQ2 =
SQ2 =
SPS2
# of respondents to the questionnaire among households
where two persons were selected for the subsample
# of persons selected for the subsample among households
where two persons were selected for the subsample
Response rate to the MEC at the person level among households where one person was selected for
the fasted subsample
SSC1 =
SC1 =
SQ1
# of participants at the MEC among households
where one person was selected for the subsample
# of respondents to the questionnaire among households
where one person was selected for the subsample
Response rate to the MEC at the person level among households where two persons were selected
for the fasted subsample
SSC2 =
SC2 =
SQ2
# of participants at the MEC among households
where two persons were selected for the subsample
# of respondents to the questionnaire among households
where two persons were selected for the subsample
Response rate to the fasted subsample at the person level among households where one person was
selected for the subsample
SSF1 =
SF1 =
SC1
# of respondents with a valid measure for the subsample among
households where one person was selected for the subsample
# of participants at the MEC among households where one
person was selected for the subsample
Response rate to the fasted subsample at the person level among households where two persons
were selected for the subsample
SSF2 =
SF2 =
SC2
# of respondents with a valid measure for the subsample among
households where two persons were selected for the subsample
# of participants at the clinic among households where two persons
were selected for the subsample
Fasted subsample combined response rate
FSCOMBRR = HR* [(RR1*SSQ1*SSC1*SSF1) + (RR2*SSQ2* SSC2* SSF2 )]
where HR, RR1 and RR2 are described in Section 10.1.1.

Canadian Health Measures Survey (CHMS) Data User Guide: Cycle 3
69
10.1.4.2 Red blood cell fatty acids subsample response rates
Of the 5,785 participants who reported to the CHMS mobile examination centre (MEC) for physical
measurements, 2,042 people 20 to 79 years of age were selected for the red blood cell fatty acids
subsample. Of these persons 1,984 had valid laboratory results. The combined response rate for the red
blood cell fatty acids subsample was 49.2%. . It is important to note that the combined response rate is
usually not obtained by multiplying the response rates at the person and household level as two persons
were selected in some households. However, since only one person per household was selected for the
red blood cell fatty acids subsample, the combined response rate could also be obtained by multiplying
the response rates. The formulas presented in this section could therefore be simplified but are presented
as though there was the possibility of more than one respondent being selected per household in order to
maintain consistency with other subsamples. Appendix 7E shows the combined response rates and the
relevant information for calculating them for the given age groups by gender.
Below is a description of how the different components of the equation must be manipulated to calculate
combined response rates correctly. Two additional response rates are required to derive the red blood cell
fatty acids combined response rates:
Response rate at the person level among households where one person was selected (red blood cell
fatty acids subsample)
FA1=
FAR1 =
FAS1
# of persons who had a valid laboratory measure for the fatty acids
subsample among MEC participants where one person was selected
# of participants at the MEC who were selected for the fatty acids
subsample among households where one person was selected
Response rate at the person level among households where two persons were selected (red blood
cell fatty acids subsample)
FA2 =
FAR2 =
FAS2
# of persons who had a valid laboratory measure for the fatty acids
subsample among MEC participants where two persons were selected
# of participants at the MEC who were selected for the fatty acids
subsample among households where two persons were selected
Red blood cell fatty acids combined response rate
FACBRR = HR * [ (RR1 * PQ1 * PC1 * FA1 ) + ( RR2 * PQ2 * PC2 * FA2 )]
where HR, RR1, PQ1, PC1, RR2, PQ2 and PC2 are described in Section 10.1.1.
10.1.4.3 Acrylamide subsample response rates
Of the 5,785 participants who reported to the CHMS mobile examination centre (MEC) for physical
measurements, 2,644 people 3 to 79 years of age were selected for the acrylamide subsample. Of these
persons 2,492 had valid laboratory results. The combined response rate for the acrylamide subsample was
49.6%. It is important to note that the combined response rate is not obtained by multiplying the response
rates at the person and household level, since two persons were selected in some households. Appendix

Canadian Health Measures Survey (CHMS) Data User Guide: Cycle 3
70
7J shows the combined response rates and the relevant information for calculating them for the given age
groups by gender.
Below is a description of how the different components of the equation must be manipulated to calculate
combined response rates correctly. Two additional response rates are required to derive the acrylamide
response rates:
Response rate at the person level among households where one person was selected for the
acrylamide subsample
AC1=
ACR1 =
ACS1
# of persons who had a valid laboratory measure for the acrylamide
subsample among MEC participants where one person was selected
# of participants at the MEC who were selected for the acrylamide
subsample among households where one person was selected
Response rate at the person level among households where two persons were selected for the
acrylamide subsample
AC2 =
ACR2 =
ACS2
# of persons who had a valid laboratory measure for the acrylamide
subsample among MEC participants where two persons were selected
# of participants at the MEC who were selected for the acrylamide
subsample among households where two persons were selected
Acrylamide subsample combined response rate
ACCBRR = HR * [ (RR1 * PQ1 * PC1 * AC1 ) + ( RR2 * PQ2 * PC2 * AC2 )]
where HR, RR1, PQ1, PC1, RR2, PQ2 and PC2 are described in Section 10.1.1.
10.1.4.4 Methyl mercury subsample response rates
Of the 5,785 participants who reported to the CHMS mobile examination centre (MEC) for physical
measurements, 1,044 people 20 to 79 year old were selected for the methyl mercury subsample. Of these
persons 1,032 had valid laboratory results. The combined response rate for the methyl mercury
subsample was 50.1%. It is important to note that the combined response rate is usually not obtained by
multiplying the response rates at the person and household level, since two persons were selected in some
households. However, since only one person per household was selected for the methyl mercury
subsample, the combined response rate could also be obtained by multiplying the response rates. The
formulas presented in this section could therefore be simplified but are presented as though there was the
possibility of more than one respondent being selected per household in order to maintain consistency
with other subsamples. Appendix 7K shows the combined response rates and the relevant information for
calculating them for the given age groups by gender.
Below is a description of how the different components of the equation must be manipulated to calculate
combined response rates correctly. Two additional response rates are required to derive the methyl
mercury response rates:

Canadian Health Measures Survey (CHMS) Data User Guide: Cycle 3
71
Response rate at the person level among households where one person was selected for the methyl
mercury subsample
MM1=
MMR1 =
MMS1
# of persons who had a valid laboratory measure for the methyl
mercury subsample among MEC participants where
one person was selected
# of participants at the MEC who were selected for the methyl
mercury subsample among households where one person was
selected
Response rate at the person level among households where two persons were selected for the
methyl mercury subsample
MM2 =
MMR2 =
MMS2
# of persons who had a valid laboratory measure for the methyl mercury
subsample among MEC participants where two persons were selected
# of participants at the MEC who were selected for the methyl mercury
subsample among households where two persons were selected
Methyl mercury subsample combined response rate
MMCBRR = HR * [ (RR1 * PQ1 * PC1 * MM1 ) + ( RR2 * PQ2 * PC2 * MM2 )]
where HR, RR1, PQ1, PC1, RR2, PQ2 and PC2 are described in Section 10.1.1.
10.1.4.5 Urine environmental contaminants subsample response rates
Of the 5,785 participants who reported to the CHMS mobile examination centre (MEC) for physical
measurements, 2,599 people 3 to 79 year old were selected for the urine environmental contaminants
subsample. Of these persons 2,538 had valid laboratory results. The combined response rate for the urine
environmental contaminants subsample was 50.7%. It is important to note that the combined response
rate is not obtained by multiplying the response rates at the person and household level, since two
persons were selected in some households. Appendix 7L shows the combined response rates and the
relevant information for calculating them for the given age groups by gender.
Below is a description of how the different components of the equation must be manipulated to calculate
combined response rates correctly. Two additional response rates are required to derive the urine
environmental contaminants response rates:
Response rate at the person level among households where one person was selected for the urine
environmental contaminants subsample
SSU1=
SU1 =
SC1
# of persons who had a valid laboratory measure for the urine
environmental contaminants subsample among MEC participants
where one person was selected
# of participants at the MEC who were selected for the urine
environmental contaminants subsample among households where
one person was selected

Canadian Health Measures Survey (CHMS) Data User Guide: Cycle 3
72
Response rate at the person level among households where two persons were selected for the urine
environmental contaminants subsample
SSU2 =
SU2 =
SC2
# of persons who had a valid laboratory measure for the urine
environmental contaminants subsample among MEC participants where
two persons were selected
# of participants at the MEC who were selected for the urine
environmental contaminants subsample among households where two
persons were selected
Urine environmental contaminants subsample combined response rate
EUCBRR = HR * [ (RR1 * PQ1 * PC1 * SSU1 ) + ( RR2 * PQ2 * PC2 * SSU2 )]
where HR, RR1, PQ1, PC1, RR2, PQ2 and PC2 are described in Section 10.1.1.
10.1.4.6 NNK metabolites subsample response rates
Of the 5,785 participants who reported to the CHMS mobile examination centre (MEC) for physical
measurements, 2,282 people 12 to 79 year old were selected for the urine NNK metabolites subsample
and 2,220 of them provided urine and had valid NNK metabolites measures. At the Canadian scale, a
combined response rate of 50.3% was observed, using the formula given below. It is important to note
that the combined response rate is usually not obtained by multiplying the response rates at the person
and household level, since two persons were selected in some households. However, since only one
person per household was selected for the urine NNK metabolites subsample, the combined response rate
could also be obtained by multiplying the response rates. The formulas presented in this section could
therefore be simplified but are presented as though there was a possibility of more than one respondent
being selected per household in order to maintain consistency with other subsamples. Appendix 7M
shows the urine NNK metabolites subsample combined response rates and the relevant information for
calculating them for the given age groups by gender.
Response rate for the urine NNK metabolites measures among households where one person was
selected for the CHMS
Number of persons with valid data
UC1NNK = U1NNK = among households where one person was selected
PS1NNK Number of persons selected for the subsample
among households where one person was selected
Response rate for the urine NNK metabolites measures among households where two persons were
selected for the CHMS
Number of persons with valid data
UC2NNK = U2NNK = among households where two persons were selected
PS2NNK Number of persons selected for the subsample
among households where two persons were selected

Canadian Health Measures Survey (CHMS) Data User Guide: Cycle 3
73
The following response rates are not shown in the Appendix 7M but they will be used in the combined
response rate calculation for the urine NNK metabolites subsample.
Response rate to the questionnaire for the persons aged 12 to 79 among households where one
person was selected for the CHMS
Number of questionnaire respondents aged 12 to 79
PQ1NNK = among households where one person was selected
Number of persons aged 12 to 79
among households where one person was selected
Response rate to the questionnaire for the persons aged 12 to 79 among households where two
persons were selected for the CHMS
Number of questionnaire respondents aged 12 to 79
PQ2NNK = among households where two persons were selected
Number of persons aged 12 to 79
among households where two persons were selected
Response rate to the MEC for the persons aged 12 to 79 among households where one person was
selected for the CHMS
Number of MEC respondents aged 12 to 79
PC1NNK = C1NNK = among households where one person was selected
PQ1NNK Number of questionnaire respondents aged 12 to 79
among households where one person was selected
Response rate to the MEC for the persons aged 12 to 79 among households where two persons were
selected for the CHMS
Number of MEC respondents aged 12 to 79
PC2NNK = C2NNK = among households where two persons were selected
PQ2NNK Number of questionnaire respondents aged 12 to 79
among households where two persons were selected
To combine the response rate, the ratio of households where one person was selected for the CHMS and
the ratio of households where two persons were selected for the CHMS are calculated:
Ratio of households where one person was selected for the CHMS
Number of respondent household
RR1NNK = HQ1NNK = among households where one person was selected
HQNNK Number of respondent households
where HQNNK = HQ1NNK + HQ2NNK
Ratio of households where two persons were selected for the CHMS
Number of respondent household

Canadian Health Measures Survey (CHMS) Data User Guide: Cycle 3
74
RR2NNK = HQ2NNK = among households where two persons were selected
HQNNK Number of respondent households
where HQNNK = HQ1NNK + HQ2NNK
Urine NNK subsample combined response rate
NNKPCRR = HR * [ ( RR1NNK * PQ1NNK * PC1NNK * UC1NNK )
+ (RR2NNK * PQ2NNK * PC2NNK * UC2NNK ) ]The CHMS
household response rate (HR) is described in Section 10.1.1.
10.1.5 Fluoride subsamples response rates
10.1.5.1 Tap water fluoride subsample household response rates
Of the 6,017 respondent households, 2,831 were selected for the tap water fluoride subsample. Of these,
2,576 provided tap water and 2,188 had valid tap water fluoride laboratory results for a household
response rate of 57.3%. Appendix 7F shows the tap water fluoride subsample household response rates
and the relevant information for calculating them with the formulas given below.
Tap water collection household response rate for the fluoride subsample
FLW = RSFLW = Number of households with tap water collected at the dwelling
RSFL Number of households selected for the subsample
Note: Because of a problem with data processing in cycle 3, some of the information required to calculate
the tap water collection response rate is missing. The tap water collection response indicator is only
available for households where at least one respondent completed the questionnaire rather than it being
available for all respondent households as originally planned.
Tap water fluoride lab measure response rate
FLWV = RSFLWV = Number of households with valid data for tap water fluoride
RSFLW Number of households with tap water collected at the dwelling
Tap water fluoride subsample household combined response rate
FLHRR = HR * FLW * FLWV,
where the CHMS household response rate (HR) is described in Section 10.1.1.
10.1.5.2 Urine fluoride subsample person response rates
Of the 2,676 respondent households that provided water for the tap water fluoride subsample, 2,728 were
selected for the urine fluoride subsample and 2,671 of them provided urine and had a valid fluoride
measure. At the Canadian scale, a combined response rate of 55.6% was observed. This was calculated
using the formula below. It is important to note that the combined response rate is not obtained by
multiplying the response rates at the person and household level, since two persons were selected in some

Canadian Health Measures Survey (CHMS) Data User Guide: Cycle 3
75
households. Appendix 7G shows the urine fluoride subsample combined response rates and the relevant
information for calculating them for the given age groups by gender.
Response rate for the urine fluoride measure among households where one person was selected for
the CHMS
Number of persons with valid data
UC1FL = U1FL = among households where one person was selected
PS1FL Number of persons selected for the subsample
among households where one person was selected
Response rate for the urine fluoride measure among households where two persons were selected
for the CHMS
Number of persons with valid data
UC2FL = U2FL = among households where two persons were selected
PS2FL Number of persons selected for the subsample
among households where two persons were selected
The following response rates are not shown in the Appendix 7G but they will be used in the combined
response rate calculation later:
Response rate to the questionnaire for the persons with tap water collected at the dwelling for
fluoride, among households where one person was selected for the CHMS
Number of questionnaire respondents with tap water collected at the dwelling
PQ1FL = among households where one person was selected
Number of persons with tap water collected at the dwelling
among households where one person was selected
Response rate to the questionnaire for the persons with tap water collected at the dwelling for
fluoride, among households where two persons were selected for the CHMS
Number of questionnaire respondents with tap water collected at the dwelling
PQ2FL = among households where two persons were selected
Number of persons with tap water collected at the dwelling
among households where two persons were selected
Response rate to the MEC for the persons with tap water collected at the dwelling for fluoride,
among households where one person was selected for the CHMS
Number of MEC respondents with tap water collected at the dwelling
PC1FL = C1FLW = among households where one person was selected
PQ1FLW Number of questionnaire respondents with tap water collected at the dwelling
among households where one person was selected
Response rate to the MEC for the persons with tap water collected at the dwelling for fluoride,
among households where two persons were selected for the CHMS
Number of MEC respondents with tap water collected at the dwelling

Canadian Health Measures Survey (CHMS) Data User Guide: Cycle 3
76
PC2FL = C2FLW = among households where two persons were selected
PQ2FLW Number of questionnaire respondents with tap water collected at the dwelling
among households where two persons were selected
To combine the response rate, the ratio of households with tap water collected at the dwelling where one
person was selected for the CHMS and the ratio of households with tap water collected at the dwelling
where two persons were selected for the CHMS need to be calculated:
Ratio of households with tap water collected where one person was selected for the CHMS
Number of households with tap water collected at the dwelling
RR1FL = HQ1FLW = among households where one person was selected
HQFLW Number of households with tap water collected at the dwelling
where HQFLW = HQ1FLW + HQ2FLW
Ratio of households with tap water collected where two persons were selected for the CHMS
Number of households with tap water collected at the dwelling
RR2FL = HQ2FLW = among households where two persons were selected
HQFLW Number of households with tap water collected at the dwelling
where HQFLW = HQ1FLW + HQ2FLW
Urine fluoride subsample combined response rate
FLPCBRR = HR * FLW * [ ( RR1FL * PQ1FL * PC1FL * UC1FL )
+ ( RR2FL * PQ2FL * PC2FL * UC2FL ) ]
The CHMS household response rate (HR) is described in Section 10.1.1. The tap water collection
response rate (FLW) is described in Section 10.1.5.1.
Note: Because of a problem with data processing in cycle 3, some of the information required to calculate
the tap water collection response rate is missing. The tap water collection response indicator is only
available for households where at least one respondent completed the questionnaire rather than it being
available for all the respondent households. Therefore, the tap water collection response rate and the
questionnaire response rate for respondents with tap water collected at the dwelling could not be
calculated separately. The questionnaire response rate is included in FLW described above and the
PQ1FL and PQ2FL response rates are exceptionally equal to 1 in cycle 3 therefore they are not presented
in Appendix 7G in cycle 3.
10.1.6 VOCs subsamples response rates
10.1.6.1 Tap water VOCs subsample household response rates
Of the 6,017 CHMS respondent households, 3,578 were selected for the tap water VOCs subsample. Of
these, 3,351 provided tap water, and among those 2,650 households had valid tap water VOCs laboratory
results for a household response rate of 54.9%. Appendix 7H shows the tap water VOCs subsample
household response rates and the relevant information for calculating them with the formulas given
below.

Canadian Health Measures Survey (CHMS) Data User Guide: Cycle 3
77
Tap water collection response rate for the VOCs subsample
VOCW = RSVOCW = Number of households with tap water collected at the dwelling
RSVOC Number of households selected for the subsample
Note:
Because of a problem with data processing in cycle 3, some of the information required to calculate the
tap water collection response rate is missing. The tap water collection response indicator is only available
for households where at least one respondent completed the questionnaire rather than it being available
for all respondent households as originally planned.
Tap water VOCs lab measure response rate
VOCWV = RSVOCWV = Number of households with valid data for tap water VOCs
RSVOCW Number of households with tap water collected at the dwelling
Tap water VOCs subsample household combined response rate
VOCHRR = HR * VOCW * VOCWV
where the CHMS household response rate (HR) is described in Section 10.1.1.
10.1.6.2 Blood VOCs subsample person response rates
Of the 3,351 respondent households who provided water for the tap water VOCs subsample, 2,667 were
selected for the blood VOCs subsample and 2,527 of these provided blood and had valid VOCs
measures. At the Canadian scale, a combined response rate of 53.9% was observed. This was calculated
using the formula below. It is important to note that the combined response rate is usually not obtained
by multiplying the response rates at the person and household level, if two persons were selected in some
households. However, since only one person was selected per household for the blood VOCs subsample,
the combined response rate could also be obtained by multiplying the response rates. Hence, the formulas
presented in this section could be simplified but they are presented this way to maintain consistency with
other subsamples. Appendix 7I shows the blood VOCs subsample combined response rates and the
relevant information for calculating them for the given age groups by gender.
Response rate for the blood VOCs measure among households where one person was selected for
the CHMS
Number of persons with valid data
BC1VOC = B1VOC = among households where one person was selected
PS1VOC Number of persons selected for the subsample
among households where one person was selected
Response rate for the blood VOCs measure among households where two persons were selected for
the CHMS
Number of persons with valid data
BC2VOC = B2VOC = among households where two persons were selected
PS2VOC Number of persons selected for the subsample

Canadian Health Measures Survey (CHMS) Data User Guide: Cycle 3
78
among households where two persons were selected
The following response rates are not shown in the Appendix 7I but they will be used in the combined
response rate calculation for the blood VOCs subsample.
Response rate to the questionnaire for the persons with tap water collected at the dwelling for
VOCs, among households where one person was selected for the CHMS
Number of questionnaire respondents with tap water collected at the dwelling
PQ1VOC = among households where one person was selected
Number of persons with tap water collected at the dwelling
among households where one person was selected
Response rate to the questionnaire for the persons with tap water collected at the dwelling for
VOCs, among households where two persons were selected for the CHMS
Number of questionnaire respondents with tap water collected at the dwelling
PQ2VOC = among households where two persons were selected
Number of persons with tap water collected at the dwelling
among households where two persons were selected
Response rate to the MEC for the persons with tap water collected at the dwelling for VOCs,
among households where one person was selected for the CHMS
Number of MEC respondents with tap water collected at the dwelling
PC1VOC = C1VOCW = among households where one person was selected
PQ1VOCW Number of questionnaire respondents with tap water collected at the dwelling
among households where one person was selected
Response rate to the MEC for the persons with tap water collected at the dwelling for VOCs,
among households where two persons were selected for the CHMS
Number of MEC respondents with tap water collected at the dwelling
PC2VOC = C2VOCW = among households where two persons were selected
PQ2VOCW Number of questionnaire respondents with tap water collected at the dwelling
among households where two persons were selected
To combine the response rate, the ratio of households with tap water collected at the dwelling where one
person was selected for the CHMS and the ratio of households with tap water collected at the dwelling
where two persons were selected for the CHMS are calculated:
Ratio of households with tap water collected where one person was selected for the CHMS
Number of households with tap water collected at the dwelling
RR1VOC = HQ1VOCW = among households where one person was selected
HQVOCW Number of households with tap water collected at the dwelling
where HQVOCW = HQ1VOCW + HQ2VOCW
Ratio of households with tap water collected where two persons were selected for the CHMS

Canadian Health Measures Survey (CHMS) Data User Guide: Cycle 3
79
Number of households with tap water collected at the dwelling
RR2VOC = HQ2VOCW = among households where two persons were selected
HQVOCW Number of households with tap water collected at the dwelling
where HQVOCW = HQ1VOCW + HQ2VOCW
Blood VOCs subsample combined response rate
VOCPCRR = HR * VOCW * [ ( RR1VOC * PQ1VOC * PC1VOC * BC1VOC )
+ ( RR2VOC * PQ2VOC * PC2VOC *BC2VOC ) ]
The CHMS household response rate (HR) is described in Section 10.1.1. The tap water collection
response rate (VOCW) is described in Section 10.1.6.1.
Because of a problem with data processing in cycle 3, some of the information required to calculate the
tap water collection response rate is missing. The tap water collection response indicator is only available
for households where at least one respondent completed the questionnaire rather than it being available
for all the respondent households. Therefore, the tap water collection response rate and the questionnaire
response rate for respondents with tap water collected at the dwelling could not be calculated separately.
The questionnaire response rate is included in VOCW described above and the PQ1VOC and PQ2VOC
response rates are exceptionally equal to 1 in cycle 3 therefore they are not presented in the Appendix 7I
in cycle 3.
10.2 Errors in surveys
A survey yields estimates based on the information collected from a sample of persons. Somewhat
different estimates may have been obtained if a complete census had been conducted using the same
questionnaire, the same interviewers, the same measurement experts, the same supervisors, the same
processing methods, etc. as used for the survey. The difference between the estimates based on the
sample and those resulting from a complete enumeration conducted under similar conditions, is called the
sampling error of the estimates.
In addition, errors that are not related to sampling may be made at almost any stage of a survey.
Interviewers may have misunderstood the instructions, respondents may have made errors when
completing the questionnaire, responses may have been incorrectly captured, measurements may have
been made incorrectly, and errors may have crept in when the data were processed and totalled. These are
all examples of non-sampling errors.
10.2.1 Non-sampling errors
Over a great number of observations, random errors will have little effect on the estimates drawn from
the survey. However, errors that occur systematically will contribute to biases in the estimates from the
survey. Much time and effort was devoted to reducing non-sampling errors in the survey. Quality
assurance measures were applied at each stage of the data collection and processing cycle to control the
quality of the data. Further details on the quality assurance procedures for each stage of the survey are
provided in Section 10.3 - Quality assurance and control.
The effect of non-response on survey results is a major source of non-sampling error in surveys. The
scope of non-response varies from partial non-response (where the respondent does not respond to one or
Canadian Health Measures Survey (CHMS) Data User Guide: Cycle 3
80
more questions) to total non-response. In cycle 3 of the CHMS, there is little partial non-response, since
once the questionnaire began, respondents tended to complete it. There was total non-response when the
person selected to participate in the survey refused to do so or could not be contacted by the interviewer.
Cases of total non-response were taken into account during weighting by correcting the weights of
persons who responded to the survey in order to compensate for those who did not respond. See Chapter
9 for more information on how the survey weights were adjusted to account for non-response.
10.2.2 Sampling errors
Since the estimates from a sample survey inevitably include sampling errors, good statistical methods
require researchers to provide users with some indication of the scope of this error. Measuring the
possible scope of sampling errors is based on the standard error of the estimates drawn from the survey
results. For a survey with a complex design, such as the CHMS, the standard error is calculated from the
bootstrap replicates (see Section, 9.10 on the creation of the bootstrap weights and Chapter 12 on
guidelines for tabulation, analysis and release for more information). To get a better indication of the size
of the standard error, it is often more useful to express the standard error in terms of the estimate being
measured. The resulting measure, called the coefficient of variation (CV), is obtained by dividing the
standard error of the estimate by the estimate itself, and it is expressed as a percentage of the estimate.
For example, assume that a person estimates that 20% of Canadians aged 12 to 79 smoke regularly and
this estimate has a standard error of 0.005. The CV of this estimate is then calculated as follows:
(0.005 / 0.20) x 100% = 2.5%
Statistics Canada often uses the CV results for data analysis, and it strongly advises users producing
estimates based on the data files from cycle 3 of the CHMS to do the same. Table 10.1 provides the
Statistics Canada guidelines for releasing estimates based on their CV.

Canadian Health Measures Survey (CHMS) Data User Guide: Cycle 3
81
Table 10.1 Sampling variability guidelines
Type of
Estimate
CV (in %) Guidelines
Acceptable 0.0 ≤ CV ≤
16.6
Estimates can be considered for general unrestricted release.
Requires no special notation.
Marginal 16.6 < CV ≤
33.3
Estimates can be considered for general unrestricted release
but should be accompanied by a warning cautioning
subsequent users of the high sampling variability associated
with the estimates. Such estimates should be identified by
the letter E (or in some other similar fashion).
Unacceptable CV > 33.3
Statistics Canada recommends not to release estimates of
unacceptable quality. However, if the user chooses to do so
then estimates should be flagged with the letter F (or in
some other fashion) and the following warning should
accompany the estimates: “The user is advised that . . .
(specify the data) . . . do not meet Statistics Canada’s
quality standards for this statistical program. Conclusions
based on these data will be unreliable and most likely
invalid. These data and any consequent findings should not
be published. If the user chooses to publish these data or
findings, then this disclaimer must be published with the
data.”
10.3 Quality assurance and control
There are many problems that can introduce errors in a direct measures survey. These errors can
significantly affect the integrity of survey results. To ensure the success of the CHMS in meeting its
objectives, quality assurance (QA) and quality control (QC) measures were implemented in all processes
including those described below and previously in Chapter 7 (Data Collection).
QA anticipates problems and therefore consists of those activities that take place before data collection or
in improving and refining data collection. QC responds to observed problems and thus consists of those
activities that take place during and after data collection. The goal of QA and QC is to ensure the
reliability and validity of the data and to reduce systematic bias to the lowest possible level.
10.3.1 Training of household interviewers and Mobile Examination Centre (MEC) staff
10.3.1.1 Initial training
Training of all staff emphasized the goals and objectives of the survey, survey methodology, and quality
control guidelines. Training also included questionnaire/application content and functionality,
standardization of survey procedures, data transmission, refusal conversion techniques, and
administrative procedures.

Canadian Health Measures Survey (CHMS) Data User Guide: Cycle 3
82
Training involved both classroom training and mandatory reading of procedures and training manuals.
The core of the position specific training involved hands-on practice with instructors. Experts from
various fields related to the survey measures (e.g., blood pressure) and biospecimen collection/processing
protocols provided seminar sessions to the appropriate staff and participated in aspects of the hands-on
training.
Household interviewers:
Three days of training were provided to household interviewers prior to collection. Household
interviewers took part in mock interviews to familiarize themselves with new household questionnaire
content, to simulate difficult situations and to practice potential non-response situations. They also
discussed techniques for dealing with sensitive questions.
Retraining was conducted with household interviewers whenever clarification was needed on the
household questionnaire or collection procedures.
MEC staff:
Three weeks of training was provided to MEC staff prior to collection. The administrative staff received
specific training on refusal conversion techniques and telephone skills.
The health measures specialists were provided additional training on calibration and maintenance of
equipment, health and occupational safety guidelines (including both respondent and staff safety),
emergency procedures and media awareness. They also received specific training on Canadian Physical
Activity, Fitness and Lifestyle Approach (CPAFLA)5 protocols, blood pressure and heart rate
measurement, skin pigmentation, FENO, spirometry, hearing and on how to accommodate respondents
with disabilities.
The laboratory technologists received supplementary training on blood and urine collection, processing,
storage, and running of laboratory tests, as well as re-enforcement training on laboratory protocols.
The site logistics officer received specific training on how to set up the trailers for the beginning of
collection at each site and how to prepare the trailers for their move to the next collection site once
collection was finished. As well, the site logistics officers received training on information technology
maintenance and troubleshooting.
10.3.1.2 Dress rehearsal
Before the start of the actual survey, a five day dress rehearsal was done in Montreal using Statistics
Canada, Health Canada and Public Health Agency of Canada employees and their relatives who
volunteered as well as members of the general public through a recruitment agency. The purpose of the
dress rehearsal was to allow both the household interview staff and the MEC staff to practice their skills
before beginning collection. The MEC staff had the opportunity to set-up, run, and prepare the MEC
trailers for transportation to another location in the same format as was to be done during the actual
survey. This included booking volunteers into the MEC using the same schedule that the staff was going
to use when operating at a site. The dress rehearsal also allowed the MEC staff the opportunity to refine
the flow through the MEC and work on other processes that needed testing (e.g., shipping). The dress
rehearsal allowed for verification of the accuracy of the documentation (e.g., procedures manuals), as
well as, the household interview and MEC staff’s understanding of the procedures, processes, and the
flows. It also allowed for training/re-training issues to be identified prior to going into the field.
Canadian Health Measures Survey (CHMS) Data User Guide: Cycle 3
83
10.3.1.3 Ongoing training – Dry run day
Prior to the start of collection at each site, one day was set aside for community volunteers to participate
in a visit to the MEC. These days were referred to as dry runs. The purpose of the dry runs was to ensure
that all the equipment was functioning correctly and to test the precision of the analytical laboratory tests.
It also provided the MEC staff with the opportunity to practice their skills before the beginning of the
collection sites, as well as perform on-going training.
10.3.1.4 Annual retraining
Half way through cycle 3, the household interviewers took part in a debriefing and retraining session.
During this session, items that were discussed included changes to the collection application and a
refresher on selected sets of questions.
A ten day annual retraining at head office was attended by MEC staff during the middle of cycle 3. These
sessions were similar to the initial training and were performed in collaboration with experts in different
fields related to the survey but focused on elements that specifically needed retraining.
10.3.2 Household component
10.3.2.1 Monitoring – Household interview
A rotating schedule of observations ensured that each interviewer was observed two or three times per
year. Additional observations were conducted for new interviewers. Formal debriefing sessions were held
in two of the sixteen sites where factors affecting data quality were discussed.
In addition to monitoring the work of the interviewers, staff from head office performed interview
observations to monitor the functionality of the household interviewing system, the respondents’
understanding of the household survey content and the usefulness of the communications tools.
Observers provided feedback on these items to the content development and respondent relations teams
at head office, and problems were addressed as required.
10.3.2.2 Household questionnaire response rates
Monitoring of the household collection response rates were conducted throughout the cycle by staff at
head office preparing collection progress reports. Staff monitored the reasons for non-response by age
and sex, the number of contact attempts, the distribution of contact attempts by time of day, the refusal
rates and refusal conversions attempts, and the distribution of the fasting/non-fasting flag to ensure that
the target number of respondents per age and sex group would be achieved.
10.3.2.3 Validation of questionnaire responses
At the end of each site, notes and remarks made by interviewers within a respondent’s case file were
reviewed and adjustments to the data were made when required. Feedback from this review was provided
to the household interviewers as required. In addition, the frequency of answer categories within a
question was determined for “other-specify”, “don’t know”, and “refusal”. Questions with a high rate of
Canadian Health Measures Survey (CHMS) Data User Guide: Cycle 3
84
non-response were monitored according to expected rates from other Statistics Canada health surveys
and investigated if the rate was higher than expected.
Validation of questionnaire responses was also performed on questions that are included in other
Statistics Canada health surveys with similar content, in particular, the Canadian Community Health
Survey – Annual Component.
10.3.3 Mobile examination centre (MEC) component
The following section will provide information concerning the quality assurance (QA) and quality
control (QC) procedures that were put in place and are specific to collection of the physical measures and
laboratory data during the visit to the MEC.
10.3.3.1 Equipment selection
The quality of the equipment used for collection was essential to ensure data accuracy and validity. In
selecting the appropriate equipment, a combination of consulting, researching, testing, and evaluation
was completed. This was done considering industry standards and in conjunction with partners (Health
Canada, Public Health Agency of Canada), experts from other physical measures surveys (e.g., National
Health and Nutrition Examination Survey (NHANES) in the United States) and CHMS advisory
committees.
When determining the MEC laboratory equipment needs, many considerations were taken into account
such as the size of the equipment (due to space constraints), the cost of the equipment, the accuracy and
precision of the testing equipment, as well as the comparability to other international surveys. The
reliability of the instrumentation, including frequency of breakdowns, repairs and maintenance, were also
examined. Other items considered when selecting the equipment used for data collection include the
infrastructure needs (e.g., use of water, energy consumption, waste disposal), the ease of operation and
maintenance, training courses included, the availability and timeliness of service throughout the country,
the laboratory biosafety guidelines, and the test throughput.
10.3.3.2 Protocols and procedures
To ensure consistency between MEC staff on all measurement techniques, procedure manuals containing
detailed protocols for each measure were developed. These protocols were developed in consultation
with, and reviewed by experts in each measurement field (when appropriate), ensuring the highest quality
and least biased data collection. For standardization purposes, these protocols were covered thoroughly
during staff training and scripted within the data capture application. Staff members were required to
review these protocols periodically during collection so as to keep themselves up to date. When changes
to protocols were made, all staff members were informed and provided with the updated protocols, re-
training was provided if necessary. All changes to protocols were documented (date of update, reason for
updating, process that was followed).
An Equipment Verification, Calibration and Maintenance Manual was developed to ensure that
appropriate calibration and maintenance of all testing equipment was performed during collection. The
calibration and maintenance was performed to meet or exceed the standards established by the equipment
manufacturers.
Experts were consulted for the MEC laboratory standard operating procedures (SOP). The SOP includes
information on pre-analytical functions (biospecimen treatment time, storage and shipping conditions),
Canadian Health Measures Survey (CHMS) Data User Guide: Cycle 3
85
testing protocols (e.g., complete blood count (CBC)), quality control procedures and equipment use,
calibration, and maintenance.
All CHMS reference laboratories also followed standard operating procedures that were developed for
every test and technique performed in these laboratories. These provided uniform assay protocols that
laboratory staff used to ensure similar results and consistent performance. The majority of the reference
laboratories are also ISO 19025 certified.
10.3.3.3 Mobile examination centre (MEC) environment
All efforts were made to ensure measurements were carried out under controlled and standardized
conditions and according to specified procedures. Due to the fact that certain measures and equipment
were highly sensitive to changes in room temperature (e.g., spirometry, blood pressure), every effort was
made to keep the MEC at a comfortable and constant room temperature (21°C ± 2°C). The environmental
conditions of the MEC testing rooms (temperature, humidity and barometric pressure) were recorded at a
minimum once per shift, as well as anytime the temperature went outside of the ± 2°C range. In addition,
careful monitoring of the conditions within the MEC laboratory were undertaken to ensure that the
collection, analysis, storage and shipment of samples were performed under the appropriate conditions.
10.3.3.4 Adherence to pre-testing guidelines
At the beginning of the visit to the MEC, adherence to the pre-testing guidelines (see Appendix 4) was
verified and documented within the data capture application and adherence rates were assessed at head
office. The purpose of these guidelines was to ensure testing standardization by minimizing the potential
that external factors would affect the results of certain tests. Pre-testing standardization was done to
enhance the quality of the data collected.
10.3.3.5 Equipment monitoring
Regular verification, calibration, and maintenance of all the equipment used for data collection during the
CHMS was performed to ensure data accuracy and validity. This testing was performed to meet or
exceed the standards established by the equipment manufacturers and experts in the field.
10.3.3.6 Data entry verification
All paper forms such as the respondent verification sheet and the consent form were manually entered
and subsequently verified by a manager to ensure data entry accuracy.
10.3.3.7 MEC – data collection monitoring
Senior staff at the MEC, staff from head office, and certain subject matter experts took turns observing
data collection at the MEC. A rotating schedule of observations ensured that each MEC staff member
was observed two or three times per year. Additional observations were conducted for new MEC staff.
Observers provided feedback on these items to the MEC staff and to the content development and quality
control teams at head office, and problems were addressed as required.
Replicate measurements were done regularly at the MEC on the anthropometry component. This allowed
an assessment of the inter- and intra-reliability of measurements performed by the MEC staff.

Canadian Health Measures Survey (CHMS) Data User Guide: Cycle 3
86
10.3.3.8 Spirometry data review
All spirometry tests were reviewed by an external reviewer via a custom application that was developed
for the CHMS. The application was designed to identify unacceptable efforts based on American
Thoracic Society testing17 criteria. The reviewer’s role was to validate the effort acceptability information
set by the application, and assign reliability and quality information to assist users with data analysis.
All tests were reviewed and assigned a test reliability factor (SPM_RELI; reliable or not reliable) to
identify whether the test is recommended for inclusion in analysis. All acceptable trials were reviewed to
determine whether the test results for FVC and FEV1 represented a maximal effort by the respondent
(quality) and met the reproducibility criteria of 150mL. The FVC quality factor (SPM_QFVC) and FEV1
quality factor (SPM_QV1) indicate whether a reproducible FVC and/or FEV1 were obtained.
Table 10.2 Quality factors for FVC and FEV1 spirometry results
Quality factor
Description
Comments
A
Excellent quality
and reproducibility
Use in analysis.
B Good quality and
reproducibility
Use in analysis. Example: A common case is for children and
adolescents who do not exhale for the required length of time (3 or 6
seconds). If these respondent‘s trials show a 1 second plateau and
the reviewer judges that the curves represent a maximum volume
(FVC) then a code B is assigned.
C Questionable
quality and
reproducibility
Use in analysis with caution. Example: A respondent has only 2
acceptable curves which are not reproducible and the other curves
are unacceptable due to early termination and large extrapolated
volumes. However, the curves with the large extrapolated volumes
do confirm the FVC reproducibility. Example: A respondent with
chronic obstructive pulmonary disease (COPD) and a low
FEV1/FVC ratio (e.g., <0.45). Because of COPD, the respondent
cannot provide a repeatable FVC with even 8 manoeuvres. So, the
grade should be at least a C or better as the lack of an acceptable
curve due to end of test failures is not a sufficient reason to exclude
or grade the subject‘s results with a D or F.
D
Highly questionable
reproducibility and
quality
Do not use in analysis.
F
Unacceptable test
results
Do not use in analysis.
10.3.3.9 Data validation
Data validation was performed to ensure that the CHMS data were consistent with similar data sources
including other Statistics Canada surveys and international surveys. Data validation was done to compare
various physical and laboratory measures, and to compare self-reported data from the household
interview to directly measured data from the MEC visit (e.g., height, weight), by site and overall. The
physical measures data were also compared against data sources that contained directly measured data,
such as the Canadian Community Health Survey (CCHS) and the National Health and Nutrition
Examination Survey (NHANES) in the United States.
Canadian Health Measures Survey (CHMS) Data User Guide: Cycle 3
87
10.3.3.10 Activity monitor data review
A data review process was developed to clean and process the activity monitor data. The review process
was broken down into four distinct steps: Step 1 involved the downloading and saving of respondent data
to ensure that no malfunctioning monitors were returned to the field, as well as following up with
respondents who had not returned the monitor. Step 2 involved stacking all respondent data into a single
file, and dropping non-valid/bad data (such as initialization errors, or spurious data); Step 3 involved
accepting only those with at least 1 day of viable wear-time (at least 5 hours of data for 3 to 5 year olds
and at least 10 hours of data for 6 to 79 year olds), and calculating the activity intensity per minute;
finally, Step 4 involved applying reserve codes to missing data and generating the derived variables. See
Section 12.2.3.2 and Appendix 8 for more information on the quality of the activity monitor data, and on
research being done.
10.3.3.11 Replicate testing
10.3.3.11.1 Anthropometry replicate testing
Two types of anthropometry replicates were done; between the same HMS referred to as intra-tester, or
between the HMS and a gold standard tester referred to as inter-tester. Intra-tester replicates are a means
of comparing consistency of results amongst the same HMS whereas inter-tester replicates are a means of
comparing consistency of results to the gold standard tester. Intra-tester replicate measurements of all the
measures of the anthropometry component were completed on 13.9% of respondents that attended the
clinic. Inter-tester replicate measurements of all the measures of the anthropometry component were
completed at the beginning of the cycle with 20 volunteers and a gold standard tester.
10.3.3.11.2 Laboratory replicate testing
Replicate samples were collected during dry-run days at the beginning of each site for a variety of
laboratory tests (such as complete blood count), and a number of biochemistry tests and environmental
exposure tests. Approximately 10 (3 for the environment testing) dry-run replicate samples were
performed by splitting the blood and urine samples from the participants into two distinct specimen tubes
with different identification numbers (IDs). As the corresponding split sample IDs were unknown to the
technician/technologist testing the samples, these “blind QC samples” were meant to monitor the
precision of the assay. Poor performance was inferred if the coefficient of variation obtained from the
replicate samples was greater than the pre-set criteria. All replicate samples were sent to the reference
laboratories along with other respondent samples and were analyzed following the same procedures as
respondent samples. Data from the dry-run replicate samples were transmitted as usual along with the
other respondent results. The lab section at head office analysed them and all results outside of the
acceptable limits were followed up on with the testing laboratory.
10.3.3.12 Mobile examination centre (MEC) laboratory
Procedures were put into place to allow for quick detection of errors related to the MEC laboratory CBC
analysis. These procedures included internal and external QC monitoring, and allowed the CHMS to ensure
accurate results and data quality for laboratory measures completed on-site. Aside from incorporating
reference material and calibrations at every shift, regular comparisons were made with QC results obtained by
peer users of the same hematology analyzer employed by the CHMS. In addition, the laboratory participated
in the analysis of external comparisons from the College of American Pathologists (CAP) according to their
respective schedules. The results of these blind QC samples provided an evaluation of the testing accuracy.
Canadian Health Measures Survey (CHMS) Data User Guide: Cycle 3
88
Specific gravity was measured on a portable device following a normalized procedure. Reference material
was used on every shift to ensure the precision and the validity of the results.
10.3.3.13 Proficiency testing
All CHMS reference laboratories were responsible for having their own (QC) programs in place and to
participate in interlaboratory/proficiency testing when available. However, the CHMS also sent reference QC
materials as a form of proficiency testing for the reference laboratories. The CHMS used commercial and
custom control samples with known concentrations for all tests included in the CHMS for which reference
QC samples were available. The use of these materials allowed the CHMS to monitor the accuracy and
precision of the analytical testing being performed at the reference laboratories. The CHMS mobile
examination centre (MEC) laboratory sent these control samples to the reference laboratories on a weekly
basis during each collection site along with the regular shipments. The test samples were aliquotted into the
same type of shipping tubes used for respondent samples and were labelled with unique sample identification
numbers so as to blind the laboratories to the process. Testing results were sent back to the CHMS head office
and were compared to the known reference ranges. The test results were assessed by head office laboratory
staff and feedback was provided to the reference laboratories for review and remedial action, if necessary.
10.3.3.14 Processing and storage of blood and urine samples
All blood specimens collected at the MEC were centrifuged in the MEC’s laboratory within three hours (two
hours for vitamin C) of collection to preserve the quality and integrity of the specimens. The specimens were
stored at the appropriate temperature (e.g., 2-6°C fridge or -30°C freezer) and the fridge and freezer
temperatures were monitored via readings during each staff’s shift and by an alarm system at all times. Urine
samples were refrigerated immediately upon collection and were subsequently processed and stored at the
appropriate temperature as soon as possible.
10.3.3.15 Shipping
As described in the Laboratory Measures Protocols (see Section 7.6), shipment temperature monitoring
ensured that only results from samples whose integrity remained intact were maintained.
10.3.3.16 Field blanks
In order to ensure that urine and blood samples were not being contaminated by the MEC laboratory
environment and processes, at the beginning of every site the MEC lab sent field blanks, in triplicate, to the
laboratory testing the respondent samples. A blank solution free of any environmental contaminants was used
to mimic the same processes carried out with respondent samples for collection and processing of certain
environmental measures on blood and urine. Deionized water was used as the blank solution for the baseline
testing of urine and blood environmental measures with the exception of mercury for which a nitric acid and
gold solution was used.
The field blank results were compared to an acceptable upper limit that was set at three times the limit of
detection of each analyte or to an acceptable upper limit that was not more than 10% of the 95th percentile of
the population. Results above these limits were reviewed by head office staff and deviations were
investigated. In consultation with the analytical lab and other experts, corrective action was taken if
necessary.
Canadian Health Measures Survey (CHMS) Data User Guide: Cycle 3
89
10.3.3.17 Tap water blanks
In order to ensure that shipping and storage conditions were not a source of contamination for the tap
water VOC bottles, Health Canada prepared travel blanks and blind blanks.
10.3.3.17.1 Tap water travel blanks
Water VOC bottles were filled with spring water in the Health Canada lab, shipped to the interviewers,
then refrigerated with bottles used for collection and shipped back to Health Canada for analysis within a
7 to 10 day period (one was returned with every tap water VOC shipment to Health Canada).
10.3.3.17.2 Tap water blind blanks
Health Canada prepared 8 water VOC bottles with distilled organic-free water before every site. These
were shipped to the interviewers, then refrigerated with bottles used for collection and shipped back with
the regular shipment to Health Canada periodically for analysis.
10.3.3.18 Hearing data review
All tympanometry, DPOAE and audiometry tests were reviewed by an external reviewer via a custom
application that was developed for the CHMS. The reviewer’s role was to assign test result acceptability
to assist users with data analysis.
All tests were reviewed and assigned a test acceptability factor to identify whether the tests are
recommended for inclusion in analysis. The reviewer had access to the respondent’s age and gender as
well as his/her responses to a number of pertinent screening questions (whether the respondent had had
ear surgery within the 3 months leading up to the clinic visit; whether the respondent had an acute
infection /pain; whether the respondent had a hearing aid; whether the respondent had ever experienced
tinnitus; whether the respondent had listened to loud music on the day of the clinic visit; whether the
respondent had been exposed to loud noise without hearing protection within 24 hours of the clinic visit;
whether the respondent had ever been diagnosed with a hearing problem) and observations from the
otoscopy test (visual, non-diagnostic examination of the outer ear) in order to provide additional
information to assist the reviewer in evaluating the overall results.
Table 10.3 Test acceptability factors for hearing results
Acceptability factor
Description
TYM_QC
Tympanometry test acceptable or not acceptable
OAE_QCR
DPOAE test on the right ear acceptable or not acceptable
OAE_QCL
DPOAE test on the left ear acceptable or not acceptable
AUD_QCR
Audiometry test on the right ear acceptable or not acceptable
AUD_QCL
Audiometry test on the left ear acceptable or not acceptable
Canadian Health Measures Survey (CHMS) Data User Guide: Cycle 3
90
10.3.4 Head office
10.3.4.1 Correcting for bias
The CHMS experienced several levels of non-response. First, the selected dwelling may refuse to provide
the household composition or refuse to provide tap water. Second, the person(s) selected amongst the
household members may refuse to answer the questionnaire. Third, the person may refuse to participate
in the MEC component. The person may refuse to provide blood and/or urine for the laboratory tests for
current or future analysis. Finally, the participants may refuse to use or not return the activity monitor
and/or the indoor air sampler provided at the MEC.
At each level of non-response, characteristics available for respondents and non-respondents are used in a
logistic regression model to identify variables which explain most non-response. The variables which
were highly correlated with response or non-response and which were used in the logistic regression
models included collection site, age group, sex, household size, education, income, travel distance to the
MEC, and the number of days and weeks to contact the dwelling and complete the household
questionnaire. Based on the results of each regression, homogeneous response groups are created. The
non-response adjustments are applied within these groups to adjust the survey weights (see Chapter 9 -
Weighting). Using the survey weights to create estimates will minimize non-response bias due to
differences in the survey variables between respondents and non-respondents.
Several studies were done on the cycle 1 data to test for bias in the respondents to the MEC, because it
was believed that less healthy people were less likely to go to the MEC, and for bias caused by the
oversampling of respondents aged 20 to 39 who were living with children aged 6 to 11.19 The results
showed that MEC respondents, with the adjustment for MEC non-response, are similar to the household
questionnaire respondents. Although the cycle 1 data did not show a significant bias due to the 2-person
selection strategy which favoured the selection of a 20 to 39 year old living with a child aged 6 to 11, it
was anticipated that a greater bias would be observed in cycle 2 with the addition of the 3 to 5 age group.
To compensate for any potential bias, the survey weights and bootstrap weights for cycles 2 and 3 were
created using a post-stratification by age group and sex, with an additional adjustment for 20 to 39 year
olds living with and without children aged 3 to 11.
Information on the treatment of other missing data such as partial non-response and lab results with
values outside the analytical range can be found in Sections 12.1.2 and 12.1.3.
10.3.4.2 Red blood cell folate data
The CHMS measured folate in red blood cells (RBC folate) rather than serum folate in order to obtain an
indicator of long-term folate status in the body, not influenced by recent dietary intake; however, RBC
folate measurements are subject to high intra-individual biological variation and significant analytical
imprecision. Furthermore, RBC folate measurements require the preparation of a hemolysate which, for
field-based epidemiological studies like the CHMS, can be operationally difficult to perform on site.
Thus, whole blood samples were sent frozen to the analytical laboratory once a week for testing,
potentially introducing additional inaccuracies and imprecision to the data.

Canadian Health Measures Survey (CHMS) Data User Guide: Cycle 3
91
11. File Usage
11.1 Description of data files
The Canadian Health Measures Survey (CHMS) dissemination files only contain data from respondents
who attended the mobile examination centre (MEC) and agreed to share their responses with Health
Canada (HC) and the Public Health Agency of Canada (PHAC). For cycle 3 of the CHMS, after the
completion of processing, and with the removal of non-share records1, 5,785 records remain on the full
sample data files.
There will be 23 data files released for CHMS cycle 3, with the releases occurring in seven waves.
See Section 12.2.4 for information on combining data from multiple cycles of the survey.
Wave Files Released Data File
Name*
Corresponding
Bootstrap
Weights File*
Date of
Release
1
• Household full sample file
Contains household
questionnaire data, except for
medication
data.
•
Clinic full sample file
Contains
clinic questionnaire and physical measures
data, except for medication, activity monitor and
indoor air data.
•
Postal code file
Contains postal code information for each
respondent in the survey
(special restrictions are in
place for the use of this file)
.
•
Climate and air quality file
Ancillary data on climate and air quality for each
MEC site across Canada (data comes from national
and provincial
weather organizations such as
Environment Canada).
hhd_full
clc_full
pc
caq
wgt_full
wgt_full
**
**
Oct 29,
2014

Canadian Health Measures Survey (CHMS) Data User Guide: Cycle 3
92
Wave Files Released Data File
Name*
Corresponding
Bootstrap
Weights File*
Date of
Release
2
•
Activity monitor full sample file
•
Non-environmental lab data full sample file
•
Activity monitor subsample file
•
Fasted subsample file
•
Red blood cell fatty acids subsample file
•
Household full sample file (revised)
Contains household questionnaire data, except for
medication data.
•
Clinic full sample file (revised)
Contains clinic questionnaire and physical measures
data, except for medication, activity monit
or and
indoor air data.
am_full
nel_full
am_sub
fast_sub
fta_sub
hhd_full
clc_full
wgt_full
wgt_full
wgt_am
wgt_fast
wgt_fta
wgt_full
wgt_full
Dec 16,
2014
2
(Revised)
• Activity monitor full sample file (revised)
•
Activity monitor subsample file (revised)
•
Activity monitor subsample weight file (revised)
am_full
am_sub
wgt_am
wgt_full
wgt_am
**
Jan 29,
2015
3
• Medication full sample file
(except for derived variables – date to be
determined)
med_full
wgt_full
Feb 18,
2015
4
•
Hearing full sample file
•
Fluoride household level subsample file (in tap
water)
•
Volatile organic compounds household level
subsample file (in tap water)
•
Fluoride person level subsample file (in urine
and tap water)
•
Volatile organic compounds person level
subsample file (in blood and tap water)
hrc_full
flh_sub
voch_sub
flp_sub
vocp_sub
wgt_full
wgt_flh
wgt_voch
wgt_flp
wgt_vocp
Apr 15
,
2015

Canadian Health Measures Survey (CHMS) Data User Guide: Cycle 3
93
Wave Files Released Data File
Name*
Corresponding
Bootstrap
Weights File*
Date of
Release
5
• Environmental lab blood and urine full sample
file
•
Acrylamide (environmental blood subsample)
file
•
Methyl mercury (environmental blood
subsample) file
•
NNK metabolites (environmental urine
subsample) file
•
Environmental urine (main subsample) file
el_full
acry_sub
mehg_sub
nnk_sub
eu_sub
wgt_full
wgt_acry
wgt_mehg
wgt_nnk
wgt_eu
Jul 15,
2015
6
•
Indoor air subsample file – household level
•
Indoor air subsample file – person level
iash
iasp
wgt_iash
wgt_iasp
Sept 16
,
2015
7
•
Environmental pooled serum data file
(details to be worked out – likely separate data
user documentation)
TBD
TBD
approx.
Fall
2016
*All files are available in .txt and .sas7bdat formats.
** The postal code and climate and air quality files are always used in conjunction with another file and its corresponding bootstrap
weights file. In many cases, it will be the full sample bootstrap weights file (wgt_full.txt) that is used with these files.
Most of the data files listed in the table above contain a weight variable. The bootstrap weight files
contain more detailed information (i.e. 500 bootstrap weight variables for variance calculation purposes).
More information on bootstrap weights and weighting can be found in Chapter 9.
The survey includes respondents 3 to 79 years of age; however, some of the measures or tests were only
done for one sex, on fasting respondents, or on a random subgroup of ages. Refer to the CHMS Content
summary (available upon request) for more information. For information regarding the actual questions
asked of the respondents, users can consult the household and clinic questionnaires at the following link:
http://www23.statcan.gc.ca/imdb/p2SV.pl?Function=getSurvInstrument&SurvId=145921&InstaId=1366
52
Canadian Health Measures Survey (CHMS) Data User Guide: Cycle 3
94
11.1.1 Household full sample file
This data file contains the responses collected during the household interview, except for the medication
derived variables which will be released in the fall of 2015.
The file also contains derived variables (DVs) created by the collection applications and other DVs
created after data processing. A household/MEC DV document is available that contains information on
how these DVs are created/calculated.
Each of the 5,785 records represents one respondent who went to the MEC, participated in at least some
of the measures, and then agreed to share their household and MEC results with HC and PHAC.
The data contained in this file covers household questionnaire content on the following topics:
• Alcohol use
• Anthropometry
• Chronic conditions
• Environmental exposure
• Family medical history
• General health
• Infection markers
• Lung health
• Musculoskeletal fitness
• Nutrition
• Physical activity
• Pregnancy/Birth
• Sexual health
• Sleep
• Smoking
• Socio-demographic characteristics
11.1.2 Clinic full sample file
This data file contains the responses collected during the MEC visit (questionnaire responses and
physical measures results), except for indoor air sampler data and derived variables for medication.
Indoor air sampler data will be released on September 16, 2015 (wave 6) and derived variables for
medication data in the fall of 2015.
The file also contains derived variables (DVs) created by the collection applications and other DVs
created after data processing. A household/MEC DV document is available that contains information on
how these DVs are created/calculated.
Each of the 5,785 records represents one respondent who went to the MEC and participated in at least
some of the measures and then agreed to share their household and MEC results with HC and PHAC.

Canadian Health Measures Survey (CHMS) Data User Guide: Cycle 3
95
The data contained in this file covers clinic questionnaire and/or physical measures content on the
following topics:
• Anthropometry
• Cardiovascular health and fitness
• Environmental exposure (questions only related to indoor air – measured data for these
variables will be available September 16, 2015)
• Hearing and noise exposure
• Lung health
• Musculoskeletal fitness
• Nutrition (Fish and shellfish consumption)
• Physical activity
• Skin pigmentation
• Sun exposure
11.1.3 Postal code file
This file contains the six character postal code (DHH_DPC) for all 5,785 persons who participated in the
survey, along with their CLINICID (see Section 11.2). The file is only available in Statistics Canada
Research Data Centers (RDCs). Users will need to link the postal code file to another data file, such as
the full sample household or full sample clinic data file, as well as to the corresponding bootstrap weights
file in order to produce estimates for the total population (see Section 11.4). Researchers must
specifically state the need for the file in their RDC application (as it is separate from other CHMS data
files) and must clearly explain what analysis will be done using postal codes.
Users need to be aware of the restrictions on the use of this file. The file can only be used for deriving
variables that are to be created and analyzed at the national level. It cannot be used to try to produce
small area estimates, as the survey is designed only for national level estimates. The file must be used at
the person level with the appropriate weights. It cannot be used to compare members of the same
household or for producing household estimates since household weights are not available.
As with all other data, the postal codes of respondents may not be removed from the RDCs; however, a
public document is available for each cycle of the survey that lists all CHMS collection sites along with
the forward sortation area (first three characters of the postal codes) that are covered off geographically
by each site.
11.1.4 Climate and air quality file
Two lung function tests are included as part of the cycle 3 CHMS MEC visit: spirometry and fractional
exhaled nitric oxide (FENO). As lung function can be affected by the atmosphere, adjustments based on
the weather and air quality at the time of the test may be required in order to analyze the data. To address
these needs, a file listing the hourly climate and air quality data for the collection period at each of the 16
MEC collection sites has been created. The data have been obtained from Environment Canada’s
National Climate Data and Information Archive (http://www.climate.weatheroffice.gc.ca) and from the
National Air Pollution Surveillance Network (http://www.ec.gc.ca/rnspa-naps/), a federal/provincial
collaborative network through which provincial NAPS partners collect their data and send them to
Environment Canada.
Canadian Health Measures Survey (CHMS) Data User Guide: Cycle 3
96
The following indicators are on the “climate and air quality file”:
Air quality: Ozone, nitrogen dioxide, particulate matter (2.5 microns)
Climate: Temperature, barometric pressure, precipitation, relative humidity, humidex, wind speed, wind
direction and wind chill
This file may be linked to the clinic full sample file by using the variables SITE, V2_YEAR,
V2_MONTH, V2_DAY, and V2_HOUR, which are present on both files. Upon merging the two files,
the climate and air quality information measured on the hour the respondent visited the MEC will be
appended to the clinic full sample file, meaning that there will be climate and air quality information
available for all 5,785 respondents.
Additional supporting documentation is available upon request.
11.1.5 Activity monitor subsample file
This file contains data for the 4,271 respondents who wore their activity monitor for at least 10 hours per
day (5 hours for 3 to 5 year olds) for 4 or more days. The file also contains a weight specific to this sub-
population. The vast majority of variables in this file are also located in the master file. The variables are
denoted by the prefix “AMM” on the master file and “AMS” on the subsample file. See Section 12.2.3.2
and Appendix 8 for more information on using this file.
11.1.6 Non-environmental lab full sample file
All 5,785 respondents from the clinic and household files are contained in this file. The file contains 51
different lab measures which include complete blood count, chemistry panel, biomarkers related to
nutrition, diabetes, cardiovascular and thyroid health, as well as reproduction hormones and hepatitis
levels. A complete list can be found by referring to the non-environmental lab file data dictionary.
11.1.7 Fasted subsample file
This file contains data for a subset of 2,571 of the 5,785 CHMS respondents, namely the selected
respondents who had fasted for a minimum of 10 hours. The file contains data for seven variables:
insulin, low density lipoproteins (LDL), triglycerides, glucose, apoliproproteins A1 and B, and vitamin C.
The file also contains a weight specific to this sub-population.
11.1.8 Red blood cell fatty acids subsample file
Respondents aged 20 to 79 eligible for blood draw were randomly selected to have their sample analysed
for red blood cell fatty acids. The subsample file has 1,984 respondents and 39 variables representing
polyunsaturated, cis-monounsaturated, saturated, and trans-fatty acids, along with a record identifier and
a subsample weight.
11.1.9 Hearing full sample file
All 5,785 respondents from the clinic and household files are contained in this file. The file contains 100
variables representing the results of the four hearing tests: Otoscopy, Tymponometry, DPOAE and
Audiometry as well as the test acceptability factors for the hearing results and the record identifier. A
complete list of the variables can be found by referring to the hearing full sample file data dictionary.
Canadian Health Measures Survey (CHMS) Data User Guide: Cycle 3
97
11.1.10 Fluoride household level subsample file (in tap water)
The file contains data for a subset of 2,188 of the 2,831 respondent households selected for the tap water
fluoride collection, namely the respondent households that had valid tap water fluoride laboratory results.
The file contains 3 variables representing fluoride measured in water, a record identifier and a subsample
weight.
11.1.11 Volatile organic compounds household level subsample file (in tap water)
The file contains data for a subset of 2,650 of the 3,578 respondent households selected for the tap water
VOCs collection, namely the respondent households that had valid tap water VOCs laboratory results.
The file contains 13 variables representing the results of common fuel pollutants (BTEX) and
trihalomethanes, a record identifier and a subsample weight. A complete list of the variables can be found
by referring to the volatile organic compounds household level subsample file (in tap water) data
dictionary.
11.1.12 Fluoride person level subsample file (in urine and tap water)
The file contains data for a subset of 2,671 of the 2,728 selected for the urine fluoride subsample. These
respondents provided urine and had a valid fluoride measure. The file contains data for four variables:
fluoride measured in urine, fluoride adjusted for urine creatinine, fluoride adjusted for specific gravity
and fluoride measured in water. The file also contains a record identifier and a weight specific to this sub-
population.
11.1.13 Volatile organic compounds person level subsample file (in blood and tap water)
The file contains data for a subset of 2,527 of the 2,667 selected for the blood VOCs subsample. These
respondents provided blood and had valid VOCs measures. The file contains 27 variables representing
the results of common fuel pollutants (BTEX), trihalomethanes, styrene, tetrachloroethylene,
trichloroethylene, alkanes, chlorinated hydrocarbons, furans and dioxins. The file also contains a record
identifier and a weight specific to this subpopulation. A complete list of the variables can be found by
referring to the volatile organic compounds person level subsample file (in blood and tap water) data
dictionary.
11.1.14 Environmental lab blood and urine full sample file
The file contains data for all 5,785 respondents aged 3 to 79. There are 24 variables on the file, including
some tobacco-related variables (7), metals and trace elements (4), other environmental variables (2) and
derived variables that adjusted the results for urine creatinine (10) or specific gravity (1). A complete list
of the variables can be found by referring to the environmental lab blood and urine full sample data
dictionary.
11.1.15 Acrylamide (environmental blood subsample) file
The file contains data for a subset of 2,492 of the 2,644 selected for the acrylamide blood subsample.
These respondents provided blood and had valid acrylamide measures. The file contains 2 variables:
acrylamide hemoglobin adduct and glycidamide hemoglobin adduct. The file also contains a record
identifier and a weight specific to this subpopulation.
Canadian Health Measures Survey (CHMS) Data User Guide: Cycle 3
98
11.1.16 Methyl mercury (environmental blood subsample) file
The file contains data for a subset of 1,032 of the 1,044 selected for the methyl mercury blood
subsample. These respondents provided blood and had valid methyl mercury measures. The file contains
the blood methyl mercury results and a record identifier and a weight specific to this subpopulation.
11.1.17 NNK metabolites (environmental urine subsample) file
The file contains data for a subset of 2,220 of the 2,282 selected for the NNK metabolites urine
subsample. These respondents provided urine and had valid NNK measures. The file contains 4 variables
: free NNAL, total NNAL, NNAL free adjusted for urine creatinine and total NNAL adjusted for urine
creatinine. The file also contains a record identifier and a weight specific to this subpopulation.
11.1.18 Environmental urine (main subsample) file
The file contains data for a subset of 2,538 of the 2,599 selected for the environmental urine main
subsample. These respondents provided urine and had valid results. The file contains 54 variables,
including polyaromatic hydrocarbons (17), metals and trace elements (6) and benzene metabolites (2), as
well as derived variables that contain the results adjusted for urine creatinine (24) and specific gravity
(5). No organophosphate insecticides or parabens are on this file as the quality of the data for these
variables needs to be examined more thoroughly before they can be released. The file also contains a
record identifier and a weight specific to this subpopulation. A complete list of the variables can be found
by referring to the environmental urine main subsample file data dictionary.
11.2 Key variables for linking data files
As a result of the large number of files disseminated for cycle 3, it will often be necessary to be able to
link these files to have access to a larger pool of information. In particular, users may want to link the
subsample files and medication file to the household and clinic full sample files in order to obtain
contextual questionnaire and physical measures information for their analysis. Users will also need to
link the appropriate bootstrap weights file to each data file in order to produce estimates for the total
population (see Section 12.1).
In order to facilitate the linking of two or more files, a variable that uniquely identifies each respondent
on each file is required. For the CHMS, the variable to be used is called CLINICID. With this variable,
data users are able to join the data from any subsample file to the household and clinic full sample files
for a particular respondent. The only data file that does not use CLINICID as the linking variable is the
climate and air quality file (see Section 11.1.4).
11.3 Key variables and definitions
Other variables which may be particularly useful for data users are listed below:
CLC_AGE Respondent’s age at the time of the MEC visit
CLC_SEX Gender of Respondent
DHH_MS Marital Status of Respondent
EDUDR04 Highest level of education - respondent, 4 levels
EDUDR10 Highest level of education - respondent, 10 levels
PROXY Proxy or non-proxy interview
Canadian Health Measures Survey (CHMS) Data User Guide: Cycle 3
99
WGT_FULL Weight for the following full sample files:
• Household
• Clinic
• Activity monitor
• Non-environmental blood and urine measures
• Medication
• Hearing
• Some environmental contaminants measured in blood and urine
WGT_ACMO Weight for the activity monitor subsample file
WGT_FAST Weight for the fasted subsample file
WGT_FTA Weight for the red blood cell fatty acids subsample file
WGT_FLH Weight for the fluoride household level subsample file (in tap water)
WGT_VOCH Weight for the volatile organic compounds household level subsample file (in tap water)
WGT_FLP Weight for the fluoride person level subsample file (in urine and tap water)
WGT_VOCP Weight for the volatile organic comp. person level subsample file (in blood & tap water)
WGT_ACRY Weight for the acrylamide (environmental blood) subsample file
WGT_MEHG Weight for the methyl mercury (environmental blood) subsample file
WGT_NNAL Weight for the NNK metabolites (environmental urine subsample) file
WGT_EU Weight for the environmental urine main subsample file
WGT_IASH Weight for the indoor air household level subsample file
WGT_IASP Weight for the indoor air person level subsample file
The naming convention used for the weighting variables listed above is the same as the naming
convention for the corresponding bootstrap weight files, with the only differences being the suffix in the
file name and the fact that the variable names are uppercase and the file names are lowercase. For
example, “.txt” can be removed from the bootstrap file “wgt_full” and then capitalized to obtain the name
of the weighting variable on the full sample data files.
Canadian Health Measures Survey (CHMS) Data User Guide: Cycle 3
100
11.4 Use of age and sex variables
Age and sex are collected twice during the survey process for the CHMS; first through the household
interview, then again during the MEC component. Because the two appointments could be several days
apart, it is possible that a respondent’s age could be different on the household and MEC files. Each
application uses the age and sex information that was collected as the reference for coverage and skips
patterns for sections within that application. For that reason, it is important to use the appropriate age and
sex variables for the data being analyzed. Incorrect usage of age and sex variables could lead to errors in
analyses, due to respondents whose ages changed between the two appointments. For example, a
respondent who is 11 at the time of the household interview and 12 at the time of the MEC visit will be in
different age groups depending on the data being analyzed (i.e. 6 to 11 for household analysis and 12 to
19 for MEC analysis).
For household variables, DHH_AGE and DHH_SEX should be used; whereas, for MEC variables,
CLC_AGE and CLC_SEX should be used. If variables from both components are analyzed, use the age
and sex variables for the module containing the most important variables of interest.
11.5 Use of weight variables
The CHMS is a sample survey, which means that the respondents “represent” many other Canadians not
included in the survey. For example, a 1% sample would mean that each CHMS respondent represented
100 Canadians. In order that the results of the survey are representative of the population, survey weights
were created. These survey weights, when applied to the survey results, enable data users to create
estimates for the entire population.
Each respondent record on each data file has a unique survey weight attached to it (exception climate and
air quality data file). In order to produce estimates for a particular characteristic, the data user must sum
the weights for each respondent with that characteristic. The total created by that calculation would
produce an estimate of that characteristic in the total population. There are various software packages
available that will use survey weights to produce estimates (see Section 12.2.5 for more information).
Because of the small sample size for cycle 3 of the CHMS, the results should only be used to produce
national estimates. Due to the different number of respondents contained within the various files output
for cycle 3, each file produced will contain a different weight variable. If subsample files are linked to the
household or clinic full sample files then the weight stored on the subsample file should be used for
creating the estimates.
For information on the use of combined weight files, see Section 12.2.4.
11.6 Variable naming convention
The CHMS naming convention for cycle 3 of the survey follows the same pattern as that used by
previous cycles of the CHMS and many other Statistics Canada surveys. The variable name is
constructed in a way that allows the data users to easily identify the originating section of the survey, the
type of variable, and the survey question that collected the data. The variable names have also been
created in such a way as to identify similar data between different cycles of the CHMS.
Canadian Health Measures Survey (CHMS) Data User Guide: Cycle 3
101
Each variable name must adhere to a mandatory requirement which restricts variable names to a
maximum of 8 characters for ease of use by analytical software products. As a result, each character of
the variable name contains information about the data contained in the variable.
Generally speaking:
Positions 1 - 3: Section name
Position 4: “_” underscore ( _= collected data) or Variable type
Positions 5 - 8: Question reference (question number or acronym/short form to represent the concept of
the variable)
For example: The variable from question 101 of the household Chronic Conditions section, CCC_101:
Positions 1 - 3: CCC chronic conditions section
Position 4: “_” underscore ( _= collected data)
Positions 5 - 7: 101 question number
AND
SPM_QFVC:
Positions 1 - 3: SPM spirometry section of the mobile examination centre questionnaire
Position 4: “_” underscore ( _= collected data)
Positions 5 - 8: QFVC quality code for the FVC results in spirometry
11.6.1 Position 4: Place Holder or Variable Type
_ Collected variable: A variable that appeared directly on the questionnaire or was collected during
the direct measures components
C Coded variable: A variable coded from one or more collected variables using standardized coding
systems (e.g., SIC, NAICS, ATC)
D Derived variable (DV): A variable assigned or calculated from one or more collected or coded
variables
F Flag variable: A variable calculated by the data collection computer application for later use
during the interview, or assigned based on one or more collected variables (similar to a DV, e.g.
CCCF1). In the case of the income imputation flag (THIFIMP4), derived in head office after
imputation.
G Grouped variable: Collected, coded, or derived variables collapsed into groups
L Limit of detection (LOD) variable for indoor air laboratory data
11.6.2 Positions 5-8: Question reference

Canadian Health Measures Survey (CHMS) Data User Guide: Cycle 3
102
In general, the fifth to seventh positions follow the variable numbering used on the questionnaire. The
letter "Q" for questions read to the respondent or “N” for interviewer-completed questions is removed,
and all question numbers are presented in a two-digit format. For example, question Q01A in the
questionnaire becomes simply 01A, and question Q15 becomes simply 15. In other cases, an acronym or
short form is used to represent the concept of the variable and an eighth character is sometimes required.
For questions that allow multiple response categories to be selected, the final position in the variable
naming sequence is represented by a letter. For this type of question, new variables were created to
differentiate between a “yes” or “no” answer for each response category. For example, if multiple
responses could be selected for Q2, the new questions would be named Q2A for category 1, Q2B for
category 2, Q2C for category 3, etc. If only categories 2 and 3 were selected, then Q2A = No (“2” on the
file), Q2B = Yes (“1” on the file), Q2C = Yes (“1” on the file) and Q2D = No (“2 on the file).
To help reconcile the variable names found on the household and clinic full sample data files from those
on the household and clinic questionnaires, users can consult the questionnaires, data dictionaries, and
other documentation available upon request.
11.7 Access to data files
Access to CHMS data is provided through the RDCs. These research data centres require researchers to
submit a research proposal before access to the data is granted. These projects are accepted based on a set
of specific rules. When the project is accepted, the researcher is designated as a "deemed employee" of
Statistics Canada for the duration of the research, and given access to the data from designated Statistics
Canada sites. For more information, please consult the Statistics Canada webpage:
http://www.statcan.gc.ca/rdc-cdr/index-eng.htm.
Another means of access to the data files is to provide Statistics Canada with specifications for
tabulations. On a fee-for-service basis, these tables are programmed and run against the data files by
Statistics Canada employees. This service allows users who do not possess knowledge of tabulation
software products or who do not have access to a RDC to get custom results. The results are screened for
confidentiality and reliability concerns before release to the client. For more information, contact Health
Statistics Division Client Services at 613-951-1746 or by e-mail at hd-ds@statcan.gc.ca.
Finally, HC and PHAC government employees have access to CHMS data files through a share
agreement. At the MEC, respondents provide their consent to “share the information collected during the
survey with its partners” who “will keep the information confidential, and use it for statistical purposes
only”. Within HC/PHAC, employees who require CHMS information in order to do their work apply for
access and are granted approval upon filling out and signing an acknowledgment document and
providing a purpose of research. To arrange access, HC employees should contact the Data and
Information System team at DAIS@hc-sc.gc.ca while PHAC employees should contact the Data
Coordination and Access Program at DCAP-PCAD@phac-aspc.gc.ca.
Canadian Health Measures Survey (CHMS) Data User Guide: Cycle 3
103
12. Guidelines for tabulation, analysis and release
This chapter provides guidelines to be applied by data users in tabulating, analyzing, publishing, or
otherwise releasing any data derived from the survey files. In addition, two data user presentations24 are
available upon request.
12.1 Guidelines for tabulation
The sample design used for this survey is not self-weighted. In other words, the sampling weight is not
the same for all the persons included in the sample. Even to produce simple estimates, including ordinary
statistical tables, the user must employ the appropriate sampling weight. Otherwise, the estimates
calculated on the basis of the full sample data files cannot be considered representative of the population
observed, and they will not correspond to those of Statistics Canada. For further information on the
creation of the survey weights (the sampling weights that have been adjusted for non-response), refer to
Chapter 9 of this User Guide. Information on the use of the weight variable is found in Section 11.5 and
information on the key variables used for linking data files is found in Section 11.2.
Users should also keep in mind that because of the treatment reserved for weights, some software
packages do not yield estimates that exactly match those of Statistics Canada.
12.1.1 Tabulation of categorical and quantitative estimates
There are two main types of point estimates of population characteristics that can be generated from the
data files: categorical estimates and quantitative estimates. A brief explanation of each estimate type is
given prior to describing how the survey data can be tabulated.
12.1.1.1 Categorical estimates
A categorical estimate is the estimate of the number or percentage of the surveyed population that
possess a certain characteristic or fall into some defined category. For example, the proportion of
respondents with diabetes and the number of persons with each type of diabetes are both categorical
estimates.
Examples of categorical questions:
Do you have diabetes? (CCC_Q51)
1 Yes
2 No
If Yes, were you diagnosed with: (CCC_Q52)
1 … insulin dependent diabetes (Type 1)?
2 … non-insulin dependent diabetes (Type 2)?
3 … gestational diabetes ?
Canadian Health Measures Survey (CHMS) Data User Guide: Cycle 3
104
Estimates of the number of people with a certain characteristic can be obtained from the data file by
summing the final weights of all records1 possessing the characteristic of interest. A proportion is
calculated as 𝑋
�𝑌
�
⁄ using the following steps:
a) Summing the final weights of records having the characteristic of interest for the numerator (𝑋
�)
b) Summing the final weights of records having the characteristic of interest for the denominator (𝑌
�)
c) Dividing the numerator estimate by the denominator estimate
For example, to obtain the proportion of respondents 20-79 with Type 2 diabetes, the numerator is
obtained by summing the weights (WGT_FULL) for all respondents aged 20 to 79 who answered non-
insulin dependent diabetes (Type 2), answer 2 to CCC_Q52. The denominator is the sum of the weights
for all 20-79 year old respondents to the survey.
12.1.1.2 Quantitative estimates
A quantitative, or continuous, estimate is an estimate of the total or of the mean, median or other measure
of central tendency of quantities based on some or all members of the surveyed population. For example,
the average age of first diagnosis with type 2 diabetes is a quantitative estimate.
Example of a quantitative question:
If CCC_Q52 = 1 or 2 then:
How old were you when this was first diagnosed? (CCC_Q53)
|_|_|_| Age in years
For CHMS data, two different estimates of the mean are commonly generated for continuous variables:
the arithmetic mean and the geometric mean. The arithmetic mean is the simple average of the data and is
best suited for variables that are evenly distributed around the mean. The arithmetic mean is calculated
by: a) Multiplying the value of the variable of interest by the final weight and summing this quantity
over all records of interest to obtain the numerator (𝑋
�)
b) Summing the final weights of records having the characteristic of interest for the denominator (𝑌
�)
c) Dividing the numerator estimate by the denominator estimate.
For example, to obtain the average age when respondents were first diagnosed with Type 2 diabetes, first
compute the numerator (𝑋
�) by summing the product between the age given in CCC_Q53 and the survey
weight (WGT_FULL) for all respondents who answered 2 to question CCC_Q52 (have Type 2 diabetes).
Next, sum the value of WGT_FULL for all respondents who answered 2 to question CCC_Q52 to obtain
the denominator (𝑌
�). Divide 𝑋
� by 𝑌
� to obtain the estimate of the average age of first diagnosis with Type
2 diabetes.
The geometric mean is also a measure of central tendency; however, it is more robust to the presence of
extreme values then the arithmetic mean. Thus, the geometric mean provides a better indication of central
tendency for data that is highly skewed, meaning the data is unevenly spread towards higher or lower
values. The geometric mean is typically used for environmental chemicals. It is calculated by:
a) Computing the natural log transform of the value of the variables of interest and multiply it by the
final weight. The numerator (𝑋
�) is then created by summing all of these values.
b) Summing the final weights of records having the characteristic of interest for the denominator (𝑌
�)
c) Dividing the numerator estimate by the denominator estimate and then calculating the exponential
value.

Canadian Health Measures Survey (CHMS) Data User Guide: Cycle 3
105
To determine if the arithmetic mean or the geometric mean is a more appropriate measure for a given
variable it is best to plot the data with a histogram. If the data has a relatively even distribution of high
and low values than the arithmetic mean will be a good indicator of central tendency. In this case, the
value of the mean and the median will be very similar. If the data show an uneven spread towards high or
low values, then a geometric mean would be more appropriate for the data. In this case, the mean and the
median would be quite different.
12.1.2 Imputation of household income
Largely due to the sensitive nature of reporting income, only 77% of the CHMS respondents reported
their total household income (THI_01) in cycle 3.
Non-respondents to total household income were asked a series of questions (THI_Q02 to THI_Q04 that
are not included in the data dictionary) in order to determine a household income range. In cycle 3, 86%
of total household income non-respondents provided a response or partial response for the range;
therefore, there is some form of household income information for 96.8% of respondents. In addition to
the low response rate, a study conducted in 2009 using data from the Canadian Community Health
Survey (CCHS), suggested that the income non-respondents had different health characteristics than the
respondents.25 Because of this difference in health profiles and the low response rate, analyses that are
based exclusively on income respondents may be biased. As a result, it was decided to impute the total
household income for the CHMS cycle 3 release.
To impute the total household income, the modelled household income (an auxiliary variable), is first
created. A regression model is used to predict the personal income of each member of all responding
CHMS households. Variables used in the model include age group, sex, education level, CHMS
collection site, marital status, aboriginal identity, racial or cultural group, period of collection, whether
the respondent worked at a job or business in the week preceding the interview, household size and its
composition (number of persons in each age group) and whether the dwelling is owned or rented. It is
worthwhile to note that no health variables are used in the model in order to prevent the creation of
artificial relationships between income and certain health variables. The personal income is then summed
for each household to create the modelled household income. This variable is then used to impute the
household income using nearest neighbour imputation. The modeled household income defined above is
used as a distance measure to determine which pair of respondent-non-respondent records is the “nearest”
within imputation classes. The data from the respondent, or donor, is then copied to the non-respondent
or recipient. For respondents who provided an income range, a nearest neighbour is selected within the
same income range and household size. For respondents who did not provide any income range, the
donor record is selected within the same collection site and household size.
With the implementation of the imputation process, there is no non-response to total household income
(variable THI_01) in cycle 3. An imputation flag THIFIMP4 is included on the file to identify which
records have an imputed value for total household income. In addition, the derived income variable
THID14 is based on the imputed household income value.
It should be noted that total personal income (variable TPI_01) is not imputed. Users should take the
appropriate steps when analyzing this variable.

Canadian Health Measures Survey (CHMS) Data User Guide: Cycle 3
106
For users interested in conducting analysis focusing specifically on household income, it is highly
recommended to rely on other income data sources rather than using the CHMS. Those interested in
analysing household income as it relates to health should use derived income variables such as income
quintiles25 rather than the actual income value directly. The imputation process performs well at
predicting income quintiles but there is variability in predicting the exact income value.
12.1.3 Other missing data and lab results outside the analytical range
Missing data are the result of non-response to some or all questions on the survey. Instances of total non-
response, where there is no data for a selected respondent, are adjusted for in the calculation of the survey
weights. Thus, by using the survey weights to create estimates, the bias that can be introduced by total
non-response is reduced. The CHMS data files contain only respondents to the survey; however some
variables may be missing for some respondents (partial non-response). There are three main options for
analysing a variable with some missing data:
a) Keep the records with missing values in the analysis and report the results for the missing
category separately. In this case, careful interpretation of the missing category is necessary.
b) Remove records with missing values from the analysis. This is valid if the missing values are
random and do not represent any non-response bias. To test this assumption, compare the
respondents with valid data to the respondents with missing data to look for any differences in
some key variables. If there are differences, then it is an indication of non-response bias due to
eliminating the missing values from the analysis.
c) Impute the missing values to a new value prior to the analysis.
Besides income imputation (see Section 12.1.2), the most common form of imputation for CHMS data is
the replacement of values of the laboratory variables that are outside the analytical range, usually below
the limit of detection (LOD). The values below the LOD are coded as 95, 995, 99.5, etc. on the data
file(s) depending on the units of the measure. During analysis, these values are often replaced by the
LOD divided by two, but other methods can be used. The analytical range values (LOD and limit of
quantification (LOQ) values when available/applicable) for each laboratory variable can be found in the
content summary document.
In the production of analytical products, if the percentage of values below LOD is greater than 40%, then
measures of central tendency, such as the geometric mean, are not calculated. This is because the mean is
rendered somewhat meaningless when a large proportion of the records have the same value. In this case,
percentiles provide a more useful tool of summarising the data.

Canadian Health Measures Survey (CHMS) Data User Guide: Cycle 3
107
12.2 Guidelines for statistical analysis
12.2.1 Precise variances or coefficients of variation
Calculation of a precise variance or coefficient of variation is not an easy matter, since there is no simple
mathematical formula that can take into account all aspects of the CHMS sample design and the selection
probabilities. It is therefore necessary to turn to other methods to estimate these measures of precision,
such as re-sampling methods. Among these, the bootstrap method is the one recommended for analysing
CHMS data (see Section 9.10 Bootstrap weights). 500 bootstrap replicates have been created for the
analysis of the full sample data and for each of the subsamples. The bootstrap replicates are available on
each weight file, labelled as BSW1-BSW500. There are several different software packages available
that will use the bootstrap replicates to create an estimate of the variance. This is done by calculating the
value of the desired estimate for each of the bootstrap replicates and then measuring the variability
between the bootstrap estimates.
12.2.2 Some recommendations for doing analysis with data from cycle 3 of the CHMS
The CHMS was designed to provide national baseline prevalence estimates for a variety of health
indicators. Due to cost considerations, 16 collection sites from 5 regional strata were chosen; 2 sites
from the Atlantic region, 4 sites from the Quebec region, 6 sites from the Ontario region, 2 sites from the
Prairies region, and 2 sites from the British Columbia region. Then a sample of individuals of all ages
was selected from each chosen site. This design should yield approximately unbiased national prevalence
estimates that would have CV’s of approximately 16.5% for a prevalence of 10% for each of the 5 age
groups (6-11, 12-19, 20-39, 40-59, and 60-79) by sex and for 3-5 year olds of both sexes combined.
While the small number of sampled collection sites can produce national baseline prevalence estimates
that meet the above criteria, it has the drawback of leaving at most 11 “degrees of freedom”26 for
variance estimation. Limited degrees of freedom have several consequences for analysis and inference27;
in particular:
• The variability of variance estimates of estimated quantities needs to be taken into account when
doing analyses,
• Estimated covariance matrices of vectors of estimates (such as the vector of estimated coefficients
of a model) could be singular or close to singular, thus possibly not invertible28,
• It may not be possible to calculate some test statistics,
• The usual asymptotic distributions of many test statistics may not hold when there are only a
small number of primary sampling units (PSUs), in this case the collection sites in the sample,
even when the total sample size is large.
Because of the possible consequences of having a small number of PSUs, a researcher is advised to
consider the following recommendations when analyzing CHMS data:
• Produce only national estimates since regional estimates will have even fewer than 11 degrees of
freedom because fewer PSUs would be involved in variance estimation. This still allows the
researcher to do analyses of many subpopulations such as a single age group or one sex, since all
ages and both sexes are in the sample from each collection site. With certain caveats, it is possible
to produce estimates at the Ontario or Quebec level by combining data from several cycles 29,
Canadian Health Measures Survey (CHMS) Data User Guide: Cycle 3
108
• Avoid fitting models with a large number of coefficients. Limit the number of parameters in a
regression model to 10 as one degree of freedom is used to estimate the intercept. A continuous
explanatory variable is equivalent to one parameter in the model. The number of parameters used
by a categorical variable is the number of categories minus 1. For example, sex has two categories
therefore it uses 1 parameter in a regression model.
• Use analytical methods that are less impacted by the limited degrees of freedom, or are
conservative. In particular, when testing a hypothesis involving a vector of quantities, avoid Wald
statistics and their modifications since they have been found to be unstable. Better choices would
be Satterthwaite-adjusted statistics or conservative Bonferroni tests.
• As the number of degrees of freedom is at most 11 and may be less for some analyses, consider
using a smaller value of alpha to determine if a test is significant. For example, a test could be
considered significant if the p-value is less than 0.01 rather than the usual cut-off of 0.05.
• Since bootstrap weights are used for variance estimation with the CHMS, it will likely be
necessary to specify the degree of freedom in the software being used because the default degree
of freedom is likely to be incorrect.
12.2.3 Data comparability over time
12.2.3.1 Normative scales
To help give some context to the raw data that was collected at the MEC, normative scales were used to
create derived variables that assign a category or health rating based on an individual’s raw data results
compared to the normative scales (e.g. using the calculated body mass index to assign ratings of
underweight, normal weight, overweight, or obese). The norms used for cycle 3 data collection were
agreed upon at the start of collection, and respondents were informed of how they measured against those
norms in the final report delivered to them. In most cases, cycle 1 and 2 norms were used again for
cycle 3 in order to maintain as much consistency as possible. As the raw data is also included on the data
files, users are free to use norms other than those included on the file.
12.2.3.2 Activity monitor data for 3 to 5 year olds
Researchers analyzing activity monitor (accelerometer) data for 3 to 5 year olds are advised to take note
of an important methodological difference between cycles 2 and 3. In cycle 2, all activity monitor data
was collected in 60 second epochs and this may not be the optimal approach for 3 to 5 year old children.
Data are being collected in shorter epochs (15 seconds) in cycle 3 (for 3 to 5 year olds only) to align with
current research. See Appendix 8 for more information on research being conducted to examine the
impact of epoch length on physical activity derived variables as well as assessing adherence to the new
preschool physical activity guidelines using accelerometer data. Reliability and quality factors to be used
when analyzing activity monitor data can be found in Section 10.3.3.10.
12.2.3.3 Vitamin B12 data
Vitamin B12 data was obtained using an immunoassay on the Centraur XP in cycle 3 and on the
Immulite 2000 in previous cycles. In order to aid comparability between previous cycles with cycle 3
data, an equation is currently in development. As the equations have not yet been developed, data
comparisons should not be done.

Canadian Health Measures Survey (CHMS) Data User Guide: Cycle 3
109
12.2.3.4 Vitamin D data
A change in the vitamin D matrix from plasma (cycles 1 and 2) to serum (cycle 3) is not related to
differences in values among cycles. Equations are currently being developed to enable data users to
adjust vitamin D values measured by immunoassay to serum values adjusted to the international Vitamin
D standardization program. Since CHMS results are not currently standardised, comparison of CHMS
data among cycles and with other studies should be done with caution.
12.2.3.5 Ferritin data
Ferritin data was obtained using an immunoassay on the Centraur XP in cycle 3 and on the Immulite
2000 in cycle 2. Results from these two different immunoassays can only be compared with caution and
after applying a correction factor of 0.96319 to the cycle 2 data (i.e. adjusted cycle 3 ferritin = cycle 2
ferritin * 0.96319).
12.2.3.6 Red blood cell folate data
This immunoassay was done on the Centraur XP in cycle 3 and on the Immulite 2000 in previous cycles.
Data comparisons should be done with caution.
12.2.3.7 Analytical intervals
The analytical intervals, including the limit of detection (LOD) and the upper limit for certain analytical
methods changed between cycles. Although the LOD values do not change by a large margin, the
differences should be noted when comparing data from different cycles. A full listing of the analytical
ranges including LOD and limits of quantification (LOQ) values can be found in the content summary
document.
12.2.3.8 Significant digits
In cycle 3, all environmental laboratory results (with the exception of indoor air) and some non-environmental
laboratory results were received from the testing laboratories in two significant digits, which reflect the level
of uncertainty of the testing method. All derived variables from a particular analyte are therefore also rounded
to the same number of significant digits (e.g. urine copper and creatinine-adjusted urine copper should have
the same number of significant digits).
NOTE: Users should be aware that although the data are received in two significant digits (or rounded to two
significant digits, in the case of the derived variables), technical limitations do not permit the data to be
displayed as such in the data files and data dictionaries. Unfortunately, all results are displayed with the same
number of decimal places and therefore, some results have additional trailing zeroes, which implies a greater
level of precision. For example, a result reported as “120” might be displayed as “120.00”, or “56” displayed
as “56.000”.
When combining or comparing results between cycles, it is important to consider that data from cycle 1 was
not received in or rounded to the appropriate significant digits. Instructions on converting cycle 1 data to
significant digits are available in the combining cycles 1 and 2 instruction document.29
Canadian Health Measures Survey (CHMS) Data User Guide: Cycle 3
110
12.2.3.9 Complete blood count data
Analysis up to site 6 was done on the Beckman Coulter HMX and on the Sysmex Poch-i100 following
that. The results from these 2 instruments are comparable.
12.2.4 Combining multiple cycles of CHMS data
Combining data from two or more cycles of the CHMS can help researchers gain statistical power,
enabling them to analyze and publish high quality results for a greater combination of data variables than
they would be able to using data from one cycle alone.Researchers combining data should use the official
Statistics Canada combined weight files for the specific combination of cycles being combined (i.e.
cycles 1 and 2 OR cycles 1 and 3 OR cycles 2 and 3 OR cycles 1, 2 and 3). An instructions
document29 is available and should be followed closely to determine the file and variable combinations
that can be combined and to be aware of any potential analysis limitations. This document will be
updated as different cycle 3 files are released.
Using the instructions and correct weights will ensure that the data and methods used in analysing the
files are as consistent as possible and that analysis done on data from multiple cycles of the survey is
representative of the population.
12.2.5 Software packages available
While many analysis procedures found in statistical packages allow weights to be used, the meaning or
definition of the weight in these procedures can differ from what is appropriate in a sample survey
framework. As a result, the procedure may produce an estimate that is correct but a variance estimate that
is almost meaningless. A software package with procedures for the analysis of survey data should be
used instead. A suitable software package for analysing CHMS data should allow the use of sampling
weights, bootstrap weights to estimate the variance, and specification of the number of degrees of
freedom to use for confidence intervals and significant tests. Examples of available software packages
are SUDAAN 10.0.1/ 11, SAS 9.2/9.3, STATA 11.2, WESVAR 5.1, and BootVar 3.2. Table 12.2 gives a
comparison of the estimates available in each software package. For more detailed comparison and
examples of the code for each program refer to Serré (2012).30 The estimates produced by these software
packages may yield slightly different estimates due to differences in the formulas for the standard error.

Canadian Health Measures Survey (CHMS) Data User Guide: Cycle 3
111
Table 12.2 Comparison of the procedures available in various software packages
SUDAAN
10.0.1 / 11
SAS 9.2/ 9.3 STATA 11.2 WESVAR 5.1 BOOTVAR 3.2
Point Estimate Yes Yes Yes Yes Yes
Standard Error Yes Yes Yes Yes Yes
Confidence Interval Yes Yes Yes Yes Yes
Coefficient of Variation can calculate Yes Yes Yes Yes
Point Estimate Yes Yes Yes Yes Yes
Standard Error Yes Yes Yes Yes Yes
Confidence Interval Yes Yes Yes Yes Yes
Coefficient of Variation can calculate can calculate Yes Yes Yes
Point Estimate Yes yes in 9.3 only Yes Yes Yes
Standard Error Yes yes in 9.3 No Yes Yes
Confidence Interval Yes yes in 9.3 No Yes Yes
Coefficient of Variation can calculate can calculate No Yes Yes
Regression coefficients
and standard errors
Yes Yes Yes Yes Yes
Satterthwaite adjusted
statistics
Yes No No No No
Logistic
Regression
Regression coefficients
and standard errors
Yes Yes Yes Yes Yes
Software package
Test
Linear
Regression
Means and
Total
Proportions
Percentiles
Estimate
12.3 Guidelines for releasing data
12.3.1 Sample size and coefficient of variation
Before releasing or publishing any estimates from the data files, users must first determine the number of
sampled respondents having the characteristic of interest to ensure that enough observations are available
to calculate a quality estimate. For the calculation of a point estimate, it is recommended to have at least
10 observations in the numerator and 20 in the denominator. For example, to report the number of
Canadian females aged 20 to 39 who have high blood pressure there should be at least 10 respondents
who have high blood pressure out of at least 20 respondents who are females aged 20 to 39. For the
creation of a data table, it is recommended that there are at least 10 observations per cell.
As mentioned in Section 10.2.2, an indicator of the scope of the sampling error as measured by the
coefficient of variation (CV) should also be produced for each estimate. Table 10.1 gives the Statistics
Canada guidelines for releasing estimates based on their CV. Users are strongly advised to adhere to
these guidelines.
12.3.2 Rounding guidelines
In order to ensure that estimates for publication or other releases derived from the data files correspond to
those produced by Statistics Canada, users are urged to adhere to the following guidelines regarding the
rounding of such estimates:
a) Estimates in the main body of a statistical table are to be rounded to the nearest hundred units using
the normal rounding technique. In normal rounding, if the first or only digit to be dropped is 0 to 4,
Canadian Health Measures Survey (CHMS) Data User Guide: Cycle 3
112
the last digit to be retained is not changed. If the first or only digit to be dropped is 5 to 9, the last
digit to be retained is raised by one. For example, in normal rounding to the nearest 100, if the last
two digits are between 00 and 49, they are changed to 00 and the preceding digit (the hundreds digit)
is left unchanged. If the last digits are between 50 and 99 they are changed to 00 and the proceeding
digit is increased by 1;
b) Marginal sub-totals and totals in statistical tables are to be derived from their corresponding
unrounded components and then are to be rounded themselves to the nearest 100 units using normal
rounding;
c) Averages, proportions, rates and percentages are to be computed from unrounded components (i.e.,
numerators and/or denominators) and then are to be rounded themselves to one decimal using normal
rounding;
d) Sums and differences of aggregates (or ratios) are to be derived from their corresponding unrounded
components and then are to be rounded themselves to the nearest 100 units (or the nearest one
decimal) using normal rounding;
e) In instances where, due to technical or other limitations, a rounding technique other than normal
rounding is used, resulting in estimates to be published or otherwise released that differ from
corresponding estimates published by Statistics Canada, users are urged to note the reason for such
differences in the publication or release document(s);
f) Under no circumstances are unrounded estimates to be published or otherwise released by users.
Unrounded estimates imply greater precision than actually exists.
NOTE: In the case of environmental lab data (except indoor air), estimates of average levels (arithmetic
or geometric) or percentile distributions should be rounded to two significant digits.
Canadian Health Measures Survey (CHMS) Data User Guide: Cycle 3
113
13. References and end notes
1. The terms “record” and “variable” are used throughout this document. A record corresponds to a line
on the file and represents a respondent. A “variable” corresponds to a column on the file and
represents either a question, a measure, a weight or a bootstrap weight.
2. Labrecque, F and A. Quigley. 2014. Sampling documentation for cycle 3 of the Canadian Health
Measures Survey. Statistics Canada internal document.
3. Strata are defined according to composition of the household in the 2011 Census, updated with
administrative information available at the time of sample selection.
4. Placeholder. Footnotes will be renumbered on a later version
5. Canadian Society for Exercise Physiology. 2003. Canadian Physical Activity, Fitness and Lifestyle
Approach (CPAFLA,. 3rd edition. Ottawa.
6. Ross, W. D. & M.J. Marfell-Jones. 1991."Kinanthropometry" in Physiological Testing of the High-
Performance Athlete, 2nd edition, Human Kinetics Books. J. D. MacDougall, H. A. Wenger, & H. J.
Green, eds. Champaign, Illinois, p. 223-308.
7. National Institutes of Health. The Practical Guide to the Identification, Evaluation and Treatment of
Overweight and Obesity in Adults. Bethesda, Maryland: National Institutes of Health, 2000.
8. Fitness Canada. 1986. Canadian Standard Test of Fitness (CSTF) Operations Manual, 3rd edition.
Ottawa.
9. Campbell, Norm R.C., Michel R. Joffre and Donald W. McKay. 2005. "Hypertension Surveillance in
Canada: Minimum Standards for Assessing Blood Pressure in Surveys ". Canadian Journal of Public
Health. Vol 96, no 3. p. 217-220.
10. Miller, M.R., J. Hankinson, V. Brusasco et al. 2005. “Standardization of spirometry”. European
Respiratory Journal. Vol. 26, p. 319-338.
11. Canadian Fitness and Lifestyle Research Institute. 1988. Canada Fitness Survey Longitudinal Study:
Reference Booklet. Ottawa.
12. The five regions are: British Columbia, the Prairies (Alberta, Manitoba, and Saskatchewan), Ontario,
Quebec and the Atlantic provinces (Newfoundland and Labrador, Prince Edward Island, Nova Scotia
and New Brunswick).
13. The number of sites selected in each region is provided in Table 6.1 in Section 6.3.1 (Sampling of
collection sites).
14. Haziza, D. and J.-F. Beaumont. 2007. “On the construction of imputation classes in surveys”.
International Statistical Review. Vol. 75(1): 25-43.
15. Rao J.N.K, C.F.J Wu and K. Yue. 1992. “Some recent work on resampling methods for complex

Canadian Health Measures Survey (CHMS) Data User Guide: Cycle 3
114
surveys”. Survey Methodology. Statistics Canada catalogue no 12-001). Vol. 18(2): 209-217.
16. Among the dwellings initially selected, some are not within the scope of the survey. These include,
for example, vacant or demolished dwellings, non-residential dwellings or dwellings in which all
household members are under 3 or over 79 years of age or are full-time members of the Canadian
Forces. These dwellings are identified during collection; otherwise they would have been excluded
during the selection process. They are not included when calculating response rates.
17. American Thoracic Society. 1995. “Standardization of Spirometry 1994 Update”. American Journal
of Respiratory and Critical Care Medicine. Vol. 152, p. 1107-1136.
18. MacIsaac, K. 2013. “Assessment of Contamination in the Indoor Air Sampler Field Blanks for Cycle
2 of the Canadian Health Measures Survey”. Statistics Canada internal report.
19. Dion, S.M. and S. Giroux. 2012. “Cycle 1 of the Canadian Health Measures Survey: Bias Study”.
Statistics Canada internal report.
20. Héroux, M.-E., N .Clark, K. Van Ryswyk, R. Mallick, N.L. Gilbert, I. Harrison, K. Rispler, D. Wang,
A. Anastassopoulos, M. Guay, M. MacNeill, A.J. Wheeler. 2010. “Predictors of indoor air
concentrations in smoking and non-smoking residences”. International Journal of Environmental
Research and Public Health. Vol. 7, no 8:3080-3099.
21. Young, D.S. 2007. Effects of preanalytical variables on clinical laboratory test, 3rd ed. American
Association for Clinical Chemistry.
22. Dion, S.M. 2013. “Insulin analysis for Cycle 2 data”. Statistics Canada internal report.
23. During the household interview, respondents were asked to name all prescription, over the counter
and herbal remedies they were taking, to a maximum of 15 per category. At the MEC interview, the
respondent was then asked if they were still taking the medication(s) they listed during the household
interview, as well as the names of any new ones they started taking since the household interview. A
maximum of five additional medications could be added into each category (prescription, over the
counter and herbal). In the case where respondent indicated more than 5 new medications for a given
category, only the first five of those medications were chosen and coded.
24. Presentations include the following:
Using data from cycle 2 of the Canadian Health Measures Survey (CHMS): Part 1
Using data from cycle 2 of the Canadian Health Measures Survey (CHMS): Part 2
25. Sarafin, C. 2009. “CCHS Health Indicators by Income Quintiles”. Statistics Canada internal
document
26. “Degrees of freedom” is being used as a generic term to reflect the amount of information used to
estimate variances and covariances. An approximation often used for the value of “degrees of
freedom” is # of PSUs - # of strata. For cycle 3 of the CHMS, the 16 collection sites are the PSUs and
there are 5 regions (strata) resulting in 11 degrees of freedom (16-5). This is an approximate estimate
of the degrees of freedom and provides only the maximum value.
27. In particular confidence intervals and tests of hypotheses.
Canadian Health Measures Survey (CHMS) Data User Guide: Cycle 3
115
28. Invertible covariance matrices are needed to perform Wald tests for tests on vectors of parameters.
29. Statistics Canada. 2014. “Instructions for Combining Multiple Cycles of Canadian Health Measures
Survey (CHMS) Data”.
30. Serré, L. 2012. “Comparison of software programs for analysing the CHMS”. Statistics Canada
internal document.
31. Adolph AL, Puyau MR, Vohra FA, et al. 2012 « Validation of uniaxial and triaxial accelerometers for
the assessment of physical activity in preschool children”. Journal of Physical Activity and Health.
Vol. 9, p. 944-953.
32. United States Environmental Protection Agency. 2015. “Definition and procedure for the
determination of the method detection limit - Revision 1.11, Federal Regulation 40 CFR 136
Appendix B”.
Canadian Health Measures Survey (CHMS) Data User Guide: Cycle 3
116
Appendix 1 - Acronyms and Abbreviations
AHFS American Hospital Formulary Service
ATC Anatomical Therapeutic Chemical
BMI body mass index
BP blood pressure
CAI Computer assisted interviewing
CATI Computer assisted telephone interview
CBC complete blood count
CCHS Canadian Community Health Survey
CHMS Canadian Health Measures Survey
CMA Census Metropolitan Area
COPD Chronic obstructive pulmonary disease
CPAFLA Canadian Physical Activity, Fitness and Lifestyle Approach
CSEP Canadian Society of Exercise Physiology
CV Coefficient of variation
DIN drug Identification Number
DPOAE Distortion product otoacoustic emissions
DV Derived variables
FENO Fractional exhaled nitric oxide
HC Health Canada
HMS Health measures specialist
HR household response rate
HRGs homogeneous response groups
IAS Indoor air sampler
IATA International Air Transport Association
INSPQ Institut national de santé publique du Québec
ISAK International Society for the Advancement of Kinanthropometry
mCAFT Modified Aerobic Fitness Test
MEC Mobile Examination Clinic
NAICS North American Industry Classification System
LOD Limit of detection
LOQ Limit of quantification
NHPN Natural Health Product Number
NIH National Institute for Health
NHANES National Health and Nutrition Examination Survey
NML National Microbiology Laboratories
NOC-S National Occupational Classification – Statistics
PAR-Q Physical Activity Readiness Questionnaire
PHAC Public Health Agency of Canada
PIA Privacy Impact Assessment
PSU primary sampling units
QA Quality assurance
QC Quality control
VOC volatile organic compound
RDC Research Data Centers
SIC Standard Industrial Classification
SOP Standard operating procedures
TTY Teletypewriter (telecommunication device for the hearing impaired)
WHO World Health Organization

Canadian Health Measures Survey (CHMS) Data User Guide: Cycle 3
117
Appendix 2 - List of other Canadian Health Measures Survey (CHMS)
documents available
Note: Many of the documents are not yet available for all waves of cycle 3 releases nor are they available
for subsequent cycles. This list shows the names of the most recent version of the documents.
Summaries of disseminated products
Plans for dissemination
CHMS Content summary for cycles 1 to 8
• The content summary document is divided into separate tables which
list all of the content topics in the survey by age group of respondent.
There are tables on the household questionnaire, mobile examination
centre (MEC) physical measures, Clinic questionnaire, laboratory blood
and urine tests, laboratory indoor air sample tests and laboratory tap
water sample tests. The laboratory tables also provide information on
analytical ranges and conversion factors.
CHMS Data User Guide – Cycle 3
• Table of Contents for CHMS Data User Guide – Cycle 3 will be
available soon.
CHMS Derived Variables (DVs) documentation – Cycle 3
• There are separate DV documents for the following types of DVs:
household and mobile examination centre (MEC), medication, activity
monitor, non-environmental laboratory measures, fluoride and volatile
organic compounds, and other environmental laboratory measures.
CHMS Data Dictionaries – Cycle 3
• There are separate data dictionaries for the following data files:
household full sample, mobile examination centre full sample,
medication full sample, activity monitor full sample, activity monitor
subsample, indoor air subsample – household level, indoor air
subsample – person level, fasting blood subsample, red blood cell
fatty acids subsample, hearing full sample, fluoride household level
subsample – in tap water, VOC household level subsample – in tap
water, fluoride person level subsample – in urine and tap water, VOC
person level subsample – in blood and tap water, non-environmental
lab data full sample, environment lab blood and urine full sample,
acrylamide (environmental blood subsample), methyl mercury
(environmental blood subsample), NNK metabolites (environmental
urine subsample), and environment urine main subsample.

Canadian Health Measures Survey (CHMS) Data User Guide: Cycle 3
118
Supporting documentation for the climate and air quality file – Cycle 3
CHMS sampling documentation – Cycle 3
Presentations on using CHMS data – Cycles 1 and 2
Instructions for Combining Multiple Cycles of Canadian Health Measures Survey (CHMS) Data
For more information or to obtain copies of the documents in the list above, please contact Statistics
Canada’s Statistical Information Service (toll-free 1-800-263-1136; 514-283-8300;
infostats@statcan.gc.ca).

Canadian Health Measures Survey (CHMS) Data User Guide: Cycle 3
119
Appendix 3 - List of Collection Sites for Cycle 3
The CHMS collection sites for cycle 3 are as follows:
• East Montréal, Quebec
• South-central Laurentians, Quebec
• Oshawa-Whitby, Ontario
• North Toronto, Ontario
• Brampton, Ontario
• Lethbridge, Alberta
• Halifax, Nova Scotia
• Victoria-Saanich, British Columbia
• Brantford-Brant County, Ontario
• Southwest Calgary, Alberta
• Windsor, Ontario
• Vancouver, British Columbia
• Southwest Montérégie, Quebec
• West Montréal, Quebec
• Kent County, New Brunswick
• Orillia, Ontario
Note: As the CHMS was designed to produce national estimates, it is not recommended to do
analysis at lower geographic levels as it could result in either extreme sampling variability or
unstable estimates of the sampling variability. Possible exceptions are analyses at the provincial
level for Ontario or Quebec when data from more than one cycle are combined (more information
on combining data from multiple cycles is available upon request).
For more information, please contact Statistics Canada’s Statistical Information Service (1-800-263-
1136; 514-283-8300; infostats@statcan.gc.ca).
Aussi disponible en français.

Canadian Health Measures Survey (CHMS) Data User Guide: Cycle 3
120
Appendix 4 - Pre-testing Guidelines
Pre-testing Guidelines for fasting appointments
GUIDELINES TO FOLLOW BEFORE YOUR APPOINTMENT
During the 2 days prior to your clinic appointment:
Do not donate blood (blood tests are permitted).
During the 24 hours prior to your clinic appointment:
Do not expose yourself to sources of loud noise (e.g., power tools, farm machinery, guns, motorcycle
riding at highway speed) without hearing protection.
During the 12 hours prior to your clinic appointment:
Do not eat or drink anything other than water (no food, candies, gum, cough lozenges, flavoured water,
coffee, alcoholic beverages, etc.);
During the 2 hours prior to your clinic appointment:
Do not exercise;
Do not smoke or use other tobacco and nicotine products;
Do not urinate, as you will be asked to provide a urine sample upon your arrival.
On the day of your clinic appointment:
Take your medications as usual;
Do not listen to loud music.
WHAT TO BRING TO YOUR APPOINTMENT
All medications (prescription or over-the-counter), herbal remedies or supplements that you did not
mention during the household interview.
Clothes appropriate for exercise (e.g., sweat pants, short-sleeved top) and flat indoor footwear.
Provincial health insurance card (health card).
Name, address and phone number of two contact persons.

Canadian Health Measures Survey (CHMS) Data User Guide: Cycle 3
121
Pre-testing Guidelines for non-fasting appointments
GUIDELINES TO FOLLOW BEFORE YOUR APPOINTMENT
During the 2 days prior to your clinic appointment:
Do not donate blood (blood tests are permitted).
During the 24 hours prior to your clinic appointment:
Do not expose yourself to sources of loud noise without hearing protection (e.g., power tools, farm
machinery, guns, motorcycle riding at highway speed).
During the 6 hours prior to your clinic appointment
Do not drink any alcoholic beverages.
During the 2 hours prior to your clinic appointment:
Do not consume caffeinated products (e.g., chocolate, coffee, tea, pop or energy drinks);
Do not exercise;
Do not smoke or use other tobacco and nicotine products;
Do not urinate, as you will be asked to provide a urine sample upon your arrival.
On the day of your clinic appointment:
Take your medications as usual;
Do not listen to loud music.
WHAT TO BRING TO YOUR APPOINTMENT
All medications (prescription or over-the-counter), herbal remedies or supplements that you did
not mention during the household interview.
Clothes appropriate for exercise (e.g., sweat pants, short-sleeved top) and flat indoor footwear.
Provincial health insurance card (health card).
Name, address and phone number of two contact persons.

Canadian Health Measures Survey (CHMS) Data User Guide: Cycle 3
122
Appendix 5 - Exclusion Criteria
The exclusion criteria for the physical measures were separated into automatic application exclusions and staff
decision exclusions. These can be defined as the following:
Automatic application exclusion criteria include exclusions that are made automatically by the application based
on previously asked questions in order to prevent the respondent from completing certain physical components
(e.g., a respondent who is pregnant is automatically screened out of the waist circumference measurement).
Staff decision exclusion criteria is based on the staff assessing if the respondent’s condition will negatively impact
the data quality of the physical measure or could compromise the safety of the respondent (e.g., the respondent has
difficulty breathing at rest; therefore, the staff decision would be to exclude the respondent from the spirometry
test).
Measure
Exclusion Criteria
Automatic application exclusions
Staff Decision
Blood Pressure
• Respondent < 6 years of age
Test Screen Out
• Blood pressure cuff too small or too large to fit
either arm
• Acute or chronic conditions on both arms
(e.g,rashes, gauze dressings, casts, edema,
paralysis, tubes, open sores or wounds, withered
arms or a-v shunts)
• Double mastectomy
• Double arm amputee
Right Arm Exclusion
• Blood pressure cuff too small or too large to fit
right arm
• Acute or chronic condition on the right arm (e.g.,
rashes, gauze dressing, cast, edema, paralysis,
tubes, open sore or wound, withered arm or a-v
shunt)
• Right mastectomy
• Right arm amputation
Standing
Height
None
• Acute or chronic condition preventing respondent
from standing upright unassisted (e.g., cast on leg)
Sitting Height
None
• Acute or chronic condition hindering respondent
from sitting upright unassisted (e.g., full leg cast)
Weight
None
• Fibreglass/plaster cast which cannot be removed
Waist
Circumference
• Pregnancy
• Acute or chronic condition (e.g., unable to
correctly landmark a wheelchair bound respondent,
a colostomy bag which interferes with taking an
accurate measurement)
Hip
Circumference
• Pregnancy
• Respondent is wheelchair bound
• Acute or chronic condition preventing respondent
from standing unassisted

Canadian Health Measures Survey (CHMS) Data User Guide: Cycle 3
123
Measure
Exclusion Criteria
Automatic application exclusions
Staff Decision
Skin
Pigmentation
• None
•
The presence of a cast, brace, bandages/dressings
(covering the measurement areas) or arm amputation on
both the right and left arms.
• Presence of very high blood pressure.
Phlebotomy
• Chemotherapy within the past 4
weeks
• Haemophilia
• Acute or chronic conditions on both arms (e.g.,
rashes, gauze dressings, casts, edema, paralysis,
tubes, open sores or wounds, withered arms or
missing limbs, damaged, sclerosed or occluded
veins, allergies to cleansing reagents, burned or
scarred tissue, shunt or IV)
Urine
• Wheelchair bound and has a
catheter
• Important language barrier preventing proper
instruction for collection
• Mental/physical disability preventing providing a
sample
FENO
• Respondent < 6 years of age
• Respondent has a stoma (tracheotomy)
• Respondent suffers from an acute or chronic
condition that prevents him/her from
performing the test (e.g. persistent cough)
Spirometry
• Respondent < 6 years of age
• Pregnancy (> 27 weeks)
• Heart attack within the last 3
months
• Major surgery on chest or abdomen
within the last 3 months
• Recent eye surgery (≤ 6 weeks)
• Acute respiratory condition (e.g., cold, bronchitis,
flu, etc.)
• Respondent with a stoma
• Difficulty breathing at rest
• Respondent taking medication for tuberculosis
• Important language barrier
• Acute condition or chronic condition (e.g.,
persistent cough)
• Any other reason as assessed by the HMS (e.g,
cleft pallet)
Activity
Monitor
• None
• Respondent is wheelchair bound for the collection
period
•
Indoor Air
Sampler
• Home visit
• Second person from a two person
household to complete the clinic
visit
• None
Grip Strength
• Respondent < 6 years of age
Test Screen Out
• Drank alcohol within the last 6 hours (depending
upon probing)
• Double arm/hand amputee
• Acute or chronic condition preventing respondent
from gripping dynamometer with both hands (e.g.,
severe burns, neurological condition)
• Any other reason as assessed by the HMS
Hand-specific exclusions :
• Right/left arm/hand amputee
• Acute or chronic condition preventing respondent
from gripping dynamometer with one hand (e.g.,
severe burn, neurological condition)
Canadian Health Measures Survey (CHMS) Data User Guide: Cycle 3
124
Measure
Exclusion Criteria
Automatic application exclusions
Staff Decision
Hearing
• None
• Respondent has an ear infection in both ears
• Respondent has a completely obstructed ear canal
in both ears
• Respondent refuses to remove hearing aid from
both ears
• If the respondent has an acute condition in both
ears (e.g. a head injury with ears bandaged, a fresh
open wounds on both ears)
• If the respondent has a chronic condition in both
ears (Congenital atresia or microtia of ear canal or
a chronic ear canal infection)

Canadian Health Measures Survey (CHMS) Data User Guide: Cycle 3
125
Appendix 6 - Medication Classification Systems
• Anatomical Therapeutic Chemical (ATC) classification system: The Anatomical Therapeutic
Chemical (ATC) classification system was developed by the World Health Organization (WHO). It
classifies pharmaceutical products according to the organ or system on which they act and their
chemical, pharmacological, and therapeutic properties. An ATC code was assigned to each
medication using the Drug Identification Number (DIN) and Health Canada’s ATC coding system.
When a medication had more than one indication, the ATC code was decided based on the main
indication of the medication. The main indication was determined by Health Canada reviewers
using the Product Monograph (a factual document on a drug product that describes the properties,
claims, indications, and conditions of use of the drug product). In cases where it was still not clear
from the Product Monograph which ATC code to assign, Health Canada contacted the ATC group
at the WHO Collaborating Centre for Drug Statistics Methodology in Norway for clarification.
A medication was not assigned an ATC code if the DIN was missing or if the DIN did not exist in
the Health Canada drug database; for example, with experimental drugs. In these cases the ATC
code appears as “not stated” on the file. The classification system is only available in English. For
more information on Anatomical Therapeutical Chemical System please refer to:
http://www.whocc.no/atc_ddd_index/.
• American Hospital Formulary Service (AHFS) classification system:
The American Hospital Formulary Service (AHFS) classification system is published by the
American Society of Health-System Pharmacists to describe the mode of action of pharmaceutical
products, including vitamin and mineral supplements. The classification system is only available in
English. For more information on the American Hospital Formulary Service (AHFS) classification
system, please refer to: http://www.ahfsdruginformation.com/.
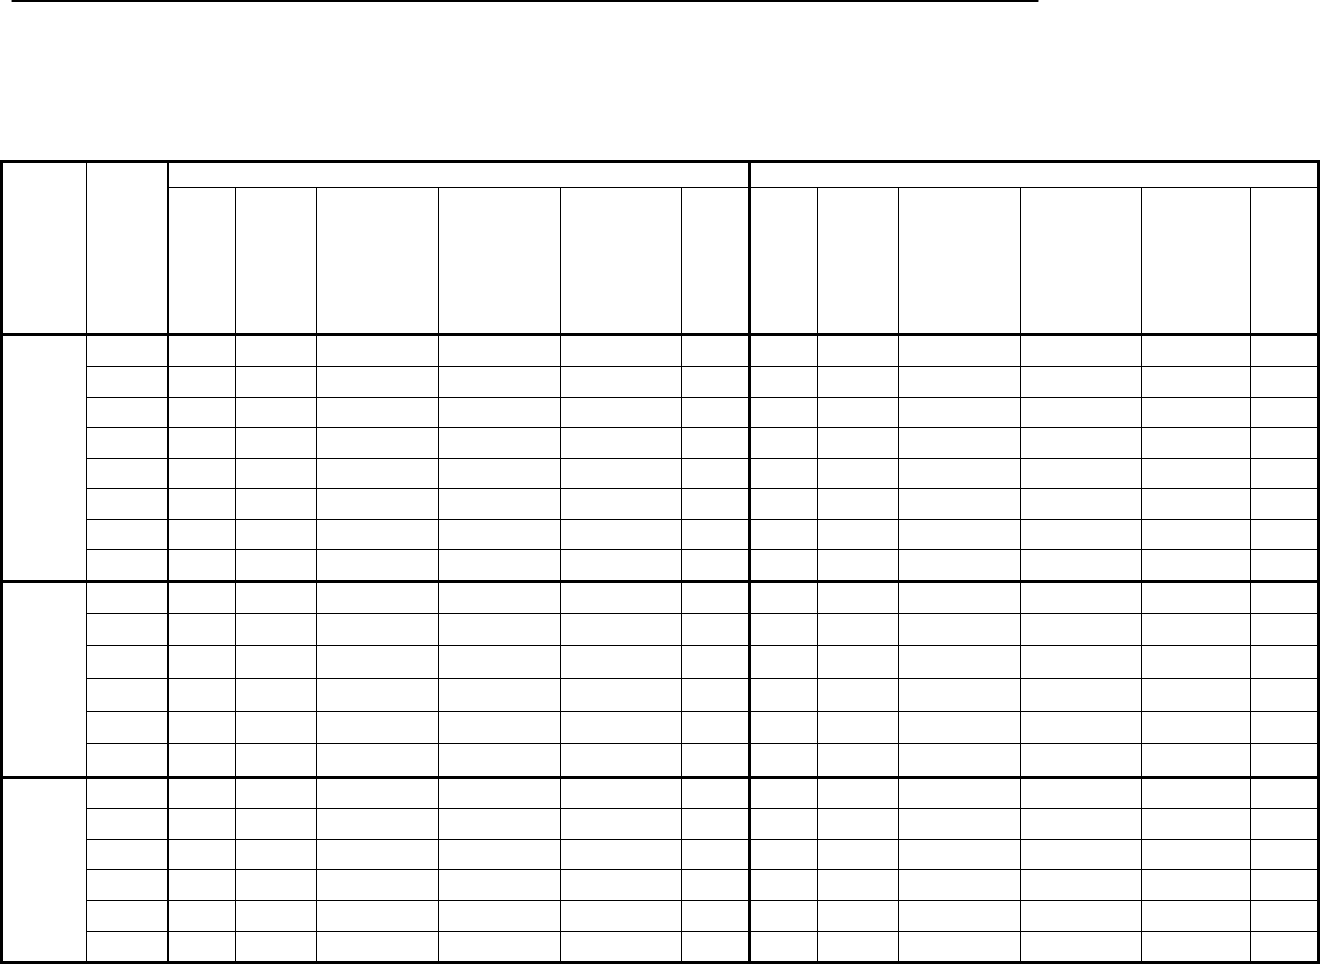
Canadian Health Measures Survey (CHMS) Data User Guide: Cycle 3
126
Appendix 7 - Response Rates
Appendix 7A - CHMS Cycle 3 Full Sample Response Rates by age group and sex
Sex
Age
Group
Households (Hhlds) where one person was selected
Households (Hhlds) where two persons were selected
#
resp.
Hhld
s
(R1)
#
persons
selecte
d
(PS1)
#
respondents
to the quest.
(Q1)
Hhld quest.
response
rate
(PQ1)
#
participants
at the MEC
(C1)
MEC
resp.
rate
(PC1)
#
resp.
Hhlds
(R2)
#
persons
selecte
d
(PS2)
#
respondents
to the quest.
(Q2)
HHLD
quest.
response
rate
(PQ2)
#
participant
s at the
MEC
(C2)
MEC
resp.
rate
(PC2)
Both
Sexes
3 to 5 1 1 1 100.0 1 100.0 813 813 738 90.8 556 75.3
6 to 11
1464 1464 1324 90.4 1027 77.6
12 to 19 818 818 714 87.3 604 84.6 551 551 496 90.0 413 83.3
20 to 39 665 665 565 85.0 422 74.7 943 943 801 84.9 630 78.7
40 to 59 844 844 751 89.0 594 79.1 715 715 621 86.9 488 78.6
60 to 79 1404 1404 1256 89.5 991 78.9 84 84 72 85.7 59 81.9
3 to 79 3732 3732 3287 88.1 2612 79.5 2285 4570 4052 88.7 3173 78.3
6 to 79 3731 3731 3286 88.1 2611 79.5 2285 3757 3314 88.2 2617 79.0
Males
6 to 11
738 738 671 90.9 521 77.6
12 to 19 423 423 366 86.5 304 83.1 271 271 240 88.6 205 85.4
20 to 39 401 401 334 83.3 251 75.1 425 425 338 79.5 263 77.8
40 to 59 416 416 365 87.7 289 79.2 382 382 318 83.2 253 79.6
60 to 79 661 661 584 88.4 489 83.7 40 40 34 85.0 26 76.5
6 to 79 1901 1901 1649 86.7 1333 80.8 1491 1856 1601 86.3 1268 79.2
Females
6 to 11
726 726 653 89.9 506 77.5
12 to 19 395 395 348 88.1 300 86.2 280 280 256 91.4 208 81.3
20 to 39 264 264 231 87.5 171 74.0 518 518 463 89.4 367 79.3
40 to 59 428 428 386 90.2 305 79.0 333 333 303 91.0 235 77.6
60 to 79 743 743 672 90.4 502 74.7 44 44 38 86.4 33 86.8
6 to 79 1830 1830 1637 89.5 1278 78.1 1516 1901 1713 90.1 1349 78.8
Canadian Health Measures Survey (CHMS) Data User Guide: Cycle 3
127
Appendix 7A - CHMS Cycle 3 Full Sample Response Rates by age group and sex, continued
Sex Age Group Overall Combined
Response Rate *
Response rate not adjusted for one or two persons selected
# persons selected # respondents to
the questionnaire HHLD questionnaire
response rate # participants at the
MEC MEC response
rate
Both Sexes
3 to 5
50.7
814 739 90.8 557 75.4
6 to 11
52.0
1464 1324 90.4 1027 77.6
12 to 19 55.0 1369 1210 88.4 1017 84.0
20 to 39 48.5 1608 1366 85.0 1052 77.0
40 to 59
51.4
1559 1372 88.0 1082 78.9
60 to 79 52.3 1488 1328 89.2 1050 79.1
3 to 79 51.7 8302 7339 88.4 5785 78.8
6 to 79 51.8 7488 6600 88.1 5228 79.2
Males
6 to 11
52.3
738 671 90.9 521 77.6
12 to 19
54.3
694 606 87.3 509 84.0
20 to 39 46.1 826 672 81.4 514 76.5
40 to 59 50.3 798 683 85.6 542 79.4
60 to 79
54.4
701 618 88.2 515 83.3
6 to 79 51.4 3757 3250 86.5 2601 80.0
Females
6 to 11 51.6 726 653 89.9 506 77.5
12 to 19 55.8 675 604 89.5 508 84.1
20 to 39
51.0
782 694 88.7 538 77.5
40 to 59
52.6
761 689 90.5 540 78.4
60 to 79 50.4 787 710 90.2 535 75.4
6 to 79 52.1 3731 3350 89.8 2627 78.4
* The number of households within the scope of the survey was 8120. This number cannot be broken down by age group or sex because no
information is known about the households that did not respond. The overall household response rate is 74.1% (6017 / 8120). This rate is used to
calculate all of the combined response rates by age group and sex.
Canadian Health Measures Survey (CHMS) Data User Guide: Cycle 3
128
Appendix 7B - CHMS Cycle 3 Activity Monitor Response Rates by age group and sex
Sex
Age
Group
Households where one person was selected Households where two persons were selected
Response rate not adjusted for one or
two persons selected
# participants
at the MEC
offered an
activity
monitor
(OF1)
# pers. who
returned the
monitor with the
required # of days
of valid entries
(V1)
Activity
monitor
response
rate
(AM1)
# participants
at the MEC
offered an
activity
monitor
(OF2)
# pers. who
returned the
monitor with the
required # of days
of valid entries
(V2)
Activity
monitor
response
rate
(AM2)
Activity
monitor
combined
response rate
(AMCBRR)
# MEC
respondents
offered an
activity monitor
# pers. who
returned the
monitor with
the required #
of days of
valid entries
Activity
monitor
response
rate
Both
Sexes
3 to 5 1 1 100.0 544 406 74.6 37.9 545 407 74.7
6 to 11
1000 802 80.2 41.7 1000 802 80.2
12 to 19 587 350 59.6 407 283 69.5 35.0 994 633 63.7
20 to 39 411 274 66.7 606 459 75.7 35.0 1017 733 72.1
40 to 59 577 474 82.1 472 396 83.9 42.7 1049 870 82.9
60 to 79 968 771 79.6 59 48 81.4 41.7 1027 819 79.7
3 to 79 2544 1870 73.5 3088 2394 77.5 38.8 5632 4264 75.7
6 to 79 2543 1869 73.5 2544 1988 78.1 39.0 5087 3857 75.8
Males
6 to 11
504 403 80.0 41.8 504 403 80.0
12 to 19 297 170 57.2 203 143 70.4 34.0 500 313 62.6
20 to 39 243 161 66.3 254 193 76.0 32.8 497 354 71.2
40 to 59 280 219 78.2 245 215 87.8 41.6 525 434 82.7
60 to 79 479 390 81.4 26 20 76.9 44.2 505 410 81.2
6 to 79 1299 940 72.4 1232 974 79.1 38.7 2531 1914 75.6
Females
6 to 11
496 399 80.4 41.5 496 399 80.4
12 to 19 290 180 62.1 204 140 68.6 36.1 494 320 64.8
20 to 39 168 113 67.3 352 266 75.6 37.2 520 379 72.9
40 to 59 297 255 85.9 227 181 79.7 43.7 524 436 83.2
60 to 79 489 381 77.9 33 28 84.8 39.5 522 409 78.4
6 to 79 1244 929 74.7 1312 1014 77.3 39.5 2556 1943 76.0
Canadian Health Measures Survey (CHMS) Data User Guide: Cycle 3
129
Appendix 7C - CHMS Cycle 3 Blood Draw and Urine Response Rates by age group and sex
Households where one person was selected
Households where two persons were selected
Sex Age
Group
#
participants
at the
MEC
(C1)
# persons
who
provided
blood
(B1)
Blood
draw
response
rate
(BC1)
# persons
who
provided
urine
(U1)
Urine
response
rate
(UC1)
#
participants
at the MEC
(C2)
# persons
who
provided
blood
(B2)
Blood
draw
response
rate
(BC2)
# persons
who
provided
urine
(U2)
Urine
response
rate
(UC2)
Blood draw
combined
response rate
(BCOMBRR)
Urine
combined
response rate
(UCOMBRR)
Both
Sexes
3 to 5
1
1
100.
0
1
100.0
556
506
91.0
523
94.1
46.2
47.7
6 to 11
1027
958
93.3
1014
98.7
48.5
51.3
12 to 19
604
585
96.9
590
97.7
413
400
96.9
409
99.0
53.3
54.1
20 to 39
422
418
99.1
419
99.3
630
623
98.9
629
99.8
48.0
48.3
40 to 59
594
591
99.5
594
100.0
488
483
99.0
488
100.0
51.0
51.4
60 to 79
991
986
99.5
985
99.4
59
58
98.3
59
100.0
52.0
52.0
3 to 79
2612
2581
98.8
2589
99.1
3173
3028
95.4
3122
98.4
50.4
51.1
6 to 79
2611
2580
98.8
2588
99.1
2617
2522
96.4
2599
99.3
50.7
51.3
Males
6 to 11
521
496
95.2
519
99.6
49.8
52.1
12 to 19
304
296
97.4
297
97.7
205
200
97.6
204
99.5
53.0
53.5
20 to 39
251
250
99.6
249
99.2
263
260
98.9
263
100.0
45.8
45.9
40 to 59
289
288
99.7
289
100.0
253
252
99.6
253
100.0
50.1
50.3
60 to 79
489
486
99.4
486
99.4
26
26
100.0
26
100.0
54.1
54.1
6 to 79
1333
1320
99.0
1321
99.1
1268
1234
97.3
1265
99.8
50.5
51.1
Females
6 to 11
506
462
91.3
495
97.8
47.2
50.5
12 to 19
300
289
96.3
293
97.7
208
200
96.2
205
98.6
53.7
54.7
20 to 39
171
168
98.2
170
99.4
367
363
98.9
366
99.7
50.3
50.8
40 to 59
305
303
99.3
305
100.0
235
231
98.3
235
100.0
52.0
52.6
60 to 79
502
500
99.6
499
99.4
33
32
97.0
33
100.0
50.1
50.1
6 to 79
1278
1260
98.6
1267
99.1
1349
1288
95.5
1334
98.9
50.7
51.6
Canadian Health Measures Survey (CHMS) Data User Guide: Cycle 3
130
Appendix 7C: CHMS Cycle 3 Blood Draw and Urine Response Rates by age group and sex, continued
Response rate not adjusted for one or two persons selected
Sex Age Group # participants
at the MEC # persons who
provided blood Blood draw
response rate # persons who
provided urine Urine
response rate
Both Sexes
3 to 5
557
507
91.0
524
94.1
6 to 11
1027
958
93.3
1014
98.7
12 to 19
1017
985
96.9
999
98.2
20 to 39
1052
1041
99.0
1048
99.6
40 to 59
1082
1074
99.3
1082
100.0
60 to 79
1050
1044
99.4
1044
99.4
3 to 79
5785
5609
97.0
5711
98.7
6 to 79
5228
5102
97.6
5187
99.2
Males
6 to 11
521
496
95.2
519
99.6
12 to 19
509
496
97.4
501
98.4
20 to 39
514
510
99.2
512
99.6
40 to 59
542
540
99.6
542
100.0
60 to 79
515
512
99.4
512
99.4
6 to 79
2601
2554
98.2
2586
99.4
Females
6 to 11
506
462
91.3
495
97.8
12 to 19
508
489
96.3
498
98.0
20 to 39
538
531
98.7
536
99.6
40 to 59
540
534
98.9
540
100.0
60 to 79
535
532
99.4
532
99.4
6 to 79
2627
2548
97.0
2601
99.0
Canadian Health Measures Survey (CHMS) Data User Guide: Cycle 3
131
Appendix 7D - CHMS Cycle 3 Fasted Subsample Response Rates by age group and sex
Households where one person was selected to be fasted
Households where two persons were selected to be fasted
Sex Age
Group
Numb.
of resp.
Hhlds
(RR1)
# pers.
select.
for
fasted
sub-
sample
(SPS1)
# resp.
to the
quest.
(SQ1)
HHLD
quest.
resp.
rate
(SSQ1)
# part.
at the
MEC
(SC1)
MEC
resp.
rate
(SSC1)
# of
fasted
resp.
(SF1)
Fasted
resp.
rate
(SSF1)
Numb.
of
resp.
Hhlds
(RR2)
# pers.
select.
for
fasted
sub-
sample
(SPS2)
# resp.
to the
quest.
(SQ2)
HHLD
quest.
resp.
rate
(SSQ2)
# part.
at the
MEC
MEC
resp.
rate
(SSC2)
# of
fasted
resp.
(SF2)
Fasted
resp.
rate
(SSF2)
Fasted
Combined
Response
Rate
(FSCOMB
RR)
Both
Sexes
6 to 11
841
841
764
90.8
592
77.5
447
75.5
39.4
12 to 19
507
507
448
88.4
371
82.8
326
87.9
260
260
233
89.6
197
84.5
161
81.7
47.0
20 to 39
678
678
574
84.7
428
74.6
384
89.7
272
272
232
85.3
185
79.7
162
87.6
42.6
40 to 59
588
588
524
89.1
417
79.6
377
90.4
283
283
249
88.0
198
79.5
170
85.9
46.5
60 to 79
806
806
718
89.1
568
79.1
522
91.9
36
36
31
86.1
25
80.6
22
88.0
47.9
6 to 79
2579
2579
2264
87.8
1784
78.8
1609
90.2
846
1692
1509
89.2
1197
79.3
962
80.4
45.2
Males
6 to 11
434
434
393
90.6
312
79.4
242
77.6
41.3
12 to 19
260
260
229
88.1
188
82.1
168
89.4
128
128
114
89.1
99
86.8
80
80.8
47.4
20 to 39
361
361
297
82.3
216
72.7
207
95.8
116
116
90
77.6
73
81.1
64
87.7
42.1
40 to 59
322
322
278
86.3
222
79.9
201
90.5
151
151
131
86.8
106
80.9
95
89.6
46.4
60 to 79
370
370
325
87.8
272
83.7
253
93.0
22
22
19
86.4
15
78.9
13
86.7
50.3
6 to 79
1313
1313
1129
86.0
898
79.5
829
92.3
632
851
747
87.8
605
81.0
494
81.7
45.6
Females
6 to 11
407
407
371
91.2
280
75.5
205
73.2
37.3
12 to 19
247
247
219
88.7
183
83.6
158
86.3
132
132
119
90.2
98
82.4
81
82.7
46.7
20 to 39
317
317
277
87.4
212
76.5
177
83.5
156
156
142
91.0
112
78.9
98
87.5
43.1
40 to 59
266
266
246
92.5
195
79.3
176
90.3
132
132
118
89.4
92
78.0
75
81.5
46.7
60 to 79
436
436
393
90.1
296
75.3
269
90.9
14
14
12
85.7
10
83.3
9
90.0
45.8
6 to 79
1266
1266
1135
89.7
886
78.1
780
88.0
627
841
762
90.6
592
77.7
468
79.1
44.2
Canadian Health Measures Survey (CHMS) Data User Guide: Cycle 3
132
Appendix 7D - CHMS Cycle 3 Fasted Subsample Response Rates by age group and sex, continued
Response rate not adjusted for one or two persons selected
Sex Age
Group
# persons
selected for
fasted
subsample
# respondents
to the
questionnaire
HHLD
questionnaire
response rate
# participants
at the MEC
MEC
response
rate
# fasted
respondents Fasted
response rate
Both
Sexes
6 to 11
841
764
90.8
592
77.5
447
75.5
12 to 19
767
681
88.8
568
83.4
487
85.7
20 to 39
950
806
84.8
613
76.1
546
89.1
40 to 59
871
773
88.7
615
79.6
547
88.9
60 to 79
842
749
89.0
593
79.2
544
91.7
6 to 79
4271
3773
88.3
2981
79.0
2571
86.2
Males
6 to 11
434
393
90.6
312
79.4
242
77.6
12 to 19
388
343
88.4
287
83.7
248
86.4
20 to 39
477
387
81.1
289
74.7
271
93.8
40 to 59
473
409
86.5
328
80.2
296
90.2
60 to 79
392
344
87.8
287
83.4
266
92.7
6 to 79
2164
1876
86.7
1503
80.1
1323
88.0
Females
6 to 11
407
371
91.2
280
75.5
205
73.2
12 to 19
379
338
89.2
281
83.1
239
85.1
20 to 39
473
419
88.6
324
77.3
275
84.9
40 to 59
398
364
91.5
287
78.8
251
87.5
60 to 79
450
405
90.0
306
75.6
278
90.8
6 to 79
2107
1897
90.0
1478
77.9
1248
84.4
Canadian Health Measures Survey (CHMS) Data User Guide: Cycle 3
133
Appendix 7E - CHMS Cycle 3 Red Blood Cell Fatty Acids Subsample Response Rates by age group and sex
Sex
Age
Group
Households where one person was selected
Households where two persons were selected
#
participant
s at the
MEC
(C1)
# persons
selected for
the fatty
acids
subsample
(FAS1)
#persons
selected with
valid
laboratory
results
(FAR1)
Fatty acids
subsample
response
rate
(FA1)
#
participants
at the MEC
(C2)
# persons
selected for
the fatty acids
subsample
(FAS2)
#persons
selected with
valid
laboratory
results
(FAR2)
Fatty
acids
subsampl
e
response
rate
(FA2)
Fatty acids
subsample
combined
response rate
(FACBRR)
Both Sexes
20 to 39
422
272
261
96.0
630
412
403
97.8
47.1
40 to 59
594
382
373
97.6
488
300
286
95.3
49.7
60 to 79
991
639
625
97.8
59
37
36
97.3
51.1
20 to 79
2007
1293
1259
97.4
1177
749
725
96.8
49.2
Males
20 to 39
251
160
155
96.9
263
178
175
98.3
45.0
40 to 59
289
174
169
97.1
253
162
155
95.7
48.5
60 to 79
489
321
314
97.8
26
15
15
100.0
53.3
20 to 79
1029
655
638
97.4
542
355
345
97.2
48.7
Females
20 to 39
171
112
106
94.6
367
234
228
97.4
49.2
40 to 59
305
208
204
98.1
235
138
131
94.9
50.8
60 to 79
502
318
311
97.8
33
22
21
95.5
49.2
20 to 79
978
638
621
97.3
635
394
380
96.4
49.8
Canadian Health Measures Survey (CHMS) Data User Guide: Cycle 3
134
Appendix 7E - CHMS Cycle 3 Red Blood Cell Fatty Acids Subsample Response Rates by age group and sex,
continued
Sex Age Group
Response rate not adjusted for one or two persons selected
# participants at
the MEC
# persons
selected for the
fatty acids
subsample
# persons selected with
valid
laboratory results
Fatty acids
subsample
response rate
Both Sexes
20 to 39
1052
684
664
97.1
40 to 59
1082
682
659
96.6
60 to 79
1050
676
661
97.8
20 to 79
3184
2042
1984
97.2
Males
20 to 39
514
338
330
97.6
40 to 59
542
336
324
96.4
60 to 79
515
336
329
97.9
20 to 79
1571
1010
983
97.3
Females
20 to 39
538
346
334
96.5
40 to 59
540
346
335
96.8
60 to 79
535
340
332
97.6
20 to 79
1613
1032
1001
97.0

Canadian Health Measures Survey (CHMS) Data User Guide: Cycle 3
135
Appendix 7F - CHMS Cycle 3 Tap water fluoride subsample household response rates by household size
Household
size
Number of
CHMS
respondent
households
(R)
Number of
households
selected for
the subsample
(RSFL)
Probability of
selection for
the household
subsample
Number of
households with
water collected
at the dwelling
(RSFLW)
Water
collection
subsample
response rate
(FLW)
Number of
households with valid
data and consent to
share data
(RSFLWV)
Water subsample
response rate (with
valid data and consent
to share data)
(FLWV)
Subsample
combined
response rate
(FLHRR)
One
person 931 282 30.3 254 90.1 198 78.0 52.0
Two
persons 1,575 548 34.8 511 93.2 421 82.4 56.9
Three or
more
persons
3,511 2,001 57.0 1,911 95.5 1,569 82.1 58.1
Total 6,017 2,831 47.1 2,676 94.5 2,188 81.8 57.3
Canadian Health Measures Survey (CHMS) Data User Guide: Cycle 3
136
Appendix 7G - CHMS Cycle 3 Urine fluoride subsample person response rates by age group and sex
Sex Age
Group
Households where one person was selected for the CHMS
Households where two persons were selected for the CHMS
Subsample
combined
response
rate
(FLPCBRR
)
Number of
questionnaire
respondents
or households
with water
collected at
the dwelling
(HQ1FLW)
(PQ1FLW)
Number of
respondents
at the MEC
with water
collected at
the dwelling
(C1FLW)
Number of
respondents
selected
for the
subsample
(PS1FL)
Number
of persons
who
provided
blood
(with
valid
data)
(U1FL)
Blood
subsampl
e
response
rate (with
valid
data)
(UC1FL)
Number of
households
with water
collected at
the dwelling
(HQ2FLW)
Number of
questionnaire
respondents
with water
collected at
the dwelling
(PQ2FLW)
Number of
respondents
at the MEC
with water
collected at
the dwelling
(C2FLW)
Number of
respondents
selected
for the
subsample
(PS2FL)
Number
of persons
who
provided
blood
(with
valid
data)
(U2FL)
Blood
subsampl
e
response
rate (with
valid
data)
(UC2FL
Both
sexes
3 to 5 0 0 0 0
703 703 536 527 493 93.5 50.0
6 to 11 0 0 0 0
708 708 565 554 549 99.1 55.4
12 to 19 493 428 427 414 97.0 307 307 259 137 135 98.5 58.7
20 to 39 120 93 93 91 97.8 588 588 461 280 280 100.0 54.6
40 to 59 238 193 192 192 100.0 408 408 322 168 167 99.4 55.6
60 to 79 405 333 331 331 100.0 53 53 43 19 19 100.0 57.5
3 to 79 1,256 1,047 1,043 1,028 98.6 1,420 2,767 2,186 1,685 1,643 97.5 55.6
6 to 79 1,256 1,047 1,043 1,028 98.6 1,383 2,064 1,650 1,158 1,150 99.3 56.5
Males
6 to 11 0 0 0 0
354 354 284 280 280 100.0 56.2
12 to 19 249 217 217 211 97.2 148 148 128 73 72 98.6 59.5
20 to 39 71 55 55 54 98.2 249 249 194 115 115 100.0 54.3
40 to 59 111 88 88 88 100.0 216 216 173 88 87 98.9 55.5
60 to 79 186 157 156 156 100.0 23 23 17 10 10 100.0 58.3
6 to 79 617 517 516 509 98.6 832 990 796 566 564 99.6 56.9
Females
6 to 11 0 0 0 0
354 354 281 274 269 98.2 54.6
12 to 19 244 211 210 203 96.7 159 159 131 64 63 98.4 57.9
20 to 39 49 38 38 37 97.4 339 339 267 165 165 100.0 54.9
40 to 59 127 105 104 104 100.0 192 192 149 80 80 100.0 55.8
60 to 79 219 176 175 175 100.0 30 30 26 9 9 100.0 56.8
6 to 79 639 530 527 519 98.5 893 1074 854 592 586 99.0 56.0
Canadian Health Measures Survey (CHMS) Data User Guide: Cycle 3
137
Appendix 7G - CHMS Cycle 3 Urine fluoride subsample person response rates by age group and sex, continued
Sex Age
Group
Response rates not adjusted for one or two persons selected
Number of questionnaire
respondents with water
collected at the dwelling
Number of participants
at the MEC with water
collected at the dwelling
Number of respondents
selected for the
subsample
Number of persons selected
for the subsample who
provided urine
(with valid data)
Urine fluoride
subsample response
rate (with valid data)
Both
sexes
3 to 5 703 536 527 493 93.5
6 to 11 708 565 554 549 99.1
12 to 19 800 687 564 549 97.3
20 to 39 708 554 373 371 99.5
40 to 59 646 515 360 359 99.7
60 to 79 458 376 350 350 100.0
3 to 79 4,023 3,233 2,728 2,671 97.9
6 to 79 3,320 2,697 2,201 2,178 99.0
Males
6 to 11 354 284 280 280 100.0
12 to 19 397 345 290 283 97.6
20 to 39 320 249 170 169 99.4
40 to 59 327 261 176 175 99.4
60 to 79 209 174 166 166 100.0
6 to 79 1,607 1,313 1,082 1,073 99.2
Females
6 to 11 354 281 274 269 98.2
12 to 19 403 342 274 266 97.1
20 to 39 388 305 203 202 99.5
40 to 59 319 254 184 184 100.0
60 to 79 249 202 184 184 100.0
6 to 79 1,713 1,384 1,119 1,105 98.7

Canadian Health Measures Survey (CHMS) Data User Guide: Cycle 3
138
Appendix 7H - CHMS Cycle 3 Tap water VOCs subsample household response rates by household size
Household
size
Number of
CHMS
respondent
households
(R)
Number of
households
selected for
the subsample
(RSVOC)
Probability of
selection for
the household
subsample
Number of
households with
water collected at
the dwelling
(RSVOCW)
Water collection
subsample
response rate
(VOCW)
Number of households
with valid data and
consent to share data
(RSVOCWV)
Water subsample
response rate (with valid
data and consent to
share data)
(VOCWV)
Subsample
combined
response rate
(VOCHRR)
One
person 931 546 58.6 487 89.2 357 73.3 48.5
Two
persons 1,575 881 55.9 816 92.6 642 78.7 54
Three or
more
persons
3,511 2,151 61.3 2,048 95.2 1,651 80.6 56.9
Total 6,017 3,578 59.5 3,351 93.7 2,650 79.1 54.9

Canadian Health Measures Survey (CHMS) Data User Guide: Cycle 3
139
Appendix 7I - CHMS Cycle 3 Blood VOCs subsample person response rates by age group and sex
Sex Age
Group
Households where one person was selected for the CHMS
Households where two persons were selected for the CHMS
Subsample
combined
response rate
(VOCPCRR)
Number of
questionnaire
respondents or
households with
water collected
at the dwelling
(HQ1VOCW)
(PQ1VOCW)
Number of
respondents
at the MEC
with water
collected at
the dwelling
(C1VOCW)
Number of
respondents
selected
for the
subsample
(PS1VOC)
Number of
persons
who
provided
blood (with
valid data)
(B1VOC)
Blood
subsample
response rate
(with valid
data)
(BC1VOC)
Number of
households
with water
collected at
the dwelling
(HQ2VOCW)
Number of
questionnaire
respondents
with water
collected at
the dwelling
(PQ2VOCW)
Number of
respondents
at the MEC
with water
collected at
the dwelling
(C2VOCW)
Number of
respondents
selected
for the
subsample
(PS2VOC)
Number of
persons
who
provided
blood (with
valid data)
(B2VOC)
Blood
subsample
response
rate (with
valid data)
(BC2VOC)
Both
sexes
12 to 19 671 576 576 534 92.7 310 310 260 242 223 92.1 54.7
20 to 39 270 208 206 195 94.7 487 487 384 377 362 96.0 51.9
40 to 59 410 335 331 322 97.3 374 374 300 296 282 95.3 54.1
60 to 79 740 611 607 579 95.4 40 40 32 32 30 93.8 54.5
12 to 79 2,091 1,730 1,720 1,630 94.8 1,208 1,211 976 947 897 94.7 53.9
Males
12 to 19 344 293 293 274 93.5 156 156 132 122 114 93.4 55.2
20 to 39 167 132 132 127 96.2 198 198 157 155 149 96.1 52.8
40 to 59 196 158 157 151 96.2 197 197 161 159 153 96.2 54.2
60 to 79 350 299 296 281 94.9 18 18 14 14 14 100.0 56.2
12 to 79 1,057 882 878 833 94.9 567 569 464 450 430 95.6 54.6
Females
12 to 19 327 283 283 260 91.9 154 154 128 120 109 90.8 54.3
20 to 39 103 76 74 68 91.9 289 289 227 222 213 95.9 50.9
40 to 59 214 177 174 171 98.3 177 177 139 137 129 94.2 54.1
60 to 79 390 312 311 298 95.8 22 22 18 18 16 88.9 53.1
12 to 79 1,034 848 842 797 94.7 641 642 512 497 467 94.0 53.2
Canadian Health Measures Survey (CHMS) Data User Guide: Cycle 3
140
Annexe 7I - CHMS Cycle 3 Blood VOCs subsample person response rates by age group and sex, continued
Sex Age
Group
Response rates not adjusted for one or two persons selected
Number of questionnaire
respondents with water
collected at the dwelling
Number of participants
at the MEC with water
collected at the dwelling
Number of respondents
selected for the
subsample
Number of persons
selected for the
subsample who provided
blood (with
valid data)
Blood VOCs subsample
response rate
(with valid data)
Both
sexes
12 to 19 981 836 818 757 92.5
20 to 39 757 592 583 557 95.5
40 to 59 784 635 627 604 96.3
60 to 79 780 643 639 609 95.3
12 to 79 3,302 2,706 2,667 2,527 94.8
Males
12 to 19 500 425 415 388 93.5
20 to 39 365 289 287 276 96.2
40 to 59 393 319 316 304 96.2
60 to 79 368 313 310 295 95.2
12 to 79 1,626 1,346 1,328 1,263 95.1
Females
12 to 19 481 411 403 369 91.6
20 to 39 392 303 296 281 94.9
40 to 59 391 316 311 300 96.5
60 to 79 412 330 329 314 95.4
12 to 79 1,676 1,360 1,339 1,264 94.4
Canadian Health Measures Survey (CHMS) Data User Guide: Cycle 3
141
Appendix 7J - CHMS Cycle 3 Acrylamide Subsample Response Rates by age group and sex
Sex
Age Group
Households where one person was selected
Households where two persons were selected
#
participants
at the MEC
(C1)
# persons
selected for
the
acrylamide
subsample
(ACS1)
#persons
selected with
valid laboratory
results
(ACR1)
Acrylamide
subsample
response rate
(AC1)
#
participants
at the MEC
(C2)
# persons
selected for the
acrylamide
subsample
(ACS2)
#persons selected
with valid
laboratory
results
(ACR2)
Acrylamid
e
subsample
response
rate
(AC2)
Acrylamide
subsample
combined
response rate
(ACCBRR)
Both Sexes
3 to 5
1
1
1
100.0
556
549
470
85.6
43.4
6 to 11
1,027
547
505
92.3
48.0
12 to 19
604
300
292
97.3
413
224
215
96.0
53.3
20 to 39
422
139
135
97.1
630
218
213
97.7
47.3
40 to 59
594
183
183
100.0
488
130
128
98.5
51.1
60 to 79
991
337
334
99.1
59
16
16
100.0
51.8
3 to 79
2,612
960
945
98.4
3,173
1,684
1,547
91.9
49.6
6 to 79
2,611
959
944
98.4
2,617
1,135
1,077
94.9
50.3
Males
6 to 11
521
266
250
94.0
49.2
12 to 19
304
147
143
97.3
205
115
111
96.5
52.7
20 to 39
251
82
80
97.6
263
86
83
96.5
44.7
40 to 59
289
86
86
100.0
253
66
66
100.0
50.3
60 to 79
489
169
168
99.4
26
6
6
100.0
54.1
6 to 79
1,333
484
477
98.6
1,268
539
516
95.7
50.0
Females
6 to 11
506
281
255
90.7
46.9
12 to 19
300
153
149
97.4
208
109
104
95.4
53.9
20 to 39
171
57
55
96.5
367
132
130
98.5
49.9
40 to 59
305
97
97
100.0
235
64
62
96.9
51.9
60 to 79
502
168
166
98.8
33
10
10
100.0
49.8
6 to 79
1,278
475
467
98.3
1,349
596
561
94.1
50.3
Canadian Health Measures Survey (CHMS) Data User Guide: Cycle 3
142
Appendix 7J - CHMS Cycle 3 Acrylamide Subsample Response Rates by age group and sex, continued
Sex Age Group
Response rate not adjusted for one or two persons selected
# participants at
the MEC
# persons
selected for the
acrylamide
subsample
# persons selected with
valid
laboratory results
Acrylamide
subsample
response rate
Both Sexes
3 to 5
557
550
471
85.6
6 to 11
1,027
547
505
92.3
12 to 19
1,017
524
507
96.8
20 to 39
1,052
357
348
97.5
40 to 59
1,082
313
311
99.4
60 to 79
1,050
353
350
99.2
3 to 79
5,785
2,644
2,492
94.3
6 to 79
5,228
2,094
2,021
96.5
Males
6 to 11
521
266
250
94.0
12 to 19
509
262
254
96.9
20 to 39
514
168
163
97.0
40 to 59
542
152
152
100.0
60 to 79
515
175
174
99.4
6 to 79
2,601
1,023
993
97.1
Females
6 to 11
506
281
255
90.7
12 to 19
508
262
253
96.6
20 to 39
538
189
185
97.9
40 to 59
540
161
159
98.8
60 to 79
535
178
176
98.9
6 to 79
2,627
1,071
1,028
96.0
Canadian Health Measures Survey (CHMS) Data User Guide: Cycle 3
143
Appendix 7K - CHMS Cycle 3 Methyl Mercury Subsample Response Rates by age group and sex
Sex
Age Group
Households where one person was selected
Households where two persons were selected
#
participants
at the MEC
(C1)
# persons
selected for
the methyl
mercury
subsample
(MMS1)
#persons
selected with
valid laboratory
results
(MMR1)
Methyl
mercury
subsample
response rate
(MM1)
#
participants
at the MEC
(C2)
# persons
selected for the
methyl
mercury
subsample
(MMS2)
#persons selected
with valid
laboratory
results
(MMR2)
Methyl
mercury
subsample
response
rate
(MM2)
Methyl
mercury
subsample
combined
response rate
(MMCBRR)
Both Sexes
20 to 39
422
153
150
98.0
630
211
209
99.1
47.8
40 to 59
594
162
159
98.1
488
155
154
99.4
50.8
60 to 79
991
343
341
99.4
59
20
19
95.0
51.9
20 to 79
2,007
658
650
98.8
1,177
386
382
99.0
50.1
Males
20 to 39
251
92
92
100.0
263
81
79
97.5
45.5
40 to 59
289
86
84
97.7
253
70
70
100.0
49.7
60 to 79
489
169
168
99.4
26
9
9
100.0
54.1
20 to 79
1,029
347
344
99.1
542
160
158
98.8
49.6
Females
20 to 39
171
61
58
95.1
367
130
130
100.0
50.2
40 to 59
305
76
75
98.7
235
85
84
98.8
51.9
60 to 79
502
174
173
99.4
33
11
10
90.9
49.8
20 to 79
978
311
306
98.4
635
226
224
99.1
50.6
Canadian Health Measures Survey (CHMS) Data User Guide: Cycle 3
144
Appendix 7K - CHMS Cycle 3 Methyl Mercury Subsample Response Rates by age group and sex, continued
Sex Age Group
Response rate not adjusted for one or two persons selected
# participants at
the MEC
# persons
selected for the
methyl mercury
subsample
# persons selected with
valid laboratory results
Methyl mercury
subsample
response rate
Both Sexes
20 to 39
1,052
364
359
98.6
40 to 59
1,082
317
313
98.7
60 to 79
1,050
363
360
99.2
20 to 79
3,184
1,044
1,032
98.9
Males
20 to 39
514
173
171
98.8
40 to 59
542
156
154
98.7
60 to 79
515
178
177
99.4
20 to 79
1,571
507
502
99.0
Females
20 to 39
538
191
188
98.4
40 to 59
540
161
159
98.8
60 to 79
535
185
183
98.9
20 to 79
1,613
537
530
98.7

Canadian Health Measures Survey (CHMS) Data User Guide: Cycle 3
145
Appendix 7L - CHMS Cycle 3 Urine environmental contaminants Subsample Response Rates by age group and sex
Sex
Age Group
Households where one person was selected
Households where two persons were selected
#
participants
at the MEC
(C1)
# persons
selected for
the env. cont.
subsample
(SC1)
#persons
selected with
valid laboratory
results
(SU1)
Env. cont.
subsample
response rate
(SSU1)
#
participants
at the MEC
(C2)
# persons
selected for the
env. cont.
subsample
(SC2)
#persons selected
with valid
laboratory
results
(SU2)
Env. cont.
subsample
response
rate
(SSU2)
Env. cont.
subsample
combined
response rate
(EUCBRR)
Both Sexes
3 to 5
1
1
1
100.0
556
533
499
93.6
47.5
6 to 11
1,027
517
507
98.1
51.0
12 to 19
604
300
290
96.7
413
223
220
98.7
53.7
20 to 39
422
139
139
100.0
630
216
216
100.0
48.5
40 to 59
594
185
185
100.0
488
127
127
100.0
51.4
60 to 79
991
342
338
98.8
59
16
16
100.0
51.7
3 to 79
2,612
967
953
98.6
3,173
1,632
1,585
97.1
50.7
6 to 79
2,611
966
952
98.6
2,617
1,099
1,086
98.8
51.1
Males
6 to 11
521
253
253
100.0
52.3
12 to 19
304
145
138
95.2
205
116
115
99.1
52.6
20 to 39
251
82
82
100.0
263
85
85
100.0
46.1
40 to 59
289
86
86
100.0
253
67
67
100.0
50.3
60 to 79
489
170
169
99.4
26
6
6
100.0
54.1
6 to 79
1,333
483
475
98.3
1,268
527
526
99.8
50.8
Females
6 to 11
506
264
254
96.2
49.7
12 to 19
300
155
152
98.1
208
107
105
98.1
54.7
20 to 39
171
57
57
100.0
367
131
131
100.0
51.0
40 to 59
305
99
99
100.0
235
60
60
100.0
52.6
60 to 79
502
172
169
98.3
33
10
10
100.0
49.5
6 to 79
1,278
483
477
98.8
1,349
572
560
97.9
51.3
Canadian Health Measures Survey (CHMS) Data User Guide: Cycle 3
146
Appendix 7L - CHMS Cycle 3 Urine environmental contaminants Subsample Response Rates by age group and
sex, continued
Sex Age Group
Response rate not adjusted for one or two persons selected
# participants at
the MEC
# persons
selected for the
env. cont.
subsample
# persons selected with
valid
laboratory results
Env. cont.
subsample
response rate
Both Sexes
3 to 5
557
534
500
93.6
6 to 11
1,027
517
507
98.1
12 to 19
1,017
523
510
97.5
20 to 39
1,052
355
355
100.0
40 to 59
1,082
312
312
100.0
60 to 79
1,050
358
354
98.9
3 to 79
5,785
2,599
2,538
97.7
6 to 79
5,228
2,065
2,038
98.7
Males
6 to 11
521
253
253
100.0
12 to 19
509
261
253
96.9
20 to 39
514
167
167
100.0
40 to 59
542
153
153
100.0
60 to 79
515
176
175
99.4
6 to 79
2,601
1,010
1,001
99.1
Females
6 to 11
506
264
254
96.2
12 to 19
508
262
257
98.1
20 to 39
538
188
188
100.0
40 to 59
540
159
159
100.0
60 to 79
535
182
179
98.4
6 to 79
2,627
1,055
1,037
98.3
Canadian Health Measures Survey (CHMS) Data User Guide: Cycle 3
147
Appendix 7M - CHMS Cycle 3 Urine NNK metabolites subsample response rates by age group and sex
Sex Age
Group
Households where one person was selected for the CHMS
Households where two persons were selected for the CHMS
Subsample
combined
response rate
(NNKPCRR)
Number of
questionnaire
respondents or
respondent
households
(HQ1NNK)
(PQ1NNK)
Number of
respondents
at the MEC
(C1NNK)
Number of
respondents
selected
for the
subsample
(PS1NNK)
Number of
persons
who
provided
urine (with
valid data)
(U1NNK)
Urine
subsample
response
rate (with
valid data)
(UC1NNK)
Number of
questionnaire
respondents or
respondent
households
(HQ2NNK)
(PQ2NNK)
Number of
respondents
at the MEC
(C2NNK)
Number of
respondents
selected
for the
subsample
(PS2NNK)
Number of
persons
who
provided
urine (with
valid data)
(U2NNK)
Urine
subsample
response
rate (with
valid data)
(UC2NNK)
Both
sexes
12 to 19 714 604 420 401 95.5 496 413 269 261 97.0 52.9
20 to 39 565 422 277 268 96.8 801 630 377 371 98.4 47.4
40 to 59 751 594 402 391 97.3 621 488 283 279 98.6 50.3
60 to 79 1,256 991 238 234 98.3 72 59 16 15 93.8 51.3
12 to 79 3,286 2,611 1,337 1,294 96.8 1,990 1,590 945 926 98.0 50.3
Males
12 to 19 366 304 207 200 96.6 240 205 135 133 98.5 52.9
20 to 39 334 251 184 178 96.7 338 263 193 192 99.5 45.3
40 to 59 365 289 230 227 98.7 318 253 150 149 99.3 49.8
60 to 79 584 489 135 131 97.0 34 26 7 7 100.0 52.9
12 to 79 1,649 1,333 756 736 97.4 930 747 485 481 99.2 50.0
Females
12 to 19 348 300 213 201 94.4 256 208 134 128 95.5 52.9
20 to 39 231 171 93 90 96.8 463 367 184 179 97.3 49.5
40 to 59 386 305 172 164 95.3 303 235 133 130 97.7 50.7
60 to 79 672 502 103 103 100.0 38 33 9 8 88.9 50.0
12 to 79 1,637 1,278 581 558 96.0 1,060 843 460 445 96.7 50.4

Canadian Health Measures Survey (CHMS) Data User Guide: Cycle 3
148
Annexe 7M- CHMS Cycle 3 Urine NNK subsample response rates by age group and sex, continued
Sex Age
Group
Response rates not adjusted for one or two persons selected
Number of questionnaire
respondents Number of participants
at the MEC
Number of respondents
selected for the
subsample
Number of persons
selected for the
subsample who provided
urine (with valid data)
Urine NNK
subsample
response rate
(with valid data)
Both
sexes
12 to 19 1,210 1,017 689 662 96.1
20 to 39 1,366 1,052 654 639 97.7
40 to 59 1,372 1,082 685 670 97.8
60 to 79 1,328 1,050 254 249 98.0
12 to 79 5,276 4,201 2,282 2,220 97.3
Males
12 to 19 606 509 342 333 97.4
20 to 39 672 514 377 370 98.1
40 to 59 683 542 380 376 98.9
60 to 79 618 515 142 138 97.2
12 to 79 2,579 2,080 1,241 1,217 98.1
Females
12 to 19 604 508 347 329 94.8
20 to 39 694 538 277 269 97.1
40 to 59 689 540 305 294 96.4
60 to 79 710 535 112 111 99.1
12 to 79 2,697 2,121 1,041 1,003 96.3
Canadian Health Measures Survey (CHMS) Data User Guide: Cycle 3
149
Appendix 8 - Activity Monitor Research
In cycle 2 of the CHMS, activity monitor data was collected in 60 second epochs for all respondents. Emerging research has demonstrated that
epochs shorter than 60 seconds may more accurately capture the sporadic and intermittent physical activity that is typical in preschool aged
children. This led the CHMS to collect activity monitor data in 15 second epochs for 3 to 5 year olds in cycle 3. In a comparative study using
two Actical accelerometers (one collecting data in 15-seconds epoch and the other one in 60-seconds epoch) in children aged 3 to 5 (Colley et
al. Health Reports 2014), it was shown that counts per minute and counts per 15-seconds epoch were highly correlated leading to correction
equations. These equations can be used to compare the results and/or to combine the data from both cycles. However, the study also showed
that the correlation was low for step counts collected in different epoch length. Therefore it is not recommended to compare steps per day in
cycles 2 and 3 nor to combined the step data.
Further research is also needed to understand how to assess the new preschool physical activity guidelines using accelerometer data. The new
guidelines state that “preschoolers should accumulate at least 180 minutes of physical activity at any intensity spread throughout the day”
(Tremblay, Leblanc et al., 2012). Intensity cut-points have been published for moderate and vigorous physical activity in this age group for the
Actical accelerometer; however, more work is needed to understand what the bottom cut-off should be (i.e. the transition between sedentary
and light). Another gap is the lack of a daily step count target for this age group. Based on CHMS data from cycle 1, a daily step target of
12,000 steps was published in 2012 for children and youth aged 6 to 19 (Colley, Janssen et al., MSSE 2012). Similar analyses need to be done
for 3 to 5 year old children to find an appropriate daily step target.
References (Activity Monitor Research) :
Colley, R.C., Harvey, A., Grattan, K.P. and Adamo, K.B.. 2014. “Impact of accelerometer epoch length on physical activity and sedentary
behaviour outcomes for preschool-aged children”. Health Reports. Vol. 25(1): 3-9.
Colley, R.C., I. Janssen and M.S. Tremblay. 2012. “Daily step count target to measures adherence to physical activity guidelines in children”.
Medicine and Science in Sports and Exercice. Vol. 44(5): 977-982.
Kim, Y., M.W. Beets, R.R. Pate and S.N. Blair. 2012. “The effect of reintegrating Actigraph accelerometer counts in preschool children:
Comparison using different epoch lengths”. Journal of Sport Science and Medicine. June 30. [Epub ahead of print]
Pfeiffer, K.A., K.L. McIver, M. Dowda, J.C.A. Almeida and R.R. Pate. 2006. “Validation and calibration of the Actical accelerometer in
preschool children”. Medicine and Science in Sports and Exercice. Vol. 38(1):152-157.
Tremblay, M.S., A.G. Leblanc, V. Carson, L. Choquette, S. Connor Gorber, C. Dillman et al. 2012. “Canadian physical activity guidelines for
the early years (aged 0-4 years)”. Applied Physiology: Nutrition and Metabolism. Vol. 37(2):345-356.
Canadian Health Measures Survey (CHMS) Data User Guide: Cycle 3
150
Appendix 9 – Changes to Wave 1 Variables
The following changes have been made between the wave 1 and wave 2 household and clinic full sample files.
As a result of these changes, the wave 2 files (household and clinic full sample) should be used instead of the wave 1 versions.
Changes to the household full sample file
Aboriginal status
There were cases with a response to question AMB_01 that had not been carried forward onto the master file, resulting in an inaccurate count
of respondents self-identifying as Aboriginal. This affected a total of 107 cases. Below is a summary of the changes:
1. Additional responses of AMB_01 = 1, which also subsequently resulted in the following changes:
• They now have a response of 1 or 2 at AMB_02A, AMB_02B, and AMB_02C;
• Variables PG_01A to PG_01L and PGDCGT are set to “Not applicable.
2. 102 additional responses of AMB_01 = 2.
Education
An error was identified in the derivation of EDUDR04 which was resulting in 64 respondents mistakenly having a code of “Not stated” at
EDUDR04. The code was changed and each of these cases now has an EDUDR04 = 1. With this change, there were also changes to the counts
of EDUDH04 – some resulting from the change in the derivation itself and some resulting from some or all of the 64 cases now having valid
values (total changes = 131).
Note: The derived variables (DV) document has been updated to reflect the change in the derivation.
Changes to the clinic full sample file
Fasting status
It was realized that the fasting status flag (PHID12) was not truly representative of fasting status for any respondent who was not selected for
the fasting subsample. This variable has been re-coded so that it now differentiates between:
1. Selected to fast, fasted;
2. Selected to fast, not fasted;
3. Not selected to fast, fasted;
4. Not selected to fast, not fasted.
Canadian Health Measures Survey (CHMS) Data User Guide: Cycle 3
151
The following changes occurred:
• 19 cases went from a status 1 to a status 2;
• 280 cases went from a status 2 to a status 3;
• 2520 cases went from a status 2 to a status 4.
With this change, the ATG_11H and ATG_11M variables were verified so that fasting time can be estimated as accurately as possible for all
respondents if needed by an analyst.
Note: The DV document has been updated to reflect the change in the derivation.
Canadian Health Measures Survey (CHMS) Data User Guide: Cycle 3
152
Appendix 10 – Changes to Wave 2 Variables
The following changes were applied to the wave 2 activity monitor full sample and subsample files.
As a result of these changes, the revised wave 2 files (activity monitor full sample and subsample) should be used instead of the original wave
2 versions.
Changes to the activity monitor full sample file
The following variables were affected for all 3 to 5 year olds (n = 557) – the data that was available on the original release has been replaced
by the appropriate code to represent “Not applicable”:
AMMDHR6
AMMDXSA6
AMMDLA6
AMMDMVA6
AMMDTCT6
AMMDACT6
AMMDSST6

Canadian Health Measures Survey (CHMS) Data User Guide: Cycle 3
153
Changes to the activity monitor subsample file
It was realized that the 6th day of data collected on the activity monitor for 3 to 5 year olds was erroneously included on the data set and in the summary statistics. With the change to a shorter and more
frequent epoch length (15 seconds), there was insufficient memory in the activity monitors for the full 7 days. The reason for this is that the number of data points collected increased from 1,440 per day
(1 per minute) to 5,760 per day (4 per minute). As a result, only 5 full days of data were successfully collected for this age group. The amount of data on the 6th day varied from person to person, and it
was therefore determined that the 6th day of data should be excluded. The requirement for inclusion on the subsample file is at least 3 valid days of data (minimum 5 hours of wear time each day). With
the removal of day 6, there were 7 respondents who no longer met that criteria, and were therefore excluded from the subsample file. The total count on that file is now n = 4,264 (previously n = 4,271).
The same changes to the variables for 3 to 5 year olds (n = 407 cases affected) in the activity monitor full sample file apply to the subsample
file. Similarly, all summary statistics have been re-calculated to exclude day 6, and so the values for the following variables have been updated
for all 3 to 4 year olds on the file:
AMMDVAL
AMMDHR
AMMDACT
AMMDMVA
AMMDLA
AMMDXSA
AMMDSST
AMMDNAP
AMMDPDP
As well as these variables for 5 year olds:
AMMDNAK
AMMDPDK
AMMDPSK
Changes to the activity monitor subsample weight file
The change in the number of respondents included in the activity monitor subsample from 4,271 to 4,264 required an adjustment of the
weights, and so wgt_am and all bootstrap weights were recalculated for all respondents in the subsample.
Changes to the activity monitor derived variable documentation
A change was made to the documentation regarding the the physical activity intensity cut-points used for 3 to 5 year olds. A light-to-moderate
physical activity cut-point of 288 counts per 15 seconds was used rather than the 2,680 counts per minute used in the previous cycle. This
value is based on a paper by Adolph et al., 2012.31
