Teledyne T101 Users Manual
T101 to the manual f3223ade-78ce-4db9-8dbd-aca16a6571d1
2015-02-03
: Teledyne Teledyne-T101-Users-Manual-464576 teledyne-t101-users-manual-464576 teledyne pdf
Open the PDF directly: View PDF ![]() .
.
Page Count: 371 [warning: Documents this large are best viewed by clicking the View PDF Link!]
- 1. INTRODUCTION
- 2. SPECIFICATIONS AND APPROVALS
- 3. GETTING STARTED
- 4. OPERATING INSTRUCTIONS
- 4.1. OVERVIEW OF OPERATING MODES
- 4.2. SAMPLE MODE
- 4.3. CALIBRATION MODE
- 4.4. SETUP MODE
- 4.4.1. SETUP – CFG: VIEWING THE ANALYZER’S CONFIGURATION INFORMATION
- 4.4.2. SETUP – ACAL: AUTO CALIBRATION
- 4.4.3. SETUP – DAS: DATA ACQUISITION
- 4.4.4. SETUP – RANGE: ANALOG OUTPUT REPORTING RANGE CONFIGURATION
- 4.4.5. SETUP – PASS: PASSWORD PROTECTION
- 4.4.6. SETUP – CLK: SETTING THE INTERNAL TIME-OF-DAY CLOCK
- 4.5. SETUP – VARS: USING THE INTERNAL VARIABLES
- 4.6. SETUP – DIAG: USING THE DIAGNOSTICS FUNCTIONS
- 4.7. SETUP – COMM: SETTING UP THE ANALYSER’S COMMUNICATION PORTS
- 4.7.1. INSTRUMENT ID
- 4.7.2. COM PORT DEFAULT SETTINGS
- 4.7.3. RS-232 COM PORT CABLE CONNECTIONS
- 4.7.4. RS-485 CONFIGURATION
- 4.7.5. DTE AND DCE COMMUNICATION
- 4.7.6. ETHERNET CONFIGURATION
- 4.7.7. USB CONFIGURATION
- 4.7.8. MULTIDROP RS-232 SET UP
- 4.7.9. MODBUS SET UP
- 4.7.10. COM PORT COMMUNICATION MODES
- 4.7.11. COM PORT BAUD RATE
- 4.7.12. COM PORT TESTING
- 4.8. USING THE DATA ACQUISITION SYSTEM (DAS )
- 5. REMOTE OPERATION
- 6. CALIBRATION PROCEDURES
- 6.1. CALIBRATION PREPARATIONS
- 6.2. MANUAL CALIBRATION
- 6.3. MANUAL CALIBRATION CHECKS
- 6.4. MANUAL CALIBRATION WITH ZERO/SPAN VALVES
- 6.5. MANUAL CALIBRATION WITH IZS OPTION
- 6.6. MANUAL CALIBRATION CHECKS WITH IZS OR ZERO/SPAN VALVES
- 6.7. MANUAL CALIBRATION IN INDEPENDENT OR AUTO REPORTING RANGE MODES
- 6.8. MANUAL CALIBRATION IN MULTIGAS MEASUREMENT MODE
- 6.9. AUTOMATIC CALIBRATION/CHECKS (AUTOCAL)
- 6.10. CALIBRATION QUALITY
- 7. EPA PROTOCOL CALIBRATION
- 8. INSTRUMENT MAINTENANCE
- 9. TROUBLESHOOTING & SERVICE
- 9.1. GENERAL TROUBLESHOOTING
- 9.2. GAS FLOW PROBLEMS
- 9.3. CALIBRATION PROBLEMS
- 9.4. OTHER PERFORMANCE PROBLEMS
- 9.5. SUBSYSTEM CHECKOUT
- 9.5.1. DETAILED PRESSURE LEAK CHECK
- 9.5.2. PERFORMING A SAMPLE FLOW CHECK
- 9.5.3. AC POWER CONFIGURATION
- 9.5.4. DC POWER SUPPLY
- 9.5.5. I2C BUS
- 9.5.6. TOUCHSCREEN INTERFACE
- 9.5.7. LCD DISPLAY MODULE
- 9.5.8. RELAY BOARD
- 9.5.9. MOTHERBOARD
- 9.5.10. CPU
- 9.5.11. RS-232 COMMUNICATION
- 9.5.12. PMT SENSOR
- 9.5.13. PMT PREAMPLIFIER BOARD
- 9.5.14. PMT TEMPERATURE CONTROL PCA
- 9.5.15. HIGH VOLTAGE POWER SUPPLY
- 9.5.16. PNEUMATIC SENSOR ASSEMBLY
- 9.5.17. IZS OPTION
- 9.5.18. BOX TEMPERATURE
- 9.5.19. PMT TEMPERATURE
- 9.6. REPAIR PROCEDURES
- 9.7. FREQUENTLY ASKED QUESTIONS (FAQS)
- 9.8. TECHNICAL ASSISTANCE
- 10. PRINCIPLES OF OPERATION
- 10.1. MEASUREMENT PRINCIPLE
- 10.2. THE UV LIGHT PATH
- 10.3. PNEUMATIC OPERATION
- 10.4. ELECTRONIC OPERATION
- 10.4.1. CPU
- 10.4.2. SENSOR MODULE & SAMPLE CHAMBER
- 10.4.3. SAMPLE CHAMBER HEATING CIRCUIT
- 10.4.4. PHOTO MULTIPLIER TUBE (PMT)
- 10.4.5. PMT COOLING SYSTEM
- 10.4.6. PMT PREAMPLIFIER
- 10.4.7. PNEUMATIC SENSOR BOARD
- 10.4.8. RELAY BOARD
- 10.4.9. STATUS LEDS & WATCH DOG CIRCUITRY
- 10.4.10. MOTHERBOARD
- 10.4.11. ANALOG OUTPUTS
- 10.4.12. EXTERNAL DIGITAL I/O
- 10.4.13. I2C DATA BUS
- 10.4.14. POWER UP CIRCUIT
- 10.5. POWER SUPPLY/ CIRCUIT BREAKER
- 10.6. FRONT PANEL/DISPLAY INTERFACE
- 10.7. SOFTWARE OPERATION
- 11. A PRIMER ON ELECTRO-STATIC DISCHARGE

OPERATION MANUAL
MODEL T101
UV FLUORESCENCE H2S ANALYZER
Also supports operation of:
Model T102 Analyzer
(when used in conjunction with T102 Addendum, PN 07267)
© TELEDYNE ADVANCED POLLUTION INSTRUMENTATION
9480 CARROLL PARK DRIVE
SAN DIEGO, CA 92121-5201
USA
Toll-free Phone:
800-324-5190
Phone:
858-657-9800
Fax:
858-657-9816
Email:
api-sales@teledyne.com
Website:
http://www.teledyne-api.com/
Copyright 2011 - 2012 07266B DCN6845
Teledyne Advanced Pollution Instrumentation 08 June 2012

i
ABOUT TELEDYNE ADVANCED POLLUTION INSTRUMENTATION (TAPI)
Teledyne Advanced Pollution Instrumentation (TAPI), a business unit of
Teledyne Instruments, Inc., is a worldwide market leader in the design and
manufacture of precision analytical instrumentation used for air quality
monitoring, continuous emissions monitoring, and specialty process monitoring
applications. Founded in San Diego, California, in 1988, TAPI introduced a
complete line of Air Quality Monitoring (AQM) instrumentation, which comply
with the United States Environmental Protection Administration (EPA) and
international requirements for the measurement of criteria pollutants, including
CO, SO2, NOx and Ozone.
Since 1988 TAPI has combined state-of-the-art technology, proven measuring
principles, stringent quality assurance systems and world class after-sales support
to deliver the best products and customer satisfaction in the business.
For further information on our company, our complete range of products, and the
applications that they serve, please visit www.teledyne-api.com or contact
sales@teledyne-api.com.
NOTICE OF COPYRIGHT
© 2011-2012 Teledyne Advanced Pollution Instrumentation. All rights reserved.
TRADEMARKS
All trademarks, registered trademarks, brand names or product names appearing
in this document are the property of their respective owners and are used herein
for identification purposes only.
07266B DCN6485

ii
This page intentionally left blank.
07266B DCN6485
iii
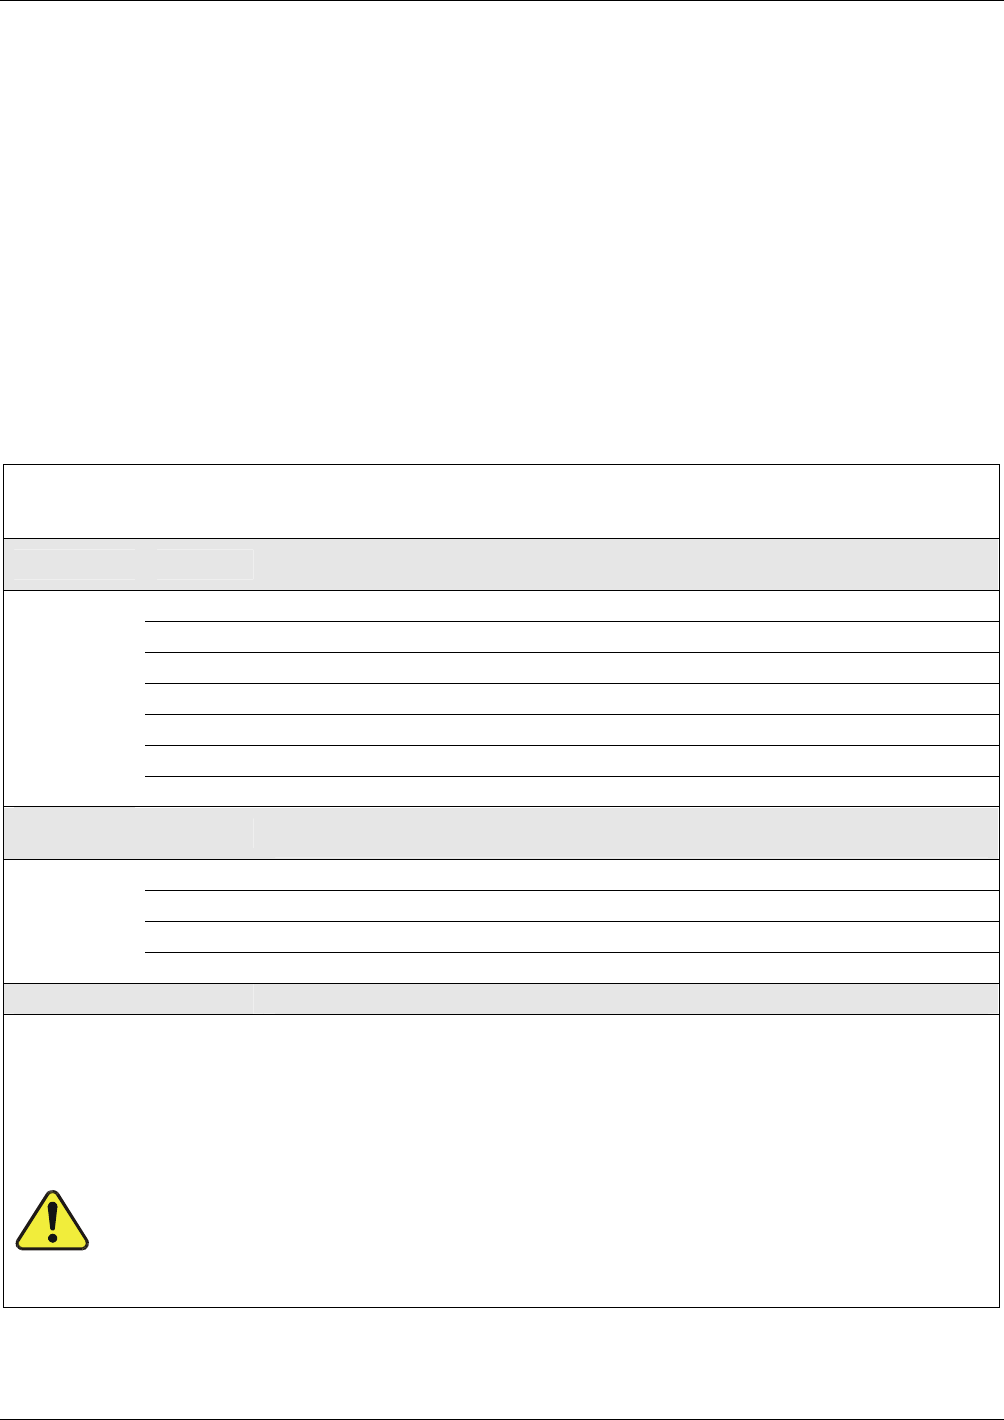
SAFETY MESSAGES
Important safety messages are provided throughout this manual for the purpose of
avoiding personal injury or instrument damage. Please read these messages
carefully. Each safety message is associated with a safety alert symbol, and are
placed throughout this manual; the safety symbols are also located inside the
instrument. It is imperative that you pay close attention to these messages, the
descriptions of which are as follows:
WARNING: Electrical Shock Hazard
HAZARD: Strong oxidizer
GENERAL WARNING/CAUTION: Read the accompanying
message for specific information.
CAUTION: Hot Surface Warning
Do Not Touch: Touching some parts of the instrument
without protection or proper tools could result in damage to the
part(s) and/or the instrument.
Technician Symbol: All operations marked with this symbol
are to be performed by qualified maintenance personnel only.
Electrical Ground: This symbol inside the instrument marks
the central safety grounding point for the instrument.
CAUTION
This instrument should only be used for the purpose and in the
manner described in this manual. If you use this instrument in a
manner other than that for which it was intended, unpredictable
behavior could ensue with possible hazardous consequences.
NEVER use any gas analyzer to sample combustible gas(es)!
Note
For Technical Assistance regarding the use and maintenance of this instrument or any other
Teledyne API product, contact Teledyne API’s Technical Support Department:
Telephone: 800-324-5190
Email: sda_techsupport@teledyne.com
or access any of the service options on our website at http://www.teledyne-api.com/
07266B DCN6485
iv
CONSIGNES DE SÉCURITÉ
Des consignes de sécurité importantes sont fournies tout au long du présent
manuel dans le but d’éviter des blessures corporelles ou d’endommager les
instruments. Veuillez lire attentivement ces consignes. Chaque consigne de
sécurité est représentée par un pictogramme d’alerte de sécurité; ces
pictogrammes se retrouvent dans ce manuel et à l’intérieur des instruments. Les
symboles correspondent aux consignes suivantes :
AVERTISSEMENT : Risque de choc électrique
DANGER : Oxydant puissant
AVERTISSEMENT GÉNÉRAL / MISE EN GARDE : Lire la consigne
complémentaire pour des renseignements spécifiques
MISE EN GARDE : Surface chaude
Ne pas toucher : Toucher à certaines parties de l’instrument sans
protection ou sans les outils appropriés pourrait entraîner des
dommages aux pièces ou à l’instrument.
Pictogramme « technicien » : Toutes les opérations portant ce
symbole doivent être effectuées uniquement par du personnel de
maintenance qualifié.
Mise à la terre : Ce symbole à l’intérieur de l’instrument détermine le
point central de la mise à la terre sécuritaire de l’instrument.
MISE EN GARDE
Cet instrument doit être utilisé aux fins décrites et de la manière
décrite dans ce manuel. Si vous utilisez cet instrument d’une
autre manière que celle pour laquelle il a été prévu, l’instrument
pourrait se comporter de façon imprévisible et entraîner des
conséquences dangereuses.
NE JAMAIS utiliser un analyseur de gaz pour échantillonner des
gaz combustibles!
07266B DCN6485
v
WARRANTY
WARRANTY POLICY (02024 F)
Teledyne Advanced Pollution Instrumentation (TAPI), a business unit of Teledyne
Instruments, Inc., provides that:
Prior to shipment, TAPI equipment is thoroughly inspected and tested. Should
equipment failure occur, TAPI assures its customers that prompt service and support
will be available.
COVERAGE
After the warranty period and throughout the equipment lifetime, TAPI stands ready
to provide on-site or in-plant service at reasonable rates similar to those of other
manufacturers in the industry. All maintenance and the first level of field
troubleshooting are to be performed by the customer.
NON-TAPI MANUFACTURED EQUIPMENT
Equipment provided but not manufactured by TAPI is warranted and will be repaired
to the extent and according to the current terms and conditions of the respective
equipment manufacturer’s warranty.
Product Return
All units or components returned to Teledyne API should be properly packed for
handling and returned freight prepaid to the nearest designated Service Center.
After the repair, the equipment will be returned, freight prepaid.
The complete Terms and Conditions of Sale can be reviewed at
http://www.teledyne-api.com/terms_and_conditions.asp
CAUTION – Avoid Warranty Invalidation
Failure to comply with proper anti-Electro-Static Discharge (ESD) handling and packing
instructions and Return Merchandise Authorization (RMA) procedures when returning
parts for repair or calibration may void your warranty. For anti-ESD handling and
packing instructions please refer to “Packing Components for Return to Teledyne API”
in the Primer on Electro-Static Discharge section of this manual, and for RMA
procedures please refer to our Website at http://www.teledyne-api.com under
Customer Support > Return Authorization.
07266B DCN6485

vi
This page intentionally left blank.
07266B DCN6485
vii
ABOUT THIS MANUAL
This T101 operation manual, PN 07266, is comprised of multiple documents in PDF
format, as listed below.
Part No. Rev Name/Description
07266 B Model T101 Operation Manual (this manual)
05492 D Menu Trees and Software Documentation (inserted as Appendix A of this manual)
07347 1/19/2011 Spare Parts List (in Appendix B of this manual)
05494 D Repair Questionnaire (inserted as Appendix C of this manual)
Documents included in Appendix D:
03956 A PCA, 03955, Relay Driver
04354 D PCA, 04003, Pressure Flow Sensor Board
04181 H PCA, 04180, PMT Preamp
04420 B PCA, 04120, UV Detector Preamp
04693 E PCA, 04692, UV Lamp Driver
04932 C PCA, Thermo-Electric Cooler Board
04468 B PCA, 04467, Analog Output Isolator
06731 B Schem, Auxiliary IO
05803 B Schem, Gen5 Motherboard
06698 D Schem, LCD Tchscrn Interface
06882 B Schem, LVDS transmitter
NOTE
Please read this manual in its entirety before making any attempt to operate the instrument.
REVISION HISTORY
T101 Operation Manual 072660000
REV DATE DCN DESCRIPTION
B 2012 June 08 6845 Administrative updates.
A 2011 February 14 5970 Initial Release
07266B DCN6485

viii
This page intentionally left blank.
07266B DCN6485

ix
TABLE OF CONTENTS
1. INTRODUCTION ......................................................................................................................... 19
1.1. Features ..............................................................................................................................19
1.2. Options................................................................................................................................20
2. SPECIFICATIONS AND APPROVALS............................................................................................ 23
2.1. Specifications........................................................................................................................23
2.2. Approvals and Certifications....................................................................................................24
2.2.1. Safety ...........................................................................................................................24
2.2.2. EMC ..............................................................................................................................24
2.2.3. Other Type Certifications..................................................................................................24
3. GETTING STARTED..................................................................................................................... 25
3.1. Unpacking and Initial Setup ....................................................................................................25
3.2. Instrument Layout.................................................................................................................26
3.2.1. Front Panel .................................................................................................................... 26
3.2.2. Rear Panel .....................................................................................................................30
3.2.3. Internal Chassis Layout....................................................................................................32
3.3. Electrical Connections ............................................................................................................33
3.3.1. Analog Inputs (Option 64) Connections ..............................................................................33
3.3.2. Connecting the Analog Outputs .........................................................................................34
3.3.2.1. Current Loop Analog Outputs (Option 41) Setup............................................................35
3.3.3. Connecting the Status Outputs..........................................................................................36
3.3.4. Connecting the Control Inputs...........................................................................................37
3.3.5. Connecting the Communications Ports................................................................................39
3.3.5.1. Connecting the Serial Ports ........................................................................................39
3.3.5.2. Connecting to a LAN or the Internet ............................................................................39
3.3.5.3. Connecting to a Personal Computer (USB Option)..........................................................39
3.3.5.4. Connecting to a Multidrop Network (Option) .................................................................39
3.4. Pneumatic Connections ..........................................................................................................39
3.4.1.1. Connections with Internal Valve Options Installed..........................................................45
3.5. Startup, Functional Checks, and Initial Calibration ......................................................................50
3.5.1. Startup..........................................................................................................................50
3.5.2. Warm-Up.......................................................................................................................50
3.5.3. Warning Messages ..........................................................................................................50
3.5.4. Functional Check.............................................................................................................52
3.6. Initial Calibration...................................................................................................................53
3.6.1. Basic Calibration Procedure ..............................................................................................53
3.6.2. Interferences for H2S Measurements ..................................................................................56
4. OPERATING INSTRUCTIONS ...................................................................................................... 57
4.1. Overview of Operating Modes..................................................................................................57
4.2. Sample Mode........................................................................................................................58
4.2.1. Test Functions ................................................................................................................58
4.2.2. Warning Messages ..........................................................................................................61
4.3. Calibration Mode ................................................................................................................... 62
4.3.1. Calibration Password Security ...........................................................................................62
4.4. Setup Mode ..........................................................................................................................64
4.4.1. Setup – CFG: Viewing the Analyzer’s Configuration Information .............................................65
4.4.2. Setup – ACAL: Auto Calibration.........................................................................................66
07266B DCN6485

TABLE OF CONTENTS Teledyne API – T101 Operation Manual
x
4.4.3. Setup – DAS: Data Acquisition ..........................................................................................66
4.4.4. Setup – Range: Analog Output Reporting Range Configuration...............................................66
4.4.4.1. Available Analog Output Signals..................................................................................66
4.4.4.2. Physical Range versus Analog Output Reporting Ranges .................................................67
4.4.4.3. Reporting Range Modes .............................................................................................68
4.4.4.4. Single Range Mode (SNGL) ........................................................................................69
4.4.4.5. Independent Range Mode (IND)..................................................................................70
4.4.4.6. Auto Range Mode (AUTO) ..........................................................................................71
4.4.4.7. Range Units .............................................................................................................72
4.4.4.8. Dilution Ratio ........................................................................................................... 73
4.4.5. Setup – Pass: Password Protection ....................................................................................74
4.4.6. SETUP – CLK: Setting the Internal Time-of-Day Clock ..........................................................75
4.5. SETUP – VARS: Using the Internal Variables..............................................................................77
4.5.1. Setting the Gas Measurement Mode...................................................................................80
4.6. SETUP – DIAG: Using the Diagnostics Functions.........................................................................81
4.6.1. Signal I/O ......................................................................................................................83
4.6.2. Analog Output Step Test ..................................................................................................84
4.6.3. Analog I/O Configuration..................................................................................................85
4.6.3.1. Analog Output Signal Type and Range Span Selection ....................................................87
4.6.3.2. Analog Output Calibration Mode..................................................................................88
4.6.3.3. Manual Analog Output Calibration and Voltage Adjustment .............................................90
4.6.3.4. Analog Output Offset Adjustment ................................................................................92
4.6.3.5. Current Loop Output Adjustment.................................................................................92
4.6.3.6. AIN Calibration.........................................................................................................95
4.6.3.7. Analog Inputs (XIN1…XIN8) Option Configuration..........................................................96
4.6.4. Optic Test ......................................................................................................................97
4.6.5. Electrical Test.................................................................................................................98
4.6.6. Lamp Calibration.............................................................................................................99
4.6.7. Pressure Calibration ...................................................................................................... 100
4.6.8. Flow Calibration ............................................................................................................ 101
4.6.9. Test Channel Output......................................................................................................102
4.7. SETUP – COMM: Setting Up the Analyser’s Communication Ports................................................ 103
4.7.1. Instrument ID .............................................................................................................. 103
4.7.2. COM Port Default Settings .............................................................................................. 105
4.7.3. RS-232 COM Port Cable Connections................................................................................ 105
4.7.4. RS-485 Configuration .................................................................................................... 107
4.7.5. DTE and DCE Communication ......................................................................................... 107
4.7.6. Ethernet Configuration...................................................................................................107
4.7.6.1. Configuring the Ethernet Interface Using DHCP ........................................................... 107
4.7.6.2. Manually Configuring the Ethernet with Static IP Addresses .......................................... 109
4.7.6.3. Changing the Analyzer’s HOSTNAME.......................................................................... 112
4.7.7. USB Configuration......................................................................................................... 114
4.7.8. Multidrop RS-232 Set Up................................................................................................ 116
4.7.9. MODBUS Set Up ........................................................................................................... 119
4.7.10. COM Port Communication Modes ................................................................................... 121
4.7.11. COM Port Baud Rate .................................................................................................... 123
4.7.12. COM Port Testing ........................................................................................................124
4.8. Using the Data Acquisition System (DAS )............................................................................... 124
4.8.1. DAS Structure .............................................................................................................. 125
4.8.1.1. DAS Channels ........................................................................................................ 125
4.8.1.2. DAS Parameters ..................................................................................................... 126
4.8.1.3. DAS Configuration Limits ......................................................................................... 127
4.8.1.4. DAS Triggering Events............................................................................................. 127
4.8.2. Default DAS Channels.................................................................................................... 128
4.8.2.1. Viewing DAS Data and Settings................................................................................. 130
4.8.2.2. Editing DAS Data Channels ...................................................................................... 131
4.8.2.3. Trigger Events........................................................................................................ 133
4.8.2.4. Editing DAS Parameters........................................................................................... 134
4.8.2.5. Sample Period and Report Period .............................................................................. 135
4.8.2.6. Number of Records ................................................................................................. 137
4.8.2.7. RS-232 Report Function........................................................................................... 139
4.8.2.8. Compact Report ..................................................................................................... 139
07266B DCN6485

Teledyne API – T101 Operation Manual TABLE OF CONTENTS
xi
4.8.2.9. Starting Date ......................................................................................................... 139
4.8.2.10. Disabling/Enabling Data Channels ........................................................................... 140
4.8.2.11. HOLDOFF Feature ................................................................................................. 141
4.8.3. Remote DAS Configuration ............................................................................................. 142
5. REMOTE OPERATION................................................................................................................ 143
5.1.1. Remote Operation Using the External Digital I/O................................................................ 143
5.1.1.1. Status Outputs ....................................................................................................... 143
5.1.1.2. Control Inputs........................................................................................................ 145
5.1.2. Remote Operation Using the External Serial I/O................................................................. 146
5.1.2.1. Terminal Operating Modes ....................................................................................... 146
5.1.2.2. Help Commands in Terminal Mode............................................................................. 147
5.1.2.3. Command Syntax ................................................................................................... 148
5.1.2.4. Data Types ............................................................................................................ 148
5.1.2.5. Status Reporting..................................................................................................... 149
5.1.2.6. General Message Format.......................................................................................... 150
5.1.2.7. Remote Access by Modem........................................................................................ 150
5.1.2.8. COM Port Password Security..................................................................................... 153
5.1.2.9. APICOM Remote Control Program.............................................................................. 153
5.1.3. Additional Communications Documentation....................................................................... 154
5.1.4. Using the T101 with a Hessen Protocol Network................................................................. 155
5.1.4.1. General Overview of Hessen Protocol......................................................................... 155
5.1.4.2. Hessen COMM Port Configuration .............................................................................. 155
5.1.4.3. Activating Hessen Protocol ....................................................................................... 156
5.1.4.4. Selecting a Hessen Protocol Type .............................................................................. 157
5.1.4.5. Setting The Hessen Protocol Response Mode............................................................... 157
5.1.4.6. Hessen Protocol Gas ID ........................................................................................... 159
5.1.4.7. Setting Hessen Protocol Status Flags ......................................................................... 160
6. CALIBRATION PROCEDURES.................................................................................................... 163
6.1. Calibration Preparations ....................................................................................................... 163
6.1.1. Required Equipment, Supplies, and Expendables ............................................................... 163
6.1.2. Zero Air....................................................................................................................... 164
6.1.3. Gas Standards .............................................................................................................. 164
6.1.4. Permeation Tubes .........................................................................................................164
6.1.5. Calibration Gas Traceability ............................................................................................ 165
6.1.6. Data Recording Devices ................................................................................................. 165
6.2. Manual Calibration............................................................................................................... 165
6.3. Manual Calibration Checks .................................................................................................... 169
6.4. Manual Calibration with Zero/Span Valves............................................................................... 170
6.5. Manual Calibration with IZS Option ........................................................................................ 173
6.6. Manual Calibration Checks with IZS or Zero/Span Valves .......................................................... 174
6.7. Manual Calibration in INDEPENDENT or AUTO Reporting Range Modes......................................... 177
6.7.1. Calibration With Remote Contact Closures ........................................................................ 177
6.8. Manual Calibration in Multigas Measurement Mode ................................................................... 178
6.9. Automatic Calibration/Checks (AutoCal).................................................................................. 179
6.9.1. Autocal of Instruments in INDEPENDENT or AUTO Reporting Range Modes ............................ 183
6.9.2. Autocal of Instruments in Multigas Measurement Mode ....................................................... 184
6.10. Calibration Quality ............................................................................................................. 185
7. EPA PROTOCOL CALIBRATION ................................................................................................. 187
7.1. Calibration Requirements...................................................................................................... 187
7.1.1. Calibration of Equipment ................................................................................................ 187
7.1.2. Data Recording Device................................................................................................... 189
7.1.3. Recommended Standards for Establishing Traceability ........................................................ 189
7.1.4. EPA Calibration Using Permeation Tubes........................................................................... 189
7.1.5. Calibration Frequency ....................................................................................................190
7.1.6. Record Keeping ............................................................................................................ 190
7.1.7. Summary of Quality Assurance Checks............................................................................. 191
7.2. Level 1 Calibrations versus Level 2 Checks .............................................................................. 191
7.3. ZERO and SPAN Checks........................................................................................................ 193
7.3.1. Zero/Span Check Procedures .......................................................................................... 193
7.4. Precisions Calibration Procedures and Checks .......................................................................... 193
7.4.1. Precision Calibration ...................................................................................................... 194
7.4.2. Precision Check............................................................................................................. 194
07266B DCN6485

TABLE OF CONTENTS Teledyne API – T101 Operation Manual
xii
7.5. Dynamic Multipoint Span Calibration ...................................................................................... 195
7.6. Special Calibration Requirements for Independent Range or Auto Range...................................... 196
7.7. References ......................................................................................................................... 196
8. INSTRUMENT MAINTENANCE................................................................................................... 197
8.1. Maintenance Schedule.......................................................................................................... 197
8.2. Predictive Diagnostics .......................................................................................................... 201
8.3. Maintenance Procedures ....................................................................................................... 202
8.3.1. Changing the Sample Particulate Filter ............................................................................. 202
8.3.2. Changing the IZS Permeation Tube.................................................................................. 203
8.3.3. Maintaining the SO2 Scrubber ......................................................................................... 203
8.3.3.1. Predicting When the SO2 Scrubber Should Be Replaced. ............................................... 203
8.3.3.2. Checking the Function of the SO2 Scrubber................................................................. 204
8.3.3.3. Changing the SO2 Scrubber Material .......................................................................... 204
8.3.4. Changing the External Zero Air Scrubber .......................................................................... 205
8.3.5. Maintaining the H2S SO2 Converter .............................................................................. 206
8.3.5.1. Predicting When the Converter Catalyst Should Be Replaced. ........................................ 206
8.3.5.2. Checking the Efficiency of the H2S SO2 Converter..................................................... 206
8.3.5.3. Changing the H2S SO2 Converter Catalyst Material ................................................... 207
8.3.6. Checking for Light Leaks ................................................................................................ 209
8.3.7. Changing the Critical Flow Orifice .................................................................................... 209
9. TROUBLESHOOTING & SERVICE............................................................................................... 211
9.1. General Troubleshooting....................................................................................................... 211
9.1.1. Fault Diagnosis with Warning Messages............................................................................ 212
9.1.2. Fault Diagnosis with Test Functions.................................................................................. 216
9.1.3. Using the Diagnostic Signal I/O Function .......................................................................... 217
9.1.4. Status LEDs ................................................................................................................. 218
9.1.4.1. Motherboard Status Indicator (Watchdog) .................................................................. 219
9.1.4.2. CPU Status Indicator ............................................................................................... 219
9.1.4.3. Relay Board Status LEDs.......................................................................................... 219
9.2. Gas Flow Problems .............................................................................................................. 220
9.2.1. Zero or Low Sample Flow ............................................................................................... 221
9.2.2. High Flow..................................................................................................................... 221
9.3. Calibration Problems ............................................................................................................ 221
9.3.1. Negative Concentrations ................................................................................................ 221
9.3.2. No Response ................................................................................................................ 222
9.3.3. Unstable Zero and Span................................................................................................. 222
9.3.4. Inability to Span - No SPAN Button.................................................................................. 222
9.3.5. Inability to Zero - No ZERO Button .................................................................................. 223
9.3.6. Non-Linear Response..................................................................................................... 223
9.3.7. Discrepancy Between Analog Output and Display ............................................................... 224
9.4. Other Performance Problems.................................................................................................224
9.4.1. Excessive Noise ............................................................................................................ 224
9.4.2. Slow Response ............................................................................................................. 224
9.4.3. The Analyzer Doesn’t Appear on the LAN or Internet .......................................................... 225
9.5. Subsystem Checkout ........................................................................................................... 225
9.5.1. Detailed Pressure Leak Check ......................................................................................... 225
9.5.2. Performing a Sample Flow Check..................................................................................... 226
9.5.3. AC Power Configuration ................................................................................................. 226
9.5.4. DC Power Supply ..........................................................................................................227
9.5.5. I2C Bus........................................................................................................................ 228
9.5.6. Touchscreen Interface ................................................................................................... 228
9.5.7. LCD Display Module.......................................................................................................228
9.5.8. Relay Board ................................................................................................................. 228
9.5.9. Motherboard................................................................................................................. 229
9.5.9.1. A/D functions ......................................................................................................... 229
9.5.9.2. Analog Output Voltages ........................................................................................... 229
9.5.9.3. Status Outputs ....................................................................................................... 230
9.5.9.4. Control Inputs........................................................................................................ 230
9.5.10. CPU........................................................................................................................... 230
9.5.11. RS-232 Communication................................................................................................ 231
9.5.11.1. General RS-232 Troubleshooting ............................................................................. 231
9.5.11.2. Modem or Terminal Operation................................................................................. 231
07266B DCN6485

Teledyne API – T101 Operation Manual TABLE OF CONTENTS
xiii
9.5.12. PMT Sensor ................................................................................................................ 232
9.5.13. PMT Preamplifier Board ................................................................................................ 232
9.5.14. PMT Temperature Control PCA....................................................................................... 232
9.5.15. High Voltage Power Supply ........................................................................................... 233
9.5.16. Pneumatic Sensor Assembly.......................................................................................... 233
9.5.16.1. Sample Pressure................................................................................................... 233
9.5.17. IZS Option ................................................................................................................. 233
9.5.18. Box Temperature ........................................................................................................ 234
9.5.19. PMT Temperature ........................................................................................................ 234
9.6. Repair Procedures ............................................................................................................... 234
9.6.1. Disk-on-Module Replacement.......................................................................................... 234
9.6.2. Adjusting the UV Lamp (Peaking the Lamp) ...................................................................... 235
9.6.3. Replacing the UV Lamp .................................................................................................. 237
9.6.4. Factory Cal (PMT Sensor, Hardware Calibration) ................................................................ 238
9.7. Frequently Asked Questions (FAQs)........................................................................................ 240
9.8. Technical Assistance ............................................................................................................ 241
10. PRINCIPLES OF OPERATION.................................................................................................. 243
10.1. Measurement Principle ....................................................................................................... 243
10.1.1. H2S Conversion ........................................................................................................... 243
10.1.2. SO2 Ultraviolet Fluorescence ......................................................................................... 244
10.2. The UV Light Path .............................................................................................................. 247
10.2.1. UV Source Lamp ......................................................................................................... 247
10.2.2. The Reference Detector................................................................................................ 248
10.2.3. The PMT..................................................................................................................... 248
10.2.4. Optical Filters ............................................................................................................. 249
10.2.4.1. UV Source Optical Filter ......................................................................................... 249
10.2.4.2. PMT Optical Filter.................................................................................................. 249
10.2.5. Optical Lenses ............................................................................................................ 250
10.2.6. Measurement Interferences .......................................................................................... 251
10.2.6.1. Direct Interference................................................................................................ 251
10.2.6.2. UV Absorption by Ozone ........................................................................................ 252
10.2.6.3. Dilution ............................................................................................................... 252
10.2.6.4. Third Body Quenching............................................................................................ 252
10.2.6.5. Light Pollution ...................................................................................................... 252
10.3. Pneumatic Operation .......................................................................................................... 253
10.3.1. Sample Gas Flow.........................................................................................................254
10.3.2. Multigas Measurement & H2S SO2 Switching Valve........................................................ 255
10.3.3. Flow Rate Control ........................................................................................................ 255
10.3.3.1. Critical Flow Orifice ............................................................................................... 255
10.3.4. Sample Particulate Filter...............................................................................................256
10.3.5. Hydrocarbon Scrubber (Kicker) ..................................................................................... 257
10.3.6. SO2 Scrubber.............................................................................................................. 257
10.3.7. Pneumatic Sensors ...................................................................................................... 258
10.3.7.1. Sample Pressure Sensor ........................................................................................ 258
10.3.7.2. Sample Flow Sensor .............................................................................................. 258
10.4. Electronic Operation........................................................................................................... 259
10.4.1. CPU........................................................................................................................... 261
10.4.1.1. Disk On Module (DOM) .......................................................................................... 261
10.4.1.2. Flash Chip............................................................................................................261
10.4.2. Sensor Module & Sample chamber ................................................................................. 262
10.4.3. Sample Chamber Heating Circuit ................................................................................... 262
10.4.4. Photo Multiplier Tube (PMT) .......................................................................................... 263
10.4.5. PMT Cooling System .................................................................................................... 264
10.4.5.1. Thermoelectric Cooler (TEC) ................................................................................... 264
10.4.5.2. TEC Control Board................................................................................................. 265
10.4.6. PMT Preamplifier ......................................................................................................... 265
10.4.7. Pneumatic Sensor Board............................................................................................... 267
10.4.8. Relay Board................................................................................................................ 267
10.4.8.1. Heater Control...................................................................................................... 267
10.4.8.2. Valve Control ....................................................................................................... 267
10.4.9. Status LEDs & Watch Dog Circuitry ................................................................................ 268
10.4.10. Motherboard ............................................................................................................. 269
07266B DCN6485

TABLE OF CONTENTS Teledyne API – T101 Operation Manual
xiv
10.4.10.1. A to D Conversion ............................................................................................... 269
10.4.10.2. Sensor Inputs ..................................................................................................... 269
10.4.10.3. Thermistor Interface............................................................................................ 270
10.4.11. Analog Outputs .........................................................................................................270
10.4.12. External Digital I/O.................................................................................................... 271
10.4.13. I2C Data Bus ............................................................................................................. 271
10.4.14. Power up Circuit ........................................................................................................ 271
10.5. Power Supply/ Circuit Breaker .............................................................................................271
10.6. Front Panel/Display Interface .............................................................................................. 273
10.6.1. LVDS Transmitter Board ............................................................................................... 273
10.6.2. Front Panel Interface PCA ............................................................................................. 273
10.7. Software Operation ............................................................................................................ 274
10.7.1. Adaptive Filter ............................................................................................................ 274
10.7.2. Calibration - Slope and Offset........................................................................................ 275
10.7.3. Temperature and Pressure Compensation (TPC) Feature ................................................... 276
10.7.4. Internal Data Acquisition System (DAS )......................................................................... 276
11. A PRIMER ON ELECTRO-STATIC DISCHARGE.......................................................................... 277
11.1. How Static Charges are Created........................................................................................... 277
11.2. How Electro-Static Charges Cause Damage ........................................................................... 278
11.3. Common Myths About ESD Damage ..................................................................................... 279
11.4. Basic Principles of Static Control .......................................................................................... 280
11.4.1. General Rules ............................................................................................................. 280
11.4.2. Basic anti-ESD Procedures for Analyzer Repair and Maintenance ........................................ 282
11.4.2.1. Working at the Instrument Rack.............................................................................. 282
11.4.2.2. Working at an Anti-ESD Work Bench........................................................................ 282
11.4.2.3. Transferring Components from Rack to Bench and Back.............................................. 283
11.4.2.4. Opening Shipments from Teledyne API..................................................................... 283
11.4.2.5. Packing Components for Return to Teledyne API........................................................ 284
LIST OF APPENDICES
APPENDIX A - VERSION SPECIFIC SOFTWARE DOCUMENTATION
APPENDIX B - T101 SPARE PARTS LIST
APPENDIX C - REPAIR QUESTIONNAIRE - T101
APPENDIX D - ELECTRONIC SCHEMATICS
07266B DCN6485

Teledyne API – T101 Operation Manual TABLE OF CONTENTS
xv
LIST OF FIGURES
Figure 3-1. Front Panel Layout ........................................................................................... 27
Figure 3-2. Display Screen and Touch Control ...................................................................... 27
Figure 3-3. Display/Touch Control Screen Mapped to Menu Charts.......................................... 29
Figure 3-4. Rear Panel Layout............................................................................................ 30
Figure 3-5. Internal Chassis Layout..................................................................................... 32
Figure 3-6. Analog In Connector......................................................................................... 33
Figure 3-7. Analog Output Connector .................................................................................. 34
Figure 3-8. Current Loop Option Installed on the Motherboard ................................................ 35
Figure 3-9. Status Output Connector................................................................................... 36
Figure 3-10. Control Input Connector .................................................................................. 38
Figure 3-11. Pneumatic Connections, Basic Configuration Using Gas Dilution Calibrator .............. 40
Figure 3-12. Pneumatic Connections, Basic Configuration Using Bottled Span Gas ..................... 41
Figure 3-13. Pneumatic Diagram of the T101 Standard Configuration ...................................... 42
Figure 3-14. Basic Pneumatic Connections for Units with Valve Options.................................... 45
Figure 3-15. Pneumatic Diagram of the T101 With Z/S Option Installed ................................... 46
Figure 3-16. Pneumatic Diagram of the T101 with IZS Options Installed................................... 49
Figure 4-1. Viewing T101 TEST Functions ............................................................................ 60
Figure 4-2. Viewing and Clearing T101 WARNING Messages ................................................... 62
Figure 4-3. Analog Output Connectors Defined ..................................................................... 66
Figure 4-4. Setup for Calibrating Analog Outputs .................................................................. 91
Figure 4-5. Setup for Calibrating Current Outputs ................................................................. 93
Figure 4-6. DIAG – Analog Inputs (Option) Configuration Menu............................................... 96
Figure 4-7. Rear Panel Connector Pin-Outs for RS-232 Mode ................................................ 105
Figure 4-8. CPU Connector Pin-Outs for RS-232 Mode ......................................................... 106
Figure 4-9. Jumper and Cables for Multidrop Mode.............................................................. 117
Figure 4-10.Multidrop PCA Host/Analyzer Interconnect Diagram............................................ 118
Figure 4-11. Default DAS Channels Setup .......................................................................... 129
Figure 4-12. APICOM User Interface for Configuring the DAS................................................ 142
Figure 5-1. Status Output Connector................................................................................. 144
Figure 5-2. Control Inputs with Local 5 V Power Supply ....................................................... 146
Figure 5-3.Control Inputs with External 5 V Power Supply .................................................... 146
Figure 5-4. APICOM Remote Control Program Interface ....................................................... 154
Figure 6-1. Setup for Manual Calibration without Z/S Valve or IZS Option .............................. 166
Figure 6-2. Setup for Manual Calibration with Z/S Valve Option Installed................................ 170
Figure 6-3. Setup for Manual Calibration Check with Z/S Valve or IZS Option.......................... 175
Figure 6-4. Typical Setup for Manual Calibratio in Multigas Measurement Mode ....................... 178
Figure 8-1. Sample Particulate Filter Assembly ................................................................... 202
Figure 8-2. Charcoal Canister Assembly............................................................................. 205
Figure 8-3. H2S - SO2 Converter Assembly........................................................................ 208
Figure 8-4. Critical Flow Orifice Assembly ......................................................................... 210
Figure 9-1. Viewing and Clearing Warning Messages ........................................................... 214
Figure 9-2. Example of Signal I/O Function ........................................................................ 218
Figure 9-3. CPU Status Indicator ...................................................................................... 219
Figure 9-4. Shutter Assembly........................................................................................... 236
Figure 9-5. Location of UV Reference Detector Potentiometer ............................................... 237
Figure 9-6. Pre-Amplifier Board Layout.............................................................................. 239
Figure 10-1. UV Absorption.............................................................................................. 245
Figure 10-2. UV Light Path .............................................................................................. 247
Figure 10-3. Source UV Lamp Construction ........................................................................ 248
Figure 10-4. Excitation Lamp UV Spectrum Before/After Filtration ......................................... 249
Figure 10-5. PMT Optical Filter Bandwidth.......................................................................... 250
Figure 10-6. Effects of Focusing Source UV in Sample Chamber ............................................ 250
Figure 10-7. T101 Gas Flow and Location of Critical Flow Orifice ........................................... 254
07266B DCN6485

TABLE OF CONTENTS Teledyne API – T101 Operation Manual
xvi
Figure 10-8. Typical Flow Control Assembly with Critical Flow Orifice ..................................... 256
Figure 10-9. T101 Hydrocarbon Scrubber (Kicker) .............................................................. 257
Figure 10-10. T101 Electronic Block Diagram ..................................................................... 259
Figure 10-11. T101 CPU Board ......................................................................................... 261
Figure 10-12. T101 Sample Chamber ................................................................................ 262
Figure 10-13. PMT Assembly............................................................................................ 263
Figure 10-14. Basic PMT Design ....................................................................................... 264
Figure 10-15. PMT Cooling System ................................................................................... 265
Figure 10-16. PMT Preamp Block Diagram ......................................................................... 266
Figure 10-17. Relay Board Status LED Locations ................................................................. 268
Figure 10-18. Power Distribution Block Diagram ................................................................. 272
Figure 10-19. Front Panel and Display Interface Block Diagram............................................. 273
Figure 10-20. Basic Software Operation............................................................................. 274
Figure 11-1. Triboelectric Charging ................................................................................... 277
Figure 11-2. Basic anti-ESD Work Station .......................................................................... 280
LIST OF TABLES
Table 1-1. Analyzer Options............................................................................................... 20
Table 2-1. Model T101 Basic Unit Specifications.................................................................... 23
Table 3-1. Display Screen and Touch Control Description ....................................................... 28
Table 3-2. Rear Panel Description ....................................................................................... 31
Table 3-3. Analog Input Pin Assignments............................................................................. 34
Table 3-4. Analog Output Pin Assignmentss ......................................................................... 35
Table 3-5. Status Output Signals........................................................................................ 37
Table 3-6. Control Input Signals......................................................................................... 38
Table 3-7. Inlet / Outlet Connector Descriptions ................................................................... 40
Table 3-8. H2S – SO2 Switching Valve Operating States ......................................................... 42
Table 3-9. NIST-SRM's Available for Traceability of H2S & SO2 Calibration Gases ....................... 44
Table 3-10. Zero/Span Valve Operating States ..................................................................... 46
Table 3-11. IZS Valve Operating States............................................................................... 49
Table 3-12. Possible Warning Messages at Start-Up .............................................................. 51
Table 4-1. Analyzer Operating Modes .................................................................................. 57
Table 4-2. Test Functions Defined....................................................................................... 59
Table 4-3. List of Warning Messages ................................................................................... 61
Table 4-4. Primary Setup Mode Features and Functions ......................................................... 64
Table 4-5. Secondary Setup Mode Features and Functions ..................................................... 64
Table 4-6. Password Levels............................................................................................... 74
Table 4-7. Variable Names (VARS)...................................................................................... 77
Table 4-8. T101 Diagnostic (DIAG) Functions ....................................................................... 81
Table 4-9. DIAG - Analog I/O Functions............................................................................... 85
Table 4-10. Analog Output Voltage Ranges .......................................................................... 85
Table 4-11. Analog Output Current Loop Range .................................................................... 86
Table 4-12. Analog Output Pin Assignments ......................................................................... 86
Table 4-13. Voltage Tolerances for Analog Output Calibration ................................................. 90
07266B DCN6485

Teledyne API – T101 Operation Manual TABLE OF CONTENTS
xvii
Table 4-14. Current Loop Output Calibration with Resistor ..................................................... 94
Table 4-15. Test Parameters Available for Analog Output A4 ................................................ 102
Table 4-16. Ethernet Status Indicators .............................................................................. 107
Table 4-17. LAN/Internet Default Configuration Properties ................................................... 109
Table 4-18. Internet Configuration Touchscreen Button Functions ......................................... 113
Table 4-19. COMM Port Communication Modes ................................................................... 121
Table 4-20. Front Panel LED Status Indicators for DAS ........................................................ 125
Table 4-21. DAS Data Channel Properties .......................................................................... 126
Table 4-22. DAS Data Parameter Functions........................................................................ 127
Table 5-1. Status Output Pin Assignments ......................................................................... 145
Table 5-2. Control Input Pin Assignments .......................................................................... 145
Table 5-3. Terminal Mode Software Commands .................................................................. 147
Table 5-4. Command Types ............................................................................................. 148
Table 5-5. Serial Interface Documents .............................................................................. 154
Table 5-6. Hessen RS-232 Communication Parameters ........................................................ 155
Table 5-7. T101 Hessen Protocol Response Modes............................................................... 157
Table 5-8. Default Hessen Status Bit Assignments .............................................................. 160
Table 6-1. NIST-SRM's Available for Traceability of H2S and SO2 Calibration Gases ................. 165
Table 6-2. AutoCal Modes................................................................................................ 179
Table 6-3. AutoCal Attribute Setup Parameters................................................................... 180
Table 6-4. Example Auto-Cal Sequence ............................................................................. 181
Table 6-5. Example Auto-Cal Sequence ............................................................................. 185
Table 7-1. Activity Matrix for Calibration Equipment & Supplies............................................. 188
Table 7-2. Activity Matrix for Calibration Procedure ............................................................. 189
Table 7-3. Activity Matrix ................................................................................................ 191
Table 7-4. Definition of Level 1 and Level 2 Zero and Span Checks........................................ 192
Table 8-1 T101 Preventive Maintenance Schedule ............................................................... 199
Table 8-2 Predictive Uses for Test Functions....................................................................... 201
Table 9-1. Warning Messages - Indicated Failures............................................................... 214
Table 9-2. Test Functions - Possible Causes for Out-Of-Range Values .................................... 216
Table 9-3. Relay Board Status LEDs .................................................................................. 220
Table 9-4. DC Power Test Point and Wiring Color Code ........................................................ 227
Table 9-5. DC Power Supply Acceptable Levels ................................................................... 227
Table 9-6. Relay Board Control Devices ............................................................................. 229
Table 9-7. Analog Output Test Function - Nominal Values .................................................... 229
Table 9-8. Status Outputs Check Pin Out ........................................................................... 230
Table 9-9. Example of UV Lamp Power Supply Outputs........................................................ 237
07266B DCN6485

TABLE OF CONTENTS Teledyne API – T101 Operation Manual
xviii
This page intentionally left blank.
07266B DCN6485

19
1. INTRODUCTION
The Model T101 UV Fluorescence H2S Analyzer measures hydrogen sulfide in levels
commonly required for Ambient Air monitoring. The analyzer converts sulfur gases to
sulfur dioxide and measures the SO2 concentrations using fluorescence technology.
1.1. FEATURES
Some features of the T101 include:
LCD Graphical User Interface with capacitive touch screen
Microprocessor controlled for versatility
Multi-tasking software allows viewing of test variables during operation
Bi-directional USB, RS-232, and 100BaseT Ethernet ports for remote
operation (optional RS-485)
Front panel USB ports for peripheral devices
Auto ranging, dual range and remote range selection
Built in self checks and diagnostic capabilities
Digital status outputs provide instrument condition
Auto Zero System
Adaptive signal filtering optimizes response time
Temperature & pressure compensation
Optional Calibration valves or permeation oven
User friendly operation and set up
Internal Zero Span
Internal Datalogger
Critical Orifices provide flow stability
07266B DCN6485
Introduction Teledyne API – T101 Operation Manual
20
1.2. OPTIONS
The options available for your analyzer are presented in Table 1-1 with name, option
number, a description and/or comments, and if applicable, cross-references to technical
details in this manual, such as setup and calibration. To order these options or to learn
more about them, please contact the Sales department of Teledyne - Advanced Pollution
Instruments at:
TOLL-FREE: 800-324-5190
TEL: +1 858-657-9800
FAX: +1 858-657-9816
E-MAIL: apisales@teledyne.com
WEB SITE: http://www.teledyne-api.com/
Table 1-1. Analyzer Options
Option Option
Number Description/Notes
Pumps Pumps meet all typical AC power supply standards while exhibiting
same pneumatic performance.
10A External Pump 100V - 120V @ 60 Hz
10B External Pump 220V - 240V @ 50 Hz
10C External Pump 220V - 240V @ 60 Hz
10D External Pump 100V – 12V @ 50 Hz
10E External Pump 100V @ 60 Hz
11A Pumpless (if one is standard either internal or external)
13 High Voltage Internal Pump 240V @ 50Hz
Rack Mount
Kits Options for mounting the analyzer in standard 19” racks
20A Rack mount brackets with 26 in. chassis slides
20B Rack mount brackets with 24 in. chassis slides
21 Rack mount brackets only (compatible with carrying strap, Option 29)
23 Rack mount for external pump pack (no slides)
Carrying Strap/Handle Side-mounted strap for hand-carrying analyzer
29
Extends from “flat” position to accommodate hand for carrying.
Recesses to 9mm (3/8”) dimension for storage.
Can be used with rack mount brackets, Option 21.
Cannot be used with rack mount slides.
CAUTION
GENERAL SAFETY HAZARD
A FULLY LOADED T101 WITH VALVE OPTIONS WEIGHS >20 KG (45
POUNDS).
To avoid personal injury we recommend that two persons lift and carry the
analyzer. Disconnect all cables and tubing from the analyzer before moving it.
07266B DCN6485
Teledyne API – T101 Operation Manual Introduction
21
Option Option
Number Description/Notes
Analog Inputs Used for connecting external voltage signals from other instrumentation (such
as meteorological instruments).
64 Also can be used for logging these signals in the analyzer’s internal DAS
Current Loop Analog
Outputs Adds isolated, voltage-to-current conversion circuitry to the
analyzer’s analog outputs.
41
Isolated 0-20 or 4-20 mA current output (up to three can be retrofitted if not
installed at the factory)
Parts Kits
42A
43 Expendables Kit with IZS includes the items needed to refurbish the
internal zero air scrubber (IZS) that is included.
45 Spare Parts Kit includes spares parts for one unit.
NO Optical Filter Recommended for High NOX backgrounds.
47B Required for EN Certification.
Calibration Valves Used to control the flow of calibration gases generated from external
sources, rather than manually switching the rear panel pneumatic
connections.
50A Ambient Zero and Ambient Span
50G Zero Scrubber and Internal Span Source (IZS)
H2 S Permeation Tubes Replacement tubes for the IZS option; identical size/shape; different
effusion rates.
Effusion Rate
(@ 50°C)
Approximate
Concentration
Specified Flow Rate (of indicated perm
tube rate)
(uncertified) 52A 106 ng/min .08 -.12 ppm 0.76 lpm (nominal) ± 25%
(certified) 52E 76 ng/min .04 - .06 ppm 0.76 lpm ± 5%
Communication Cables For remote serial, network and Internet communication with the
analyzer.
Type Description
60A RS-232
Shielded, straight-through DB-9F to DB-25M cable, about 1.8 m
long. Used to interface with older computers or code activated
switches with DB-25 serial connectors.
60B RS-232
Shielded, straight-through DB-9F to DB-9F cable of about 1.8 m
length.
60C Ethernet
Patch cable, 2 meters long, used for Internet and LAN
communications.
60D USB
Cable for direct connection between instrument (rear panel USB
port) and personal computer.
Concentration Alarm
Relay Issues warning when gas concentration exceeds limits set by user.
61
Four (4) “dry contact” relays on the rear panel of the instrument. This relay
option is different from and in addition to the “Contact Closures” that come
standard on all TAPI instruments.
07266B DCN6485

Introduction Teledyne API – T101 Operation Manual
22
Option Option
Number Description/Notes
RS-232 Multidrop Enables communications between host computer and up to eight
analyzers.
62
Multidrop card seated on the analyzer’s CPU card.
Each instrument in the multidrop network requires this card and a
communications cable (Option 60B).
Special Features Built in features, software activated
N/A
Maintenance Mode Switch, located inside the instrument, places the
analyzer in maintenance mode where it can continue sampling, yet ignore
calibration, diagnostic, and reset instrument commands. This feature is of
particular use for instruments connected to Multidrop or Hessen protocol
networks.
Call Technical Support for activation.
N/A
Second Language Switch activates an alternate set of display messages in
a language other than the instrument’s default language.
Call Technical Support for a specially programmed Disk on Module containing the
second language.
N/A
Dilution Ratio Option allows the user to compensate for diluted sample gas,
such as in continuous emission monitoring (CEM) where the quality of gas in a
smoke stack is being tested and the sampling method used to remove the gas
from the stack dilutes the gas. Call Technical Support for activation.
07266B DCN6485

23
2. SPECIFICATIONS AND APPROVALS
2.1. SPECIFICATIONS
Table 2-1. Model T101 Basic Unit Specifications
PARAMETER DESCRIPTION
Ranges H2S: Min 0-50 ppb Full scale; Max 0-10 ppm Full scale
SO2: Up to 0-20 ppm Full scale
(selectable, independent ranges and auto ranging supported)
Measurement Units ppb, ppm, µg/m3, mg/m3 (selectable)
Zero Noise1 <0.2 ppb (RMS)
Span Noise1 <0.5% of reading (RMS) above 50 ppb
Lower Detectable Limit2 0.4 ppb
Zero Drift (24 hours) <0.5 ppb
Span Drift (24 hours) <0.5% of full scale
Lag Time 20 seconds
Rise/Fall Time1 <120 seconds to 95%
Linearity 1% of full scale
Precision 0.5% of reading above 50 ppb
Sample Flow Rate 650 cm3/min ±10%
Temperature Coefficient < 0.1% per oC
Voltage Coefficient < 0.05% per V
Temperature Range 5-40oC
Humidity Range 0 - 95% RH, non-condensing
Dimensions H x W x D 7" x 17" x 23.5" (178 mm x 432 mm x 597 mm)
Weight, Analyzer
(Basic Configuration)
41 lbs (18.3 kg)
45 lbs (20.5 kg) w/internal pump
AC Power 100V-120V, 60 Hz (202W); 220V-240V, 50 Hz (200W)
Analog Output Ranges 10 V, 5V, 1V, 0.1V (selectable)
Analog Output Resolution 1 part in 4096 of selected full-scale voltage
Recorder Offset ±10%
Environmental Installation category (over-voltage category) II; Pollution degree 2
07266B DCN6485

Specifications and Approvals Teledyne API – T101 Operation Manual
24
PARAMETER DESCRIPTION
Standard I/O 1 Ethernet: 10/100Base-T
2 RS-232 (300 – 115,200 baud)
2 USB device ports
8 opto-isolated digital status outputs
6 opto-isolated digital control inputs
4 analog outputs
Optional I/O 1 USB com port
1 RS485
8 analog inputs (0-10V, 12-bit)
4 digital alarm outputs
Multidrop RS232
3 4-20mA current outputs
For indoor use at altitudes ≤ 2000m only
2.2. APPROVALS AND CERTIFICATIONS
The Teledyne API Model T101 analyzer was tested and certified for Safety and
Electromagnetic Compatibility (EMC). This section presents the compliance statements
for those requirements and directives.
2.2.1. SAFETY
IEC 61010-1:2001, Safety requirements for electrical equipment for
measurement, control, and laboratory use.
CE: 2006/95/EC, Low-Voltage Directive
North American:
cNEMKO (Canada): CAN/CSA-C22.2 No. 61010-1-04
NEMKO-CCL (US): UL No. 61010-1 (2nd Edition)
2.2.2. EMC
EN 61326-1 (IEC 61326-1), Class A Emissions/Industrial Immunity
EN 55011 (CISPR 11), Group 1, Class A Emissions
FCC 47 CFR Part 15B, Class A Emissions
CE: 2004/108/EC, Electromagnetic Compatibility Directive
2.2.3. OTHER TYPE CERTIFICATIONS
For additional certifications, please contact Technical Support:
Toll-free Phone:
800-324-5190
Phone:
858-657-9800
Fax:
858-657-9816
Email:
Sda_techsupport@teledyne.com
07266B DCN6485
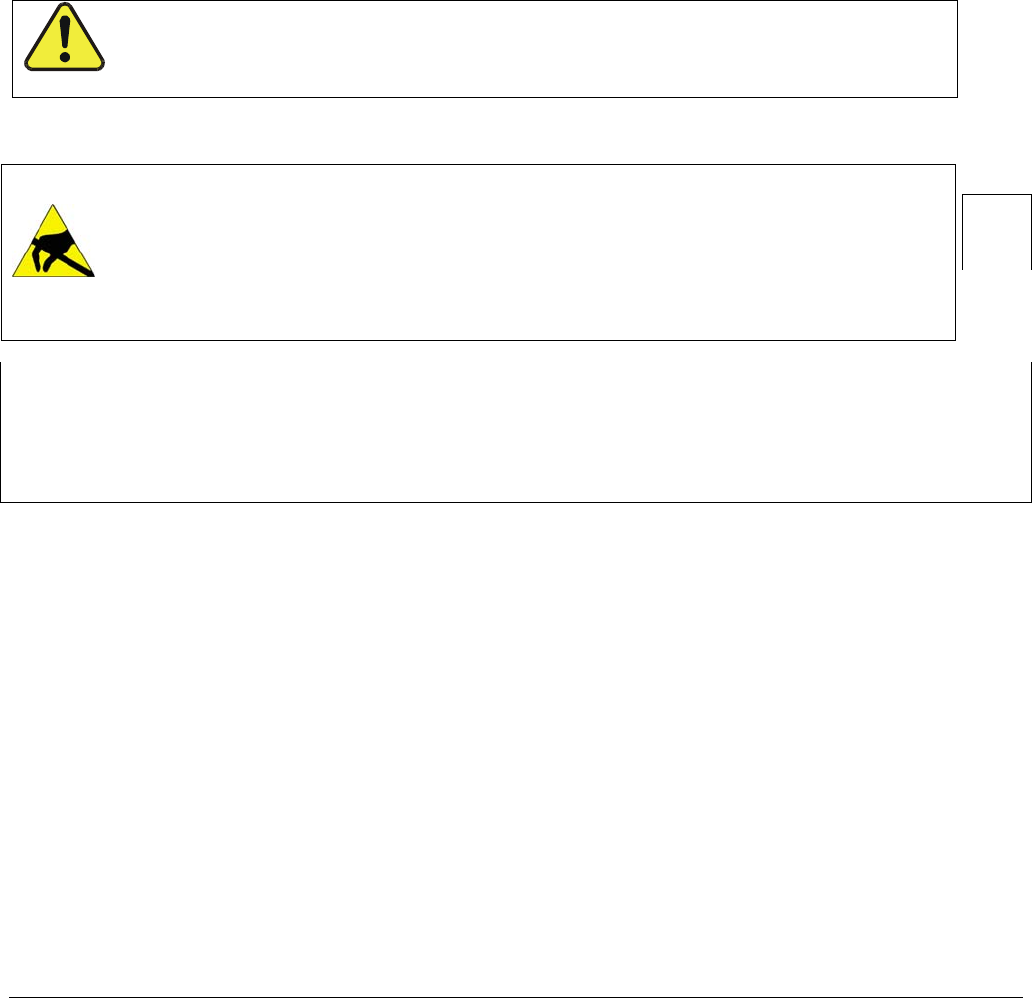
25
3. GETTING STARTED
3.1. UNPACKING AND INITIAL SETUP
CAUTION
To avoid personal injury, always use two persons to lift and carry the Model T101.
NO
TE
Remove dust plugs prior to operating instrument. It is recommended that you store shipping
containers/materials, including shipping screws and dust plugs for the pneumatic ports, for future use
if/when the instrument should be returned to the factory for repair and/or calibration service. See
Warranty section in this manual and shipping procedures on our Website at
http://www.teledyne-api.com under Customer Support > Return Authorization.
1. Inspect the received packages for external shipping damage. If damaged,
please advise the shipper first, then Teledyne API.
2. Included with your analyzer is a printed record (Form number 04551) of
the final performance characterization performed on your instrument at
the factory. This record is an important quality assurance and calibration
record for this instrument. It should be placed in the quality records file
for this instrument.
3. Carefully remove the top cover of the analyzer and check for internal
shipping damage.
Remove the set screw located in the top, center of the rear panel
Remove the screws fastening the top cover to the unit (four per side).
Lift the cover straight up.
CAUTION – Avoid Warranty Invalidation
Printed circuit assemblies (PCAs) are sensitive to electro-static discharges too small
to be felt by the human nervous system. Damage resulting from failure to use ESD
protection when working with electronic assemblies will void the instrument warranty.
See A Primer on Electro-Static Discharge in this manual for more information on preventing
ESD damage.
07266B DCN6485

Getting Started Teledyne API – T101 Operation Manual
26
4. Inspect the interior of the instrument to make sure all circuit boards and
other components are in good shape and properly seated.
5. Check the connectors of the various internal wiring harnesses and
pneumatic hoses to make sure they are firmly and properly seated.
6. Verify that all of the optional hardware ordered with the unit has been
installed. These are checked on the paperwork (Form 04551)
accompanying the analyzer.
7. VENTILATION CLEARANCE: Whether the analyzer is set up on a bench
or installed into an instrument rack, be sure to leave sufficient ventilation
clearance.
AREA MINIMUM REQUIRED CLEARANCE
Back of the instrument 10 cm / 4 inches
Sides of the instrument 2.5 cm / 1 inch
Above and below the instrument. 2.5 cm / 1 inch
Various rack mount kits are available for this analyzer.
3.2. INSTRUMENT LAYOUT
Instrument layout includes front panel and display, rear panel connectors, and internal
chassis layout.
3.2.1. FRONT PANEL
Figure 3-1 shows the analyzer’s front panel layout, followed by a close-up of the display
screen in Figure 3-2, which is described in Table 3-1. The two USB ports on the front
panel are provided for the connection of peripheral devices:
• plug-in mouse (not included) to be used as an alternative to the
touchscreen interface
• thumb drive (not included) to download updates to instruction software
(contact TAPI Technical Support for information).
07266B DCN6485
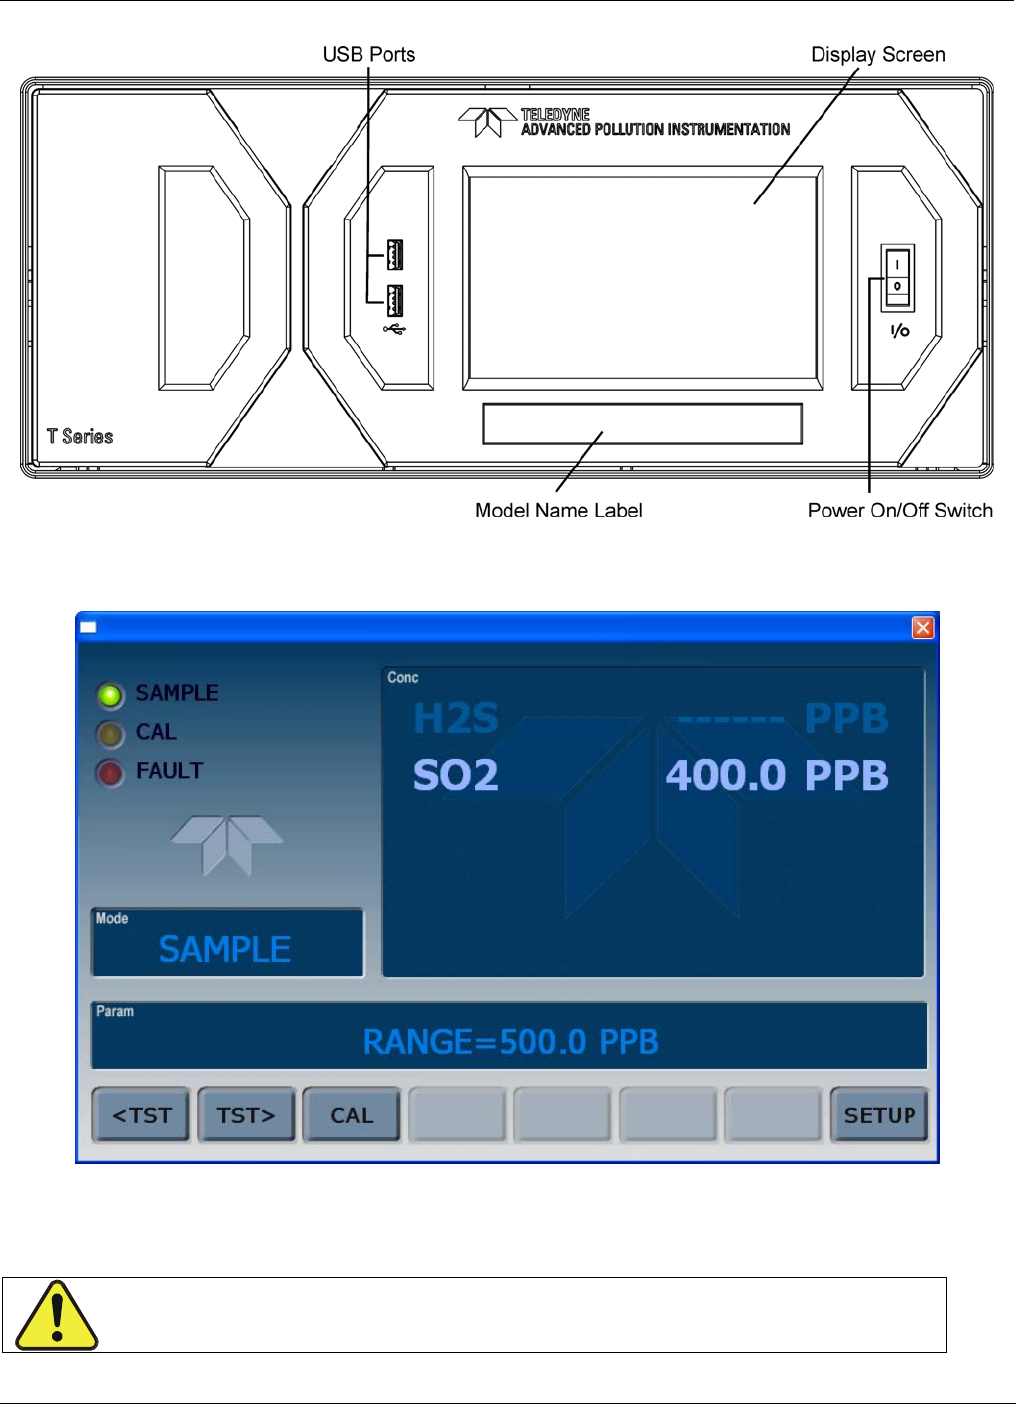
Teledyne API – T101 Operation Manual Getting Started
27
Figure 3-1. Front Panel Layout
Figure 3-2. Display Screen and Touch Control
CAUTION – Avoid Damaging Touchscreen
Do not use hard-surfaced instruments such as pens to operate the
touchscreen.
07266B DCN6485
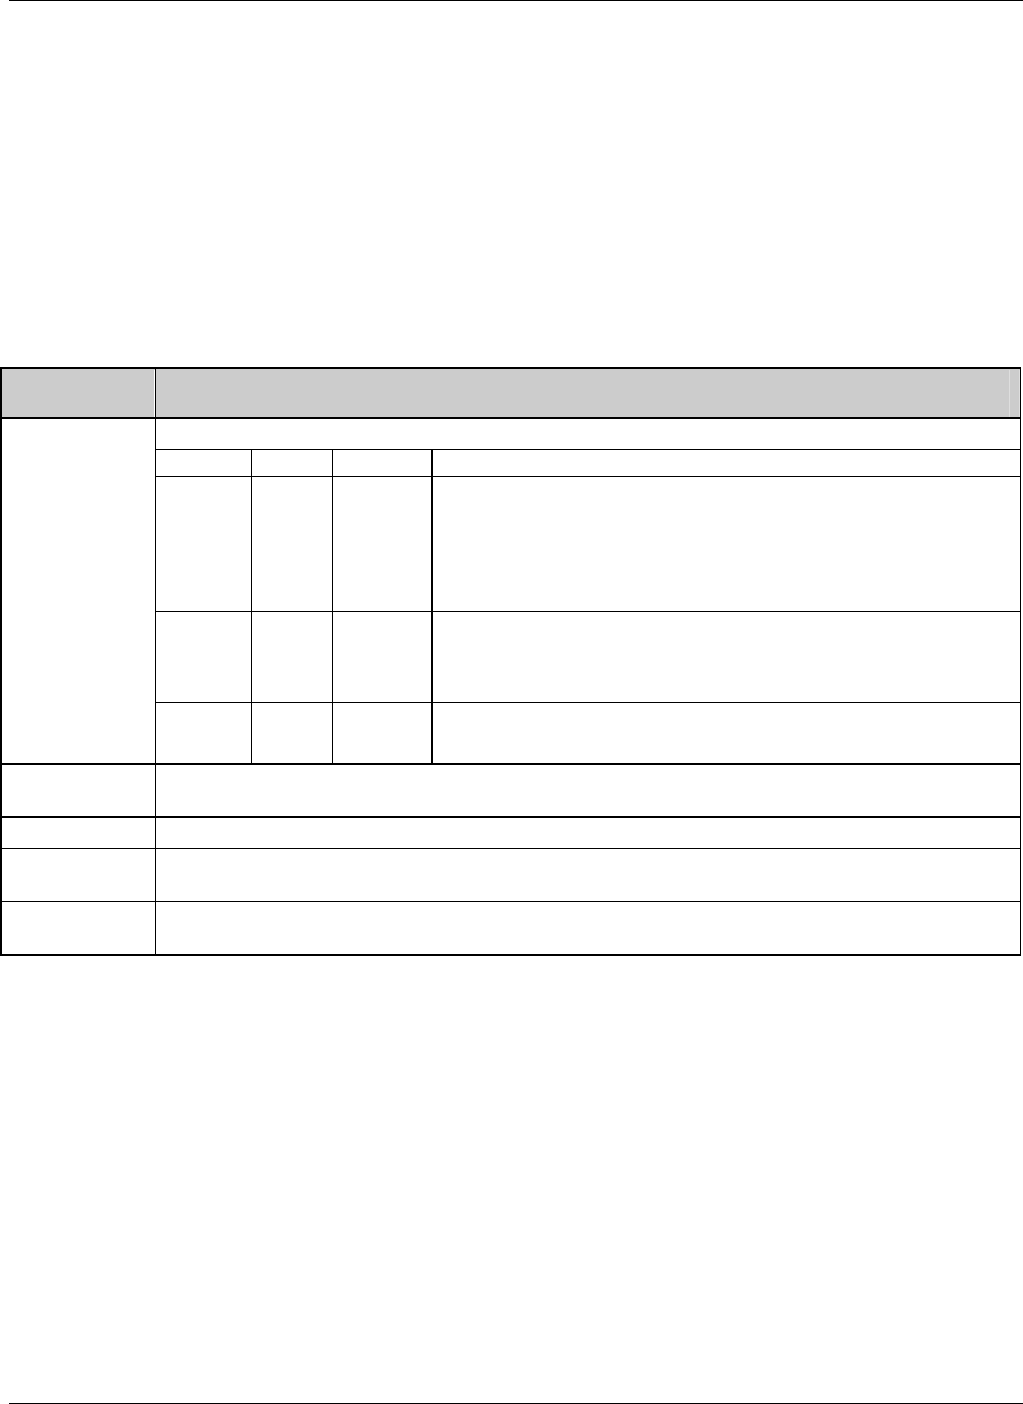
Getting Started Teledyne API – T101 Operation Manual
28
The front panel liquid crystal display screen includes touch control. Upon analyzer start-
up, the screen shows a splash screen and other initialization indicators before the main
display appears, similar to Figure 3-2 above (may or may not display a Fault alarm). The
LEDs on the display screen indicate the Sample, Calibration and Fault states; also on the
screen is the gas concentration field (Conc), which displays real-time readouts for the
primary gas and for the secondary gas if installed. The display screen also shows what
mode the analyzer is currently in, as well as messages and data (Param). Along the
bottom of the screen is a row of touch control buttons; only those that are currently
applicable will have a label. Table 3-1 provides detailed information for each component
of the screen.
Table 3-1. Display Screen and Touch Control Description
Field Description/Function
LEDs indicating the states of Sample, Calibration and Fault, as follows:
Name Color State Definition
SAMPLE Green
Off
On
Blinking
Unit is not operating in sample mode, DAS is disabled.
Sample Mode active; Front Panel Display being updated; DAS
data being stored.
Unit is operating in sample mode, front panel display being
updated, DAS hold-off mode is ON, DAS disabled
CAL Yellow
Off
On
Blinking
Auto Cal disabled
Auto Cal enabled
Unit is in calibration mode
Status
FAULT Red Off
Blinking
No warnings exist
Warnings exist
Conc Displays the actual concentration of the sample gas currently being measured by the
analyzer in the currently selected units of measure
Mode Displays the name of the analyzer’s current operating mode
Param Displays a variety of informational messages such as warning messages, operational data,
test function values and response messages during interactive tasks.
Control
Buttons
Displays dynamic, context sensitive labels on each button, which is blank when inactive until
applicable.
Figure 3-3 shows how the front panel display is mapped to the menu charts illustrated in
this manual. The Mode, Param (parameters), and Conc (gas concentration) fields in the
display screen are represented across the top row of each menu chart. The eight touch
control buttons along the bottom of the display screen are represented in the bottom row
of each menu chart.
07266B DCN6485
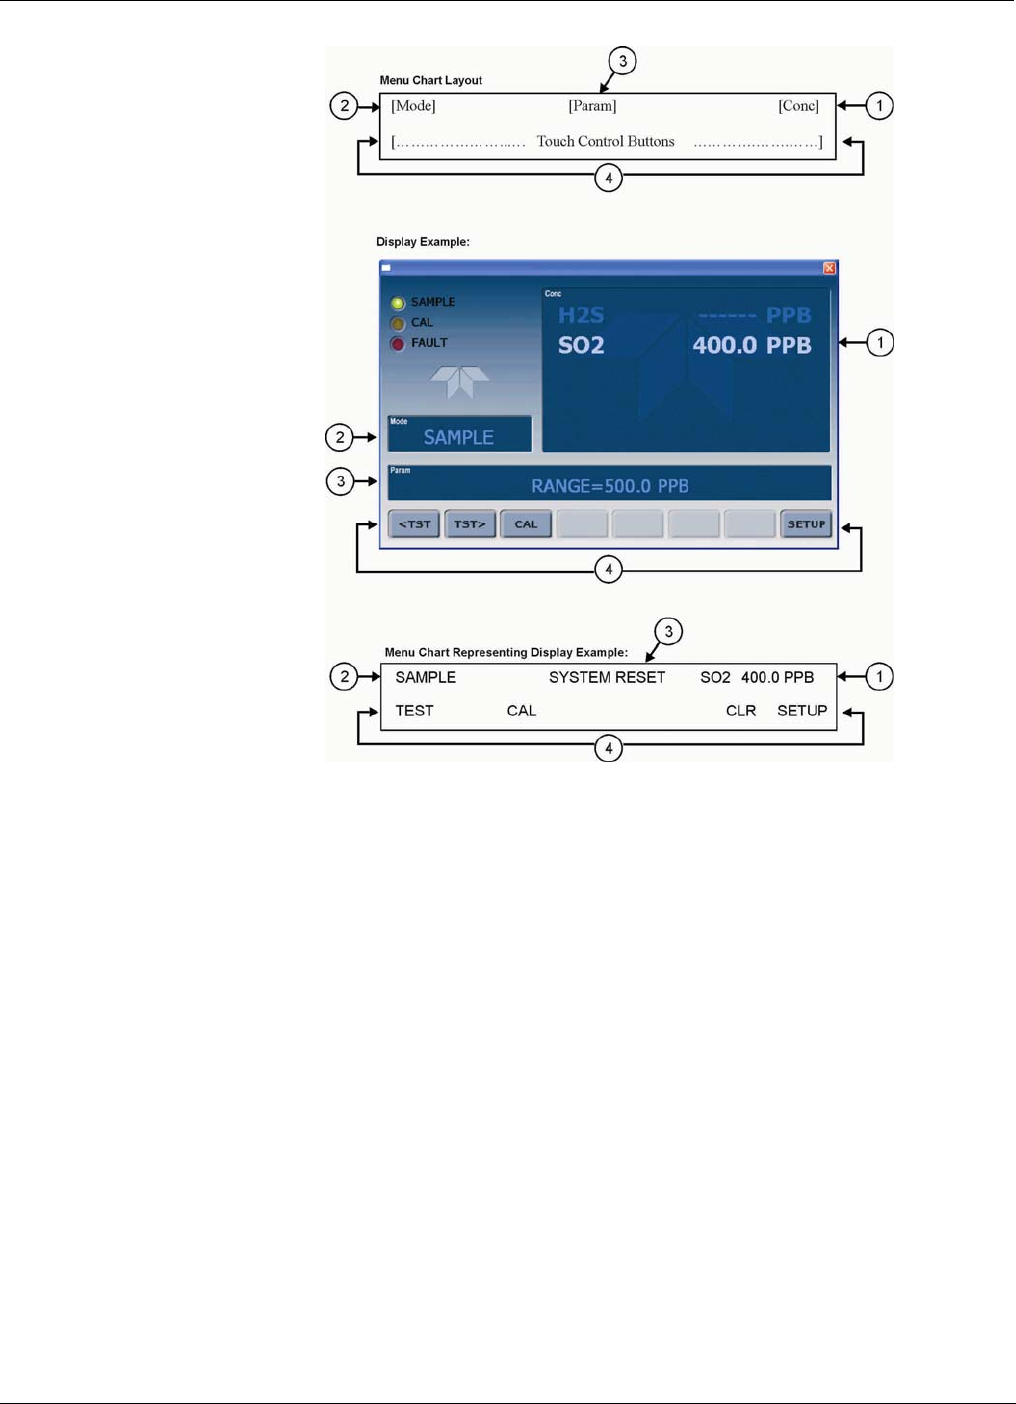
Teledyne API – T101 Operation Manual Getting Started
29
Figure 3-3. Display/Touch Control Screen Mapped to Menu Charts
07266B DCN6485
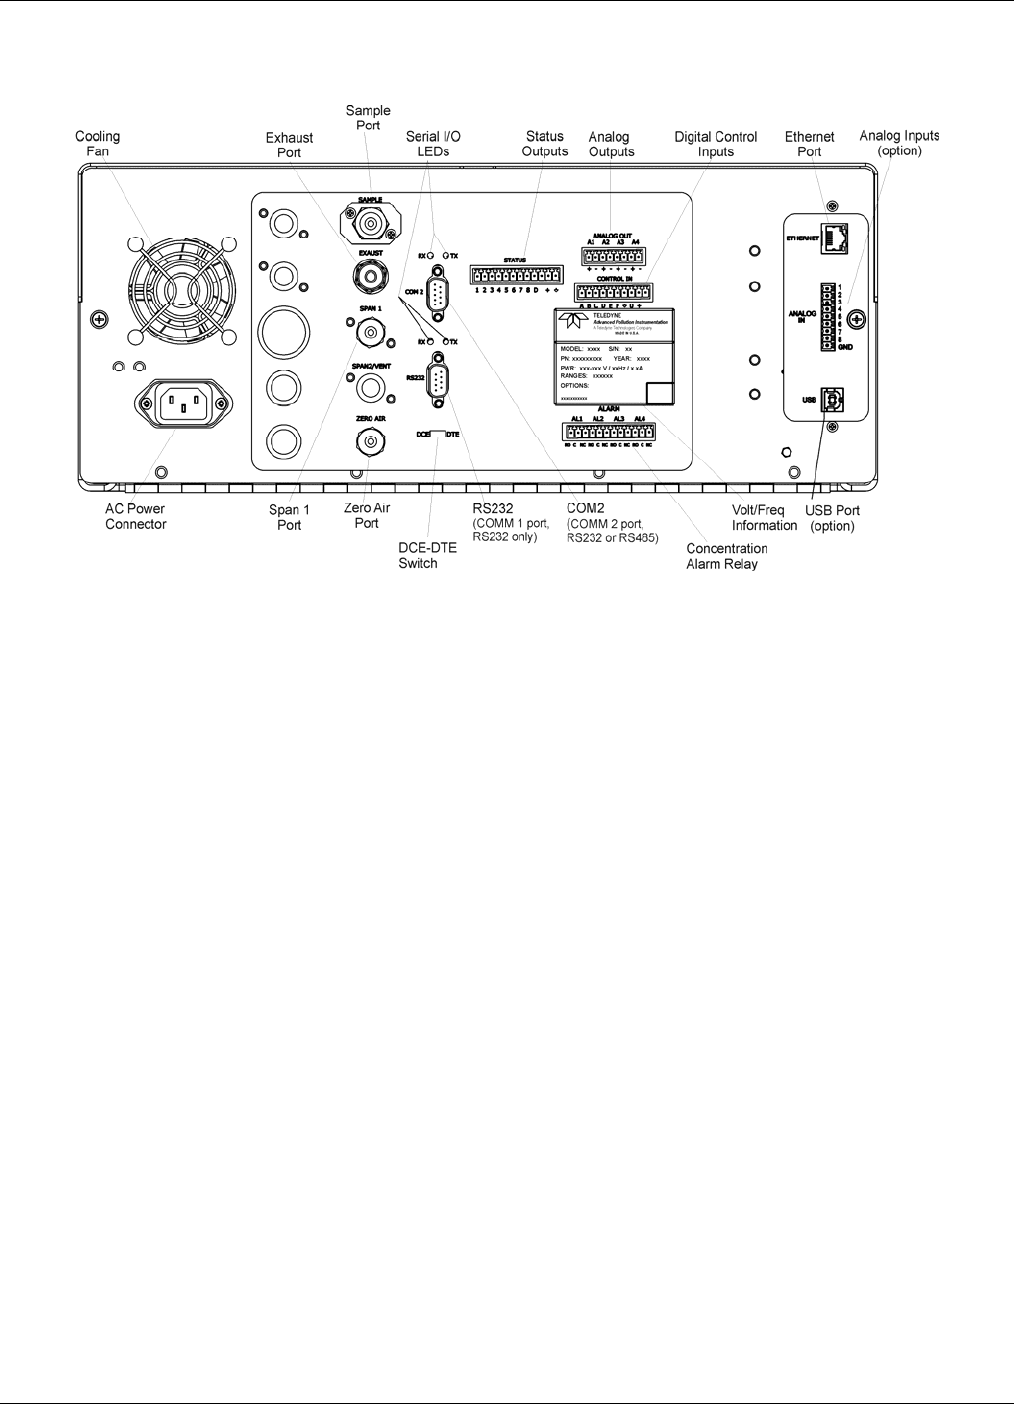
Getting Started Teledyne API – T101 Operation Manual
30
3.2.2. REAR PANEL
Figure 3-4. Rear Panel Layout
07266B DCN6485
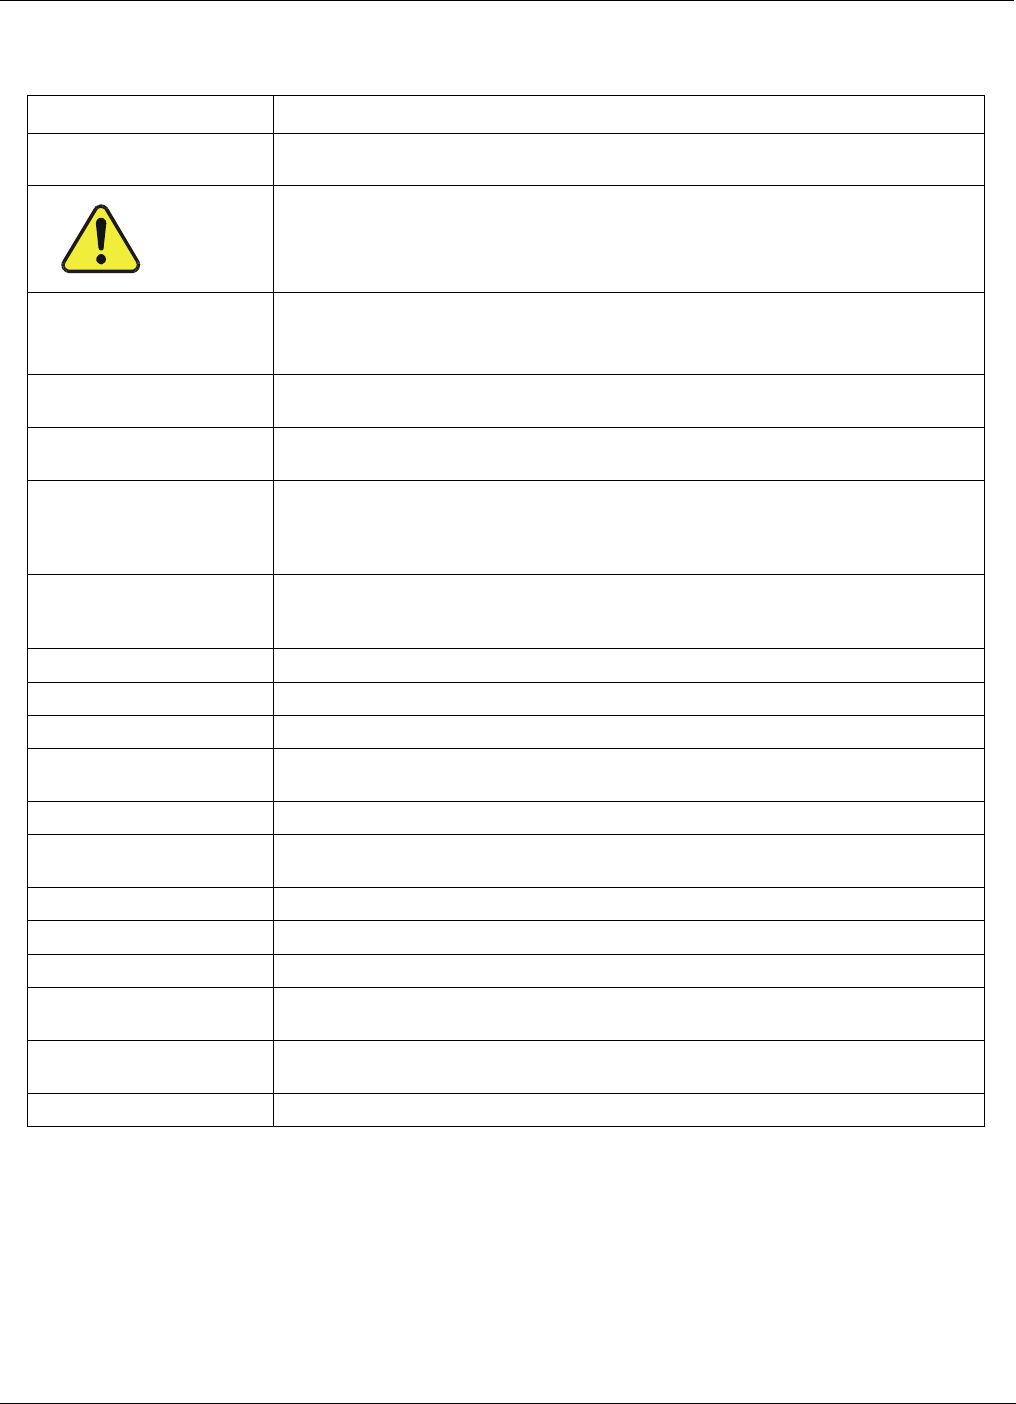
Teledyne API – T101 Operation Manual Getting Started
31
Table 3-2. Rear Panel Description
Component Function
cooling fan
Pulls ambient air into chassis through side vents and exhausts through
rear.
AC
power
connect
or
Connector for three-prong cord to apply AC power to the analyzer.
CAUTION! The cord’s power specifications (specs) MUST comply
with the power specs on the analyzer’s rear panel Model number
label
SAMPLE
Connect a gas line from the source of sample gas here.
Calibration gases are also inlet here on units without zero/span/shutoff
valve options installed.
EXHAUST
Connect an exhaust gas line of not more than 10 meters long here that
leads outside the shelter or immediate area surrounding the instrument.
SPAN 1
On units with zero/span/shutoff valve options installed, connect a gas line
to the source of calibrated span gas here.
SPAN2/VENT
Used as a second cal gas input line when instrument is configured with
zero/span valves and a dual gas option, or as a cal gas vent line when
instrument is configured with a pressurized span option (Call factory for
details).
ZERO AIR
Internal Zero Air: On units with zero/span/shutoff valve options installed
but no internal zero air scrubber attach a gas line to the source of zero air
here.
RX TX
LEDs indicate receive (RX) and transmit (TX) activity on the when blinking.
COM 2
Serial communications port for RS-232 or RS-485.
RS-232
Serial communications port for RS-232 only.
DCE DTE
Switch to select either data terminal equipment or data communication
equipment during RS-232 communication.
STATUS
For outputs to devices such as Programmable Logic Controllers (PLCs).
ANALOG OUT
For voltage or current loop outputs to a strip chart recorder and/or a data
logger.
CONTROL IN
For remotely activating the zero and span calibration modes.
ALARM
Option for concentration alarms and system warnings.
Information Label
Identifies the analyzer model number and provides power specifications
ETHERNET
Connector for network or Internet remote communication, using Ethernet
cable
ANALOG IN
Option for external voltage signals from other instrumentation and for
logging these signals
USB
Connector for direct connection to personal computer, using USB cable.
07266B DCN6485
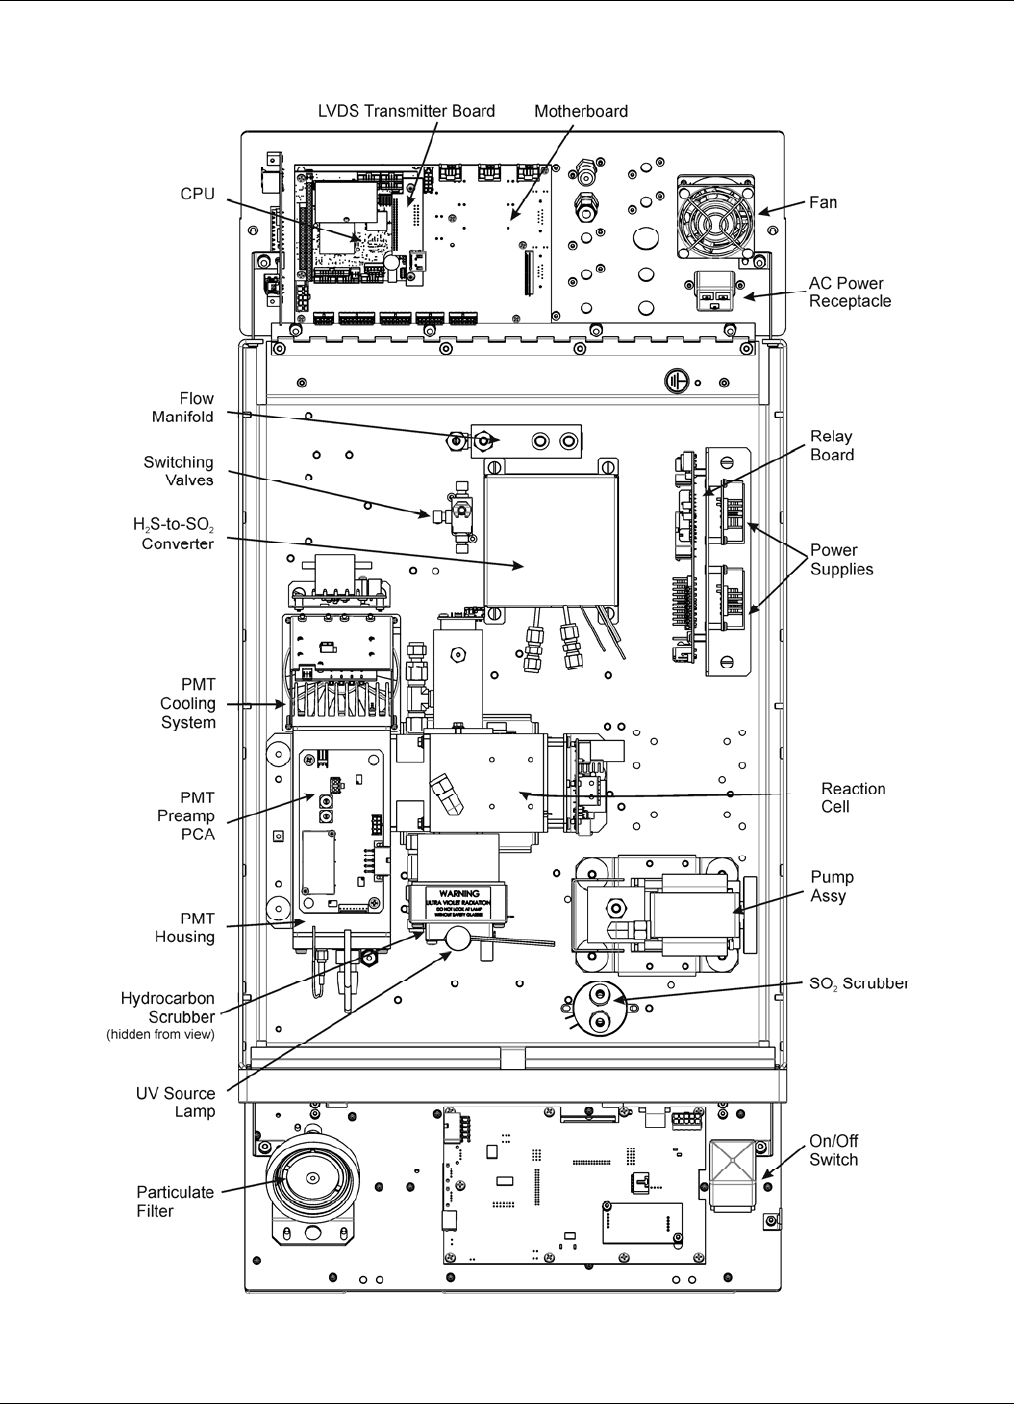
Getting Started Teledyne API – T101 Operation Manual
32
3.2.3. INTERNAL CHASSIS LAYOUT
Figure 3-5. Internal Chassis Layout
07266B DCN6485
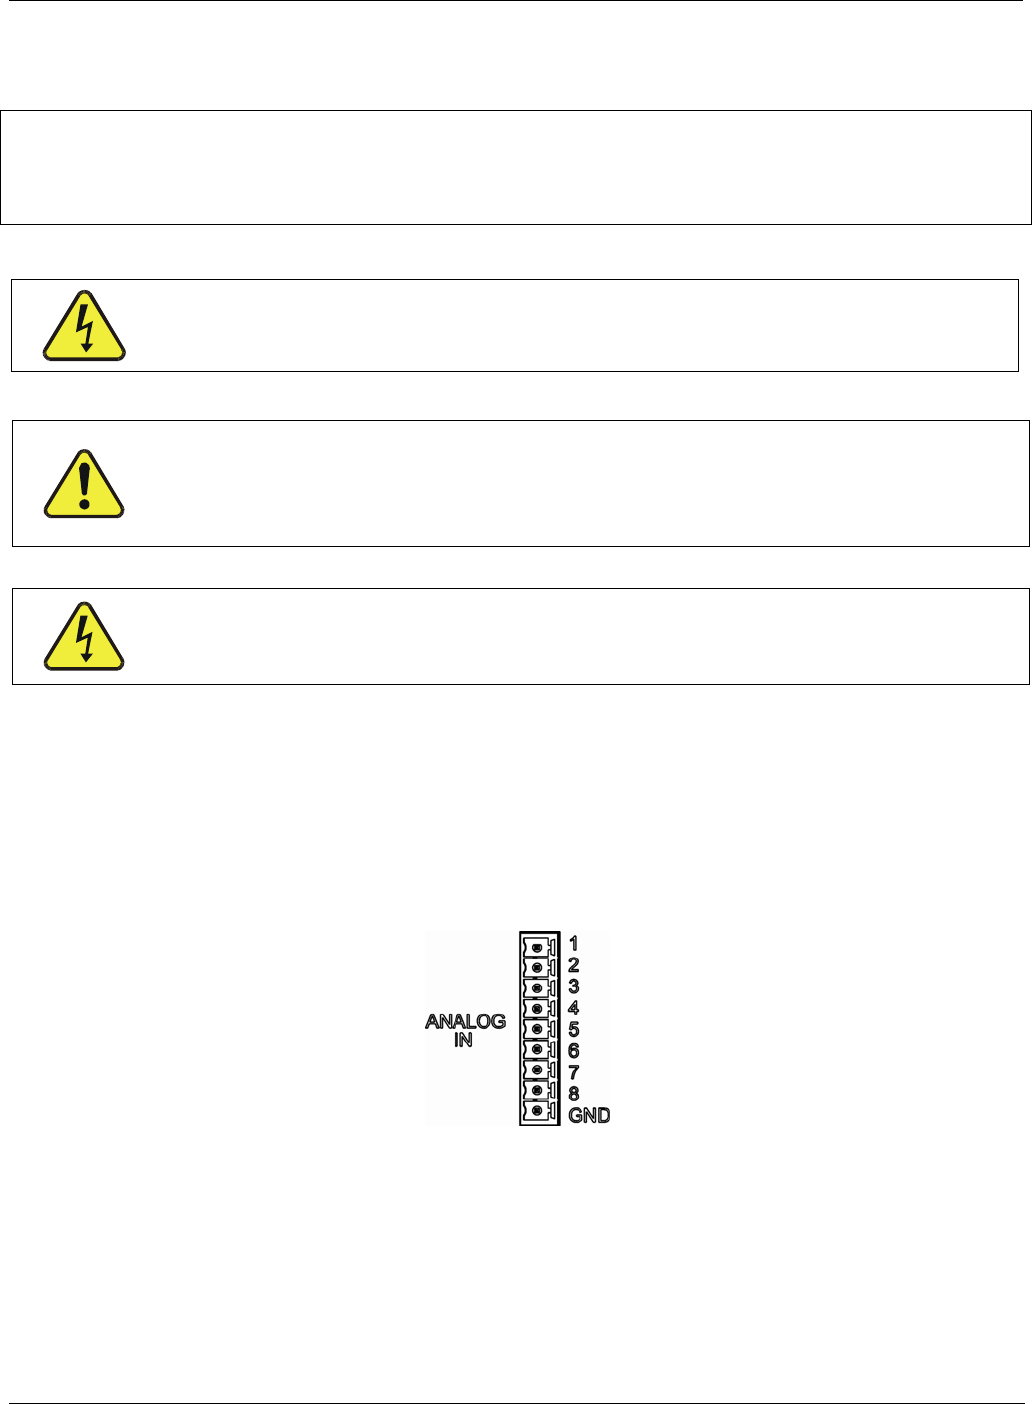
Teledyne API – T101 Operation Manual Getting Started
33
3.3. ELECTRICAL CONNECTIONS
NOTE
To maintain compliance with EMC standards, it is required that the cable length be no greater than
3 meters for all I/O connections, which include Analog In, Analog Out, Status Out, Control In,
Ethernet/LAN, USB, RS-232, and RS-485.
CAUTION
Check the voltage and frequency label on the rear panel of the instrument for
compatibility with the local power before plugging the T101 into line power.
Do not plug in the power cord if the voltage or frequency is incorrect.
CAUTION
Power connection must have functioning ground connection. Do not defeat the ground
wire on power plug.
3.3.1. ANALOG INPUTS (OPTION 64) CONNECTIONS
The Analog In connector is used for connecting external voltage signals from other
instrumentation (such as meteorological instruments) and for logging these signals in the
analyzer’s internal DAS. The input voltage range for each analog input is 1-10 VDC, and
the input impedance is nominally 20kΩ in parallel with 0.1µF.
Figure 3-6. Analog In Connector
Pin assignments for the Analog In connector are presented in Table 3-3.
WARNING - ELECTRICAL SHOCK HAZARD
Never connect/disconnect PCAs, wiring harnesses or electronic subassemblies while
under power. Never operate with cover off.
07266B DCN6485
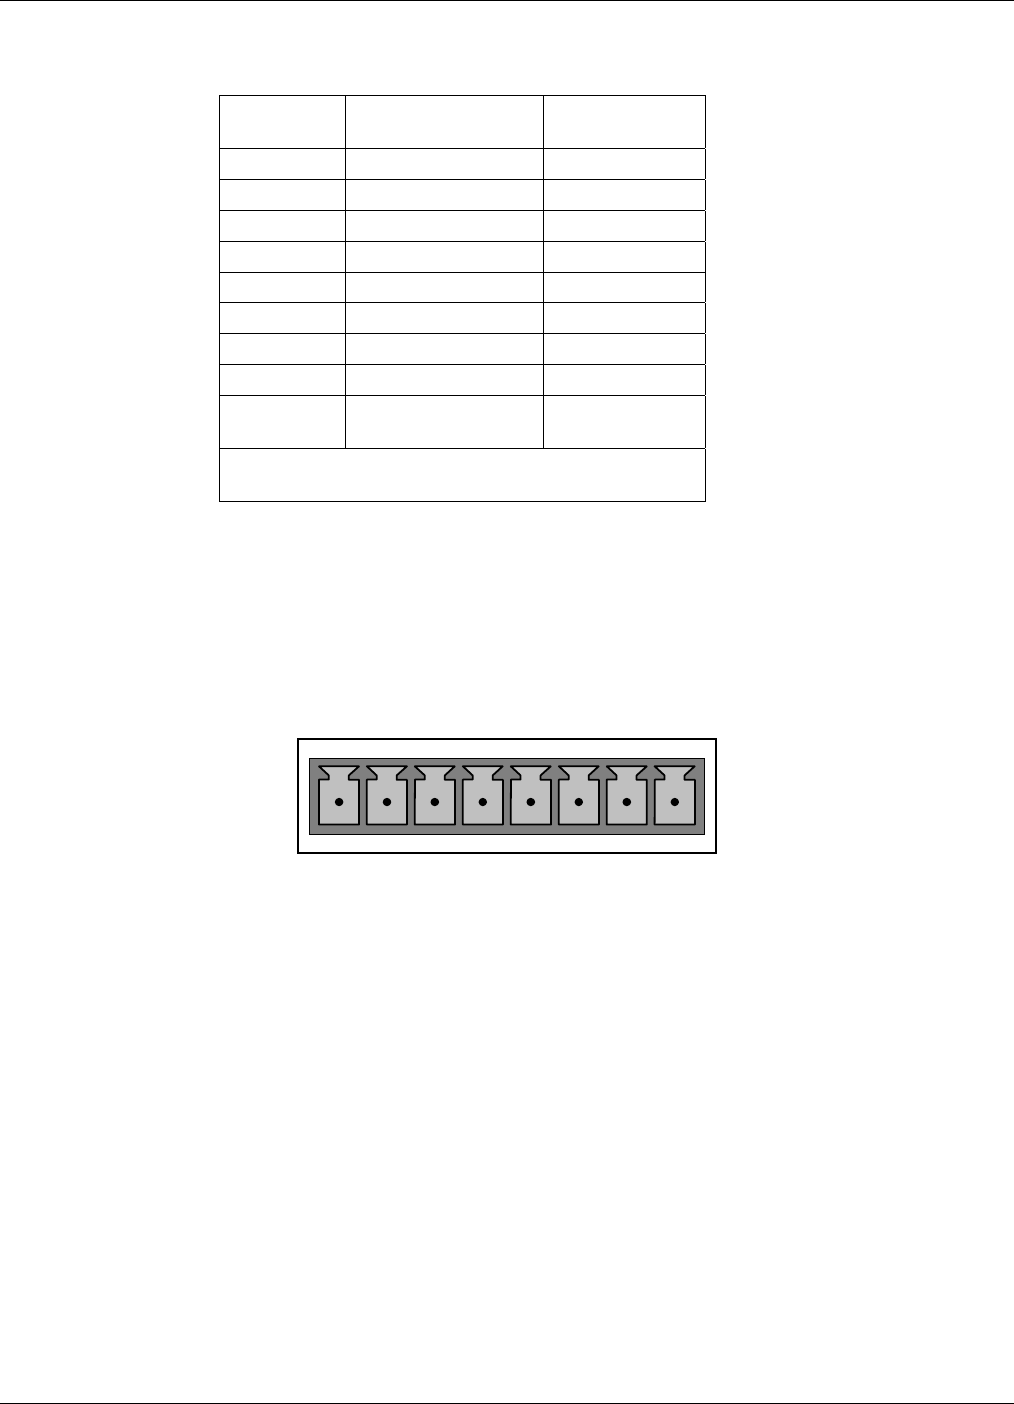
Getting Started Teledyne API – T101 Operation Manual
34
Table 3-3. Analog Input Pin Assignments
PIN DESCRIPTION DAS
PARAMETER1
1 Analog input # 1 AIN 1
2 Analog input # 2 AIN 2
3 Analog input # 3 AIN 3
4 Analog input # 4 AIN 4
5 Analog input # 5 AIN 5
6 Analog input # 6 AIN 6
7 Analog input # 7 AIN 7
8 Analog input # 8 AIN 8
GND Analog input
Ground
N/A
1 See Section 4.8 for details on setting up the
DAS.
3.3.2. CONNECTING THE ANALOG OUTPUTS
Attach a strip chart recorder and/or data-logger to the appropriate contacts of the analog
output connecter on the rear panel of the analyzer.
ANALOG OUT
A1 A2 A3 A4
+ - + - + - + -
Figure 3-7. Analog Output Connector
The A1 and A2 channels output a signal that is proportional to the H2S concentration of
the sample gas.
The output, labeled A4 is special. It can be set by the user (Section 4.6.9) to output any
one of the parameters accessible through the <TST TST> buttons of the unit’s Sample
display.
Pin-outs for the Analog Output connector at the rear panel of the instrument are presented
in Table 3-4.
07266B DCN6485
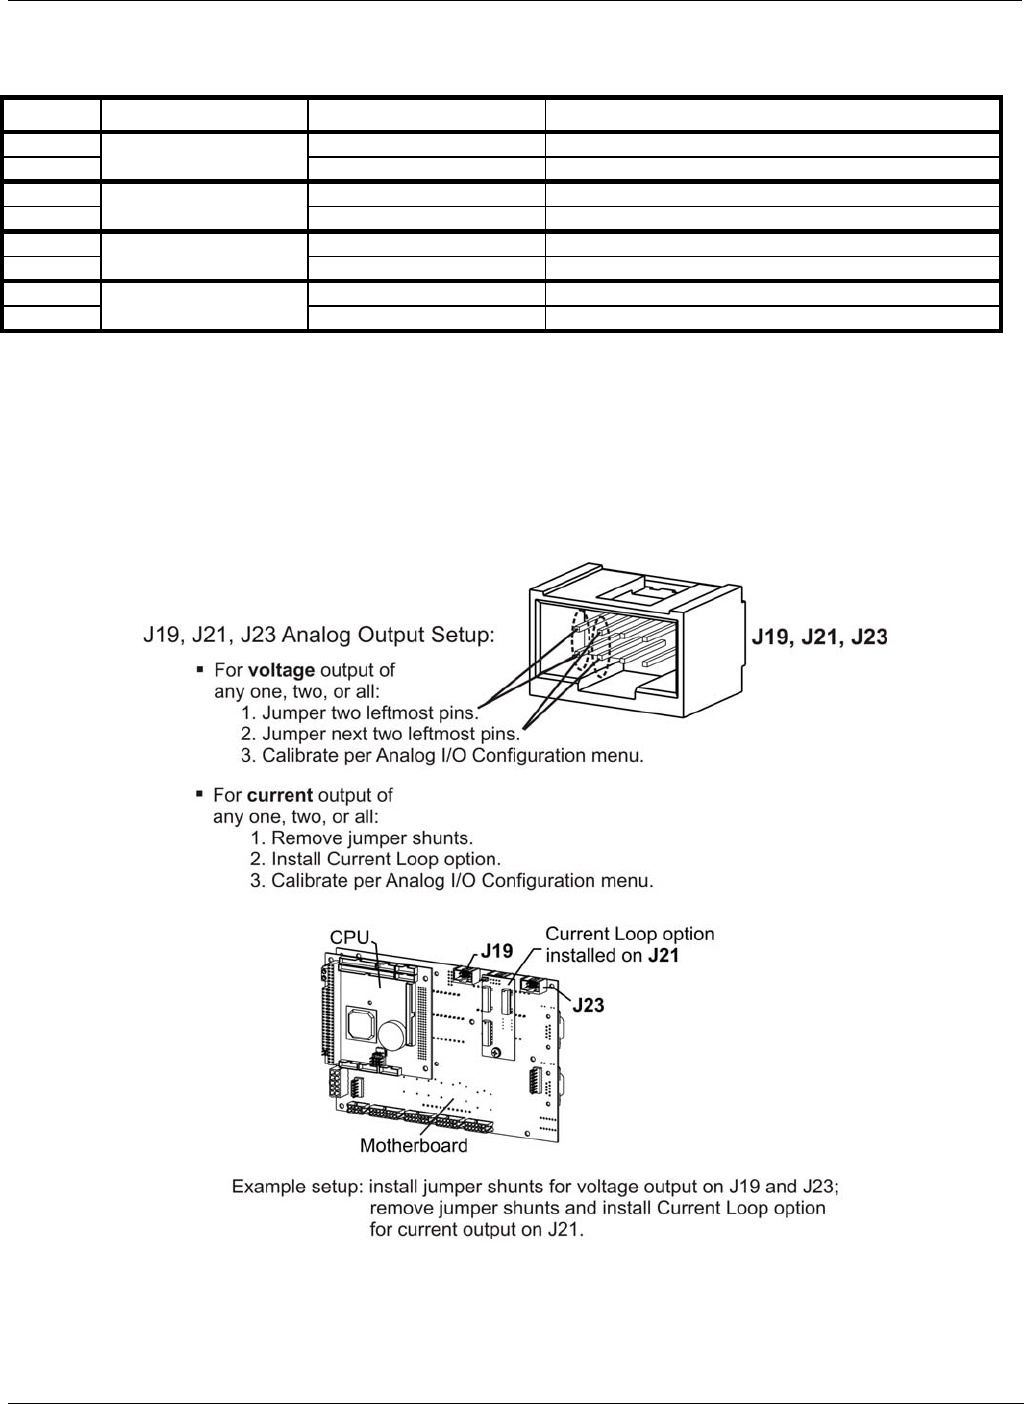
Teledyne API – T101 Operation Manual Getting Started
35
Table 3-4. Analog Output Pin Assignmentss
PIN ANALOG OUTPUT VOLTAGE OUTPUT CURRENT LOOP OPTION
1 V Out I Out +
2 A1 Ground I Out -
3 V Out I Out +
4 A2 Ground I Out -
5 Not Available I Out +
6 A3 Not Available I Out -
7 V Out Not Available
8 A4 Ground Not Available
The default analog output voltage setting of the T101 UV Fluorescence H2S Analyzer is 0
– 5 VDC with a range of 0 – 500 ppb. To change these settings, see Sections 4.6.3 and
4.4.4 respectively.
An optional Current Loop output is available for each output.
3.3.2.1. Current Loop Analog Outputs (Option 41) Setup
Figure 3-8. Current Loop Option Installed on the Motherboard
07266B DCN6485
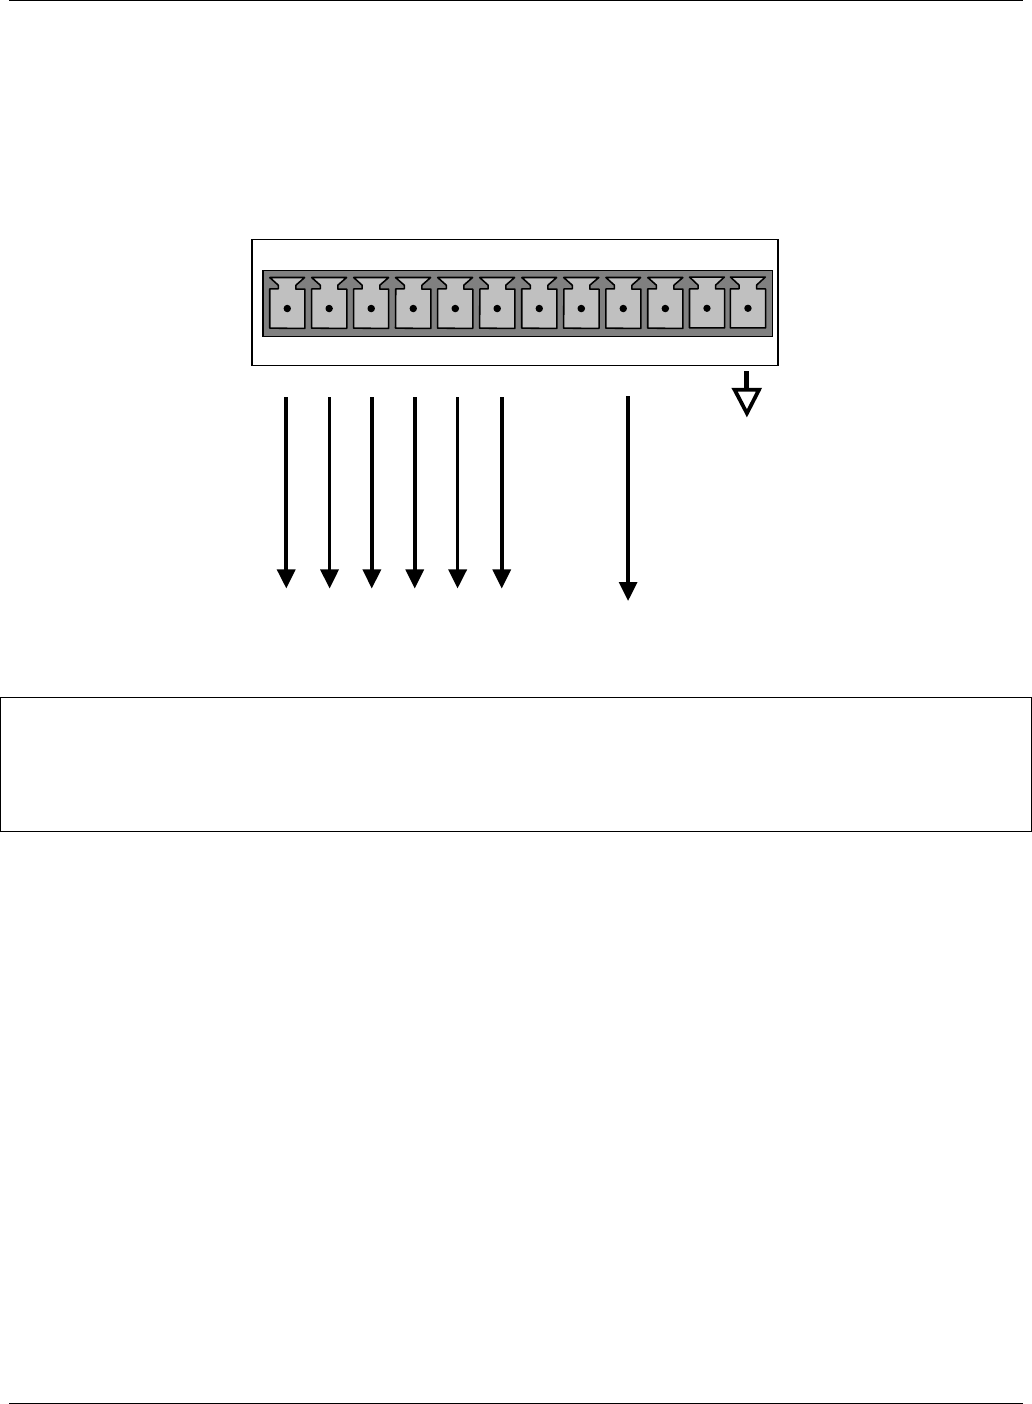
Getting Started Teledyne API – T101 Operation Manual
36
3.3.3. CONNECTING THE STATUS OUTPUTS
The analyzer’s status outputs are accessed through a 12-pin connector on the analyzer’s
rear panel labeled STATUS. They are used to interface with a device that accepts closed-
contact digital inputs, such as programmable logic controllers (PLC’s).
Connect to Internal
Ground of Monitoring
STATUS
1 2 3 4 5 6 7 8 D +
SYSTEM O
K
HIGH RANGE
CONC VALID
ZERO CAL
SPAN CAL
DIAGNOSTIC MODE
Figure 3-9. Status Output Connector
NOTE
Most PLCs have internal provisions for limiting the current the input will draw. When connecting to
a unit that does not have this feature, external resistors must be used to limit the current through
the individual transistor outputs to ≤50mA (120 Ω for 5V supply).
07266B DCN6485
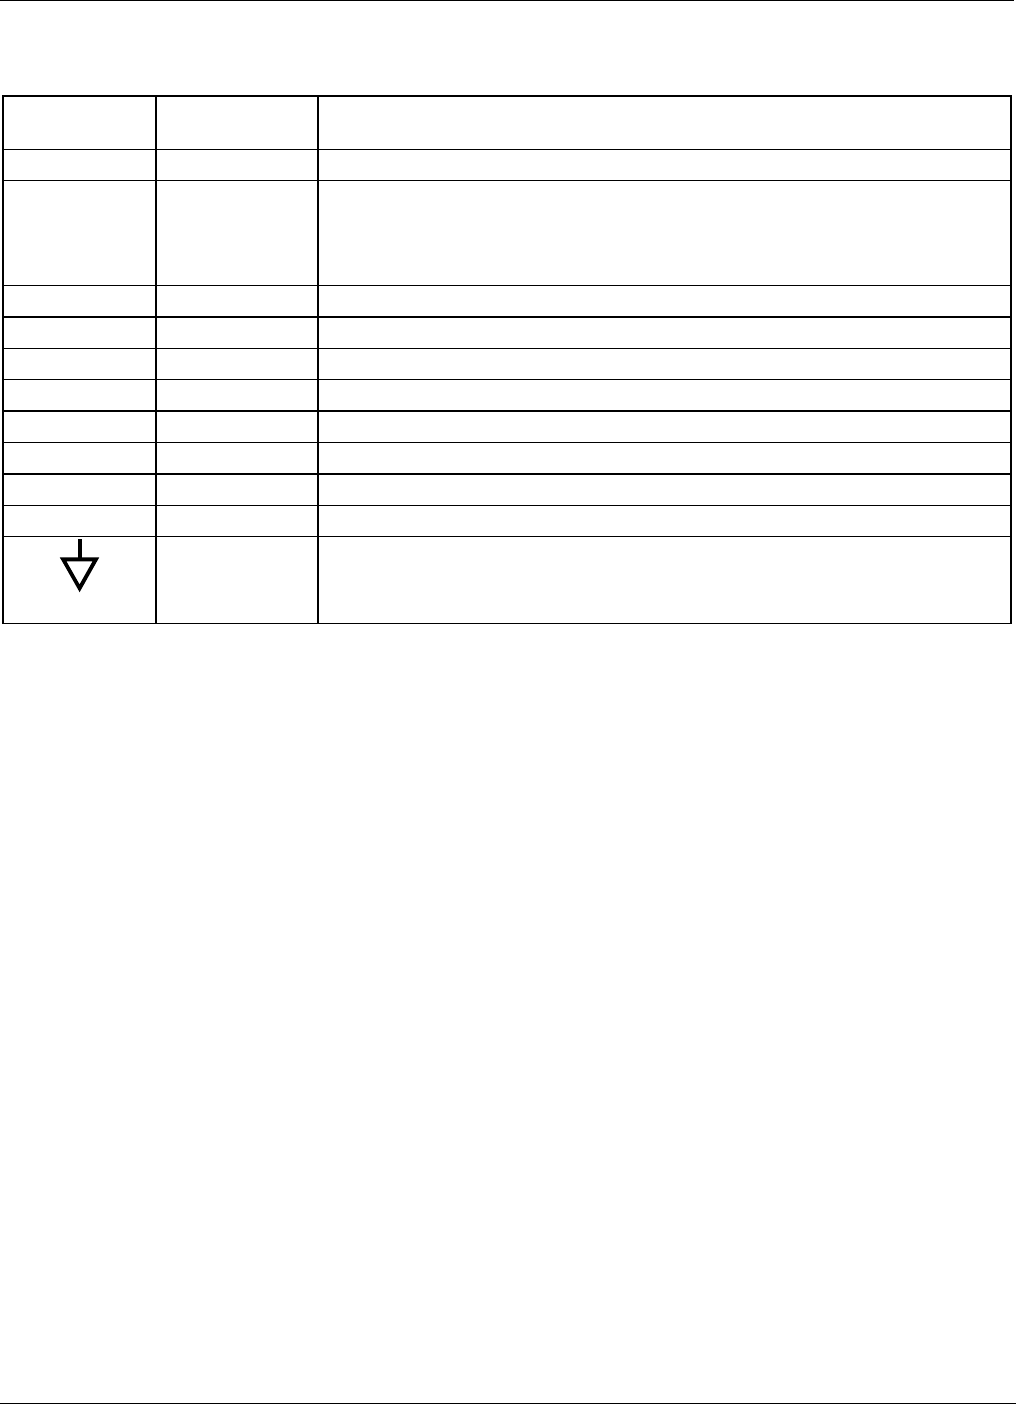
Teledyne API – T101 Operation Manual Getting Started
37
Table 3-5. Status Output Signals
REAR PANEL
LABEL STATUS
DEFINITION CONDITION
1 SYSTEM OK ON if no faults are present.
2 CONC VALID
OFF any time the HOLD OFF feature is active, such as during calibration
or when other faults exist possibly invalidating the current concentration
measurement (example: sample flow rate is outside of acceptable limits).
ON if concentration measurement is valid.
3 HIGH RANGE ON if unit is in high range of the AUTO Range Mode
4 ZERO CAL ON whenever the instrument’s ZERO point is being calibrated.
5 SPAN CAL ON whenever the instrument’s SPAN point is being calibrated.
6 DIAG MODE ON whenever the instrument is in DIAGNOSTIC mode
7 - 8 SPARE
D EMITTER BUS The emitters of the transistors on pins 1-8 are bussed together.
SPARE
+ DC POWER + 5 VDC, 300 mA source (combined rating with Control Output, if used).
Digital
Ground The ground level from the analyzer’s internal DC power supplies
3.3.4. CONNECTING THE CONTROL INPUTS
If you wish to use the analyzer to remotely activate the zero and span calibration modes,
several digital control inputs are provided through a 10-pin connector labeled CONTROL
IN on the analyzer’s rear panel.
There are two methods for energizing the control inputs. The internal +5V available from
the pin labeled “+” is the most convenient method. However, if full isolation is required,
an external 5 VDC power supply should be used.
07266B DCN6485
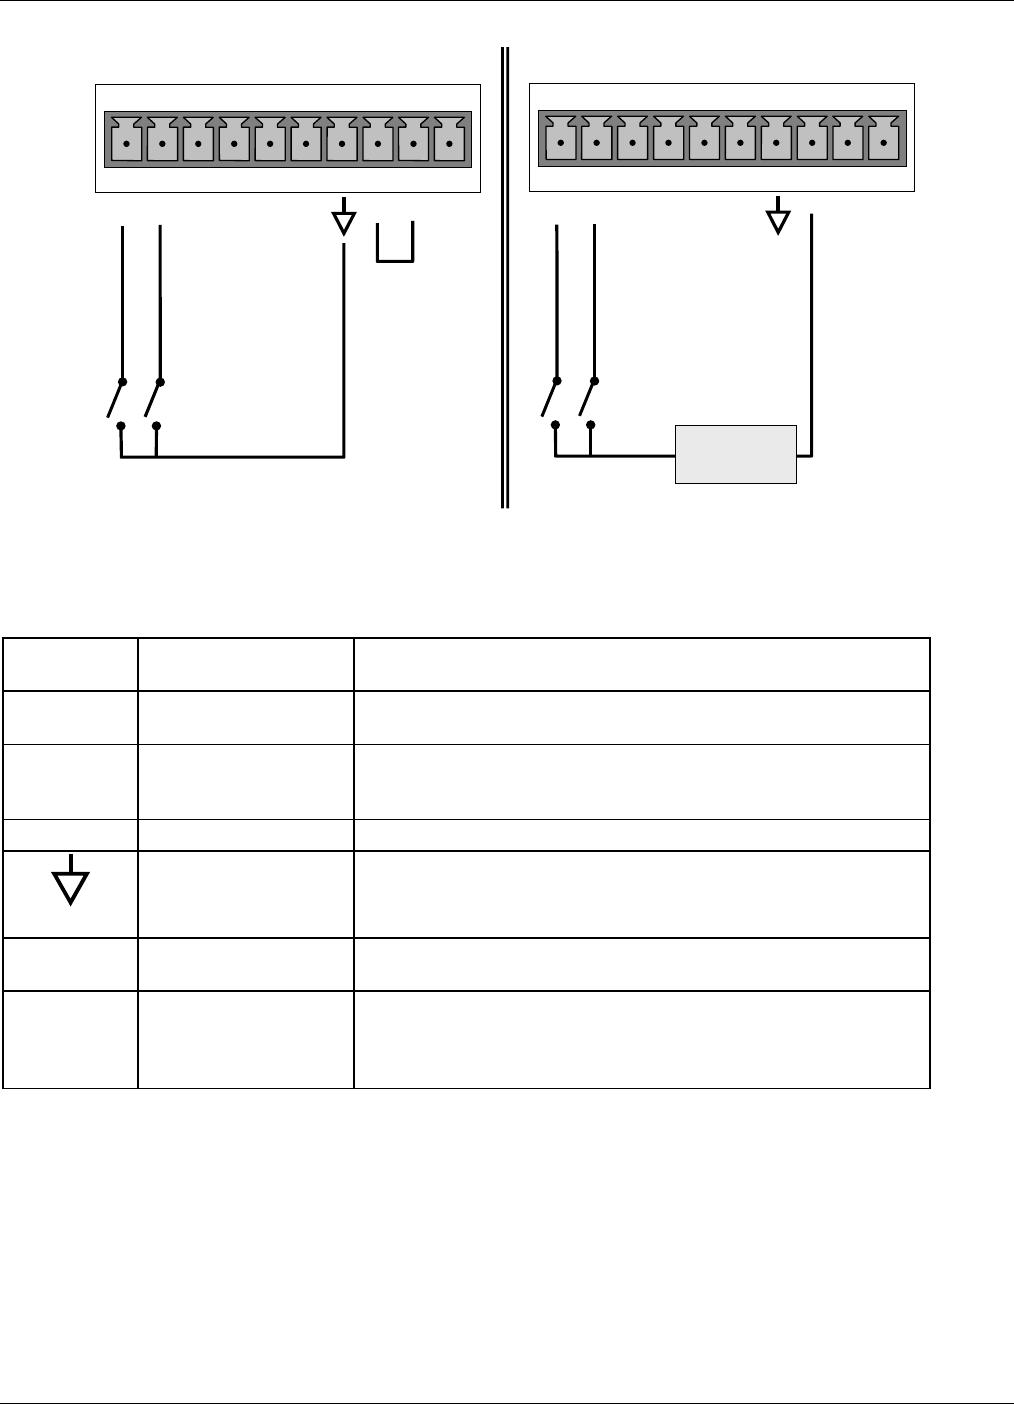
Getting Started Teledyne API – T101 Operation Manual
38
SPAN CAL
ZERO CAL
SPAN CAL
ZERO CAL
CONTROL IN
A B C D E F U +
CONTROL IN
A B C D E F U +
-
+
Local Power Connections
External Power Connections
5 VDC Power
Supply
Figure 3-10. Control Input Connector
Table 3-6. Control Input Signals
INPUT # STATUS
DEFINITION ON CONDITION
A REMOTE ZERO CAL The analyzer is placed in Zero Calibration mode. The mode
field of the display will read ZERO CAL R.
B REMOTE
LO SPAN CAL
The analyzer is placed in low span calibration mode as part
of performing a low span (midpoint) calibration. The mode
field of the display will read LO CAL R.
C, D, E & F SPARE
Digital Ground The ground level from the analyzer’s internal DC power
supplies (same as chassis ground)
U External Power
input Input pin for +5 VDC required to activate pins A – F.
+
5 VDC output
Internally generated 5V DC power. To activate inputs A – F,
place a jumper between this pin and the “U” pin. The
maximum amperage through this port is 300 mA (combined
with the analog output supply, if used).
07266B DCN6485
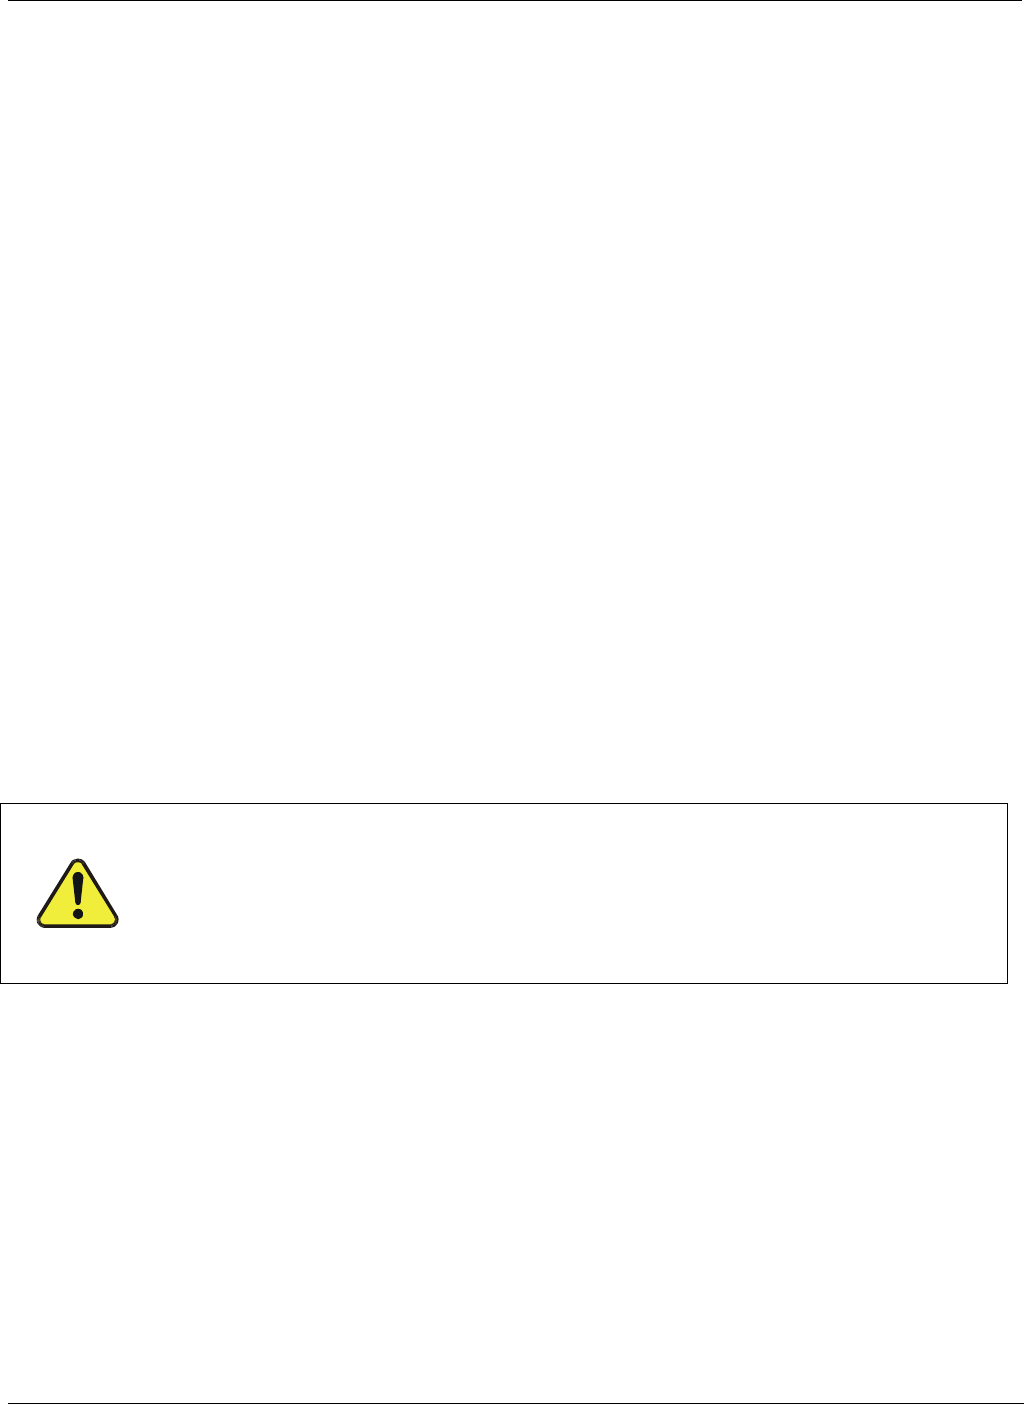
Teledyne API – T101 Operation Manual Getting Started
39
3.3.5. CONNECTING THE COMMUNICATIONS PORTS
3.3.5.1. Connecting the Serial Ports
To utilize either of the analyzer’s two serial interfaces, refer to Sections 4.7 and 5 of this
manual for instructions on configuration and usage. For RS-485 communication, contact
the factory.
3.3.5.2. Connecting to a LAN or the Internet
For network or Internet communication with the analyzer, connect an Ethernet cable from
the analyzer’s rear panel Ethernet interface connector to an Ethernet port. (DHCP setup is
the default, Section 4.7.6.1; manual setup for static IP address is recommended: see
Section 4.7.6.2).
3.3.5.3. Connecting to a Personal Computer (USB Option)
For direct communication between the analyzer and a personal computer (PC), connect a
USB cable between the analyzer and desktop or laptop USB ports. (If this option is
installed, the COM2 port can only be used for RS232 multidrop communication). See
Section 4.7.7 for setup instructions.
3.3.5.4. Connecting to a Multidrop Network (Option)
If your unit has the Teledyne API RS-232 Multidrop Option card installed, see Section
4.7.8 for setup instructions.
3.4. PNEUMATIC CONNECTIONS
CAUTION!
Do not operate this instrument until you’ve removed dust plugs from SAMPLE and
EXHAUST ports on the rear panel. (Plugs were inserted into the rear panel pneumatic
fittings to prevent dust from getting into the analyzer. It is recommended that these
dust plugs be stored for future use such as shipping or storage.
Sample and calibration gases should only come into contact with PTFE (Teflon) or glass
materials. They should not come in contact with FEP or stainless steel materials.
Figure 3-11 and Figure 3-12 show the most common configurations for gas supply and
exhaust lines to the Model T101 Analyzer. Figure 3-14 shows the connections for units
with valve options installed.
Please refer to Figure 3-4 for pneumatic connections at the rear panel and Table 3-2 for
their descriptions.
07266B DCN6485
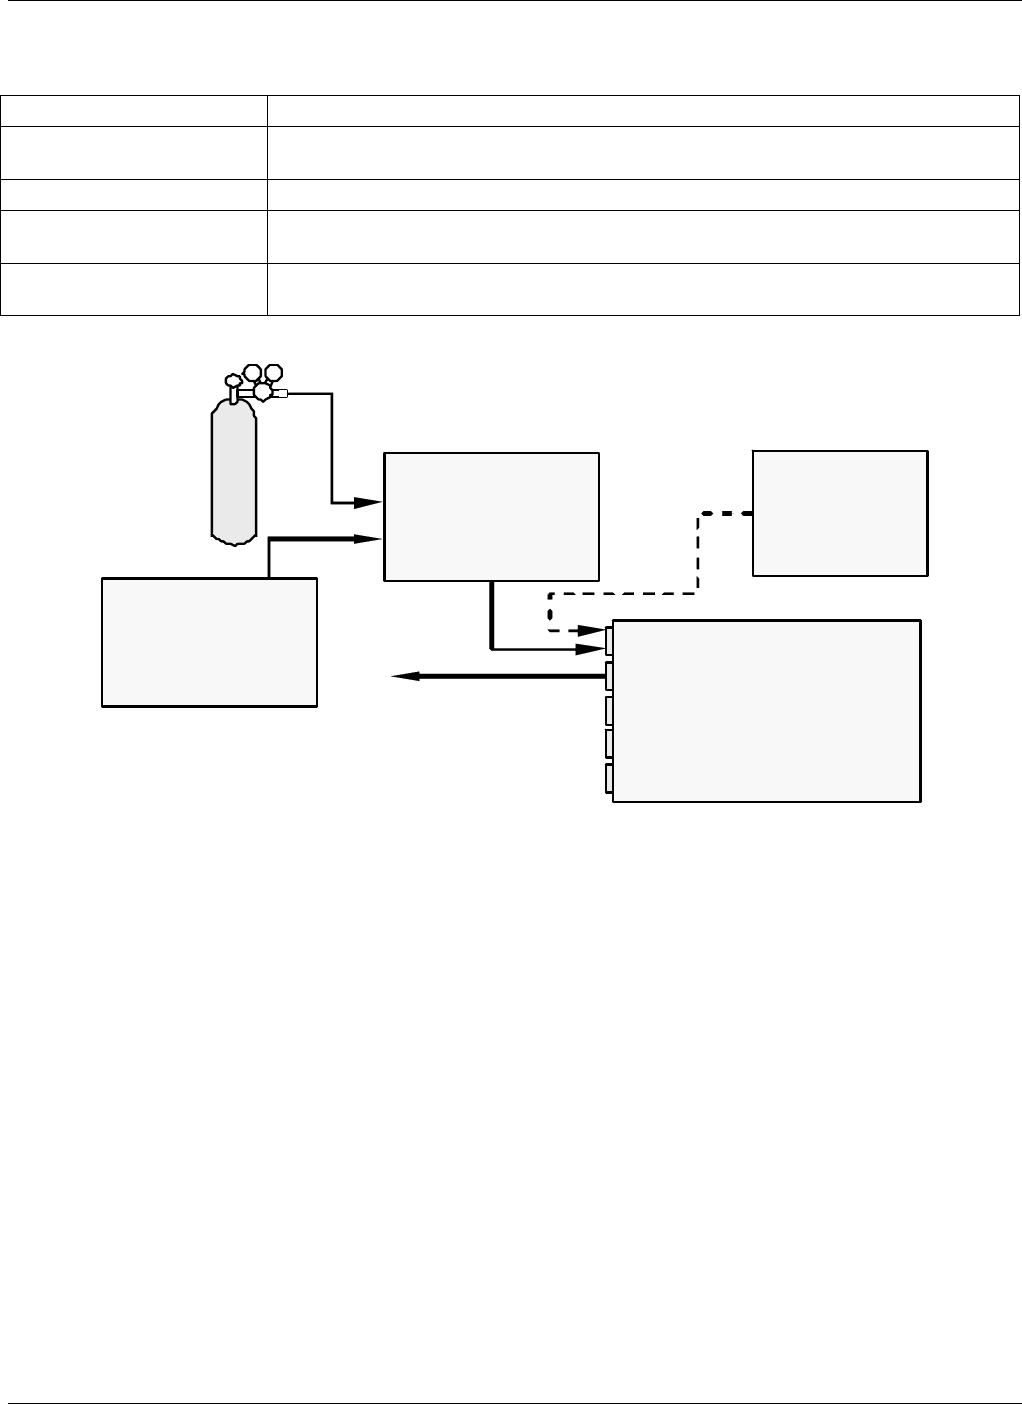
Getting Started Teledyne API – T101 Operation Manual
40
Table 3-7. Inlet / Outlet Connector Descriptions
REAR PANEL LABEL FUNCTION
SAMPLE Connects the sample gas to the analyzer. When operating the analyzer without
zero span option, this is also the inlet for any calibration gases.
EXHAUST Connects the exhaust of the analyzer with the external vacuum pump.
SPAN On units with zero/span/shutoff valve options installed, connect a gas line to
the source of calibrated span gas here.
ZERO AIR On Units with zero/span valve or IZS option installed, this port connects the
zero air gas or the zero air cartridge to the analyzer.
Chassis
Sa mple
Zero Air
Exhaust
Span
MODEL 701
Zero Air
Generator
Calibrated
H2S GAS
(A t hi gh
concentration)
Source of
SAMPLE Gas
Removed
during
Cal ibration
MODEL T700 Gas
Dilution
Calibrator
Figure 3-11. Pneumatic Connections, Basic Configuration Using Gas Dilution Calibrator
07266B DCN6485
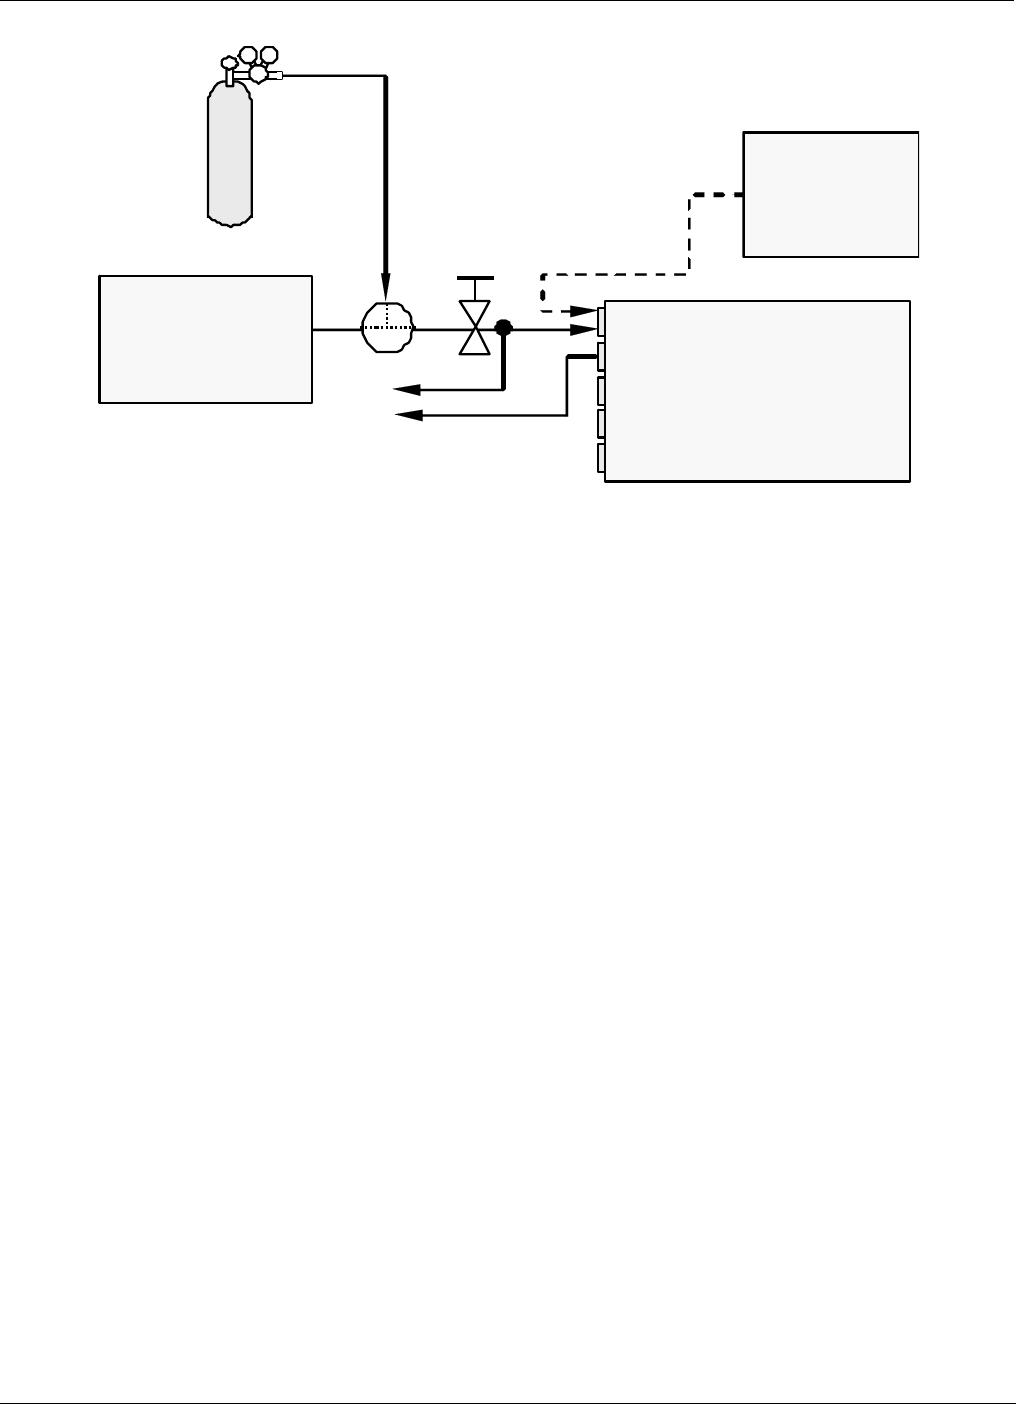
Teledyne API – T101 Operation Manual Getting Started
41
Valve
Needle valve to
control flow
Chassis
Sample
Zero Air
Ex haust
Span
MODEL 701
Zero Air
Generator
VENT
Calibrated
SO2 or H2S
GAS
(At span gas
concentration)
Source o
f
SAMPLE Gas
Removed
during
calibration
Figure 3-12. Pneumatic Connections, Basic Configuration Using Bottled Span Gas
07266B DCN6485
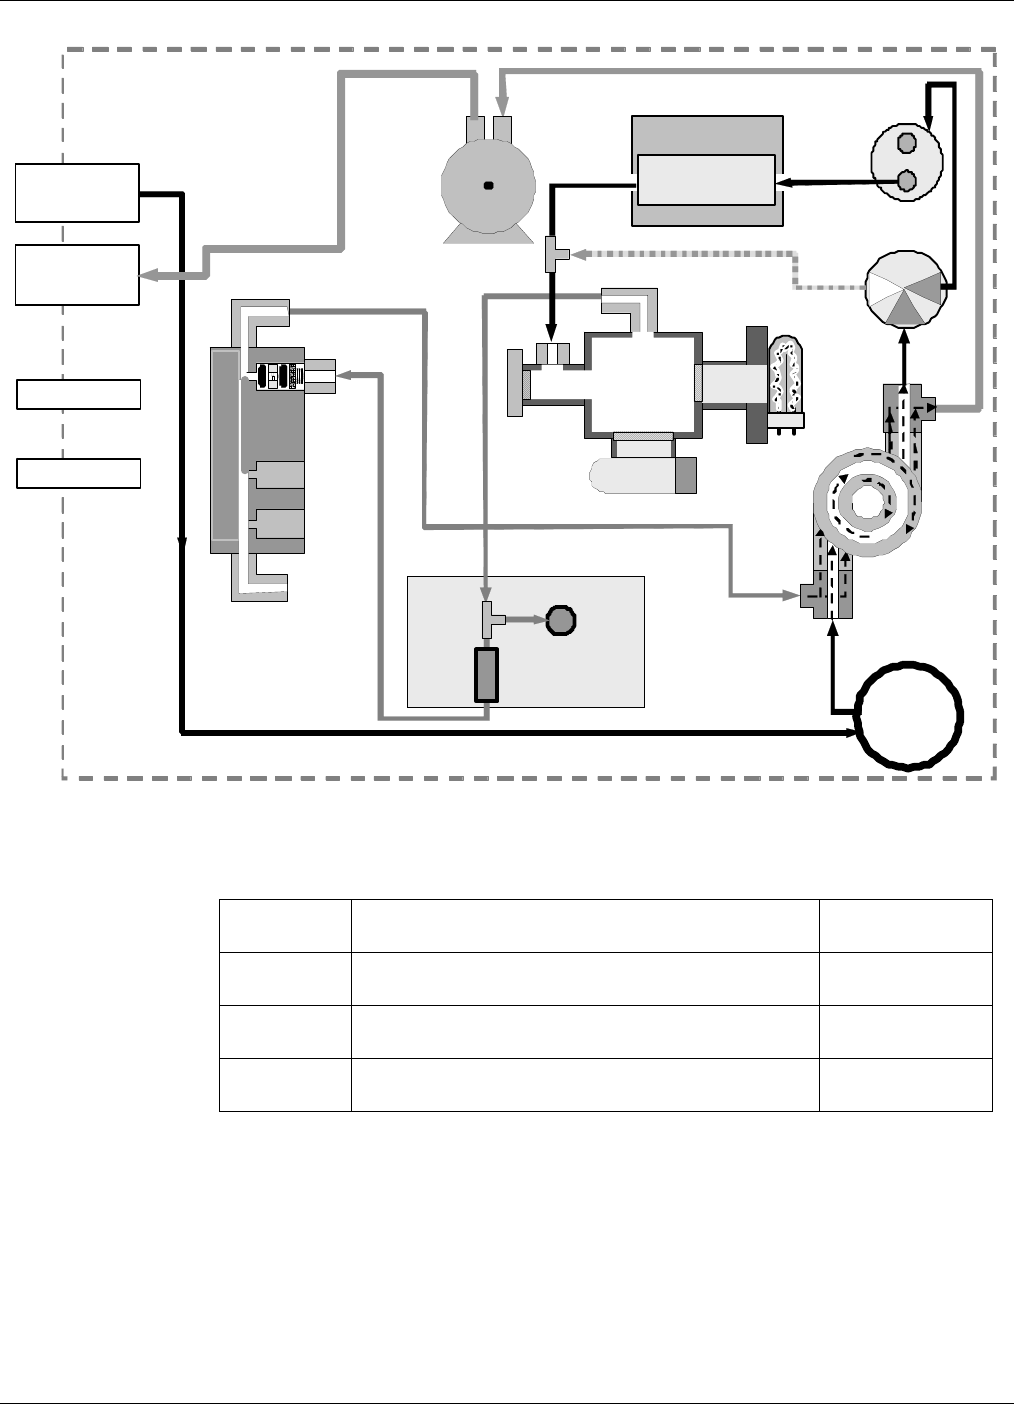
Getting Started Teledyne API – T101 Operation Manual
42
PMT
EXHA UST THROUGH OUTER
LAYER O F KICK ER
REACTION CELL PURGE
FL O W
SENSOR FLOW / PRESSURE
SENSOR PCA SAMPLE
FILTER
INSTRUMENT CHASSIS
EXH AUST GAS
OUTLET
VACUUM MANIFOLD
SAMPLE GAS
INLET
KICKER EX HAUST TO PU MP
PUMP
FL O W
CO NTR O L
AS SY
SAMPLE
PRESSURE
SENSOR
UV
LAM P
HYDROC ARB ON
SC RUB BER
(KICKE R)
SPAN GAS INLET
ZERO AIR INLET
SAMPLE
CHAMBER
COM
NC NO
SO2
Scrubber
MOLYBDENUM
CONVERTER
SO2 H2S
H2S / S O2
MODE VALVE
G as Fl ow wh en m ulti gas versi on of
Analyzer is measuring SO
2.
Figure 3-13. Pneumatic Diagram of the T101 Standard Configuration
Table 3-8. H2S – SO2 Switching Valve Operating States
GAS
MODE CONDITION OF H2S –SO2 SWITCHING
VALVE VALVE PORT
CONNECTION
H2S Open to SO2 Scrubber and Molybdenum
Converter COM NO
SO2 Open to directly to Sample Chamber. Bypasses
SO2 Scrubber and Molybdenum Converter COM NC
H2S –SO2 Switches between above two states every 10
minutes. - -
1. Attach the 1/4" exhaust line to the EXHAUST port of the analyzer and to
the inlet port of the pump.
07266B DCN6485

Teledyne API – T101 Operation Manual Getting Started
43
CAUTION
The exhaust from the external pump needs to be vented outside the immediate area or
shelter surrounding the instrument and conform to all safety requirements using a
maximum of 10 meters of 1/4” PTFE tubing.
2. Attach the sample line to the SAMPLE inlet port. Ideally, the pressure of
the sample gas should be equal to ambient atmospheric pressure.
NOTE
Maximum pressure of any gas at the sample inlet should not exceed 0.5 in-Hg above ambient pressure
and ideally should equal ambient atmospheric pressure.
In applications where the sample gas is received from a pressurized manifold, a vent must be provided to
equalize the sample gas with ambient atmospheric pressure before it enters the analyzer. The vented gas
needs to be routed outside the immediate area or shelter surrounding the instrument.
3. Attach zero air and span gas supply lines as appropriate (see Figures 3-6
& 3.7). For this type of analyzer, zero air and span gas are defined as
follows:
Zero air and span gas inlets should supply their respective gases in excess
of the 700 cc3/min demand of the analyzer. Supply and vent lines should
be of sufficient length and diameter to prevent back diffusion and pressure
effects.
SPAN GAS
Span gas is specifically mixed to match the chemical composition of the type of gas being
measured at near full scale of the desired measurement range. In the case of H2S,
measurements made with the Model T101 UV Fluorescence H2S Analyzer it is
recommended that you use a span gas with a H2S concentration equal to 90% of the
measurement range for your application.
EXAMPLE: If the application is to measure between 0 ppb and 500 ppb, an appropriate
span gas concentration would be 450 ppb H2S in air.
Cylinders of calibrated H2S gas traceable to NIST-Standard Reference Material
specifications (also referred to as SRM’s or EPA protocol calibration gases) are
commercially available. Table 3-5 lists specific NIST-SRM reference numbers for various
concentrations of H2S.
Some applications, such as EPA monitoring, require a multipoint calibration procedure
where span gases of different concentrations are needed. We recommend using a bottle of
calibrated H2S gas of higher concentration in conjunction with a gas dilution calibrator such
as a Teledyne API Model T700. This type of calibrator precisely mixes a high
concentration gas from zero air (both supplied externally) to accurately produce span gas
of the correct concentration. Linearity profiles can be automated with this model and run
unattended over night.
07266B DCN6485

Getting Started Teledyne API – T101 Operation Manual
44
Table 3-9. NIST-SRM's Available for Traceability of H2S & SO2 Calibration Gases
NIST-SRM4 TYPE NOMINAL
CONCENTRATION
2730
2731
Hydrogen sulfide in N2
Hydrogen sulfide in N2
5000 ppb
20 ppm
1693a
1694a
1661a
Sulfur dioxide in N2
Sulfur dioxide in N2
Sulfur dioxide in N2
50 ppm
100 ppm
500 ppm
ZERO AIR
Zero air is similar in chemical composition to the earth’s atmosphere but without the gas
being measured by the analyzer, in this case H2S. If your analyzer is equipped with an
IZS or external zero air scrubber option, it is capable of creating zero air.
For analyzers without these options, a zero air generator such as the Teledyne API Model
701 can be used.
Once the appropriate pneumatic connections have been made, check all pneumatic fittings
for leaks using a procedure similar to that defined in Section 9.5.1.
07266B DCN6485
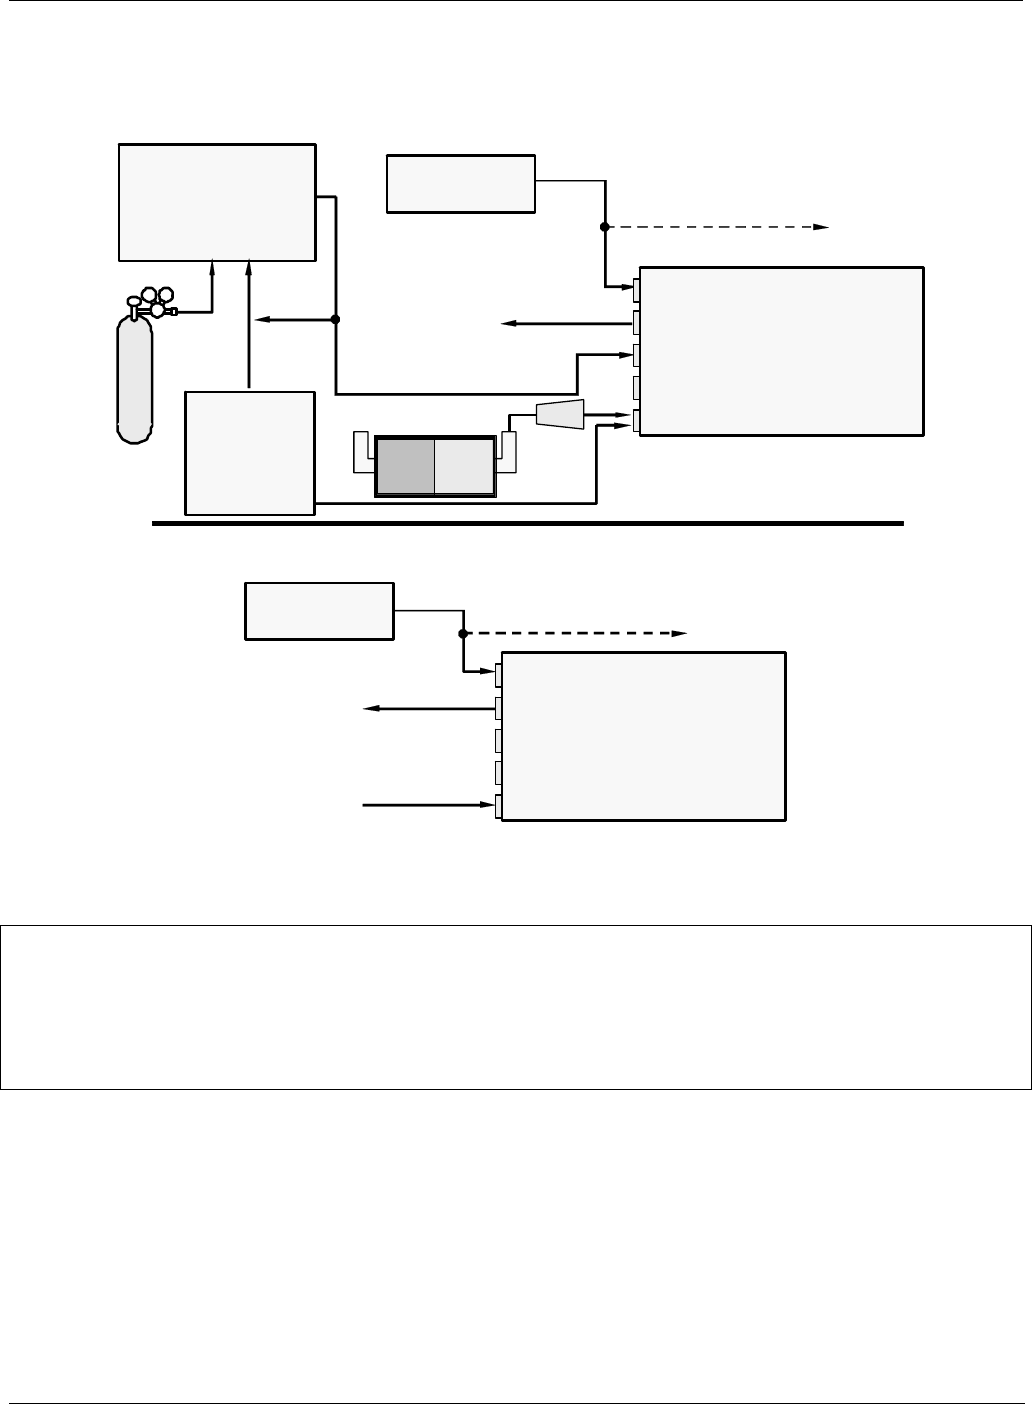
Teledyne API – T101 Operation Manual Getting Started
45
3.4.1.1. Connections with Internal Valve Options Installed
This section covers pneumatic connections for the optional valves, Z/S and IZS.
External Zero
Air Scrubber
Filter
MODEL 701
Zero Air
Generator
Source of
SAMPLE Gas VENT if input is pressurized
Zero
/
S
p
an Valves – O
p
tion 50
MODEL T700
Gas Dilution Calibrator
VENT
Chassis
Sam
p
l
e
Zero Ai
r
Exhaust
Span
Source of
SAMPLE Gas VENT if input is pressurized
Internal Zero/Span Option (IZS) – Option 51
Chassis
Sam
p
le
Zero Air
Exhaust
S
p
an
Calibrated
SO2 or H2S
gas
(At high
con cen tr ati on)
Ambient
Air
Figure 3-14. Basic Pneumatic Connections for Units with Valve Options
CAUTION
Gas flow must be maintained at all times for units with IZS Options installed. The IZS option includes a
permeation tube which emits H2S. Insufficient gas flow can build up H2S to levels that will damage the
instrument.
Remove the permeation device when taking the analyzer out of operation.
07266B DCN6485
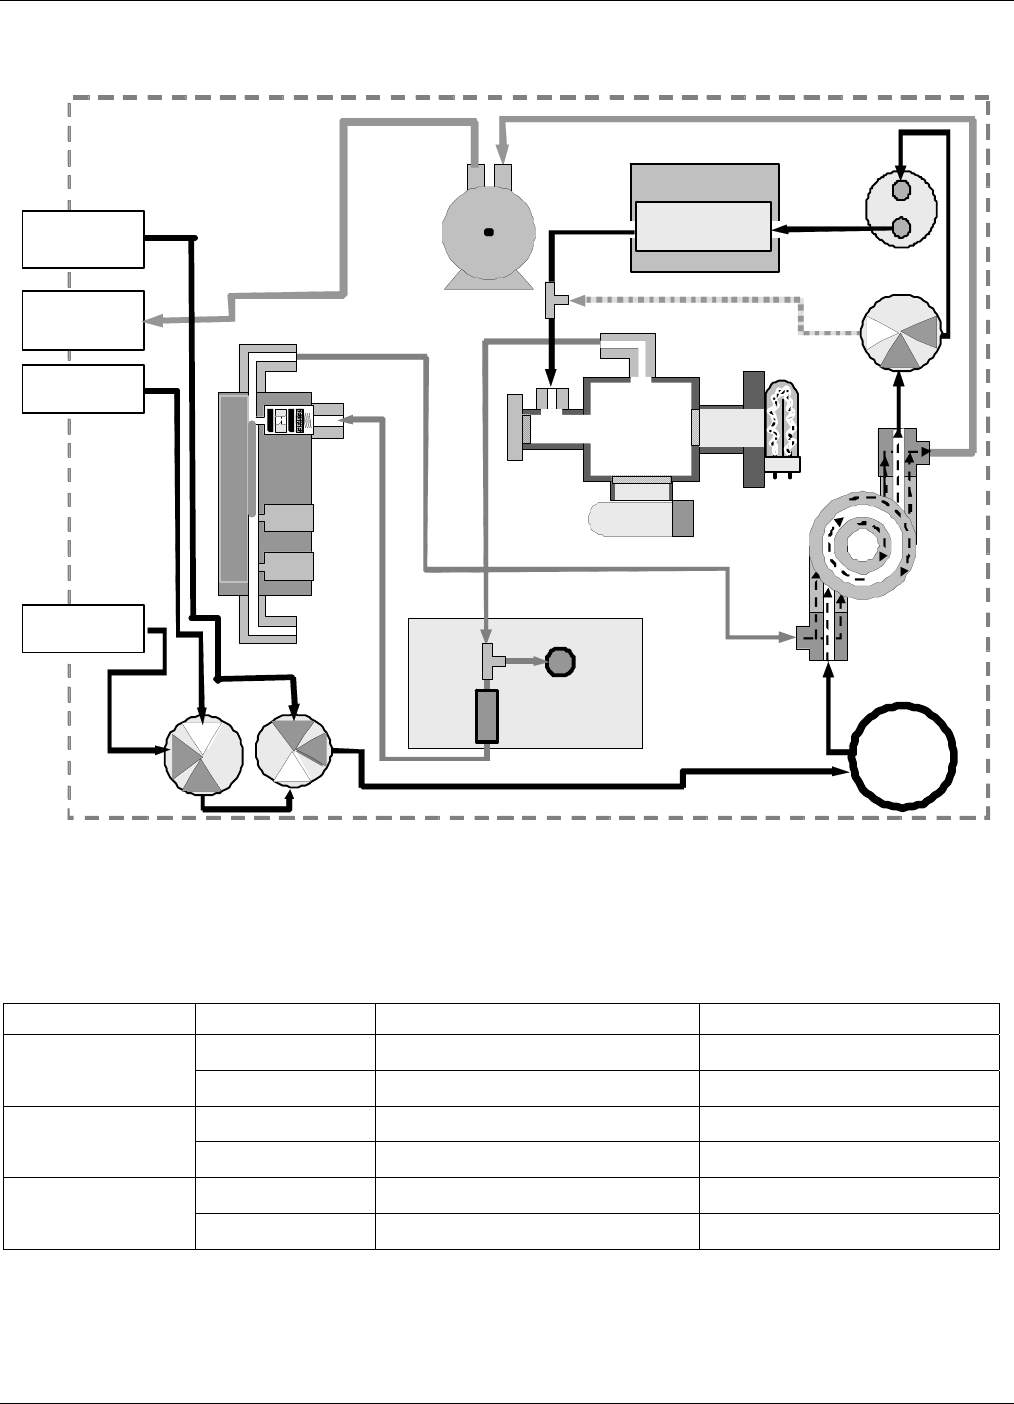
Getting Started Teledyne API – T101 Operation Manual
46
ZERO/SPAN (Z/S) VALVE GAS FLOW
PMT
EXHAUST TO OUTER
LAYER OF KICKER
REACTION CELL PURGE
FL O W
SENSOR FLOW / PRESSURE
SENSOR PCA SAMPLE
FILTER
INSTRUMENT CHASSIS
EXH AUST GAS
OUTLET
VACUUM MANIFOLD
KICKER EXHAUST TO PUMP
PUMP
FL OW
CO NTR O L
AS SY
SAMPLE
PRESSURE
SENSOR
UV
LAM P
HYDROCARBON
SC RUB BER
(KICKE R)
SAMPLE
CHAMBER
SO2
Scrubber
MOLYBDENUM
CONVERTER
SO2 H2S
H2S / S O2
MODE VALVE
ZERO AIR
INLET
SPAN GAS
INLET
SAMPLE/ CAL
VALV E
NO
COM
NC
SAMPLE GAS
INLET
Gas Fl ow when m ult i gas versi on of
Analyzer is measuring SO
2.
COM
NC NO
ZERO/SPAN
VALVE
NC
NO
COM
Figure 3-15. Pneumatic Diagram of the T101 With Z/S Option Installed
The following table describes the state of each valve during the analyzer’s various
operational modes.
Table 3-10. Zero/Span Valve Operating States
MODE VALVE CONDITION VALVE PORT CONNECTION
Sample/Cal Open to SAMPLE inlet NO COM
SAMPLE Zero/Span Open to ZERO AIR inlet NO COM
Sample/Cal Open to zero/span inlet NC COM
ZERO CAL Zero/Span Open to ZERO AIR inlet NO COM
Sample/Cal Open to zero/span inlet NC COM
SPAN CAL Zero/Span Open to SPAN GAS inlet NC COM
07266B DCN6485

Teledyne API – T101 Operation Manual Getting Started
47
The state of the zero/span valves can also be controlled:
Manually from the analyzer’s front panel by using the SIGNAL I/O
controls located under the DIAG Menu (Section 4.6.1),
By activating the instrument’s AutoCal feature (Section 4.4.2),
Remotely by using the external digital control inputs (Section 5.1.1.2 and
Section 6.7.1), or
Remotely through the RS-232/485 serial I/O ports (see Appendix A for the
appropriate commands).
Sources of zero and span gas flow must be capable of supplying at least 600 cm3/min.
Both supply lines should be vented outside of the analyzer’s enclosure. In order to prevent
back-diffusion and pressure effects, these vent lines should be between 2 and 10 meters in
length.
INTERNAL ZERO/SPAN (IZS) VALVE GAS FLOW
The T101 can be equipped with an internal zero air and span gas generator (IZS). This
option includes a heated enclosure for a permeation tube for containing the calibration gas
under high pressure (not included; H2S perm tubes can be ordered from Teledyne API;
SO2 perm tubes must be ordered from a manufacturer), an external scrubber for producing
zero air and a set of valves for switching between the sample gas inlet and the output of
the zero/span subsystem, functionally very similar to the valves included in the zero/span
valve option.
Sources of zero and span gas flow must be capable of supplying at least 600 cm3/min.
Both supply lines should be vented outside of the analyzer’s enclosure. In order to prevent
back-diffusion and pressure effects, these vent lines should be between 2 and 10 meters in
length.
NOTE
The instrument can only be fitted with one type of permeation tube at a time. Therefore the IZS option can
only be used to calibrate or check the instrument for one gas, H2S or SO2, but not both.
External Zero Air Scrubber
The IZS option includes an external zero air scrubber assembly that removes all H2S the
zero air source. The scrubber is filled with activated charcoal.
The Permeation Source
Span gas is created when zero air passes over a permeation tube containing liquid H2S
under high pressure, which slowly permeates through a PTFE membrane into the
surrounding air. The speed at which the H2S permeates the membrane is called the
effusion rate. The concentration of the span gas is determined by three factors: membrane
size, sample gas temperature, and zero air flow rate
Size of the membrane: The larger the area of the membrane, the more permeation
occurs.
07266B DCN6485

Getting Started Teledyne API – T101 Operation Manual
48
Temperature of the H2S: Increasing the temperature of the increases the pressure inside
the tube and therefore increases the effusion rate.
Flow rate of the zero air: If the previous two variables are constant, the permeation rate
of the calibration gas into the zero air stream will be constant. Therefore, a lower flow
rate of zero air produces higher concentrations of H2S. The T101 usually has a constant
flow rate and a constant permeation rate; hence, variations in concentration can be
achieved by changing the IZS temperature.
NOTE
The permeation tube is not included in the IZS Option and must be ordered separately.
Permeation Tube Heater
In order to keep the permeation rate constant, the IZS enclosure is heated to a constant
50° C (10° above the maximum operating temperature of the instrument). The IZS heater
is controlled by a precise PID (Proportional/Integral/Derivative) temperature control loop.
A thermistor measures the actual temperature and reports it to the CPU for control
feedback.
07266B DCN6485
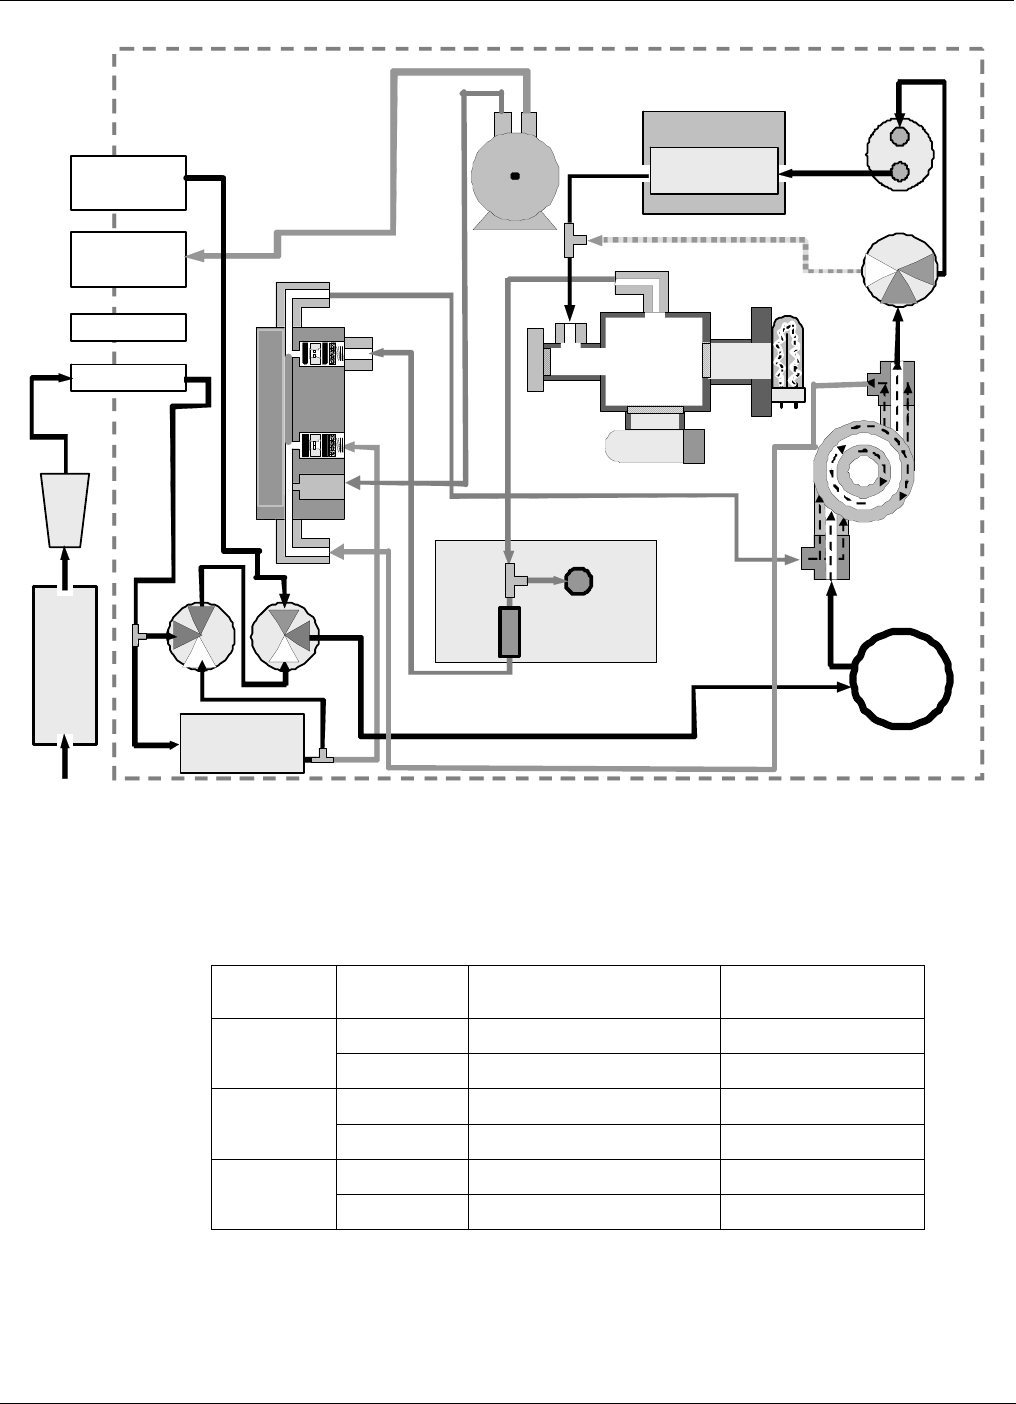
Teledyne API – T101 Operation Manual Getting Started
49
PMT
EXHAUST TO OUTER
LAYER OF KICKER
REA CTION
CELL PUR GE
FLOW
SENSO
R
FLOW / PRESSURE
SENSOR PCA
INSTRUMENT CHASSIS
EXHAUST GAS
OUTLET
VACUUM MANIFOLD
KICKER EXH AUST TO PU MP
PUMP
FLOW
CONTROL
ASSY
SAMPLE
PRESSURE
SENS OR
UV
LAMP
HYDROCARBON
SCRUBB ER
(KICKER)
SAMPLE
CHAMBER
SO2
Scrubber
MOLYBDENUM
CONVERTER
SO2
H2S
H2S / SO2
MODE VALVE
SPAN GAS INLET
ZERO AIR INLET
ZERO/SPAN
V ALVE C OM
NO
NC
SAMP LE/CAL
VALVE
NO
COM
NO
IZS
Pe r m ea ti o n Tube
H2S Sour ce
ZERO AIR
SCRUBBER FILTER
SAMPLE GAS
INLET
SAMPLE
FILTER
Ga s Fl ow wh en mu lt ig as v ersio n of
Anal yzer is me asuri ng SO2.
IZS PERMEATION TUBE EXIT
12 MIL ORIFICE
5 MIL ORI F IC E
COM
NC NO
Figure 3-16. Pneumatic Diagram of the T101 with IZS Options Installed
The following table describes the state of each valve during the analyzer’s various
operational modes.
Table 3-11. IZS Valve Operating States
MODE VALVE CONDITION VALVE PORT
CONNECTIONS
Sample/Cal Open to SAMPLE inlet NO COM
SAMPLE Zero/Span Open to ZERO AIR inlet NO COM
Sample/Cal Open to zero/span valve NC COM
ZERO CAL Zero/Span Open to ZERO AIR inlet NO COM
Sample/Cal Open to zero/span valve NC COM
SPAN CAL Zero/Span Open to SPAN GAS inlet NC COM
07266B DCN6485

Getting Started Teledyne API – T101 Operation Manual
50
The state of the IZS valves can also be controlled:
Manually from the analyzer’s front panel by using the SIGNAL I/O
controls located under the DIAG Menu (Section 4.6.1),
By activating the instrument’s AutoCal feature (Section 6.9),
Remotely by using the external digital control inputs (Section 5.1.1.2 and
Section 6.7.1), or
Remotely through the RS-232/485 serial I/O ports (see Appendix A-6 for
the appropriate commands).
3.5. STARTUP, FUNCTIONAL CHECKS, AND INITIAL
CALIBRATION
If you are unfamiliar with the T101 theory of operation, we recommend that you read
Section 10 before proceeding.
For information on navigating the analyzer’s software menus, see the menu trees
described in Appendix A.1.
3.5.1. STARTUP
After the electrical and pneumatic connections are made, an initial functional check is in
order. Turn on the instrument. The pump and exhaust fan should start immediately. The
front panel display screen will briefly show a logo splash screen at the start of
initialization.
The analyzer should automatically switch to Sample Mode after completing the boot-up
sequence and start monitoring H2S gas. However, there is an approximately one hour
warm-up period before reliable gas measurements can be taken. During the warm-up
period, the front panel display may show messages in the Parameters field.
3.5.2. WARM-UP
Allow a 60-minute warm-up period before collecting sample data.
3.5.3. WARNING MESSAGES
Because internal temperatures and other conditions may be outside of specified limits
during the analyzer’s warm-up period, the software will suppress most warning
conditions for 60 minutes after power up.
If warning messages persist after 60 minutes, investigate their cause using the
troubleshooting guidelines in Section 9. The following table includes a brief description
of the various warning messages that may appear.
07266B DCN6485
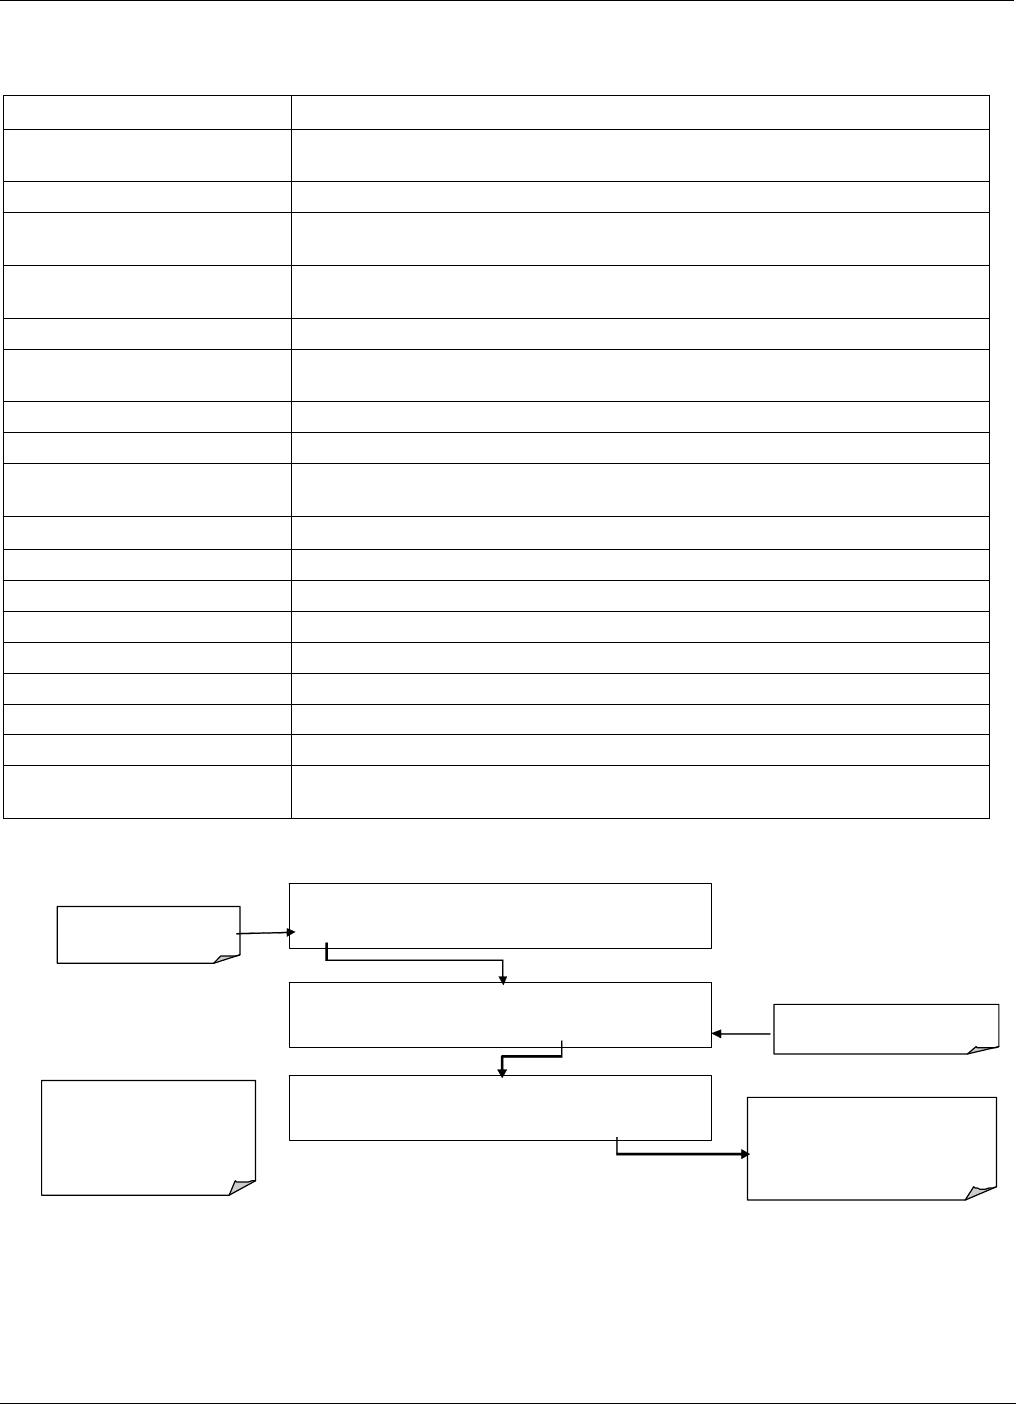
Teledyne API – T101 Operation Manual Getting Started
51
Table 3-12. Possible Warning Messages at Start-Up
WARNING MESSAGE MEANING
ANALOG CAL WARNING The instrument’s A/D circuitry or one of its analog outputs is not
calibrated.
BOX TEMP WARNING The temperature inside the T101 chassis is outside the specified limits.
CANNOT DYN SPAN Remote span calibration failed while the dynamic span feature was set to
active
CANNOT DYN ZERO Remote zero calibration failed while the dynamic zero feature was set to
active
CONFIG INITIALIZED Configuration was reset to factory defaults or was erased.
SHUTTER WARNING Dark offset above limit specified indicating that too much stray light is
present in the sample chamber.
DATA INITIALIZED DAS data storage was erased.
HVPS WARNING High voltage power supply for the PMT is outside of specified limits.
IZS TEMP WARNING On units with IZS options installed: The permeation tube temperature is
outside of specified limits.
PMT DET WARNING PMT detector output outside of operational limits.
PMT TEMP WARNING PMT temperature is outside of specified limits.
RCELL TEMP WARNING Sample chamber temperature is outside of specified limits.
REAR BOARD NOT DET The CPU is unable to communicate with the motherboard.
RELAY BOARD WARN The firmware is unable to communicate with the relay board.
SAMPLE FLOW WARN The flow rate of the sample gas is outside the specified limits.
SAMPLE PRESS WARN Sample pressure outside of operational parameters.
SYSTEM RESET The computer was rebooted.
UV LAMP WARNING The UV lamp intensity measured by the reference detector reading too
low or too high
To view and clear warning messages:
SAMPLE HVPS WARNING SO2 = 0.00
TEST CAL MSG CLR SETUP
Press CLR to clear the displayed
message.
If more than one warning is active, the
next message is displayed.
SAMPLE RANGE=500.000 PPB SO2 = 0.00
< TST TST > CAL MSG CLR SETUP
SA MPLE S
Y
STEM RESET SO2 = 0.00
TEST CAL MSG CLR SETUP
TEST suppresses the
warning messages
MSG returns active warning
messages to the Param field.
NOTE:
If the warning message persists
after several attempts to clear it,
the message may indicate a
real problem and not an artifact
of the warm-up period
07266B DCN6485
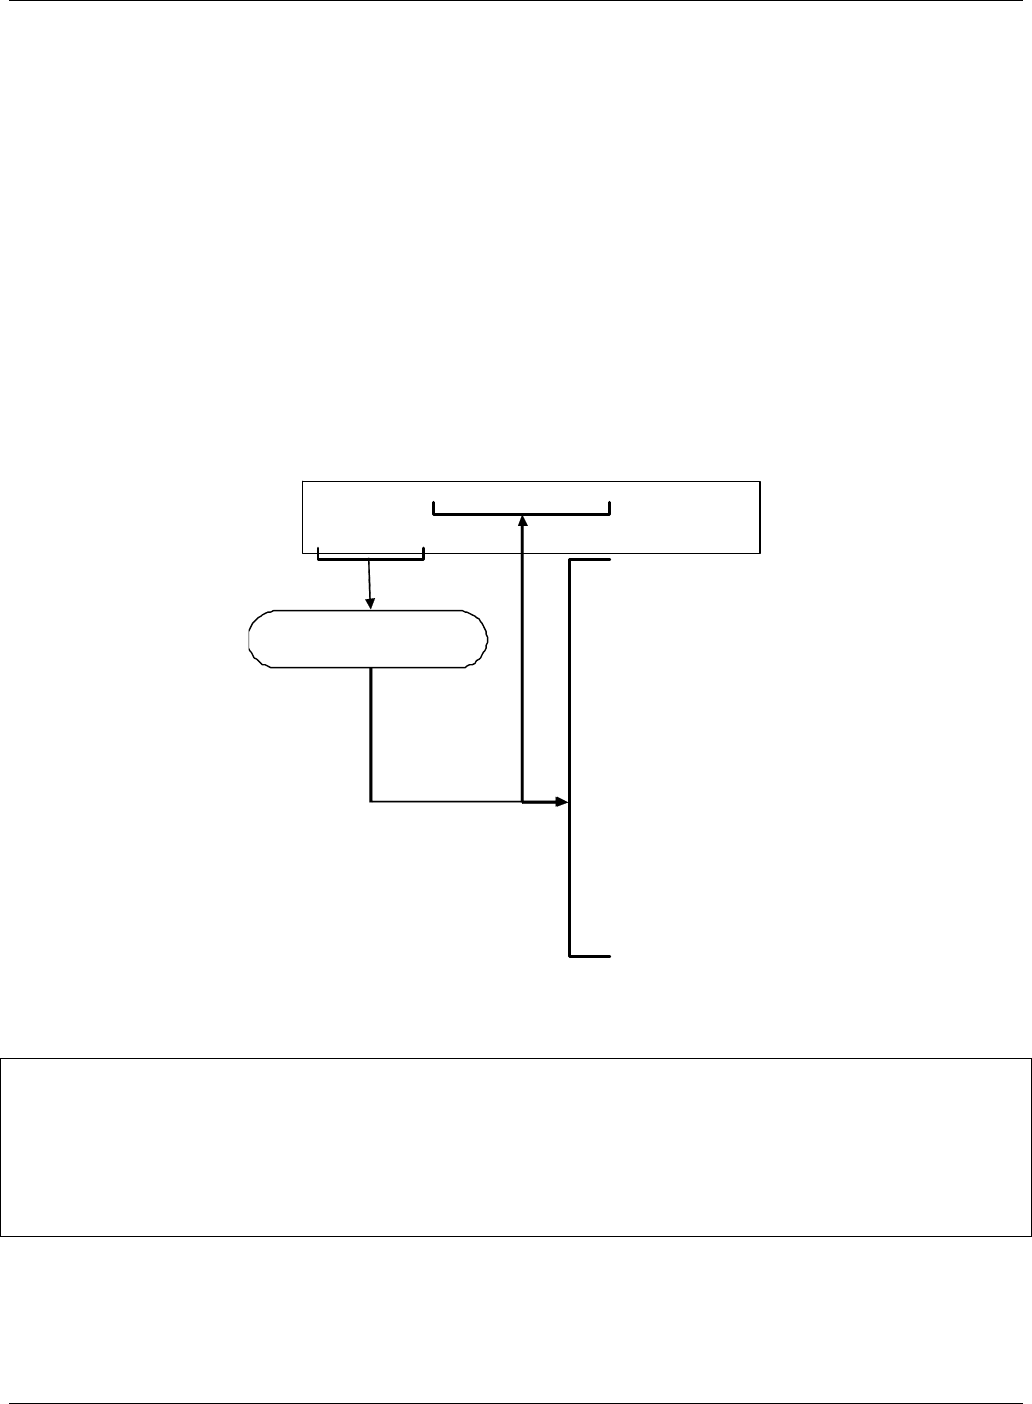
Getting Started Teledyne API – T101 Operation Manual
52
3.5.4. FUNCTIONAL CHECK
1. After the analyzer’s components have warmed up for at least 30 minutes,
verify that the software properly supports any hardware options that were
installed.
2. Check to make sure that the analyzer is functioning within allowable
operating parameters. Appendix C includes a list of test functions viewable
from the analyzer’s front panel as well as their expected values. These
functions are also useful tools for diagnosing performance problems with
your analyzer (Section 9.1.2). The enclosed Final Test and Validation Data
sheet (part number 04551) lists these values before the instrument left
the factory.
To view the current values of these parameters press the following button
sequence on the analyzer’s front panel. Remember until the unit has
completed its warm up these parameters may not have stabilized.
1
Only appears if IZS option is
installed.
2 Only appears if analog output A4
is actively reporting a test function.
3 Shown as they appear when analyzer
is in H2S mode. In SO2 mode appear as SO2 STB, SO2 OFFS &
SO2 SLOPE. In multigas mode, both versions appear.
RANGE
H2S STB3
SAMP FL
PRES
PMT
NORM PMT
UV LAMP
LAMP RATIO
STR. LGT
DARK PMT
DARK LAMP
H2S SLOPE3
H2S OFFS3
HVPS
RCELL TEMP
BOX TEMP
PMT TEMP
CONV TEMP
IZS TEMP1
TEST2
TIME
SAMPLE RANGE = 500.0 PPB H2S = X.X
< TST TST > CAL SETUP
Toggle <TST TST> to scroll
throu
g
h list of functions
NOTE
Once you have completed the above set-up procedures, please fill out the Quality Questionnaire that was
shipped with your unit and return it to Teledyne API.
This information is vital to our efforts in continuously improving our service and our products.
THANK YOU.
07266B DCN6485
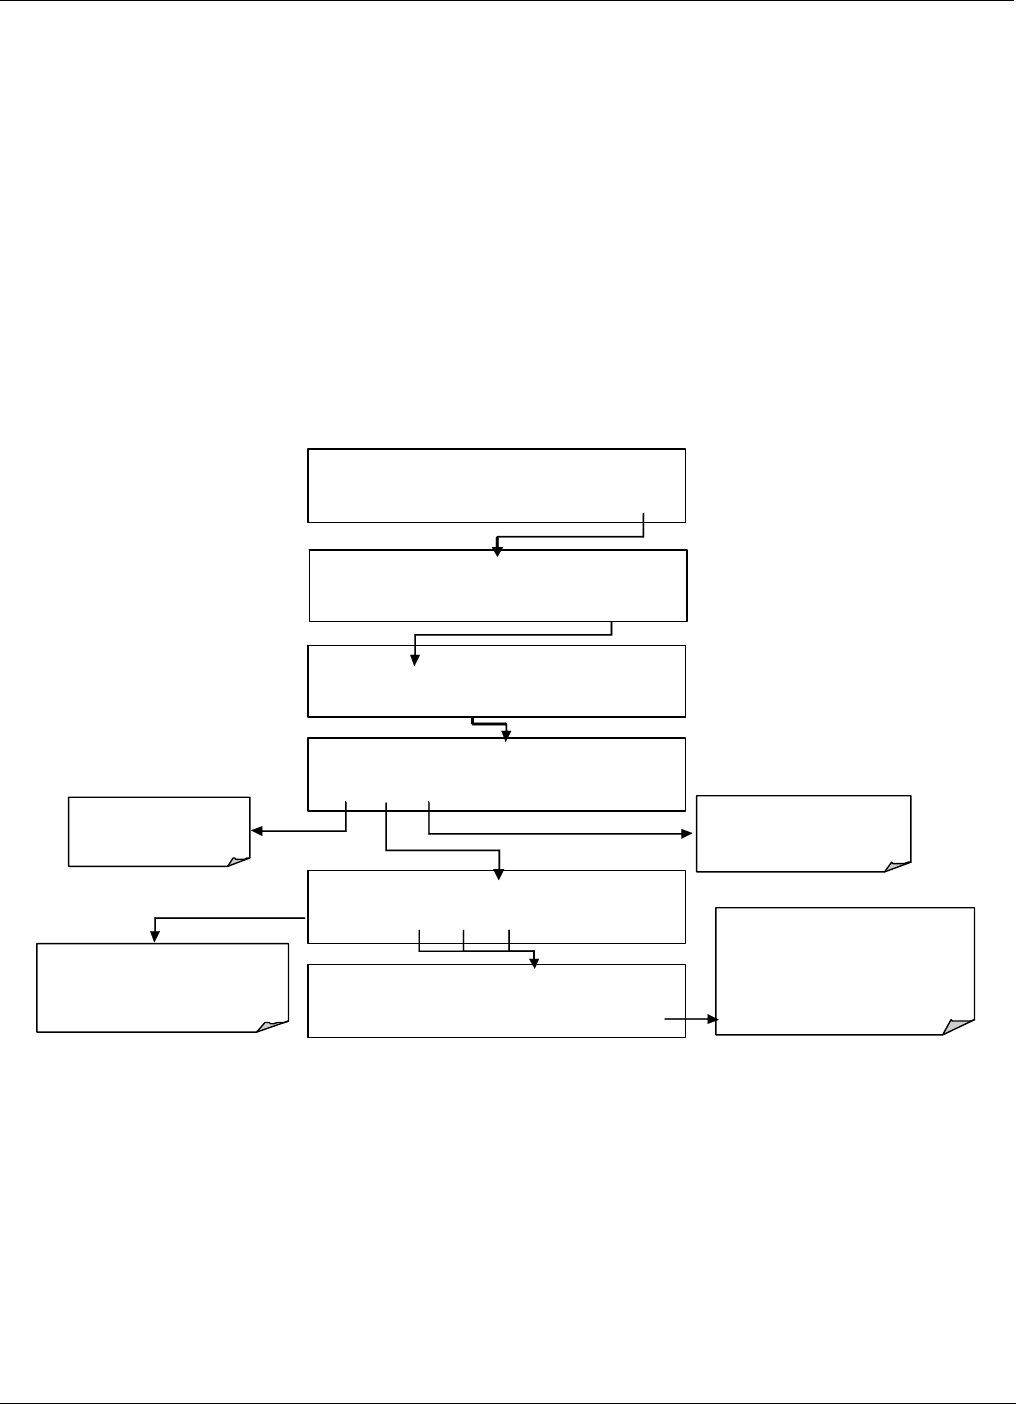
Teledyne API – T101 Operation Manual Getting Started
53
3.6. INITIAL CALIBRATION
3.6.1. BASIC CALIBRATION PROCEDURE
The following three-step procedure assumes that the instrument does not have any of the
available zero/span (Z/S) or IZS valve options installed. Section 6 contains instructions
for calibrating instruments with valve options.
The initial calibration should be carried out with the analyzer’s reporting range for
SINGLE range mode with a range span of 500 PPB (factory default settings for most
units). This will enable you to compare your results to the factory calibration.
STEP ONE: Set/verify the analog output reporting range of the T101:
SETUP X. X RANGE CONTROL MENU
MODE
SET UNIT EXIT
Press this button to set
the analyzer for
SNGL
DUAL or AUTO ranges
SETUP X. X RANGE: 500.0 CONC
0 0 5 0 0 .0 ENTR EXIT
To change the val ue of the reporting
ra nge span, enter the number by
pressing the button under each digit
until the e xpecte d valu e appears.
Pr ess th is butt on to select th e
concentration units of measure:
PPB, PPM, UGM, MGM
EXIT ignores the new setting and
returns to the RANGE CONTROL
MENU.
ENTR accepts the new setting and
returns to the
RANGE CONTROL MENU.
SETUP X. X
CFG DAS RNGE PASS CL K MORE EXIT
SAMPLE RANGE = 500.0 PPB H2S =XXX.X
< TST TST > CAL SETUP
SETUP X. X R ANGE: 500.0 Con
c
0 0 0 5 0 .0 ENTR EXIT
SAMPLE ENTER SETUP PASS : 818
8 1 8 ENTR EXIT
07266B DCN6485
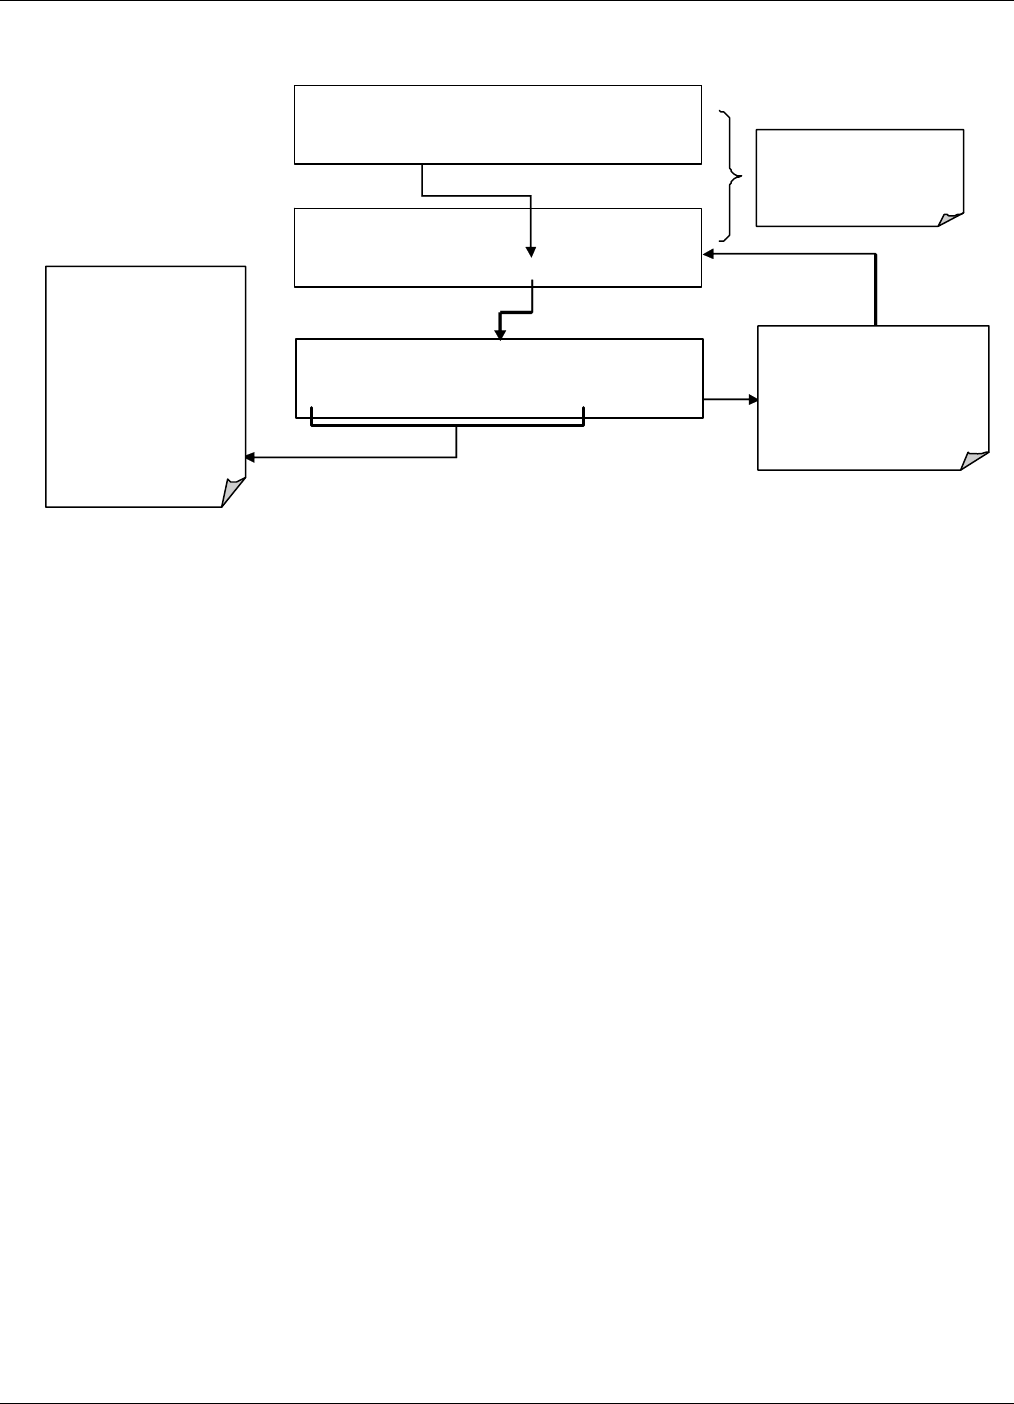
Getting Started Teledyne API – T101 Operation Manual
54
STEP TWO: Set the expected H2S span gas concentration.
This sequence causes the
analyzer to p ro mpt for the
expected H2S span
con centra tion .
M-P CAL H2S SPAN CONC: 450.0 Con
c
0 0 0 4 5 0 .0 ENTR EXIT
M-P CAL RANGE = 500.000 PPB H2S =X.XXX
< TST TST > ZERO CONC EXIT
SAMPLE RANGE = 500.0 PPB H2S =XXX.X
< TST TST > CAL SETUP
The H2S span
concentrati on val ues
automatically default to
450.0 Conc.
To change this value to
the actual co ncen tration of
the spa n gas, en ter the
number by pressing the
button un der each digit
until the expected value
appears.
EXIT ign ores the ne w setting
and r etur ns to the pr evio us
display.
ENTR accepts the new setting
and returns to the
previous display..
07266B DCN6485
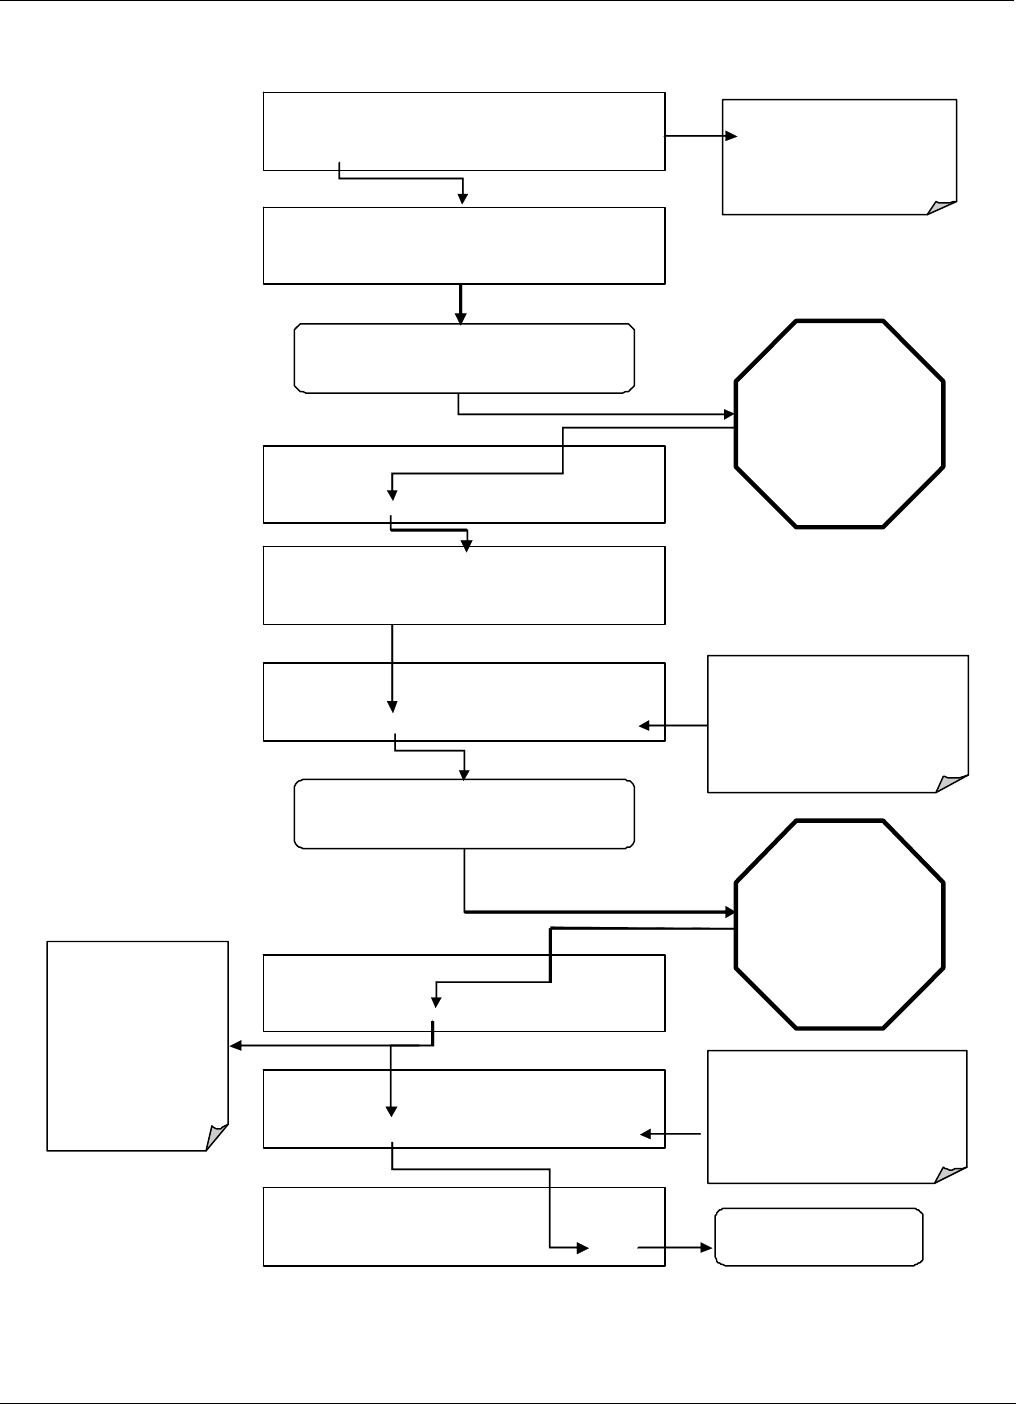
Teledyne API – T101 Operation Manual Getting Started
55
STEP THREE: Perform the zero/span calibration procedure:
M-P CAL H2S STB=X.XXX PPB SO2 =X.XXX
< TST TST > ENTR CONC EXIT
M-P CAL H2S STB=X.XXX PPB SO2 =X.XXX
< TST TST > CAL SETUP
M-P CAL H2S STB=X.XXX PPB SO2 =X.XXX
< TST TST > ZERO CONC EXIT
EXIT returns to the main
SAMPLE display
A
CTION:
Allow zero gas to enter the sample port at the
rear of the instrument.
M-P CAL H2S STB=X.XXX PPB H2S =X.XXX
< TST TST > SPAN CONC EXIT
M-P CAL RANGE = 500.0 PPB H2S =X.XXX
< TST TST > ENTR SPAN CONC EXIT
M- P CAL R ANGE = 500 .0 PPB H2S =X.XXX
< TST TST > ENTR CONC EXIT
Wait until H2S STB
falls below 0.5 ppb.
This may take several
minutes.
The SPAN button now
appea rs durin g the
transition from zero to
span. You may see
both buttons.
If either the ZERO or
SPAN buttons fail to
appear see Section 11
for trouble shooting tips.
SAMPLE RANGE = 500.0 PPB H2S =XXX.X
< TST TST > CAL SETUP
SAMPLE H2S STB=X.XXX PPB H2S =X.XXX
< TST TST > CAL SE TUP
Set the Display to show the H2S
STB test function.
This function calculates the
stability of the H2S
measur ement
Press ENTR to ed it the OFFSET &
SLOPE values for the H2S
m easurem en ts.
Press EXIT to l eave the calib ratio n
unchanged an d re turn to the
previous menu.
A
CTION:
Allow span gas to enter the sample port at the
rear of the instrument.
The value of
H2S STB may jump
significantly.
Wait until it falls back
below 0.5 ppb.
This may take several
minutes.
Press ENTR to chan ge the offset &
slope values for the H2S
measurements.
Press EXIT to l ea ve the cali brati on
unchanged and re turn to the
p
revious menu.
The Model T101 analyzer is now ready for operation.
07266B DCN6485

Getting Started Teledyne API – T101 Operation Manual
56
3.6.2. INTERFERENCES FOR H2S MEASUREMENTS
It should be noted that the fluorescence method for detecting H2S is subject to
interference from a number of sources. Since the T101 converts H2S into SO2 and
measures the UV fluorescence of the SO2, the most common source of interference is
from other gases that fluoresce in a similar fashion to SO2, when exposed to UV Light
such poly-nuclear aromatics (PNA), of which certain hydrocarbons such as meta-xylene
and naphthalene are the most pervasive. The T101 has been successfully tested for its
ability to reject interference from most of these sources.
For a more detailed discussion of this topic, see Section 10.2.6.
NOTE
Once you have completed the above set-up procedures, please fill out the quality questionnaire that was
shipped with your unit and return it to Teledyne API. This information is vital to our efforts in
continuously improving our service and our products. Thank you.
.
07266B DCN6485
57
4. OPERATING INSTRUCTIONS
The T101 is a micro-computer-controlled analyzer with a dynamic menu interface for
easy and yet powerful and flexible operation. All major operations are controlled from
the front panel touch screen control.
To assist in navigating the system’s software, a series of menu trees can be found in
Appendix A of this manual.
NOTE
The ENTR button may disappear if you select a setting that is invalid or out of the allowable range for that
parameter, such as trying to set the 24-hour clock to 25:00:00. Once you adjust the setting to an
allowable value, the ENTR button will reappear.
4.1. OVERVIEW OF OPERATING MODES
The T101 software has a variety of operating modes. Most commonly, the analyzer will
be operating in SAMPLE mode. In this mode, a continuous read-out of the H2S
concentration is displayed on the front panel and output as an analog voltage from rear
panel terminals, calibrations can be performed, and TEST functions and WARNING
messages can be examined.
The second most important operating mode is SETUP mode. This mode is used for
performing certain configuration operations, such as for the DAS system, the reporting
ranges, or the serial (RS-232/RS-485/Ethernet) communication channels. The SET UP
mode is also used for performing various diagnostic tests during troubleshooting.
The Mode field of the front panel display indicates to the user which operating mode the
unit is currently running.
In addition to SAMPLE and SETUP, other modes the analyzer can be operated in are:
Table 4-1. Analyzer Operating Modes
MODE DESCRIPTION
DIAG One of the analyzer’s diagnostic modes is active (Section 4.6).
M-P CAL This is the basic calibration mode of the instrument and is activated by pressing
the CAL button.
SAMPLE Sampling normally, flashing text indicates adaptive filter is on.
SAMPLE A Indicates that unit is in SAMPLE mode and AUTOCAL feature is activated.
07266B DCN6485

Operating Instructions Teledyne API – T101 Operation Manual
58
MODE DESCRIPTION
SETUP X.#2 SETUP mode is being used to configure the analyzer. The gas measurement will
continue during this process.
SPAN CAL A1 Unit is performing SPAN calibration initiated automatically by the analyzer’s
AUTOCAL feature
SPAN CAL M1 Unit is performing SPAN calibration initiated manually by the user.
SPAN CAL R1 Unit is performing SPAN calibration initiated remotely through the COM ports or
digital control inputs.
ZERO CAL A1 Unit is performing ZERO calibration procedure initiated automatically by the
AUTOCAL feature
ZERO CAL M1 Unit is performing ZERO calibration procedure initiated manually by the user.
ZERO CAL R1 Unit is performing ZERO calibration procedure initiated remotely through the COM
ports or digital control inputs.
1 Only Appears on units with Z/S valve or IZS options
2 The revision of the analyzer firmware is displayed following the word SETUP, e.g., SETUP c.4
Finally, the various CAL modes allow calibration of the analyzer. Calibration is described
in Section 6.
4.2. SAMPLE MODE
This is the analyzer’s standard operating mode. In this mode, the instrument is analyzing
H2S and calculating concentrations.
4.2.1. TEST FUNCTIONS
A series of test functions is available at the front panel while the analyzer is in SAMPLE
mode. These parameters provide information about the present operating status of the
instrument and are useful during troubleshooting (Section 9.1.2). They can also be
recorded in one of the DAS channels (Section 4.8) for data analysis. To view the test
functions, press one of the <TST TST> buttons repeatedly in either direction.
07266B DCN6485

Teledyne API – T101 Operation Manual Operating Instructions
59
Table 4-2. Test Functions Defined
DISPLAY PARAMETER UNITS DESCRIPTION
RANGE Range
- -
Range1
Range2
PPB, PPM,
UGM &
MGM
The full scale limit at which the reporting range of the analyzer’s
ANALOG OUTPUTS are currently set. THIS IS NOT the physical range
of the instrument.
If IND or AUTO Range modes have been selected, two RANGE
functions will appear, one for each range.
H2S STB1 Stability PPB
Standard deviation of H2S Concentration readings. Data points are
recorded every ten seconds. The calculation uses the last 25 data
points.
SAMP FL Sample Flow cm³/min
(cc/m) The flow rate of the sample gas through the sample chamber.
PRES Sample
Pressure in-Hg-A The current pressure of the sample gas as it exits the sample
chamber, measured after the sample chamber.
PMT PMT Signal mV The raw output voltage of the PMT.
NORM
PMT NORMALIZED
PMT Signal mV The output voltage of the PMT after normalization for
temperature/pressure compensation (if activated).
UV LAMP Source UV
Lamp Intensity mV The output voltage of the UV reference detector.
LAMP
RATIO UV Source
lamp ratio %
The current output of the UV reference detector divided by the
reading stored in the CPU’s memory from the last time a UV Lamp
calibration was performed.
STR. LGT Stray Light ppb The offset due to stray light recorded by the CPU during the last zero-
point calibration performed.
DRK PMT Dark PMT mV The PMT output reading recorded the last time the UV source lamp
shutter was closed.
DRK LMP Dark UV
Source Lamp mV The UV reference detector output reading recorded the last time the
UV source lamp shutter was closed.
SO2
SLOPE1 SO2
measurement
Slope
- The sensitivity of the instrument as calculated during the last
calibration activity. The slope parameter is used to set the span
calibration point of the analyzer.
SO2
OFFS1 SO2
measurement
Offset
mV
The overall offset of the instrument as calculated during the last
calibration activity. The offset parameter is used to set the zero point
of the analyzer response.
H2S
SLOPE1 H2S
measurement
Slope
- The sensitivity of the instrument as calculated during the last
calibration activity. The slope parameter is used to set the span
calibration point of the analyzer.
H2S
OFFS1 H2S
measurement
Offset
mV
The overall offset of the instrument as calculated during the last
calibration activity. The offset parameter is used to set the zero point
of the analyzer response.
HVPS - - V The PMT high voltage power supply.
RCELL
TEMP Sample
Chamber Temp °C The current temperature of the sample chamber.
BOX
TEMP Box
Temperature °C The ambient temperature of the inside of the analyzer case.
PMT
TEMP Pmt
Temperature °C The current temperature of the PMT.
IZS
TEMP1 IZS
Temperature1 °C The current temperature of the internal zero/span option. Only
appears when IZS option is enabled
CONV H2S SO2 °C The current temperature of the catalytic converter that changes the
07266B DCN6485
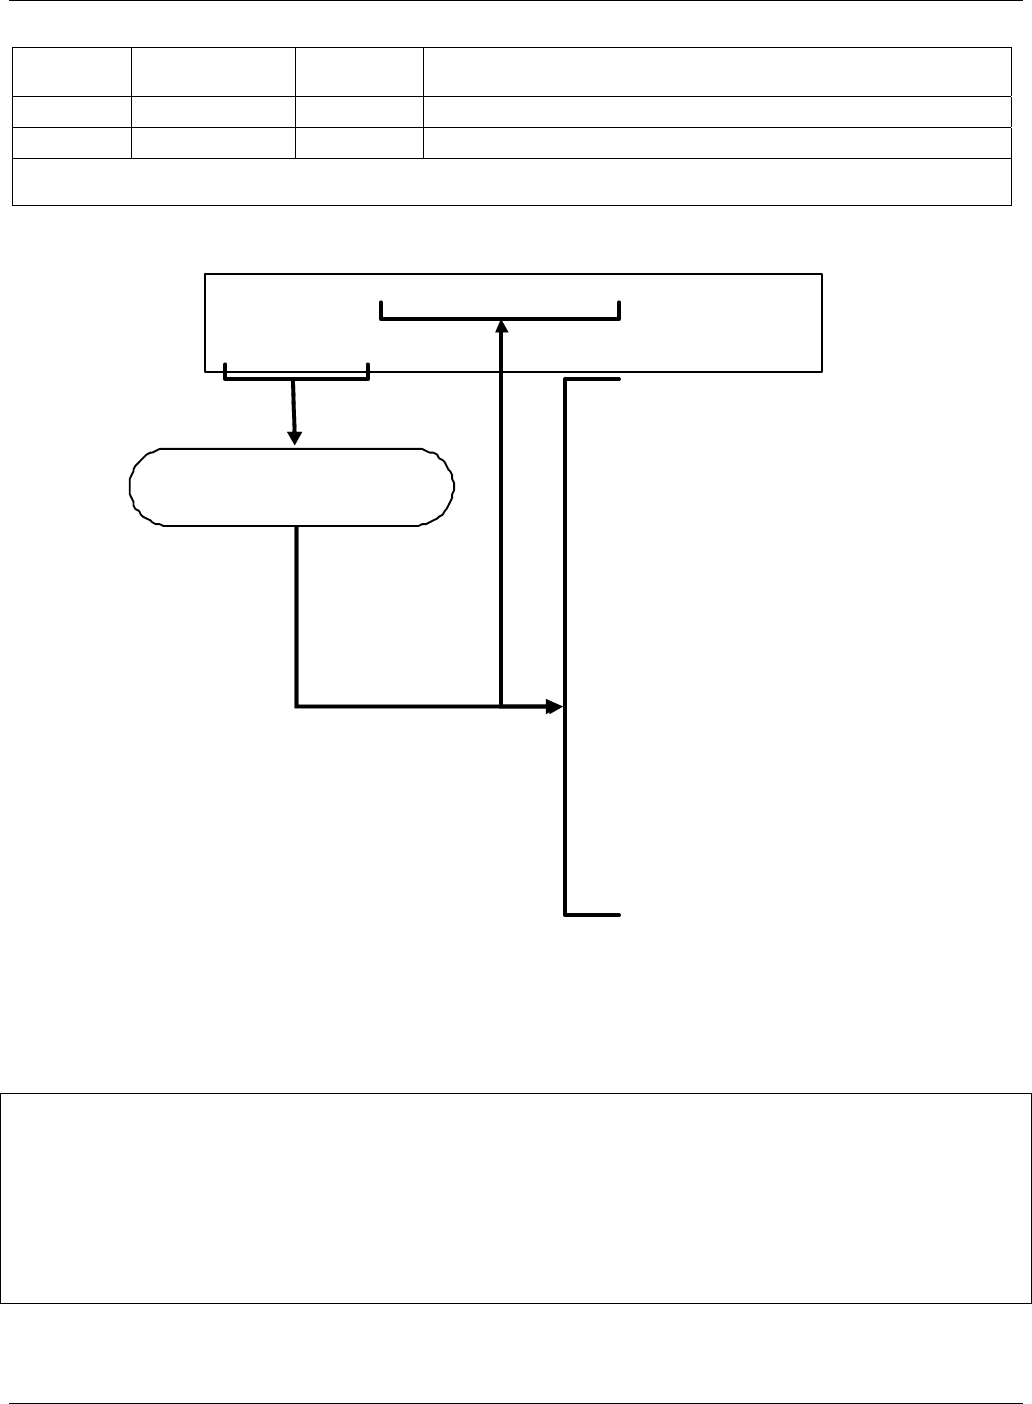
Operating Instructions Teledyne API – T101 Operation Manual
60
TEMP Converter
Temperature
H2S present in the sample gas into SO2.
TEST2 Test Signal2 mV Signal of a user-defined test function on output channel A4.
TIME Clock Time hh:mm:ss The current day time for DAS records and calibration events.
1Shown as they appear when analyzer is in H2S mode. In SO2 mode appear as SO2 STB, SO2 OFFS & SO2 SLOPE. In
multigas mode, both versions appear.
To view the TEST Functions press the following touchscreen control button sequence:
1 Only appears if IZS option is
installed.
2 Only appears if analog output A4
is actively reporting a test function.
3 Shown as they appear when analyzer
is in H2S mode. In SO2 mode appear as SO2 STB, SO2 OFFS &
SO2 SLOPE. In multigas mode, both versions appear.
RANGE
H2S STB3
SAMP FL
PRES
PMT
NORM PMT
UV LAMP
LAMP RATIO
STR. LGT
DARK PMT
DARK LAMP
H2S SLOPE3
H2S OFFS3
HVPS
RCELL TEMP
BOX TEMP
PMT TEMP
CONV TEMP
IZS TEMP1
TEST2
TIME
SAMPLE RANGE = 500.0 PPB SO2 400 PPB
< TST TST > CAL SETUP
Toggle <TST TST> buttons
to scroll throu
g
h list of
Figure 4-1. Viewing T101 TEST Functions
NOTE
A value of “XXXX” displayed for any of the TEST functions indicates an out-of-range reading or the
analyzer’s inability to calculate it.
All pressure measurements are represented in terms of absolute pressure. Absolute, atmospheric
pressure is 29.92 in-Hg-A at sea level. It decreases about 1 in-Hg per 300 m gain in altitude. A variety of
factors such as air conditioning and passing storms can cause changes in the absolute atmospheric
pressure.
07266B DCN6485

Teledyne API – T101 Operation Manual Operating Instructions
61
4.2.2. WARNING MESSAGES
The most common instrument failures will be reported as a warning on the analyzer’s
front panel and through the COM ports. Section 9.1.1 explains how to use these messages
to troubleshoot problems. Table 4-3 lists the warning messages.
Table 4-3. List of Warning Messages
MESSAGE MEANING
ANALOG CAL WARNING The instrument’s A/D circuitry or one of its analog outputs is not
calibrated.
BOX TEMP WARNING The temperature inside the T101 chassis is outside the specified
limits.
CANNOT DYN SPAN Remote span calibration failed while the dynamic span feature was
set to turned on
CANNOT DYN ZERO Remote zero calibration failed while the dynamic zero feature was
set to turned on
CONFIG INITIALIZED Configuration was reset to factory defaults or was erased.
CONV TEMP WARNING The temperature of the H2S SO2 catalytic converter is outside its
optimal operating range.
DARK CAL WARNING Dark offset above limit specified indicating that too much stray
light is present in the sample chamber.
DATA INITIALIZED DAS data storage was erased.
HVPS WARNING High voltage power supply for the PMT is outside of specified
limits.
IZS TEMP WARNING On units with IZS options installed: The permeation tube
temperature is outside of specified limits.
PMT DET WARNING PMT detector output outside of operational limits.
PMT TEMP WARNING PMT temperature is outside of specified limits.
RCELL TEMP WARNING Sample chamber temperature is outside of specified limits.
REAR BOARD NOT DET The CPU is unable to communicate with the motherboard.
RELAY BOARD WARN The firmware is unable to communicate with the relay board.
SAMPLE FLOW WARN The flow rate of the sample gas is outside the specified limits.
SAMPLE PRESS WARN Sample pressure outside of operational parameters.
SYSTEM RESET The computer was rebooted.
UV LAMP WARNING The UV lamp intensity measured by the reference detector reading
too low or too high
07266B DCN6485

Operating Instructions Teledyne API – T101 Operation Manual
62
To view and clear warning messages:
SAMPLE HVPS WARNING H2S = 0.00
TEST CAL MSG CLR SETUP
Make sure warning messages are
not due to real problems.
Press CLR to clear the current
message.
If more than one warning is active, the
next message will take its place
Once the last warning has been
cleared, the analyzer returns to
SAMPLE mode
SAMPLE RANGE=500.000 PPB H2S = 0.00
< TST TST > CAL MSG CLR SETUP
SA MPLE HVPS WARNING H2S = 0.00
TEST CAL MSG CLR SETUP
TEST deactivates warning
messages
MSG activates warning
messages.
<TST TST> replaced with TEST
NOTE:
If the warning message persists
after several attempts to clear it,
the message may indicate a
real problem and not an artifact
of the warm-up period
Figure 4-2. Viewing and Clearing T101 WARNING Messages
4.3. CALIBRATION MODE
Pressing the CAL button switches the T101 into multi-point calibration mode. In this
mode, the user can calibrate the instrument or check the instrument’s calibration with the
use of calibrated zero or span gases.
If the instrument includes either the zero/span valve option or IZS option, the display will
also include CALZ and CALS buttons. Pressing either of these buttons also puts the
instrument into multipoint calibration mode.
The CALZ button is used to initiate a calibration of the zero point.
The CALS button is used to calibrate the span point of the analyzer. It is
recommended that this span calibration is performed at 90% of full scale
of the analyzer’s currently selected reporting range.
Because of their critical importance and complexity, calibration operations are described
in Section 6 of this manual.
4.3.1. CALIBRATION PASSWORD SECURITY
The T101 calibration functions may be password protected for to prevent inadvertent
adjustments. When the calibration password has been enabled using the PASS menu item
found under the Setup Menu (Section 4.4.5), the system will prompt the user for a
password anytime CAL, CALZ, CALS activated.
07266B DCN6485
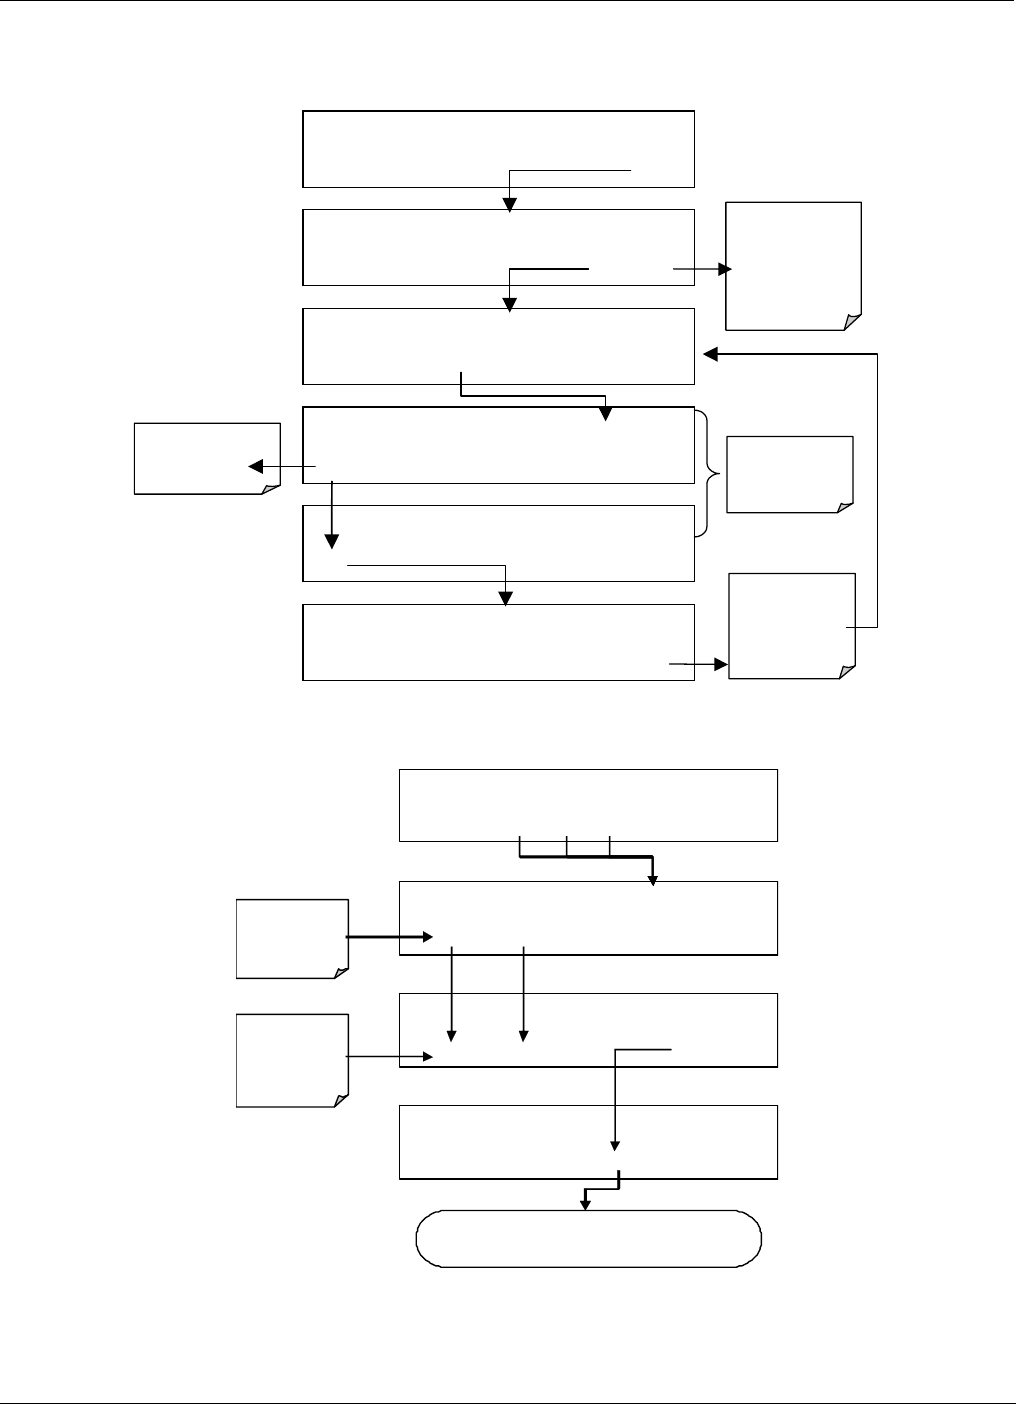
Teledyne API – T101 Operation Manual Operating Instructions
63
The default status of the calibration password is OFF. To enable the calibration password
press:
SAMPLE ENTER SETUP PASS : 818
8 1 8 ENTR EXIT
SAMPLE RANGE = 500.0 PPB H2S =X.XXX
< TST TST > CAL SETUP
SETUP X.X PRIMARY SETUP MENU
CFG DAS RNGE PASS CLK MORE EXIT
SETUP X.X CAL. PASSWORD ENABLE: OFF
OFF ENTR EXIT
SETUP X.X PASSWORD ENABLE: ON
ON ENTR EXIT
SETUP X.X PASSWORD ENABLE: ON
ON ENTR EXIT
ENTR accepts
the change
EXIT ignores
the change
Toggles
password
status On/Off
ENTR accepts
displayed
password value
EXIT returns to
SAMPLE display
CAL. PASSWORD
default state is
OFF
If the calibration password (101) is enabled, the following menu button sequence will be
required to enter one of the calibration modes:
SAMPLE ENTER SETUP PASS : 0
0 0 0 ENTR EXIT
SAMPLE RANGE = 500.0 PPB H2S =X.XXX
< TST TST > CAL CALZ CALS SETUP
M-P CAL RANGE = 500.0 PPB H2S =X.XXX
< TST TST > ZERO CONC EXIT
Prompts
password
numbe r
SAMPLE ENTER SETUP PASS : 0
1 0 1 ENTR EXIT
Pr ess
individual
buttons to set
101
Continue calib ratio n pr ocess …
07266B DCN6485

Operating Instructions Teledyne API – T101 Operation Manual
64
4.4. SETUP MODE
The SETUP mode allows you to configure the analyzer’s hardware and software features,
perform diagnostic procedures, gather information on the instrument’s performance and
configure or access data from the internal data acquisition system (DAS). For a visual
representation of the software menu trees, refer to Appendix A.
Pressing the SETUP button activates a prompt for a security password. The default
password is 818. Press ENTR to proceed.
However, there is the option to enable a higher level of security; described in Section
4.4.5.
Other password levels exist allowing access to special diagnostic tools and variables used
only for specific and rarely needed troubleshooting and adjustment procedures. They
may be made available as needed by Teledyne API’s Technical Support department.
The following two tables decribe the menus under Setup mode:
Table 4-4. Primary Setup Mode Features and Functions
MODE OR FEATURE TOUCHSCREEN
BUTTON DESCRIPTION MANUAL
SECTION
Analyzer Configuration CFG Lists key hardware and software configuration
information 4.4.1
Auto Cal Feature ACAL
Used to set up and operate the AutoCal feature.
Only appears if the analyzer has one of the internal
valve options installed
6.9
Internal Data Acquisition
system (DAS ) DAS Used to set up the DAS system and view recorded
data 4.8
Analog Output Reporting
Range Configuration RNGE Used to configure the output signals generated by
the instrument’s Analog outputs. 4.4.4
Calibration Password
Security PASS Turns the calibration password feature ON/OFF 4.4.5
Internal Clock
Configuration CLK Used to Set or adjust the instrument’s internal
clock 4.4.6
Advanced SETUP
features MORE This button accesses the instrument’s secondary
setup menu
(Table
4-5)
Table 4-5. Secondary Setup Mode Features and Functions
MODE OR FEATURE TOUCHSCREEN
BUTTON DESCRIPTION MANUAL
SECTION
External Communication
Channel Configuration COMM Used to set up and operate the analyzer’s various
external I/O channels including RS-232; RS 485,
modem communication and/or Ethernet access.
4.7 & 5
System Status Variables VARS Used to view various variables related to the
instrument’s current operational status 4.5
System Diagnostic
Features DIAG Used to access a variety of functions that are used
to configure, test or diagnose problems with a
variety of the analyzer’s basic systems
4.6
07266B DCN6485
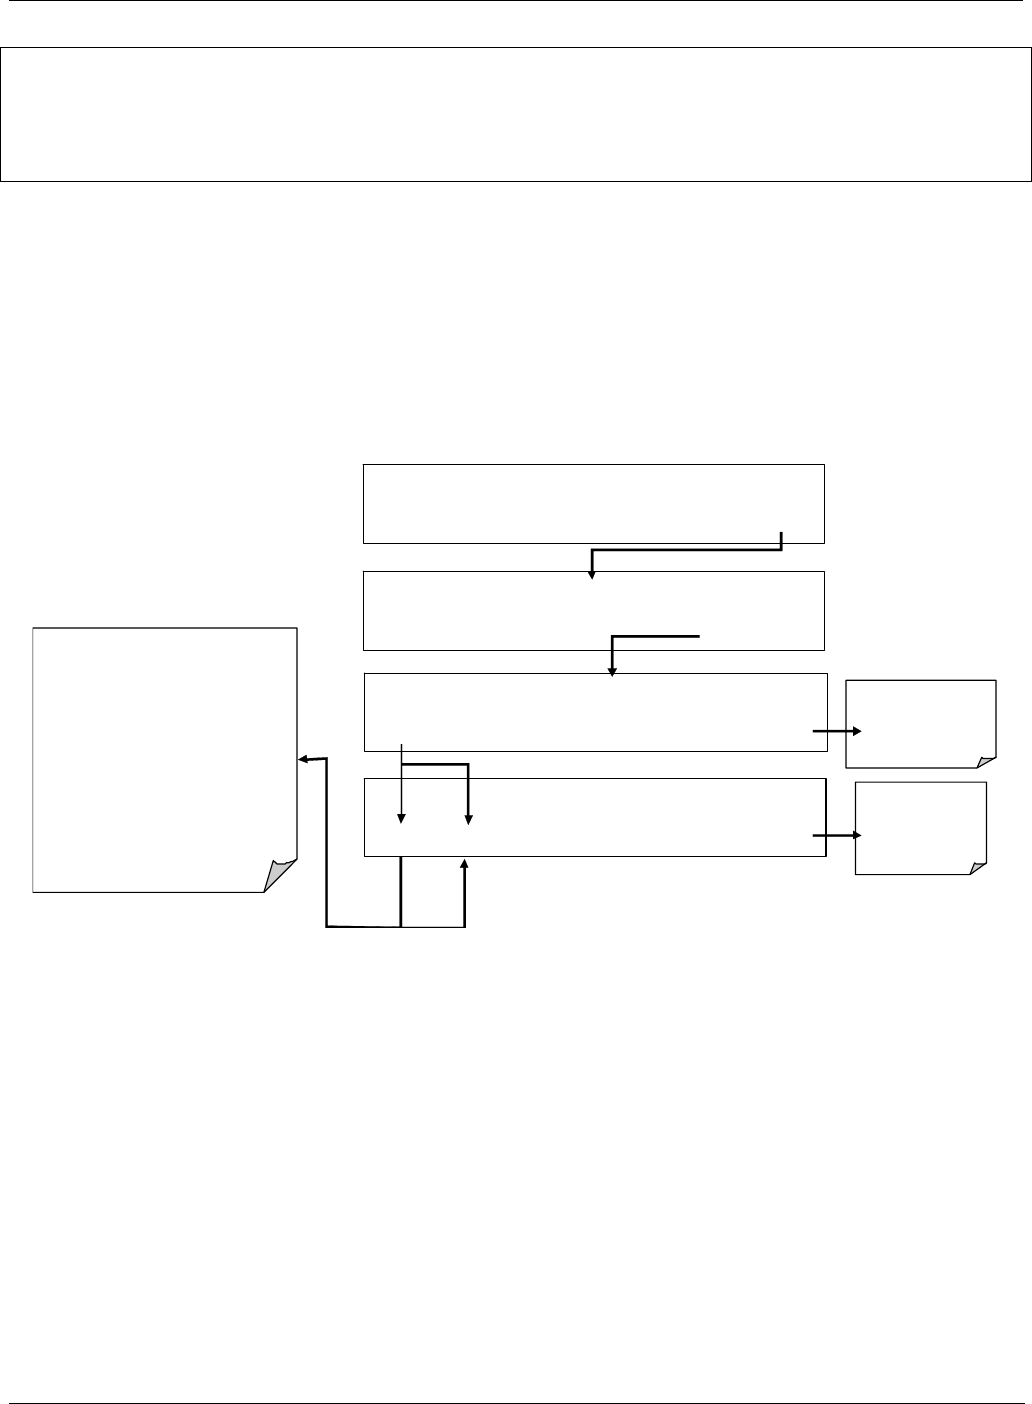
Teledyne API – T101 Operation Manual Operating Instructions
65
NOTE
If the analyzer beeps when you press the EXIT button, it means that you’ve made a
change/entered a new value for a parameter but have not caused it to be accepted by
pressing ENTR first.
4.4.1. SETUP – CFG: VIEWING THE ANALYZER’S
CONFIGURATION INFORMATION
Pressing the CFG button displays the instrument configuration information. This display
lists the analyzer model, serial number, firmware revision, software library revision, CPU
type and other information. Use this information to identify the software and hardware
when contacting Technical Support. Special instrument or software features or installed
options may also be listed here.
SAMPLE* RANGE = 500.0 PPB H2S =X.XXX
< TST TST > CAL SETUP
SAMPLE ENTER SETUP PASS : 818
8 1 8 ENTR EXIT
SAMPLE PRIMARY SETUP MENU
CFG DAS RNGE PASS CLK MORE EXIT
SAMPLE T101 SO2-H2S ANALYZER
NEXT PREV EXIT
Press EXIT
at
any time to
return to
SETUP menu
Press EXIT
at
any time to
return to the
SAMPLE dis
p
la
y
Press NEXT of PREV to move back
and forth through the following list
of Configuration information:
MODEL NAME
SERIAL NUMBER
SOFTWARE REVISION
LIBRARY REVISION
iCHIP SOFTWARE REVISION1
HESSEN PROTOCOL REVISION1
ACTIVE SPECIAL SOFTWARE
OPTIONS1
CPU TYPE
DATE FACTORY CONFIGURATION
SAVED
1
Only appears if relevant opt ion of Fe ature is active.
07266B DCN6485
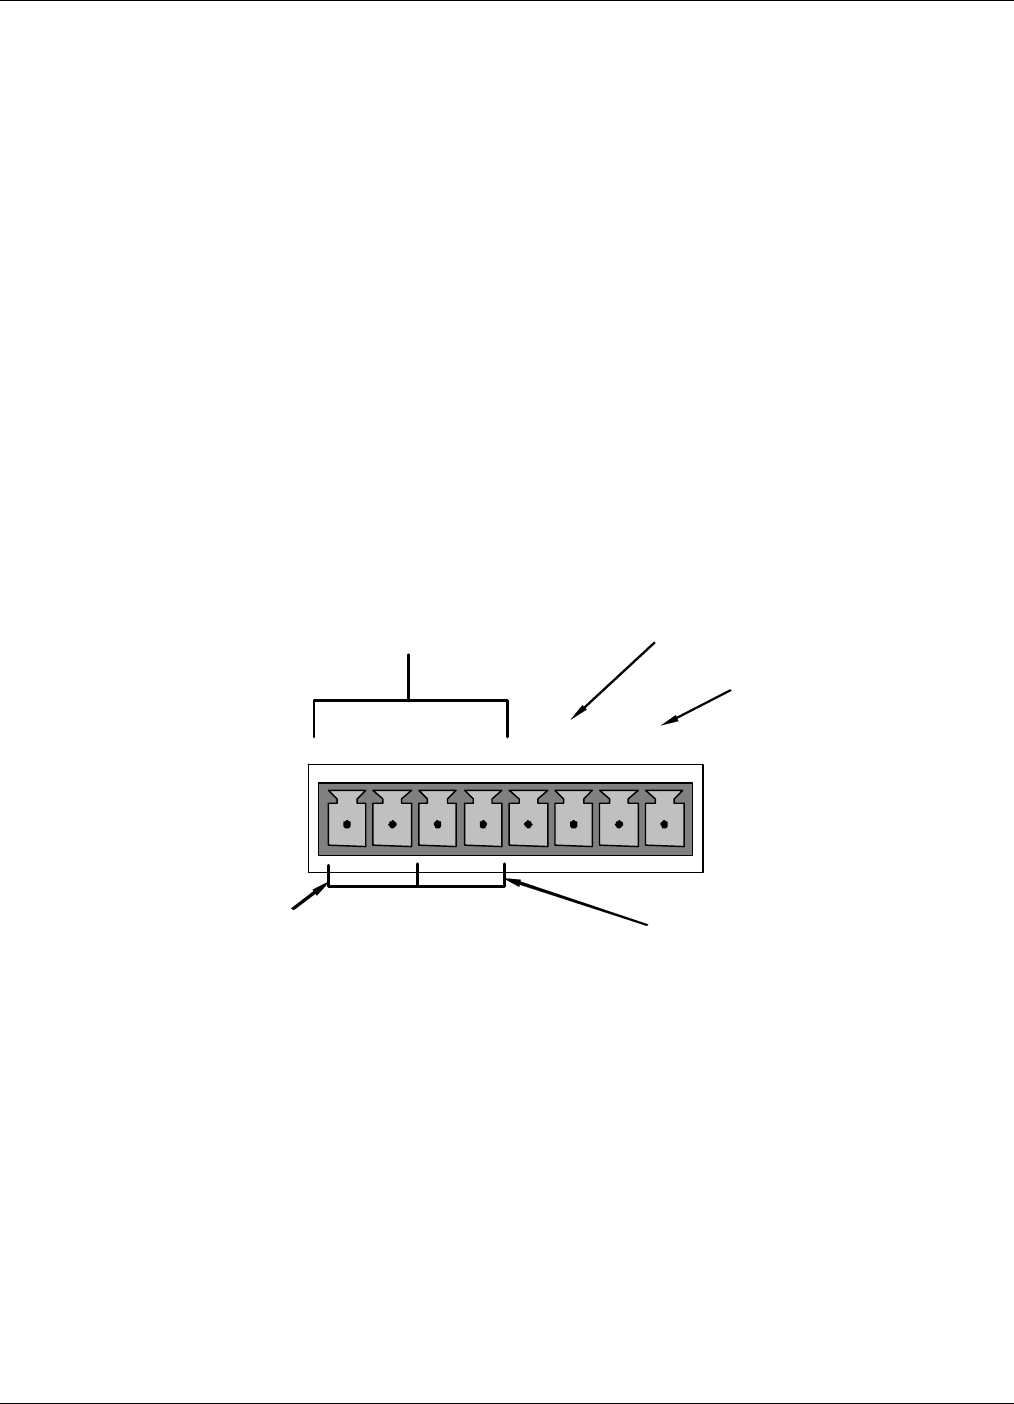
Operating Instructions Teledyne API – T101 Operation Manual
66
4.4.2. SETUP – ACAL: AUTO CALIBRATION
Used to set up and operate the internal valve options if installed. Section 6 provides
details.
4.4.3. SETUP – DAS: DATA ACQUISITION
Used to set up the data acquisition system and record data.
4.4.4. SETUP – RANGE: ANALOG OUTPUT REPORTING RANGE
CONFIGURATION
4.4.4.1. Available Analog Output Signals
The analyzer has three active analog output signals, accessible through a connector on the
rear panel.
ANALOG OUT
A1 A2 A3 A4
+ - + - + - + -
H
2S/SO2
concentration out
p
uts
HIGH range when
DUAL mode is selecte
d
Not Used
Test Channel
LOW range when
DUAL mode is selected
Figure 4-3. Analog Output Connectors Defined
All three outputs can be configured either at the factory or by the user for full scale
outputs of 0.1 VDC, 1VDC, 5VDC or 10VDC. Additionally A1 and A2 may be equipped
with optional 0-20 mADC current loop drivers and configured for any current output
within that range (e.g. 0-20, 2-20, 4-20, etc.). The user may also adjust the signal level
and scaling of the actual output voltage or current to match the input requirements of the
recorder or data logger (See Sections 4.6.3.3 and 4.6.3.5).
In its basic configuration, the A1 and A2 channels of the T101 output a signal that is
proportional to the H2S concentration of the sample gas. Several operating modes are
available which allow them to be slaved together (SNGL Mode, see Section 4.4.4.4 or
07266B DCN6485

Teledyne API – T101 Operation Manual Operating Instructions
67
AUTO mode, see section 4.4.4.6) or operate independently (IND mode, see Section
4.4.4.5) The user may also select between a variety of reporting range spans as well:
EXAMPLE:
A1 OUTPUT: Output Signal = 0-5 VDC representing 0-1000 ppm concentration values
A2 OUTPUT: Output Signal = 0 – 10 VDC representing 0-500 ppm concentration
values.
NOTE
On analyzers with the SO2-H2S multigas measurement option installed the outputs of A1
and A2 correspond to:
Output SO2
SO2 – H2S H
2S
Channel Mode Mode Mode
A1 SO2 SO2 H
2S
A2 SO2 H
2S H
2S
As the instrument switches from H2S mode to SO2 mode and back, only the reporting range and analog
output associated with the gas currently being measured will be active. The reporting range and analog
output for the gas no being measured will continue to report the last valid reading.
The output, labeled A4 is special. It can be set by the user (see Section 4.6.9) to output
many of the parameters accessible through the <TST TST> buttons of the units Sample
Display.
Output A3 is not available on the Model T101 Analyzer.
4.4.4.2. Physical Range versus Analog Output Reporting Ranges
The T101 UV Fluorescence H2S Analyzer has two hardware physical ranges that cover
H2S concentrations between 0 and 20,000 ppb. The low range is 0 to 2,000 ppb, while the
high range is 0 to 20,000 ppb. The proper physical range is determined by the software to
include the maximum measurement concentration selected by the user. Once properly
calibrated, the analyzer’s front panel will accurately report concentrations along the entire
span of its 0 and 20,000 ppb physical range.
Because, most applications use only a small part of the analyzer’s two physical ranges,
the width of the Model T101’s physical range can create data resolution problems for
most analog recording devices. For example, in an application where the expected
concentration of SOx is typically less than 500 ppb, the full scale of expected values is
only 0.25% of the instrument’s 20,000 ppb physical range. Unmodified, the
corresponding output signal would also be recorded across only 0.25% of the range of the
recording device.
The T101 solves this problem by allowing the user to select a scaled reporting range for
the analog outputs that only includes that portion of the physical range relevant to the
specific application. Only the reporting range of the analog outputs is scaled, the physical
range of the analyzer and the readings displayed on the front panel remain unaltered.
07266B DCN6485
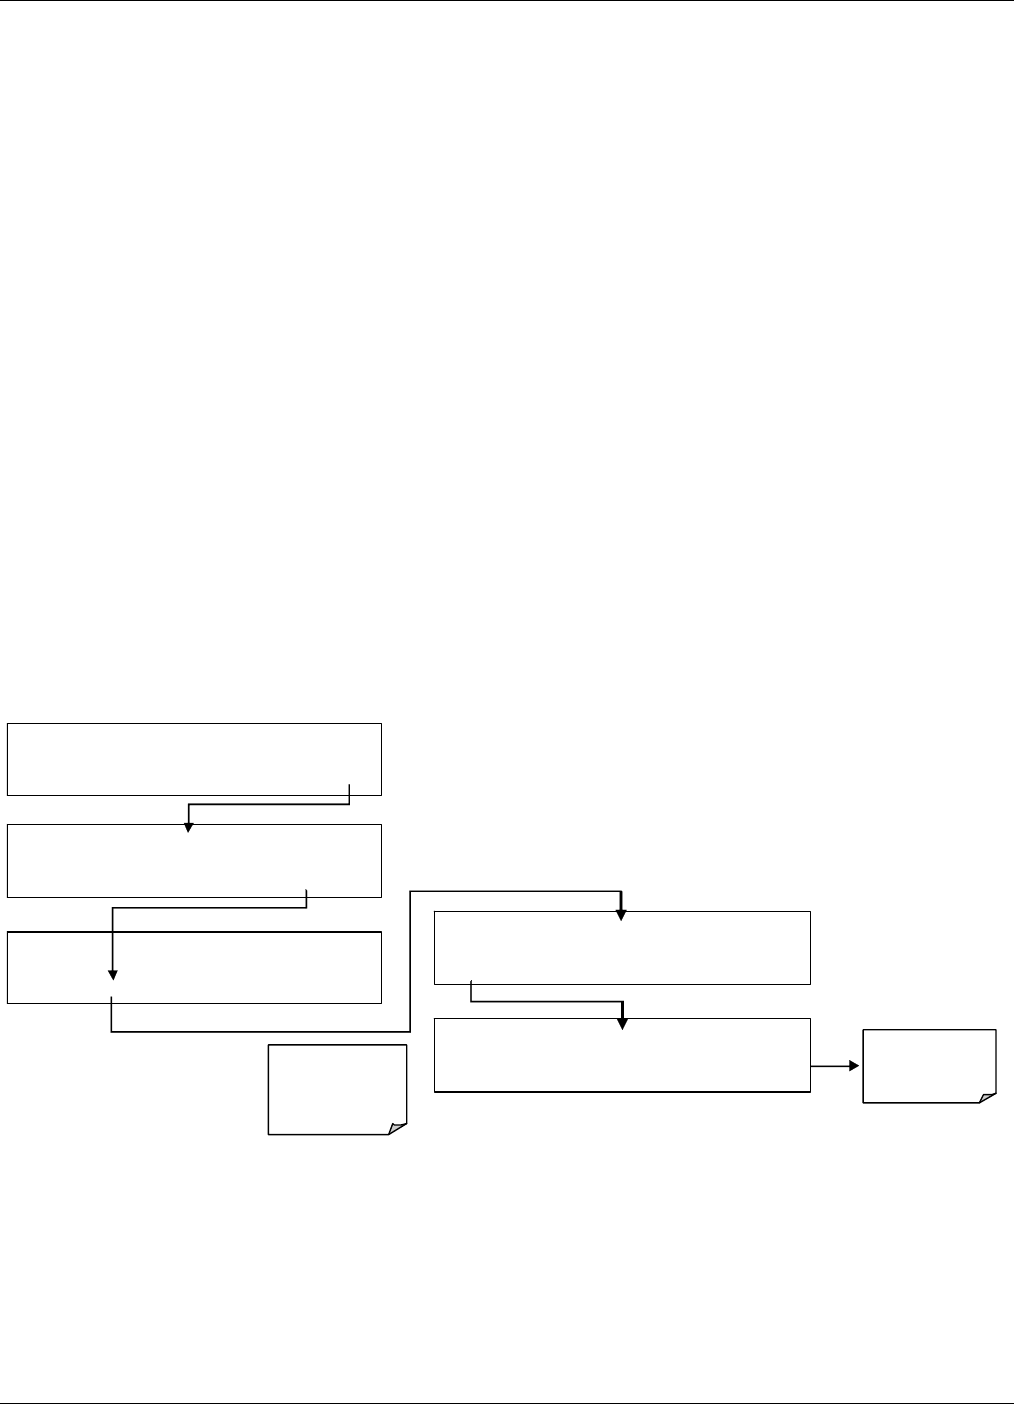
Operating Instructions Teledyne API – T101 Operation Manual
68
4.4.4.3. Reporting Range Modes
The T101 provides three analog output range modes to choose from. The actual signals
output on the two analog signal channels depends on whether or not the analyzer includes
a SO2/H2S multigas measurement option and if so which measurement mode is selected.
Single range (SNGL) mode: This mode sets a single maximum range for
the analog output. If single range is selected (see Section 4.4.4.4) both
outputs are slaved together and will represent the same measurement
span (e.g. 0-50 ppm), however their electronic signal levels may be
configured differently (e.g. 0-10 VDC vs. 0-.1 VDC – see Section 4.6.3.1).
In SO2/H2S multigas measurement mode, although the two inputs are
measuring different gases, the two measurements scales are identical.
Independent range (IND) mode: This mode allows the A1 and A2 outputs to be
configured with different measurement spans (see Section 4.4.4.5) as well as separate
electronic signal levels (see Section 4.6.3.1) and, if the instrument is equipped with the
SO2/H2S multigas measurement option, different gas measurements.
Auto range (AUTO) mode: As in single range mode, both outputs are
slaved together and will represent the same measurement span; however
this mode gives the analyzer the ability switch to automatically switch
between the two user selected ranges (High and Low). This switching
occurs dynamically as the concentration value fluctuates.
High/low range status is output via the External Digital I/O Status Bits (see Section
5.1.1.1).
To select the Analog Output Range Type press:
SAMPLE RANGE = 500.0 PPB H2S =XXX .X
< TST TST > CAL SETUP
SAMPLE ENTER SETUP PASS : 818
8 1 8 ENTR EXIT
SE TUP X. X
CFG DAS RNGE PASS CL K MORE EXIT
SETUP X.X RANGE CONTROL MENU
MODE
SET U NIT EXIT
SETUP X.X RANGE MODE: SNG L
SNGL
IND AUTO ENTR EXIT
EXI
T
Returns
to the Main
SAMPLE Display
Only on e of the
range modes may
be acti ve at any
tim e.
07266B DCN6485
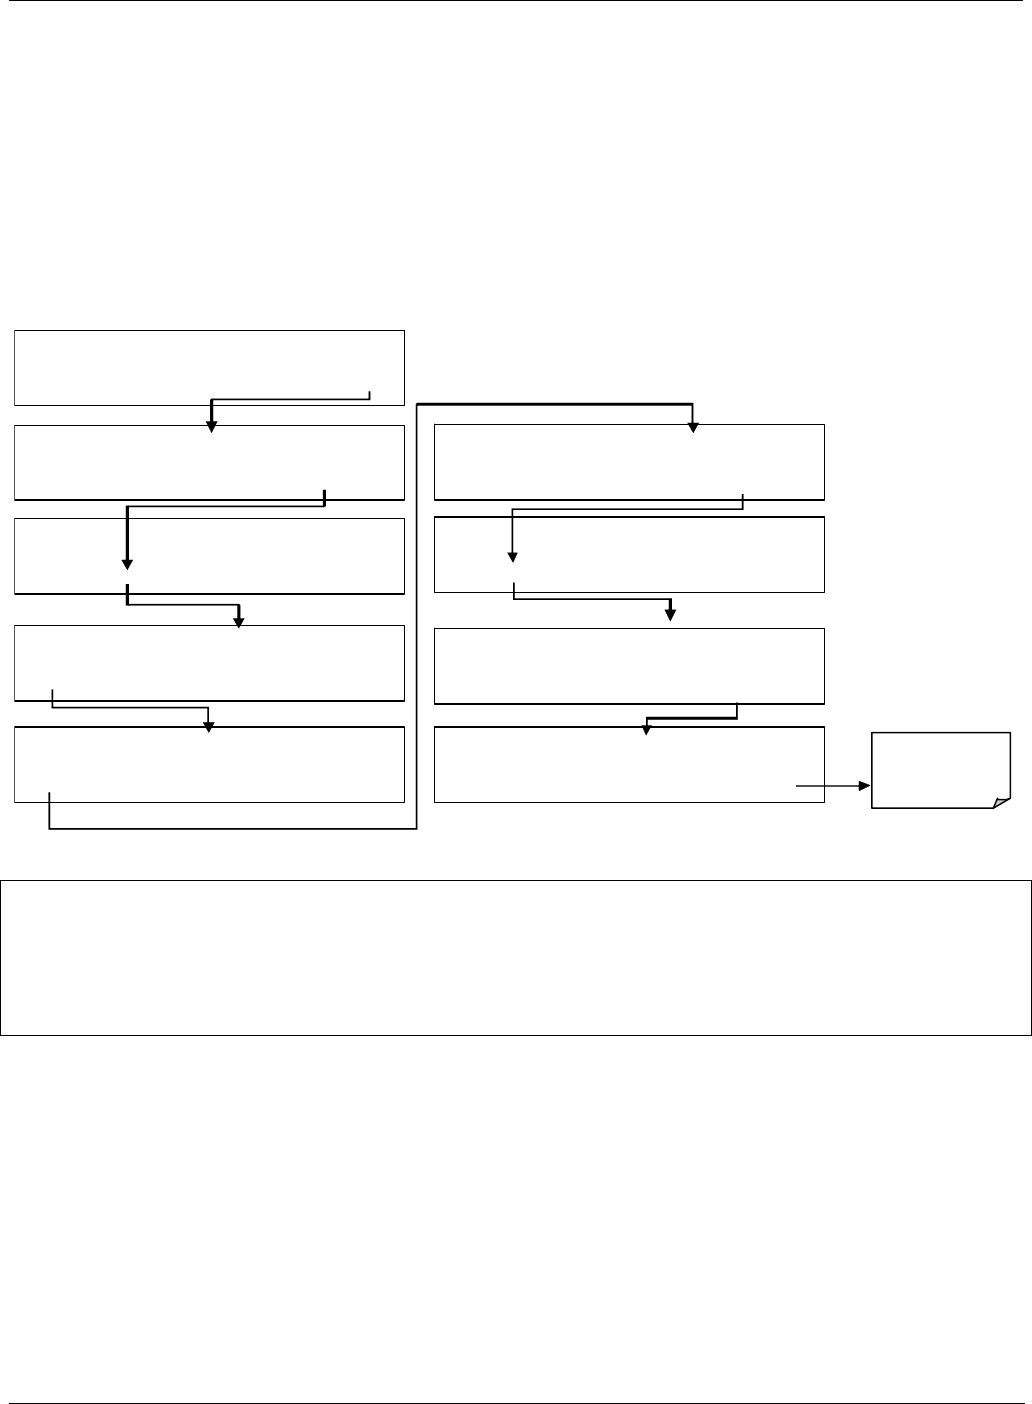
Teledyne API – T101 Operation Manual Operating Instructions
69
4.4.4.4. Single Range Mode (SNGL)
The default range mode for the analyzer is single range, in which all analog concentration
outputs are set to the same reporting range. This reporting range can be set to any value
between 5.0 ppb and 20 000 ppb.
While the two outputs always have the same reporting range, the span and scaling of their
electronic signals may also be configured for different differently (e.g., A1 = 0-10 V; A2
= 0-0.1 V).
To select SNGLE range mode and to set the upper limit of the range, press:
SAMPLE ENTER SETUP PASS : 818
8 1 8 ENTR EXIT
SE TUP C.3 PRIMARY SETUP MENU
CFG DAS RNGE PASS CLK MORE EXIT
SETUP C.3 RANGE CONTROL MENU
MODE
SET UNIT EXIT
SE TUP C.3 RANGE MO DE: SNGL
SN GL
IND AUTO ENTR EXIT
EXIT x 2 returns
to the main
SAMPLE di splay
SETUP C.3 RANGE MODE: SNGL
SNGL
IND AUTO ENTR EXIT
SETUP C.3 RANGE CONTROL MENU
MODE
SET UNIT EXIT
SETUP C.3 RANGE: 500.0 Conc
0 0 5 0 0 .0 ENTR EXIT
SETUP C.3 RANGE CONTROL MENU
MODE SET UNIT EXIT
SAMPLE RANGE = 500.0 PPB H2S =XXX. X
< TST TST > CAL SETUP
NOTE
On analyzers with the multigas option activated (see Sections 4.5.1 and 6.8) the concentration value will
switch back and forth between from “H2S=XXX.X” to “SO2=XXX.X” depending on which gas is currently
being measured.
07266B DCN6485
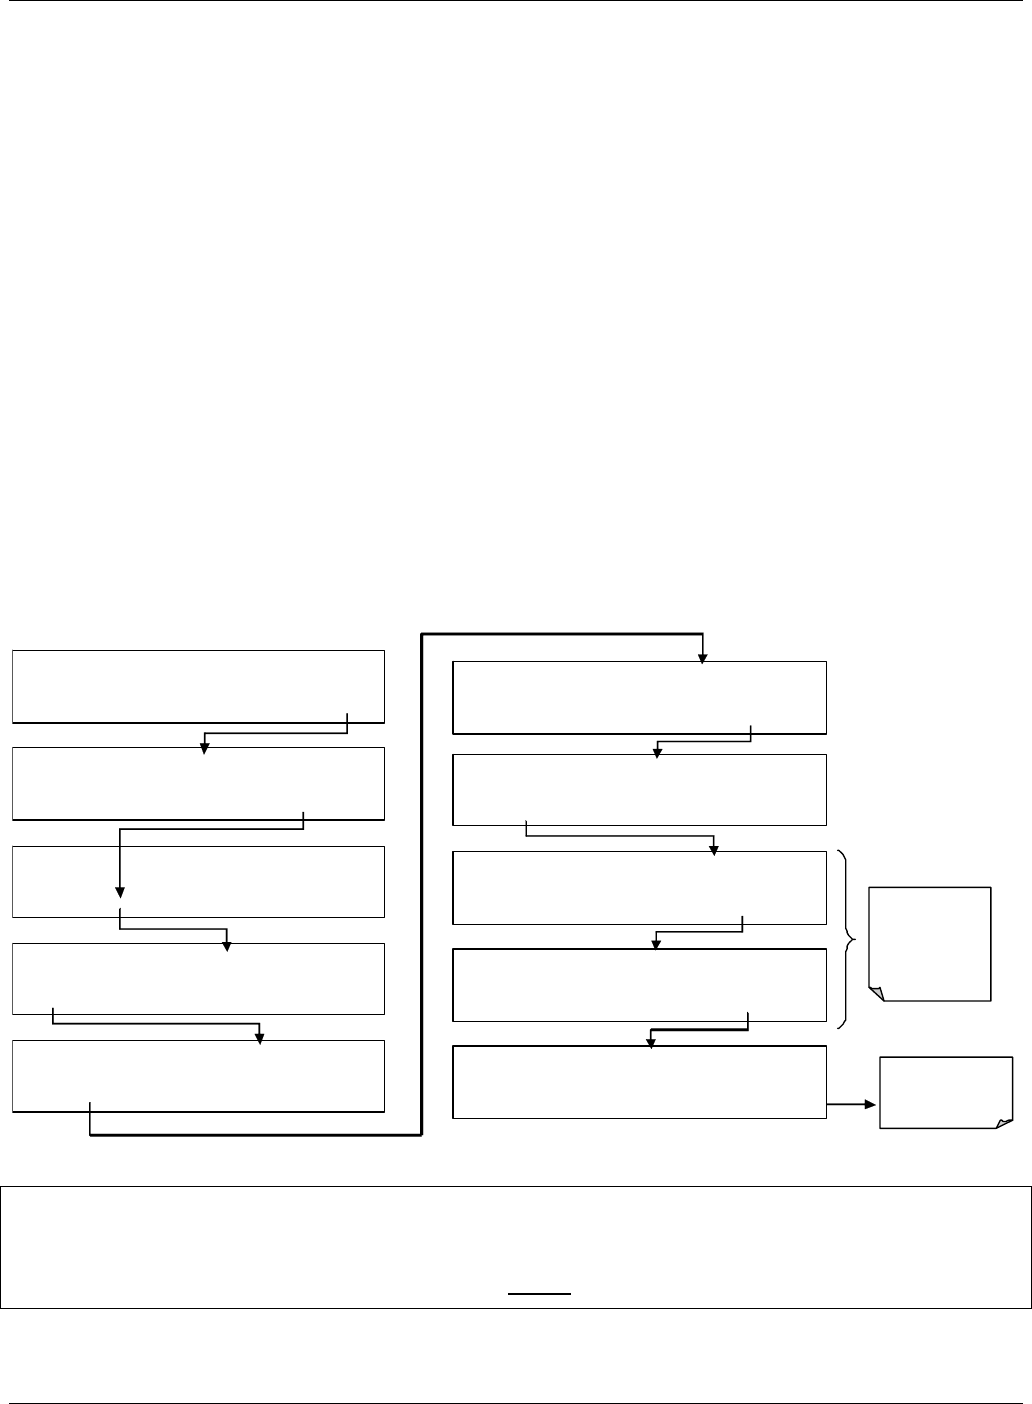
Operating Instructions Teledyne API – T101 Operation Manual
70
4.4.4.5. Independent Range Mode (IND)
Selecting independent range mode allows the A1 and A2 outputs to be configured with
different measurement ranges. The analyzer software calls these two ranges LOW and
HIGH. The LOW range setting corresponds with the analog output labeled A1 on the
rear panel of the instrument. The HIGH range setting corresponds with the A2 output.
While the software names these two ranges LOW and HIGH, they do not have to be
configured that way.
Also, in this mode the RANGE Test function displayed on the front panel during
SAMPLE mode will be replaced by two separate functions, RANGE1 & RANGE2.
LOW range = RANGE1 = Range value for output A1 = 0-1500 ppb
H2S.
HIGH range = RANGE2 = Range value for output A2 = 0-500 ppb
H2S.
For T101’s configured to measure both SO2 and H2S in multigas measurement mode:
LOW range = RANGE1 = Range value for output A1= 0-1500 ppm
SO2.
HIGH range = RANGE2 = Range value for output A2 =0-1000 ppm
H2S.
To select the independent reporting range mode and set the upper measurement limits for
the two outputs, press:
SAMPLE ENTER SETUP PASS : 818
8 1 8 ENTR EXIT
SE TUP X.X PRIMARY SETUP MENU
CFG DAS RNGE PASS CLK MORE EXIT
SETUP X.X RANGE CONTROL MENU
MODE
SET UNIT EXIT
SE TUP X.X RAN GE MODE : SNGL
SNG L IND AUTO ENTR EXIT
SETUP X.X RANGE CONTROL MENU
MODE
SET UNIT EXIT
SETUP X.X HIGH RANGE: 500.0 Con
c
0 0 5 0 0 .0 ENTR EXIT
SETUP X.X LOW RANG
E
: 500.0 Conc
0 0 1 0 0 .0 ENTR EXIT
SETUP X.X RANGE CONTROL MENU
MODE
SET UNIT EXIT
EXIT Returns
to the Main
SAMPLE Display
SET UP X.X RANG E MODE : DUAL
SNGL
IND AUTO ENTR EXIT
Toggle the
buttons under
each digit to set
the upper limit
of each ra ng e.
SAMPLE RANGE = 500.0 PPB H2S =XXX.X
< TST TST > CAL SETUP
NOTE
In INDEPENDENT range mode the two reporting ranges have separate slopes and offsets
for computing concentration and MUST be independently calibrated.
07266B DCN6485
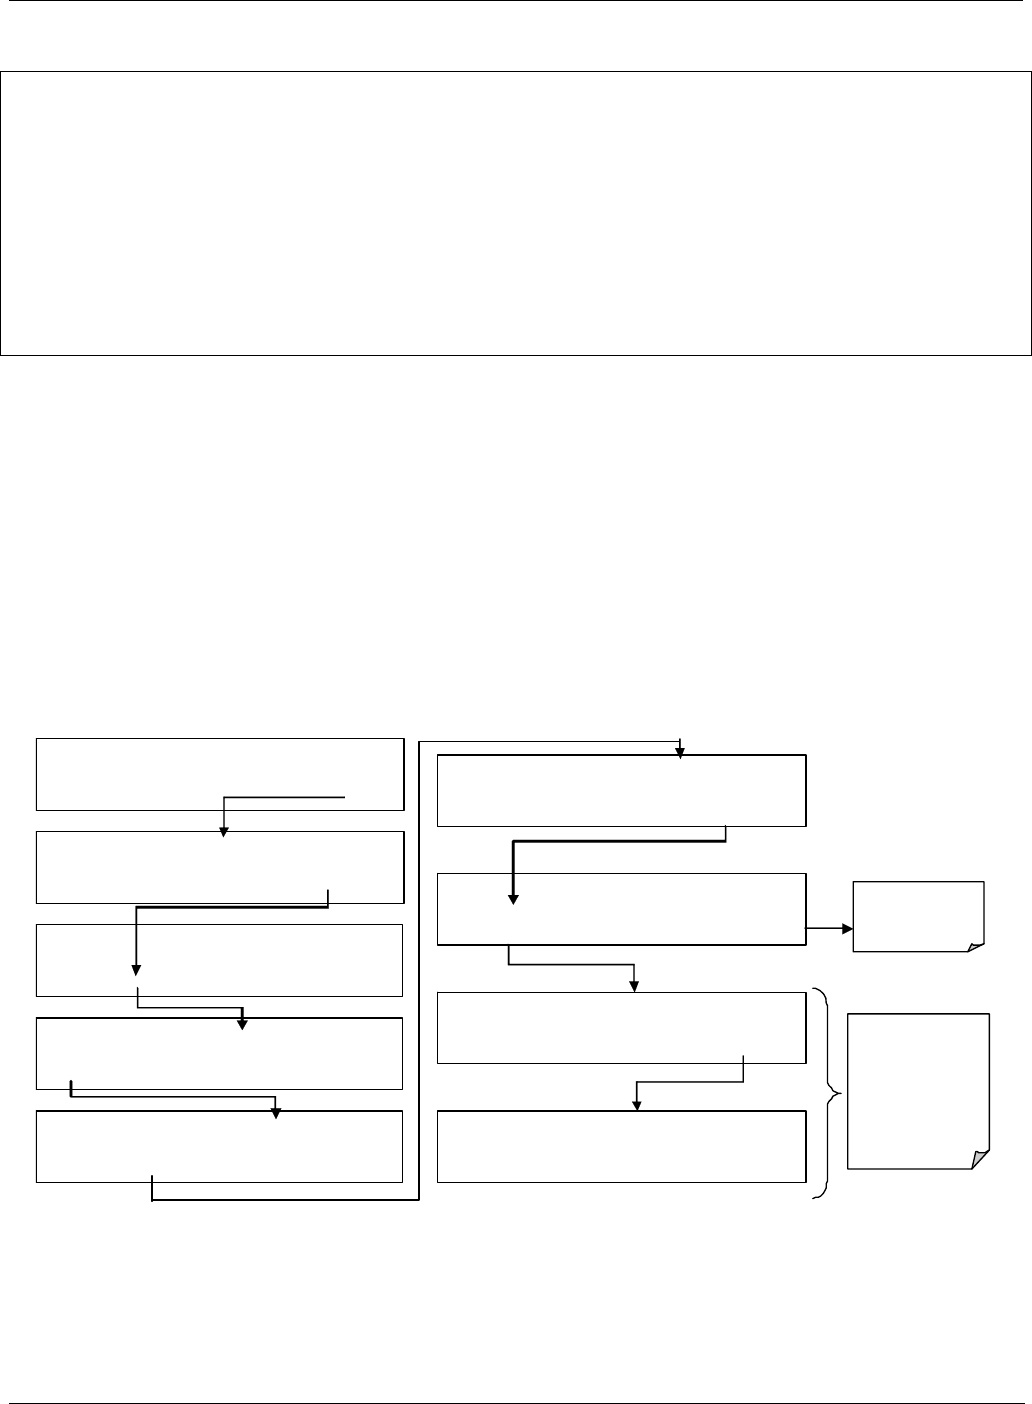
Teledyne API – T101 Operation Manual Operating Instructions
71
NOTE
On analyzers with the multigas option activated (see Sections 4.5.1 and 6.8) the titles
displayed on the instrument’s front panel during the previous operation appear as:
LOW range appears as SO2 RANGE
high range appears as H2S RANGE
As the instrument switches from H2S mode to SO2 mode and back, only the reporting
range and analog output associated with the gas currently being measured will be active.
The reporting range and analog output for the gas no being measured will continue to
report the last valid reading.
4.4.4.6. Auto Range Mode (AUTO)
In AUTO range mode, the analyzer automatically switches the reporting range between
two user-defined ranges (low and high). The unit will switch from low range to high
range when the H2S concentration exceeds 98% of the low range span. The unit will
return from high range back to low range once both the H2S concentration falls below
75% of the low range span.
When set up to measure a single gas (H2S or SO2), in AUTO Range mode the instrument
reports the same data in the same range on both the A1 and A2 outputs and automatically
switches both outputs between ranges as described above.
To select auto range mode and set the upper span limits for the high and low ranges, press
the following menu button sequence.
SAMPLE RANGE = 500.0 PPB H2S =XXX .X
< TST TST > CAL SETUP
SETUP X.X PRIMARY SETUP MENU
CFG DAS RNGE PASS CLK MORE EXIT
SETUP X.X RANGE CONTROL MENU
MODE
SET UNIT EXIT
SETUP X.X RANGE MODE: SNGL
SNGL IND AU TO ENTR EXIT
SAMPLE ENTER SETUP PASS : 818
8 1 8 ENTR EXIT EXIT x 2 returns
to the main
SAMPLE di splay
SETUP X.X RANGE MODE:
A
UTO
SNGL IND AUTO ENTR EXIT
SETUP X.X RANGE CONTROL MENU
MODE
SET UNIT EXIT
SETUP X.X HIGH RANGE: 500.0 Con
c
0 0 5 0 0 .0 ENTR EXIT
SETUP X.X LOW RANGE: 500.0 Con
c
0 0 5 0 0 .0 ENTR EXIT
Toggle the numeral
buttons to set the
LOW and HIG H
range value.
ENTR accepts the
new setting, EXIT
ig nor es the new
setting.
07266B DCN6485
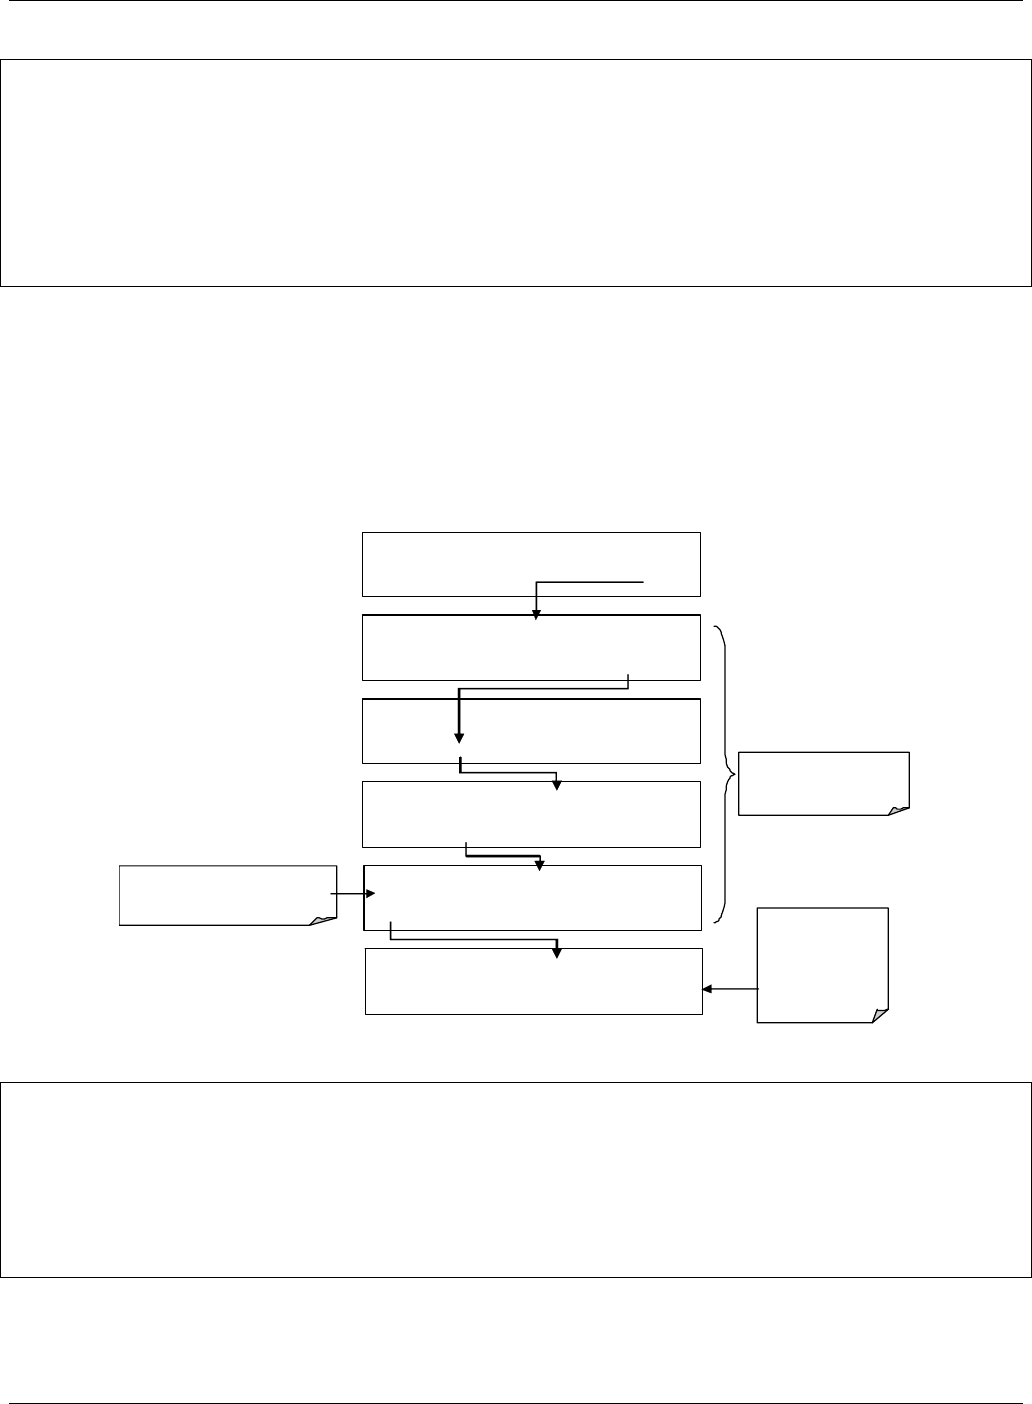
Operating Instructions Teledyne API – T101 Operation Manual
72
NOTE
On analyzers with the multigas option activated (see Section s 4.5.1 and 6.8) the concentration value will
switch back and forth between from “H2S=XXX.X” to “SO2=XXX.X” depending on which gas is currently
being measured.
Also, The analyzer will switch between the HIGH and LOW analog reporting ranges
whenever the concentration level of the gas being currently measured fulfills the trigger
criteria listed at the beginning of this section.
4.4.4.7. Range Units
The T101 can display concentrations in parts per billion (109 mols per mol, PPB), parts
per million (106 mols per mol, PPM), micrograms per cubic meter (µg/m3, UG) or
milligrams per cubic meter (mg/m3, MG). Changing units affects all of the display,
analog outputs, COM port and DAS values for all reporting ranges regardless of the
analyzer’s range mode.
To change the concentration units:
SE TUP X .X CONC UNITS: PPM
PPM PPB UGM MGM % ENTER EXIT
SAMPLE RANGE = 500.0 PPB H2S =X XX . X
< TST TST > CAL SETUP
SE TUP X.X
PRIMARY SETUP MENU
CFG DAS RNGE PASS CLK MORE EXIT
SE TUP X.X RANGE CONTROL MENU
MODE
SE T UNIT EXIT
SETUP X.X CONC UNITS: PPB
PPM PPB UGM MGM ENTER EXIT
SAMPLE ENTER SETUP PASS : 818
8 1 8 ENTR EXIT
Select the preferred
concentration unit.
EXIT returns
to the main menu.
ENTR accepts
the new unit,
EXIT returns
to the SETUP
menu.
NOTE
Concentrations displayed in mg/m3 and µg/m3 use standard temperature and pressure
(STP). The conversion factors from volumetric to mass units used in the T101 are:
SO2: ppb x 2.86 = µg/m3; ppm x 2.86 = mg/m3
H2S: ppb x 1.52 = µg/m3; ppm x 1.52 = mg/m3
07266B DCN6485
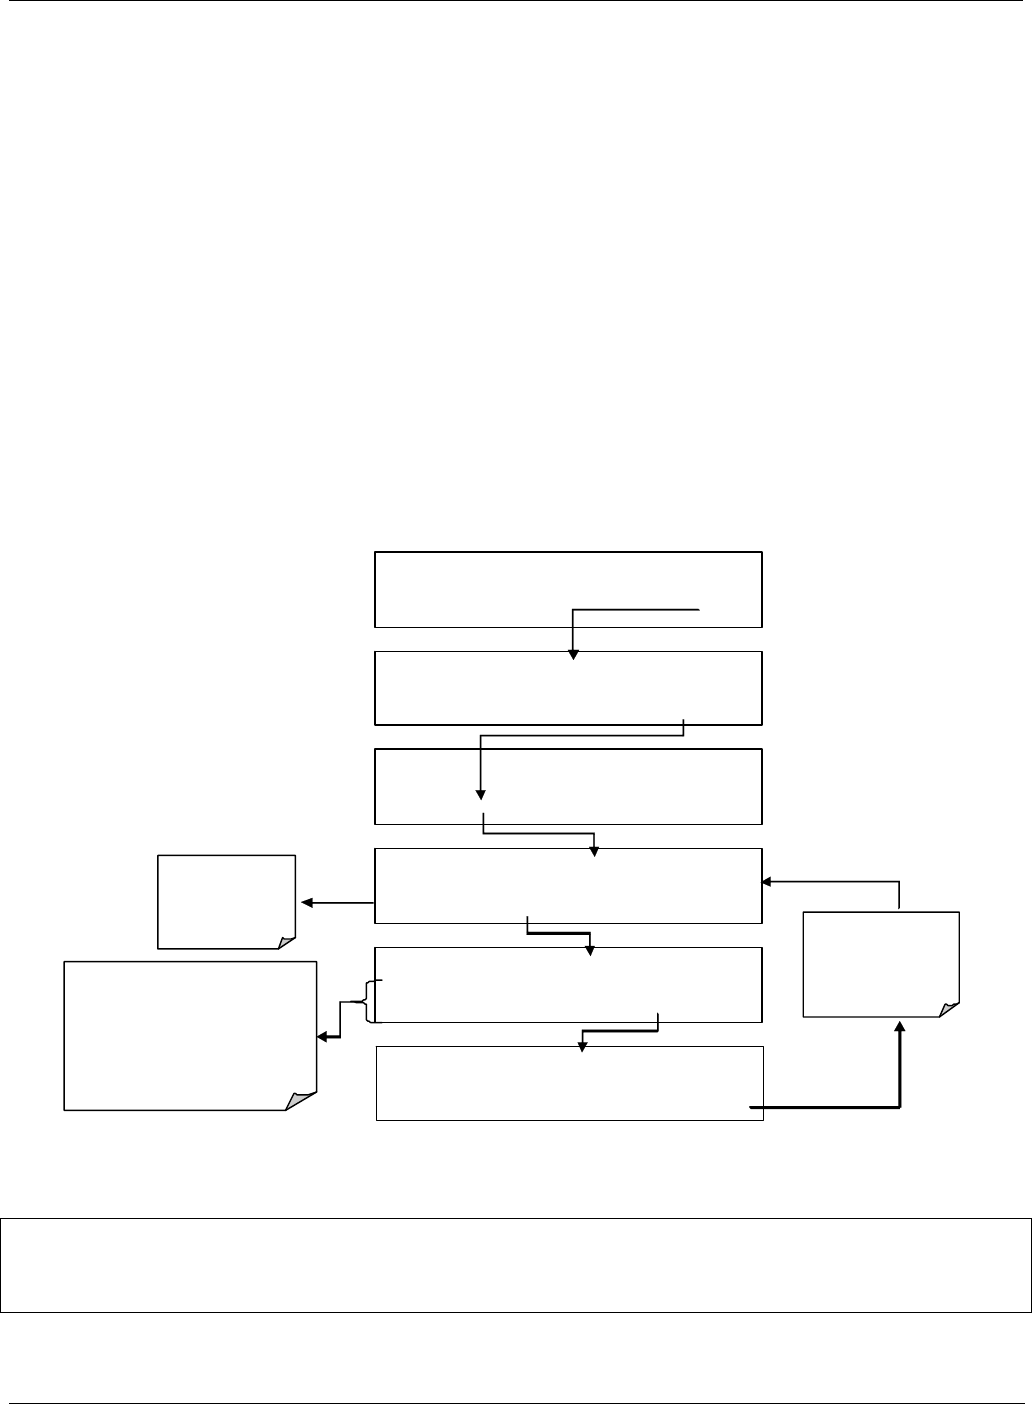
Teledyne API – T101 Operation Manual Operating Instructions
73
4.4.4.8. Dilution Ratio
The dilution ratio is a software option that allows the user to compensate for any dilution
of the sample gas before it enters the sample inlet.
1. Select reporting range units: Follow the procedure in Section 4.4.4.7.
2. Select the range: Use the procedures in Section 4.4.4.3 – 4.4.4.6.
Make sure:
that the SPAN value entered is the maximum expected concentration of
the undiluted calibration gas, and
that the span gas is either supplied through the same dilution inlet system
as the sample gas or has an appropriately lower actual concentration.
For example, with a dilution set to 100, a 1 ppm gas can be used to
calibrate a 100 ppm sample gas if the span gas is not routed through the
dilution system. On the other hand, if a 100 ppm span gas is used, it
needs to pass through the same dilution steps as the sample gas.
3. Set the dilution factor as a gain (e.g., a value of 20 means 20 parts
diluent and 1 part of sample gas):
SAMPLE RANGE = 50 0.0 PPB H2S =XXX.X
< TST TST > CAL SETUP
SETUP C.3 PRIMARY SETUP MENU
CFG DAS RNGE PASS CLK M ORE EXIT
SETUP C.3 RANGE CONTROL MENU
MODE
S ET UN IT DIL EXIT
DIL only ap pears
if the diluti on ratio
option has be en
enabled
SETUP C.3 DIL F
A
CTOR: 1.0 GAIN
0 0 0 1 .0 ENTR EXIT
Toggl e these button s to set the
dil ution factor.
This is the number by which the
analyzer wil l mul tip ly the H2S
co ncentratio ns of the gas passin g
through the reaction cell.
SETUP C.3 DIL FACTOR: 20.0 GAIN
0 0 2 0 .0 ENTR EXIT
EXIT ignores the
new setting.
ENTR accepts the
new setting.
SAMPLE ENTER SETUP PASS : 818
8 1 8 ENTR EXIT
The analyzer multiplies the measured gas concentrations with this dilution factor and
displays the result.
NOTE
Once the above settings have been entered, the instrument needs to be recalibrated using one of the
methods discussed in Section 6.
07266B DCN6485
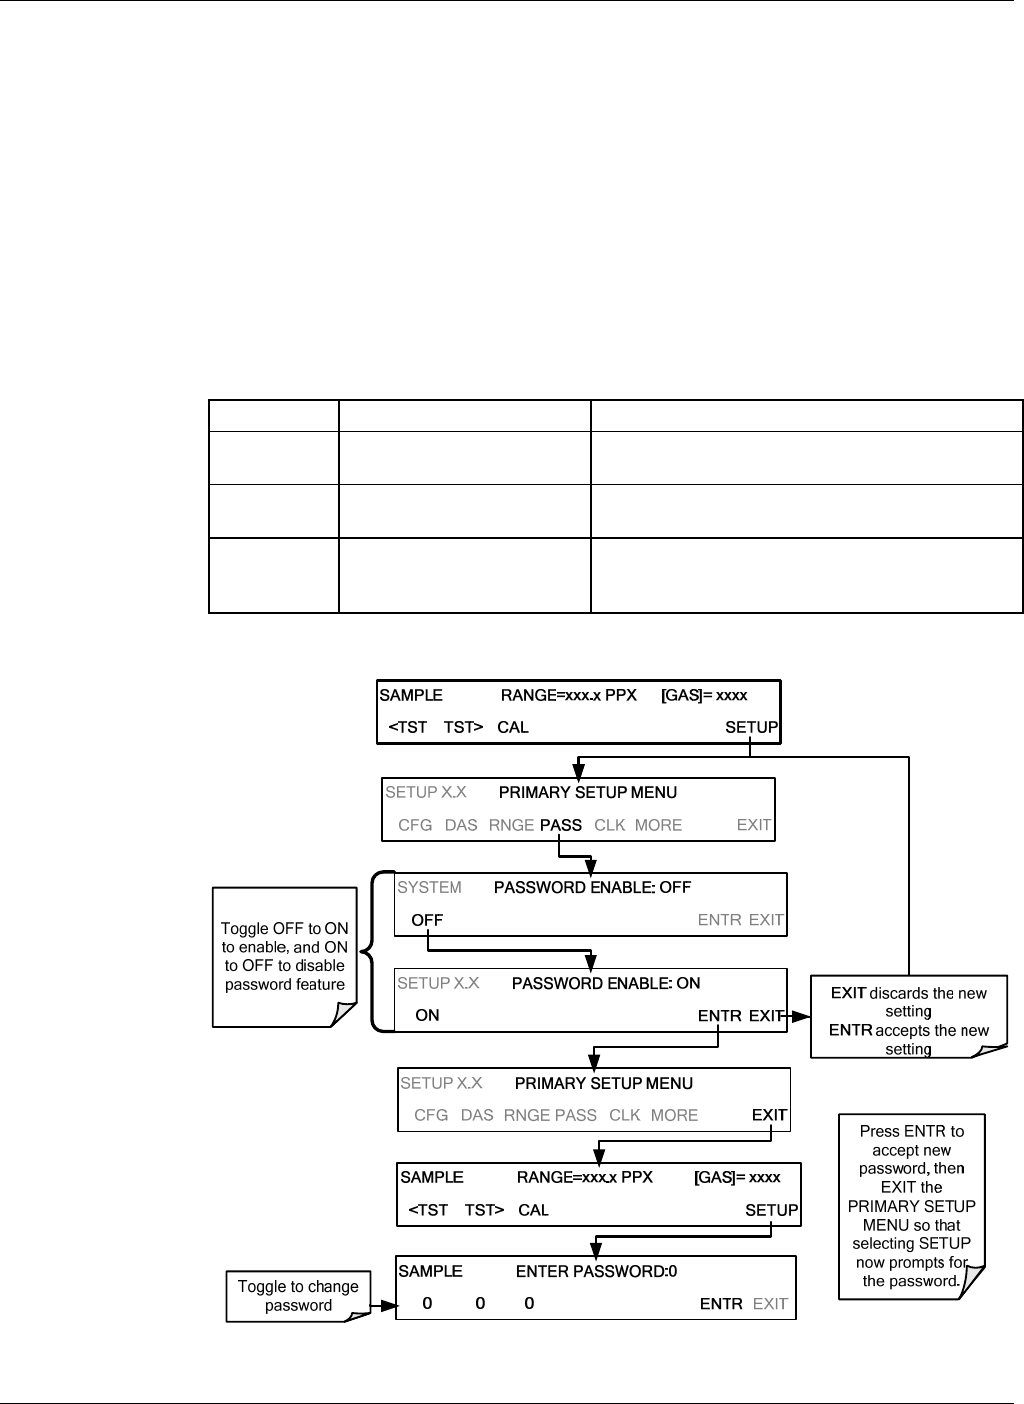
Operating Instructions Teledyne API – T101 Operation Manual
74
4.4.5. SETUP – PASS: PASSWORD PROTECTION
The menu system provides password protection of the calibration and setup functions to
prevent unauthorized adjustments. When the passwords have been enabled in the PASS
menu item, the system will prompt the user for a password anytime a password-protected
function (e.g., SETUP) is selected. This allows normal operation of the instrument, but
requires the password (101) to access to the menus under SETUP. When PASSWORD is
disabled (SETUP>OFF), any operator can enter the Primary Setup (SETUP) and
Secondary Setup (SETUP>MORE) menus. Whether PASSWORD is enabled or disabled,
a password (default 818) is required to enter the VARS or DIAG menus in the
SETUP>MORE menu.
Table 4-6. Password Levels
PASSWORD LEVEL MENU ACCESS ALLOWED
Null (000) Operation All functions of the main menu (top level, or
Primary, menu)
101 Configuration/Maintenance
Access to Primary and Secondary SETUP
Menus when PASSWORD is enabled
818 Configuration/Maintenance
Access to Secondary SETUP Submenus VARS
and DIAG whether PASSWORD is enabled or
disabled.
To enable or disable passwords, press:
07266B DCN6485
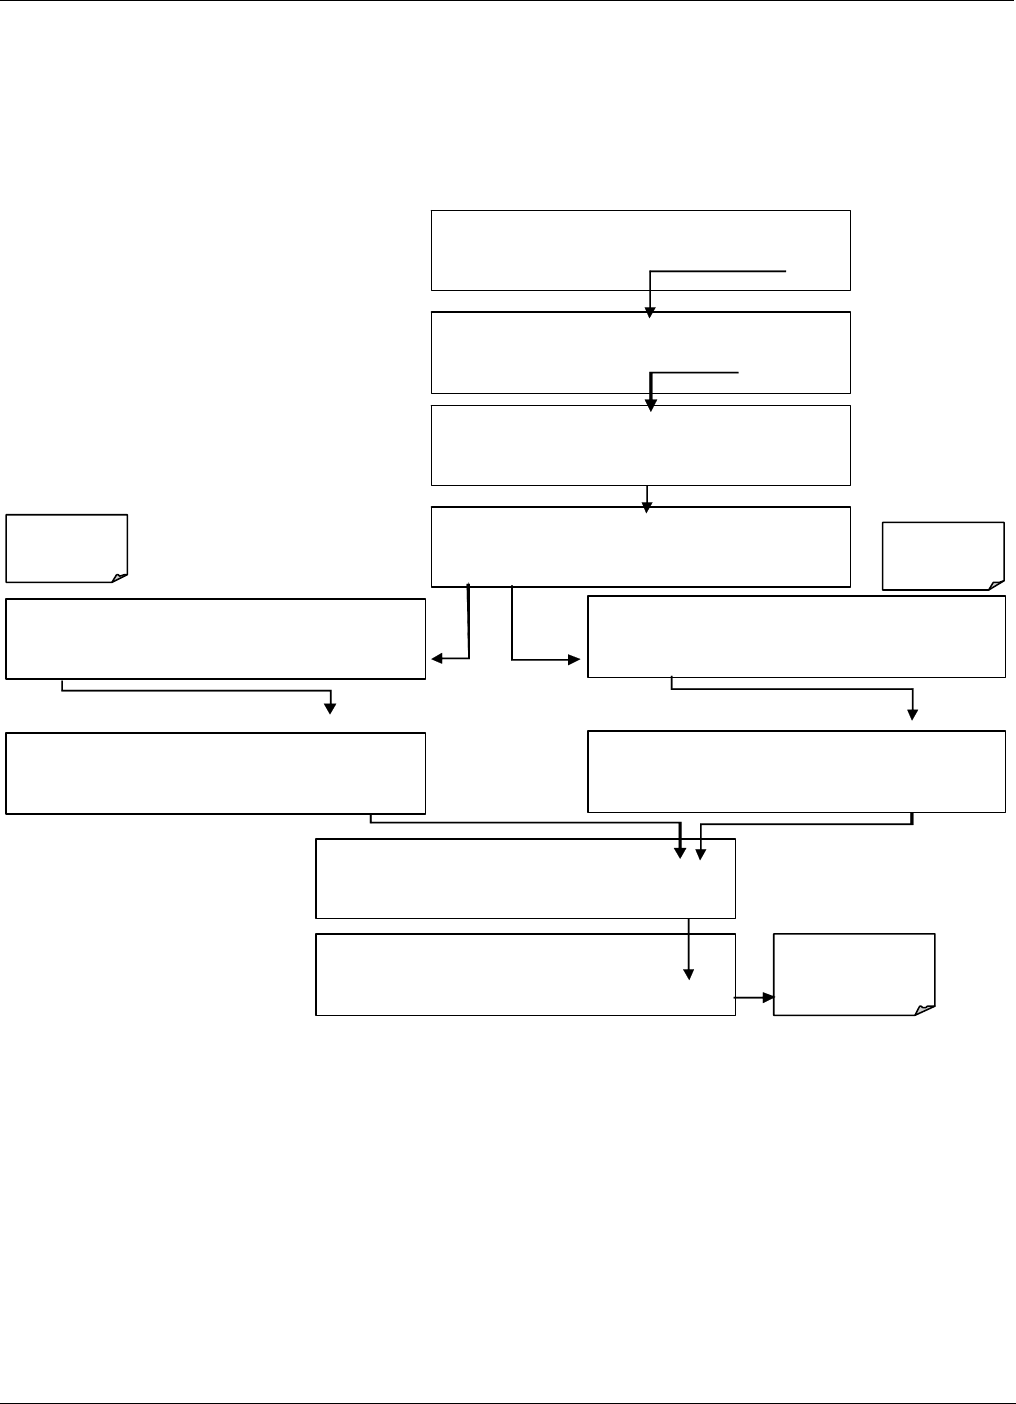
Teledyne API – T101 Operation Manual Operating Instructions
75
4.4.6. SETUP – CLK: SETTING THE INTERNAL TIME-OF-DAY
CLOCK
The T101 has a built-in clock for the AutoCal timer, Time TEST function, and time
stamps on COM port messages and DAS data entries. To set the time-of-day, press:
SET UP X.
X
TIME-OF-DAY CLOCK
TIME DATE EXIT
SETUP X. X PRIMARY SETUP M ENU
CFG DAS RNGE PASS CLK MORE EXIT
EXIT returns
to the main
SAMPLE display
Enter Current
Date-of-Year
SETUP X.X DATE: 01-JAN-02
0 1 JAN 0 2 ENTR EXIT
SETUP X.X DATE: 01-JAN-02
0 1 JAN 0 2 ENTR EXIT
SETUP X. X TIM
E
-OF-DAY CLOCK
TIME DATE EXIT
Enter Current
Time-of-Day
SETUP X.X3 TIME: 12:00
1 2 : 0 0 ENTR EXIT
SETUP X.
X
TIME: 12:00
1 2 : 0 0 ENTR EXIT
SET UP X.X
PRIMARY SETUP MENU
CFG DAS RNGE PASS CLK MOR E EXIT
SAMPLE ENTER SETUP PASS : 81
8
8 1 8 ENTR EXIT
SAMPLE RANGE = 500.0 PPB H2S =XXX.X
< TST TST > CAL SETUP
07266B DCN6485
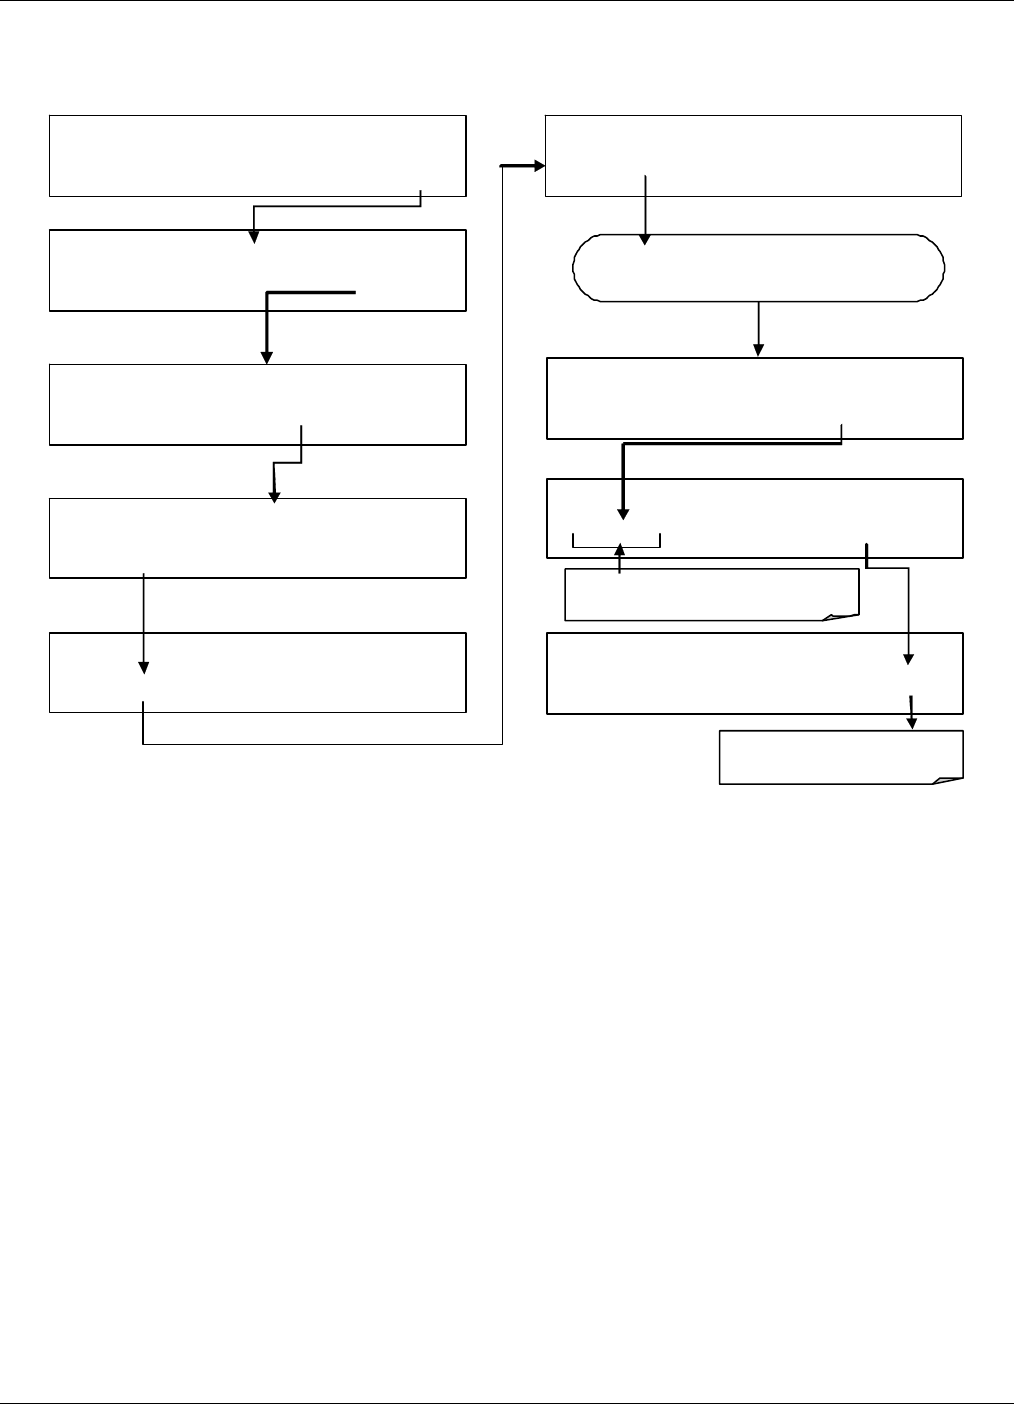
Operating Instructions Teledyne API – T101 Operation Manual
76
In order to compensate for CPU clocks which run fast or slow, there is a variable to speed
up or slow down the clock by a fixed amount every day. To change this variable, press:
SAMPLE RANGE = 500.0 PPB H2S =X XX. X
< TST TST > CAL SETUP
SAMPLE ENTER SETUP PASS : 818
8 1 8 ENTR EXIT
SETUP X.X PRIMARY SETUP MENU
CFG DAS RNGE PASS CLK MORE EXIT
3x EXIT returns
to the main SAMPLE display
SETUP X. X 0 ) ME ASURE_MODE =H2S
NEXT JUMP EDIT PRNT EXIT
Enter sig n and num ber of seconds per
da
y
the clock
g
ai ns
(
-
)
or loses
(
+
)
.
SETUPX.X 1 ) DAS_HOLD_OFF=15.0 Minutes
PREV NEXT JUMP EDIT PRNT EXIT
SETUP X.X 8) CLOCK_ADJ=0 Sec/Da
y
PREV JUMP EDIT PRNT EXIT
SETUP X .X CLOCK _A DJ:0 Sec/Da
y
+ 0 0 ENTR EXIT
SETUP X.X 8) CLOCK_ADJ=0 Sec/Day
PREV NEXT JUMP EDIT PRNT EXIT
SETUP X.X SECONDARY SETUP MENU
COMM VARS DIAG EXIT
Continue to press NEXT until …
07266B DCN6485

Teledyne API – T101 Operation Manual Operating Instructions
77
4.5. SETUP – VARS: USING THE INTERNAL VARIABLES
The T101 has several-user adjustable software variables, which define certain operational
parameters. Usually, these variables are automatically set by the instrument’s firmware,
but can be manually re-defined using the VARS menu. Table Table 4-7 lists variables that
are available within the 818 password protected level.
Table 4-7. Variable Names (VARS)
NO. VARIABLE DESCRIPTION ALLOWED
VALUES
0 MEASURE_MODE
Selects the gas measurement mode in which the instrument
is to operate. SO2 only, H2S only or dual gas measurement
of SO2 and H2S simultaneously. Dual gas mode requires
that a special switching option be installed (see Sections
4.5.1 and 10.3.2).
SO2;
SO2 – H2S;
H2S
1 CAL_GAS
Used to select the calibration gas (SO2 or H2S) or to select
default behavior (DEF) where valve position and slope-
offset are same.
DEF, SO2 , H2S
2 DAS_HOLD_OFF
Changes the internal data acquisition system (DAS ) hold-
off time, which is the duration when data are not stored in
the DAS because the software considers the data to be
questionable. That is the case during warm-up or just after
the instrument returns from one of its calibration modes to
SAMPLE mode. DAS_HOLD_OFF can be disabled entirely in
each DAS channel.
Can be between 0.5
and 20 minutes
Default=15 min.
3 TPC_ENABLE
Enables or disables the temperature and pressure
compensation (TPC) feature. ON/OFF
4 RCELL_SET
Sets the sample chamber temperature. Increasing or
decreasing this temperature will increase or decrease the
rate at which SO2* decays into SO2. (Section 10.1.2).
Do not adjust this setting unless under the direction of
Teledyne API’s Technical Support personnel.
30º C - 70º C
Default= 50º C
5 IZS_SET
Sets the IZS option temperature. Increasing or decreasing
this temperature will increase or decrease the permeation
rate of the IZS source.
30º C - 70º C
Default= 50º C
6 DYN_ZERO
Dynamic zero automatically adjusts offset and slope of the
H2S response when performing a zero point calibration
during an AutoCal (Section 6).
ON/OFF
7 DYN_SPAN
Dynamic span automatically adjusts slope and slope of the
H2S response when performing a zero point calibration
during an AutoCal (Section 6).
Note that the DYN_ZERO and DYN_SPAN features are not
allowed for applications requiring EPA equivalency.
ON/OFF
8 CONC_PRECISION
Allows the user to set the number of significant digits to the
right of the decimal point display of concentration and
stability values.
AUTO, 1, 2, 3, 4
Default=AUTO
9 CLOCK_ADJ
Adjusts the speed of the analyzer’s clock. Choose the +
sign if the clock is too slow, choose the - sign if the clock is
too fast.
-60 to +60 s/day
10 SERVICE_CLEAR Resets the service interval timer. OFF/ON
07266B DCN6485

Operating Instructions Teledyne API – T101 Operation Manual
78
NO. VARIABLE DESCRIPTION ALLOWED
VALUES
11 TIME_SINCE_SVC Displays time in hours since last service. 0-500000
12 SVC_INTERVAL Sets the interval in hours between service reminders 0-100000
07266B DCN6485
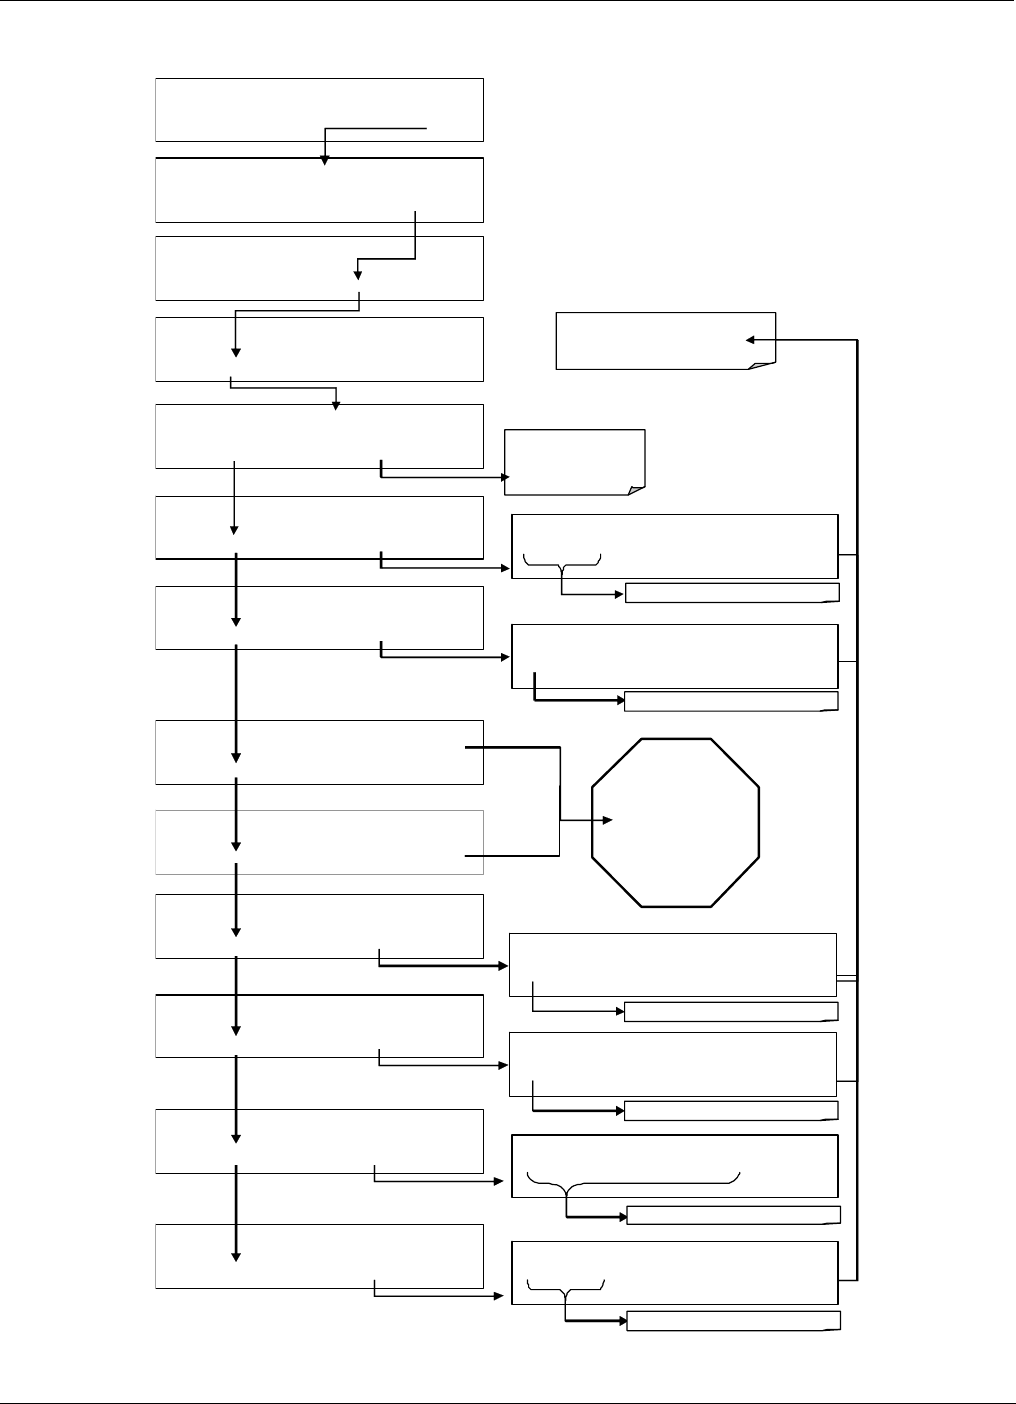
Teledyne API – T101 Operation Manual Operating Instructions
79
To access and navigate the VARS menu, use the following touchscreen button sequence:
See Section 6.8.1
for instructions
regarding this setting
SETUP X.X 0 ) MEASURE_MODE=H2S
NEXT JUMP EDIT PRNT EXIT
SE TUP X .X 1 ) DAS_HOLD_OFF=15.0 Mi nu tes
NEXT JUMP EDIT PRNT EXIT
SE TUP X .X 1 ) TPC_ENABLE=ON
PREV NEXT JUMP EDIT PRNT EXIT
SETUP X.X DAS_HOLD_OFF=15.
0
Minutes
1 5 .0 ENTR EXIT
SETUP X.X 3)RCELL_SET=50 .0 De gC
PREV NEXT JUMP EDIT PRN T EX IT
SETUP X.
X
3) IZS_SET=50.0 DegC
PREV NEXT JUMP EDIT PRN T EXIT
DO NOT change
theses set-points
unless
spec ifically
instructed to by
T-API Customer
Service.
SE TUP X. X CLOCK_ADJ=0 Sec/Day
+ 0 0 ENTR EXIT
SETUP X.
X
8) CLOCK_
A
DJ=0 Sec/Da
y
PREV NEXT JUMP EDIT PRN T EXIT
EXIT ignores the new setting.
ENTR accepts the new setting.
SE TUP X. X TPC_ENABLE=ON
ON ENTR EXIT
SE TUP X .X 5 ) DYN_ZERO=ON
PREV NEXT JUMP EDIT PRNT EXIT
SETUP X.
X
DYN_ZERO=ON
ON ENTR EXIT
Toggle to change setting
Toggle to change setting
SE TUP X .X 6) DYN_SPAN=ON
PREV NEXT JUMP EDIT PRNT EXIT
SETUP X.
X
DYN_SPAN=ON
ON ENTR EXIT
Toggle to change setting
Toggle to change setting
Toggle each to change setting
SE TUP X. X CONC_PRECISION : 3
AUTO 0 1 2 3 4 ENTR EXIT
SETUP X.X 7) CONC_PRECISION : 1
PREV NEXT JUMP EDIT PRN T EXIT
Toggle each to ch ange se ttin gs
SAMPLE ENTER SETUP PASS : 818
8 1 8 ENTR EXIT
SE TUP X .X PRIMARY SETUP MENU
CFG DAS RNGE PASS CLK MORE EXIT
SE TUP X .X SECONDARY SETUP MENU
COMM VARS DIAG EXIT
SAMPLE RANGE = 500.0 PPB H2S =XXX. X
< TST TST > CAL SETUP
07266B DCN6485
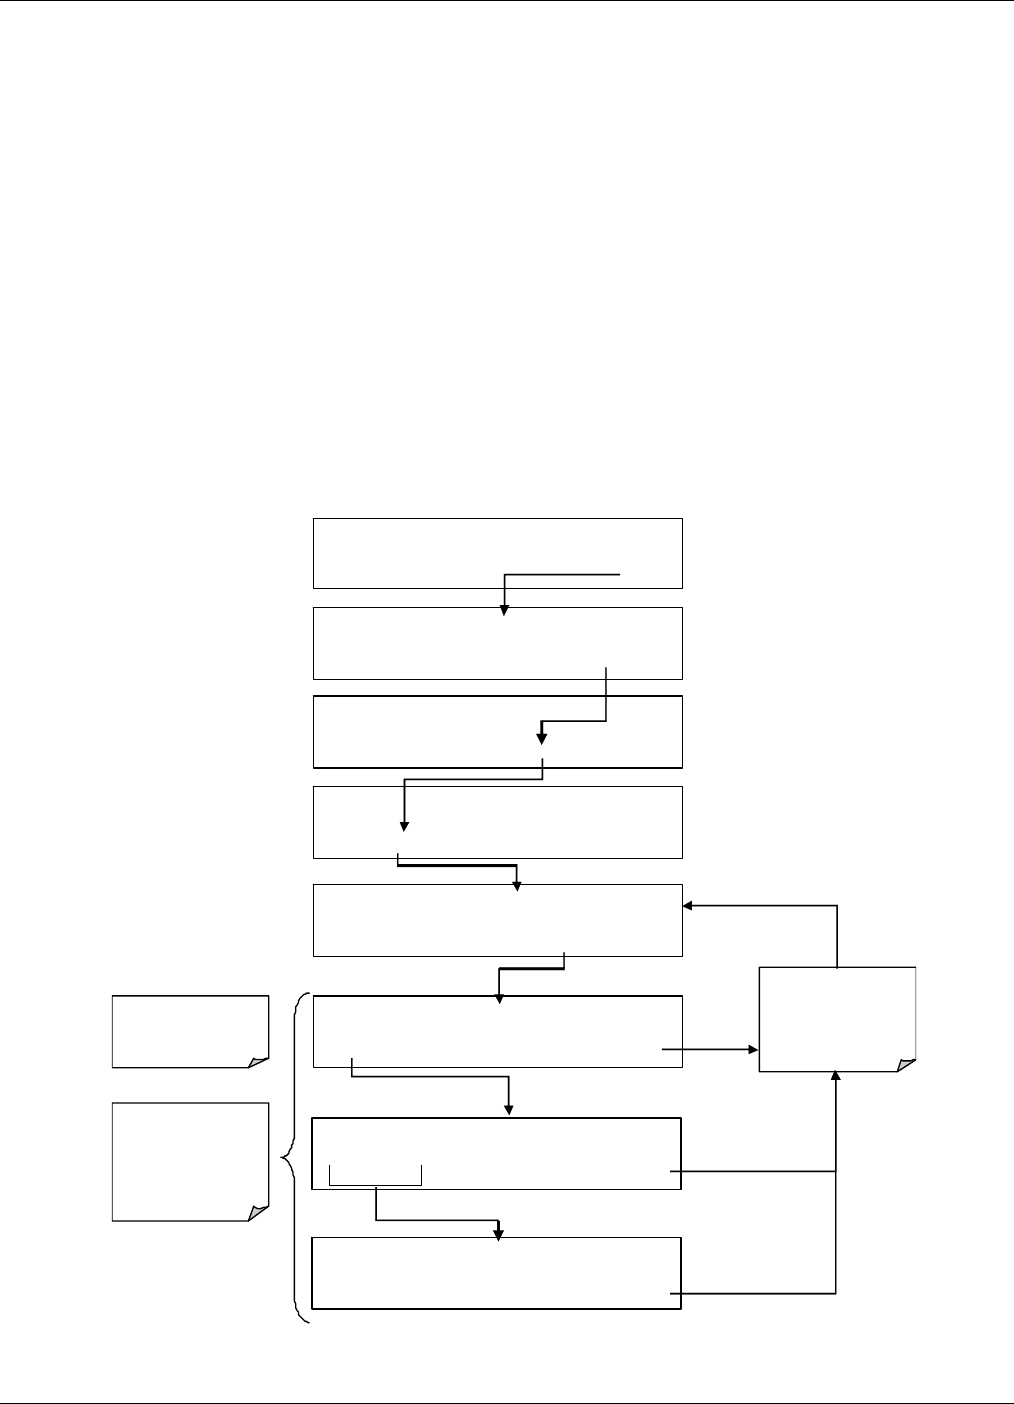
Operating Instructions Teledyne API – T101 Operation Manual
80
4.5.1. SETTING THE GAS MEASUREMENT MODE
If the switching valves software is activated, the T101 can be set to one of three gas
measurement modes:
H2S
The sample gas stream is stripped of any ambient SO2 by a special
chemical scrubber, then passed through a catalytic converter that changes
the H2S present into SO2 which is then measured using the UV
Fluorescence method
SO2
The sample gas stream bypasses the SO2 Scrubber and catalytic converter
allowing the only ambient SO2 to be measured.
H2S – SO2
The switching valve alternates the gas stream between the two paths at
regular intervals allowing the instrument to measure both gases.
To select one of these three measurement modes (see Section 10.3.2 for additional
details), press:
SETUP X.X 0 ) MEASURE_MODE=H2S
NEXT JUMP EDIT PRNT EXIT
EXIT ignores the new
setting.
ENTR accepts the
new setting.
SAMPLE ENTER SETUP PASS : 818
8 1 8 ENTR EXIT
SETUP X.X
PRIMARY SETUP MENU
CFG DAS RNGE PASS CLK MORE EXIT
SETUP X.X
SECONDARY SETUP MENU
COMM VARS DIAG EXIT
SAMPLE RANGE = 500.0 PPB H2S =XXX.X
< TST TST > CAL SETUP
SETUP X.X MEASURE MODE: H2S
PREV ENTR EXIT
SETUP X.X MEASURE MODE: H2S-SO2
PREV NEXT ENTR EXIT
SETUP X.X MEASURE MODE: SD2
NEXT ENTR EXIT
H2S mode is the
default mode.
Press the PREV
and NEXT buttons
to scroll among gas
measurement
mo de cho ice s.
07266B DCN6485

Teledyne API – T101 Operation Manual Operating Instructions
81
4.6. SETUP – DIAG: USING THE DIAGNOSTICS
FUNCTIONS
A series of diagnostic tools is grouped together under the SETUPMOREDIAG
menu. As these parameters are dependent on firmware revision (see Menu Tree A-5 in
Appendix A). The individual parameters, however, are explained in more detail in the
following section, indicated in Table 4-8. These tools can be used in a variety of
troubleshooting and diagnostic procedures and are referred to in many places of the
maintenance and trouble-shooting sections.
Table 4-8. T101 Diagnostic (DIAG) Functions
DIAGNOSTIC FUNCTION AND MEANING FRONT PANEL
MODE
INDICATOR SECTION
SIGNAL I/O: Allows observation of all digital and analog signals in the
instrument. Allows certain digital signals such as valves and heaters to be
toggled ON and OFF.
DIAG I/O 4.6.1
ANALOG OUTPUT: When entered, the analyzer performs an analog
output step test. This can be used to calibrate a chart recorder or to test
the analog output accuracy.
DIAG AOUT 4.6.2
ANALOG I/O CONFIGURATION: Analog input/output parameters are
available for viewing and configuration. DIAG AIO 4.6.3
OPTIC TEST When activated, the analyzer performs an optic test, which
turns on an LED located inside the sensor module near the PMT (Fig. 10-
15). This diagnostic tests the response of the PMT without having to
supply span gas.
DIAG OPTIC
4.6.4
ELECTRICAL TEST: When activated, the analyzer performs an electric
test, which generates a current intended to simulate the PMT output to
verify the signal handling and conditioning of the PMT preamp board.
DIAG ELEC 4.6.5
LAMP CALIBRATION: The analyzer records the current voltage output
of the UV source reference detector. This value is used by the CPU to
calculate the lamp ration used in determining the H2S/SO2 concentration
(see 10.2.2)
DIAG LAMP
4.6.6
PRESSURE CALIBRATION: The analyzer records the current output of
the sample gas pressure sensor. This value is used by the CPU to
compensate the H2S concentration when the TPC feature is enabled.
DIAG PCAL 4.6.7
FLOW CALIBRATION: This function is used to calibrate the gas flow
output signals of sample gas and ozone supply. These settings are
retained when exiting DIAG.
DIAG FCAL 4.6.8
TEST CHAN OUTPUT: Configures the A4 analog output channel. DIAG TCHN 4.6.9
07266B DCN6485
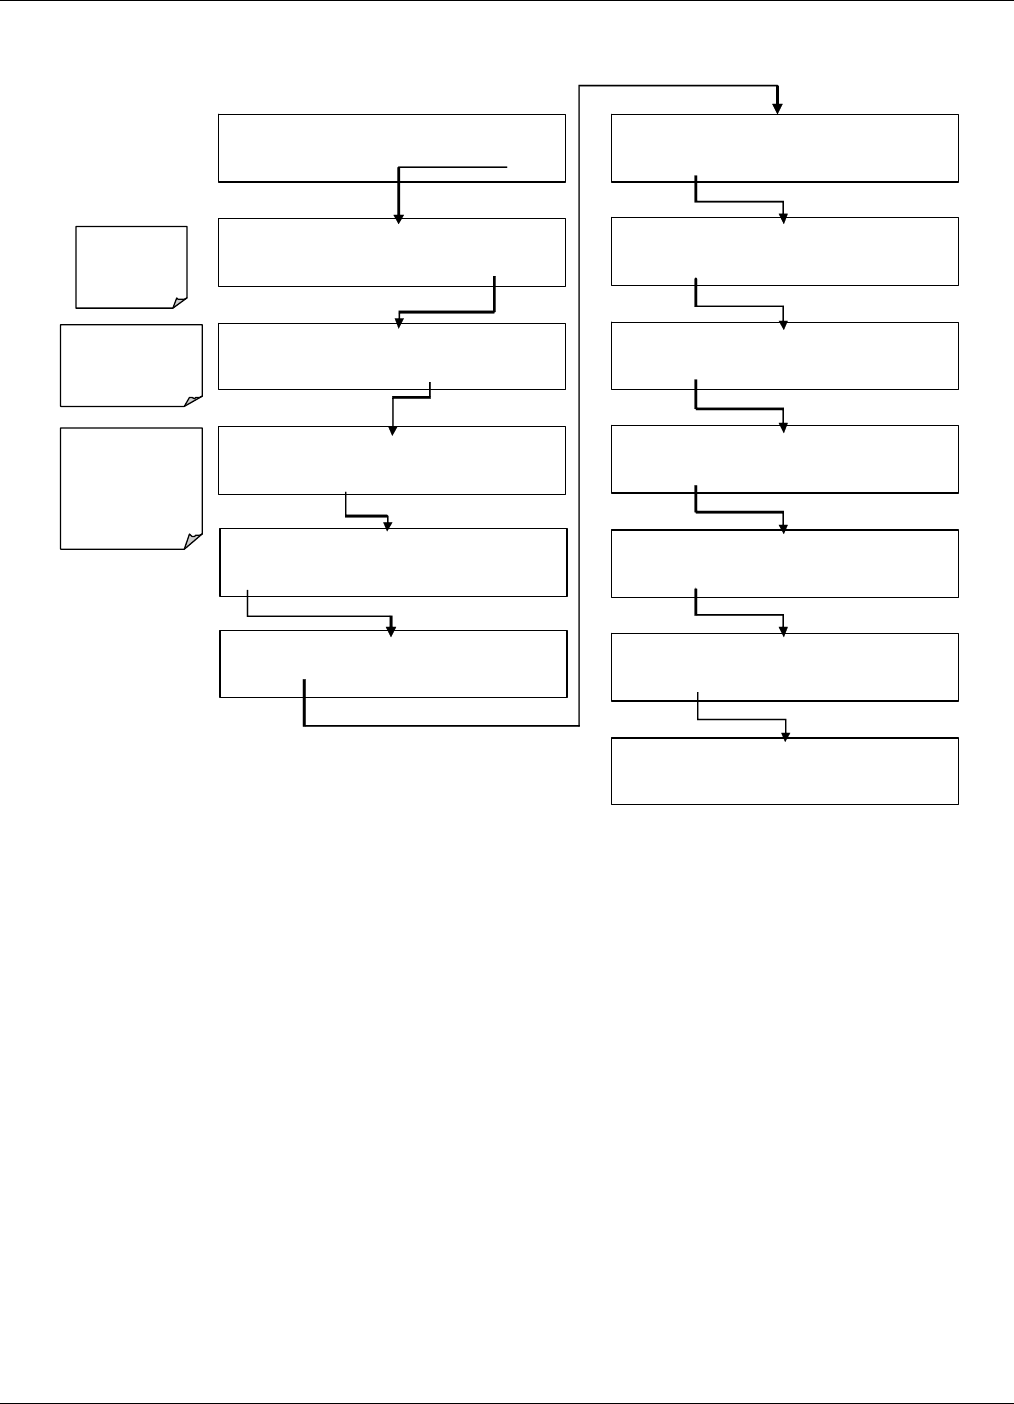
Operating Instructions Teledyne API – T101 Operation Manual
82
To access the DIAG functions press the following buttons:
SAMPLE ENTER SETUP PASS : 818
8 1 8 ENTR EXIT
SETUP X.X PRIMARY SETUP MENU
CFG DAS RNGE PASS CLK MORE EXIT
SETUP X.X SECONDARY SETUP MENU
COMM VARS DIAG EXIT
SAMPLE RANGE = 500.0 PPB H2S =XXX.X
< TST TST > CAL SETUP
Within the COMM,
VARS an d DIAG
me nus, EXIT returns
to the
SECONDARY
SETUP MENU
EXIT returns
to the PRIMARY
SETUP MENU
DIAG PRESSURE CALIBRATION
PREV NEXT ENTR EXIT
DIAG OPTIC TEST
PREV NEXT ENTR EXIT
DIAG SIGNAL I / O
NEXT ENTR EXIT
DIAG AN AL OG OUTPUT
PRE V NEXT ENTR EXIT
DIAG
A
NALOG I / O CONFIGURATION
PREV NEXT ENTR EXIT
DIAG TEST CHAN OUTPUT
PREV ENTR EXIT
DIAG ELECTRICAL TEST
PREV NEXT ENTR EXIT
DIAG LAMP CALIBRATION
PREV NEXT ENTR EXIT
EXIT returns
to the mai n
SAMPLE
displ ay
DIAG FLOW CALIBRATION
PREV NEXT ENTR EXIT
07266B DCN6485
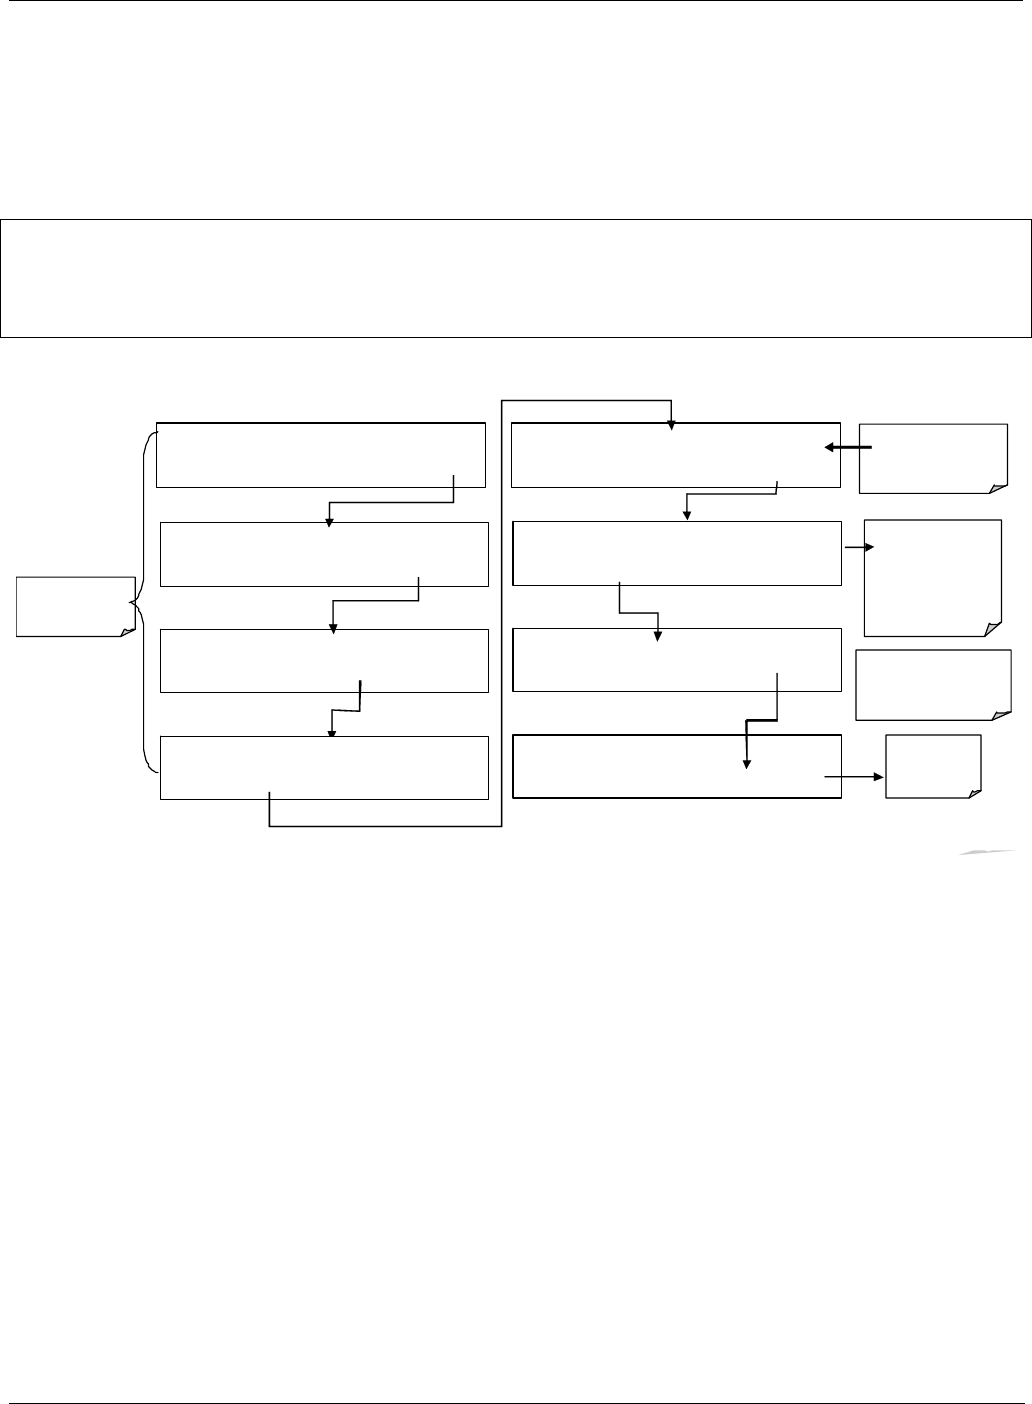
Teledyne API – T101 Operation Manual Operating Instructions
83
4.6.1. SIGNAL I/O
The signal I/O diagnostic mode allows reviewing and changing the digital and analog
input/output functions of the analyzer. See Appendix A for a list of the parameters
available under this menu.
NOTE
Any changes of signal I/O settings will remain in effect only until the signal I/O menu is exited. Exceptions
are the ozone generator override and the flow sensor calibration, which remain as entered when exiting.
To enter the signal I/O test mode, press:
SAMPLE RANGE = 500.0 PPB H2S =XXX.X
< TST TST > CAL SETUP
EXAMP LE
SAMPLE ENTER SETUP PASS : 818
8 1 8 ENTR EXIT
SETUP X.X PRIMARY SETUP M ENU
CFG DAS RNGE PASS CLK MORE EXIT
DIAG SIGNAL I / O
PREV NEXT JUMP ENTR EXIT
DIAG I / O EXT_ZERO_CAL=OFF
PREV NEXT JUMP PRNT EXIT
Press JUMP to go
dir ectly to a specific
signal
See Appendix A-4 for
a complete li st of
ava ila ble SIGNALS
DIAG I / O JUMP TO: 12
1 2 ENTR EXIT
EXAMP LE :
Enter 12 to Jump to
12) ST_CONC_VALID
DIAG I / O ST_CONC_VALID = ON
PREV NE XT JUMP ON PR NT EXIT
Exit to return
to th e
DIAG menu
SETUP X.X SECOND ARY SETUP MENU
COMM VARS DIAG EXIT
Pr ess NEXT & PREV to
m ove b etwee n sign al
types.
Pressing PRNT will send a formatted printout to the serial port and can be captured
wi th a comp uter o r other ou tput device .
EXIT returns
to the main
SAMPLE display
07266B DCN6485
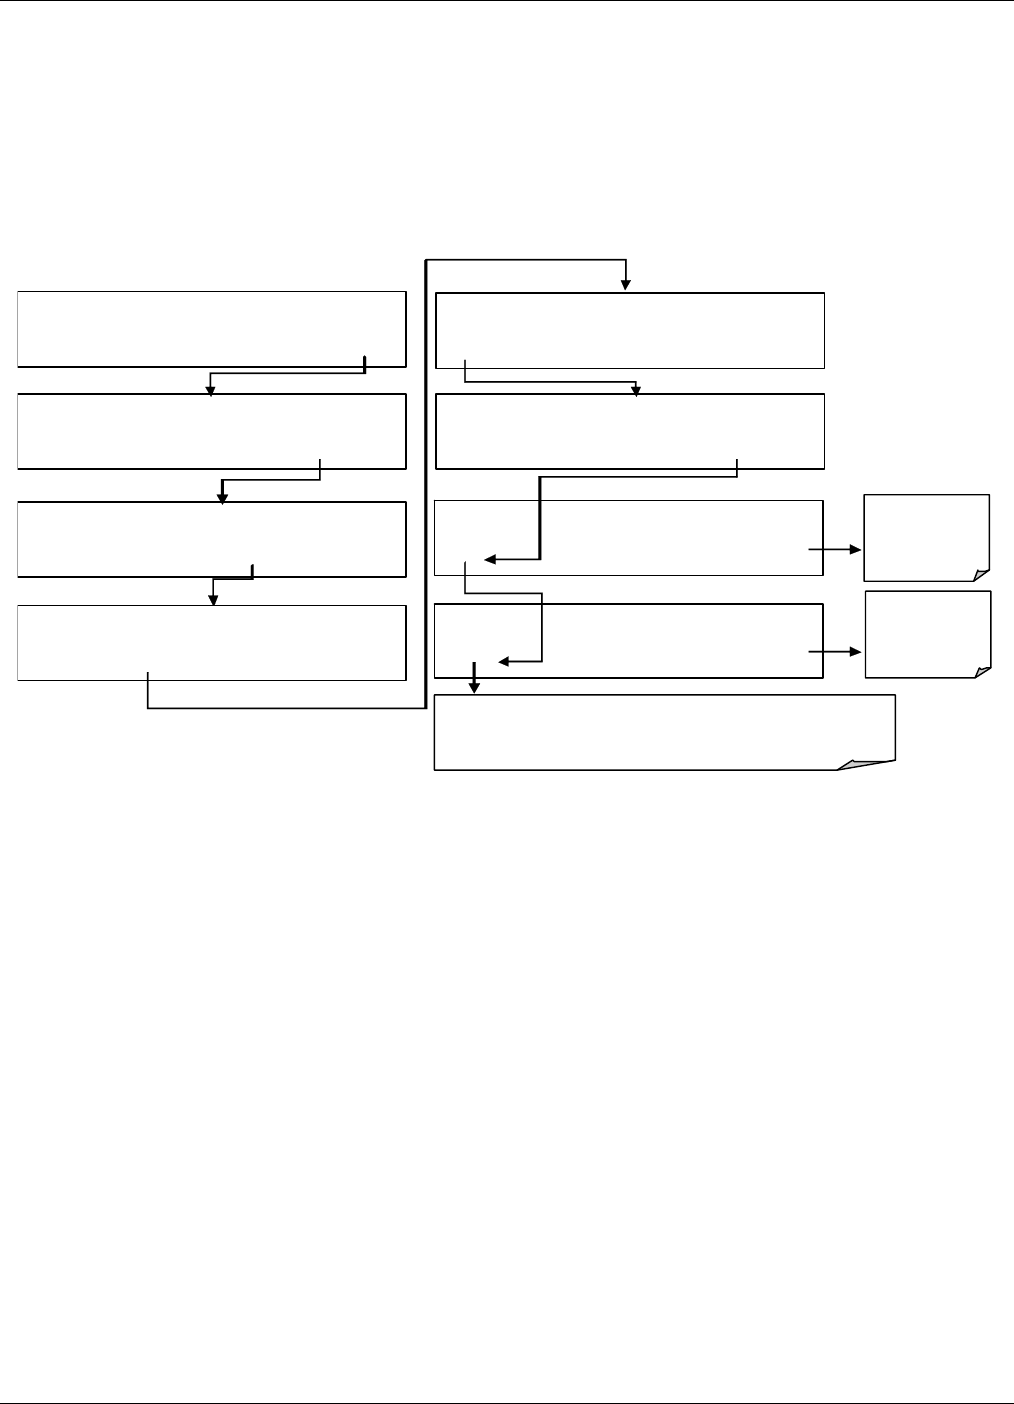
Operating Instructions Teledyne API – T101 Operation Manual
84
4.6.2. ANALOG OUTPUT STEP TEST
This test can be used to check the accuracy and proper operation of the analog outputs.
The test forces all four analog output channels to produce signals ranging from 0% to
100% of the full scale range in 20% increments. This test is useful to verify the operation
of the data logging/recording devices attached to the analyzer.
To begin the Anog Output Step Test press:
SAMPLE RANGE = 500.0 PPB H2S =X XX.X
< TST TST > CAL SETUP
SAMPLE ENTER SETUP PASS : 818
8 1 8 ENTR EXIT
SETUP X .X PRIM ARY SETUP MENU
CFG DAS RNGE PASS CL K MORE EXIT
DIAG SIGNAL I / O
NEXT ENTR EXIT
Exit-Exit
returns to the
DIAG menu
SETUP X .X SECONDARY SETUP MENU
C OMM VARS DIAG EXIT
DIAG
A
NALOG OUTPUT
PREV NEXT ENTR EX IT
DIAG AOUT ANALOG OUTPUT
0% EXIT
Perform s
analog output
step test.
0% - 10 0%
DIAG AOUT ANALOG OUTPUT
[0%] EXIT
Pre ssi ng the button under “0%” whil e p erformin g the test will pause
the test at that l evel . Brackets will ap pe ar aro und th e value; exa mple:
[20%] Pressing the sam e bu tton again wi ll resume the test.
07266B DCN6485

Teledyne API – T101 Operation Manual Operating Instructions
85
4.6.3. ANALOG I/O CONFIGURATION
Table 4-8 lists the analog I/O functions that are available in the T101.
Table 4-9. DIAG - Analog I/O Functions
SUB MENU FUNCTION
AOUTS
CALIBRATED: Shows the status of the analog output calibration (YES/NO) and initiates a
calibration of all analog output channels.
CONC_OUT_1 Sets the basic electronic configuration of the A1 analog output (H2S). There are
three options:
RANGE: Selects the signal type (voltage or current loop) and full scale level
of the output.
REC_OFS: Allows setting a voltage offset (not available when RANGE is set
to current loop.
AUTO_CAL: Performs the same calibration as AOUT CALIBRATED, but on
this one channel only.
NOTE: Any change to RANGE or REC_OFS requires recalibration of this output.
CONC_OUT_2 Same as for CONC_OUT_1 but for analog channel 2 (H2S)
TEST OUTPUT Same as for CONC_OUT_1 but for analog channel 4 (TEST)
AIN CALIBRATED Shows the calibration status (YES/NO) and initiates a calibration of the analog to
digital converter circuit on the motherboard.
XIN1
.
.
.
XIN8
For each of 8 external analog inputs channels, shows the gain, offset, engineering
units, and whether the channel is to show up as a Test function.
To configure the analyzer’s four analog outputs, set the electronic signal type of each
channel and calibrate the outputs. This consists of:
Selecting an output type (voltage or current, if an optional current output driver has
been installed) and the signal level that matches the input requirements of the
recording device attached to the channel (Section 4.6.3.1).
Calibrating the output channel. This can be done automatically or manually for each
channel (Sections 4.6.3.2 and 4.6.3.3).
Adding a bipolar recorder offset to the signal, if required (Section 4.6.3.4)
In its standard configuration, the analyzer’s outputs can be set for the following DC
voltages. Each range is usable from -5% to + 5% of the nominal range.
Table 4-10. Analog Output Voltage Ranges
RANGE MINIMUM OUTPUT MAXIMUM OUTPUT
0-0.1 V -5 mV +105 mV
0-1 V -0.05 V +1.05 V
0-5 V -0.25 V +5.25 V
0-10 V -0.5 V +10.5 V
The default offset for all ranges is 0 VDC.
07266B DCN6485
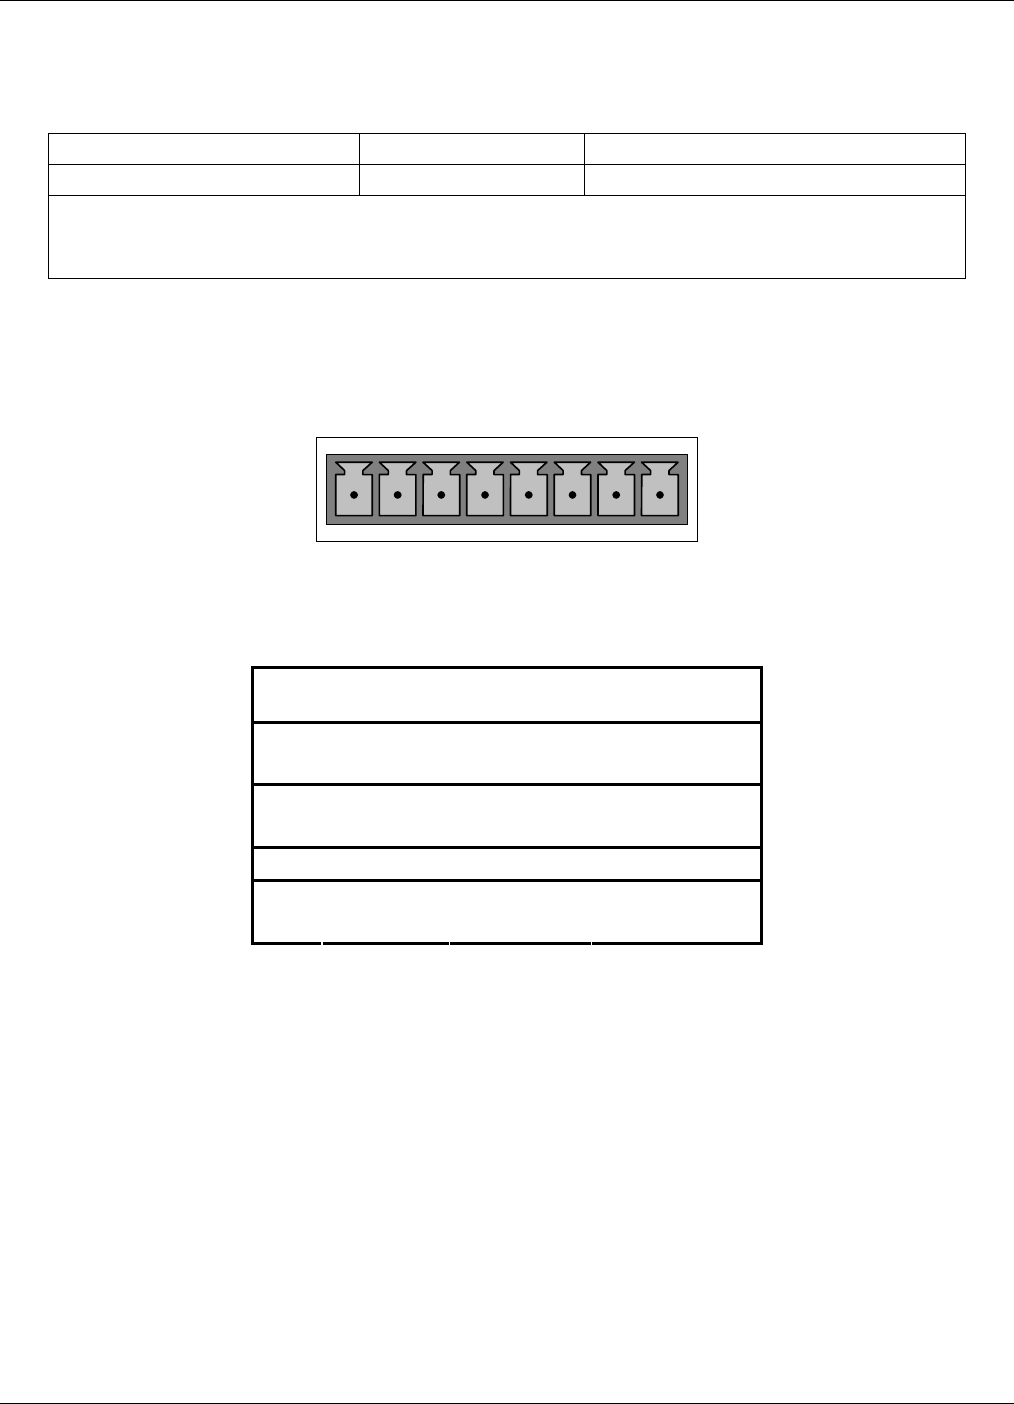
Operating Instructions Teledyne API – T101 Operation Manual
86
The following DC current output limits apply to the current loop modules:
Table 4-11. Analog Output Current Loop Range
RANGE MINIMUM OUTPUT MAXIMUM OUTPUT
0-20 mA 0 mA 20 mA
These are the physical limits of the current loop modules, typical applications use 2-20 or 4-20
mA for the lower and upper limits. Please specify desired range when ordering this option.
The default offset for all ranges is 0 mA.
Pin assignments for the output connector at the rear panel of the instrument are shown in
Table 4-12.
ANALOG OUT
A1 A2 A3 A4
+ - + - + - + -
Table 4-12. Analog Output Pin Assignments
PIN ANALOG
OUTPUT VOLTAGE
SIGNAL CURRENT
SIGNAL
1 V Out I Out +
2 A1 Ground I Out -
3 V Out I Out +
4 A2 Ground I Out -
5 A3 Not Used Not Used
7 V Out not available
8 A4 Ground not available
See Figure 3-4 for a the location of the analog output connector on the instrument’s rear
panel.
07266B DCN6485
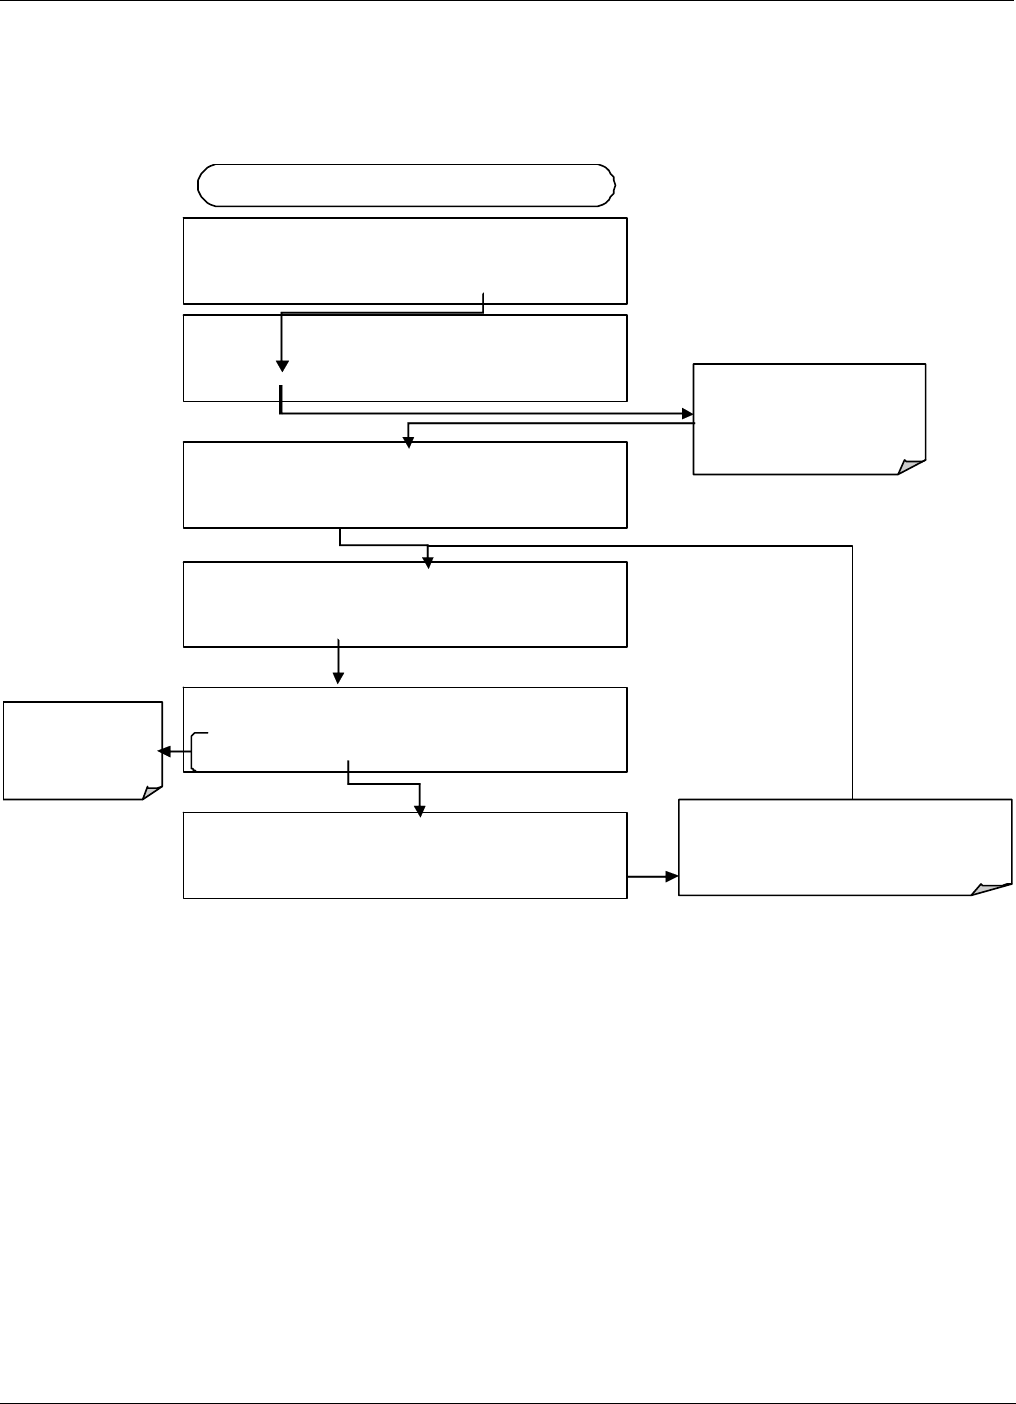
Teledyne API – T101 Operation Manual Operating Instructions
87
4.6.3.1. Analog Output Signal Type and Range Span Selection
To select an output signal type (DC Voltage or current) and level for one output channel,
activate the ANALOG I/O CONFIGURATION MENU (see Section 4.6.3) then press:
DIAG AIO CONC_OUT_2 RANGE: 5V
SET> EDIT EXIT
DIAG ANALOG I / O CONFIGURATION
PREV NEXT ENTR EXIT
DIAG AIO A OU TS CAL IBRATED: NO
< SET SET> CAL EXIT
FROM ANALOG I/O CONFIGURATION MENU
DIAG AIO OUTPUT RANGE: 5V
0.1V 1V 5V 10V CURR ENTR EXIT
Togg le to set the
signal level and
type of the
se lected channel
DIAG AIO CONC_OUT_2:5V, CAL
< SET SET> EDIT EXIT
Press SET> to select the
ana log o utput ch an ne l to be
configured. Press EDIT to
co ntinue
Pr essing ENTR records the new se ttin g
and r etur ns to the pr evious menu.
Pressing EXIT ig nores the new settin g and
returns to the previous menu.
DIAG AI O OUTPUT RANGE: 10V
0.1V 1V 5V 10V CURR ENTR EXIT
07266B DCN6485
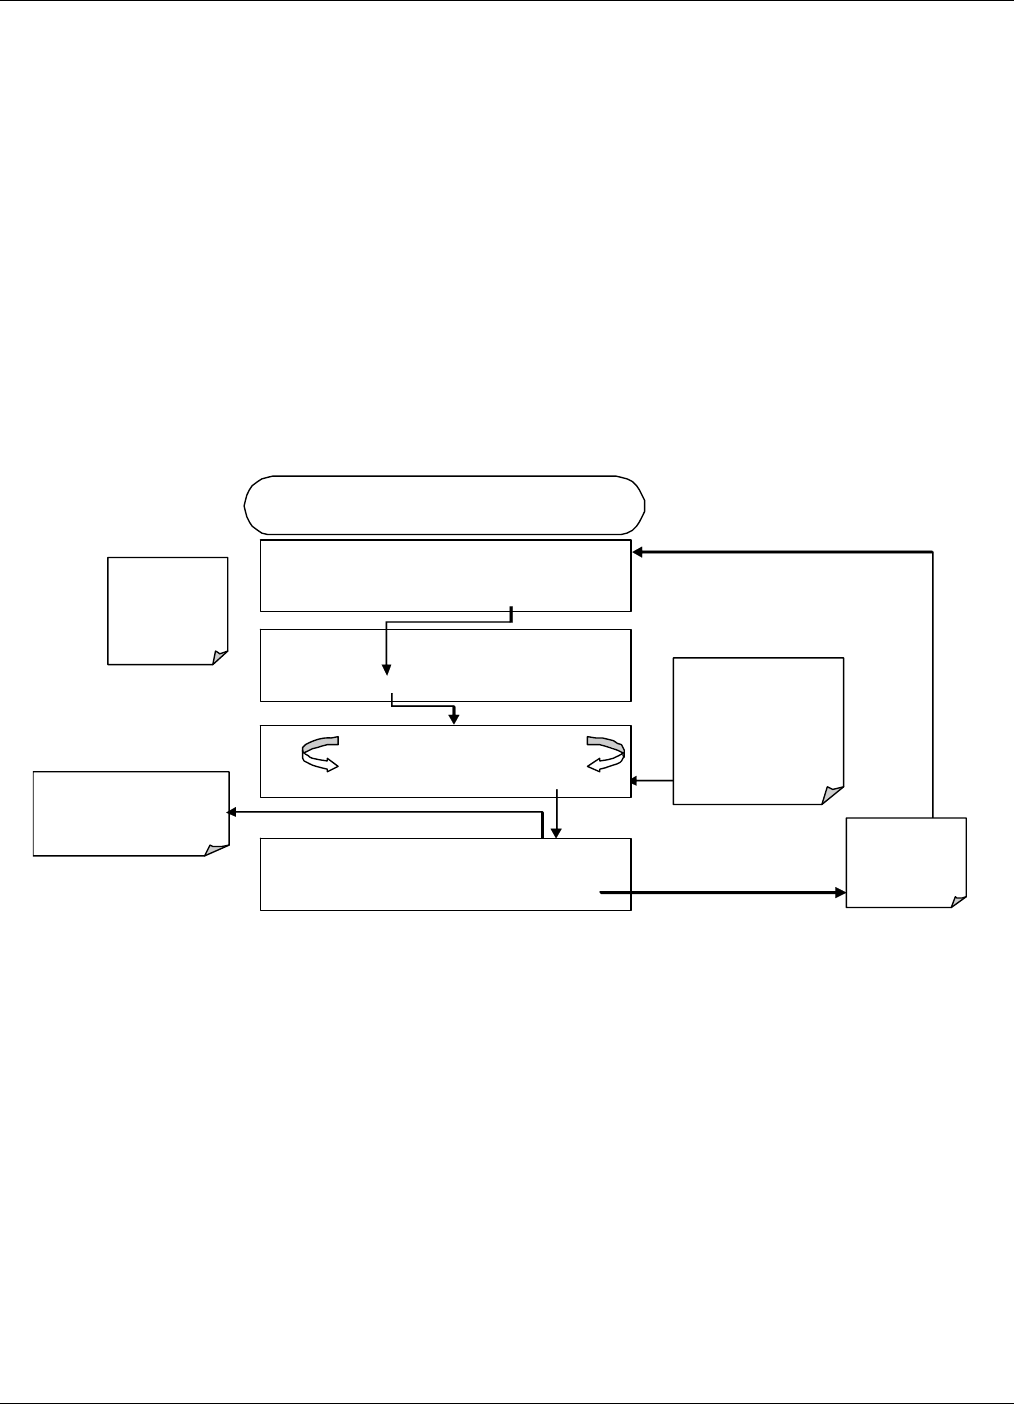
Operating Instructions Teledyne API – T101 Operation Manual
88
4.6.3.2. Analog Output Calibration Mode
Analog output calibration should be carried out on first startup of the analyzer (performed
in the factory as part of the configuration process) or whenever recalibration is required.
The analog outputs can be calibrated automatically, either as a group or individually, or
adjusted manually.
In its default mode, the instrument is configured for automatic calibration of all channels,
which is useful for clearing any analog calibration warnings associated with channels that
will not be used or connected to any input or recording device, e.g., datalogger.
Manual calibration should be used for the 0.1V range or in cases where the outputs must
be closely matched to the characteristics of the recording device. Manual calibration
requires the AUTOCAL feature to be disabled.
To calibrate the outputs as a group, activate the ANALOG I/O configuration menu (see
Section 4.6.3), then press:
DIAG AIO AUTO CALIBRATING CONC_OUT_1
AUTO CALIBRATING CONC_OUT_2
AUTO CALIBRATING TEST_OUTPUT
Exit at any ti me
to return to the
main DIAG
menu
DIAG
A
NALOG I / O CONFIGURATION
PREV NEXT ENTR EXIT
DIAG AIO
A
OUTS CALIBRATED: NO
< SET SE T> CAL EX IT If AutoCal has been
turned off for any
channel, the messa ge
for that channel will be
similar to:
NOT AUTO CAL
CONC_OUT_1
Exit to return to
the I/O
configuration
menu
STARTING FROM DIAGNOSTIC MENU
( see Se cti on 6.9.1)
If a ny of the c hannels h ave
not be en calibr ated this
mess age wil l r ead NO.
DIAG AIO AOUTS CALIBRATED: YES
< SET SET> CAL EXIT
07266B DCN6485
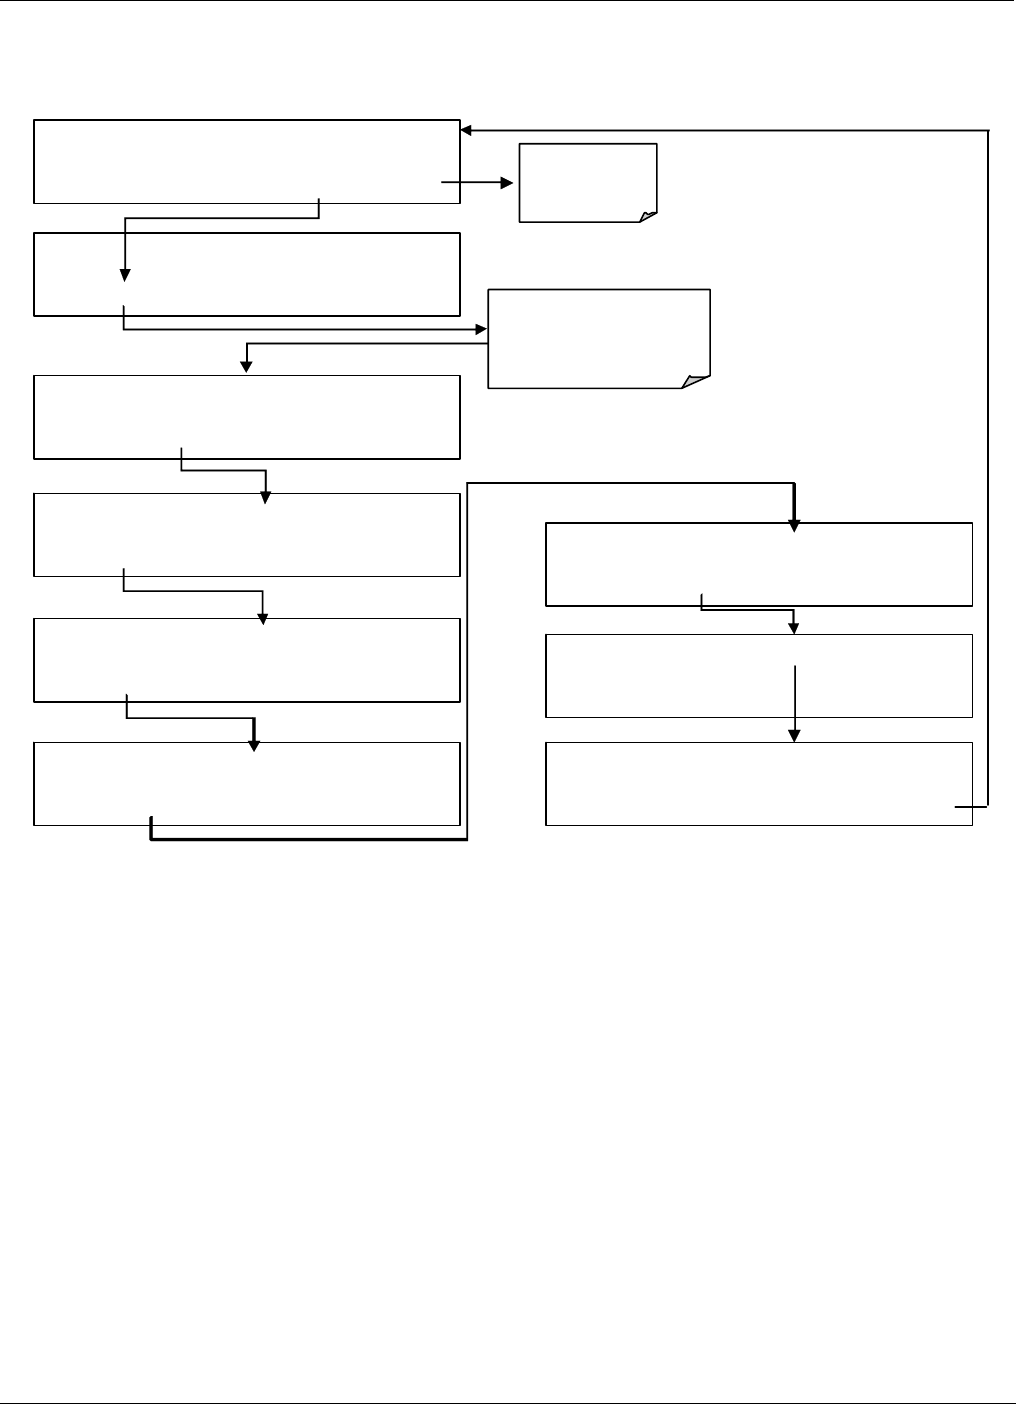
Teledyne API – T101 Operation Manual Operating Instructions
89
To automatically calibrate an single analog channel, activate the ANALOG I/O
CONFIGURATION MENU (see Section 4.6.3), then press:
DIAG AIO CONC_OUT_2 CALIBR
A
TED: NO
<SET CAL EXIT
DIAG AIO
A
UTO CALIBRATING CONC_OUT_2
DIAG AIO CONC_OUT_2 CALIBRATED: YES
<SET CAL EXIT
DIAG ANALOG I / O CONFIGURATION
PREV NEXT ENTR EXIT
DIAG AIO AOUTS CALIBRATED: NO
< SET> CAL EXIT
DIAG AIO CONC_OUT_2 RANGE: 5V
SET> EDIT EXIT
DIAG AIO CONC_OUT_2:5V, CAL
< SET SET> EDIT EXIT
DIAG AIO CONC_OUT_2 REC OF
S
: 0 mV
< SET SET> EDIT EXIT
DIAG AIO CONC_OUT_2 AUTO CAL: ON
< SET SET> EDIT EXIT
EXIT to Return
to the main
Sample Display
Press SET
>
to select the
Analog Output ch annel to
be co nfig ured. The n Press
EDIT to continue
07266B DCN6485
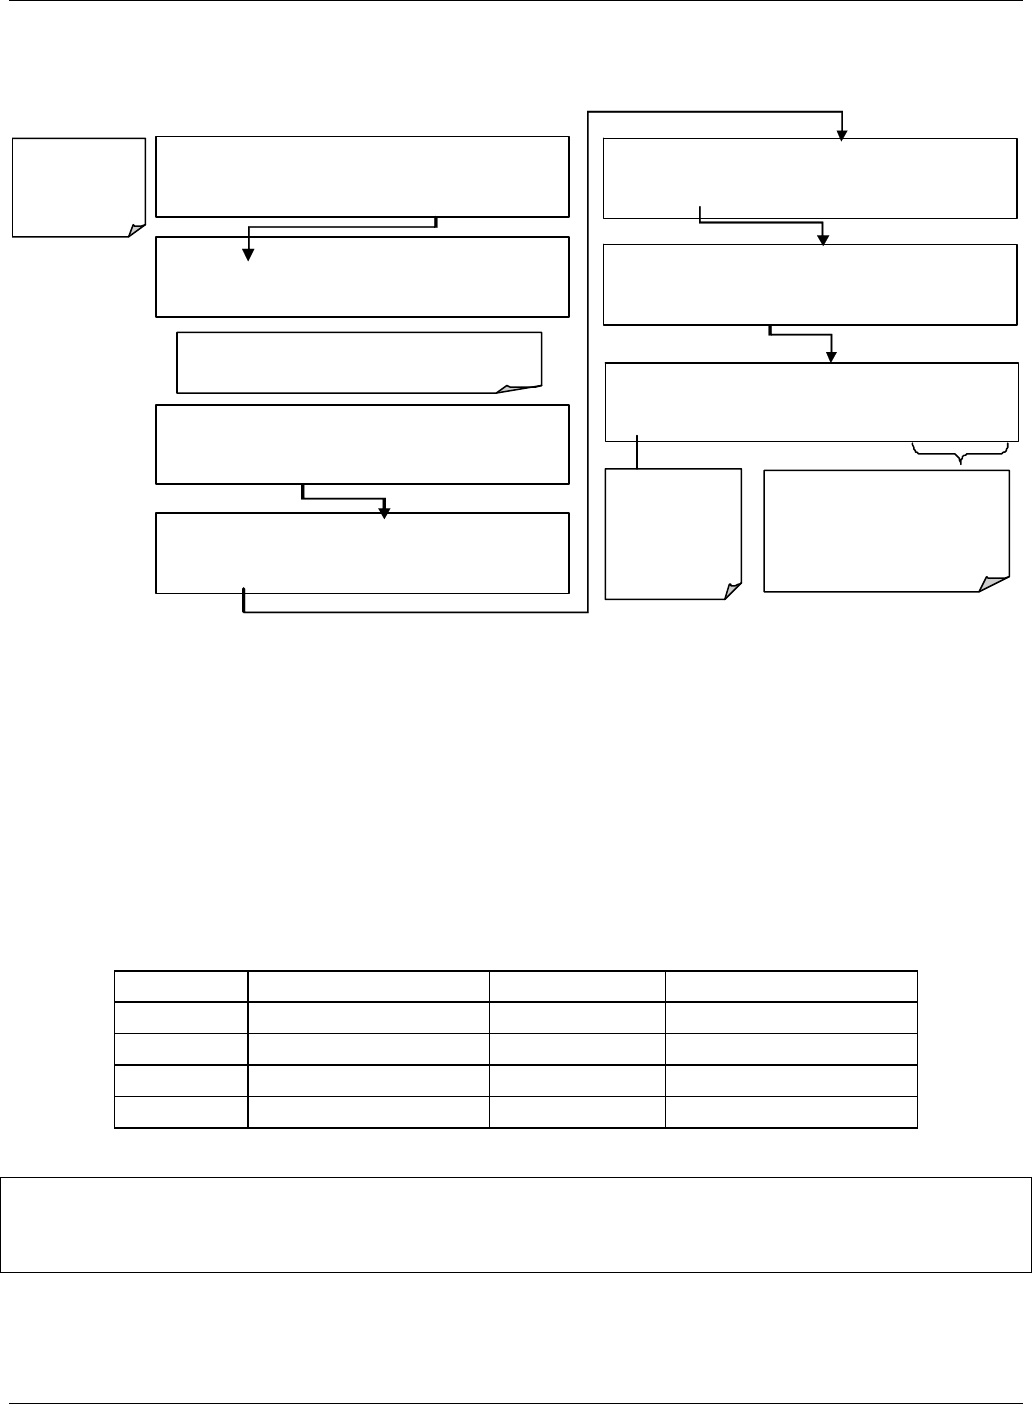
Operating Instructions Teledyne API – T101 Operation Manual
90
To select manual output calibration for a particular channel, activate the ANALOG I/O
CONFIGURATION MENU (see Section 4.6.3), then press:
DIAG AIO AOUT AUTO CAL: ON
ON ENTR EXIT
Exit to return to
th e main
sample display
DIAG ANALOG I / O CONFIGURATION
PREV NEXT ENTR EXIT
DIA G AIO AOUTS CA LIBRATED: NO
< SET SET> CAL EXIT
DIAG AIO CONC_OUT_2 RANGE: 5V
SET> EDIT EXIT
Toggles the
auto cal mode
ON/ OFF f or
this an alo g
output ch annel
only.
DIAG AIO CONC_OUT_2:5V, CAL
< SET SET> EDIT EXIT
Press SET> to sele ct the analog output channel to
be config ure d. Then press EDIT to continue
ENTR accepts the new setting
and returns to the previ ous
menu. EXIT ign or es the new
setting an d returns to the
pre vi ous menu .
DIAG AIO CONC_OUT_2 REC OFS: 0 mV
< SET SET> EDIT EXIT
DIAG AIO CONC_OUT_2 AUTO CAL: ON
< SET SET> EDIT EXIT
Now the analog output channels should either be automatically calibrated or they should
be set to manual calibration, which is described next.
4.6.3.3. Manual Analog Output Calibration and Voltage Adjustment
For highest accuracy, the voltages of the analog outputs can be manually calibrated.
Calibration is done through the instrument software with a voltmeter connected across the
output terminals (Figure 4-4). Adjustments are made using the front panel buttons by
setting the zero-point first and then the span-point (Table 4-13).
The software allows this adjustment to be made in 100, 10 or 1 count increments.
Table 4-13. Voltage Tolerances for Analog Output Calibration
Full Scale Zero Tolerance Span Voltage Span Tolerance
0.1 VDC ±0.0005V 90 mV ±0.001V
1 VDC ±0.001V 900 mV ±0.001V
5 VDC ±0.002V 4500 mV ±0.003V
10 VDC ±0.004V 4500 mV ±0.006V
NOTE
Outputs configured for 0.1V full scale should always be calibrated manually.
07266B DCN6485
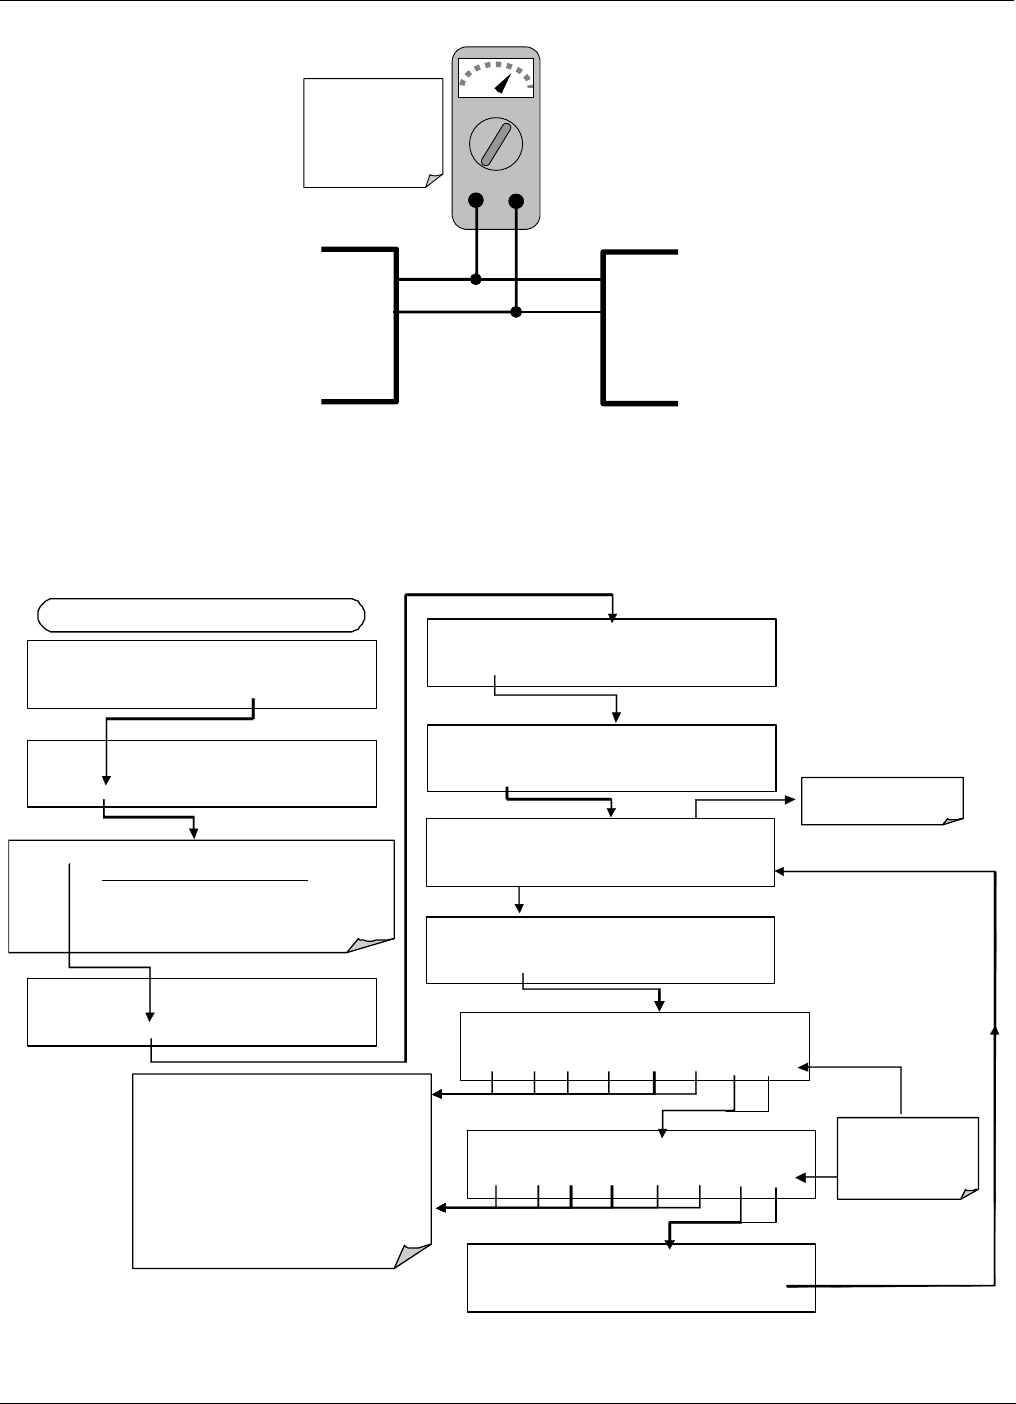
Teledyne API – T101 Operation Manual Operating Instructions
91
V
+DC Gnd
V OUT +
V OUT -
V IN +
V IN -
Recording
Device
ANALYZER
See Table 3-1 for
pin assignments
of Analog Out
connector on the
rear panel
Figure 4-4. Setup for Calibrating Analog Outputs
To make these adjustments, the AOUT auto-calibration feature must be turned off
(Section6.9). Activate the ANALOG I/O CONFIGURATION MENU (see Section
4.6.3), then press:
Pre ss SET> to select the analog output channel to be configured:
DISPLAYED AS = CHANNEL
CONC_OUT_1 = A1
CONC_OUT_2 = A2
TEST OUTPUT = A4
DIAG ANALOG I / O CONFIGURATION
PREV NEXT ENTR EXIT
DIA G AIO AOUTS CA LI BRA TED: NO
< SET SET> CAL EXIT
FROM ANALOG I/O CONFIGURATION MENU
DIAG AIO CONC_OUT_1 :5V, NO CAL
< SET SET> EDIT EXIT
DIAG AIO CONC_OUT_1 CALIBRATED: YES
< SET CAL EXIT
DIAG AIO CONC_OUT_1 RANGE: 5V
SET> EDIT EXIT
DIAG AIO CONC_OUT_2 CALIBRATED: NO
< SET CAL EXIT
DI AG AIO CONC_OUT_1 VOLT
–
Z : 0 mV
U100 UP10 UP DOWN DN10 D100 ENTR EXIT
Toggle to increase / decrease the analog output
by 100, 10 or 1 counts.
Continue adjustments until the voltage measured
at t he o utput of the anal yze r and /or the input of
the recording device matches the value in the
upper r igh t hand co rner of the di splay to the
tolerance specified.
The co ncentratio n display will not change. Only
the voltage reading of your voltmeter will change.
DIAG AIO CONC_OUT_1 VOLT
–
S : 4500 mV
U100 UP10 UP DOWN DN10 D100 ENTR EXIT
DIAG AIO CONC_OUT_1 REC OFS: 0 mV
< SET SET> EDIT EXIT
If AutoCal is ON, go to
Section 6.7.3
EXIT ig nor es the
new setting.
ENTR accepts the
new setting.
DIAG AIO CONC_OUT_1 AUTO CAL: OFF
< SET SET> EDIT EXIT
07266B DCN6485
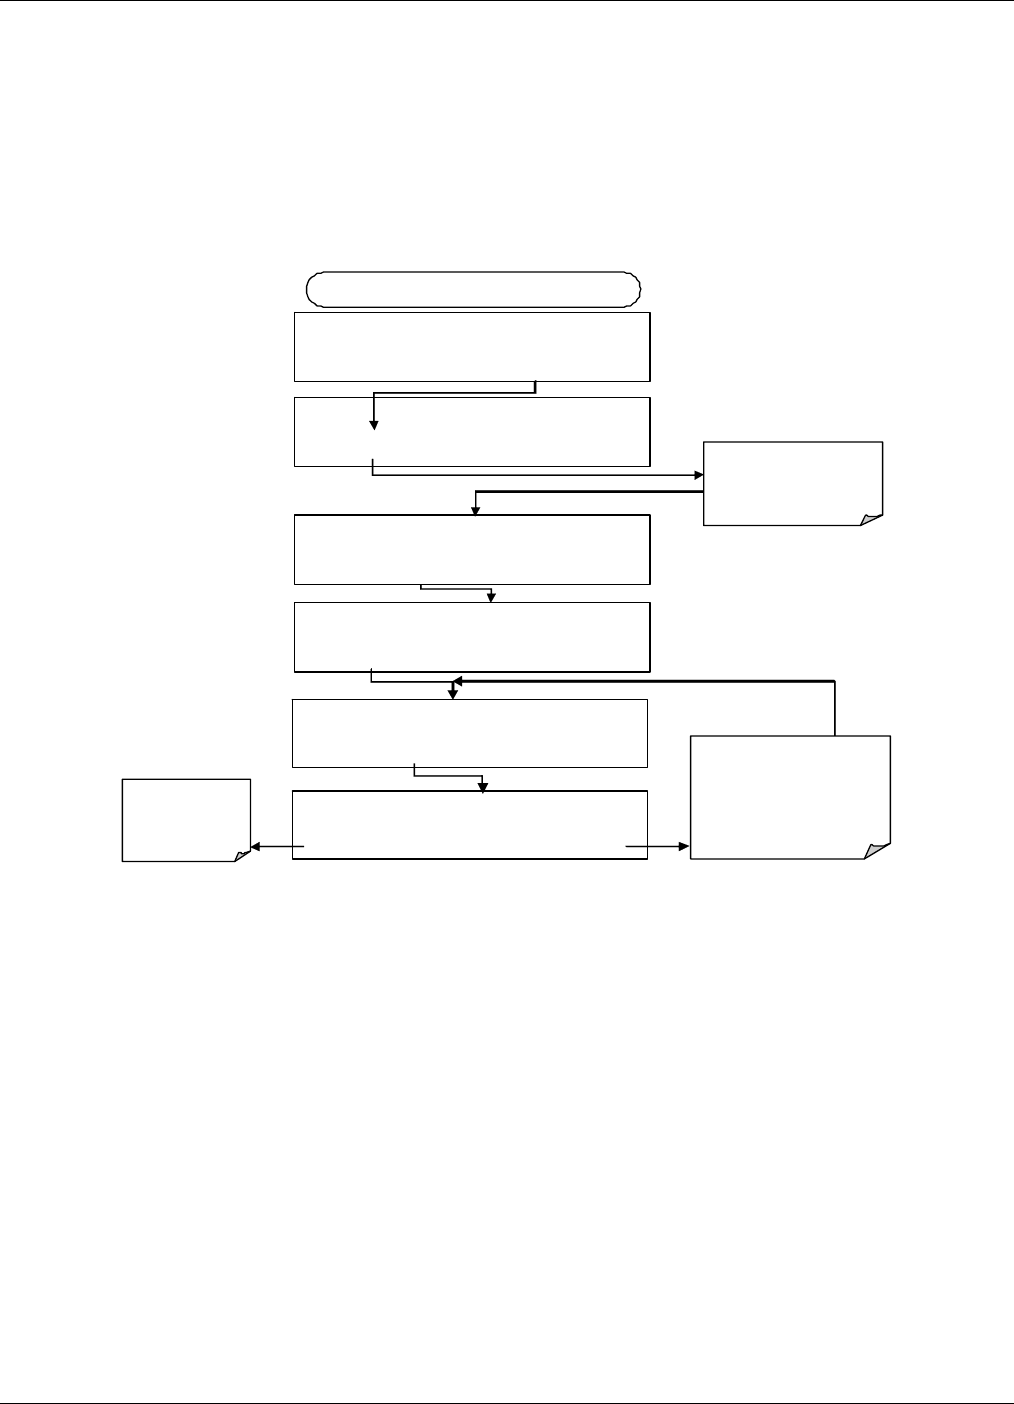
Operating Instructions Teledyne API – T101 Operation Manual
92
4.6.3.4. Analog Output Offset Adjustment
Some analog signal recorders require that the zero signal is significantly different from
the baseline of the recorder in order to record slightly negative readings from noise
around the zero point. This can be achieved in the T101 by defining a zero offset, a small
voltage (e.g., 10% of span), which can be added to the signal of individual output
channels by activating the ANALOG I/O CONFIGURATION MENU (see Section 4.6.3),
then pressing:
DIAG AIO RECORD OFFSET: 0 MV
+ 0 0 0 0 ENTR EXIT
DIAG
A
NALOG I / O CONFIGURATION
PREV NEXT ENTR EXIT
DIAG AIO AOUTS CA LIBRATE D: NO
< SET SET> CAL EXIT
FROM ANALOG I/O CONFIGURATION MENU
DIAG AIO CONC_OUT_2 RANGE: 5V
SET> EDIT EXIT
Set the recorder
offset (in mV) of
the selected
ch an nel
DIAG AIO CONC_OUT_2:5V, CAL
< SET SET> EDIT EXIT
DIAG AIO CONC_OUT_2 REC OFS: 0 mV
< SET SET> EDIT EXIT Pressing ENT
R
accepts the
new setting and return s to the
pr eviou s m en u.
Pressing EXIT ignores the new
se ttin g an d returns to the
pr eviou s m en u.
Press SET> to select the
analog output channel to
be configured. Then press
EDIT to continue
4.6.3.5. Current Loop Output Adjustment
A current loop option is available and can be installed as a retrofit for each of the analog
outputs of the analyzer. This option converts the DC voltage analog output to a current
signal with 0-20 mA output current. The outputs can be scaled to any set of limits within
that 0-20 mA range. However, most current loop applications call for either 2-20 mA or
4-20 mA range. All current loop outputs have a +5% over-range. Ranges with the lower
limit set to more than 1 mA (e.g., 2-20 or 4-20 mA) also have a -5% under-range.
To switch an analog output from voltage to current loop after installing the current output
printed circuit assembly, follow the instructions in Section 4.6.3.1 and select curr from the
list of options on the “Output Range” menu.
Adjusting the signal zero and span values of the current loop output is done by raising or
lowering the voltage of the respective analog output. This proportionally raises or lowers
the current produced by the current loop option.
07266B DCN6485
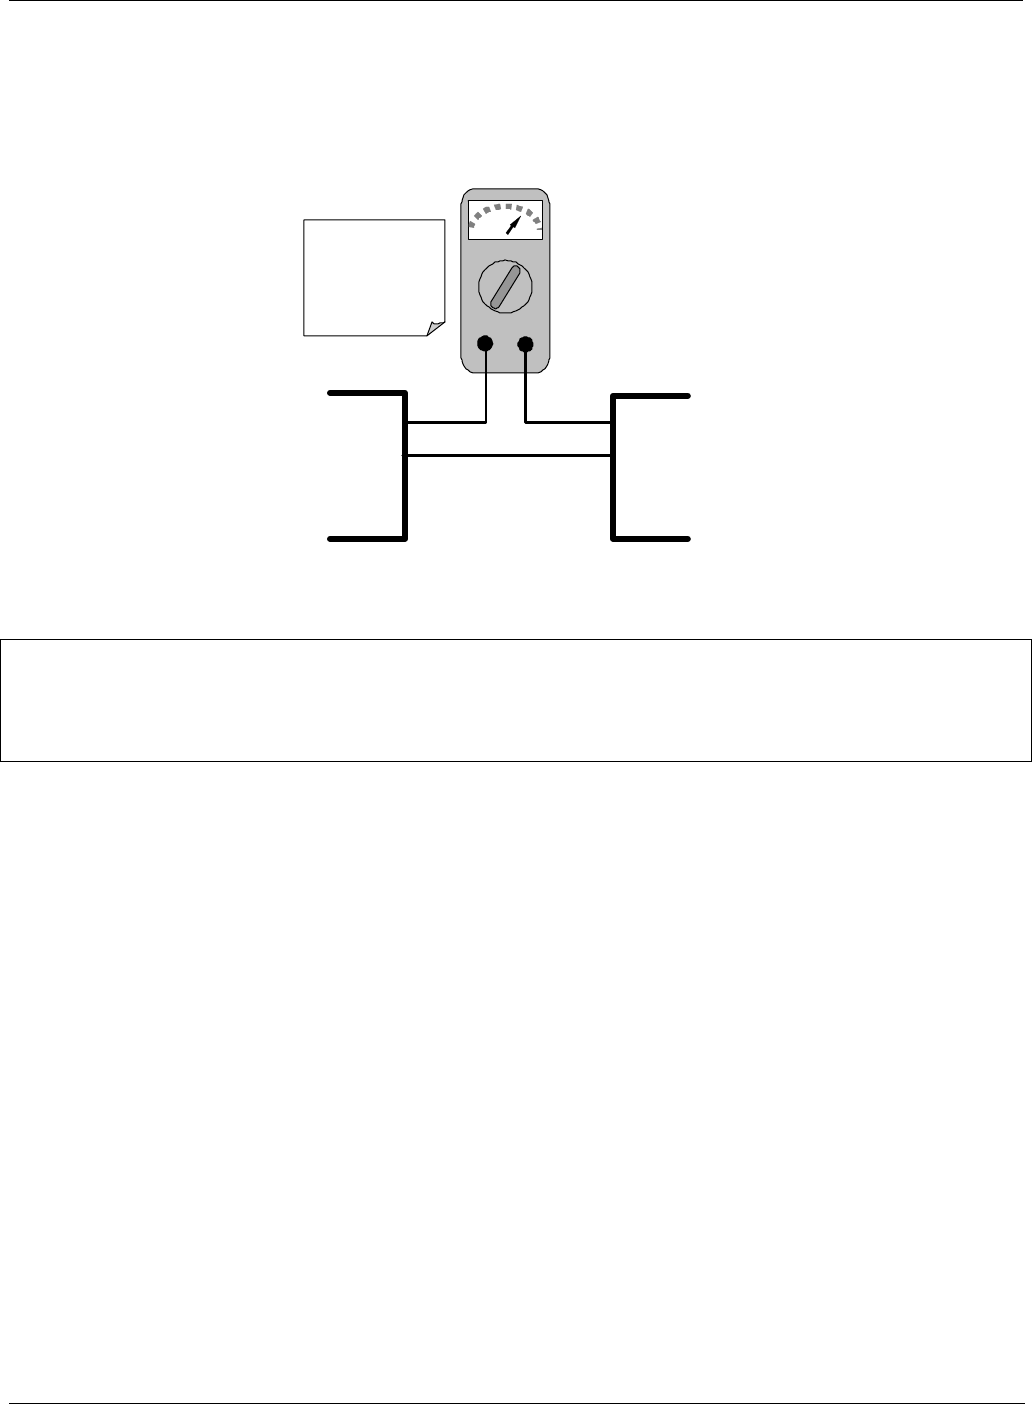
Teledyne API – T101 Operation Manual Operating Instructions
93
Similar to the voltage calibration, the software allows this current adjustment to be made
in 100, 10 or 1 count increments. Since the exact current increment per voltage count
varies from output to output and from instrument to instrument, you will need to measure
the change in the current with a current meter placed in series with the output circuit
(Figure 4-5).
mA
IN OU
T
I OUT +
I OUT -
I IN +
I IN -
Recording
Device
Analyzer
See Table 3-2 for
pin assignments of
the Analog Out
connector on the
rear panel.
Figure 4-5. Setup for Calibrating Current Outputs
NOTE
Do not exceed 60 V between current loop outputs and instrument ground.
07266B DCN6485
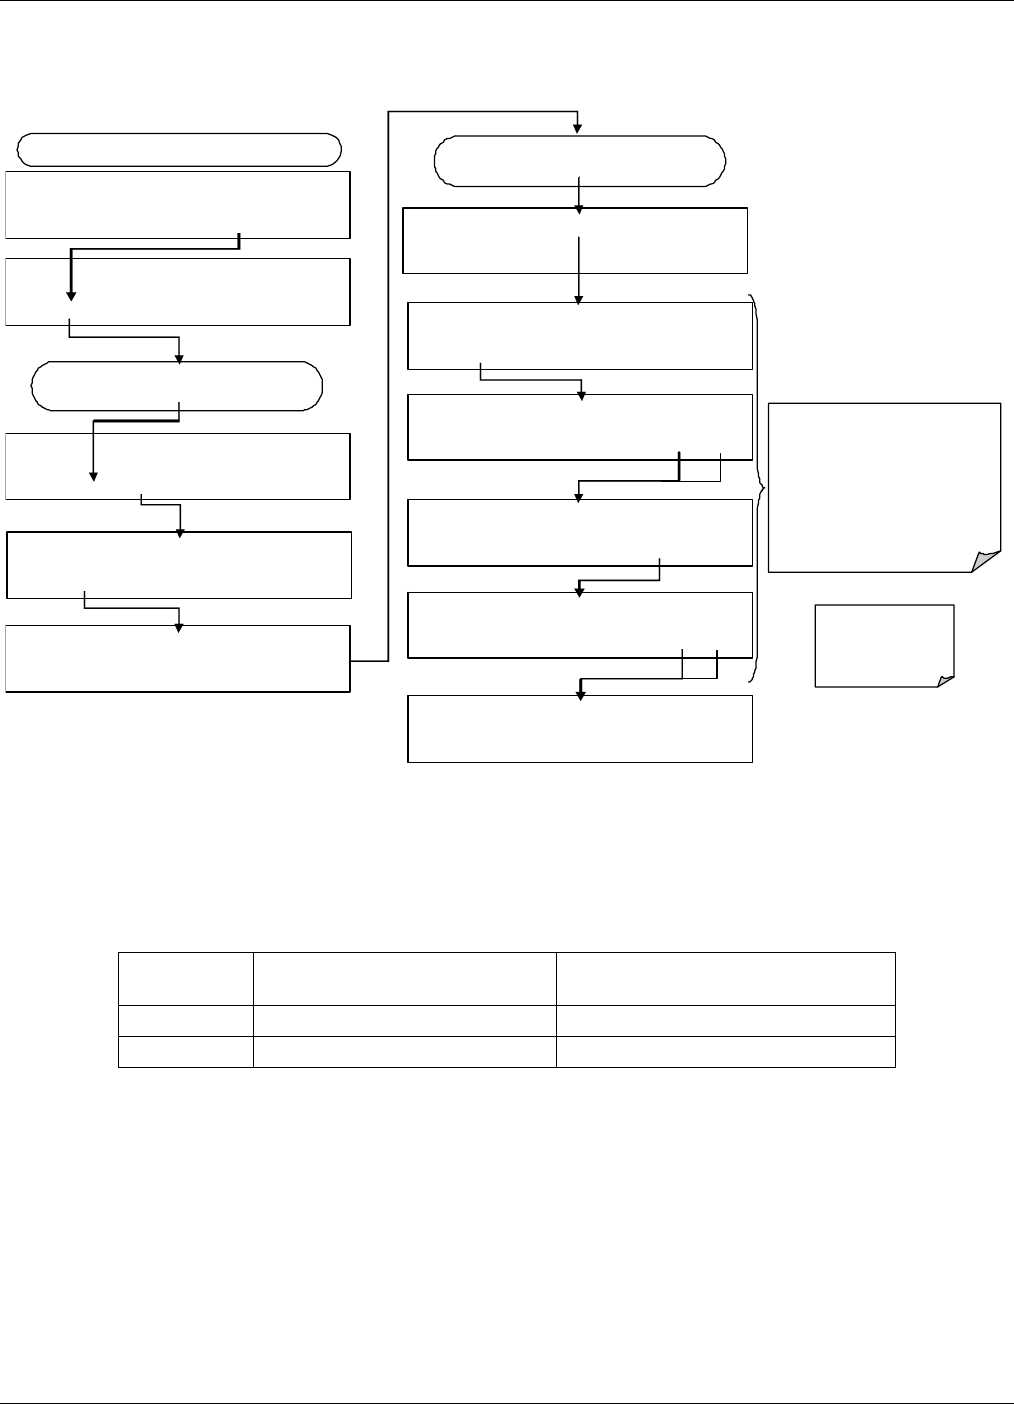
Operating Instructions Teledyne API – T101 Operation Manual
94
To adjust the zero and span values of the current outputs, activate the ANALOG I/O
CONFIGURATION MENU (see Section 4.6.3), then press:
DIAG AIO CONC_OUT_2 SPAN: 5000 mV
U100 UP10 UP DOWN DN1 0 D100 ENTR E XIT
DIAG AIO AUTO CALIBRATING CONC_OUT_2
DIAG AIO AIN CALIBRATED: NO
SET> EDIT EXI T
DI AG ANALOG I / O CONFIGURATION
PREV NEXT ENTR EXI T
FROM ANALOG I/O CONFIGURATION MENU
DIAG AIO CONC_OUT_2 RANGE: CURR
<SET SET> EDIT EXIT
DIAG AIO CONC_OUT_2 CALIBRATED: NO
< SET CAL EXIT
DI AG AIO CONC_OUT_2:CURR, NO CAL
< SET SET> EDIT EXI T
Press SET> to select the analog output channel
to be configured:.
Increase or decrea se the current
output by 100, 10 or 1 counts.
The resulting change in output
voltage is displayed in the upper
line.
Cont inue adjustments until the
correct current is measured with
the current m eter.
DIAG AIO CONC_OUT_2 ZERO: 27 mV
U100 UP10 UP DOWN DN10 D100 ENTR EXIT
EXIT ignores the
new setting, EN TR
accepts the new
setting.
DIAG AIO CONC_OUT_2 CALIBRATED: YES
< SET CAL EXIT
DIAG AIO CONC_OUT_2 ZERO: 4921 mV
U100 UP10 UP DOWN DN10 D100 ENTR EXIT
DIAG AIO CONC_OUT_2 CURR-Z: 0 mV
U100 UP10 UP DOWN DN10 D100 ENTR EXIT
The instr ume nt attem pt t o a utom aticall y cal ibr ate
the channel … the n beep.
If a current meter is not available, an alternative method for calibrating the current loop
outputs is to connect a 250 1% resistor across the current loop output. Using a
voltmeter, connected across the resistor, follow the procedure above but adjust the output
to the following values:
Table 4-14. Current Loop Output Calibration with Resistor
FULL
SCALE VOLTAGE FOR 2-20 MA
(measured across resistor) VOLTAGE FOR 4-20 MA
(measured across resistor)
0% 0.5 V 1.0 V
100% 5.0 V 5.0 V
07266B DCN6485
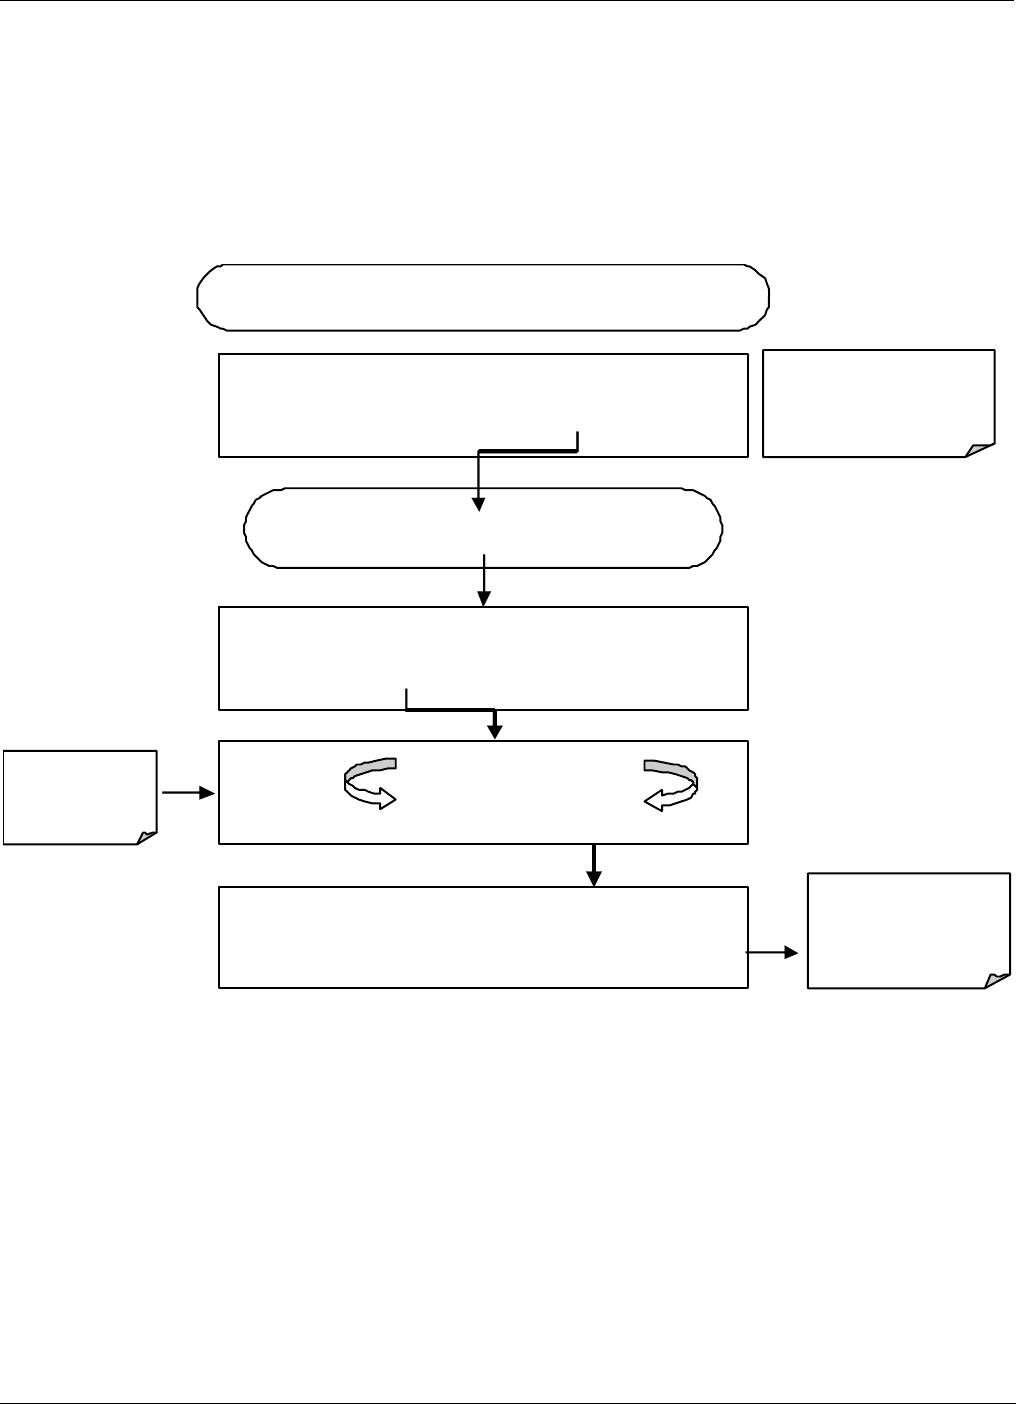
Teledyne API – T101 Operation Manual Operating Instructions
95
4.6.3.6. AIN Calibration
This is the sub-menu to conduct the analog input calibration. This calibration should only
be necessary after major repair such as a replacement of CPU, motherboard or power
supplies. Activate the ANALOG I/O CONFIGURATION MENU (see Section 4.6.3),
then press:
Exit at an y tim e to
r eturn to th e mai n
DIAG menu
DIAG
A
NALOG I / O CONFIGURATION
PR EV NEXT ENTR EXIT
Contin ue pressin g SET> until …
DIAG AIO
A
IN CALIBRATED: NO
< SET SET> CAL EXIT
DIAG AIO
A
IN CALIBRATED: YES
< SET SET> CAL EXIT
Instrument
calibrates
automatically
Exit to return to the
ANALOG I/O
CONFIGURATION
MENU
STARTING FROM ANALOG I / O CONFIGURATION MENU
DIAG AIO CALIBRATING A/D ZERO
CALIBRATING A/D SPAN
07266B DCN6485
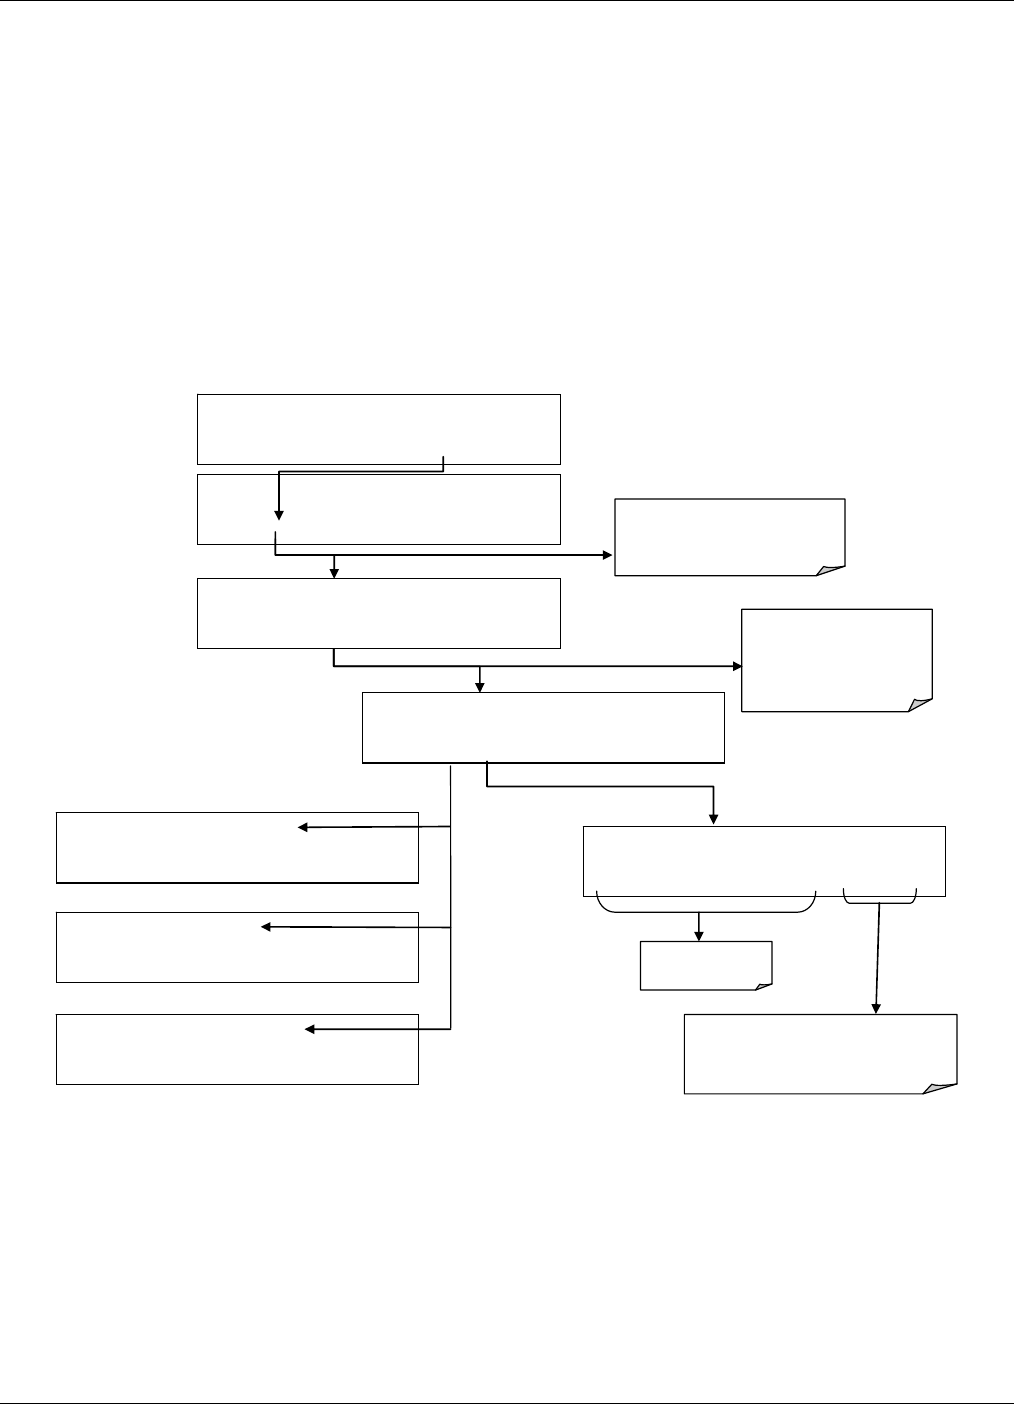
Operating Instructions Teledyne API – T101 Operation Manual
96
4.6.3.7. Analog Inputs (XIN1…XIN8) Option Configuration
To configure the analyzer’s optional analog inputs define for each channel:
gain (number of units represented by 1 volt)
offset (volts)
engineering units to be represented in volts (each press of the touchscreen button
scrolls the list of alphanumeric characters from A-Z and 0-9)
whether to display the channel in the Test functions
To adjust settings for the Analog Inputs option parameters press:
DIAG AIO
X
IN1 GAIN:1.00V/V
SET> EDIT EXIT
DIAG ANALOG I / O CONFIGURATION
PREV NEXT ENTR EXIT
DIAG AIO AOUTS CALIBRATED: NO
< SET SET> CAL EXIT
DIAG AIO
X
IN1 GAIN:1.00V/V
+ 0 0 1 .0 0 ENTR EXIT
Press to change
Gain value
DIAG AIO XIN1:1.00,0.00,V,OFF
< SET SET> EDIT EXIT
Press SET> to scroll to the first
channel. Continue pressing SET>
to view each of 8 channels.
Pressing ENT
R
records the new setting
and returns to the previous menu.
Pressing EXIT ignores the new setting and
returns to the previous menu.
Press EDIT at any channel
to to change Gain, Offset,
Units and whether to display
the channel in the Test
functions (OFF/ON).
DIAG AIO XIN1 OFFSET:0.00V
< SET SET> EDIT EXIT
DIAG AIO XIN1 UNITS:V
< SET SET> EDIT EXIT
DIAG AIO XIN1 DISPLAY:OFF
< SET EDIT EXIT
Figure 4-6. DIAG – Analog Inputs (Option) Configuration Menu
07266B DCN6485
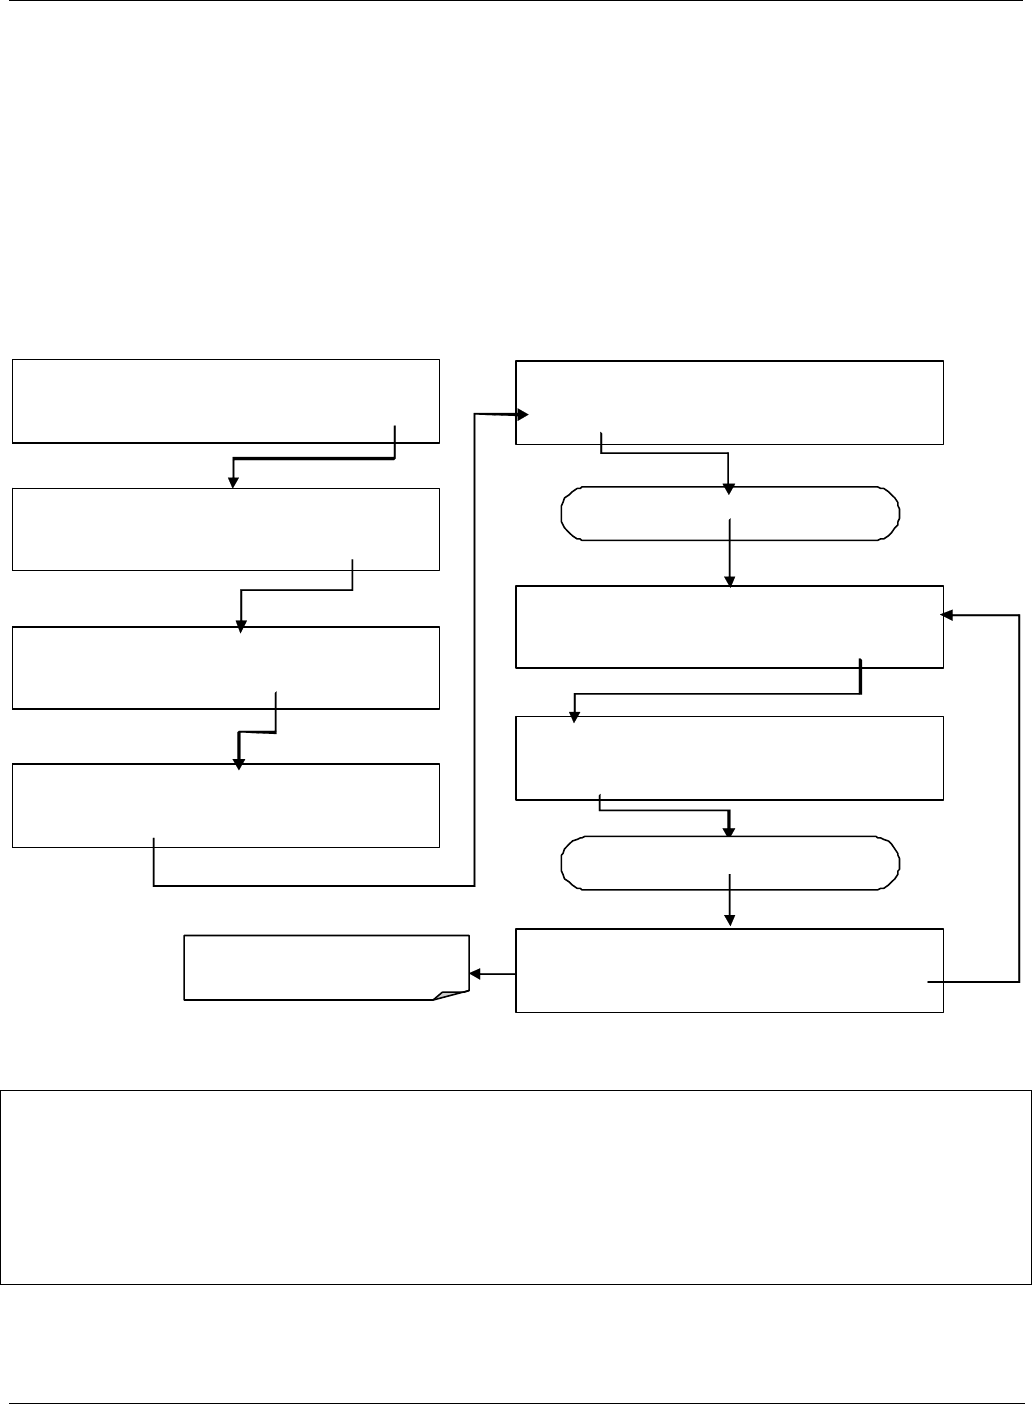
Teledyne API – T101 Operation Manual Operating Instructions
97
4.6.4. OPTIC TEST
The optic test function tests the response of the PMT sensor by turning on an LED located
in the cooling block of the PMT (Fig. 10-15). The analyzer uses the light emitted from the
LED to test its photo-electronic subsystem, including the PMT and the current to voltage
converter on the pre-amplifier board. To make sure that the analyzer measures only the
light coming from the LED, the analyzer should be supplied with zero air. The optic test
should produce a PMT signal of about 2000±1000 mV. To activate the electrical test
press:
SAMPLE RANGE = 500.0 PPB H2S =XXX.X
< TST TST > CAL SETUP
SAMPLE ENTER SETUP PASS : 818
8 1 8 ENTR EXIT
SETUP X.X PRIMARY SETUP MENU
CFG DAS RNGE PASS CLK MORE EXIT
SETUP X.X SECONDAR Y SETUP MENU
COMM VARS DIAG EXIT
DIAG SIGNAL I / O
NEXT ENTR EX IT
DIAG OPTIC RANGE = 500 .000 PP B SO2=X. XXX
<TST TST> EXIT
Press NEXT until…
DIAG OPTIC TEST
PREV NEXT ENTR EXIT
Press TST until…
DIAG ELEC PMT = 2751 MV SO 2=X.XX X
<TST TST> EXIT
While the optic test is activated,
PMT shoul d be 2000 mV ± 1000 mV
NOTE
This is a coarse test for functionality and not an accurate calibration tool. The resulting
PMT signal can vary significantly over time and also changes with low-level calibration.
07266B DCN6485
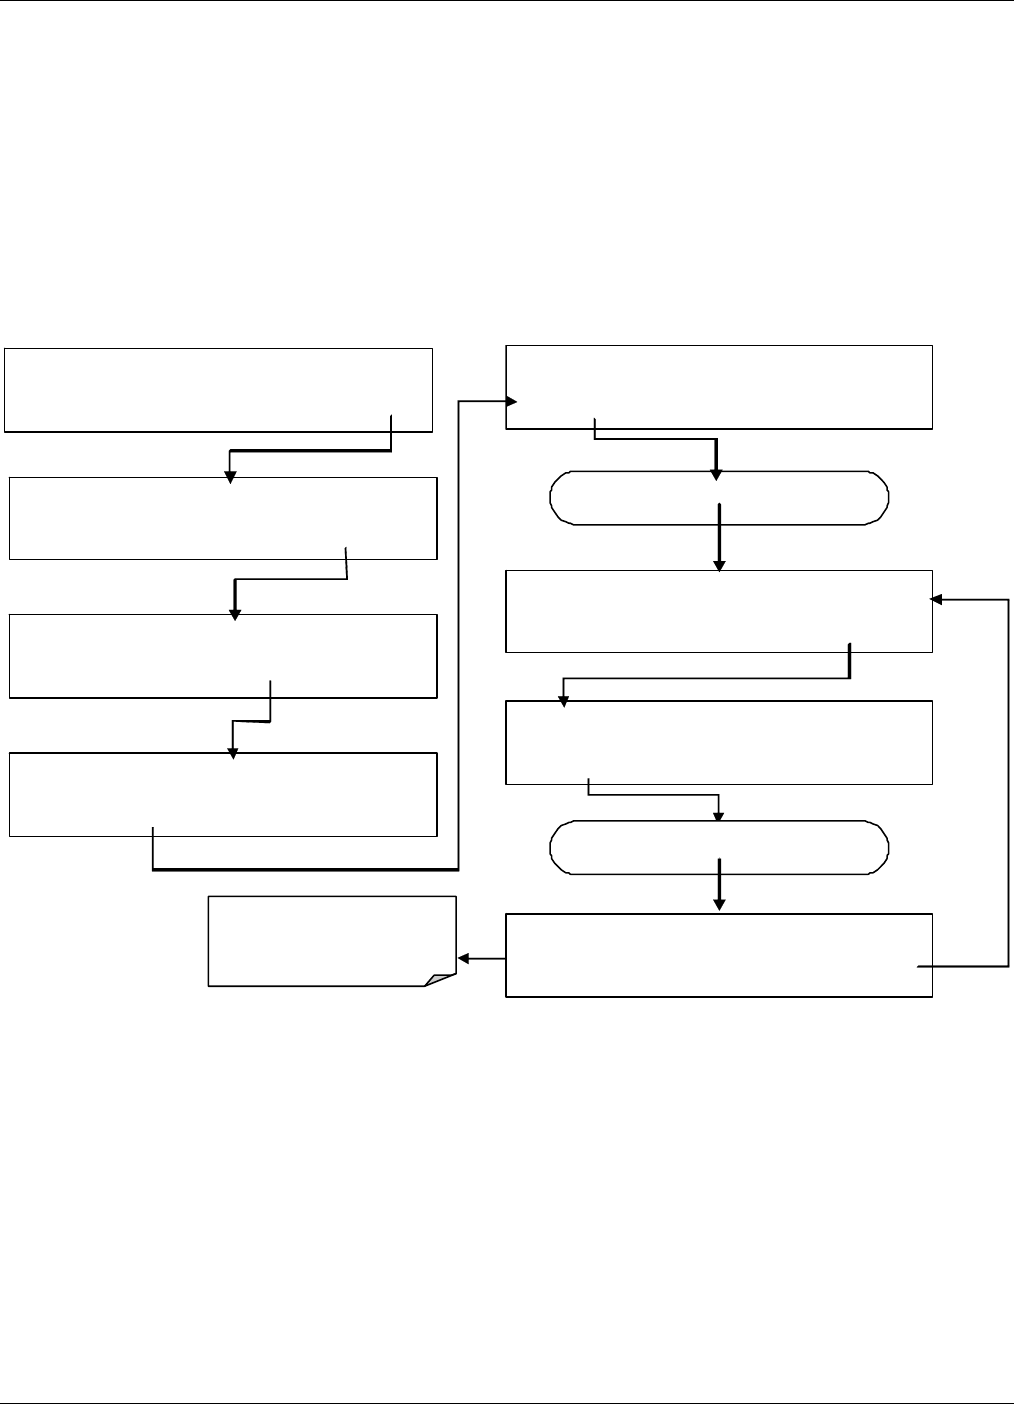
Operating Instructions Teledyne API – T101 Operation Manual
98
4.6.5. ELECTRICAL TEST
The electrical test function creates a current, which substitutes the PMT signal, and feeds
it into the preamplifier board. This signal is generated by circuitry on the pre-amplifier
board itself and tests the filtering and amplification functions of that assembly along with
the A/D converter on the motherboard. It does not test the PMT itself. The electrical test
should produce a PMT signal of about 2000 ±1000 mV.
To activate the electrical test press:
SETUP X.X SECONDARY SETUP MENU
COMM VARS DIAG EXIT
SAMPLE RANGE = 500.0 PPB H2S =XXX.X
< TST TST > CAL SETUP
SAMPLE ENTER SETUP PASS : 818
8 1 8 ENTR EXIT
SETUP X.X PRIMARY SETUP MENU
CFG DAS RNGE PASS CL K MORE EXIT
DIAG SIGNAL I / O
NEXT ENTR EXIT
DIAG ELEC RANGE = 500.000 PPB O2=X.XXX
<TST TST> EXIT
Pr ess NEXT until…
DIAG ELECTRICAL TEST
PREV NEXT ENTR EXIT
Pre ss TST until…
DIAG ELEC PMT = 1732 MV SO 2=X.X XX
<TST TST> EXIT
While the ele ctr ical test is
activated, PMT should equal:
2000 mV ± 1000 mV
07266B DCN6485
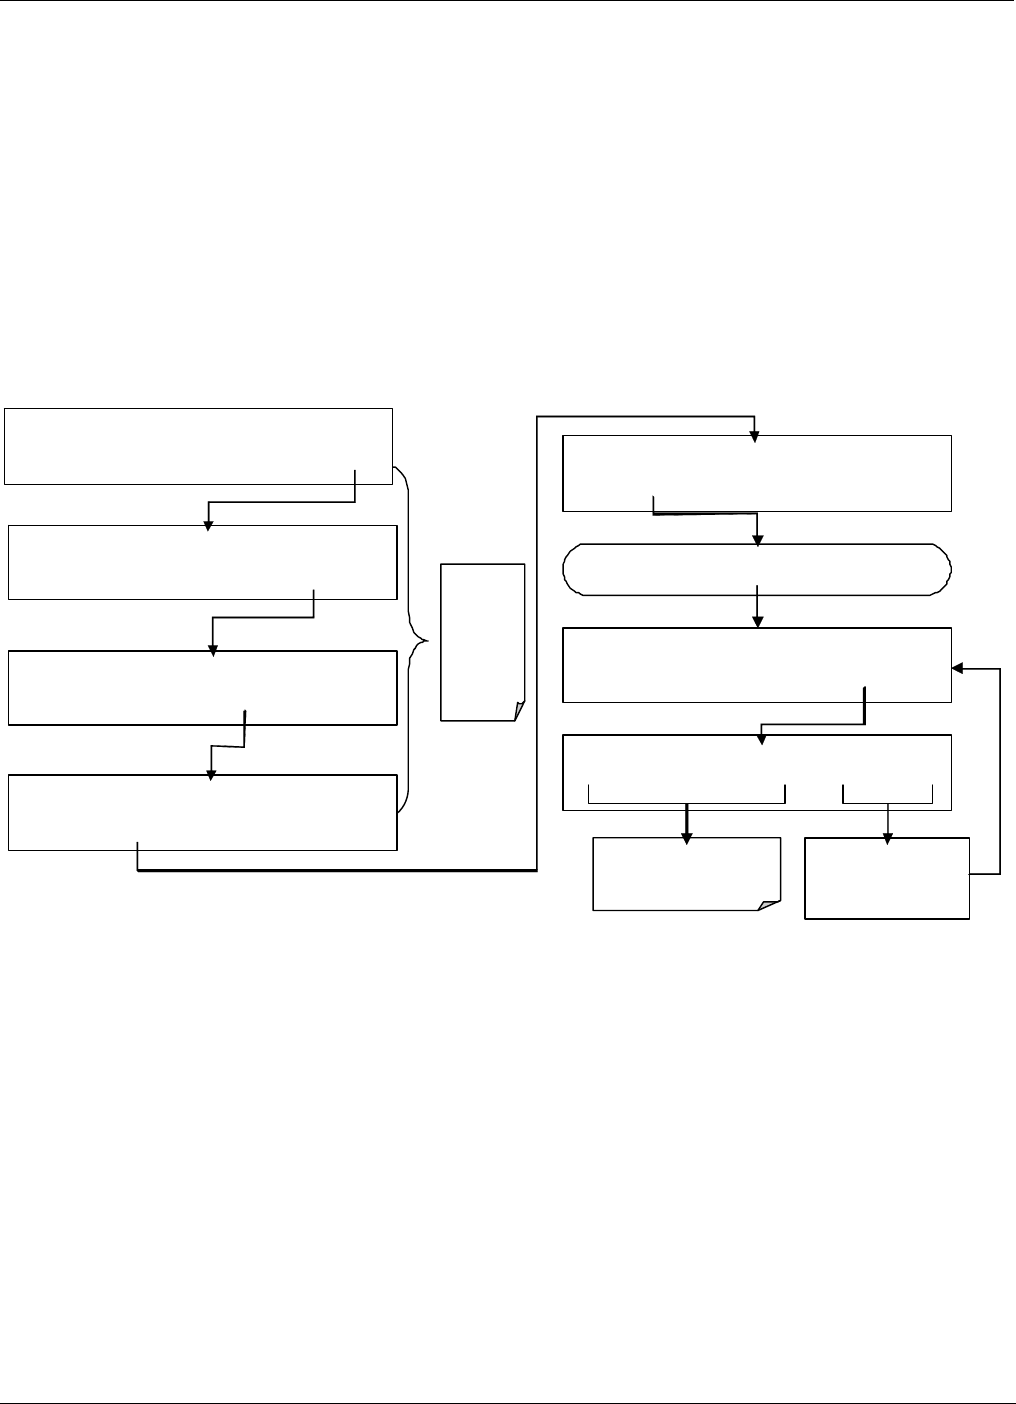
Teledyne API – T101 Operation Manual Operating Instructions
99
4.6.6. LAMP CALIBRATION
An important factor in accurately determining H2S concentration, once the H2S is
converted to SO2, is the amount of UV light available to transform the SO2 into SO2* (see
Sections 10.1.1 and 10.1.2). The Model T101 compensates for variations in the intensity
of the available UV light by adjusting the H2S concentration calculation using a ratio
(LAMP RATIO)that results from dividing the current UV lamp (UV LAMP) intensity
by a value stored in the CPU’s memory (LAMP_CAL). Both LAMP Ratio and UV
Lamp are test functions viewable from the instrument’s front panel.
To cause the analyzer to measure and record a value for LAMP_CAL, press:
Exit at
any tim e
to return
to main
th e
SETUP
menu
DIAG SIGNAL I / O
NEXT ENTR EXIT
Repeat Pressing NEXT until . . .
DIAG LAMP CALIBRATION
PREV NEXT ENTR EXIT
DIAG FCAL LAMP CAL VALUE:4262.4 mV
4 2 6 2 .4 ENTR EXIT
ENTR accepts the
new value
EXIT ignores the new
value
The value displayed is the
cu rrent output of t h e UV
source reference detector
SETUP X.X SECONDAR Y SETUP MENU
COMM VARS DIAG EXIT
SAMPLE RANGE = 500.0 PPB H2S =XXX.X
< TST TST > CAL SETUP
SAMPLE ENTER SETUP PASS : 818
8 1 8 ENTR EXIT
SETUP X.X PRIMARY SETUP MENU
CFG DAS RNGE PASS CLK MORE EXIT
07266B DCN6485
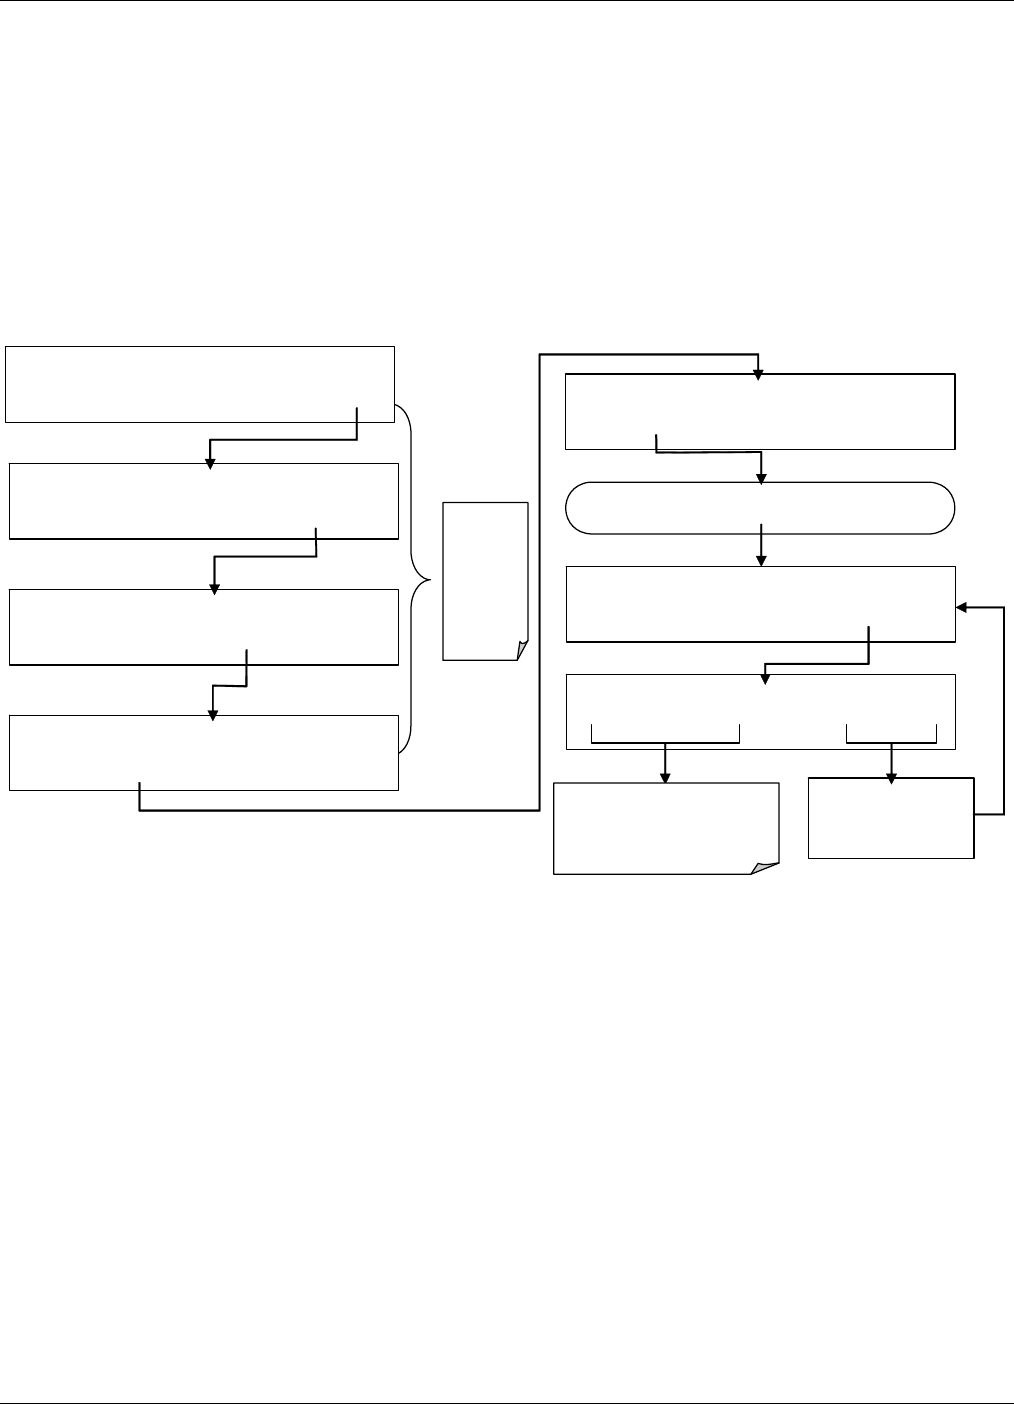
Operating Instructions Teledyne API – T101 Operation Manual
100
4.6.7. PRESSURE CALIBRATION
A sensor at the exit of the sample chamber continuously measures the pressure of the
sample gas. This data is used to compensate the final H2S concentration calculation for
changes in atmospheric pressure when the instrument’s TPC feature (see Section 10.7.3)
is turned on and is stored in the CPU’s memory as the test function PRES (also viewable
via the front panel).
To cause the analyzer to measure and record a value for PRES, press:
Exit at
any time
to return
to main
the
SETUP
menu
DIAG SIGNAL I / O
NEXT ENTR EXIT
Repeat Pressing NEXT until . . .
DIAG PRESSURE CALIBRATION
PREV NEXT ENTR EXIT
DIAG PCAL
A
CTUAL PRES :27.20 IN-HG-
A
2 7 .2 0 ENTR EXIT
ENTR accepts the
new value
EXIT ignores the new
value
SETUP X.X SECONDARY SETUP MENU
COMM VARS DIAG EXIT
SAMPLE RANGE = 500.0 PPB H2S =XXX.X
< TST TST > CAL SETUP
SAMPLE ENTER SETUP PASS : 818
8 1 8 ENTR EXIT
SETUP X.X PRIMARY SETUP MENU
CFG DAS RNGE PASS CLK MORE EXIT
Adjust these values until the
displayed pressure equals the
pressure measured by the
independent pressure meter.
07266B DCN6485
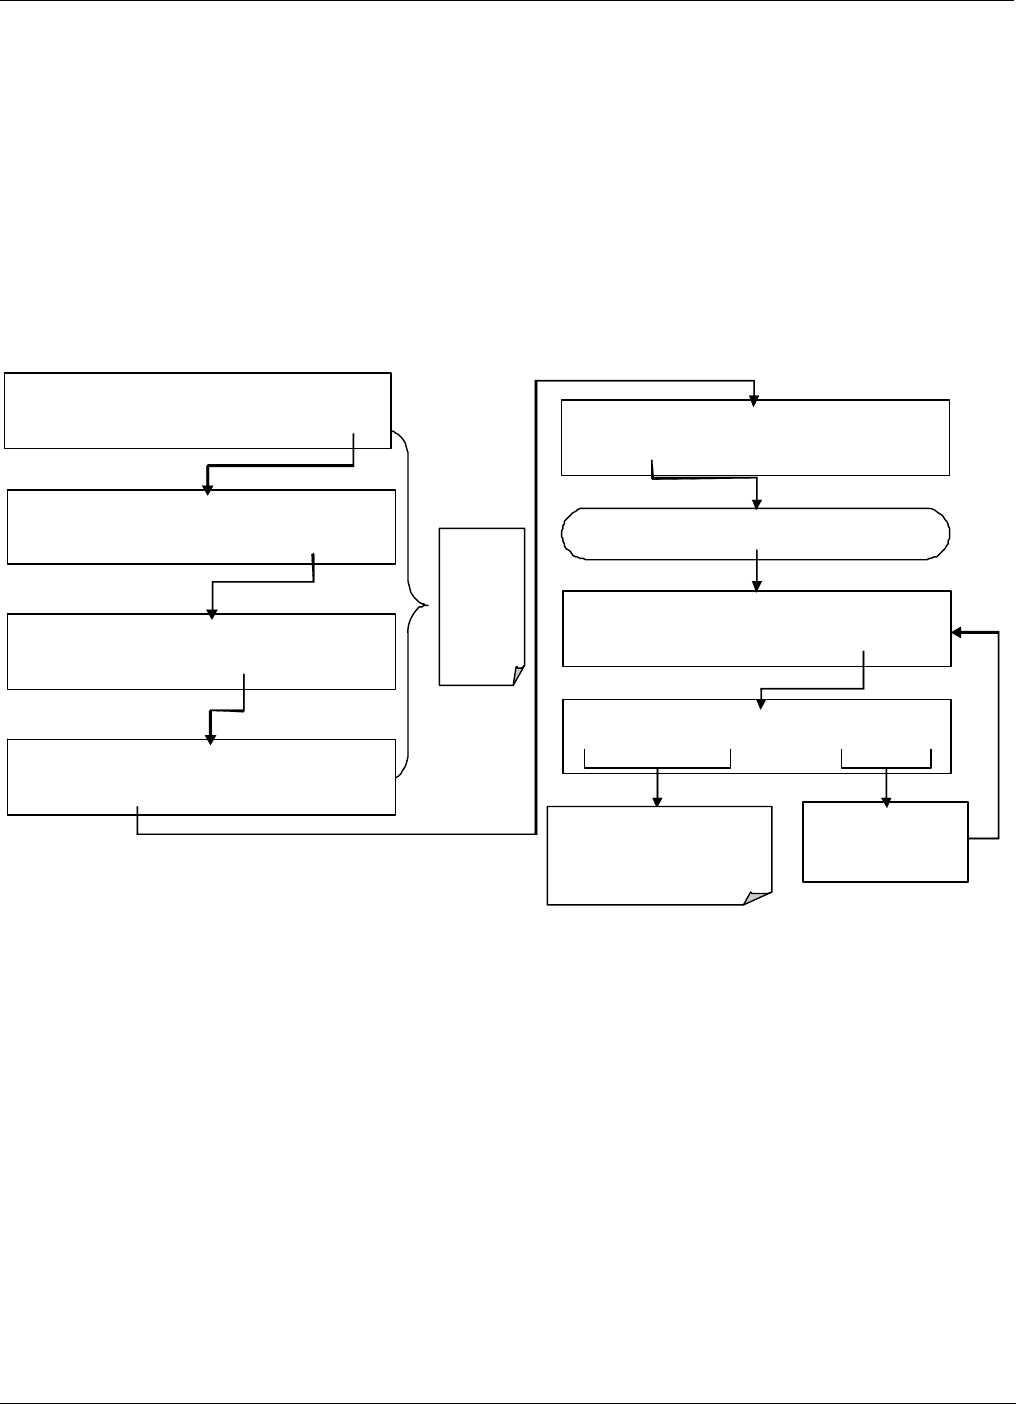
Teledyne API – T101 Operation Manual Operating Instructions
101
4.6.8. FLOW CALIBRATION
The flow calibration allows the user to adjust the values of the sample flow rates as they
are displayed on the front panel and reported through COM ports to match the actual flow
rate measured at the sample inlet. This does not change the hardware measurement of the
flow sensors, only the software calculated values.
To carry out this adjustment, connect an external, sufficiently accurate flow meter to the
sample inlet (see Section 9.5.2 for more details). Once the flow meter is attached and is
measuring actual gas flow, press:
Exit at
any time
to return
to main
the
SETUP
me nu
DIAG SIGNAL I / O
NEXT ENTR EXI T
Repeat Pressing NEXT until . . .
DIAG FLOW CALIBRATION
PREV NEXT ENTR EXIT
DIAG FCAL
A
CTUAL FLOW: 607 CC / M
0 6 0 7 ENTR EXIT
ENTR acce pts the
new val ue
EXIT igno res the new
value
SETUP X.X SECONDARY SETUP MENU
COMM VARS DIAG EXIT
SAMPLE RANGE = 500.0 PPB H2S =XXX .X
< TST TST > CAL SETUP
SAMPLE ENTER SETUP PASS : 818
8 1 8 ENTR EXIT
SETUP X.X PRIMARY SETUP MENU
CFG DAS RNGE PASS CL K MORE EXIT
Adjust these values until the
displayed flow rate equals the
flow rate being measured by the
independ en t flo w m eter.
07266B DCN6485
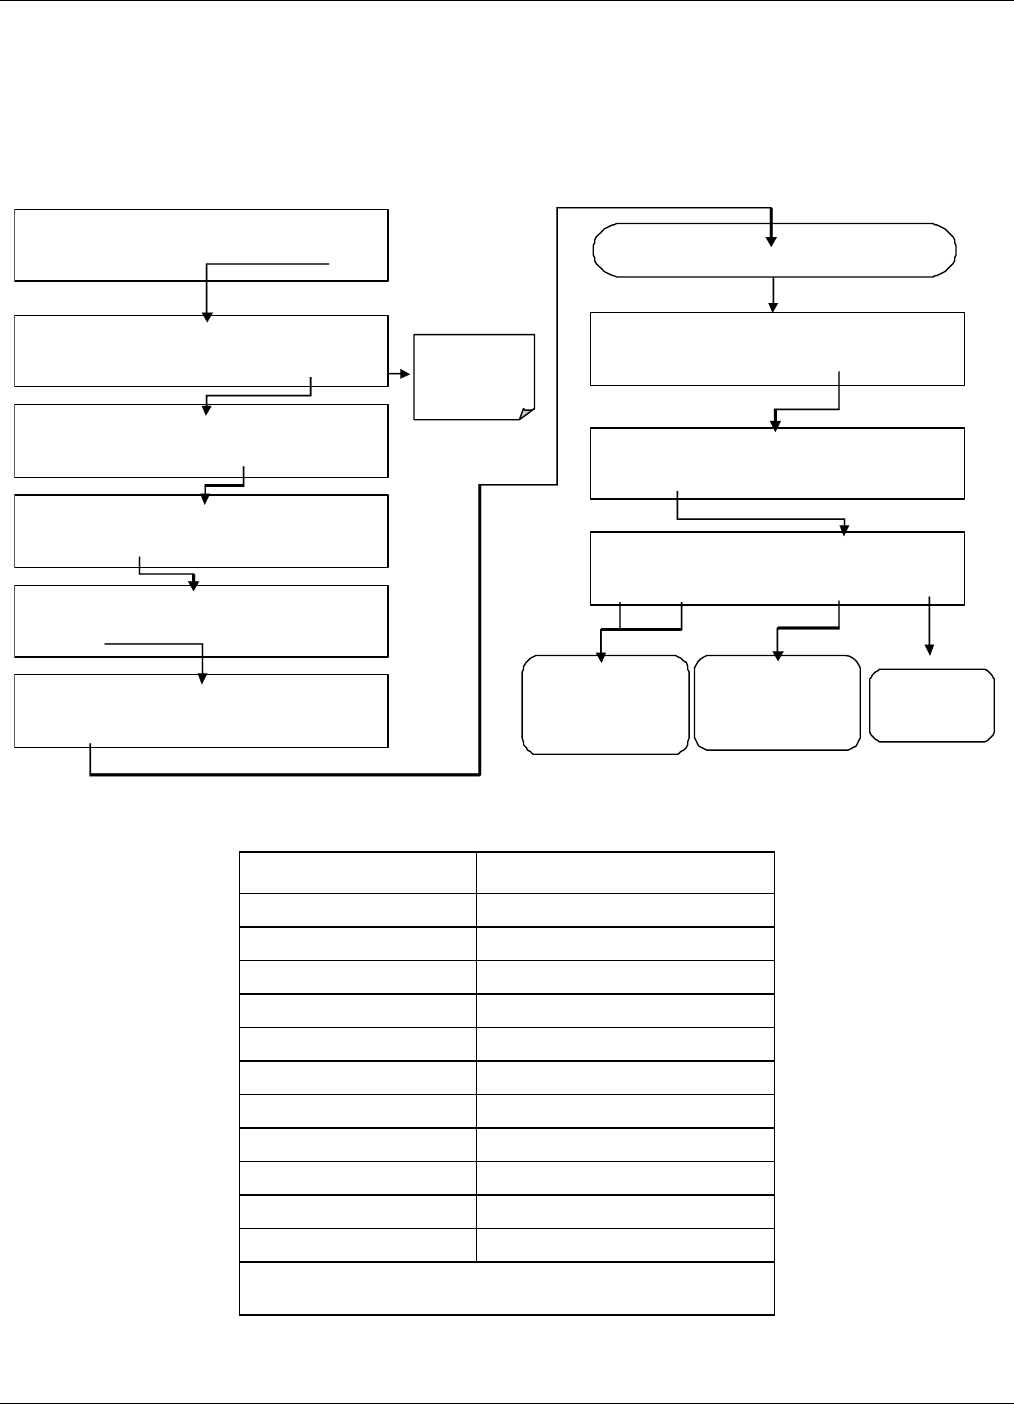
Operating Instructions Teledyne API – T101 Operation Manual
102
4.6.9. TEST CHANNEL OUTPUT
When activated, output channel A4 can be used to report one of the test functions
viewable from the SAMPLE mode display. To activate the A4 channel and select a test
function, follow this button sequence :
SAMPLE RANGE = 500.0 PPB H2S =XXX.X
< TST TST > CAL SETUP
SAMPLE ENTER SETUP PASS :
8
18
8 1 8 ENTR EXIT
SETUP X.X PRIMARY SETUP MENU
CFG DAS RNGE PASS CL K MORE EXIT
DIAG SIGNAL I / O
NEXT ENTR EXIT
DIAG AN AL OG OUTP UT
PRE V NEXT ENTR EXIT
DIAG TC HN TEST CHANNEL: NONE
NEXT ENTR EXIT
DIAG TEST CHAN OUTPUT
PREV NEXT ENTR EXIT
EXIT returns
to the main
SAMPLE
display
Continue to press NEXT until …
DIAG TC HN TEST CHANNEL: PMT READING
PREV NEXT ENTR EXIT
Pr ess PRE
V
or NEX
T
to move through the
list of avail ab le
parameters
( Tab le 6- 13)
Press EXIT to
return to the
DIAG menu
Press ENTR to select
the displayed
parameter activating
the test channel.
SETUP X.X SECONDARY SETUP MENU
COMM VARS DIAG EXIT
Table 4-15. Test Parameters Available for Analog Output A4
TEST CHANNEL TEST PARAMETER RANGE 1
NONE Test channel is turned off
PMT READING 0-5000 mV
UV READING 0-5000 mV
SAMPLE PRESSURE 0-40 in-Hg-A
SAMPLE FLOW 0-1000 cm³/min
RCELL TEMP 0-70° C
CHASSIS TEMP 0-70° C
IZS TEMP 0-70° C
PMT TEMP 0-50° C
CHASSIS TEMP 0-70° C
HVPS VOLTAGE 0-5000 V
1 This refers to the voltage range of the parameter and
not the output signal of the test channel.
07266B DCN6485

Teledyne API – T101 Operation Manual Operating Instructions
103
Once a TEST function is selected, the instrument begins to report a signal on the A4
output and adds TEST= to the list of test functions viewable on the display (just before
the TIME display).
4.7. SETUP – COMM: SETTING UP THE ANALYSER’S
COMMUNICATION PORTS
For remote operation the T101 is equipped with an Ethernet port, a USB port and two
serial communication (com) ports located on the rear panel. Both com ports (labeled
RS232, which is the COM1 port, and COM2) operate similarly and give the user the
ability to communicate with, issue commands to, and receive data from the analyzer
through an external computer system or terminal. By default, both ports operate on the
RS-232 protocol.
The RS232 port can also be configured to operate in single or RS-232 Multidrop mode
(Option 62). The COM2 port can be left in its default configuration for standard RS-232
operation, or reconfigured for half-duplex RS-485 operation; (contact the factory for
configuration information). When COM2 is configured for RS-485 communication, the
rear panel USB port is disabled.
A code-activated switch (CAS), can also be used on either port to connect typically
between 2 and 16 send/receive instruments (host computer(s) printers, data loggers,
analyzers, monitors, calibrators, etc.) into one communications hub. Contact Teledyne
API’s Sales for more information on CAS systems.
4.7.1. INSTRUMENT ID
Each type of Teledyne API’s analyzer is configured with a default ID code. The default
ID code for all T101 analyzers is either “0” or 101. The ID number is only important if
more than one analyzer is connected to the same communications channel such as when
several analyzers are on the same Ethernet LAN, in a RS-232 Multidrop chain, or
operating over a RS-485 network. If two analyzers of the same model type are used on
one channel, the ID codes of one or both of the instruments needs to be changed so that
they are unique to the instruments.
07266B DCN6485
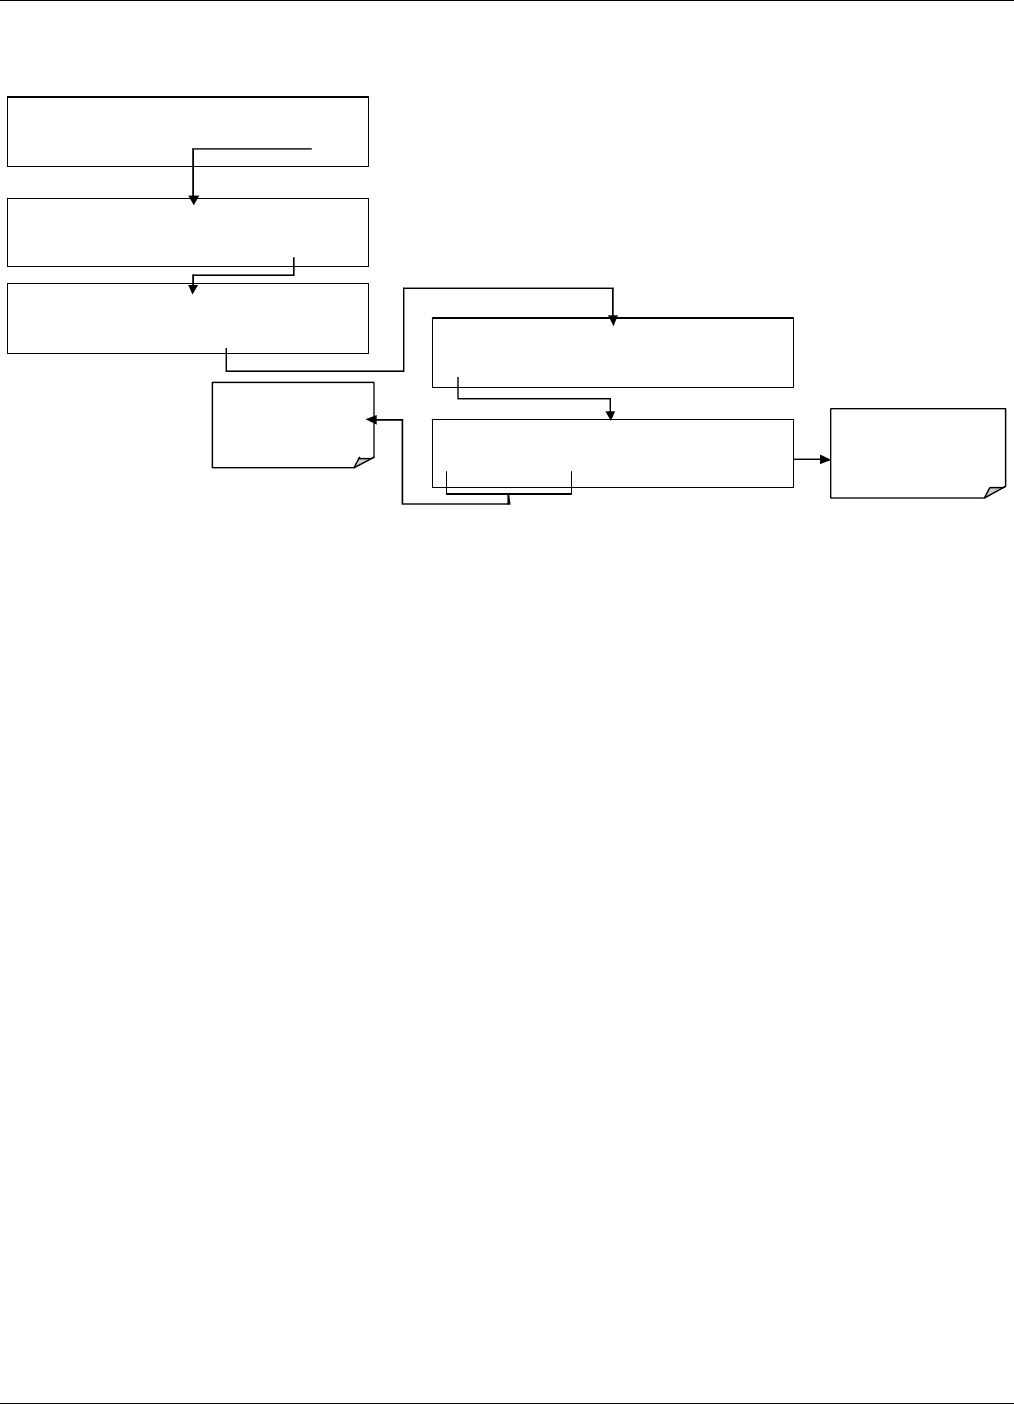
Operating Instructions Teledyne API – T101 Operation Manual
104
To edit the instrument’s ID code, press:
SETUP X.X COMMUNICATIONS MENU
ID HESN COM1 COM2
EXIT
SETUP X. MACHINE ID: 100 ID
0 1 0 1 ENTR EXIT
Toggle these buttons
to cycle through the
avail abl e cha racter se t:
0-9
ENTR
accepts the new
settings
EXIT ig nores the n ew
settin
g
s
SAMPLE RANGE = 500.0 PPB H2S =X XX.X
< TST TST > CAL SETUP
SAMPLE ENTER SETUP PASS : 81
8
8 1 8 ENTR EXIT
SETUP X .X PRIMARY SETUP MENU
CFG DAS RNGE PASS CL K MORE EXIT
The ID can be any 4 digit number and can also be used to identify analyzers in any
number of ways (e.g. location numbers, company asset number, etc.)
07266B DCN6485
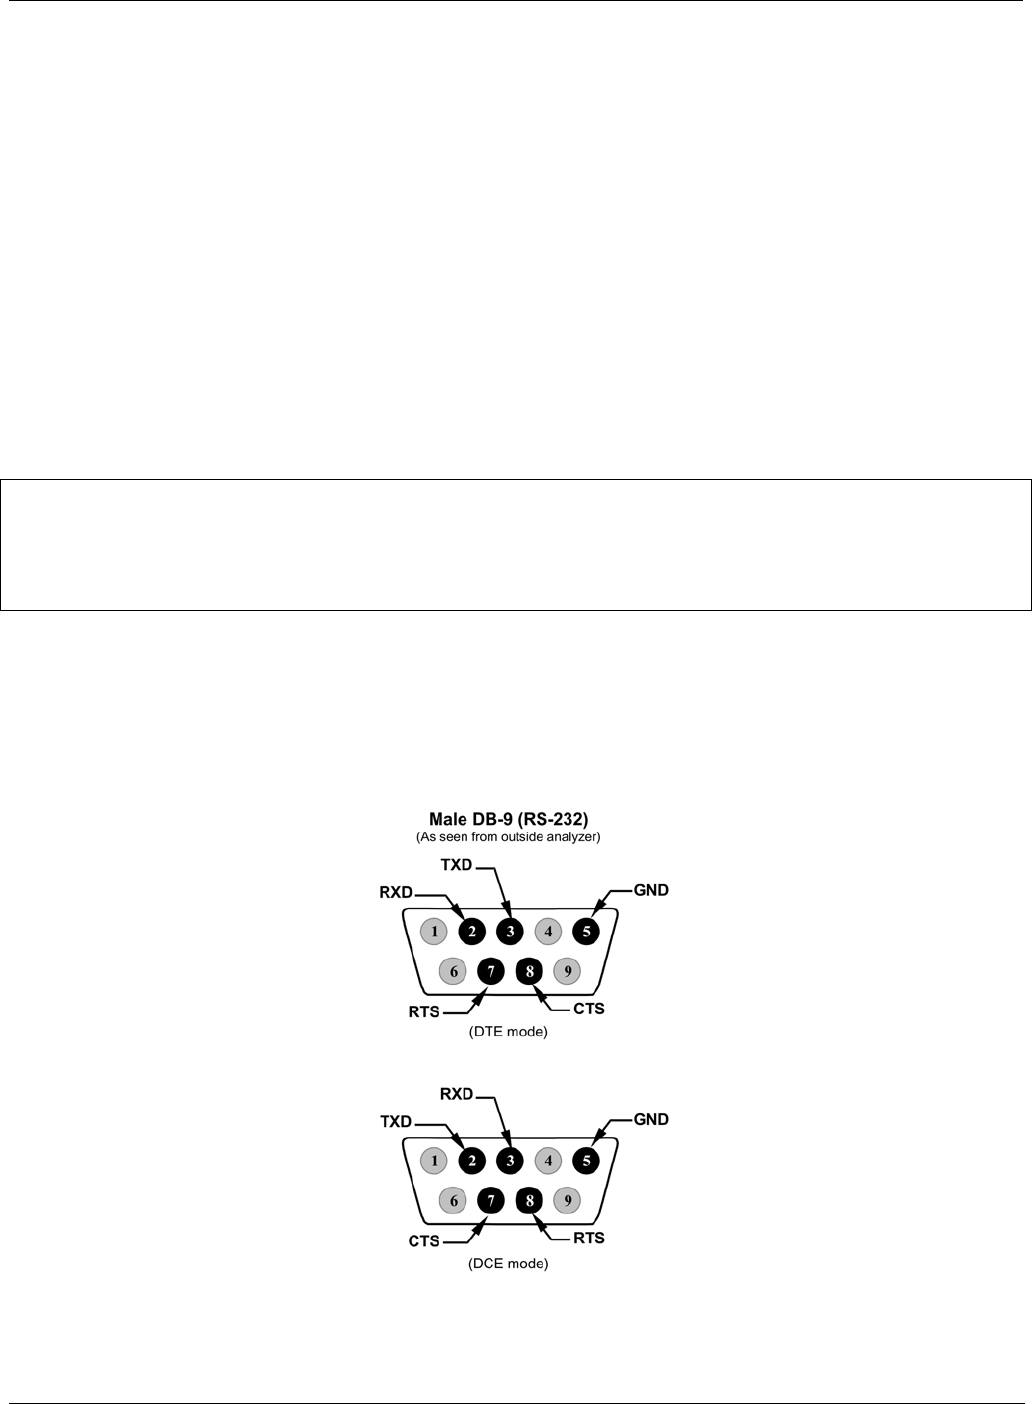
Teledyne API – T101 Operation Manual Operating Instructions
105
4.7.2. COM PORT DEFAULT SETTINGS
As received from the factory, the analyzer is set up to emulate a DCE or modem, with pin
3 of the DB-9 connector designated for receiving data and pin 2 designated for sending
data.
RS232: RS-232 (fixed), DB-9 male connector.
o Baud rate: 115200 bits per second (baud).
o Data Bits: 8 data bits with 1 stop bit.
o Parity: None.
COM2: RS-232 (configurable), DB-9 female connector.
o Baud rate: 19200 bits per second (baud).
o Data Bits: 8 data bits with 1 stop bit.
o Parity: None.
CAUTION
Cables that appear to be compatible because of matching connectors may incorporate internal wiring that
make the link inoperable. Check cables acquired from sources other than Teledyne API for pin
assignments before using.
4.7.3. RS-232 COM PORT CABLE CONNECTIONS
In its default configuration, the T101 analyzer has two available RS-232 Com ports
accessible via 2 DB-9 connectors on the back panel of the instrument. The COM1
connector is a male DB-9 connector and the COM2 is a female DB9 connector.
Figure 4-7. Rear Panel Connector Pin-Outs for RS-232 Mode
07266B DCN6485
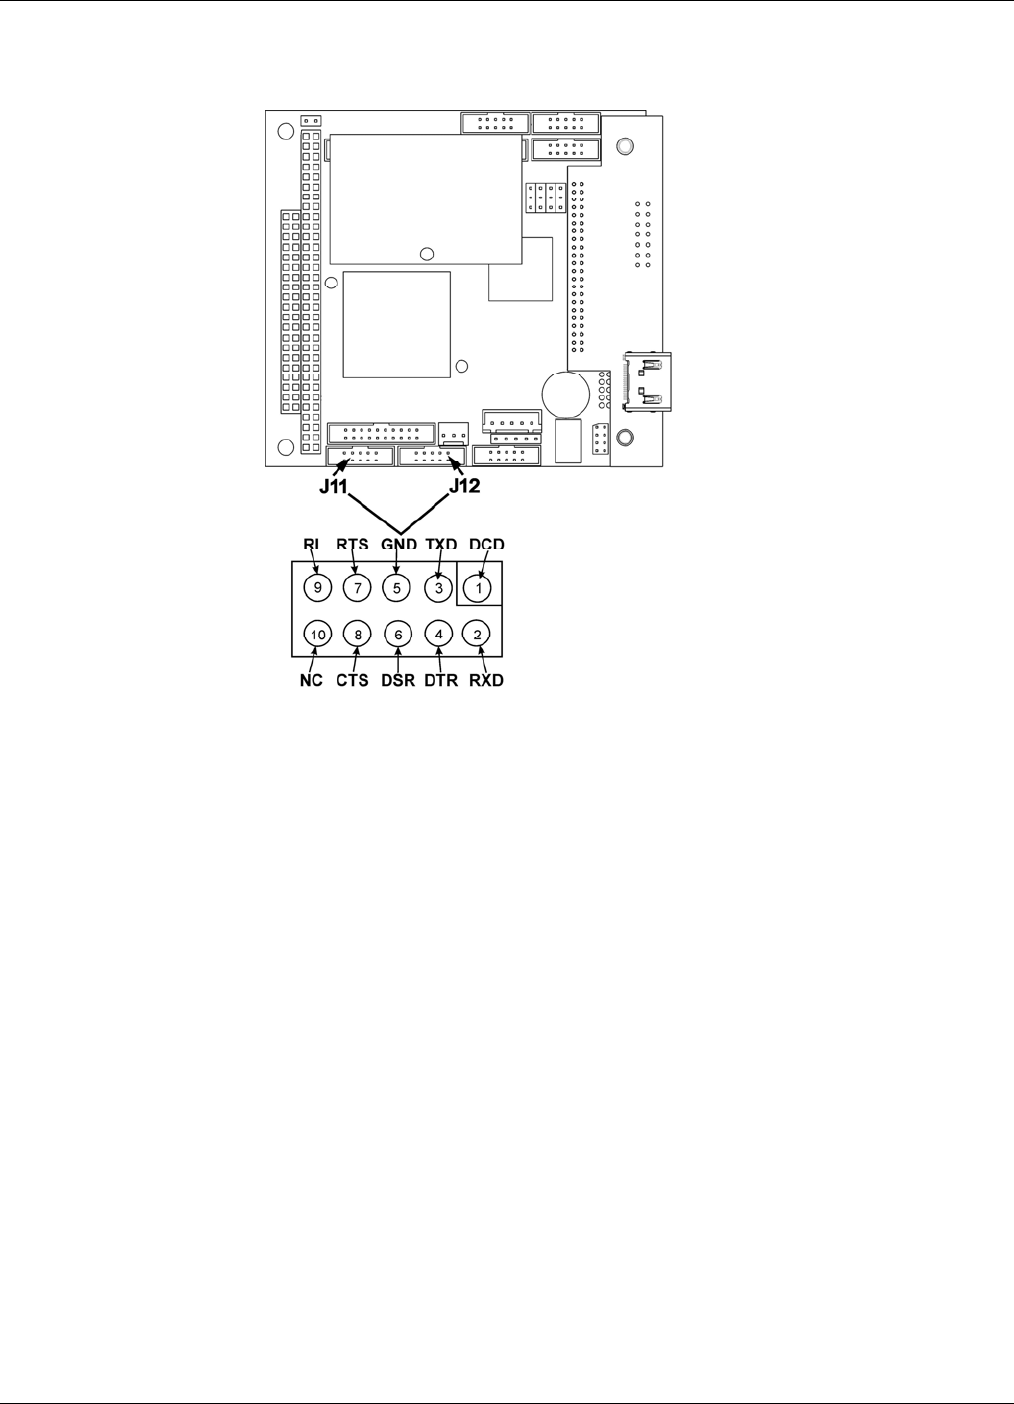
Operating Instructions Teledyne API – T101 Operation Manual
106
The signals from these two connectors are routed from the motherboard via a wiring
harness to two 10-pin connectors on the CPU card, J11 and J12.
Figure 4-8. CPU Connector Pin-Outs for RS-232 Mode
Teledyne API offers two mating cables, one of which should be applicable for your use.
Part number WR000077, a DB-9 female to DB-9 female cable, 6 feet long.
Allows connection of COM1 with the serial port of most personal
computers.
Part number WR000024, a DB-9 female to DB-25 male cable. Allows
connection to the most common styles of modems (e.g. Hayes-
compatible) and code activated switches.
Both cables are configured with straight-through wiring and should require no additional
adapters.
To assist in properly connecting the serial ports to either a computer or a modem, there
are activity indicators just above the COM1 port. Once a cable is connected between the
analyzer and a computer or modem, both the red and green LEDs should be on. If the
lights for COM 1 are not lit, use small switch on the rear panel to switch it between DTE
and DCE modes (see Section 4.7.5). If both LEDs are still not illuminated, check the
cable for proper wiring.
The two LEDs located over COM2 are currently deactivated. If you have problems
getting COM2 to activate, it may be necessary to install a null-modem cable (contact
Technical Support for information).
07266B DCN6485

Teledyne API – T101 Operation Manual Operating Instructions
107
4.7.4. RS-485 CONFIGURATION
As delivered from the factory, COM2 is configured for RS-232 communications. This
port can be re-configured for operation as a non-isolated, half-duplex RS-485 port capable
of supporting up to 32 instruments with a maximum distance between the host and the
furthest instrument being 4000 feet. However, with the RS-485 configuration the USB
comm port is disabled. If you require full-duplex or isolated operation, please contact
Teledyne API’s Technical Support.
4.7.5. DTE AND DCE COMMUNICATION
RS-232 was developed for allowing communications between data terminal equipment
(DTE) and data communication equipment (DCE). Basic terminals always fall into the
DTE category whereas modems are always considered DCE devices. The difference
between the two is the pin assignment of the Data Receive and Data Transmit functions.
DTE devices receive data on pin 2 and transmit data on pin 3.
DCE devices receive data on pin 3 and transmit data on pin 2.
To allow the analyzer to be used with terminals (DTE), modems (DCE) and computers
(which can be either), a switch mounted below the serial ports on the rear panel allows the
user to set the configuration of COM1 for one of these two modes. This switch
exchanges the receive and transmit lines on COM1 emulating a cross-over or null-modem
cable. The switch has no effect on COM2.
4.7.6. ETHERNET CONFIGURATION
For network or Internet communication, the analyzer can be connected to any standard
10BaseT or 100BaseT Ethernet network via low-cost network hubs, switches or routers.
The interface operates as a standard TCP/IP device on port 3000. This allows a remote
computer to connect through the internet to the analyzer using APICOM, terminal
emulators or other programs.
The Ethernet cable connector on the rear panel has two LEDs indicating the Ethernet’s
current operating status.
Table 4-16. Ethernet Status Indicators
LED FUNCTION
amber (link) On when connection to the LAN is valid.
green (activity Flickers during any activity on the LAN.
4.7.6.1. Configuring the Ethernet Interface Using DHCP
The analyzer is shipped with DHCP enabled by default. This allows the instrument to be
connected to a network or router with a DHCP server. Consult with your network
administrator to affirm that your network server is running DHCP. If so, the instrument
07266B DCN6485
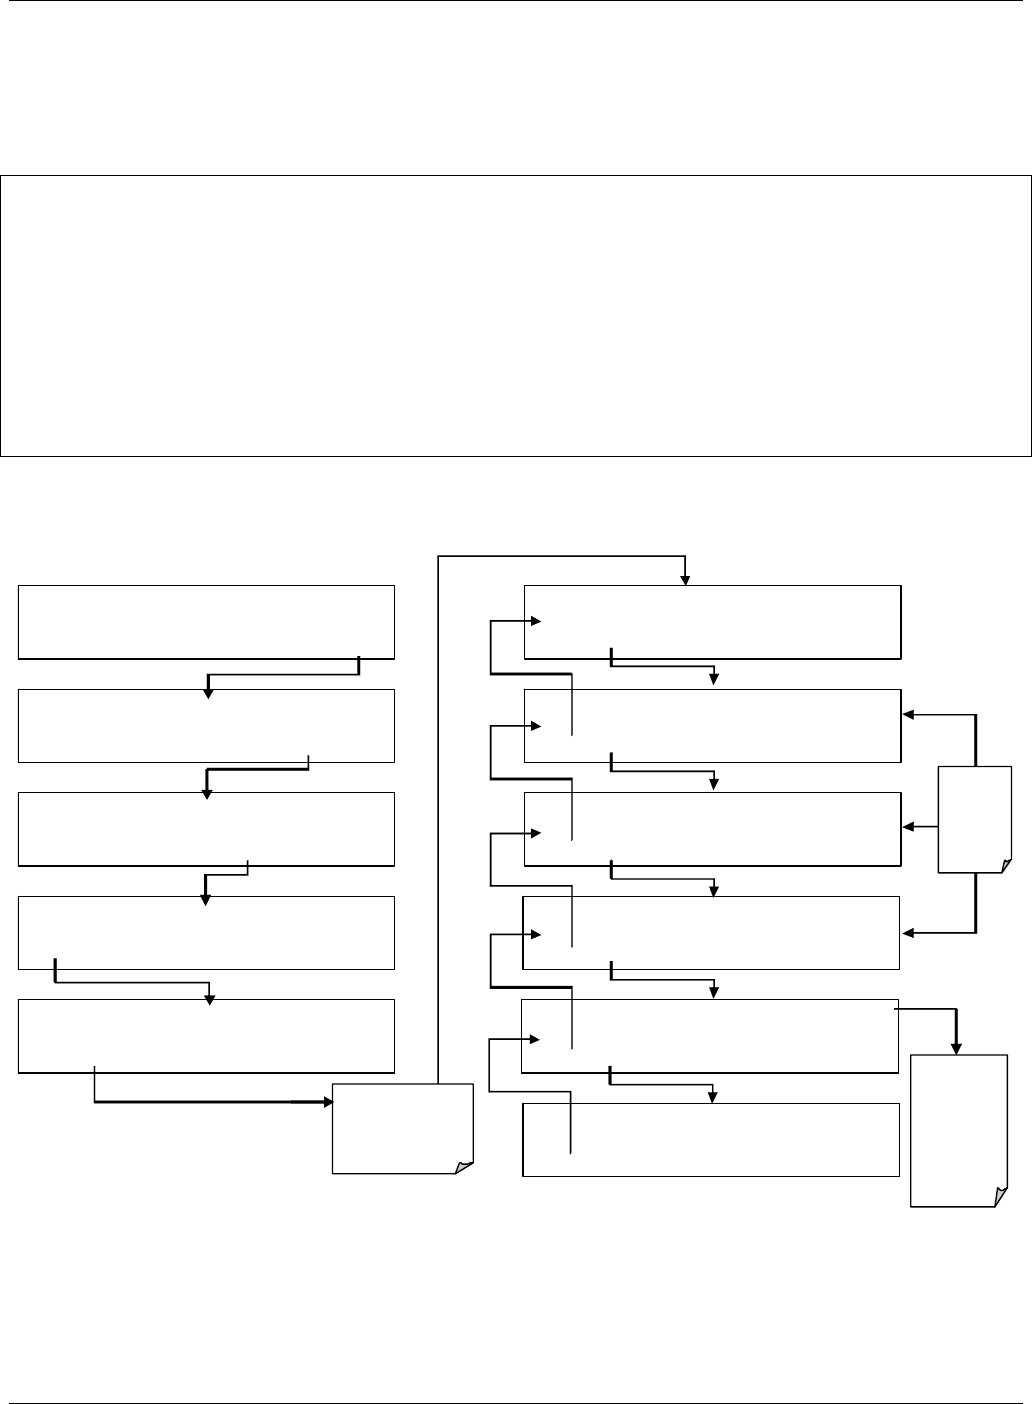
Operating Instructions Teledyne API – T101 Operation Manual
108
will automatically be assigned an IP address by the DHCP server (Section 4.10.6.2). This
configuration is useful for quickly getting an instrument up and running on a network.
However, for permanent Ethernet connections, a static IP address should be used. Section
4.7.6.2 below details how to configure the instrument with a static IP address.
NOTE
It is a good idea to check these settings the first time you power up your analyzer after it has been
physically connected to the LAN/Internet to make sure that the DHCP has successfully downloaded the
appropriate information from you network server(s).
If the gateway IP, instrument IP and the subnet mask are all zeroes (e.g. “0.0.0.0”), the DCHP was not
successful.
You may have to manually configure the analyzer’s Ethernet properties.
See your network administrator.
To view the LAN/Internet default configuration properties, press:
SAMPLE EN
T
ER SETUP PASS : 818
8 1 8 EN TR EXIT
SE TUP X.X PRIMARY SETUP MENU
CFG DAS RNGE PASS CLK MORE EXIT
SAMPLE RANGE = 500.0 PPB H2S =X XX . X
< TST TST > CAL SETUP
SE TUP X.X COMMUNICATIONS MENU
ID INET COM1 COM2 EXIT
SE TUP X.X SECONDARY SETUP MENU
COMM VARS DIAG EXIT
SETUP X.X DHCP: ON
SET> EDIT EXIT
SETUP X.X INST IP: 0.0.0.0
<SET SET> EXIT
SETUP X.X GATEWAY IP: 0.0.0.0
<SET SET> EXIT
SETUP X.X SUBNET MASK: 0.0.0.0
<SET SET> EXIT
SETUP X. X TCP PORT: 3000
<SET SET> EDIT EXIT
SETUP X.X HOSTNAME: T101
<SET EDIT EXIT
EDITING
disabled
when
DHCP is
ON
From this point on,
EXIT returns to
COMMUNICATIONS
MENU
Do not alter
unless
directed to by
Teledyne
AP I ’ s
Customer
Service
personnel
07266B DCN6485

Teledyne API – T101 Operation Manual Operating Instructions
109
4.7.6.2. Manually Configuring the Ethernet with Static IP Addresses
1. Connect a cable from the analyzer’s Ethernet port to a Local Area Network
(LAN) or Internet port.
2. Access Ethernet configuration through: SETUP>MORE>COMM>INET.
3. Follow the setup sequence as shown in the illustrations that follow, and
edit the Instrument and Gateway IP addresses and Subnet Mask to the
desired settings. (From the computer, enter the same information through
an application such as HyperTerminal).
Table 4-17. LAN/Internet Default Configuration Properties
PROPERTY DEFAULT STATE DESCRIPTION
DHCP ON
This displays whether the DHCP is turned ON or
OFF. Press EDIT and toggle ON for automatic
configuration after first consulting network
administrator.
INSTRUMENT IP
ADDRESS 0.0.0.0
This string of four packets of 1 to 3 numbers each
(e.g. 192.168.76.55.) is the address of the
analyzer itself.
GATEWAY IP
ADDRESS
0.0.0.0
Can only be edited when DHCP is set to OFF.
A string of numbers very similar to the Instrument
IP address (e.g. 192.168.76.1.) that is the address
of the computer used by your LAN to access the
Internet.
SUBNET MASK 0.0.0.0
Can only be edited when DHCP is set to OFF.
Also a string of four packets of 1 to 3 numbers each
(e.g. 255.255.252.0) that identifies the LAN to
which the device is connected.
All addressable devices and computers on a LAN
must have the same subnet mask. Any
transmissions sent to devices with different subnets
are assumed to be outside of the LAN and are
routed through the gateway computer onto the
Internet.
TCP PORT1 3000
This number defines the terminal control port by
which the instrument is addressed by terminal
emulation software, such as Internet or Teledyne
API’s APICOM.
HOST NAME T101
The name by which your analyzer will appear when
addressed from other computers on the LAN or via
the Internet. To change, see Section 4.7.6.3.
1 Do not change the setting for this property unless instructed to by Teledyne API’s Technical
Support personnel.
07266B DCN6485
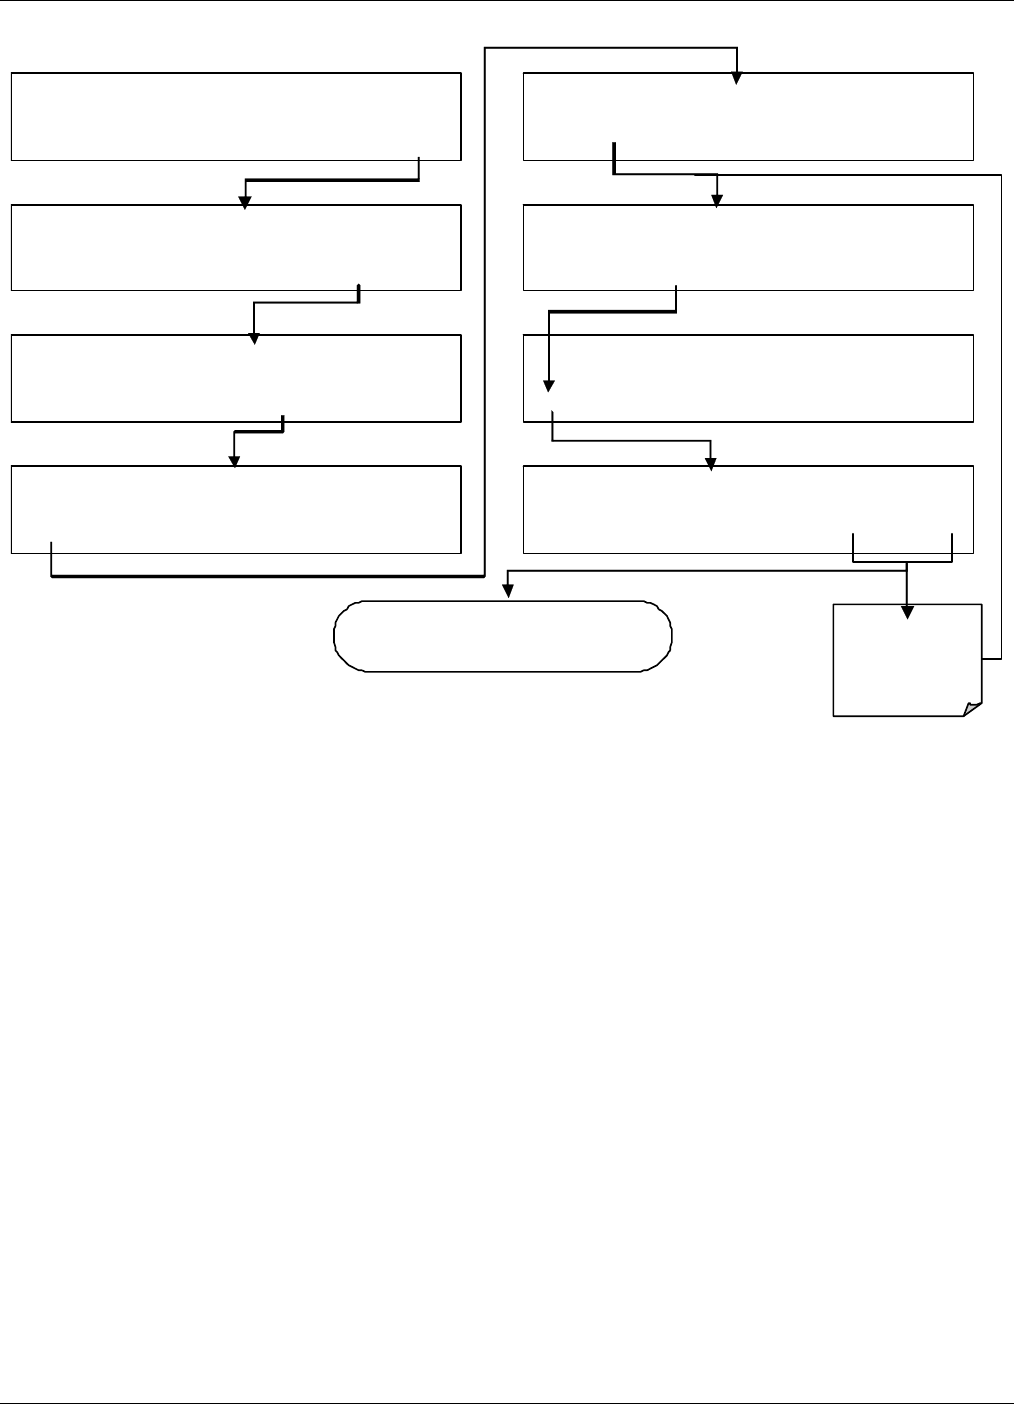
Operating Instructions Teledyne API – T101 Operation Manual
110
ENTR accept
new settings
EXIT ignores
new settin
g
s
SETUP X.X PRIMARY SETUP MENU
CFG DAS RNGE PASS CL K MORE EXIT
SAMPLE ENTER SETUP PASS :
8
18
8 1 8 ENTR EXIT
SAMPLE RANGE = 500.0 PPB H2S =XXX.X
< TST TST > CAL SETUP
SETUP X.X COMMUNICATIONS MENU
ID INET COM1 COM2 EXIT
SETUP X.X SECONDARY SETUP MENU
COMM VARS DIAG EXIT
SETUP X.X DHCP: ON
ON ENTR EXIT
SETUP X.X DHCP: ON
<SET SET> EDIT EXIT
SETUP X.X DHCP: OFF
OFF ENTR EXIT
(continues in next illustration)
07266B DCN6485
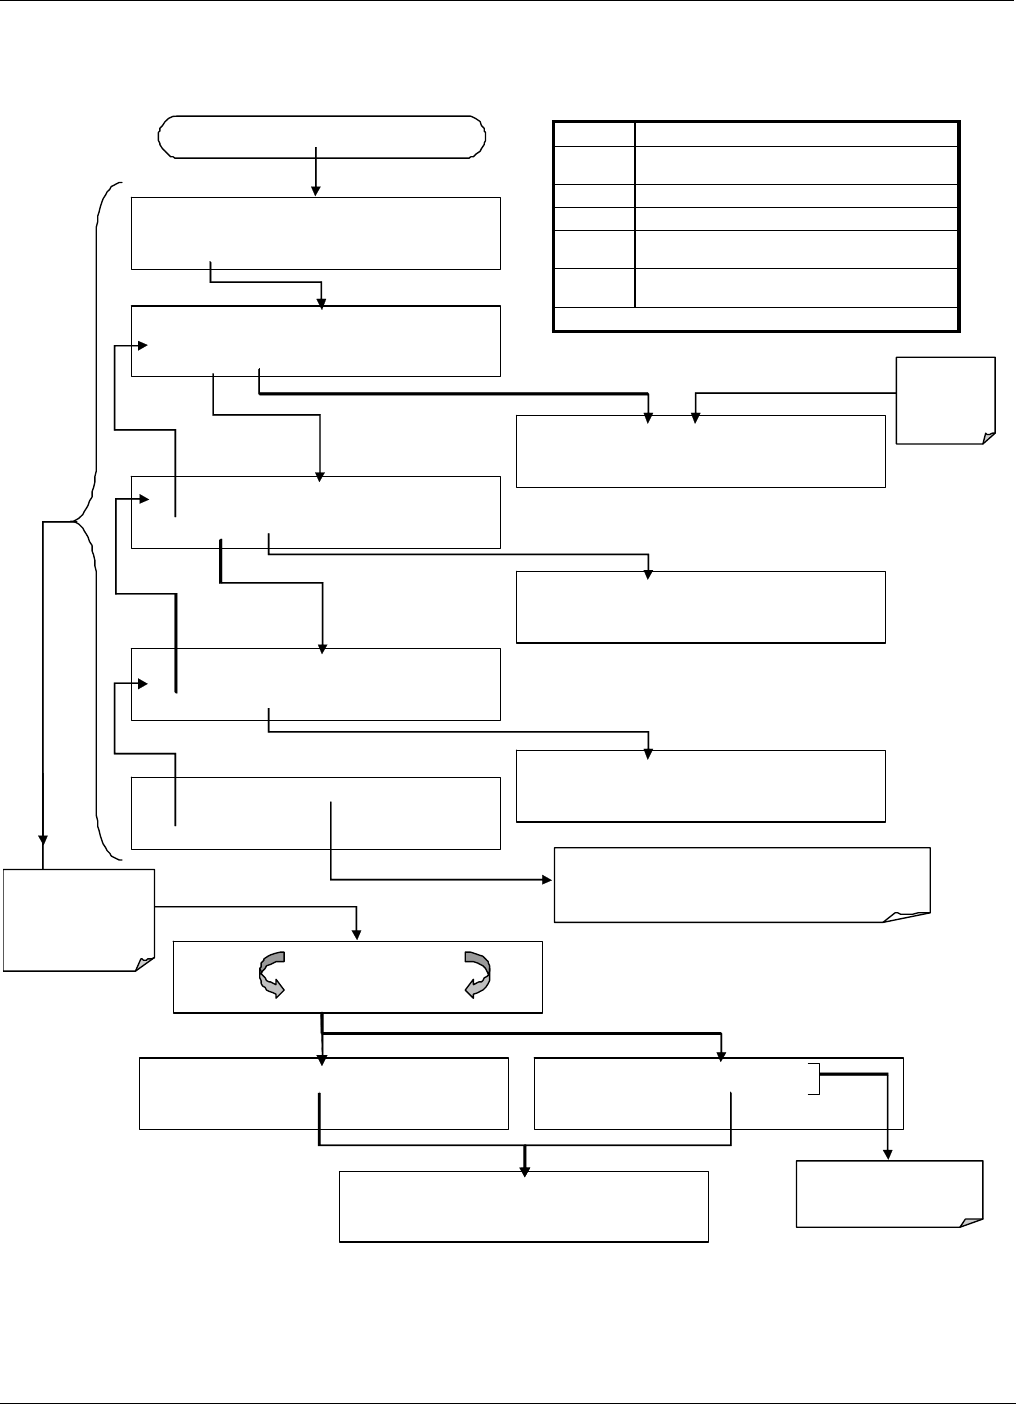
Teledyne API – T101 Operation Manual Operating Instructions
111
Configure the INSTRUMENT IP, GATEWAY IP and SUBNET MASK addresses:
Internet Configuration Touchscreen Functions
BUTTON FUNCTION
[0] Press to cycl e through th e range of n um erals a nd
ava ila ble chara cters (“0 – 9” & “ . ”)
<CH CH> Move s the cursor one cha racter l eft or righ t.
DEL Deletes a character at the cursor location.
ENTR Acce pts the ne w setting and returns to the pre viou s
me nu.
EXIT Ign ore s th e ne w se ttin g an d re turns to the p revi ous
me nu.
Butt ons a ppear o nly a s a ppl icab le.
SETUP X.X DHCP: OFF
SET> EDIT EXIT
SETUP X.X INST IP: 000.000.000.000
<SET SET> EDIT EXIT
SETUP X.X GATEWAY IP: 000.000.000.000
<SET SET> EDIT EXIT
SETUP X.X INST IP: [0] 00.000.000
<CH CH> DEL [0] ENTR EXIT
SETUP X.X SUBNET MASK:255.255.255.0
<SET SET> EDIT EXIT
SETUP X.X SUBNET MASK:[2]55.255.255.0
<CH CH> DEL [?] ENTR EXIT
SETUP X.X TCP PORT 3000
<SET EDI T EXIT
The PORT number needs to remain at 3000.
Do not change this setting unless instructed to by
Teledyne API’s Customer Service personnel.
(Continued from preceding illustration)
SETUP X.X GATEWAY IP: [0] 00.000.000
<CH CH> DEL [?] ENTR EXIT
Cursor
location is
indicated by
brackets
SETUP X.X INITIALIZING INET 0%
…
INITIALIZING INET 100%
SETUP X.X INITIALIZATI0N SUCCEEDED
SETUP X.X INITIALIZATION FAILED
SETUP X.X
COMMUNICATIONS MENU
ID INET COM1 COM2 EXIT
Pressing EXIT from
any of th e above
display menus
ignore s any ch anges
made.
Contact your IT
Network Administrator
07266B DCN6485
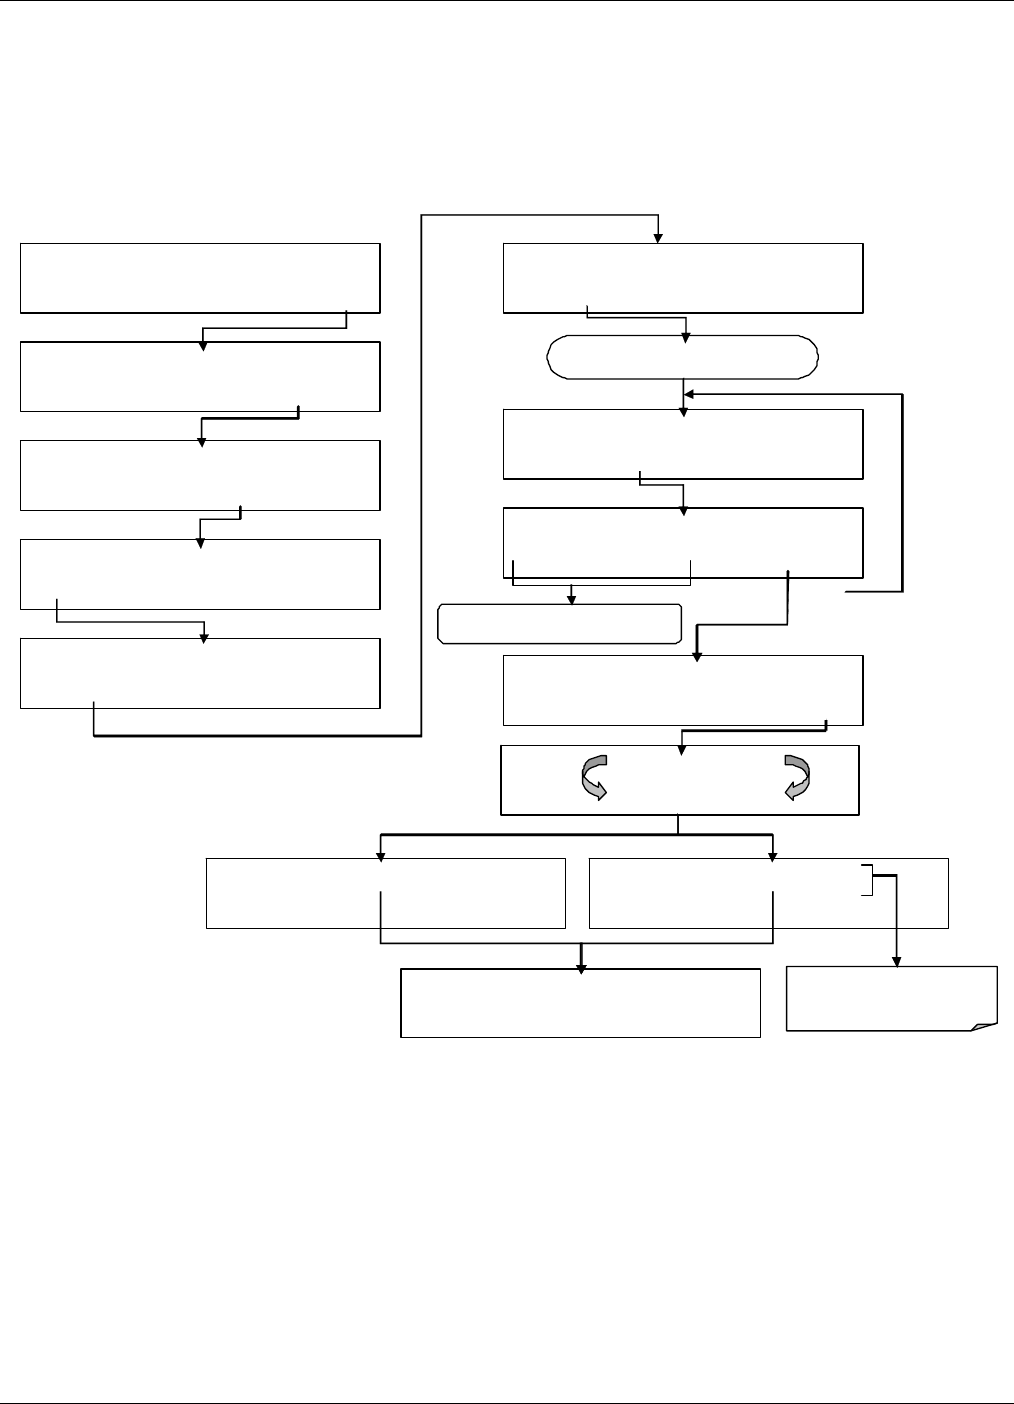
Operating Instructions Teledyne API – T101 Operation Manual
112
4.7.6.3. Changing the Analyzer’s HOSTNAME
The HOSTNAME is the name by which the analyzer appears on your network. The
default name for all Teledyne API Model T101 analyzers is T101. To change this name
(particularly if you have more than one Model T101 analyzer on your network), press.
SETU P X.X COMMUNICATIONS MENU
ID INET COM1 COM2 EXIT
SAMPLE ENTER SETUP PASS :
8
1
8
8 1 8 ENTR EXIT
SETU P X.X PRIMARY SETUP MENU
CFG DAS RNGE PASS CL K MORE EXIT
SAMPLE RANGE = 500.0 PPB H2S =XXX.X
< TST TST > CAL SETUP
SETUP X.X SECONDARY SETUP MENU
COMM VARS DIAG ALRM EXIT
SETUP X.X DHCP: ON
SET> EDIT EXIT
SETUP X.X HOSTNAME: 101
<SET EDIT EXIT
SETUP X.X
HOSTNAME: [T]101
<CH CH> INS DEL [?] ENTR EXIT
SETUP X.X HOSTNAME: 101-FIELD1
<SET EDIT EXIT
Continue pressing SET> UNTIL …
SETUP X.X INITIALIZING INET 0%
…
INITIALIZING INET 100%
SETUP X.X INITIALIZATI0N SUCCEEDED
SETUP X.X INITIALIZATION FAILED
SE TUP X. X
COMMUNICATIONS MENU
ID INET COM1 COM2 EXIT
Contact your IT Network
Administrator
Use thesebuttons (see Table 6-19)
to edit HOSTNAME
07266B DCN6485

Teledyne API – T101 Operation Manual Operating Instructions
113
Table 4-18. Internet Configuration Touchscreen Button Functions
BUTTON FUNCTION
<CH Moves the cursor one character to the left.
CH> Moves the cursor one character to the right.
INS Inserts a character before the cursor location.
DEL Deletes a character at the cursor location.
[?] Press this key to cycle through the range of numerals and characters available
for insertion. 0-9, A-Z, space ’ ~ ! # $ % ^ & * ( ) - _ = +[ ] { } <
>\ | ; : , . / ?
ENTR Accepts the new setting and returns to the previous menu.
EXIT Ignores the new setting and returns to the previous menu.
Some buttons only appear when applicable/usable.
07266B DCN6485
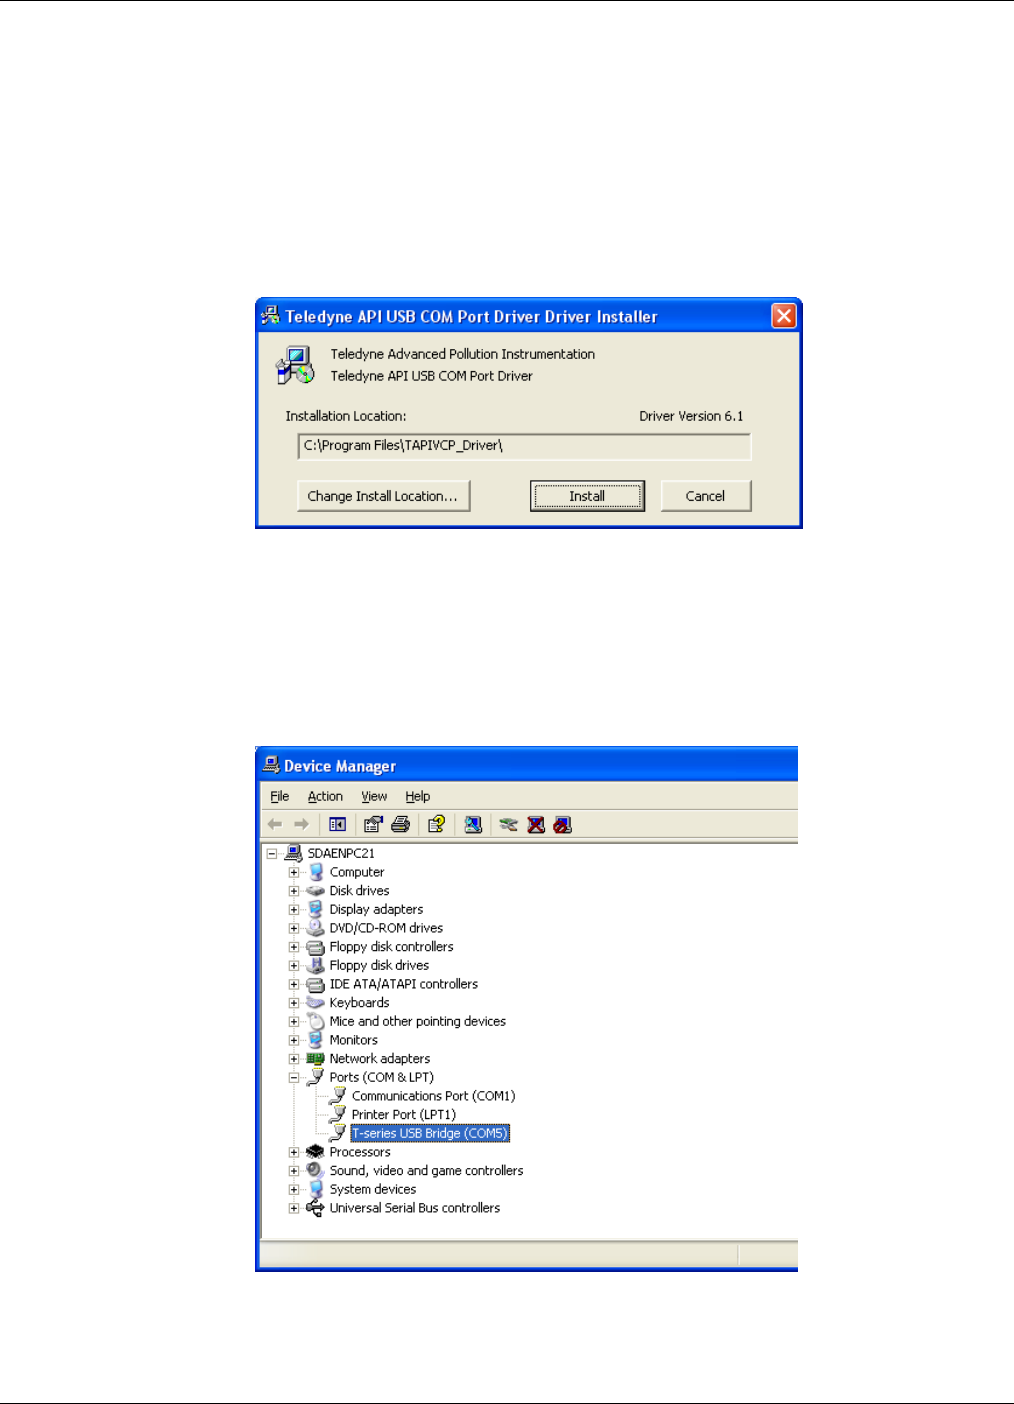
Operating Instructions Teledyne API – T101 Operation Manual
114
4.7.7. USB CONFIGURATION
The analyzer can be operated through a personal computer by downloading the TAPI
USB driver and directly connecting their respective USB ports.
1. Install the Teledyne T-Series USB driver on your computer, downloadable from the
Teledyne API website under Help Center>Software Downloads (www.teledyne-
api.com/software).
2. Run the installer file: “TAPIVCPInstaller.exe”
3. Connect the USB cable between the USB ports on your personal computer and your
analyzer. The USB cable should be a Type A – Type B cable, commonly used as a
USB printer cable.
4. Determine the Windows XP Com Port number that was automatically assigned to the
USB connection. (Start → Control Panel → System → Hardware → Device
Manager). This is the com port that should be set in the communications software,
such as APIcom or Hyperterminal.
Refer to the Quick Start (Direct Cable Connection) section of the Teledyne APIcom
Manual, PN 07463.
07266B DCN6485
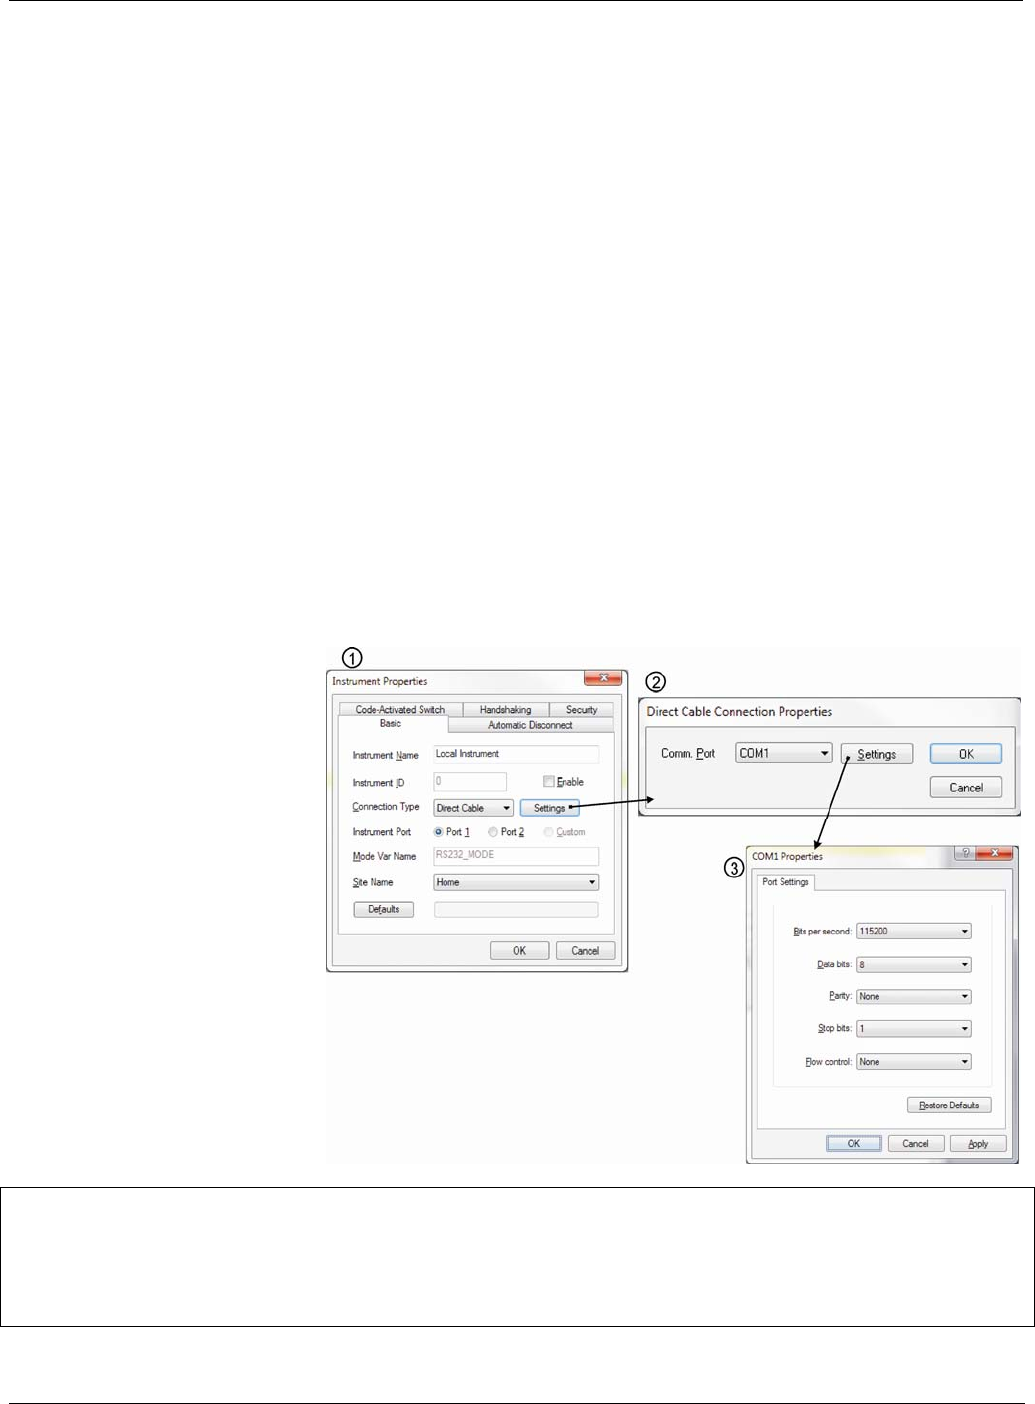
Teledyne API – T101 Operation Manual Operating Instructions
115
5. In the instrument’s SETUP>MORE>COMM>COM2 menu, make the following settings:
Baud Rate: 115200
COM2 Mode Settings:
Quiet Mode ON
Computer Mode ON
MODBUS RTU OFF
MODBUS ASCII OFF
E,8,1 MODE OFF
E,7,1 MODE OFF
RS-485 MODE OFF
SECURITY MODE OFF
MULTIDROP MODE OFF
ENABLE MODEM OFF
ERROR CHECKING ON
XON/XOFF HANDSHAKE OFF
HARDWARE HANDSHAKE OFF
HARDWARE FIFO ON
COMMAND PROMPT OFF
6. Next, configure your communications software, such as APIcom. Use the COM port
determined in Step 4 and the baud rate set in Step 5. The figures below show how
these parameters would be configured in the Instrument Properties window in
APIcom when configuring a new instrument. See the APIcom manual (PN 07463) for
more details.
NOTE
USB configuration requires that the baud rates of the instrument and the PC match; check the PC baud
rate and change if needed.
Using the USB port disallows use of the rear panel COM2 port except for multidrop communication.
07266B DCN6485

Operating Instructions Teledyne API – T101 Operation Manual
116
After connecting a USB cable between your PC and the instrument, ensure their baud
rates match (change the baud rate setting for either your PC’s software or the instrument).
The baud rate setting is in the Communications Menu under COM2, which is the default
setup menu for USB configuration.
Also, while there are various communication modes available (Table 4-18), the default
settings are recommended for USB, except to change the baud rate if required..
4.7.8. MULTIDROP RS-232 SET UP
When the RS-232 Multidrop option is installed, connection adjustments and configuration
through the menu system are required. This section provides instructions for the internal
connection adjustments, then for external connections, and ends with instructions for
menu-driven configuration.
NOTE
Because the RS-232 Multidrop option uses both the RS232 and COM2 DB9 connectors on the analyzer’s
rear panel to connect the chain of instruments, COM2 port is no longer available for separate RS-232 or
RS-485 operation.
CAUTION
Printed Circuit Assemblies (PCAs) are sensitive to electro-static discharges too small to be felt by the
human nervous system. Failure to use ESD protection when working with electronic assemblies will void
the instrument warranty. Refer to Section 13 for more information on preventing ESD damage..
In each instrument with the Multidrop option there is a shunt jumpering two pins on the
serial Multidrop and LVDS printed circuit assembly (PCA), as shown in Figure 4-9. This
shunt must be removed from all instruments except that designated as last in the
multidrop chain, which must remain terminated. This requires powering off and opening
each instrument and making the following adjustments:
1. With NO power to the instrument, remove its top cover and lay the rear
panel open for access to the Multidrop/LVDS PCA, which is seated on the
CPU.
2. On the Multidrop/LVDS PCA’s JP2 connector, remove the shunt that
jumpers Pins 21 22 as indicated in Figure 4-9. (Do this for all but the
last instrument in the chain where the shunt should remain at Pins 21
22).
3. Check that the following cable connections are made in all instruments
(again refer to Figure 4-9):
J3 on the Multidrop/LVDS PCA to the CPU’s COM1 connector
(Note that the CPU’s COM2 connector is not used in Multidrop)
J4 on the Multidrop/LVDS PCA to J12 on the motherboard
J1 on the Multidrop/LVDS PCS to the front panel LCD
07266B DCN6485
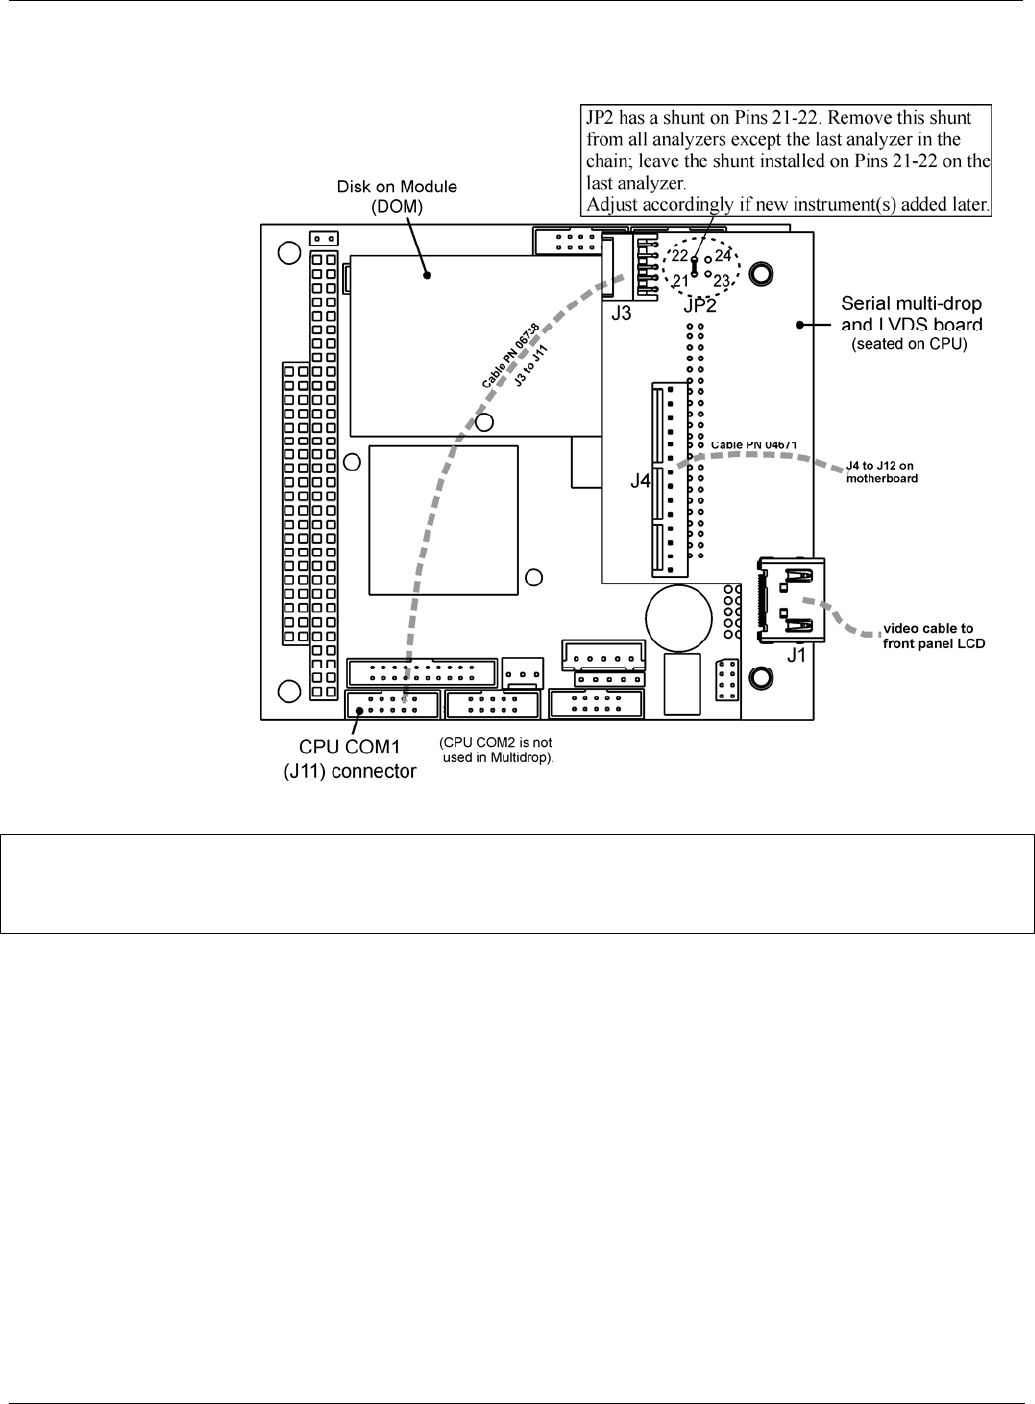
Teledyne API – T101 Operation Manual Operating Instructions
117
Figure 4-9. Jumper and Cables for Multidrop Mode
Note
If you are adding an instrument to the end of a previously configured chain, remove the shunt between
Pins 21 22 of JP2 on the Multidrop/LVDS PCA in the instrument that was previously the last instrument
in the chain.
4. Close the instrument.
5. Referring to Figure 4-10 use straight-through DB9 male DB9 female
cables to interconnect the host RS232 port to the first analyzer’s RS232
port; then from the first analyzer’s COM2 port to the second analyzer’s
RS232 port; from the second analyzer’s COM2 port to the third analyzer’s
RS232 port, etc., connecting in this fashion up to eight analyzers, subject
to the distance limitations of the RS-232 standard.
6. On the rear panel of each analyzer, adjust the DCE DTE switch so that the
green and the red LEDs (RX and TX) of the COM1 connector (labeled
RS232) are both lit. (Ensure you are using the correct RS-232 cables
internally wired specifically for RS-232 communication; see Table 1-1,
“Communication Cables” and the preceding subsection, “RS-232
Connection”).
07266B DCN6485
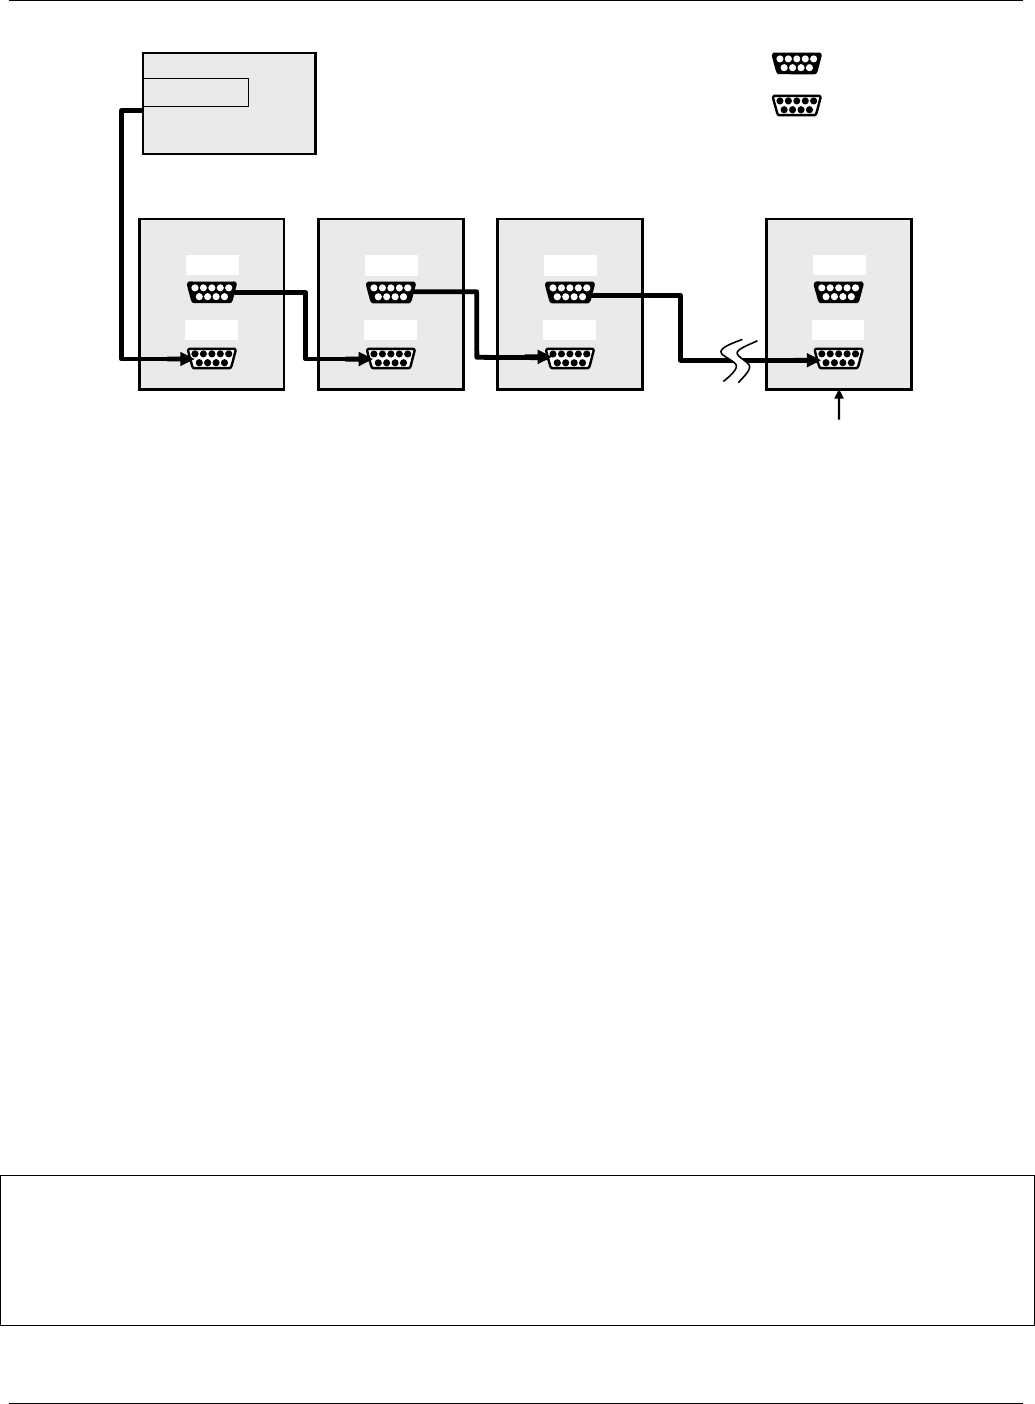
Operating Instructions Teledyne API – T101 Operation Manual
118
Analyzer Analyzer Analyzer Last Analyzer
Female DB9
Male DB9
RS-232
COM2
RS-232
COM2
RS-232
COM2
RS-232
COM2
Host
RS-232 port
Ensure jumper is
installed between
JP2 pins 21 22
in last instrument
of multidrop chain.
Figure 4-10.Multidrop PCA Host/Analyzer Interconnect Diagram
7. BEFORE communicating from the host, power on the instruments and
check that the Instrument ID code is unique for each (see Section 4.7.1).
a. In the SETUP Mode menu go to SETUP>MORE>COMM>ID. The default
ID is typically the model number or “0”.
b. To change the identification number, press the button below the digit
to be changed.
c. Press/select ENTER to accept the new ID for that instrument.
8. Next, in the SETUP>MORE>COMM>COM1 menu (do not use the COM2
menu for multidrop), edit the COM1 MODE parameter as follows:
press/select EDIT and set only QUIET MODE, COMPUTER MODE, and
MULTIDROP MODE to ON. Do not change any other settings.
9. Press/select ENTER to accept the changed settings, and ensure that COM1
MODE now shows 35.
10. Press/select SET> to go to the COM1 BAUD RATE menu and ensure it
reads the same for all instruments (edit as needed so that all instruments
are set at the same baud rate).
Note
Teledyne API recommends setting up the first link between the Host and the first analyzer and testing it
before setting up the rest of the chain.
The (communication) Host instrument can address only one instrument at a time, each by its unique ID
(see step 7 above).
07266B DCN6485

Teledyne API – T101 Operation Manual Operating Instructions
119
4.7.9. MODBUS SET UP
The following set of instructions assumes that the user is familiar with MODBUS
communications, and provides minimal information to get started. For additional
instruction, please refer to the Teledyne API MODBUS manual, PN 06276. Also refer to
www.modbus.org for MODBUS communication protocols.
Minimum Requirements
Instrument firmware with MODBUS capabilities installed.
MODBUS-compatible software (TAPI uses MODBUS Poll for testing; see
www.modbustools.com)
Personal computer
Communications cable (Ethernet or USB or RS232)
Possibly a null modem adapter or cable
Actions
Set Com Mode parameters
Comm
Slave ID
Ethernet: Using the front panel menu, go to SETUP – MORE – COMM – INET; scroll
through the INET submenu until you reach TCP PORT 2 (the standard setting is
502), then continue to TCP PORT 2 MODBUS TCP/IP; press EDIT and toggle the
menu button to change the setting to ON, then press ENTR. (Change Machine
ID if needed: see “Slave ID”).
USB/RS232: Using the front panel menu, go to SETUP – MORE – COMM – COM2 – EDIT;
scroll through the COM2 EDIT submenu until the display shows COM2 MODBUS
RTU: OFF (press OFF to change the setting to ON. Scroll NEXT to COM2
MODBUS ASCII and ensure it is set to OFF. Press ENTR to keep the new
settings. (If RTU is not available with your communications equipment, set the
COM2 MODBUS ASCII setting to ON and ensure that COM2 MODBUS RTU is set
to OFF. Press ENTR to keep the new settings).
If your analyzer is connected to a network with at least one other analyzer of the same
model, a unique Slave ID must be assigned to each. Using the front panel menu, go to
SETUP – MORE – COMM – ID. The MACHINE ID default is the same as the model number.
Toggle the menu buttons to change the ID.
Reboot analyzer For the settings to take effect, power down the analyzer, wait 5 seconds, and power up the
analyzer.
Make appropriate cable
connections
Connect your analyzer either:
via its Ethernet or USB port to a PC (this may require a USB-to-RS232 adapter for your PC;
if so, also install the sofware driver from the CD supplied with the adapter, and reboot the
computer if required), or
via its COM2 port to a null modem (this may require a null modem adapter or cable).
Specify MODBUS software
settings
(examples used here are for
MODBUS Poll software)
1. Click Setup / [Read / Write Definition] /.
a. In the Read/Write Definition window (see example that follows) select a Function
(what you wish to read from the analyzer).
b. Input Quantity (based on your firware’s register map).
c. In the View section of the Read/Write Definition window select a Display
(typically Float
Inverse).
d. Click OK.
2. Next, click Connection/Connect.
a. In the Connection Setup window (see example that follows), select the options based on
your computer.
b. Press OK.
Read the Modbus Poll
Register
Use the Register Map to find the test parameter names for the values displayed (see example
that follows If desired, assign an alias for each.
07266B DCN6485
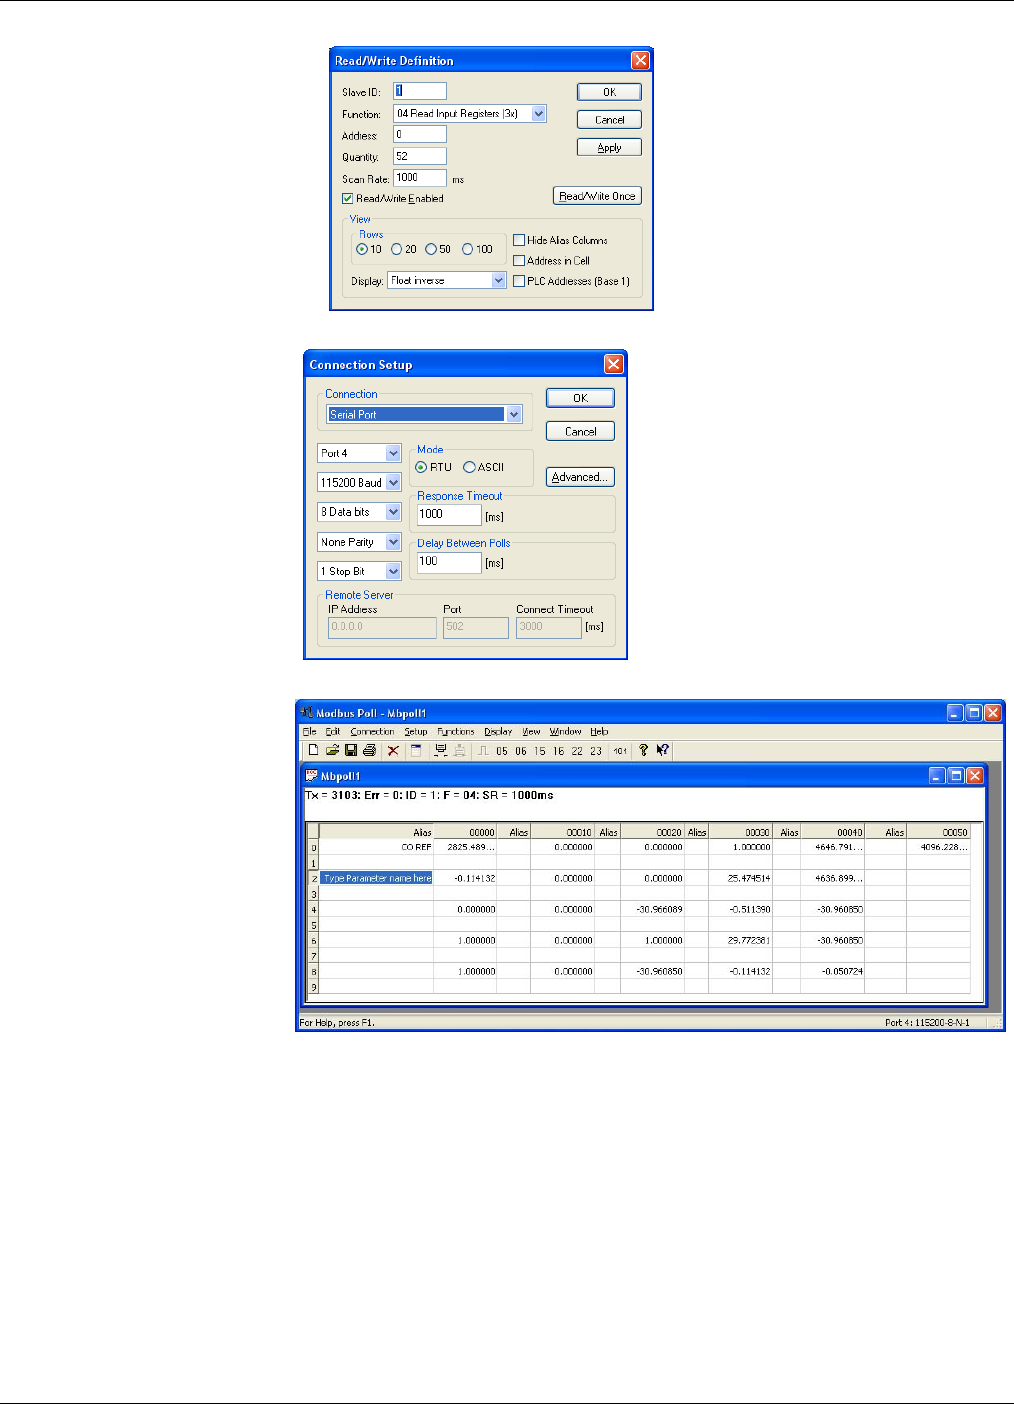
Operating Instructions Teledyne API – T101 Operation Manual
120
Example Read/Write Definition window:
Example Connection Setup window:
Example MODBUS Poll window:
07266B DCN6485

Teledyne API – T101 Operation Manual Operating Instructions
121
4.7.10. COM PORT COMMUNICATION MODES
Each of the analyzer’s serial ports can be configured to operate in a number of different
modes, which are listed in Table 4-18 and which can be combined by adding the Mode ID
numbers. For example, quiet mode, computer mode and internet-enabled mode would
carry a combined mode ID of 1, the standard configuration on the T101 COM2 port. Note
that each COM port needs to be configured independently.
Table 4-19. COMM Port Communication Modes
MODE1 ID DESCRIPTION
QUIET
1
Quiet mode suppresses any feedback from the analyzer (DAS reports, and
warning messages) to the remote device and is typically used when the port
is communicating with a computer program such as APICOM. Such feedback
is still available but a command must be issued to receive them.
COMPUTER 2 Computer mode inhibits echoing of typed characters and is used when the
port is communicating with a computer program, such as APICOM.
SECURITY 4 When enabled, the serial port requires a password before it will respond.
The only command that is active is the help screen (? CR).
HESSEN
PROTOCOL 16 The Hessen communications protocol is used in some European countries.
Teledyne API part number 02252 contains more information on this
protocol.
E, 7, 1
2048
When turned on this mode switches the COMM port settings
from
No parity; 8 data bits; 1 stop bit
to
Even parity; 7 data bits; 1 stop bit
RS-485 1024 Configures the COM2 Port for RS-485 communication. RS-485 mode has
precedence over Multidrop mode if both are enabled.
MULTIDROP
PROTOCOL 32 Multidrop protocol allows a multi-instrument configuration on a single
communications channel. Multidrop requires the use of instrument IDs.
ENABLE
MODEM 64 Enables to send a modem initialization string at power-up. Asserts certain
lines in the RS-232 port to enable the modem to communicate.
ERROR
CHECKING2 128 Fixes certain types of parity errors at certain Hessen protocol installations.
XON/XOFF
HANDSHAKE2 256 Disables XON/XOFF data flow control also known as software handshaking.
HARDWARE
HANDSHAKE 8 Enables CTS/RTS style hardwired transmission handshaking. This style of
data transmission handshaking is commonly used with modems or terminal
emulation protocols as well as by Teledyne API’s APICOM software.
HARDWARE
FIFO2 512 Improves data transfer rate when on of the COMM ports.
COMMAND
PROMPT 4096 Enables a command prompt when in terminal mode.
1 Modes are listed in the order in which they appear in the
SETUP MORE COMM COM[1 OR 2] MODE menu
2 The default sting for this feature is ON. Do not disable unless instructed to by Teledyne API Technical Support
personnel.
07266B DCN6485
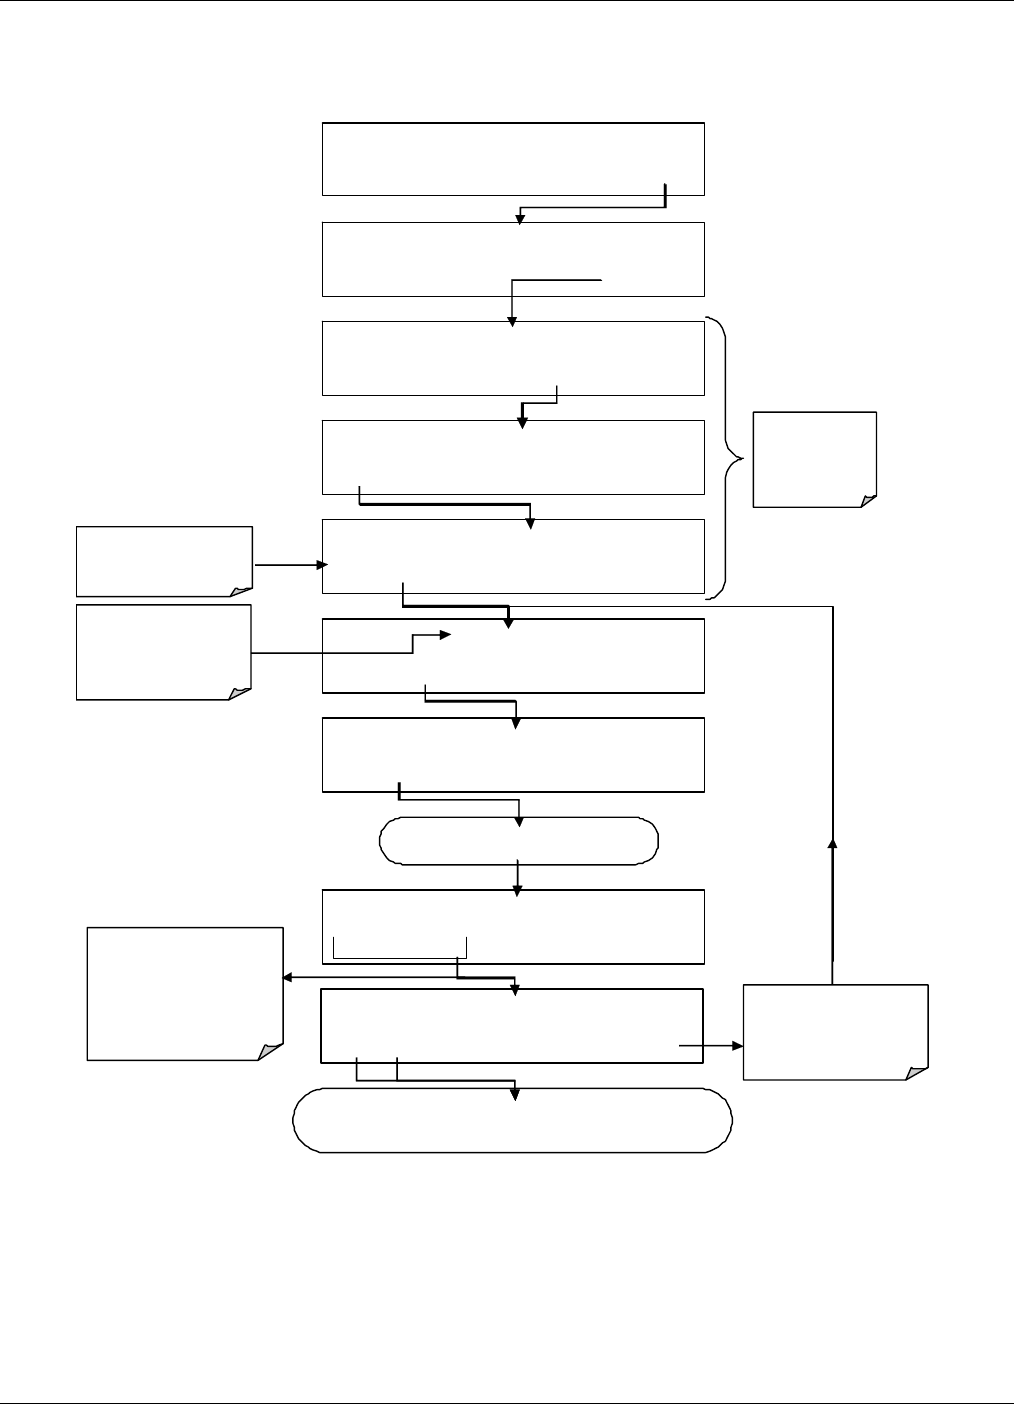
Operating Instructions Teledyne API – T101 Operation Manual
122
Press the following buttons to select a communication mode for a one of the COMM
Ports, such as the following example where HESSEN PROTOCOL mode is enabled:
Continue pressing next until …
SETUP X.X PRIMARY SETUP MENU
CFG DAS RNGE PASS CL K MORE EXIT
SETUP X.X SECONDARY SETUP MENU
COMM VARS DIAG ALRM EXIT
SAMPLE RANGE = 500.0 PPB H2S =XXX.X
< TST TST > CAL SETUP
SETUP X.X COMMUNICATIONS MENU
ID COM1 COM2 EXIT
SETUP X.X COM1 MODE:0
SET> EDIT EXIT
SETUP X.X COM1 QUIET MODE: OFF
NEXT OFF ENTR EXIT
SETU P X.X COM1 HESSEN PROTOCOL : ON
PREV NEXT ON ENTR EXIT
SETUP X.X COM1 HESSEN PROTOCOL : OFF
PREV NEXT OFF ENTR EXIT
Continue pressing the NEXT and PREV keys to select any other
m odes you whi ch to enabl e or di sabl e
SAMPLE ENTER SETUP PASS : 818
8 1 8 ENTR EXIT
Use PREV and NEXT
keys to move between
available modes.
A mode is enabled by
tog gli ng the ON/OF F
key.
Select whic h COM
port to configure
EXIT returns
to the
previous
menu
ENTR key accepts the
new settings
EXIT key ignores the
new settings
The s um of th e mode
IDs of the selected
modes is displayed
here
07266B DCN6485
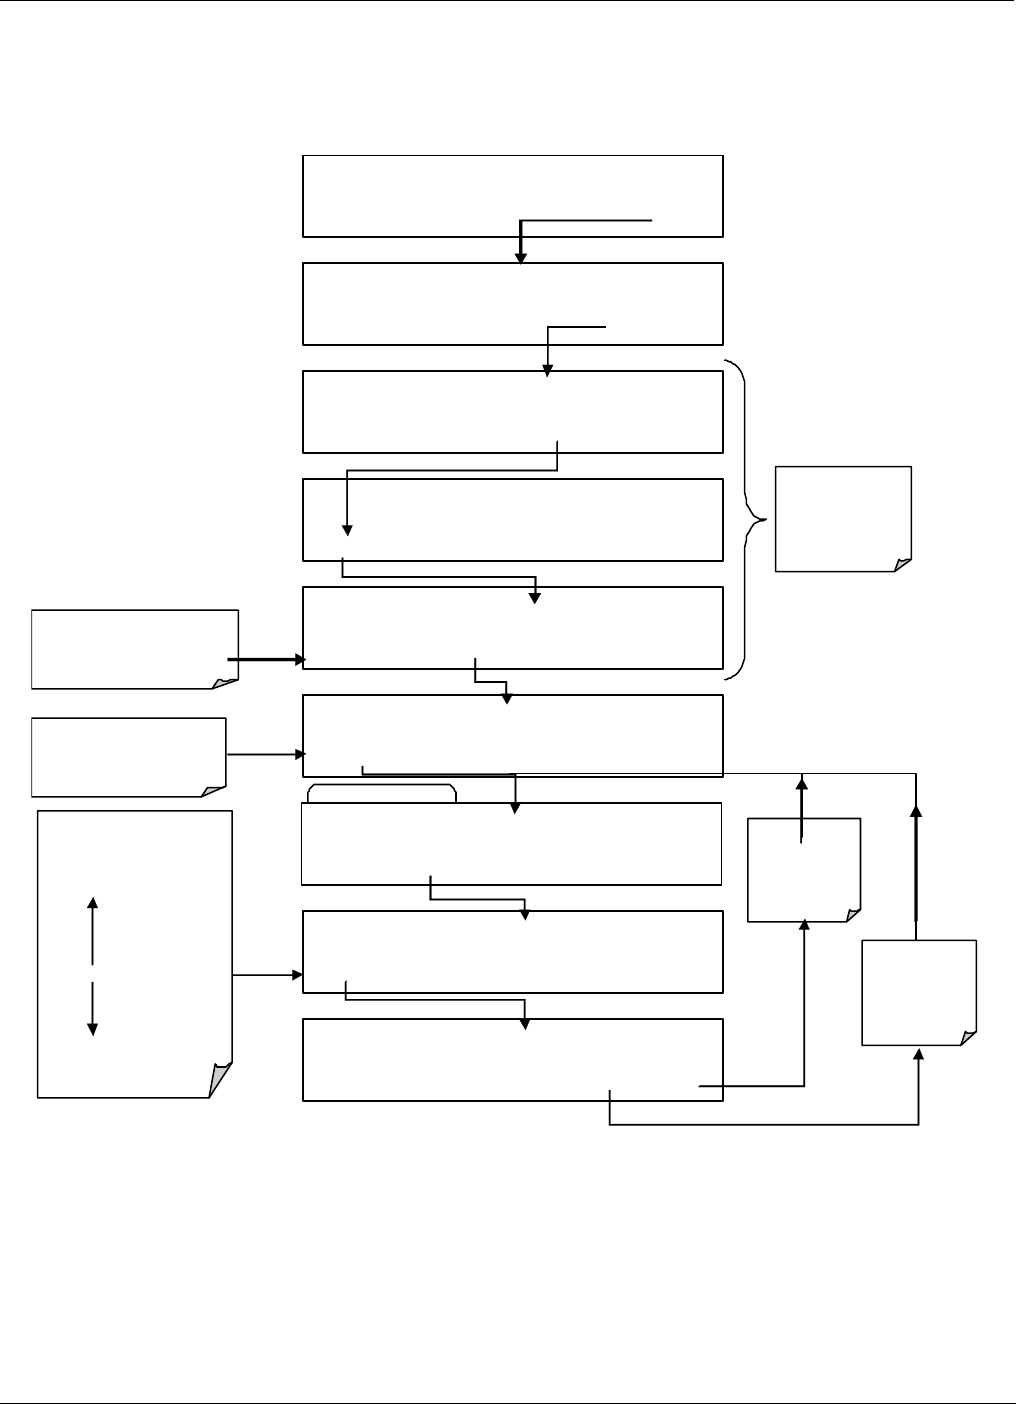
Teledyne API – T101 Operation Manual Operating Instructions
123
4.7.11. COM PORT BAUD RATE
To select the baud rate of one of the COM Ports, press:
EXAMPLE
SETUP X.X COM2 BAUD RATE:19200
PREV NEXT ENTR EXIT
SETUP X.X COM1 BAUD RATE:9600
NEXT ON ENTR EXIT
SETUP X.X
PRIMARY SETUP MENU
CFG DAS RNGE PASS CLK MORE EXIT
SETUP X.X
SECONDARY SETUP MENU
COMM VARS DIAG EXIT
SAMPLE RANGE = 500.0 PPB H2S =XXX.X
< TST TST > CAL SETUP
SETUP X.X COMMUNICATIONS MENU
ID INET COM1 COM2 EXIT
SETUP X.X COM2 MODE:0
SET> EDIT EXIT
SETUP X.X COM2 BAUD RATE:11200
<SET SET> EDIT EXIT
SAMPLE ENTER SETUP PASS : 818
8 1 8 ENTR EXIT
Rear panel USB is
assigned COM2 in the
Com mu nicati ons M enu .
EXIT returns
to the
previous
menu
EXIT
ign ores
the new
setting
Use PREV and NEXT
keys to move
between available
baud rates.
300
1200
4800
9600
19200
38400
57600
115200
Pr es s SET> u nti l y ou
reach COM1 BAUD
RATE
ENTR
ac cep ts
the new
setting
07266B DCN6485
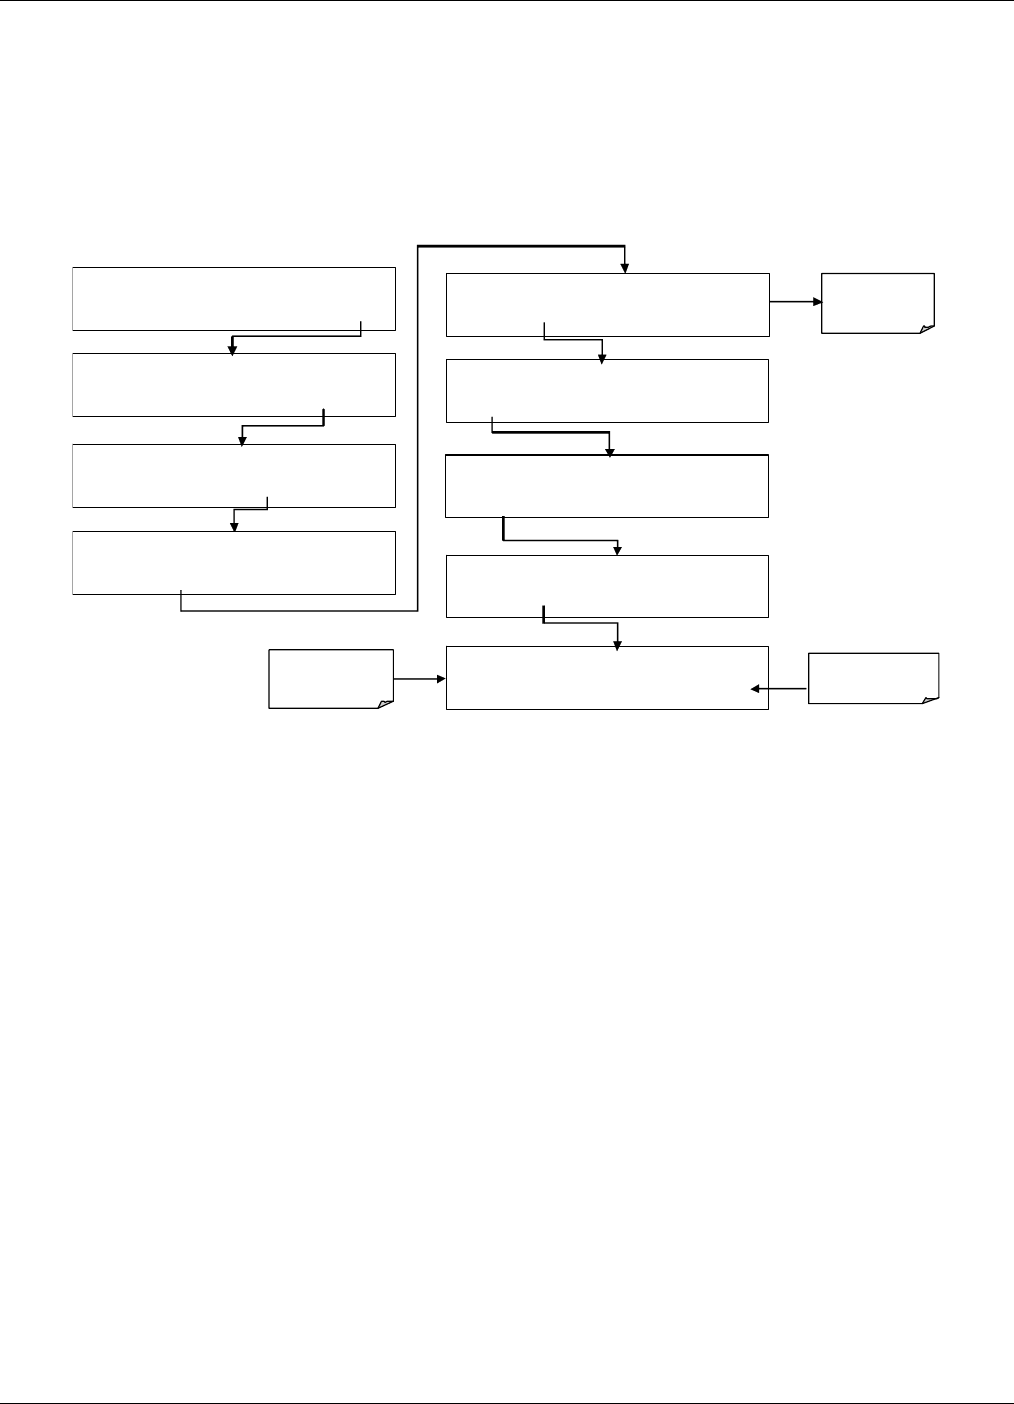
Operating Instructions Teledyne API – T101 Operation Manual
124
4.7.12. COM PORT TESTING
The serial ports can be tested for correct connection and output in the COMM menu. This
test sends a string of 256 ‘w’ characters to the selected COM port. While the test is
running, the red LED on the rear panel of the analyzer should flicker.
To initiate the test press the following button sequence .
SAMPLE RANGE = 500.0 PPB H2S =XXX.X
< TST TST > CAL SETUP
SAMPLE EN TER SETUP PASS : 818
8 1 8 ENTR EX IT
SETUP X.X PRIMARY SETUP MENU
CFG DAS RNGE PASS CLK MORE EXIT
SETUP X.X SECONDARY SETUP MENU
COMM VARS DIAG EXIT
Select which
COM port to
test.
SE TUP X. X COMMUNICATIONS MENU
ID INET COM1 COM2 EXIT
SE TUP X.X COM1 : TEST PORT
<SET TEST EXIT
SE TUP X.X TRANSMITTING TO COM1
<SET TEST EXIT
SE TUP X. X COM1 MODE:0
SET> EDIT EXIT
SETUP X.X COM1 BAUD RATE:19200
<SET SET> EDIT EXIT
EXIT returns to
COMM menu
Test runs
automatically
4.8. USING THE DATA ACQUISITION SYSTEM (DAS )
The T101 analyzer contains a flexible and powerful, internal data acquisition system
(DAS ) that enables the analyzer to store concentration and calibration data as well as a
host of diagnostic parameters. The DAS of the T101 can store several months of data,
depending on how it is configured. The data are stored in non-volatile memory and are
retained even when the instrument is powered off. Data are stored in plain text format for
easy retrieval and use in common data analysis programs (such as spreadsheet-type
programs).
The DAS is designed to be flexible, users have full control over the type, length and
reporting time of the data. The DAS permits users to access stored data through the
instrument’s front panel or its communication ports. Using APICOM, data can even be
retrieved automatically to a remote computer for further processing.
The principal use of the DAS is logging data for trend analysis and predictive diagnostics,
which can assist in identifying possible problems before they affect the functionality of
the analyzer. The secondary use is for data analysis, documentation and archival in
electronic format.
To support the DAS functionality, Teledyne API offers APICOM, a program that
provides a visual interface for remote or local setup, configuration and data retrieval of
07266B DCN6485

Teledyne API – T101 Operation Manual Operating Instructions
125
the DAS (Section 4.8). The APICOM manual, which is included with the program,
contains a more detailed description of the DAS structure and configuration, which is
briefly described in this section.
The T101 is configured with a basic DAS configuration, which is enabled by default.
New data channels are also enabled by default but each channel may be turned off for
later or occasional use. Note that DAS operation is suspended while its configuration is
edited through the front panel. To prevent such data loss, it is recommended to use the
APICOM graphical user interface for DAS changes.
The green SAMPLE LED on the instrument front panel, which indicates the analyzer
status, also indicates certain aspects of the DAS status:
Table 4-20. Front Panel LED Status Indicators for DAS
LED
STATE DAS STATUS
Off System is in calibration mode. Data logging can be enabled or disabled
for this mode. Calibration data are typically stored at the end of
calibration periods, concentration data are typically not sampled,
diagnostic data should be collected.
Blinking Instrument is in hold-off mode, a short period after the system exits
calibrations. DAS channels can be enabled or disabled for this period.
Concentration data are typically disabled whereas diagnostic should be
collected.
On Sampling normally.
The DAS can be disabled only by disabling or deleting its individual data channels.
4.8.1. DAS STRUCTURE
The DAS is designed around the feature of a “record”. A record is a single data point of
one parameter, stored in one (or more) data channels and generated by one of several
triggering event. The entire DAS configuration is stored in a script, which can be edited
from the front panel or downloaded, edited and uploaded to the instrument in form of a
string of plain-text lines through the communication ports.
DAS data are defined by the PARAMETER type and are stored through different
triggering EVENTS in data CHANNELS, which relate triggering events to data
parameters and define certain operational functions related to the recording and reporting
of the data.
4.8.1.1. DAS Channels
The key to the flexibility of the DAS is its ability to store a large number of combinations
of triggering events and data parameters in the form of data channels. Users may create
up to 20 data channels and each channel can contain one or more parameters. For each
channel one triggering event is selected and up to 50 data parameters, which can be the
same or different between channels. Each data channel has several properties that define
the structure of the channel and allow the user to make operational decisions regarding
the channel (Table 4-20).
07266B DCN6485

Operating Instructions Teledyne API – T101 Operation Manual
126
Table 4-21. DAS Data Channel Properties
PROPERTY DESCRIPTION DEFAULT SETTING RANGE
NAME The name of the data channel. “NONE” Up to 6 letters and digits
(more with APICOM, but
only the first six are
displayed on the front
panel).
TRIGGERING
EVENT
The event that triggers the data channel to
measure and store its data parameters. See
APPENDIX A-5 for a list of available
triggering events.
ATIMER Any allowed event.
NUMBER AND
LIST OF
PARAMETERS
A User-configurable list of data types to be
recorded in any given channel. See
APPENDIX A-5 for a list of available
parameters
1 -
PMTDET
Any available
concentration,
temperature, pneumatic
or diagnostic parameter.
REPORT
PERIOD
The amount of time between each channel
data point.
000:01:00 000:00:01 to
366:23:59
(Days:Hours:Minutes)
NUMBER OF
RECORDS
The number of reports that will be stored in
the data file. Once the specified limit has
been exceeded, the oldest data are over-
written to make space for new data.
100 Configuration-dependent,
limited by available
storage space.
RS-232
REPORT
Enables the analyzer to automatically report
channel values to the RS-232 ports.
OFF OFF or ON
CHANNEL
ENABLED
Enables or disables the channel. Provides a
convenient means to temporarily disable a
data channel.
ON OFF or ON
CAL HOLD OFF Disables sampling of data parameters while
instrument is in calibration mode.
Note that - when enabled here - there is
also a length of the DAS HOLD OFF after
calibration mode, which is set in the VARS
menu (Section 4.11.2.11.)
OFF OFF or ON
4.8.1.2. DAS Parameters
Data parameters are types of data that may be measured and stored by the DAS . For each
Teledyne API analyzer model, the list of available data parameters is different, fully
defined and not customizable. Appendix A-5 lists firmware specific data parameters for
the T101. The most common parameters are concentrations of measured gases (H2S, H2S
and NO2), temperatures of heated zones (converter, sample chamber, box temperature…),
pressures and flows of the pneumatic subsystem and other diagnostic measurements as
well as calibration data (slope and offset) for each gas.
Most data parameters have associated measurement units, such as mV, ppb, cm³/min, etc.,
although some parameters have no units. The only units that can be changed are those of
the concentration readings according to the SETUP-RANGE settings. Note that the DAS
does not keep track of the unit of each concentration value and DAS data files may
contain concentrations in multiple units if the unit was changed during data acquisition.
Each data parameter has user-configurable functions that define how the data are recorded
(Table 4-21).
07266B DCN6485

Teledyne API – T101 Operation Manual Operating Instructions
127
Table 4-22. DAS Data Parameter Functions
FUNCTION EFFECT
PARAMETER Instrument-specific parameter name.
SAMPLE MODE INST: Records instantaneous reading.
AVG: Records average reading during reporting interval.
MIN: Records minimum (instantaneous) reading during
reporting interval.
MAX: Records maximum (instantaneous) reading during
reporting interval.
PRECISION Decimal precision of parameter value (0-4).
STORE NUM.
SAMPLES OFF: stores only the average (default).
ON: stores the average and the number of samples in each
average for a parameter. This property is only useful when the
AVG sample mode is used. Note that the number of samples is
the same for all parameters in one channel and needs to be
specified only for one of the parameters in that channel.
4.8.1.3. DAS Configuration Limits
Users can specify up to 50 parameters per data channel (the T101 provides about 30
parameters). However, the number of DAS objects are limited by the instrument’s finite
storage capacity. For information regarding the maximum number of channels,
parameters, and records and how to calculate the file size for each data channel, refer to
the DAS manual downloadable from the TAPI website at http://www.teledyne-
api.com/manuals/ under Special Manuals.
4.8.1.4. DAS Triggering Events
Triggering events define when and how the DAS records a measurement of any given
data channel. Triggering events are firmware-specific and are listed in Appendix A. The
most common triggering events are:
ATIMER: Sampling at regular intervals specified by an automatic timer.
Most trending information is usually stored at such regular intervals, which
can be instantaneous or averaged.
EXITZR, EXITSP, SLPCHG (exit zero, exit span, slope change):
Sampling at the end of (irregularly occurring) calibrations or when the
response slope changes. These triggering events create instantaneous
data points, e.g., for the new slope and offset (concentration response)
values at the end of a calibration. Zero and slope values are valuable to
monitor response drift and to document when the instrument was
calibrated.
WARNINGS: Some data may be useful when stored if one of several
warning messages appears. This is helpful for trouble-shooting by
monitoring when a particular warning occurred.
07266B DCN6485

Operating Instructions Teledyne API – T101 Operation Manual
128
4.8.2. DEFAULT DAS CHANNELS
A set of default Data Channels has been included in the analyzer’s software for logging
H2S concentration and certain predictive diagnostic data. These default channels include
but are not limited to:
CONC: Samples H2S concentration at one minute intervals and stores an average every
hour with a time and date stamp. Readings during calibration and calibration hold off are
not included in the data. By default, the last 800 hourly averages are stored.
PNUMTC: Collects sample flow and sample pressure data at five minute intervals and
stores an average once a day with a time and date stamp. This data is useful for
monitoring the condition of the pump and critical flow orifice (sample flow) and the
sample filter (clogging indicated by a drop in sample pressure) over time to predict when
maintenance will be required. The last 360 daily averages (about 1 year) are stored.
CALDAT: Logs new slope and offset every time a zero or span calibration is performed.
This Data Channel also records the instrument reading just prior to performing a
calibration. Note: this Data Channel collects data based on an event (a calibration) rather
than a timer. This Data Channel will store data from the last 200 calibrations. This does
not represent any specific length of time since it is dependent on how often calibrations
are performed. As with all Data Channels, a time and date stamp is recorded for every
data point logged.
The Channel Properties. Triggering Events and Data Parameters/Functions for these
default channels are:
07266B DCN6485
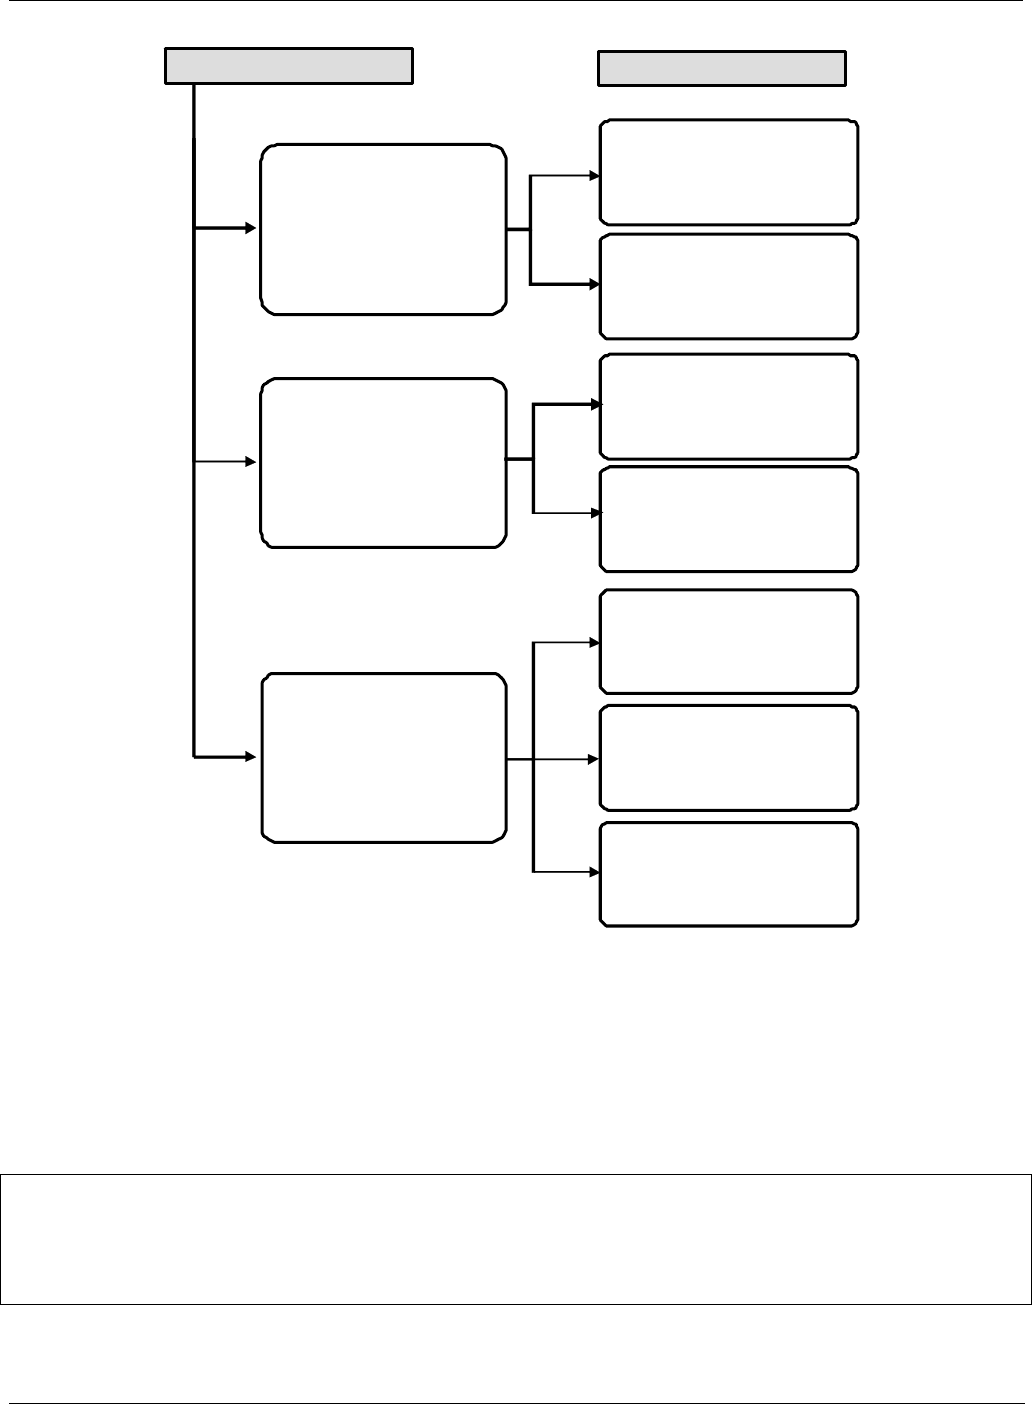
Teledyne API – T101 Operation Manual Operating Instructions
129
LIST OF PARAMETERS
NAME: PNUMTC
EVENT: ATIMER
REPORT PE RIOD: 001:00:00
NO. OF RECORDS: 360
RS-232 REPORT: OFF
CHANNEL ENABLED: ON
CAL HOLD OFF: OFF
NAME: CALDAT
EVENT: SLPCHG
NO. OF RECORDS:200
RS-232 REPORT: OFF
CHANNEL ENABLED: ON
CAL HOLD OFF : OFF
PARAMETER: SMPLFLW
MODE: AVG
PRECISION: 1
STORE NUM SAMPLE S OFF
PARAMETER: SMPLPRS
MODE: AVG
PRECISION: 1
STORE NUM SAMPLE S OFF
PARAMETER: S2OFS1
MODE: INST
PRECISION: 1
STORE NUM SAMPLE S OFF
PARAMETER: S2SLP1
MODE: INST
PRECISION:3
STORE NUM SAMPLE S OFF
PARAMETER: S2ZSC1
MODE: INST
PRECISION: 1
STORE NUM SAMPLE S OFF
PARAMETER: S2CONC1
MODE: AVG
PRECISION: 1
STORE NUM SAMPLE S OFF
PARAMETER: S2CONC1
MODE: AVG
PRECISION: 1
STORE NUM SAMPLE S OFF
NAME: CONC
EVENT: ATIMER
REPORT PE RIOD: 000:00:05
NO. OF RECORDS: 4032
RS-232 REPORT: OFF
CHANNEL ENABLED: ON
CAL HOLD OFF: ON
LIST OF CHANNELS
Figure 4-11. Default DAS Channels Setup
These default Data Channels can be used as they are, or they can be customized from the
front panel to fit a specific application. They can also be deleted to make room for custom
user-programmed Data Channels.
Appendix A-5 lists the firmware-specific DAS configuration in plain-text format. This
text file can either be loaded into APICOM and then modified and uploaded to the
instrument or can be copied and pasted into a terminal program to be sent to the analyzer.
NOTE
Sending an DAS configuration to the analyzer through its COM ports will replace the
existing configuration and will delete all stored data. Back up any existing data and the
DAS configuration before uploading new settings.
07266B DCN6485
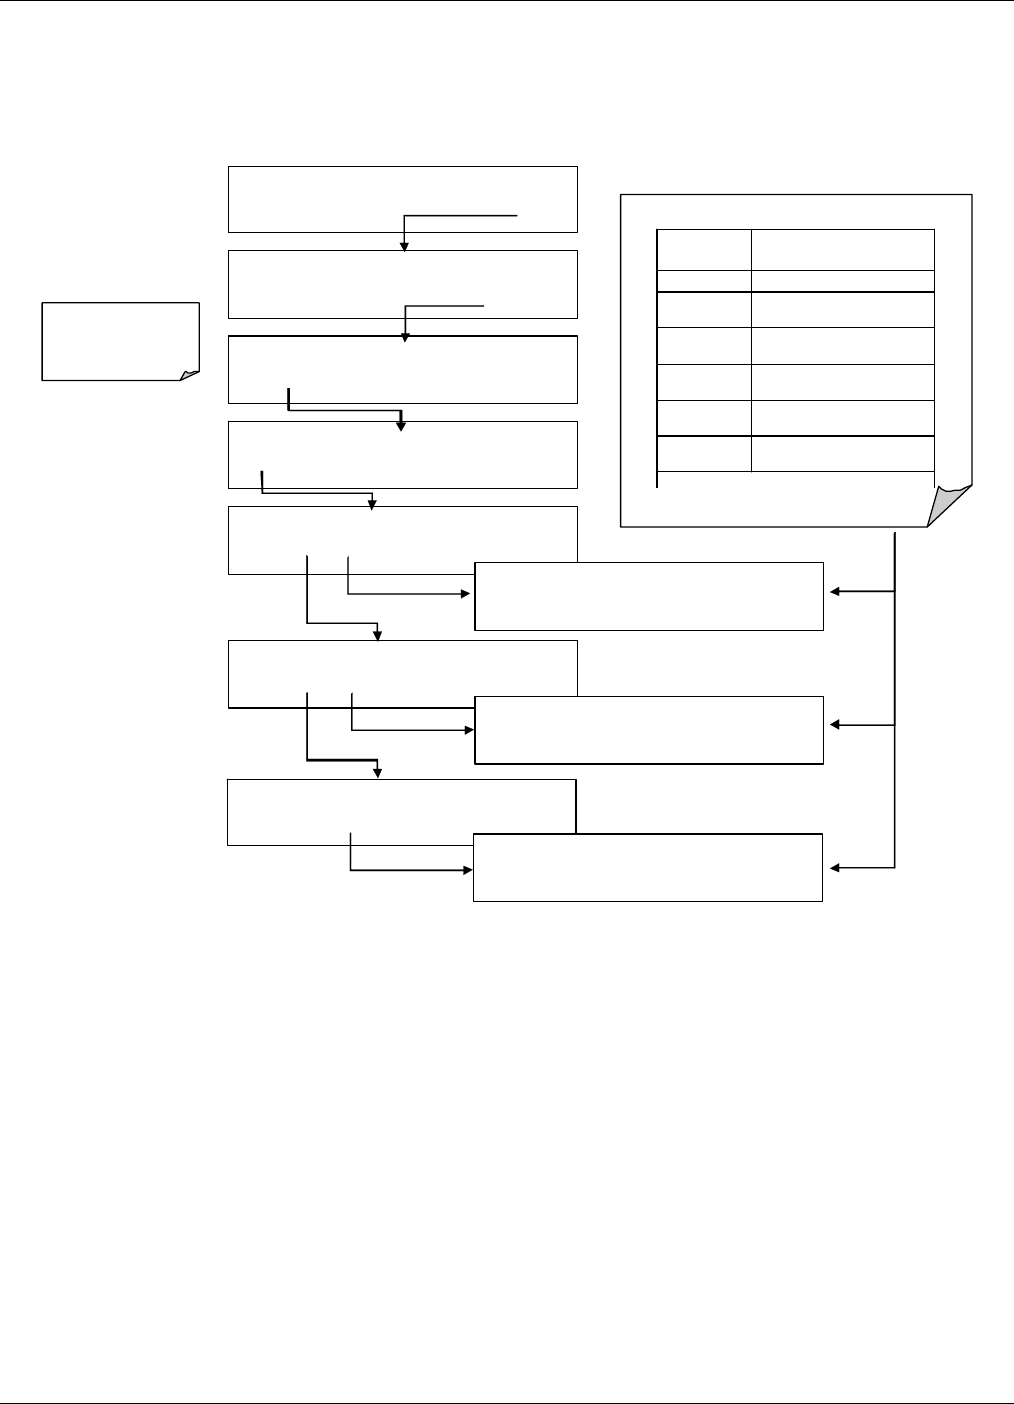
Operating Instructions Teledyne API – T101 Operation Manual
130
4.8.2.1. Viewing DAS Data and Settings
DAS data and settings can be viewed on the front panel through the following keystroke
sequence.
SAMPLE RANGE = 500.0 PPB H2S =XXX.X
< TS T TS T > CAL SETUP
SETUP X.
X
CONC : DATA AVAILABLE
NEXT VIEW EXIT
SE TUP X. X PNUMTC: DATA AVAILABLE
PREV NEXT VIEW EXIT
SE TUP X .
X
CALDAT: DATA AVAILABLE
PREV VIEW EXIT
SETUP X.X 00:00:00 S2SLP1=0.000
PV10 PREV <PRM PRM> EXIT
SETUP X. X 00:00: 00 S2SCN1 =0.0 PPM
PV10 PREV NEXT NX10 <PRM PRM> EX IT
SETUP X. X 00:00:00 SMPFLW=000.0 cc / m
<PRM
PRM > EXIT
SETUP X.X DATA ACQUISITION
VIEW
EDIT EXIT
SETUP X.X PRIMARY SETUP MENU
CFG DAS RNGE PASS CLK MORE EXIT
TOUCHSCREEN BUTTON FUNCTIONS
BUTTON FUNCTION
<PRM Moves to the ne xt Para meter
PRM> Moves to the previous
Parameter
NX 10 M oves t he vi ew forward 10
data points/chan ne ls
NEXT Moves to the next data
point/channel
PREV Mo ves to the previous data
point/channel
PV10 Move s th e view back 10 data
points/cha nne ls
Butto ns a
pp
ear onl
y
as a
pp
licable.
EXIT will return to the
main SAMPLE Display.
SAMPLE ENTER SETUP PASS : 81
8
8 1 8 ENTR EXIT
07266B DCN6485
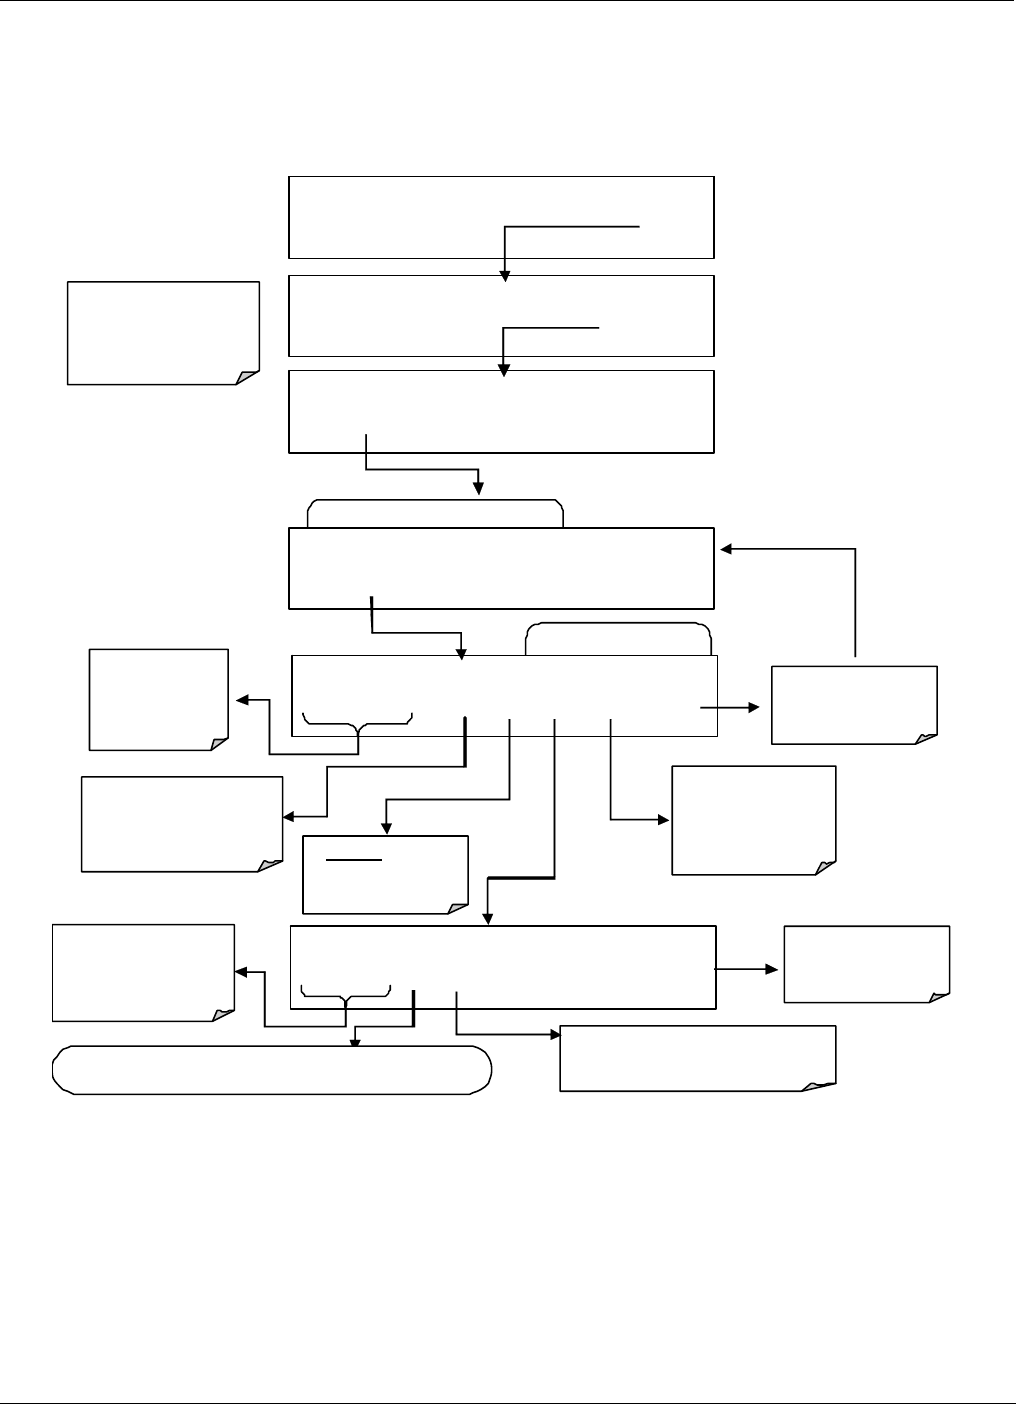
Teledyne API – T101 Operation Manual Operating Instructions
131
4.8.2.2. Editing DAS Data Channels
DAS configuration is most conveniently done through the APICOM remote control
program. The following list of key strokes shows how to edit using the front panel.
Main Data Acquisition Menu
Edit Data Chan nel Menu
SAMPLE RANGE = 500.0 PPB H2S =XXX.X
< TST TST > CAL SETUP
SETUP X.X 0) CONC: ATIMER, 2, 4032, R
PREV NEXT INS DEL EDIT PRNT EXIT
SETUP X.X
PRIMARY SETUP MENU
CFG DAS RNGE PASS CLK MORE EXIT
SAMPLE ENTER SETUP PASS : 81
8
8 1 8 ENTR EXIT
EXIT will return to the
previous SAMPLE
display.
SETUP X.X DATA ACQUISITION
VIEW
EDIT EXIT
Moves the
display up &
down the list of
Data Channels
Inserts a new Data
Channe l into the l ist
BEFORE the Channel
currently bei ng displa yed Deletes The Data
Channel currently
being displayed
Exports the
configuration of all
data cha nne ls to
RS-232 inter face.
Exits to the Main
Data Acquisition
Menu
SETUP X.X NAME:CONC
<SET SET> EDIT PRNT EXIT
Moves the display
between the
pr opertie s for this data
channel.
Reports the configuratio n of curr ent
data cha nne ls to the RS-23 2 ports.
EXIT returns to the
previo us Menu
To edit the cha nn el name, see n ext sequence.
When editing the data channels, the top line of the display indicates some of the
configuration parameters. For example, the display line:
0) CONC: ATIMER, 4, 800
translates to the following configuration:
Channel No.: 0
NAME: CONC
TRIGGER EVENT: ATIMER
07266B DCN6485
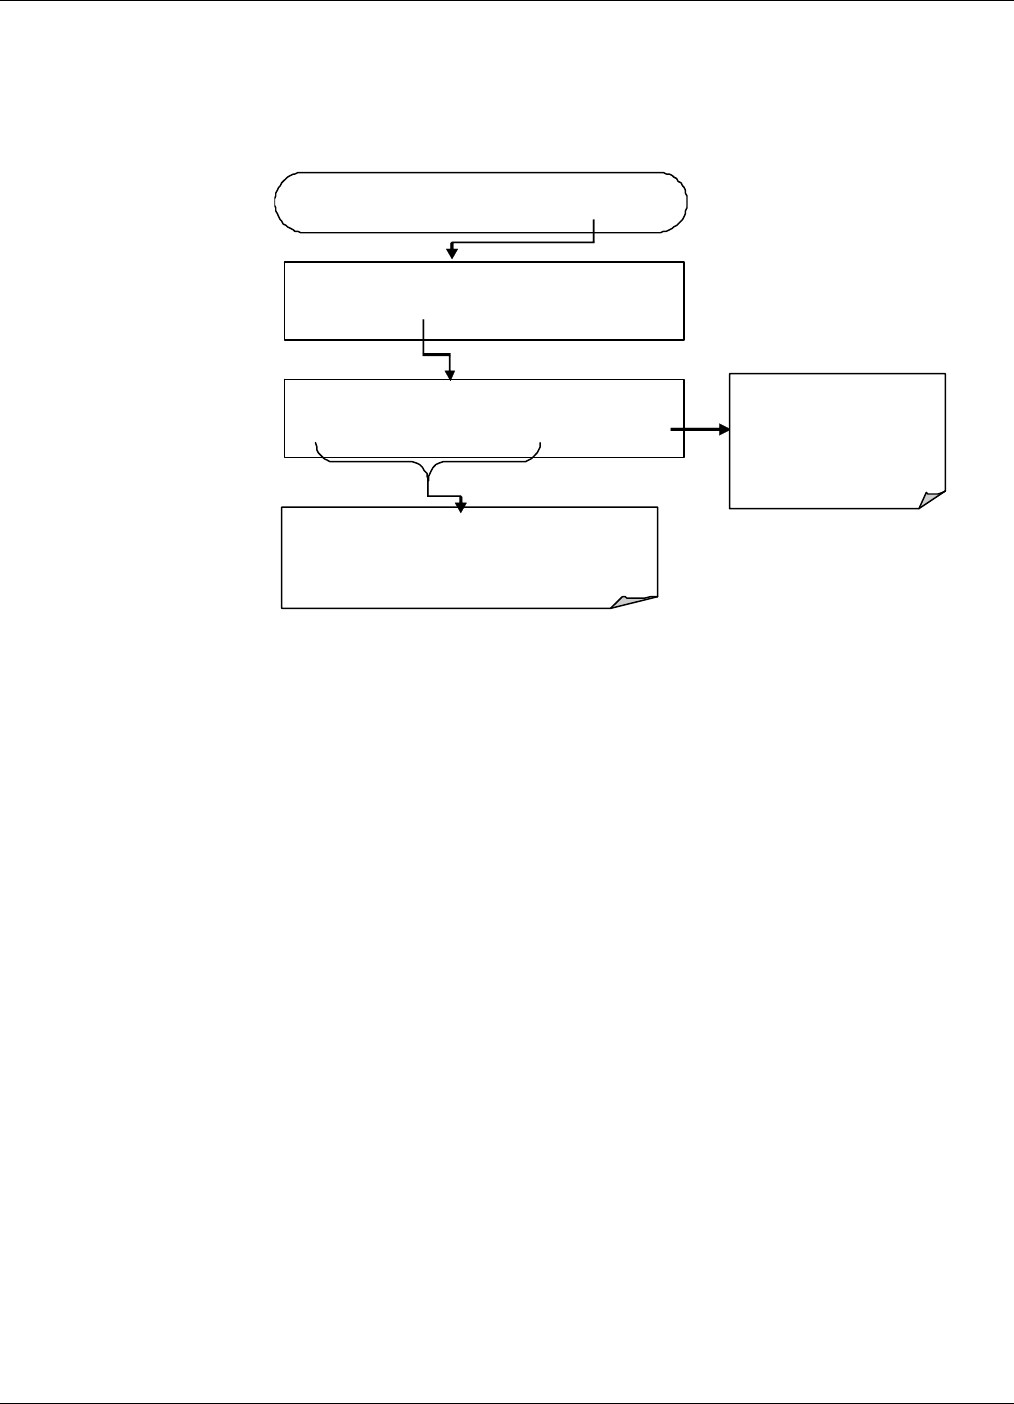
Operating Instructions Teledyne API – T101 Operation Manual
132
PARAMETERS: Four parameters are included in this channel
EVENT: This channel is set up to record 800 data points.
To edit the name of a data channel, follow the above button sequence and then press:
FROM THE PREVIOUS SEQUENCE …
SE TUP X.X NAME:CONC
C O N C - - ENTR EXIT
ENT
R
accepts the new string
and returns to the previous
m enu .
EXIT ignores the new string
and returns to the previous
m enu .
Press each button repeatedly to cycle through
the available character set:
0-9, A-Z, space ’ ~ ! # $ % ^ & * ( ) - _ = +[ ]
{ } < >\ | ; : , . / ?
SE TUP X.X NAME:CONC
<SET SET> EDIT PRINT EXIT
07266B DCN6485
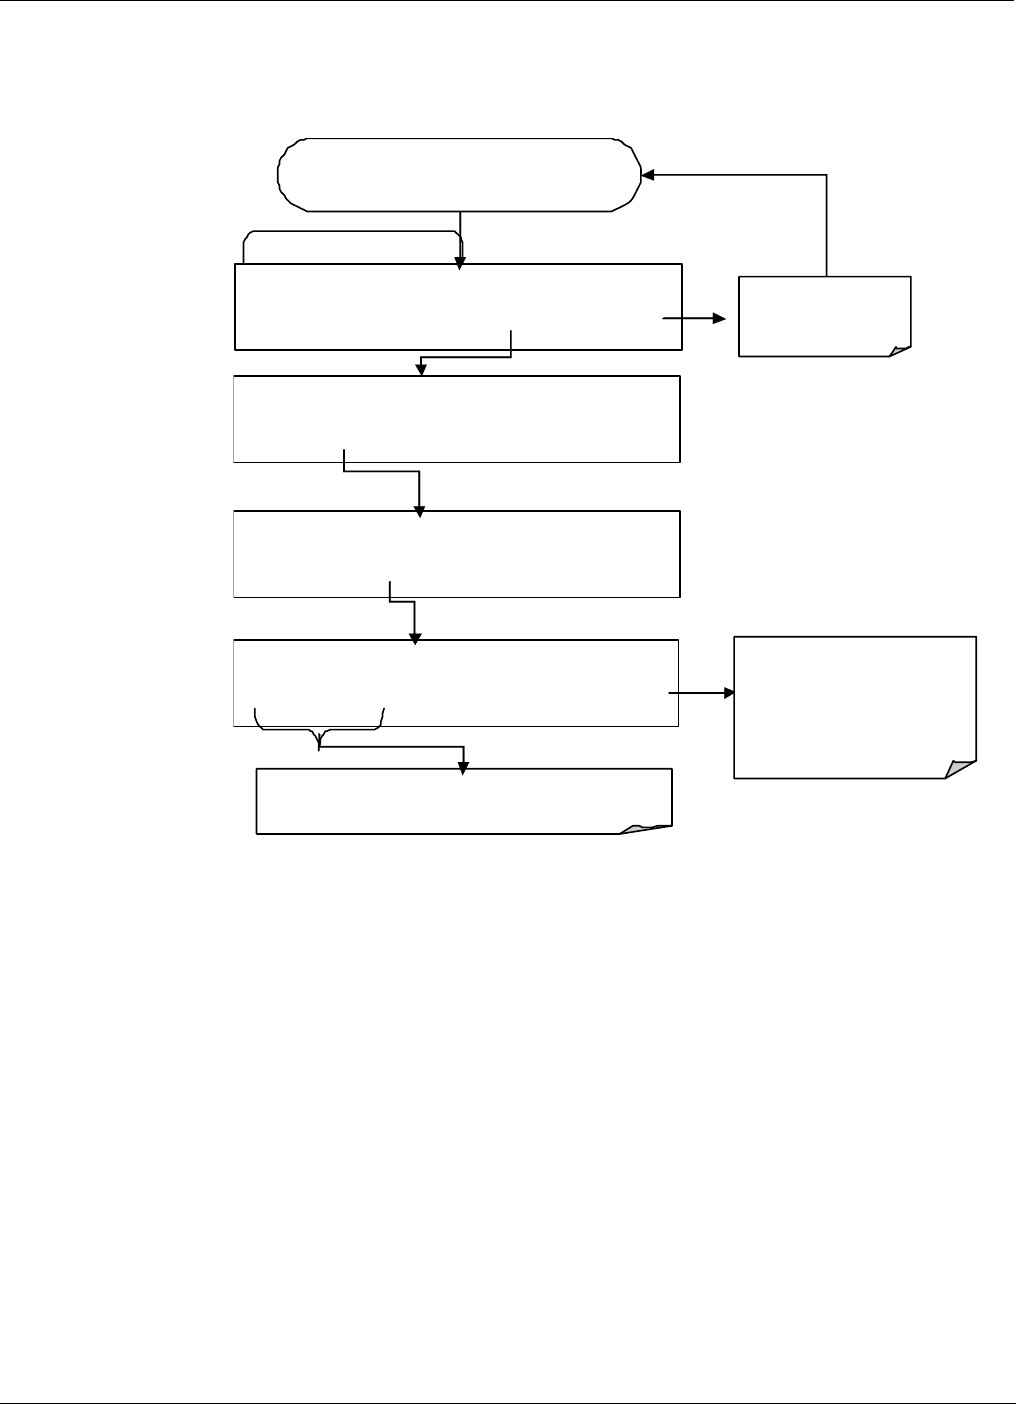
Teledyne API – T101 Operation Manual Operating Instructions
133
4.8.2.3. Trigger Events
To edit the list of data parameters associated with a specific data channel, press:
SETUP X.X EVENT:ATIMER
<PREV NEXT> ENTR EXIT
Edit Data Chann el Menu
SETUP X.X 0) CONC: ATIMER, 2, 4032,
R
PREV NEXT INS DEL EDIT PRNT EXIT
Exits to the Main
Data Acquisition
menu
Press to cycle through the list of available
trigger events.
SETUP X.X NAME:CONC
<SET SET> EDIT PRINT EXIT
SETUP X.X EVENT:ATIMER
<SET SET> EDIT PRINT EXIT
ENT
R
accepts the ne w stri ng
and returns to the previous
menu.
EXIT ignores the new string
and returns to the previous
menu.
From the DATA ACQUISITION menu
(see Section 6.11.2.2)
07266B DCN6485
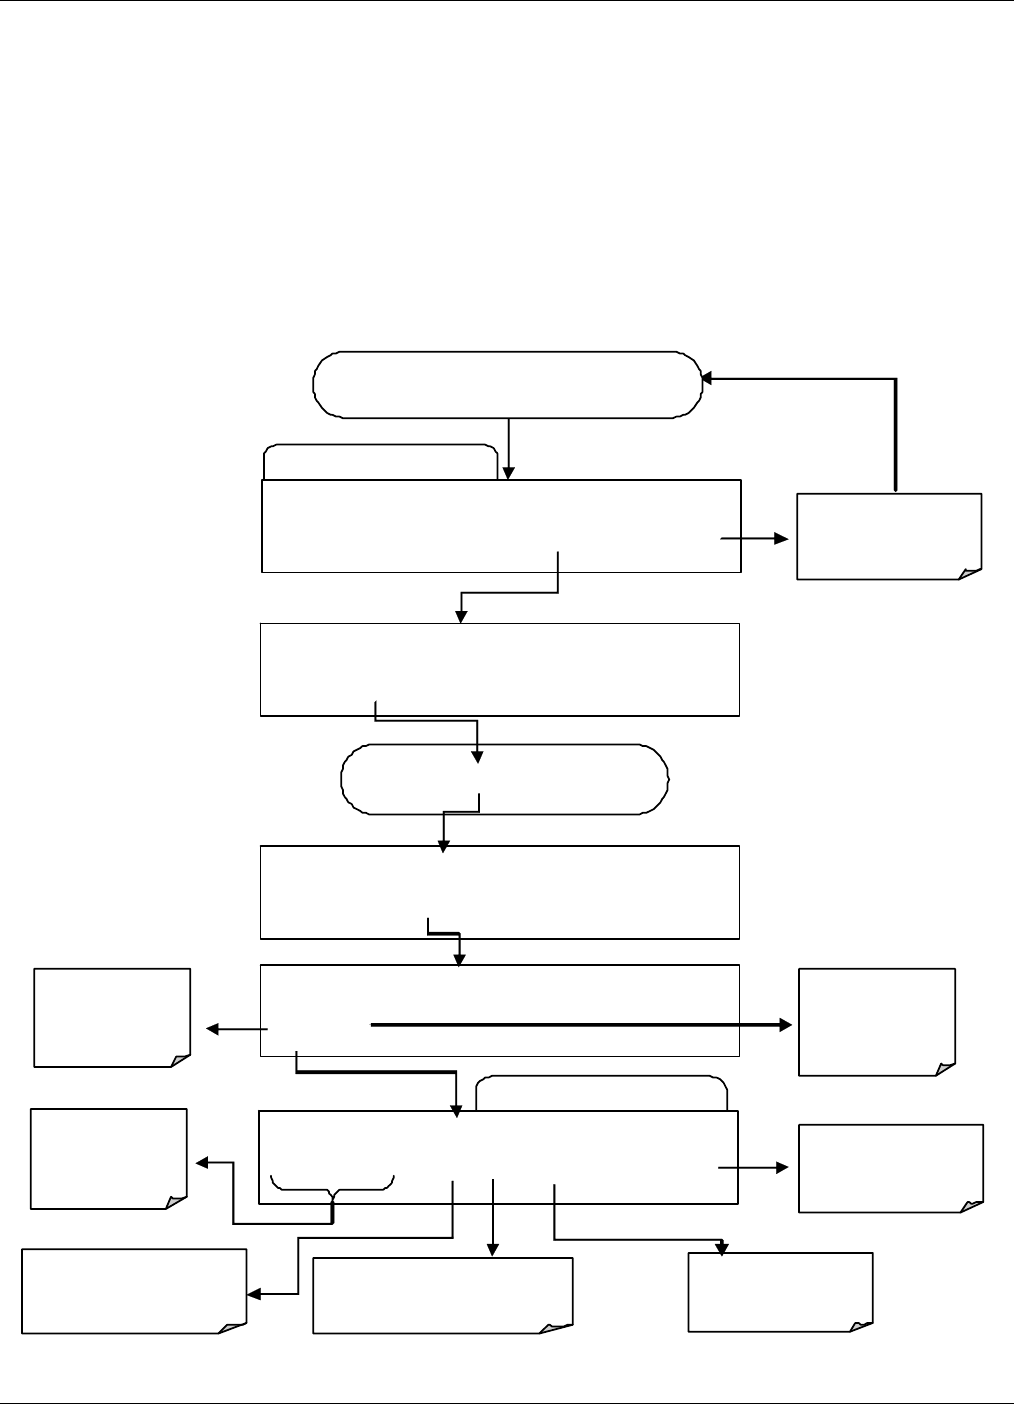
Operating Instructions Teledyne API – T101 Operation Manual
134
4.8.2.4. Editing DAS Parameters
Data channels can be edited individually from the front panel without affecting other data
channels. However, when editing a data channel, such as during adding, deleting or
editing parameters, all data for that particular channel will be lost, because the DAS can
store only data of one format (number of parameter columns etc.) for any given channel.
In addition, an DAS configuration can only be uploaded remotely as an entire set of
channels. Hence, remote update of the DAS will always delete all current channels and
stored data.
To modify, add or delete a parameter, follow the instruction shown in Section 4.11.2.2
then press:
Edit Data Parameter Menu
Edit Data Chan ne l Menu
SETUP X.X 0) CONC: ATIMER, 2, 4032, R
PREV NEXT INS DEL EDIT PRNT EXIT
Exits to the main
Data Acquisition
menu
SET UP X.X NAME:CONC
<SET SET> EDIT PRINT EXIT
SET UP X.X PARAMETERS : 2
<SET SET> EDIT PRINT EXIT
SETUP X.X 0) PARAM=S2SCN1, MODE=AVG
PREV NEXT INS DEL EDIT EXIT
Press SET> until…
SET UP X.X EDIT P
A
RAMS (DELETE DATA)
YES NO
NO returns to
the previous
men u an d
re tain s all data.
Moves the
display betwee n
available
Pa ram et er s
Inserts a new Parameter
before the currently
displayed Parameter
Deletes the Parameter
curr ently d isplayed.
Use to configure
the functi ons for
th is P ar ame ter.
Exits to the main
Data Acquisition
menu
YES will delete
all data in that
entire channel.
From the DATA ACQUISITION menu
07266B DCN6485
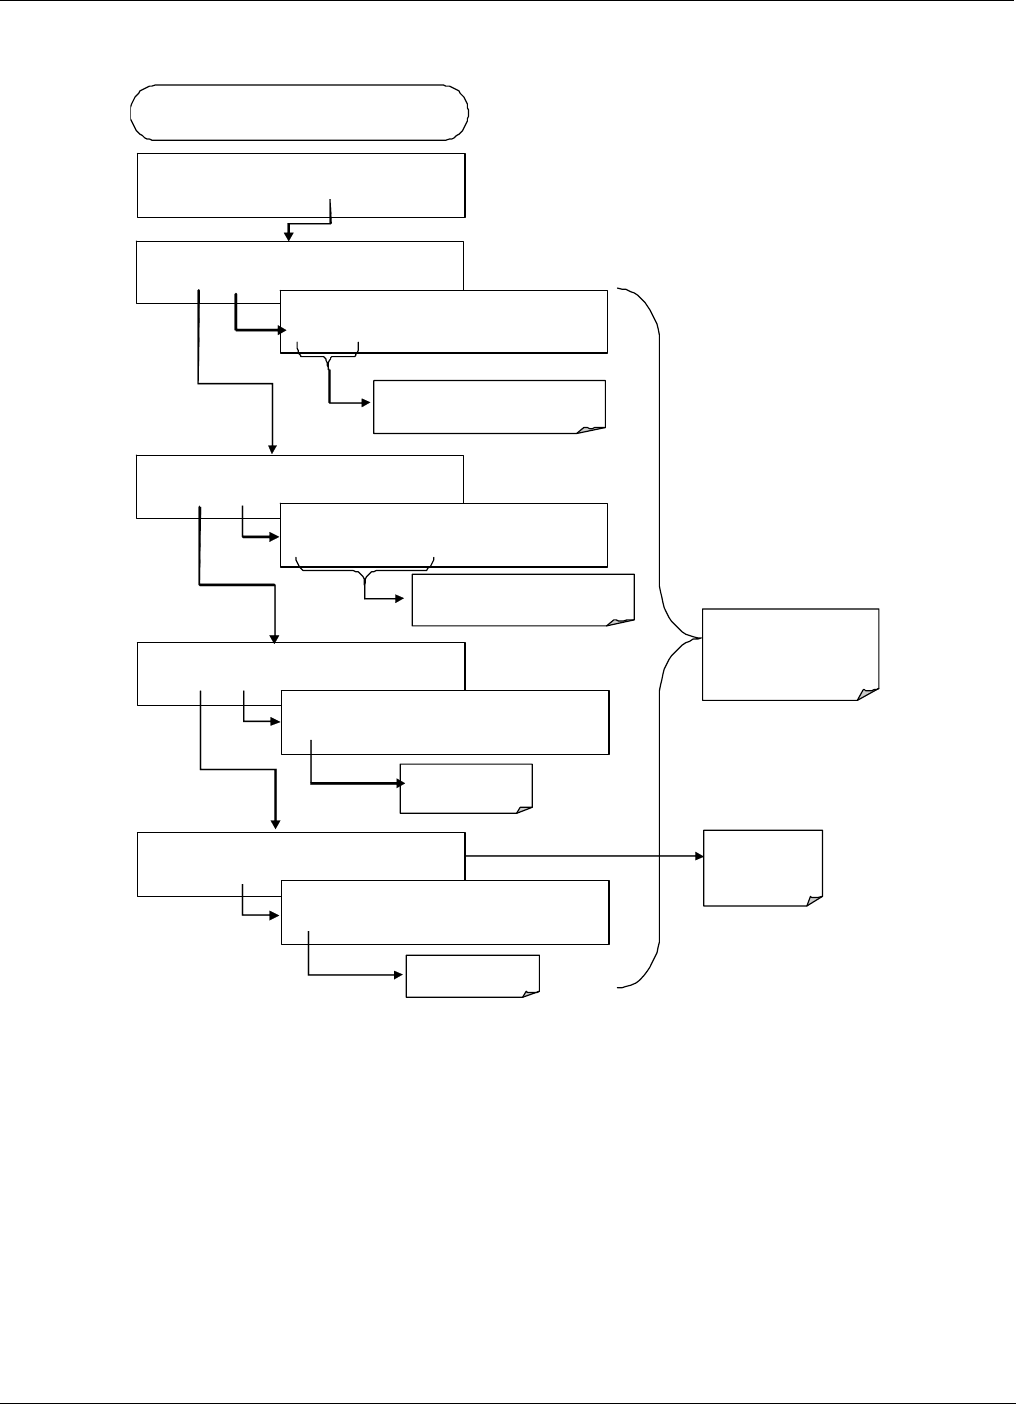
Teledyne API – T101 Operation Manual Operating Instructions
135
To configure the parameters for a specific data parameter, press:
FROM THE EDIT DATA PARAMETER MENU
(see previous section)
SETUP X.X 0) PARAM=S2SCN1, MODE=AVG
PREV NEXT INS DEL EDIT EXIT
SETUP X.X PARAMETERS:S2SCN1
SET> EDIT EXIT
SETUP X.X SAMPLE MODE:AVG
<SET SET> EDIT EXIT
SETUP X.X PARAMETERS: S2SCN1
PREV NEXT ENTR EXIT
Cycle through list of avail able
Parameters.
ENT
R
accepts the new
setting and returns to the
previous me nu .
EXIT ign ores the ne w se tting
and returns to the p revious
SETUP X.X SAMPLE MODE: INST
INST AVG MIN MAX EXIT
Press the key for the desire d mode
SETUP X. X PRECISION: 1
<SET SET> EDIT EXIT
SETUP X.X PRECISION: 1
1 EXIT
Set for 0-4
SETUP X. X STORE NUM. SAMPLES: OFF
<SET EDIT EXIT
SETUP X.X STORE NUM. SAMPLES: OFF
OFF ENTR EXIT
Turn ON or OFF
<SET Returns to
pr evious
Function s
4.8.2.5. Sample Period and Report Period
The DAS defines two principal time periods by which sample readings are taken and
permanently recorded:
SAMPLE PERIOD: Determines how often DAS temporarily records a sample reading
of the parameter in volatile memory. The SAMPLE PERIOD is set to one minute by
default and generally cannot be accessed from the standard DAS front panel menu, but is
available via the instrument’s communication ports by using APICOM or the analyzer’s
standard serial data protocol.
07266B DCN6485

Operating Instructions Teledyne API – T101 Operation Manual
136
SAMPLE PERIOD is only used when the DAS parameter’s sample mode is set for
AVG, MIN or MAX.
REPORT PERIOD: Sets how often the sample readings stored in volatile memory are
processed, (e.g. average, minimum or maximum are calculated) and the results stored
permanently in the instrument’s Disk-on-module as well as transmitted via the analyzer’s
communication ports. The REPORT PERIOD may be set from the front panel.
If the INST sample mode is selected the instrument stores and reports an instantaneous
reading of the selected parameter at the end of the chosen REPORT PERIOD
In AVG, MIN or MAX sample modes, the settings for the SAMPLE PERIOD and the
REPORT PERIOD determine the number of data points used each time the average,
minimum or maximum is calculated, stored and reported to the COMM ports. The actual
sample readings are not stored past the end of the of the chosen REPORT PERIOD.
Also, the SAMPLE PERIOD and REPORT PERIOD intervals are synchronized to the
beginning and end of the appropriate interval of the instrument’s internal clock.
If SAMPLE PERIOD were set for one minute the first reading would occur
at the beginning of the next full minute according to the instrument’s
internal clock.
If the REPORT PERIOD were set for of one hour the first report activity
would occur at the beginning of the next full hour according to the
instrument’s internal clock.
EXAMPLE: Given the above settings, if DAS were activated at 7:57:35 the first sample
would occur at 7:58 and the first report would be calculated at 8:00 consisting of data
points for 7:58. 7:59 and 8:00.
During the next hour (from 8:01 to 9:00) the instrument will take a sample reading every
minute and include 60 sample readings.
When the STORE NUM. SAMPLES feature is turned on the instrument will also store
how many sample readings were used for the AVG, MIN or MAX calculation but not the
readings themselves.
REPORT PERIODS IN PROGRESS WHEN INSTRUMENT IS POWERED OFF
If the instrument is powered off in the middle of a REPORT PERIOD, the samples
accumulated so far during that period are lost. Once the instrument is turned back on, the
DAS restarts taking samples and temporarily them in volatile memory as part of the
REPORT PERIOD currently active at the time of restart. At the end of this REPORT
PERIOD only the sample readings taken since the instrument was turned back on will be
included in any AVG, MIN or MAX calculation. Also, the STORE NUM. SAMPLES
feature will report the number of sample readings taken since the instrument was
restarted.
07266B DCN6485
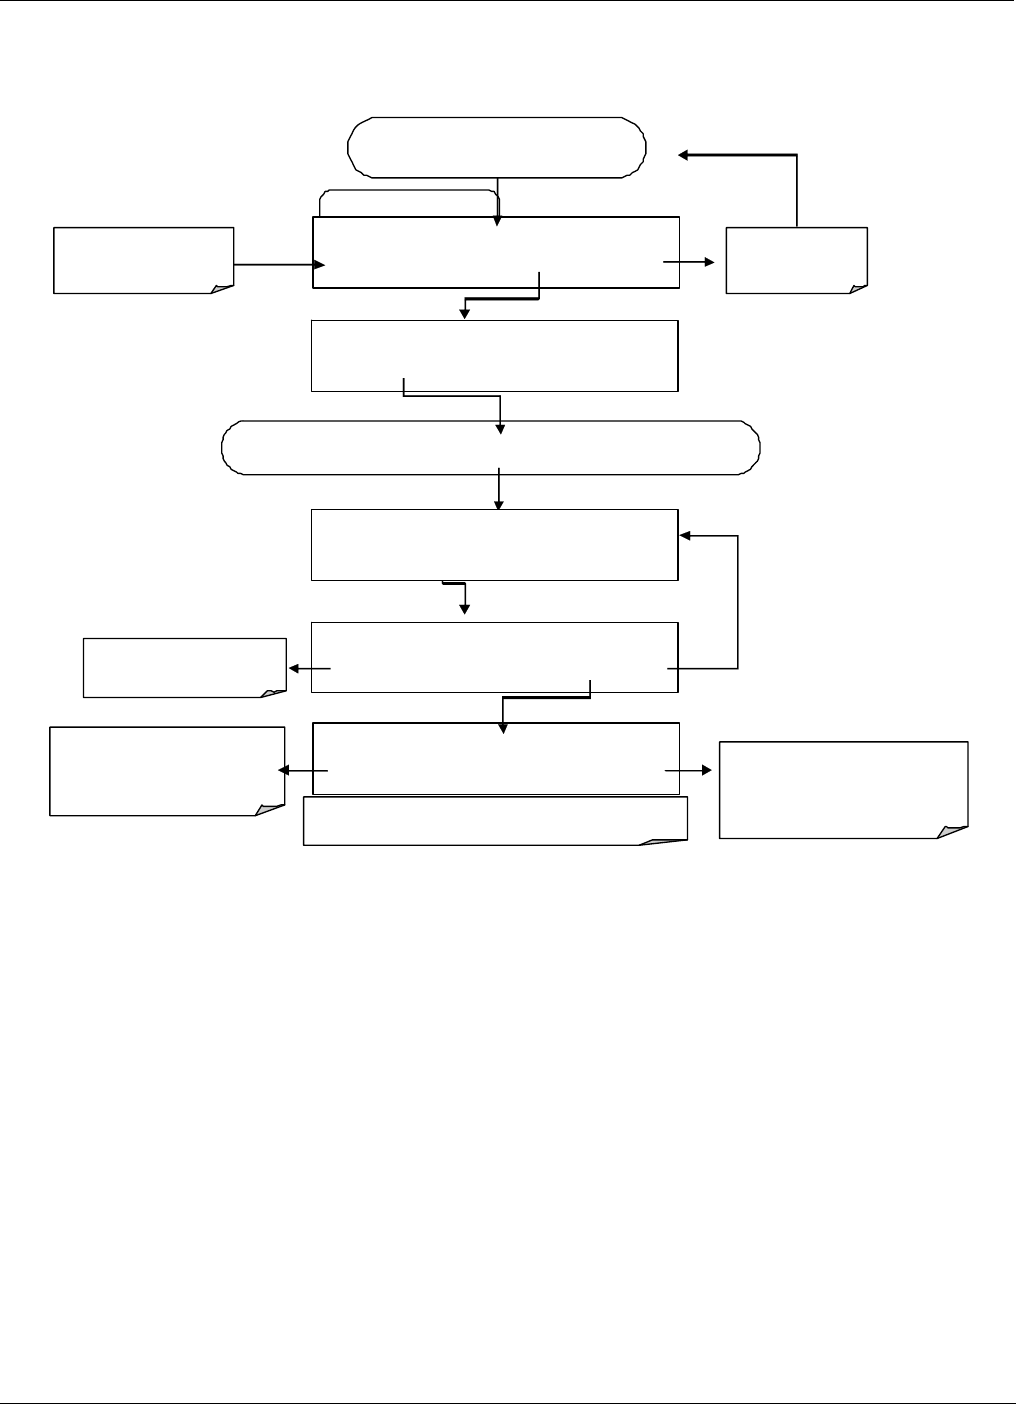
Teledyne API – T101 Operation Manual Operating Instructions
137
To define the REPORT PERIOD, follow the instruction shown in Section 4.11.2.2 then
press:
Edit Data Channel Menu
SE TUP X.X 0) CONC: ATIMER, 2, 4032, R
PREV NEXT INS DEL EDIT PRNT EXIT
Exits to the main
Data Acquisition
menu.
SETUP X. X NAME:CONC
<SET SET> EDIT PRINT EXIT
Press SET> until you reach REPORT PERIOD …
SETUP X. X REPORT PERIODD:DAYS:0
0 0 0 ENTR EXIT
ENTR accepts th e ne w strin g a nd
returns to the p revio us menu.
EXIT ignores the new strin g an d
returns to the p revio us menu.
Press to set length of time
between reports in the format :
HH:MM (max: 23:59).
Set the number of days
between reports (0-366).
If at any tim e an i llegal entry i s se lected (e.g., days > 366) the
ENTR butto n will di sappear from the displ ay.
SE TUP X. X REPORT PERIODD:TIME:01:01
0 0 0 5 ENTR EXIT
SETUP X. X REPORT PERIOD:000:00:05
<SET SET> EDIT PRINT EXIT
Use PREV and NEXT to
scroll to the data channel
to be edi ted.
From the DATA ACQUISITION menu
4.8.2.6. Number of Records
The number of data records in the DAS is cumulative across all channels and parameters,
filling about one megabyte of space on the disk-on-module; this means that the actual
number of records is limited by the total number of parameters and channels and other
settings in the DAS configuration. Every additional data channel (up to 20), parameter (up
to 50 per channel), number of samples setting etc. will govern the maximum amount of
data points.
The DAS will check the amount of available data space and prevent the user from
specifying too many records at any given point. If, for example, the DAS memory space
can accommodate 375 more data records, the ENTR button will disappear when trying to
specify more than that number of records. This check for memory space may also make
an upload of a DAS configuration with APICOM or a Terminal program fail, if the
07266B DCN6485
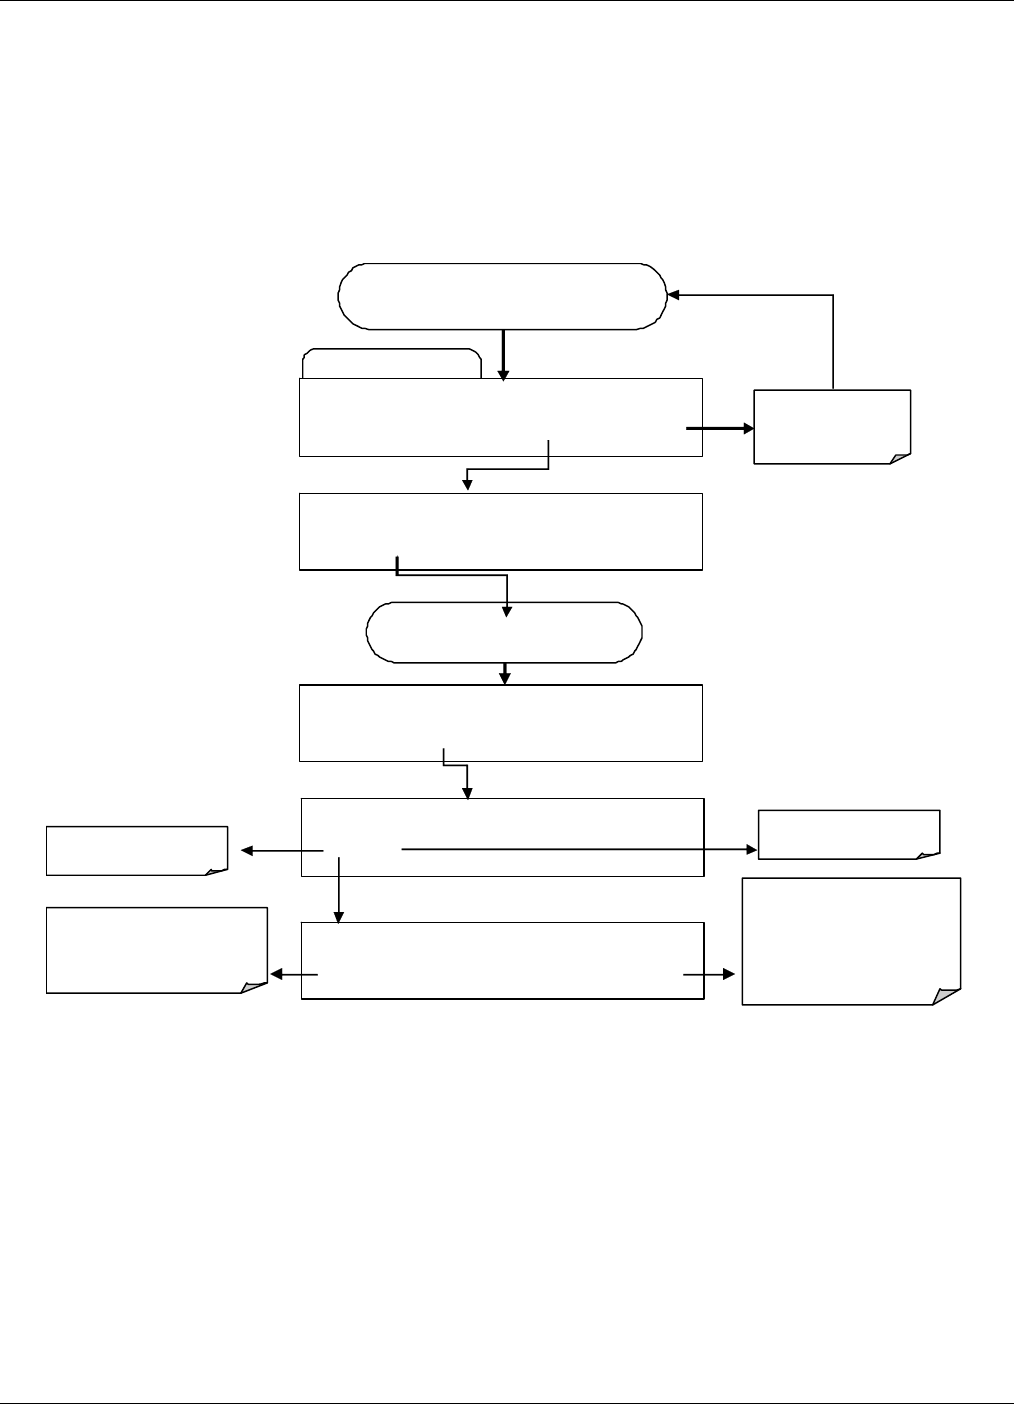
Operating Instructions Teledyne API – T101 Operation Manual
138
combined number of records would be exceeded. (For information regarding the
maximum number of channels, parameters, and records and how to calculate the file size
for each data channel, refer to the DAS manual downloadable from the TAPI website at
http://www.teledyne-api.com/manuals/ under Special Manuals). To set the number of
records for one channel from the front panel, press SETUP>DAS>EDIT>ENTR and the
following button sequence:
Edit Data Channel Menu
SETUP X.X 0) CONC: ATIMER, 2, 900
PREV NEXT INS DEL EDIT PRNT EXIT
Exits to the main
Data Acquisition
menu
SETUP X.X NAME:CONC
<SET SET> EDIT PRINT EXIT
SETUP X.X NUMBER OF RECORDS:000
<SET SET> EDIT PRINT EXIT
SETUP X.X REPORT PERIODD:DAYS:0
0 0 0 0 0 ENTR EXIT
ENTR accepts the new
setting and returns to the
previous m enu.
EXIT ignores the new setting
and returns to the previous
menu.
Toggle buttons to set
number of reco rds
(1-99999)
SETUP X.X EDIT RECOPRDS (DELET DATA)
YES NO
NO returns to the
p
revious menu.YES will delete all data
in this channel.
Press SET> key until…
From the DATA ACQUISITION menu
(see Sectio n 6.1 2.2.2)
07266B DCN6485
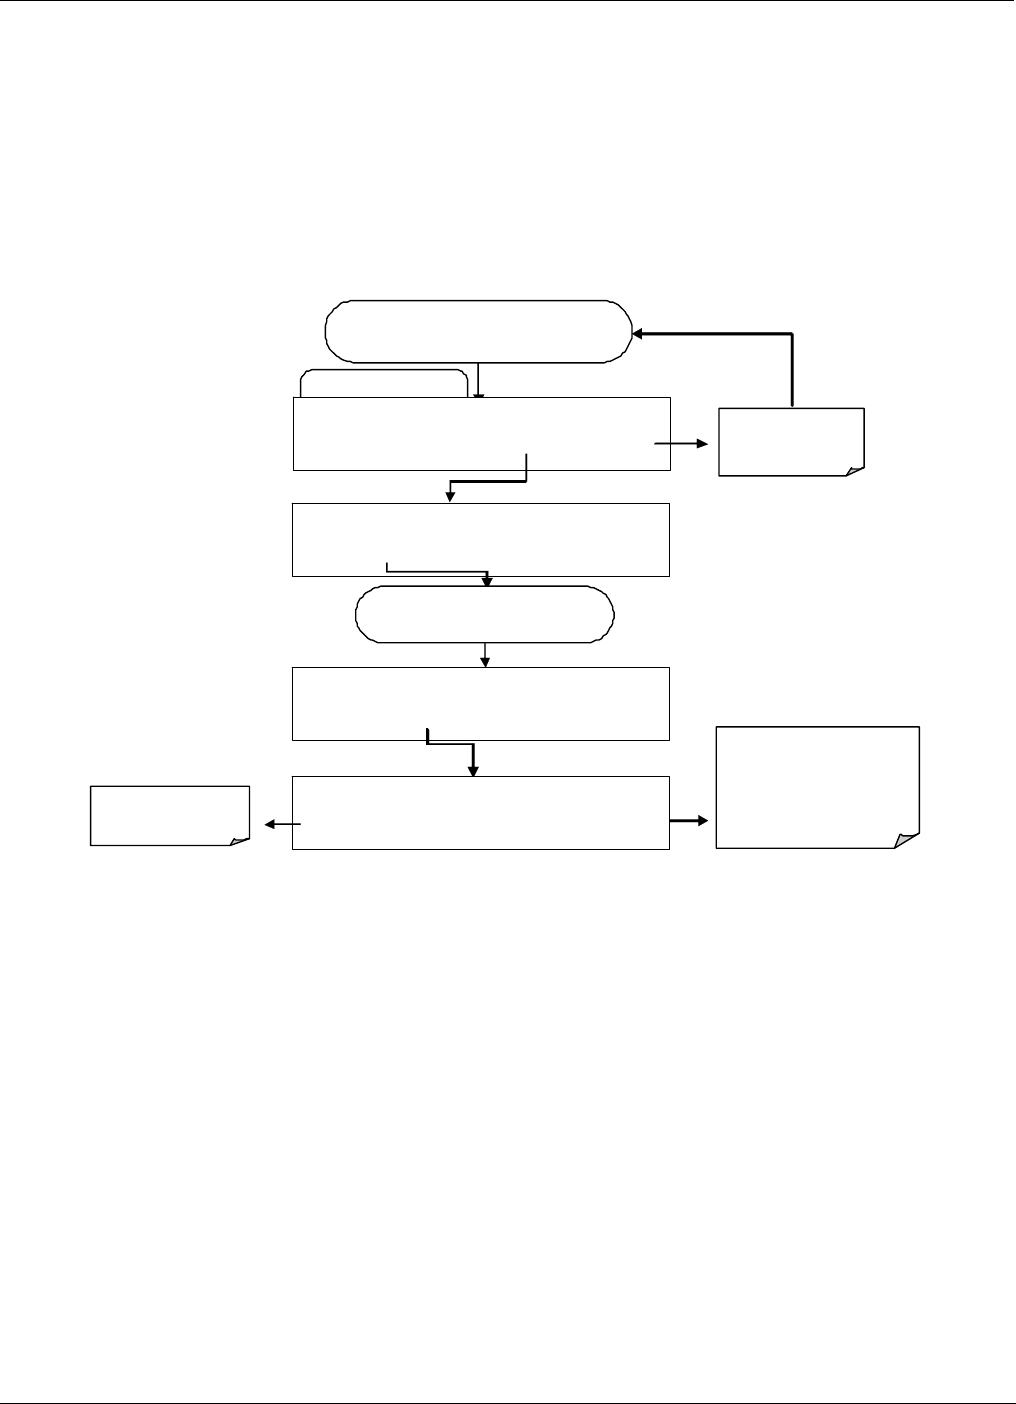
Teledyne API – T101 Operation Manual Operating Instructions
139
4.8.2.7. RS-232 Report Function
The T101 DAS can automatically report data to the communications ports, where they
can be captured with a terminal emulation program or simply viewed by the user.
To enable automatic COM port reporting, follow the instruction shown in Section
4.11.2.2 then press:
Edit Data Channel Menu
From the DATA ACQUISITION menu
SETUP X.X 0) CONC: ATIMER, 2, 4032, R
PREV NEXT INS DEL EDIT PRNT EXIT
Exits to t h e mai n
Data Acquisition
menu
SE TUP X. X NAME:CONC
<SET SET> EDIT PRINT EXIT
SE TUP X. X RS-232 REPORT: OFF
<SET SET> EDIT PRINT EXIT
ENTR accepts the ne w
setting and re turns to the
previous menu.
EXIT ignores the new setting
and returns to the previous
menu.
SETUP X.X RS-232 REPORT: OFF
OFF ENTR EXIT
Toggl e to turn
rep or ti ng ON or OFF
Press SET> key until…
4.8.2.8. Compact Report
When enabled, this option avoids unnecessary line breaks on all RS-232 reports. Instead
of reporting each parameter in one channel on a separate line, up to five parameters are
reported in one line, instead.
4.8.2.9. Starting Date
This option allows specifying a starting date for any given channel in case the user wants
to start data acquisition only after a certain time and date. If the Starting Date is in the
past, the DAS ignores this setting.
07266B DCN6485
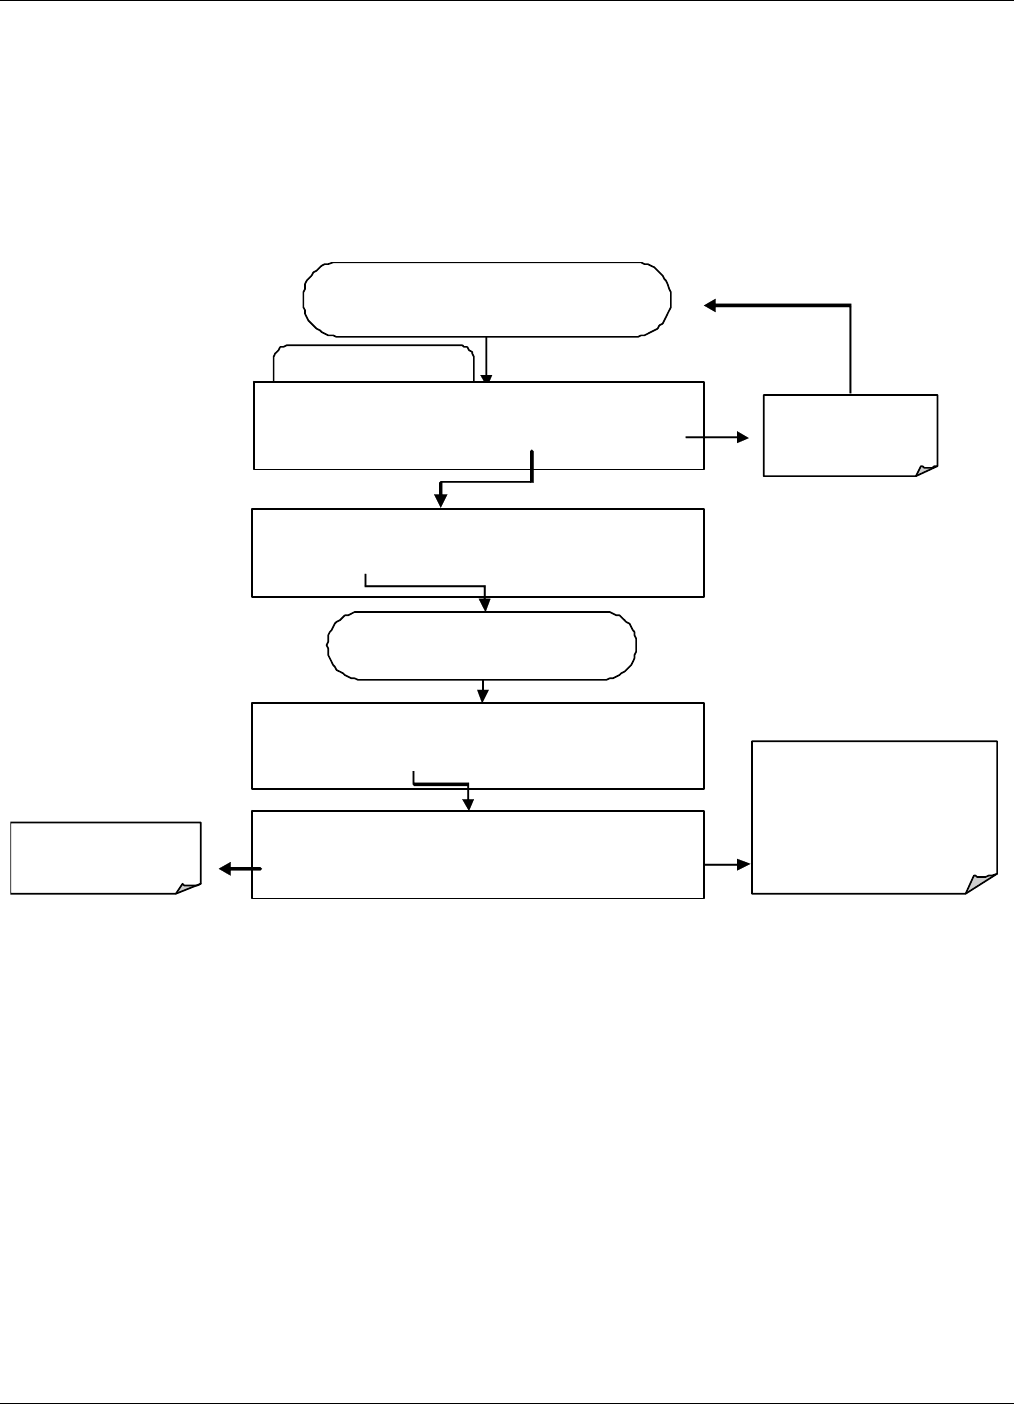
Operating Instructions Teledyne API – T101 Operation Manual
140
4.8.2.10. Disabling/Enabling Data Channels
Data channels can be temporarily disabled, which can reduce the read/write wear on the
disk-on-module . The ALL_01 channel of the T101, for example, is disabled by default.
To disable a data channel, follow the instruction shown in Section 4.11.2.2 then press:
Edi t Da ta Channel Menu
From the DATA ACQUISITION menu
SETUP X.X 0) CONC: ATIMER, 2, 4032, R
PREV NEXT INS DEL EDIT PRNT EXIT
Exits to the main
Data Acquisition
menu
SETUP X.X NAME:CONC
<SET SET> EDIT PRINT EXIT
SETUP X.X CHANNEL ENABLE:ON
<SET SET> EDIT PRINT EXIT ENTR accepts the new
setting and returns to the
previous menu .
EXIT ign or es the new setting
and returns to the previo us
menu.
SETUP X.X CHANNEL ENABLE:ON
OFF ENTR EXIT
Toggl e to turn
cha nnel ON or OFF
Press SET> until…
07266B DCN6485
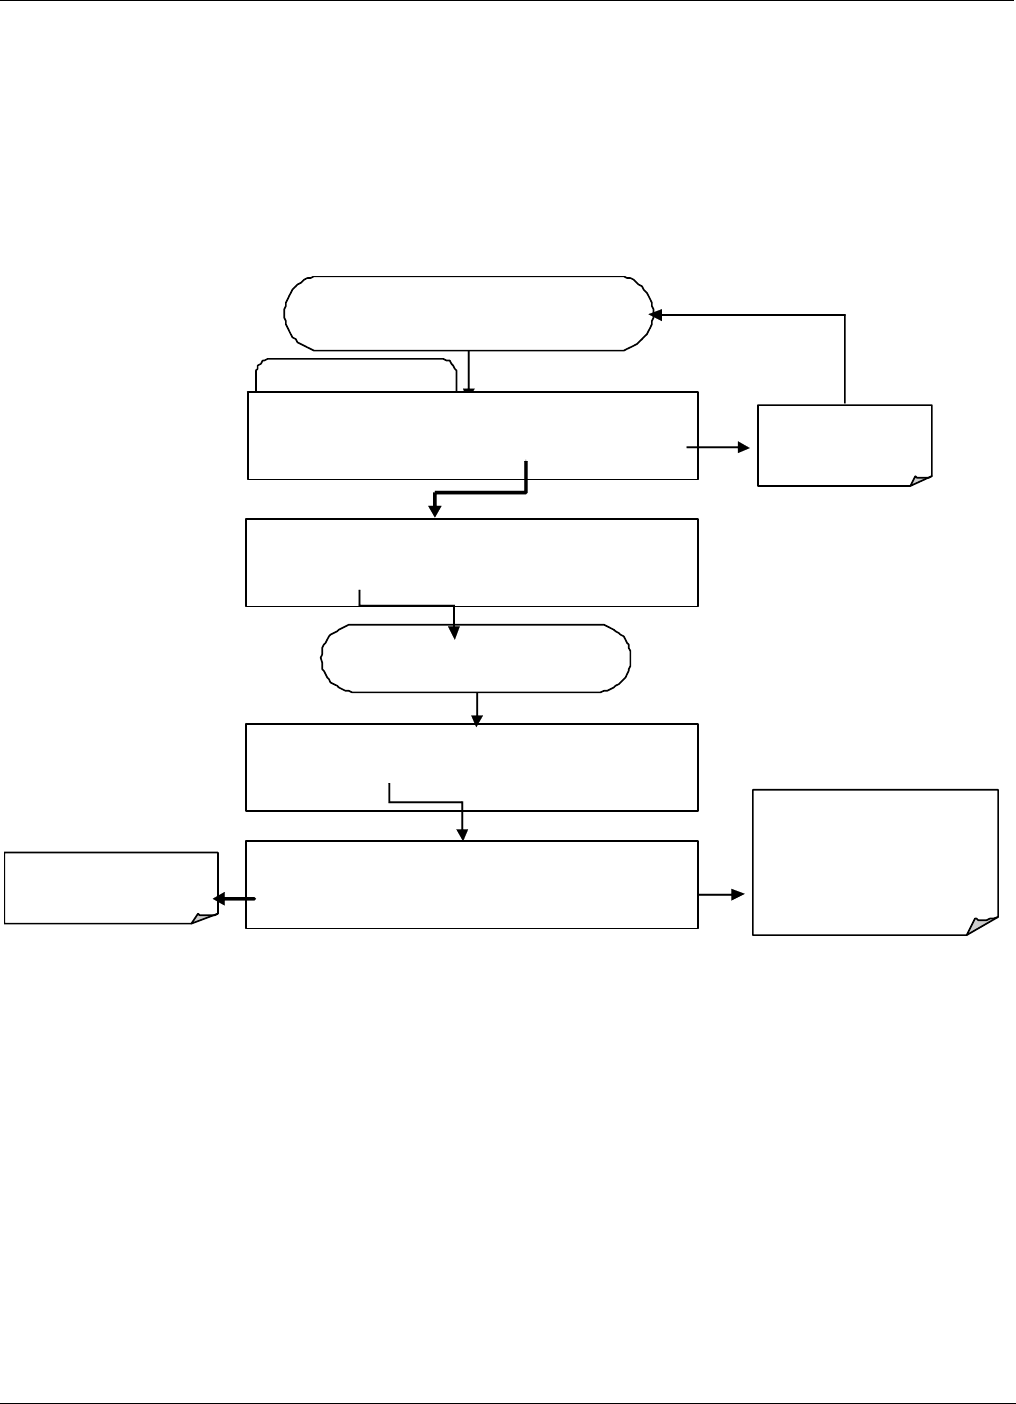
Teledyne API – T101 Operation Manual Operating Instructions
141
4.8.2.11. HOLDOFF Feature
The DAS HOLDOFF feature allows to prevent data collection during calibrations and
during the DAS_HOLDOFF period enabled and specified in the VARS (Section 4.8). To
enable or disable the HOLDOFF, follow the instruction shown in Section 4.11.2.2 then
press:
Edit Data Chan nel Menu
From th e DATA ACQUISITION menu
SETUP X.X 0) CONC: ATIMER, 2, 4032, R
PREV NEXT INS DEL EDIT PRNT EXIT
Exits to the main
Data Acquisition
menu
SETUP X.X NAME:CONC
<SET SET> EDIT P RINT EXIT
SETUP X.X CAL HOLD OFF:ON
SET> EDIT PRINT EXIT
ENTR accepts the new
setting and retu rns to the
previous me nu.
EXIT ignor es the new setting
and returns to the previo us
menu.
SETUP X.X CAL HOLD OFF:ON
ON ENTR EXIT
Toggle to turn HOLDOFF
ON or OFF
Press SET> until…
07266B DCN6485
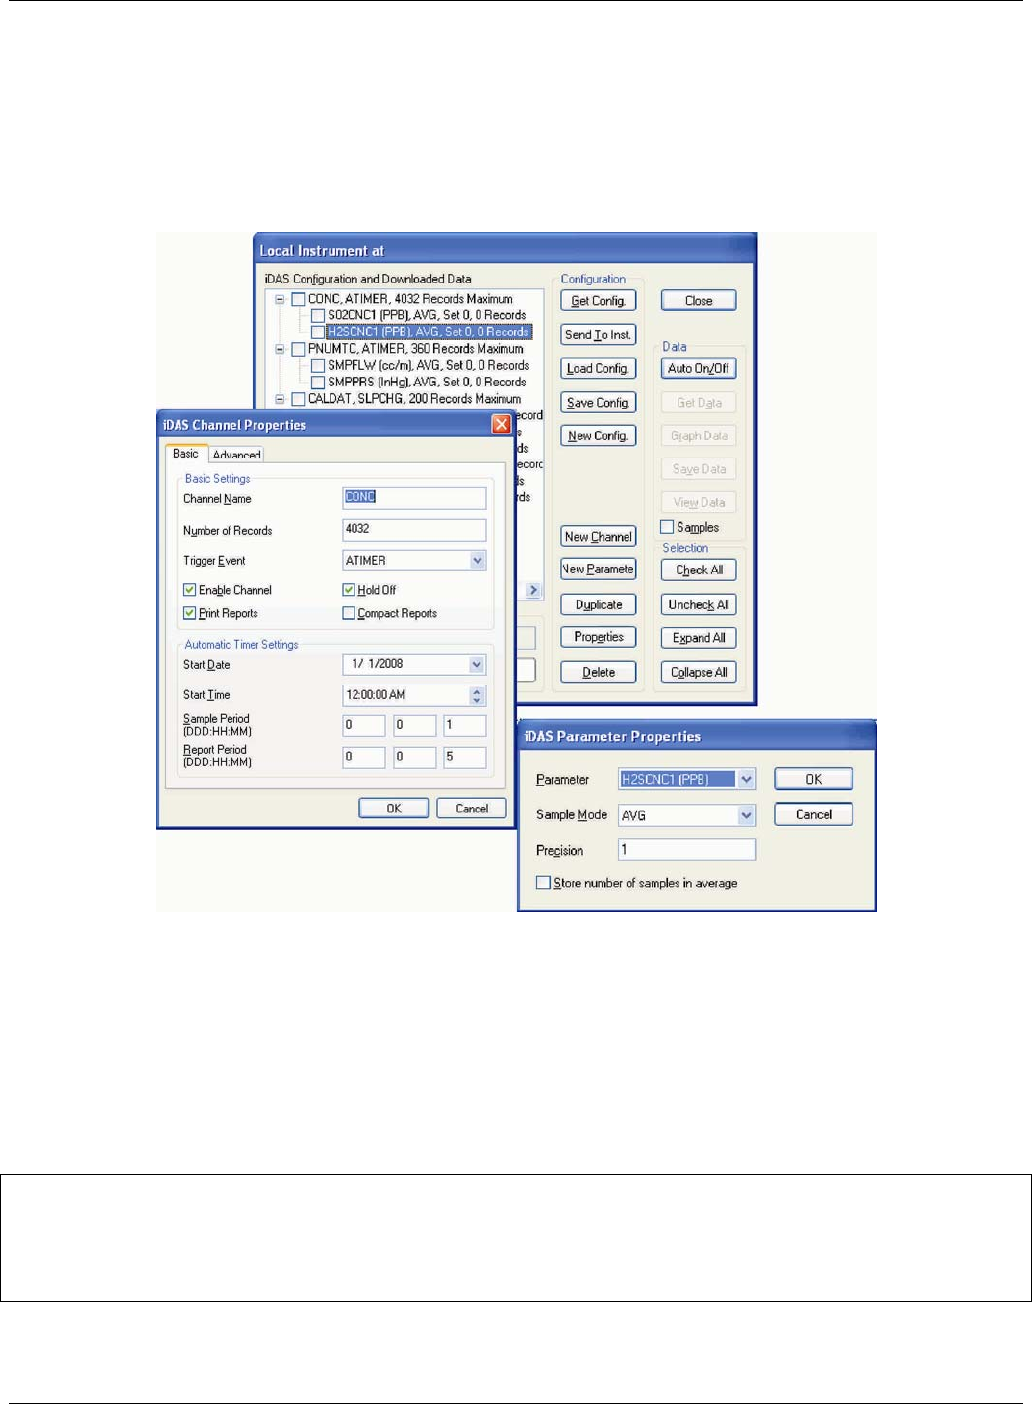
Operating Instructions Teledyne API – T101 Operation Manual
142
4.8.3. REMOTE DAS CONFIGURATION
Editing channels, parameters and triggering events as described in this section is can be
performed via the APICOM remote control program using the graphic interface shown in
Figure 4-15. Refer to the next Section 4.12 for details on remote access to the T101
analyzer.
Figure 4-12. APICOM User Interface for Configuring the DAS
Once an DAS configuration is edited (which can be done offline and without interrupting
DAS data collection), it is conveniently uploaded to the instrument and can be stored on a
computer for later review, alteration or documentation and archival. Refer to the
APICOM manual for details on these procedures. The APICOM user manual is included
in the APICOM installation file, which can be downloaded at http://www.teledyne-
api.com/software/apicom/.
CAUTION – Avoid losing data and saved configurations.
All data, parameters and channels will be replaced when uploading a DAS configuration
script to the analyzer through its communication ports. Back up data and the original
DAS configuration before attempting any DAS changes.
07266B DCN6485

Teledyne API – T101 Operation Manual Remote Operation
143
5. REMOTE OPERATION
5.1.1. REMOTE OPERATION USING THE EXTERNAL DIGITAL I/O
5.1.1.1. Status Outputs
The status outputs report analyzer conditions via optically isolated NPN transistors, which
sink up to 50 mA of DC current. These outputs can be used interface with devices that
accept logic-level digital inputs, such as programmable logic controllers (PLC’s). Each
Status bit is an open collector output that can withstand up to 40 VDC. All of the emitters
of these transistors are tied together and available at D.
NOTE
Most PLC’s have internal provisions for limiting the current that the input will draw from
an external device. When connecting to a unit that does not have this feature, an
external dropping resistor must be used to limit the current through the transistor
output to less than 50 mA. At 50 mA, the transistor will drop approximately 1.2V from
its collector to emitter.
The status outputs are accessed through a 12 pin connector on the analyzer’s rear panel
labeled STATUS (see Figure 5-1). The function of each pin is defined in Table 5–1.
07266B DCN6485
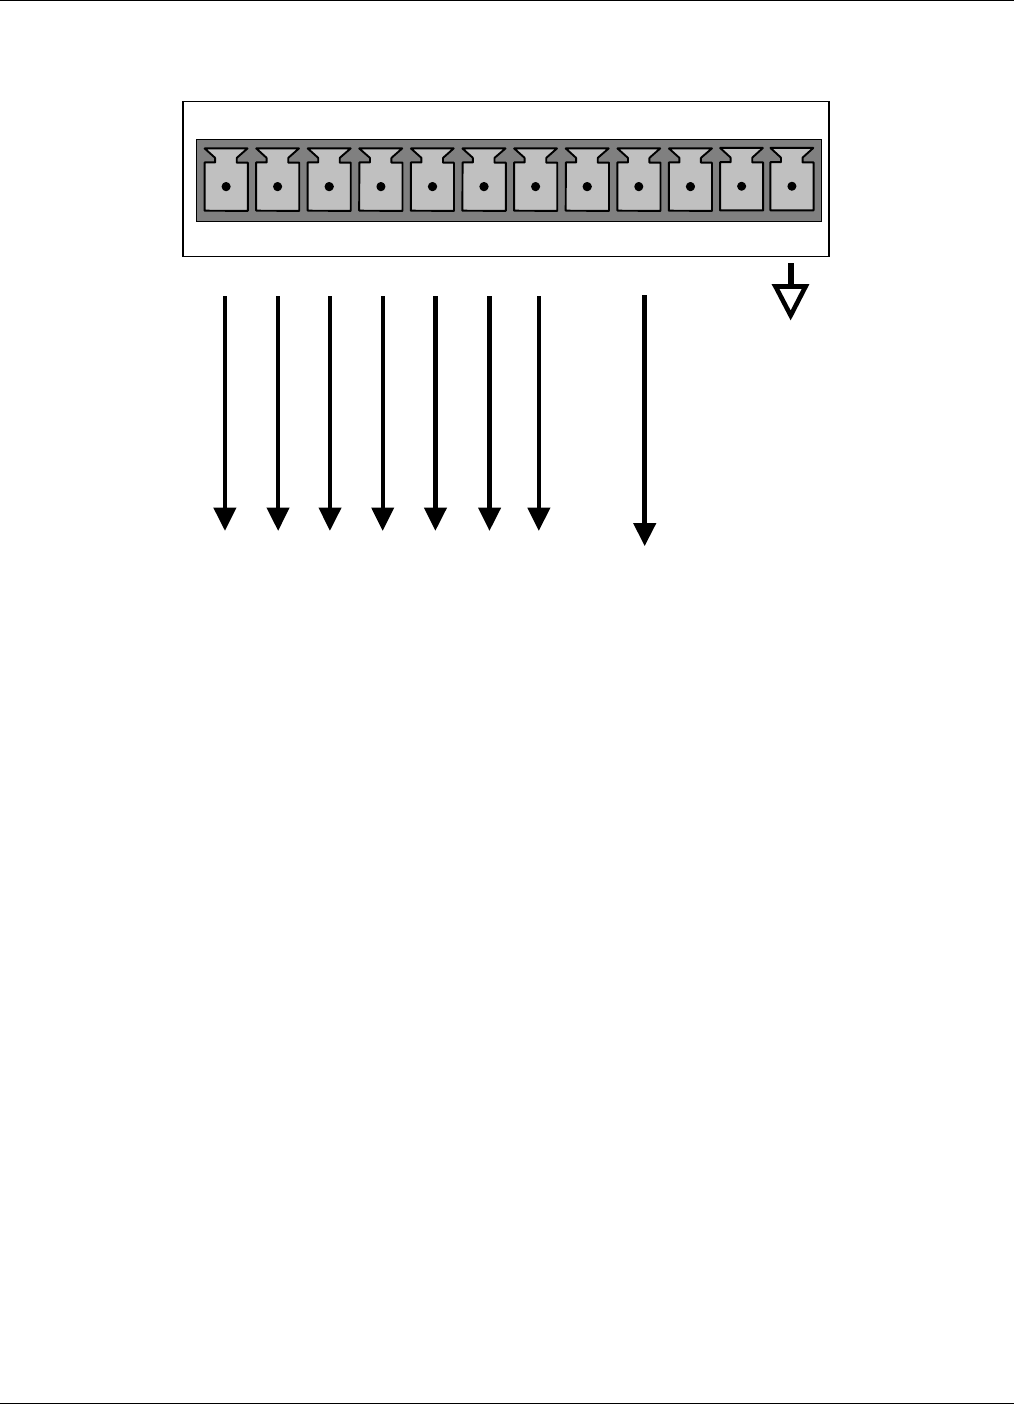
Remote Operation Teledyne API – T101 Operation Manual
144
Connect to Internal
Ground of Monitoring
STATUS
1 2 3 4 5 6 7 8 D +
SYSTEM O
K
HIGH RANGE
CONC VALID
ZERO CAL
SPAN CAL
DIAGNOSTIC MODE
LOW SPAN
Figure 5-1. Status Output Connector
07266B DCN6485
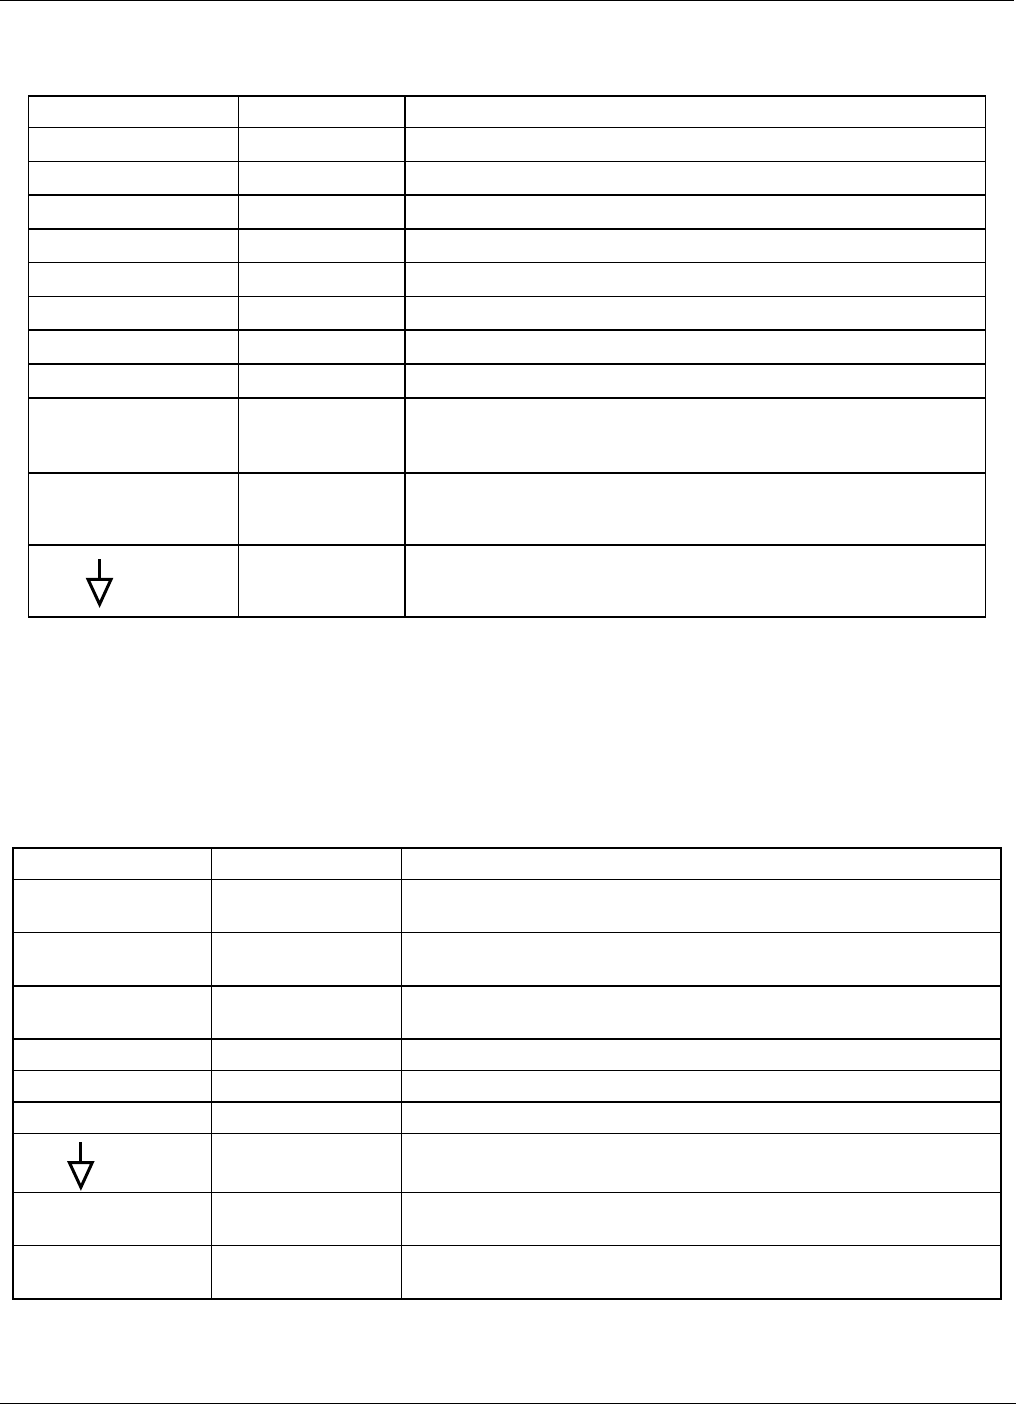
Teledyne API – T101 Operation Manual Remote Operation
145
Table 5-1. Status Output Pin Assignments
CONNECTOR PIN STATUS CONDITION (ON=CONDUCTING)
1 System Ok ON if no faults are present.
2 Conc Valid ON if concentration measurement is valid, OFF when invalid.
3 High Range ON if unit is in high range of any AUTO range mode.
4 Zero Cal ON whenever the instrument is in ZERO calibration mode.
5 Span Cal ON whenever the instrument is in SPAN calibration mode.
6 Diag Mode ON whenever the instrument is in DIAGNOSTIC mode.
7 Low Range ON if unit is in low range of any AUTO range mode.
8 Unused
D Emitter Bus
The emitters of the transistors on pins 1-8 are bussed
together. For most applications, this pin should be connected
to the circuit ground of the receiving device.
+ Dc Power + 5 VDC source, 30 mA maximum (combined rating with
Control Inputs)
Digital Ground The ground from the analyzer’s internal, 5/±15 VDC power
supply.
5.1.1.2. Control Inputs
Control inputs allow the user to remotely initiate ZERO and SPAN calibration modes are
provided through a 10-pin connector labeled CONTROL IN on the analyzer’s rear panel.
These are opto-isolated, digital inputs that are activated when a 5 VDC signal from the
“U” pin is connected to the respective input pin.
Table 5-2. Control Input Pin Assignments
INPUT STATUS CONDITION WHEN ENABLED
A External Zero Cal Zero calibration mode is activated. The mode field of the
display will read ZERO CAL R.
B External Span Cal Span calibration mode is activated. The mode field of the
display will read SPAN CAL R.
C External Low
Span Cal
Low span (mid-point) calibration mode is activated. The mode
field of the display will read LO CAL R.
D Unused
E Unused
F Unused
Digital Ground Provided to ground an external device (e.g., recorder).
U DC Power For
Input Pull Ups
Input for +5 VDC required to activate inputs A - F. This voltage
can be taken from an external source or from the “+” pin.
+ Internal +5v
Supply
Internal source of +5V which can be used to activate inputs
when connected to pin U.
07266B DCN6485
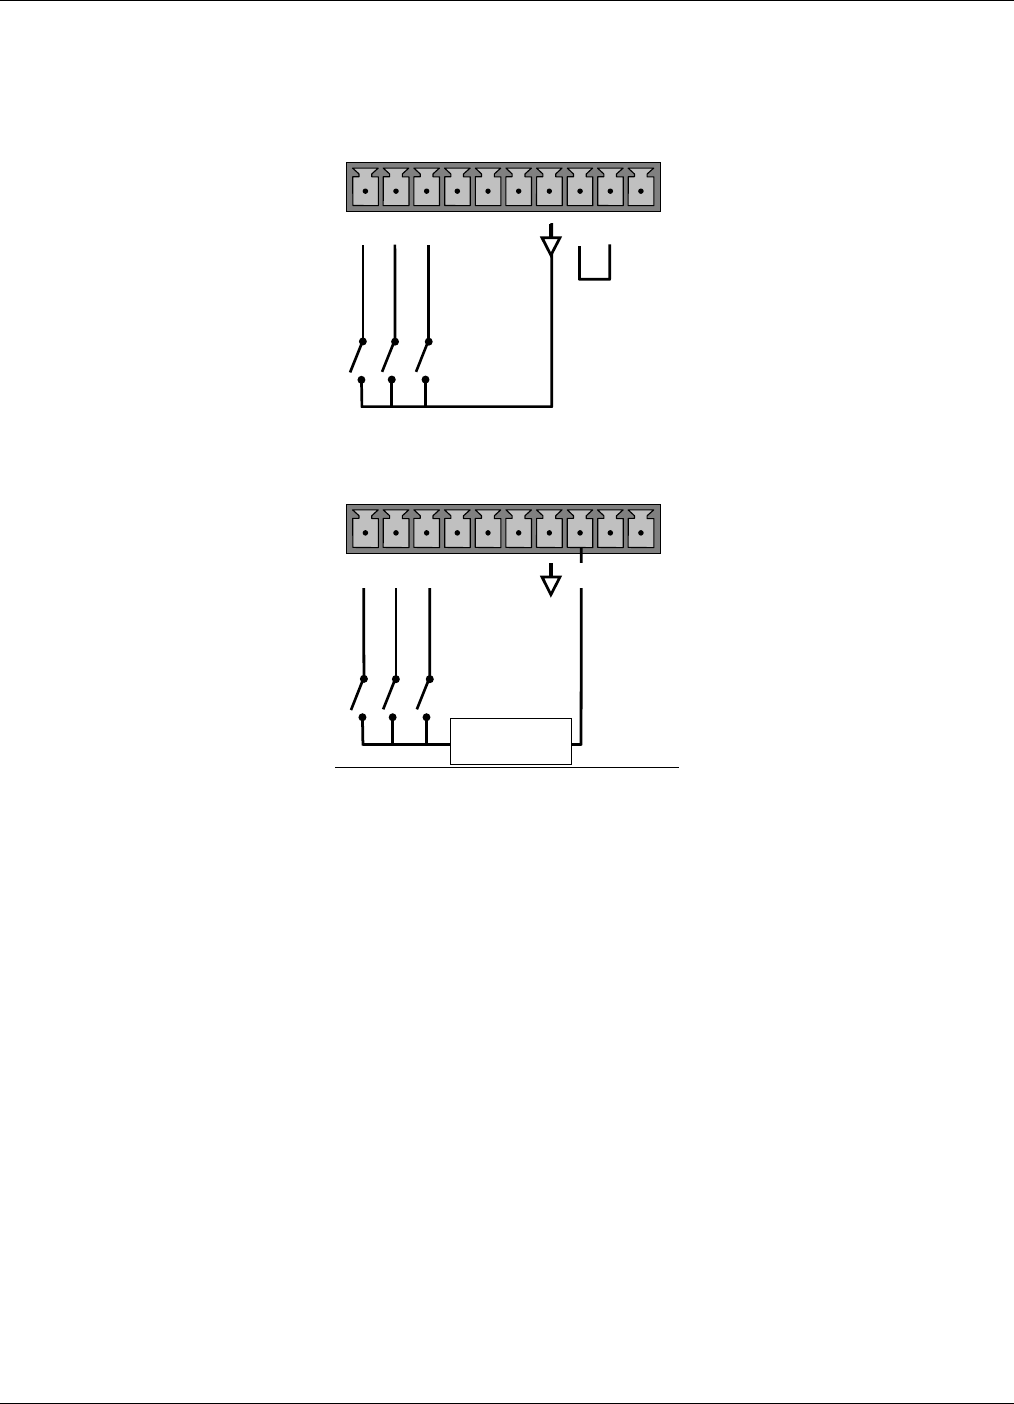
Remote Operation Teledyne API – T101 Operation Manual
146
There are two methods to activate control inputs. The internal +5V available from the “+”
pin is the most convenient method (Figure 4.18). However, to ensure that these inputs are
truly isolated, a separate, external 5 VDC power supply should be used (Figure 4.19).
CONTROL IN
A B C D E F U +
LOW SPAN
ZERO
SPAN
Figure 5-2. Control Inputs with Local 5 V Power Supply
CONTROL IN
-
+
5 VDC Power
Supply
LOW SPAN
ZERO
SPAN
A B C D E F U +
Figure 5-3.Control Inputs with External 5 V Power Supply
5.1.2. REMOTE OPERATION USING THE EXTERNAL SERIAL I/O
5.1.2.1. Terminal Operating Modes
The Model T101 can be remotely configured, calibrated or queried for stored data
through the serial ports. As terminals and computers use different communication
schemes, the analyzer supports two communicate modes specifically designed to interface
with these two types of devices.
Computer mode is used when the analyzer is connected to a computer
with a dedicated interface program such as APICOM. More information
regarding APICOM can be found in later in this section or on the Teledyne
API website at http://www.teledyne-api.com/software/apicom/.
Interactive mode is used with a terminal emulation programs such as
HyperTerminal or a “dumb” computer terminal. The commands that are
used to operate the analyzer in this mode are listed in Table 5-3.
07266B DCN6485

Teledyne API – T101 Operation Manual Remote Operation
147
5.1.2.2. Help Commands in Terminal Mode
Table 5-3. Terminal Mode Software Commands
COMMAND Function
Control-T Switches the analyzer to terminal mode (echo, edit). If mode flags 1 & 2 are OFF,
the interface can be used in interactive mode with a terminal emulation program.
Control-C Switches the analyzer to computer mode (no echo, no edit).
CR
(carriage return)
A carriage return is required after each command line is typed into the
terminal/computer. The command will not be sent to the analyzer to be executed
until this is done. On personal computers, this is achieved by pressing the ENTER
key.
BS
(backspace)
Erases one character to the left of the cursor location.
ESC
(escape)
Erases the entire command line.
? [ID] CR This command prints a complete list of available commands along with the
definitions of their functionality to the display device of the terminal or computer
being used. The ID number of the analyzer is only necessary if multiple analyzers
are on the same communications line, such as the multi-drop setup.
Control-C Pauses the listing of commands.
Control-P Restarts the listing of commands.
07266B DCN6485

Remote Operation Teledyne API – T101 Operation Manual
148
5.1.2.3. Command Syntax
Commands are not case-sensitive and all arguments within one command (i.e. ID
numbers, keywords, data values, etc.) must be separated with a space character.
All Commands follow the syntax:
X [ID] COMMAND <CR>
Where
X is the command type (one letter) that defines the type of
command. Allowed designators are listed in Table 4-25 and
Appendix A-6.
[ID] is the analyzer identification number (Section 4.10.1.). Example:
the Command “? 200” followed by a carriage return would print
the list of available commands for the revision of software
currently installed in the instrument assigned ID Number 200.
COMMAND is the command designator: This string is the name of the
command being issued (LIST, ABORT, NAME, EXIT, etc.). Some
commands may have additional arguments that define how the
command is to be executed. Press ? <CR> or refer to Appendix A-
6 for a list of available command designators.
<CR> is a carriage return. All commands must be terminated by a
carriage return (usually achieved by pressing the ENTER key on a
computer).
Table 5-4. Command Types
COMMAND COMMAND TYPE
C Calibration
D Diagnostic
L Logon
T Test measurement
V Variable
W Warning
5.1.2.4. Data Types
Data types consist of integers, hexadecimal integers, floating-point numbers, Boolean
expressions and text strings.
Integer data are used to indicate integral quantities such as a number of
records, a filter length, etc. They consist of an optional plus or minus sign,
followed by one or more digits. For example, +1, -12, 123 are all valid
integers.
Hexadecimal integer data are used for the same purposes as integers.
They consist of the two characters “0x,” followed by one or more
07266B DCN6485

Teledyne API – T101 Operation Manual Remote Operation
149
hexadecimal digits (0-9, A-F, a-f), which is the ‘C’ programming language
convention. No plus or minus sign is permitted. For example, 0x1, 0x12,
0x1234abcd are all valid hexadecimal integers.
Floating-point numbers are used to specify continuously variable values
such as temperature set points, time intervals, warning limits, voltages,
etc. They consist of an optional plus or minus sign, followed by zero or
more digits, an optional decimal point, and zero or more digits. (At least
one digit must appear before or after the decimal point.) Scientific
notation is not permitted. For example, +1.0, 1234.5678, -0.1, 1 are all
valid floating-point numbers.
Boolean expressions are used to specify the value of variables or I/O
signals that may assume only two values. They are denoted by the
keywords ON and OFF.
Text strings are used to represent data that cannot be easily represented
by other data types, such as data channel names, which may contain
letters and numbers. They consist of a quotation mark, followed by one or
more printable characters, including spaces, letters, numbers, and
symbols, and a final quotation mark. For example, “a”, “1”, “123abc”, and
“()[]<>” are all valid text strings. It is not possible to include a quotation
mark character within a text string.
Some commands allow you to access variables, messages, and other
items, such as DAS data channels, by name. When using these
commands, you must type the entire name of the item; you cannot
abbreviate any names.
5.1.2.5. Status Reporting
Reporting of status messages as an audit trail is one of the three principal uses for the RS-
232 interface (the other two being the command line interface for controlling the
instrument and the download of data in electronic format). You can effectively disable the
reporting feature by setting the interface to quiet mode (Section 4.10.8., Table 4-18).
Status reports include DAS data (when reporting is enabled), warning messages,
calibration and diagnostic status messages. Refer to Appendix A-3 for a list of the
possible messages, and this section for information on controlling the instrument through
the RS-232 interface.
07266B DCN6485

Remote Operation Teledyne API – T101 Operation Manual
150
5.1.2.6. General Message Format
All messages from the instrument (including those in response to a command line request)
are in the format:
X DDD:HH:MM [Id] MESSAGE<CRLF>
Where
X is a command type designator, a single character indicating the
message type, as shown in the Table 4-25.
DDD:HH:MM is the time stamp, the date and time when the message was
issued. It consists of the Day-of-year (DDD) as a number from 1
to 366, the hour of the day (HH) as a number from 00 to 23, and
the minute (MM) as a number from 00 to 59.
[ID] is the analyzer ID, a number with 1 to 4 digits.
MESSAGE is the message content that may contain warning messages, test
measurements, DAS reports, variable values, etc.
<CRLF> is a carriage return / line feed pair, which terminates the
message.
The uniform nature of the output messages makes it easy for a host computer to parse
them into an easy structure. Keep in mind that the front panel display does not give any
information on the time a message was issued, hence it is useful to log such messages for
trouble-shooting and reference purposes. Terminal emulation programs such as
HyperTerminal can capture these messages to text files for later review.
5.1.2.7. Remote Access by Modem
The T101 can be connected to a modem for remote access. This requires a cable between
the analyzer’s COM port and the modem, typically a DB-9F to DB-25M cable (available
from Teledyne API with part number WR0000024).
Once the cable has been connected, check to make sure the DTE-DCE is in the correct
position. Also make sure the T101 COM port is set for a baud rate that is compatible with
the modem, which needs to operate with an 8-bit word length with one stop bit.
The first step is to turn on the MODEM ENABLE communication mode (Mode 64,
Section 4.10.8). Once this is completed, the appropriate setup command line for your
modem can be entered into the analyzer. The default setting for this feature is
AT Y0 &D0 &H0 &I0 S0=2 &B0 &N6 &M0 E0 Q1 &W0
This string can be altered to match your modem’s initialization and can be up to 100
characters long.
07266B DCN6485
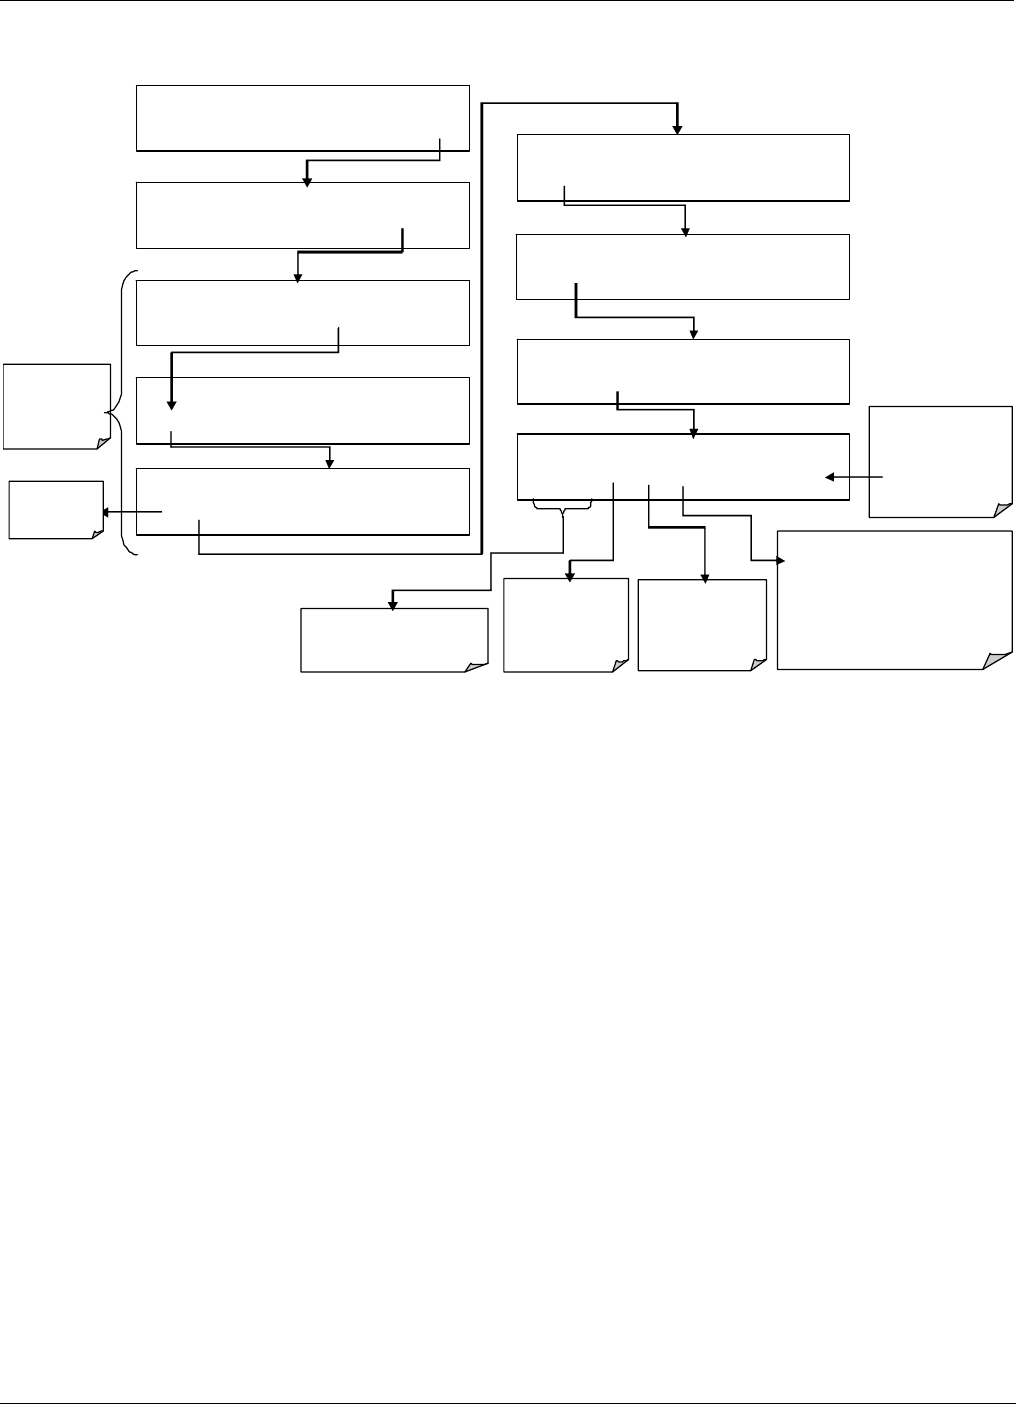
Teledyne API – T101 Operation Manual Remote Operation
151
To change this setting press:
SETUP X.X SECONDARY SETUP MENU
COMM VARS DIAG ALRM EXIT
SAMPLE ENTER SETUP PASS : 818
8 1 8 ENTR EXIT
SETUP X.X PRIMARY SETUP MENU
CFG DAS RNGE PASS CLK MORE EXIT
SAMPLE RANGE = 500.0 PPB H2S =XXX.X
< TST TST > CAL SETUP
SE TUP X. X COM1 MODEM INIT:AT Y &D &H
<SET SET> EDIT EXIT
SETUP X.X COM1 MODEM INIT:[A]T Y &D &H
<CH CH> INS DEL [A] ENTR EXIT
SE TUP X. X COM1 MODE: 0
SET> EDIT EXIT
SETUP X.X COM1 BAUD RATE:19200
<SET SET> EDIT EXIT
ENT
R
accepts the
new st rin g an d retu rns
to the previous men u.
EXIT ignores the new
string and returns to
the previous menu.
<C H and CH> mo ve the [ ]
cur sor left an d rig ht along the
text string
INS inserts a
chara cter before
the cursor location.
Press [?]
repeatedly to cycle through the
available character set:
0-9
A-Z
space ’ ~ ! # $ % ^ & * ( ) - _ =
+[ ] { } < >\ | ; : , . / ?
DEL deletes a
chara cter at the
cursor location.
SETUP X.X COMMUNICATIONS MENU
ID COM1 COM2 EXIT
Select which
COM Port is
tested
EXIT returns
to the
previous
menu
07266B DCN6485
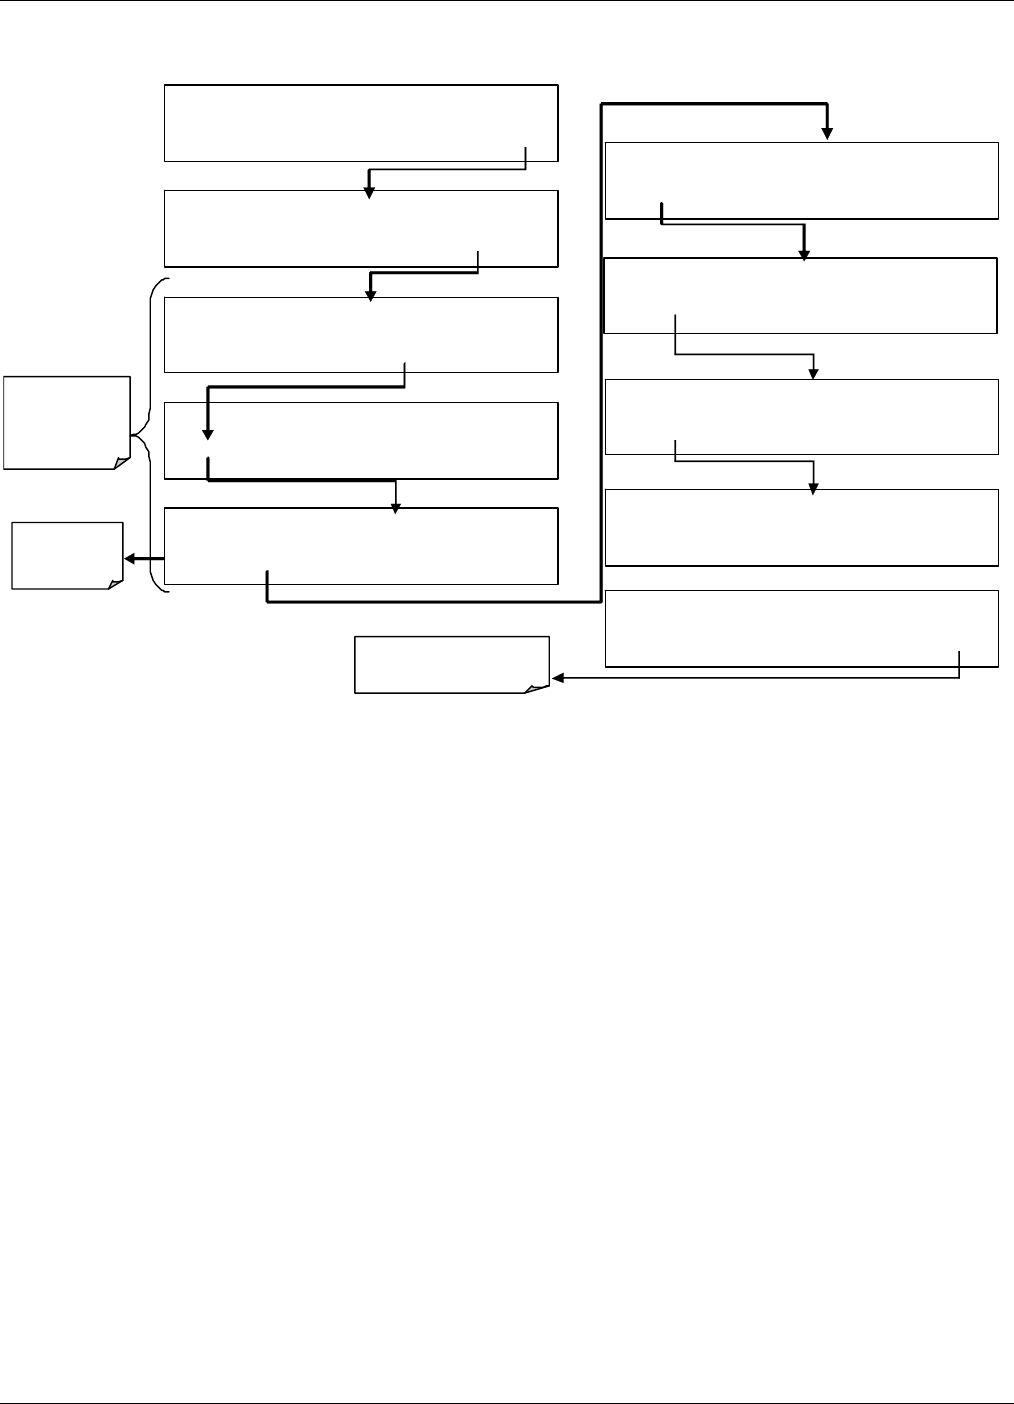
Remote Operation Teledyne API – T101 Operation Manual
152
To Initialize the modem press:
Select which
COM Port is
tested
SETUP X.X SECONDARY SETUP MENU
COMM VARS DIAG ALRM EXIT
SAMPLE ENTER SETUP PASS : 818
8 1 8 ENTR EXI T
SETUP X.X PRIMARY SETUP MENU
CFG DAS RNGE PASS CLK MORE EXIT
SAMPLE RANGE = 500.0 PPB H2S =XXX.X
< TST TST > CAL SETUP
SETUP X.X COMMUNICATIONS MENU
ID INET COM1 COM2 EXIT
EXIT returns
to the
previous
menu
SETUP X.X COM1 MODEM INIT:AT Y
&D
&H
<SET SET> EDIT EXIT
SETUP X.X COM1 INITIALIZE MODEM
<SET SET> INIT EXIT
SETUP X.X COM1 MODE:0
SET> EDIT EXIT
SETUP X.X COM1 BAUD RATE:19200
<SET SET> EDIT EXIT
EXI
T
returns to the
C ommunica ti on s Menu .
SETUP X.X INITIALIZING MODEM
<SET SET> INIT EXIT
07266B DCN6485

Teledyne API – T101 Operation Manual Remote Operation
153
5.1.2.8. COM Port Password Security
In order to provide security for remote access of the T101, a LOGON feature can be
enabled to require a password before the instrument will accept commands. This is done
by turning on the SECURITY MODE (Section 4.10.8). Once the SECURITY MODE is
enabled, the following items apply.
A password is required before the port will respond or pass on commands.
If the port is inactive for one hour, it will automatically logoff, which can
also be achieved with the LOGOFF command.
Three unsuccessful attempts to log on with an incorrect password will
cause subsequent logins to be disabled for 1 hour, even if the correct
password is used.
If not logged on, the only active command is the '?' request for the help
screen.
The following messages will be returned at logon:
o LOGON SUCCESSFUL - Correct password given
o LOGON FAILED - Password not given or incorrect
o LOGOFF SUCCESSFUL - Connection terminated successfully
To log on to the Model T101 analyzer with SECURITY MODE feature enabled, type:
LOGON 940331
940331 is the default password. To change the default password, use the variable
RS232_PASS issued as follows:
V RS232_PASS=NNNNNN
Where N is any numeral between 0 and 9.
5.1.2.9. APICOM Remote Control Program
APICOM is an easy-to-use, yet powerful interface program that allows accessing and
controlling any of Teledyne API’s main line of ambient and stack-gas instruments from a
remote connection through direct cable, modem or Ethernet. Running APICOM, a user
can:
Establish a link from a remote location to the T101 through direct cable
connection via RS-232 modem or Ethernet.
View the instrument’s front panel and remotely access all functions that
could be accessed when standing in front of the instrument.
Remotely edit system parameters and set points.
Download, view, graph and save data for predictive diagnostics or data
analysis.
Retrieve, view, edit, save and upload DAS configurations.
Check on system parameters for trouble-shooting and quality control.
APICOM is very helpful for initial setup, data analysis, maintenance and trouble-
shooting. Figure 4-16 shows an example of APICOM being used to remotely
configuration the instrument’s DAS feature. Figure 4-20 shows examples of APICOM’s main
interface, which emulates the look and functionality of the instrument’s actual front panel
07266B DCN6485
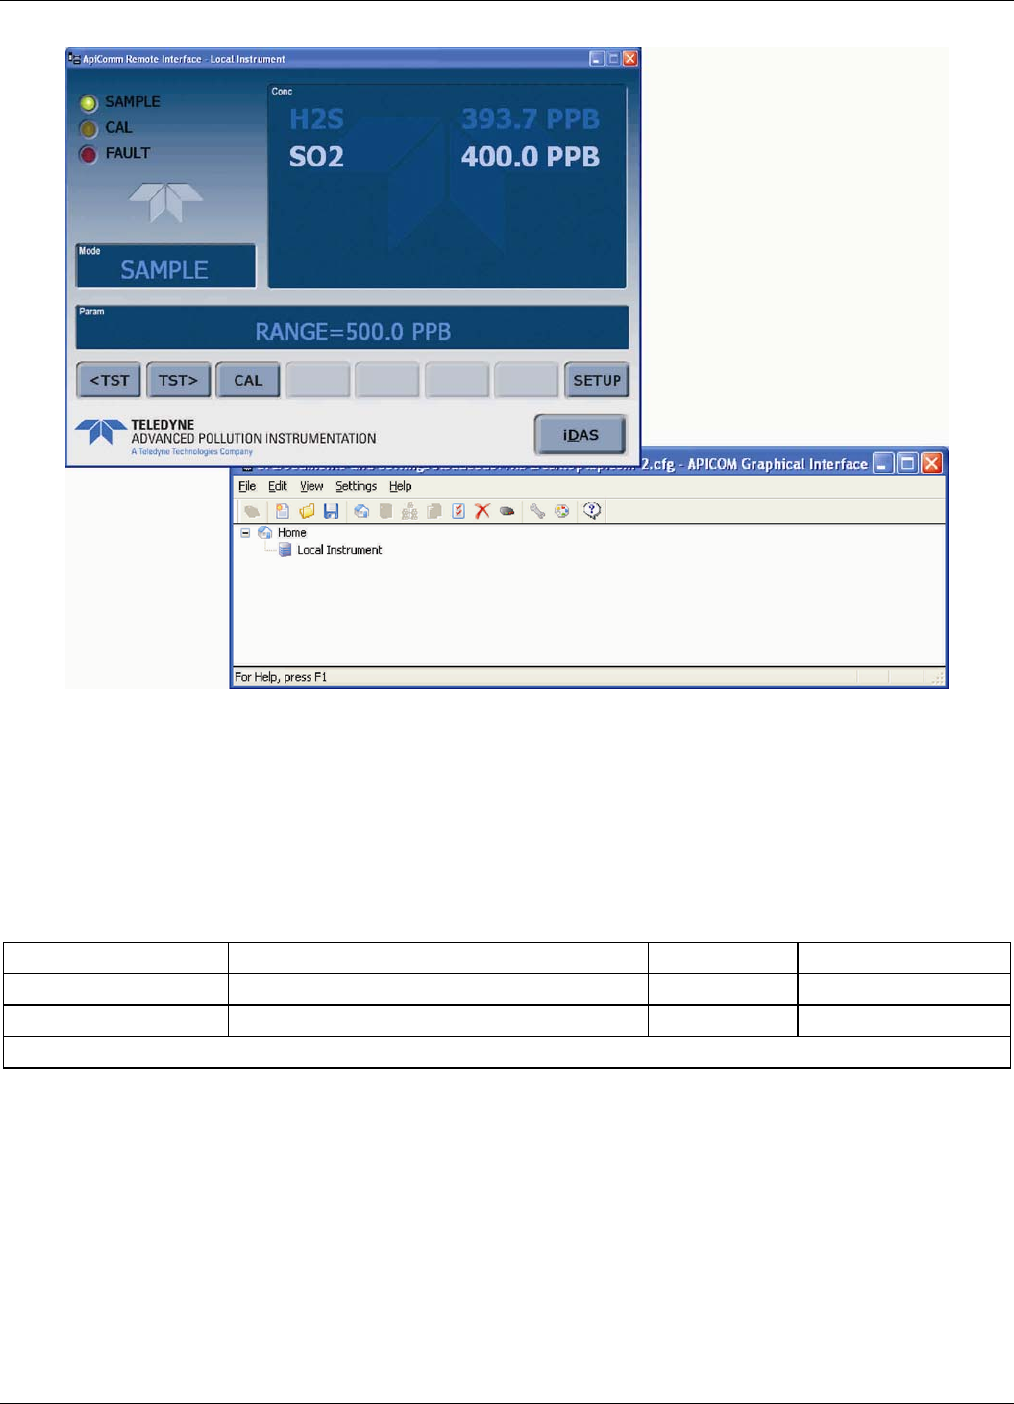
Remote Operation Teledyne API – T101 Operation Manual
154
Figure 5-4. APICOM Remote Control Program Interface
APICOM is included free of cost with the analyzer and the latest versions can also be
downloaded for free at http://www.teledyne-api.com/software/apicom/.
5.1.3. ADDITIONAL COMMUNICATIONS DOCUMENTATION
Table 5-5. Serial Interface Documents
Interface / Tool Document Title Part Number Available Online*
APICOM APICOM User Manual 039450000 YES
DAS Manual Detailed description of the DAS . 028370000 YES
* These documents can be downloaded at http://www.teledyne-api.com/manuals/
07266B DCN6485

Teledyne API – T101 Operation Manual Remote Operation
155
5.1.4. USING THE T101 WITH A HESSEN PROTOCOL NETWORK
5.1.4.1. General Overview of Hessen Protocol
The Hessen protocol is a Multidrop protocol, in which several remote instruments are
connected via a common communications channel to a host computer. The remote
instruments are regarded as slaves of the host computer. The remote instruments are
unaware that they are connected to a Multidrop bus and never initiate Hessen protocol
messages. They only respond to commands from the host computer and only when they
receive a command containing their own unique ID number.
The Hessen protocol is designed to accomplish two things: to obtain the status of remote
instruments, including the concentrations of all the gases measured; and to place remote
instruments into zero or span calibration or measure mode. API’s implementation
supports both of these principal features.
The Hessen protocol is not well defined, therefore while API’s application is completely
compatible with the protocol itself, it may be different from implementations by other
companies.
The following subsections describe the basics for setting up your instrument to operate
over a Hessen Protocol network. for more detailed information as well as a list of host
computer commands and examples of command and response message syntax, download
the Manual Addendum for Hessen Protocol from the Teledyne API web site:
http://www.teledyne-api.com/manuals/index.asp .
5.1.4.2. Hessen COMM Port Configuration
Hessen protocol requires the communication parameters of the T101’s COMM ports to be
set differently than the standard configuration as shown in the table below.
Table 5-6. Hessen RS-232 Communication Parameters
Parameter Standard Hessen
Data Bits 8 7
Stop Bits 1 2
Parity None Even
Duplex Full Half
To change the rest of the COMM port parameters and modes. see Section 4.10.8.
To change the baud rate of the T101’s COMM ports, see Section 4.10.9.
NOTE
Make sure that the communication parameters of the host computer are also properly
set.
Also, the instrument software has a 200 ms. latency before it responds to commands
issued by the host computer. This latency should present no problems, but you should be
aware of it and not issue commands to the instrument too frequently.
07266B DCN6485
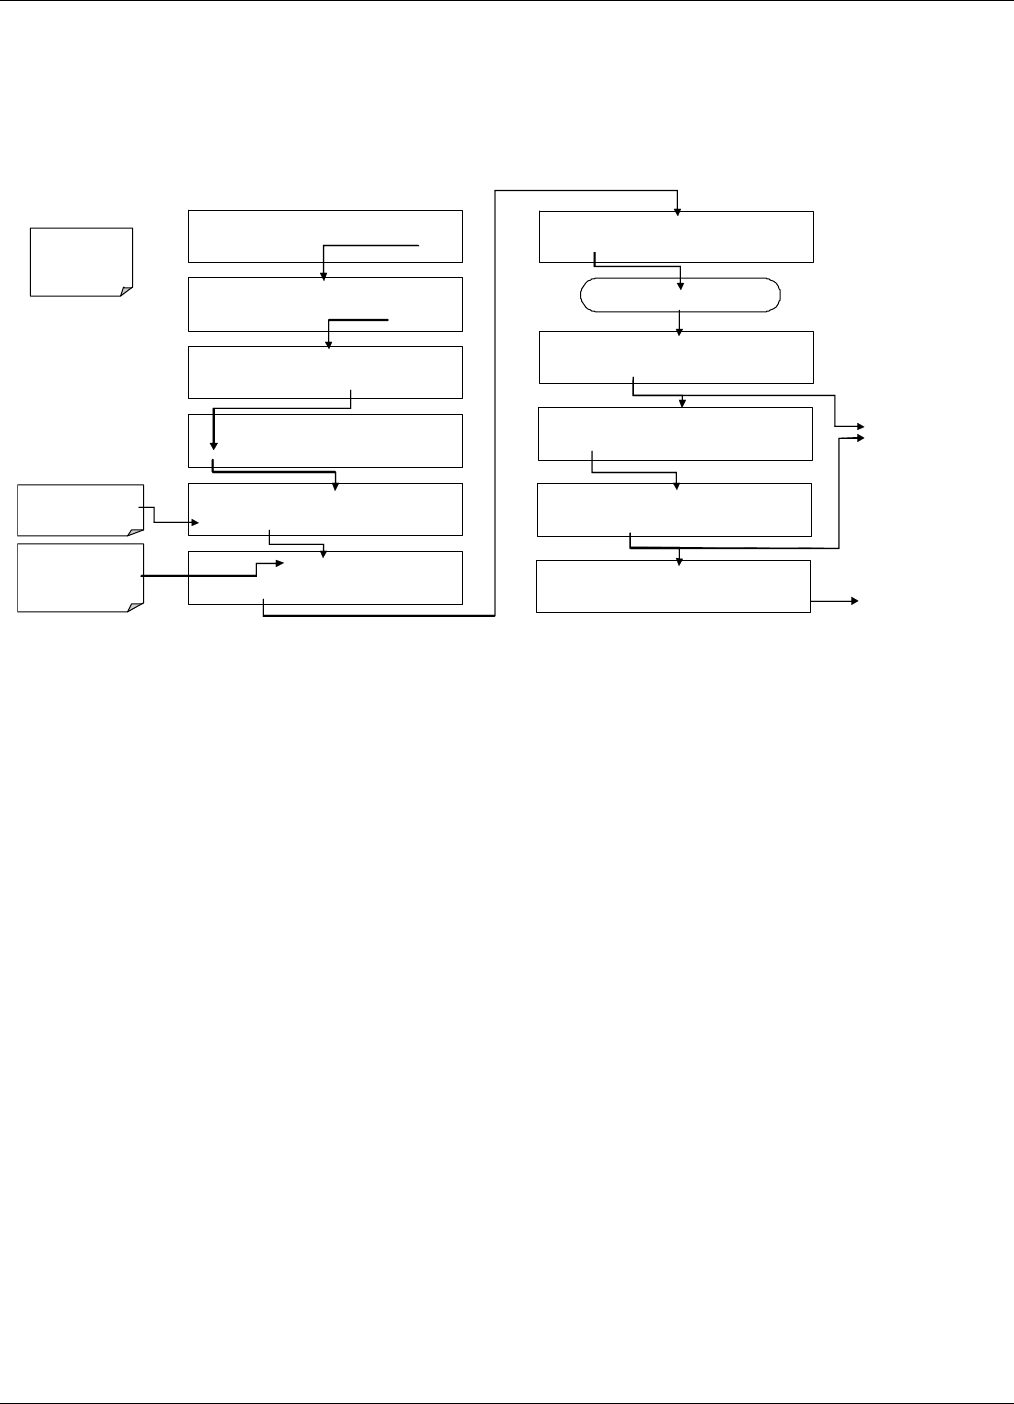
Remote Operation Teledyne API – T101 Operation Manual
156
5.1.4.3. Activating Hessen Protocol
The first step in configuring the T101 to operate over a Hessen protocol network is to
activate the Hessen mode for COMM ports and configure the communication parameters
for the port(s) appropriately. Press:
SAMPLE ENTER SETUP PASS : 818
8 1 8 ENTR EX IT
SETUP X.X PRIMARY SETUP MENU
CFG DAS RNGE PASS CLK MORE EXIT
SAMPLE RANGE = 500.0 PPB H2S =XXX.X
< TST TST > CAL SETUP
SETUP X.X SECON DARY SETUP MENU
COMM VARS DIAG ALRM EXIT
SETUP X.X COMMUNICATIONS MENU
ID INET COM1 COM2
EXIT
SETUP X.X COM1 MODE:
0
SET> EDIT EXIT
Co ntinu e pressing ne xt un til …
Select which COMM
port to configure
SETUP X.X COM1 QUIET MODE: OFF
NEXT OFF ENTR EXIT
SETUP X.X COM1 HESSEN PROTOCOL : ON
PRE V NEXT ON ENTR EXIT
SETUP X.X COM1 HESSEN PROTOCOL : OFF
PREV NE XT OFF ENTR EXIT
ENTR accepts the new
settings
EXIT ignores the new
settin
g
s
The sum of the mode
IDs of the selected
modes is displayed
here
SE TUP X.X COM1 E,7,1 MODE: ON
PREV NEXT ON ENTR EXIT
SETUP X.X COM1 E,7,1 MODE: OFF
PREV NEXT OFF ENTR EXIT
Toggle OFF/ON to
change
activate/deactivate
selected mode.
Repeat the
entire process to
set up the
COM2 port
07266B DCN6485
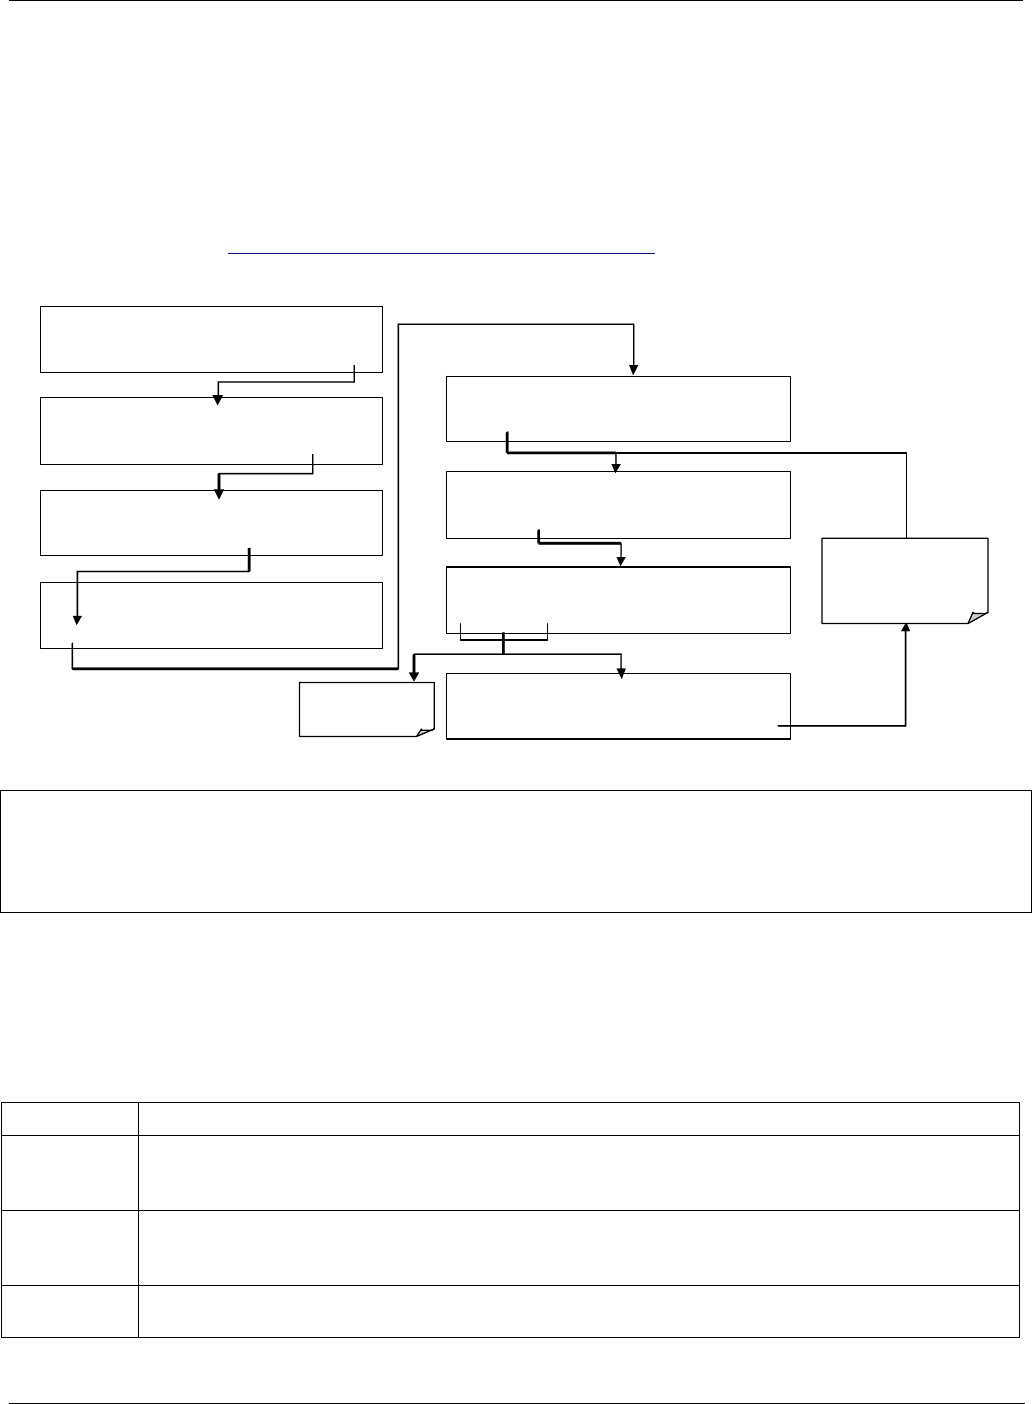
Teledyne API – T101 Operation Manual Remote Operation
157
5.1.4.4. Selecting a Hessen Protocol Type
Currently there are two version of Hessen Protocol in use. The original implementation,
referred to as TYPE 1, and a more recently released version, TYPE 2 that more
flexibility when operating with instruments that can measure more than one type of gas.
For more specific information about the difference between TYPE 1and TYPE 2
download the Manual Addendum for Hessen Protocol from the Teledyne API web site:
http://www.teledyne-api.com/manuals/index.asp .
To select a Hessen Protocol Type press:
SETUP X.X SECONDARY SETUP MENU
COMM VARS DIAG ALRM EXIT
SAMPLE ENTER SETUP PASS : 818
8 1 8 ENTR EXIT
SETUP X.X PRIMARY SETUP MENU
CFG DAS RNGE PASS CLK MORE EXIT
SAMPLE RANGE = 500.0 PPB H2S =X XX .X
< TST TST > CAL SETUP
SE TUP X .
X
COMMUNICATIONS MENU
ID HESN COM1 COM2
EXIT
SETUP X. HESSEN VARIATION: TYPE 1
SET> EDIT EXIT
SE TUP X .X HESSEN VARIATION: TYPE 1
TYPE1 TYPE 2
ENTR EXIT
SE TUP X .X HESSEN VARIATION: TYPE 2
PREV NEXT OFF ENTR EXIT
Press to change
protocol type.
ENTR accepts the new
settings
EXIT ign ores the new
settin
g
s
NOTE
While Hessen Protocol Mode can be activated independently for COM1 and COM2, The
TYPE selection affects both Ports.
5.1.4.5. Setting The Hessen Protocol Response Mode
The Teledyne API’s implementation of Hessen Protocol allows the user to choose one of
several different modes of response for the analyzer.
Table 5-7. T101 Hessen Protocol Response Modes
MODE ID MODE DESCRIPTION
CMD This is the Default Setting. Reponses from the instrument are encoded as the traditional
command format. Style and format of responses depend on exact coding of the initiating
command.
BCC Responses from the instrument are always delimited with <STX> (at the beginning of the
response, <ETX> (at the end of the response followed by a 2 digit Block Check Code
(checksum), regardless of the command encoding.
TEXT Responses from the instrument are always delimited with <CR> at the beginning and the end
of the string, regardless of the command encoding.
07266B DCN6485
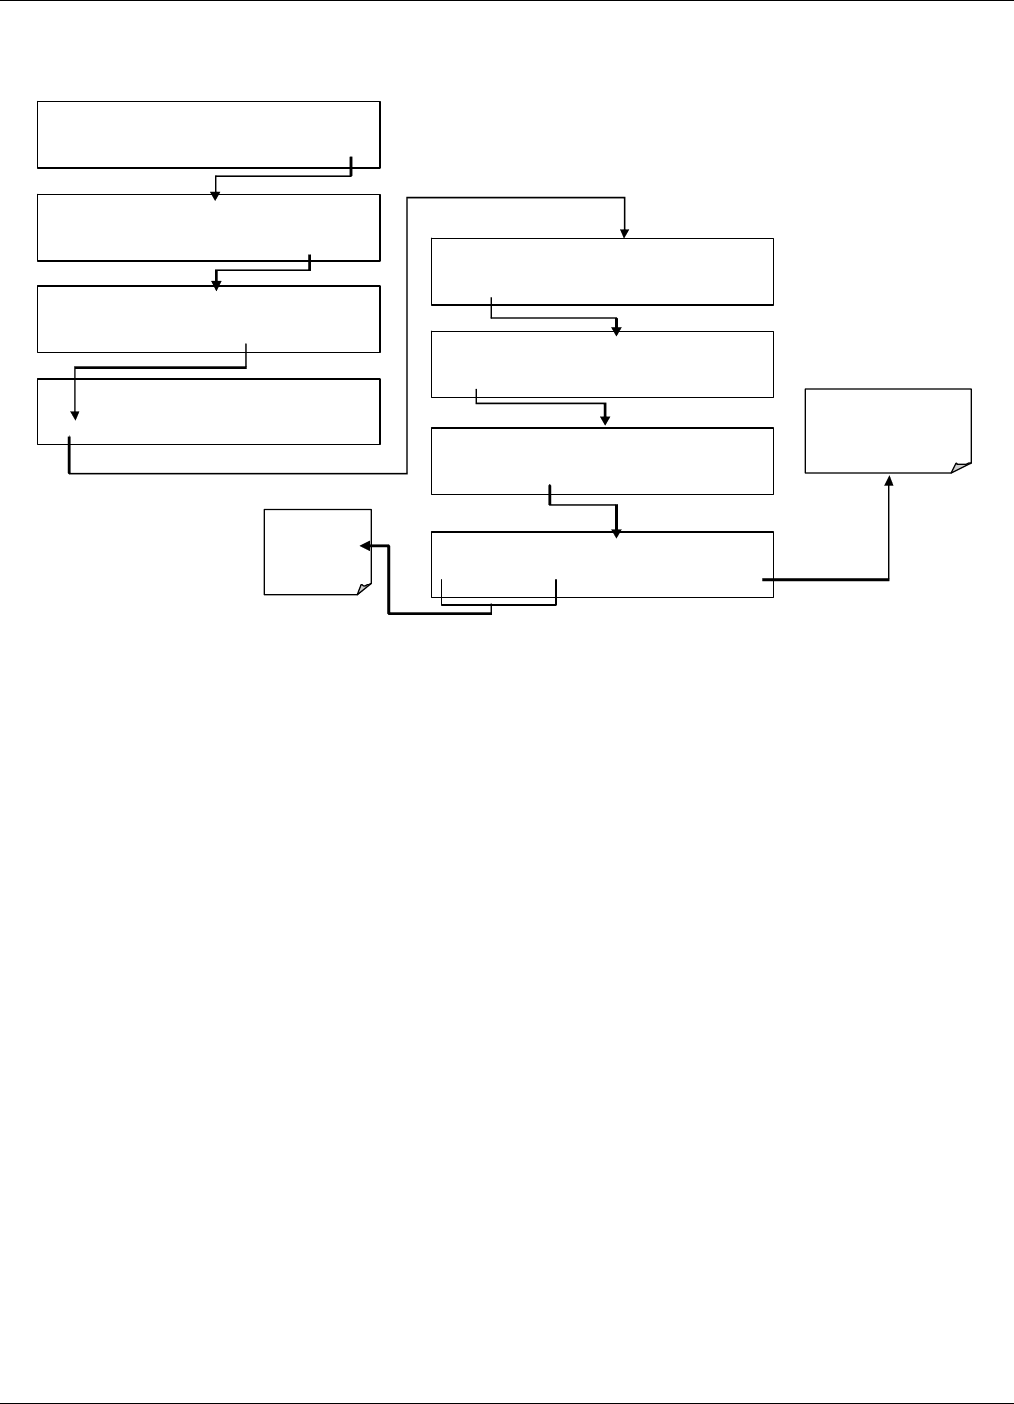
Remote Operation Teledyne API – T101 Operation Manual
158
To Select a Hessen response mode, press:
SETUP X. X SECONDARY SETUP MEN
U
COMM VARS DIAG ALRM EXIT
SAMPLE ENTER SETUP PASS : 81
8
8 1 8 ENTR EXIT
SETUP X. X PRIMARY SETUP MENU
CFG DAS RNGE PASS CLK MORE EXIT
SAMPLE RANGE = 500.0 PPB H2S =X XX.X
< TST TST > CAL SETUP
SETUP X.X HESSEN RESPONSE MODE :CMD
<SET SET> EDIT EXIT
SETUP X.X COMMUNICATIONS MENU
ID HESN COM1 COM2 EXIT
SETUP X.X HESSEN VARIATION: TYPE 1
SET> EDIT EXIT
SETUP X. X HESSEN RESPONSE MODE :CMD
BCC TEXT EDIT ENTR EXIT
Press to
change
response
mod e.
ENTR accepts the new
settings
EXIT ignores the new
settin
g
s
07266B DCN6485
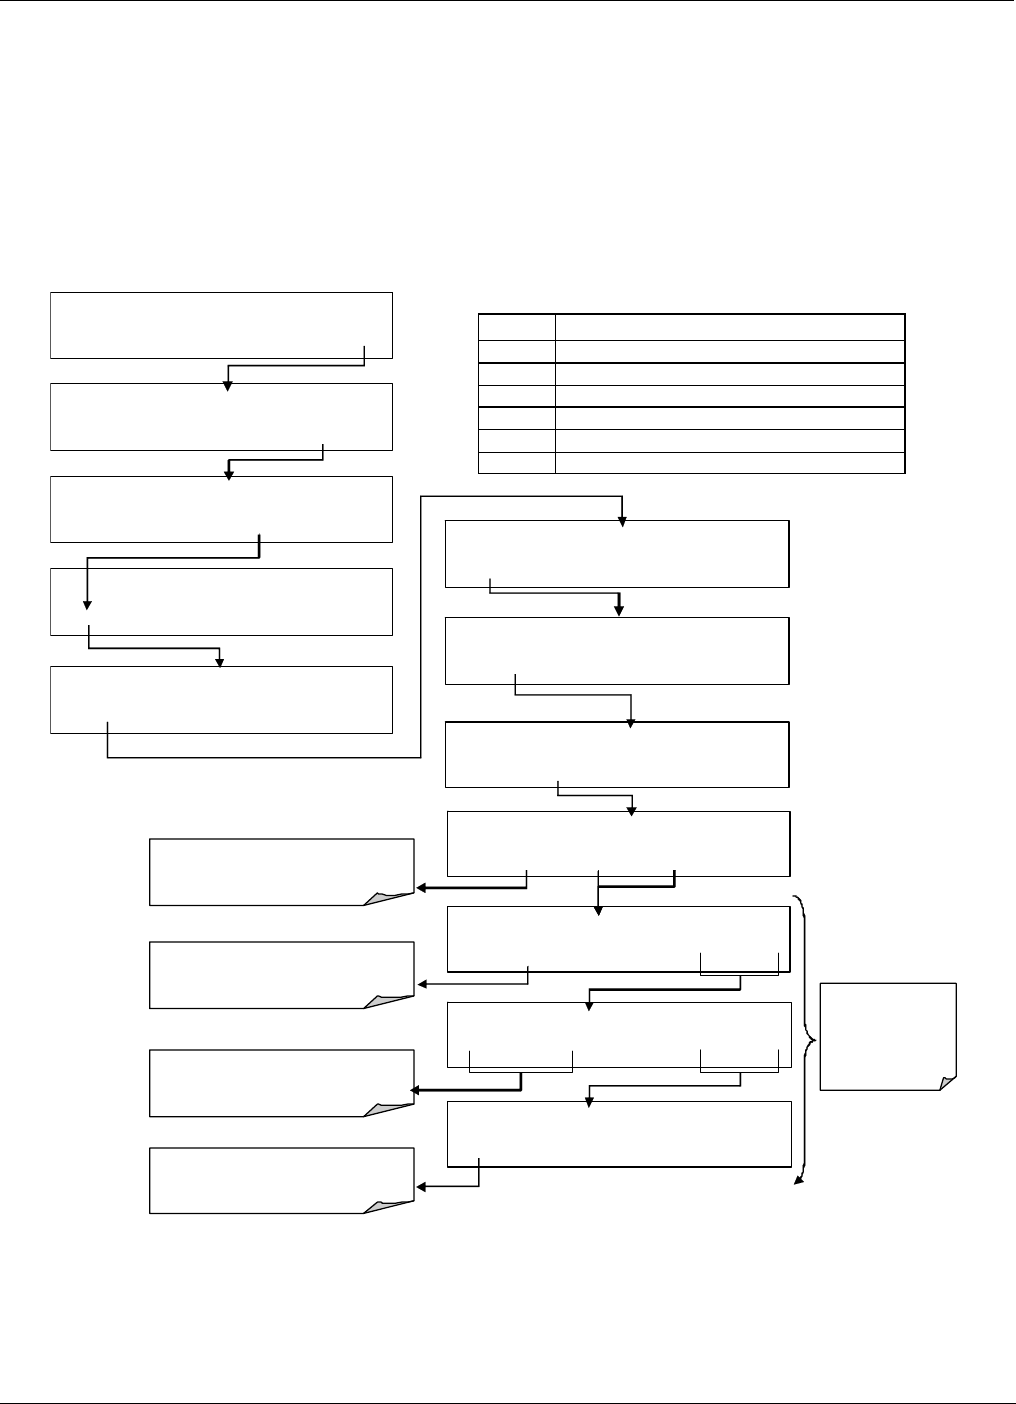
Teledyne API – T101 Operation Manual Remote Operation
159
5.1.4.6. Hessen Protocol Gas ID
Since the T101 can be, when the proper optional equipment is installed and operating, a
multigas instrument that measures both H2S and SO2, both of these gases are listed in the
Hessen protocol gas list. In its default state the Hessen protocol firmware assigns both
gases a Hessen ID number and actively reports both even if the instrument is only
measuring one.
To change or edit these settings press:
BUTTON
FUNCTION
<PREV Moves to next g as e ntry in list
NEXT> Moves th e cu rsor previou s ga s en try in lis t
INS Inserts a ne w gas e ntry i nto the list.
DEL Delete s the >>>>>.
ENTR Accepts the new setting and returns to the previous men u.
EXIT Ignores the new se tting a nd ret urns t o th e previo us menu .
SETUP X.X SECONDARY SETUP MENU
COMM VARS DIAG ALRM EXIT
SAMPLE ENTER SETUP PASS : 818
8 1 8 ENTR EXIT
SETUP X.X PRIMARY SETUP MENU
CFG DAS RNGE PASS CLK MORE EXIT
SAMPLE RANGE = 500.0 PPB H2S =X XX .X
< TST TST > CAL SETUP
SE TUP X .X HESSEN RESPONSE MODE :CMD
<SET SET> EDIT EXIT
SE TUP X. X COMMUNICATIONS MENU
ID HESN COM1 COM2 EXIT
SE TUP X .X HESSEN V
A
RIATION: TYPE 1
SET> EDIT EXIT
SETUP X.X HESSEN GAS LIST
<SET SET> EDIT EXIT
ENTR accepts the
new settings
EXIT ignores the
new settings
SETUP X.X SO2, 111, REPORTED
<P RE V NEXT> INS DEL EDIT PRNT EXIT
SETUP X.X GAS TYPE SO2
<P RE V NEXT> ENTR EXIT
Press PREV & NEXT kto cycle
between the SO2 & H2S
SETUP X.X GAS ID: 111
0 0 0 ENTR EXIT
Press PREV & NEXT to cycle
between the SO2 & H2S
SETUP X.X REPORTED : ON
ON ENTR EXIT
Toggle to sw itch reporting Between
ON and OFF
Press PREV & NEXT to cycle existing
entries in Hessen gas list
07266B DCN6485

Remote Operation Teledyne API – T101 Operation Manual
160
5.1.4.7. Setting Hessen Protocol Status Flags
Teledyne API’s implementation of Hessen protocols includes a set of status bits that the
instrument includes in responses to inform the host computer of its condition. Each bit
can be assigned to one operational and warning message flag. The default settings for
these bit/flags are:
Table 5-8. Default Hessen Status Bit Assignments
NOTES
It is possible to assign more than one flag to the same Hessen status bit. This allows the
grouping of similar flags, such as all temperature warnings, under the same status bit.
Be careful not to assign conflicting flags to the same bit as each status bit will be
triggered if any of the assigned flags is active.
STATUS FLAG NAME DEFAULT BIT
ASSIGNMENT
WARNING FLAGS
SAMPLE FLOW WARNING 0001
PMT DET WARNING 0002
UV LAMP WARNING 0002
HVPS WARNING 0004
DARK CAL WARNING 0008
RCELL TEMP WARNING 0010
IZS TEMP WARNING 0020
PMT TEMP WARNING 0040
CONV TEMP WARNING 1000
OPERATIONAL FLAGS
Instrument Off 0100
In Manual Calibration Mode 0200
In Zero Calibration Mode 0400
In Span Calibration Mode 0800
UNITS OF MEASURE FLAGS
UGM 0000
MGM 2000
PPB 4000
PPM 6000
SPARE/UNUSED BITS 0080, 8000
UNASSIGNED FLAGS
Box Temp Warning Analog Cal Warning
Sample Press Warning Cannot Dyn Zero
System Reset Cannot Dyn Span
Rear Board Not Detected Invalid Conc
Relay Board Warning
07266B DCN6485
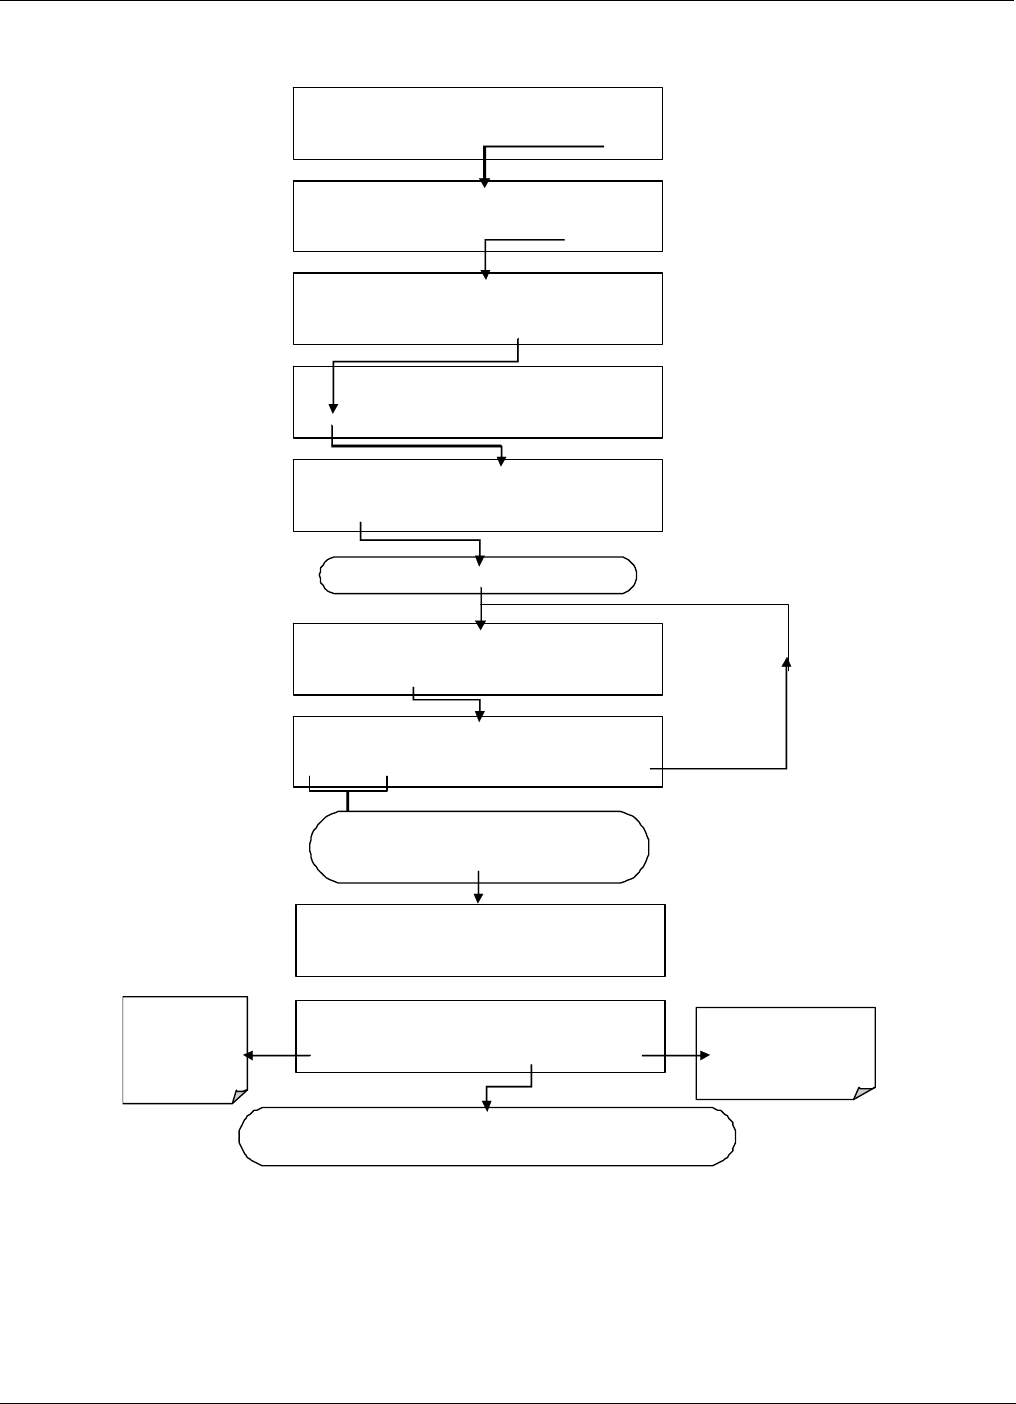
Teledyne API – T101 Operation Manual Remote Operation
161
To assign or reset the status flag bit assignments, press:
SETUP X.X SECONDARY SETUP MENU
COMM VARS DIAG ALRM EXIT
SAMPLE ENTER SETUP PASS : 818
8 1 8 ENTR EXIT
SETUP X.X PRIMARY SETUP MENU
CFG DAS RNGE PASS CL K MORE EXIT
SAMPLE RANGE = 500.0 PPB H2S =XXX.X
< TST TST > CAL SETUP
SETUP X. HESSEN STATUS FLAGS
<SET SET> EDIT EXIT
SETUP X.X COMMUNICATIONS MENU
ID HESN COM1 COM2 EXIT
SETUP X. PMT DET WARNING: 0002
PREV NEXT EDIT PRNT EXIT
Repeat pre ssing SET> until …
SETUP X. SYSTEM RESET: 0000
PREV NEXT EDIT PRNT EXIT
<CH and CH> k
move the [ ]
cursor left and
right along the
bit string.
Repeat pr essing NEXT or PREV u ntil the desired
message flag is displayed. See Table 6-27.
For example …
ENTR
accepts the new
settings
EXIT ignores the new
settin
g
s
SETUP X. SYSTEM RESET: [0]000
<CH CH> [0] ENTR EXIT
Press [?] repeatedl y to cycle through the available cha racter set: 0-9
(Some alpha characters may also be available but are meaningless).
07266B DCN6485

Remote Operation Teledyne API – T101 Operation Manual
162
This page intentionally left blank.
07266B DCN6485

Teledyne API – T101 Operation Manual Calibration Procedures
163
6. CALIBRATION PROCEDURES
This Section describes the calibration procedures for the T101. All of the methods
described in this section can be initiated and controlled through the COM ports.
NOTE
If you are using the T101 for US-EPA controlled monitoring of SO2, see Section 8 for
information on the EPA calibration protocol.
6.1. CALIBRATION PREPARATIONS
The calibration procedures in this section assume that the analog output reporting range
and units of measure, reporting range mode, and reporting range span have already been
selected for the analyzer. If this has not been done, please do so before continuing
(Section 4.4.4 for instructions).
Also, unless otherwise stated, the procedures in this Section are written with the
assumption that the T101 is being used in its default configuration as an H2S analyzer.
The same methods and setups can be followed when the instrument is configured for SO2
measurement by substituting SO2 span gas for the H2S span gas listed in the procedure.
For analyzers configured in H2S SO2 multigas mode, see Section 6.8
NOTE
In applications where the instrument may be used to measure SO2 as well as H2S make
sure that the calibration gas being used matches the gas measurement mode in which
the instrument is set during the calibration procedure.
6.1.1. REQUIRED EQUIPMENT, SUPPLIES, AND EXPENDABLES
Calibration of the Model T101 analyzer requires a certain amount of equipment and
supplies. These include, but are not limited to, the following:
Zero-air source
Hydrogen sulfide span gas source
Gas lines - all gas line materials should be Teflon-type or glass.
A recording device such as a strip-chart recorder and/or data logger
(optional).
07266B DCN6485

Calibration Procedures Teledyne API – T101 Operation Manual
164
6.1.2. ZERO AIR
Zero air is similar in chemical composition to the Earth’s atmosphere but scrubbed of all
components that might affect the analyzer’s readings. For H2S measuring devices, zero air
should be similar in composition to the sample gas but devoid of H2S, hydrocarbons, and
Sulfur dioxide (SO2).
Devices such as the API Model 701 zero air generator that condition ambient air by
drying and removal of pollutants are available. We recommend this type of device for
generating zero air.
6.1.3. GAS STANDARDS
Span gas is specifically mixed to match the chemical composition of the gas being
measured at about 90% of the desired full measurement range. For example, if the
measurement range is 500 ppb, the span gas should have an H2S concentration of about
450 ppb.
We strongly recommend that span calibration is carried out with bottled, calibrated H2S
or SO2 span gas, although it is possible to use a permeation tube such as that included in
the IZS valve option. Span gases should be certified to a specific accuracy to ensure
accurate calibration of the analyzer. Typical gas accuracy for calibrated span gases is 1 or
2 %. H2S and SO2 standard gases should be mixed in nitrogen.
6.1.4. PERMEATION TUBES
Teledyne API offers an IZS option operating with permeation devices. The accuracy of
these devices is about ±5%. Whereas this may be sufficient for quick, daily calibration
checks, we recommend the use of certified H2S gases for accurate calibration.
NOTE
Applications requiring US-EPA equivalency do not allow permeation devices to be used as
sources of span gas for calibration of the analyzer where EPA equivalency is required,
such as SO2 monitoring.
07266B DCN6485

Teledyne API – T101 Operation Manual Calibration Procedures
165
6.1.5. CALIBRATION GAS TRACEABILITY
All equipment used to produce calibration gases should be verified against standards of
the National Institute for Standards and Technology (NIST). To ensure NIST traceability,
we recommend acquiring cylinders of working gas that are certified to be traceable to NIST
Standard Reference Materials (SRM). These are available from a variety of commercial
sources.
Table 6-1. NIST-SRM's Available for Traceability of H2S and SO2 Calibration Gases
NIST-SRM4 TYPE NOMINAL
CONCENTRATION
2730
2731
Hydrogen sulfide in N2
Hydrogen sulfide in N2
5000 ppb
20 ppm
1693a
1694a
1661a
Sulfur dioxide in N2
Sulfur dioxide in N2
Sulfur dioxide in N2
50 ppm
100 ppm
500 ppm
6.1.6. DATA RECORDING DEVICES
A strip chart recorder, data acquisition system or digital data acquisition system should be
used to record data from the T101’s serial or analog outputs. If analog readings are used,
the response of the recording system should be checked against a NIST traceable voltage
source or meter. Data recording device should be capable of bi-polar operation so that
negative readings can be recorded. For electronic data recording, the T101 provides an
internal data acquisition system (DAS ), which is described in detail in Section 4.8.
6.2. MANUAL CALIBRATION
The following section describes the basic method for manually calibrating the Model
T101 analyzer in H2S measurement mode. The same method may be used to calibrate the
T101 analyzers configured for SO2 measurement by substituting SO2 span gas for the H2S
span gas listed. See Section 6.8 for instructions on calibrating analyzers configured for
multigas measurement mode.
NOTE on Calibration and Calibration Checks
If you wish to perform a calibration CHECK, do not press ENTR - see Section 6.3.
Pressing ENTR during the following procedure re-calculates the stored values for H2S OFFS1 and H2S
SLOPE1 (instrument response curve) and alters the instrument’s calibration.
07266B DCN6485
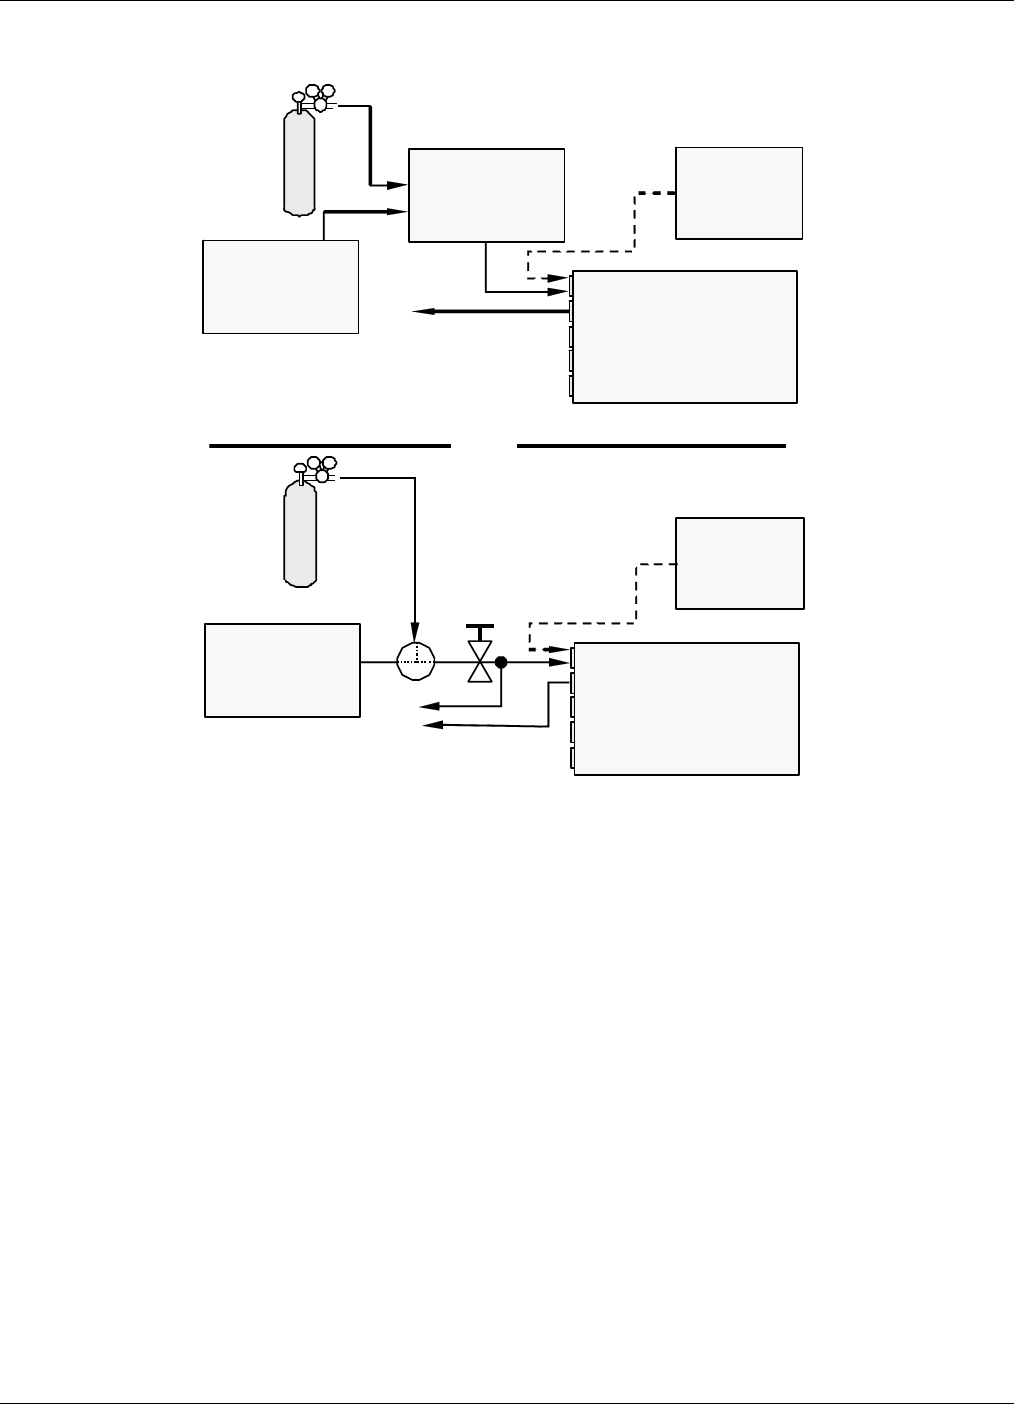
Calibration Procedures Teledyne API – T101 Operation Manual
166
STEP ONE: Connect the sources of zero air and span gas as shown below.
No Valve Options Installed
Chassis
Sample
Zero Air
Exhaust
S
p
an
MODEL 701
Zero Air
Generator
Calibrated
H2S GAS
(At high
concentration)
Source of
SAMPLE Gas
Removed
during
Calibration
Val ve
OR
Needle valve to
control flow
Chassis
Sam
p
le
Zero Air
Exhaust
Span
MODEL 701
Zero Air
Generator
VENT
Calibrated
H2S GAS
(At span gas
concentr ation)
Source of
SAMPLE Gas
Removed
during
ca librat ion
MO DEL T700 Gas
Dilution
Calibrator
Figure 6-1. Setup for Manual Calibration without Z/S Valve or IZS Option
07266B DCN6485
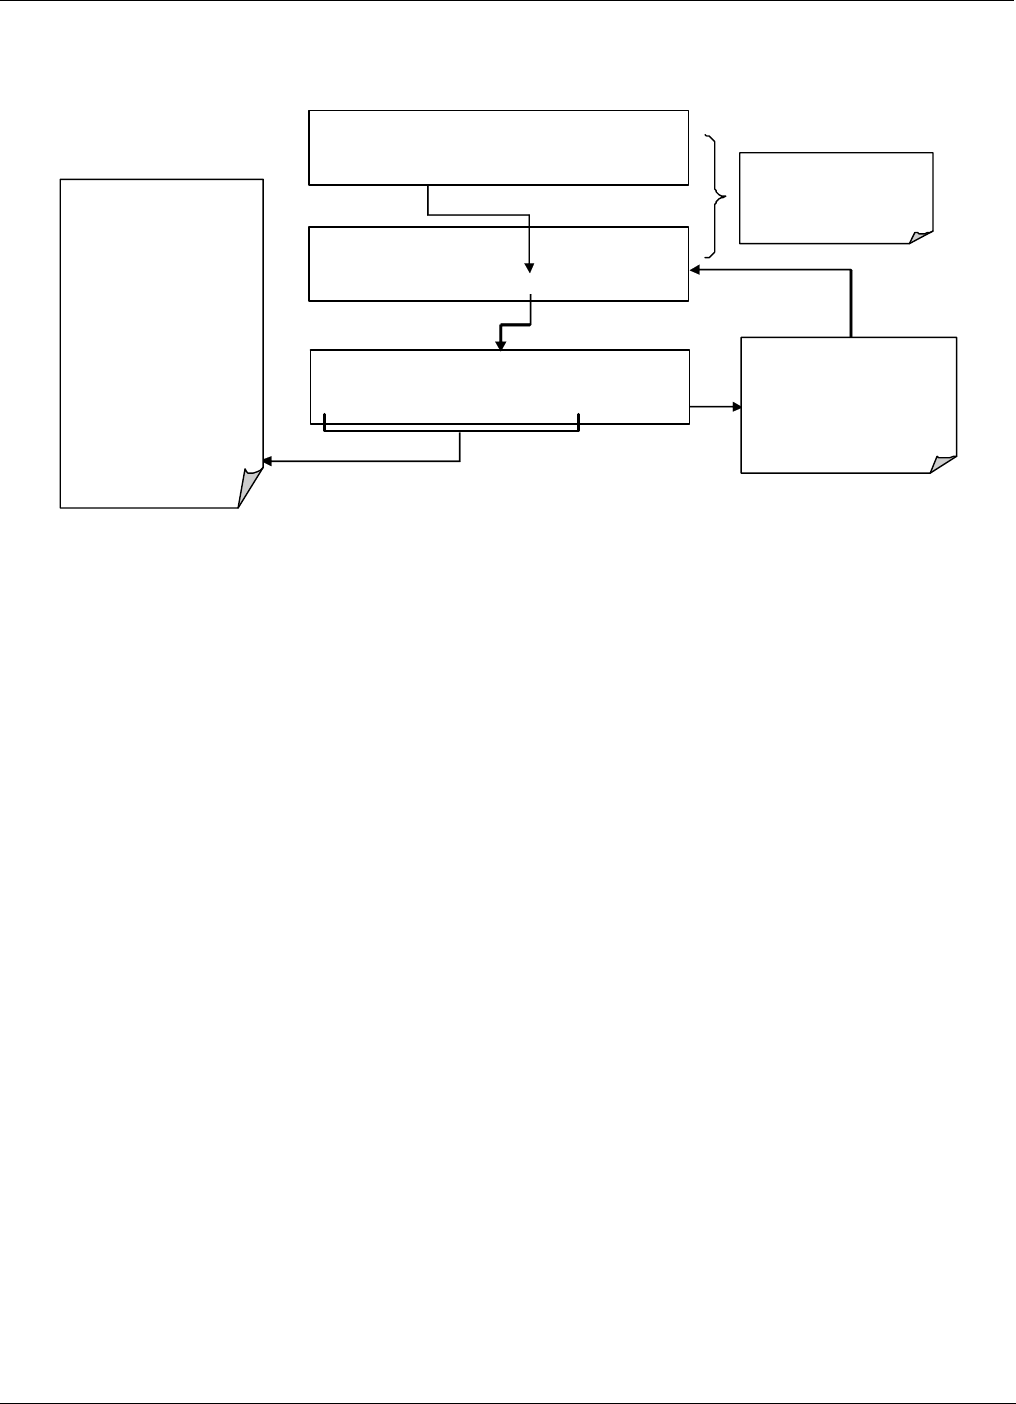
Teledyne API – T101 Operation Manual Calibration Procedures
167
STEP TWO: Set the expected H2S span gas concentrations. In this example the
instrument is set for single (SNGL) range mode with a reporting range span of 500 ppb.
This sequence causes the
analyzer to prompt for the
expected H2S span
concentra tion .
M-P CAL H2S SPAN CONC: 450.0 Con
c
0 0 0 4 5 0 .0 ENTR EXIT
SAMPLE RANGE = 500.0 PPB H2S =XXX.X
< TST TST > ZERO CONC EX IT
SAMPLE RANGE = 500.0 PPB H2S =XXX.X
< TST TST > CAL SE TUP
The H2S span concentration
values a utoma ti cally defaul t
to 450.0 ppb.
To change this value to the
actual concentration of the
sp an gas, enter the number
by pressing the key under
each digit until the expected
value appear s.
The span gas con centration
should always be 90% of the
se lected rep orting ra ng e
EXAMPLE
Rep orting ra nge = 800 ppb
Span gas conc.= 720 ppb
EXIT ign ores the ne w se ttin g
and r etur ns to the previo us
display.
ENTR accepts the new setting
and returns to the
pre vious display..
07266B DCN6485
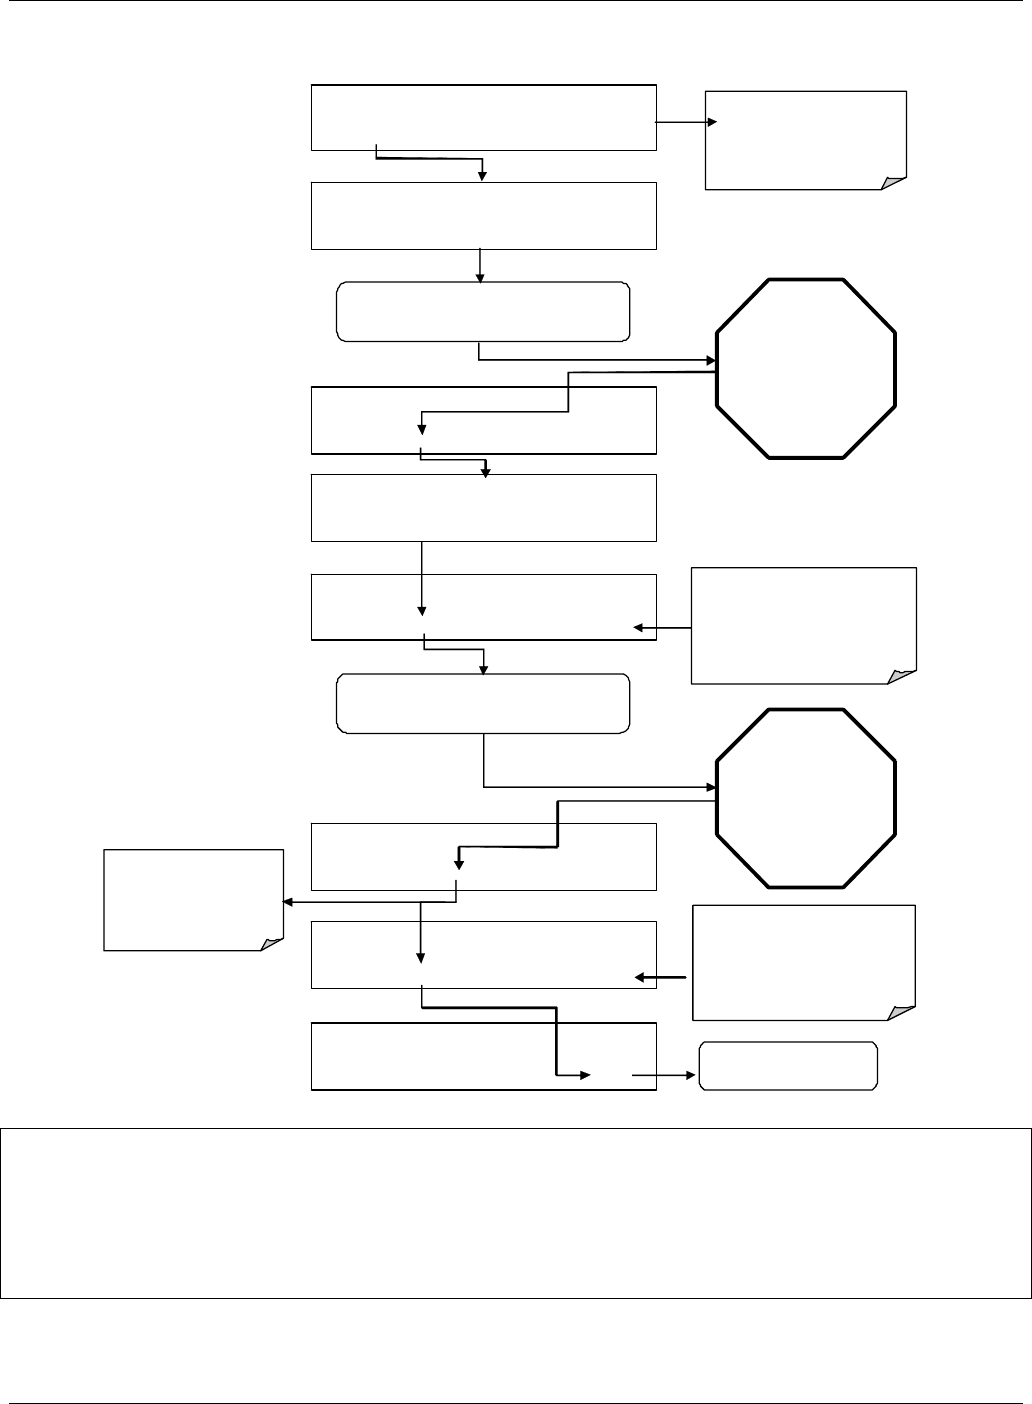
Calibration Procedures Teledyne API – T101 Operation Manual
168
STEP THREE: Perform the zero/span calibration:
M-P CAL H2S STB=X.XXX PPB H2S =XXX.
X
< TST TST > ENTR CONC EXIT
M-P CAL H2S STB=X.XXX PPB H2S =XXX.X
< TST TST > CAL SETUP
M-P CAL H2S STB=X.XXX PPB H2S =X XX . X
< TST TST > ZERO CONC EXIT
EXIT returns to the main
SAMPLE display
A
CTION:
Allow zero gas to enter the sample port at the
r ear of the instrumen t.
M-P CAL H2S STB=X.XXX PPB H2S =X XX. X
< TST TST > SPAN CONC EXIT
M-P CAL RANGE = 500.0 PPB H2S =X XX . X
< TST TST > ENTR SPAN CONC EXIT
M-P CAL RANGE = 500.0 PPB H2S =XXX.X
< TST TST > ENTR CONC EXIT
Wait until H2S STB
falls below 0.5 ppb.
This may take several
minutes.
The SPAN butto n no w
appears during the
transition from zero to span.
You may see both buttons.
SAMPLE RANGE = 500.0 PPB H2S =XXX.X
< TST TST > CAL SETUP
SAMPLE RANGE = 500.0 PPB H2S =XXX.X
< TST TST > CAL SETUP
Set the Display to show the H
2
S
STB test function.
This funct ion calcu lates the
stability of the H2S
measurement
Press ENTR to ch ang es the
OFFSET & SLOPE values for the
H2S measur eme nts.
Pr ess EXIT to leave the calibration
unchanged and return to the
previ ous menu.
A
CTION:
Allow span gas to enter the sample port at the
r ear of the instrumen t.
The value of
H2S STB may jump
significantly.
Wait until it falls back
below 0.5 pp b.
This may take several
minutes.
Press ENTR to change the
OFFSET & SLOPE va lue s fo r th e
H2S measu rements.
Press EXIT to leave the calibration
unchanged and re turn to the
previous menu.
NOTE
If the ZERO or SPAN buttons are not displayed during zero or span calibration, the
measured concentration value is too different from the expected value and the analyzer
does not allow zeroing or spanning the instrument.
Consult Section 9.3 for more information on calibration problems.
07266B DCN6485
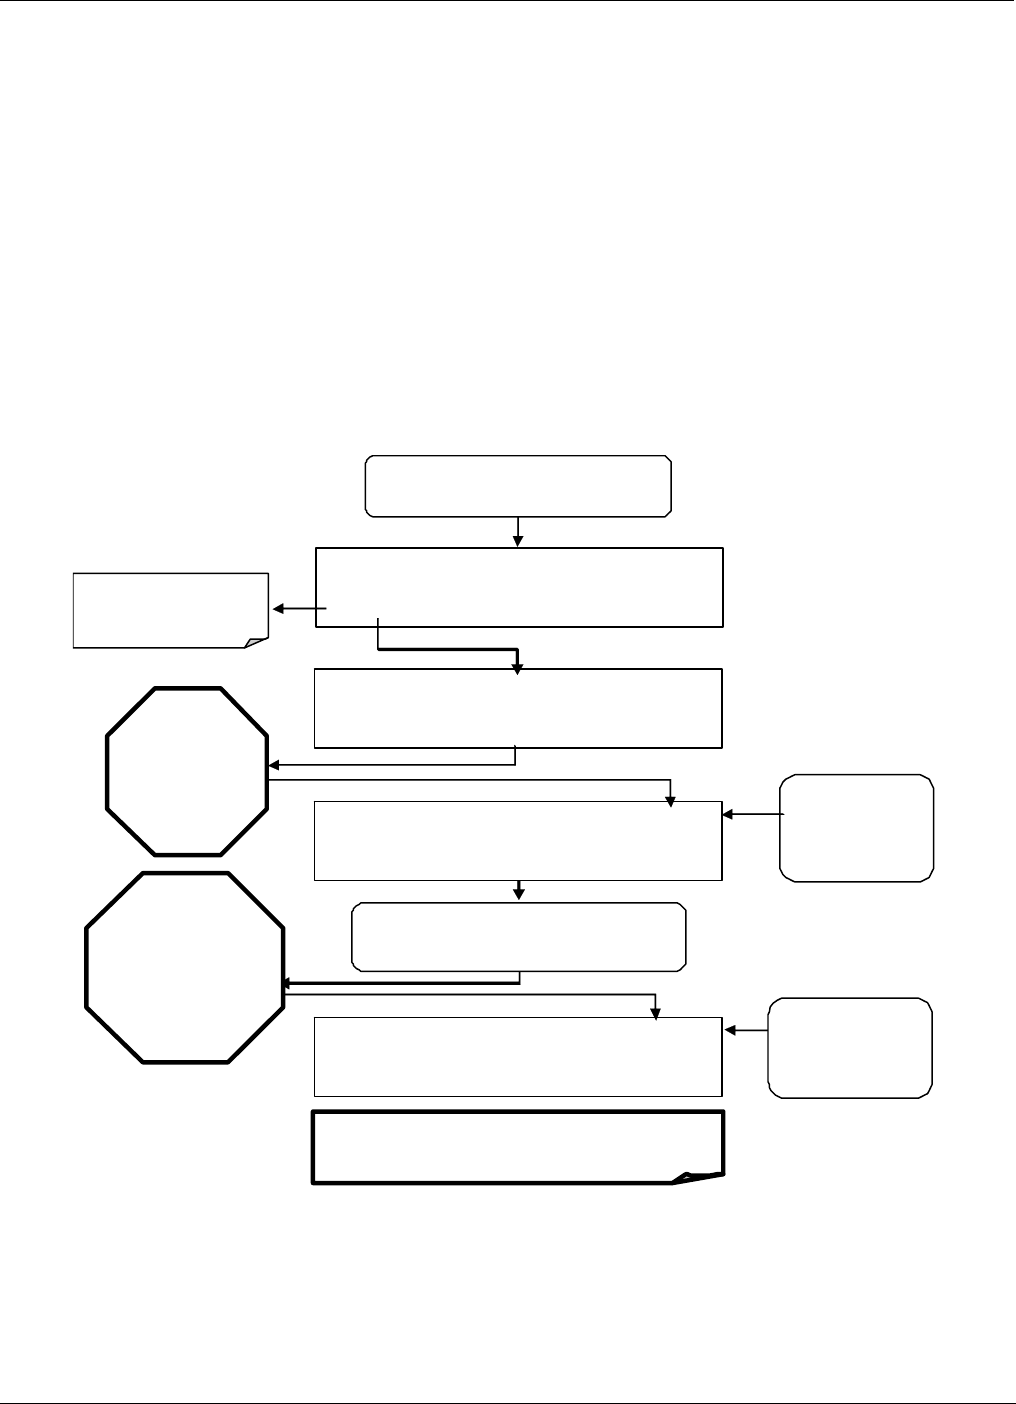
Teledyne API – T101 Operation Manual Calibration Procedures
169
6.3. MANUAL CALIBRATION CHECKS
Informal calibration checks, which only evaluate but do not alter the analyzer’s response
curve, are recommended as a regular maintenance item and in order to monitor the
analyzer’s performance.
The following section describes the basic method for manually checking the calibration of
the Model T101 analyzer in H2S measurement mode. The same method may be used to
manually check the calibrate the T101 analyzers configured for SO2 measurement by
substituting SO2 span gas for the H2S span gas listed. See Section 6.8 for instructions for
performing calibration checks on analyzers configured for multigas measurement mode.
To carry out a calibration check rather than a full calibration, follow these steps.
STEP ONE: Connect the sources of zero air and span gas as shown in Figure 6.1.
STEP TWO: Perform the zero/span calibration check procedure:
SAMPLE H2 S STB=XX X.X PPB H2S =XXX.X
< TST TST > CAL SE TUP
AC TIO N:
Record theH2S
concentration
reading.
A
CTION:
Supply span ga s to th e instrument
SAMPLE H2S STB=XXX.X PPB H2S =XXX.X
< TST TST > CAL SE TUP
ACTION:
Record the H2S
co nce ntration
reading.
Wait until H2S
STB is below
0.5 ppb. This
may take
several minutes.
The va lue of H2S
STB may jump
significantl y.
Wait until it falls
below 0.5 ppb. This
may take several
minutes.
SAMPLE H2S STB=XXX.X PPB H2S =X XX . X
< TST TST > CAL SE TUP
The SPAN button appea rs during the tr ansiti on from zero
to span. You may see both buttons.
SAMPLE RANGE = 500.0 PPB H2S =XXX . X
< TST TST > CAL SETUP
Scroll the display to the
H2S STB test function.
A
CTION:
Supply th e in strument with zero gas.
07266B DCN6485
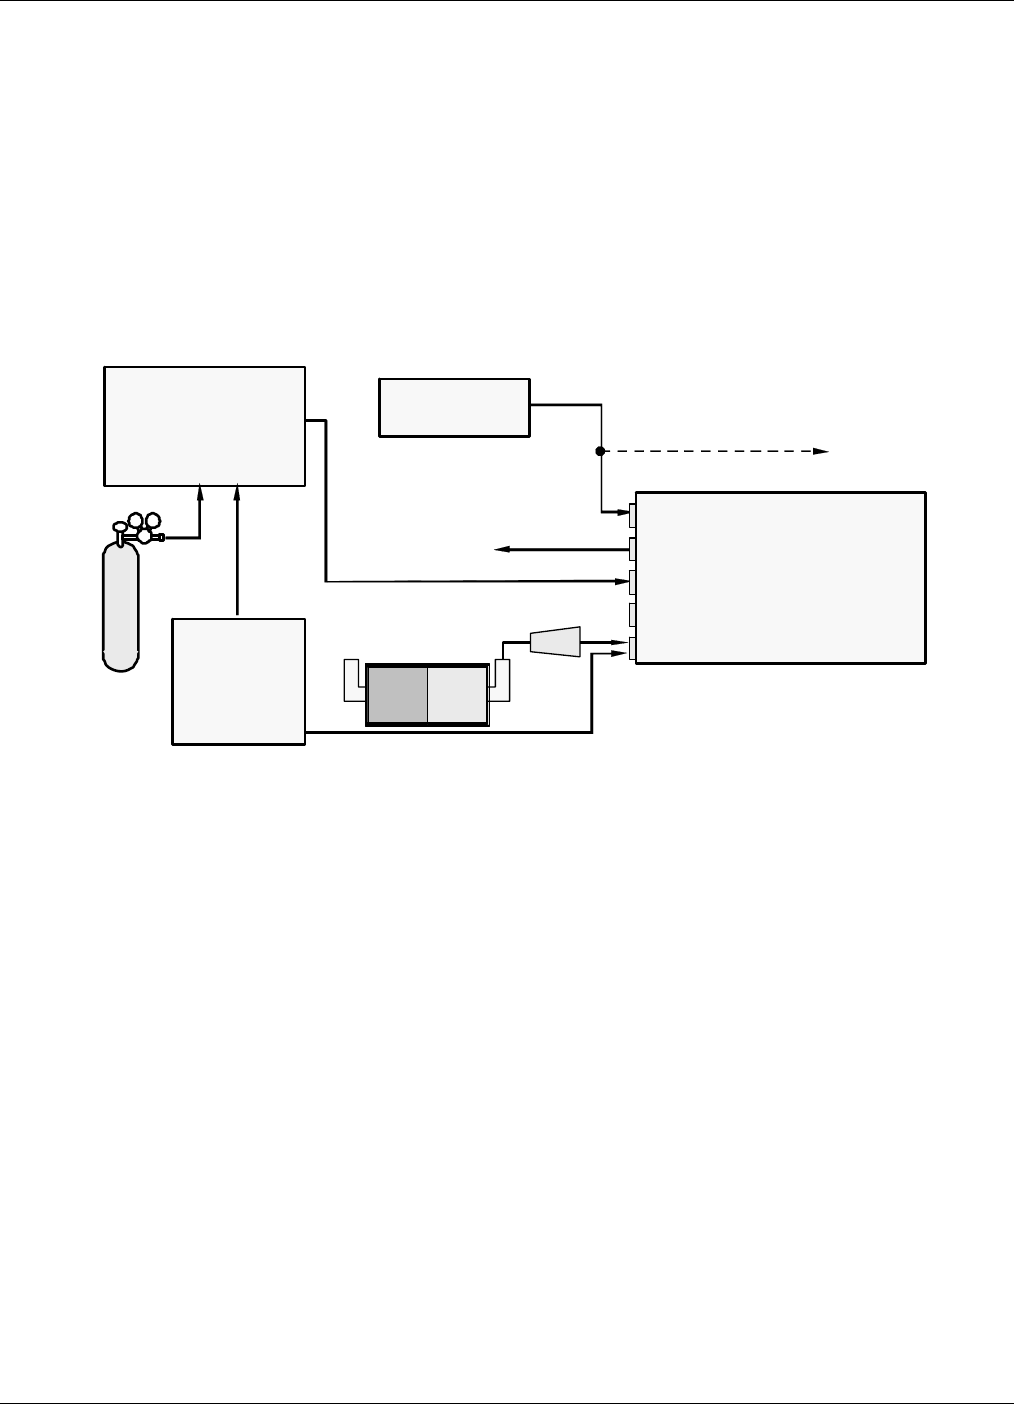
Calibration Procedures Teledyne API – T101 Operation Manual
170
6.4. MANUAL CALIBRATION WITH ZERO/SPAN VALVES
Zero and Span calibrations using the Zero/Span Valve option are similar to that described
in Section 6.2 except that:
Zero air and span gas is supplied to the analyzer through the zero gas and span gas inlets
rather than through the sample inlet.
The zero and cal operations are initiated directly and independently with dedicated
buttons (CALZ & CALS)
STEP ONE: As shown below connect the sources of zero air and span gas to the
respective ports on the rear panel (Figure 3-2).
External Zero
Air Scrubber
Filter
MODEL 701
Zero Air
Generator
Source of
SAMPLE Gas VENT if input is pressurized
MODEL T700
Gas Dilution Calibrator
Chassis
Sam
p
le
Zero Air
Exhaust
Span
Calibrated
H2S gas
(At high
co nce ntr at ion )
Figure 6-2. Setup for Manual Calibration with Z/S Valve Option Installed
07266B DCN6485
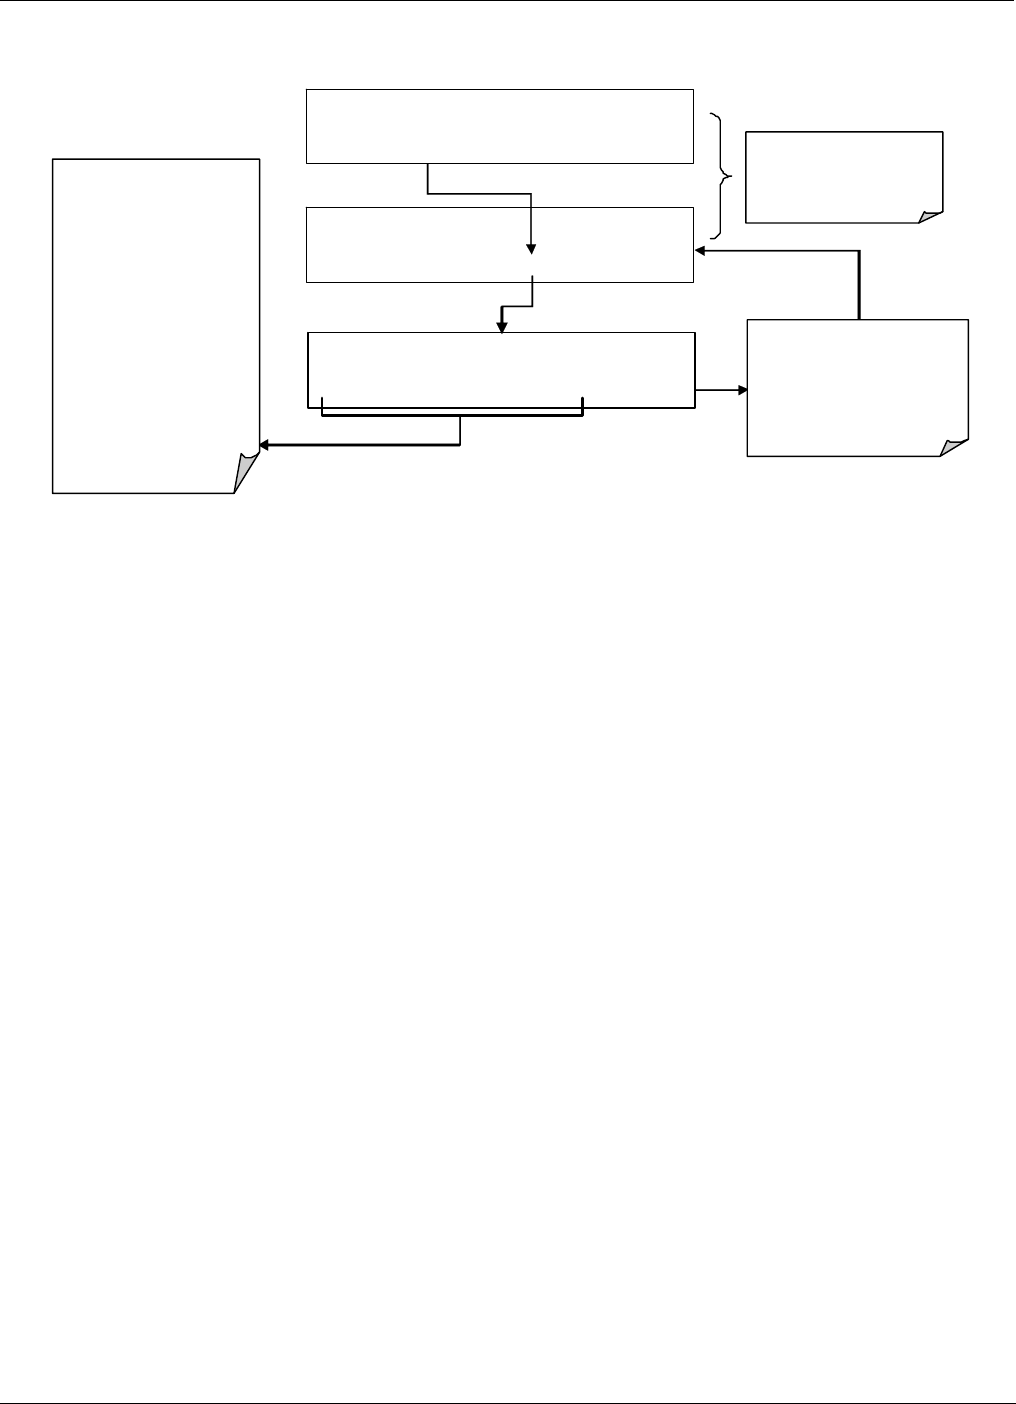
Teledyne API – T101 Operation Manual Calibration Procedures
171
Step Two: Set the expected H2S span gas value:
This sequence ca uses the
analyzer to pro mpt for the
exp ected H 2S sp an
con centration .
M-P CAL H2S SPAN CONC:
4
50.0 Conc
0 0 0 4 5 0 .0 ENTR EXIT
M-P CAL RA NGE = 500.000 PPB H2S =XXX.X
< TST TST > ZERO CONC EXIT
SAMPLE RANGE = 500.0 PPB H2S =XXX.X
< TST TST > CAL SETUP
The H2S sp an concentratio n
valu es automati cally defaul t
to 450.0 ppb.
To cha nge this value to th e
actual concentrati on o f the
sp an gas, enter the number
by pressing the key under
each digit until the expected
val ue a ppe ar s.
The span gas concentr ation
should always be 90% of the
se lected rep ortin g ra ng e
EXAMPLE
Reporting range = 800 ppb
Span gas conc.= 720 ppb
EXIT ign ores th e new settin g
and returns to the pr evio us
display.
ENTR accepts the new setting
and returns to the
pre vious display..
07266B DCN6485
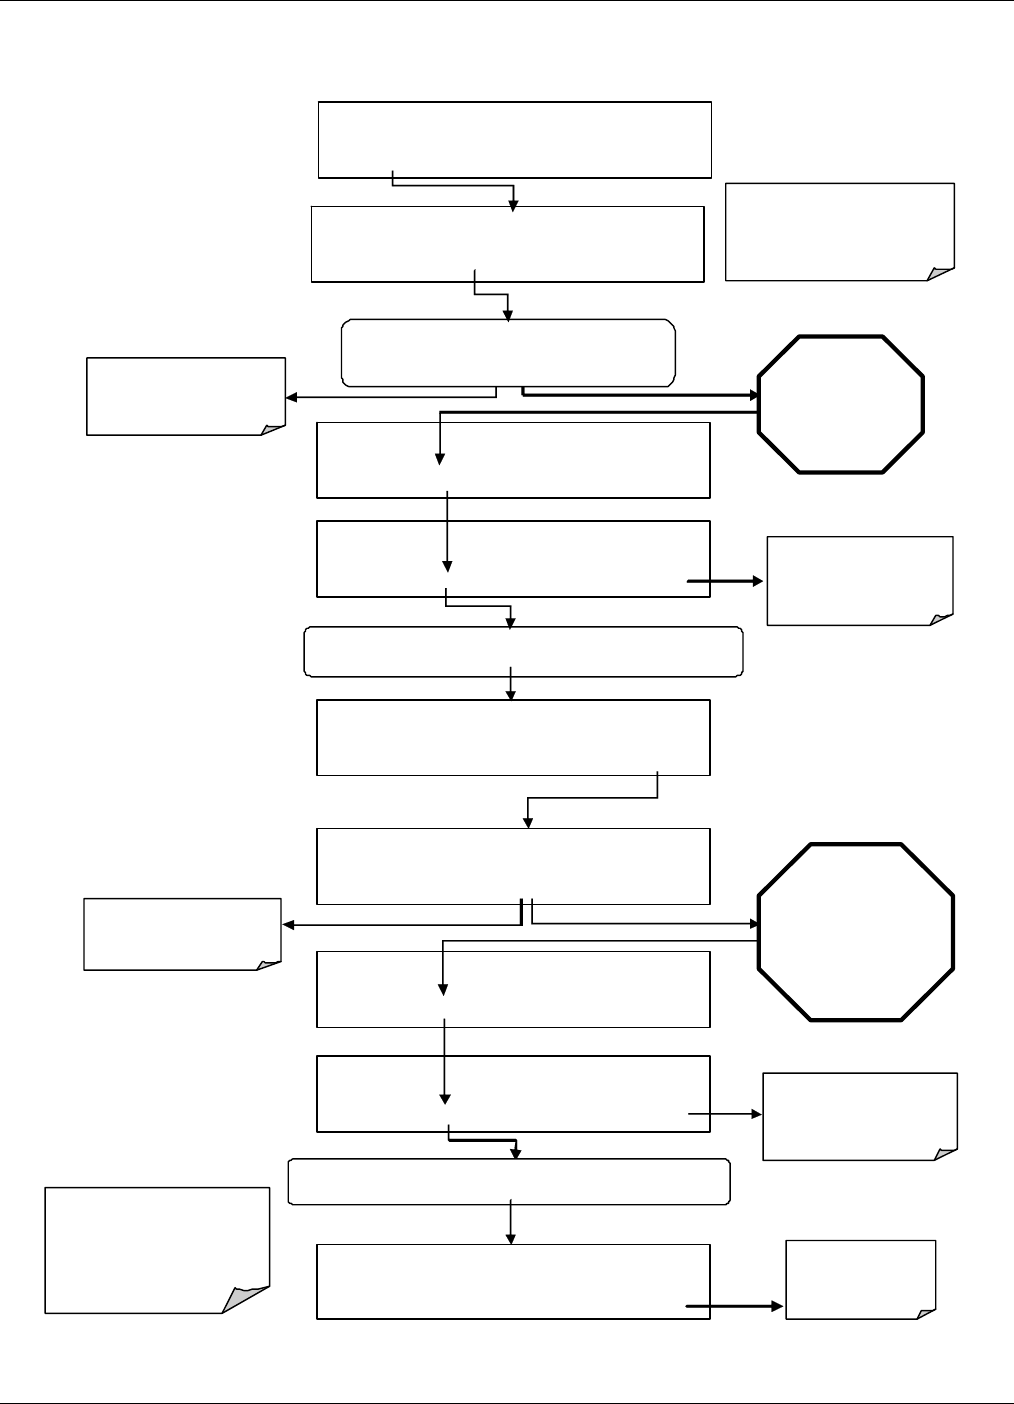
Calibration Procedures Teledyne API – T101 Operation Manual
172
Step Three: Perform the calibration or calibration check according to the following flow
chart:
Wait until H2S
STB falls below
0.5 ppb. This may
take several
minutes.
ZERO CAL M H2S STB=XXX.X PPB H2S =XXX.X
< TST TST > ZERO CONC EXIT
EXI
T
returns to the
main SAMPLE
display
ZERO CAL M H2S STB=XXX.X PPB H2S =XXX.X
< TST TST > ENTR CONC EXIT
Pressing ENTR changes the calibration of the instrument.
If either the ZERO or
SPAN button fails to
appear, see Chapter 11
for troubleshooting tips.
Anal yzer en ters ZERO
CAL mode.
EXIT returns the unit to
SAMPLE mode without
changing the calibration
values.
ZERO CAL M H2S STB=XXX.X PPB H2S =X.XXX
< TST TST > ZERO CONC EXIT
ZERO CAL M H2S STB=XXX.X PPB H2S =X XX. X
< TST TST > CAL CALZ CALS SETUP
SPAN CAL M H2 S STB=XX X. X P PB H2S =XXX.X
< TS T TS T > SPAN CONC EXIT
SPAN CAL M H2 S STB=XXX.X PPB H2S =X XX .X
< TST TST > ENTR CONC EXIT
EXIT returns to the
SAMPLE mode without
changing the calibration
val ues.
SPAN CAL M H2 S STB=XXX.X PPB H2S =X XX .X
< TST TST > SPAN CONC EXIT
A
CTION:
Allo w zero gas to enter the sam ple port at the
rear of the instrument.
SAMPLE RANGE = 500.0 PPB H2S =XXX.X
< TST TST > CAL CALZ CALS SETUP
SAMPLE H2S STB=XXX.X PPB H2S =XXX.X
< TST TST > CAL CALZ CALS SETUP
Scroll the display to the H2S
STB test function. This function
calculates the stability of the
H2S measurements.
The value of H2S
STB may jump
significantly. Wait
until it falls below 0.5
ppb. This may take
several minutes.
Pressing ENTR changes the calibration of the instrument.
Analyzer enters SPAN
CAL Mode.
07266B DCN6485

Teledyne API – T101 Operation Manual Calibration Procedures
173
6.5. MANUAL CALIBRATION WITH IZS OPTION
The following section describes the basic method for manually calibrating the Model
T101 analyzer in H2S measurement mode using the IZS option. The same method may
be used to calibrate the T101 analyzers configured for SO2 measurement but requires that
an SO2 permeation tube be installed in the instrument instead of the standard H2S tube.
(SO2 permeation tubes differ from H2S tubes and can be purchased directly from a
manufacturer).
See Section 6.8 for instructions on calibrating analyzers configured for multigas
measurement mode.
Under the best conditions, the accuracy off the H2S effusion rate of the IZS option’s
permeation tube is about ±5%. This can be subject to significant amounts of drift as the
tube ages and the amount of H2S contained in the tube is depleted. Whereas this may be
sufficient for calibrating instrument configured for H2S measurement and for informal
calibration checks of instruments measuring SO2, it is not adequate for formal SO2
calibrations and is not approved for use by the US EPA as a calibration source for
calibrating SO2 monitoring equipment.
For applications where more stringent calibration requirements are specified for an
instrument with an IZS option installed the following provisions must be followed.
1. Zero air and span gas must be supplied to the analyzer through the
sample gas inlet as depicted in Figure 6-1.
2. The calibration procedure must be initiated using the CAL button (not the
CALZ and CALS buttons) using the procedure defined in Section 6.2.
3. Using the CAL button does not activate the zero/span or sample/cal
valves of the IZS option, thus allowing the introduction of zero air and
sample gas through the sample port from more accurate, external sources
such as a calibrated bottle of H2S and SO2 or a Model T700 Dilution
Calibrator.
SAMPLE RANGE = 500.0 PPB H2S =XXX.X
< TST TST > CAL CALZ CALS SETUP
Use for formal
calibration
operations.
Use only for
informal calibration
checks.
07266B DCN6485

Calibration Procedures Teledyne API – T101 Operation Manual
174
6.6. MANUAL CALIBRATION CHECKS WITH IZS OR
ZERO/SPAN VALVES
Zero and span checks using the zero/span valve or IZS option are similar to that described
in Section 6.3, except:
On units with an IZS option installed, zero air and span gas are supplied to the analyzer
through the zero gas inlet and from ambient air.
On units with a zero/span valve option installed, zero air and span gas are supplied to the
analyzer through the zero gas and span gas inlets from two different sources.
The zero and calibration operations are initiated directly and independently with
dedicated buttons CALZ and CALS.
To perform a manual calibration check of an analyzer with a zero/span valve or IZS
Option installed, use the following method:
NOTE
The instrument can only be fitted with one type of permeation tube at a time. Therefore the IZS option can
only be used to calibrate or check the instrument for one gas, H2S or SO2, but not both. (SO2 permeation
tubes differ from H2S tubes and can be purchased directly from a manufacturer).
07266B DCN6485
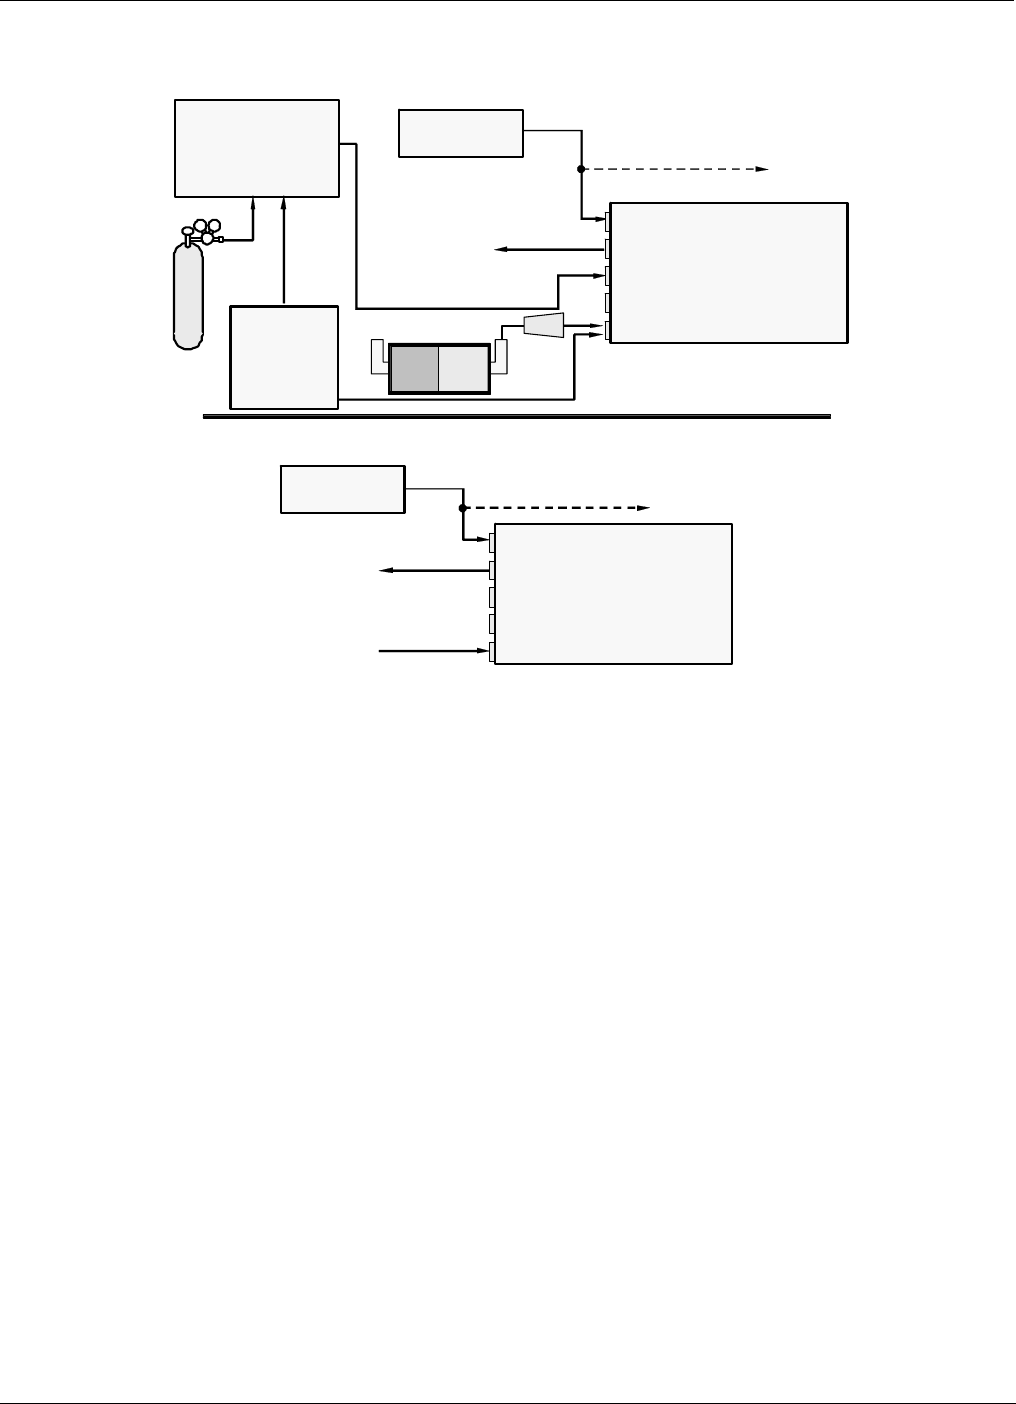
Teledyne API – T101 Operation Manual Calibration Procedures
175
STEP ONE: Connect the sources of Zero Air and Span Gas as shown below.
External Zero
Air Scrubber
Filter
MODEL 701
Zero Air
Generator
Source of
SAMPLE Gas VENT if input is pressurized
Zero
/
S
p
an Valves – O
p
tion 50
MODEL T700
Gas Dilution Calibrator
Chassis
Sam
p
le
Zero Air
Exhaust
Span
Source of
SAMPLE Gas VENT if input is pressurized
Internal Zero/Span Option (IZS) – Option 51
Chassis
Sam
p
l
e
Zero Air
Exhaust
Span
Calibrated
H2S gas
(At high
con cen tr ati on)
Ambient
Air
Figure 6-3. Setup for Manual Calibration Check with Z/S Valve or IZS Option
07266B DCN6485
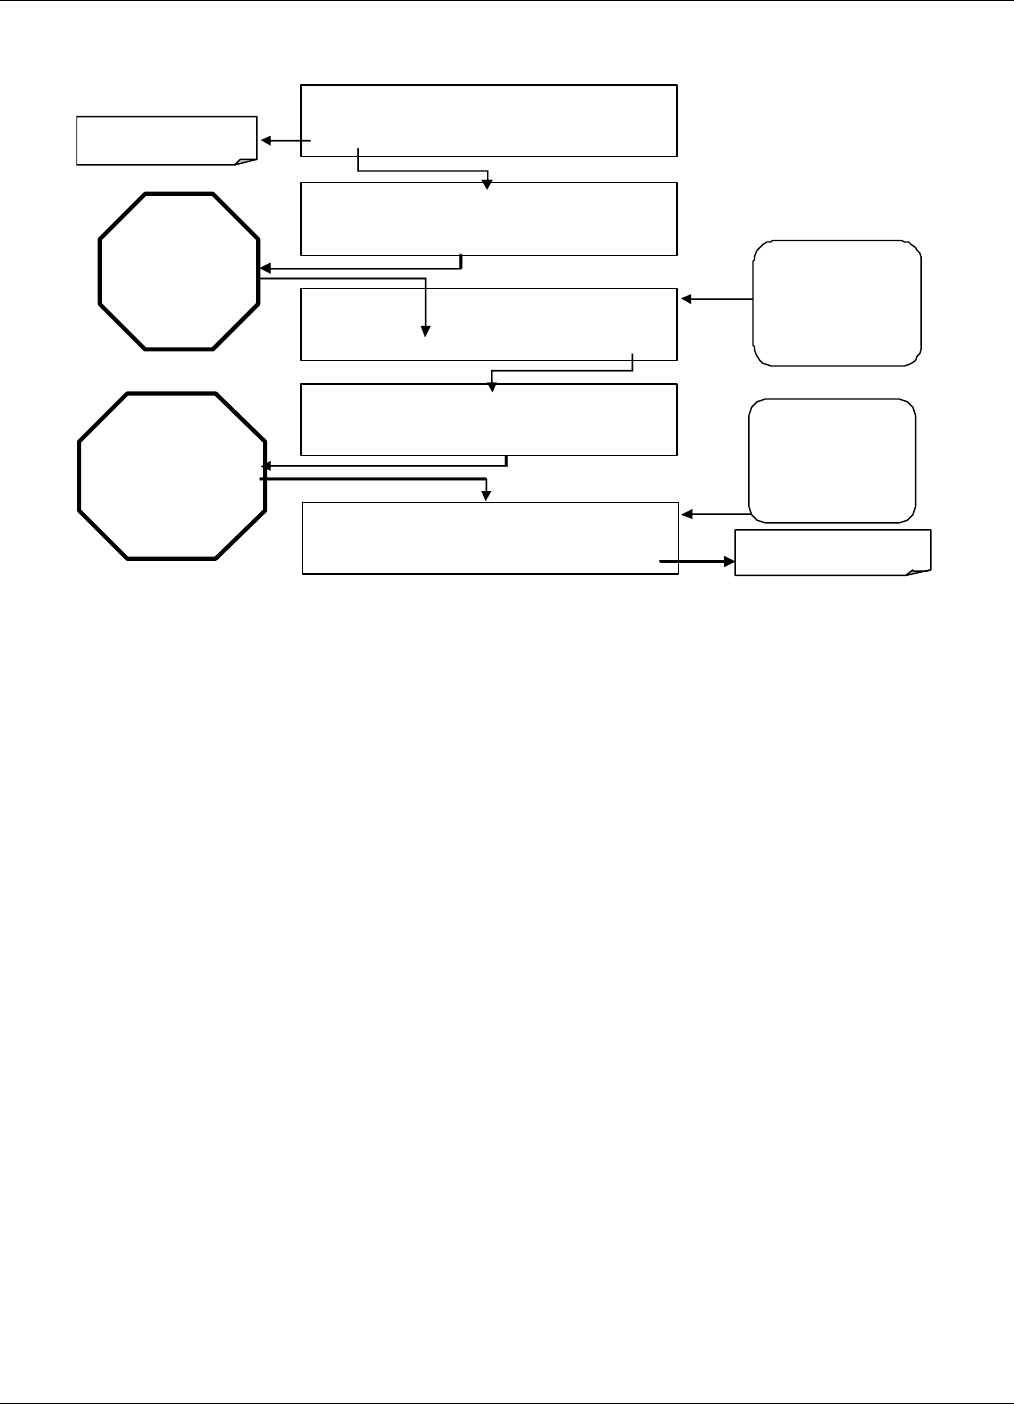
Calibration Procedures Teledyne API – T101 Operation Manual
176
STEP TWO: Perform the zero/span check.
Wait until H2S
STB falls below
0.5 pp b. This may
take several
minutes.
The value of H2S
STB may jump
si gnificantly. Wait
until H2S STB falls
below 0.5 ppb. This
may take several
minutes. SPAN CAL M H2S STB=XXX.X PPB H2S =XXX.X
< TST TST > ZER O SPAN CONC EXIT
SAMPLE H2S STB=XXX.X PPB H2S =XXX.X
< TST TST > CAL CALZ CALS SETUP
ZERO CAL M H2S STB=XXX.X PPB H2S =XXX.X
< TST TST > ZERO CONC EXIT
SAMPLE H 2S S TB=XX X.X PPB H2S =XXX.X
< TST TST > CAL CALZ CALS SETUP
EXIT r eturn s to t h e mai n
SAMPLE dis
p
la
y
ACTION:
Record the
H2S readings
presented in the
upper right corner of
the display.
ACTION:
Record the
H2S r ead ings
presented in the
upper right corner of
the displa y.
SAMP LE RANGE = 500 .0 PPB H2S =XXX.X
< TST TST > CAL CALZ CALS SETUP
Scroll to the H2S
STB test fun cti on .
07266B DCN6485
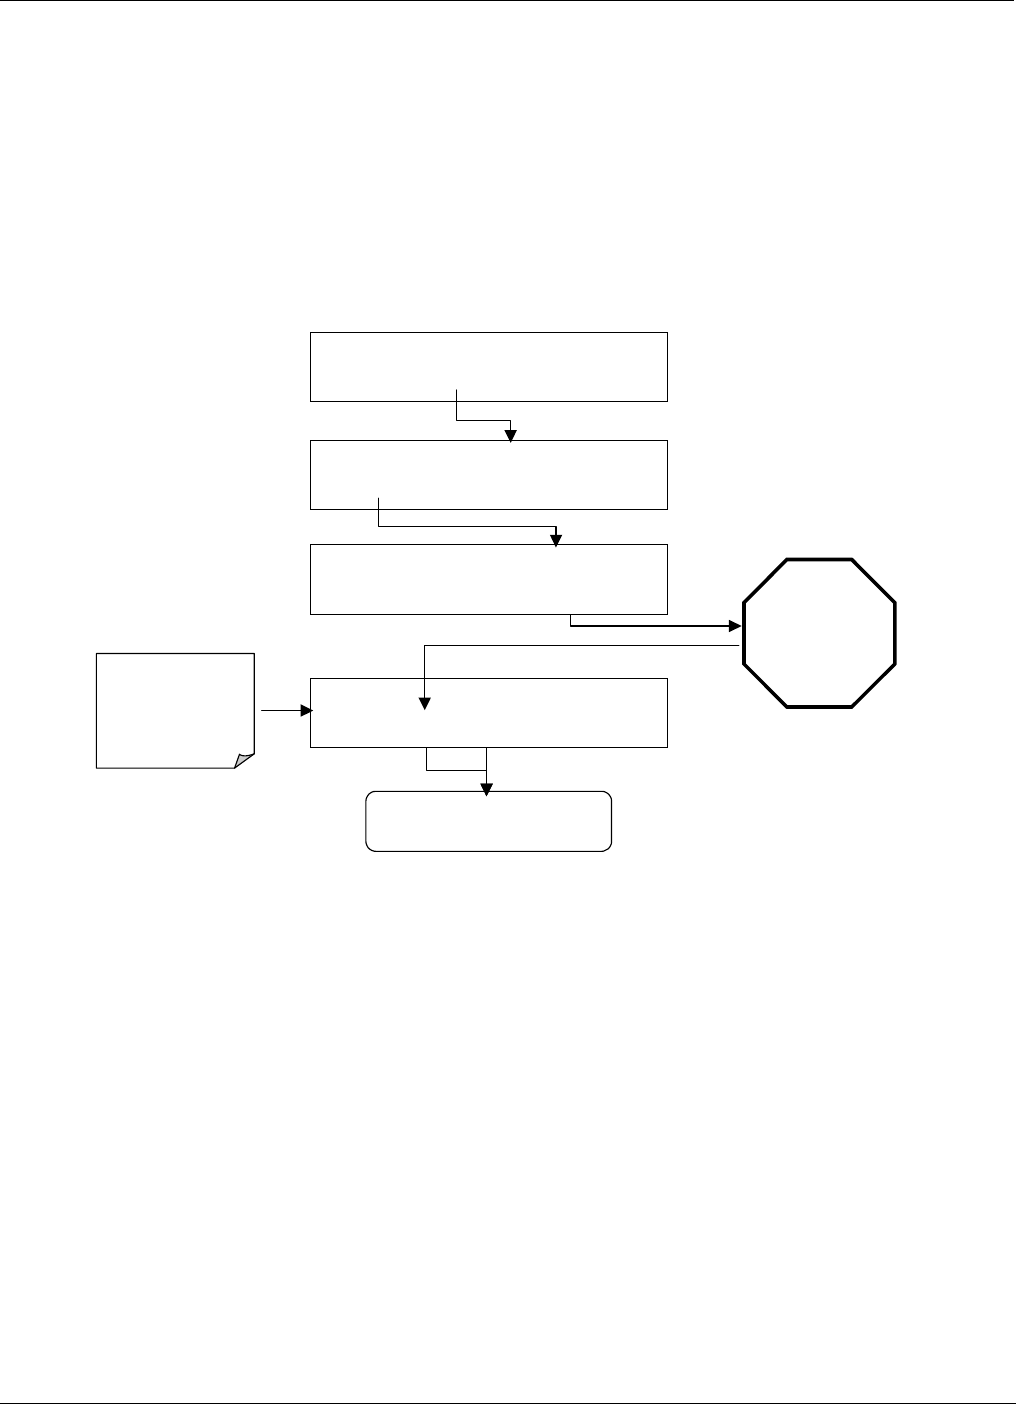
Teledyne API – T101 Operation Manual Calibration Procedures
177
6.7. MANUAL CALIBRATION IN INDEPENDENT OR AUTO
REPORTING RANGE MODES
If the analyzer is being operated in Ind or Auto Range mode, then the High and Low
ranges must be independently checked.
When the analyzer is in either Independent or Auto Range modes the user must run a
separate calibration procedure for each range. After pressing the Cal, CALZ or Cals
buttons the user is prompted for the range that is to be calibrated as seen in the CALZ
example below:
Continue Calibration as per
Standard Procedure
SAMPLE H2S STB = XXX.X PPB H2S =XXX.X
< TST TST > CAL CALZ CALS SETUP
ZERO CAL M H2S STB XXX.XX PPB H2S =XXX.X
< TST TST > ZERO CONC EXIT
Analyzer enters
ZERO CAL Mode
See Table 5-1 for Z/S
Valve States during
this operating mode
SAMPLE RANGE TO CAL: LOW
LOW HIGH ENTR SETUP
SAMPLE RANGE TO CAL: HIGH
LOW HIGH ENTR SETUP Wait until H2S
STB falls below
0.5 ppb. This may
take several
minutes.
Once this selection is made, the calibration procedure continues as previously described
in Sections 6.2 through 6.6. The other range may be calibrated by starting over from the
main SAMPLE display.
6.7.1. CALIBRATION WITH REMOTE CONTACT CLOSURES
Contact closures for controlling calibration and calibration checks are located on the rear
panel CONTROL IN connector. Instructions for setup and use of these contacts can be
found in Section 5.1.2.
When the appropriate contacts are closed for at least 5 seconds, the instrument switches
into zero, low span or high span mode and the internal zero/span valves will be
automatically switched to the appropriate configuration. The remote calibration contact
closures may be activated in any order. It is recommended that contact closures remain
closed for at least 10 minutes to establish a reliable reading; the instrument will stay in the
selected mode for as long as the contacts remain closed.
07266B DCN6485
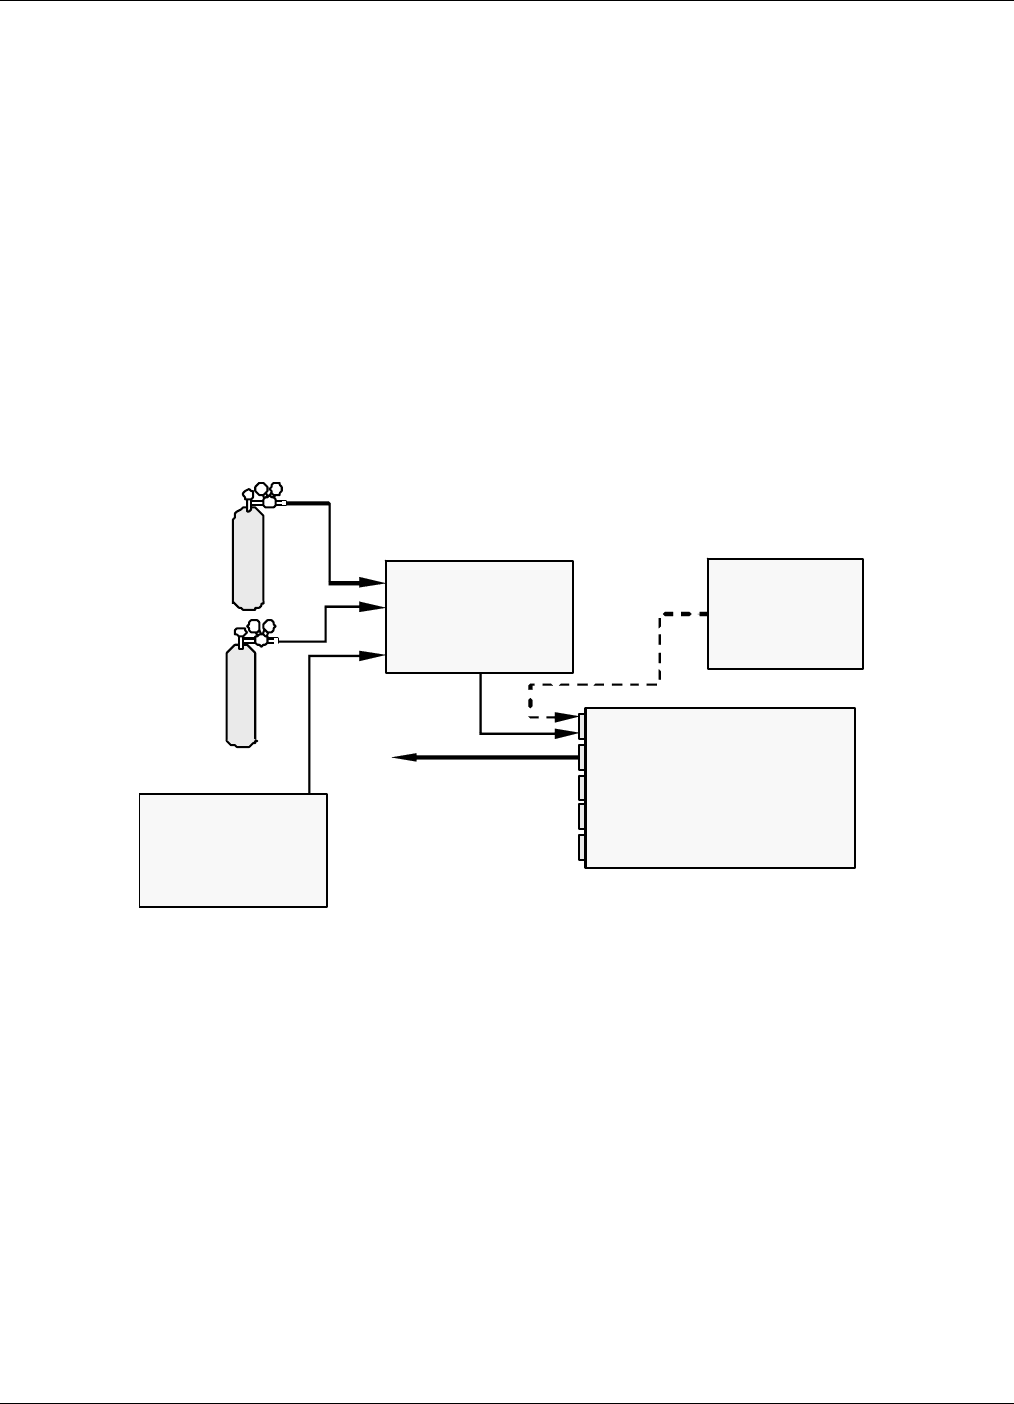
Calibration Procedures Teledyne API – T101 Operation Manual
178
If contact closures are used in conjunction with the analyzer’s AutoCal (Section 6.9)
feature and the AutoCal attribute CALIBRATE is enabled, the T101 will not re-calibrate
the analyzer until the contact is opened. At this point, the new calibration values will be
recorded before the instrument returns to SAMPLE mode.
If the AutoCal attribute CALIBRATE is disabled, the instrument will return to SAMPLE
mode, leaving the instrument’s internal calibration variables unchanged.
6.8. MANUAL CALIBRATION IN MULTIGAS
MEASUREMENT MODE
If the analyzer is being operated in multigas measurement mode, the methods and setups
for performing calibrations are identical to those defined in Sections 6.2 and 6.4 with the
two exceptions
Some provision must be made for supplying both types of calibrated span gas to the
analyzer. A typical setup for this might be:
No Valve Options Installed
Chassis
Sample
Zer o Air
Exhaust
Span
MODEL 701
Zero Air
Generator
Calibrated
H2S GAS
(A t hi gh
concentration) Source of
SAMPLE Gas
Removed
during
Calibration
MODEL T700 Gas
Dilution
Calibrator
(with Ozone Bench
Op t io n )
Calibrated
SO2
GAS
(At high
conc entration)
Figure 6-4. Typical Setup for Manual Calibratio in Multigas Measurement Mode
07266B DCN6485
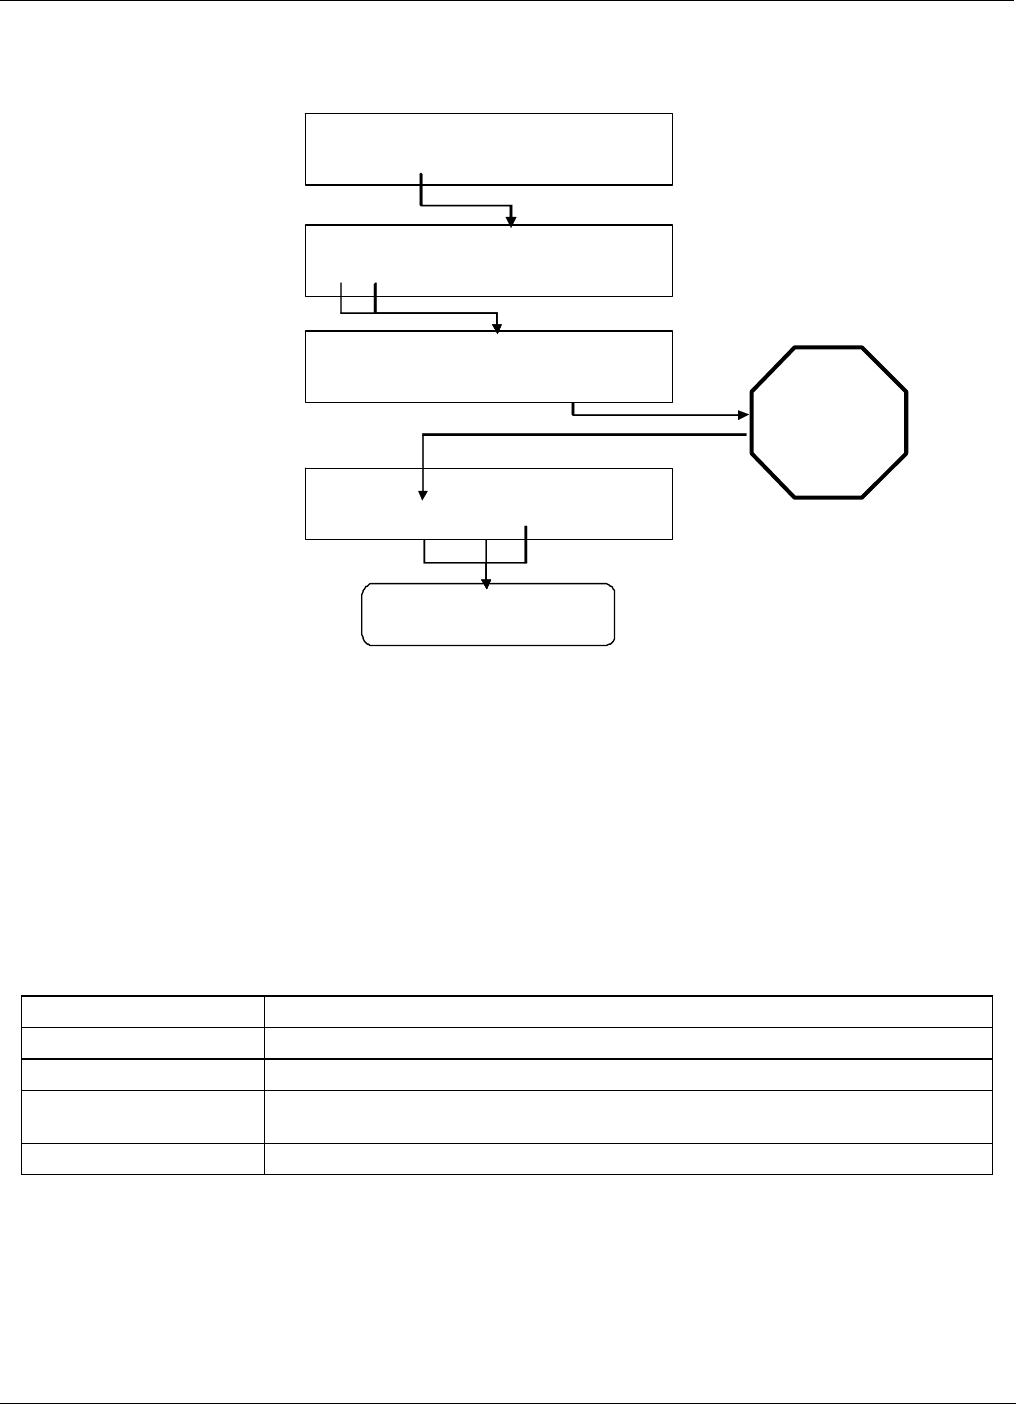
Teledyne API – T101 Operation Manual Calibration Procedures
179
The analyzer will ask to have the GAS TYPE specified at the beginning of the process as
follows:
Continue Calibration as per
Standard Procedure
SAMPLE H2S STB =XXX.X PPB H2S =X XX. X
< TST TST > CAL CALZ CALS SETUP
ZERO CAL M H2S STB =XXX.X PPB H2S =XXX.X
< TST TST > ZERO SPAN CONC EXIT
SAMPLE GAS TO CAL: H2
S
SO2 H2S ENTR SETUP
SAMPLE GAS TO CAL: SO2
LOW HIGH ENTR SETUP Wait until H2S
STB falls below
0.5 ppb. This may
take several
minutes.
Once this selection is made, the calibration procedure continues as previously described.
The other gas may be calibrated by starting over from the main SAMPLE display.
6.9. AUTOMATIC CALIBRATION/CHECKS (AUTOCAL)
The AutoCal system allows unattended, periodic operation of the zero/span valve options
by using the analyzer’s internal time of day clock. AutoCal operates by executing user-
defined sequences to initiate the various calibration modes of the analyzer and to open
and close valves appropriately. It is possible to program and run up to three separate
sequences (SEQ1, SEQ2 and SEQ3). Each sequence can operate in one of three modes
or be disabled.
Table 6-2. AutoCal Modes
MODE ACTION
DISABLED Disables the sequence
ZERO Causes the sequence to perform a zero calibration or check
ZERO-SPAN Causes the sequence to perform a zero and span concentration calibration or
check
SPAN Causes the sequence to perform a span concentration calibration or check
Each mode has seven parameters that control operational details of the sequence
(Table 6-3).
07266B DCN6485

Calibration Procedures Teledyne API – T101 Operation Manual
180
Table 6-3. AutoCal Attribute Setup Parameters
Attribute Name ACTION
Timer Enabled Turns on the Sequence timer
Starting Date Sequence will operate on Starting Date
Starting Time Sequence will operate at Starting Time
Delta Days Number of days to skip between each sequence
Delta Time Incremental delay on each Delta Day that the sequence starts.
Duration Duration of the sequence in minutes
Calibrate Enable to do dynamic zero/span calibration, disable to do a cal check only.
This must be set to OFF for units used in US EPA applications and with IZS
option installed.
NOTE
The programmed STARTING_TIME must be a minimum of 5 minutes later than the real
time clock (See Section 4.4.6 for setting real time clock).
NOTE
Avoid setting two or more sequences at the same time of the day. Any new sequence
which is initiated whether from a timer, the COM ports, or the contact closure inputs will
override any sequence which is in progress.
NOTE
If at any time an illegal entry is selected (Example: Delta Days > 367) the ENTR button
will disappear from the display.
07266B DCN6485
Teledyne API – T101 Operation Manual Calibration Procedures
181
The following example sets Sequence2 to carry out a zero-span calibration every other
day starting at 01:00 on September 4, 2002, lasting 15 minutes. This sequence will start
0.5 hours later each day.
Table 6-4. Example Auto-Cal Sequence
MODE AND
ATTRIBUTE VALUE COMMENT
SEQUENCE 2 Define Sequence #2
MODE ZERO-SPAN Select Zero and Span Mode
TIMER ENABLE ON Enable the timer
STARTING DATE Sept. 4, 2002 Start after Sept 4, 2002
STARTING TIME 01:00 First Span starts at 01:00
DELTA DAYS 2 Do Sequence #2 every other day
DELTA TIME 00:30 Do Sequence #2 0.5 h later each day
DURATION 15.0 Operate Span valve for 15 min
CALIBRATE ON The instrument will re-set the slope and offset values for the H2S
channel at the end of the AutoCal sequence
07266B DCN6485
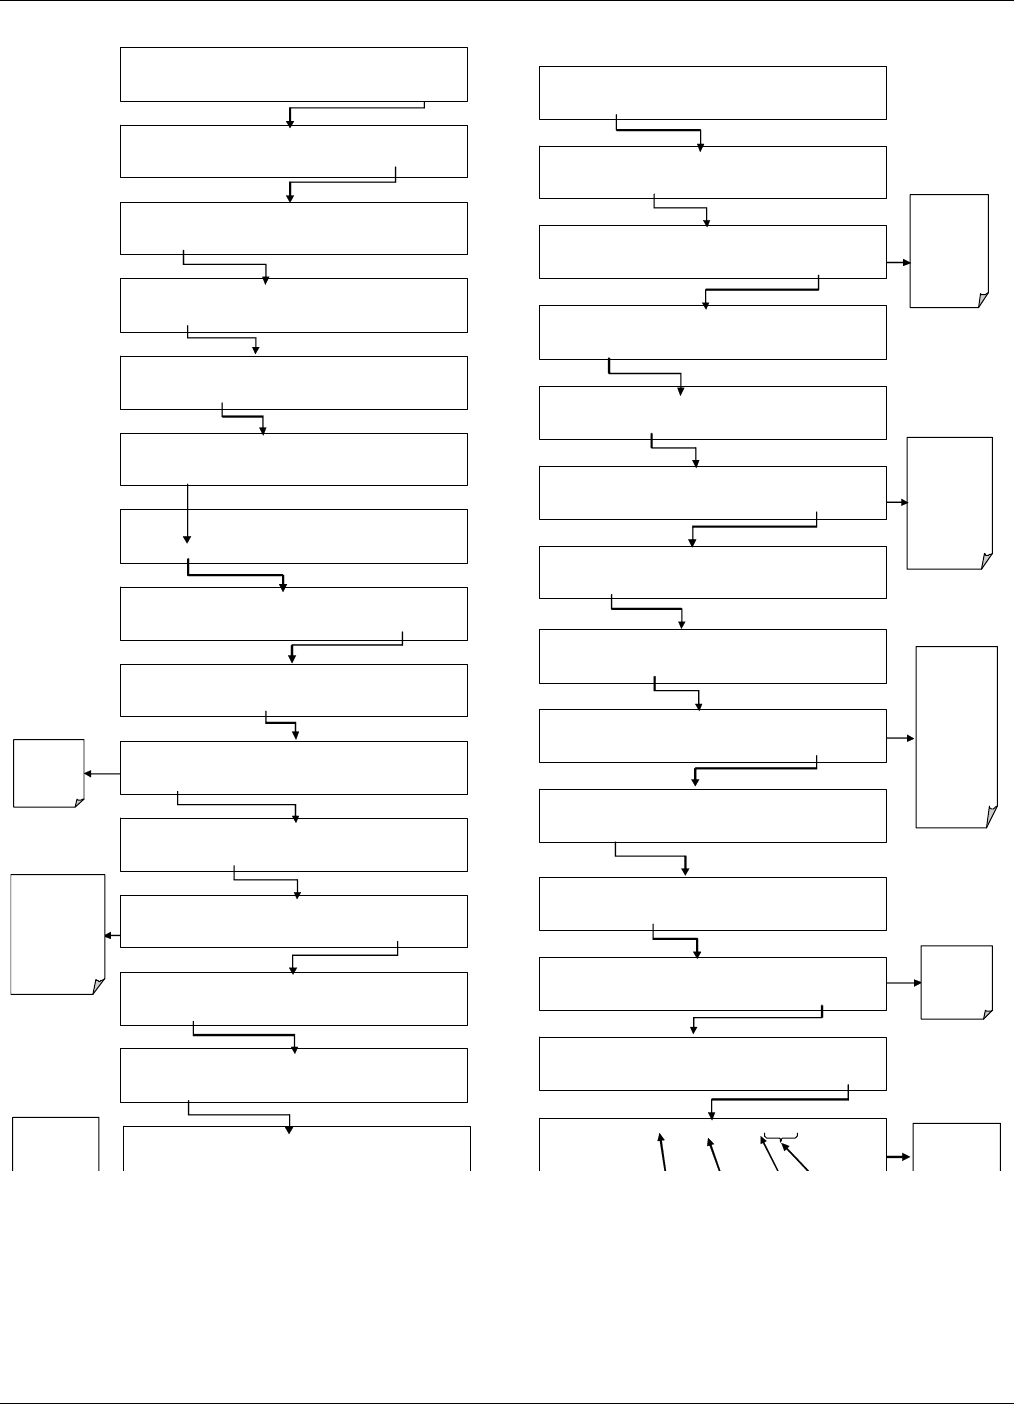
Calibration Procedures Teledyne API – T101 Operation Manual
182
Toggle to
se t
number of
days
between
procedures
(1-367)
Toggle to set
delay time for
each iteration
of the
seq uence:
HH:MM
(0 – 24:00)
SETUP X.X DELTA DAYS: 1
<SET SET> EDIT EXIT
SETUP X.X DELTA DAYS: 1
0 0 2 ENTR EXIT
SETUP X.X DELTA DAYS:2
<SET SET> EDIT EXIT
SETUP X.X DELTA TIME00:00
<SET SET> EDIT EXIT
SETUP X.X DELTA TIME: 00:00
0 0 :3 0 ENTR EXIT
SETUP X.X DELTA TIEM:00:30
<SET SET> EDIT EXIT
SETUP X.X STARTING TIME:14:15
<SET SET> EDIT EXIT
EXIT retu rns
to the SETUP
Menu
SETUP X.X DURATION:15.0 MINUTES
<SET SET> EDIT EXIT
SETUP X.X DURATION 15.0MINUTES
3 0 .0 ENTR EXIT
SETUP X.X DURATION:30.0 MINUTES
<SET SET> EDIT EXIT
Toggle to
set
duration for
each
iteration of
the
sequence:
Set in
Decimal
minutes
from
0.1 – 60.0
SETUP X.X C
A
LIBRATE: OFF
<SET SET> EDIT EXIT
SETUP X.X CALIBRATE: OFF
ON ENTR EXIT
SETUP X.X CALIBRATE: ON
<SET SET> EDIT EXIT
Toggle
button
betwee n
Off and
ON
SETUP X.X SEQ 2) ZERO
–
SPAN, 2:00:3
0
PREV NEXT MODE SET EXIT
SAMPLE ENTER SETUP PASS : 818
8 1 8 ENTR EXIT
SETUP X.X PRIMARY SETUP MENU
CFG ACAL DAS RNGE PASS CLK MORE EXIT
SETUP X.X SEQ 1) DISABLED
NEXT MODE EXI T
SETUP X.X SEQ 2) DISABLED
PREV NEXT MODE EXI T
SETUP X.X MODE: DISABLED
NEXT ENTR EXIT
SETUP X.X MODE: ZERO
PREV NEXT ENTR EXI T
SETUP X.X MODE: ZERO
–
SPAN
PREV NEXT ENTR EXIT
SETUP X.X SEQ 2) ZERO–SPAN, 1:00:00
PREV NEXT MODE SET EXIT
SETUP X.X TIMER ENABLE: ON
SET> EDIT EXIT
SETUP X.X STARTING DATE: 01–JAN–02
<SET SET> EDIT EXIT
SETUP X.X STARTING DATE: 01–JAN–02
0 4 SEP 0 3 ENTR EXIT
Toggle to set
day, month &
year:
Format :
DD-MON-YY
SETUP X.X STARTING DATE: 04–SEP–03
<SET SET> EDIT EXIT
Default
value is
ON
SETUP X.X STARTING DATE: 04–SEP–03
<SET SET> EDIT EXIT
SETUP X.X STARTING TIME:00:00
<
S
ET
S
ET> EDIT EXIT
Toggle to set
time:
Format : HH:MM
This is a 24
hr
SA MPLE RANGE = 500.0 PPB H2S =XXX.X
< TST TST > CAL CALZ CALS SETUP
With dynamic calibration turned on, the state of the internal setup variables dyn_Span and
DYN_ZERO is set to ON and the instrument will reset the slope and offset values for the
H2S response each time the AutoCal program runs. This continuous re-adjustment of
calibration parameters can often mask subtle fault conditions in the analyzer.
07266B DCN6485
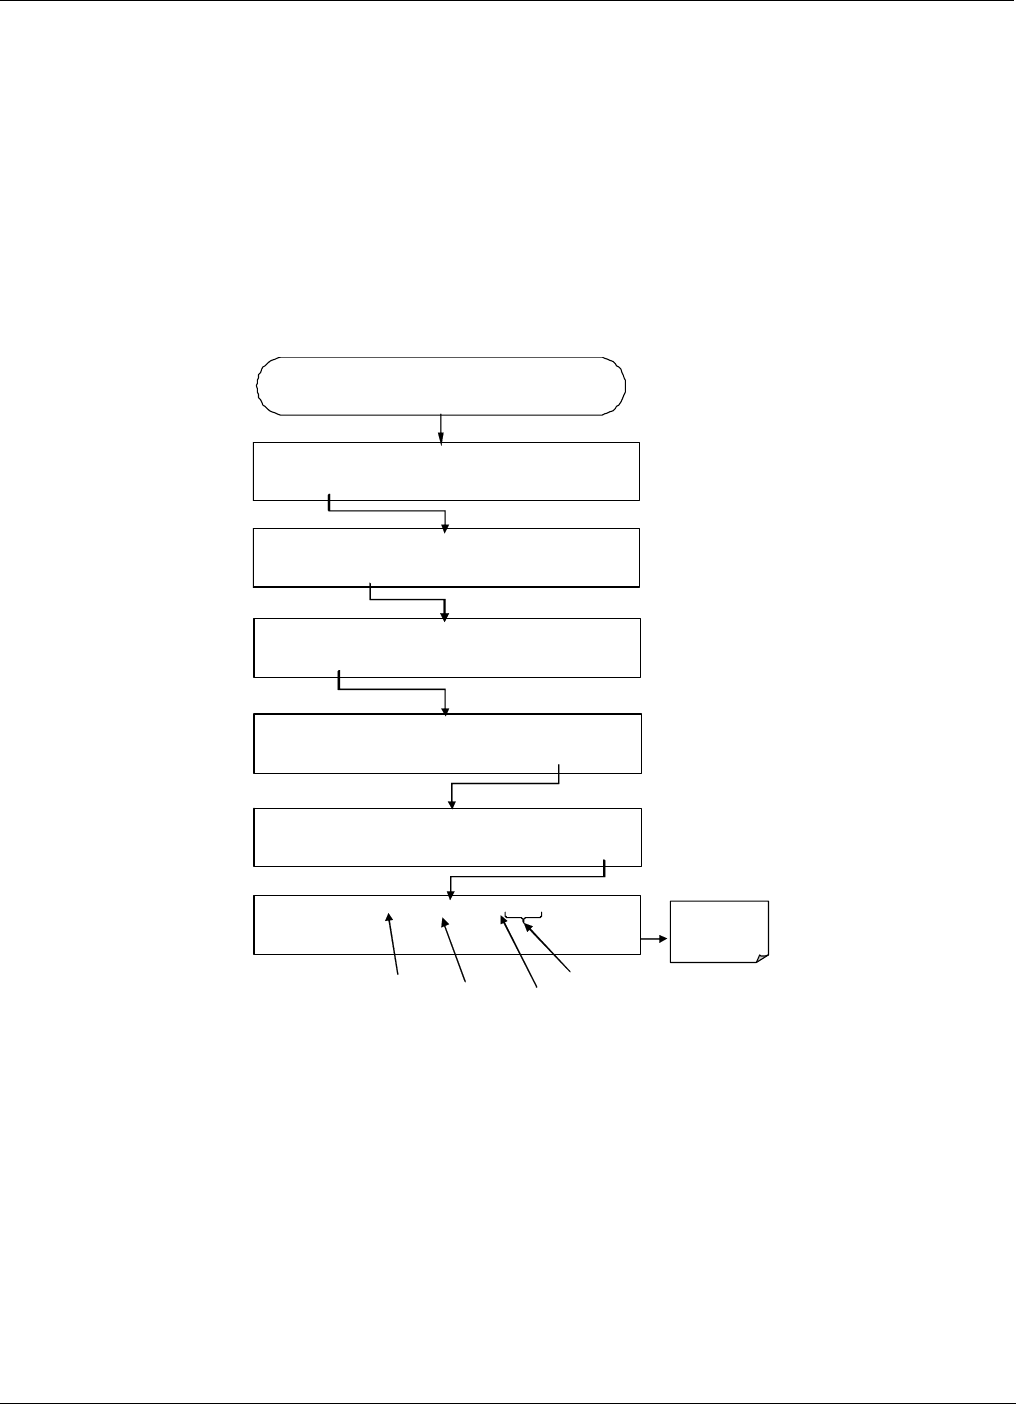
Teledyne API – T101 Operation Manual Calibration Procedures
183
It is recommended that, if dynamic calibration is enabled, the analyzer’s test functions,
slope and offset values be checked frequently to assure high quality and accurate data
from the instrument.
6.9.1. AUTOCAL OF INSTRUMENTS IN INDEPENDENT OR AUTO
REPORTING RANGE MODES
If the analyzer is being operated in IND or AUTO Range mode, then the High and Low
ranges must be specified as part of the Auto Cal set up. This parameter appears at the end
of the programming sequences after the CALIBRATE: ON/OFF parameter is set. For
example:
SETUP X.X RANGE TO CAL: LO
W
<SE T EDIT EXIT
EXIT returns
to the SETUP
Menu
SETUP X.X CALIBR ATE: ON
<SE T SET> EDIT EXIT
SETUP X.X SEQ 2) ZERO–SPAN, 2:00:30
PREV NEXT MODE SET EXIT
Sequence Delta Time
MODE Delta Days
Follow standard AutoCal programming process to this
point, then …
SETUP X.X RANGE TO CAL: LOW
LOW HIGH ENTR EX IT
SETUP X.X RANGE TO CAL: HIGH
LOW HIGH ENTR EXIT
SETUP X.X RANGE TO CAL: HIGH
<SET EDIT EXIT
07266B DCN6485
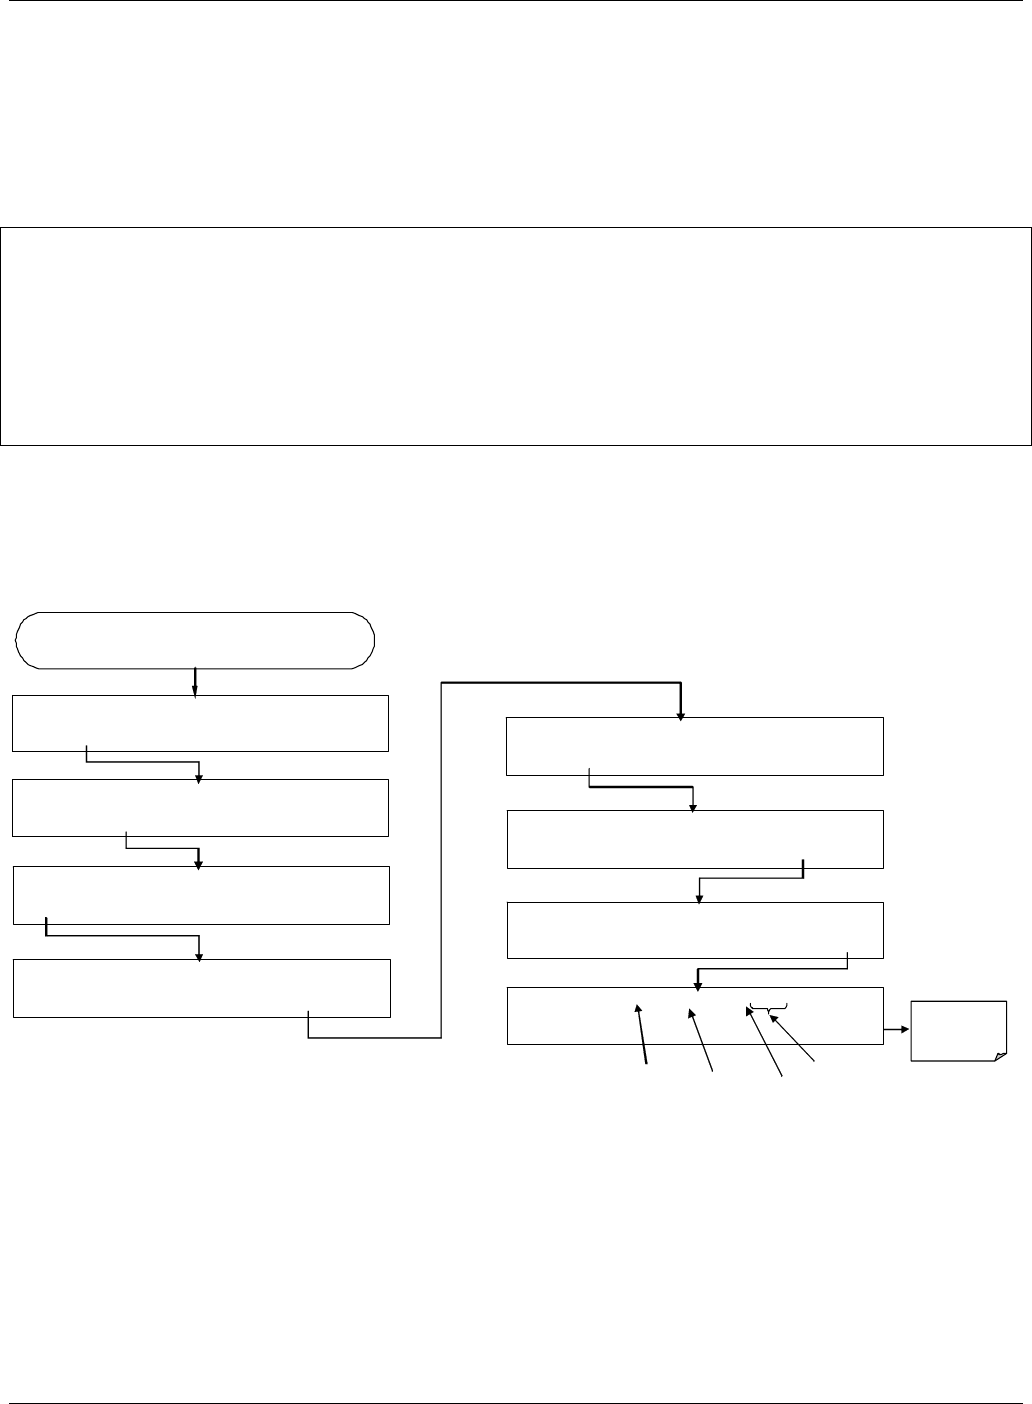
Calibration Procedures Teledyne API – T101 Operation Manual
184
6.9.2. AUTOCAL OF INSTRUMENTS IN MULTIGAS
MEASUREMENT MODE
If the analyzer is being operated in multigas measurement mode, auto cal can only be
programmed to calibrate the instrument with one of the available gases.
NOTE
Make sure that the gas for which the AutoCal sequence has been programmed is being
supplied to the analyzer at the time the autocal program initiates.
If the wrong gas is being supplied to the instrument, the analyzer will be mis-calibrated.
If the instrument is in multigas measurement mode and the SNGL reporting range mode
is selected, the AutoCal sequence is programmed as described above. If the reporting
range of the T101 must is set for either IND or AUTO. the gas type and range to be
measured must be specified. This parameter appears at the end of the programming
sequences after the CALIBRATE: ON/OFF parameter is set. For example:
SETUP X.X GAS-RANGE: H2S-HIGH
<SET EDIT EXIT
SETUP X.X CALIBRATE: ON
<SET SET> EDIT EXIT
Follow standard AutoCal programming process to this
point, then …
SETUP X.X GAS TO CAL: H2S
SO2 H2S ENTR EXIT
SETUP X.X Gas TO CAL: SO2
LOW HIGH ENTR EXIT EXIT ret urns
to the SETUP
Menu
SETUP X.X SEQ 2) ZERO
–
SPAN, 2:00:30
PREV NEXT MODE SET EXIT
Sequ ence Delta Time
MODE Delta Days
SETUP X.X RANGE TO CAL: LOW
LOW HIGH ENTR EXIT
SETUP X.X RANGE TO CAL: HIGH
LOW HIGH ENTR EXIT
SETUP X.X GAS-RANGE: SO2-LOW
<SET EDIT EXIT
07266B DCN6485

Teledyne API – T101 Operation Manual Calibration Procedures
185
6.10. CALIBRATION QUALITY
After completing one of the calibration procedures described above, it is important to
evaluate the analyzer’s calibration slope and offset parameters. These values describe the
linear response curve of the analyzer. The values for these terms, both individually and
relative to each other, indicate the quality of the calibration. To perform this quality
evaluation, you will need to record the values of both test functions (Section 4.2.1 or
Appendix A-3), all of which are automatically stored in the DAS channel CALDAT for
data analysis, documentation and archival.
Make sure that these parameters are within the limits listed in Table 6-5.
Table 6-5. Example Auto-Cal Sequence
FUNCTION MINIMUM VALUE OPTIMUM VALUE MAXIMUM VALUE
H2S SLOPE1 -0.700 1.000 1.300
H2S OFFS1 -50.0 mV <100 250.0 mV
These values should not be significantly different from the values recorded on the Teledyne API Final Test
and Validation Data sheet that was shipped with your instrument. If they are, refer to the troubleshooting
Section 9.
1 Shown as they appear when analyzer is in H2S mode. In SO2 mode they appear as SO2 OFFS & SO2
SLOPE. In multigas mode, both versions are listed and should be checked
07266B DCN6485

Calibration Procedures Teledyne API – T101 Operation Manual
186
This page intentionally left blank.
07266B DCN6485

187
7. EPA PROTOCOL CALIBRATION
7.1. CALIBRATION REQUIREMENTS
When configured for SO2 measurement mode or multigas measurement mode, the T101
may be used for EPA SLAMS monitoring. In these cases it must be calibrated in
accordance with the instructions in this section.
At the writing of this manual there is no EPA requirements for the monitoring of H2S or
published H2S calibration protocols, therefore these instruction only discuss the
calibration of the SO2 measurement feature.
In order to insure that high quality, accurate measurements are obtained at all times, the
T101 must be calibrated prior to use. A quality assurance program centered on this aspect
and including attention to the built-in warning features of the T101, periodic inspection,
regular zero/span checks and routine maintenance is paramount to achieving this.
In order to have a better understanding of the factors involved in assuring continuous and
reliable information from the T101, it is strongly recommended that Publication No. PB
273-518 Quality Assurance Handbook for Air Pollution Measurement Systems
(abbreviated, Q.A. Handbook) be purchased from the NTIS (phone 703-605-6000).
Special attention should be paid to Section 2.9 of the handbook which deals with
fluorescence based SO2 analyzers and upon which most of this section is based. Specific
regulations regarding the use and operation of ambient hydrogen sulfide analyzers can be
found in 40 CFR 50 and 40 CFR 58. Both publications are available from the U.S.
Government Printing Office (phone 202-512-0327).
7.1.1. CALIBRATION OF EQUIPMENT
In general, calibration is the process of adjusting the gain and offset of the T101 against
some recognized standard. The reliability and usefulness of all data derived from any
analyzer depends primarily upon its state of calibration. In this section the term dynamic
calibration is used to express a multipoint check against known standards and involves
introducing gas samples of known concentration into the instrument in order to adjust the
instrument to a predetermined sensitivity and to produce a calibration relationship. This
relationship is derived from the instrumental response to successive samples of different
known concentrations. As a minimum, three reference points and a zero point are
recommended to define this relationship. The true values of the calibration gas must be
traceable to NIST-SRM's See Table 7.1.
All monitoring instrument systems are subject to some drift and variation in internal
parameters and cannot be expected to maintain accurate calibration over long periods of
07266B DCN6485

EPA Protocol Calibration Teledyne API – T101 Operation Manual
188
time. Therefore, it is necessary to dynamically check the calibration relationship on a
predetermined schedule. Zero and span checks must be used to document that the data
remains within control limits. These checks are also used in data reduction and validation.
Table 7-3 summarizes the initial quality assurance activities for calibrating equipment.
Table 7-2 is a matrix for the actual dynamic calibration procedure.
Calibrations should be carried out at the field monitoring site. The Analyzer should be in
operation for at least several hours (preferably overnight) before calibration so that it is
fully warmed up and its operation has stabilized. During the calibration, the T101 should
be in the CAL mode, and therefore sample the test atmosphere through all components
used during normal ambient sampling and through as much of the ambient air inlet
system as is practicable. If the Instrument will be used on more than one range (i.e. IND
or AUTO ranges), it should be calibrated separately on each applicable range. Calibration
documentation should be maintained with each analyzer and also in a central backup file.
Table 7-1. Activity Matrix for Calibration Equipment & Supplies
EQUIPMENT/SUPPLIES ACCEPTANCE LIMITS FREQUENCY AND
METHOD OF
MEASUREMENT
ACTION IF REQUIREMENTS
ARE NOT MET
Recorder Compatible with output
signal of analyzer; min.
chart width of 150 mm (6
in) is recommended
Check upon receipt Return equipment to
supplier
Sample Line And Manifold Constructed of PTFE or
glass
Check upon receipt Return equipment to
supplier
Calibration Equipment Meets guidelines of
reference 1 and Section
2.3.2 (Q.A. Handbook)
See Section 2.3.9
(Q.A. Handbook)
Return equipment/ supplies
to supplier or take
corrective action
Working Standard SO2
Cylinder Gas Or SO2
Permeation Tube
Traceable to NIST-SRM
meets limits in traceability
protocol for accuracy and
stability (Section 2.0.7,
Q.A. Handbook)
Analyzed against
NIST-SRM; see
protocol in Section
2.0.7, Q.A.
Handbook
Obtain new working
standard and check for
traceability
Zero Air Clean dry ambient air, free
of contaminants that cause
detectable response with
the SO2 analyzer.
See Section 2.9.2
(Q.A. Handbook)
Obtain air from another
source or regenerate.
Record Form Develop standard forms N/A Revise forms as
appropriate
Audit Equipment Must not be the same as
used for calibration
System must be
checked out against
known standards
Locate problem and correct
or return to supplier
07266B DCN6485

Teledyne API – T101 Operation Manual EPA Protocol Calibration
189
Table 7-2. Activity Matrix for Calibration Procedure
EQUIPMENT/
SUPPLIES ACCEPTANCE LIMITS FREQUENCY AND METHOD OF
MEASUREMENT ACTION IF REQUIREMENTS ARE
NOT MET
Calibration
Gases
NIST traceable Assayed against an NIST-SRM
semi-annually, Sec. 2.0.7,
(Q.A. Handbook)
Working gas standard is unstable,
and/or measurement method is
out of control; take corrective
action such as obtaining new
calibration gas.
Dilution Gas Zero air, free of
contaminants
See Section 2.9.2 (Q.A.
Manual)
Return to supplier or take
appropriate action with
generation system
Multi-Point
Calibration
Use calibration
procedure in Section
2.2 (Q.A. Handbook);
also Federal Register
Perform at least once every
quarter or anytime a level span
check indicates a discrepancy,
or after maintenance which
may affect the calibration;
Section 2.5 (Q.A. Manual)
Repeat the calibration
7.1.2. DATA RECORDING DEVICE
Either a strip chart recorder, data acquisition system, digital data acquisition system
should be used to record the data from the Mode; T101 RS-232 port or analog outputs. If
analog readings are being used, the response of that system should be checked against a
NIST referenced voltage source or meter. Data recording device should be capable of bi-
polar operation so that negative readings can be recorded.
7.1.3. RECOMMENDED STANDARDS FOR ESTABLISHING
TRACEABILITY
To assure data of desired quality, two considerations are essential: (1) the measurement
process must be in statistical control at the time of the measurement and (2) the
systematic errors, when combined with the random variation in the measurement process,
must result in a suitably small uncertainty.
Evidence of good quality data includes documentation of the quality control checks and
the independent audits of the measurement process by recording data on specific forms or
on a quality control chart and by using materials, instruments, and measurement
procedures that can be traced to appropriate standards of reference. To establish
traceability, data must be obtained routinely by repeat measurements of standard
reference samples (primary, secondary, and/or working standards). More specifically,
working calibration standards must be traceable to standards of higher accuracy, such as
those listed in Table 7-1.
Cylinders of working gas traceable to NIST-SRM's (called EPA Protocol Calibration
Gas) are also commercially available (from sources such as Scott Specialty Gases, etc.).
7.1.4. EPA CALIBRATION USING PERMEATION TUBES
Teledyne API does not recommend the use of permeation tubes as a source of span gas
for EPA protocol calibration operations.
07266B DCN6485

EPA Protocol Calibration Teledyne API – T101 Operation Manual
190
7.1.5. CALIBRATION FREQUENCY
To ensure accurate measurements of the SO2 concentrations, calibrate the analyzer at the
time of installation, and re-calibrate it:
No later than three months after the most recent calibration
or performance audit which indicated that the analyzer
calibration was found to be acceptable.
An interruption of more than a few days in analyzer
operation.
Any repairs which might affect its calibration.
Physical relocation of the analyzer.
Any other indication (including excessive zero or span drift)
of possible significant inaccuracy of the analyzer.
Following any of the activities listed above, the zero and span should be checked to
determine if a calibration is necessary. If the analyzer zero and span drifts exceed locally
established calibration units or the calibration limits in Section 2.0.9, Subsection 9.1.3
(Q.A. Handbook), a calibration should be performed.
7.1.6. RECORD KEEPING
Record keeping is a critical part of all quality assurance programs. Standard forms similar
to those that appear in this manual should be developed for individual programs. Three
things to consider in the development of record forms are:
Does the form serve a necessary function?
Is the documentation complete?
Will the forms be filed in such a manner that they can easily
be retrieved when needed?
07266B DCN6485

Teledyne API – T101 Operation Manual EPA Protocol Calibration
191
7.1.7. SUMMARY OF QUALITY ASSURANCE CHECKS
The following items should be checked on a regularly scheduled basis to assure high
quality data from the T101. See Table 7-3 for a summary of activities. Also the QA
Handbook should be checked for specific procedures.
Table 7-3. Activity Matrix
CHARACTERISTIC ACCEPTANCE LIMITS FREQUENCY AND
METHOD OF
MEASUREMENT
ACTION IF REQUIREMENTS ARE
NOT MET
Shelter
Temperature
Mean temperature between
22oC and 28oC (72o and 82oF),
daily fluctuations not greater
than ±2oC
Check thermograph
chart weekly for
variations greater
than ±2oC (4oF)
Mark strip chart for the affected
time period
Repair or adjust temperature
control
Sample
Introduction
System
No moisture, foreign material,
leaks, obstructions; sample line
connected to manifold
Weekly visual
inspection
Clean, repair, or replace as
needed
Recorder Adequate ink & paper
Legible ink traces
Correct chart speed and range
Correct time
Weekly visual
inspection
Replenish ink and paper supply
Adjust time to agree with clock;
note on chart
Analyzer
Operational
Settings
TEST measurements at nominal
values
2. T101 in SAMPLE mode
Weekly visual
inspection
Adjust or repair as needed
Analyzer
Operational
Check
Zero and span within tolerance
limits as described in Section.
9.1.3 of Sec. 2.0.9 (Q.A.
Handbook)
Level 1 zero/span
every 2 weeks; Level
2 between Level 1
checks at frequency
desired analyzer by
user
Find source of error and repair
After corrective action, re-
calibrate analyzer
Precision Check Assess precision as described in
Sec. 2.0.8 and Section. 3.4.3
(Ibid.)
Every 2 weeks,
Section. 3.4.3 (Ibid.)
Calc, report precision, Sec. 2.0.8
(Ibid.)
7.2. LEVEL 1 CALIBRATIONS VERSUS LEVEL 2 CHECKS
Essential to quality assurance are scheduled checks for verifying the operational status of
the monitoring system. The operator should visit the site at least once each week. It is
recommended Level 1 zero and span check conducted on the analyzer every two weeks.
Level 2 zero and span checks should be conducted at a frequency desired by the user.
Definitions of these terms are given in Table 7-4.
In addition, an independent precision check between 0.08 and 0.10 ppm must be carried
out at least once every two weeks. Table 7-3 summarizes the quality assurance activities
for routine operations. A discussion of each activity appears in the following sections.
To provide for documentation and accountability of activities, a checklist should be
compiled and then filled out by the field operator as each activity is completed.
07266B DCN6485

EPA Protocol Calibration Teledyne API – T101 Operation Manual
192
Table 7-4. Definition of Level 1 and Level 2 Zero and Span Checks
(from Section 2.0.9 of Q.A. Handbook for Air Pollution Measurement Systems)
LEVEL 1 ZERO AND SPAN CALIBRATION
A Level 1 zero and span calibration is a
simplified, two-point analyzer calibration used
when analyzer linearity does not need to be
checked or verified. (Sometimes when no
adjustments are made to the analyzer, the Level
1 calibration may be called a zero/span check, in
which case it must not be confused with a Level 2
zero/span check.) Since most analyzers have a
reliably linear or near-linear output response with
concentration, they can be adequately calibrated
with only two concentration standards (two-point
concentration). Furthermore, one of the
standards may be zero concentration, which is
relatively easily obtained and need not be
certified. Hence, only one certified concentration
standard is needed for the two-point (Level 1)
zero and span calibration. Although lacking the
advantages of the multipoint calibration, the two-
point zero and span calibration--because of its
simplicity--can be (and should be) carried out
much more frequently. Also, two-point
calibrations are easily automated. Frequency
checks or updating of the calibration relationship
with a two-point zero and span calibration
improves the quality of the monitoring data by
helping to keep the calibration relationship more
closely matched to any changes (drifts) in the
analyzer response.
LEVEL 2 ZERO AND SPAN CHECK
A Level 2 zero and span check is an "unofficial" check
of an analyzer's response. It may include dynamic
checks made with uncertified test concentrations,
artificial stimulation of the analyzer's detector,
electronic or other types of checks of a portion of the
analyzer, etc.
Level 2 zero and span checks are not to be used as a
basis for analyzer zero or span adjustments,
calibration updates, or adjustment of ambient data.
They are intended as quick, convenient checks to be
used between zero and span calibrations to check for
possible analyzer malfunction or calibration drift.
Whenever a Level 2 zero or span check indicates a
possible calibration problem, a Level 1 zero and span
(or multipoint) calibration should be carried out
before any corrective action is taken.
If a Level 2 zero and span check is to be used in the
quality control program, a "reference response" for
the check should be obtained immediately following a
zero and span (or multipoint) calibration while the
analyzer's calibration is accurately known.
Subsequent Level 2 check responses should then be
compared to the most recent reference response to
determine if a change in response has occurred. For
automatic Level 2 zero and span checks, the first
scheduled check following the calibration should be
used for the reference response. It should be kept in
mind that any Level 2 check that involves only part of
the analyzer's system cannot provide information
about the portions of the system not checked and
therefore cannot be used as a verification of the
overall analyzer calibration.
07266B DCN6485

Teledyne API – T101 Operation Manual EPA Protocol Calibration
193
7.3. ZERO AND SPAN CHECKS
A system of Level 1 and Level 2 zero span checks (see Table 8-4) is recommended. These
checks must be conducted in accordance with the specific guidance given in Subsection
9.1 of Section 2.0.9 (Q.A. Handbook). It is recommended Level 1 zero and span checks
conducted every two weeks. Level 2 checks should be conducted in between the Level 1
checks at a frequency desired by the user. Span concentrations for both levels should be
between 70 and 90% of the measurement range.
Zero and span data are to be used to:
Provide data to allow analyzer adjustment for zero and span drift;
Provide a decision point on when to calibrate the analyzer;
Provide a decision point on invalidation of monitoring data.
Items 1 and 2 are described in detail in Subsection 9.1.3 of Section 2.0.9 (Q.A.
Handbook). Item 3 is described in Subsection 9.1.4 of the same section.
Refer to the Troubleshooting Section 10 of this manual if the instrument is not within the
allowed variations.
7.3.1. ZERO/SPAN CHECK PROCEDURES
The Zero and Span calibration can be checked a variety of different ways. They include:
Manual Zero/Span Check - Zero and Span can be checked from the front panel keyboard.
Follow the procedures described in Section 6.3 and6-6 of this manual using calibrated
SO2 span gas (see Table 6-1) only.
Automatic Zero/Span Checks - After the appropriate setup, Z/S checks can be performed
automatically every night. Follow the procedure described in Section 6.9 of this manual
using calibrated SO2 span gas (see Table 6-1).
Zero/Span checks via remote contact closure = Zero/Span checks can be initiated via
remote contact closures on the rear panel. Follow the procedures described Section 6.7.1
of this manual using calibrated SO2 span gas (see Table 6-1).
Zero/Span via RS-232 port - Z/S checks can be controlled via the RS-232 port.
7.4. PRECISIONS CALIBRATION PROCEDURES AND
CHECKS
Calibration must be performed with a calibrator that meets all conditions specified in
Subsection 2.9.2 (Q.A. Handbook). The user should be sure that all flow meters are
calibrated under the conditions of use against a reliable standard. All volumetric flow
rates should be corrected to 25oC (77oF) and 760mm (29.92in) Hg. Make sure the
calibration system can supply the range of the concentration at a sufficient flow over the
whole range of concentration that will be encountered during calibration.
All operational adjustments to the T101 should be completed prior to the calibration. The
following software features must be set into the desired state before calibration.
07266B DCN6485

EPA Protocol Calibration Teledyne API – T101 Operation Manual
194
Single range selection. See Section 4.7.4 of this manual. If the instrument
will be used more than one range, it should be calibrated separately on
each applicable range.
Automatic temperature/pressure compensation.
Alternate units, make sure ppb units are selected for EPA monitoring. See
Section 4.7.7.
The analyzer should be calibrated on the same range for monitoring. If the AUTO range
mode is selected, the highest of the ranges will result in the most accurate calibration, and
should be used.
7.4.1. PRECISION CALIBRATION
To perform a precision calibration, the instrument set up:
Input sources of zero air and calibrated SO2 span gas (see Table 6-1).
Follow the procedures described in Section 6.2 for analyzers with no valve
options or with an IZS valve option (Do not use the method defined in
Section 6.7).
Follow the procedures described in Section 6.5 for analyzers with Z/S
options installed.
7.4.2. PRECISION CHECK
A periodic check is used to assess the data for precision. A one-point precision check
must be carried out at least once every 2 weeks on each analyzer at an SO2 concentration
between 0.08 and 0.10 ppm. The analyzer must be operated in its normal sampling mode,
and the precision test gas must pass through all filters, scrubbers, conditioners, and other
components used during normal ambient sampling. The standards from which precision
check test concentrations are obtained must be traceable to NIST-SRM (see Table 7-1).
Those standards used for calibration or auditing may be used.
To perform a precision check, the instrument set up; sources of zero air and SO2 span gas
and procedures should conform to those described in Section 6.3 for analyzers with no
valve options or with an IZS valve option installed and Section 6.6 for analyzers with Z/S
options installed with the following exception:
Connect the analyzer to a precision gas that has an SO2 concentration
between 0.08 and 0.10 ppm. If a precision check is made in conjunction
with a zero/span check, it must be made prior to any zero or span
adjustments.
Record this value. Information from the check procedure is used to assess the precision of
the monitoring data; see 40 CFR 58 for procedures for calculating and reporting
precision.
07266B DCN6485
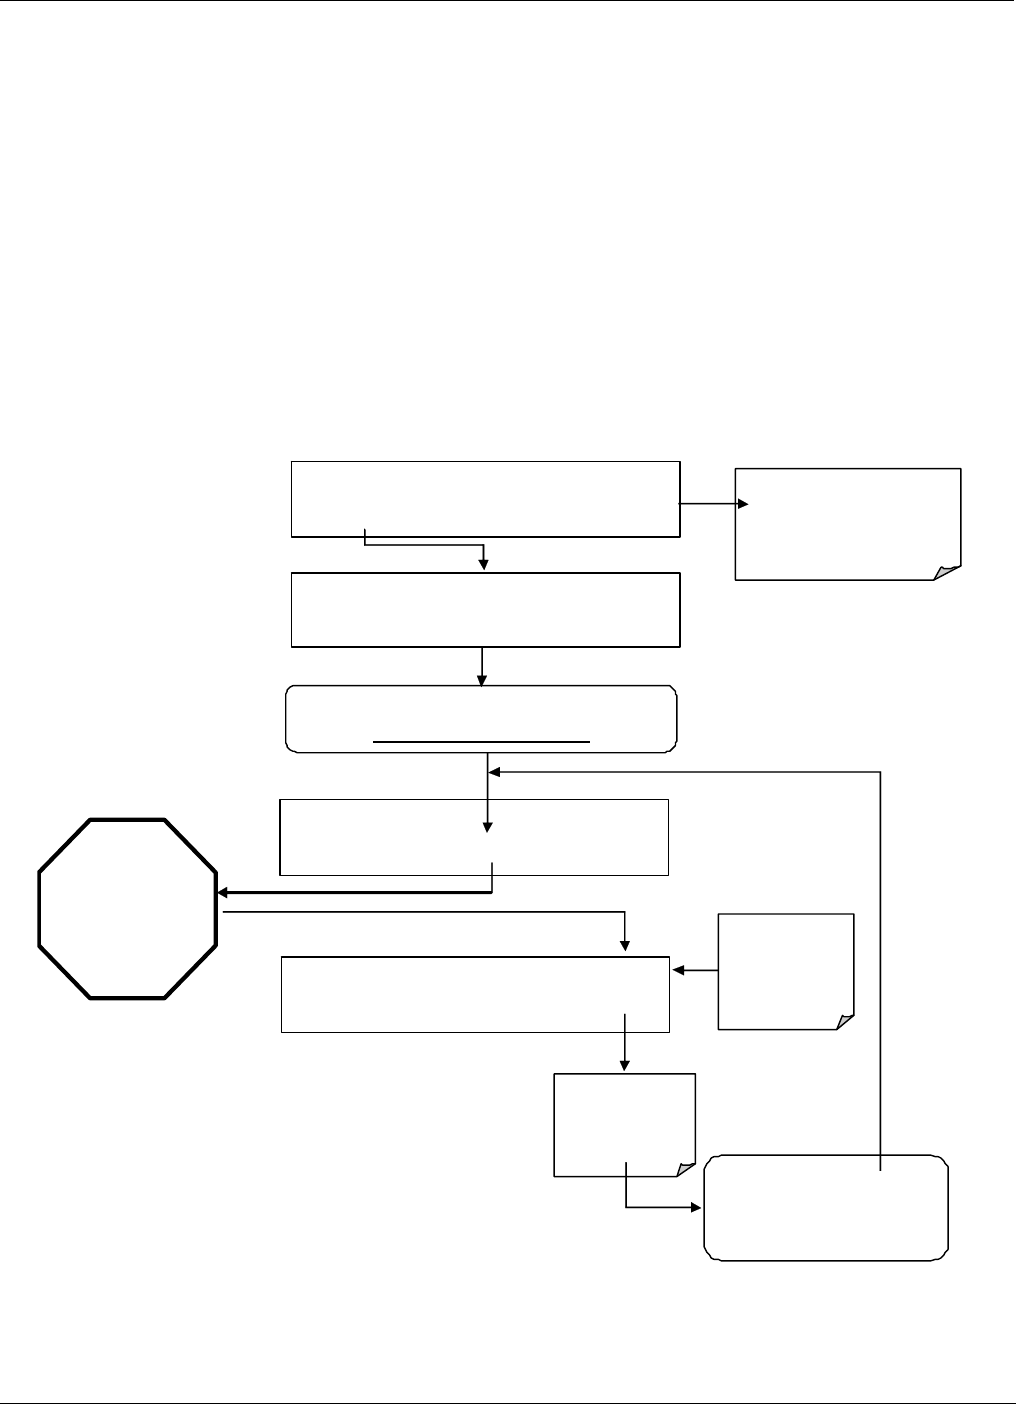
Teledyne API – T101 Operation Manual EPA Protocol Calibration
195
7.5. DYNAMIC MULTIPOINT SPAN CALIBRATION
Dynamic calibration involves introducing gas samples of known concentrations to an
instrument in order to record the instrument’s performance at a predetermined sensitivity
and to derive a calibration relationship. A minimum of three reference points and one zero
point uniformly spaced covering 0 to 90 percent of the operating range are recommended
to define this relationship.
The analyzer's recorded response is compared with the known concentration to derive the
calibration relationship.
To perform a precision check, the instrument set up, sources of zero air and sample gas
should conform to those described in Section 6.2.
Follow the procedures described in section 6.2 for calibrating the zero points.
For each mid point:
SPAN CAL M RANGE = 50 0.0 PPB SO2X.XXX
< TST TST > ZERO SP AN CONC EXIT
Wait until
SO2 STB falls
below 0.5 ppb.
This may take
several minutes.
SAMPLE SO2 STB=X.XXX PPB SO2 =X.XXX
< TST TST > CAL CALZ CALS SE TUP
Record the SO2
reading as
displayed on the
instrument’s front
panel
Press EXIT to
Return to the
Main SAMPLE
Display
ACT I ON :
Allow Calibration Gas diluted to
proper concentration for
Midpoint N+1 to enter the sample
port
A
CTION:
Allow cal ibra tion g as dilu ted to prope r concentra ti on for
Midp oint N to enter the samp le p ort
SAMPLE* RANGE = 500.000 PPB SO2 =X.XXX
< TST TST > CAL SETUP
SAMPLE SO2 STB =X.XXX PPB SO2 =X.XXX
< TST TST > CAL SETUP
Set the Display to show the
SO2 STB test function.
Th is function calculates the
stab ility of the SO2
m easu reme nt
07266B DCN6485

EPA Protocol Calibration Teledyne API – T101 Operation Manual
196
7.6. SPECIAL CALIBRATION REQUIREMENTS FOR
INDEPENDENT RANGE OR AUTO RANGE
If Independent Range or Auto Range is selected, then it should be calibrated for both
Range1 and Range2 separately.
For zero and span point calibration, follow the procedure described in Section 6.2.
Repeat the procedure for both the high and low Ranges
7.7. REFERENCES
1. Environmental Protection Agency, Title 40, Code of Federal Regulations,
Part 50, Appendix A, Section 10.3.
2. Quality Assurance Handbook for Air Pollution Measurement Systems -
Volume II, Ambient Air Specific Methods, EPA-600/4-77-027a, 1977.
3. Catalog of NBS Standard Reference Materials. NBS Special Publication
260, 1975-76 Edition. U.S. Department of Commerce, NBS. Washington,
D.C. June 1975. (Tel: 301-975-6776 for ordering the catalog)
4. Quality Assurance Handbook for Air Pollution Measurement Systems -
Volume I, Principles. EPA-600/9-76-005. March 1976.
07266B DCN6485
197
8. INSTRUMENT MAINTENANCE
Predictive diagnostic functions including data acquisition, failure warnings and alarms
built into the analyzer allow the user to determine when repairs are necessary without
performing unnecessary, preventative maintenance procedures. There is, however, a
minimal number of simple procedures that, when performed regularly, will ensure that
the analyzer continues to operate accurately and reliably over its lifetime. Repair and
troubleshooting procedures are covered in Section 8 and Section 9 of this manual.
8.1. MAINTENANCE SCHEDULE
Table 8-1 shows a typical maintenance schedule for the analyzer. Please note that in
certain environments (i.e. dusty, very high ambient pollutant levels) some maintenance
procedures may need to be performed more often than shown.
NOTE
A span and zero calibration check must be performed following some of the
maintenance procedures listed below.
See Sections 6.3, 6.6 and 6.9 for instructions on performing checks.
CAUTION
Risk of electrical shock. Disconnect power before performing any
operations that require entry into the interior of the analyzer.
NOTE
The operations outlined in this Section must be performed by qualified
maintenance personnel only.
NOTE
The front panel of the analyzer is hinged at the bottom and may be opened to gain
access to various components mounted on the panel itself or located near the front of
the instrument (such as the particulate filter).
A locking screw located at the top center of the panel and two fasteners located in the
upper right and left corners of the panel serve to lock it shut.
07266B DCN6485

Instrument Maintenance Teledyne API – T101 Operation Manual
198 047400102 Rev XC
This page intentionally left blank.
07266B DCN6485

Instrument Maintenance Model T101 Instruction Manual
199
Table 8-1 T101 Preventive Maintenance Schedule
ITEM ACTION FREQUENCY CAL
CHECK MANUAL
SECTION DATE PERFORMED
SO2 scrubber Replace As required Yes 8.3.3
H2S SO2
Converter Catalyst Replace As required Yes 8.3.5
1Particulate filter Change
particle filter Weekly No 8.3.1
Verify test
functions
Review and
evaluate Weekly No Appendix C
Zero/span check
Evaluate
offset and
slope
Weekly -- 6.3, 6.6,
6.9
1Zero/span
calibration
Zero and
span
calibration
Every 3 months --
6.2, 6.4,
6.5, 6.7,
6.8
1External zero air
scrubber
(optional)
Exchange
chemical Every 3 months No 8.3.4
1Perform flow
check Check Flow Every 6 Months No 9.5.2
1Critical flow
orifice & sintered
filters
Replace Annually Yes 8.3.7
Internal IZS
Permeation Tube Replace As required YES 8.3.2
Perform
pneumatic leak
check
Verify Leak
Tight
Annually or after
repairs involving
pneumatics
Yes 9.5.1
2Pump diaphragm Replace
At least Every 2 years
or if PRES is ≥ 33.00
in-Hg-A
Yes
See
instruction
in
diaphragm
kit
PMT sensor
hardware
calibration
Low-level
hardware
calibration
On PMT/ preamp
changes if
0.7 < SLOPE or
SLOPE >1.3
Yes 9.6.4
1 These Items are required to maintain full warranty; all other items are strongly recommended.
2 A pump rebuild kit is available from Teledyne API Technical Support including all instructions and required parts (see Appendix B for part numbers).
07266B DCN6485

Instrument Maintenance Model T101 Instruction Manual
200
This page intentionally left blank.
07266B DCN6485

Model T101 Instruction Manual Instrument Maintenance
201
8.2. PREDICTIVE DIAGNOSTICS
The analyzer’s test functions can be used to predict failures by looking at trends in their
values. The current value of these functions can be viewed via the front panel, recorded
via the DAS system (see Section 4.8) or even downloaded via the internet from a
remote location using Teledyne API’s APICOM control software can be used to
download and review these data (see Section 5.1.2.9).
Table 8-2 Predictive Uses for Test Functions
BEHAVIOR
TEST
FUNCTION DAS
FUNCTION
CONDITION EXPECTED ACTUAL INTERPRETATION
H2S STB1 N/A Zero Gas
≤ 1 ppb with
zero air Increasing
Pneumatic Leaks – instrument &
sample system
Detector deteriorating
Fluctuating Developing leak in pneumatic system
Slowly
increasing
Flow path is clogging up.
Developing leak in pneumatic system
to vacuum
- Check critical flow orifice &
sintered filter.
PRES SMPPRS sample gas
Constant
within
atmospheric
changes
Slowly
decreasing Replace particulate filter
DRK PMT DRKPMT
PMT output
when UV
Lamp shutter
closed
Constant
within ±20 of
check-out
value
Significantly
increasing
PMT cooler failure
Shutter Failure
Change in instrument response
At span with
IZS option
installed
Constant
response
from day to
day
Decreasing
over time Degradation of IZS permeation tube
SO2
Concentration CONC1
Standard
configuration
at span
stable for
constant
concentration
Decreasing
over time
Drift of instrument response; UV
Lamp output is excessively low;
clean RCEL window
Slowly
Decreasing
Flow path is clogging up.
- Check critical flow orifice &
sintered filter.
- Replace particulate filter
SAMP FL SMPFLW Standard
Operation Stable
Fluctuating Leak in gas flow path.
Fluctuating
or Slowly
increasing
UV detector wearing out
UV source Filter developing pin holes
LAMP RATIO LAMPR Standard
Operation
Stable and
near 100% Slowly
decreasing
UV detector wearing out
Opaque oxides building up on UV
source Filter
UV lamp aging
H2S OFFS1 OFSET1 During Zero
Cal Stable
Slowly
increasing or
decreasing
Bad PMT
Failed HVPS
Leak in sample gas flow
Contamination in zero gas source.
H2S SLOPE1 SLOPE1 During Span
Cal Stable
Slowly
increasing or
decreasing
UV lamp aging
UV detector wearing out
Leak in Sample gas or calibration gas
flow path
Deterioration / contamination of
calibration gas source(s)
1 Shown as they appear when analyzer is in H2S mode. In SO2 mode appear as SO2 OFFS & SO2 SLOPE. In multigas
mode, both versions appear.
07266B DCN6485
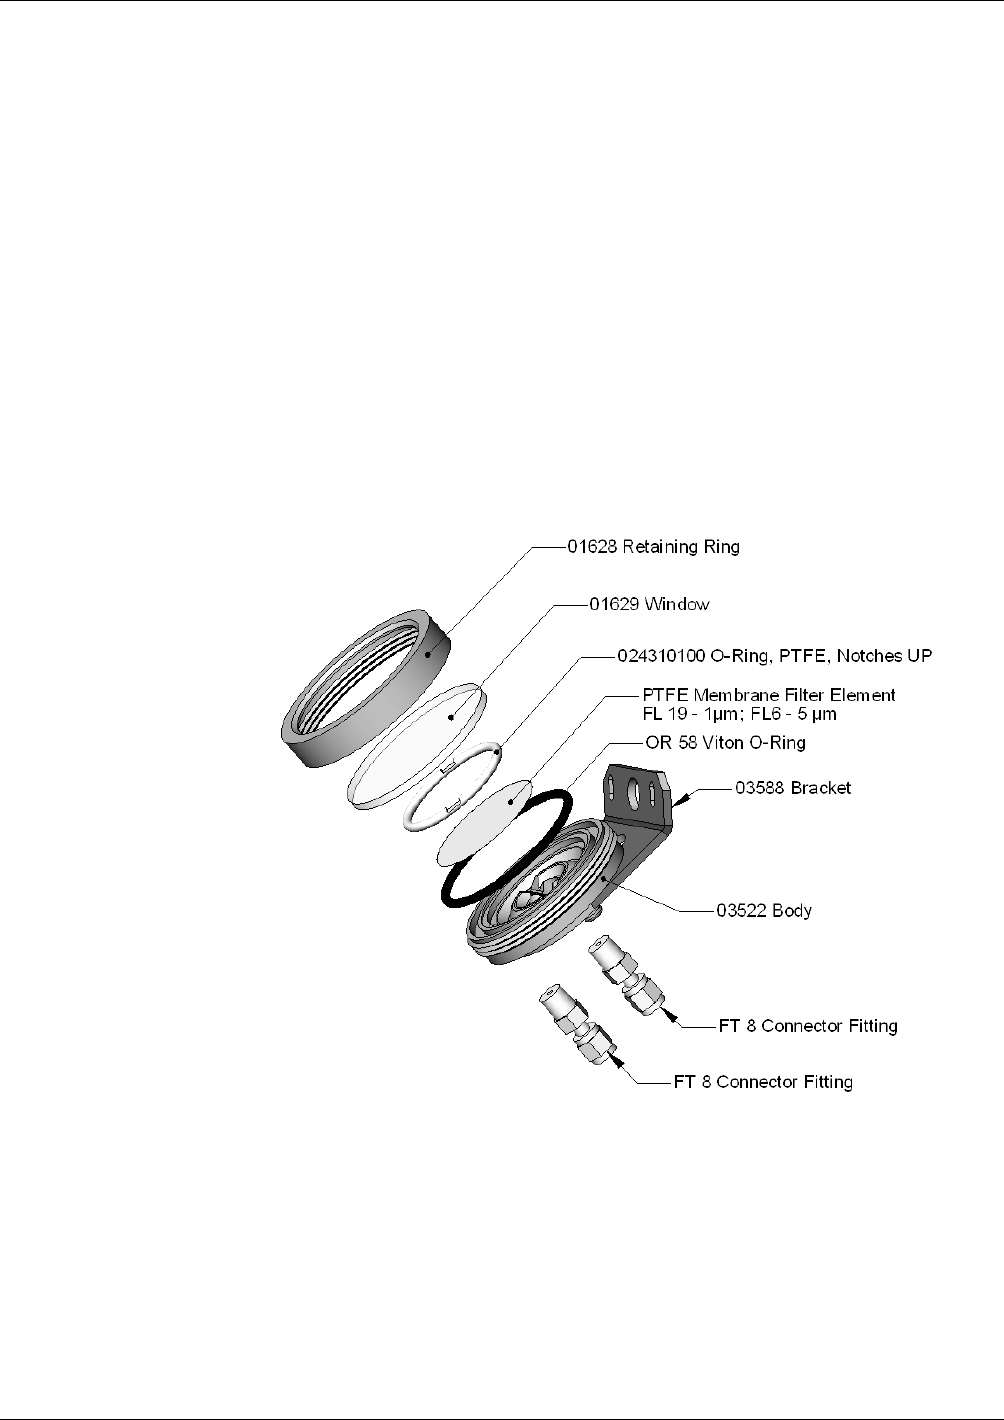
Instrument Maintenance Model T101 Instruction Manual
202
8.3. MAINTENANCE PROCEDURES
The following procedures need to be performed regularly as part of the standard
maintenance of the Model T101.
8.3.1. CHANGING THE SAMPLE PARTICULATE FILTER
The particulate filter should be inspected often for signs of plugging or excess dirt. It
should be replaced according to the service interval in Table 8-1 even without obvious
signs of dirt. Filters with 1 and 5 µm pore size can clog up while retaining a clean look.
We recommend handling the filter and the wetted surfaces of the filter housing with
gloves and tweezers. Do not touch any part of the housing, filter element, PTFE
retaining ring, glass cover and the O-ring with bare hands.
To change the filter according to the service interval in Table 8-1:
1. Turn OFF the analyzer to prevent drawing debris into the sample line.
2. Open the T101’s hinged front panel and unscrew the knurled retaining
ring of the filter assembly.
Figure 8-1. Sample Particulate Filter Assembly
3. Carefully remove the retaining ring, glass window, PTFE O-ring and filter
element.
4. Replace the filter element, carefully centering it in the bottom of the
holder.
5. Re-install the PTFE O-ring with the notches facing up, the glass cover,
then screw on the hold-down ring and hand-tighten the assembly.
Inspect the (visible) seal between the edge of the glass window and the
O-ring to assure proper gas tightness.
6. Re-start the analyzer.
07266B DCN6485
Model T101 Instruction Manual Instrument Maintenance
203
8.3.2. CHANGING THE IZS PERMEATION TUBE
1. Turn off the analyzer, unplug the power cord and remove the cover.
2. Locate the IZS oven in the rear left of the analyzer.
3. Remove the top layer of insulation if necessary.
4. Unscrew the black aluminum cover of the IZS oven (3 screws) using a
medium Phillips-head screw driver. Leave the fittings and tubing
connected to the cover.
5. Remove the old permeation tube if necessary and replace it with the new
tube. Make sure that the tube is placed into the larger of two holes and
that the open permeation end of the tube (plastic) is facing up.
6. Re-attach the cover with three screws and make sure that the sealing O-
ring is properly in place and that the three screws are tightened evenly.
7. Replace the analyzer cover, plug the power cord back in and turn on the
analyzer.
8. Carry out an IZS span check to see if the new permeation device works
properly. The permeation rate may need several days to stabilize.
WARNING
Do not leave instrument turned off for more than 8 hours without
removing the permeation tube. Do not ship the instrument without
removing the permeation tube. The tube continues to emit gas, even at
room temperature and will contaminate the entire instrument.
8.3.3. MAINTAINING THE SO2 SCRUBBER
The SO2 scrubber of your T101 utilizes a consumable compound to absorb SO2 form the
sample gas that must be replaced periodically in order for the analyzer to continue
measuring H2S accurately and reliability.
This material is capable of efficiently scrubbing SO2 for up to 1000 ppm/hours. This
means that if the SO2 content of the sample gas is typically around 100 ppb, the scrubber
will function for approximately 10 000 hours, a little over 13 months. If, however, the
typical ambient SO2 level of the sample gas is 250 ppb, the scrubber would only last for
approximately 4000 hours or about 5 ½ months.
8.3.3.1. Predicting When the SO2 Scrubber Should Be Replaced.
To determine how long the SO2 scrubber will operate efficiently:
1. Measure the amount of SO2 in the sample gas.
If your T101 has the multigas measurement options activated, this
can be done by following instructions found in Section 4.5.1 and
selecting MEASURE MODE = SO2.
Let the analyzer operate for 30 minutes, then note the SO2
concentration.
2. Divide 1 000 by the SO2 concentration.
07266B DCN6485

Instrument Maintenance Model T101 Instruction Manual
204
EXAMPLE: If the SO2 concentration is 125 ppb:
Operational hours = 1000 ppm/hr ÷ 0.125 ppm
Operational hours = 1,000,000 ppb/hr ÷ 125 ppb
Operational hours = 8000 hrs
8.3.3.2. Checking the Function of the SO2 Scrubber
To check to see if your SO2 scrubber is operating properly:
1. With the analyzer set of H2S measurement mode, introduce gas mixture
into the sample gas stream that includes SO2 at a concentration of at
least 20% of the reporting range currently selected (see Section 4.4.4.3).
For example, if the analyzer is set for a Single Range & 500 ppb, a
concentration of 1000 ppb would be appropriate.
2. An increase of more than 2% in the H2S reading is an indication that the
efficiency of the scrubber is decreasing to the point that the absorbing
material should be replaced.
8.3.3.3. Changing the SO2 Scrubber Material
1. Input zero air for 5 minutes
2. Turn off analyzer
3. Locates the SO2 scrubber cartridge in the front of the analyzer, looks like
a big white cylinder (See Figure 3-9).
4. Undo the two 1/8 inch fittings on the top of the scrubber
5. Remove the two screws holding the scrubber to the instrument chassis
and remove the scrubber
6. Take the two Teflon fitting off the instrument.
7. Empty the SO2 scrubbing material in to a hazmat bin
8. Fill each side of the scrubber with new SO2 scrubber material until it is ½
an inch from the bottom of the thread lines so about ½ inches from the
top of the scrubber, do not fill it too high or the fitting will crush the
material.
9. Remove the Teflon tape from both of the removed fittings, and re-tape
them with new Teflon tape.
10. Install both fittings back onto the scrubber.
11. Put the scrubber back into the analyzer and replace the two screws on
the bottom.
12. Screw the two 1/8 fittings back onto the top of the scrubber, they can be
hooked up either way.
13. Return analyzer to normal operation
07266B DCN6485
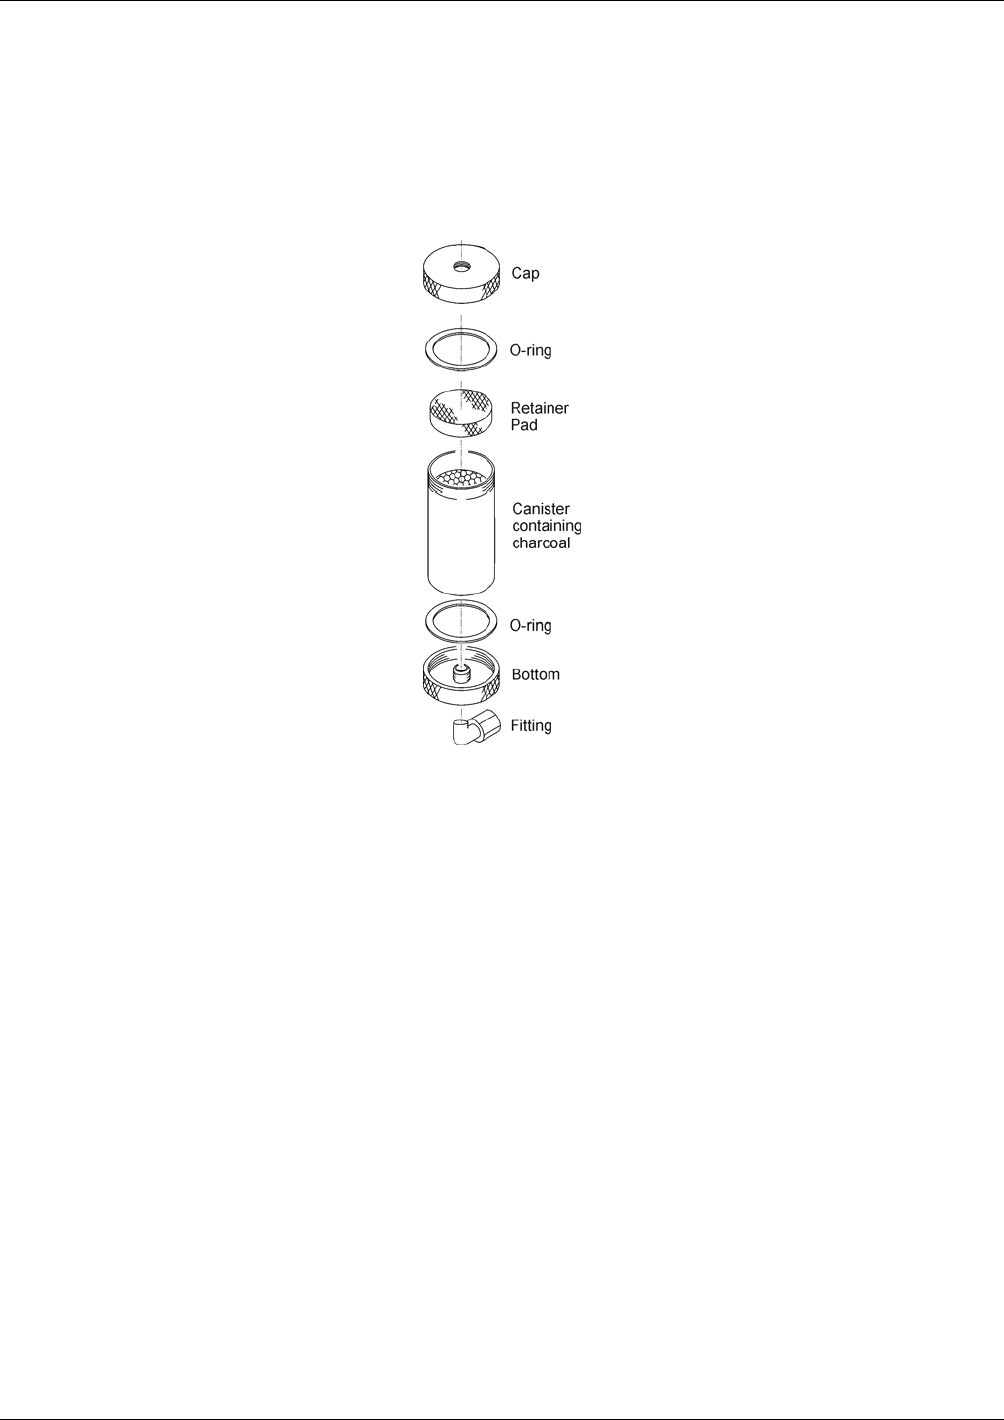
Model T101 Instruction Manual Instrument Maintenance
205
8.3.4. CHANGING THE EXTERNAL ZERO AIR SCRUBBER
The chemicals in the external scrubber need to be replaced periodically according to
Table 9-1 or as needed. This procedure can be carried out while the instrument is
running. Make sure that the analyzer is not in ZERO calibration mode.
1. Locate the scrubber on the outside rear panel. Figure 9-2 shows an
exploded view of the scrubber assembly.
Figure 8-2. Charcoal Canister Assembly
2. Remove the old scrubber by disconnecting the 1/4” plastic tubing from
the particle filter using 9/16” and 1/2" wrenches.
3. Remove the particle filter from the cartridge using 9/16” wrenches.
4. Unscrew the top of the scrubber canister and properly disposition the
charcoal contents in accordance with local laws about discarding these
chemicals. The rebuild kit (listed in Appendix B) comes with a Material
and Safety Data Sheet, which contains more information on these
chemicals.
5. Refill the scrubber canister with charcoal.
6. Place a retainer pad over the charcoal, and then close the cartridge with
the screw-top cap.
7. Tighten the cap on the scrubber - hand-tight only.
8. Replace the DFU filter with a new unit and discard the old.
9. Replace the scrubber assembly into its clips on the rear panel.
10. Reconnect the plastic tubing to the fitting of the particle filter.
11. Adjust the scrubber cartridge such that it does not protrude above or
below the analyzer in case the instrument is mounted in a rack. If
necessary, squeeze the clips for a tighter grip on the cartridge.
07266B DCN6485

Instrument Maintenance Model T101 Instruction Manual
206
8.3.5. MAINTAINING THE H2S SO2 CONVERTER
The catalyst contained in the H2S SO2 converter of your T101 must be replaced
periodically in order for the analyzer to continue measuring H2S accurately and
reliability.
This material is capable of efficiently converting H2S into SO2 for up to 6000
ppm/hours. This means that if the H2S content of the sample gas is typically around 600
ppb, the scrubber will function for approximately 10 000 hours, a little over 13 months.
If, however, the typical ambient H2S level of the sample gas is 1000 ppb, the scrubber
would only last for approximately 6000 hours or about 8 months.
8.3.5.1. Predicting When the Converter Catalyst Should Be Replaced.
To determine how long the H2S SO2 converter will operate efficiently:
1. Measure the amount of H2S in the sample gas.
2. Divide 6000 by the H2S concentration.
EXAMPLE: If the H2S concentration is 750 ppb:
Operational hours= 6000 ppm/hr ÷ 0.75 ppm
Operational hours= 6,00,000 ppb/hr ÷ 750 ppb
Operational hours= 8000 hrs
8.3.5.2. Checking the Efficiency of the H2S SO2 Converter
To check to see if your H2S SO2 converter is operating properly:
1. Set the analyzer to SO2 measurement mode (see Section 4.5.1).
2. Supply a gas with a known concentration of SO2 to the sample gas inlet
of the analyzer.
3. Wait until the analyzer’s SO2 concentration measurement stabilizes. This
can be determined by setting the analyzer’s display to show the SO2
STB test function (see Section 4.2.1) SO2 STB should be 0.5 ppb or
less before proceeding.
4. Record the stable SO2 concentration
5. Set the analyzer to H2S measurement mode (see Section 4.5.1).
6. Supply a gas with a known concentration of H2S, equal to that of the SO2
gas used in steps 2-4 above, to the sample gas inlet of the analyzer.
7. Wait until the analyzer’s SO2 concentration measurement stabilizes. This
can be determined by setting the analyzer’s display to show the H2S
STB test function (see Section 4.2.1) H2S STB should be 0.5 ppb or
less before proceeding.
8. Record the stable H2S concentration
9. Divide the H2S concentration by the SO2 concentration
EXAMPLE: If the SO2 and H2S concentration of the two test gases used is
500 ppb:
Measured SO2 concentration = 499.1 ppb
Measured H2S concentration = 490.3 ppb
07266B DCN6485
Model T101 Instruction Manual Instrument Maintenance
207
Converter Efficiency = 490.3 ÷ 499.1
Converter Efficiency = 0.982 (98.2%)
10. It is recommended that the H2S SO2 converter catalyst material be
replaced if the converter efficiency falls below 96% or whatever efficiency
rating is specified by local regulatory requirements.
8.3.5.3. Changing the H2S SO2 Converter Catalyst Material
The H2S SO2 converter is located in the center of the instrument, see Figure 3-5 for
location, and Figure 8-3 for the assembly. The converter is designed for replacement of
the cartridge only; the heater with built-in thermocouple can be reused.
Turn off the analyzer power, remove the cover and allow the converter to
cool.
Remove the top lid of the converter as well as the top layers of the
insulation until the converter cartridge can be seen.
CAUTION
The converter operates at 315º C. Severe burns can result if the
assembly is not allowed to cool. Do not handle the assembly until it is at
room temperature. This may take several hours.
Remove the tube fittings from the converter.
Disconnect the power and the thermocouple of the converter. Unscrew
the grounding clamp of the power leads with a Phillips-head screw driver.
Remove the converter assembly (cartridge and band heater) from the
can. Make a note of the orientation of the tubes relative to the heater
cartridge.
Unscrew the band heater and loosen it, take out the old converter
cartridge.
07266B DCN6485
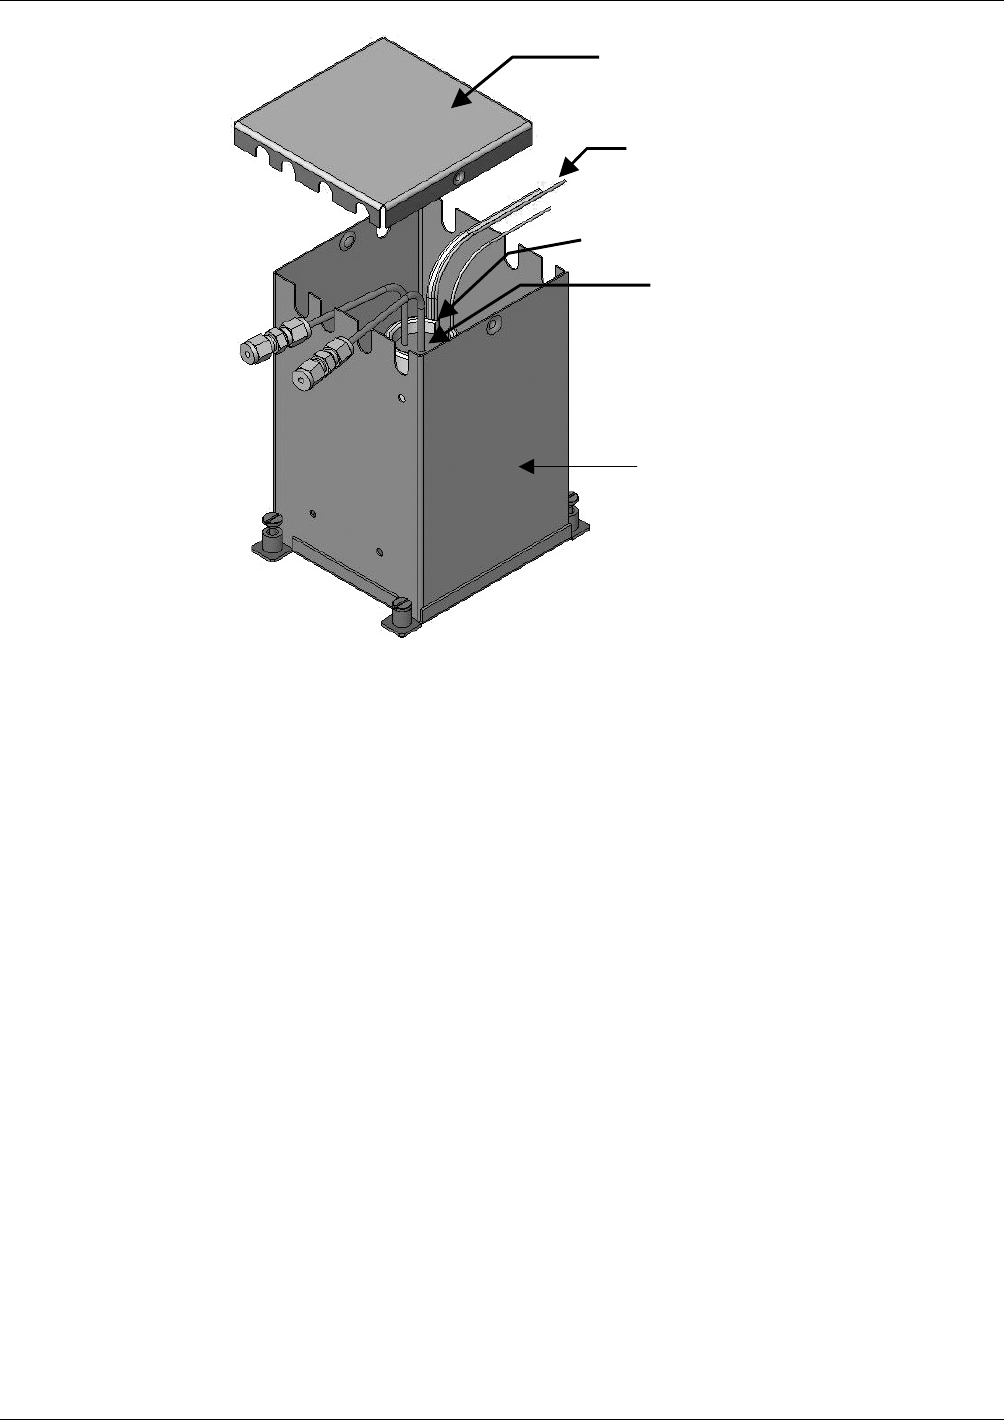
Instrument Maintenance Model T101 Instruction Manual
208
Converter
Assembly Cover
Band Heater and
T/C Assembly
H2S SO2
converter
Converter
Assembly Housing
Band Heater
Power LEads
Figure 8-3. H2S - SO2 Converter Assembly
Wrap the band heater around the new replacement cartridge and tighten
the screws using a high-temperature anti-seize agent such as copper
paste. Make sure to use proper alignment of the heater with respect to
the converter tubes.
Replace the converter assembly, route the cables through the holes in
the housing and reconnect them properly. Reconnect the grounding
clamp around the heater leads for safe operation.
Re-attach the tube fittings to the converter and replace the insulation
and cover.
Replace the instrument cover and power up the analyzer.
07266B DCN6485

Model T101 Instruction Manual Instrument Maintenance
209
8.3.6. CHECKING FOR LIGHT LEAKS
When re-assembled or operated improperly, the T101 can develop small leaks around
the PMT, which let stray light from the analyzer surrounding into the PMT housing. To
find such light leaks, follow the procedures below.
CAUTION
This procedure can only be carried out with the analyzer running
and its cover removed. This procedure should only be carried out by
qualified personnel.
1. Scroll the TEST functions to PMT.
2. Supply zero gas to the analyzer.
3. With the instrument still running, carefully remove the analyzer cover.
Take extra care not to touch any of the inside wiring with the metal cover
or your body. Do not drop screws or tools into a running analyzer!
4. Shine a powerful flashlight or portable incandescent light at the inlet and
outlet fitting and at all of the joints of the sample chamber as well as
around the PMT housing. The PMT value should not respond to the light,
the PMT signal should remain steady within its usual noise.
5. If there is a PMT response to the external light, symmetrically tighten the
sample chamber mounting screws or replace the 1/4” vacuum tubing
with new, black PTFE tubing (this tubing will fade with time and become
transparent). Often, light leaks are also caused by O-rings being left out
of the assembly.
6. Carefully replace the analyzer cover.
7. If tubing or O-rings were changed, carry out a leak check (Section
9.5.1).
8.3.7. CHANGING THE CRITICAL FLOW ORIFICE
A critical flow orifice, located on the exhaust manifold maintains the proper flow rate of
gas through the T101 analyzer. Refer to section 10.3.3.1 for a detailed description of its
functionality and location. Despite the fact this device is protected by sintered stainless
steel filters, it can, on occasion, clog, particularly if the instrument is operated without a
sample filter or in an environment with very fine, sub-micron particle-size dust.
1. Turn off power to the instrument and vacuum pump.
2. Locate the critical flow orifice on the pressure sensor assembly (called
out in Figure 8-4).
3. Disconnect the pneumatic line.
4. Unscrew the NPT fitting.
07266B DCN6485
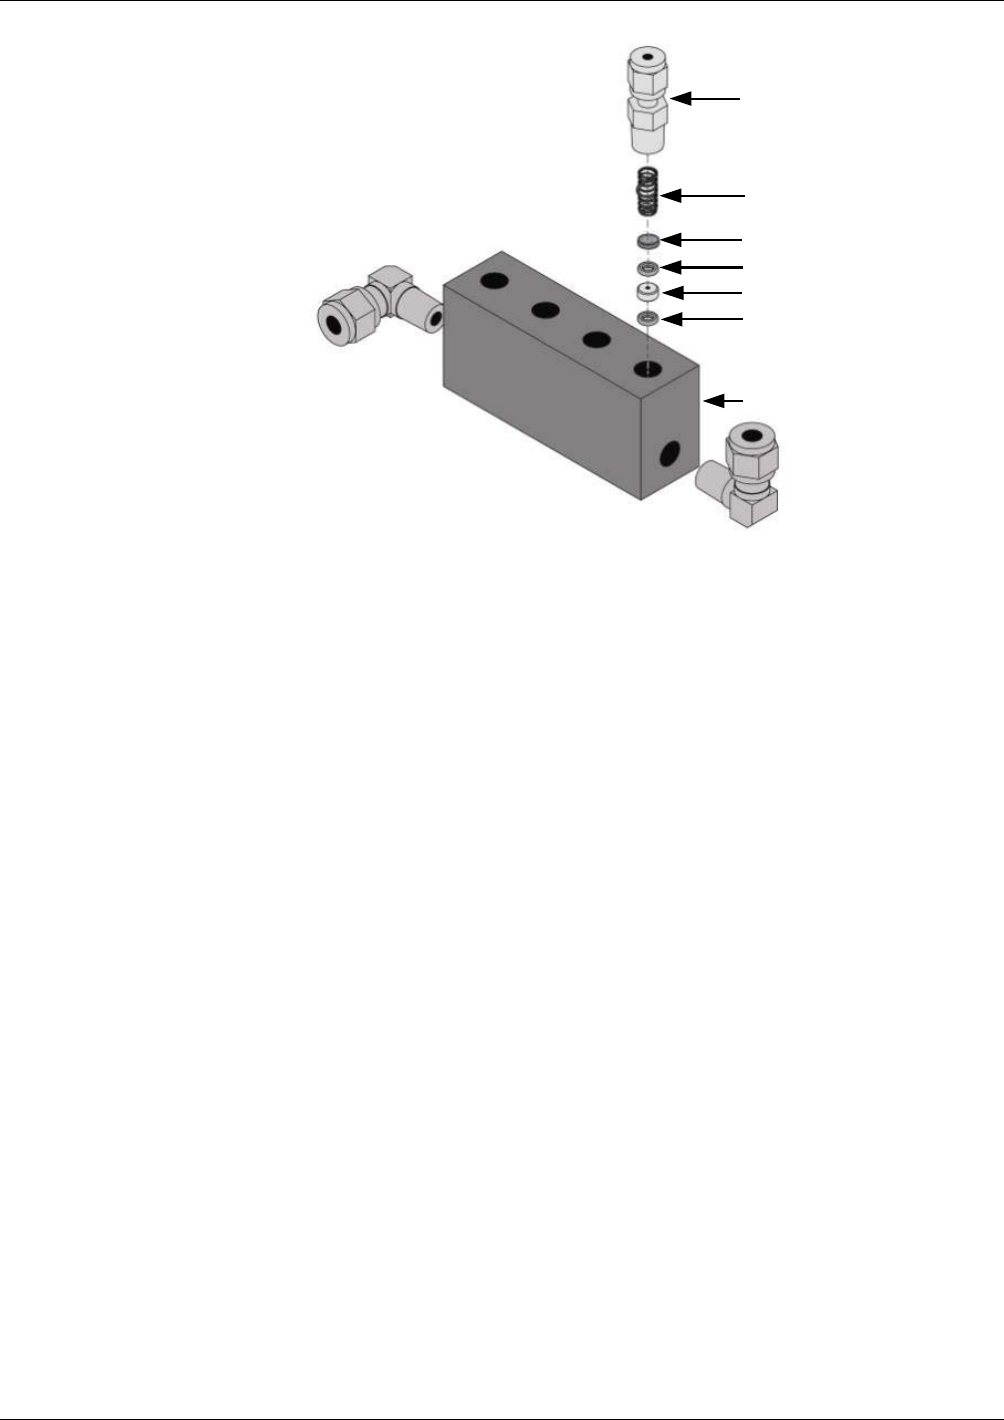
Instrument Maintenance Model T101 Instruction Manual
210
Gas Line fitting
Spring
Sintered Filter
O-Ring
Critical Flow Orifice
O-Ring
Vacuum Manifold
Figure 8-4. Critical Flow Orifice Assembly
5. Take out the components of the assembly: a spring, a sintered filter, two
O-rings and the critical flow orifice.
You may need to use a scribe or pressure from the vacuum port to get the parts out
of the manifold.
6. Discard the two O-rings and the sintered filter.
7. Replace the critical flow orifice.
8. Let the part dry.
9. Re-assemble the parts as shown in Figure 8-4 using a new filter and o-
rings.
10. Reinstall the NPT fitting and connect all tubing.
11. Power up the analyzer and allow it to warm up for 60 minutes.
8. Perform a leak check (refer to Section 9.5).
07266B DCN6485
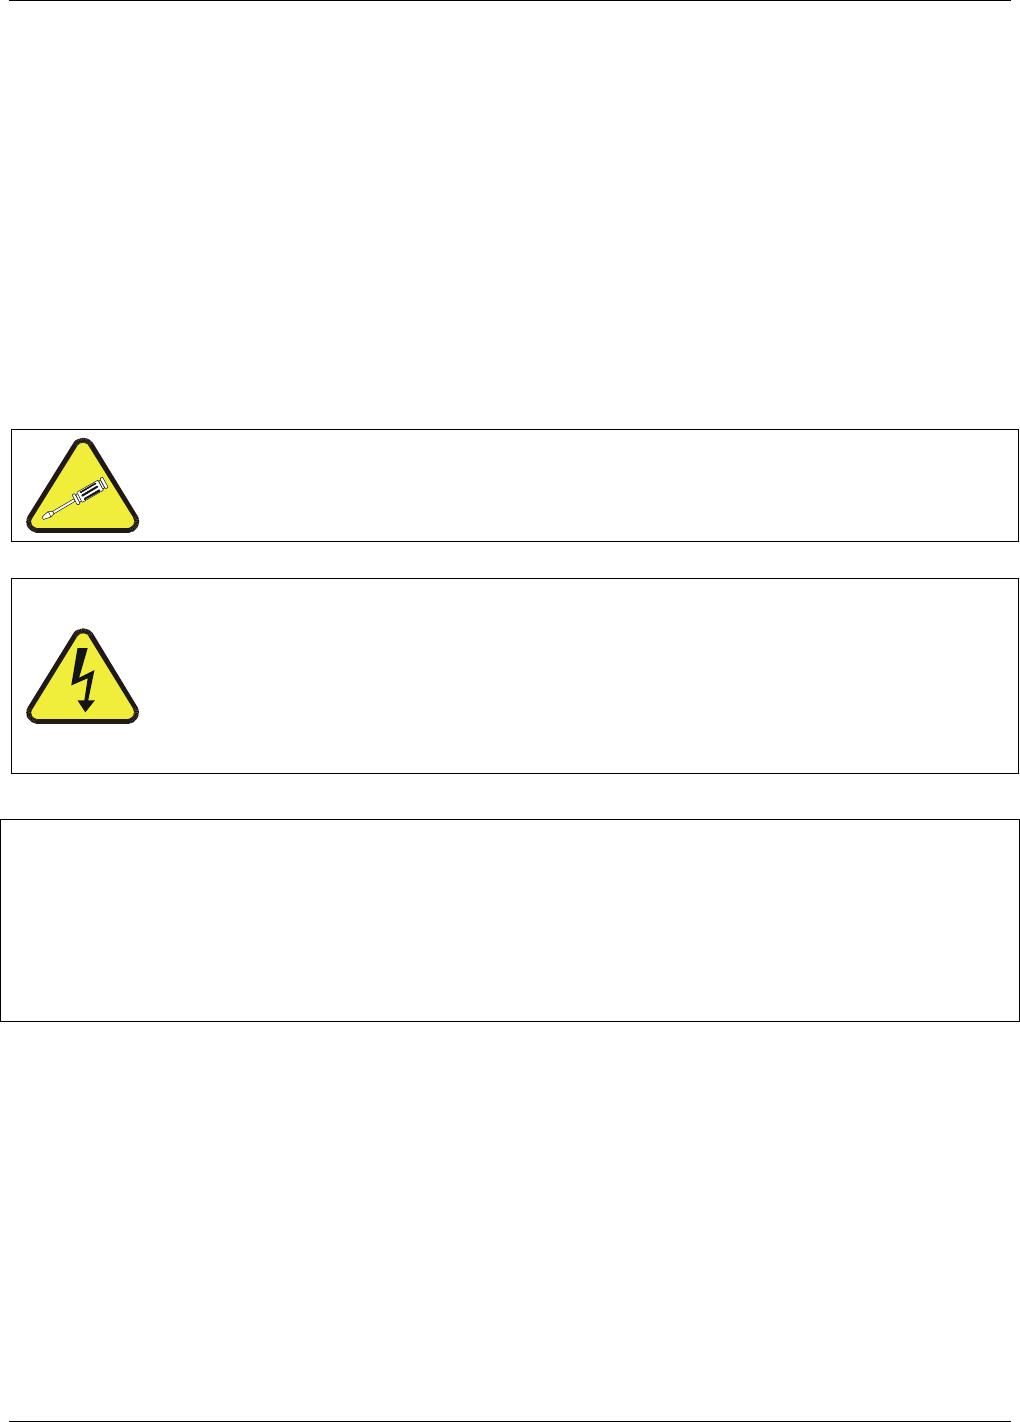
Model T101 Instruction Manual Troubleshooting & Service
211
9. TROUBLESHOOTING & SERVICE
This section contains a variety of methods for identifying and solving performance
problems with the analyzer.
CAUTION
The operations outlined in this Section must be performed by qualified
maintenance personnel only.
CAUTION
Risk of electrical shock. Some operations need to be carried out with the
analyzer open and running. Exercise caution to avoid electrical shocks and
electrostatic or mechanical damage to the analyzer. Do not drop tools into
the analyzer or leave those after your procedures. Do not shorten or touch
electric connections with metallic tools while operating inside the
analyzer. Use common sense when operating inside a running analyzer.
NOTE
The front panel of the analyzer is hinged at the bottom and may be opened to gain
access to various components mounted on the panel itself or located near the front of
the instrument (such as the particulate filter).
A locking screw located at the top center of the panel and two fasteners located in the
upper right and left corners of the panel lock it shut (Figure 3-9).
9.1. GENERAL TROUBLESHOOTING
The analyzer has been designed so that problems can be rapidly detected, evaluated and
repaired. During operation, the analyzer continuously performs diagnostic tests and
provides the ability to evaluate its key operating parameters without disturbing
monitoring operations.
A systematic approach to troubleshooting will generally consist of the following five
steps:
Note any warning messages and take corrective action as necessary.
07266B DCN6485

Troubleshooting & Service Model T101 Instruction Manual
212
Examine the values of all TEST functions and compare them to factory
values. Note any major deviations from the factory values and take
corrective action.
Use the internal electronic status LED’s to determine whether the
electronic communication channels are operating properly. Verify that the
DC power supplies are operating properly by checking the voltage test
points on the relay board. Note that the analyzer’s DC power wiring is
color-coded and these colors match the color of the corresponding test
points on the relay board.
Suspect a leak first! Technical Support data indicate that half of all
problems are eventually traced to leaks in the pneumatic system of the
analyzer, the source of zero air or span gases or the sample gas delivery
system. Check for gas flow problems such as clogged or blocked
internal/external gas lines, damaged seals, punctured gas lines, a
damaged pump diaphragm, etc.
Follow the procedures defined in Section 9.5 for confirming that the
analyzer’s basic components are working (power supplies, CPU, relay
board, keyboard, PMT cooler, etc.). See Figure 3-8 for general layout of
components and sub-assemblies in the analyzer. See the wiring
interconnect drawing and interconnect list, see Appendix D.
9.1.1. FAULT DIAGNOSIS WITH WARNING MESSAGES
The most common and/or serious instrument failures will result in a warning message
displayed on the front panel. Table 11-1 contains a list of warning messages, along with
a list of possible faults that might be responsible for the warning condition.
It should be noted that if more than two or three warning messages occur at the same
time, it is often an indication that some fundamental analyzer sub-system (power supply,
relay board, motherboard) has failed rather than an indication of the specific failures
referenced by the warnings. In this case, a combined-error analysis needs to be
performed.
The analyzer will alert the user that a warning is active by flashing the FAULT LED and
displaying the Warning message in the Param field along with the CLR button (press to
clear Warning message). The MSG button displays if there is more than one warning in
queue or if you are in the TEST menu and have not yet cleared the message. The
following display/touchscreen examples provide an illustration of each:
07266B DCN6485
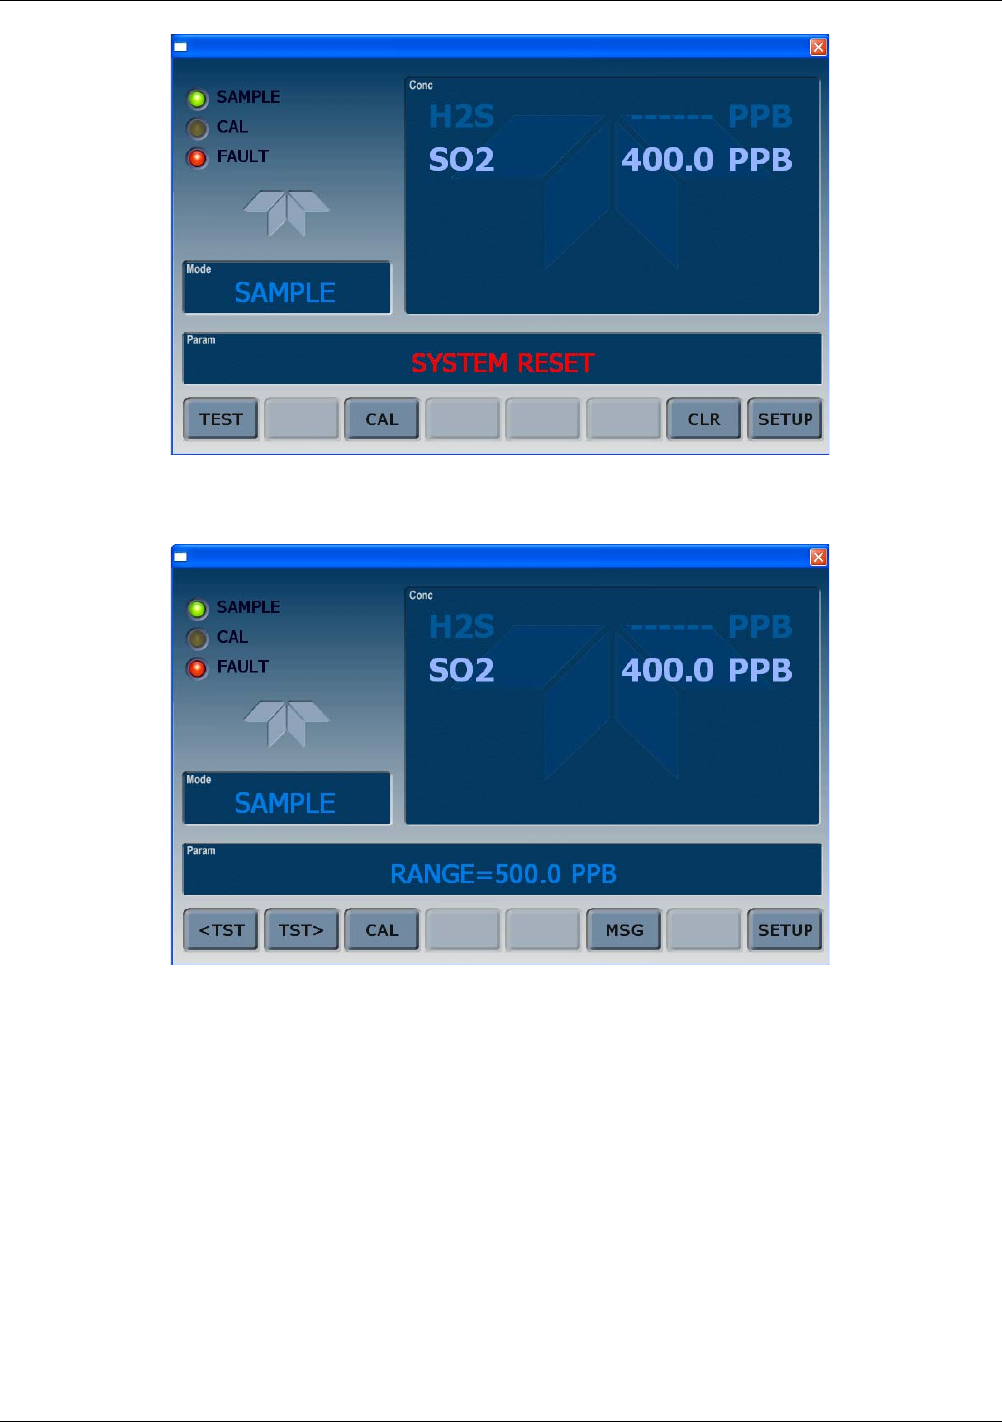
Model T101 Instruction Manual Troubleshooting & Service
213
(Fault LED lit, warning msg in Param field, CLR button active)
(Fault LED lit, Test menu active, MSG button replaces CLR button)
The analyzer also issues a message to the serial port(s).
07266B DCN6485
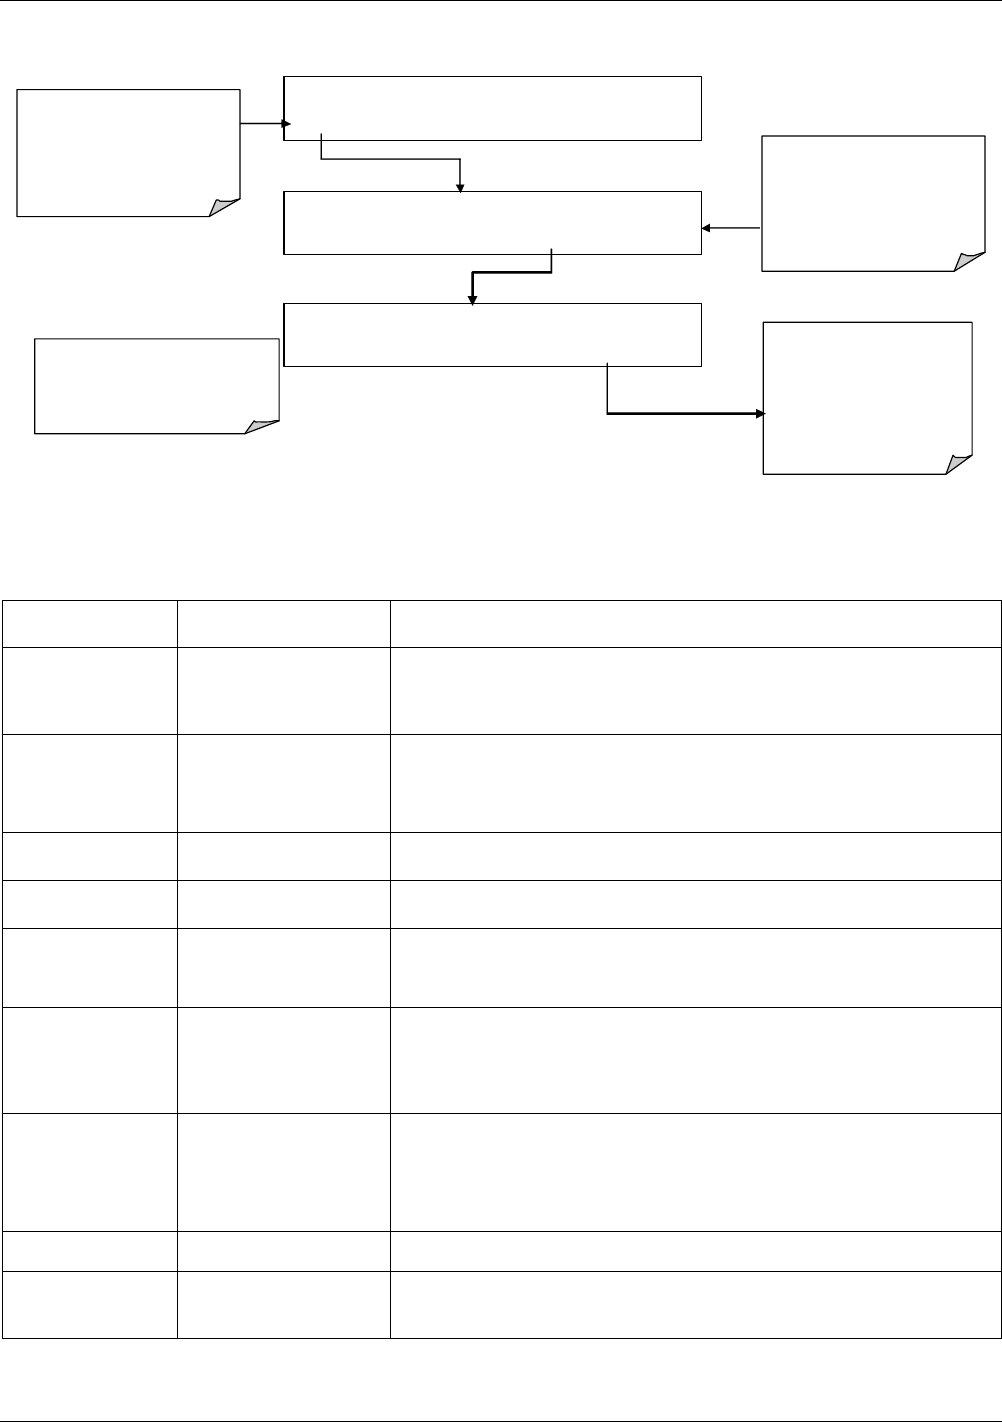
Troubleshooting & Service Model T101 Instruction Manual
214
To view or clear a warning message press:
SAMPLE SYSTEM RESET H2S = XXX.X
TEST CAL MSG CLR SETUP
If warning messages re-appear,
the cause needs to be found. Do
not repeatedly clear warnings
without corrective action.
Press CLR to clear the current
warning message.
If more than one warning is
active, the next message will
take its place.
Once the last warning has been
cleared, the analyzer returns to
SAMPLE Mode.
SAMPLE RANGE=500 PPB H2S = XXX.X
< TST TST > CAL MSG CLR SETUP
SAMPLE SYSTEM RESET H2S = X XX.X
< TST TST > CAL MSG CLR SETUP
In WARNING mode, <TST TST>
buttons replaced with TEST
buttom. Pressing TEST switches
to SAMPLE mode and hides
warning messages until new
wa rning(s) are activated.
MSG indicates that one or more
warning message are active but
hidden. Pressing MSG cycles
through warnings
In SAMPLE m ode, all warning
messages are hidden, but MSG
button appears
Figure 9-1. Viewing and Clearing Warning Messages
Table 9-1. Warning Messages - Indicated Failures
WARNING
MESSAGE FAULT CONDITION POSSIBLE CAUSES
ANALOG CAL
WARNING The instrument’s A/D
circuitry or one of its
analog outputs is not
calibrated
A parameter for one of the analog outputs has been changed and the
calibration routine was not re-run
A/D circuitry failure on motherboard
Other motherboard electro9nic failure
BOX TEMP
WARNING
Box Temp is < 5 °C or
> 48 °C.
NOTE: Box temperature typically runs ~7oc warmer than ambient
temperature.
Poor/blocked ventilation to the analyzer.
Stopped exhaust-fan
Ambient temperature outside of specified range
CANNOT DYN
SPAN
Dynamic Span
operation failed
Measured concentration value is too high or low.
Concentration slope value to high or too low
CANNOT DYN
ZERO
Dynamic Zero
operation failed
Measured concentration value is too high.
Concentration offset value to high.
CONFIG
INITIALIZED
Configuration and
Calibration data reset
to original Factory
state.
Failed disk on module
User erased data
CONV TEMP
WARNING
The temperature of the
H2S SO2 catalytic
converter is outside its
optimal operating
range.
Bad converter heater
Bad converter temperature sensor
Bad relay controlling the converter heater
Entire relay board is malfunctioning
I2C buss malfunction
DARK CAL
WARNING The Dark Cal signal is
higher than 100 mV.
Light leak in reaction cell
Shutter solenoid is not functioning
Failed relay board
I2C bus failure
Loose connector/wiring
PMT preamp board bad or out of cal
DATA
INITIALIZED Data Storage in DAS
was erased
Failed disk on module
User cleared data
HVPS WARNING High voltage power
supply output is <400
V or >900 V
High voltage power supply is bad
High voltage power supply is out of cal
A/D converter circuitry is bad
07266B DCN6485

Model T101 Instruction Manual Troubleshooting & Service
215
WARNING
MESSAGE FAULT CONDITION POSSIBLE CAUSES
IZS TEMP
WARNING On units with IZS
options installed: The
permeation tube
temperature is Sample
chamber temperature
is
< 45°C or > 55°C
Bad IZS heater
Bad IZS temperature sensor
Bad relay controlling the IZS heater
Entire relay board is malfunctioning
I2C buss malfunction
Failure of thermistor interface circuitry on motherboard
PMT DET
WARNING PMT detector output is
> 4995 mV
Failed PMT
Malfunctioning PMR preamp board
A/D converter circuitry failure
PMT TEMP
WARNING PMT temperature is
Sample chamber
temperature is
< 2°C or > 12°C
Bad PMT thermo-electric cooler
Failed PMT TEC driver circuit
Bad PMT preamp board
Failed PMT temperature sensor
Loose wiring between PMT temperature sensor and PMT Preamp board
Malfunction of analog sensor input circuitry on motherboard
RCELL TEMP
WARNING Sample chamber
temperature is
< 45°C or > 55°C
Bad reaction cell heater
Bad reaction cell temperature sensor
Bad relay controlling the reaction cell heater
Entire relay board is malfunctioning
I2C buss malfunction
Warning
Message Fault Condition Possible Causes
REAR BOARD
NOT DET Mother Board not
detected on power up.
Warning only appears on serial I/O com port(s)
Front panel display will be frozen, blank or will not respond.
Massive failure of mother board.
Relay BOARD
WARN The CPU cannot
communicate with the
Relay Board.
I2C buss failure
Failed relay board
Loose connectors/wiring
SAMPLE FLOW
WARN Sample flow rate is <
500 cc/min or > 1000
cc/min.
Failed sample pump
Blocked sample inlet/gas line
Dirty particulate filter
Leak downstream of critical flow orifice
Failed flow sensor/circuitry
SAMPLE PRES
WARN Sample Pressure is <10
in-Hg or
> 35 in-Hg1
If sample pressure is < 10 in-hg:
o Blocked particulate filter
o Blocked sample inlet/gas line
o Failed pressure sensor/circuitry
If sample pressure is > 35 in-hg:
o Blocked vent line on pressurized sample/zero/span gas supply
o Bad pressure sensor/circuitry
SYSTEM RESET The computer has
rebooted.
This message occurs at power on.
If it is confirmed that power has not been interrupted:
Failed +5 VDC power,
Fatal error caused software to restart
Loose connector/wiring
UV LAMP
WARNING The UV lamp intensity is
< 600mV or > 4995 mV
UV lamp is bad
Reference detector is bad
Motherboard analog sensor input circuitry has failed.
Fogged or damaged lenses/filters in UV light path
A/D converter circuitry failure
1 Normally 29.92 in-Hg at sea level decreasing at 1 in-Hg per 1000 ft of altitude
(with no flow – pump disconnected).
07266B DCN6485

Troubleshooting & Service Model T101 Instruction Manual
216
9.1.2. FAULT DIAGNOSIS WITH TEST FUNCTIONS
Besides being useful as predictive diagnostic tools, the TEST functions, viewable from
the front panel, can be used to isolate and identify many operational problems when
combined with a thorough understanding of the analyzer’s theory of operation (Section
10). We recommend use of the APICOM remote control program to download, graph
and archive TEST data for analysis, and long-term monitoring of diagnostic data.
The acceptable ranges for these test functions are listed in Table A-3 in Appendix A-3.
The actual values for these test functions on checkout at the factory were also listed in
the Final Test and Validation Data Sheet, which was shipped with the instrument.
Values outside the acceptable ranges indicate a failure of one or more of the analyzer’s
subsystems. Functions with values that are within the acceptable range but have
significantly changed from the measurements recorded on the factory data sheet may
also indicate a failure or a maintenance item. A problem report worksheet has been
provided in Appendix C to assist in recording the value of these test functions. The
following table (Table 9-2) contains some of the more common causes for these values
to be out of range.
Table 9-2. Test Functions - Possible Causes for Out-Of-Range Values
TEST FUNCTION INDICATED FAILURE(S)
H2S STB1 Unstable concentrations; leaks
SAMPLE FL Leaks; clogged critical flow orifice
PMT Calibration error; HVPS problem; PMT problem; No flow (leaks)
NORM PMT Calibration error; HVPS problem; PMT problem
HVPS HVPS broken; preamp board circuit problems
RCELL TEMP Malfunctioning heater; relay board communication (I2C bus); relay
burnt out
BOX TEMP Environment out of temperature operating range; broken
thermistor; runaway heater
PMT TEMP TEC cooling circuit broken; High chassis temperature; 12V power
supply
IZS TEMP
(OPTION) Malfunctioning heater; relay board communication (I2C bus); relay
burnt out
CONV TEMP Malfunctioning heater or temperature sensor; relay board
communication (I2C bus); relay burnt out
PRESS Leak; malfunctioning valve; malfunctioning pump; clogged flow
orifices; sample inlet overpressure;
H2S SLOPE1 Calibration error; span gas concentration incorrect; leaks; low lamp
output
H2S OFFS1 Incorrect span gas concentration/contaminated zero air/leak; low-
level calibration off
TIME OF DAY Internal clock drifting; move across time zones; daylight savings
time?
1 Shown as they appear when analyzer is in H2S mode. In SO2 mode appear as SO2 STB,
SO2 OFFS & SO2 SLOPE. In multigas mode, both versions appear.
07266B DCN6485

Model T101 Instruction Manual Troubleshooting & Service
217
9.1.3. USING THE DIAGNOSTIC SIGNAL I/O FUNCTION
The signal I/O parameters found under the diagnostics (DIAG) menu combined with a
thorough understanding of the instrument’s theory of operation (Section 10) are useful
for troubleshooting in three ways:
The technician can view the raw, unprocessed signal level of the
analyzer’s critical inputs and outputs.
All of the components and functions that are normally under instrument
control can be manually changed.
Analog and digital output signals can be manually controlled.
This allows the user to systematically observe the effect of these functions on the
operation of the analyzer.
Figure 9-2 shows an example of how to use the signal I/O menu to view the raw voltage
of an input signal or to control the state of an output voltage or control signal. The
specific parameter will vary depending on the situation. Please note that the analyzer
will freeze it’s concentration output while in the diagnostic signal I/O menu. This is
because manually changing I/O outputs can invalidate the instrument reading.
07266B DCN6485
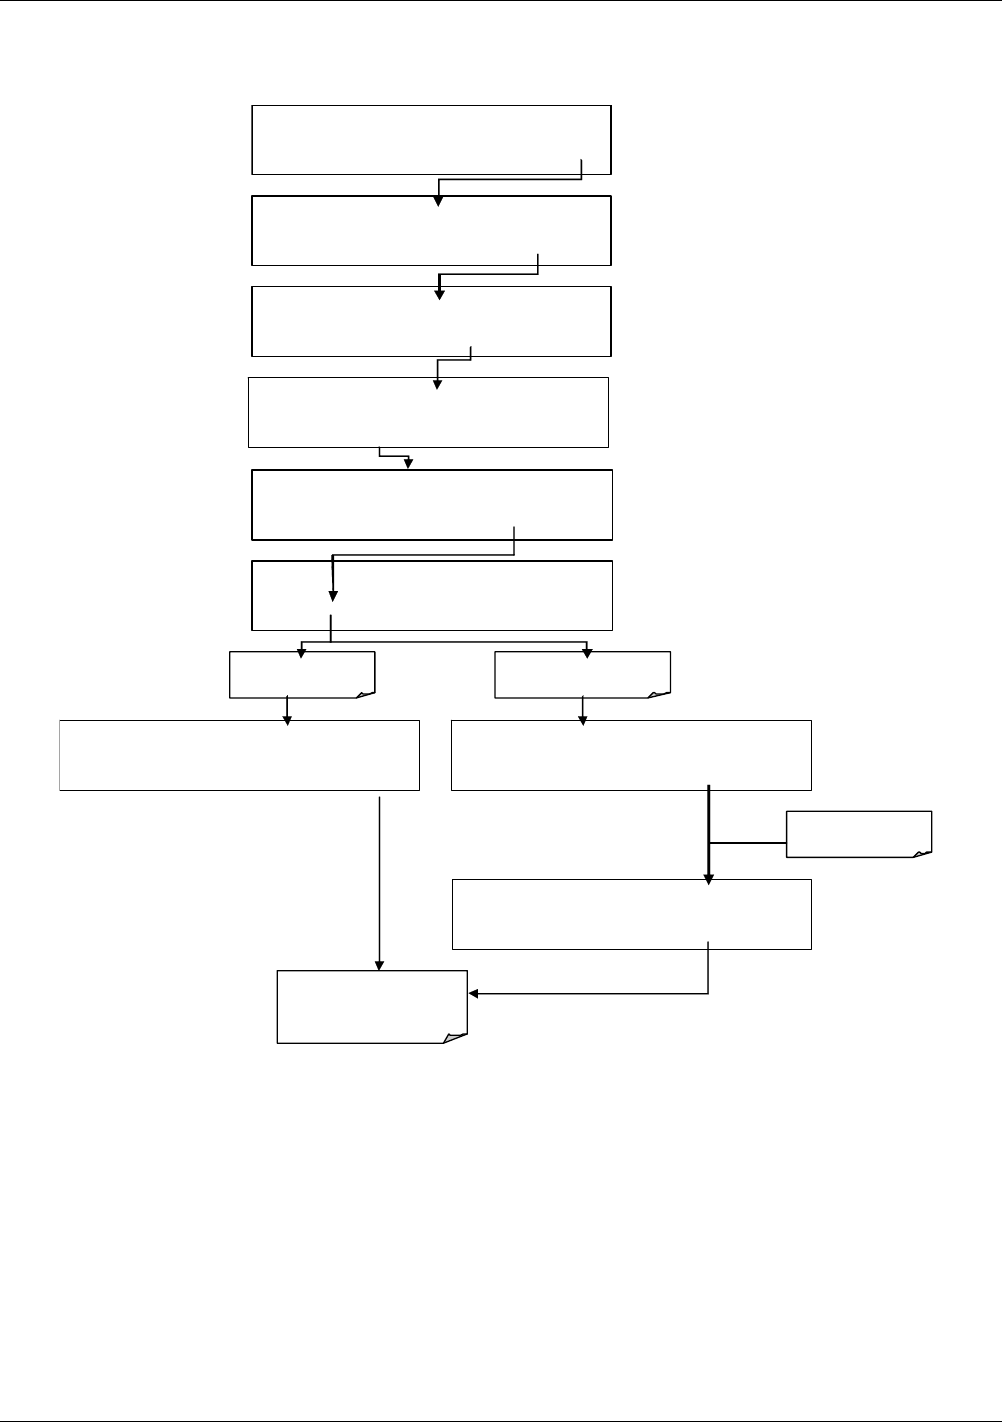
Troubleshooting & Service Model T101 Instruction Manual
218
Toggles parameter
ON/OFF
Exit returns to
DIAG display & all values
return to software control
DIAG SIGNAL I/O
PREV NEXT ENTR EXIT
DIAG I/O 0 ) EXT_ZERO_CAL=ON
PREV NEXT JUMP PRNT EXIT
DIAG I/O 23) ST H2S_MODE=ON
PREV NEXT JUMP ON PRNT EXIT
D IAG I/O 3 7) SAMPLE_PR ESSURE=600 0.0 MV
PREV NEXT JUMP PRNT EXIT
DIAG I/O 23) ST H2S_MODE OFF
PREV NEXT JUMP OFF PRNT EXIT
If parameter is an
in pu t signal
If parameter is an output
signal or control
SETUP X.X SECONDARY SETUP MENU
COMM VARS DIAG EX IT
SAMPLE ENTER SETUP PASS : 818
8 1 8 ENTR EXIT
SETUP X.X PRIMARY SETUP MENU
CFG DAS RNGE PASS CLK MORE EXIT
SAMPLE RANGE = 500.0 PPB H2S =XXX.X
< TST TST > CAL SETUP
Figure 9-2. Example of Signal I/O Function
9.1.4. STATUS LEDS
Several color-coded, light-emitting diodes (LEDs) are located inside the instrument to
determine if the analyzer’s CPU, I2C communications bus and relay board are
functioning properly.
07266B DCN6485
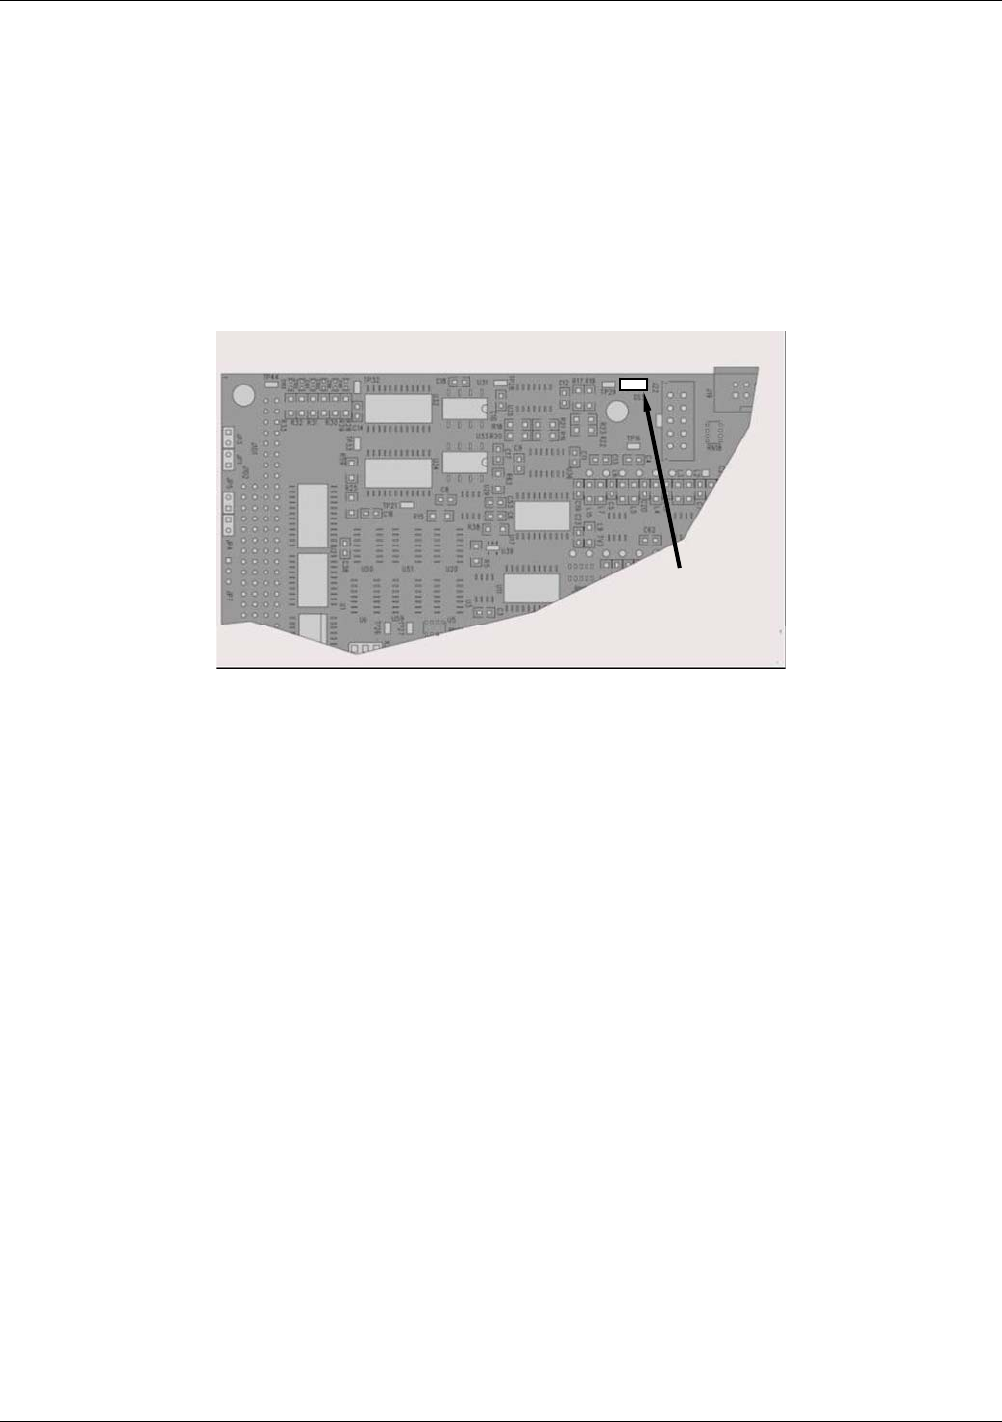
Model T101 Instruction Manual Troubleshooting & Service
219
9.1.4.1. Motherboard Status Indicator (Watchdog)
DS5, a red LED on the upper portion of the motherboard, just to the right of the CPU
board, flashes when the CPU is running the main program. After power-up, DS5 should
flash on and off about once per second. If characters are written to the front panel
display but DS5 does not flash then the program files have become corrupted. Contact
Technical Support because it may be possible to recover operation of the analyzer. If, 30
- 60 seconds after a restart, DS5 is not flashing and no characters have been written to
the front panel display, the firmware may be corrupted or the CPU may be defective. If
DS5 is permanently off or permanently on, the CPU board is likely locked up and the
analyzer should not respond (either with locked-up or dark front panel).
Motherboard
CPU Status LED
Figure 9-3. CPU Status Indicator
9.1.4.2. CPU Status Indicator
The CPU board has two red LEDs. LED1 is the upper-most LED and is a +5V power
indicator, so it should always be on. However, both CPU LEDs only indicate if the CPU
is powered up properly and generally working. The lower LED will sometimes be
stable, and sometimes will blink. It can continue to blink even if the CPU or firmware
are locked up, and is not an effective indicator for debugging system problems.
9.1.4.3. Relay Board Status LEDs
The most important status LED on the relay board is the red I2C Bus watch-dog LED,
labeled D1 (or W/D), which indicates the health of the I2C communications bus. This
LED is located in the upper left-hand corner of the relay board when looking at the
electronic components. If D1 is blinking, then the other LED’s can be used in
conjunction with the DIAG menu I/O functions to test hardware functionality by
switching devices on and off and watching the corresponding LED go on or off. The
LED only indicates that the logic signal for an output has been activated. If the output
driver (i.e. the relay or valve driver IC) is defective, then the LED will light up, but the
attached peripheral device will not turn on.
07266B DCN6485

Troubleshooting & Service Model T101 Instruction Manual
220
Table 9-3. Relay Board Status LEDs
LED COLOR FUNCTION FAULT
STATUS INDICATED FAILURE(S)
D1 red Watchdog Circuit; I2C bus
operation.
Continuously
ON or OFF
Failed or halted CPU; faulty
motherboard, keyboard, relay board;
wiring between motherboard, keyboard
or relay board; +5 V power supply.
D2 yellow Relay 0 - sample chamber
heater
Continuously
ON or OFF
Heater broken, thermistor broken
D3 yellow Relay 1 – H2S converter
heater
Continuously
ON or OFF
Heater broken, thermocouple broken
D41 yellow Spare N/A N/A
D5 yellow Relay 3 - IZS heater Continuously
ON or OFF
Heater broken, thermistor broken
D6 yellow Relay 4 - Spare N/A N/A
D72 green Valve 0 - zero/span valve
status
Continuously
ON or OFF
Valve broken or stuck, valve driver chip
broken
D82 green Valve 1 - sample/cal valve
status
Continuously
ON or OFF
Valve broken or stuck, valve driver chip
broken
D9 green Valve 2 - auto-zero valve
status
Continuously
ON or OFF
Valve broken or stuck, valve driver chip
broken
D10 green Valve 3 - SO/SOx valve
status
Continuously
ON or OFF
Valve broken or stuck, valve driver chip
broken
D11 green Valve 4 - Spare N/A N/A
D12 green Valve 5 - Spare N/A N/A
D13 green Valve 6 - Spare N/A N/A
D14 green Valve 7 - Spare N/A N/A
D15 green Mosfet1-Unused N/A N/A
D16 Green Mosfet2-Unused N/A N/A
1 Special configurations only
2 Only active for instruments with Z/S valve or IZS options installed
9.2. GAS FLOW PROBLEMS
The standard T101 has one main flow path. With the IZS option installed, there is a
second flow path flow path through the IZS oven that runs whenever the IZS is on
standby to purge H2S from the oven chamber. The IZS flow is not measured and is not
available from the front panel. The full flow diagrams of the standard configuration
(Figure 3-10) and with options installed (Figure 3-2 and 5-3) help in trouble-shooting
flow problems. In general, flow problems can be divided into three categories:
Flow is too high
Flow is greater than zero, but is too low, and/or unstable
Flow is zero (no flow)
When troubleshooting flow problems, it is essential to confirm the actual flow rate
without relying on the analyzer’s flow display. The use of an independent, external flow
meter to perform a flow check as described in Section 9.5.2 is essential.
07266B DCN6485

Model T101 Instruction Manual Troubleshooting & Service
221
9.2.1. ZERO OR LOW SAMPLE FLOW
If the pump is operating but the unit reports a 0 gas flow, do the following three steps:
Check for actual sample flow
Check pressure
Carry out a leak check
To check the actual sample flow, disconnect the sample tube from the sample inlet on
the rear panel of the instrument. Make sure that the unit is in basic SAMPLE mode.
Place a finger over the inlet and see if it gets sucked in by the vacuum or, more properly,
use a flow meter to measure the actual flow. If there is proper flow of around 550-650
cm³/min, contact Technical Support. If there is no flow or low flow, continue with the
next step.
Check that the sample pressure is at or around 26 in-Hg-A (about 1” below ambient
atmospheric pressure).
9.2.2. HIGH FLOW
Flows that are significantly higher than the allowed operating range (typically ±10% of
the nominal flow) should not occur in the T101 unless a pressurized sample, zero or
span gas is supplied to the inlet ports. Be sure to vent excess pressure and flow just
before the analyzer inlet ports.
When supplying sample, zero or span gas at ambient pressure, a high flow would
indicate that one or more of the critical flow orifices are physically broken (very
unlikely case), allowing more than nominal flow, or were replaced with an orifice of
wrong specifications. If the flows are more than 15% higher than normal, we
recommend that the technician re-calibrate the flow electronically using the procedure in
Section 4.6.8, followed by a thorough and regular monitoring of these flows to see if the
new setting is retained properly.
9.3. CALIBRATION PROBLEMS
This section presents som possible calibratio, problems and suggested solutions.
9.3.1. NEGATIVE CONCENTRATIONS
Negative concentration values can be caused for several things:
A slight, negative signal is normal when the analyzer is operating under
zero gas and the signal is drifting around the zero calibration point. This
is caused by the analyzer’s zero noise and may cause reported
concentrations to be negative for a few seconds at a time down to -20
ppb, but should alternate with similarly high, positive values.
Mis-calibration is the most likely explanation for negative concentration
values. If the zero air contained some H2S gas (contaminated zero air or
a worn-out zero air scrubber) and the analyzer was calibrated to that
concentration as “zero”, the analyzer may report negative values when
measuring air that contains little or no H2S. The same problem occurs, if
the analyzer was zero-calibrated using ambient air or span gas.
07266B DCN6485

Troubleshooting & Service Model T101 Instruction Manual
222
If the response offset test function for H2S (H2S OFFS) are greater than
150 mV, a failed PMT or high voltage supply, or sample chamber
contamination, could be the cause. Clean the sample chamber according
to Section 8.3.6.
9.3.2. NO RESPONSE
If the instrument shows no response (display value is near zero) even though sample gas
is supplied properly and the instrument seems to perform correctly,
Confirm response by supplying H2S span gas of about 80% of the range
value to the analyzer.
Check the sample flow rate for proper value.
Check for disconnected cables to the sensor module.
Carry out an electrical test with the ELECTRICAL TEST (ETEST)
procedure in the diagnostics menu, see Section 4.6.5. If this test
produces a concentration reading, the analyzer’s electronic signal path is
working.
Carry out an optical test using the OPTIC TEST (OTEST) procedure in
the diagnostics menu, see Section 4.6.4. If this test results in a
concentration signal, then the PMT sensor and the electronic signal path
are operating properly. If the T101 passes both ETEST and OTEST, the
instrument is capable of detecting light and processing the signal to
produce a reading. Therefore, the problem must be in the pneumatics,
optics or the UV lamp/lamp driver.
9.3.3. UNSTABLE ZERO AND SPAN
Leaks in the T101 or in the external gas supply and vacuum systems are the most
common source of unstable and non-repeatable concentration readings.
Check for leaks in the pneumatic systems as described in Section 9.5.1.
Consider pneumatic components in the gas delivery system outside the
T101 such as a change in zero air source (ambient air leaking into zero
air line or a worn-out zero air scrubber) or a change in the span gas
concentration due to zero air or ambient air leaking into the span gas
line.
Once the instrument passes a leak check, do a flow check (Section 9.5.2)
to make sure that the instrument is supplied with adequate sample gas.
Confirm the UV lamp, sample pressure and sample temperature readings
are correct and steady.
Verify that the sample filter element is clean and does not need to be
replaced.
9.3.4. INABILITY TO SPAN - NO SPAN BUTTON
In general, the T101 will not display certain keyboard choices whenever the actual value
of a parameter is outside of the expected range for that parameter. If the calibration
menu does not show a SPAN button when carrying out a span calibration, the actual
concentration must be outside of the range of the expected span gas concentration,
which can have several reasons.
07266B DCN6485

Model T101 Instruction Manual Troubleshooting & Service
223
Verify that the expected concentration is set properly to the actual span
gas concentration in the CONC sub-menu.
Confirm that the H2S span gas source is accurate. This can be done by
comparing the source with another calibrated analyzer, or by having the
H2S source verified by an independent traceable photometer.
Check for leaks in the pneumatic systems as described in Section 9.5.1.
Leaks can dilute the span gas and, hence, the concentration that the
analyzer measures may fall short of the expected concentration defined
in the CONC sub-menu.
If the physical, low-level calibration has drifted (changed PMT response)
or was accidentally altered by the user, a low-level calibration may be
necessary to get the analyzer back into its proper range of expected
values. One possible indicator of this scenario is a slope or offset value
that is outside of its allowed range (0.7-1.3 for slope, -20 to 150 for
offsets). See Section 9.6.4 on how to carry out a low-level hardware
calibration.
9.3.5. INABILITY TO ZERO - NO ZERO BUTTON
In general, the T101 will not display certain keyboard choices whenever the actual value
of a parameter is outside of the expected range for that parameter. If the calibration
menu does not show a ZERO button when carrying out a zero calibration, the actual gas
concentration must be significantly different from the actual zero point (as per last
calibration), which can have several reasons.
Confirm that there is a good source of zero air. If the IZS option is
installed, compare the zero reading from the IZS zero air source to an
external zero air source using H2S and SO2 free air. Check the zero air
scrubber for performance. It may need to be replaced (Section 8.3.3).
Check to make sure that there is no ambient air leaking into the zero air
line. Check for leaks in the pneumatic systems as described in Section
9.5.
9.3.6. NON-LINEAR RESPONSE
The T101 was factory calibrated to a high level of H2S and should be linear to within
1% of full scale. Common causes for non-linearity are
Leaks in the pneumatic system. Leaks can add a constant of ambient air,
zero air or span gas to the current sample gas stream, which may be
changing in concentrations as the linearity test is performed. Check for
leaks as described in Section 9.5.
The calibration device is in error. Check flow rates and concentrations,
particularly when using low concentrations. If a mass flow calibrator is
used and the flow is less than 10% of the full scale flow on either flow
controller, you may need to purchase lower concentration standards.
The standard gases may be mislabeled as to type or concentration.
Labeled concentrations may be outside the certified tolerance.
The sample delivery system may be contaminated. Check for dirt in the
sample lines or sample chamber.
Calibration gas source may be contaminated.
07266B DCN6485

Troubleshooting & Service Model T101 Instruction Manual
224
Dilution air contains sample or span gas.
Sample inlet may be contaminated with H2S exhaust from this or other
analyzers. Verify proper venting of the pump exhaust.
Span gas overflow is not properly vented and creates a back-pressure on
the sample inlet port. Also, if the span gas is not vented at all and does
not supply enough sample gas, the analyzer may be evacuating the
sample line. Make sure to create and properly vent excess span gas.
If the instrument is equipped with an intern IZS valve option and the H2S
span value is continuously trending downward, the IZS permeation tube
may require replacement
9.3.7. DISCREPANCY BETWEEN ANALOG OUTPUT AND DISPLAY
If the concentration reported through the analog outputs does not agree with the value
reported on the front panel, you may need to re-calibrate the analog outputs. This
becomes more likely when using a low concentration or low analog output range.
Analog outputs running at 0.1 V full scale should always be calibrated manually. See
Section 4.6.3.3. for a detailed description of this procedure.
9.4. OTHER PERFORMANCE PROBLEMS
Dynamic problems (i.e. problems which only manifest themselves when the analyzer is
monitoring sample gas) can be the most difficult and time consuming to isolate and
resolve. The following section provides an itemized list of the most common dynamic
problems with recommended troubleshooting checks and corrective actions.
9.4.1. EXCESSIVE NOISE
Excessive noise levels under normal operation usually indicate leaks in the sample
supply or the analyzer itself. Make sure that the sample or span gas supply is leak-free
and carry out a detailed leak check as described earlier in this chapter.
Another possibility of excessive signal noise may be the preamplifier board, the high
voltage power supply and/or the PMT detector itself. Contact the factory on trouble-
shooting these components.
9.4.2. SLOW RESPONSE
If the analyzer starts responding too slowly to any changes in sample, zero or span gas,
check for the following:
Dirty or plugged sample filter or sample lines.
Sample inlet line is too long.
Dirty or plugged critical flow orifices. Check flows (Section 9.5.2),
pressures (Section 9.5.1) and, if necessary, change the critical flow
orifice (Section 8.3.7).
Wrong materials in contact with sample - use Teflon materials only.
Sample vent line is located too far from the instrument sample inlet and
causes long mixing and purge times. Locate sample inlet (overflow) vent
as close as possible to the analyzer’s sample inlet port.
07266B DCN6485

Model T101 Instruction Manual Troubleshooting & Service
225
Dirty sample chamber. Clean the sample chamber.
Insufficient time allowed for purging of lines upstream of the analyzer.
Insufficient time allowed for H2S calibration gas source to become stable.
9.4.3. THE ANALYZER DOESN’T APPEAR ON THE LAN OR
INTERNET
Most problems related to Internet communications via the Ethernet will be due to
problems external to the analyzer (e.g. bad network wiring or connections, failed routers,
malfunctioning servers, etc.). However, there are several symptoms that indicate the
problem may be with the Ethernet card itself.
If neither of the Ethernet cable’s two status LED’s (located on the back of the cable
connector) is lit while the instrument is connected to a network:
• Verify that the instrument is being connected to an active network jack.
• Check the internal cable connection between the Ethernet card and the
CPU board.
9.5. SUBSYSTEM CHECKOUT
The preceding sections of this manual discussed a variety of methods for identifying
possible sources of failures or performance problems within the analyzer. In most cases
this included a list of possible causes and, in some cases, quick solutions or at least a
pointer to the appropriate sections describing them. This section describes how to
determine if a certain component or subsystem is actually the cause of the problem being
investigated.
9.5.1. DETAILED PRESSURE LEAK CHECK
Obtain a leak checker similar to Teledyne API’s part number 01960, which contains a
small pump, shut-off valve, and pressure gauge to create both over-pressure and
vacuum. Alternatively, a tank of pressurized gas, with the two stage regulator adjusted to
≤ 15 psi, a shutoff valve and pressure gauge may be used.
CAUTION
Once tube fittings have been wetted with soap solution under a pressurized system, do not apply or re-
apply vacuum as this will cause soap solution to be sucked into the instrument, contaminating inside
surfaces.
Do not exceed 15 PSI when pressurizing the system.
1. Turn OFF power to the instrument and remove the instrument cover.
2. Install a leak checker or a tank of gas (compressed, oil-free air or
nitrogen) as described above on the sample inlet at the rear panel.
3. Pressurize the instrument with the leak checker or tank gas, allowing
enough time to fully pressurize the instrument through the critical flow
orifice. Check each tube connection (fittings, hose clamps) with soap
07266B DCN6485

Troubleshooting & Service Model T101 Instruction Manual
226
bubble solution, looking for fine bubbles. Once the fittings have been
wetted with soap solution, do not re-apply vacuum as it will draw soap
solution into the instrument and contaminate it. Do not exceed 15 psi
pressure.
4. If the instrument has the zero and span valve option, the normally closed
ports on each valve should also be separately checked. Connect the leak
checker to the normally closed ports and check with soap bubble
solution.
5. If the analyzer is equipped with an IZS Option, connect the leak checker
to the Dry Air inlet and check with soap bubble solution.
6. Once the leak has been located and repaired, the leak-down rate of the
indicated pressure should be less than 1 in-Hg-A (0.4 psi) in 5 minutes
after the pressure is turned off.
7. Clean soap solution from all surfaces, re-connect the sample and exhaust
lines, and replace the instrument cover. Restart the analyzer.
9.5.2. PERFORMING A SAMPLE FLOW CHECK
CAUTION
Use a separate, calibrated flow meter capable of measuring flows between 0 and 1000
cm³/min to measure the gas flow rate though the analyzer. Do not use the built in flow
measurement viewable from the front panel of the instrument.
Sample flow checks are useful for monitoring the actual flow of the instrument, to
monitor drift of the internal flow measurement. A decreasing, actual sample flow may
point to slowly clogging pneumatic paths, most likely critical flow orifices or sintered
filters. To perform a sample flow check:
1. Disconnect the sample inlet tubing from the rear panel SAMPLE port
shown in Figure 3-2.
2. Attach the outlet port of a flow meter to the sample inlet port on the rear
panel. Ensure that the inlet to the flow meter is at atmospheric pressure.
3. The sample flow measured with the external flow meter should be 600
cm³/min 75 cm³/min. If a combined sample/ozone air Perma Pure dryer
is installed (optional equipment), the flow will be 740 cm³/min ± 10%
(600 cm³/min for the sample and 140 cm³/min for the ozone generator
supply air).
4. Low flows indicate blockage somewhere in the pneumatic pathway.
9.5.3. AC POWER CONFIGURATION
The T101 can be easily configured for two main power regimes, 100-120 V and 220-240
V at either 50 or 60 Hz. The analyzer is correctly configured for the AC power voltage
in use if it turns on and shows a front panel display after about 30 seconds. Internally,
several LEDs should turn on as soon as the power is supplied. If an incorrect power
configuration is suspected, check for the correct voltage and frequency at the line input
on the rear panel.
07266B DCN6485

Model T101 Instruction Manual Troubleshooting & Service
227
If the unit is set for 220-240 V and is plugged into 100-120 V, the analyzer will not start.
If the unit is set for 100-120 V and is plugged into 220-240 V, the circuit breaker built
into the ON/OFF Switch on the front panel will trip to the OFF position immediately
after power is switched on. Note that the analyzer will be severely damaged if 220-240
V is supplied to it when configured for 100-120 V. Never bypass the power switch or
circuit breaker.
9.5.4. DC POWER SUPPLY
If you have determined that the analyzer’s AC main power is working, but the unit is
still not operating properly, there may be a problem with one of the instrument’s
switching power supplies, which convert AC power to 5 and ±15 V (PS1) as well as +12
V DC power (PS2). The supplies can either have DC output at all or a noisy output
(fluctuating).
To assist tracing DC Power Supply problems, the wiring used to connect the various
printed circuit assemblies and DC powered components and the associated test points on
the relay board follow a standard color-coding scheme as defined in Table 11-4.
Table 9-4. DC Power Test Point and Wiring Color Code
NAME TEST POINT# COLOR DEFINITION
DGND 1 Black Digital ground
+5V 2 Red
AGND 3 Green Analog ground
+15V 4 Blue
-15V 5 Yellow
+12V 6 Purple
+12R 7 Orange 12 V return (ground) line
A voltmeter should be used to verify that the DC voltages are correct as listed in Table
11-5. An oscilloscope, in AC mode and with band limiting turned on, can be used to
evaluate if the supplies are excessively noisy (>100 mV peak-to-peak).
Table 9-5. DC Power Supply Acceptable Levels
CHECK RELAY BOARD TEST POINTS
From Test Point
To Test Point
POWER
SUPPLY VOLTAGE
Name # Name #
MIN V MAX V
PS1 +5 DGND 1 +5 2 +4.80 +5.25
PS1 +15 AGND 3 +15 4 +13.5 +16.0
PS1 -15 AGND 3 -15V 5 -14.0 -16.0
PS1 AGND AGND 3 DGND 1 -0.05 +0.05
PS1 Chassis DGND 1 Chassis N/A -0.05 +0.05
PS2 +12 +12V Ret 6 +12V 7 +11.8 +12.5
PS2 DGND +12V Ret 6 DGND 1 -0.05 +0.05
07266B DCN6485

Troubleshooting & Service Model T101 Instruction Manual
228
9.5.5. I2C BUS
Operation of the I2C bus can be verified by observing the behavior of the LED labeled
D1 on the relay board in conjunction with the performance of the front panel display.
Assuming that the DC power supplies are operating properly and the wiring from the
motherboard to the keyboard as well as from the keyboard to the relay board is intact,
the I2C bus is operating properly if:
D1 on the relay board is flashing or;
D1 is not flashing but pressing a button on the touchscreen results in a
change to the display.
If the display is locked up or if the analyzer is not booting up at all, the I2C bus may be
the cause. Contact Technical Support if you suspect a problem with the I2C bus.
9.5.6. TOUCHSCREEN INTERFACE
Verify the functioning of the touch screen by observing the display when pressing a
touch-screen control button. Assuming that there are no wiring problems and that the
DC power supplies are operating properly, but pressing a control button on the touch
screen does not change the display, any of the following may be the problem:
The touch-screen controller may be malfunctioning
The internal USB bus may be malfunctioning
9.5.7. LCD DISPLAY MODULE
Verify the functioning of the front panel display by observing it when power is applied
to the instrument. Assuming that there are no wiring problems and that the DC power
supplies are operating properly, the display screen should light and show the splash
screen and other indications of its state as the CPU goes through its initialization
process.
9.5.8. RELAY BOARD
The relay board circuit can most easily be checked by observing the condition of its
status LEDs as described in Section 10.4.9, and the associated output when toggled on
and off through the SIGNAL I/O function in the DIAG menu, see Section 4.6.1.
If the front panel display responds to key presses and D1 on the relay board is not
flashing, then either the I2c connection between the motherboard and the relay board is
bad, or the relay board itself is bad.
If D1 on the relay board is flashing, but toggling an output in the Signal I/O function
menu does not toggle the output’s status LED, the there is a circuit problem, or possibly
a blown driver chip, on the relay board.
If D1 on the Relay board is flashing and the status indicator for the output in question
(heater, valve, etc.) toggles properly using the Signal I/O function, but the output device
does not turn on/off, then the associated device (valve or heater) or its control device
(valve driver, heater relay) is malfunctioning.
Several of the control devices are in sockets and can easily be replaced. The table below
lists the control device associated with a particular function:
07266B DCN6485

Model T101 Instruction Manual Troubleshooting & Service
229
Table 9-6. Relay Board Control Devices
FUNCTION CONTROL DEVICE SOCKETED
Valve0 – Valve3 U5 Yes
Valve4 – Valve7 U6 Yes
All heaters K1-K5 Yes
9.5.9. MOTHERBOARD
9.5.9.1. A/D functions
A basic check of the analog to digital (A/D) converter operation on the motherboard is
to use the Signal I/O function under the DIAG menu. Check the following two A/D
reference voltages and input signals that can be easily measured with a voltmeter.
Using the Signal I/O function (Section 4.6.1 and Appendix D), view the
value of REF_4096_MV and REF_GND. If these signals are within 10
mV and 3 mV, respectively, of their nominal values (4096 and 0) and are
stable to within ±0.5 mV, the basic A/D converter is functioning properly.
If these values fluctuate largely or are off by more than specified above,
one or more of the analog circuits may be overloaded or the
motherboard may be faulty.
Choose one parameter in the Signal I/O function such as
SAMPLE_PRESSURE (see previous section on how to measure it).
Compare its actual voltage with the voltage displayed through the
SIGNAL I/O function. If the wiring is intact but there is a difference of
more than ±10 mV between the measured and displayed voltage, the
motherboard may be faulty.
9.5.9.2. Analog Output Voltages
To verify that the analog outputs are working properly, connect a voltmeter to the output
in question and perform an analog output step test as described in Section 4.6.2.
For each of the steps, taking into account any offset that may have been programmed
into the channel (Section 4.6.3.4), the output should be within 1% of the nominal value
listed in the table below except for the 0% step, which should be within 2-3 mV. If one
or more of the steps is outside of this range, a failure of one or both D/A converters and
their associated circuitry on the motherboard is likely.
Table 9-7. Analog Output Test Function - Nominal Values
FULL SCALE OUTPUT VOLTAGE
100MV 1V 5V 10V
STEP % NOMINAL OUTPUT VOLTAGE
1 0 0 mV 0 0 0
2 20 20 mV 0.2 1 2
3 40 40 mV 0.4 2 4
4 60 60 mV 0.6 3 6
5 80 80 mV 0.8 4 8
6 100 100 mV 1.0 5 10
07266B DCN6485

Troubleshooting & Service Model T101 Instruction Manual
230
9.5.9.3. Status Outputs
The procedure below can be used to test the Status outputs.
1. Connect a cable jumper between the “-“ pin and the “” pin on the status
output connector.
2. Connect a 1000 Ω resistor between the +5 V and the pin for the status
output that is being tested.
Table 9-8. Status Outputs Check Pin Out
PIN
(left to right) STATUS
1 System Ok
2 Conc Valid
3 High Range
4 Zero Cal
5 Span Cal
6 Diag Mode
7 Spare
8 Spare
3. Connect a voltmeter between the “-“ pin and the pin of the output being
tested (Table 11-8).
4. Under the DIAG > SIGNAL I/O menu (Section 4.6.1), scroll through the
inputs and outputs until you get to the output in question. Alternately turn
on and off the output noting the voltage on the voltmeter, it should vary
between 0 volts for ON and 5 volts for OFF.
9.5.9.4. Control Inputs
The control input bits can be tested by the following procedure:
1. Connect a jumper from the +5 V pin on the STATUS connector to the +5 V
on the CONTROL IN connector.
2. Connect a second jumper from the ‘-‘ pin on the STATUS connector to the
A pin on the CONTROL IN connector. The instrument should switch from
SAMPLE mode to ZERO CAL R mode.
3. Connect a second jumper from the ‘-‘ pin on the STATUS connector to the
B pin on the CONTROL IN connector. The instrument should switch from
SAMPLE mode to SPAN CAL R mode.
In each case, the T101 should return to SAMPLE mode when the jumper is removed.
9.5.10. CPU
There are two major types of CPU board failures, a complete failure and a failure
associated with the Disk-On-Module (DOM). If either of these failures occur, contact
the factory.
For complete failures, assuming that the power supplies are operating properly and the
wiring is intact, the CPU is faulty if on power-on, the watchdog LED on the
motherboard is not flashing.
07266B DCN6485

Model T101 Instruction Manual Troubleshooting & Service
231
In some rare circumstances, this failure may be caused by a bad IC on the motherboard,
specifically U57, the large, 44 pin device on the lower right hand side of the board. If
this is true, removing U57 from its socket will allow the instrument to start up but the
measurements will be invalid.
If the analyzer stops during initialization (the front panel display shows a fault or
warning message), it is likely that the DOM, the firmware or the configuration and data
files have been corrupted.
9.5.11. RS-232 COMMUNICATION
9.5.11.1. General RS-232 Troubleshooting
Teledyne API analyzers use the RS-232 protocol as the standard, serial communications
protocol. RS-232 is a versatile standard, which has been used for many years but, at
times, is difficult to configure. Teledyne API instruments conform to the standard pin
assignments in the implementation of RS-232. Problems with RS-232 connections
usually center around 4 general areas:
Incorrect cabling and connectors. This is the most common problem. See
Figure 4-8 for connector and pin-out information and Section 4.7.3.
The communications (baud) rate and protocol parameters are incorrectly
configured. See Section 4.7.11 on how to set the baud rate.
The COM port communications mode is set incorrectly (Section 4.7.10).
If a modem is used, additional configuration and wiring rules must be
observed. See Section 5.1.2.7.
Incorrect setting of the DTE - DCE Switch is set correctly See Section
4.7.5.
9.5.11.2. Modem or Terminal Operation
These are the general steps for troubleshooting problems with a modem connected to a
Teledyne API analyzer.
Check cables for proper connection to the modem, terminal or computer.
Check the correct position of the DTE/DCE as described in Section 4.7.5.
Check the correct setup command (Section 5.1.2.7).
Verify that the Ready to Send (RTS) signal is at logic high. The T101 sets
pin 7 (RTS) to greater than 3 volts to enable modem transmission.
Make sure the baud rate, word length, and stop bit settings between
modem and analyzer match, see Section 5.1.2.7 and Section 4.7.
Use the RS-232 test function to send “w” characters to the modem,
terminal or computer; See Section 4.7.10.
Get your terminal, modem or computer to transmit data to the analyzer
(holding down the space bar is one way). The green LED on the rear
panel should flicker as the instrument is receiving data.
Make sure that the communications software is functioning properly.
07266B DCN6485

Troubleshooting & Service Model T101 Instruction Manual
232
Further help with serial communications is available in a separate manual “RS-232
Manual”, Teledyne API part number 013500000, available online at
http://www.Teledyne-api.com/manuals/.
9.5.12. PMT SENSOR
The photo multiplier tube detects the light emitted by the UV excited fluorescence of
H2S. It has a gain of about 500000 to 1000000. It is not possible to test the detector
outside of the instrument in the field. The best way to determine if the PMT is working
properly is by using the optical test (OTEST), which is described in Section 4.6.4. The
basic method to diagnose a PMT fault is to eliminate the other components using
ETEST, OTEST and specific tests for other sub-assemblies.
9.5.13. PMT PREAMPLIFIER BOARD
To check the correct operation of the preamplifier board, we suggest the technician carry
out the electrical and optical tests described in Sections 4.6.4. and 4.6.5. If the ETEST
fails, the preamplifier board may be faulty.
9.5.14. PMT TEMPERATURE CONTROL PCA
The TEC control printed circuit assembly is located on the sensor housing assembly,
under the slanted shroud, next to the cooling fins and directly above the cooling fan.
If the red LED located on the top edge of this assembly is not glowing the control circuit
is not receiving power. Check the analyzers power supply, the Relay board’s power
distribution circuitry and the and the wiring connecting them to the PMT temperature
control PCA.
TEC Control Test Points
Four test points are also located at the top of this assembly they are numbered left to
right start with the T1 point immediately to the right of the power status LED. These
test points provide information regarding the functioning of the control circuit.
To determine the current running through the control circuit, measure
the voltage between T1 and T2. Multiply that voltage by 10.
To determine the drive voltage being supplied by the control circuit to
the TEC, measure the voltage between T2 and T3.
If this voltage is zero, the TEC circuitry is most likely open.
Or,
If the voltage between T2 and T3 = 0 VDC and the voltage measured
between T1 and T2 = 0 VDC there is most likely an open circuit or
failed op amp on control PCA itself
If the voltage between T2 and T3 = 0 VDC and the voltage measured
between T1 to T2 is some voltage other than 0 VDC, the TEC is most
likely shorted
T4 is tied directly to ground. To determine the absolute voltage on any
one of the other test points make a measurement between that test
point and T4.
07266B DCN6485

Model T101 Instruction Manual Troubleshooting & Service
233
9.5.15. HIGH VOLTAGE POWER SUPPLY
The HVPS is located in the interior of the sensor module and is plugged into the PMT
tube (Figure 10-13). It requires 2 voltage inputs. The first is +15 which powers the
supply. The second is the programming voltage which is generated on the Preamp
Board. This power supply is unlike a traditional PMT HVPS. It is like having 10
independent power supplies, one to each pin of the PMT. The test procedure below
allows you to test each supply.
Adjustment of the HVPS is covered in the factory calibration procedure in Section 9.6.4.
9.5.16. PNEUMATIC SENSOR ASSEMBLY
The pressure/flow sensor circuit board, located behind the sensor assembly, can be
checked with a voltmeter using the following procedure, which assumes that the wiring
is intact and that the motherboard and the power supplies are operating properly.
Measure the voltage across TP1 and TP2, it should be 10.0 0.25 V. If not, the board is
faulty. Measure the voltage across capacitor C2; it should be 5.0 ± 0.25 V. If not, the
board may be faulty.
9.5.16.1. Sample Pressure
Measure the voltage across test points TP1 and TP4. With the sample pump
disconnected or turned off, this voltage should be 4500 250 mV. With the pump
running, it should be about 0.2 V less as the sample pressure drops by about 1 in-Hg-A
from ambient pressure. If this voltage is significantly different, the pressure transducer
S2 or the board may be faulty. A leak in the sample system to vacuum may also cause
this voltage to be between about 0.6 and 4.5. Make sure that the front panel reading of
the sample pressure is at about 1 in-Hg-A less than ambient pressure.
9.5.17. IZS OPTION
The zero/span valves and IZS options need to be enabled in the software (contact the
factory on how to do this). See Figure 3-2 and 5-3 for a flow diagram with zero/span
valve or IZS option.
Check for the physical presence of the valves or the IZS option.
Check that a working perm-tube is installed in the IZS oven assembly.
Check front panel for correct software configuration. When the
instrument is in SAMPLE mode, the front panel display should show CALS
and CALZ buttons in the second line of the display. The presence of the
buttons indicates that the option has been enabled in software. In
addition, the IZS option is enabled if the TEST functions show a
parameter named IZS TEMP.
The semi-permeable PTFE membrane of the permeation tube is affected by humidity. If
the instrument is installed in an air-conditioned shelter, the air is usually dry enough to
produce good results. If the instrument is installed in an environment with variable or
high humidity, variations in the permeation tube output will be significant. In this case, a
dryer for the supply air is recommended (dew point should be-20° C or less).
07266B DCN6485

Troubleshooting & Service Model T101 Instruction Manual
234
The IZS option is heated with a proportional heater circuit and the temperature is
maintained at 50° C ±1°. Check the IZS TEMP function via front panel display (Section
4.2.1) and the IZS_TEMP signal voltage using the SIGNAL I/O function under the
DIAG Menu (Section 4.6.1). At 50° C, the temperature signal from the IZS thermistor
should be around 2500 mV.
9.5.18. BOX TEMPERATURE
The box temperature sensor (thermistor) is mounted on the motherboard at the bottom,
right corner of the CPU board when looking at it from the front. It cannot be
disconnected to check its resistance. Box temperature will vary with, but will always
read about 5° C higher than, ambient (room) temperature because of the internal heating
zones from the H2S converter, sample chamber and other devices. To check the box
temperature functionality, we recommend checking the BOX_TEMP signal voltage
using the SIGNAL I/O function under the DIAG Menu (Section 4.6.1). At about 30° C
(5 above typical room temperature), the signal should be around 1500 mV. We
recommend using a certified or calibrated external thermometer / temperature sensor to
verify the accuracy of the box temperature.
9.5.19. PMT TEMPERATURE
PMT temperature should be low and constant. It is more important that this temperature
is maintained constant than it is to maintain it low. The PMT cooler uses a Peltier,
thermo-electric element powered by 12 VDC from the switching power supply PS2. The
temperature is controlled by a proportional temperature controller located on the
preamplifier board. Voltages applied to the cooler element vary from +/- 0.1 to +/- 12
VDC. The temperature set point (hard-wired into the preamplifier board) will vary by
about ±1 C due to component tolerances. The actual temperature will be maintained to
within 0.1 C around that set point. On power-up of the analyzer, the front panel enables
the user to watch that temperature drop from about ambient temperature down to its set
point of 6-8° C. If the temperature fails to drop after 20 minutes, there is a problem in
the cooler circuit. If the control circuit on the preamplifier board is faulty, a temperature
of -1 C is reported.
9.6. REPAIR PROCEDURES
This section contains some procedures that may need to be performed when a major
component of the analyzer requires repair or replacement. Note that replacement
procedures that are discussed in detail in Section 8 (Maintenance) are not listed here.
Servicing of circuit components requires electrostatic discharge protection, i.e. ESD
grounding straps, mats and containers. Failure to use ESD protection when working
with electronic assemblies will void the instrument warranty.
9.6.1. DISK-ON-MODULE REPLACEMENT
Replacing the Disk-on-Module (DOM) will cause loss of all DAS data; it also may
cause loss of some instrument configuration parameters unless the replacement DOM
carries the exact same firmware version. Whenever changing the version of installed
software, the memory must be reset. Failure to ensure that memory is reset can cause the
analyzer to malfunction, and invalidate measurements. After the memory is reset, the
A/D converter must be re-calibrated, and all information collected in Step 1 below must
07266B DCN6485

Model T101 Instruction Manual Troubleshooting & Service
235
be re-entered before the instrument will function correctly. Also, zero and span
calibration should be performed.
1. Document all analyzer parameters that may have been changed, such as
range, auto-cal, analog output, serial port and other settings before
replacing the DOM
2. Turn off power to the instrument, fold down the rear panel by loosening
the mounting screws.
3. When looking at the electronic circuits from the back of the analyzer,
locate the Disk-on-Module in the right-most socket of the CPU board.
4. The DOM should carry a label with firmware revision, date and initials of
the programmer.
5. Remove the nylon fastener that mounts the DOM over the CPU board,
and lift the DOM off the CPU. Do not bend the connector pins.
6. Install the new Disk-on-Module, making sure the notch at the end of the
chip matches the notch in the socket.
7. It may be necessary to straighten the pins somewhat to fit them into the
socket. Press the DOM all the way in and reinsert the offset clip.
8. Close the rear panel and turn on power to the machine.
9. If the replacement DOM carries a firmware revision, re-enter all of the
setup information.
9.6.2. ADJUSTING THE UV LAMP (PEAKING THE LAMP)
There are two ways in which ambient conditions can affect the UV Lamp output and
therefore the accuracy of the SO2 concentration measurement: lamp aging and lamp
positioning.
Lamp Aging - Over a period of months, the UV energy will show a downward trend
and can be up to 50% in the first 90 days, and then a slower rate, until the end of useful
life of the lamp. Periodically running the UV lamp calibration routine (refer to Section
4.6.6) will compensate for this until the lamp output becomes too low to function at all.
NOTE
As the lamp degrades over time, the software for the CPU compensates for the loss of
UV output.
Lamp Positioning – The UV output level of the lamp is not even across the entire length
of the lamp. Some portions of the lamp shine slightly more brightly than others. At the
factory the position of the UV lamp is adjusted to optimize the amount of UV light
shining through the UV filter/lens and into the reaction cell. Changes to the physical
alignment of the lamp can affect the analyzers ability to accurately measure SO2.
07266B DCN6485
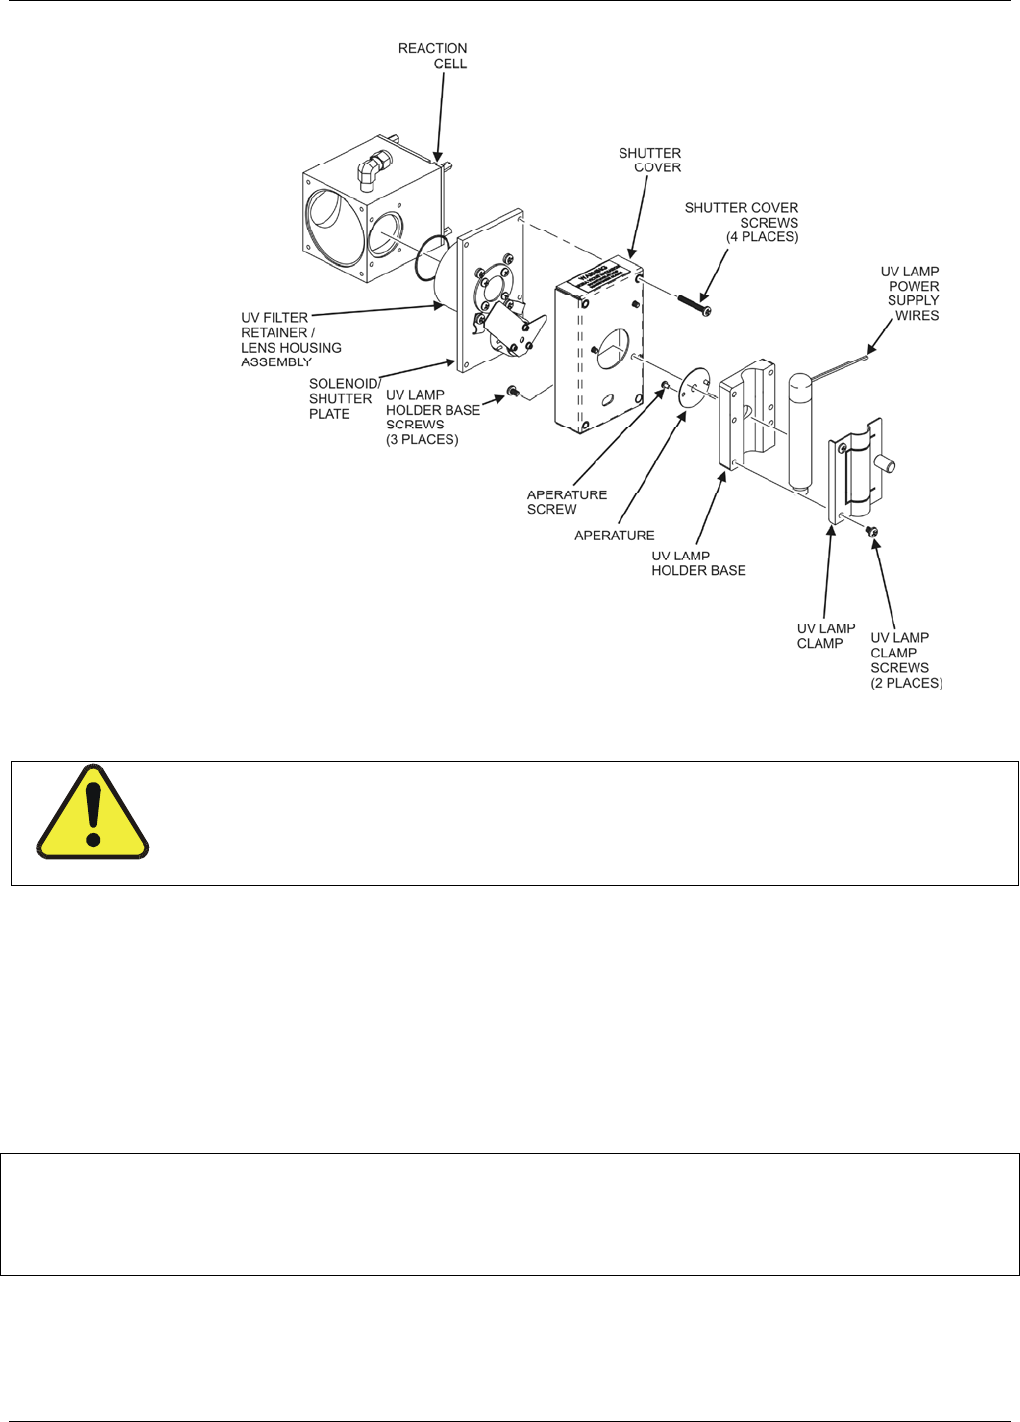
Troubleshooting & Service Model T101 Instruction Manual
236
Figure 9-4. Shutter Assembly
CAUTION
ALWAYS wear UV-Protective, Safety Glasses when working with the UV
Lamp Assembly.
4.
1. Set the analyzer display to show the signal I/O function,
UVLAMP_SIGNAL.
2. Slightly loosen the large brass thumbscrew located on the shutter
housing (refer to Figure 9-5) so that the lamp can be moved.
3. While watching the UVLAMP_SIGNAL reading, slowly rotate the lamp or
move it back and forth vertically until the UVLAMP_SIGNAL reading is
at its maximum.
NOTE
DO NOT grasp the UV lamp by its cap when changing its position.
Always grasp the main body of the lamp.
4. Compare the UVLAMP_SIGNAL reading to the information in Table 9-2
and follow the instructions there.
07266B DCN6485
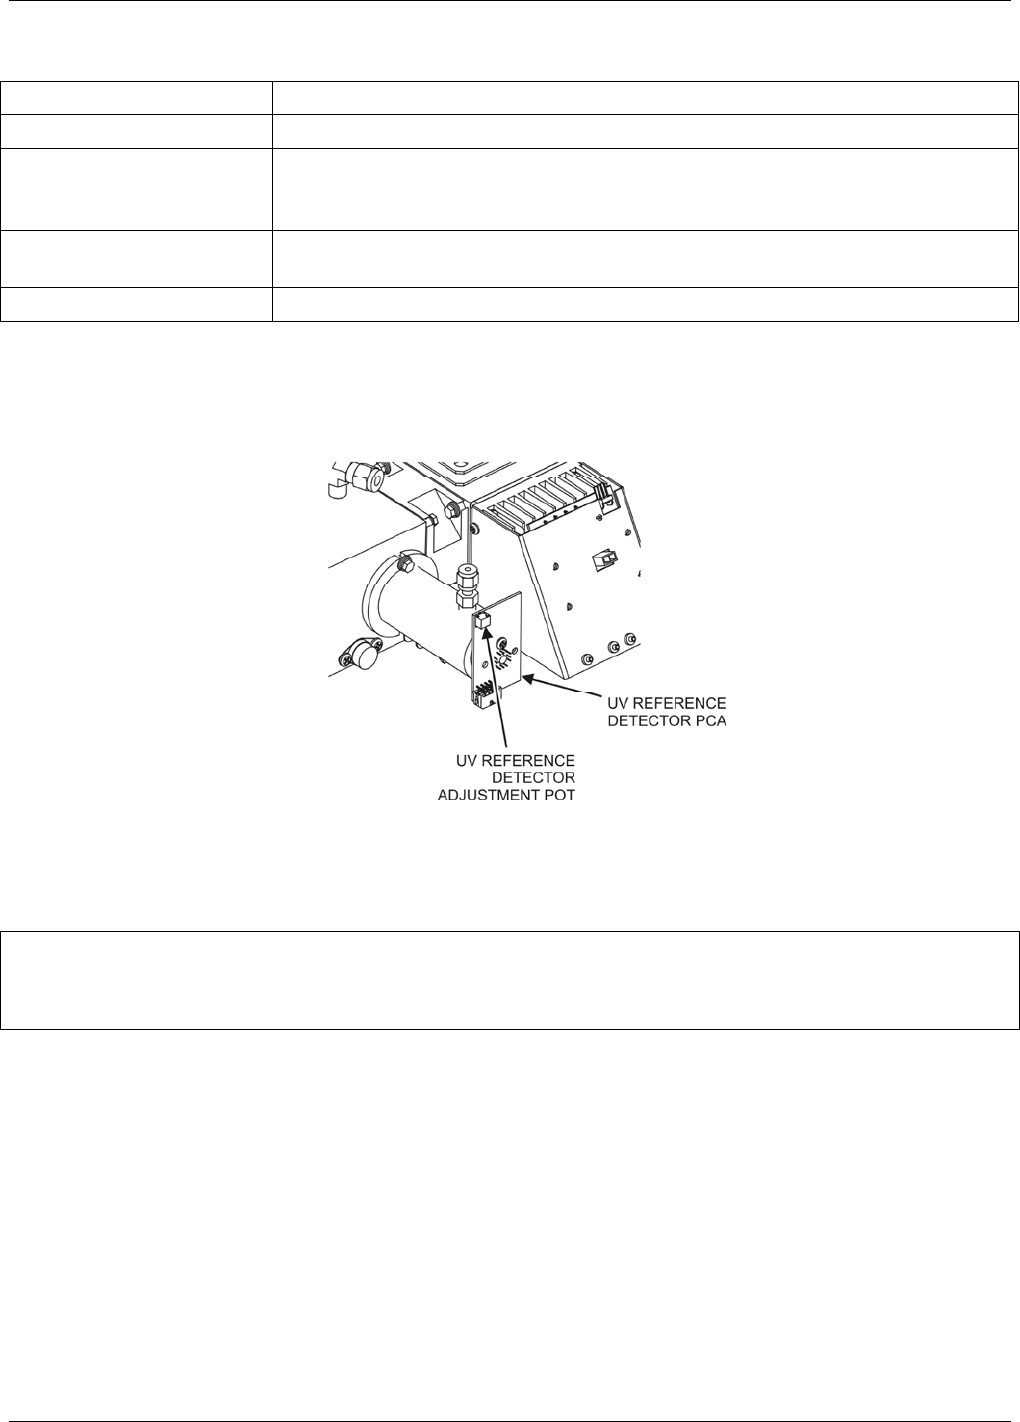
Model T101 Instruction Manual Troubleshooting & Service
237
Table 9-9. Example of UV Lamp Power Supply Outputs
UVLAMP_SIGNAL ACTION TO BE TAKEN
3500mV±200mV. No Action Required
> 4900mV at any time.
Adjust the UV reference detector potentiometer (refer to Figure 9-6)
until UVLAMP_SIGNAL reads approximately 3600mV before
continuing to adjust the lamp position.
>3700mV or < 3300mV Adjust the UV reference detector potentiometer (refer to Figure 9-6)
until UVLAMP_SIGNAL reads as close to 3500mV as possible.
.< 600mV Replace the lamp.
Figure 9-5. Location of UV Reference Detector Potentiometer
5. Finger tighten the thumbscrew.
NOTE
DO NOT over-tighten the thumbscrew.
9.6.3. REPLACING THE UV LAMP
1. Turn off the analyzer.
2. Disconnect the UV lamp from its power supply.
You can find the power supply connector by following the two, white
UV Lamp power supply wires from the lamp to the power supply.
3. Loosen, but do not remove the two UV lamp bracket screws and the
large brass thumbscrew located on the shutter housing (refer to Figure
9-4) so that the lamp can be moved.
07266B DCN6485

Troubleshooting & Service Model T101 Instruction Manual
238
NOTE
DO NOT grasp the UV lamp by its cap when changing its position (refer to Figure 9-4).
Always grasp the main body of the lamp.
4. Remove the UV Lamp by pulling it straight up.
5. Insert the new UV lamp into the bracket.
6. Tighten the two UV lamp bracket screws, but leave the brass thumb
screw un-tightened.
7. Connect the new UV lamp to the power supply.
8. Turn the instrument on and perform the UV adjustment procedure as
defined in Section 9.6.2. above.
9. Finger tighten the thumbscrew.
NOTE
DO NOT over-tighten the thumbscrew.
10. Perform a lamp calibration procedure (refer to Section 4.6.6) and a zero
point and span point calibration (refer to Section 6).
9.6.4. FACTORY CAL (PMT SENSOR, HARDWARE CALIBRATION)
The sensor module hardware calibration adjusts the slope of the PMT output when the
Instrument’s slope and offset values are outside of the acceptable range and all other
more obvious causes for this problem have been eliminated.
1. Set the instrument reporting range to SNGL (Section 4.4.4.4)
2. Perform a full zero calibration using zero air (Sections 6.2, 6.4, or 6.8).
3. Let the instrument run for one hour to stabilize the lamp and run a lamp
calibration from the diagnostic menu. This is required to ensure proper
scaling of the NORM PMT value.
4. Locate the Preamp board (Figure 3-9).
5. Locate the following components on the Preamp board (Figure 9-7):
HVPS coarse adjustment switch (Range 0-9, then A-F)
HVPS fine adjustment switch (Range 0-9, then A-F)
Gain adjustment potentiometer (Full scale is 10 turns).
07266B DCN6485
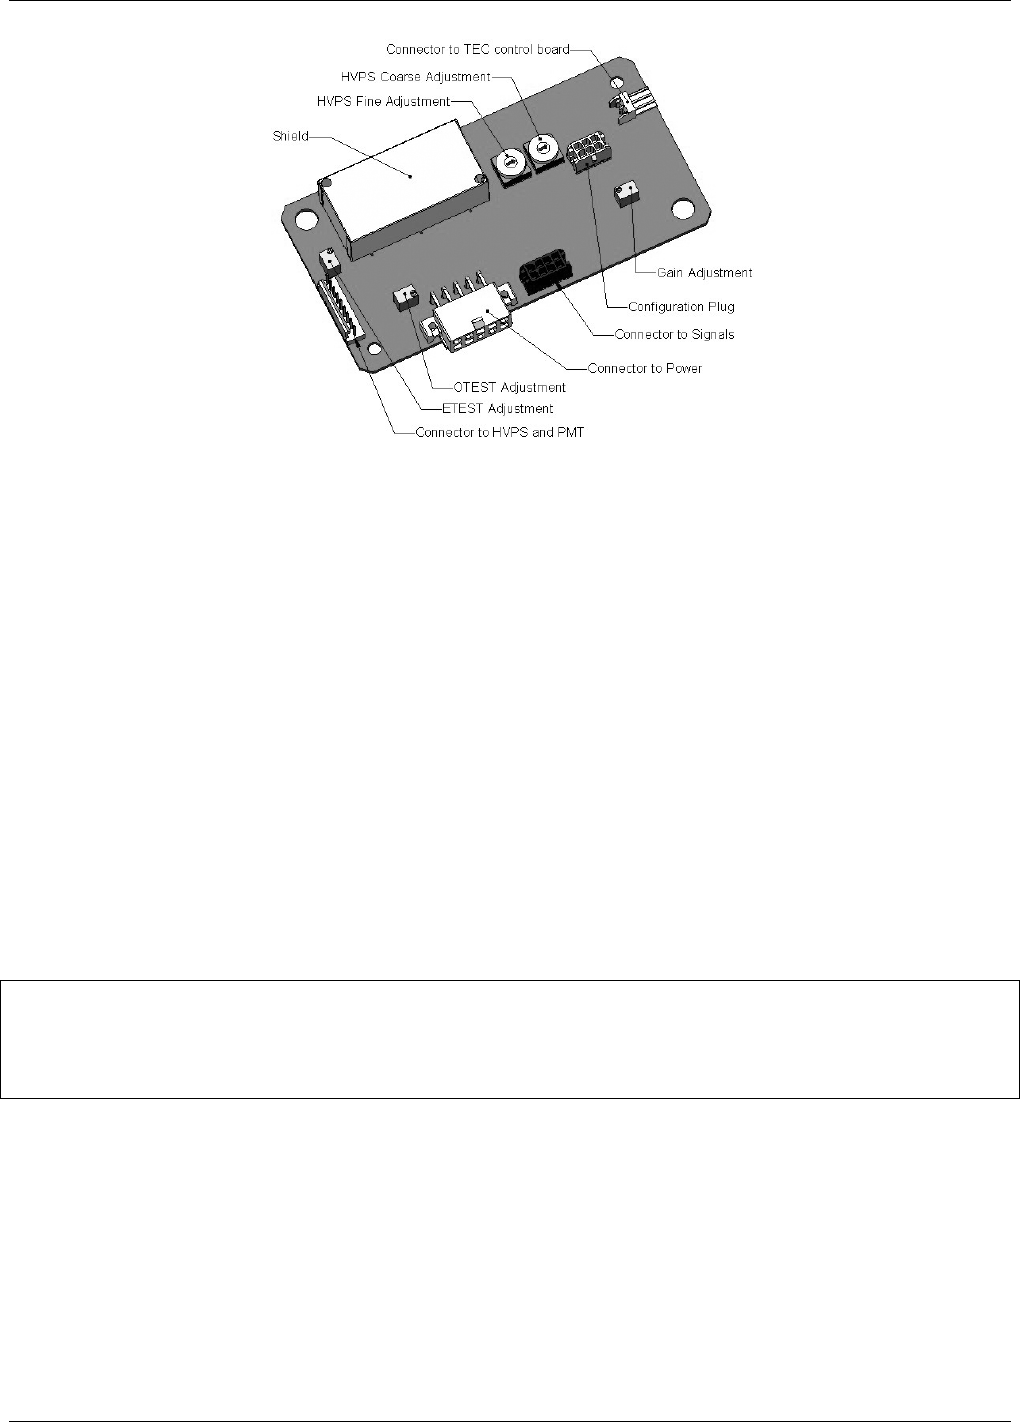
Model T101 Instruction Manual Troubleshooting & Service
239
Figure 9-6. Pre-Amplifier Board Layout
6. Turn the gain adjustment potentiometer 12 turns clockwise to its
maximum setting.
7. While feeding 400 ppb H2S (or 80% range value) to the analyzer and
waiting until the STABIL value is below 0.5 ppb look at the front panel
and scroll to the NORM PMT value. This value should always be two times
the span gas concentration in ppb. With 400 ppb H2S, the NORM PMT
should show 800 mV on a properly calibrated analyzer.
8. Set the HVPS coarse adjustment to its minimum setting (0). Set the
HVPS fine adjustment switch to its maximum setting (F).
9. Set the HVPS coarse adjustment switch to the lowest setting that will
give you more than 800 mV NORM PMT signal. The coarse adjustment
typically increments the NORM PMT signal in 100-300 mV steps.
10. Adjust the HVPS fine adjustment such that the NORM PMT value is just
above 800 mV. It may be necessary to go back and forth between coarse
and fine adjustments if the proper value is at the threshold of the
min/max coarse setting.
NOTE
Do not overload the PMT by accidentally setting both adjustment switches to their maximum setting.
This can cause permanent damage to the PMT.
11. Adjust the NORM PMT value with the gain potentiometer down to 800±10
mV. This is the final very-fine adjustment.
12. Perform software span and zero calibrations (Sections 6.2, 6.4, or 6.8) to
normalize the sensor response to its new PMT sensitivity.
13. Review the slope and offset values, the slopes should be 1.000±0.300
and the offset values should be <250 mV.
07266B DCN6485

Troubleshooting & Service Model T101 Instruction Manual
240
9.7. FREQUENTLY ASKED QUESTIONS (FAQS)
The following list contains some of the most commonly asked questions relating to the
T101.
QUESTION ANSWER
Why is the ZERO or SPAN
button not displayed during
calibration?
The T101 disables these buttons when the expected span or zero value
entered by the users is too different from the gas concentration actually
measured value at the time. This is to prevent the accidental recalibration
of the analyzer to an out-of-range response curve.-EXAMPLE: The span
set point is 400 ppb but gas concentration being measured is only 50 ppb.
Why does the ENTR button
sometimes disappear on
the Front Panel Display?
During certain types of adjustments or configuration operations,
the ENTR button will disappear if you select a setting that is
nonsensical (such as trying to set the 24-hour clock to 25:00:00)
or out of the allowable range for that parameter (such as
selecting a DAS hold off period of more than 20 minutes).-Once
you adjust the setting in question to an allowable value, the
ENTR button will re-appear.
How do I enter or change the
value of my Span Gas?
Press the CONC button found under the CAL or CALS menus of the main
SAMPLE menu to enter the expected SO2 span concentration.
Can I automate the
calibration of my analyzer?
Any analyzer with zero/span valve or IZS option can be
automatically calibrated using the instrument’s AutoCal feature.-
However, the accuracy of the IZS option’s permeation tube is
±5%. While this may be acceptable for basic calibration checks,
the IZS option is not permitted as a calibration source in
applications following US EPA protocols. -To achieve highest
accuracy, it is recommended to use cylinders of calibrated span
gases in combination with a zero air source. Teledyne API offers a
zero air generator Model 701 and a gas dilution calibrator Model
T700 for this purpose.
What do I do if the
concentration on the
instrument's front panel
display does not match the
value recorded or displayed
on my data logger even if
both instruments are
properly calibrated?
This most commonly occurs for one of the following reasons:
-A difference in circuit ground between the analyzer and the data
logger or a wiring problem;
-A scale problem with the input to the data logger.
-The analog outputs of the T101 can be manually adjusted to
compensate for either or both of these effects, refer to 4.6.3.4;
-The analog outputs are not calibrated, which can happen after a
firmware upgrade.
-Both the electronic scale and offset of the analog outputs can be
adjusted (refer to Section 4.6.3.2). Alternately, use the data
logger itself as the metering device during calibrations
procedures.
How do I perform a leak
check?
Refer to Section 9.5.1.
How do I measure the
sample flow?
Sample flow is measured by attaching a calibrated flow meter to
the sample inlet port when the instrument is operating. The
sample flow should be 650 cm³/min 10%. Section 9.5.2 includes
detailed instructions on performing a check of the sample gas
flow.
07266B DCN6485

Model T101 Instruction Manual Troubleshooting & Service
241
QUESTION ANSWER
How often do I need to
change the particulate
filter?
Once per week. Table 8-1 contains a maintenance schedule listing
the most important, regular maintenance tasks.
What is the averaging time
for a T101? The default averaging time, optimized for ambient pollution
monitoring, is 240 seconds for stable concentrations and 20
seconds for rapidly changing concentrations; Refer to 10.7.1 for
more information.
My analyzer has the
optional, user -configurable
analog output channels.
How do I program and use
them?
Instructions for this can be found in the Manual Addendum for
Configurable Analog Output, PN 06270.
How long does the sample
pump last? The sample pump should last about one year and the pump
diaphragms should to be replaced annually or when necessary.
Use the PRES test function displayed via the front panel to see if
the diaphragm needs replacement (refer to Section 9.1.2).
Do I need a strip chart
recorder or external data
logger?
No, the T101 is equipped with a very powerful internal data
acquisition system (DAS). Section 4.8 describes the setup and
operation in detail.
14.
9.8. TECHNICAL ASSISTANCE
If this manual and its trouble-shooting / repair sections do not solve your problems,
technical assistance may be obtained from Teledyne API, Technical Support, 9480
Carroll Park Drive, San Diego, CA 92121. Phone: +1 858 657 9800 or 1-800 324 5190.
Fax: +1 858 657 9816. Email: sda_techsupport@teledyne.com.
Before you contact Technical Support, fill out the problem report form in Appendix C,
which is also available online for electronic submission at http://www.teledyne-
api.com/forms/index.asp.
07266B DCN6485

Troubleshooting & Service Model T101 Instruction Manual
242
This page intentionally left blank.
07266B DCN6485

Model T101 Instruction Manual Principles Of Operation
243
10. PRINCIPLES OF OPERATION
The T101 UV Fluorescence H2S Analyzer is a microprocessor controlled analyzer that
determines the concentration of hydrogen sulfide (H2S), in a sample gas drawn through
the instrument It requires that sample and calibration gases be supplied at ambient
atmospheric pressure in order to establish a constant gas flow through the sample
chamber where the H2S in the sample gas is converted into SO2 which is then exposed to
ultraviolet light causing the SO2 molecules to change to an excited state (SO2*). As these
SO2* molecules decay back into SO2, they fluoresce. The instrument measures the
amount of fluorescence to determine the amount of SO2 is present in the sample chamber
and by inference therefore the amount of H2S present in the sample gas.
Calibration of the instrument is performed in software and usually does not require
physical adjustments to the instrument. During calibration, the microprocessor measures
the sensor output signal when gases with known amounts of H2S at various
concentrations are supplied and stores these measurements in memory. The
microprocessor uses these calibration values along with other performance parameters
such as the PMT dark offset, UV lamp ratio and the amount of stray light present and
measurements of the temperature and pressure of the sample gas to compute the final
H2S concentration.
This concentration value and the original information from which it was calculated are
stored in the unit’s internal data acquisition system and reported to the user through a
vacuum fluorescent display or as electronic data via several communication ports.
This concentration value and the original information from which it was calculated are
stored in the unit’s internal data acquisition system (DAS Section 4.8) and reported to
the user through a vacuum fluorescent display or several communication ports.
10.1. MEASUREMENT PRINCIPLE
10.1.1. H2S CONVERSION
The T101 H2S analyzer is basically a SO2 analyzer with a H2S SO2 conversion stage
inserted into the gas stream before the sample gas enters the sample chamber.
The H2S to SO2 converter receives sample gas from which the SO2 has been removed by
a scrubber. Once the naturally occurring SO2 is removed from the sample gas, the
special converter changes the H2S in the sample stream to SO2 using a high-temperature
catalytic oxidation.
07266B DCN6485

Principles Of Operation Model T101 Instruction Manual
244
The chemical process is:
2222 SO2OH2O3SH2
The converter is a heated stainless steel core containing a catalyst across which the
sample gas passes just before induction into the reaction cell. The temperature of the
converter is maintained by a heater controlled by the CPU via the I2C bus and the relay
card. The converter is enclosed in high-temperature insulation and encased in a stainless
steel housing.
The converter is most efficient when it operates at 315°C, converting 95% of the H2S
into SO2. Converter temperature is viewable via the front panel as the test function
CONV TEMP (see Section 4.2.1) and can also be output via the test channel analog
output (see Section 4.6.9). A warning message, CONV TEMP WARNING (see Section
4.2.2) will be issued by the CPU if the converter’s temperature is below 310°C or above
320°C.
When the converter is operating at peak efficiency there is a nearly 1:1 relationship
between the amount of H2S entering the catalytic converter and the amount of SO2
leaving it. Therefore, by measuring the amount of SO2 in the gas after it leaves the
converter, the amount of H2S originally present on the sample gas can be directly
inferred. This is accomplished by measuring the ultraviolet fluorescence of the SO2 in
the sample chamber.
10.1.2. SO2 ULTRAVIOLET FLUORESCENCE
The physical principle upon which the T101’s measurement method is based is the
fluorescence that occurs when Sulfur dioxide (SO2) is changed to excited state (SO2*) by
ultraviolet light with wavelengths in the range of 190 nm - 230 nm. This reaction is a
two-step process.
The first stage (Equation 10-1) occurs when SO2 molecules are struck by ultraviolet
photons (hv) of the appropriate wavelength. (In the case of the Model T101, a band pass
filter between the source of the UV light and the affected gas limits the wavelength of the
UV light to approximately 214 nm.) The SO2 absorbs some of the energy from the UV
light, causing one of the electrons of each affected SO2 molecule to move to a higher
energy orbital state (SO2*).
*
22142 SOhvSO Ia
nm
(Equation 10-1)
The amount of SO2 converted to SO2* in the sample chamber is dependent on the
average intensity of the UV light (Ia) and not its peak intensity because the intensity of
UV light is not constant in every part of the sample chamber. Some of the photons are
absorbed by the SO2 as the light travels through the sample gas.
07266B DCN6485
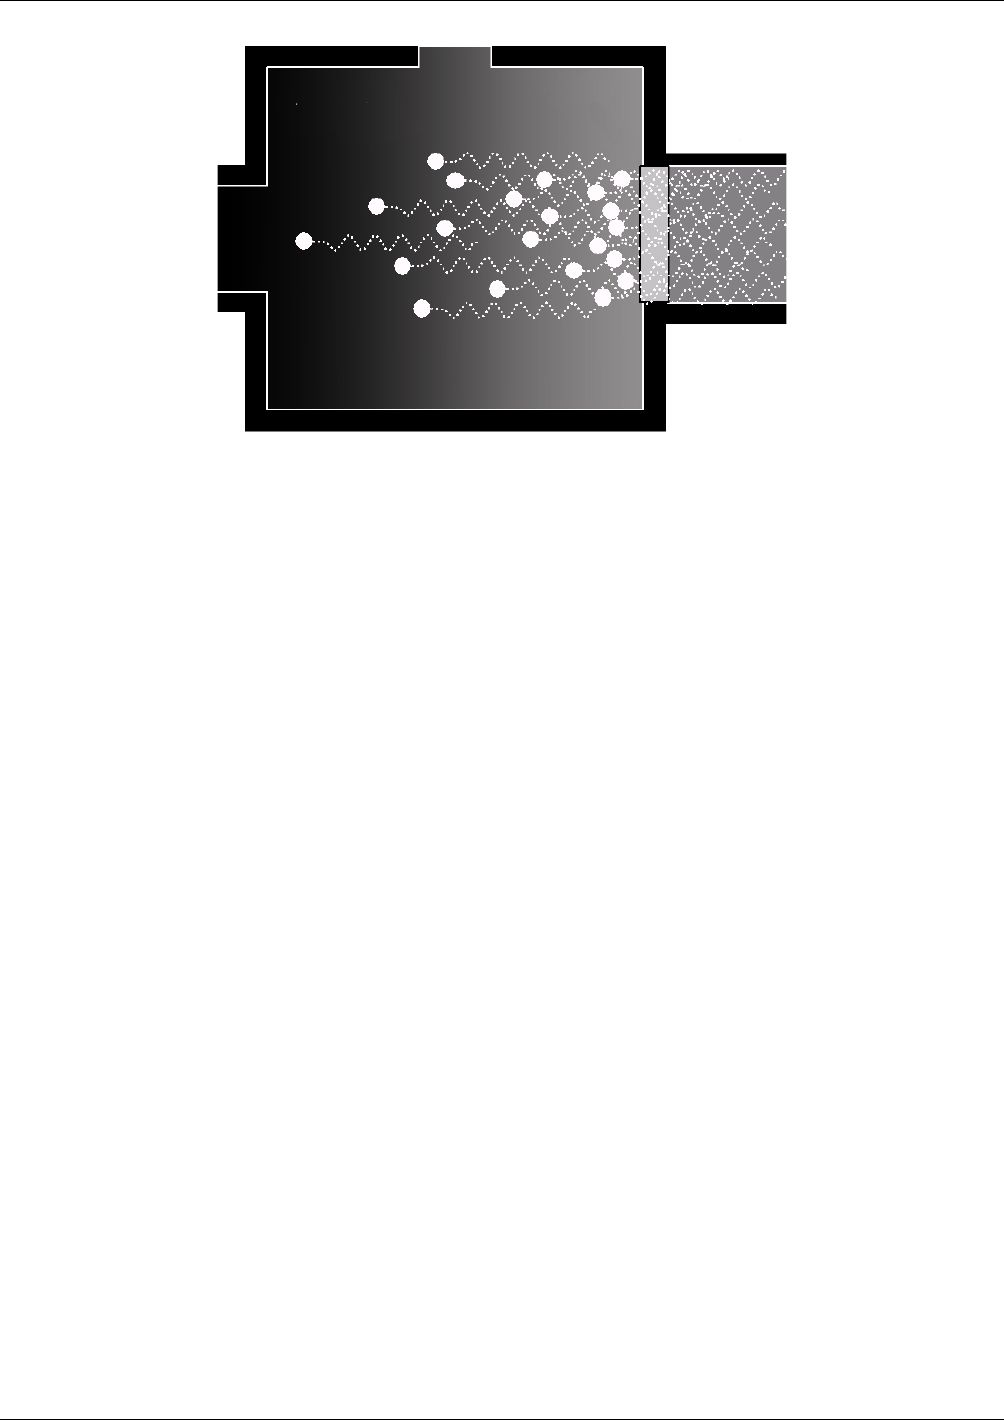
Model T101 Instruction Manual Principles Of Operation
245
Figure 10-1. UV Absorption
The equation for defining the average intensity of the UV light (Ia) is:
20 SOaxexp1IIa
Where: (Equation 10-2)
I0 = Intensity of the excitation UV light.
a = The absorption coefficient of SO2.
SO2 = Concentration of SO2 in the sample chamber.
x = The distance between the UV source and the SO2 molecule(s) being
affected (path length).
The second stage of this reaction occurs after the SO2 reaches its excited state (SO2*).
Because the system will seek the lowest available stable energy state, the SO2* molecule
quickly returns to its ground state (Equation 10-3) by giving off the excess energy in the
form of a photon (h). The wavelength of this fluoresced light is also in the ultraviolet
band but at a longer (lower energy) wavelength centered at 330nm.
nm33022 hvSO*SO
(Equation 10-3)
The amount of detectable UV (F) given off by the decay of the SO2* is affected by the rate
at which this reaction occurs (k).
07266B DCN6485

Principles Of Operation Model T101 Instruction Manual
246
*SOkF 2
Where:
F = the amount of fluorescent light given off.
k = The rate at which the SO2* decays into SO2.
SO2* = Amount of excited state SO2 in the sample chamber.
Therefore:
nm3302
kF
2hvSO*SO
Furthermore, the function (k) is affected by the temperature of the gas. The warmer the
gas, the faster the individual molecules decay back into their ground state and the more
photons of UV light are given off per unit of time.
Given that the absorption rate (a) of SO2 is constant, the amount of fluorescence (F) is a
result of:
The amount of SO2* created which is affected by the variable factors
from equation 10-2 above: concentration of SO2; intensity of UV light
(I0); path length of the UV light (x) and;
The amount of fluorescent light created which is affected by the variable
factors from equation 10-5: the amount of SO2* present and the rate of
decay (k) which changes based on the temperature of the gas.
The amount of fluorescent light emitted (F) is directly related to the concentration of the
SO2 in the Sample Chamber, when:
the intensity of the light (I0) is known
the path length of excitation light is short (x)
the temperature of the gas is known and compensated for so that the
rate of SO2*decay is constant (k)
there are no interfering conditions present (such as interfering gases or
stray light)
The Model T101 UV Fluorescence SO2 Analyzer is specifically designed to create these
circumstances.
The light path is very short.
The optical design reduces the effects of stray light geometrically and
spectrally.
A special hydrocarbon scrubber removes the most common interfering
gases from the sample gas.
A reference detector measures the intensity of the available excitation UV
light and is used to remove effects of lamp drift.
Finally, the temperature of the sample gas is measured and controlled
via heaters attached to the sample chamber.
The net result is that any variation in UV fluorescence can be directly attributed to
changes in the concentration of SO2 in the sample gas.
07266B DCN6485

Model T101 Instruction Manual Principles Of Operation
247
10.2. THE UV LIGHT PATH
The optical design of the Model T101’s sample chamber optimizes the fluorescent
reaction between SO2 and UV Light (Figure 10-2) and assures that only UV light
resulting from the decay of SO2* into SO2 is sensed by the instrument’s fluorescence
detector.
UV radiation is generated by a lamp specifically designed to produce a maximum
amount of light of the wavelength needed to excite SO2 into SO2* (330 nm) and a
special reference detector circuit constantly measures lamp intensity (see Equation 10-
2). A Photo Multiplier Tube (PMT) detects the UV given off by the SO2* decay (214
nm) and outputs an analog signal. Several focusing lenses and optical filters make sure
that both detectors are exposed to an optimum amount of only the right wavelengths of
UV. To further assure that the PMT only detects light given off by decaying SO2* the
pathway of the excitation UV and field of view of the PMT are perpendicular to each
other and the inside surfaces of the sample chamber are coated with a layer of black
Teflon® that absorbs stray light.
UV
Lamp
PMT
UV Source
Optical Filter
(214 nm)
Fluorescent UV
Optical Filter
(330 nm)
UV Source
Lens
PMT Lens
Reference
Detector
Window / Seal
Sa
m
p
l
e
Gas
IN
Sample Gas OUT
Unabsorbed Excitation UV
Broadband
UV From
Lamp
Filtered
Excitation UV
Fluorescent
UV
Only
Focused
Fluorescent
UV
Collimated
Excitation UV
Reflected
Excitation UV
and
Fluorescent U
V
SO2
Figure 10-2. UV Light Path
10.2.1. UV SOURCE LAMP
The source of excitation UV light for the Model T101 is a low pressure zinc-vapor lamp.
An AC voltage heats up and vaporizes zinc contained in the lamp element creating a
light-producing plasma arc. Zinc-vapor lamps are preferred over the more common
mercury-vapor lamps for this application because they produce very strong emission
levels at the wavelength required to convert SO2 to SO2*, 214.3 nm (see Figure 10-4).
07266B DCN6485

Principles Of Operation Model T101 Instruction Manual
248
The lamp used in the Model T101 is constructed with a vacuum jacket surrounding a
double-bore lamp element (Figure 10-3). The vacuum jacket isolates the plasma arc
from most external temperature fluctuations. The jacket also contains the thermal energy
created by the lamps operation thereby helping the lamp heat up to and maintain proper
vaporization temperature. Light is emitted through a 20 mm x 5 mm portal.
Light Output
Portal
Zinc-
V
apor
Plasma Arc
V
acuum
Jacket
Dual Bore
Figure 10-3. Source UV Lamp Construction
10.2.2. THE REFERENCE DETECTOR
A vacuum diode UV detector that converts UV light to a DC current is used to measure
the intensity of the excitation UV source lamp. Its location, directly across from the
source lamp at the back of a narrow tube-shaped light trap, places it directly in the path
of the excitation UV light. A window transparent to UV light provides an air-proof seal
that prevents ambient gas from contaminating the sample chamber. The shape of the
light trap and the fact that the detector is blind to wavelengths other than UV means no
extra optical filtering is needed.
10.2.3. THE PMT
The amount of fluoresced UV produced in the sample chamber is much less than the
intensity of excitation UV source lamp (see Figure 10-4). Therefore a much more
sensitive device is needed to detect this light with enough resolution to be meaningful.
The Model T101 uses a Photo Multiplier Tube or PMT for this purpose (see 10.4.4 for
more details regarding the electronic operation of the PMT).
07266B DCN6485
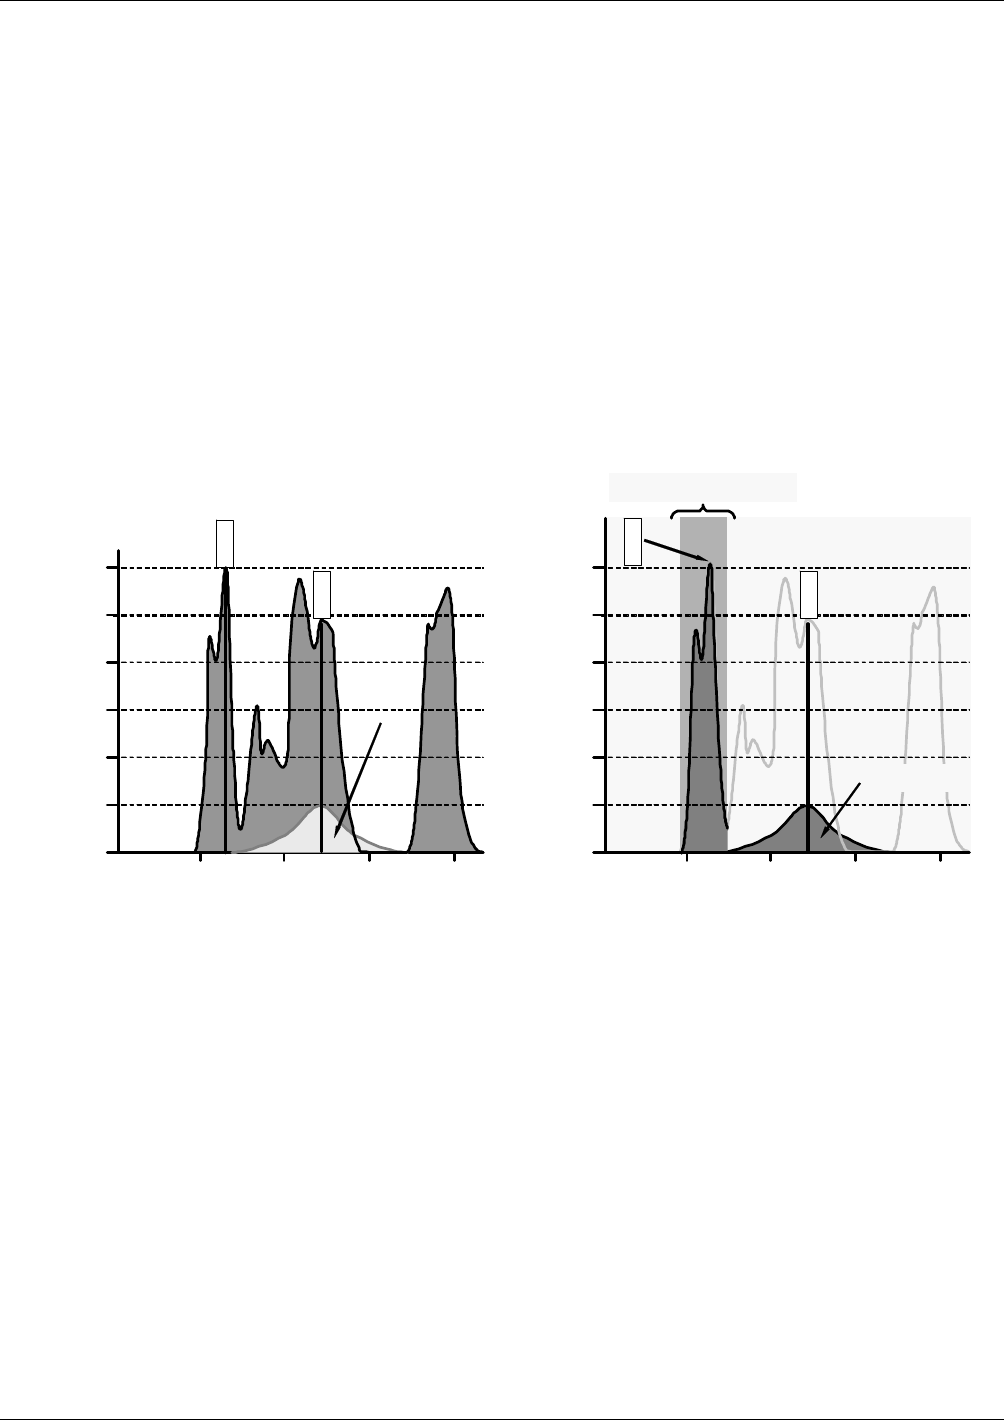
Model T101 Instruction Manual Principles Of Operation
249
10.2.4. OPTICAL FILTERS
The Model T101 analyzer uses two stages of optical filters to enhance performance. The
first stage conditions the UV light used to excite the SO2 by removing frequencies of
light that are not needed to produce SO2*. The second stage protects the PMT detector
from reacting to light not produced by the SO2* returning to its ground state.
10.2.4.1. UV Source Optical Filter
Zinc-vapor lamps output light at other wavelengths beside the 214nm required for the
SO2 SO2* transformation including a relatively bright light of the same wavelength at
which SO2* fluoresces as it returns to its SO2 ground state (330 nm). In fact, the
intensity of the light emitted by the UV lamp at 330nm is so bright, nearly five orders of
magnitude brighter than that resulting from the SO2* decay, it would drown out the
SO2* fluorescence.
LAMP OUTPUT
(Arbitrary Untis)
105
104
102
202.5
307.6
481.1
103
101
1
100 200 300 400 500
WAVELENGTH (nm)
0
214.3
330.3
275.6
SO2*
Fluorescent
Spectrum
LAMP OUTPUT
(Arbitrary U ntis)
105
104
102
103
101
1
100 200 300 400 500
WAVELENGTH (nm)
0
214.3
330.3
SO2* FLUORESCENT
SPECTRUM
UV SOURCE OPTICAL FILTE
R
BANDWIDTH
BEFORE AFTER
Figure 10-4. Excitation Lamp UV Spectrum Before/After Filtration
To solve this problem, the light emitted by the excitation UV lamp passes through a
bandpass filter that screens out photons with wavelengths outside the spectrum required
to excite SO2 into SO2*. (Figure 10-4).
10.2.4.2. PMT Optical Filter
The PMT used in the Model T101 reacts to a wide spectrum of light which includes
much of the visible spectrum and most of the UV spectrum. Even though the 214 nm
light used to excite the SO2 is focused away from the PMT, some of it scatters in the
direction of the PMT as it interacts with the sample gas. A second optical bandpass filter
placed between the sample chamber (see Figure 10-2) and the PMT strips away light
outside of the fluorescence spectrum of decaying SO2* (see Figure 10-5) including
reflected UV form the source lamp and other stray light.
07266B DCN6485
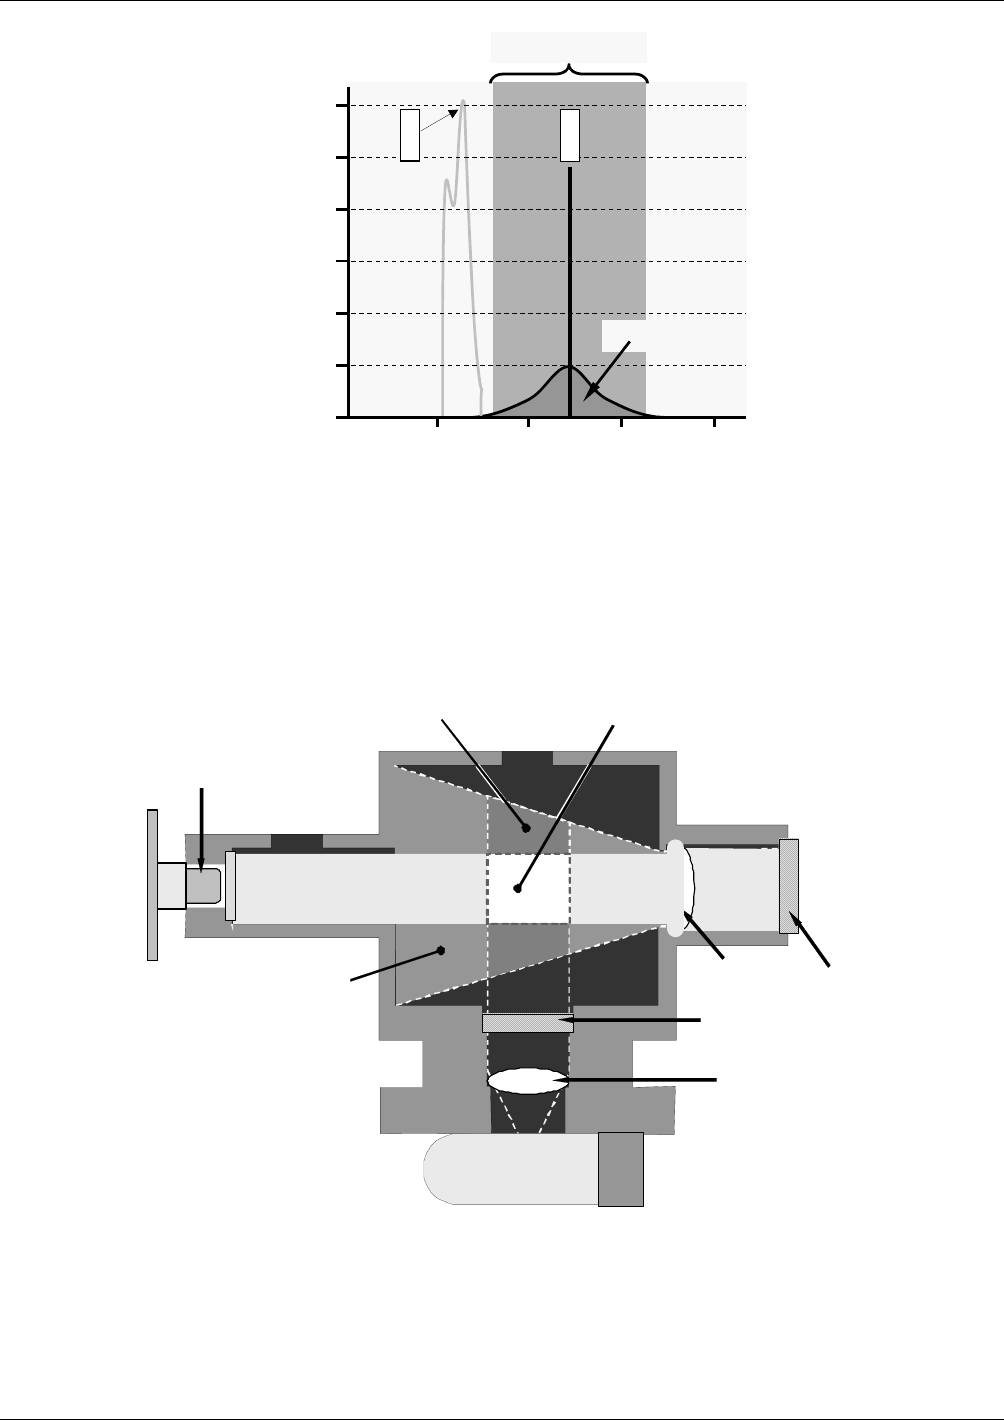
Principles Of Operation Model T101 Instruction Manual
250
LAMP OUTPUT
(Arbitrary Untis)
105
104
102
103
101
1
100 200
300
400
500
WAVELENGTH (nm)
0
213.9
330.3
SO2* FLUORESCENT
SPECTRUM
PMT OPTICAL FILTER
BANDWIDTH
Figure 10-5. PMT Optical Filter Bandwidth
10.2.5. OPTICAL LENSES
Two optical lenses are used to focus and optimize the path of light through the sample
chamber.
214 nm
Filter
330 nm
Filter
UV Source
Lens
PMT Lens
Reference
Detector
If source UV is unfocused, PMT
receives fluorescence from area
outside Reference Detector’s view
PMT
When source UV is focused, PMT
and Reference Detector view
similar volume of SO2*
When source UV is focused,
Reference Detector sees
most of the emitted light
If source UV is unfocused,
Reference Detector only sees a
small portion of emitted light
Figure 10-6. Effects of Focusing Source UV in Sample Chamber
A lens located between PMT and the sample chamber collects as much of the fluoresced
UV created there as possible and focuses it on the most sensitive part of the PMT’s
photo cathode.
07266B DCN6485

Model T101 Instruction Manual Principles Of Operation
251
Another lens located between the excitation UV source lamp and the sample chamber
collimates the light emitted by the lamp into a steady, circular beam and focuses that
beam directly onto the reference detector. This allows the reference detector to
accurately measure the effective intensity of the excitation UV by:
Eliminating the effect of reflected light from the UV lamp reaching the PMT.
Making sure that all of the light emitted by the source lamp, passed though the 214 nm
filter and not absorbed by the SO2 reaches the reference detector. Conversely, this also
makes sure that the volume of sample gas affected by the excitation beam is similar to
the volume of fluorescing SO2* being measured by the PMT, eliminating a possible
source of measurement offset.
10.2.6. MEASUREMENT INTERFERENCES
It should be noted that the fluorescence method for detecting H2S is subject to
interference from a number of sources. The T101 has been successfully tested for its
ability to reject interference from most of these sources.
10.2.6.1. Direct Interference
Obviously, since the T101 measures H2S by converting it to SO2, the most significant
interfering gas for this measurement would be ambient SO2 that is present in the sample
gas. The T101 circumvents this by passing the sample gas through a chemical scrubber
that removes all SO2 from the sample gas before the H2S SO2 conversion takes place.
This ensures that the only SO2 present in the sample chamber is the result of the H2S
SO2 conversion. Obviously to make sure that the analyzer operates correctly it is
important to make sure that this scrubber is functioning properly.
The second most common source of interference is from other gases that fluoresce in a
similar fashion to SO2 when exposed to UV Light. The most significant of these is a
class of hydrocarbons called poly-nuclear aromatics (PNA) of which xylene and
naphthalene are two prominent examples. Nitric oxide fluoresces in a spectral range near
to SO2. For critical applications where high levels of NO are expected an optional
optical filter is available that improves the rejection of NO (contact Technical Support
for more information).
The Model T101 Analyzer has several methods for rejecting interference from these
gasses.
A special scrubber (kicker) mechanism removes any PNA chemicals present in the
sample gas before it the reaches the sample chamber.
The exact wavelength of light needed to excite a specific non-SO2 fluorescing gas is
removed by the source UV optical filter.
The light given off by Nitrogen Oxide and many of the other fluorescing gases is outside
of the bandwidth passed by the PMT optical filter.
07266B DCN6485

Principles Of Operation Model T101 Instruction Manual
252
10.2.6.2. UV Absorption by Ozone
Because ozone absorbs UV Light over a relatively broad spectrum it could cause a
measurement offset by absorbing some of the UV given off by the decaying SO2* in the
sample chamber. The Model T101 prevents this from occurring by having a very short
light path between the area where the SO2* fluorescence occurs and the PMT detector.
Because the light path is so short, the amount of O3 needed to cause a noticeable effect
would be much higher than could be reasonably expected in any application for which
this instrument is intended.
10.2.6.3. Dilution
Certain gases with higher viscosities can lower the flow rate though the critical flow
orifice that controls the movement of sample gas though the analyzer reducing the
amount of sample gas in the sample chamber and thus the amount of SO2 available to
react with the to the UV light. While this can be a significant problem for some
analyzers, the design of the Model T101 is very tolerant of variations in sample gas flow
rate and therefore does not suffer from this type of interference.
10.2.6.4. Third Body Quenching
While the decay of SO2* to SO2 happens quickly, it is not instantaneous. Because it is
not instantaneous it is possible for the extra energy possessed by the excited electron of
the SO2* molecule to be given off as kinetic energy during a collision with another
molecule. This in effect heats the other molecule slightly and allows the excited electron
to move into a lower energy orbit without emitting a photon.
The most significant interferents in this regard are nitric oxide (NO), carbon dioxide
(CO2), water vapor (H2O) and molecular oxygen (O2). In ambient applications the
quenching effect of these gasses is negligible. For stack applications where the
concentrations of some or all of these may be very high, specific steps MUST be taken
to remove them from the sample gas before it enters the analyzer.
10.2.6.5. Light Pollution
Because T101 measures light as a means of calculating the amount of SO2 present,
obviously stray light can be a significant interfering factor. The Model T101 removes
this interference source in several ways.
The sample chamber is designed to be completely light tight to light from sources other
than the excitation UV source lamp.
All pneumatic tubing leading into the sample chamber is completely opaque in order to
prevent light from being piped into the chamber by the tubing walls.
The optical filters discussed in section 10.2.4; remove UV with wavelengths extraneous
to the excitation and decay of SO2/SO2*.
During instrument calibration, when the analyzer is sampling zero air (calibration gas
devoid of H2S) a measurement of the background light that is still present in the sample
chamber is recorded and used to offset the value of the PMT output used to calculate the
H2S concentration.
07266B DCN6485

Model T101 Instruction Manual Principles Of Operation
253
10.3. PNEUMATIC OPERATION
CAUTION
It is important that the sample airflow system is leak-tight and not pressurized over
ambient pressure. Regular leak checks should be performed on the analyzer as
described in the maintenance schedule, Table 8-1. Procedures for correctly performing
leak checks can be found in Section 9.5.1.
NOTE
Relative Pressure versus Absolute Pressure
In this manual vacuum readings are given in inches of mercury absolute pressure (in-
Hg-A), i.e. indicate an absolute pressure referenced against zero (a perfect vacuum).
07266B DCN6485
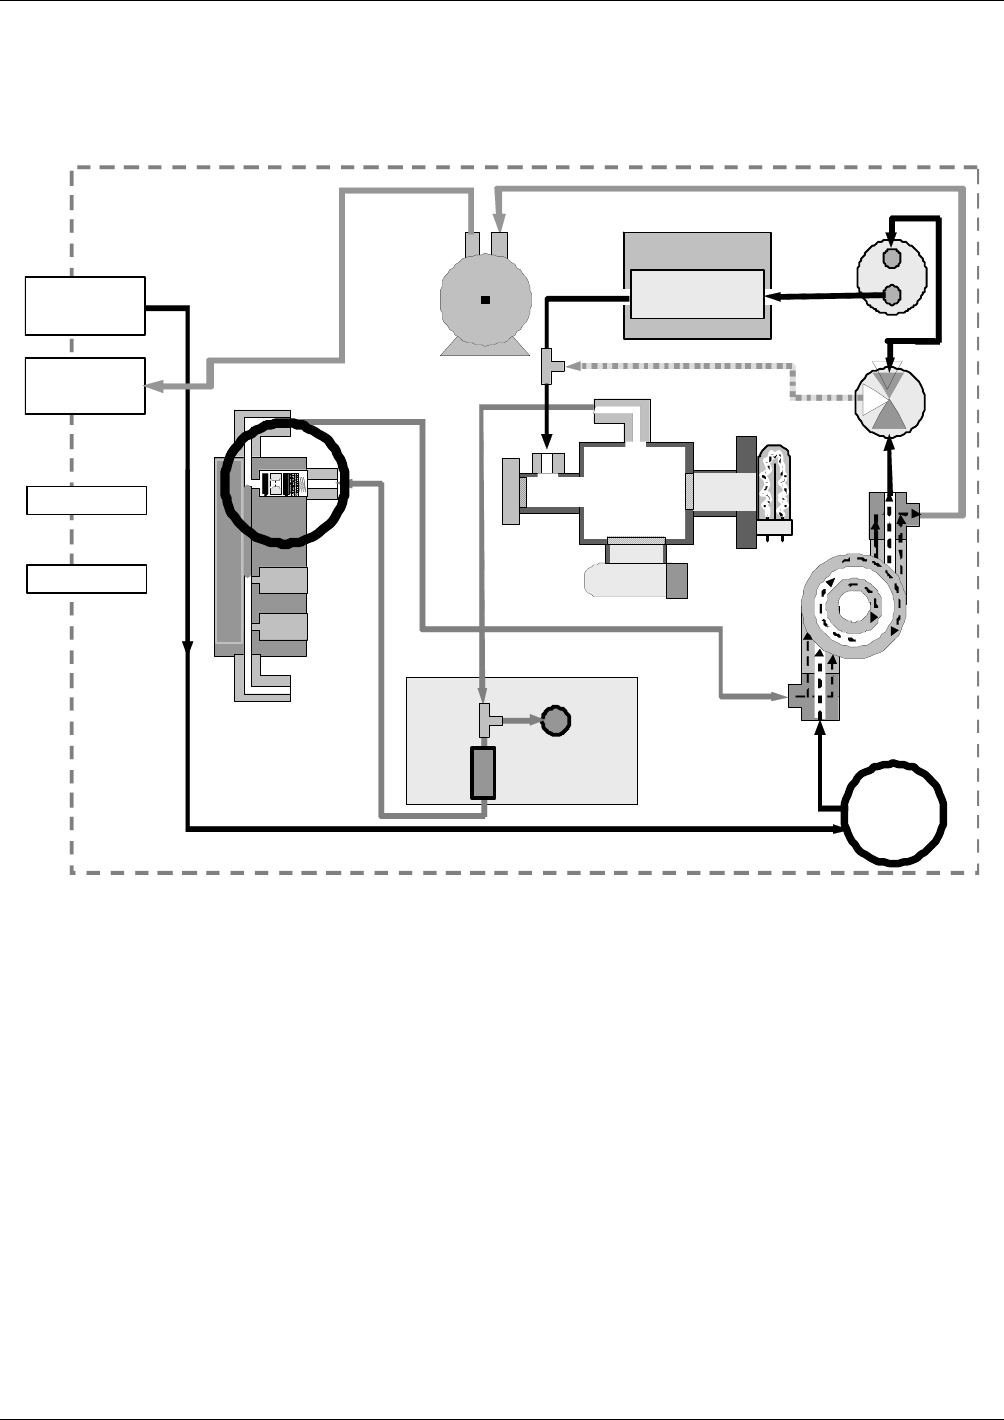
Principles Of Operation Model T101 Instruction Manual
254
10.3.1. SAMPLE GAS FLOW
The flow of gas through the T101 UV Fluorescence H2S Analyzer is created by a small
internal pump that pulls air though the instrument.
PMT
EXHAUST TO OUTER
LAYER OF
KICKER
R EAC TION CELL PURGE
FLOW
SENSOR FLOW / PRESSURE
SENSOR PCA SAMPLE
FILTER
INSTRUMENT CHASSIS
EXH AUST GAS
OUTLET
VACUUM MANIFOLD
SAMPLE GAS
INLET
KICKER EXHAUST TO PUMP
PUMP
FLOW
CO N T RO L
ASSY
SAMPLE
PRESSURE
SENSOR
UV
LA MP
HYD ROCARBON
SCRUBBER
(KICKER)
SPAN GAS INLET
ZERO AIR INLET
SAMPLE
CHAMBER
2
1
3
SO2
Scrubber
MOLYBDENUM
CONVERTER
SO2
H2S
H2S / SO2
MODE VALVE
Ga s Fl ow w hen m ult ig as versi on of
Analyzer is measuring SO2.
Figure 10-7. T101 Gas Flow and Location of Critical Flow Orifice
07266B DCN6485

Model T101 Instruction Manual Principles Of Operation
255
10.3.2. MULTIGAS MEASUREMENT & H2S SO2 SWITCHING
VALVE.
When activated for operation the multigas measurement mode allows the instrument to
measure either or both H2S or SO2 via a Teflon® switching valve. This valve, under CPU
control via the I2C buss and the relay board, directs the sample gas stream either through
the SO2 scrubber and H2S SO2 converter (H2S measurement mode) or directly to the
sample chamber bypassing the H2S SO2 converter, allowing the analyzer to measure
SO2. The cycle for this operation is
Table 10-1. T101 Multigas Valve Cycle-Phases
Gas Mode H2S SO2 Valve Status Default
Time
Settings
Activity
0 – 3
minutes
Wait period. Ensures sample chamber has
been flushed of previous gas.
H2S Gas stream directed
through scrubber and
converter 3 – 10 m Analyzer measures florescence in sample
chamber
0 – 3
minutes
Wait period (dwell time). Ensures sample
chamber has been flushed of previous gas.
SO2 Gas stream bypasses
through scrubber and
converter 3 – 10 m Analyzer measures florescence in sample
chamber
Cycle repeats every ~20Minuites
The timing of the above cycle is set by two variables (see Appendix A-2),
MEASURE_PERIOD, which sets the total dwell time for each gas mode, and
MEASURE_DELAY which sets the wait period before the instrument begins making
measurements after the gas mode has been switch.
10.3.3. FLOW RATE CONTROL
The Model T101 uses a special flow control assembly located in the exhaust vacuum
manifold (Figure 10-7) to maintain a constant flow rate of the sample gas through the
instrument. This assembly consists of:
a critical flow orifice
two o-rings: Located just before and after the critical flow orifice, the o-
rings seal the gap between the walls of assembly housing and the critical
flow orifice.
a spring: Applies mechanical force needed to form the seal between the
o-rings, the critical flow orifice and the assembly housing.
10.3.3.1. Critical Flow Orifice
The most important component of this flow control assembly is the critical flow orifice.
Critical flow orifices are a remarkably simple way to regulate stable gas flow rates. They
operate without moving parts by taking advantage of the laws of fluid dynamics. By
restricting the flow of gas though the orifice, a pressure differential is created. This
07266B DCN6485
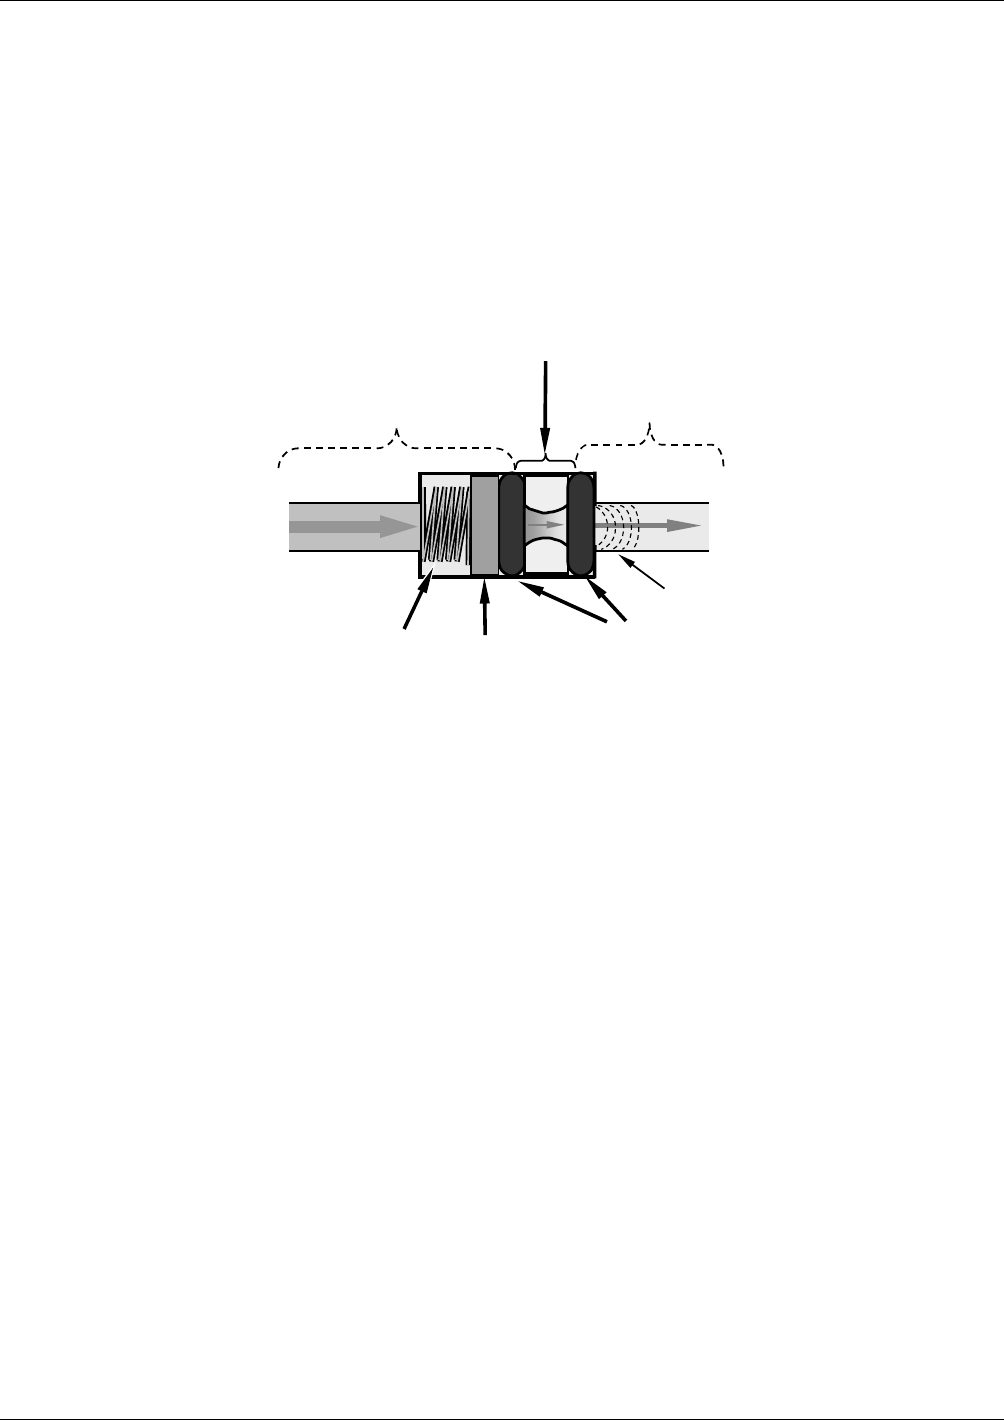
Principles Of Operation Model T101 Instruction Manual
256
pressure differential combined with the action of the analyzer’s external pump draws the
gas through the orifice.
As the pressure on the downstream side of the orifice (the pump side) continues to drop,
the speed that the gas flows though the orifice continues to rise. Once the ratio of
upstream pressure to downstream pressure is greater than 2:1, the velocity of the gas
through the orifice reaches the speed of sound. As long as that ratio stays at least 2:1 the
gas flow rate is unaffected by any fluctuations, surges, or changes in downstream
pressure because such variations only travel at the speed of sound themselves and are
therefore cancelled out by the sonic shockwave at the downstream exit of the critical
flow orifice.
SPRING O-RINGS
FILTER
CRITICAL
FLOW
ORIFICE
A
REA OF
LOW
PRESSURE
AREA OF
HIGH
PRESSURE
Sonic
Shockwave
Figure 10-8. Typical Flow Control Assembly with Critical Flow Orifice
The actual flow rate of gas through the orifice (volume of gas per unit of time), depends
on the size and shape of the aperture in the orifice. The larger the hole, the more gas
molecules, moving at the speed of sound, pass through the orifice.
The result is that he flow rate of the gas is unaffected by degradations in pump
efficiency due to age.
The critical flow orifice used in the Model T101 is designed to provide a flow rate of
600 cm3/min.
10.3.4. SAMPLE PARTICULATE FILTER
To remove particles in the sample gas, the analyzer is equipped with a Teflon membrane
filter of 47 mm diameter (also referred to as the sample filter) with a 1 µm pore size. The
filter is accessible through the front panel, which folds down, and should be changed
according to the suggested maintenance schedule in Table 9-1.
07266B DCN6485
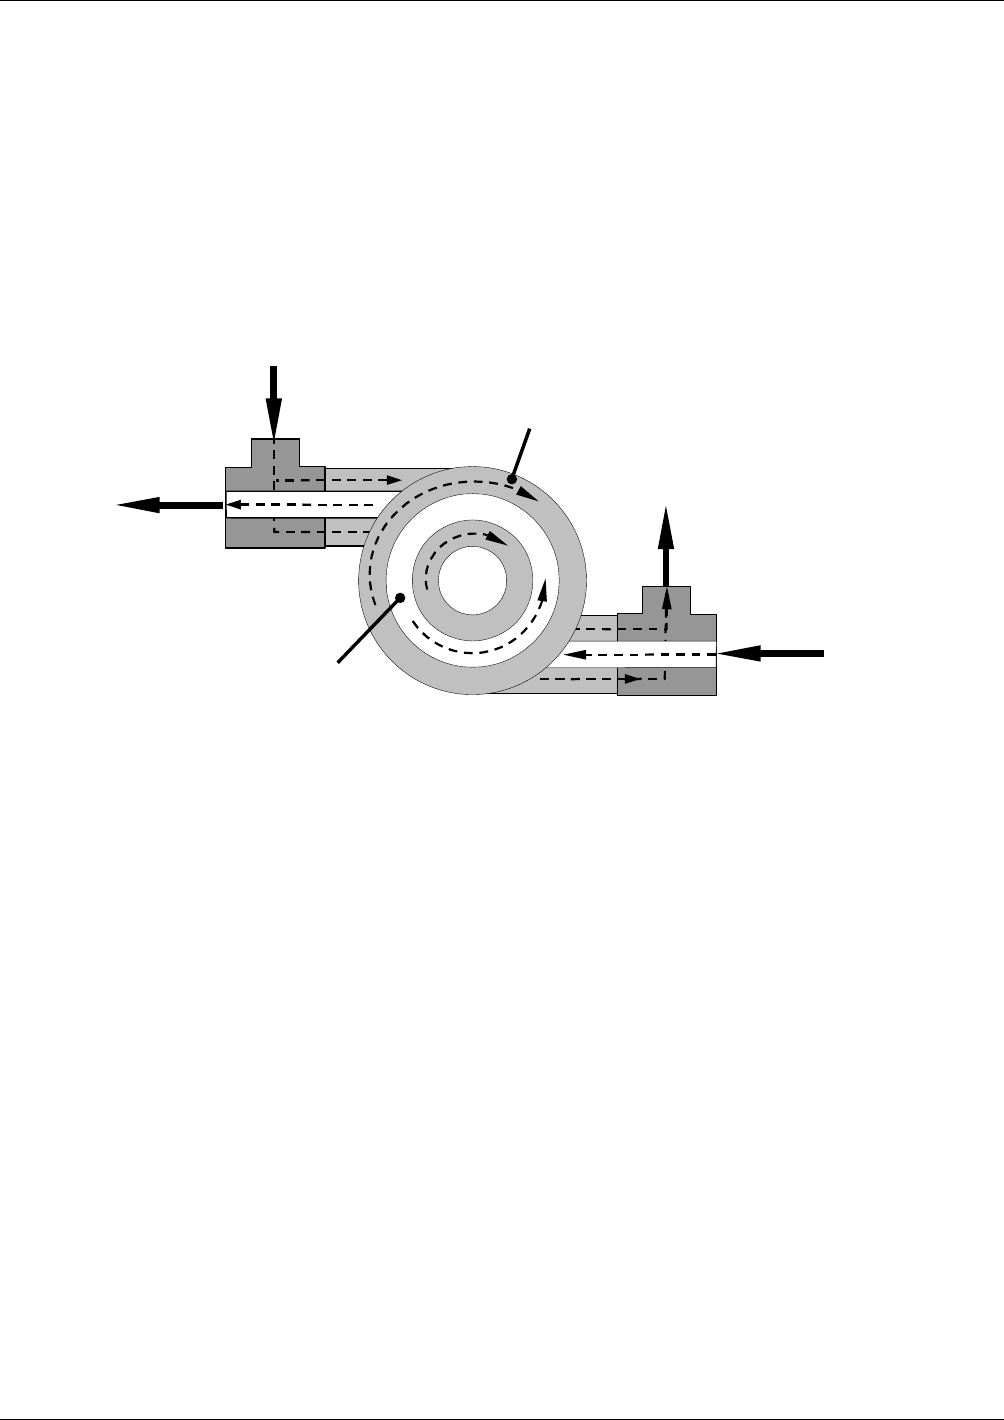
Model T101 Instruction Manual Principles Of Operation
257
10.3.5. HYDROCARBON SCRUBBER (KICKER)
It is very important to make sure the air supplied to sample the chamber is clear of
hydrocarbons. To accomplish this task the T101 uses a single tube permeation scrubber.
The scrubber consists of a single tube of a specialized plastic that absorbs hydrocarbons
very well. This tube is located within the outer flexible plastic tube shell. As gas flows
through the inner tube, hydrocarbons are absorbed into the membrane walls. and
transported through the membrane wall and into the hydrocarbon free, purge gas flowing
through the outer tube. This process is driven by the hydrocarbon partial pressure
gradient between the inner and outer tubes.
INNER
TUBE
(Ambient Air)
OUTER TUBE
(Clean Air)
SAMPLE AIR
FROM
PARTICULATE FILTER
CLEANED
SAMPLE AIR
TO
SAMPLE
CHAMBER
CLEAN
PURGE AIR
FROM
VACUUM MANIFOLD
USED PURGE AIR
TO
PUMP
AND
EXHAUST PORT
Figure 10-9. T101 Hydrocarbon Scrubber (Kicker)
In the T101 some of the cleaned air from the inner tube is returned to be used as the
purge gas in the outer tube (Figure 10-9). This means that when the analyzer is first
started, the concentration gradient between the inner and outer tubes is not very large
and the scrubber’s efficiency is relatively low. When the instrument is turned on after
having been off for more than 30 minutes, it takes a certain amount of time for the
gradient to become large enough for the scrubber to adequately remove hydrocarbons
from the sample air.
10.3.6. SO2 SCRUBBER
In order to ensure that no ambient SO2 interferes with the analyzer’s H2S measurement
the sample gas stream is passed through a chemical scrubber that removes SO2 from the
sample stream before it is passed though the catalytic converter (see Figure 10-7).
The SO2 scrubber is a Teflon encased, stand-alone unit containing a room-temperature
tube mounted in the front right side of the analyzer case (see Figure 3.8) near the
instrument’s on/off switch.
The SO2 scrubber material is consumed as it removes SO2. If the expected
concentrations of SO2 are very high, the lifetime of the scrubber will be short. The
expected life of the scrubber is approximately 1000 ppm-hours. See Section 8.3.3 for
information on when and how to replace the SO2 scrubber material)
07266B DCN6485

Principles Of Operation Model T101 Instruction Manual
258
10.3.7. PNEUMATIC SENSORS
The T101 uses two pneumatic sensors to verify gas streams. These sensors are located
on a printed circuit assembly, called the pneumatic pressure/flow sensor board.
10.3.7.1. Sample Pressure Sensor
An absolute pressure transducer plumbed to the input of the analyzer’s sample chamber
is used to measure the pressure of the sample gas before it enters the chamber. This
upstream used to validate the critical flow condition (2:1 pressure ratio) through the
instrument’s critical flow orifice (Section 10.3.3.1). Also, if the temperature/pressure
compensation (TPC) feature is turned on (Section 10.7.3), the output of this sensor is
also used to supply pressure data for that calculation.
The actual pressure measurement is viewable through the analyzer’s front panel display
as the test function PRESS.
10.3.7.2. Sample Flow Sensor
A thermal-mass flow sensor is used to measure the sample flow through the analyzer.
This sensor is also mounted on the pneumatic pressure/flow sensor board upstream of
the sample chamber. The flow rate is monitored by the CRT which issues a warning
message (SAMP FLOW WARN) if the flow rate is too high or too low.
The flow rate of the sample gas is viewable via the front panel as the SAMP FL test
function.
07266B DCN6485
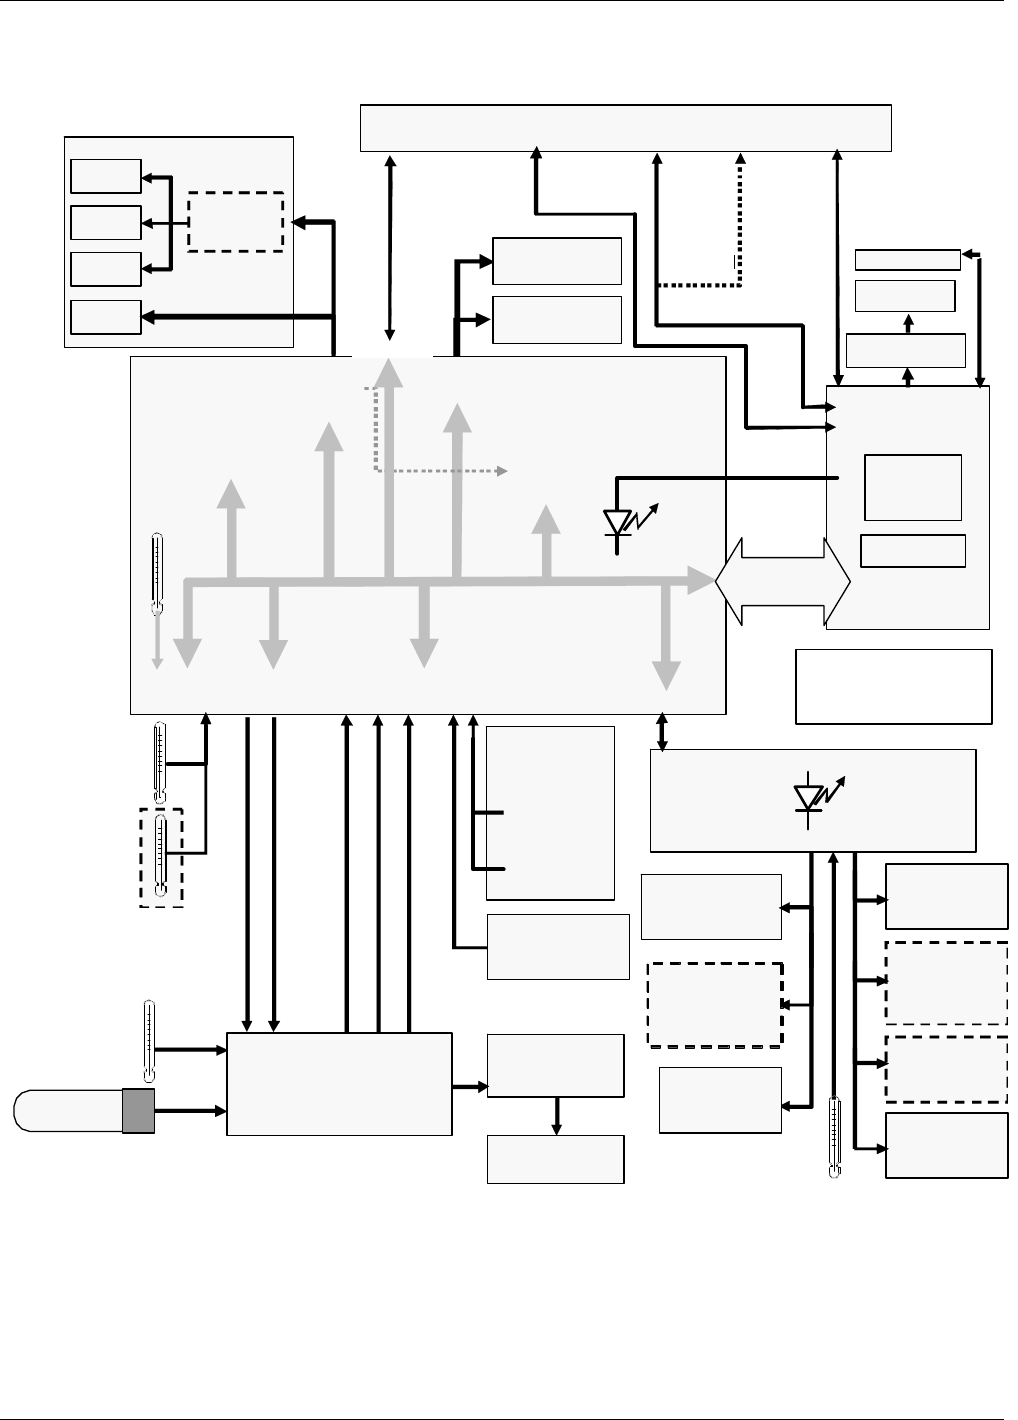
Model T101 Instruction Manual Principles Of Operation
259
10.4. ELECTRONIC OPERATION
Analog In
Pneumatic
Sensor
Board
Sample
Pressure
Sensor
Sample Flow
Sensor
Analog Outputs
Status Outputs:
1 – 8
Control Inputs:
1 – 6
PC 104
CPU Card
Disk On
Module
Flash Chip
Power-Up
Circuit
I2C Bus
Analog
Sensor Inputs
Box
Temp
Thermisto r
Int erface
SAMPLE
CHAMBER
TEMPERATURE
PMT
Temperature
Sensor
A1
A2
A3
Optional
4-20 mA
MOTHER
BOARD
A/D
Converter
(V/F)
PC 104
Bus
External
Digital I/O)
Analog
Out puts
(D/A)
RELAY
BOARD
I2C Status
LE D
PUMP
(Externally Powered)
A4
CPU
STATUS
LED
IZS PERM-TUBE
TEMPERATURE
Shutter
control
Sample Cal
Valve
Option
IZS Valve
Option
Sample Chamber
Heater
IZS Option
Permeation
Tube Heater
PMT TEC
PMT
TEC Drive
PCA
Internal
Di git al I/O
ELECTRIC TEST CONTROL
OPTIC TEST CONTROL
PMT OUTPUT (PMT DET)
HIGH VOLTAGE POWER SUPPLY LEVEL
PMT TEMPERATURE
PMT
PREAMP PCA
UV Reference
Detector
H2S SO2
Converter
Heater
H2SSO2
CONVERTER
TEMPERATURE SENSOR
H2S SO2
Valve
(
I2C Bus
)
LVDS
transmitter board
Touchscreen
USB
Display
COM2
Female
RS232
Male Ethernet
USB COM
port
COM1
(RS–232 ONLY)
or
USB)
COM 2
(RS –232 or RS–485)
Figure 10-10. T101 Electronic Block Diagram
07266B DCN6485

Principles Of Operation Model T101 Instruction Manual
260
The core of the analyzer is a microcomputer that controls various internal processes,
interprets data, makes calculations, and reports results using specialized firmware
developed by Teledyne API. It communicates with the user as well as receives data from
and issues commands to a variety of peripheral devices through a separate printed circuit
assembly to which the CPU is mounted: the motherboard.
The motherboard is directly mounted to the rear panel and collects data, performs signal
conditioning duties and routs incoming and outgoing signals between the CPU and the
analyzer’s other major components.
Concentration data of the T101 are generated by the photo multiplier tube (PMT), which
produces an analog current signal corresponding to the brightness of the fluorescence
reaction in the sample chamber. This current signal is amplified to a DC voltage signal
(front panel test parameter PMT) by a PMT preamplifier printed circuit assembly
(located on top of the sensor housing). PMT is converted to digital data by a bi-polar,
analog-to-digital converter, located on the motherboard.
In addition to the PMT signal, a variety of sensors report the physical and operational
status of the analyzer’s major components, again through the signal processing
capabilities of the motherboard. These status reports are used as data for the H2S
concentration calculation (e.g. pressure and temperature reading used by the
temperature/pressure compensation feature) and as trigger events for certain warning
messages and control commands issued by the CPU. They are stored in the CPU’s
memory and, in most cases, can be viewed through the front panel display.
The CPU communicates with the user and the outside world in a variety of ways:
Through the analyzer’s keyboard and vacuum fluorescent display over a
clocked, digital, serial I/O bus using the I2C protocol (pronounced “I-
squared-C”);
RS 232 & RS485 serial I/O channels;
Various analog voltage and current outputs and
Several digital I/O channels.
Finally, the CPU issues commands (also over the I2C bus) to a series of relays and
switches located on a separate printed circuit assembly, the relay board (located in the
rear of the chassis on its own mounting bracket) to control the function of key
electromechanical devices such as heaters that keep the sample chamber at a steady
temperature and, when installed, the zero/span and internal zero/span valve sets and
heaters.
07266B DCN6485
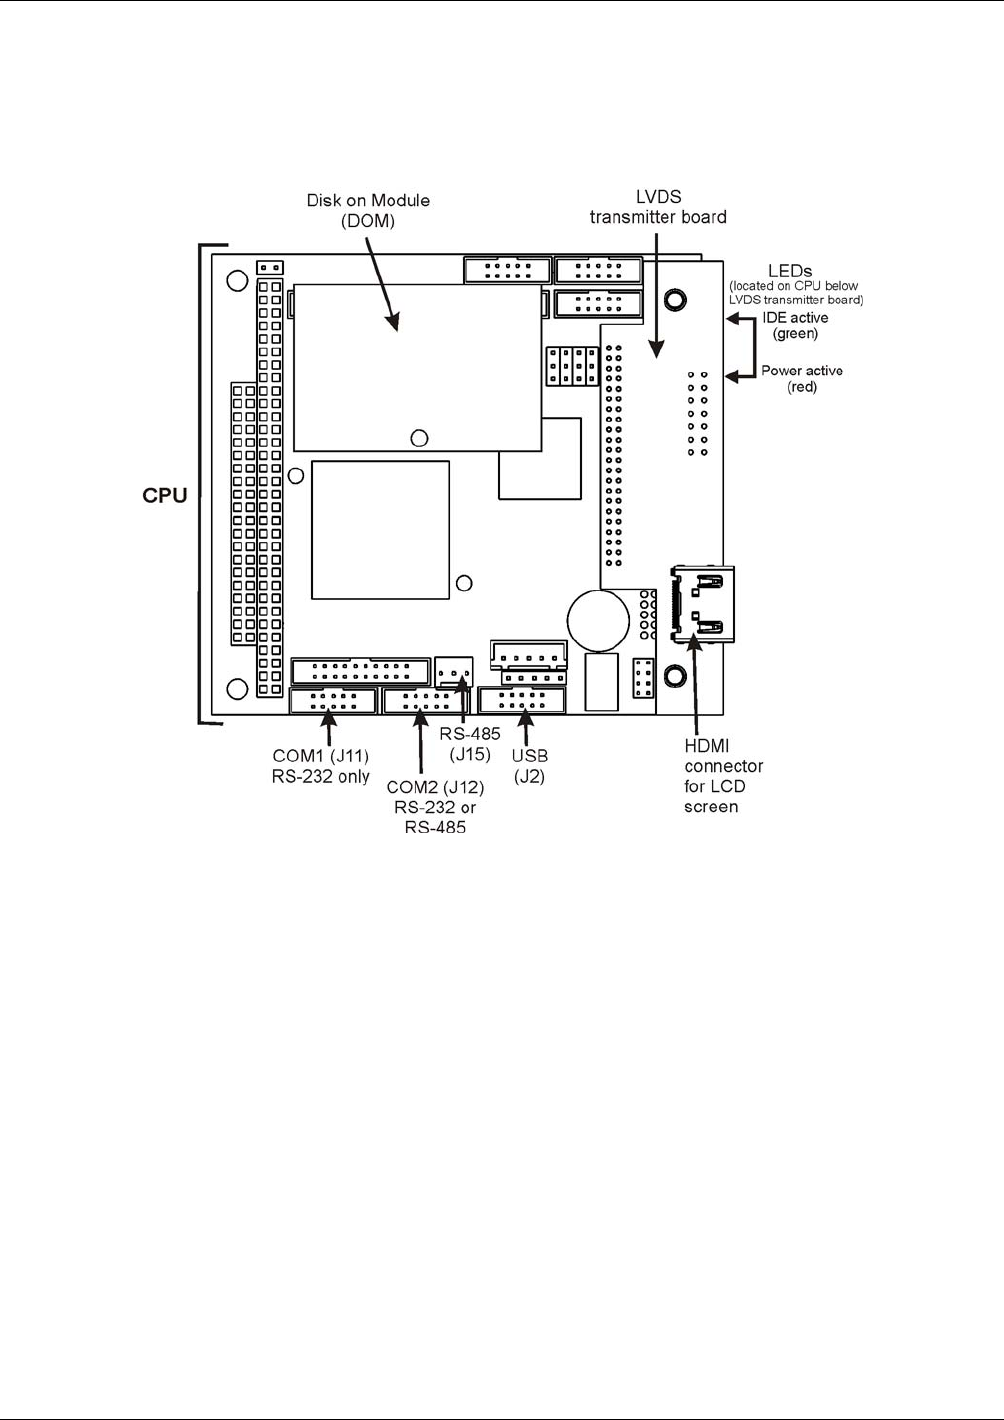
Model T101 Instruction Manual Principles Of Operation
261
10.4.1. CPU
The unit’s CPU card, installed on the motherboard located inside the rear panel, is a low
power (5 VDC, 720mA max), high performance, Vortex 86SX-based microcomputer
running Windows CE. Its operation and assembly conform to the PC 104 specification..
Figure 10-11. T101 CPU Board
The CPU includes two types of non-volatile data storage: a Disk on Module (DOM) and
an embedded flash chip.
10.4.1.1. Disk On Module (DOM)
The DOM is a 44-pin IDE flash chip with storage capacity to 256 MB. It is used to store
the computer’s operating system, the Teledyne API firmware, and most of the
operational data generated by the analyzer’s internal data acquisition system (DAS).
10.4.1.2. Flash Chip
This non-volatile, embedded flash chip includes 2MB of storage for calibration data as
well as a backup of the analyzer configuration. Storing these key data onto a less heavily
accessed chip significantly decreases the chance data corruption.
In the unlikely event that the flash chip should fail, the analyzer will continue to operate
with just the DOM. However, all configuration information will be lost, requiring that
the unit be recalibrated.
07266B DCN6485
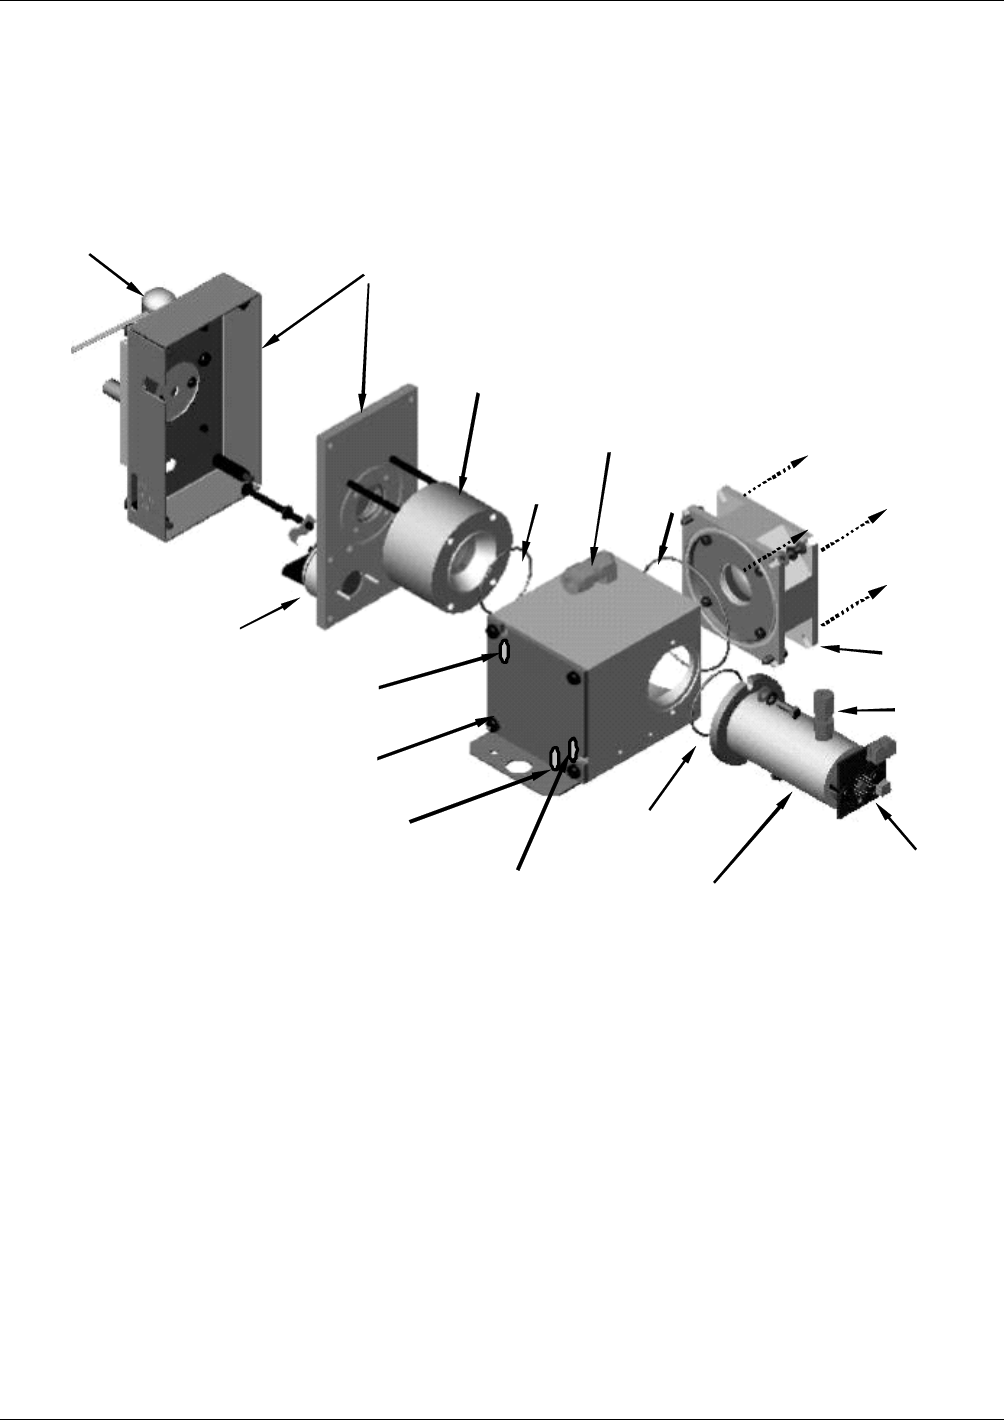
Principles Of Operation Model T101 Instruction Manual
262
10.4.2. SENSOR MODULE & SAMPLE CHAMBER
Electronically, the T101 sensor module is a group of subassemblies with different tasks:
to detect the intensity of the light from the fluorescence reaction between SO2 and UV
light in the sample chamber, to produce a current signal proportional to the intensity of
the fluorescence and to control the temperature of the PMT cooler to ensure the accuracy
and stability of the measurements.
UV Source Lamp Shutter Housing
Shutter Assy
(hidden from vie w)
UV Source Lens &
Housing
PMT Lens
Housing
Sample Chamber
Sample Chamber
Heater
Sample Chamber
Temperature Sensor Reference
Detector
Light Trap
Sample Air
Outlet
O-Ring
Seal
Sample
Air Inlet
Sample Chamber
Heater
O-Ring
Seal
O
-
Ring
Seal
PMT
Housing
Attaches
Here
Figure 10-12. T101 Sample Chamber
10.4.3. SAMPLE CHAMBER HEATING CIRCUIT
In order to reduce temperature effects, the sample chamber is maintained at a constant
50°C, just above the high end of the instrument’s operation temperature range. Two AC
heaters, one embedded into the top of the sample chamber, the other embedded directly
below the reference detector’s light trap, provide the heat source. These heaters operate
off of the instrument’s main AC power and are controlled by the CPU through a power
relay on the relay board. A thermistor, also embedded in the bottom of the sample
chamber, reports the cell’s temperature to the CPU through the thermistor interface
circuitry of the motherboard.
07266B DCN6485
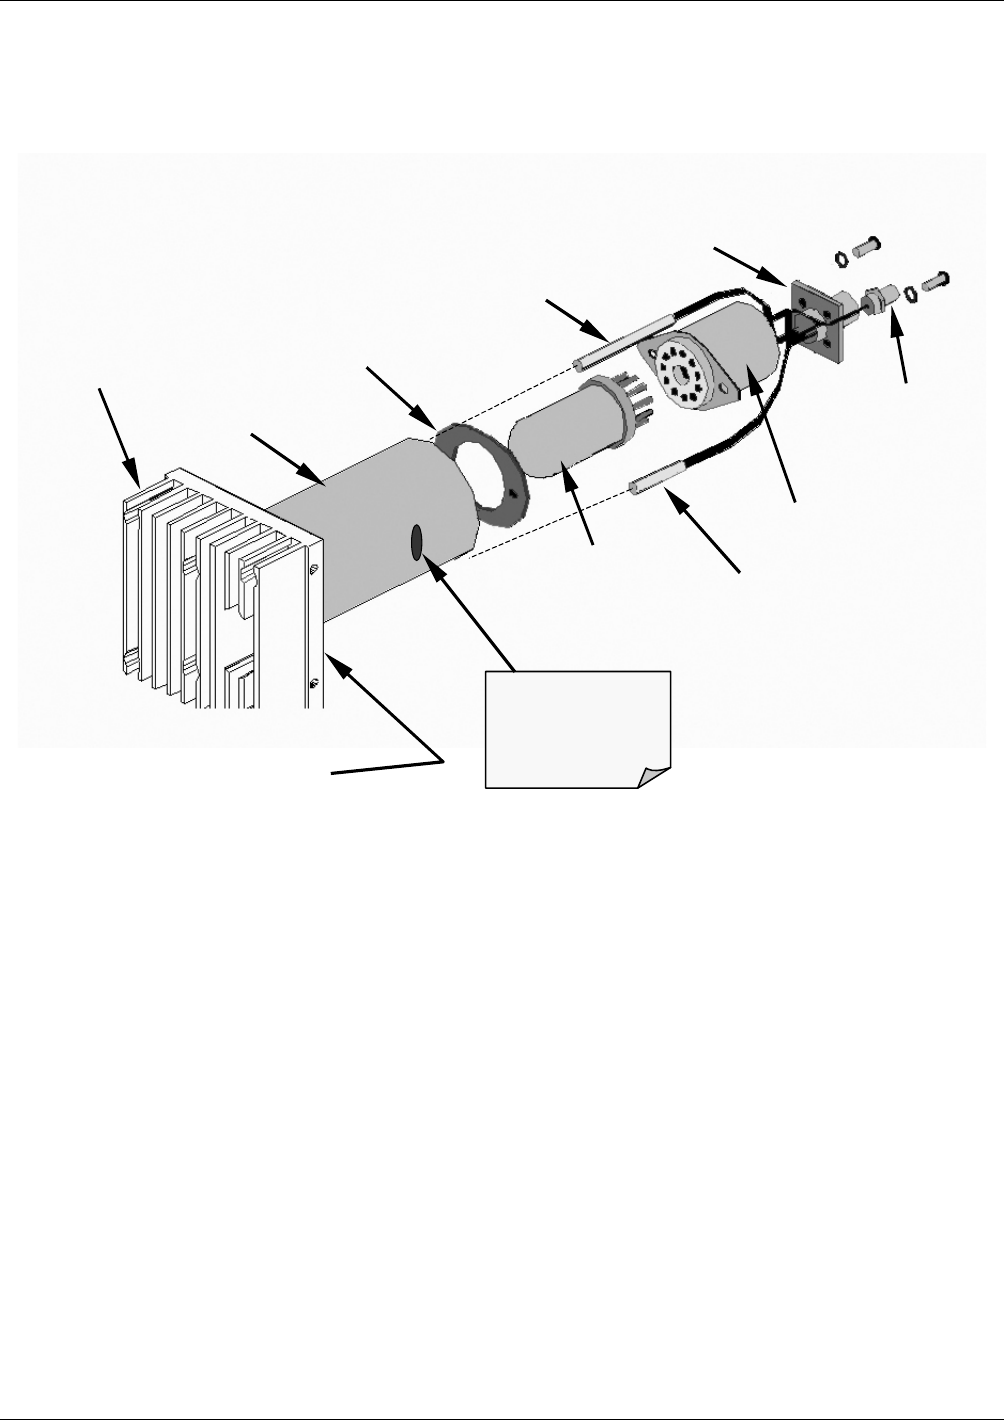
Model T101 Instruction Manual Principles Of Operation
263
10.4.4. PHOTO MULTIPLIER TUBE (PMT)
The T101 uses a photo multiplier tube (PMT) to detect the amount of fluorescence
created by the SO2 and UV light reaction in the sample chamber.
PMT Input
Signal
Connector
Optical Test
LED
PMT
High Voltage
Power Supply
Insulator
Cold Block
PMT Temperature
Sensor
Heat Sink
PMT Output
Signal
Connector
TEC located
between Cold Block
and Heat Sink
Light from Reaction
Chamber shines
throu
g
h hole is side
of Cold Block
Figure 10-13. PMT Assembly
A typical PMT is a vacuum tube containing a variety of specially designed electrodes.
Photons from the reaction are filtered by an optical high-pass filter, enter the PMT and
strike a negatively charged photo cathode causing it to emit electrons. A high voltage
potential across these focusing electrodes directs the electrons toward an array of high
voltage dynodes. The dynodes in this electron multiplier array are designed so that each
stage multiplies the number of emitted electrons by emitting multiple, new electrons.
The greatly increased number of electrons emitted from one end of electron multiplier
are collected by a positively charged anode at the other end, which creates a useable
current signal. This current signal is amplified by the preamplifier board and then
reported to the motherboard.
07266B DCN6485
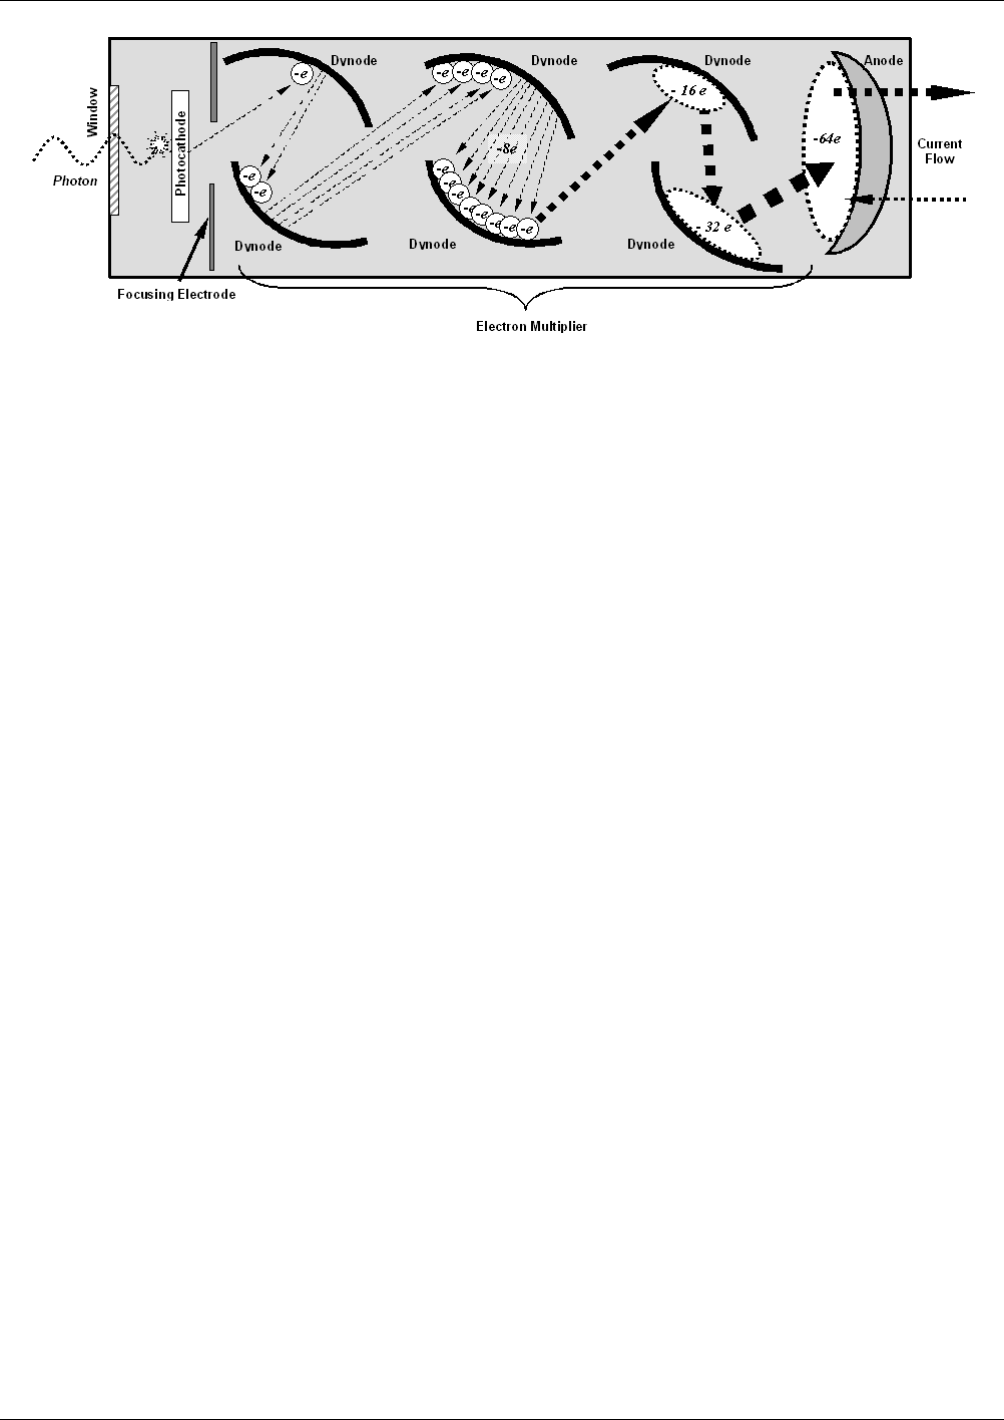
Principles Of Operation Model T101 Instruction Manual
264
Figure 10-14. Basic PMT Design
A significant performance characteristic of the PMT is the voltage potential across the
electron multiplier. The higher the voltage, the greater is the number of electrons emitted
from each dynode of the electron multiplier, making the PMT more sensitive and
responsive to small variations in light intensity but also more noisy (dark noise). The
gain voltage of the PMT used in the T101 is usually set between 450 V and 800 V. This
parameter is viewable through the front panel as test function HVPS (Section 4.2.1). For
information on when and how to set this voltage, see Section 9.6.2.
The PMT is housed inside the PMT module assembly (Figure 10-13). This assembly
also includes the high voltage power supply required to drive the PMT, an LED used by
the instrument’s optical test function, a thermistor that measures the temperature of the
PMT and various components of the PMT cooling system including the thermo-electric
cooler (TEC).
10.4.5. PMT COOLING SYSTEM
The performance of the analyzer’s PMT is significantly affected by temperature.
Variations in PMT temperature are directly reflected in the signal output of the PMT.
The signal to noise ratio of the PMT output is radically influenced by temperature as
well. The warmer The PMT is, the noisier its signal becomes until the noise renders the
concentration signal useless. To alleviate this problem a special cooling system exists
that maintains the PMT temperature at a stable, low level
10.4.5.1. Thermoelectric Cooler (TEC)
The core of the T101 PMT cooling system is a solid state heat pump called a
thermoelectric cooler (TEC). Thermoelectric coolers transfer heat from a one side of a
special set of semiconductor junctions to the other when a DC current is applied. The
heat is pumped at a rate proportional to the amount of current applied. In the Model
T101 the TEC is physically attached to a cold block that absorbs heat directly from the
PMT and a heat sink that is cooled by moving air (see Figure 10-15). A Thermocouple
embedded into the cold block generates an analog voltage corresponding to the current
temperature of the PMT. The PMT Preamp PCA conditions and amplifies this signal
then passes it on to the TEC Control PCA
07266B DCN6485
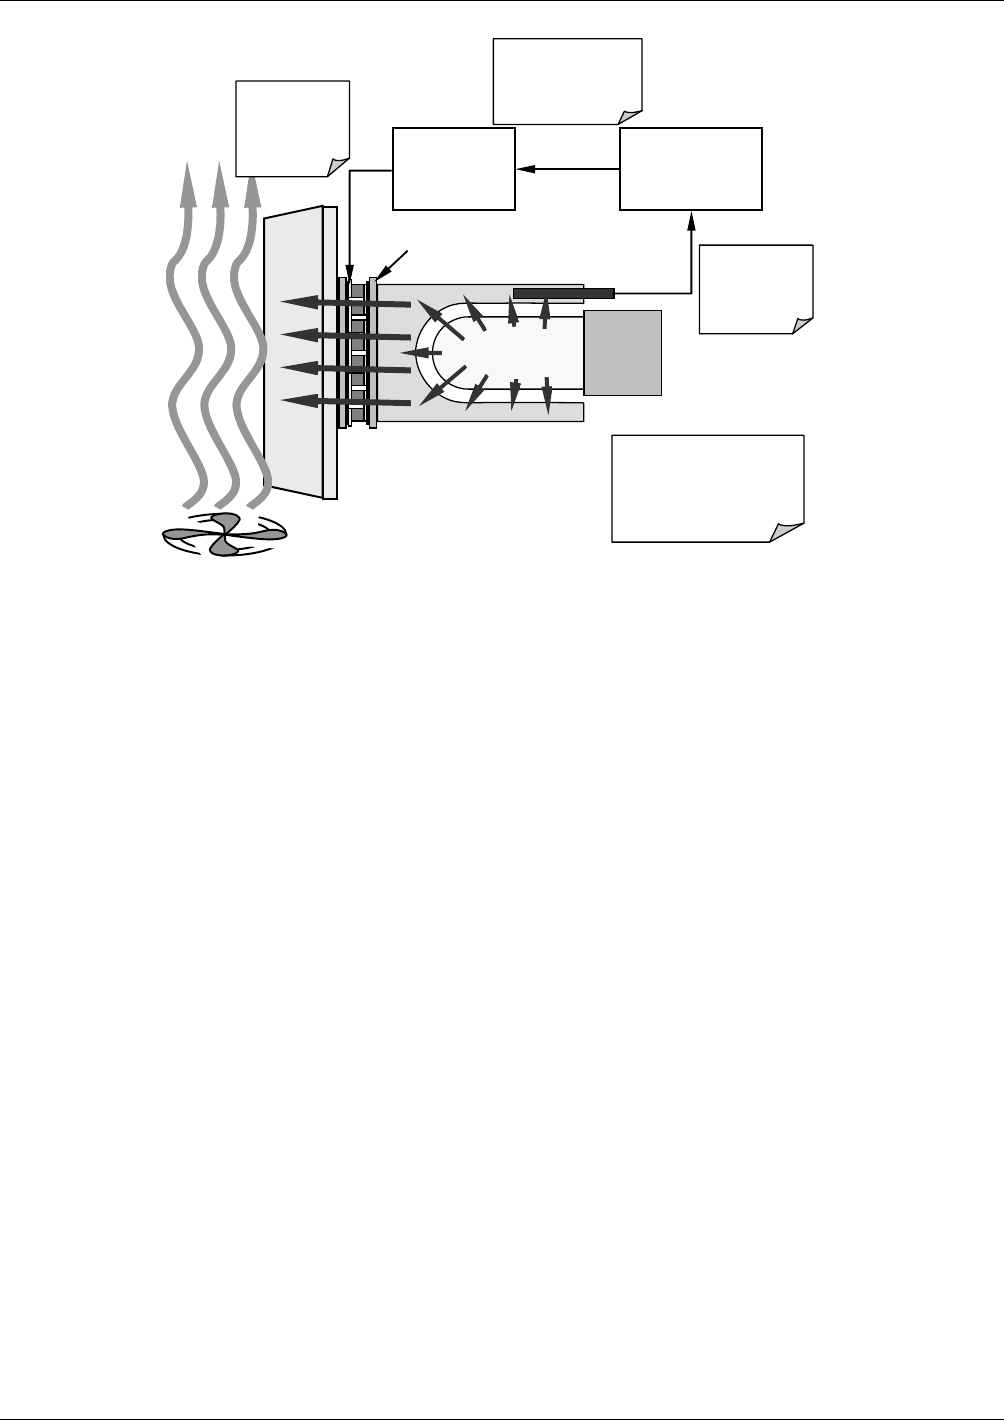
Model T101 Instruction Manual Principles Of Operation
265
TEC
Control
PCA
PMT Preamp
PCA
Thermistor
outputs temp of
cold block to
preamp PCA
Preamp PCA sends
buffered and
amplified thermistor
signal to TEC PCA
TEC PCA sets
appropriate
drive voltage
for cooler
Heat from PMT is absorbed
by the cold block and
transferred to the heat sink
via the TEC then bled off
into the cool air stream.
PMT
Cold Block
Heat Sink
Cooling Fan
ThermoElectric Cooler
Figure 10-15. PMT Cooling System
10.4.5.2. TEC Control Board
The TEC control printed circuit assembly is located on the sensor housing assembly,
under the slanted shroud, next to the cooling fins and directly above the cooling fan.
Using the amplified PMT temperature signal from the PMT preamplifier board (Section
10.4.6); it sets the drive voltage for the thermoelectric cooler. The warmer the PMT gets,
the more current is passed through the TEC causing it to pump more heat to the heat
sink.
TEC Control Power Status LED
A red LED located on the top edge of this assembly glows constantly to indicate that the
control circuit is receiving power.
TEC Control Test Points
Four test points are also located at the top of this assembly they are numbered left to
right start with the point immediately to the right of the power status LED. See Section
9.5.3 for more information.
10.4.6. PMT PREAMPLIFIER
The PMT preamplifier board amplifies the PMT signal into a useable analog voltage
(PMT) that can be processed by the motherboard into a digital signal to be used by the
CPU to calculate the H2S concentration of the gas in the sample chamber.
The output signal of the PMT is controlled by two different adjustments. First, the
voltage across the electron multiplier array of the PMT is adjusted with a set of two
hexadecimal switches. Adjusting this voltage directly affects the HVPS voltage and,
hence, the signal from the PMT. Secondly, the gain of the amplified signal can further
07266B DCN6485
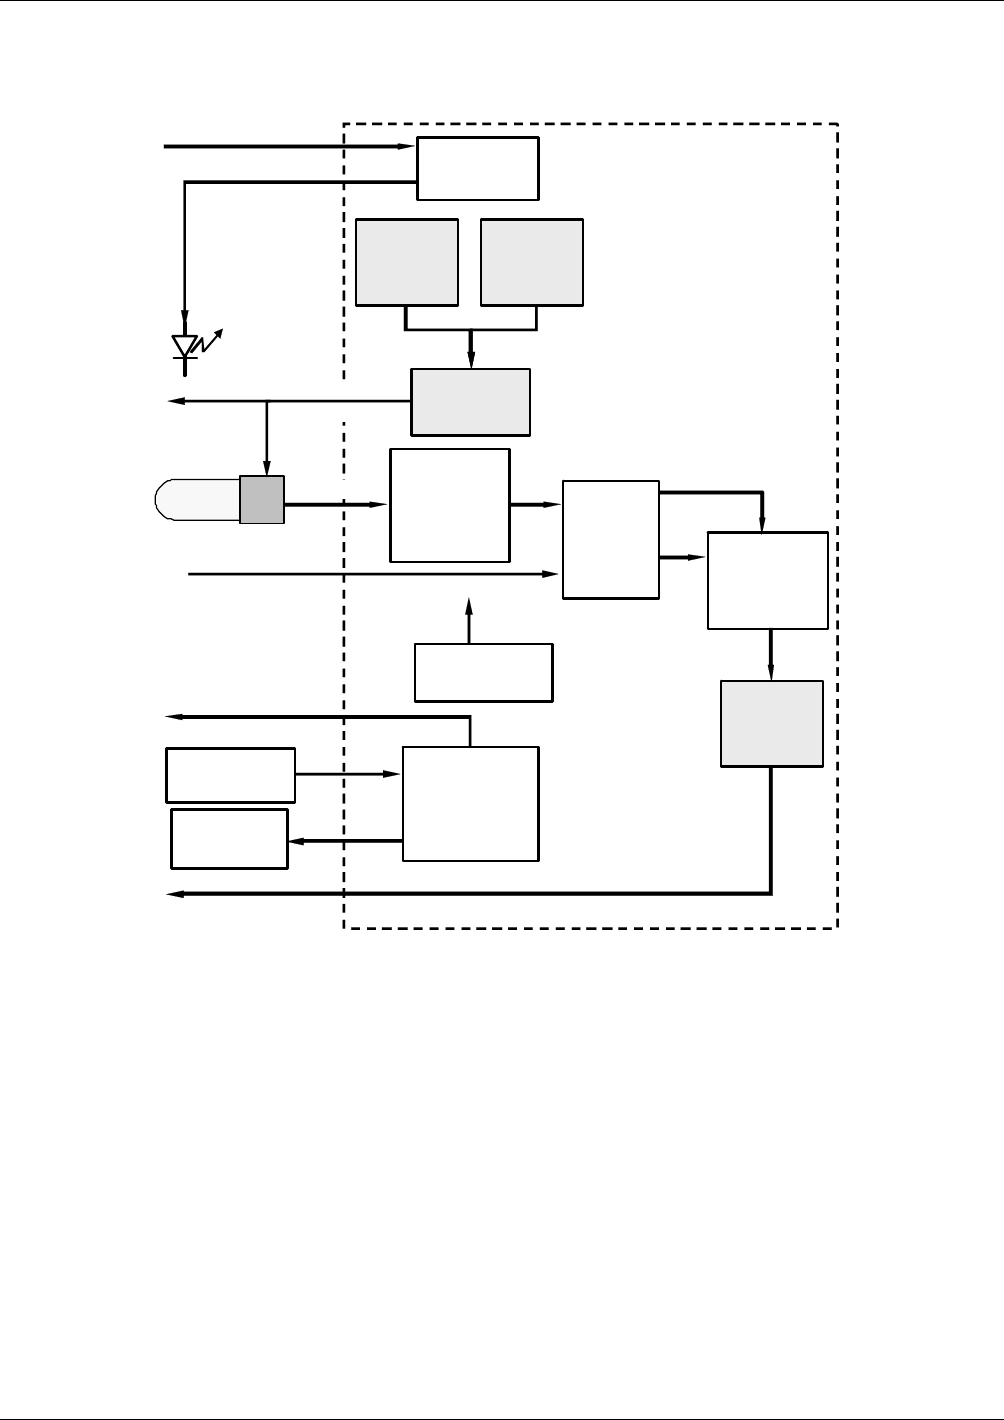
Principles Of Operation Model T101 Instruction Manual
266
be adjusted through a potentiometer. These adjustments should only be performed when
encountering problems with the software calibration that cannot be rectified otherwise.
See Section 9.6.4 for this hardware calibration.
To
Motherboard
PMT Preamp PCA
Low Pass
Noise
Filter
Electrical Test Control
From CPU
MUX
Amp to
Voltage
Converter/
Amplifier
D-A
Converter
PMT Coarse
Gain Set
(Rotary
Switch)
PMT Fine
Gain Set
(Rotary
Switch)
PMT
Signal
Offset
Electrical Test
Generator
Optical Test
Generator
Optical Test Control
From CPU
PMT Temp
Sensor PMT
Temperature
Feedback
Circuit
TEC Control
PCA
PMT Output
PMT HVPS
Drive Voltage
PMT Temp Analog Signal
to Motherboard
PMT Output S ignal
(PMT) to Motherboard
Optical Test LED
Figure 10-16. PMT Preamp Block Diagram
The PMT temperature control loop maintains the PMT temperature around 7° C and can
be viewed as test function PMT TEMP on the front panel.
The electrical test (ETEST) circuit generates a constant, electronic signal intended to
simulate the output of the PMT (after conversion from current to voltage). By bypassing
the detector’s actual signal, it is possible to test most of the signal handling and
conditioning circuitry on the PMT preamplifier board. See Section 4.6.5 for instructions
on performing this test.
The optical test (OTEST) feature causes an LED inside the PMT cold block to create a
light signal that can be measured with the PMT. If zero air is supplied to the analyzer,
the entire measurement capability of the sensor module can be tested including the PMT
and the current to voltage conversion circuit on the PMT preamplifier board. See
Section 4.6.4 for instructions on performing this test.
07266B DCN6485

Model T101 Instruction Manual Principles Of Operation
267
10.4.7. PNEUMATIC SENSOR BOARD
The flow and pressure sensors of the T101 are located on a printed circuit assembly just
behind the PMT sensor. Refer to Section 9.5.15 on how to test this assembly. The
signals of this board are supplied to the motherboard for further signal processing. All
sensors are linearized in the firmware and can be span calibrated from the front panel.
See Section 4.6.7 for instructions on performing this test.
10.4.8. RELAY BOARD
The relay board is the central switching unit of the analyzer. It contains power relays,
status LEDs for all heated zones and valves as well as valve drivers, thermocouple
amplifiers, power distribution connectors and the two switching power supplies of the
analyzer. The relay board communicates with the motherboard over the I2C bus and is
the main board for trouble-shooting power problems of any kind.
10.4.8.1. Heater Control
The T101 uses a variety of heaters for its individual components. All heaters are AC
powered and can be configured for 100/120 VAC or 220/230VAC at 50-60 Hz.
The two sample chamber heaters are electronically connected in parallel for analyzers at
100/120 VAC line power and in series for units configured for 220/230 VAC. One
configuration plug on the relay board determines the power configuration for the entire
analyzer.
On units with IZS options installed, an additional set of AC heaters is attached to the IZS
permeation tube. Some special T101 models may have other, non-standard heating zones
installed, such as a dilution manifold.
In order to operate efficiently, the H2S SO2 converter must be heated to 315˚C. An
AC band heater wrapped around the converter cartridge contains two heater coils that
are also configured in parallel or in series depending on the Type of AC power being
supplied. A thermocouple imbedded in the heater measures the temperature and feeds a
small voltage to the relay board’s thermocouple amplifier, which, in turn, transmits the
linearized analog voltage to the motherboard. This information is sent to the CPU via
the instrument’s I2C buss. The CPU returns activate/deactivate signals to the
appropriate relay also via the I2C buss.
On units with IZS options installed, an additional set of AC heaters is attached to the IZS
oven. Some special T101 models may have other, non-standard heating zones installed,
such as a bypass manifold.
10.4.8.2. Valve Control
The relay board also hosts two valve driver chips, each of which can drive up four
valves. In its basic configuration the Model T101 requires no special valves to operate.
However, on units with either the zero/span valve or the IZS option installed The valves
are. Manifold valves may also be present in certain special versions of the analyzer.
07266B DCN6485
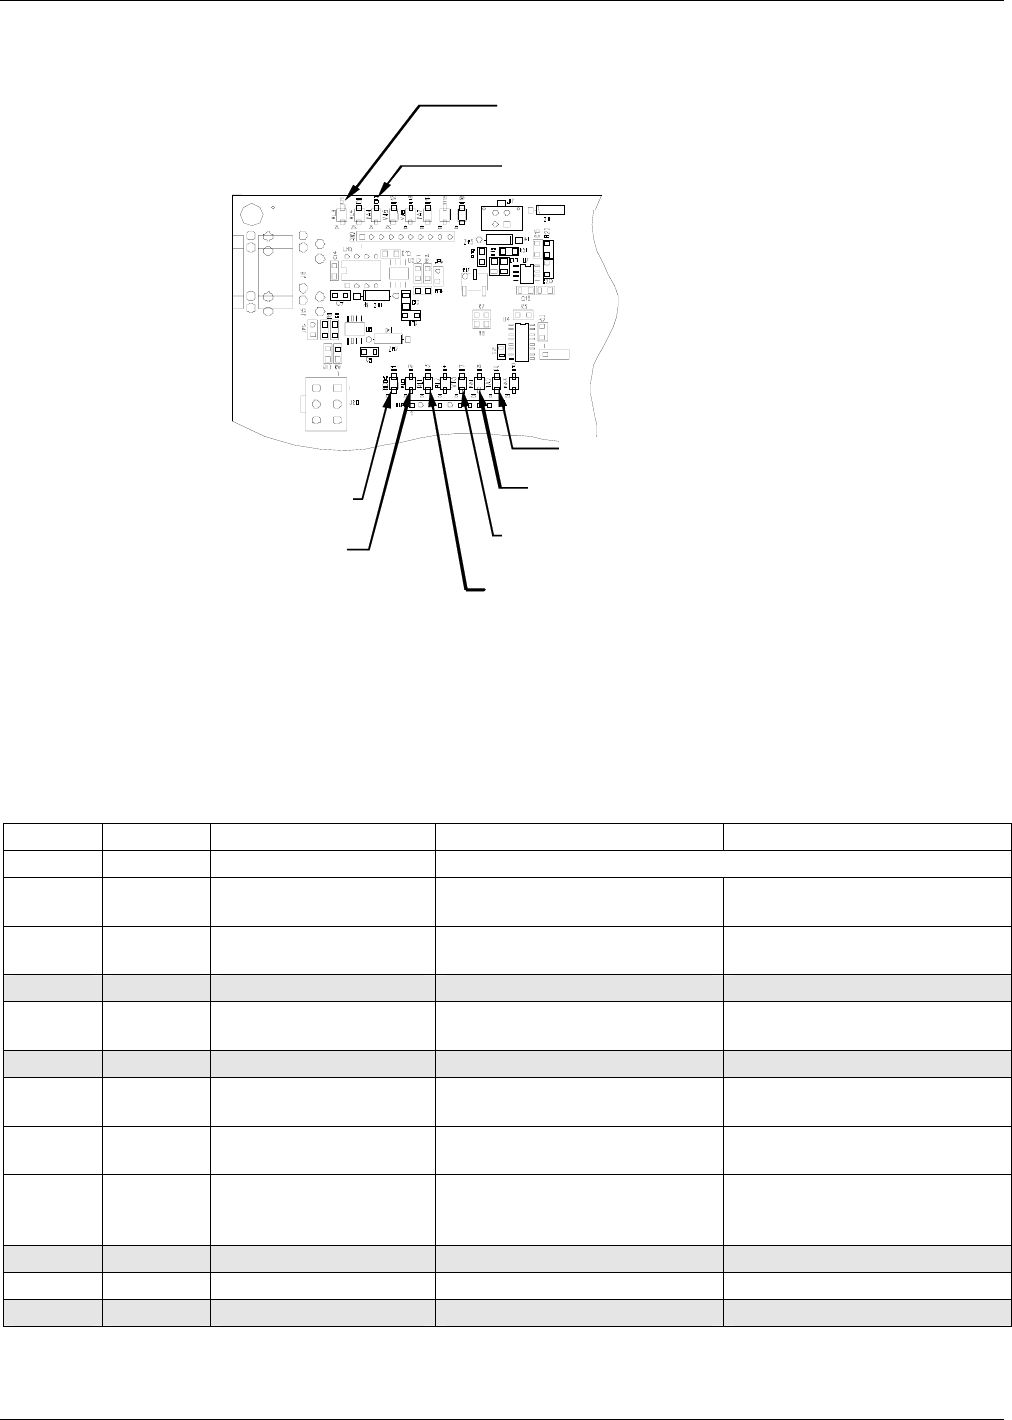
Principles Of Operation Model T101 Instruction Manual
268
10.4.9. STATUS LEDS & WATCH DOG CIRCUITRY
Z
ero/Span and IZS Options
S
ample/Cal Valve
IZS Option
Permeation Tube Heater
Dark Shutter
Sample Chamber
Heater
I2C
Watchdo
g
LED
Zero/Span and IZS Options
Zero/Span Valve
H2S SO2 converter heater
SO2/H2S valve
Figure 10-17. Relay Board Status LED Locations
Thirteen LEDs are located on the analyzer’s relay board to indicate the status of the
analyzer’s heating zones and valves as well as a general operating watchdog indicator.
Table 10-2 shows the states of these LEDs and their respective functionality.
Table 10-2. Relay Board Status LEDs
LED COLOR FUNCTION STATUS WHEN LIT STATUS WHEN UNLIT
D1 RED Watchdog circuit Cycles On/Off every 3 seconds under control of the CPU.
D2 YELLOW
Sample chamber
heater HEATING NOT HEATING
D3 YELLOW
H2S SO2 converter
heater HEATING NOT HEATING
D4 YELLOW Unused N/A N/A
D5 YELLOW
IZS heater Perm.
Tube (option) HEATING NOT HEATING
D6 YELLOW Unused N/A N/A
D7 GREEN
Sample/Cal Valve
(option)
Valve open to zero/span
valve. Valve open to sample inlet
D8 GREEN
Zero/Span Valve
(option) Valve open to zero gas inlet Valve open to span gas inlet
D9 GREEN SO2/H2S valve
Gas stream bypasses H2S
SO2 converter. Analyzer
measuring SO2
Valve open to H2S SO2
converter. Analyzer
measuring H2S.
D10 GREEN Unused N/A N/A
D11 GREEN UV Lamp Shutter Shutter open Shutter closed
D12-14 GREEN Unused N/A N/A
07266B DCN6485

Model T101 Instruction Manual Principles Of Operation
269
As a Safety measure, special circuitry on the Relay Board watches the status of LED D1.
Should this LED ever stay ON or OFF for 30 seconds, indicating that the CPU or I2C
bus has stopped functioning, the Watchdog Circuit will automatically shut of all valves
as well as turn off the UV Source(s) and all heaters. The Sample Pump will still be
running.
10.4.10. MOTHERBOARD
This printed circuit assembly provides a multitude of functions including A/D
conversion, digital input/output, PC-104 to I2C translation, temperature sensor signal
processing and is a pass through for the RS-232 and RS-485 signals.
10.4.10.1. A to D Conversion
Analog signals, such as the voltages received from the analyzer’s various sensors, are
converted into digital signals that the CPU can understand and manipulate by the analog
to digital converter (A/D).Under the control of the CPU, this functional block selects a
particular signal input and then coverts the selected voltage into a digital word.
The A/D consists of a voltage-to-frequency (V-F) converter, a programmable logic
device (PLD), three multiplexers, several amplifiers and some other associated devices.
The V-F converter produces a frequency proportional to its input voltage. The PLD
counts the output of the V-F during a specified time period, and sends the result of that
count, in the form of a binary number, to the CPU.
The A/D can be configured for several different input modes and ranges but in the is
used in uni-polar mode with a +5V full scale. The converter includes a 1% over and
under-range. This allows signals from -0.05V to +5.05V to be fully converted.
For A to D calibration purposes, two reference voltages are supplied to the A/D
converter: Reference ground and +4.096 VDC. During calibration the device measures
these two voltages and outputs their digital equivalent to the CPU. The CPU uses these
values to compute the A to D converter’s offset and slope (not the same offset and slope
recorded during zero/span calibration) and uses these factors for subsequent conversions.
See 4.6.3.4 for instructions on performing this calibration.
10.4.10.2. Sensor Inputs
The key analog sensor signals are coupled to the A/D through the master multiplexer
from two connectors on the motherboard. 100K terminating resistors on each of the
inputs prevent cross talk from appearing on the sensor signals.
PMT Detector Output: This signal, output by the PMT preamp PCA, is used in the
computation of the H2S concentration displayed at the top right hand corner of the front
panel display and output through the instrument’s analog outputs and COMM ports.
PMT HIGH VOLTAGE POWER SUPPLY LEVEL: This input is based on the drive
voltage output by the PMT pram board to the PMT’s high voltage power supply
(HVPS). It is digitized and sent to the CPU where it is used to calculate the voltage
setting of the HVPS and stored in the instrument’s memory as the test function HVPS.
HVPS is viewable as a test function (Section 4.2.1) through the analyzer’s front panel.
PMT TEMPERATURE: This signal is the output of the thermistor attached to the PMT
cold block amplified by the PMT temperature feedback circuit on the PMT preamp
07266B DCN6485

Principles Of Operation Model T101 Instruction Manual
270
board. It is digitized and sent to the CPU where it is used to calculate the current
temperature of the PMT.
This measurement is stored in the analyzer’s memory as the test function PMT TEMP
and is viewable as a test function (Section 4.2.1) through the analyzer’s front panel.
SAMPLE GAS PRESSURE SENSOR: This sensor measures the gas pressure at the exit
of the sample chamber.
SAMPLE FLOW SENSOR: This sensor measure the flow rate of the sample gas as it
exits the sample chamber.
10.4.10.3. Thermistor Interface
This circuit provides excitation, termination and signal selection for several negative-
coefficient, thermistor temperature sensors located inside the analyzer. They are:
SAMPLE CHAMBER TEMPERATURE SENSOR: The source of this signal is a
thermistor embedded in the of the sample chamber block. It measures the temperature of
the sample gas in the chamber. This data are used by the CPU to control sample chamber
the heating circuit and as part of the H2S, calculations when the instrument’s
Temperature/Pressure Compensation feature is enabled.
This measurement is stored in the analyzer memory as a parameter (RCEL TEMP) and
is viewable as a test function under the same name (Section6.2.1) through the analyzer’s
front panel.
IZS OPTION PERMEATION TUBE TEMPERATURE SENSOR: This thermistor,
attached to the permeation tube in the IZS option, reports the current temperature of that
tube to the CPU as part of control loop that keeps the tube at a constant temperature.
BOX TEMPERATURE SENSOR: A thermistor is attached to the motherboard. It
measures the analyzer’s inside temperature. This information is stored by the CPU and
can be viewed by the user for troubleshooting purposes through the front panel display.
This measurement is stored in the analyzer. Memory as the test function BOX TEMP
and is viewable as a test function (Section 4.2.1) through the analyzer’s front panel.
10.4.11. ANALOG OUTPUTS
The analyzer comes equipped with four Analog Outputs: A1, A2, A4 and a fourth that is
a spare.
A1 and A2 Outputs: The first two, A1 and A2 are normally set up to operate in parallel
so that the same data can be sent to two different recording devices. While the names
imply that one should be used for sending data to a chart recorder and the other for
interfacing with a data logger, either can be used for both applications.
Both of these channels output a signal that is proportional to the H2S concentration of
the sample gas. The A1 and A2 outputs can be slaved together or set up to operated
independently. A variety of scaling factors are available; see Section 4.4.4 for
information on setting the reporting range type and scaling factors for these output
channels
Test Output: The third analog output, labeled A4 is special. It can be set by the user (see
Section 4.6.9) to carry the current signal level of any one of the parameters accessible
through the TEST menu of the unit’s software.
07266B DCN6485

Model T101 Instruction Manual Principles Of Operation
271
In its standard configuration, the analyzer comes with all three of these channels set up
to output a DC voltage. However, 4-20mA current loop drivers can be purchased for the
first two of these outputs, A1 and A2.
Output Loop-back: All three of the functioning analog outputs are connected back to the
A/D converter through a Loop-back circuit. This permits the voltage outputs to be
calibrated by the CPU without need for any additional tools or fixtures
10.4.12. EXTERNAL DIGITAL I/O
This External Digital I/O performs two functions.
STATUS OUTPUTS: Logic-Level voltages are output through an optically isolated 8-
pin connector located on the rear panel of the analyzer. These outputs convey good/bad
and on/off information about certain analyzer conditions. They can be used to interface
with certain types of programmable devices (see Section 5.1.1.1).
CONTROL INPUTS: By applying +5VDC power supplied from an external source such
as a PLC or Data logger (see Section 5.1.1.2), Zero and Span calibrations can be
initiated by contact closures on the rear panel.
10.4.13. I2C DATA BUS
I2C is a two-wire, clocked, bi-directional, digital serial I/O bus that is used widely in
commercial and consumer electronic systems. A transceiver on the Motherboard
converts data and control signals from the PC-104 bus to I2C. The data is then fed to the
relay board and optional analog input circuitry.
10.4.14. POWER UP CIRCUIT
This circuit monitors the +5V power supply during start-up and sets the analog outputs,
external digital I/O ports, and I2C circuitry to specific values until the CPU boots and the
instrument software can establish control.
10.5. POWER SUPPLY/ CIRCUIT BREAKER
The analyzer operates on 100 VAC, 115 VAC or 230 VAC power at either 50Hz or
60Hz. Individual units are set up at the factory to accept any combination of these five
attributes. As illustrated in Figure 10-18 below, power enters the analyzer through a
standard IEC 320 power receptacle located on the rear panel of the instrument. From
there it is routed through the ON/OFF switch located in the lower right corner of the
front panel.
AC line power is converted stepped down and converted to DC power by two DC power
supplies. One supplies +12 VDC, for various valves and valve options, while a second
supply provides +5 VDC and ±15 VDC for logic and analog circuitry as well as the TEC
cooler. All AC and DC Voltages are distributed through the Relay Board.
07266B DCN6485
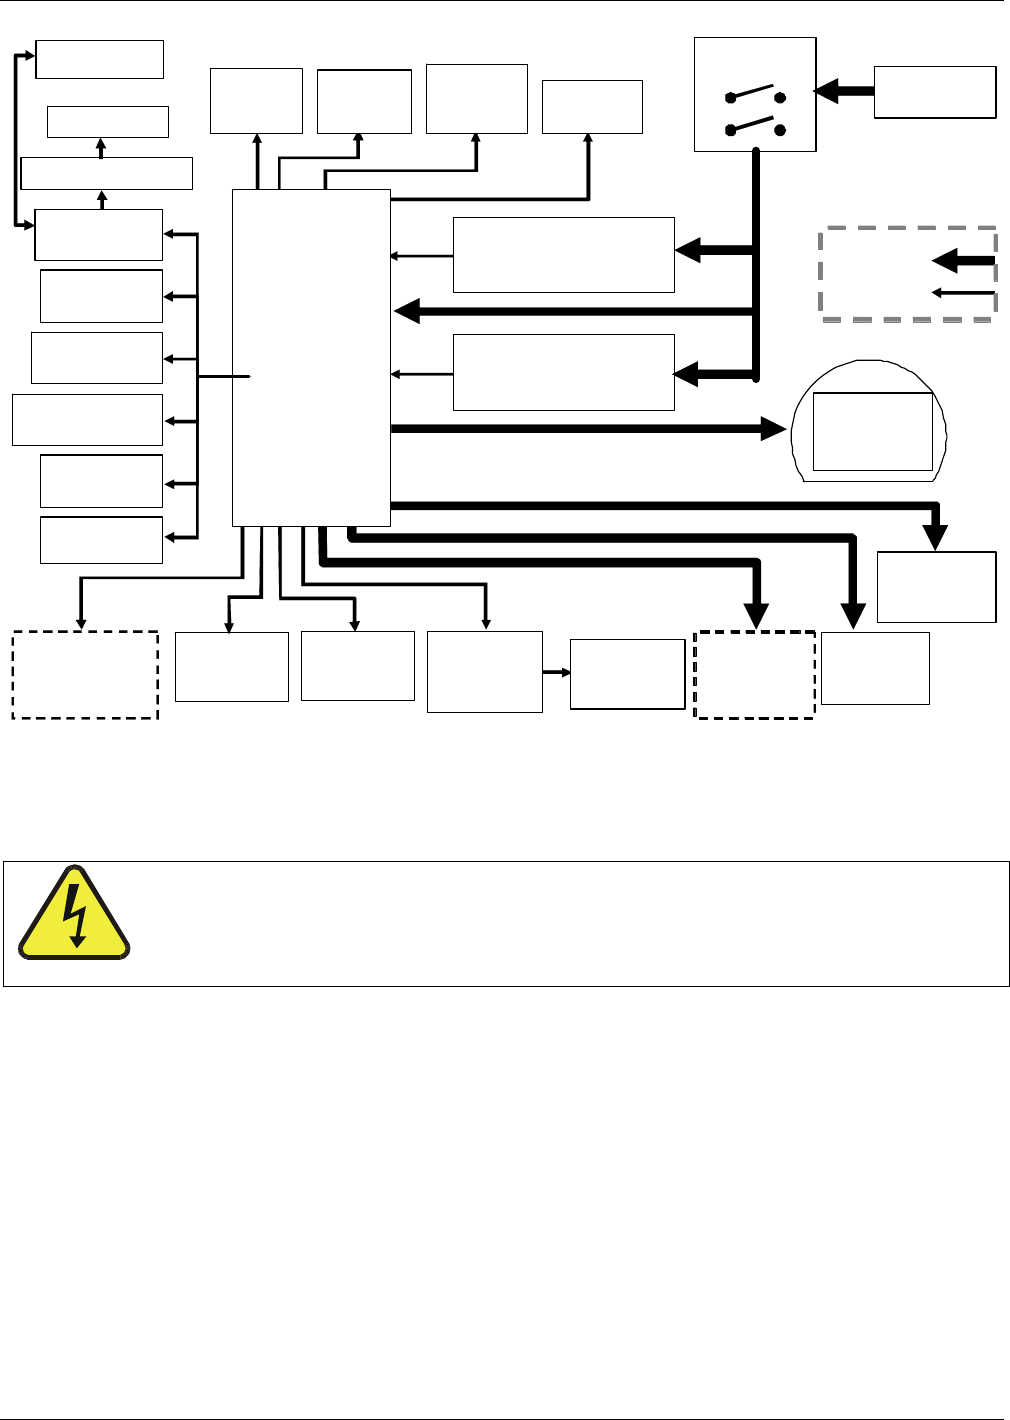
Principles Of Operation Model T101 Instruction Manual
272
AC POWER
ENTRANCE
ON/OFF
SWITCH
PS 1 (+5 VDC; ±15 VDC)
PS 2 (+12 VDC)
Chassis
Cooling
Fan
IZS Option
Permeation
Tube
Heater
PUMP
Sample
Chamber
Heaters
Sample/Cal
for Z/S and
IZS Valve
Options
AC POWER
DC POWER
UV Source
Lamp
Power
Su
pp
l
y
PMT
Cooling
Fan
PMT
Preamp
UV Source
Lamp
Shutter
TEC
Control
PCA
UV Source
Lamp
Shutter
H2S SO2
Converter
Heaters
H2S SO2
Vlavle
RELAY
BOARD
Pressure
Sensor
Mother
Board
CPU
PMT High
Voltage Supply
Temperature
Sensors
Gas Flow
Sensor
USB
LVDS transmitter board
Display
Touchscreen
Figure 10-18. Power Distribution Block Diagram
A 6.75 ampere circuit breaker is built into the ON/OFF switch. In case of a wiring fault
or incorrect supply power, the circuit breaker will automatically turn off the analyzer.
CAUTION
Should the power circuit breaker trip, correct the condition causing this
situation before turning the analyzer back on.
07266B DCN6485
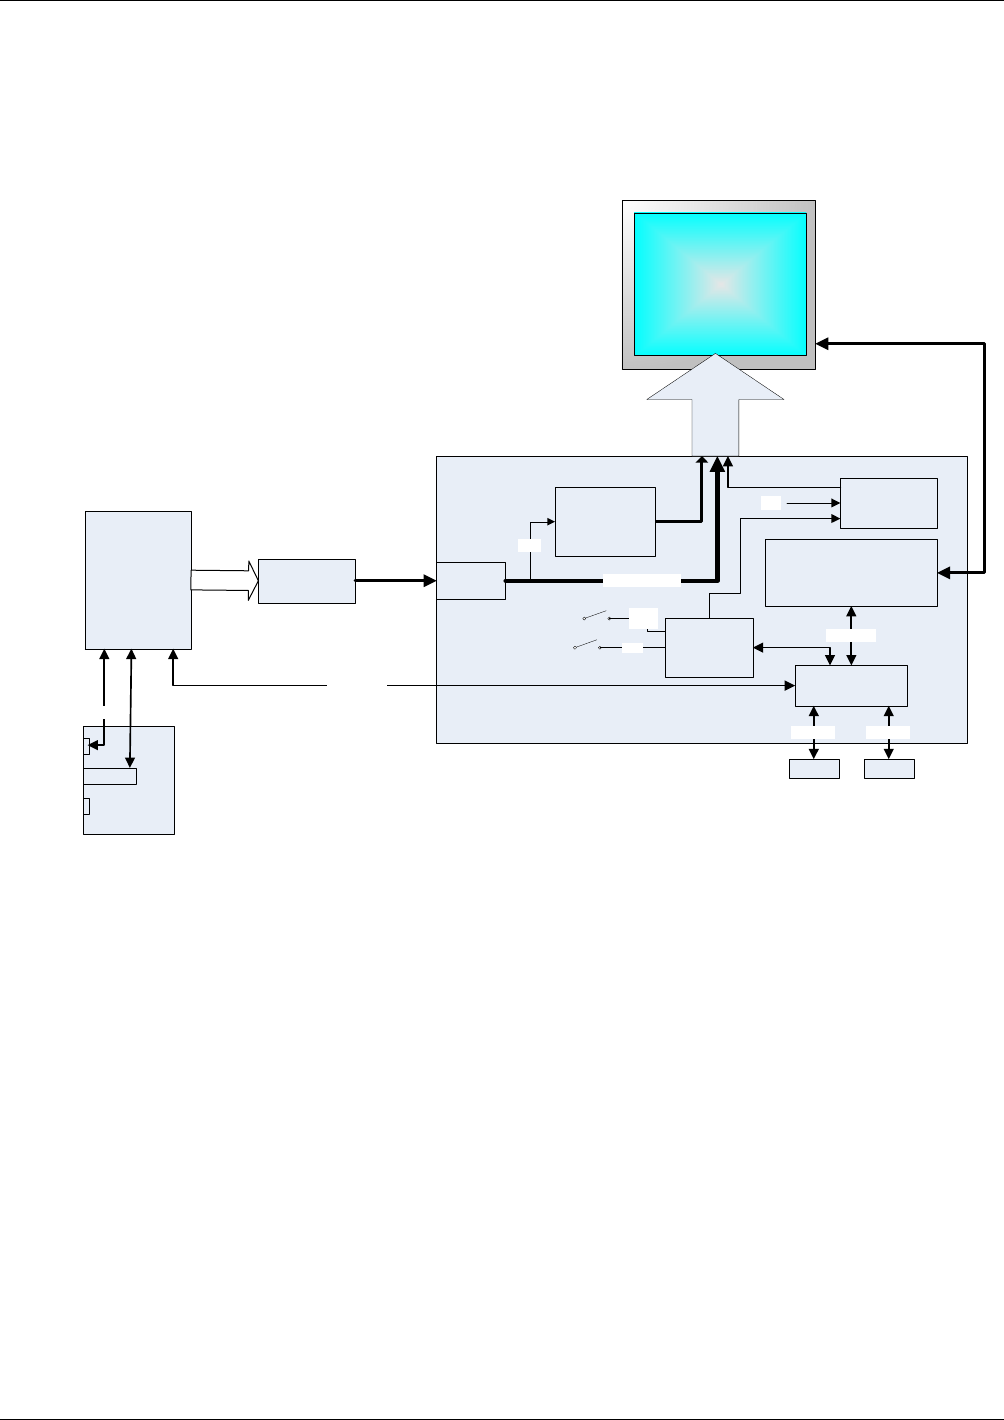
Model T101 Instruction Manual Principles Of Operation
273
10.6. FRONT PANEL/DISPLAY INTERFACE
Users can input data and receive information directly through the front panel touch-
screen display. The LCD display is controlled directly by the CPU board. The
touchscreen is interfaced to the CPU by means of a touchscreen controller that connects
to the CPU via the internal USB bus and emulates a computer mouse.
CPU
LCD Display
and
Touchscreen
TFT BIAS
Supply
10.4, -7.0, 16, 4V
3.3V
Touch Screen Controller
USB2 HUB
USB & 5V
USB-1 USB-2
Powered Powered
LVDS
Receiver
LVDS
Transmitter
Board
USB Master
Back-Light
Supply
18 Bit TTL Data
+5V
BL Cont.
PWM
LAN COM4 USB4
Aux I/O PCA
Ethernet
USB Slave
Front Panel Interface PCA
Utility
Controller
Lang.
Remote
Local
Ethernet Port
USB
Type B Port
Analog Input
Terminal Block
Figure 10-19. Front Panel and Display Interface Block Diagram
10.6.1. LVDS TRANSMITTER BOARD
The LVDS (low voltage differential signaling) transmitter board converts the parallel
display bus to a serialized, low voltage, differential signal bus in order to transmit the
video signal to the LCD interface PCA.
10.6.2. FRONT PANEL INTERFACE PCA
The front panel interface PCA controls the various functions of the display and
touchscreen. For driving the display it provides connection between the CPU video
controller and the LCD display module. This PCA also contains:
• power supply circuitry for the LCD display module
• a USB hub that is used for communications with the touchscreen
controller and the two front panel USB device ports
• the circuitry for powering the display backlight
07266B DCN6485
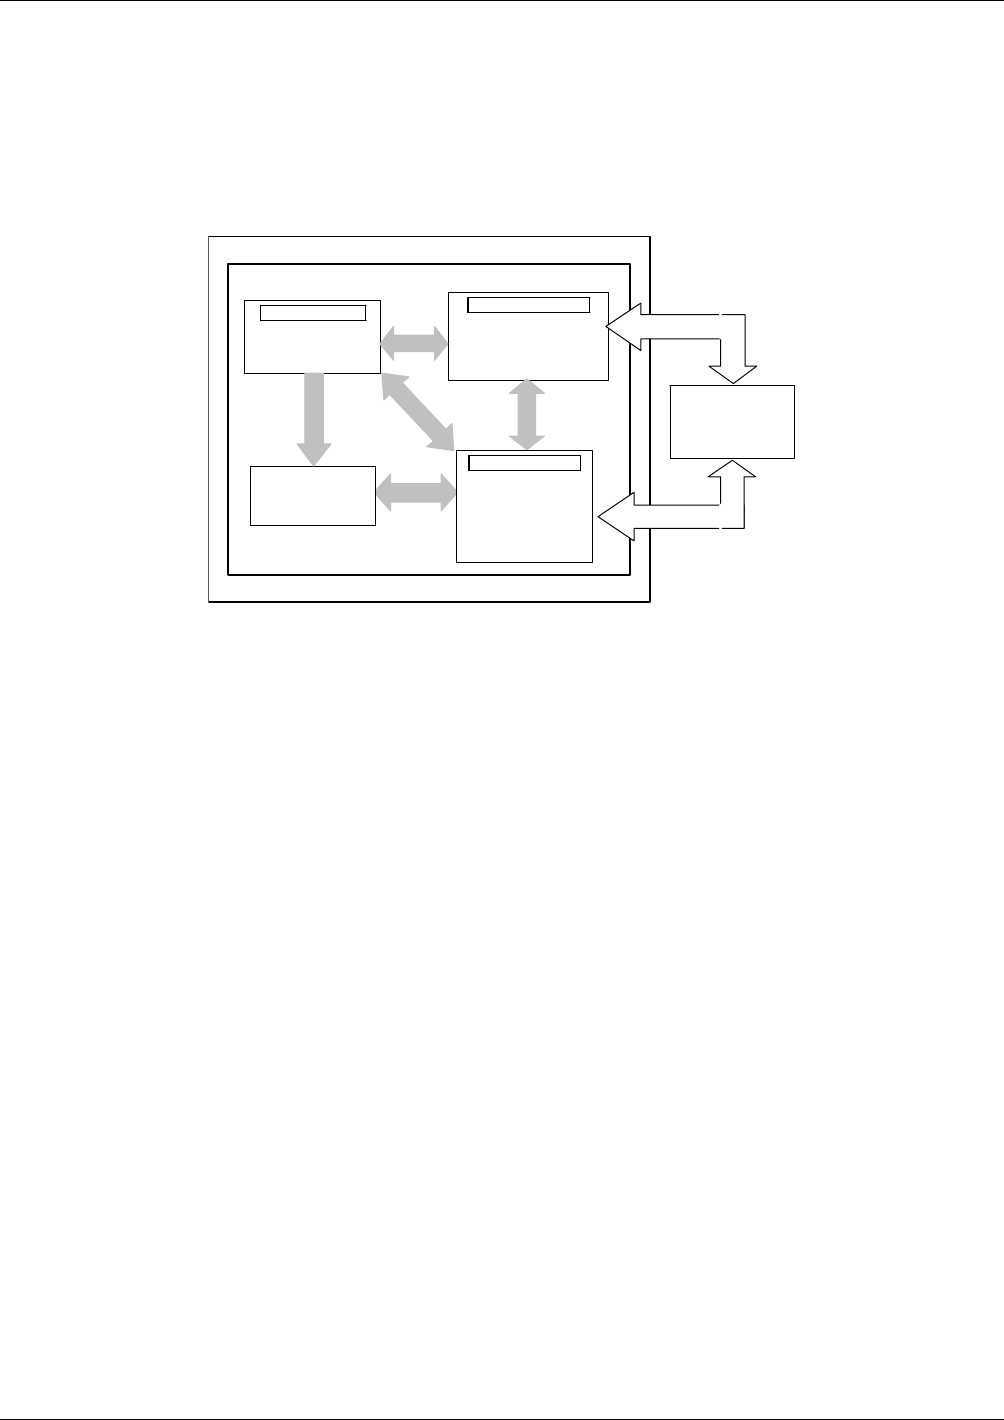
Principles Of Operation Model T101 Instruction Manual
274
10.7. SOFTWARE OPERATION
The T101 H2S analyzer is at its heart a high performance, 386-based microcomputer
running MS-DOS. Inside the DOS shell, special software developed by Teledyne API
interprets user commands via the various interfaces, performs procedures and tasks,
stores data in the CPU’s various memory devices and calculates the concentration of the
sample gas.
Windows CE
API FIRMWARE
Analyzer Operations
Calibrat ion P rocedures
Configuration Procedures
Autonomic Systems
Diagnostic Routines
Memory Handling
DAS Records
Calibration Data
System Status Data
Interface Handling
Sensor input Data
Display Messages
Touchscreen
Analog Output Data
RS232 & RS485
External Digital I/O
Measurement
Algorithm
(H2S & SO2 )
ANALYZER
HARDWARE
PC/104 BUS
PC/104 BUS
Figure 10-20. Basic Software Operation
10.7.1. ADAPTIVE FILTER
The T101 H2S analyzer software processes sample gas measurement and reference data
through a built-in adaptive filter built into the software. Unlike other analyzers that
average the sensor output signal over a fixed time period, the T101 calculates averages
over a set number of samples. During operation, the software automatically switches
between two filters of different lengths based on the conditions at hand.
During conditions of constant or nearly constant concentration the software computes an
average of the last 240 samples. This provides the calculation portion of the software
with smooth stable readings. If a rapid change in concentration is detected, the adaptive
filter switches modes and only averages the last 48 samples. This allows the analyzer to
respond to the rapidly changing concentration more quickly. Once triggered, the short
filter remains engaged for a fixed time period to prevent chattering.
Two conditions must be simultaneously met to switch to the short filter. First the
instantaneous concentration must exceed the average in the long filter by a fixed
amount. Second, the instantaneous concentration must exceed the average in the long
filter by a portion, or percentage, of the average in the long filter.
If necessary, the filter lengths of these two modes may be changed to any value between
1 and 1000 samples. Long sample lengths provide better signal to noise rejection, but
poor response times. Conversely shorter filter lengths result in poor signal to noise
rejection, but quicker response times.
07266B DCN6485
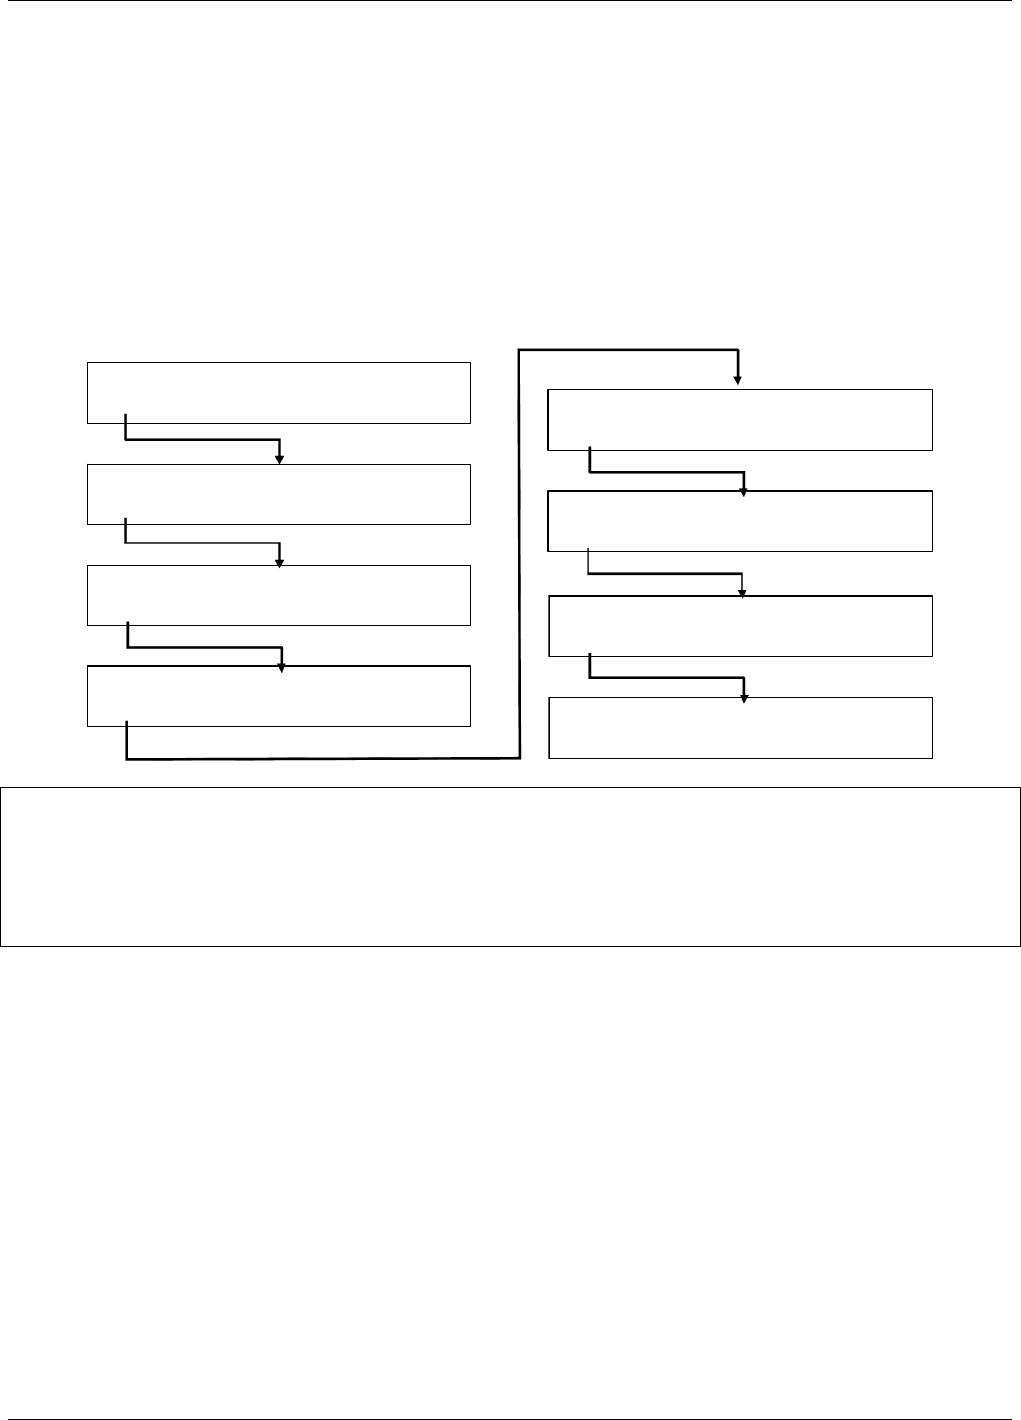
Model T101 Instruction Manual Principles Of Operation
275
10.7.2. CALIBRATION - SLOPE AND OFFSET
Calibration of the analyzer is performed exclusively in software. During instrument
calibration (Chapters 6 and 7) the user enters expected values for zero and span through
the front panel keypad and commands the instrument to make readings of sample gases
with know concentrations of H2S. The readings taken are adjusted, linearized, and
compared to the expected values as input. With this information the software computes
values for instrument both slope and offset and stores these values in memory for use in
calculating the H2S concentration of the sample gas.
Instrument slope and offset values recorded during the last calibration can be viewed by
pressing the following keystroke sequence
SAMPLE RANGE = 500.0 PPB H2S =XXX.X
< TST TST > CAL SETUP
SAMPLE TIME = HH:MM:SS H2S =XXX.X
< TST TST > CAL SETUP
SAMPLE PMT TEMP=7.0C H2S =XXX.X
< TST TST > CAL SETUP
SA MPLE BOX TEMP=30.0C H2S
=XXX.X
SAMP LE RCELL TEMP=50.0C H2S
=XXX.X
SAMPLE HVPS 553 VOLTS H2S =XXX.X
< TST TST > CAL SETUP
SAMPLE H2S OFFS=XX.X MV H2S =XXX.X
< TST TST > CAL SETUP
SAMPLE H2S SLOPE=XXX H2S =XXX.X
< TST TST > CAL SETUP
NOTE
Separate slope and offset values are calculated and recorded for H2S and SO2 gas
measurements. Here they are shown as they appear when analyzer is in H2S Mode.
In SO2 Mode they appear as SO2 OFFS & SO2 SLOPE. In multigas mode, both versions
appear.
07266B DCN6485

Principles Of Operation Model T101 Instruction Manual
276
10.7.3. TEMPERATURE AND PRESSURE COMPENSATION (TPC)
FEATURE
As explained previously, changes in temperature can significantly affect the amount of
fluoresced UV light generated in the instrument’s sample chamber. To negate this effect
the Model T101 maintains the sample gas at a stable, raised temperature.
Pressure changes can also have a noticeable, if more subtle, effect on the H2S
concentration calculation. To account for this, the Model T101 software includes a
feature which allows the instrument to include a compensation factor in the H2S
calculations that is based on changes in ambient pressure.
When the TPC feature is enabled, the analyzer’s H2S concentration is divided by a factor
called PRESSCO which is based on the ratio between the ambient pressure of the
sample gas and standard atmospheric pressure (Equation 10-5). As ambient pressure
increases, the compensated H2S concentration is decreased.
A)-HG(" 29.92 _SLOPESAMP_PRESSA)-HG(" SSURESAMPLE_PRE
PRESSCO
Equation 10-5
SAMPLE-PRESSURE: The ambient pressure of the sample gas as measured by the
instrument’s sample pressure sensor (see Figure 10-7) in “Hg-A.
SAMP_PRESS_SLOPE: Sample pressure slope correction factor.
Section 4.5 describes the method for enabling/disabling the TPC feature.
10.7.4. INTERNAL DATA ACQUISITION SYSTEM (DAS )
The DAS is designed to implement predictive diagnostics that stores trending data for
users to anticipate when an instrument will require service. Large amounts of data can be
stored in non-volatile memory and retrieved in plain text format for further processing
with common data analysis programs. The DAS has a consistent user interface in all
Teledyne API instruments. New data parameters and triggering events can be added to
the instrument as needed.
Depending on the sampling frequency and the number of data parameters the DAS can
store several months of data, which are retained even when the instrument is powered
off or a new firmware is installed. The DAS permits users to access the data through the
instrument’s front panel or the remote interface. The latter can automatically download
stored data for further processing. For information on using the DAS, refer to Section
4.8.
07266B DCN6485
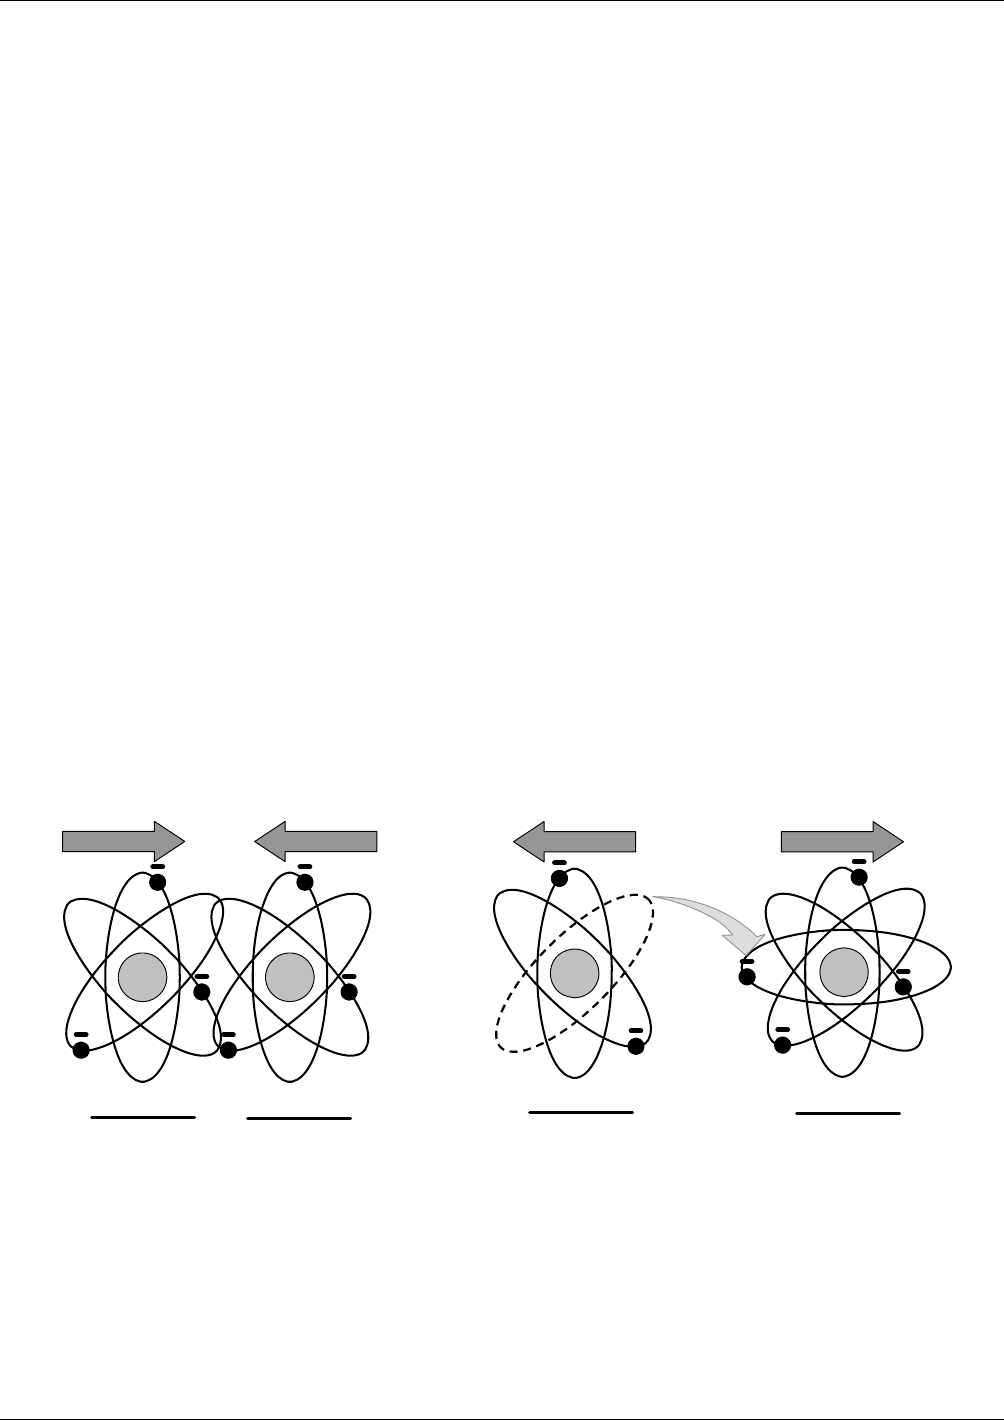
Model T101 Instruction Manual A Primer on Electro-Static Discharge
277
11. A PRIMER ON ELECTRO-STATIC DISCHARGE
Teledyne API considers the prevention of damage caused by the discharge of static
electricity to be extremely important part of making sure that your analyzer continues to
provide reliable service for a long time. This section describes how static electricity
occurs, why it is so dangerous to electronic components and assemblies as well as how
to prevent that damage from occurring.
11.1. HOW STATIC CHARGES ARE CREATED
Modern electronic devices such as the types used in the various electronic assemblies of
your analyzer, are very small, require very little power and operate very quickly.
Unfortunately, the same characteristics that allow them to do these things also make
them very susceptible to damage from the discharge of static electricity. Controlling
electrostatic discharge begins with understanding how electro-static charges occur in the
first place.
Static electricity is the result of something called triboelectric charging which happens
whenever the atoms of the surface layers of two materials rub against each other. As the
atoms of the two surfaces move together and separate, some electrons from one surface
are retained by the other.
+
+
Materials
Makes
Contact
PROTONS = 3
ELECTRONS = 3
NET CHARGE = 0
PROTONS = 3
ELECTRONS = 3
NET CHARGE = 0
Materials
Separate
+
PROTONS = 3
ELECTRONS = 2
NET CHARGE = -1
+
PROTONS = 3
ELECTRONS = 4
NET CHARGE = +1
Figure 11-1. Triboelectric Charging
If one of the surfaces is a poor conductor or even a good conductor that is not grounded,
the resulting positive or negative charge cannot bleed off and becomes trapped in place,
or static. The most common example of triboelectric charging happens when someone
wearing leather or rubber soled shoes walks across a nylon carpet or linoleum tiled floor.
With each step, electrons change places and the resulting electro-static charge builds up,
quickly reaching significant levels. Pushing an epoxy printed circuit board across a
07266B DCN6485

A Primer on Electro-Static Discharge Model T101 Instruction Manual
278
workbench, using a plastic handled screwdriver or even the constant jostling of
Styrofoam TM pellets during shipment can also build hefty static charges
Table 11-1. Static Generation Voltages for Typical Activities
MEANS OF GENERATION 65-90%
RH 10-25%
RH
Walking across nylon carpet 1,500V 35,000V
Walking across vinyl tile 250V 12,000V
Worker at bench 100V 6,000V
Poly bag picked up from bench 1,200V 20,000V
Moving around in a chair padded
with urethane foam 1,500V 18,000V
11.2. HOW ELECTRO-STATIC CHARGES CAUSE DAMAGE
Damage to components occurs when these static charges come into contact with an
electronic device. Current flows as the charge moves along the conductive circuitry of
the device and the typically very high voltage levels of the charge overheat the delicate
traces of the integrated circuits, melting them or even vaporizing parts of them. When
examined by microscope the damage caused by electro-static discharge looks a lot like
tiny bomb craters littered across the landscape of the component’s circuitry.
A quick comparison of the values in Table 11-1 with the those shown in the Table 11-2,
listing device susceptibility levels, shows why Semiconductor Reliability News estimates
that approximately 60% of device failures are the result of damage due to electro-static
discharge.
Table 11-2. Sensitivity of Electronic Devices to Damage by ESD
DAMAGE SUSCEPTIBILITY
VOLTAGE RANGE
DEVICE DAMAGE BEGINS
OCCURRING AT CATASTROPHIC
DAMAGE AT
MOSFET 10 100
VMOS 30 1800
NMOS 60 100
GaAsFET 60 2000
EPROM 100 100
JFET 140 7000
SAW 150 500
Op-AMP 190 2500
CMOS 200 3000
Schottky Diodes 300 2500
Film Resistors 300 3000
This Film
Resistors 300 7000
ECL 500 500
SCR 500 1000
Schottky TTL 500 2500
Potentially damaging electro-static discharges can occur:
07266B DCN6485

Model T101 Instruction Manual A Primer on Electro-Static Discharge
279
Any time a charged surface (including the human body) discharges to a
device. Even simple contact of a finger to the leads of a sensitive device
or assembly can allow enough discharge to cause damage. A similar
discharge can occur from a charged conductive object, such as a metallic
tool or fixture.
When static charges accumulated on a sensitive device discharges from
the device to another surface such as packaging materials, work
surfaces, machine surfaces or other device. In some cases, charged
device discharges can be the most destructive.
A typical example of this is the simple act of installing an electronic assembly into the
connector or wiring harness of the equipment in which it is to function. If the assembly
is carrying a static charge, as it is connected to ground a discharge will occur.
Whenever a sensitive device is moved into the field of an existing
electro-static field, a charge may be induced on the device in effect
discharging the field onto the device. If the device is then momentarily
grounded while within the electrostatic field or removed from the region
of the electrostatic field and grounded somewhere else, a second
discharge will occur as the charge is transferred from the device to
ground.
11.3. COMMON MYTHS ABOUT ESD DAMAGE
I didn’t feel a shock so there was no electro-static discharge: The
human nervous system isn’t able to feel a static discharge of less than
3500 volts. Most devices are damaged by discharge levels much lower
than that.
I didn’t touch it so there was no electro-static discharge: Electro-
static charges are fields whose lines of force can extend several inches or
sometimes even feet away from the surface bearing the charge.
It still works so there was no damage: Sometimes the damaged
caused by electro-static discharge can completely sever a circuit trace
causing the device to fail immediately. More likely, the trace will be only
partially occluded by the damage causing degraded performance of the
device or worse, weakening the trace. This weakened circuit may seem
to function fine for a short time, but even the very low voltage and
current levels of the device’s normal operating levels will eat away at the
defect over time causing the device to fail well before its designed
lifetime is reached.
These latent failures are often the most costly since the failure of the equipment in
which the damaged device is installed causes down time, lost data, lost productivity,
as well as possible failure and damage to other pieces of equipment or property.
Static Charges can’t build up on a conductive surface: There are
two errors in this statement:
Conductive devices can build static charges if they are not grounded. The charge
will be equalized across the entire device, but without access to earth ground, they
are still trapped and can still build to high enough levels to cause damage when they
are discharged.
A charge can be induced onto the conductive surface and/or discharge triggered in
the presence of a charged field such as a large static charge clinging to the surface of
a nylon jacket of someone walking up to a workbench.
07266B DCN6485
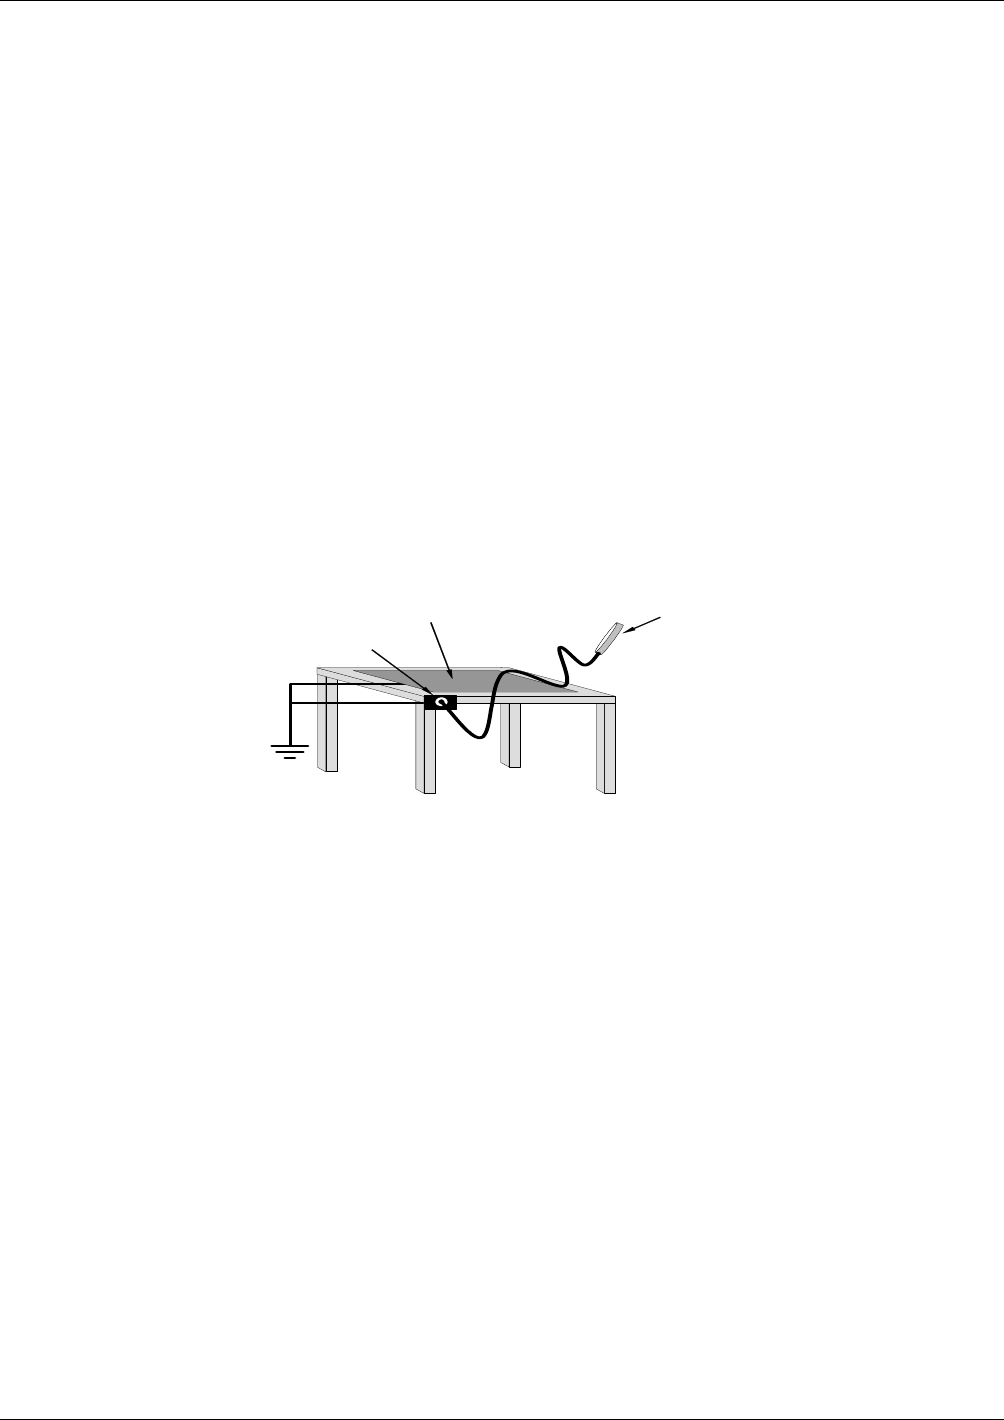
A Primer on Electro-Static Discharge Model T101 Instruction Manual
280
As long as my analyzer is properly installed, it is safe from
damage caused by static discharges: It is true that when properly
installed the chassis ground of your analyzer is tied to earth ground and
its electronic components are prevented from building static electric
charges themselves. This does not prevent discharges from static fields
built up on other things, like you and your clothing, from discharging
through the instrument and damaging it.
11.4. BASIC PRINCIPLES OF STATIC CONTROL
It is impossible to stop the creation of instantaneous static electric charges. It is not,
however difficult to prevent those charges from building to dangerous levels or prevent
damage due to electro-static discharge from occurring.
11.4.1. GENERAL RULES
Only handle or work on all electronic assemblies at a properly set up ESD station.
Setting up an ESD safe workstation need not be complicated. A protective mat properly
tied to ground and a wrist strap are all that is needed to create a basic anti-ESD
workstation (see figure 11-2).
Wrist Strap
P rotective M at
Ground Point
Figure 11-2. Basic anti-ESD Work Station
For technicians that work in the field, special lightweight and portable anti-ESD kits are
available from most suppliers of ESD protection gear. These include everything needed
to create a temporary anti-ESD work area anywhere.
Always wear an Anti-ESD wrist strap when working on the
electronic assemblies of your analyzer. An anti-ESD wrist strap
keeps the person wearing it at or near the same potential as other
grounded objects in the work area and allows static charges to dissipate
before they can build to dangerous levels. Anti-ESD wrist straps
terminated with alligator clips are available for use in work areas where
there is no available grounded plug.
Also, anti-ESD wrist straps include a current limiting resistor (usually around one meg-
ohm) that protects you should you accidentally short yourself to the instrument’s power
supply.
Simply touching a grounded piece of metal is insufficient. While
this may temporarily bleed off static charges present at the time, once
you stop touching the grounded metal new static charges will
immediately begin to re-build. In some conditions, a charge large
enough to damage a component can rebuild in just a few seconds.
07266B DCN6485

Model T101 Instruction Manual A Primer on Electro-Static Discharge
281
Always store sensitive components and assemblies in anti-ESD
storage bags or bins: Even when you are not working on them, store
all devices and assemblies in a closed anti-Static bag or bin. This will
prevent induced charges from building up on the device or assembly and
nearby static fields from discharging through it.
Use metallic anti-ESD bags for storing and shipping ESD sensitive
components and assemblies rather than pink-poly bags. The
famous, “pink-poly” bags are made of a plastic that is impregnated with
a liquid (similar to liquid laundry detergent) which very slowly sweats
onto the surface of the plastic creating a slightly conductive layer over
the surface of the bag.
While this layer may equalizes any charges that occur across the whole bag, it does not
prevent the build up of static charges. If laying on a conductive, grounded surface, these
bags will allow charges to bleed away but the very charges that build up on the surface
of the bag itself can be transferred through the bag by induction onto the circuits of your
ESD sensitive device. Also, the liquid impregnating the plastic is eventually used up
after which the bag is as useless for preventing damage from ESD as any ordinary
plastic bag.
Anti-Static bags made of plastic impregnated with metal (usually silvery in color)
provide all of the charge equalizing abilities of the pink-poly bags but also, when
properly sealed, create a Faraday cage that completely isolates the contents from
discharges and the inductive transfer of static charges.
Storage bins made of plastic impregnated with carbon (usually black in color) are also
excellent at dissipating static charges and isolating their contents from field effects and
discharges.
Never use ordinary plastic adhesive tape near an ESD sensitive
device or to close an anti-ESD bag. The act of pulling a piece of
standard plastic adhesive tape, such as Scotch® tape, from its roll will
generate a static charge of several thousand or even tens of thousands
of volts on the tape itself and an associated field effect that can
discharge through or be induced upon items up to a foot away.
07266B DCN6485

A Primer on Electro-Static Discharge Model T101 Instruction Manual
282
11.4.2. BASIC ANTI-ESD PROCEDURES FOR ANALYZER REPAIR
AND MAINTENANCE
11.4.2.1. Working at the Instrument Rack
When working on the analyzer while it is in the instrument rack and plugged into a
properly grounded power supply.
1. Attach your anti-ESD wrist strap to ground before doing anything else.
Use a wrist strap terminated with an alligator clip and attach it to a bare
metal portion of the instrument chassis. This will safely connect you to
the same ground level to which the instrument and all of its components
are connected.
2. Pause for a second or two to allow any static charges to bleed away.
3. Open the casing of the analyzer and begin work. Up to this point, the
closed metal casing of your analyzer has isolated the components and
assemblies inside from any conducted or induced static charges.
4. If you must remove a component from the instrument, do not lay it down
on a non-ESD preventative surface where static charges may lie in wait.
5. Only disconnect your wrist strap after you have finished work and closed
the case of the analyzer.
11.4.2.2. Working at an Anti-ESD Work Bench.
When working on an instrument of an electronic assembly while it is resting on an anti-
ESD work bench:
1. Plug your anti-ESD wrist strap into the grounded receptacle of the work
station before touching any items on the work station and while standing
at least a foot or so away. This will allow any charges you are carrying
to bleed away through the ground connection of the workstation and
prevent discharges due to field effects and induction from occurring.
2. Pause for a second or two to allow any static charges to bleed away.
3. Only open any anti-ESD storage bins or bags containing sensitive devices
or assemblies after you have plugged your wrist strap into the
workstation.
Lay the bag or bin on the workbench surface.
Before opening the container, wait several seconds for any static
charges on the outside surface of the container to be bled away by the
workstation’s grounded protective mat.
4. Do not pick up tools that may be carrying static charges while also
touching or holding an ESD Sensitive Device.
Only lay tools or ESD-sensitive devices and assemblies on the
conductive surface of your workstation. Never lay them down on any
non-ESD preventative surface.
5. Place any static sensitive devices or assemblies in anti-static storage bags
or bins and close the bag or bin before unplugging your wrist strap.
07266B DCN6485

Model T101 Instruction Manual A Primer on Electro-Static Discharge
283
6. Disconnecting your wrist strap is always the last action taken before
leaving the workbench.
11.4.2.3. Transferring Components from Rack to Bench and Back
When transferring a sensitive device from an installed Teledyne API analyzer to an
Anti-ESD workbench or back:
1. Follow the instructions listed above for working at the instrument rack
and workstation.
2. Never carry the component or assembly without placing it in an anti-ESD
bag or bin.
3. Before using the bag or container allow any surface charges on it to
dissipate:
If you are at the instrument rack, hold the bag in one hand while your
wrist strap is connected to a ground point.
If you are at an anti-ESD workbench, lay the container down on the
conductive work surface.
In either case wait several seconds.
4. Place the item in the container.
5. Seal the container. If using a bag, fold the end over and fastening it with
anti-ESD tape.
Folding the open end over isolates the component(s) inside from the
effects of static fields.
Leaving the bag open or simply stapling it shut without folding it
closed prevents the bag from forming a complete protective envelope
around the device.
6. Once you have arrived at your destination, allow any surface charges
that may have built up on the bag or bin during travel to dissipate:
Connect your wrist strap to ground.
If you are at the instrument rack, hold the bag in one hand while your
wrist strap is connected to a ground point.
If you are at a anti-ESD work bench, lay the container down on the
conductive work surface
In either case wait several seconds
7. Open the container.
11.4.2.4. Opening Shipments from Teledyne API
Packing materials such as bubble pack and Styrofoam pellets are extremely efficient
generators of static electric charges. To prevent damage from ESD, Teledyne API ships
all electronic components and assemblies in properly sealed anti-ESD containers.
Static charges will build up on the outer surface of the anti-ESD container during
shipping as the packing materials vibrate and rub against each other. To prevent these
07266B DCN6485
A Primer on Electro-Static Discharge Model T101 Instruction Manual
284
static charges from damaging the components or assemblies being shipped make sure
that you always unpack shipments from Teledyne API by:
1. Opening the outer shipping box away from the anti-ESD work area.
2. Carry the still sealed ant-ESD bag, tube or bin to the anti-ESD work area.
3. Follow steps 6 and 7 of Section 11.4.2.4 above when opening the anti-
ESD container at the work station.
4. Reserve the anti-ESD container or bag to use when packing electronic
components or assemblies to be returned to Teledyne API.
11.4.2.5. Packing Components for Return to Teledyne API
Always pack electronic components and assemblies to be sent to Teledyne API
Technical Support in anti-ESD bins, tubes or bags.
WARNING
DO NOT use pink-poly bags.
NEVER allow any standard plastic packaging materials to touch the
electronic component/assembly directly.
This includes, but is not limited to, plastic bubble-pack, Styrofoam
peanuts, open cell foam, closed cell foam, and adhesive tape.
DO NOT use standard adhesive tape as a sealer. Use ONLY anti-ESD tape.
1. Never carry the component or assembly without placing it in an anti-ESD
bag or bin.
2. Before using the bag or container allow any surface charges on it to
dissipate:
If you are at the instrument rack, hold the bag in one hand while your
wrist strap is connected to a ground point.
If you are at an anti-ESD workbench, lay the container down on the
conductive work surface.
In either case wait several seconds.
3. Place the item in the container.
4. Seal the container. If using a bag, fold the end over and fastening it with
anti-ESD tape.
Folding the open end over isolates the component(s) inside from the
effects of static fields.
Leaving the bag open or simply stapling it shut without folding it
closed prevents the bag from forming a complete protective envelope
around the device.
NOTE
If you do not already have an adequate supply of anti-ESD bags or containers available,
Teledyne API’s Technical Support department will supply them. Follow the instructions
listed above for working at the instrument rack and workstation.
07266B DCN6485

Model T101 Instruction Manual Clossary
285
GLOSSARY
Note: Some terms in this glossary may not occur elsewhere in this manual.
Term Description/Definition
10BaseT an Ethernet standard that uses twisted (“T”) pairs of copper wires to
transmit at 10 megabits per second (Mbps)
100BaseT same as 10BaseT except ten times faster (100 Mbps)
APICOM name of a remote control program offered by Teledyne-API to
its customers
ASSY Assembly
CAS Code-Activated Switch
CD Corona Discharge, a frequently luminous discharge, at the
surface of a conductor or between two conductors of the same
transmission line, accompanied by ionization of the
surrounding atmosphere and often by a power loss
CE Converter Efficiency, the percentage of light energy that is
actually converted into electricity
CEM Continuous Emission Monitoring
Chemical formulas that may be included in this document:
CO2 carbon dioxide
C3H8 propane
CH4 methane
H2O water vapor
HC general abbreviation for hydrocarbon
HNO3 nitric acid
H2S hydrogen sulfide
NO nitric oxide
NO2 nitrogen dioxide
NOX nitrogen oxides, here defined as the sum of NO and NO2
NOy nitrogen oxides, often called odd nitrogen: the sum of NOX
plus other compounds such as HNO3 (definitions vary
widely and may include nitrate (NO3), PAN, N2O and other
compounds as well)
NH3 ammonia
07266B DCN6485

Glossary Model T101 Instruction Manual
286
Term Description/Definition
O2 molecular oxygen
O3 ozone
SO2 sulfur dioxide
cm3 metric abbreviation for cubic centimeter (replaces the
obsolete abbreviation “cc”)
CPU Central Processing Unit
DAC Digital-to-Analog Converter
DAS Data Acquisition System
DCE Data Communication Equipment
DFU Dry Filter Unit
DHCP Dynamic Host Configuration Protocol. A protocol used by LAN
or Internet servers to automatically set up the interface
protocols between themselves and any other addressable
device connected to the network
DIAG Diagnostics, the diagnostic settings of the analyzer.
DOM Disk On Module, a 44-pin IDE flash drive with up to 128MB
storage capacity for instrument’s firmware, configuration
settings and data
DOS Disk Operating System
DRAM Dynamic Random Access Memory
DR-DOS Digital Research DOS
DTE Data Terminal Equipment
EEPROM Electrically Erasable Programmable Read-Only Memory also
referred to as a FLASH chip or drive
ESD Electro-Static Discharge
ETEST Electrical Test
Ethernet a standardized (IEEE 802.3) computer networking technology
for local area networks (LANs), facilitating communication and
sharing resources
FEP Fluorinated Ethylene Propylene polymer, one of the polymers
that Du Pont markets as Teflon®
Flash non-volatile, solid-state memory
07266B DCN6485

Model T101 Instruction Manual Glossary
287
Term Description/Definition
FPI Fabry-Perot Interface: a special light filter typically made of a
transparent plate with two reflecting surfaces or two parallel,
highly reflective mirrors
GFC Gas Filter Correlation
I2C bus a clocked, bi-directional, serial bus for communication between
individual analyzer components
IC Integrated Circuit, a modern, semi-conductor circuit that can
contain many basic components such as resistors, transistors,
capacitors etc in a miniaturized package used in electronic
assemblies
IP Internet Protocol
IZS Internal Zero Span
LAN Local Area Network
LCD Liquid Crystal Display
LED Light Emitting Diode
LPM Liters Per Minute
MFC Mass Flow Controller
M/R Measure/Reference
MOLAR MASS the mass, expressed in grams, of 1 mole of a specific substance.
Conversely, one mole is the amount of the substance needed for the
molar mass to be the same number in grams as the atomic mass of that
substance.
EXAMPLE: The atomic weight of Carbon is 12 therefore the molar
mass of Carbon is 12 grams. Conversely, one mole of carbon equals
the amount of carbon atoms that weighs 12 grams.
Atomic weights can be found on any Periodic Table of Elements.
NDIR Non-Dispersive Infrared
NIST-SRM National Institute of Standards and Technology - Standard Reference
Material
PC Personal Computer
PCA Printed Circuit Assembly, the PCB with electronic components,
ready to use
PC/AT Personal Computer / Advanced Technology
PCB Printed Circuit Board, the bare board without electronic
component
07266B DCN6485

Glossary Model T101 Instruction Manual
288
Term Description/Definition
PFA Per-Fluoro-Alkoxy, an inert polymer; one of the polymers that
Du Pont markets as Teflon®
PLC Programmable Logic Controller, a device that is used to control
instruments based on a logic level signal coming from the
analyzer
PLD Programmable Logic Device
PLL Phase Lock Loop
PMT Photo Multiplier Tube, a vacuum tube of electrodes that
multiply electrons collected and charged to create a detectable
current signal
P/N (or PN) Part Number
PSD Prevention of Significant Deterioration
PTFE Poly-Tetra-Fluoro-Ethylene, a very inert polymer material used
to handle gases that may react on other surfaces; one of the
polymers that Du Pont markets as Teflon®
PVC Poly Vinyl Chloride, a polymer used for downstream tubing
Rdg Reading
RS-232 specification and standard describing a serial communication method
between DTE (Data Terminal Equipment) and DCE (Data Circuit-
terminating Equipment) devices, using a maximum cable-length of 50
feet
RS-485 specification and standard describing a binary serial communication
method among multiple devices at a data rate faster than RS-232 with a
much longer distance between the host and the furthest device
SAROAD Storage and Retrieval of Aerometric Data
SLAMS State and Local Air Monitoring Network Plan
SLPM Standard Liters Per Minute of a gas at standard temperature and
pressure
STP Standard Temperature and Pressure
TCP/IP Transfer Control Protocol / Internet Protocol, the standard
communications protocol for Ethernet devices
TEC Thermal Electric Cooler
TPC Temperature/Pressure Compensation
USB Universal Serial Bus: a standard connection method to establish
communication between peripheral devices and a host controller, such
as a mouse and/or keyboard and a personal computer or laptop
VARS Variables, the variable settings of the instrument
V-F Voltage-to-Frequency
Z/S Zero / Span
07266B DCN6485

Teledyne API T/E-Series Models 101, 102, and 108 Software Documentation (PN05492D DCN6485)
A-1
APPENDIX A - Version Specific Software Documentation
APPENDIX A-1: Software Menu Trees, S/W Version C.7 (E-Series), 1.0.5 (T-Series) ....................3
APPENDIX A-2: Setup Variables For Serial I/O, S/W Version C.7 (E-Series), 1.0.5 (T-Series) ......11
APPENDIX A-3: Warnings and Test Measurements, S/W Version C.7 (E-Series), 1.0.5 (T-Series).21
APPENDIX A-4: Signal I/O Definitions, S/W Version C.7 (E-Series), 1.0.5 (T-Series)..................25
APPENDIX A-5: DAS Functions, S/W Version C.7 (E-Series), 1.0.5 (T-Series)............................29
Appendix A-6: DAS Functions ............................................................................................31
APPENDIX A-7: MODBUS Register Map................................................................................34
07266B DCN6485

Teledyne API T/E-Series Models 101, 102, and 108 Software Documentation (PN05492D DCN6485)
A-2
This page intentionally left blank.
07266B DCN6485
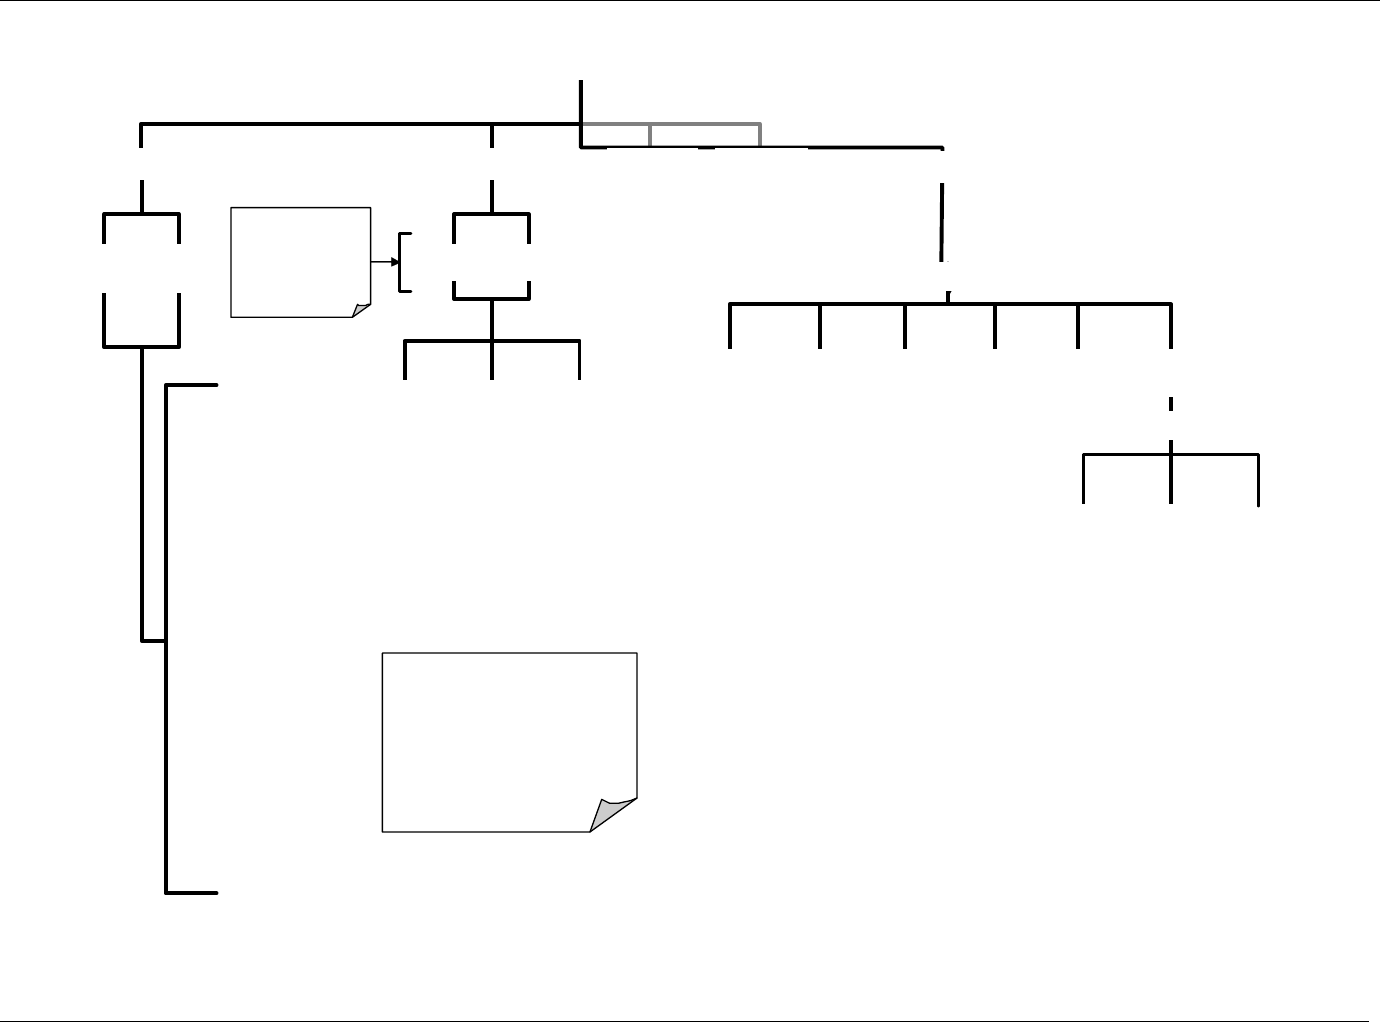
Teledyne API T/E-Series Models 101, 102, and 108 Software Documentation (PN05492D DCN6485)
A-3
APPENDIX A-1: Software Menu Trees, S/W Version C.7 (E-Series), 1.0.5 (T-Series)
ZERO
SPAN
CONC
SAMPLE
<TS
T
TST>
RANGE
H2S STB
SAMP FL
PRES
PMT
NORM PMT
UV LAMP
LAMP RATIO
STR. LGT
DARK PMT
DARK LMP
SO2 SLOPE
SO2 OFFSET
H2S SLOPE
H2S OFFSET
HVPS
RCELL TEMP
BOX TEMP
PMT TEMP
IZS TEMP1
CONV TEMP
TEST2
TIME
Only appear if
reporting range
is set for
AUTO range
mode.
LOW
HIGH
CAL
MSG1,2
TEST1
CLR1,3
TEST FUNCTIONS
Viewable by user while
instrument is in
SAMPLE Mode
1 Only appears when warning messages are activated
2 Press to cycle through list of active warning
messages.
3 Press to clear the warning message currently
displayed
COMM
DIAG
SETUP
CFG DAS RANG
PASS
CLK MORE
VARS
(Secondary Setup Menu)
(Primary Setup Menu)
Figure A-1: Basic Sample Display Menu
07266B DCN6485
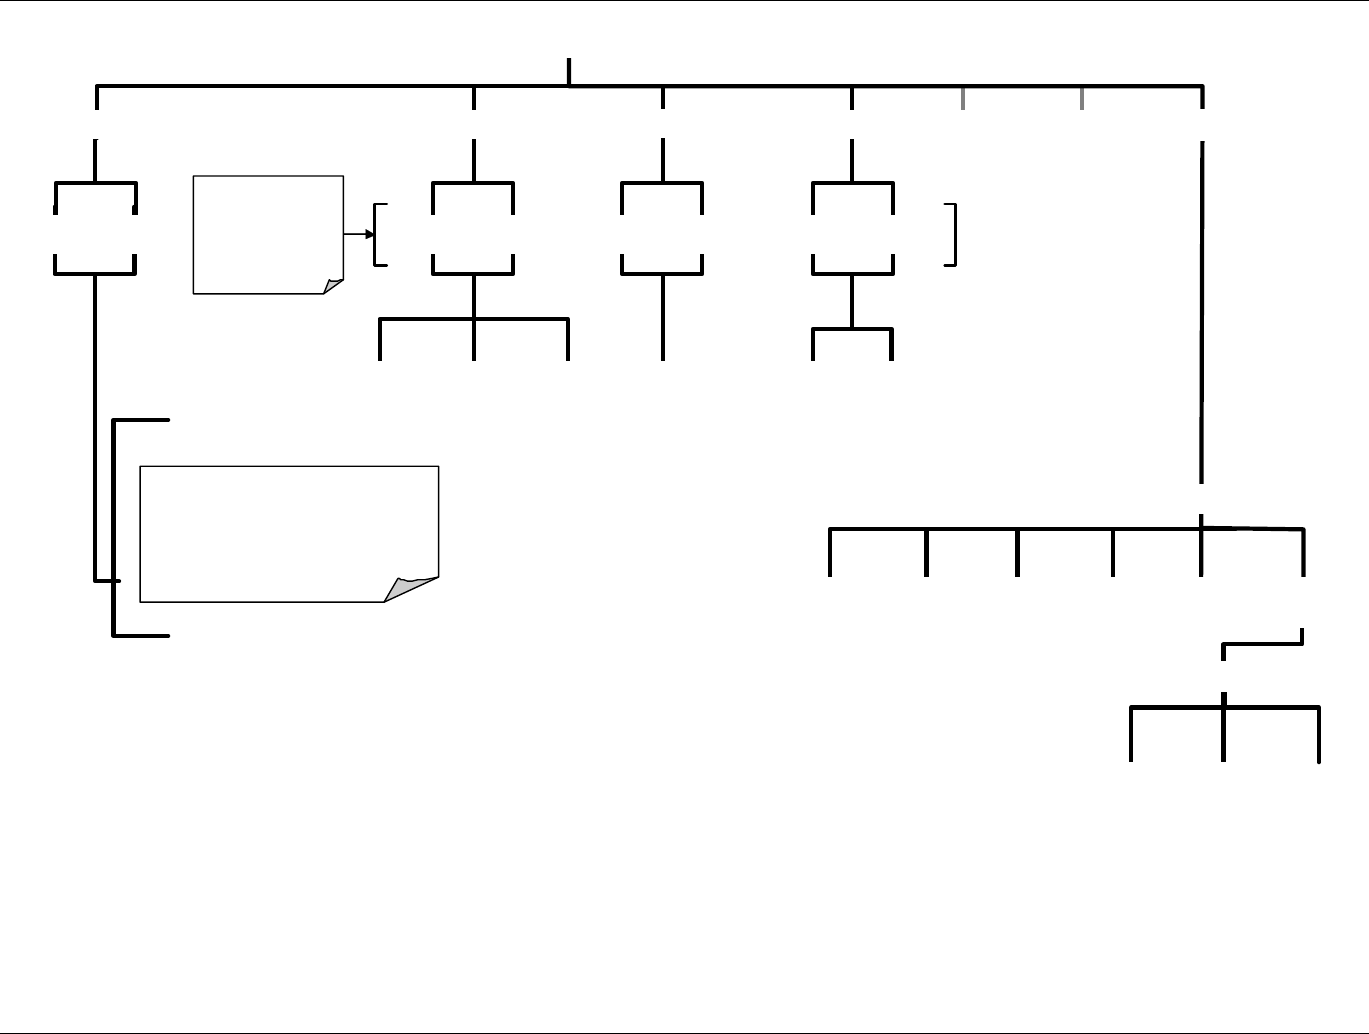
Teledyne API T/E-Series Models 101, 102, and 108 Software Documentation (PN05492D DCN6485)
A-4
LO
W
HIGH
ZER
O
SPAN
CONC
SAMPLE
<TST TST>
SETUP
COMM
DIAG
VARS
(Secondary Setup Menu)
CFG DA
S
RANG
PAS
S
CL
K
MORE
(Primary Setup Menu)
Only appear if
reporting range
is set for
AUTO range
mode.
LO
W
HIGH
ZER
O
LOW HIGH
SPAN CONC
MSG1,2
CLR1,3
CAL
CALZ
CALS
TEST
1
1
Only appears when warning messages are activated
2 Press to cycle through list of active warning
messages.
3 Press to clear/erase the warning message currently
displayed
TEST FUNCTION
S
Viewable by user while
instrument is in SAMPLE Mode
(see preceding menu tree)
Figure A-2: Sample Display Menu - Units with Z/S Valve or IZS Option installed
07266B DCN6485
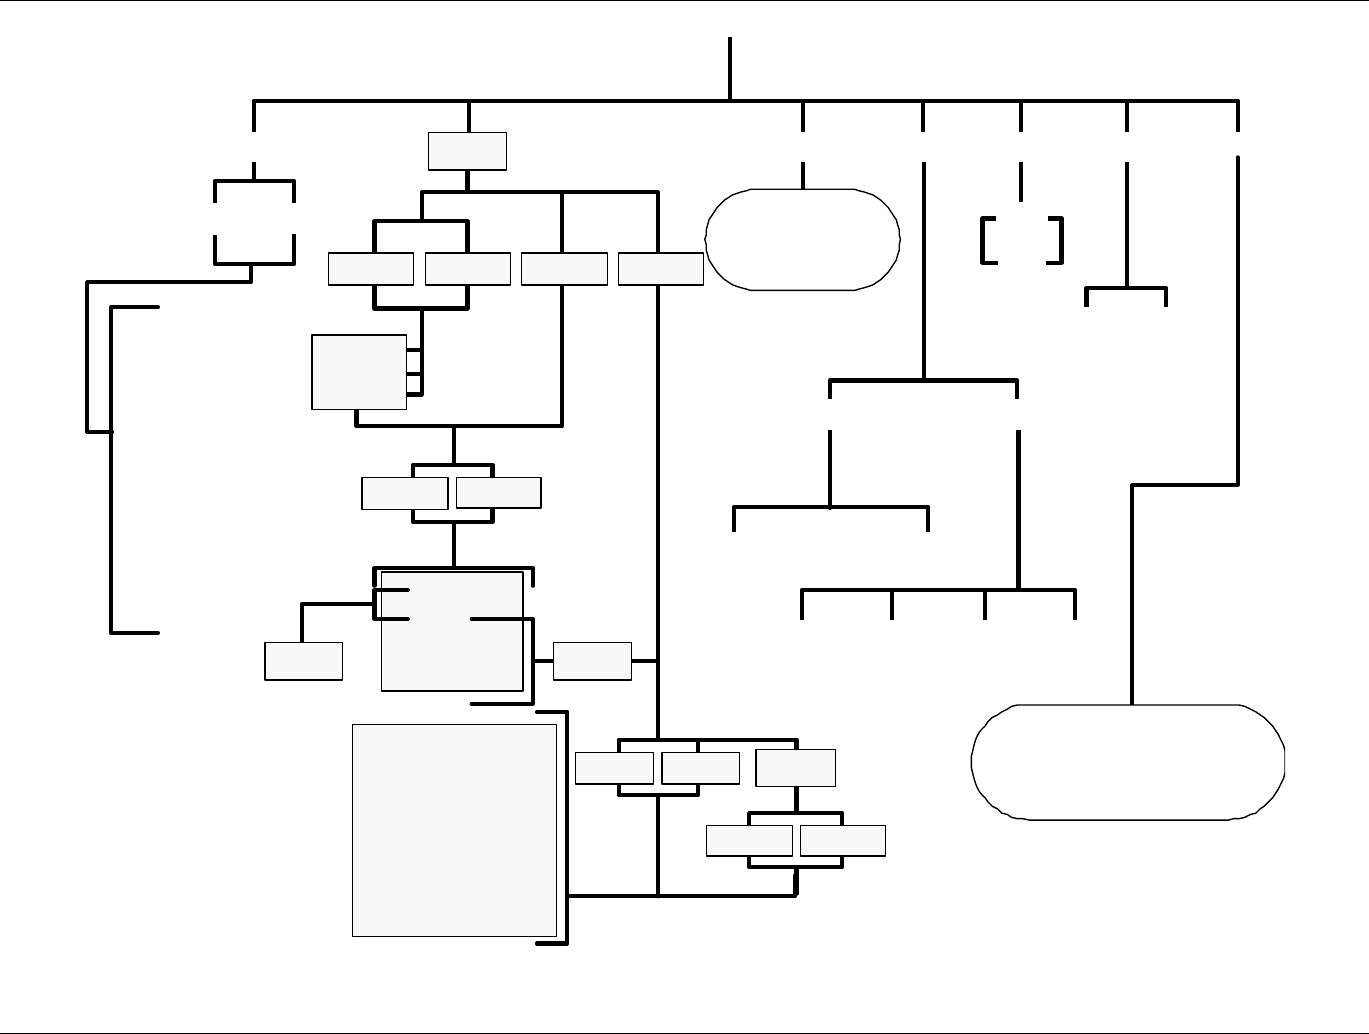
Teledyne API T/E-Series Models 101, 102, and 108 Software Documentation (PN05492D DCN6485)
A-5
CFG
MODEL NAME
PART NUMBER
SERIAL NUMBER
SOFTWARE
REVISION
LIBRARY REVISION
iCHIP SOFTWARE
REVISION1
HESSEN PROTOCOL
REVISION1
ACTIVE SPECIAL
SOFTWARE
OPTIONS1
CPU TYPE
DATE FACTORY
CONFIGURATION
SAVED
PREV NEXT
1 Only appears if a applicable
option/feature is installed
and activated.
2 Appears whenever the
currently displayed
sequence is not set for
DISABLED.
3 Only appears when
reporting range is set to
AUTO range mode.
CL
K
PASS
MORE
TIME
DATE
ON
OFF
SNGL
IND AUTO
MODE SET
UNIT
RNGE
DAS
Go To DAS MENU
TREE
(Fig. A-8)
Go To
SECONDARY SETUP MENU
(Fig. A-5)
<SET
SET>
ACAL1
PREV
NEXT
SE
Q
1)
SEQ 2)
SEQ 3)
PRE
V
NEXT
DISABLED
ZERO
ZERO/SPAN
SPAN
TIMER ENABLE
STARTING DATE
STARTING TIME
DELTA DAYS
DELTA TIME
DURATION
CALIBRATE
RANGE TO CAL3
MOD
E
ENTR
SET
2
ENTR
EDIT
LOW3
HIGH3
PPM
UGM
MGM
PPB
SETU
P
Figure A-3: Primary Setup Menu (Except DAS)
07266B DCN6485
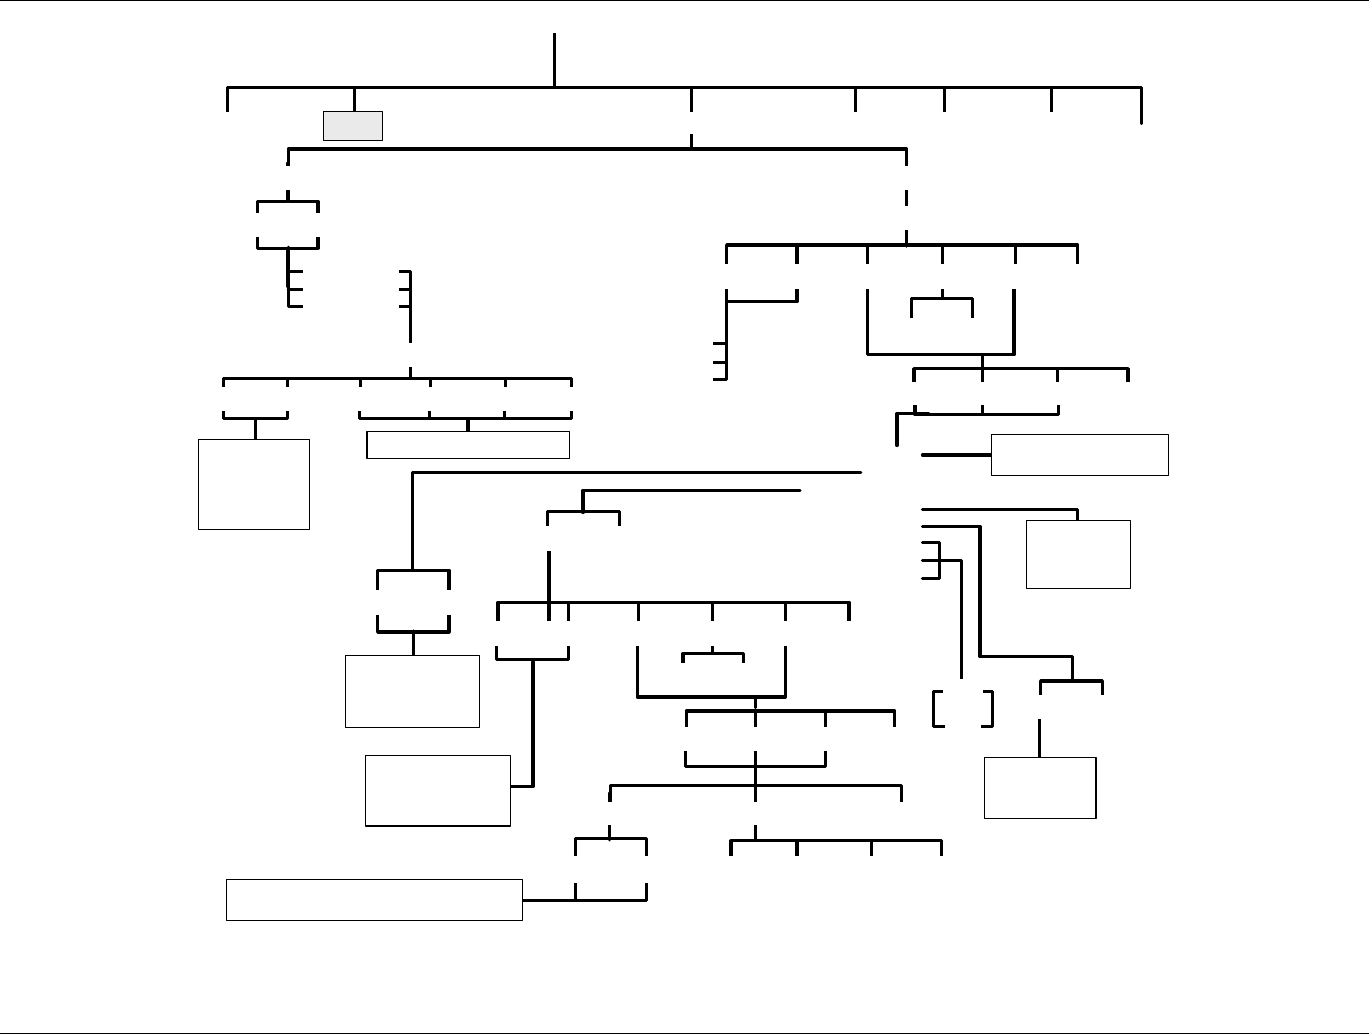
Teledyne API T/E-Series Models 101, 102, and 108 Software Documentation (PN05492D DCN6485)
A-6
NAME
EVENT
PARAMETERS
REPORT PERIOD
NUMBER OF RECORDS
RS-232 REPORT
CHANNEL ENABLE
CAL. HOLD
CFG ACAL1
1 Only appears if Z/S valve or IZS option is installed.
SETUP
CLK
PAS
S
MORE
R
NGE
DA
S
VIEW EDI
T
CONC
PNUMTC
CALDAT
VIEW
CONC
PNUMTC
CALDAT
DEL
EDIT
PRNT
INS
SET>
EDIT PRNT
<SET
Cycles through
available trigger
events
(see Section 6.11.2.3).
Cycles through
lists of
parameters
chosen for this
iDAS channel
Selects data point to view.
PREV
NEXT
NX10
PV10
<PRM PRM>
DEL
EDIT
PRNT
INS
Cycles through
already active
parameters
(
see Section 6.11.2.4
)
.
SET>
EDIT PRNT
<SET
SAMPLE MODE
PRECISION
Cycles through available/active parameters
(see main manual).
AVG MIN MAX INST
OFF
ON
Creates/changes name
(see Section 6.11.2.2).
Selects max
no. of records
for this channel
PREV NEXT
PREV NEXT
PREV NEXT
PREV NEXT
PREV NEXT
PARAMETE
R
YES NO
YES NO
YES NO
YES NO
Sets the
amount of time
between each
report.
ENTER SETUP PASS: 818
Figure A-4: Primary Setup Menu (DAS)
07266B DCN6485
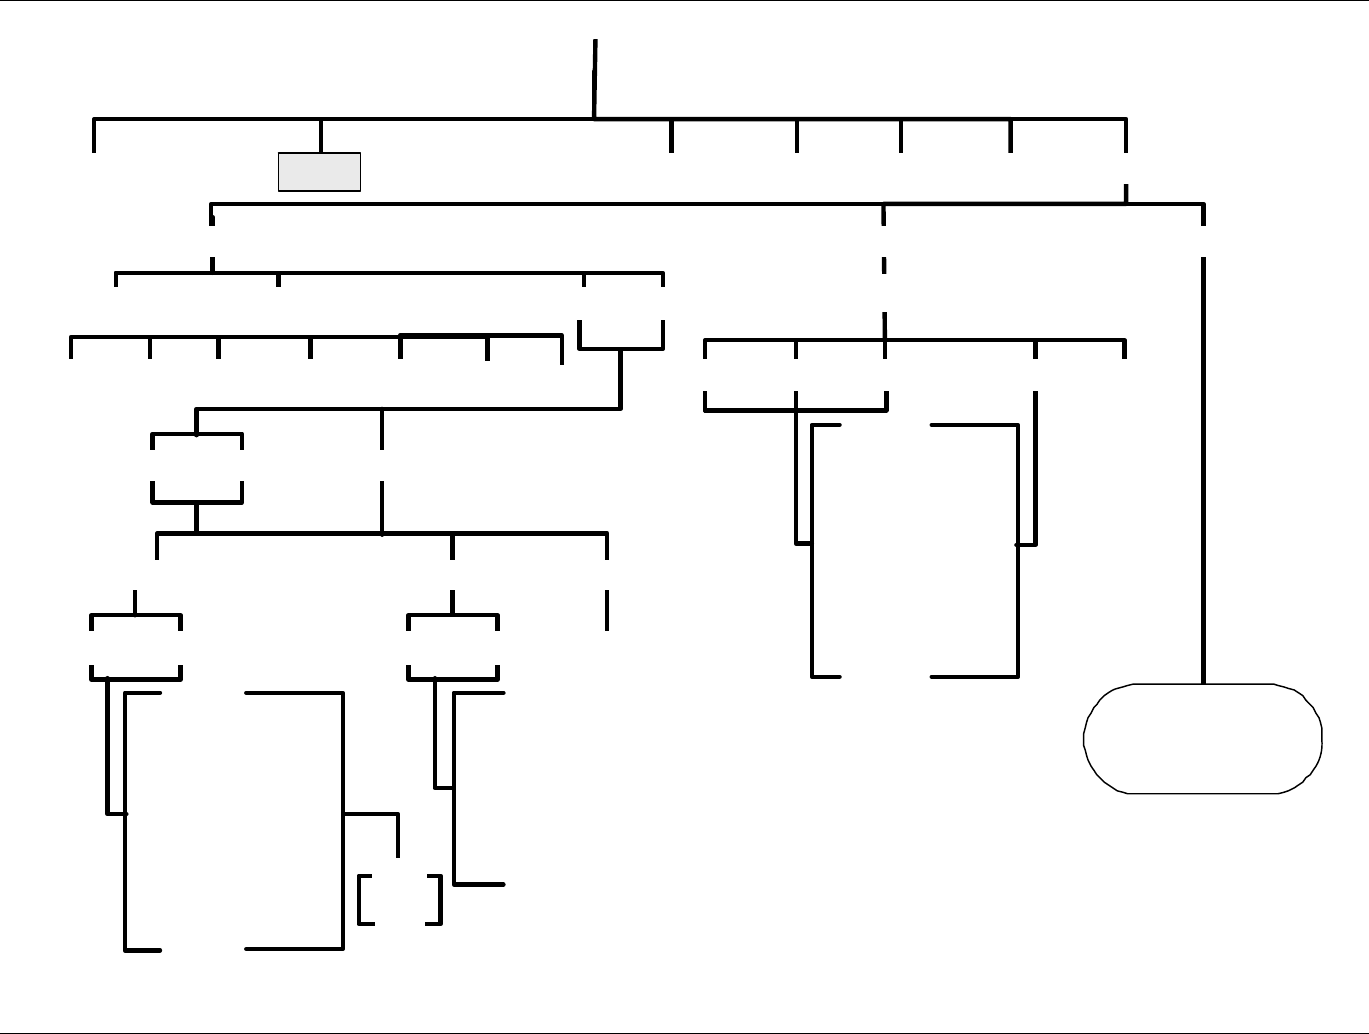
Teledyne API T/E-Series Models 101, 102, and 108 Software Documentation (PN05492D DCN6485)
A-7
QUIET
COMPUTER
HESSEN PROTOCOL
E, 8,1
E, 7, 1
RS-485
SECURITY
MULTIDROP PROTOCOL
ENABLE MODEM
ERROR CHECKING2
XON/XOFF HANDSHAKE2
HARDWARE HANDSHAKE
HARDWARE FIFO2
COMMAND PROMPT
CFG ACAL1
SAMPLE
CLK
PAS
S
RNGE DAS
MORE
COMM
VARS
DIAG
Go To
DIAG MENU TREE
(Fig A-8)
1 Only appears if Z/S valve or IZS option is installed.
2 Only appears on units with IZS option installed.
3 Standard in T-Series; option in E-Series, only appears
when enabled
,
then COM 2 is no lon
g
er available.
INET
3
2
DHCP
IP
GTWY
COM1
COM2
BAUD RATE
PREV NEXT
MODE
<SET SET> EDIT
OFF
ON
PREV NEXT
300
1200
2400
4800
9600
19200
38400
57760
115200
TEST
TEST PORT
PREV
NEXT JUMP
EDIT
PRINT
MEASURE_MODE
CAL_GAS
DAS_HOLD_OFF
TPC_ENABLE
RCELL_SET
IZS_SET
DYN_ZERO
DYN_SPAN
CONC_PRECISION
CLOCK_ADJ
SERVICE_CLEAR
TIME_SINCE_SVC
SVC_INTERVAL
ID ENTER SETUP PASS: 818
TCP2
SNET HOST
TCP1
Figure A-5: Secondary Setup Menu (COMM & VARS)
07266B DCN6485
Teledyne API T/E-Series Models 101, 102, and 108 Software Documentation (PN05492D DCN6485)
A-8
INSTRUMENT IP5
GATEWAY IP5
SUBNET MASK5
TCP PORT3
DHCP
INSTRUMENT IP
GATEWAY IP
SUBNET MASK
TCP PORT3
HOSTNAME4
CFG ACAL1
SETUP
CLK
PASS
RNGE DAS
MORE
COMM
VARS
DIAG
Go To
DIAG MENU TREE
(Fig A-8)
1 Only appears if a valve option is installed.
2 Standard in T-Series; for E-Series, only appears when the Ethernet card (option 63) is installed.
3 Although TCP PORT is editable regardless of the DHCP state, do not change the setting for this property unless
instructed to by Teledyne Instruments Customer Service personnel.
4 HOST NAME is only editable when DHCP is ON.
5 INSTRUMENT IP, GATEWAY IP & SUBNET MASK are only editable when DHCP is OFF.
COM1
PREV
NEXT JUMP
EDIT
PRINT
MEASURE_MODE
CAL_GAS
DAS_HOLD_OFF
TPC_ENABLE
RCELL_SET
IZS_SET
DYN_ZERO
DYN_SPAN
CONC_PRECISION
CLOCK_ADJ
SERVICE_CLEAR
TIME_SINCE_SVC
SVC_INTERVAL
ID ENTER SETUP PASS: 818
<SET SET>
INET2
COMM - VARS
MENU TREE
(Fig A-5)
EDIT
ON
OFF EDIT
Figure A-6: Secondary Setup Menu
07266B DCN6485
Teledyne API T/E-Series Models 101, 102, and 108 Software Documentation (PN05492D DCN6485)
A-9
.
YES NO
SAMPLE FLOW WARNING
BENCH TEMP WARNING
SOURCE WARNING
BOX TEMP WARNING
WHEEL TEMP WARNING
SAMPLE TEMP WARNING
SAMPLE PRESSURE WARNING
INVALID CONC
INSTRUMENT OFF
IN MANUAL CALIBRATION MODE
IN ZERO CALIBRATION MODE
IN SPAN CALIBRATION MODE
UGM
MGM
PPB
PPM
TYPE 1
TYPE 2
CFG ACAL1
SETUP
CLK
PASS
RNGE DAS
MORE
COMM
VARS
See
Fi
g
A
-8
1 Only appears if a valve is installed.
2 Only appears when the HESSEN mode is enabled for
either COM1 or COM2.
COM1
COM2
See manual for Flag
Assignments
See
Fi
g
A-5
ID
<SET SET>
HESN2
RESPONSE MODE
GAS LIST
STATUS FLAGS VARIATION
EDIT
BCC TEXT
CMD
DE
L
EDIT
PRNT
INS PREV NEXT
SO2, 111, REPORTED
DIAG
See
Fi
g
A-5
H@S, 112, REPORTED
GAS TYPE
GAS ID
REPORTED
Select from list of
available gases
(see Section 6.12.4.6).
ON
OFF
Set Hessen ID number for
selected gas type
(see Section 6.12.4.6).
Figure A-7: Secondary Setup Menu - HESSEN Submenu
07266B DCN6485
Teledyne API T/E-Series Models 101, 102, and 108 Software Documentation (PN05492D DCN6485)
A-10
37 INTERNAL ANALOG
VOLTAGE SIGNALS
72 (see Appendix A tables)
CFG ACAL1 CL
K
PAS
S
RNGE
DAS
MORE
COMM VARS
2 Only relevant to analyzers with IZS options installed
ANALOG
OUTPUT LAMP
CALIBRATION
0) EXT ZERO CAL
1) EXT SPAN CAL
2) SELECT SEC GAS
3 MAINT MODE
4) LANG2 SELECT
5) SAMPLE LED
6) CAL LED
7) FAULT LED
8) AUDIBLE BEEPER
9) ELEC TEST
10) OPTIC TEST
11) PREAMP RANGE HI
12) ST SYSTEM OK
13) ST CONC VALID
14) ST HIGH RANGE
15) ST ZERO CAL
16) ST SPAN CAL
17) ST DIAG MODE
18) ST H2S MODE
19) ST LAMP ALARM
20) ST DARK CAL ALARM
21) ST FLOW ALARM
22) ST PRESS ALARM
23) ST TEMP ALARM
24) ST HVPS ALARM
25) ST_SYSTEM_OK2
26) ST CONC ALARM 1
27) ST CONC ALARM 2
28) ST HIGH RANGE2
29) RELAY WATCHDOG
30) RCELL HEATER
31) CONV_HEATER
32) IZS HEATER1
33) CAL VALVE
34) SPAN VALVE
35) H2S VALVE
36) DARK SHUTTER
SIGNAL
I/O
OFF
ON
ENTR
Start step Test
SAMPLE
DIAG
PREV NEXT
NONE
PMT READING
UV READING
SAMPLE PRESSURE
SAMPLE FLOW
RCELL TEMP
CHASSIS TEMP
IZS TEMP2
PMT TEMP
HVPS VOLTAGE
PREV NEXT ENTR
ENTR
OPTIC
TEST ELECTRICAL
TEST
Starts Test Starts Test
AOUTS CALIBRATED
CONC OUT 1
CONC OUT 2
TEST OUTPUT
CA
L
RANGE
REC OFFSET
AUTO CAL
AIN CAL’D
0.1V
1V
5V 10V
CURR
SET>
EDIT
CAL
OFF
ON
SET>
<SET
<SET
ANALOG I/O
CONFIGURATION
ENTR
Starts Test
PRESSURE
CALIBRATION
ENTR
Starts Test
ENTR
Starts Test
FLOW
CALIBRATION
ENTER SETUP PASS: 818
TEST
CHANNEL
OUTPUT
Figure A-8: Secondary Setup Menu (DIAG)
07266B DCN6485

Teledyne API T/E-Series Models 101, 102, and 108 Software Documentation (PN05492D DCN6485)
A-11
APPENDIX A-2: Setup Variables For Serial I/O, S/W Version C.7 (E-Series), 1.0.5 (T-
Series)
Table A-1: Setup Variables
Setup Variable Numeric
Units Default
Value Value Range Description
Low Access Level Setup Variables (818 password)
MEASURE_MODE — SO2-H2S,
TRS 6
SO2,
H2S,
TRS 6,
SO2-H2S,
SO2-TRS 6,
H2S-TRS 6,
SO2-H2S-
TRS 6,
SO2-H2S-
REMOTE,
H2S-SO2-
REMOTE
Gas measurement mode.
Enclose value in double
quotes (") when setting from
the RS-232 interface.
CAL_GAS — DEF DEF,
SO2,
H2S
Selects calibration gas (i.e.
valve position, as opposed to
slope/offset). DEF selects
default behavior, in which
valve position and
slope/offset are the same.
Enclose value in double
quotes (") when setting from
the RS-232 interface.
DAS_HOLD_OFF Minutes 15 0.5–20 Duration of DAS hold off
period.
TPC_ENABLE — ON OFF, ON ON enables temperature and
pressure compensation; OFF
disables it.
50 RCELL_SET ºC
Warnings:
45–55
30–70 Reaction cell temperature
set point and warning limits.
50 IZS_SET ºC
Warnings:
45–55
30–70 IZS temperature set point
and warning limits.
DYN_ZERO — OFF OFF, ON ON enables contact closure
dynamic zero; OFF disables
it.
DYN_SPAN — OFF OFF, ON ON enables contact closure
dynamic span; OFF disables
it.
07266B DCN6485

Teledyne API T/E-Series Models 101, 102, and 108 Software Documentation (PN05492D DCN6485)
A-12
Setup Variable Numeric
Units Default
Value Value Range Description
CONC_PRECISION — 1 AUTO,
0,
1,
2,
3,
4
Number of digits to display
to the right of the decimal
point for concentrations on
the display. Enclose value in
double quotes (“) when
setting from the RS-232
interface.
CLOCK_ADJ Sec./Day 0 -60–60 Time-of-day clock speed
adjustment.
SERVICE_CLEAR — OFF OFF
ON ON resets the service
interval timer.
TIME_SINCE_SVC Hours 0 0–500000 Time since last service.
SVC_INTERVAL Hours 0 0–100000 Sets the interval between
service reminders.
Medium Access Level Setup Variables (929 password)
LANGUAGE_SELECT — ENGL ENGL,
SECD,
EXTN
Selects the language to use
for the user interface.
Enclose value in double
quotes (“) when setting from
the RS-232 interface.
LATCH_WARNINGS — ON ON, OFF ON enables latching warning
messages; OFF disables
latching
DAYLIGHTSAVING_ENABLE — ON ON, OFF ON enables Daylight Saving
Time (DST) change; OFF
disables DST.
MAINT_TIMEOUT Hours 2 0.1–100 Time until automatically
switching out of software-
controlled maintenance
mode.
MEASURE_PERIOD Minutes 10 1–60 Length of time to measure
each gas.
MEASURE_DELAY Minutes 3 0.1–20 How long to defer sampling
after switching streams.
FLUSH_DURATION 7 Seconds 10 0.1–100 Length of time to flush prior
to measuring each gas.
CONV_TIME — 33 MS 33 MS,
66 MS,
133 MS,
266 MS,
533 MS,
1 SEC,
2 SEC
Conversion time for PMT and
UV detector channels.
Enclose value in double
quotes (“) when setting from
the RS-232 interface.
DWELL_TIME Seconds 1 0.1–10 Dwell time before taking
each sample.
FILT_SIZE Samples 240 1–480 Moving average filter size.
FILT_ASIZE Samples 20 1–100 Moving average filter size in
adaptive mode.
07266B DCN6485

Teledyne API T/E-Series Models 101, 102, and 108 Software Documentation (PN05492D DCN6485)
A-13
Setup Variable Numeric
Units Default
Value Value Range Description
FILT_DELTA PPB 20 1–100 Absolute change to trigger
adaptive filter.
FILT_PCT % 5 1–100 Percent change to trigger
adaptive filter.
FILT_DELAY Seconds 180 0–300 Delay before leaving
adaptive filter mode.
FILT_ADAPT — ON OFF, ON ON enables adaptive filter;
OFF disables it.
DIL_FACTOR — 1 0.1–1000 Dilution factor if dilution
enabled with FACTORY_OPT
variable.
USER_UNITS — PPB PPB,
PPM,
UGM,
MGM
Concentration units for user
interface. Enclose value in
double quotes (“) when
setting from the RS-232
interface.
LAMP_CAL mV 3500 1000–5000 Last calibrated UV lamp
reading.
LAMP_GAIN — 0.9 0.5–1.5 UV lamp compensation
attenuation factor.
TEMPCO_GAIN — 0.15 0.01–10 Temperature coefficient
attenuation factor for
pressure readings.
PMT_TARG_CONC 9 Conc 400 0.01–
9999.99 Target SO2 concentration
during PMT calibration.
PMT_UPDATE_PERIOD 9 Seconds 10 1–100 Period between HVPS gain
updates during PMT
calibration.
PMT_CAL_TIMEOUT 9 Minutes 5 1–100 Maximum time for PMT
calibration to succeed.
HVPS_ADJUST 9 — 0 0–200 HVPS gain adjustment.
HVPS_INTEG 9 Gain 5 0–500 Integral coefficient for
adjusting HVPS gain during
PMT calibration.
HVPS_STABIL 9 — 1 0.1–10 HVPS gain must stabilize to
within this limit for PMT
calibration to succeed.
PMT_ADJUST 9 — 0 0–65535 PMT gain adjustment.
SLOPE_CONST — 8 0.1–10 Constant to make visible
slope close to 1.
DARK_ENABLE — ON,
OFF 9 OFF, ON ON enables PMT/UV dark
calibration; OFF disables it.
DARK_FREQ Minutes 30 0.1–1440 Dark calibration period.
DARK_PRE_DWELL Seconds 10 1–60 Dwell time after closing dark
shutter or turning off lamp
or selecting preamp range.
DARK_POST_DWELL Seconds 10 1–180 Dwell time after opening
dark shutter or turning on
lamp.
07266B DCN6485

Teledyne API T/E-Series Models 101, 102, and 108 Software Documentation (PN05492D DCN6485)
A-14
Setup Variable Numeric
Units Default
Value Value Range Description
DARK_SAMPLES Samples 5 1–10 Number of dark samples to
average.
DARK_FSIZE Samples 2 1–100 Dark offset moving average
filter size.
DARK_LIMIT mV 200 0–1000 Maximum dark offset
allowed.
SO2_SPAN1 Conc 400 0.1–50000 Target SO2 concentration
during span calibration of
range 1.
SO2_SPAN2 Conc 400 0.1–50000 Target SO2 concentration
during span calibration of
range 2.
SO2_SLOPE1 PPB/mV 1 0.25–4 SO2 slope for range 1.
SO2_SLOPE2 PPB/mV 1 0.25–4 SO2 slope for range 2.
SO2_OFFSET1 mV 0 -1500–1500 SO2 offset for range 1.
SO2_OFFSET2 mV 0 -1500–1500 SO2 offset for range 2.
H2S_SPAN1 Conc 400 0.1–50000 Target H2S concentration
during span calibration of
range 1.
H2S_SPAN2 Conc 400 0.1–50000 Target H2S concentration
during span calibration of
range 2.
H2S_SLOPE1 PPB/mV 1 0.25–4 H2S slope for range 1.
H2S_SLOPE2 PPB/mV 1 0.25–4 H2S slope for range 2.
H2S_OFFSET1 mV 0 -1500–1500 H2S offset for range 1.
H2S_OFFSET2 mV 0 -1500–1500 H2S offset for range 2.
CE_FACTOR1 — 1 0.8–1.2 Converter efficiency factor
for H2S/TRS for range 1.
CE_FACTOR2 — 1 0.8–1.2 Converter efficiency factor
for H2S/TRS for range 2.
TRS_SPAN1 6 Conc 400 0.1–50000 Target TRS concentration
during span calibration of
range 1.
TRS_SPAN2 6 Conc 400 0.1–50000 Target TRS concentration
during span calibration of
range 2.
TRS_SLOPE1 6 PPB/mV 1 0.25–4 TRS slope for range 1.
TRS_SLOPE2 6 PPB/mV 1 0.25–4 TRS slope for range 2.
TRS_OFFSET1 6 mV 0 -1500–1500 TRS offset for range 1.
TRS_OFFSET2 6 mV 0 -1500–1500 TRS offset for range 2.
TRS_CE_FACTOR1 6 — 1 0.8–1.2 Converter efficiency factor
for TRS for range 1.
TRS_CE_FACTOR2 6 — 1 0.8–1.2 Converter efficiency factor
for TRS for range 2.
RANGE_MODE — SNGL SNGL,
IND,
AUTO
Range control mode. Enclose
value in double quotes (“)
when setting from the RS-
232 interface.
07266B DCN6485

Teledyne API T/E-Series Models 101, 102, and 108 Software Documentation (PN05492D DCN6485)
A-15
Setup Variable Numeric
Units Default
Value Value Range Description
PHYS_RANGE1 PPM 2 0.1–2500 Low pre-amp range.
PHYS_RANGE2 PPM 20 0.1–2500 High pre-amp range.
CONC_RANGE1 Conc 500 0.1–50000 D/A concentration range 1.
CONC_RANGE2 Conc 500 0.1–50000 D/A concentration range 2.
CONC_RANGE3 6 Conc 500 0.1–50000 D/A concentration range 3.
150 OXY_FLOW_SET 4 cc/m
Warnings:
50–300
0–500 Nominal oxygenator flow set
point and warning limits.
OXY_FLOW_SLOPE 4 — 1 0.5–1.5 Slope term to correct
oxygenator flow rate.
700 SAMP_FLOW_SET cc/m
Warnings:
350–1200
0–1200 Sample flow set point for
flow calculation and warning
limits.
SAMP_FLOW_SLOPE — 1 0.5–1.5 Sample flow slope correction
factor (adjusted flow =
measured flow x slope).
SFLOW_FILT_SIZE Samples 50 1–200 Sample flow adaptive
moving average filter size.
29.92 SAMP_PRESS_SET "Hg
Warnings:
15–35
0–100 Sample pressure set point
for pressure compensation
and warning limits.
CONV_TYPE 2 — MOLY NONE, MOLY Converter type.
315 CONV_SET 2 ºC
Warnings:
310–320
0–350 Converter temperature set
point and warning limits.
30 BOX_SET ºC
Warnings:
8–50
5–60 Box temperature warning
limits. Set point is not used.
7,
15 9
PMT_SET ºC
Warnings:
2–12,
2–20 9
0–40 PMT temperature set point
and warning limits.
07266B DCN6485

Teledyne API T/E-Series Models 101, 102, and 108 Software Documentation (PN05492D DCN6485)
A-16
Setup Variable Numeric
Units Default
Value Value Range Description
RS232_MODE BitFlag 0 0–65535 RS-232 COM1 mode flags.
Add values to combine flags.
1 = quiet mode
2 = computer mode
4 = enable security
16 = enable Hessen protocol
5
32 = enable multi-drop
64 = enable modem
128 = ignore RS-232 line
errors
256 = disable XON / XOFF
support
512 = disable hardware
FIFOs
1024 = enable RS-485 mode
2048 = even parity, 7 data
bits, 1 stop bit
4096 = enable command
prompt
BAUD_RATE — 115200 300,
1200,
2400,
4800,
9600,
19200,
38400,
57600,
115200
RS-232 COM1 baud rate.
Enclose value in double
quotes (“) when setting from
the RS-232 interface.
MODEM_INIT — “AT Y0 &D0
&H0 &I0
S0=2 &B0
&N6 &M0 E0
Q1 &W0”
Any
character in
the allowed
character
set. Up to
100
characters
long.
RS-232 COM1 modem
initialization string. Sent
verbatim plus carriage return
to modem on power up or
manually. Enclose value in
double quotes (“) when
setting from the RS-232
interface.
RS232_MODE2 BitFlag 0 0–65535 RS-232 COM2 mode flags.
(Same settings as
RS232_MODE.)
07266B DCN6485

Teledyne API T/E-Series Models 101, 102, and 108 Software Documentation (PN05492D DCN6485)
A-17
Setup Variable Numeric
Units Default
Value Value Range Description
BAUD_RATE2 — 19200 300,
1200,
2400,
4800,
9600,
19200,
38400,
57600,
115200
RS-232 COM2 baud rate.
Enclose value in double
quotes (“) when setting from
the RS-232 interface.
MODEM_INIT2 — “AT Y0 &D0
&H0 &I0
S0=2 &B0
&N6 &M0 E0
Q1 &W0”
Any
character in
the allowed
character
set. Up to
100
characters
long.
RS-232 COM2 modem
initialization string. Sent
verbatim plus carriage return
to modem on power up or
manually. Enclose value in
double quotes (“) when
setting from the RS-232
interface.
RS232_PASS Password 940331 0–999999 RS-232 log on password.
MACHINE_ID ID 101
2,
102 3,
108 4
0–9999 Unique ID number for
instrument.
COMMAND_PROMPT — “Cmd> ” Any
character in
the allowed
character
set. Up to
100
characters
long.
RS-232 interface command
prompt. Displayed only if
enabled with RS232_MODE
variable. Enclose value in
double quotes (“) when
setting from the RS-232
interface.
TEST_CHAN_ID — NONE
NONE,
PMT
READING,
UV
READING,
OXY FLOW4,
SAMPLE
FLOW,
SAMPLE
PRESSURE,
RCELL
TEMP,
CHASSIS
TEMP,
IZS TEMP,
PMT TEMP,
CONV TEMP 2
,
HVPS
VOLTAGE
Diagnostic analog output ID.
Enclose value in double
quotes (“) when setting from
the RS-232 interface.
07266B DCN6485

Teledyne API T/E-Series Models 101, 102, and 108 Software Documentation (PN05492D DCN6485)
A-18
Setup Variable Numeric
Units Default
Value Value Range Description
REMOTE_CAL_MODE — SO2-LOW SO2-LOW,
SO2-HIGH,
H2S-LOW,
H2S-HIGH,
TRS-LOW6,
TRS-HIGH6
Gas and range to calibrate
during contact-closure and
Hessen calibration. Enclose
value in double quotes (“)
when setting from the RS-
232 interface.
HOLD_DAC_ON_CAL — OFF OFF, ON ON holds D/A outputs during
zero/span calibration; OFF
permits D/A outputs to
change.
PASS_ENABLE — OFF OFF, ON ON enables passwords; OFF
disables them.
RCELL_CYCLE Seconds 2 0.5–30 Reaction cell temperature
control cycle period.
RCELL_PROP 1/ºC 0.3 (prop.
band = 3.3
ºC)
0–10 Reaction cell temperature
PID proportional coefficient.
RCELL_INTEG — 0.005 0–10 Reaction cell temperature
PID integral coefficient.
RCELL_DERIV — 0.5 0–10 Reaction cell temperature
PID derivative coefficient.
IZS_CYCLE Seconds 2 0.5–30 IZS temperature control
cycle period.
IZS_PROP 1/ºC 1 (prop.
band = 1 ºC) 0–10 IZS temperature PID
proportional coefficient.
IZS_INTEG — 0.03 0–10 IZS temperature PID integral
coefficient.
IZS_DERIV — 0 0–10 IZS temperature PID
derivative coefficient.
650 HVPS_SET Volts
Warnings:
400–900
0–2000 High voltage power supply
warning limits. Set point is
not used.
MAX_PMT_DETECTOR mV 4995 0–5000 PMT detector maximum
warning limit.
450 PHOTO_ABS_LIMITS mV
Warnings:
125–625
0–5000 Pre-amplified UV lamp
minimum/maximum warning
limits. Set point is not used.
3500 UV_LAMP_LIMITS mV
Warnings:
1000–4995
0–5000 UV lamp minimum/maximum
warning limits. Set point is
not used.
ELEC_TEST_LEVEL 9 — 0 0–65535 Electrical test level setting.
OPTIC_TEST_LEVEL 9 — 0 0–65535 Optical test level setting.
07266B DCN6485

Teledyne API T/E-Series Models 101, 102, and 108 Software Documentation (PN05492D DCN6485)
A-19
Setup Variable Numeric
Units Default
Value Value Range Description
SERIAL_NUMBER —
“00000000
” Any
character in
the allowed
character
set. Up to
100
characters
long.
Unique serial number for
instrument. Enclose value in
double quotes (“) when
setting from the RS-232
interface.
DISP_INTENSITY — HIGH HIGH,
MED,
LOW,
DIM
Front panel display intensity.
Enclose value in double
quotes (“) when setting from
the RS-232 interface.
I2C_RESET_ENABLE — ON OFF, ON I2C bus automatic reset
enable.
CLOCK_FORMAT — “TIME=%H:
%M:%S” Any
character in
the allowed
character
set. Up to
100
characters
long.
Time-of-day clock format
flags. Enclose value in
double quotes (“) when
setting from the RS-232
interface.
“%a” = Abbreviated
weekday name.
“%b” = Abbreviated month
name.
“%d” = Day of month as
decimal number (01 – 31).
“%H” = Hour in 24-hour
format (00 – 23).
“%I” = Hour in 12-hour
format (01 – 12).
“%j” = Day of year as
decimal number (001 –
366).
“%m” = Month as decimal
number (01 – 12).
“%M” = Minute as decimal
number (00 – 59).
“%p” = A.M./P.M. indicator
for 12-hour clock.
“%S” = Second as decimal
number (00 – 59).
“%w” = Weekday as decimal
number (0 – 6; Sunday is
0).
“%y” = Year without
century, as decimal number
(00 – 99).
“%Y” = Year with century,
as decimal number.
“%%” = Percent sign.
07266B DCN6485

Teledyne API T/E-Series Models 101, 102, and 108 Software Documentation (PN05492D DCN6485)
A-20
Setup Variable Numeric
Units Default
Value Value Range Description
ALARM_TRIGGER 8 Cycles 3 1–100 Number of times
concentration must exceed
limit to trigger alarm.
FACTORY_OPT BitFlag 0 0–65535 Factory option flags. Add
values to combine flags.
1 = enable dilution factor
2 = zero/span valves
installed
4 = IZS installed (implies
zero/span valves installed)
16 = display units in
concentration field
32 = enable software-
controlled maintenance
mode
128 = enable switch-
controlled maintenance
mode
2048 = enable Internet
option
1 All instances of “H2S” in T101, M101E are changed to “TRS” in T102, M102E, and “TS” in T108, M108E.
2 T101, M101E.
3 T102, M102E.
4 T108, M108E.
5 Must power-cycle instrument for these options to fully take effect.
6 Triple-gas option.
7 Fast measurement option.
8 Concentration alarm option.
9 T108U, M108EU.
07266B DCN6485

Teledyne API T/E-Series Models 101, 102, and 108 Software Documentation (PN05492D DCN6485)
A-21
APPENDIX A-3: Warnings and Test Measurements, S/W Version C.7 (E-Series), 1.0.5
(T-Series)
Table A-2: Warning Messages
Name 1 Message Text Description
Warnings
WSYSRES SYSTEM RESET Instrument was power-cycled or the
CPU was reset.
WDATAINIT DATA INITIALIZED Data storage was erased.
WCONFIGINIT CONFIG INITIALIZED Configuration storage was reset to
factory configuration or erased.
WSO2ALARM1 7 SO2 ALARM 1 WARN SO2 concentration alarm limit #1
exceeded
WSO2ALARM2 7 SO2 ALARM 2 WARN SO2 concentration alarm limit #2
exceeded
WH2SALARM1 7 H2S ALARM 1 WARN H2S/TRS concentration alarm limit
#1 exceeded
WH2SALARM2 7 H2S ALARM 2 WARN H2S/TRS concentration alarm limit
#2 exceeded
WTRSALARM1 7+5 TRS ALARM 1 WARN TRS concentration alarm limit #1
exceeded
WTRSALARM2 7+5 TRS ALARM 2 WARN TRS concentration alarm limit #2
exceeded
WPMT PMT DET WARNING PMT detector outside of warning
limits specified by DETECTOR_LIMIT
variable.
WUVLAMP UV LAMP WARNING UV lamp reading outside of warning
limits specified by DETECTOR_LIMIT
variable.
WOXYFLOW 6 OXY FLOW WARNING Oxygenator flow outside of warning
limits specified by OXY_FLOW_SET
variable.
WSAMPFLOW SAMPLE FLOW WARN Sample flow outside of warning
limits specified by SAMP_FLOW_SET
variable.
WSAMPPRESS SAMPLE PRESS WARN Sample pressure outside of warning
limits specified by SAMP_PRESS_SET
variable.
WCONVTEMP 4 CONV TEMP WARNING Converter temperature outside of
warning limits specified by
CONV_SET variable.
WBOXTEMP BOX TEMP WARNING Chassis temperature outside of
warning limits specified by BOX_SET
variable.
WRCELLTEMP RCELL TEMP WARNING Reaction cell temperature outside of
warning limits specified by
RCELL_SET variable.
WIZSTEMP IZS TEMP WARNING IZS temperature outside of warning
limits specified by IZS_SET variable.
07266B DCN6485

Teledyne API T/E-Series Models 101, 102, and 108 Software Documentation (PN05492D DCN6485)
A-22
WPMTTEMP PMT TEMP WARNING PMT temperature outside of warning
limits specified by PMT_SET variable.
WDARKCAL DARK CAL WARNING Dark offset above limit specified by
DARK_LIMIT variable.
WHVPS HVPS WARNING High voltage power supply output
outside of warning limits specified by
HVPS_SET variable.
WDYNZERO CANNOT DYN ZERO Contact closure zero calibration
failed while DYN_ZERO was set to
ON.
WDYNSPAN CANNOT DYN SPAN Contact closure span calibration
failed while DYN_SPAN was set to
ON.
WREARBOARD REAR BOARD NOT DET Rear board was not detected during
power up.
WRELAYBOARD RELAY BOARD WARN Firmware is unable to communicate
with the relay board.
WFRONTPANEL FRONT PANEL WARN Firmware is unable to communicate
with the front panel.
WANALOGCAL ANALOG CAL WARNING The A/D or at least one D/A channel
has not been calibrated.
1 The name is used to request a message via the RS-232 interface, as in “T BOXTEMP”.
2 Engineering software.
3 Current instrument units.
4 T101, M101E.
5 Triple-gas option.
6 T108, M108E.
7 Concentration alarm option.
8 T108U, M108EU.
9 Optional.
07266B DCN6485

Teledyne API T/E-Series Models 101, 102, and 108 Software Documentation (PN05492D DCN6485)
A-23
Table A-3: Test Measurements
TEST Measurement Message Text DESCRIPTION
RANGE RANGE=500.0 PPB 3 D/A range in single or auto-range
modes.
RANGE1 RANGE1=500.0 PPB 3 D/A #1 range in independent range
mode.
RANGE2 RANGE2=500.0 PPB 3 D/A #2 range in independent range
mode.
RANGE3 5 RANGE3=500.0 PPB 3 D/A #3 range in independent range
mode.
STABILITY SO2 STB=11.4 PPB 3 Concentration stability #1.
STABILITY2 8 SO2 STB2=6.3 PPB 3 Concentration stability #2.
RESPONSE 2 RSP=1.11(0.00) SEC Instrument response. Length of
each signal processing loop. Time in
parenthesis is standard deviation.
OXYFLOW 6 OXY FLOW=150 CC/M Oxygenator flow rate
SAMPFLOW SAMP FL=700 CC/M Sample flow rate.
SAMPPRESS PRES=29.9 IN-HG-A Sample pressure.
PMTDET PMT=762.5 MV Raw PMT reading.
NORMPMTDET NORM PMT=742.9 MV PMT reading normalized for
temperature, pressure, auto-zero
offset, but not range.
UVDET UV LAMP=3457.6 MV UV lamp reading.
STABILITYUV 9 UV STB=5.607 MV UV lamp stability reading.
LAMPRATIO LAMP RATIO=100.0 % UV lamp ratio of current reading
divided by calibrated reading.
STRAYLIGHT STR. LGT=0.1 PPB Stray light offset.
DARKPMT DRK PMT=19.6 MV PMT dark offset.
DARKLAMP DRK LMP=42.4 MV UV lamp dark offset.
SO2SLOPE SO2 SLOPE=1.000 Slope for current range, computed
during zero/span calibration.
SO2OFFSET SO2 OFFS=0.0 MV Offset for current range, computed
during zero/span calibration.
H2SSLOPE H2S SLOPE=1.000 Slope for current range, computed
during zero/span calibration.
H2SOFFSET H2S OFFS=0.0 MV Offset for current range, computed
during zero/span calibration.
TRSSLOPE 5 TRS SLOPE=1.000 Slope for current range, computed
during zero/span calibration.
TRSOFFSET 5 TRS OFFS=0.0 MV Offset for current range, computed
during zero/span calibration.
HVPS HVPS=650 VOLTS High voltage power supply output.
RCELLDUTY 2 RCELL ON=0.00 SEC Reaction cell temperature control
duty cycle.
RCELLTEMP RCELL TEMP=52.1 C Reaction cell temperature.
BOXTEMP BOX TEMP=35.5 C Internal chassis temperature.
07266B DCN6485

Teledyne API T/E-Series Models 101, 102, and 108 Software Documentation (PN05492D DCN6485)
A-24
TEST Measurement Message Text DESCRIPTION
PMTTEMP PMT TEMP=7.0 C PMT temperature.
IZSDUTY 2 IZS ON=0.00 SEC IZS temperature control duty cycle.
IZSTEMP IZS TEMP=52.2 C IZS temperature.
CONVTEMP 4 CONV TEMP=315.0 C Converter temperature.
SO2 SO2=261.4 PPB SO2 concentration for current range.
H2S/TRS H2S/TRS=331.6 PPB H2S/TRS concentration for current
range.
TRS 5 TRS=378.4 PPB TRS concentration for current range.
TESTCHAN TEST=3721.1 MV Value output to TEST_OUTPUT
analog output, selected with
TEST_CHAN_ID variable.
CLOCKTIME TIME=10:38:27 Current instrument time of day
clock.
1 The name is used to request a message via the RS-232 interface, as in “T BOXTEMP”.
2 Engineering software.
3 Current instrument units.
4 T101, M101E.
5 Triple-gas option.
6 T108, M108E.
7 Concentration alarm option.
8 T108U, M108EU.
9 Optional.
07266B DCN6485
Teledyne API T/E-Series Models 101, 102, and 108 Software Documentation (PN05492D DCN6485)
A-25
APPENDIX A-4: Signal I/O Definitions, S/W Version C.7 (E-Series), 1.0.5 (T-Series)
Table A-4: Signal I/O Definitions
Signal Name Bit or Channel
Number Description
Internal inputs, U7, J108, pins 9–16 = bits 0–7, default I/O address 322 hex
0–7 Spare
AUX board digital outputs, default I2C address 30 hex
ELEC_TEST 7 0 1 = electrical test on
0 = off
OPTIC_TEST 7 1 1 = optic test on
0 = off
DARK_TEST 7 2 1 = dark test on
0 = off
PREAMP_RANGE_HI 7 3 1 = select high preamp range
0 = select low range
Internal outputs, U8, J108, pins 1–8 = bits 0–7, default I/O address 322 hex
ELEC_TEST 0 1 = electrical test on
0 = off
OPTIC_TEST 1 1 = optic test on
0 = off
PREAMP_RANGE_HI 2 1 = select high preamp range
0 = select low range
3–5 Spare
I2C_RESET 6 1 = reset I2C peripherals
0 = normal
I2C_DRV_RST 7 0 = hardware reset 8584 chip
1 = normal
Control inputs, U11, J1004, pins 1–6 = bits 0–5, default I/O address 321 hex
EXT_ZERO_CAL 0 0 = go into zero calibration
1 = exit zero calibration
EXT_SPAN_CAL 1 0 = go into span calibration
1 = exit span calibration
SELECT_SEC_GAS 2 0 = select second gas specified by MEASURE_MODE
variable (when one of the “remote” modes are
used)
1 = select first gas
3–5 Spare
6–7 Always 1
Control inputs, U14, J1006, pins 1–6 = bits 0–5, default I/O address 325 hex
0–5 Spare
07266B DCN6485

Teledyne API T/E-Series Models 101, 102, and 108 Software Documentation (PN05492D DCN6485)
A-26
Signal Name Bit or Channel
Number Description
6–7 Always 1
Control outputs, U17, J1008, pins 1–8 = bits 0–7, default I/O address 321 hex
0–7 Spare
Control outputs, U21, J1008, pins 9–12 = bits 0–3, default I/O address 325 hex
0–3 Spare
Alarm outputs, U21, J1009, pins 1–12 = bits 4–7, default I/O address 325 hex
ST_SYSTEM_OK2 4 1 = system OK
0 = any alarm condition or in diagnostics mode
ST_CONC_ALARM_1 5 5 1 = conc. limit 1 exceeded
0 = conc. OK
ST_CONC_ALARM_2 5 6 1 = conc. limit 2 exceeded
0 = conc. OK
ST_HIGH_RANGE2 6 7 1 = high auto-range in use (mirrors
ST_HIGH_RANGE status output)
0 = low auto-range
A status outputs, U24, J1017, pins 1–8 = bits 0–7, default I/O address 323 hex
ST_SYSTEM_OK 0 0 = system OK
1 = any alarm condition
ST_CONC_VALID 1 0 = conc. valid
1 = warnings or other conditions that affect validity
of concentration
ST_HIGH_RANGE 2 0 = high auto-range in use
1 = low auto-range
ST_ZERO_CAL 3 0 = in zero calibration
1 = not in zero
ST_SPAN_CAL 4 0 = in span calibration
1 = not in span
ST_DIAG_MODE 5 0 = in diagnostic mode
1 = not in diagnostic mode
ST_H2S_MODE 6 0 = secondary gas mode (H2S/TRS)
1 = primary gas mode (SO2)
ST_TRS_MODE 3 7 0 = TRS gas mode
1 = primary gas mode (SO2)
B status outputs, U27, J1018, pins 1–8 = bits 0–7, default I/O address 324 hex
ST_LAMP_ALARM 0 0 = lamp intensity low
1 = lamp intensity OK
ST_DARK_CAL_ALARM 1 0 = dark cal. warning
1 = dark cal. OK
ST_FLOW_ALARM 2 0 = any flow alarm
1 = all flows OK
ST_PRESS_ALARM 3 0 = any pressure alarm
07266B DCN6485

Teledyne API T/E-Series Models 101, 102, and 108 Software Documentation (PN05492D DCN6485)
A-27
Signal Name Bit or Channel
Number Description
1 = all pressures OK
ST_TEMP_ALARM 4 0 = any temperature alarm
1 = all temperatures OK
ST_HVPS_ALARM 5 0 = HVPS alarm
1 = HVPS OK
6–7 Spare
Front panel I2C keyboard, default I2C address 4E hex
MAINT_MODE 5 (input) 0 = maintenance mode
1 = normal mode
LANG2_SELECT 6 (input) 0 = select second language
1 = select first language (English)
SAMPLE_LED 8 (output) 0 = sample LED on
1 = off
CAL_LED 9 (output) 0 = cal. LED on
1 = off
FAULT_LED 10 (output) 0 = fault LED on
1 = off
AUDIBLE_BEEPER 14 (output) 0 = beeper on (for diagnostic testing only)
1 = off
Relay board digital output (PCF8575), default I2C address 44 hex
RELAY_WATCHDOG 0 Alternate between 0 and 1 at least every 5 seconds
to keep relay board active
RCELL_HEATER 1 0 = reaction cell heater on
1 = off
CONV_HEATER 1 2 0 = converter cell heater on
1 = off
3 Spare
IZS_HEATER 4 0 = IZS heater on
1 = off
5 Spare
CAL_VALVE 6 0 = let cal. gas in
1 = let sample gas in
SPAN_VALVE 7 0 = let span gas in
1 = let zero gas in
TRS_VALVE 3 8 0 = switch to TRS gas position
1 = primary gas position (SO2)
H2S_VALVE,
TRS_VALVE 0 = switch to secondary gas position (H2S/TRS)
1 = primary gas position (SO2)
TS_VALVE 2
9
0 = primary gas position (SO2)
1 = switch to secondary gas position (TS) 2
07266B DCN6485

Teledyne API T/E-Series Models 101, 102, and 108 Software Documentation (PN05492D DCN6485)
A-28
Signal Name Bit or Channel
Number Description
DARK_SHUTTER 10 0 = close dark shutter
1 = open
FLUSH_VALVE 4 11 0 = open flow restrictor bypass (flush) valve
1 = close
12–15 Spare
AUX board analog inputs, default I2C address 30 hex
PMT_SIGNAL 7 0 (register number) PMT detector
UVLAMP_SIGNAL 7 1 UV lamp intensity
NORM_PMT_SIGNAL 7 2 Normalized PMT detector
PMT_TEMP 7 3 PMT temperature
HVPS_VOLTAGE 7 4 HV power supply output
PMT_DARK 7 5 PMT reading during dark cycles
LAMP_DARK 7 6 Lamp reading during dark cycles
AGND_DARK 7 7 AGND reading during dark cycles
AGND_LIGHT 7 8 AGND reading during light cycles
VREF_DARK 7 9 VREF4096 reading during dark cycles
VREF_LIGHT 7 10 VREF4096 reading during light cycles
Rear board primary MUX analog inputs
PMT_SIGNAL 0 PMT detector
HVPS_VOLTAGE 1 HV power supply output
PMT_TEMP 2 PMT temperature
UVLAMP_SIGNAL 3 UV lamp intensity
4 Temperature MUX
PHOTO_ABS 5 Pre-amplified UV lamp intensity
OXY_FLOW 2 6 Oxygenator flow rate
SAMPLE_PRESSURE 7 Sample pressure
TEST_INPUT_8 8 Diagnostic test input
REF_4096_MV 9 4.096V reference from MAX6241
SAMPLE_FLOW 10 Sample flow rate
TEST_INPUT_11 11 Diagnostic test input
CONV_TEMP 1 12 Converter temperature
13 Spare (thermocouple input?)
14 DAC MUX
REF_GND 15 Ground reference
Rear board temperature MUX analog inputs
BOX_TEMP 0 Internal box temperature
RCELL_TEMP 1 Reaction cell temperature
IZS_TEMP 2 IZS temperature
3 Spare
07266B DCN6485
Teledyne API T/E-Series Models 101, 102, and 108 Software Documentation (PN05492D DCN6485)
A-29
Signal Name Bit or Channel
Number Description
TEMP_INPUT_4 4 Diagnostic temperature input
TEMP_INPUT_5 5 Diagnostic temperature input
TEMP_INPUT_6 6 Diagnostic temperature input
7 Spare
Rear board DAC MUX analog inputs
DAC_CHAN_1 0 DAC channel 1 loopback
DAC_CHAN_2 1 DAC channel 2 loopback
DAC_CHAN_3 2 DAC channel 3 loopback
DAC_CHAN_4 3 DAC channel 4 loopback
Rear board analog outputs
CONC_OUT_1 0 Concentration output #1
CONC_OUT_2 1 Concentration output #2
CONC_OUT_3 3 2 Concentration output #3
TEST_OUTPUT 3 Test measurement output
1 T101, M101E.
2 T108, M108E.
3 Triple-gas option.
4 Fast measurement option.
5 Concentration alarm option.
6 High auto range relay option
7 T108U, M108EU.
APPENDIX A-5: DAS Functions, S/W Version C.7 (E-Series), 1.0.5 (T-Series)
07266B DCN6485

Teledyne API T/E-Series Models 101, 102, and 108 Software Documentation (PN05492D DCN6485)
A-30
Table A-5: DAS Trigger Events
Name Description
ATIMER Automatic timer expired
EXITZR Exit zero calibration mode
EXITHS Exit high span calibration mode
EXITMP Exit multi-point calibration mode
SLPCHG Slope and offset recalculated
EXITDG Exit diagnostic mode
PMTDTW PMT detector warning
UVLMPW UV lamp warning
DRKCLW Dark calibration warning
CONCW1 2 Concentration limit 1 exceeded
CONCW2 2 Concentration limit 2 exceeded
RCTMPW Reaction cell temperature warning
IZTMPW IZS temperature warning
PTEMPW PMT temperature warning
CTEMPW 1 Converter temperature warning
OFLOWW Oxygenator flow warning
SFLOWW Sample flow warning
SPRESW Sample pressure warning
BTEMPW Box temperature warning
HVPSW High voltage power supply warning
1 T101, M101E.
2 Concentration alarm option.
07266B DCN6485

Teledyne API T/E-Series Models 101, 102, and 108 Software Documentation (PN05492D DCN6485)
A-31
Appendix A-6: DAS Functions
Name Description Units
PMTDET PMT detector reading mV
PHABS Pre-amplified UV lamp intensity reading mV
UVDET UV lamp intensity reading mV
LAMPR UV lamp ratio of calibrated intensity %
DRKPMT PMT electrical offset mV
DARKUV UV lamp electrical offset mV
S2SLP1 SO2 slope for range #1 PPB/mV
S2SLP2 SO2 slope for range #2 PPB/mV
H2SLP1 or TRSLP1 H2S/TRS slope for range #1 PPB/mV
H2SLP2 or TRSLP2 H2S/TRS slope for range #2 PPB/mV
TRSLP1 2 TRS slope for range #1 PPB/mV
TRSLP2 2 TRS slope for range #2 PPB/mV
S2OFS1 SO2 offset for range #1 mV
S2OFS2 SO2 offset for range #2 mV
H2OFS1 or TROFS1 H2S/TRS offset for range #1 mV
H2OFS2 or TROFS2 H2S/TRS offset for range #2 mV
TROFS1 2 TRS offset for range #1 mV
TROFS2 2 TRS offset for range #2 mV
S2ZSC1 SO2 concentration for range #1 during zero/span calibration,
just before computing new slope and offset PPB
S2ZSC2 SO2 concentration for range #2 during zero/span calibration,
just before computing new slope and offset PPB
H2ZSC1 or TRZSC1 H2S/TRS concentration for range #1 during zero/span
calibration, just before computing new slope and offset PPB
H2ZSC2 or TRZSC2 H2S/TRS concentration for range #2 during zero/span
calibration, just before computing new slope and offset PPB
TRZSC1 2 TRS concentration for range #1 during zero/span
calibration, just before computing new slope and offset PPB
TRZSC2 2 TRS concentration for range #2 during zero/span
calibration, just before computing new slope and offset PPB
S2CNC1 SO2 concentration for range #1 PPB
S2CNC2 SO2 concentration for range #2 PPB
H2CNC1 or TRCNC1 H2S/TRS concentration for range #1 PPB
H2CNC2 or TRCNC2 H2S/TRS concentration for range #2 PPB
TRCNC1 2 TRS concentration for range #1 PPB
TRCNC2 2 TRS concentration for range #2 PPB
STABIL Concentration stability #1 PPB
STABL2 4 Concentration stability #2 PPB
STABUV 5 UV lamp stability mV
STRLGT Stray light reading PPB
07266B DCN6485

Teledyne API T/E-Series Models 101, 102, and 108 Software Documentation (PN05492D DCN6485)
A-32
Name Description Units
RCTEMP Reaction cell temperature C
IZSTMP IZS temperature C
PMTTMP PMT temperature C
CNVEF1 Converter efficiency factor for range #1 —
CNVEF2 Converter efficiency factor for range #2 —
TRCEF1 2 TRS converter efficiency factor for range #1 —
TRCEF2 2 TRS converter efficiency factor for range #2 —
CNVTMP 1 Converter temperature C
OXYFLW 3 Oxygenator flow rate cc/m
SMPFLW Sample flow rate cc/m
SMPPRS Sample pressure “Hg
BOXTMP Internal box temperature C
HVPS High voltage power supply output Volts
TEST8 Diagnostic test input (TEST_INPUT_8) mV
TEST11 Diagnostic test input (TEST_INPUT_11) mV
TEMP4 Diagnostic temperature input (TEMP_INPUT_4) C
TEMP5 Diagnostic temperature input (TEMP_INPUT_5) C
TEMP6 Diagnostic temperature input (TEMP_INPUT_6) C
REFGND Ground reference (REF_GND) mV
RF4096 4096 mV reference (REF_4096_MV) mV
XIN16 Channel 1 Analog In
XIN1SLPE6 Channel 1 Analog In Slope
XIN1OFST6 Channel 1 Analog In Offset
XIN26 Channel 2 Analog In
XIN2SLPE6 Channel 2 Analog In Slope
XIN2OFST6 Channel 2 Analog In Offset
XIN36 Channel 3 Analog In
XIN3SLPE6 Channel 3 Analog In Slope
XIN3OFST6 Channel 3 Analog In Offset
XIN46 Channel 4 Analog In
XIN4SLPE6 Channel 4 Analog In Slope
XIN4OFST6 Channel 4 Analog In Offset
XIN56 Channel 5 Analog In
XIN5SLPE6 Channel 5 Analog In Slope
XIN5OFST6 Channel 5 Analog In Offset
XIN66 Channel 6 Analog In
XIN6SLPE6 Channel 6 Analog In Slope
XIN6OFST6 Channel 6 Analog In Offset
07266B DCN6485
Teledyne API T/E-Series Models 101, 102, and 108 Software Documentation (PN05492D DCN6485)
A-33
Name Description Units
XIN76 Channel 7 Analog In
XIN7SLPE6 Channel 7 Analog In Slope
XIN7OFST6 Channel 7 Analog In Offset
XIN86 Channel 8 Analog In
XIN8SLPE6 Channel 8 Analog In Slope
XIN8OFST6 Channel 8 Analog In Offset
AGNDDK 4 AGND reading during dark cycles mV
AGNDLT 4 AGND reading during light cycles mV
RF4VDK 4 VREF4096 reading during dark cycles mV
RF4VLT 4 VREF4096 reading during light cycles mV
1 T101, M101E.
2 Triple-gas option.
3 T108, M108E.
4 T108U, M108EU.
5 Optional.
6 Analog In option, T-Series only.
07266B DCN6485

Teledyne API T/E-Series Models 101, 102, and 108 Software Documentation (PN05492D DCN6485)
A-34
APPENDIX A-7: MODBUS Register Map
MODBUS Register
Address
(dec., 0-based)
Description Units
MODBUS Floating Point Input Registers
(32-bit IEEE 754 format; read in high-word, low-word order; read-only)
0 PMT detector reading mV
2 UV lamp intensity reading mV
4 UV lamp ratio of calibrated intensity %
6 PMT electrical offset mV
8 UV lamp electrical offset mV
10 SO2 slope for range #1 PPB/mV
12 SO2 slope for range #2 PPB/mV
14 H2S/TRS slope for range #1 PPB/mV
16 H2S/TRS slope for range #2 PPB/mV
18 SO2 offset for range #1 mV
20 SO2 offset for range #2 mV
22 H2S/TRS offset for range #1 mV
24 H2S/TRS offset for range #2 mV
26 SO2 concentration for range #1 during zero/span
calibration, just before computing new slope and offset PPB
28 SO2 concentration for range #2 during zero/span
calibration, just before computing new slope and offset PPB
30 H2S/TRS concentration for range #1 during zero/span
calibration, just before computing new slope and offset PPB
32 H2S/TRS concentration for range #2 during zero/span
calibration, just before computing new slope and offset PPB
34 SO2 concentration for range #1 PPB
36 SO2 concentration for range #2 PPB
38 H2S/TRS concentration for range #1 PPB
40 H2S/TRS concentration for range #2 PPB
42 Concentration stability #1 PPB
44 Stray light reading PPB
46 Reaction cell temperature C
48 IZS temperature C
50 PMT temperature C
52 Converter efficiency factor for range #1 —
54 Converter efficiency factor for range #2 —
56 Sample flow rate cc/m
07266B DCN6485

Teledyne API T/E-Series Models 101, 102, and 108 Software Documentation (PN05492D DCN6485)
A-35
58 Sample pressure “Hg
60 Internal box temperature C
62 High voltage power supply output Volts
64 Diagnostic test input (TEST_INPUT_8) mV
66 Diagnostic test input (TEST_INPUT_11) mV
68 Diagnostic temperature input (TEMP_INPUT_4) C
70 Diagnostic temperature input (TEMP_INPUT_5) C
72 Diagnostic temperature input (TEMP_INPUT_6) C
74 Ground reference (REF_GND) mV
76 4096 mV reference (REF_4096_MV) mV
78 Pre-amplified UV lamp intensity reading mV
80 1 Converter temperature C
82 5 Oxygenator flow rate cc/m
84 6 Concentration stability #2 PPB
86 7 UV lamp stability mV
100 4 TRS slope for range #1 PPB/mV
102 4 TRS slope for range #2 PPB/mV
104 4 TRS offset for range #1 mV
106 4 TRS offset for range #2 mV
108 4 TRS concentration for range #1 during zero/span
calibration, just before computing new slope and offset PPB
110 4 TRS concentration for range #2 during zero/span
calibration, just before computing new slope and offset PPB
112 4 TRS concentration for range #1 PPB
114 4 TRS concentration for range #2 PPB
116 4 TRS converter efficiency factor for range #1 —
118 4 TRS converter efficiency factor for range #2 —
MODBUS Floating Point Holding Registers
(32-bit IEEE 754 format; read/write in high-word, low-word order; read/write)
0 Maps to SO2_SPAN1 variable; target conc. for range #1 Conc. units
2 Maps to SO2_SPAN2 variable; target conc. for range #2 Conc. units
4 Maps to H2S_SPAN1 variable; target conc. for range #1 Conc. units
6 Maps to H2S_SPAN2 variable; target conc. for range #2 Conc. units
100 4 Maps to TRS_SPAN1 variable; target conc. for range #1 Conc. units
102 4 Maps to TRS_SPAN2 variable; target conc. for range #2 Conc. units
MODBUS Discrete Input Registers
(single-bit; read-only)
0 PMT detector warning
1 UV detector warning
2 Dark calibration warning
3 Box temperature warning
07266B DCN6485

Teledyne API T/E-Series Models 101, 102, and 108 Software Documentation (PN05492D DCN6485)
A-36
4 PMT temperature warning
5 Reaction cell temperature warning
6 Sample pressure warning
7 HVPS warning
8 System reset warning
9 Rear board communication warning
10 Relay board communication warning
11 Front panel communication warning
12 Analog calibration warning
13 Dynamic zero warning
14 Dynamic span warning
15 Invalid concentration
16 In zero calibration mode
17 In span calibration mode
18 In multi-point calibration mode
19 System status is OK (same meaning as SYSTEM_OK I/O signal)
20 Sample flow warning
21 IZS temperature warning
22 1 Converter temperature warning
23 5 Oxygenator flow warning
24 2 SO2 concentration alarm limit #1 exceeded
25 2 SO2 concentration alarm limit #2 exceeded
26 2 H
2S/TRS concentration alarm limit #1 exceeded
27 2 H
2S/TRS concentration alarm limit #2 exceeded
28 2+4 TRS concentration alarm limit #1 exceeded
29 2+4 TRS concentration alarm limit #2 exceeded
MODBUS Coil Registers
(single-bit; read/write)
0 Maps to relay output signal 36 (MB_RELAY_36 in signal I/O list)
1 Maps to relay output signal 37 (MB_RELAY_37 in signal I/O list)
2 Maps to relay output signal 38 (MB_RELAY_38 in signal I/O list)
3 Maps to relay output signal 39 (MB_RELAY_39 in signal I/O list)
20 3 Triggers zero calibration of range #1 (on enters cal.; off exits cal.)
21 3 Triggers span calibration of range #1 (on enters cal.; off exits cal.)
22 3 Triggers zero calibration of range #2 (on enters cal.; off exits cal.)
23 3 Triggers span calibration of range #2 (on enters cal.; off exits cal.)
07266B DCN6485

Teledyne API T/E-Series Models 101, 102, and 108 Software Documentation (PN05492D DCN6485)
A-37
1 T101, M101E.
2 Concentration alarm option.
3 Set DYN_ZERO or DYN_SPAN variables to ON to enable calculating new slope or offset. Otherwise a
calibration check is performed.
4 Triple-gas option.
5 T108, M108E.
6 T108U, M108EU.
7 Optional.
07266B DCN6485

Teledyne API T/E-Series Models 101, 102, and 108 Software Documentation (PN05492D DCN6485)
A-38
This page intentionally left blank.
07266B DCN6485
T101 Spare Parts List
PARTNUMBER DESCRIPTION
000940100 CD, ORIFICE, .003 GREEN
000940400 CD, ORIFICE, .004 BLUE
000940800 CD, ORIFICE, .012 (NO PAINT)
002690000 CD, LENS, PL-CON (KB)
002700000 CD, LENS, BI-CON (KB)
002720000 CD, FILTER, 330NM (KB)
003290000 THERMISTOR, BASIC (VENDOR ASSY)(KB)
005960000 AKIT, EXP, 6LBS ACT CHARCOAL (2 BT=1)
009690000 AKIT, TFE FLTR ELEM (FL6 100=1) 47mm
009690100 AKIT, TFE FLTR ELEM (FL6, 30=1) 47mm
011630000 HVPS INSULATOR GASKET (KB)
012720000 ASSY, CELL ADAPTOR, (KB)
013140000 ASSY, COOLER FAN (NOX/SOX)
013210000 ASSY, VACUUM MANIFOLD
013390000 ASSY, KICKER
013400000 CD, PMT, SO2, (KB)
013420000 ASSY, ROTARY SOLENOID
013570000 THERMISTOR HOUSING ASSY SOX/NOX(KB)
014080100 ASSY, HVPS, SOX/NOX
014400100 OPTION, ZERO AIR SCRUBBER
014750000 AKIT, EXP KIT, IZS
016290000 WINDOW, SAMPLE FILTER, 47MM (KB)
016300700 ASSY, SAMPLE FILTER, 47MM, ANG BKT
037860000 ORING, TEFLON, RETAINING RING, 47MM (KB)
040010000 ASSY, FAN REAR PANEL
040030100 PCA, PRESS SENSORS (1X), w/FM4
041020000 ASSY, MOLY CONV, WELD, (KB)
041620100 ASSY, SO2 SENSOR (KB)
041800400 PCA, PMT PREAMP, VR
042410200 ASSY, PUMP, INT, SOX/O3/IR *
043570000 AKIT, EXPENDABLES
045230200 PCA, RELAY CARD
046250000 ASSY, RXCELL HEATER/FUSE
046260000 ASSY, THERMISTOR, RXCELL (KB)
046880000 ASSY, SO2 SCRUBBER, PTFE CARTRIDGE
048830000 AKIT, EXP KIT, EXHAUST CLNSR, SILCA GEL
049310100 PCA,TEC DRIVER,PMT,(KB)
049760100 ASSY, TC PROG PLUG, MINI HICON, 'K', TC1
050510200 PUMP, INT, 115/240V * (KB)
050610100 OPTION, 100-120V/60Hz (KB)
050610200 OPTION, 100-120V/50Hz (KB)
050610300 OPTION, 220-240V/50Hz, (KB)
050610400 OPTION, 220-240V/60Hz (KB)
050630100 PCA, REF DET w/OP20, DUAL OUT
051990000 ASSY, SCRUBBER, INLINE EXHAUST, DISPOS
052660000 ASSY, HEATER/THERM, IZS
052930200 ASSY, BAND HEATER TYPE K, NOX
055100200 ASSY, OPTION, PUMP, 240V *
055560000 ASSY, VALVE, VA59 W/DIODE, 5" LEADS
(Reference: 073470000, 1/19/2011 10:10:13 AM)
07266B DCN6845
B-1
T101 Spare Parts List
PARTNUMBER DESCRIPTION
(Reference: 073470000, 1/19/2011 10:10:13 AM)
058021100 PCA, MOTHERBD, GEN 5-ICOP
061930000 PCA, UV LAMP DRIVER, GEN-2 43mA *
062390000 ASSY, MOLY GUTS w/WOOL
066970000 PCA, INTRF. LCD TOUCH SCRN, F/P
067240000 CPU, PC-104, VSX-6154E, ICOP *
067300000 PCA, AUX-I/O BD, ETHERNET, ANALOG & USB
067300100 PCA, AUX-I/O BOARD, ETHERNET
067300200 PCA, AUX-I/O BOARD, ETHERNET & USB
067900000 LCD MODULE, W/TOUCHSCREEN(KB)
068810000 PCA, LVDS TRANSMITTER BOARD
069500000 PCA, SERIAL & VIDEO INTERFACE BOARD
072150000 ASSY. TOUCHSCREEN CONTROL MODULE
072660000 MANUAL, T101, OPERATORS
073480100 DOM, w/SOFTWARE, T101 *
CN0000073 POWER ENTRY, 120/60 (KB)
CN0000458 PLUG, 12, MC 1.5/12-ST-3.81 (KB)
CN0000520 PLUG, 10, MC 1.5/10-ST-3.81 (KB)
FL0000001 FILTER, SS (KB)
FL0000003 FILTER, DFU (KB)
FM0000004 FLOWMETER (KB)
HW0000005 FOOT
HW0000020 SPRING
HW0000030 ISOLATOR
HW0000031 FERRULE, SHOCKMOUNT
HW0000036 TFE TAPE, 1/4" (48 FT/ROLL)
HW0000101 ISOLATOR
HW0000453 SUPPORT, CIRCUIT BD, 3/16" ICOP
HW0000685 LATCH, MAGNETIC, FRONT PANEL
KIT000093 AKIT, REPLCMNT(3187)214NM FLTR (BF)
KIT000095 AKIT, REPLACEMENT COOLER
KIT000207 KIT, RELAY RETROFIT
KIT000219 AKIT, 4-20MA CURRENT OUTPUT
KIT000236 KIT, UV LAMP, w/ADAPTER (BIR)
KIT000253 ASSY & TEST, SPARE PS37
KIT000254 ASSY & TEST, SPARE PS38
KIT000261 AKIT, SOX SCRUBBER MATERIAL (CH17), 1oz
OP0000031 WINDOW, QUARTZ, 1/2"DIA, .063" THICK (KB
OR0000001 ORING, 2-006VT *(KB)
OR0000004 ORING, 2-029V
OR0000006 ORING, 2-038V
OR0000007 ORING, 2-039V
OR0000015 ORING, 2-117V
OR0000016 ORING, 2-120V
OR0000025 ORING, 2-133V
OR0000027 ORING, 2-042V
OR0000039 ORING, 2-012V
OR0000046 ORING, 2-019V
OR0000083 ORING, 105M, 1MM W X 5 MM ID, VITON
OR0000084 ORING, 2-020V
B-2
07266B DCN6845
T101 Spare Parts List
PARTNUMBER DESCRIPTION
(Reference: 073470000, 1/19/2011 10:10:13 AM)
OR0000094 ORING, 2-228V, 50 DURO VITON(KB)
PU0000022 REBUILD KIT, FOR PU20 & 04241 (KB)
RL0000015 RELAY, DPDT, (KB)
SW0000025 SWITCH, POWER, CIRC BREAK, VDE/CE *(KB)
SW0000059 PRESSURE SENSOR, 0-15 PSIA, ALL SEN
WR0000008 POWER CORD, 10A(KB)
07266B DCN6845
B-3
This page intentionally left blank.
B-4
07266B DCN6845

Appendix C
Warranty/Repair Questionnaire
T101, M101E
(05494D DCN5798)
C-1
Company: _________________________ Contact Name: _____________________________
Phone Number: ___________ Fax Number: _____________ Email: ____________________
Site Address: __________________________________________________________________
Can we connect to the instrument? If so, provide IP address or modem #:___________________
Model Serial Number: _________________________ Firmware revision: _________________
The serial number can be found on the back of the instrument, the firmware revision is displayed in the upper left corner of the
display when pressing SETUP on the front panel (Example: C.3).
1. List all front panel error/warning messages:_________________________________________
______________________________________________________________________________
2. Please complete the following table: (Depending on options installed, not all test parameters
shown below may be available in your instrument)
PARAMETER RECORDED
VALUE
ACCEPTABLE
VALUE PARAMETER RECORDED
VALUE
ACCEPTABLE
VALUE
RANGE ppb/ppm
50 ppb - 20 ppm SO2 SLOPE 1.0 ± 0.3
H2S STB ppb
≤ 1 ppb with zero air
SO2 OFFS mV < 250
SAMP FL cm³/min
600 ± 75 H2S SLOPE
PRES IN-HG-A
~5”<ambient H2S OFFS mV < 250
PMT signal
with zero air
mV
-20 to 150 HVPS V 400-900
PMT signal at
span gas conc
mV
ppb/ppm
0-5000
0-20 000 ppb
RCELL TEMP °C 50 ± 1
NORM PMT at
span gas conc
mV
ppb/ppm
0-5000
0-20 000 ppb
BOX TEMP °C Ambient + ~5
UV LAMP mV
1000 to 4800 PMT TEMP °C 7 ± 2
LAMP RATIO %
30-120% IZS TEMP °C 50 ± 3
STR. LGT ppm
≤ 100 ppb/ zero air
CONV TEMP °C 315 ± 5
DARK PMT mV
-50 to 200 ETEST (DIAG menu)
mV 2000 ± 1000
DARK LAMP mV
-50 to 200 OTEST (DIAG menu)
mV 2000 ± 1000
3. Has the analyzer been checked for leaks? Yes No For proper flows? Yes No
4. What are the failure symptoms? _________________________________________________
______________________________________________________________________________
______________________________________________________ Continue on back if necessary
5. Which tests have you done trying to solve the problem? _______________________________
______________________________________________________________________________
________________________________________________________ Continue on back if necessary
6. If possible, fax a portion of a strip chart or email a data file to customer service.
CUSTOMER SERVICE CONTACT INFORMATION: 6565 Nancy Ridge Drive, San Diego, CA 92121.
PHONE: +1 858 657 9800 or 1-800 324 5190. FAX: +1 858 657 9816. EMAIL: api-customerservice@teledyne.com.
You can access and submit an online version of this form at http://www.teledyne-api.com/forms/p-fm101e.asp
07266B DCN6845

Appendix C
Warranty/Repair Questionnaire
T101, M101E
(05494D DCN5798)
C-2
Notes and further information: _____________________________________________________
______________________________________________________________________________
______________________________________________________________________________
______________________________________________________________________________
______________________________________________________________________________
______________________________________________________________________________
______________________________________________________________________________
______________________________________________________________________________
______________________________________________________________________________
______________________________________________________________________________
______________________________________________________________________________
______________________________________________________________________________
______________________________________________________________________________
______________________________________________________________________________
______________________________________________________________________________
______________________________________________________________________________
______________________________________________________________________________
______________________________________________________________________________
______________________________________________________________________________
______________________________________________________________________________
______________________________________________________________________________
______________________________________________________________________________
______________________________________________________________________________
______________________________________________________________________________
______________________________________________________________________________
______________________________________________________________________________
______________________________________________________________________________
______________________________________________________________________________
______________________________________________________________________________
______________________________________________________________________________
______________________________________________________________________________
______________________________________________________________________________
______________________________________________________________________________
______________________________________________________________________________
______________________________________________________________________________
07266B DCN6845
APPENDIX D – Wire List and Electronic Schematics
07266B DCN6845
D-1
This page intentionally left blank.
D-2
07266B DCN6845

Interconnect List, T101
(Reference 0736501 Rev01)
Revisio
n
Checked Dat
e
DCN
01 KV 9/3/10
Cable PN Signal Assembl
y
PN J/P Pin
A
ssembl
y
PN J/P Pin
0337801 CBL ASSY, ADD-ON MOLY HEATE
R
Common1 Relay PCA 045230100 P2 6 Moly Heater 052930200 2
Load1 Relay PCA 045230100 P2 7 Moly Heater 052930200 1
AC Neutral Relay PCA 045230100 P2 10 Moly Heater 052930200 3
0364901 CBL ASSY, AC POWE
R
AC Line Power Entry CN0000073 L Power Switch SW0000025 L
AC Neutral Power Entry CN0000073 N Power Switch SW0000025 N
Power Grnd Power Entry CN0000073 Shield
Power Grnd Power Entry CN0000073 Chassis
AC Line Switched Power Switch SW0000025 L PS2 (+12) 068020000 SK2 1
AC Neu Switched Power Switch SW0000025 N PS2 (+12) 068020000 SK2 3
Power Grnd Power Entry CN0000073 PS2 (+12) 068020000 SK2 2
AC Line Switched Power Switch SW0000025 L PS1 (+5, ±15) 068010000 SK2 1
AC Neu Switched Power Switch SW0000025 N PS1 (+5, ±15) 068010000 SK2 3
Power Grnd Power Entry CN0000073 PS1 (+5, ±15) 068010000 SK2 2
AC Line Switched Power Switch SW0000025 L Relay PCA 045230100 J1 1
AC Neu Switched Power Switch SW0000025 N Relay PCA 045230100 J1 3
Power Grnd Power Entry CN0000073 Relay PCA 045230100 J1 2
03829 CBL ASSY, DC POWER TO MOTHERBOAR
D
DGND Relay PCA 045230100 J7 1 Motherboard 058021100 J15 1
+5V Relay PCA 045230100 J7 2 Motherboard 058021100 J15 2
AGND Relay PCA 045230100 J7 3 Motherboard 058021100 J15 3
+15V Relay PCA 045230100 J7 4 Motherboard 058021100 J15 4
AGND Relay PCA 045230100 J7 5 Motherboard 058021100 J15 5
-15V Relay PCA 045230100 J7 6 Motherboard 058021100 J15 6
+12V RET Relay PCA 045230100 J7 7 Motherboard 058021100 J15 7
+12V Relay PCA 045230100 J7 8 Motherboard 058021100 J15 8
Chassis Gnd Relay PCA 045230100 J7 10 Motherboard 058021100 J15 9
04023 CBL, I2C, RELAY BOARD TO MOTHERBOAR
D
I2C Serial Clock Motherboard 058021100 P107 3 Relay PCA 045230100 P3 1
I2C Serial Data Motherboard 058021100 P107 5 Relay PCA 045230100 P3 2
I2C Reset Motherboard 058021100 P107 2 Relay PCA 045230100 P3 4
I2C Shield Motherboard 058021100 P107 6 Relay PCA 045230100 P3 5
040260
2
CBL, IZS HTR/TH, RXCELL & OB TH
RTHA Motherboard 058021100 P27 7 RX Cell Thermistor 046260000 2
RTHB Motherboard 058021100 P27 14 RX Cell Thermistor 046260000 1
IZTA Motherboard 058021100 P27 6 IZS Therm/Htr 052660000 2
IZTB Motherboard 058021100 P27 13 IZS Therm/Htr 052660000 3
IZS-L Relay PCA 045230100 P18 1 IZS Therm/Htr 052660000 4
IZS-N Relay PCA 045230100 P18 2 IZS Therm/Htr 052660000 1
GND Relay PCA 045230100 P18 11 Shield
O2-L Relay PCA 045230100 P18 6 O2 Sensor Therm/Htr 043420000 4
O2-N Relay PCA 045230100 P18 7 O2 Sensor Therm/Htr 043420000 2
TS3 Relay PCA 045230100 P18 3 Relay PCA 045230100 P18 4
TS4 Relay PCA 045230100 P18 8 Relay PCA 045230100 P18 9
N/C Relay PCA 045230100 P18 12 Shield
O2TA Motherboard 058021100 P27 4 O2 Sensor Therm/Htr 043420000 3
O2TB Motherboard 058021100 P27 11 O2 Sensor Therm/Htr 043420000 1
0402701 CBL, RX CELL HEATERS
Common0 Relay PCA 045230100 P2 1 RX Cell Heaters 046250000 4
Common0 Relay PCA 045230100 P2 1 RX Cell Heaters 046250000 6
Load0 Relay PCA 045230100 P2 2 RX Cell Heaters 046250000 3
TS0 Relay PCA 045230100 P2 3 RX Cell Heaters 046250000 1
Relay0 Relay PCA 045230100 P2 4 RX Cell Heaters 046250000 2
AC Neutral Relay PCA 045230100 P2 5 RX Cell Heaters 046250000 5
TS2 Relay PCA 045230100 P2 13 Relay PCA 045230100 P2 14
TS1 Relay PCA 045230100 P2 8 Relay PCA 045230100 P2 9
0410
5
CBL, KEYBD TO MTHBR
D
Kbd Interupt LCD Interface PCA 066970000 J1 7 Motherboard 058021100 J106 1
DGND LCD Interface PCA 066970000 J1 2 Motherboard 058021100 J106 8
SDA LCD Interface PCA 066970000 J1 5 Motherboard 058021100 J106 2
SCL LCD Interface PCA 066970000 J1 6 Motherboard 058021100 J106 6
Shld LCD Interface PCA 066970000 J1 10 Motherboard 058021100 J106 5
FROM TO
Descriptio
n
Prototype Release
07266B DCN6845
D-3

Interconnect List, T101
(Reference 0736501 Rev01)
Cable PN Signal Assembl
y
PN J/P Pin
A
ssembl
y
PN J/P Pin
FRO
M
TO
0417
6
CBL, DC POWER TO RELAY BOAR
D
DGND Relay PCA 045230100 P8 1 Power Supply Triple 068010000 J1 3
+5V Relay PCA 045230100 P8 2 Power Supply Triple 068010000 J1 1
+15V Relay PCA 045230100 P8 4 Power Supply Triple 068010000 J1 6
AGND Relay PCA 045230100 P8 5 Power Supply Triple 068010000 J1 4
-15V Relay PCA 045230100 P8 6 Power Supply Triple 068010000 J1 5
+12V RET Relay PCA 045230100 P8 7 Power Supply Single 068020000 J1 3
+12V Relay PCA 045230100 P8 8 Power Supply Single 068020000 J1 1
04437 CBL, PREAMPLIFIER TO TE
C
Preamp TEC drive VREF Preamp PCA 041800400 J1 1 TEC PCA 049310100 J3 1
Preamp TEC drive CTRL Preamp PCA 041800400 J1 2 TEC PCA 049310100 J3 2
Preamp TEC drive AGND Preamp PCA 041800400 J1 3 TEC PCA 049310100 J3 3
0448501 CBL, SHUTTER TO RELAY BOAR
D
+12V RET Shutter 013420000 1 Relay PCA 045230100 P6 1
+12V Shutter 013420000 2 Relay PCA 045230100 P6 2
04488 CBL, MAIN HARNES
S
AGND Relay PCA 045230100 P5 1 O2 Sensor 049210000 P1 5
-V15 Relay PCA 045230100 P5 2 O2 Sensor 049210000 P1 6
Motherboard 058021100 P109 10 O2 Sensor 049210000 P1 9
O2 SIGNAL- Motherboard 058021100 P109 7 O2 Sensor 049210000 P1 10
O2 SIGNAL+ Motherboard 058021100 P109 1 Shield
PMT TEMP Motherboard 058021100 P109 4 PMT Preamp PCA 041800400 P6 5
HVPS Motherboard 058021100 P109 5 PMT Preamp PCA 041800400 P6 6
PMT SIGNAL+ Motherboard 058021100 P109 6 PMT Preamp PCA 041800400 P6 7
AGND Motherboard 058021100 P109 12 PMT Preamp PCA 041800400 P6 8
AGND Motherboard 058021100 P109 11 Shield
ETEST Motherboard 058021100 P108 8 PMT Preamp PCA 041800400 P6 1
OTEST Motherboard 058021100 P108 16 PMT Preamp PCA 041800400 P6 2
PHYSICAL RANGE Motherboard 058021100 P108 7 PMT Preamp PCA 041800400 P6 4
AGND Motherboard 058021100 P109 9 UV Ref PCA 050630100 P1 4
CH7 Motherboard 058021100 P109 3 UV Ref PCA 050630100 P1 1
CH2 Motherboard 058021100 P109 2 UV Ref PCA 050630100 P1 5
+15V Relay PCA 045230100 P10 4 UV Ref PCA 050630100 P1 2
-15V Relay PCA 045230100 P10 6 UV Ref PCA 050630100 P1 3
TEC +12V RET Relay PCA 045230100 P10 7 TEC PCA 049310100 2
TEC +12V Relay PCA 045230100 P10 8 TEC PCA 049310100 1
DISP RET Relay PCA 045230100 P10 1 LCD Interface PCA 066970000 P14 8
+5 DISP Relay PCA 045230100 P10 2 LCD Interface PCA 066970000 P14 1
EGND Shield LCD Interface PCA 066970000 P14 4
SDA Lamp Driver PCA 061930000 P1 4 LCD Interface PCA 066970000 P14 5
SCL Lamp Driver PCA 061930000 P1 3 LCD Interface PCA 066970000 P14 6
+12V Lamp Driver PCA 061930000 P1 1 Relay PCA 045230100 P9 8
+12RET Lamp Driver PCA 061930000 P1 2 Relay PCA 045230100 P9 7
DGND PMT Preamp PCA 041800400 P5 1 Relay PCA 045230100 P9 1
VCC PMT Preamp PCA 041800400 P5 2 Relay PCA 045230100 P9 2
+15V PMT Preamp PCA 041800400 P5 4 Relay PCA 045230100 P9 4
-15V PMT Preamp PCA 041800400 P5 6 Relay PCA 045230100 P9 6
DGND LCD Interface PCA 066970000 P14 2 Relay PCA 045230100 P11 1
VCC LCD Interface PCA 066970000 P14 3 Relay PCA 045230100 P11 2
+12RET Fan 040010000 1 Relay PCA 045230100 P11 7
+12V Fan 040010000 2 Relay PCA 045230100 P11 8
AGND Flow Module PCA 040030100 P1 3Relay PCA 045230100 P11 3
+15V Flow Module PCA 040030100 P1 6 Relay PCA 045230100 P11 4
PRESS SIGNAL 1 Flow Module PCA 040030100 P1 2 Motherboard 058021100 P110 6
PRESS SIGNAL 2 Flow Module PCA 040030100 P1 4 Motherboard 058021100 P110 5
FLOW SIGNAL 1 Flow Module PCA 040030100 P1 5 Motherboard 058021100 P110 4
FLOW SIGNAL 2 Flow Module PCA 040030100 P1 1 Motherboard 058021100 P110 3
SHIELD Shield Motherboard 058021100 P110 12
SHIELD Shield Motherboard 058021100 P110 9
TC SIGNAL 1 Relay PCA 045230100 P17 1 Motherboard 058021100 P110 2
TC 1 SIGNAL DGND Relay PCA 045230100 P17 2 Motherboard 058021100 P110 8
TC SIGNAL 2 Relay PCA 045230100 P17 3 Motherboard 058021100 P110 1
TC 2 SIGNAL DGND Relay PCA 045230100 P17 4 Motherboard 058021100 P110 7
D-4
07266B DCN6845

Interconnect List, T101
(Reference 0736501 Rev01)
Cable PN Signal Assembl
y
PN J/P Pin
A
ssembl
y
PN J/P Pin
FRO
M
TO
04562 CBL, Z/S IZS VALVES
Sample Valve +12V Relay PCA 045230100 P4 1 SMP/CAL 055560000 P1 1
Sample Valve +12V RET Relay PCA 045230100 P4 2 SMP/CAL 055560000 P1 2
Zero/Span valve +12V Relay PCA 045230100 P4 3 ZS/HI S 055560100 P1 1
Zero/Span valve +12V R
E
Relay PCA 045230100 P4 4 ZS/HI S 055560100 P1 2
Low Span Valve +12V Relay PCA 045230100 P4 5 Lo Span 055560100 P1 1
Low Span Valve +12V R
E
Relay PCA 045230100 P4 6 Lo Span 055560100 P1 2
AutoZero Valve +12V Relay PCA 045230100 P4 7 Zero 055560000 P1 1
A
utoZero Valve +12V RE
T
Relay PCA 045230100 P4 8 Zero 055560000 P1 2
04671 CBL, MOTHERBOARD TO XMITTER BD (MULTIDROP OPTION
GND Motherboard 058021100 P12 2 Xmitter bd w/Multidrop 069500000 J4 2
RX0 Motherboard 058021100 P12 14 Xmitter bd w/Multidrop 069500000 J4 14
RTS0 Motherboard 058021100 P12 13 Xmitter bd w/Multidrop 069500000 J4 13
TX0 Motherboard 058021100 P12 12 Xmitter bd w/Multidrop 069500000 J4 12
CTS0 Motherboard 058021100 P12 11 Xmitter bd w/Multidrop 069500000 J4 11
RS-GND0 Motherboard 058021100 P12 10 Xmitter bd w/Multidrop 069500000 J4 10
RTS1 Motherboard 058021100 P12 8 Xmitter bd w/Multidrop 069500000 J4 8
CTS1/485- Motherboard 058021100 P12 6 Xmitter bd w/Multidrop 069500000 J4 6
RX1 Motherboard 058021100 P12 9 Xmitter bd w/Multidrop 069500000 J4 9
TX1/485+ Motherboard 058021100 P12 7 Xmitter bd w/Multidrop 069500000 J4 7
RS-GND1 Motherboard 058021100 P12 5 Xmitter bd w/Multidrop 069500000 J4 5
RX1 Motherboard 058021100 P12 9 Xmitter bd w/Multidrop 069500000 J4 9
TX1/485+ Motherboard 058021100 P12 7 Xmitter bd w/Multidrop 069500000 J4 7
RS-GND1 Motherboard 058021100 P12 5 Xmitter bd w/Multidrop 069500000 J4 5
06737 CBL, I2C to AUX I/O (ANALOG IN OPTION
ATX- Motherboard 058021100 J106 1 Aux I/O PCA 067300000 J2 1
ATX+ Motherboard 058021100 J106 2 Aux I/O PCA 067300000 J2 2
LED0 Motherboard 058021100 J106 3 Aux I/O PCA 067300000 J2 3
ARX+ Motherboard 058021100 J106 4 Aux I/O PCA 067300000 J2 4
ARX- Motherboard 058021100 J106 5 Aux I/O PCA 067300000 J2 5
LED0+ Motherboard 058021100 J106 6 Aux I/O PCA 067300000 J2 6
LED1+ Motherboard 058021100 J106 8 Aux I/O PCA 067300000 J2 8
06738 CBL, CPU COM to AUX I/O
(
USB OPTION
RXD CPU PCA 067240000 COM1 1 Aux I/O PCA 0673000 or -02 J3 1
DCD CPU PCA 067240000 COM1 2 Aux I/O PCA 0673000 or -02 J3 2
DTR CPU PCA 067240000 COM1 3 Aux I/O PCA 0673000 or -02 J3 3
TXD CPU PCA 067240000 COM1 4 Aux I/O PCA 0673000 or -02 J3 4
DSR CPU PCA 067240000 COM1 5 Aux I/O PCA 0673000 or -02 J3 5
GND CPU PCA 067240000 COM1 6 Aux I/O PCA 0673000 or -02 J3 6
CTS CPU PCA 067240000 COM1 7 Aux I/O PCA 0673000 or -02 J3 7
RTS CPU PCA 067240000 COM1 8 Aux I/O PCA 0673000 or -02 J3 8
RI CPU PCA 067240000 COM1 10 Aux I/O PCA 0673000 or -02 J3 10
06738 CBL, CPU COM to AUX I/O
(
MULTIDROP OPTION
RXD CPU PCA 067240000 COM1 1 Xmitter bd w/Multidrop 069500000 J3 1
DCD CPU PCA 067240000 COM1 2 Xmitter bd w/Multidrop 069500000 J3 2
DTR CPU PCA 067240000 COM1 3 Xmitter bd w/Multidrop 069500000 J3 3
TXD CPU PCA 067240000 COM1 4 Xmitter bd w/Multidrop 069500000 J3 4
DSR CPU PCA 067240000 COM1 5 Xmitter bd w/Multidrop 069500000 J3 5
GND CPU PCA 067240000 COM1 6 Xmitter bd w/Multidrop 069500000 J3 6
CTS CPU PCA 067240000 COM1 7 Xmitter bd w/Multidrop 069500000 J3 7
RTS CPU PCA 067240000 COM1 8 Xmitter bd w/Multidrop 069500000 J3 8
RI CPU PCA 067240000 COM1 10 Xmitter bd w/Multidrop 069500000 J3 10
06739 CBL, CPU ETHERNET TO AUX I/
O
ATX- CPU PCA 067240000 LAN 1 Aux I/O PCA 06730XXXX J2 1
ATX+ CPU PCA 067240000 LAN 2 Aux I/O PCA 06730XXXX J2 2
LED0 CPU PCA 067240000 LAN 3 Aux I/O PCA 06730XXXX J2 3
ARX+ CPU PCA 067240000 LAN 4 Aux I/O PCA 06730XXXX J2 4
ARX- CPU PCA 067240000 LAN 5 Aux I/O PCA 06730XXXX J2 5
LED0+ CPU PCA 067240000 LAN 6 Aux I/O PCA 06730XXXX J2 6
LED1 CPU PCA 067240000 LAN 7 Aux I/O PCA 06730XXXX J2 7
LED1+ CPU PCA 067240000 LAN 8 Aux I/O PCA 06730XXXX J2 8
06741 CBL, CPU USB TO FRONT PANE
L
GND CPU PCA 067240000 USB 8 LCD Interface PCA 066970000 J9
LUSBD3+ CPU PCA 067240000 USB 6 LCD Interface PCA 066970000 J9
LUSBD3- CPU PCA 067240000 USB 4 LCD Interface PCA 066970000 J9
VCC CPU PCA 067240000 USB 2 LCD Interface PCA 066970000 J9
07266B DCN6845
D-5
Interconnect List, T101
(Reference 0736501 Rev01)
Cable PN Signal Assembl
y
PN J/P Pin
A
ssembl
y
PN J/P Pin
FRO
M
TO
0674
6
CBL, MB TO 06154 CP
U
GND Motherboard 058021100 P12 2 Shield
RX0 Motherboard 058021100 P12 14 CPU PCA 067240000 COM1 1
RTS0 Motherboard 058021100 P12 13 CPU PCA 067240000 COM1 8
TX0 Motherboard 058021100 P12 12 CPU PCA 067240000 COM1 4
CTS0 Motherboard 058021100 P12 11 CPU PCA 067240000 COM1 7
RS-GND0 Motherboard 058021100 P12 10 CPU PCA 067240000 COM1 6
RTS1 Motherboard 058021100 P12 8 CPU PCA 067240000 COM2 8
CTS1/485- Motherboard 058021100 P12 6 CPU PCA 067240000 COM2 7
RX1 Motherboard 058021100 P12 9 CPU PCA 067240000 COM2 1
TX1/485+ Motherboard 058021100 P12 7 CPU PCA 067240000 COM2 4
RS-GND1 Motherboard 058021100 P12 5 CPU PCA 067240000 COM2 6
RX1 Motherboard 058021100 P12 9 CPU PCA 067240000 485 1
TX1/485+ Motherboard 058021100 P12 7 CPU PCA 067240000 485 2
RS-GND1 Motherboard 058021100 P12 5 CPU PCA 067240000 485 3
06910 CBL, COOLER FA
N
+12V RET Relay PCA 045230100 P12 7 Cooler Fan 013140000 2
+12V Relay PCA 045230100 P12 8 Cooler Fan 013140000 1
WR25
6
CBL, XMITTER TO INTERFACE
LCD Interface PCA 066970000 J15 Transmitter PCA 068810000 J1
D-6
07266B DCN6845
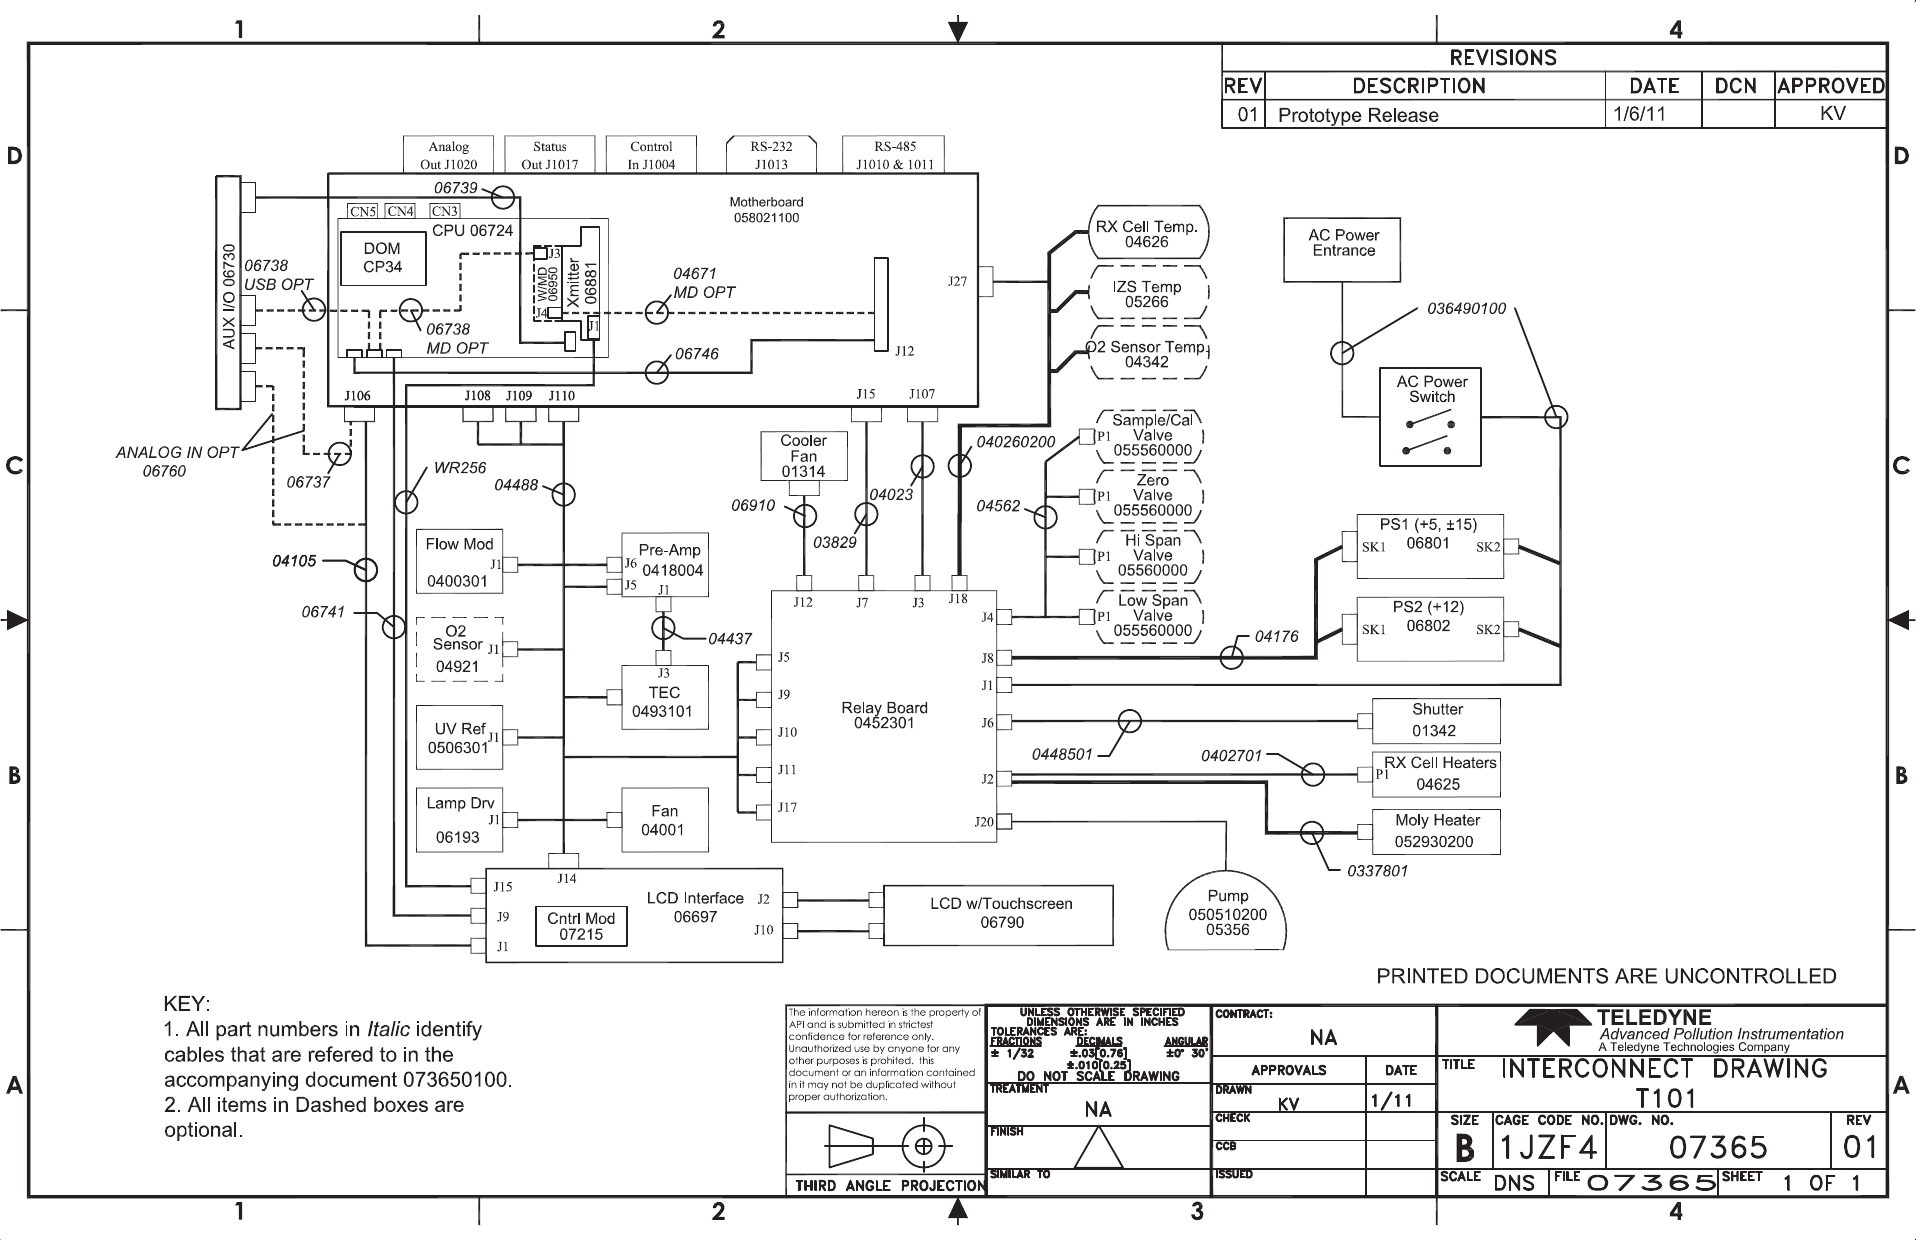
07266B DCN6845
D-7
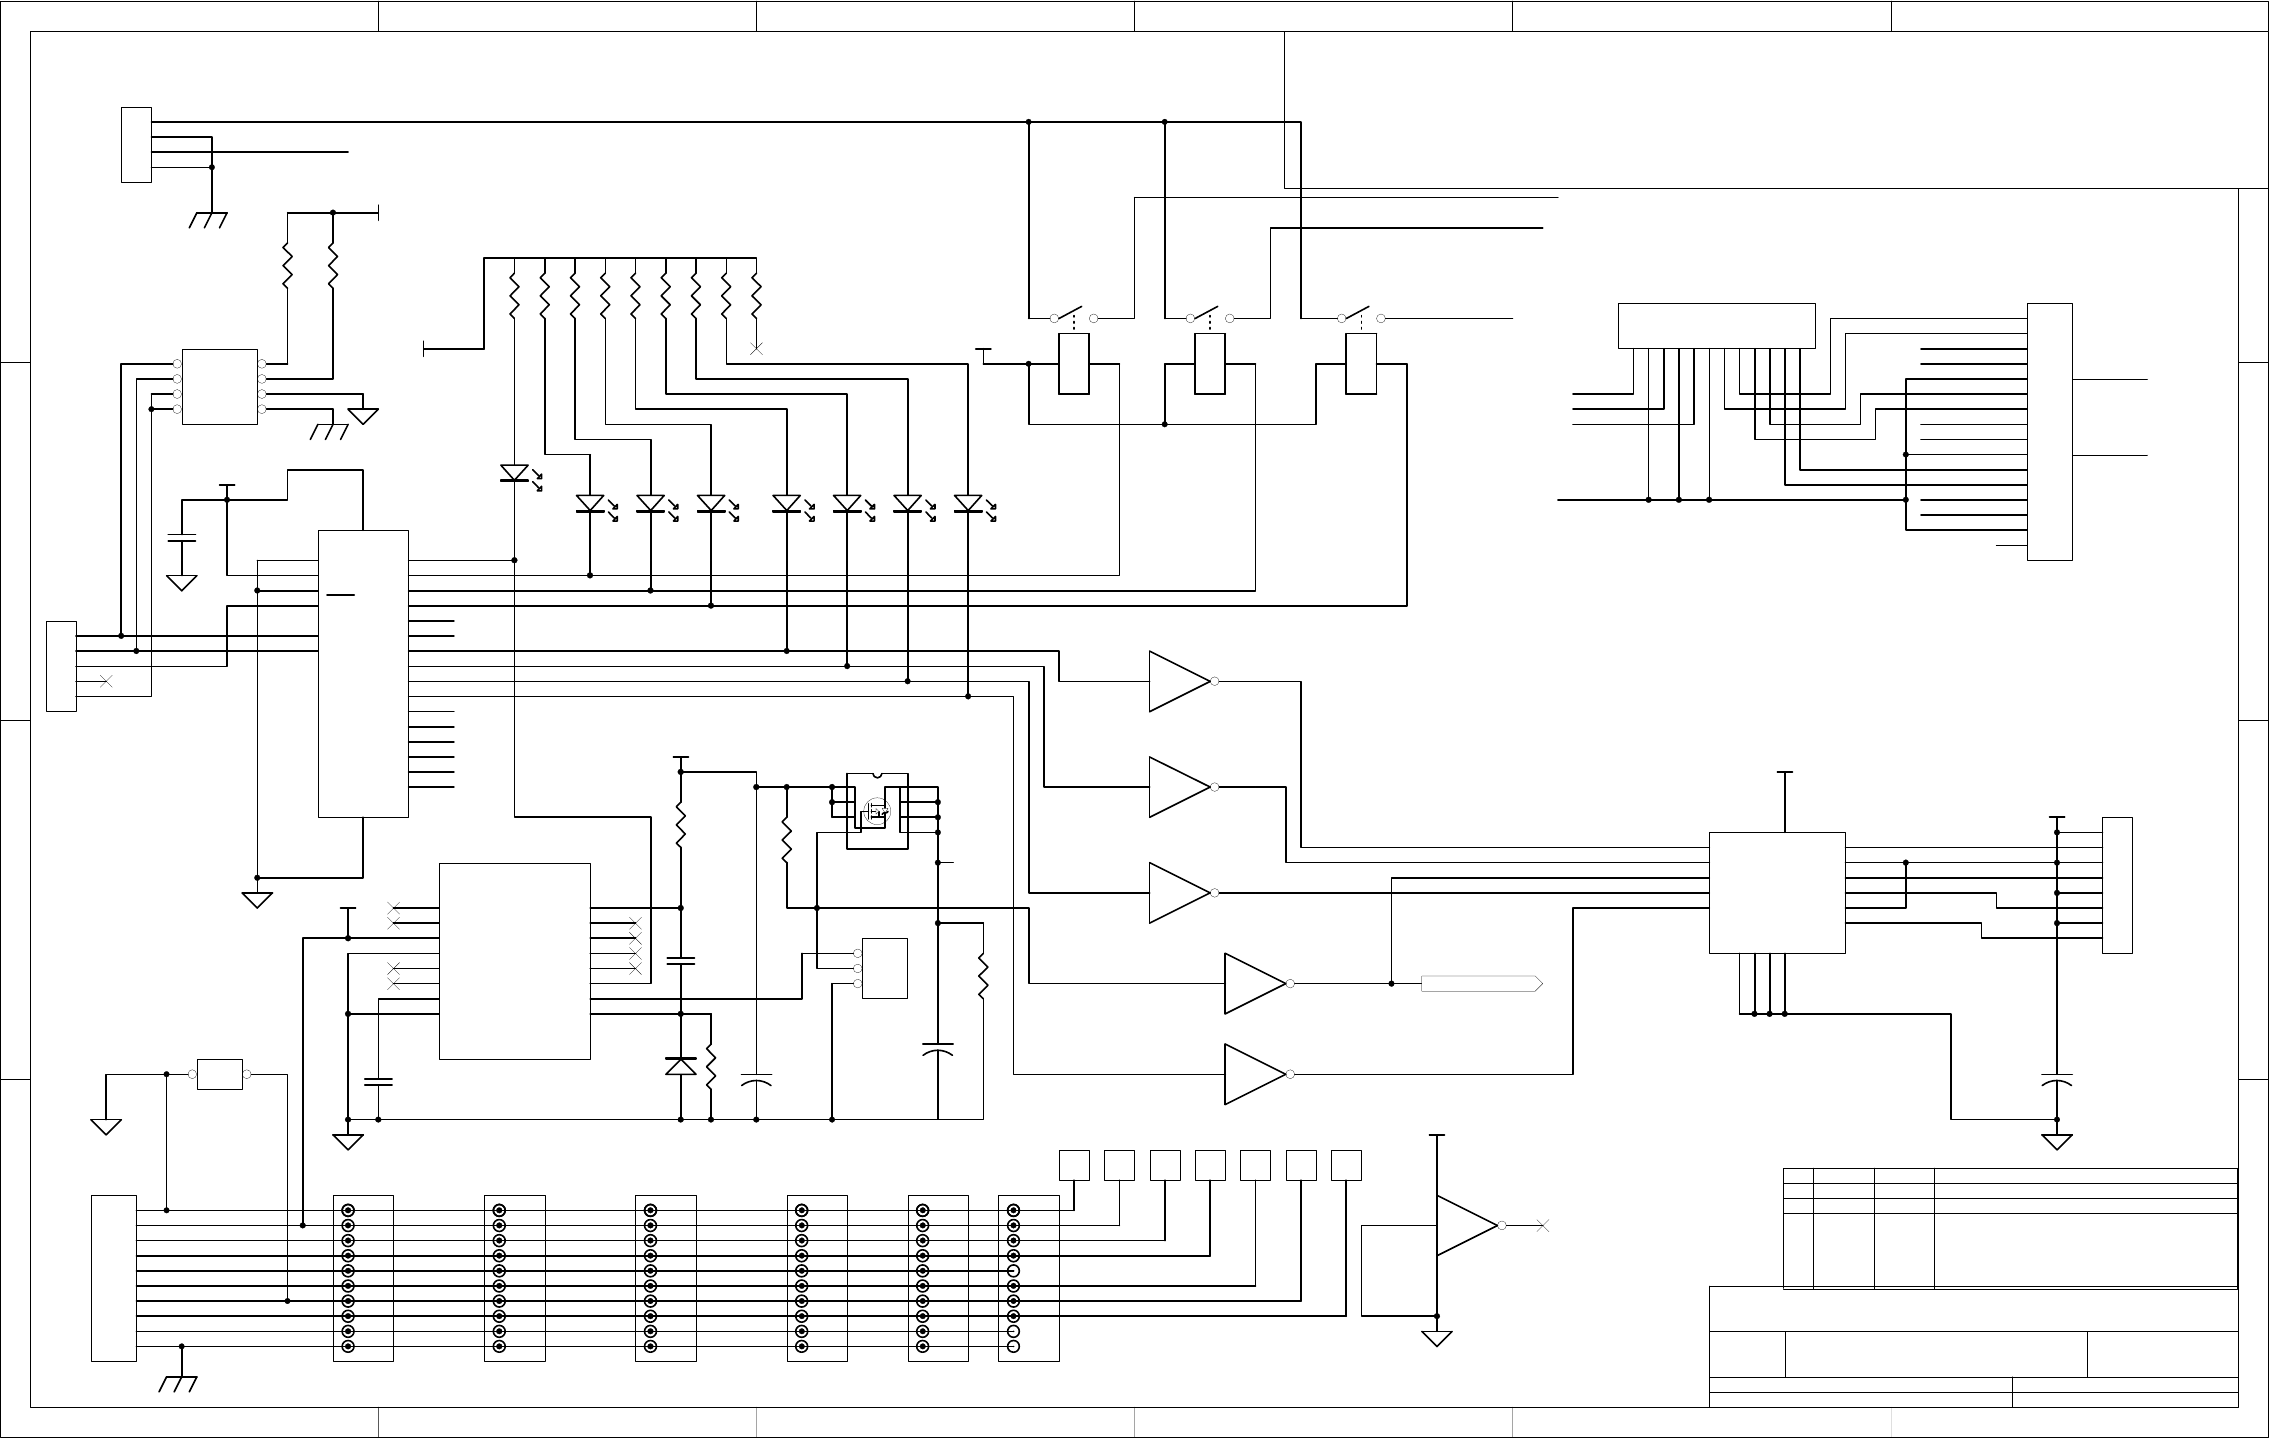
1 2 3 4 5 6
A
B
C
D
6
54321
D
C
B
A
Title
Number RevisionSize
B
Date: 30-Jun-2004 Sheet of
File: N:\PCBMGR\RELEASED\03954cc\PROTEL\03954a.ddbDrawn By:
Te
Te
03956 A
M100E/M200E Relay PCB
31 3
1 2
U2A
SN74HC04
3 4
U2B
5 6
U2C
11 10
U2E
13 12
147
U2F
OUT4 1
K2
OUT 3 3
GND
4GND
5
OUT 2 6
K7
OUT 1 8
IN 1
9IN 2
10
VCC 11
GND
12 GND
13
ENABLE
14 IN 3
15 IN 4
16 U5
UDN2540B(16)
1
2
3
4
5
J3
CON5
VBATT
1
VOUT
2
VCC
3
GND
4
BATT_ON
5
LOW LINE'
6
OSC IN
7
OSC SEL
8
RESET 16
RESET' 15
WDO' 14
CD IN' 13
CD OUT' 12
WDI 11
PFO' 10
PFI 9
U4
MAX693
C2
0.001
VCC
R4
1M
C3
1
A
AKK
D17
RLS4148
VCC
D1
RED
2
1
3
4
5
6
7
8
9
10
RN1
330
I2C_Vcc
D2
YEL
D3
YEL
D4
YEL
D7
GRN
D8
GRN
D9
GRN
AA
K
K
D10
GRN
9 8
U2D
VCC
1
2
3
4
5
6
7
8
J4
8 PIN
VALVE0
VALVE1
VALVE2
VALVE3
11
2
2
+
C6
2000/25
+12V
1
2
3
4
5
6
7
8
9
10
J5
CON10THROUGH
11
2
3
4
5
6
7
8
9
10
J7
CON10THROUGH
11
2
3
4
5
6
7
8
9
10
J8
CON10THROUGH
11
2
3
4
5
6
7
8
9
10
J9
CON10THROUGH
DGND
VCC
AGND
+15V
AGND
-15V
+12RET
+12V
EGND
CHS_GND
AC_Line
AC_Neutral
I2C_Vcc
1 2
JP3
HEADER 1X2
DC PWR IN KEYBRD MTHR BRD SYNC DEMOD SPARE
VCC
1 2
+
3-4
K1
SLD-RLY
1 2
+
3-4
K2
SLD-RLY
1 2
+
3-4
K3
SLD-RLY
I2C_Vcc
1
2
3
JP4
WTCDG OVR
+
C5
10/16
11
2
2
+C4
10/16
C1
0.1
R3
20K
1
2
3
4
J1
4 PIN
1
2
3
4
5
6
7
8
9
10
11
12
13
14
15
16
J216 PIN
11
2
3
4
5
6
7
8
9
10
J10
CON10THROUGH
1
TP1
DGND
1
TP2
+5V
1
TP3
AGND
1
TP4
+15V
1
TP5
-15V
1
TP6
+12RT
1
TP7
+12V
T
General Trace Width Requirements
1. Vcc (+5V) and I2C VCC should be 15 mil
2. Digitial grounds should be at least 20 mils
3. +12V and +12V return should be 30 mils
4. All AC lines (AC Line, AC Neutral, RELAY0 - 4, All signals on JP2) should be 30 mils wide, with 120 mil isolation/creepage distance around them
5. Traces between J7 - J12 should be top and bottom and at least 140 mils.
6. Traces to the test points can be as small as 10 mils.
T
Q1
IRF7205
RELAY0 RELAY1 RELAY2
1 2
3 4
5 6
7 8
JP1
HEADER 4X2
R1
2.2K R2
2.2K
VCC
R6
10K
R5
10K
INT
1
A1
2
A2
3
SCL
22
SDA
23
P10 13
P00 4
P01 5
P02 6
P03 7
P04 8
P05 9
P06 10
P07 11
Vss
12
A0
21
P11 14
P12 15
P13 16
P14 17
P15 18
P16 19
P17 20
Vdd 24
U1
PCF8575
I2C_Vcc
IO3
IO4
IO10
IO11
IO12
IO13
IO14
IO15
AC_Neutral
RELAY0
RELAY1
RELAY2
VLV_ENAB
1
2
3
4
5
6
7
8
9
10
11
12
JP2
Heater Config Jumper
RELAY0
TS0
TS1
TS2
RELAY1
RELAY2
TS0
TS1
TS2
11
2
3
4
5
6
7
8
9
10
J11
CON10THROUGH
11
2
3
4
5
6
7
8
9
10
J12
CON10THROUGH
RELAY0
RELAY1
RELAY2
WDOG
RL0 RL1 RL2 VA0 VA1 VA2 VA3
COMMON0
COMMON1
COMMON2
LOAD0
LOAD1
LOAD2
REV AUTH DATE
BCAC 10/3/02 CE MARK LINE VOLTAGE TRACE SPACING FIX
APPLIES TO PCB 03954
D-8
07266B DCN6845
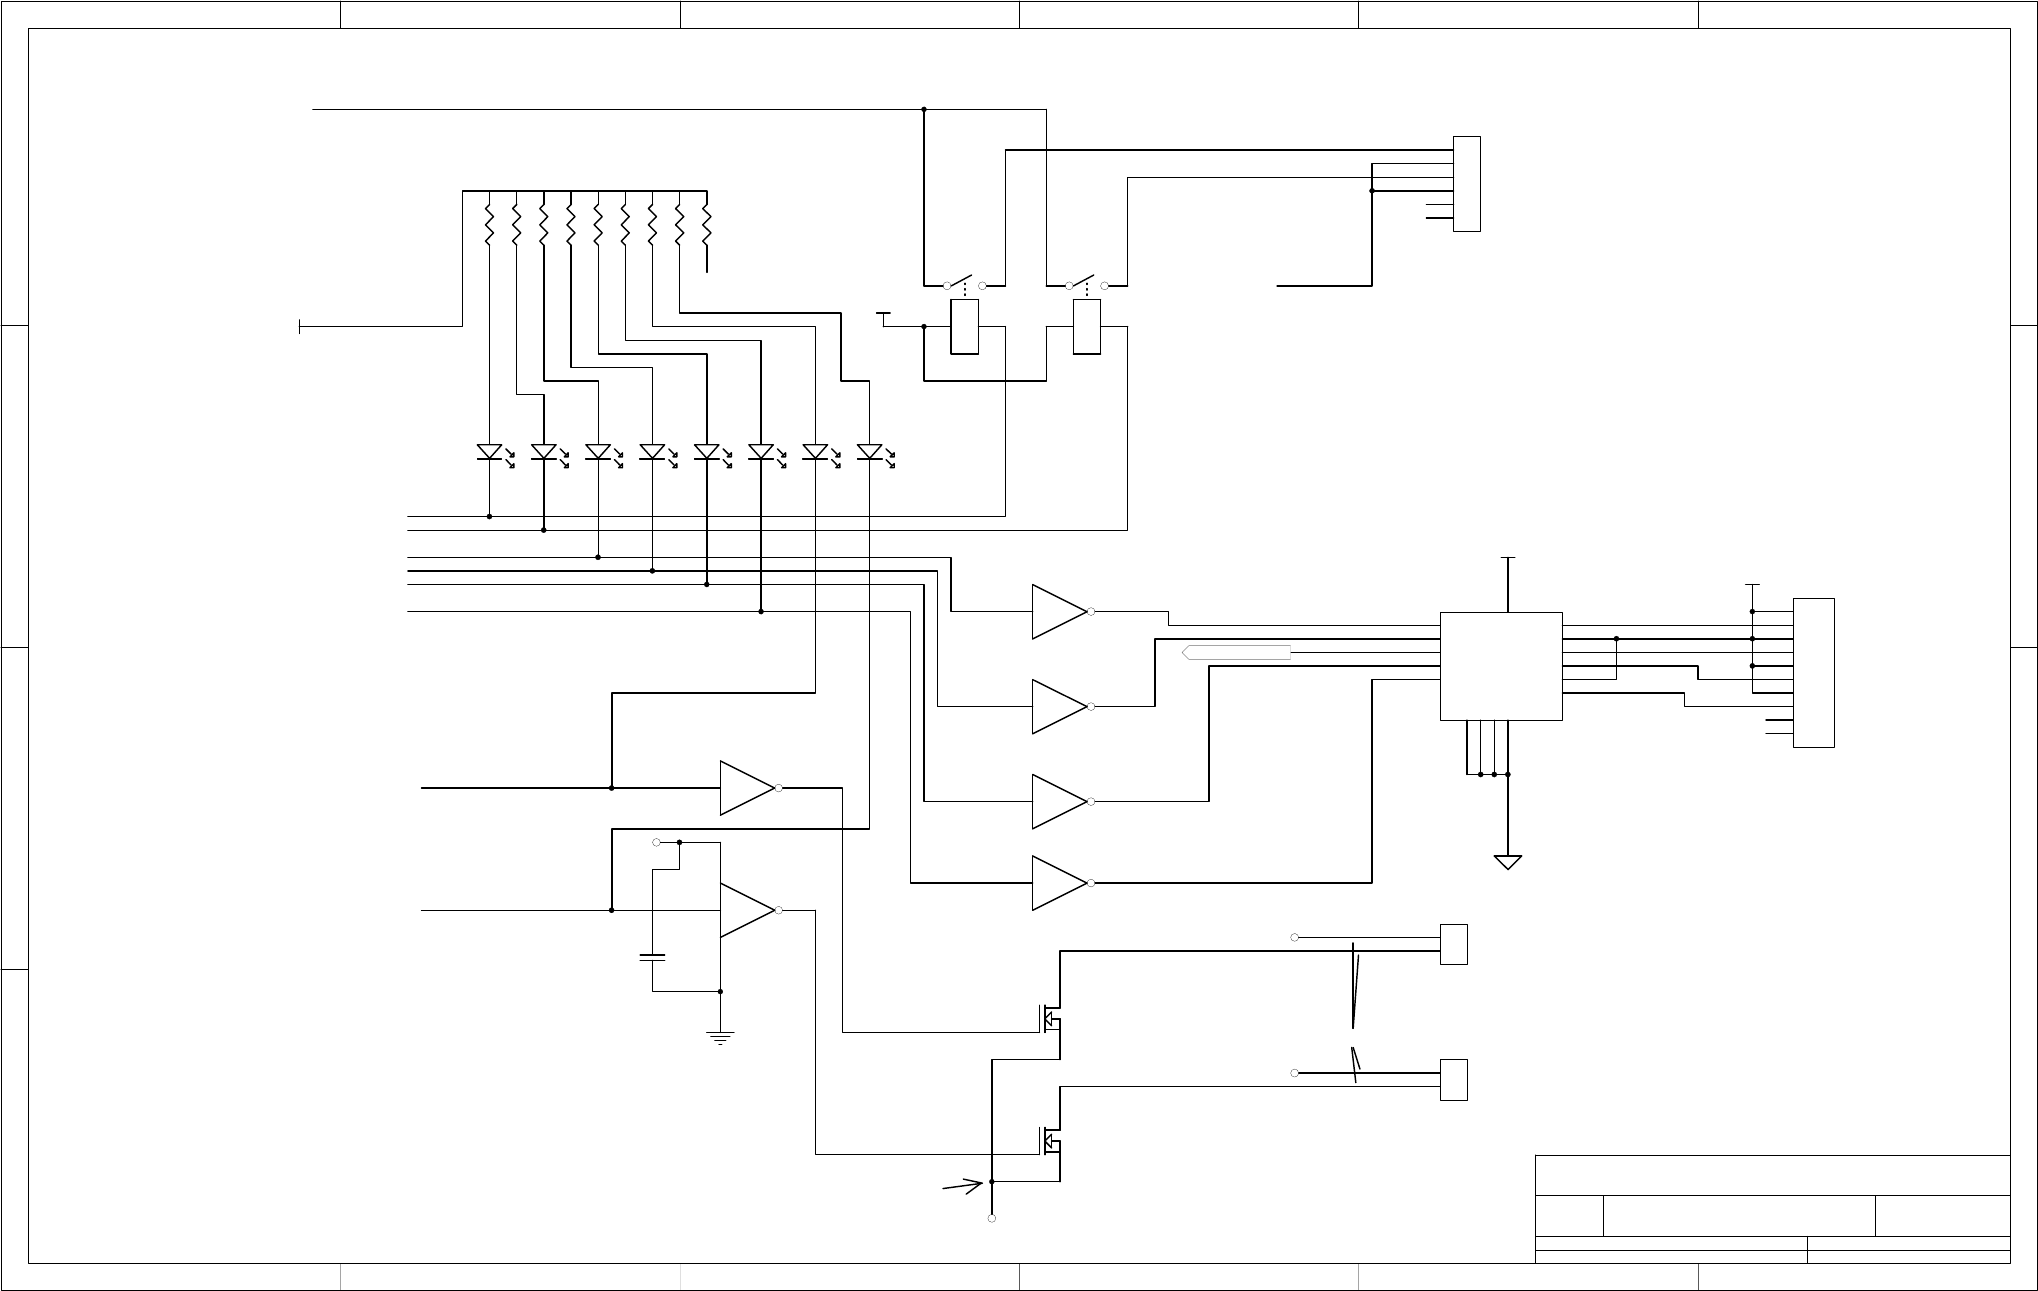
1 2 3 4 5 6
A
B
C
D
6
54321
D
C
B
A
Title
Number RevisionSize
B
Date: 30-Jun-2004 Sheet of
File: N:\PCBMGR\RELEASED\03954cc\PROTEL\03954a.ddbDrawn By:
Te
Te
03956 A
100E/200E/400E RELAY PCB
32 3
1 2
U3A
SN74HC04
9 8
U3D
11 10
U3E
OUT4 1
K2
OUT 3 3
GND
4GND
5
OUT 2 6
K7
OUT 1 8
IN 1
9IN 2
10
VCC 11
GND
12 GND
13
ENABLE
14 IN 3
15 IN 4
16 U6
UDN2540B(16)
2
1
3
4
5
6
7
8
9
10
RN2
330
D5
YEL D6
YEL D11
GRN D12
GRN D13
GRN D14
GRN D15
GRN
VCC
1
2
3
4
5
6
7
8
9
10
J6
CON10
Valve4
Valve5
Valve6
Valve7
+12V
I2C_Vcc
1 2
+
3-4
K4
SLD-RLY
1 2
+
3-4
K5
SLD-RLY
I2C_Vcc
T
T
RELAY3 RELAY4
IO3
IO4
IO10
IO11
IO12
IO13
13 12
147
U3F
IO14
IO15
AC_Line
1
2
3
4
5
6
J20
MOLEX6
AC_Neutral
Aux Relay Connector
RELAY3
RELAY4
VLV_ENAB
AA
K
K
D16
GRN
3 4
U3B
5 6
U3C
1
2
J13
MINIFIT-2
1
2
J14
MINIFIT-2
VCC
C13
0.1
Q2
IRL3303
Q3
IRL3303
+12V
+12V
+12RET
Use 50 mil traces
Use 40 mil traces
RL3 RL4 VA4 VA5 VA6 VA7 TR0 TR1
07266B DCN6845
D-9
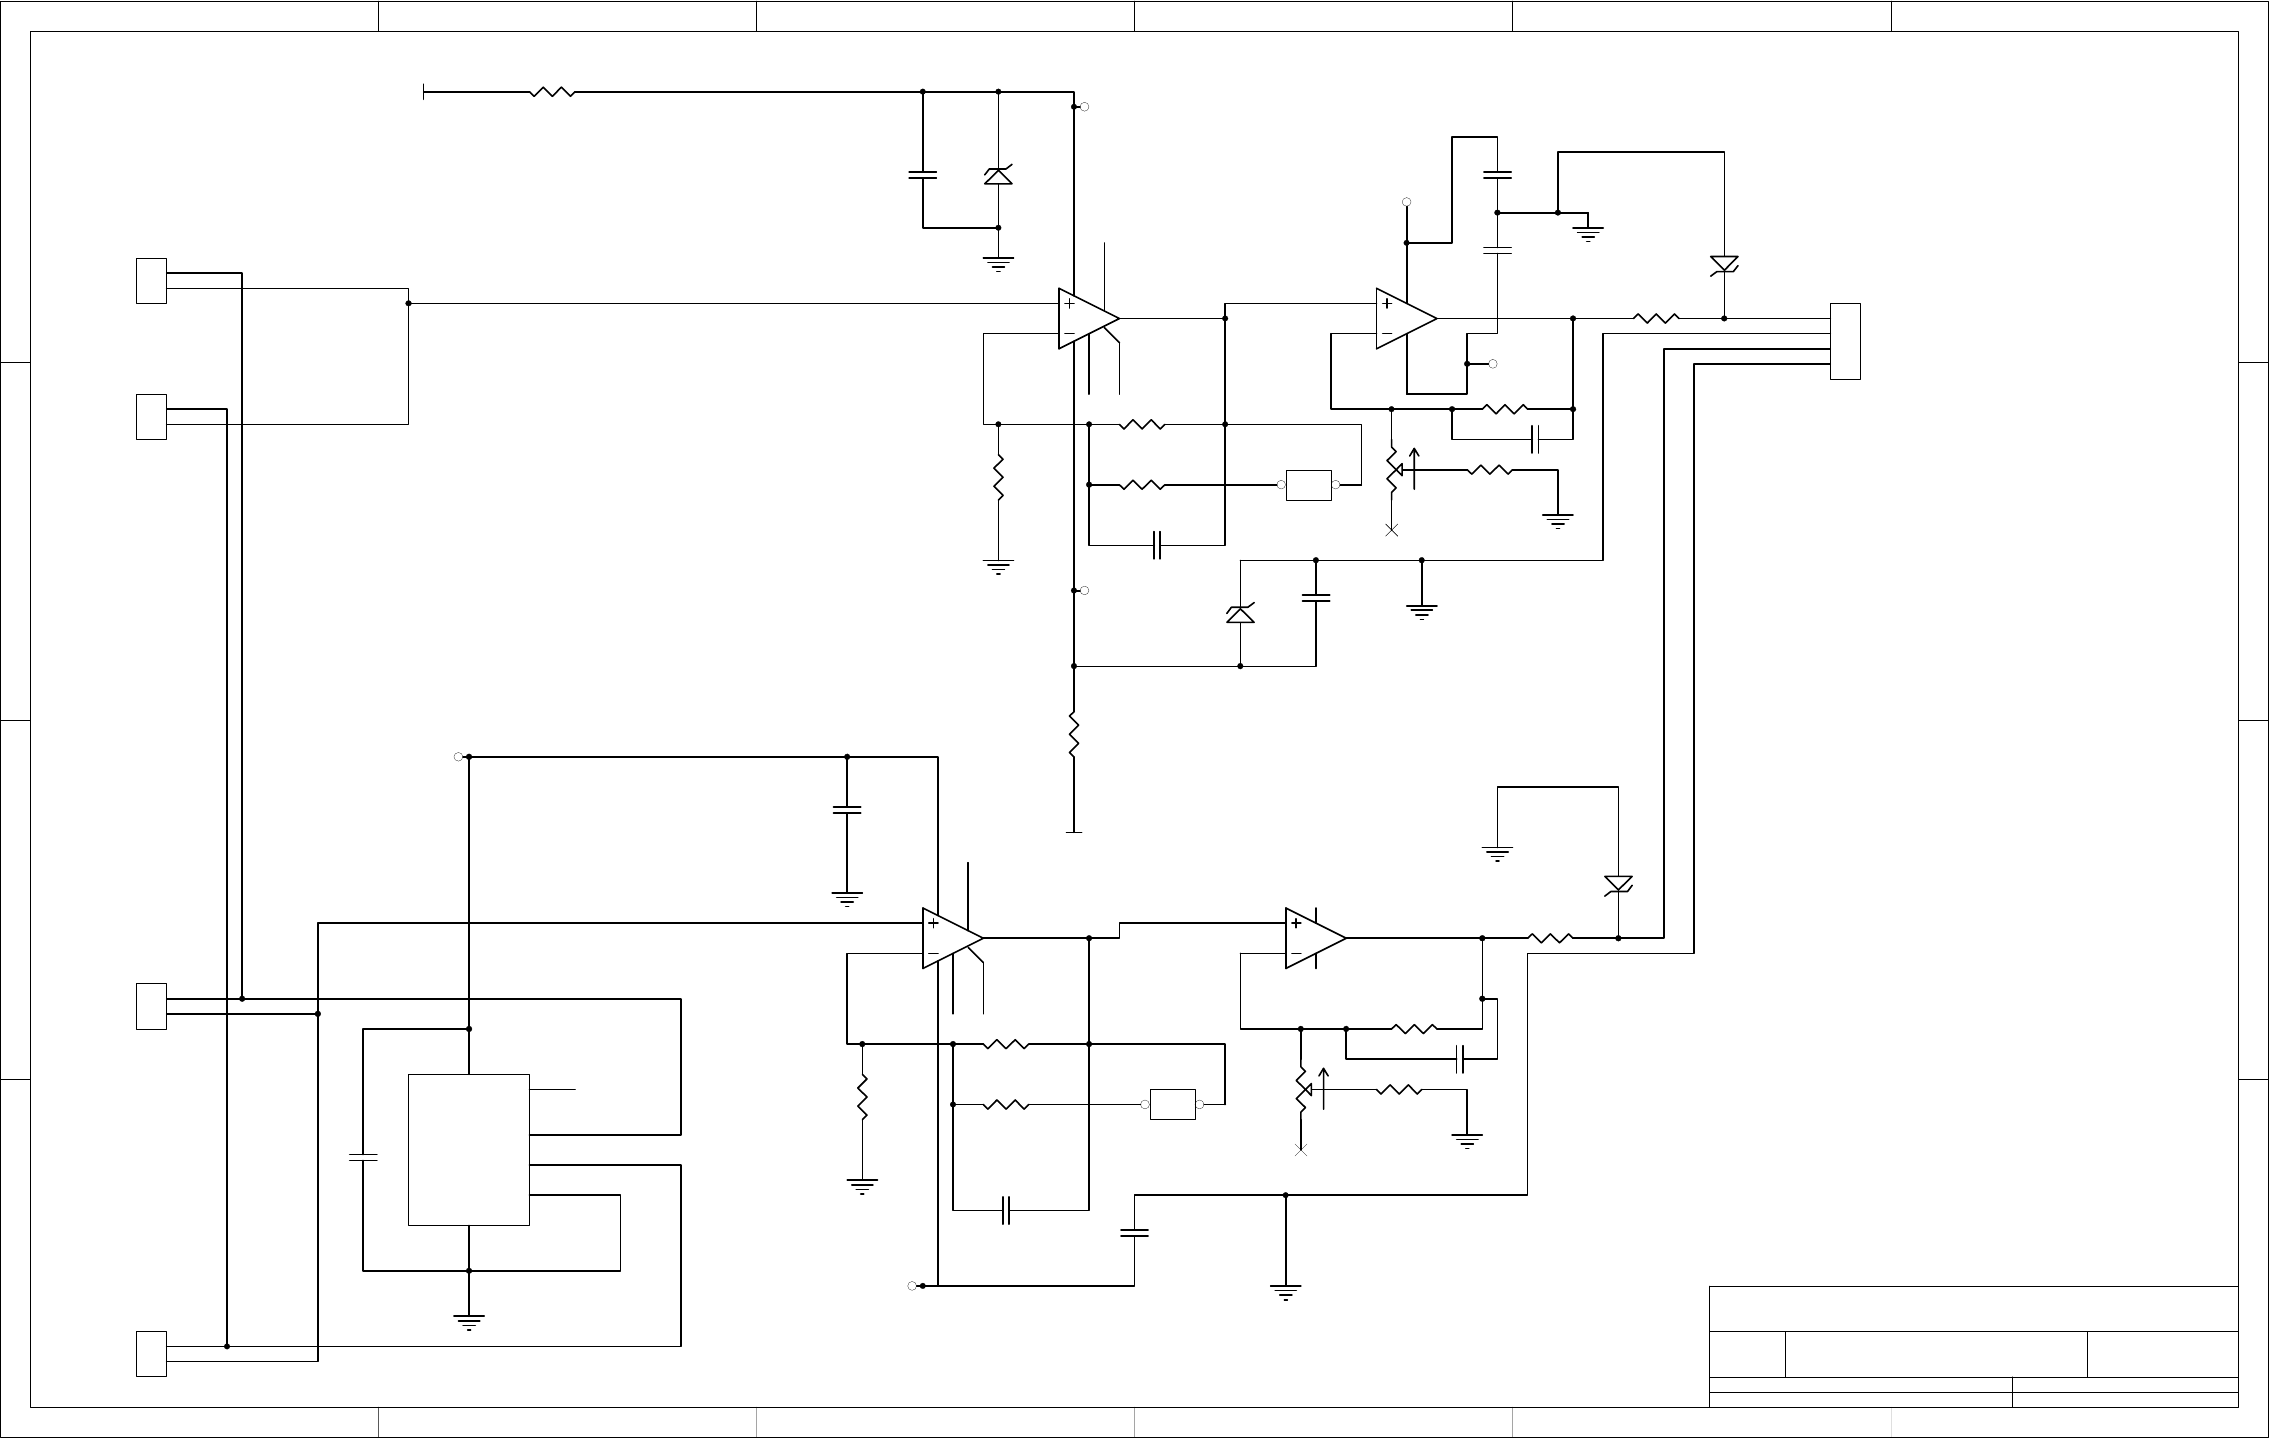
1 2 3 4 5 6
A
B
C
D
6
54321
D
C
B
A
Title
Number RevisionSize
B
Date: 30-Jun-2004 Sheet of
File: N:\PCBMGR\RELEASED\03954cc\PROTEL\03954a.ddbDrawn By:
Te
Te
03956 A
100E/200E/400E RELAY PAB
33 3
3
26
1
58
74
U8
LTC1050
ZR1
5.6V
A
AKK
ZR2
5.6V
C7
0.1
C9
0.1
-15V
+15V
R8
2.55K
R7
2.55K
R11
249K
R9
1K
1
2
J15
TYPE J
1
2
J18
TYPE k
C8
0.1
K TC Connector
J TC Connector
1
2
3
4
J17
MICROFIT-4
VDD_TC
VEE_TC
3
26
1
58
74
U9
LTC1050
K7
Vin 2
Gnd
4
J8
TOUT 3
R- 5
U10
LT1025 C12
0.1
R12
249K
R10
1K
1
2
J16
TYPE J
1
2
J19
TYPE K
C11
0.1
K TC Connector
J TC Connector
VDD_TC
VEE_TC
C10
0.1
C14
0.1
R14
676K 1 2
JP6
JUMPER
R13
332K 1 2
JP5
JUMPER
3
21
84
U7A
OPA2277
R15
11K
R19
10K
CCW
CCW
WW
CW CW
CW
R17
5K
+15V
-15V
C15
0.1
C16
0.1
5
67
U7B
OPA2277
R16
11K
R20
10K
CW
R18
5K
C17
1
C20
1 uF
AA
K
K
ZR3
10V
AA
K
K
ZR4
10V
R21
20k
R22
20k
++
+
+
+
-
-
-
-
D-10
07266B DCN6845
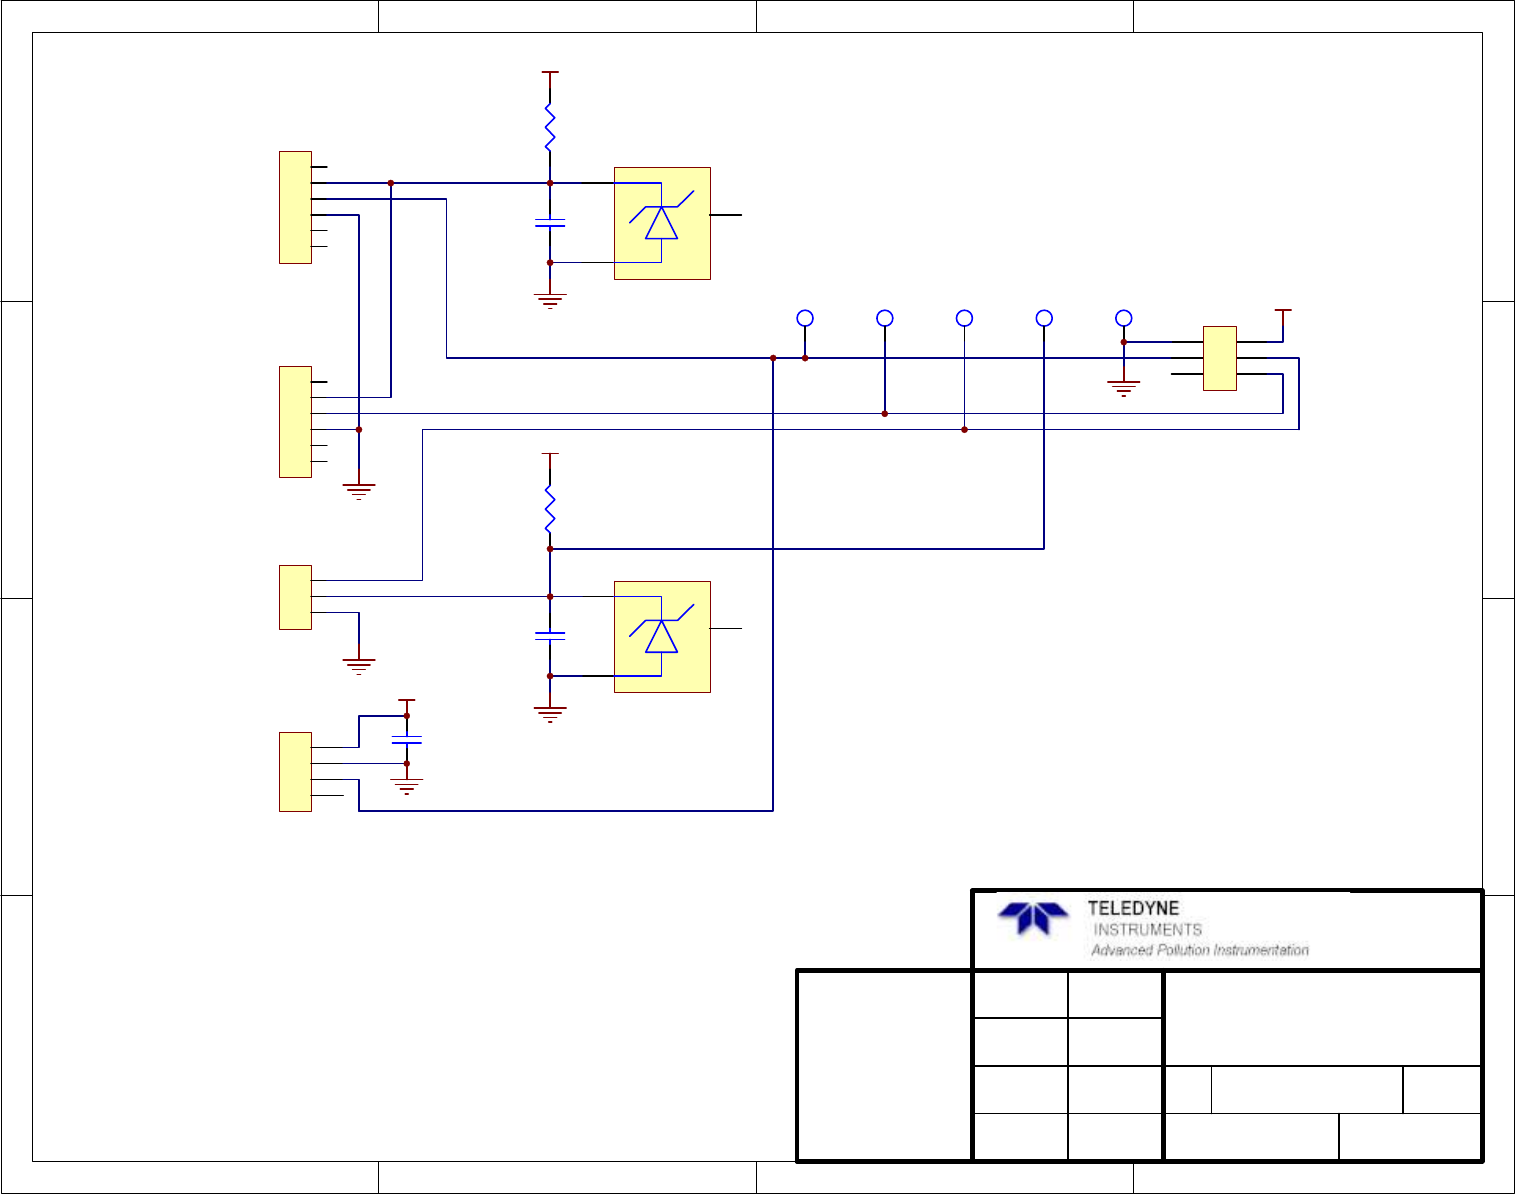
1 2 34
A
B
C
D
4321
D
C
B
A
APPROVALS
DRAWN
CHECKED
APPROVED
DATE
SIZE DRAWING NO.REVISION
SHEET
The information herein is the
property of API and is
submitted in strictest con-
Unauthorized use by anyone
fidence for reference only.
for any other purposes is
prohibited. This document or
any information contained
in it may not be duplicated
without proper authorization.
SCH, PCA 04003, PRESS/FLOW, 'E' SERIES
04354D
113-Dec-2007
LAST MOD.
B
of
R2
1.1K
+15V
1
2
3
4
5
6
S1
ASCX PRESSURE SENSOR
1
2
3
4
5
6
S2
ASCX PRESSURE SENSOR
1
2
3
S3
FLOW SENSOR
+15V
+15V
TP5
S2_OUT
TP4
S1/S4_OUT
TP2
10V_REF
TP1
GND
TP3
S3_OUT
2
3
1
VR2
LM4040CIZ
2
3
1
VR1
LM4040CIZ
R1
499
1
2
3
4
5
6
J1
MINIFIT6
C1
1.0UF
C2
1.0UF
1
2
3
4
S4
CON4
+15V
C3
1.0
CN_647 X 3
FM_4
07266B DCN6845
D-11

1 2 3 4 5 6
A
B
C
D
6
54321
D
C
B
A
Title
Number RevisionSize
B
Date: 10-May-2007 Sheet of
File: N:\PCBMGR\04179cc\Source\RevG\04179.ddbDrawn By:
H04181
M100E/200E PMT Preamp PCA
03
Interconnections
04181H-1-m100e200e.sch
preamp cktry
04181H-2-m100e200e.SCH
HVPS Cktry
04181H-3-m100e200e.SCH
D-12
07266B DCN6845
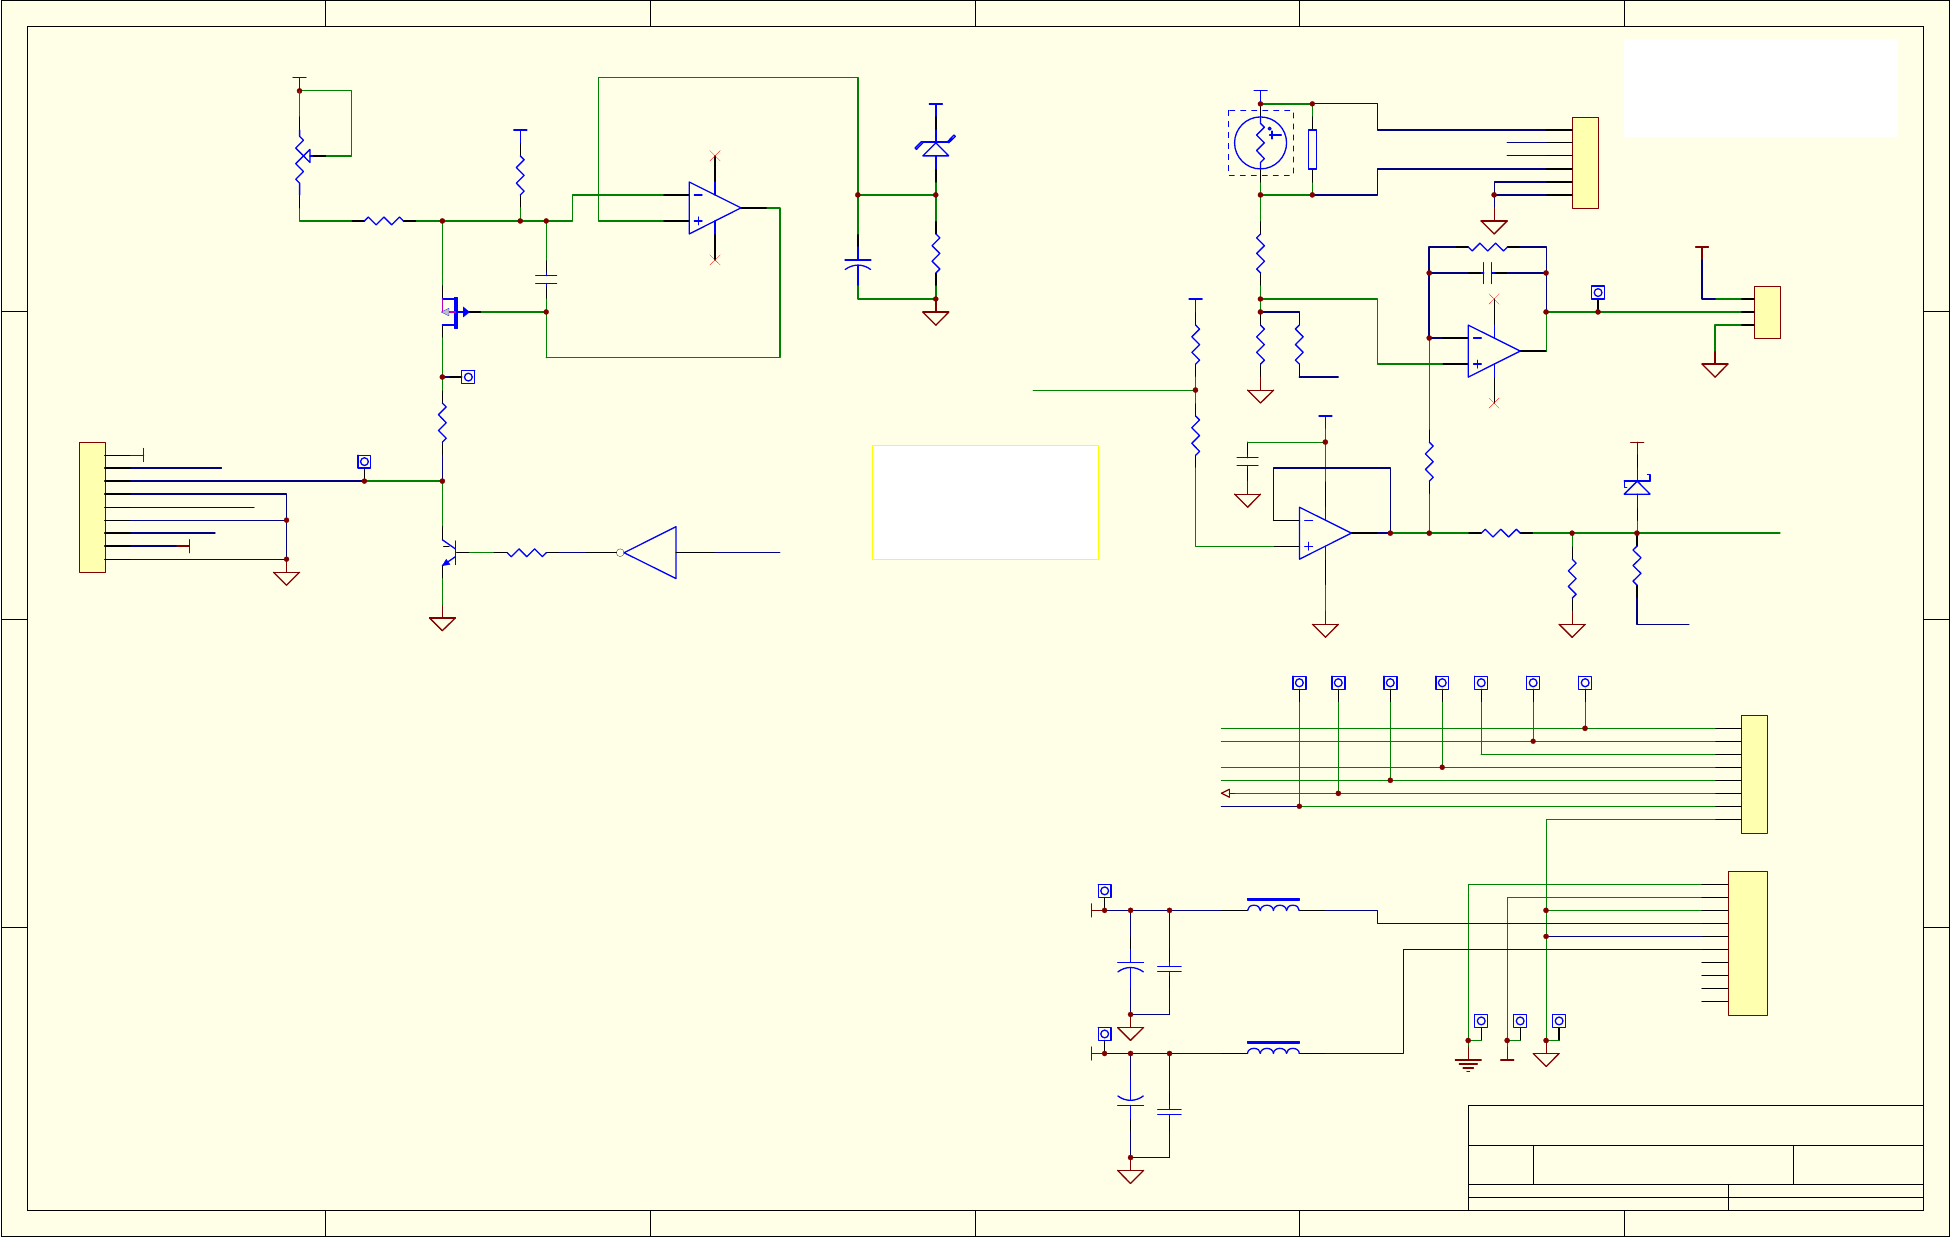
1 2 3 4 5 6
A
B
C
D
6
54321
D
C
B
A
Title
Number RevisionSize
B
Date: 10-May-2007 Sheet of
File: N:\PCBMGR\04179cc\Source\RevG\04179.ddbDrawn By:
R27 499
R8
150K
R15
SEE TABLE
R32
499
R35
1.0K
R2
51.1K
b1
c2
E
3
Q2
PN2222
C23
100 pF
+15V
+15V
+15V
+15V
R7
10K
R1
10K
R16
100K
R6
100K
R9
2.0K
+12V_REF
+12V_REF
Q3
J176
RT1
C6
0.1 uF
C26
0.1 uF
5
6
7
48
U3B
LF353
48
2
3
1
U3A
LF353
48
2
3
1
U2A
LF353
+
C1
N/I
R37
3.3K
+5V_SYS
1
2
3
J2
3 PIN INLINE
TP23
*
TP24
*
TP3
*
VREF
COOLER CONTROL
AGND
TH1
6.2V
S
G
D
R28
50K 1
2
3
D2
11DQ05
D1
6.2V ZENER
OPTIC TEST
R18
SEE TABLE
FSV
+12V_REF
LED+
THERMISTOR+
R23
4.99K
PMT TEMPERATURE FEEDBACK
TO TEC BOARD
PMT_TEMP
OPTIC_TEST
1
2
3
4
5
6
7
8
J6
MICROFIT-8
+5V_SYS
TP16*
TP11*
TP15
*TP14
*TP13
*
TP20
*
TP21
*
TP22
*
TP19
*
TP25
*
TP17
*
TP18
*
ELEC TEST
OPTIC TEST
PREAMP RNG BIT2
PREAMP RNG BIT1
PMT TEMP
HVPS VOLTAGE
PMT SIGNAL
HVPS
PMT_TEMP
OPTIC_TEST
1
2
3
4
5
6
7
8
9
J3
INLINE-9-RA
+15V
HVPS
THERMISTOR+
LED+
PREAMP1
100E/200E PMT PREAMP PCA Schematic
H
1 3
04181
HIGAIN
ETEST
1
2
3
4
5
6
7
8
9
10
J5
MINIFIT-10
Power Connector
Signal Connector
+15V
L2
4.7 uH
+
C21
100uF
C49
0.68 uF
-15V
L1
4.7 uH
+
C16
4.7uF, 16v
C46
0.68 uF
R41
300K
R10
SEE TABLE
1
2
3
4
5
6
JP2
PMT TEMP CONFIG JUMPER
TJP1A
TJP1A
TJP2A
TJP2A
-15V
VPMT
2
4
U13
74AHC1GU04
ON JP2:
FOR 100E/200E : SHORT PINS 2 &5 ONLY.
FOR 200EU: SHORT PINS 3 & 6 and PINS 2 & 5.
COMP. 100E 200E 0200EU
-------------------------------------------------
R18 10K 10K 14K
R15 55K 55K 47K
R10 8.09K 8.09K 10K
Printed documents are uncontrolled
07266B DCN6845
D-13
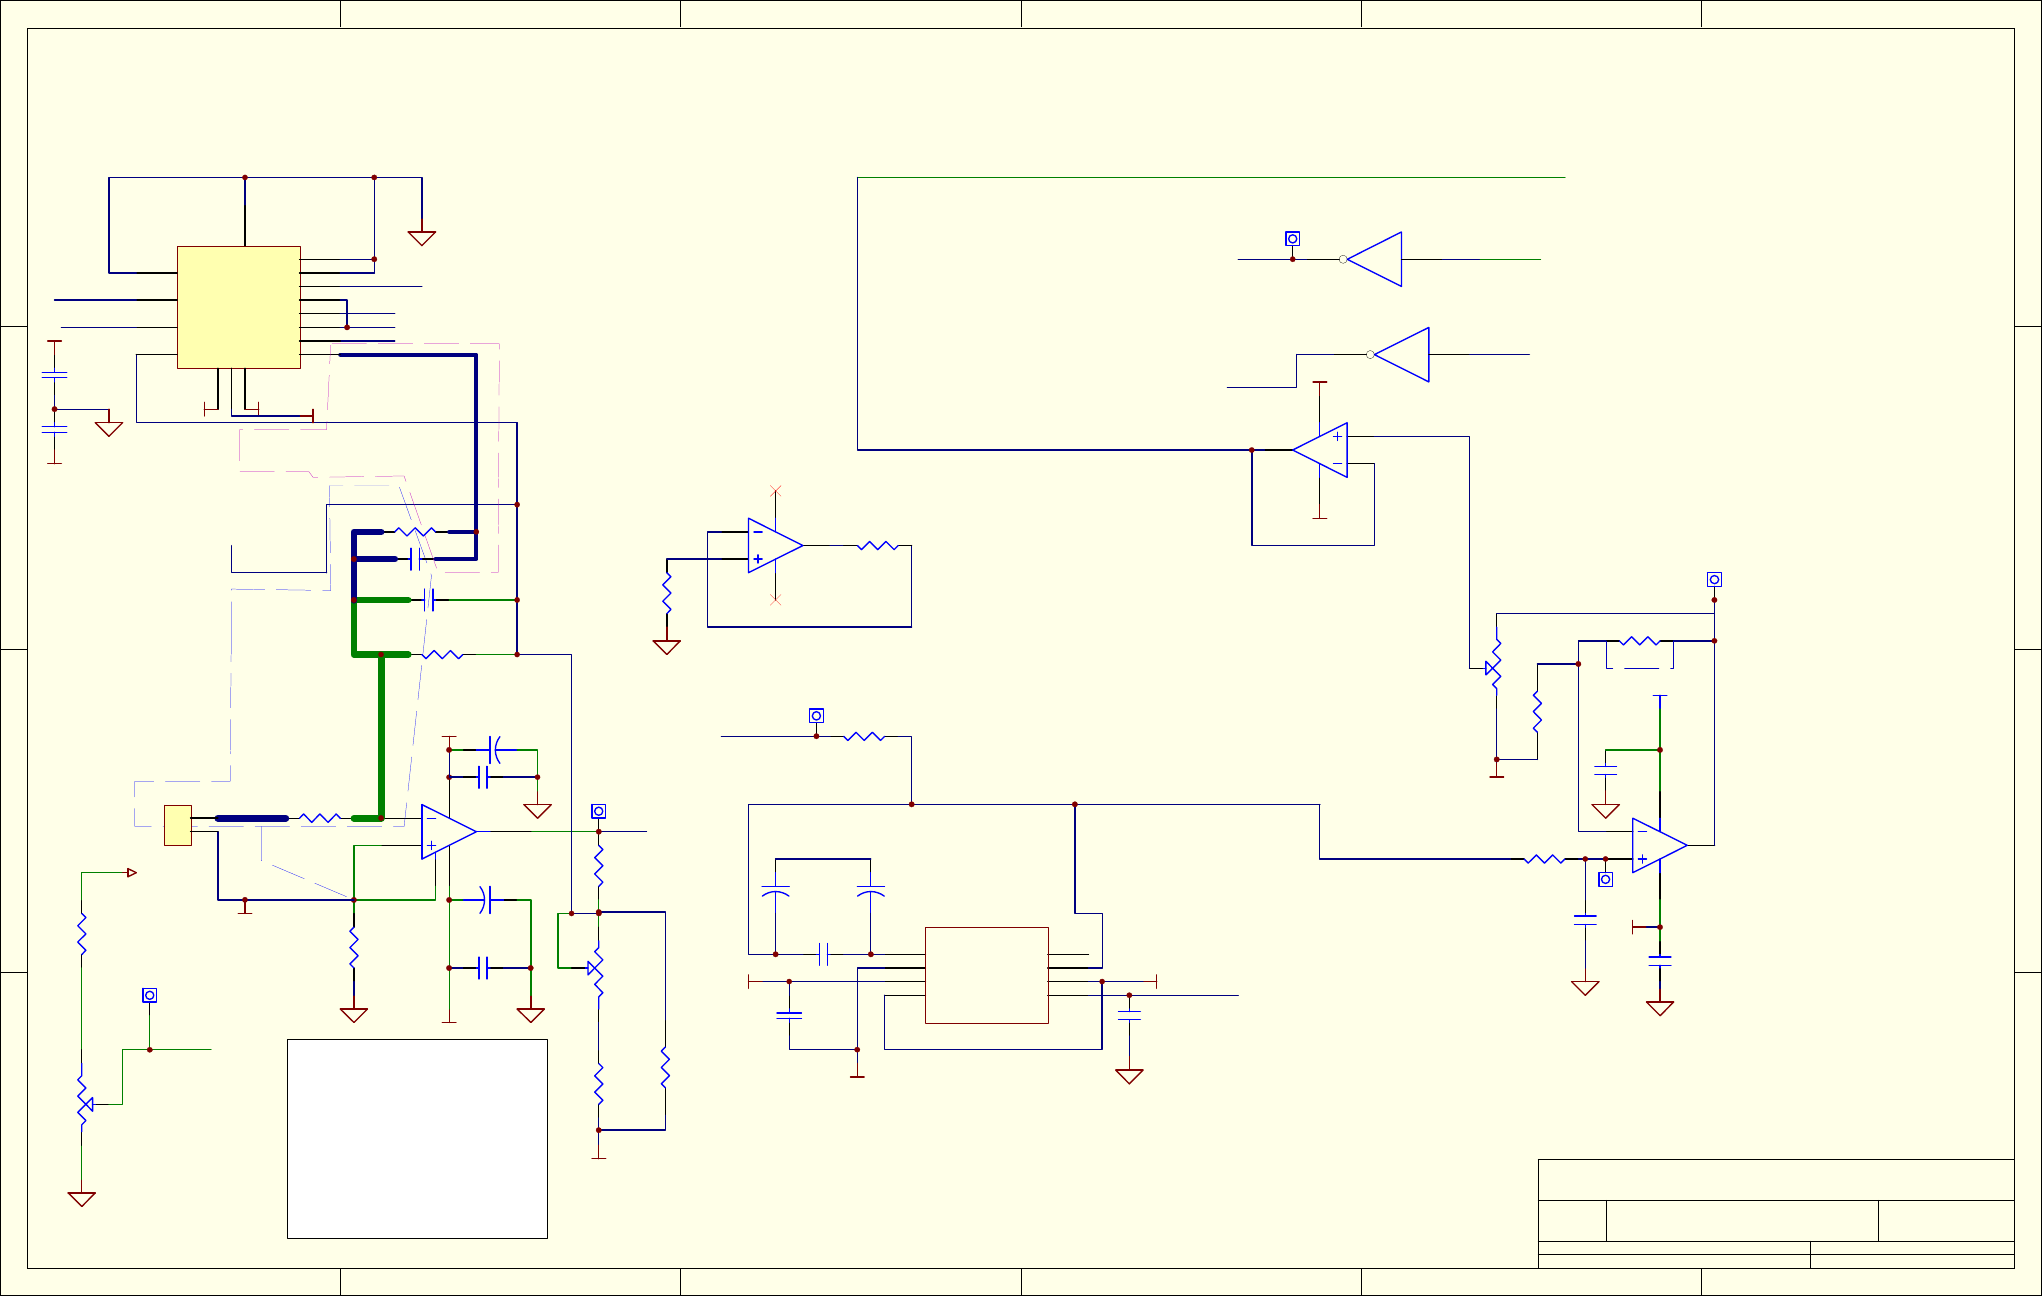
1 2 3 4 5 6
A
B
C
D
6
54321
D
C
B
A
Title
Number RevisionSize
B
Date: 10-May-2007 Sheet of
File: N:\PCBMGR\04179cc\Source\RevG\04179.ddbDrawn By:
R12
1000M
R3
4.99K
R38
N/I
R17
SEE TABLE
+
C28 10uF/25V
+
C2710uF/25V
C2 100 pF
-15V
+15V
GUARD RING
NOTES: UNLESS OTHERWISE SPECIFIED
3.
2.
1.
RESISTANCE IS IN OHMS.
RESISTORS ARE 1%, 1/4W.
CAPACITANCE IS IN MICROFARADS.
R13
N/I, POT
1
2
3
3
2
6
8
7
4
U1
OPA124
SPAN ADJUST
THIS CIRCUIT MUST BE USED
AS A MATCHED PAIR WITH THE
TEC CONTROL CIRCUIT
4.
R4
100
R44
SEE TABLE
R11 100M
IN1 1
COM1 2
NC1
3
V-
4GND 5
NC4
6COM4 7
IN 4 8
IN 3 9
COM3 10
NC3
11
V(L)
12 V+
13
NC2
14 COM2 15
IN2 16
U4
DG444DY
-15V
+15V
C4 0.001 uF
+5V_SYS
ETEST
R43
4.99K
TP6
*
VREF
R19
10K, POT
1
2
3
ELECT. TEST
PREAMP1
PREAMP2
PREAMP1 PREAMP2
ETEST
ETEST_SIGNAL
ETEST_SIGNAL
ETEST
2
4
U17
74AHC1GU04
2
4
U5
74AHC1GU04
ETEST
HIGAIN
R36
250K
C3
SEE TABLE
5
6
7
48
U2B
LF353, OPAMP
+15V
C48
0.1 uF
C47
0.68 uF
-15V
HIGAIN
VPMT
R5
N/I, SHORTED
FB
1
AGND
2
V-
3
DIV RATIO
4C OSC 5
V+ 6
OUT 7
BUFOUT 8
U11
LTC1062CN8
+12V_REF
-2.5V
C9
3900 pF, FILM
C11
1.0uF
TP9
*
TP1
*
TP8
*
TP7
*
C30 0.68 uF
C5 0.68 uF
R29
50k, POT
1
2
J1
COAX
PMT Signal Connector
PMTGND
PMTGND
PMTGND
PMTGND
5
6
7
48
U16B
LF353, OPAMP
R48
1K
R46 100
4
8
2
3
1
U9A
LF353
+15V
-15V
TP2
*
C31
0.68 uF
C29
0.68 uF
+15V
-15V
R51
SEE TABLE
HIGAIN
R50
N/I
H04181
M100E/200E PMT Preamp PCA Schematic
23
VERSION TABLE:
0100 - M10XE
0200 - M20XE
COMP. 0100 0200
----------------------------------------------
R17 20.0K 10.0 ohms
R44 39.2K 25.5K
R51 10K not installed
C3 0.1 uF 0.012
C11 11.0 1.0
C36
0.1 uF
+C11A
22uF/25V +C11B
22uF/25V
For 1.0 uF use C11.
For 11 uF use C11A & C11B.
SEE TABLE
Printed documents are uncontrolled
D-14
07266B DCN6845
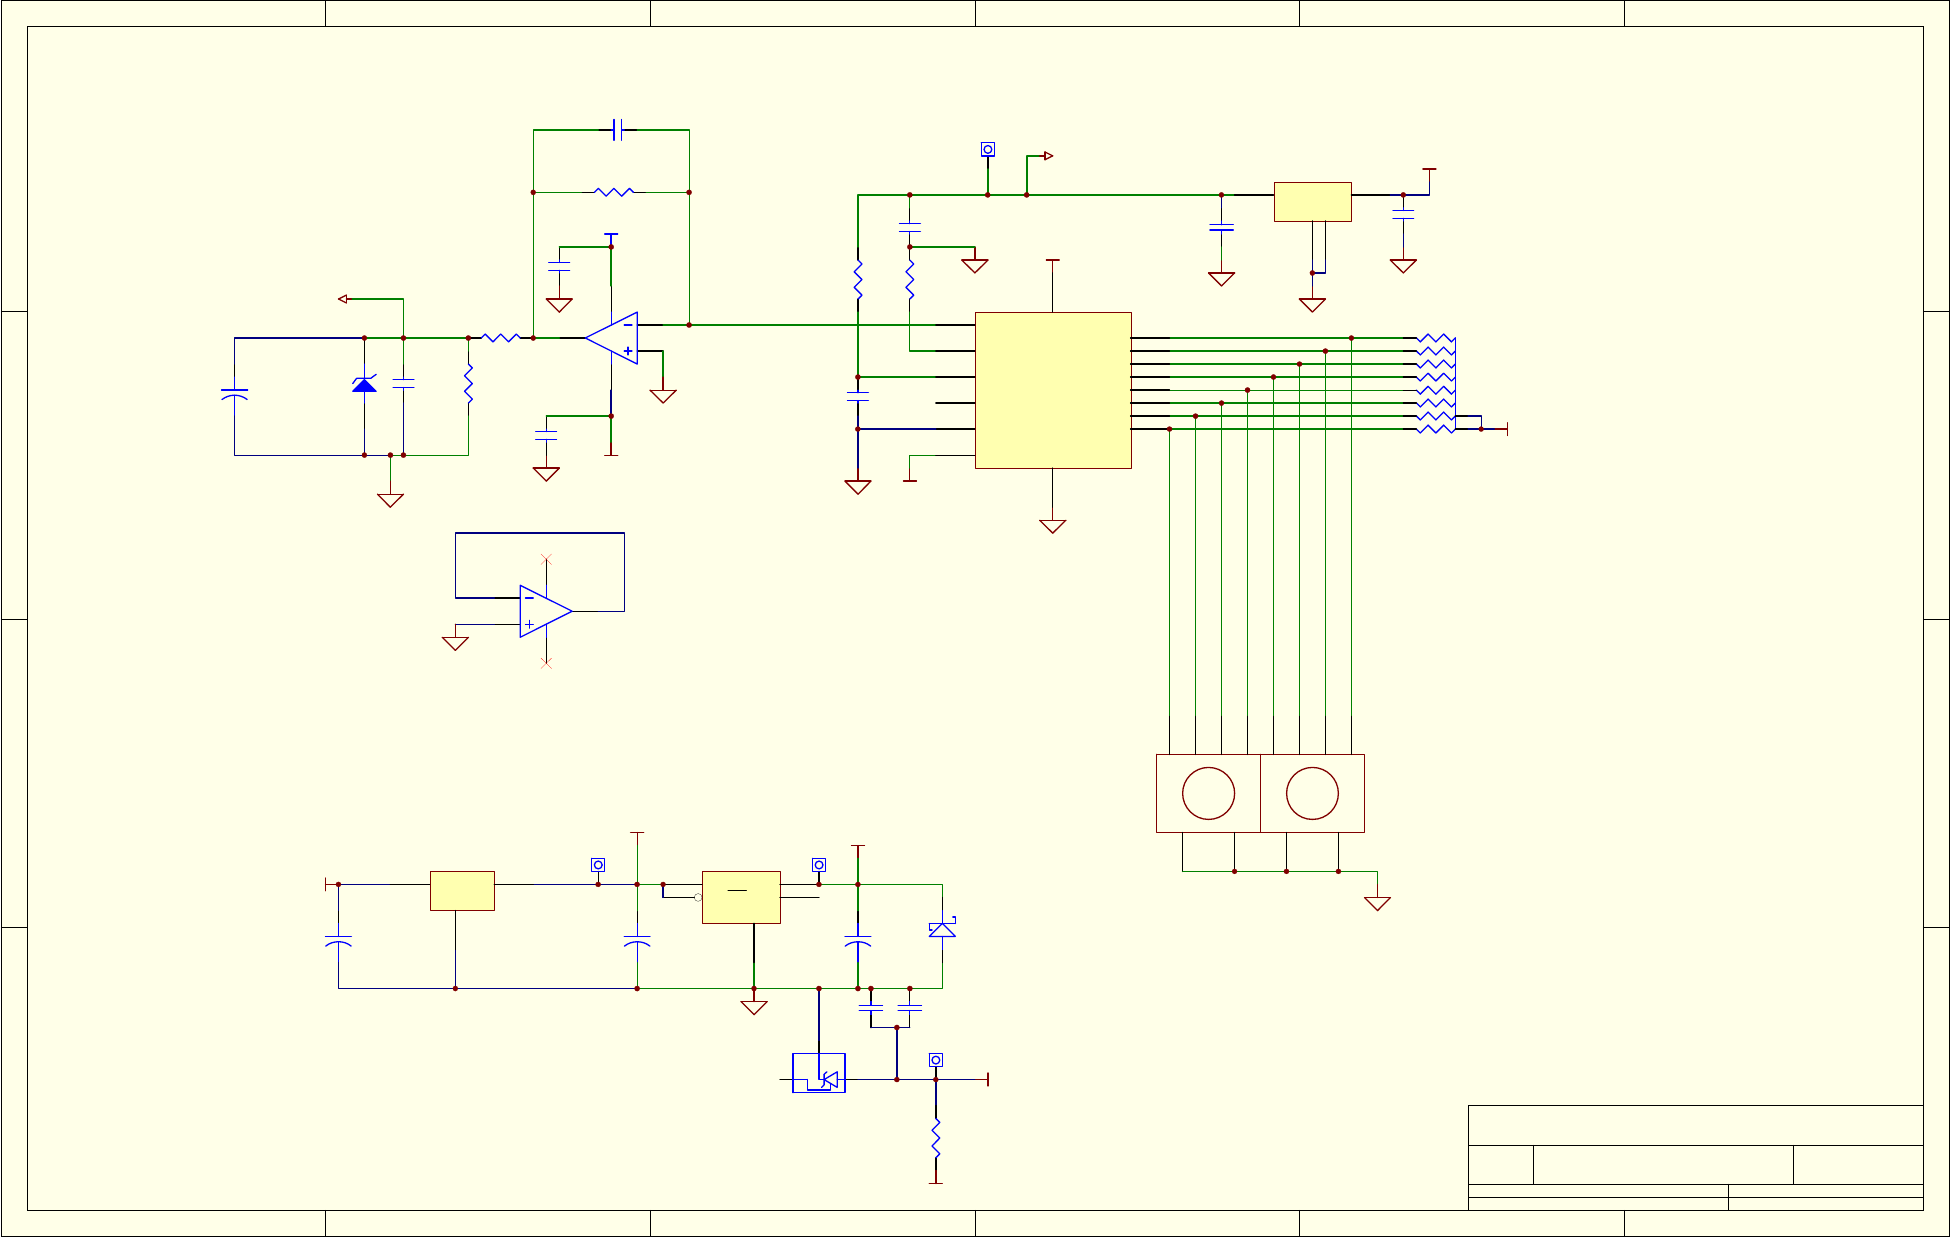
1 2 3 4 5 6
A
B
C
D
6
54321
D
C
B
A
Title
Number RevisionSize
B
Date: 10-May-2007 Sheet of
File: N:\PCBMGR\04179cc\Source\RevG\04179.ddbDrawn By:
48
2
3
1
U16A
LF353, OPAMP
R33 4.99K
R47
3.92K
R49
1.0K
C45 100pF
C20
0.68 uF
+12V_REF
+C15
10uF/25V
+ C50
10uF/25V
-15V
+5V_LOCAL
C33
0.68 uF
C7
0.68 uF
C32
1.0uF/16V
R42
4.99K
R20
4.99K
1
4
3
6
2
5
S1
1
4
3
6
2
5
S2
+5V_LOCAL
+15V
TP4
*
TP10*
+5V_LOCAL
VREF
1 12 4 8 2 4 8
HVPS
D6
11DQ05
+C34
10uF/25V
A1
K
2
D7
16V
HIGH VOLTAGE SUPPLY
3
2
1
VR1
LM336Z-2.5 R24
2k
-15V
-2.5V
TP12
*
TP5
*
C42
0.68 uF
C14
10uF/25V
+15V
5
6
7
48
U9B
LF535
C
10
1
2
3
4
6
7
8
9
5
RN1
100Kx8
IN
1
ON/OFF
3OUT 5
NC 4
GND
2
U14
LP2981IM5
+ C22
10uF/25V
IN
3OUT 1
GND
2
U8
LM78L12ACZ(3)
+15V
-15V
C25
0.1 uF
C24
0.1 uF
H04181
M100E/200E PMT PREAMP PCA Schematic
33
C51
0.1uF/ 50V
CA0000199
CA0000192
IN 4
OUT
6
GND
1GND
2
U22 LT1790AIS6-5
GND
6Vcc 1
Iout
8
D7 9
Vrf(-)
3D6 10
D5 11
Vrf(+)
2D4 12
D3 13
D2 14
COMP
4
D1 15
D0 16
Vee
7
TC
5
U6
DAC0802
Printed documents are uncontrolled
07266B DCN6845
D-15
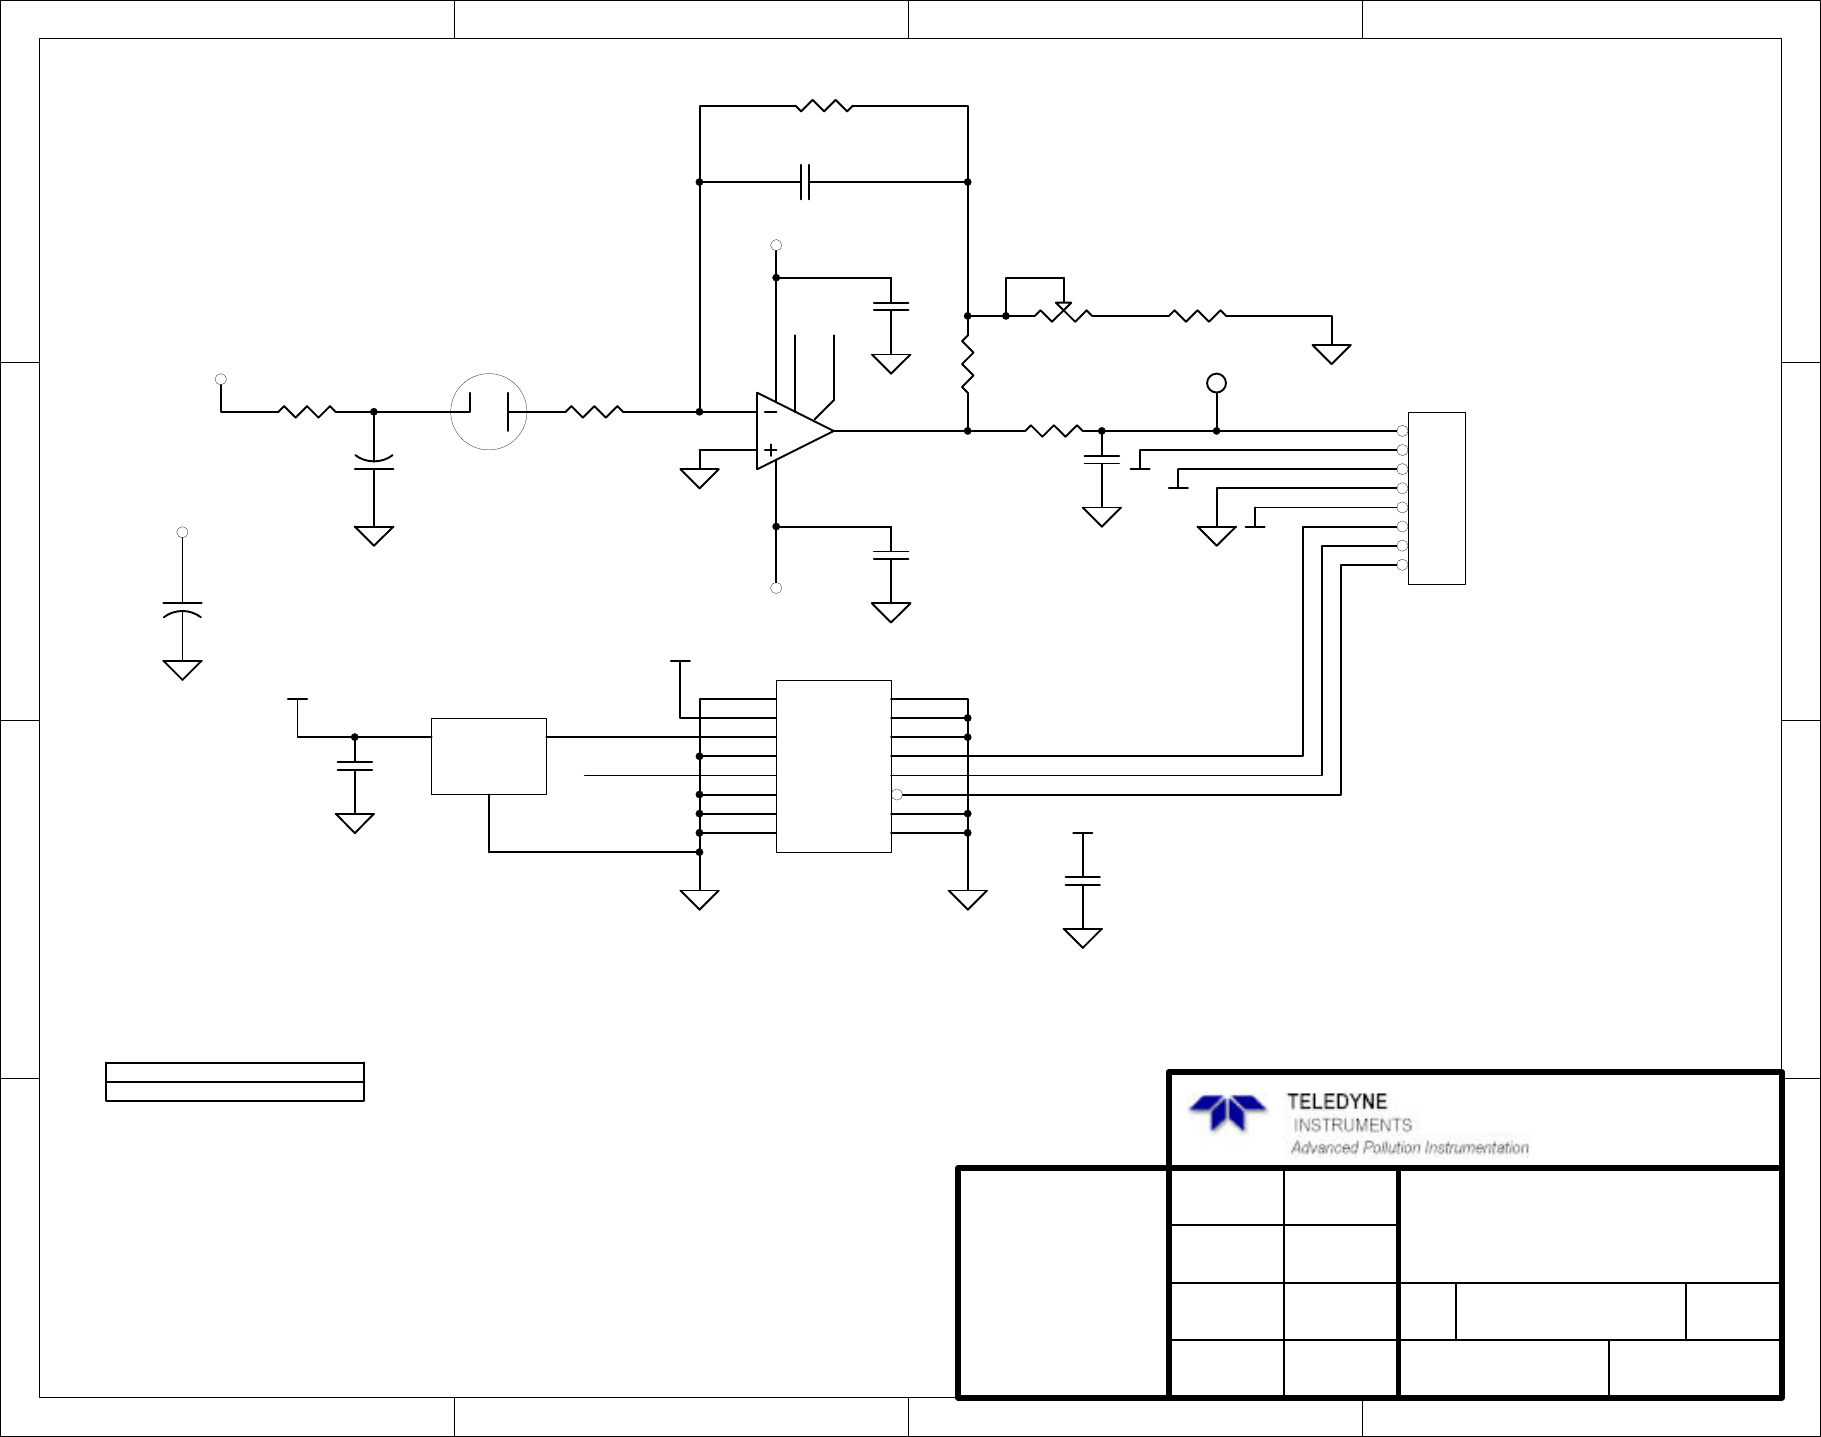
1 2 3 4
A
B
C
D
4
321
D
C
B
A
APPROVALS
DRAWN
CHECKED
APPROVED
DATE
SIZE DRAWING NO. REVISION
SHEET
The information herein is the
property of API and is
submitted in strictest con-
Unauthorized use by anyone
fidence for reference only.
for any other purposes is
prohibited. This document or
any information contained
in it may not be duplicated
without proper authorization.
PCA, UV DETECTOR PREAMP
04420 B
1 13-Aug-2004
LAST MOD.
A
of
USA
+15V
D1
PHOTOCELL
R1
SEE TABLE
C1
100pf
-15V
+15V
+C2
1.0uf
C4
0.1uf
C5
0.1uf
-15V
3
2
6
1
5
7 4
U1
OPA124
R2
1.0K
+
C3
1.0uF
R3
1.0K
R4
5K
VR1
5K
R5
100
1
2
3
4
5
6
7
8
J1
MICROFIT
+15V
-15V
GND
1
VCC
2
REF+
3
REF-
4
IN+
5
IN-
6
GND
7
GND
8GND 9
GND 10
CS 11
SDO 12
SCK 13
F0 14
GND 15
GND 16
U2
LTC2413
VCC
IN
1
GND
3
OUT 2
VR2
LT1460S3-2.5
C6
0.1uf
+15V
PHOTO_OUT
PHOTO_OUT
REF_2.5V
C7
N.P.
VCC
R6
1.0K
TP1
TEST_PLUG
C8
0.1
VCC
PCA VERSION TABLE
04120-0000
PCA# R1
4.99M
04120-0200 2.0M
D-16
07266B DCN6845
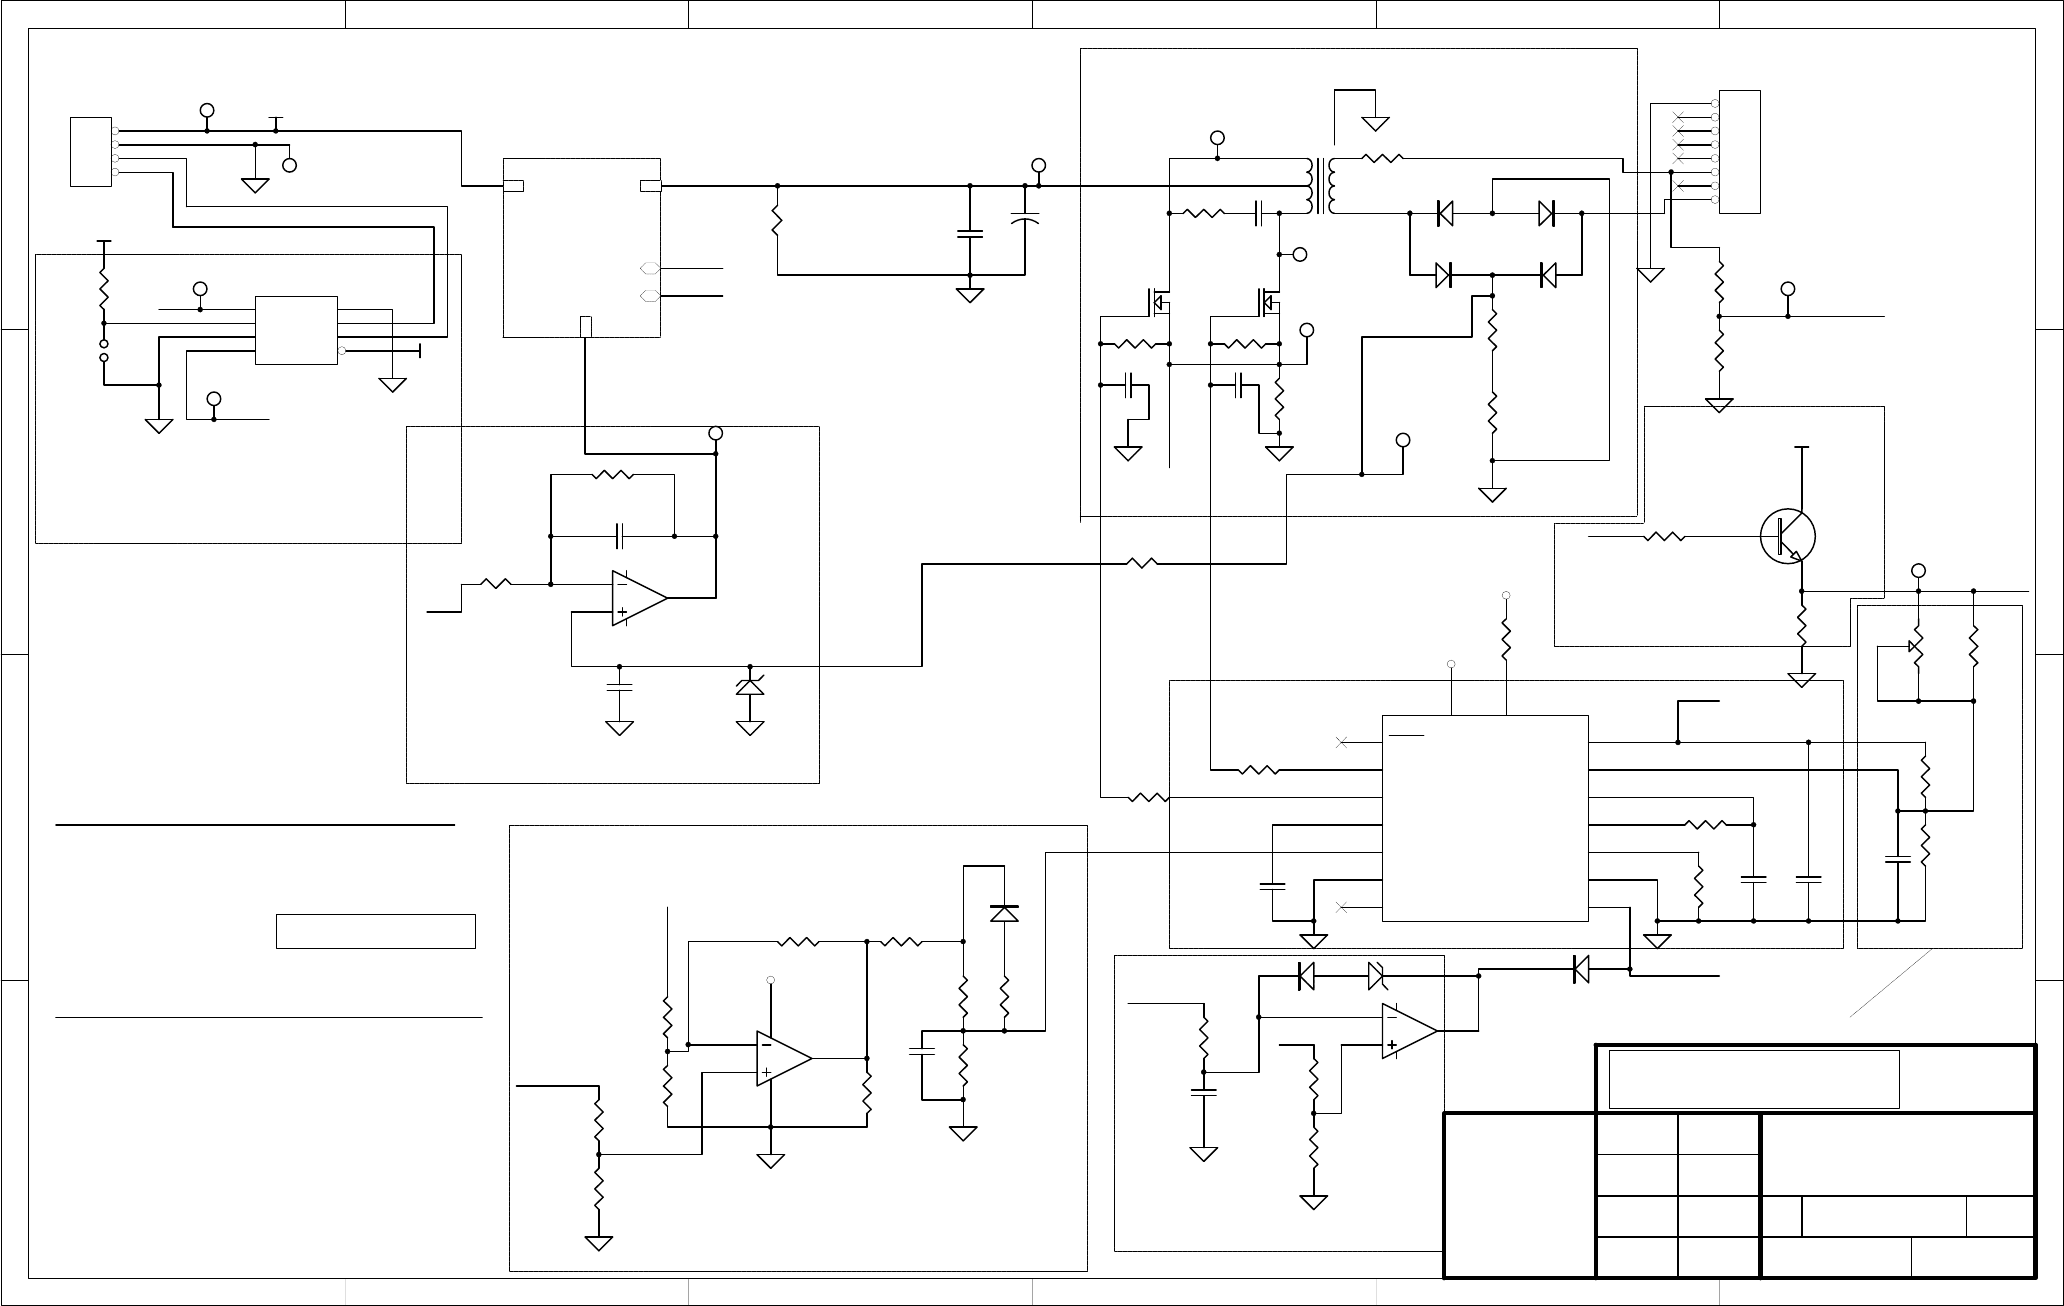
1 2 3 4 5 6
A
B
C
D
6
54321
D
C
B
A
APPROVALS
DRAWN
CHECKED
APPROVED
DATE
SIZE DRAWING NO. REVISION
SHEET
Error : LOGO.BMP file not found.
The information herein is the
property of API and is
submitted in strictest con-
Unauthorized use by anyone
fidence for reference only.
for any other purposes is
prohibited. This document or
any information contained
in it may not be duplicated
without proper authorization.
Sch, Bursting UV Lamp Drv, M100E
04693 E
1 22-Jun-2004
LAST MOD.
B
of
T1
PE-6196
Q3
IRF520
Q2
IRF520
R2
N/I
R3
N/I
R4
100
C4
0.01 uF
R12
249
R13
249
R20
2.7k, 25W
+12V
R14
10
+12V
R16
3.9K
R15
232
C11
0.0047 uF
C12
0.1 uF
C9
0.1 uF
3
2
1
84
U1A
LM358
5
6
7
U1B
LM358
C6
0.03 uF
C5
0.01 uF
+12V
D3
1N4148
D5
1N4148
D4
1N4148
D6
1N4148
R6
75, 1/4W
1
2
3
4
5
6
7
8
P2
LAMP OUTPUT
C2
0.1 uF
CAC 5/1/03
1 2
RP2A
4.7K
3 4
RP2B
4.7K
7 8
RP2D
4.7K
DATE CHANGE DESCRIPTION INITIALREV.
5/1/03 CREATED CACA
Vdd
1
A0
2
A1
3
Vout
4PD 5
SCL 6
SDA 7
GND 8
U3
AD5321-RM8
A0 A1 WRITE ADDRESS READ ADDRESS
DAC I2C ADDRESS
0 0
0 1
1 0
1 1
ASSY NUMBER
18
1A
1C
1E
19
1B
1D
1F
TBD
TBD
TBD
TBD
VREF
OUTPUT A
11
OUPUT B
14
SOFT START
8
INV. INPUT
1
SHUTDOWN
10 GROUND 12
RT 6
DISCHARGE 7
CT 5
NONINV. INPUT 2
VREF 16
VCC 15
VC 13
SYNC
3
OSC. OUTPUT
4COMP 9
U2
SG3525
TP1
TEST_PLUG
TP2
TEST_PLUG
TP3
TEST_PLUG
TP4
TEST_PLUG
R7
3.9K
VREF
VREF
1
2
3
4
P1
HEADER 4
JP1
JUMPER2
R10
75, 1/4W
Applies to PCAs: 04540 -01 and -02
R21
0.2 Ohms, 2W
TP8
Primary Current
TP11
Lamp Current
R1
N/I
R5
N/I
TP9
Lamp Voltage
TP5
Drive Voltage
TP6
Q2 Drain V
TP7
Q3 Drain V
VREF
R17
47K
R18
40k
R11
47K
R22
30K
R25
10K,1%
Q6
NPN
C7
0.01 uF
ACOMP
R29
100K
R31
47K
C14
1 uF
R30
47K
D8
1N914
R34
40K
R35
40K
VDAC
R27
40K
VSET
R32
40K
R33
40K
ACOMP
+12V
LAMP_FDBACK
R8 10k
VDAC
VREF
+12V
VDRIVE
VLAMP
5
6
7
U4B
LM358
D9
1N914
R39
255K
R40
30K
R38
4.7K
C16
0.01 uF
IPRIMARY
IPRIMARY
VREF
VCOMP
VCOMP
LAMP POWER CONTROL DAC
LAMP CURRENT FEEDBACK AMPLIFIER
BLINK MULTIVIBRATOR PRIMARY WINDING OVERCURRENT CUTOFF
PWM CONTROLLER
CC STAGE AMPLIFIER FOR COMP
LAMP DRIVE POWER STAGE
HYSTERIESIS SET RESISTORS FOR PWM ERROR COMPARATOR
R28
5.1K
R36
20K
TP10
PreReg_Control
+12V VDRIVE
LAMP_FDBACK
VREF
ACOMP_2
04693_p2
04693_p2.sch
+
C3
220
R26
50K
TP12
ACOMP
D2
7v ZENER
D1
1N914
D7
7V
VREF
ACOMP
C23
N/I C24
N/I
6/1/03 Changed layout on 1st switvher stage CACB
9/3/03 Changed R15 value CACC
11/18/03 Changed R43 & C15 values CACC1
Used for PCA 04692
07266B DCN6845
D-17
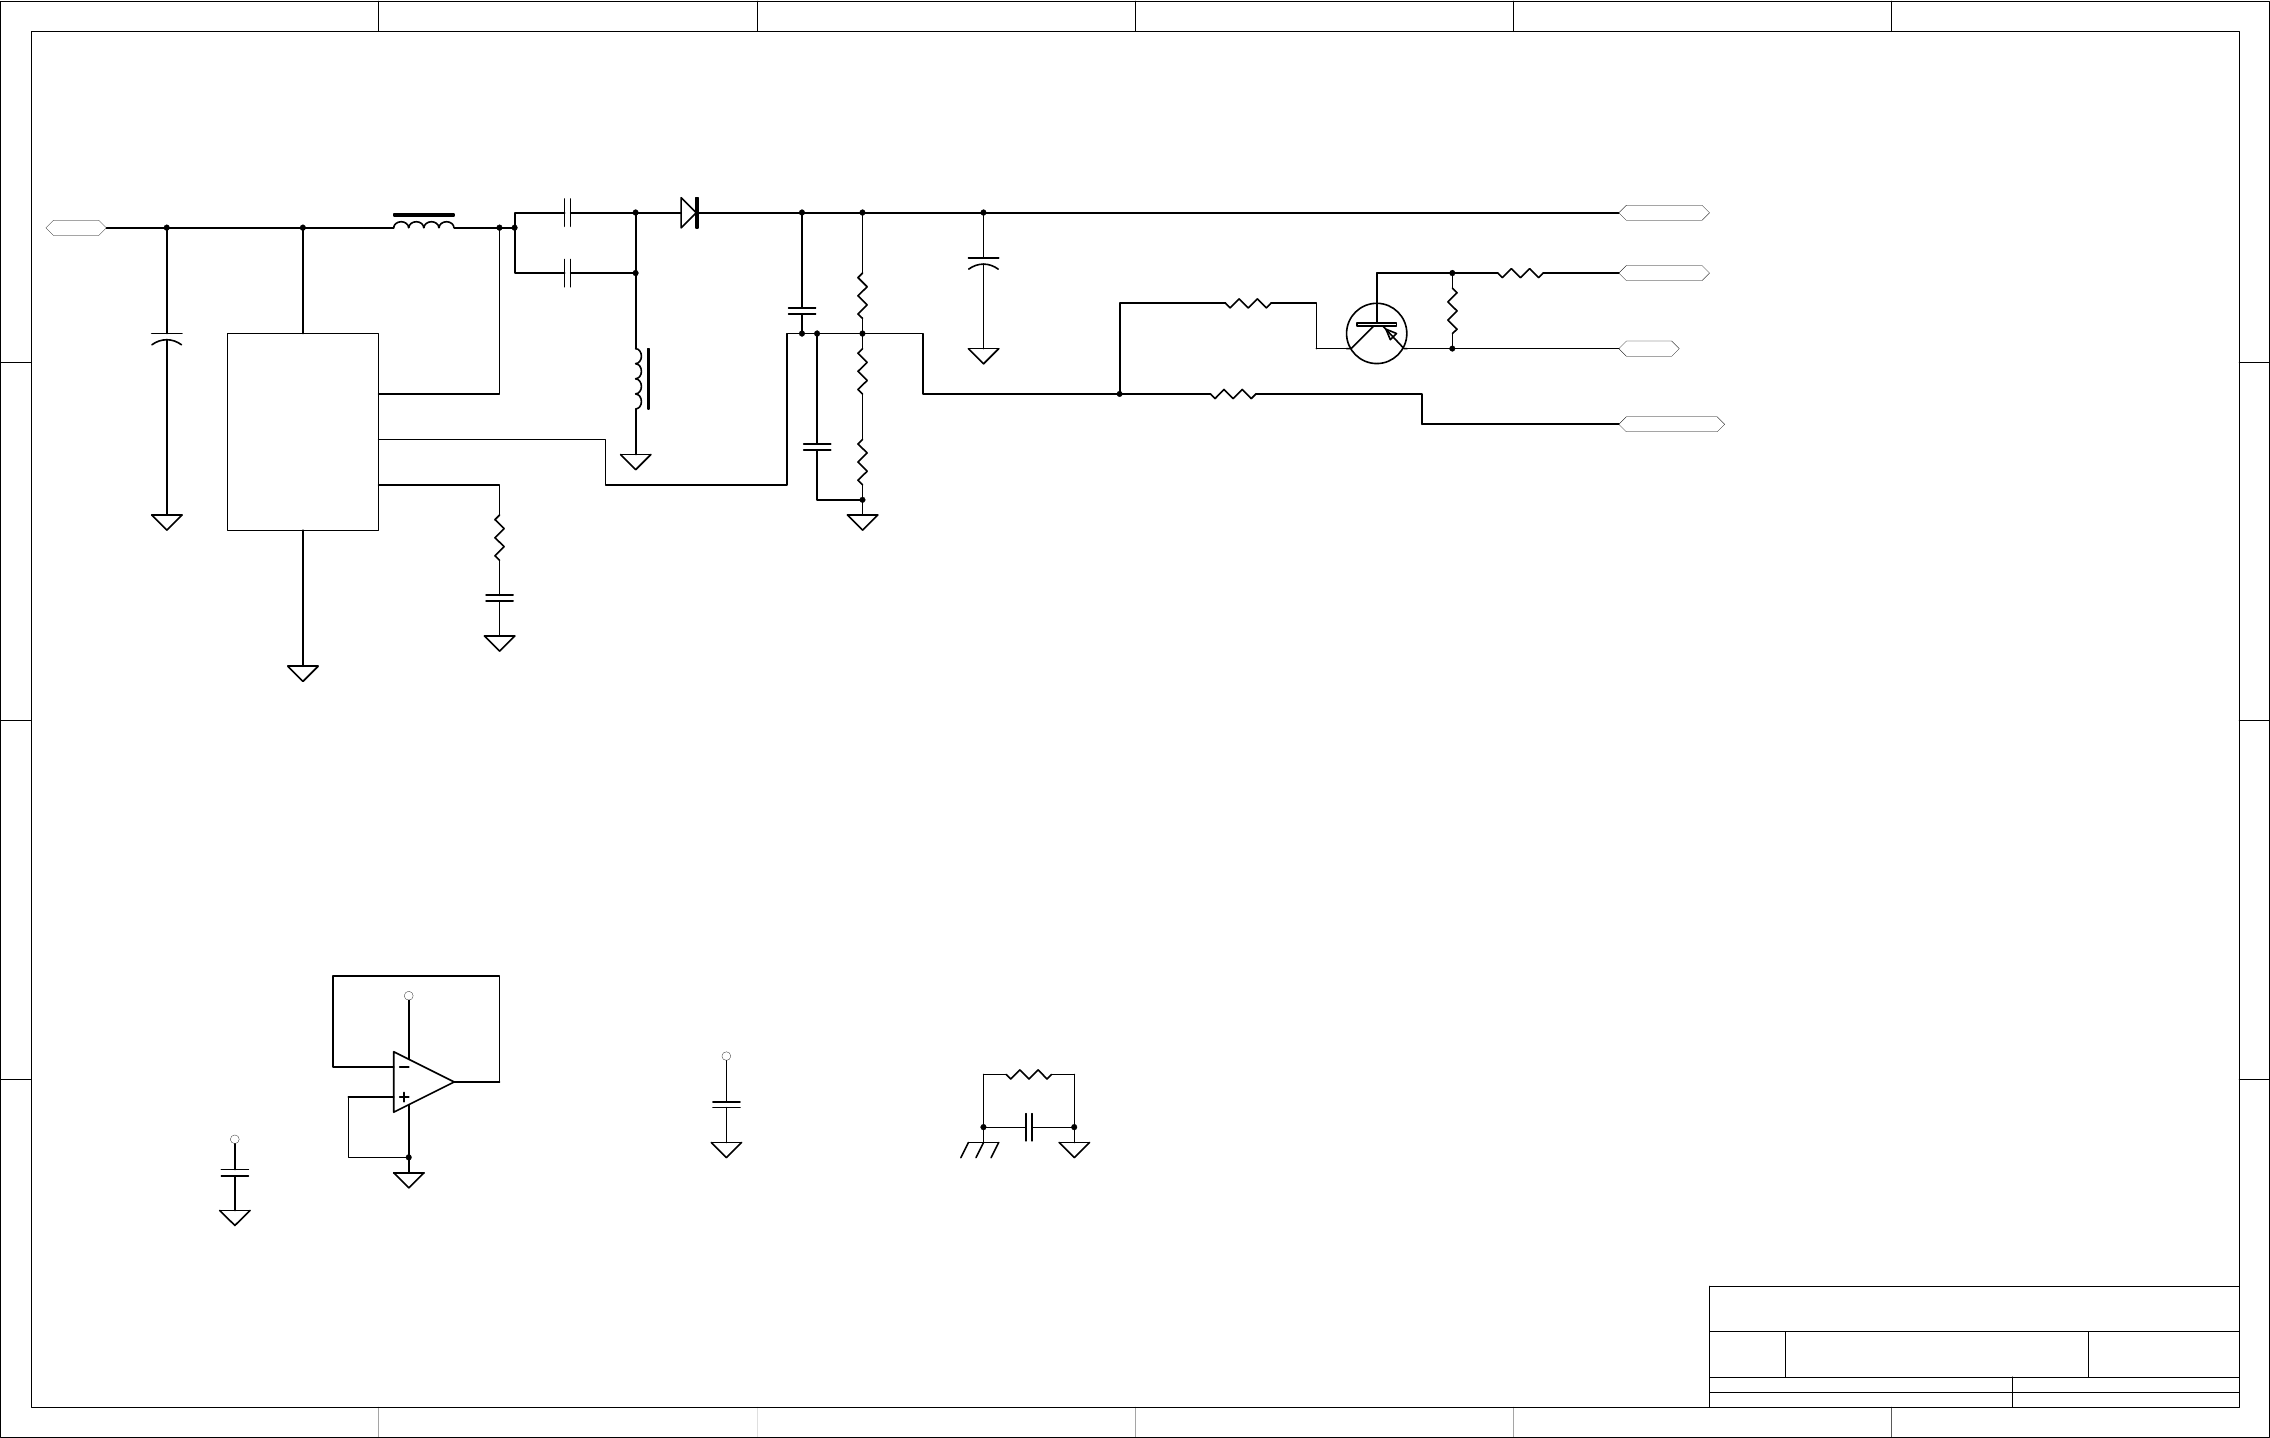
1 2 3 4 5 6
A
B
C
D
6
54321
D
C
B
A
Title
Number RevisionSize
B
Date: 2-Jun-2004 Sheet of
File: N:\PCBMGR\RELEASED\04691CC\source\04693e.ddbDrawn By:
VIN 5
GND
3
SW 4
FB 2
VCOMP 1
U5
LT1268
L1
25 uH
L2
25 uH
C21
4.7 uF
C18
4.7 uF
R41
1k
R42
25.5K
R43
2k
C15
0.68 uF
LAMP_FDBACK
D10
DIODE
R37
1k
+C20
1000 uF
+
C17
100 uF
+12V VDRIVE
C19
N/I
C8
0.1 uF
+12V
3
21
84
U4A
LM358
+12V
+12V
C10
0.1 uF C13
0.1 uF
R44
0
+12V VDRIVE
lamp_fdback
VSWITCH R45
5.1K
C22
N/I
R23
5.1K
VREF
ACOMP_2
R47
100K
R46
50K
Q1 PN3645_PNP
E04693
Sch, Bursting UV Lamp Drv, M100E
2 2
D-18
07266B DCN6845
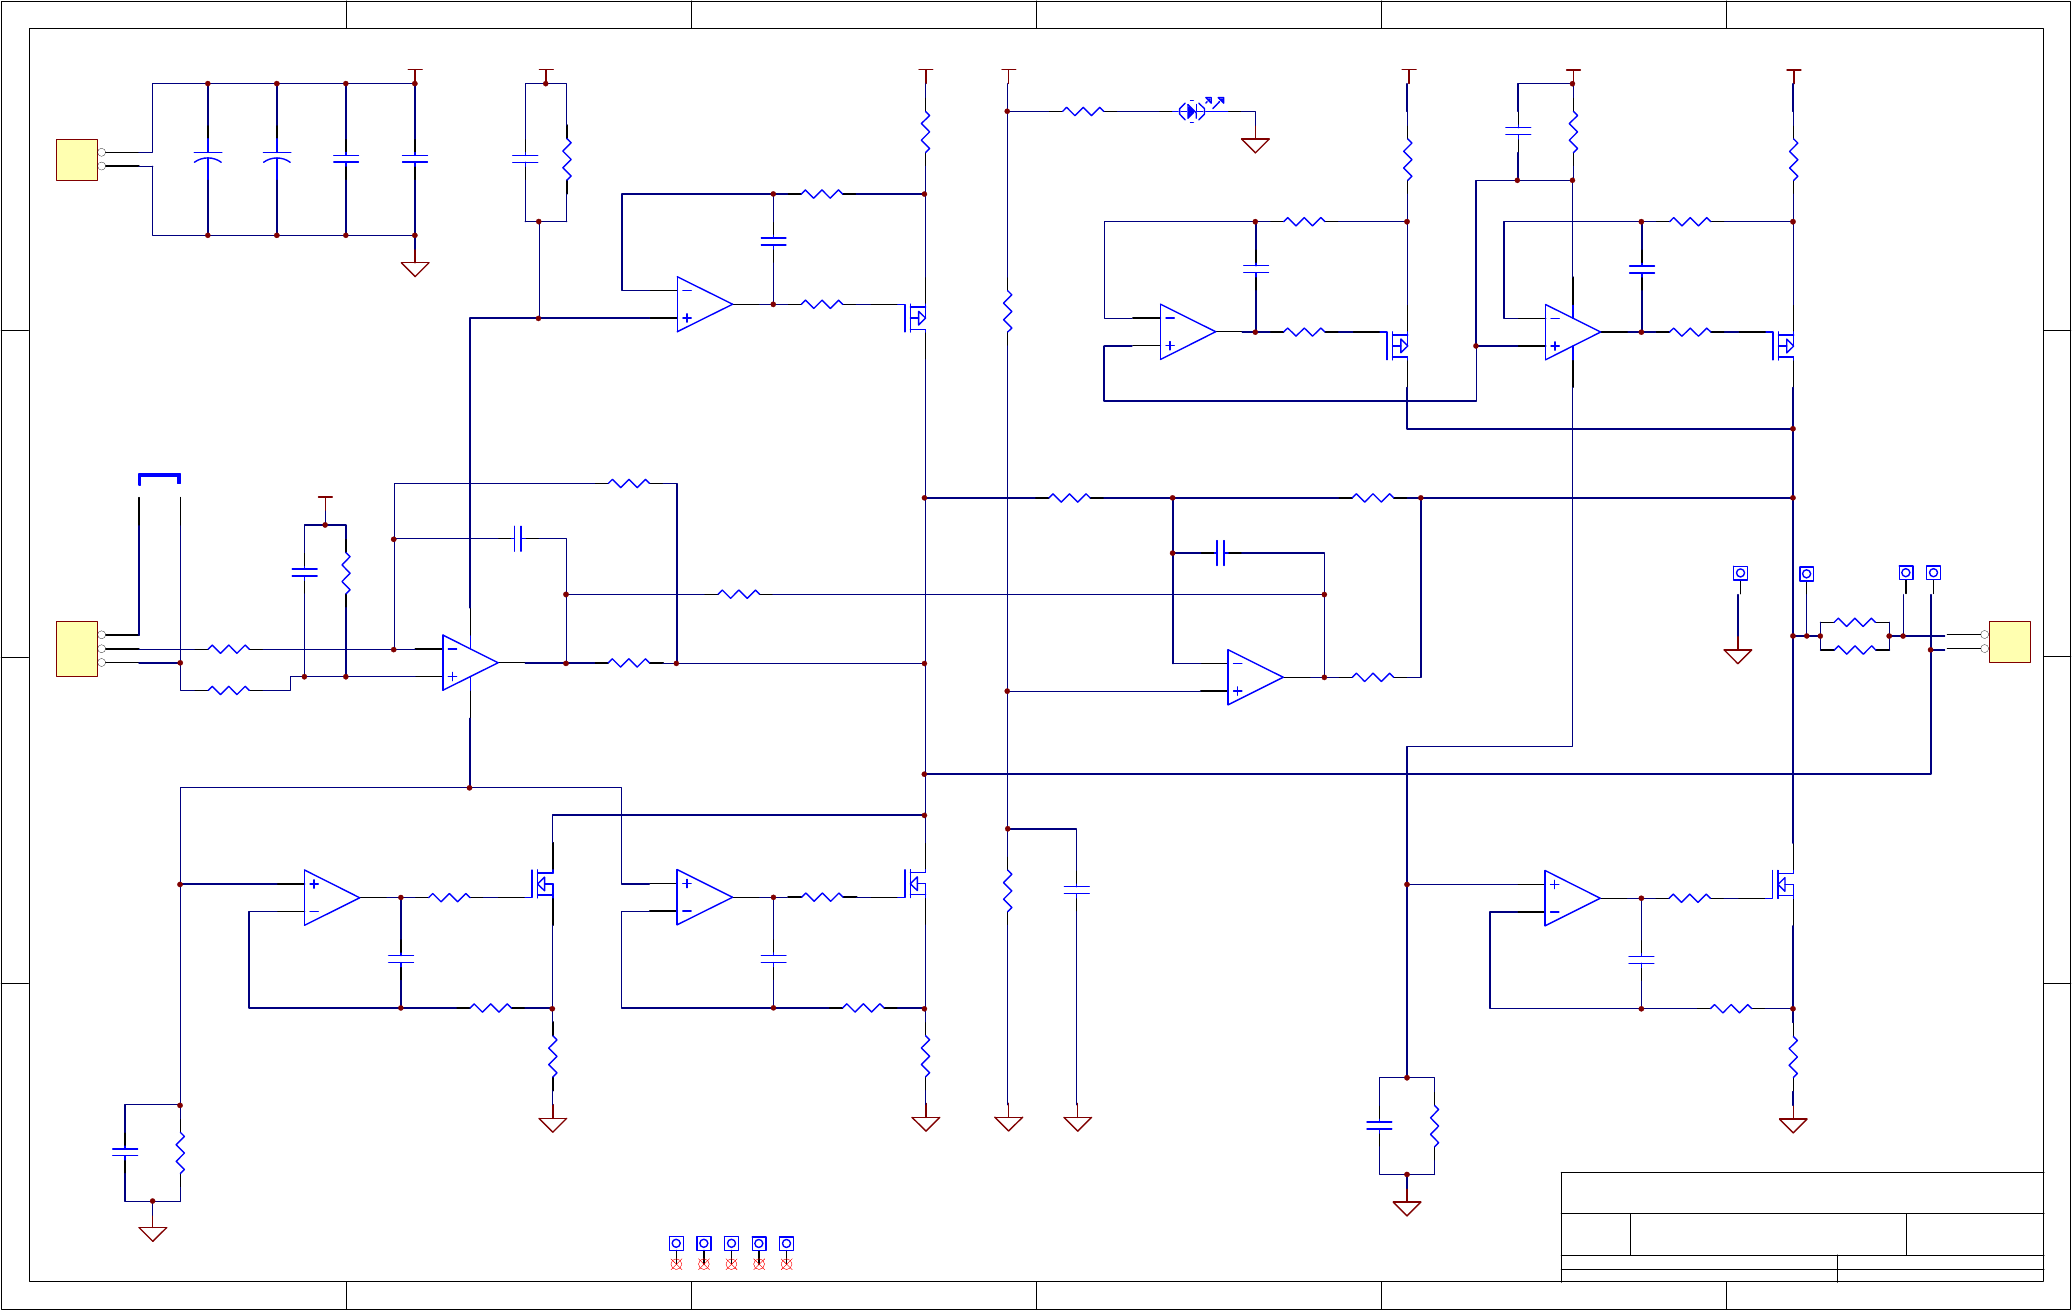
12345 6
A
B
C
D
6
5
4
3
2
1
D
C
B
A
Title
Number RevisionSize
B
Date: 13-Jan-2005 Sheet of
File: N:\PCBMGR\UNREL\04930PW\Protel\04930.DDBDrawn By:
1
2
J2
+15
TP2 TP3
C16
0.1uF
R12
49.9
+15 +15
+15
+15
+
C14
22uF
1
2
J1
1
2
3
J3
+15
TP4
TEC Amplifier PCB
C
1 1
04932
R33 1.00K
+
C15
22uF
2
3
1
11 4
U1A
LMC6464BIM
6
5
7
U1B
LMC6464BIM
6
5
7
U2B
LMC6464BIM
13
12
14
U1D
LMC6464BIM
R1 10.0K
R2 10.0K
R16
20.0K
R13 20.0K
R14 10.0K
C6
0.1uF
C7 0.1uF
Open for M200E
Closed for M100A
C17
0.1uF
1
2
JP1
JUMPER
Q4
NTB30N06L
Q1
MTB30P6V
R31 1.00K
R7 1.00K
C2
0.1uF
C4
0.1uF
U1V+
R3
0.2
R6
0.2
R8 1.00K
C1
0.1uF
R32 1.00K
9
10
8
U1C
LMC6464BIM
Q5
NTB30N06L
R9
0.2
R10 1.00K
C3
0.1uF
R11
49.9
C5
0.1uF
U2V+
U1V-
R15 2.00K
R22
49.9
+15
C12
0.1uF
R27
6.04K
R28
6.04K
C18
0.1uF
C9
0.1uF
R29 1.00K
R17
0.2
Q3
MTB30P6V
R18 1.00K
+15
2
3
1
11 4
U2A
LMC6464BIM
C8
0.1uF
R24 1.00K
R4
0.2
Q2
MTB30P6V
R5 1.00K
9
10
8
U2C
LMC6464BIM
R25 20.0K
R23 10.0K
C13 0.1uF
R26 20.0K
R30 1.00K
13
12
14
U2D
LMC6464BIM
Q6
NTB30N06L
R19
0.2
R20 1.00K
C10
0.1uF
R21
49.9
C11
0.1uF
U2V+
RJ
X1 X2 X3 X4 X5
Mounting Holes
U2V-
TP1
D1
R34 2.00K
R36 0.2
R35 0.2
07266B DCN6845
D-19
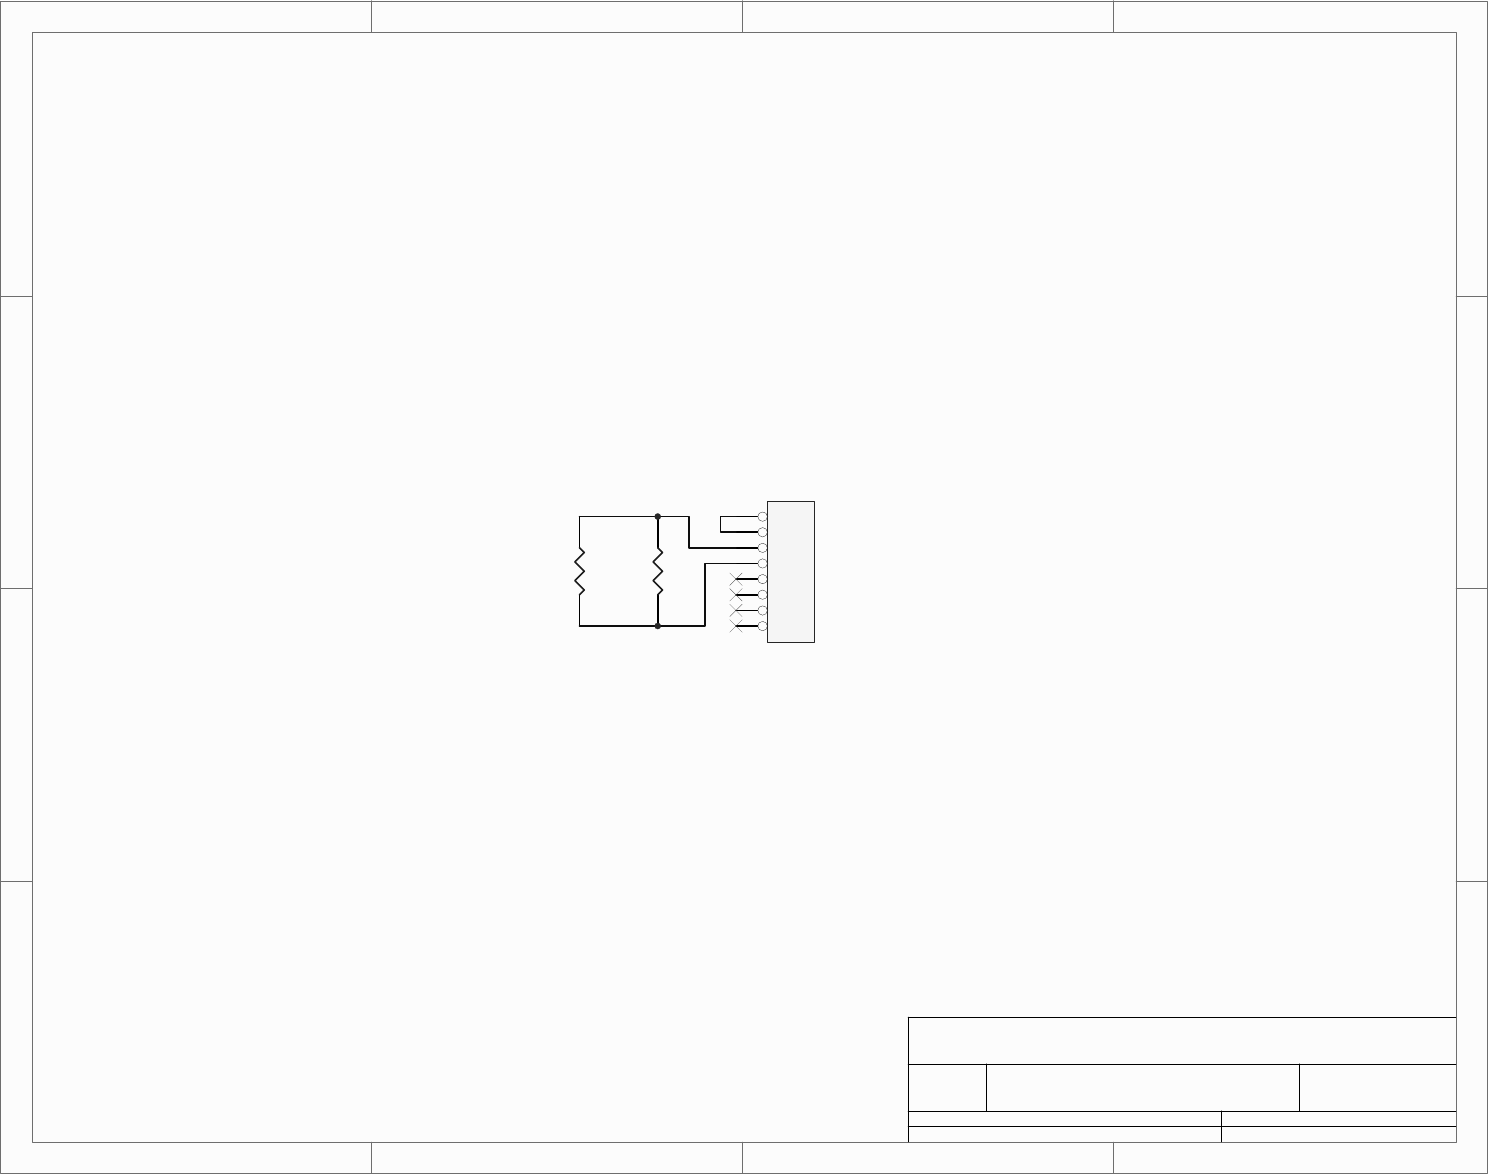
1
1
2
2
3
3
4
4
D D
C C
B B
A A
Ti tle
Number RevisionSize
A
Date: 6/28/2004 Sheet of
File: N:\PCBMGR\..\04468B.sch Drawn By:
1
2
3
4
5
6
7
8
JP1
No t U sed
R1
22
R2
SCH, E-Series Analog Output Isolator, PCA 04467
04468 B
D-20
07266B DCN6845
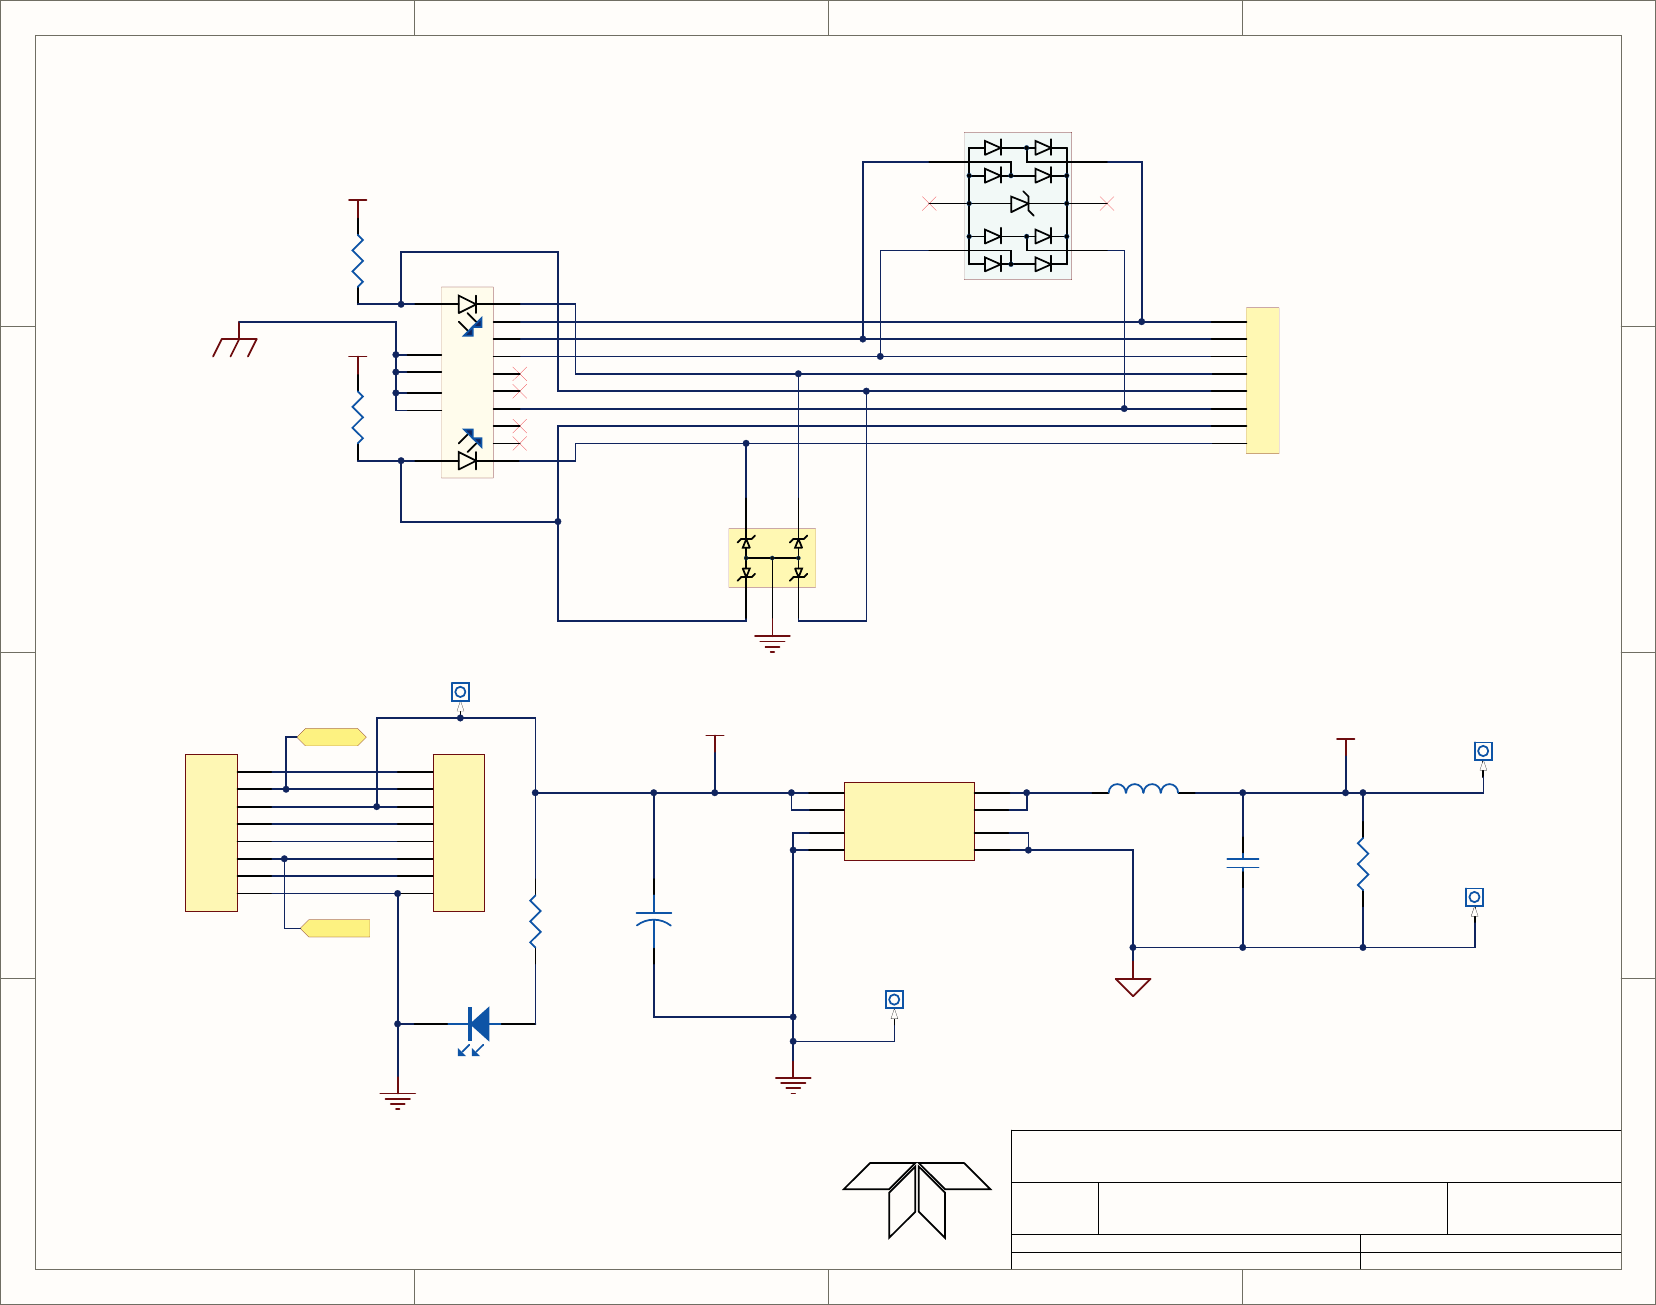
1
1
2
2
3
3
4
4
D D
C C
B B
A A
Title
Number RevisionSize
A
Date: 1/28/2010 Sheet of
File: N:\PCBMGR\..\06731-1_ETHERNET.SchDocDrawn By:
Auxiliary I/O Board (PWR-ETHERNET)
A
31
RT
06731
STRAIGHT THROUGH ETHERNET
GND
+5V
SCL
SDA
R7
1.37K
+5V
R8
1.37K
+5V-ISO
+C1
100u
GND
DS3
GRN
1
2
3
4
5
6
7
8
P2
Header 8
+5V
1
2
3 4
5
6
U6
SP3050
1
2
3 4
5
U7
SMF05T2G
GND
R10
2.2k
L1
47uH
TP1
TP3
TP2
8
2
3
5
7
4
6
1
J2
DF11-8DP-2DS(24)
SDA
SCL
CHASSIS-1
10 9
12 11
1
2
3
4
5
6
7
8
15
16
14
13
J1
CONN_RJ45_LED
+5V-OUT
TP4
ISO-GND
C2
4. u
R16
1k
L1
ATX+
ATX-
ARX+
ARX-
LED0
LED0+
LED1+
LED1
VDD2 5
GND2 7
VDD1
4
GND1
1
12
11
14
13
U8
LME0505
1
2
3
4
5
6
7
8
P3
Header 8
07266B DCN6845
D-21
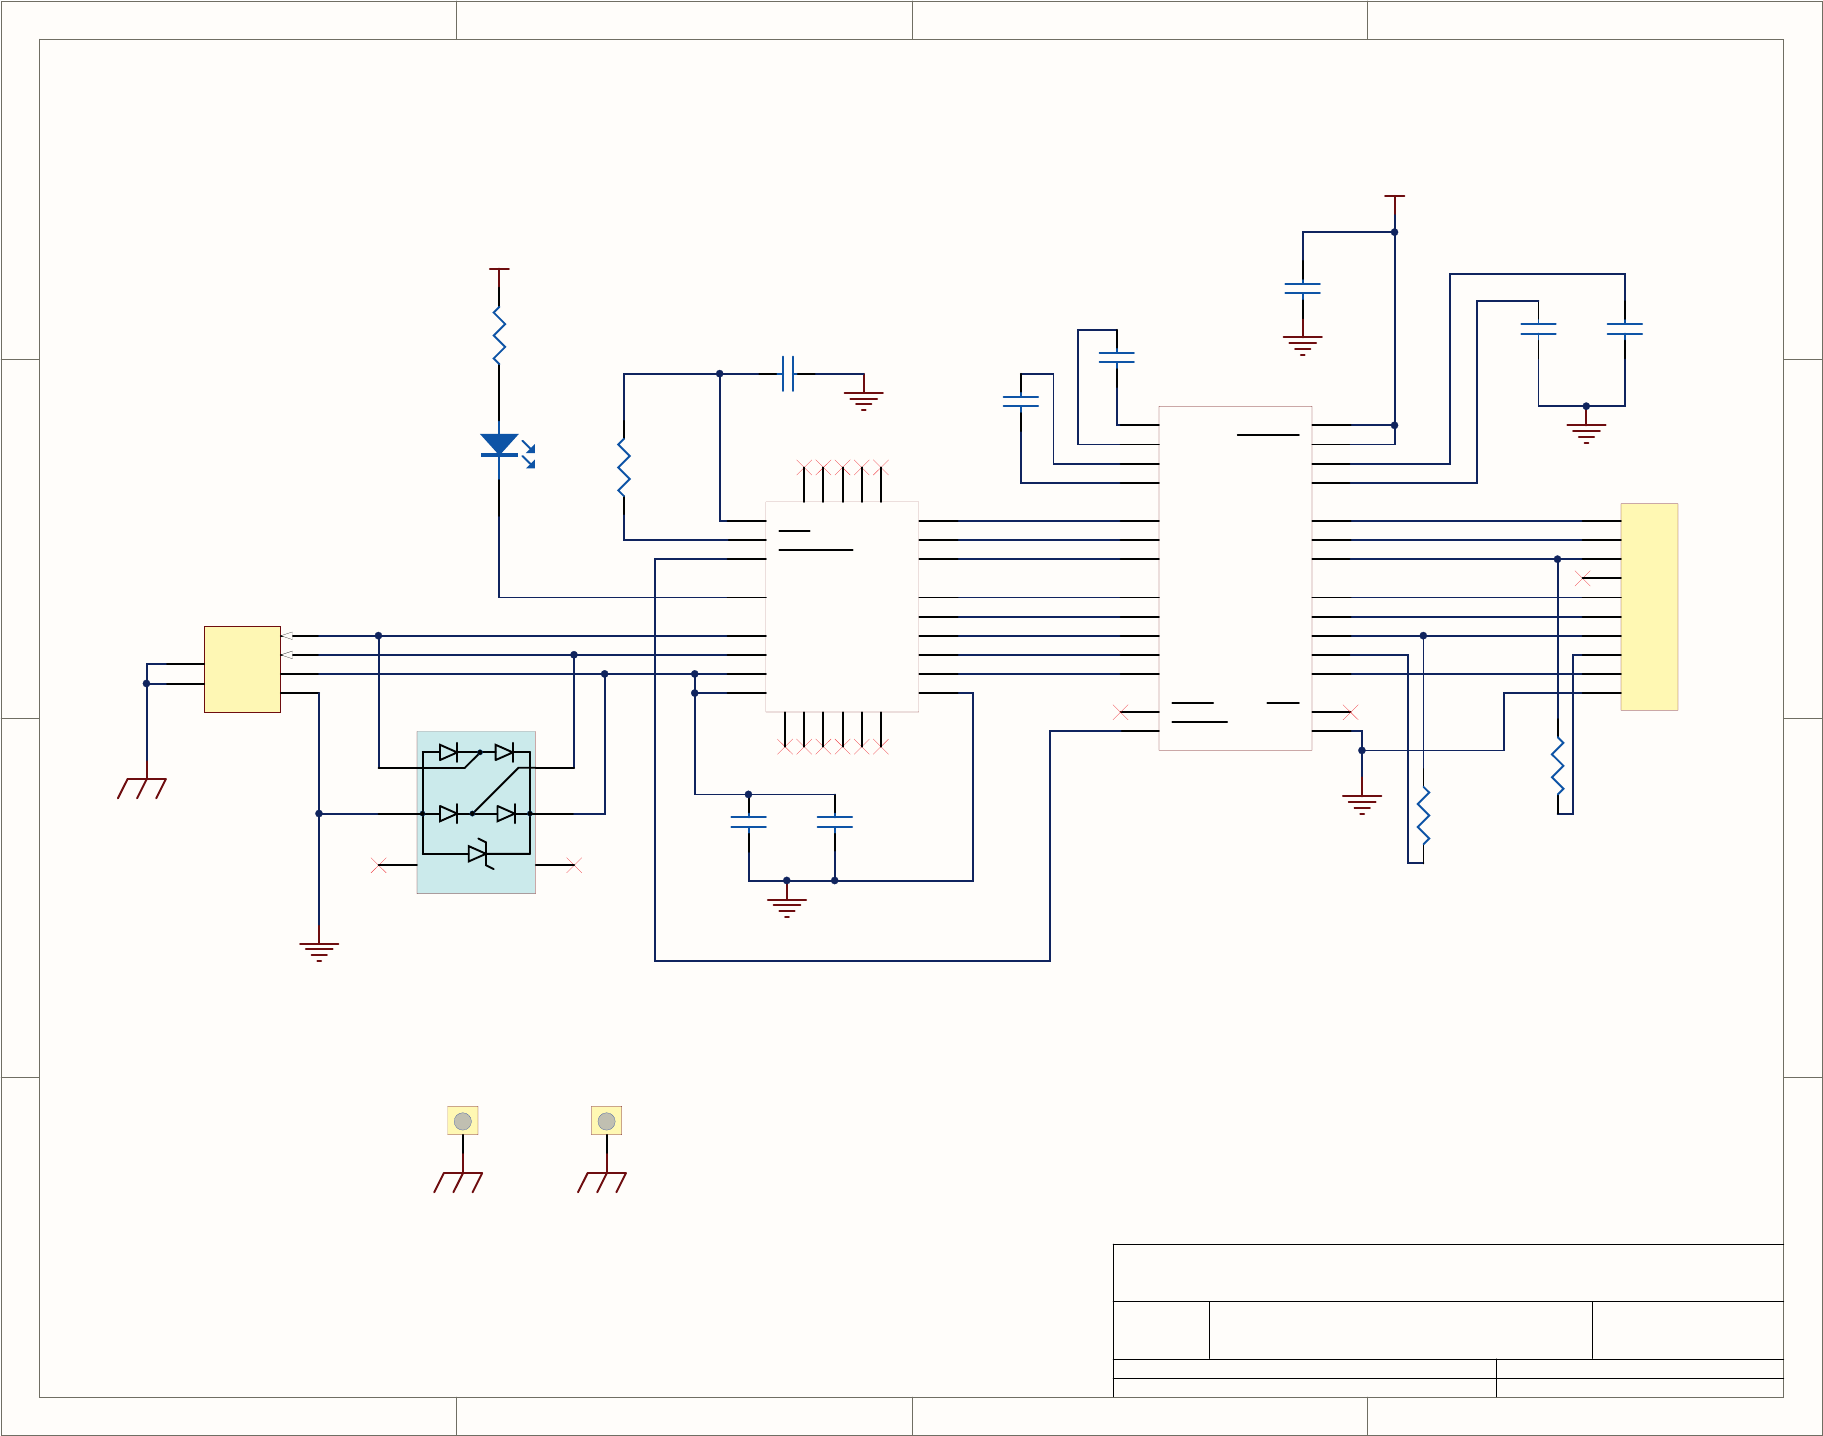
1
1
2
2
3
3
4
4
D D
C C
B B
A A
Title
Number RevisionSize
A
Date: 1/28/2010 Sheet of
File: N:\PCBMGR\..\06731-2_USB.SchDoc Drawn By:
Auxiliary I/O Board (USB)
A
32
RT
06731
TXD-A
RTS-A
DTR-A
RXD-A
CTS-A
DSR-A
DCD-A
RI-A
V-BUS
VBUS 1
D- 2
D+ 3
GND 4
J4
USB
GND
GND
V-BUS
CHASSIS
GND
GND
C1+
28
C1-
24
C2+
1
C2-
2
TI1
14
TI2
13
TI3
12
RI3 6
RI2 5
RI1 4
TO3 11
TO2 10
TO1 9
RO2 20
V- 3
V+ 27
VCC 26
STAT
21
SHTDN
22
RI4 7
RI5 8
ONLINE 23
GND 25
RO1
19
RO2
18
RO3
17
RO4
16
RO5
15
U9
SP3243EU
GND
R12
4.75k
GND
1
2
nc
3nc 4
5
6
U11
NUP2202W1
TXD-B
RXD-B
CTS-B
RTS-B
DSR-B
DTR-B
RI-B
DCD-B
MT1
MT-HOLE
C24
4. u
C26
1u
C25
0.1u
C22
0.1u
C23
0.1u
C19
0.1u
C20
0.1u
C21
0.1u
DS4
GRN
R11
2.2k
CHASSIS
MT2
MT-HOLE
R14
0
R15
0
DCD
2
RXD
1
TXD
4
DTR
3
GND
6
DSR
5
RTS
8
CTS
7
RI
10
N/C
9
J3
DF11-10DP-2DS(24)
V-BUS
CHASSIS-1
22
21
19
18
DCD 1
RI 2
DTR 28
DSR 27
TXD 26
RXD 25
RTS 24
CTS 23
GND 3
16
15
13
10
14 20
17
VBUS
8VREG-I
7D-
5
RST
9
SUSPEND
11
SUSPEND
12
VDD
6
D+
4U10
CP2102
3.3V
D-22
07266B DCN6845
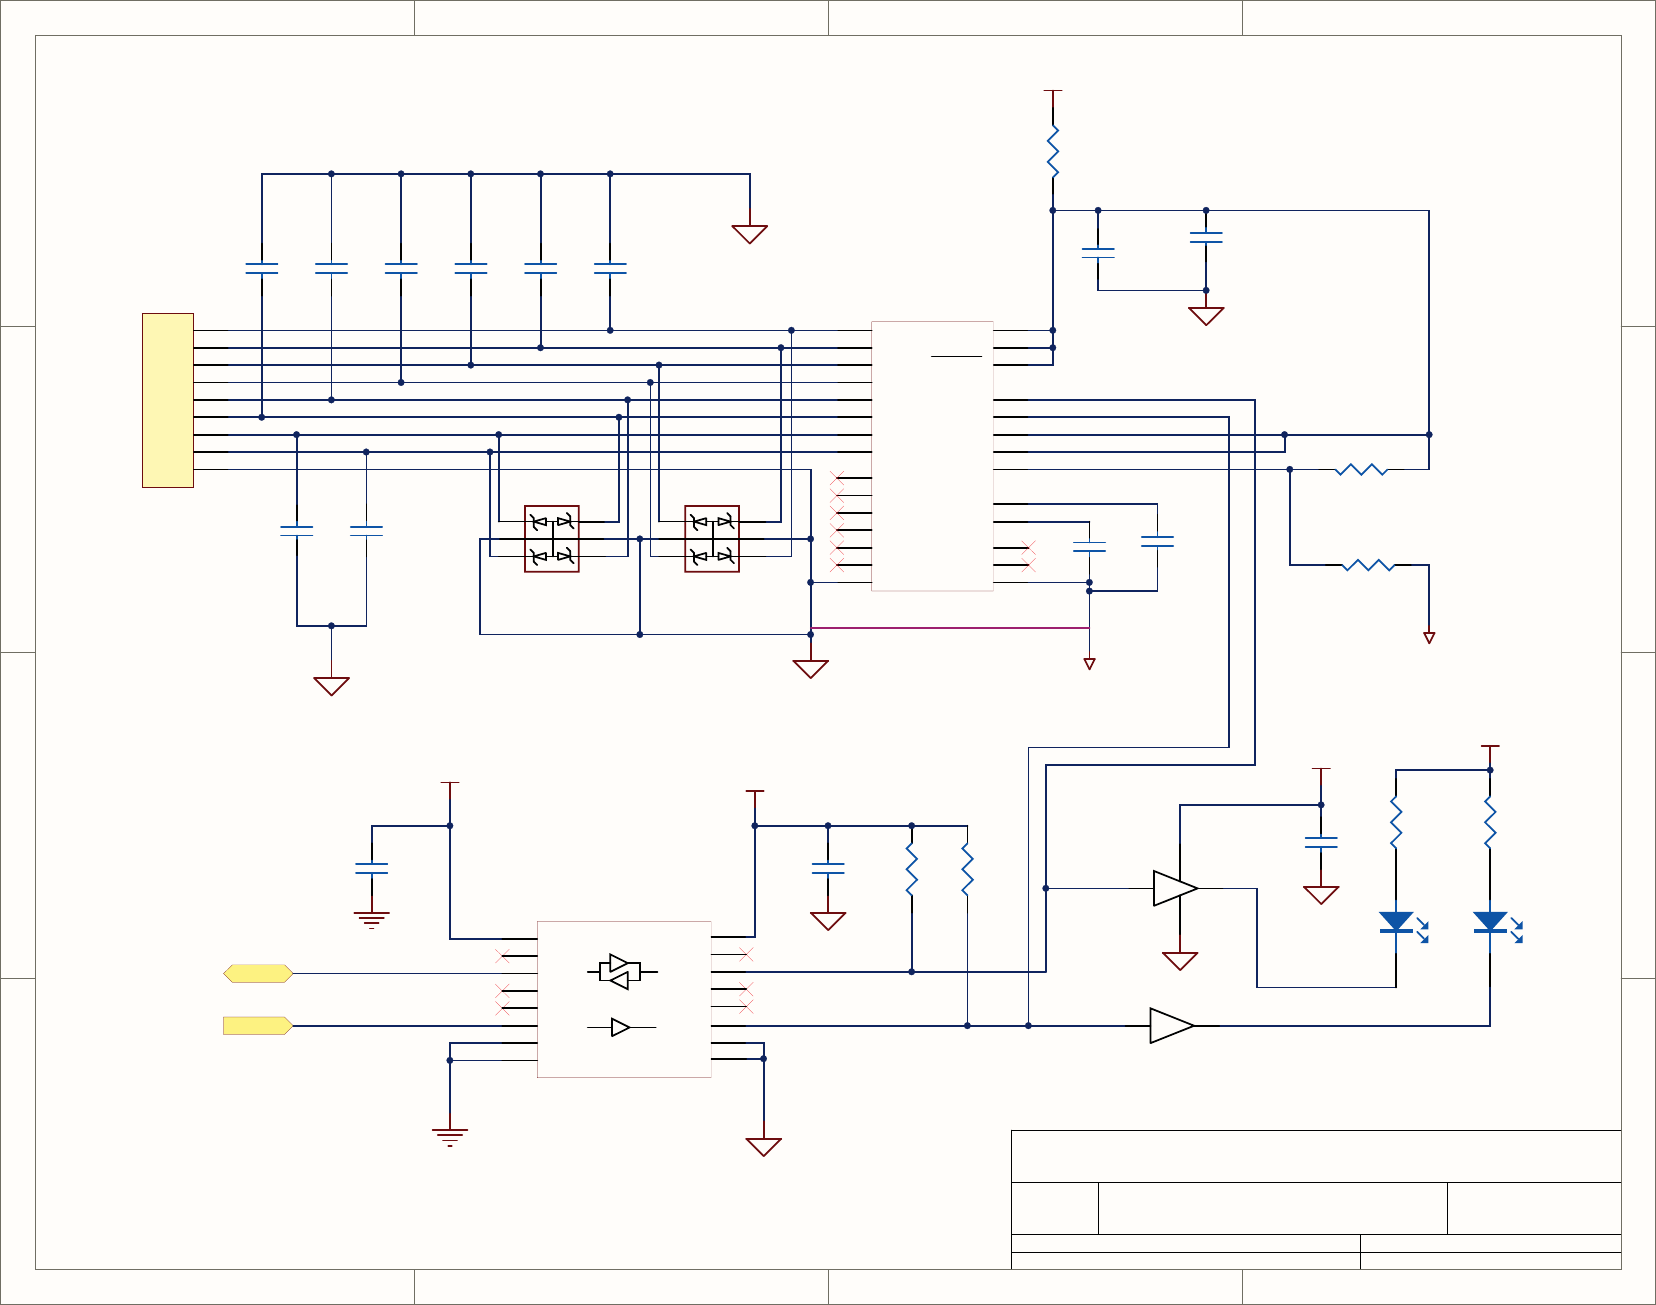
1
1
2
2
3
3
4
4
D D
C C
B B
A A
Title
Number RevisionSize
A
Date: 1/28/2010 Sheet of
File: N:\PCBMGR\..\06731-3_ADC.SchDoc Drawn By:
Auxiliary I/O Board (ADC)
A
33
RT
06731
1
2
3
4
5
6
7
8
9
P1
ANALOG INPUT
+5V-ISO
CH0
15
CH1
16
CH2
17
CH3
18
CH4
19
CH5
20
CH6
21
CH7
23
NC
4
NC
7
SHTDN 13
VDD 2
VDD 1
SDA 9
SCL 5
A2 10
A1 12
A0 6
REF 27
NC
8
AGND
14
REF-AJ 26
DGND 3
NC
22
NC
24 NC 28
NC 25
NC
11
U1
MAX1270BCAI+
+5V
GND
GND
+5V-ISO
SCL
SDA
ISO-GND
ISO-GND
ISO-GND
+5V-ISO
1 6
52
U4A
NC7WZ17P6X
3 4
U4B
NC7WZ17P6X
ISO-GND
+5V-ISO
ISO-GND
1
3
2
4
5
6
U2
SMS12
C13
0.1u
C14
0.1u
C12
0.1u
C1
0.1u
C11
0.01u
YEL
DS2
SCL
YEL
DS1
SDA
GND1
1
NC
2VDD1
3
NC
4SDA1
5
SCL1
6
GND1
7
NC
8
GND2 9
NC 15
VDD2 14
NC 13
SDA2 12
SCL2 11
GND2 16
NC 10
U5
ADuM2251
R1
4.75k
R2
4.75k
C
0.1u C9
0.1u
C2
0.1u
C3
0.1u
C4
0.1u
C5
0.1u
C6
0.1u
C
0.1u
C10
4. u
AN-CH0
AN-CH1
AN-CH2
AN-CH3
AN-CH4
AN-CH5
AN-CH6
AN-CH7
R9
4.99
C2
4. u
ISO-GND
+5V-ADC
ISO-GND
ISO-GND
ISO-GND
ISO-GND
R3
2.2k
R5
2.2k
R6
2.2k
1
3
2
4
5
6
U3
SMS12
R4
2.2k
07266B DCN6845
D-23
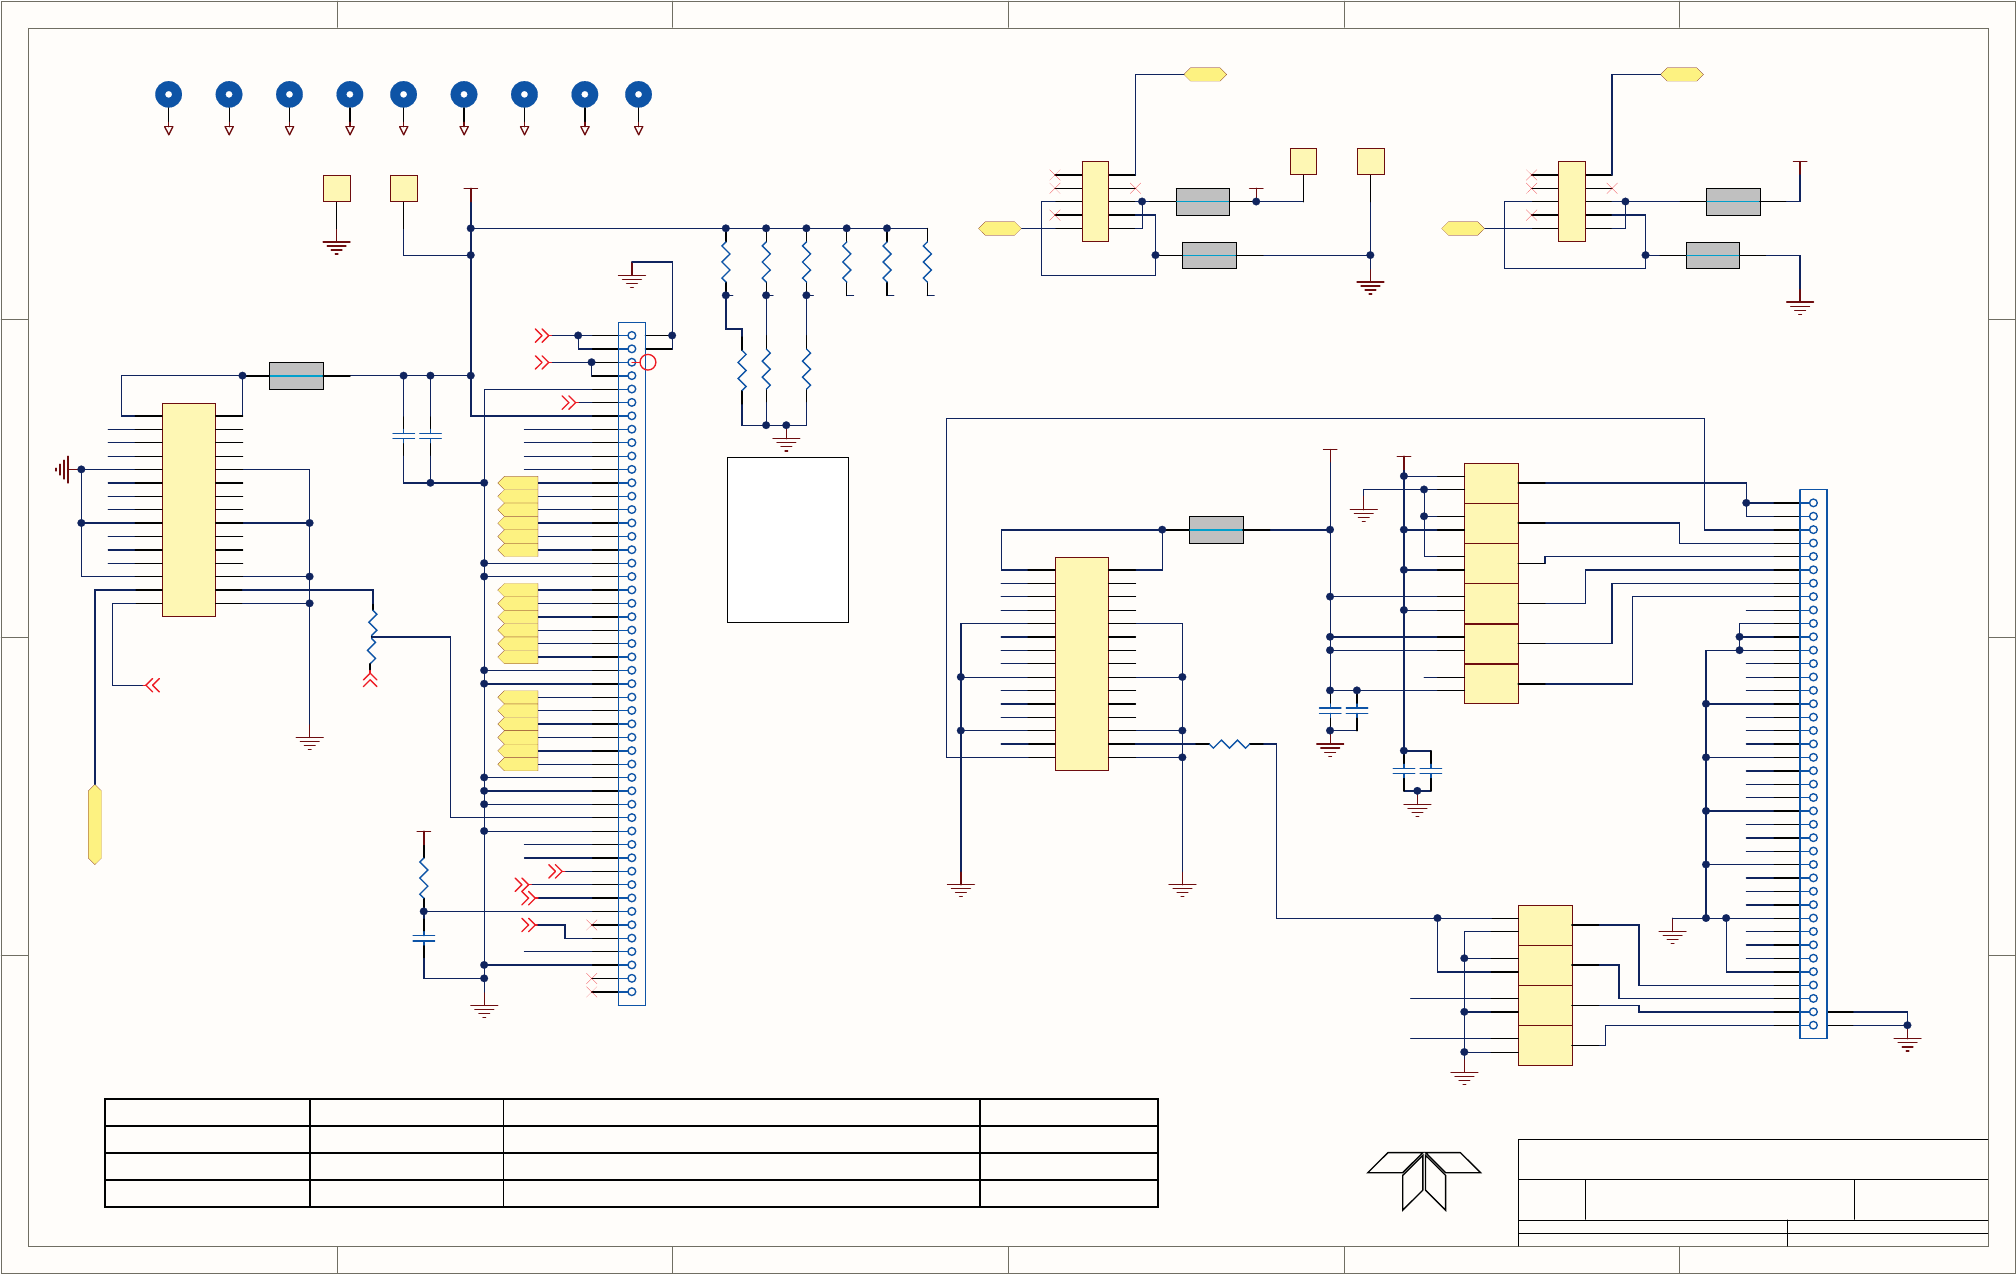
1
1
2
2
3
3
4
4
5
5
6
6
D D
C C
B B
A A
Title
Number RevisionSize
B
Date: 6/24/2010 Sheet of
File: N:\PCBMGR\..\06696.P1.R3.schdoc Drawn By:
GUI Interface
06698 D
14
2
3
4
5
6
7
8
1
51
52
9
10
11
12
13
14
15
16
17
18
19
20
21
22
23
24
25
26
27
28
29
30
31
32
33
34
35
36
37
38
39
40
41
42
43
44
45
46
47
48
49
50
GM800480X-70-TTX2NLW
J2
CL586-0529-2
Mode
aVsync
aHSync
3.3V
100K
R7
L/R
U/D
aReset
DithB
L/RU/DDithB
10K
R1
22uF/6.3V
C1
JMK316BJ226KL 0.0022
CA_112
C2
Mode
aVsync
aHSync
i BackLightDrive
aB7aB6
aB5aB4
aB3aB2
aG7aG6
aG5aG4
aG3aG2
aR6
aR5aR4
aR3aR2
aR7
aDCLK
3.3V
1.0
C7
GMK107BJ105KA
B5B4
B3B2
B1B0
G5G4
G3G2
G1G0
R4
R3R2
R1R0
R5
DEN
2
3
4
5
6
7
8
1
41
42
9
10
11
12
13
14
15
16
17
18
19
20
21
22
23
24
25
26
27
28
29
30
31
32
33
34
35
36
37
38
39
40
NI
J3
CL586-0527-7
B4
B2
B0
G4
G2
G0
R4
R2
R0
B5
B3
B1
G5
G3
G1
R3
R1
R5
DEN
DCLK
L/R
U/D
Mode
3.3V +5V
+5V
5V-GND
1
32
4
65
7
98
10
12 11
JP3
4X3 Jumper
1
32
4
65
7
98
10
12 11
13
15 14
16
18 17
JP2
6X3 Jumper
Bklght+
Bklght-
Vcom
Vgh
AVdd
Vcom
aG1
aG0
aR1
aR0
aB1
aB0
CHASSIS CHASSIS CHASSIS CHASSIS
MT1
TP1
1
2
38
5
7
4
6
10
9
J1
0039300100
1 2
3 4
5 6
7 8
9 10
11 12
13 14
15 16
17 18
19 20
21 22
23 24
25 26
27 28
29 30
B30B-PHDSS (LF)(SN)
J7
1 2
3 4
5 6
7 8
9 10
11 12
13 14
15 16
17 18
19 20
21 22
23 24
25 26
27 28
29 30
B30B-PHDSS (LF)(SN)
NI
J8
FBMH3216HM501NT
FB1
CHASSIS CHASSIS CHASSIS CHASSIS CHASSIS
Vgl
Make Model JP
2
JP
3
FEM A
G
M
800
4
80
W
1
-
2
,4-5,7-
8
,
10
-
11
,
13
-
1
4,
16
-
1
7
1
-
2
,4-5,7-
8
,
10
-
11
Dat a Image F
G0
7
00
A
0
D
S
WB
G01 3
-
2
,
6
-5,
9
-
8
,
12
-
11
,
1
5-
1
4,
18
-
1
7
2
-
3
,5-
6
,
8
-
9
,
11
-
12
United Radiant Tech. UM
S
H-
81
7
3
MD-
1
T
2
-
3
,4
/
5
/6
N
C
,7
/8/9
N
C
,
10
-
11
,
13
-
1
4,
16/ 1
7
/18
N
C2
-
3
,5-
6
,
8
-
9
,
11
-
12
Internal Dithering
0 = Enable
1 = Disable
Scan Direction
U/D L/R Scan Dir.
0 1 UD, LR
1 0 DU, RL
0 0 UD, RL
1 1 DU, LR
(1 = H, 0 = L)
22uF/6.3V
C3
JMK316BJ226KL
22uF/6.3V
C5
JMK316BJ226KL
10K
R2
10K
R3
10K
R4
10K
R5
10K
R6
FBMH3216HM501NT
FB2
FBMH3216HM501NT
FB3
FBMH3216HM501NT
FB4
0.0022
CA_112
C4
0.0022
CA_112
C6
TP3 TP4
R280
MT2 MT3 MT4 MT5 MT6 MT7 MT8 MT9
5V-GND
5V-GND
TP2
BACKL
A
B
R21
jumper
bDCLK
CLK
NI
R48
R47
0
NI
R46
aB6
aB5
aB4
aB3
aB2
aG7
aG6
aG5
aG4
aG3
aG2
aR7
aR6
aR5
aR4
aR3
SCL
SDA
aB7
aR2
aData Enable
aData Enable
aB7
aB6
aB5
aB4
aB3
aB2
aG7
aG6
aG5
aG4
aG3
aG2
aR7
aR6
aR5
aR4
aR3
aR2
aData Enable
Default:R21B
+5V
5V-GND
1
2
38
5
7
4
6
10
9
J14
0039300100
FBMH3216HM501NT
FB16
FBMH3216HM501NT
FB17
SCL
SDA
RT
D-24
07266B DCN6845
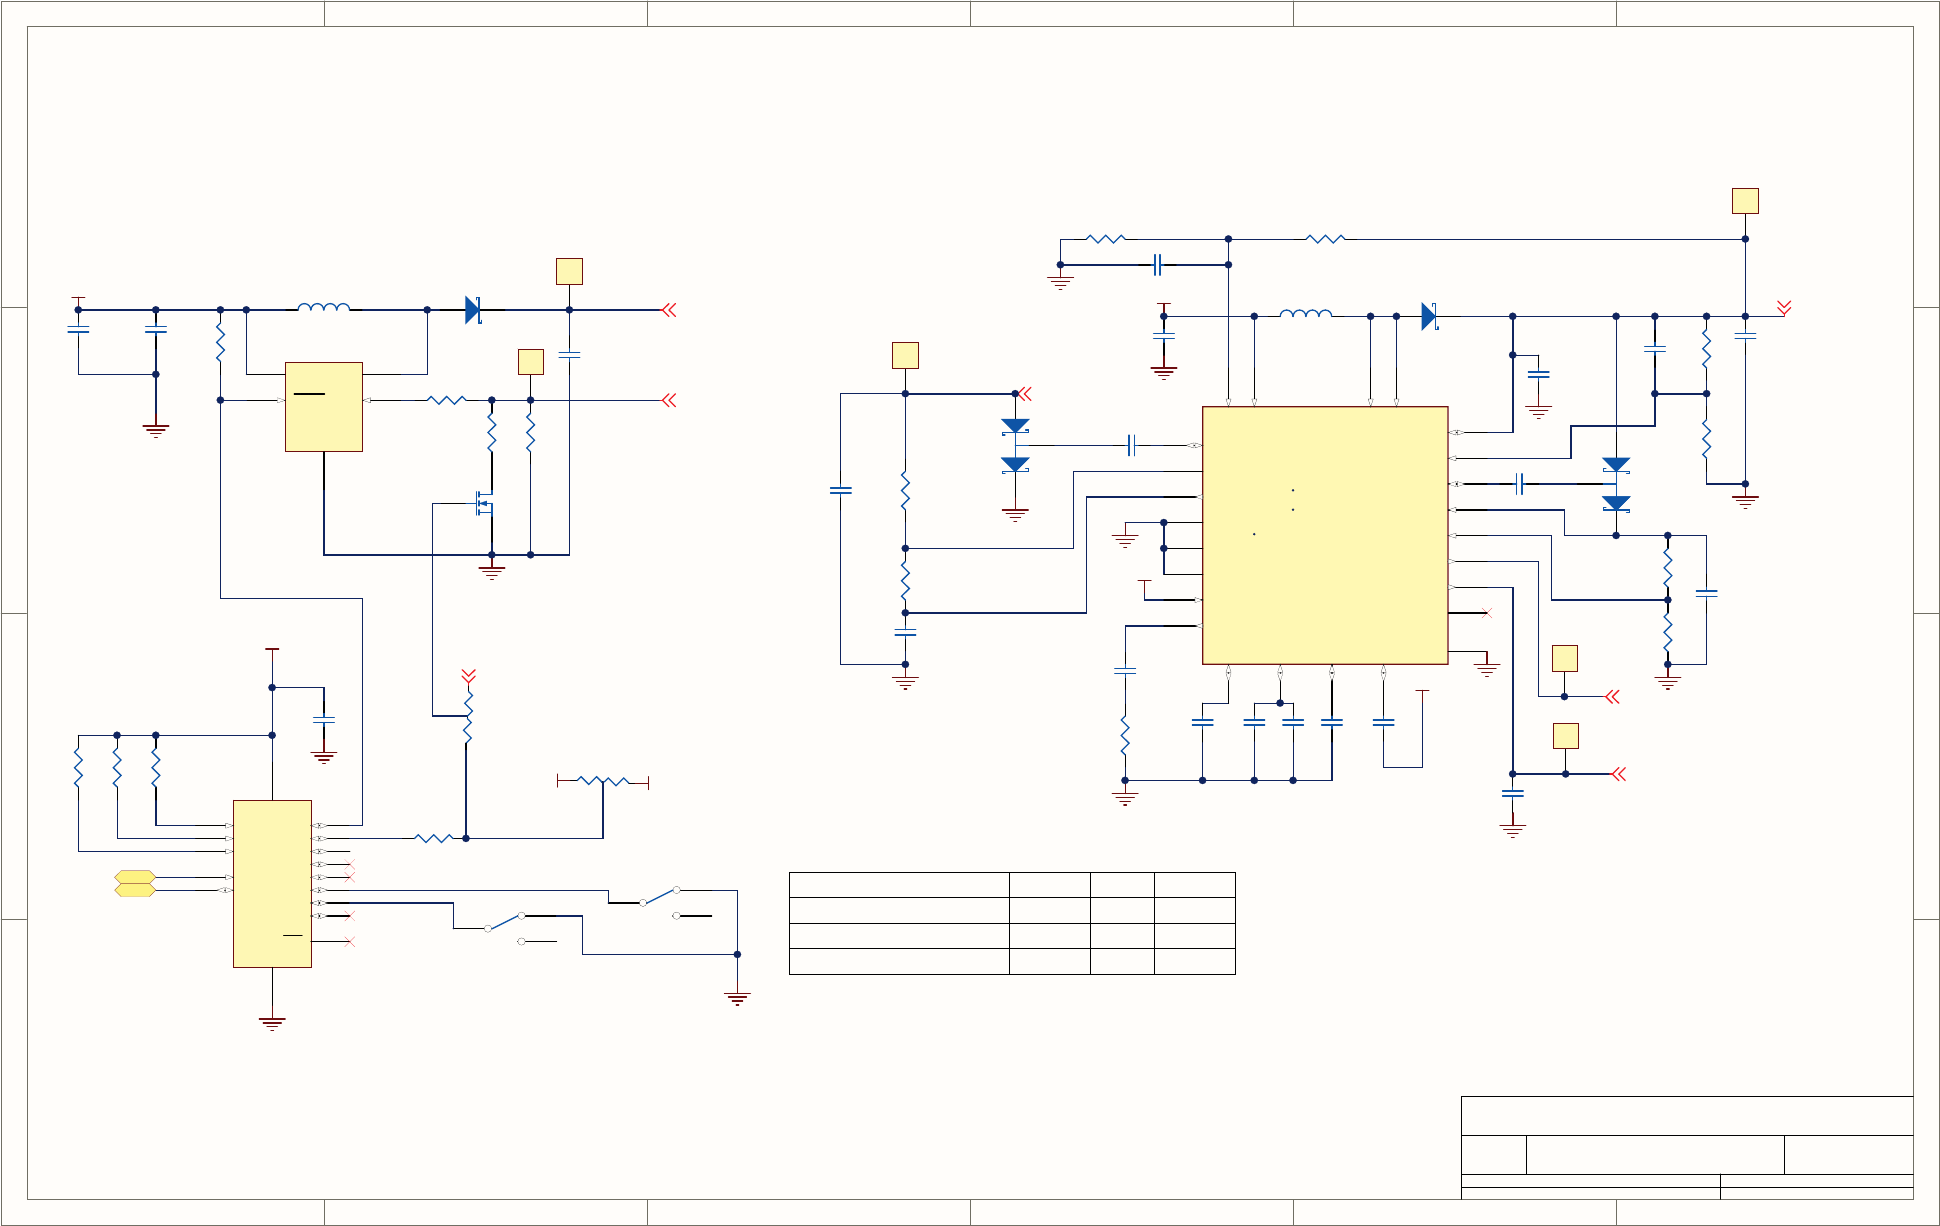
1
1
2
2
3
3
4
4
5
5
6
6
D D
C C
B B
A A
Title
Number RevisionSize
B
Date: 6/24/2010 Sheet of
File: N:\PCBMGR\..\06696.P2.R3.schdoc Drawn By:
06698 D
24
22uH
L1
Vin
5
SHDN
4
SW 1
GND
2
FB 3
U1
CAT4139TD-GT3
4.7uF/16V
C9
1K
R12
2.0
R14
5V-GND
+5V
9.76
R13
3.9uH
L2
487K
R9
309K
R8
80.6K
R18
66.5K
R19
464K
R16
806K
R11
A
2K1
D2
MBRM120LT1G
0.001C8
24pf
C13
0.33
C16
0.220
C20
470pf
C21
22uf/25V
C12
TMK325BJ226MM
0.1
C26
3.3V
33K
R23
43pf
C23
D3
BAT54S
3.3V
Bklght+
Bklght-
Vcom
Vgh
AVdd
3.3V
D3
G
1
S
2
Q1
FDV305N
5V-GND
+5V
Default: NI
R22 jumper
AVdd: +10.4V
TP5
AO
1
A1
2
A2
3
SCL
14
SDA
15
INT 13
P0 4
P1 5
P2 6
P3 7
P4 9
P5 10
P6 11
P7 12
Vdd 16
Vss
8
U3
PCF8574
S2
SW_46
Maint_SW
Lang_Select
5V-GND
5V-GND
+5V
FDLY
24
PGND
8
DRVP 17
PGND
7
DRVN
18
VCOM 10
SUP 9
COMP
22
IN 11
VGH 15
REF
20
GND
19
SW 6
DLY2
3
SW 5
FB 1
DLY1
2
FBP 12
FBN
21
ADJ
14
GD 23
CTRL
13
CPI 16
VIN 4
TPS65150PWP
?
HTSNK 25
U2
D1
CD214A-B140LF
S1
SW_46
Opt. Lang. Sw.
Opt. Main Sw
Vgl
22uF/6.3V
C11
JMK316BJ226KL
1.0
C14
GMK107BJ105KA
1.0
C15
GMK107BJ105KA
1.0
C27
GMK107BJ105KA
24pf
C22
43pf
C24
43pf
C25
10K
R10
10K
R24
10K
R25
10K
R26
100K
R15
806K
R17
0.33
C17
0.33
C18
0.33
C19
D4
BAT54S
4.7uF/16V
C10
Vgh: +16V
TP9
Vcom: +4V
TP10
Vgl: -7V
TP7
TP6
TP8
GUI Interface
C35
0.1
5V-GND AB
R31
10K
3.3V
A
B
R27
jumper
BACKL
SCL
SDA
Default:R27B
Default:R31B
Backlight Brightness Control
Control Mode R22 R27 R31
Remote – Video Port NO A NO
Remote – I2C YES B NO
Fixed Bright (default) NO B B
RT
07266B DCN6845
D-25
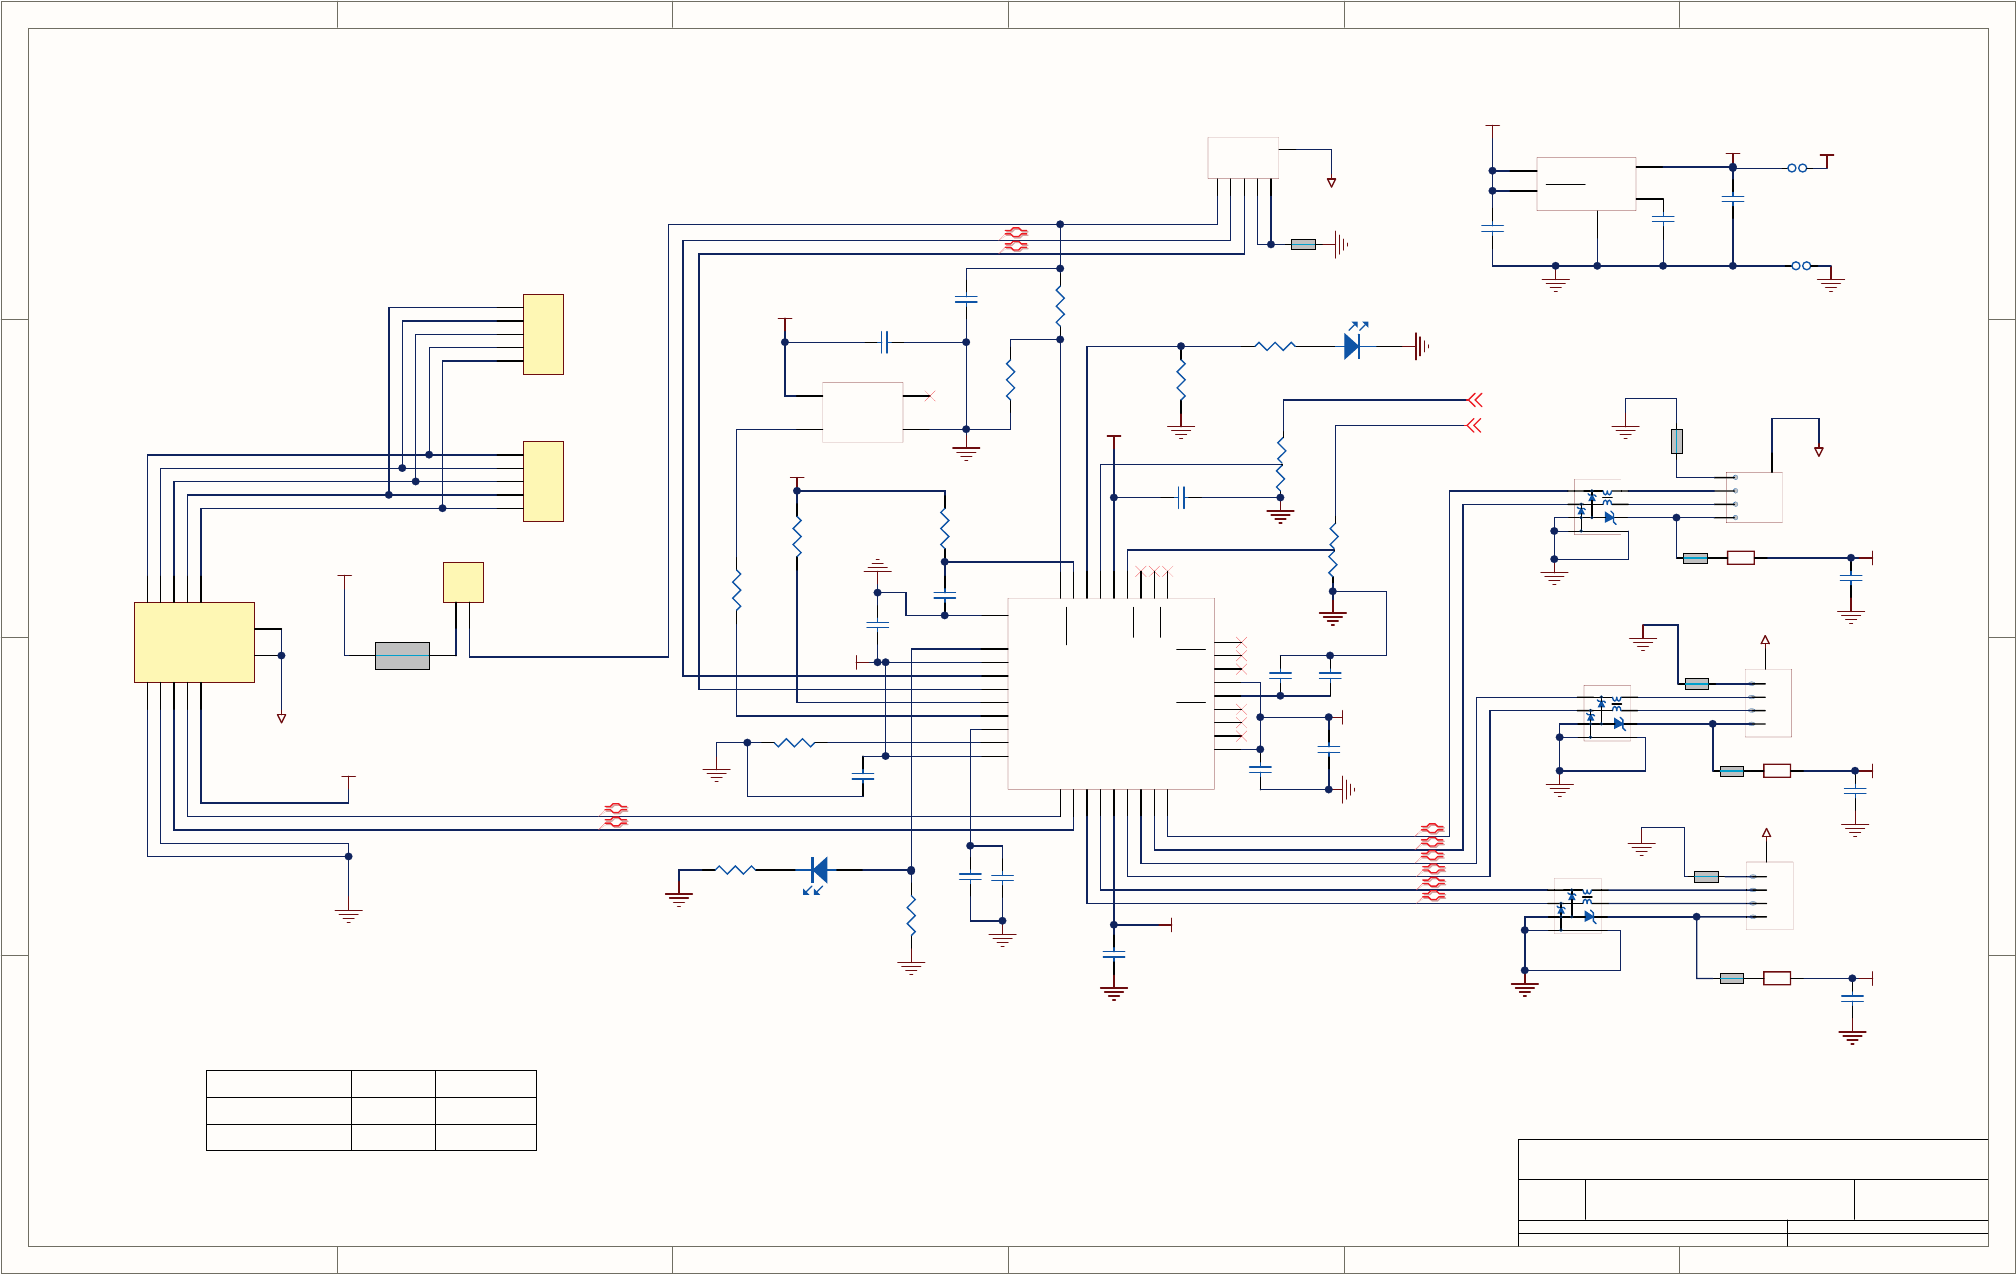
1
1
2
2
3
3
4
4
5
5
6
6
D D
C C
B B
A A
Title
Number RevisionSize
B
Date: 6/24/2010 Sheet of
File: N:\PCBMGR\..\06696.P3.R3.schdoc Drawn By:
06698 D
43
1
2
3
4
5
To old TScreen
70553-004
NI
J11
LL
RL
SD
RT
LT
+5V
CHASSIS
1
2
NI
J12
BUS +5
1
2
3
4
5
To new TScreen
70553-004
J10
LT 1
RT 2
SHLD 3
RL 4
LL 5
GND
6
GND
7
D+
8
D-
9
+5
10
CHS A
CHS B
A1
TSHARC-12C
RT
RL
SD
LL
LT
VBUS
1
D-
2
D+
3
ID
4
GND
5
6
J9
USB-B-MINI
VBUS
CHASSIS
CHASSIS
5V-GND
USB3.3V
SDA
SCL
USB3.3V
USB3.3V
USB3.3V
USB3.3V
USB3.3V
R36
12K
E1
+V
4
-V 2
OUT
3
U5
24MHZ
DS2
GRN
DS1
YEL
SCL
SDA
R37
100K
5V-GND
5V-GND
5V-GND 5V-GND
5V-GND
5V-GND
5V-GND
5V-GND
5V-GND
5V-GND
5V-GND
+5V
5V-GND
C28
1uF
USB3.3V
IN
8
SHTDN
6
GND
2
OUT 1
BP 4
U4
3.3V-REG
R38
1K
F3
0.5A/6V
D1-
1
D1+
2
D2-
3
D2+
4
+3.3V
5
D3-
6
D3+
7
D4-
8
D4+
9
+3.3V 10
TEST 11
PWR1 12
OCS1 13
+1.8V 14
3.3VCR 15
PWR2 16
OCS2 17
PWR3 18
OCS3 19
PWR4 20
OCS4 21
SDA/R1 22
+3.3V 23
SCL/S0 24
HS-IND/S1 25
RESET 26
VBUS-DET 27
SUS/R0
28
+3.3V
29
USB-
30
USB+
31
XTL2
32
CLK-IN
33
1.8VPLL
34
RBIAS
35
+3.3PLL
36
GND
37
U8
USB2514-AEZG
C32
1uF
C44
1uF
5V-GND
+5V
1D-
2D+
3GND
4
5
J4
USB-A_R/A
5V-GND
CHASSIS
CHASSIS
FBMH3216HM501NT
FB5
C34
0.1
C36
0.1uF
C33
0.1uF
C31
0.1uF
R30
100K
R29
1K
F2
0.5A/6V
F1
0.5A/6V
1
2
3
4
5
D+
D-
GND
+5V J5
USB-A_VERT
C29
470pf
C30
1uF
C37 0.01uF
JP4
3.3V
GND
FB7
R20
49.9
FB8
FB9
FB10
FB11
FB12
FB13
GUI Interface
1 8
72
3
4
6
5
U7
1 8
72
3
4
6
5
U9
1 8
72
3
4
6
5
U11
C40
0.1uF
C42
0.1uF
C45
0.1uF
C390.1
C43
0.1uF
C41
0.1
R33
100K
AB
R45
AB
R32
R34
100K
R35
100K
C38
1uF
R39
100K
JP5
C60
0.1uF
C59
0.1
1
2
3
4
5
D+
D-
GND
+5V J6
USB-A_VERT
+5V
D1_N
D1_P D4_P
D4_N
D3_P
D3_N
D2_P
D2_N
D_P
D_N
Configuration Select
Mode R32 R45
Default A A
MBUS B B
Install 100K for A, 0 Ohm for B
+5V
+5V
+5V
5V-GND
5V-GND
5V-GND
5V-GND
5V-GND
5V-GND
5V-GND
5V-GND
5V-GND
RT
D-26
07266B DCN6845
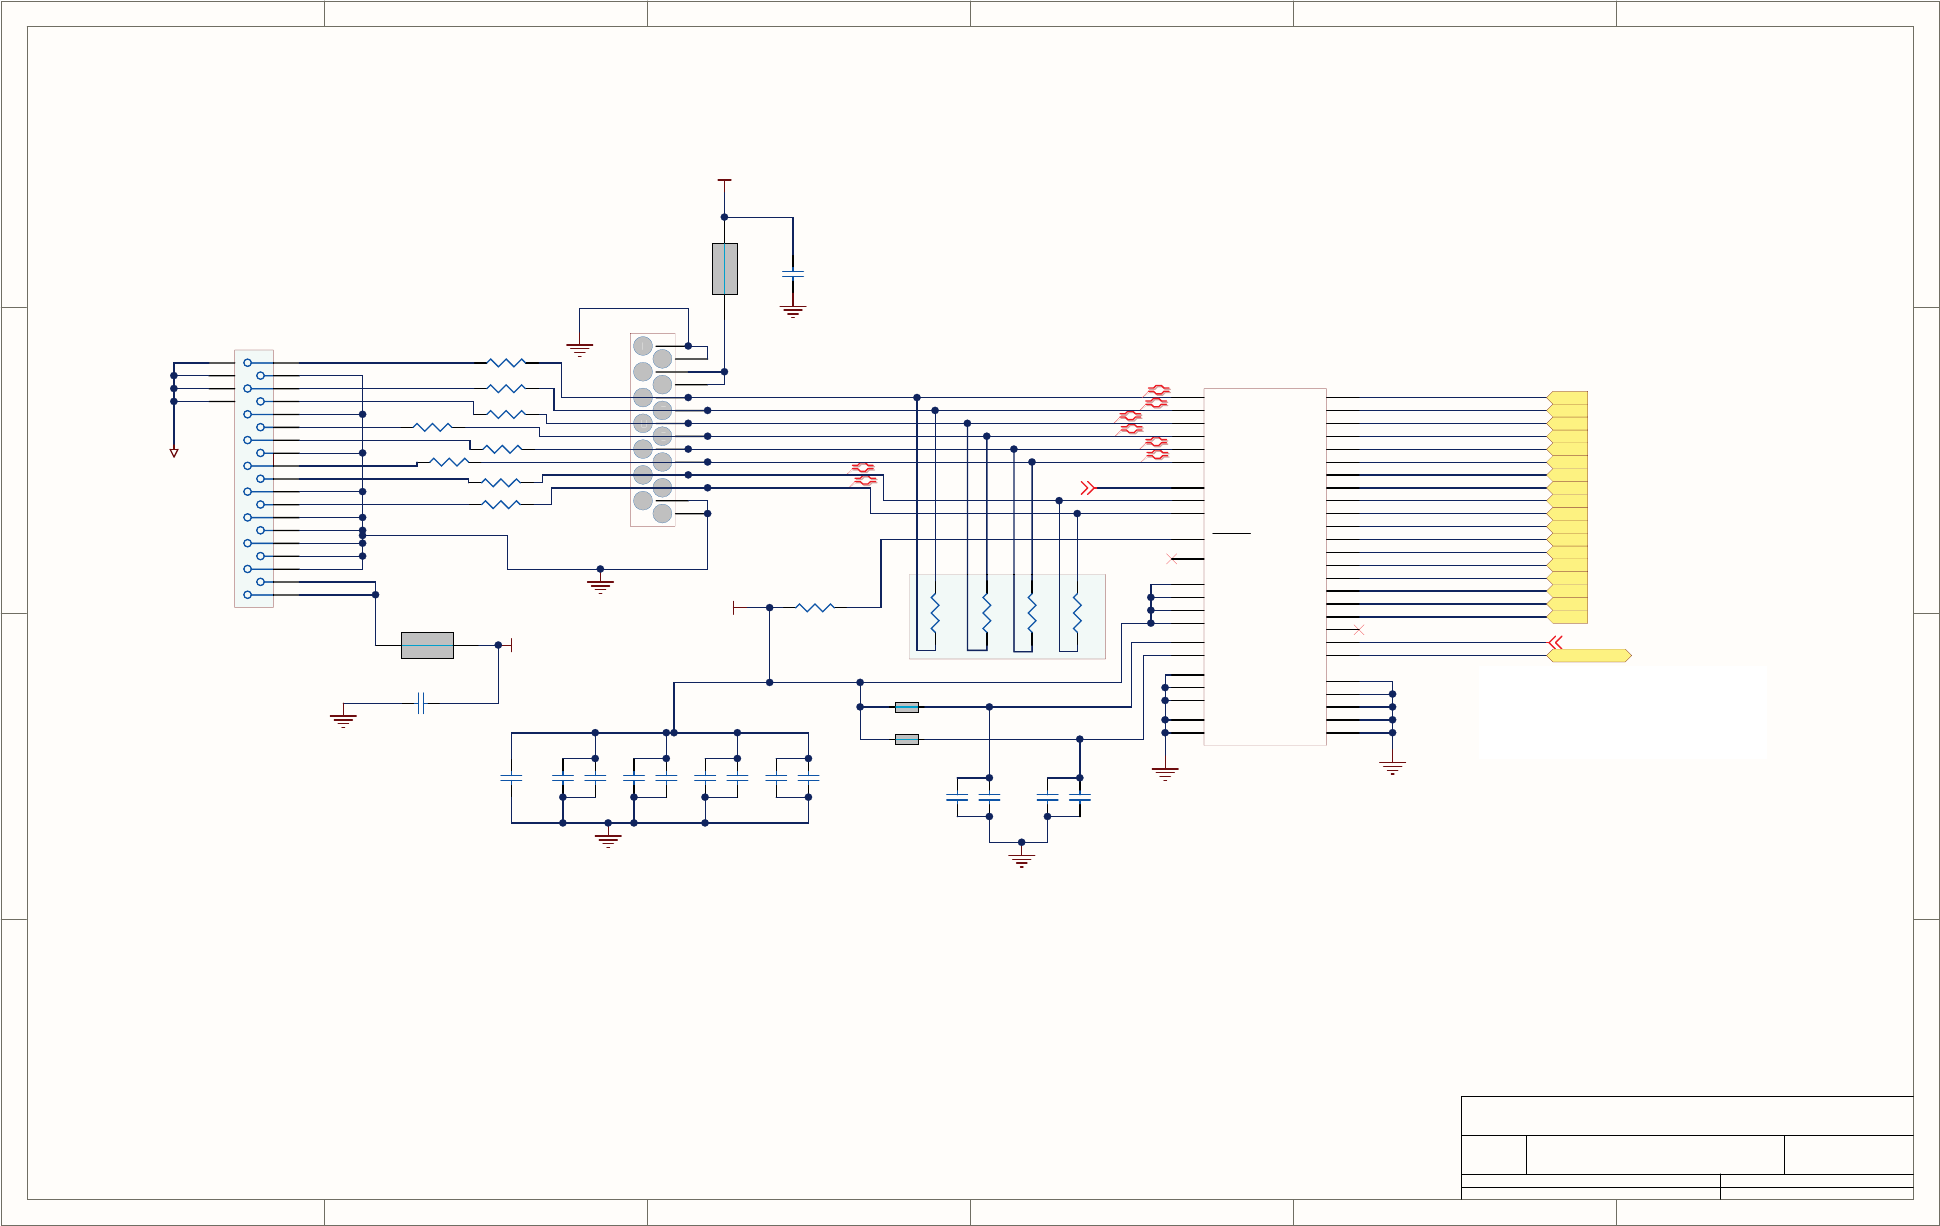
1
1
2
2
3
3
4
4
5
5
6
6
D D
C C
B B
A A
Title
Number RevisionSize
B
Date: 6/24/2010 Sheet of
File: N:\PCBMGR\..\06696.P4.R3.schdoc Drawn By:
06698 D
44
TOUCH SCREEN INTERFACE CIRCUITRY ( TBD)
GUI Interface
R40
10K
Option
CLKOUT_P
CLKOUT_N
3.3V
C49
0.1
R41
100
FB6
FB14
Vcc PIN 28
C47
0.01
22uF/6.3V
C46
JMK316BJ226KL
C50
0.1
C51
0.1
C52
0.1 C55
0.1
C57
0.1
bDCLK
BACKL
NOTE:
To receive backlight control (BACKL) from CPU board
when using ICOP_0096 LVDS Transmitter.
The connection from pin 42 on the TTL video connector
(VSYNC) to U1-23 must be broken and connected to
pin 43.
aB6
aB5
aB4
aB3
aB2
aG7
aG6
aG5
aG4
aG3
aG2
aR7
aR6
aR5
aR4
aR3
aB7
aR2
aData Enable
R42
100
R43
100
R44
100
Vcc PIN 36
C48
0.01
Vcc PIN 42
C53
0.01
Vcc PIN 48
C54
0.01 C56
0.01
C58
0.01
FBMH3216HM501NT
FB15 C61
0.1
1
2
3
4
5
6
7
8
9
10
11
12
13
14
1
2
3
4
5
6
7
8
9
10
11
12
13
14
J13
HEADER-7X2
Y0M
8Y0P
9
Y1M
10 Y1P
11
Y2M
14
Y2P
15
CLKOUT
23
CLKINM
16
CLKINP
17
SHTDN
22
NC
6
VCC
48
VCC
28
VCC
36
VCC
42
LVDS/VCC
12
PLLVCC
20
LVDSGND
7
LVDSGND
13
LVDSGND
18
PLLGND
19
PLLGND
21
D0 24
D1 26
D2 27
D3 29
D4 30
D5 31
D6 33
D7 34
D8 35
D9 37
D10 39
D11 40
D12 41
D13 43
D14 45
D15 46
D16 47
D17 1
D18 2
D19 4
D20 5
GND 3
GND 25
GND 32
GND 38
GND 44
U6
SN75LVDS86A
3.3V
Y0_P
Y0_N
Y1_P
Y1_N
Y2_N
Y2_P
MH3
MH4
2
9
4
5
6
3
8
7MH1
MH2
1
12
11
10
13
14
15
16
17
18
19
J15
G3168-05000202-00
CHASSIS
R490
R500
R510
R520
R530
R540
R550
R560
FBMH3216HM501NT
FB18
C62
0.1
3.3V
Y0_P1
Y0_N1
Y1_P1
Y1_N1
Y2_N1
Y2_P1
CLKOUT_N1
CLKOUT_P1
RT
07266B DCN6845
D-27
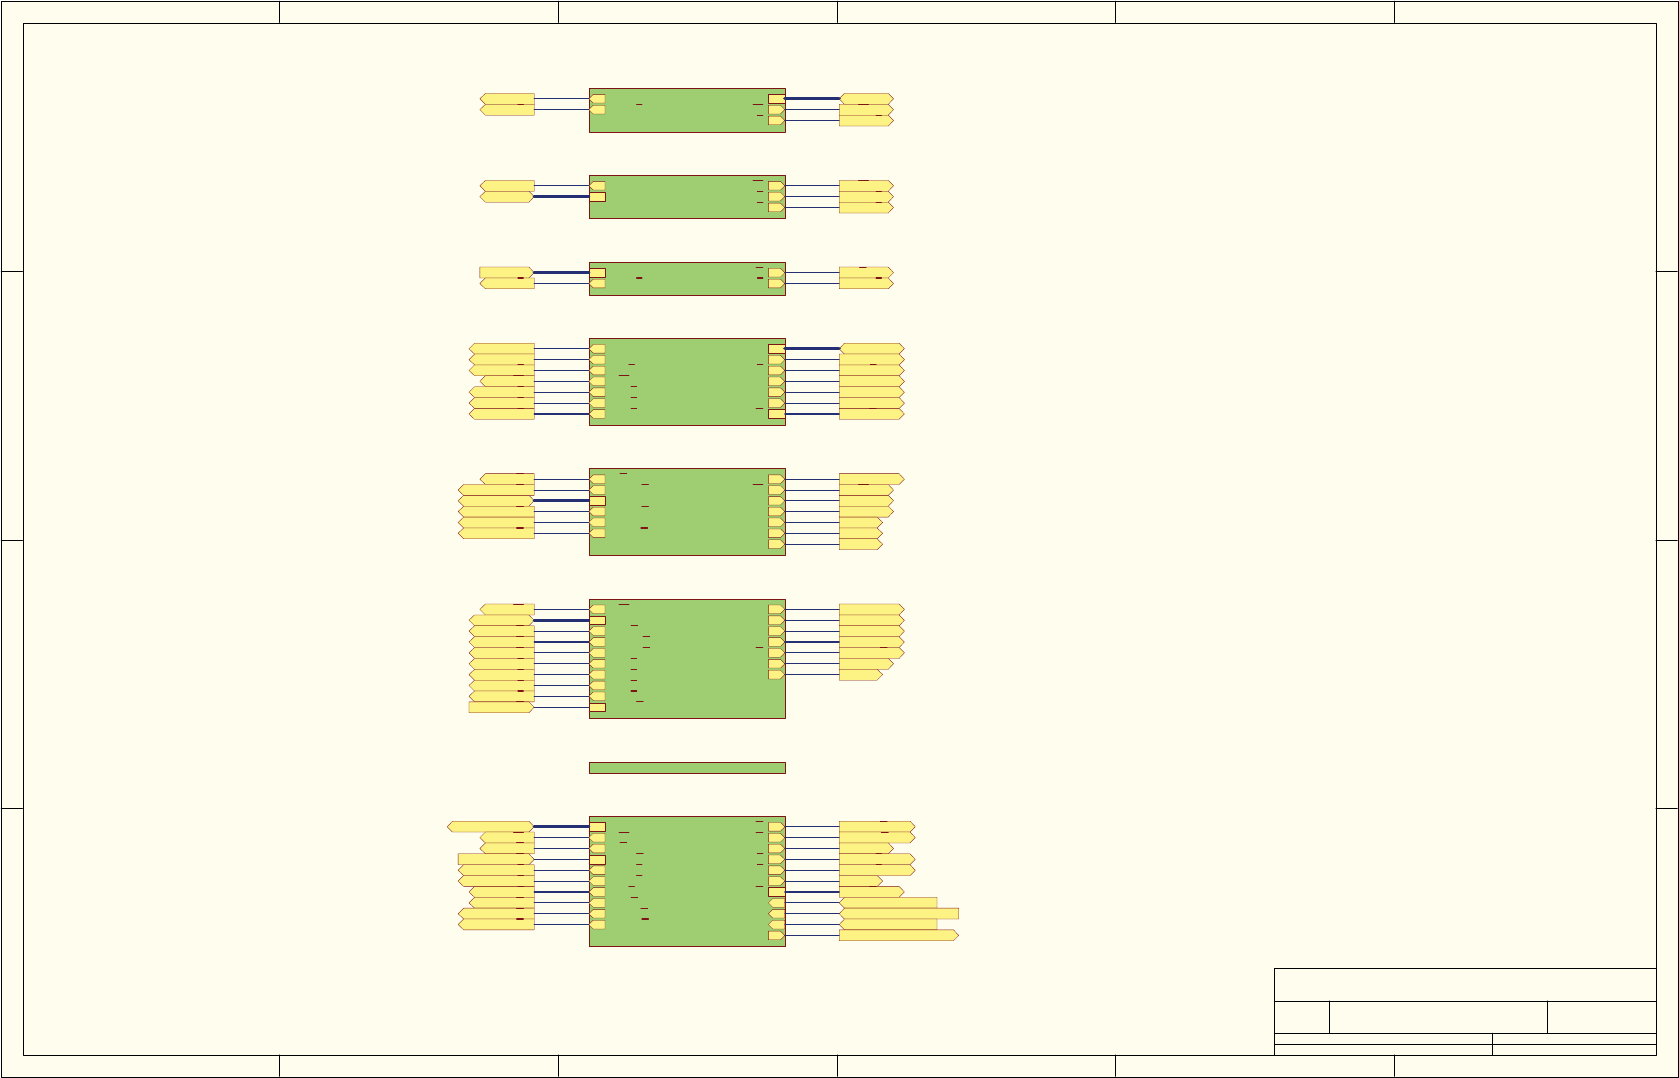
$
%
&
'
'
&
%
$
7LWOH
1XPEHU 5HYLVLRQ6L]H
2UFDG%
'DWH 0D\ 6KHHWRI
)LOH 1?3&%0*5?5-(VHULHV0RWKHUERDUG*HQHUDWLRQ?6RXUFH?EGGE'UDZQ%\
'>@
,2:
,25
6+'$&
',*,2
',*,2
7(03
'$&9
:5'$&
9)352*
&+*$,1
9)5($'
6+'1
',*,2
',*,2
7&
6+'1
,&B5(6(7
,&B'59B567
,&B5(6(7
,&B'59B567
3&,)
E3VFK
'>@ '>@
,2:
,25
6+'$&
',*,2
',*,2
7(03
'$&9
:5'$&
9)352*
&+*$,1
9)5($'
6+'1
',*,2
',*,2
7&
6+'1
,&B5(6(7
,&B'59B567
,&B5(6(7
,&B'59B567
VKHHW
E3VFK
,2:
'>@
'$&9
&6'$&$
&6'$&%
'$&
'$&
'$&
'$&
6+'$&
'$&9
'$&9
'$&9
'$&9
:5'$&
95()
7&
$1$287
E3VFK
,2:
'>@ '>@
'$&9
&6'$&$
&6'$&%
'$&
'$&
'$&
'$&
6+'$&
'$&9
'$&9
'$&9
'$&9
:5'$&
95()
7&
,25
9)5($'
'>@
9)352*
'$&08;
&+*$,1
7(0308;
,2:
6+'1
95()
7&
7&
7&
$1$,1
E3VFK
,25
9)5($'
'>@ '>@
9)352*
'$&08;
&+*$,1
7(0308;
,2:
6+'1
95()
7&
7&
7&
7(0308;
'$&08;
7(03
,2:
'$&
'$&
'$&
'>@
'$&9
'$&
'$&9
'$&9
'$&9
6+'1
6(1625,1
E3VFK
7(0308;
'$&08;
7(03
,2:
'$&
'$&
'$&
'>@
'>@
'$&9
'$&
'$&9
'$&9
'$&9
6+'1
'>@
',*,2
,25
',*,2
',*,1
E3VFK
'>@ '>@
',*,2
,25
',*,2
6+'1
'>@
,2:
',*,2
',*,2
',*287
E3VFK
6+'1
'>@ '>@ ,2:
',*,2
',*,2
6+'1
',*,2
'>@
,2:
',*,2
',*287
E3VFK
6+'1
',*,2
'>@
'>@
,2:
',*,2
D-28
07266B DCN6845
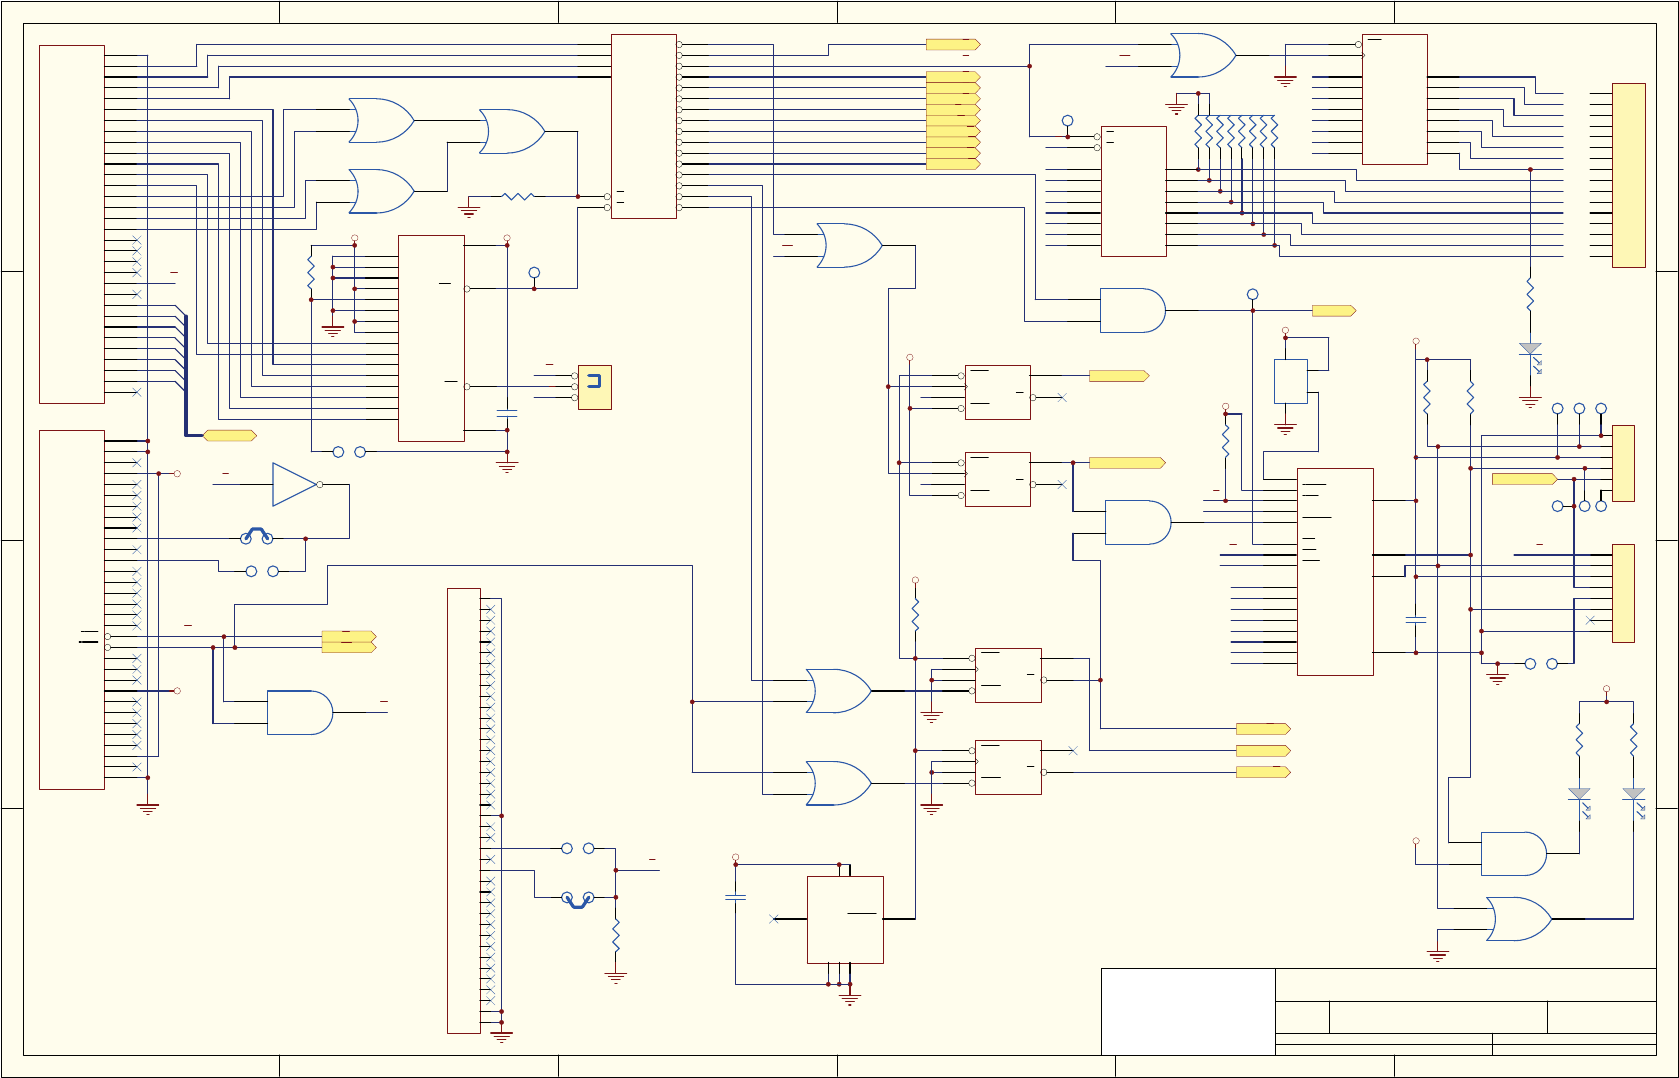
$
%
&
'
'
&
%
$
7LWOH
1XPEHU 5HYLVLRQ6L]H
2UFDG%
'DWH 0D\ 6KHHWRI
)LOH 1?3&%0*5?5-(VHULHV0RWKHUERDUG*HQHUDWLRQ?6RXUFH?EGGE'UDZQ%\
$
$
$
'
'
,2:
$
$
'
,25
6<6&/.
'
'
'
'
'
$
$
$
$
$
$
,17
;(
;'
,2(1
$(1
$
$
$
$
$
$
(1$%
,17
'
'
'
'
'
'
,2:
'
'
,2:
'
'
'
'
'
'
'
'
'
'
,25
'
'
'
,25
'
'
'
',*,2
,54 .%,17
73
$
$
$
$
$
$
$
$
*
*
<
<
<
<
<
<
<
<
8
+&
-
0,&52),7
&
51 .[
'
&/.
4
4
35(
&/5
8%
+&
*1'
$
,2&+(&.
'
'
'
'
'
'
'
'
,2&+5'<
$(1
$
$
$
$
$
$
$
$
$
$
$
$
$
$
$
$
$
$
$
-$
3&
*1'
5(6(7'59
9
,54
9
'54
9
(1';)5
9
.(<
60(0:
60(05
,2:
,25
'$&.
'54
'$&.
'54
5()5(6+
6<6&/.
,54
,54
,54
,54
,54
'$&.
7&
%$/(
9
26&
*1'
*1'
-%
3&
5
N
5
.
$
$
$
$
$
$
$
$
%
%
%
%
%
%
%
%
(1
3 4
9&&
*1'
8 +&
'
'
'
'
'
'
'
'
&/.
2&
4
4
4
4
4
4
4
4
8+&
&
X)FHUDPLF
73
$
%
&
'
*
*
<
<
<
<
<
<
<
<
<
<
<
<
<
<
<
<
8 +&
-3
,'&+($'(5
&
X)FHUDPLF
8$
+&
'
&/.
4
4
35(
&/5
8$ +&
-
3&&'
-3
,'&+($'(5
5
N
8%
+&
,$&.
,17
9&&
$
6'$
966
5'
&6
:5
5(6(7
'%
'%
'%
'%
'%
'%
'%
'%
6&/
&/.
8 3&)
-3 ,'&+($'(5
73
5
.
-
,1/,1(
8'
+&
5
.
9&&
9&&
*1'
*1'
:',
5(6(7
*1'
8
/7&&6
;
-,72'&)2+0
&
X)9
'>@
,2:
,25
6+'$&
',*,2
',*,2
7(03
'$&9
:5'$&
9)352*
&+*$,1
9)5($'
6+'1
',*,2
',*,2
7&
6+'1
,&B5(6(7
,&B5(6(7
,&B'59B567
9&&
9&&
9
9&&
9&&
9&&
9&&
9&&
!"#$%&'*+7
5
N
5
127,167$//('
'2
'2
'2
'2
'2
'2
'2
',
',
',
',
',
',
',
',
'2
'2
'2
'2
'2
'2
'2
'2
',
',
',
',
',
',
',
',
6&/
6'$
'*1'
-
0,&52),7
.%,17
'
' '
&/.
4
4
35(
&/5
8% +&
'
&/.
4
4
35(
&/5
8$
+&
9&&
'2
,54
5
.
'6
/('5('VPW
8
$+&*8
-3
,'&+($'(5
!"#%8;+**7
$(1
,2(1
,2:
-3
+($'(5'()$8/7('
VKRUWHGVOGUVLGH
-3
VKRUWHGVOGUVLGH
-3
6'$
6&/
'*1'
9&&
1RWHV
7KLVVFKHPDWLFLVIRU3&$
7KLVVFKHPDWLFLVIRU3&%
3LQVVKRUWHGRQ3&%
;&
;)
$
$
$
$
$
$
$
$
$
$
$
$
$
$
$
$
9&&
8&
+&
'6
'6
*
5
5
9&&
9&&
9&&
''
''
56
,&
,&
*' *'
6'$
6&/
8'
+&
8&
+&
8'
+&
8$
+&
8$
+&
73
73
73
73
73
73
,&
8%
+&
8&
+&
8'
+&
07266B DCN6845
D-29
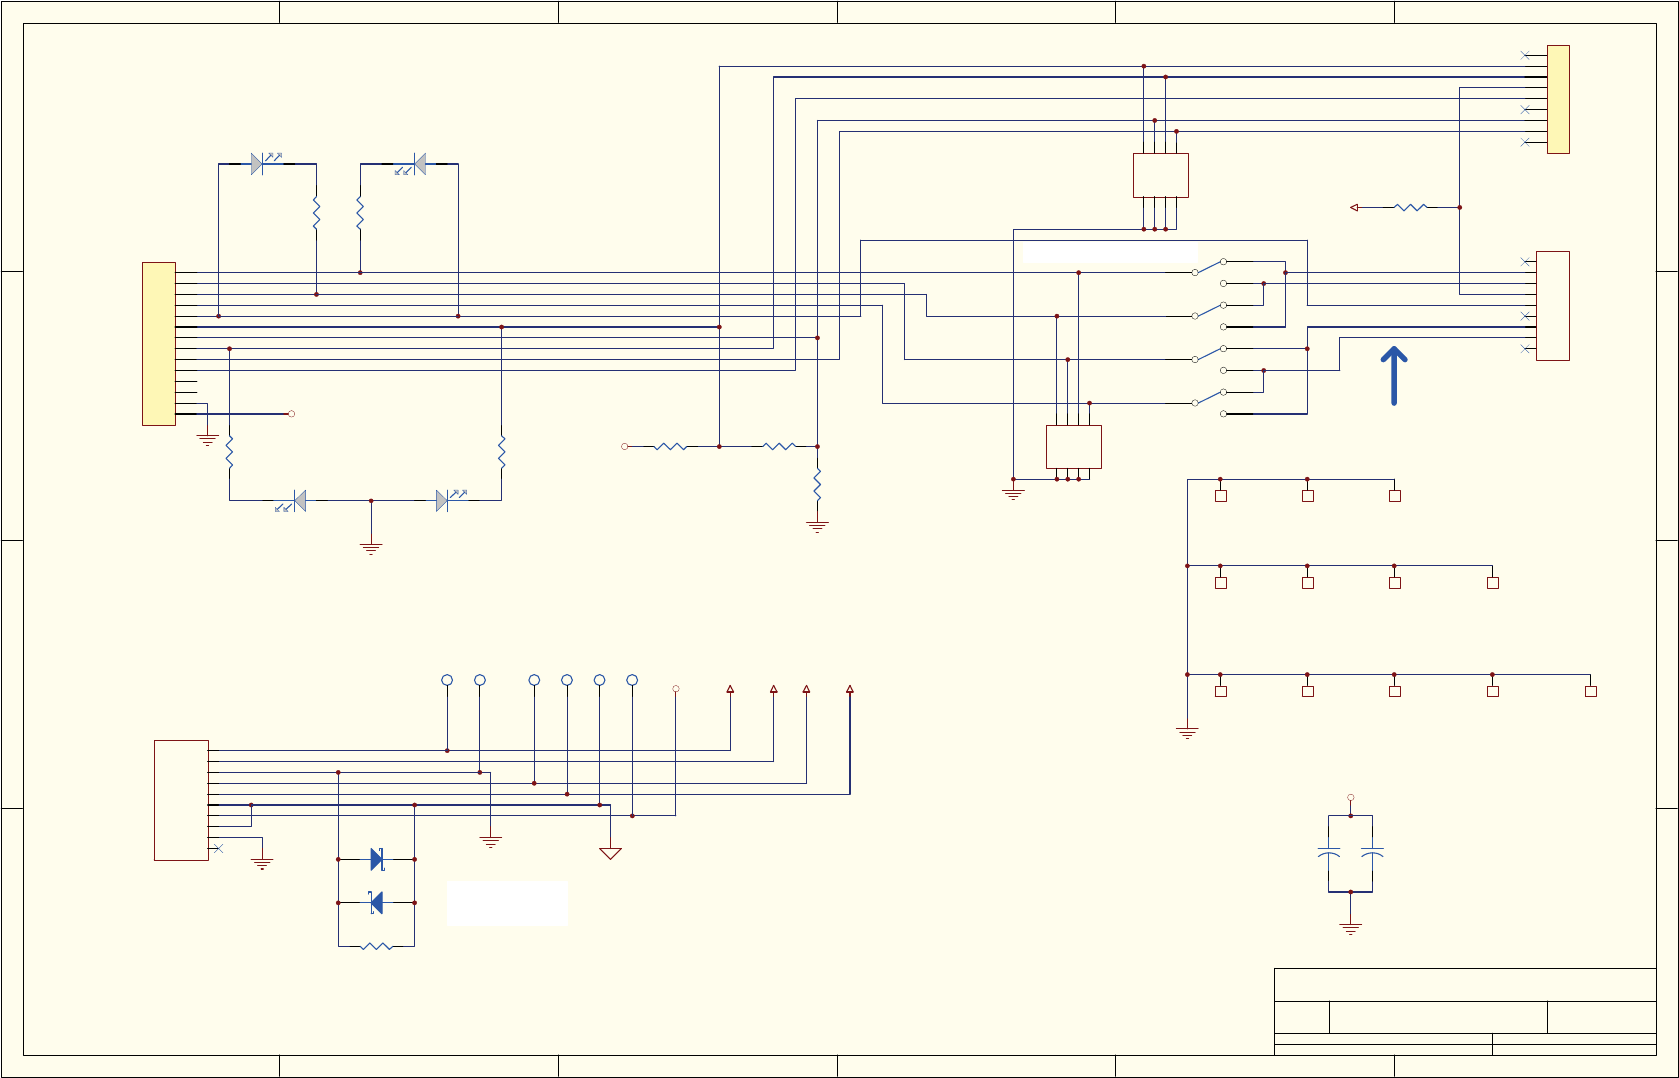
$
%
&
'
'
&
%
$
7LWOH
1XPEHU 5HYLVLRQ6L]H
2UFDG%
'DWH 0D\ 6KHHWRI
)LOH 1?3&%0*5?5-(VHULHV0RWKHUERDUG*HQHUDWLRQ?6RXUFH?EGGE'UDZQ%\
07
02817,1*+2/(
73
9
5(7
'*1'
9
9
$*1'
9
$*1'
(*1'
&+$6*1'
-
02/(;
6:
6:6/,'(3'7
79$55$<
79
60'$/&&
79$55$<
79
60'$/&&
-
,1/,1(
5
.
1&
5;'
7;'
1&
*1'
1&
576
&76
1&
-
'%0
$.
'6
/('*51VPW
5
127,167$//('
$ .
'6
/('5(' 5
N
73
73
5
.
73
5
127,167$//('
5
127,167$//('
73
73
9 99&& 95(79
9
-
'%)(0$/(
7;
&76
56*1'
5;
7;
576
&76
56*1'
5;
576
9&&
07
02817,1*+2/(
07
02817,1*+2/(
07
02817,1*+2/(
07
02817,1*+2/(
07
02817,1*+2/(
07
02817,1*+2/(
07
02817,1*+2/(
07
02817,1*+2/(
'
&
(
V
L
GH
R
I
VZ
L
WF
KL
V
V
L
GH
WRZD
U
GV
S
LQ
+<
!<
9&&
5;
7;
576
&76
56*1'
+
&
X)97$17$/80
9&&
&
X)97$17$/80
'
0%56&7
'
0%56&7
5
127,167$//('
''5PXVWEH
ZLWKLQRI-
''B
=
02817,1*+2/(
=
02817,1*+2/(
=
02817,1*+2/(
'6
/('5('
'6
/('*51
5
.
5
.
+< !<
D-30
07266B DCN6845
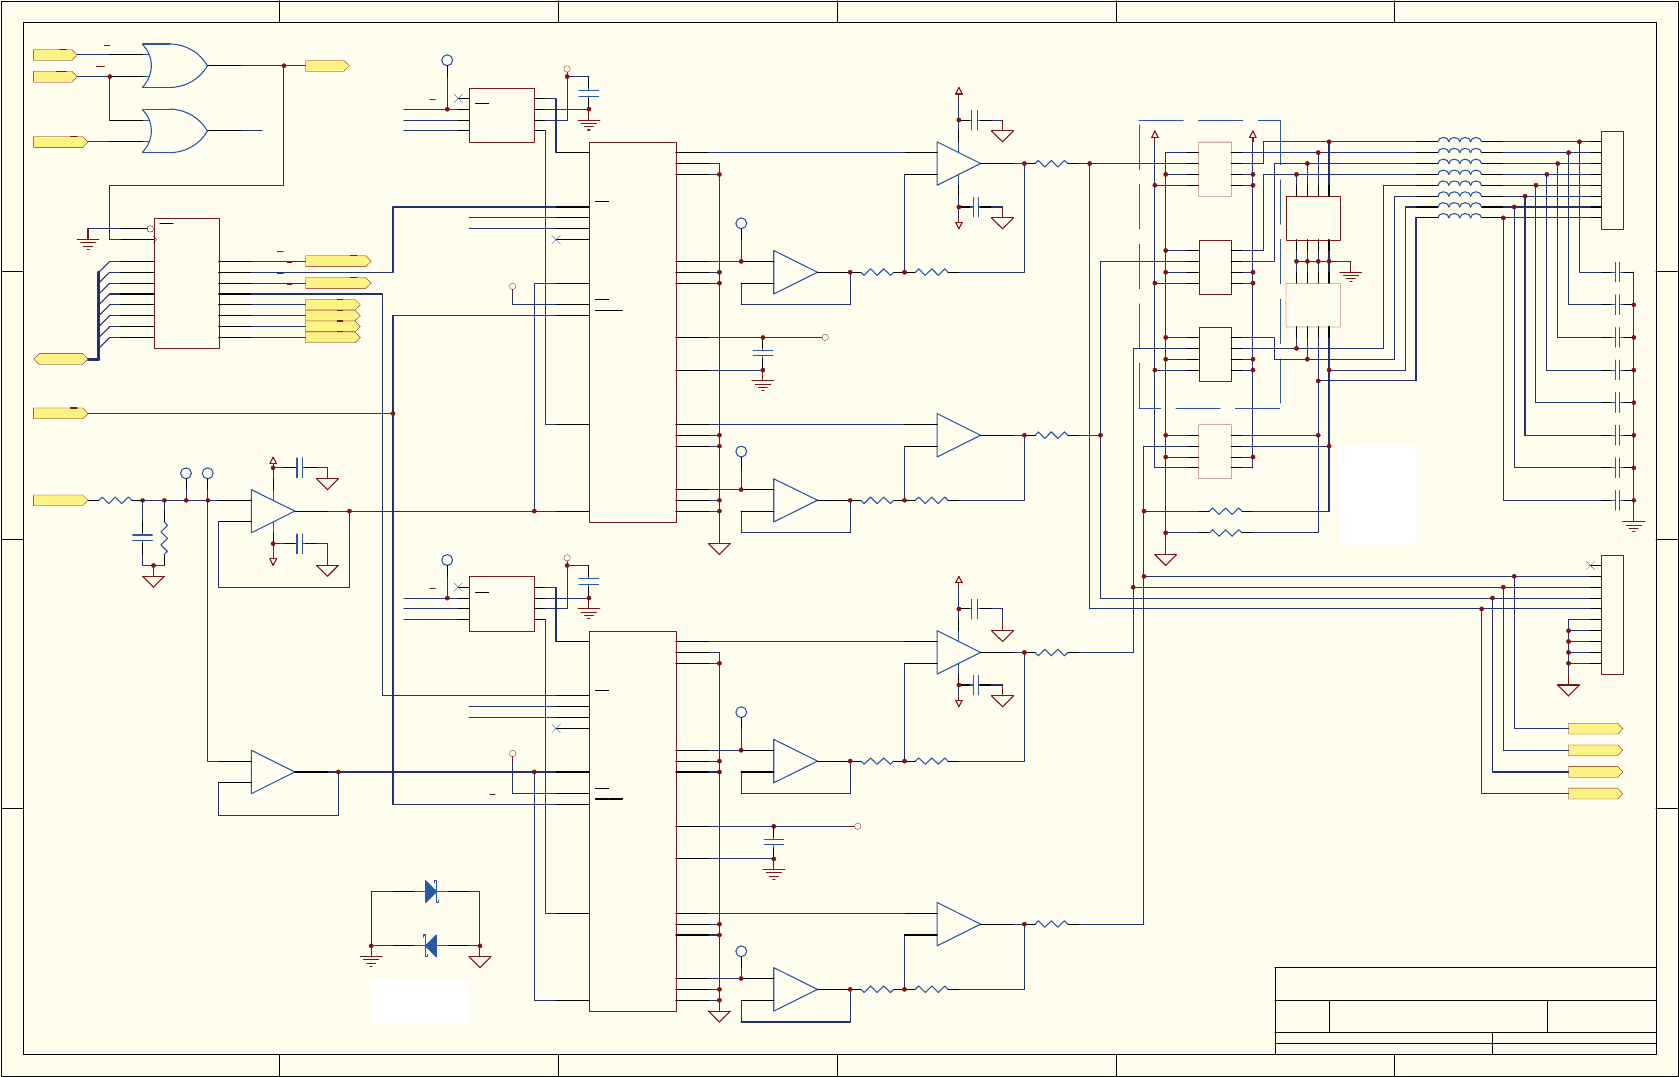
> $
$
>
+?
@ !FGJ
M
Q XZX[
&?Q Q\!\!8XXGG\@\]^GZQ
'
&/.
'
&/.
&6'$&$
&
X)FHUDPLF
*`
;
jM
$
jM
M'+
>
j q
8 '$&%,7
73
[
8&
23$8$
x
x >
>
[
x>
>
q
!
q
x
[
j $
> $
*`
>
M
y
>
;
8 327',*,7$/
73
&
X)FHUDPLF
&
X)FHUDPLF
5
N
5
.
73
5
N
>
8$
23$8$
&
X)FHUDPLF
>
8'
23$8$
$
q
8%
23$8$
5
.
y
j
j
j
j
Xj
zj
'$&
'8$/'$&$
5
5
'
0%56&7
'
0%56&7
'DQG'
0XVWEHORFDWHG
ZLWKLQRI8
'
&/.
6+'$&
'
&/.
&6'$&%
&
X)FHUDPLF
$
q
8%
23$8$
>
8'
23$8$
73
x
x >
>
[
x>
>
q
!
q
x
[
j $
> $
*`
>
M
y
>
;
8 327',*,7$/
*`
;
jM
$
jM
M'+
>
j q
8 '$&%,7
5
N
5
.
&
X)FHUDPLF
>
8$
23$8$
[
8&
23$8$
&
X)FHUDPLF
73
&
X)FHUDPLF
5
.
5
N
73
j
j
zj
j
j
Xj
'$&
'$&
'8$/'$&$
5
5
'$&9
>
>
$
$
qq
-
,'&
>
>
$
$
qq
-
,'&
>
>
$
$
qq
-
,'&
>
>
$
$
q
q
[
[
-
0,&52),7
>
$
q
-
7(50%/2&.
zjXj
$1$/2*92/7$*(&855(172873876
,62/$7('0$237,21$/%2$5'6
/
/
/
/
)(%($'
/
/
/
)(%($'
&
S)
&
S)
&
S)
&
S)
&
S)
&
S)
&
S)
&
S)
/
'$&9
'$&9
'$&9
j
j
'$&9
'
'
'
'
'
'
,2:
'
&/.
'
&65$1*(
&65$1*(
[
8&
+&
>
$
8%
+&
;Mx
j
x!
+
>
>
$
$
q
q
[
*`
M
{ [
{
{ q
{> $
{
{$ >
{q
{
8 +&
|]]q}
'$&5$1*(2))6(7352*5$0
&6'$&%
&6'$&$
&
X)FHUDPLF
&
X)FHUDPLF
&
X)FHUDPLF
5
N
5 .
73
j!&
Xj
zj
''B
56
73
>
8$
23$
$
q
8%
23$
62&.(78
62&.(78
>
>
$
$
qq
-
+($'(5,'&
79$55$<
>>
q
q$
$
79
60'$/&&
79$55$<
>>
q
q$
$
79
60'$/&&
5
5
,QVWDOO-IRU
P$RQWK
FKDQQHO
,QVWDOO5
5LIP$
RQWKFKDQQHO
QRWXVHG
56
07266B DCN6845
D-31
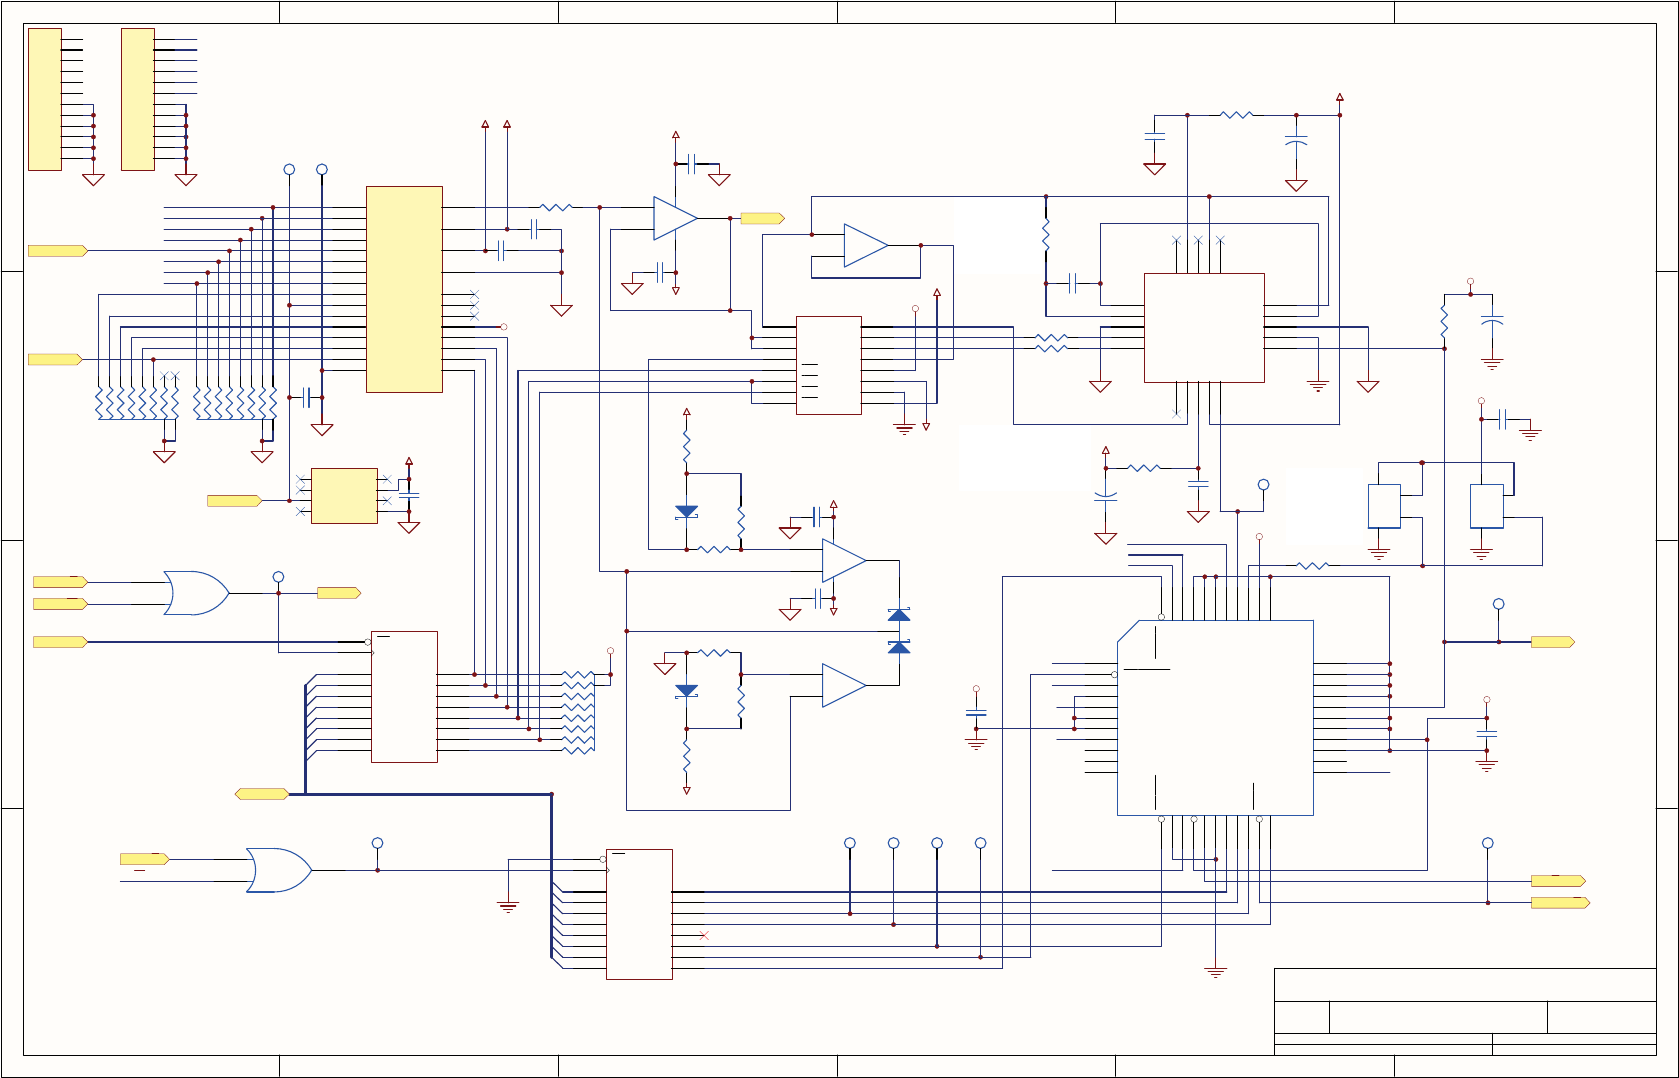
$
%
&
'
'
&
%
$
7LWOH
1XPEHU 5HYLVLRQ6L]H
2UFDG%
'DWH 0D\ 6KHHWRI
)LOH 1?3&%0*5?5-(VHULHV0RWKHUERDUG*HQHUDWLRQ?6RXUFH?EGGE'UDZQ%\
,2:
&+
&+
&+
&+
&+
&+
&+
&+
&+
6%
0,'
6$
6&
06%
'
'
'
'
/6%
67$57
'
6(/
'
6(/
&+
&+
'
'
'
'
'
'
'
'
'
'
'
'
'
'
'
'
'
'
73
;
-,72'&$$(0+=
&
X)97$17$/80
73
-
0,&52),7
&
X)FHUDPLF
& X)FHUDPLF
5
.
&
X)9FHUDPLF
73
,1
,1
,1
,1
,1
,1
,1
,1
,1
1&
966
1&
,1
,1
,1
,1
(1%
$
$
$
$
95()
,1
*1'
,1
966
287
,1
8
$108;
&
X)97$17$/80
73
73
5
1&
9,1
75,0
9287
15
1&
*1'
1&
8
92/7$*(5()
&
X)FHUDPLF
73
&
X)FHUDPLF
&
X)FHUDPLF
&
X)FHUDPLF
&
X)9
'
'
'
'
'
'
'
'
&/.
2(
4
4
4
4
4
4
4
4
8
+&
&
X)FHUDPLF
&
X)9
73
&26
2379
96
&/.
)287
9,
9,
*1'
$*1'
&203
&203
23287
1&
96
23
23
5()
9,
1&
1&
8
$'.3
'
'
'
'
'
'
'
'
&/.
2(
4
4
4
4
4
4
4
4
8
+&
73
5
5
73
-
0,&52),7
5
;
0%+0+=
&
X)97$17$/80
5
0&+,3
&
X)FHUDPLF
7,(
7,(
7,(
7,(
7,(
)5(4
7,(
7,(
*1'
'%
7,(
'%
,&/.
7,(
'%
5'0%<7(
9&&,2
6(/
67$57
7'2
7',
706
7&.
5'06%
9)&/.
'%
'%
7,(
7,(
'%
9&&,17
5'/6%
5($'
6&
6%
*1'
,25
9&&,17
'%
7,(
6$
'%
7,(
*1'
8
;LOLQ[&3/'
&
X)FHUDPLF
&
51
.[
'
6
96
*1'
6
'
,1
,1
6
,1
,1
'
6
96
9&&
'
8
'*'<
,25
9)5($'
'>@
9)352*
'$&08;
&+*$,1
7(0308;
,2:
6+'1
95()
7&
7&
7&
9
9&&
9
9&&
9
9&&
9
9
9
9&&
9
9&&
9&&
9
9&&
9
&
51 .[
&
51 .[
&+
&+
&+
&+
&+
&+
&+
&+
&+
&+
&+
&+
&+
73
95()
73
$*1'
>
5
3/$&(
2+0
5(6,6725$6
&/26($6
3266,%/(72
;$1';
5LQGXFHVDQ
RIIVHWLQDQDORJ
VLJQDOWRJLYHD
OLYHIRUVHQVRUV
ZLWKRUVOLJKWO\
QHJDWLYHRXWSXW
5DQG5UHGXFHWKHJDLQ
IRUDQDORJLQSXWVE\VR
WKDWZHFDQUHDGVOLJKWO\
DERYHIXOOVFDOHWRSUHYHQW
RYHUIORZRI$'&UHDGLQJ
9&&
6FKHPDWLFIRU(6HULHV*0RWKHUERDUG3&$31
%
,&
23$8$
&
X)
&
X)
9
9
,&
8%
/)
8$
/)
5
.
5
.
5
.
5
.
5
.
5
.
9
'
%$6
9
''
' %$6
' %$6
56
56
5 . $'&95()
95()&/,3
&$B
56
''
56
8$
23$
8%
23$
8$
+&
8%
+&
D-32
07266B DCN6845
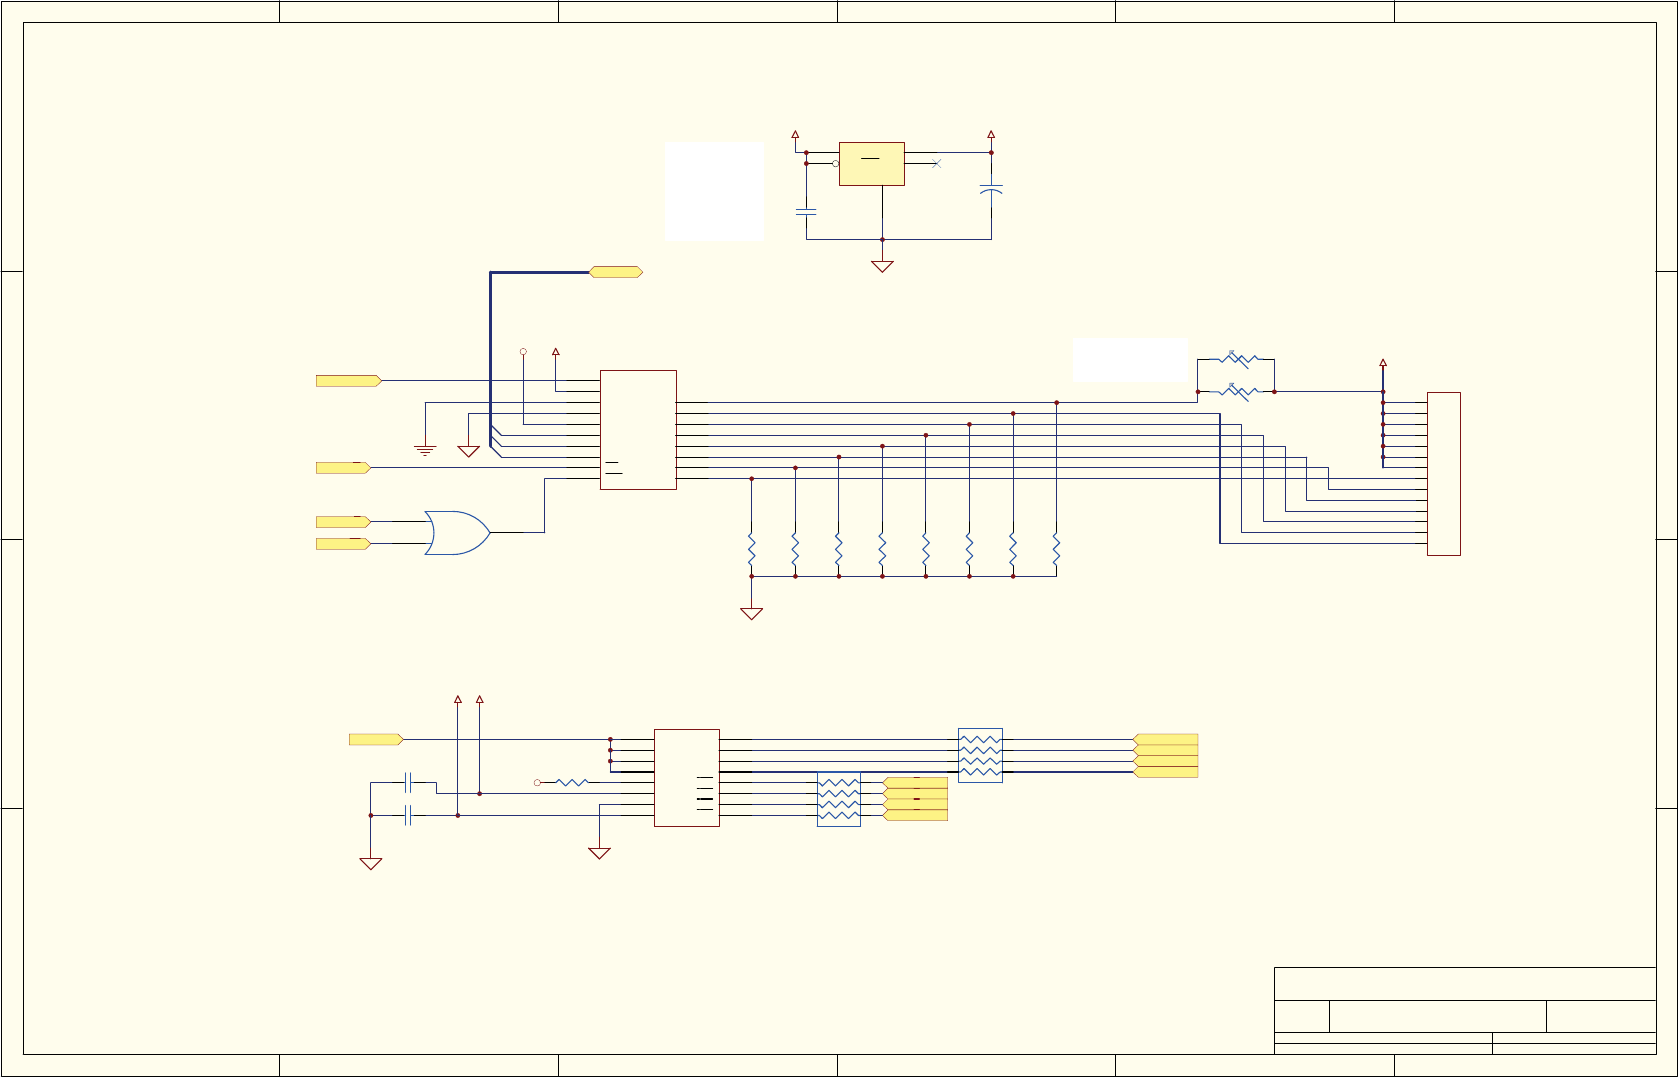
$
%
&
'
'
&
%
$
7LWOH
1XPEHU 5HYLVLRQ6L]H
2UFDG%
'DWH 0D\ 6KHHWRI
)LOH 1?3&%0*5?5-(VHULHV0RWKHUERDUG*HQHUDWLRQ?6RXUFH?EGGE'UDZQ%\
j
j
j
j
& X)FHUDPLF
& X)FHUDPLF
51 .[
$
(1%
9
,1
,1
,1
,1
287
,1
:5
$
*1'
966
,1
,1
,1
$
56
8
0$;&:1
'
6
96
*1'
6
'
,1
,1
6
,1
,1
'
6
96
9&&
'
8
'*'<
-
0,&52),7
;7
7+(50,67(5
7(0308;
'$&08;
7(03
,2:
'$&
'$&
'$&
'>@
'$&9
'$&
'$&9
'$&9
'$&9
6+'1
99
9$1$
9&&
9&& 9
9$1$9
51 .[
5 .
7+(50,67(5
7+(50,67(5
7+(50,67(5
7+(50,67(5
7+(50,67(5
7+(50,67(5
7+(50,67(5
7+(50,67(5
,1
212))
287
1&
*1'
8
/3,0
&
X)
%<3$66&$36
0867%(:,7+,1
2)7+(
5(*8/$725
,1387287387
3,16
&
X)97$17$/80
5
.
56 5
.
5
.
5
.
5
.
5
.
5
.
5
.
7+(50,67(5
7+(50,67(5
7+(50,67(5
7+(50,67(5
7+(50,67(5
7+(50,67(5
7+(50,67(5
7+(50,67(5
8'
+&
;7
7+(50,67(5
,QVWDOO;7WKURXJKKROH
25;760'
EXWQRWERWK
07266B DCN6845
D-33
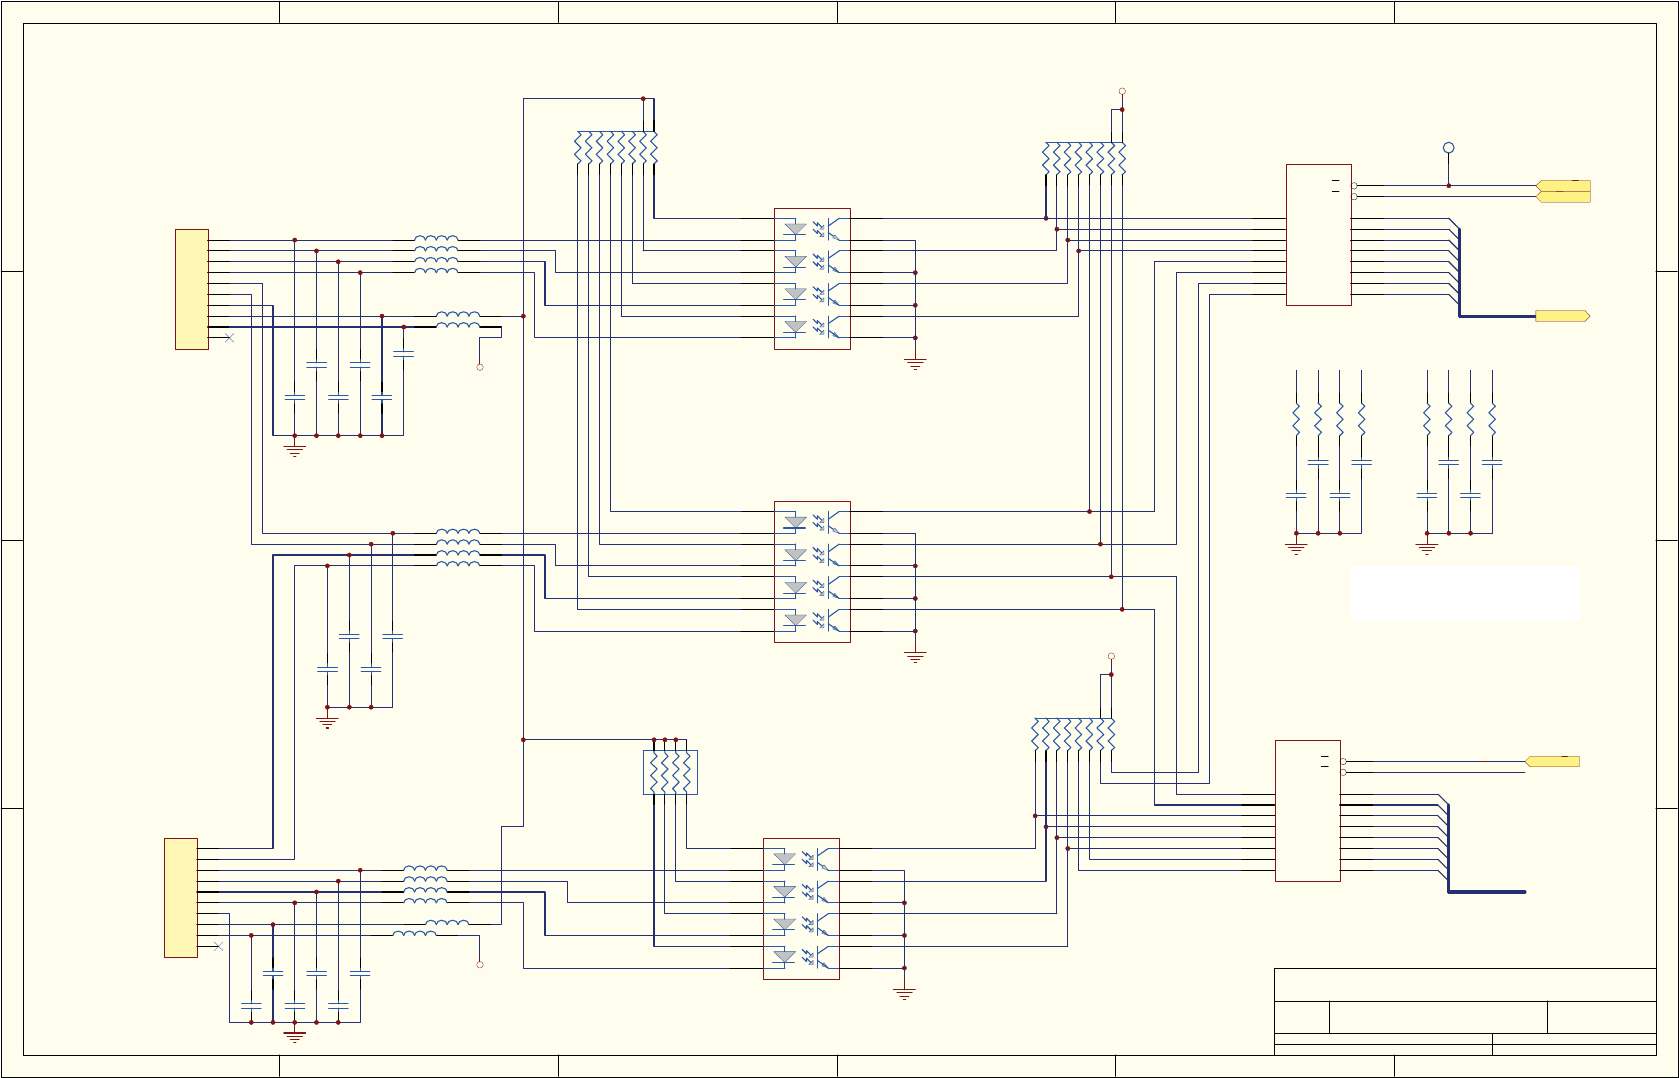
$
%
&
'
'
&
%
$
7LWOH
1XPEHU 5HYLVLRQ6L]H
2UFDG%
'DWH 0D\ 6KHHWRI
)LOH 1?3&%0*5?5-(VHULHV0RWKHUERDUG*HQHUDWLRQ?6RXUFH?EGGE'UDZQ%\
$
'
'
'
'
'
'
'
'
'>@
,25
'
'
'
'
'
'
'
'
$
$
$
$
$
$
$
$
*
*
<
<
<
<
<
<
<
<
8
+&
-
7(50%/2&.
73
-
7(50%/2&.
51
[
8
36
$
$
$
$
$
$
$
$
*
*
<
<
<
<
<
<
<
<
8
+&
8
36
8
36
'>@
',*,2
,25
',*,2
9&&
9&&
<+!*
M+!M*
;
<+!*
M+!M*
;
(;7B9B287
(;7B9B287
/
/
/ )(%($'
/
/
/
/)(%($'
/
/
/
/
)(%($'
/
&
S)
&
&
&
S)
&
S)
&
&
&
S)
&
S)
&
&
&
S)
&
51
[
&
51
.[
&
51
.[
&
S)9
&
&
&
S)9
&
S)9
&
&
&
S)9
5
5
5
5
5
5
5
5
'
'
'
'
'
'
'
'
3ODFHWKHVHWHUPLQDWLRQUHVLVWRUVDWWKHHQGRIHDFKGDWD
OLQH(DFKGDWDOLQH
VKRXOGEHODLGRXWDVDGDLV\FKDLQWKHVLJQDOSDVVLQJ
IURPRQH,&WRWKHQH[W
&
&
/
/
&
&
/
/
D-34
07266B DCN6845
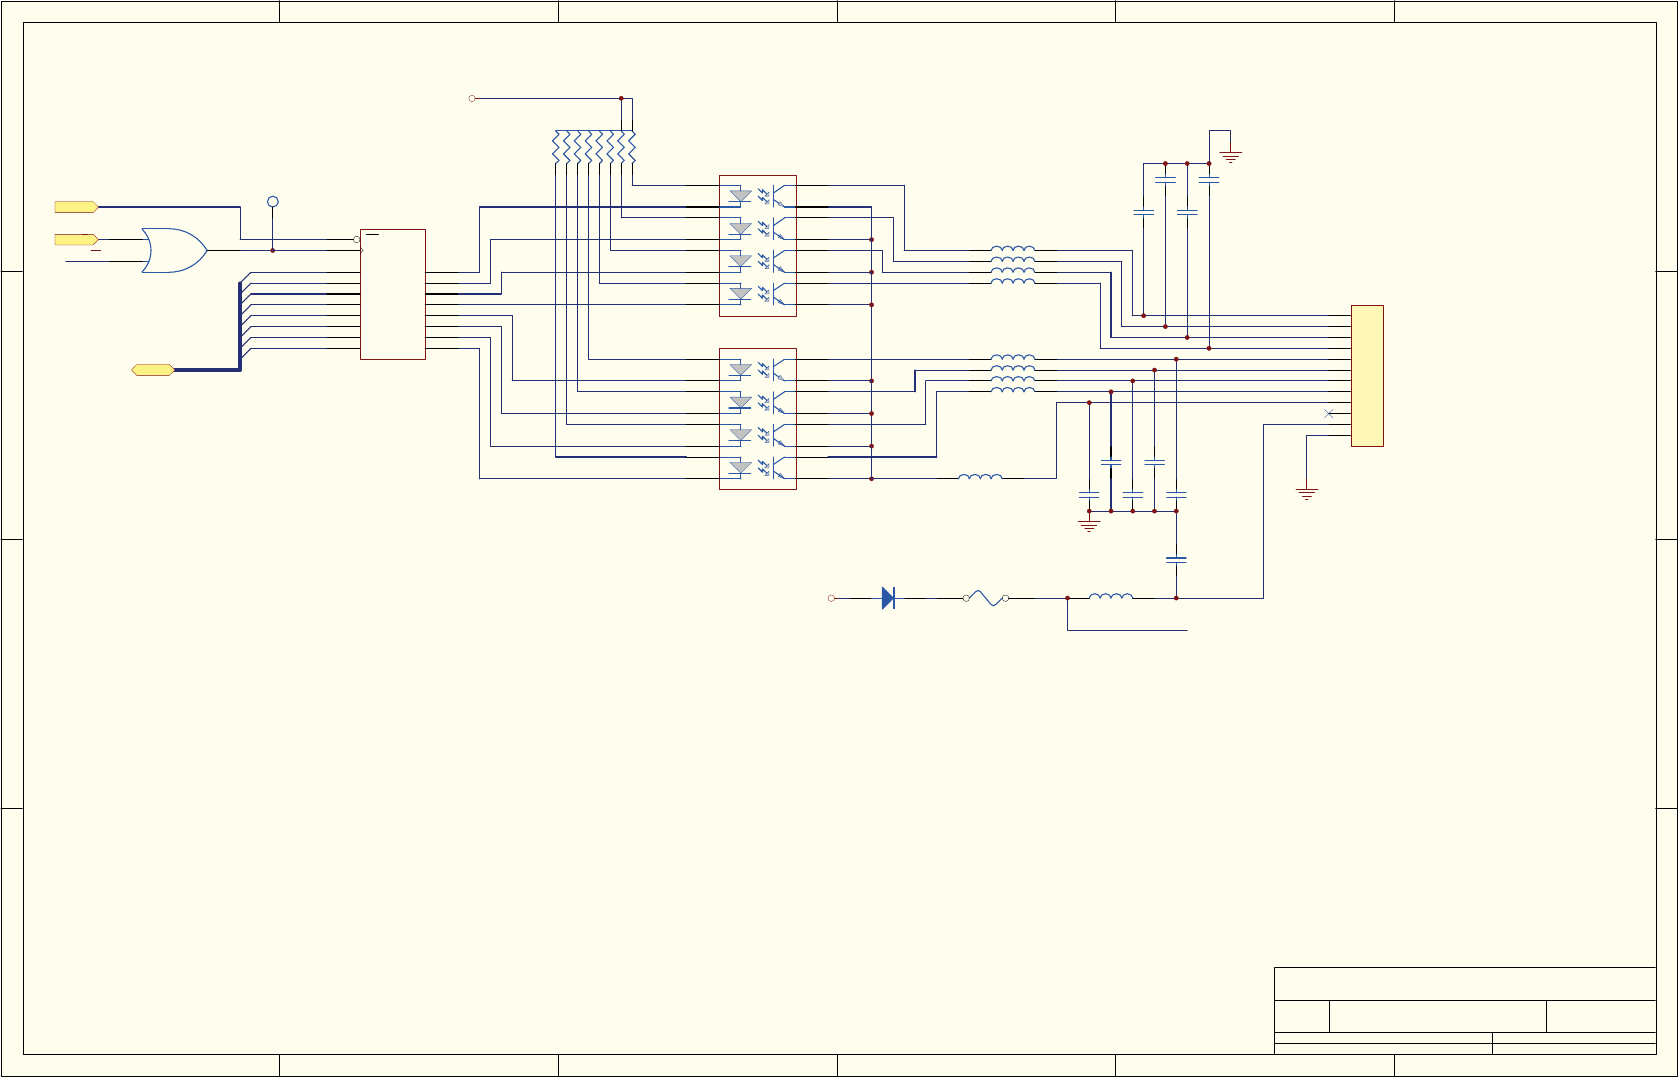
$
%
&
'
'
&
%
$
7LWOH
1XPEHU 5HYLVLRQ6L]H
2UFDG%
'DWH 0D\ 6KHHWRI
)LOH 1?3&%0*5?5-(VHULHV0RWKHUERDUG*HQHUDWLRQ?6RXUFH?EGGE'UDZQ%\
q
>
$
;Mx
q
y
73
8 36
'
'
'
'
'
'
'
'
&/.
2(
4
4
4
4
4
4
4
4
8
+&
8 36
-
7(50%/2&.
6+'1
'>@
',*,2
9&&
9&&
'
',2'(6&+277.<
)
5(6(77$%/()86($9
/
/
/ )(%($'
/
/
/
/ )(%($'
/
&
S)
&
&
&
S)
&
S)
&
&
&
S)
(;7B9B287
&
51
[
/
)(%($'
/
)(%($'
&
&
8%
+&
07266B DCN6845
D-35
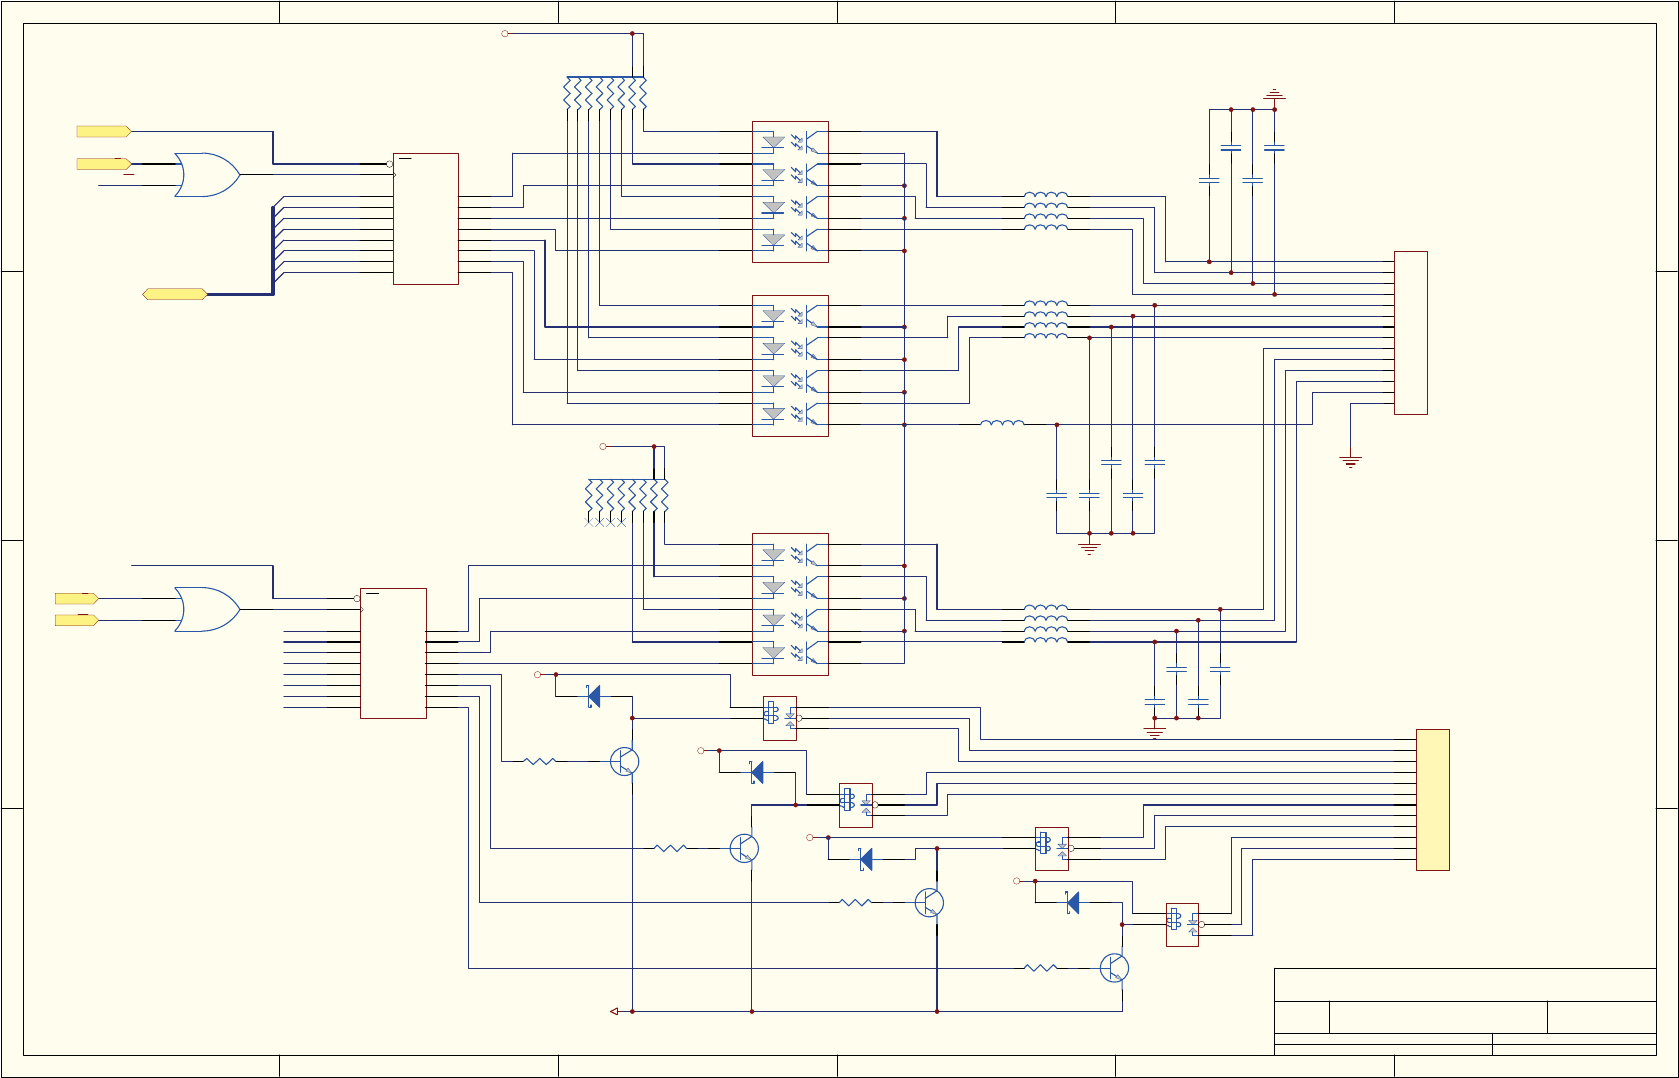
$
%
&
'
'
&
%
$
7LWOH
1XPEHU 5HYLVLRQ6L]H
2UFDG%
'DWH 0D\ 6KHHWRI
)LOH 1?3&%0*5?5-(VHULHV0RWKHUERDUG*HQHUDWLRQ?6RXUFH?EGGE'UDZQ%\
,2:
6+'1
'
'
'
'
'
'
'
'
'
6+'1
'
'
'
'
'
'
'
4
62
5
.
.
5(/$<63'7
5
.
. 5(/$<63'7
-
7(50%/2&.
4
62
5
.
.
5(/$<63'7
'
'
'
'
'
'
'
'
&/.
2(
4
4
4
4
4
4
4
4
8
+&
4
62
8 36
5 .
.
5(/$<63'7
4
62
8 36
'
'
'
'
'
'
'
'
&/.
2(
4
4
4
4
4
4
4
4
8
+&
-
7(50%/2&.
8 36
6+'1
',*,2
'>@
,2:
',*,2
9&&
9&&
9
9
9
9
95(7
<+!$*
!$!$*
$*$!M'+'+
'
',2'(6&+277.<
'
',2'(6&+277.<
'
',2'(6&+277.<
'
',2'(6&+277.<
/
/
/ )(%($'
/
/
/
/ )(%($'
/
/
/
/ )(%($'
/
&
S)
&
&
&
S)
&
S)
&
&
&
S)
&
S)
&
&
&
S)
&
51
[
&
51
[
/ )(%($'
&
S)
&2B(;7B5(7
8&
+&
8$
+&
D-36
07266B DCN6845
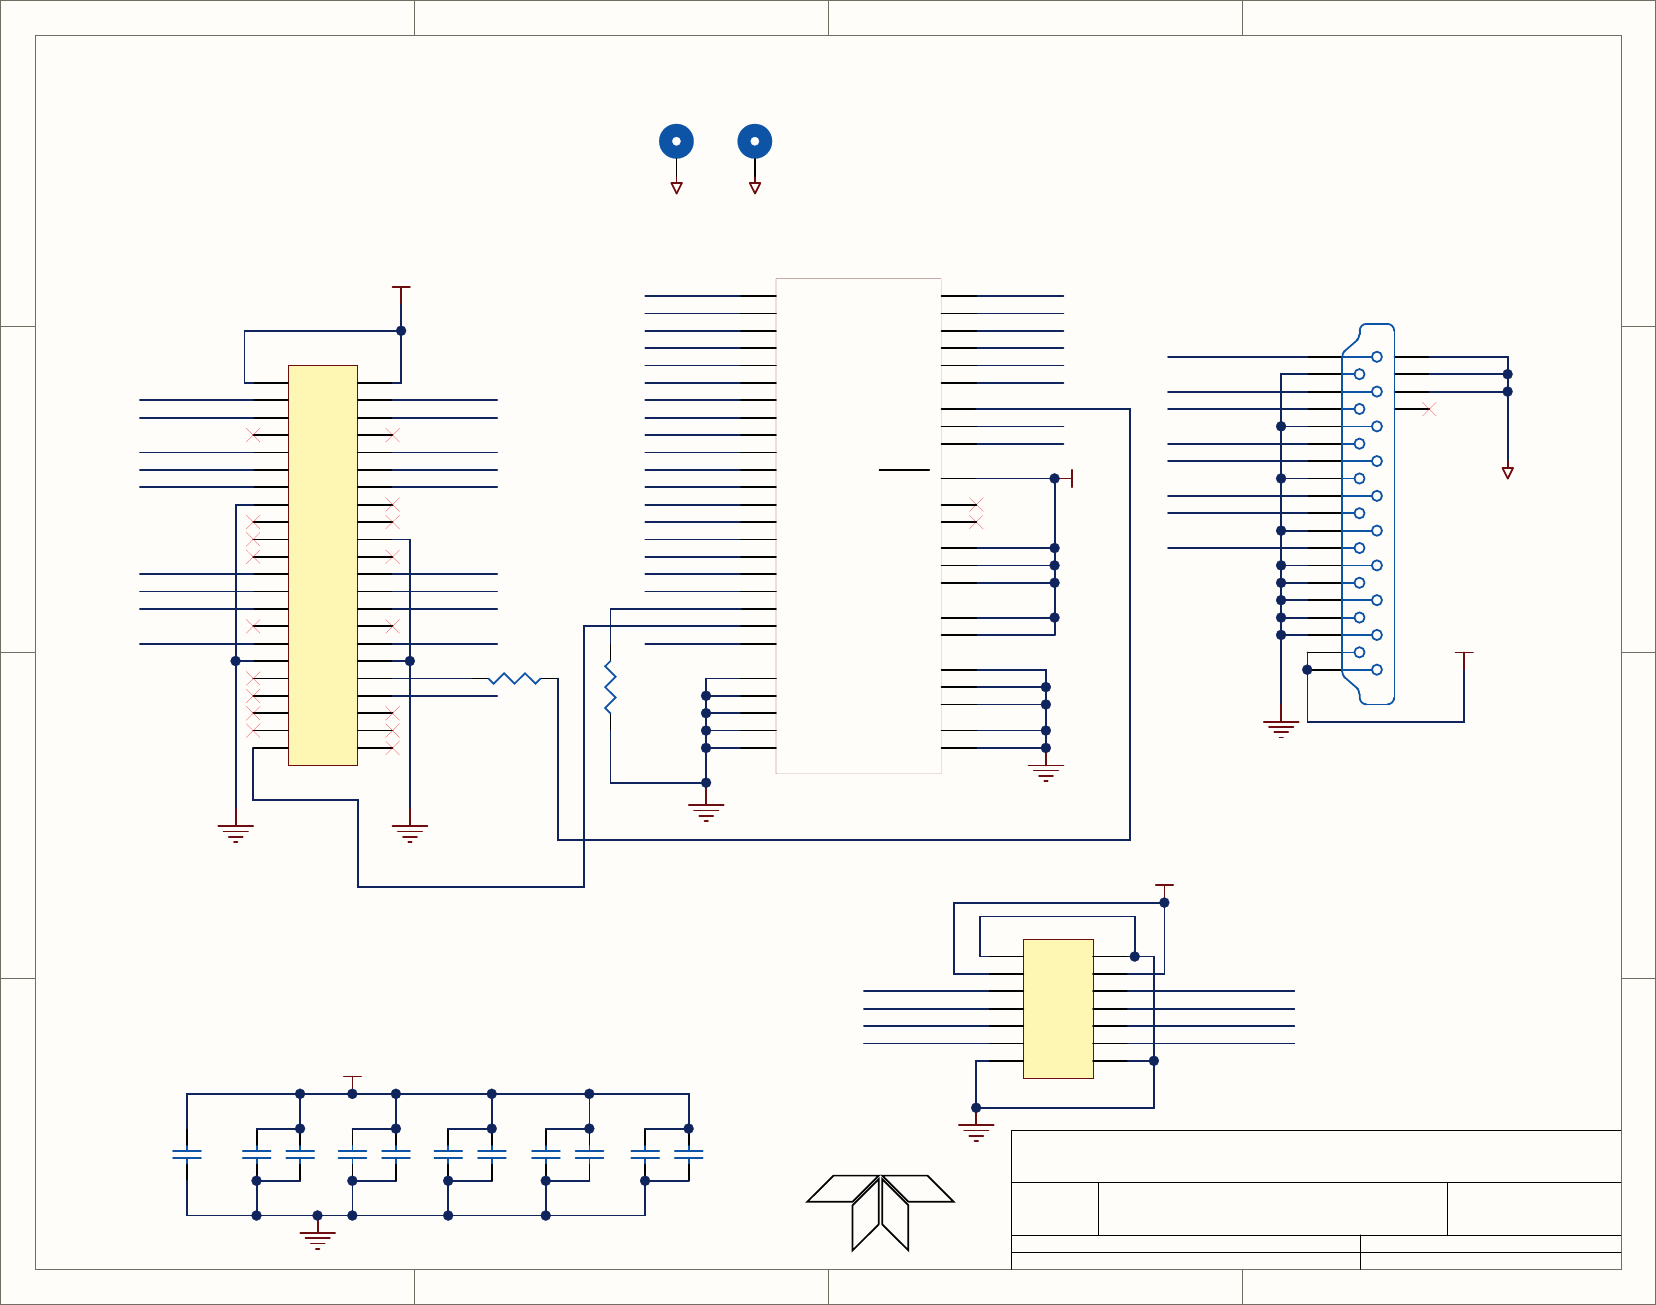
1
1
2
2
3
3
4
4
D D
C C
B B
A A
Title
Number RevisionSize
A
Date: 5/7/2010 Sheet of
File: N:\PCBMGR\..\06882-P1-R0.SchDoc Drawn By:
LVDS, Transmitter Board
B
11
RT
06882
VAD6
VAD7
VAD8
VAD9
VAD10
VAD11
VBD10
VBD11
VAD0
VAD1
VAD2
VAD3
VBD2
VBD3
VBD4
VBD5
VBD6
VBD7
VBDE
Y0_N
Y0_P
Y1_N
Y1_P
Y2_N
Y2_P
CLKOUT_N
CLKOUT_P
R2
22.1
From ICOP CPU To LCD Display
D0
44
D1
45
D2
47
D3
48
D4
1
D5
3
D6
4
D7
6
D8
7
D9
9
D10
10
D11
12
D12
13
D13
15
D14
16
D15
18
D16
19
D17
20
D18
22
D19
23
D20
25
GND
5
GND
11
GND
17
GND
24
GND
46
Y2P 34
Y2M 35
Y1P 38
Y1M 39
Y0P 40
Y0M 41
CLKOUTP 32
CLKOUTM 33
CLKIN 26
SHTDN 27
NC 14
NC 43
VCC 2
VCC 8
VCC 21
LVDSVCC 37
PLLVCC 29
VLDSGND 42
VLDSGND 36
VLDSGND 31
PLLGND 30
PLLGND 28
U1
SN75LVDS84A
CHASSIS-0 CHASSIS
1 2
3 4
5 6
7 8
910
11 12
13 14
15 16
17 18
19 20
21 22
23 24
25 26
27 28
29 30
31 32
33 34
35 36
37 38
39 40
41 42
43 44
J2 Header 22X2
MH3
MH4
2
3
4
5
6
7
8
1MH1
MH2
9
10
11
12
13
14
15
16
17
18
19
J1
G3168-05000101-00
CHASSIS
+3.3V
+3.3V
VAD0 VAD1
VAD2 VAD3
VAD6 VAD7
VAD8 VAD9
VAD10 VAD11
VBD2 VBD3
VBD4 VBD5
VBD6 VBD7
VBD10 VBD11
VBDE
VBGCLK
+3.3V
CLKIN
Y0_N
Y0_P
Y1_N
Y1_P
Y2_N
Y2_P
CLKOUT_N
CLKOUT_P
10K
R1
BACKL
BACKL
C2
0.1
C3
0.01
22uF/6.3V
C1
JMK316BJ226KL
C4
0.1
C6
0.1
C5
0.01
C7
0.01
+3.3V
C8
0.1
C9
0.01
C10
0.1
C11
0.01
1 2
3 4
5 6
7 8
910
11 12
13 14
J3
Header 7X2
+3.3V
Y0_P Y0_N
Y1_P Y1_N
CLKOUT_P
Y2_N
CLKOUT_N
Y2_P
MT1 MT2
07266B DCN6845
D-37
