metraTec QR15HL RFID Module User Manual FM8 DOC022 52 53 90367
metraTec GmbH RFID Module FM8 DOC022 52 53 90367
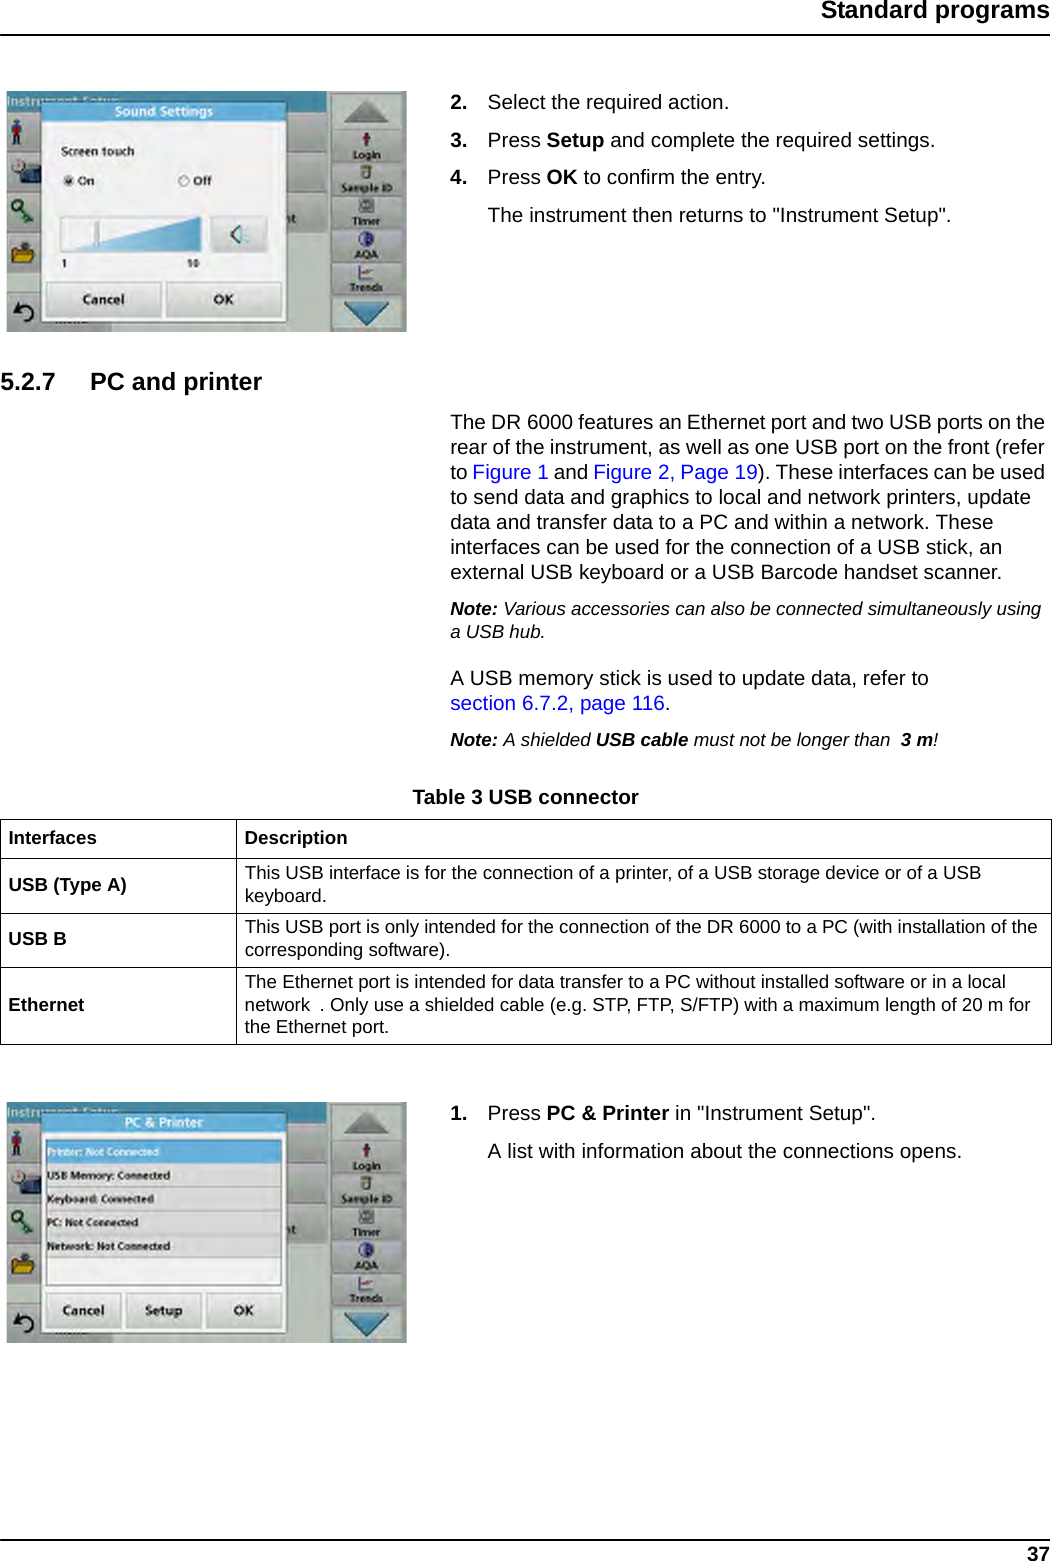
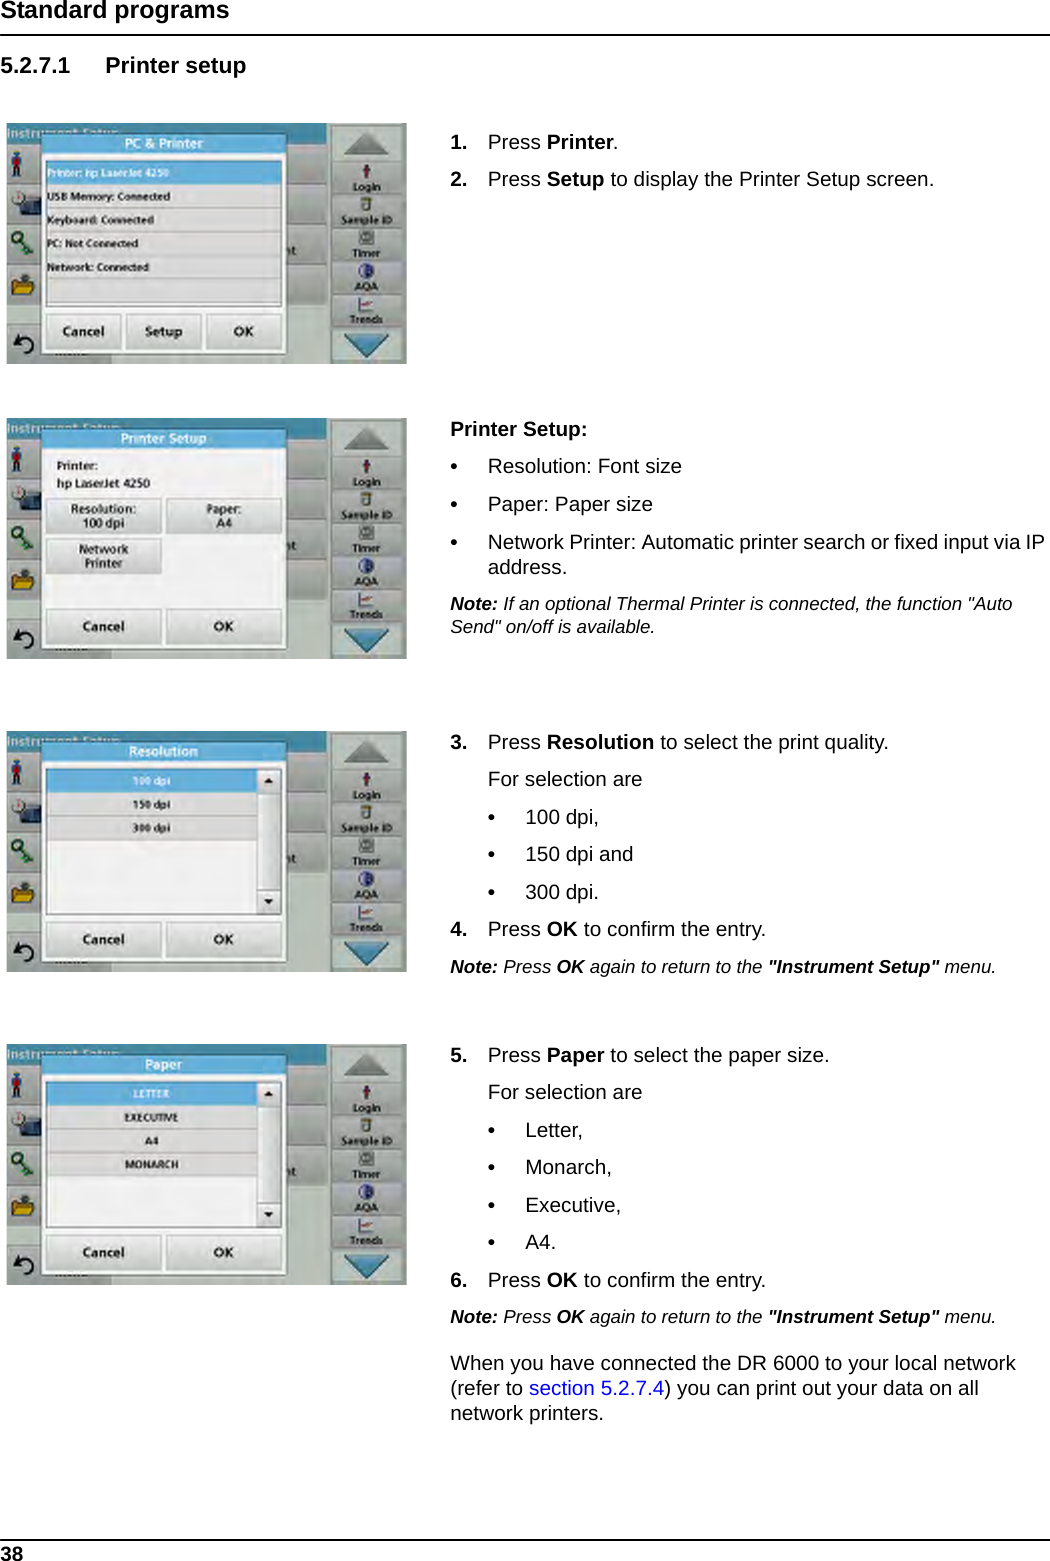
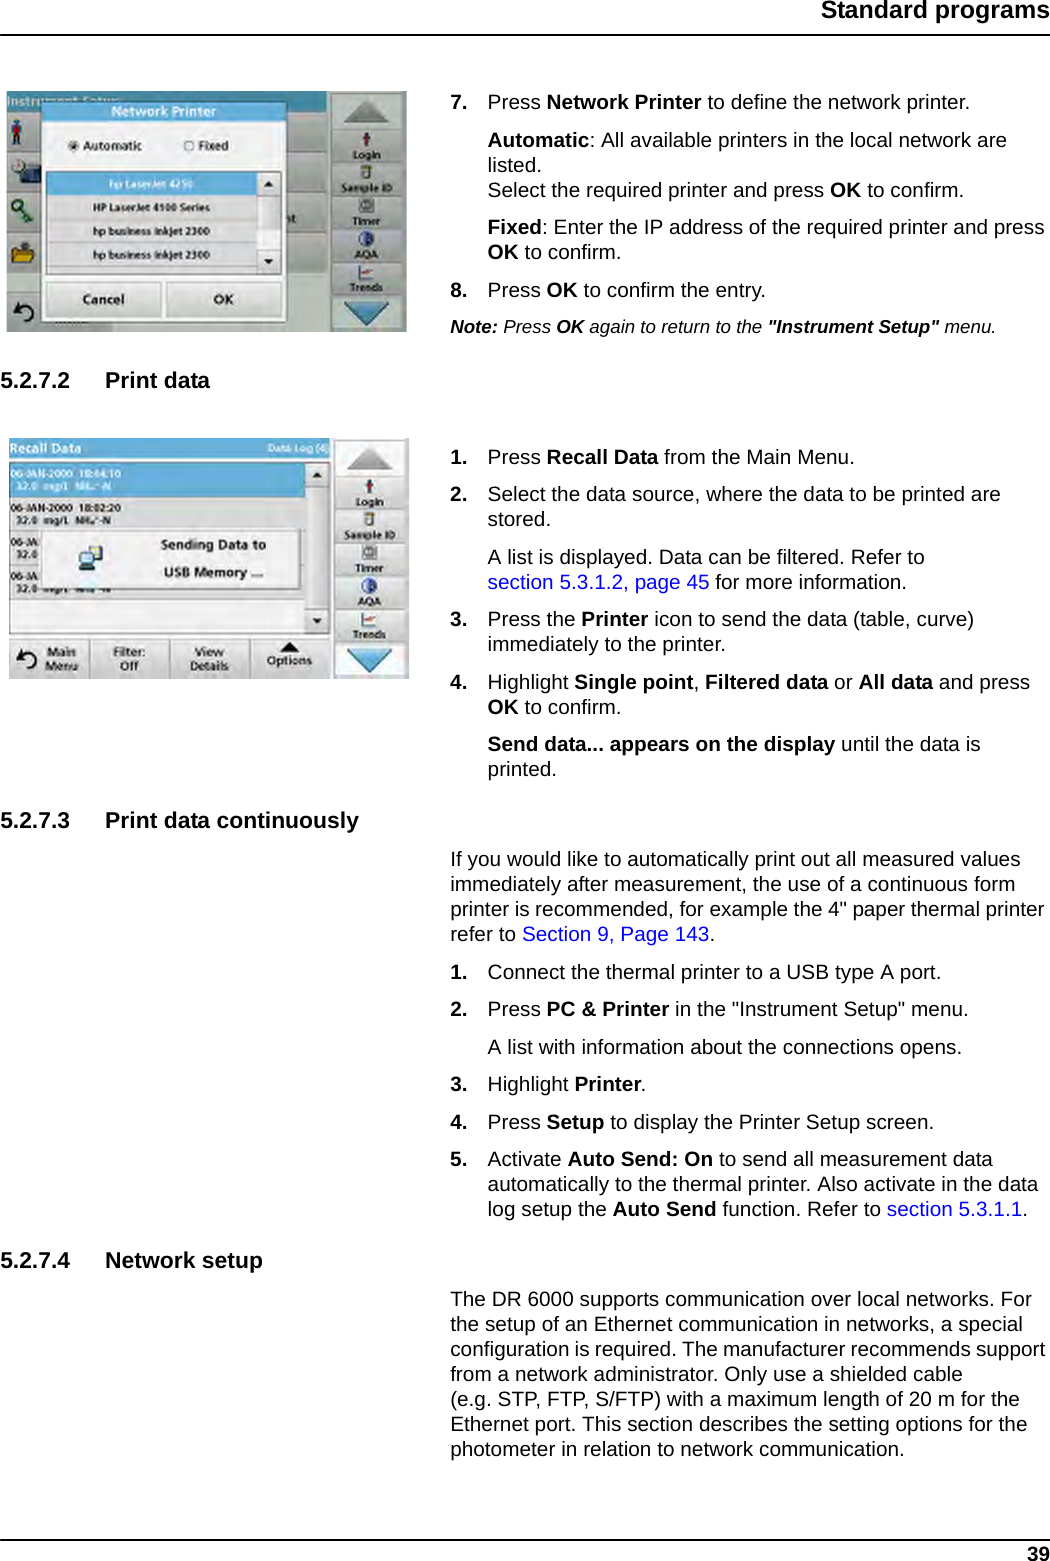
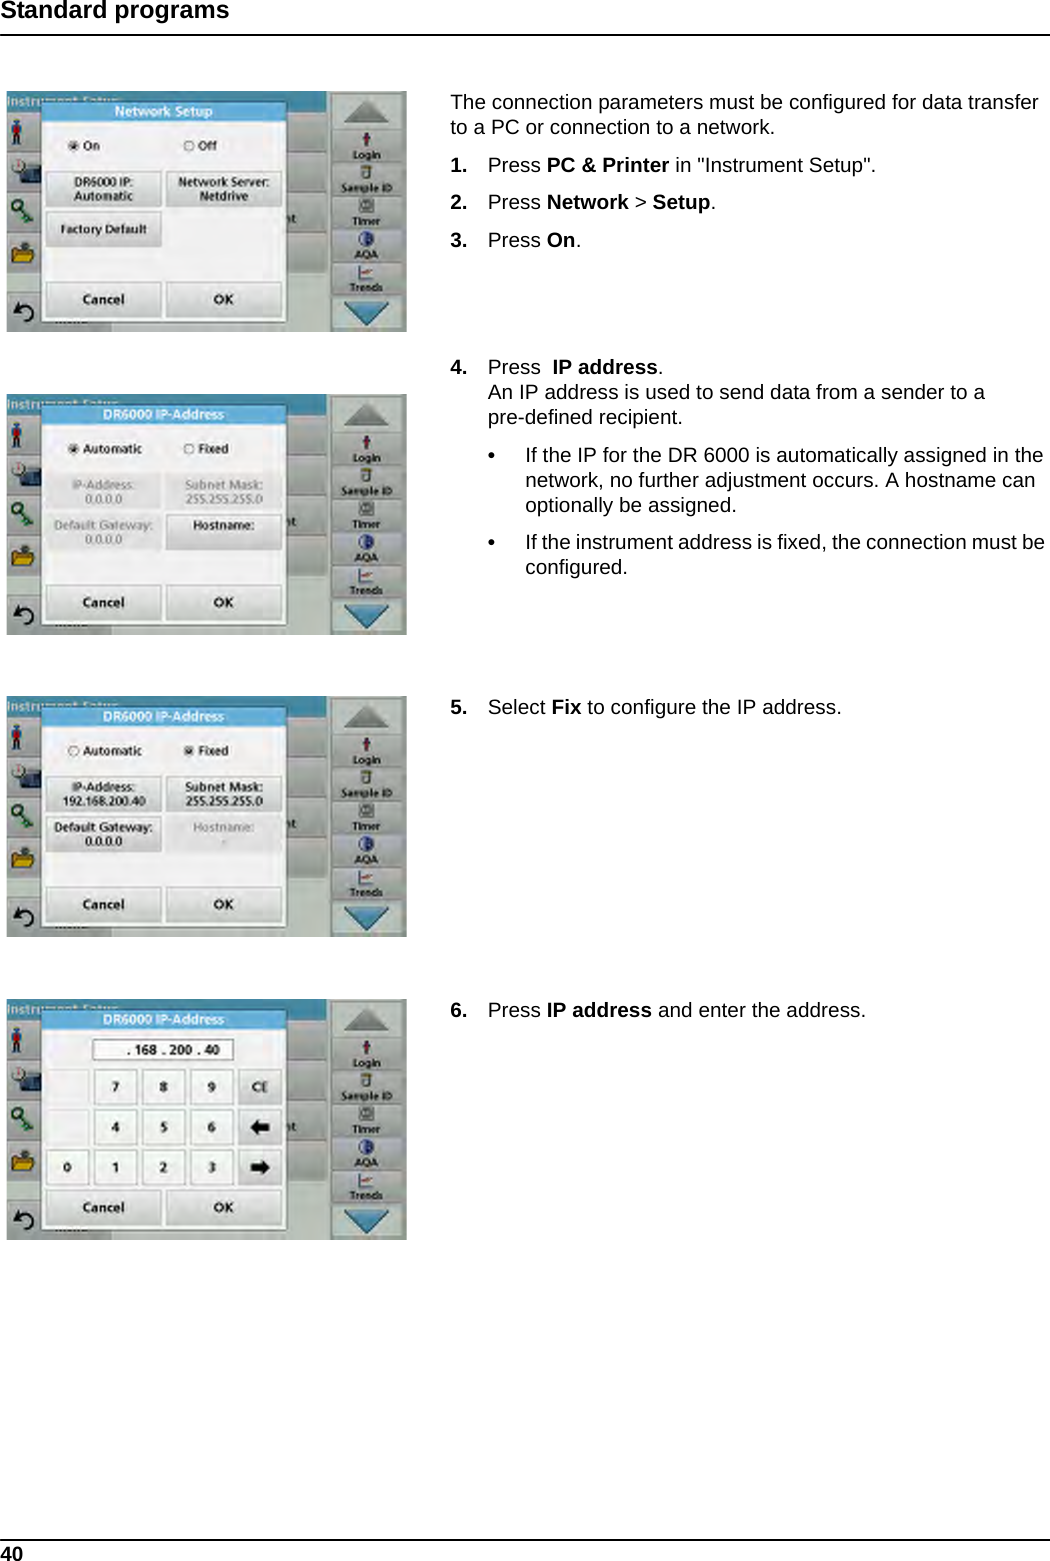
UserManual.wiki
>
metraTec
>
QR15HL User Manual
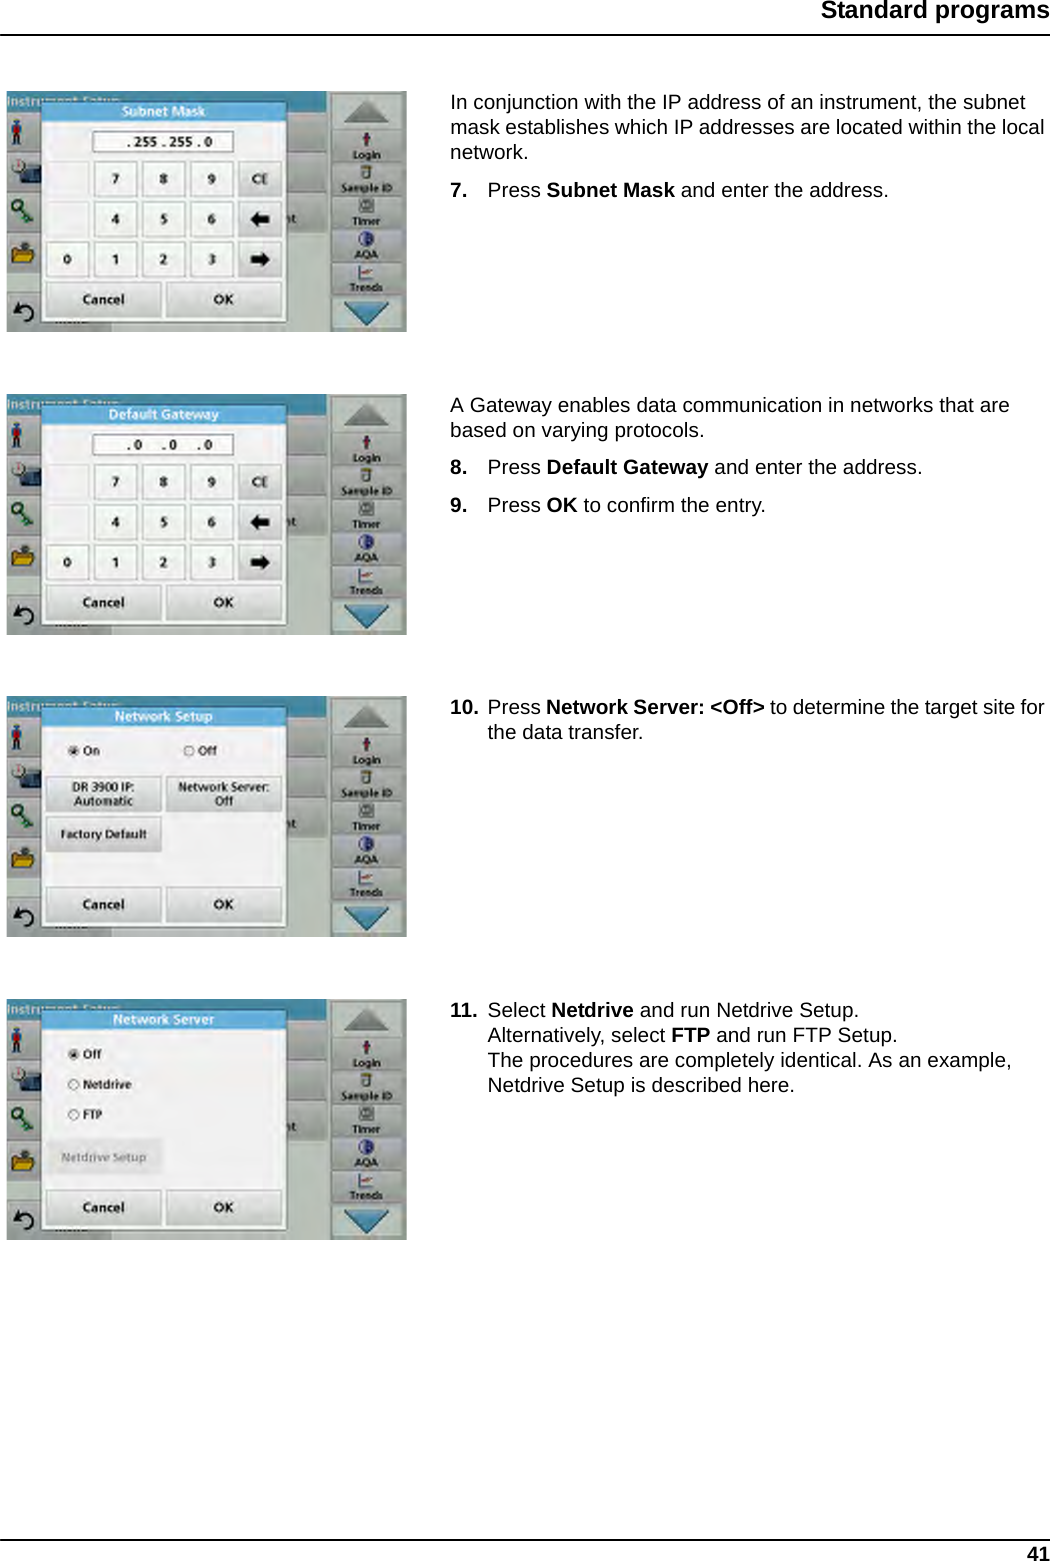
>
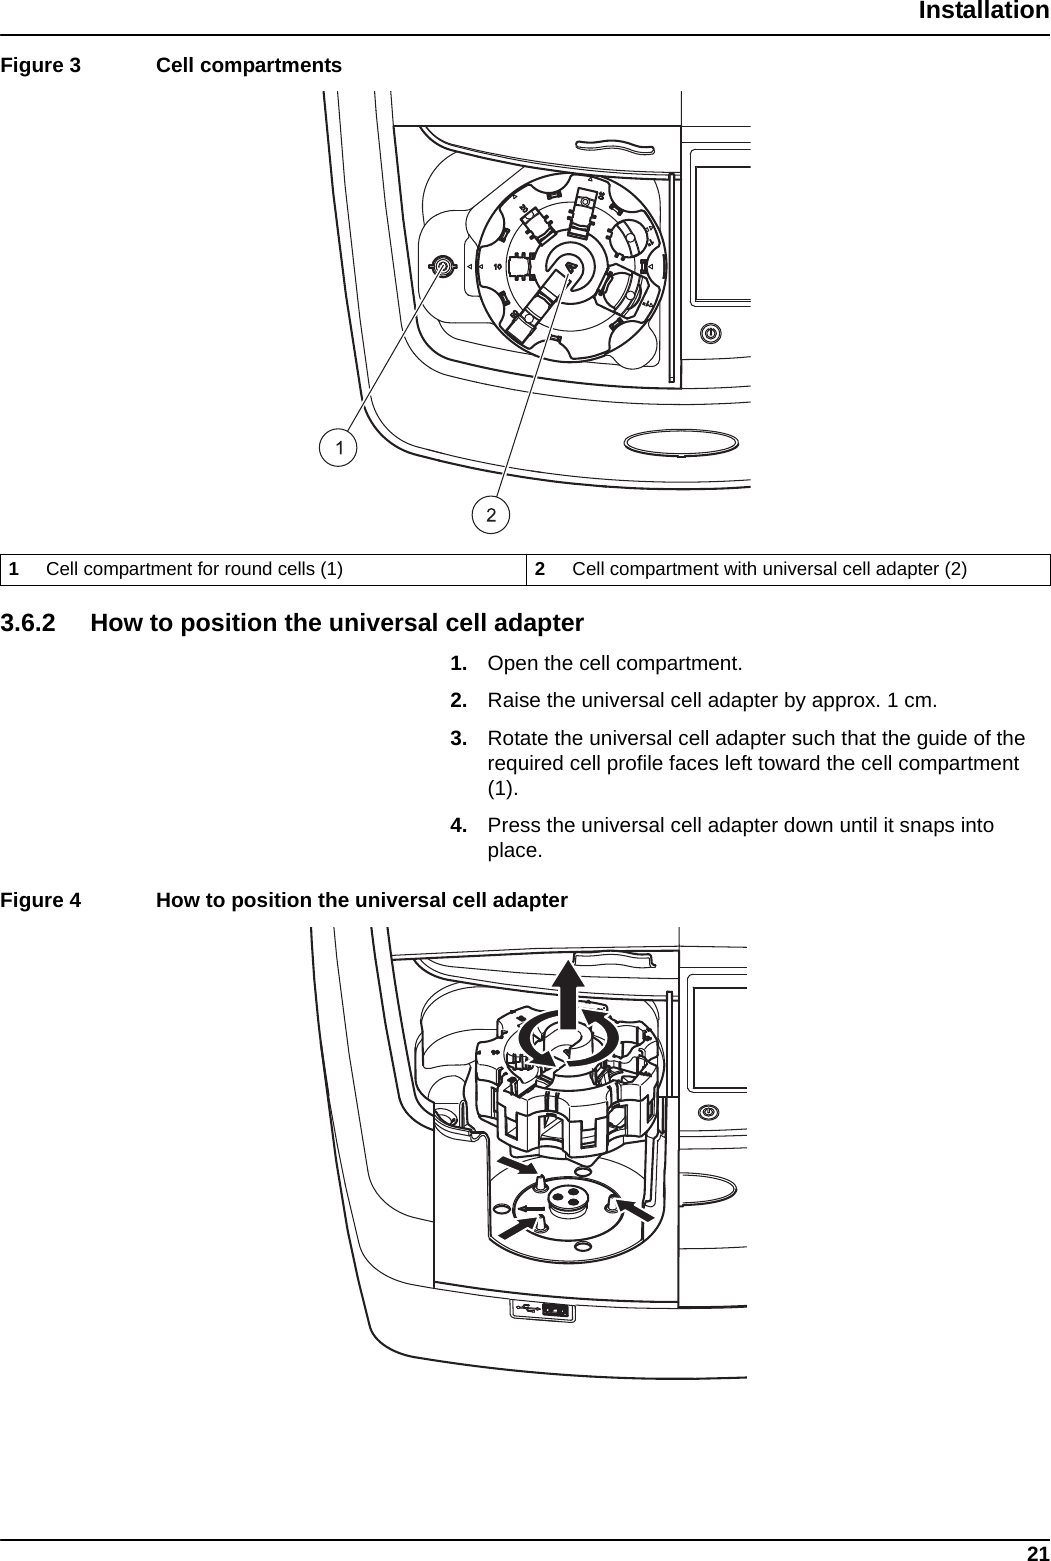
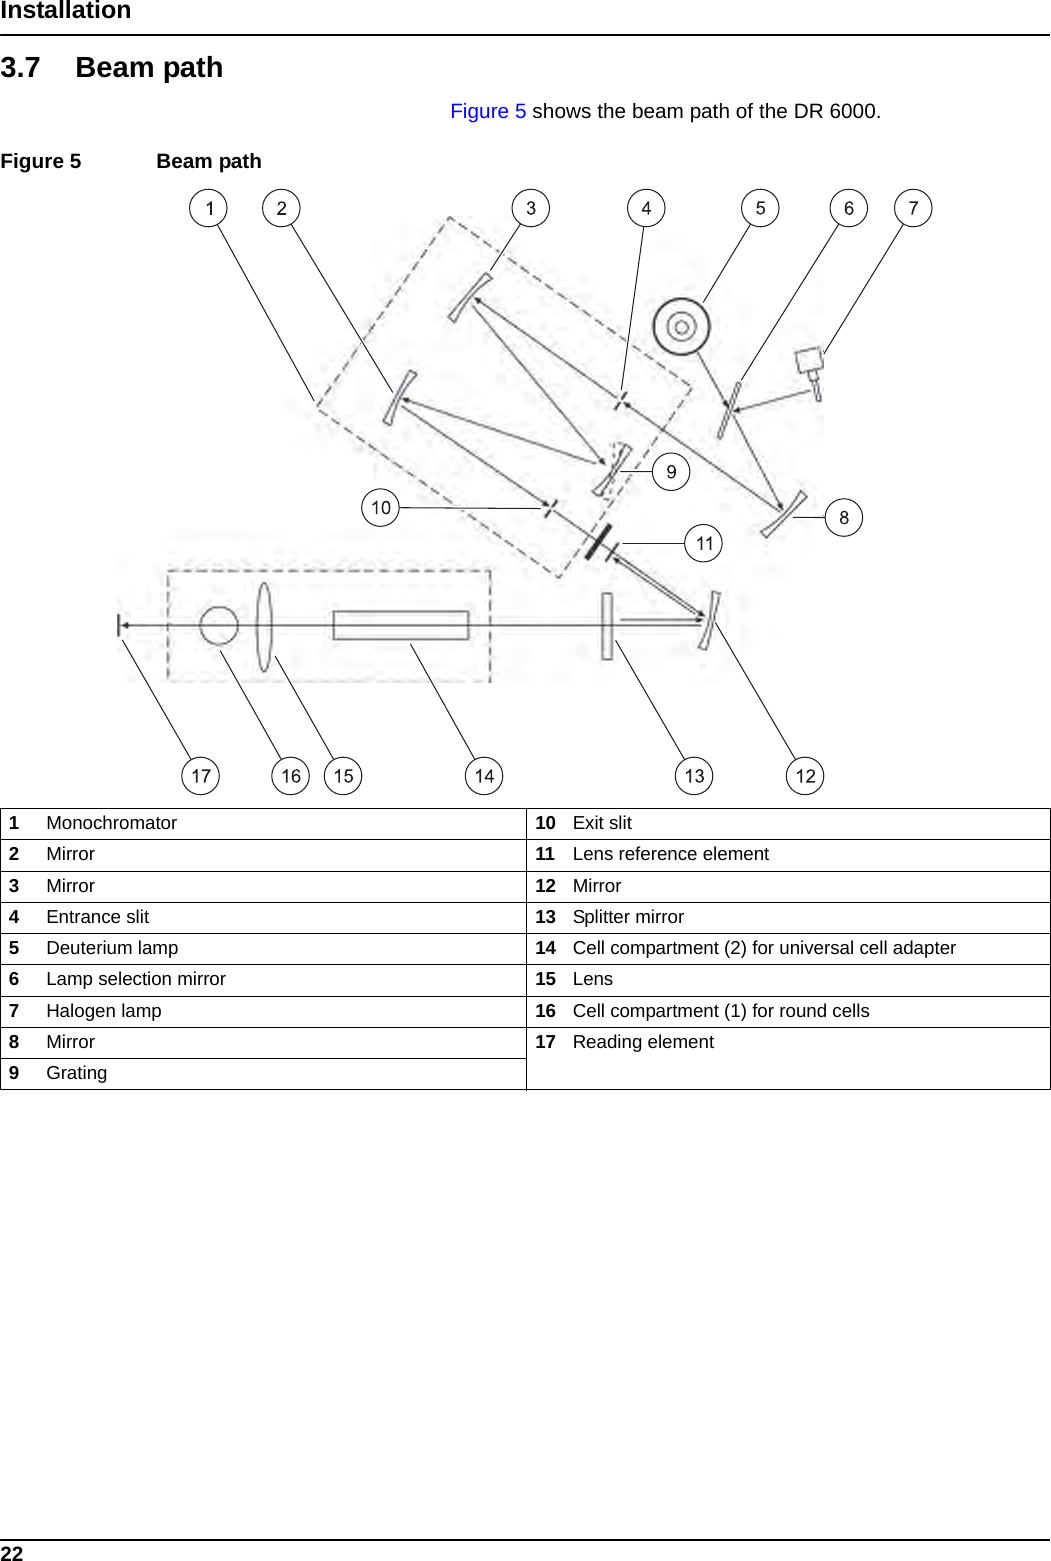
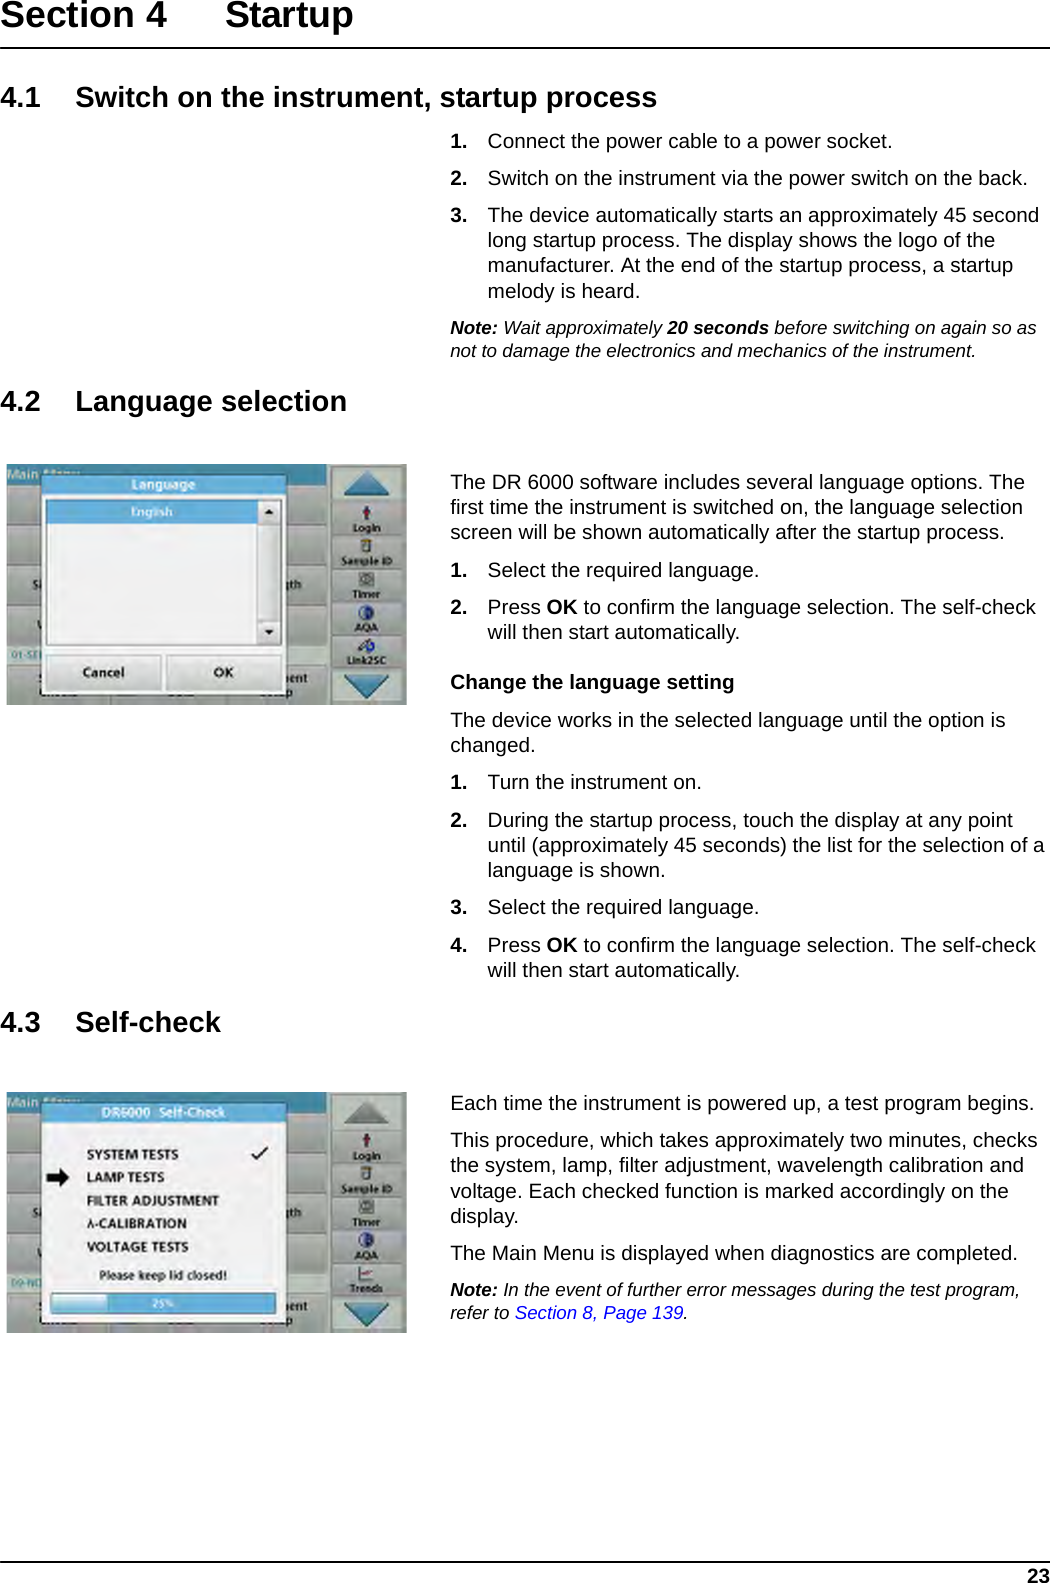
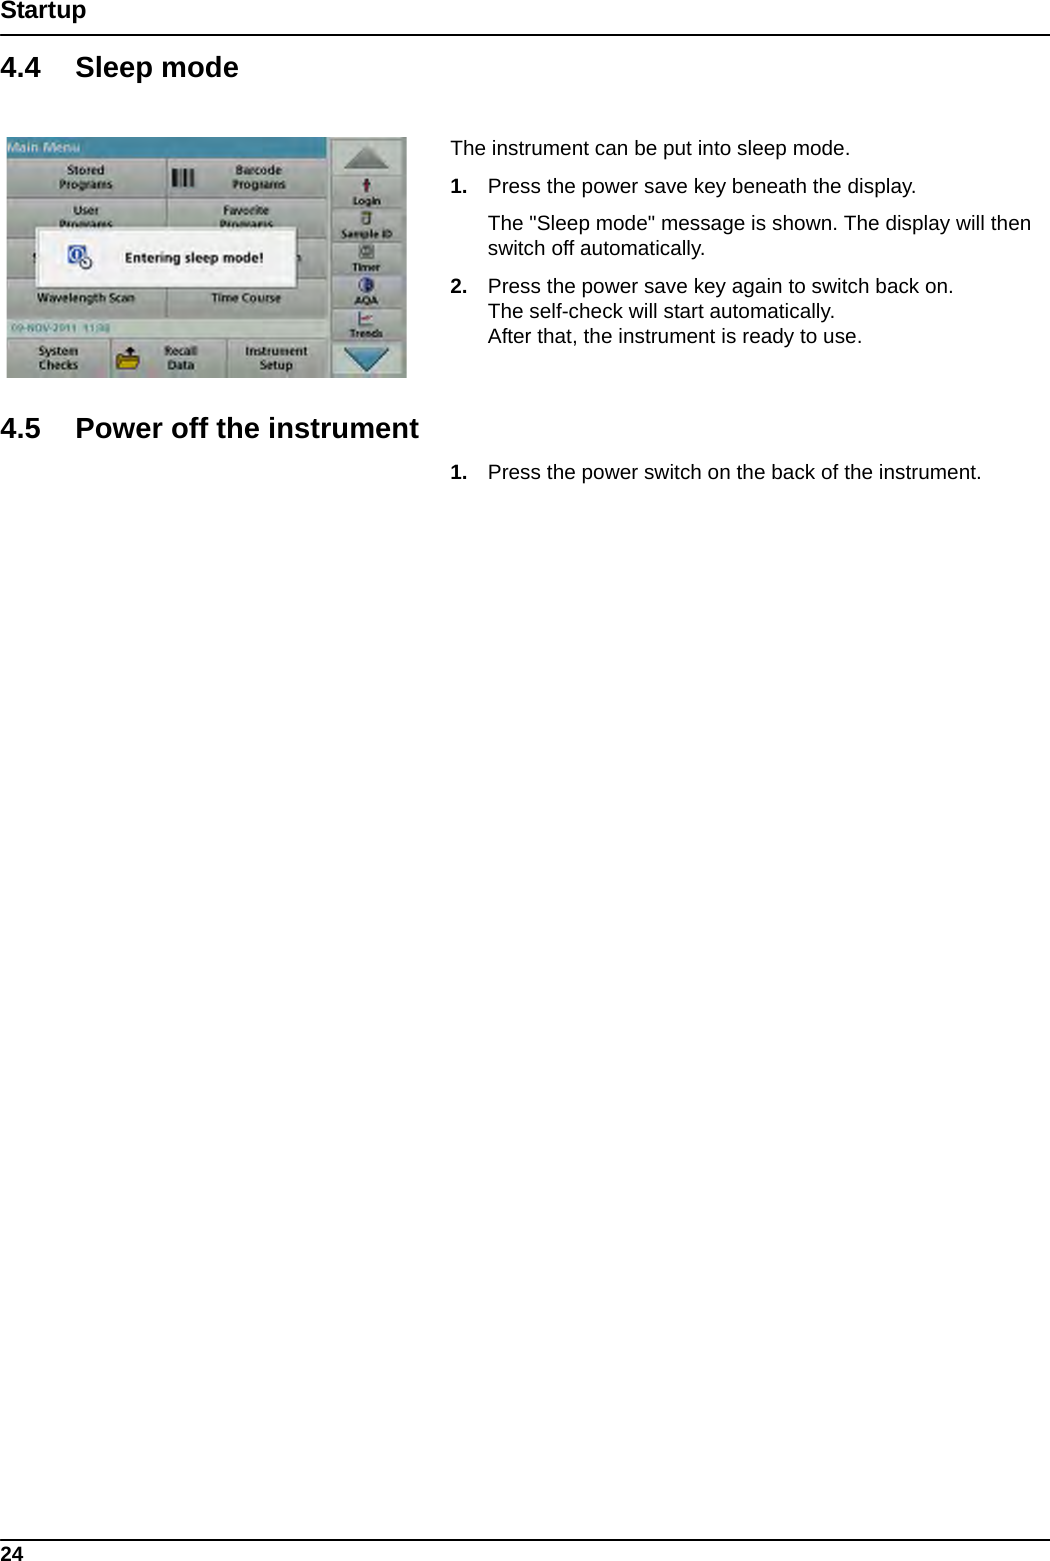
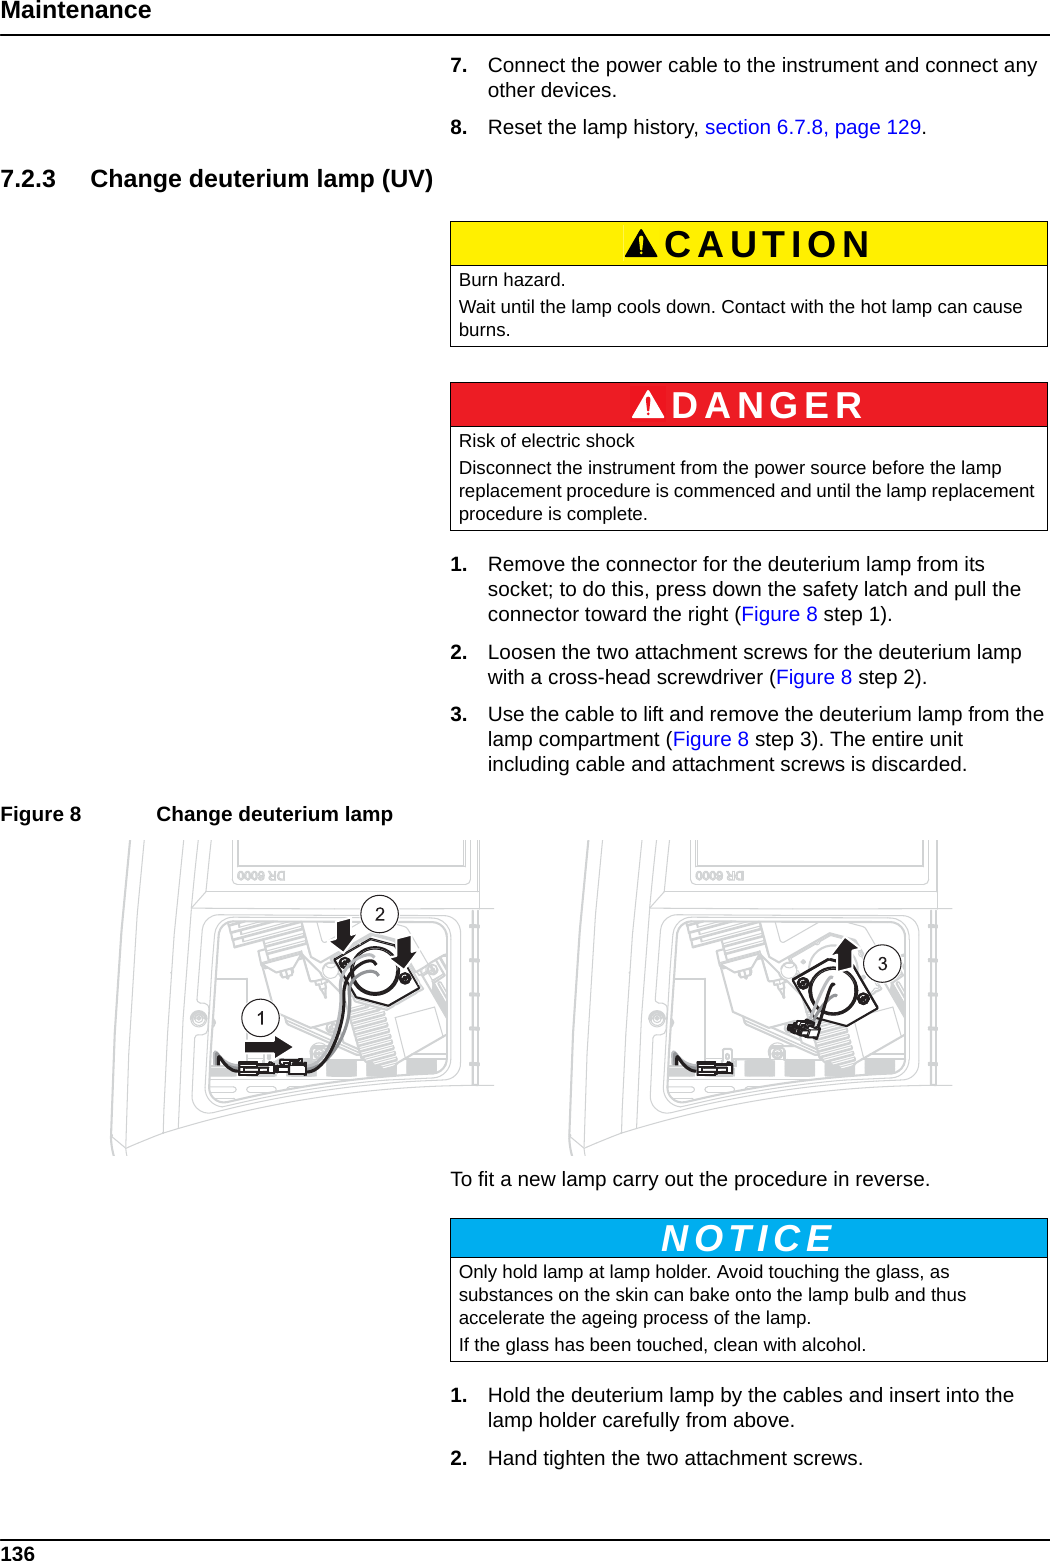
user manual DR6000
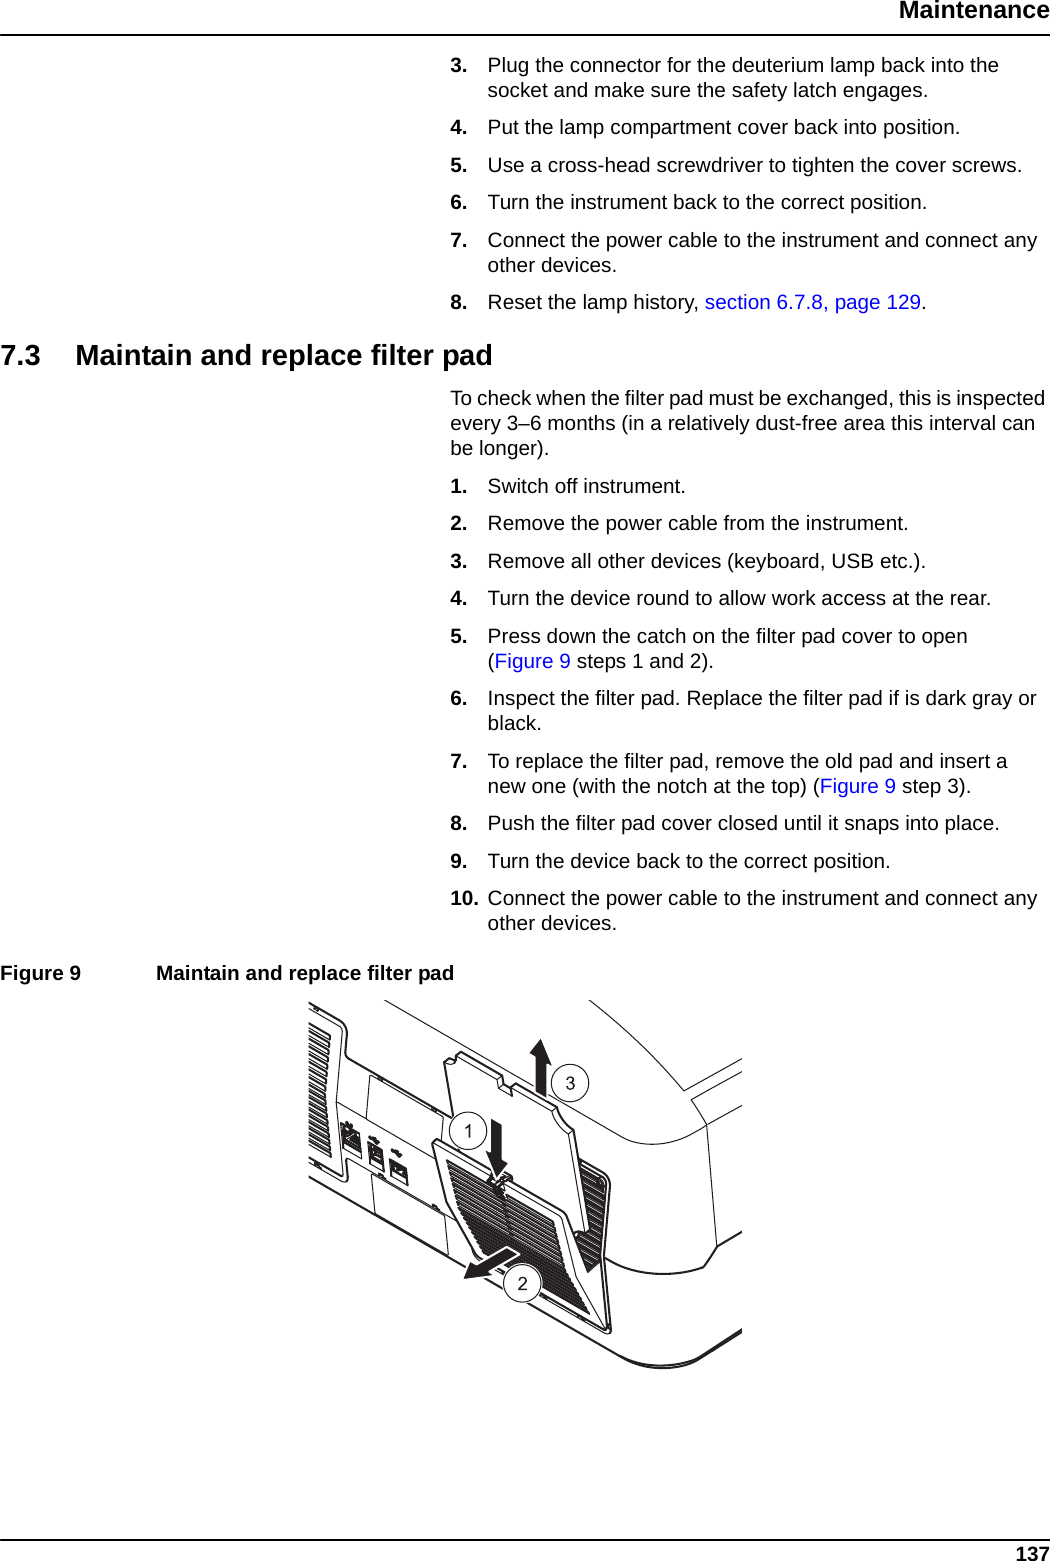
Contents
1.
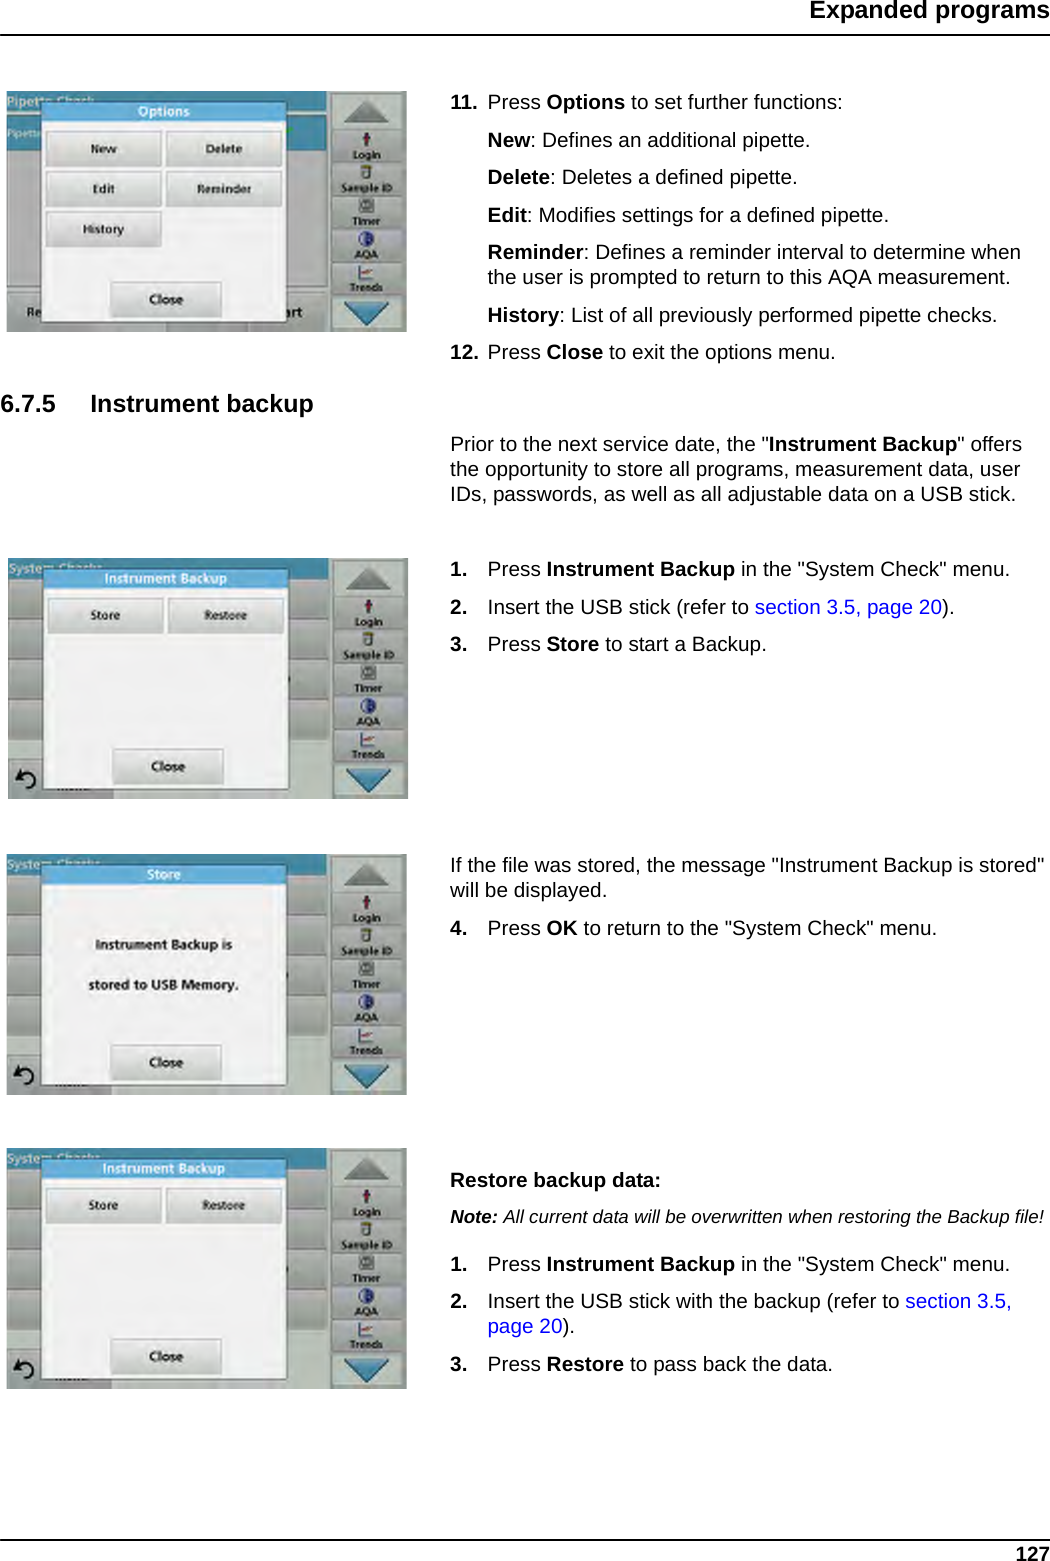
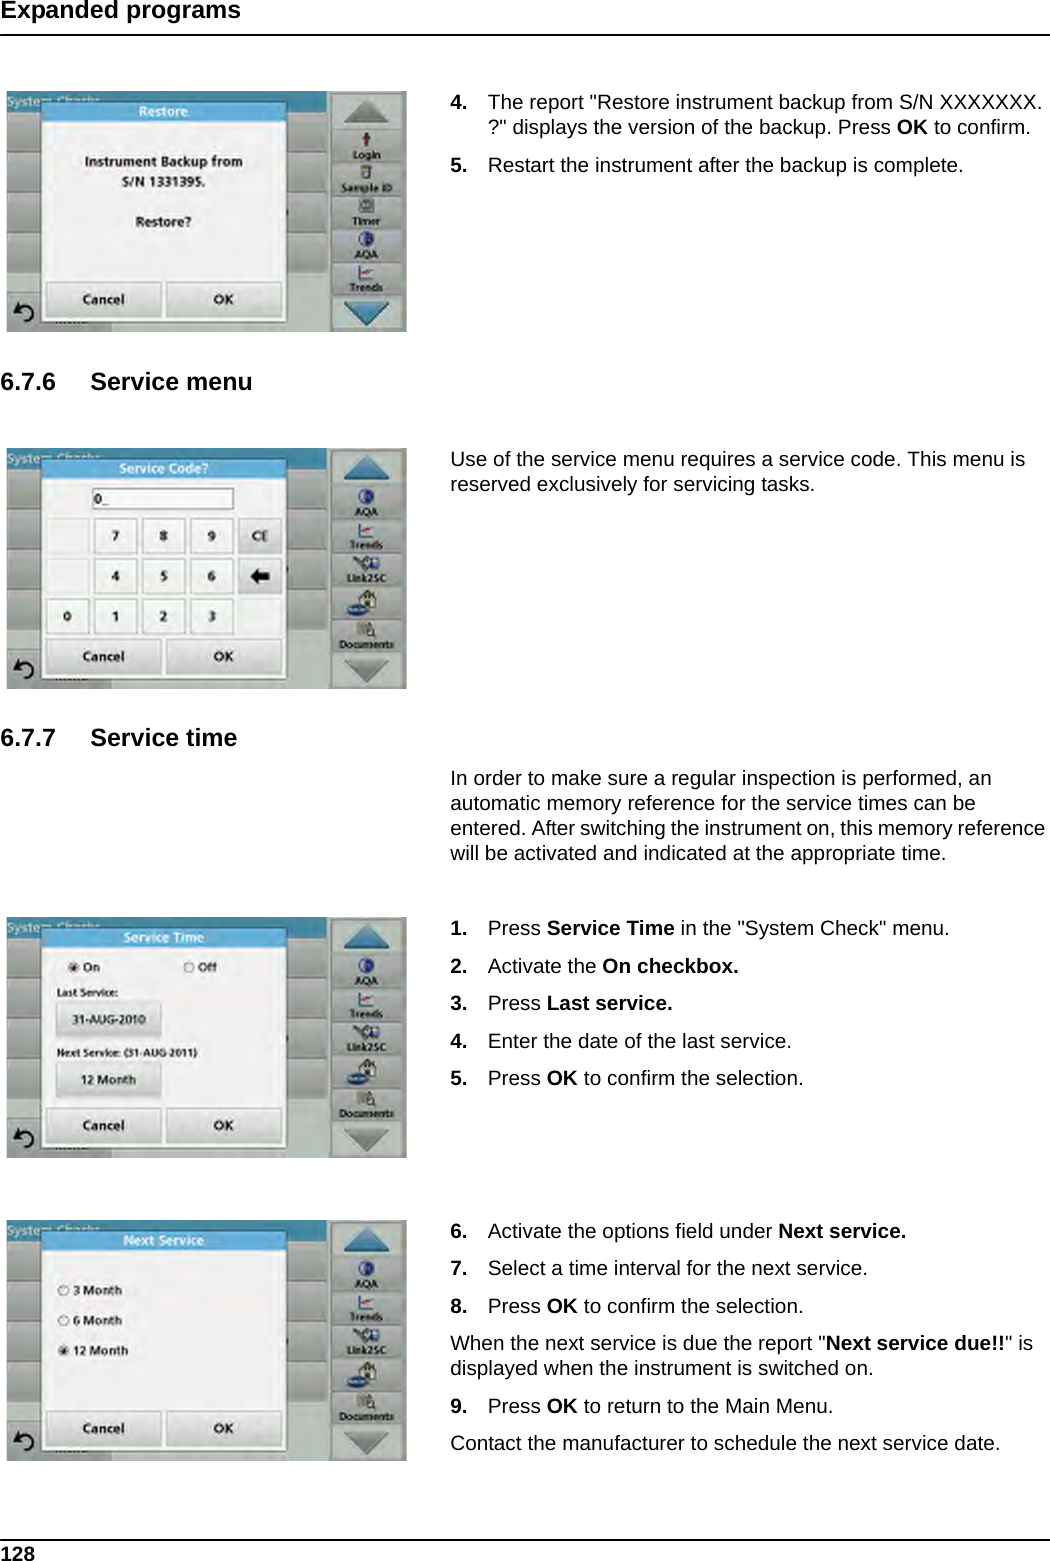
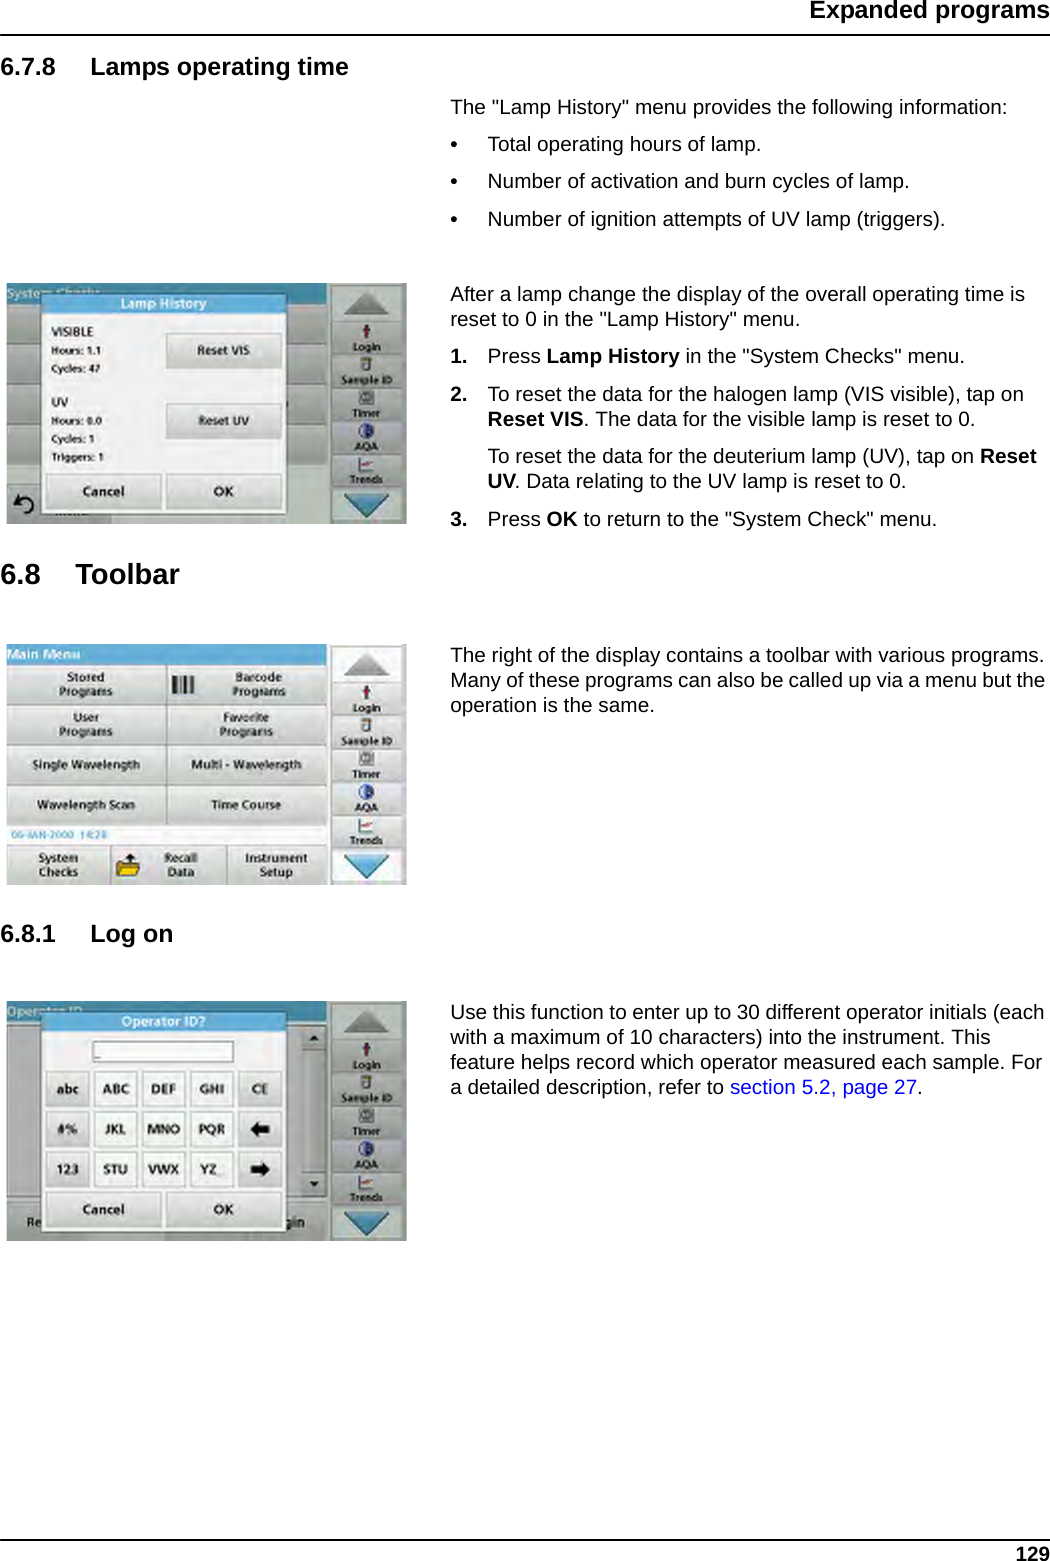
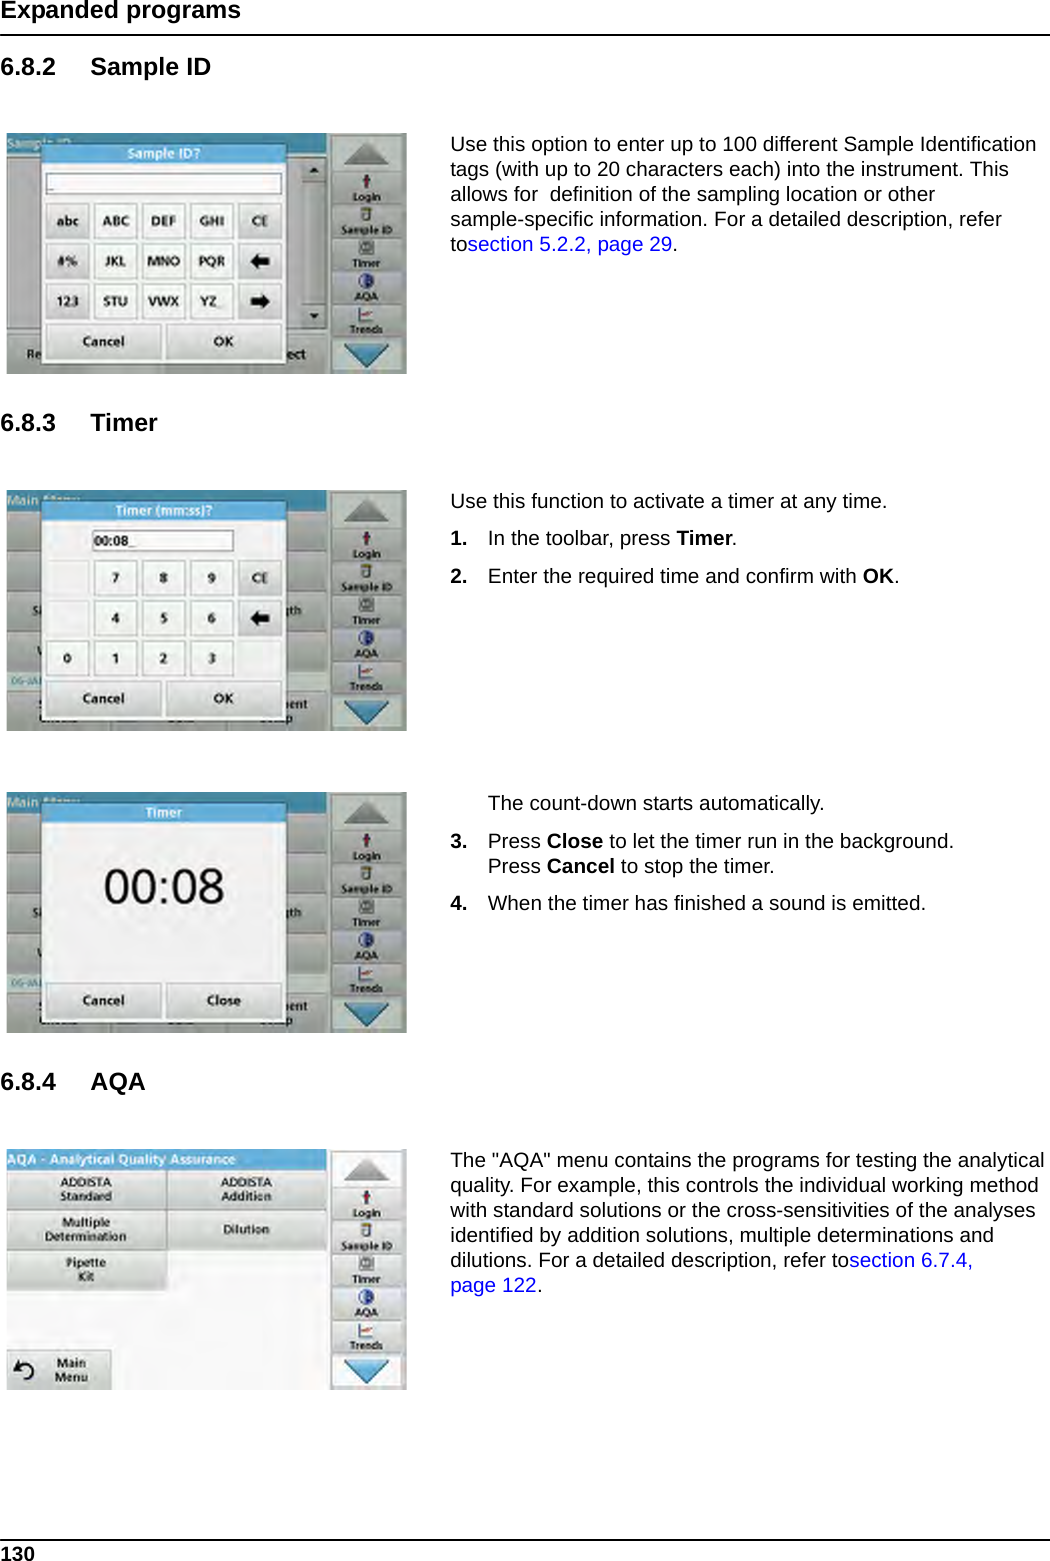
Users Manual
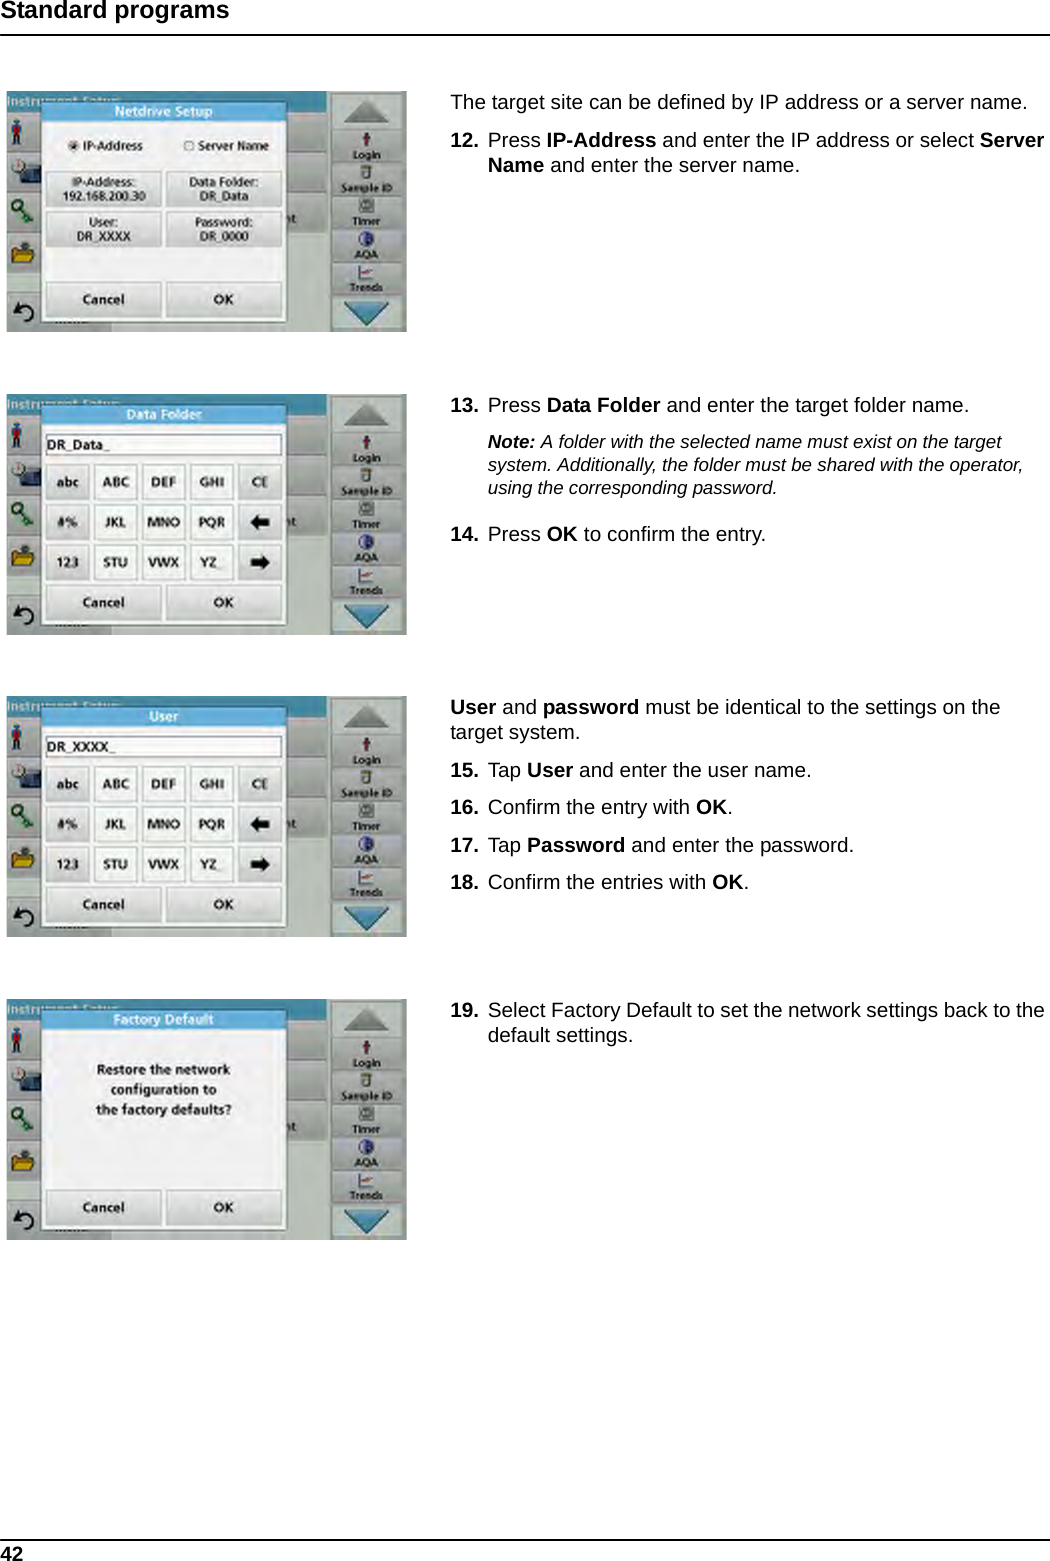
2.
user manual Dr3900
3.
user manual DR6000
4.
user manual TU5200 EPA
5.
user manual TU5200 ISO
user manual DR6000
Navigation menu
Upload a User Manual
Namespaces
Wiki Guide
HTML
PDF
Info
Views
User Manual
Discussion / Help
Navigation
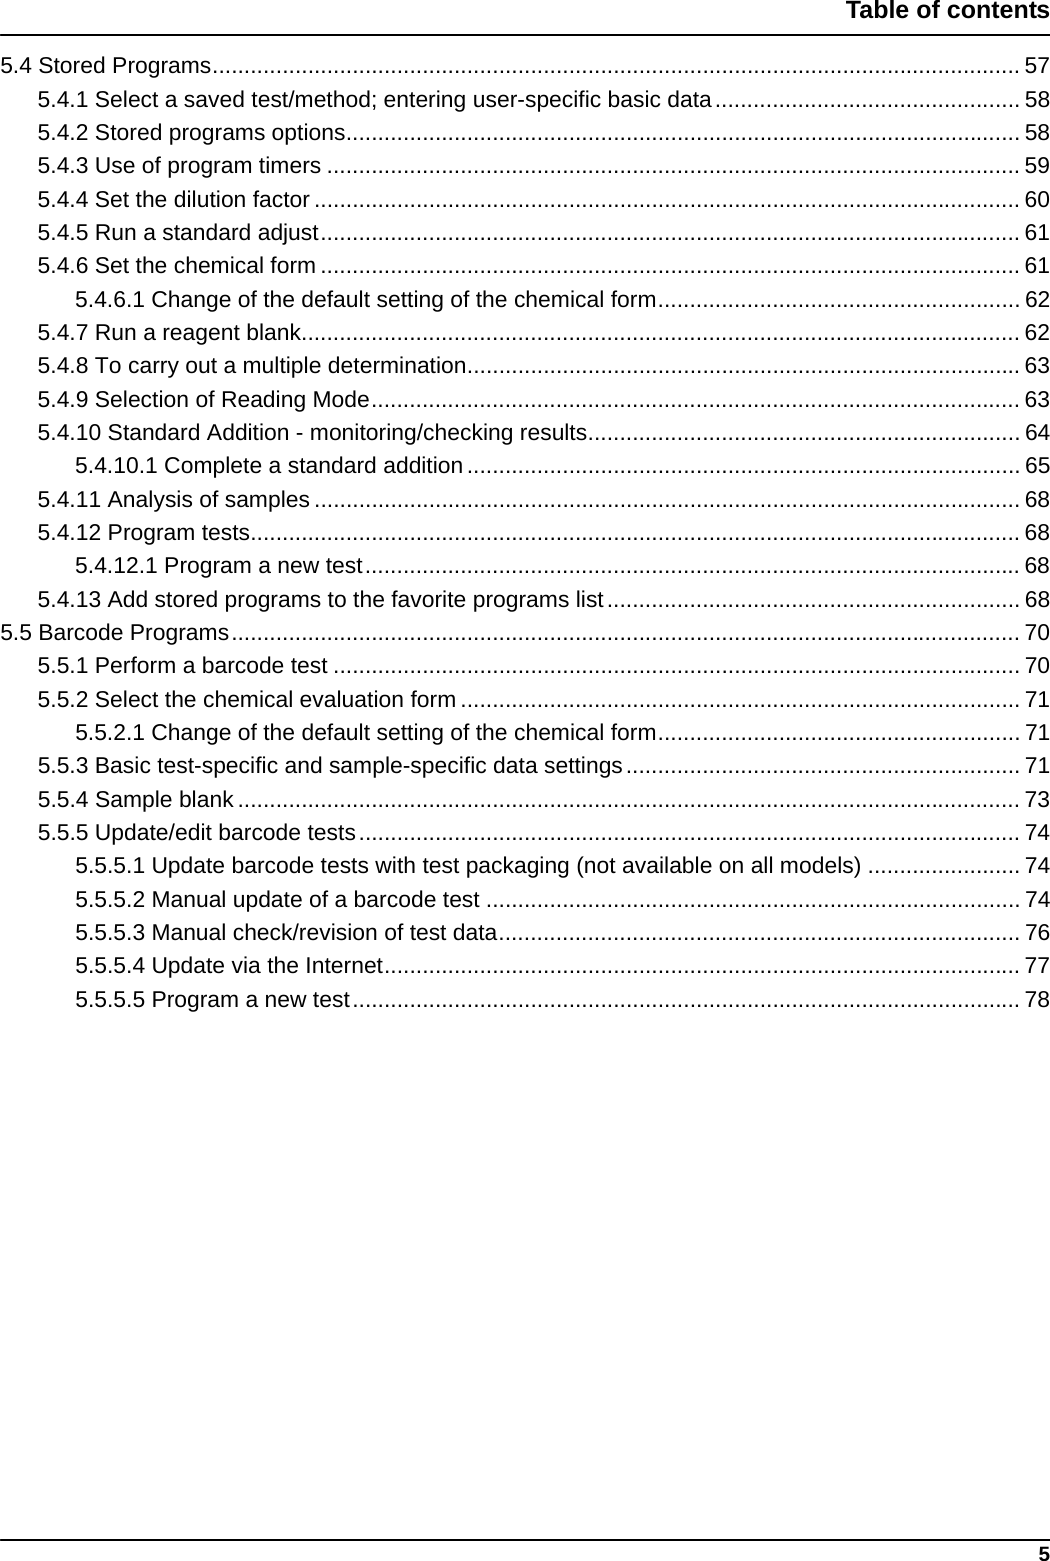
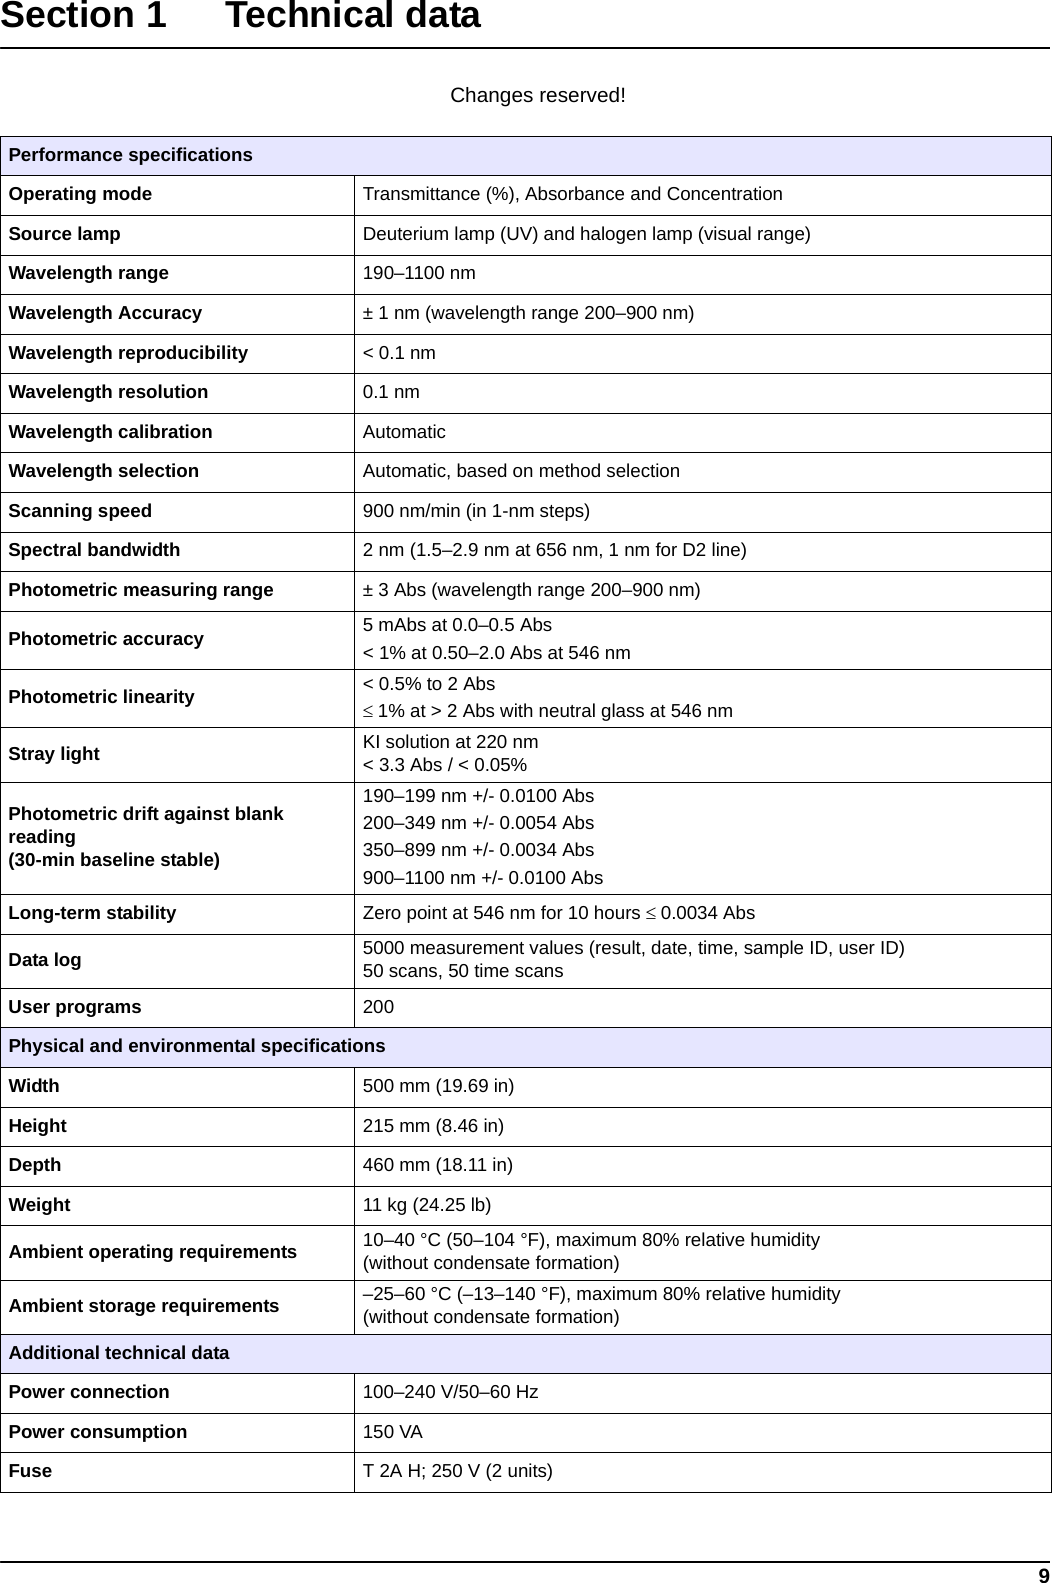
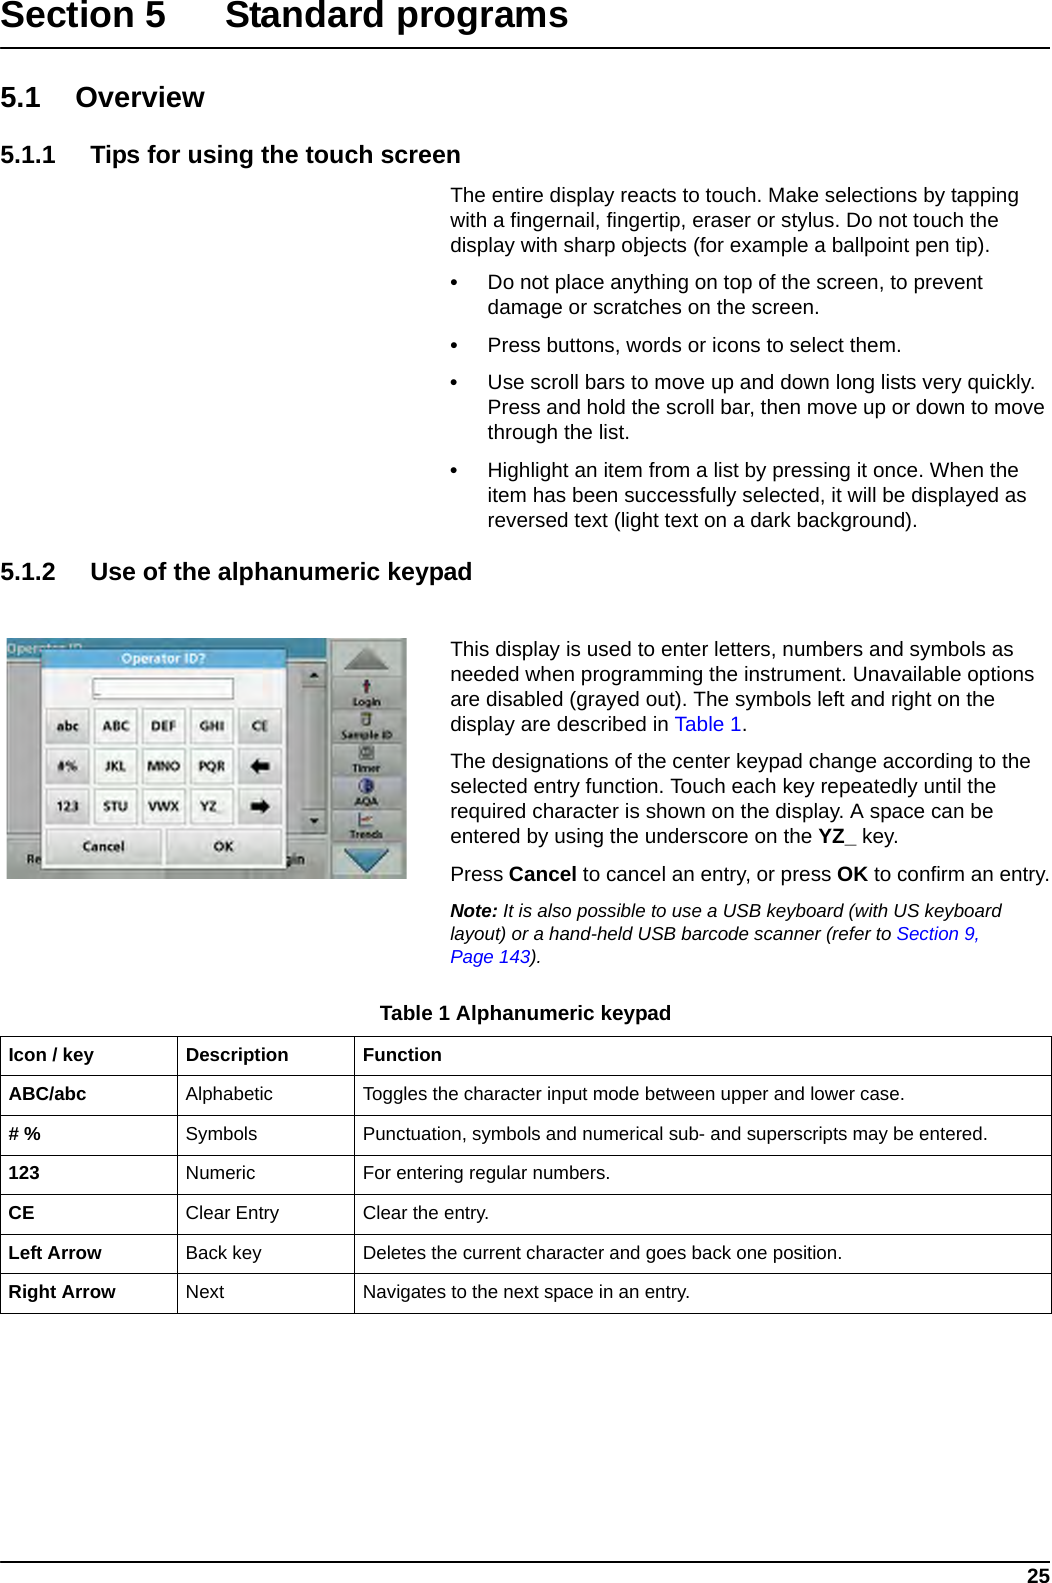
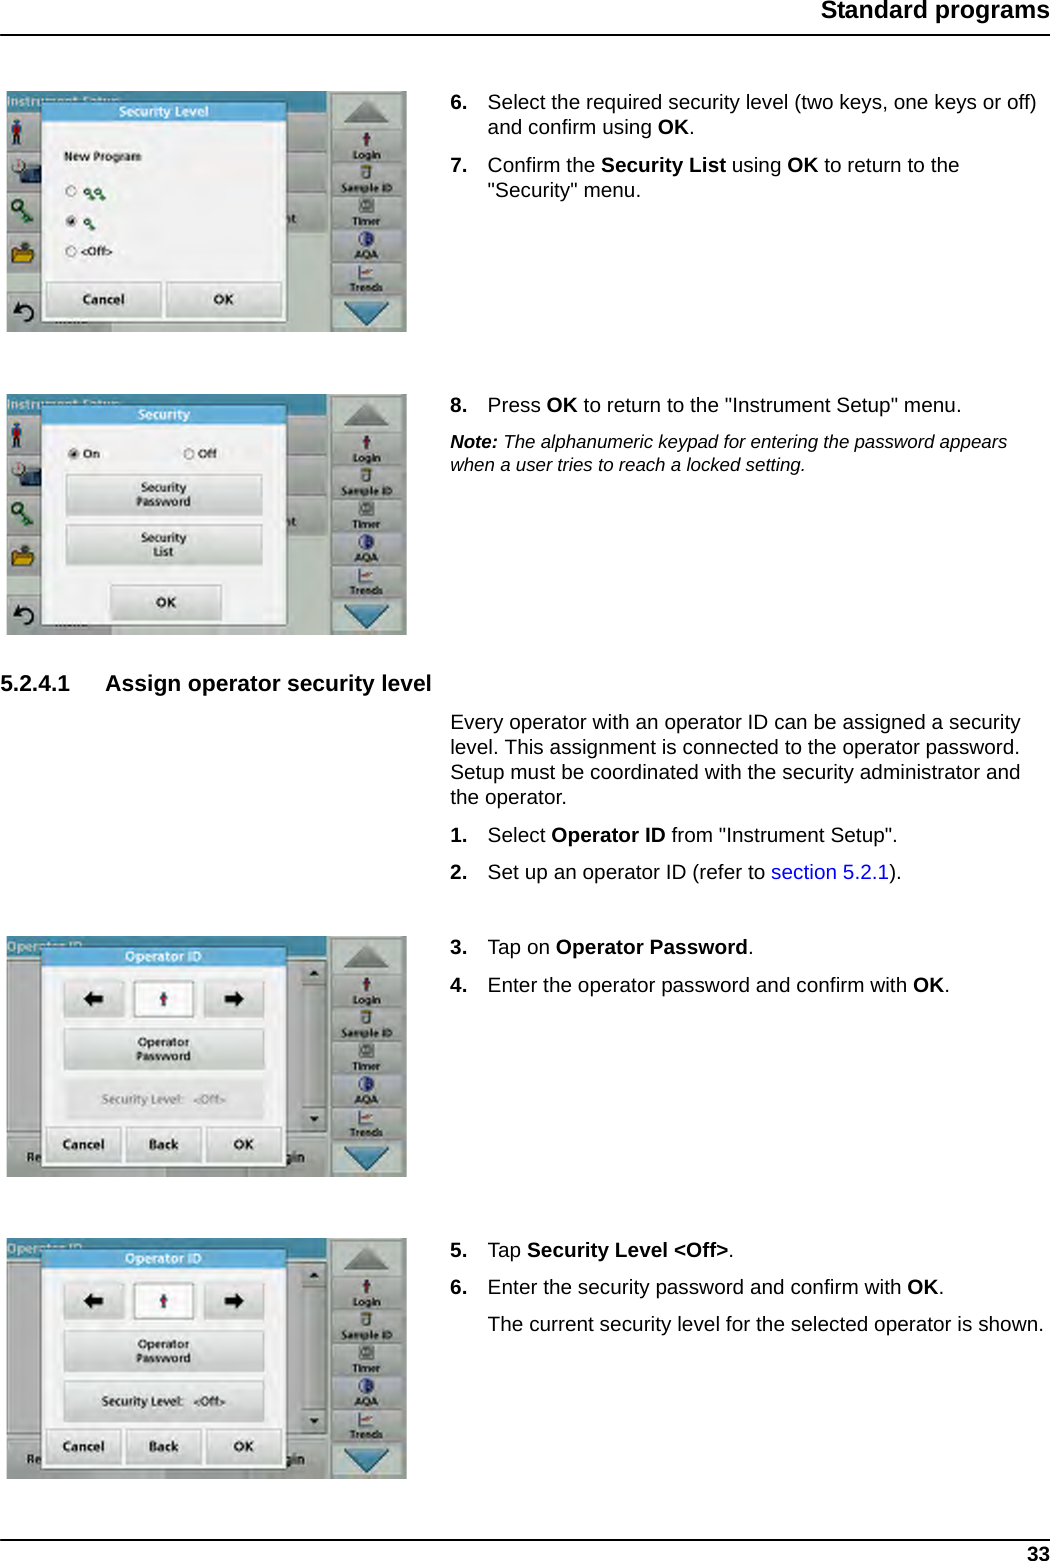
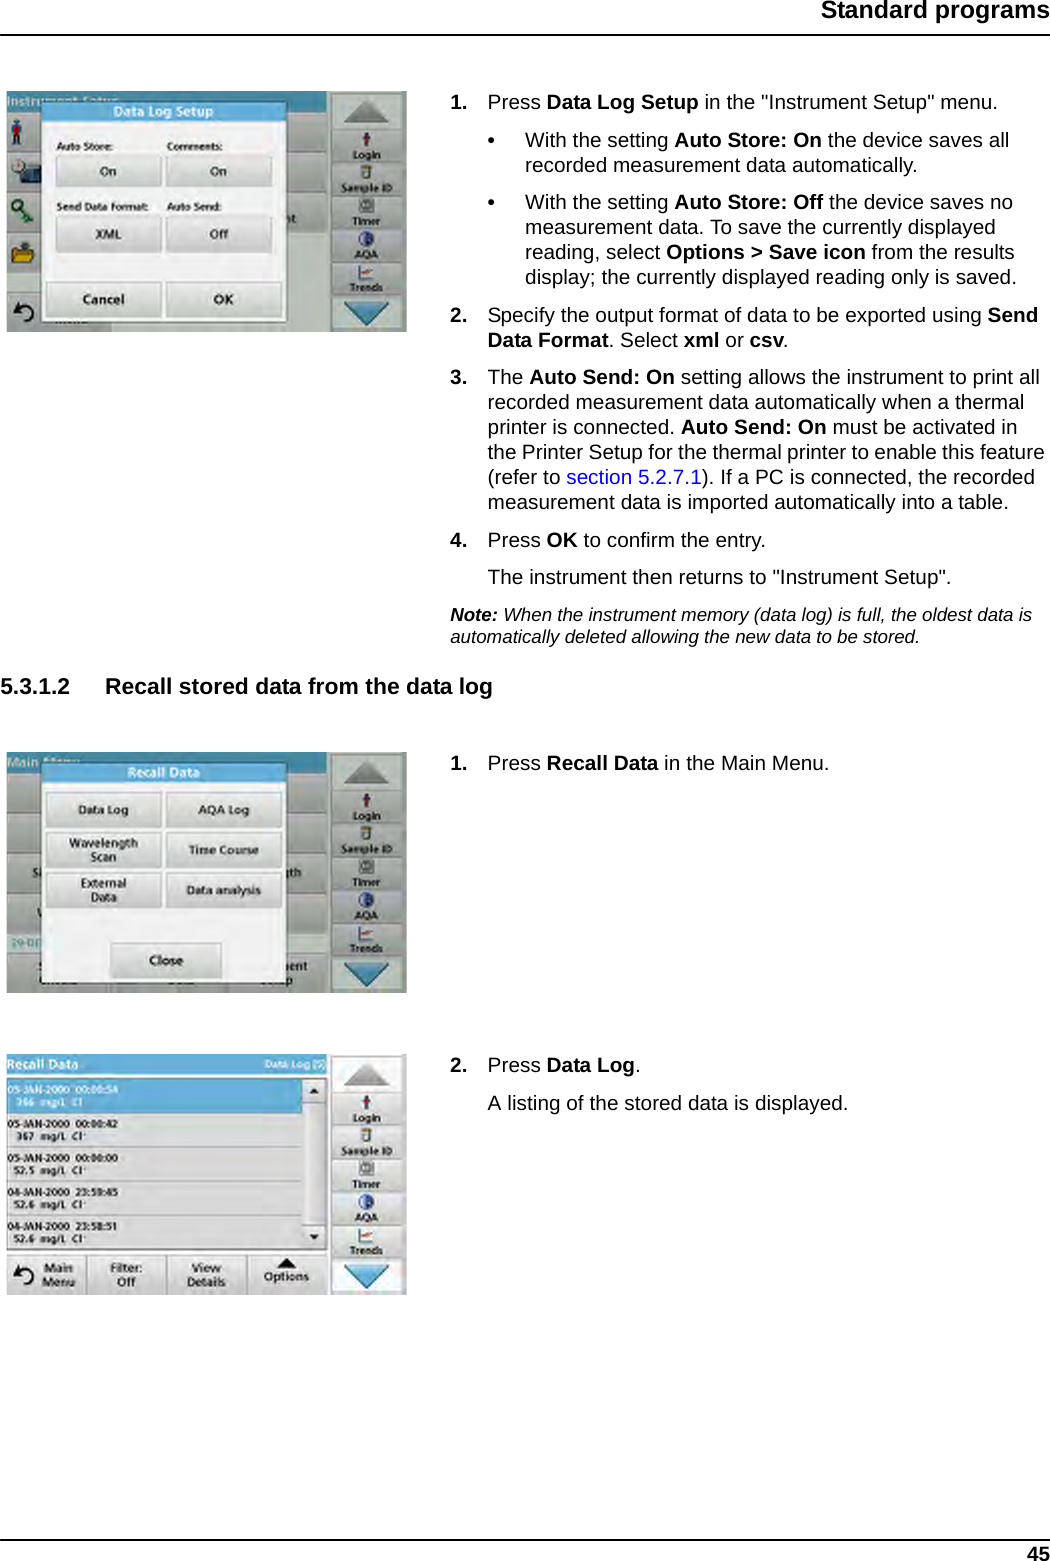
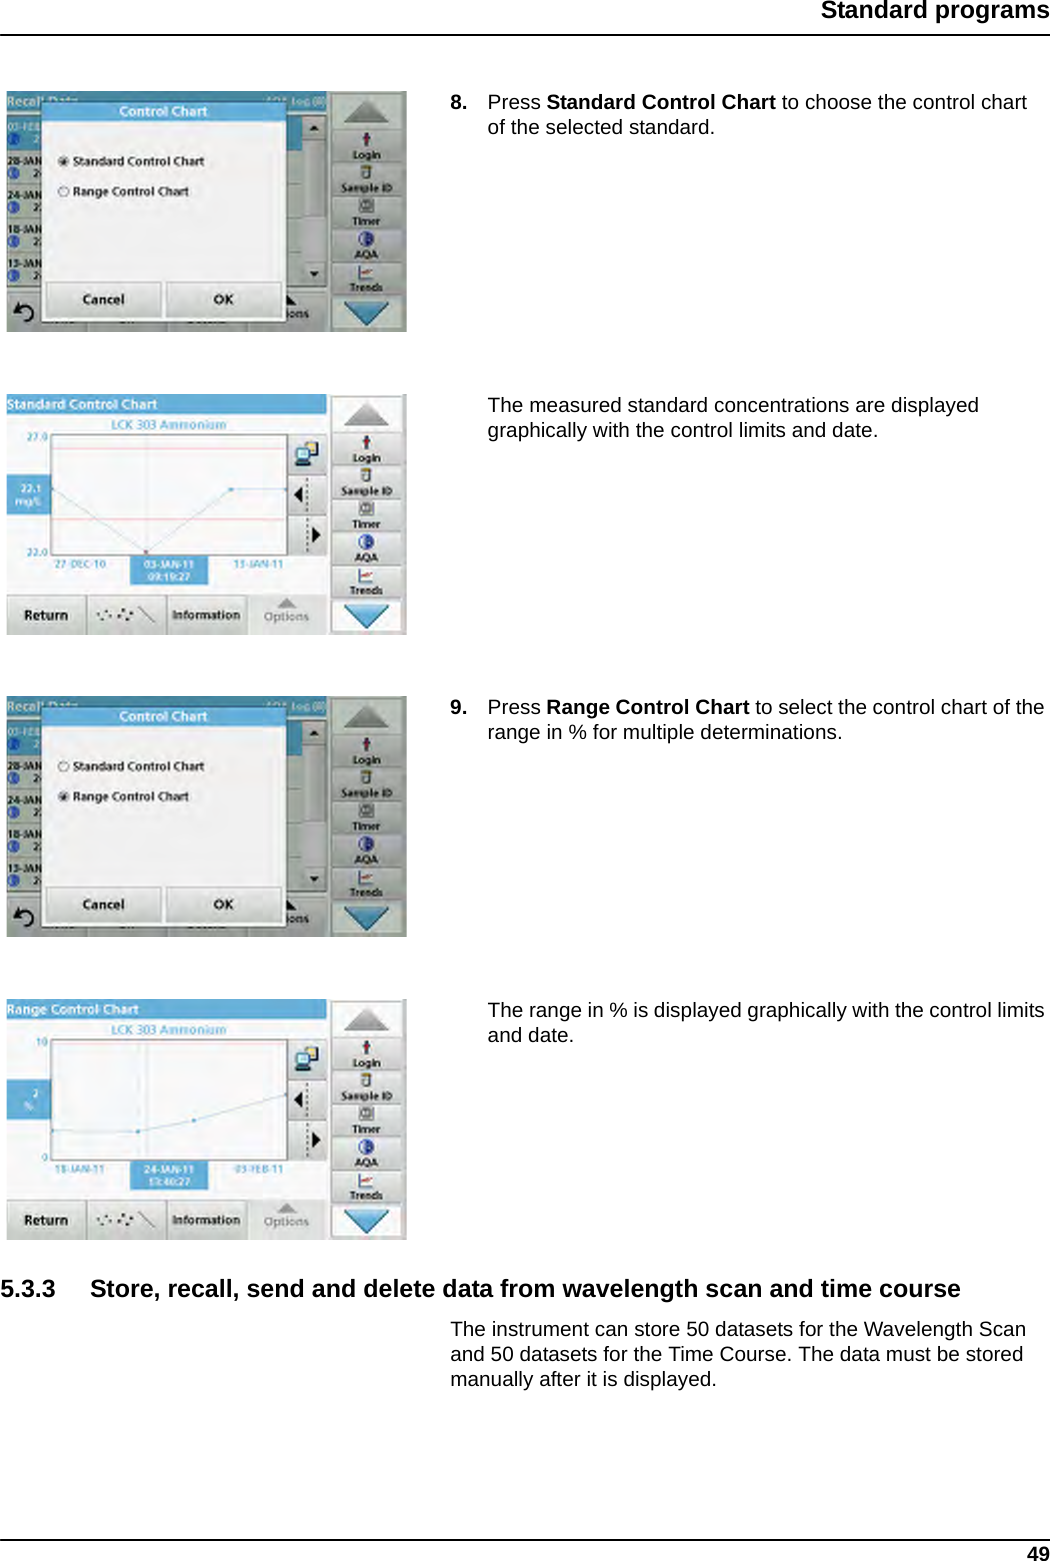

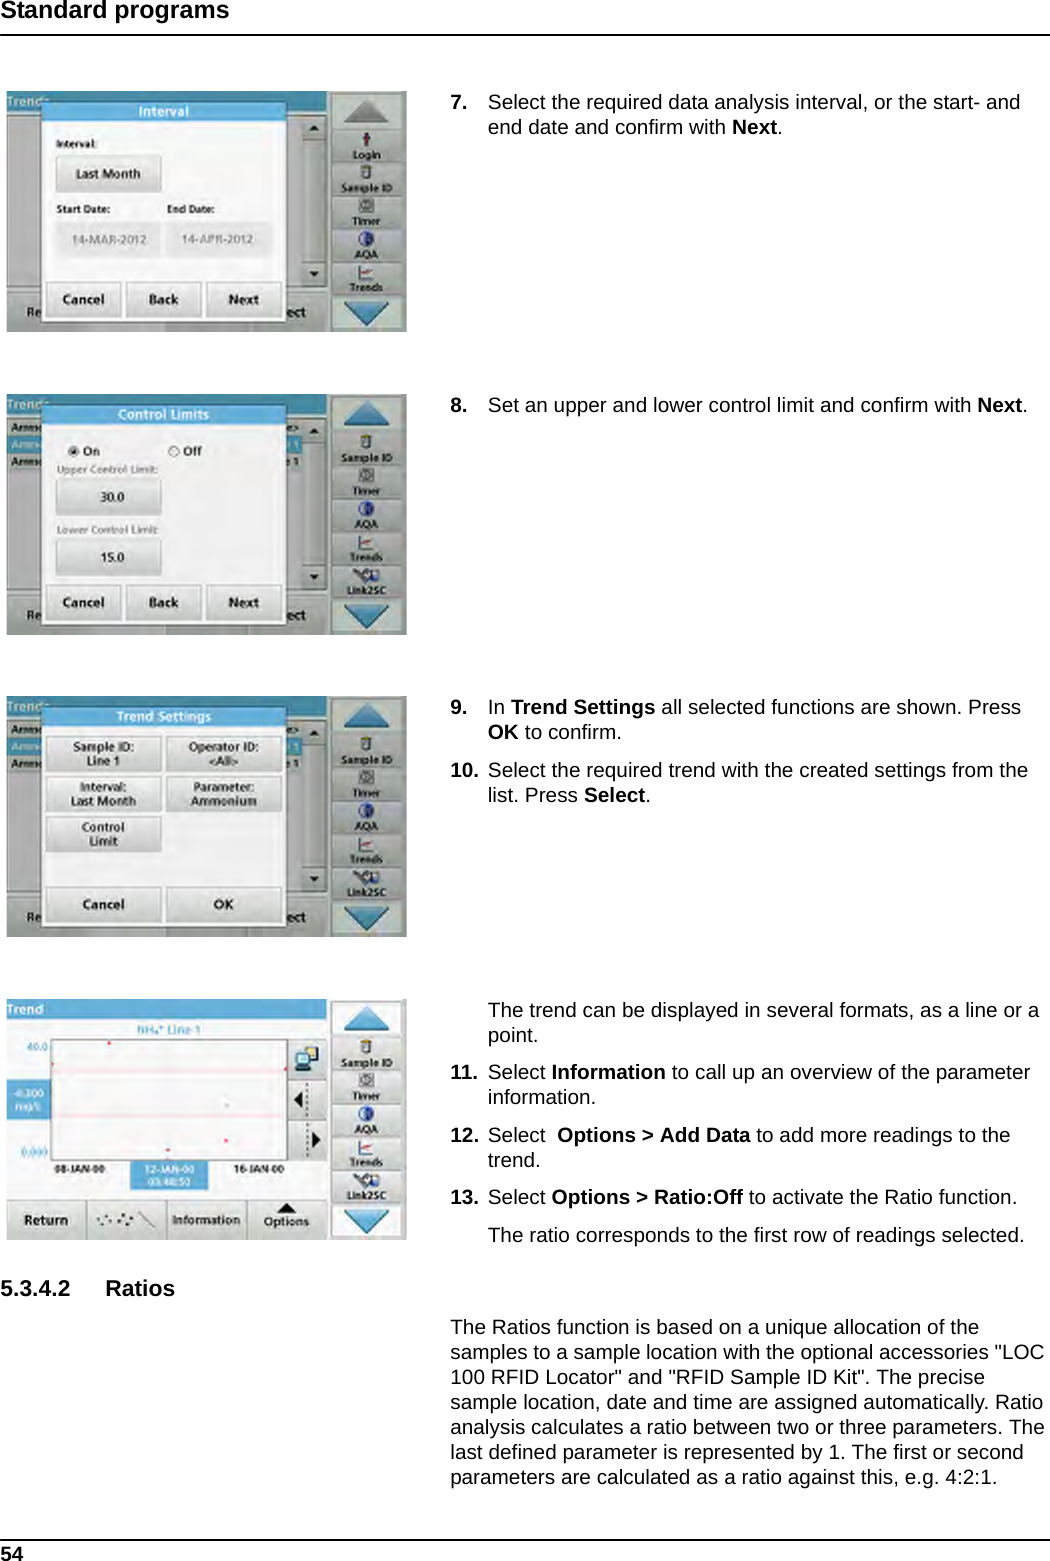
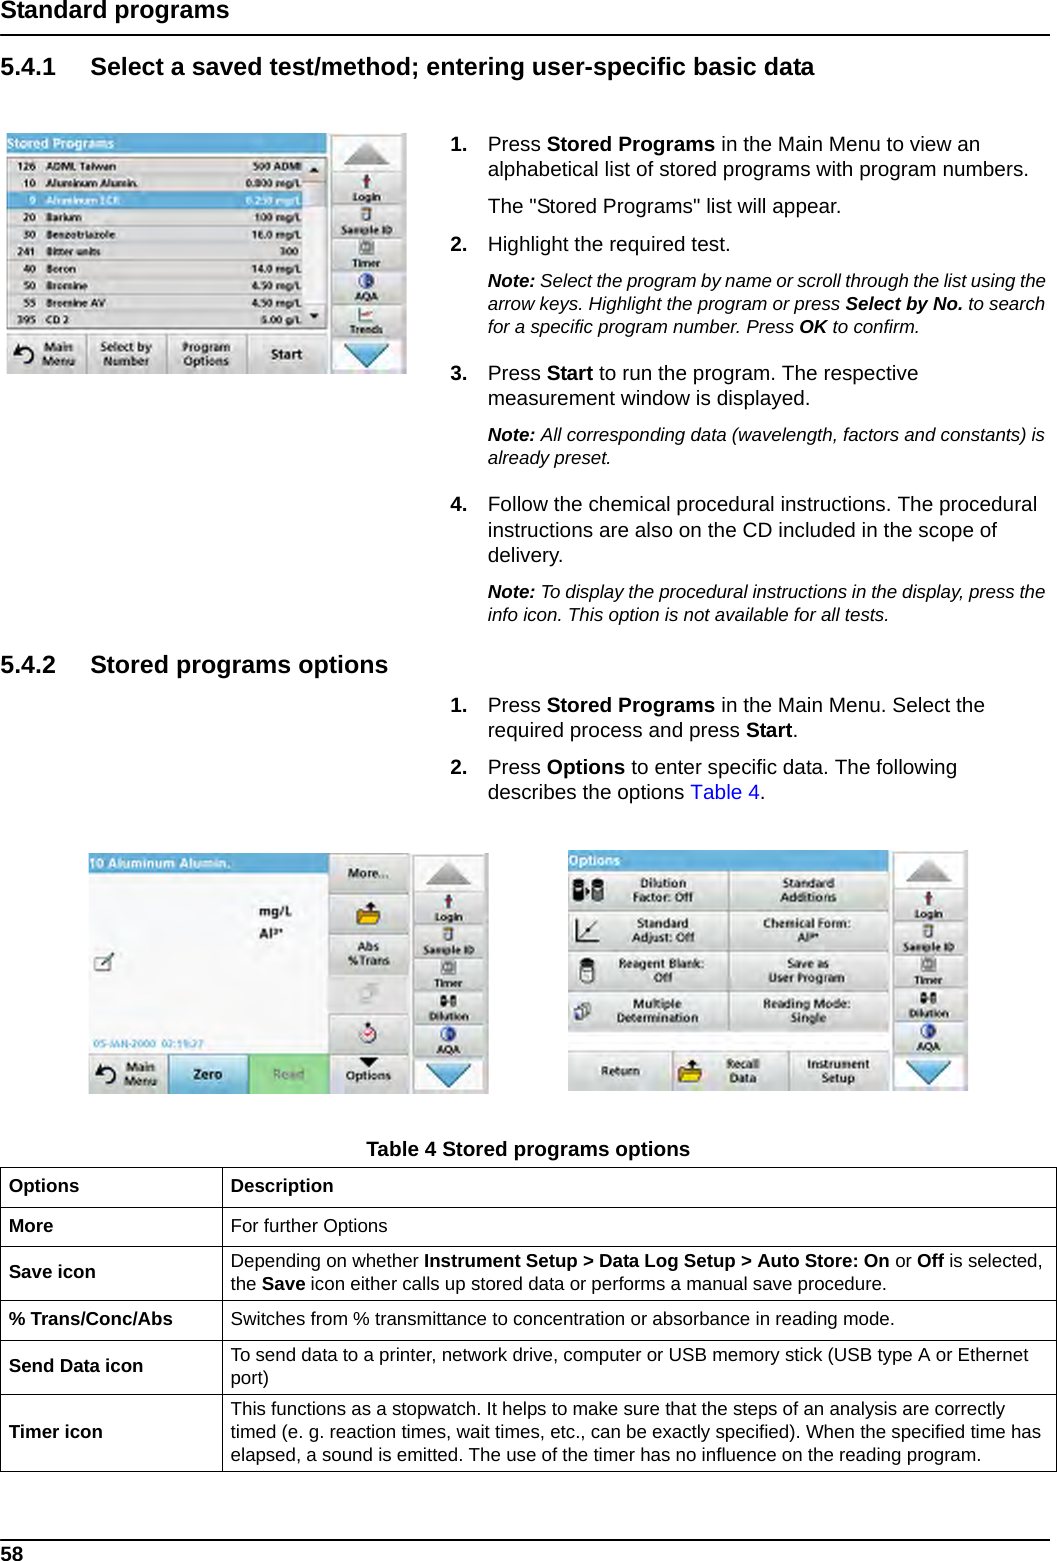
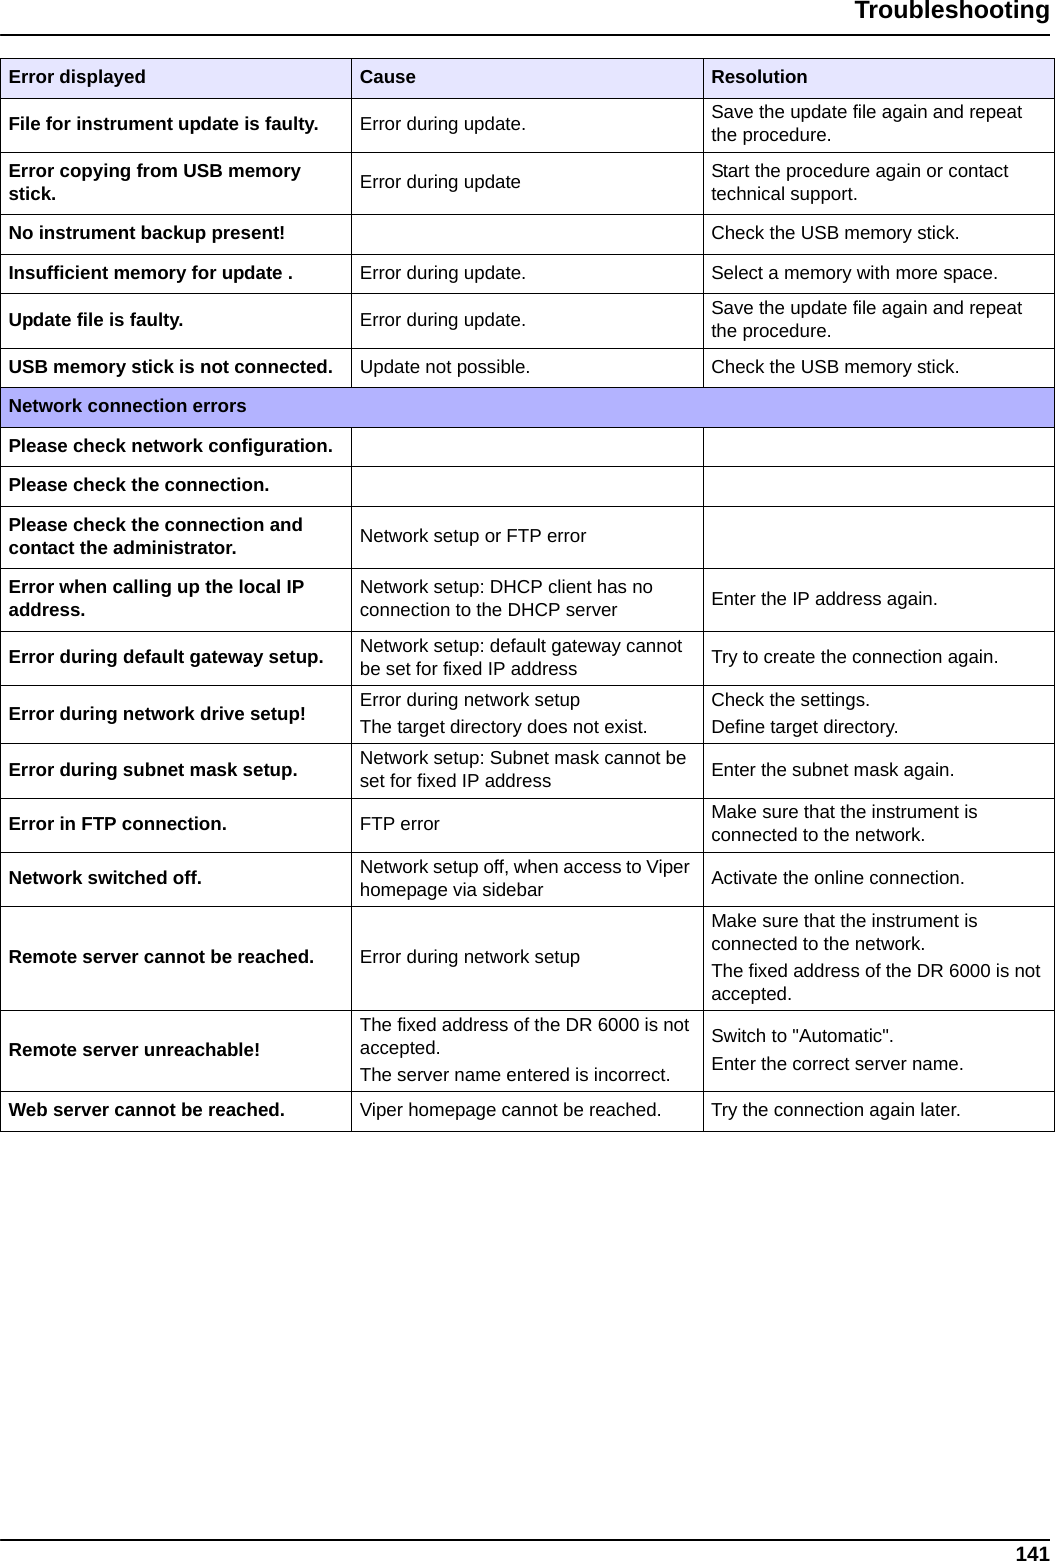
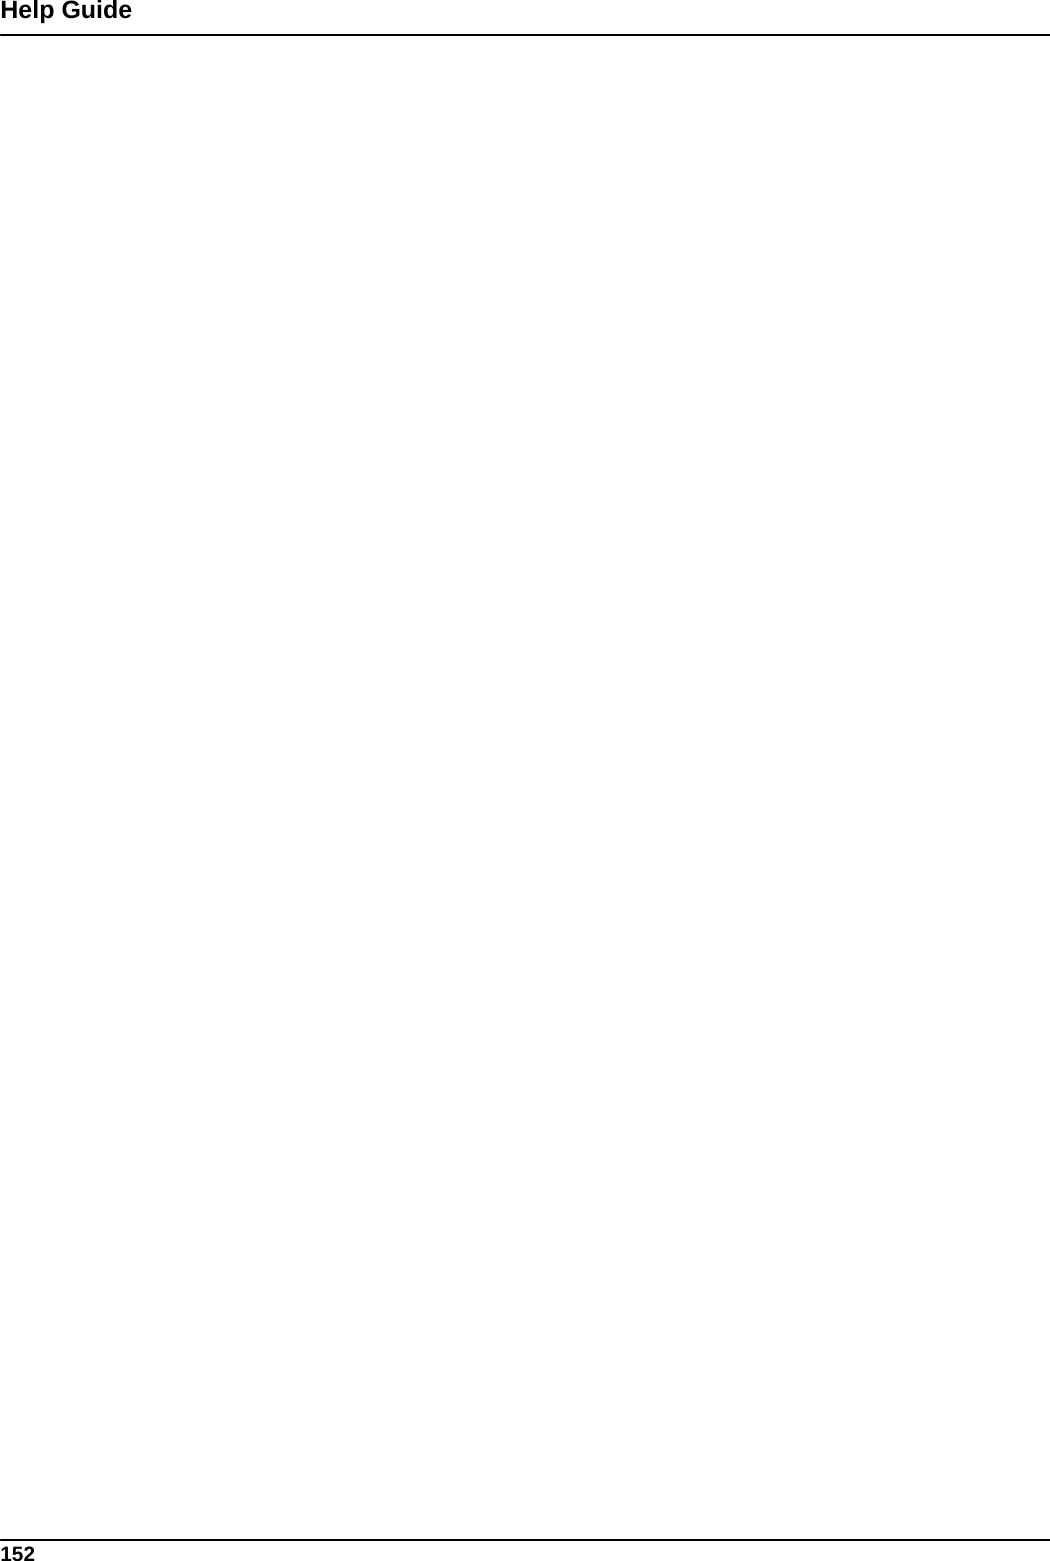
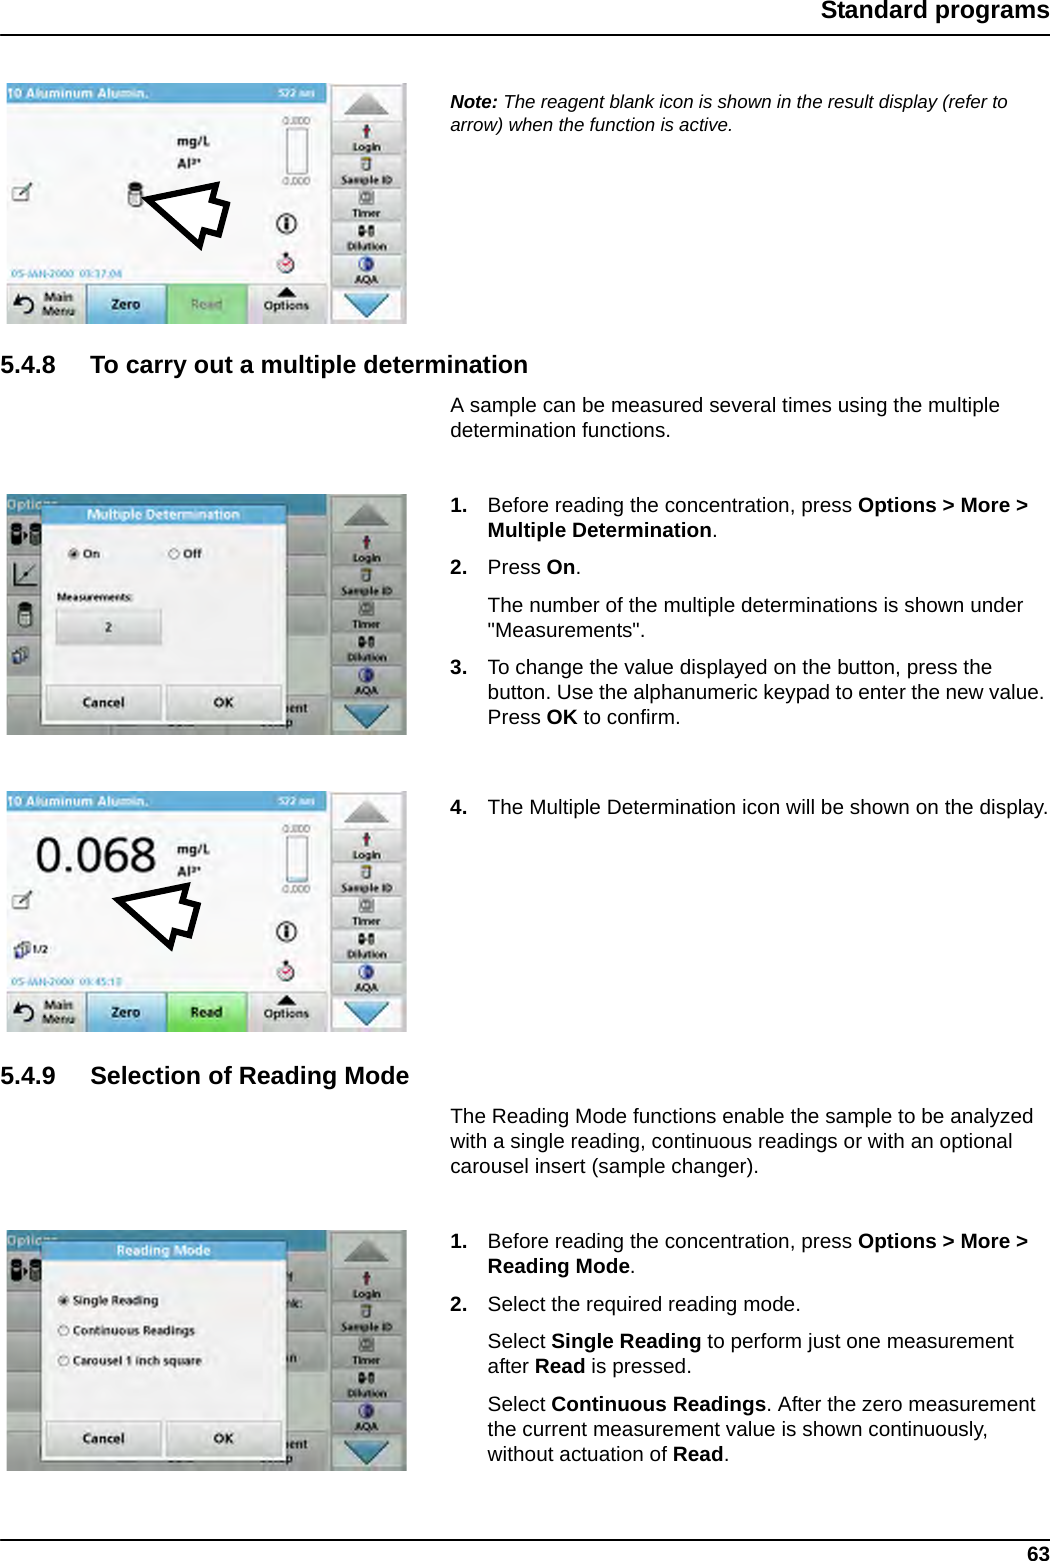
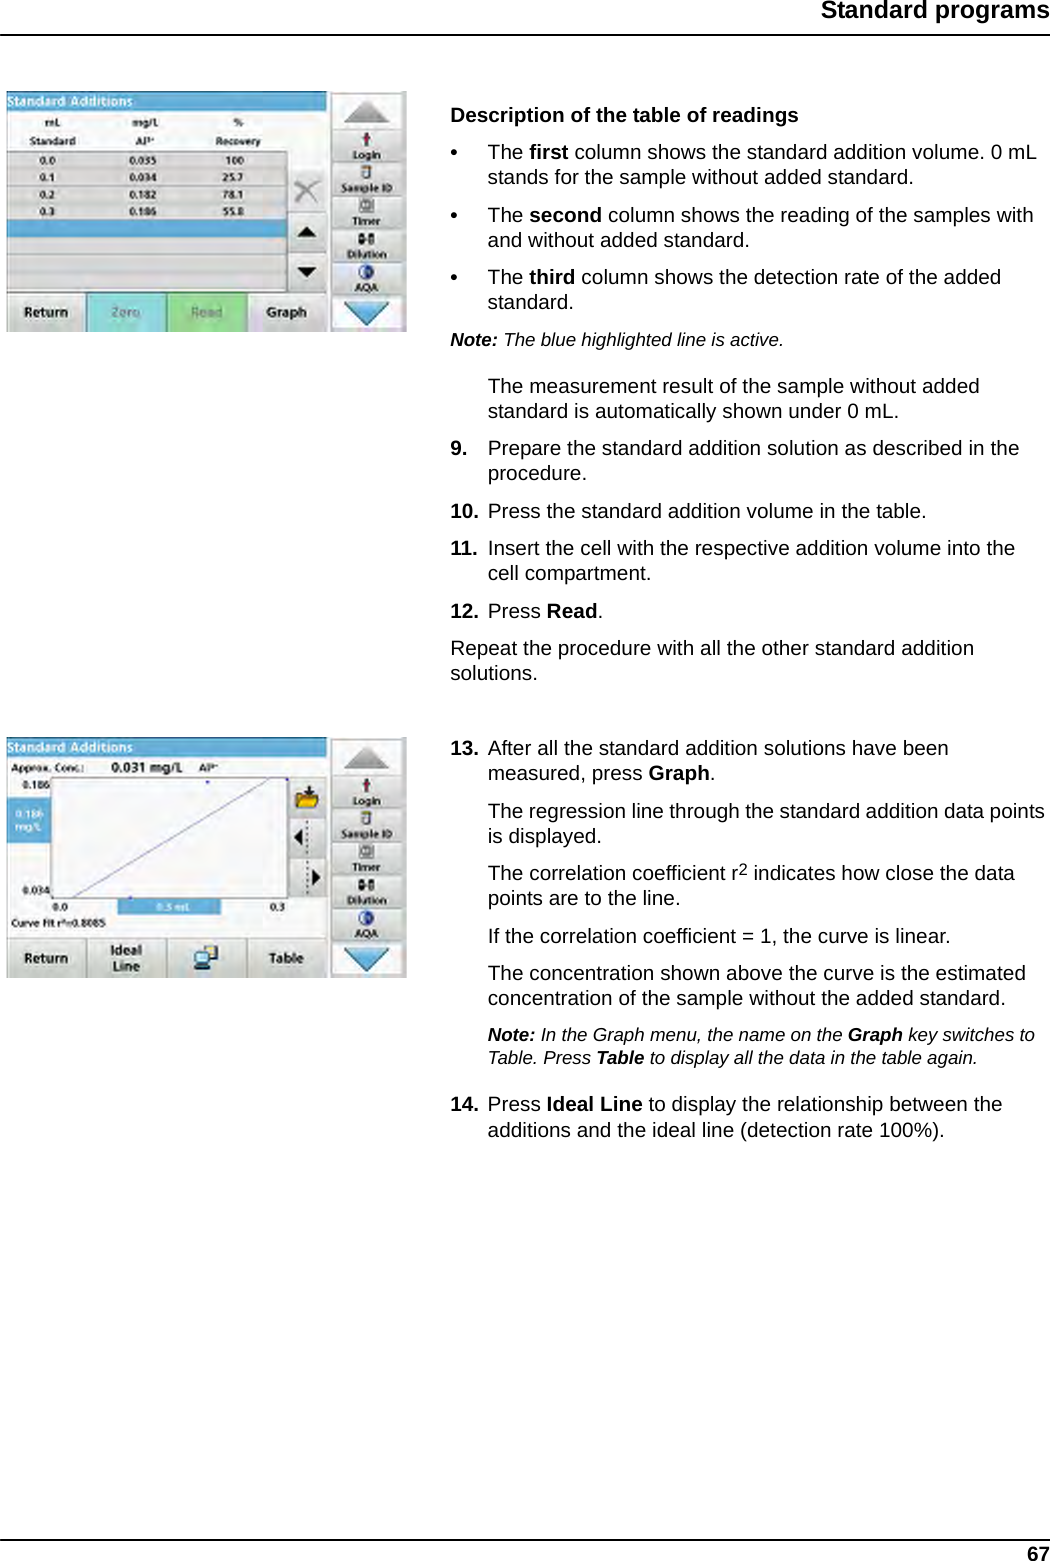
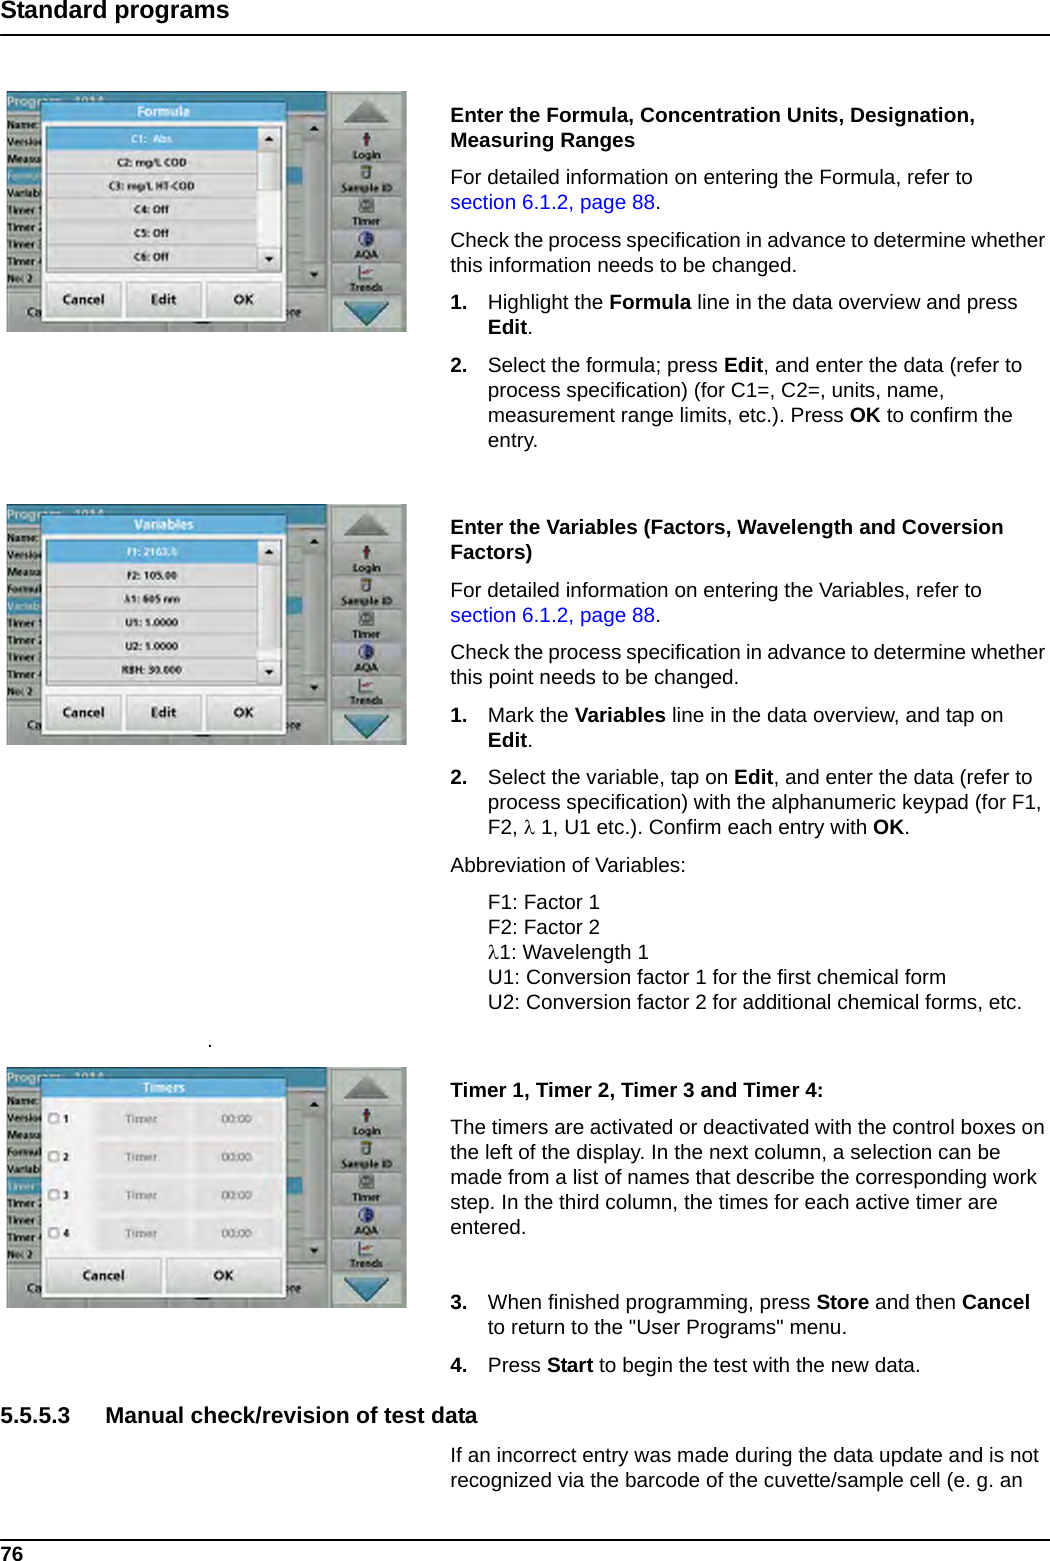
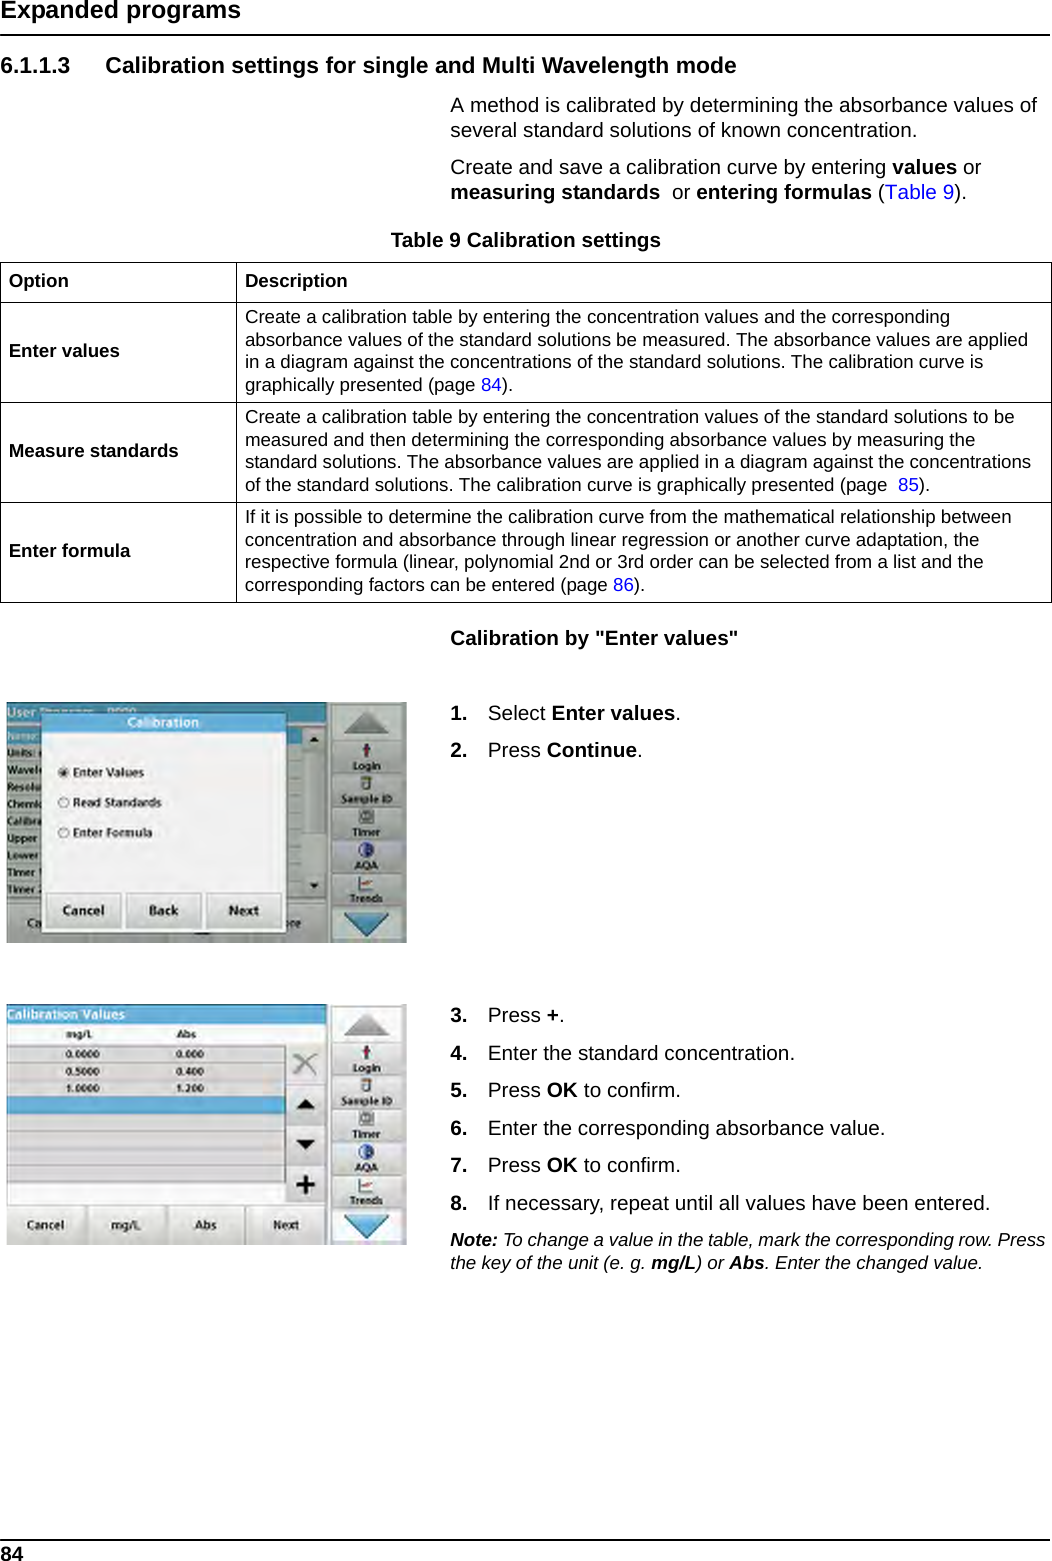
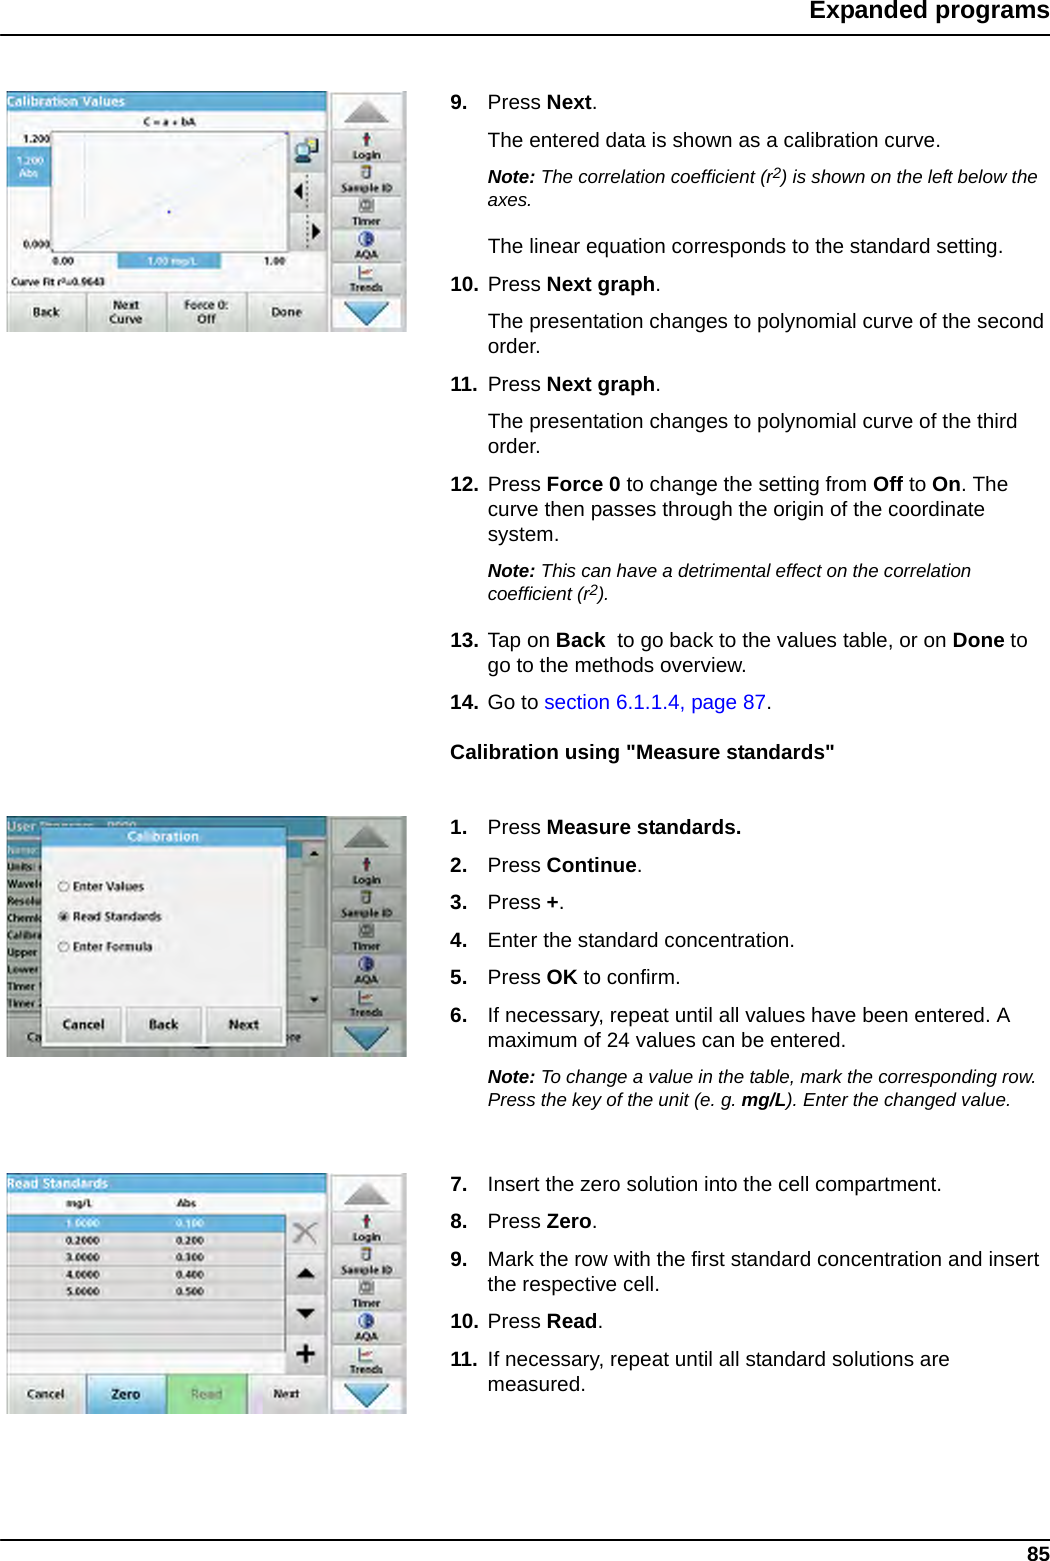
![59Standard programs5.4.3 Use of program timersSome procedures do not require the use of timers. Other procedures require several timers. These timers are pre-programmed into each Stored Program, along with a description of the activity to be performed during the timed period.Dilution Factor Off/OnA corrective dilution factor can be entered in order to take account of certain properties.The number entered at the dilution factor prompt will be multiplied by the result to compensate for the adjustment. For example, if the sample has been diluted by a factor of 2, enter 2. The default setting of the dilution factor is turned off.Note: During use of a dilution factor, the dilution symbol is shown on the display.Standard Addition This option enables the accuracy of the measurements to be checked. The procedural instructions for test parameters contain a detailed explanation of how to use this function.Standard Adjust: Off/On The procedural instructions for test parameters indicate whether a standard adjustment is necessary and, if so, how to proceed.Chemical Form Some of the stored tests/methods allow selection of the chemical form and measuring range.Reagent Blank: Off/OnSome of the stored tests/methods include the "Reagent Blank" function. This enables the reagent blank value to be added to or subtracted from, the subsequent readings. The reagent blank value shifts the calibration curve along the y-axis, without changing the shape or gradient of the curve. The effect corresponds to a y-axis intercept of the calibration straight line. This is clarified by the following formula: concentration =[conc. factor) x Abs] - (reagent blank)Save as User Program To store the selected parameters as a User Program, refer to section 6.1, page 79.Multiple determination This option allows multiple measurements of a sample.Reading ModeThe "Reading Mode" function is available for some saved tests/methods. Single Reading: A single reading is displayed when Read is pressed.Continuous Readings: After the zero measurement, all readings are displayed automatically and continuously.Carousel 1 inch square: Optional measurement of carousel insert with up to 5 square cells.Carousel 1 cm square: Optional measurement of carousel insert with up to 7 square cells.Recall Data To recall saved measurement data or time courses, refer to section 5.3, page 44.Instrument Setup mode Basic data for the instrument, refer to section 5.2, page 27.Table 4 Stored programs options (Continued)Options Description](https://usermanual.wiki/metraTec/QR15HL.user-manual-DR6000/User-Guide-1697771-Page-59.png)
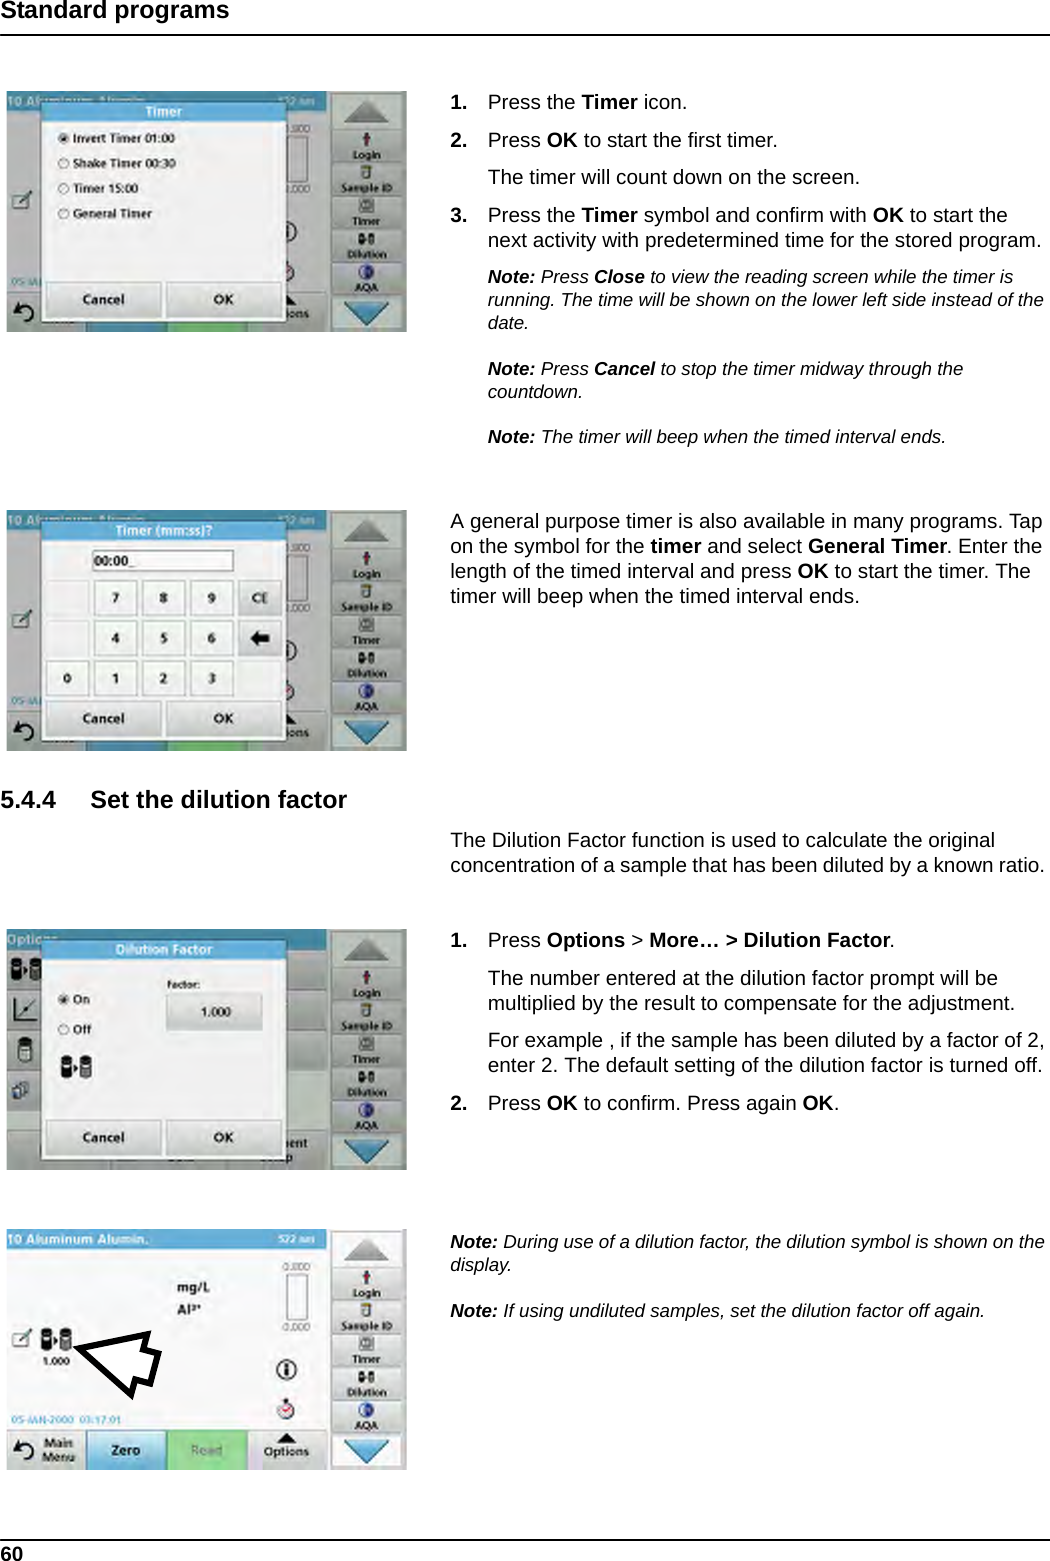
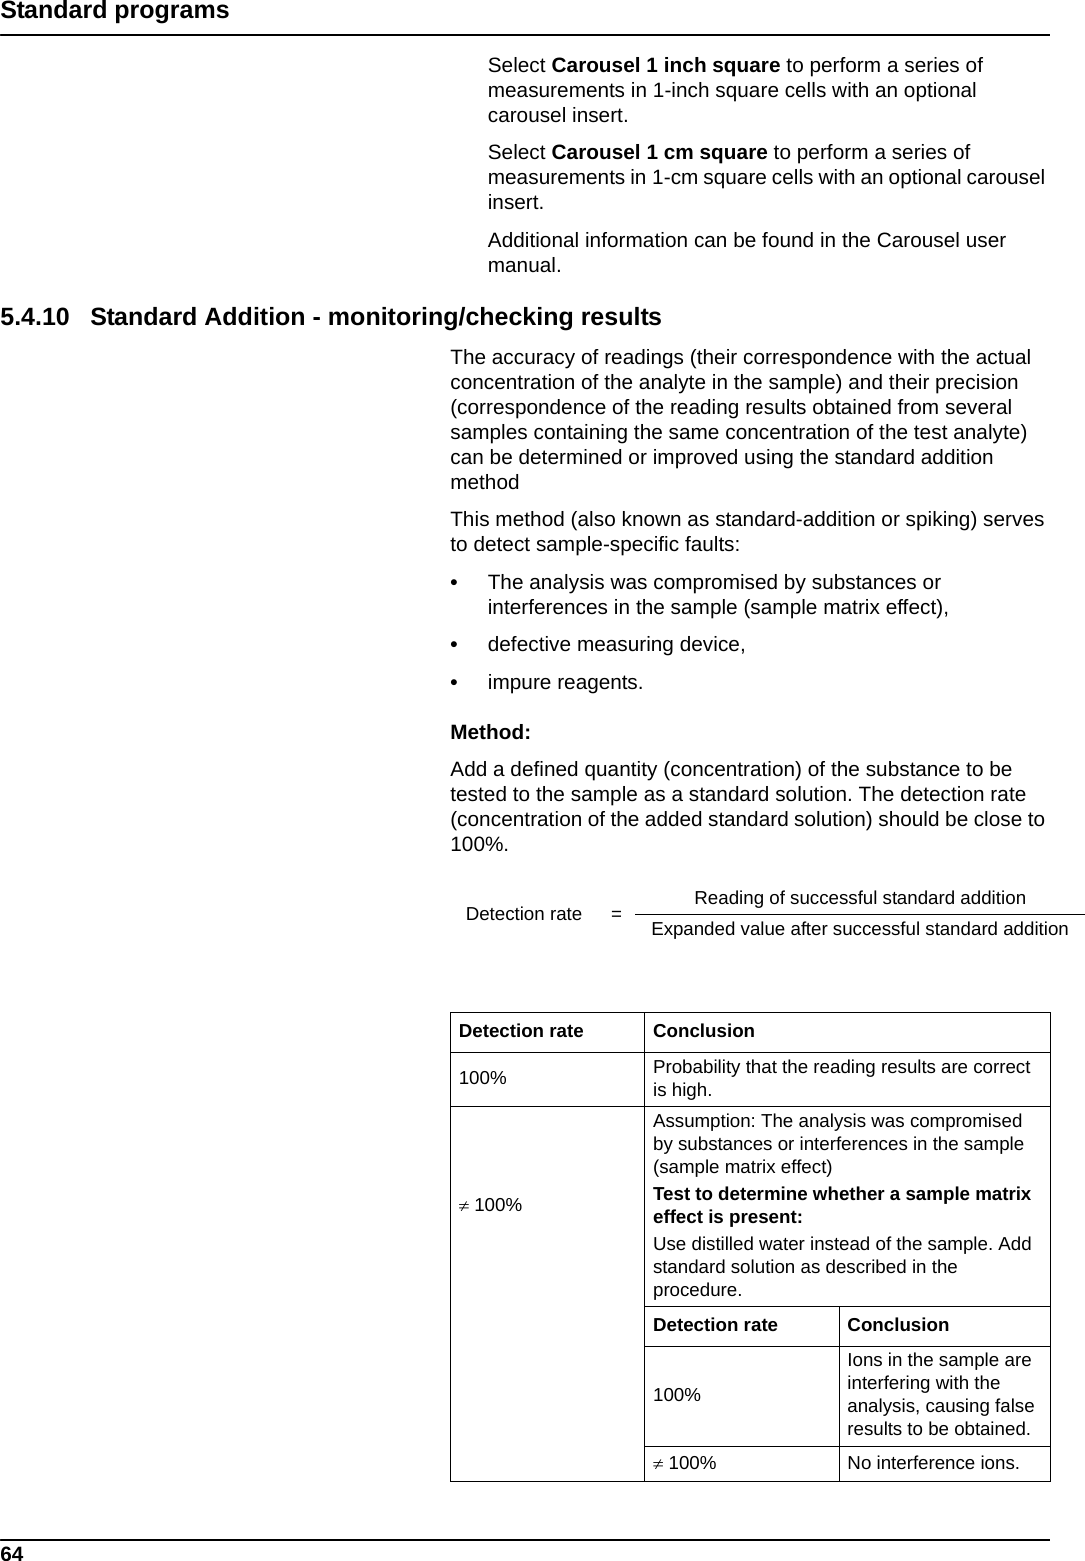
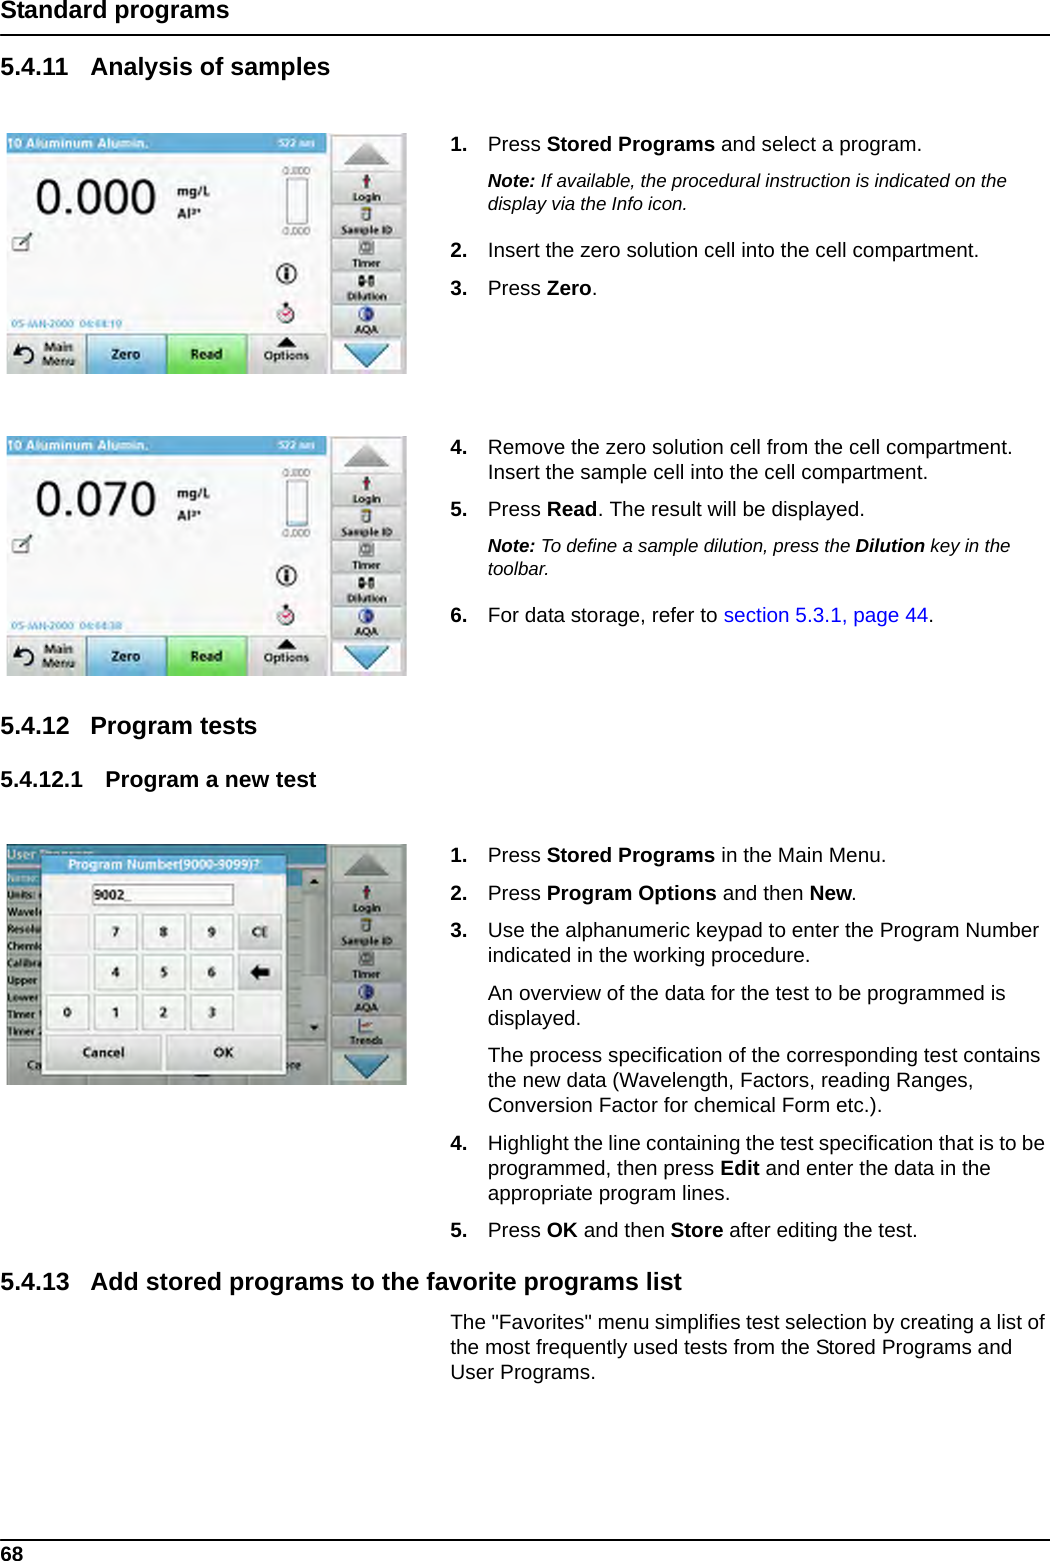
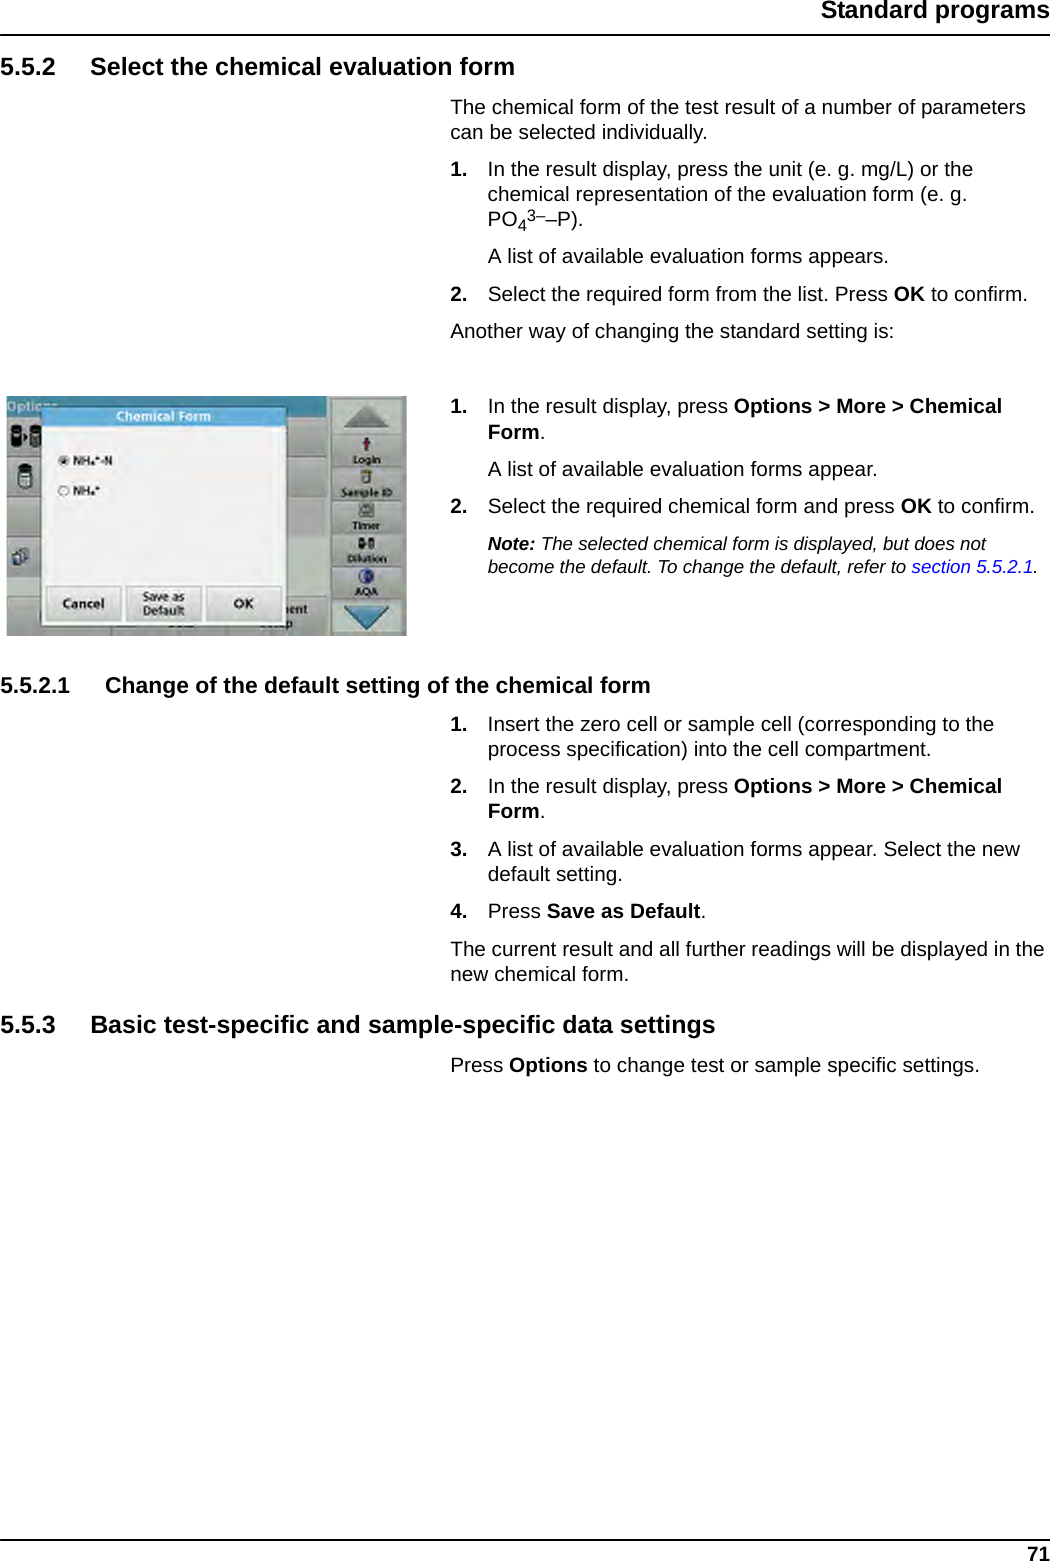
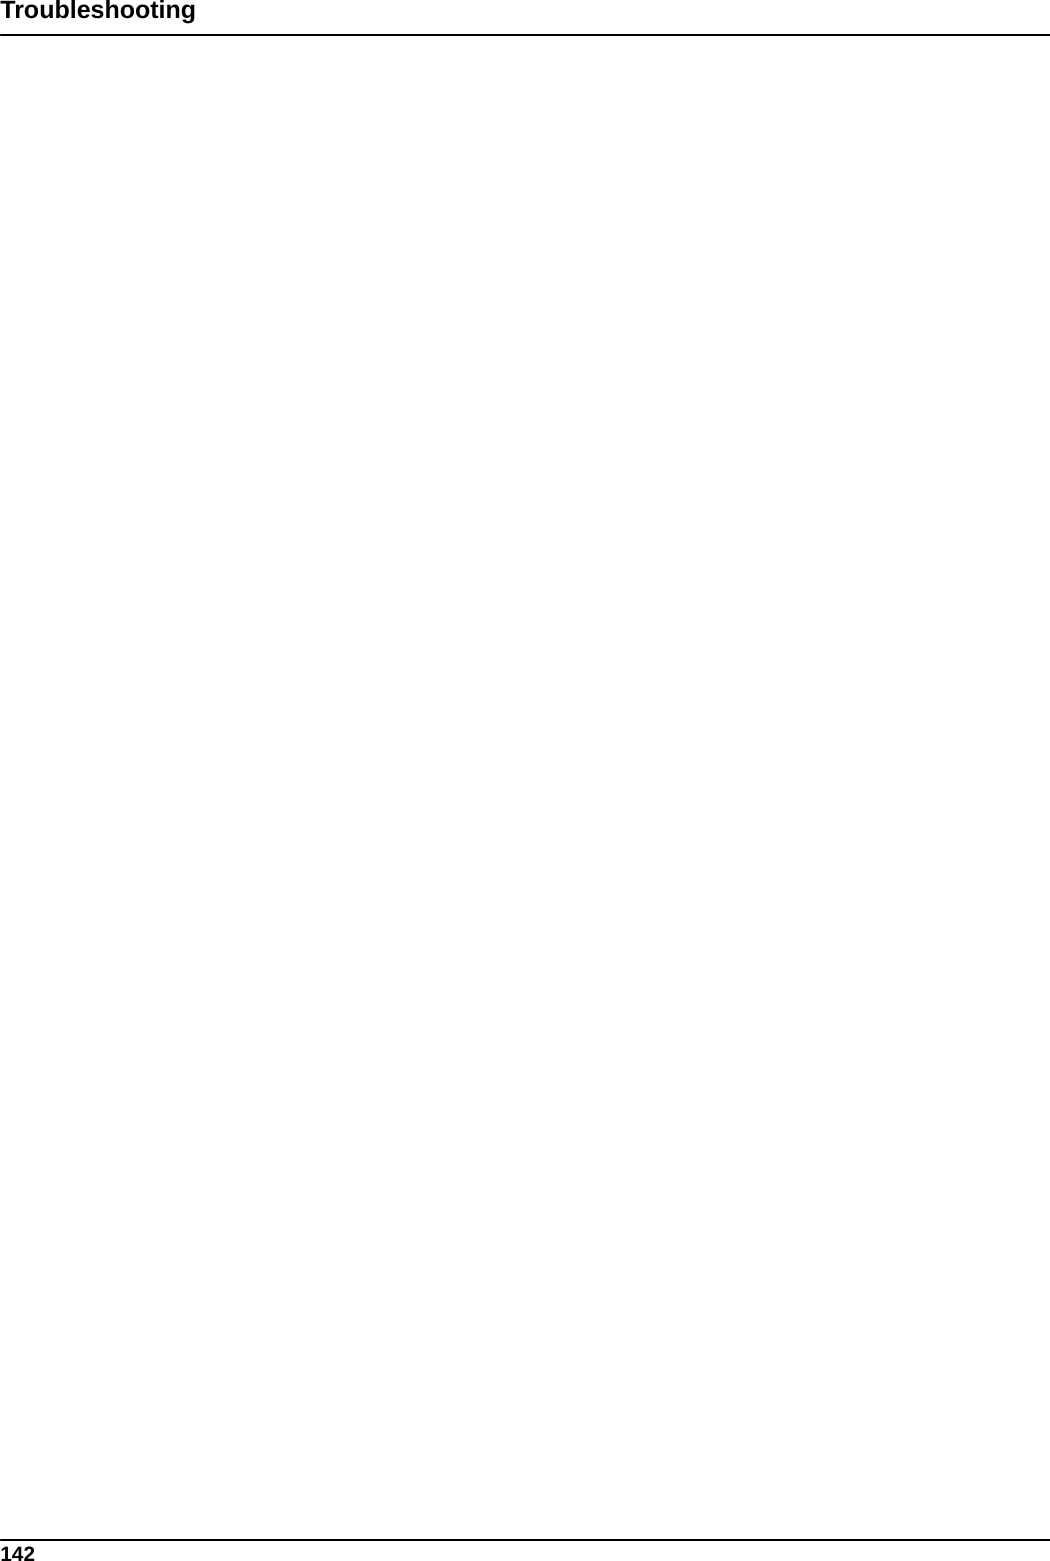
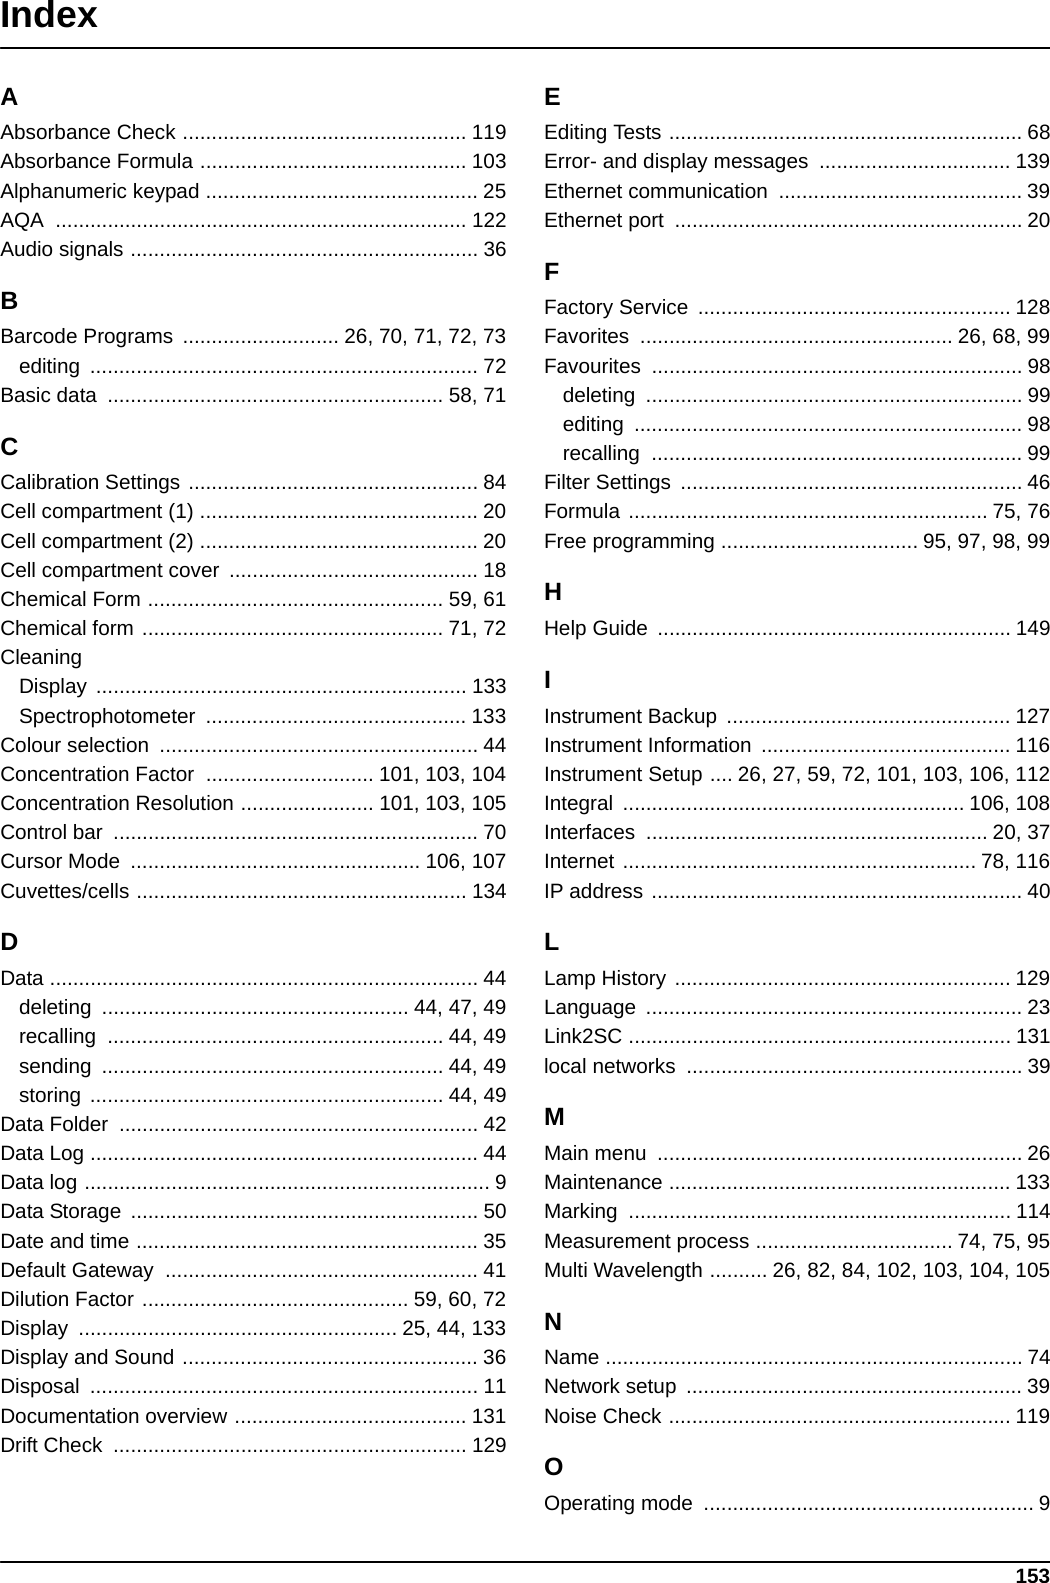
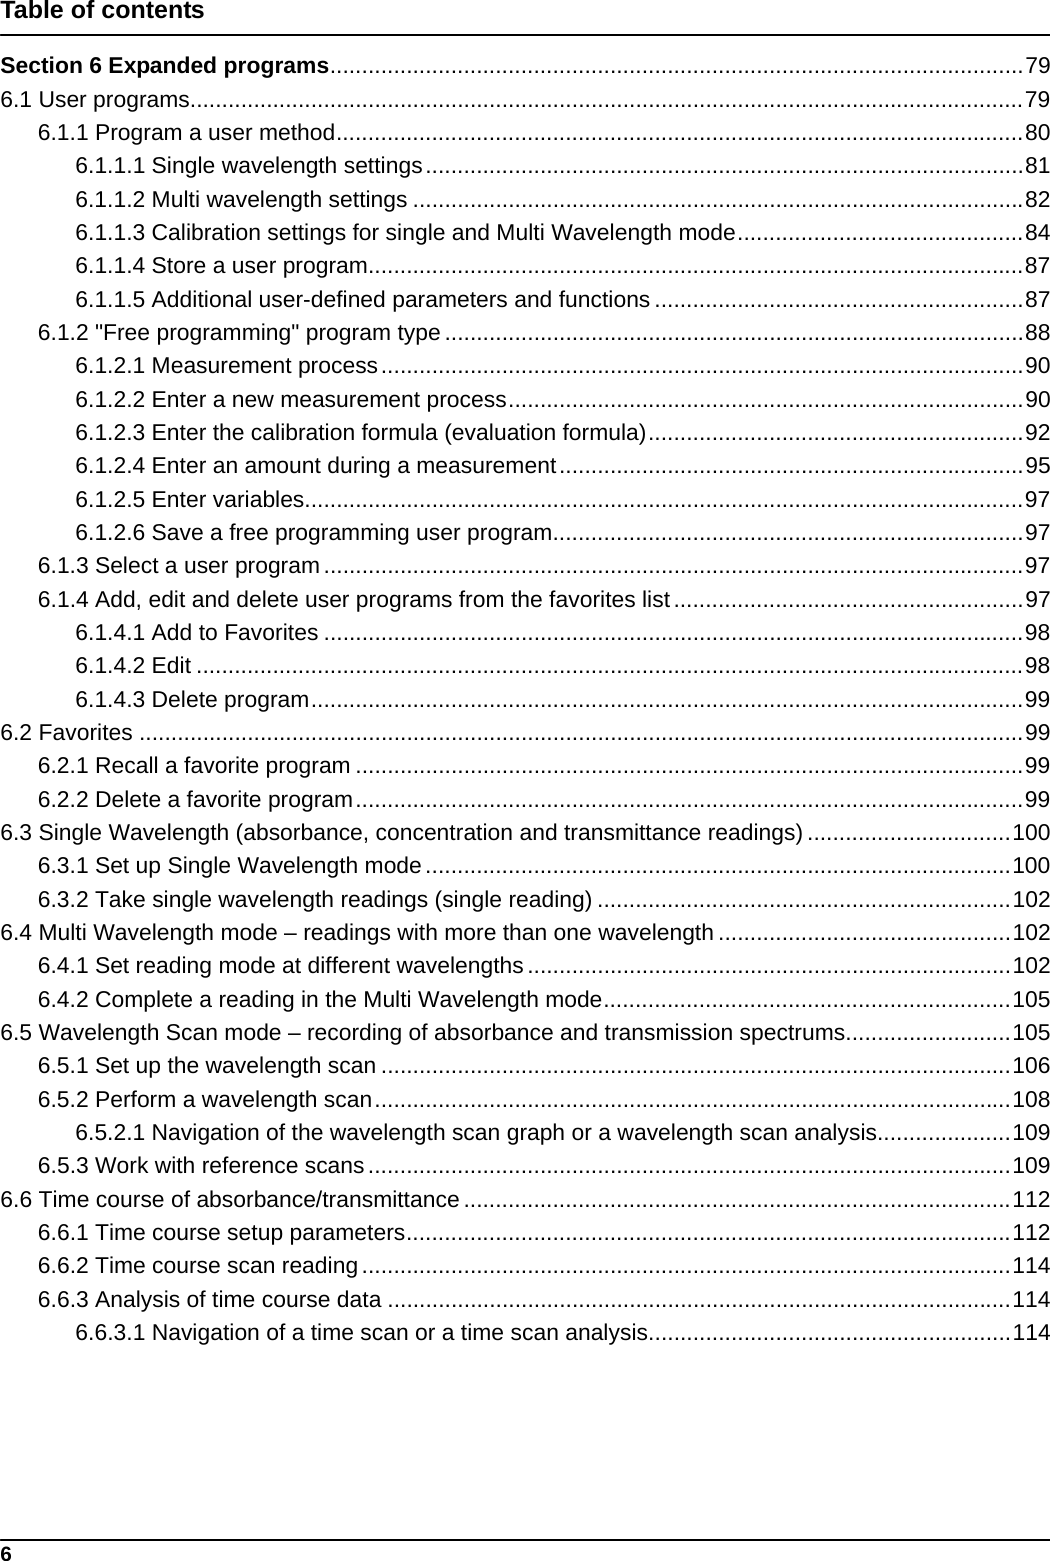
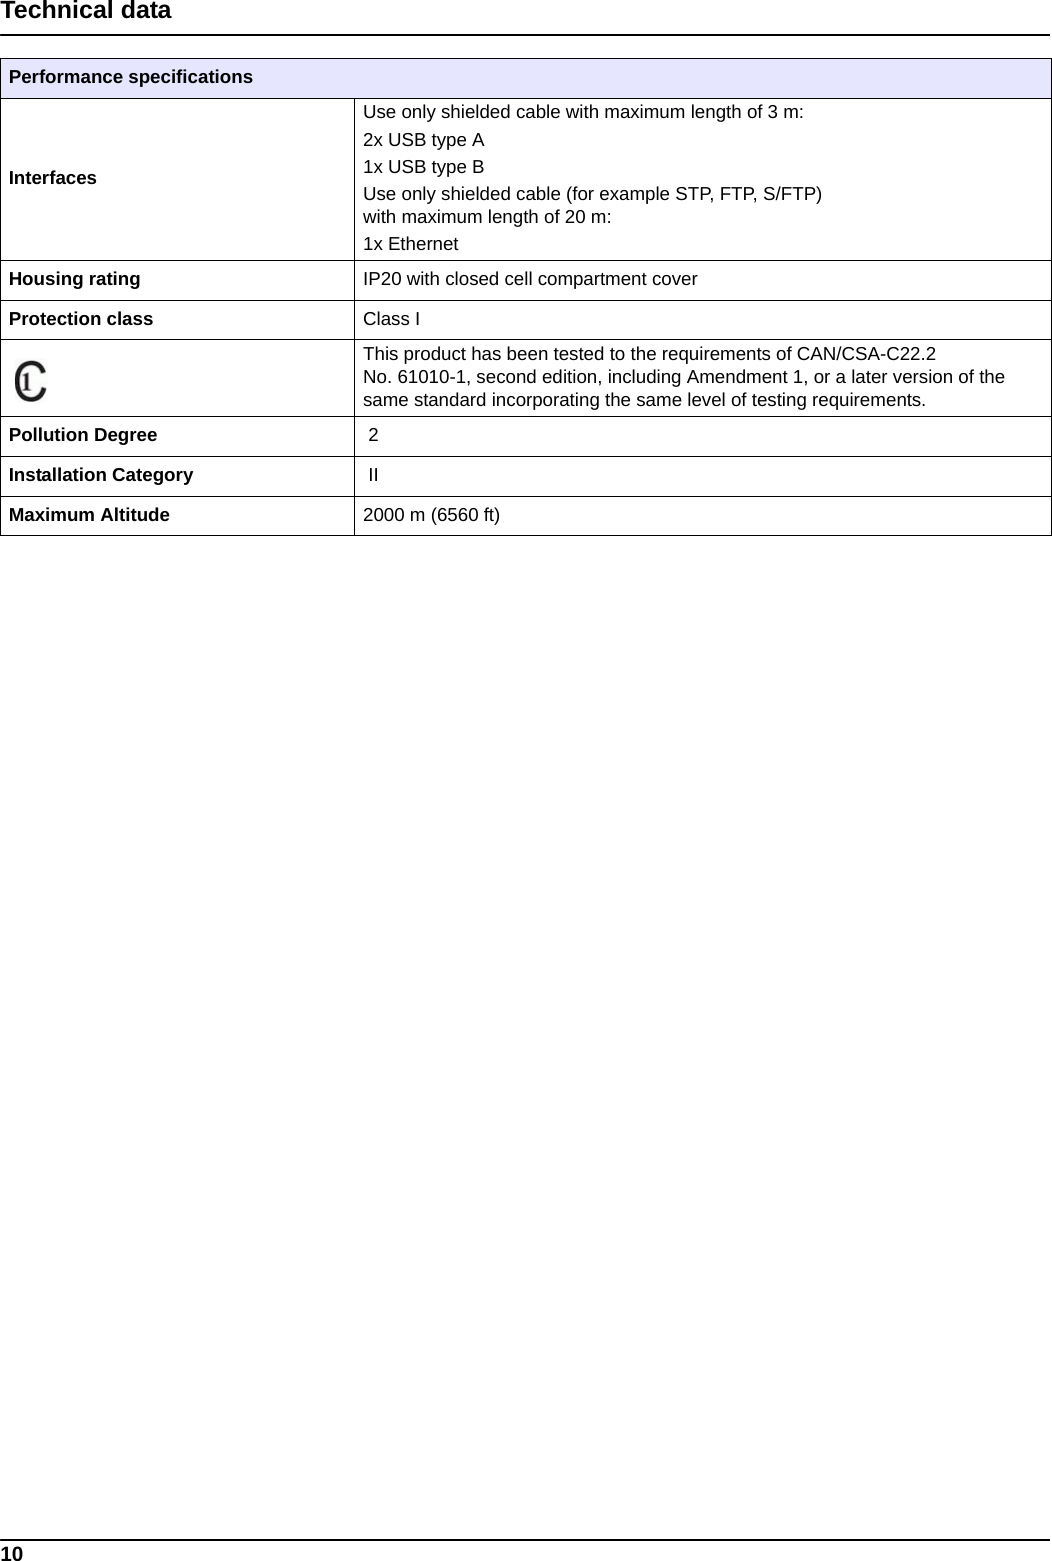
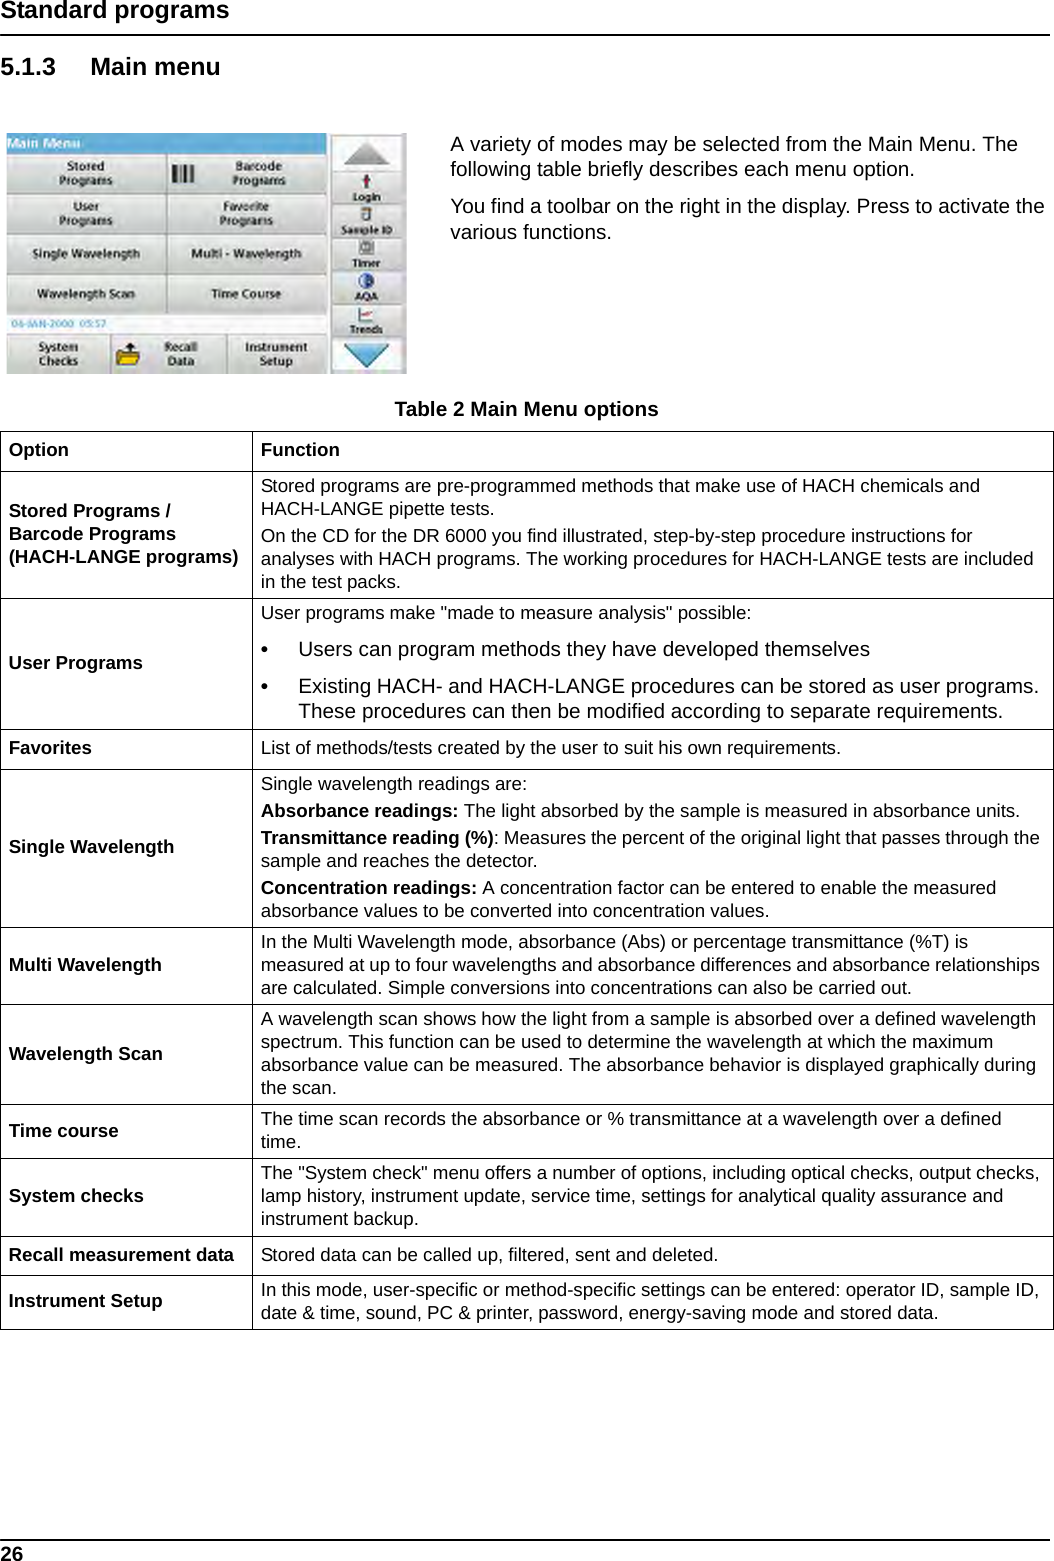
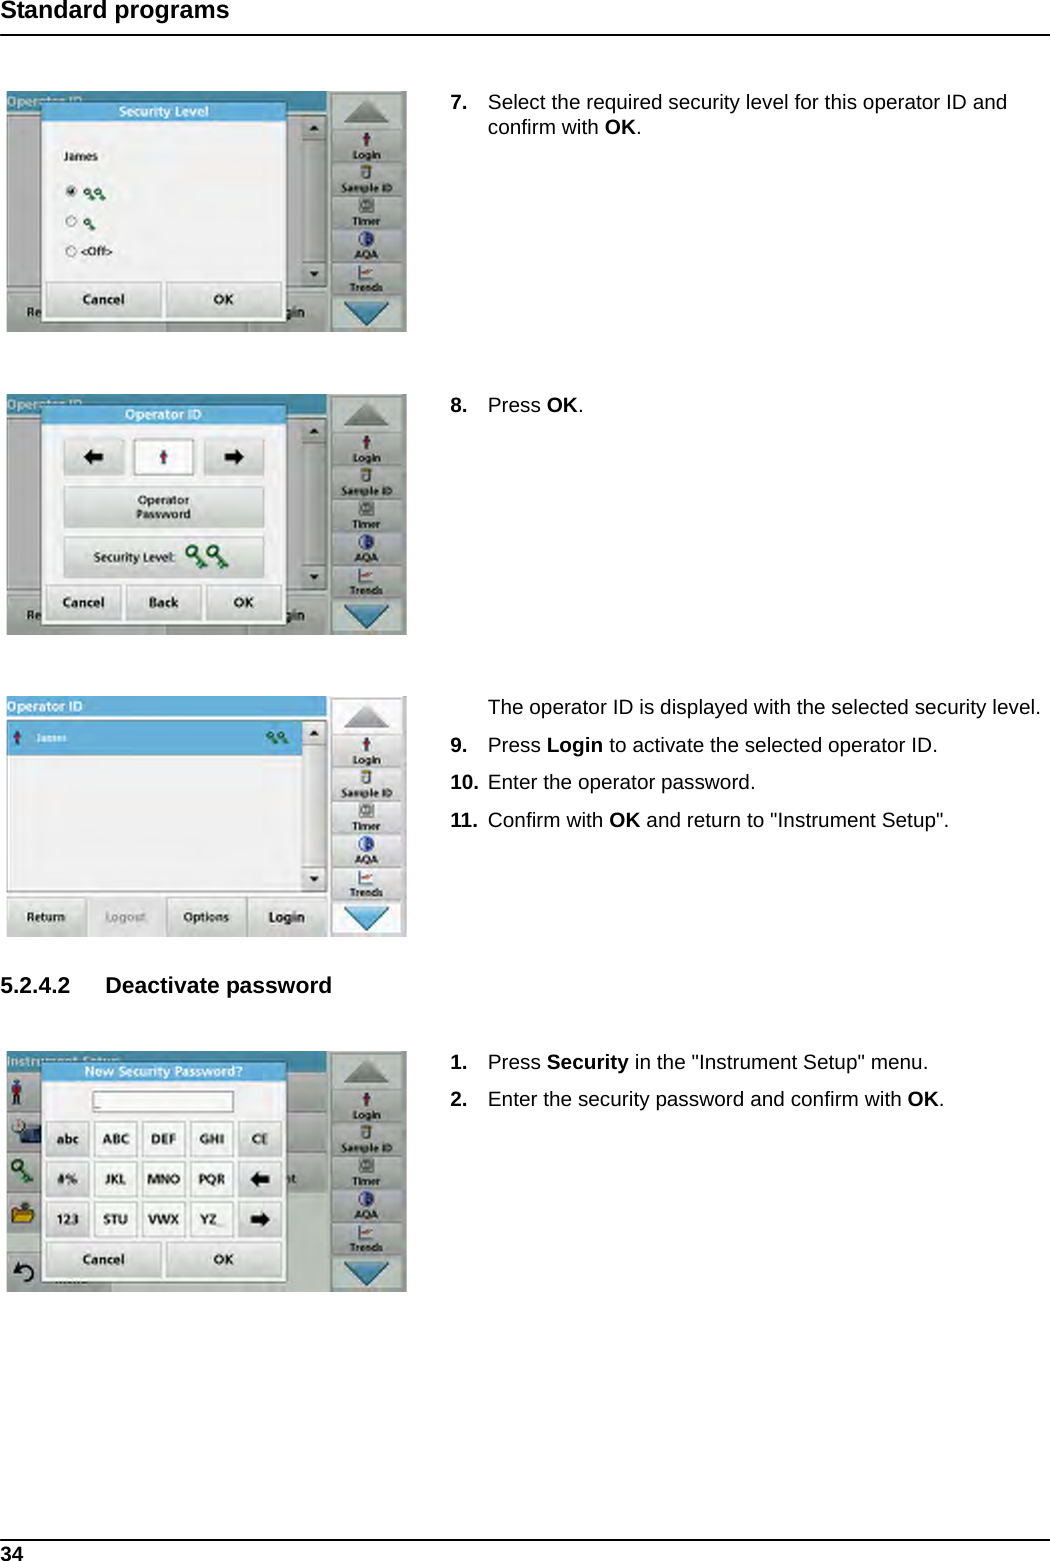
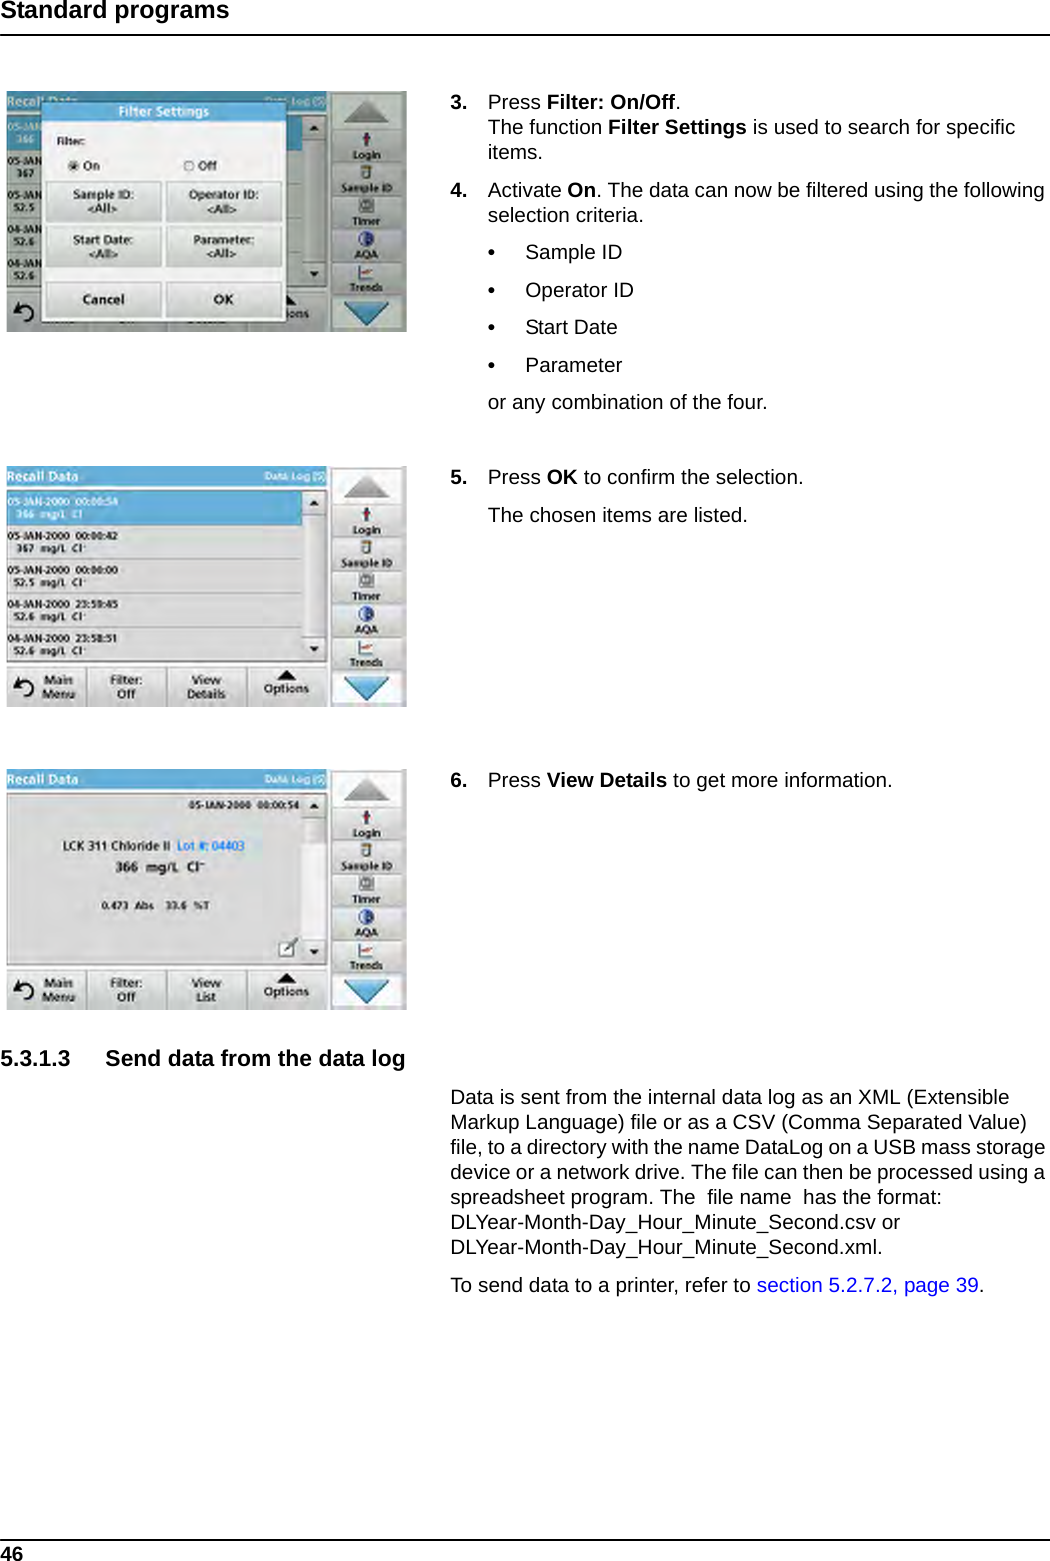
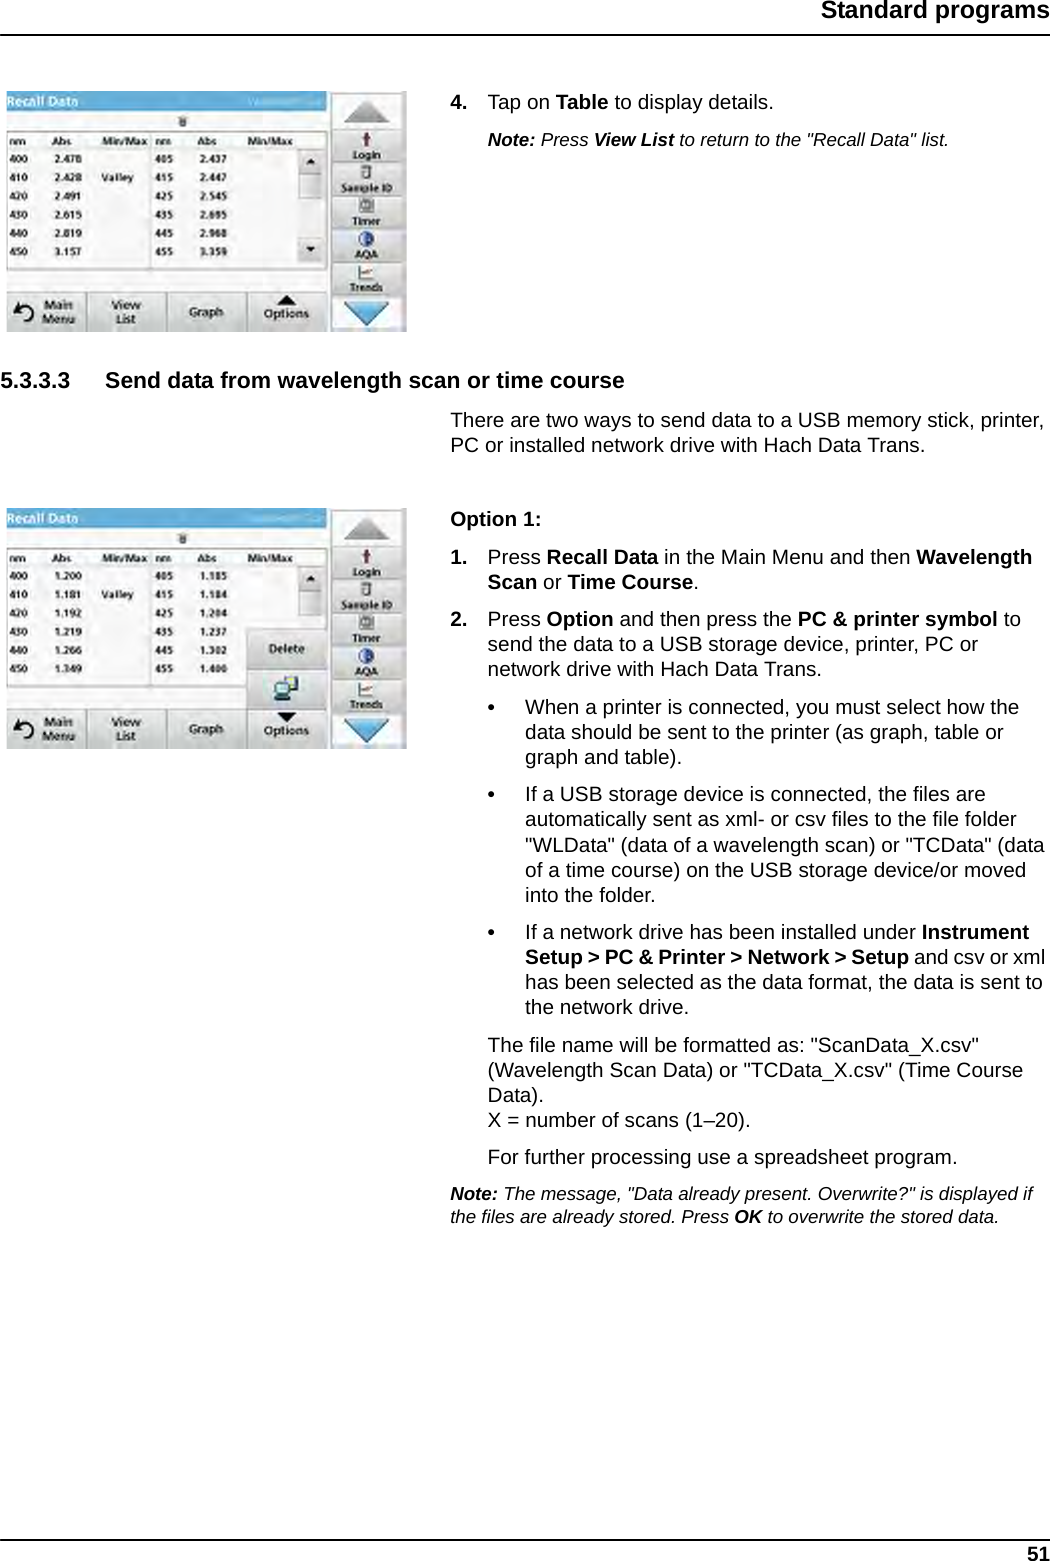
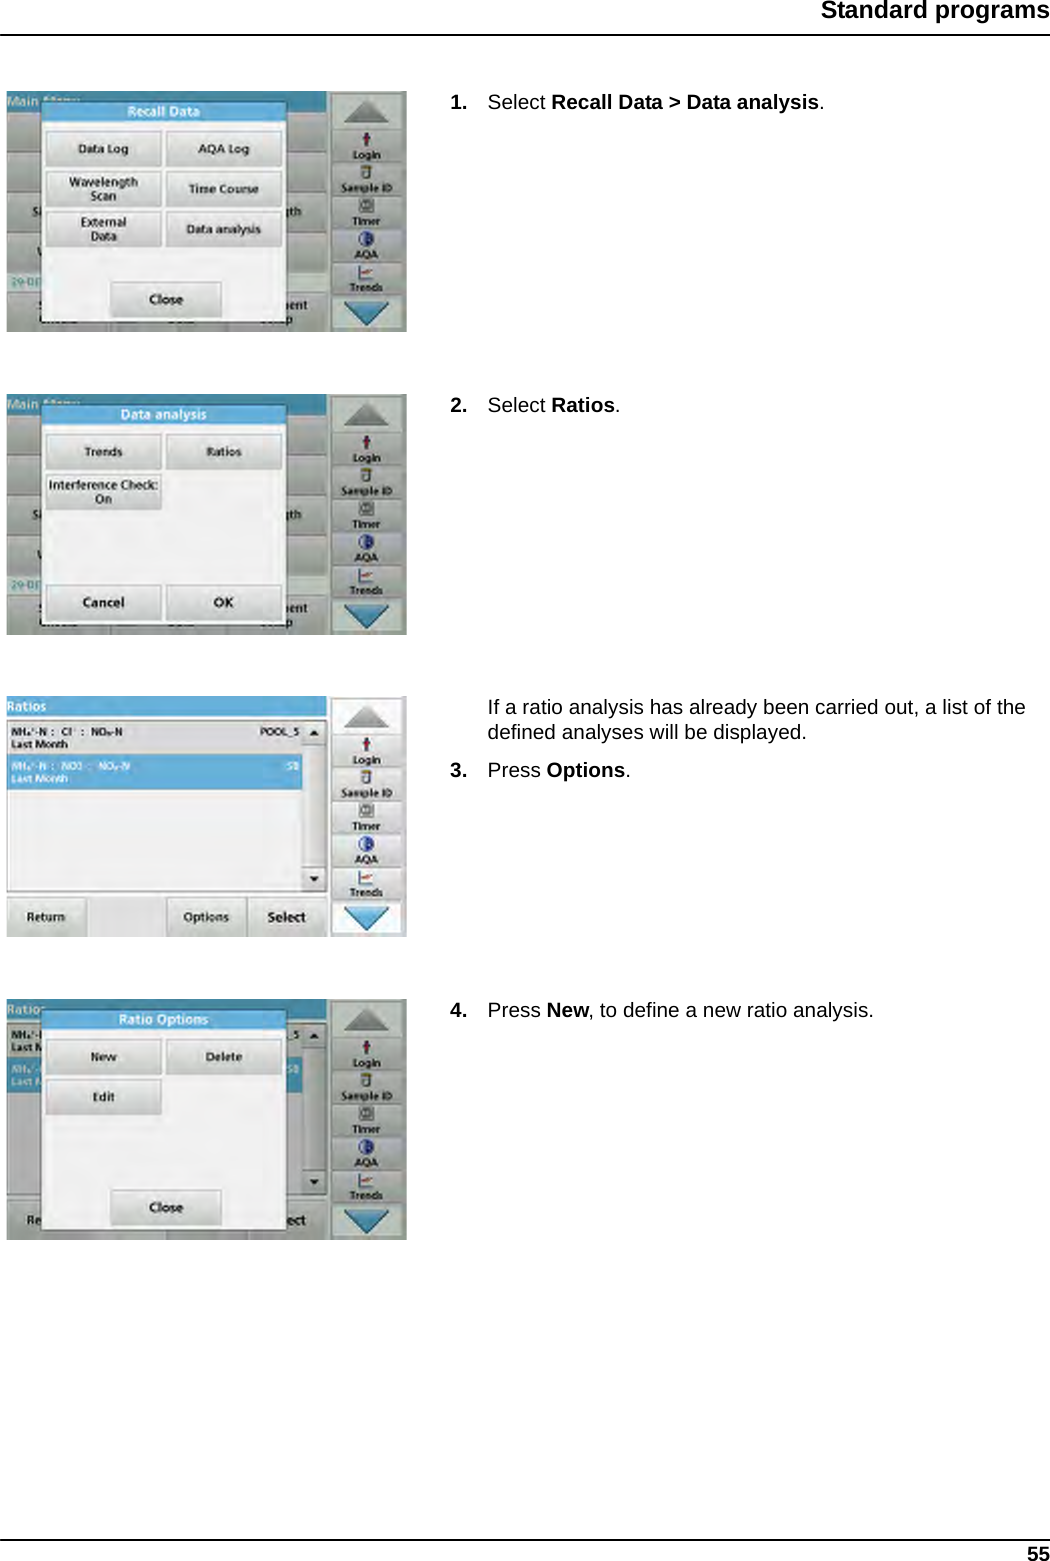
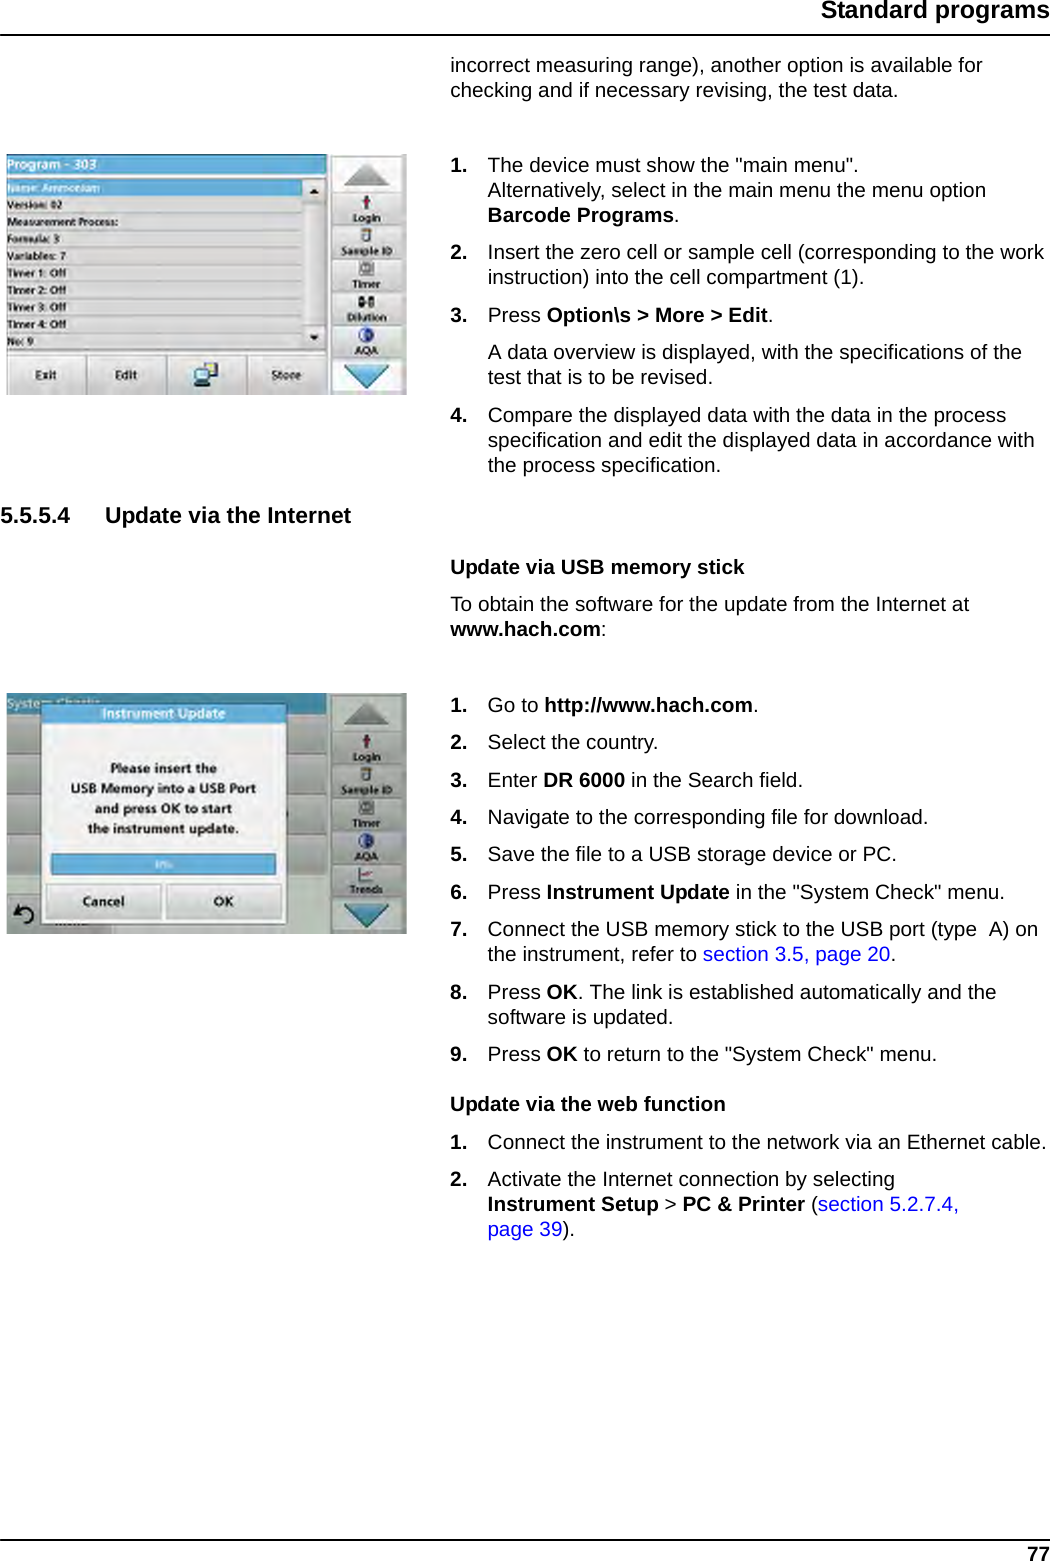
![72Standard programsTable 5 Barcode program optionsOptions DescriptionMore For further OptionsSave icon Depending on setup under Instrument Setup > Data Log Setup > Auto Store: On or Off the stored data is called up with the Save symbol or a manual save is performed.Abs % Trans Switches from % transmittance to absorbance in reading mode.Send Data icon To send data to a printer, computer or USB memory stick (USB A) or network.Timer icon This functions as a stopwatch. It helps to make sure that the steps of an analysis are correctly timed (e. g. reaction times, wait times, etc., can be exactly specified). When the specified time has elapsed, a sound is emitted. The use of the timer has no influence on the reading program.Dilution Factor Off/OnA corrective dilution factor can be entered in order to take account of certain properties.The number entered at the dilution factor prompt will be multiplied by the result to compensate for the adjustment. For example, if the sample has been diluted by a factor of 2, enter 2. The default setting of the dilution factor is turned off.Note: During use of a dilution factor, the dilution symbol is shown on the display.Note: If undiluted samples are used, set the dilution factor off.Chemical Form Some of the stored tests/methods allow to select the chemical form and the measuring range.Reagent Blank: Off/OnThe function "Reagent Blank" is available for several barcode tests. This enables the reagent blank value to be added to or subtracted from, the subsequent readings. The reagent blank value shifts the calibration curve along the y-axis, without changing the shape or gradient of the curve. The effect corresponds to a y-axis intercept of the calibration straight line. This is clarified by the following formula: concentration =[conc. factor) * Abs] - (reagent blank)Edit To modify an existing programLot information All relevant manufacturing data is stored here.Save as User Program To store the selected parameters as a User Program, refer to section 6.1, page 79.Multiple determination This option allows multiple measurements of the same sample.Reading Mode Barcode test function not available. Recall measurement data Recall saved measurement data, wave-length scans or time courses, see section 5.3, page 44.Instrument Setup mode For basic instrument data, refer to section 5.2, page 27.](https://usermanual.wiki/metraTec/QR15HL.user-manual-DR6000/User-Guide-1697771-Page-72.png)
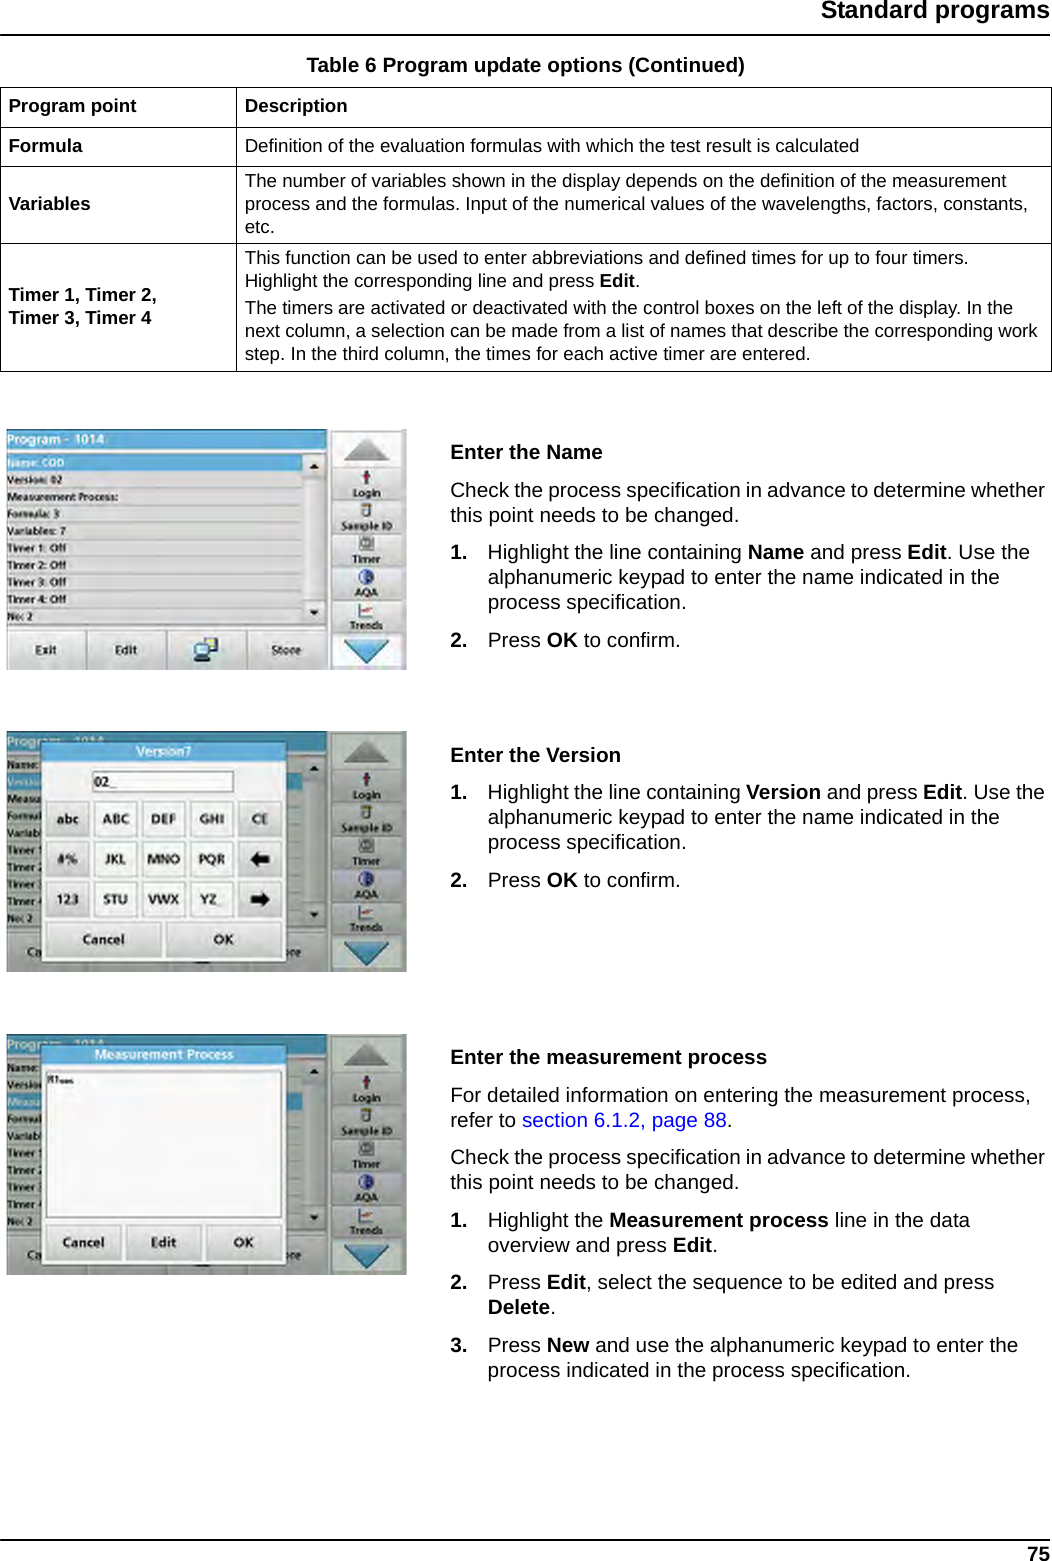
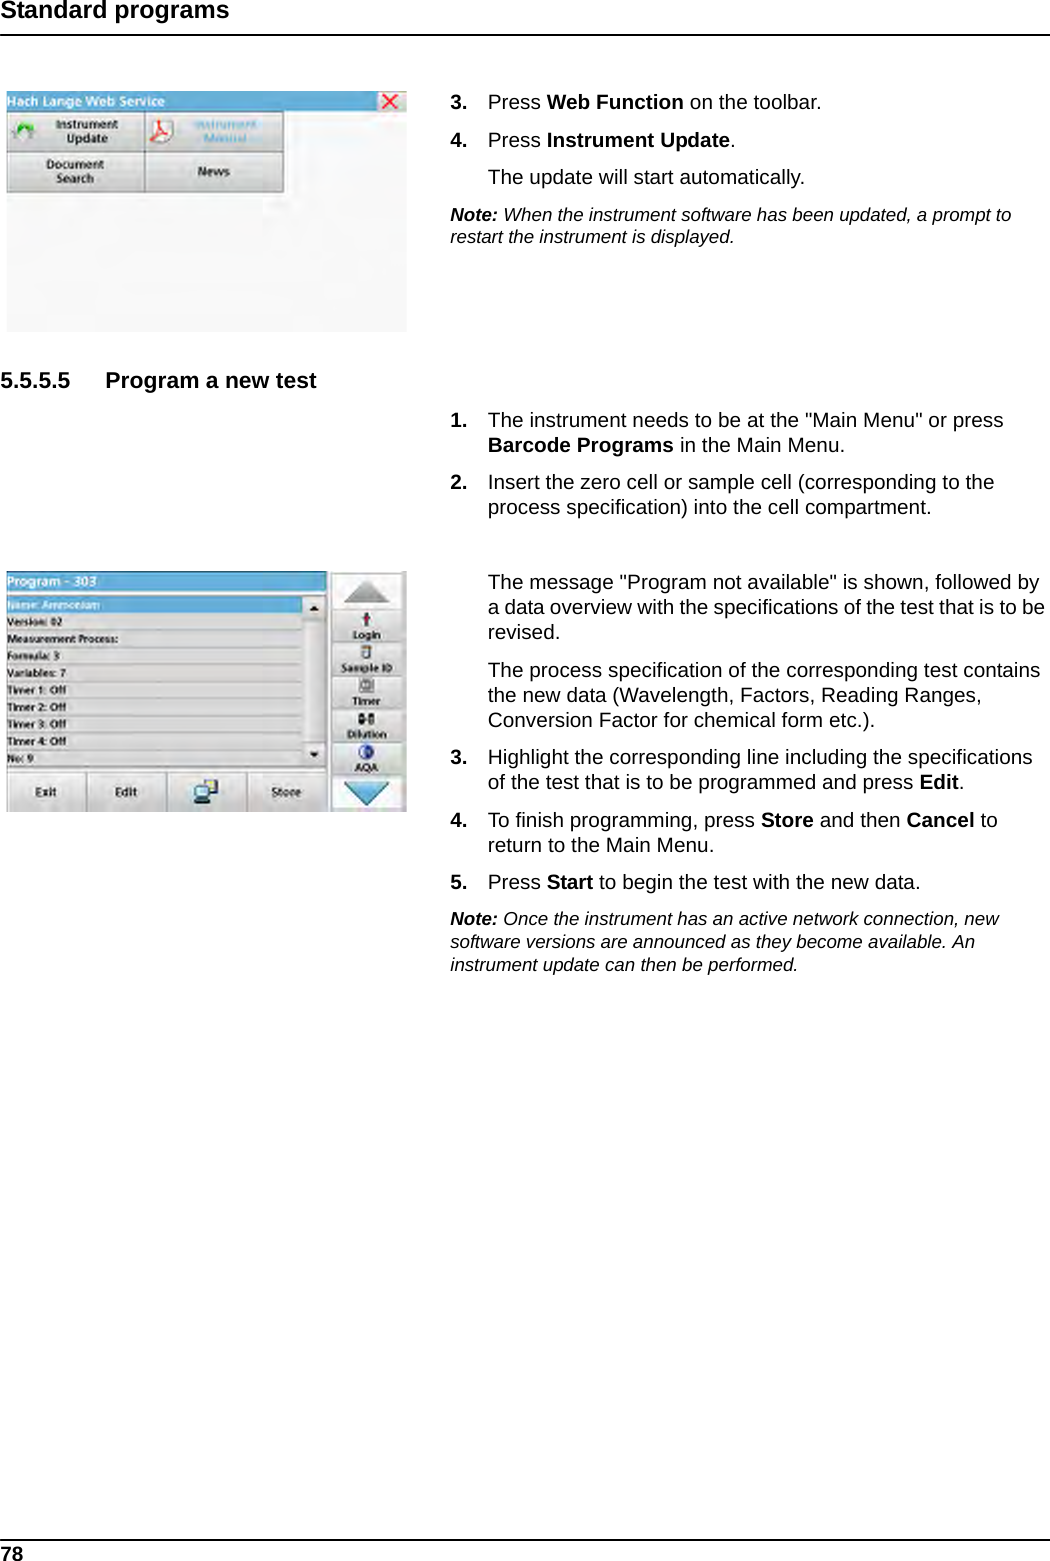
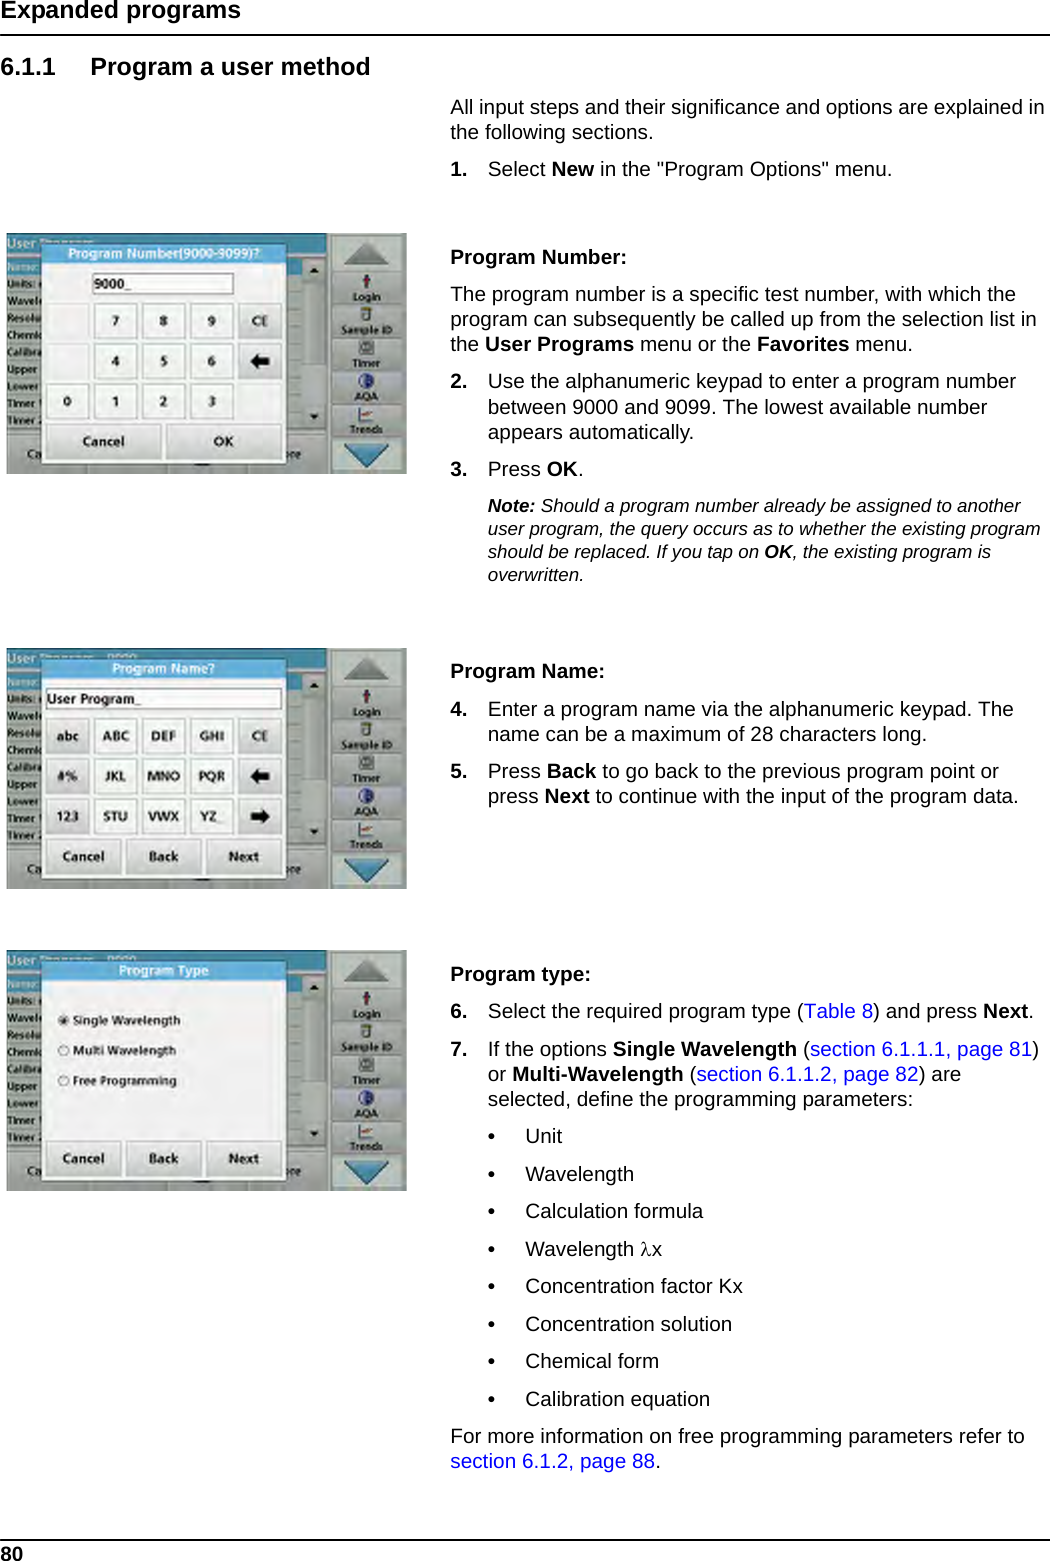
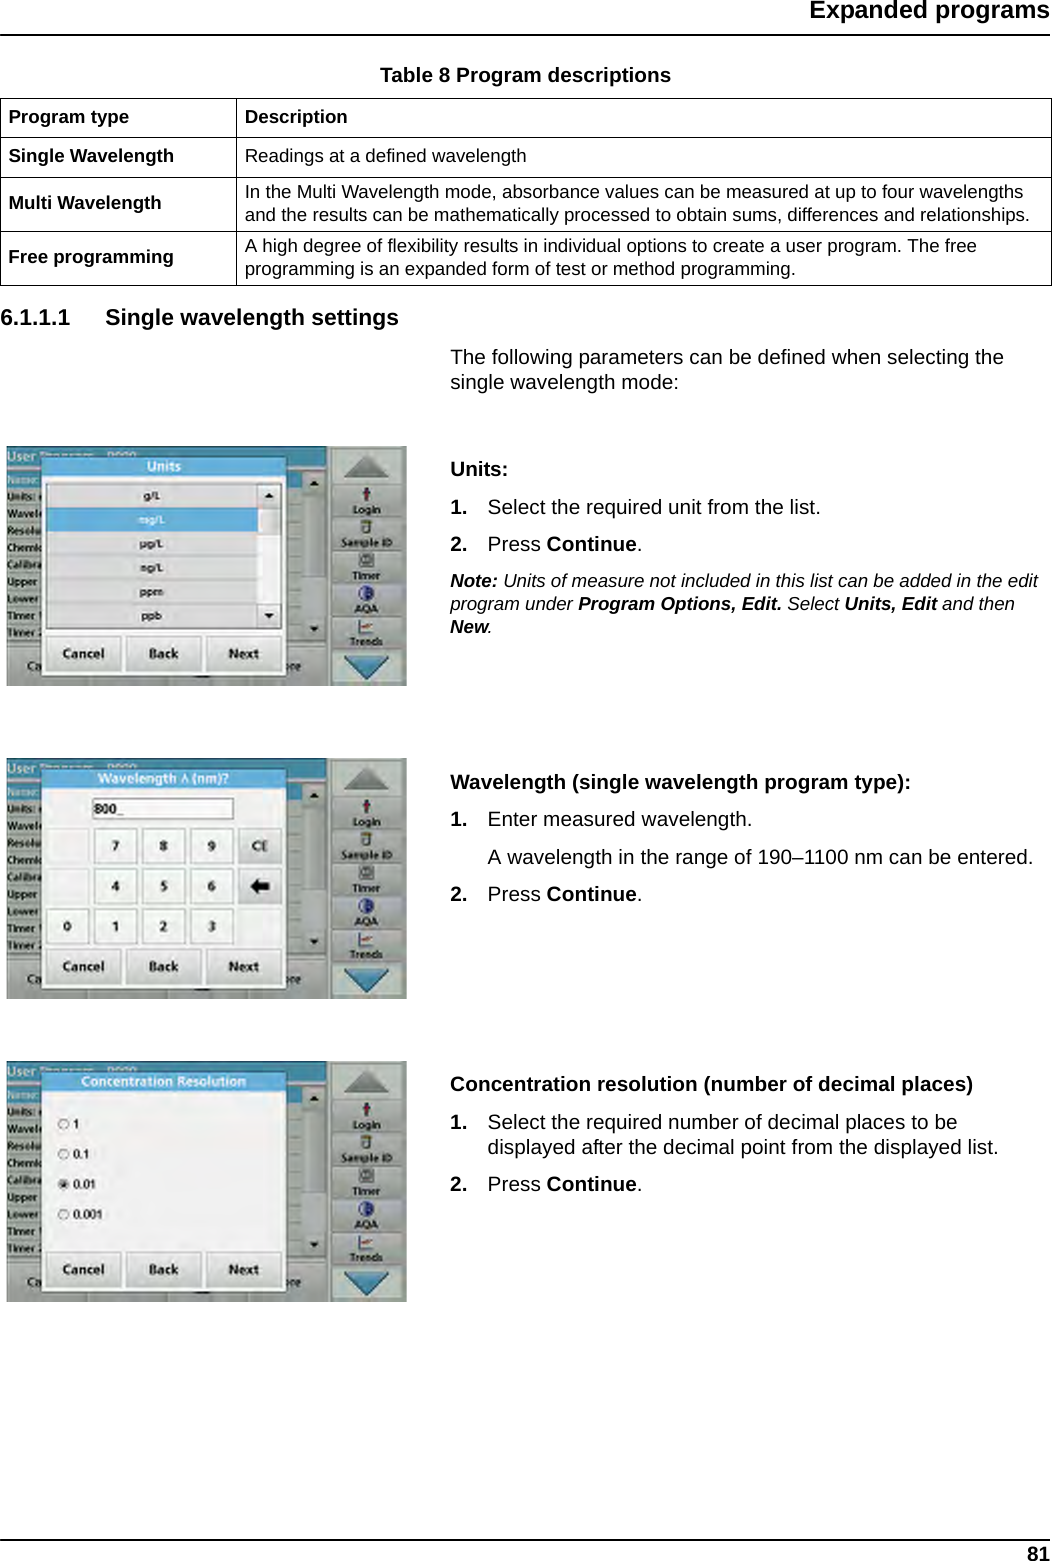
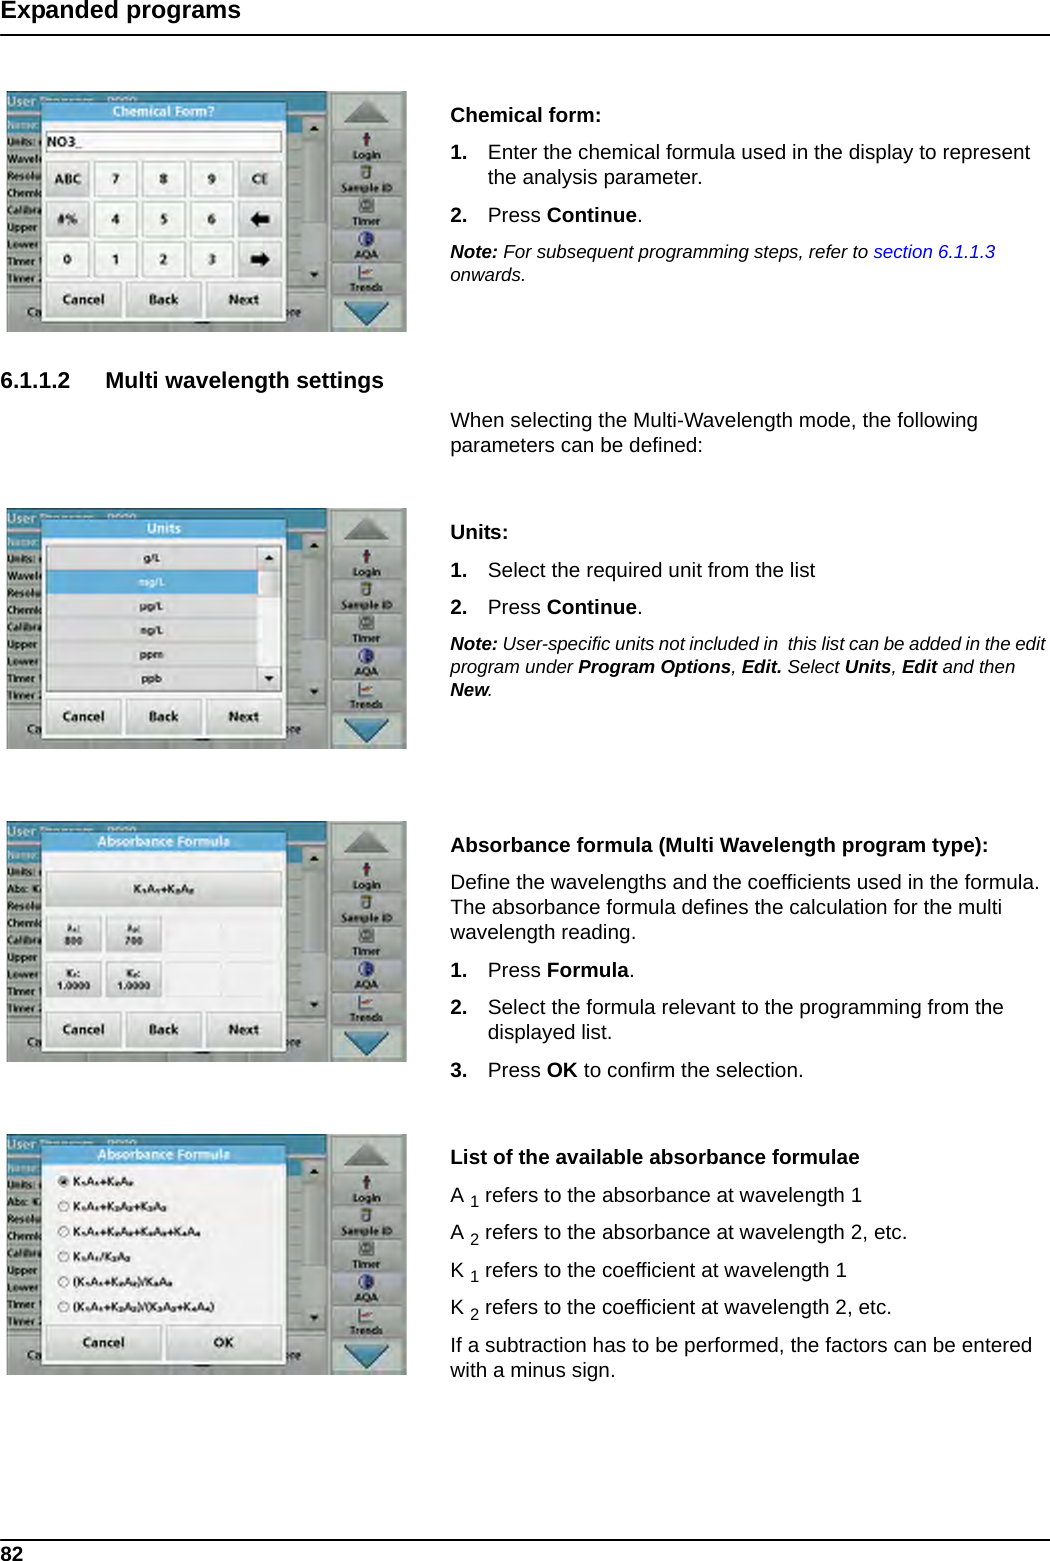
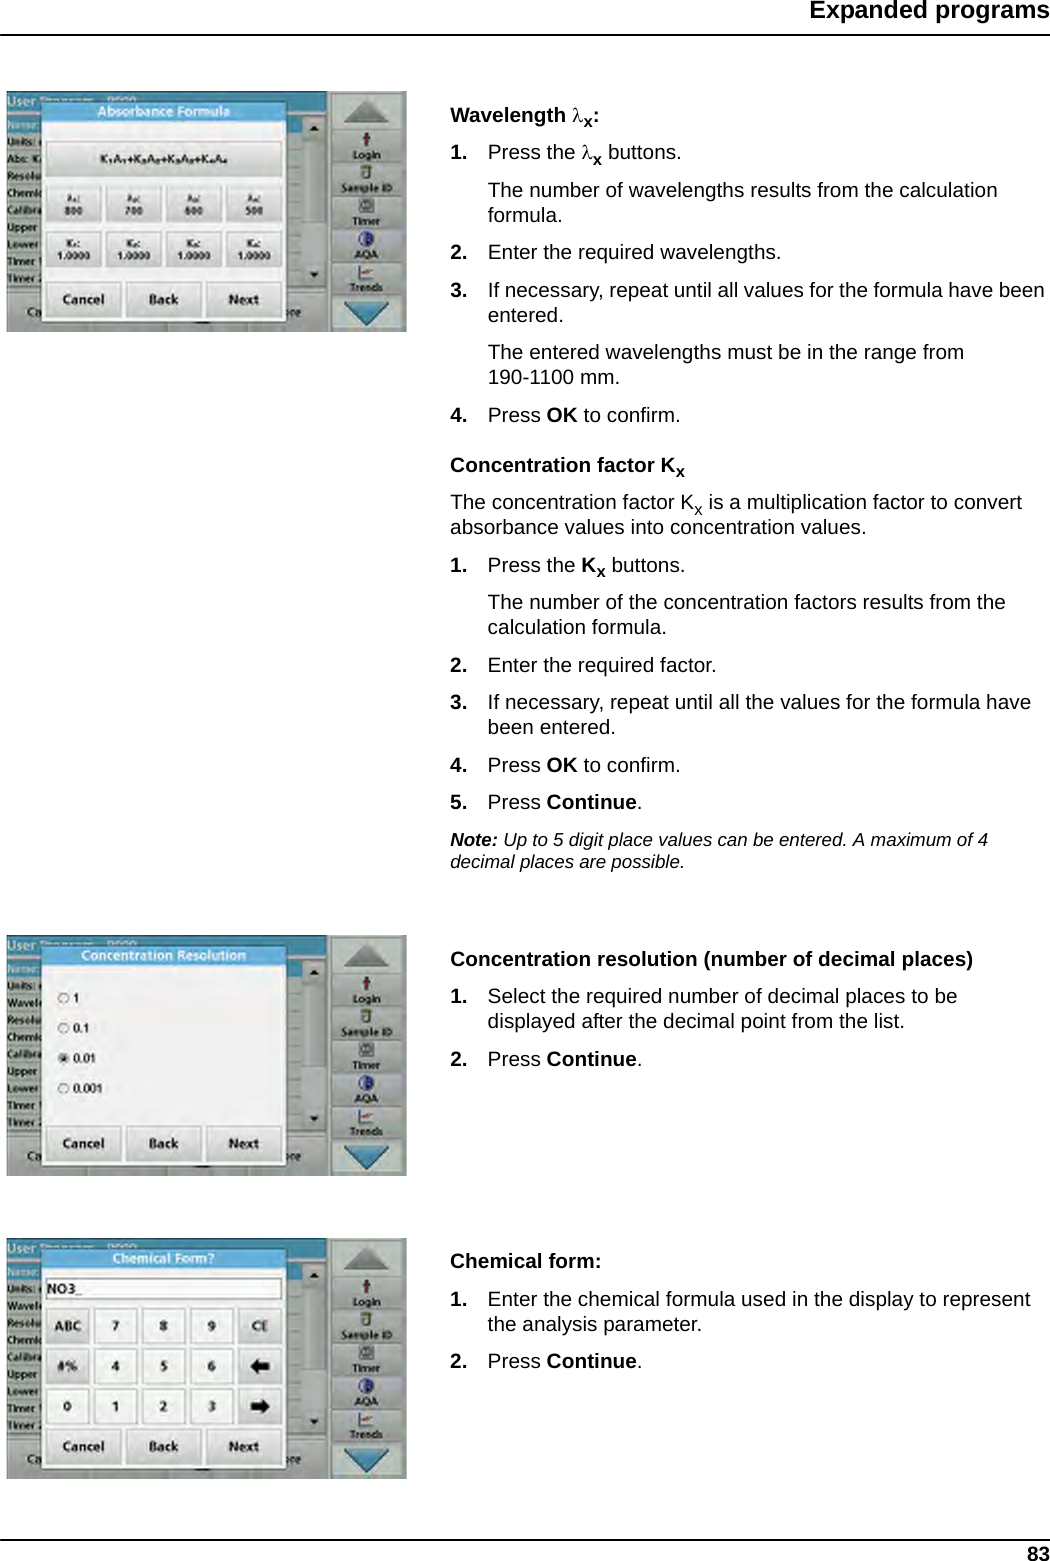
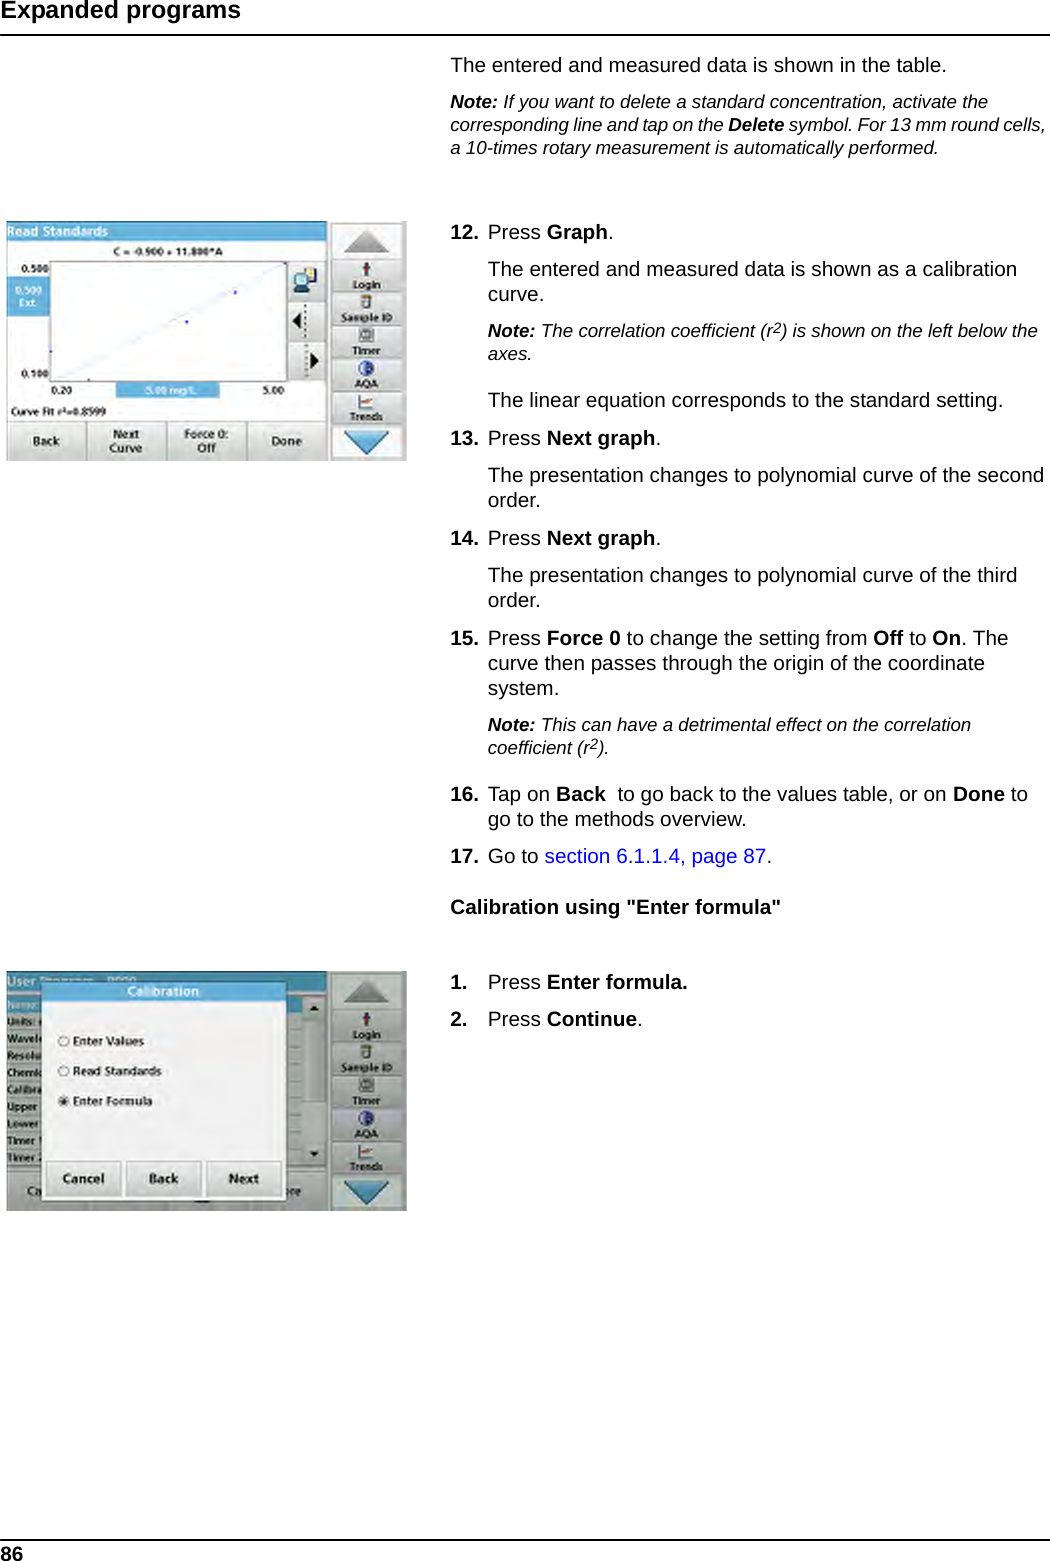
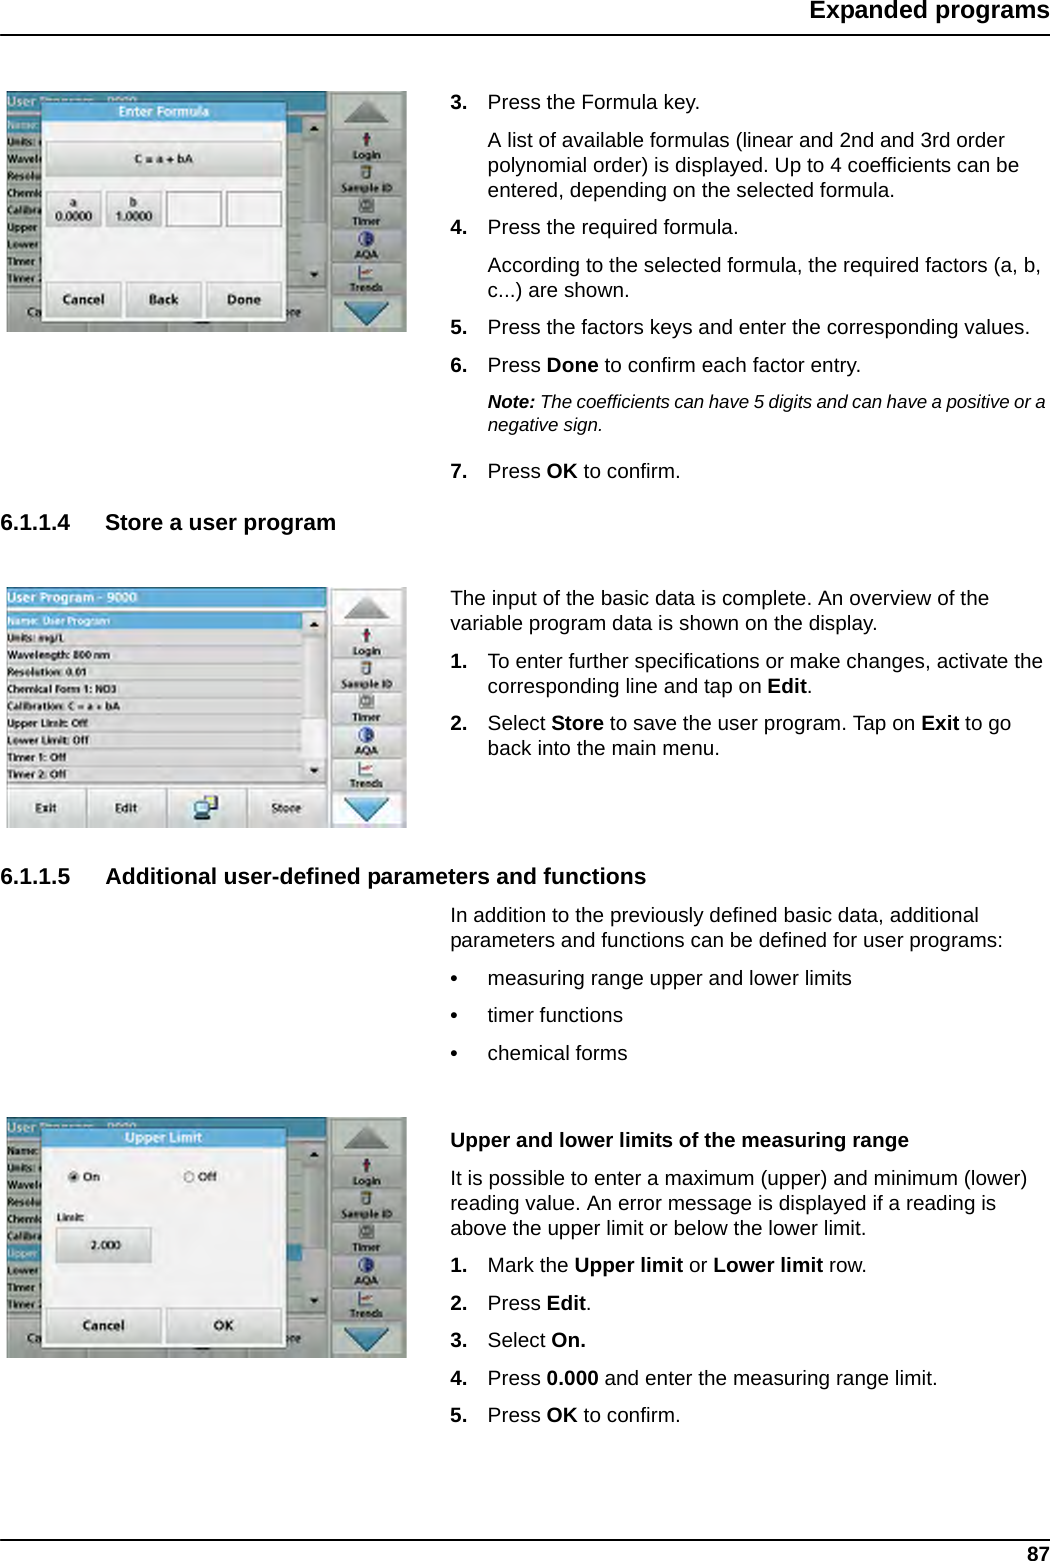
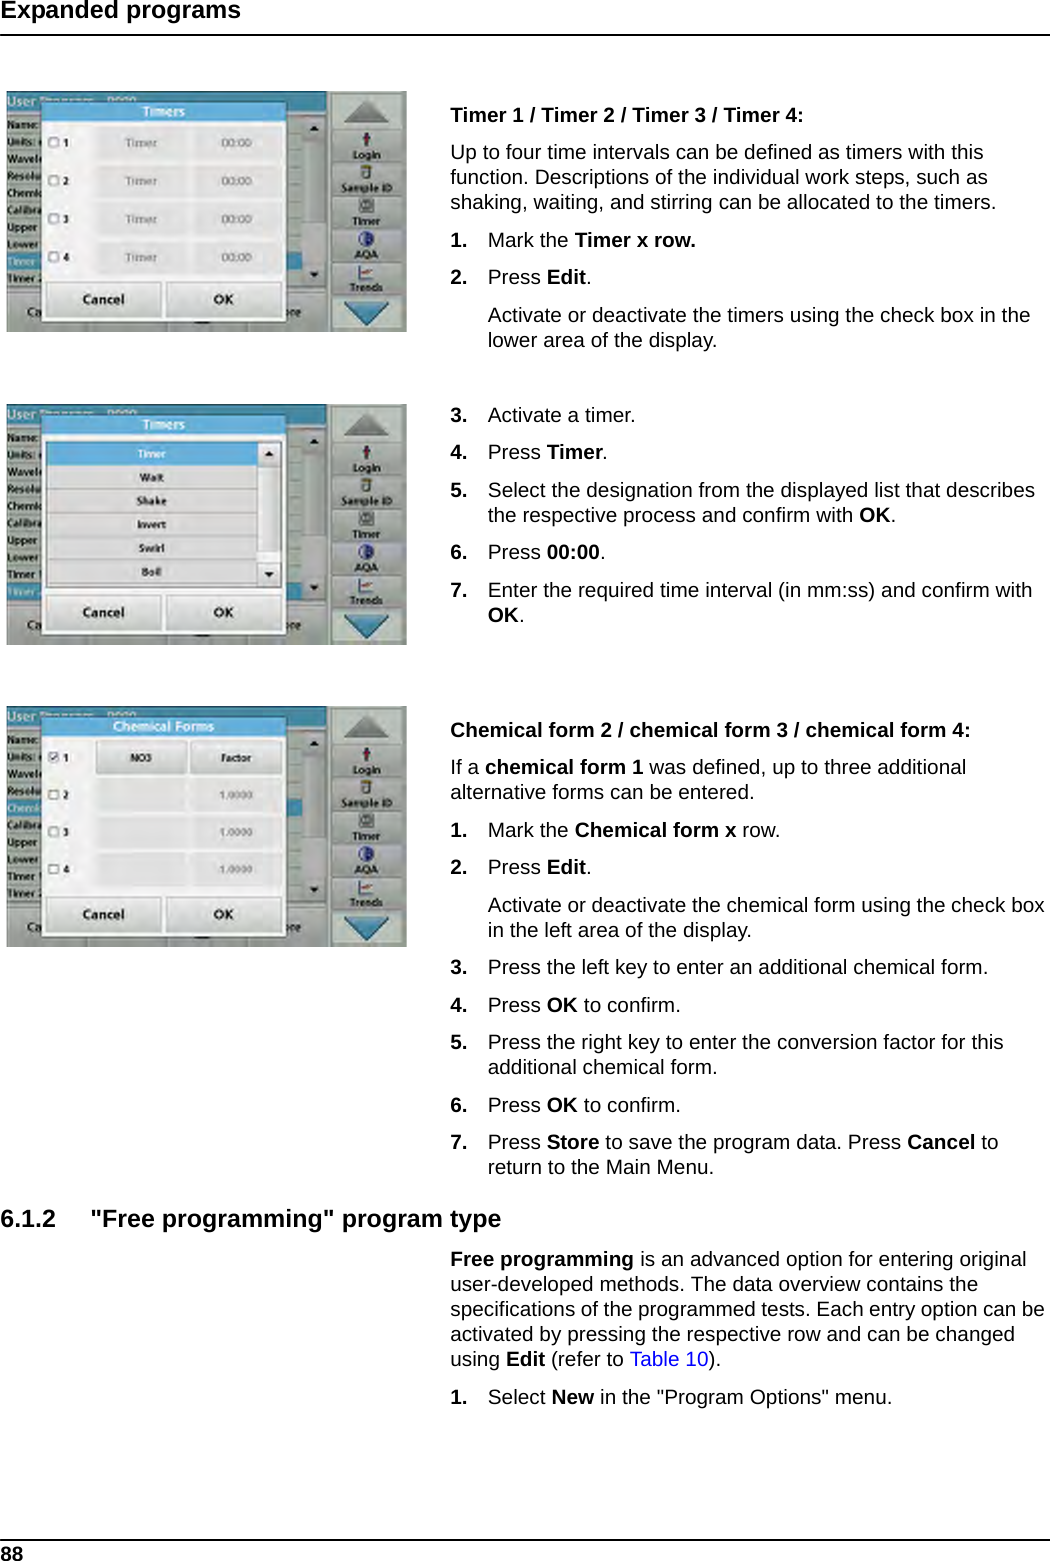
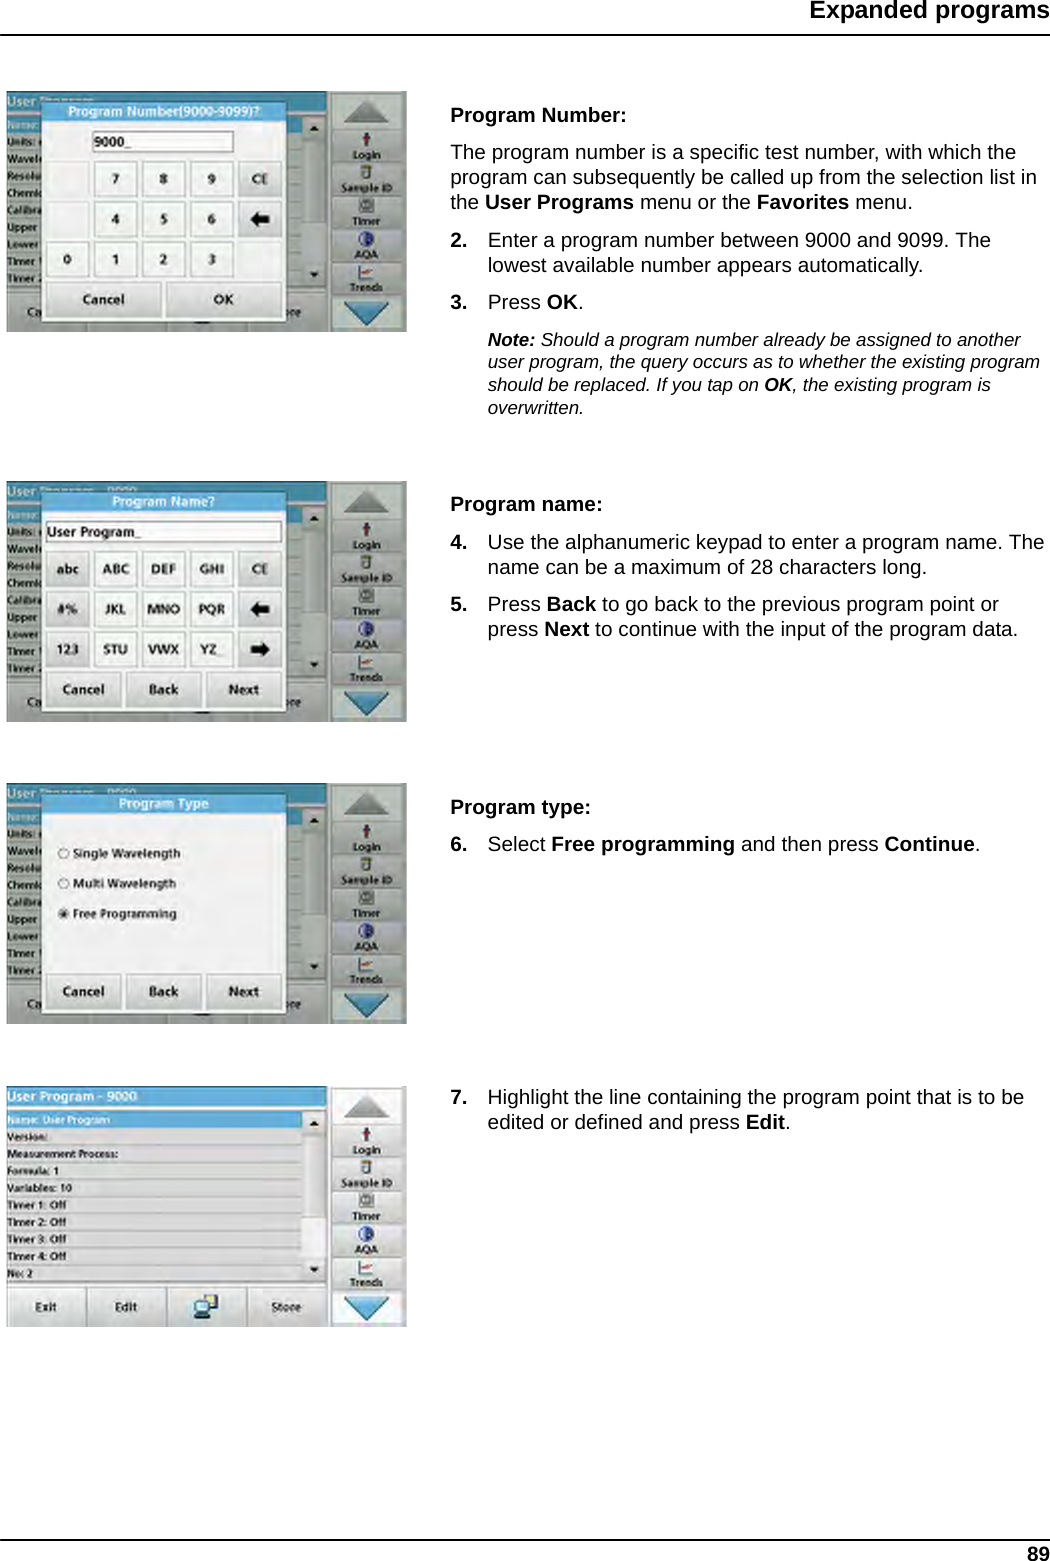
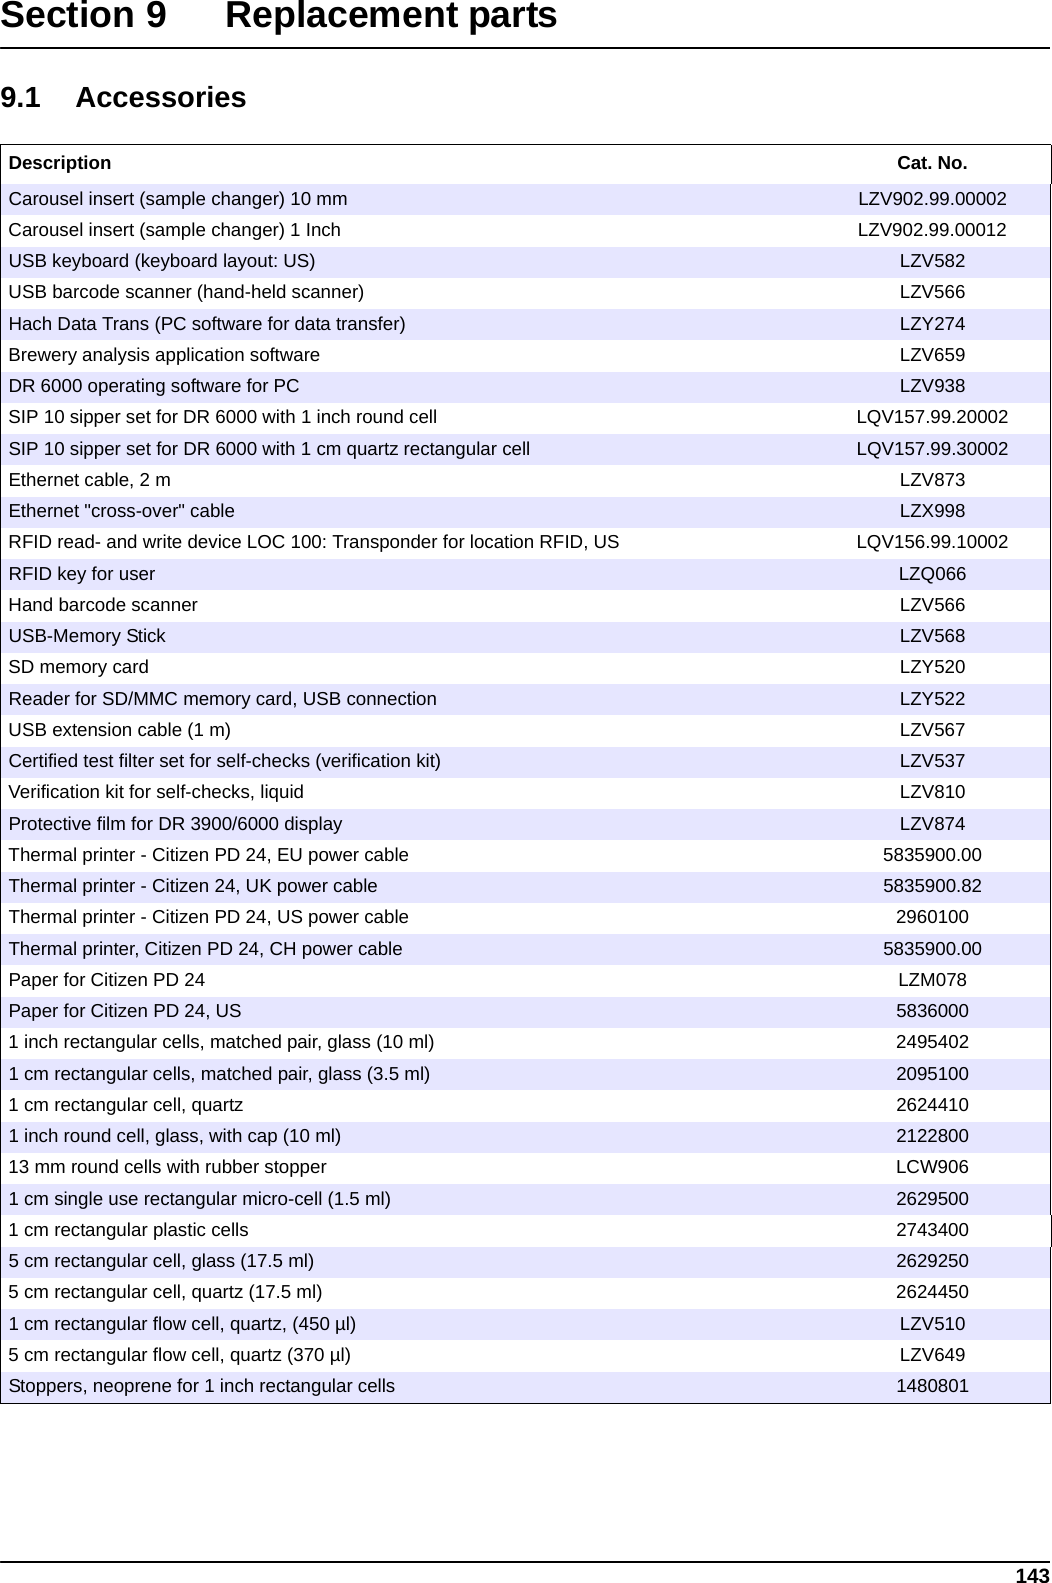
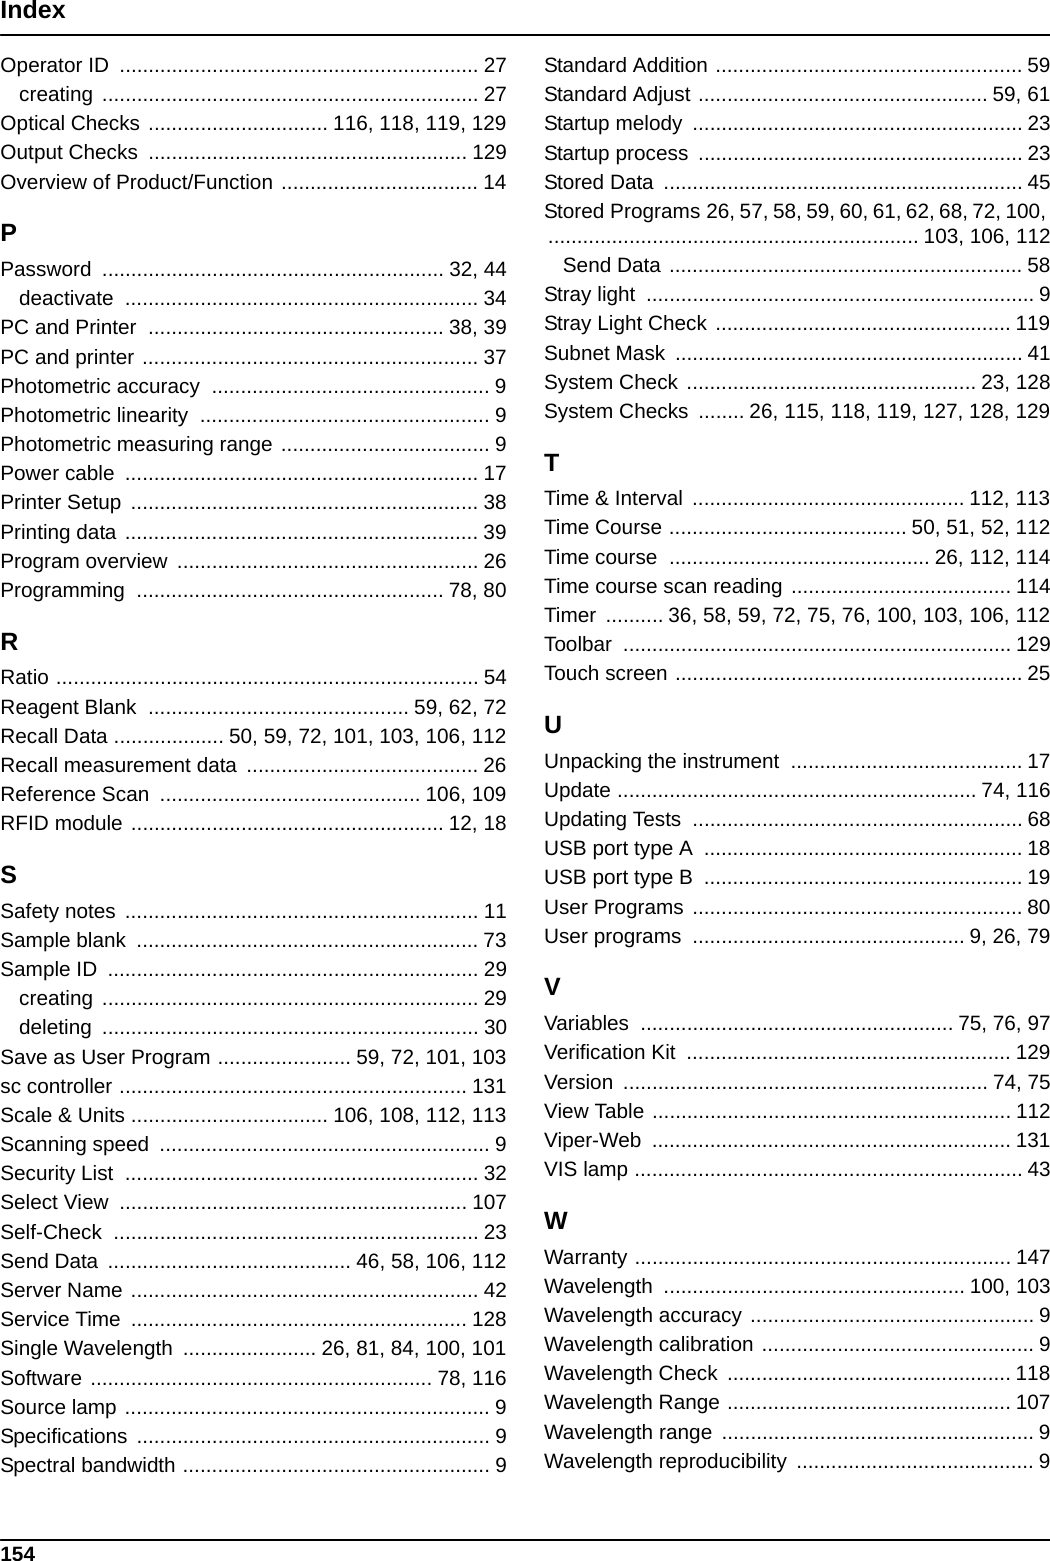
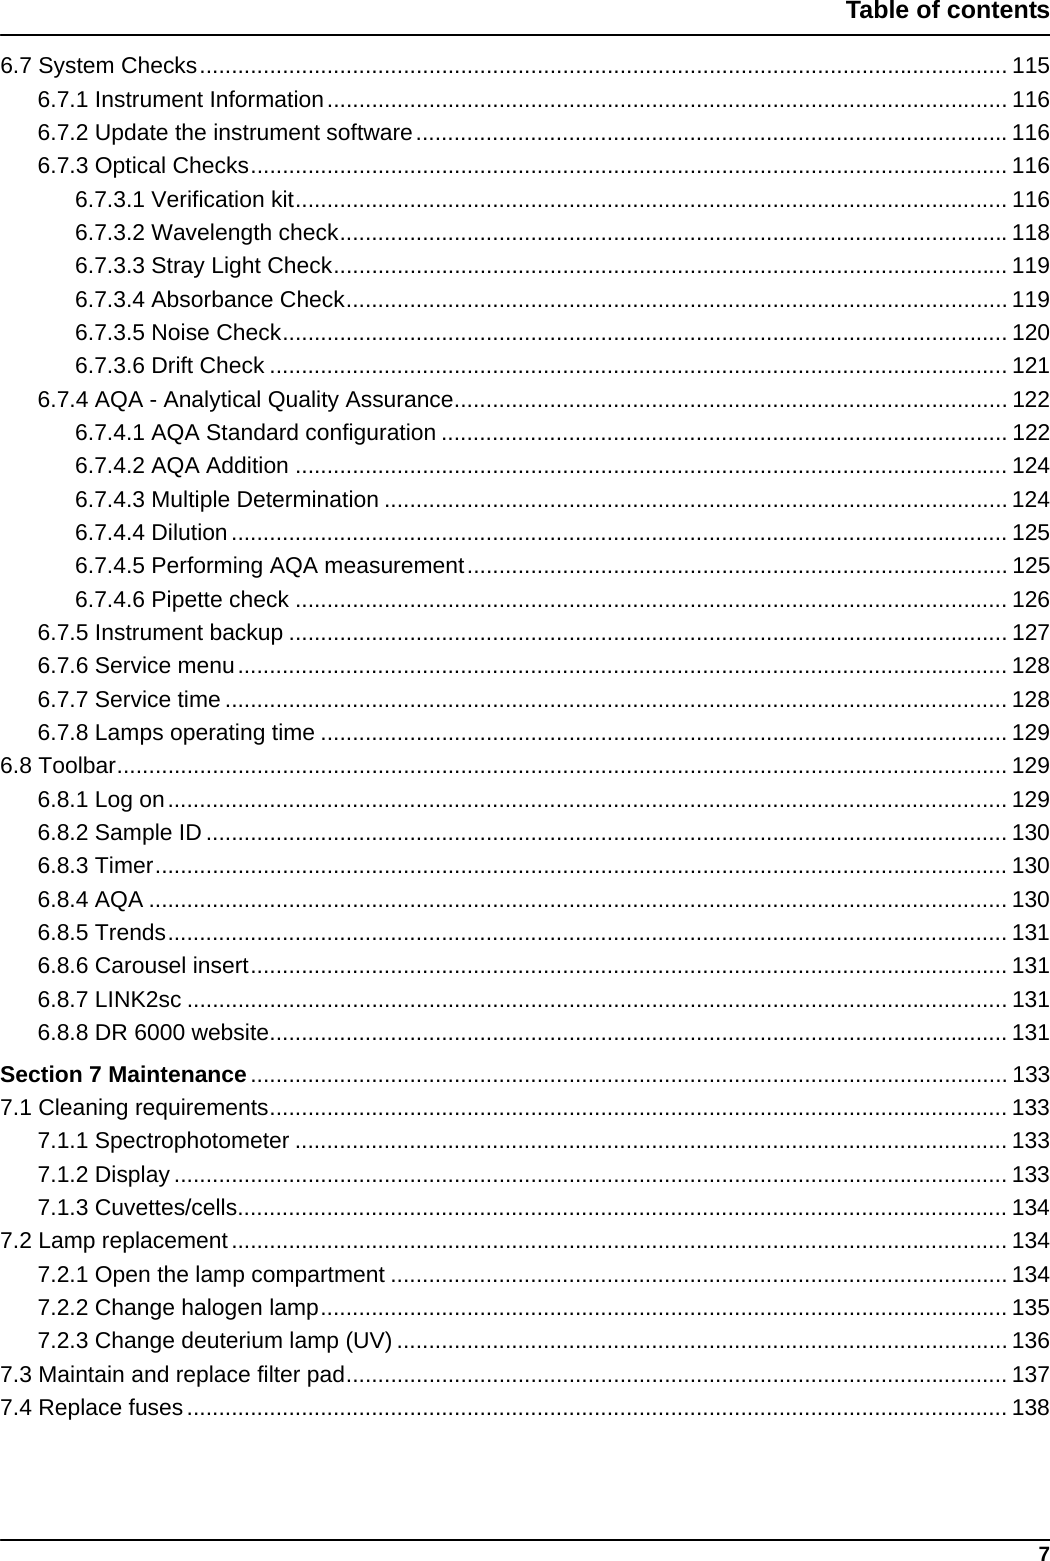
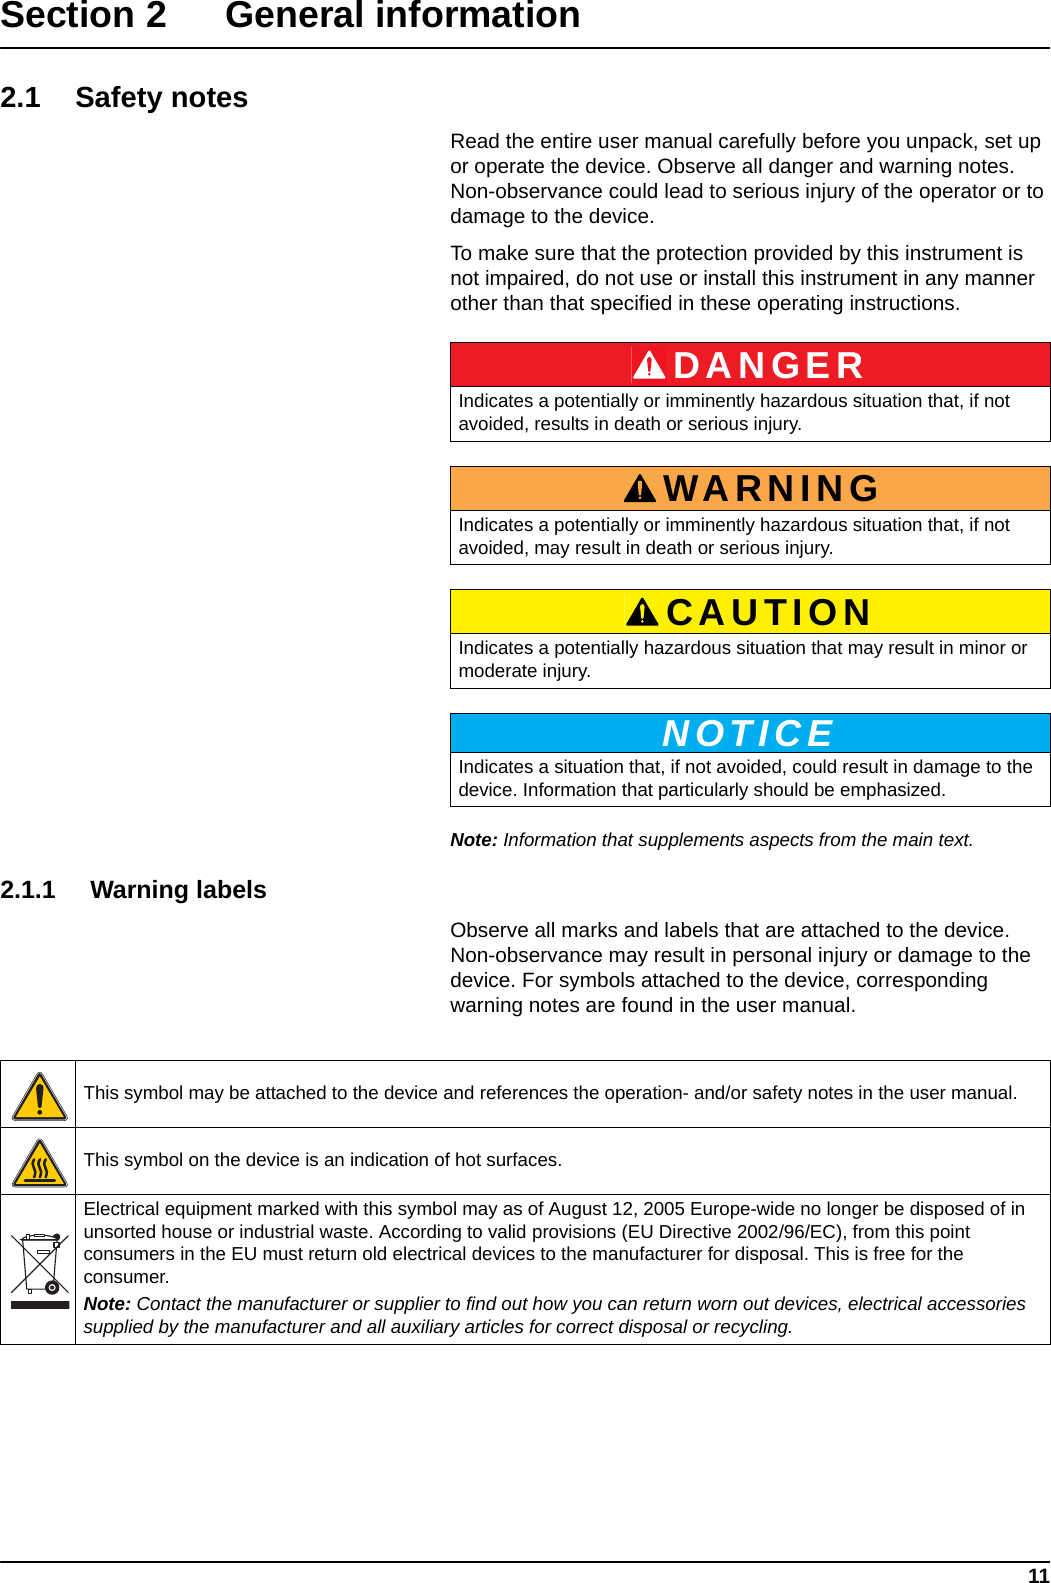
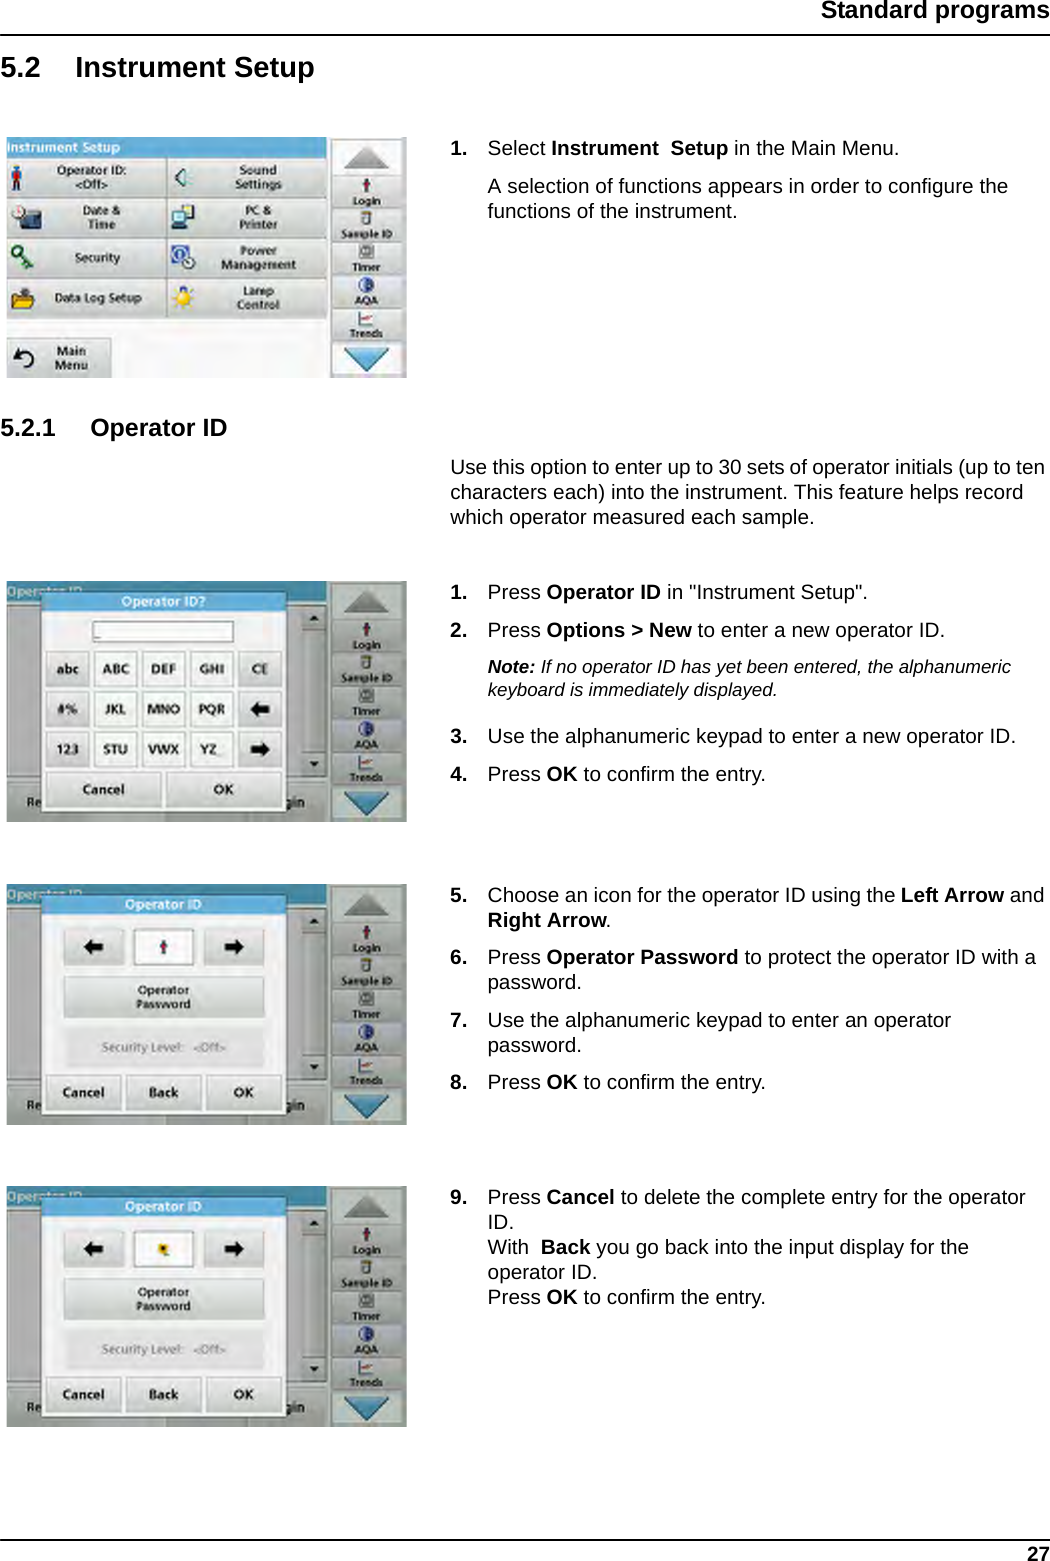
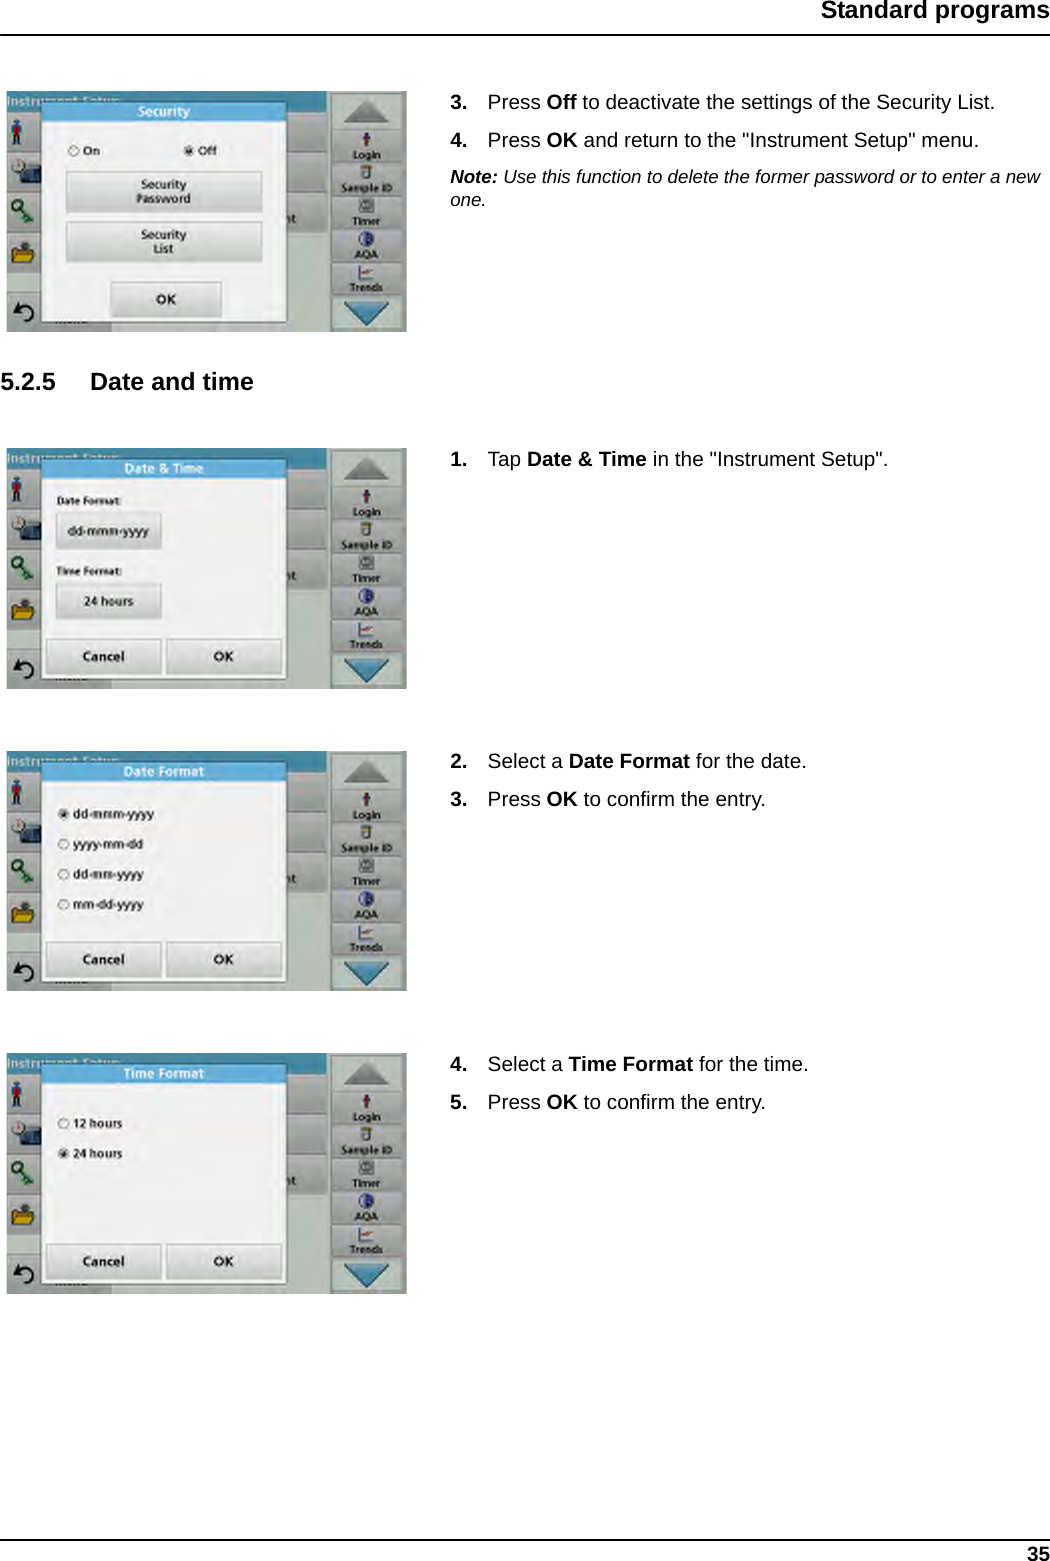
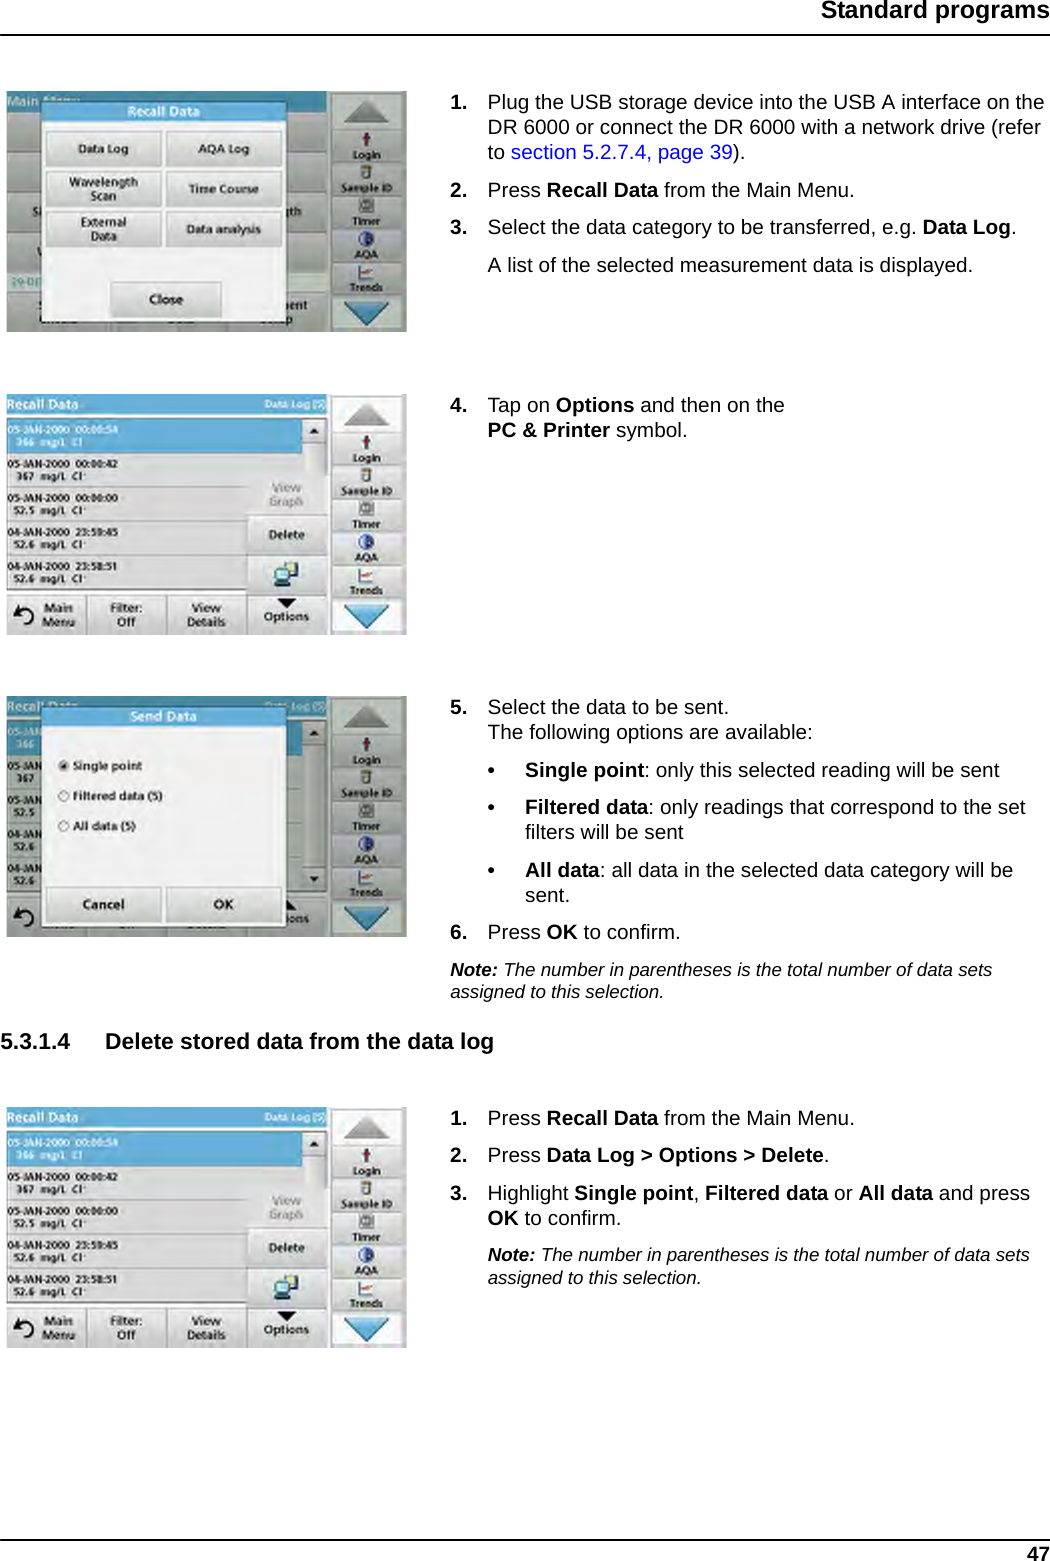
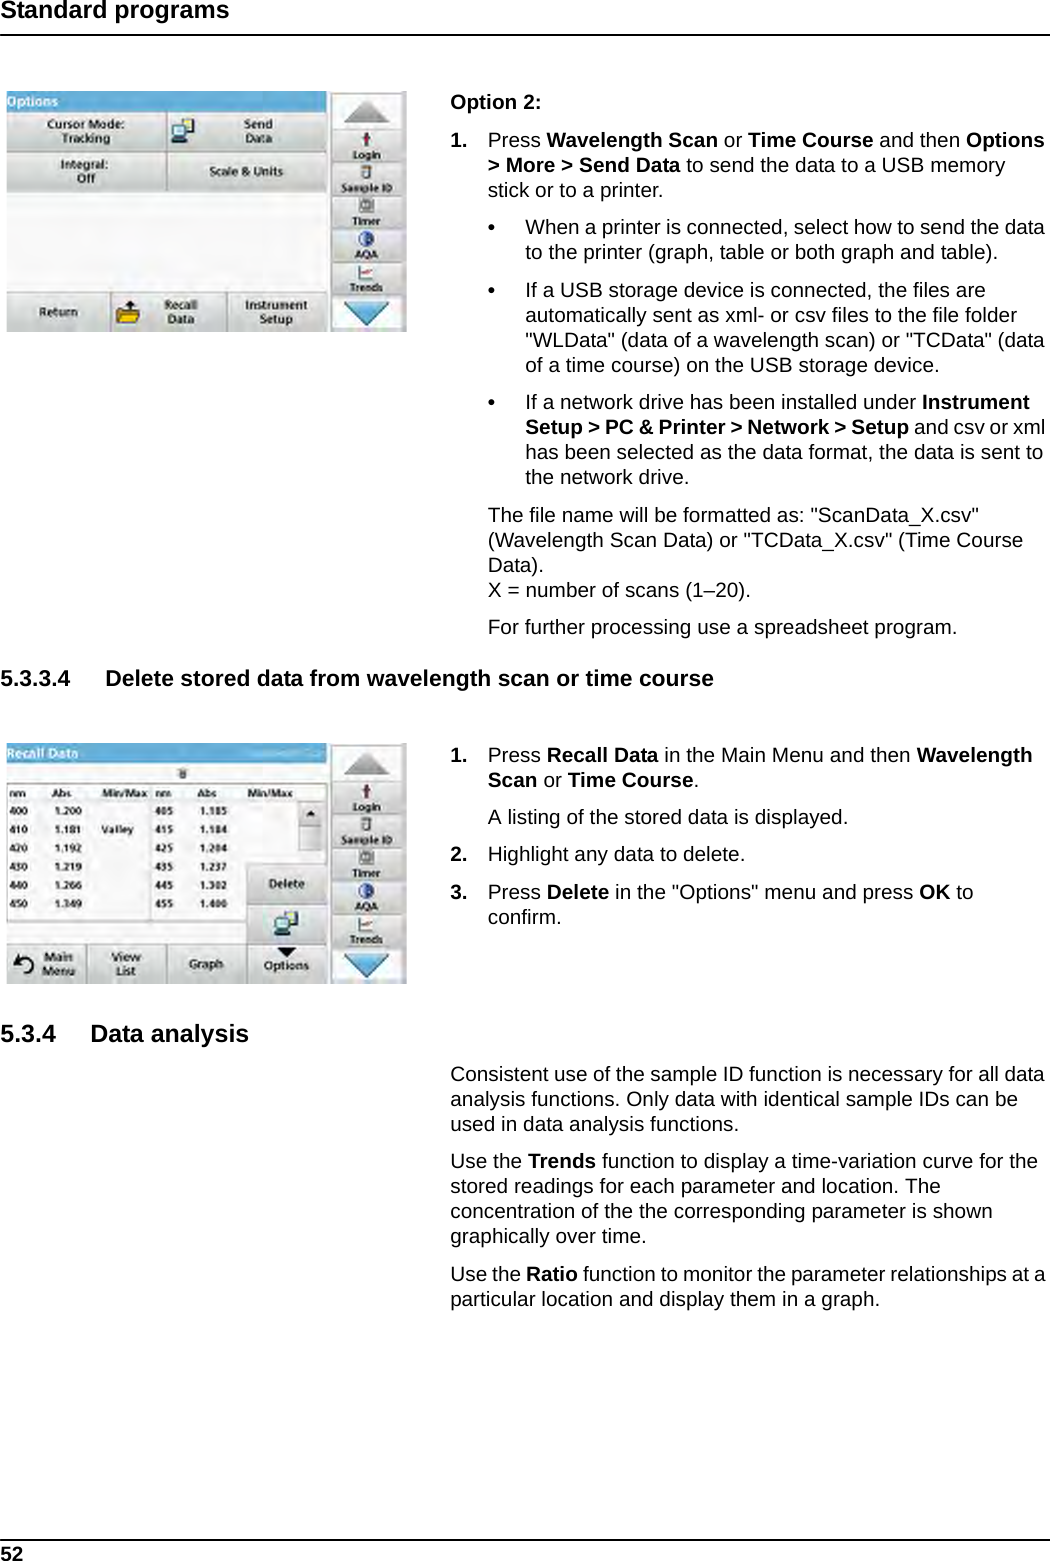
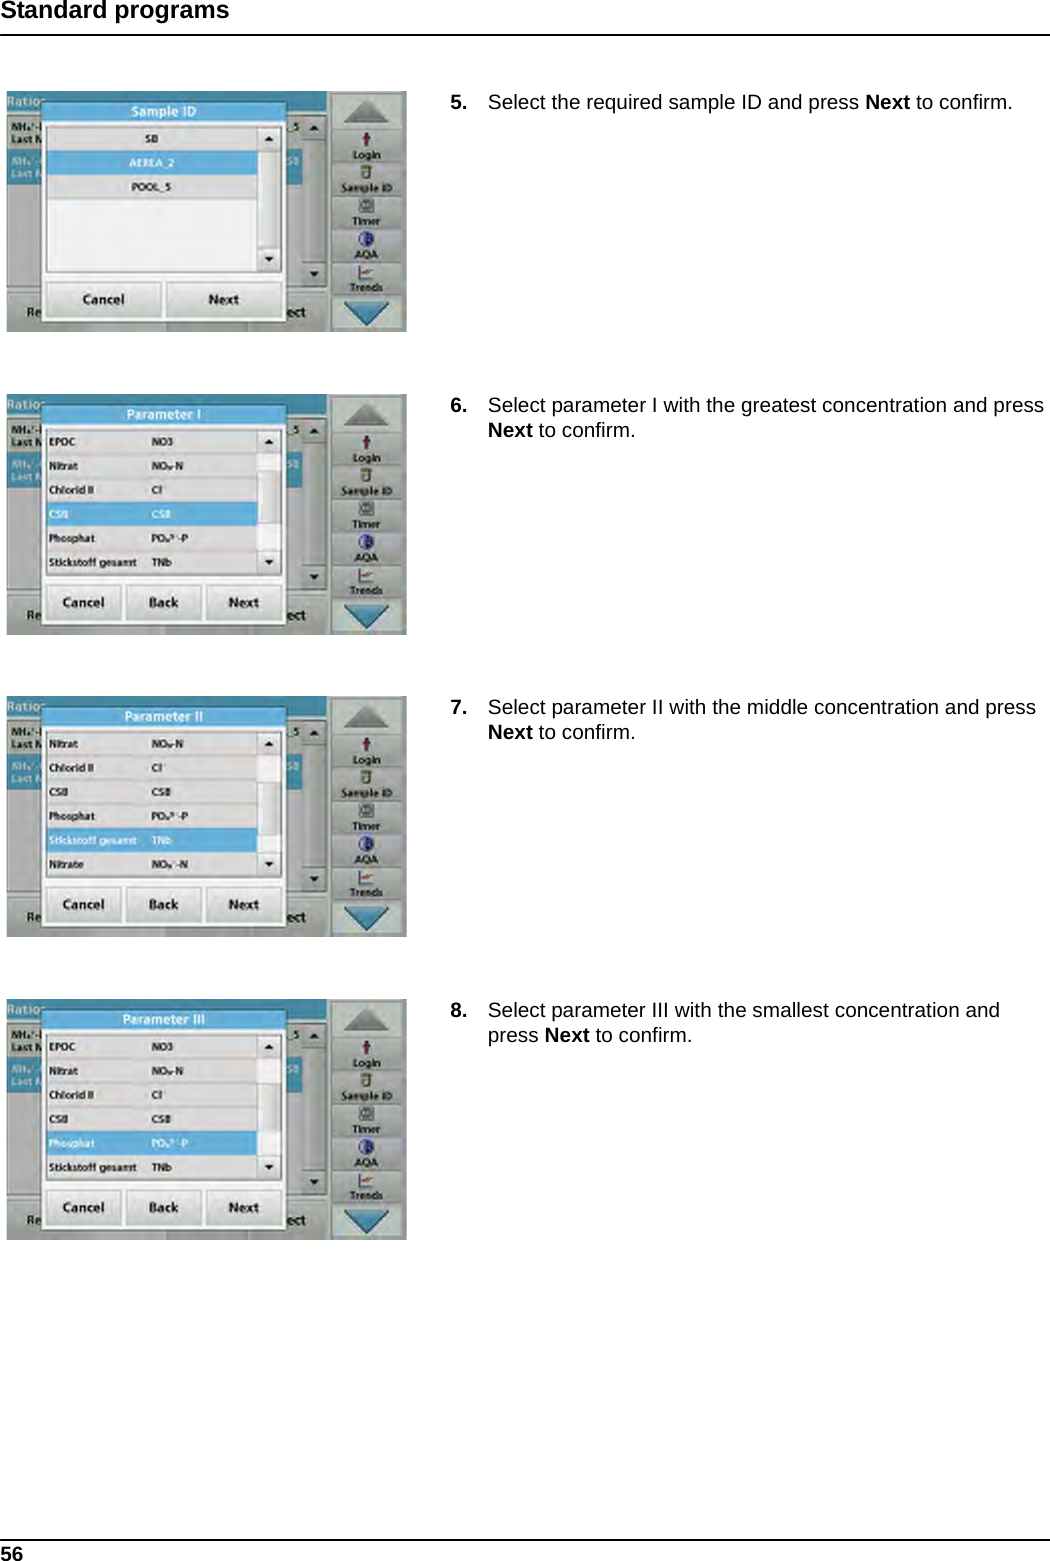
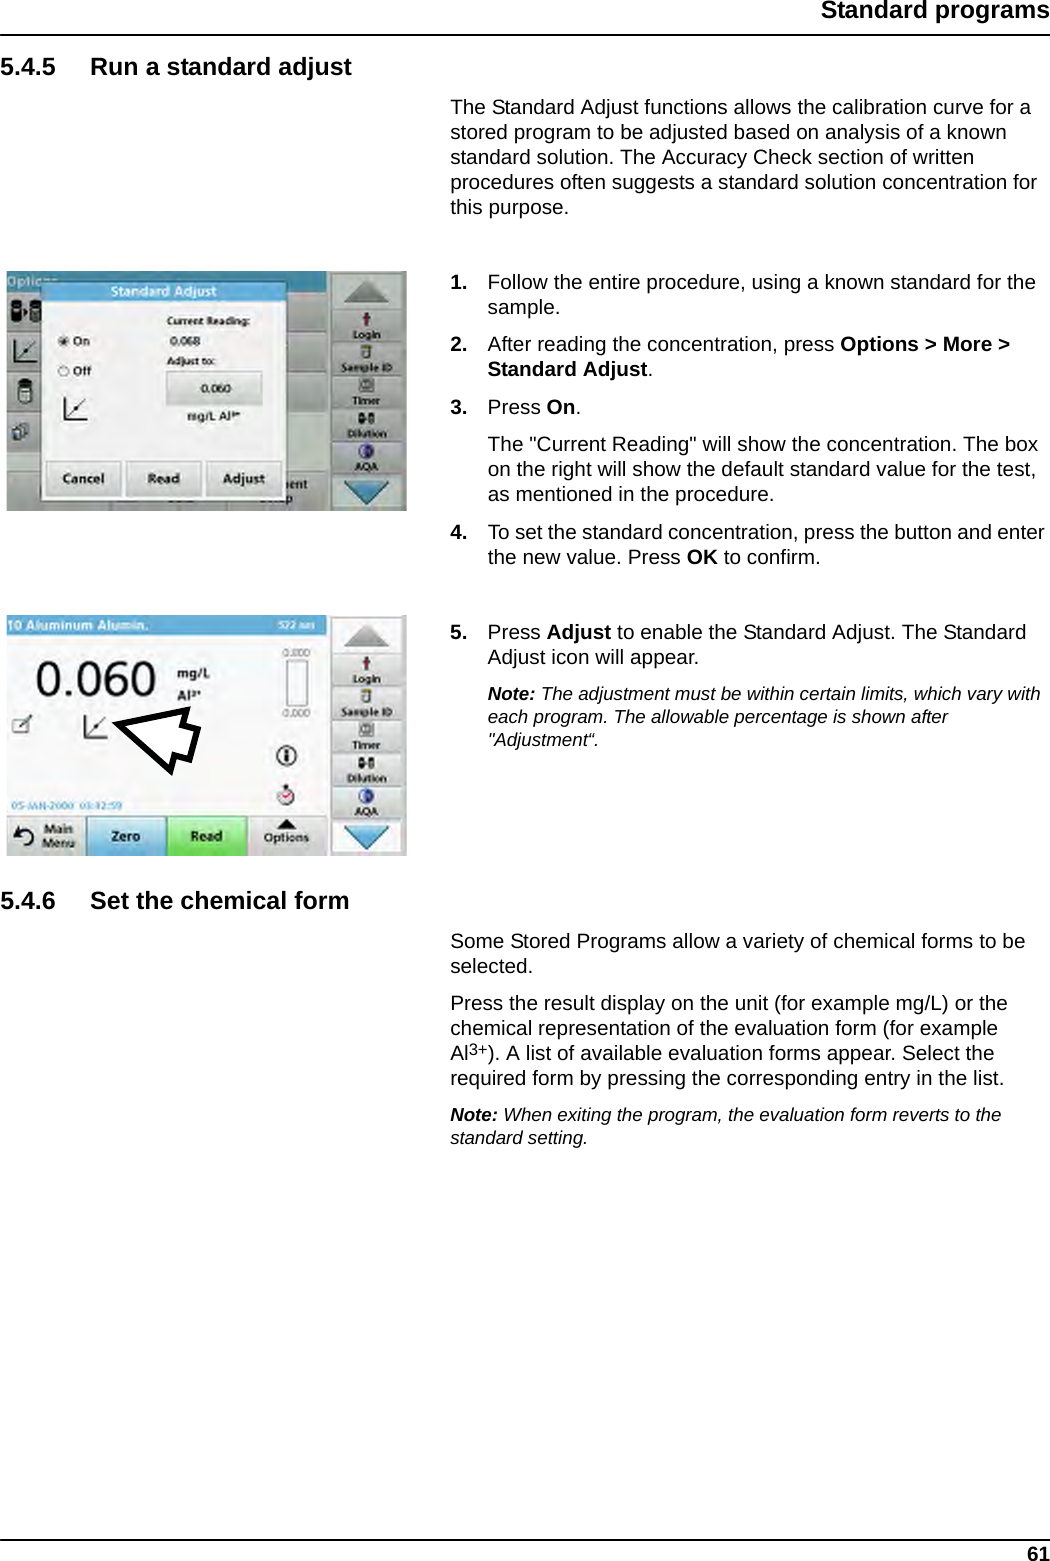
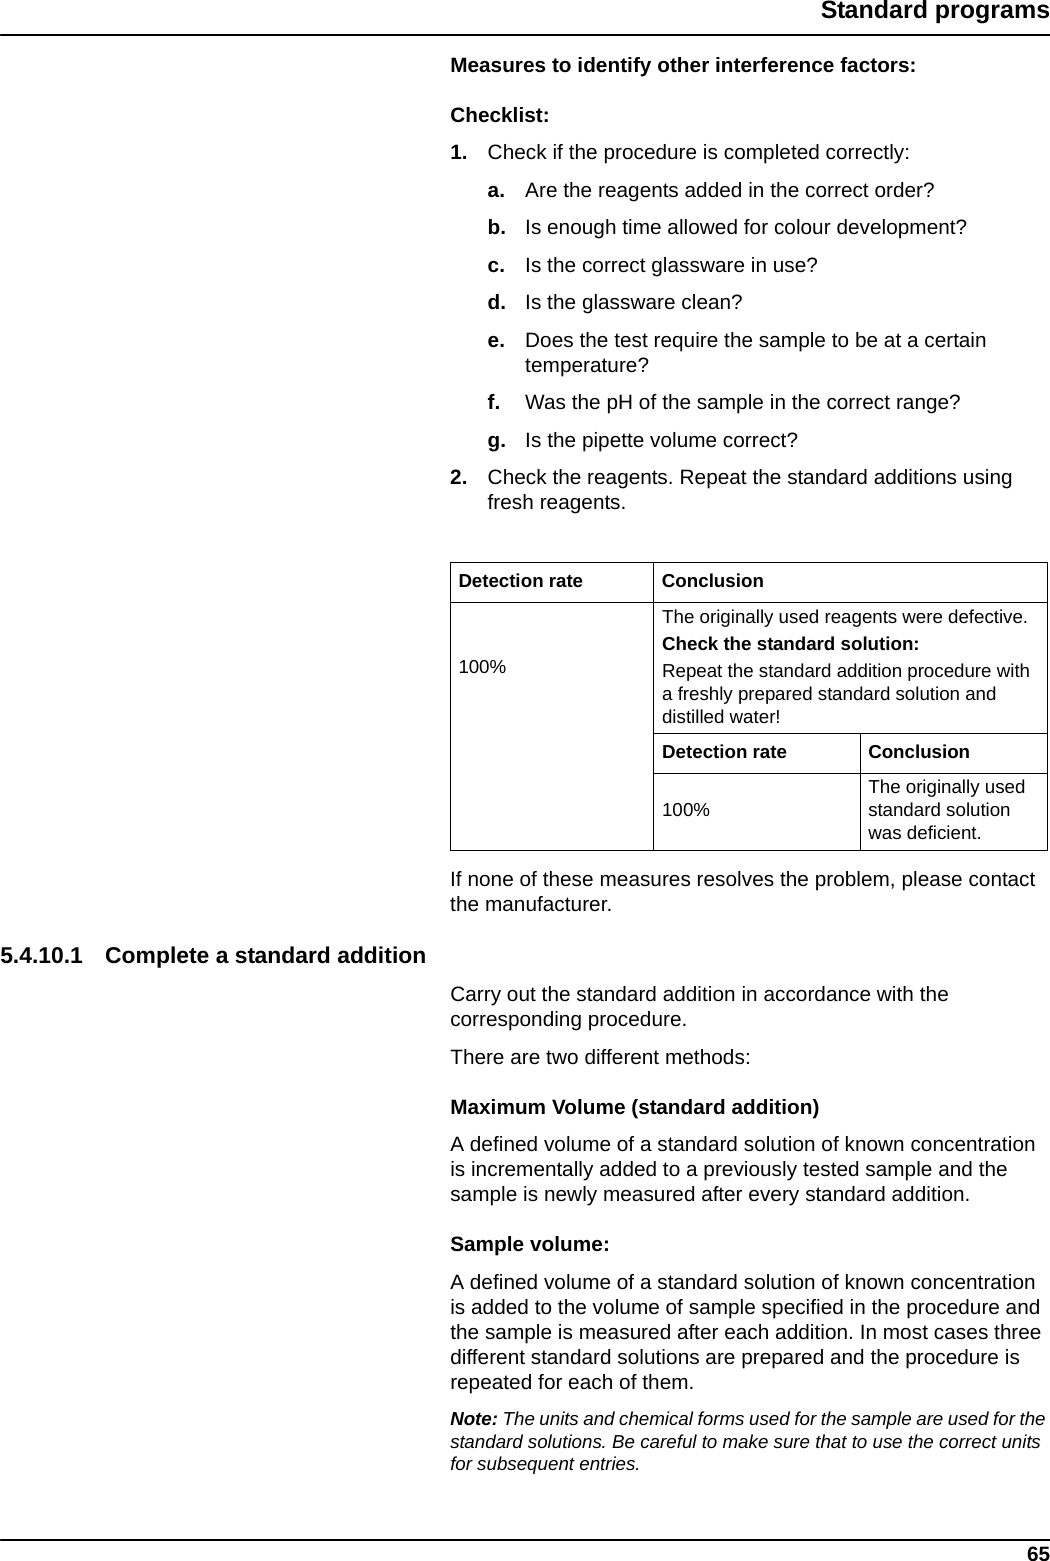
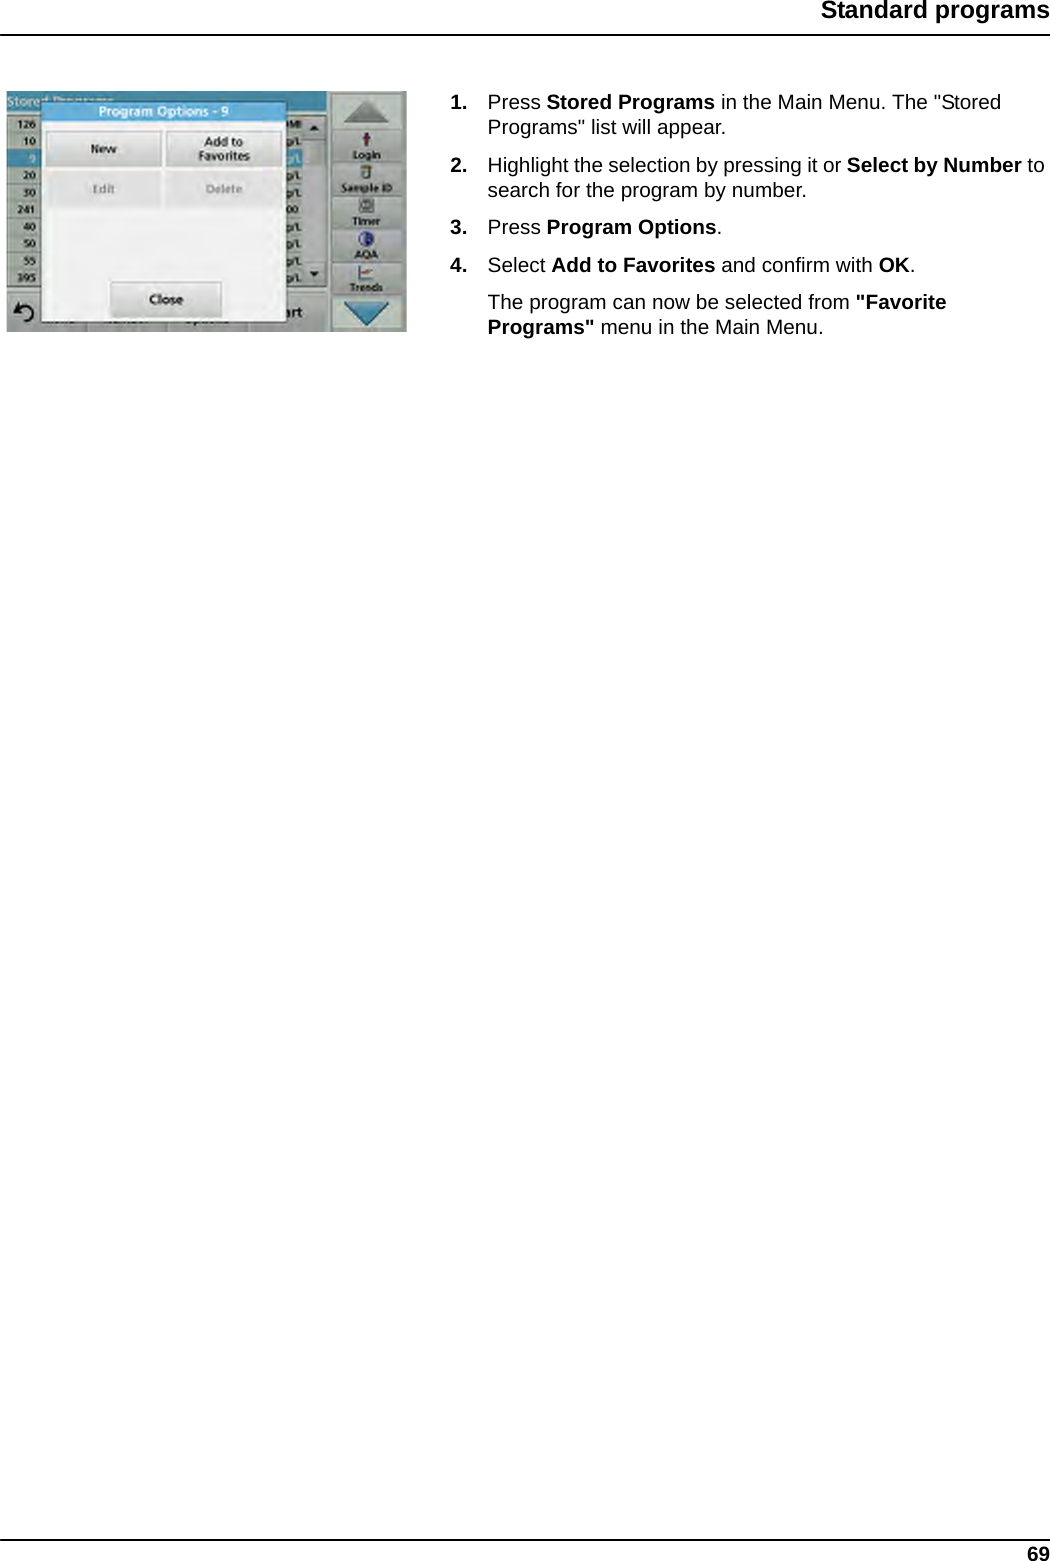
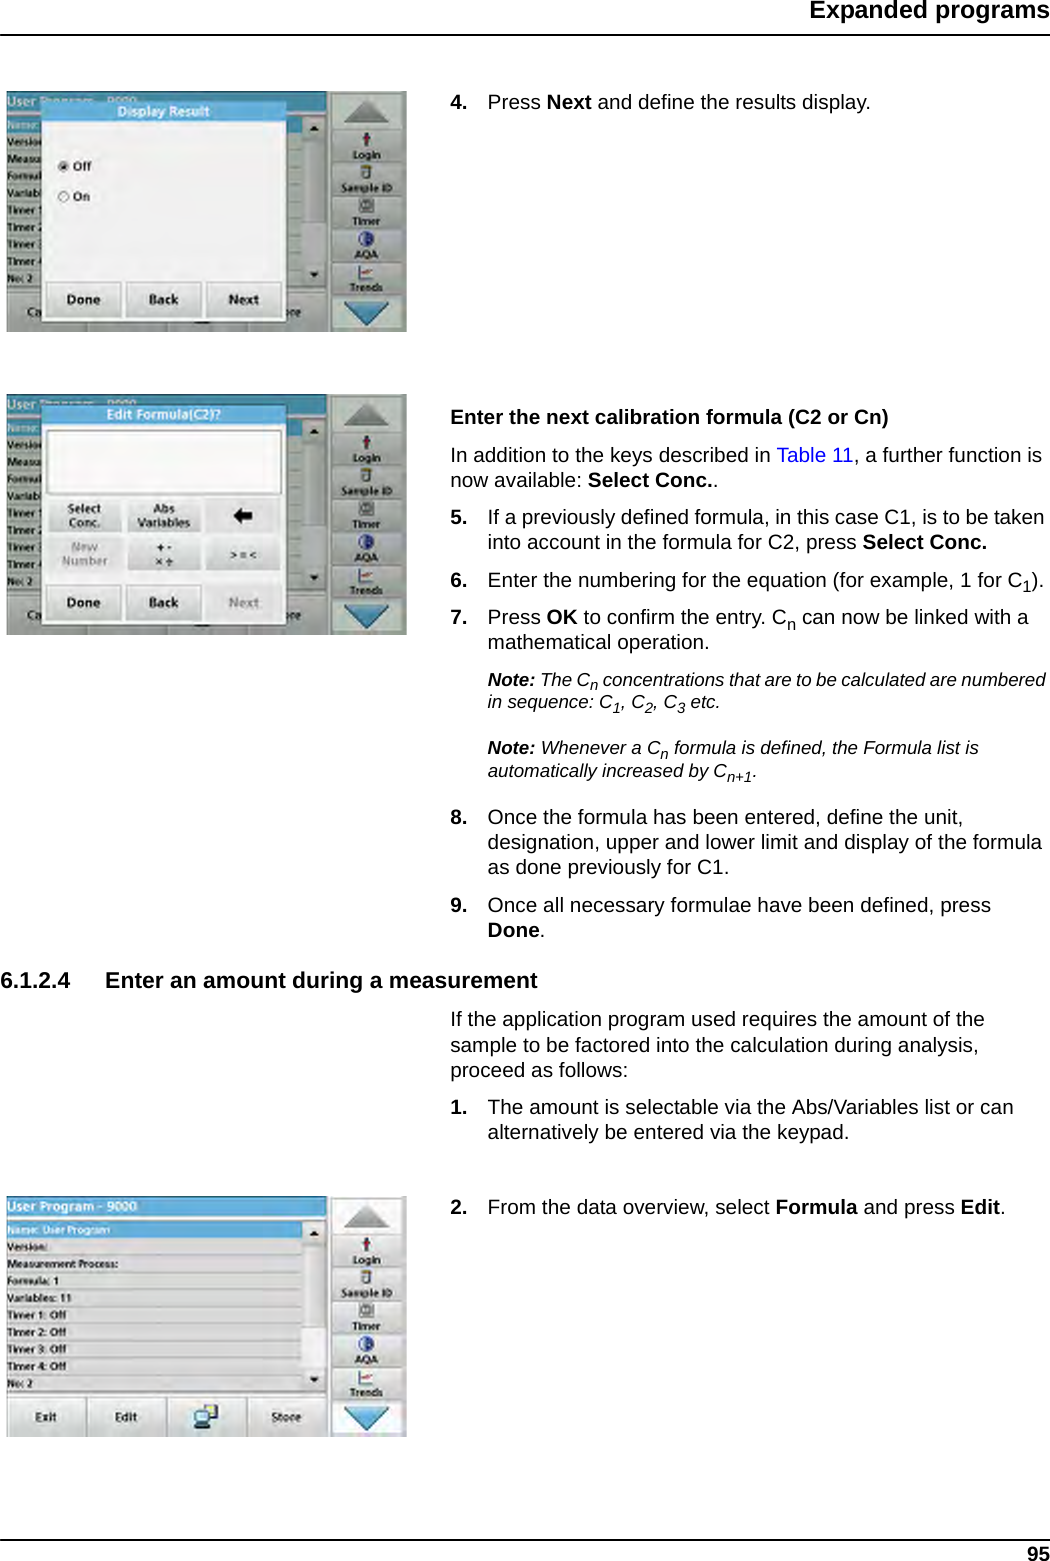
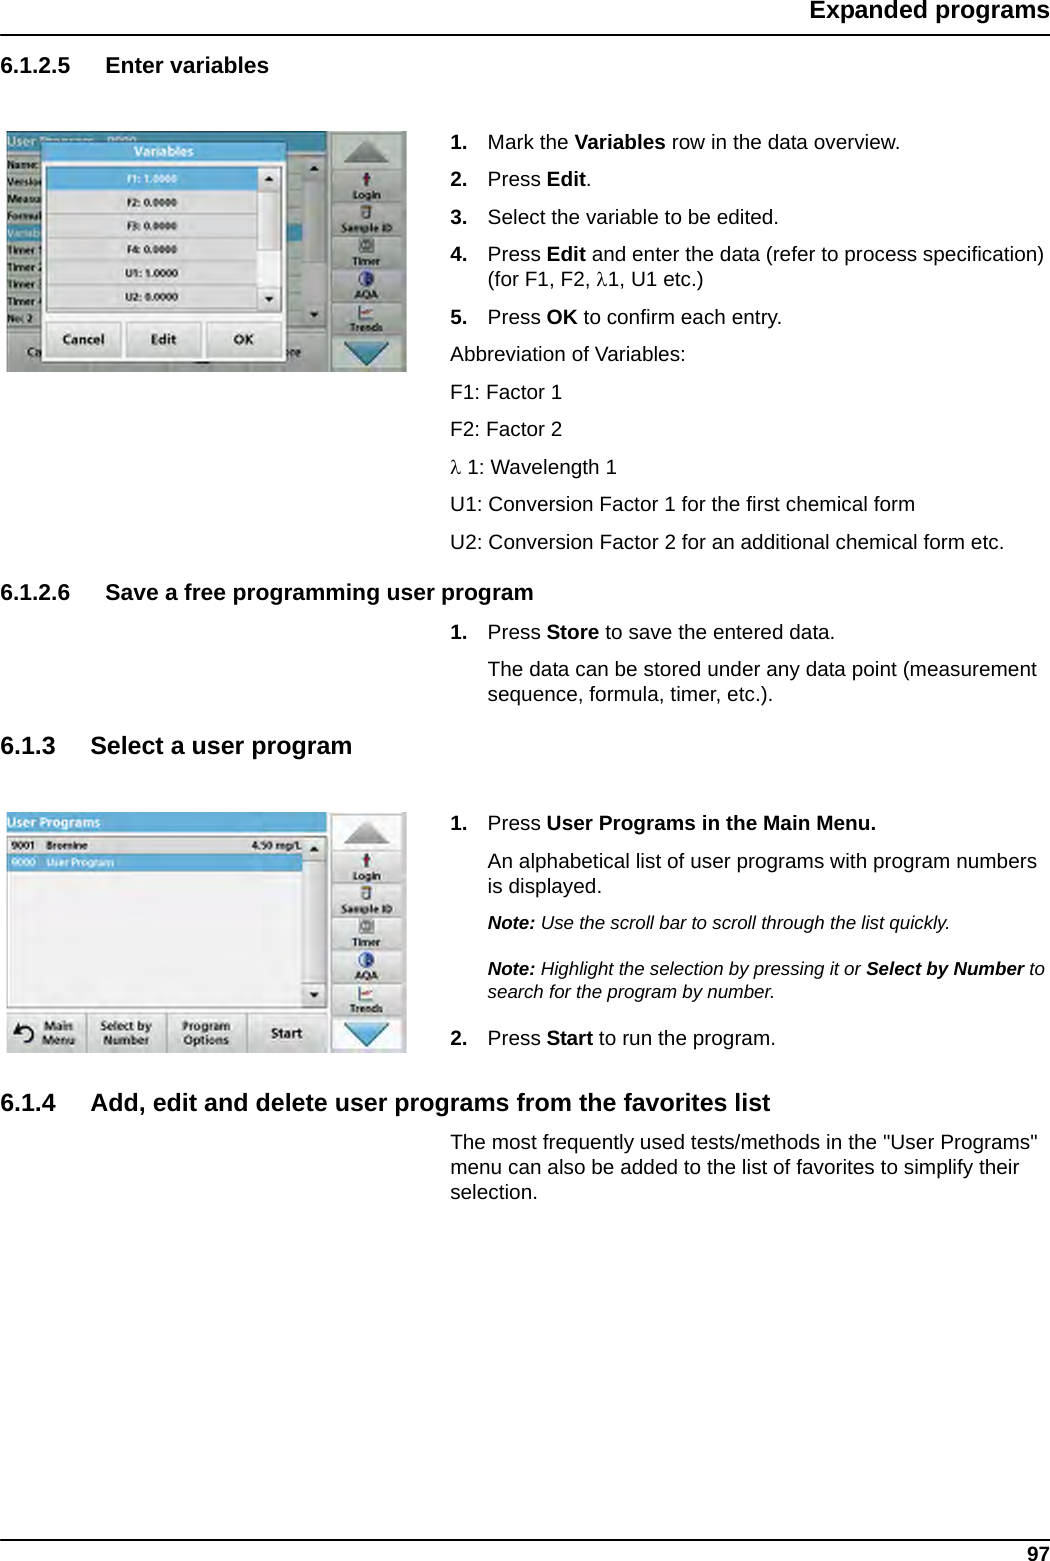
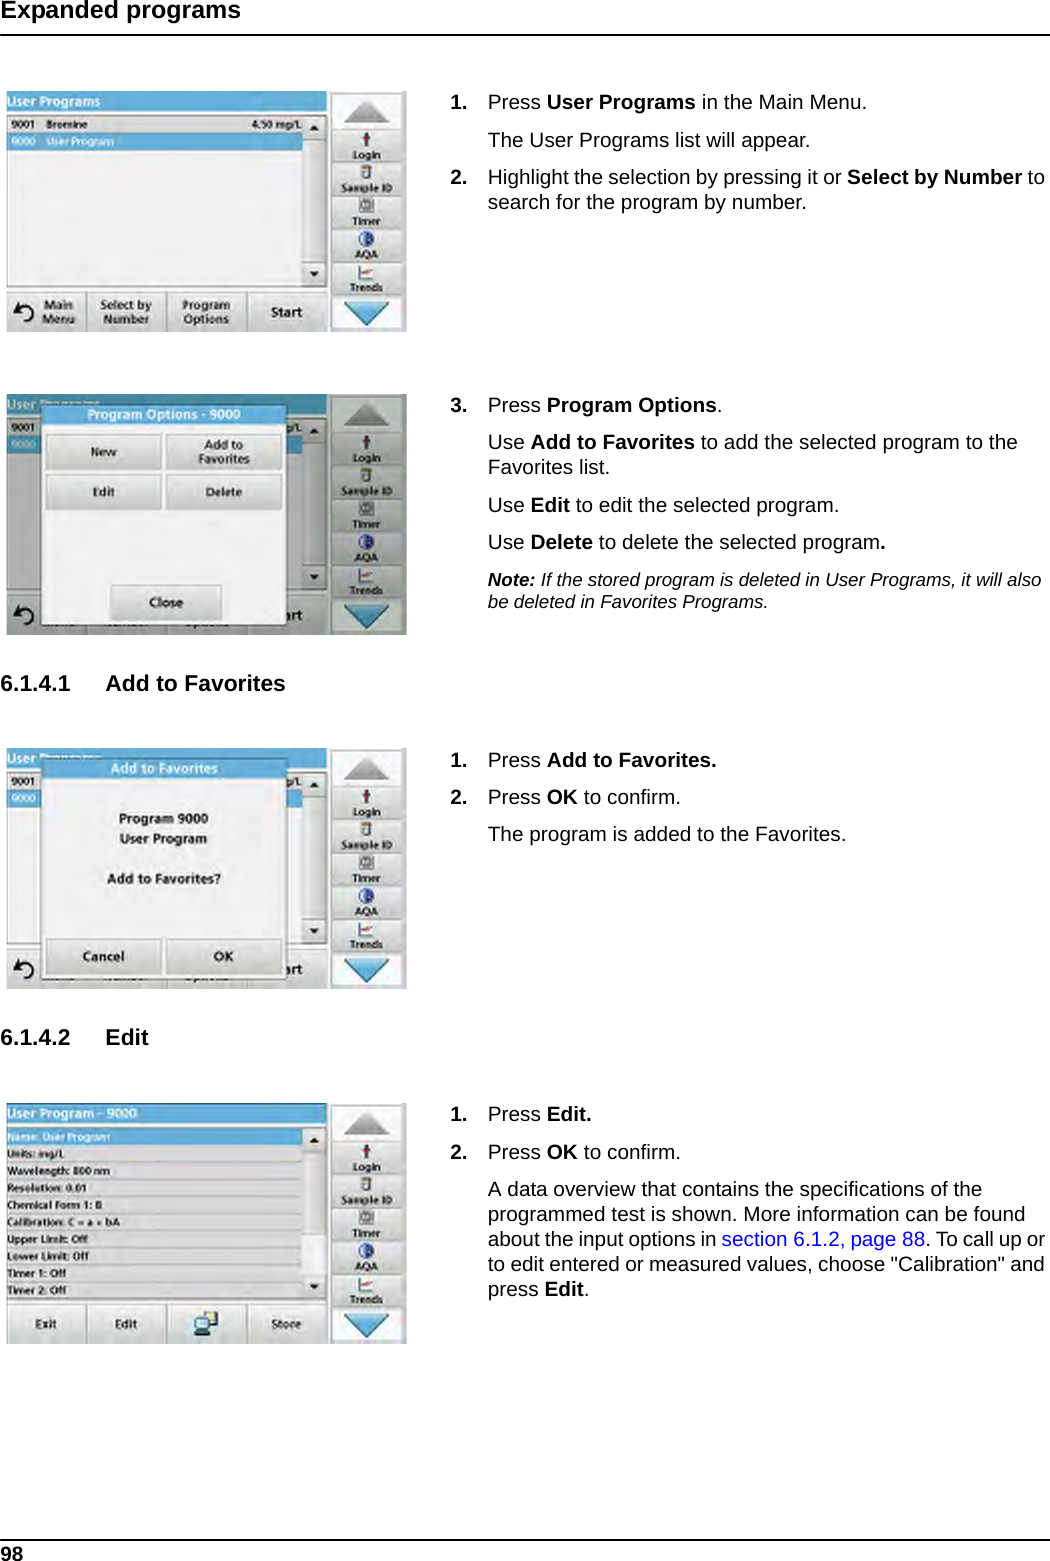
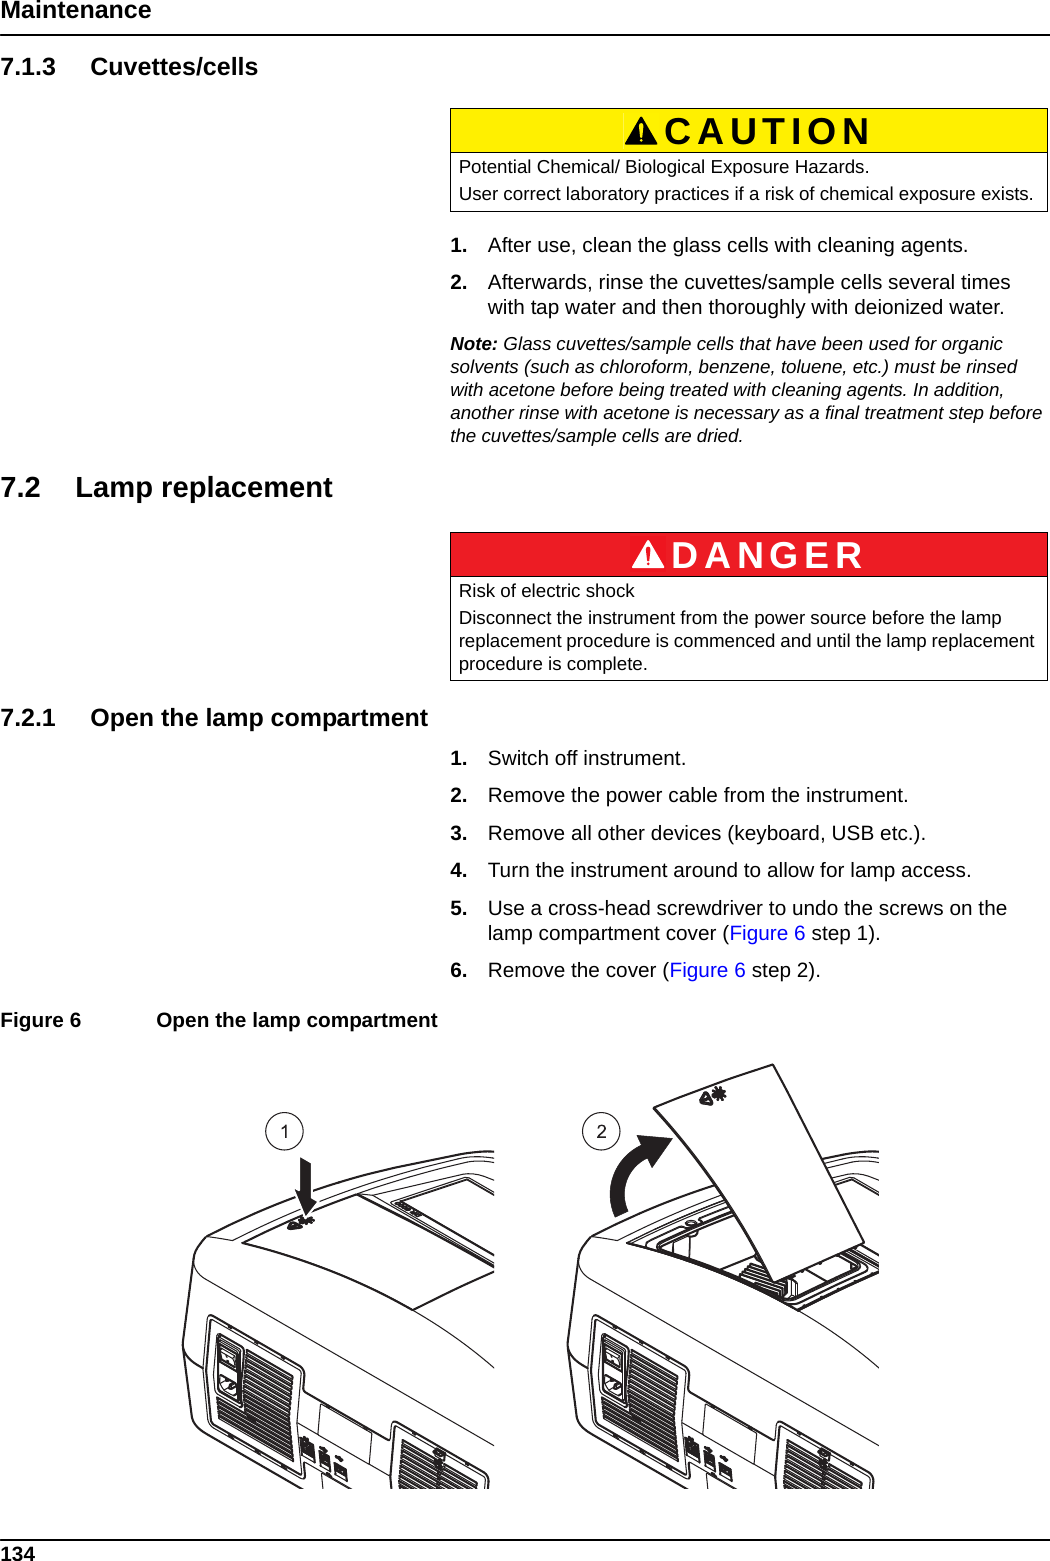
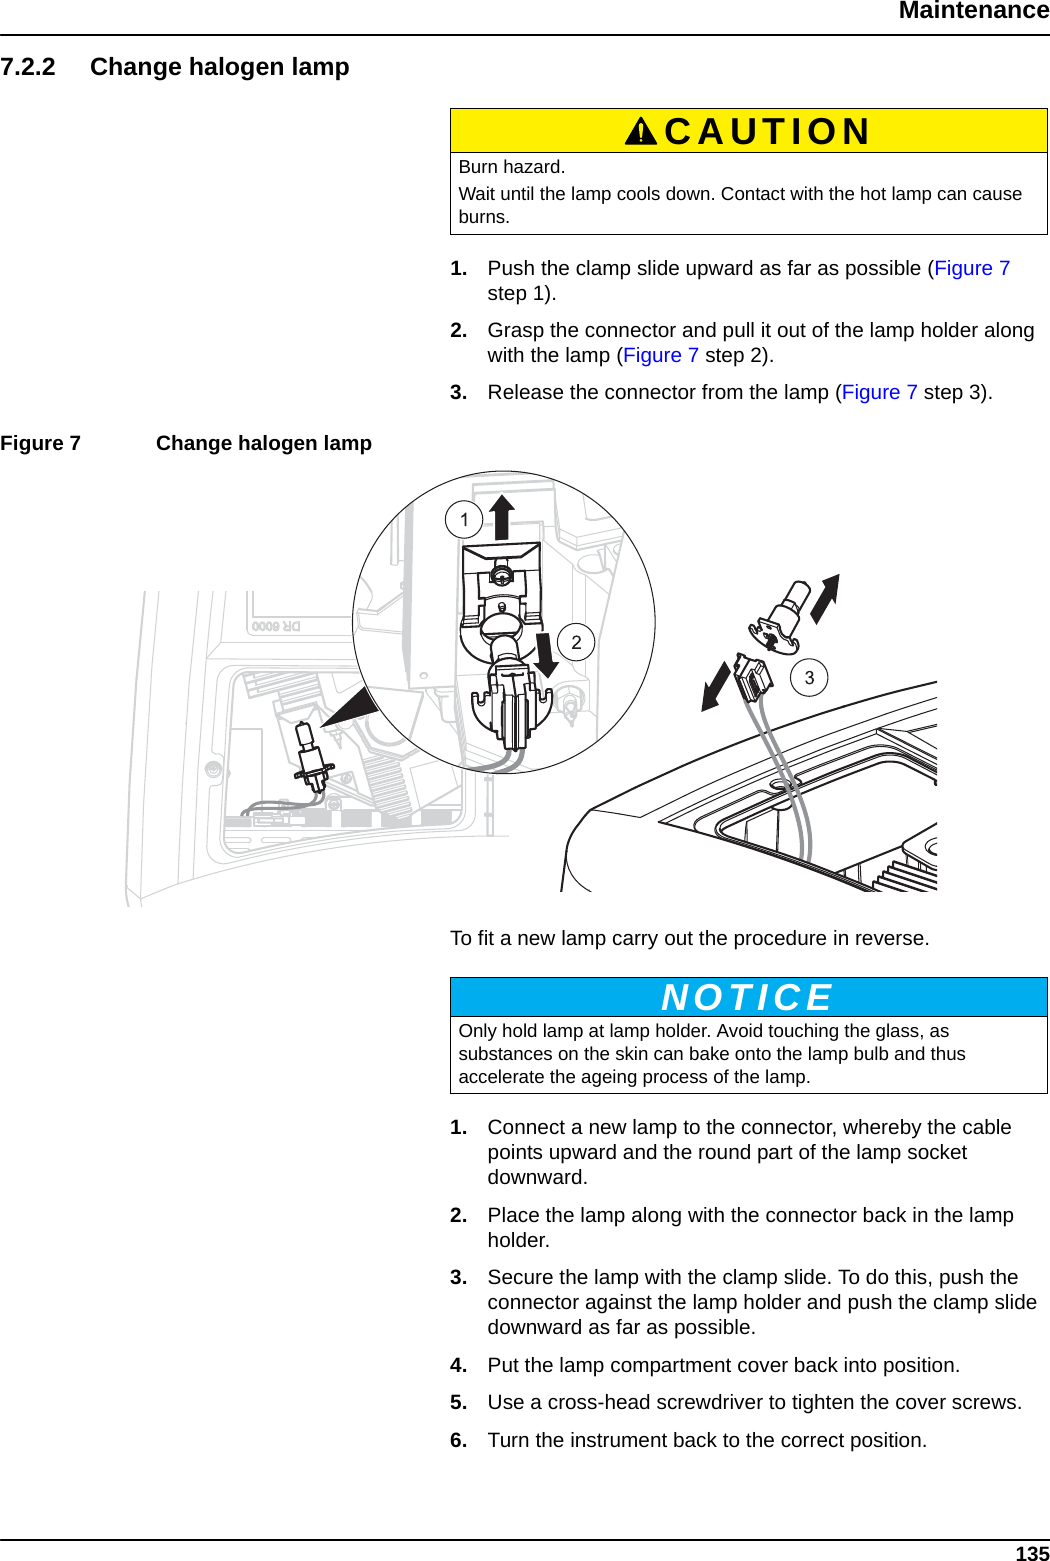
![90Expanded programs6.1.2.1 Measurement process The measurement process defines the handling and the readings of the test: •At which and how many wavelengths should readings be completed?•How many absorbance readings must be completed? •When should the zero reading and the sample reading be completed? •Are waiting times necessary between readings? •Should individual program sequences be repeated?The elements of a measuring sequence, such as zero and sample readings and the timers (reaction times, waiting times etc.) are individually defined.6.1.2.2 Enter a new measurement process Note: Each component of the measurement process must be entered in the order in which it will be completed.[Z] key / Zeroing... 1. Press [Z] to program a zero reading. 2. Press Zeroing and enter the wavelength for which the zero reading is to be performed.3. If zero readings are to be carried out at a number of wavelengths, repeat the steps starting with 1 for each wavelength. Note: The entered reading sequence is displayed.Table 10 Definitions of the program pointsProgram point DescriptionName Name of the analysis parameter Version An abbreviation or version number assigned by the user is entered here.Measurement process Exact definition of the test: the number of wavelengths at which readings are carried out, the number of absorbance readings needed, the keys to be used, any waiting periods between readings, etc.Formula Definition of the formulas with which the test result is calculated.Variables The number of variables shown in the display depends on the definition of the measurement process and the formulas. Input of the numerical values of the wavelengths, factors, constants, etc.Timer 1, Timer 2, Timer 3, Timer 4This function can be used to enter abbreviations and defined times for up to four timers. Highlight the corresponding line and press Edit. The timers are activated or deactivated with the control boxes on the left of the display. In the next column, a selection can be made from a list of names that describe the corresponding work step. In the third column, the times for each active timer are entered.](https://usermanual.wiki/metraTec/QR15HL.user-manual-DR6000/User-Guide-1697771-Page-90.png)
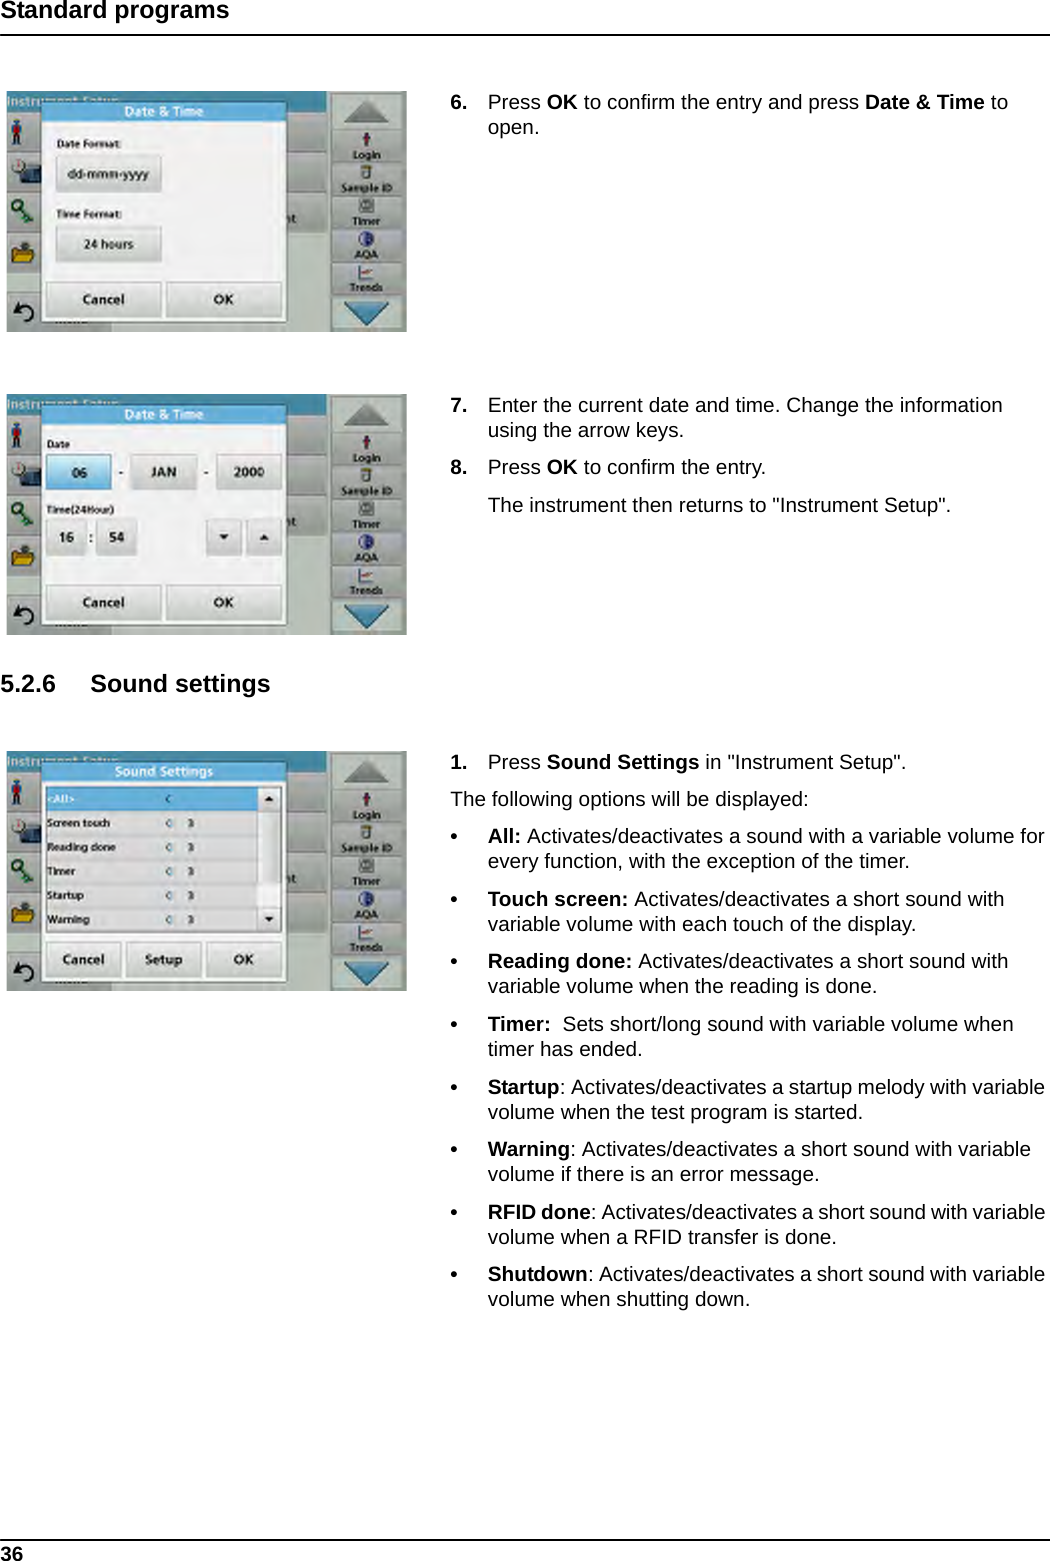
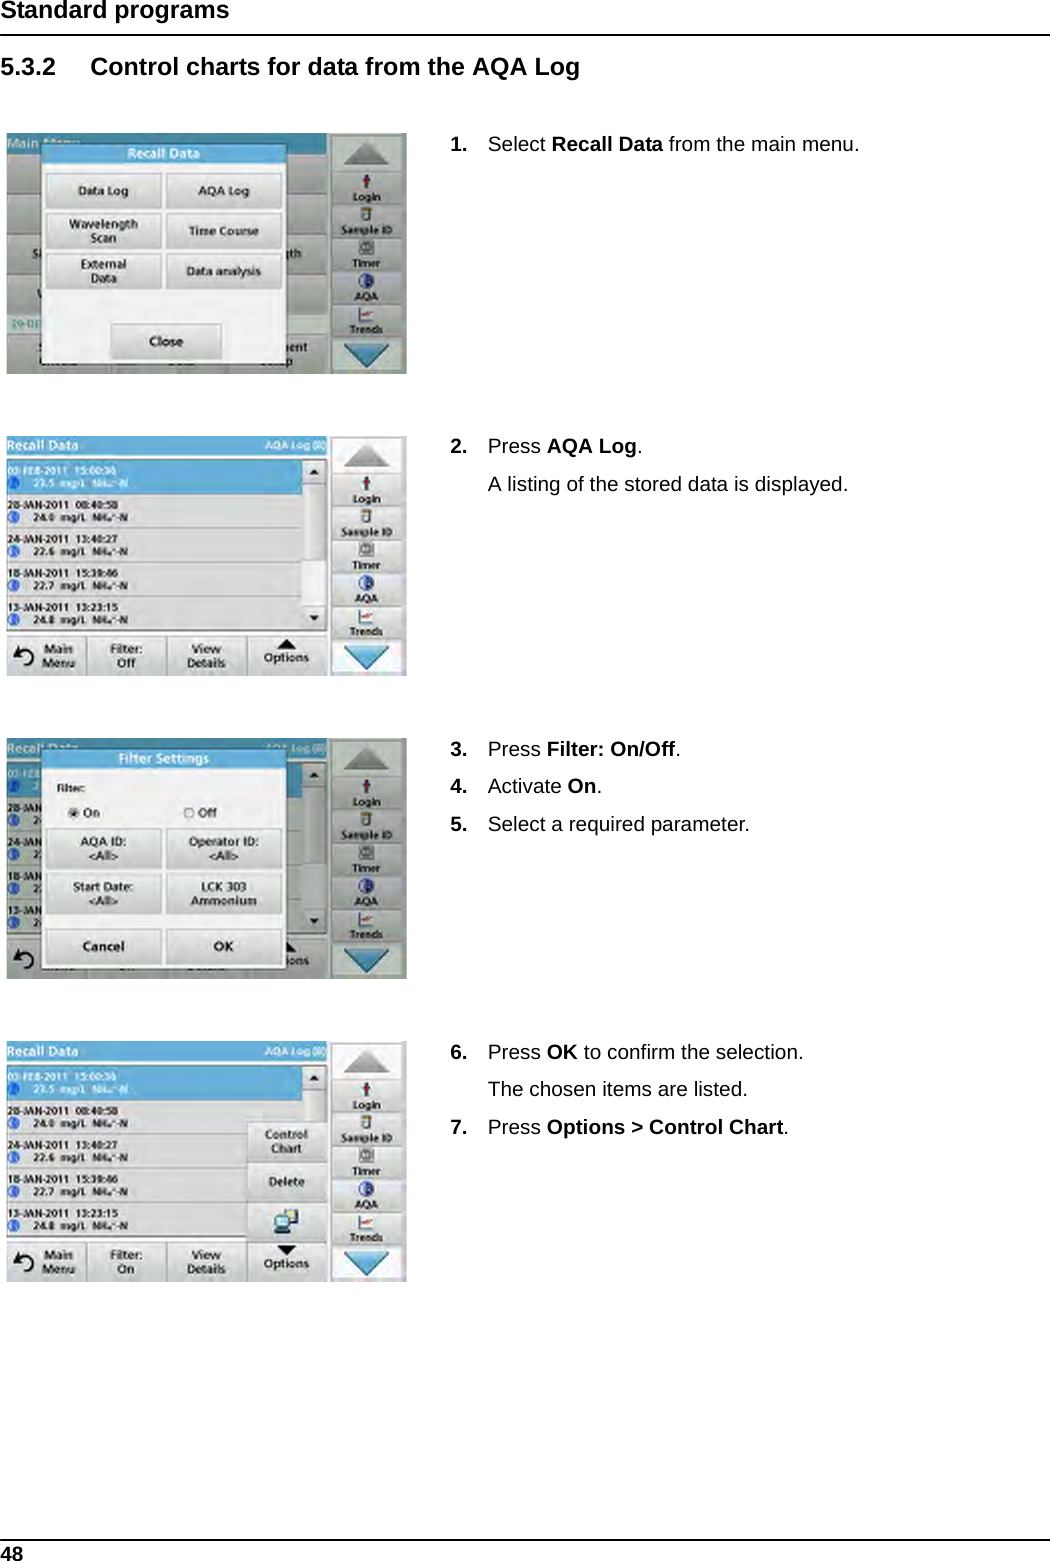
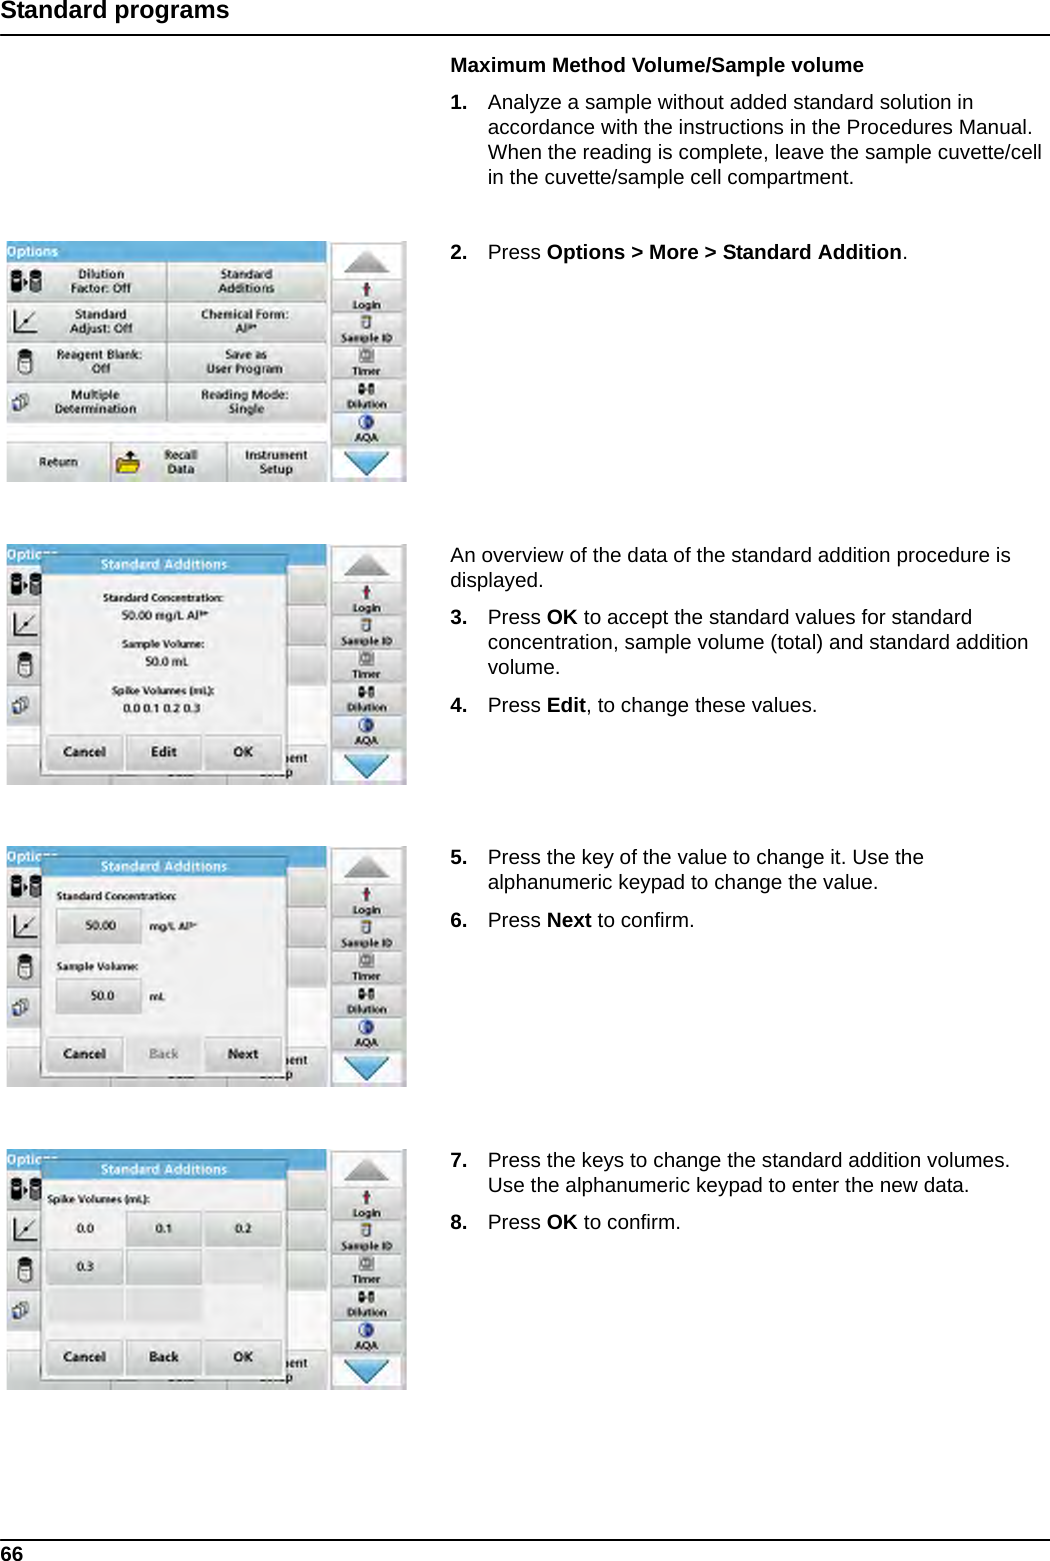
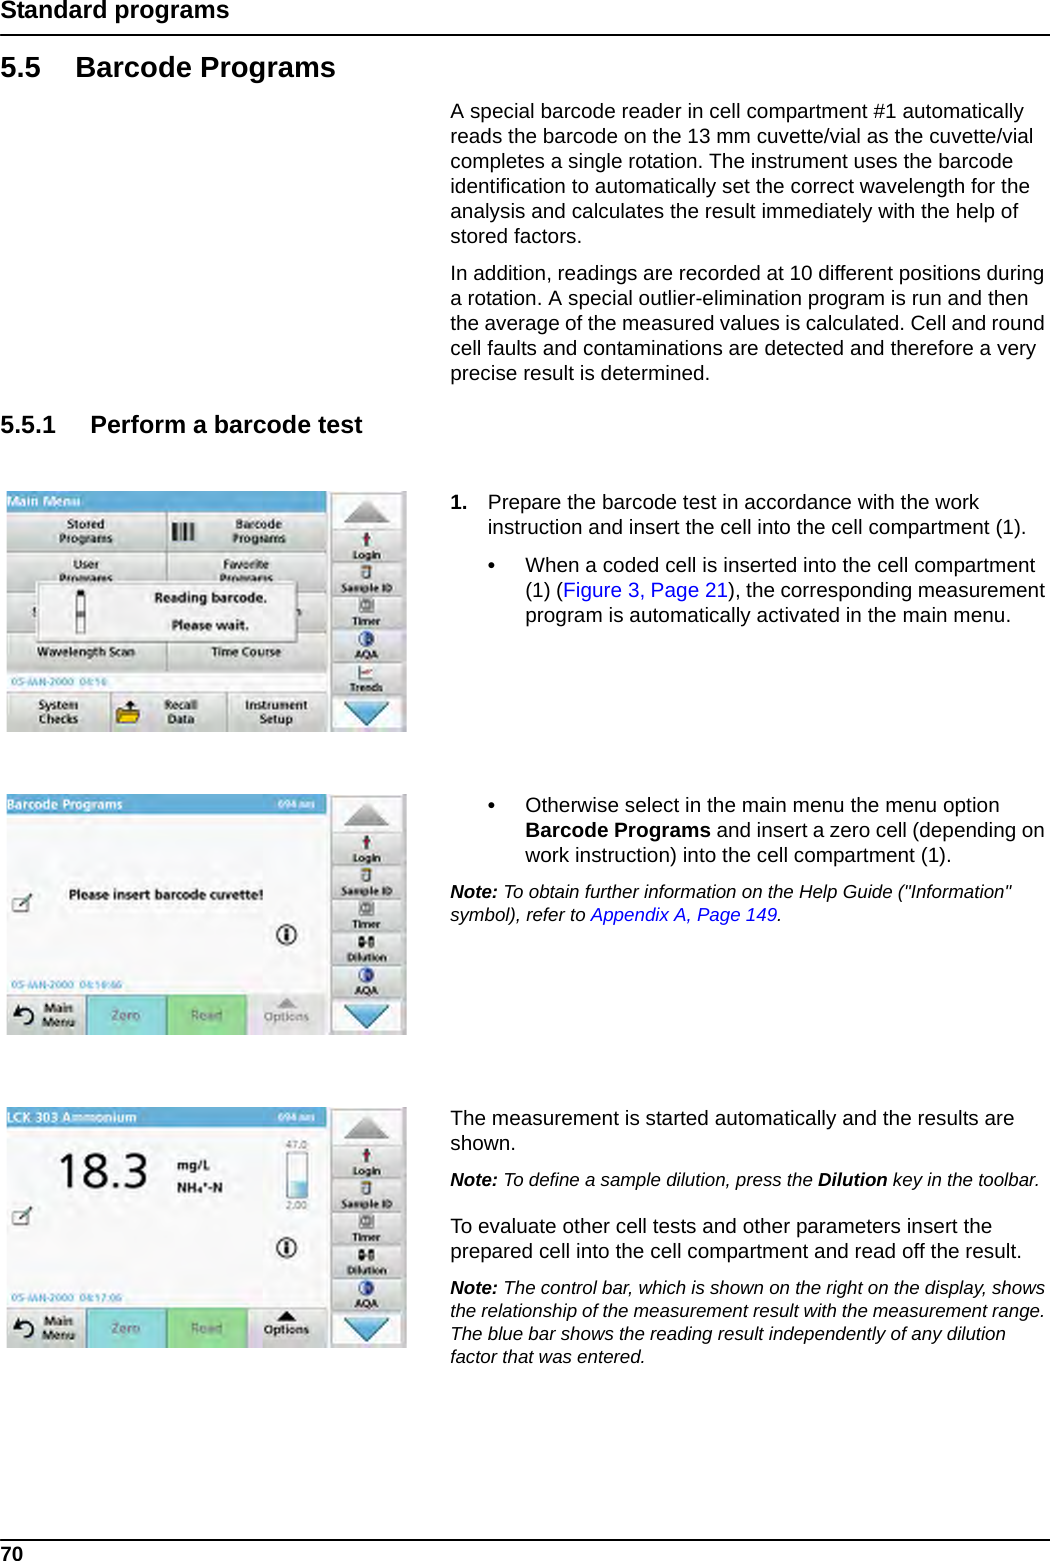
![91Expanded programsProcess Timer key 1. Tap on the Process Timer key to enter wait-, reaction- or handling times. 2. Tap on OK and confirm the entry.Note: This time is integrated into the measurement process.Note: The entered reading sequence is displayed.[R] key / Reading... 1. Press [R] to program a reading of the substance that is to be analyzed. 2. Press Reading... and enter the wavelength to be used for the measurement. 3. If readings are to be completed at a number of wavelengths, repeat the steps starting with 1 for each wavelength. Note: The entered reading sequence is displayed.Key { } Elements of the reading sequence that are to be repeated are placed in brackets. The left bracket "{"marks the start of the sequence that is to be repeated and the right bracket "}" marks the end. Note: The button with the right parenthesis remains inactive until a left bracket is entered. 1. To start the repetition sequence tap on {. 2. Tap on the key that defines the sequence to be repeated: [Z] or [R]. 3. Tap on the key Zeroing... or Reading... and enter the wavelength to be used for the measurement. Define additional steps that are to be included in the repetition sequence. 4. Press }.5. Once the measurement process has been defined, click Next. Alternate entry of measurement process via function listA pre-programmed selection can be accessed and edited via List.](https://usermanual.wiki/metraTec/QR15HL.user-manual-DR6000/User-Guide-1697771-Page-91.png)
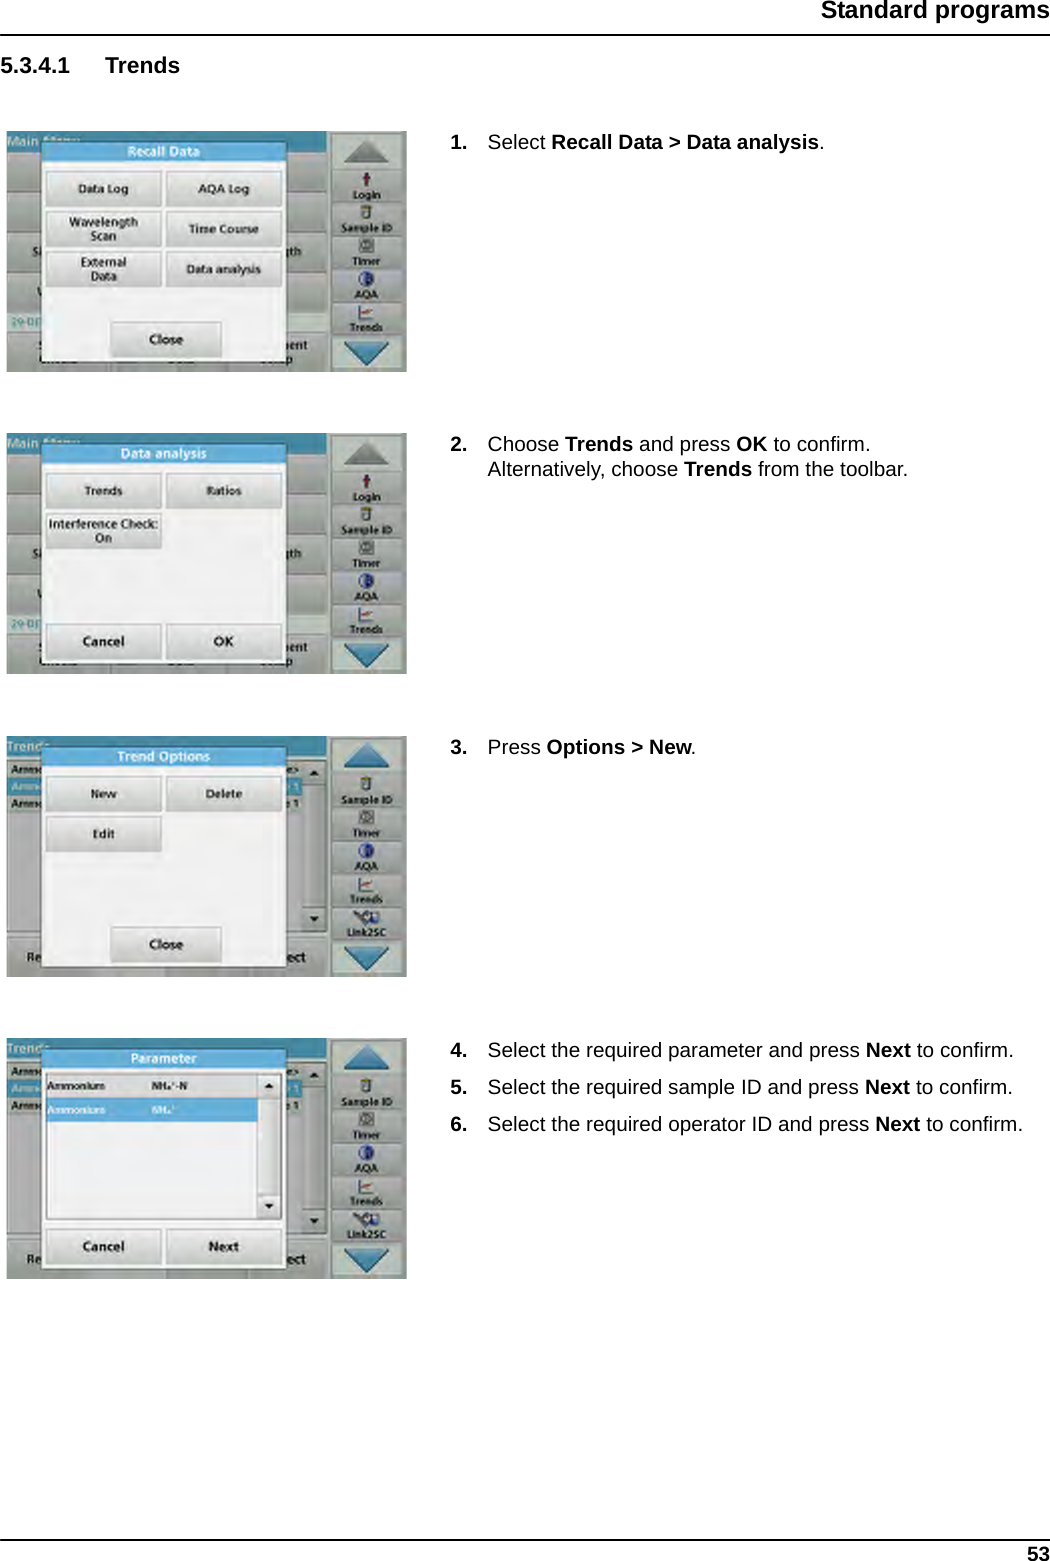
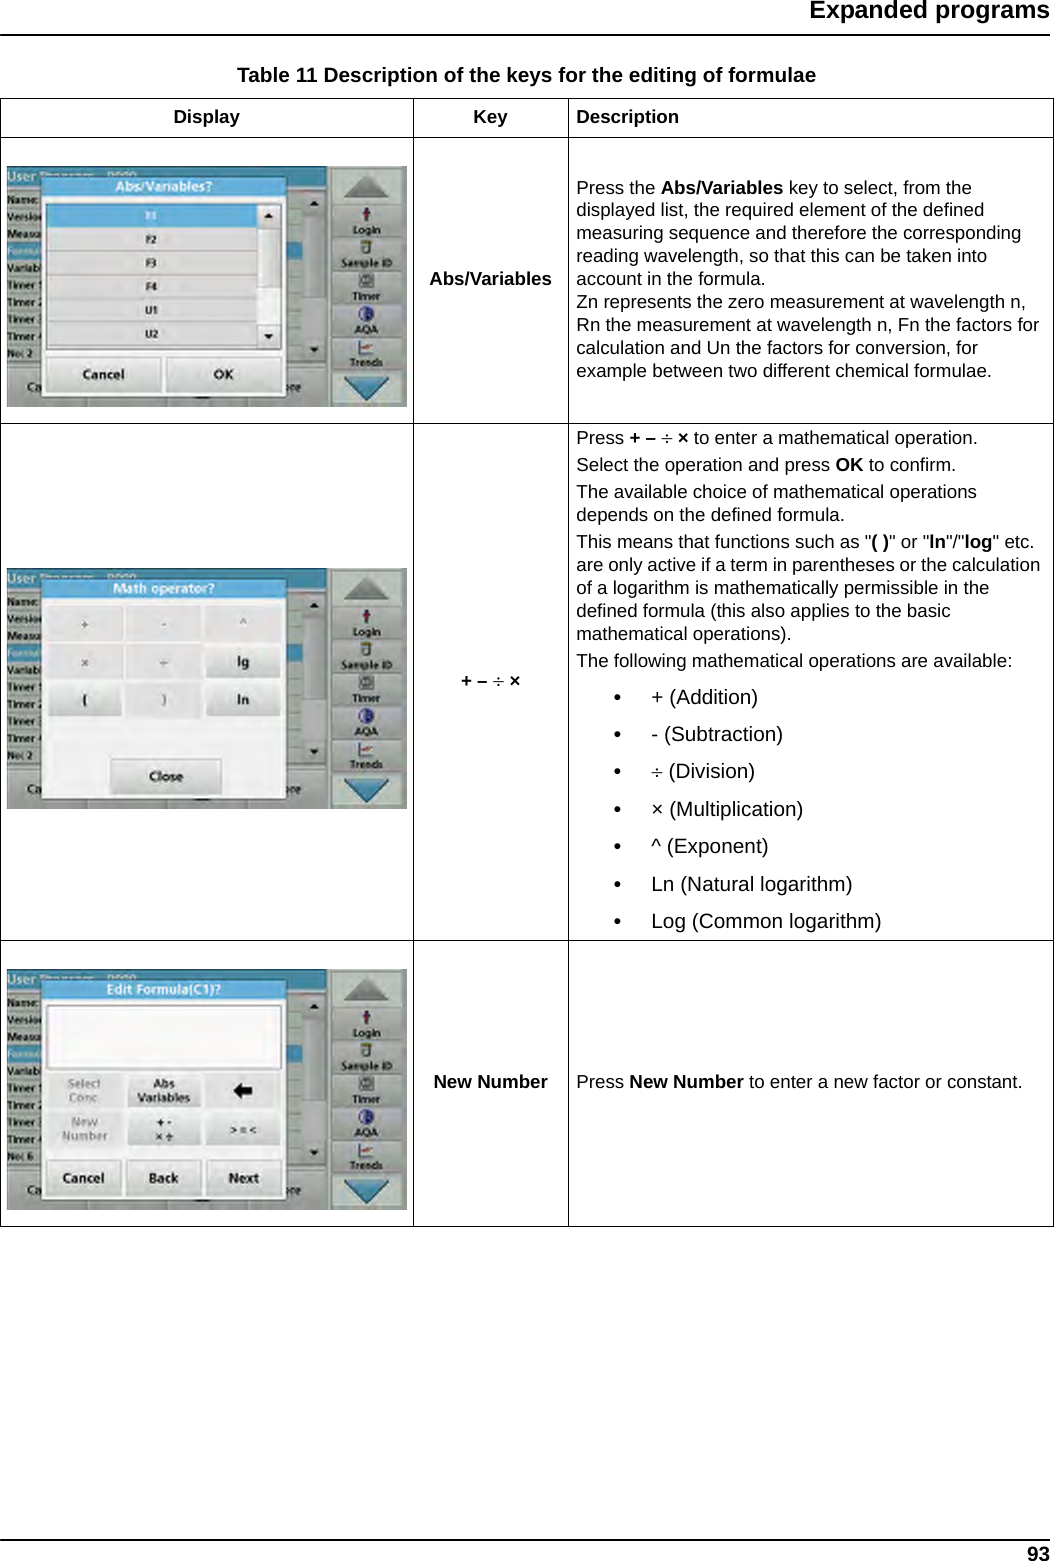
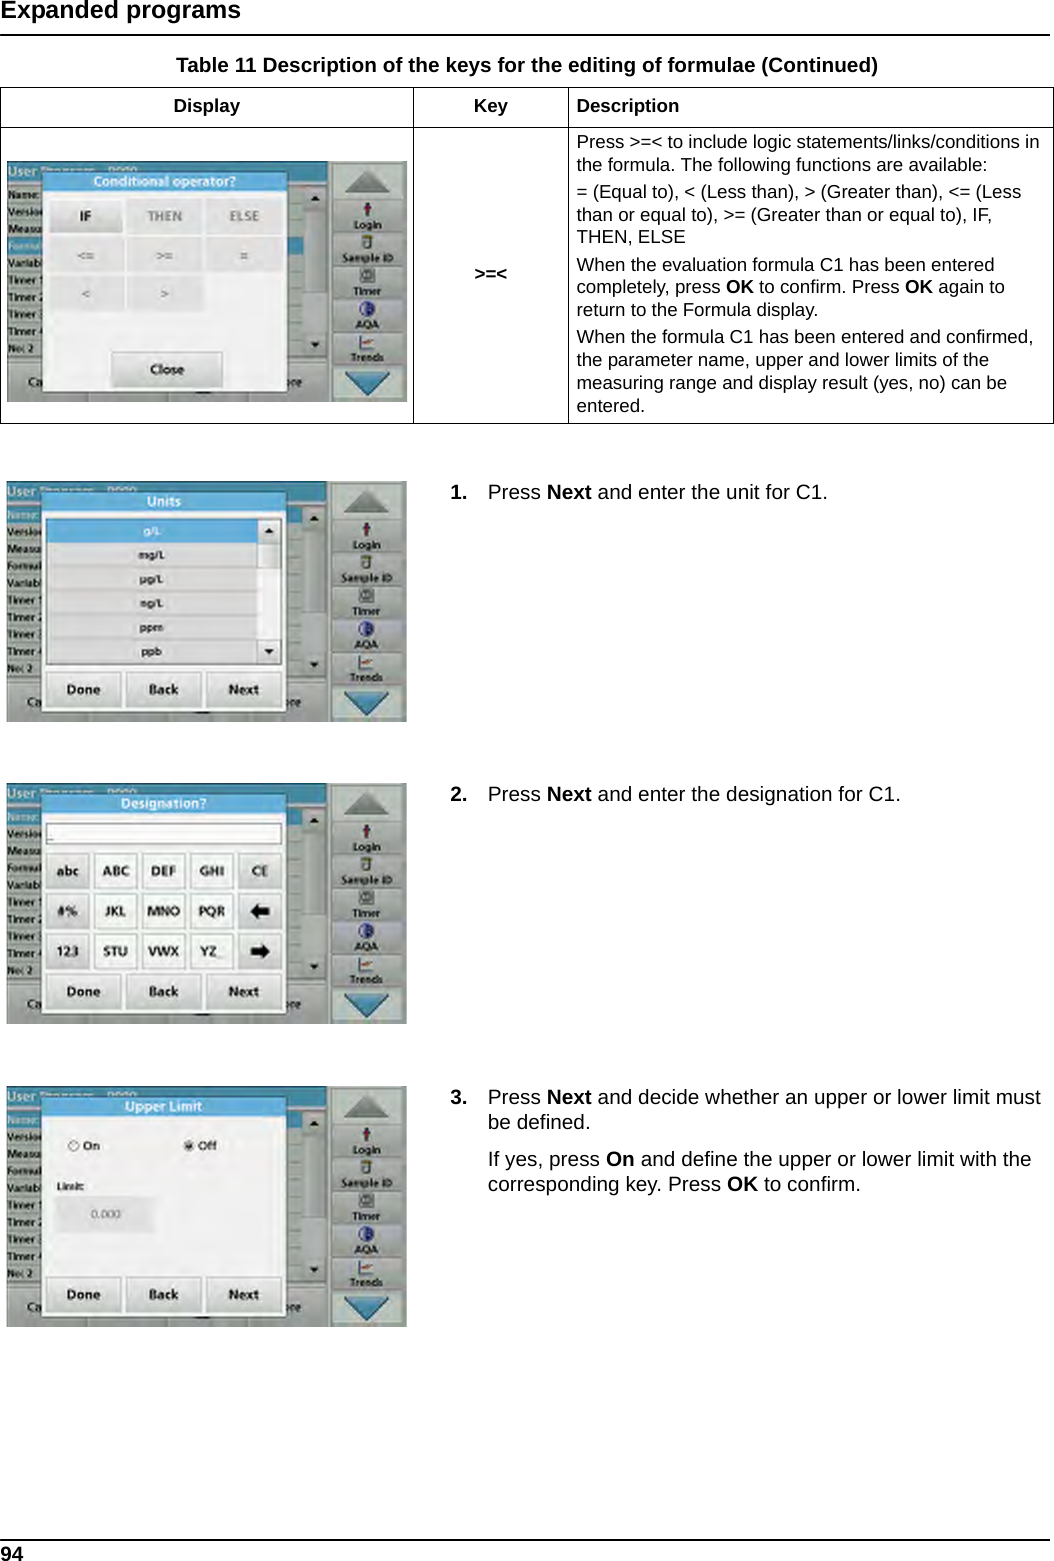
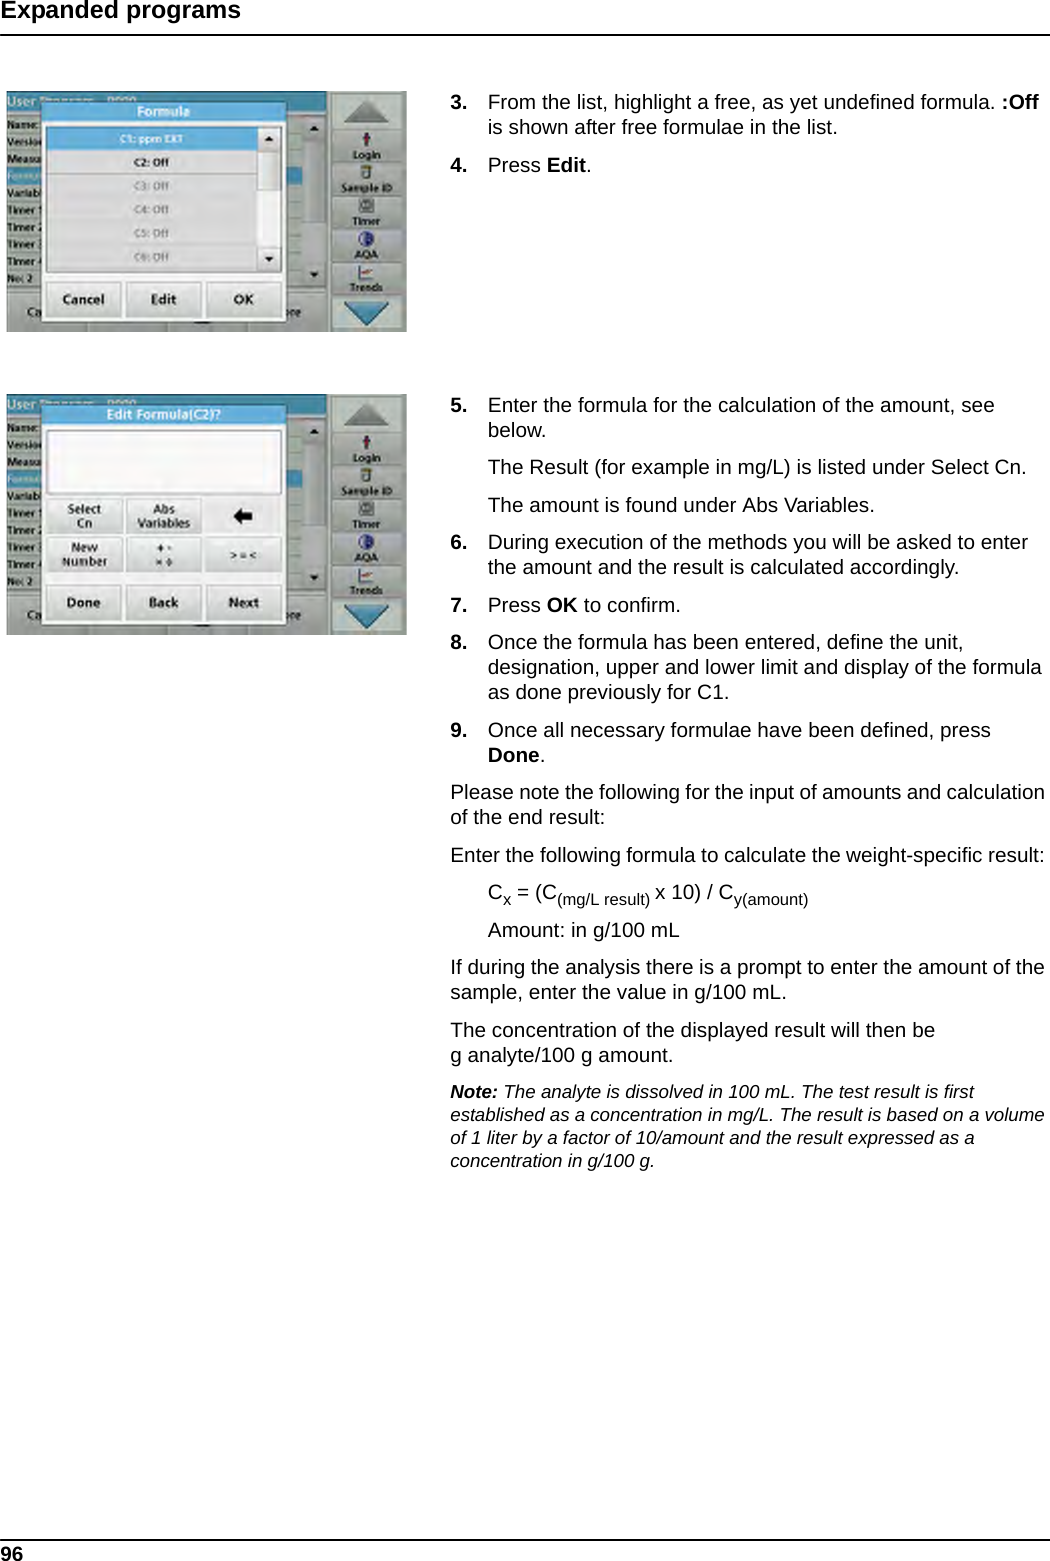
![92Expanded programs1. Click on List.2. Select the required measurement process.•[Z]Z11{ [R]R11}: Zero measurement, repeated single-wavelength measurement.•[Z]Z11 [R]R11: Zero measurement with subsequent measurement on one wavelength.•[Z]Z11 [R]Z21 {[R] R11}: Two zero measurements, repeated measurement on one wavelength. For example, zero measurement against air, zero measurement against sample blank value, measurement of sample.•[Z]Z11 [R]R11 [R] R21: Zero measurement, two measurements on one wavelength. For example, zero measurement, measurement of sample with reagent 1, measurement of sample with reagent 2.•[Z]Z11 Z22 [R] R11 R12: Two dual-wavelength zero measurements, two dual-wavelength measurements of sample. 3. Press OK.4. Input the wavelength and press OK to confirm. The wavelength is displayed in the measurement process.5. Press Next.6.1.2.3 Enter the calibration formula (evaluation formula) The calibration formula (evaluation formula) defines the calculation and display of intermediate and final results. The previously defined elements of the measuring sequence are the basis for calculating the concentrations.Refer to Table 11 for detailed information on the Edit formula keys. Note: The evaluation formula is built up successively in the display in accordance with the input. Note: The key with the arrow deletes the last entered section of the equation.](https://usermanual.wiki/metraTec/QR15HL.user-manual-DR6000/User-Guide-1697771-Page-92.png)

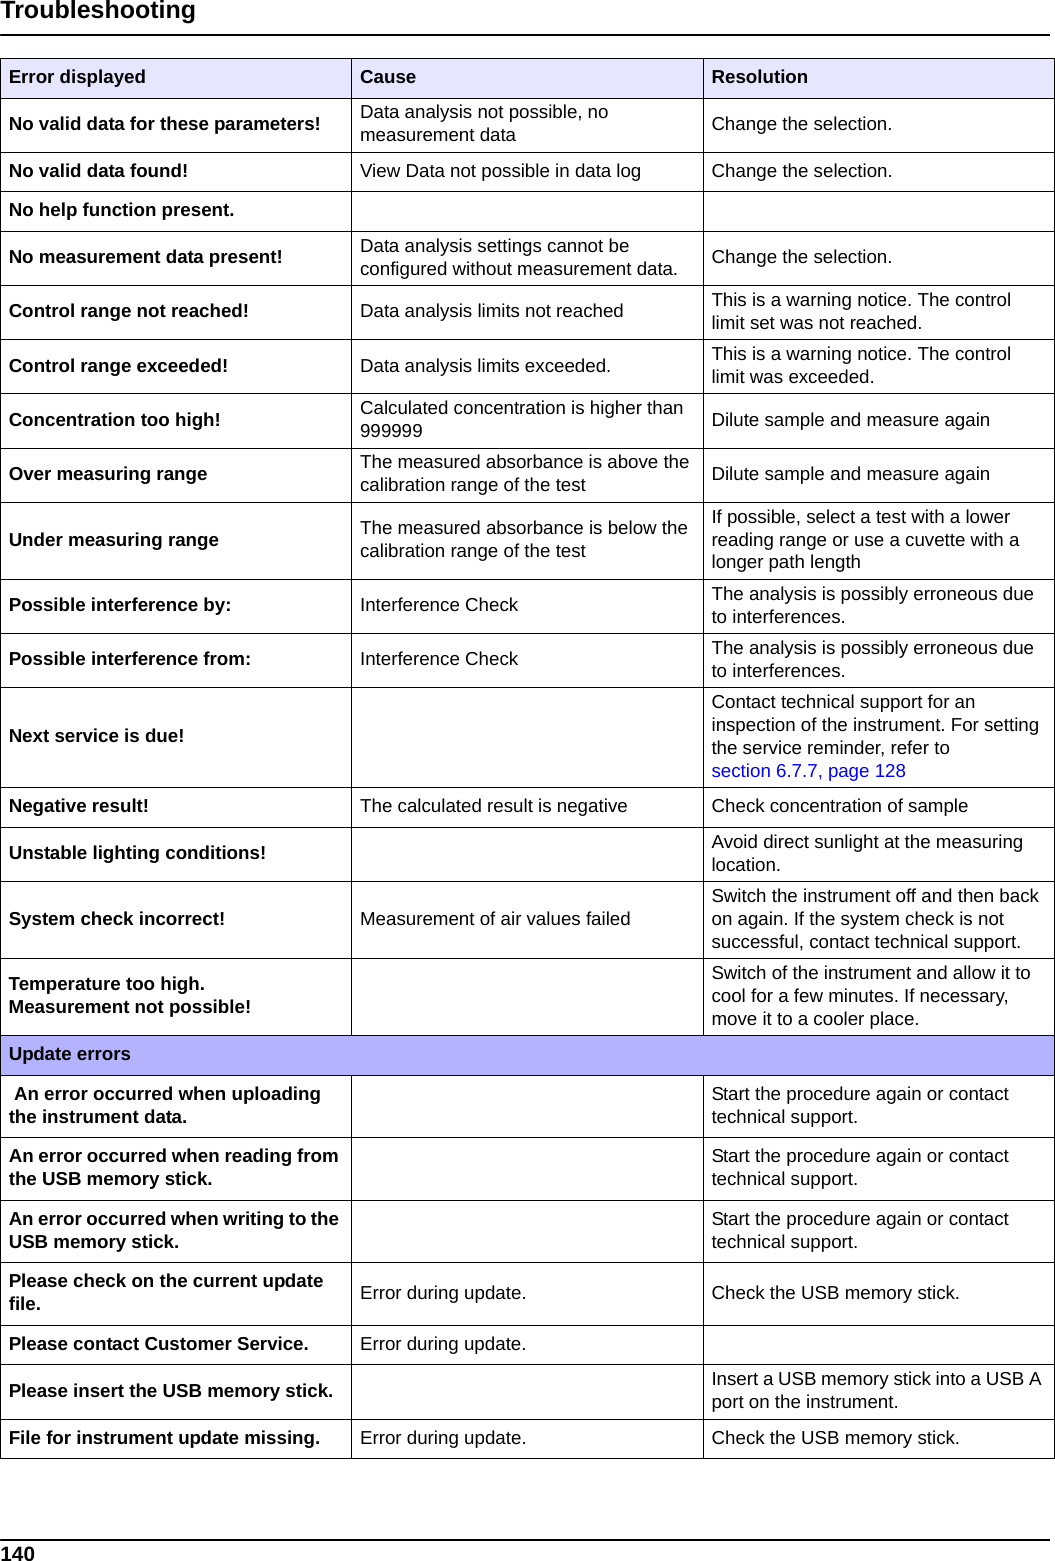
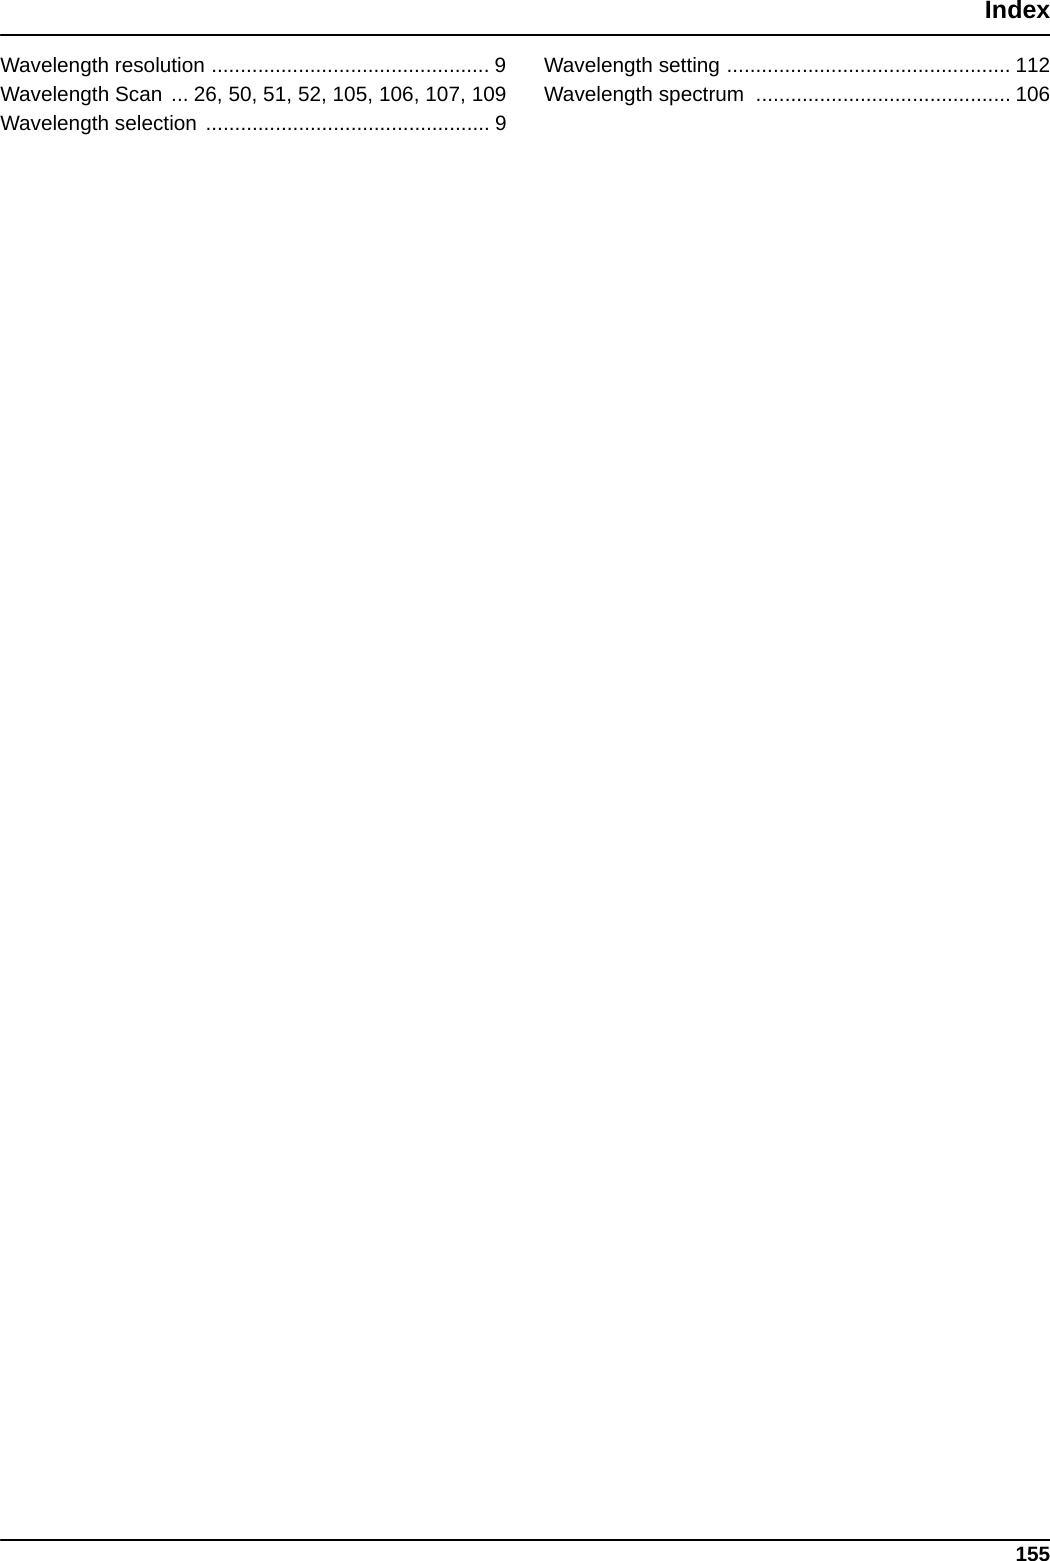
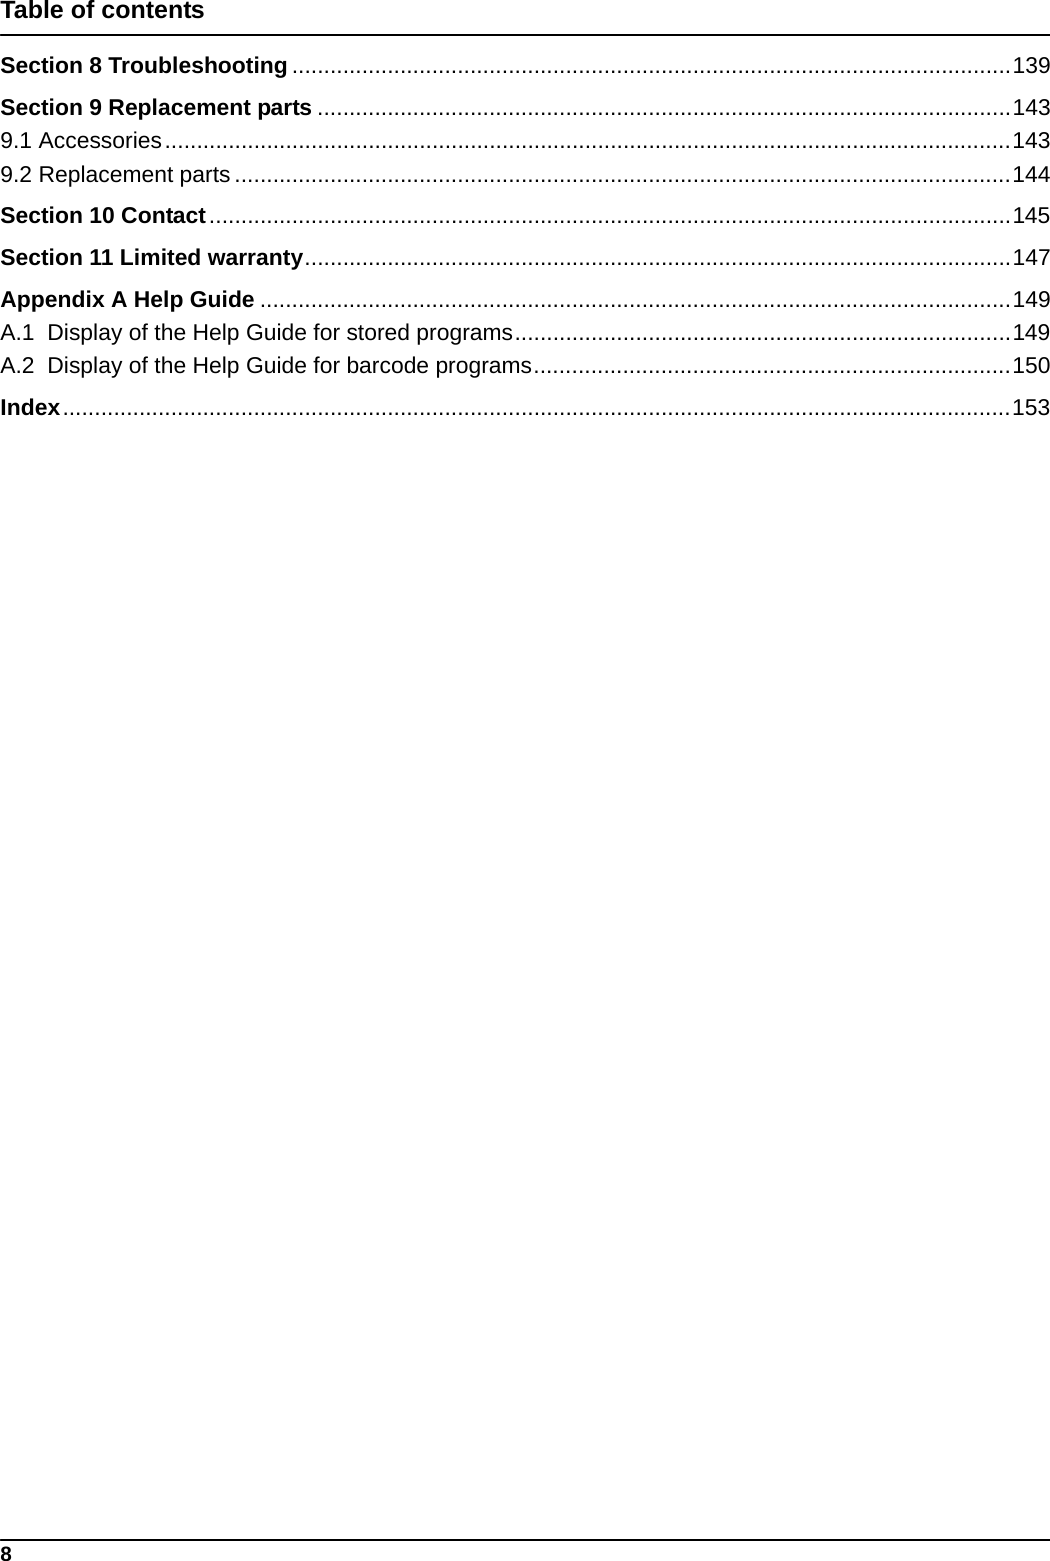
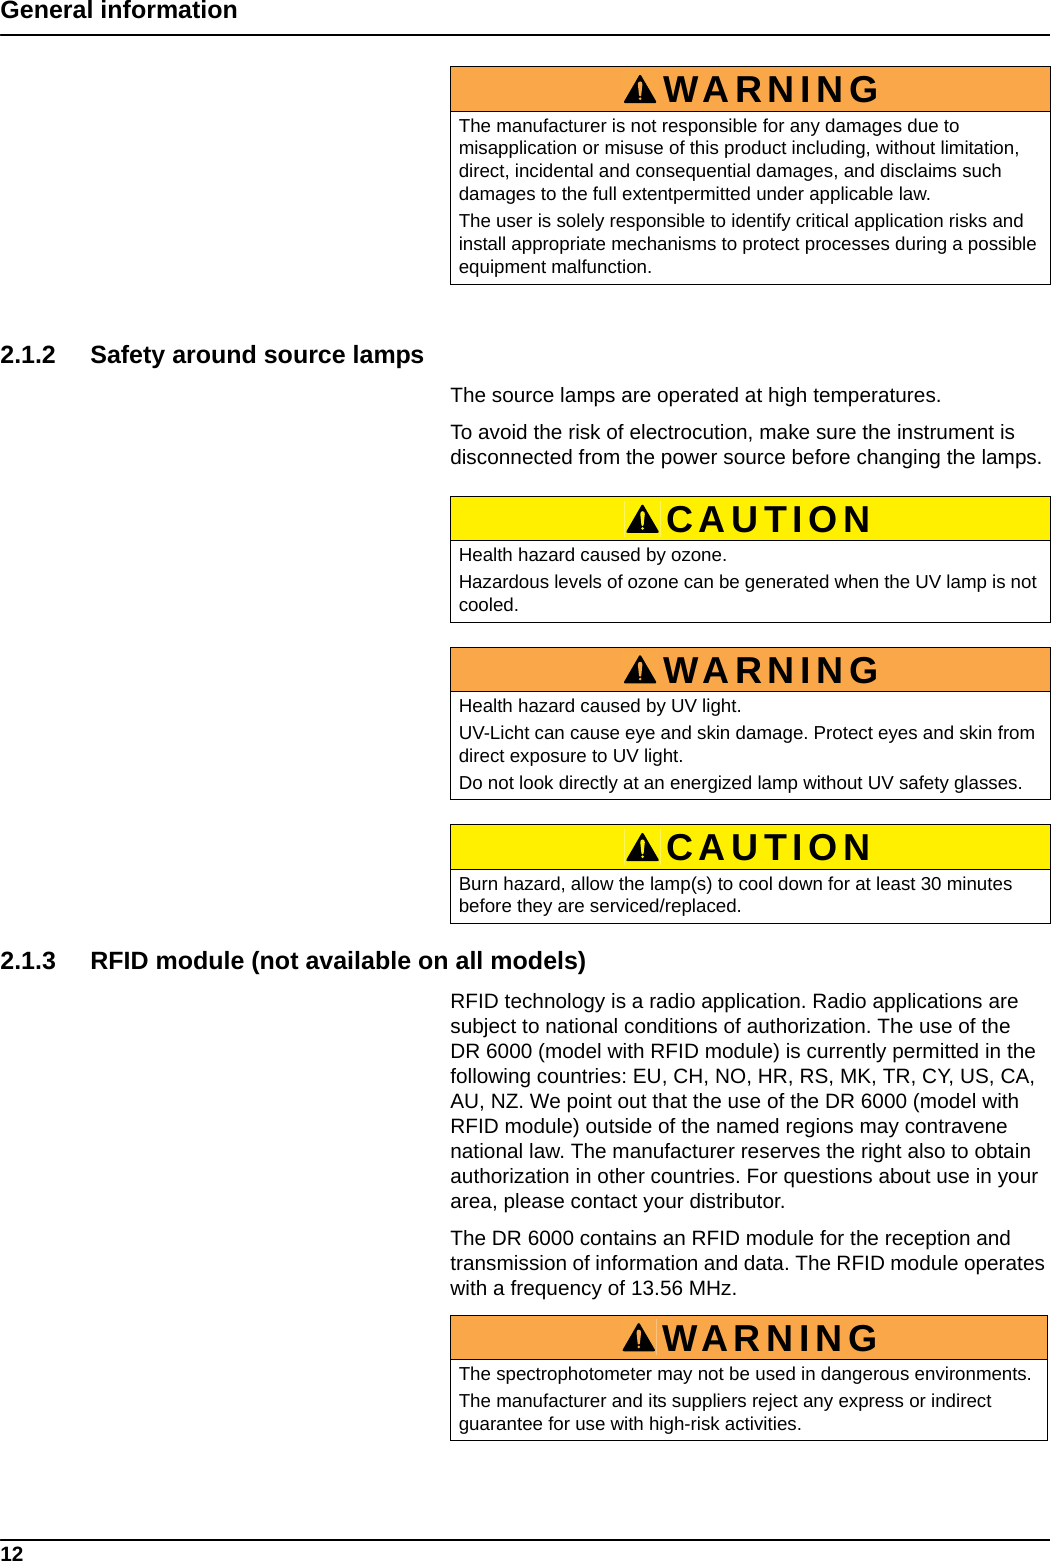
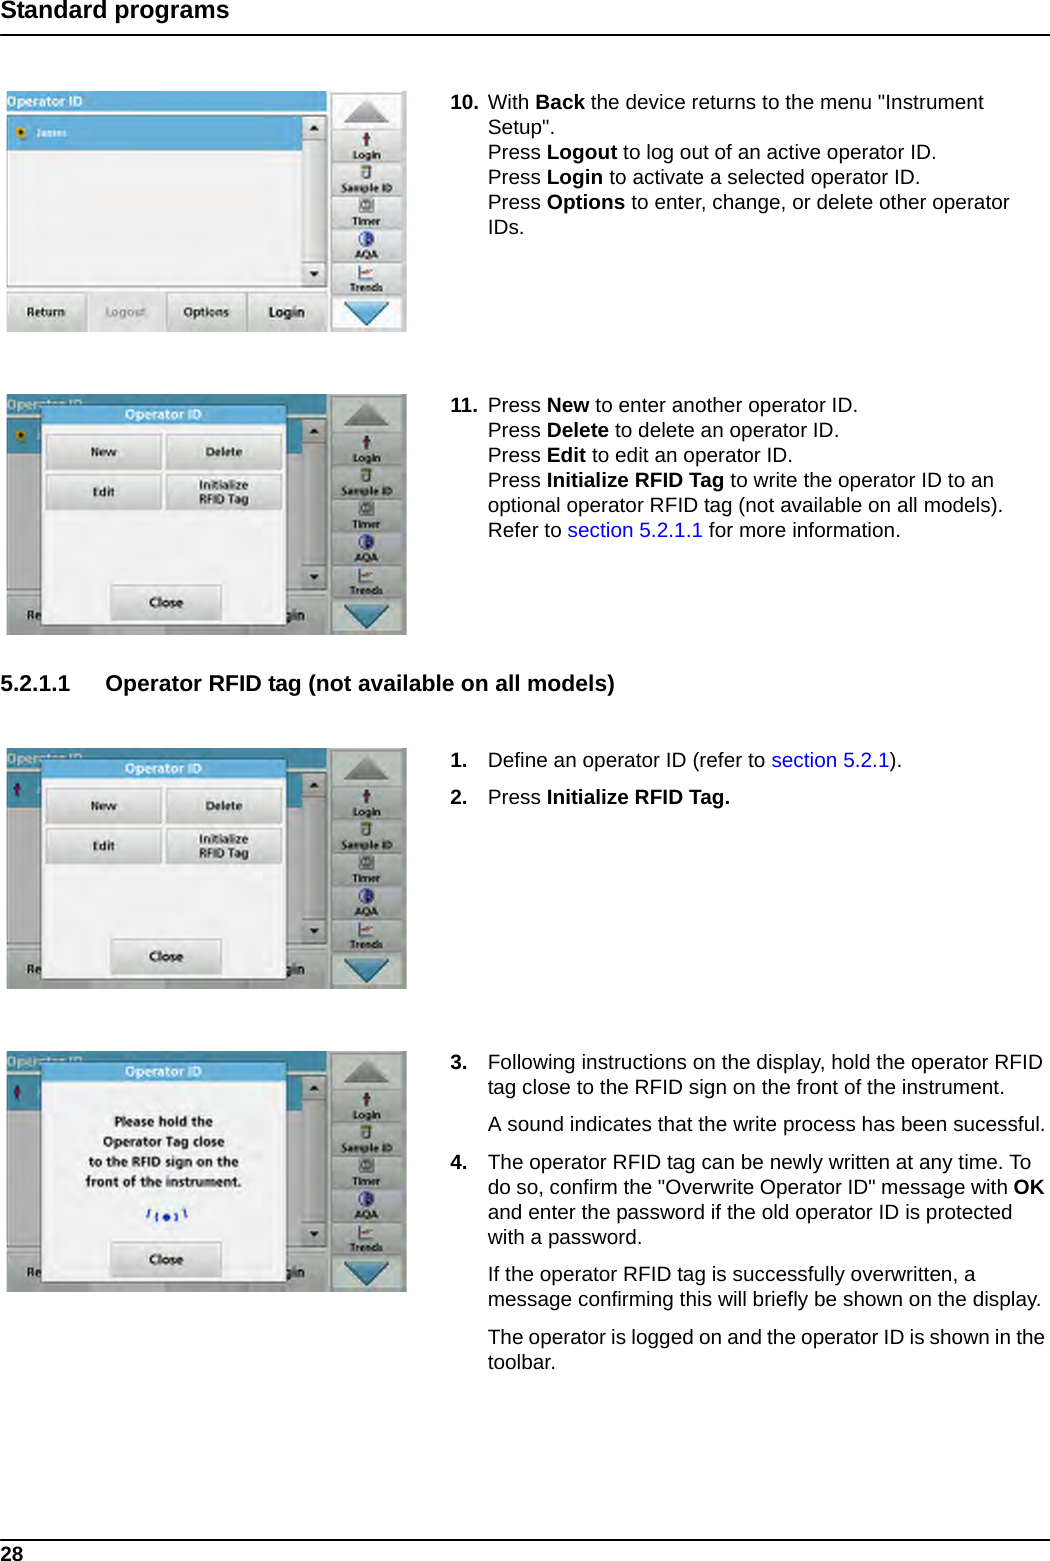
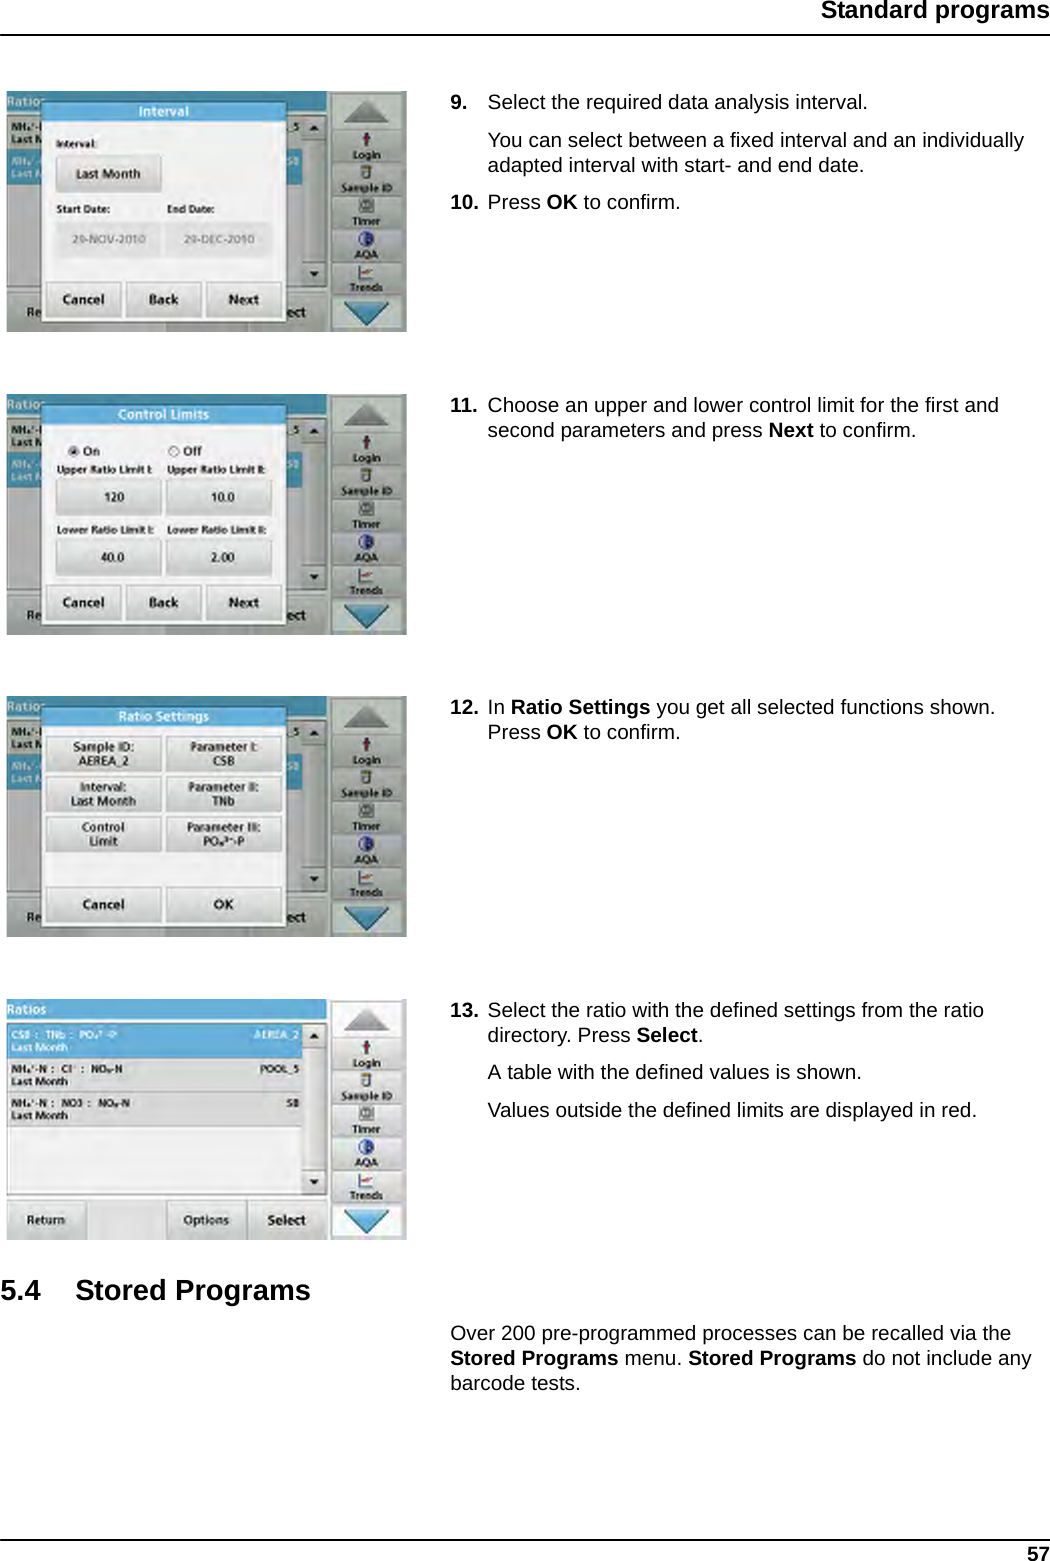
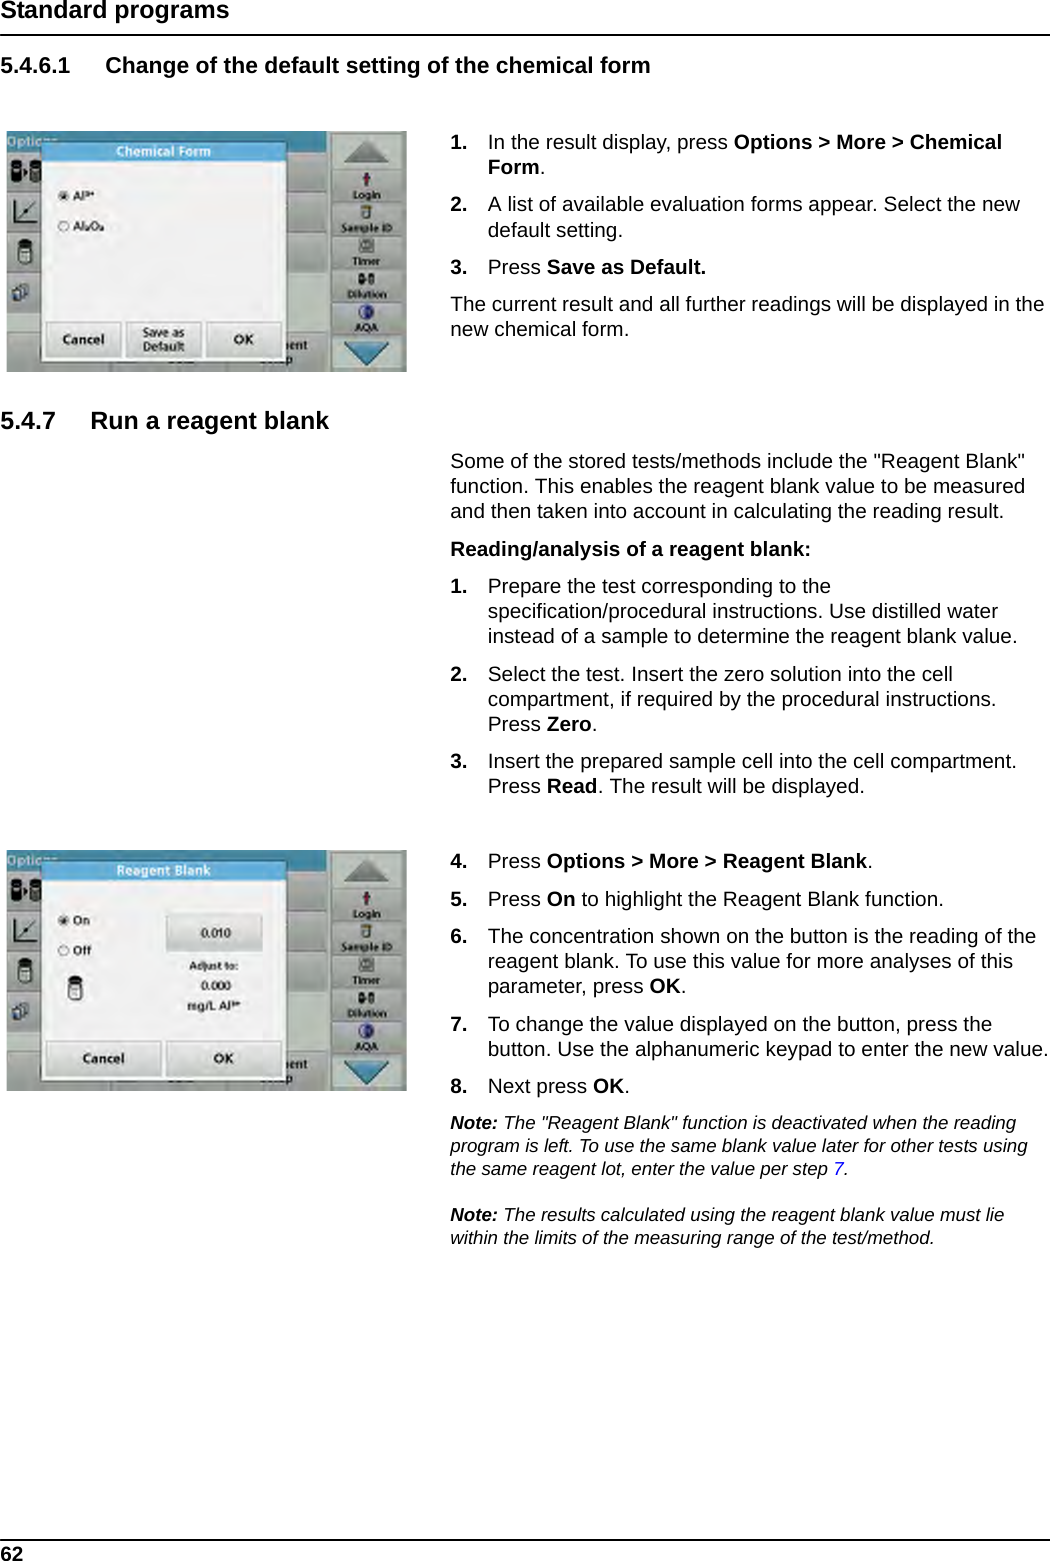
![139Section 8 TroubleshootingError displayed Cause ResolutionTest execution errorsBarcode label not read Barcode faultyReinsert the cell.If the barcode is not recognised, contact technical support.Please close the cover. Close the cover.Absorbance > 3.5! The measured absorbance exceeds 3.5 Dilute sample and measure againFaultBarcode check number?Please update program data! Deviation to the stored data Update program dataIt’s recommended to execute a Full System Check Check of the air values failedSwitch the instrument off and then back on again. If the system check is not successful, contact technical support.Blank value correction not possible! Blank value correction not possible with LCW919.FaultProgram not accessible.Please update program data! Barcode test not present Update program dataFaultClean cuvette! The cuvette is dirty or there are undissolved particles in the cuvetteClean the cuvette; allow the particles to settleFaultTest program stopped!Please check lampClose the lid.Error [xx]Test program stops when the instrument is started Check the lamp and replace it if necessary. Close lid. Press Start Again.FaultTest program stopped!Please remove the cuvetteClose the lid.Test program stops when the instrument is started Remove the cuvette/sample cell from the cell compartment.Press OK.ErrorSelfcheck stopped.Hardware error.Error [x]Electronic defect Contact technical support and indicate the error numberErrorToo much ambient light!Move instrument into shadeor close the lidThe instrument sensors detects too much ambient light.Decrease ambient light. (Avoid direct sunlight.) Close lid.No help function is available for this program.Shelf life exceeded! Use chemicals? The analysis is possibly erroneous. Use new chemicalsNo evaluation! Error in the test database / user databaseCheck programmingContact technical supportNo barcode! No barcode foundReinsert the cell.If the barcode is not recognised, contact technical support.Entry invalid! Password incorrect Forgotten your password?Contact technical support.](https://usermanual.wiki/metraTec/QR15HL.user-manual-DR6000/User-Guide-1697771-Page-139.png)