Arista Networks SS300ATC60 SpectraGuard Access Point / Sensor User Manual SS 300AT C 60 UserMan Part2
AirTight Networks, Inc. SpectraGuard Access Point / Sensor SS 300AT C 60 UserMan Part2
Contents
- 1. Users Manual
- 2. Users Manual-1
- 3. Users Manual-2
- 4. Users Manual-3
- 5. Users Manual-4
- 6. Users Manual-5
- 7. Users Manual-6
- 8. (SS-300AT-C-60) UserMan-Part1_2013.12.11 revised
- 9. (SS-300AT-C-60) UserMan-Part2
- 10. (SS-300AT-C-60) UserMan-Part3
- 11. (SS-300AT-C-60) UserMan-Part4
- 12. (SS-300AT-C-60) UserMan-Part5
- 13. (SS-300AT-C-60) UserMan-Part6
(SS-300AT-C-60) UserMan-Part2
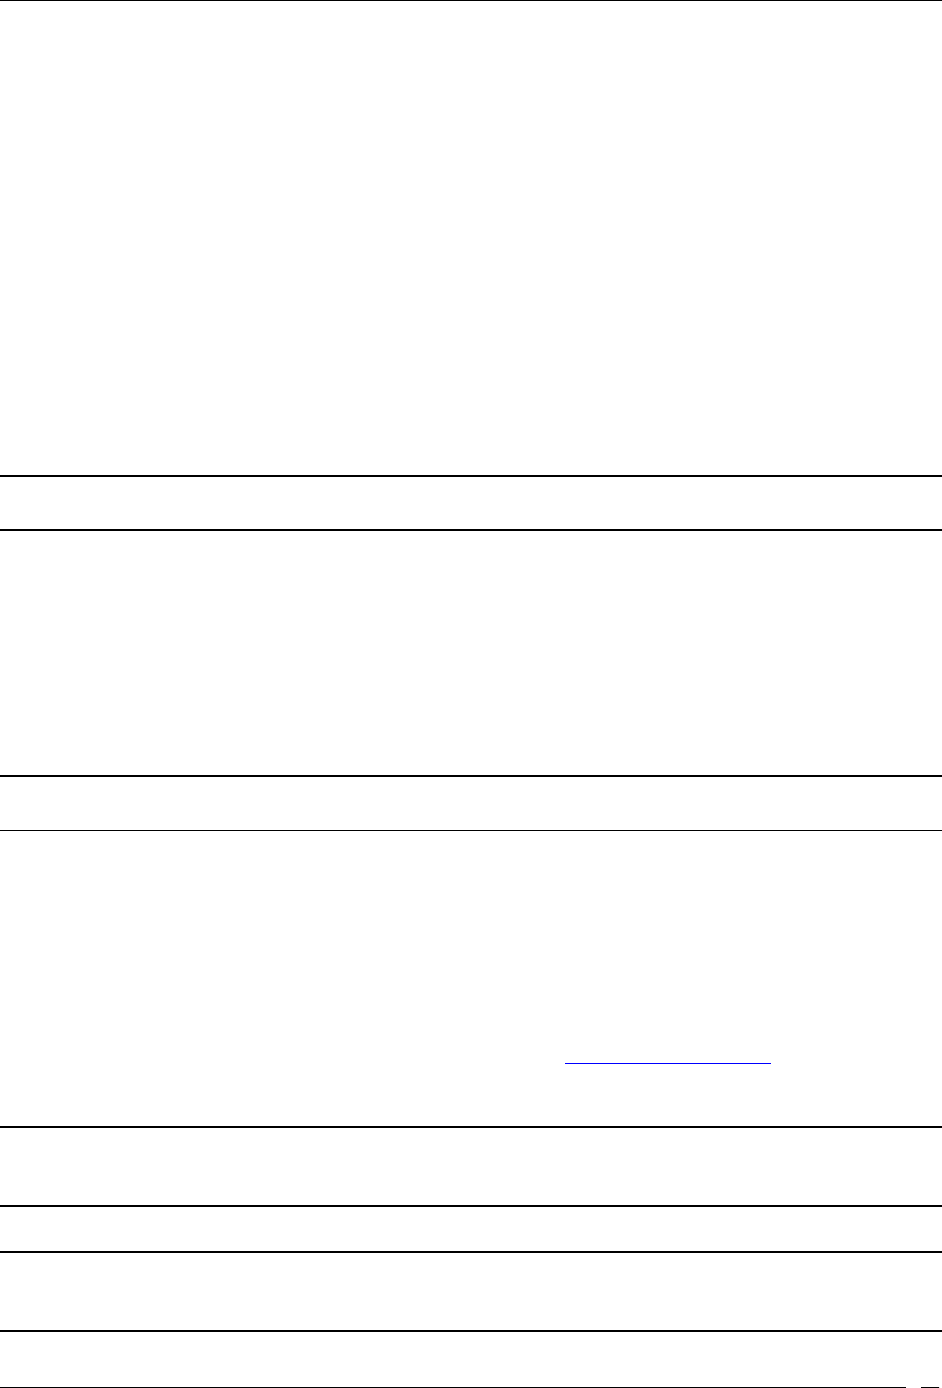
Devices Tab
SpectraGuard® Enterprise User Guide
51
If a Sensor is available, the system automatically selects a defending Sensor for an Authorized AP.
The Quarantine status of the AP then appears as Quarantined.
If a Sensor is not currently available, the Quarantine status of the AP appears as Quarantine
Pending. As soon as a Sensor is available, it starts defending the AP. The AP may appear as
Quarantine Pending if it is not currently an active threat (the AP is inactive). The system keeps
quarantining the AP until you manually remove it from quarantine.
Remove from Quarantine: Available only if the AP is manually Quarantined, this option enables you to
stop quarantine on the AP, thereby enabling wireless communication.
Start DoS Prevention: Available only if the system has determined an AP to be under a DoS attack and DoS
countermeasures have not already been started. This option enables you to start DoS countermeasure on a
selected AP.
Stop DoS Prevention: Available only if DoS Prevention is initiated on the AP, this option enables you to
manually terminate DoS countermeasure on a selected AP.
Enable Auto-quarantine: Enabled by default, this option ensures that the system automatically quarantines
an AP, thereby honoring the specified Intrusion Prevention policy.
Disable Auto-quarantine: This option ensures that the system does not automatically quarantine an AP
(regardless of the policies).
Note: The menu items Block Wired Port, Mark Port as Unblocked, Move to Quarantine, Start DoS Prevention, and
Enable Auto-quarantine are not visible only if the WIDS license is applied.
Add to Banned List: Enables you to add the selected AP to the Banned List to prevent the AP from
engaging in wireless communication.
Remove from Banned List: Available only if the AP is already in the Banned List, this option enables
you to remove the selected AP from the Banned List.
Start Troubleshooting: Opens the Troubleshoot tab of the AP Device dialog, which allows you to
start a troubleshooting session in either Packet Level Mode or Event Level Mode. Click <Start
Troubleshooting> to start troubleshooting.
Stop Troubleshooting: Available only if a troubleshooting session is in progress, this option enables
manual termination of the session.
Note: From SGE 6.2 release onwards, it is possible to start/ stop quarantine and troubleshooting on individual BSSID of the
Merged AP.
Split: Enables you to split the merged APs.
Mark as Known: Enables you to mark an External AP as Known External AP. When an AP is
marked as Known External AP, the row color changes to dark blue.
Mark as Unknown: Enables you to mark a Known External AP as Unknown External AP. An
Unknown External AP’s row color is light blue.
Delete: Enables you to delete a selected AP.
Change Location: Opens the Location Tag dialog that enables you to:
View the complete list of locations
Change the location of the selected AP (see Manual Location Tagging)
Move to…: Enables you to categorize the AP in your network by moving it to the Authorized,
Rogue, or External folder.
Note: The menu items Block Wired Port, Mark Port as Unblocked, and Move to Quarantine appear only in the AP
context-sensitive menu on the Devices screen and not in the AP context-sensitive menu on the Quarantined Devices dialog.
All other items are available on both the menus.
Note: Details, Performance, Events, Locate, Move to/Remove from Quarantine, Start/Stop DoS Prevention, and
Start/Stop Troubleshooting are the only the menu items that appear in AP context-sensitive for the BSSIDs of the Merged
APs as shown in the figure below.
Devices Tab
SpectraGuard® Enterprise User Guide
52
Merged AP Context-Sensitive Menu for the BSSIDs of the Merged APs
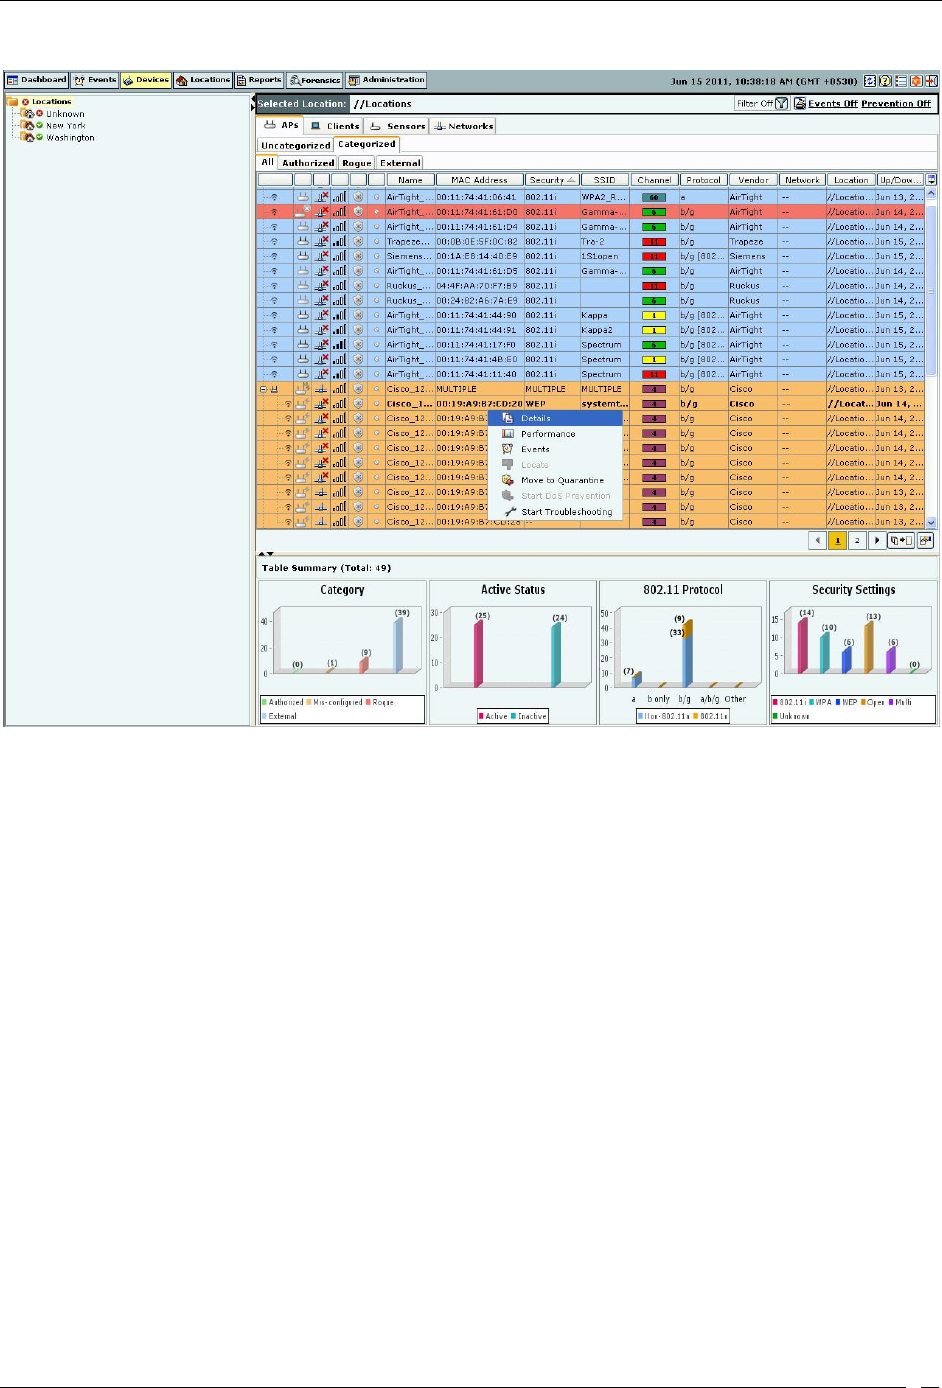
AP Details Dialog
To open AP Details dialog, right-click an AP row on the Devices screen, and select the Details menu item. The AP
Details dialog has the following tabs: Properties, Events, Performance, Troubleshoot, and Locate. The Properties tab
is displayed by default.
Devices Tab
SpectraGuard® Enterprise User Guide
53
AP Properties Tab
Fields in the AP Properties Tab
The AP Properties tab enables you to view and edit the properties of an AP.
MAC/Protocol: Select the MAC/Protocol from the drop-down list to display the relevant information of the
selected BSSID. MAC/Protocol field appears only for merged APs. The Primary BSSID of the AP is shown in
bold.
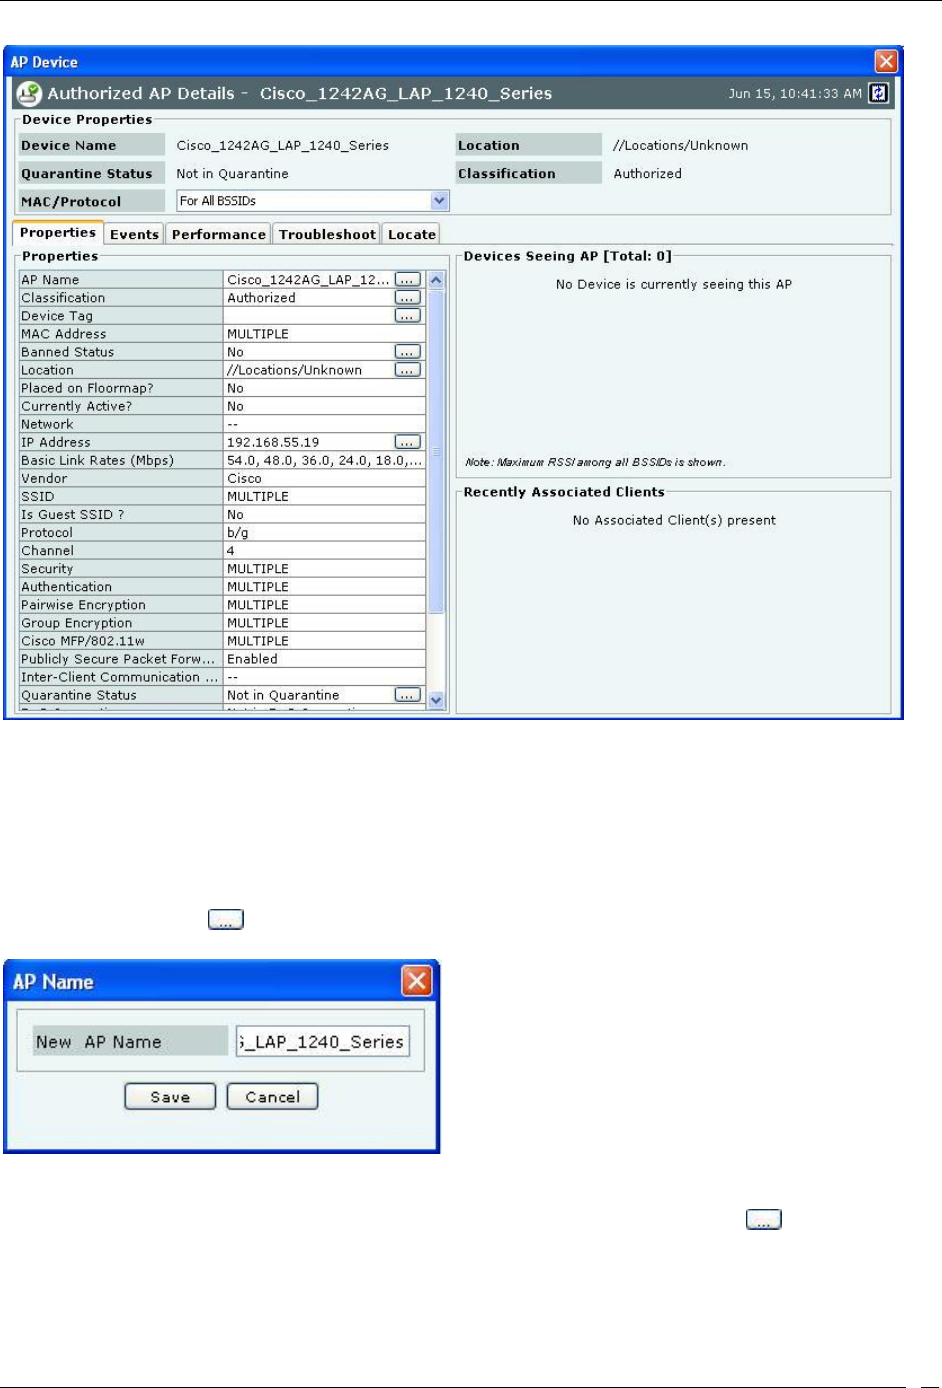
AP Name: Click and specify the name used to identify the AP in the AP Name dialog. Click Save. The
new AP name automatically displays in the Device Name field in the header of the AP Details dialog.
AP Name Dialog
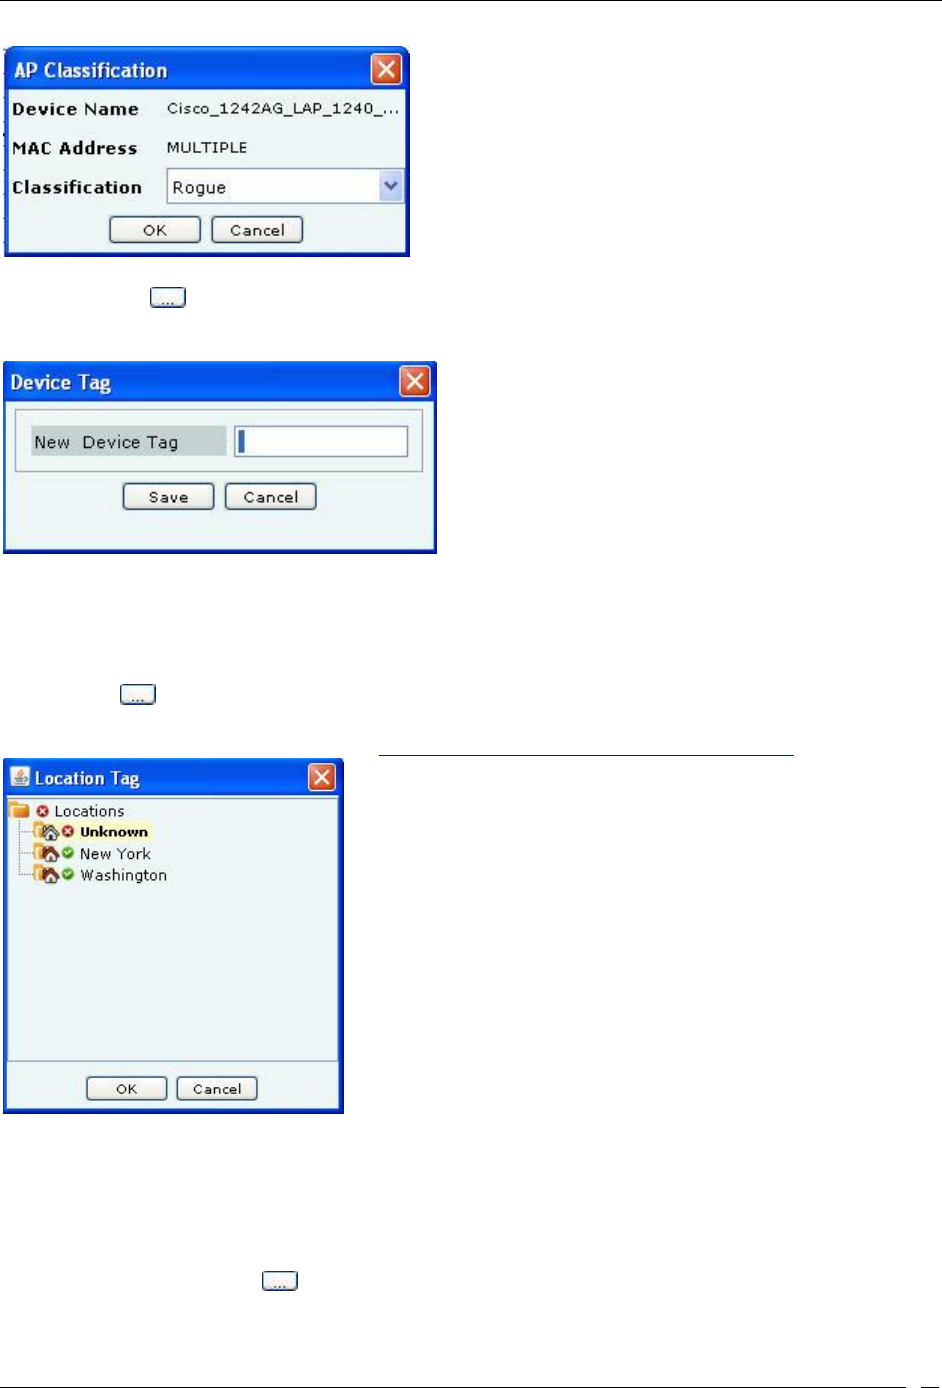
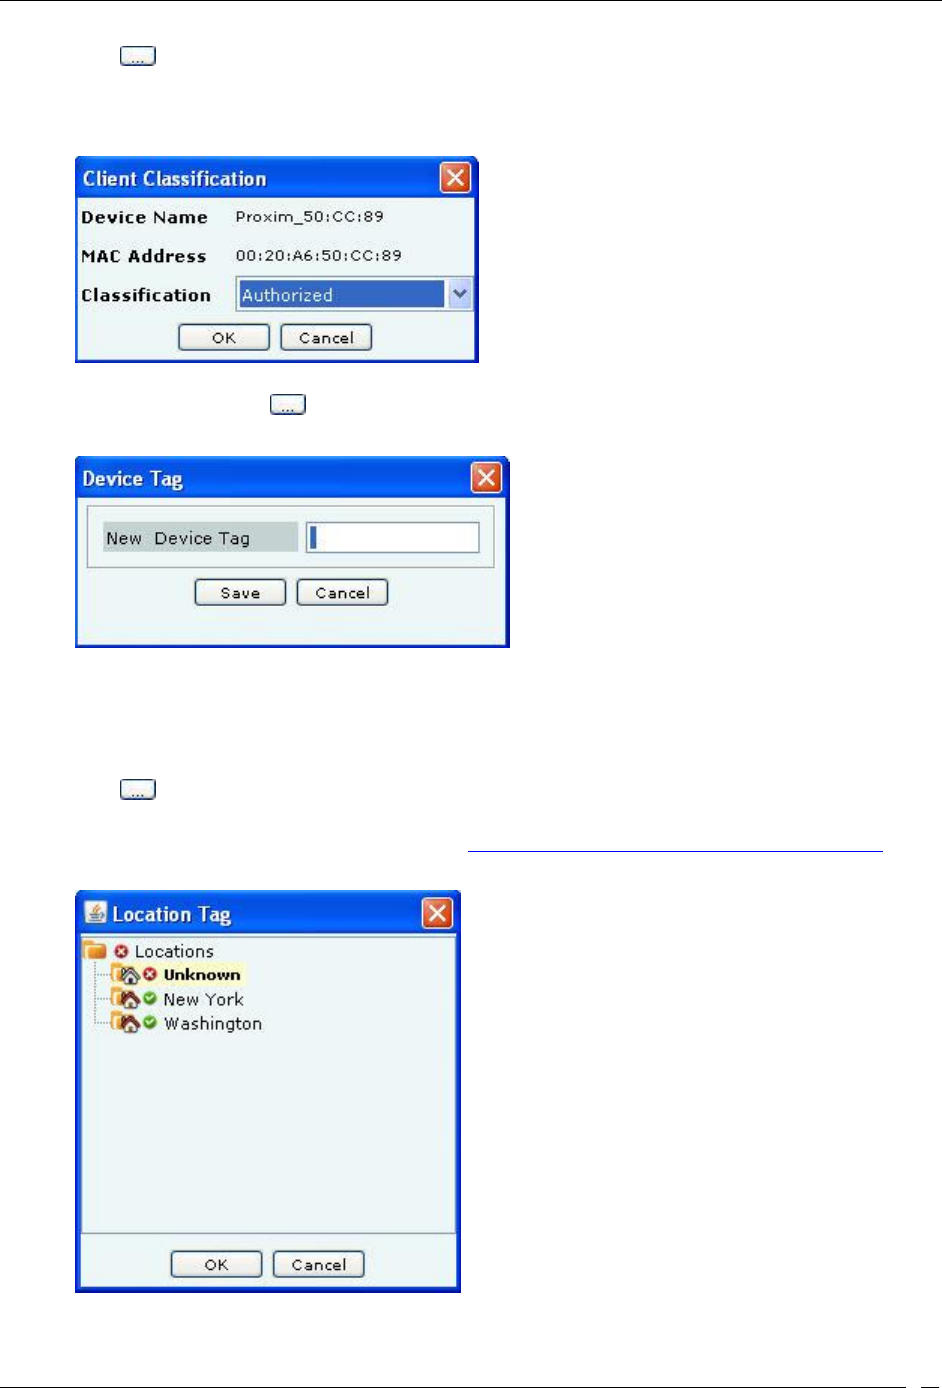
Classification: Specifies the classification of the AP–Authorized, Rogue, External, or Indeterminate. This
automatically displays in the Classification field in the header of the AP Details dialog. Click to open the AP
Classification dialog. Here, you can change the AP classification to Authorized, Rogue, or External. Click <OK> to
move the AP to the selected folder.
Devices Tab
SpectraGuard® Enterprise User Guide
54
AP Classification Dialog
Device Tag: Click to specify text that provides additional information about the AP in the Device Tag dialog;
for example, Hawaii Conference Room, Bldg 15 – Cubicle G2, or Executive Area. Click Save to save the device tag.
AP Device Tag Dialog
MAC Address: Specifies the unique 48-bit address of the AP/ 802.11 PHY modes used by the AP.
MULTIPLE displays, if For All BSSIDs is selected in the MAC/Protocol field.
Location: Enables you to view the name of the AP’s location and the complete list of locations. This
automatically displays in the Location field in the header of the AP Details dialog.
Click to open the Location Tag dialog. Here, you can view the complete list of locations and choose a
location for the AP. To view the list of locations, you must first set up your list of locations on the Locations
screen as explained in the section (see Working with Location Folders and Location Nodes).
AP Location Tag Dialog
Placed on Floormap?: Indicates if the AP is placed on the floor map.
Currently Active?: Indicates if the AP is currently active.
Up/Down Since: Specifies the time since the AP is up/down.
Network: Shows additional information about the IP Address and subnet that identifies the network
on which the AP is located.
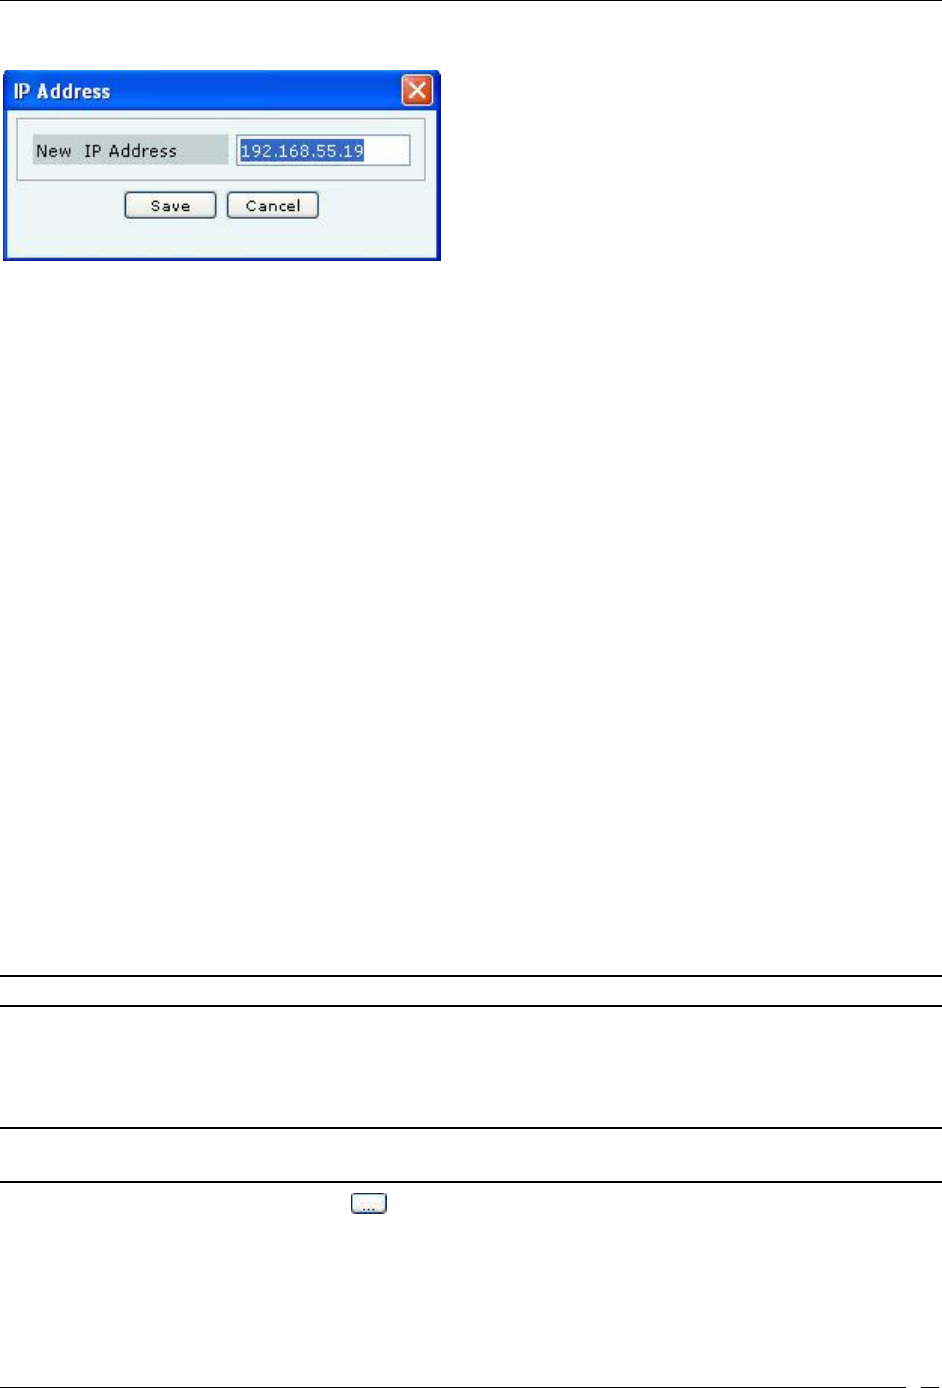
IP Address: Click to open the IP Address dialog. Specify the IP address for an Authorized or
Indeterminate AP. This field is disabled for Rogue and External APs.
Devices Tab
SpectraGuard® Enterprise User Guide
55
AP IP Address Dialog
Basic Link Rates (Mbps): Displays a comma separated list of link rates supported by the AP.
Vendor: Specifies the name of the AP manufacturer, which is inferred from the first three bytes of
the MAC address.
SSID: Specifies the unique identity that prospective Clients use to recognize the network.
MULTIPLE is displayed, if For All BSSIDs is selected in the MAC/Protocol field.
Is Guest SSID?: Indicates if the SSID is a guest SSID.
Protocol: An 802.11 device could implement and use protocols a, b/g or a/b/g. The protocol decides
the PHY layer properties and capabilities of the device.
Channel: Specifies the channel number on which the AP operates.
Security: Shows the security settings for the AP. If this option is enabled, the AP enforces WEP
encryption on the wireless link. MULTIPLE is displayed, if For All BSSIDs is selected in the
MAC/Protocol field.
Authentication: Specifies the procedure used by APs to verify the identity of a Client. MULTIPLE
is displayed, if For All BSSIDs is selected in the MAC/Protocol field.
Pairwise Encryption: Specifies the encryption used for unicast communication between the AP and
a Client. MULTIPLE is displayed, if For All BSSIDs is selected in the MAC/Protocol field.
Group Encryption: Specifies the encryption used for broadcast or multicast communication from
the AP. MULTIPLE is displayed, if For All BSSIDs is selected in the MAC/Protocol field.
Cisco MFP/802.11w: Indicates if the AP implements pre-802.11w standard from Cisco or 802.11w
standard to mitigate against the DoS attacks against AP. MULTIPLE is displayed, if For All
BSSIDs is selected in the MAC/Protocol field.
Turbo Capability: Indicates if an AP can transmit wireless signals at 108 Mbps.
Super AG Capability: This field indicates that the AP supports Super AG capability. This
capability provides speed and throughput of more than double of standard wireless LAN (802.11)
technologies.
802.11n Capability: This indicates 802.11n capability of the AP. The field provides information
about whether the AP is compliant with early or standard implementations of the 802.11n standard.
Note: You will see Turbo Capability, Super AG Capability and Pre-11n Capability only if the selected AP has these capabilities.
Publicly Secure Packet Forwarding: Specifies if the AP relays packets among wireless Clients, that
is, specifies if Publicly Secure Packet Forwarding (PSPF) is disabled on the Client.
Inter-Client Communication Last Detected: For WEP enabled APs, specifies the date and time
when communication between two wireless Clients was last seen.
Note: For Authorized but Mis-configured APs, any properties that violate the specified Authorized SSID template for that
location are shown in red. Read the tool tip on the Console for more information.
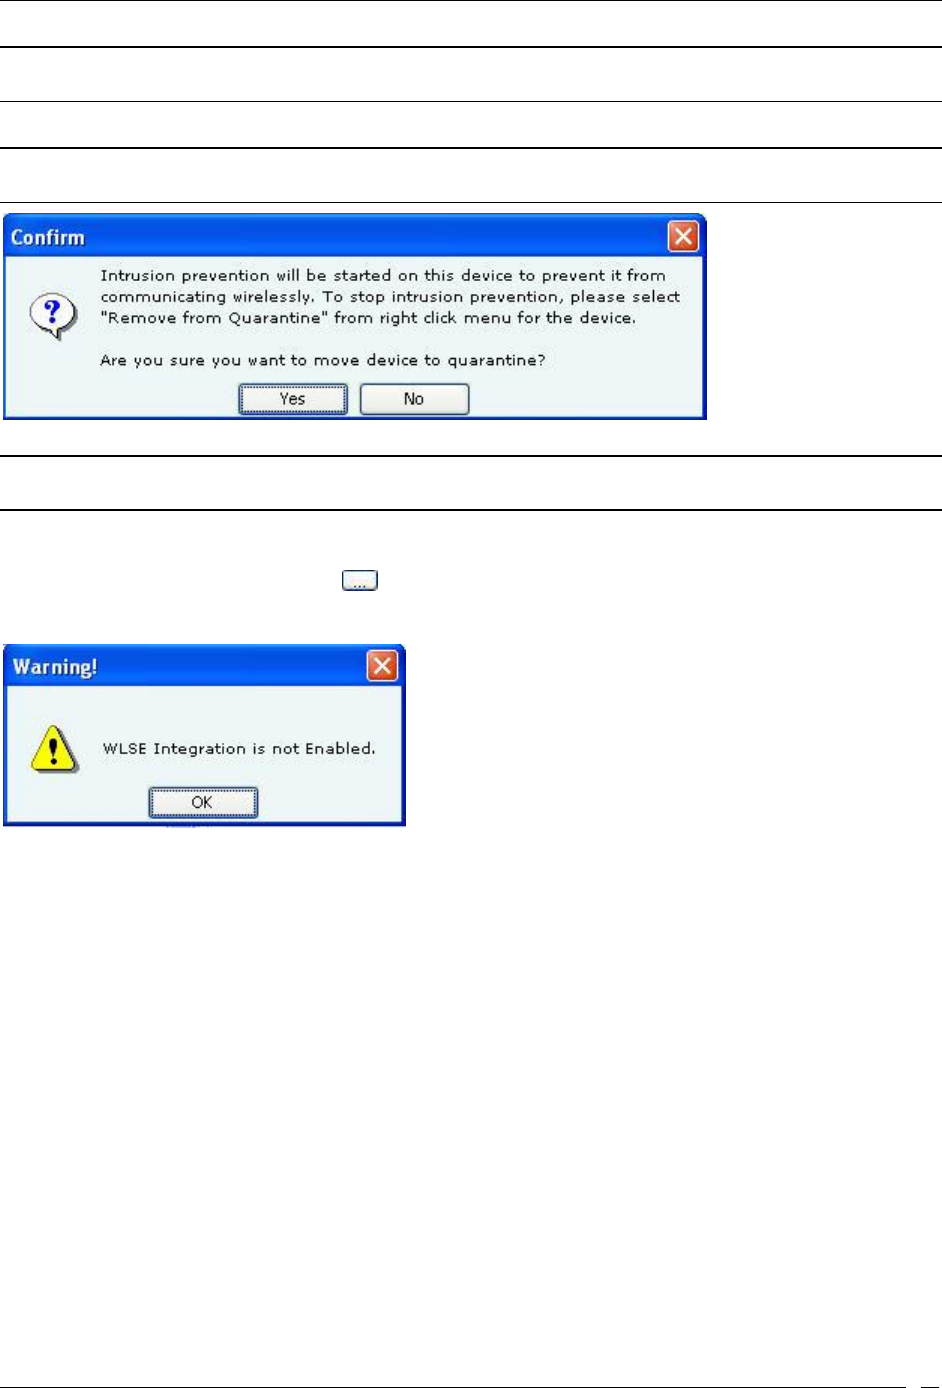
Quarantine Status: Click to open the Quarantine Confirmation dialog and to quarantine the
selected AP if a Sensor is available. If a Sensor is not available, the Quarantine Status of the AP is
Quarantine Pending. Click <Yes> to quarantine the AP.
This automatically displays in the Quarantine Status field in the header of the AP Details dialog.
Devices Tab
SpectraGuard® Enterprise User Guide
56
Note: Quarantine Status, Defending Sensor, Port Block Status, and Port Block Details fields are not visible if WIDS
license is applied.
Note: If the selected AP is currently quarantined, a Remove from Quarantine button appears in the AP Properties dialog.
Click <Remove from Quarantine> to view an Information message and to enable wireless communication to the AP.
AP Quarantine Confirmation Dialog
Note: The system quarantines only those interfaces that are mis-configured (non-policy compliant). The system allows policy
compliant interfaces to operate unhindered.
Defending Sensor: If an AP is quarantined, it specifies the name of the Sensor that is actively
preventing the AP from engaging in wireless communication.
Port Block Status: Click to block the wired side Ethernet port to which the AP is connected.
WLSE integration is needed to block wired side Ethernet port of the AP.
AP Port Block Status Dialog
Port Block Details: Specifies the IP address of the switch and the port to which the AP is connected.
Beacon Interval (ms): Specifies in milliseconds the time interval between successive beacons of the AP.
First Detected At: Specifies the date and time when the AP was first detected by the system.
802.11n Properties: Appears when the AP is 802.11n capable.
Channel Width: Specifies whether an AP is operating on 20 MHz or 40 MHz channel width. 802.11n allows
for the use of standard channel width of 20 MHz or double channel width of 40 MHz. 40 MHz channel
width is achieved by using two adjacent channels to send data simultaneously.
Channel Offset: For AP operating on 40 MHz channel width, channel offset specifies whether the adjacent
channel used in 40 MHz operation is above or below the primary channel. This field can have following
values:
Above 40 MHz: AP is currently operating on 40 MHz and adjacent channel lies above the primary
channel.
Below 40 MHz: AP is currently operating on 40 MHz and adjacent channel lies below the primary
channel.
802.11n Data Rate: Specifies the highest 11n rate of the AP with which it communicates with the Client.
Short G1 for 20 MHz: Indicates if the AP is capable of using short guard interval for 20 MHz.
Short G1 for 40 MHz: Indicates if the AP is capable of using short guard interval for 40 MHz.
MCS Support: Specifies the various Modulation and Coding Schemes (MCS) supported for 802.11n. The
802.11n standard defines a total of 77 MCS. Each MCS is a combination of a certain modulation (for example,

Devices Tab
SpectraGuard® Enterprise User Guide
57
BPSK, QPSK, 64-QAM), coding rate (for example, 1/2, 3/4), guard interval (800 or 400 ns), and number of
spatial streams. Support for MCS 0-15 is mandatory for 802.11n APs and support for MCS 0-7 is mandatory
for 802.11n Clients.
Greenfield Mode: Indicates if the AP is capable of working in the Greenfield mode. Greenfield mode is an
optional high-throughput mode in the 802.11n standard, which is not backward compatible with legacy
(802.11a/b/g) protocols and is expected to provide maximum performance benefits of 802.11n.
Beam forming Capability: Indicates if the AP is capable of Beamforming. Beamforming is an RF
transmission method that helps in focusing the radiated RF energy directly at a receiving Client. This
improves signal reception at the Client and consequently the throughput.
To add the selected AP to the Banned List, click .
To delete data for the selected AP and re-initialize data gathering, click .
To refresh the AP Details screen, manually click . The system does not auto refresh after a pre-defined
interval.
Devices Seeing AP Section
Under Device Seeing AP, you can view a list of devices (which could be either APs or Sensors) that can see the
selected AP. The details of these devices such as Device Active/Inactive icon, Name and RSSI of the AP seen by that
device are displayed in the rows. To view details of a specific Device seeing the current AP, click Name, and a new
AP Details or Sensor Details dialog appears.
Note: Total gives the total number of devices seeing the AP.
Recently Associated Clients Section
Under Recently Associated Clients, you can view a list of Clients that are recently associated to the selected AP. The
criteria for Recent Association is either 12 hours or 100 thousand Clients (this is the total number of associations in
the system and not per device). Client details such as Client Active/Inactive icon, Client Name, SSID, and Last
Detected At (which shows the date and time or Present, Present when the association is currently active.) are
displayed in the rows. To view details of a specific Client, click Client Name the Client Details screen opens.
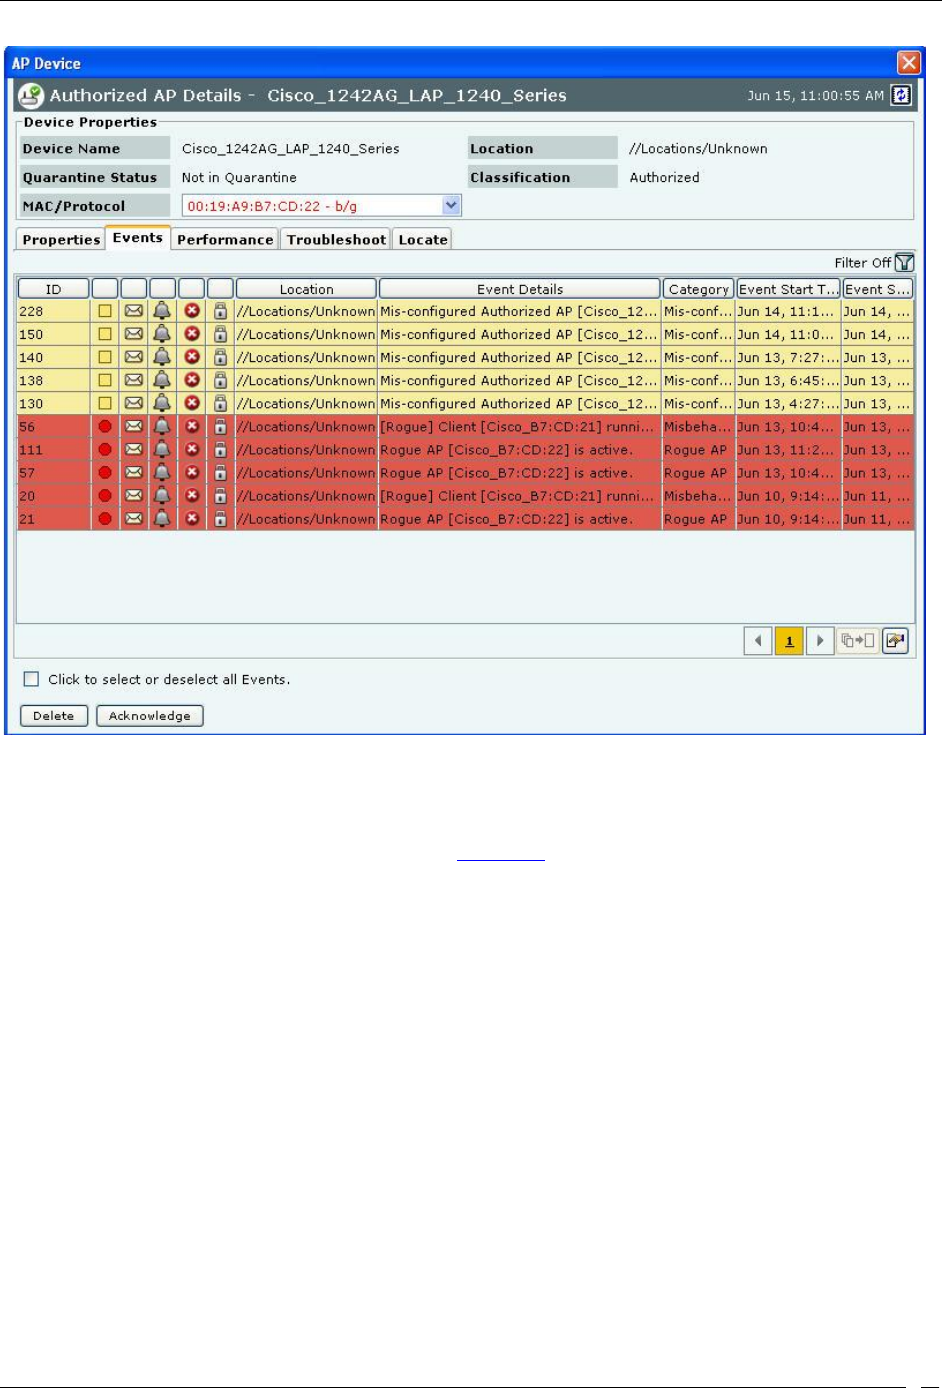
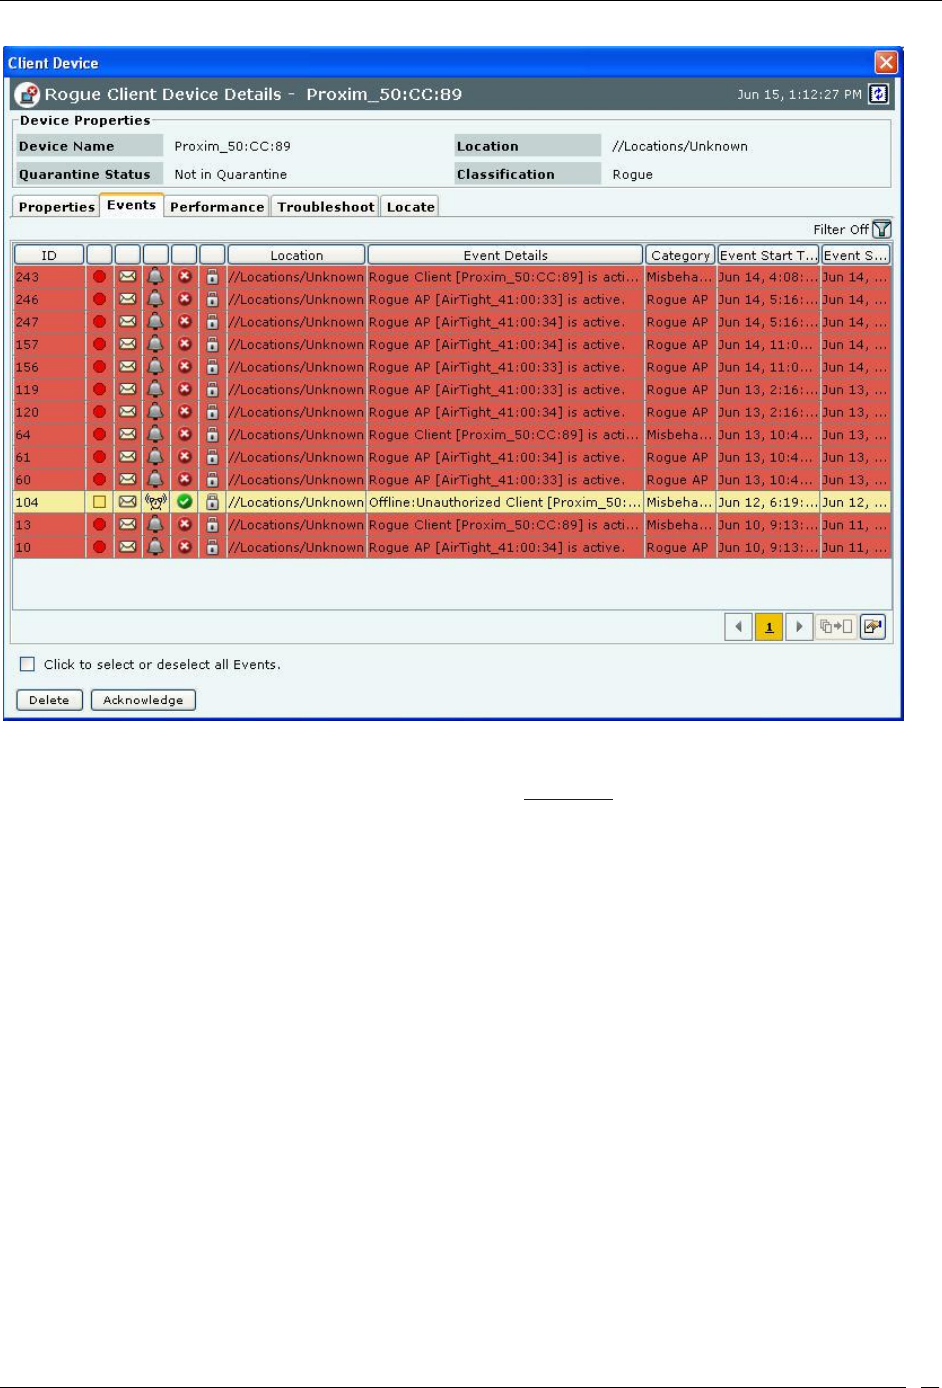
Fields in the AP Events Tab
To open the AP Events tab, on the Devices screen right-click an AP row and select the Events menu item
Devices Tab
SpectraGuard® Enterprise User Guide
58
AP Events Tab
The AP Events tab enables you to view the events where the AP is participating device.
MAC/Protocol: Select the MAC/Protocol from the drop-down list and the relevant events of the selected BSSID is
displayed. MAC/Protocol field appears only for merged APs.
For the columns in the Events details screen, refer to the Events Tab chapter for more details.
Check the Click to select or deselect all Events checkbox to select all the Events displayed on that page.
Click Delete to delete the selected events.
Click Acknowledge to add comments for the selected events.
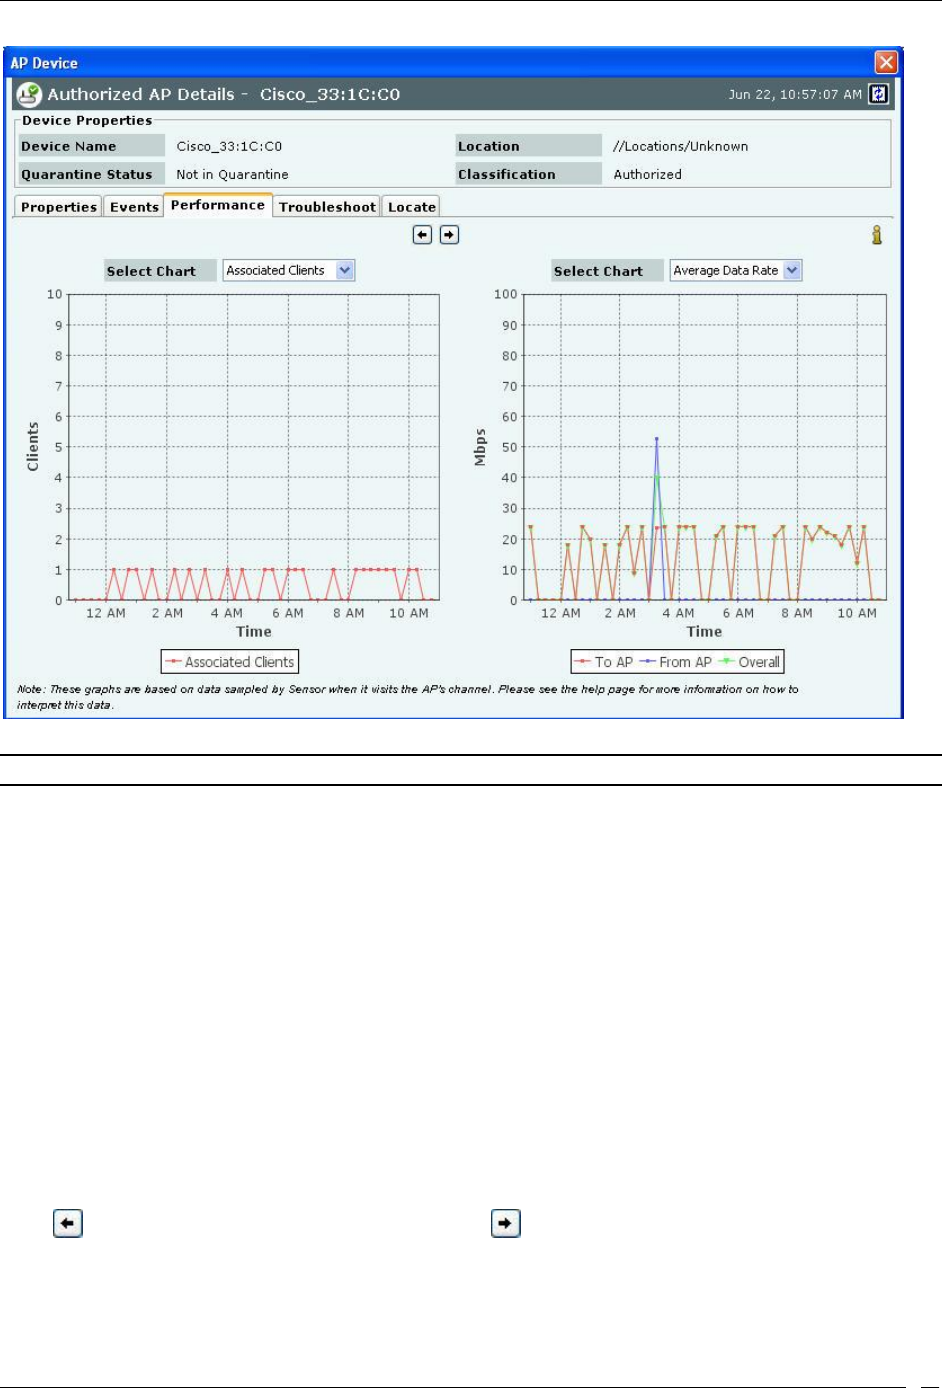
Fields in the AP Performance Tab
To open the AP Performance tab, on the Devices screen right-click an AP row and select the Performance menu item
Devices Tab
SpectraGuard® Enterprise User Guide
59
AP Performance Tab
Note: In the Performance tab, data is only available for Authorized devices.
The AP Performance tab enables you to view the data related to performance of an AP in chart form.
MAC/Protocol: Select the MAC/Protocol from the drop-down list and the relevant performance information of the
selected BSSID is displayed. MAC/Protocol field appears only for merged APs.
Line Charts are shown on the Performance Tab. Choose one of the Chart types available from the Select Chart drop-
down list:
Associated Clients: Sensor samples the number of associations with the AP at the end of each time interval.
Average Data Rate: Sensor keeps track of transmission rates of data frames in the AP’s BSS and reports
weighted average transmission rate over each time interval.
Traffic: Sensor reports data traffic sent and received by the AP over each time interval. The channel-rotating
Sensor spends only a fraction of total time on any given channel; therefore this parameter typically
underestimates the actual traffic by a factor equal to the total number of channels scanned by the Sensor
radio. For example, if b/g radio on the Sensor scans 11 channels in all, the measured traffic could be about
1/11th of the actual traffic if the traffic is continuous. Similarly, if a radio on the Sensor scans 30 channels in
all, the measured traffic could be about 1/30th of the actual traffic. However, if the traffic comes in bursts,
straightforward scaling as above cannot be applied.
Utilization: Sensor keeps track of cumulative time occupancy of frames in the AP’s BSS and reports the
cumulative time occupancy as percentage of total scan time on the channel in each time interval.
Click to view enlarged Chart on the left hand side. Click to view enlarged Chart on the right hand side.
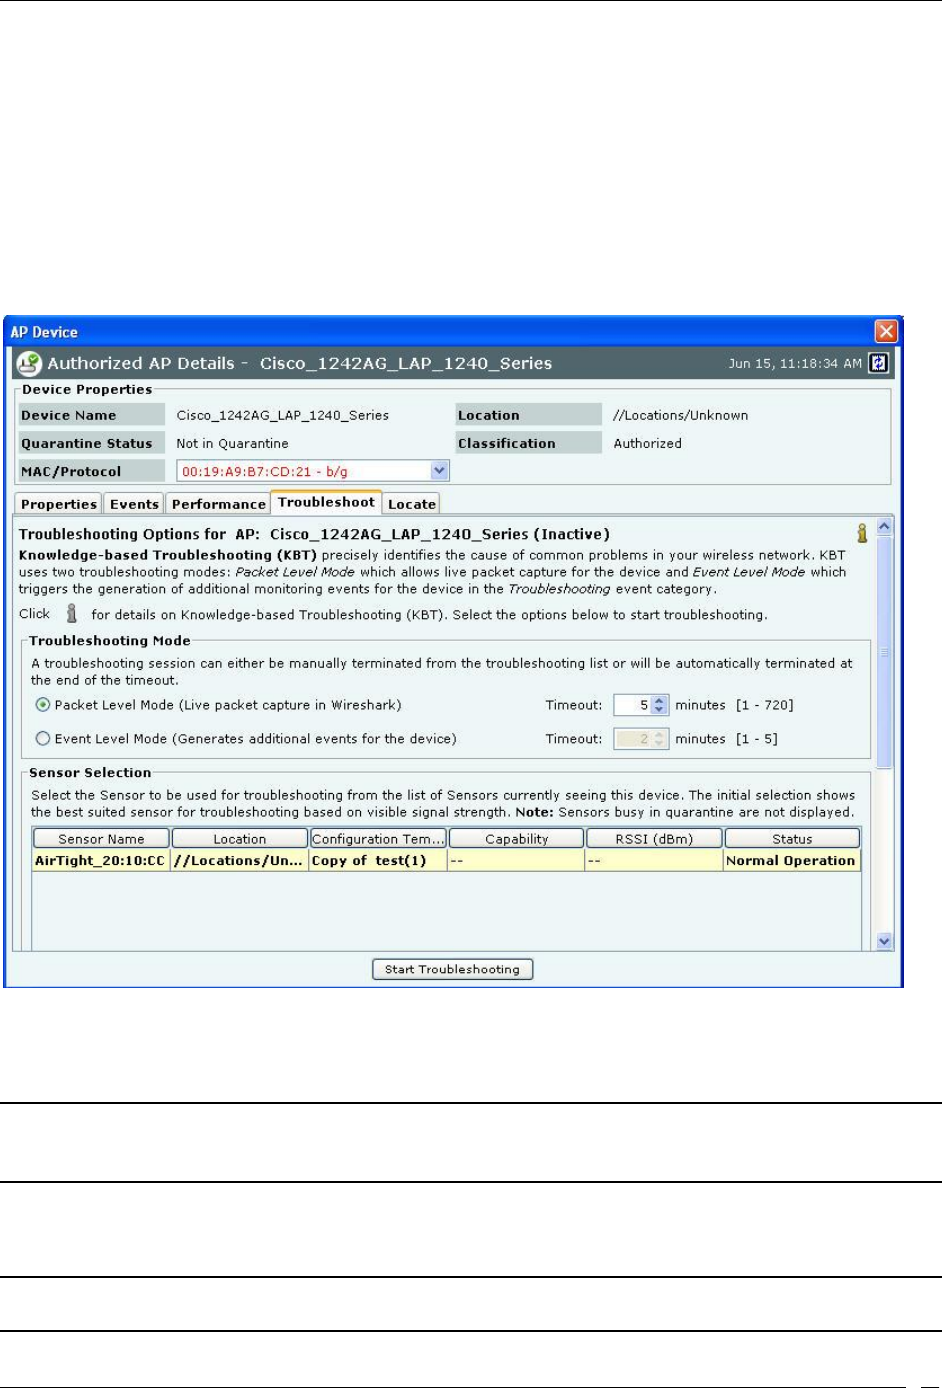
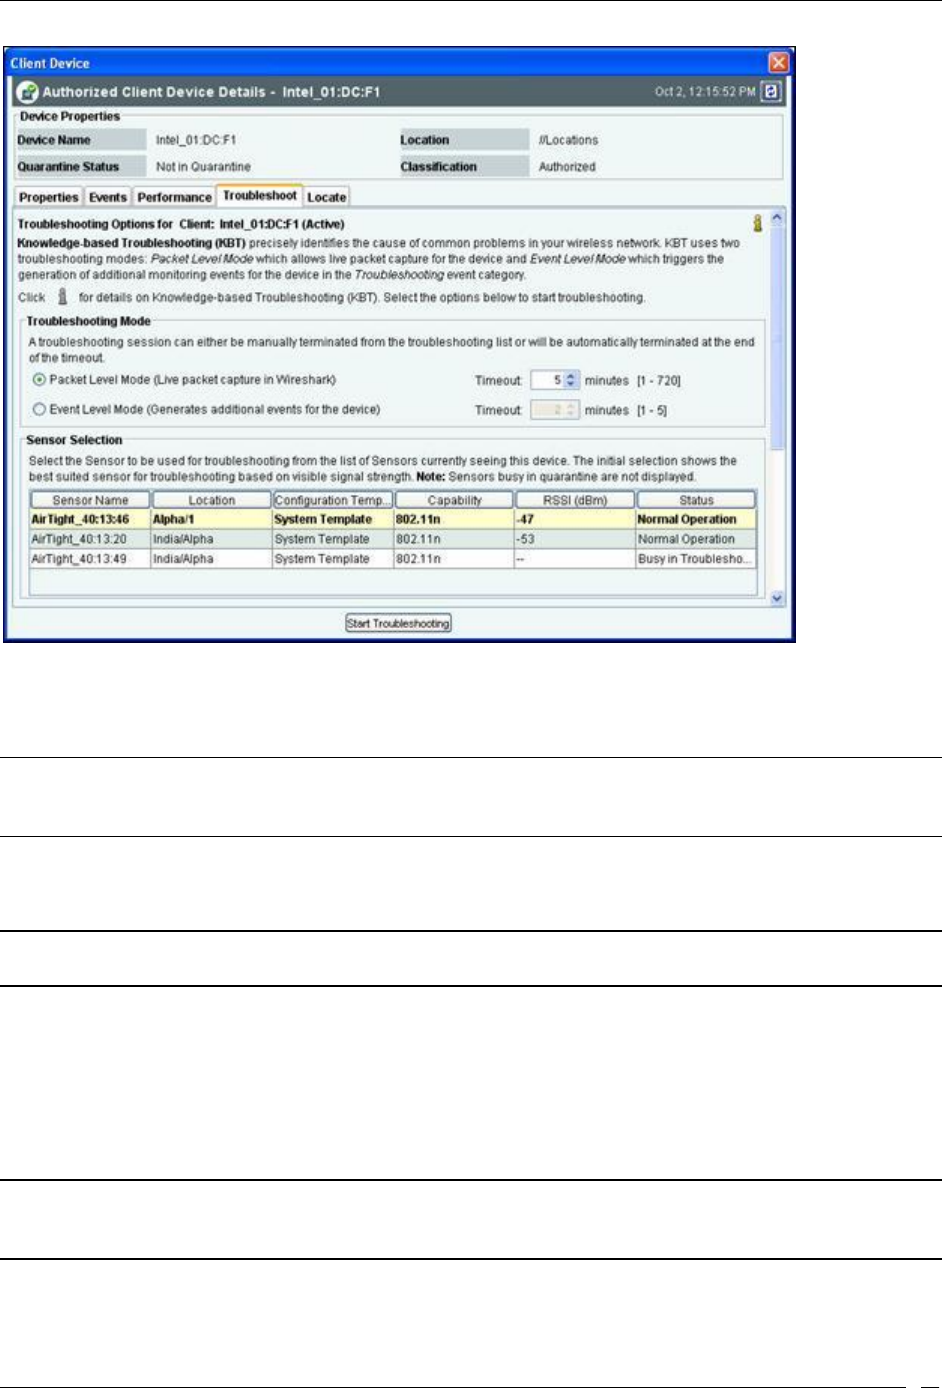
Fields in the AP Troubleshoot Tab
Devices Tab
SpectraGuard® Enterprise User Guide
60
The system provides Knowledge–based Troubleshooting (KBT) which enables you to precisely identify the cause of
common problems in your wireless network. KBT uses a knowledge base of wireless problem symptoms and their
root causes. The knowledge base is derived from extensive experimentation with WLANs.
You can initiate knowledge-based troubleshooting in one of the following modes:
Packet Level Mode: Enables you to remotely capture all packets seen by a selected Sensor that is in the
vicinity of a device. Selection of the Sensor can be manual or automatic.
Event Level Mode: Triggers the generation of detailed monitoring events for a device in the
Troubleshooting event sub-category.
To open the AP Troubleshoot tab, on the Devices screen right-click an AP row and select the Start Troubleshooting
menu item.
Packet Level Troubleshooting for an AP
1. Select the Troubleshooting Mode and set the corresponding Timeout interval. If you select Packet
Level Troubleshooting, ensure that the Sensor used for troubleshooting is reachable from the computer
used to launch the Console.
Note: A troubleshooting session automatically times out or terminates after the Timeout irrespective of the activity. You can
manually stop troubleshooting from the device context-sensitive menu by selecting Stop Troubleshooting or from the
Troubleshooting tab by clicking <Stop Troubleshooting>.
2. Under Sensor Selection, select the Sensor to use for troubleshooting. Sensor Status appears as Normal
Operation, Busy in Quarantine, or Busy in Troubleshooting. Within each category, Sensors are sorted based
on availability and signal strength.
Note: Do not select a Sensor that is Busy in Quarantine or Busy in Troubleshooting. If you select a Sensor that is Busy in
Quarantine, the troubleshooting operation fails.
Devices Tab
SpectraGuard® Enterprise User Guide
61
3. Under Protocol and Channel Selection:
The Protocol and Channel on which the AP is operating automatically selects by default.
For Merged APs in the MAC/Protocol field, For all BSSIDs automatically selects by default. A
message is displayed that “Please select BSSID to troubleshoot”. Select a BSSID from the
MAC/Protocol field’s drop-down list to initiate troubleshooting.
Note: A Configuration template is assigned to each Sensor. The Channels list contains only those channels enabled for scanning
in that Configuration template. If no channel in a Protocol is enabled, then the Protocol option is disabled. Thus, the Channels
list and the status of the Protocol checkboxes change with the Sensor selected.
4. Under Packet Selection, choose to view all the packets visible to the selected Sensor or only the packets
from the selected device visible to the Sensor.
5. Click Start Troubleshooting to begin the session. If the Sensor is assigned a Configuration template,
where no channels are selected for scanning, an error message displays.
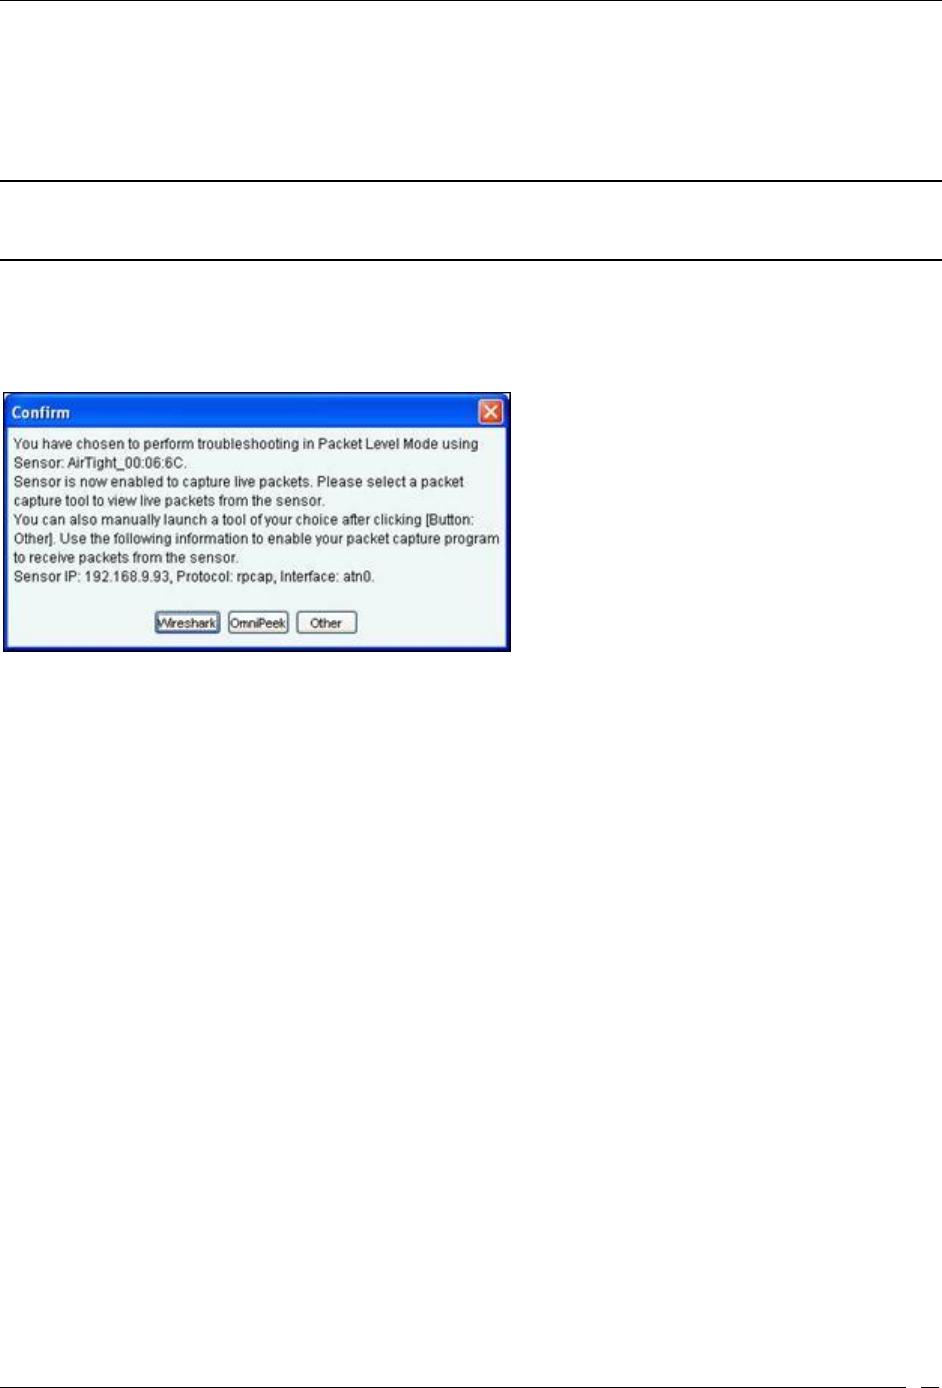
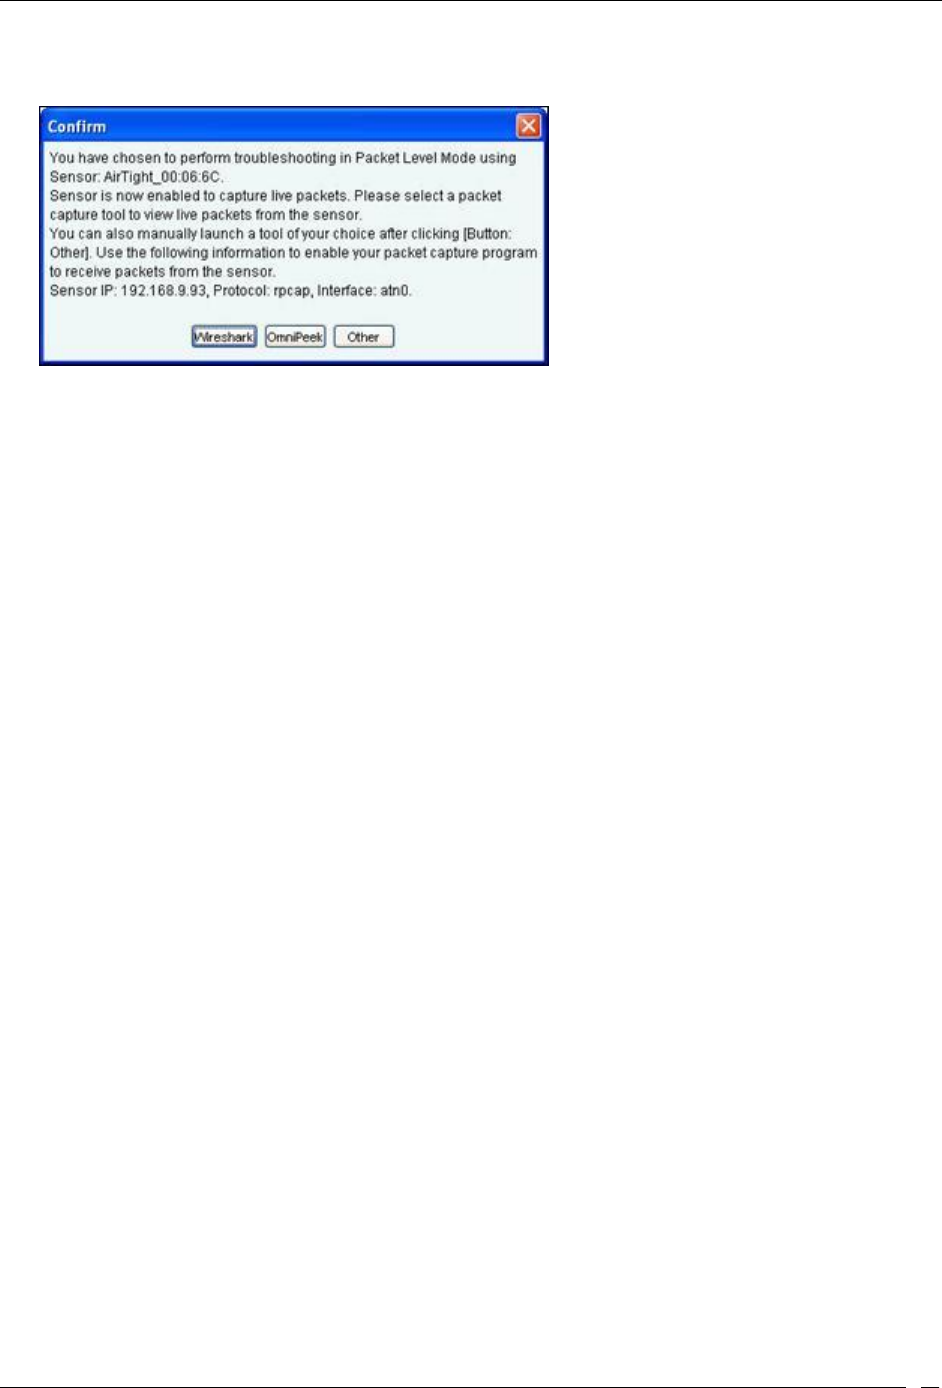
Packet Level Troubleshooting Confirm Dialog
6. On the Confirm dialog, you may have two or three packet capture tool options, depending on the
licensing agreement with AirTight Inc. Select a packet capture tool.
If you have a product license that has OmniPeek support, you have three packet capture tool options –
Wireshark, OmniPeek, and ‘Other’. If you have a product license that does not have OmniPeek support, you
have two packet capture tool options – Wireshark and ‘Other’. Select the ‘Other’ option for other tools that you
can use to capture packets. Typical packet capture tools are Tcpdump, Ethereal, Wireshark, OmniPeek, and
others. You must use Tcpdump and Ethereal with Rpcap support. Tcpdump, Ethereal, and Wireshark are
available freely on the Internet.
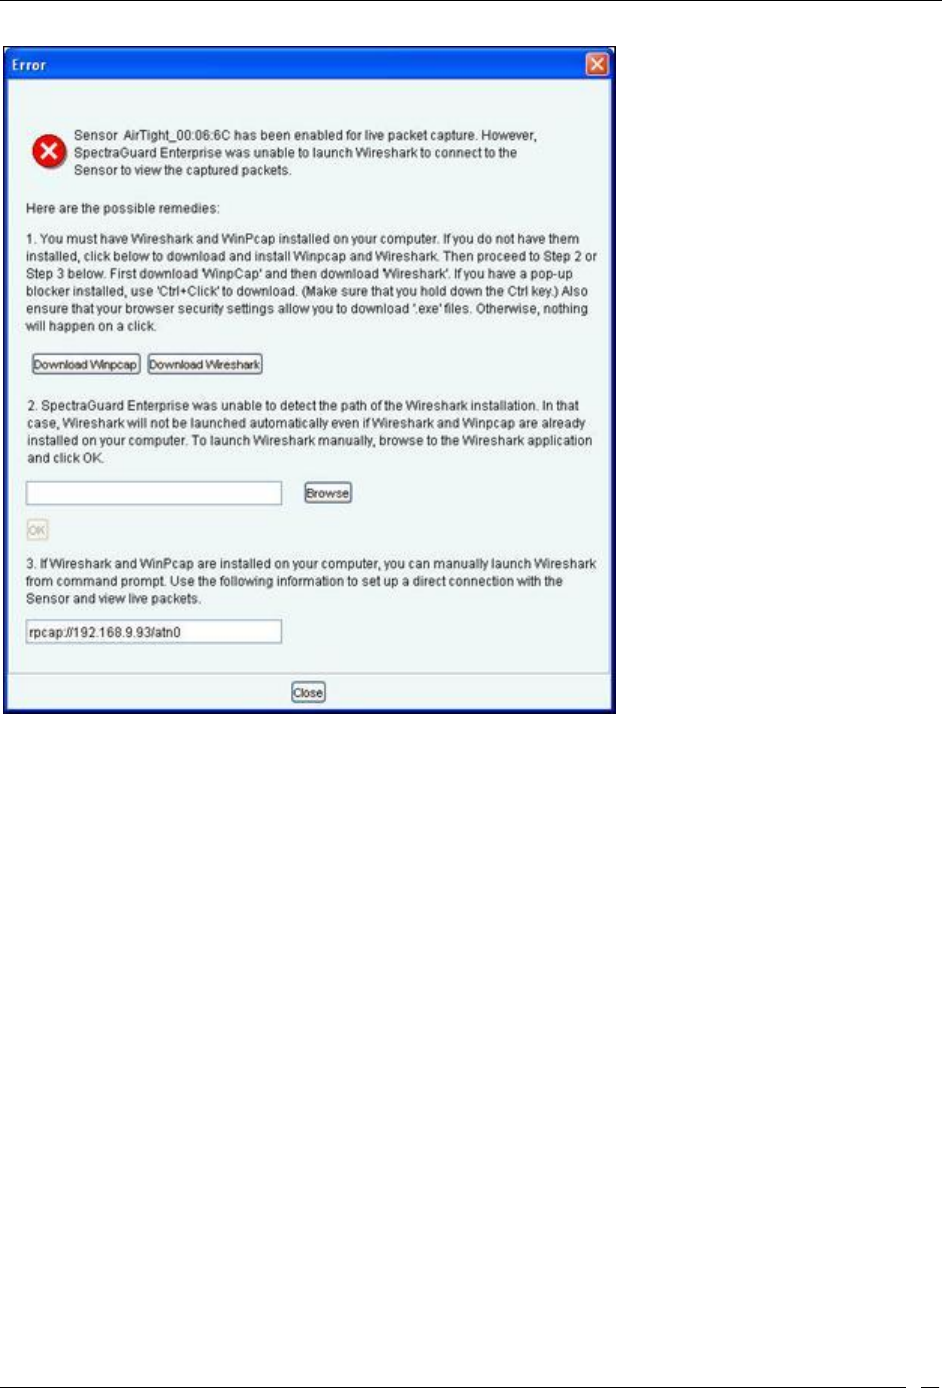
7. If you click Wireshark, and the application is installed correctly, the system launches the application and
the packet capture session begins immediately. Alternatively, if you do not have Wireshark installed, an
Error dialog appears.
Devices Tab
SpectraGuard® Enterprise User Guide
62
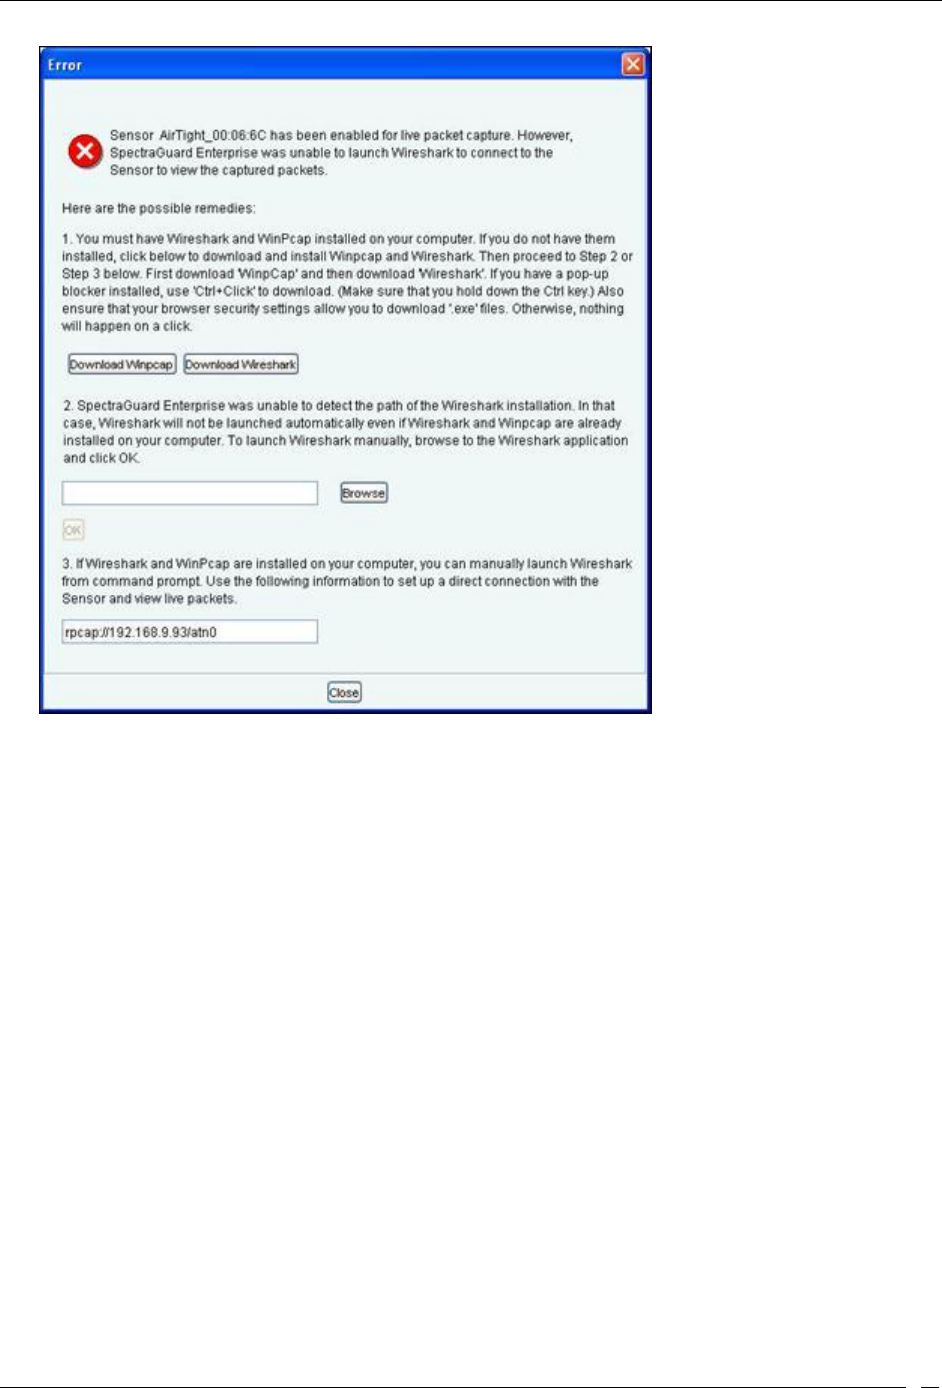
System unable to Launch Wireshark Dialog
8. On the Error dialog, there are three possibilities:
You can download and install Wireshark and optionally install WinPcap. Wireshark requires a
compatible version of WinPcap. If the installed version and expected version mismatch, you need
to install the suggested and expected version of WinPcap.
If the system does not find Wireshark installed at the default location, ‘C:\Program
Files\Wireshark’, Wireshark will not launch automatically. To launch Wireshark manually, click
Browse to specify the appropriate location and click OK.
To launch Wireshark manually from the command prompt, you need to copy and paste the link to
set up a direct connection with the Sensor and view live packets.
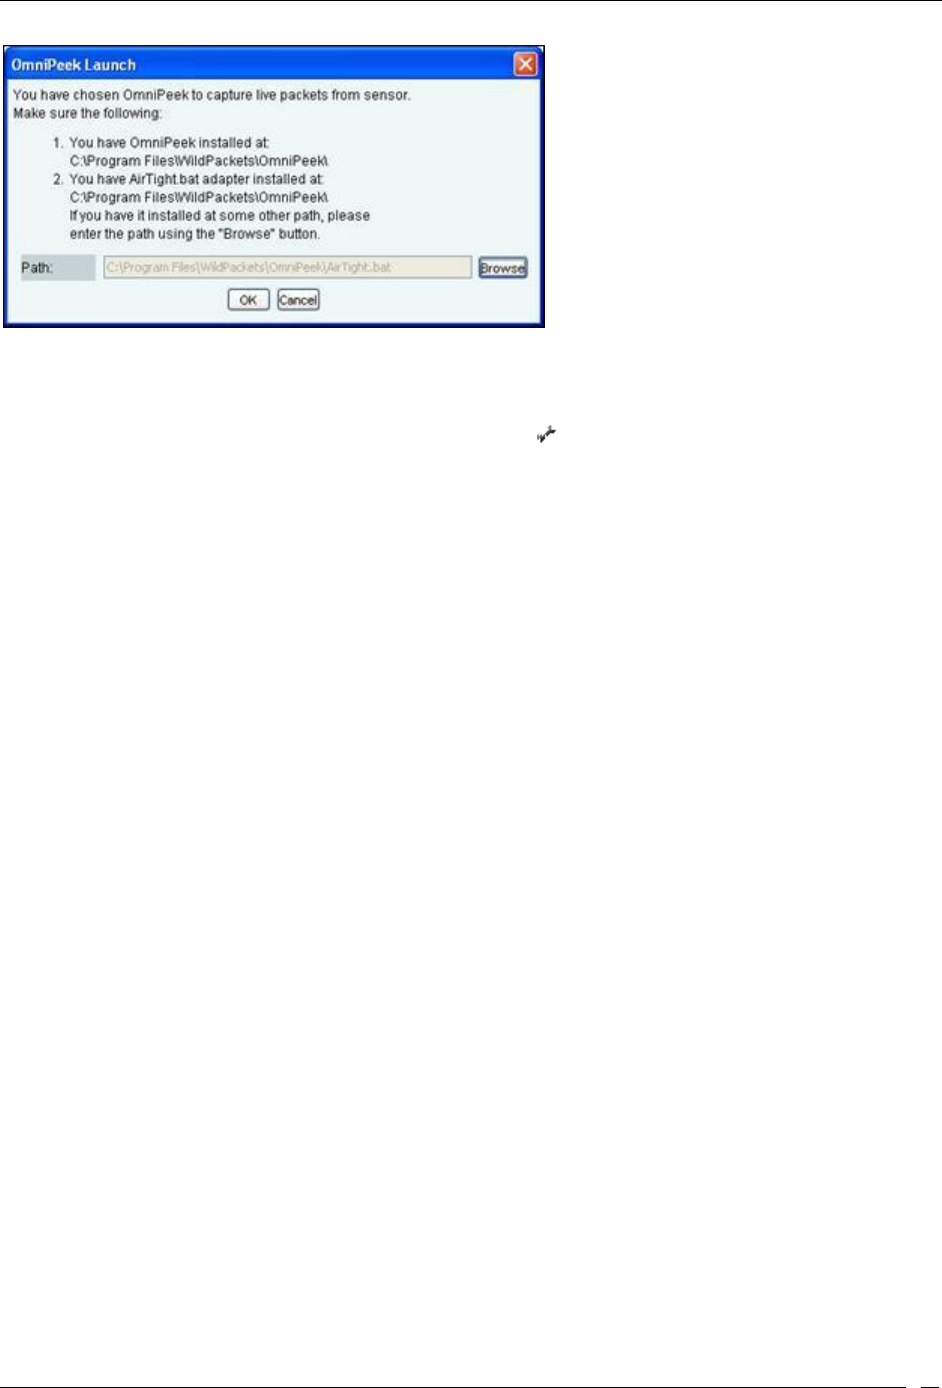
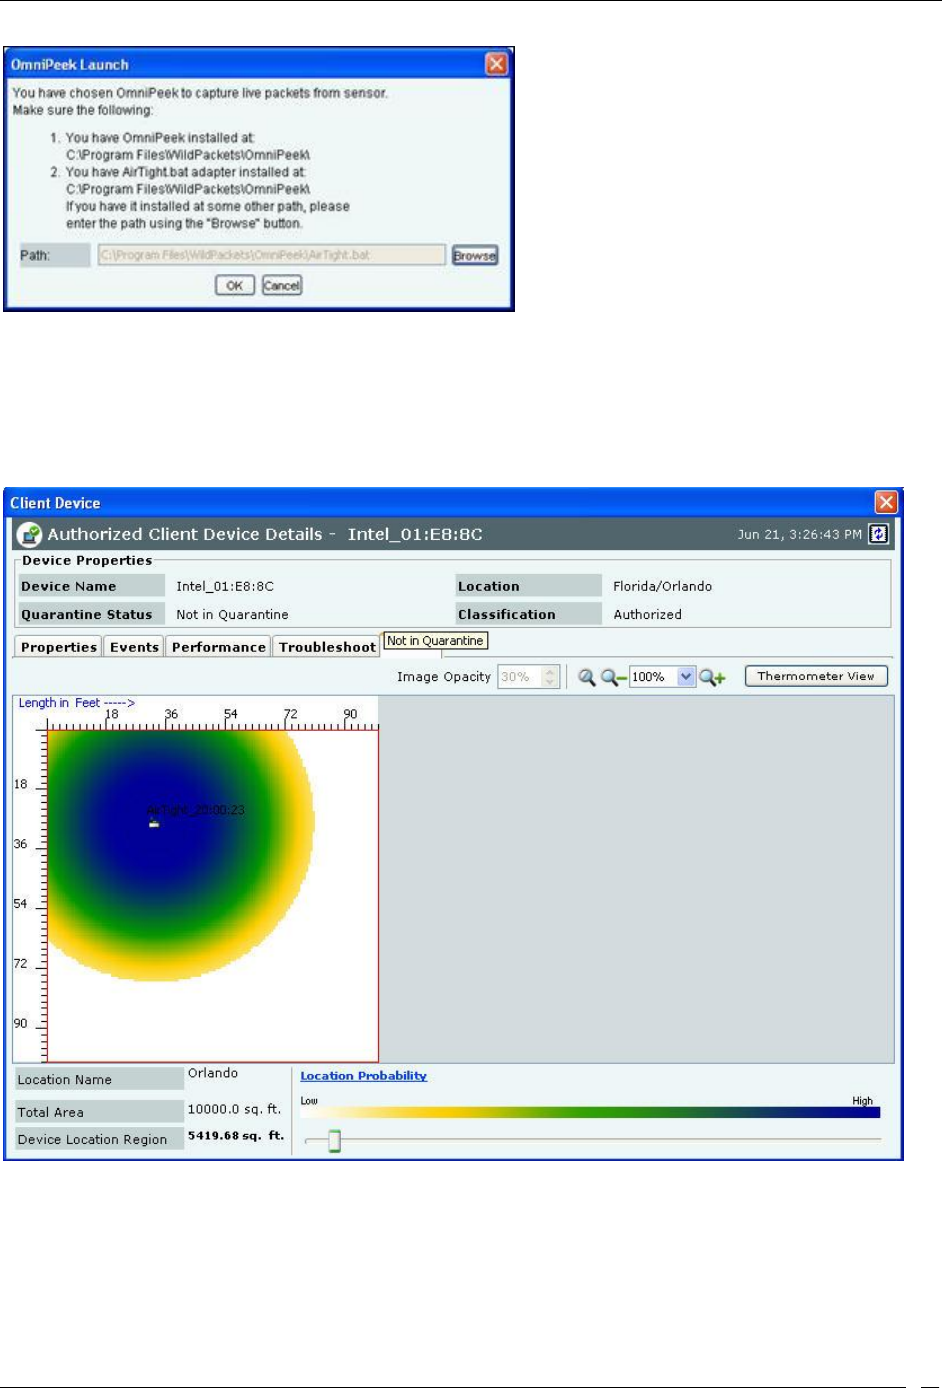
9. If you click OmniPeek, ensure that the application and the OmniPeek Airtight Adapter are correctly
installed. If you have these installed at some other location, click Browse to specify the appropriate
location. The installation location for OmniPeek could be other than the default location, ‘C:\Program
Files\WildPackets\OmniPeek\’.
10. Click OK. The system launches the application and the packet capture session begins immediately.
Alternatively, if you do not have the OmniPeek tool installed, you should install the same with
appropriate purchase from WildPackets Inc. Airtight does not provide installation of OmniPeek.
Devices Tab
SpectraGuard® Enterprise User Guide
63
Launching OmniPeek
Points to note during Troubleshooting
When a troubleshooting session is in progress, a blinking icon appears on the navigation bar.
Once the packet capture based troubleshooting session begins from the Console and the packet capture tool
is either interrupted or terminated (gracefully or abruptly), you have to first stop the ongoing
troubleshooting session from the Console either manually (if it is still going on) or ensure that the session
has indeed ended before you can start another packet capture session. You must then restart the fresh
troubleshooting session from the Console.
If a troubleshooting session is in progress with a chosen tool (Wireshark, OmniPeek, or user specified tool),
another capture from the command prompt, using user specified capture parameters (viz. rpcap://sensor-
ip/iface ) will not succeed from the same or another computer.
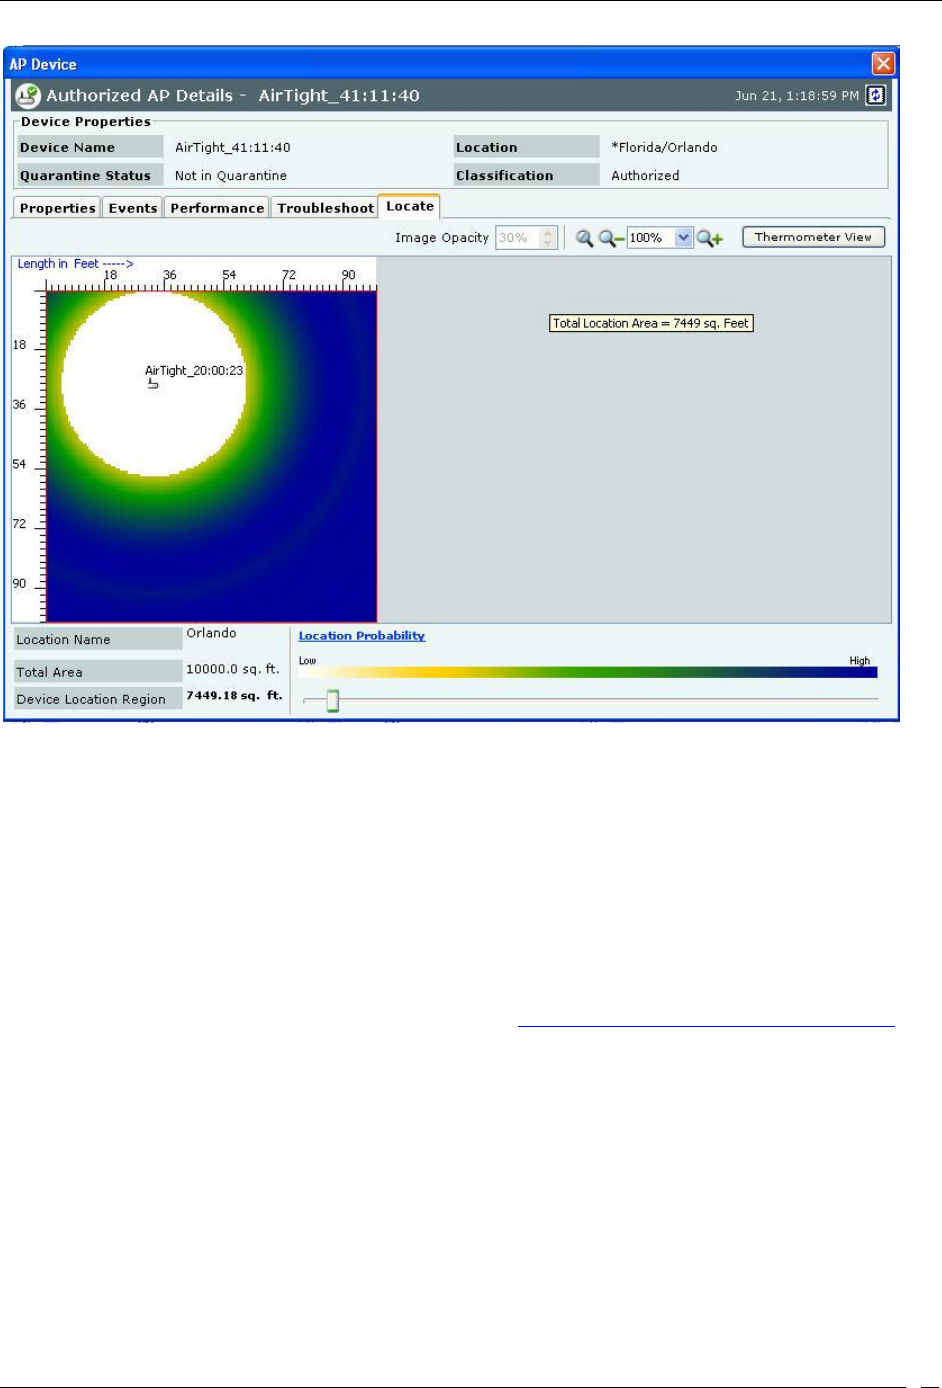
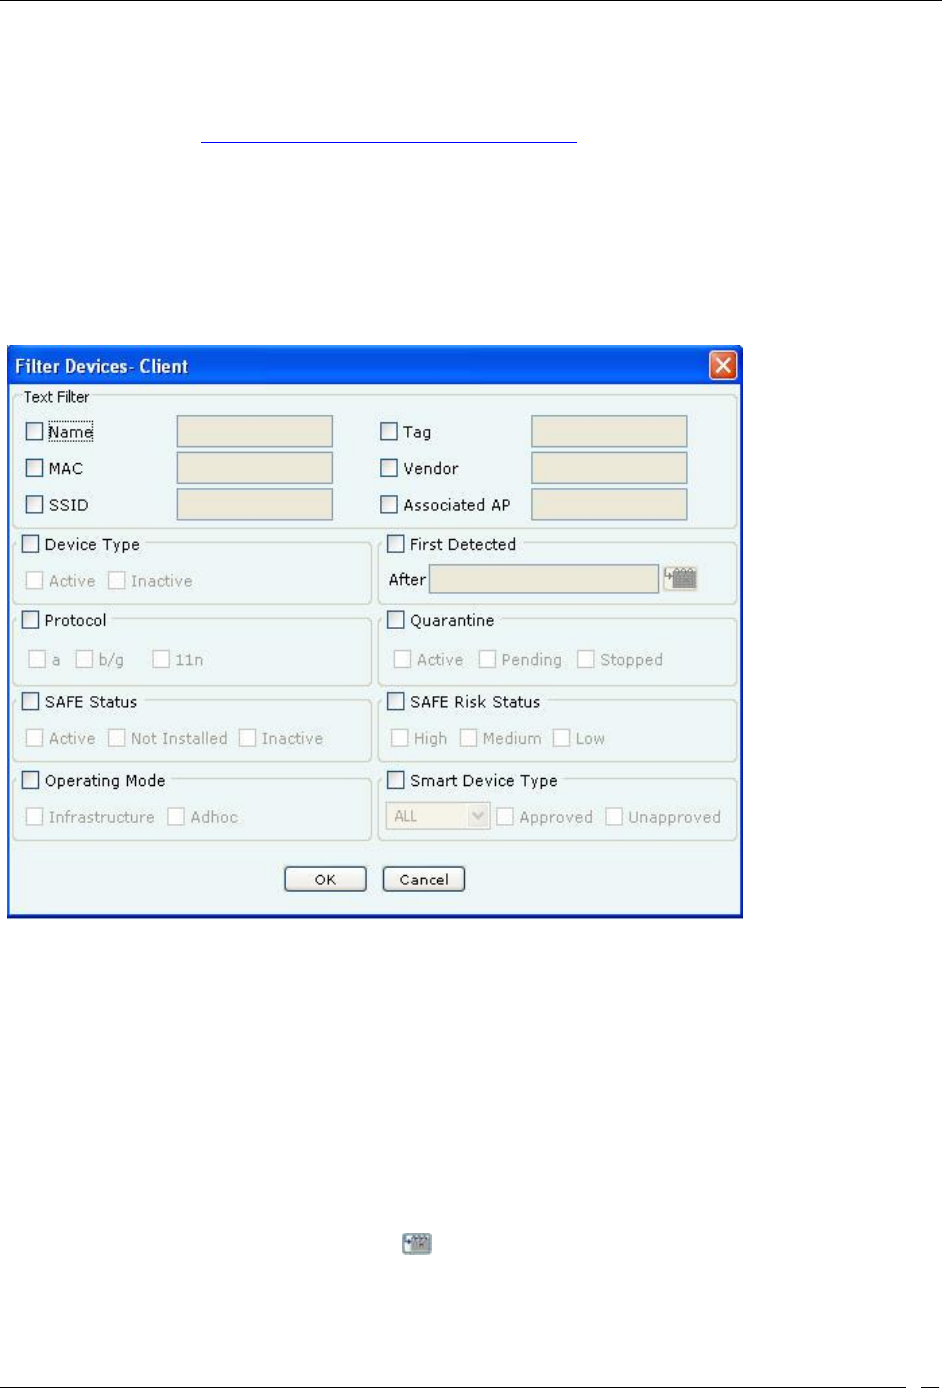
Fields in the AP Locate Tab
To open the AP Locate, on the Devices screen, right-click an AP row and select the Locate menu item. The Floor Map
View of an AP displays the location of the Locating Device, which is the Sensor or Controller monitoring the AP.
Devices Tab
SpectraGuard® Enterprise User Guide
64
AP Locate Tab – Floor Map view
The AP Locate tab enables you to view the following details of an AP.
Monitoring Device Filter:Click the Monitoring Device Filter icon and apply the appropriate filters.
Image Opacity: Displays the percentage opacity of the image
Location Name: Displays the name of the selected location.
Total Area: Displays the total area of the selected location.
Device Location Region: Displays the total area (blue shaded region) shown for the estimated location and
it decreases as the selected location probability criteria increases.
Location Probability: Location Probability defines a lower bound on probability of finding the device in the
blue shaded region.
Click Thermometer View to view the distance from the Locating Device in feet/meter from the
Sensor(s)/Controller to which the AP is visible. Refer to Locating an AP/Client placed on the Floor Map for
details.
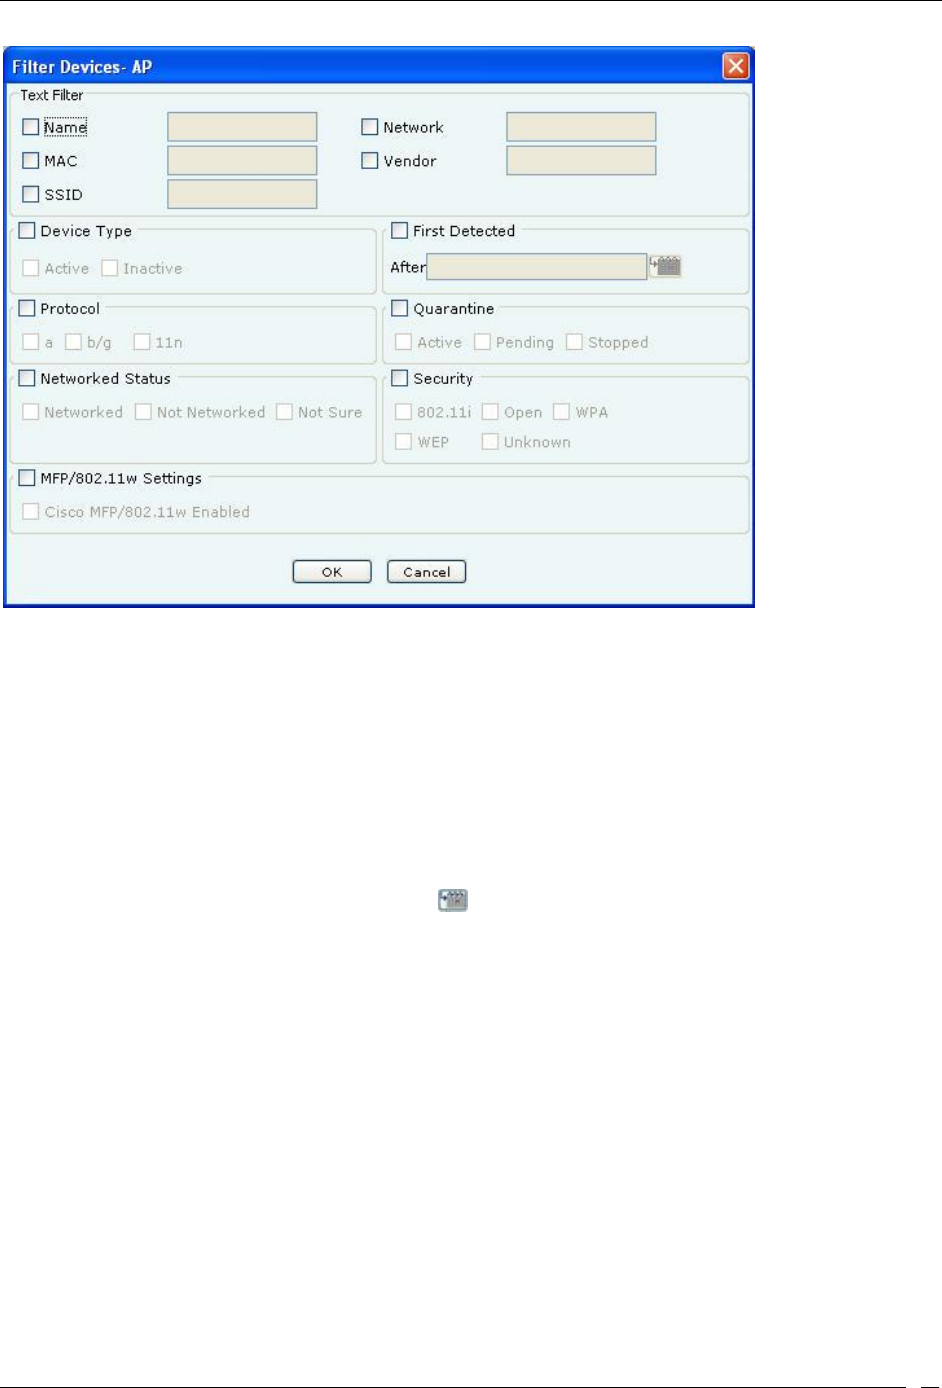
Filtering in APs
To focus your attention to a subset of APs based on a filtering criteria (such as device type, or of network status, and
so on) system provides you with the capability to filter APs. Use the following steps to filter APs:
1. On the Devices screen, click the APs tab and click the Filter icon to open the Filter Devices - AP
dialog.
Devices Tab
SpectraGuard® Enterprise User Guide
65
Filter Devices – AP
2. Under Text Filter, select one or more of the following check boxes and enter the appropriate values
manually for searching data related to it:
Name
MAC
SSID
Network
Vendor
3. Select the Device Type check box, select one or more of the following check boxes:
Active
Inactive
4. Select First Detected check box, click the icon to specify the first detected date and time of the AP
and then click <OK>. The search displays the APs, which were first detected by the system after the
date as specified above.
5. Select theProtocolcheck box, select one or more of the following check boxes:
a
b/g
11n
6. Select the Quarantine check box, select one or more of the following check boxes:
Active
Pending
Stopped
7. Select the Networked Status check box, select one or more of the following check boxes:
Networked
Not Networked
Not Sure
8. Select the Security checkbox, select one or more of the following checkboxes:
802.11i

Devices Tab
SpectraGuard® Enterprise User Guide
66
WPA
Cisco MFP
WEP
Open
Unknown
9. To save and apply the AP filtering criteria, click OK. When the filter is applied it is denoted by Filter
On on the Console, if no filter is applied it is denoted by Filter Off on the Console.
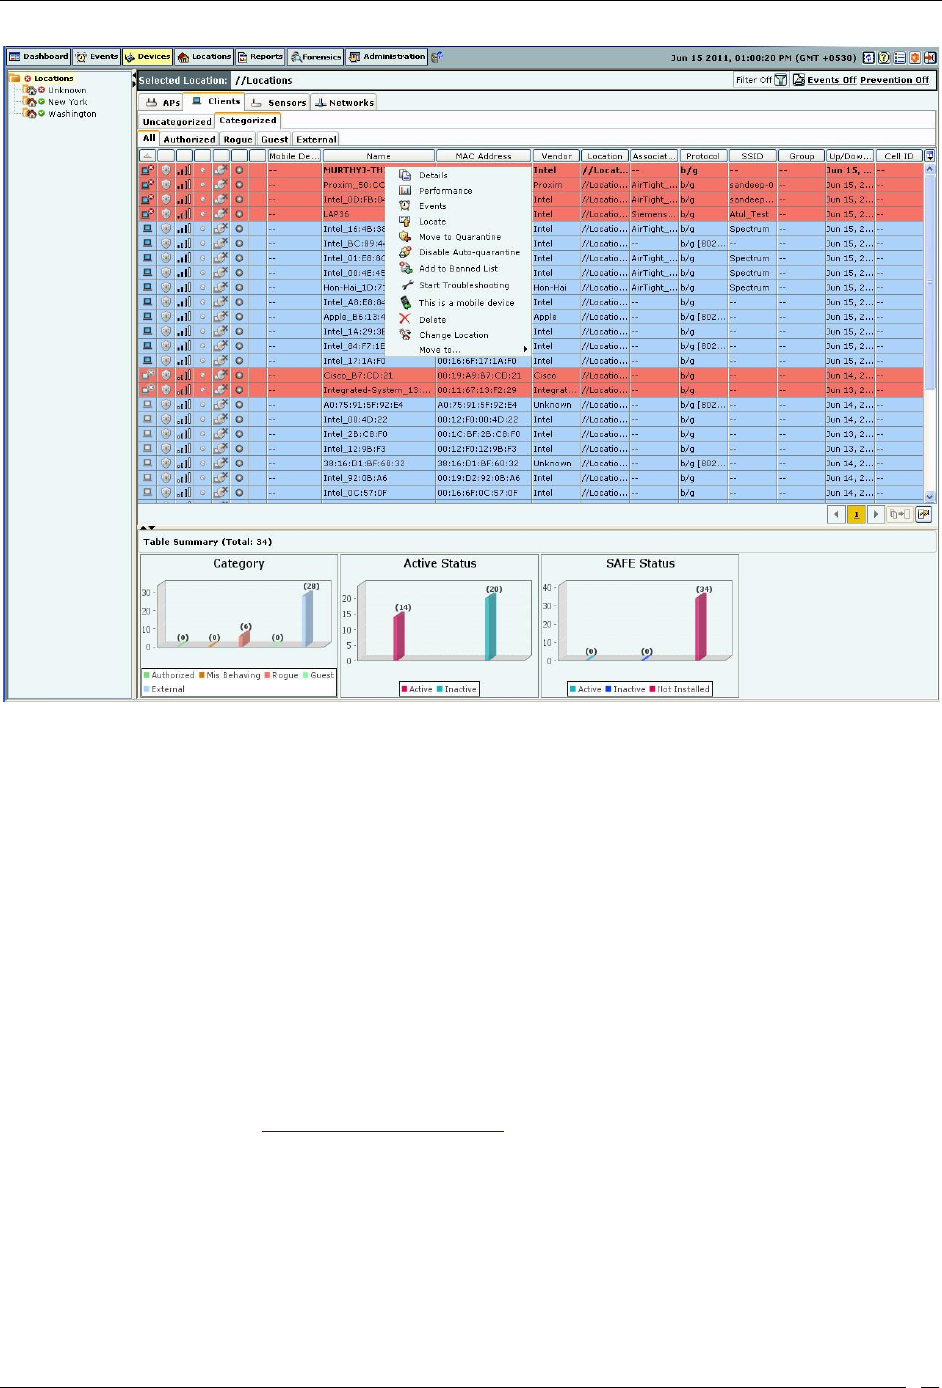
Client Context-Sensitive Menu
A Client is a laptop, a handheld device, or any other system that uses the 802.11 wireless medium for communication.
The context-sensitive menu for Clients enables you to
View client details
Associated events
Performance charts
Edit a Client’s details
Locate a Client
Quarantine a Client
Enable/disable Auto-quarantine on a Client
Troubleshoot a Client
Delete a Client
Change a Client’s location, and category (Authorized, External Guest, Rogue)
Tag/untag a device as a smart device, and/or change smart device type of client device
Method for Opening Client Context-Sensitive Menu
To open a Client context-sensitive menu, click the Devices tab and then right-click a Client row to open the context-
sensitive menu.
Devices Tab
SpectraGuard® Enterprise User Guide
67
Client Context-Sensitive Menu on Devices Screen
Items in the Client Context-Sensitive Menu
The Client context-sensitive menus include the following items.
Details: Opens the Properties tab of the Client Device dialog, which allows you to:
View/Edit the Client’s name
View/Edit Client’s classification
Assign a user-defined location tag so that you can easily locate the Client; the location of a
manually tagged Client is shown with an asterisk (*) under the Location column
Enables you to view Primary details of the Client, Devices seeing Clients Recently
Associated APs/Ad hoc Networks Recently Probed SSIDs
Performance: Opens the Performance tab of the Client Device dialog, which allows you to view
performance graphs for the Client.
Events: Opens the Events tab of the Client Device dialog, which allows you to view events
associated with the Client, so that you can take the necessary actions.
Locate: Opens the Locate tab of the Client Device dialog, which allows you view the Client
Location (see Fields in the Client Locate Tab).
Move to Quarantine: Enables you to block any wireless communication to the Client, that is,
quarantine the Client.
If a Sensor is available, the system automatically selects a defending Sensor for an Authorized
Client. The Quarantine status of the Client is then Quarantined.
If a Sensor is not currently available, the Quarantine status of the Client is Quarantine
Pending. As soon as a Sensor is available, it starts defending the Client. The Client may appear
as Quarantine Pending if it is not currently an active threat (the Client is inactive). The system
keeps quarantining the Client until you manually remove it from quarantine.

Devices Tab
SpectraGuard® Enterprise User Guide
68
Remove from Quarantine: Available only if the Client is manually Quarantined this option
enables you to stop quarantine on the Client, thereby enabling wireless communication.
Enable Auto-quarantine: Enabled by default, this option ensures that the system automatically
quarantines a Client, thereby honoring the specified Intrusion Prevention policy.
Disable Auto-quarantine: This option ensures that the system does not automatically quarantine
a Client (regardless of the policies).
Reset RF Fingerprint: Resets the data transmitted by the Client.
Add to Banned List: Enables you to add the selected Client to the Banned List to prevent the
Client from engaging in wireless communication.
Remove from Banned List: Available only if the Client is already in the Banned List, this option
enables you to remove the selected Client from the Banned List.
Start Troubleshooting: Opens the Troubleshoot tab of the Client Device dialog, which allows
you to start a troubleshooting session in either Packet Level Mode or Event Level Mode. Click
<Start Troubleshooting> to start troubleshooting.
Stop Troubleshooting: Available only if a troubleshooting session is in progress, this option
enables you manually terminate the session.
Delete: Enables you to delete a selected Client.
Change Location: Opens the Location Tag dialog that enables you to view the complete list of
locations, and change the location of the selected Client (see Manual Location Tagging).
Smart Device: Allows you to change the device type or untag the smart device to a regular device.
Move to…: Enables you to categorize a Client in your network by moving it to the Authorized,
External, Guest, or Rogue folder. If you move a Client manually, the system never re-classifies that
Client automatically based on the Client classification policy. To enable automatic re-classification, you
must delete that Client and let the system re-discover it.
Fetch SAFE Report: Available only if a SAFE Client is Active, this option displays a progress bar and
then fetches a fresh report from the SAFE Client.
Change SAFE Group: Enables you to change the SAFE Client group for the selected SAFE Client.
Note: The menu items Fetch SAFE Report and Change SAFE Group are visible only if a SAFE Client connects to the system
at least once. However, if the SAFE Client goes down, Fetch SAFE Report is disabled and Change SAFE Group is enabled. The
Client’s group changes when it next connects to the system.
Client Details Dialog
You can open the Client Details dialog in the following manner:
On the Devices screen, right-click a Client row and select the Details menu item. The Client Details dialog has the
following tabs: Properties, Events, Performance, Troubleshoot, and Locate. By default the Properties tab displays and
is treated as the current tab.
Devices Tab
SpectraGuard® Enterprise User Guide
69
Client Properties Tab
Fields in the Client Properties Tab
The Client Properties tab enables you to view and edit the properties of a Client.
Under Client Properties, you can modify the following:
Client Name: Client name field displays the name of the client, derived from the MAC address, by default.
Host name of the client is displayed, if it is available to the system. Click and specify the name used to
identify the Client in the Client Name dialog. Click <Save>. The new Client name automatically displays in
the Device Name field in the header of Client Details dialog.
Client Name Dialog
Note: While upgrading to SGE 6.6or above, from an older version, the manually assigned client names, if any, are retained.
User Name: User name field displays the login name of the user who has logged in to the client
machine. This is a non-editable field.
Classification: Specifies the classification of the Client – Authorized, Rogue, Guest, or External.
Devices Tab
SpectraGuard® Enterprise User Guide
70
Click to open the Client Classification dialog. Here, you can change the Client classification to
Authorized, Rogue, Guest, or External. Click <OK> to move the Client to the selected folder. The
changed Client classification automatically displays in the Classification field in the header of Client
Details dialog.
Client Classification Dialog
Device Tag: Click to open the Device Tag dialog. Specify text that provides additional
information about the Client.
Client Device Tag Dialog
MAC Address: Specifies the unique 48-bit IEEE format address of the Client assigned to the network
adapter by the manufacturer.
Banned Status: Indicates if the Client is in the Banned Client List.
Location: Enables you to view the name of the Client’s usual location.
Click to open the Location Tag dialog. Here, you can view the complete list of locations and choose a
location for the Client. To view the list of locations, you must first set up your list of locations on the
Locations screen as explained in the section, Working with Location Folders and Location Nodes. The
changed location automatically displays in the Location field in the header of Client Details dialog.
Client Location Dialog
Devices Tab
SpectraGuard® Enterprise User Guide
71
Placed on Floormap?: Indicates if the Client is placed on the floor map.
Currently Active?: Indicates if the Client is currently active.
Up/Down Since: Specifies the time since the Client is up/down.
Mode of Operation: Specifies whether the Client is connected to an AP (Infrastructure mode) or to
a peer-to-peer network (Ad hoc mode).
Ad hoc Cell ID: Specifies the unique ID of the ad hoc network connection of which the selected
Client is a member.
IP Address: Specifies the IP address for an Authorized or Indeterminate Client.
Vendor: Specifies the name of the Client manufacturer. The vendor name is inferred from the first
three bytes of the MAC address.
Protocol: 802.11 protocol in which the Client is operating currently.
Channel: Specifies the channel number on which the Client operates.
Security: Shows the security settings for the Client that is Open, WEP, WPA, and so on.
Quarantine Status: Specifies whether the Client is quarantined. Click to quarantine the
selected Client if a Sensor is available. If a Sensor is not available, the Quarantine Status of the
Client is Quarantine Pending. The changed quarantine status automatically displays in the
Quarantine Status field in the header of Client Details dialog.
Note: If the Client is quarantined a <Remove from Quarantine> button appears in the Client Properties tab. Click <Remove
from Quarantine> to view an Information message and to enable wireless communication to the Client.
Defending Sensor: If a Client is quarantined, it specifies the name of the Sensor that is actively
preventing the Client from engaging in wireless communication.
Network: Shows additional information about the IP Address and subnet that identifies the
network on which the Client is located.
Associated to AP: Specifies the AP’s BSSID to which the Client is associated to. This field appears
only for the Merged APs.
Bridging/ICS mode: Indicates if the Client is in Bridging/ICS mode.
First Detected At: Specifies the date and time when the Client was first detected by the system.
SpectraGuard SAFE Properties: Displays the properties for the selected SpectraGuard SAFE Client
First Name
Last Name
Hostname
Email
SAFE Version
SAFE Build
Activation Date
Wireless Risk Level
SpectraGuard SAFE status
Note: SAFE Details are visible for only those Clients that have SAFE installed.
To add the selected Client to the Banned List, click . This is available only for non-authorized Clients.
To delete data for the selected Client and re-initialize data gathering, click .
To refresh the Client Details screen, manually click . The system does not auto refresh Client Details dialog.
Devices Seeing Client Section
Under Device Seeing Client, you can view a list of devices (which could be either Clients or Sensors) that can see the
selected Client. The details of these devices such as Device Active/Inactive icon, Name and RSSI of the Client seen by
Devices Tab
SpectraGuard® Enterprise User Guide
72
that device are displayed in the rows. To view details of a specific Device seeing the current Client, click Name, and a
new Client Details or Sensor Details dialog appears.
Note: Total gives the total number of devices seeing the Client.
Recently Associated APs/Ad hoc Networks Section
Under Recently Associated APs/Ad hoc Networks, you can view a list of APs/Ad hoc networks to which the Client
was associated to. APs/Ad hoc Network details such as AP/Ad hoc Network Active/Inactive icon, AP Name/Ad hoc
ID, SSID, Last Detected At (which shows the date and time or Present, Present when the association is currently
active.) are displayed in the rows. The criteria for Recent Association is either 12 hours or 100 thousand APs/Ad hoc
Networks (this is the total number of associations in the system and not per device). To view details of a specific
AP/Ad hoc Network or the AP, click AP Name/Ad hoc ID, and the AP Details screen/Ad hoc Networks screen
opens.
The following table lists the Recently Associated APs/Ad hoc Networks rows, their conditions, and color code.
Mode, Condition, and Color code of Recently Associated APs/Ad hoc Networks
Mode
Condition
Color
Infrastructure
AP is Authorized Non Guest and Client Authorized
GREEN
AP is External and Client is Unauthorized
BLUE
AP is Authorized Guest and Client is Non-
authorized/Uncategorized
BLUE
AP is Deleted or Client is Deleted
WHITE
AP is Uncategorized and Client is Non-authorized/Uncategorized
WHITE
AP is External and Client is Uncategorized
WHITE
AP is Mis-configured
RED
AP is Banned or Client is Banned
RED
Client is Authorized and AP is Authorized
GREEN
Client is Authorized and AP is Potentially Authorized
GREEN
Client is Authorized and AP is Misconfigured Authorized
RED
Client is Authorized and AP is Guest
RED
Client is Authorized and AP is External
RED
Client is Authorized and AP is Potentially External
RED
Client is Authorized and AP is Rogue
RED
Client is Authorized and AP is Potentially Rogue
RED
Client is Authorized and AP is Indeterminate
RED
Client is Guest and AP is Authorized
RED
Client is Guest and AP is Potentially Authorized
RED
Client is Guest and AP is Guest
GREEN
Client is Guest and AP is External
WHITE
Client is Guest and AP is Potentially External
WHITE
Client is Guest and AP is Rogue
RED
Client is Guest and AP is Potentially Rogue
RED
Client is Guest and AP is Indeterminate
RED
Client is Rogue and AP is Authorized
RED
Client is Rogue and AP is Potentially Authorized
RED
Client is Rogue and AP is Guest
RED
Client is Rogue and AP is External
RED
Client is Rogue and AP is Potentially External
RED
Client is Rogue and AP is Rogue
RED
Client is Rogue and AP is Potentially Rogue
RED
Client is Rogue and AP is Indeterminate
RED
Devices Tab
SpectraGuard® Enterprise User Guide
73
Client is External and AP is Authorized
RED
Client is External and AP is Potentially Authorized
RED
Client is External and AP is Guest
RED
Client is External and AP is External
WHITE
Client is External and AP is Potentially External
WHITE
Client is External and AP is Rogue
RED
Client is External and AP is Potentially Rogue
RED
Client is External and AP is Indeterminate
WHITE
Client is Uncategorized and AP is Authorized
RED
Client is Uncategorized and AP is Potentially Authorized
RED
Client is Uncategorized and AP is Guest
WHITE
Client is Uncategorized and AP is External
WHITE
Client is Uncategorized and AP is Potentially External
WHITE
Client is Uncategorized and AP is Rogue
RED
Client is Uncategorized and AP is Potentially Rogue
RED
Client is Uncategorized and AP is Indeterminate
WHITE
Ad hoc
Client is Non-authorized/Uncategorized
BLUE
Client is Banned
RED
Note: Default row color is RED for both Infrastructure and Ad hoc mode.
Recently Probed SSIDs
Under Recently Probed SSIDs, you can view list of SSIDs which the Client has probed. Probed SSID details are
presented in rows containing the columns: SSID column which shows the SSID and Detail column which provides
additional details about the SSID in terms of being in the Vulnerable/HotSpot SSID list or not.
If SSID is present in HOTSPOT or Vulnerable list of SSIDs then it is marked in Red, otherwise it is marked in white.
Fields in the Client Events Tab
To open the Client Events tab on the Devices screen right-click a Client row and select the Events menu item
Devices Tab
SpectraGuard® Enterprise User Guide
74
Client Events Tab
The Client Events tab enables you to view the events details of a Client
For the columns in the Events details screen, refer to the Events Tab chapter for more details.
Check the Click to select or deselect all Events checkbox to select all the Events displayed on that page.
Click Delete to delete the selected events.
Click Acknowledge to add comments for the selected events.
Fields in the Client Performance Tab
To open the Client Performance tab on the Devices screen right-click a Client row and select the Performance menu
item
Devices Tab
SpectraGuard® Enterprise User Guide
75
Client Performance Tab
The Client Performance tab enables you to view the data related to Client performance in chart form.
Line Charts are shown on the Performance Tab. Choose one of the Chart types available from the Select Chart drop-
down list:
Average Data Rate: Sensor keeps track of transmission rates of data frames in Client’s associations (across
multiple associations if that is the case) and reports weighted average transmission rate over each time
interval.
Traffic: Sensor reports data traffic sent and received by Client (across multiple associations if that is the case)
over each time interval. The channel-rotating Sensor spends only a percentage of total time on any given
channel; therefore this parameter typically underestimates the actual traffic by a factor equal to the total
number of channels scanned by the Sensor radio. For example, if b/g radio on the Sensor scans 11 channels
in all, the measured traffic will be about 1/11th of the actual traffic if the traffic is continuous. Similarly, if a
radio on the Sensor scans 30 channels in all, the measured traffic will be about 1/30th of the actual traffic.
However, if the traffic comes in bursts, straightforward scaling as above cannot be applied.
Click to view enlarged Chart on the left hand side. Click to view enlarged Chart on the right hand side.
Fields in the Client Troubleshoot Tab
To open the Client Troubleshoot tab on the Devices screen right-click a Client row and select the Start
Troubleshooting menu item.
Devices Tab
SpectraGuard® Enterprise User Guide
76
Packet Level Troubleshooting for an Client
1. Select the Troubleshooting Mode and set the corresponding Timeout interval. If you select Packet
Level Troubleshooting, ensure that the Sensor used for troubleshooting is reachable from the computer
used to launch the Console.
Note: A troubleshooting session automatically times out or terminates after the Timeout irrespective of the activity. You can
manually stop troubleshooting from the device context-sensitive menu by selecting Stop Troubleshooting or from the
Troubleshooting tab by clicking <Stop Troubleshooting>.
2. Under Sensor Selection, select the Sensor to use for troubleshooting. Sensor Status appears as Normal
Operation, Busy in Quarantine, or Busy in Troubleshooting. Within each category, Sensors are sorted based
on availability and signal strength.
Note: Do not select a Sensor that is Busy in Quarantine or Busy in Troubleshooting. If you select a Sensor that is Busy in
Quarantine, the troubleshooting operation fails.
3. Under Protocol and Channel Selection:
If the Client is associated to an AP, by default the Client troubleshoots on the Protocol (802.11an or
802.11b/gn) and Channel of the AP on which the Client is associated.
If the Client is not associated to any AP, then by default both the protocols 802.11an and
802.11b/gn are selected and Rotate on all channels is selected. The user can also select the 802.11n
protocol, the corresponding channel(s) and width on which the chosen Sensor should initiate
troubleshooting.
Note: A Configuration template is assigned to each Sensor. The Channels list contains only those channels enabled for scanning
in that Configuration template. If no channel in a Protocol is enabled, then the Protocol option is disabled. Thus, the Channels
list and the status of the Protocol checkboxes change with the Sensor selected.
4. Under Packet Selection, choose to view all the packets visible to the selected Sensor or only the packets
from the selected device visible to the Sensor.
Devices Tab
SpectraGuard® Enterprise User Guide
77
5. Click <Start Troubleshooting> to begin the session. If the Sensor is assigned a Configuration template,
where no channels are selected for scanning, an error message displays.
Packet Level Troubleshooting Confirm Dialog
6. On the Confirm dialog, you may have two or three packet capture tool options, depending on the
licensing agreement with AirTight Inc. Select a packet capture tool. If you have a product license that
has OmniPeek support, you have three packet capture tool options – Wireshark, OmniPeek, and ‘Other’.
If you have a product license that does not have OmniPeek support, you have two packet capture tool
options – Wireshark and ‘Other’. Select the ‘Other’ option for other tools that you can use to capture
packets. Typical packet capture tools are Tcpdump, Ethereal, Wireshark, OmniPeek, and others. You
must use Tcpdump and Ethereal with Rpcap support. Tcpdump, Ethereal, and Wireshark are available
freely on the Internet.
7. If you click <Wireshark>, and the application is installed correctly, the system launches the application
and the packet capture session begins immediately. Alternatively, if you do not have Wireshark
installed, an Error dialog appears.
Devices Tab
SpectraGuard® Enterprise User Guide
78
System unable to Launch Wireshark Dialog
8. On the Error dialog, there are three possibilities:
You can download and install Wireshark and optionally install WinPcap. Wireshark requires a
compatible version of WinPcap. If the installed version and expected version mismatch, you need
to install the suggested and expected version of WinPcap.
If the system does not find Wireshark installed at the default location, ‘C:\Program
Files\Wireshark’, Wireshark is not launched automatically. To launch Wireshark manually, click
Browse to specify the appropriate location and click OK.
To launch Wireshark manually from the command prompt, you need to copy and paste the link to
set up a direct connection with the Sensor and view live packets.
9. If you click OmniPeek, ensure that the application and the OmniPeek Airtight Adapter are correctly
installed. If you have these installed at some other location, click Browse to specify the appropriate
location. The installation location for OmniPeek could be other than the default location, ‘C:\Program
Files\WildPackets\OmniPeek\’.
10. Click OK. The system launches the application and the packet capture session begins immediately.
Alternatively, if you do not have the OmniPeek tool installed, you should install the same with
appropriate purchase from WildPackets Inc. Airtight does not provide installation of OmniPeek.
Devices Tab
SpectraGuard® Enterprise User Guide
79
Launching OmniPeek
Fields in the Client Locate Tab
To open the Client Locate tab, on the Devices screen, right-click a Client row and select the Locate menu item. The
Floor Map View of a Client displays the location of the Locating Device which shows the probable location of the
Client on the floor map, if the Sensor monitoring the Client is on the floor map.
Client Locate Tab – Floor Map View
The Client Locate tab enables you to view the following details of a Client.
Monitoring Device Filter
Image Opacity
Location Name
Total Area
Devices Tab
SpectraGuard® Enterprise User Guide
80
Device Location Region
Location Probability
Click Thermometer View to view the distance from Locating Device in feet/meter from the Sensor(s) to which the
Client is visible. Refer to Locating an AP/Client placed on the Floor Map for details.
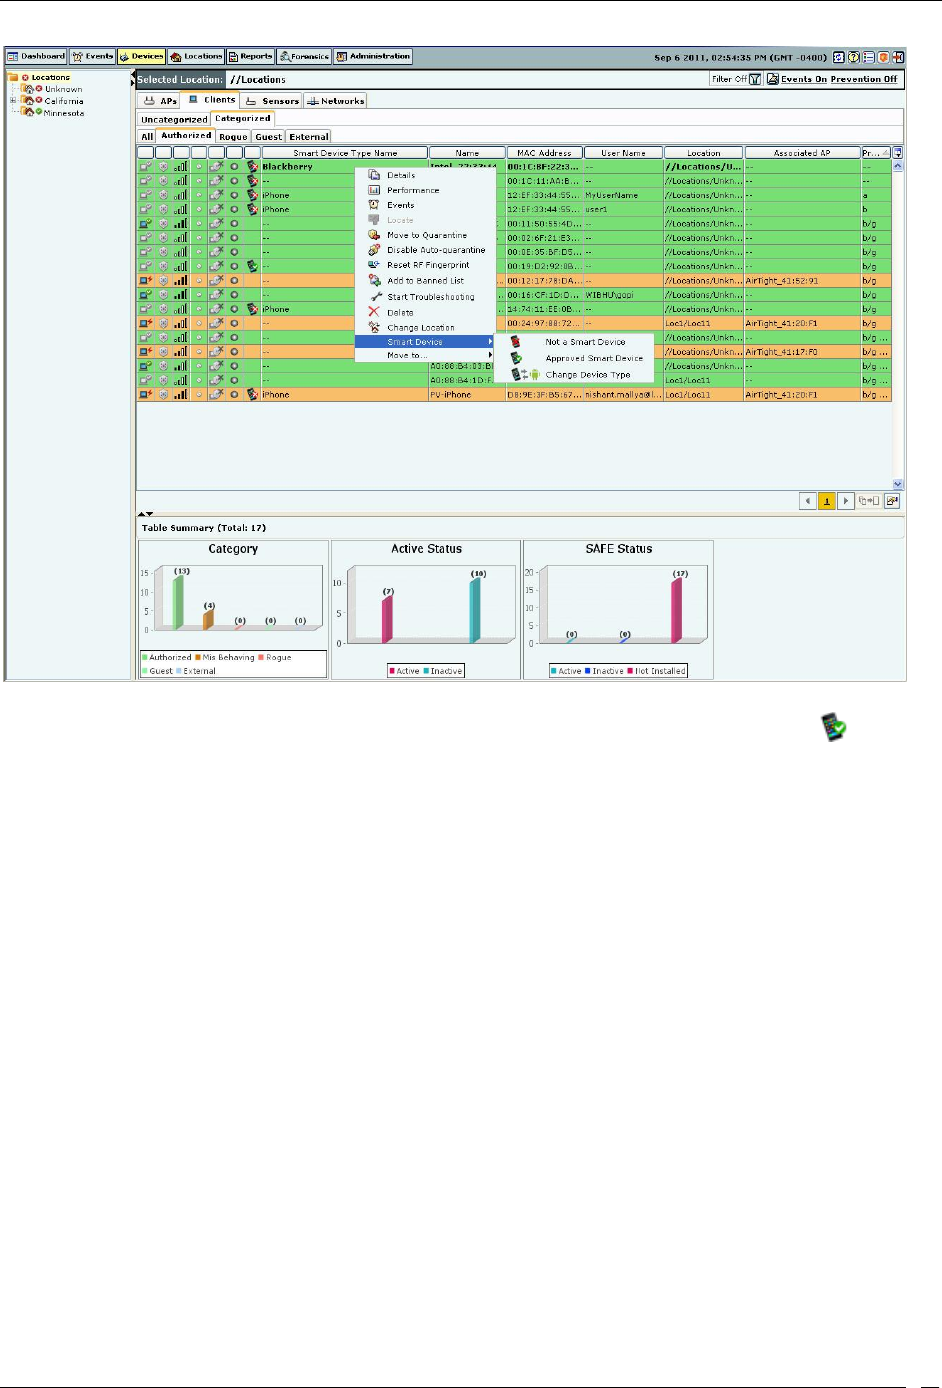
Filtering in Clients
To focus your attention to a subset of Clients based on a filtering criteria (such as device type, or protocol, and so on)
system provides you with the capability to filter Clients. Use the following steps to filter Clients:
1. On the Devices screen, click the Clients tab and click the Filter icon to open the Filter Devices -
Client dialog.
Filter Devices - Client
2. Under Text Filter, select one or more of the following checkboxes and enter the appropriate values
manually for searching data related to it:
Name
MAC
SSID
Tag
Vendor
Associated AP
3. Select the Device Type check box, select one or more of the following check boxes:
Active
Inactive
4. Select First Detected check box, click the icon to specify the first detected date and time of the Client
and then click <OK>. The search displays the Clients, which were first detected by the system after the date
as specified above.
5. Select the Protocol check box, select one or more of the following check boxes:

Devices Tab
SpectraGuard® Enterprise User Guide
81
a
b/g
11n
6. Select the Quarantine check box, select one or more of the following check boxes:
Active
Pending
Stopped
7. Select the SAFE Status check box, select one or more of the following check boxes:
Active
Not Installed
Inactive
8. Select the SAFE Risk Status check box, select one or more of the following check boxes:
High
Medium
Low
9. Select the Operating Mode check box, select one or more of the following check boxes:
Infrastructure
Ad hoc
10. Select the Smart Device Type check box, select the smart device type from the list, and select one of
Approved, Unapproved or both Approved as well as Unapproved.
11. To save and apply the Client filtering criteria, click OK. When the filter is applied it is denoted by Filter
On on the Console, if no filter is applied it is denoted by Filter Off on the Console.
Smart Device Detection
A smart device is a wi-fi and internet enabled, high-end, handheld digital device. Some smart devices can be used in
place of a laptop or a personal computer. The system can detect smart devices automatically. The smart device
detection feature is useful when it comes to defining the intrusion prevention policy. It also helps to know how
many smart devices are in the network.
The system automatically detects iPhone, i PodTouch, iPad, Blackberry, Android, Nokia, Motorola, Samsung, and
HTC smart devices. The system detects smart devices that are authorized or guest clients only. You can also
manually tag an authorized client or a guest client as a smart device. Authorized clients can be further classified as
approved or unapproved smart devices. There is no such distinction in case of guest clients.
When an authorized smart device is detected automatically for the first time, it is shown on the UI as an unapproved
smart device, by default. You can manually tag an authorized smart device as an approved smart device. When a
guest smart device is detected automatically for the first time, it is shown on the UI as a smart device.
The smart device for some of the device types can also get detected based on the Organizational Unique Identifier
(OUI) of the MAC address of the individual devices. You can set, modify,or delete the OUIs through the server
command line interface, using the set smart device oui command. For details on the command, refer to the 'Server
Config Shell Commands' section in the 'Config Shell Commands' chapter in the Installation Guide.
The following sections describe how to manually tag/untag smart devices.
Manually tagging authorized clients as smart devices
You can manually tag one or more authorized clients as smart devices, if they have not already been detected as
smart devices automatically.
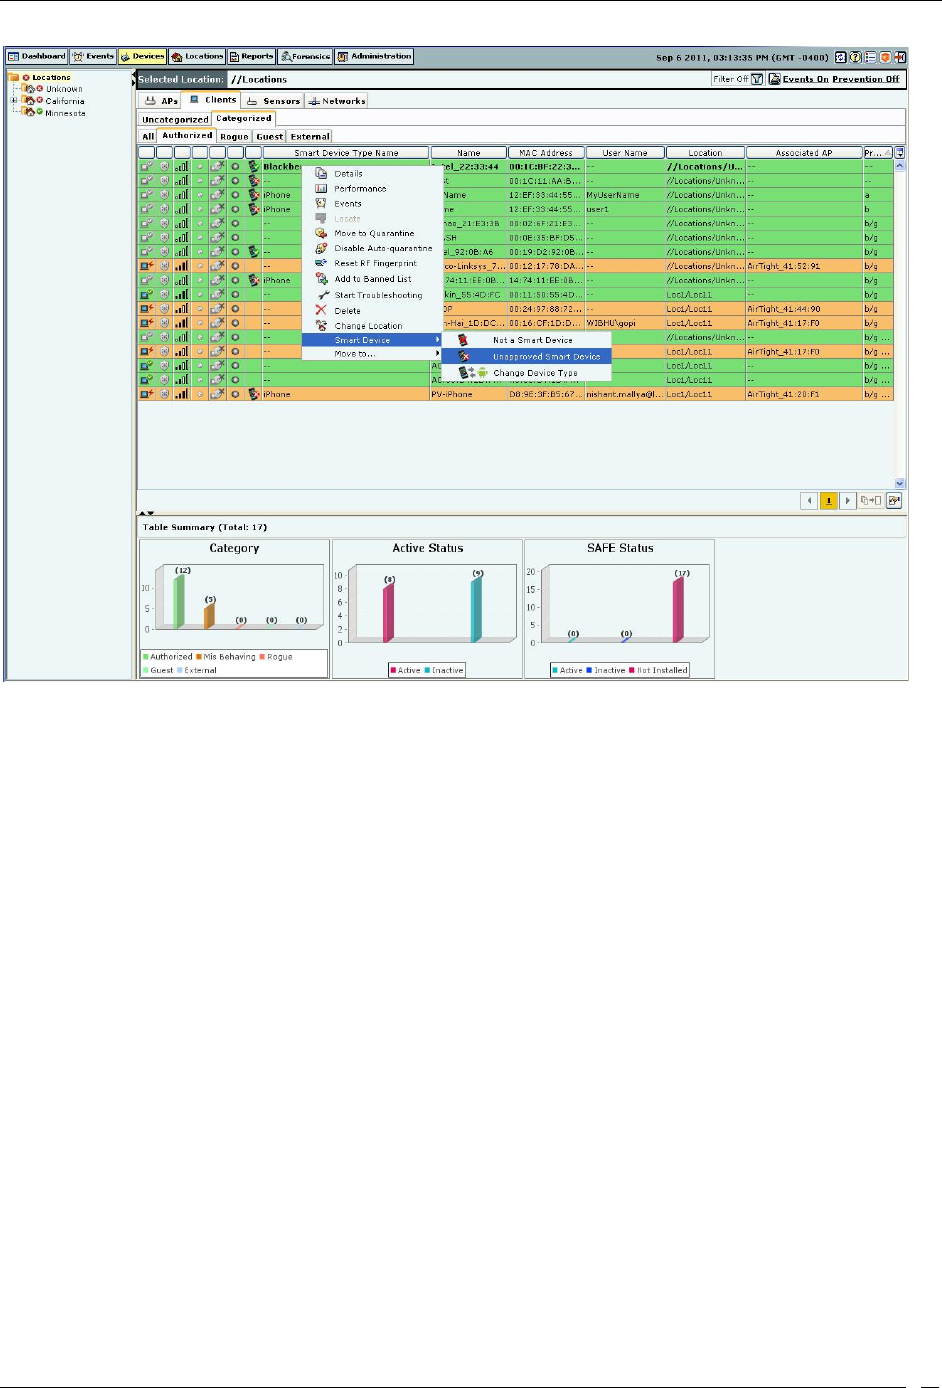
Tagging an authorized client as an approved smart device
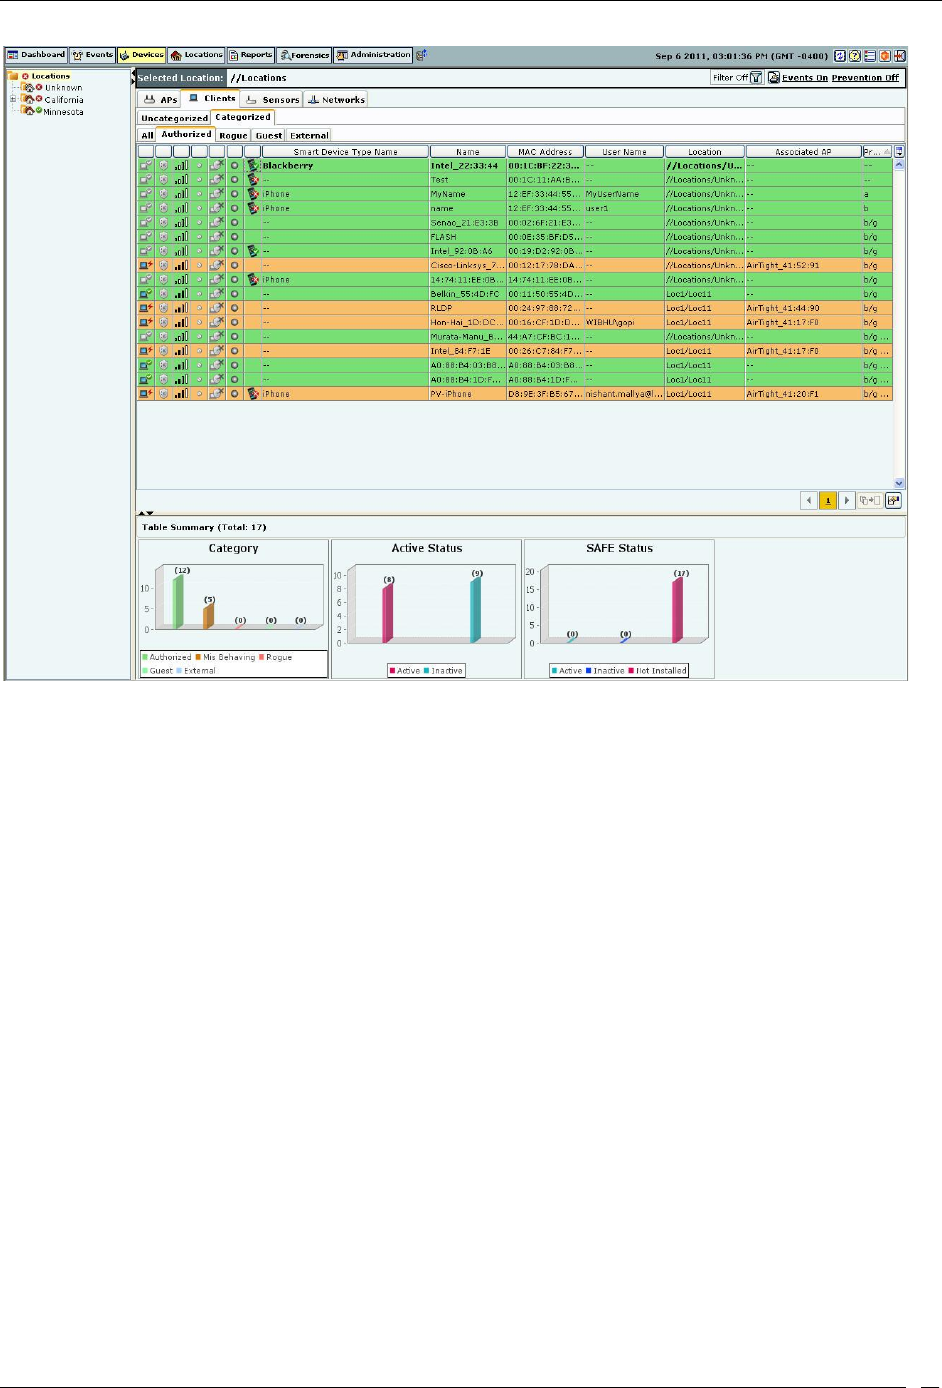
Under Devices->Clients->Categorized->Authorized tab, click to select the client row to be tagged as an approved
smart device. Right-click this row to view the menu. Click Smart Device->Approved option to tag the client as an
approved smart device. Follow the same procedure to tag an unapproved smart device as an approved smart device.
The following figure shows the right-click menu options.
Devices Tab
SpectraGuard® Enterprise User Guide
82
Tagging an Authorized Client as a Smart Device
The following figure shows the approved smart device. An approved smart device is indicated by the icon.
Devices Tab
SpectraGuard® Enterprise User Guide
83
Approved smart device
Tagging an authorized client as an unapproved smart device
Under Devices->Clients-> Categorized->Authorized tab, click the client row to be tagged as an unapproved smart
device. Right-click this row and click the Smart Device->Unapproved option to tag the client as an unapproved smart
device. To tag multiple clients at the same time, hold down the <Ctrl> key and click the desired rows one by one.
Follow the same procedure to tag an approved smart device as an unapproved smart device.
The following figure shows the menu option for unapproved smart device.
Devices Tab
SpectraGuard® Enterprise User Guide
84
Tagging a Client as Unapproved Smart Device
The following figure shows the unapproved smart device.

Devices Tab
SpectraGuard® Enterprise User Guide
85
Unapproved smart device
An unapproved smart device is indicated by the icon.
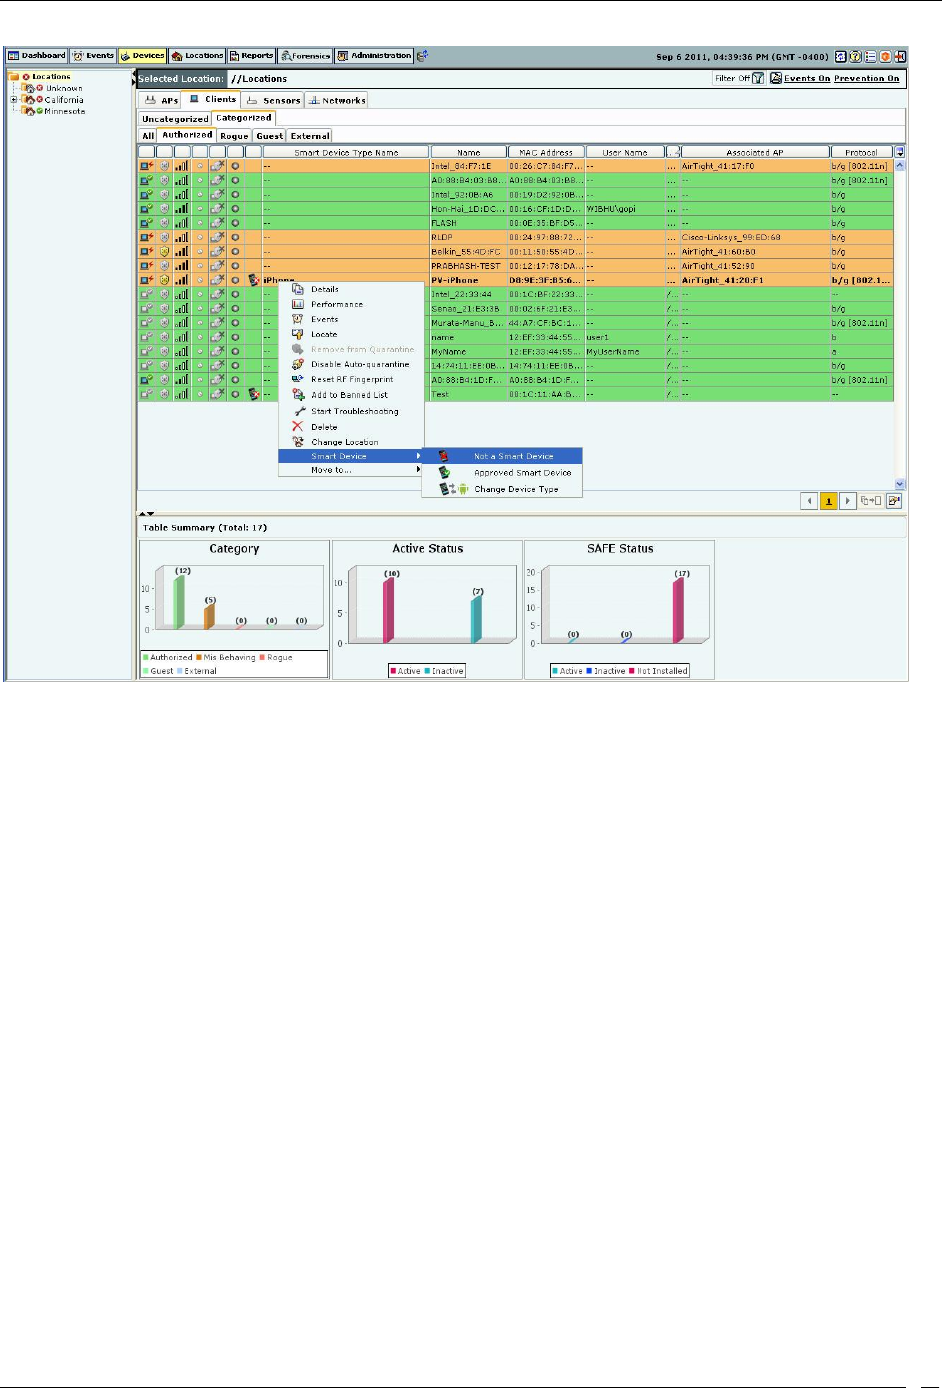
Removing the smart device tag for authorized clients
Under Devices->Clients-> Categorized->Authorized tab, click the smart device (client) row to be untagged. Right-
click this row and click the Smart Device->Not a Smart Device option to remove the smart device tag from the client
device. To tag multiple clients at the same time, hold down the <Ctrl> key and click the desired rows one by one.
The following figure shows the menu option to be selected to remove the smart device tag for authorized clients.
Devices Tab
SpectraGuard® Enterprise User Guide
86
Remove the smart device tag
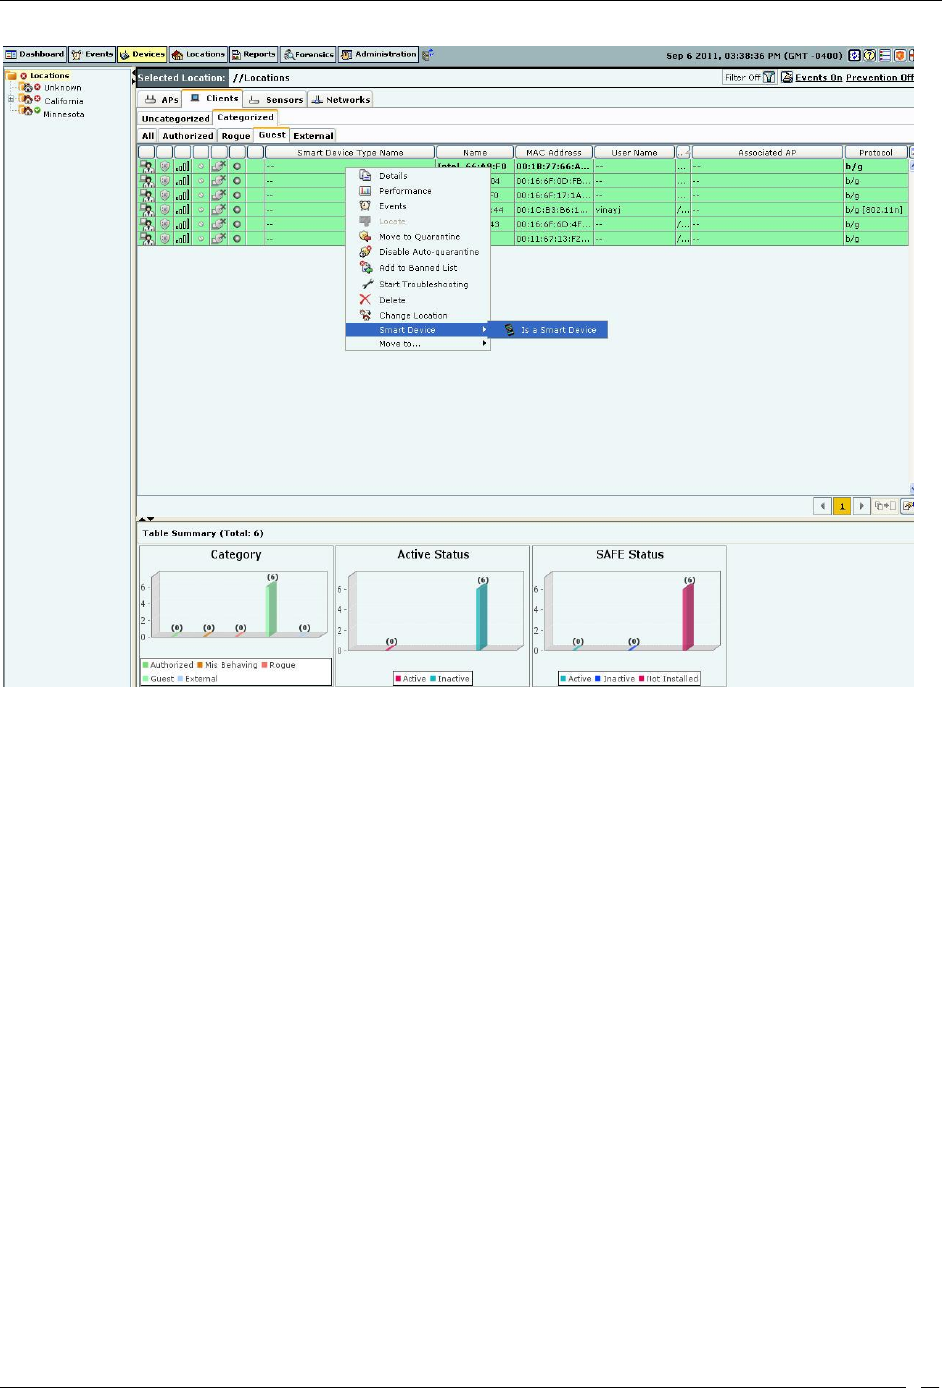
Manually Tagging Guest clients as Smart Devices
You can manually tag one or more guest clients as smart devices, if they have not already been detected as smart
devices automatically. Under Devices ->Clients-> Categorized->Guest tab, click the client row to be selected. Right-
click this row and click the Is a Smart Device option to tag the client as a smart device.
Devices Tab
SpectraGuard® Enterprise User Guide
87
Tagging a Guest Client as a smart device
Removing the smart device tag from guest clients
You can manually remove the smart device tag from a guest client. Follow the steps given below.
1. Under Devices->Clients->Categorized->Guest, click to select the client row.
2. Right-click this row and select Smart Device->Not a Smart Device to remove the smart device tag.
Devices Tab
SpectraGuard® Enterprise User Guide
88
Untagging a smart device
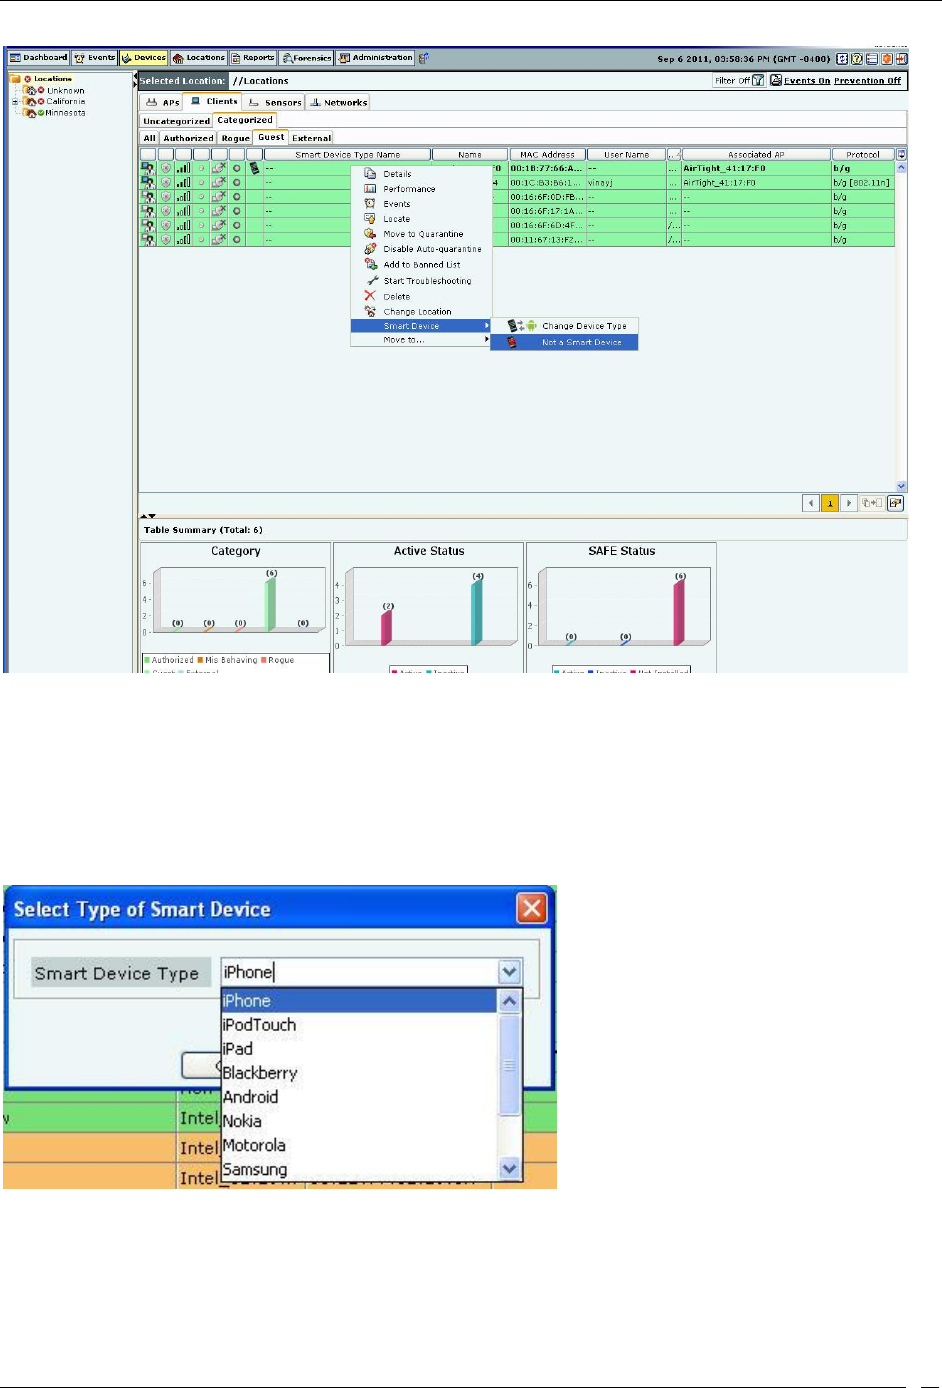
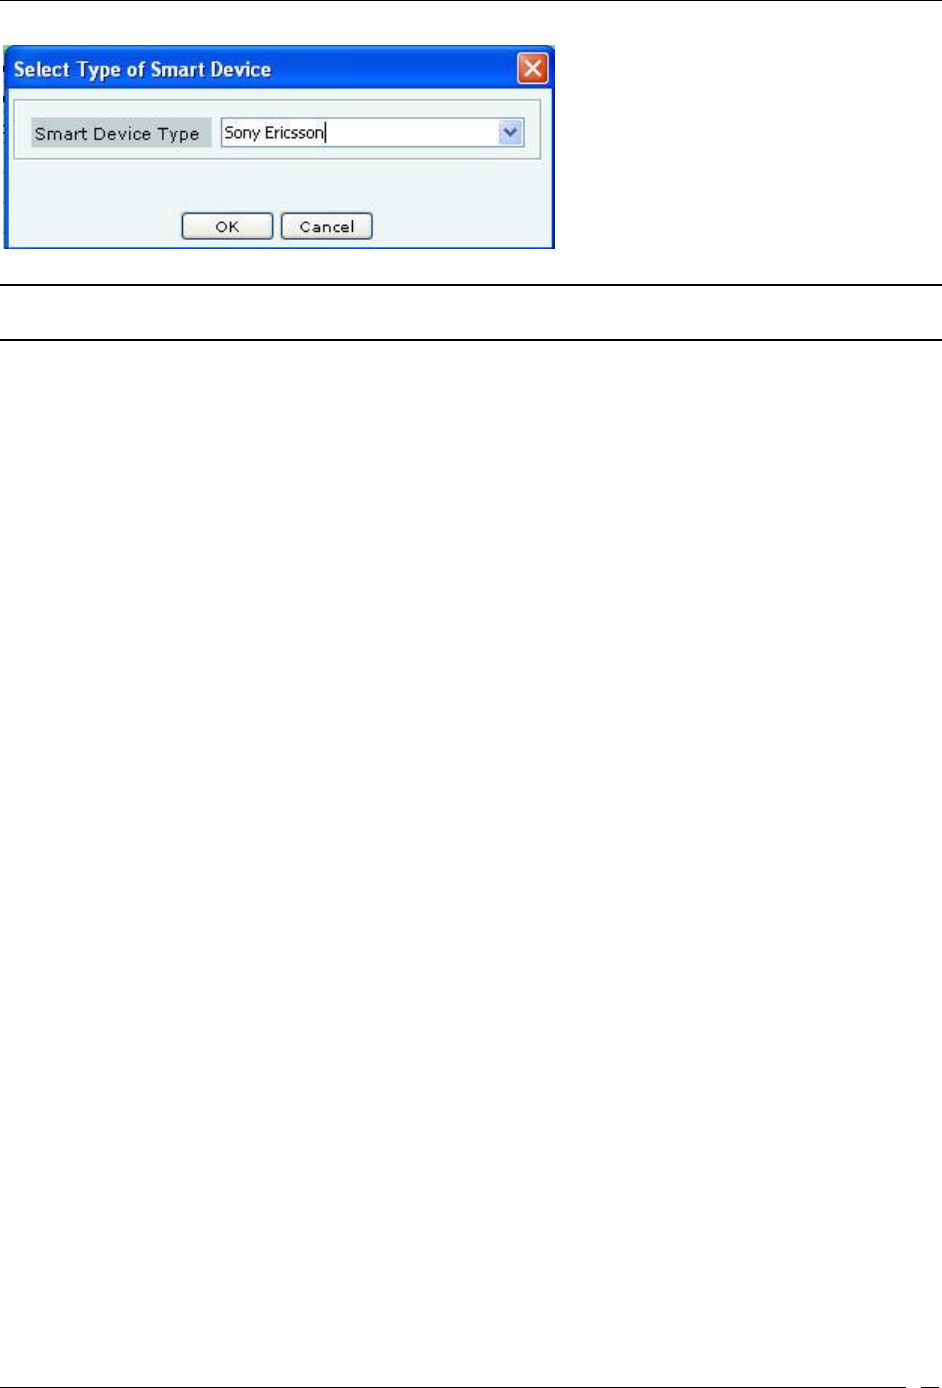
Changing the smart device type
You can change the smart device type of authorized and guest clients. To change the smart device type, select the
authorized client or the guest client row, right-click and select Smart Device->Change Device Type. Here, you can
select from the list of available smart devices or directly type in a new smart device type as shown in the figures
below, and click OK.
Change smart device type - Select from the existing list
Devices Tab
SpectraGuard® Enterprise User Guide
89
Change smart device type - Add a new device type
Note: To delete a smart device type added from Select Type of Smart Device dialog, go to Administration->Global-Device
Settings->Smart Device Type.
Sensor Context-Sensitive Menu
Sensors proactively scan the network and generate events. Sensors communicate event information to the system.
Sensors monitor various channels in which the 802.11 devices operate. The context-sensitive menu for Sensors
enables you to:
View a Sensor’s details
Events associated with the Sensor
Performance Charts of the Sensor
Edit a Sensor’s properties
Troubleshoot a Sensor
Reboot a Sensor
Delete a Sensor
Change device template
Change sensor location
Upgrade/Repair a Sensor
Method for Opening Sensor Menu
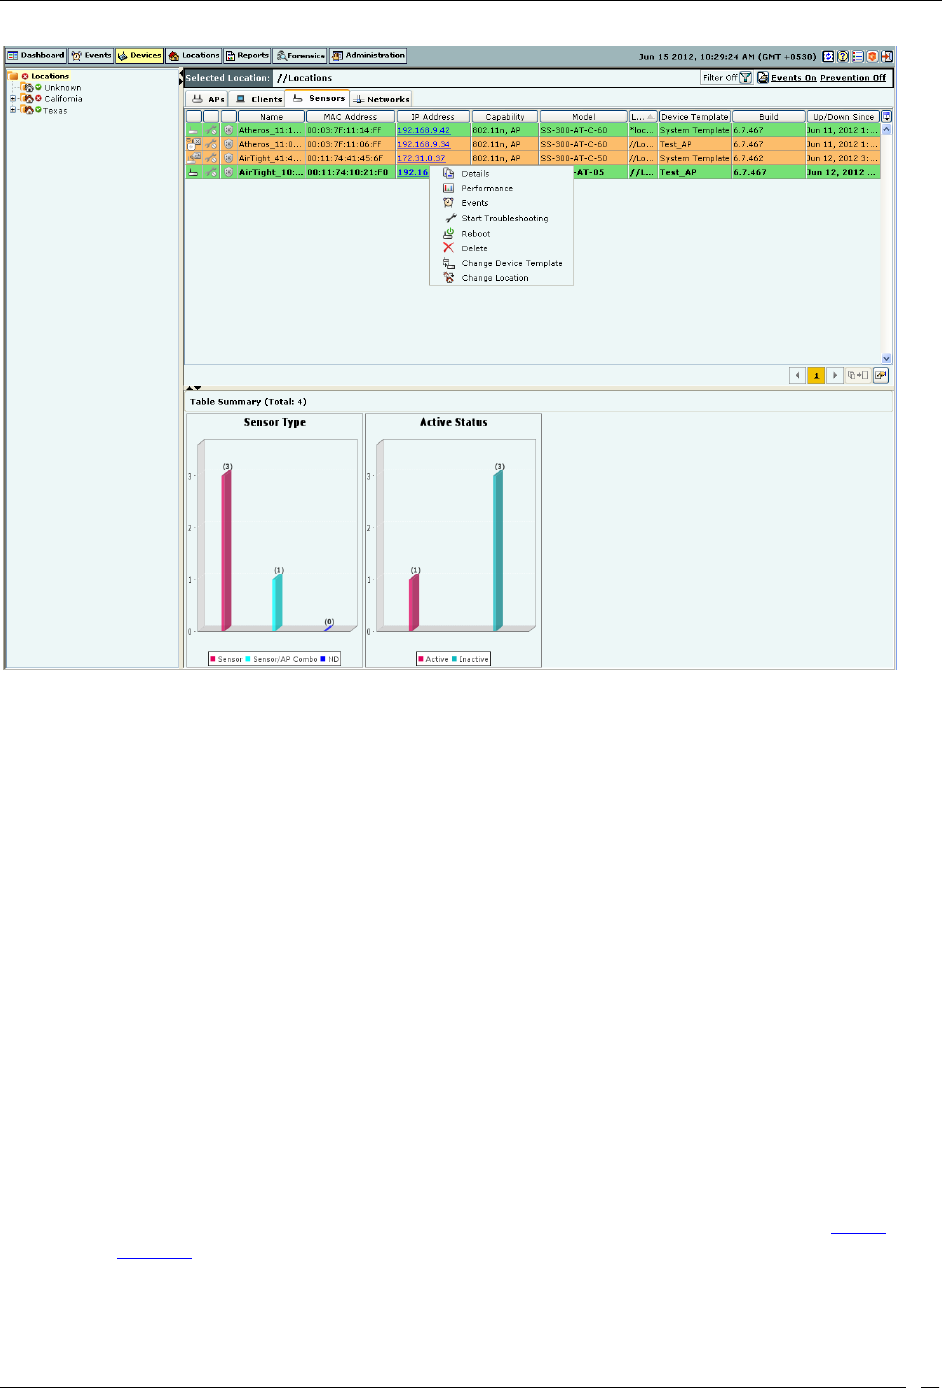
To open a Sensor context-sensitive menu, click the Devices tab and then right-click a Sensor row to open the context-
sensitive menu.
Devices Tab
SpectraGuard® Enterprise User Guide
90
Sensor Context-Sensitive Menu
Items in the Sensor Context-Sensitive Menu
The Sensor context-sensitive menu includes the following items.
Details: Opens the Properties tab of the Sensor Device dialog, which allows you to:
View/Edit the Sensor’s name
Change the Configuration Template assigned to the Sensor
Assign a user-defined location tag so that you can easily locate the Sensor; the location of a
manually tagged Sensor is shown with an asterisk (*) under the Location column
Enables you to view Primary details of the Sensor Visible Clients Visible APs Visible VLANs
Performance: Opens the Performance tab of the Sensor Device dialog, which allows you to view
performance graphs for the Sensor.
Events: Opens the Events tab of the Sensor Device dialog, which allows you to view events associated
with the Sensor, so that you can take whatever actions are necessary.
Reboot: Enables you to restart the Sensor.
Delete: Enables you to delete a selected Sensor; you are prompted to confirm this action.
Start Troubleshooting: Opens the Troubleshoot tab of the Sensor Device dialog, which allows you to
start a troubleshooting session in Packet Level Mode. This option is not available in case of Sensor/AP
Combo.
Stop Troubleshooting: Available only if a troubleshooting session is in progress, this option enables
you to manually terminate the session. This option is not available in case of Sensor/AP Combo.
Change Device Template: Opens the Select Sensor Template dialog. Refer to the section Device
Template for more details. The Select Sensor Template dialog enables you to:
View the list of configured Sensor templates
Change the Sensor template of the selected Sensor(s)
Change Location: Opens the Location Tag dialog that enables you to:
Devices Tab
SpectraGuard® Enterprise User Guide
91
View a complete list of locations
Change the location of the selected Sensor (see Manual Location Tagging)
Upgrade/Repair: Opens the Confirm Upgrade/Repair of Sensor(s) to Build X dialog that enables
you to upgrade the Sensor version or repair a Sensor.
Cancel Upgrade/Repair: Enables you to cancel the repair/upgrade process for a Sensor in
Upgrade/Repair Pending state.
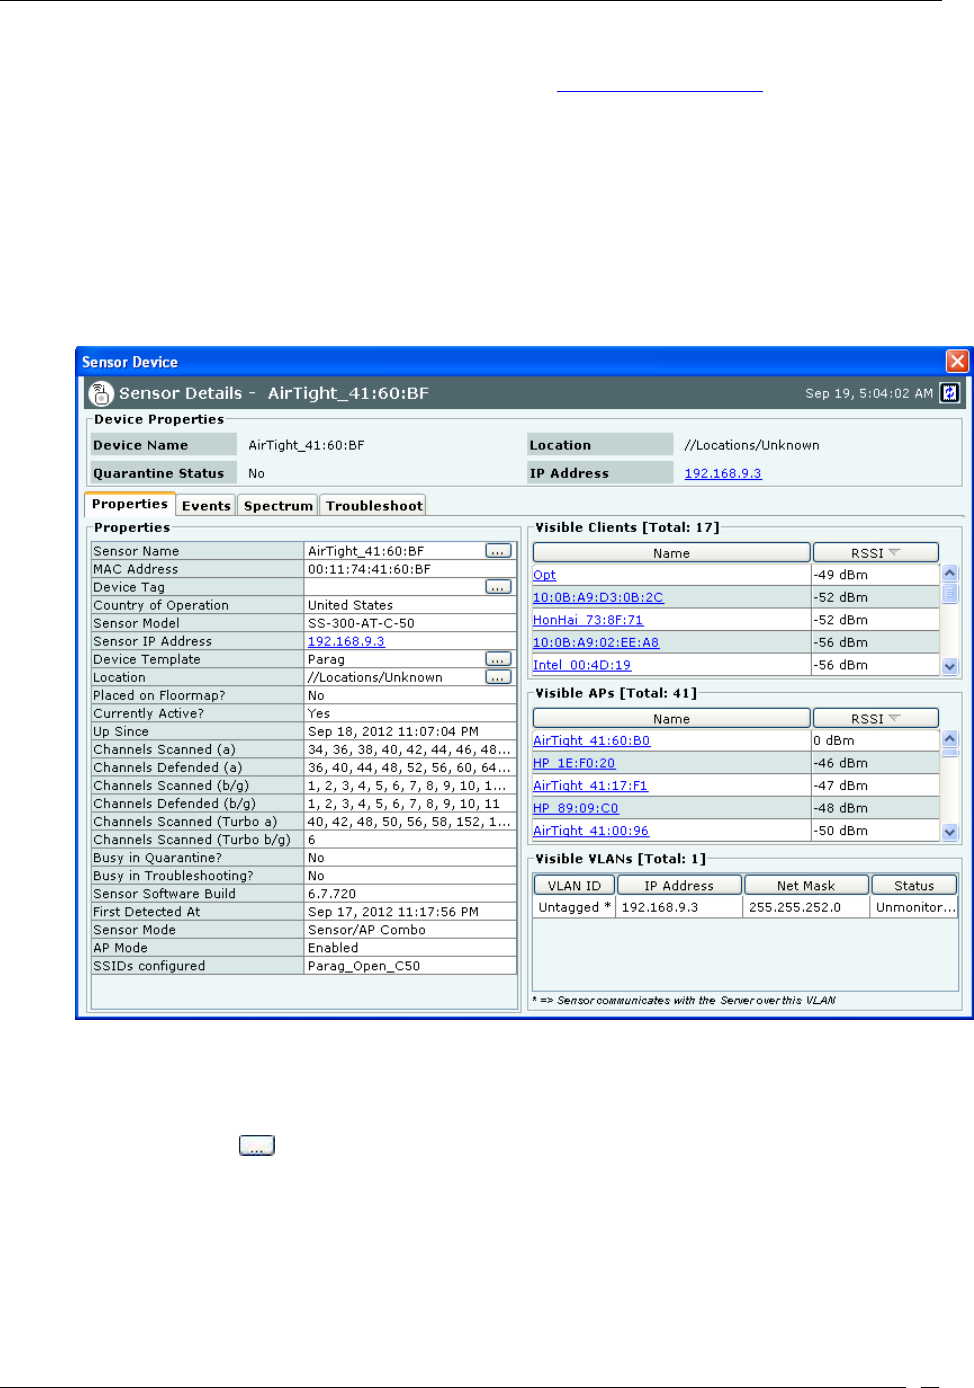
Sensor Details Dialog
You can open the Sensor Details dialog in the following manner:
On the Devices screen, right-click a Sensor row and then select the Details menu item. The Sensor Details
dialog has the following tabs: Properties, Events, Performance,Spectrum and Troubleshoot. The Properties
tab appears by default and is treated as the current tab.
Sensor Properties Tab
Fields in the Sensor Properties Tab
The Sensor Properties tab enables you to view/edit the properties of a Sensor and consists the following.
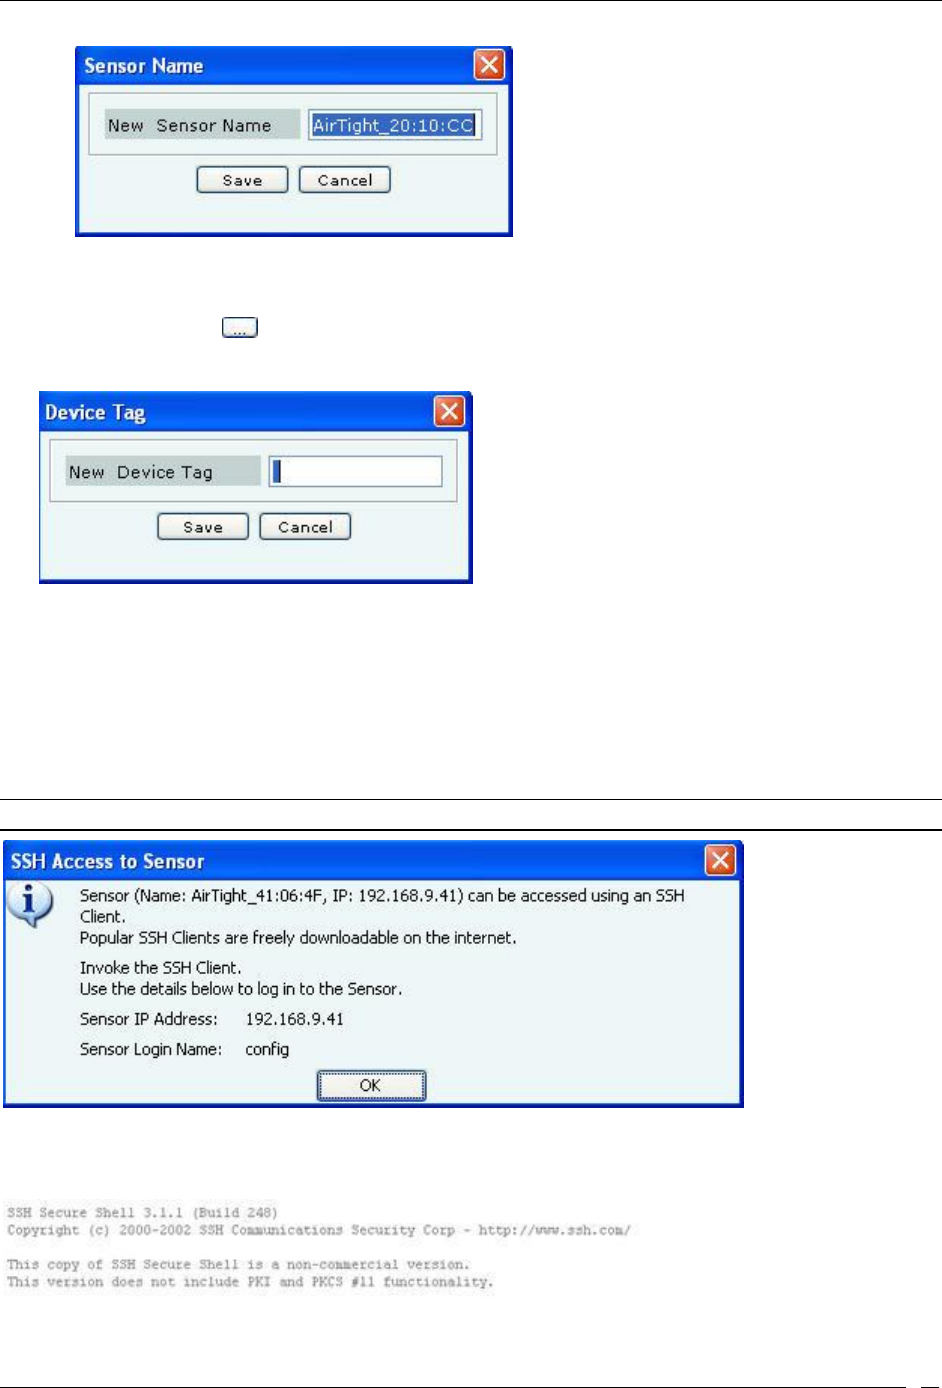
Sensor Name: Click and specify the name used to identify the Sensor in the Sensor Name dialog. Click
Save. The new Sensor name automatically displays in the Device Name field in the header of the Sensor
Details dialog.
Devices Tab
SpectraGuard® Enterprise User Guide
92
Sensor Name Dialog
MAC Address: Specifies the unique 48-bit IEEE format address of the Sensor assigned to the network
adapter by the manufacturer.
Device Tag: Click to specify text that provides additional information about the Sensor in the Device
Tag dialog. Click Save to save the device tag.
Sensor Device Tag Dialog
Country of Operation: Specifies the country in which the Sensor operates.
Sensor Model: Specifies the model number of the Sensor.
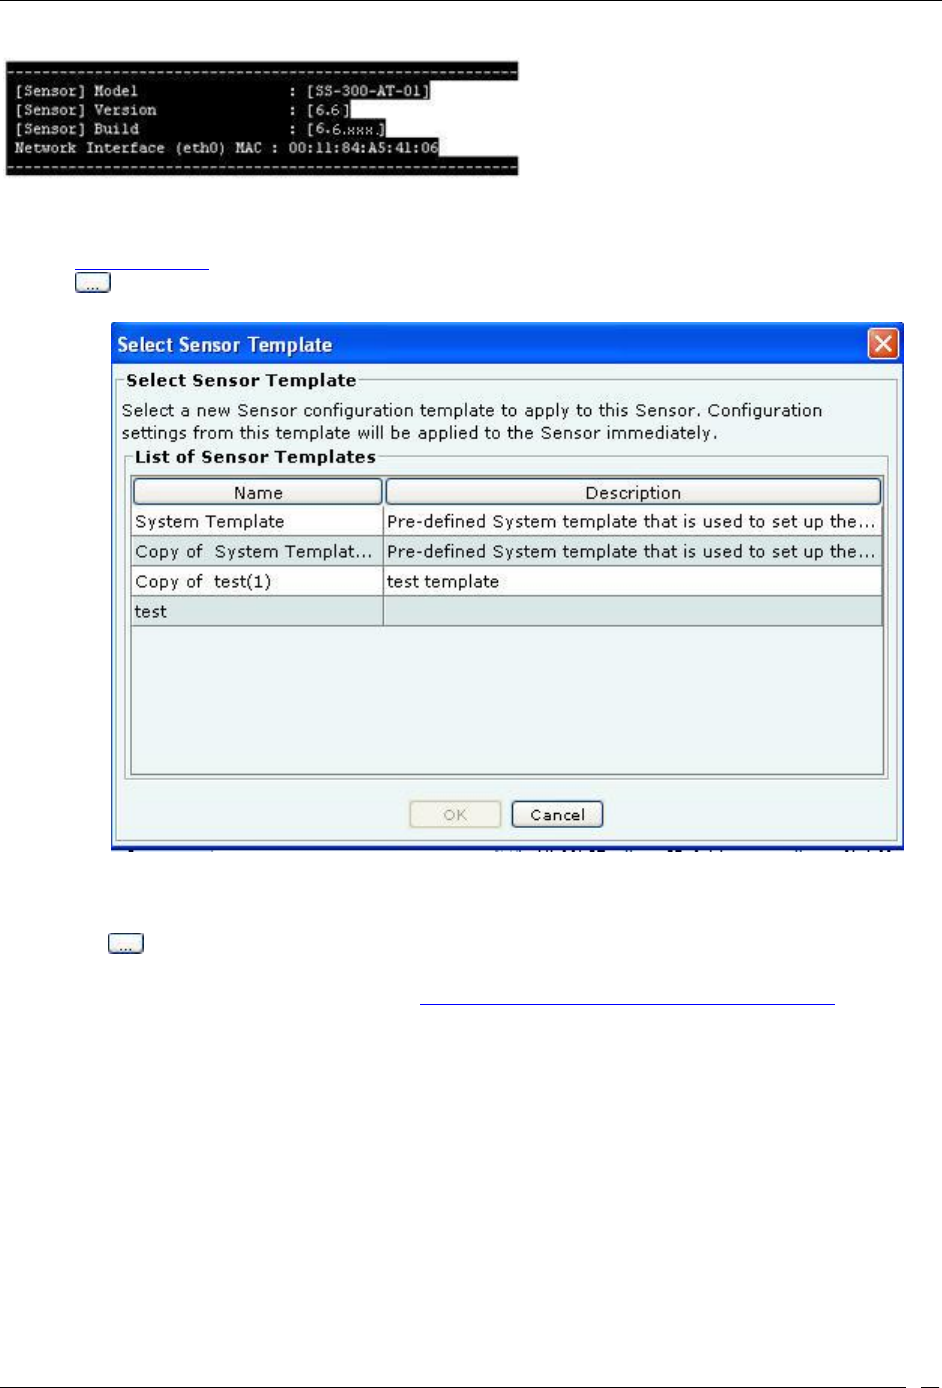
Sensor IP Address: Specifies the Sensor’s IP address, that is, the IP Layer or Layer 3 address. Click the
hyperlink to open the SSH Access to Sensor dialog. This dialog displays the IP Address and Login Name of
the Sensor you can log in to. You can access the Sensor using an SSH Client, which you can freely download
from the Internet. The Sensor IP address also displays in the IP Address field in the header of the Sensor
Details dialog on all tabs.
Note: Multiple Sensor IP Addresses are displayed if IPv6 is enabled on the server CLI.
SSH Access to Sensor Dialog
On connecting to the Sensor using the IP Address and Login Name, the SSH Secure Shell window appears. This is
the Sensor Config shell.
Devices Tab
SpectraGuard® Enterprise User Guide
93
Sensor Config Shell
Configuration Template: Shows the current configuration template assigned to the Sensor. Refer to the
Device Template section for more details. In order to change the Sensor Configuration Template, Click
to open the Select Sensor Template dialog. Select the appropriate Sensor template and click <OK> to
assign that Sensor template to the Sensor.
Select Sensor Template Dialog
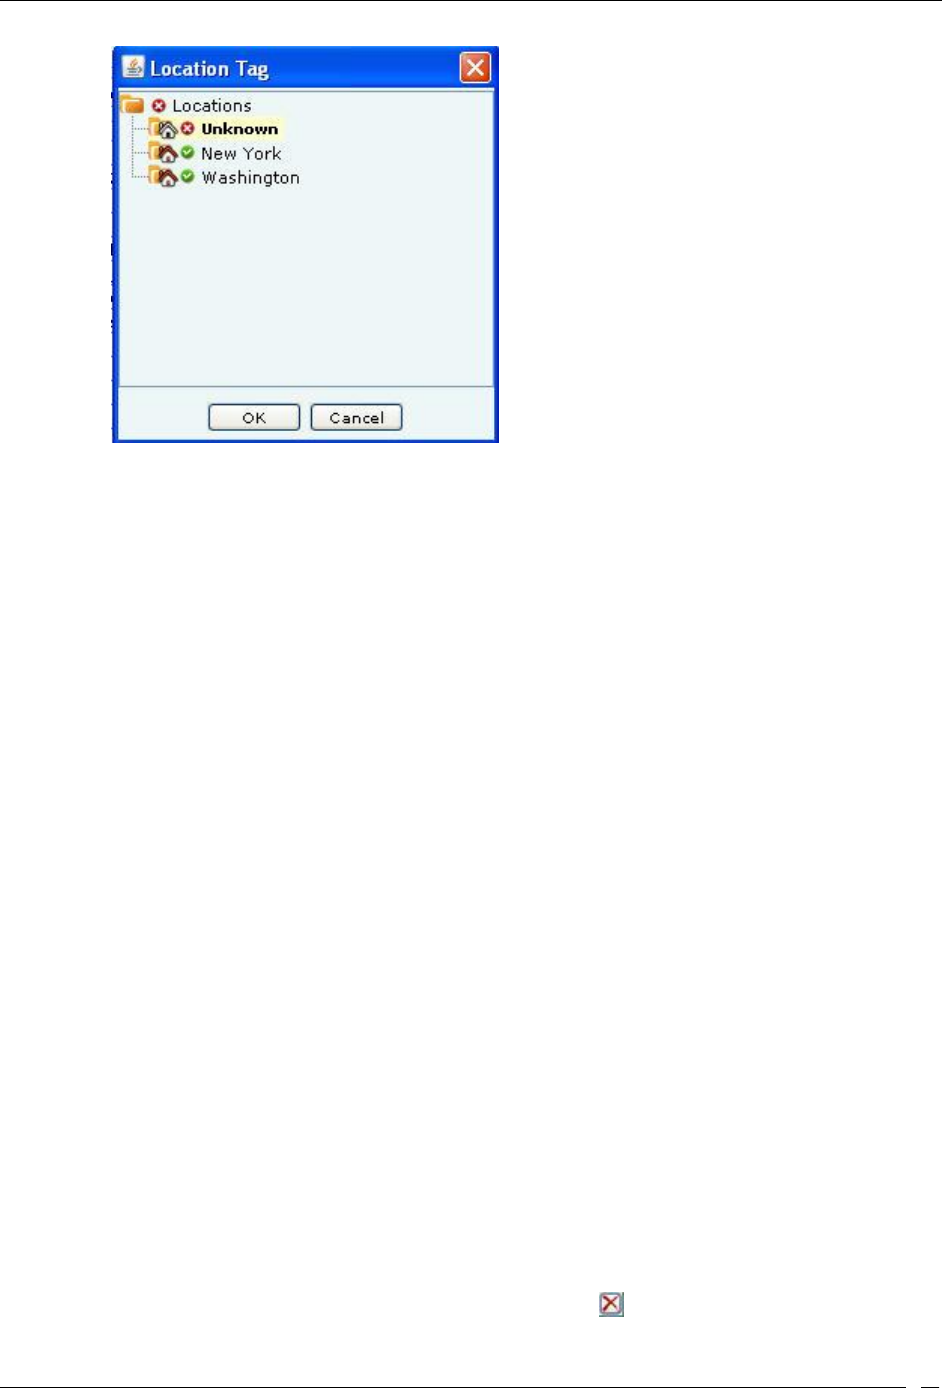
Location: Shows you the name of the Sensor’s location. The Sensor Location name always displays in the
Location field in the header of the Sensor Properties Tab dialog.
Click to open the Location Tag dialog. Here, you can view the complete list of locations and choose a
location for the Sensor. To view the list of locations, you must first set up your list of locations on the
Locations screen as explained in the section, Working with Location Folders and Location Nodes.
Devices Tab
SpectraGuard® Enterprise User Guide
94
Sensor Location Tag Dialog
You cannot change the location of a Sensor placed on a floor map. If you attempt to do so, an error message appears.
A Sensor placed on a floor map is automatically assigned the location tag of that location. To change the location tag,
you must first delete the Sensor from the floor map.
Placed on Floormap?: Indicates if the Sensor is placed on the floor map.
Currently Active?: Indicates if the Sensor is currently active.
Up/Down Since: Indicates the time since the Sensor is up/down.
Channels Scanned (a): Specifies the 802.11a channels on which Sensor is configured to scan.
Channels Defended (a): Specifies the 802.11a channels on which the Sensor is configured to defend.
Channels Scanned (b/g): Specifies the 802.11 b/g channels on which Sensor is configured to scan.
Channels Defended (b/g): Specifies the 802.1b/g channels on Sensor is configured to defend.
Channels Scanned (Turbo a): For turbo APs, specifies the 802.11a channels on which the Sensor is
configured to scan.
Channels Scanned (Turbo b/g): For Turbo APs, specifies the 802.11 b/g channels on which the Sensor is
configured to scan.
Busy in Quarantine? Indicates if the Sensor is currently busy quarantining a device. The quarantine status is
always displayed in the Quarantine Status field in the header of the Sensor Details dialog for every tab.
Sensor Software Build: Shows you the build number of software loaded in the Sensor.
First Detected At: Specifies the date and time when the system first detected the Sensor.
Busy in Troubleshooting?: Indicates whether the Sensor is currently busy capturing packets for
troubleshooting.
Sensor Mode: Specifies the mode of Sensor: Sensor, ND, or Sensor/AP Combo.
AP Mode: Indicates whether AP mode is enabled or disabled, that is whether the device is in AP mode or
not.
SSIDs configured: Specifies the SSIDs configured for the device in case AP mode is enabled. One or more
SSIDs will be seen here, depending on the number of SSIDs configured in the device template for this device.
To delete data for the selected Sensor and re-initialize data gathering, click .
Devices Tab
SpectraGuard® Enterprise User Guide
95
To refresh the Sensor Details screen manually click . The system does not auto refresh after a pre-defined interval.
Visible Clients Section
Under the Visible Clients Section, you can view a list of Clients that the selected Sensor can see. Client details such
as Name and RSSI received by the Sensor are displayed in the rows. To view details of a specific Client, click Name
the Client Details screen opens.
Note: Total gives the total number of visible Clients that the selected Sensor can see.
Visible APs Section
Under the Visible APs Section, you can view a list of APs that the selected Sensor can see. AP details such as Name
and RSSI received by the Sensor are displayed in the rows. To view details of a specific AP, click Name the AP
Details screen opens.
Note: Total gives the total number of visible APs that the selected Sensor can see.
Visible VLANs Section
Under the Visible VLANs Section, you can view a list of VLANs that the selected Sensor can see. VLAN details such
as VLAN ID, IP Address, Net Mask, and Status are displayed in the rows. VLAN over which the Sensor is
communicating with the server is marked with an asterix(*).
Note: Total gives the total number of visible VLANs that the selected Sensor can see.
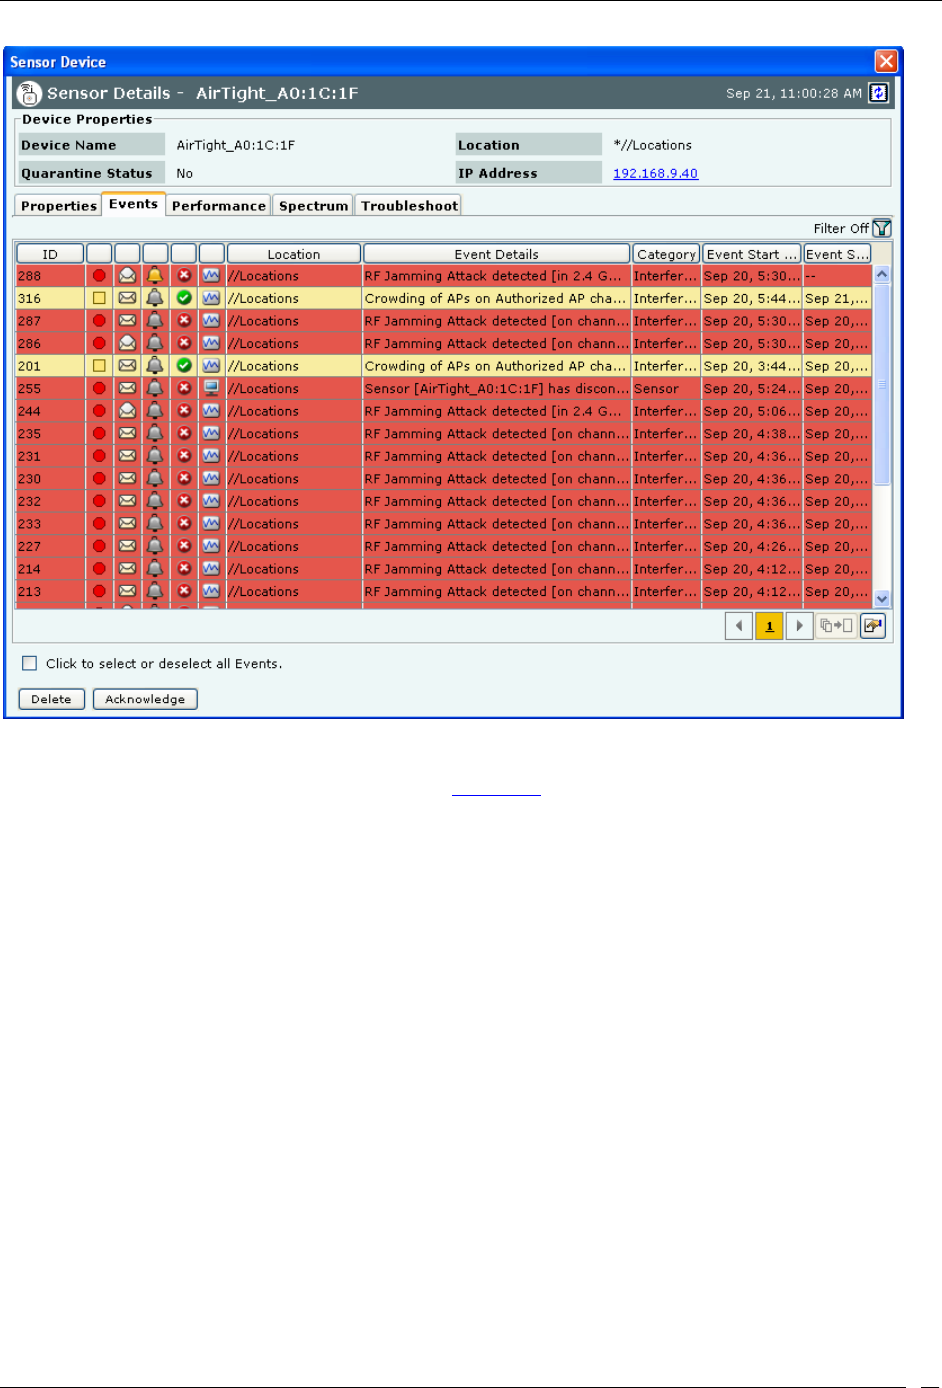
Sensor Events Tab
To open the Sensor Events tab on the Devices screen right-click a Sensor row and select the Events menu item
Devices Tab
SpectraGuard® Enterprise User Guide
96
Sensor Events Tab
The Sensor Events tab enables you to view the event details involving the selected Sensor.
For the columns in the Events details screen, refer to the Events Tab chapter for more details.
Check the Click to select or deselect all Events checkbox to select all the Events displayed on that page.
Click Delete to delete the selected events.
Click Acknowledge to add comments for the selected events.
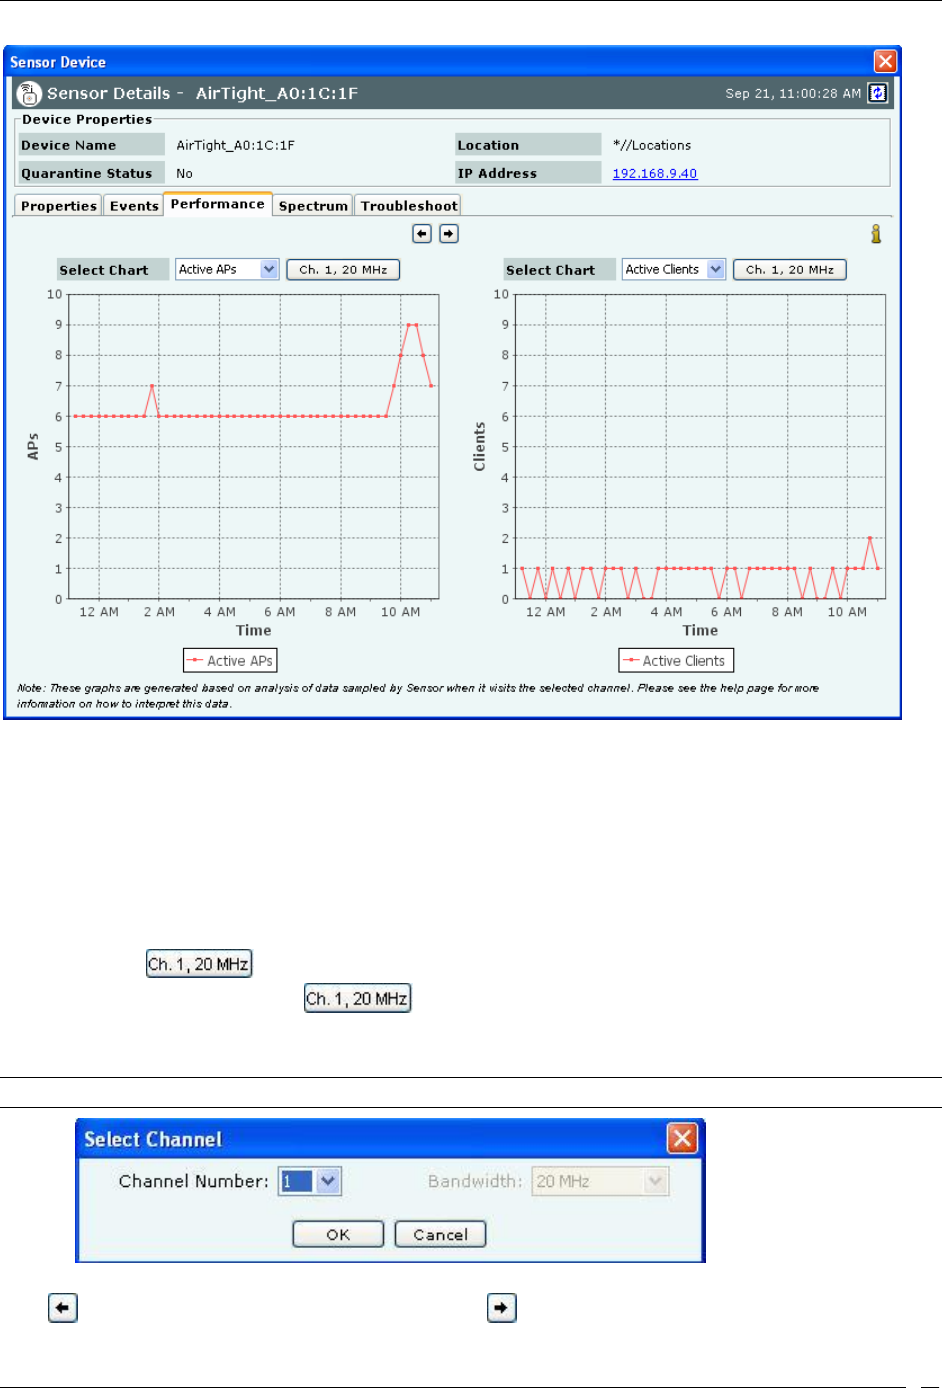
Sensor Performance Tab
To open the Sensor Performance tab on the Devices screen right-click a Sensor row and select the Performance
menu item
Devices Tab
SpectraGuard® Enterprise User Guide
97
Sensor Performance Tab
The Sensor Performance tab enables you to view the data related to performance of a Sensor in chart form.
Line Charts are shown on the Performance Tab. Choose one of the Chart types available from the Select Chart drop-
down list:
Active APs: Sensor samples the number of active APs on each channel at the end of each time interval.
Active Clients:Sensor samples the number of associated Clients on each channel at the end of each time
interval.
Interference:Sensor reports average interference on each channel over each time interval.
A button such as next to the chart type selection shows you the current channel and channel width
used in the chart display. Clicking on allows you to select a new channel and width. Specify the
Channel Number and Width from the respective drop-downs in the Sensor Performance Tab – Select Channel
dialog.
Note: Width is enabled only for 11n Sensors.
Sensor Performance Tab – Select Channel
Click to view enlarged Chart on the left hand side. Click to view enlarged Chart on the right hand side
Devices Tab
SpectraGuard® Enterprise User Guide
98
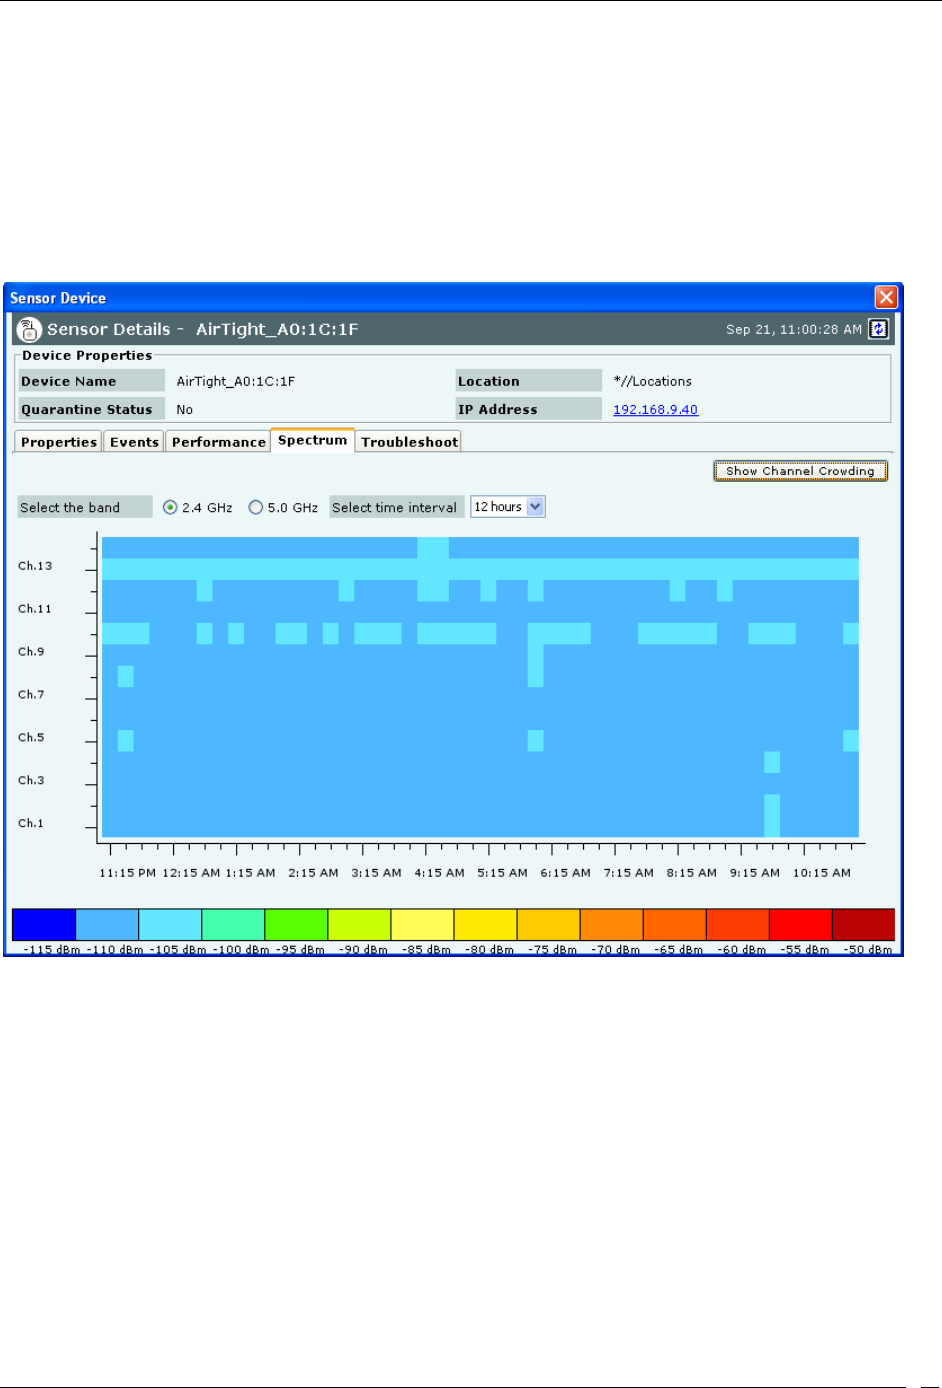
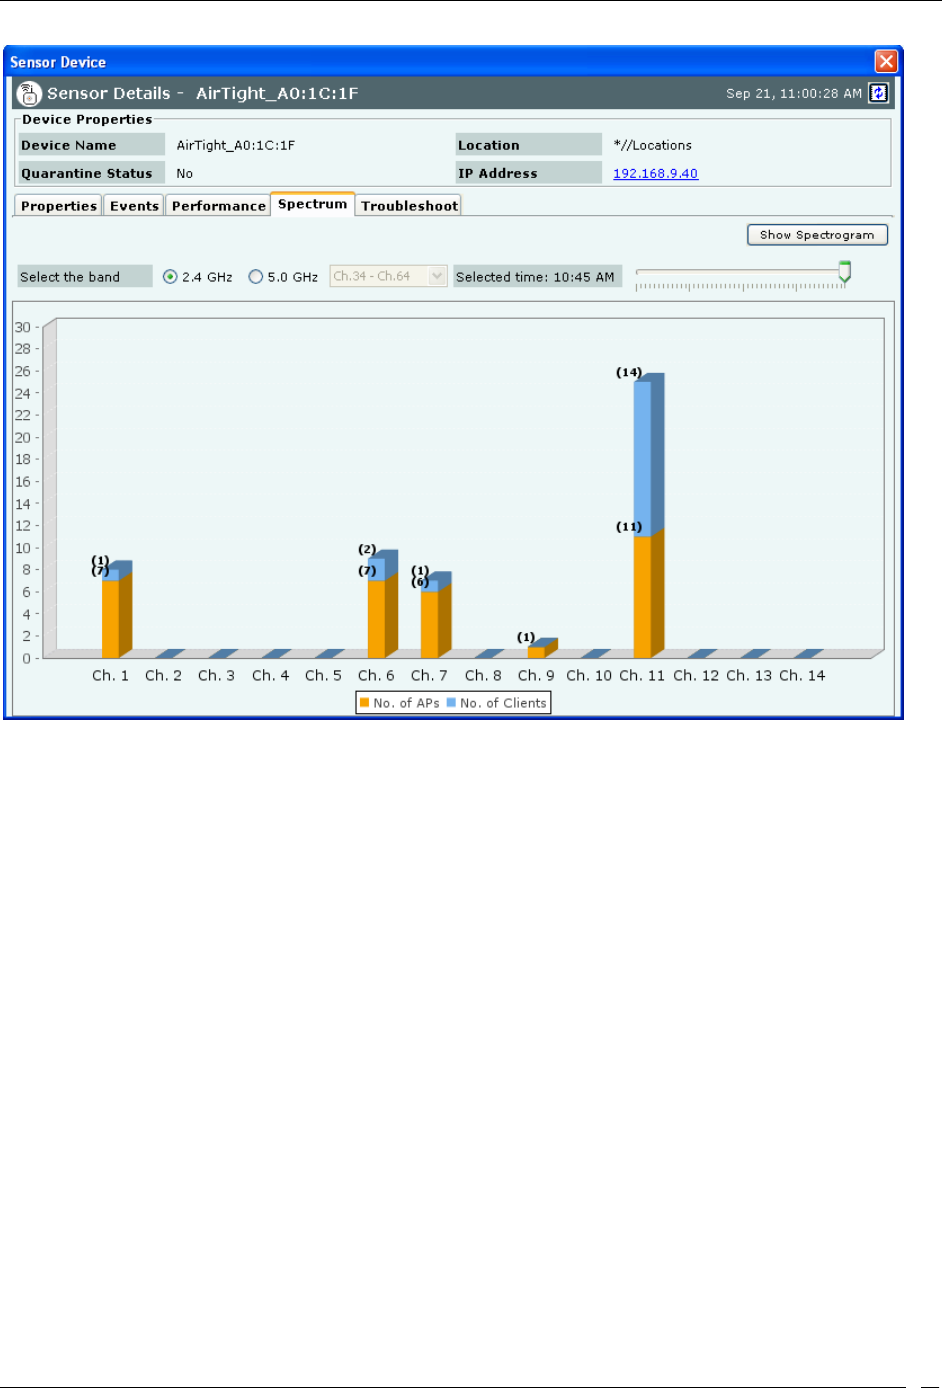
Sensor Spectrum Tab
On the Devices screen, right-click a Sensor row and then select the Details menu item. Select the Spectrum tab to
view the Spectrogram, or Channel Crowding details. Spectrogram is a graphical representation of the interference for
the selected radio and time frame. At a given point in time, either the Spectrogram or the Channel Crowding is seen
in this tab. By default you will see the Channel Crowding in this tab.
Spectrogram
To see the Spectrogram, click Show Spectrogram.
Sensor Details- Spectrogram
Select the radio band and the time interval for which the impedance is to be viewed. The legend for the power ratio is
given at the bottom for reference.
Channel Crowding
Click Channel Crowding to view the graphical representation of the APs and clients detected on various channels by
the sensor, for the selected radio and time frame.
Devices Tab
SpectraGuard® Enterprise User Guide
99
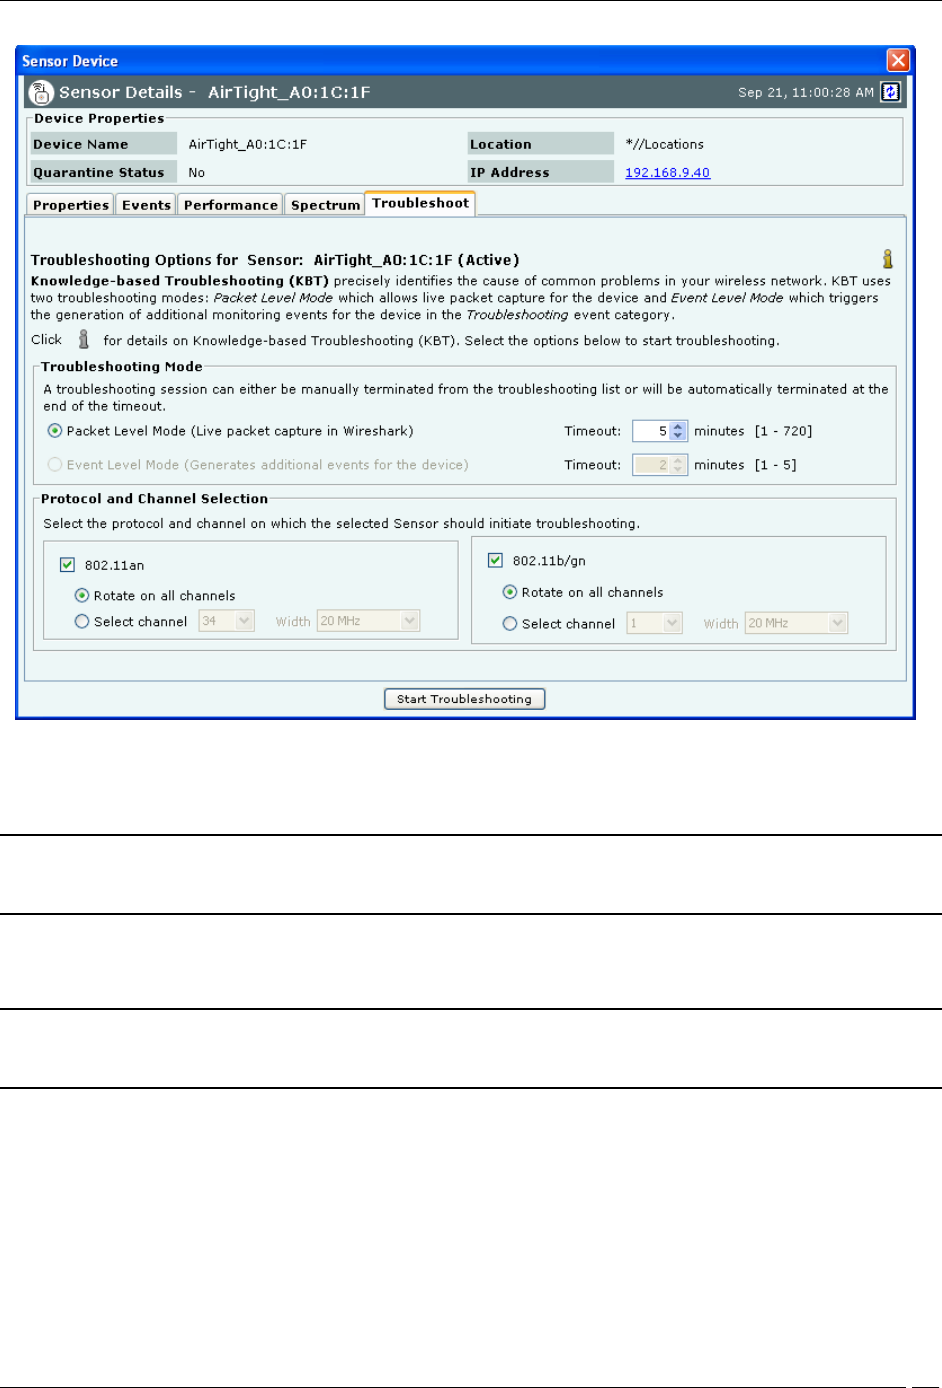
Sensor Troubleshoot Tab
To open the Sensor Troubleshoot tab on the Devices screen right-click a Sensor row and select the Start
Troubleshooting menu item.
Devices Tab
SpectraGuard® Enterprise User Guide
100
Sensor Troubleshoot tab
1. Select the Troubleshooting Mode and set the corresponding Timeout interval. If you select Packet
Level Troubleshooting, ensure that the Sensor used for troubleshooting is reachable from the computer
used to launch the Console.
Note: A troubleshooting session automatically times out or terminates after the Timeout irrespective of the activity. You can
manually stop troubleshooting from the device context-sensitive menu by selecting Stop Troubleshooting or from the
Troubleshooting tab by clicking <Stop Troubleshooting>.
2. Under Protocol and Channel Selection, by default both 802.11an and 802.11b/gn protocol are selected
and Rotate on all channels is selected. The user can also select the 802.11n protocol, the corresponding
channel(s) and width on which the chosen Sensor should initiate troubleshooting.
Note: A Configuration template is assigned to each Sensor. The Channels list contains only those channels enabled for scanning
in that Configuration template. If no channel in a Protocol is enabled, then Troubleshooting in that protocol is not possible.
Thus, the Channels list and the status of the Protocol checkboxes change with the Sensor selected.
3. Click Start Troubleshooting to begin the session. If the Sensor is assigned a Configuration template,
where no channels are selected for scanning, an error message displays.
Devices Tab
SpectraGuard® Enterprise User Guide
101
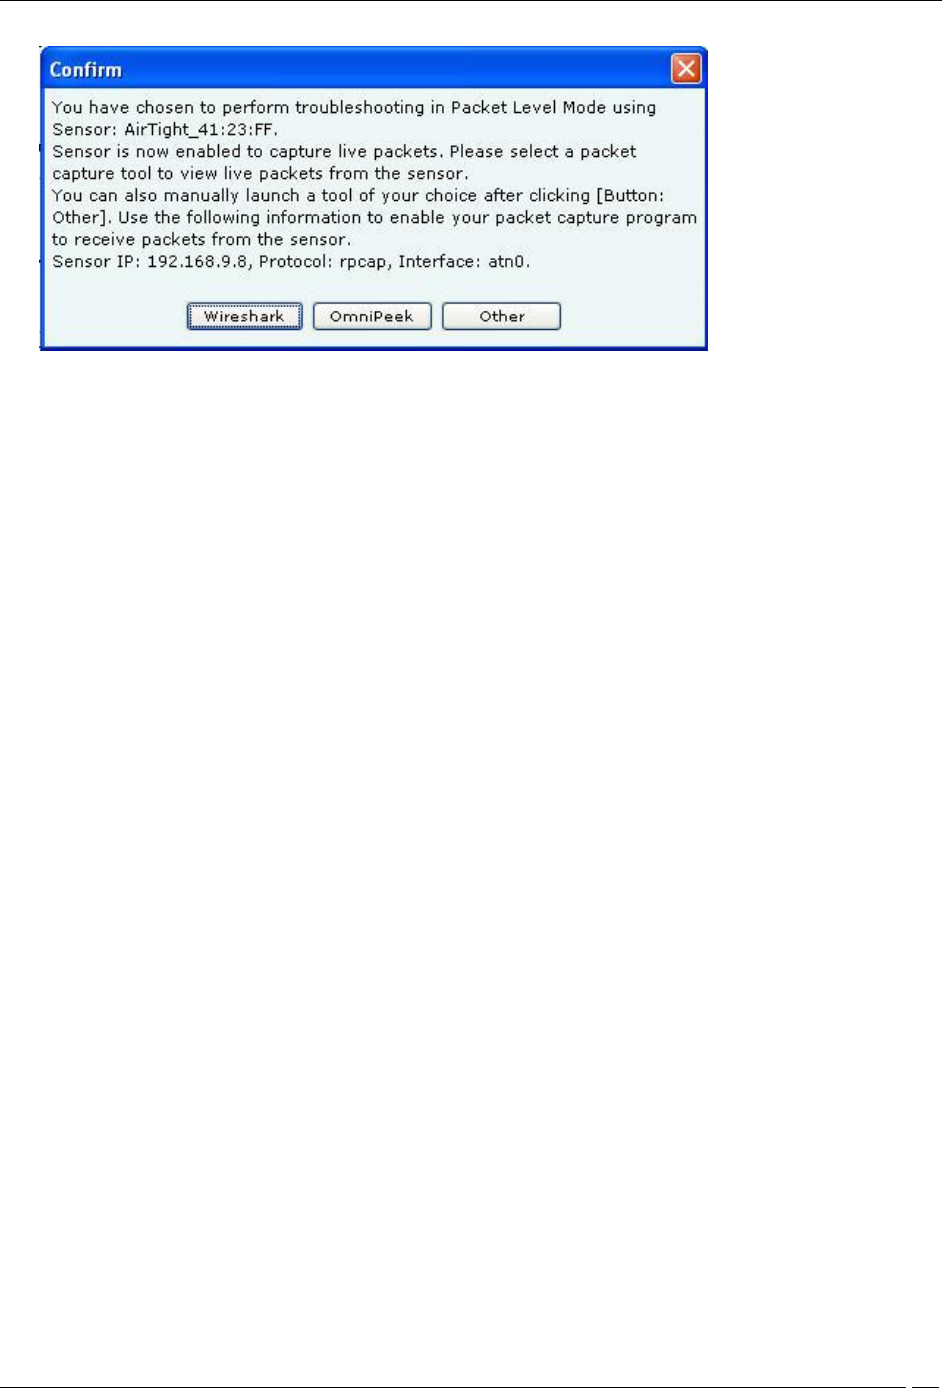
Packet Level Troubleshooting Confirm Dialog
4. On the Confirm dialog, you may have two or three packet capture tool options, depending on the
licensing agreement with AirTight Inc. Select a packet capture tool.
If you have a product license that has OmniPeek support, you have three packet capture tool options –
Wireshark, OmniPeek, and ‘Other’. If you have a product license that does not have OmniPeek support, you
have two packet capture tool options – Wireshark and ‘Other’. Select the ‘Other’ option for other tools that you
can use to capture packets. Typical packet capture tools are Tcpdump, Ethereal, Wireshark, OmniPeek, and
others. You must use Tcpdump and Ethereal with Rpcap support. Tcpdump, Ethereal, and Wireshark are
available freely on the Internet.
5. If you click Wireshark, and the application is installed correctly, the system launches the application
and the packet capture session begins immediately. Alternatively, if you do not have Wireshark
installed, an Error dialog appears.
Devices Tab
SpectraGuard® Enterprise User Guide
102
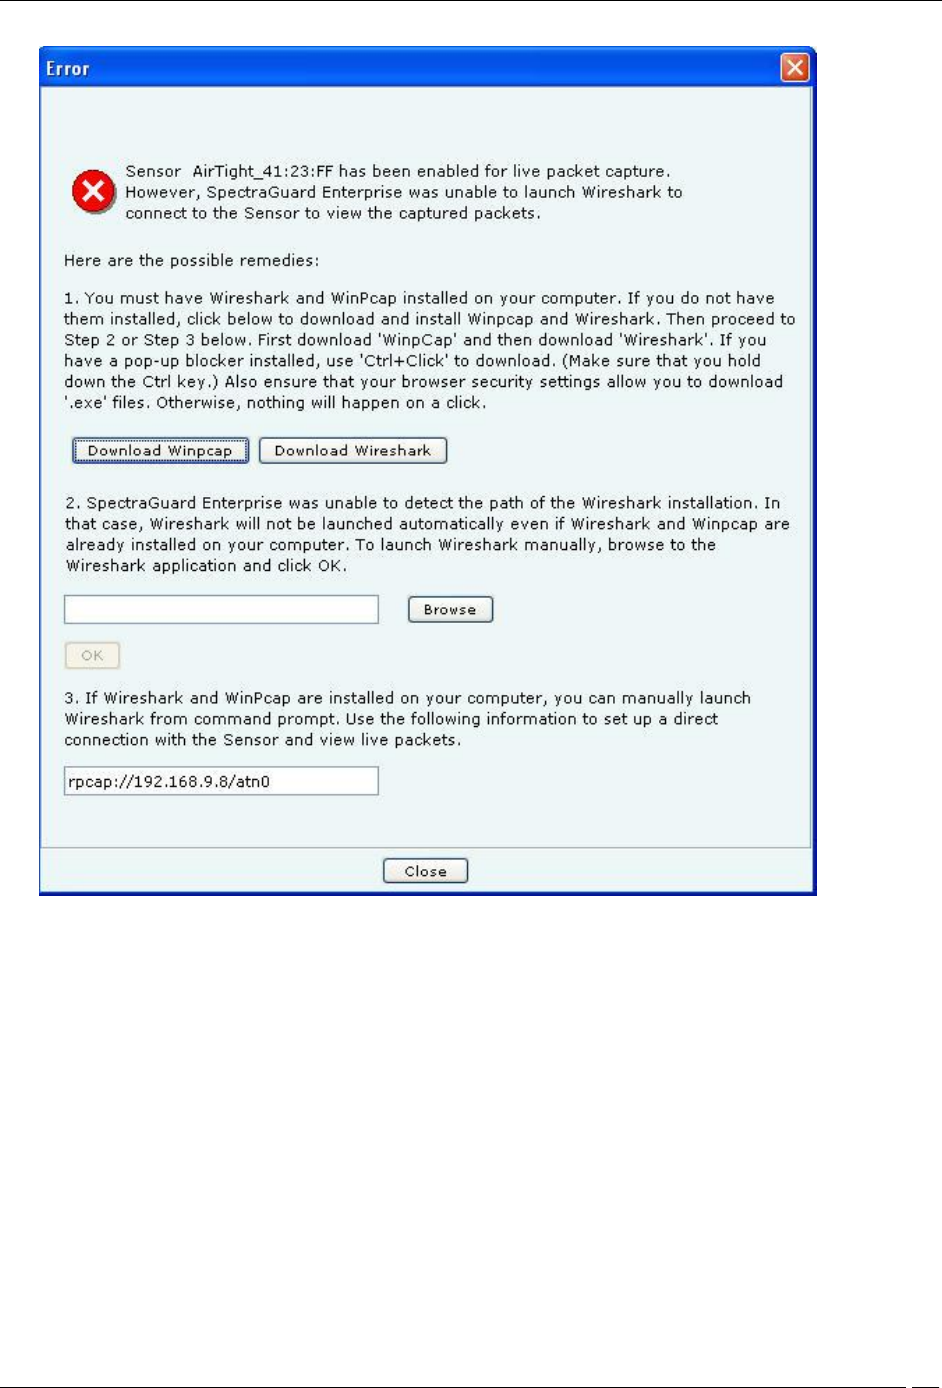
System unable to Launch Wireshark Dialog
6. On the Error dialog, there are three possibilities:
You can download and install Wireshark and optionally install WinPcap. Wireshark requires a
compatible version of WinPcap. If the installed version and expected version mismatch, you need
to install the suggested and expected version of WinPcap.
If the system does not find Wireshark installed at the default location, ‘C:\Program
Files\Wireshark’, Wireshark is not launched automatically. To launch Wireshark manually, click
Browse to specify the appropriate location and click OK.
To launch Wireshark manually from the command prompt, you need to copy and paste the link to
set up a direct connection with the Sensor and view live packets.
7. If you click OmniPeek, ensure that the application and the OmniPeek Airtight Adapter are correctly
installed. If you have these installed at some other location, click Browse to specify the appropriate
location. The installation location for OmniPeek could be other than the default location, ‘C:\Program
Files\WildPackets\OmniPeek\’.
8. Click OK. The system launches the application and the packet capture session begins immediately.
Alternatively, if you do not have the OmniPeek tool installed, you should install the same with
appropriate purchase from WildPackets Inc. Airtight does not provide installation of OmniPeek.
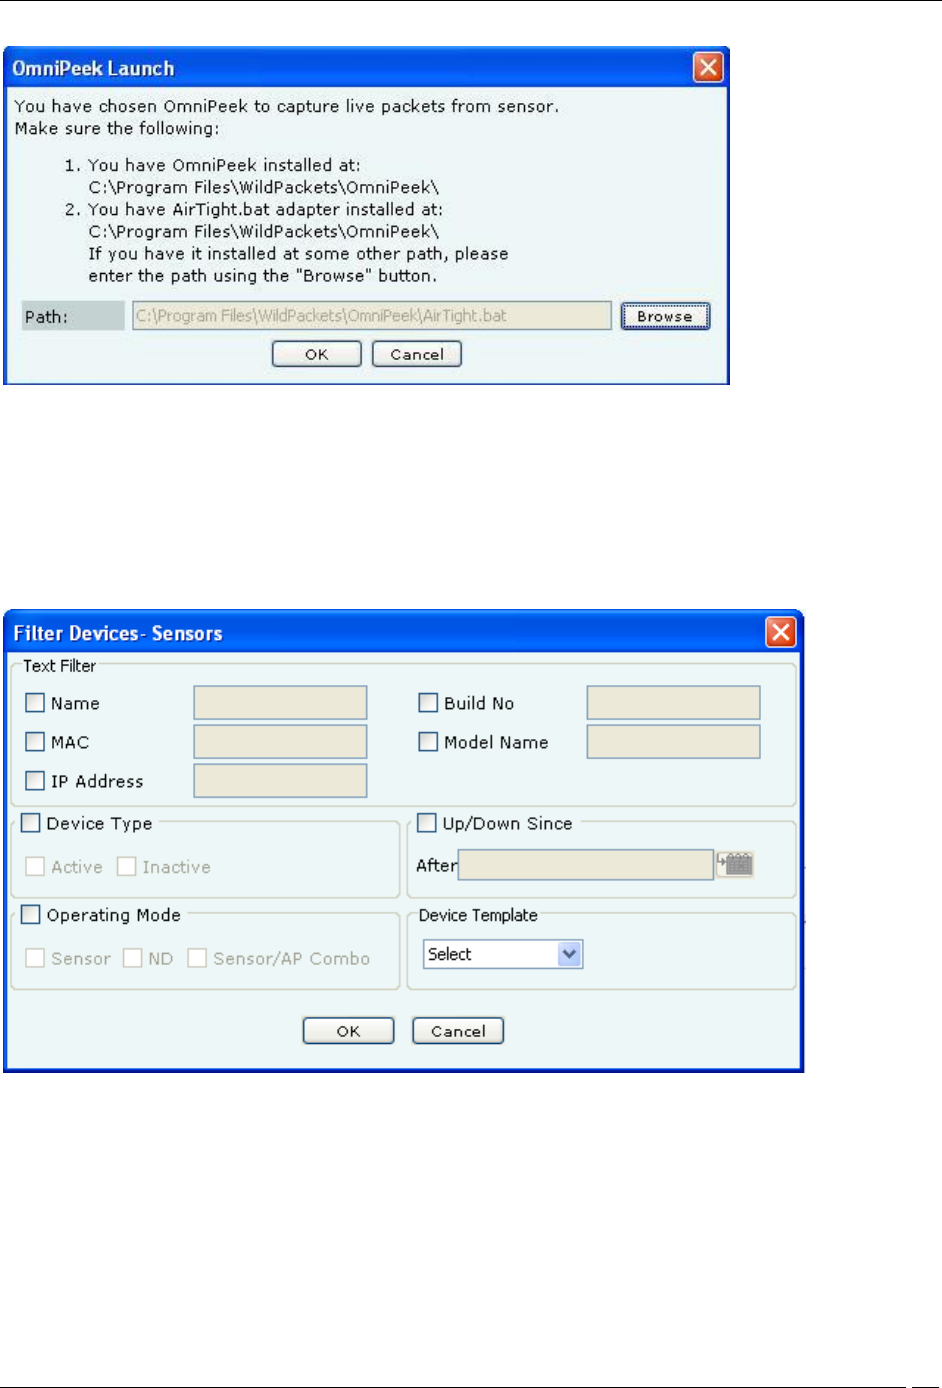
Devices Tab
SpectraGuard® Enterprise User Guide
103
Launching OmniPeek
Filtering in Sensors
To focus your attention to a subset of Sensors based on a filtering criteria (such as device type, up/down since, and so
on) system provides you with the capability to filter Sensors. Use the following steps to filter Sensors:
1. On the Devices screen, click the Sensor tab and click the Filter icon to open the Filter Devices -
Sensors dialog.
Filter Devices – Sensors
2. Under Text Filter, select one or more of the following check boxes and enter the appropriate values
manually for searching data related to it:
Name
MAC
IP Address
Build No
Model Name
3. Select the Device Type check box, select one or more of the following check boxes:
Active
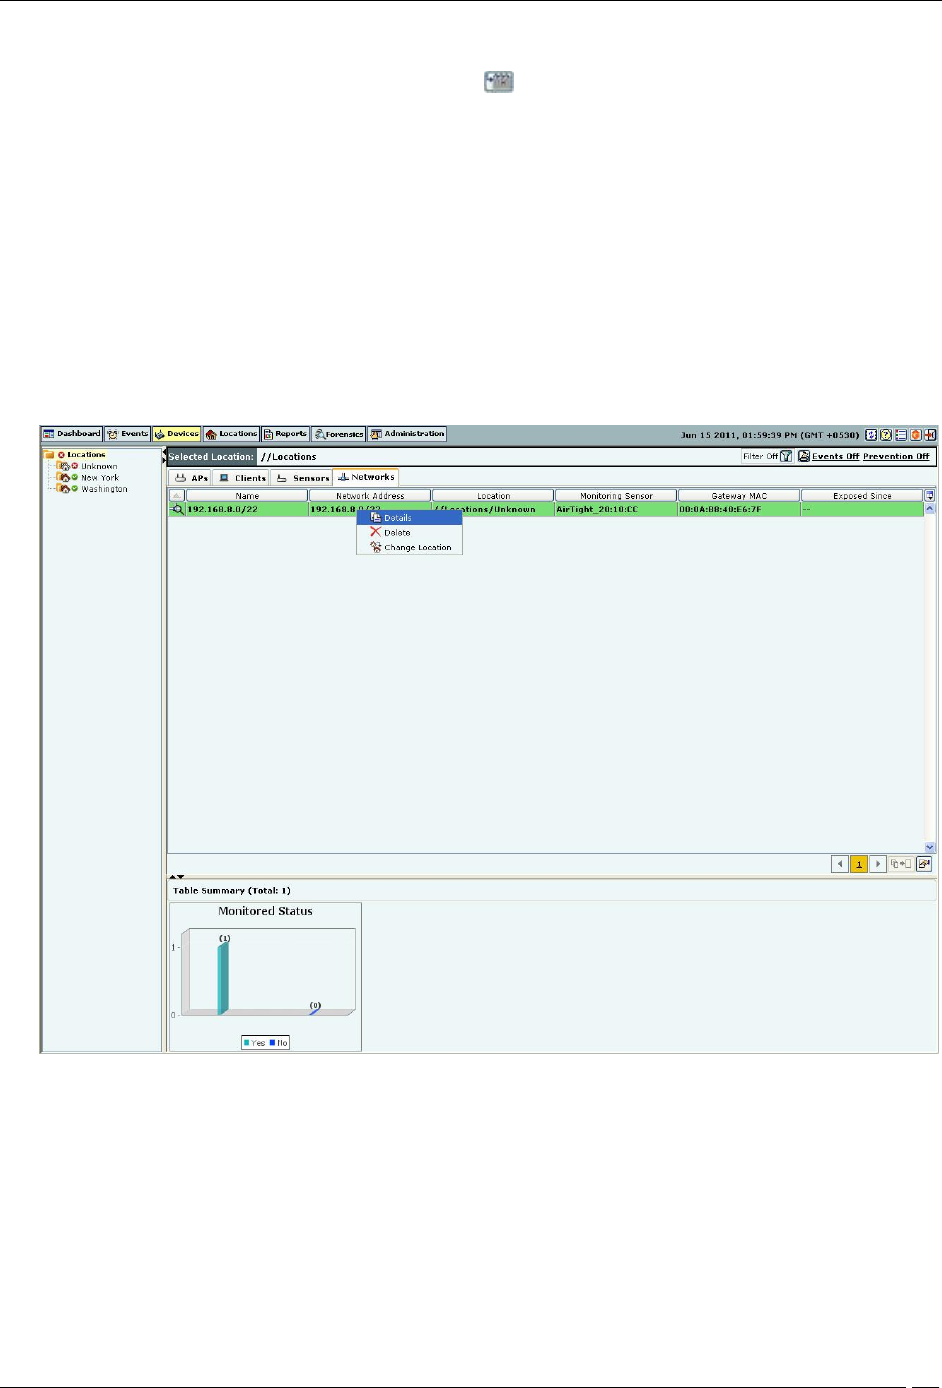
Devices Tab
SpectraGuard® Enterprise User Guide
104
Inactive
4. Select the Up/Down Since check box, click the icon to specify the up/down since date and time of
the Sensor and then click OK. The search displays the Sensors, which were first detected by the system
after the date as specified above.
5. Select the Operating Mode check box, select one or more of the following check boxes:
Sensor
ND
Sensor/AP Combo
6. Under Sensor Template, select the template name from the drop down box for searching data related to
it.
7. To save and apply the Sensor filtering criteria, clickOK. When the filter is applied it is denoted by Filter
On on the Console, if no filter is applied it is denoted by Filter Offon the Console.
Network Details Dialog
You can open the Network Details dialog in the following manner:
On the Devices tab, click the Networks tab. Right-click a network row and then select the Details menu item.
Navigating to Network Details dialog
The Network Details dialog has the following tabs: APs and, Sensors.
APs tab
The APs tab appears by default. The following screen displays the Network Details dialog.
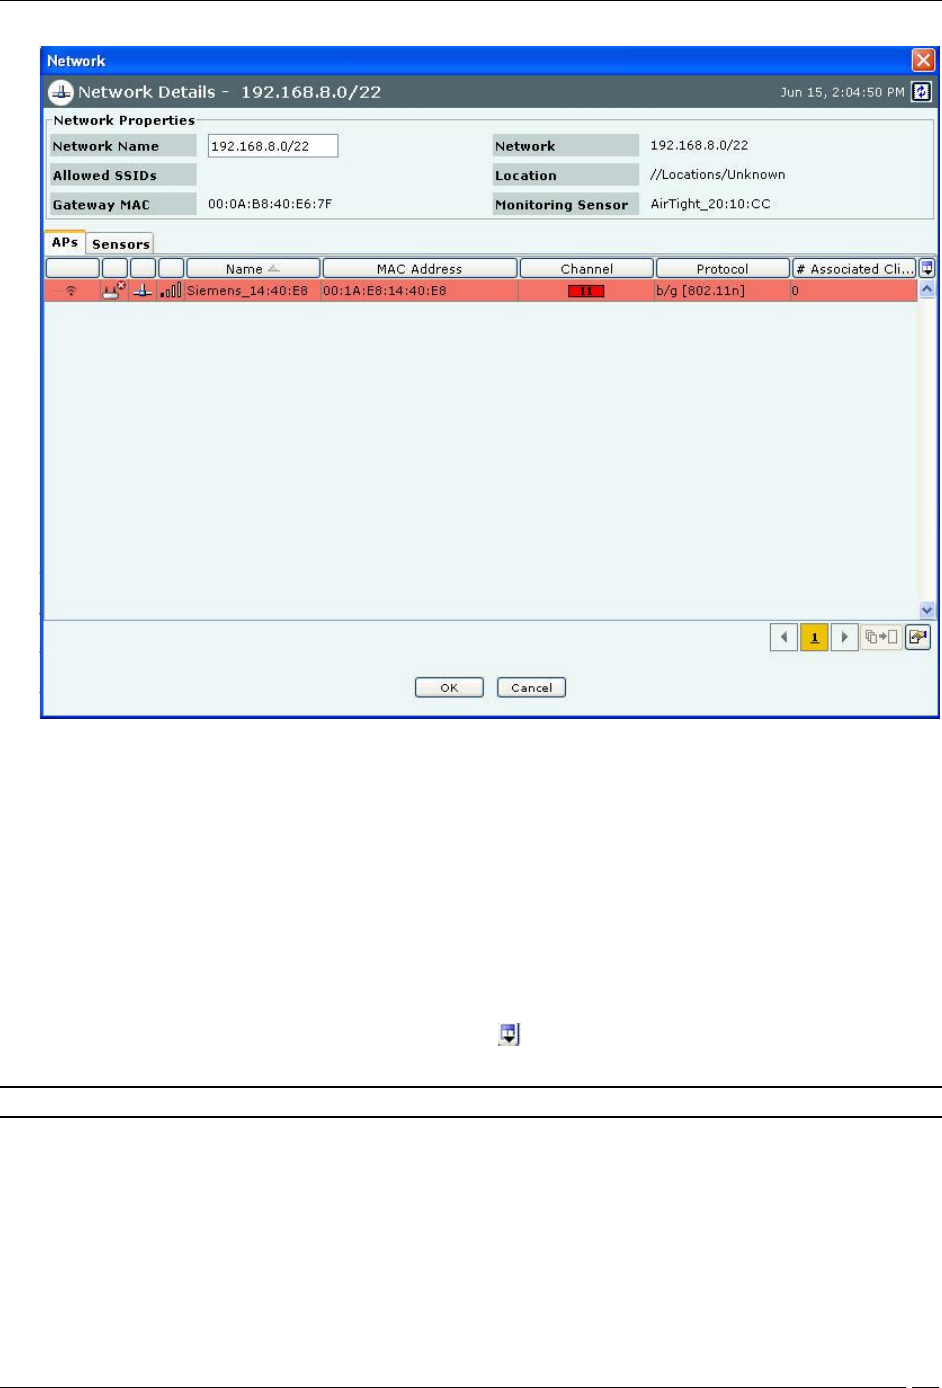
Devices Tab
SpectraGuard® Enterprise User Guide
105
Network Details – APs
All APs associated with the network, and with the location including the sub locations under that location, are seen
in APs tab under Network Details.
Fields in Network Details are as follows:
Network Name: specifies the network name
Allowed SSIDs: : This is the list of SSIDs allowed (from SSID templates) on this network at or below the location of
this network.
Gateway MAC: specifies the gateway MAC address.
Network: specifies the IP address of the network.
Location: specifies the network location.
Monitoring sensor: specifies the sensor monitoring the network.
The fields in the APs tab are the same as seen in Devices->AP tab.
You can select the fields that you want to view by clicking the icon.
You can view the AP details dialog by double clicking any AP row.
Note: Uncategorized APs are seen as rows with white background.
The Sensors tab appears on the Network Details dialog. The following screen displays the Sensors tab.
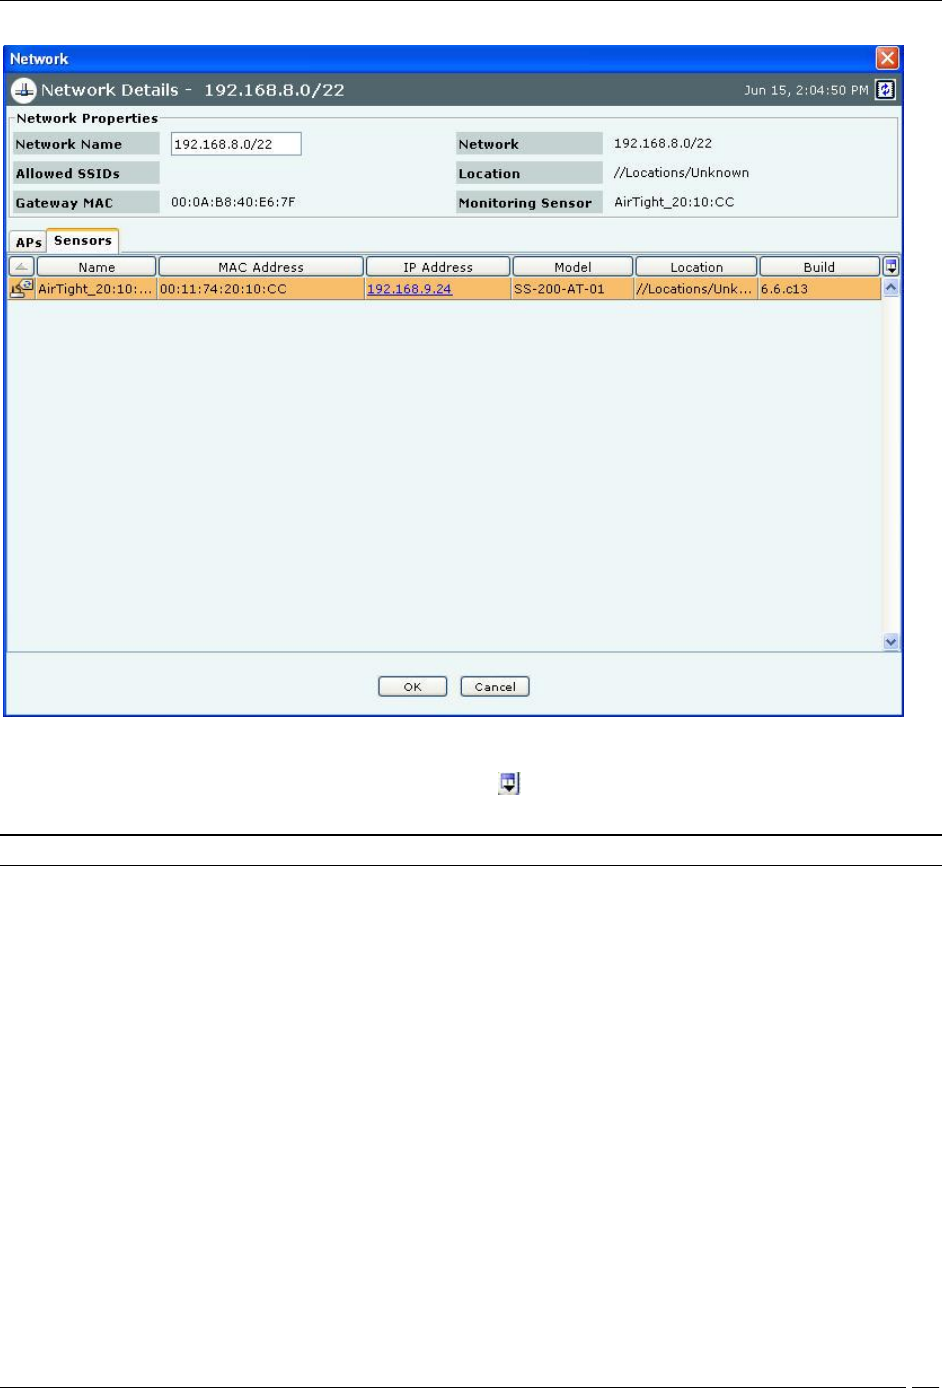
Devices Tab
SpectraGuard® Enterprise User Guide
106
Network Details – Sensors
The fields in the Sensors tab are the same as seen in Devices->Sensors tab.
You can select the fields that you want to view by clicking the icon.
You can view the Sensor details dialog by double clicking any sensor row.
Note: Only currently active sensors in the network are seen in the Sensors tab under Network Details.
Changing the location of a network
Location of a network is same as location of the Sensor that reported the network first. If there are multiple sensors
connected to a network, location of such network is the nearest common location of all reporting sensors. To change
the location of the network, right click the network row whose location you want to change. Following figure
displays the method to change location.
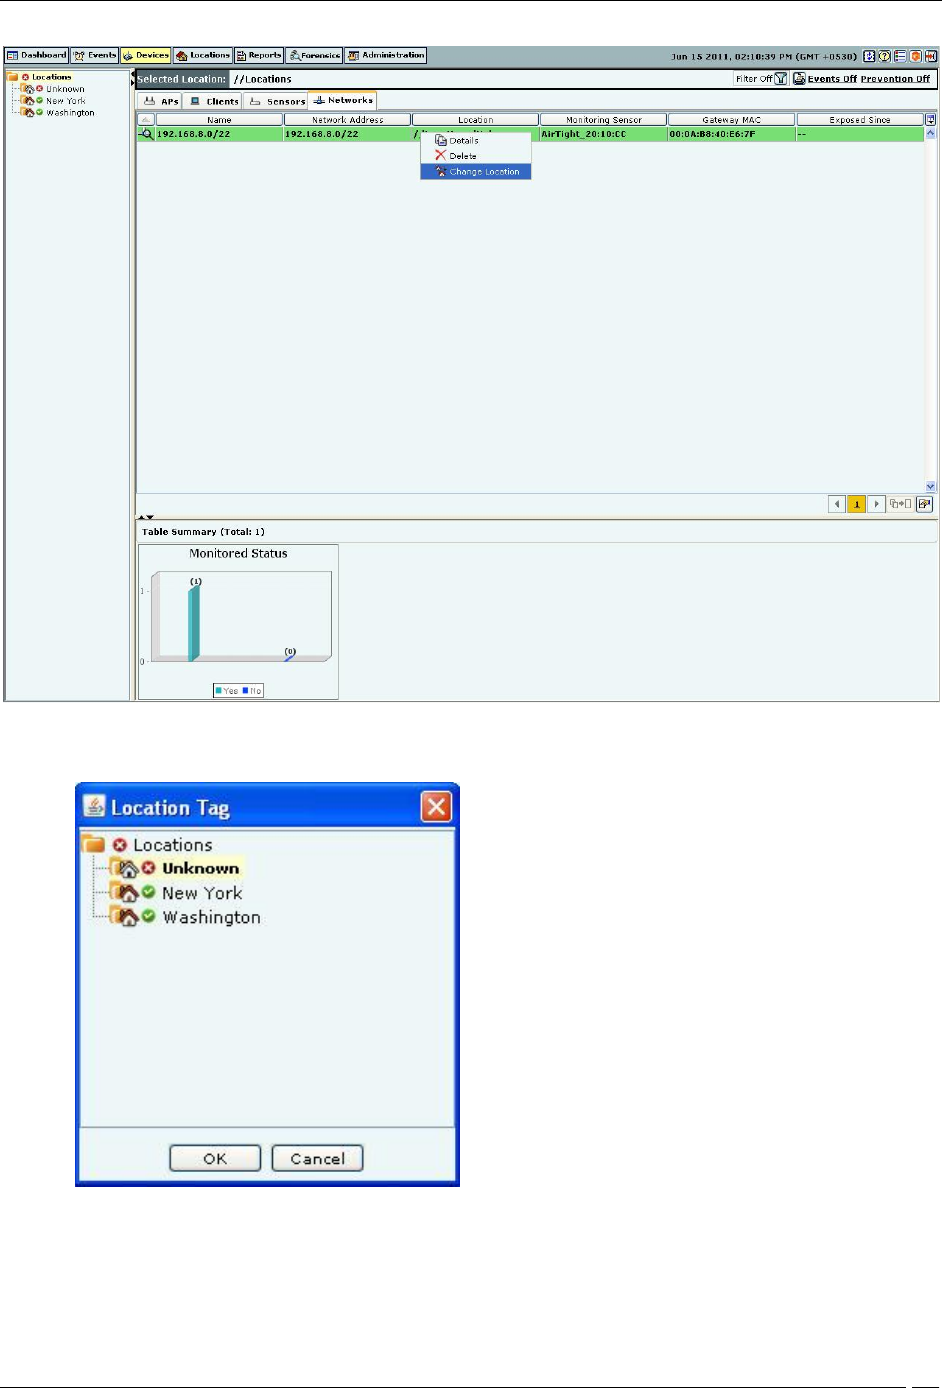
Devices Tab
SpectraGuard® Enterprise User Guide
107
Changing the network location
Click the Change location menu item.
The following screen appears on clicking Change Location.
Select the new location
Select the new location and click OK to move the network to the new location. To cancel the operation, click Cancel.
On selecting a new location, the network is seen under the new location.
Deleting a network from Networks Tab
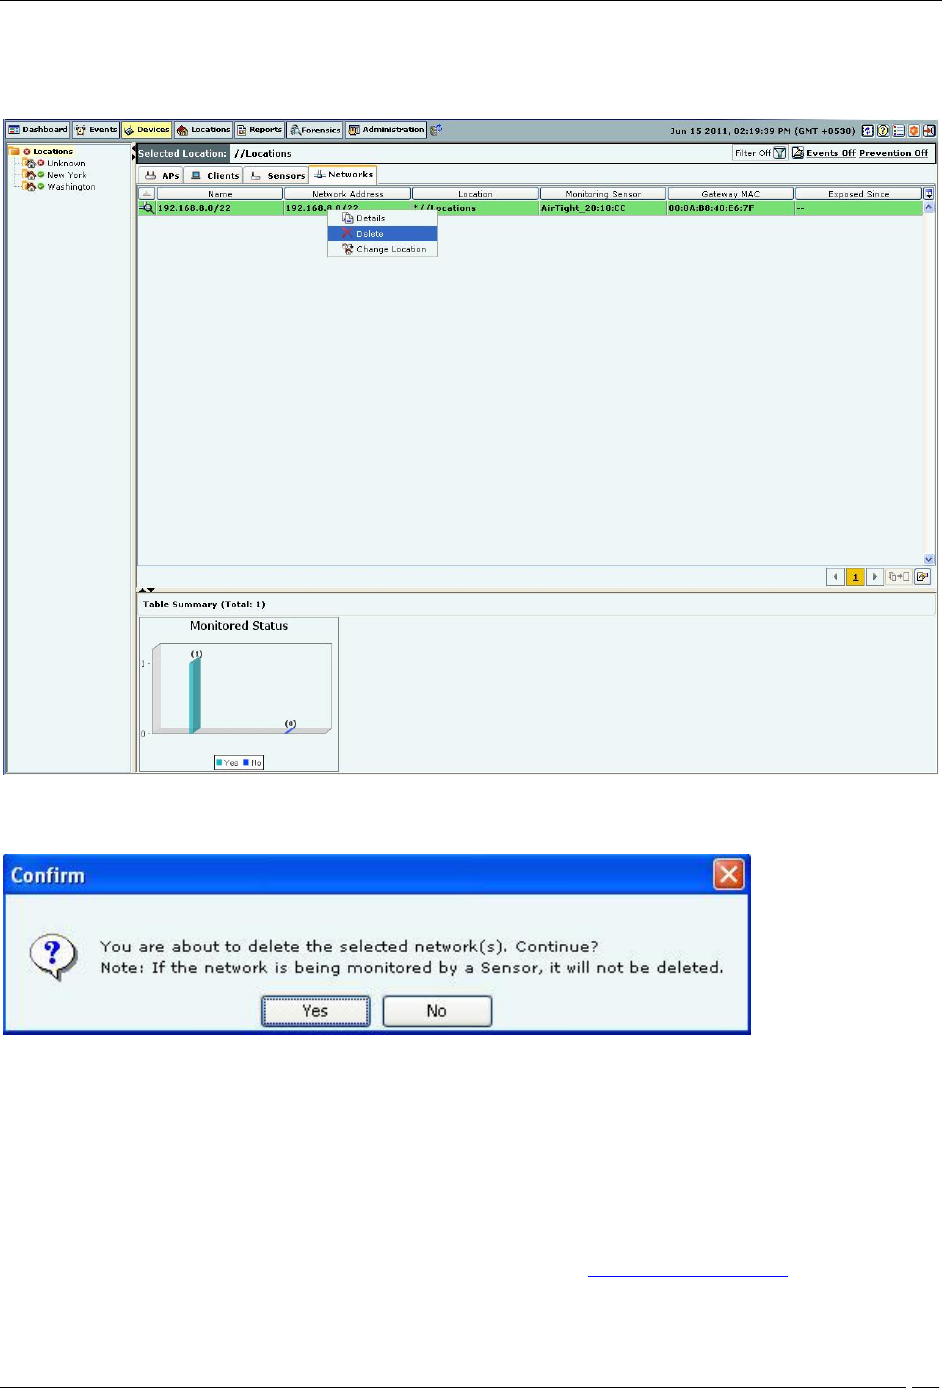
Devices Tab
SpectraGuard® Enterprise User Guide
108
To delete a network from the Networks tab, right click the network row you want to delete. Following figure
displays the method to delete network from networks tab.
Delete a network
Click the Delete option. The following message box is displayed.
.
Confirm network deletion
To delete the selected network, click Yes. To cancel the network deletion, click No.
The network will not be deleted if it is being monitored by a sensor.
Locating an AP/Client placed on the Floor Map
The system enables you to find the distance of a device from various Sensors to which it is visible and determine the
possibility that the tracked device is present at a certain location on the floor map. Location tracking in a dynamic
wireless environment works on probabilities. Use the following steps to locate a device:
1. Open an AP/Client list using the steps explained in the Viewing APs/Clients List section.
2. Right-click an AP/Client row.
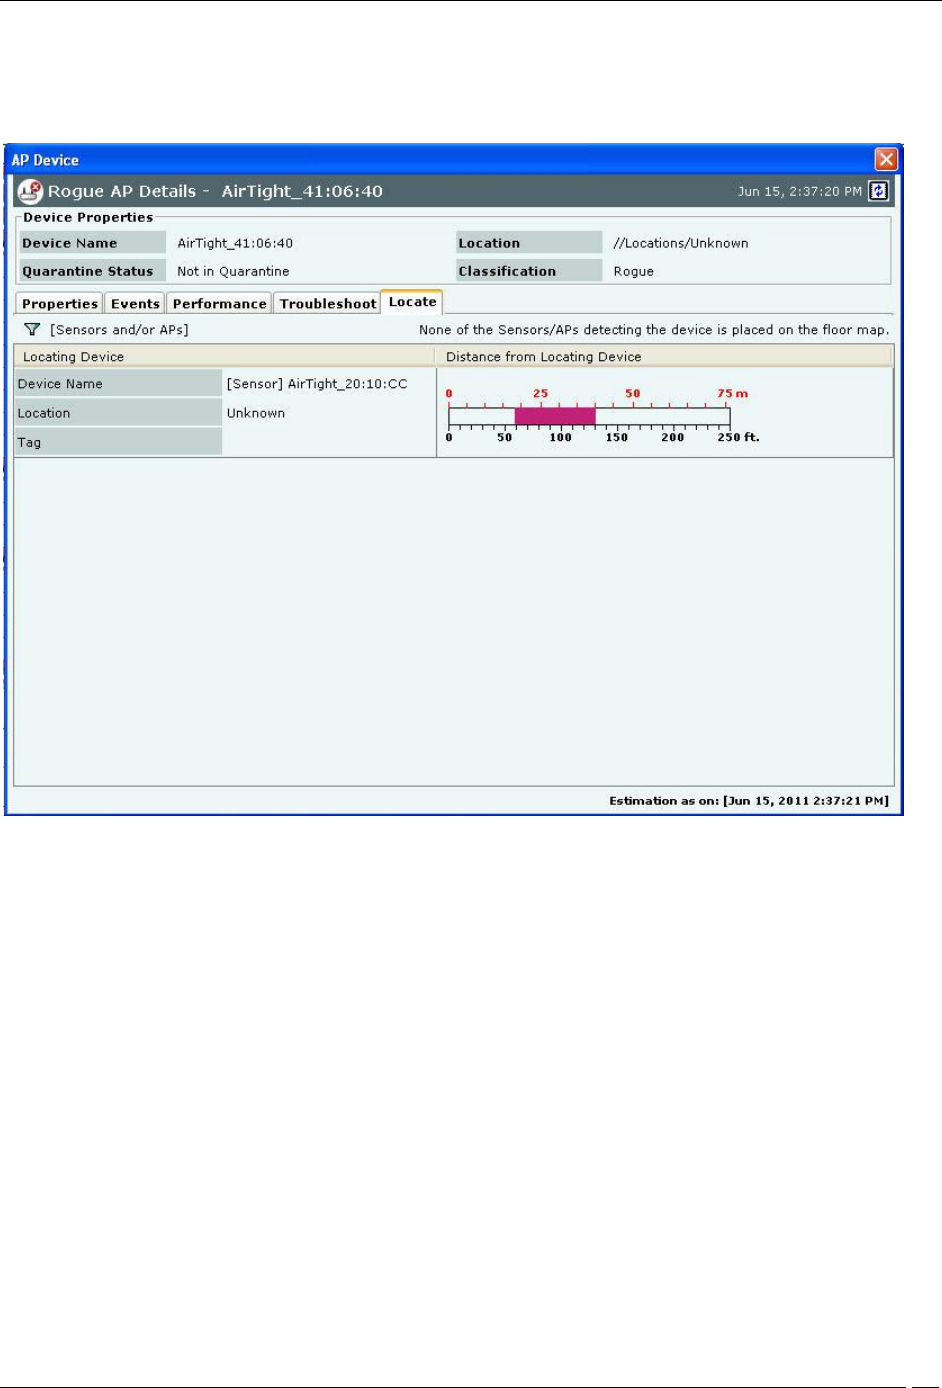
Devices Tab
SpectraGuard® Enterprise User Guide
109
3. From the context-sensitive menu, select Locate. A Tracking Location progress bar followed by a Locate
tab appears. The Locate tab displays the distance in feet and meter of the selected device from the
locating device, which appears in the Thermometer View. Alternatively, if the device for which you are
searching is not visible to any Sensor, a message appears.
AP Locate Tab – Thermometer View
Distance from Locating Device displays the approximate distance of the device (AP/Client) being located
from the Locating Device which does RSSI measurement. RSSI measurement can be taken by the Sensor or
the AP, if RSSI integration is enabled with the AP.
4. Click Floor Map View to view the current location of the AP/Client on the Floor Map.
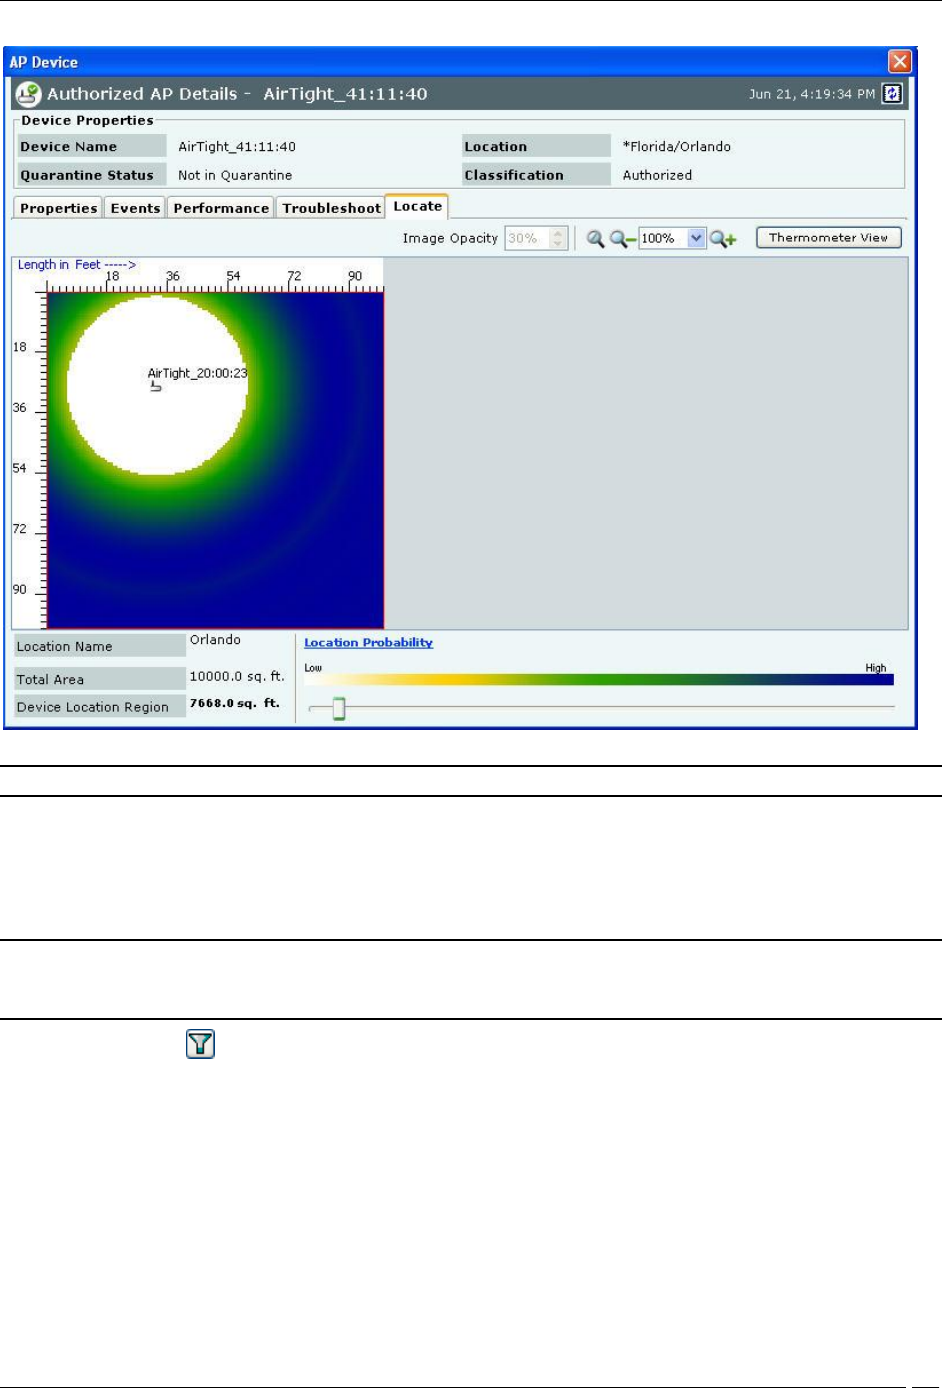
Devices Tab
SpectraGuard® Enterprise User Guide
110
AP Locate Tab – Floor Map View
Note: The Floor Map View appears only if you have placed Authorized APs and Sensors on the Floor Map.
The Floor Map View dialog displays color shaded regions around Sensors and APs with colors indicating the
probability of the location of the device. It displays Location Probability slider which shows the color coding from
low to high probability. Based on the slider position, the system color codes only those locations on the map where
the probability of locating the device is higher than the value set in this slider bar. You can move the Location
Probability slider to High to select regions where the probability of locating the device is higher.
Note: If you move the slider to Low, you see locations with both low and high probabilities. The number and placement of
Sensors helps determine the accuracy of location tracking. Increasing the number of Sensors enhances the location tracking
accuracy.
5. Click the icon to open the Monitoring Device Filter dialog. In this dialog, you can specify which
APs/Sensors at the current location or other locations used to locate the current device location on the
floor map. You can specify the following:
To use APs and/or Sensors from the current floor only, select Use signal data from devices at this
location only. This option computes the best possible position for the selected device on the
current floor.
To use APs and/or Sensors from the other floors also, select Use signal data from devices at other
locations also. This option computes the best possible position for the selected device using
monitoring devices from other floors too. This may result in the selected device being tracked on
some other floor.
You can also specify whether the location tracking should use data from Sensors only, APs only or both.
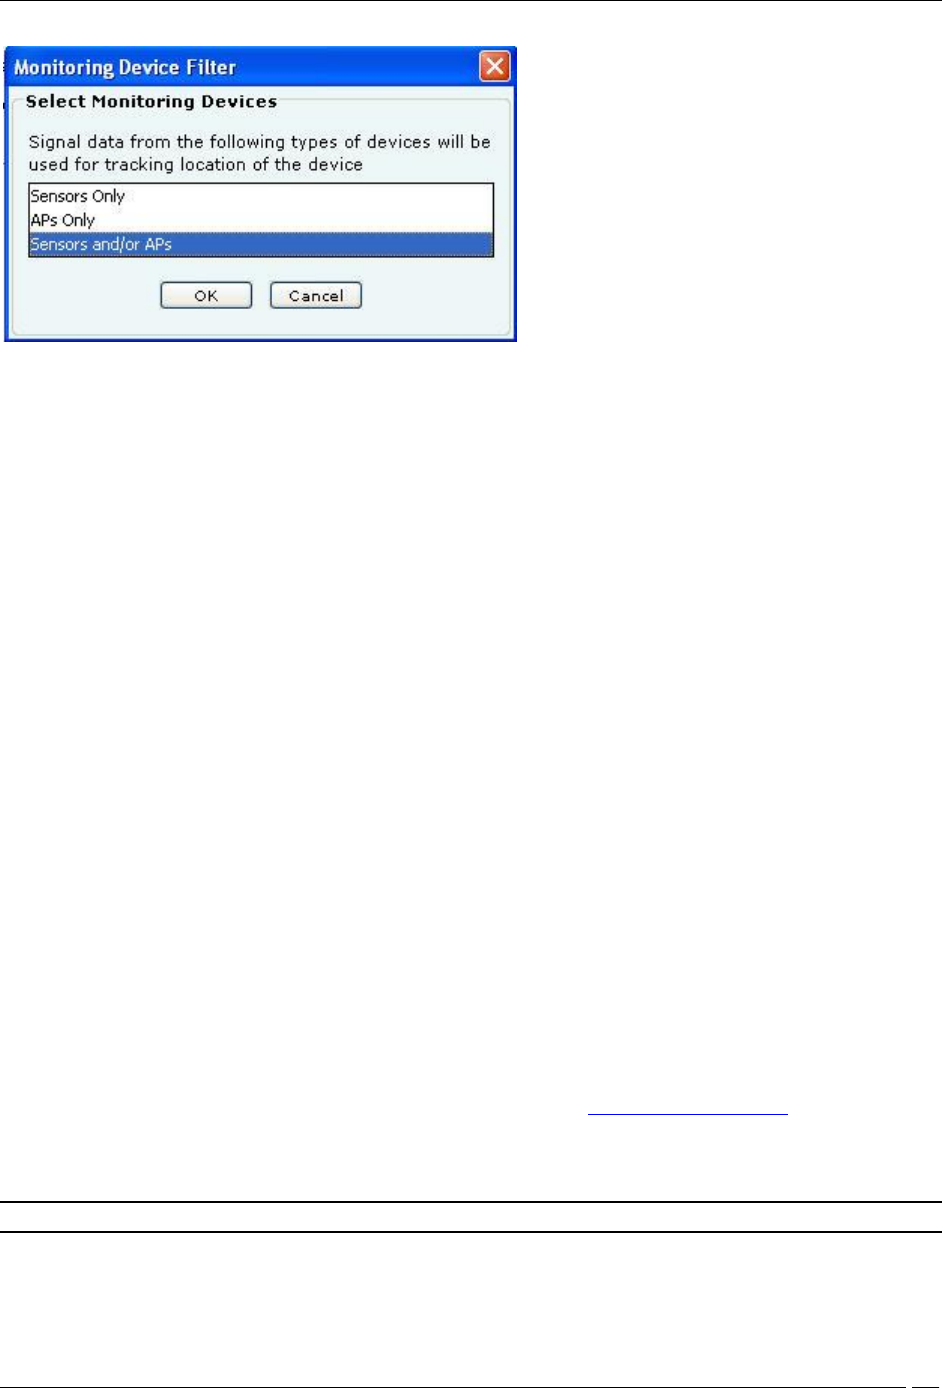
Devices Tab
SpectraGuard® Enterprise User Guide
111
Monitoring Device Filter Dialog
Removing a Device from Quarantine
The system enables you to remove a device from quarantine so that wireless communication can start on that device.
You can remove a device from quarantine in several ways.
If the device is automatically quarantined, you can do one of the following:
Right-click the device row and select Disable Auto-quarantine.
Change the Intrusion Prevention policy that quarantines the device.
Deselect the checkbox Activate Intrusion Prevention for location ‘<selected location>’ on the
AdministrationLocal tabLocation PropertiesIntrusion Prevention Activation screen
Change the classification of a device manually. For example, manually move an AP from the Rogue
folder to the External folder by right-clicking the Rogue AP row and selecting Move to… and then
External. The External AP will move out of quarantine.
Change the security settings on the SSID template so that the AP no longer violates the specified
security settings. For example, consider an AP that has become misconfigured by virtue of following
the Security Settings, for example WEP at location ‘Floor 1’. This AP violates the Security Settings, for
example WPA in its SSID template. You can now edit the SSID template in such a way that it matches
the configuration of the existing Misconfigured AP. This Misconfigured AP will now become become
policy compliant and thus Authorized. As a result, this AP will move out of quarantine.
Delete the AP and let the system re-discover it. For example, consider an AP that has become a Rogue
by virtue of following the Security Settings, for example WEP at location ‘Floor 1’. This AP violates the
Security Settings, for example WPA in its SSID template. You can now edit the SSID template in such a
way that the Rogue AP now becomes policy compliant. As the system does not automatically remove
Rogue APs out of quarantine, delete this Rogue AP. The system will re-discover this AP. The AP may
appear in some other device folder and may be moved out of quarantine.
If the device is manually quarantined, right-click the device row and select Remove from Quarantine.
Moving an AP/Client to a Different Folder
The system enables you to re-classify a device, that is, move a device to a different folder based on fresh information.
You cannot however move Categorized APs/Clients to the Uncategorized folder. Use the following steps to move a
device to a specific folder:
1. Open an AP/Client list using the steps explained in the Viewing APs/Clients List section.
2. Right-click an AP/Client row.
3. From the resulting context sensitive menu, select Move to….
4. Select the category to which you want to move the AP/Client.
Note: If you move an AP placed on a floor map, an Error dialog appears.
Merging APs
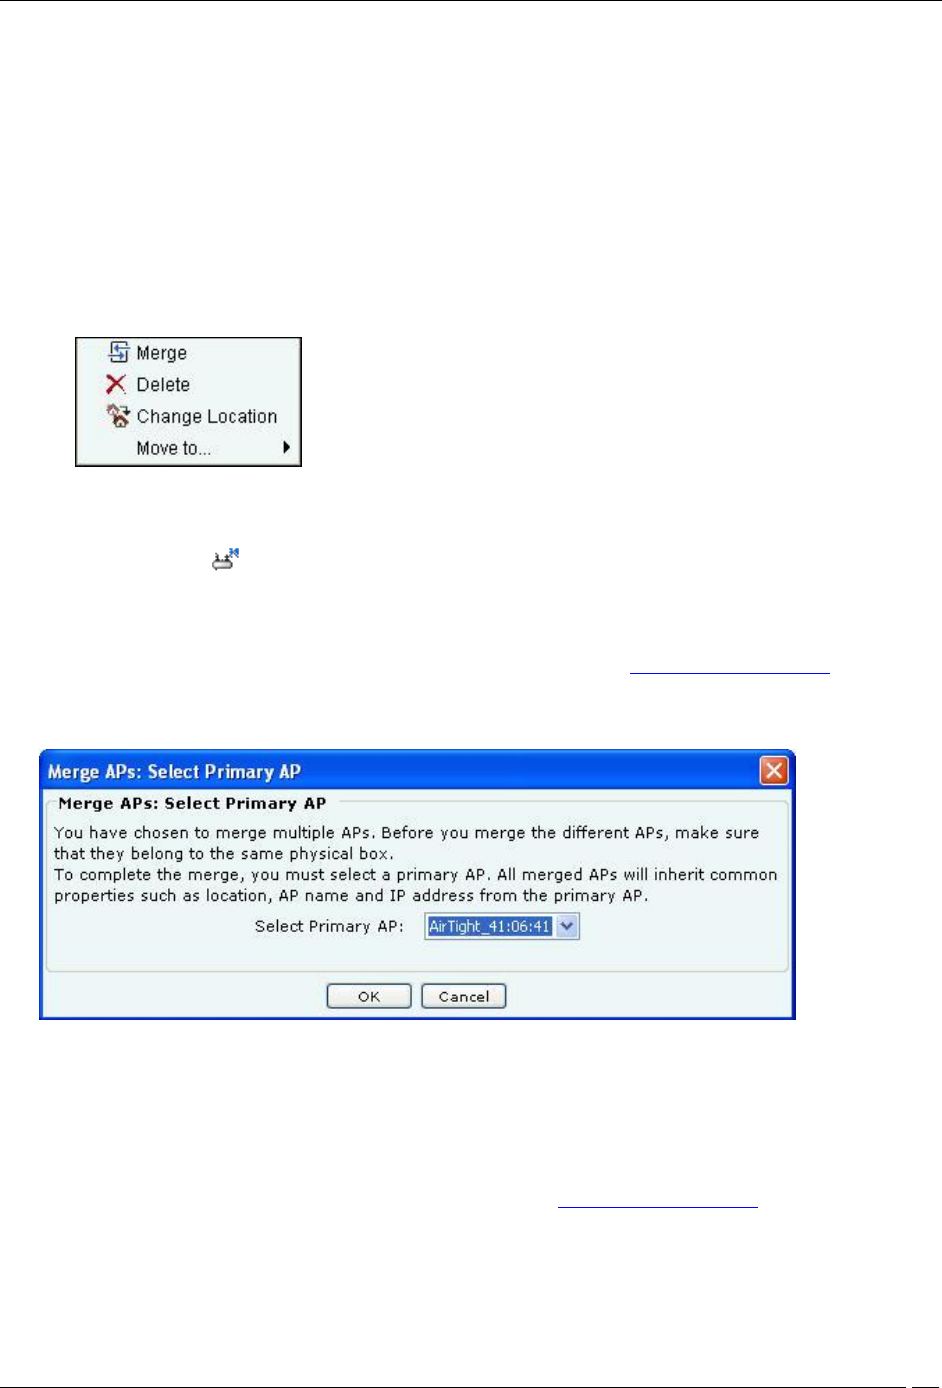
Devices Tab
SpectraGuard® Enterprise User Guide
112
Many modern APs have multiple network interfaces and SSIDs on a single device to support 802.11a and 802.11b/g
simultaneously. Each interface has a different MAC address, which causes the system to identify them as different
APs. The system displays such APs in separate rows on the Console. This may lead to confusion.
Merge can be of two types:
1. Automatic: The system performs automatic merge of certain APs based on their MAC addresses or other
available information.
2. Manual: The system allows you to manually merge APs based on their IP addresses or if the system does
not automatically merge them based on the available information.
On selecting two or more AP rows under the Authorized tab, the AP context-sensitive menu shows the Merge option.
Merge allows you to merge two or more MAC addresses (network interfaces) of one or more APs into a single AP.
Select a primary AP to complete the merge operation.
AP Context-Sensitive Menu for Multiple AP Selection
A merged AP has the following characteristics:
Inherits common properties such as location, AP name, and IP address from the primary AP
Identified by the icon on the Console
Can merge with more APs
Can be separated into its individual interfaces using the Split option
Use the following steps to merge APs into a single AP:
1. Open an Authorized AP list using the steps explained in the Viewing APs/Clients List section.
2. Select the APs that you want to merge and right-click one of the selected AP rows.
3. From the resulting context-sensitive menu, select Merge. A Merge APs dialog appears.
Merging an AP Dialog
4. Select the Primary AP.
5. Click OK to merge the selected APs.
Splitting APs
You need to split APs if they were merged incorrectly either manually or automatically based on the information
available with the system. Use the following steps to split merged APs into individual APs:
1. Open an Authorized AP list using the steps explained in the Viewing APs/Clients List section.
2. Select the merged APs that you want to split and right-click the corresponding AP row.
3. From the resulting context-sensitive menu, select Split. A Confirm dialog appears.
4. Click Yes to split the selected APs.
Devices Tab – User Saved Settings

Devices Tab
SpectraGuard® Enterprise User Guide
113
The following User choices made during browsing of Devices Tab are saved by the system:
Filtering Devices – APs, Clients, and Sensors.
Display Columns.
Column Width and Column order
These settings are saved on log out as well as movement to other tabs on the Console.
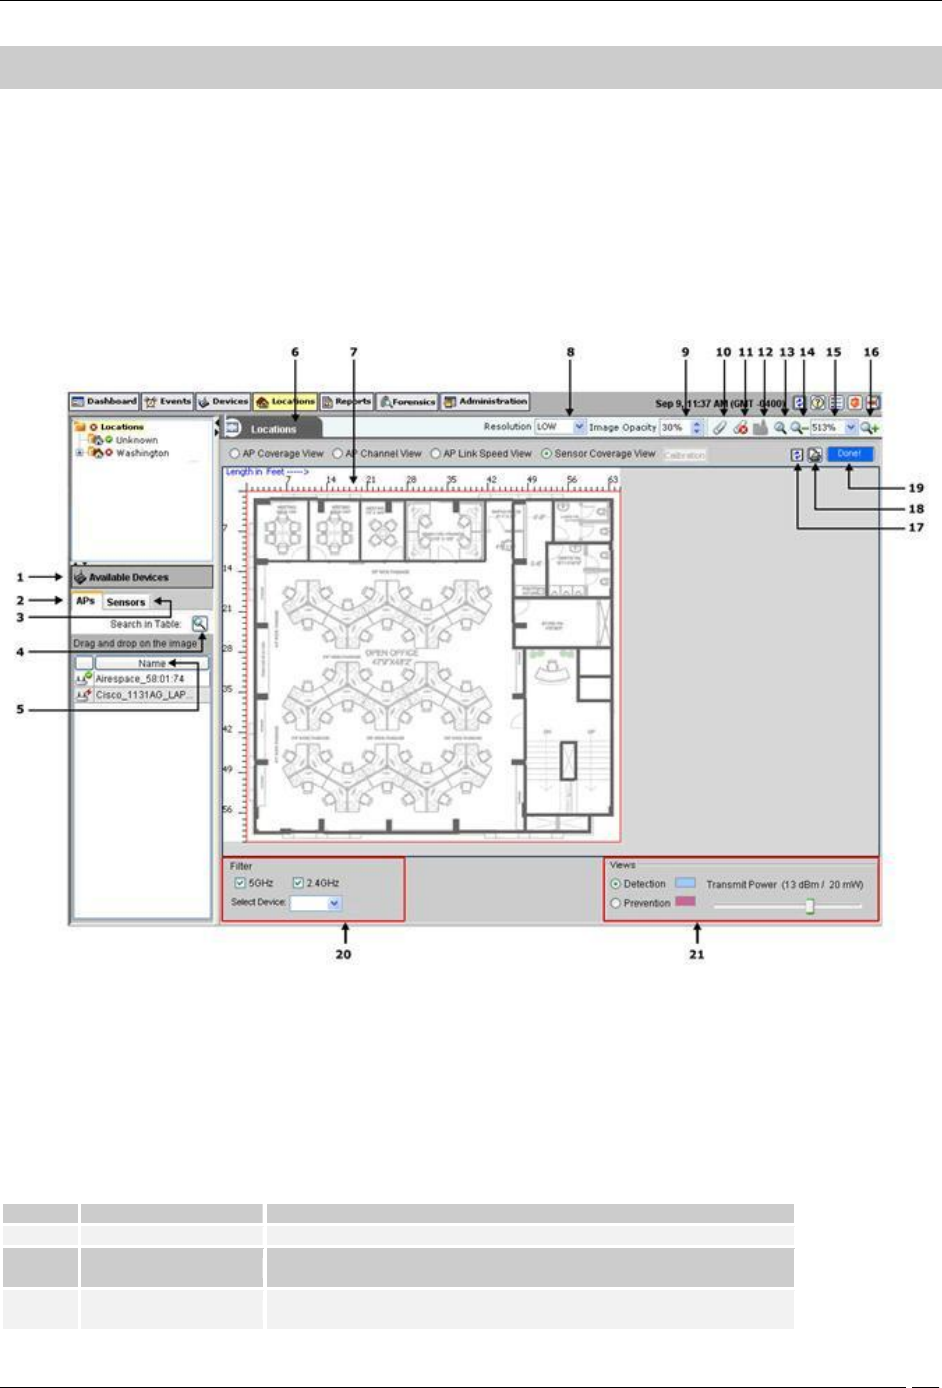
Locations Tab
SpectraGuard® Enterprise User Guide
114
Locations Tab
Locations: Panel for Creating Locations
The Locations screen enables you to organize your network into a list of locations and view live 802.11 RF coverage
maps for each location node. On the Locations tab, you can add, delete, and move a location folder or node, import a
floor map on a location node, attach or detach an image from a location, place available locations on an attached
image, and place devices on the floor map. You can also view live RF maps.
Locations Screen
You can open the Locations screen by selecting the Locations tab on the navigation bar.
Locations Screen
The Locations screen includes two panes:
On the left, the Locations tree and a list of available locations and devices.
On the right, the image attached to the selected location, locations placed on a location folder and devices placed on
a location node.
The following table lists the names and description of each component.
Name and description of components on the Locations screen
Sr. No.
Name
Enables you to…
1
Available Devices
View APs and Sensors available for that node.
2
Available APs
View a list of Authorized APs not tagged or placed on any
location node.
3
Available Sensors
View a list of available Sensors not tagged or placed on any
location node.
Locations Tab
SpectraGuard® Enterprise User Guide
115
4
Search
Look for a device or location in the table.
5
Sort
Sort devices or locations in ascending/descending order.
6
Location Details
View the list of locations of a specific location node.
7
Ruler
View the dimensions of the floor map: in feet.
8
Resolution
Change the resolution to Low, Medium, or High.
9
Image Opacity
Control the Opacity of the image: Decrease the value to better
comprehend RF coverage or increase the value to pinpoint exact
device information on the floor map.
10
Attach Image on floor
Attach an image of a floor map to a location node.
11
Detach Image from
floor
Detach an attached image.
12
Save
Save the properties of a location node.
13
Best Fit
Fit the layout image to the window/page. This is the default
mode in which the layout image appears on the right pane.
14
Zoom Out
Zoom out of a layout image.
15
Choose/Enter Value to
Zoom In/Zoom Out
Enter or choose a value from the drop-down combo box, to view
the layout image in terms of an exact zoom percentage.
(Minimum: 1%; Maximum: 1000%)
16
Zoom In
Zoom into a layout image for an enlarged view.
17
Refresh
Refreshes the Locations screen.
18
Printable View
Saves the printable view of the Location as jpg, png, or HTML
format.
19
Done
Indicates whether the RF View computation on a location is
completed.
20
Filter
Changes RF Views based on the operating band or particular
radio selected.
21
Views
Displays the Detection and Prevention range of a Sensor on the
selected location.
Working with Location Folders and Location Nodes
A list of locations comprises location folders and location nodes.
Location folders represent organizational components such as buildings, cities, or countries.
Root Location: This is the root location. The factory default name for this location is Locations.
You can rename this location. However, you cannot delete or move this location.
Unknown: This is the default location folder of the root location. You cannot create, delete,
rename, move, or add a location to the Unknown folder. When the system detects a new
untagged Sensor, it tags this Sensor to the Unknown location folder. In other words, when the
location tag of a location-aware entity is not known or cannot be determined, it is tagged to the
Unknown folder. By default, the Unknown folder inherits all the policies except the Operating
Policies from the root location. You can customize these policies (see Local Policies).
Location nodes represent component details such as a floor in a building. For example, Hawaii Conference Room,
Bldg 15–Cubicle G2, or Executive Area.
Adding a New Location
Use the following steps to add a location:
1. In the Location tree, select the location under which you wish to add a new location.
2. Right-click and from the resulting context-sensitive menu, select Add New Location.
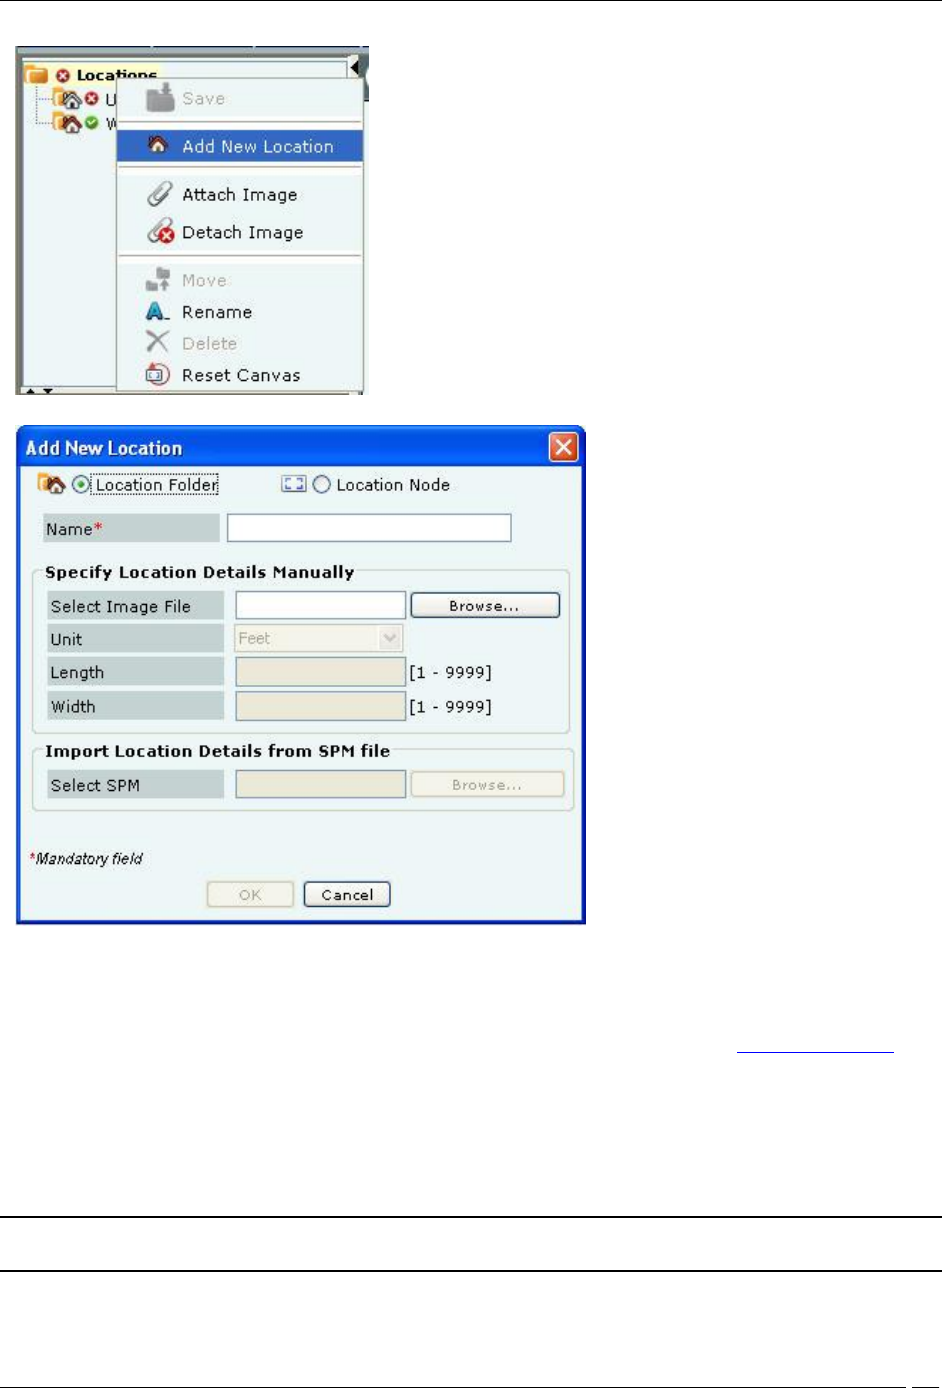
Locations Tab
SpectraGuard® Enterprise User Guide
116
Adding a New Location
Specifying Location Properties
3. In the Add New Location dialog, select the type of location, that is, Location Folder or Location Node.
4. Enter a name for the new location and optionally enter the following details.
Select Image File: Click Browse to navigate to the path of the image that you wish to attach to the
location folder or node. You can attach the image later as explained in the Attaching an Image
section.
Unit: Specify the unit of measurement (feet or meters) for the location node.
Length: Specify the length of the location node.
Width: Specify the width of the location node.
Select SPM: Click Browse to navigate to the path of the .SPM file that you wish to import from
Planner into the new location node.
Note: Unit, Length, Width, and Select SPM options are available only for a location node. They are grayed out for a location
folder.
5. Click Save to create a new location.
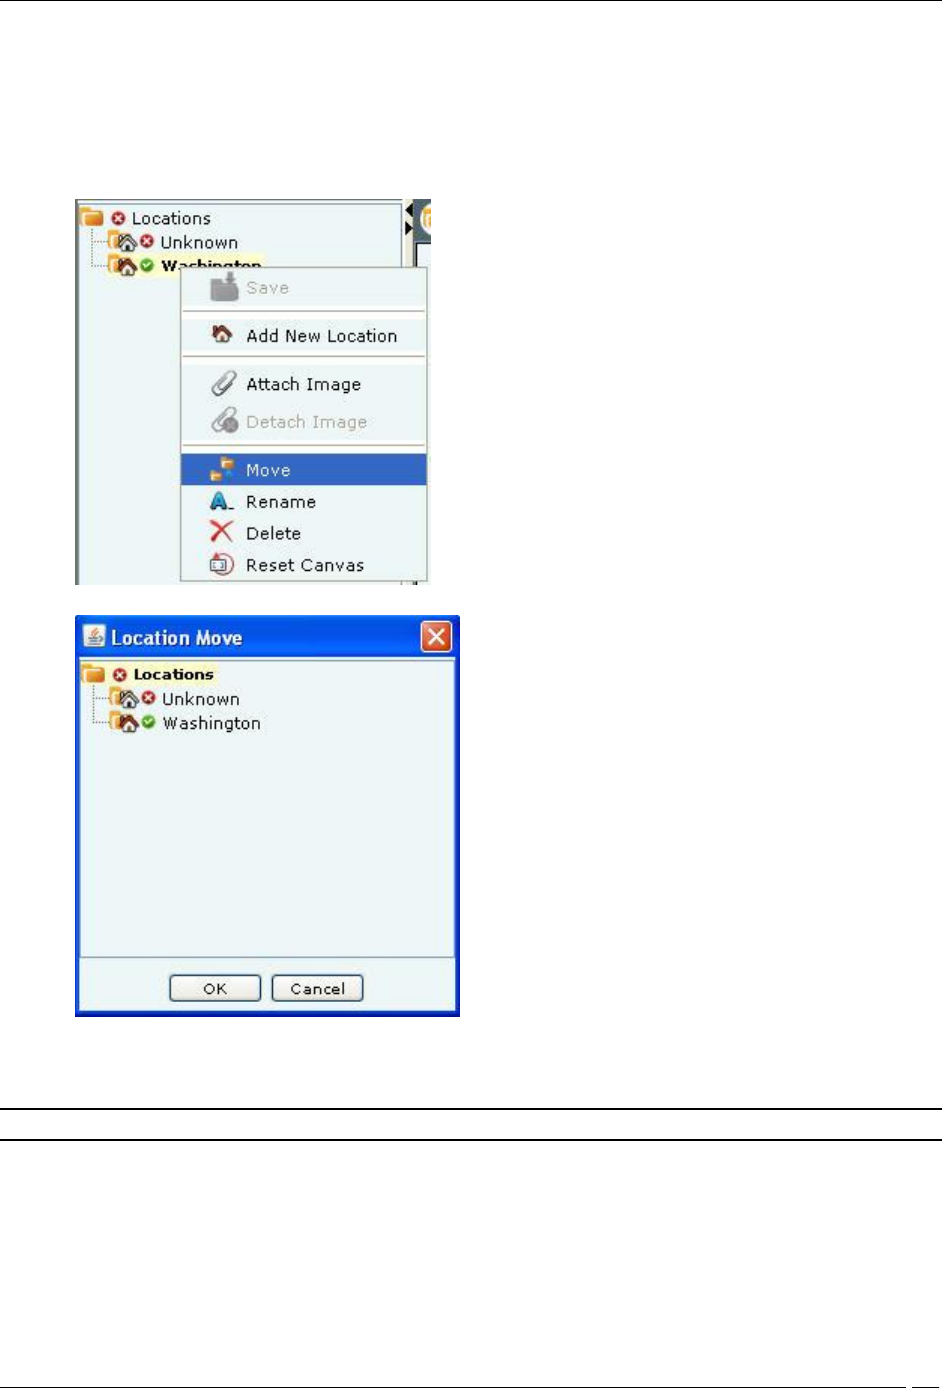
Locations Tab
SpectraGuard® Enterprise User Guide
117
Moving a Location
The system enables you to move a location to a different location folder. Use the following steps to move a location to
a specific folder:
1. In the Location tree, select the location that you wish to move.
2. Right-click and from the resulting context-sensitive menu, select Move.
Moving a Location
Selecting a Destination Location
3. In the Location Move dialog, select the destination location folder to which you want to move the
selected location. Refer to the section Location Move for more details.
Note: You cannot move the Unknown location or any location into this location.
4. Click OK to move the location.
Renaming a Location
Use the following steps to rename a location.
1. In the Location tree, select the location that you wish to rename.
2. Right-click and from the resulting context-sensitive menu, select Rename.
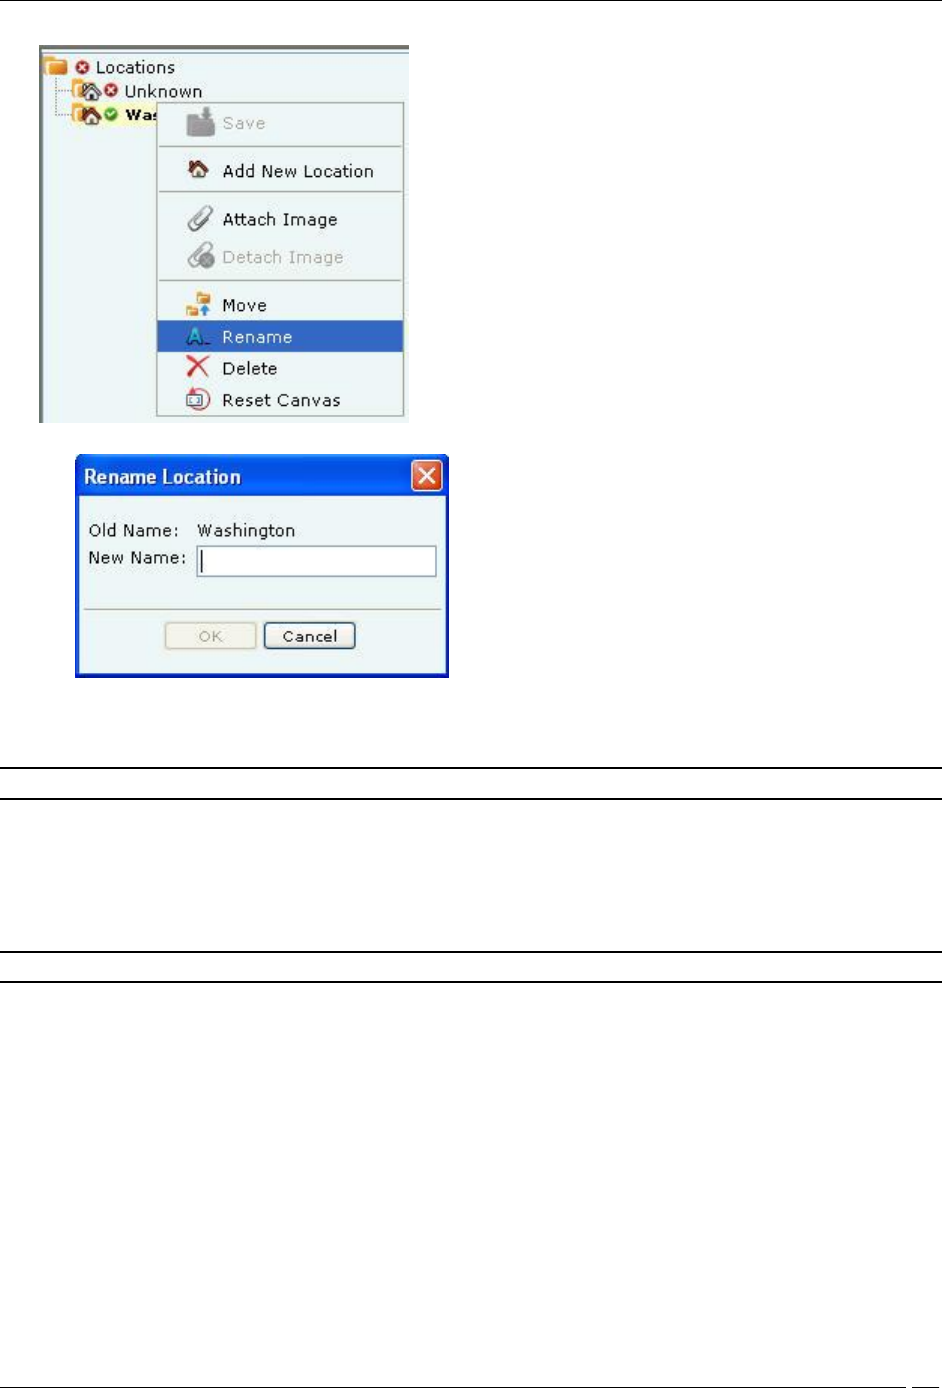
Locations Tab
SpectraGuard® Enterprise User Guide
118
Renaming a Location
Specifying a New Name for a Location
3. In the Rename Location dialog, enter the new name for the location.
4. Click OK to rename the location.
Note: You cannot rename the location folder Unknown.
Deleting a Location
When you delete a location folder, the system deletes all subfolders and location nodes below that folder. If there are
any devices tagged to the location being deleted, these devices would either be auto tagged (according to the tagging
logic) or they will be tagged to the Unknown location folder. Use the following steps to remove a location folder
and/or a location node.
Note: You cannot delete the Root Location and Unknown location folders.
1. In the Location tree, select the location that you wish to delete.
2. Right-click and from the resulting context-sensitive menu, select Delete.
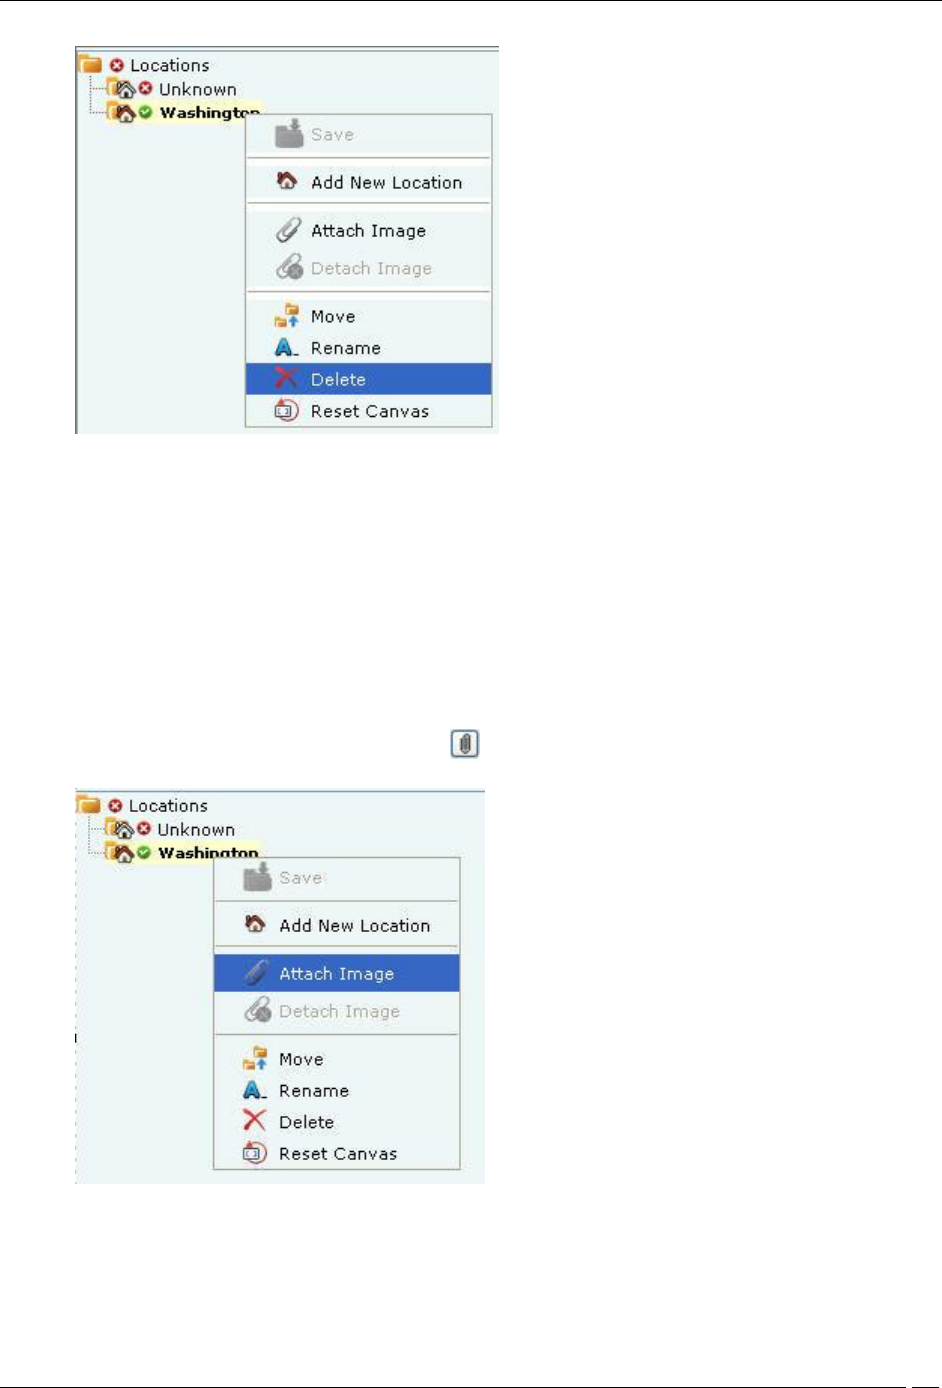
Locations Tab
SpectraGuard® Enterprise User Guide
119
Deleting a location
3. Click Yes in the Confirm dialog to remove the selected location.
Working with Images
This section shows you how to add an image to a location, delete an image from the location, and import a Planner
file into a location node. It also shows you how to use the zoom feature while viewing a layout image.
Attaching an Image
Use the following steps to attach an image:
1. In the Location tree, select the location to which you wish to attach an image.
2. Do one of the following:
Right-click and from the resulting context-sensitive menu, select Attach Image.
Click the Attach Image on floor icon ( ) in the right corner.
Attaching an Image to a Location
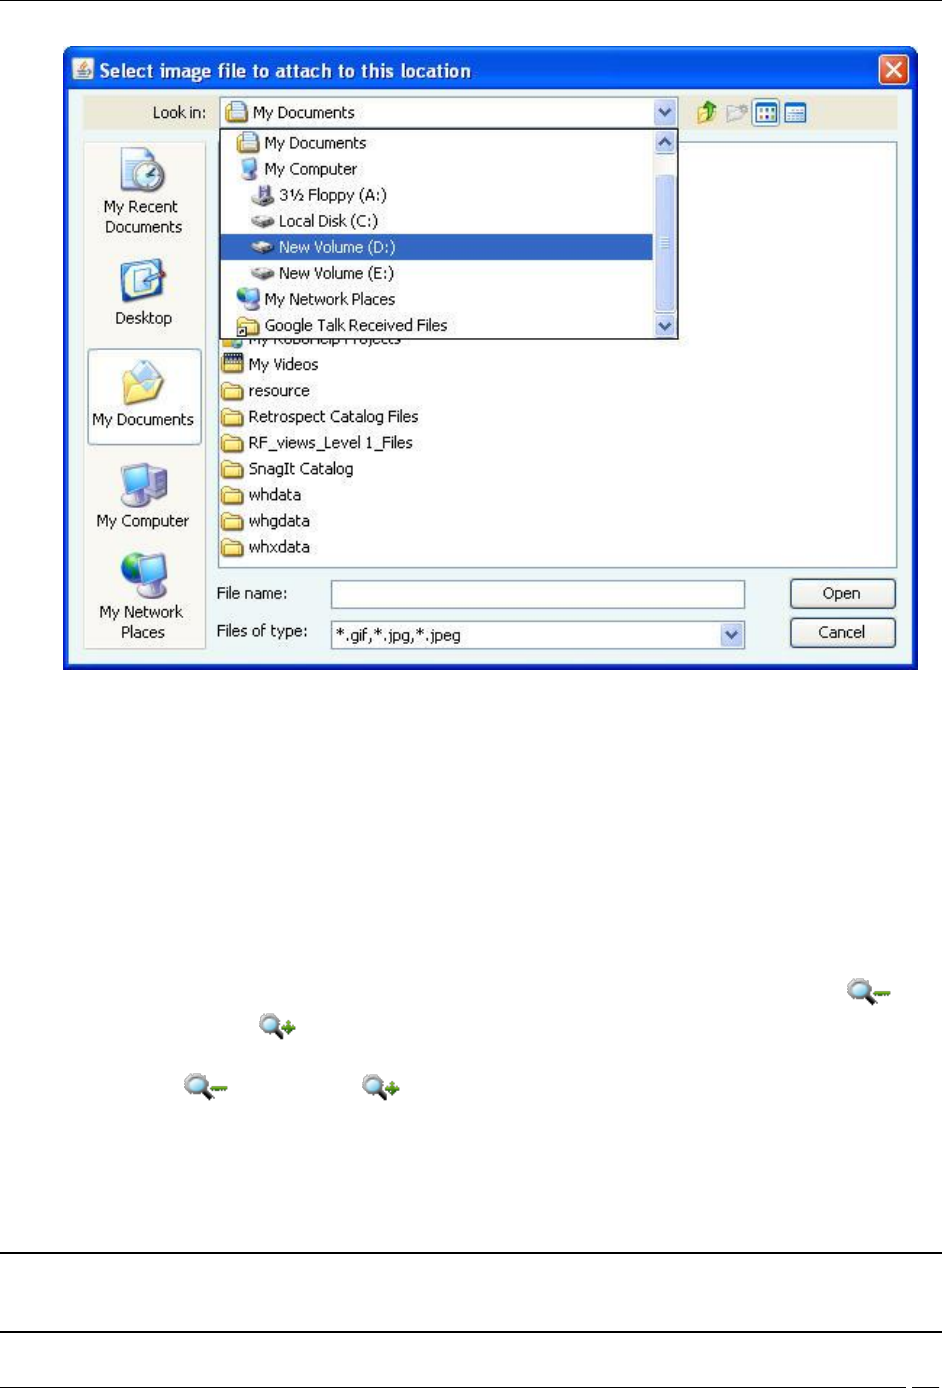
Locations Tab
SpectraGuard® Enterprise User Guide
120
Specifying a Path to attach an Image
3. On the Select image file to attach to attach to this location dialog, browse to the appropriate image and
then click <Open>.
Zooming In/Zooming Out, Opacity Control, Resolution of an Image
Considerable screen area is required to display a large sized layout (for example, 3000 x 2000 sq. ft.) defined or
imported in the system. The zooming in/zooming out feature makes it easier to comprehend the RF coverage and
device placement information. It also avoids excessive scrolling.
Use the following steps to zoom in/zoom out of an image and control its opacity.
1. In the Location tree, select the location node that has a .SPM file imported or attached image and
devices placed on it.
2. Do one of the following for zooming out or zooming in:
Select a zoom percentage (%) from the drop-down list and then click the Zoom out icon or
Zoom in icon .
Enter a zoom % between 1% to 1000% in the editable drop-down box and then click the Zoom out
icon or Zoom in icon .
3. To change the opacity of the image, select an Image Opacity value. Decrease this value to better
comprehend RF coverage or increase this value to pinpoint exact device placement information.
4. Select an appropriate Resolution for rendering of the heat maps. A lower resolution would mean much
faster rendering although with a higher pixelization effect (coarser look). High resolution would mean
much slower rendering due to the large number of pixel cells for which values need to be calculated.
Note: The system proportionately resizes the RF layout display area depending on the zoom % specified by the user. Additionally,
attached image, if any, and scale markings change accordingly. The system also readjusts scrollbars to keep the displayed objects
center point invariant.