Boston Scientific CRMN11906 Implantable Defibrillator User Manual Part 2 Teligen Manual
Boston Scientific Corporation Implantable Defibrillator Part 2 Teligen Manual
Contents
Part 2 Teligen Manual
PACING THERAPIES
ATRIAL TACHY RESPONSE 5-19
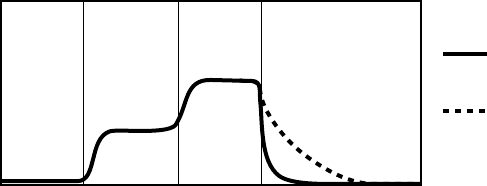
Recovery Time
MSR
Paced rate
LRL
Rest Stage 1 RestStage 2
Time
Longer
Recovery Time
Nominal
Recovery Time
The figure shows the effect of higher and lower settings during a theoretical two-stage exercise test.
Figure 5-11. Recovery Time in exercise test
Programming Recovery Time for Normal Settings also changes the
corresponding selection for Post-Therapy Settings.
ATRIAL TACHY RESPONSE
ATR Mode Switch
ATR limits the amount of time that the ventricular paced rate is at the MTR
or exhibits upper-rate behavior (2:1 block or Wenckebach) in response to a
pathological atrial arrhythmia.
In the presence of detected atrial activity that exceeds the Atrial Arrhythmia
Rate Threshold, ATR switches the pacing mode from a tracking mode to a
nontracking mode as follows:
• From DDD(R) to DDI(R) or VDI(R)
• From VDD(R) to VDI(R)
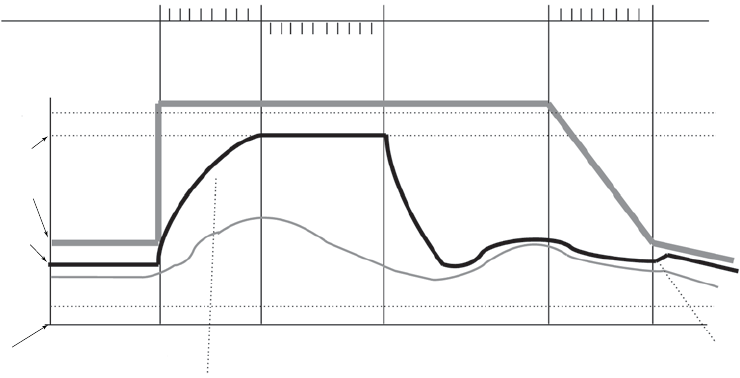
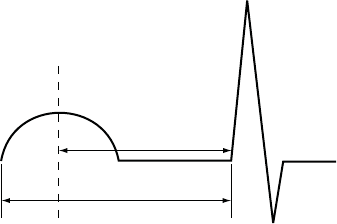
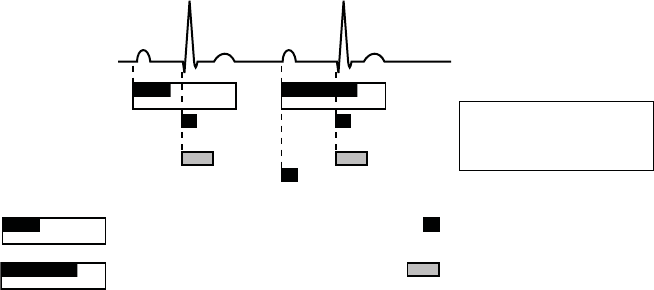
An example of ATR behavior is shown (Figure 5-12 on page 5-20).
- DRAFT -
5-20 PACING THERAPIES
ATRIAL TACHY RESPONSE
ATR Counter
Duration Counter
0 8
Detect Duration Fallback Reset
0 8
Exit Count = 8
8 atrial cycles <
Atrial Arrhythmia
Rate Threshold
N
Entry Count = 8
8 atrial cycles >
Atrial Arrhythmia
Rate Threshold
Rate
Atrial
tachycardia
starts
Rate Smoothing
applied here
Atrial
tachycardia
confirmed
ATR Duration
fulfilled
Atrial
tachycardia
terminates
MODE SWITCHING
DDDR VDIR
DDDR
Atrial
tachycardia
termination
confirmed
Rate
Smoothing
applied
here
Atrial Arrhythmia
Rate Threshold =
170 min-1 (ppm)
MTR =
120 min-1 (ppm)
Atrial Rate
Right Ventricular
Rate
Sensor Rate
ATR/VTR Fallback
LRL = 70 min-1 (ppm)
LRL = 60 min-1 (ppm)
Figure 5-12. ATR behavior
NOTE: Parameter settings that reduce the atrial sensing window may inhibit
ATR therapy.
Atrial Arrhythmia Rate Threshold
The Atrial Arrhythmia Rate Threshold determines the rate at which the pulse
generator begins to detect atrial tachycardias.
The pulse generator monitors atrial events throughout the pacing cycle,
except during the atrial blanking period and the noise interrogation intervals.
Atrial events faster than the Atrial Arrhythmia Rate Threshold increase the
ATR detection counter; atrial events slower than the Atrial Arrhythmia Rate
Threshold decrease the counter.
When the ATR detection counter reaches the programmed entry count, the
ATR Duration begins. When the ATR detection counter counts down from the
programmed Exit Count value to zero at any point in time, ATR Duration and/or
fallback are terminated, and the ATR algorithm is reset. An event marker is
generated whenever the ATR detection counter is incremented or decremented.
NOTE: During post-therapy pacing, ATR functions the same as in normal
pacing.
- DRAFT -
PACING THERAPIES
ATRIAL TACHY RESPONSE 5-21
ATR Duration
ATR Duration determines the number of cardiac cycles during which the
atrial events continue to be evaluated after initial detection. This feature is
intended to avoid mode switching due to short, nonsustained episodes of atrial
tachycardia. If the ATR counter reaches zero during ATR Duration, the ATR
algorithm will be reset, and no mode switch will occur.
If the atrial tachycardia persists for the programmed ATR Duration, then
mode switching occurs and the ventricular rate begins decreasing to the
sensor-indicated rate, VRR rate or the ATR/VTR Fallback LRL, depending
on the programmed Fallback Mode.
Entry Count
The Entry Count determines how quickly an atrial arrhythmia is initially detected.
The lower the programmable value, the fewer the fast atrial events required to
fulfill initial detection. Once the number of fast atrial events detected equals
the programmable Entry Count, ATR Duration begins, and the Exit Count is
enabled.
CAUTION: Exercise care when programming the Entry Count to low values
in conjunction with a short ATR Duration. This combination allows mode
switching with very few fast atrial beats. For example, if the Entry Count was
programmed to 2 and the ATR Duration to 0, ATR mode switching could occur
on 2 fast atrial intervals. In these instances, a short series of premature atrial
events could cause the device to mode switch.
Exit Count
The Exit Count determines how quickly the ATR algorithm is terminated once
the atrial arrhythmia is no longer detected.
The lower the programmed value, the more quickly the pulse generator will
return to an atrial tracking mode. Once the number of slow atrial events
detected equals the programmable Exit Count, ATR Duration and/or Fallback
will be terminated, and the ATR algorithm will be reset.
CAUTION: Exercise care when programming the Exit Count to low values.
Forexample,iftheExitCountwasprogrammedto2,afewcyclesofatrial
undersensing could cause termination of mode switching.
- DRAFT -
5-22 PACING THERAPIES
ATRIAL TACHY RESPONSE
Fallback Mode
Fallback Mode is the nontracking pacing mode that the pulse generator
automatically switches to when ATR Duration is fulfilled.
After switching modes, the pulse generator gradually decreases the ventricular
paced rate to the ATR/VTR Fallback LRL, VRR rate, if enabled, or the
sensor-indicated rate if programmed to an adaptive-rate mode, whichever is
higher. The decrease in the ventricular paced rate is controlled by the Fallback
Time parameter.
NOTE: Dual-chamber pacing fallback mode values are only available when
the Normal pacing mode is also set to dual chamber.
Fallback Time
Fallback Time controls how quickly the paced rate will decrease during fallback
to the ATR/VTR Fallback LRL, the sensor-indicated rate, or VRR if enabled.
During fallback, the following features are disabled:
• Rate Smoothing—disabled until fallback reaches the ATR/VTR Fallback
LRL, the sensor-indicated rate, or VRR; if VRR is enabled, then Rate
Smoothing is disabled throughout the mode switch
• Rate Hysteresis
•AVSearch+
• PVARP Extension
All sensor parameters must be programmed when the adaptive-rate Fallback
Mode is selected. When the pulse generator is permanently programmed to
an adaptive-rate mode with an adaptive-rate ATR Fallback Mode, the pulse
generator will use the sensor and sensor parameters already in effect at the
time of the switch. If the pulse generator is permanently programmed to a
nonadaptive rate mode, it is possible to program the ATR Fallback Mode to an
adaptive-rate ATR Fallback Mode using the accelerometer sensor. In this case,
the Accelerometer field displays ATR Only.
- DRAFT -
PACING THERAPIES
ATRIAL TACHY RESPONSE 5-23
Fallback LRL
The ATR/VTR Fallback LRL is the programmed lower rate to which the rate
decreases during mode switching.
Consider the following interactions when programming the ATR/VTR Fallback
LRL:
• If an adaptive-rate mode is programmed and the sensor-indicated rate
is greater than the ATR/VTR Fallback LRL, the rate decreases to the
sensor-indicated rate
• If VRR is enabled and the VRR rate is greater than the ATR/VTR fallback
LRL, the rate decreases to the VRR rate
• If an adaptive-rate mode is programmed and VRR is enabled, the rate
will decrease to the faster of the sensor-indicated rate, VRR rate, and the
ATR/VTR Fallback LRL
• The ATR/VTR Fallback LRL is also the Backup VVI pacing rate during
backup pacing in the presence of detected ventricular arrhythmias
End of ATR Episode
The End of ATR Episode identifies the point when the pulse generator reverts
to AV synchronous pacing because the atrial arrhythmia is no longer detected.
The pulse generator continues to pace in the Fallback Mode at the
sensor-indicated rate, the VRR-calculated rate, or the ATR Fallback LRL until
the atrial arrhythmia terminates. With the termination of the arrhythmia, the
ATR Exit Count decrements from its programmed value until it reaches 0.
The ATR Exit Count is decremented by atrial events slower than the ATR
Trigger Rate or any ventricular event that occurs more than two seconds after
the last atrial event. When the ATR Exit Count reaches 0, the pacing mode
automatically switches to the programmed tracking mode, and AV-synchronous
pacing is restored.
Ventricular Tachy Response (VTR)
VTR serves as an automatic mode switch for backup VVI pacing in the
presence of detected ventricular tachyarrhythmias.
- DRAFT -
5-24 PACING THERAPIES
ATRIAL TACHY RESPONSE
When detection is satisfied in a ventricular tachycardia zone, the pacing mode
switches to VVI (RV) or to Off if the current mode is AAI(R) or Off.
When the mode switches, backup pacing occurs at the programmed ATR/VTR
Fallback LRL and uses the programmed ATP ventricular Pulse Width and
Amplitude values.
Ventricular Rate Regulation (VRR)
VRR is designed to reduce the V–V cycle length variability during partially
conducted atrial arrhythmias by modestly increasing the ventricular pacing rate.
The VRR algorithm calculates a VRR-indicated pacing interval based on a
weighted sum of the current V–V cycle length and the previous VRR-indicated
pacing intervals.
• Paced intervals have more influence than sensed intervals such that paced
events cause a decrease in the VRR-indicated rate.
• For sensed intervals, the VRR-indicated rate may be increased; however,
the influence is tempered by the previous history.
• The VRR-indicated rate is further bound by the LRL and the VRR MPR.
When VRR is programmed on in tracking modes, it is only active when an ATR
mode switch has occurred. Once the tracking mode operation resumes at the
termination of the atrial arrhythmia, VRR becomes inactive. In tracking modes
where both Rate Smoothing and VRR are programmed on, whenever VRR
is active, the pulse generator automatically disables Rate Smoothing, then
reactivates it once the ATR terminates.
When programmed to On in single-chamber modes, VRR is continually active
and updates the following on each cardiac cycle:
• VRR-indicated pacing rate
• Smoothed average
Ventricular Rate Regulation Maximum Pacing Rate (VRR MPR)
The VRR MPR limits the maximum pacing rate for VRR.
VRR operates between the LRL and the MPR.
- DRAFT -
PACING THERAPIES
ATRIAL TACHY RESPONSE 5-25
Atrial Flutter Response (AFR)
Atrial Flutter Response is designed to:
• Prevent pacing into the atrial vulnerable period
• Provide immediate fallback for atrial rates higher than the AFR
programmable rate
The fallback is maintained for as long as atrial events continually exceed the
AFR programmable rate.
Example: When AFR is programmed to 170 ppm, a detected atrial event inside
the PVARP or a previously triggered AFR interval starts an AFR window of
353 ms (170 ppm). Atrial detection inside the AFR is classified as refractory
senses and is not tracked. Tracking starts only after both the AFR and the
PVARP expire. Paced atrial events scheduled inside an AFR window are
delayed until the AFR window expires. If there are fewer than 50 ms remaining
before a ventricular pace, the atrial pace is inhibited for the cycle.
Ventricular pacing is not affected by AFR and will take place as scheduled. The
wide programmable range for AFR rates allows for appropriate sensing of
slow atrial flutters. High-rate atrial sensing may continuously retrigger the AFR
window, effectively resulting in fallback to the VDI(R) mode.
NOTE: When both AFR and ATR are active and in the presence of atrial
arrhythmias, nontracking ventricular paced behavior may occur sooner, but the
ATR mode switch may take longer.
NOTE: For atrial arrhythmias that meet the programmed AFR rate criteria,
using the AFR feature will result in slower ventricular pacing rates.
PMT Termination
PMT Termination detects and attempts to interrupt pacemaker-mediated
tachycardia (PMT) conditions.
In the DDD(R) and VDD(R) pacing modes, any device may detect and track
retrograde conducted P-waves that fall outside of PVARP, causing triggered
ventricular pacing rates as high as the MTR (i.e., PMT). When PMT Termination
is programmed to On, a PMT condition is detected when 16 successive
ventricular paces are counted at the MTR following atrial sensed events.
- DRAFT -
5-26 PACING THERAPIES
RATE ENHANCEMENTS
During the 16 intervals, the V–A interval is monitored to determine if:
• A PMT is occurring
• The intrinsic atrial rate is simply meeting the MTR or exceeding it
The V–A intervals are compared to the second V–A interval measured during
the 16 ventricular paced events.
• If any of the successive intervals is more than 32 ms shorter or longer
than this second interval, the algorithm continues to monitor successive
ventricular paces for the presence of a PMT
• If the V–A intervals are all within this 32 ms criteria, the rhythm is declared
aPMT
When PMT Termination is programmed to On, the pulse generator stores PMT
episodes in the Arrhythmia Logbook.
When a PMT condition is detected at the MTR, the pulse generator sets the
PVARP setting to a fixed setting of 500 ms for one cardiac cycle in an attempt
to break the PMT. Programming the PVARP After PVC option and/or Rate
Smoothing can also be useful in controlling the pulse generator’s response to
retrograde conduction.
RATE ENHANCEMENTS
Rate Enhancements includes the parameters as described.
Rate Hysteresis
Rate Hysteresis can improve device longevity by reducing the number of
pacing stimuli. In dual-chamber models, this feature is available in DDD, DDI,
VVI, and AAI modes. In single-chamber models, this feature is available in VVI
mode. In DDD, DDI, and AAI modes, rate hysteresis is activated by a single
nonrefractory sensed atrial event. In VVI mode, rate hysteresis is activated by
a single nonrefractory, sensed ventricular event.
Hysteresis is deactivated by the following:
• A single atrial pace at the hysteresis rate
- DRAFT -
PACING THERAPIES
RATE ENHANCEMENTS 5-27
• In DDD mode:
– AsingleatrialpaceduringacardiaccyclewhenanRVpaceis
scheduled at the hysteresis LRL
– An atrial rate that rises above the MTR
NOTE: In VVI mode, hysteresis is deactivated by a single ventricular pace
at the hysteresis rate.
When Rate Smoothing Down is enabled, Rate Hysteresis remains in effect until
pacing occurs at the hysteresis rate. This allows Rate Smoothing to control
the transition to the hysteresis rate.
Hysteresis Offset
Hysteresis Offset is used to lower the escape rate below the LRL when the
pulse generator senses intrinsic atrial activity.
If intrinsic activity below the rate limit occurs, then Hysteresis Offset allows
inhibition of pacing until the LRL minus Hysteresis Offset is reached. As a
result, the patient might benefit from longer periods of sinus rhythm.
Search Hysteresis
When Search Hysteresis is enabled, the pulse generator periodically lowers the
escape rate by the programmed Hysteresis Offset in order to reveal potential
intrinsic atrial activity below the LRL.
During Search Hysteresis, the pacing rate is lowered by the Hysteresis Offset
for up to 8 cardiac cycles. When the search ends, hysteresis remains active
if intrinsic atrial activity is sensed during that period. If there is no intrinsic
atrial activity during the 8-cycle search, pacing resumes at the LRL. If Rate
Smoothing Up is enabled, pacing will rate smooth up to the LRL.
Example: At a rate of 70 ppm and a search interval of 256 cycles, a search
for intrinsic atrial activity would occur approximately every 3.7 minutes
(256 ÷ 70 = 3.7).
Rate Smoothing is disabled during the search cycles. If no intrinsic atrial activity
is detected during the search, the pacing rate is brought up to the LRL. If Rate
Smoothing Up is enabled, the pacing will rate smooth up to the LRL.
- DRAFT -
5-28 PACING THERAPIES
RATE ENHANCEMENTS
NOTE: In VVI mode, the intrinsic activity would be a sensed ventricular event
instead of a sensed atrial event.
Rate Smoothing
Rate Smoothing controls the pulse generator’s response to atrial and/or
ventricular rate fluctuations that cause sudden changes in pacing intervals.
Rate Smoothing is an important enhancement to ATR because it can
significantly reduce the rate fluctuations associated with the onset and
cessation of atrial arrhythmias.
Patients who experience large variations in their ventricular paced rate can
feel symptomatic during these episodes. Rate Smoothing can prevent these
sudden rate changes in patients along with the accompanying symptoms (such
as palpitations, dyspnea, and dizziness).
In a normal conduction system, limited cycle-to-cycle rate variations occur.
However, the paced rate can change dramatically from one beat to the next in
the presence of any of the following:
• Sinoatrial disease such as sinus pause or arrest, sinoatrial block, and
brady-tachy syndrome
• PACs and/or PVCs
• Pacemaker Wenckebach
• Intermittent, brief, self-terminating SVTs, and atrial flutter/fibrillation
• Retrogradely conducted P-waves
• Pulse generator sensing of myopotential signals, EMI, crosstalk, etc.
In single-chamber models, Rate Smoothing operates between the LRL and
the MPR when programmed to VVI.
In dual-chamber models, Rate Smoothing operates between the LRL and the
MTR when programmed to DDD or VDD and it operates between the LRL and
MPR when programmed to DDI, VVI, or AAI.
In single-chamber models, when the sensor is enabled, the operational range
is from LRL to MSR. Rate Smoothing is also applicable between the hysteresis
rate and LRL when hysteresis is active, except during Search Hysteresis.
In dual-chamber models, when the sensor is enabled and MSR is higher than
MTR, the operational range is from LRL to MSR. Rate Smoothing is also
- DRAFT -
PACING THERAPIES
RATE ENHANCEMENTS 5-29
applicable between the hysteresis rate and LRL when hysteresis is active,
except during Search Hysteresis.
When Rate Smoothing is programmed to On, the following information applies.
• Programmable Rate Smoothing values are a percentage of the RV
R–R interval (3% to 25% in 3% increments) and can be independently
programmed for:
– Increase—Rate Smoothing Up
– Decrease—Rate Smoothing Down
–Off
• The pulse generator stores the most recent R–R interval in memory.
R-waves may be either intrinsic or paced. Based on this R–R interval
and the programmed Rate Smoothing value, the device sets up two
synchronization windows for the next cycle: one for the atrium and one
for the right ventricle.
NOTE: Single-chamber pulse generators set up a ventricular window.
• Rate Smoothing is functional except:
– During the 8 cycles of rate Search Hysteresis
– During ATR Fallback until fallback reaches the ATR LRL, the
sensor-indicated rate, or the VRR interval
– During VRR when active
– Upon triggering PMT Termination
– Immediately following programmed LRL increases
– When above the MTR
Rate Smoothing Example Based on a Dual-Chamber Tracking Mode
Based on the most recent R–R interval stored in memory and the programmed
Rate Smoothing value, the pulse generator sets up the two synchronization
windows for the next cycle: one for the atrium and one for the ventricle. The
synchronization windows are defined below:
- DRAFT -
5-30 PACING THERAPIES
RATE ENHANCEMENTS
Ventricular synchronization window: previous R–R interval ± Rate
Smoothing value
Atrial synchronization window: (previous R–R interval ± Rate Smoothing
value) - AV Delay
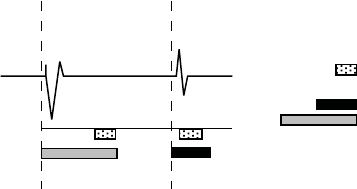
The following example explains how these windows are calculated (Figure 5-13
on page 5-30):
• Previous R–R interval = 800 ms
• AV Delay = 150 ms
• Rate Smoothing Up = 9%
• Rate Smoothing Down = 6%
Thewindowswouldbecalculatedasfollows:
Ventricular Synchronization Window = 800 - 9% to 800 + 6% =
800 ms - 72 ms to 800 ms + 48 ms = 728 ms to 848 ms
Atrial Synchronization Window = Ventricular Synchronization Window - AV
Delay = 728 ms - 150 ms to 848 ms - 150 ms = 578 ms to 698 ms
The timing for both windows is initiated at the end of every ventricular event
(R-R interval).
If paced activity is to occur, it must occur within the appropriate synchronization
window.
Paced AV Delay (150 ms)
A
trial
Event
Atrial
Event
R-R Interval (800 ms)
RV Event
Atrial Smoothing Window
578 ms 650 ms 698 ms
RV Smoothing Window
728 ms 800 ms 848 msRV Event
Figure 5-13. Rate smoothing synchronization window
It is important to ascertain the patient’s physiologic cycle-to-cycle variation
and program the Rate Smoothing parameter to a value that protects against
pathologic interval changes, yet allows physiologic interval changes in response
to increases in activity or exercise.
- DRAFT -
PACING THERAPIES
LEAD CONFIGURATION 5-31
NOTE: Without Rate Smoothing, a sudden, large atrial rate increase (e.g.,
PAT) will cause a simultaneous sudden increase in the paced ventricular rate
as high as the programmed MTR. With Rate Smoothing, the ventricular paced
rate in response to such a change might not reach the programmed MTR.
Rate Smoothing Up
Rate Smoothing Up controls the largest pacing rate increase allowed when the
intrinsic or sensor rate is increasing.
Rate Smoothing Down
Rate Smoothing Down controls the largest pacing rate decrease allowed when
the intrinsic or sensor rate is decreasing.
NOTE: When Rate Smoothing Down is programmed on and Rate Smoothing
Up is programmed off, the pulse generator will automatically prevent fast
intrinsic beats (e.g., PVCs) from resetting the Rate Smoothing Down escape
rate any faster than 12% per cycle.
Rate Smoothing Maximum Pacing Rate (MPR)
The Rate Smoothing Maximum Pacing Rate places a limit on the maximum
pacing rate that Rate Smoothing can reach.
The Rate Smoothing Down parameter requires a programmed MPR when in
AAI, VVI, or DDI. Rate Smoothing will then be used only between the MPR and
the LRL or the hysteresis rate (if applicable).
When both VRR and Rate Smoothing are programmed on in the VVI(R) or
DDI(R) mode, VRR will have priority; Rate Smoothing will be suspended.
LEAD CONFIGURATION
The pulse generator has independent outputs for the following:
• Atrium (in dual-chamber models)
• Right Ventricle
The atrial and RV leads are set to Bipolar pacing and sensing. The atrial lead
has the option of being programmed Off.
- DRAFT -
5-32 PACING THERAPIES
AV DELAY
AV DELAY
AV Delay is the programmable time period from the occurrence of either a
paced or sensed right atrial event to a paced RV event.
AV Delay helps preserve the heart’s AV synchrony. If a sensed ventricular
event does not occur during the AV delay following an atrial event, the pulse
generator delivers a ventricular pacing pulse when AV Delay expires.
AV Delay can be programmed to the following operations:
• Paced AV Delay
• Sensed AV Delay
This behavior occurs under the following conditions:
• Pacing state: Normal, Post-Therapy, or Temporary
• Pacing mode: DDD(R), DDI(R), or VDD(R)
Paced AV Delay
Paced AV Delay corresponds to the AV Delay following an atrial pace.
When the minimum value is less than the maximum value, then the Paced AV
Delay is scaled dynamically according to the current pacing rate. Dynamic AV
Delay provides a more physiologic response to rate changes by automatically
shortening the Paced AV Delay or Sensed AV Delay with each interval during
an increase in atrial rate. This helps minimize the occurrence of large rate
changes at the upper rate limit and allows one-to-one tracking at higher rates.
The pulse generator automatically calculates a linear relationship based on
the interval length of the previous A–A cycle and the programmed values for
the following:
• Minimum AV Delay
• Maximum AV Delay
•LRL
•MTR
•MSR
- DRAFT -
PACING THERAPIES
AV DELAY 5-33
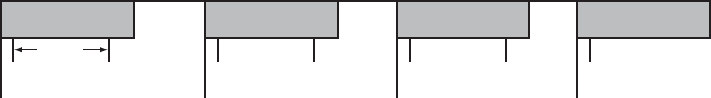
The dynamic AV Delay is not adjusted following a PVC or when the previous
cardiac cycle was limited by the MTR.
When the atrial rate is between the LRL and the higher of the MTR and the
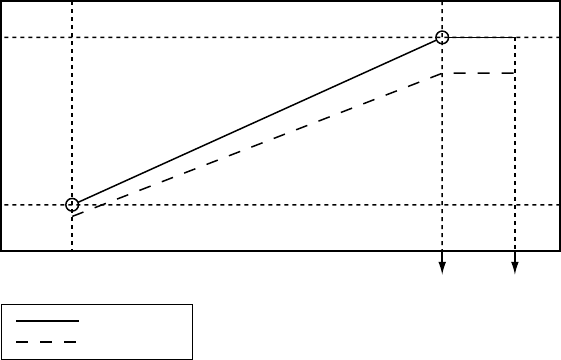
MSR, the pulse generator calculates the linear relationship to determine the
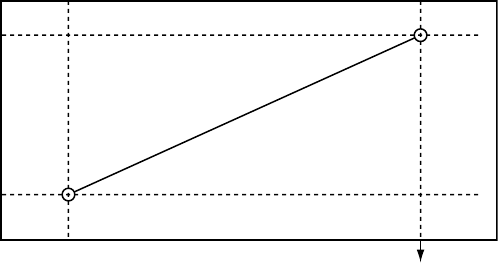
Dynamic AV Delay (Figure 5-14 on page 5-33).
Maximum
AV Delay
Minimum
AV Delay
Higher of MTR
and MSR interval LRL Interval
Dynamic AV Delay
Figure 5-14. Dynamic AV Delay linear relationship
Dynamic AV Delay is activated during Paced AV Delay programming. The AV
delaymaybeprogrammedtoeitherafixed or dynamic value as follows:
• Fixed AV Delay—occurs when Paced AV Delay minimum and maximum
values are equal
• Dynamic AV Delay—occurs when Paced AV Delay minimum and maximum
values are not equal
Sensed AV Delay
Sensed AV Delay corresponds to the AV Delay after a sensed atrial event.
Sensed AV Delay may be programmed to a value shorter than or equal to the
Paced AV Delay. A shorter value is intended to compensate for the difference
in timing between paced atrial events and sensed atrial events (Figure 5-15 on
page 5-34).
- DRAFT -
5-34 PACING THERAPIES
AV DELAY
SAV
PAV
Ap As Vp
Ap = Paced atrial event
As = Sensed atrial event
Vp = Paced ventricular event
SAV = Sensed AV Delay (As-Vp interval)
PAV = Paced AV Delay (Ap-Vp interval)
Figure 5-15. Sensed AV Delay
The hemodynamic impact of the Sensed AV Delay depends on the
appropriateness of the timing between the atrial and ventricular contractions.
An atrial pace starts the atrial contraction, whereas the atrial sense occurs
during the contraction. As a result, when Sensed AV Delay is programmed to
the same value as Paced AV Delay, the hemodynamic AV interval will differ
between paced and sensed atrial events.
Using Sensed AV Delay with Paced AV Delay—Fixed
When Paced AV Delay is programmed to a fixed value (i.e., the minimum and
maximum Paced AV Delay values are the same), then the Sensed AV Delay
will be fixed at the programmed Sensed AV Delay value.
Using Sensed AV Delay with Paced AV Delay—Dynamic
When Paced AV Delay is programmed as dynamic (i.e., the minimum Paced
AV Delay value is programmed at less than the maximum Paced AV Delay
value), then the Sensed AV Delay will also be dynamic.
Dynamic Sensed AV Delay and Paced AV Delay are based on the atrial rate. To
reflect the shortening of the PR interval during periods of increased metabolic
demand, the AV Delay shortens linearly from the programmed (maximum)
value at the LRL to a value determined by the ratio of minimum and maximum
AV Delay at the higher of the MTR or MSR (Figure 5-16 on page 5-35). When
Dynamic AV Delay is used, if the Sensed AV Delay value is programmed as
shorter than the maximum Paced AV Delay value, then the Sensed AV Delay
value will also be shorter than the minimum Paced AV Delay value at upper
rates.
- DRAFT -
PACING THERAPIES
AV DELAY 5-35
Maximum
Paced AV
Delay
Minimum
Paced AV
Delay
Shorter of MTR
or MSR Interval LRL Interval Hysteresis Rate
Interval
Paced AV Delay
Sensed AV Delay
Figure 5-16. Dynamic and Sensed AV Delay as a function of the escape interval
NOTE: The minimum value is programmable only in VDD(R) mode.
AV Search+
AV Search+ is designed to promote intrinsic A–V conduction if present; AV
Search + will watch for intrinsic AV conduction to occur beyond the programmed
AV Delay. In patients with exercise-dependent or intermittent AV nodal block,
this intrinsic AV conduction can improve hemodynamic performance and
increase device longevity by reducing the amount of ventricular pacing pulses.
When AV Search+ is enabled, the AV Delay is lengthened periodically
(according to the programmed value) for up to 8 consecutive paced or sensed
cardiac cycles. The AV Search+ AV delay remains active as long as the
intrinsic PR intervals are shorter than the maximum programmed Search AV
Delay value.
The pulse generator reverts to the programmed AV Delay at the following points:
• When the 8-cycle search expires without sensing intrinsic ventricular activity
• When two ventricular paced events occur within the 10-cycle window.
- DRAFT -
5-36 PACING THERAPIES
REFRACTORY
Search AV Delay
The Search AV Delay parameter determines the length of the sensed and
paced AV delays during the search cycles and during the AV hysteresis period.
NOTE: The Search AV Delay value must be programmed to longer than the
maximum Paced AV Delay.
Search Interval
The Search Interval controls the frequency at which AV Search+ will attempt a
search.
REFRACTORY
Refractory includes the features as described.
A-Refractory (PVARP)
PVARP is definedaccordingtothepacingmode:
Single-chamber atrial modes: AAI(R)—the time period after a sensed or
paced atrial event when an atrial sense event does not inhibit an atrial pace.
Dual-chamber modes: DDD(R), DDI(R), VDD(R)—the time period after a
sensed or paced RV event when an atrial event does not inhibit an atrial
pace or trigger a ventricular pace. The atrial refractory period prevents atrial
sensing and tracking of retrograde atrial activity initiated in the ventricle.
A long atrial refractory period shortens the brady atrial sensing window.
Programming long atrial refractory periods in combination with certain AV Delay
periods can cause 2:1 block to occur abruptly at the programmed MTR.
In DDD(R) and VDD(R) pacing modes, the pulse generator may detect
retrograde conduction in the atrium, causing triggered ventricular pacing rates
as high as the MTR (i.e., PMT). Retrograde conduction times may vary over
a patient’s lifetime as a function of changing autonomic tone. If testing does
not reveal retrograde conduction at implantation, it may still occur at a later
time. This problem can usually be avoided by increasing the atrial refractory
period to a value that exceeds the retrograde conduction time. In controlling
the pulse generator’s response to retrograde conduction, it may also be useful
to program the following:
- DRAFT -
PACING THERAPIES
REFRACTORY 5-37
•PVARPafterPVC
• PMT Termination
• Rate Smoothing
PVARP after PVC
PVARP after PVC is designed to help prevent PMT due to retrograde
conduction, which is typically associated with PVCs.
When the pulse generator detects a sensed RV event without a preceding
sensed or paced atrial event, including sensed events in refractory (i.e., a
PVC), the atrial refractory period automatically extends to the programmed
PVARP after PVC value for one cardiac cycle. After a PVC is detected, the
timing cycles reset automatically. PVARP extends no more frequently than
every other cardiac cycle.
RV-Refractory (RVRP)
The RVRP provides an interval following an RV pace event during which RV
sensed events do not impact the timing of therapy delivery.
The use of a long RVRP shortens the RV sensing window for ventricular tachy
detection.
RVRP is available in any mode where ventricular sensing is enabled, and RVRP
canbeprogrammedtoafixed or dynamic interval (Figure 5-17 on page 5-38):
• Fixed—RVRP remains at the programmed, fixed RVRP value between the
LRL and the applicable upper rate limit (MPR, MTR or MSR).
• Dynamic—RVRP shortens as ventricular pacing increases from the LRL to
the applicable upper rate limit, allowing more time for RV sensing.
– Maximum—if the pacing rate is less than or equal to the LRL (i.e.,
hysteresis), the programmed Maximum VRP is used as the RVRP.
– Minimum—if the pacing rate is greater than or equal to the applicable
upper rate limit, the programmed Minimum VRP us used as the RVRP.
- DRAFT -
5-38 PACING THERAPIES
REFRACTORY
Dynamic VRP
shortens
Sensing window
is constant
Figure 5-17. Relationship between ventricular rate and refractory interval
To provide an adequate sensing window, the following refractory value
programming is strongly recommended:
• Single-chamber modes—less than or equal to one-half the LRL in ms
• Dual-chamber modes—less than or equal to one-half the applicable upper
rate limit
Blanking and Noise Rejection
Blanking is the first part of the refractory period where sense amplifiers are
completely disabled. It is used to prevent cross-chamber sensing and inhibition.
During a blanking interval, the sensing circuit in one chamber ignores sensed
electrical activity generated by a pulse generator pulse in the other chamber
(crosstalk).
• If ventricular pacing were sensed in the atrium, it would initiate an
inappropriately high ventricular pacing rate in any pulse generator
attempting to maintain AV synchrony. Therefore, in DDD(R), DDI(R), and
VDD modes, a ventricular pace initiates a programmable atrial blanking
interval.
• If atrial pacing were sensed in the ventricle, it would inhibit ventricular
pulses and thereby cause an inappropriate decrease in paced rate.
Therefore, in DDD(R) and DDI(R) modes, an atrial pace initiates a
programmable ventricular blanking interval.
RV-Blank after A-Pace
RV-Blank after A-Pace, a cross-chamber blanking period, inhibits RV sensing
following an atrial pace.
- DRAFT -
PACING THERAPIES
REFRACTORY 5-39
If the value is programmed to Smart, the pulse generator automatically
adjusts the sensitivity value in order to reject far-field atrial events. This
allows for sensing of true ventricular events that had previously fallen in the
cross-chamber blanking period.
A-Blank after V-Pace
A-Blank after V-Pace, a cross-chamber blanking period, inhibits atrial sensing
following a ventricular pace.
If the value is programmed to Smart, the pulse generator automatically adjusts
the sensitivity value in order to reject far-field ventricular events. This allows
for sensing of true atrial events that had previously fallen in the cross-chamber
blanking period.
A-Blank after RV-Sense
A-Blank after RV-Sense, a cross-chamber blanking period, inhibits atrial
sensing following an RV sensed event.
If the value is programmed to Smart, the pulse generator automatically adjusts
the sensitivity value in order to reject far-field ventricular events. This allows
for sensing of true atrial events that had previously fallen in the cross-chamber
blanking period.
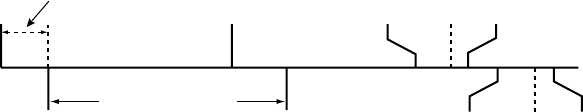
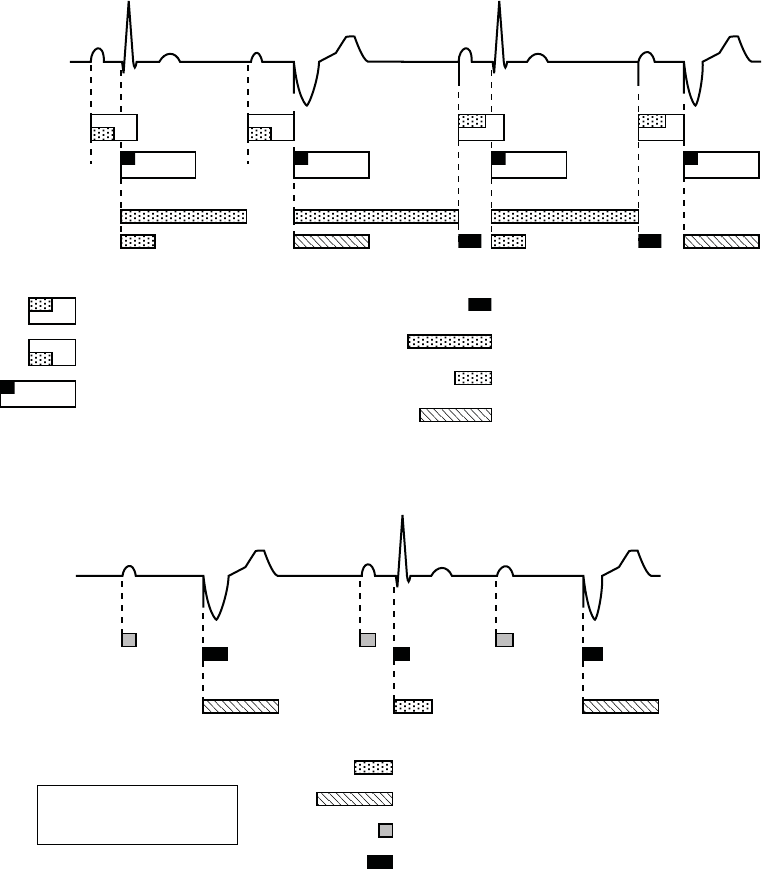
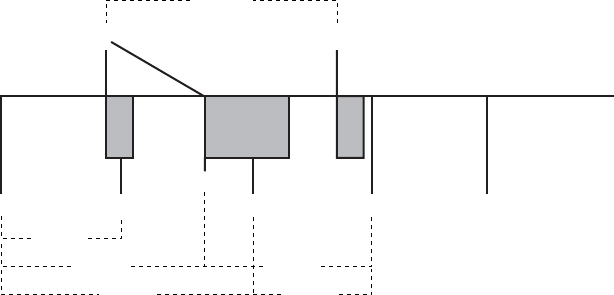
Refer to the following illustrations:
- DRAFT -
5-40 PACING THERAPIES
REFRACTORY
AV Delay after paced atrial event (150 ms)
AV Delay after sensed atrial event (programmable,
includes 85 ms absolute refractory)
Atrial Refractory-PVARP (programmable; includes
programmable atrial cross chamber blank)
V-A interval (may be lengthened by
modified ventricular timing)
V Sensed Refractory (135 ms)
Dynamic Ventricular Refractory (programmable)
Ventricular Cross Chamber Blank (programmable)
A
sense
d
V sensed
A
sense
d
V paced
A
pace
d
V sensed
A
pace
d
V paced
ECG
Atrial Channel
Ventricular Channel
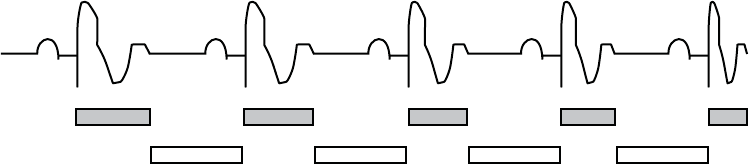
Figure 5-18. Refractory periods, dual-chamber pacing modes
A sensed*
V paced
A sensed*
V sensed
A sensed*
V paced
ECG
Atrial Channel
Ventricular Channel
Atrial Sensed Refractory (85 ms)
V Sensed Refractory (135 ms)
Ventricular Refractory (programmable)
Atrial Cross Chamber Blank (programmable)
* An atrial sense occurs during VVI
if an atrial feature is programmed
on (eg, atrial electrograms).
Figure 5-19. Refractory periods, VVI pacing mode
- DRAFT -
PACING THERAPIES
NOISE RESPONSE 5-41
Sensed Atrial Refractory-PVARP (programmable;
includes 85 ms absolute refractory)
RV Sensed Refractory (135 ms)
Cross Chamber Blank (programmable
atrial and RV)
Paced Atrial Refractory-PVARP (programmable;
includes 150 ms absolute refractory)
ECG
Atrial Sensing
Ventricular Sensing
A sensed
RV sensed*
A paced
RV sensed*
* An RV sense occurs during AAI
pacing due to the tachycardia
function of the pulse generator.
Figure 5-20. Refractory periods, AAI pacing mode
If the value is programmed to Smart, the pulse generator automatically adjusts
the sensitivity value in order to reject far-field ventricular events. This allows
for sensing of true atrial events that had previously fallen in the cross-chamber
blanking period.
NOISE RESPONSE
Noise Response allows you to choose whether to pace or inhibit pacing in
the presence of noise.
A retriggerable, 40-ms noise window exists within each refractory and
cross-chamber blanking period. The window is initiated by either a sensed
or paced event. Both the noise window and the refractory period must be
completed for each cardiac cycle in one chamber before the next sensed
event restarts the timing in the same chamber. Recurrent noise activity may
cause the noise window to restart, extending the noise window and possibly
the effective refractory period or blanking period.
The Inhibit mode is intended for patients whose arrhythmias may be triggered by
asynchronous pacing. If Noise Response is programmed to an asynchronous
mode and the noise persists so that the noise window is extended longer
than the programmed pacing escape interval, the pulse generator paces
asynchronously at the programmed pacing rate until the noise ceases.
RefertoFigure5-21onpage5-42.
- DRAFT -
5-42 PACING THERAPIES
NOISE RESPONSE
ECG
RV Sensing
RV Paced
event
RV Sensed
event
Noise window (40 ms)
RV Refractory:
sensed = nonprogrammable
paced = programmable
Figure 5-21. Refractory periods and noise windows, RV
If Noise Response is programmed to Inhibit, and the sensed noise extends the
noise window beyond the programmed paced or sensed interval, the pace
escape interval timing will reset and the pulse generator will not pace until
one escape interval after the noise ceases. The pulse generator will continue
to use a retriggerable noise window. In addition, a Dynamic Noise algorithm
is intended to automatically adjust the maximum sensitivity to avoid noise
detection. This algorithm is active in all rate channels.
If event markers are being transmitted:
Single-Chamber
• The marker [VS] occurs when the noise window is initially triggered
following a V pace
• If retriggered for 340 ms, the marker [VN] occurs
• With continuous retriggers, the marker [VN] occurs frequently
Dual-Chamber
• Depending on the chamber where noise is occurring, the marker [AS] or
[VS] occurs when the noise window is initially triggered following a pace
• If retriggered for 340 ms, the marker [AN] or [VN] occurs
• With continuous retriggers, the marker [AN] or [VN] occurs frequently
NOTE: In pacer-dependent patients, use care when considering setting Noise
Response to Inhibit as pacing will not occur.
- DRAFT -
PACING THERAPIES
VENTRICULAR TACHY SENSING INTERACTIONS 5-43
VENTRICULAR TACHY SENSING INTERACTIONS
Refractory periods and blanking intervals are an integral part of the pulse
generator sensing system. They are used to efficiently suppress detection of
pulse generator artifacts (e.g., a pace or shock) and certain intrinsic signal
artifacts (e.g., a T-wave or far-field R-wave). The pulse generator does not
discriminate between events that occur during refractory periods and blanking
intervals. As a result, all events (pulse generator artifacts, intrinsic artifacts, and
intrinsic events) that occur during a refractory period or blanking interval are
ignored for purposes of pacing timing cycles and ventricular tachy detection.
Certain programmed combinations of pacing parameters are known to interfere
with ventricular tachy detection. When an intrinsic beat from a VT occurs during
a pulse generator refractory period, the VT beat will not be detected. As a
result, detection and therapy of the arrhythmia may be delayed until enough VT
beats are detected to satisfy the tachy detection criteria ("Ventricular Detection
Windows" on page 3-13).
Pacing Parameter Combination Examples
The following examples illustrate the effects of certain pacing parameter
combinations on ventricular sensing. When programming pulse generator
pacing and tachy detection parameters, consider the possible interactions of
these features in light of the expected arrhythmias. In general, the PRM screen
displays Parameter Interaction Attentions and advisory messages to inform you
about programming combinations that could interact to cause these scenarios;
the interactions can be resolved by reprogramming the pacing rate, AV Delay
and/or refractory/blanking periods.
Example 1: Ventricular Undersensing Due to Ventricular Refractory Period
If the pulse generator is programmed as follows, a VT that occurs synchronous
with the pacing will not be detected:
• Brady Mode = VVI
• LRL = 75 ppm (800 ms)
•VRP=500ms
• VT Zone = 150 bpm (400 ms)
In this scenario, the pulse generator is VVI pacing at LRL (800 ms). A 500 ms
VRP follows each ventricular pace. VT beats that occur during VRP are ignored
for purposes of pacemaker timing and ventricular tachy detection/therapy. If
a stable VT of 400 ms starts simultaneously with a ventricular pace, the VT
- DRAFT -
5-44 PACING THERAPIES
VENTRICULAR TACHY SENSING INTERACTIONS
will not be detected because every beat will occur during the 500 ms VRP,
either concurrent with a ventricular pace or 400 ms after a pace (Figure 5-22 on
page 5-44).
NOTE: It is not required for the VT to start concurrently with a pace for
undersensing to occur. In this example, all pacing will be inhibited and tachy
detection will subsequently occur, as soon as a single VT beat is detected.
VP VP VP VP
(VT) (VT) (VT) (VT) (VT) (VT) (VT)
VRP = 500 ms
400 ms
LRL = 800 ms
Figure 5-22. Ventricular undersensing due to VRP
When the programming interaction described in this scenario is present, a
message will describe the interaction of VRP with LRL. In rate-responsive or
tracking modes (e.g., DDDR), similar messages may describe the interaction
of VRP with MTR, MSR, or MPR. Along with each message, the pertinent
programmable parameters are displayed to assist you in resolving the
interaction. Programming Dynamic VRP can be useful in resolving these
types of interactions.
Example 2: Ventricular Undersensing Due To V-Blank After A-Pace
Certain programmed combinations of dual-chamber pacing parameters may
also interfere with ventricular tachy detection. When dual-chamber pacing
occurs, pulse generator refractory periods are initiated by both atrial and
ventricular paces. The ventricular refractory period following a ventricular pace
is controlled by the VRP parameter; the ventricular refractory period following
an atrial pace is controlled by the V-Blank After A-Pace parameter.
Undersensing of a VT due to the pulse generator refractory periods may occur
when the pulse generator is pacing at or above LRL. For example, if the pulse
generator is rate-adaptive pacing at 100 ppm (600 ms) and is programmed
as follows, then a VT that occurs synchronous with the pacing may not be
detected:
• LRL = 90 ppm (667 ms), MTR/MSR = 130 ppm (460 ms)
• Brady Mode = DDDR, fixed AV delay = 300 ms
•VRP=230ms
• V-Blank After A-Pace = 65 ms
- DRAFT -
PACING THERAPIES
VENTRICULAR TACHY SENSING INTERACTIONS 5-45
• VT zone = 150 bpm (400 ms)
In this scenario, the pulse generator is DDDR pacing at 600 ms. A VRP of
230 ms follows each ventricular pace; a ventricular refractory period of 65 ms
(V-Blank After A-Pace) follows each atrial pace; an atrial pace occurs 300
ms after each ventricular pace. VT beats that occur during either refractory
period are ignored for purposes of pacemaker timing and ventricular tachy
detection/therapy. If a stable VT of 350 ms starts, then the VT will not be
detected because most beats will occur during a ventricular refractory period,
either V-Blank After A-Pace or VRP. Some VT beats will be detected, but not
enough to satisfy the 8 of 10 tachy detection criteria ("Ventricular Detection
Windows" on page 3-13).
NOTE: It is not required for the VT to start concurrently with a refractory
period or blanking interval for undersensing to occur. In this example, it is likely
that the VT will not be detected until either the VT accelerates to faster than
350 ms or the sensor-driven pacing rate changes from 600 ms.
VT (VT) (VT) VTVS*
APAP AV = 300 ms
VRP
230 ms
VP
600 ms
350 ms
350 ms700 ms
600 ms 450 ms
Repeat pattern
AP, VP, AP, VS, VT
Figure 5-23. Ventricular undersensing due to V-Blank after A-Pace
When the programming interaction described in this scenario is present, a
message will describe the interaction of Tachy Rate Threshold with LRL and
AV Delay. Similar messages may describe the interaction of V-Blank After
A-Pace with MTR, MPR, or LRL. Along with each message, the pertinent
programmable parameters are displayed to assist you in resolving the
interaction. Programming Dynamic VRP can be useful in resolving these
types of interactions.
- DRAFT -
5-46 PACING THERAPIES
VENTRICULAR TACHY SENSING INTERACTIONS
Programming Considerations
Certain programmed combinations of pacing parameters are known to interfere
with ventricular tachy detection. The risk of ventricular tachy undersensing
due to device refractory periods is indicated by the interactive warnings on
the parameter screen.
As with all device programming, you should evaluate the benefits and the
risks of the programmed features for each patient (for example, the benefit
of Rate Smoothing with a long AV Delay versus the risk of ventricular tachy
undersensing).
The following programming recommendations are provided to reduce the risk
of ventricular undersensing due to the refractory period caused by an atrial
pace (V-Blank after A-Pace):
• If a dual-chamber pacing mode with Rate Smoothing or Rate Adaptive
Pacing is necessary:
– Reduce the LRL
– Shorten the AV Delay or use Dynamic AV Delay and reduce the
minimum Dynamic AV Delay setting
– Reduce the percent AV Search Hysteresis
– Increase the Down Rate Smoothing percentage to the largest possible
value
– Decrease the recovery time for Rate Adaptive Pacing modes
– Reduce the MTR or MPR if Down Rate Smoothing is on
– Reduce the MSR if the pacing mode is rate adaptive
• If Rate Smoothing or Rate Adaptive Pacing are not required for the patient,
consider programming these features Off. Programming these features Off
can reduce the likelihood of atrial pacing at elevated rates.
• If atrial pacing is not required for the patient, consider using VDD rather
than DDD pacing mode.
- DRAFT -
PACING THERAPIES
VENTRICULAR TACHY SENSING INTERACTIONS 5-47
• In certain usage scenarios, you may elect to program long AV Delays to
reduce ventricular pacing for patients with long PR intervals, while providing
sensor pacing or rate smoothing to address other patient needs.
• In certain usage scenarios, if a pattern of atrial pacing and VT beats is
detected, the AV delay is automatically adjusted to facilitate confirmation
of a suspected VT. If no VT is present, the AV delay is returned to the
programmed value. For programming scenarios where the automatic AV
delay adjustment may occur, a specific Parameter Interaction Attention
will not be displayed.
For discussion of details and additional information regarding these or other
programmed settings, please contact Technical Services at the 24-Hour
Consultation phone number on the back of this manual.
In summary, when programming the pulse generator pacing and tachy
detection parameters, it is useful to consider the possible interactions of these
features in light of the expected arrhythmias of a particular patient. In general,
the interactions will be brought to your attention through Parameter Interaction
Attention messages on the PRM screen and can be resolved by reprogramming
the pacing rate, AV delay, and/or refractory/blanking periods.
- DRAFT -
5-48 PACING THERAPIES
VENTRICULAR TACHY SENSING INTERACTIONS
- DRAFT -

6-1
SYSTEM DIAGNOSTICS
CHAPTER 6
This chapter contains the following topics:
• "Battery Status" on page 6-2
• "Lead Tests" on page 6-6
- DRAFT -
6-2 SYSTEM DIAGNOSTICS
BATTERY STATUS
BATTERY STATUS
Pulse generator battery summary information is displayed on the Summary
screen. The Summary screen contains the following components:
• Time Remaining—screen area with the following items:
– Battery status gauge—displays a visual indication of the battery
capacity status, from BOL to explant recommendation
– Approximate Time To Explant––displays the approximate time at which
explant is recommended based on the pulse generator’s programmed
parameters and recent usage history
• Charge Time––displays the amount of time it took the pulse generator
to charge for the most recent maximum-energy shock or capacitor
re-formation
• Battery Detail icon—when selected, this icon displays the Battery Detail
screen
Battery Status Indicators
The following battery status indicators appear in the battery status gauge. All
indicated longevity projections are calculated based on the pulse generator’s
programmed parameters.
• BOL—the pulse generator’s battery is at full capacity.
• One Year Remaining—the pulse generator’s battery has approximately
one year of full function remaining.
- DRAFT -
SYSTEM DIAGNOSTICS
BATTERY STATUS 6-3
• Explant—the pulse generator’s battery is nearing depletion and the pulse
generator has reached the point at which explant is recommended. This
status indicates that pulse generator replacement must be scheduled.
Once Explant status is reached there is sufficient battery capacity to
monitor and pace 100% under existing conditions for three months and to
deliver six maximum-energy shocks. Once the battery capacity is depleted,
pulse generator functionality is degraded.
Once the battery capacity is depleted, the following occurs:
– Number of zones reverts to one ventricular zone (VF) with a rate
threshold of 165 bpm
– ATP therapy and low-energy shocks are unavailable
– The programmed mode reverts to VVI
– LRL defaults to 50 ppm
– The following features are disabled:
– RF telemetry
– Daily measurement trends
– Brady enhancement features
– Episode storage
– Diagnostic and EP tests
– Device programming (Brady Mode and Ventricular Tachy Mode can
be programmed to Off)
– Telemetry interrogation (using a wand) is still available and manual
capacitor re-formation can be selected.
If the device reaches a point where insufficient battery capacity is available
for continued operation, the device will revert to Storage Mode.
NOTE: The device uses the programmed parameters and recent usage
history to predict time to Explant. Greater than normal battery usage may
result in the subsequent day’s approximate time to Explant to appear less
than expected.
- DRAFT -
6-4 SYSTEM DIAGNOSTICS
BATTERY STATUS
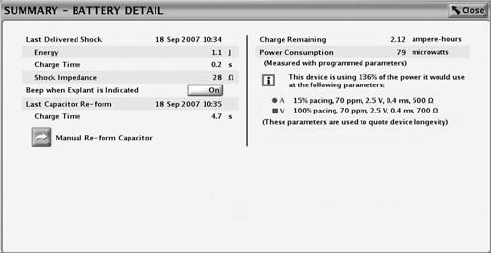
Battery Detail Summary Screen
The Battery Detail summary screen provides the following information about
pulse generator battery status (Figure 6-1 on page 6-5):
• Last Delivered Shock––date, energy, charge time, and shock impedance
data
• Beep When Explant Is Indicated––if this feature is programmed to On, the
pulse generator emits 16 beeping tones every six hours after it reaches the
Explant indicator. The tone can then be programmed to Off. Once the
battery capacity is depleted, Beep When Explant Is Indicated is enabled by
the device.
CAUTION: Patients should be advised to contact their physician
immediately if they hear tones coming from their device.
• Last Capacitor Re-form––date and charge time
• Manual Re-form Capacitor––this feature is used to command a capacitor
re-formation when needed.
• Charge Remaining (measured in ampere-hours)––the amount of charge
remaining based on the pulse generator’s programmed parameters until
the battery is depleted.
• Power Consumption (measured in microwatts)––the amount of power being
consumed by the battery based on the pulse generator’s programmed
parameters.
• Power Consumption longevity impact––compares the power consumption
at the pulse generator’s currently programmed parameters with the power
consumption of the parameters used to quote device longevity.
- DRAFT -
SYSTEM DIAGNOSTICS
BATTERY STATUS 6-5
Figure 6-1. Battery Detail summary screen
Capacitor Re-formation
Automatic Capacitor Re-form. Capacitor deformation may occur during
periods when no shocks are delivered, resulting in longer charge times. To
reduce the effect of capacitor deformation on charge time, the capacitors are
automatically re-formed. Tones will not be emitted from the pulse generator
during automatic capacitor re-formations (even if the Beep During Capacitor
Charge feature is programmed to On). During a capacitor re-formation, the
Charge Time is measured and stored for later retrieval.
Manual Capacitor Re-form. Manual capacitor re-forms are not necessary, but
may be commanded via the PRM as follows:
1. Select the Manual Re-form Capacitor button on the Battery Detail screen
and ensure that telemetry communication is established. A message
will appear indicating that the capacitors are charging. Warbling tones
from the pulse generator (if the Beep During Capacitor Charge feature is
programmed to On) will sound while the capacitors are charging.
2. The entire re-form cycle typically takes less than 15 seconds. After
completion of the cycle, the capacitor energy is delivered to the pulse
generator’s internal test load. The initial Charge Time is displayed on the
Battery Detail screen.
Charge Time Measurement
The pulse generator measures the Charge Time whenever its capacitors
charge. The last measured value is stored in pulse generator memory and
displayed by the PRM system on the Battery Detail screen.
- DRAFT -
6-6 SYSTEM DIAGNOSTICS
LEAD TESTS
Last Delivered Ventricular Shock
When a shock has been delivered to the patient, the following information
from the last shock delivered is stored in the pulse generator’s memory and
displayed on the Battery Detail screen:
•Date
• Energy level
•Chargetime
• Shocking lead impedance
This does not include auto capacitor re-forms or shocks that may have been
diverted. If a fault condition is encountered (i.e., high or low impedance), the
fault will be indicated so that corrective action may be taken.
NOTE: For shocks of 1.0 J or less, the accuracy of the impedance
measurement decreases.
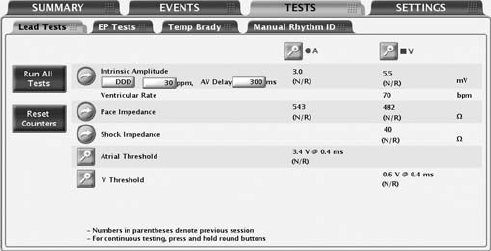
LEAD TESTS
The following lead tests are available (Figure 6-2 on page 6-6):
• Pace Impedance
• Shock Impedance
• Intrinsic Amplitude
• Pace Threshold
Figure 6-2. Lead Tests screen
Lead tests can be accessed by using the following steps:
- DRAFT -
SYSTEM DIAGNOSTICS
LEAD TESTS 6-7
1. From the main screen, select the Tests tab
2. From the Tests screen, select the Lead Tests tab
All lead tests may be performed following two different processes:
• ViatheLeadTestsscreen––allowsyoutoperformthesameleadtests
across all chambers
• By selecting the desired chamber button––allows you to perform all tests
onthesamelead
Intrinsic Amplitude Test
The intrinsic amplitude test measures the intrinsic P- and R-wave amplitudes
for the respective chambers.
An intrinsic amplitude test can be performed from the Lead Tests screen by
completing the following steps:
1. You may change the following preselected values as necessary to elicit
intrinsic activity in the chamber(s) being tested:
• Programmed Normal Brady Mode
• LRL at 30 ppm
• AV Delay at 300 ms
2. Select the Intrinsic Amplitude button. During the test, a window will display
the test’s progress. Selecting and holding the Intrinsic Amplitude Button will
cause measurements to be repeated for up to 10 seconds until the button is
released. When the window closes, the same test can be performed again
by selecting the Intrinsic Amplitude button. To cancel the test, select the
Cancel button or press the DIVERT THERAPY key on the PRM.
3. When the test is complete, the intrinsic amplitude measurement will be
displayed. If the test is repeated, the measurements from the previous
session’s test and the current test will be displayed.
NOTE: The test results from the last measurement are stored in pulse
generator memory, retrieved during the initial interrogation, and displayed on
the Lead Tests screen. The measurements are also provided on the Quick
Notes report.
- DRAFT -
6-8 SYSTEM DIAGNOSTICS
LEAD TESTS
Lead Impedance Test
A lead impedance test can be performed and used as a relative measure of
lead integrity over time.
A shock impedance test is a useful tool in detecting shocking lead integrity
changes over time. Evaluating this information together with the Last Delivered
Shock impedance (displayed on the Battery Detail screen) or a subsequent
high-energy shock impedance and other non-invasive diagnostic techniques
may help troubleshoot potential lead system conditions.
Pace and Shock lead impedance tests can be performed from the Lead Tests
screen by completing the following steps:
1. Select the desired lead impedance test button. Selecting and holding a
button will cause measurements to be repeated for up to 10 seconds until
the button is released.
2. During the test, a window will display the test progress. When the window
closes, the same test can be performed by once again selecting the desired
lead impedance test button. To cancel the test, select the Cancel button or
press the DIVERT THERAPY key on the PRM.
3. When the test is complete, the impedance measurement will be displayed.
If the test is repeated, the impedance measurements from the previous
session’s test and the current test will be displayed.
NOTE: The test results from the last measurement are stored in pulse
generator memory, retrieved during the initial interrogation, and displayed on
the Lead Tests screen. The measurements are also provided on the Quick
Notes report.
Pace Threshold Test
The Pace Threshold Test determines the minimum pace amplitude and/or
pulse width needed for capture in a specific chamber. The minimum 2x voltage
or 3x pulse width safety margin is recommended for each chamber based
on the capture thresholds, which should provide an adequate safety margin
and help preserve battery longevity.
Manual Pace Threshold Test
- DRAFT -
SYSTEM DIAGNOSTICS
LEAD TESTS 6-9
Thetestbeginsataspecified starting value and steps that value down
(amplitude or pulse width) as the test progresses. The PRM beeps with each
decrement. The values used during the threshold test are programmable.
The parameters are only in effect during the test. Testing for a chamber is
allowed only when pacing is active for that chamber in the mode specified in
the start column.
NOTE: The starting values for Amplitude and Pulse Width values are
automatically calculated. The device retrieves the stored results for the
previous pace threshold measurement (for the parameter being tested) and
sets the parameter at three steps above the previous threshold measurement.
The LRL is preselected at 90 ppm. For DDD mode, the LRL is further limited
to 10 ppm below the MTR.
NOTE: If DDD mode is chosen, selecting either the atrial or ventricular test
will cause the pacing output to decrease only in the chamber selected.
NOTE: When DDD mode and a ventricular test are selected, only the
pacing output of the ventricular chamber decreases; the atrium is paced at a
continuous amplitude.
Once the test is started, the device operates with the specified brady
parameters. Using the programmed number of cycles per step, the device
then decrements (steps down) the selected test type parameter (Amplitude or
Pulse Width) until the test is complete. Real-time electrograms and annotated
event markers, which include the values being tested, continue to be available
during threshold testing. The display will automatically adjust to reflect the
chamber being tested.
During the threshold test, the programmer displays the test parameters in a
window while the test is in progress. To pause the test or perform a manual
adjustment, select the Hold button on the window. Select the + or −button to
manually increase or decrease the value being tested. To continue the test,
select the Continue button.
The threshold test is complete and all parameters are returned to the normal
programmed values when any of the following occur:
• The test is terminated via a command from the PRM (e.g., pressing the End
Test button or DIVERT THERAPY key)
• The lowest available setting for Amplitude or Pulse Width is reached and
the programmed number of cycles has completed
- DRAFT -
6-10 SYSTEM DIAGNOSTICS
LEAD TESTS
• Telemetry communication is interrupted
A pace threshold test can be performed from the Lead Tests screen using
the following steps:
1. Select the desired chamber to be tested
2. Select the Pace Threshold details button
3. Select the test type
4. Change the following parameter values as desired to elicit pacing in the
chamber(s) being tested:
• Mode
•LRL
• Paced AV Delay
• Amplitude
• Pulse Width
• Cycles per Step
For DDD mode, the normal Brady MTR is used.
5. Watch the ECG display and stop the test by selecting the End Test button
or pressing the DIVERT THERAPY key when loss of capture is observed.
If the test continues until the programmed number of cycles at the lowest
setting have occurred, the test is automatically terminated. The final
thresholdtestvaluewillbedisplayed(thevalueisonestepabovethevalue
when the test was terminated).
NOTE: The threshold test result can be edited by selecting the Edit Today’s
Test button on the Threshold Test screen
6. To perform another test, make changes to the test parameter values if
desired, then begin again. Results of the new test will be displayed.
NOTE: The test results from the most recent measurement are stored in
pulse generator memory, retrieved during initial interrogation, and displayed on
the Lead Tests screen and on the Lead Status screen. The measurements are
also provided on the Quick Notes report.
- DRAFT -

7-1
PATIENT DIAGNOSTICS
CHAPTER 7
This chapter contains the following topics:
• "Therapy History" on page 7-2
• "Trends" on page 7-3
• "Arrhythmia Logbook" on page 7-5
• "Patient Triggered Monitor" on page 7-13
- DRAFT -
7-2 PATIENT DIAGNOSTICS
THERAPY HISTORY
THERAPY HISTORY
The pulse generator automatically records detection and therapy information
for each detected episode. This data can be reviewed at various levels of
detail using the PRM.
History data storage includes the following information for each episode:
• Episode detail
• Electrograms with annotated markers
• Intervals
The data includes information from all active electrodes. The device
compresses the history data to store a maximum of 17 minutes of electrogram
data (13 minutes with Patient Triggered Monitor enabled). However, the
amount of time actually stored may vary based on the data being compressed
(e.g., noise on the EGM or an episode of VF).
The priority, maximum number, and minimum number of episodes to be stored
by the device for each episode type under normal conditions are specified
(Table 7-1 on page 7-3). The device stores up to the maximum number of
episodes for a specific episode type, unless the device memory is filled up first.
The minimum number of episodes for each episode type protects a few low
priority episodes from high priority episodes when device memory is full.
Once the device memory available for episode data is filled, the device attempts
to prioritize the types of stored episodes and overwrite the stored episodes
according to the following rules:
• If the device memory is full, and there are episode types that have more
than the minimum number of episodes listed in the table, then the oldest
of the lowest priority episodes from these episode types will be deleted.
In this case, the low priority episodes are not deleted if their number of
episodes is less than the minimum number listed in the table.
• If the device memory is full, and there are no episode types that have more
than the minimum number of episodes listed in the table, then the oldest of
the lowest priority episodes of all episode types will be deleted.
• For non-commanded episodes, the episode type for VT-1, VT, and VF
episodes is determined according to the zone Duration that expires
first. If no zone Duration expires during an episode, the episode type
is nonsustained.
- DRAFT -

PATIENT DIAGNOSTICS
TRENDS 7-3
• An episode in progress has the highest priority until its type can be
determined.
Table 7-1. Episode Priority
Episode Type Priority Minimum number of
episodes stored
Maximum number
of episodes stored
VF 1 510
Patient Triggered
Monitor
111
VT/VT-1 235
Cmd V 302
NonSustV 312
ATRa413
PMTa413
a. Not available in VR models.
Once the history data is saved to a disk, it can be accessed at any time without
device interrogation.
TRENDS
Trends provide a graphical view of specific patient and device data. This data
can be useful when evaluating your patient’s condition and the effectiveness of
programmed parameters. The following trends are available:
• Events––displays both atrial and ventricular events.
• Heart Rate––displays a trend of the patient’s heart rate. Intervals used in
this calculation must be valid sinus rhythm intervals. The validity of an
interval and the Heart Rate Trend data for the 24-hour collection period is
determined by the Heart Rate Trend collection criteria.
• Activity Level––displays a measure of the patient’s daily activity.
• Atrial Burden––the amount of time spent in an ATR mode switch.
• Respiratory Rate ––provides a trend of the patient’s daily respiratory rate.
• Amplitude––provides amplitude measurements
• Impedance––provides impedance measurements
Follow the steps below to access Trends:
1. From the Events screen, select the Trends Tab
- DRAFT -

7-4 PATIENT DIAGNOSTICS
TRENDS
2. Choose the Select Trends button to specify the trends you want to view.
You can choose from the following categories:
• Atrial Arrhythmia––includes Events, Heart Rate, and Atrial Burden
trends
• Activity––includes Heart Rate, Activity Level, and Respiratory Rate
trends
• Custom––allows you to select three trends to customize the information
displayed on the Trends screen
Thedisplayonthescreencanbeviewedinthefollowingmanners:
• Select the desired time on the View button to choose the length of visible
trend data.
• Adjust the start and end dates by moving the slider bar at the top of
the window. You can also adjust these dates by selecting the left- and
right-arrow buttons.
• Move the vertical axis across the graph by moving the slider bar at the
bottom of the display window.
Heart Rate Trend Collection Criteria
Only valid sinus rhythm intervals are used in the heart Rate Trend data
calculations. For Heart Rate Trend, valid intervals are those which include
only valid Heart Rate Trend events. Heart Rate Trend event validation criteria
are listed below:
Valid Heart Rate Trend Events Invalid Heart Rate Trend Events
AS with an interval not faster than
MTR, followed by a VS
AP
AS followed by VP at the programmed
AV Delay
AS with an interval faster than MTR
Non-tracked VP events
Consecutive AS events (no
intervening V event)
VP-Ns
- DRAFT -
PATIENT DIAGNOSTICS
ARRHYTHMIA LOGBOOK 7-5
Rate Smoothing events (e.g., RVP↑)
PVC
Heart Rate Trend data may not be reported for a variety of reasons; the most
common are as follows:
• Less than 67% of the 24-hour collection period (approximately 16 hours)
contains valid Heart Rate Trend events
• Brady parameters were programmed within the last 24 hours
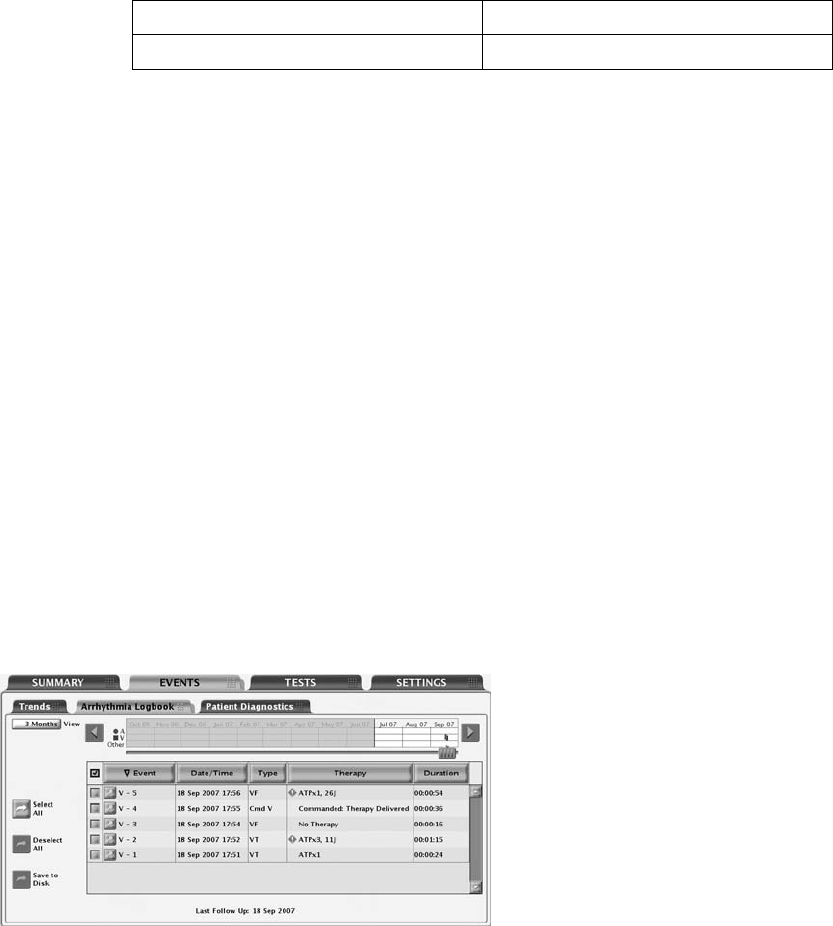
ARRHYTHMIA LOGBOOK
The Arrhythmia Logbook screen provides the following information about each
event (Figure 7-1 on page 7-5):
• The number, date, and time of the event
• The type of event with zone
• A summary of therapy delivered or attempted (if applicable)
• Whether or not intervals and EGMs are stored as indicated by the presence
of details button
• Duration of the event
Figure 7-1. Arrhythmia Logbook screen
To display Arrhythmia Logbook data, use the following steps:
- DRAFT -
7-6 PATIENT DIAGNOSTICS
ARRHYTHMIA LOGBOOK
1. From the Events tab, select Arrhythmia Logbook. If necessary, the pulse
generator will be automatically interrogated and current data will be
displayed. Data from a patient disk also can be displayed:
a. Select the Utilities button on the toolbar.
b. From the Utilities screen, select the Disk tab. Choose the Read Disk
option.
2. While retrieving the data, the programmer will display a window indicating
the progress of the interrogation. No information will be displayed if you
select the Cancel button before all of the stored data are retrieved.
3. Use the slider and View button to control the range of dates for the events
youwanttodisplayinthetable.
4. Select the Details button of an event in the table to display the event
details. Event details, available if the details button is present, are useful in
evaluating each detection or therapy sequence.
5. To sort events by date, type, therapy, or duration, select the corresponding
column header button. To reverse the order, select the column header
again.
6. To save specific events, select the event and choose the Save to Disk
button. To print specific events, select the event and choose Reports from
the toolbar. Choose the selected Episodes Report and select the Print
button.
NOTE: An “in-progress” episode will not be saved; an episode must be
complete before it will be saved by the application.
Events Summary
The Events Summary screen displays additional details about the selected
episode corresponding to the Arrhythmia Logbook.
The summary data include the following:
Episode Details
• Episode number, date, time, type (VF, VT, VT-1, spontaneous/induced, or
PTM indicating a Patient Triggered Monitor episode)
- DRAFT -
PATIENT DIAGNOSTICS
ARRHYTHMIA LOGBOOK 7-7
• Average atrial and ventricular rates
• Type of therapy delivered
• For ATP therapy, the time of therapy delivery and the number of bursts
• For shock therapy, the start time of charging, charge time, impedance,
energy level
• Time the episode ended
ATR Episodes
• Episode number, date, time, and type (ATR)
• Average atrial and ventricular rate during ATR mode switch
• Duration
PMT Episodes
• Episode number, date, time, and type (PMT)
• Atrial rate at PMT start
• Average atrial and ventricular rates
Follow the steps below to view episode detail:
1. Select the desired episode on the Arrhythmia Logbook screen. The Stored
Event screen will appear.
2. From the Stored Event screen, select the EGM tab to view the detailed
information for this episode.
3. Select the Previous Event or the Next Event button to display a previous
or more current episode, one episode at a time.
4. Select the Print Event button to print the episode detail being viewed.
5. Select the Save to Disk button to save the episode detail to a patient data
disk.
- DRAFT -
7-8 PATIENT DIAGNOSTICS
ARRHYTHMIA LOGBOOK
Stored Electrograms
The pulse generator can store annotated electrograms sensed from the
following leads prior to the onset of an episode around duration met, and
around therapy start and end:
• Shock lead
• RV pace/sense lead
• Atrial pace/sense lead
The particular electrograms stored depend upon the episode type. The EGM
storage capacity varies depending on EGM signal condition and heart rate.
The stored data are shared by all events. The total amount of stored EGM
data associated with an episode may be limited; EGMs from the middle of the
episode may be removed for episodes greater than 4 minutes in duration.
When the memory allocated to EGM storage is full, the device overwrites older
EGM data segments in order to store the new EGM data. The EGM is recorded
in segments consisting of episode Onset, Attempt, and End EGM storage.
Each segment of data is visible when the left caliper is in the specific section.
The following information is retained:
• Onset retains up to 25 seconds of data prior to Duration expiring
• Reconfirmation retains up to 20 seconds of data prior to therapy delivery
• Therapy data is displayed. In the case of ATP therapy, a maximum of 4
bursts and up to 20 seconds of data, for each burst, will be retained
• Post-therapy or diverted therapy retains up to 10 seconds of data
Episode onset refers to the period of time (measured in seconds) of EGM prior
to the first attempt. Onset includes the following information:
• Type of event
• Average RA Rate at the start of Event
• Average RV Rate at start of Event
• Programming of Detection Enhancements (Rate only, Rhythm ID, or
Onset/stability)
- DRAFT -
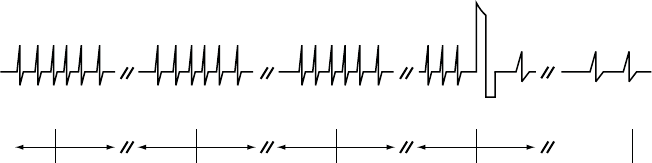
PATIENT DIAGNOSTICS
ARRHYTHMIA LOGBOOK 7-9
Attempt information may be displayed as Attempt or In Progress, if an attempt
is in progress. Attempt includes the following information:
• Detection information:
– Average RA Rate at start of Attempt
– Average RV Rate at start of Attempt
–RateZone
• Measured Values of Detection Enhancements
• Therapy Attempt Information:
– Attempt Number
– Type (diverted, commanded, or inhibited)
– Number of bursts (ATP attempt)
–Chargetime
– Lead impedance
– Lead polarity
– Shock faults
– Reason for No Therapy
The End EGM storage starts following therapy delivery and stores up to 10
seconds of EGM (Figure 7-2 on page 7-9).
Onset after
3 fast beats
Duration expires Charging begins Start End-of-
Episode timer
End-of-Episode
times out.
Episode is over.
5 s 10 s 10 s 10 s 10 s 10 s 10 s 10 s
Note: Charging may begin
when duration expires.
Shock
Figure 7-2. Relationship between ventricular tachy episode EGM storage and surface ECG strip chart
recording
To view the EGM data, select the desired episode on the Arrhythmia Logbook
screen. Use the following steps to view specific details about each episode:
- DRAFT -
7-10 PATIENT DIAGNOSTICS
ARRHYTHMIA LOGBOOK
1. Select the EGM tab to view the stored EGMs on the screen.
• EGM strips for the appropriate sources are displayed. Each strip
includes the EGMs sensed during the episode with the corresponding
annotated markers. Blue vertical bars indicate the segment (Onset,
Attempt, End) boundaries.
• You can move the calipers along the trace and will display the time
interval between the calipers.
• A speed button changes the trace speed in millimeters/seconds.
2. Select the Previous Event or Next Event button to display a different event
strip. If EGMs are not available for an episode, the Episode Detail screen
will be displayed.
3. To print the entire episode report, select the Print Event button. To save the
entire episode report, select the Save to Disk button.
NOTE: Refer to "Use of Atrial Information" on page 3-5 for additional
information about device performance when the atrial lead is programmed to
Off.
Intervals
The pulse generator stores event markers and associated time stamps. The
PRM derives event intervals from the event markers and time stamps.
To view the episode intervals, use the following steps:
1. From the Stored Event screen, select the Intervals tab. If all of the episode
data is not visible in the window, use the scroll bar to view more data.
2. Select the Previous Event or the Next Event button to display a previous
or more current episode, one episode at a time.
3. Select the Print Event button to print the entire episode report.
4. Select the Save to Disk button to save the entire episode report to a patient
data disk.
- DRAFT -
PATIENT DIAGNOSTICS
ARRHYTHMIA LOGBOOK 7-11
Histograms
The Histograms feature retrieves information from the pulse generator and
displays the total number and percentage of paced and sensed events for
the chamber.
Histograms data can provide the following clinical information:
• The distribution of the patient’s heart rates
• How the ratio of paced to sensed beats varies by rate
• How the ventricle responds to paced and sensed atrial beats across rates
Use the following steps to access the Histograms screen:
1. From the Events screen, select the Patient Diagnostics tab.
2. The initial display shows the paced and sensed data since the last time the
counters were reset.
3. Select the Details button to display the data type and time period.
4. Select the Rate Counts button on the Details screen to view rate counts
by chamber.
Counters
The following counters are recorded by the pulse generator and displayed on
the Patient Diagnostics screen:
• Ventricular Tachy
• Brady
Ventricular Tachy Counters
Information about Ventricular Tachy Counters is available by selecting the
Ventricular Tachy Counters button. This screen displays both Ventricular Tachy
Episode and Therapy counters. For each counter, the number of events since
last reset and device totals are displayed. Ventricular Tachy Episode counters
contains the following data:
- DRAFT -
7-12 PATIENT DIAGNOSTICS
ARRHYTHMIA LOGBOOK
• Total episodes
• Treated––VF, VT, VT-1, and Commanded
• Nontreated––No Therapy Programmed, Nonsustained, and Other
Untreated Episodes
Ventricular Tachy Therapy counters consist of ventricular shock and ATP
therapy attempts. They can provide useful data about the effectiveness of a
patient’s therapy prescription. These counters include the following information:
• ATP Delivered
• ATP % Successful––the percent of time that the arrhythmia is converted
and the episode ends without delivery of a programmed shock
• Shocks Delivered
• First Shock % Successful––the percent of time that the arrhythmia is
converted and the episode ends without requiring a second programmed
shock
•ShocksDiverted
The ventricular ATP counter is incremented at the start of the delivery of the
first burst of an ATP scheme. Subsequent ATP bursts in the same scheme are
not counted individually during the same episode.
An ATP scheme is counted as diverted only if it is diverted prior to delivery
of the first burst.
Brady Counters
Information about Brady Counters are displayed by selecting the Brady
Counters button. This screen displays the brady episode counters. For each
counter, the number of events since last reset and reset before last are
displayed. Brady counters contains the following details:
• Percent of atrial paced
• Percent of RV paced
- DRAFT -
PATIENT DIAGNOSTICS
PATIENT TRIGGERED MONITOR 7-13
• Intrinsic Promotion––includes Rate Hystereses % successful and AV
Search+ % successful
• Atrial burden––includes Episodes by Duration and Total PACs
• Ventricular counters––includes total PVCs and Three or More PVCs
PATIENT TRIGGERED MONITOR
Patient Triggered Monitor allows the patient to trigger the storage of EGMs,
intervals, and annotated marker data during a symptomatic episode by placing
a magnet over the device.
Patient Triggered Monitor is enabled by selecting Store EGM as the desired
magnet response. This can be found in the Magnet and Beeper section on the
V-Tachy Therapy Setup screen. When enabled, the device will store up to 2
minutes of patient monitor data prior to and up to 1 minute after triggering
the monitoring. The stored data include the episode number, the atrial and
ventricular rates at magnet application, and the start time and date of magnet
application.
When data are stored, the corresponding episode type is recorded as PTM
in the Arrhythmia Logbook.
Use care when enabling Patient Triggered Monitor, because the following
conditions will exist:
• All other magnet features are disabled, including inhibiting therapy (until
the EGM is stored). The Magnet/Beeper feature will not indicate magnet
position.
• Device longevity is impacted. Once the patient has triggered this feature to
store episode data or the feature is disabled, the impact on device longevity
is no longer present. To help reduce the longevity effect, this feature is
automatically disabled after 60 days from the day it was enabled.
• Once the EGM is stored, the device magnet response automatically will be
set to Inhibit Therapy.
To program the Patient Triggered Monitor feature, follow these steps:
- DRAFT -
7-14 PATIENT DIAGNOSTICS
PATIENT TRIGGERED MONITOR
1. From the Settings tab on the main screen, select Settings Summary.
2. From the Settings Summary tab, select Ventricular Tachy Therapy.
3. From Ventricular Tachy Therapy, select the V-Tachy Therapy Setup details
button.
4. Program the Magnet Response to Store EGM.
CAUTION: Determine if the patient is capable of activating this feature
prior to being given the magnet and prior to enabling Patient Triggered
Monitor. Remind the patient to avoid strong magnet fields so the feature is
not inadvertently triggered.
CAUTION: Consider having the patient initiate a stored EGM at the time
Patient Triggered Monitor is enabled to assist with patient education and
feature validation. Verify the activation of the feature on the Arrhythmia
Logbook screen.
WARNING: Ensure that Patient Triggered Monitor is enabled prior
to sending the patient home by confirming the magnet response is
programmed to Store EGM. If the feature is inadvertently left in the Inhibit
Therapy setting, the patient could potentially disable tachyarrhythmia
detection and therapy.
WARNING: Once the Patient Triggered Monitor feature has been
triggered by the magnet and an EGM has been stored, or after 60 days
have elapsed from the day that Store EGM was enabled, the Magnet
Response programming automatically will be set to Inhibit Therapy.
When this happens, the patient should not apply the magnet because
tachyarrhythmia therapy could be inhibited.
NOTE: When the Magnet Response programming has automatically
been set to Inhibit Therapy, magnet application will cause the device to
emit beeping tones. Inform the patient that if they hear tones coming from
their device after applying the magnet, they should remove the magnet.
5. Patient Triggered Monitor can only be enabled for a 60-day period of time.
To disable the feature within the 60-day time period, reprogram the magnet
response to a setting other than Store EGM. When 60 days have passed
since enabling Patient Triggered Monitor, the feature will automatically
disable itself and the magnet response will revert to Inhibit Therapy. To
re-enable the feature, repeat these steps.
- DRAFT -
PATIENT DIAGNOSTICS
PATIENT TRIGGERED MONITOR 7-15
For additional information, contact Technical Services at the number shown on
the back cover of this manual.
- DRAFT -
7-16 PATIENT DIAGNOSTICS
PATIENT TRIGGERED MONITOR
- DRAFT -

8-1
ELECTROPHYSIOLOGIC TESTING
CHAPTER 8
This chapter contains the following topics:
• "EP Test Features" on page 8-2
• "Induction Methods" on page 8-4
• "Commanded Therapy Methods" on page 8-10
- DRAFT -
8-2 ELECTROPHYSIOLOGIC TESTING
EP TEST FEATURES
EP TEST FEATURES
Electrophysiologic (EP) Testing features enable you to induce and terminate
arrhythmias noninvasively in order to monitor and test the effectiveness of
selected detection criteria and therapies. The EP Test features can be used in
conjunction with the ECG display so that real-time traces may be viewed. The
status of the pulse generator/patient interaction is also displayed.
The features allowing noninvasive EP testing of arrhythmias include the
following:
• VFib induction
• Shock on T induction
• PES induction
• 50 Hz/Manual Burst pacing induction
• Commanded Shock therapy
• Commanded ATP therapy
Temporary EP Mode
Temporary EP Mode allows you to program the device mode to a temporary
value for EP test delivery, and ensures that the normal device mode remains
unchanged.
Backup Ventricular Pacing During Atrial EP Testing
Backup ventricular pacing is available during atrial EP testing (PES, 50
Hz/Manual Burst) regardless of the programmed Normal or Post-therapy
pacing modes. (The mode can also be programmed to Off.) Program the
backup pacing parameters by selecting the EP Test Pacing button displayed on
the relevant atrial EP tests.
EP Test Screen
The EP Test screen displays the real-time status of the detection and therapy
process of the pulse generator when telemetry communication is occurring.
Viewing this display allows you to induce and test either a programmed
detection/therapy prescription or optional therapies while monitoring the pulse
generator’s progress.
Refer to the EP Test screen (Figure 8-1 on page 8-3):
- DRAFT -
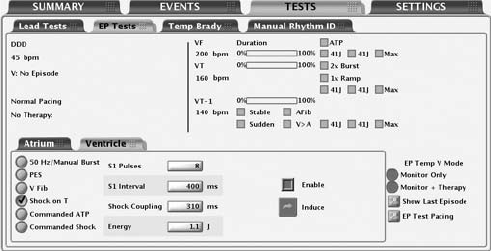
ELECTROPHYSIOLOGIC TESTING
EP TEST FEATURES 8-3
Figure 8-1. EP Test Screen
The screen provides the following information:
• Status messages indicate detection and therapy status and are described
below:
– Ventricular episode status—if an episode is occurring, the duration of
the episode is displayed. (If it is greater than 10 minutes, then it is
displayed as > 10:00 m:s).
– Ventricular detection status—if an episode is occurring, it indicates
whether ventricular detection is in Initial Detection, Redetection, or the
zone in which that detection is met. If no episode is occurring, the
programmer will also display the text Time since last V therapy along
with the continually updated time in minutes (up to 10).
– Brady pacing and SRD status.
– The type of therapy initiated and the zone.
– The status of the therapy such as In progress, Diverted, or Delivered.
• Duration timer—Progression of the duration timer is graphically displayed
using a scale. The bar in the scale moves from left to right to show the
percent complete of programmed duration. When duration is expired and
therapy delivery begins, the bar is removed.
• Detection status—The status for each programmed detection enhancement
is displayed. When enhancement criteria are met, a mark appears in the
adjacent box.
- DRAFT -

8-4 ELECTROPHYSIOLOGIC TESTING
INDUCTION METHODS
• Therapy prescriptions—Only those therapy prescriptions that are
programmed are displayed. As each therapy is delivered, a check mark
or number will appear in the box adjacent to the respective therapy. ATP
therapies indicate the scheme type as well as the programmed number of
bursts in the scheme. A number will appear and increment (1, 2, etc.) in
the ATP therapy box each time an ATP burst is delivered. Shock therapies
indicate the programmed energy level for the programmable shocks. A
number will appear and increment (1, 2, etc.) in the Max box each time a
maximum-energy shock is delivered.
Follow the steps below to perform EP Test functions:
1. Select the Tests tab, then select the EP Tests tab.
2. Establish telemetry communication. Telemetry communication between the
programmer and the pulse generator should be maintained throughout all
EP test procedures.
3. Program the EP Temp V mode appropriate to the EP Test method
(Table 8-1 on page 8-4).
Table 8-1. EP Temp V Mode for EP Test Functions
EP Temp V Mode
EP Test MethodaMonitor + TherapydMonitor OnlyeOff
50 Hz/Manual BurstbX
PESbX
VFibcX
Shock on TcX
Commanded ATPcX
Commanded ShockcXX
a. EP functions cannot be performed if the pulse generator is in Storage Mode.
b. Available method for both atrial and ventricular induction.
c. Available method only for ventricular induction.
d. The Ventricular Tachy Mode must be programmed to Monitor + Therapy.
e. The Ventricular Tachy Mode must be programmed to Monitor Only or Monitor + Therapy.
INDUCTION METHODS
Each induction method available from the EP Test screen is described below
with instructions for performing the induction. During any type of induction
delivery, the pulse generator recognizes the induction and performs no other
- DRAFT -
ELECTROPHYSIOLOGIC TESTING
INDUCTION METHODS 8-5
activity until the induction delivery is ceased, at which time the programmed
mode will take effect and the pulse generator will respond accordingly.
Consider the following information when using these methods:
• All inductions and tachycardia therapy delivery are inhibited when a
magnet is positioned over the pulse generator (if magnet response is set to
Inhibit Therapy).
• Pacing pulses during induction are delivered at the programmed EP Test
pacing parameters.
VFib Induction
VFib induction uses the shocking electrodes to stimulate the right ventricle
at very fast rates.
The following settings are available to allow use of the minimum energy
necessary for induction:
• VFib Low delivers a stimulation waveform of 9 volts
• VFib High delivers a stimulation waveform of 15 volts
Performing VFib Induction
NOTE: The patient should be sedated prior to delivery of fibrillation induction
pulses. The large surface area of the shocking electrodes tends to stimulate
the surrounding muscle and can be uncomfortable.
1. Select the VFib option. Buttons for each test and an Enable checkbox
are displayed.
2. Select the Enable checkbox.
3. Select the desired Hold for Fib button to initiate delivery of the fibrillation
induction train. The induction train is delivered up to 15 seconds as long as
the button is held and the telemetry link is maintained.
During induction the pulse generator is automatically disabled from
detecting, and automatically re-enabled following induction delivery.
If VFib induction is initiated during an episode, the end-of-episode is
declared before the VFib induction pulses are started. A new episode (with
initial detection and therapy) can be declared after the VFib induction is
- DRAFT -
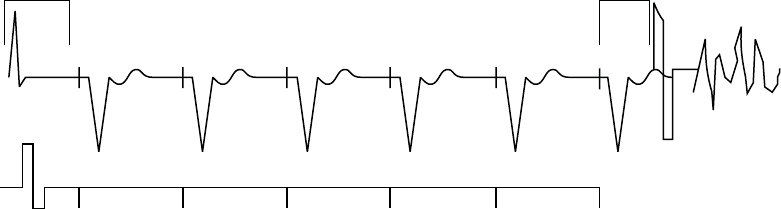
8-6 ELECTROPHYSIOLOGIC TESTING
INDUCTION METHODS
completed. Event markers and EGMs are interrupted during VFib induction
and will automatically restart following induction.
4. To stop the induction train, release the button (the button will become
dimmed again).
5. To deliver another fibrillation induction, repeat these steps.
Shock on T Induction
A Shock on T wave induction method allows the device to deliver a drive train
(up to 30 equally timed pacing pulses, or S1 pulses) through the ventricular
pace/sense electrodes followed by shock delivery through the shocking
electrodes (Figure 8-2 on page 8-6).
400 400 400 400 400 400
S1 S1 S1 S1 S1 S1
Last sensed or
paced beat
Coupling
Interval
Drive Pulses
Shock
S1 Interval
Figure 8-2. Shock on T induction drive train
The initial S1 pulse follows the last sensed or paced event at the S1 interval.
The shock is coupled to the last S1 pulse of the drive train.
Performing Shock on T Induction
1. Select the Shock on T option. The programmable induction parameters
will be displayed.
2. Select the desired value for each parameter.
3. Select the Enable checkbox. The Induce button will no longer be dimmed.
4. Select the Induce button to begin delivery of the drive train. The pulses are
delivered in sequence until the programmed number of pulses is reached.
- DRAFT -
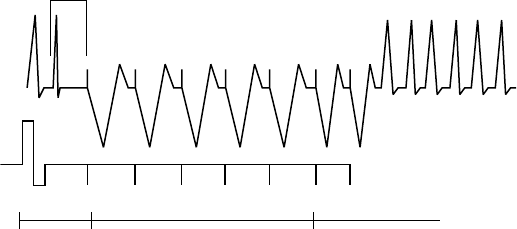
ELECTROPHYSIOLOGIC TESTING
INDUCTION METHODS 8-7
Once induction is initiated, the drive train delivery will not stop if you
interrupt telemetry communication. You can press the DIVERT THERAPY
key to stop the induction delivery command.
5. Shock on T induction is complete when the drive train and shock are
delivered, at which time the pulse generator automatically restarts
detection.
NOTE: Prior to drive train delivery, tones will be heard indicating capacitor
charging in preparation for shock delivery.
NOTE: The shock delivered during Shock on T induction does not increment
episode or therapy counters.
Programmed Electrical Stimulation (PES)
PES induction allows the pulse generator to deliver up to 30 equally timed
pacing pulses (S1) followed by up to 4 premature stimuli (S2–S5) to induce or
terminate arrhythmias. Drive pulses, or S1 pulses, are intended to capture and
drive the heart at a rate slightly faster than the intrinsic rate. This ensures that
the timing of the premature extra stimuli will be accurately coupled with the
cardiaccycle(Figure8-3onpage8-7).
The initial S1 pulse is coupled to the last sensed or paced beat at the S1
interval. All pulses are delivered in XOO modes (where X is the chamber) at
the programmed EP Test pacing parameters.
S1 S1 S1 S1 S1 S2 S3
600 400600 600 600 600 450
Coupling
Interval
Coupling
Interval
Extra
Stimuli
Drive Pulses
Figure 8-3. PES induction drive train
- DRAFT -
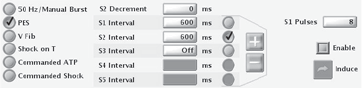
8-8 ELECTROPHYSIOLOGIC TESTING
INDUCTION METHODS
Performing PES Induction
1. Select the PES option. Buttons for the S1–S5 pulses and the corresponding
burst cycle lengths are displayed.
2. Select the desired value for the S1–S5 intervals (Figure 8-4 on page 8-8).
You can either select a value box for the desired S interval and choose a
value from the box or use the plus or minus symbols to change the value
visible in the value box.
Figure 8-4. PES induction options
3. Select the Enable checkbox.
4. Select (do not hold) the Induce button to begin delivery of the drive train.
When the programmed number of S1 pulses is delivered, the pulse
generator will then deliver the programmed S2–S5 pulses. The pulses are
delivered in sequence until a pulse is encountered that is set to Off (e.g.,
if S1 and S2 are set to 600 ms, and S3 is Off, then S3, S4, and S5 will
not be delivered). Once induction is initiated, the PES delivery will not
stop if you interrupt telemetry communication. (You can press the DIVERT
THERAPY key to stop induction delivery.) If PES induction is initiated
during an episode, the end-of-episode is declared before the PES induction
pulses are started. A new episode (with initial detection and therapy) can
be declared after the PES induction is completed.
5. PES induction is complete when the drive train and extra stimuli are
delivered, at which time the pulse generator automatically restarts
detection.
NOTE: Ensure the PES induction is complete before beginning another
induction.
NOTE: When PES is used to terminate an arrhythmia that has been detected
(and an episode declared), the episode is terminated when the PES is
commanded regardless of whether it is successful or not. The PES itself is not
recorded in therapy history; this may result in several episodes being counted
in therapy history.
- DRAFT -
ELECTROPHYSIOLOGIC TESTING
INDUCTION METHODS 8-9
50 Hz/Manual Burst Pacing
50 Hz/Manual Burst pacing induction is used to induce or terminate arrhythmias
and allows two separate pacing inductions, both of which can be delivered to
either the atrium or ventricle.
Manual Burst pacing pulses are delivered in XOO mode (where X is the
chamber) at the programmed EP Test pacing parameters through the
rate-sensing leads. For Atrial Manual Burst, backup pacing parameters are
provided.
Performing Manual Burst Pacing
1. Select the 50 Hz/Manual Burst option.
2. Select the desired value for the Burst Interval, Minimum, and Decrement.
This indicates the cycle length of the intervals in the drive train.
3. Select the Enable checkbox.
4. To deliver the burst, select and hold the Hold for Burst button.
The ventricular Manual Burst will be delivered up to 30 seconds as long as
the Hold for Burst button is held and the telemetry link is maintained.
The atrial Manual Burst will be delivered up to 45 seconds as long as the
Hold for Burst button is held and the telemetry link is maintained. The
intervals will continue to be decremented until the minimum interval is
reached, then all further pulses will be at the Minimum interval.
5. To stop the burst delivery, release the Hold for Burst button. The Hold for
Burst button will become dimmed again.
6. To deliver additional Manual Burst pacing, repeat these steps.
Performing 50 Hz Burst Pacing
1. Select the 50 Hz/Manual Burst option.
2. Select the Enable checkbox.
3. To deliver the burst, select and hold the Hold for 50 Hz Burst button.
- DRAFT -
8-10 ELECTROPHYSIOLOGIC TESTING
COMMANDED THERAPY METHODS
The ventricular 50 Hz Burst will be delivered up to 30 seconds as long as
the Hold for Burst button is held and the telemetry link is maintained.
The atrial 50 Hz Burst will be delivered up to 45 seconds as long as the
Hold for Burst button is held and the telemetry link is maintained.
NOTE: During Hold for 50 Hz Burst pacing, the S1 interval is automatically
set to 20 ms and the decrement to 0. These values will not be displayed on the
screen.
4. To stop the burst delivery, release the Hold for 50 Hz Burst button. The
Hold for 50 Hz Burst button will become dimmed again.
5. To deliver additional 50 Hz Burst pacing, repeat these steps.
COMMANDED THERAPY METHODS
The commanded EP test methods, Commanded Shock and Commanded ATP,
may be delivered independently of the programmed detection and therapy
parameters. If the pulse generator is in the process of delivering therapy when
a commanded method is initiated, the EP Test function overrides and aborts
the therapy in process. If an episode is not in progress, then a Commanded
Ventricular Episode will be recorded in the Arrhythmia Logbook. Commanded
Shock and Commanded ATP delivery is inhibited when a magnet is positioned
over the pulse generator, if it is programmed to Inhibit Therapy.
Commanded Shock
The Commanded Shock feature allows delivery of a shock with programmable
energy and coupling interval.
All Commanded Shocks are Committed and delivered R-wave synchronously
when the coupling interval is programmed to Sync. Shock waveform and
polarity are identical to detection-initiated shocks but a programmed coupling
interval may be specified. The coupling interval is initiated at the point where
the shock would have been delivered in Sync mode, but is instead delivered at
the programmed coupling interval. Following any Commanded Shock delivery,
Post-shock Redetection is used and post-shock pacing is activated.
Performing Commanded Shock Delivery
1. Select the Commanded Shock option.
- DRAFT -
ELECTROPHYSIOLOGIC TESTING
COMMANDED THERAPY METHODS 8-11
2. Select the desired values for the Coupling interval and Shock Energy.
3. Select the Enable checkbox. The Deliver Shock button will become
available.
4. Select the Deliver Shock button to initiate shock delivery. The Commanded
Shock is recorded in therapy history.
5. To deliver subsequent shocks, repeat these steps.
Commanded ATP
Commanded ATP allows you to manually deliver ATP schemes, independent
of the programmed detection and therapy parameters. You can configure
the Commanded ATP by either selecting the type of ATP scheme or by
programming ATP parameters on the Details screen in order to deliver
Commanded ATP.
The EP Temp V Mode must be programmed to Monitor Only to ensure the
Commanded ATP does not interfere with detection-initiated ATP.
Performing Commanded ATP
1. If the pulse generator Ventricular Tachy Mode is not currently programmed
to Monitor Only, select the Monitor Only EP Temp V Mode option.
2. Select the type of ATP scheme and select the value for Number of Bursts.
3. Select the Start ATP button to initiate the first burst in the selected ATP
scheme. The Bursts Remaining counter will decrement as each burst is
completed.
4. Select the Continue button for each additional burst delivery desired. If all
bursts in a scheme have been delivered, the Bursts Remaining counter will
return to the initial count, and the Continue button will be dimmed.
5. Other ATP schemes may be selected at any time; select the desired
scheme and repeat the above sequence. The Commanded ATP is
recorded as a physician-commanded therapy counter and displayed on
the counters screen.
- DRAFT -
8-12 ELECTROPHYSIOLOGIC TESTING
COMMANDED THERAPY METHODS
6. After using Commanded ATP, remember to program the EP Temp V Mode
to Monitor + Therapy or leave the screen so that the EP Temp V Mode is
ended and the permanent Tachy Mode is resumed.
NOTE: If any button other than the Continue button is selected during delivery
of a Commanded ATP scheme, the scheme will be reset and the Bursts
Remaining box will be restored to its initial value. The Start ATP button must be
reselected to initiate the scheme again.
- DRAFT -

9-1
IMPLANT INFORMATION
CHAPTER 9
This chapter contains the following topics:
• "Implanting the Pulse Generator" on page 9-2
- DRAFT -
9-2 IMPLANT INFORMATION
IMPLANTING THE PULSE GENERATOR
IMPLANTING THE PULSE GENERATOR
Step A: Check Equipment
Step B: Interrogate and Check the Pulse Generator
Step C: Implant the Lead System
Step D: Take Baseline Measurements
Step E: Form the Implantation Pocket
Step F: Connect the Leads to the Pulse Generator
Step G: Evaluate Lead Signals
Step H: Program the Pulse Generator
Step I: Implant the Pulse Generator
Step J: Complete and Return the Implantation Form
Step A: Check Equipment
It is recommended that instrumentation for cardiac monitoring, defibrillation,
and lead signal measurement should be available during the implant procedure.
This includes the PRM system with its related accessories and the software
application. Before beginning the implantation procedure, become completely
familiar with the operation of all the equipment and the information in the
respective operator’s and user’s manuals. Verify the operational status of all
equipment that may be used during the procedure. Sterile duplicates of all
implantable items and the following accessories should be available in case of
accidental damage or contamination:
• Internal defibrillator paddles
•Externaldefibrillator paddles
• Torque and non-torque wrenches
During the implantation procedure, a standard transthoracic defibrillator
with external pads or internal paddles should be available for use during
defibrillation threshold testing.
- DRAFT -
IMPLANT INFORMATION
IMPLANTING THE PULSE GENERATOR 9-3
Step B: Interrogate and Check the Pulse Generator
To maintain sterility, test the pulse generator as described below before opening
the sterile blister tray. The pulse generator should be at room temperature to
ensure accurately measured parameters.
1. Interrogate the pulse generator using the PRM. Verify that the pulse
generator’s Tachy mode is programmed to Storage. If otherwise, call
Technical Services at the phone number provided on the back of this
manual.
2. Perform a manual capacitor re-formation.
3. Review the pulse generator’s current battery status. Counters should be
at zero. If the pulse generator battery status is not at BOL, do not implant
the pulse generator. Call Technical Services at the phone number provided
on the back of this manual.
Step C: Implant the Lead System
The pulse generator requires a lead system for sensing, pacing, and delivering
shocks. The pulse generator uses its case as a defibrillating electrode.
Selection of lead configuration and specific surgical procedures is a matter of
professional judgement. The following lead system configurations are available
for use with the pulse generator:
• ENDOTAK endocardial cardioversion/defibrillation and pacing lead system
• Ventricular endocardial bipolar lead
• Atrial bipolar lead
• Unipolar sutureless myocardial leads and, if necessary, an appropriate
Guidant lead adapter
• Superior vena cava lead coupled with a ventricular patch lead
• Two-patch epicardial leads configuration
CAUTION: The absence of a lead or plug in a lead port may affect device
performance. If a lead is not used, be sure to properly insert a plug in the
unused port.
- DRAFT -
9-4 IMPLANT INFORMATION
IMPLANTING THE PULSE GENERATOR
Whichever lead configuration is used for both pacing/sensing and defibrillating,
several considerations and cautions should be heeded. Such factors as
cardiomegaly or drug therapy may necessitate repositioning of the defibrillating
leads or substituting one lead for another to facilitate arrhythmia conversion.
In some instances, no lead configuration may be found that provides reliable
arrhythmia termination at energy levels available from the pulse generator;
implantation of the pulse generator is not recommended in these cases.
Implant the leads via the surgical approach chosen.
CAUTION: Do not suture directly over the lead body as this may cause
structural damage. Use the lead stabilizer to secure the lead lateral to the
venous entry side.
Step D: Take Baseline Measurements
Once the leads are implanted, take baseline measurements. Evaluate the
lead signals. If performing a pulse generator replacement procedure, existing
leads should be reevaluated, (e.g., signal amplitudes, pacing thresholds, and
impedance). The use of radiography may help ensure lead position and
integrity. If testing results are unsatisfactory, lead system repositioning or
replacement may be required.
- DRAFT -

IMPLANT INFORMATION
IMPLANTING THE PULSE GENERATOR 9-5
• Connect the pace/sense lead(s) to a pacing system analyzer (PSA).
Pace/sense lead measurements, measured approximately 10 minutes
after placement, are listed below (Table 9-1 on page 9-5). Note that the
pulse generator measurements may not exactly correlate to the PSA
measurements due to signal filtering.
Table 9-1. Lead measurements
Pace/sense lead
(acute)
Pace/sense lead
(chronic)
Shocking lead
(acute)
Shocking lead
(chronic)
R-wave amplitudeab > 5 mV > 5 mV > 1.0 mV > 1.0 mV
P-wave amplitudeab >1.5mV >1.5mV
R-wave durationbcd < 100 ms < 100 ms
Pacing threshold (right
ventricle)
<1.5V
endocardial
< 2.0 V epicardial
< 3.0 V endocardial
<3.5Vepicardial
Pacing threshold (atrium) <1.5V
endocardial
< 3.0 V endocardial
Lead impedance (at 5 V and
0.5 ms atrium and ventricle)
200–2000 Ω200–2000 Ω20–80 Ω20–80 Ω
a. Amplitudes less than 2 mV cause inaccurate rate counting in the chronic state, and result in inability to sense a tachyarrhythmia or
the misinterpretation of a normal rhythm as abnormal.
b. Lower R-wave amplitudes and longer duration may be associated with placement in ischemic or scarred tissues. Since signal
quality may deteriorate chronically, efforts should be made to meet the above criteria by repositioning the leads to obtain signals
with the largest possible amplitude and shortest duration.
c. Durations longer than 135 ms (the pulse generator’s refractory period) may result in inaccurate cardiac rate determination, inability
to sense a tachyarrhythmia, or in the misinterpretation of a normal rhythm as abnormal.
d. This measurement is not inclusive of current of injury.
Step E: Form the Implantation Pocket
Using standard operating procedures to prepare an implantation pocket,
choose the position of the pocket based on the implanted lead configuration and
the patient’s body habitus. Giving consideration to patient anatomy and pulse
generator size and motion, gently coil any excess lead and place adjacent to
the pulse generator. It is important to place the lead into the pocket in a manner
that minimizes lead tension, twisting, sharp angles, and/or pressure. Pulse
generators are typically implanted subcutaneously in order to minimize tissue
trauma and facilitate explant. However, deeper implantation (e.g., subpectoral)
may help avoid erosion or extrusion in some patients. Verify magnet function
and wanded telemetry to ensure the pulse generator is within acceptable range.
Consider the following situations during the implant the procedure:
- DRAFT -
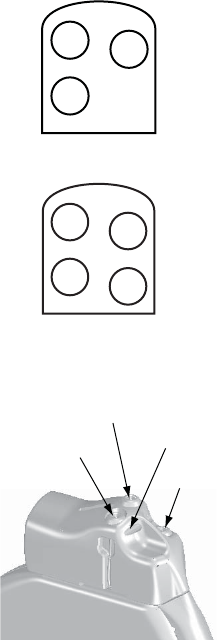
9-6 IMPLANT INFORMATION
IMPLANTING THE PULSE GENERATOR
• If an abdominal implant is suitable, it is recommended that implantation
occur on the left abdominal side.
• Tunnel the leads if necessary. If a Guidant tunneler is not used, cap
the lead terminal pins, gently tunnel the leads subcutaneously to the
implantation pocket, and reevaluate the lead signals to determine if any of
the leads have been damaged during the tunneling procedure. A Penrose
drain, large chest tube, or tunneling tool may be used to tunnel the leads.
• If the lead terminal pins are not connected to a pulse generator at the time
of lead implantation, they must be capped before closing the incision.
Step F: Connect the Leads to the Pulse Generator
Lead connections are illustrated below.
– +
RV
DF-1
IS-1
BI
DF-1
Figure 9-1. Lead connections, single chamber
– +
RV RA
DF-1
IS-1
BI
DF-1
IS-1
BI
Figure 9-2. Lead connections, dual chamber
Setscrew locations are illustrated below.
Front of Pulse Generator
Defib (+)
Defib (-)
Suture Hole
RV (-)
Figure 9-3. Setscrew and suture hole locations, single chamber
- DRAFT -
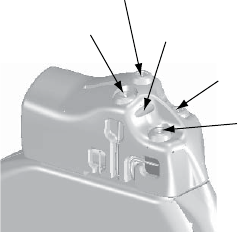
IMPLANT INFORMATION
IMPLANTING THE PULSE GENERATOR 9-7
Front of Pulse Generator
Defib (+)
Defib (-)
Suture Hole
RV (-)
RA (-)
Figure 9-4. Setscrew and suture hole locations, dual chamber
Lead to pulse generator connections
CAUTION: Do not insert a lead into the pulse generator connector without
first visually verifying that the setscrew is sufficiently retracted to allow insertion.
Fully insert each lead into its lead port and then tighten the setscrew onto
the electrodes.
1. As each lead is inserted into the pulse generator, secure the lead in place
by tightening the setscrew with the torque wrench.
a. Insert the wrench into the center, preslit depression of the seal plug.
b. Place pressure on the lead to maintain its position in the pulse
generator lead port. Be certain that the lead remains fully inserted
intheleadport.
c. The large-handled torque wrench is preset to apply the proper amount
of force to the captive setscrew. Tighten the setscrew, making sure it is
not crooked, until the wrench ratchets; additional force is unnecessary.
d. Apply gentle traction to the leads to ensure a secure connection.
2. In models with IS-1 connectors, insert and secure the right ventricular
pace/sense lead terminal into the RV lead port.
NOTE: When connecting leads to a device header, connect the RV lead
first. An RV lead is required to establish RV-based timing cycles that yield
appropriate sensing and pacing in all chambers, regardless of the programmed
configuration.
- DRAFT -
9-8 IMPLANT INFORMATION
IMPLANTING THE PULSE GENERATOR
3. In models with atrial connectors, insert and secure the atrial pace/sense
lead terminal into the A lead port.
4. In models with DF-1 connectors, insert the defibrillating lead anode
(+, proximal) into the pulse generator’s (+) Defib lead port. For proper
connection, be certain that the lead terminal pin is fully inserted in the pulse
generator lead port. When viewed through the side of the header, the pin
tip should extend through the terminal block.
5. Insert and secure the defibrillating cathode (–, distal) in the (–) Defiblead
port in a similar manner as above.
CAUTION: For IS-1/DF-1 leads, never change the shock waveform
polarity by physically switching the lead anodes and cathodes in the pulse
generator header—use the programmable Polarity feature. Device damage
or nonconversion of the arrhythmia post-operatively may result if the polarity
is switched physically.
CAUTION: The absence of a lead or plug in a lead port may affect device
performance. If a lead is not used, be sure to properly insert a plug in the
unused port.
Consider the following lead connection information during the implant
procedure:
• The IS-1 pace/sense lead port(s) has one setscrew for securing the
terminal pin.
• The DF-1 port has one setscrew for securing the terminal pin.
• Avoid allowing blood or other body fluids to enter the lead ports in the pulse
generator header. If fluid inadvertently enters the ports, they should be
thoroughly cleaned using sterile water.
• To connect leads to the pulse generator, use only the tools provided in the
pulse generator tray or accessory kit to avoid damage to the seal plugs.
Failure to properly insert the wrench in the preslit depression of the seal
plug may result in damage to the plug and its sealing properties. Failure
to use the supplied torque wrench may result in damage to the screw or
connector threads. Do not implant the pulse generator if the seal plugs
appear to be damaged. Retain the tools until all testing procedures are
complete and the pulse generator is implanted.
- DRAFT -
IMPLANT INFORMATION
IMPLANTING THE PULSE GENERATOR 9-9
• If necessary, lubricate the lead connectors sparingly with sterile water to
make insertion easier.
• If a lead terminal encounters resistance on insertion into the lead port,
insert the wrench into the preslit depression of the seal plug and angle it
gently to open the valve and allow excess air to bleed out of the seal plug.
•Significant amounts of fluid or sterile water in a lead bore may make it
difficult to fully insert leads. If significant amounts of fluid or sterile water
are present, insert the torque wrench into the setscrew before inserting the
leads. This will allow fluid to drain from the lead bore.
• For proper connection of an IS-1 lead to the pulse generator, be certain that
the connector pin visibly extends through the connector block at least 1 mm.
Step G: Evaluate Lead Signals
1. Take the pulse generator out of power-saving Storage mode by
programming the Tachy Mode to Off.
CAUTION: To prevent inappropriate shocks, ensure that the pulse generator’s
Tachy Mode is programmed to Off when not in use and before handling the
device. For tachyarrhythmia therapy, verify that the Tachy Mode is activated.
2. Evaluate the pace/sense and defibrillation lead signals by viewing the
real-time EGMs and markers. The signal from the implanted defibrillation
leads should be continuous and without artifact, similar to a body-surface
ECG. A discontinuous signal may indicate a poor connection, lead fracture
or otherwise damaged lead, or an insulation break that would necessitate
lead replacement. Inadequate signals may result in failure of the pulse
generator system to detect an arrhythmia, inability to deliver programmed
therapy, or unnecessary delivery of therapy. Lead measurements should
reflect those in (Table 9-1 on page 9-5).
CAUTION: For dual-chamber models, take care to ensure that artifacts from
the ventricles are not present on the atrial channel, or atrial oversensing may
result. If ventricular artifacts are present in the atrial channel, the atrial lead
may need to be repositioned to minimize its interaction.
3. Evaluate all lead impedances using the Lead Impedance test accessed
from the Diagnostic Evaluation tool.
- DRAFT -
9-10 IMPLANT INFORMATION
IMPLANTING THE PULSE GENERATOR
CAUTION: Never implant the device with a lead system that has less than
15 Ωtotal shock lead impedance. Device damage may result. If a shocking
lead impedance is less than 20 Ω, reposition the shocking electrodes to allow a
greater distance between the shocking electrodes.
Step H: Program the Pulse Generator
1. Check the programmer clock and set and synchronize the pulse generator
as necessary so that the proper time appears on printed reports and PRM
strip chart recordings.
2. It may be useful to program the Beep During Capacitor Charge feature to
On during conversion testing and implantation to help recognize when the
pulse generator is charging to deliver shock.
3. Perform a manual capacitor re-formation if not already performed.
4. Program the pulse generator to desired parameters appropriate for the
patient for necessary testing.
5. Shocks intended for VF therapy should be programmed with a 10 J safety
margin above the shock energy level that the physician determines is
required for successful VF conversion.
CAUTION: To prevent inappropriate shocks, ensure that the pulse generator’s
Tachy Mode is programmed to Off when not in use and before handling the
device. For tachyarrhythmia therapy, verify that the Tachy Mode is activated.
Step I: Implant the Pulse Generator
1. Program the Tachy Mode to Off.
2. Ensure that the pulse generator has good contact with surrounding tissue
of the implantation pocket. Suture hole locations are illustrated below.
Gently coil excess lead and place adjacent to the pulse generator. Flush
the pocket with saline solution, if necessary, to avoid a dry pocket.
WARNING: Kinking leads may cause additional stress on the leads,
possibly resulting in lead fracture.
CAUTION: Improper insertion can cause insulation damage near the
terminal end that could result in lead failure.
- DRAFT -
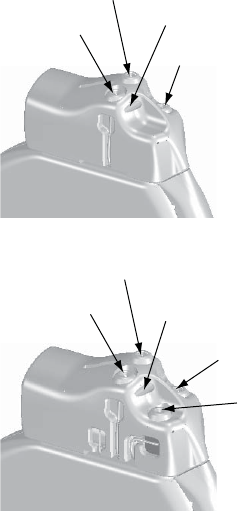
IMPLANT INFORMATION
IMPLANTING THE PULSE GENERATOR 9-11
Front of Pulse Generator
Defib (+)
Defib (-)
Suture Hole
RV (-)
Figure 9-5. Setscrew and suture hole locations, single chamber
Front of Pulse Generator
Defib (+)
Defib (-)
Suture Hole
RV (-)
RA (-)
Figure 9-6. Setscrew and suture hole locations, dual chamber
3. Close the implantation pocket. Consideration should be given to place
the leads in a manner to prevent contact with suture materials. It is
recommended that absorbable sutures be used for closure of tissue layers.
4. Complete any electrocautery procedures before reactivating the pulse
generator.
5. Program the Tachy Mode to the desired setting and confirm final
programmed parameters.
6. Print out parameter reports and save all data to disk using the programmer’s
Save to Disk option.
Step J: Complete and Return the Implantation Form
Within ten days of implantation, complete the Warranty Validation and Lead
Registration form and return the original to Boston Scientificalongwithacopy
of the patient data disk. This information enables Boston Scientifictoregister
each implanted pulse generator and set of leads, initiate the warranty period,
- DRAFT -
9-12 IMPLANT INFORMATION
IMPLANTING THE PULSE GENERATOR
and provide clinical data on the performance of the implanted system. Keep a
copy of the Warranty Validation and Lead Registration form and programmer
printouts, and the original patient data disk for the patient’s file.
Complete the temporary patient identification card and give it to the patient.
After receiving the validation form, Boston Scientific sends the patient a
permanent identification card.
NOTE: A registration form is packaged with each pulse generator lead. If
completing the pulse generator Warranty Validation and Lead Registration
form for the pulse generator, completing separate validation forms for each
lead is not necessary.
- DRAFT -

10-1
POST IMPLANT INFORMATION
CHAPTER 10
This chapter contains the following topics:
• "Follow Up Testing" on page 10-2
• "Post Implant features" on page 10-3
• "Explantation" on page 10-8
- DRAFT -
10-2 POST IMPLANT INFORMATION
FOLLOW UP TESTING
FOLLOW UP TESTING
It is recommended that device functions be evaluated during follow-up testing.
WARNING: Ensure that an external defibrillator and medical personnel skilled
in CPR are present during post-implant device testing should the patient
require external rescue.
Predischarge Follow Up
During the pre-discharge follow-up test, the following procedures should be
performed via telemetry using the PRM:
1. Interrogate the pulse generator and review the Summary screen.
2. Perform pacing thresholds and lead impedance tests, and intrinsic
amplitude measurements.
3. Review Histograms.
4. When all testing is complete, perform a final interrogation and save all the
data to a patient data disk.
5. Print the Quick Notes and Patient Data reports to retain in your files for
future reference.
6. It is important to clear the therapy counters so that at the next follow-up
session the most recent episode data will be displayed. Note that the
histogram counters can be cleared from either the Brady or Tachy Counters
screen as well.
Routine Follow Up
You should conduct routine follow-up examinations one month after the
pre-discharge study and every three months thereafter. During the routine
follow-up test, the following procedures should be performed via telemetry
using the programming system:
1. Interrogate the device and review the Summary screen.
2. Perform pacing thresholds and lead impedance tests, and intrinsic
amplitude measurements.
- DRAFT -
POST IMPLANT INFORMATION
POST IMPLANT FEATURES 10-3
3. Print and review the Quick Notes report, and retain it in your files for future
reference.
4. For episodes of interest, review the Arrhythmia Logbook screen and print
episode details and stored electrogram information.
5. It is important to clear the therapy counters so that at the next follow-up
session the most recent episode data will be displayed.
CAUTION: Verify with a conversion test that the patient’s tachyarrhythmias
can be detected and terminated by the pulse generator system if the patient’s
status has changed or parameters have been reprogrammed.
POST IMPLANT FEATURES
Sensitivity Adjustment
The Sensitivity Adjustment feature allows you to shift the atrial sensing range to
make it less sensitive (i.e., a larger signal would be required for the device to
detect). It allows shifting the ventricular sensing range to make it less or more
sensitive. While the Nominal setting is primarily indicated for both atrial and
ventricular sensing, an adjustment can be made if, in a rare situation, atrial or
ventricular oversensing/undersensing has been observed post-implant (i.e.,
inhibition of bradycardia pacing or inappropriate tachy therapy).
Should it become necessary to adjust the sensing range in a chamber,
always choose the setting that allows the greatest sensitivity, but resolves
oversensing/undersensing:
• To reduce oversensing, program the sensitivity to a higher value.
• To reduce undersensing, program the sensitivity to a lower value.
After any change to sensitivity, evaluate for appropriate sensing for both
bradycardia pacing and tachycardia detection.
If proper sensing cannot be restored with an adjustment or if any undersensing
is observed after making a change, consider repositioning the lead or implanting
a new sensing lead and then programming the setting back to nominal.
CAUTION: Following any sensing range adjustment or any modification of
the sensing lead, always verify appropriate sensing.
- DRAFT -
10-4 POST IMPLANT INFORMATION
POST IMPLANT FEATURES
Beeper Feature
The pulse generator contains a beeper that emits audible tones to
communicate status information. The beeper includes both programmable and
nonprogrammable features.
Programmable Features
The following beeper features are programmable:
• Beep During Capacitor Charge—When programmed to On, regardless of
the Tachy mode, a warbling tone will sound continuously while the pulse
generator is charging (except when charging during an auto capacitor
re-form). The tone will continue until charging is complete. When this
feature is programmed to Off, there is no audible indication that the pulse
generator is charging. This feature is useful during EP testing.
• Beep When Explant Is Indicated—When this feature is programmed to
On, the pulse generator emits tones upon reaching Explant. The Explant
indicator consists of 16 tones repeated every six hours after the pulse
generator reaches Explant until the feature is turned off via the programmer.
When this feature is programmed to Off, there is no audible indication
of Explant.
Perform the following steps to program the magnet and beeper features:
Magnet and Beeper Response
1. Select the Settings tab.
2. From Ventricular Tachy, select the Therapy button.
3. Select the V-Tachy Therapy Setup button.
4. Enter the desired values.
Beep when Explant is indicated
1. Select the Summary tab.
2. Select the Battery button.
3. From the Battery Status summary screen, select the Battery Detail button.
- DRAFT -
POST IMPLANT INFORMATION
POST IMPLANT FEATURES 10-5
4. From the Battery Detail summary screen, select the desired value for Beep
when Explant is indicated.
NOTE: When the Magnet Response is programmed to Inhibit Therapy,
magnet application will cause other types of beeping tones to be emitted,
depending on the device mode. Refer to "Magnet Feature" on page 10-5 for
more information.
Nonprogrammable Features
The following beeper features are nonprogrammable:
• Battery capacity depleted—Regardless of whether Beep When Explant
Is Indicated is programmed to On or Off, once the battery capacity is
depleted, the pulse generator will emit the explant indicator tones
• Fault code tones—For certain fault codes or when safety mode is entered,
the pulse generator will beep 16 times every 6 hours.
NOTE: Beeping tones may emit under nonprogrammable scenarios in
response to device self-diagnostic testing. Advise patients to have their
pulse generator checked whenever they hear tones coming from the device.
Contact Technical Services at the phone number on the back of this manual
for assistance.
Magnet Feature
The magnet feature allows certain device functions to be triggered when a
magnet is placed in close proximity to the pulse generator (Figure 10-1 on
page 10-6).
- DRAFT -
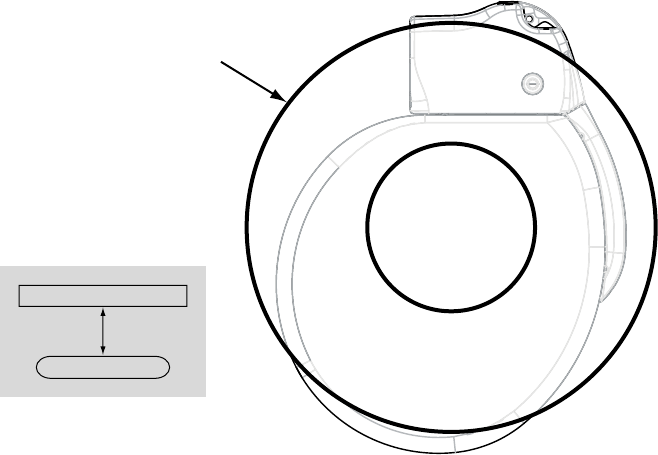
10-6 POST IMPLANT INFORMATION
POST IMPLANT FEATURES
Position the magnet over the
pulse generator as shown.
Magnet (model 6860)
3.0 cm
Pulse generator
Top View
Figure 10-1. Proper position of magnet Model 6860 to activate the pulse generator magnet feature
The pulse generator Magnet Response settings can be programmed to control
the behavior of the pulse generator when a magnet is detected. The Magnet
Response settings are located in the Magnet and Beeper section of the V-Tachy
Therapy Setup screen. The following Magnet Response settings are available:
• Off—no response
• Store EGM—patient monitoring data will be stored
• Inhibit Therapy—therapy will be stopped
Off
When the Magnet Response is programmed to Off, application of the magnet
will have no effect on the pulse generator.
Store EGM
When the Magnet Response is programmed to Store EGM, application of the
magnet will activate the patient triggered monitor functionality. Refer to "Patient
Triggered Monitor" on page 7-13 for additional information.
Inhibit Therapy
- DRAFT -
POST IMPLANT INFORMATION
POST IMPLANT FEATURES 10-7
When the Magnet Response is programmed to Inhibit Therapy, application of
the magnet will inhibit and/or divert charging for a shock, divert a shock that is
about to be delivered, or inhibit and/or divert further ATP therapy.
When Magnet Response is programmed to Inhibit Therapy, initiation of
tachyarrhythmia therapy and arrhythmia induction is inhibited any time the
magnet is properly positioned over the pulse generator. The tachyarrhythmia
detection process continues, but therapy or induction cannot be triggered.
When a magnet is placed over the pulse generator, the following will occur:
• If the Tachy mode is Monitor + Therapy or Off when the magnet is applied,
the Tachy mode changes temporarily to Monitor Only mode and will
remain in Monitor Only mode as long as the magnet is applied. Three
seconds after the magnet is removed, the mode will return to the previously
programmed mode.
• If the pulse generator is charging to deliver shock therapy when the magnet
is applied, the charging continues but is then terminated within one to two
seconds of magnet application, and the charge is diverted. (This delay
occurs in case the magnet is inadvertently passed over the device when
therapy inhibition is not desired.) The pulse generator remains in temporary
Monitor Only mode while the magnet is applied. No further therapy is
initiated until the magnet is removed; however, detection will continue.
• If charging is complete or completes within the 1–2 second delay period,
holding the magnet over the pulse generator for more than two seconds
will divert the shock. (If the magnet is removed during the delay period,
the shock could still be delivered.) Shocks will not be delivered with the
magnet in place.
• If the pulse generator is initiating fibrillation induction or ATP pulses, it
terminates the delivery after one to two seconds of magnet application. No
further induction or ATP pulse sequences are initiated until the magnet
is removed.
• If the Tachy Mode is Monitor Only or Off, magnet application will produce a
constant tone to indicate that the device is in a non-therapy mode.
• If the Tachy Mode is Monitor + Therapy or the pulse generator is in
Electrocautery Protection Mode, magnet application will cause the pulse
generator to beep once per second to indicate that the device is in a
therapy mode.
- DRAFT -
10-8 POST IMPLANT INFORMATION
EXPLANTATION
NOTE: If tachy detection occurs while the magnet is in place, detailed therapy
history will indicate that therapy was not delivered because the device was
in Monitor Only mode.
EXPLANTATION
An Observation/Complication/Out-of-Service Reporting form should be
completed and sent to Boston Scientific when a product is removed from
service. Return all explanted pulse generators and leads with product
performance allegations or warranty considerations to Boston Scientific.
Examination of explanted devices provides information for continued
improvement in device reliability and will permit calculation of any warranty
replacement credit use.
In the event of patient death (regardless of cause), the explanted pulse
generator and/or lead should be returned to Boston Scientificalong
with the Observation/Complication/Out-of-Service Reporting form and
copies of the autopsy report, if performed. For other observation or
complications reasons, also complete and return to Boston Scientificthe
Observation/Complication/Out-of-Service Reporting form.
NOTE: Disposal of explanted devices is subject to local, state, and federal
regulations. Contact your sales representative or call the phone number on the
back cover of this manual for a Returned Product Kit.
NOTE: Discoloration of the pulse generator may have occurred due to a
normal process of anodization, and has no effect on the pulse generator
function.
CAUTION: Be sure that the pulse generator is removed before cremation.
Cremation and incineration temperatures might cause the pulse generator to
explode.
CAUTION: Before explanting, cleaning, or shipping the device, complete the
following actions to prevent unwanted shocks, overwriting of important therapy
history data, and audible tones:
• Program the pulse generator Tachy and Brady Modes to Off.
• Program the Magnet Response feature to Off.
• Program the Beep When Explant is Indicated feature to Off.
Consider the following items when explanting and returning the pulse generator:
- DRAFT -
POST IMPLANT INFORMATION
EXPLANTATION 10-9
• Interrogate the pulse generator and print a Combined Follow-up report.
• Deactivate the pulse generator before explantation.
• Disconnect the leads from the pulse generator.
• If leads are also explanted, attempt to remove them intact. Do not remove
leads with hemostats or any other clamping tool that may damage the
leads. Resort to tools only if manual manipulation cannot free the lead.
• Wash, but do not submerge, the pulse generator and leads to remove
body fluids and debris using a disinfectant solution. Do not allow fluids to
enter the pulse generator’s lead ports.
• UseaBostonScientific Returned Product Kit to properly package the
pulse generator.
• Complete the Observation/Complication/Out-of-Service Reporting form.
• Send the form and the Returned Product Kit to Boston Scientific.
- DRAFT -
10-10 POST IMPLANT INFORMATION
EXPLANTATION
- DRAFT -

A-1
PROGRAMMABLE OPTIONS
APPENDIX A
Table A-1. ZIP Telemetry settings
Parameter Programmable Values Nominal
Communication Mode Enable use of ZIP telemetry (May
require limited use of wand), Use
wand for all telemetry
Enable use of ZIP telemetry (May
require limited use of wand)
Table A-2. Tachy Mode parameter
Parameter Programmable Values Nominal
Tachy Mode Off, Monitor Only, Monitor + Therapy,
Enable Electrocautery Protection
Storage
Table A-3. Ventricular Zones parameter
Parameter Programmable Values Nominal
Ventricular Zones 1, 2, 3 2
Table A-4. Detection parameters for 1-zone, 2-zone, and 3-zone configurations
Parameter VT-1 Zone VT Zone VF Zone Nominal
Ratea( bpm) 3 zones
(intervals in ms)
90, 95, ..., 200
(667–300)
110, 115, ..., 210
(545–286) 220 (273)
130, 135, ..., 210
(462–286), 220, 230,
240, 250 (273–240)
140 (Tolerance ± 5
ms) for VT-1 Zone
160 (Tolerance ± 5
ms) for VT Zone
200 (Tolerance ± 5
ms) for VF Zone
Ratea( bpm) 2 zones
(intervals in ms)
–– 90, 95, ..., 210
(667–286) 220 (273)
110, 115, ..., 210
(545–286) 220, 230,
240, 250 (273–240)
160 (Tolerance ± 5
ms) for VT Zone
200 (Tolerance ± 5
ms) for VF Zone
Ratea( bpm) 1 zone
(intervals in ms)
–– –– 90, 95, ..., 210 (667–
286) 220 (273)
200 (Tolerance ± 5
ms)
Initial Durationb
(sec) 3 zones
1.0, 1.5, ..., 5.0, 6.0,
7.0, ..., 15.0, 20.0,
25.0, ..., 60.0
1.0, 1.5, ..., 5.0, 6.0,
7.0, ..., 15.0, 20.0,
25.0, 30.0
1.0, 1.5, ..., 5.0, 6.0,
7.0, ..., 15.0
2.5 (Tolerance ± 1
cardiac cycle) for
VT-1 Zone
2.5 (Tolerance ± 1
cardiac cycle) for VT
Zone
1.0 (Tolerance ± 1
cardiac cycle) for VF
Zone
- DRAFT -

A-2 PROGRAMMABLE OPTIONS
Table A-4. Detection parameters for 1-zone, 2-zone, and 3-zone configurations (continued)
Parameter VT-1 Zone VT Zone VF Zone Nominal
Initial Durationb
(sec) 2 zones
–– 1.0, 1.5, ..., 5.0, 6.0,
7.0, ..., 15.0, 20.0,
25.0, 30.0
1.0, 1.5, ..., 5.0, 6.0,
7.0, ..., 15.0
2.5 (Tolerance ± 1
cardiac cycle) for VT
Zone
1.0 (Tolerance ± 1
cardiac cycle) for VF
Zone
Initial Durationb
(sec) 1 zone
–– –– 1.0, 1.5, ..., 5.0, 6.0,
7.0, ..., 15.0
1.0 (Tolerance ± 1
cardiac cycle)
Redetection
Durationb(sec) 3
zones
1.0, 1.5, ..., 5.0, 6.0,
7.0, ..., 15.0
1.0, 1.5, ..., 5.0, 6.0,
7.0, ..., 15.0
1.0
(nonprogrammable)
1.0 (Tolerance ± 1
cardiac cycle) for all
zones
Redetection
Durationb(sec) 2
zones
–– 1.0, 1.5, ..., 5.0, 6.0,
7.0, ..., 15.0
1.0
(nonprogrammable)
1.0 (Tolerance ± 1
cardiac cycle) for all
zones
Redetection
Durationb(sec) 1
zone
–– –– 1.0
(nonprogrammable)
1.0 (Tolerance ± 1
cardiac cycle)
Post-shock
Durationb(sec) 3
zones
1.0, 1.5, ..., 5.0, 6.0,
7.0, ..., 15.0, 20.0,
25.0, ..., 60.0
1.0, 1.5, ..., 5.0, 6.0,
7.0, ..., 15.0, 20.0,
25.0, 30.0
1.0
(nonprogrammable)
1.0 (Tolerance ± 1
cardiac cycle) for all
zones
Post-shock
Durationb(sec) 2
zones
–– 1.0, 1.5, ..., 5.0, 6.0,
7.0, ..., 15.0, 20.0,
25.0, 30.0
1.0
(nonprogrammable)
1.0 (Tolerance ± 1
cardiac cycle) for all
zones
Post-shock
Durationb(sec) 1
zone
–– –– 1.0
(nonprogrammable)
1.0 (Tolerance ± 1
cardiac cycle)
a. The Rate difference between each tachy zone must be at least 20 bpm. The lowest Tachy Rate Threshold must be ≥5 bpm
higher than the Maximum Tracking Rate, Maximum Sensor Rate, and the Maximum Pacing Rate; and the lowest Tachy Rate
Threshold must be ≥15 bpm higher than the Lower Rate Limit.
b. The Duration in a zone must be equal to or greater than the Duration in the next highest zone.
Table A-5. Ventricular Detection Enhancement Type for 2-zone and 3-zone configurations
Parameter Programmable Values Nominal
Detection Enhancement Type Off, Rhythm ID, Onset/Stability Rhythm ID
Table A-6. Onset/Stability detection enhancement parameters for 2-zone and 3-zone configurations
Parameter VT-1 Zone VT Zone VF Zone Nominal
V Rate > A Rate 3
zones
Off, On –– –– On
V Rate > A Rate 2
zones
–– Off, On –– On
- DRAFT -

PROGRAMMABLE OPTIONS A-3
Table A-6. Onset/Stability detection enhancement parameters for 2-zone and 3-zone configurations
(continued)
Parameter VT-1 Zone VT Zone VF Zone Nominal
AFib Rate Threshold
( bpm) 3 zones
Off, 100, 110, ..., 300 –– –– 170 (Tolerance ± 5
ms)
AFib Rate Threshold
( bpm) 2 zones
–– Off, 100, 110, ..., 300 –– 170 (Tolerance ± 5
ms)
Stability (ms) 3
zones
Off, 6, 8, ..., 32 35,
40, ..., 60 70, 80, ...,
120
–– –– 20 (DR); 30 (VR)
(Tolerance ± 5 ms)
Stability (ms) 2
zones
–– Off, 6, 8, ..., 32 35,
40, ..., 60 70, 80, ...,
120
–– 20 (DR); 30 (VR)
(Tolerance ± 5 ms)
Shock If Unstable
(ms) 3 zones
–– Off, 6, 8, ..., 32 35,
40, ..., 60 70, 80, ...,
120
–– 30 (Tolerance ± 5
ms)
Shock If Unstable
(ms) 2 zones
–– Off, 6, 8, ..., 32 35,
40, ..., 60 70, 80, ...,
120
–– Off (Tolerance ± 5
ms)
Onset (% or ms) 3
zones
Off, 9, 12, 16, 19, ...,
37 41, 44, 47, 50%
or 50, 60, ..., 250 ms
–– –– 9% (Tolerance ± 5
ms)
Onset (% or ms) 2
zones
–– Off, 9, 12, 16, 19, ...,
37, 41, 44, 47, 50%
or 50, 60, ..., 250 ms
–– 9% (Tolerance ± 5
ms)
Stability And/Or
Onset 3 zones
And, Or –– –– And
Stability And/Or
Onset 2 zones
–– And, Or –– And
Sustained Rate
Duration (min:sec) 3
zones
Off, 00:10, 00:15, ...,
00:55 01:00, 01:15,
..., 02:00 02:30,
03:00, ..., 10:00
15:00, 20:00, ...,
60:00
–– –– 03:00 (Tolerance ± 1
cardiac cycle)
Sustained Rate
Duration (min:sec) 2
zones
–– Off, 00:10, 00:15, ...,
00:55 01:00, 01:15,
..., 02:00 02:30,
03:00, ..., 10:00
15:00, 20:00, ...,
60:00
–– 03:00 (Tolerance ± 1
cardiac cycle)
Detection
Enhancement 3
zones
Off, On Off, On –– On (VT-1) Off (VT)
- DRAFT -

A-4 PROGRAMMABLE OPTIONS
Table A-6. Onset/Stability detection enhancement parameters for 2-zone and 3-zone configurations
(continued)
Parameter VT-1 Zone VT Zone VF Zone Nominal
Detection
Enhancement 2
zones
–– Off, On –– On
Atrial
Tachyarrhythmia
Discrimination 3
zones
Off, On –– –– On
Atrial
Tachyarrhythmia
Discrimination 2
zones
–– Off, On –– On
Sinus Tachycardia
Discrimination 3
zones
Off, On –– –– On
Sinus Tachycardia
Discrimination 2
zones
–– Off, On –– On
Polymorphic VT
Discrimination 3
zones
–– Off, On –– On
Polymorphic VT
Discrimination 2
zones
–– Off, On –– Off
Table A-7. Rhythm ID detection enhancement parameters for 2-zone and 3-zone configurations
Parameter VT-1 Zone VT Zone VF Zone Nominal
Detection
Enhancement 3
zones
Off, On Off, On –– On (VT-1) Off (VT)
Detection
Enhancement 2
zones
–– Off, On –– On
Sustained Rate
Duration (min:sec) 3
zones
Off, 00:10, 00:15,
..., 01:00, 01:15,
..., 02:00, 02:30,
..., 10:00, 15:00, ...,
60:00
Off, 00:10, 00:15,
..., 01:00, 01:15,
..., 02:00, 02:30,
..., 10:00, 15:00, ...,
60:00
–– 03:00 (VT-1 and
VT) (Tolerance ± 1
cardiac cycle)
Sustained Rate
Duration (min:sec) 2
zones
–– Off, 00:10, 00:15,
..., 01:00, 01:15,
..., 02:00, 02:30,
..., 10:00, 15:00, ...,
60:00
–– 03:00 (Tolerance ± 1
cardiac cycle)
- DRAFT -

PROGRAMMABLE OPTIONS A-5
Table A-7. Rhythm ID detection enhancement parameters for 2-zone and 3-zone configurations (continued)
Parameter VT-1 Zone VT Zone VF Zone Nominal
Passive Method 3
zones (one value for
all zones)
Off, On Off, On –– On
Passive Method 2
zones (one value for
all zones)
–– Off, On –– On
Active Method 3
zones (one value for
all zones)
Off, On Off, On –– On
Active Method 2
zones (one value for
all zones)
–– Off, On –– On
Temp LRL ( ppm)
(one value for all
zones)
Use Norm LRL, 30,
35, ..., 105
Use Norm LRL, 30,
35, ..., 105
–– Use Norm LRL
(Tolerance ± 5 ms)
Temp LRL 2 zones
( ppm) (one value for
all zones)
–– Use Norm LRL, 30,
35, ..., 105
–– Use Norm LRL
(Tolerance ± 5 ms)
Atrial Tachy
Discrimination 3
zones (one value for
all zones)
Off, On Off, On –– On
Atrial Tachy
Discrimination 2
zones (one value for
all zones)
–– Off, On –– On
AFib Rate Threshold
( bpm) 3 zones (one
value for all zones)
100, 110, ..., 300 100, 110, ..., 300 –– 170 (Tolerance ± 5
ms)
AFib Rate Threshold
( bpm) 2 zones (one
value for all zones)
–– 100, 110, ..., 300 –– 170 (Tolerance ± 5
ms)
Stability (ms) 3
zonesa(one value
for all zones)
6, 8, ..., 32, 35, 40,
..., 60, 70, ..., 120
6, 8, ..., 32, 35, 40,
..., 60, 70, ..., 120
–– 20 (DR); 30 (VR)
(Tolerance ± 5 ms)
Stability (ms) 2
zonesa(one value
for all zones)
–– 6, 8, ..., 32, 35, 40,
..., 60, 70, ..., 120
–– 20 (DR); 30 (VR)
(Tolerance ± 5 ms)
a. The Stability parameter only applies in Post-shock for VR devices.
- DRAFT -

A-6 PROGRAMMABLE OPTIONS
Table A-8. Post-shock Onset/Stability detection enhancement parameters for 2-zone and 3-zone
configurations
Parameter VT-1 Zone VT Zone VF Zone Nominal
Post-shock V Rate >
A Rate 3 zones
Off, On –– –– On
Post-shock V Rate >
A Rate 2 zones
–– Off, On –– On
Post-shock AFib
Rate Threshold
( bpm) 3 zones
Off, 100, 110, ..., 300 –– –– 170 (Tolerance ± 5
ms)
Post-shock AFib
Rate Threshold
( bpm) 2 zones
–– Off, 100, 110, ..., 300 –– 170 (Tolerance ± 5
ms)
Post-shock Stability
(ms) 3 zones
Off, 6, 8, ..., 32, 35,
40, ..., 60, 70, 80, ...,
120
–– –– 20 (DR); 30 (VR)
(Tolerance ± 5 ms)
Post-shock Stability
(ms) 2 zones
–– Off, 6, 8, ..., 32, 35,
40, ..., 60, 70, 80, ...,
120
–– 20 (DR); 30 (VR)
(Tolerance ± 5 ms)
Post-shock
Sustained Rate
Duration (min:sec) 3
zones
Off, 00:10, 00:15, ...,
00:55, 01:00, 01:15,
..., 02:00, 02:30,
03:00, ..., 10:00,
15:00, 20:00, ...,
60:00
–– –– 00:15 (Tolerance ± 1
cardiac cycle)
Post-shock
Sustained Rate
Duration (min:sec) 2
zones
–– Off, 00:10, 00:15, ...,
00:55, 01:00, 01:15,
..., 02:00, 02:30,
03:00, ..., 10:00,
15:00, 20:00, ...,
60:00
–– 00:15 (Tolerance ± 1
cardiac cycle)
Table A-9. Post-shock Rhythm ID detection enhancement parameters for 2-zone and 3-zone configurations
Parameter VT-1 Zone VT Zone VF Zone Nominal
Post-shock
Detection
Enhancement 3
zones
Off, On Off, On –– Off
Post-shock
Detection
Enhancement 2
zones
–– Off, On –– Off
- DRAFT -

PROGRAMMABLE OPTIONS A-7
Table A-9. Post-shock Rhythm ID detection enhancement parameters for 2-zone and 3-zone configurations
(continued)
Parameter VT-1 Zone VT Zone VF Zone Nominal
Post-shock
Sustained Rate
Duration (min:sec) 3
zones
Off, 00:10, 00:15,
01:00, 01:15, ...,
02:00, 02:30, ...,
10:00, 15:00, ...,
60:00
Off, 00:10, 00:15,
01:00, 01:15, ...,
02:00, 02:30, ...,
10:00, 15:00, ...,
60:00
–– 0:15 (Tolerance ± 1
cardiac cycle)
Post-shock
Sustained Rate
Duration (min:sec) 2
zones
–– Off, 00:10, 00:15,
01:00, 01:15, ...,
02:00, 02:30, ...,
10:00, 15:00, ...,
60:00
–– 0:15 (Tolerance ± 1
cardiac cycle)
Table A-10. Ventricular ATP parameters (specified into a 750 Ωload)
Parameter VT-1 Zone VT Zone VF Zone Nominal
ATP Type 3 zones Off, Burst, Ramp,
Scan, Ramp/Scan
Off, Burst, Ramp,
Scan, Ramp/Scan
–– Off (VT-1); Burst (VT
ATP1); Ramp (VT
ATP2)
ATP Type 2 zones –– Off, Burst, Ramp,
Scan, Ramp/Scan
–– Burst (VT ATP1);
Ramp (VT ATP2)
Number of Bursts
(per scheme) 3
zones
Off, 1, 2, ..., 30 Off, 1, 2, ..., 30 –– Off (VT-1); 2 (VT
ATP1); 1 (VT ATP2)
Number of Bursts
(per scheme) 2
zones
–– Off, 1, 2, ..., 30 –– 2 (VT ATP1); 1 (VT
ATP2)
Initial Pulse (pulses)
3 zones
1, 2, ..., 30 1, 2, ..., 30 –– 4 (VT-1); 10 (VT)
Initial Pulse (pulses)
2 zones
–– 1, 2, ..., 30 –– 10
Pulse Increment
(pulses) 3 zones
0, 1, ..., 5 0, 1, ..., 5 –– 0
Pulse Increment
(pulses) 2 zones
–– 0, 1, ..., 5 –– 0
Maximum Number
of Pulses 3 zones
1, 2, ..., 30 1, 2, ..., 30 –– 4 (VT-1); 10 (VT)
Maximum Number
of Pulses 2 zones
–– 1, 2, ..., 30 –– 10
Coupling Interval (%
or ms) 3 zones
50, 53, 56, 59; 63,
66, ..., 84, 88, 91,
94, 97% or 120, 130,
..., 750 ms
50, 53, 56, 59; 63,
66,...,84,88,91,
94, 97% or 120, 130,
..., 750 ms
–– 81% (Tolerance ± 5
ms)
- DRAFT -

A-8 PROGRAMMABLE OPTIONS
Table A-10. Ventricular ATP parameters (specified into a 750 Ωload) (continued)
Parameter VT-1 Zone VT Zone VF Zone Nominal
Coupling Interval (%
or ms) 2 zones
–– 50, 53, 56, 59; 63,
66,...,84,88,91,
94, 97% or 120, 130,
..., 750 ms
–– 81% (Tolerance ± 5
ms)
Coupling Interval
Decrement (ms) 3
zones
0, 2, ..., 30 0, 2, ..., 30 –– 0(Tolerance±5ms)
Coupling Interval
Decrement (ms) 2
zones
–– 0, 2, ..., 30 –– 0(Tolerance±5ms)
Burst Cycle Length
(BCL) (% or ms) 3
zones
50, 53, 56, 59; 63,
66, ..., 84, 88, 91,
94, 97% or 120, 130,
..., 750 ms
50, 53, 56, 59; 63,
66,...,84,88,91,
94, 97% or 120, 130,
..., 750 ms
–– 81% (Tolerance ± 5
ms)
Burst Cycle Length
(BCL) (% or ms) 2
zones
–– 50, 53, 56, 59; 63,
66,...,84,88,91,
94, 97% or 120, 130,
..., 750 ms
–– 81% (Tolerance ± 5
ms)
Ramp Decrement
(ms) 3 zones
0, 2, ..., 30 0, 2, ..., 30 –– 0(VT-1);0(VT
ATP1); 10 (VT ATP2)
(Tolerance ± 5 ms)
Ramp Decrement
(ms) 2 zones
–– 0, 2, ..., 30 –– 0 (VT ATP1); 10 (VT
ATP2) (Tolerance ±
5ms)
Scan Decrement
(ms) 3 zones
0, 2, ..., 30 0, 2, ..., 30 –– 0(Tolerance±5ms)
Scan Decrement
(ms) 2 zones
–– 0, 2, ..., 30 –– 0(Tolerance±5ms)
Minimum Interval
(ms) 3 zones
120, 130, ..., 400 120, 130, ..., 400 –– 220 (Tolerance ± 5
ms)
Minimum Interval
(ms) 2 zones
–– 120, 130, ..., 400 –– 220 (Tolerance ± 5
ms)
Right Ventricular
ATP Pulse Widtha
(ms) 3 zones (one
value for all zones)
0.1, 0.2, ..., 2.0 0.1, 0.2, ..., 2.0 –– 1.0(Tolerance±
0.03 ms at < 1.8 ms;
±0.08msat≥1.8
ms)
Right Ventricular
ATP Pulse Widtha
(ms) 2 zones (one
value for all zones)
–– 0.1, 0.2, ..., 2.0 –– 1.0(Tolerance±
0.03 ms at < 1.8 ms;
±0.08msat≥1.8
ms)
- DRAFT -

PROGRAMMABLE OPTIONS A-9
Table A-10. Ventricular ATP parameters (specified into a 750 Ωload) (continued)
Parameter VT-1 Zone VT Zone VF Zone Nominal
Right Ventricular
ATP Amplitudea(V)
3 zones (one value
for all zones)
0.1, 0.2, ..., 3.5, 4.0,
..., 7.5
0.1, 0.2, ..., 3.5, 4.0,
..., 7.5
–– 5.0(Tolerance±
15% or ± 100 mV,
whichever is greater)
Right Ventricular
ATP Amplitudea(V)
2 zones (one value
for all zones)
–– 0.1, 0.2, ..., 3.5, 4.0,
..., 7.5
–– 5.0(Tolerance±
15% or ± 100 mV,
whichever is greater)
ATP Time-outb
(seconds) 3 zones
Off, 10, 15, ..., 60,
75, 90, ..., 120, 150,
..., 600, 900, ...,
3600
Off, 10, 15, ..., 60,
75, 90, ..., 120, 150,
..., 600, 900, ...,
3600
–– 60 (Tolerance ± 1
cardiac cycle)
ATP Time-outb
(seconds) 2 zones
–– Off, 10, 15, ..., 60,
75, 90, ..., 120, 150,
..., 600, 900, ...,
3600
–– 60 (Tolerance ± 1
cardiac cycle)
QUICK CONVERT
ATP (VF Only) 3
zones
–– –– Off, On On
QUICK CONVERT
ATP (VF Only) 2
zones
–– –– Off, On On
a. The programmed Amplitude and Pulse Width values affect Post Therapy Brady Pacing, but are separately programmable from
Normal Brady Pacing, Temporary Brady Pacing, and EP Test.
b. The VT-1 ATP Time-out must be greater than or equal to the VT ATP Time-out.
Table A-11. Ventricular Shock Parameters
Parameter Programmable Values Nominal
Shocks 1 and 2 energy (J)abc
(stored energy)
Off, 0.1, 0.3, 0.6, 0.9, 1.1, 1.7, 2, 3,
5, 6, 7, 9, 11, 14, 17, 21, 23, 26, 29,
31, 36 (HE), 41 (HE)
41 J (Tolerance ± 60% for ≤0.3 J, ±
40% for ≤0.6–3 J, ± 20% for 5–36
J, ± 10% for 41 J)
Energy of Remaining Shocks (J)ac
(stored energy)
Off, 41 (HE) 41 J (Tolerance ± 10% for 41 J)
Lead PolaritydInitial, Reversed Initial
Committed Shock Off, On Off
Shock Lead Vector RV Coil to RA Coil and Can, RV Coil
to Can, RV Coil to RA Coil
RV Coil to RA Coil and Can
a. Biphasic energy is specified.
b. The Shock 2 energy level must be greater than or equal to the Shock 1 energy level.
c. In a VT-1 zone of a 3-zone configuration or a VT zone of a 2-zone configuration, all or some of the shocks may be programmed to
Off while other shocks in that zone are programmed in joules.
d. A commanded STAT SHOCK is delivered at the programmed Polarity.
- DRAFT -

A-10 PROGRAMMABLE OPTIONS
Table A-12. Pacing therapy parameters (Normal, Post-Therapy, and Temporary) (specified into a 750 Ωload)
Parameter Programmable Values Nominal
Modeabgk DDD(R), DDI(R), VDD(R), VVI(R),
AAI(R), Off; Temporary: DDD, DDI,
DOO, VDD, VVI, VOO, AAI, AOO,
Off
DDD (DR); VVI (VR)
Lower Rate Limit (LRL)ac( ppm) 30, 35, ..., 185 60 (Tolerance ± 5 ms)
Maximum Tracking Rate (MTR) gj
( ppm)
30, 35, ..., 185 130(Tolerance±5ms)
Maximum Sensor Rate (MSR)gj
( ppm)
30, 35, ..., 185 130(Tolerance±5ms)
Pulse Amplitudeadef(atrium) (V) 0.1, 0.2, ... 3.5, 4.0, ..., 5.0 3.5 (5.0 post-therapy) (Tolerance
± 15% or ± 100mV, whichever is
greater)
Pulse Amplitudeadef(right ventricle)
(V)
0.1, 0.2, ..., 3.5, 4.0, ..., 7.5 3.5 (5.0 post-therapy) (Tolerance
± 15% or ± 100mV, whichever is
greater)
Pulse Widthadef(atrium, right
ventricle) (ms)
0.1, 0.2, ..., 2.0 0.4 (1.0 post-therapy) (Tolerance ±
0.03 ms at < 1.8 ms; ± 0.08 ms at
≥1.8 ms)
Atrial Pace/Sense Configurationag Bipolar, Off Bipolar
Activity Thresholdgj Very High, High, Medium High,
Medium, Medium Low, Low, Very
Low
Medium
Reaction Timegj(sec) 10, 20, ..., 50 30
Response Factorgj 1, 2, ..., 16 8
Recovery Timegj(min) 2, 3, ..., 16 2
Maximum PVARPag(ms) 150, 160, ..., 500 280(Tolerance±5ms)
Minimum PVARPag(ms) 150, 160, ..., 500 240(Tolerance±5ms)
PVARP After PVCag(ms) Off, 150, 200, ..., 500 400 (Tolerance ± 5 ms)
V-Blank After A-Paceah(ms) 45, 65, 85, Smart Smart (Tolerance ± 5 ms)
A-Blank After V-Paceah(ms) 45, 65, 85, Smart Smart (Tolerance ± 5 ms)
A-Blank After V-Senseah(ms) 45, 65, 85, Smart Smart (Tolerance ± 5 ms)
Maximum VRP (right ventricle)ai
(ms)
150, 160, 170, ..., 500 250(Tolerance±5ms)
Minimum VRP (right ventricle)ai
(ms)
150, 160, ..., 500 230 (DR); 250 (VR) (Tolerance ± 5
ms)
Maximum Paced AV Delayag(ms) 30, 40, ..., 400 180(Tolerance±5ms)
Minimum Paced AV Delayag(ms) 30, 40, ..., 400 80 (Tolerance ± 5 ms)
- DRAFT -

PROGRAMMABLE OPTIONS A-11
Table A-12. Pacing therapy parameters (Normal, Post-Therapy, and Temporary) (specified into a 750 Ω
load) (continued)
Parameter Programmable Values Nominal
Maximum Sensed AV Delayag(ms) 30, 40, ..., 400 150(Tolerance±5ms)
Minimum Sensed AV Delayag(ms) 30, 40, ..., 400 65 (Tolerance ± 5 ms)
AV Search +gj Off, On Off
AV Search + Search Intervalgj
(cycles)
32, 64, 128, 256, 512, 1024 32 (Tolerance ± 1 cycle)
AV Search + Search AV Delaygj
(ms)
30,40 ..., 400 300(Tolerance±5ms)
Respiratory Sensorag Off, On On
Rate Hysteresis Hysteresis Offsetg
j( ppm)
-80, -75, ... ,-5, Off Off (Tolerance ± 5 ms)
Rate Hysteresis Search Hysteresisg
j(cycles)
Off, 256, 512, 1024, 2048, 4096 Off (Tolerance ± 1 cycle)
Rate Smoothing (up, down)gj(%) Off, 3, 6, 9, 12, 15, 18, 21, 25 Off (Tolerance 1%)
Noise Responseagl AOO, VOO, DOO, Inhibit Pacing DOO for DDD(R) and DDI(R)
modes; VOO for VDD(R) and VVI(R)
modes; AOO for AAI(R) mode
Maximum Pacing Rateag (ppm) 30, 35, ... ,185 130(Tolerance±5ms)
Post-therapy Pacing Period
(min:sec) (available post-shock
only)
00:15, 00:30, 00:45, 01:00, 01:30,
02:00, 03:00, 04:00, 05:00, 10:00,
15:00, 30:00, 45:00, and 60:00
00:30 (Tolerance ± 1 cardiac cycle)
a. The programmed Normal Brady values will be used as the nominal values for Temporary Brady pacing.
b. Refer to the NASPE/BPEG codes below for an explanation of the programmable values. The identification code of the North
American Society of Pacing and Electrophysiology (NASPE) and the British Pacing and Electrophysiology Group (BPEG) is based
on the categories listed in the table.
c. The basic pulse period is equal to the pacing rate and the pulse interval (no hysteresis). Runaway protection circuitry inhibits
bradycardia pacing above 205 ppm. Magnet application does not affect pacing rate (test pulse interval).
d. Separately programmable for ATP/Post-Shock, Temporary Brady, and EP Test.
e. The minimum value of energy delivered at 5 V and 0.5 ms is 20 µJ with 200–500 Ω, and 12 µJ with 1000 Ωresistive load
at 37°C ± 1°C for BOL and Explant.
f. Values are not affected by temperature variation within the range 20°–43°C.
g. This parameter is used globally in Normal Brady pacing and Post-shock Brady pacing. Changing the value for Normal Brady will
change the value for Post-shock Brady.
h. This parameter is automatically set to at least 85 ms for Post-Shock Brady.
i. This parameter is automatically adjusted in Post-Shock Brady to allow appropriate sensing.
j. This parameter is disabled during Temporary Brady.
k. The programmable values for VR devices only include VVI(R), Off; Temporary: VVI, VOO, Off
l. The programmable values for VR devices only includes VOO and Inhibit Pacing and as such the nominal is VOO.
Table A-13. Atrial Tachy Parameters
Parameter Programmable Values Nominal
ATR Mode Switchab Off, On On
ATR Trigger Rateab( bpm) 100, 110, ..., 300 170(Tolerance±5ms)
- DRAFT -

A-12 PROGRAMMABLE OPTIONS
Table A-13. Atrial Tachy Parameters (continued)
Parameter Programmable Values Nominal
ATR Durationab(cycles) 0, 8, 16, 32, 64, 128, 256, 512,
1024, 2048
8(Tolerance±1cardiaccycle)
Entry Countab(cycles) 1, 2, ..., 8 8
Exit Countab(cycles) 1, 2, ..., 8 8
ATR Fallback Modeab VDI, DDI, VDIR, DDIR DDI
ATR Fallback Timeab(min:sec) 0, 0:15, 0:30, 0:45, 1:00, 1:15, 1:30,
1:45, 2:00
0:30
ATR/VTR Fallback LRLab( ppm) 30, 35, ..., 185 70 (Tolerance ± 5 ms)
ATR VRRab Off, On On
ATR Maximum Pacing Rateab
( ppm)
30, 35, ..., 185 130
Atrial Flutter Responsebc Off, On Off
Atrial Flutter Response Ratebc
( bpm)
100, 110, ..., 300 170(Tolerance±5ms)
PMT Terminationbc Off, On On
VRRbc Off, On Off
a. The programmed Normal Brady values will be used as the nominal values for Temporary Brady pacing.
b. This parameter is used globally in Normal Brady pacing and Post-shock Brady pacing. Changing the value for Normal Brady will
change the value for Post-shock Brady.
c. This parameter gets disabled during Temporary Brady.
Table A-14. Brady Mode values based on NASPE/BPEG codes
Position I II III IV V
Category Chambers
Paced
Chambers
Sensed
Response
to Sensing
Programmability,
rate modulation
Antitachyarrhythmia
Functions
Letters 0–None 0–None 0–None 0–None 0–None
A–Atrium A–Atrium T–Triggered P–Simple
Programmable
P–Pacing
(Antitachyarrhythmia)
V–Ventricle V–Ventricle I–Inhibited M–Multiprogrammable S–Shock
D–Dual (A&V) D–Dual (A&V) D–Dual (T&I) C–Communicating D–Dual (P&S)
R–Rate Modulation
Mfrs.
Designation
Only
S–Single (A or
V)
S–Single (A or
V)
- DRAFT -

PROGRAMMABLE OPTIONS A-13
Table A-15. Magnet and Beeper functions
Parameter Programmable Values Nominal
Magnet Response Off, Store EGM, Inhibit Therapy Inhibit Therapy
Beep During Capacitor Charge Off, On Off
Beep When Explant is Indicated Off, On On
Table A-16. Sensitivity Adjustment
Parameter Programmable Values Nominal
Atrial Sensitivity AGC 0.15, AGC 0.2, AGC 0.25,
AGC 0.3, AGC 0.4, ..., AGC 1.0,
AGC 1.5
AGC 0.25
Right Ventricular Sensitivity AGC 0.15, AGC 0.2, AGC 0.25,
AGC 0.3, AGC 0.4, ..., AGC 1.0,
AGC 1.5
AGC 0.6
Table A-17. Ventricular Commanded ATP
ParameteraProgrammable Values Nominal
Commanded Ventricular ATP (Type) Burst, Ramp, Scan, Ramp/Scan Burst
Number Of Bursts 1, 2, ..., 30 30
Initial Pulses per Burst (pulses) 1, 2, ..., 30 4
Pulse Increment (pulses) 0, 1, .., 5 0
Maximum Number of Pulses 1, 2, ..., 30 4
Coupling Interval (% or ms) 50, 53, 56, 59; 63, 66, ..., 84; 88, 91,
94, 97% or 120, 130, ..., 750 ms
81%(Tolerance±5ms)
Coupling Interval Decrement (ms) 0, 2, ..., 30 0(Tolerance±5ms)
Burst Cycle Length (BCL) (% or ms) 50, 53, 56, 59; 63, 66, ..., 84; 88, 91,
94, 97% or 120, 130, ..., 750 ms
81%(Tolerance±5ms)
Ramp Decrement (ms) 0, 2, ..., 30 0(Tolerance±5ms)
Scan Decrement (ms) 0, 2, ..., 30 0(Tolerance±5ms)
Minimum Interval (ms) 120, 130, ..., 400 200(Tolerance±5ms)
a. The ventricular Commanded ATP Pulse Width and Amplitude values are the same as programmed for ventricular ATP therapy.
Table A-18. 50 Hz/Manual Burst Pacing
ParameteraProgrammable Values Nominal
Burst Interval (ms) 20, 30, ..., 750 600(Tolerance±5ms)
- DRAFT -

A-14 PROGRAMMABLE OPTIONS
Table A-18. 50 Hz/Manual Burst Pacing (continued)
ParameteraProgrammable Values Nominal
Minimum Interval (ms) 20, 30, ...,750 200(Tolerance±5ms)
Decrement (ms) 0, 10, ..., 50 50 (Tolerance ± 5 ms)
a. Applied to the atrium or ventricle depending on the chamber selected.
Table A-19. Ventricular Commanded Shock
Parameter Programmable Values Nominal
Shock (stored energy) (J) 0.1, 0.3, 0.6, 0.9, 1.1, 1.7, 2, 3, 5, 6,
7, 9, 11, 14, 17, 21, 23, 26, 29, 31,
36 (HE), 41 (HE)
41 (Tolerance ± 60% for ≤0.3 J; ±
40% for ≤0.6–3 J; ± 20% for 5–36
J, ± 10% for 41 J)
Coupling Interval (ms) Sync, 50, 60, ..., 500 Sync
Table A-20. VFib (Ventricular Fibrillation) Induction
Parameter Values
VFib High 15V (nonprogrammable) (Tolerance ± 10V)
VFib Low 9V (nonprogrammable) (Tolerance ± 7V)
Table A-21. Shock on T Induction
Parameter Programmable Values Nominal
Shock (stored energy) (J) 0.1, 0.3, 0.6, 0.9, 1.1, 1.7, 2, 3, 5, 6,
7, 9, 11, 14, 17, 21, 23, 26, 29, 31,
36 (HE), 41 (HE)
1.1 J (Tolerance ± 60% for ≤0.3 J;
± 40% for ≤0.6–3 J; ± 20% for 5–36
J, ± 10% for 41 J)
Number of S1 Pulses 1, 2, ..., 30 8
S1 Interval (ms) 120, 130, ..., 750 400
Coupling Interval (ms) Sync, 10, 20, , ..., 500 310
Table A-22. PES (Programmed Electrical Stimulation)
ParameteraProgrammable Values Nominal
Number of S1 Intervals (pulses) 1, 2, ..., 30 8
S2 Decrement 0, 10, ..., 50 0
S1 Interval (ms) 120, 130, ..., 750 600(Tolerance±5ms)
S2 Interval (ms) Off, 120, 130, ..., 750 600 (Tolerance ± 5 ms)
S3 Interval (ms) Off, 120, 130, ..., 750 Off (Tolerance ± 5 ms)
- DRAFT -

PROGRAMMABLE OPTIONS A-15
Table A-22. PES (Programmed Electrical Stimulation) (continued)
ParameteraProgrammable Values Nominal
S4 Interval (ms) Off, 120, 130, ..., 750 Off (Tolerance ± 5 ms)
S5 Interval (ms) Off, 120, 130, ..., 750 Off (Tolerance ± 5 ms)
a. Applied to the atrium or right ventricle as commanded by the programmer.
- DRAFT -
A-16 PROGRAMMABLE OPTIONS
- DRAFT -

B-1
PACEMAKER INTERACTION
APPENDIX B
There may be instances where patients may have a separate temporary or
permanent pacemaker. Temporary or permanent pacemakers can interact
with an ICD and can interfere with the identification of tachyarrhythmias in
the following ways:
• During a tachyarrhythmia, if the pacemaker does not sense the arrhythmia
and paces, and the pacing pulse detected from the ICD rate-sensing
electrode is large enough, it could cause the ICD to interpret the pacing
as a normal rhythm at the rate of the pacemaker. The ICD would neither
detect the arrhythmia nor deliver therapy.
• The pacemaker could present signals to the ICD resulting from the
following events:
– Inappropriate sensing
– Lead dislodgment
– Failure to capture
This could cause the ICD’s rate measurement to be faster than the patient’s
actual heart rate. As a result, the ICD could deliver inappropriate therapy.
• Conduction delay could cause the ICD to count both pacemaker artifact and
ventricular depolarization. This could result in inappropriate ICD therapy.
For these reasons, the use of a pacemaker that results in pacemaker and ICD
interaction is not recommended. Unipolar pacemakers are contraindicated for
usewithanICD.
Consider the following actions if a separate pacemaker is used:
• Always deactivate a patient’s ICD when:
– Using temporary bipolar or temporary AV sequential pacing
– Reprogramming a separate implanted pacemaker
If cardioversion or defibrillation is needed at such times, use an external
defibrillator.
- DRAFT -
B-2 PACEMAKER INTERACTION
• The ICD rate-sensing electrodes should be as far from the pacing
electrodes as possible.
• After implanting the pacing leads, examine the signals from the ICD
rate-sensing electrodes to ensure that minimal pacemaker artifacts are
present.
• Since it is difficult to predict the relative magnitudes of pacemaker artifacts
and various tachyarrhythmia electrograms that may occur chronically or
during EP testing, it is important to reduce artifacts to a minimum.
• All of the patient’s rhythms should be induced while the ICD is activated
and the separate pacemaker is programmed to an asynchronous mode at
maximum output. This should provide the greatest opportunity for inhibition
of arrhythmia detection due to pacemaker artifacts. Leads may have to be
repositioned to eliminate artifacts.
• To reduce the possibility of pacemaker interaction, consider testing the
separate pacemaker by programming it to the following settings:
– The lowest amplitude allowable for safe capture in the chronic state
– The maximum sensitivity to ensure that pacing is inhibited during VF
– The minimum cardiac rate acceptable for the patient
Also consider using rate-sensing and pacemaker leads with close
intraelectrode spacing (e.g., 11 mm).
• Consider turning off the bradycardia pacing function of the ICD or
programming that function to a rate less than the separate pacemaker rate.
• For pacing control following any shock therapy, consider whether to use the
ICD’s post-therapy bradycardia pacing feature at higher rates and outputs
or the separate pacemaker.
The following test procedure aids in determining the potential for
pacemaker/ICD interaction (Figure B-1 on page B-3).
- DRAFT -

PACEMAKER INTERACTION B-3
Test for inappropriate tachy therapy
due to multiple counting of pacing
artifacts/depolarization.
Observe the electrogram on the
rate-sensing electrodes by reviewing
the rate-sensing recording on the
PRM programming system. Note the
amplitude of the pacing artifact on the
ICD pulse generator rate-sensing
electrogram. If the amplitude of the
pacing artifact is 1/3 or more of the
R-wave amplitude, reposition the
rate-sensing electrodes.
Program pulse generator ventricular
mode on Monitor Only. Enable event
markers.
Program PSA/pacemaker to either a
rate greater than the intrinsic rate or
an asynchronous mode (e.g., DOO,
AOO, VOO).
If multiple counting is noted, reposition
the pacing leads and/or rate-sensing
electrode as appropriate.
If it was necessary to decrease
pacemaker output settings during
testing, to eliminate multiple counting,
record maximum allowable settings
for future reference should the need
for reprogramming occur.
STEP ONE STEP THREE STEP TWO
Test for inappropriate inhibition of
tachy therapy due to detection of
pacing artifacts instead of the
arrhythmia.
Test all tachyarrhythmias.
Enable pulse generator event
markers.
Program PSA/pacemaker to an
asynchronous mode (e.g., DOO,
AOO, VOO) at maximum amplitude
and pulse width.
Verify appropriate nondetection of
pacing artifact.
Induce tachyarrhythmia. Observe
event markers and electrogram
for pacing artifact.
BE PREPARED TO DELIVER A STAT
ICD SHOCK IF THE ARRHYTHMIA
IS NOT SENSED.
If inappropriate therapy inhibition is
noted, reduce pacemaker output
and/or reposition rate-sensing leads.
REPEAT ICD CONVERSION MUST
THEN BE PERFORMED.
If it was necessary to decrease output
settings during testing, to prevent
oversensing of pacing artifact during
the arrhythmia, record maximum
allowable settings for future reference
should the need for reprogramming
occur.
NOTE: The Guidant Model 6860 Magnet also can be used to assess pacemaker interaction if the magnet function is enabled.
Placing the magnet over a device in a ventricular Monitor + Therapy mode should produce tones.
Final device programming.
Following conversion testing,
reinterrogate the pacemaker to ensure
that the mode or other parameters
have not been altered or that the ICD
pulse generator shock did not damage
the pacemaker.
Program pacemaker to desired mode,
rate, amplitudes, and pulse widths.
Record if the programmed pacing
output is sufficient to ensure capture
post-shock; if not, consider
programming the ICD pulse generator
post-shock pacing at high outputs and
at a rate greater than the pacemaker
rate.
Figure B-1. Test procedure for pacemaker-ICD interaction
- DRAFT -
B-4 PACEMAKER INTERACTION
- DRAFT -

C-1
CLINICAL STUDY - MADIT II
APPENDIX C
SUMMARY
Guidant Cardiac Rhythm Management has received FDA approval for the
following expanded indications for patients identified by the Multicenter
Automatic Defibrillator Implantation Trial II (MADIT II) to be at high risk for
sudden cardiac death.
The Multicenter Automatic Defibrillator Implantation Trial II (MADIT II) was
designed to determine if implantation of an ICD in high-risk cardiac patients
with advanced left ventricular dysfunction could improve overall survival. The
previous MADIT I trial demonstrated improved overall survival with an ICD
in high-risk patients with coronary heart disease, left ventricular dysfunction,
asymptomatic nonsustained ventricular tachyarrhythmias and an inducible
nonsuppressible ventricular tachycardia at EP study.
INDICATIONS FOR USE
Guidant implantable cardioverter defibrillators (ICDs) are indicated in patients
who have had spontaneous and/or inducible life-threatening ventricular
arrhythmias and those who are at high risk for developing such arrhythmias. In
addition, this device is indicated for prophylactic treatment of patients with a
prior myocardial infarction and an ejection fraction (EF) ≤30%.
OBSERVED ADVERSE EVENTS
The Multicenter Automatic Defibrillator Implantation Trial II (MADIT II) was a
prospective, randomized, controlled, multicenter, unblinded study conducted at
76 sites (71 in the United States and 5 in Europe) and enrolled a total of 1,232
patients. Patients were randomly assigned in a 3:2 ratio to receive an ICD (742
patients) or conventional medical therapy (490 patients). There were a total of
22 conventional therapy patients that were crossed over to the ICD group and a
total of 32 patients randomized to the ICD arm that were considered crossovers.
Of these 32 crossovers, 11 were due to subsequent device explants.
There were no unanticipated adverse events reported in the MADIT II study
as of December 7, 2001. There were no patient deaths that occurred during
implantation. Table C-1 on page C-2 provides information on all adverse events
reported from implant through the randomization period in patients attempted or
implanted with the MADIT II criteria. The table includes a total of 3,161 events
- DRAFT -

C-2 CLINICAL STUDY - MADIT II
reported for a total of 1,206 patients as of the data cutoff date of January 16,
2002. The number of patients is less than the total enrolled 1,232 patients
because not all patients had reached the point of the one-month follow-up. The
observed adverse events do not reflect an intention-to-treat analysis.
Table C-1. Adverse events through the randomization period
Adverse Event # Of Events
(# of pts)a
%
Complications
(Patients)
Complications
per 100
Device Months
(Events)
%
Observations
(Patients)
Observations per
100 Device Months
(Events)
Total of All Adverse
Events (AE)
3161 (813a) 49.7 (599) 7.9 (1761) 46.9 (566) 6.3 (1400)
ICD Therapy (Total
AEs–treatment
group)
2105 (503) 51.5 (376) 8.4 (1172) 49.9 (364) 6.7 (933)
Conventional
Therapy (Total
AEs–control
group)
1056 (310) 46.8 (223) 7.0 (589) 42.4 (202) 5.5 (476)
TOTAL CARDIOVASCULAR RELATED ADVERSE EVENTS
Device-Related Eventsb
Prophylactic
replacement
7 (7) 0.6 (7) 0.0 (7) 0.0 (0) 0.0 (0)
Lead related
problem
14 (13) 0.8 (10) 0.0 (10) 0.3 (3) 0.0 (4)
Battery depletion –
normal (at EOL)
2 (2) 0.2 (2) 0.0 (2) 0.0 (0) 0.0 (0)
Electromagnetic
interference (EMI)
2 (2) 0.0 (0) 0.0 (0) 0.2 (2) 0.0 (2)
Nonconversion of
arrhythmia
3 (3) 0.2 (3) 0.0 (3) 0.0 (0) 0.0 (0)
Sense time
prolonged /
inappropriate
5 (5) 0.2 (3) 0.0 (3) 0.2 (2) 0.0 (2)
Generator
manufacturing
problem
2 (2) 0.2 (2) 0.0 (2) 0.0 (0) 0.0 (0)
Pacemaker
mediated
tachycardia
79 (47) 0.0 (0) 0.0 (0) 3.9 (47) 0.4 (79)
Individual events
that occurred one
time
18 (18) 1.0 (10) 0.0 (10) 0.8 (8) 0.0 (8)
- DRAFT -

CLINICAL STUDY - MADIT II C-3
Table C-1. Adverse events through the randomization period (continued)
Adverse Event # Of Events
(# of pts)a
%
Complications
(Patients)
Complications
per 100
Device Months
(Events)
%
Observations
(Patients)
Observations per
100 Device Months
(Events)
Subtotal Device
Related Events
132 (91a) 2.9 (35) 0.2 (37) 4.9 (59) 0.4 (95)
Procedure Related Eventsb
Infection 13 (13) 0.8 (9) 0.0 (9) 0.3 (4) 0.0 (4)
Lead problem 2 (2) 0.1 (1) 0.0 (1) 0.1 (1) 0.0 (1)
Patient bleeding 2 (2) 0.1 (1) 0.0 (1) 0.1 (1) 0.0 (1)
Pulse generator
flipped (Twiddler)
2 (2) 0.0 (0) 0.0 (0) 0.2 (2) 0.0 (2)
Pocket
inflammation/hematoma
15 (15) 0.9 (11) 0.0 (11) 0.3 (4) 0.0 (4)
Pain 10 (10) 0.1 (1) 0.0 (1) 0.7 (9) 0.0 (9)
Fibrillation, atrial 2 (2) 0.0 (0) 0.0 (0) 0.2 (2) 0.0 (2)
Deep Vein
Thrombosis
3 (3) 0.1 (1) 0.0 (1) 0.2 (2) 0.0 (2)
Anxiety 2 (2) 0.0 (0) 0.0 (0) 0.2 (2) 0.0 (2)
Individual events
that occurred one
time
17 (17) 0.8 (8) 0.0 (8) 0.9 (9) 0.0 (9)
Subtotal
Procedure Related
Events
68 (59a) 2.2 (26) 0.1 (32) 3.0 (36) 0.2 (36)
Cardiovascular Related Events (n=730 pts): ICD Therapy (treatment group)
Arrhythmia, atrial 78 (66) 4.2 (31) 0.2 (34) 5.3 (39) 5.3 (39)
Arrhythmia,
ventricular
64 (49) 5.3 (39) 0.4 (53) 1.4 (10) 0.1 (11)
Mitral valve
regurgitation
1 (1) 0.1 (1) 0.0 (1) 0.0 (0) 0.0 (0)
Congestive heart
failure
444 (227) 22.9 (167) 2.2 (304) 14.1 (103) 1.0 (140)
Palpitation,
pounding heart
21 (18) 1.0 (7) 0.1 (7) 1.5 (11) 0.1 (14)
Syncope 62 (50) 4.7 (34) 0.3 (40) 2.5 (18) 0.2 (22)
Infarction,
myocardial
34 (28) 3.8 (28) 0.2 (34) 0.0 (0) 0.0 (0)
- DRAFT -

C-4 CLINICAL STUDY - MADIT II
Table C-1. Adverse events through the randomization period (continued)
Adverse Event # Of Events
(# of pts)a
%
Complications
(Patients)
Complications
per 100
Device Months
(Events)
%
Observations
(Patients)
Observations per
100 Device Months
(Events)
Angina pectoris 166 (110) 10.0 (73) 0.8 (112) 6.0 (44) 0.4 (54)
Bradycardia, sinus 8 (8) 1.0 (7) 0.1 (7) 0.1 (1) 0.0 (1)
Tachycardia 7 (7) 0.3 (2) 0.0 (2) 0.7 (5) 0.0 (5)
AV Block,
Complete
1 (1) 0.1 (1) 0.1 (1) 0.0 (0) 0.0 (0)
Cardiac allograft
rejection
2 (2) 0.3 (2) 0.0 (2) 0.0 (0) 0.0 (0)
Hypotension 28 (26) 1.4 (10) 0.1 (10) 2.2 (16) 0.1 (18)
Hypertension 6 (6) 0.1 (1) 0.0 (1) 0.7 (5) 0.0 (5)
Claudication 10 (7) 0.8 (6) 0.1 (9) 0.1 (1) 0.0 (1)
Carotid stenosis 5 (5) 0.5 (4) 0.0 (4) 0.1 (1) 0.0 (1)
Aneurysm 1 (1) 0.1 (1) 0.0 (1) 0.0 (0) 0.0 (0)
Deep vein
thrombosis
9 (9) 1.0 (7) 0.1 (7) 0.3 (2) 0.0 (2)
Pulmonary
Embolus
4 (4) 0.5 (4) 0.0 (4) 0.0 (0) 0.0 (0)
Individual events
that occurred one
time
5 (5) 0.5 (4) 0.0 (4) 0.1 (1) 0.0 (1)
Subtotal
Cardiovascular
Related Events:
ICD Therapy
(treatment group)
956 (354) 36.8 (269) 4.6 (637) 26.8 (196) 2.3 (319)
Cardiovascular Related Events (n=476 pts): Conventional Therapy (control group)
Arrhythmia, atrial 31 (29) 3.2 (15) 0.2 (16) 3.2 (15) 0.2 (15)
Arrhythmia,
ventricular
33 (26) 4.6 (22) 0.3 (27) 1.1 (5) 0.1 (6)
Arrhythmia,
general report
3 (3) 0.4 (2) 0.0 (2) 0.2 (1) 0.0 (1)
Mitral valve
regurgitation
1 (1) 0.2 (1) 0.0 (1) 0.0 (0) 0.0 (0)
Congestive heart
failure
212 (128) 16.6 (79) 1.5 (126) 14.3 (68) 1.0 (86)
- DRAFT -

CLINICAL STUDY - MADIT II C-5
Table C-1. Adverse events through the randomization period (continued)
Adverse Event # Of Events
(# of pts)a
%
Complications
(Patients)
Complications
per 100
Device Months
(Events)
%
Observations
(Patients)
Observations per
100 Device Months
(Events)
Palpitation,
pounding heart
6 (5) 0.4 (2) 0.0 (3) 0.6 (3) 0.0 (3)
Syncope 35 (31) 4.8 (23) 0.3 (24) 2.1 (10) 0.1 (11)
Infarction,
myocardial
19 (17) 3.6 (17) 0.2 (19) 0.0 (0) 0.0 (0)
Angina pectoris 93 (71) 10.7 (51) 0.8 (64) 5.5 (26) 0.3 (29)
Bradycardia, sinus 8 (8) 1.7 (8) 0.1 (8) 0.0 (0) 0.0 (0)
AV Block,
Complete
4 (2) 0.4 (2) 0.0 (3) 0.2 (1) 0.0 (1)
Bundle branch
block
4 (4) 0.4 (2) 0.0 (2) 0.4 (2) 0.0 (2)
Hypotension 17 (13) 1.9 (9) 0.1 (12) 1.1 (5) 0.1 (5)
Hypertension 2 (2) 0.0 (0) 0.0 (0) 0.4 (2) 0.0 (2)
Claudication 6 (4) 0.6 (3) 0.1 (5) 0.2 (1) 0.0 (1)
Carotid stenosis 5 (5) 1.1 (5) 0.1 (5) 0.0 (0) 0.0 (0)
Aneurysm 3 (3) 0.6 (3) 0.0 (3) 0.0 (0) 0.0 (0)
Deep vein
thrombosis
3 (3) 0.6 (3) 0.0 (3) 0.0 (0) 0.0 (0)
Pulmonary
Embolus
2 (2) 0.4 (2) 0.0 (2) 0.0 (0) 0.0 (0)
Tachycardia 2 (2) 0.2 (1) 0.0 (1) 0.2 (1) 0.0 (1)
Individual events
that occurred one
time
7 (7) 1.1 (5) 0.1 (5) 0.4 (2) 0.0 (2)
Subtotal
Cardiovascular
Related Events:
Conventional
Therapy (control
group)
496 (222) 34.7 (165) 3.9 (329) 25.0 (119) 2.0 (165)
Subtotal
Cardiovascular
Related Events:
Both groups
1452 (576a) 36.0 (434) 4.3 (968) 26.1 (315) 2.2 (484)
a. Identifies number of unique patients. Patients may have one or more adverse events.
b. Events include only patients in the ICD treatment group.
- DRAFT -

C-6 CLINICAL STUDY - MADIT II
MORTALITY
There were a total of 202 deaths that occurred during the trial and recorded as
of the stop date, November 20, 2001. These deaths occurred during the study
periods as shown in Table C-2 on page C-6 along with the cause of death as
adjudicated by an independent events committee.
Table C-2. Cause of death during the treatment period
Cause of Death
(as a percent of total pts)
ICD Therapy
(N=742) Patients (%)
Conventional Therapy
(N=490) Patients (%)
Total
(N=202)
Noncardiac 25 (3.4%) 21 (4.3%) 46 (3.7%)
Cardiac: Arrhythmic 28 (3.8%) 48 (9.8%) 76 (6.2%)
Cardiac: Nonarrhythmic 45 (6.1%) 22 (4.5%) 67 (5.4%)
Cardiac: Undetermined cause 1 (0.1%) 2 (0.4%) 3 (0.2%)
Unknown 6 (0.8%) 4 (0.8%) 10 (0.8%)
Total Deaths 105 (14.2%) 97 (19.8%) 202 (16.3%)
SUMMARY OF CLINICAL STUDY
Guidant supported the MADIT II Clinical Study as conducted by the University
of Rochester to evaluate the potential survival benefit of a prophylactically
implanted ICD in patients with a prior myocardial infarction and a left ventricular
ejection of ≤30 percent. Unlike MADIT I1, patients enrolled in MADIT II were
not required to undergo electrophysiologic testing to induce arrhythmias prior to
implant. Patients were randomized to either ICD or conventional therapy. All
cause mortality was the primary endpoint of the study.
The MADIT II trial was monitored using a sequential design and on November
20, 2001, after review of the data by the Data and Safety Monitoring Board, the
study was stopped. Results of the trial data indicated a 31percent decrease in
the mortality rate in patients implanted with an ICD device compared to patients
randomized to the conventional therapy group, thus meeting its effectiveness
endpoint.
The trial began July 11, 1997 and was conducted over a period of four years at
76 investigational centers both within and outside the United States.
1. Moss AJ, Hall WJ, Cannom DS, et al. Improved survival with an implanted defibrillator in
patients with coronary disease at high risk for ventricular arrhythmia. NEJM 1996;335:1993-40
- DRAFT -
CLINICAL STUDY - MADIT II C-7
STUDY DESIGN
MADIT II was a prospective, randomized (3:2 ICD to conventional non-ICD
therapy), controlled, unblinded, multicenter trial. Randomization to the ICD
group consisted of implantation of a legally marketed Guidant ICD device.
Randomization to the conventional therapy group consisted of beta-adrenergic
blocking drugs and angiotensin-converting enzyme (ACE) inhibitors when
indicated.
Patients provided written informed consent and received a baseline reference
examination that included prior clinical history, physical examination and a
12-lead ECG. Following completion of the baseline evaluation, patients were
randomized by the Coordination and Data Center (CDC) in a 3:2 fashion to
receive either an ICD or conventional medical therapy; randomization was
done separately for each center, with blocking, to assure proper balance
between the two treatment groups within each center. Each randomized patient
remained counted as a member of the original randomization assignment
(intention-to-treat) regardless of subsequent crossover or protocol adherence.
Patients randomized to the ICD arm were implanted with Guidant transvenous
defibrillator devices by MADIT II investigators. All Guidant ICD systems used
during the trial were legally approved devices and the use of investigational
devices was strictly prohibited. Following randomization, patients were seen
at a 1-month follow-up visit in the clinic and at 3-month intervals thereafter
until termination of the study.
Primary Endpoint
The primary endpoint for MADIT II was all cause mortality.
Primary Objective
The primary objective of the trial was to determine if implantation of ICDs in
moderately high-risk coronary patients would result in significant reduction in
death when compared to patients treated without an ICD.
Secondary Objectives
The secondary objectives of the trial were as follows:
• Determine if (electrophysiology study) EPS inducibility at ICD implantation
in the ICD group was associated with a higher appropriate ICD discharge
rate during follow-up than noninducibility.
- DRAFT -
C-8 CLINICAL STUDY - MADIT II
• Determine if Holter-recorded noninvasive electrocardiologic parameters
(SAECG, heart rate variability, temporal dispersion of refractoriness,
T-wave alternans, and T-wave lability) can identify patients with an
increased mortality rate in the non-ICD group.
• Evaluate the cost-effectiveness of ICDs in saving lives.
• Determine if ICD therapy is associated with an improved quality of life.
The results of these secondary objectives are pending and were not included
as part of the approval for this expanded indication.
INCLUSION/EXCLUSION CRITERIA
Study inclusion criteria were as follows:
• Patients must have an ejection fraction ≤0.30 obtained ≤3monthspriorto
enrollment by angiographic, radionuclide, or echocardiographic methods.
This ejection fraction must be obtained at least 30 days following the most
recent myocardial infarction, coronary artery bypass graft surgery, or
coronary revascularization procedure.
• Patients must have had at least one or more documented Q-wave or other
enzyme positive infarctions. If enzyme information is not available, then
there must be clear evidence of an infarct identified as a Q-wave on an
ECG, fixed defect (scar) on a thallium scan, or infarcted area on a coronary
angiogram or echocardiography.
• Patients must be men or women greater than 21 years of age (no upper
cut-off).
Studyexclusioncriteriawereasfollows:
• Previous cardiac arrest or syncopal ventricular tachycardia unassociated
with an acute myocardial infarction (existing ICD indication)
• Patients meeting MADIT I criteria with EF ≤0.35, nonsustained VT, and
inducible-nonsuppressible VT at electrophysiologic study (existing ICD
indication)
• Cardiogenic shock, symptomatic hypotension while in a stable baseline
rhythm
- DRAFT -
CLINICAL STUDY - MADIT II C-9
• NYHA functional Class IV
• Current use of antiarrhythmic agents except when indicated for atrial
arrhythmias
• Coronary artery bypass graft surgery or PTCA within the past 3 months
• Enzyme-positive myocardial infarction ≤30 days prior to enrollment
• Patients with angiographic evidence of coronary disease who are
candidates for coronary revascularization and are likely to undergo
coronary artery bypass graft surgery or PTCA in the foreseeable future
• Patients with irreversible brain damage from preexisting cerebral disease
• Women of childbearing potential not using medically prescribed
contraceptive measures
• Presence of any disease, other than the patient’s cardiac disease,
associated with a reduced likelihood of survival for the duration of the trial,
e.g., cancer, uremia (BUN ≥70 mg% and/or creatinine ≥30 mg%)
• Patients participating in other clinical heart disease trials
• Patients unwilling or unable to cooperate with the study due to dementia,
psychological, or other related reasons
• Patients who were unable to participate due to one or more logistical
considerations
• Patient’s primary care physician refuses to allow patient to participate
• Patients who are on the heart transplant list. If the patient is pending
evaluation for the heart transplant list, the patient cannot be enrolled in
MADIT II until it is definitively determined that the patient will NOT be
placed on the transplant list
• ICD cannot be implanted due to anatomical abnormality or other medical
problem
- DRAFT -
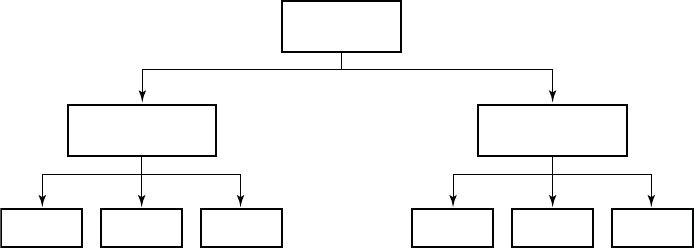
C-10 CLINICAL STUDY - MADIT II
PATIENT STATUS
There were a total of 1,232 patients with a prior myocardial infarction and a
left ventricular ejection fraction of ≤0.30 enrolled in the MADIT II trial. A total
of 742 patients were randomized to receive an ICD and 490 patients were
randomized to conventional therapy. Figure C-1 on page C-10 provides an
overview of the patient enrollment.
Patients Enrolled
n = 1232*
ICD
(device)
n = 742
Dead
n = 105
Alive
n = 625
Dead
n = 97
Alive
n = 381
Conventional Therapy
(Control)
n = 490
Unknown
n = 12
Unknown
n = 12
* Includes crossovers
(32 in Device arm, 22
in Control arm)
Figure C-1. Patient enrollment cascade primary endpoint
PRIMARY ENDPOINT
The primary endpoint for MADIT II was death from any cause. Analysis was
performed according to the intention-to-treat principle. The trial was designed
to have 95 percent power to detect a 38 percent reduction in the two-year
mortality rate among the patients in the ICD group, given a postulated two-year
mortality rate of 19 percent among patients assigned to conventional therapy,
with a two-sided significance level of 5 percent. For proportional-hazards
modeling, power was maintained for a true hazard ratio of 0.63, after allowance
for crossovers. A triangular sequential design was used, which was modified
for two-sided alternatives. The data was corrected to account for any lag in
obtaining data accrued (during weekly monitoring), but not reported before
the termination of the trial with preset boundaries to permit termination of the
trial if the ICD therapy was found to be superior to, inferior to, or equal to
conventional medical therapy.
Secondary analyses were performed with use of the Cox proportional hazards
regression model. Survival curves were determined according to the Kaplan
and Meier method, with comparisons of cumulative mortality based on
- DRAFT -
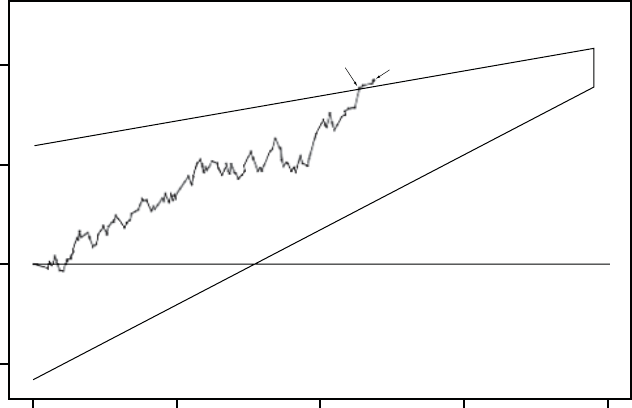
CLINICAL STUDY - MADIT II C-11
logarithmic transformation. The p-values were termed nominal when they were
not adjusted for sequential monitoring. All p-values were two-tailed.
At the recommendation of the Data and Safety Monitoring Board (DSMB),
the trial was stopped on November 20, 2001, when it was revealed that the
difference in mortality between the two groups had reached the prespecified
efficacy boundary (p=0.027) (Figure C-2 on page C-11).
0 20 40 60 80
-10
0
10
20
Log-Rank
Statistic
Variance
Vlow = 11.72
Lower Boundary: -11.77 + 0.3819*V
x = 77.8
Upper Boundary: 11.77 + 0.1273*V
Nov. 13, 2001
Dec. 7, 2001
Figure C-2. Sequential monitoring in the triangular design
FOLLOW-UP SCHEDULE
Following randomization, patients were seen at a 1-month follow-up visit in the
clinic and at 3-month intervals thereafter until termination of the study. During
each clinic visit, an appropriate clinical evaluation was completed. Patients with
an ICD device underwent device testing according to an agreed-upon protocol
at the investigational center. Patients were followed from between 6 days and
53 months averaging 20 months.
- DRAFT -

C-12 CLINICAL STUDY - MADIT II
STUDY RESULTS
Study Duration
Study duration, measured in months, is displayed in Table C-3 on page C-12.
The mean duration was similar between the ICD group and the conventional
therapy group. As expected, the ICD group accumulated >15,000 months
of follow-up.
Table C-3. Study duration in months
Therapy No. Mean ±SD Minimum Maximum Cumulative
ICD Therapy 742 20.5 12.9 0.2 51.7 15,190
Conventional Therapy 490 19.6 12.6 0.2 52.3 9,624
Demographic Data
Table C-4 on page C-12 provides a summary of the general characteristics of
the enrolled MADIT II patient population. Characteristics were balanced across
therapy groups and no statistical differences were found during data analysis
as indicated by the p-values in the table.
Table C-4. Patient population characteristics
Characteristic ICD Patients
(n=742)
Conventional
Therapy Patients
(n=490)
p-value
Age at Enrollment
> 65 years (patients, %) 397 (53.5%) 262 (53.5%)
Mean ± Standard Deviation (years) 64.4 ± 10.4 64.6 ± 10.3
0.99
Gender (patients, %)
Male 623 (83.9%) 417 (85.1%) 0.59
LVEF (%)
Mean ± Standard Deviation 23.1 ± 5.4 23.2 ± 5.6 0.93
LVEFa
≤25% (patients, %) 502 (76.7%) 330 (67.3%) 0.91
New York Heart Association Classification 3 months before enrollment (patients, %)
- DRAFT -

CLINICAL STUDY - MADIT II C-13
Table C-4. Patient population characteristics (continued)
Characteristic ICD Patients
(n=742)
Conventional
Therapy Patients
(n=490)
p-value
No CHF 179 (24.1%) 129 (26.3%)
Class I 75 (10.1%) 58 (11.8%)
Class II 258 (34.8%) 162 (33.1%)
Class III 187 (25.2%) 111 (22.7%)
Class IV 33 (4.5%) 20 (4.1%)
Unknown 10 (1.4%) 10 (2.0%)
0.64
Canadian Heart Association Classification
Class I 126 (16.9%) 81 (16.5%)
Class II, III, IV 168 (23.1%) 120 (24.4%)
Angina Decubitus 35 (4.7%) 15 (3.1%)
No Angina Pectoris 402 (54.1%) 268 (54.7%)
Unknown 11 (1.4%) 6 (1.2%)
0.62
Other
Ventricular arrhythmias requiring treatment (patients,
%)
74 (10.0%) 64 (13.1%) 0.24
Atrial Arrhythmias requiring treatment (patients, %) 201 (27.1%) 120 (24.4%) 0.56
History of Hypertension (patients, %) 411 (55.3%) 277 (56.5%) 0.71
Blood Urea Nitrogen (patients, %) > 25 mg % 213 (28.7%) 153 (31.2%) 0.52
Diabetes Mellitus (patients, %) 246 (33.2%) 184 (37.6%) 0.45
Non-CABG Revascularization Procedures (patients, %) 331 (44.6%) 205 (41.8%) 0.56
CABG Surgery (patients, %) 428 (57.7%) 274 (55.9%) 0.53
Permanent Pacemaker (patients, %) 62 (8.4%) 30 (6.1%) 0.22
EP Study prior to enrollment (262 patients) n=150 (20.2%) n=112 (22.8%) 0.27
Inducible 8(5.3%) 2(1.8%) 0.25
a. Two patients enrolled with EF > 30%.
Medications
Table C-5 on page C-14 provides a summary of the medication utilization for the
patients enrolled. The two treatment groups were balanced and appropriately
treated with standard cardiac therapy. There were no differences in ACE
- DRAFT -

C-14 CLINICAL STUDY - MADIT II
inhibitors, beta blockers, or digitalis therapy between the ICD therapy group
and the conventional therapy patients.
Table C-5. Patient population medication therapy
Medication ICD Patients
(n = 742)
Conventional Therapy
Patients
(n = 490)
p-value
ACE inhibitor use (patients, %)
Baseline/Enrollment 574 (77.4%) 377 (76.9%) 0.47
Last Follow-up 533 (71.8%) 363 (74.1%) 0.31
Amiodarone use (patients, %)
Baseline/Enrollment 49 (6.6%) 36 (7.3%) 0.41
Last Follow-up 94 (12.7) 51 (10.4%) 0.23
Antiarrhythmic use (patients, %)
Baseline/Enrollment 18 (2.4%) 15 (3.1%) 0.37
Last Follow-up 21 (2.8%) 12 (2.4%) 0.43
Aspirin use (patients, %)
Baseline/Enrollment 503 (67.8%) 344 (70.2%) 0.30
Last Follow-up 477 (64.3%) 332 (67.8%) 0.20
Beta blocker use (patients, %)
Baseline/Enrollment 469 (63.2%) 295 (60.2%) 0.28
Last Follow-up 529 (71.3%) 351 (71.6%) 0.46
Digitalis use (patients, %)
Baseline/Enrollment 441 (59.4%) 277 (56.5%) 0.29
Last Follow-up 451 (60.8%) 290 (59.2%) 0.41
Diuretics use (patients, %)
Baseline/Enrollment 541 (72.9%) 379 (77.3%) 0.09
Last Follow-up 562 (75.7%) 396 (80.8%) 0.04
Lipid Lowering use (patients, %)
Baseline/Enrollment 492 (66.3%) 315 (64.3%) 0.37
Last Follow-up 556 (74.9%) 339 (69.2%) 0.04
Sotalol use (patients, %)
- DRAFT -
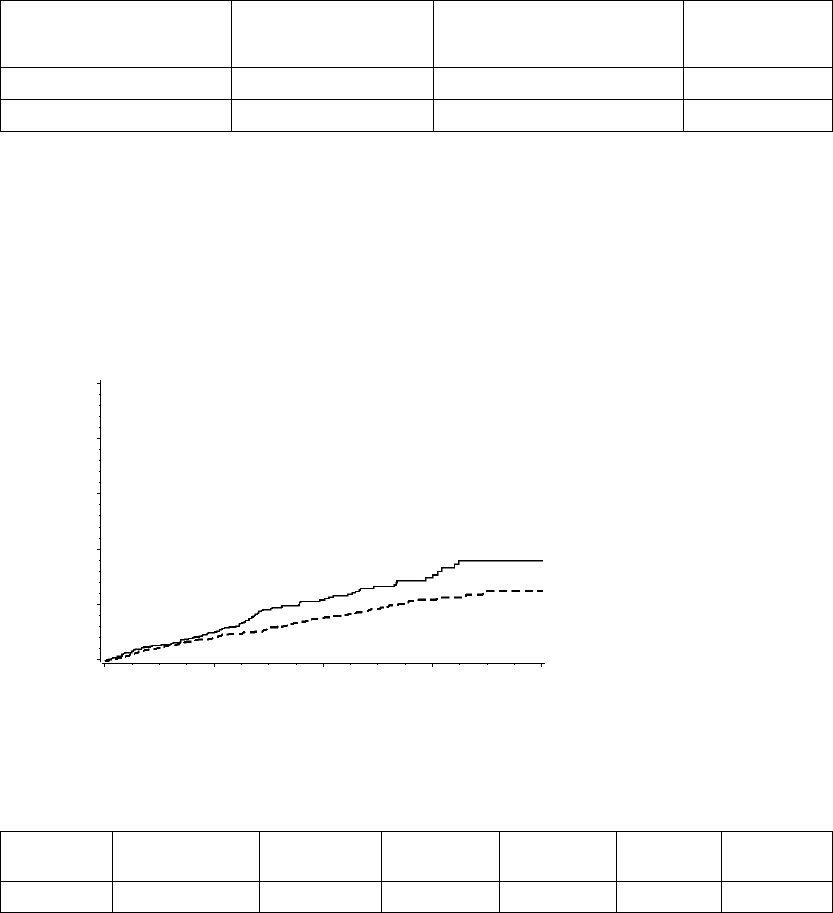
CLINICAL STUDY - MADIT II C-15
Table C-5. Patient population medication therapy (continued)
Medication ICD Patients
(n = 742)
Conventional Therapy
Patients
(n = 490)
p-value
Baseline/Enrollment 7 (0.9%) 3 (0.6%) 0.38
Last Follow-up 18 (2.4%) 4 (0.8%) 0.05
All Cause Mortality
The Kaplan Meier mortality curves depicting mortality for the two groups
are shown in Figure C-3 on page C-15. Although the conventional and ICD
survival curves remain close during the first nine months, they progressively
separate thereafter. Table C-6 on page C-15 presents information derived from
these curves, with the conclusion that 3-year cumulative all-cause mortality is
estimated to be reduced by 29 percent in those with an ICD.
01234
0.0
0.2
0.4
0.6
0.8
1.0
Probability of All Cause Mortality
Years
ICD Group
Conventional Group
742
490
503
329
274
170
110
65
9
3
Number of patients
ICD:
Conventional:
Figure C-3. Kaplan-Meier Mortality Curve: Conventional vs. ICD groups
Table C-6. Cumulative mortality and percentage reduction
Year Conventional
Arm
ICD Arm Difference Reduction CIa%p-valueb
1 Year 9.9 8.8 1.1 11% -29, 39 0.53
- DRAFT -

C-16 CLINICAL STUDY - MADIT II
Table C-6. Cumulative mortality and percentage reduction (continued)
Year Conventional
Arm
ICD Arm Difference Reduction CIa%p-valueb
2 Years 21.5 15.5 6.0 28% 5, 46 0.02
3 Years 30.4 21.6 8.8 29% 6, 46 0.02
a. Indicates Confidence Interval for the percentage reduction in cumulative mortality. The cumulative mortality (and associated
standard errors) is taken from the Kaplan-Meier analyses; percentage reduction analyses are based on a log transform method.
b. For null hypothesis that the percentage (%) reduction is zero.
The pre-specified primary analysis of the trial was based on computation of a
hazard ratio, based on an assumption that the two survival curves satisfy a
proportional hazards condition (one is a power —the ‘hazard ratio’— of the
other), and recognizing the sequential stopping rule of the trial. The hazard
ratio is interpreted as the ratio of instantaneous risks of dying, at each point in
time, in the two treatment groups. The hazard ratio for the ICD group relative to
the conventional therapy group was found to be 0.69, indicating a 31percent
reduction in instantaneous risk (95 percent confidence interval, 0.51 to 0.93;
p=0.016, reduced from p=0.027 when reaching the stopping boundary, by
incorporation of lagged data). The Cox regression analyses used for this
purpose were stratified by enrollment centers, thus allowing for somewhat
different patient pools at differing locations.
The proportional hazards assumption was evaluated by several standard
statistical methods, all providing support. One method is derived from
finding parallelism in so-called log (-log) plots of the cumulative hazards.
Another is from fitting models that allow for differing hazard ratios in differing
intervals of time, and demonstrating that any apparent differences among the
period-specific hazard ratios can be attributed to chance. One such analysis is
summarizedinTableC-7onpageC-16.
Table C-7. Year-specific hazard ratio (HR)
Year Estimate CI
1 Year 0.87 0.59, 1.29
2 Years 0.56 0.29, 1.07
3+ Years 0.61 0.28, 1.34
Overall 0.69 0.51, 0.93
The p-value = 0.16 for differences among the 3 HRs, and the p-value = 0.016
for the overall HR. The exponential mortality curves fit the data very well,
with risks of mortality of 0.0100 each month for patients in the conventional
- DRAFT -
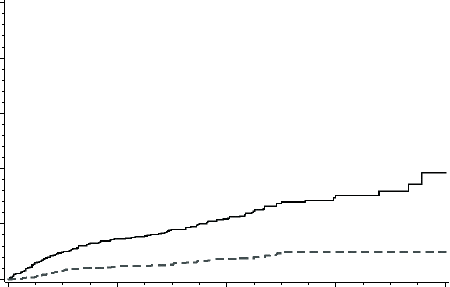
CLINICAL STUDY - MADIT II C-17
therapy group and 0.0069 each month in the ICD group, with the ratio, 0.69, in
agreement with that reported above.
Verification of ICD Shock Therapy Treatment
Of the 710 patients that were implanted with an ICD, 134 received appropriate
therapy for ventricular tachycardia/ventricular fibrillation (VT/VF) and the
probability of therapy increased over time. There was a 34 percent cumulative
probability that ICD patients received therapy from the device for VT/VF within
three years (Figure C-4 on page C-17). The probability of first appropriate
shock for VF only at one year was 4 percent and increased to 10 percent after
four years. These percentages are closely related to the survival probability
differences observed between the ICD and conventional therapy groups (1
percent and 11 percent, respectively) as shown in Figure C-3 on page C-15.
01234
0.0
0.2
0.4
0.6
0.8
1.0
Cumulative Probability of 1st Therapy
Years
Shock for VF
ATP/Shock for VT/VF
Probability of 1st Therapy Due to VT/VF
Figure C-4. Probability of first therapy due to VT/VF
The probability of appropriate ICD shocks for ventricular fibrillation (Figure C-4
on page C-17) correlates closely to the difference in the cumulative number of
deaths between the ICD and conventional groups (Figure C-3 on page C-15).
Hospitalization Results
The rate of occurrence of patients requiring hospitalization due to adverse
events was 0.29 per year of observation in both the conventional therapy
patients and in the ICD patients. Table C-8 on page C-18 provides the
summary of all hospitalizations that occurred as a result of adverse events.
Adverse events that resulted in hospitalizations do not differ significantly
between groups.
- DRAFT -

C-18 CLINICAL STUDY - MADIT II
Table C-8. Adverse events requiring hospitalizations (Rate/Year)
Treatment Group Cumulative Years
of Observation
Total Number of
Individuals with
Adverse Events
Rate per Year of
Individuals with
Adverse Events
p-value
Conventional (n=490) 703.6 201 (41%) 0.29 0.85
ICD Therapy Group
(n=742)
1155.97 337 (45%) 0.29
Table C-9 on page C-18 provides a summary of hospitalizations that were
required as a result of congestive heart failure (CHF) related adverse events.
There were 78 of the 490 patients in the conventional group and 161 of the
742 ICD patients who had one or more hospitalizations that did not result in
death. The annual rate of hospitalization for CHF for each treatment group was
calculated by dividing the number of patients with one or more hospitalizations
for new or worsening CHF by the cumulative years of observation. The rate
of hospitalization for CHF per year was somewhat higher in the ICD group
(161/115.97 = 0.14) compared to the conventional therapy group (78/703.6 =
0.11); however, this difference in the rate of hospitalization for CHF was not
statistically significant (p=0.11).
Table C-9. Heart failure adverse events requiring hospitalization (Rate/Year)
Treatment Group Cumulative Years
of Observation
Total Number of
Individuals with
Adverse Events
Rate per Year of
Individuals with
Adverse Events
p-value
Conventional (n=490) 703.6 78 (16%) 0.11 0.11
ICD Therapy Group (n=742) 1155.97 161 (22%) 0.14
Reasons for Crossover
The MADIT II study was an intention-to-treat analysis, therefore, any patient
receiving therapy outside of their randomized therapy group was counted as a
crossover. Table C-10 on page C-18 details crossovers by treatment group.
Table C-10. Reasons for crossovers by treatment group
Description ICD Therapy
(n=742)
Conventional Therapy
(n=490)
Refusal of therapy 21 0
Met ICD implant criteria N/A 21
Heart transplant 9 0
Sepsis related to CABG surgery 10
- DRAFT -

CLINICAL STUDY - MADIT II C-19
Table C-10. Reasons for crossovers by treatment group (continued)
Description ICD Therapy
(n=742)
Conventional Therapy
(n=490)
Nonconversion of arrhythmia 10
Physician Discretion 0 1
Total Crossovers (54) 32 22
A crossover patient was defined as a patient who, at the time of a specified
data cutoff date, was receiving treatment that was different than their originally
randomized assignment. Crossovers from the conventional therapy group to
the ICD group were strongly discouraged unless a patient was determined to
have a strong clinical justification such as positive inducibility during EP testing
or spontaneous ventricular arrhythmia event(s) requiring hospitalization that
wouldbeanapprovedindicationforreceivinganICD.
Follow-up Compliance
The compliance rate is calculated by dividing the number of successful
visits by the sum of the visits expected for the designated month sequence.
Table C-11 on page C-19 details reported visit compliance in six-month
intervals. Compliance to follow-up was ≥88 percent at the majority of required
visits. There was no difference in the follow-up rates between the two groups.
Table C-11. Follow-up compliance
Follow-up Sequence Month % Compliant
ICD Group
% Compliant
Conventional Therapy Group
1–6 months 98 96
7–12 months 97 95
13–18 months 96 93
19–24 months 95 93
25–30 months 93 89
31–36 months 97 90
37–42 months 95 85
- DRAFT -
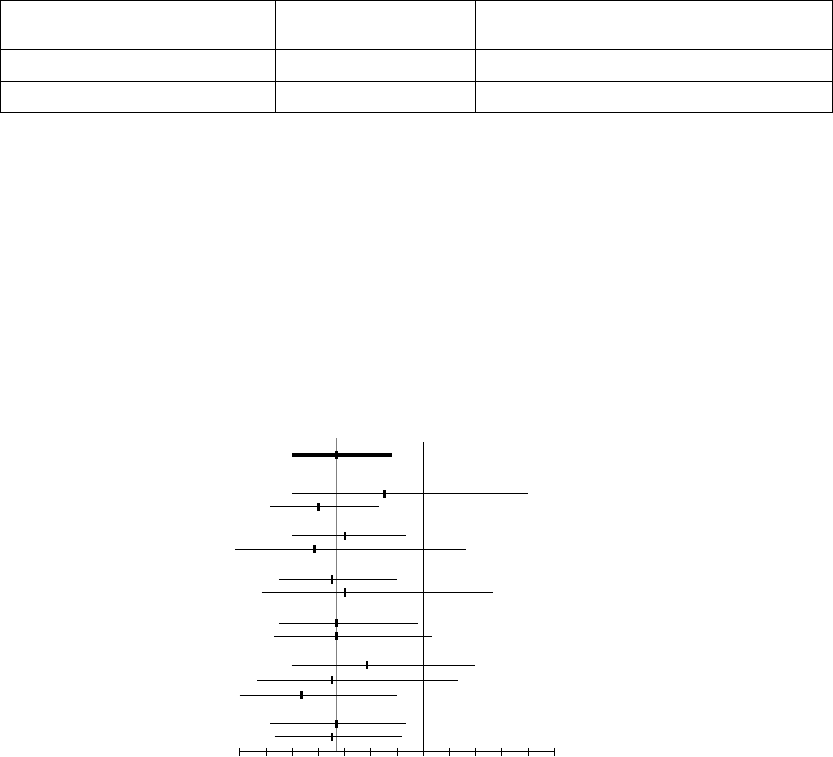
C-20 CLINICAL STUDY - MADIT II
Table C-11. Follow-up compliance (continued)
Follow-up Sequence Month % Compliant
ICD Group
% Compliant
Conventional Therapy Group
43–51 months 96 100
Total Average 96 94
Subgroup Analysis of MADIT II Patient Population
Figure C-5 on page C-20 provides the hazard ratios and 95 percent confidence
intervals for death from any cause in the ICD group as compared to the
conventional therapy group according to selected clinical characteristics.
The hazard ratios in the various subgroups were similar, with no statistically
significant interactions. The dotted vertical line represents the results for the
entire study (nominal hazard ratio, 0.66, without adjustment for the stopping
rule). The horizontal lines indicate nominal 95 percent confidence intervals.
0.4 0.6 0.8 1.0 1.41.2
ICD Better Conventional Better
Hazard Ratio
A
ll patients 1232
Age
< 65 yr 573
≥ 65 yr 659
Sex
Male 1040
Female 192
LVEF
≤ 0.25 831
> 0.25 401
NYHA Class
≤ II 861
> II 351
QRS
< 0.12 s 597
0.12 - 0.15 s 352
> 0.15 s 262
Beta-blockers
Yes 844
No 388
Variable Number of patients
Figure C-5. Hazard ratios and 95 percent confidence intervals
Analysis of Inducibility as a Risk Factor
There were 583 patients enrolled in MADIT II who had EP testing performed
either prior to or during ICD implant. The definition for inducibility was the
same one used for the MADIT I study. Of these 583 patients, 373 (63 percent)
were not inducible and the remaining 210 (36 percent) were inducible. Of the
210 patients who were inducible, 180 (88 percent) had EP testing performed
- DRAFT -

CLINICAL STUDY - MADIT II C-21
at implant using a catheter method and 24 (12 percent) using the ICD for
induction; there was no data on the method of induction for 6 patients.
The Occurrence of ICD Therapy for VT, VF, or VT/VF Combined
Therapy for VT was defined as antitachycardia pacing (ATP) or ICD shock
delivered by the device in an attempt to stop an arrhythmia as reported by the
enrolling center. Therapy for VF was defined as the delivery of ICD shock
therapy. The endpoint for VT/VF was defined by the occurrence of either VT or
VF therapy. The occurrence of therapy for each of these groups is provided in
Table C-12 on page C-21. All analyses were Cox regression analyses, stratified
by enrollment center, with time to VT, time to VF or time to VT/VF therapy
as the respective endpoint.
Table C-12. ICD patients receiving one or more therapies
Type of ICD TherapyaNumber of Patients Percent of Patients with
Therapy Episodes
VT (ATP or shock) 89 15.4%
VF (Shock only) 36 6.2%
VT/VF VF (ATP + shock) 114 19.7%
a. Some patients received both types of therapy.
Predictions of VT and VF Therapy in ICD Patients
A statistical analysis was performed to evaluate whether inducibility at EP
testing provides predictability of the potential effectiveness of an ICD. To this
end, the occurrence of each of the three endpoints defined above (VT, VF
and VT/VF), in ICD patients with EP testing were evaluated. Analyses were
done by Cox proportional hazards regression, stratified by enrollment center.
(Table C-13 on page C-22)
A list of potential risk factors was considered for these endpoints, such as age,
gender, and standard cardiological variables like NYHA class, EF, etc., and
developed a parsimonious regression model in the 583 ICD patients identified
above. GENDER and BUN (dichotomized at up to 25 versus 26 and over) were
observed as potential risk factors for these endpoints, with males and elevated
BUN associated with increased occurrence of these endpoints. Further
analysis investigated whether inducibility added any additional, independent
predictive power for each of these endpoints.
The conclusion was that inducibility increases the risk of VT events by perhaps
60 percent (p=0.07) and decreases the risk of VF events by perhaps 50
- DRAFT -

C-22 CLINICAL STUDY - MADIT II
percent (p=0.08). As a consequence of these opposite directional effects of
similar magnitudes, there was no reliable evidence that inducibility affects the
frequency of VT/VF events (p=0.26); it may be associated with a slight increase
since VT events occur more frequently than VF.
Table C-13. Therapy predictability based on induced arrhythmia
Inducible
Therapy Delivered for the
Following Type of Arrhythmia Yes No
VF
Yes 729
No 202 341
VT
Yes 43 46
No 166 324
VT/VF
Yes 48 66
No 161 304
- DRAFT -

D-1
CLINICAL STUDY - VENTAK AV II DR
APPENDIX D
CLINICAL STUDY POPULATIONS
Guidant ICDs have been demonstrated to be safe and effective in patient
populations including, but not limited to, those with:
• Prior myocardial infarction and an ejection fraction (EF) ≤30%, based on
the Guidant sponsored MADIT II clinical study. (Guidant devices were the
only devices studied in the MADIT II clinical trial. The trial demonstrated
these devices to be safe and effective in the MADIT II population.)
• Prior myocardial infarction, left ventricular ejection fraction of ≤35%, and
a documented episode of nonsustained VT, with an inducible ventricular
tachyarrhythmia, based on the Guidant sponsored MADIT clinical study.
(Guidant devices were the only devices studied in the MADIT clinical trial.
The trial demonstrated these devices to be safe and effective in the MADIT
population.)
CHRONIC IMPLANT STUDY - VENTAK AV II DR
Since this pulse generator system has many of the same therapies, diagnostics,
and electrophysiology testing features as the VENTAK AV III DR system, the
VENTAK AV II DR implant study, which was used to support the VENTAK AV III
DR system, was used also to support this pulse generator system.
The purpose of the implant study was to confirm that the VENTAK AV II DR
could sense, detect, and deliver ventricular tachyarrhythmia therapy. In
addition, the adaptive-rate pacing function was evaluated by exercise testing.
Fifty-two patients were enrolled and implanted in 18 centers outside the U.S.
between June 27 and October 21, 1997. A total of 53 devices were used
throughout the duration of the study and consisted of VENTAK AV II DR,
models 1821 and 1826. The VENTAK AV II was approved for commercial
distribution in the U.S. on March 13, 1998.
This clinical data remains applicable to these pulse generator systems since
there are no significant differences between tachyarrhythmia therapy and
adaptive-rate pacing capabilities.
- DRAFT -
D-2 CLINICAL STUDY - VENTAK AV II DR
Patients Studied
The patients (46 M/ 6 F) had a mean age of 60 years (range 30 to 78) and a left
ventricular ejection fraction of 36% (14% to 76%). Most (86%) presented with
coronary artery disease or ischemic cardiomyopathy and 53% presented with
monomorphic ventricular tachycardia (MVT) as their primary arrhythmia.
Methods
This was an observational study. No control group was used. Patients
underwent standard ICD implant procedure and were evaluated at
predischarge, 1 month, and 3 months postimplant. At the one-month follow-up,
an exercise test consisting of a 6 minute brisk walk or 6 minutes of stair climbing
was required for all patients included in the study if the accelerometer sensor
was programmed on. The purpose of the exercise test was to verify if there
was an adequate rate response of the sensor under exercise conditions. After
the test, the device was interrogated to verify if the rate response during activity
functioned according to patient need. If the rate response was insufficient, the
trending function was used to optimize the sensor settings.
Results
The mean implant duration was 3.03 months (range 0.23 to 3.8) with a
cumulative implant duration of 157.4 months. All patients were implanted in a
lead alone configuration. Two patients were later revised to add SQ arrays. The
mean DFT for 26 patients who were tested under a step down to failure protocol
was 10.3 J stored energy. A total of 432 episodes of ventricular arrhythmias
(VF/PVT and MVT) were treated including spontaneous (N = 112) and induced
(N = 320). Three patients had episodes that were not converted by the device.
One patient had 4 VF episodes during DFT testing at implant that were not
converted by the device and were converted externally. A second patient
had an electrical storm directly postimplant in which two episodes of MVT
were converted externally; the device detected all episodes appropriately and
used multiple attempts to deliver therapy for all episodes in the storm. A third
patient’s MVT accelerated to VF and was successfully terminated by the device.
All other episodes of ventricular arrhythmias were converted by device therapy.
There were two patient deaths: one was classified witnessed, noncardiac,
nonsudden, and the other was classified unwitnessed, assumed sudden.
Forty patients had the sensor programmed “ON” and performed an exercise
test. The remaining patients were not tested for the following reasons: patient
had sinus rhythm and did not require adaptive-rate pacing, patient could not
tolerate exercise testing, and patient death. Nominal settings were appropriate
- DRAFT -

CLINICAL STUDY - VENTAK AV II DR D-3
for 80% of patients tested; in all cases, the physician was able to program
appropriate adaptive-rate settings to accommodate patient need (Table D-1
on page D-3).
Table D-1. Implant study results
Effectiveness Measure VENTAK AV II DR
Mean + SD [95% CI]
N
Defibrillation threshold (J) stored energy 10.3 + 3.7
[8.8, 11.8]
N=26
Safety Measure Rate (%)
Operative mortality 1/52 (1.9%)
Conversion efficacy for all ventricular arrhythmias 425/432 (98.4%)
- DRAFT -
D-4 CLINICAL STUDY - VENTAK AV II DR
- DRAFT -

E-1
CLINICAL STUDY - VITALITY
APPENDIX E
CLINICAL STUDY POPULATIONS
Guidant ICDs have been demonstrated to be safe and effective in patient
populations including, but not limited to, those with:
• Prior myocardial infarction and an ejection fraction (EF) ≤30%, based on
the Guidant sponsored MADIT II clinical study. (Guidant devices were the
only devices studied in the MADIT II clinical trial. The trial demonstrated
these devices to be safe and effective in the MADIT II population.)
• Prior myocardial infarction, left ventricular ejection fraction of ≤35%, and
a documented episode of nonsustained VT, with an inducible ventricular
tachyarrhythmia, based on the Guidant sponsored MADIT clinical study.
(Guidant devices were the only devices studied in the MADIT clinical trial.
The trial demonstrated these devices to be safe and effective in the MADIT
population.)
CHRONIC IMPLANT STUDY - VITALITY
The purpose of this study was to evaluate the safety and effectiveness of
Guidant VITALITY family devices with Automatic Intrinsic Rhythm ID. This
clinical study was a single-arm, prospective, multi-center study. There were
a total of 100 patients enrolled at 21 US investigational centers between
December 3, 2002 and January 10, 2003.
Patient Population
One hundred patients were enrolled in this study and 96 patients received
investigational devices. The mean age of the patients implanted with the
VITALITY device was 67.3 ± 10.8 years old. The mean left ventricular ejection
fraction was 30.4% (range 11.0% - 71.0%). Seventy-eight (78) patients (81.3%)
were male. The primary cardiovascular disease (42.1%) was coronary artery
disease (CAD) and the primary tachyarrhythmia (38.5%) was monomorphic
ventricular tachycardia (MVT).
Methods
A prospective, multi-center, nonrandomized clinical study evaluated the safety
and effectiveness of the VITALITY device in humans. Ninety-six patients
- DRAFT -

E-2 CLINICAL STUDY - VITALITY
selected from the investigator’s general patient population who met the
indications for use of the VITALITY device were followed through pre-discharge,
2-week and 1-month follow-ups and continued every 3 months thereafter until
study closure.
Results
A total of 100 patients were enrolled in this study. Of these, 96 patients were
successfully implanted, with 4 intents. Ninety-three (93) patients finished their
1-month follow-up per the study protocol. All primary and secondary endpoints
of this study were met. The results from this study provide evidence of the
safety and effectiveness of the VITALITY with Automatic Intrinsic Rhythm ID
algorithm (Table E-1 on page E-2).
Table E-1. VITALITY Chronic Study Results
Safety Endpoints
VT/VF Detection Time 3.43 seconds
Primary Endpoints
Sensitivity
Induced VT/VF 100%
Spontaneous VT/VF 100%
Specificity––Induced
Rhythm Physician/Annotation Device Decision–SVT Specificity
Atrial Fibrillation 71 68 95.8%
Atrial Flutter 94 88 93.6%
Sinus Tachycardia 75
71.4%
Total Induced 172 161 93.6%
Specificity–Spontaneous
Rhythm Physician/Annotation Device Decision–SVT Specificity
Atrial Fibrillation 65 65 100%
Atrial Flutter 31 28 90.3%
Sinus Tachycardia 37 32 86.5%
Other 77
100%
Total Spontaneous 140 132 94.3%a
Combined
Specificityb
312 293 93.9%
- DRAFT -

CLINICAL STUDY - VITALITY E-3
Table E-1. VITALITY Chronic Study Results (continued)
Secondary Endpoints
Acute Automatic Rhythm ID Accuracy (2 weeks) 100%
Automatic Rhythm ID Accuracy (1 month) 97.7%
Manual Rhythm ID Accuracy (1 month) 100%
a. GEE adjusted specificity = 93.7%
b. Combined specificity includes both Induced and Spontaneous data.
ACUTE STUDY - VITALITY
The VITALITY ICD was compared to a commercially available ICD (VENTAK
PRIZM‚ or VENTAK PRIZM 2 ICD) in an acute (nonimplant) paired study of 50
patients enrolled at nine investigating centers between March 8, 2001 and July
24, 2001. A total of 47 patients were tested with the study device, followed by
a control device at the time of a Guidant commercially approved (VENTAK
PRIZM, model 1851 or VENTAK PRIZM 2, model 1861) implantation.
The purpose of the acute study was to demonstrate that the addition of an SVT
detection enhancement and brady features did not adversely impact normal
ICD sensing and detection functionality. A total of 50 patients were tested
in nine U.S. centers.
Patients studied
The patients (38 M/9 F) had a mean age of 66 years (range 37 to 90) and
a left ventricular ejection fraction of 32% (range 10% to 62%). Most (40%)
presented with monomorphic ventricular tachycardia (MVT) and nonsustained
VT as their primary arrhythmia. Of the patients studied, 87 percent presented
with coronary artery disease or ischemic cardiomyopathy.
Methods and statistics
The acute study was done in the operating room or electrophysiology
laboratory without implantation of the study device. The primary endpoint was
to determine that VT/VF detection time for induced episodes is within two
seconds of the VENTAK PRIZM or VENTAK PRIZM 2 detection time.
Results
A total of 50 patients were enrolled in the acute study. Of those, 47
patients were successfully tested with the system per study protocol; there
were two attempted procedures and one intent. There was one clinical
- DRAFT -

E-4 CLINICAL STUDY - VITALITY
complication and two observations reported in the acute study, all of which
were non-investigational device related. No patient deaths were reported.
The VT/VF detection time of the VITALITY ICD was found to be within two
seconds of the VENTAK PRIZM 2 detection time, leading to the conclusion that
activating the additional VITALITY features does not have a negative effect on
the existing ICD sensing and detection functionality (Table E-2 on page E-4).
Table E-2. Acute study results
Study Endpoint VITALITY
(Mean ± std)
N
VENTAK
PRIZM 2 DR
(Mean ± std)
N
VT/VF Detection Time (seconds) 3.60 ± 0.60
N=47
3.52 ± .057
N=47
p-value: <0.001
- DRAFT -

F-1
CLINICAL STUDY - SUMMARY OF GDT1000 SENSING ACUTE
STUDY
APPENDIX F
CLINICAL STUDY POPULATIONS
GDT1000 study included patients indicated for a CRT-D device. Excluded from
the study were patients meeting any of the following criteria:
• Having no intrinsic P and/or R waves at implant
• Having a pre-existing unipolar pacemaker that was not to be
explanted/abandoned
• Enrolled in a concurrent study that would confound the study results
• Having ventricular tachyarrhythmias associated with a reversible cause
(e.g., digitalis toxicity, hypoxia, sepsis, transient electrolyte imbalance,
acute myocardial infarction, electrocution, or drowning)
• Women who were pregnant or planned to become pregnant
• Having a prosthetic mechanical tricuspid heart valve
STUDY METHODS
This clinical investigation was a 50 patient, multi-center, acute study conducted
at seven (7) centers in the United States. The main purpose of this clinical
investigation was to characterize the performance of the new Automatic Gain
Control (AGC) sensing platform, with the Dynamic Noise Adjustment (DNA)
feature, that is used in both COGNIS and TELIGEN devices. The AGC
sensing platform was studied using a Guidant Acute Sensing Device (GASD)
system, a non-implantable device containing the COGNIS/TELIGEN system
board, hardware, and firmware required for sensing intracardiac signals. The
study enrolled a total of 50 patients and was conducted in two phases. In the
first phase, 28 of 30 patients completed protocol testing. The algorithm was
modified after the first phase, and it was re-evaluated in the second phase, in
which 17 of 20 patients completed protocol testing. Of the five patients who
did not complete testing in the two phases, three were attempts, and two were
intents.
- DRAFT -
F-2 CLINICAL STUDY - SUMMARY OF GDT1000 SENSING ACUTE STUDY
Protocol Testing
Four scenarios were tested, including different combinations of sensed atrial
signals (AS), paced atrial signals (AP), sensed ventricular signals (VS), and
paced ventricular signals (VP), i.e., AS/VS, AS/VP, AP/VS, and AP/VP. Sensing
algorithm performance was analyzed from patients’ real-time electrograms
(EGM) and electronic signals. Primary analysis was performed by visually
reviewing the EGM and markers of the printed strips for proper sensing, as well
as for instances of undersensing and oversensing.
Additional analysis included tabulating the sensed and paced events stored
in the patient data files from the patient CD-ROM. During this tabulation,
unexpected events were noted. An example of an unexpected event is a
sensed event during an AP/VP testing scenario. The sensed event could be a
real event, such as a PVC, or an oversensed event. These unexpected events
were evaluated by viewing the electronic signals stored in the patient data files
and correlating these signals to the printed strips.
Statistical Analysis
The sensitivity, specificity, positive predictive value, rate of oversensing, and
rate of undersensing of the sensing algorithm were analyzed for each chamber.
A true positive (TP) is the number of intrinsic/paced signals appropriately
sensed, a false positive (FP) is the number of intrinsic/paced signals from
the opposite chamber oversensed, a false negative (FN) is the number of
intrinsic/paced signals undersensed, and a true negative (TN) is the number
of intrinsic/paced signals from the opposite chamber appropriately not
sensed. The sensing sensitivity was calculated as TP/(TP+FN), specificity
as TN/(TN+FP), positive predictive value (PPV) as TP/(TP+FP), rate of
oversensing as FP/(TP+FP), and rate of undersensing as FN/(TP+FN).
The sensing performance results from the first phase of the study are provided
and compared to the results from the second phase in order to demonstrate
the improvement in the operation of the updated sensing algorithm following
the between-phase changes. Results from the second phase of the study are
the most clinically relevant, as they reflect the performance of the final sensing
algorithm implemented in the COGNIS/TELIGEN devices.
The GDT1000 protocol did not pre-specify acceptable sensitivities, specificities,
PPV, rates of oversensing, or rates of undersensing for the RA, RV, and LV
channels.
- DRAFT -

CLINICAL STUDY - SUMMARY OF GDT1000 SENSING ACUTE STUDY F-3
STUDY RESULTS
Patient Characteristics
The table below shows the characteristics of the patients implanted or
attempted (Table F-1 on page F-3).
Table F-1. All patients implanted or attempted, Phase 1 and Phase 2
Characteristic Measurement Phase 1 Result (N=29) Phase 2 Result (N=19)
Age at implant Mean ± SD 65.8 ± 12.2 68.1 ± 9.6
Range [44.6, 85.5] [51.3, 81.8]
Gender [N (%)] Female 14 (48.0) 14 (74.0)
Male 15 (52.0) 5 (26.0)
NYHA Class [N (%)] III 27 (93) 19 (100)
IV 2(7) 0(0)
LVEF (%) Mean ± SD 22.4 ± 7.7 23.5 ± 6.4
Range [10.0, 35.0] [15.0, 35.0]
QRS Duration Mean ± SD 161± 29 149± 30
Range [124, 248] [106, 220]
Cardiac Disease [N (%)] Nonischemic
Cardiomyopathy
14 (48) 7 (37)
Ischemic Cardiomyopathy,
CAD
10 (34) 9 (47)
Hypertension 3(10) 0(0)
Coronary Artery Disease
(CAD)
1(3) 0(0)
Ischemic Cardiomyopathy,
no CAD
1 (3) 3 (16)
Valvular Heart Disease 0(0) 1(5)
Other 0 (0) 1 (5)
Lead Position
In this study, the position of each lead was per physician’s discretion. A majority
of the atrial leads in the first/second phase of the study were placed in the
right atrial appendage (19/12) with the remaining placed in the lateral wall
(5/2), septal wall (2/3), and unspecified location (1/0). A majority of the right
ventricular leads were implanted in the right ventricular apex, with the remaining
- DRAFT -

F-4 CLINICAL STUDY - SUMMARY OF GDT1000 SENSING ACUTE STUDY
placed in the septal wall (0/1) and unspecified location (1/0). A majority of
the left ventricular leads were implanted in the lateral, postero-lateral, or
posterior wall (21/15), with the remaining placed in an antero-lateral, anterior,
or postero-septal location (4/3).
Lead Configurations
In this study, both RA and RV leads used a bipolar configuration, which was not
programmable. The LV lead configuration programming was per physician’s
discretion. In the first phase, 20 patients had LV sensing programmed to the
LVtip>>LVring configuration, four to LVtip>>RVcoil, and one to LVtip>>Can.
In the second phase, 13 patients had LV sensing programmed to the
LVtip>>LVring configuration, and four to LVtip>>RVcoil.
Lead Performance
The lead performance, including pacing threshold, pacing impedance and
sensing amplitude, were measured at implant by a commercially available
Pacing System Analyzer (PSA). The results are provided in the table below
(Table F-2 on page F-4).
Table F-2. Lead performance
Measurement Lead Location Number of
Leads: Phase 1
Mean ± SD:
Phase 1
Number of
Leads: Phase 2
Mean ± SD:
Phase 2
Pacing
Impedance (Ω)
Left Ventricle 25 1034 ± 394 18 779 ± 227
Right Atrium 28 520 ± 161 17 519 ± 112
Right Ventricle 29 816 ± 263 18 649 ± 206
Pacing
Threshold (V)
Left Ventricle 25 1.9 ± 1.4 18 1.3 ± 1.0
Right Atrium 28 1.1 ± 0.7 16 1.2 ± 0.6
Right Ventricle 29 1.0 ± 0.4 18 0.8 ± 0.3
Sensing
Amplitude (mV)
Left Ventricle 25 14.1 ± 7.6 18 13.2 ± 7.3
Right Atrium 28 2.9 ± 1.5 16 3.7 ± 3.3
Right Ventricle 29 12.3 ± 6.2 18 13.4 ± 7.0
Sensing Performance
In the first phase of the study, a total of 55,207 signals were recorded, including
54,151 appropriate sensed intrinsic and paced beats and 1,056 inappropriate
- DRAFT -

CLINICAL STUDY - SUMMARY OF GDT1000 SENSING ACUTE STUDY F-5
sensed events (223 undersense and 833 oversense events). The sensing
algorithm used in the first phase achieved the sensitivities, specificities, positive
predictive values (PPV), rates of undersensing (1-sensitivity), and rates of
oversensing (1-PPV) are summarized in the table below (Table F-3 on page
F-5).
Table F-3. Summary of Sensing Performance - First Phase
Sensitivity
(Rate of
Undersensing)
Specificity Positive
Predictive
Value
(Rate of
Oversensing)
Appropriate
Sensed
Beats
Inappropriate
Sensed
Beats:
Undersense
Inappropriate
Sensed
Beats:
Oversense
Right Atrial
Channel
100% (0%) 96.81% 97.03%
(2.97%)
19,478 0 615
Right
Ventricular
Channel
100% (0%) 98.94% 98.86%
(1.14%)
18,439 0 216
Left
Ventricular
Channel
98.63%
(1.37%)
99.99% 99.99%
(0.01%)
16,054 223 2
Totals 54,151 223 833
In the second phase of the study, a total of 35,998 signals were recorded
including 35,831 appropriate sensed intrinsic and paced beats and 171
inappropriate sensed events (2 undersense and 169 oversense events).
The upgraded sensing algorithm used in the second phase achieved
the sensitivities, specificities, positive predictive values (PPV), rates of
undersensing (1-sensitivity), and rates of oversensing (1-PPV) summarized in
the table below; the table also summarizes the results of the analysis from the
second phase (Table F-4 on page F-5).
Table F-4. Summary of Sensing Performance - Second Phase
Sensitivity
(Rate of
Undersensing)
Specificity Positive
Predictive
Value
(Rate of
Oversensing)
Appropriate
Sensed
Beats
Inappropriate
Sensed
Beats:
Undersense
Inappropriate
Sensed
Beats:
Oversense
Right Atrial
Channel
100% (0%) 98.64% 98.54%
(1.46%)
11,372 0 168
Right
Ventricular
Channel
100% (0%) 100% 100% (0%) 12,230 0 0
- DRAFT -

F-6 CLINICAL STUDY - SUMMARY OF GDT1000 SENSING ACUTE STUDY
Table F-4. Summary of Sensing Performance - Second Phase (continued)
Sensitivity
(Rate of
Undersensing)
Specificity Positive
Predictive
Value
(Rate of
Oversensing)
Appropriate
Sensed
Beats
Inappropriate
Sensed
Beats:
Undersense
Inappropriate
Sensed
Beats:
Oversense
Left
Ventricular
Channel
99.98%
(0.016%)
99.99% 99.99%
(0.008%)
12,227 2 1
Totals 35,831 2 169
Comparing the performance between the two phases, there were 1,056
inappropriate sensing events out of 55,027 signals (1.919%) in the first phase
of the study, and a total of 171 inappropriate sensing events out of 35,998
signals (0.475%) in the second phase of the study, reflecting a 75.2% reduction
in inappropriate sensing events from phase one to two.
Oversense Events
During the analysis of the first phase data, some unexpected oversense events
were identified. There were a total of 831 oversense events in the RA (615) and
RV (216) channels in phase one. The majority of the RA and RV oversense
events were attributed to an artificial event introduced while pacing. This type
of oversense was observed in 6 patients in the RA channel and 7 patients in
the RV channel. The results for the second phase of the study demonstrated
that oversensing artificial events observed in the first phase of the study were
successfully eliminated by using the upgraded GASD system. There were no
artificial events introduced in the second phase of the study.
In the second phase, a total of 168 oversense events in the RA channel were
observed in one patient. This patient had an intrinsic P-R interval greater
than 300 ms. In order to complete the AP/VS test scenario, the device was
programmedwithaLRL=80bpmandAVDelay=300ms,whichisthe
maximum allowable AV Delay in a CRT-D device. At the end of the AV Delay,
no intrinsic activity occurred and the device paced both ventricles. These paced
beats were oversensed by the atrial channel. If the atrial blanking period were
programmed to a larger value, atrial oversensing would have been eliminated.
Therefore, excluding this patient’s AP/VS test scenario from the analysis, there
were no undersensing or oversensing events in the RA channel.
In one patient, the single oversense event in the LV channel was caused by
noise.
- DRAFT -
CLINICAL STUDY - SUMMARY OF GDT1000 SENSING ACUTE STUDY F-7
Undersense Events
LV undersense events (223) in the first phase of the study primarily occurred
in one patient whose LV intrinsic amplitude was less than 1.0 mV, which is
much smaller than the clinically acceptable threshold. This small LV intrinsic
amplitude resulted in undersensing some LV events.
Two LV undersense events occurred in the second phase of the study. A
potential cause for the LV undersense events was premature ventricular
contractions while atrial pacing.
CONCLUSIONS
This acute study demonstrated excellent sensitivity (100% in the RA, 100% in
the RV, and 99.98% in the LV channels), specificity (98.64% in the RA, 100% in
the RV, and 99.99% in the LV channels), and positive predictive values (98.54%
in the RA, 100% in the RV, and 99.99% in the LV channels). In conclusion, the
new sensing platform evaluated in the GDT1000 study will be implemented in
COGNIS/TELIGEN devices.
By excluding one patient’s oversensed events that could be eliminated by
programming a longer atrial blanking period, the modified specificity and
positive predictive values in the RA channel are 100% and 100% (oversensing
eliminated). While the GDT1000 protocol did not pre-specify acceptable
sensitivities, specificities, or PPV values, a Sensing Tape Testing DAT report
for COGNIS/TELIGEN on file at Boston ScientificCRM
1reported a 99.96%
sensitivity (0.04% Undersensing) and a 99.97% positive predictive value
(0.03% Oversensing) for the RV channel in normal sinus rhythm. Using the RV
values as a benchmark (RA and LV values were not calculated), the results of
this study compare favorably.
1. Sensing Tape Testing Design Analysis Test report 100019-687 Revision A describes testing
performed in which the COGNIS/TELIGEN sensing platform is modeled and compared to a
previous Guidant device, CONTAK RENEWAL TR. The analysis was performed using 219
patient rhythms from the Gold Development Database, including normal sinus rhythm and
atrial and ventricular arrhythmias.
- DRAFT -
F-8 CLINICAL STUDY - SUMMARY OF GDT1000 SENSING ACUTE STUDY
- DRAFT -
INDEX
Symbols
50 Hz/manual burst pacing 8-9
A
A-blank
after RV-sense 5-39
after V-pace 5-39
A-tachy response (ATR)
mode switch 5-19
Accelerate, in zone 4-3
Accelerometer 5-13
activity threshold 5-14
reaction time 5-15
recovery time 5-18
response factor 5-16
Activity threshold 5-14
Adaptive-rate pacing 5-12
Adverse event 1-18
AFib rate threshold 3-28, 3-35, 3-37
Amplitude 5-8
ATP (antitachycardia pacing) 4-18
intrinsic test 6-7
Application screen 2-6
Arrhythmia logbook 7-5
episode detail 7-6
events summary 7-6
interval 7-10
stored EGM 7-8
ATP (antitachycardia pacing) 4-10
amplitude 4-18
burst cycle length (BCL) 4-14
burst scheme 4-15
commanded, EP test 8-11
coupling interval 4-12
minimum interval 4-14
number of bursts 4-11
pulse count 4-11
pulse width 4-18
ramp scheme 4-15
ramp/scanscheme4-17
redetection after ATP 3-17
scan scheme 4-16
time-out 4-19
ATR (atrial tachy response)
atrial flutter response 5-25
duration 5-21
end of ATR episode 5-23
entry count 5-21
exit count 5-21
LRL, fallback 5-23
maximum pacing rate 5-24
mode switch 5-19
mode, fallback 5-22
PMT termination 5-25
rate threshold 5-20
time, fallback 5-22
ventricular rate regulation 5-24
VTR (ventricular tachy response) 5-23
Atrial
refractory period, post ventricular atrial
(PVARP) 5-36
use of atrial information 3-5
Atrial arrhythmia rate threshold 5-20
Atrial flutter response 5-25
Atrial tachy
ATRmodeswitch5-19
atrial flutter response 5-25
PMT termination 5-25
ventricular rate regulation 5-24
Attention conditions, yellow 2-10
Automatic Intrinsic Rhythm ID 3-7
AV delay 5-32
paced 5-32
sensed 5-33
AV Delay
Search 5-36
AV search + 5-35
AV Search +
Search AV Delay 5-36
- DRAFT -
Search Interval 5-36
B
Backup VVI pacing during atrial stimulation,
EP test 8-2
Battery
Beginning of life (BOL) 6-2
Explant status 6-2
icon 2-9
indicator 6-2
status 6-2
Beep
during capacitor charge 6-5
feature setup 10-4
Blanking
A-blank after RV-sense 5-39
A-blank after V-pace 5-39
Blanking; Noise
rejection, blanking 5-38
Burst
ATP (antitachycardia pacing) 4-11
cycle length (BCL) 4-14
minimum interval 4-14
number of bursts 4-11
pacing, 50 Hz/manual burst 8-9
parameter 4-11
pulse count 4-11
scheme 4-15
Buttons, software 2-8
C
Capacitor
deformation 4-22, 6-5
re-formation 6-5
Characteristics as shipped 1-22
Charge time 4-22
measurement 6-5
Check
icon 2-9
Commanded
ATP, EP test 8-11
shock, EP test 8-10
therapy, EP test 8-10
Committed shock 3-10, 4-23
Communication, telemetry
radio frequency (RF) 2-12
Connection, lead to pulse generator 1-20, 9-6
Content, package 1-21
Contraindications 1-6
Counter
brady 7-12
therapy history 7-11
ventricular 7-11
Coupling interval 4-12
decrement 4-12
D
Data
disk 2-11
patient 2-11
Decelerate,inzone4-3
Decrement
coupling interval 4-12
ramp scheme 4-15
scan scheme 4-16
Defibrillation
backup defibrillator, safety mode 2-19
Demonstration
Programmer/recorder/monitor (PRM)
mode 2-6
Description, device 1-4
Detail icon 2-8
Detection
AFib rate threshold 3-28
duration 3-14
enhancement 3-7, 3-22
episode 3-19
- DRAFT -
onset 3-33
rate sensing 3-3
rate threshold 3-4
reconfirmation/committed shock 4-23
redetection 3-11
stability 3-31
sustained rate duration (SRD) 3-34
tachyarrhythmia 3-1
tachyarrhythmia, safety mode 2-19
Vrate>Arate3-27
vector timing and correlation 3-26
ventricular, initial 3-6
window 3-13
Device
characteristics as shipped 1-22
description 1-4
mode 3-2
specification 1-19
storage 1-8
Diagnostic
battery status 6-2
histogram 7-11
lead test 6-6
patient triggered monitor 7-13
Disk
data 2-11
read 2-11
save 2-11
Disposal of pulse generator 10-8
DIVERT THERAPY 2-17
Duration 3-14
ATR (atrial tachy response) 5-21
post-shock 3-17
redetection 3-17
E
ECG (electrocardiogram)
display 2-7
EGM (electrogram)
display 2-7
Electrocautery
mode 3-3
Electrode, lead configuration 5-31
Electromagnetic interference (EMI) 1-12
EMI (electromagnetic interference) 1-12
EndofATRepisode5-23
Energy
shock 4-21
Enhancement
detection 3-7, 3-22
Entry count 5-21
EP test (electrophysiologic test) 8-2
ATP, commanded 8-11
backup VVI pacing during atrial
stimulation 8-2
burst pacing, 50 Hz/manual 8-9
commanded therapy 8-10
fibrillation 8-5
induction 8-4
mode, temporary 8-2
programmed electrical stimulation
(PES) 8-7
shock on T 8-6
shock, commanded 8-10
VFib 8-5
Episode 3-19
end of ATR 5-23
nontreated 3-19, 7-11
treated 3-19, 7-11
ventricular 3-19
Event
adverse, potential 1-18
counter 7-11
icon 2-9
therapy history 7-2
Events
summary 7-6
Exit count 5-21
Explantation 10-8
- DRAFT -
F
Fallback, atrial mode switch
LRL 5-23
mode 5-22
time 5-22
Federal Communications Commission
(FCC) 1-24
Fibrillation
VFib induction 8-5
Follow-up
examination, routine 10-2
predischarge 10-2
test 10-2
H
Histogram 7-11
Horizontal slider
icon 2-9
I
Icon
battery 2-9
check 2-9
details 2-8
event 2-9
horizontal slider 2-9
increment and decrement 2-10
lead 2-9
patient 2-9
patient information 2-11
Programmer/recorder/monitor (PRM)
mode indicator 2-6
run 2-9
scrolling 2-10
sorting 2-9
vertical slider 2-9
Identifier, x-ray 1-23
Impedance test, lead 6-8
Implant
post, follow-up 10-2
post, information 10-3
predischarge follow-up 10-2
procedure 9-2
Increment and decrement
icon 2-10
Indications and usage 1-6
Indications Based Programming (IBP) 2-2
Induction, EP test 8-4
Industry Canada (IC) 1-24
Information
implant 2-11, 9-2
lead 2-11
patient 2-11
patient counseling 1-27
post implant 10-2
related 1-6
warranty 1-26
Interrogate 2-13
Interval
arrhythmia logbook 7-10
coupling, ATP 4-12
minimum, burst cycle length 4-14
Intrinsic amplitude test 6-7
Items included in package 1-21
L
Last delivered shock 6-6
Latitude 2-2
Lead
configuration 5-31
connection to pulse generator 1-20
connection to pulse generator (PG) 9-6
icon 2-9
impedance 6-8
intrinsic amplitude 6-7
pace threshold 6-8
- DRAFT -
test 6-6
Logbook 7-5
Longevity
pulse generator 1-25
Lower rate limit (LRL) 5-4
M
Magnet 1-8
electromagnetic interference (EMI) 1-12
feature setup 10-5
inhibit tachy therapy 10-5
static magnetic fields 1-16
Magnetic fields 1-16
Magnetic Resonance Imaging (MRI) 1-7
Manual programming 2-5
Manual/50 Hz burst pacing 8-9
Maximum
pacing rate 5-24
sensor rate (MSR) 5-6
tracking rate (MTR) 5-5
Maximum pacing rate
rate smoothing 5-31
Measurement
lead, baseline 9-5
Mechanical specification 1-19
Memory, pulse generator 2-11
Minimum
interval 4-14
Mode
device 3-2
electrocautery 3-3
fallback ATR (atrial tachy response) 5-22
pacing 5-3
Programmer/recorder/monitor (PRM) 2-6
temporary, EP test 8-2
ventricular tachy 3-2
N
Noise
response 5-41
Nominal parameter setting A-1
Number of bursts 4-11
pulse count 4-11
O
Onset 3-10, 3-33, 3-37, 3-38
P
Pace
STAT PACE 2-18
Pace threshold test 6-8
pacing
Indications Based Programming
(IBP) 2-2
Pacing
adaptive-rate 5-12
amplitude 5-8
ATRmodeswitch5-19
AV delay 5-32
backup pacemaker in safety mode 2-19
backup VVI during atrial stimulation 8-2
burst, 50 Hz/manual 8-9
lower rate limit (LRL) 5-4
maximum sensor rate (MSR) 5-6
maximum tracking rate (MTR) 5-5
mode 5-3
noise response 5-41
Parameter, BASIC 5-2
post therapy 5-9, 5-10
post-therapy 5-9
pulse width 5-7
refractory 5-36
runaway protection 5-4
- DRAFT -
sensitivity 5-8
sensor 5-11
temporary 5-10
therapy 5-2
Package
content 1-21
symbol on 1-21
Parameter, characteristics 1-22
Patient
counseling information 1-27
handbook 1-28
information icon 2-9
Patient triggered monitor 7-13
PES (programmed electrical stimulation) 8-7
PMT (pacemaker-mediated tachycardia)
termination 5-25
Polarity
shock 4-22
Post implant information 10-2, 10-3
beeper feature 10-4
magnet feature 10-5
sensitivity adjustment 10-3
Post-shock
detection parameter 3-11
duration 3-17
pacing 5-9, 5-10
Post-therapy pacing 5-9
Precautions 1-8
Predischarge follow-up 10-2
Premature ventricular contraction (PVC) 5-37
Prescription
therapy 4-2
Print
report 2-12
Printer
external 2-12
Program 2-2
Programmable option, parameter A-1
Programmer/recorder/monitor (PRM) 2-2
controls 2-5, 2-6
modes 2-6
software terminology 2-6
use of color 2-10
Programming recommendation 2-2, 2-5
Protection
runaway 5-4
Pulse amplitude 5-8
Pulse count 4-11
Pulse generator (PG)
disposal 10-8
explantation 10-8
implant 9-2
longevity 1-25
memory 2-11
setscrew locations 9-6
suture hole 9-6
Pulse width 5-7
ATP (antitachycardia pacing) 4-18
PVARP (post ventriuclar atrial refractory
period) 5-36
after PVC (premature ventricular
contraction) 5-37
PVC (premature ventricular contraction) 5-37
Q
QUICK CONVERT ATP 4-20
Quit
Ending a telemetry session 2-14
R
Radio frequency (RF)
ending telemetry 2-14
interference 2-15
operating temperature, telemetry 2-15
starting telemetry 2-14
telemetry 2-12, 2-13
Ramp scheme 4-15
Ramp/Scanscheme4-17
Rate
adaptive 5-12
- DRAFT -
AFib threshold 3-28
calculation 3-4
lower limit (LRL) 5-4
maximum sensor 5-6
maximum tracking 5-5
sensing 3-3
sustained rate duration (SRD) 3-34
threshold, ventricular 3-4
Vrate>Arate3-27
ventricular 3-4
zone 3-4
Rate enhancement, pacing 5-26
rate hysteresis 5-26
rate smoothing 5-28
Rate smoothing 5-28
down 5-31
Maximum pacing rate 5-31
up 5-31
Rate threshold, ATR 5-20
Reaction time 5-15
Read disk 2-11
Reconfirmation 3-10, 4-23
Recovery time 5-18
Red warning conditions 2-10
Redetection 3-11
after ATP delivery 3-17, 4-8
after shock delivery 3-17, 4-9
duration 3-17
ventricular 4-8
Reform, capacitor 6-5
Refractory
atrial, post ventricular (PVARP) 5-36
blanking and noise rejection 5-38
PVARP after PVC 5-37
right ventricular (RVRP) 5-37
Refractory; pacing
refractory 5-36
Related information 1-6
Reliability 1-26
Report, printed 2-7, 2-11
ECG/EGM 2-7
Response factor 5-16
Rhythm
ID, automatic intrinsic 3-7
Right ventricular refractory (RVRP) 5-37
Run
icon 2-9
Runaway protection 5-4
RV-blank after A-pace 5-38
S
Safety core 2-19
Safety mode 2-19
Safety Tachy Mode 2-20
Save disk 2-11
Scan scheme 4-16
Screen, programmer application 2-6
Scrolling
icon 2-10
Search +, AV 5-35
Search AV Delay 5-36
Search Interval 5-36
Security
ZIP telemetry 2-14
Sensing, rate 3-3
Sensitivity 5-8
Sensitivity adjustment 10-3
Sensor and trending, pacing 5-11
accelerometer 5-13
adaptive-rate 5-12
maximum sensor rate (MSR) 5-6
Setscrew locations 9-6
Setting
parameter value A-1
zone configuration 3-4
Shock
charge time, energy 4-22, 6-5
commanded, EP test 8-10
committed 4-23
diverting 2-17
energy 4-21
impedance 6-8
last delivered 6-6
- DRAFT -
on T induction 8-6
polarity 4-22
post-shock pacing 5-9, 5-10
redetection 3-17
selection 4-3
sequence 4-2
STAT SHOCK 2-17
therapy 4-21
ventricular therapy 4-21
waveform 4-22
Shock if unstable 3-33
Shock on T induction 8-6
Software terminology 2-6
Sorting
icon 2-9
Specification, mechanical 1-19
Stability 3-10, 3-31, 3-35, 3-37, 3-38
STAT PACE 2-18
STAT SHOCK 2-17
Sterilization 1-8
Stimulation, PES induction 8-7
Storage of device 1-8
Stored EGM
arrhythmia logbook 7-8
Sustained rate duration (SRD) 3-34
Suture hole 9-6
Symbol
on package 1-21
T
Tabs, software 2-8
Tachy mode 3 - 2
Safety Mode 2-20
Tachyarrhythmia
detection 3-1
detectioninsafetymode2-19
Indications Based Programming
(IBP) 2-2
therapy 4-2
therapy in safety mode 2-19
zone 3-4
Tele m e t r y
ending ZIP 2-14
operating temperature, ZIP 2-15
starting ZIP 2-14
wand 2-12
wanded 2-13
ZIP 2-12, 2-13
Temporary
pacing 5-10
Test
EP (electrophysiologic) 8-2
follow-up 10-2
intrinsic amplitude 6-7
lead 6-6
lead impedance 6-8
pace threshold 6-8
Therapy
ATP (antitachycardia pacing) 4-10
pacing 5-2
post-shock pacing 5-9, 5-10
prescription 4-2
selection 4-3
shock 4-21
tachyarrhythmia 4-2
tachyarrhythmia, safety mode 2-19
Therapy history 7-2
arrhythmia logbook 7-5
counter 7-11
histogram 7-11
patient triggered monitor 7-13
Threshold
AFib rate 3-28
rate 3-4
Threshold, activity 5-14
Time-out, ATP 4-19
Timing
blanking 5-38
PVARP after PVC 5-37
Timing, pacing 5-36
Toolbar 2-8
Trending
sensor 5-11
- DRAFT -
Trends 7-3
V
Vrate>Arate3-27
Vector timing and correlation 3-26, 3-35
Ventricular
ATP (antitachycardia pacing) 4-10
detection, tachyarrhythmia 3-6
redetection after ventricular ATP
therapy 4-8
redetection after ventricular shock
therapy 4-9
redetection after ventricular therapy
delivery 4-8
shock therapy 4-21
tachy mode 3-2
tachyarrhythmia therapy 4-2
Ventricular rate regulation 5-24
maximum pacing rate 5-24
Ventricular shock vector 4-21
Vertical slider
icon 2-9
VFib induction 8-5
VTR (ventricular tachy response) 5-23
W
Wand, telemetry 2-2, 2-12, 2-13
Warning conditions, red 2-10
Warnings 1-7
Warranty 1-26
Waveform, shock 4-22
Wenckebach 5-28
Window
detection 3-13
X
X-ray identifier 1-23
Y
Yellow attention conditions 2-10
Z
ZIP telemetry 2-12, 2-13
advantages 2-13
indicator light 2-14
interference 2-15
operating temperature 2-15
radio frequency (RF) 2-14
security 2-14
session 2-14
Zone
configuration 3-4
ventricular 3-4
ventricular tachyarrhythmia 3-4
ZOOM LATITUDE Programming System
components 2-2
ZOOMVIEW Software Application 2-2
purpose 2-2
screens and icons 2-6
use of color 2-10
- DRAFT -
- DRAFT -
- DRAFT -

Boston Scientific
4100 Hamline Avenue North
St. Paul, MN 55112–5798 USA
www.bostonscientific.com
1.800.CARDIAC (227.3422)
+1.651.582.4000
© 2007 Boston Scientificoritsaffiliates
All rights reserved.
357389-001 EN US 12/07
FCC ID: ESCCRMN11906
IC: 4794A-CRMN1196
Part 2 of 2
*357389-001*
- DRAFT -