Boston Scientific CRMN11906 Implantable Defibrillator User Manual Cognis Part 4 Manual
Boston Scientific Corporation Implantable Defibrillator Cognis Part 4 Manual
Contents
Cognis Part 4 Manual
CLINICAL STUDY - COMPANION B-15
Sub-study Primary Endpoint and Additional Tertiary Endpoints
Exercise performance––the co-primary endpoint, which consists of Peak VO2
and Six-Minute Walk, is designed to demonstrate improvement in exercise
performance with CRT (CONTAK TR and CONTAK CD pooled data) compared
to OPT at six months post-baseline.
Additional tertiary endpoints included Quality of Life as measured by the
Minnesota Living with Heart Failure Questionnaire®and NYHA Class.
FOLLOW-UP SCHEDULE
The follow-up schedule included the following:
• Enrollment––initial assessment of patient eligibility; taking of patient history
• Baseline screening––special testing (included a Symptom-Limited Treadmill
Test with measurement of oxygen uptake (Peak VO2), a Six-Minute Walk,
Quality of Life [QOL] questionnaire and NYHA Classification)
• Randomization––randomization status (OPT, CRT-P, or CRT-D) was
assigned
• Implant (CRT-P or CRT-D arm)––implant of investigational devices and
acute device testing for those randomized to a CRT therapy arm
• Routine follow-up––routine evaluation of device function and patient
condition at pre-discharge, one week, and one month post-implant
• Three- and six-month visits––evaluation of randomized therapy with special
testing and device function at three and six months after the Post-Recovery
Visit
• Quarterly Visits––after the six-month visit, patients were seen for routine
evaluation of device function and patient condition
DEMOGRAPHIC DATA
All baseline patient characteristics are presented in Table B-5 on page B-16.
- DRAFT -

B-16 CLINICAL STUDY - COMPANION
Table B-5. Patient population characteristics for COMPANION (OPT and CRT-D)
Characteristic OPT
(N = 308)
CRT-D
(N = 595)
P-value
Age (years) Mean ± SD 66.7 ± 10.7 65.6 ± 11.2 0.14
Female 97 (31.4) 194 (32.6) 0.73
Gender [N (%)]
Male 211 (68.5) 401 (67.3) 0.73
Class III 253 (82.1) 512 (86.1) 0.12
NYHA Classification [N (%)]
Class IV 55 (17.8) 83 (13.9) 0.12
Ischemic 58.7 54.6 0.13
Ischemic Etiology (%)
Non-ischemic 41.3 45.4 0.13
LVEF (%) Mean ± SD 22.8 ± 7.2 22.5 ± 6.8 0.47
Resting Heart Rate (bpm) Mean ± SD 72 ± 12 73 ± 13 0.37
QRS Width (ms) Mean ± SD 156 ± 24 159 ± 24 0.09
LBBB 69.8 72.9 0.21
Non-specific21.4 16.8 0.21
Conduction Abnormality (%)
RBBB 8.77 10.2 0.21
Duration of Heart Failure (years) Mean ± SD 4.86 ± 4.41 4.44 ± 3.83 0.43
Diuretic 94.4 96.6 0.12
ACE inhibitor or ARB 88.6 89.6 0.66
Beta Blockers 66.2 67.6 0.69
Aldosterone Antagonist 54.8 55.1 0.94
Heart Failure Medications [(%)]
Digoxin 67.2 70.9 0.25
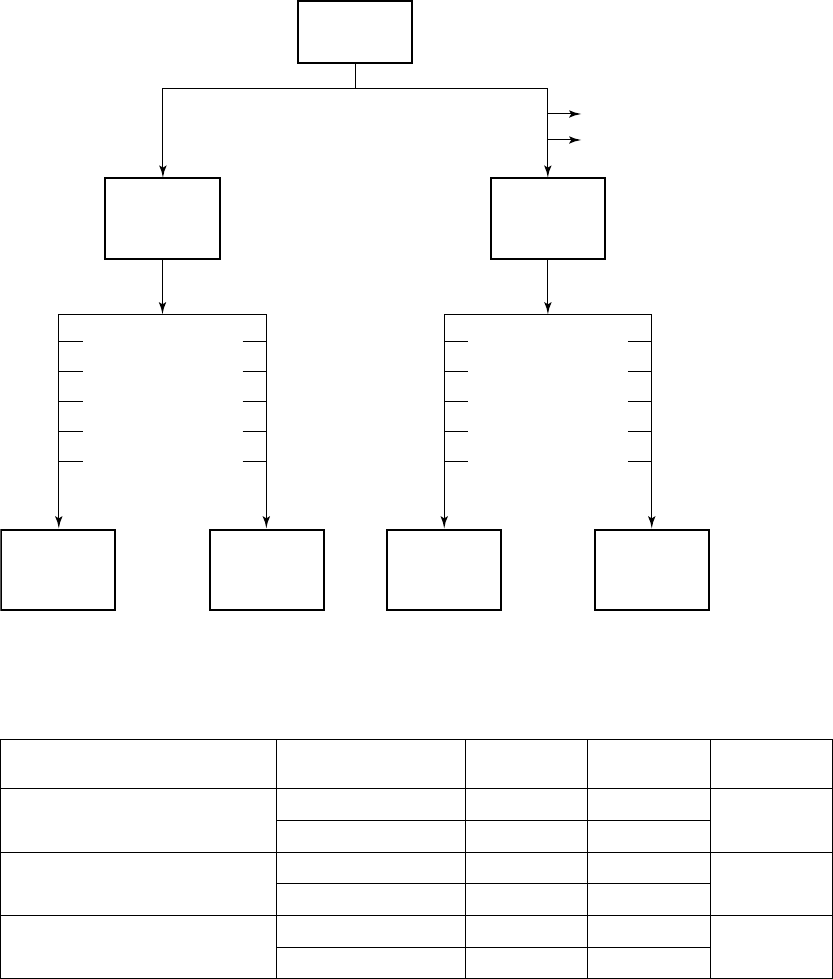
PATIENT ACCOUNTABILITY AND FOLLOW-UP DURATION
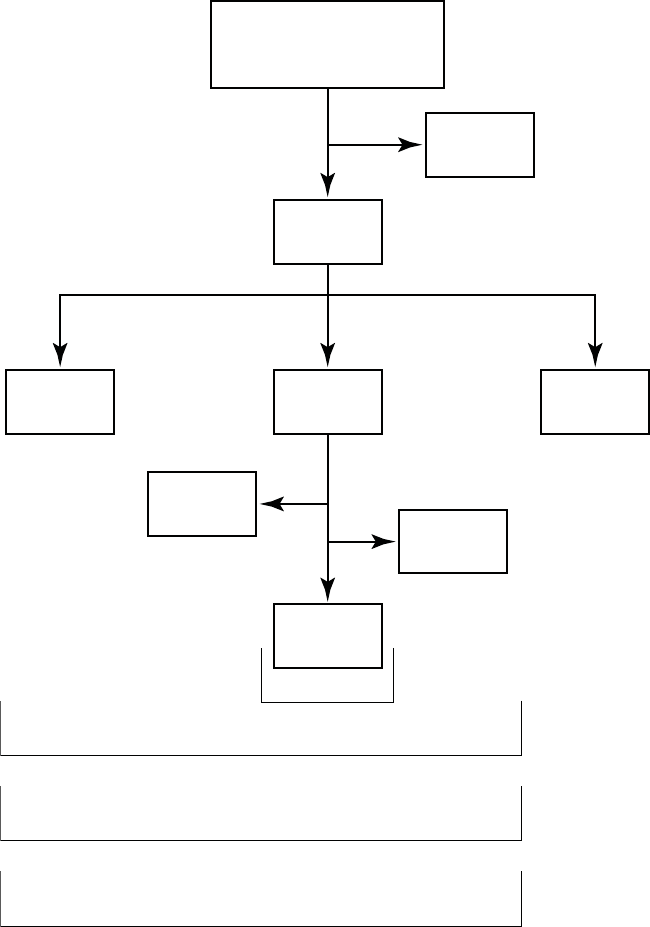
The COMPANION study enrolled 1638 patients, with 1520 patients randomized
to a treatment group and one hundred eighteen patients (118) not randomized
due to changes in patient condition or consent between time of enrollment and
time of randomization, such that the inclusion criteria were no longer satisfied.
Of the 1520 patients, 595 were randomized to CRT-D with a mean follow-up of
1.3 years and 308 were randomized to OPT with a mean follow-up of 1.1 years.
Figure B-1 on page B-18 provides an overview of patient enrollment.
Table B-6 on page B-17 gives a summary (by treatment group) of patient
disposition over time through 12 months after randomization. This does not
- DRAFT -

CLINICAL STUDY - COMPANION B-17
account for patients that had a hospitalization or death event that contributed to
the primary endpoint or secondary endpoint of all-cause mortality.
Table B-6. Patient follow-up disposition 12 months post-randomization
CRT-D OPT
#of
Withdrawn
Patients
#of
Deceased
Patients
(N =
595) #
Reached
end of
study
(Nov. 30,
2002)
#of
Active
Patients
at end
of time
interval
#of
Withdrawn
Patients
#of
Deceased
Patients
(N = 308)#
Reached
end of
study
(Nov. 30,
2002)
#of
Active
Patients
at end
of time
interval
1Day-
7Days
4 3 0 588 6 0 0 302
7Days-
1 Month
435576 10 3 1 288
1Month-
3 Months
4 15 6 551 11 11 1 265
3 Months
-
9 Months
12 28 49 462 26 22 29 188
9 Months
-12
Months
1 12 35 414 11 11 19 147
- DRAFT -
B-18 CLINICAL STUDY - COMPANION
COMPANION
Enrolled
n = 1638
Fall out prior to
Randomization
n = 118
Randomized
n = 1520
Randomized to
OPT
n = 308
Randomized to
CRT-D
n = 595
Randomized to
CRT-P
n = 617
CRT-D Implant
Intents
n = 7 CRT-D Implant
Attempts
n = 47
Implanted CRT-D
Devices
n = 541
System Safety Endpoint
n = 541
All-cause mortality endpoint through 12/1/02 for OPT and CRT-D
n = 903
All adverse events through 11/26/03 for OPT and CRT-D
n = 903
All-cause mortality or first hospitalization and cardiac morbidity endpoints
through 12/1/02 for OPT and CRT-D
n = 903
Figure B-1. Study patient enrollment and randomization for CRT-D and OPT
- DRAFT -
CLINICAL STUDY - COMPANION B-19
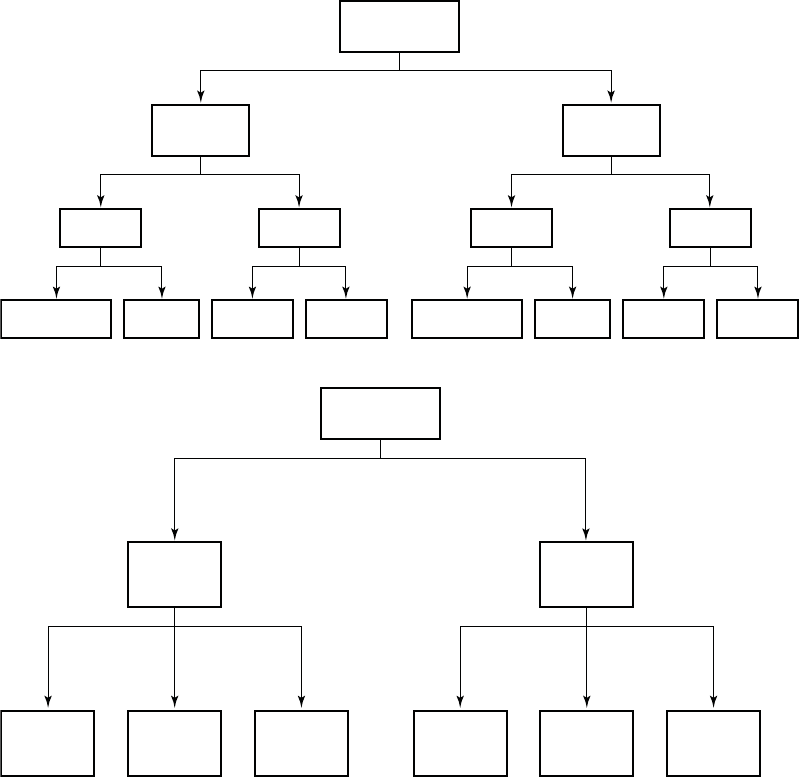
Event Contributing to Primary Endpoint and Secondary Endpoint of
All-cause Mortality
A total of 903 COMPANION patients in the CRT-D (595) and OPT (308) groups
were eligible for the primary endpoint. Figure B-2 on page B-19 provides patient
randomization and status for the primary endpoint and Figure B-3 on page B-19
provides patient randomization and status for the secondary mortality endpoint.
Randomized
n = 903 of 1520
OPT
n = 308
CRT-P
n = 595
Hospitalization
n = 196
Death
n = 20
Unknown
n = 15
No event
n = 77
Hospitalization
n = 372
Death
n = 18
Unknown
n = 5
No event
n = 200
No event
n = 92
Event
n = 216
No event
n = 205
Event
n = 390
Figure B-2. CRT-D and OPT patient randomization for primary endpoint
Randomized
n = 903
Alive
n = 218
Unknown
n = 15
Dead
n = 77
Alive
n = 484
Unknown
n = 6
Dead
n = 105
OPT
n = 308
CRT-D
n = 595
Figure B-3. CRT-D and OPT patient randomization for mortality endpoint
- DRAFT -
B-20 CLINICAL STUDY - COMPANION
DATA ANALYSIS AND RESULTS FOR PRIMARY ENDPOINT AND
SECONDARY ALL-CAUSE MORTALITY ENDPOINT
Sequential Monitoring
The COMPANION DSMB met approximately every six months to review the
trial’s progress and to review the safety and effectiveness data collected. An
“O’Brien-Fleming” type boundary as implemented by Lan and DeMets was
used in monitoring the trial. The Group sequential procedure ensured that
the total alpha spent across repeated analyses did not exceed the total type I
error, in this case a=0.03.
On November 18, 2002 the DSMB reviewed the study progress for the final
time. The CRT-D arm of the Study had reached the target number of events
for both the combined mortality and hospitalization endpoint as well as the
all-cause mortality endpoint prompting the DSMB to recommend to the Steering
Committee that enrollment be stopped. All effectiveness follow-ups ended
on December 1, 2002.
Results
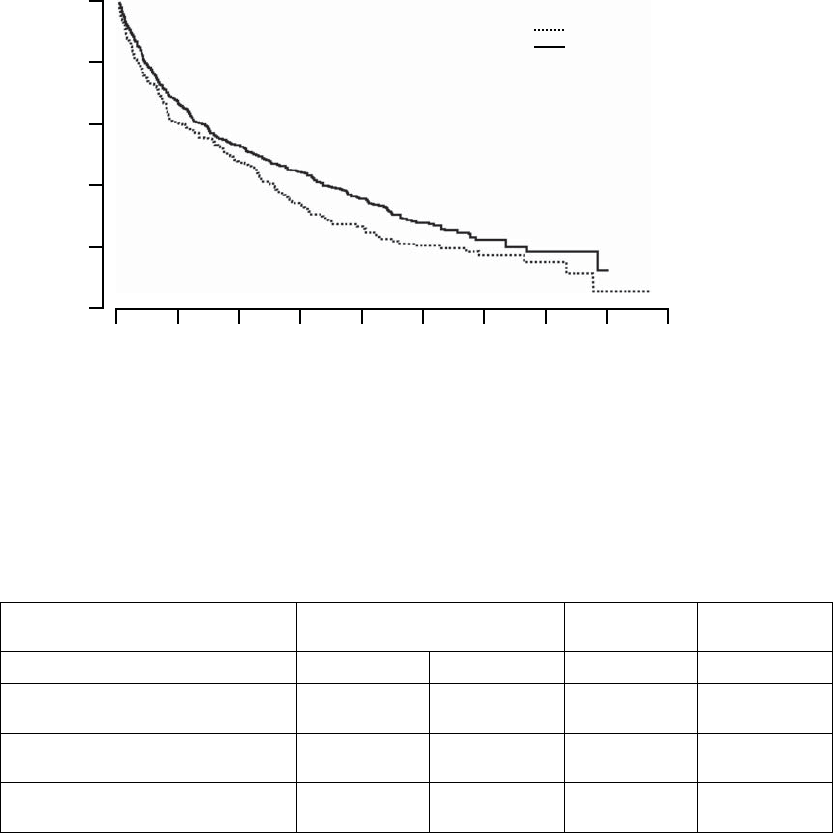
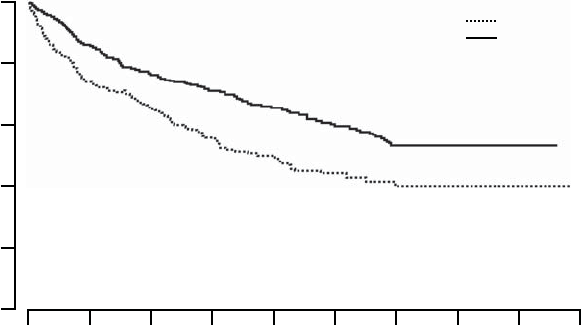
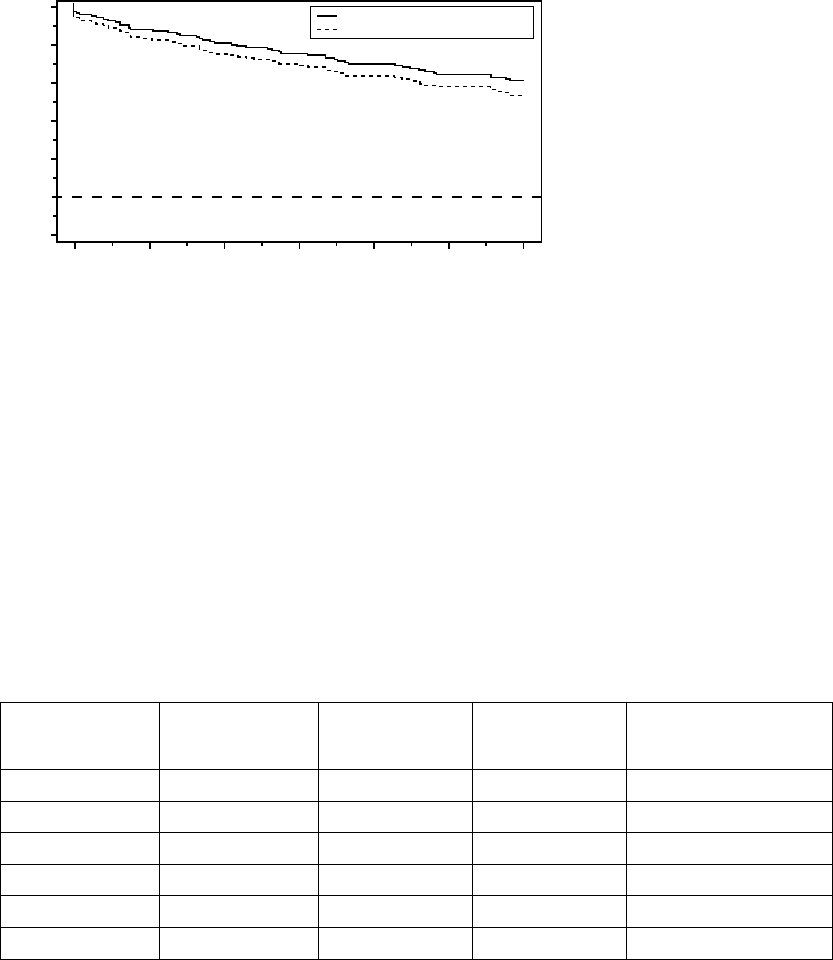
Primary Endpoint: All-cause Mortality or First Hospitalization
The Kaplan-Meier curves illustrate the time to all-cause mortality or first
hospitalization (Figure B-4 on page B-21). There were 216 primary endpoint
events observed in the OPT arm and 390 in the CRT-D arm (p = 0.010; p =
0.011 after adjustment for interim analyses). The median time to first event was
209 days in the OPT group and 269 days in the CRT-D group. The annual
event rates for OPT and CRT-D, respectively, were 68.0% and 55.9%, with a
hazard ratio of 0.80; 95% CI (0.68, 0.95). This result demonstrated that CRT-D
significantly reduced the relative risk of all-cause mortality or first hospitalization
by 20% when compared to OPT alone.
- DRAFT -
CLINICAL STUDY - COMPANION B-21
1080 960 840 720 600 480 360 240 120 0
100
80
60
40
20
0
% of Patients Event-Free
Days from Randomization
All-cause Mortality or First Hospitalization
CRT-D vs. OPT: p = 0.010
Number of Events
OPT: 216
CRT-D: 390
OPT
CRT-D
308
595
Number of
Patients at Risk
OPT
CRT-D
176
385
115
283
72
217
46
128
24
61
16
25
6
8
1
0
HR = 0.80. 95% CI (0.68, 0.95)
Figure B-4. Primary Endpoint: All-cause mortality or first hospitalization
In addition to the hazard ratio, point estimates of risk reduction were also
calculated (Table B-7 on page B-21). These estimates will vary with time from
the true treatment effect, and thus should be interpreted with caution.
Table B-7. Risk reduction point estimates
% Failure Absolute Risk
Reduction
Relative Risk
Reduction
OPT CRT-D
6months 44.9%
(38.9%, 50.3%)
42.9%
(38.7%, 46.7%)
2.0% 4.5%
12 months 68.0%
(61.7%, 73.2%)
55.9%
(51.6%, 59.8%)
12.1% 17.8%
18 months 77.8%
(71.6%, 82.7%)
69.0%
(64.5%, 73.1%)
8.8% 11.3%
Secondary Endpoints
All-cause Mortality––deaths from any cause were reported in 77 patients
randomized to OPT and 105 patients randomized to CRT-D (p = 0.003, p
= 0.004 after adjusting for interim analyses). The Kaplan-Meier curves are
- DRAFT -
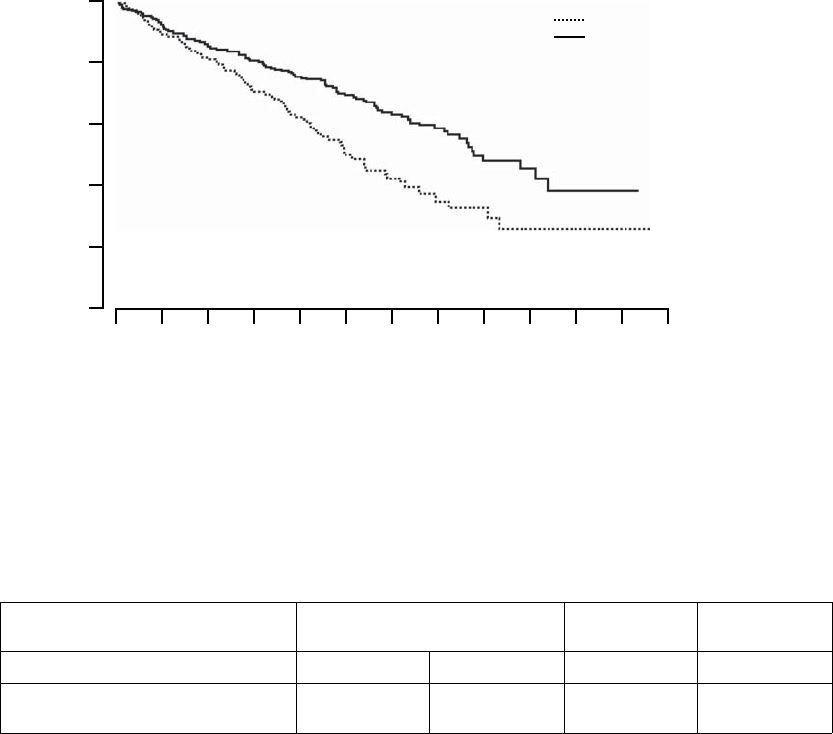
B-22 CLINICAL STUDY - COMPANION
depicted in Figure B-5 on page B-22. These numbers correspond to an annual
mortality rate of 19% in the OPT arm and 12% in the CRT-D arm, with a hazard
ratio of 0.64, 95% CI (0.48, 0.86). These results demonstrated that CRT-D
was associated with a 36% reduction in the risk of all-cause mortality when
compared to OPT alone.
1080 720 630 540 450 360 270 180 90 0
100
90
80
70
60
50
% of Patients Event-Free
Days from Randomization
All-cause Mortality
CRT-D vs. OPT: p = 0.003
Number of Events
OPT: 77
CRT-D: 105
OPT
CRT-D
308
595
Number of
Patients at Risk
OPT
CRT-D
284
555
255
517
217
470
186
420
141
331
94
219
57
148
45
95
HR = 0.64. 95% CI (0.48, 0.86)
25
47
4
21
2
1
810 900 990
Figure B-5. Secondary Endpoint: All-cause mortality
In addition to the hazard ratio, point estimates of risk reduction were also
calculated (Table B-8 on page B-22). These estimates will vary with time from
the true treatment effect, and thus should be interpreted with caution.
Table B-8. Mortality endpoint risk reduction point estimates
% Failure Absolute Risk
Reduction
Relative Risk
Reduction
OPT CRT-D
6months 9.0%
(5.7%, 12.2%)
7.3%
(5.1%, 9.3%)
1.7% 18.9%
- DRAFT -

CLINICAL STUDY - COMPANION B-23
Table B-8. Mortality endpoint risk reduction point estimates (continued)
% Failure Absolute Risk
Reduction
Relative Risk
Reduction
OPT CRT-D
12 months 18.9%
(14.1%, 23.5%)
12.1%
(9.3%, 14.8%)
6.8% 36.0%
18 months 28.4%
(22.3%, 34.1%)
18.0%
(14.4%, 21.5%)
10.4% 36.6%
Results for Secondary Cardiac Morbidity Endpoint
During a hospitalization more than one of the pre-specified cardiac morbid
events could occur. The Anderson-Gill extension to the Cox proportional
hazard model was used to analyze time to multiple cardiac morbid events.
Caution must be used in interpreting p-values in this analysis because this
analysis does not account for the competing risk of death.
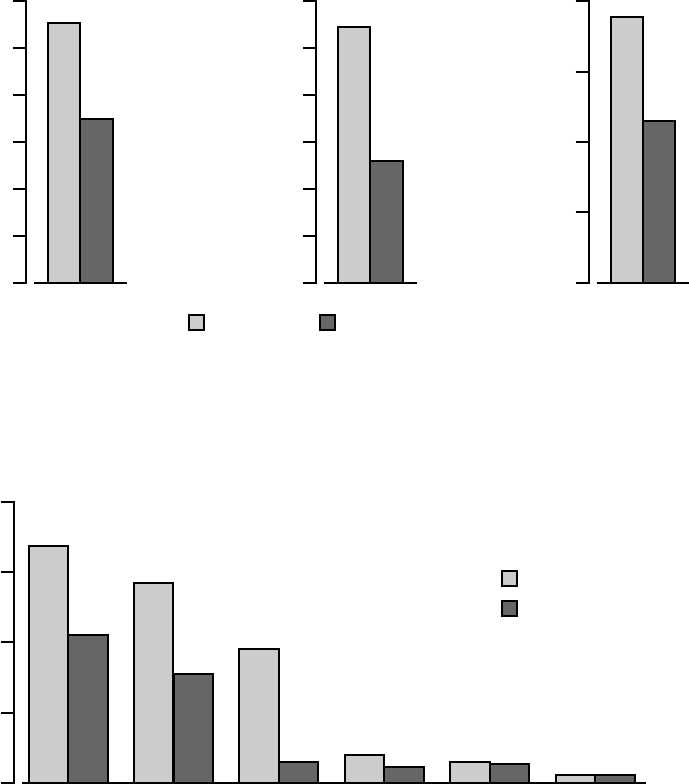
In Figure B-6 on page B-24, the frequency and duration of cardiac morbid
events are illustrated. CRT-D was associated with a 36% reduction (p <
0.0001) in the proportion of patients with at least one event, a 52% reduction
(p < 0.0001) in events on an annual basis, and a 41% reduction (p < 0.0001)
in the hospital duration on an annual basis. These reductions are primarily
due to the reduction of hospitalizations for acute decompensation of heart
failure, worsening heart failure resulting in IV inotrope or vasoactive therapy
> 4 hours (during an inpatient hospitalization) and cardiac surgery (including
percutaneous intervention) (Figure B-7 on page B-24).
- DRAFT -
B-24 CLINICAL STUDY - COMPANION
55% 1.08 7.6
60
50
40
20
10
30
0
1.2
1.0
0.8
0.4
0.2
0.6
0.0
8
6
4
2
0
35%
Proportion of Patients with ≥ 1 Event (%)
0.52
Event Rate (Events/Patient-Year)
4.5
Duration (Days/Patient-Year)
Frequency (per Patient)
36% reduction
p < 0.0001
Duration
41% reduction
p < 0.0001
Frequency (per Patient Year)
52% reduction
p < 0.0001
OPT (n = 308) CRT-D (n = 595)
Figure B-6. Secondary Endpoint: cardiac morbidity
Caution must be used in interpreting p-values; analysis does not account for
competing risk of death.
0.68
0.8
0.6
0.4
0.2
0.0
0.42
Events per Patient Year
0.57
0.31
0.38
0.06 0.06
0.08 0.04 0.05
0.02 0.02
OPT
CRT-D
Hospitalization
for acute
decompensation
of HF
Worsening HF
resulting in IV
inotrope or
vasoactive > 4
hours
Cardiac surgery,
including
percutaneous
intervention
Hospitalization
resulting in
death from
cardiac causes
Mechanical
respiratory or
cardiac support
Resuscitated
cardiac arrest or
sustained VT
requiring
external
intervention
38% reduction
p < 0.0001
46% reduction
p < 0.0001
84% reduction
p < 0.0001
50% reduction
p = 0.016
17% reduction
p = 0.54
No change
p = 0.55
Figure B-7. Cardiac morbidity by major component
- DRAFT -

CLINICAL STUDY - COMPANION B-25
For a given cardiac hospitalization, patients may have events in more than
one category, and if there are multiple occurrences in a single category, then
only the first occurrence was counted.
ADDITIONAL STUDY DATA
Implant Disposition
Table B-9 on page B-25 identifies the number of initial and subsequent implant
procedures attempted in patients randomized to CRT-D and the rate of success
for each additional implant procedure. There were 81 CRT-D patients that
had an unsuccessful initial implant for the CRT-D system. Fifty (50) of these
patients had a second implant procedure, of which 33 were successful and 17
were unsuccessful. Three patients had a third implant procedure, of which one
was successful. Therefore, there were 541 patients implanted with the CRT-D
system.
Table B-9. CRT-D system implant disposition
Attempt
successful
Failed implant Reattempt not
done after this
procedure
Initial implants 588 (98.8%) 507 (85.0%) 81 (14.0%) 31 (5.2%)
First reattempt 50 (8.4%) 33 (5.5%) 17 (2.9%) 14 (2.3%)
Second reattempt 3 (0.5%) 1 (0.2%) 2 (0.3%) 2 (0.34%)
ADDITIONAL OUTCOME MEASURES
First Heart Failure Hospitalizations
An additional outcome that was not pre-specified in the protocol provides
further insight into the results observed in the composite primary endpoint.
This post-hoc analysis was conducted using cause-specific hospitalizations as
adjudicated by the morbidity and mortality committee and therefore should
be interpreted with caution.
The outcome of all-cause mortality or first heart failure hospitalization was
analyzed on an intention-to-treat basis and time to first event.
Hospitalizations were defined per any of the following:
• Care provided at a hospital for any reason in which the duration is
associated with a date change
- DRAFT -
B-26 CLINICAL STUDY - COMPANION
• Use of intravenous inotropes and/or vasoactive drugs for a duration > 4
hours (inpatient or outpatient)
NOTE: Hospitalizations associated with a device implant attempt or
re-attempt are excluded.
Those contributing to the heart failure hospitalization outcome were required
by the Morbidity and Mortality committee to meet at least one of the following
additional criteria:
•IVdiuretics
• IV inotrope/vasoactive therapy
• Other parenteral therapy for the treatment of heart failure
•Significant alterations in oral therapy for the treatment of heart failure
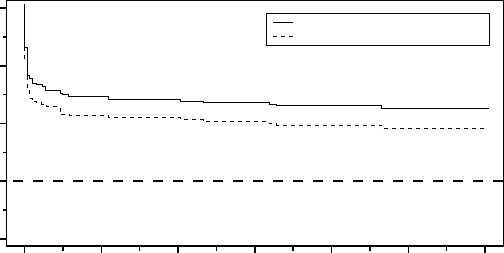
All-cause Mortality or First Heart Failure Hospitalization
The Kaplan-Meier curves for all-cause mortality or first heart failure
hospitalization is shown in Figure B-8 on page B-27. OPT and CRT-D had
annual event rates of 45% and 29%, respectively with a hazard ratio of 0.60,
95% CI (0.49-0.75), p < 0.001. Therefore, CRT-D was associated with a
40% relative reduction in the risk of all-cause mortality or first heart-failure
hospitalization when compared to OPT alone.
- DRAFT -
CLINICAL STUDY - COMPANION B-27
10809608407206004803602401200
100
80
60
40
20
0
% of Patients Event-Free
Days from Randomization
All-cause Mortality or First Heart Failure Hospitalization
CRT-D vs. OPT: p < 0.001
Number of Events
OPT: 145
CRT-D: 212
OPT
CRT-D
308
595
Number of
Patients at Risk
OPT
CRT-D
216
497
161
411
118
470
76
228
39
131
28
71
11
27
HR = 0.60. 95% CI (0.49, 0.75)
2
5
Figure B-8. All-cause mortality or first heart failure hospitalization
Disposition of Hospitalization
Implantation of the CRT-D system generally requires hospitalization. To
differentiate between the hospitalization required to implant the system and
those hospitalizations that occurred after the system was implanted, the
following terms are used:
• Implant hospitalization––the elective hospitalization associated with either
the implant procedure or a repeat implant procedure if the initial procedure
was unsuccessful.
• All other hospitalizations––patients who required a revision for an implanted
system (e.g., lead dislodgment or infection) were included in this category
as were hospitalizations for non-elective device related implants.
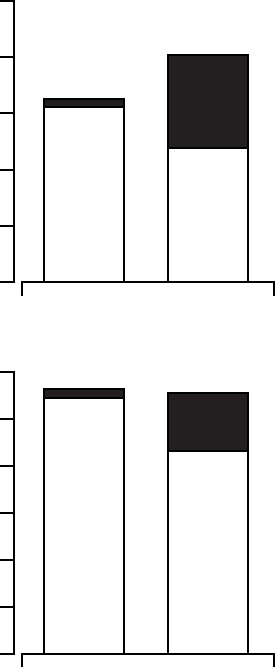
The hospitalizations analysis (Figure B-9 on page B-28) and hospitalization
days analysis (Figure B-10 on page B-28) depicts hospitalization data
stratified by implant and non-elective hospitalizations. This analysis was on
an intention-to-treat basis and includes patients who underwent an attempted
implant procedure. Patients randomized to CRT-D had a follow-up duration
approximately 30% longer than OPT patients. Thus, hospitalization data
- DRAFT -
B-28 CLINICAL STUDY - COMPANION
are normalized per patient-year of follow-up. An additional comparison of
hospitalization days for heart failure hospitalizations is shown in Figure B-11
on page B-29.
NOTE: CRT-D was associated with a reduction in all-cause mortality and
therefore there is a competing risk for hospitalizations. This data should be
interpreted with caution.
2.5
2.0
1.0
0.5
1.5
0.0
Initial
Implant 0.07
Non-elective
1.55
1.62 Initial
Implant 0.83
Non-elective
1.18
2.01
OPT
(n = 308)
CRT-D
(n = 595)
Hospitalizations (In-patient)
per Patient-Year of Follow-up
Figure B-9. Hospitalizations per patient year
12
8
4
2
6
0
Initial
Implant 0.2
Non-elective
10.9
11.2
Initial
Implant 2.4
Non-elective
8.6
11.1
OPT
(n = 308)
CRT-D
(n = 595)
All-cause Hospitalization (In-patient)
Days per Patient-Year of Follow-up
10
Figure B-10. Hospitalization days per patient year
- DRAFT -

CLINICAL STUDY - COMPANION B-29
6
4
2
1
3
0
5.9
3.8
OPT
(n = 308)
CRT-D
(n = 595)
Heart Failure Hospitalization Days
per Patient-Year of Follow-up
5
Figure B-11. Heart failure hospitalization days per patient year
DATA ANALYSIS AND RESULTS - CRT-D SYSTEM SAFETY
The system-related complication-free rate analysis was not a predefined
endpoint in the protocol. The intent of this analysis is to provide reasonable
assurance of safety of the CONTAK CD system in this patient population.
The system-related complication-free rate was defined over a six-month
follow-up period as the proportion of patients who are free of complications
attributed to:
• Any implanted component (e.g, pulse generator, coronary venous lead,
right atrial pace/sense lead, cardioversion/defibrillation lead)
• The surgical procedure required to implant the CRT-D system
In the COMPANION study, this analysis was performed on an intention-to-treat
basis and also extends to those patients who underwent an implant procedure
but did not ultimately receive a device. Of the 595 patients analyzed, 522
(87.7%) were free of system-related complications.
Of the 73 (12.3%) patients who experienced a system-related complication,
the most common were loss of left ventricular capture (25 patients, 4.2%),
loss of right atrial capture (9 patients, 1.5%), and phrenic nerve/diaphragmatic
stimulation (8 patients, 1.3%).
When analyzed on a time-to-event basis, the system-related complication-free
rate was 87.7%. The safety performance of the CONTAK CD system compares
favorably with the safety performance observed in the prior CONTAK CD study
(P010012, May 2, 2002).
- DRAFT -
B-30 CLINICAL STUDY - COMPANION
DATA ANALYSIS AND RESULTS - COMPANION SUB-STUDY
The Exercise Performance Sub-study consisted of the following components.
CRT Effectiveness
Primary Co-primary endpoint consisting of Peak VO2derived from a
symptom-limited exercise test and Six-Minute Walk, with CRT results pooled
from the CONTAK TR and CONTAK CD arms.
Effectiveness was determined by assessing both Peak VO2and Six-Minute
Walk distance improvements with CRT compared to OPT.
Prospectively, success was defined as occurring if either of the following
occurred:
•PeakVO
2improved ≥0.7 ml/kg/min (p < 0.05) and 6 MWD improvement
resulted in p < 0.10
•PeakVO
2improved ≥0.5 ml/kg/min (p < 0.10) and 6 MWD improvement
resulted in p < 0.05
Additional: Quality of Life as measured by the Minnesota Living with Heart
Failure Questionnaire®‚ and NYHA Class
- DRAFT -
CLINICAL STUDY - COMPANION B-31
Patient Accountability (Figure B-12 on page B-31)
OPT
Baseline Visit
87
Peak VO2
Assessable for
effectiveness
46
6MW
Assessable for
effectiveness
57
Patient related
Crossover
Withdrawn
Death
Other
11
6
4
10
10
6
5
4
10
5
Peak VO2
Assessable for
effectiveness
231
6MW
Assessable for
effectiveness
261
Patient related
Mode Change
Withdrawn
Death
Other
28
20
16
2
21
24
12
16
2
3
CRT
Baseline Visit
318
Randomized
448
Met Exclusion Criteria 6
Intent/Attempt 37
Figure B-12. Enrollment and follow-up of randomized patients
Baseline Characteristics— (Table B-10 on page B-31)
Table B-10. Patient population characteristics
Characteristic CRT
(N = 318)
OPT
(N = 87)
P-valuea
Age (years) Mean ± SD 62.1 ± 11.8 63.1 ± 10.6 0.48
Range 32.0–86.0 27.0–85.0
Gender [N (%)] Female 109 (34.3) 24 (27.6) 0.24
Male 209 (65.7) 63 (72.4)
NYHA Classification [N (%)] III 294 (92.5) 79 (90.8) 0.61
IV 24 (7.5) 8 (9.2)
- DRAFT -

B-32 CLINICAL STUDY - COMPANION
Table B-10. Patient population characteristics (continued)
Characteristic CRT
(N = 318)
OPT
(N = 87)
P-valuea
Ischemic Etiology Ischemic 141 (44.3) 42 (48.3) 0.51
Non-ischemic 177 (55.7) 45 (51.7)
LVEF (%) Mean ± SD 22.5 ± 6.9 22.2 ± 8.0 0.79
Range 5.0–35.0 5.0–35.0
Resting Heart Rate (bpm) Mean ± SD 73.1 ± 12.8 73.5 ± 11.5 0.78
Range 46.0–122.0 54.0–103.0
QRS Width (ms) Mean ± SD 159.2 ± 25.0 155.7 ± 25.8 0.26
Range 120.0–276.0 120.0–224.0
LBBB/NSIVCD (%) LBBB 230 (72.3) 62 (71.3) 0.60
Nonspecific 54 (17.0) 18 (20.7)
RBBB 34 (10.7) 7 (8.0)
Peak VO2(ml/kg/min) Mean ± SD 12.7 ± 3.3 12.4 ± 3.3 0.42
Range 3.0–21.2 4.8–21.5
Six-MInute Walk Distance (m) Mean ± SD 292.4 ± 65.5 291.6 ± 70.5 0.92
Range 152.0–411.5 162.4–414.0
Quality of Life Score (points) Mean ± SD 59.8 ± 23.1 55.4 ± 23.3 0.12
Range 0.0–105.0 0.0–97.0
Heart Failure Medications [N (%)] Diuretic 300 (94.3) 82 (94.3) 0.98
ACE Inhibitor or ARB 286 (89.9) 82 (94.3) 0.22
Beta Blockers 240 (75.5) 60 (69.0) 0.22
Aldosterone Antagonist 178 (56.0) 51 (58.6) 0.66
Digoxin 239 (75.2) 65 (74.7) 0.93
a. Continuous data were analyzed using a two-tailed t-test procedure, and categorical data were analyzed using a two-tailed
chi-square procedure. A p-value < 0.05 is considered significant.
CRT Effectiveness
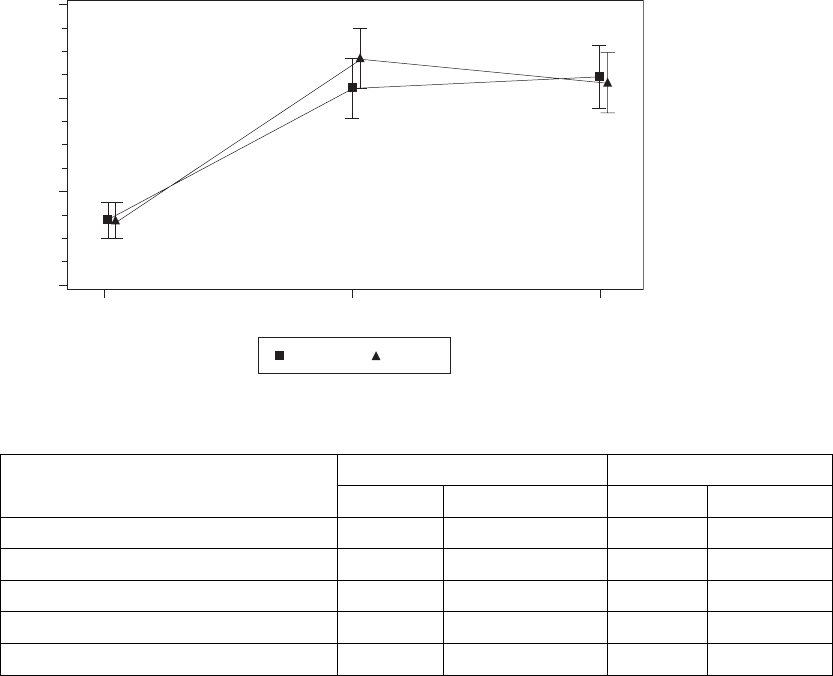
Peak VO2—Peak VO2was determined from a standardized protocol for
exercise testing as a means of measuring a patient’s capacity for performing
physical activity (Figure B-13 on page B-33, Table B-11 on page B-33).
- DRAFT -

CLINICAL STUDY - COMPANION B-33
2.0
1.0
0.5
1.5
0.0
Time (months)
∆ Peak VO2 (ml/kg/min)
3 6
CRT
OPT
∆ = 0.8
p = 0.026
∆ = 0.6
p = 0.074
(Critical boundary = 0.10)
Mean ± SE
Figure B-13. Maximal Oxygen Consumption Results
Table B-11. Maximal Oxygen Consumption Results
CRT OPT
Peak VO2(ml/kg/min)
N Mean ±
S.E.
N Mean ±
S.E.
P-valuea
Change at 3 months 247 1.1 ± 0.2 52 0.3 ± 0.4 0.026
Change at 6 months 230 1.2 ± 0.2 46 0.6 ± 0.4 0.074
a. P-values obtained using one-tailed longitudinal analysis methods.
The longitudinal analysis was performed on all available data. The percentages
of missing data at the six-month endpoints for Peak VO2and Six-Minute Walk
were 36 percent and 28 percent for the CRT arm and 47 percent and 34 percent
for the OPT arm. The longitudinal analysis performed is most appropriate when
missing data occurs at the percentages found in this trial.
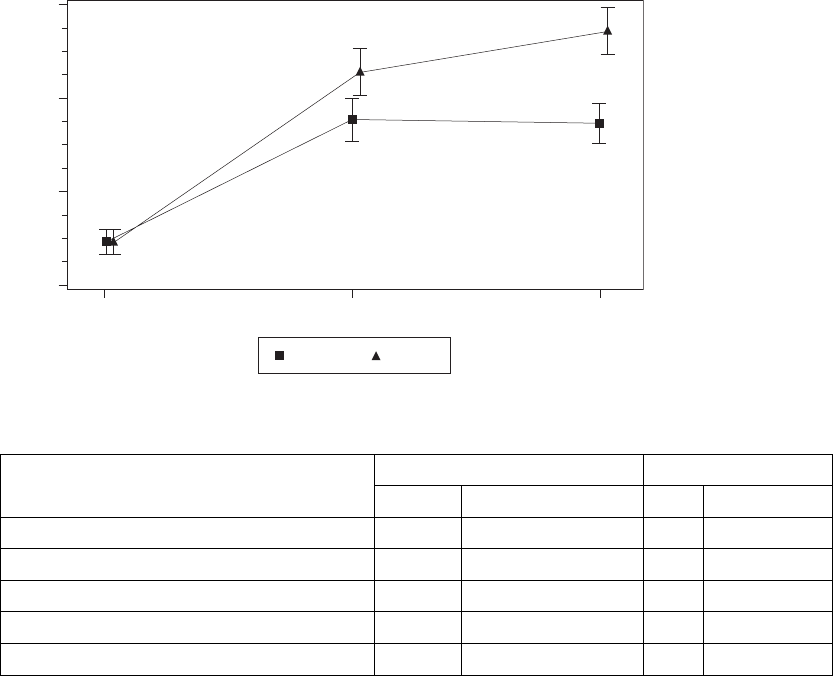
Six-Minute Walk––the Six-Minute Walk test is a measure of a patient’s ability
to sustain exercise during an activity similar to that which a patient may typically
perform on a daily basis. For this test, patients are instructed to walk as far as
possible in 6 minutes in a level corridor (Figure B-14 on page B-34, Table B-12
on page B-34).
- DRAFT -

B-34 CLINICAL STUDY - COMPANION
50
20
10
40
0
Time (months)
∆ Six Minute Walk Distance (m)
3 6
CRT
OPT
∆ = 24
p = 0.016
∆ = 24
p = 0.017
(Critical boundary = 0.05)
Mean ± SE
30
Figure B-14. Change in six-minute walk
Table B-12. Change in six-minute walk
CRT OPT
Six-Minute Walk (m)
N Mean ±
S.E.
NMean±
S.E.
P-valuea
Change at 3 months 274 37 ± 5 63 13 ± 10 0.016
Change at 6 months 260 41 ± 5 57 17 ± 10 0.017
a. P-values obtained using one-tailed longitudinal analysis methods.
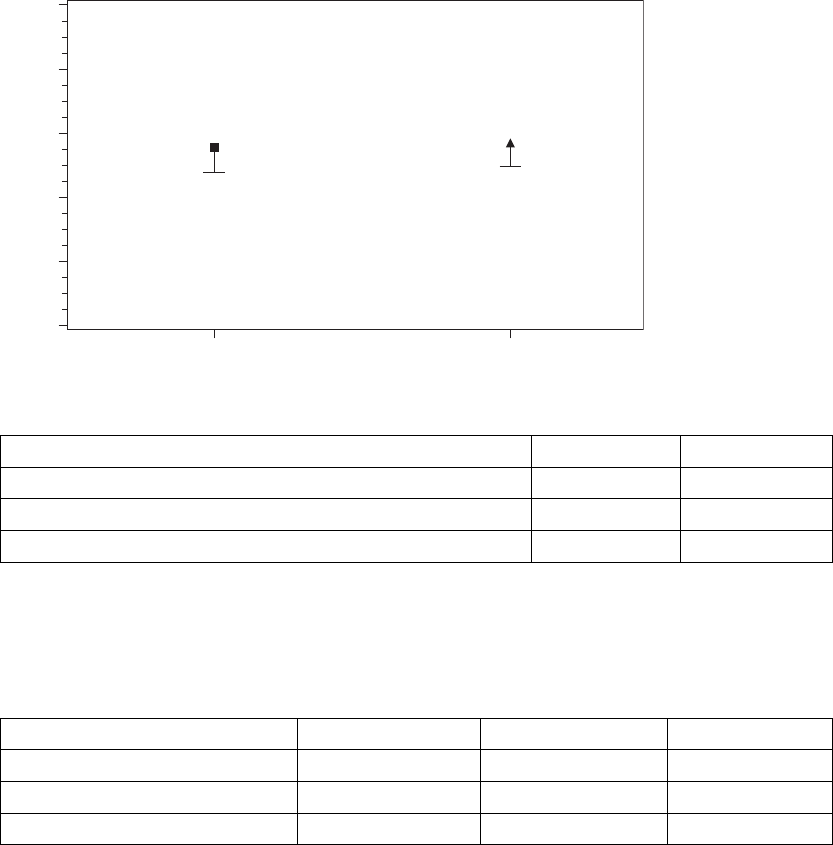
NYHA Class––the determination for New York Heart Association (NYHA) Class
is based on mutual assessment, by the patient and physician, of the patient’s
heart failure symptoms both at rest and while performing ordinary physical
activity(FigureB-15onpageB-35,TableB-13onpageB-35).
- DRAFT -
CLINICAL STUDY - COMPANION B-35
100
80
40
20
60
0
CRT OPT
36
NYHA Class (%)
CRT OPT
Improve 2 Classes
Improve 1 Class
No Change
Worsen 1 Class
Time (months)
Figure B-15. Change in NYHA
Table B-13. Change in NYHA
CRT OPT
NYHA
Classification
Change
N Patients N Patients
P-valuea
3 months Improve 2 Classes 294 22 (7.5%) 69 3 (4.4%) <0.01
Improve 1 Class 142
(48.3%)
13 (18.8%)
No Change 122
(41.5%)
48 (69.6%)
Worsen 1 Class 8 (2.7%) 5 (7.3%)
6 months Improve 2 Classes 291 20 (6.9%) 65 2 (3.1%) 0.032
Improve 1 Class 149
(51.2%)
28 (43.1%)
No Change 118 (40.6%) 34 (52.3%)
Worsen 1 Class 4 (1.4%) 1 (1.5%)
a. P-values are not adjusted for multiplicity and were obtained using a one-tailed Mantel-Haenszel chi-square method.
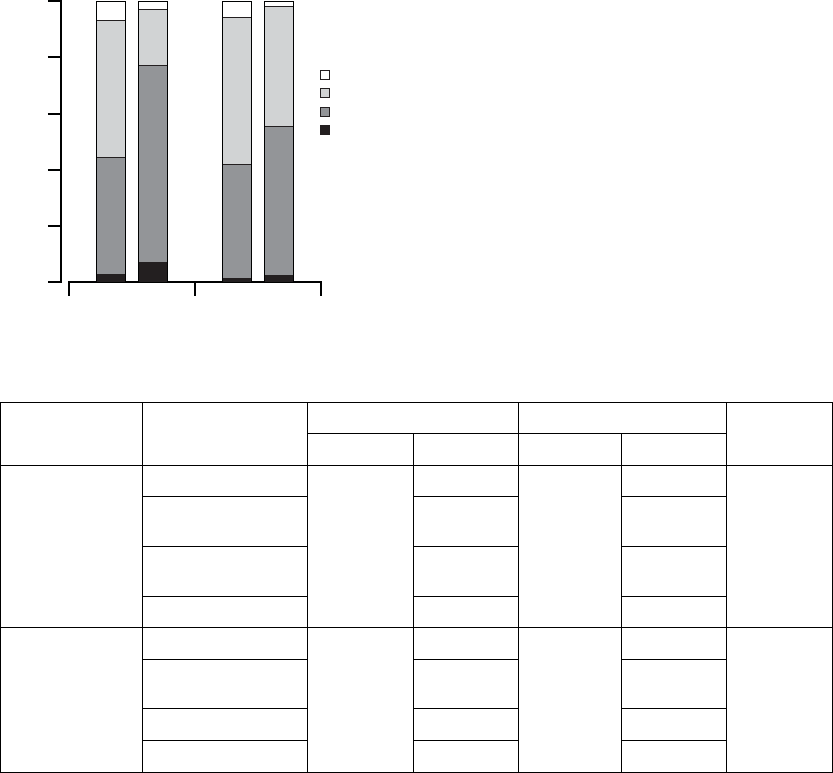
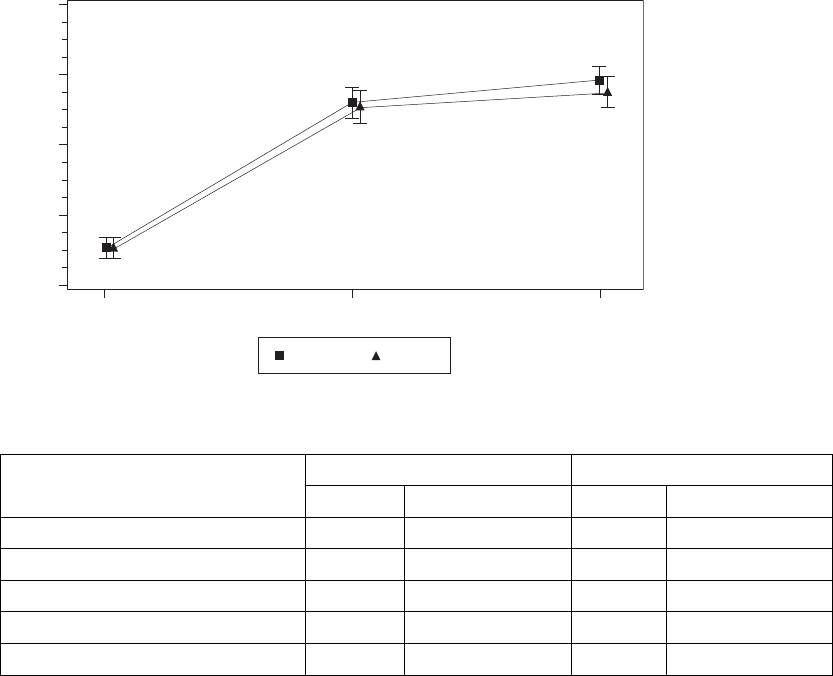
Quality of Life (QOL)––Quality of Life was assessed using the 21-question
Minnesota Living with Heart Failure questionnaire. Each question, answered
by the patient, is ranked on a scale ranging from 0 to 5. A lower total score
indicatesanimprovedqualityoflife(FigureB-16onpageB-36,TableB-14on
page B-36).
- DRAFT -
B-36 CLINICAL STUDY - COMPANION
25
10
5
20
0
Time (months)
∆ Quality of Life Score (points)
3 6
CRT
OPT
∆ = 17 ∆ = 13
Mean ± SE
15
30
Figure B-16. Quality of Life score
TableB-14. QualityofLifescore
CRT OPT
Quality of Life
(points) NMean ± S.E. (95% CI) NMean ± S.E. (95% CI)
P-valuea
Change at 3 months 289 23 ± 1 (20.1, 25.7) 72 6±3(0.6,11.3) < 0.001
Change at 6 months 279 23 ± 1 (19.7, 25.4) 66 10 ± 3 (4.2, 15.2) < 0.001
a. P-values are not adjusted for multiplicity and were obtained using one-tailed longitudinal analysis methods.
Additional Functional Capacity Data
In addition to the Exercise Performance sub-study, functional capacity was
evaluated by means of NYHA Class, six-minute walk distance, and Minnesota
Living with Heart Failure Questionnaire QOL for the all patients randomized
to OPT and CRT-D through 6-months of follow up.
NYHA Class, six-minute walk distance, and QOL scores were significantly
improved in the CRT-D group compared to the OPT group at 3 and 6 months
(Table B-15 on page B-36). These findings are similar to those presented in
the exercise performance sub-study and previous cardiac resynchronization
therapy trials.
Table B-15. Changes in six-minute walk, QOL, and NYHA
CRT-D OPT P-valuea
Six Minute Walk Distance NMean ± SD NMean ± SD
Change at 3 months 420 42 ± 98 172 8 ± 82 < 0.0001
- DRAFT -

CLINICAL STUDY - COMPANION B-37
Table B-15. Changes in six-minute walk, QOL, and NYHA (continued)
CRT-D OPT P-valuea
Change at 6 months 377 45 ± 98 141 2 ± 92 < 0.0001
QOL NMean ± SD NMean ± SD
Change at 3 months 514 -24 ± 28 243 -8 ± 21 < 0.0001
Change at 6 months 479 -23 ± 28 207 -12 ± 23 < 0.0001
NYHA N % Improved N% Improved
Change at 3 months 543 55 242 24 < 0.0001
Change at 6 months 498 57 199 38 < 0.0001
a. P-values are not adjusted for multiplicity and were obtained using t-tests for continuous data and chi-square for categorical data.
- DRAFT -
B-38 CLINICAL STUDY - COMPANION
- DRAFT -

C-1
CLINICAL STUDY - DECREASE HF
APPENDIX C
SUMMARY
The DECREASE-HF study was designed to determine if LV-CRT and LV Offset
are safe and effective as compared to the control treatment (BiV-CRT) in
patients with heart failure and an indication for an implantable cardioverter
defibrillator (ICD). The primary effectiveness endpoint was a composite of
peak VO2and left ventricular end systolic diameter (LVESD). The primary
safety endpoints were heart failure related adverse event free rate and system
related adverse event free rate. The LV Offset arm supports the safety and
effectiveness of the LV Offset feature.
The DECREASE-HF Study design has been previously described in medical
literature.1
STUDY DESIGN
Patients were randomized (1:1:1) to receive one of these three therapies.
Patients who could not be randomized due to their inability to complete baseline
testing or because Expert Ease recommended BiV-CRT were followed for
safety data only in a separate “safety arm.” Available data for all patients were
analyzed by randomization group assignment, regardless of actual therapy
received (i.e., intent to treat).
The DECREASE-HF clinical investigation used CONTAK RENEWAL 2/4/4HE
devices to study the LV Offset feature as well as other features that are not
available in the CONTAK RENEWAL 1/3/3HE devices. The 2/4/4HE devices
are physically and mechanically identical to the 1/3/3HE devices and they both
contain the LV Offset feature. As such, the data from the DECREASE-HF
clinical study regarding the LV Offset feature, studied by using the 2/4/4HE
devices, applies to the CONTAK RENEWAL 1/3/3HE devices. The LV Offset
arm supports the safety and effectiveness of the LV Offset feature.
1.De Lurgio D, Foster E, Higginbotham M, Larntz K, Saxon L. A Comparison of cardiac
resynchronization by sequential biventricular pacing and left ventricular pacing to simultaneous
biventricular pacing: Rationale and design of the DECREASE-HF clinical trial. J Card Fail.
2005;11(3):233-239
- DRAFT -

C-2 CLINICAL STUDY - DECREASE HF
FOLLOW-UP SCHEDULE
The follow-up schedule for the DECREASE HF study is detailed below
(Table C-1 on page C-2).
Table C-1. DECREASE HF follow-up schedule
Follow-up period Follow-up schedule
Pre-implant Initial assessment of patient eligibility; taking of patient history.
Administration of baseline Quality of Life (QOL) questionnaire.
Implant Implant of investigational devices and acute device testing.
Two-week visit Physical assessment, including NYHA assessment, and device evaluation.
Special Testingato establish the patient’s baseline condition, after which the randomization
assignment was assigned.
Three- and six-month
visit
Evaluation of randomized therapy with Special Testing and device functionb.
Quarterly visits After the six-month visit, patients were seen for routine evaluation of device function
and patient condition.
a. Special Testing included a Symptom-Limited Treadmill Test with measurement of oxygen uptake (Peak VO2), Echocardiography,
QOL questionnaire.
b. Holter monitor recordings were taken at the three-month visit for patients in the Holter Substudy.
INCLUSION/EXCLUSION CRITERIA
Patients enrolled in the investigation were required to meet the following
inclusion criteria:
• Must meet the general indications for a CRT-D implant
• Moderate or severe heart failure, defined as NYHA Class III-IV despite
optimal pharmacological heart failure therapy
• A 12-lead electrocardiogram (ECG) obtained no more than 90 days prior to
enrollment documenting a sinus rate > 50 bpm, QRS duration ≥150 ms,
PR interval ≤320 ms measured from any two leads and a P-wave duration
< 150 ms measured from lead V1
• Creatinine ≤2.5 mg/dL obtained no more than 14 days prior to enrollment
• Left ventricular ejection fraction ≤35% [measured by echo, multiple gated
acquisition (MUGA) scan, cardiac catheterization, etc.] no more than 14
days prior to enrollment
- DRAFT -
CLINICAL STUDY - DECREASE HF C-3
• Willing and capable of undergoing a device implant and participating in all
testing associated with this clinical investigation
• Have a life expectancy of more than 180 days, per physician discretion
• Age 18 or above, or of legal age to give informed consent specific to state
and national law
Patients were excluded from the investigation if they met any one of the
following exclusion criteria:
• Right bundle branch block morphology (per World Health Organization
Guidelines), on a 12-lead ECG obtained no more than 90 days prior to
enrollment
• Had previous cardiac resynchronization therapy, a previous coronary
venous lead, or met the general indications for antibradycardia pacing
• Had a neuromuscular, orthopedic, or other non-cardiac condition that
prevented normal, unsupported walking
• Had an atrial tachyarrhythmia that was permanent (i.e., did not terminate
spontaneously and could not be terminated with medical intervention) or
persistent (i.e., could be terminated with medical intervention, but did not
terminate spontaneously) within 180 days prior to enrollment
• Had a hypersensitivity to a 0.7 mg dose of dexamethasone acetate
• Had surgically uncorrected primary valvular heart disease
• Required dialysis at the time of enrollment
• Had chronic obstructive pulmonary disease (COPD), defined as FEV1/FVC
<60%
• Had a myocardial infarct, unstable angina, percutaneous coronary
intervention, or coronary artery bypass graft during the 30 days prior to
enrollment
• Had hypertrophic obstructive cardiomyopathy or infiltrative cardiomyopathy
(e.g., amyloidosis, sarcoidosis)
• Had a mechanical tricuspid prosthesis
- DRAFT -
C-4 CLINICAL STUDY - DECREASE HF
• Were enrolled in any concurrent study, without Guidant written approval,
that may confound the results of this study
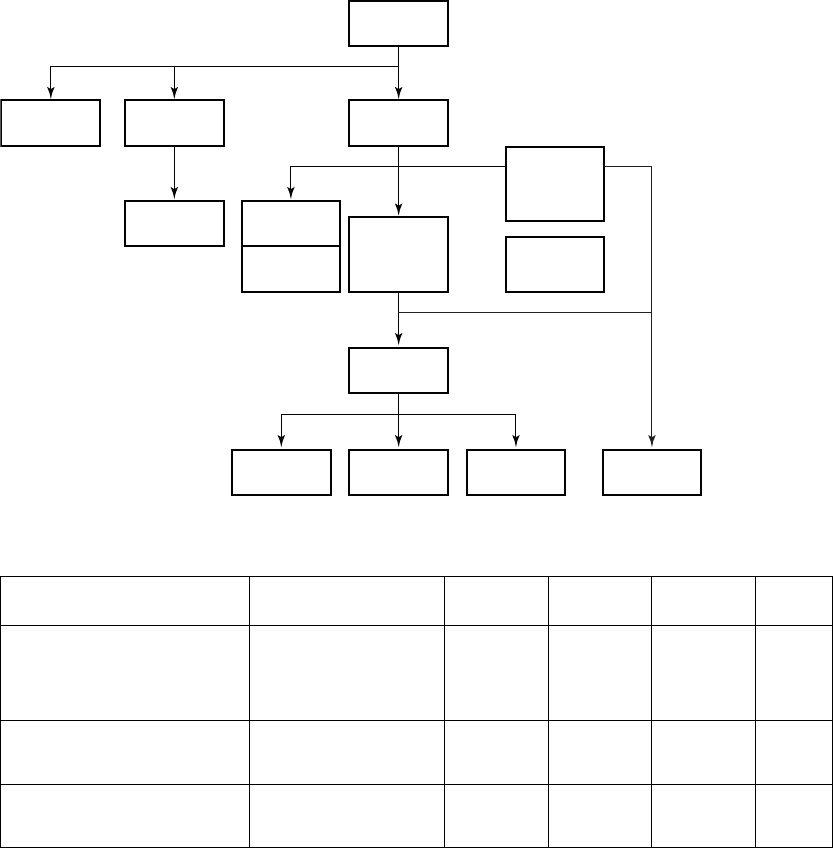
DEMOGRAPHIC DATA
Patient enrollment (Figure C-1 on page C-4) and baseline characteristics
(Table C-2 on page C-4) are detailed below.
Enrolled
360
Implant
342
Attempt
16
Death
1
Intent
2
Death
3 Received
Randomization
Assignment
325
Withdrawal
1
Incomplete
Baseline
Testing
13
Expert Ease
BiV Suggestion
19
Randomized
306
LV-CRT
101
LV Offset
104
BiV-CRT
101
Safety Arm
32
Figure C-1. DECREASE-HF Study Patient Enrollment and Randomization
Table C-2. DECREASE-HF study patient characteristics
Characteristic Measurement LV-CRT
(N=101)
LV Offset
(N=104)
BiV-CRT
(N=101)
P-valuea
Age at Implant (years) N 101 104 101
Mean ± SD 67.4 ± 9.6 66.6 ± 10.5 66.2 ± 10.6 0.69
Range 45.4 - 87.3 32.4 - 85.6 40.6 - 86.2
Gender [N (%)] Male 66 (65) 70 (67) 69 (68) 0.90
Female 35 (35) 34 (33) 32 (32)
NYHA Class [N (%)] III 98 (97) 100 (96) 101 (100) 0.16
IV 3(3) 4(4) 0(0)
- DRAFT -

CLINICAL STUDY - DECREASE HF C-5
Table C-2. DECREASE-HF study patient characteristics (continued)
Characteristic Measurement LV-CRT
(N=101)
LV Offset
(N=104)
BiV-CRT
(N=101)
P-valuea
LVEF (%) N 101 104 100
Mean ± SD 22.6 ± 6.6 22.4 ± 6.7 23.2 ± 7.1 0.67
Range 8.0 - 35.0 9.0 - 35.0 5.0 - 35.0
QRS Duration (ms) N 101 104 101
Mean ± SD 165 ± 15 167 ± 16 168 ± 15 0.29
Range 150 - 220 150 - 220 150 - 218
PR Interval (ms) N 101 104 101
Mean ± SD 195 ± 42 195 ± 42 194 ± 39 0.98
Range 120 - 318 100 - 320 88 - 320
P-Wave Duration (ms) N 101 104 101
Mean ± SD 91 ± 22 96 ± 22 95 ± 24 0.21
Range 39 - 140 40 - 140 40 - 145
Concomitant Medicationsb[N
(%)]
ACE Inhibitor/ARB 88 (87) 88 (85) 91 (90) 0.50
Beta Blocker 84 (83) 84 (81) 82 (81) 0.89
Digoxin 47 (47) 55 (53) 46 (46) 0.52
Diuretic 89 (88) 93 (89) 82 (81) 0.19
Loop Diuretic 87 (86) 91 (88) 80 (79) 0.22
Nonloop Diuretic 8(8) 8(8) 8(8) 1.00
Aldosterone Antagonist 40 (40) 37 (36) 40 (40) 0.79
Antiarrhythmic 21 (21) 14 (13) 13 (13) 0.22
Etiology [N (%)] Ischemic 67 (66) 70 (67) 58 (57) 0.27
Nonischemic 34 (34) 34 (33) 43 (43)
Conduction Disorder [N (%)] Left Bundle Branch
Block
94 (93) 95 (91) 97 (96) 0.68
Nonspecific
Intraventricular
Conduction
6(6) 8(8) 4(4)
Right Bundle Branch
Block
1(1) 1(1) 0(0)
a. P-values for continuous variables were calculated from a Student’s t-test; p-values for discrete variables were calculated from
a Chi-squared test.
b. Patients may appear in more than one category.
- DRAFT -
C-6 CLINICAL STUDY - DECREASE HF
STUDY RESULTS
Therapy Effectiveness
Primary Endpoint
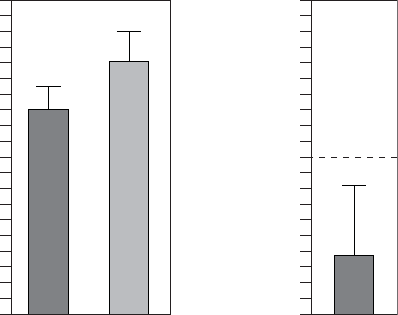
Composite Score––Effectiveness of LV Offset was measured using a
Composite Score that combines six-month changes in Peak VO2and LVESD
(FigureC-2onpageC-6,TableC-3onpageC-7).Basedontheseestimatesof
clinically meaningful improvement (1 ml/kg/min and -5 mm, for Peak VO2and
LVESD, respectively), a scaling factor of 5 was chosen to give each component
approximately equal weight, as follows: Composite Score = (5 x change in
peak VO2) - (change in LVESD).
To evaluate the effectiveness of LV Offset, the Composite Score was compared
to the control arm using a longitudinal analysis. The null hypothesis was to be
rejected if the upper one-sided confidence bound of the difference were less
than 10 points.
The observed mean differences from the BiV-CRT control arm was 3.6 ± 2.4
in the LV Offset arm, with upper one-sided confidence bound of 8.2 showing
statistical equivalence to BiV-CRT.
20
0
4
8
12
16
LV Offset BiV-CRT
6-month Composite Score
20
0
4
8
12
16
LV Offset
Difference from BiV-CRT in a 6-month Score
Acceptable
Boundary
All patients with peak VO2 and LVESD data at a minimum of one visit, N=189
Figure C-2. Composite Score Equivalence to BiV-CRT at Six Months
- DRAFT -

CLINICAL STUDY - DECREASE HF C-7
Table C-3. Composite score equivalence to BiV-CRT at six months
Statistic LV Offset BiV-CRT
NaEstimate ± SE NaEstimate ± SE
3-Month Composite Score 71 12.4 ± 1.5 70 16.0 ± 1.5
6-Month Composite Score 70 12.8 ± 1.7 76 16.4 ± 1.7
Difference at 6 Months
(BiV-CRT - LV Offset)
3.6 ± 2.4
Confidence Interval Upper Bound 8.2
a. N refers to the number of patients with paired data.
Secondary Endpoints
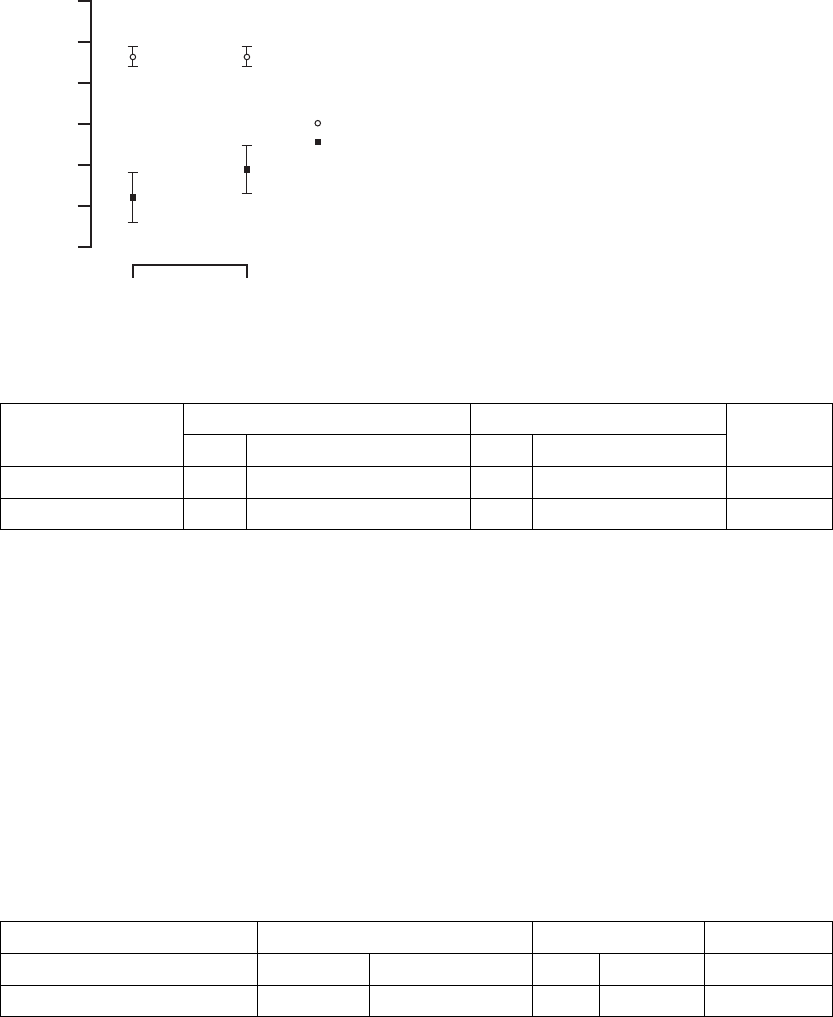
Peak VO2––A patient’s capacity for performing physical activity was assessed
using six-month change in Peak VO2achieved during CPX testing. The
endpoint analysis includes only CPX tests that are representative of maximal
patient effort, defined as achievement of a Borg RPE ≥16 or RER ≥1.1.
As defined in the Protocol, patients with a baseline Peak VO2greater than
20 ml/kg/min were excluded from the analysis. A longitudinal analysis that
included all patients with data at a minimum of one visit was performed to
estimate six-month change from baseline in each group.
As shown in (Figure C-3 on page C-8) and Table C-4 on page C-8, both
treatment arms showed a statistically significant and clinically meaningful (≥
1.0 ml/kg/min) improvement in Peak VO2, an endpoint considered clinically
meaningful in previous randomized controlled trials of CRT. The null hypothesis
was to be rejected if the lower one-sided 95% confidence bound were greater
than zero. The observed lower one-sided confidence bound for LV Offset is
1.1 ml/kg/min.
- DRAFT -
C-8 CLINICAL STUDY - DECREASE HF
15
13
12
Peak VO2 (ml/kg/min)
14
Baseline 3-Month 6-Month
LV Offset BiV-CRT
All patients with data at a minimum of one visit, N=189
Figure C-3. Improvement in Peak V02 at Six Months
Table C-4. Improvement in Peak VO2 at six months
Statistic LV Offset BiV-CRT
NaEstimate ± SE NaEstimate ± SE
Baseline 89 12.7 ± 0.2 88 12.7 ± 0.2
3 Months 72 14.2 ± 0.3 71 14.5 ± 0.3
6 Months 71 14.3 ± 0.3 76 14.2 ± 0.3
Improvement at 6 Months 1.6 ± 0.3 1.5 ± 0.3
Confidence Interval Lower Bound 1.1 1.0
a. N refers to the number of patients with paired data.
Left Ventricular End Systolic Diameter (LVESD)––TheeffectofLV
Offset was also assessed using six-month change in LVESD. A recorded
echocardiographic examination was performed at the randomization visit (prior
to CRT initiation) and subsequently at the three-month and six-month visits. A
longitudinal analysis that included all patients with data at a minimum of one
visit was performed to estimate six-month change from baseline in each group.
Both arms showed a statistically significant and clinically meaningful
improvement (≤-5 mm) in LVESD (Figure C-4 on page C-9, Table C-5 on
page C-9). The null hypothesis was to be rejected if the upper one-sided 95%
confidence bound were less than zero. The observed upper one-sided bound
for LV Offset is -4.2 mm.
- DRAFT -
CLINICAL STUDY - DECREASE HF C-9
46
54
58
LVESD (mm)
50
Baseline 3-Month 6-Month
LV Offset BiV-CRT
All patients with data at a minimum of one visit, N=205
56
52
48
Figure C-4. Improvement in LVESD at Six Months
Table C-5. Improvement in LVESD at six months
Statistic LV Offset BiV-CRT
NaEstimate ± SE NaEstimate ± SE
Baseline 104 55.7 ± 0.5 100 55.7 ± 0.5
3 Months 97 50.5 ± 0.9 97 48.9 ± 0.9
6 Months 92 50.3 ± 0.9 91 47.1 ± 0.9
Improvement at 6 Months -5.4 ± 0.7 -8.7 ± 0.7
Confidence Interval Upper Bound -4.2 -7.5
a. N refers to the number of patients with paired data.
Quality of Life (QOL)––The effect of CRT on the patient’s perceived quality
of life was assessed using six-month change in QOL score. The Minnesota
Living with Heart Failure Questionnaire‚ was administered prior to implant and
subsequently at the three-month and six-month visits. A longitudinal analysis
that included all patients with data at a minimum of one visit was performed to
estimate six-month change from baseline in each group.
Both arms showed a statistically significant and clinically meaningful
improvement (≤-10 points) in QOL, an endpoint considered clinically
meaningful in previous randomized controlled trials of CRT (Figure C-5 on page
C-10, Table C-6 on page C-10). The null hypothesis was to be rejected if the
- DRAFT -
C-10 CLINICAL STUDY - DECREASE HF
upper one-sided 95% confidence bound were less than zero. The observed
upper one-sided confidence bound for LV Offset was -19.4 points.
20
QOL Score
Baseline 3-Month 6-Month
LV Offset BiV-CRT
All patients with data at a minimum of one visit, N=205
30
40
50
60
Figure C-5. Improvement in Quality of Life at Six months
Table C-6. Improvement in QOL at six months.
Statistic LV Offset BiV-CRT
NaEstimate ± SE NaEstimate ± SE
Baseline 100 54.6 ± 1.4 98 54.6 ± 1.4
3 Months 94 33.5 ± 2.4 95 34.0 ± 2.3
6 Months 88 31.3 ± 2.4 91 32.5 ± 2.4
Improvement at 6 Months -23.4 ± 2.4 -22.1 ± 2.4
Confidence Interval Upper Bound -19.4 -18.1
a. N refers to the number of patients with paired data.
NYHA Class––The effect of CRT on the patient’s heart failure related
symptoms (as measured by NYHA Class) was assessed prior to implant and
subsequently at the three-month and six-month visits. The analysis of NYHA
Class included all patients with data at enrollment and six months.
As shown in Figure C-6 on page C-11 and Table C-7 on page C-11, both arms
showed a statistically significant percentage of patients who improved at least
one NYHA Class, an endpoint considered clinically meaningful in previous
randomized controlled trials of CRT. The null hypothesis was to be rejected
- DRAFT -
CLINICAL STUDY - DECREASE HF C-11
if the lower one-sided 95% confidence bound of the percentage of patients
improving one or more NYHA Class were greater than zero. The observed
lower one-sided confidence bound for LV Offset was 47.9%.
100
Percent of Patients Improved
LV Offset BiV-CRT
All patients with data at a minimum of one visit, N=187
60
40
20
0
80
Figure C-6. Improvement in NYHA Class at Six Months
Table C-7. Improvement in NYHA Class at six months
Statistic LV Offset BiV-CRT
Total Patients 95 92
Number (Percent) of Patients Improved 54 (56.8%) 54 (58.7%)
Lower Bound of One-Sided Exact 95% Confidence Interval 47.9% 49.6%
Table C-8 on page C-11 provides additional detail, showing the percent of
patients who improved two or three classes, as well as the percent of those
who had no change or worsened.
Table C-8. Six-month change in NYHA by treatment group
6-Month Change in NYHAaLV Offset (N=95) BiV-CRT (N=92) Total (N=187)
Improved 3 Classes 1 (1.1) 0 (0.0) 1 (0.5)
Improved 2 Classes 16 (16.8) 8 (8.7) 24 (12.8)
Improved 1 Class 37 (38.9) 46 (50.0) 83 (44.4)
- DRAFT -

C-12 CLINICAL STUDY - DECREASE HF
Table C-8. Six-month change in NYHA by treatment group (continued)
6-Month Change in NYHAaLV Offset (N=95) BiV-CRT (N=92) Total (N=187)
No Change 35 (36.8) 36 (39.1) 71 (38.0)
Worsened 1 Class 6 (6.3) 2 (2.2) 8 (4.3)
a. All patients with paired data; N=187.
Device Effectiveness
Primary Endpoint
Ventricular Tachycardia/Fibrillation Detection Time––The objective of this
endpoint was to demonstrate that CRT does not affect the ability to detect
VT/VF. The results for VT/VF detection time are shown in Table C-9 on page
C-12.
Table C-9. VT/VF detection time
Number of PatientsaMean SD Upper Bound of One-Sided
95% Confidence Interval
338 2.46 0.58 2.50
a. All patients implanted with non-missing data; N=338.
The null hypothesis was to be rejected if the upper one-sided 95% confidence
bound for mean VF detection time were less than 6 seconds. The observed
upper one-sided 95% confidence bound for VF detection time was 2.50
seconds. These data demonstrate device effectiveness in the detection of
VT/VF.
Therapy Safety
Primary Endpoint
Heart Failure-Related Adverse Event Free Rate––Therapy safety was
assessed by the heart failure related adverse event free rate observed
through six months of therapy delivery (randomization visit through six months
post-randomization). The heart failure related adverse event free rate is
defined as the number of patients who do not experience a heart failure related
adverse event divided by the total number of patients implanted and active
at the randomization visit. All patients who were successfully implanted and
remained active at the randomization visit were included in the analysis.
- DRAFT -

CLINICAL STUDY - DECREASE HF C-13
Table C-10 on page C-13 summarizes the heart failure related adverse event
rates through the six-month visit. A Kaplan-Meier analysis is also presented in
FigureC-7onpageC-14toshowtimetoevents.
Table C-10. Heart failure-related adverse event free rate at six months
Adverse EventaNumber
of
Events
Number of
Patients
Heart Failure
Adverse
Event Free Rate
Lower One-Sided 95%
Confidence Bound
Multiple heart failure symptoms 38 29 91.4 88.5
Dyspnea - Heart failure 13 13 96.2 94.0
Heart failure symptoms -
Unspecified
13 12 96.4 94.3
Hypotension - Heart failure 10 9 97.3 95.4
Weight gain - Heart failure 54 98.8 97.3
Fatigue - Heart failure 4 4 98.8 97.3
Pulmonary edema - Heart failure 4 4 98.8 97.3
Renal insufficiency - Heart failure 4 3 99.1 97.7
Gastrointestinal - Heart failure 3 3 99.1 97.7
Multi-system failure - Heart failure 2 2 99.4 98.1
Peripheral edema - Heart failure 2 2 99.4 98.1
Chest pain - Heart failure 1 1 99.7 98.6
Dehydration - Heart failure 1 1 99.7 98.6
Dizziness - Heart failure 1 1 99.7 98.6
Elevated BNP - Heart Failure 1 1 99.7 98.6
Total 102 67 80.2 76.3
a. All patients implanted and active at the randomization visit; N=338.
The null hypothesis was to be rejected if the lower one-sided 95% confidence
bound for heart failure adverse event free rate through six months post-implant
were greater than 50%. The heart failure related adverse event free rate at six
months was 80.2% with a lower one-sided 95% confidence bound of 76.3%.
- DRAFT -
C-14 CLINICAL STUDY - DECREASE HF
Months from Randomization Visit
Percent Free from HF AE
All patients implanted and active at the randomization follow-up; N=338.
40
50
60
70
80
90
100
N
Acceptance Boundary
338 313 300 290 279 267 258
0123456
Event-Free Rate
Lower One-Sided 95% Confidence Bound
Figure C-7. Time to Heart Failure Related Adverse Event
Device Safety
Primary Endpoint
System-Related Complication Free Rate––The safety of the investigational
system was assessed by the system related complication free rate observed
in the period between implant and six months post-implant in all patients
attempted or implanted. System related complication free rate is defined
as the proportion of patients without a system related complication within
six months post-implant. All patients who underwent an implant procedure
were included in the analysis. Table C-11 on page C-14 shows the system
related complication free rates by event type. A Kaplan-Meier analysis is also
presented in (Figure C-8 on page C-15) to show time to events.
Table C-11. System-related complication free rate at six months
ComplicationaNumber
ofEvents
Number
of Patients
Complication
Free Rate
Lower One-Sided
95% Confidence
Bound
LV Lead 35 31 91.3 88.5
RA Lead 11 9 97.5 95.7
RV Lead 3 3 99.2 97.8
PG 14 14 96.1 94.0
Procedure 17 16 95.5 93.3
Tota l b80 60 83.2 79.7
a. All patients implanted or attempted; N=358.
b. Includes patients in the Safety Arm.
- DRAFT -
CLINICAL STUDY - DECREASE HF C-15
The null hypothesis was to be rejected if the lower one-sided 95% confidence
bound for system related complication rate through six months post-implant
were greater than 70%. The system related complication free rate at six months
was 83.2% with a lower 95% confidence bound of 79.7%.
Months from Implant
0 1 2 3 4 5 6
60
70
80
90
100
N 358 287 285 280 272 268 265
Acceptance Boundary
Percent Free from System Comp
All patients implanted or attempted; N=358.
Event-Free Rate
Lower One-Sided 95% Confidence Bound
Figure C-8. Time to System Related Complication
The Holter Substudy
Ancillary Endpoints
Sixty-nine patients at nine centers were included in the Holter Substudy. Data
were collected at the three-month visit at centers participating in the Holter
Substudy. Holter recordings were analyzed by a Holter core laboratory.
Continuous Appropriate Pacing During Activities of Daily Living––The
safety of CRT therapy provided by the investigational system was assessed by
the percent of time a patient is appropriately paced over a 24-hour period, as
recorded with a Holter monitor at the three-month visit. The appropriateness
of CRT delivery is defined by whether the device delivers CRT in accordance
with the physician’s programming. The objective of this endpoint was to
demonstrate that patients receive continuous appropriate pacing from the
device during activities of daily living.
It is expected that patients will receive pacing approximately 95% of the time on
average. The null hypothesis was to be rejected if the lower one-sided 95%
confidence bound of the mean time paced were greater than 90%. Due to the
non-normality of the data, a non-parametric test of the median was performed,
which compared the median to 90% instead of comparing the lower 95%
confidence bound of the mean to 90%.
- DRAFT -

C-16 CLINICAL STUDY - DECREASE HF
The mean percentage of appropriately paced beats during activities of daily
living was 99.5 ± 1.3 with a median of 100.0% (p <0.01) (Table C-12 on page
C-16).
Table C-12. Continuous appropriate pacing during activities of daily living
StatisticaResult
N69
Mean ± SD 99.5 ± 1.3
Median 100.0
Range 93.1 - 100.0
P-valueb<0.01
a. All patients in the Holter Substudy; N=69.
b. P-value calculated from a signed-rank test.
Continuous Appropriate Pacing During Exercise––The safety of CRT
therapy provided by the investigational system was assessed by the percent
of time a patient receives appropriate pacing during the patient’s three-month
CPX test, as recorded with a Holter monitor. The appropriateness of CRT
delivery is defined by whether or not the device delivers CRT in accordance
with the physician’s programming. The objective of this endpoint was to
demonstrate that patients receive continuous appropriate pacing from the
device during exercise.
It is expected that patients will receive pacing approximately 95% of the time on
average. The null hypothesis was to be rejected if the lower one-sided 95%
confidence bound of the mean time paced were greater than 90%. Due to the
non-normality of the data, a non-parametric test of the median was performed
comparing the median to 90% instead of comparing the lower 95% confidence
bound to 90%.
The mean percentage of appropriately paced beats during exercise was 99.4 ±
1.9 with a median of 100.0% (p < 0.01) (Table C-13 on page C-16).
Table C-13. Continuous appropriate pacing during exercise
StatisticaResult
N67
Mean ± SD 99.4 ± 1.9
Median 100.0
- DRAFT -

CLINICAL STUDY - DECREASE HF C-17
Table C-13. Continuous appropriate pacing during exercise (continued)
StatisticaResult
Range 90.3 - 100.0
P-valueb<0.01
a. All patients in the Holter Substudy; N=67.
b. P-value calculated from a signed-rank test.
- DRAFT -
C-18 CLINICAL STUDY - DECREASE HF
- DRAFT -

D-1
CLINICAL STUDY - CONTAK CD
APPENDIX D
CLINICAL STUDY POPULATIONS
Guidant CRT-Ds, when compared to OPT alone, have been demonstrated with
reasonable assurance, to be safe and effective in significantly reducing: the
risk of a composite of all-cause mortality or first hospitalization by 20%, the
risk of all-cause mortality by 36%, and heart failure symptoms in patients who
have moderate to severe heart failure (NYHA III/IV) including left ventricular
dysfunction (EF ≤35%) and QRS duration ≥120 ms and remain symptomatic
despite stable, optimal heart failure drug therapy, based on the Guidant
sponsored COMPANION clinical study. (Guidant devices were the only devices
studied in the COMPANION clinical trial.)
SUMMARY
Guidant conducted the CONTAK CD Study to demonstrate the safety and
effectiveness of the CONTAK CD system and to demonstrate a reasonable
assurance of the safety and effectiveness of biventricular stimulation, or cardiac
resynchronization therapy (CRT), using the Guidant Model 1822 VENTAK CHF
AICD and Model 1823 CONTAK CD CRT-D along with the EASYTRAK (Models
4510/4511/4512/4513) coronary venous, steroid-eluting, single-electrode
pace/sense lead.
The CONTAK CD Study failed to prospectively demonstrate effectiveness of the
CRT portion of the device. The CONTAK CD Study met the Lead and System
Effectiveness endpoints as well as the Lead and System Safety endpoints.
Subgroup analysis revealed a population of patients that had Class III/IV heart
failure at the time of randomization that appeared to have improvements on
certain functional endpoints, including the Peak VO2and the Six-Minute Hall
walk. A second study was performed (Focused Confirmatory Study) using this
subgroup of patients to confirm the effectiveness of CRT.
OBSERVED ADVERSE EVENTS
The VENTAK CHF/CONTAK CD/EASYTRAK Biventricular Pacing Study
(hereafter referred to as the CONTAK CD Study) was a prospective,
randomized, controlled, multicenter, double-blind study conducted at 47 sites in
the United States and enrolled a total of 581 patients. Of these, 57 patients
initially underwent a thoracotomy procedure to receive the Guidant Model 1822
VENTAK CHF AICD; 7 patients underwent a repeat procedure to receive an
- DRAFT -

D-2 CLINICAL STUDY - CONTAK CD
EASYTRAK lead. An additional 510 patients initially underwent an implant
procedure to receive the Model 1823 CONTAK CD CRT-D along with the
EASYTRAK (Models 4510/4511/4512/4513) coronary venous, single-electrode
pace/sense lead for a total of 517 patients who underwent an EASYTRAK
lead implant procedure. In 69 patients the EASYTRAK lead implant attempt
was unsuccessful.
Table D-1 on page D-2 provides information on all adverse events reported
from implant through the randomization period in patients attempted or
implanted with the EASYTRAK lead. During this period, a total of 765 events
were reported in 310 patients. Of these, 155 were classified as complications,
and 610 were classified as observations.
Table D-1. Adverse events through randomization period
# Of Events
(# of pts)
%
Complications
(Patients)
Complications
per 100
Device Months
(Events)
%
Observations
(Patients)
Observations
per 100
Device Months
(Events)
Total Adverse
Events
765 (310) 23.4 (121) 6.0 (155) 51.8 (268) 23.5 (610)
PG-Related Events
Migration of device 1 (1) 0.0 (0) 0.0 (0) 0.2 (1) 0.0 (1)
Pacemaker-mediated
tachycardia (PMT)
3 (3) 0.0 (0) 0.0 (0) 0.6 (3) 0.1 (3)
Telemetry difficulty 1 (1) 0.2 (1) 0.0 (1) 0.0 (0) 0.0 (0)
LV Lead-Related Events
Loss of capture 43 (41) 5.6 (29) 1.1 (29) 2.5 (13) 0.5 (14)
Inappropriate shock
due to oversensing
1 (1) 0.0 (0) 0.0 (0) 0.2 (1) 0.0 (1)
Insulation breach
observed
1 (1) 0.2 (1) 0.0 (1) 0.0 (0) 0.0 (0)
Multiple counting 31 (22) 1.0 (5) 0.2 (5) 3.9 (20) 1.0 (26)
Phrenic
nerve/diaphragm
stimulation
15 (15) 0.4 (2) 0.1 (2) 2.5 (13) 0.5 (13)
RA Lead-Related Events
Loss of capture 6 (6) 1.0 (5) 0.2 (5) 0.2 (1) 0.0 (1)
Oversensing 3 (3) 0.0 (0) 0.0 (0) 0.6 (3) 0.1 (3)
Undersensing 1 (1) 0.2 (1) 0.0 (1) 0.0 (0) 0.0 (0)
RV Lead-Related Events
- DRAFT -

CLINICAL STUDY - CONTAK CD D-3
Table D-1. Adverse events through randomization period (continued)
# Of Events
(# of pts)
%
Complications
(Patients)
Complications
per 100
Device Months
(Events)
%
Observations
(Patients)
Observations
per 100
Device Months
(Events)
Loss of capture 10 (9) 0.6 (3) 0.1 (3) 1.2 (6) 0.3 (7)
Elevated DFTs 6 (6) 0.4 (2) 0.1 (2) 0.8 (4) 0.2 (4)
Inappropriate shock
above rate cutoff
49 (38) 0.4 (2) 0.1 (2) 7.2 (37) 1.8 (47)
Inappropriate shock
due to oversensing
5 (4) 0.0 (0) 0.0 (0) 0.8 (4) 0.2 (5)
Nonconversion of
VF
1 (1) 0.2 (1) 0.0 (1) 0.0 (0) 0.0 (0)
Oversensing 2 (2) 0.0 (0) 0.0 (0) 0.4 (2) 0.1 (2)
Phantom shock 2 (2) 0.0 (0) 0.0 (0) 0.4 (2) 0.1 (2)
Phrenic
nerve/diaphragm
stimulation
5 (5) 0.4 (2) 0.1 (2) 0.6 (3) 0.1 (3)
Subtotal
Device-Related
Events
186 (135) 9.5 (49) 2.1 (54) 19.0 (98) 5.1 (132)
Procedure-Related Events
AV block 7 (7) 0.0 (0) 0.0 (0) 1.4 (7) 0.3 (7)
Coronary sinus
dissection
5 (5) 0.0 (0) 0.0 (0) 1.0 (5) 0.2 (5)
Coronary venous
perforation
5 (5) 0.2 (1) 0.0 (1) 0.8 (4) 0.2 (4)
Hematoma 11 (10) 0.8 (4) 0.2 (4) 1.2 (6) 0.3 (7)
Hypotension 7 (7) 0.0 (0) 0.0 (0) 1.4 (7) 0.3 (7)
Infection,
post-operative
wound
7 (7) 0.6 (3) 0.1 (3) 0.8 (4) 0.2 (4)
Pneumothorax 7 (7) 0.8 (4) 0.2 (4) 0.6 (3) 0.1 (3)
Post surgical
wound discomfort
10 (9) 0.2 (1) 0.0 (1) 1.5 (8) 0.3 (9)
Renal failure 5 (5) 0.2 (1) 0.0 (1) 0.8 (4) 0.2 (4)
Other 18 (18) 1.2 (6) 0.2 (6) 2.3 (12) 0.5 (12)
Subtotal
Procedure-Related
Events
79 (71) 3.9 (20) 0.7 (17) 10.0 (51) 2.2 (56)
- DRAFT -

D-4 CLINICAL STUDY - CONTAK CD
Table D-1. Adverse events through randomization period (continued)
# Of Events
(# of pts)
%
Complications
(Patients)
Complications
per 100
Device Months
(Events)
%
Observations
(Patients)
Observations
per 100
Device Months
(Events)
Cardiovascular-Related Events
AV Block 3 (3) 0.0 (0) 0.0 (0) 0.6 (3) 0.1 (3)
Arrhythmia - SVT 49 (42) 0.2 (1) 0.0 (1) 7.9 (41) 1.8 (48)
Arrhythmia - VT 20 (17) 1.0 (5) 0.2 (5) 2.7 (14) 0.6 (15)
Arrhythmia - brady 16 (14) 0.2 (1) 0.0 (1) 2.5 (13) 0.6 (15)
Cardiac arrest 2 (2) 0.4 (2) 0.1 (2) 0.0 (0) 0.0 (0)
Chest pain 30 (20) 1.0 (5) 0.2 (5) 3.1 (16) 1.0 (25)
Coagulopathy 3 (3) 0.2 (1) 0.0 (1) 0.4 (2) 0.1 (2)
Congestive heart
failure
140 (91) 3.5 (18) 0.7 (18) 16.1 (83) 4.7 (122)
Distal
thromboemboli
3 (2) 0.0 (0) 0.0 (0) 0.4 (2) 0.1 (3)
Dizziness 17 (17) 0.0 (0) 0.0 (0) 3.3 (17) 0.7 (17)
Dyspnea
(shortness of
breath)
16 (13) 0.0 (0) 0.0 (0) 2.5 (13) 0.6 (16)
Fatigue 10 (10) 0.0 (0) 0.0 (0) 1.9 (10) 0.4 (10)
Hypertension 1 (1) 0.0 (0) 0.0 (0) 0.2 (1) 0.0 (1)
Hypotension 11 (9) 0.2 (1) 0.0 (1) 1.7 (9) 0.4 (10)
Myocardial
infarction
2 (2) 0.0 (0) 0.0 (0) 0.4 (2) 0.1 (2)
Pacemaker
syndrome
1 (1) 0.0 (0) 0.0 (0) 0.2 (1) 0.0 (1)
Palpitations 2 (2) 0.0 (0) 0.0 (0) 0.4 (2) 0.1 (2)
Pulmonary edema 6 (6) 0.4 (2) 0.1 (2) 0.8 (4) 0.2 (4)
Shock 4 (4) 0.2 (1) 0.0 (1) 0.6 (3) 0.1 (3)
Stroke syndrome or
CVA
4 (4) 0.0 (0) 0.0 (0) 0.8 (4) 0.2 (4)
Syncope 9 (9) 0.0 (0) 0.0 (0) 1.7 (9) 0.3 (9)
Thrombosis 3 (3) 0.0 (0) 0.0 (0) 0.6 (3) 0.1 (3)
Vascular related 6 (6) 1.0 (5) 0.2 (5) 0.2 (1) 0.0 (1)
- DRAFT -

CLINICAL STUDY - CONTAK CD D-5
Table D-1. Adverse events through randomization period (continued)
# Of Events
(# of pts)
%
Complications
(Patients)
Complications
per 100
Device Months
(Events)
%
Observations
(Patients)
Observations
per 100
Device Months
(Events)
Subtotal
Cardiovascular-
Related Events
358 (200) 7.7 (40) 1.6 (42) 35.6 (184) 12.2 (316)
Tota l
Noncardiovascular-
Related Events
142 (92) 6.2 (32) 1.5 (39) 13.5 (70) 4.0 (103)
Deaths
A total of 109 deaths occurred during the study. These deaths occurred during
the study periods as shown in Table D-2 on page D-5 along with the cause of
death as adjudicated by an independent events committee.
Table D-2. Deaths that occurred during CONTAK CD study
Cause of Death
Study Perioda#ofpt
deaths Cardiac:
Pump
Failure
Cardiac:
Arrhythmic
Cardiac:
Other
Non-
cardiac
Unknown
After unsuccessful implant
procedure
21 1 0 0 0
Peri-operative (≤30 days) 10 52021
Randomized therapy phase: No
CRTb
16 9 0 1 3 3
Randomized therapy phase: CRTb11 4 1 2 2 2
Post-randomized therapy phasec70 26 511620
Total 109 47 9 4 23 26
a. All patients enrolled, N = 581.
b. Day 31 to 120 for Phase I patients, day 31 to 210 for Phase II patients.
c. Day 121 and beyond for Phase I patients, day 211 and beyond for Phase II patients.
STUDY DESIGN
The CONTAK CD Study was a prospective, randomized, controlled,
multi-center, double-blind study conducted at 47 sites in the United States
and enrolled a total of 581 patients. All patients enrolled were intended to be
implanted with a device capable of delivering both CRT and treating ventricular
tachyarrhythmias. Patients were randomized to CRT Off (VVI lower rate 40)
- DRAFT -
D-6 CLINICAL STUDY - CONTAK CD
or CRT On (VDD). The study began as a crossover design (called "Phase I")
and enrolled 248 patients with a primary endpoint of functional status with
three months of follow-up. The study was later modified to a parallel design
(called "Phase II") and enrolled 333 patients with a longer, six-month follow-up.
Thedatafromthefirst three months of the crossover phase were pooled
with data obtained from the six-month parallel phase. The visit schedule
and testing requirements remained the same. Additionally, while the study
originally used the VENTAK CHF ICD in conjunction with epicardial leads
placed via thoracotomy, the CONTAK CD CRT-D and EASYTRAK lead (placed
transvenously) were added to the protocol later in the study.
INCLUSION/EXCLUSION CRITERIA
Patients enrolled in the study were required to meet the following inclusion
criteria:
• Meet the general indication for ICD implant
• Symptomatic heart failure despite optimal drug therapy (ACE inhibitors with
diuretic and/or digoxin, as determined to be indicated and tolerated by
the patient’s physician-investigator)
• Left ventricular ejection fraction ≤35%
• QRS duration ≥120 ms
•Age≥18 years
• Normal sinus node function
Patients were excluded from the investigation if they met any of the following
criteria:
• Meet the general indications for permanent antibradycardia pacing,
including pacemaker dependence
• Have chronic, medically refractory atrial tachyarrhythmias
• Require concomitant cardiac surgery
• Are unable to undergo device implant, including general anesthesia if
required
• Are unable to comply with the protocol and follow-up requirements,
including exercise testing
• Have a life expectancy of less than six months due to other medical
conditions
• Have amyloid disease (amyloidosis)
• Have hypertrophic obstructive cardiomyopathy
- DRAFT -
CLINICAL STUDY - CONTAK CD D-7
• Require in-hospital continuous intravenous inotropes
• Have pre-existing cardioversion/defibrillation leads other than those
specified in this investigational plan (unless the investigator intends to
replace them with permitted cardioversion/defibrillation leads)
• Women who are pregnant or not using medically accepted birth control
• Have a mechanical tricuspid prosthesis
• Involved in other cardiovascular clinical investigations of active therapy
or treatment
FOLLOW-UP SCHEDULE
The follow-up schedule for the clinical study consisted of the following
components:
• Pre-implant visit––initial assessment of patient eligibility; taking of patient
history.
• Implant––implant of investigational devices and acute device testing.
Randomization status (CRT or No CRT) was assigned for implementation
after a 30-day recovery period.
• Recovery period––minimum 30-day period over which the patient recovered
from the implant procedure and had his/her heart failure medications
adjusted, but with no CRT, regardless of the randomization assignment.
• Post-recovery visit––first visit after the Recovery Period in which patients
underwent Special Testing to establish their baseline condition, after which
the randomization assignment was implemented (CRT or No CRT).
• Three- and six-month visit––evaluation of randomized therapy with Special
Testing and device function at three- and six-months after the post-recovery
visit.
• Quarterly visits––After the six-month visit, patients were seen for routine
evaluation of device function and patient condition.
NOTE: Special Testing included a Symptom-Limited Treadmill Test
with measurement of oxygen uptake (Peak VO2), a Six-Minute Walk,
Echocardiography, Holter monitoring, blood chemistry testing, and a Quality
of Life (QOL) questionnaire
- DRAFT -
D-8 CLINICAL STUDY - CONTAK CD
DEMOGRAPHIC DATA
The CONTAK CD Study included patients with symptomatic heart failure
despite optimal drug therapy as defined in the inclusion criteria. The population
included patients who were NYHA Class II, III, or IV at the time of implant.
Based upon the clinical results from the covariate analyses in this study and the
internal consistency of these clinical findings with those from other completed
CRT studies, the patient subgroup with NYHA Class III/IV heart failure in this
study was examined further.
• All Patients––all patients (NYHA Class II/III/IV at the time of implant)
implanted with an investigational system (N = 501). Ten patients died
and one withdrew before the post-recovery visit. Therefore, therapy
effectiveness analyses used N = 490.
• NYHA Class III/IV (Advanced Heart Failure)––this subgroup was defined
as those patients with moderate to severe heart failure at the time of the
Post-Recovery Visit (N = 227). A percentage of patients either had an
improvement or worsening of their NYHA Class during the post-implant
recovery period. The patients in the Advanced Heart Failure subgroup
were only those who remained in NYHA Class III/IV at the end of the
post-recovery period. This subgroup was determined from interaction
analysis of preselected covariates with the functional status endpoints.
ENDPOINTS
The CONTAK CD Study had three investigational elements consisting of the
following components:
• CRT effectiveness
– Primary––composite endpoint consisting of all-cause mortality,
hospitalization for heart failure, and ventricular tachyarrhythmia
requiring device intervention
– Secondary–Peak VO2derived from a symptom-limited exercise test
and Quality of Life as measured by the Minnesota Living with Heart
Failure Questionnaire®
– Additional––Six-Minute Walk, NYHA Class, Echocardiographic
Analysis, Change in Norepinephrine, and Change in Heart Rate
- DRAFT -
CLINICAL STUDY - CONTAK CD D-9
• Lead and System Effectiveness
– Lead––left ventricular pacing thresholds, biventricular sensing,
biventricular lead impedance, and lead placement success rate
– System––VF detection time and biventricular ATP effectiveness
• Lead and System Safety
– Lead––incidence of lead-related adverse events
– System––incidence of severe, device-related adverse events and
operative mortality
STUDY RESULTS
Patient Accountability (Figure D-1 on page D-10)
- DRAFT -
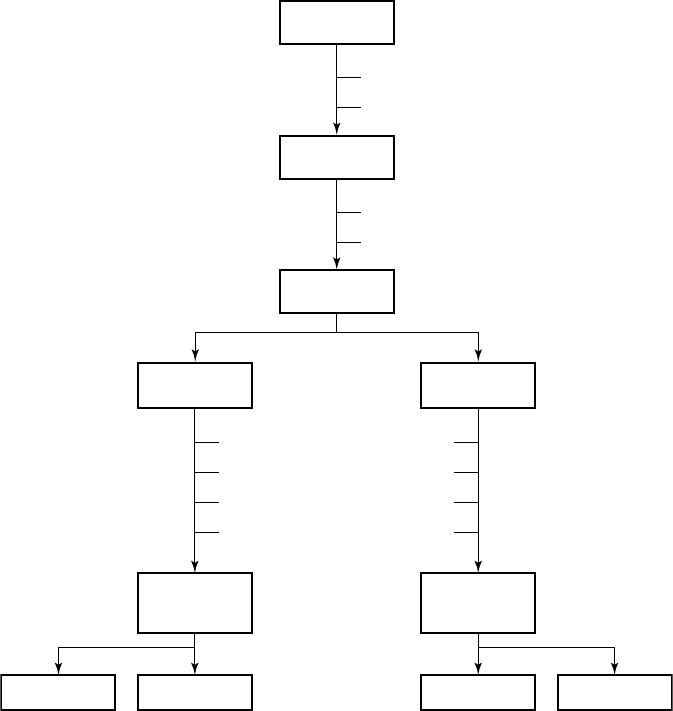
D-10 CLINICAL STUDY - CONTAK CD
Control (No CRT)
n = 245
Assessable for
effectiveness
n = 224
Assessable for
effectiveness
n = 232
CRT
n = 245
Randomized
n = 490
16
2
3
0
Death
Uncorrected lead dislodgement
Heart transplant
Withdrew
11
0
1
1
Six months
n = 125
Three months
n = 99
Six months
n = 126
Three months
n = 106
10
1
Death
Withdrew
Implanted
n = 501
14
66
Withdrew prior to surgery (“Intent”)
Unable to implant lead (“Attempt”)
Enrolled
n = 581
Figure D-1. Enrollment and follow-up of randomized patients
Baseline Characteristics––Includes all patients implanted; N = 501(Table D-3
on page D-11, Table D-4 on page D-12).
- DRAFT -

CLINICAL STUDY - CONTAK CD D-11
Table D-3. Pre-implant assessment
All Patients NYHA Class III/IV
Characteristic
CRT
(N = 248)
No CRT
(N = 253)
P-valueaCRT
(N = 117)
No CRT
(N = 110)
P-valuea
Age at Implant
(years)
N 248 253 117 110
Mean ±
SD
66.0 ± 10.5 66.3 ± 10.5 0.73 66.1 ±
10.5
65.8 ± 10.5 0.80
Range 26.1 - 82.6 29.5 - 86.3 26.1 - 82.5 38.3 - 85.3
Gender [N (%)] Male 210 (84.7) 211 (83.4) 0.70 90 (76.9) 86 (78.2) 0.82
Female 38 (15.3) 42 (16.6) 27 (23.1) 24 (21.8)
NYHA Class [N
(%)]
II 80 (32.3) 83 (32.8) 0.66 20 (17.1) 11 (10.0) 0.08
III 148 (59.7) 144 (56.9) 85 (72.6) 78 (70.9)
IV 20 (8.1) 26 (10.3) 12 (10.3) 21 (19.1)
Concomitant
Medications [N
(%)]
ACE or
ARB
212 (85.5) 224 (88.5) 0.31 95 (81.2) 98 (89.1) 0.10
Beta
Blocker
119 (48.0) 117 (46.2) 0.70 53 (45.3) 44 (40.0) 0.42
Digoxin 172 (69.4) 171 (67.6) 0.67 84 (71.8) 75 (68.2) 0.55
Diuretic 217 (87.5) 210 (83.0) 0.16 108 (92.3) 95 (86.4) 0.15
Qualifying LVEF
(%)
N 248 253 117 110
Mean ±
SD
21.4 ± 6.6 21.5 ± 6.7 0.74 20.6 ± 6.4 21.1 ± 6.2 0.61
Range 5.0 - 35.0 10.0 - 35.0 8.0 - 35.0 10.0 - 35.0
PR Intervalb(ms) N 224 222 107 91
Mean ±
SD
205± 42 202 ± 49 0.44 204 ± 41 200 ± 54 0.60
Range 88 - 336 104 - 400 136 - 336 110 - 400
Qualifying QRS
Durationb(ms)
N 226 224 109 93
Mean ±
SD
160 ± 27 156 ± 26 0.06 164 ± 27 152 ± 24 < 0.01
Range 120 - 240 120 - 264 120 - 240 120 - 222
Resting Heart Rate
( bpm)
N 248 253 117 110
- DRAFT -

D-12 CLINICAL STUDY - CONTAK CD
Table D-3. Pre-implant assessment (continued)
All Patients NYHA Class III/IV
Characteristic
CRT
(N = 248)
No CRT
(N = 253)
P-valueaCRT
(N = 117)
No CRT
(N = 110)
P-valuea
Mean ±
SD
73 ± 12 75 ± 14 0.37 75 ± 13 74 ± 15 0.61
Range 43 - 108 48 - 120 43 - 108 50 - 120
Systolic Blood
Pressure (mmHg)
N 247 253 116 110
Mean ±
SD
118 ± 21 118 ± 21 0.95 116 ± 20 117 ± 23 0.72
Range 79 - 197 70 - 190 79 - 191 74 - 190
Diastolic Blood
Pressure (mmHg)
N 247 253 116 110
Mean ±
SD
67 ± 12 69 ± 12 0.27 68 ± 12 67 ± 14 0.85
Range 31 - 100 40 - 109 31 - 100 40 - 109
a. P-values for comparing means were calculated with Student’s t-test; p-values for comparing proportions were calculated with
Pearson’s chi-squared test.
b. PR interval and QRS duration were not obtained for thoracotomy patients.
Table D-4. Pre-implant history
All Patients NYHA Class III/IV
Characteristic
CRT
(N = 248)
No CRT
(N = 253)
P-valueaCRT
(N = 117)
No CRT
(N = 110)
P-valuea
Primary
Tachyarrhythmia [N
(%)]
Monomorphic
VT (MVT)
148
(59.7)
136
(53.8)
0.44 72 (61.5) 48 (43.6) 0.03
Polymorphic
VT (PVT)
16 (6.5) 20 (7.9) 7 (6.0) 7 (6.4)
Nonsustained
VT
58 (23.4) 63 (24.9) 30 (25.6) 35 (31.8)
Ventricular
Fibrillation
(VF)
26 (10.5) 32 (12.6) 8 (6.8) 18 (16.4)
Other 0 (0.0) 2 (0.8) 0 (0.0) 2 (1.8)
Other Arrhythmias [N
(%)]
Paroxysmal
Atrial
Fibrillation
43 (17.3) 62 (24.5) 0.05 21 (17.9) 29 (26.4) 0.13
Atrial Flutter 10 (4.0) 13 (5.1) 0.55 3 (2.6) 7 (6.4) 0.16
- DRAFT -

CLINICAL STUDY - CONTAK CD D-13
Table D-4. Pre-implant history (continued)
All Patients NYHA Class III/IV
Characteristic
CRT
(N = 248)
No CRT
(N = 253)
P-valueaCRT
(N = 117)
No CRT
(N = 110)
P-valuea
Arrhythmia/Conduction
Disorder [N (%)]
LBBB 133
(53.6)
138
(54.5)
0.83 59 (50.4) 59 (53.6) 0.55
RBBB 35 (14.1) 31 (12.3) 21 (17.9) 14 (12.7)
Non-Specific 80 (32.3) 84 (33.2) 37 (31.6) 37 (33.6)
Etiology [N (%)] Ischemic 167
(67.3)
178
(70.4)
0.47 76 (65.0) 78 (70.9) 0.34
Non-Ischemic 81 (32.7) 75 (29.6) 41 (35.0) 32 (29.1)
a. P-values were calculated with Pearson’s chi-squared test.
CRT Effectiveness
Heart Failure Progression (Composite Index)––the Composite Index
(primary endpoint) was a combination of three events: all-cause mortality,
hospitalization for heart failure, and VT/VF event requiring therapy (Table D-5
on page D-13). A committee consisting of three heart failure specialists and
an electrophysiologist reviewed and adjudicated all patient deaths and all
hospitalizations, defined as an admission greater than 23 hours. Outpatient
care, emergency room care, and clinic visits less than 23 hours were collected
but not considered to be hospitalizations for the purposes of analysis.
Table D-5. Heart Failure Progression (Composite Index)
CRT No CRT
GroupaHeart Failure Mortality
or Morbidity Event N%N%
Relative Reduction
with CRT
All Patients
(N = 490)
Death from any cause 114.5166.5 15% p = 0.35
HF hospitalization 32 13.1 39 15.9
VT/VF 36 14.7 39 15.9
NYHA Class III/IV
(N = 227)
Death from any cause 11 9.4 11 10.0 22% p = 0.23
HF hospitalization 23 19.7 27 24.5
VT/VF 21 17.9 22 20.0
a. All patients implanted and active 31 days post-implant.
Twenty-seven patients died during the therapy phase. Mortality stratified by
treatment group and cause, as adjudicated by the Events Committee, is shown
- DRAFT -
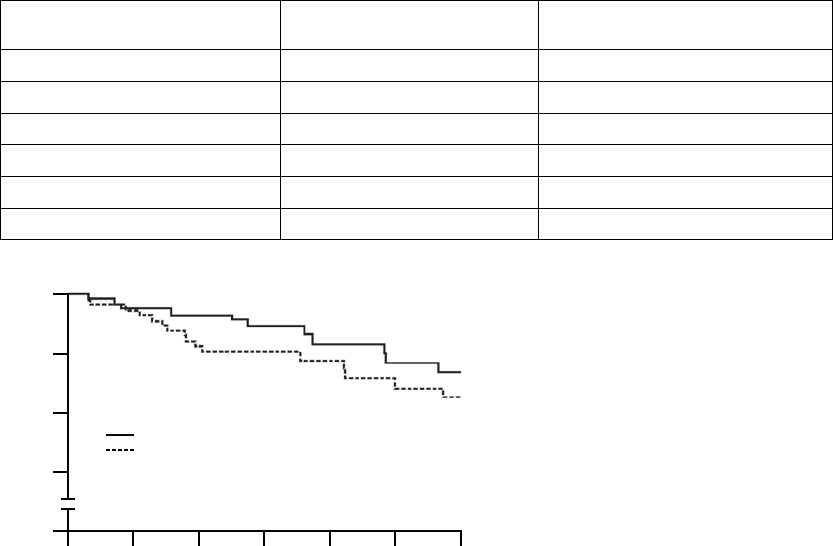
D-14 CLINICAL STUDY - CONTAK CD
inTable D-6 on page D-14. The Kaplan-Meier curve, showing total survival by
treatment group, is shown in Figure D-2 on page D-14.
TableD-6. Mortalitystratified by treatment group and cause
DeathsaPatients with CRT
(N = 245)
Patients with No CRT
(N = 245)
Cardiac, pump failure 4 (1.6%) 9 (3.7%)
Cardiac, arrhythmic 1 (0.4%) 0 (0.0%)
Cardiac, other 2 (0.8%) 1 (0.4%)
Noncardiac 2 (0.8%) 3 (1.2%)
Unknown 2 (0.8%) 3 (1.2%)
Tota l 11 (4.5%) 16 (6.5%)
a. All patients implanted and active at 31 days post-implant; N = 490.
630
100
95
90
85
0
Total Survival (%)
Time Post-randomization (Months)
No CRT
CRT
245
245
242
241
239
233
127
130
125
129
123
126
122
125
p = 0.32
CRT
No CRT
Patients at Risk
Figure D-2. Kaplan-Meier curve
Table D-7 on page D-15 presents the reasons for hospitalization within the
treatment period as determined by the Events Committee. This table represents
the number of patients with each category of hospitalization. Patients may have
multiple hospitalizations that fall into different categories.
- DRAFT -

CLINICAL STUDY - CONTAK CD D-15
Table D-7. Patients hospitalized during treatment period
All Patients NYHA Class III/IV
Reason for Hospitalizationa
CRT
(N = 245)
No CRT
(N = 245)
Total
(N = 490)
CRT
(N = 117)
No CRT
(N = 110)
Total
(N = 227)
Heart failure 32 39 71 23 27 50
Cardiac, other 20 25 45 14 14 28
Noncardiac 26 19 45 14 14 28
Total Hospitalizations 66 70 136 40 46 86
a. All patients implanted and active at 31 days post-implant; N = 490.
Peak VO2––the Peak VO2was determined from a standardized protocol for
exercise testing as a means of measuring a patient’s capacity for performing
physical activity. Figure D-3 on page D-15 and Table D-8 on page D-15 provide
the change in Peak VO2.
15
13
12
14
11
Time (months)
Peak VO2 (ml/kg/min)
06
All Patients
∆ = 0.8 ± 0.4
p = 0.030
Mean ± SE
CRT (n = 216)
No CRT (n = 201)
Time (months)
06
NYHA Class III/IV
∆ = 1.8 ± 0.6
p = 0.003
CRT (n = 96)
No CRT (n = 80)
Figure D-3. Change in Peak VO2
Table D-8. Change in Peak VO2
All Patients NYHA Class III/IV
Peak VO2
(ml/kg/min) CRT
(N = 216)
No CRT
(N = 201)
P-valueaCRT
(N = 96)
No CRT
(N = 80)
P-valuea
Post-recovery Visit 13.5 ± 0.2 13.5 ± 0.2 –– 12.0 ± 0.3 12.0 ± 0.3 ––
- DRAFT -
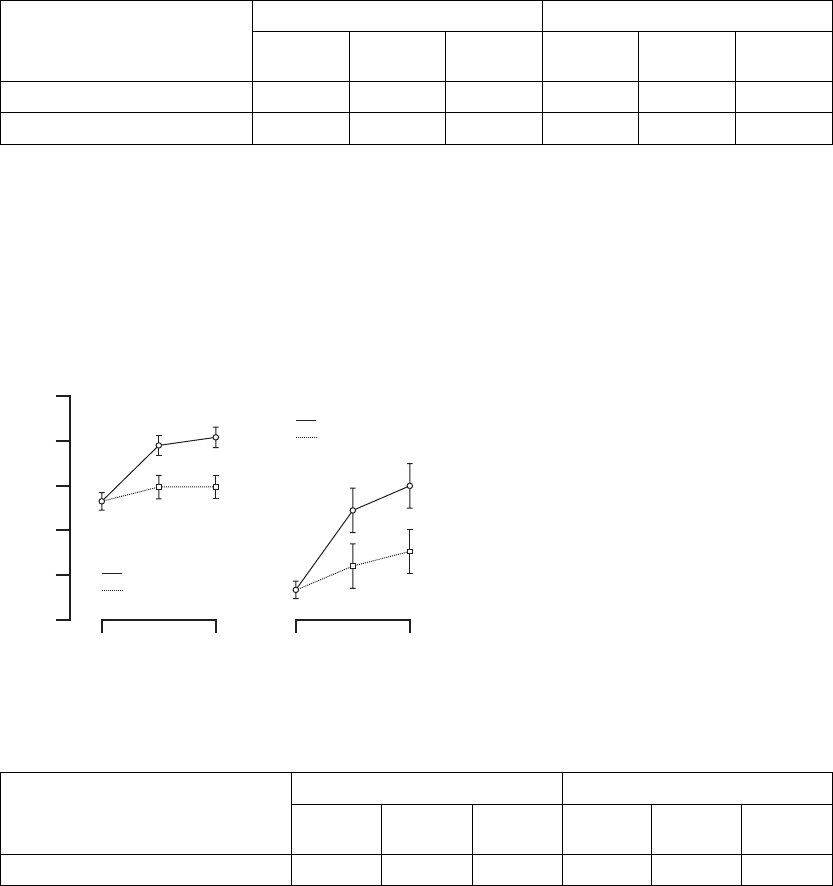
D-16 CLINICAL STUDY - CONTAK CD
Table D-8. Change in Peak VO2 (continued)
All Patients NYHA Class III/IV
Peak VO2
(ml/kg/min) CRT
(N = 216)
No CRT
(N = 201)
P-valueaCRT
(N = 96)
No CRT
(N = 80)
P-valuea
3 Months 14.3 ± 0.2 13.9 ± 0.2 0.206 12.8 ± 0.4 12.1 ± 0.4 0.084
6 Months 14.4 ± 0.3 13.6 ± 0.3 0.030 13.8 ± 0.5 12.0 ± 0.5 0.003
a. P-values reflect the between-group differences with respect to baseline.
Six-Minute Walk––the Six-Minute Walk test is a measure of a patient’s ability
to sustain exercise during an activity similar to that which a patient may typically
perform on a daily basis. For this test, patients are instructed to walk as far
as possible in 6 minutes in a level corridor. Figure D-4 on page D-16 and
Table D-9 on page D-16 provide the change in Six-Minute Walk.
375
325
275
350
250
Time (months)
Six Minute Walk Distance (m)
06
All Patients
∆ = 21 ± 10
p = 0.043
Mean ± SE
CRT (n = 224)
No CRT (n = 220)
Time (months)
06
NYHA Class III/IV
∆ = 39 ± 18
p = 0.029
CRT (n = 99)
No CRT (n = 90)
300
Figure D-4. Change in Six-Minute Walk
Table D-9. Change in Six-Minute Walk
All Patients NYHA Class III/IV
SixMinuteWalkDistance(meters)
CRT
(N = 224)
No CRT
(N = 200)
P-valueaCRT
(N = 99)
No CRT
(N = 90)
P-valuea
Post-recovery Visit 317 ± 5 317 ± 5 –– 268 ± 9 268 ± 9 ––
- DRAFT -
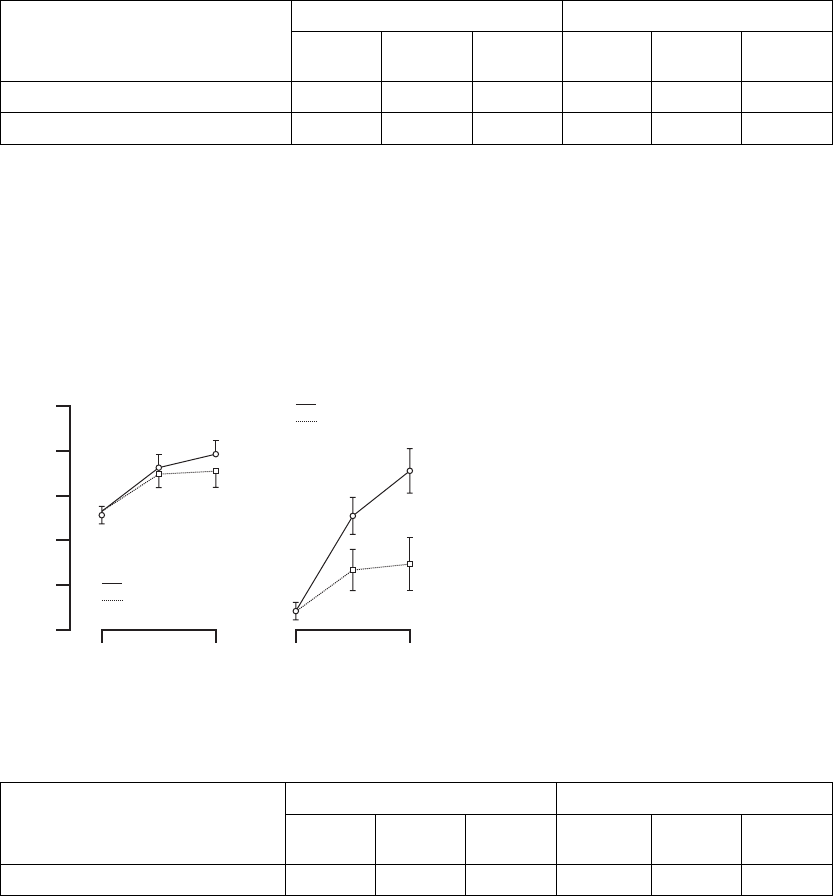
CLINICAL STUDY - CONTAK CD D-17
Table D-9. Change in Six-Minute Walk (continued)
All Patients NYHA Class III/IV
SixMinuteWalkDistance(meters)
CRT
(N = 224)
No CRT
(N = 200)
P-valueaCRT
(N = 99)
No CRT
(N = 90)
P-valuea
3 Months 348 ± 7 331 ± 8 0.058 312 ± 12 280 ± 12 0.028
6 Months 353 ± 8 332 ± 8 0.043 327 ± 14 288 ± 15 0.029
a. P-values reflect the between-group differences with respect to baseline.
Quality of Life (QOL)––QOL was assessed using the 21-question Minnesota
Living with Heart Failure Questionnaire®. Each question is answered by the
patient, ranking each item on a scale ranging from 0 to 5. A lower total score
indicates an improved quality of life. Figure D-5 on page D-17 and Table D-10
on page D-17 provide the change in QOL.
30
40
50
35
55
Time (months)
QOL Score (points)
06
All Patients
∆ = -2.1 ± 2.4
p = 0.40
Mean ± SE
CRT (n = 234)
No CRT (n = 225)
Time (months)
06
NYHA Class III/IV
∆ = -10.1 ± 4.2
p = 0.017
CRT (n = 107)
No CRT (n = 96)
45
Figure D-5. Change in Quality of Life
Table D-10. Change in Quality of Life
All Patients NYHA Class III/IV
QOL (points)
CRT
(N = 234)
No CRT
(N = 225)
P-valueaCRT
(N = 107)
No CRT
(N = 96)
P-valuea
Post-recovery Visit 41.8 ± 1.1 41.8 ± 1.1 –– 52.7 ± 1.5 52.7 ± 1.5 ––
- DRAFT -
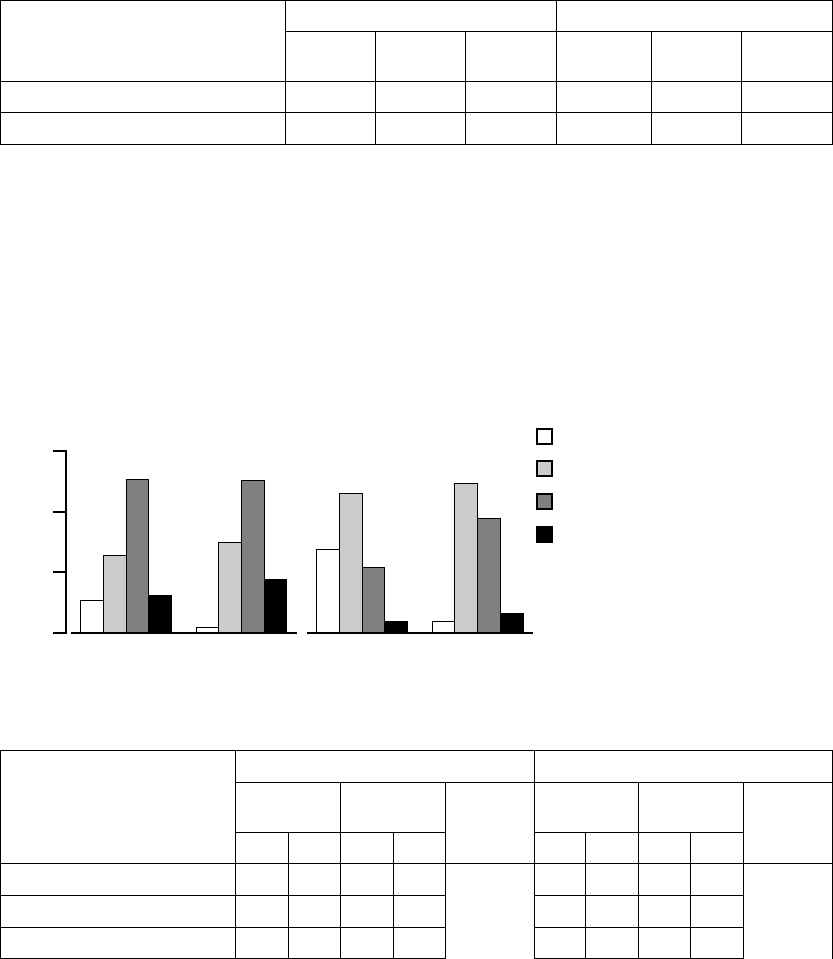
D-18 CLINICAL STUDY - CONTAK CD
Table D-10. Change in Quality of Life (continued)
All Patients NYHA Class III/IV
QOL (points)
CRT
(N = 234)
No CRT
(N = 225)
P-valueaCRT
(N = 107)
No CRT
(N = 96)
P-valuea
3 Months 36.6 ± 1.5 37.3 ± 1.6 0.711 41.9 ± 2.4 47.5 ± 2.6 0.078
6 Months 34.8 ± 1.8 36.9 ± 1.8 0.395 37.2 ±- 3.1 47.3 ± 3.2 0.017
a. P-values reflect the between-group differences with respect to baseline.
NYHA Class––the determination of New York Heart Association (NYHA) Class
is based on mutual assessment by the patient and the patient’s physician of
the patient’s heart failure symptoms both at rest and while performing ordinary
physical activity. NYHA Class was determined at each follow-up visit by a
physician who was blinded to the patient’s randomized therapy. Figure D-6 on
pageD-18andTableD-11onpageD-18providethechangeinNYHAClass
results.
60
40
20
0
Change in NYHA Class (%)
CRT
(n = 109)
No CRT
(n = 116)
CRT
(n = 45)
No CRT
(n = 48)
Improve ≥ 2 Classes
Worsen ≥ 1 Class
Improve = 1 Class
No change
All Patients
(NYHA Class II / III / IV)
p = 0.10
NYHA Class III / IV
p = 0.006
Figure D-6. Change in NYHA Class
Table D-11. Change in NYHA Class
All Patients NYHA Class III/IV
CRT
(N = 109)
No CRT
(N = 116)
CRT
(N = 45)
No CRT
(N = 48)
Change in NYHA Class
N%N%
P-valuea
N%N%
P-valuea
Improve 2 or More Classes 12 11.0 2 1.7 0.10 12 26.7 2 4.2 0.006
Improve1Class 27 24.8 35 30.2 21 46.7 24 50.0
No Change 56 51.4 59 50.9 10 22.2 18 37.5
- DRAFT -

CLINICAL STUDY - CONTAK CD D-19
Table D-11. Change in NYHA Class (continued)
All Patients NYHA Class III/IV
CRT
(N = 109)
No CRT
(N = 116)
CRT
(N = 45)
No CRT
(N = 48)
Change in NYHA Class
N%N%
P-valuea
N%N%
P-valuea
Worsen 1 Class 13 11.9 19 16.4 2 4.4 4 8.3
Worsen2orMoreClasses 10.910.9 00.000.0
a. P-value was calculated from Mantel-Haenszel test and reflects the between-group differences with respect to baseline.
Echocardiography––several echocardiography (echo) variables were
identified to assist in measuring the possible hemodynamic impact of CRT
(Table D-12 on page D-19). The limitation of this data is that patients
are measured while at rest, and therefore, the data may not reflect any
hemodynamic benefit that may be observed when patients are exercising and
performing their daily activities.
Table D-12. Echocardiography results
CRT No CRT Between Groups
Parameter Timepoint
NMean ± SE NMean ± SE Mean ± SE P-value
All Patients
LVIDd (mm) Post-recovery
Visit
228 70.4 ± 0.5 219 70.4 ± 0.5 0 ––
Change at 6
Months
228 -3.4 ± 0.6 219 -0.3 ± 0.6 -3.1 ± 0.9 < 0.001
LVIDs (mm) Post-recovery
Visit
228 58.3 ± 0.5 219 58.3 ± 0.5 0 ––
Change at 6
Months
228 -4.0 ± 0.7 219 -0.7 ± 0.7 -3.3 ± 0.9 < 0.001
LVEF (%) Post-recovery
Visit
222 27.8 ± 0.3 216 27.8 ± 0.3 0 ––
Change at 6
Month
222 5.1 ± 0.7 216 2.8 ± 0.7 2.4 ± 1.0 0.020
NYHA Class III/IV
LVIDd (mm) Post-recovery
Visit
104 71.2 ± 0.7 92 71.2 ± 0.7 0 ––
Change at 6
Months
104 -4.9 ± 1.0 92 -0.2 ± 1.1 -4.7 ± 1.5 0.001
LVIDs (mm) Post-recovery
Visit
104 59.2 ± 0.7 92 59.2 ± 0.7 0 ––
- DRAFT -

D-20 CLINICAL STUDY - CONTAK CD
Table D-12. Echocardiography results (continued)
CRT No CRT Between Groups
Parameter Timepoint
NMean ± SE NMean ± SE Mean ± SE P-value
Change at 6
Months
104 -5.4 ± 1.1 92 -0.6 ± 1.1 -4.8 ± 1.5 0.002
LVEF (%) Post-recovery
Visit
99 26.9 ± 0.5 91 26.9 ± 0.5 0 ––
Change at 6
Months
99 6.0 ± 1.1 91 2.3 ± 1.2 3.7 ± 1.7 0.029
Measures of Sympathetic Tone––Mean Norepinephrine levels (Table D-13 on
page D-20) and Mean Heart Rate (Table D-14 on page D-20) were examined as
markers of how CRT may influence the excessive sympathetic drive associated
with chronic heart failure.
Table D-13. Mean Norepinephrine results
All Patients NYHA Class III/IV
Norepinephrine (pg/mL)
CRT
(N =
228)
No CRT
(N =
217)
P-value CRT
(N =
104)
No CRT
(N = 90)
P-value
Post-recovery Visit 663 ± 19 663 ± 19 –– 720 ± 31 720 ± 31 ––
3 Months 651 ± 31 681 ± 32 0.479 685 ± 55 743 ± 60 0.463
6 Months 658 ± 40 738 ± 41 0.143 681 ± 75 827 ± 79 0.163
Table D-14. Mean heart rate results
All Patients NYHA Class III/IV
Heart Rate (bpm)
CRT
(N = 240)
No CRT
(N = 233)
P-value CRT
(N = 113)
No CRT
(N = 101)
P-value
Post-recovery Visit 72.3 ± 0.6 72.3 ± 0.6 –– 74.5 ± 1.0 74.5 ± 1.0 ––
3 Months 70.8 ± 0.8 72.1 ± 0.8 0.20 74.1 ± 1.2 73.9 ± 1.3 0.94
6 Months 69.4 ± 1.0 70.2 ± 1.0 0.58 70.6 ± 1.6 72.5 ± 1.6 0.40
EASYTRAK Lead and System Effectiveness
It was hypothesized that the upper tolerance limit of the chronic left ventricular
pacing threshold of the EASYTRAK lead be less than 5.5 V to ensure that
an adequate safety margin exists. Chronic left ventricular pacing thresholds
- DRAFT -
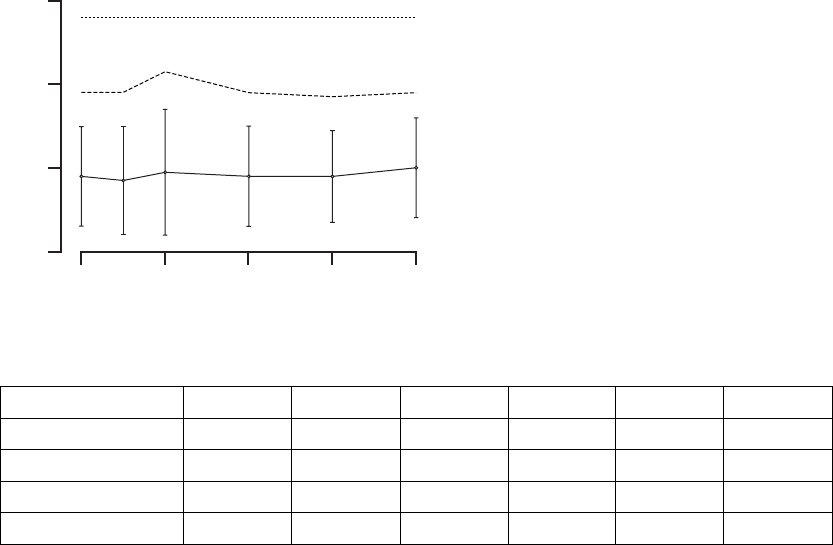
CLINICAL STUDY - CONTAK CD D-21
shown in Figure D-7 on page D-21 and Table D-15 on page D-21 are well
within this limit.
6
4
2
0
LV Pacing Threshold (V at 0.5 ms)
02418126
Acceptance Boundary
90% Tolerance Interval
Implant Duration (months)
Figure D-7. EASYTRAK lead threshold measurements
Table D-15. EASYTRAK lead threshold measurements
StatisticaImplant 3 Months 6 Months 12 Months 18 Months 24 Months
N 435 347 330 233 103 25
Mean ± SD 1.8 ± 1.2 1.7 ± 1.3 1.9 ± 1.5 1.8 ± 1.2 1.8 ± 1.1 2.0 ± 1.2
Range 0.2 - 7.5 0.2 - 7.5 0.2 - 7.5 0.4 - 7.5 0.6 - 7.5 0.6 - 5.0
Upper Tolerance Limit 3.8 3.8 4.3 3.8 3.7 3.9
a. EASYTRAK lead models: 4511, 4512, and 4513
Mean chronic biventricular R-wave amplitudes are measured as a combination
of the R-waves from both the right ventricle (commercially available ENDOTAK
lead) and left ventricle (EASYTRAK lead). It was hypothesized that the mean
biventricularR-waveamplitudebegreaterthan5mVtoensurepropersensing.
InFigureD-8onpageD-22andTableD-16onpageD-22,theperformanceof
the EASYTRAK lead system was significantly above this value (p < 0.01).
- DRAFT -
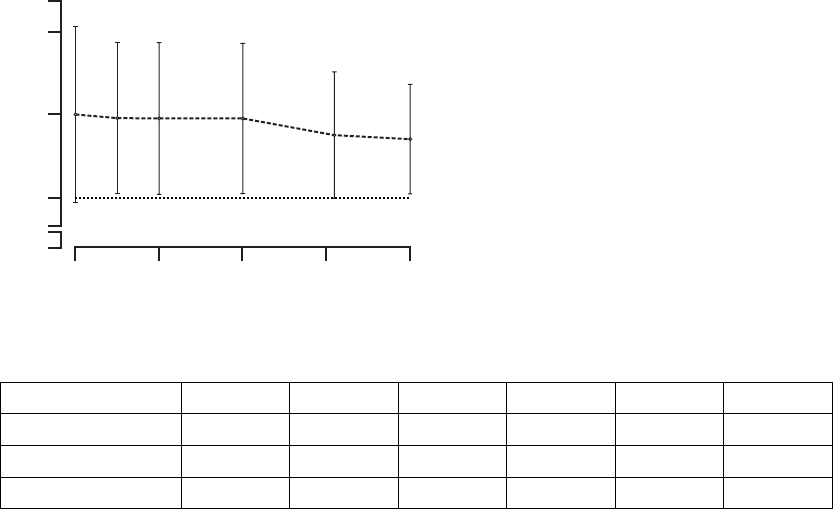
D-22 CLINICAL STUDY - CONTAK CD
10
5
0
BiV R-wave Amplitude (mV)
02418126
Acceptance Boundary
Implant Duration (months)
15
Mean
Figure D-8. EASYTRAK biventricular-sensed R-wave amplitude
Table D-16. EASYTRAK biventricular-sensed R-wave amplitude
StatisticaImplant 3 Months 6 Months 12 Months 18 Months 24 Months
N 433 346 326 220 99 23
Mean ± SD 10.0 ± 5.2 9.9 ± 4.4 9.9 ± 4.5 9.8 ± 4.4 8.9 ± 3.5 8.5 ± 3.3
Upper Tolerance Limit 1.9 - 25.0 1.4 - 25.0 1.7 - 25.0 1.2 - 25.0 2.6 - 20.4 2.2 - 13.6
The impedance measured by the CONTAK CD device is the parallel
combination of the left ventricular (EASYTRAK) and right ventricular
(ENDOTAK) leads simultaneously. Therefore, the biventricular lead impedance
will be substantially less than that of either lead alone. It was hypothesized
that the lower limit of the 95% confidence interval of the mean chronic
biventricular lead impedance would be greater than 200 Ωto ensure proper
pulse generator function. The lower limit of the 95% confidence interval of the
chronic biventricular lead impedance exceeds this value (Figure D-9 on page
D-23, Table D-17 on page D-23).
- DRAFT -

CLINICAL STUDY - CONTAK CD D-23
300
200
0
BiV Lead Impedance (Ω)
02418126
Acceptance Boundary
Implant Duration (months)
400
Lower Bound
of 95% CI
Figure D-9. EASYTRAK biventricular pacing impedance
Table D-17. EASYTRAK biventricular pacing impedance
StatisticaImplant 3 Months 6 Months 12 Months 18 Months 24 Months
N 436 355 336 237 107 26
Mean ± SD 340 ± 46 352 ± 47 349 ± 50 351 ± 51 347 ± 46 356 ± 67
Range 243 - 550 248 - 519 186 - 534 237 - 513 254 - 507 267 - 520
95% CI (336, 344) (347, 357) (344, 355) (345, 358) (338, 356) (329, 383)
EASYTRAK Lead Placement Success Rate––the EASYTRAK lead was
implanted in 448/517 (87%) of patients who underwent the implant procedure.
Table D-18 on page D-23 shows the reasons for inability to place the
EASYTRAK lead. Table D-19 on page D-24 provides the EASYTRAK lead
implant success rate.
Table D-18. Reasons for unsuccessful EASYTRAK lead implant
Reason #ofpts
a%
Inability to locate or cannulate the coronary sinus 29 42
Dislodgment of EASYTRAK lead while removing guide catheter 13 18.8
Inability to advance the lead to a stable position 11 15.9
Inability to obtain adequate pacing thresholds 6 8.7
Procedure stopped due to coronary sinus dissection or perforation 57.2
Procedure stopped due to transient AV block 1 1.4
Procedure stopped due to venous perforation during subclavian stick 11.4
Reason not stated 11.4
- DRAFT -
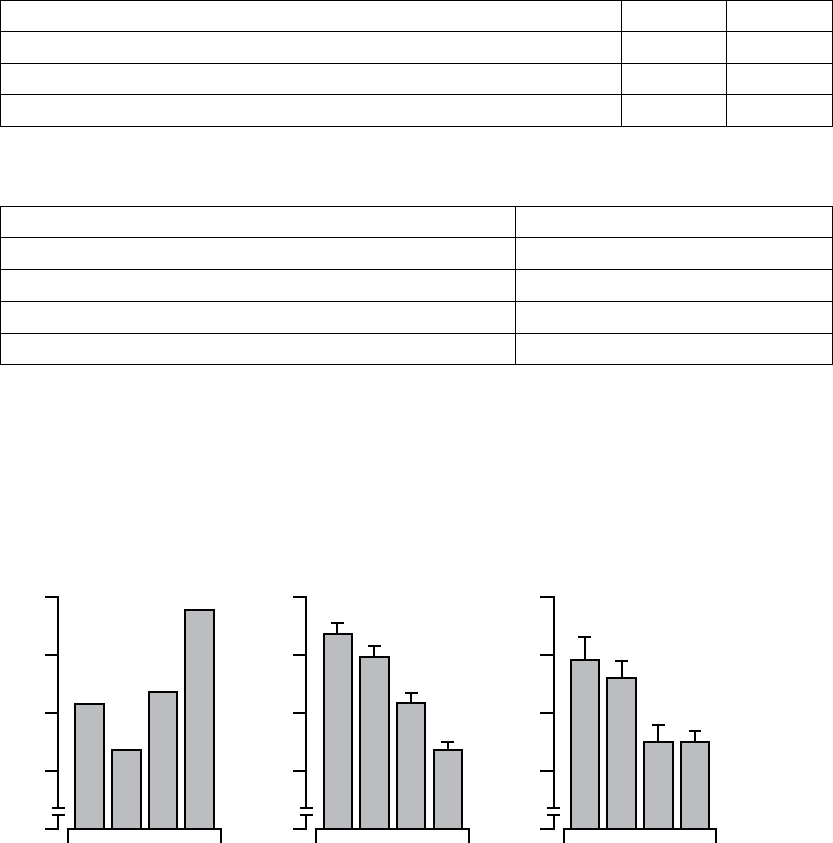
D-24 CLINICAL STUDY - CONTAK CD
Table D-18. Reasons for unsuccessful EASYTRAK lead implant (continued)
Reason #ofpts
a%
Extracardiac stimulation 1 1.4
Inability to place an atrial pace/sense lead 11.4
Tota l 69 100
a. Patients with unsuccessful attempt to implant EASYTRAK lead; N = 69.
Table D-19. EASYTRAK lead placement success rate
Measurement All Proceduresa
Number of patients implanted or attempted 517
Number of placements of the EASYTRAK Leadb448
Rate 87%
95% CI (84%, 90%)
a. All patients implanted or attempted with EASYTRAK lead; N = 517.
b. Defined as an EASYTRAK implant procedure that is concluded with the implant of the investigational cardiac resynchronization
system.
Although some situations such as patient anatomy and poor thresholds cannot
be avoided, increased investigator experience with the EASYTRAK lead and
accessories was associated with improved success, decreased total procedure
time (measured skin-to-skin), and decreased fluoroscopy exposure time
(FigureD-10onpageD-24).
95
Implant Success Rate (%)
90
85
80
0
8-15
>15
4-7
1-3
250
Mean Procedure Time (min)
200
150
100
0
8-15
>15
4-7
1-3
60
Mean Fluoroscopy Exposure Time (min)
50
40
30
0
8-15
>15
4-7
1-3
Mean ± SEMean ± SE
Implants (by order of enrollment)
Figure D-10. EASYTRAK success rate, procedure time, and fluoroscopy exposure time
- DRAFT -

CLINICAL STUDY - CONTAK CD D-25
Biventricular ATP Conversion Effectiveness Performance––the conversion
rate of induced monomorphic ventricular tachycardia (MVT) was 64% and
that of spontaneous MVT was 88%.
Ventricular Tachyarrhythmia Detection Time––the VENTAK CHF and
CONTAK CD devices sense events from both ventricles simultaneously.
Ventricular tachyarrhythmia detection time was analyzed to determine if the
additional lead had an adverse effect on sensing VT/VF. Guidant’s ICDs
typically have a detection time of two seconds. The VF detection time of 2.1
± 0.6 seconds was statistically significantly lower than 6 seconds (p < 0.01),
demonstrating that there was no statistically significant prolongation of induced
VF detection times with the additional left ventricular lead1.Therewerealso
no adverse events reported in which a VENTAK CHF or CONTAK CD failed to
detect a spontaneous ventricular tachyarrhythmia.
EASYTRAK Lead and System Safety
EASYTRAK Lead Safety––safety was established using the rate of adverse
events that are either related to the EASYTRAK lead or to the implant
procedure necessary to place the EASYTRAK lead.
An EASYTRAK lead implant procedure was performed in 517 patients with 448
patients (86.7%) being successfully implanted with the EASYTRAK lead. The
upper boundary of the 95% confidence interval was hypothesized to be less
than 23% at six months (Table D-20 on page D-25).
Table D-20. Lead-related adverse events at six months
Patient Population N Event Rate (%) 95% CI
All Patients 517 12.2 (9.4, 15.0)
NYHA Class III/IV 201 17.4 (12.7, 22.7)
Fifty-three lead-related adverse events were reported during the clinical
investigation of the EASYTRAK lead among the 448 patients who were
implanted with an EASYTRAK lead. Twenty-seven procedure-related adverse
events were reported among the 517 patients who underwent the implant
procedure for an EASYTRAK lead.2The overall lead-related adverse event
1. Detection time at implant with legally marketed Guidant ICD devices is typically two seconds,
and investigators have stated that an additional delay of 3 to 5 seconds would be a clinically
significant event. The expected detection time is 2 seconds (95% CI: [0, 6 sec]).
2. For purposes of defining event rates, a denominator of 448 will be used for those adverse
events that pertain to chronically implanted EASYTRAK leads, and a denominator of 517 will
be used for those adverse events that pertain to the implant procedure of the EASYTRAK lead.
- DRAFT -

D-26 CLINICAL STUDY - CONTAK CD
ratewas14.5%(95%CI[11.5–17.5%]). TableD-21onpageD-26reports
lead-related adverse events observed during the CONTAK CD Study.
Table D-21. EASYTRAK lead-related adverse events
Adverse EventsaTotal % of pts (95% Cl)
Lead-Related, N = 448
Loss of capture/lead dislodgment 31b6.9 (4.6–9.3)
Ventricular oversensing 11 2.5 (1.0–3.9)
Extracardiac stimulation 9 2.0 (0.7–3.3)
Insulation breach 2 0.4 (0.0–1.1)
Procedure-Related, N = 517
Transient AV block 6 1.2 (0.2–2.1)
Coronary venous dissection 51.0 (0.1–1.8)
Coronary venous perforation 51.0 (0.1–1.8)
Transient renal failure 51.0 (0.1–1.8)
Pericardial effusion 20.4 (0.0–0.9)
Finishing wire left in lead 10.2 (0.0–0.6)
Right ventricular lead dislodgment 1 0.2 (0.0–0.6)
Guide wire fracture 10.2 (0.0–0.6)
Hypotension due to blood loss 1 0.2 (0.0–0.6)
Total (unique patients) 75 14.5 (11.5–17.5)
a. All patients implanted, N = 448; All patients attempted, N = 517.
b. Twenty-six events were successfully corrected in a repeat procedure.
The most common of the 53 lead-related adverse events (>1% incidence)
included the following:
• Loss of left ventricular capture (31 patients, 6.9%)
• Ventricular oversensing (11 patients, 2.5%)
• Extracardiac stimulation (9 patients, 2.0%)
These events were typically resolved with surgical intervention.
The most common of the 27 procedure-related adverse events (> 1%
incidence) included the following:
• Coronary venous trauma (10 patients, 2.0%)
• Transient atrioventricular block (6 patients, 1.2%)
- DRAFT -

CLINICAL STUDY - CONTAK CD D-27
• Transient renal failure (5 patients, 1.0%)
These events were typically resolved without intervention and no permanent
long-term sequelae were reported.
Severe, Device-Related Adverse Events and Operative Mortality––the
incidence of severe, device-related events was reported in 7 of 567 patients
(1.2%); this was significantly less than the hypothesized rate of 20% (p <
0.01) (Table D-22 on page D-27). Table D-23 on page D-27 reports system,
device-related, severe adverse events observed during the CONTAK CD Study.
Table D-22. Adverse events and operative mortality
MeasurementaN%95%CI
Severe, Device-Related Adverse Events (Type I)b71.2 (0.3, 2.1)
All-Cause Operative Mortality (< = 30 Days Post Implant) 12 2.1 (0.9, 3.3)
a. All patients attempted or implanted, N = 567
b. Percent is of patients with at least one event.
Table D-23. System, device-related, severe adverse events
Adverse Eventa# of pts % of pts (95% CI)
Te l em e t ry d if ficulty; device explanted 20.4 (0.0–0.9)
Ventricular tachycardia during CPX testing 10.2 (0.0–0.5)
Coronary sinus perforation 10.2 (0.0–0.5)
Inappropriate shock due to oversensing 1 0.2 (0.0–0.5)
Lead dislodgment 1 0.2 (0.0–0.5)
Anaphylaxis in association with use of a pulmonary artery
catheter
10.2 (0.0–0.5)
a. All patients attempted or implanted, N = 567
Operative mortality, definedasdeathfromanycausewithin30daysofimplant,
was reported in 12 of 567 patients (2.1%) undergoing the implant procedure.
The outcome is significantly less than the hypothesized rate of 9% (p < 0.01).
Table D-24 on page D-28 reports the cause of death for operative mortality.
- DRAFT -

D-28 CLINICAL STUDY - CONTAK CD
Table D-24. Cause of death for operative mortality
Cause of Death Implants
N=501
Attempts
N=66
Totala
N=567
Cardiac: pump failure 516
Cardiac: arrhythmic 213
Noncardiac 2 0 2
Unknown 1 0 1
Tota l 10 2 12
a. All patients attempted or implanted, N = 567.
System Safety Profile––analysis of system safety was performed on the
complication-free rate of device-related adverse events, regardless of whether
or not they were related to the investigational device (Figure D-11 on page
D-29). Table D-25 on page D-28 outlines the device related complications. This
study used an acceptance criterion such that the lower boundary of the 95%
confidence interval could not be less than 70%.
Table D-25. Device-related complications
Complicationa#ofpts %ofpts
All patients implanted (N = 448)
Loss of LV capture 31 6.9
Loss of right atrial capture 71.6
Ventricular oversensing 6 1.3
Extracardiac stimulation 51.1
All patients attempted or implanted (N = 517)
Infections 71.4
a. This table represents patients attempted or implanted with the EASYTRAK lead; most common (> 1%) device-related
complications reported.
- DRAFT -
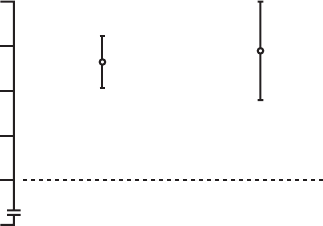
CLINICAL STUDY - CONTAK CD D-29
90
80
70
85
0
Complication-free Rate (%)
75
Acceptance Boundary
All Patients
(NYHA Class II / III / IV) NYHA Class III / IV
Figure D-11. System safety
Verification of CRT Delivery
The delivery of biventricular pacing throughout the CONTAK CD Study was
confirmed by comparing the programmed device output to the biventricular
pacing threshold and demonstrating that capture was maintained in daily
activities and during exercise.
The investigational plan recommended programming the device output to at
least twice the biventricular pacing voltage threshold. Electrocardiograms
(ECGs) from Holter Monitors during daily activities were received and analyzed
to verify that total capture was maintained at the 3-month and 6-month visits
and to ensure that the safety margin was adequate. Cardiopulmonary exercise
tests (CPX) were performed on patients who were randomized to receive CRT
therapy at 3- and 6- month visits.
• In 623 evaluations of safety margin at baseline, three-, and six-months, the
device output was programmed to deliver a voltage approximately three
times that necessary to stimulate both ventricles.
• A total of 1139 Holter monitors were placed throughout the study at
baseline, three-, and six-months. The tests indicated only 4 instances
(0.4%) of inappropriate pacing or sensing that were all corrected with
device programming.
• A total of 316 CPX tests at the three- and six-month follow-up visits were
performed in patients with CRT who also had interpretable ECG results. Of
these, 277 (88%) had continuous CRT delivery throughout exercise. The
remaining 39 patients (12%) had continuous CRT delivery until the sinus
rate exceeded the maximum tracking rate (MTR).
- DRAFT -
D-30 CLINICAL STUDY - CONTAK CD
FOCUSED CONFIRMATORY STUDY
Study Design
The Focused Confirmatory Study (FCS) was a prospective, multicenter study
conducted in the United States in 127 patients who participated in an exercise
performance study. The purpose of the FCS was to confirm effectiveness
results related to functional capacity measures, specifically the Peak VO2and
6-Minute Hall Walk, previously reported in the NYHA Class III/IV subgroup of
the CONTAK CD Study.
CRT was provided in the same manner for the FCS as for the CONTAK CD
Study. The EASYTRAK lead, along with market approved right atrial and right
ventricular leads were used to provide biventricular stimulation.
Demographic Data
The patients in the FCS had the same heart failure indications as the patients
in the NYHA Class III/IV subgroup of the CONTAK CD Study; i.e., patient
inclusion criteria included NYHA Class III or IV while on drug therapy, QRS
duration ≥120 ms, and Left Ventricular Ejection Fraction (LVEF) ≤35%.
A baseline physical assessment and functional measures were performed prior
to CRT system implant. Patients were eligible for participation in the study if
they were capable of walking between 150 and 425 meters. In addition to
a Six-Minute Walk test, other special tests were performed prior to implant
consisting of a symptom-limited treadmill test and completion of the Minnesota
Living with Heart Failure Questionnaire®to assess Quality of Life. CRT therapy
was enabled immediately upon device implant. Patients were followed at one
week, one month, three months, six months and every three months thereafter
for a routine physical assessment and device evaluation. Special testing as
defined above was repeated at three months and six months post-implant.
Prior to study entry, patients were stable on optimal heart failure medications
(ACE inhibitors or substitute > 1 month and beta blockers > 3 months). Patients
were excluded if they were indicated for either a pacemaker or ICD or if they
were hospitalized for heart failure in the month prior to enrollment.
The patient characteristics at study entry are summarized in Table D-26 on
page D-31.
- DRAFT -

CLINICAL STUDY - CONTAK CD D-31
Table D-26. Pre-implant characteristics of study patients
Characteristics All Patients Receiving CRT
Age (years) 61 ± 12
Male Gender (%) 69
NYHA Class III (%) 94
Ischemic Etiology (%) 49
Resting heart rate (bpm) 73 ± 12
QRS width (ms) 159 ± 27
LBBB/NSIVCD (%) 91
Heart failure medications (%)
ACE inhibitor or ARB 91
Beta blockers 77
Digoxin 76
Diuretics 98
Inclusion Criteria
Inclusion criteria included:
• Moderate or severe heart failure, defined as symptomatic heart failure
for at least six months with NYHA Class III or IV symptoms at the time
of enrollment, AND at least one of the following events in the previous
12 months:
– Hospitalization for heart failure management
– Outpatient visit in which intravenous (IV) inotropes or vasoactive
infusion were administered continuously for at least 4 hours
– Emergency room visit of at least twelve hours duration in which IV
heart failure medications were administered (including diuretics)
•QRS≥120 ms and PR interval > 150 ms from any two leads of a 12-lead
ECG
• Left ventricular ejection fraction ≤35%
• Left ventricular end diastolic dimension ≥60 mm (required only if LVEF
measured by echo)
- DRAFT -
D-32 CLINICAL STUDY - CONTAK CD
•Age≥18 years
• Optimal pharmacologic therapy for heart failure
• Abletowalkbetween150and425minaSix-MinuteWalktest
Major Differences Between CONTAK CD and Focused Confirmatory
Study Patients
The CONTAK RENEWAL 3, CONTAK RENEWAL, and CONTAK CD devices
provide the same cardiac resynchronization therapy (biventricular pacing) and
have the same Indications for Use. Therefore, the CONTAK CD clinical trial
data used to support CONTAK CD is also applicable to CONTAK RENEWAL
and CONTAK RENEWAL 3. The primary difference between CONTAK CD
devices and CONTAK RENEWAL and CONTAK RENEWAL 3 devices is that
CONTAK CD utilizes an electrically common RV and LV sensing/pacing circuit
whereas CONTAK RENEWAL and CONTAK RENEWAL 3 incorporate an
independent RV and LV sensing/pacing circuit. Additional clinical analysis
was also conducted with CONTAK RENEWAL to provide confirmation that the
independent sensing and pacing capability did not adversely affect the ability
of the device to detect ventricular tachyarrhythmias or provide continuous
biventricular pacing therapy.
Some of the major differences between the study populations included:
• Patients were excluded from the FCS if they were indicated for either
a pacemaker or implantable cardioverter defibrillator (ICD). Patients in
the CONTAK CD Study were excluded if they met the indications for a
pacemaker; however, they were required to meet the general indications
for an ICD.
• Patients were excluded from the FCS if they were hospitalized for heart
failure in the month prior to enrollment; whereas, there was no exclusion
for hospitalization for heart failure in the month prior to enrollment for the
CONTAK CD patients.
• Patients in the FCS must have been on stable, optimal heart failure
medications, including beta blocker therapy for three months, prior to study
entry. Patients in the CONTAK CD Study could be optimized on drug
therapy between the time from device implant until the treatment phase
(either CRT or No CRT) began.
- DRAFT -
CLINICAL STUDY - CONTAK CD D-33
• Patients in the FCS had baseline measurements performed prior to implant.
Patients in the CONTAK CD Study had baseline measurements performed
post-implant, but before programming of the randomized therapy.
• Seventy-seven percent of patients in the FCS (98 of N = 127) were on beta
blockers compared to 42% in the CONTAK CD Study (95 of N = 227).
• Forty-nine percent of patients in the FCS (62 of N = 127) had ischemic
etiology compared to 68% in the CONTAK CD Study (154 of N = 227).
Endpoints
The primary endpoints of the study were Peak VO2and Six-Minute Walk
distance. The study was designed to show a mean change of at least
1ml/kg/min and a 95% lower confidence bound (LCB) at least 0.5 ml/kg/min.
The study was also designed to detect a statistically significant improvement
in the Six-Minute Walk distance at a one-sided significance level of 0.10.
Additionally, two ancillary analyses of Quality of Life Score and NYHA Class
had to demonstrate a change that was directionally favorable towards CRT
using descriptive statistics.
Study Results
Study results for the Focused Confirmatory Study include the following:
•PeakVO
2––a statistically significant improvement from baseline of 0.94 ±
0.30 ml/kg/min with a 95% LCB of 0.45 was observed in Peak VO2after six
months of CRT
• Six-Minute Walk––statistically significant improvements versus baseline
were observed in Six-Minute Walk distance after six months of CRT with an
observed mean improvement of 50.9 ± 10.4 m with a 95% LCB of 37.6 m
• Quality of Life––consistent with the other analyses, a statistically significant
improvement of 23.9 ± 2.6 points was observed in the Quality of Life score
after six months of CRT with a 95% LCB of 19.7 points
• New York Heart Association Class––after six months of CRT, a statistically
significant improvement in NYHA Class was observed with 60.4% of
patients improving one or more NYHA Class
- DRAFT -
D-34 CLINICAL STUDY - CONTAK CD
- DRAFT -

E-1
CLINICAL STUDY - CONTAK RENEWAL
APPENDIX E
CLINICAL STUDY POPULATIONS
Guidant CRT-Ds, when compared to OPT alone, have been demonstrated with
reasonable assurance, to be safe and effective in significantly reducing: the
risk of a composite of all-cause mortality or first hospitalization by 20%, the
risk of all-cause mortality by 36%, and heart failure symptoms in patients who
have moderate to severe heart failure (NYHA III/IV) including left ventricular
dysfunction (EF ≤35%) and QRS duration ≥120 ms and remain symptomatic
despite stable, optimal heart failure drug therapy, based on the Guidant
sponsored COMPANION clinical study. (Guidant devices were the only devices
studied in the COMPANION clinical trial.)
SUMMARY
Guidant conducted the CONTAK RENEWAL Study, which demonstrated the
device’s ability to appropriately detect ventricular tachyarrhythmias with an
independent sensing configuration. Finally, the CONTAK RENEWAL Holter
Study was conducted to provide confirmation of the device’s ability to provide
continuous biventricular pacing on both a daily basis and during exercise.
STUDY DESIGN
The CONTAK RENEWAL Study was a prospective, multi-center,
non-randomized evaluation conducted in Europe and enrolled a total of 45
patients. The purpose of the study was to verify that the CONTAK RENEWAL
device performs according to specification.
INCLUSION/EXCLUSION CRITERIA
Patients who were enrolled in the study were required to meet the following
inclusion criteria:
• Symptomatic heart failure
• Left ventricular dysfunction
•WideQRS
• At risk for sudden cardiac death
• 18 years or of legal age in order to give informed consent according to
national laws
- DRAFT -

E-2 CLINICAL STUDY - CONTAK RENEWAL
• Able to understand the nature of the procedure
• Available for follow-up on a regular basis at an approved investigational
center
Patients were excluded from the investigation if they met any of the following
criteria:
• Life expectancy of less than six months due to other medical conditions
• For women: Pregnancy or absence of medically accepted birth control
• Inability or refusal to sign the Patient Informed Consent
• Inability or refusal to comply with the follow up schedule or protocol
requirements
• Mechanical tricuspid prosthesis
• Currently enrolled in another investigational study, including drug
investigations
• Hypertrophic Obstructive Cardiomyopathy
• Are unable to undergo device implant, including general anesthesia if
required
• Have pre-existing leads other than those specified in the investigational
plan (unless the investigator intended to replace them with the permitted
leads)
DEMOGRAPHIC DATA
The patient characteristics at study entry are summarized in Table E-1 on page
E-2.
Table E-1. Pre-implant characteristics of study patient
CharacteristicsaPatient Data
N patients implanted 44
Gender Male (91%), Female (9%)
Age (years) 65 ± 9
NYHA II (14%), III (77%), IV (9%)
LVEF (%) 22 ± 6
BBB LBBB/NSIVCD (86%),RBBB (14%)
Etiology Ischemic (56%), Non-ischemic (44%)
QRS Width 172 ± 24 ms
- DRAFT -

CLINICAL STUDY - CONTAK RENEWAL E-3
Table E-1. Pre-implant characteristics of study patient (continued)
CharacteristicsaPatient Data
PR Interval 211 ± 49 ms
Resting HR 70 ± 12 bpm
a. Continuous measures are reported as means ± standard deviations.
VENTRICULAR TACHYARRHYTHMIA DETECTION TIME
The CONTAK RENEWAL device has independent Left Ventricular and Right
Ventricular Sensing. Ventricular tachyarrhythmia detection time was analyzed
to determine if the sensing configuration had any effect on sensing VT/VF.
Based on previous clinical studies of the VENTAK AV family, upon which the
ICD function of CONTAK CD and CONTAK RENEWAL are built, Guidant’s
ICDs typically have a VF detection time of approximately two seconds. The VF
detection time of 2.4 ± 0.5 seconds in the RENEWAL study was statistically
lower than 6 seconds (p < 0.01), demonstrating that there was no statistically
significant prolongation of induced VF detection times with the independent
sensing configuration.1There were no adverse events reported in which
a CONTAK RENEWAL device failed to detect a spontaneous ventricular
tachyarrhythmia.
HOLTER STUDY - CONTAK RENEWAL
Study Design
The CONTAK RENEWAL Holter Study was a prospective, multi-center,
non-randomized evaluation conducted in Europe, in which 46 patients
completed testing. The purpose of the study was to demonstrate continuous
appropriate biventricular (BiV) pacing over a 24 hour period and during
exercise using Holter monitor recordings. All patients had been implanted with
a CONTAK RENEWAL for a minimum of one month at the time of the study
initiation.
1. Detection time at implant with legally marketed Guidant ICD devices is typically two seconds,
and investigators have stated than an additional delay of 3 to 5 seconds would be a clinically
significant event. The expected detection time is 2 seconds (95% CI: [0, 6 sec]).
- DRAFT -

E-4 CLINICAL STUDY - CONTAK RENEWAL
Inclusion/Exclusion Criteria
Patients who were enrolled in the study were required to meet the following
inclusion criteria:
• Availability for 24 hours follow-up at an approved study center
• Willingness and ability to participate in all testing associated with this study
• Age 18 or above, or of legal age to give informed consent as specified
by national law
• Implanted with the CONTAK RENEWAL system for at least 1 month
• Stable when programmed according to labeled recommendations for
continuous BV pacing
• Sinus rhythm at follow-up
• Active atrial lead implanted
Patients were excluded from the investigation if they met any of the following
criteria:
• Life expectancy of less than six months due to other medical conditions
• Concurrent participation in any other clinical study, including drug study
•Inatrialfibrillation at follow-up
• Inability or refusal to sign the Patient Informed Consent
• Inability or refusal to comply with the follow-up schedule
• Known pregnancy
Demographic Data
The patient characteristics at study entry are summarized in Table E-2 on page
E-4.
Table E-2. Pre-implant characteristics of study patients
Characteristics Patient Data
N patients 46
Gender Male: 40 (87%), Female: 6 (13%)
Age (years) 60.9 ± 9.0
NYHA at implant [N (%)] I0(0%)
II 5(10.9%)
III 34 (73.9%)
- DRAFT -

CLINICAL STUDY - CONTAK RENEWAL E-5
Table E-2. Pre-implant characteristics of study patients (continued)
Characteristics Patient Data
IV 7(15.2)%
NYHA current [N (%)] I9(19.6%)
II 25 (54.3%)
III 11 (23.9%)
IV 1 (2.2%)
Duration implanted (months) Mean ± SD 8.3 ± 4.1
Range 1.5 – 15.0
Median 9.0
Programming Parameters
Refer to the Pacing Therapies chapter for information about programming to
maintain CRT. Programming recommendations in this study were consistent
with the recommendations in that chapter.
Endpoints
The study had the following primary endpoints:
• Continuous appropriate BiV pacing during activities of daily living
• Continuous appropriate BiV pacing during exercise
The mean percentage of sinus beats appropriately BiV paced was measured by
a Holter monitor over a 24 hour period and during exercise. Exercise intensity
was measured using the Borg rating of perceived exertion (RPE) 6-20 scale.
PatientswereaskedtoexercisetoaBorglevelof15(difficult). The exercise
protocol used was left to the discretion of the physician based on the patients’
functional status. The type of exercise performed, duration and intensity of
exercise testing is listed in Table E-3 on page E-5 and Table E-4 on page E-6.
Table E-3. Type of exercise testing performed
Exercise Performed Number of Patients
Bicycle Ergometry 24 (52.2%)
Hall Walk 8(17.4%)
- DRAFT -

E-6 CLINICAL STUDY - CONTAK RENEWAL
Table E-3. Type of exercise testing performed (continued)
Exercise Performed Number of Patients
Stair Climbing 14 (30.4%)
Tota l 46
Table E-4. Duration and intensity of exercise testing
Results (N = 46)
Borg RPE Rating Obtained Mean ± SD 15 ± 1
Median 15
Range 7 – 18
Duration of Exercise (minutes) Mean ± SD 6.6 ± 3.3
Median 6.0
Range 1 – 17
Maximum HR Obtained (bpm) Mean ± SD 103 ± 20
Median 105
Range 60 – 156
Study Results
Pacing during activities of daily living
The mean percentage of appropriately continuously paced beats during daily
living was calculated as 99.6 ± 1.3% with a median of 100% and is summarized
in Table E-5 on page E-6. Continuous appropriate BiV pacing is defined as
pacing provided between the lower rate limit and the MTR, excluding PVCs.
Table E-5. Activities of daily living: continuous appropriate BiV pacing
Statistic P-valuea
Mean ± SD 99.6 ± 1.3 –
Range 91.4 – 100 –
Medianb100 <0.01
a. The p-value is based on the sign-rank test.
b. Due to the non-normality of the data a non-parametric test of the median was performed comparing the median to 90%.
- DRAFT -

CLINICAL STUDY - CONTAK RENEWAL E-7
Pacing During Exercise
The mean percentage of appropriately continuously paced beats during
exercise was calculated as 98.3 ± 5.6% with a median of 100% and is
summarized in Table E-6 on page E-7. Continuous appropriate BiV pacing
is defined as pacing provided between the lower rate limit and the MTR,
excluding PVCs.
Table E-6. Exercise: continuous appropriate BiV pacing
Statistic P-value
Mean ± SD 98.3 ± 5.6 –
Range 68.1 – 100 –
Median 100 <0.01
Device Counters
Finally, during the study CONTAK RENEWAL device counters were found
to correlate highly to the data collected on the independent Holter monitors
(Table E-7 on page E-7).
Table E-7. Correlation between holter and device
Mean ± SD Correlation (P-value)
Holter 97,536 ± 13,307 0.97 (<0.01)
Device 100,143 ± 13,373 –
- DRAFT -
E-8 CLINICAL STUDY - CONTAK RENEWAL
- DRAFT -

F-1
CLINICAL STUDY - SUMMARY OF CRT OPTIMIZATION
ALGORITHM VALIDATION STUDY
APPENDIX F
CLINICAL STUDY DESIGN
NOTE: The SmartDelay optimization feature was previously known as Expert
Ease for Heart Failure (EEHF+).
This clinical investigation was a 50 patient, multi-center, acute hemodynamic
study at 5 centers in the United States to validate the performance of Expert
Ease for Heart Failure AV delay optimization algorithm (EEHF+1).
The main purposes of this clinical investigation were: (A) to test prospectively
the effectiveness of EEHF+ in optimizing LV dP/dtmax (maximum rate of LV
pressure change) for biventricular (BV) CRT in atrial sensing and pacing
modes; and (B) to evaluate and compare LV dP/dtmax and stroke volume as
measured by AoVTI2at AV delays determined by a CRT optimization method
(EEHF+, Echo) and also by a series of population fixed values, for BV CRT
in atrial sensing and pacing modes.
The study consisted of three phases in the following order: an acute test
(during implant), a device implant, and an echocardiography study. In the
acute test the LV pressure data was collected invasively at various stimulation
mode/site/AV delay combinations. After the implant of a CRT/CRT-D device
using standard procedures, a standard non-invasive Doppler echo procedure
was performed, in which Doppler flow-velocity profiles from aortic, mitral,
and pulmonary valves were collected during BV CRT at various stimulation
mode/AV delay combinations.
Inclusion/Exclusion Criteria
Patients enrolled in this study were required to meet the criteria for a
CRT/CRT-D device implant at the time of implant (Sept 2003 - Oct 2004).
Patients were excluded from the study if they met any of the following criteria:
1. From this point on, Expert Ease for Heart Failure AV delay optimization algorithm is referred
as EEHF+.
2. Otto CM, Pearlman AS, Comess K, Reamer R, Janko C, Huntsman L. Determination of
the stenotic aortic valve area in adults using Doppler echocardiography. J Am Coll Cardiol
1986;7:509-17.
- DRAFT -
F-2 CLINICAL STUDY - SUMMARY OF CRT OPTIMIZATION ALGORITHM VALIDATION STUDY
• Patients in AF that can not be cardioverted for the study
• Sustained, uncontrolled ventricular tachycardia
• Frequent ectopic activity that makes stable hemodynamic measurements
infeasible
• Sinus rhythm < 30 bpm or > 100 bpm
• Complete AV node block
• Acute severe heart failure exacerbation
• Severeaorticvalvularstenosis(valvearea<1.0squarecm)
• Hypertrophic obstructive cardiomyopathy
• CABG within 2 weeks
• Congenital heart disease
• Pregnancy
• Patient involved in other clinical investigations of active therapy or treatment
• Patient at unacceptably high risk for catheterization (a patient who would
not medically be indicated for an EP study or diagnostic catheterization)
STUDY RESULTS
Patient Accountability
Fifty patients were enrolled in the study. Forty-one patients had valid acute
hemodynamic tests completed and thirty-eight patients had valid echo tests
completed. Among the 9 patients with invalid acute hemodynamic tests, 7
were attempts, and 2 completed the acute test but with invalid results (one of
them had an unstable atrial rate and the other had 2:1 AV conduction). A valid
echo was defined as a subject who had a valid acute hemodynamic test and
also completed the echo test.
Patient Characteristics
The subject demographics are shown below (Table F-1 on page F-3).
- DRAFT -

CLINICAL STUDY - SUMMARY OF CRT OPTIMIZATION ALGORITHM VALIDATION STUDY F-3
Table F-1. Subject Demographics
Characteristic Measurement Result
Age at Implant Number of subjects 50
Mean ± SD 68.1 ± 10.5
Range [47.0, 85.0]
Gender [N (%)] Female 12 (24.0)
Male 38 (76.0)
NYHA Class [N (%)] II 1(2.0)
III 49 (98.0)
LVEF Number of subjects 50
Mean ± SD 26.6 ± 6.6
Range [5.0, 35.0]
Conduction Disorder LBBB 38 (86.4)
RBBB 12 (27.3)
LV DP/dtmax Results
Correlation between the LV dP/dtmax at the EEHF+ recommended AV
delay and maximum achievable LV dP/dtmax
• For the regression analysis, the 95% confidence intervals of the regression
slope were [0.98, 1.07] and [0.94, 1.10] for atrial sensing and pacing. The
corresponding intercept values were [-2.07, -0.86] and [-3.73, -0.76] for
atrial sensing and pacing (Figure F-1 on page F-4). The ability of EEHF+ to
suggest an AV delay that maximizes %LV dP/dtmax for both atrial sensing
and atrial pacing is demonstrated in the regression plots. For patients
with a near-zero maximum improvement in %LV dP/ dtmax from baseline,
the %LV dP/dtmax at the AV delay estimated by EEHF+ was close to the
maximum achievable %LV dP/dtmax as indicated by the small intercept
(-1.47 for atrial sensing and -2.25 for atrial pacing).
- DRAFT -
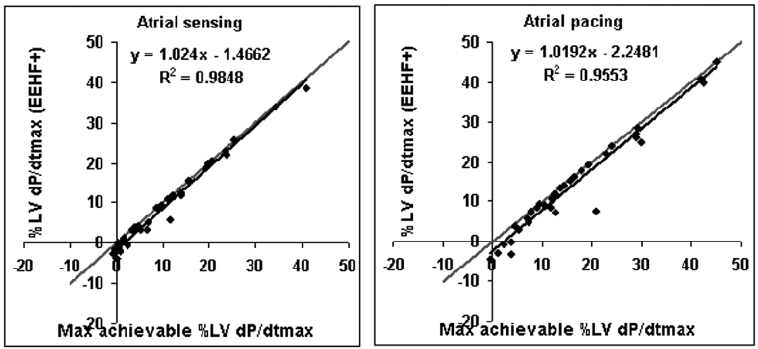
F-4 CLINICAL STUDY - SUMMARY OF CRT OPTIMIZATION ALGORITHM VALIDATION STUDY
Correlation between maximum achievable %LV dP/dtmax and the %LV dP/dtmax achieved with the
EEHF+ delay for both atrial sensing (left, n=38) and atrial pacing (right, n=36).
Figure F-1. Correlation between achievable and achieved
Comparison of EEHF+ recommended AV delay to fixed AV delays of 100
ms, 120 ms, 140 ms or 160 ms in achieving LV dP/dtmax
• Differences between the %LV dP/dtmax achieved with EEHF+ and the
%LV dP/dtmax achieved with fixed AV delays were plotted for each fixed
AV delay (Figure F-2 on page F-5). A negative value indicated that the
%LV dP/dtmax achieved with EEHF+ was higher. See the tables below for
further details about the number of subjects, mean, standard deviation,
p-value, and confidence interval for each comparison (Table F-2 on page
F-5, Table F-3 on page F-6).
- DRAFT -
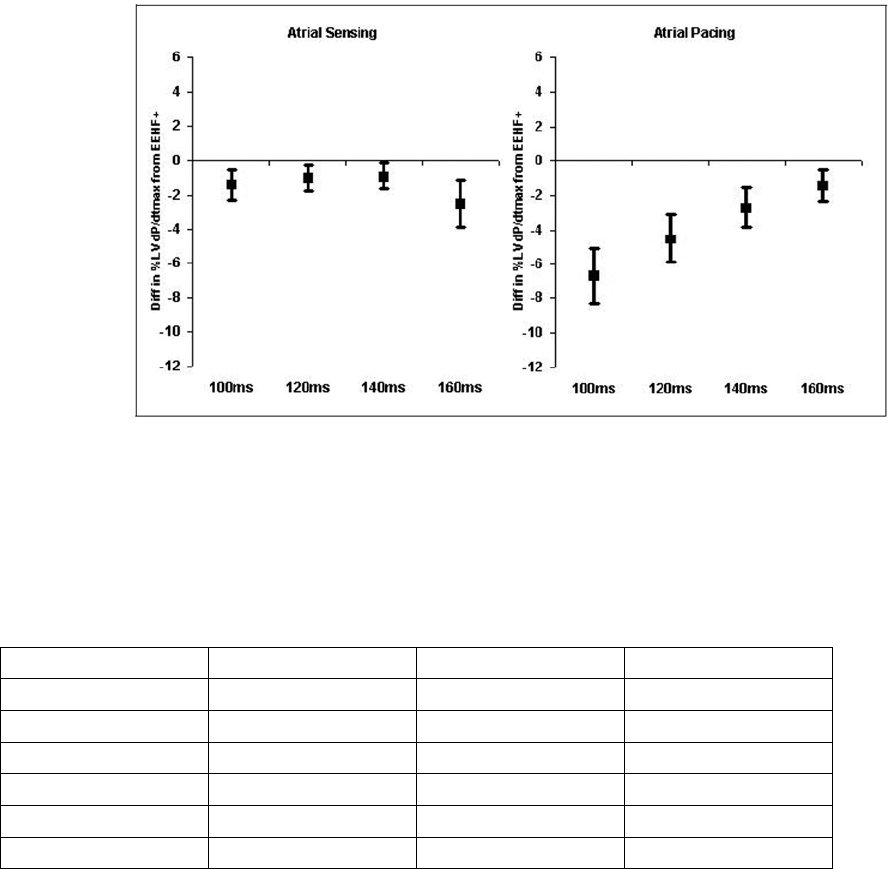
CLINICAL STUDY - SUMMARY OF CRT OPTIMIZATION ALGORITHM VALIDATION STUDY F-5
Differences between %LV dP/dtmax achieved with EEHF+ and with fixed AV delays of 100 ms, 120
ms, 140 ms or 160 ms for atrial sensing (left) and atrial pacing (right). A negative value indicates
that the EEHF+ algorithm is better. The box represents the mean and error bars represent 95%
CI of mean.
Figure F-2. Differences, achieved with EEHF+ and fixed AV delays
Table F-2. Differences between maximal achievable %LV dP/dt max and that achieved using EEHF+ and a
fixed AV delay of 100 ms, 120 ms, 140 ms and 160 ms, during atrial sensing
n, mean ± std, 95% CI n, mean ± std, 95% CI n, mean ± std, 95% CI Paired t-test
EEHF+ 100 ms Paired difference P-value
38, -1.2 ± 1.3, (-1.6, -0.8) 38, -2.7 ± 2.9, (-3.6, -1.8) 38, -1.4 ± 2.8, (-2.3, -0.6) 0.0025
EEHF+ 120 ms Paired difference P-value
38, -1.2 ± 1.3, (-1.6, -0.8) 38, -2.2 ± 2.2, (-2.9, -1.5) 38, -1.0 ± 2.3, (-1.7, -0.2) 0.0130
EEHF+ 140 ms Paired difference P-value
36, -1.3 ± 1.3, (-1.7, -0.8) 36, -2.1 ± 2.0, (-2.8, -1.5) 36, -0.9 ± 2.3, (-1.6, -0.1) 0.0279
- DRAFT -

F-6 CLINICAL STUDY - SUMMARY OF CRT OPTIMIZATION ALGORITHM VALIDATION STUDY
Table F-2. Differences between maximal achievable %LV dP/dt max and that achieved using EEHF+ and a
fixed AV delay of 100 ms, 120 ms, 140 ms and 160 ms, during atrial sensing (continued)
n, mean ± std, 95% CI n, mean ± std, 95% CI n, mean ± std, 95% CI Paired t-test
EEHF+ 160 ms Paired difference P-value
33, -1.1 ± 1.3, (-1.6, -0.7) 33, -3.6 ± 3.8, (-4.9, -2.3) 33, -2.5 ± 4.0, (-3.8, -1.1) 0.0013
Table F-3. Differences between maximal achievable %LV dP/dt max and that achieved using EEHF+ and a
fixed AV delay of 100 ms, 120 ms, 140 ms and 160 ms, during atrial pacing
n, mean ± std, 95% CI n, mean ± std, 95% CI n, mean ± std, 95% CI Paired t-test
EEHF+ 100 ms Paired difference P-value
36, -2.0 ± 2.6, (-2.8, -1.1) 36, -8.7 ± 5.1, (-10.3, -7.0) 36, -6.7 ± 4.8, (-8.3, -5.2) < 0.0001
EEHF+ 120 ms Paired difference P-value
36, -2.0 ± 2.6, (-2.8, -1.1) 36, -6.5 ± 4.7, (-8.0, -4.9) 36, -4.5 ± 4.2, (-5.9, -3.2) < 0.0001
EEHF+ 140 ms Paired difference P-value
36, -2.0 ± 2.6, (-2.8, -1.1) 36, -4.7 ± 4.2, (-6.1, -3.3) 36, -2.7 ± 3.5, (-3.9, -1.6) < 0.0001
EEHF+ 160 ms Paired difference P-value
36, -2.0 ± 2.6, (-2.8, -1.1) 36, -3.4 ± 3.6, (-4.5, -2.2) 36, -1.4 ± 2.8, (-2.3, -0.5) 0.0049
Comparison of EEHF+ recommended AV delay to the echo-based Ritter
and AoVTI methods in achieving LV dP/dtmax
• Differences between the %LV dP/dtmax achieved with EEHF+ and the %LV
dP/dtmax achieved with the Ritter and AoVTI echo methods were plotted for
the two echo methods (Figure F-3 on page F-7). A negative value indicated
that the LV dP/dtmax achieved with EEHF+ was higher. See the tables
below for further details about the number of subjects, mean, standard
deviation, p-value, and confidence interval for each comparison (Table F-4
on page F-7, Table F-5 on page F-7).
- DRAFT -
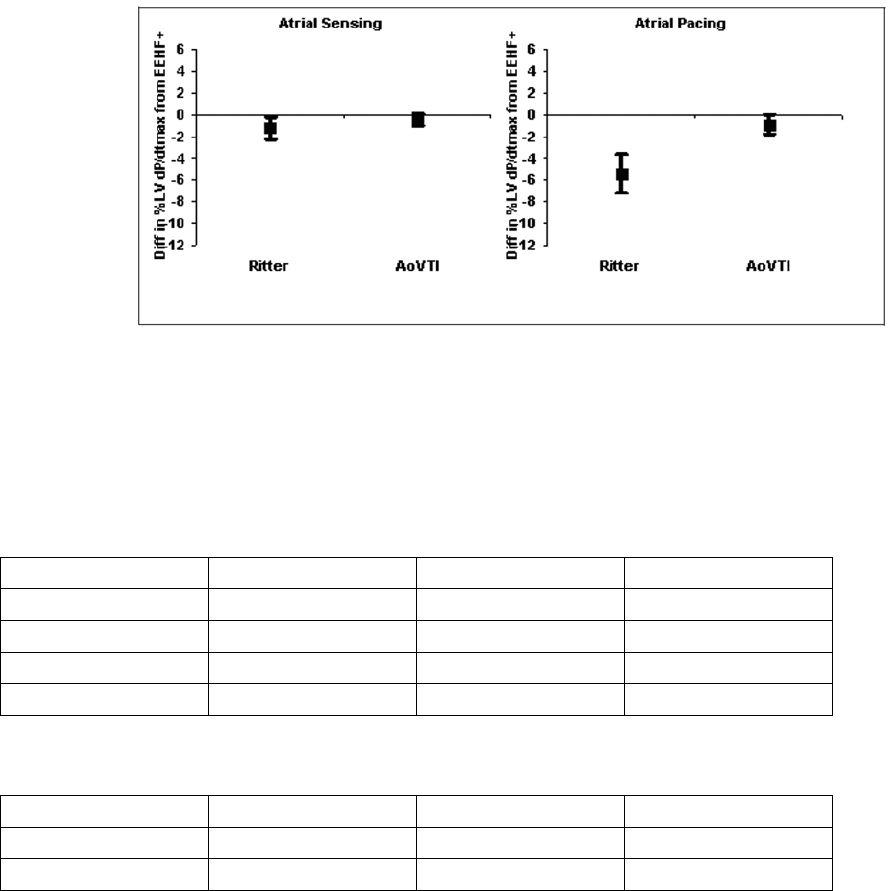
CLINICAL STUDY - SUMMARY OF CRT OPTIMIZATION ALGORITHM VALIDATION STUDY F-7
Differences between %LV dP/dtmax achieved with EEHF+ and with two echo-based methods: the
Ritter method and the AoVTI method for atrial sensing (left) and atrial pacing (right). A negative
value indicates that EEHF+ was better. The box represents the mean and error bars represent
95% CI of mean.
Figure F-3. Differences, achieved with EEHF+ and echo-based methods
Table F-4. Differences between maximal achievable %LV dP/dt max and that achieved from the EEHF+, the
Ritter method, and the AoVTI method during atrial sensing
n, mean ± std, 95% CI n, mean ± std, 95% CI n, mean ± std, 95% CI Paired t-test
EEHF+ Ritter method Paired difference P-value
35, -1.3 ± 1.3, (-1.7, -0.8) 35, -2.5 ± 2.7, (-3.3, -1.6) 35, -1.2 ± 3.0, (-2.1, -0.2) 0.0259
EEHF+ AoVTI method Paired difference P-value
33, -1.3 ± 1.3, (-1.8, -0.8) 33, -1.7 ± 1.9, (-2.3, -1.0) 33, -0.4 ± 1.6, (-0.9, 0.2) 0.2036
Table F-5. Differences between maximal achievable %LV dP/dt max and that achieved from the EEHF+, the
Ritter method, and the AoVTI method during atrial pacing
n, mean ± std, 95% CI n, mean ± std, 95% CI n, mean ± std, 95% CI Paired t-test
EEHF+ Ritter method Paired difference P-value
33, -2.0 ± 2.7, (-2.9, -1.1) 33, -7.4 ± 5.5, (-9.3, -5.5) 33, -5.4 ± 5.1, (-7.2, -3.7) < 0.0001
- DRAFT -

F-8 CLINICAL STUDY - SUMMARY OF CRT OPTIMIZATION ALGORITHM VALIDATION STUDY
Table F-5. Differences between maximal achievable %LV dP/dt max and that achieved from the EEHF+, the
Ritter method, and the AoVTI method during atrial pacing (continued)
n, mean ± std, 95% CI n, mean ± std, 95% CI n, mean ± std, 95% CI Paired t-test
EEHF+ AoVTI method Paired difference P-value
34, -2.0 ± 2.6, (-2.8, -1.1) 34, -2.8 ± 2.9, (-3.8, -1.8) 34, -0.9 ± 2.6, (-1.8, 0.0) 0.0617
AoVTI Results
There was a large variance in the difference in %AoVTImax achieved by all the
methods evaluated in this study, which is consistent with the inherent variability
of the AoVTI measurements3.
Comparison of EEHF+ recommended AV delay to fixed AV delays of 100
ms, 120 ms, 140 ms, and 160 ms in achieving AoVTImax
• As shown in the tables below, there was a large variance in the difference
in %AoVTImax achieved by EEHF+ and the fixed AV delays for both atrial
sensing and pacing; the tables also provide further details about the
number of subjects, mean, standard deviation, p-value, and confidence
interval(TableF-6onpageF-8,TableF-7onpageF-9).
Table F-6. Differences between maximal achievable %AoVTI and that achieved using the EEHF+ and a fixed
AV delay of 100 ms, 120 ms, 140 ms, and 160 ms during atrial sensing.
n, mean ± std, 95% CI n, mean ± std, 95% CI n, mean ± std, 95% CI Paired t-test
EEHF+ 100 ms Paired difference P-value
36, -8.5 ± 8.3, (-11.2, -5.8) 36, -6.6 ± 5.7, (-8.4, -4.7) 36, 1.9 ± 9.5, (-1.2, 5.0) 0.2323
EEHF+ 120 ms Paired difference P-value
35, -7.7 ± 7.0, (-10.0, -5.4) 35, -5.1 ± 6.9, (-7.3, -2.8) 35, 2.7 ± 8.9, (-0.3, 5.6) 0.0837
EEHF+ 140 ms Paired difference P-value
36, -8.5 ± 8.3, (-11.2, -5.8) 36, -6.1 ± 4.4, (-7.5, -4.6) 36, 2.4 ± 9.3, (-0.6, 5.5) 0.1296
3. Otto CM, Pearlman AS, Comess K, Reamer R, Janko C, Huntsman L. Determination of
the stenotic aortic valve area in adults using Doppler echocardiography. J Am Coll Cardiol
1986;7:509-17.
- DRAFT -

CLINICAL STUDY - SUMMARY OF CRT OPTIMIZATION ALGORITHM VALIDATION STUDY F-9
Table F-6. Differences between maximal achievable %AoVTI and that achieved using the EEHF+ and a fixed
AV delay of 100 ms, 120 ms, 140 ms, and 160 ms during atrial sensing. (continued)
n, mean ± std, 95% CI n, mean ± std, 95% CI n, mean ± std, 95% CI Paired t-test
EEHF+ 160 ms Paired difference P-value
36, -8.5 ± 8.3, (-11.2, -5.8) 36, -7.3 ± 6.4, (-9.4, -5.2) 36, 1.2 ± 9.8, (-2.0, 4.4) 0.4769
Table F-7. Differences between maximal achievable %AoVTI and that achieved using the EEHF+ and a fixed
AV delay of 100 ms, 120 ms, 140 ms, and 160 ms during atrial pacing
n, mean ± std, 95% CI n, mean ± std, 95% CI n, mean ± std, 95% CI Paired t-test
EEHF+ 100 ms Paired difference P-value
35, -6.6 ± 5.2, (-8.3, -4.8) 35, -11.9 ± 6.4, (-14.0,
-9.8)
35, -5.4 ± 9.3, (-8.4, -2.3) 0.0017
EEHF+ 120 ms Paired difference P-value
34, -6.4 ± 5.3, (-8.2, -4.7) 34, -9.3 ± 7.1, (-11.7, -6.9) 34, -2.8 ± 9.9, (-6.2, 0.5) 0.1046
EEHF+ 140 ms Paired difference P-value
35, -6.6 ± 5.2, (-8.3, -4.8) 35, -7.9 ± 5.3, (-9.7, -6.2) 35, -1.4 ± 7.7, (-3.9, 1.2) 0.2977
EEHF+ 160 ms Paired difference P-value
35, -6.6 ± 5.2, (-8.3, -4.8) 35, -7.1 ± 5.4, (-8.9, -5.3) 35, -0.5 ± 7.7, (-3.1, 2.0) 0.6896
Comparison of EEHF+ recommended AV delay to echo-based Ritter
method in achieving AoVTImax
• As shown in the tables below, there was a large variance in the difference
in %AoVTI obtained with EEHF+ and that obtained with Ritter method in
atrial sensing mode and atrial pacing mode; the tables also provide further
details about the number of subjects, mean, standard deviation, p-value,
and confidence interval (Table F-8 on page F-10, Table F-9 on page F-10).
- DRAFT -

F-10 CLINICAL STUDY - SUMMARY OF CRT OPTIMIZATION ALGORITHM VALIDATION STUDY
Table F-8. Differences between maximum achievable %AoVTI and that achieved with EEHF+ and Ritter
during atrial sensing
n, mean ± std, 95% CI n, mean ± std, 95% CI n, mean ± std, 95% CI Paired t-test
EEHF+ Ritter method Paired difference P-value
36, -8.5 ± 8.3, (-11.2, -5.8) 36, -6.5 ± 5.6, (-8.3, -4.6) 36, 2.0 ± 9.1, (-0.9, -5.0) 0.1895
Table F-9. Differences between maximum achievable %AoVTI and that achieved with EEHF+ and Ritter
during atrial pacing
n, mean ± std, 95% CI n, mean ± std, 95% CI n, mean ± std, 95% CI Paired t-test
EEHF+ Ritter method Paired difference P-value
34, -6.8 ± 5.2, (-8.5, -5.0) 34, -10.4 ± 6.6, (-12.6,
-8.1)
34, -3.6 ± 9.0, (-6.7, -0.6) 0.0255
CONCLUSIONS
The results of the CRTAVO study are summarized as follows:
• The algorithm recommended AV delays that maximized global contractile
function as measured by LV dP/dt.
• The EEHF+ algorithm recommended an AV delay that increased acute
hemodynamic responses in terms of %LV dP/dtmax, as compared to fixed
AV delays of 100 ms, 120 ms, 140 ms or 160 ms.
• The EEHF+ algorithm recommended an AV delay that increased acute
hemodynamic responses in terms of %LV dP/dtmax, as compared to AV
delay recommended by Ritter method.
- DRAFT -

G-1
CLINICAL STUDY - VITALITY
APPENDIX G
CLINICAL STUDY POPULATIONS
Guidant CRT-Ds, when compared to OPT alone, have been demonstrated with
reasonable assurance, to be safe and effective in significantly reducing: the
risk of a composite of all-cause mortality or first hospitalization by 20%, the
risk of all-cause mortality by 36%, and heart failure symptoms in patients who
have moderate to severe heart failure (NYHA III/IV) including left ventricular
dysfunction (EF ≤35%) and QRS duration ≥120 ms and remain symptomatic
despite stable, optimal heart failure drug therapy, based on the Guidant
sponsored COMPANION clinical study. (Guidant devices were the only devices
studied in the COMPANION clinical trial.)
CHRONIC IMPLANT STUDY - VITALITY
The purpose of this study was to evaluate the safety and effectiveness of
Guidant VITALITY family devices with Automatic Intrinsic Rhythm ID. This
clinical study was a single-arm, prospective, multi-center study. There were
a total of 100 patients enrolled at 21 US investigational centers between
December 3, 2002 and January 10, 2003.
Patient Population
One hundred patients were enrolled in this study and 96 patients received
investigational devices. The mean age of the patients implanted with the
VITALITY device was 67.3 ± 10.8 years old. The mean left ventricular ejection
fraction was 30.4% (range 11.0% - 71.0%). Seventy-eight (78) patients (81.3%)
were male. The primary cardiovascular disease (42.1%) was coronary artery
disease (CAD) and the primary tachyarrhythmia (38.5%) was monomorphic
ventricular tachycardia (MVT).
Methods
A prospective, multi-center, nonrandomized clinical study evaluated the safety
and effectiveness of the VITALITY device in humans. Ninety-six patients
selected from the investigator’s general patient population who met the
indications for use of the VITALITY device were followed through pre-discharge,
2-week and 1-month follow-ups and continued every 3 months thereafter until
study closure.
- DRAFT -

G-2 CLINICAL STUDY - VITALITY
Results
A total of 100 patients were enrolled in this study. Of these, 96 patients were
successfully implanted, with 4 intents. Ninety-three (93) patients finished their
1-month follow-up per the study protocol. All primary and secondary endpoints
of this study were met. The results from this study provide evidence of the
safety and effectiveness of the VITALITY with Automatic Intrinsic Rhythm ID
algorithm (Table G-1 on page G-2).
Table G-1. VITALITY Chronic Study Results
Safety Endpoints
VT/VF Detection Time 3.43 seconds
Primary Endpoints
Sensitivity
Induced VT/VF 100%
Spontaneous VT/VF 100%
Specificity––Induced
Rhythm Physician/Annotation Device Decision–SVT Specificity
Atrial Fibrillation 71 68 95.8%
Atrial Flutter 94 88 93.6%
Sinus Tachycardia 75
71.4%
Total Induced 172 161 93.6%
Specificity–Spontaneous
Rhythm Physician/Annotation Device Decision–SVT Specificity
Atrial Fibrillation 65 65 100%
Atrial Flutter 31 28 90.3%
Sinus Tachycardia 37 32 86.5%
Other 77
100%
Total Spontaneous 140 132 94.3%a
Combined
Specificityb
312 293 93.9%
Secondary Endpoints
Acute Automatic Rhythm ID Accuracy (2 weeks) 100%
- DRAFT -

CLINICAL STUDY - VITALITY G-3
Table G-1. VITALITY Chronic Study Results (continued)
Automatic Rhythm ID Accuracy (1 month) 97.7%
Manual Rhythm ID Accuracy (1 month) 100%
a. GEE adjusted specificity = 93.7%
b. Combined specificity includes both Induced and Spontaneous data.
ACUTE STUDY - VITALITY
The VITALITY ICD was compared to a commercially available ICD (VENTAK
PRIZM‚ or VENTAK PRIZM 2 ICD) in an acute (nonimplant) paired study of 50
patients enrolled at nine investigating centers between March 8, 2001 and July
24, 2001. A total of 47 patients were tested with the study device, followed by
a control device at the time of a Guidant commercially approved (VENTAK
PRIZM, model 1851 or VENTAK PRIZM 2, model 1861) implantation.
The purpose of the acute study was to demonstrate that the addition of an SVT
detection enhancement and brady features did not adversely impact normal
ICD sensing and detection functionality. A total of 50 patients were tested
in nine U.S. centers.
Patients studied
The patients (38 M/9 F) had a mean age of 66 years (range 37 to 90) and
a left ventricular ejection fraction of 32% (range 10% to 62%). Most (40%)
presented with monomorphic ventricular tachycardia (MVT) and nonsustained
VT as their primary arrhythmia. Of the patients studied, 87 percent presented
with coronary artery disease or ischemic cardiomyopathy.
Methods and statistics
The acute study was done in the operating room or electrophysiology
laboratory without implantation of the study device. The primary endpoint was
to determine that VT/VF detection time for induced episodes is within two
seconds of the VENTAK PRIZM or VENTAK PRIZM 2 detection time.
Results
A total of 50 patients were enrolled in the acute study. Of those, 47
patients were successfully tested with the system per study protocol; there
were two attempted procedures and one intent. There was one clinical
complication and two observations reported in the acute study, all of which
were non-investigational device related. No patient deaths were reported.
- DRAFT -

G-4 CLINICAL STUDY - VITALITY
The VT/VF detection time of the VITALITY ICD was found to be within two
seconds of the VENTAK PRIZM 2 detection time, leading to the conclusion that
activating the additional VITALITY features does not have a negative effect on
the existing ICD sensing and detection functionality (Table G-2 on page G-4).
Table G-2. Acute study results
Study Endpoint VITALITY
(Mean ± std)
N
VENTAK
PRIZM 2 DR
(Mean ± std)
N
VT/VF Detection Time (seconds) 3.60 ± 0.60
N=47
3.52 ± .057
N=47
p-value: <0.001
- DRAFT -

H-1
CLINICAL STUDY - SUMMARY OF GDT1000 SENSING ACUTE
STUDY
APPENDIX H
CLINICAL STUDY POPULATIONS
GDT1000 study included patients indicated for a CRT-D device. Excluded from
the study were patients meeting any of the following criteria:
• Having no intrinsic P and/or R waves at implant
• Having a pre-existing unipolar pacemaker that was not to be
explanted/abandoned
• Enrolled in a concurrent study that would confound the study results
• Having ventricular tachyarrhythmias associated with a reversible cause
(e.g., digitalis toxicity, hypoxia, sepsis, transient electrolyte imbalance,
acute myocardial infarction, electrocution, or drowning)
• Women who were pregnant or planned to become pregnant
• Having a prosthetic mechanical tricuspid heart valve
STUDY METHODS
This clinical investigation was a 50 patient, multi-center, acute study conducted
at seven (7) centers in the United States. The main purpose of this clinical
investigation was to characterize the performance of the new Automatic Gain
Control (AGC) sensing platform, with the Dynamic Noise Adjustment (DNA)
feature, that is used in both COGNIS and TELIGEN devices. The AGC
sensing platform was studied using a Guidant Acute Sensing Device (GASD)
system, a non-implantable device containing the COGNIS/TELIGEN system
board, hardware, and firmware required for sensing intracardiac signals. The
study enrolled a total of 50 patients and was conducted in two phases. In the
first phase, 28 of 30 patients completed protocol testing. The algorithm was
modified after the first phase, and it was re-evaluated in the second phase, in
which 17 of 20 patients completed protocol testing. Of the five patients who
did not complete testing in the two phases, three were attempts, and two were
intents.
- DRAFT -
H-2 CLINICAL STUDY - SUMMARY OF GDT1000 SENSING ACUTE STUDY
Protocol Testing
Four scenarios were tested, including different combinations of sensed atrial
signals (AS), paced atrial signals (AP), sensed ventricular signals (VS), and
paced ventricular signals (VP), i.e., AS/VS, AS/VP, AP/VS, and AP/VP. Sensing
algorithm performance was analyzed from patients’ real-time electrograms
(EGM) and electronic signals. Primary analysis was performed by visually
reviewing the EGM and markers of the printed strips for proper sensing, as well
as for instances of undersensing and oversensing.
Additional analysis included tabulating the sensed and paced events stored
in the patient data files from the patient CD-ROM. During this tabulation,
unexpected events were noted. An example of an unexpected event is a
sensed event during an AP/VP testing scenario. The sensed event could be a
real event, such as a PVC, or an oversensed event. These unexpected events
were evaluated by viewing the electronic signals stored in the patient data files
and correlating these signals to the printed strips.
Statistical Analysis
The sensitivity, specificity, positive predictive value, rate of oversensing, and
rate of undersensing of the sensing algorithm were analyzed for each chamber.
A true positive (TP) is the number of intrinsic/paced signals appropriately
sensed, a false positive (FP) is the number of intrinsic/paced signals from
the opposite chamber oversensed, a false negative (FN) is the number of
intrinsic/paced signals undersensed, and a true negative (TN) is the number
of intrinsic/paced signals from the opposite chamber appropriately not
sensed. The sensing sensitivity was calculated as TP/(TP+FN), specificity
as TN/(TN+FP), positive predictive value (PPV) as TP/(TP+FP), rate of
oversensing as FP/(TP+FP), and rate of undersensing as FN/(TP+FN).
The sensing performance results from the first phase of the study are provided
and compared to the results from the second phase in order to demonstrate
the improvement in the operation of the updated sensing algorithm following
the between-phase changes. Results from the second phase of the study are
the most clinically relevant, as they reflect the performance of the final sensing
algorithm implemented in the COGNIS/TELIGEN devices.
The GDT1000 protocol did not pre-specify acceptable sensitivities, specificities,
PPV, rates of oversensing, or rates of undersensing for the RA, RV, and LV
channels.
- DRAFT -

CLINICAL STUDY - SUMMARY OF GDT1000 SENSING ACUTE STUDY H-3
STUDY RESULTS
Patient Characteristics
The table below shows the characteristics of the patients implanted or
attempted (Table H-1 on page H-3).
Table H-1. All patients implanted or attempted, Phase 1 and Phase 2
Characteristic Measurement Phase 1 Result (N=29) Phase 2 Result (N=19)
Age at implant Mean ± SD 65.8 ± 12.2 68.1 ± 9.6
Range [44.6, 85.5] [51.3, 81.8]
Gender [N (%)] Female 14 (48.0) 14 (74.0)
Male 15 (52.0) 5 (26.0)
NYHA Class [N (%)] III 27 (93) 19 (100)
IV 2(7) 0(0)
LVEF (%) Mean ± SD 22.4 ± 7.7 23.5 ± 6.4
Range [10.0, 35.0] [15.0, 35.0]
QRS Duration Mean ± SD 161± 29 149± 30
Range [124, 248] [106, 220]
Cardiac Disease [N (%)] Nonischemic
Cardiomyopathy
14 (48) 7 (37)
Ischemic Cardiomyopathy,
CAD
10 (34) 9 (47)
Hypertension 3(10) 0(0)
Coronary Artery Disease
(CAD)
1(3) 0(0)
Ischemic Cardiomyopathy,
no CAD
1 (3) 3 (16)
Valvular Heart Disease 0(0) 1(5)
Other 0 (0) 1 (5)
Lead Position
In this study, the position of each lead was per physician’s discretion. A majority
of the atrial leads in the first/second phase of the study were placed in the
right atrial appendage (19/12) with the remaining placed in the lateral wall
(5/2), septal wall (2/3), and unspecified location (1/0). A majority of the right
ventricular leads were implanted in the right ventricular apex, with the remaining
- DRAFT -

H-4 CLINICAL STUDY - SUMMARY OF GDT1000 SENSING ACUTE STUDY
placed in the septal wall (0/1) and unspecified location (1/0). A majority of
the left ventricular leads were implanted in the lateral, postero-lateral, or
posterior wall (21/15), with the remaining placed in an antero-lateral, anterior,
or postero-septal location (4/3).
Lead Configurations
In this study, both RA and RV leads used a bipolar configuration, which was not
programmable. The LV lead configuration programming was per physician’s
discretion. In the first phase, 20 patients had LV sensing programmed to the
LVtip>>LVring configuration, four to LVtip>>RVcoil, and one to LVtip>>Can.
In the second phase, 13 patients had LV sensing programmed to the
LVtip>>LVring configuration, and four to LVtip>>RVcoil.
Lead Performance
The lead performance, including pacing threshold, pacing impedance and
sensing amplitude, were measured at implant by a commercially available
Pacing System Analyzer (PSA). The results are provided in the table below
(Table H-2 on page H-4).
Table H-2. Lead performance
Measurement Lead Location Number of
Leads: Phase 1
Mean ± SD:
Phase 1
Number of
Leads: Phase 2
Mean ± SD:
Phase 2
Pacing
Impedance (Ω)
Left Ventricle 25 1034 ± 394 18 779 ± 227
Right Atrium 28 520 ± 161 17 519 ± 112
Right Ventricle 29 816 ± 263 18 649 ± 206
Pacing
Threshold (V)
Left Ventricle 25 1.9 ± 1.4 18 1.3 ± 1.0
Right Atrium 28 1.1 ± 0.7 16 1.2 ± 0.6
Right Ventricle 29 1.0 ± 0.4 18 0.8 ± 0.3
Sensing
Amplitude (mV)
Left Ventricle 25 14.1 ± 7.6 18 13.2 ± 7.3
Right Atrium 28 2.9 ± 1.5 16 3.7 ± 3.3
Right Ventricle 29 12.3 ± 6.2 18 13.4 ± 7.0
Sensing Performance
In the first phase of the study, a total of 55,207 signals were recorded, including
54,151 appropriate sensed intrinsic and paced beats and 1,056 inappropriate
- DRAFT -

CLINICAL STUDY - SUMMARY OF GDT1000 SENSING ACUTE STUDY H-5
sensed events (223 undersense and 833 oversense events). The sensing
algorithm used in the first phase achieved the sensitivities, specificities, positive
predictive values (PPV), rates of undersensing (1-sensitivity), and rates of
oversensing (1-PPV) are summarized in the table below (Table H-3 on page
H-5).
Table H-3. Summary of Sensing Performance - First Phase
Sensitivity
(Rate of
Undersensing)
Specificity Positive
Predictive
Value
(Rate of
Oversensing)
Appropriate
Sensed
Beats
Inappropriate
Sensed
Beats:
Undersense
Inappropriate
Sensed
Beats:
Oversense
Right Atrial
Channel
100% (0%) 96.81% 97.03%
(2.97%)
19,478 0 615
Right
Ventricular
Channel
100% (0%) 98.94% 98.86%
(1.14%)
18,439 0 216
Left
Ventricular
Channel
98.63%
(1.37%)
99.99% 99.99%
(0.01%)
16,054 223 2
Totals 54,151 223 833
In the second phase of the study, a total of 35,998 signals were recorded
including 35,831 appropriate sensed intrinsic and paced beats and 171
inappropriate sensed events (2 undersense and 169 oversense events).
The upgraded sensing algorithm used in the second phase achieved
the sensitivities, specificities, positive predictive values (PPV), rates of
undersensing (1-sensitivity), and rates of oversensing (1-PPV) summarized in
the table below; the table also summarizes the results of the analysis from the
second phase (Table H-4 on page H-5).
Table H-4. Summary of Sensing Performance - Second Phase
Sensitivity
(Rate of
Undersensing)
Specificity Positive
Predictive
Value
(Rate of
Oversensing)
Appropriate
Sensed
Beats
Inappropriate
Sensed
Beats:
Undersense
Inappropriate
Sensed
Beats:
Oversense
Right Atrial
Channel
100% (0%) 98.64% 98.54%
(1.46%)
11,372 0 168
Right
Ventricular
Channel
100% (0%) 100% 100% (0%) 12,230 0 0
- DRAFT -

H-6 CLINICAL STUDY - SUMMARY OF GDT1000 SENSING ACUTE STUDY
Table H-4. Summary of Sensing Performance - Second Phase (continued)
Sensitivity
(Rate of
Undersensing)
Specificity Positive
Predictive
Value
(Rate of
Oversensing)
Appropriate
Sensed
Beats
Inappropriate
Sensed
Beats:
Undersense
Inappropriate
Sensed
Beats:
Oversense
Left
Ventricular
Channel
99.98%
(0.016%)
99.99% 99.99%
(0.008%)
12,227 2 1
Totals 35,831 2 169
Comparing the performance between the two phases, there were 1,056
inappropriate sensing events out of 55,027 signals (1.919%) in the first phase
of the study, and a total of 171 inappropriate sensing events out of 35,998
signals (0.475%) in the second phase of the study, reflecting a 75.2% reduction
in inappropriate sensing events from phase one to two.
Oversense Events
During the analysis of the first phase data, some unexpected oversense events
were identified. There were a total of 831 oversense events in the RA (615) and
RV (216) channels in phase one. The majority of the RA and RV oversense
events were attributed to an artificial event introduced while pacing. This type
of oversense was observed in 6 patients in the RA channel and 7 patients in
the RV channel. The results for the second phase of the study demonstrated
that oversensing artificial events observed in the first phase of the study were
successfully eliminated by using the upgraded GASD system. There were no
artificial events introduced in the second phase of the study.
In the second phase, a total of 168 oversense events in the RA channel were
observed in one patient. This patient had an intrinsic P-R interval greater
than 300 ms. In order to complete the AP/VS test scenario, the device was
programmedwithaLRL=80bpmandAVDelay=300ms,whichisthe
maximum allowable AV Delay in a CRT-D device. At the end of the AV Delay,
no intrinsic activity occurred and the device paced both ventricles. These paced
beats were oversensed by the atrial channel. If the atrial blanking period were
programmed to a larger value, atrial oversensing would have been eliminated.
Therefore, excluding this patient’s AP/VS test scenario from the analysis, there
were no undersensing or oversensing events in the RA channel.
In one patient, the single oversense event in the LV channel was caused by
noise.
- DRAFT -
CLINICAL STUDY - SUMMARY OF GDT1000 SENSING ACUTE STUDY H-7
Undersense Events
LV undersense events (223) in the first phase of the study primarily occurred
in one patient whose LV intrinsic amplitude was less than 1.0 mV, which is
much smaller than the clinically acceptable threshold. This small LV intrinsic
amplitude resulted in undersensing some LV events.
Two LV undersense events occurred in the second phase of the study. A
potential cause for the LV undersense events was premature ventricular
contractions while atrial pacing.
CONCLUSIONS
This acute study demonstrated excellent sensitivity (100% in the RA, 100% in
the RV, and 99.98% in the LV channels), specificity (98.64% in the RA, 100% in
the RV, and 99.99% in the LV channels), and positive predictive values (98.54%
in the RA, 100% in the RV, and 99.99% in the LV channels). In conclusion, the
new sensing platform evaluated in the GDT1000 study will be implemented in
COGNIS/TELIGEN devices.
By excluding one patient’s oversensed events that could be eliminated by
programming a longer atrial blanking period, the modified specificity and
positive predictive values in the RA channel are 100% and 100% (oversensing
eliminated). While the GDT1000 protocol did not pre-specify acceptable
sensitivities, specificities, or PPV values, a Sensing Tape Testing DAT report
for COGNIS/TELIGEN on file at Boston ScientificCRM
1reported a 99.96%
sensitivity (0.04% Undersensing) and a 99.97% positive predictive value
(0.03% Oversensing) for the RV channel in normal sinus rhythm. Using the RV
values as a benchmark (RA and LV values were not calculated), the results of
this study compare favorably.
1. Sensing Tape Testing Design Analysis Test report 100019-687 Revision A describes testing
performed in which the COGNIS/TELIGEN sensing platform is modeled and compared to a
previous Guidant device, CONTAK RENEWAL TR. The analysis was performed using 219
patient rhythms from the Gold Development Database, including normal sinus rhythm and
atrial and ventricular arrhythmias.
- DRAFT -
H-8 CLINICAL STUDY - SUMMARY OF GDT1000 SENSING ACUTE STUDY
- DRAFT -
INDEX
Symbols
50 Hz/manual burst pacing 8-9
A
A-blank
after RV-sense 5-57
after V-pace 5-57
A-tachy response (ATR)
mode switch 5-27
ABM (Autonomic Balance Monitor) 7-4
Accelerate, in zone 4-3
Accelerometer 5-21
activity threshold 5-22
reaction time 5-23
recovery time 5-26
response factor 5-24
Activity threshold 5-22
Adaptive-rate pacing 5-20
Adverse event 1-19
AFib rate threshold 3-29, 3-36, 3-38
Amplitude 5-16
ATP (antitachycardia pacing) 4-18
intrinsic test 6-7
Application screen 2-5
Arrhythmia logbook 7-5
episode detail 7-7
events summary 7-7
interval 7-11
stored EGM 7-8
ATP (antitachycardia pacing) 4-10
amplitude 4-18
burst cycle length (BCL) 4-14
burst scheme 4-15
commanded, EP test 8-11
coupling interval 4-12
minimum interval 4-14
number of bursts 4-11
pulse count 4-11
pulse width 4-18
ramp scheme 4-15
ramp/scanscheme4-17
redetection after ATP 3-18
scan scheme 4-16
time-out 4-18
ATR (atrial tachy response)
atrial flutter response 5-34
biventricular trigger 5-33
duration 5-29
end of ATR episode 5-32
entry count 5-29
exit count 5-30
LRL, fallback 5-31
maximum pacing rate 5-33
mode switch 5-27
mode, fallback 5-30
PMT termination 5-35
rate threshold 5-29
time, fallback 5-31
ventricular rate regulation 5-32
VTR (ventricular tachy response) 5-32
Atrial
refractory period, post ventricular atrial
(PVARP) 5-52
use of atrial information 3-5
Atrial arrhythmia rate threshold 5-29
Atrial flutter response 5-34
Atrial tachy
ATRmodeswitch5-27
atrial flutter response 5-34
PMT termination 5-35
ventricular rate regulation 5-32
Attention conditions, yellow 2-10
Automatic Intrinsic Rhythm ID 3-8
AV delay 5-46
paced 5-46
sensed 5-48
- DRAFT -
B
Backup VVI pacing during atrial stimulation,
EP test 8-2
Battery
Beginning of life (BOL) 6-2
Explant status 6-2
icon 2-9
indicator 6-2
status 6-2
Beep
during capacitor charge 6-5
feature setup 10-4
Biventricular trigger 5-33
maximumpacingrate5-34
Blanking
A-blank after RV-sense 5-57
A-blank after V-pace 5-57
Blanking; Noise
rejection, blanking 5-56
Burst
ATP (antitachycardia pacing) 4-11
cycle length (BCL) 4-14
minimum interval 4-14
number of bursts 4-11
pacing, 50 Hz/manual burst 8-9
parameter 4-11
pulse count 4-11
scheme 4-15
Buttons, software 2-8
C
Capacitor
deformation 4-22, 6-5
re-formation 6-5
Characteristics as shipped 1-23
Charge time 4-22
measurement 6-5
Check
icon 2-9
Commanded
ATP, EP test 8-11
shock, EP test 8-10
therapy, EP test 8-10
Committed shock 3-11, 4-23
Communication, telemetry
radio frequency (RF) 2-12
Connection, lead to pulse generator 1-21, 9-6
Content, package 1-22
Contraindications 1-6
Counter
brady/CRT 7-16
therapy history 7-15
ventricular 7-15
Coupling interval 4-12
decrement 4-12
CRT (cardiac resynchronization therapy)
delivery zone 3-5
D
Data
disk 2-11
patient 2-11
Decelerate,inzone4-3
Decrement
coupling interval 4-12
ramp scheme 4-15
scan scheme 4-16
Defibrillation
backup defibrillator, safety mode 2-19
Demonstration
Programmer/recorder/monitor (PRM)
mode 2-6
Description, device 1-4
Detail icon 2-8
Detection
AFib rate threshold 3-29
duration 3-15
enhancement 3-7, 3-23
episode 3-20
- DRAFT -
onset 3-34
rate sensing 3-3
rate threshold 3-4
reconfirmation/committed shock 4-23
redetection 3-11
stability 3-32
sustained rate duration (SRD) 3-35
tachyarrhythmia 3-1
tachyarrhythmia, safety mode 2-19
Vrate>Arate3-28
vector timing and correlation 3-27
ventricular, initial 3-6
window 3-13
Device
characteristics as shipped 1-23
description 1-4
mode 3-2
programming recommendation 5-2
specification 1-21
storage 1-8
Diagnostic
battery status 6-2
heart rate variability (HRV) 7-12
histogram 7-11
lead test 6-6
patient triggered monitor 7-17
Disk
data 2-11
read 2-11
save 2-11
Disposal of pulse generator 10-8
DIVERT THERAPY 2-16
Duration 3-15
ATR (atrial tachy response) 5-29
post-shock 3-18
redetection 3-18
E
ECG (electrocardiogram)
display 2-7
EGM (electrogram)
display 2-7
Electrocautery
mode 3-3
Electrode, lead configuration 5-42
Electromagnetic interference (EMI) 1-12
EMI (electromagnetic interference) 1-12
EndofATRepisode5-32
Energy
shock 4-21
Enhancement
detection 3-7, 3-23
Entry count 5-29
EP test (electrophysiologic test) 8-2
ATP, commanded 8-11
backup VVI pacing during atrial
stimulation 8-2
burst pacing, 50 Hz/manual 8-9
commanded therapy 8-10
fibrillation 8-5
induction 8-4
mode, temporary 8-2
programmed electrical stimulation
(PES) 8-7
shock on T 8-6
shock, commanded 8-10
VFib 8-5
Episode 3-20
end of ATR 5-32
nontreated 3-20, 7-15
treated 3-20, 7-15
ventricular 3-20
Event
adverse, potential 1-19
counter 7-15
icon 2-9
therapy history 7-2
Events
summary 7-7
Exit count 5-30
Explantation 10-8
- DRAFT -
F
Fallback, atrial mode switch
LRL 5-31
mode 5-30
time 5-31
Federal Communications Commission
(FCC) 1-25
Fibrillation
VFib induction 8-5
Follow-up
examination, routine 10-2
predischarge 10-2
test 10-2
H
Heart failure 5-2
Heart rate variability (HRV) 7-12
Histogram 7-11
Horizontal slider
icon 2-9
I
Icon
battery 2-9
check 2-9
details 2-8
event 2-9
horizontal slider 2-9
increment and decrement 2-9
lead 2-8
patient 2-8
patient information 2-11
Programmer/recorder/monitor (PRM)
mode indicator 2-6
run 2-9
scrolling 2-10
sorting 2-9
vertical slider 2-9
Identifier, x-ray 1-24
Impedance test, lead 6-8
Implant
post, follow-up 10-2
post, information 10-3
predischarge follow-up 10-2
procedure 9-2
Increment and decrement
icon 2-9
Indications and usage 1-6
Indications Based Programming (IBP) 2-2
Induction, EP test 8-4
Industry Canada (IC) 1-25
Information
implant 2-11, 9-2
lead 2-11
patient 2-11
patient counseling 1-28
post implant 10-2
related 1-5
warranty 1-27
Interrogate 2-13
Interval
arrhythmia logbook 7-11
coupling, ATP 4-12
minimum, burst cycle length 4-14
Intrinsic amplitude test 6-7
Items included in package 1-22
L
Last delivered shock 6-6
Latitude 2-2
Lead
configuration 5-42
connection to pulse generator 1-21
connection to pulse generator (PG) 9-6
icon 2-8
impedance 6-8
- DRAFT -
intrinsic amplitude 6-7
pace threshold 6-8
test 6-6
Left ventricular protection period (LVPP) 5-55
Left ventricular refractory period (LVRP) 5-55
Logbook 7-5
Longevity
pulse generator 1-26
Lower rate limit (LRL) 5-10
LV offset 5-14
LV-blank after A-pace 5-57
M
Magnet 1-8
electromagnetic interference (EMI) 1-12
feature setup 10-5
inhibit tachy therapy 10-5
static magnetic fields 1-17
Magnetic fields 1-17
Magnetic Resonance Imaging (MRI) 1-7
Maintaining cardiac resynchronization
therapy
maintaining CRT 5-4
Manual programming 2-5
Manual/50 Hz burst pacing 8-9
Maximum
pacing rate 5-33, 5-34
sensor rate (MSR) 5-13
tracking rate (MTR) 5-11
Maximum pacing rate
rate smoothing 5-42
Measurement
lead, baseline 9-5
Mechanical specification 1-21
Memory, pulse generator 2-11
Minimum
interval 4-14
Mode
device 3-2
electrocautery 3-3
fallback ATR (atrial tachy response) 5-30
pacing 5-7
Programmer/recorder/monitor (PRM) 2-6
temporary, EP test 8-2
ventricular tachy 3-2
MTR (maximum tracking rate) 5-4
N
Noise
response 5-60
Nominal parameter setting A-1
Number of bursts 4-11
pulse count 4-11
O
Onset 3-10, 3-34, 3-38, 3-39
P
Pace
STAT PACE 2-18
Pace threshold test 6-8
pacing
CRT (cardiac resynchronization
therapy) 5-4
Indications Based Programming
(IBP) 2-2
Pacing
adaptive-rate 5-20
amplitude 5-16
ATRmodeswitch5-27
AV delay 5-46
backup pacemaker in safety mode 2-19
backup VVI during atrial stimulation 8-2
burst, 50 Hz/manual 8-9
- DRAFT -
chamber, ventricular 5-14
lower rate limit (LRL) 5-10
LV offset 5-14
maximum sensor rate (MSR) 5-13
maximum tracking rate (MTR) 5-11
mode 5-7
noise response 5-60
Parameter, BASIC 5-7
post therapy 5-17, 5-18
post-therapy 5-17
programming recommendation 5-2
pulse width 5-15
refractory 5-52
runaway protection 5-11
sensitivity 5-16
sensor 5-19
SmartDelay optimization 5-50
temporary 5-18
therapy 5-6
Package
content 1-22
symbol on 1-22
Parameter, characteristics 1-23
Patient
counseling information 1-28
handbook 1-29
information icon 2-8
Patient triggered monitor 7-17
PES (programmed electrical stimulation) 8-7
PMT (pacemaker-mediated tachycardia)
termination 5-35
Polarity
shock 4-22
Post implant information 10-2, 10-3
beeper feature 10-4
magnet feature 10-5
sensitivity adjustment 10-3
Post-shock
detection parameter 3-12
duration 3-18
pacing 5-17, 5-18
Post-therapy pacing 5-17
Precautions 1-8
Predischarge follow-up 10-2
Premature ventricular contraction (PVC) 5-54
Prescription
therapy 4-2
Print
report 2-12
Printer
external 2-12
Program 2-2
Programmable option, parameter A-1
Programmer/recorder/monitor (PRM) 2-2
controls 2-5
modes 2-6
software terminology 2-5
use of color 2-10
programming recommendation 5-2
Programming recommendation 2-2, 2-5
Protection
period, left ventricular (LVPP) 5-55
runaway 5-11
Pulse amplitude 5-16
Pulse count 4-11
Pulse generator (PG)
disposal 10-8
explantation 10-8
implant 9-2
longevity 1-26
memory 2-11
setscrew locations 9-6
suture hole 9-6
Pulse width 5-15
ATP (antitachycardia pacing) 4-18
PVARP (post ventriuclar atrial refractory
period) 5-52
after PVC (premature ventricular
contraction) 5-54
PVC (premature ventricular contraction) 5-54
Q
QUICK CONVERT ATP 4-20
- DRAFT -
Quit
Ending a telemetry session 2-14
R
Radio frequency (RF)
ending telemetry 2-14
interference 2-15
operating temperature, telemetry 2-14
starting telemetry 2-13
telemetry 2-12
Ramp scheme 4-15
Ramp/Scan scheme 4-17
Rate
adaptive 5-20
AFib threshold 3-29
calculation 3-4
lower limit (LRL) 5-10
maximum sensor 5-13
maximum tracking 5-11
sensing 3-3
sustained rate duration (SRD) 3-35
threshold, ventricular 3-4
Vrate>Arate3-28
ventricular 3-4
zone 3-4
Rate enhancement, pacing 5-35
rate hysteresis 5-36
rate smoothing 5-38
tracking preference 5-36
Rate smoothing 5-38
down 5-41
Maximum pacing rate 5-42
up 5-41
Rate threshold, ATR 5-29
Reaction time 5-23
Read disk 2-11
Reconfirmation 3-11, 4-23
Recovery time 5-26
Red warning conditions 2-10
Redetection 3-11
after ATP delivery 3-18, 4-8
after shock delivery 3-18, 4-9
duration 3-18
ventricular 4-8
Reform, capacitor 6-5
Refractory
atrial, post ventricular (PVARP) 5-52
blanking and noise rejection 5-56
left ventricular (LVRP) 5-55
left ventricular protection period 5-55
PVARP after PVC 5-54
right ventricular (RVRP) 5-54
Refractory; pacing
refractory 5-52
Related information 1-5
Reliability 1-27
Report, printed 2-7, 2-11
ECG/EGM 2-7
Response factor 5-24
Rhythm
ID, automatic intrinsic 3-8
Right ventricular refractory (RVRP) 5-54
Run
icon 2-9
Runaway protection 5-11
RV-blank after A-pace 5-56
S
Safety core 2-18
Safety mode 2-18
Safety Tachy Mode 2-20
Save disk 2-11
Scan scheme 4-16
Screen, programmer application 2-5
Scrolling
icon 2-10
Security
ZIP telemetry 2-14
Sensing, rate 3-3
Sensitivity 5-16
- DRAFT -
Sensitivity adjustment 10-3
Sensor and trending, pacing 5-19
accelerometer 5-21
adaptive-rate 5-20
maximum sensor rate (MSR) 5-13
SmartDelay optimization 5-50
Setscrew locations 9-6
Setting
parameter value A-1
zone configuration 3-4
Shock
charge time, energy 4-22, 6-5
commanded, EP test 8-10
committed 4-23
diverting 2-16
energy 4-21
impedance 6-8
last delivered 6-6
on T induction 8-6
polarity 4-22
post-shock pacing 5-17, 5-18
redetection 3-18
selection 4-3
sequence 4-2
STAT SHOCK 2-17
therapy 4-21
ventricular therapy 4-21
waveform 4-22
Shock if unstable 3-34
Shock on T induction 8-6
SmartDelay optimization 5-50
Software terminology 2-5
Sorting
icon 2-9
Specification, mechanical 1-21
Stability 3-10, 3-32, 3-36, 3-38, 3-39
STAT PACE 2-18
STAT SHOCK 2-17
Sterilization 1-8
Stimulation, PES induction 8-7
Storage of device 1-8
Stored EGM
arrhythmia logbook 7-8
Sustained rate duration (SRD) 3-35
Suture hole 9-6
Symbol
on package 1-22
T
Tabs, software 2-8
Tach y m o d e 3 - 2
Safety Mode 2-20
Tachyarrhythmia
detection 3-1
detectioninsafetymode2-19
Indications Based Programming
(IBP) 2-2
therapy 4-2
therapy in safety mode 2-19
zone 3-4
Tele m e t r y
ending ZIP 2-14
operating temperature, ZIP 2-14
starting ZIP 2-13
wand 2-12
wanded 2-13
ZIP 2-12
Temporary
pacing 5-18
Test
EP (electrophysiologic) 8-2
follow-up 10-2
intrinsic amplitude 6-7
lead 6-6
lead impedance 6-8
pace threshold 6-8
Therapy
ATP (antitachycardia pacing) 4-10
pacing 5-6
post-shock pacing 5-17, 5-18
prescription 4-2
selection 4-3
shock 4-21
- DRAFT -
tachyarrhythmia 4-2
tachyarrhythmia, safety mode 2-19
Therapy history 7-2
arrhythmia logbook 7-5
counter 7-15
heart rate variability (HRV) 7-12
histogram 7-11
patient triggered monitor 7-17
Threshold
AFib rate 3-29
rate 3-4
Threshold, activity 5-22
Time-out, ATP 4-18
Timing
blanking 5-56
left ventricular protection period
(LVPP) 5-55
PVARP after PVC 5-54
Timing, pacing 5-52
Toolbar 2-7
Tracking preference 5-36
Trending
sensor 5-19
Trends 7-3
V
Vrate>Arate3-28
Vector timing and correlation 3-27, 3-36
Ventricular
ATP (antitachycardia pacing) 4-10
detection, tachyarrhythmia 3-6
redetection after ventricular ATP
therapy 4-8
redetection after ventricular shock
therapy 4-9
redetection after ventricular therapy
delivery 4-8
shock therapy 4-21
tachy mode 3-2
tachyarrhythmia therapy 4-2
Ventricular pacing chamber 5-14
Ventricular rate regulation 5-32
maximum pacing rate 5-33
Ventricular shock vector 4-21
Vertical slider
icon 2-9
VFib induction 8-5
VTR (ventricular tachy response) 5-32
W
Wand, telemetry 2-2, 2-12, 2-13
Warning conditions, red 2-10
Warnings 1-6
Warranty 1-27
Waveform, shock 4-22
Wenckebach 5-4, 5-38
Window
detection 3-13
X
X-ray identifier 1-24
Y
Yellow attention conditions 2-10
Z
ZIP telemetry 2-12
advantages 2-13
indicator light 2-13
interference 2-15
operating temperature 2-14
- DRAFT -
radio frequency (RF) 2-13
security 2-14
session 2-13, 2-14
Zone
cardiac resynchronization therapy (CRT)
delivery 3-5
configuration 3-4
ventricular 3-4
ventricular tachyarrhythmia 3-4
ZOOM LATITUDE Programming System
components 2-2
ZOOMVIEW Software Application 2-2
purpose 2-2
screens and icons 2-5
use of color 2-10
- DRAFT -
- DRAFT -

Boston Scientific
4100 Hamline Avenue North
St. Paul, MN 55112–5798 USA
www.bostonscientific.com
1.800.CARDIAC (227.3422)
+1.651.582.4000
© 2007 Boston Scientificoritsaffiliates
All rights reserved.
357400-001 US 12/07
FCC ID: ESCCRMN11906
IC: 4794A-CRMN1196
Part 2 of 2
*357400-001*
- DRAFT -