Boston Scientific CRMN11906 Implantable Defibrillator User Manual Cognis Part 3 Manual
Boston Scientific Corporation Implantable Defibrillator Cognis Part 3 Manual
Contents
Cognis Part 3 Manual
PACING THERAPIES
VENTRICULAR TACHY SENSING INTERACTIONS 5-65
When the programming interaction described in this scenario is present, a
message will describe the interaction of Tachy Rate Threshold with LRL and
AV Delay. Similar messages may describe the interaction of V-Blank After
A-Pace with MTR, MPR, or LRL. Along with each message, the pertinent
programmable parameters are displayed to assist you in resolving the
interaction. Programming Dynamic VRP can be useful in resolving these
types of interactions.
Programming Considerations
Certain programmed combinations of pacing parameters are known to interfere
with ventricular tachy detection. The risk of ventricular tachy undersensing
due to device refractory periods is indicated by the interactive warnings on
the parameter screen.
As with all device programming, you should evaluate the benefits and the
risks of the programmed features for each patient (for example, the benefit
of Rate Smoothing with a long AV Delay versus the risk of ventricular tachy
undersensing).
The following programming recommendations are provided to reduce the risk
of ventricular undersensing due to the refractory period caused by an atrial
pace (V-Blank after A-Pace):
• If a dual-chamber pacing mode with Rate Smoothing or Rate Adaptive
Pacing is necessary:
– Reduce the LRL
– Shorten the AV Delay or use Dynamic AV Delay and reduce the
minimum Dynamic AV Delay setting
– Increase the Down Rate Smoothing percentage to the largest possible
value
– Decrease the recovery time for Rate Adaptive Pacing modes
– Reduce the MTR or MPR if Down Rate Smoothing is on
– Reduce the MSR if the pacing mode is rate adaptive
- DRAFT -
5-66 PACING THERAPIES
VENTRICULAR TACHY SENSING INTERACTIONS
• If Rate Smoothing or Rate Adaptive Pacing are not required for the patient,
consider programming these features Off. Programming these features Off
can reduce the likelihood of atrial pacing at elevated rates.
• If atrial pacing is not required for the patient, consider using VDD rather
than DDD pacing mode.
• In certain usage scenarios, you may elect to program long AV Delays to
reduce ventricular pacing for patients with long PR intervals, while providing
sensor pacing or rate smoothing to address other patient needs.
• In certain usage scenarios, if a pattern of atrial pacing and VT beats is
detected, the AV delay is automatically adjusted to facilitate confirmation
of a suspected VT. If no VT is present, the AV delay is returned to the
programmed value. For programming scenarios where the automatic AV
delay adjustment may occur, a specific Parameter Interaction Attention
will not be displayed.
For discussion of details and additional information regarding these or other
programmed settings, please contact Technical Services at the 24-Hour
Consultation phone number on the back of this manual.
In summary, when programming the pulse generator pacing and tachy
detection parameters, it is useful to consider the possible interactions of these
features in light of the expected arrhythmias of a particular patient. In general,
the interactions will be brought to your attention through Parameter Interaction
Attention messages on the PRM screen and can be resolved by reprogramming
the pacing rate, AV delay, and/or refractory/blanking periods.
- DRAFT -

6-1
SYSTEM DIAGNOSTICS
CHAPTER 6
This chapter contains the following topics:
• "Battery Status" on page 6-2
• "Lead Tests" on page 6-6
- DRAFT -
6-2 SYSTEM DIAGNOSTICS
BATTERY STATUS
BATTERY STATUS
Pulse generator battery summary information is displayed on the Summary
screen. The Summary screen contains the following components:
• Time Remaining—screen area with the following items:
– Battery status gauge—displays a visual indication of the battery
capacity status, from BOL to explant recommendation
– Approximate Time To Explant––displays the approximate time at which
explant is recommended based on the pulse generator’s programmed
parameters and recent usage history
• Charge Time––displays the amount of time it took the pulse generator
to charge for the most recent maximum-energy shock or capacitor
re-formation
• Battery Detail icon—when selected, this icon displays the Battery Detail
screen
Battery Status Indicators
The following battery status indicators appear in the battery status gauge. All
indicated longevity projections are calculated based on the pulse generator’s
programmed parameters.
• BOL—the pulse generator’s battery is at full capacity.
• One Year Remaining—the pulse generator’s battery has approximately
one year of full function remaining.
- DRAFT -
SYSTEM DIAGNOSTICS
BATTERY STATUS 6-3
• Explant—the pulse generator’s battery is nearing depletion and the pulse
generator has reached the point at which explant is recommended. This
status indicates that pulse generator replacement must be scheduled.
Once Explant status is reached there is sufficient battery capacity to
monitor and pace 100% under existing conditions for three months and to
deliver six maximum-energy shocks. Once the battery capacity is depleted,
pulse generator functionality is degraded.
Once the battery capacity is depleted, the following occurs:
– Number of zones reverts to one ventricular zone (VF) with a rate
threshold of 165 bpm
– ATP therapy and low-energy shocks are unavailable
– The programmed mode reverts to VVI/BiV
– LRL defaults to 50 ppm
– The following features are disabled:
– RF telemetry
– Daily measurement trends
– Brady enhancement features
– Episode storage
– Diagnostic and EP tests
– Device programming (Brady Mode and Ventricular Tachy Mode can
be programmed to Off)
– Telemetry interrogation (using a wand) is still available and manual
capacitor re-formation can be selected.
If the device reaches a point where insufficient battery capacity is available
for continued operation, the device will revert to Storage Mode.
NOTE: The device uses the programmed parameters and recent usage
history to predict time to Explant. Greater than normal battery usage may
result in the subsequent day’s approximate time to Explant to appear less
than expected.
- DRAFT -
6-4 SYSTEM DIAGNOSTICS
BATTERY STATUS
Battery Detail Summary Screen
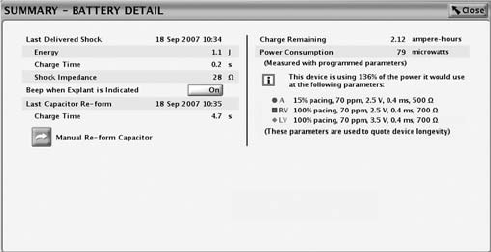
The Battery Detail summary screen provides the following information about
pulse generator battery status (Figure 6-1 on page 6-5):
• Last Delivered Shock––date, energy, charge time, and shock impedance
data
• Beep When Explant Is Indicated––if this feature is programmed to On, the
pulse generator emits 16 beeping tones every six hours after it reaches the
Explant indicator. The tone can then be programmed to Off. Once the
battery capacity is depleted, Beep When Explant Is Indicated is enabled by
the device.
CAUTION: Patients should be advised to contact their physician
immediately if they hear tones coming from their device.
• Last Capacitor Re-form––date and charge time
• Manual Re-form Capacitor––this feature is used to command a capacitor
re-formation when needed.
• Charge Remaining (measured in ampere-hours)––the amount of charge
remaining based on the pulse generator’s programmed parameters until
the battery is depleted.
• Power Consumption (measured in microwatts)––the amount of power being
consumed by the battery based on the pulse generator’s programmed
parameters.
• Power Consumption longevity impact––compares the power consumption
at the pulse generator’s currently programmed parameters with the power
consumption of the parameters used to quote device longevity.
- DRAFT -
SYSTEM DIAGNOSTICS
BATTERY STATUS 6-5
Figure 6-1. Battery Detail summary screen
Capacitor Re-formation
Automatic Capacitor Re-form. Capacitor deformation may occur during
periods when no shocks are delivered, resulting in longer charge times. To
reduce the effect of capacitor deformation on charge time, the capacitors are
automatically re-formed. Tones will not be emitted from the pulse generator
during automatic capacitor re-formations (even if the Beep During Capacitor
Charge feature is programmed to On). During a capacitor re-formation, the
Charge Time is measured and stored for later retrieval.
Manual Capacitor Re-form. Manual capacitor re-forms are not necessary, but
may be commanded via the PRM as follows:
1. Select the Manual Re-form Capacitor button on the Battery Detail screen
and ensure that telemetry communication is established. A message
will appear indicating that the capacitors are charging. Warbling tones
from the pulse generator (if the Beep During Capacitor Charge feature is
programmed to On) will sound while the capacitors are charging.
2. The entire re-form cycle typically takes less than 15 seconds. After
completion of the cycle, the capacitor energy is delivered to the pulse
generator’s internal test load. The initial Charge Time is displayed on the
Battery Detail screen.
Charge Time Measurement
The pulse generator measures the Charge Time whenever its capacitors
charge. The last measured value is stored in pulse generator memory and
displayed by the PRM system on the Battery Detail screen.
- DRAFT -
6-6 SYSTEM DIAGNOSTICS
LEAD TESTS
Last Delivered Ventricular Shock
When a shock has been delivered to the patient, the following information
from the last shock delivered is stored in the pulse generator’s memory and
displayed on the Battery Detail screen:
•Date
• Energy level
•Chargetime
• Shocking lead impedance
This does not include auto capacitor re-forms or shocks that may have been
diverted. If a fault condition is encountered (i.e., high or low impedance), the
fault will be indicated so that corrective action may be taken.
NOTE: For shocks of 1.0 J or less, the accuracy of the impedance
measurement decreases.
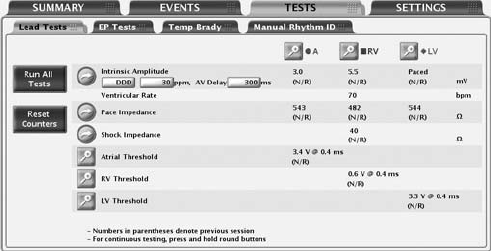
LEAD TESTS
The following lead tests are available (Figure 6-2 on page 6-6):
• Pace Impedance
• Shock Impedance
• Intrinsic Amplitude
• Pace Threshold
Figure 6-2. Lead Tests screen
Lead tests can be accessed by using the following steps:
- DRAFT -
SYSTEM DIAGNOSTICS
LEAD TESTS 6-7
1. From the main screen, select the Tests tab
2. From the Tests screen, select the Lead Tests tab
All lead tests may be performed following two different processes:
• ViatheLeadTestsscreen––allowsyoutoperformthesameleadtests
across all chambers
• By selecting the desired chamber button––allows you to perform all tests
onthesamelead
Intrinsic Amplitude Test
The intrinsic amplitude test measures the intrinsic P- and R-wave amplitudes
for the respective chambers.
An intrinsic amplitude test can be performed from the Lead Tests screen by
completing the following steps:
1. You may change the following preselected values as necessary to elicit
intrinsic activity in the chamber(s) being tested:
• Programmed Normal Brady Mode
• LRL at 30 ppm
• AV Delay at 300 ms
2. Select the Intrinsic Amplitude button. During the test, a window will display
the test’s progress. Selecting and holding the Intrinsic Amplitude Button will
cause measurements to be repeated for up to 10 seconds until the button is
released. When the window closes, the same test can be performed again
by selecting the Intrinsic Amplitude button. To cancel the test, select the
Cancel button or press the DIVERT THERAPY key on the PRM.
3. When the test is complete, the intrinsic amplitude measurement will be
displayed. If the test is repeated, the measurements from the previous
session’s test and the current test will be displayed.
NOTE: The test results from the last measurement are stored in pulse
generator memory, retrieved during the initial interrogation, and displayed on
the Lead Tests screen. The measurements are also provided on the Quick
Notes report.
- DRAFT -
6-8 SYSTEM DIAGNOSTICS
LEAD TESTS
Lead Impedance Test
A lead impedance test can be performed and used as a relative measure of
lead integrity over time.
A shock impedance test is a useful tool in detecting shocking lead integrity
changes over time. Evaluating this information together with the Last Delivered
Shock impedance (displayed on the Battery Detail screen) or a subsequent
high-energy shock impedance and other non-invasive diagnostic techniques
may help troubleshoot potential lead system conditions.
Pace and Shock lead impedance tests can be performed from the Lead Tests
screen by completing the following steps:
1. Select the desired lead impedance test button. Selecting and holding a
button will cause measurements to be repeated for up to 10 seconds until
the button is released.
2. During the test, a window will display the test progress. When the window
closes, the same test can be performed by once again selecting the desired
lead impedance test button. To cancel the test, select the Cancel button or
press the DIVERT THERAPY key on the PRM.
3. When the test is complete, the impedance measurement will be displayed.
If the test is repeated, the impedance measurements from the previous
session’s test and the current test will be displayed.
NOTE: The test results from the last measurement are stored in pulse
generator memory, retrieved during the initial interrogation, and displayed on
the Lead Tests screen. The measurements are also provided on the Quick
Notes report.
Pace Threshold Test
The Pace Threshold Test determines the minimum pace amplitude and/or
pulse width needed for capture in a specific chamber. The minimum 2x voltage
or 3x pulse width safety margin is recommended for each chamber based
on the capture thresholds, which should provide an adequate safety margin
and help preserve battery longevity.
Manual Pace Threshold Test
- DRAFT -
SYSTEM DIAGNOSTICS
LEAD TESTS 6-9
Thetestbeginsataspecified starting value and steps that value down
(amplitude or pulse width) as the test progresses. The PRM beeps with each
decrement. The values used during the threshold test are programmable.
The parameters are only in effect during the test. Testing for a chamber is
allowed only when pacing is active for that chamber in the mode specified in
the start column.
NOTE: The starting values for Amplitude and Pulse Width values are
automatically calculated. The device retrieves the stored results for the
previous pace threshold measurement (for the parameter being tested) and
sets the parameter at three steps above the previous threshold measurement.
The LRL is preselected at 90 ppm. For DDD mode, the LRL is further limited
to 10 ppm below the MTR.
NOTE: If DDD mode is chosen, selecting either the atrial or ventricular test
will cause the pacing output to decrease only in the chamber selected.
CAUTION: During the LV threshold test, RV backup pacing is unavailable.
NOTE: When VVI mode and a ventricular test are selected, only the pacing
output of the selected ventricular chamber decreases; the other ventricular
chamber is not affected.
NOTE: When DDD mode and a ventricular test are selected, only the pacing
output of the selected ventricular chamber decreases; the atrium is paced at a
continuous amplitude, and the other ventricular chamber is not paced.
Once the test is started, the device operates with the specified brady
parameters. Using the programmed number of cycles per step, the device
then decrements (steps down) the selected test type parameter (Amplitude or
Pulse Width) until the test is complete. Real-time electrograms and annotated
event markers, which include the values being tested, continue to be available
during threshold testing. The display will automatically adjust to reflect the
chamber being tested.
During the threshold test, the programmer displays the test parameters in a
window while the test is in progress. To pause the test or perform a manual
adjustment, select the Hold button on the window. Select the + or −button to
manually increase or decrease the value being tested. To continue the test,
select the Continue button.
- DRAFT -
6-10 SYSTEM DIAGNOSTICS
LEAD TESTS
The threshold test is complete and all parameters are returned to the normal
programmed values when any of the following occur:
• The test is terminated via a command from the PRM (e.g., pressing the End
Test button or DIVERT THERAPY key)
• The lowest available setting for Amplitude or Pulse Width is reached and
the programmed number of cycles has completed
• Telemetry communication is interrupted
A pace threshold test can be performed from the Lead Tests screen using
the following steps:
1. Select the desired chamber to be tested
2. Select the Pace Threshold details button
3. Select the test type
4. Change the following parameter values as desired to elicit pacing in the
chamber(s) being tested:
• Mode
•LRL
• Paced AV Delay
• Pacing Lead Config (programmable only for LV threshold test)
• Amplitude
• Pulse Width
• Cycles per Step
• LVPP (programmable only for LV threshold test)
For DDD mode, the normal Brady MTR is used.
NOTE: A long LVPP may inhibit left ventricular pacing at higher pacing rates.
LVPP can be temporarily programmed (for example, to a shorter LVPP or Off)
through the Pace Threshold Test screen.
5. Watch the ECG display and stop the test by selecting the End Test button
or pressing the DIVERT THERAPY key when loss of capture is observed.
If the test continues until the programmed number of cycles at the lowest
- DRAFT -
SYSTEM DIAGNOSTICS
LEAD TESTS 6-11
setting have occurred, the test is automatically terminated. The final
thresholdtestvaluewillbedisplayed(thevalueisonestepabovethevalue
when the test was terminated).
NOTE: The threshold test result can be edited by selecting the Edit Today’s
Test button on the Threshold Test screen
6. To perform another test, make changes to the test parameter values if
desired, then begin again. Results of the new test will be displayed.
NOTE: The test results from the most recent measurement are stored in
pulse generator memory, retrieved during initial interrogation, and displayed on
the Lead Tests screen and on the Lead Status screen. The measurements are
also provided on the Quick Notes report.
- DRAFT -
6-12 SYSTEM DIAGNOSTICS
LEAD TESTS
- DRAFT -

7-1
PATIENT DIAGNOSTICS
CHAPTER 7
This chapter contains the following topics:
• "Therapy History" on page 7-2
• "Trends" on page 7-3
• "Arrhythmia Logbook" on page 7-5
• "Patient Triggered Monitor" on page 7-17
- DRAFT -
7-2 PATIENT DIAGNOSTICS
THERAPY HISTORY
THERAPY HISTORY
The pulse generator automatically records detection and therapy information
for each detected episode. This data can be reviewed at various levels of
detail using the PRM.
History data storage includes the following information for each episode:
• Episode detail
• Electrograms with annotated markers
• Intervals
The data includes information from all active electrodes. The device
compresses the history data to store a maximum of 17 minutes of electrogram
data (13 minutes with Patient Triggered Monitor enabled). However, the
amount of time actually stored may vary based on the data being compressed
(e.g., noise on the EGM or an episode of VF).
The priority, maximum number, and minimum number of episodes to be stored
by the device for each episode type under normal conditions are specified
(Table 7-1 on page 7-3). The device stores up to the maximum number of
episodes for a specific episode type, unless the device memory is filled up first.
The minimum number of episodes for each episode type protects a few low
priority episodes from high priority episodes when device memory is full.
Once the device memory available for episode data is filled, the device attempts
to prioritize the types of stored episodes and overwrite the stored episodes
according to the following rules:
• If the device memory is full, and there are episode types that have more
than the minimum number of episodes listed in the table, then the oldest
of the lowest priority episodes from these episode types will be deleted.
In this case, the low priority episodes are not deleted if their number of
episodes is less than the minimum number listed in the table.
• If the device memory is full, and there are no episode types that have more
than the minimum number of episodes listed in the table, then the oldest of
the lowest priority episodes of all episode types will be deleted.
• For non-commanded episodes, the episode type for VT-1, VT, and VF
episodes is determined according to the zone Duration that expires
first. If no zone Duration expires during an episode, the episode type
is nonsustained.
- DRAFT -

PATIENT DIAGNOSTICS
TRENDS 7-3
• An episode in progress has the highest priority until its type can be
determined.
Table 7-1. Episode Priority
Episode Type Priority Minimum number of
episodes stored
Maximum number
of episodes stored
VF 1 510
Patient Triggered
Monitor
111
VT/VT-1 235
Cmd V 302
NonSustV 312
ATR 4 1 3
PMT 4 1 3
Once the history data is saved to a disk, it can be accessed at any time without
device interrogation.
TRENDS
Trends provide a graphical view of specific patient and device data. This data
can be useful when evaluating your patient’s condition and the effectiveness of
programmed parameters. The following trends are available:
• Events––displays both atrial and ventricular events.
• Heart Rate––displays a trend of the patient’s heart rate. Intervals used in
this calculation must be valid sinus rhythm intervals. The validity of an
interval and the Heart Rate Trend data for the 24-hour collection period is
determined by the HRV collection criteria.
• Activity Level––displays a measure of the patient’s daily activity.
• Atrial Burden––the amount of time spent in an ATR mode switch.
• Respiratory Rate ––provides a trend of the patient’s daily respiratory rate.
• SDANN––Standard Deviation of Averaged Normal R to R intervals. The
HRV collection period comprises 288 5-minute segments (24 hours). The
SDANN is the standard deviation of the averages of intrinsic intervals in the
288 5-minute segments. Only intervals that meet the HRV collection criteria
are considered valid. If the HRV data for the collection period is invalid,
then a value of “N/R” is displayed.
- DRAFT -
7-4 PATIENT DIAGNOSTICS
TRENDS
• HRV Footprint––displays the percentage of the graph area used by the
HRV plot. The graph area portrays an “at-a-glance snapshot” of the
distribution of variability versus heart rate over a 24-hour period. The
trended percentage is a normalized score based on the footprint in the
graph. If an HRV plot was not obtained for the 24-hour period, then the
HRV Footprint is not calculated and a value of “N/R” is displayed.
• ABM (Autonomic Balance Monitor)––a device calculation based on
R–R interval measurements; it mathematically functions as a surrogate
measurement for LF/HF ratio.1Intervalsusedinthecalculationmustbe
valid sinus rhythm intervals as determined by the HRV collection criteria. If
the HRV data is invalid for the 24-hour collection period, then the ABM is
not calculated for that collection period and a value of "N/R" is displayed.
• Amplitude––provides amplitude measurements
• Impedance––provides impedance measurements
Follow the steps below to access Trends:
1. From the Events screen, select the Trends Tab
2. Choose the Select Trends button to specify the trends you want to view.
You can choose from the following categories:
• Heart Failure––includes Heart Rate, SDANN, and HRV Footprint trends
• Atrial Arrhythmia––includes Events, Heart Rate, and Atrial Burden
trends
• Activity––includes Heart Rate, Activity Level, and Respiratory Rate
trends
• Custom––allows you to select three trends to customize the information
displayed on the Trends screen
Thedisplayonthescreencanbeviewedinthefollowingmanners:
• Select the desired time on the View button to choose the length of visible
trend data.
1. Parasympathetic tone is primarily reflected in the high-frequency (HF) component of
spectral analysis. The low-frequency (LF) component is influenced by both the sympathetic
and parasympathetic nervous systems. The LF/HF ratio is considered a measure of
sympathovagal balance and reflects sympathetic modulations. (Source: ACC/AHA Guidelines
for Ambulatory Electrocardiography—Part III, JACC VOL. 34, No. 3, September 1999:912–48)
- DRAFT -

PATIENT DIAGNOSTICS
ARRHYTHMIA LOGBOOK 7-5
• Adjust the start and end dates by moving the slider bar at the top of
the window. You can also adjust these dates by selecting the left- and
right-arrow buttons.
• Move the vertical axis across the graph by moving the slider bar at the
bottom of the display window.
Valid Heart Rate Trend Events Invalid Heart Rate Trend Events
AS with an interval not faster than
MTR, followed by a VS
AP
AS followed by VP at the programmed
AV Delay
AS with an interval faster than MTR
Non-tracked VP events
Consecutive AS events (no
intervening V event)
VP-Ns
Rate Smoothing events (e.g., RVP↑)
PVC
Heart Rate Trend data may not be reported for a variety of reasons; the most
common are as follows:
• Less than 67% of the 24-hour collection period (approximately 16 hours)
contains valid Heart Rate Trend events
• Brady parameters were programmed within the last 24 hours
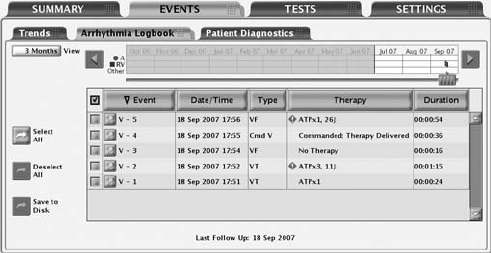
ARRHYTHMIA LOGBOOK
The Arrhythmia Logbook screen provides the following information about each
event (Figure 7-1 on page 7-6):
• The number, date, and time of the event
• The type of event with zone
• A summary of therapy delivered or attempted (if applicable)
• Whether or not intervals and EGMs are stored as indicated by the presence
of details button
- DRAFT -
7-6 PATIENT DIAGNOSTICS
ARRHYTHMIA LOGBOOK
• Duration of the event
Figure 7-1. Arrhythmia Logbook screen
To display Arrhythmia Logbook data, use the following steps:
1. From the Events tab, select Arrhythmia Logbook. If necessary, the pulse
generator will be automatically interrogated and current data will be
displayed. Data from a patient disk also can be displayed:
a. Select the Utilities button on the toolbar.
b. From the Utilities screen, select the Disk tab. Choose the Read Disk
option.
2. While retrieving the data, the programmer will display a window indicating
the progress of the interrogation. No information will be displayed if you
select the Cancel button before all of the stored data are retrieved.
3. Use the slider and View button to control the range of dates for the events
youwanttodisplayinthetable.
4. Select the Details button of an event in the table to display the event
details. Event details, available if the details button is present, are useful in
evaluating each detection or therapy sequence.
5. To sort events by date, type, therapy, or duration, select the corresponding
column header button. To reverse the order, select the column header
again.
6. To save specific events, select the event and choose the Save to Disk
button. To print specific events, select the event and choose Reports from
- DRAFT -
PATIENT DIAGNOSTICS
ARRHYTHMIA LOGBOOK 7-7
the toolbar. Choose the selected Episodes Report and select the Print
button.
NOTE: An “in-progress” episode will not be saved; an episode must be
complete before it will be saved by the application.
Events Summary
The Events Summary screen displays additional details about the selected
episode corresponding to the Arrhythmia Logbook.
The summary data include the following:
Episode Details
• Episode number, date, time, type (VF, VT, VT-1, spontaneous/induced, or
PTM indicating a Patient Triggered Monitor episode)
• Average atrial and ventricular rates
• Type of therapy delivered
• For ATP therapy, the time of therapy delivery and the number of bursts
• For shock therapy, the start time of charging, charge time, impedance,
energy level
• Time the episode ended
ATR Episodes
• Episode number, date, time, and type (ATR)
• Average atrial and ventricular rate during ATR mode switch
• Duration
PMT Episodes
• Episode number, date, time, and type (PMT)
• Atrial rate at PMT start
• Average atrial and ventricular rates
Follow the steps below to view episode detail:
- DRAFT -
7-8 PATIENT DIAGNOSTICS
ARRHYTHMIA LOGBOOK
1. Select the desired episode on the Arrhythmia Logbook screen. The Stored
Event screen will appear.
2. From the Stored Event screen, select the EGM tab to view the detailed
information for this episode.
3. Select the Previous Event or the Next Event button to display a previous
or more current episode, one episode at a time.
4. Select the Print Event button to print the episode detail being viewed.
5. Select the Save to Disk button to save the episode detail to a patient data
disk.
Stored Electrograms
The pulse generator can store annotated electrograms sensed from the
following leads prior to the onset of an episode around duration met, and
around therapy start and end:
• Shock lead
• RV pace/sense lead
• LV pace/sense lead
• Atrial pace/sense lead
The particular electrograms stored depend upon the episode type. The EGM
storage capacity varies depending on EGM signal condition and heart rate.
The stored data are shared by all events. The total amount of stored EGM
data associated with an episode may be limited; EGMs from the middle of the
episode may be removed for episodes greater than 4 minutes in duration.
When the memory allocated to EGM storage is full, the device overwrites older
EGM data segments in order to store the new EGM data. The EGM is recorded
in segments consisting of episode Onset, Attempt, and End EGM storage.
Each segment of data is visible when the left caliper is in the specific section.
The following information is retained:
• Onset retains up to 25 seconds of data prior to Duration expiring
• Reconfirmation retains up to 20 seconds of data prior to therapy delivery
- DRAFT -
PATIENT DIAGNOSTICS
ARRHYTHMIA LOGBOOK 7-9
• Therapy data is displayed. In the case of ATP therapy, a maximum of 4
bursts and up to 20 seconds of data, for each burst, will be retained
• Post-therapy or diverted therapy retains up to 10 seconds of data
Episode onset refers to the period of time (measured in seconds) of EGM prior
to the first attempt. Onset includes the following information:
• Type of event
• Average RA Rate at the start of Event
• Average RV Rate at start of Event
• Programming of Detection Enhancements (Rate only, Rhythm ID, or
Onset/stability)
Attempt information may be displayed as Attempt or In Progress, if an attempt
is in progress. Attempt includes the following information:
• Detection information:
– Average RA Rate at start of Attempt
– Average RV Rate at start of Attempt
–RateZone
• Measured Values of Detection Enhancements
• Therapy Attempt Information:
– Attempt Number
– Type (diverted, commanded, or inhibited)
– Number of bursts (ATP attempt)
–Chargetime
– Lead impedance
– Lead polarity
– Shock faults
– Reason for No Therapy
- DRAFT -
7-10 PATIENT DIAGNOSTICS
ARRHYTHMIA LOGBOOK
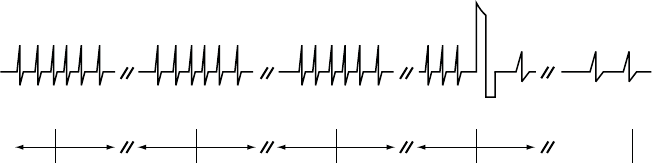
The End EGM storage starts following therapy delivery and stores up to 10
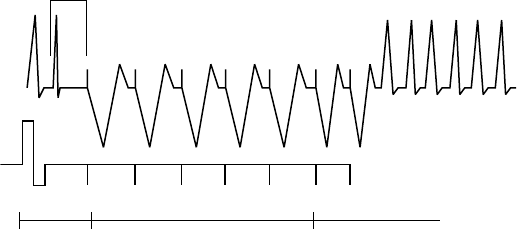
seconds of EGM (Figure 7-2 on page 7-10).
Onset after
3 fast beats
Duration expires Charging begins Start End-of-
Episode timer
End-of-Episode
times out.
Episode is over.
5 s 10 s 10 s 10 s 10 s 10 s 10 s 10 s
Note: Charging may begin
when duration expires.
Shock
Figure 7-2. Relationship between ventricular tachy episode EGM storage and surface ECG strip chart
recording
To view the EGM data, select the desired episode on the Arrhythmia Logbook
screen. Use the following steps to view specific details about each episode:
1. Select the EGM tab to view the stored EGMs on the screen.
• EGM strips for the appropriate sources are displayed. Each strip
includes the EGMs sensed during the episode with the corresponding
annotated markers. Blue vertical bars indicate the segment (Onset,
Attempt, End) boundaries.
• You can move the calipers along the trace and will display the time
interval between the calipers.
• A speed button changes the trace speed in millimeters/seconds.
2. Select the Previous Event or Next Event button to display a different event
strip. If EGMs are not available for an episode, the Episode Detail screen
will be displayed.
3. To print the entire episode report, select the Print Event button. To save the
entire episode report, select the Save to Disk button.
NOTE: Refer to "Use of Atrial Information" on page 3-5 for additional
information about device performance when the atrial lead is programmed to
Off.
- DRAFT -
PATIENT DIAGNOSTICS
ARRHYTHMIA LOGBOOK 7-11
Intervals
The pulse generator stores event markers and associated time stamps. The
PRM derives event intervals from the event markers and time stamps.
To view the episode intervals, use the following steps:
1. From the Stored Event screen, select the Intervals tab. If all of the episode
data is not visible in the window, use the scroll bar to view more data.
2. Select the Previous Event or the Next Event button to display a previous
or more current episode, one episode at a time.
3. Select the Print Event button to print the entire episode report.
4. Select the Save to Disk button to save the entire episode report to a patient
data disk.
Histograms
The Histograms feature retrieves information from the pulse generator and
displays the total number and percentage of paced and sensed events for
the chamber.
Histograms data can provide the following clinical information:
• The distribution of the patient’s heart rates
• How the ratio of paced to sensed beats varies by rate
• How the ventricle responds to paced and sensed atrial beats across rates
When combined with verified biventricular capture, Histograms can be used to
determine the amount of CRT delivery. The percentage of paced and sensed
ventricular events indicates delivery of biventricular pacing.
Use the following steps to access the Histograms screen:
1. From the Events screen, select the Patient Diagnostics tab.
2. The initial display shows the paced and sensed data since the last time the
counters were reset.
- DRAFT -
7-12 PATIENT DIAGNOSTICS
ARRHYTHMIA LOGBOOK
3. Select the Details button to display the data type and time period.
4. Select the Rate Counts button on the Details screen to view rate counts
by chamber.
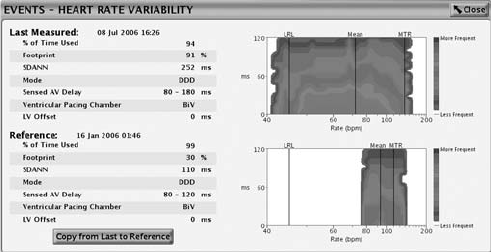
Heart Rate Variability (HRV)
Heart Rate Variability (HRV) is a measure of the changes in a patient’s intrinsic
heart rate within a 24-hour collection period.
This feature can assist in evaluating the clinical status of heart failure patients.
The HRV monitor feature provides the following information using the intrinsic
interval data from the 24-hour collection period that meets the HRV collection
criteria (Figure 7-3 on page 7-13):
• Date and time the 24-hour collection period was completed.
• % of Time Used—displays the percentage of time during the 24-hour
collection period in which there are valid intrinsic beats. If the % of Time
Used falls below 67%, data will not be displayed for that collection period.
• HRV footprint plot—shows the percentage of the graph area used by
the HRV plot. The graph area portrays an “at-a-glance snapshot” of the
distribution of variability versus heart rate over a 24-hour period. The
trended percentage is a normalized score based on the footprint in the
graph.
• Standard Deviation of Averaged Normal R to R intervals (SDANN)—the
HRV collection period comprises 288 5-minute segments (24-hours) of
intrinsic intervals. The SDANN is the standard deviation of the averages
of intrinsic intervals in the 288 5-minute segments. This measurement is
also available in the Trends.
• Current Normal Brady/CRT parameters––Mode, LRL, MTR, Sensed AV
Delay, and Pacing Chamber with LV Offset.
• An HRV plot for current and previous collection periods including a line
that shows the mean heart rate. The HRV plot summarizes the cardiac
variation on a cycle-to-cycle basis. The x-axis shows the heart rate range;
the y-axis shows the beat-to-beat variability displayed in milliseconds. The
color indicates the frequency of beats at any particular heart rate and heart
rate variability combination.
- DRAFT -
PATIENT DIAGNOSTICS
ARRHYTHMIA LOGBOOK 7-13
Figure 7-3. Heart Rate Variability display
Consider the following information when using HRV:
• The cardiac cycle (R–R interval) in HRV is determined by RV sensed and
paced events (LV paced events when the pacing chamber is programmed
to LV).
• Programming the pacing parameters causes the data acquired for the
current 24-hour collection period to be invalid.
• The device saves only one set of values and corresponding HRV plot for
the Reference portion of the screen. Once the values are copied from Last
Measured to Reference, older data cannot be retrieved.
•Thefirst time the HRV feature is used, the Reference screen will show the
data from the first valid 24-hour collection period.
Follow the steps below to view HRV:
1. To access the HRV monitor screen, select the Events tab.
2. From the Events screen, select the Patient Diagnostics tab.
3. Once the device is interrogated, Last Measured and Reference data is
displayed.
4. Select the Heart Rate Variability Details button to view the Last Measured
and Reference data.
5. To copy the Last Measured HRV measurements into the Reference section,
select the Copy From Last to Reference button.
- DRAFT -
7-14 PATIENT DIAGNOSTICS
ARRHYTHMIA LOGBOOK
The HRV monitor screen displays a set of measurements and a HRV plot
based on the most recent 24-hour collection period in the Last Measured
portion of the screen; measurements from a previously saved collection period
are displayed in the Reference portion of the screen. Both collection periods
can be viewed simultaneously to compare data that could show trends in the
patient’s HRV changes over a period of time. By saving the Last Measured
values to the Reference portion of the screen, you can view the last measured
data during a later session.
HRV Collection Criteria
The pulse generator only collects interval data for HRV when the Normal
Brady/CRT mode is programmed to non-rate-responsive tracking modes (VDD
or DDD). In addition, only valid sinus rhythm intervals are used in the HRV data
calculations. For HRV, valid intervals are those which include only valid HRV
events. HRV event validation criteria are listed below:
Valid HRV Events Invalid HRV Events
AS with an interval not faster
than MTR, followed by a VS
AP
AS followed by VP at the programmed
AV Delay
AS with an interval faster than MTR
Non-tracked VP events
Consecutive AS events (no
intervening V event)
VP-Ns
Rate Smoothing events (e.g., RVP↑)
PVC
HRV data may not be reported for a variety of reasons; the most common
are as follows:
• Brady mode is not DDD or VDD
• Less than 67% of the 24-hour collection period (approximately 16 hours)
contains valid HRV events
• Brady Parameters were programmed within the last 24 hours
- DRAFT -
PATIENT DIAGNOSTICS
ARRHYTHMIA LOGBOOK 7-15
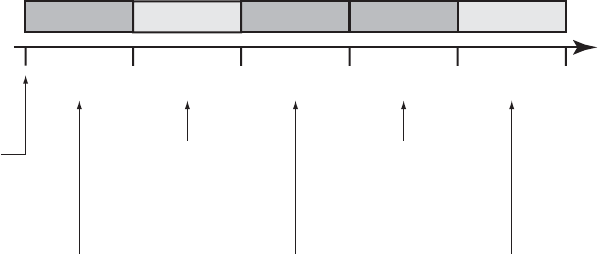
An example of how HRV data is recorded is shown (Figure 7-4 on page 7-15).
In this example, the HRV data in the first collection period is invalid because
the Brady parameters were programmed after the device was taken out of
Storage. HRV data is successfully calculated and reported at the end of the
second 24-hour collection period. Subsequent HRV data is not reported until
the end of Collection Period 5.
Invalid ValidValid Invalid Invalid
24-hour
Collection
Period 1
Collection Period 1:
Invalid HRV due to Brady
parameters modification
(programming)
Collection Period 2:
Valid HRV; greater than 67%
of collection criteria met; HRV
footprint created
Collection Period 3:
Invalid HRV due to Brady
parameter modifications
(programming)
Collection Period 4:
Invalid HRV; less than 67%
of daily intervals were valid
Collection Period 5:
Valid HRV; greater than 67%
of collection criteria met
24-hour
Collection
Period 2
24-hour
Collection
Period 3
24-hour
Collection
Period 4
24-hour
Collection
Period 5
24 hour
collection
period begins
Figure 7-4. Example of HRV data collection
Counters
The following counters are recorded by the pulse generator and displayed on
the Patient Diagnostics screen:
• Ventricular Tachy
• Brady/CRT
Ventricular Tachy Counters
Information about Ventricular Tachy Counters is available by selecting the
Ventricular Tachy Counters button. This screen displays both Ventricular Tachy
Episode and Therapy counters. For each counter, the number of events since
last reset and device totals are displayed. Ventricular Tachy Episode counters
contains the following data:
• Total episodes
• Treated––VF, VT, VT-1, and Commanded
- DRAFT -
7-16 PATIENT DIAGNOSTICS
ARRHYTHMIA LOGBOOK
• Nontreated––No Therapy Programmed, Nonsustained, and Other
Untreated Episodes
Ventricular Tachy Therapy counters consist of ventricular shock and ATP
therapy attempts. They can provide useful data about the effectiveness of a
patient’s therapy prescription. These counters include the following information:
• ATP Delivered
• ATP % Successful––the percent of time that the arrhythmia is converted
and the episode ends without delivery of a programmed shock
• Shocks Delivered
• First Shock % Successful––the percent of time that the arrhythmia is
converted and the episode ends without requiring a second programmed
shock
•ShocksDiverted
The ventricular ATP counter is incremented at the start of the delivery of the
first burst of an ATP scheme. Subsequent ATP bursts in the same scheme are
not counted individually during the same episode.
An ATP scheme is counted as diverted only if it is diverted prior to delivery
of the first burst.
Brady/CRT Counters
Information about Brady/CRT Counters are displayed by selecting the
Brady/CRT Counters button. This screen displays the Brady/CRT episode
counters. For each counter, the number of events since last reset and reset
before last are displayed. Brady/CRT counters contains the following details:
• Percent of atrial paced
• Percent of RV paced
NOTE: The RV pace event for a BiVentricular Trigger pace will be counted
as an RV sense.
• Percent of LV paced
- DRAFT -
PATIENT DIAGNOSTICS
PATIENT TRIGGERED MONITOR 7-17
• Intrinsic Promotion––includes Rate Hystereses % successful
• Atrial burden––includes Episodes by Duration and Total PACs
• Ventricular counters––includes total PVCs and Three or More PVCs
PATIENT TRIGGERED MONITOR
Patient Triggered Monitor allows the patient to trigger the storage of EGMs,
intervals, and annotated marker data during a symptomatic episode by placing
a magnet over the device.
Patient Triggered Monitor is enabled by selecting Store EGM as the desired
magnet response. This can be found in the Magnet and Beeper section on the
V-Tachy Therapy Setup screen. When enabled, the device will store up to 2
minutes of patient monitor data prior to and up to 1 minute after triggering
the monitoring. The stored data include the episode number, the atrial and
ventricular rates at magnet application, and the start time and date of magnet
application.
When data are stored, the corresponding episode type is recorded as PTM
in the Arrhythmia Logbook.
Use care when enabling Patient Triggered Monitor, because the following
conditions will exist:
• All other magnet features are disabled, including inhibiting therapy (until
the EGM is stored). The Magnet/Beeper feature will not indicate magnet
position.
• Device longevity is impacted. Once the patient has triggered this feature to
store episode data or the feature is disabled, the impact on device longevity
is no longer present. To help reduce the longevity effect, this feature is
automatically disabled after 60 days from the day it was enabled.
• Once the EGM is stored, the device magnet response automatically will be
set to Inhibit Therapy.
To program the Patient Triggered Monitor feature, follow these steps:
1. From the Settings tab on the main screen, select Settings Summary.
2. From the Settings Summary tab, select Ventricular Tachy Therapy.
- DRAFT -
7-18 PATIENT DIAGNOSTICS
PATIENT TRIGGERED MONITOR
3. From Ventricular Tachy Therapy, select the V-Tachy Therapy Setup details
button.
4. Program the Magnet Response to Store EGM.
CAUTION: Determine if the patient is capable of activating this feature
prior to being given the magnet and prior to enabling Patient Triggered
Monitor. Remind the patient to avoid strong magnet fields so the feature is
not inadvertently triggered.
CAUTION: Consider having the patient initiate a stored EGM at the time
Patient Triggered Monitor is enabled to assist with patient education and
feature validation. Verify the activation of the feature on the Arrhythmia
Logbook screen.
WARNING: Ensure that Patient Triggered Monitor is enabled prior
to sending the patient home by confirming the magnet response is
programmed to Store EGM. If the feature is inadvertently left in the Inhibit
Therapy setting, the patient could potentially disable tachyarrhythmia
detection and therapy.
WARNING: Once the Patient Triggered Monitor feature has been
triggered by the magnet and an EGM has been stored, or after 60 days
have elapsed from the day that Store EGM was enabled, the Magnet
Response programming automatically will be set to Inhibit Therapy.
When this happens, the patient should not apply the magnet because
tachyarrhythmia therapy could be inhibited.
NOTE: When the Magnet Response programming has automatically
been set to Inhibit Therapy, magnet application will cause the device to
emit beeping tones. Inform the patient that if they hear tones coming from
their device after applying the magnet, they should remove the magnet.
5. Patient Triggered Monitor can only be enabled for a 60-day period of time.
To disable the feature within the 60-day time period, reprogram the magnet
response to a setting other than Store EGM. When 60 days have passed
since enabling Patient Triggered Monitor, the feature will automatically
disable itself and the magnet response will revert to Inhibit Therapy. To
re-enable the feature, repeat these steps.
For additional information, contact Technical Services at the number shown on
the back cover of this manual.
- DRAFT -

8-1
ELECTROPHYSIOLOGIC TESTING
CHAPTER 8
This chapter contains the following topics:
• "EP Test Features" on page 8-2
• "Induction Methods" on page 8-4
• "Commanded Therapy Methods" on page 8-10
- DRAFT -
8-2 ELECTROPHYSIOLOGIC TESTING
EP TEST FEATURES
EP TEST FEATURES
Electrophysiologic (EP) Testing features enable you to induce and terminate
arrhythmias noninvasively in order to monitor and test the effectiveness of
selected detection criteria and therapies. The EP Test features can be used in
conjunction with the ECG display so that real-time traces may be viewed. The
status of the pulse generator/patient interaction is also displayed.
The features allowing noninvasive EP testing of arrhythmias include the
following:
• VFib induction
• Shock on T induction
• PES induction
• 50 Hz/Manual Burst pacing induction
• Commanded Shock therapy
• Commanded ATP therapy
Temporary EP Mode
Temporary EP Mode allows you to program the device mode to a temporary
value for EP test delivery, and ensures that the normal device mode remains
unchanged.
Backup Ventricular Pacing During Atrial EP Testing
Backup ventricular pacing is available during atrial EP testing (PES, 50
Hz/Manual Burst) regardless of the programmed Normal or Post-therapy
pacing modes. (The mode can also be programmed to Off.) Program the
backup pacing parameters by selecting the EP Test Pacing button displayed on
the relevant atrial EP tests.
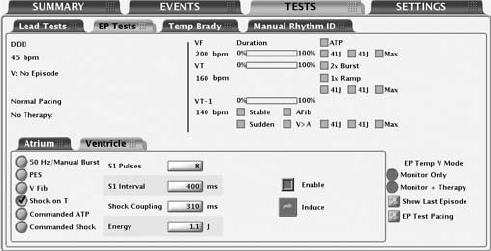
EP Test Screen
The EP Test screen displays the real-time status of the detection and therapy
process of the pulse generator when telemetry communication is occurring.
Viewing this display allows you to induce and test either a programmed
detection/therapy prescription or optional therapies while monitoring the pulse
generator’s progress.
Refer to the EP Test screen (Figure 8-1 on page 8-3):
- DRAFT -
ELECTROPHYSIOLOGIC TESTING
EP TEST FEATURES 8-3
Figure 8-1. EP Test Screen
The screen provides the following information:
• Status messages indicate detection and therapy status and are described
below:
– Ventricular episode status—if an episode is occurring, the duration of
the episode is displayed. (If it is greater than 10 minutes, then it is
displayed as > 10:00 m:s).
– Ventricular detection status—if an episode is occurring, it indicates
whether ventricular detection is in Initial Detection, Redetection, or the
zone in which that detection is met. If no episode is occurring, the
programmer will also display the text Time since last V therapy along
with the continually updated time in minutes (up to 10).
– Brady pacing and SRD status.
– The type of therapy initiated and the zone.
– The status of the therapy such as In progress, Diverted, or Delivered.
• Duration timer—Progression of the duration timer is graphically displayed
using a scale. The bar in the scale moves from left to right to show the
percent complete of programmed duration. When duration is expired and
therapy delivery begins, the bar is removed.
• Detection status—The status for each programmed detection enhancement
is displayed. When enhancement criteria are met, a mark appears in the
adjacent box.
- DRAFT -

8-4 ELECTROPHYSIOLOGIC TESTING
INDUCTION METHODS
• Therapy prescriptions—Only those therapy prescriptions that are
programmed are displayed. As each therapy is delivered, a check mark
or number will appear in the box adjacent to the respective therapy. ATP
therapies indicate the scheme type as well as the programmed number of
bursts in the scheme. A number will appear and increment (1, 2, etc.) in
the ATP therapy box each time an ATP burst is delivered. Shock therapies
indicate the programmed energy level for the programmable shocks. A
number will appear and increment (1, 2, etc.) in the Max box each time a
maximum-energy shock is delivered.
Follow the steps below to perform EP Test functions:
1. Select the Tests tab, then select the EP Tests tab.
2. Establish telemetry communication. Telemetry communication between the
programmer and the pulse generator should be maintained throughout all
EP test procedures.
3. Program the EP Temp V mode appropriate to the EP Test method
(Table 8-1 on page 8-4).
Table 8-1. EP Temp V Mode for EP Test Functions
EP Temp V Mode
EP Test MethodaMonitor + TherapydMonitor OnlyeOff
50 Hz/Manual BurstbX
PESbX
VFibcX
Shock on TcX
Commanded ATPcX
Commanded ShockcXX
a. EP functions cannot be performed if the pulse generator is in Storage Mode.
b. Available method for both atrial and ventricular induction.
c. Available method only for ventricular induction.
d. The Ventricular Tachy Mode must be programmed to Monitor + Therapy.
e. The Ventricular Tachy Mode must be programmed to Monitor Only or Monitor + Therapy.
INDUCTION METHODS
Each induction method available from the EP Test screen is described below
with instructions for performing the induction. During any type of induction
delivery, the pulse generator recognizes the induction and performs no other
- DRAFT -
ELECTROPHYSIOLOGIC TESTING
INDUCTION METHODS 8-5
activity until the induction delivery is ceased, at which time the programmed
mode will take effect and the pulse generator will respond accordingly.
Consider the following information when using these methods:
• Ventricular PES, Shock on T wave, and Ventricular ATP are BiV.
• All inductions and tachycardia therapy delivery are inhibited when a
magnet is positioned over the pulse generator (if magnet response is set to
Inhibit Therapy).
• Pacing pulses during induction are delivered at the programmed EP Test
pacing parameters.
VFib Induction
VFib induction uses the shocking electrodes to stimulate the right ventricle
at very fast rates.
The following settings are available to allow use of the minimum energy
necessary for induction:
• VFib Low delivers a stimulation waveform of 9 volts
• VFib High delivers a stimulation waveform of 15 volts
Performing VFib Induction
NOTE: The patient should be sedated prior to delivery of fibrillation induction
pulses. The large surface area of the shocking electrodes tends to stimulate
the surrounding muscle and can be uncomfortable.
1. Select the VFib option. Buttons for each test and an Enable checkbox
are displayed.
2. Select the Enable checkbox.
3. Select the desired Hold for Fib button to initiate delivery of the fibrillation
induction train. The induction train is delivered up to 15 seconds as long as
the button is held and the telemetry link is maintained.
During induction the pulse generator is automatically disabled from
detecting, and automatically re-enabled following induction delivery.
If VFib induction is initiated during an episode, the end-of-episode is
- DRAFT -
8-6 ELECTROPHYSIOLOGIC TESTING
INDUCTION METHODS
declared before the VFib induction pulses are started. A new episode (with
initial detection and therapy) can be declared after the VFib induction is
completed. Event markers and EGMs are interrupted during VFib induction
and will automatically restart following induction.
4. To stop the induction train, release the button (the button will become
dimmed again).
5. To deliver another fibrillation induction, repeat these steps.
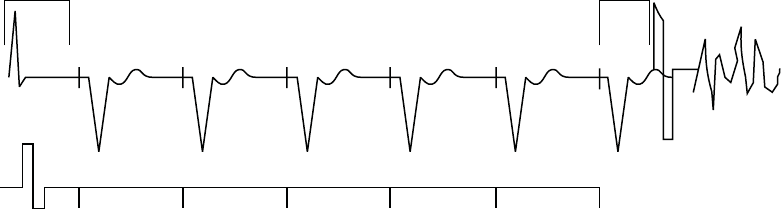
Shock on T Induction
A Shock on T wave induction method allows the device to deliver a drive train
(up to 30 equally timed pacing pulses, or S1 pulses) through the ventricular
pace/sense electrodes followed by shock delivery through the shocking
electrodes (Figure 8-2 on page 8-6).
400 400 400 400 400 400
S1 S1 S1 S1 S1 S1
Last sensed or
paced beat
Coupling
Interval
Drive Pulses
Shock
S1 Interval
Figure 8-2. Shock on T induction drive train
The initial S1 pulse follows the last sensed or paced event at the S1 interval.
The shock is coupled to the last S1 pulse of the drive train.
Performing Shock on T Induction
1. Select the Shock on T option. The programmable induction parameters
will be displayed.
2. Select the desired value for each parameter.
3. Select the Enable checkbox. The Induce button will no longer be dimmed.
- DRAFT -
ELECTROPHYSIOLOGIC TESTING
INDUCTION METHODS 8-7
4. Select the Induce button to begin delivery of the drive train. The pulses are
delivered in sequence until the programmed number of pulses is reached.
Once induction is initiated, the drive train delivery will not stop if you
interrupt telemetry communication. You can press the DIVERT THERAPY
key to stop the induction delivery command.
5. Shock on T induction is complete when the drive train and shock are
delivered, at which time the pulse generator automatically restarts
detection.
NOTE: Prior to drive train delivery, tones will be heard indicating capacitor
charging in preparation for shock delivery.
NOTE: The shock delivered during Shock on T induction does not increment
episode or therapy counters.
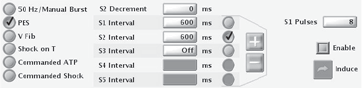
Programmed Electrical Stimulation (PES)
PES induction allows the pulse generator to deliver up to 30 equally timed
pacing pulses (S1) followed by up to 4 premature stimuli (S2–S5) to induce or
terminate arrhythmias. Drive pulses, or S1 pulses, are intended to capture and
drive the heart at a rate slightly faster than the intrinsic rate. This ensures that
the timing of the premature extra stimuli will be accurately coupled with the
cardiaccycle(Figure8-3onpage8-7).
The initial S1 pulse is coupled to the last sensed or paced beat at the S1
interval. All pulses are delivered in XOO modes (where X is the chamber) at
the programmed EP Test pacing parameters.
S1 S1 S1 S1 S1 S2 S3
600 400600 600 600 600 450
Coupling
Interval
Coupling
Interval
Extra
Stimuli
Drive Pulses
Figure 8-3. PES induction drive train
- DRAFT -
8-8 ELECTROPHYSIOLOGIC TESTING
INDUCTION METHODS
Performing PES Induction
1. Select the PES option. Buttons for the S1–S5 pulses and the corresponding
burst cycle lengths are displayed.
2. Select the desired value for the S1–S5 intervals (Figure 8-4 on page 8-8).
You can either select a value box for the desired S interval and choose a
value from the box or use the plus or minus symbols to change the value
visible in the value box.
Figure 8-4. PES induction options
3. Select the Enable checkbox.
4. Select (do not hold) the Induce button to begin delivery of the drive train.
When the programmed number of S1 pulses is delivered, the pulse
generator will then deliver the programmed S2–S5 pulses. The pulses are
delivered in sequence until a pulse is encountered that is set to Off (e.g.,
if S1 and S2 are set to 600 ms, and S3 is Off, then S3, S4, and S5 will
not be delivered). Once induction is initiated, the PES delivery will not
stop if you interrupt telemetry communication. (You can press the DIVERT
THERAPY key to stop induction delivery.) If PES induction is initiated
during an episode, the end-of-episode is declared before the PES induction
pulses are started. A new episode (with initial detection and therapy) can
be declared after the PES induction is completed.
5. PES induction is complete when the drive train and extra stimuli are
delivered, at which time the pulse generator automatically restarts
detection.
NOTE: Ensure the PES induction is complete before beginning another
induction.
NOTE: When PES is used to terminate an arrhythmia that has been detected
(and an episode declared), the episode is terminated when the PES is
commanded regardless of whether it is successful or not. The PES itself is not
recorded in therapy history; this may result in several episodes being counted
in therapy history.
- DRAFT -
ELECTROPHYSIOLOGIC TESTING
INDUCTION METHODS 8-9
50 Hz/Manual Burst Pacing
50 Hz/Manual Burst pacing induction is used to induce or terminate arrhythmias
and allows two separate pacing inductions, both of which can be delivered to
either the atrium or ventricle.
Manual Burst pacing pulses are delivered in XOO mode (where X is the
chamber) at the programmed EP Test pacing parameters through the
rate-sensing leads. For Atrial Manual Burst, backup pacing parameters are
provided.
Performing Manual Burst Pacing
1. Select the 50 Hz/Manual Burst option.
2. Select the desired value for the Burst Interval, Minimum, and Decrement.
This indicates the cycle length of the intervals in the drive train.
3. Select the Enable checkbox.
4. To deliver the burst, select and hold the Hold for Burst button.
The ventricular Manual Burst will be delivered up to 30 seconds as long as
the Hold for Burst button is held and the telemetry link is maintained.
The atrial Manual Burst will be delivered up to 45 seconds as long as the
Hold for Burst button is held and the telemetry link is maintained. The
intervals will continue to be decremented until the minimum interval is
reached, then all further pulses will be at the Minimum interval.
5. To stop the burst delivery, release the Hold for Burst button. The Hold for
Burst button will become dimmed again.
6. To deliver additional Manual Burst pacing, repeat these steps.
Performing 50 Hz Burst Pacing
1. Select the 50 Hz/Manual Burst option.
2. Select the Enable checkbox.
3. To deliver the burst, select and hold the Hold for 50 Hz Burst button.
- DRAFT -
8-10 ELECTROPHYSIOLOGIC TESTING
COMMANDED THERAPY METHODS
The ventricular 50 Hz Burst will be delivered up to 30 seconds as long as
the Hold for Burst button is held and the telemetry link is maintained.
The atrial 50 Hz Burst will be delivered up to 45 seconds as long as the
Hold for Burst button is held and the telemetry link is maintained.
NOTE: During Hold for 50 Hz Burst pacing, the S1 interval is automatically
set to 20 ms and the decrement to 0. These values will not be displayed on the
screen.
4. To stop the burst delivery, release the Hold for 50 Hz Burst button. The
Hold for 50 Hz Burst button will become dimmed again.
5. To deliver additional 50 Hz Burst pacing, repeat these steps.
COMMANDED THERAPY METHODS
The commanded EP test methods, Commanded Shock and Commanded ATP,
may be delivered independently of the programmed detection and therapy
parameters. If the pulse generator is in the process of delivering therapy when
a commanded method is initiated, the EP Test function overrides and aborts
the therapy in process. If an episode is not in progress, then a Commanded
Ventricular Episode will be recorded in the Arrhythmia Logbook. Commanded
Shock and Commanded ATP delivery is inhibited when a magnet is positioned
over the pulse generator, if it is programmed to Inhibit Therapy.
Commanded Shock
The Commanded Shock feature allows delivery of a shock with programmable
energy and coupling interval.
All Commanded Shocks are Committed and delivered R-wave synchronously
when the coupling interval is programmed to Sync. Shock waveform and
polarity are identical to detection-initiated shocks but a programmed coupling
interval may be specified. The coupling interval is initiated at the point where
the shock would have been delivered in Sync mode, but is instead delivered at
the programmed coupling interval. Following any Commanded Shock delivery,
Post-shock Redetection is used and post-shock pacing is activated.
Performing Commanded Shock Delivery
1. Select the Commanded Shock option.
- DRAFT -
ELECTROPHYSIOLOGIC TESTING
COMMANDED THERAPY METHODS 8-11
2. Select the desired values for the Coupling interval and Shock Energy.
3. Select the Enable checkbox. The Deliver Shock button will become
available.
4. Select the Deliver Shock button to initiate shock delivery. The Commanded
Shock is recorded in therapy history.
5. To deliver subsequent shocks, repeat these steps.
Commanded ATP
Commanded ATP allows you to manually deliver ATP schemes, independent
of the programmed detection and therapy parameters. You can configure
the Commanded ATP by either selecting the type of ATP scheme or by
programming ATP parameters on the Details screen in order to deliver
Commanded ATP.
The EP Temp V Mode must be programmed to Monitor Only to ensure the
Commanded ATP does not interfere with detection-initiated ATP.
Performing Commanded ATP
1. If the pulse generator Ventricular Tachy Mode is not currently programmed
to Monitor Only, select the Monitor Only EP Temp V Mode option.
2. Select the type of ATP scheme and select the value for Number of Bursts.
3. Select the Start ATP button to initiate the first burst in the selected ATP
scheme. The Bursts Remaining counter will decrement as each burst is
completed.
4. Select the Continue button for each additional burst delivery desired. If all
bursts in a scheme have been delivered, the Bursts Remaining counter will
return to the initial count, and the Continue button will be dimmed.
5. Other ATP schemes may be selected at any time; select the desired
scheme and repeat the above sequence. The Commanded ATP is
recorded as a physician-commanded therapy counter and displayed on
the counters screen.
- DRAFT -
8-12 ELECTROPHYSIOLOGIC TESTING
COMMANDED THERAPY METHODS
6. After using Commanded ATP, remember to program the EP Temp V Mode
to Monitor + Therapy or leave the screen so that the EP Temp V Mode is
ended and the permanent Tachy Mode is resumed.
NOTE: If any button other than the Continue button is selected during delivery
of a Commanded ATP scheme, the scheme will be reset and the Bursts
Remaining box will be restored to its initial value. The Start ATP button must be
reselected to initiate the scheme again.
- DRAFT -

9-1
IMPLANT INFORMATION
CHAPTER 9
This chapter contains the following topics:
• "Implanting the Pulse Generator" on page 9-2
- DRAFT -
9-2 IMPLANT INFORMATION
IMPLANTING THE PULSE GENERATOR
IMPLANTING THE PULSE GENERATOR
Step A: Check Equipment
Step B: Interrogate and Check the Pulse Generator
Step C: Implant the Lead System
Step D: Take Baseline Measurements
Step E: Form the Implantation Pocket
Step F: Connect the Leads to the Pulse Generator
Step G: Evaluate Lead Signals
Step H: Program the Pulse Generator
Step I: Implant the Pulse Generator
Step J: Complete and Return the Implantation Form
Step A: Check Equipment
It is recommended that instrumentation for cardiac monitoring, defibrillation,
and lead signal measurement should be available during the implant procedure.
This includes the PRM system with its related accessories and the software
application. Before beginning the implantation procedure, become completely
familiar with the operation of all the equipment and the information in the
respective operator’s and user’s manuals. Verify the operational status of all
equipment that may be used during the procedure. Sterile duplicates of all
implantable items and the following accessories should be available in case of
accidental damage or contamination:
• Internal defibrillator paddles
•Externaldefibrillator paddles
• Torque and non-torque wrenches
During the implantation procedure, a standard transthoracic defibrillator
with external pads or internal paddles should be available for use during
defibrillation threshold testing.
- DRAFT -
IMPLANT INFORMATION
IMPLANTING THE PULSE GENERATOR 9-3
Step B: Interrogate and Check the Pulse Generator
To maintain sterility, test the pulse generator as described below before opening
the sterile blister tray. The pulse generator should be at room temperature to
ensure accurately measured parameters.
1. Interrogate the pulse generator using the PRM. Verify that the pulse
generator’s Tachy mode is programmed to Storage. If otherwise, call
Technical Services at the phone number provided on the back of this
manual.
2. Perform a manual capacitor re-formation.
3. Review the pulse generator’s current battery status. Counters should be
at zero. If the pulse generator battery status is not at BOL, do not implant
the pulse generator. Call Technical Services at the phone number provided
on the back of this manual.
Step C: Implant the Lead System
The pulse generator requires a lead system for sensing, pacing, and delivering
shocks. The pulse generator uses its case as a defibrillating electrode.
Selection of lead configuration and specific surgical procedures is a matter of
professional judgement. The following lead system configurations are available
for use with the pulse generator:
• ENDOTAK endocardial cardioversion/defibrillation and pacing lead system
• Ventricular endocardial bipolar lead
• Atrial bipolar lead
• Guidant transvenous coronary venous (pace/sense) lead
• Unipolar sutureless myocardial leads and, if necessary, an appropriate
Guidant lead adapter
• Superior vena cava lead coupled with a ventricular patch lead
• Two-patch epicardial leads configuration
- DRAFT -
9-4 IMPLANT INFORMATION
IMPLANTING THE PULSE GENERATOR
NOTE: If the coronary venous lead cannot be used and the physician’s
medical judgment indicates that a limited left thoracotomy is justified to place
an epicardial lead, the use of sutureable, steroid-eluting pace/sense epicardial
leads is recommended.
CAUTION: The absence of a lead or plug in a lead port may affect device
performance. If a lead is not used, be sure to properly insert a plug in the
unused port.
Whichever lead configuration is used for both pacing/sensing and defibrillating,
several considerations and cautions should be heeded. Such factors as
cardiomegaly or drug therapy may necessitate repositioning of the defibrillating
leads or substituting one lead for another to facilitate arrhythmia conversion.
In some instances, no lead configuration may be found that provides reliable
arrhythmia termination at energy levels available from the pulse generator;
implantation of the pulse generator is not recommended in these cases.
Implant the leads via the surgical approach chosen.
CAUTION: Do not suture directly over the lead body as this may cause
structural damage. Use the lead stabilizer to secure the lead lateral to the
venous entry side.
Step D: Take Baseline Measurements
Once the leads are implanted, take baseline measurements. Evaluate the
lead signals. If performing a pulse generator replacement procedure, existing
leads should be reevaluated, (e.g., signal amplitudes, pacing thresholds, and
impedance). The use of radiography may help ensure lead position and
integrity. If testing results are unsatisfactory, lead system repositioning or
replacement may be required.
- DRAFT -

IMPLANT INFORMATION
IMPLANTING THE PULSE GENERATOR 9-5
• Connect the pace/sense lead(s) to a pacing system analyzer (PSA).
Pace/sense lead measurements, measured approximately 10 minutes
after placement, are listed below (Table 9-1 on page 9-5). Note that the
pulse generator measurements may not exactly correlate to the PSA
measurements due to signal filtering.
Table 9-1. Lead measurements
Pace/sense lead
(acute)
Pace/sense lead
(chronic)
Shocking lead
(acute)
Shocking lead
(chronic)
R-wave amplitudeab > 5 mV > 5 mV > 1.0 mV > 1.0 mV
P-wave amplitudeab >1.5mV >1.5mV
R-wave durationbcd < 100 ms < 100 ms
Pacing threshold (right
ventricle)
<1.5V
endocardial
< 2.0 V epicardial
< 3.0 V endocardial
<3.5Vepicardial
Pacing threshold (left
ventricle)
< 2.5 V coronary
venous
< 2.0 V epicardial
< 3.5 V coronary
venous
<3.5Vepicardial
Pacing threshold (atrium) <1.5V
endocardial
< 3.0 V endocardial
Lead impedance (at 5 V and
0.5 ms atrium and ventricle)
200–2000 Ω200–2000 Ω20–80 Ω20–80 Ω
Lead impedance (at 5 V
and 0.5 ms left ventricle)
200–2000 Ω200–2000 Ω20–80 Ω20–80 Ω
a. Amplitudes less than 2 mV cause inaccurate rate counting in the chronic state, and result in inability to sense a tachyarrhythmia or
the misinterpretation of a normal rhythm as abnormal.
b. Lower R-wave amplitudes and longer duration may be associated with placement in ischemic or scarred tissues. Since signal
quality may deteriorate chronically, efforts should be made to meet the above criteria by repositioning the leads to obtain signals
with the largest possible amplitude and shortest duration.
c. Durations longer than 135 ms (the pulse generator’s refractory period) may result in inaccurate cardiac rate determination, inability
to sense a tachyarrhythmia, or in the misinterpretation of a normal rhythm as abnormal.
d. This measurement is not inclusive of current of injury.
Step E: Form the Implantation Pocket
Using standard operating procedures to prepare an implantation pocket,
choose the position of the pocket based on the implanted lead configuration and
the patient’s body habitus. Giving consideration to patient anatomy and pulse
generator size and motion, gently coil any excess lead and place adjacent to
the pulse generator. It is important to place the lead into the pocket in a manner
that minimizes lead tension, twisting, sharp angles, and/or pressure. Pulse
generators are typically implanted subcutaneously in order to minimize tissue
trauma and facilitate explant. However, deeper implantation (e.g., subpectoral)
- DRAFT -

9-6 IMPLANT INFORMATION
IMPLANTING THE PULSE GENERATOR
may help avoid erosion or extrusion in some patients. Verify magnet function
and wanded telemetry to ensure the pulse generator is within acceptable range.
Consider the following situations during the implant the procedure:
• If an abdominal implant is suitable, it is recommended that implantation
occur on the left abdominal side.
• Tunnel the leads if necessary. If a Guidant tunneler is not used, cap
the lead terminal pins, gently tunnel the leads subcutaneously to the
implantation pocket, and reevaluate the lead signals to determine if any of
the leads have been damaged during the tunneling procedure. A Penrose
drain, large chest tube, or tunneling tool may be used to tunnel the leads.
• If the lead terminal pins are not connected to a pulse generator at the time
of lead implantation, they must be capped before closing the incision.
Step F: Connect the Leads to the Pulse Generator
Lead connections are illustrated below.
– +
RV RA
DF-1
IS-1
BI
DF-1
LV LV-1
UNI/BI
IS-1
BI
– +
RV RA
DF-1
IS-1
BI
DF-1
IS-1
BI
LV IS-1
UNI/BI
Figure 9-1. Lead connections
Setscrew locations are illustrated below.
- DRAFT -
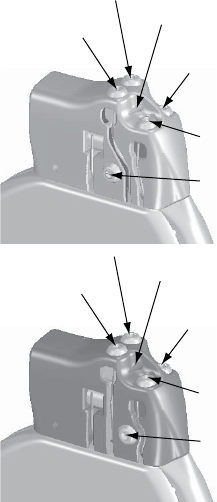
IMPLANT INFORMATION
IMPLANTING THE PULSE GENERATOR 9-7
Front of Pulse Generator
Suture Hole
RA (-)
LV (-)
Defib (-)
RV (-)
Defib (+)
Front of Pulse Generator
Suture Hole
RA (-)
LV (-)
Defib (-)
RV (-)
Defib (+)
Figure 9-2. Setscrew and suture hole locations
Lead to pulse generator connections
CAUTION: Do not insert a lead into the pulse generator connector without
first visually verifying that the setscrew is sufficiently retracted to allow insertion.
Fully insert each lead into its lead port and then tighten the setscrew onto
the electrodes.
1. As each lead is inserted into the pulse generator, secure the lead in place
by tightening the setscrew with the torque wrench.
a. Insert the wrench into the center, preslit depression of the seal plug.
b. Place pressure on the lead to maintain its position in the pulse
generator lead port. Be certain that the lead remains fully inserted
intheleadport.
c. The large-handled torque wrench is preset to apply the proper amount
of force to the captive setscrew. Tighten the setscrew, making sure it is
not crooked, until the wrench ratchets; additional force is unnecessary.
- DRAFT -
9-8 IMPLANT INFORMATION
IMPLANTING THE PULSE GENERATOR
d. Apply gentle traction to the leads to ensure a secure connection.
2. In models with IS-1 connectors, insert and secure the right ventricular
pace/sense lead terminal into the RV lead port.
NOTE: When connecting leads to a device header, connect the RV lead
first. An RV lead is required to establish RV-based timing cycles that yield
appropriate sensing and pacing in all chambers, regardless of the programmed
configuration.
3. In models with atrial connectors, insert and secure the atrial pace/sense
lead terminal into the A lead port.
4. Insert and secure the left ventricular coronary venous pace/sense lead
terminal into the LV lead port.
5. In models with DF-1 connectors, insert the defibrillating lead anode
(+, proximal) into the pulse generator’s (+) Defib lead port. For proper
connection, be certain that the lead terminal pin is fully inserted in the pulse
generator lead port. When viewed through the side of the header, the pin
tip should extend through the terminal block.
6. Insert and secure the defibrillating cathode (–, distal) in the (–) Defiblead
port in a similar manner as above.
CAUTION: For IS-1/DF-1 leads, never change the shock waveform
polarity by physically switching the lead anodes and cathodes in the pulse
generator header—use the programmable Polarity feature. Device damage
or nonconversion of the arrhythmia post-operatively may result if the polarity
is switched physically.
CAUTION: The absence of a lead or plug in a lead port may affect device
performance. If a lead is not used, be sure to properly insert a plug in the
unused port.
Consider the following lead connection information during the implant
procedure:
• The IS-1 pace/sense lead port(s) has one setscrew for securing the
terminal pin.
• The DF-1 port has one setscrew for securing the terminal pin.
- DRAFT -
IMPLANT INFORMATION
IMPLANTING THE PULSE GENERATOR 9-9
• The LV-1 pace/sense lead port(s) has one setscrew for securing the
terminal pin.
• Avoid allowing blood or other body fluids to enter the lead ports in the pulse
generator header. If fluid inadvertently enters the ports, they should be
thoroughly cleaned using sterile water.
• To connect leads to the pulse generator, use only the tools provided in the
pulse generator tray or accessory kit to avoid damage to the seal plugs.
Failure to properly insert the wrench in the preslit depression of the seal
plug may result in damage to the plug and its sealing properties. Failure
to use the supplied torque wrench may result in damage to the screw or
connector threads. Do not implant the pulse generator if the seal plugs
appear to be damaged. Retain the tools until all testing procedures are
complete and the pulse generator is implanted.
• If necessary, lubricate the lead connectors sparingly with sterile water to
make insertion easier.
• If a lead terminal encounters resistance on insertion into the lead port,
insert the wrench into the preslit depression of the seal plug and angle it
gently to open the valve and allow excess air to bleed out of the seal plug.
•Significant amounts of fluid or sterile water in a lead bore may make it
difficult to fully insert leads. If significant amounts of fluid or sterile water
are present, insert the torque wrench into the setscrew before inserting the
leads. This will allow fluid to drain from the lead bore.
• For proper connection of an IS-1 lead to the pulse generator, be certain that
the connector pin visibly extends through the connector block at least 1 mm.
Step G: Evaluate Lead Signals
1. Take the pulse generator out of power-saving Storage mode by
programming the Tachy Mode to Off.
CAUTION: To prevent inappropriate shocks, ensure that the pulse generator’s
Tachy Mode is programmed to Off when not in use and before handling the
device. For tachyarrhythmia therapy, verify that the Tachy Mode is activated.
2. Evaluate the pace/sense and defibrillation lead signals by viewing the
real-time EGMs and markers. The signal from the implanted defibrillation
leads should be continuous and without artifact, similar to a body-surface
- DRAFT -
9-10 IMPLANT INFORMATION
IMPLANTING THE PULSE GENERATOR
ECG. A discontinuous signal may indicate a poor connection, lead fracture
or otherwise damaged lead, or an insulation break that would necessitate
lead replacement. Inadequate signals may result in failure of the pulse
generator system to detect an arrhythmia, inability to deliver programmed
therapy, or unnecessary delivery of therapy. Lead measurements should
reflect those in (Table 9-1 on page 9-5).
CAUTION: Take care to ensure that artifacts from the ventricles are not
present on the atrial channel, or atrial oversensing may result. If ventricular
artifacts are present in the atrial channel, the atrial lead may need to be
repositioned to minimize its interaction.
3. Evaluate all lead impedances using the Lead Impedance test accessed
from the Diagnostic Evaluation tool.
CAUTION: Never implant the device with a lead system that has less than
15 Ωtotal shock lead impedance. Device damage may result. If a shocking
lead impedance is less than 20 Ω, reposition the shocking electrodes to allow a
greater distance between the shocking electrodes.
CAUTION: Patients should be tested for diaphragmatic stimulation by pacing
the LV lead through the pulse generator at 7.5 V and adjusting the lead
position as necessary. PSA testing at higher outputs (e.g., 10.0 V) may also
be considered to better characterize stimulation margins. The probability of
diaphragmatic stimulation increases when a pacing system includes an LV lead
because of this lead’s proximity to the phrenic nerve.
Step H: Program the Pulse Generator
1. Check the programmer clock and set and synchronize the pulse generator
as necessary so that the proper time appears on printed reports and PRM
strip chart recordings.
2. It may be useful to program the Beep During Capacitor Charge feature to
On during conversion testing and implantation to help recognize when the
pulse generator is charging to deliver shock.
3. Perform a manual capacitor re-formation if not already performed.
4. Program the pulse generator to desired parameters appropriate for the
patient for necessary testing.
- DRAFT -
IMPLANT INFORMATION
IMPLANTING THE PULSE GENERATOR 9-11
5. Shocks intended for VF therapy should be programmed with a 10 J safety
margin above the shock energy level that the physician determines is
required for successful VF conversion.
CAUTION: To prevent inappropriate shocks, ensure that the pulse generator’s
Tachy Mode is programmed to Off when not in use and before handling the
device. For tachyarrhythmia therapy, verify that the Tachy Mode is activated.
Step I: Implant the Pulse Generator
1. Program the Tachy Mode to Off.
2. Ensure that the pulse generator has good contact with surrounding tissue
of the implantation pocket. Suture hole locations are illustrated below.
Gently coil excess lead and place adjacent to the pulse generator. Flush
the pocket with saline solution, if necessary, to avoid a dry pocket.
WARNING: Kinking leads may cause additional stress on the leads,
possibly resulting in lead fracture.
CAUTION: Improper insertion can cause insulation damage near the
terminal end that could result in lead failure.
- DRAFT -

9-12 IMPLANT INFORMATION
IMPLANTING THE PULSE GENERATOR
Front of Pulse Generator
Suture Hole
RA (-)
LV (-)
Defib (-)
RV (-)
Defib (+)
Front of Pulse Generator
Suture Hole
RA (-)
LV (-)
Defib (-)
RV (-)
Defib (+)
Figure 9-3. Setscrew and suture hole locations
3. Close the implantation pocket. Consideration should be given to place
the leads in a manner to prevent contact with suture materials. It is
recommended that absorbable sutures be used for closure of tissue layers.
4. Complete any electrocautery procedures before reactivating the pulse
generator.
5. Program the Tachy Mode to the desired setting and confirm final
programmed parameters.
6. Print out parameter reports and save all data to disk using the programmer’s
Save to Disk option.
Step J: Complete and Return the Implantation Form
Within ten days of implantation, complete the Warranty Validation and Lead
Registration form and return the original to Boston Scientificalongwithacopy
of the patient data disk. This information enables Boston Scientifictoregister
each implanted pulse generator and set of leads, initiate the warranty period,
and provide clinical data on the performance of the implanted system. Keep a
- DRAFT -
IMPLANT INFORMATION
IMPLANTING THE PULSE GENERATOR 9-13
copy of the Warranty Validation and Lead Registration form and programmer
printouts, and the original patient data disk for the patient’s file.
Complete the temporary patient identification card and give it to the patient.
After receiving the validation form, Boston Scientific sends the patient a
permanent identification card.
NOTE: A registration form is packaged with each pulse generator lead. If
completing the pulse generator Warranty Validation and Lead Registration
form for the pulse generator, completing separate validation forms for each
lead is not necessary.
- DRAFT -
9-14 IMPLANT INFORMATION
IMPLANTING THE PULSE GENERATOR
- DRAFT -

10-1
POST IMPLANT INFORMATION
CHAPTER 10
This chapter contains the following topics:
• "Follow Up Testing" on page 10-2
• "Post Implant features" on page 10-3
• "Explantation" on page 10-8
- DRAFT -
10-2 POST IMPLANT INFORMATION
FOLLOW UP TESTING
FOLLOW UP TESTING
It is recommended that device functions be evaluated during follow-up testing.
WARNING: Ensure that an external defibrillator and medical personnel skilled
in CPR are present during post-implant device testing should the patient
require external rescue.
Predischarge Follow Up
During the pre-discharge follow-up test, the following procedures should be
performed via telemetry using the PRM:
1. Interrogate the pulse generator and review the Summary screen.
2. Perform pacing thresholds and lead impedance tests, and intrinsic
amplitude measurements.
3. Review Histograms.
4. When all testing is complete, perform a final interrogation and save all the
data to a patient data disk.
5. Print the Quick Notes and Patient Data reports to retain in your files for
future reference.
6. It is important to clear the therapy counters so that at the next follow-up
session the most recent episode data will be displayed. Note that the
histogram counters can be cleared from either the Brady or Tachy Counters
screen as well.
NOTE: Echo-Doppler studies may be used to evaluate AV Delay and other
programming options non-invasively post-implant.
Routine Follow Up
You should conduct routine follow-up examinations one month after the
pre-discharge study and every three months thereafter. During the routine
follow-up test, the following procedures should be performed via telemetry
using the programming system:
1. Interrogate the device and review the Summary screen.
- DRAFT -
POST IMPLANT INFORMATION
POST IMPLANT FEATURES 10-3
2. Perform pacing thresholds and lead impedance tests, and intrinsic
amplitude measurements.
3. Print and review the Quick Notes report, and retain it in your files for future
reference.
4. For episodes of interest, review the Arrhythmia Logbook screen and print
episode details and stored electrogram information.
5. It is important to clear the therapy counters so that at the next follow-up
session the most recent episode data will be displayed.
CAUTION: Verify with a conversion test that the patient’s tachyarrhythmias
can be detected and terminated by the pulse generator system if the patient’s
status has changed or parameters have been reprogrammed.
POST IMPLANT FEATURES
Sensitivity Adjustment
The Sensitivity Adjustment feature allows you to shift the atrial sensing range to
make it less sensitive (i.e., a larger signal would be required for the device to
detect). It allows shifting the ventricular sensing range to make it less or more
sensitive. While the Nominal setting is primarily indicated for both atrial and
ventricular sensing, an adjustment can be made if, in a rare situation, atrial or
ventricular oversensing/undersensing has been observed post-implant (i.e.,
inhibition of bradycardia pacing or inappropriate tachy therapy).
WARNING: Left ventricular lead dislodgment to a position near the atria can
result in atrial oversensing or left ventricular pacing inhibition.
Should it become necessary to adjust the sensing range in a chamber,
always choose the setting that allows the greatest sensitivity, but resolves
oversensing/undersensing:
• To reduce oversensing, program the sensitivity to a higher value.
• To reduce undersensing, program the sensitivity to a lower value.
After any change to sensitivity, evaluate for appropriate sensing for both
bradycardia pacing and tachycardia detection.
- DRAFT -
10-4 POST IMPLANT INFORMATION
POST IMPLANT FEATURES
If proper sensing cannot be restored with an adjustment or if any undersensing
is observed after making a change, consider repositioning the lead or implanting
a new sensing lead and then programming the setting back to nominal.
CAUTION: Following any sensing range adjustment or any modification of
the sensing lead, always verify appropriate sensing.
Beeper Feature
The pulse generator contains a beeper that emits audible tones to
communicate status information. The beeper includes both programmable and
nonprogrammable features.
Programmable Features
The following beeper features are programmable:
• Beep During Capacitor Charge—When programmed to On, regardless of
the Tachy mode, a warbling tone will sound continuously while the pulse
generator is charging (except when charging during an auto capacitor
re-form). The tone will continue until charging is complete. When this
feature is programmed to Off, there is no audible indication that the pulse
generator is charging. This feature is useful during EP testing.
• Beep When Explant Is Indicated—When this feature is programmed to
On, the pulse generator emits tones upon reaching Explant. The Explant
indicator consists of 16 tones repeated every six hours after the pulse
generator reaches Explant until the feature is turned off via the programmer.
When this feature is programmed to Off, there is no audible indication
of Explant.
Perform the following steps to program the magnet and beeper features:
Magnet and Beeper Response
1. Select the Settings tab.
2. From Ventricular Tachy, select the Therapy button.
3. Select the V-Tachy Therapy Setup button.
4. Enter the desired values.
- DRAFT -
POST IMPLANT INFORMATION
POST IMPLANT FEATURES 10-5
Beep when Explant is indicated
1. Select the Summary tab.
2. Select the Battery button.
3. From the Battery Status summary screen, select the Battery Detail button.
4. From the Battery Detail summary screen, select the desired value for Beep
when Explant is indicated.
NOTE: When the Magnet Response is programmed to Inhibit Therapy,
magnet application will cause other types of beeping tones to be emitted,
depending on the device mode. Refer to "Magnet Feature" on page 10-5 for
more information.
Nonprogrammable Features
The following beeper features are nonprogrammable:
• Battery capacity depleted—Regardless of whether Beep When Explant
Is Indicated is programmed to On or Off, once the battery capacity is
depleted, the pulse generator will emit the explant indicator tones
• Fault code tones—For certain fault codes or when safety mode is entered,
the pulse generator will beep 16 times every 6 hours.
NOTE: Beeping tones may emit under nonprogrammable scenarios in
response to device self-diagnostic testing. Advise patients to have their
pulse generator checked whenever they hear tones coming from the device.
Contact Technical Services at the phone number on the back of this manual
for assistance.
Magnet Feature
The magnet feature allows certain device functions to be triggered when a
magnet is placed in close proximity to the pulse generator (Figure 10-1 on
page 10-6).
- DRAFT -
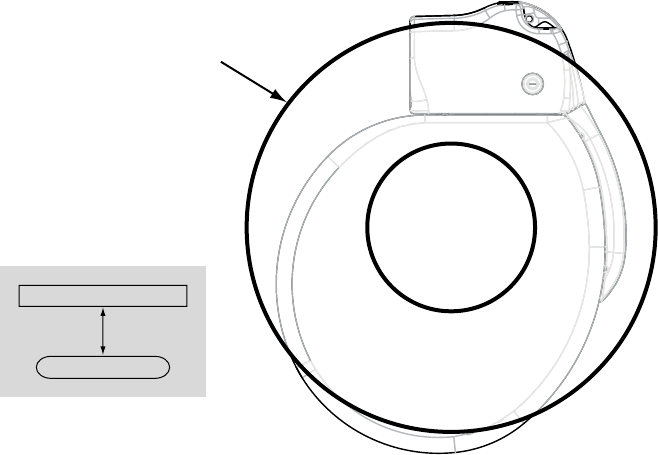
10-6 POST IMPLANT INFORMATION
POST IMPLANT FEATURES
Position the magnet over the
pulse generator as shown.
Magnet (model 6860)
3.0 cm
Pulse generator
Top View
Figure 10-1. Proper position of magnet Model 6860 to activate the pulse generator magnet feature
The pulse generator Magnet Response settings can be programmed to control
the behavior of the pulse generator when a magnet is detected. The Magnet
Response settings are located in the Magnet and Beeper section of the V-Tachy
Therapy Setup screen. The following Magnet Response settings are available:
• Off—no response
• Store EGM—patient monitoring data will be stored
• Inhibit Therapy—therapy will be stopped
Off
When the Magnet Response is programmed to Off, application of the magnet
will have no effect on the pulse generator.
Store EGM
When the Magnet Response is programmed to Store EGM, application of the
magnet will activate the patient triggered monitor functionality. Refer to "Patient
Triggered Monitor" on page 7-17 for additional information.
Inhibit Therapy
- DRAFT -
POST IMPLANT INFORMATION
POST IMPLANT FEATURES 10-7
When the Magnet Response is programmed to Inhibit Therapy, application of
the magnet will inhibit and/or divert charging for a shock, divert a shock that is
about to be delivered, or inhibit and/or divert further ATP therapy.
When Magnet Response is programmed to Inhibit Therapy, initiation of
tachyarrhythmia therapy and arrhythmia induction is inhibited any time the
magnet is properly positioned over the pulse generator. The tachyarrhythmia
detection process continues, but therapy or induction cannot be triggered.
When a magnet is placed over the pulse generator, the following will occur:
• If the Tachy mode is Monitor + Therapy or Off when the magnet is applied,
the Tachy mode changes temporarily to Monitor Only mode and will
remain in Monitor Only mode as long as the magnet is applied. Three
seconds after the magnet is removed, the mode will return to the previously
programmed mode.
• If the pulse generator is charging to deliver shock therapy when the magnet
is applied, the charging continues but is then terminated within one to two
seconds of magnet application, and the charge is diverted. (This delay
occurs in case the magnet is inadvertently passed over the device when
therapy inhibition is not desired.) The pulse generator remains in temporary
Monitor Only mode while the magnet is applied. No further therapy is
initiated until the magnet is removed; however, detection will continue.
• If charging is complete or completes within the 1–2 second delay period,
holding the magnet over the pulse generator for more than two seconds
will divert the shock. (If the magnet is removed during the delay period,
the shock could still be delivered.) Shocks will not be delivered with the
magnet in place.
• If the pulse generator is initiating fibrillation induction or ATP pulses, it
terminates the delivery after one to two seconds of magnet application. No
further induction or ATP pulse sequences are initiated until the magnet
is removed.
• If the Tachy Mode is Monitor Only or Off, magnet application will produce a
constant tone to indicate that the device is in a non-therapy mode.
• If the Tachy Mode is Monitor + Therapy or the pulse generator is in
Electrocautery Protection Mode, magnet application will cause the pulse
generator to beep once per second to indicate that the device is in a
therapy mode.
- DRAFT -
10-8 POST IMPLANT INFORMATION
EXPLANTATION
NOTE: If tachy detection occurs while the magnet is in place, detailed therapy
history will indicate that therapy was not delivered because the device was
in Monitor Only mode.
EXPLANTATION
An Observation/Complication/Out-of-Service Reporting form should be
completed and sent to Boston Scientific when a product is removed from
service. Return all explanted pulse generators and leads with product
performance allegations or warranty considerations to Boston Scientific.
Examination of explanted devices provides information for continued
improvement in device reliability and will permit calculation of any warranty
replacement credit use.
In the event of patient death (regardless of cause), the explanted pulse
generator and/or lead should be returned to Boston Scientificalong
with the Observation/Complication/Out-of-Service Reporting form and
copies of the autopsy report, if performed. For other observation or
complications reasons, also complete and return to Boston Scientificthe
Observation/Complication/Out-of-Service Reporting form.
NOTE: Disposal of explanted devices is subject to local, state, and federal
regulations. Contact your sales representative or call the phone number on the
back cover of this manual for a Returned Product Kit.
NOTE: Discoloration of the pulse generator may have occurred due to a
normal process of anodization, and has no effect on the pulse generator
function.
CAUTION: Be sure that the pulse generator is removed before cremation.
Cremation and incineration temperatures might cause the pulse generator to
explode.
CAUTION: Before explanting, cleaning, or shipping the device, complete the
following actions to prevent unwanted shocks, overwriting of important therapy
history data, and audible tones:
• Program the pulse generator Tachy and Brady Modes to Off.
• Program the Magnet Response feature to Off.
• Program the Beep When Explant is Indicated feature to Off.
Consider the following items when explanting and returning the pulse generator:
- DRAFT -
POST IMPLANT INFORMATION
EXPLANTATION 10-9
• Interrogate the pulse generator and print a Combined Follow-up report.
• Deactivate the pulse generator before explantation.
• Disconnect the leads from the pulse generator.
• If leads are also explanted, attempt to remove them intact. Do not remove
leads with hemostats or any other clamping tool that may damage the
leads. Resort to tools only if manual manipulation cannot free the lead.
• Wash, but do not submerge, the pulse generator and leads to remove
body fluids and debris using a disinfectant solution. Do not allow fluids to
enter the pulse generator’s lead ports.
• UseaBostonScientific Returned Product Kit to properly package the
pulse generator.
• Complete the Observation/Complication/Out-of-Service Reporting form.
• Send the form and the Returned Product Kit to Boston Scientific.
- DRAFT -
10-10 POST IMPLANT INFORMATION
EXPLANTATION
- DRAFT -

A-1
PROGRAMMABLE OPTIONS
APPENDIX A
Table A-1. ZIP Telemetry settings
Parameter Programmable Values Nominal
Communication Mode Enable use of ZIP telemetry (May
require limited use of wand), Use
wand for all telemetry
Enable use of ZIP telemetry (May
require limited use of wand)
Table A-2. Tachy Mode parameter
Parameter Programmable Values Nominal
Tachy Mode Off, Monitor Only, Monitor + Therapy,
Enable Electrocautery Protection
Storage
Table A-3. Ventricular Zones parameter
Parameter Programmable Values Nominal
Ventricular Zones 1, 2, 3 2
Table A-4. Detection parameters for 1-zone, 2-zone, and 3-zone configurations
Parameter VT-1 Zone VT Zone VF Zone Nominal
Ratea( bpm) 3 zones
(intervals in ms)
90, 95, ..., 200
(667–300)
110, 115, ..., 210
(545–286) 220 (273)
130, 135, ..., 210
(462–286), 220, 230,
240, 250 (273–240)
140 (Tolerance ± 5
ms) for VT-1 Zone
160 (Tolerance ± 5
ms) for VT Zone
200 (Tolerance ± 5
ms) for VF Zone
Ratea( bpm) 2 zones
(intervals in ms)
–– 90, 95, ..., 210
(667–286) 220 (273)
110, 115, ..., 210
(545–286) 220, 230,
240, 250 (273–240)
160 (Tolerance ± 5
ms) for VT Zone
200 (Tolerance ± 5
ms) for VF Zone
Ratea( bpm) 1 zone
(intervals in ms)
–– –– 90, 95, ..., 210 (667–
286) 220 (273)
200 (Tolerance ± 5
ms)
Initial Durationb
(sec) 3 zones
1.0, 1.5, ..., 5.0, 6.0,
7.0, ..., 15.0, 20.0,
25.0, ..., 60.0
1.0, 1.5, ..., 5.0, 6.0,
7.0, ..., 15.0, 20.0,
25.0, 30.0
1.0, 1.5, ..., 5.0, 6.0,
7.0, ..., 15.0
2.5 (Tolerance ± 1
cardiac cycle) for
VT-1 Zone
2.5 (Tolerance ± 1
cardiac cycle) for VT
Zone
1.0 (Tolerance ± 1
cardiac cycle) for VF
Zone
- DRAFT -

A-2 PROGRAMMABLE OPTIONS
Table A-4. Detection parameters for 1-zone, 2-zone, and 3-zone configurations (continued)
Parameter VT-1 Zone VT Zone VF Zone Nominal
Initial Durationb
(sec) 2 zones
–– 1.0, 1.5, ..., 5.0, 6.0,
7.0, ..., 15.0, 20.0,
25.0, 30.0
1.0, 1.5, ..., 5.0, 6.0,
7.0, ..., 15.0
2.5 (Tolerance ± 1
cardiac cycle) for VT
Zone
1.0 (Tolerance ± 1
cardiac cycle) for VF
Zone
Initial Durationb
(sec) 1 zone
–– –– 1.0, 1.5, ..., 5.0, 6.0,
7.0, ..., 15.0
1.0 (Tolerance ± 1
cardiac cycle)
Redetection
Durationb(sec) 3
zones
1.0, 1.5, ..., 5.0, 6.0,
7.0, ..., 15.0
1.0, 1.5, ..., 5.0, 6.0,
7.0, ..., 15.0
1.0
(nonprogrammable)
1.0 (Tolerance ± 1
cardiac cycle) for all
zones
Redetection
Durationb(sec) 2
zones
–– 1.0, 1.5, ..., 5.0, 6.0,
7.0, ..., 15.0
1.0
(nonprogrammable)
1.0 (Tolerance ± 1
cardiac cycle) for all
zones
Redetection
Durationb(sec) 1
zone
–– –– 1.0
(nonprogrammable)
1.0 (Tolerance ± 1
cardiac cycle)
Post-shock
Durationb(sec) 3
zones
1.0, 1.5, ..., 5.0, 6.0,
7.0, ..., 15.0, 20.0,
25.0, ..., 60.0
1.0, 1.5, ..., 5.0, 6.0,
7.0, ..., 15.0, 20.0,
25.0, 30.0
1.0
(nonprogrammable)
1.0 (Tolerance ± 1
cardiac cycle) for all
zones
Post-shock
Durationb(sec) 2
zones
–– 1.0, 1.5, ..., 5.0, 6.0,
7.0, ..., 15.0, 20.0,
25.0, 30.0
1.0
(nonprogrammable)
1.0 (Tolerance ± 1
cardiac cycle) for all
zones
Post-shock
Durationb(sec) 1
zone
–– –– 1.0
(nonprogrammable)
1.0 (Tolerance ± 1
cardiac cycle)
a. The Rate difference between each tachy zone must be at least 20 bpm. The lowest Tachy Rate Threshold must be ≥5 bpm
higher than the Maximum Tracking Rate, Maximum Sensor Rate, and the Maximum Pacing Rate; and the lowest Tachy Rate
Threshold must be ≥15 bpm higher than the Lower Rate Limit.
b. The Duration in a zone must be equal to or greater than the Duration in the next highest zone.
Table A-5. Ventricular Detection Enhancement Type for 2-zone and 3-zone configurations
Parameter Programmable Values Nominal
Detection Enhancement Type Off, Rhythm ID, Onset/Stability Onset/Stability
Table A-6. Onset/Stability detection enhancement parameters for 2-zone and 3-zone configurations
Parameter VT-1 Zone VT Zone VF Zone Nominal
V Rate > A Rate 3
zones
Off, On –– –– On
V Rate > A Rate 2
zones
–– Off, On –– On
- DRAFT -

PROGRAMMABLE OPTIONS A-3
Table A-6. Onset/Stability detection enhancement parameters for 2-zone and 3-zone configurations
(continued)
Parameter VT-1 Zone VT Zone VF Zone Nominal
AFib Rate Threshold
( bpm) 3 zones
Off, 100, 110, ..., 300 –– –– 170 (Tolerance ± 5
ms)
AFib Rate Threshold
( bpm) 2 zones
–– Off, 100, 110, ..., 300 –– 170 (Tolerance ± 5
ms)
Stability (ms) 3
zones
Off, 6, 8, ..., 32 35,
40, ..., 60 70, 80, ...,
120
–– –– 20 (Tolerance ± 5
ms)
Stability (ms) 2
zones
–– Off, 6, 8, ..., 32 35,
40, ..., 60 70, 80, ...,
120
–– 20 (Tolerance ± 5
ms)
Shock If Unstable
(ms) 3 zones
–– Off, 6, 8, ..., 32 35,
40, ..., 60 70, 80, ...,
120
–– 30 (Tolerance ± 5
ms)
Shock If Unstable
(ms) 2 zones
–– Off, 6, 8, ..., 32 35,
40, ..., 60 70, 80, ...,
120
–– Off (Tolerance ± 5
ms)
Onset (% or ms) 3
zones
Off, 9, 12, 16, 19, ...,
37 41, 44, 47, 50%
or 50, 60, ..., 250 ms
–– –– 9% (Tolerance ± 5
ms)
Onset (% or ms) 2
zones
–– Off, 9, 12, 16, 19, ...,
37, 41, 44, 47, 50%
or 50, 60, ..., 250 ms
–– 9% (Tolerance ± 5
ms)
Stability And/Or
Onset 3 zones
And, Or –– –– And
Stability And/Or
Onset 2 zones
–– And, Or –– And
Sustained Rate
Duration (min:sec) 3
zones
Off, 00:10, 00:15, ...,
00:55 01:00, 01:15,
..., 02:00 02:30,
03:00, ..., 10:00
15:00, 20:00, ...,
60:00
–– –– 03:00 (Tolerance ± 1
cardiac cycle)
Sustained Rate
Duration (min:sec) 2
zones
–– Off, 00:10, 00:15, ...,
00:55 01:00, 01:15,
..., 02:00 02:30,
03:00, ..., 10:00
15:00, 20:00, ...,
60:00
–– 03:00 (Tolerance ± 1
cardiac cycle)
Detection
Enhancement 3
zones
Off, On Off, On –– On (VT-1) Off (VT)
- DRAFT -

A-4 PROGRAMMABLE OPTIONS
Table A-6. Onset/Stability detection enhancement parameters for 2-zone and 3-zone configurations
(continued)
Parameter VT-1 Zone VT Zone VF Zone Nominal
Detection
Enhancement 2
zones
–– Off, On –– On
Atrial
Tachyarrhythmia
Discrimination 3
zones
Off, On –– –– On
Atrial
Tachyarrhythmia
Discrimination 2
zones
–– Off, On –– On
Sinus Tachycardia
Discrimination 3
zones
Off, On –– –– On
Sinus Tachycardia
Discrimination 2
zones
–– Off, On –– On
Polymorphic VT
Discrimination 3
zones
–– Off, On –– On
Polymorphic VT
Discrimination 2
zones
–– Off, On –– Off
Table A-7. Rhythm ID detection enhancement parameters for 2-zone and 3-zone configurations
Parameter VT-1 Zone VT Zone VF Zone Nominal
Detection
Enhancement 3
zones
Off, On Off, On –– On (VT-1) Off (VT)
Detection
Enhancement 2
zones
–– Off, On –– Off
Sustained Rate
Duration (min:sec) 3
zones
Off, 00:10, 00:15,
..., 01:00, 01:15,
..., 02:00, 02:30,
..., 10:00, 15:00, ...,
60:00
Off, 00:10, 00:15,
..., 01:00, 01:15,
..., 02:00, 02:30,
..., 10:00, 15:00, ...,
60:00
–– 03:00 (VT-1 and
VT) (Tolerance ± 1
cardiac cycle)
Sustained Rate
Duration (min:sec) 2
zones
–– Off, 00:10, 00:15,
..., 01:00, 01:15,
..., 02:00, 02:30,
..., 10:00, 15:00, ...,
60:00
–– 03:00 (Tolerance ± 1
cardiac cycle)
- DRAFT -

PROGRAMMABLE OPTIONS A-5
Table A-7. Rhythm ID detection enhancement parameters for 2-zone and 3-zone configurations (continued)
Parameter VT-1 Zone VT Zone VF Zone Nominal
Passive Method 3
zones (one value for
all zones)
Off, On Off, On –– On
Passive Method 2
zones (one value for
all zones)
–– Off, On –– On
Active Method 3
zones (one value for
all zones)
Off, On Off, On –– On
Active Method 2
zones (one value for
all zones)
–– Off, On –– On
Temp LRL ( ppm)
(one value for all
zones)
Use Norm LRL, 30,
35, ..., 105
Use Norm LRL, 30,
35, ..., 105
–– Use Norm LRL
(Tolerance ± 5 ms)
Temp LRL 2 zones
( ppm) (one value for
all zones)
–– Use Norm LRL, 30,
35, ..., 105
–– Use Norm LRL
(Tolerance ± 5 ms)
Atrial Tachy
Discrimination 3
zones (one value for
all zones)
Off, On Off, On –– On
Atrial Tachy
Discrimination 2
zones (one value for
all zones)
–– Off, On –– On
AFib Rate Threshold
( bpm) 3 zones (one
value for all zones)
100, 110, ..., 300 100, 110, ..., 300 –– 170 (Tolerance ± 5
ms)
AFib Rate Threshold
( bpm) 2 zones (one
value for all zones)
–– 100, 110, ..., 300 –– 170 (Tolerance ± 5
ms)
Stability (ms) 3
zones (one value for
all zones)
6, 8, ..., 32, 35, 40,
..., 60, 70, ..., 120
6, 8, ..., 32, 35, 40,
..., 60, 70, ..., 120
–– 20 (Tolerance ± 5
ms)
Stability (ms) 2
zones (one value for
all zones)
–– 6, 8, ..., 32, 35, 40,
..., 60, 70, ..., 120
–– 20 (Tolerance ± 5
ms)
- DRAFT -

A-6 PROGRAMMABLE OPTIONS
Table A-8. Post-shock Onset/Stability detection enhancement parameters for 2-zone and 3-zone
configurations
Parameter VT-1 Zone VT Zone VF Zone Nominal
Post-shock V Rate >
A Rate 3 zones
Off, On –– –– On
Post-shock V Rate >
A Rate 2 zones
–– Off, On –– On
Post-shock AFib
Rate Threshold
( bpm) 3 zones
Off, 100, 110, ..., 300 –– –– 170 (Tolerance ± 5
ms)
Post-shock AFib
Rate Threshold
( bpm) 2 zones
–– Off, 100, 110, ..., 300 –– 170 (Tolerance ± 5
ms)
Post-shock Stability
(ms) 3 zones
Off, 6, 8, ..., 32, 35,
40, ..., 60, 70, 80, ...,
120
–– –– 20 (Tolerance ± 5
ms)
Post-shock Stability
(ms) 2 zones
–– Off, 6, 8, ..., 32, 35,
40, ..., 60, 70, 80, ...,
120
–– 20 (Tolerance ± 5
ms)
Post-shock
Sustained Rate
Duration (min:sec) 3
zones
Off, 00:10, 00:15, ...,
00:55, 01:00, 01:15,
..., 02:00, 02:30,
03:00, ..., 10:00,
15:00, 20:00, ...,
60:00
–– –– 00:15 (Tolerance ± 1
cardiac cycle)
Post-shock
Sustained Rate
Duration (min:sec) 2
zones
–– Off, 00:10, 00:15, ...,
00:55, 01:00, 01:15,
..., 02:00, 02:30,
03:00, ..., 10:00,
15:00, 20:00, ...,
60:00
–– 00:15 (Tolerance ± 1
cardiac cycle)
Table A-9. Post-shock Rhythm ID detection enhancement parameters for 2-zone and 3-zone configurations
Parameter VT-1 Zone VT Zone VF Zone Nominal
Post-shock
Detection
Enhancement 3
zones
Off, On Off, On –– Off
Post-shock
Detection
Enhancement 2
zones
–– Off, On –– Off
- DRAFT -

PROGRAMMABLE OPTIONS A-7
Table A-9. Post-shock Rhythm ID detection enhancement parameters for 2-zone and 3-zone configurations
(continued)
Parameter VT-1 Zone VT Zone VF Zone Nominal
Post-shock
Sustained Rate
Duration (min:sec) 3
zones
Off, 00:10, 00:15,
01:00, 01:15, ...,
02:00, 02:30, ...,
10:00, 15:00, ...,
60:00
Off, 00:10, 00:15,
01:00, 01:15, ...,
02:00, 02:30, ...,
10:00, 15:00, ...,
60:00
–– 0:15 (Tolerance ± 1
cardiac cycle)
Post-shock
Sustained Rate
Duration (min:sec) 2
zones
–– Off, 00:10, 00:15,
01:00, 01:15, ...,
02:00, 02:30, ...,
10:00, 15:00, ...,
60:00
–– 0:15 (Tolerance ± 1
cardiac cycle)
Table A-10. Ventricular ATP parameters (specified into a 750 Ωload)
Parameter VT-1 Zone VT Zone VF Zone Nominal
ATP Type 3 zones Off, Burst, Ramp,
Scan, Ramp/Scan
Off, Burst, Ramp,
Scan, Ramp/Scan
–– Off (VT-1); Burst (VT
ATP1); Ramp (VT
ATP2)
ATP Type 2 zones –– Off, Burst, Ramp,
Scan, Ramp/Scan
–– Burst (VT ATP1);
Ramp (VT ATP2)
Number of Bursts
(per scheme) 3
zones
Off, 1, 2, ..., 30 Off, 1, 2, ..., 30 –– Off (VT-1); 2 (VT
ATP1); 1 (VT ATP2)
Number of Bursts
(per scheme) 2
zones
–– Off, 1, 2, ..., 30 –– 2 (VT ATP1); 1 (VT
ATP2)
Initial Pulse (pulses)
3 zones
1, 2, ..., 30 1, 2, ..., 30 –– 4 (VT-1); 10 (VT)
Initial Pulse (pulses)
2 zones
–– 1, 2, ..., 30 –– 10
Pulse Increment
(pulses) 3 zones
0, 1, ..., 5 0, 1, ..., 5 –– 0
Pulse Increment
(pulses) 2 zones
–– 0, 1, ..., 5 –– 0
Maximum Number
of Pulses 3 zones
1, 2, ..., 30 1, 2, ..., 30 –– 4 (VT-1); 10 (VT)
Maximum Number
of Pulses 2 zones
–– 1, 2, ..., 30 –– 10
Coupling Interval (%
or ms) 3 zones
50, 53, 56, 59; 63,
66, ..., 84, 88, 91,
94, 97% or 120, 130,
..., 750 ms
50, 53, 56, 59; 63,
66,...,84,88,91,
94, 97% or 120, 130,
..., 750 ms
–– 81% (Tolerance ± 5
ms)
- DRAFT -

A-8 PROGRAMMABLE OPTIONS
Table A-10. Ventricular ATP parameters (specified into a 750 Ωload) (continued)
Parameter VT-1 Zone VT Zone VF Zone Nominal
Coupling Interval (%
or ms) 2 zones
–– 50, 53, 56, 59; 63,
66,...,84,88,91,
94, 97% or 120, 130,
..., 750 ms
–– 81% (Tolerance ± 5
ms)
Coupling Interval
Decrement (ms) 3
zones
0, 2, ..., 30 0, 2, ..., 30 –– 0(Tolerance±5ms)
Coupling Interval
Decrement (ms) 2
zones
–– 0, 2, ..., 30 –– 0(Tolerance±5ms)
Burst Cycle Length
(BCL) (% or ms) 3
zones
50, 53, 56, 59; 63,
66, ..., 84, 88, 91,
94, 97% or 120, 130,
..., 750 ms
50, 53, 56, 59; 63,
66,...,84,88,91,
94, 97% or 120, 130,
..., 750 ms
–– 81% (Tolerance ± 5
ms)
Burst Cycle Length
(BCL) (% or ms) 2
zones
–– 50, 53, 56, 59; 63,
66,...,84,88,91,
94, 97% or 120, 130,
..., 750 ms
–– 81% (Tolerance ± 5
ms)
Ramp Decrement
(ms) 3 zones
0, 2, ..., 30 0, 2, ..., 30 –– 0(VT-1);0(VT
ATP1); 10 (VT ATP2)
(Tolerance ± 5 ms)
Ramp Decrement
(ms) 2 zones
–– 0, 2, ..., 30 –– 0 (VT ATP1); 10 (VT
ATP2) (Tolerance ±
5ms)
Scan Decrement
(ms) 3 zones
0, 2, ..., 30 0, 2, ..., 30 –– 0(Tolerance±5ms)
Scan Decrement
(ms) 2 zones
–– 0, 2, ..., 30 –– 0(Tolerance±5ms)
Minimum Interval
(ms) 3 zones
120, 130, ..., 400 120, 130, ..., 400 –– 220 (Tolerance ± 5
ms)
Minimum Interval
(ms) 2 zones
–– 120, 130, ..., 400 –– 220 (Tolerance ± 5
ms)
Right Ventricular
ATP Pulse Widtha
(ms) 3 zones (one
value for all zones)
0.1, 0.2, ..., 2.0 0.1, 0.2, ..., 2.0 –– 1.0(Tolerance±
0.03 ms at < 1.8 ms;
±0.08msat≥1.8
ms)
Right Ventricular
ATP Pulse Widtha
(ms) 2 zones (one
value for all zones)
–– 0.1, 0.2, ..., 2.0 –– 1.0(Tolerance±
0.03 ms at < 1.8 ms;
±0.08msat≥1.8
ms)
- DRAFT -

PROGRAMMABLE OPTIONS A-9
Table A-10. Ventricular ATP parameters (specified into a 750 Ωload) (continued)
Parameter VT-1 Zone VT Zone VF Zone Nominal
Left Ventricular ATP
Pulse Widtha(ms) 3
zones (one value for
all zones)
0.1, 0.2, ..., 2.0 0.1, 0.2, ..., 2.0 –– 1.0(Tolerance±
0.03 ms at < 1.8 ms;
±0.08msat≥1.8
ms)
Left Ventricular ATP
Pulse Widtha(ms) 2
zones (one value for
all zones)
–– 0.1, 0.2, ..., 2.0 –– 1.0(Tolerance±
0.03 ms at < 1.8 ms;
±0.08msat≥1.8
ms)
Right Ventricular
ATP Amplitudea(V)
3 zones (one value
for all zones)
0.1, 0.2, ..., 3.5, 4.0,
..., 7.5
0.1, 0.2, ..., 3.5, 4.0,
..., 7.5
–– 5.0(Tolerance±
15% or ± 100 mV,
whichever is greater)
Right Ventricular
ATP Amplitudea(V)
2 zones (one value
for all zones)
–– 0.1, 0.2, ..., 3.5, 4.0,
..., 7.5
–– 5.0(Tolerance±
15% or ± 100 mV,
whichever is greater)
Left Ventricular ATP
Amplitudea(V) 3
zones (one value for
all zones)
0.1, 0.2, ..., 3.5, 4.0,
..., 7.5
0.1, 0.2, ..., 3.5, 4.0,
..., 7.5
–– 5.0(Tolerance±
15% or ± 100 mV,
whichever is greater)
Left Ventricular ATP
Amplitudea(V) 2
zones (one value for
all zones)
–– 0.1, 0.2, ..., 3.5, 4.0,
..., 7.5
–– 5.0(Tolerance±
15% or ± 100 mV,
whichever is greater)
ATP Time-outb
(seconds) 3 zones
Off, 10, 15, ..., 60,
75, 90, ..., 120, 150,
..., 600, 900, ...,
3600
Off, 10, 15, ..., 60,
75, 90, ..., 120, 150,
..., 600, 900, ...,
3600
–– 60 (Tolerance ± 1
cardiac cycle)
ATP Time-outb
(seconds) 2 zones
–– Off, 10, 15, ..., 60,
75, 90, ..., 120, 150,
..., 600, 900, ...,
3600
–– 60 (Tolerance ± 1
cardiac cycle)
QUICK CONVERT
ATP (VF Only) 3
zones
–– –– Off, On On
QUICK CONVERT
ATP (VF Only) 2
zones
–– –– Off, On On
a. The programmed Amplitude and Pulse Width values affect Post Therapy Brady Pacing, but are separately programmable from
Normal Brady Pacing, Temporary Brady Pacing, and EP Test.
b. The VT-1 ATP Time-out must be greater than or equal to the VT ATP Time-out.
- DRAFT -

A-10 PROGRAMMABLE OPTIONS
Table A-11. Ventricular Shock Parameters
Parameter Programmable Values Nominal
Shocks 1 and 2 energy (J)abc
(stored energy)
Off, 0.1, 0.3, 0.6, 0.9, 1.1, 1.7, 2, 3,
5, 6, 7, 9, 11, 14, 17, 21, 23, 26, 29,
31, 36 (HE), 41 (HE)
41 J (Tolerance ± 60% for ≤0.3 J, ±
40% for ≤0.6–3 J, ± 20% for 5–36
J, ± 10% for 41 J)
Energy of Remaining Shocks (J)ac
(stored energy)
Off, 41 (HE) 41 J (Tolerance ± 10% for 41 J)
Lead PolaritydInitial, Reversed Initial
Committed Shock Off, On Off
Shock Lead Vector RV Coil to RA Coil and Can, RV Coil
to Can, RV Coil to RA Coil
RV Coil to RA Coil and Can
a. Biphasic energy is specified.
b. The Shock 2 energy level must be greater than or equal to the Shock 1 energy level.
c. In a VT-1 zone of a 3-zone configuration or a VT zone of a 2-zone configuration, all or some of the shocks may be programmed to
Off while other shocks in that zone are programmed in joules.
d. A commanded STAT SHOCK is delivered at the programmed Polarity.
Table A-12. Pacing therapy parameters (Normal, Post-Therapy, and Temporary) (specified into a 750 Ωload)
Parameter Programmable Values Nominal
Modeabg DDD(R), DDI(R), VDD(R), VVI(R),
AAI(R), Off; Temporary: DDD, DDI,
DOO, VDD, VVI, VOO, AAI, AOO,
Off
DDD
Lower Rate Limit (LRL)ac( ppm) 30, 35, ..., 185 45 (Tolerance ± 5 ms)
Maximum Tracking Rate (MTR) gj
( ppm)
30, 35, ..., 185 130(Tolerance±5ms)
Maximum Sensor Rate (MSR)gj
( ppm)
30, 35, ..., 185 130(Tolerance±5ms)
Pulse Amplitudeadef(atrium) (V) 0.1, 0.2, ... 3.5, 4.0, ..., 5.0 3.5 (5.0 post-therapy) (Tolerance
± 15% or ± 100mV, whichever is
greater)
Pulse Amplitudeadef(right ventricle)
(V)
0.1, 0.2, ..., 3.5, 4.0, ..., 7.5 3.5 (5.0 post-therapy) (Tolerance
± 15% or ± 100mV, whichever is
greater)
Pulse Widthadef(atrium, right
ventricle) (ms)
0.1, 0.2, ..., 2.0 0.4 (1.0 post-therapy) (Tolerance ±
0.03 ms at < 1.8 ms; ± 0.08 ms at
≥1.8 ms)
Atrial Pace/Sense Configurationag Bipolar, Off Bipolar
Activity Thresholdgj Very High, High, Medium High,
Medium, Medium Low, Low, Very
Low
Medium
Reaction Timegj(sec) 10, 20, ..., 50 30
- DRAFT -

PROGRAMMABLE OPTIONS A-11
Table A-12. Pacing therapy parameters (Normal, Post-Therapy, and Temporary) (specified into a 750 Ω
load) (continued)
Parameter Programmable Values Nominal
Response Factorgj 1, 2, ..., 16 8
Recovery Timegj(min) 2, 3, ..., 16 2
Maximum PVARPag(ms) 150, 160, ..., 500 280(Tolerance±5ms)
Minimum PVARPag(ms) 150, 160, ..., 500 240(Tolerance±5ms)
PVARP After PVCag(ms) Off, 150, 200, ..., 500 400 (Tolerance ± 5 ms)
RV-Blank After A-Paceah(ms) 45, 65, 85, Smart Smart (Tolerance ± 5 ms)
A-Blank After V-Paceah(ms) 85, 105, 125, Smart Smart (Tolerance ± 5 ms)
A-Blank After RV-Senseah(ms) 45, 65, 85, Smart Smart (Tolerance ± 5 ms)
Maximum VRP (right ventricle)ai
(ms)
150, 160, 170, ..., 500 250(Tolerance±5ms)
Minimum VRP (right ventricle)ai
(ms)
150, 160, ..., 500 230(Tolerance±5ms)
Maximum Paced AV Delayag(ms) 30, 40, ..., 300 180(Tolerance±5ms)
Minimum Paced AV Delayag(ms) 30, 40, ..., 300 180(Tolerance±5ms)
Maximum Sensed AV Delayag(ms) 30, 40, ..., 300 120(Tolerance±5ms)
Minimum Sensed AV Delayag(ms) 30, 40, ..., 300 120(Tolerance±5ms)
Respiratory Sensorag Off, On On
Tracking Preferencegj Off, On On
Rate Hysteresis Hysteresis Offsetg
j( ppm)
-80, -75, ... ,-5, Off Off (Tolerance ± 5 ms)
Rate Hysteresis Search Hysteresisg
j(cycles)
Off, 256, 512, 1024, 2048, 4096 Off (Tolerance ± 1 cycle)
Rate Smoothing (up, down)gj(%) Off, 3, 6, 9, 12, 15, 18, 21, 25 Off (Tolerance 1%)
Noise Responseag AOO, VOO, DOO, Inhibit Pacing DOO for DDD(R) and DDI(R)
modes; VOO for VDD(R) and VVI(R)
modes; AOO for AAI(R) mode
- DRAFT -

A-12 PROGRAMMABLE OPTIONS
Table A-12. Pacing therapy parameters (Normal, Post-Therapy, and Temporary) (specified into a 750 Ω
load) (continued)
Parameter Programmable Values Nominal
Maximum Pacing Rateag (ppm) 30, 35, ... ,185 130(Tolerance±5ms)
Post-therapy Pacing Period
(min:sec) (available post-shock
only)
00:15, 00:30, 00:45, 01:00, 01:30,
02:00, 03:00, 04:00, 05:00, 10:00,
15:00, 30:00, 45:00, and 60:00
00:30 (Tolerance ± 1 cardiac cycle)
a. The programmed Normal Brady values will be used as the nominal values for Temporary Brady pacing.
b. Refer to the NASPE/BPEG codes below for an explanation of the programmable values. The identification code of the North
American Society of Pacing and Electrophysiology (NASPE) and the British Pacing and Electrophysiology Group (BPEG) is based
on the categories listed in the table.
c. The basic pulse period is equal to the pacing rate and the pulse interval (no hysteresis). Runaway protection circuitry inhibits
bradycardia pacing above 205 ppm. Magnet application does not affect pacing rate (test pulse interval).
d. Separately programmable for ATP/Post-Shock, Temporary Brady, and EP Test.
e. The minimum value of energy delivered at 5 V and 0.5 ms is 20 µJ with 200–500 Ω, and 12 µJ with 1000 Ωresistive load
at 37°C ± 1°C for BOL and Explant.
f. Values are not affected by temperature variation within the range 20°–43°C.
g. This parameter is used globally in Normal Brady pacing and Post-shock Brady pacing. Changing the value for Normal Brady will
change the value for Post-shock Brady.
h. This parameter is automatically set to at least 85 ms for Post-Shock Brady.
i. This parameter is automatically adjusted in Post-Shock Brady to allow appropriate sensing.
j. This parameter is disabled during Temporary Brady.
Table A-13. Brady/CRT left ventricular pacing parameters (specified into a 750 Ωload)
Parameter Programmable Values Nominala
Ventricular Pacing ChamberbRV Only, BiV BiV
LV Offsetbg(ms) -100, -90, ..., 0 0(Tolerance±5ms)
Pulse Amplitudecde(left ventricle)
(V)
0.1, 0.2, ..., 3.5, 4.0, ..., 7.5 3.5 (5.0 post therapy) (Tolerance
± 15% or ± 100mV) (whichever is
greater)
Pulse Widthcde(left ventricle) (ms) 0.1, 0.2, ..., 2.0 0.4 (1.0 post therapy) (Tolerance ±
0.03 ms at < 1.8 ms; ± 0.08 ms at
≥1.8 ms)
LV-Blank After A-Pacef(ms) 45, 65, 85, Smart Smart (Tolerance ± 5 ms)
LVRPb(ms) 250, 260, ..., 500 250 (Tolerance ± 7.5 ms)
LVPPb(ms) 300, 350, ..., 500 400(Tolerance±5ms)
BiV TriggerbOff, On On
Left Ventricular Electrode
Configurationb
Dual, Single, None None
- DRAFT -

PROGRAMMABLE OPTIONS A-13
Table A-13. Brady/CRT left ventricular pacing parameters (specified into a 750 Ωload) (continued)
Parameter Programmable Values Nominala
Left Ventricular Pace ConfigurationbSingle or Dual:
LVtip>>Can
LVtip>>RV
Dual Only:
LVring>>Can
LVring>>RV
LVtip>>LVring
LVring>>LVtip
Single: LVtip>>RV
Dual: LVtip>>LVring
Left Ventricular Sense
Configurationb
Single or Dual:
LVtip>>Can
LVtip>>RV
Off
Dual Only:
LVring>>Can
LVring>>RV
LVtip>>LVring
Single: LVtip>>RV
Dual: LVtip>>LVring
a. The programmed Normal Brady values will be used as the nominal values for Temporary Brady pacing.
b. This parameter is used globally in Normal Brady pacing and Post-shock Brady pacing. Changing the value for Normal Brady will
change the value for Post-shock Brady.
c. Separately programmable for ATP/Post-Shock, Temporary Brady, and EP Test.
d. The minimum value of energy delivered at 5 V and 0.5 ms is 20 µJ with 200–500 Ω, and 12 µJ with 1000 Ωresistive load
at 37°C ± 1°C for BOL and Explant.
e. Values are not affected by temperature variation within the range 20°–43°C.
f. This parameter is automatically set to at least 85 ms for Post-Shock Brady.
g. WhentheLVOffsetis0theLVPacefollowstheRVPaceby2.5ms
Table A-14. Atrial Tachy Parameters
Parameter Programmable Values Nominal
ATR Mode Switchab Off, On On
ATR Trigger Rateab( bpm) 100, 110, ..., 300 170(Tolerance±5ms)
ATR Durationab(cycles) 0, 8, 16, 32, 64, 128, 256, 512,
1024, 2048
8(Tolerance±1cardiaccycle)
Entry Countab(cycles) 1, 2, ..., 8 8
Exit Countab(cycles) 1, 2, ..., 8 8
ATR Fallback Modeab VDI, DDI, VDIR, DDIR DDI
ATR Fallback Timeab(min:sec) 0, 0:15, 0:30, 0:45, 1:00, 1:15, 1:30,
1:45, 2:00
0:30
ATR/VTR Fallback LRLab( ppm) 30, 35, ..., 185 70 (Tolerance ± 5 ms)
ATR VRRab Off, Min, Med, Max Min
ATR Maximum Pacing Rateab
( ppm)
30, 35, ..., 185 130
ATR BiV Triggerab Off, On On
- DRAFT -

A-14 PROGRAMMABLE OPTIONS
Table A-14. Atrial Tachy Parameters (continued)
Parameter Programmable Values Nominal
Atrial Flutter Responsebc Off, On Off
Atrial Flutter Response Ratebc
( bpm)
100, 110, ..., 300 170(Tolerance±5ms)
PMT Terminationbc Off, On On
VRRbc Off, Min, Med, Max Off
a. The programmed Normal Brady values will be used as the nominal values for Temporary Brady pacing.
b. This parameter is used globally in Normal Brady pacing and Post-shock Brady pacing. Changing the value for Normal Brady will
change the value for Post-shock Brady.
c. This parameter gets disabled during Temporary Brady.
Table A-15. Brady Mode values based on NASPE/BPEG codes
Position I II III IV V
Category Chambers
Paced
Chambers
Sensed
Response
to Sensing
Programmability,
rate modulation
Antitachyarrhythmia
Functions
Letters 0–None 0–None 0–None 0–None 0–None
A–Atrium A–Atrium T–Triggered P–Simple
Programmable
P–Pacing
(Antitachyarrhythmia)
V–Ventricle V–Ventricle I–Inhibited M–Multiprogrammable S–Shock
D–Dual (A&V) D–Dual (A&V) D–Dual (T&I) C–Communicating D–Dual (P&S)
R–Rate Modulation
Mfrs.
Designation
Only
S–Single (A or
V)
S–Single (A or
V)
Table A-16. Magnet and Beeper functions
Parameter Programmable Values Nominal
Magnet Response Off, Store EGM, Inhibit Therapy Inhibit Therapy
Beep During Capacitor Charge Off, On Off
Beep When Explant is Indicated Off, On On
Table A-17. Sensitivity Adjustment
Parameter Programmable Values Nominal
Atrial Sensitivity AGC 0.15, AGC 0.2, AGC 0.25,
AGC 0.3, AGC 0.4, ..., AGC 1.0,
AGC 1.5
AGC 0.25
- DRAFT -

PROGRAMMABLE OPTIONS A-15
Table A-17. Sensitivity Adjustment (continued)
Parameter Programmable Values Nominal
Right Ventricular Sensitivity AGC 0.15, AGC 0.2, AGC 0.25,
AGC 0.3, AGC 0.4, ..., AGC 1.0,
AGC 1.5
AGC 0.6
Left Ventricular Sensitivity AGC 0.15, AGC 0.2, AGC 0.25,
AGC 0.3, AGC 0.4, ..., AGC 1.0,
AGC 1.5
AGC 1.0
Table A-18. Ventricular Commanded ATP
ParameteraProgrammable Values Nominal
Commanded Ventricular ATP (Type) Burst, Ramp, Scan, Ramp/Scan Burst
Number Of Bursts 1, 2, ..., 30 30
Initial Pulses per Burst (pulses) 1, 2, ..., 30 4
Pulse Increment (pulses) 0, 1, .., 5 0
Maximum Number of Pulses 1, 2, ..., 30 4
Coupling Interval (% or ms) 50, 53, 56, 59; 63, 66, ..., 84; 88, 91,
94, 97% or 120, 130, ..., 750 ms
81%(Tolerance±5ms)
Coupling Interval Decrement (ms) 0, 2, ..., 30 0(Tolerance±5ms)
Burst Cycle Length (BCL) (% or ms) 50, 53, 56, 59; 63, 66, ..., 84; 88, 91,
94, 97% or 120, 130, ..., 750 ms
81%(Tolerance±5ms)
Ramp Decrement (ms) 0, 2, ..., 30 0(Tolerance±5ms)
Scan Decrement (ms) 0, 2, ..., 30 0(Tolerance±5ms)
Minimum Interval (ms) 120, 130, ..., 400 200(Tolerance±5ms)
a. The ventricular Commanded ATP Pulse Width and Amplitude values are the same as programmed for ventricular ATP therapy.
Table A-19. 50 Hz/Manual Burst Pacing
ParameteraProgrammable Values Nominal
Burst Interval (ms) 20, 30, ..., 750 600(Tolerance±5ms)
- DRAFT -

A-16 PROGRAMMABLE OPTIONS
Table A-19. 50 Hz/Manual Burst Pacing (continued)
ParameteraProgrammable Values Nominal
Minimum Interval (ms) 20, 30, ...,750 200(Tolerance±5ms)
Decrement (ms) 0, 10, ..., 50 50 (Tolerance ± 5 ms)
a. Applied to the atrium or ventricle depending on the chamber selected.
Table A-20. Ventricular Commanded Shock
Parameter Programmable Values Nominal
Shock (stored energy) (J) 0.1, 0.3, 0.6, 0.9, 1.1, 1.7, 2, 3, 5, 6,
7, 9, 11, 14, 17, 21, 23, 26, 29, 31,
36 (HE), 41 (HE)
41 (Tolerance ± 60% for ≤0.3 J; ±
40% for ≤0.6–3 J; ± 20% for 5–36
J, ± 10% for 41 J)
Coupling Interval (ms) Sync, 50, 60, ..., 500 Sync
Table A-21. VFib (Ventricular Fibrillation) Induction
Parameter Values
VFib High 15V (nonprogrammable) (Tolerance ± 10V)
VFib Low 9V (nonprogrammable) (Tolerance ± 7V)
Table A-22. Shock on T Induction
Parameter Programmable Values Nominal
Shock (stored energy) (J) 0.1, 0.3, 0.6, 0.9, 1.1, 1.7, 2, 3, 5, 6,
7, 9, 11, 14, 17, 21, 23, 26, 29, 31,
36 (HE), 41 (HE)
1.1 J (Tolerance ± 60% for ≤0.3 J;
± 40% for ≤0.6–3 J; ± 20% for 5–36
J, ± 10% for 41 J)
Number of S1 Pulses 1, 2, ..., 30 8
S1 Interval (ms) 120, 130, ..., 750 400
Coupling Interval (ms) Sync, 10, 20, , ..., 500 310
Table A-23. PES (Programmed Electrical Stimulation)
ParameteraProgrammable Values Nominal
Number of S1 Intervals (pulses) 1, 2, ..., 30 8
S2 Decrement 0, 10, ..., 50 0
S1 Interval (ms) 120, 130, ..., 750 600(Tolerance±5ms)
S2 Interval (ms) Off, 120, 130, ..., 750 600 (Tolerance ± 5 ms)
S3 Interval (ms) Off, 120, 130, ..., 750 Off (Tolerance ± 5 ms)
- DRAFT -

PROGRAMMABLE OPTIONS A-17
Table A-23. PES (Programmed Electrical Stimulation) (continued)
ParameteraProgrammable Values Nominal
S4 Interval (ms) Off, 120, 130, ..., 750 Off (Tolerance ± 5 ms)
S5 Interval (ms) Off, 120, 130, ..., 750 Off (Tolerance ± 5 ms)
a. Applied to the atrium or right ventricle as commanded by the programmer.
- DRAFT -
A-18 PROGRAMMABLE OPTIONS
- DRAFT -

B-1
CLINICAL STUDY - COMPANION
APPENDIX B
CLINICAL STUDY POPULATIONS
Guidant CRT-Ds, when compared to OPT alone, have been demonstrated with
reasonable assurance, to be safe and effective in significantly reducing: the
risk of a composite of all-cause mortality or first hospitalization by 20%, the
risk of all-cause mortality by 36%, and heart failure symptoms in patients who
have moderate to severe heart failure (NYHA III/IV) including left ventricular
dysfunction (EF ≤35%) and QRS duration ≥120 ms and remain symptomatic
despite stable, optimal heart failure drug therapy, based on the Guidant
sponsored COMPANION clinical study. (Guidant devices were the only devices
studied in the COMPANION clinical trial.)
SUMMARY
The COMPANION clinical study was designed to determine whether combined
all-cause mortality or first hospitalization in heart failure patients receiving
optimal pharmacologic therapy (OPT) can be reduced by combining OPT and
either of the following:
• Biventricular pacing therapy alone (CRT-P)
• Biventricular pacing with defibrillation (CRT-D)
All-cause mortality or first hospitalization (time to first event) analyzed from the
time of randomization, was the primary endpoint of the study.
Guidant conducted the COMPANION study in part to demonstrate the safety
and effectiveness of Guidant CRT-D and CRT-P devices in the COMPANION
patient population. Trial objectives included establishing that OPT combined
with biventricular pacing with defibrillation (CONTAK CD) is superior to OPT
alone in improving exercise performance (Sub-study), reducing combined
all-cause mortality or first hospitalization (Primary endpoint), reducing cardiac
morbidity (Secondary endpoint) and reducing all-cause mortality (Secondary
endpoint).
The COMPANION trial utilized a Steering Committee, Data Safety Monitoring
Board (DSMB), and Morbidity and Mortality Committee for study conduct,
safety, and event adjudication respectively.
- DRAFT -
B-2 CLINICAL STUDY - COMPANION
The clinical study began January 20, 2000 and was conducted at 128 centers
within the United States.
The COMPANION clinical study was monitored using a sequential design
and on November 18, 2002, after review of the data by the Data Safety and
Monitoring Board, enrollment in the study was stopped. The CRT-D arm of
the trial had reached the target number of events for the combined primary
all-cause mortality or first hospitalization endpoint, as well as the secondary
all-cause mortality endpoint. All effectiveness follow-ups ended by December
1, 2002.
OBSERVED ADVERSE EVENTS
Prior History
The CONTAK RENEWAL 3, CONTAK RENEWAL, and CONTAK CD devices
provide the same defibrillation and cardiac resynchronization therapy
(biventricular pacing) and have the same Indications for Use. Therefore,
the Comparison of Medical, Pacing, and Defibrillation Therapies in Heart
Failure (COMPANION) clinical trial data (based on CONTAK CD devices)
used to support expanding Guidant CRT-D indications to the COMPANION
patient population, are also applicable to CONTAK RENEWAL and CONTAK
RENEWAL 3.
The primary difference between CONTAK CD devices and CONTAK
RENEWAL/CONTAK RENEWAL 3 devices is that CONTAK CD utilizes an
electrically common RV and LV sensing/pacing circuit whereas CONTAK
RENEWAL and CONTAK RENEWAL 3 incorporate an independent RV and
LV sensing/pacing circuit. Additional clinical analysis was conducted with
CONTAK RENEWAL, in a European study, to provide confirmation that the
independent sensing and pacing capability did not adversely affect the ability
of the device to detect ventricular tachyarrhythmias or provide continuous
biventricular pacing therapy.
Study Background
The Comparison of Medical Therapy, Pacing, and Defibrillation in Heart Failure
(COMPANION) Study was a prospective, open-label, randomized, controlled,
multi-center, unblinded study conducted at 128 sites and enrolled a total of
1638 patients, of which 1520 were randomized. Patients were randomly
assigned 1:2:2 to receive optimal pharmacological therapy (OPT, 308 patients)
or a cardiac resynchronization therapy pacemaker (CRT-P, 617 patients) or a
cardiac resynchronization therapy pacemaker with defibrillator (CRT-D, 595
- DRAFT -

CLINICAL STUDY - COMPANION B-3
patients). Of the 1520 patients randomized, 903 were randomized to OPT and
CRT-D. This summary focuses on data and analyses for the CRT-D and OPT
groups, only, with the exception of the Exercise Performance results, which are
based on pooled CRT-D and CRT-P data.
The CRT-D devices (CONTAK CD) in this trial, were approved for commercial
distribution via the CONTAK CD study, which provided a reasonable assurance
of safety. A similar safety analysis was applied to the COMPANION patient
population. The results were consistent with safety measurements obtained in
the CONTAK CD trial.
Adverse Event Definitions
Adverse events were defined as any undesirable clinical occurrence, whether
it was related to the device or not. Table B-1 on page B-3 includes adverse
events occurring in the first six months related to the device (pulse generator
and leads) and implant procedures (including attempts). Table B-2 on page B-6
includes adverse events occurring in the first six months related to patient
condition (i.e., worsening heart failure). Adverse events are listed in descending
order by total number of patients experiencing the event.
Adverse events related to the device were further reported using two
sub-categories based on the nature of the intervention. These events were
defined as a complication if the event resulted in invasive intervention,
loss of significant device function, and death or permanent disability.
An observation was a device-related adverse event that was resolved
non-invasively. Forty-nine percent of CRT-D patients reported a device and/or
procedure-related adverse event.
Table B-1. Device- and procedure-related adverse events
Total Events
(Patients)
% Comps
(Patients)
%Obs
(Patients)
Total Adverse Eventsa498 (290) 13.1 (77) 43.4 (255)
Post surgical wound discomfort 68 (62) 0.0 (0) 10.5 (62)
Phrenic nerve/diaphragm stimulation 77 (59) 1.4 (8) 9.0 (53)
Brady capture - LV 38 (36) 4.3 (25) 2.2 (13)
Hematoma 37 (34) 0.3 (2) 5.4 (32)
Inappropriate shock above rate cutoff 26 (24) 0.0 (0) 4.1 (24)
Multiple counting - tachy 22 (17) 0.3 (2) 2.9 (17)
Pocket infection 19 (17) 0.5 (3) 2.6 (15)
- DRAFT -

B-4 CLINICAL STUDY - COMPANION
Table B-1. Device- and procedure-related adverse events (continued)
Total Events
(Patients)
% Comps
(Patients)
%Obs
(Patients)
Dissection, coronary sinus 15 (15) 0.0 (0) 2.6 (15)
Brady capture - atrium 14 (12) 1.5 (9) 0.5 (3)
Inappropriate shock due to oversensing 11 (11) 0.0 (0) 1.9 (11)
Pneumothorax 10 (10) 1.0 (6) 0.7 (4)
Hypotension 10 (9) 0.2 (1) 1.4 (8)
Brady capture - RV 8 (8) 0.9 (5) 0.5 (3)
Physical trauma 8 (8) 0.2 (1) 1.2 (7)
AV Block - heart block, complete 7 (7) 0.2 (1) 1.0 (6)
Pacemaker-mediated tachycardia (PMT) 7 (6) 0.0 (0) 1.0 (6)
Physiological reactionb6 (6) 0.0 (0) 1.0 (6)
Arrhythmia - atrial fibrillation 5 (5) 0.0 (0) 0.9 (5)
Bleeding/fluid accumulation 5 (5) 0.0 (0) 0.9 (5)
Perforation, coronary venous 5 (5) 0.5 (3) 0.3 (2)
Renal failure 5 (5) 0.0 (0) 0.9 (5)
Thrombosis 5 (5) 0.0 (0) 0.9 (5)
Vascular related 5 (5) 0.0 (0) 0.9 (5)
Oversensing - atrium pace sense 4 (4) 0.3 (2) 0.3 (2)
Allergic reaction 3 (3) 0.0 (0) 0.5 (3)
Congestive heart failure 3 (3) 0.0 (0) 0.5 (3)
Nausea (2), Constipation (1) 3 (3) 0.0 (0) 0.5 (3)
High DFTs - tachy 3 (3) 0.2 (1) 0.3 (2)
Oversensing - ventricle rate - tachy 3 (3) 0.2 (1) 0.3 (2)
Respiratory related 3 (3) 0.2 (1) 0.3 (2)
Ventricular tachycardia 3 (3) 0.2 (1) 0.3 (2)
Cardiac tamponade 2 (2) 0.3 (2) 0.0 (0)
Dyspnea (shortness of breath) 2 (2) 0.0 (0) 0.3 (2)
Electrolyte/lab 2 (2) 0.0 (0) 0.3 (2)
Hemorrhage 2 (2) 0.2 (1) 0.2 (1)
Insulation breach suspected 2 (2) 0.3 (2) 0.0 (0)
Migration of device 2 (2) 0.0 (0) 0.3 (2)
- DRAFT -

CLINICAL STUDY - COMPANION B-5
Table B-1. Device- and procedure-related adverse events (continued)
Total Events
(Patients)
% Comps
(Patients)
%Obs
(Patients)
Muscle stimulation 2 (2) 0.0 (0) 0.3 (2)
Myocardial infarction 2 (2) 0.0 (0) 0.3 (2)
Numbness 2 (2) 0.0 (0) 0.3 (2)
Perforation, venous 2 (2) 0.0 (0) 0.3 (2)
Phantom shock 2 (2) 0.0 (0) 0.3 (2)
Undersensing - atrium pace sense - brady 2 (2) 0.2 (1) 0.2 (1)
Altered hemodynamic status 1 (1) 0.0 (0) 0.2 (1)
Arrhythmia 1 (1) 0.0 (0) 0.2 (1)
Arrhythmia - sinus tachycardia 1 (1) 0.0 (0) 0.2 (1)
Bruise 1 (1) 0.0 (0) 0.2 (1)
Cardiac arrest 1 (1) 0.2 (1) 0.0 (0)
Change in arrhythmia - SVT 1 (1) 0.0 (0) 0.2 (1)
Change in arrhythmia - brady 1 (1) 0.0 (0) 0.2 (1)
Change in arrhythmia - junctional 1 (1) 0.0 (0) 0.2 (1)
Change in physical status 1 (1) 0.0 (0) 0.2 (1)
Chest pain 1 (1) 0.0 (0) 0.2 (1)
Dizziness, cause undetermined 1 (1) 0.0 (0) 0.2 (1)
Edema 1 (1) 0.0 (0) 0.2 (1)
Fatigue 1 (1) 0.0 (0) 0.2 (1)
Febrile 1 (1) 0.0 (0) 0.2 (1)
Unable to urinate 1 (1) 0.0 (0) 0.2 (1)
Helix related (screw tip), broken or stretched 1 (1) 0.2 (1) 0.0 (0)
Hemoglobin drop 1 (1) 0.2 (1) 0.0 (0)
Hypertension 1 (1) 0.0 (0) 0.2 (1)
Infection 1 (1) 0.2 (1) 0.0 (0)
Insulation breech observed 2 (1) 0.2 (1) 0.0 (0)
Malfunction, memory problem 1 (1) 0.2 (1) 0.0 (0)
Materials unretrieved in body 1 (1) 0.2 (1) 0.0 (0)
Pacemaker mediated tachycardia (PMT) 1 (1) 0.0 (0) 0.2 (1)
Pacemaker syndrome 1 (1) 0.0 (0) 0.2 (1)
- DRAFT -

B-6 CLINICAL STUDY - COMPANION
Table B-1. Device- and procedure-related adverse events (continued)
Total Events
(Patients)
% Comps
(Patients)
%Obs
(Patients)
Pericardial effusion 1 (1) 0.2 (1) 0.0 (0)
Pericarditis 2 (1) 0.0 (0) 0.2 (1)
Placement difficulty, stylet related 1 (1) 0.2 (1) 0.0 (0)
Pleural effusion 1 (1) 0.2 (1) 0.0 (0)
Pleurisy 2 (1) 0.0 (0) 0.2 (1)
Pocket erosion/extrusion 1 (1) 0.2 (1) 0.0 (0)
Anxiety 1 (1) 0.0 (0) 0.2 (1)
Respiratory arrest 1 (1) 0.2 (1) 0.0 (0)
Ventricular fibrillation 1 (1) 0.0 (0) 0.2 (1)
a. Observations and complications may not sum to total because some patient may have events in both categories.
b. Physiological reaction includes: swelling, rash, and/or drainage.
Table B-2. Patient-related adverse events
Total Events (Patients) % of Patients with
Events
Events/Patient Year
CRT-D OPT CRT-D
N=595
Patients
OPT
N=308
Patients
CRT-D
281 Years
OPT
134 Years
Total Patient Related
Adverse Events
1437 (443) 625 (207) 74.5 67.2 5.11 (1437) 4.66 (625)
Cardiovascular Related
Events
814 (351) 399 (176) 59.0 57.1 2.90 (814) 2.98 (399)
Congestive heart failurea269 (166) 185 (111) 27.9 36.0 0.96 (269) 1.38 (185)
Chest pain 83 (65) 50 (37) 10.9 12.0 0.30 (83) 0.37 (50)
Supraventricular
tachyarrhythmia
69 (56) 11 (11) 9.4 3.6 0.25 (69) 0.08 (11)
Ventricular tachyarrhythmia 66 (51) 16 (15) 8.6 4.9 0.23 (66) 0.12 (16)
Electrolyte/lab 51 (42) 17 (16) 7.1 5.2 0.18 (51) 0.13 (17)
Hypotension 42 (40) 16 (15) 6.7 4.9 0.15 (42) 0.12 (16)
Dizziness, cause
undetermined
33 (30) 26 (23) 5.0 7.5 0.12 (33) 0.19 (26)
Renal failure 40 (29) 16 (14) 4.9 4.5 0.14 (40) 0.12 (16)
Fatigue 27 (25) 12 (12) 4.2 3.9 0.10 (27) 0.09 (12)
Bradyarrhythmia 32 (30) 5 (5) 5.0 1.6 0.11 (32) 0.04 (5)
- DRAFT -

CLINICAL STUDY - COMPANION B-7
Table B-2. Patient-related adverse events (continued)
Total Events (Patients) % of Patients with
Events
Events/Patient Year
CRT-D OPT CRT-D
N=595
Patients
OPT
N=308
Patients
CRT-D
281 Years
OPT
134 Years
Vascular 14 (11) 11 (10) 1.8 3.2 0.05 (14) 0.08 (11)
Syncope 12 (12) 7 (7) 2.0 2.3 0.04 (12) 0.05 (7)
GI bleed 14 (13) 4 (4) 2.2 1.3 0.05 (14) 0.03 (4)
Arrhythmia 12 (10) 6 (6) 1.7 1.9 0.04 (12) 0.04 (6)
Hypertension 12 (9) 6 (5) 1.5 1.6 0.04 (12) 0.04 (6)
Palpitations 9(9) 3(3) 1.5 1.0 0.03 (9) 0.02 (3)
Myocardial infarction 7 (7) 4 (4) 1.2 1.3 0.02 (7) 0.03 (4)
Stroke syndrome or CVA 7 (7) 2 (2) 1.2 0.6 0.02 (7) 0.01 (2)
Deep vein thrombosis 4(4) 0(0) 0.7 0.0 0.01 (4) 0.00 (0)
Transient ischemic attack
(TIA)
3(3) 1(1) 0.5 0.3 0.01 (3) 0.01 (1)
Hematuria 3(3) 0(0) 0.5 0.0 0.01 (3) 0.00 (0)
Ischemia 2(2) 1(1) 0.3 0.3 0.01 (2) 0.01 (1)
Coagulopathy 2 (2) 0 (0) 0.3 0.0 0.01 (2) 0.00 0(0)
Bleeding/fluid accumulation 1 (1) 0 (0) 0.2 0.0 0.00 (1) 0.00 (0)
Non-cardiovascular Related
Events
623 (293) 226 (119) 49.2 38.6 2.22 (623) 1.69 (226)
Respiratory relatedb130 (108) 53 (41) 18.2 13.3 0.46 (130) 0.40 (53)
GIc124 (95) 30 (24) 16.0 7.8 0.44 (124) 0.22 (30)
Pain 82 (66) 40 (32) 11.1 10.4 0.29 (82) 0.30 (40)
Physiological reactiond76 (61) 20 (18) 10.3 5.8 0.27 (76) 0.15 (20)
Infection 54 (37) 18 (15) 6.2 4.9 0.19 (54) 0.13 (18)
Endocrine 41 (35) 16 (14) 5.9 4.5 0.15 (41) 0.12 (16)
Psychological effects 24 (19) 13 (12) 3.2 3.9 0.09 (24) 0.10 (13)
Change in physical status 20 (18) 9 (9) 3.0 2.9 0.07 (20) 0.07 (9)
Physical trauma 26 (22) 4 (4) 3.7 1.3 0.09 (26) 0.03 (4)
Neurologic 14 (14) 6 (6) 2.4 1.9 0.05 (14) 0.04 (6)
Genitourinary 9 (7) 5 (4) 1.2 1.3 0.03 (9) 0.04 (5)
Cancer, other 5 (5) 6 (5) 0.8 1.6 0.02 (5) 0.04 (6)
- DRAFT -

B-8 CLINICAL STUDY - COMPANION
Table B-2. Patient-related adverse events (continued)
Total Events (Patients) % of Patients with
Events
Events/Patient Year
CRT-D OPT CRT-D
N=595
Patients
OPT
N=308
Patients
CRT-D
281 Years
OPT
134 Years
Febrile 7(7) 0(0) 1.2 0.0 0.02 (7) 0.00 (0)
Respiratory failure 4 (4) 1 (1) 0.7 0.3 0.01 (4) 0.01 (1)
Tumors, growths 1(1) 2(2) 0.2 0.6 0.00 (1) 0.01 (2)
Ulceration 2(1) 2(2) 0.2 0.6 0.01 (2) 0.01 (2)
Diabetes complications 2(2) 0(0) 0.3 0.0 0.01 (2) 0.00 (0)
Pulmonary embolism 1(1) 1(1) 0.2 0.3 0.00 (1) 0.01 (1)
Pneumonia (respiratory
infection)
1(1) 0(0) 0.2 0.0 0.00 (1) 0.00 (0)
a. Congestive heart failure includes: congestive heart failure, dyspnea, volume overload, edema, pulmonary edema, change in
drug therapy.
b. The most frequent three events in this category were: upper respiratory infection, bronchitis, and influenza.
c. The most frequent three events in this category were: nausea, diarrhea, and abdominal pain.
d. The most frequent three events in this category were: swelling, rash, and weight gain.
Deaths
There were a total of 182 deaths (77 OPT, 105 CRT-D) that occurred during
the trial and recorded through November 30, 2002. Table B-3 on page B-8
presents cause of death stratified by treatment group.
Table B-3. CRT-D and OPT cause of death
Cause of Death OPT Arm
(N = 308)
CRT-D Arm
(N = 595)
Total
(N = 903)
Cardiac 58 (18.8%) 76 (12.8%) 134 (14.8%)
Vascular 0 (0.0%) 3 (0.5%) 3 (0.3%)
Non-Cardiac 11 (3.6%) 21 (3.5%) 32 (3.5%)
- DRAFT -

CLINICAL STUDY - COMPANION B-9
Table B-3. CRT-D and OPT cause of death (continued)
Cause of Death OPT Arm
(N = 308)
CRT-D Arm
(N = 595)
Total
(N = 903)
Unknown/ Unclassified 8 (2.6%) 5 (0.8%) 13 (1.4%)
Total Deaths 77 (25.0%) 105 (17.6%) 182 (20.2%)
NOTE: After the study was stopped in November 2002, follow-up for safety
continued for approximately one more year on 151 OPT and 449 CRT-D
patients with the final data cut-off on November 26, 2003. During this post-trial
follow-up period, an additional 54 deaths were reported, consisting of 14/151
(9.3%) OPT patients and 40/449 (8.9%) CRT-D patients.
The mortality rates are approximately equal during this post-trial follow-up
period. This may be because CRT devices were made available to OPT
patients. Thus, most patients were receiving the same therapy during this
interval.
STUDY DESIGN
The COMPANION study design and study results have been previously
described in the medical literature.12
The COMPANION study was a prospective, randomized (1:2:2 to OPT, CRT-P
[delivered by the CONTAK TR device], or CRT-D [delivered by the CONTAK
CD device]), controlled, multi-center study. Both of these devices became
commercially available during the course of the study.
Randomization was stratified by centers and by beta-blocker use to
assure proper balance between the treatment groups within each center.
Each randomized patient remained counted as a member of the original
randomization assignment (intention-to-treat) regardless of subsequent
crossover or protocol adherence.
Eligible patients were also enrolled in a sub-study designed to measure
improvement in exercise performance in patients randomized to CRT (CRT-P
and CRT-D pooled data) therapy compared to OPT.
1. Bristow MR, Feldman AM, Saxon LA. Heart failure management using implantable devices for
ventricular resynchronization: Comparison of Medical Therapy, Pacing, and Defibrillation in
Chronic Heart Failure (COMPANION) trial. J Card Fail. 2000;6(3):276-285.
2. Bristow MR, Saxon LA, Boehmer J, et al. Cardiac resynchronization therapy with or without an
implantable defibrillator in advanced chronic heart failure. N Engl J Med. 2004;350:2140-2150.
- DRAFT -
B-10 CLINICAL STUDY - COMPANION
INCLUSION/EXCLUSION CRITERIA
The study population consisted of patients with moderate to severe heart
failure, New York Heart Association Classification III or IV, left ventricular
ejection fraction ≤35%, and QRS width ≥120 ms due to ischemic or
non-ischemic cardiomyopathy.
All patients were required to have been treated with a stable dose of
beta-blocker, ACE inhibitor or ARB, diuretic, and aldosterone antagonist. A
stable dose was defined as 30 days for all drugs except beta-blocker, which
required 90 days stabilization from last up titration prior to randomization.
Diuretic dosage could be adjusted any time by the investigator using medical
discretion.
Patients enrolled in the study were required to meet the following inclusion
criteria:
• Moderate or severe heart failure, defined as symptomatic heart failure
for at least six months with NYHA class III or IV symptoms at the time of
enrollment, and at least one of the following events in the previous 12
months:
– Hospitalization for heart failure management
– Outpatient visit in which intravenous (IV) inotropes or vasoactive
infusion were administered continuously for at least 4 hours
– Emergency room visit of at least twelve hours duration in which IV
heart failure medications were administered (including diuretics)
•QRS≥120 ms and PR interval > 150 ms from any two leads of a 12–lead
ECG
• Left ventricular ejection fraction ≤35%
• Left ventricular end diastolic dimension ≥60 mm (required only if LVEF
measured by echo) or > 3.0 cm/m2(The cm/m2is calculated by LVEDD [in
cm] divided by BSA [body surface area])
•Age≥18 years
• Optimal pharmacologic therapy for heart failure (beta blocker, ACE inhibitor,
diuretics, and spironolactone)
- DRAFT -
CLINICAL STUDY - COMPANION B-11
Additional eligibility criteria for the Exercise Performance sub-study:
• Understand the nature of the sub-study and provide informed consent
• Have been enrolled at a participating sub-study investigational center
• Have no neuromuscular or vascular disability that prevents normal walking
(e.g., intermittent claudication, arthritis, residual stroke weakness)
• Have no history of angina during previous exercise testing
•FEV
1/FVC ≥50%
•150m≤Six-minute walk distance ≤425 m
• Baseline Peak VO2< 22 ml/kg/min
• Have no cardiac disabilities that would ordinarily contraindicate exercise
testing:
– Changing pattern on the ECG
– Changing pattern of chest discomfort
– Decompensated heart failure
– Uncontrolled arrhythmias
Patients were excluded from the investigation if they met any of the following
criteria:
• Unable or unwilling to undergo device implant and follow-up testing
• Patients with a hypersensitivity to 0.7 mg nominal dose of dexamethasone
acetate
• Meet the general indications for an implantable cardioverter defibrillator
• Surgically uncorrected primary valvular disease
• Meet the general indications for antibradycardia pacing
• Coronary artery disease (CAD) in which surgical or percutaneous correction
is recent (within 60 days of randomization)
- DRAFT -
B-12 CLINICAL STUDY - COMPANION
• Expected to receive a heart transplant in the next six months
• Women who are pregnant or not using medically acceptable birth control
• Chronic, medically refractory atrial tachyarrhythmias
• Hypertrophic obstructive cardiomyopathy
• Unexplained syncope
• Amyloid disease
• Myocardial infarction within 60 days of randomization
• Hospitalization for heart failure or IV inotropic or vasoactive therapy in
excess of 4 hours in the 30 days prior to enrollment
• History of non-compliance with oral heart failure therapy
• Involved in any other investigational studies
• Progressive or unstable angina
• Life expectancy < 6 months due to any other medical conditions
• Uncontrolled blood pressure: Systolic BP > 160 mm Hg or < 85 mm Hg
or diastolic BP > 90 mm Hg
ENDPOINTS
This summary focuses on the CRT-D vs. OPT contrast, providing evidence
of safety and effectiveness for Guidant CRT-Ds in the COMPANION patient
population.3The clinical data and analyses herein address the following study
endpoints for all patients randomized to CRT-D and OPT only, unless otherwise
stated as a sub-study measurement (where CRT-D and CRT-P data were
pooled for exercise performance).
Primary Endpoint
The primary endpoint was a composite consisting of all-cause mortality or first
hospitalization (time to first event) as analyzed from the date of randomization
3. Guidant CRT-Ps are already approved for use in the COMPANION patient population,
P030005, approved 01/26/04.
- DRAFT -

CLINICAL STUDY - COMPANION B-13
on an intention-to-treat basis. The study was designed to demonstrate a 25%
relative reduction with CRT-D when compared to an estimated 40% annual rate
in the OPT cohort. All-cause mortality was defined as death from any cause.
Hospitalization is defined below:
Qualifying Duration for Hospitalization––the intent behind hospitalization
was to capture hospitalizations that were of sufficient duration to enter into a
composite with all-cause mortality. Thus, hospitalization was defined as care
provided at a hospital in which hospital admission and discharge occurred on
separate dates. Patients excluded from this definition were those who received
care at a hospital, but were discharged on the same day as admission. In
addition to hospitalizations, the use of intravenous inotropes or vasoactive
agents for a duration of greater than four hours was also considered to be of
significant importance to be treated as an instance of hospitalization.
Hospitalizations Related to the Implant Procedure––hospitalizations
associated with device implant (initial and reattempted for unsuccessful
initial implant) were not considered to be an event for evaluating the primary
endpoint. Similarly, hospitalizations associated with elective implant of devices
(i.e., absence of an electrophysiological indication or an ongoing hospitalization
requiring intravenous therapy) in the OPT cohort also were not considered to
be a primary endpoint event. Surgical revisions of a previous implanted system
did count as a primary endpoint event if the revision was of a sufficient duration
to result in different admission and discharge dates. Table B-4 on page B-13
summarizes the criteria for determining which hospitalization events were
considered as a primary endpoint event.
Table B-4. Hospitalizations contributing to primary endpoint
Event Description CRT-D OPT
Initial implant/reattempts No No
Surgical revisions of system YesaYe sa
Hospitalization with no calendar date change No No
Hospitalization with a calendar date change Yes Yes
IV inotrope and/or vasoactive drug use > 4 hours Yes Yes
a. If calendar date change.
Secondary Endpoints
All-cause mortality––the all-cause mortality (death from any cause) endpoint
was designed to show a 25% reduction in mortality in the CRT-D arm from an
OPT annual mortality rate of 24%. Difference in mortality was determined by
- DRAFT -
B-14 CLINICAL STUDY - COMPANION
contrasting patients randomized to CRT-D in addition to OPT versus patients
randomized to OPT alone.
Cardiac morbidity––the hospitalization component of the primary endpoint
included non-cardiac events that may not be impacted by CRT-D. The cardiac
morbidity endpoint was unique to the COMPANION study. It is a more specific
outcome measure intended to determine whether CRT-D when compared to
OPT would reduce the type of events that are pertinent to a hospitalization
for heart failure.
Cardiac morbidity was defined as the occurrence of one or more of the
following events:
• Worsening heart failure resulting in use of intravenous vasoactive or
inotropic therapy exceeding four hours
• Mechanical respiratory or cardiac support
• Any cardiac surgery, including heart transplant
• Resuscitated cardiac arrest or sustained ventricular tachycardia requiring
intervention (e.g., chest thump, external cardioversion, or external
defibrillation)
• Hospitalization for acute decompensation of heart failure
• Hospitalization that results in death from cardiac causes
•Significant device-related events resulting in:
– Permanent disability
– Hospitalization for pending death or permanent disability
Safety––CRT-D system-related complication-free rate is determined by
measuring complications related to any of the implanted components or
their associated implant procedure in those patients who were successfully
implanted with the CRT-D system.
NOTE: During the course of the COMPANION clinical study, the EASYTRAK
Coronary Venous pace/sense lead was established as safe and effective in a
separate clinical study and was approved for commercial distribution (P010012,
05/02/02). Refer to the commercially available EASYTRAK Coronary Venous
pace/sense lead labeling for clinical safety and performance characteristics.
- DRAFT -