Cambium Networks 45700 Wireless Ethernet Bridge, Dual Channel OFDM MIMO Combination Point to Point / Point to Multipoint Equipment User Manual PTP700 Series User Guide
Cambium Networks Limited Wireless Ethernet Bridge, Dual Channel OFDM MIMO Combination Point to Point / Point to Multipoint Equipment PTP700 Series User Guide
Contents
User Guide Part 3

Chapter 6: Configuration and alignment
This chapter describes how to use the web interface to configure the PTP 700 link. It also
describes how to align antennas. This chapter contains the following topics:
• Preparing for configuration and alignment on page 6-2
• Connecting to the unit on page 6-4
• Using the web interface on page 6-6
• Installation menu on page 6-9
• System menu on page 6-30
• Management menu on page 6-58
• SNMP pages (for SNMPv3) on page 6-80
• SNMP pages (for SNMPv1/2c) on page 6-89
• Security menu on page 6-93
• Configuring security for FIPS 140-2 applications on page 6-105
• Aligning antennas on page 6-108
• Other configuration tasks on page 6-116
Page 6-1
Chapter 6: Configuration and alignment Preparing for configuration and alignment
Preparing for configuration and alignment
This section describes the checks to be performed before proceeding with unit configuration
and antenna alignment.
Safety precautions
All national and local safety standards must be followed while configuring the units and
aligning the antennas.
Warning
Ensure that personnel are not exposed to unsafe levels of RF energy. The units start to
radiate RF energy as soon as they are powered up. Respect the safety standards
defined in Compliance with safety standards on page 4-22, in particular the minimum
separation distances.
Observe the following guidelines:
• Never work in front of the antenna when the ODU is powered.
• Always power down the PSU before connecting or disconnecting the drop cable
from the PSU, ODU or LPU.
Warning
When installing the PTP 700 ATEX/HAZLOC product variants in hazardous locations,
follow the instructions contained in the PTP 700 Series Hazardous Location Guide
(supplied in box with the products), in addition to the instructions in this user guide.
Regulatory compliance
All applicable radio regulations must be followed while configuring the units and aligning the
antennas. For more information, refer to Compliance with radio regulations on page 4-28.
Caution
If the system designer has provided a list of channels to be barred for TDWR radar
avoidance, the affected channels must be barred before the units are allowed to
radiate on site, otherwise the regulations will be infringed. To bar these channels,
follow the procedure Barring channels on page 7-39.
Attention
Si le concepteur du système a fourni une liste de canaux à interdire pour éviter les
radars TDWR, les cannaux concernées doivent être interdits avant que les unités sont
autorisées à émettre sur le site, sinon la réglementation peut être enfreinte. Pour
bloquer ces canaux, suivez la procédure Barring channels page 7-39.
Page 6-2
Chapter 6: Configuration and alignment Preparing for configuration and alignment
Selecting configuration options
Use the installation report to determine which configuration options are required. Refer to
LINKPlanner on page 3-25.
Generating license keys
To obtain License Keys for capabilities that are not factory-installed, proceed as follows:
1
Identify and purchase access keys for the required capability upgrades by referring to ODU
capability upgrades on page 2-8.
2
Obtain the MAC Address of the ODU (it is on the System Status page).
3
Go to the Cambium Support web page (see Contacting Cambium Networks on page 1) and
navigate to the
Cambium Networks License Key Generator
.
4
Enter the MAC Address and Access Key.
5
Select the country of operation for the link. The list of available countries depends on the
regional variant; not all countries are available in all variants. The generated license will
automatically include all of the regulatory bands approved for that country.
6
Select any other required capabilities from those that are available.
7
Submit the web form. Cambium will send the License Key by email.
Use the Software License Key page to configure the ODU with newlicense keys (Software
License Key page on page 6-11).
Page 6-3
Chapter 6: Configuration and alignment Connecting to the unit
Connecting to the unit
This section describes how to connect the unit to a management PC and power it up.
Configuring the management PC
Use this procedure to configure the local management PC to communicate with the PTP 700.
Procedure:
1
Select
Properties
for the Ethernet port. In Windows 7 this is found in
Control Panel >
Network and Internet > Network Connections > Local Area Connection
.
2
Select
Internet Protocol (TCP/IP)
:
3
Click
Properties
.
Page 6-4
Chapter 6: Configuration and alignment Connecting to the unit
4
Enter an IP address that is valid for the 169.254.X.X network, avoiding 169.254.0.0 and
169.254.1.1. A good example is 169.254.1.3:
5
Enter a subnet mask of 255.255.0.0. Leave the default gateway blank.
Connecting to the PC and powering up
Use this procedure to connect a management PC and power up the PTP 700.
Procedure:
1
Check that the ODU and PSU are correctly connected.
2
Connect the PC Ethernet port to the LAN port of the PSU using a standard (not crossed)
Ethernet cable.
3
Apply mains or battery power to the PSU. The green Power LED should illuminate
continuously.
4
After about 45 seconds, check that the orange Ethernet LED starts with 10 slow flashes.
5
Check that the Ethernet LED then illuminates continuously. If the Power and Ethernet LEDs
do not illuminate correctly, refer to Testing link end hardware on page 8-7.
Page 6-5
Chapter 6: Configuration and alignment Using the web interface
Using the web interface
This section describes how to log into the PTP 700 web interface and use its menus.
Logging into the web interface
Use this procedure to log into the web interface as a system administrator.
Procedure:
1
Start the web browser from the management PC.
2
Type the IP address of the unit into the address bar. The factory default IP addres
s is
169.254.1.1
. Press ENTER. The web interface menu and System Summary page are displayed:
3
On the menu, click
System
. The login page is displayed with Password only (the default) or
with Username and Password (if
identity-based user accounts have been enabled):
4
Enter Username (if requested) and Passwo
rd (the default is blank) and click
Login
.
Page 6-6

Chapter 6: Configuration and alignment Using the web interface
Using the menu options
Use the menu navigation bar in the left panel to navigate to each web page. Some of the menu
options are only displayed for specific system configurations. Use Table 115 to locate
information about using each web page.
Table 115
Menu options and web pages
Main menu
Menu option
Web page information
Home
System Summary page on page 7-2
Status
System Status page on page 7-3
System
Configuration System Configuration page on page 6-30
LAN Configuration LAN Configuration page on page 6-34
QoS Configuration QoS Configuration page on page 6-44
SFP Configuration SFP Configuration page on page 6-47
TDM Configuration TDM Configuration page on page 6-50
Save and Restore Save and Restore Configuration page on page 6-
52
Reset Configuration Reset Configuration page on page 6-53
Spectrum Expert Spectrum Management on page 7-26
Statistics System Statistics page on page 7-47
Comparing actual to predicted performance on
page 6-115
Wireless Port Counters Wireless Port Counters page on page 7-52
Test Ethernet packet errors reported by ODU on
page 8-11
Main Port Counters Main Port Counters page on page 7-53
Aux Port Counters Aux Port Counters page on page 7-55
SFP Port Counters SFP Port Counters page on page 7-56
SyncE Status SyncE Status page on page 7-57
Diagnostics Plotter Diagnostics Plotter page on page 7-59
CSV Download Generate Downloadable Diagnostics page on page
7-60
Cable Diagnostics Cable Diagnostics on page 8-2
Software Upgrade Software Upgrade page on page 6-54
Reboot Reboot Wireless Unit page on page 7-15
Page 6-7

Chapter 6: Configuration and alignment Using the web interface
Main menu
Menu option
Web page information
Installation
Installation menu on page 6-9
Graphical Install Graphical Install page on page 6-113
Management
Web Web-Based Management page on page 6-58
Local User Accounts Local User Accounts page on page 6-61
RADIUS Configuration RADIUS Configuration page on page 6-66
Login Information Login Information page on page 7-15
Web Properties Webpage Properties page on page 6-67
SNMP SNMP pages (for SNMPv3) on page 6-80
SNMP pages (for SNMPv1/2c) on page 6-89
Email Email Configuration page on page 6-71
Diagnostic Alarms Diagnostic Alarms page on page 6-73
Time Time Configuration page on page 6-74
Syslog Syslog page on page 7-22
Syslog Configuration Syslog Configuration page on page 6-78
Security
Security menu on page 6-93
Zeroize CSPs Zeroize CSPs page on page 6-104
Change
Password
Change Password page on page 7-16
Logout
Logging out on page 7-16
Page 6-8

Chapter 6: Configuration and alignment Installation menu
Installation menu
This section describes how to use the Installation Wizard to complete the essential system
configuration tasks that must be performed on a new link.
Caution
If the system designer has provided a list of channels to be barred for TDWR radar
avoidance, the affected channels must be barred before the units are allowed to
radiate on site, otherwise the regulations will be infringed. To bar these channels,
follow the procedure Barring channels on page 7-39.
Starting the Installation Wizard
To start the Installation Wizard: on the menu, click
Installation
. The response depends upon the
state of the unit:
• If the unit is newly installed, the Software License Key page is displayed. Continue at
Software License Key page on page 6-11.
• If the unit is armed for alignment, the Disarm Installation page is displayed. Continue at
Disarm Installation page on page 6-10.
• If the unit is not armed, the Current Installation Summary page is displayed. Continue at
Current Installation Summary page on page 6-10.
Page 6-9
Chapter 6: Configuration and alignment Installation menu
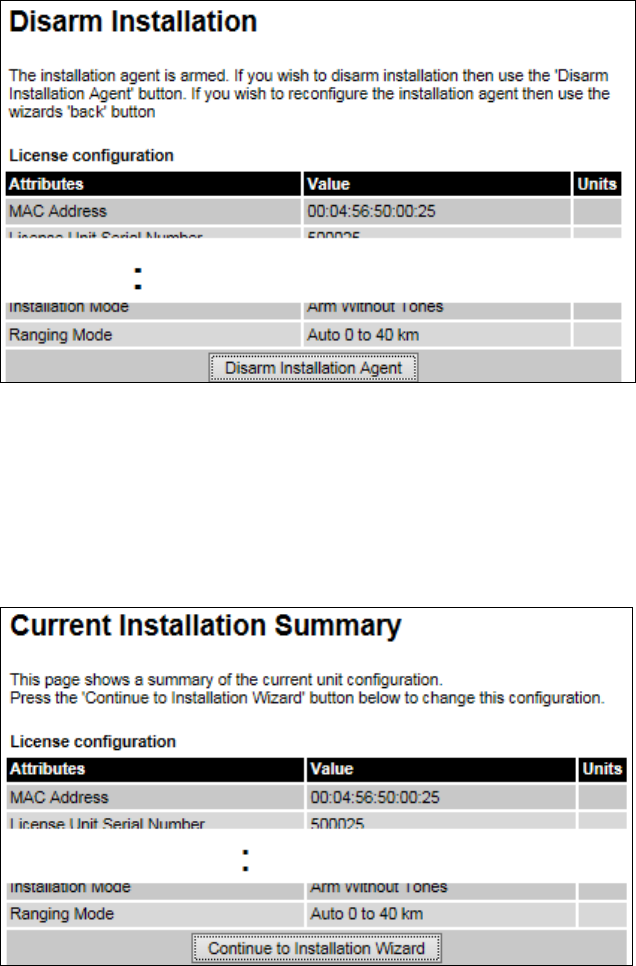
Disarm Installation page
Menu option:
Installation
(Figure 123). This page is displayed only when unit is armed.
Figure 123
Disarm Installation page (top and bottom of page shown)
To disarm the unit, click
Disarm Installation Agent
.
Current Installation Summary page
Menu option:
Installation
(Figure 124). This page is displayed only when unit is not armed.
Figure 124
Current Installation Summary page (top and bottom of page shown)
Click
Continue to Installation Wizard
.
Page 6-10
Chapter 6: Configuration and alignment Installation menu
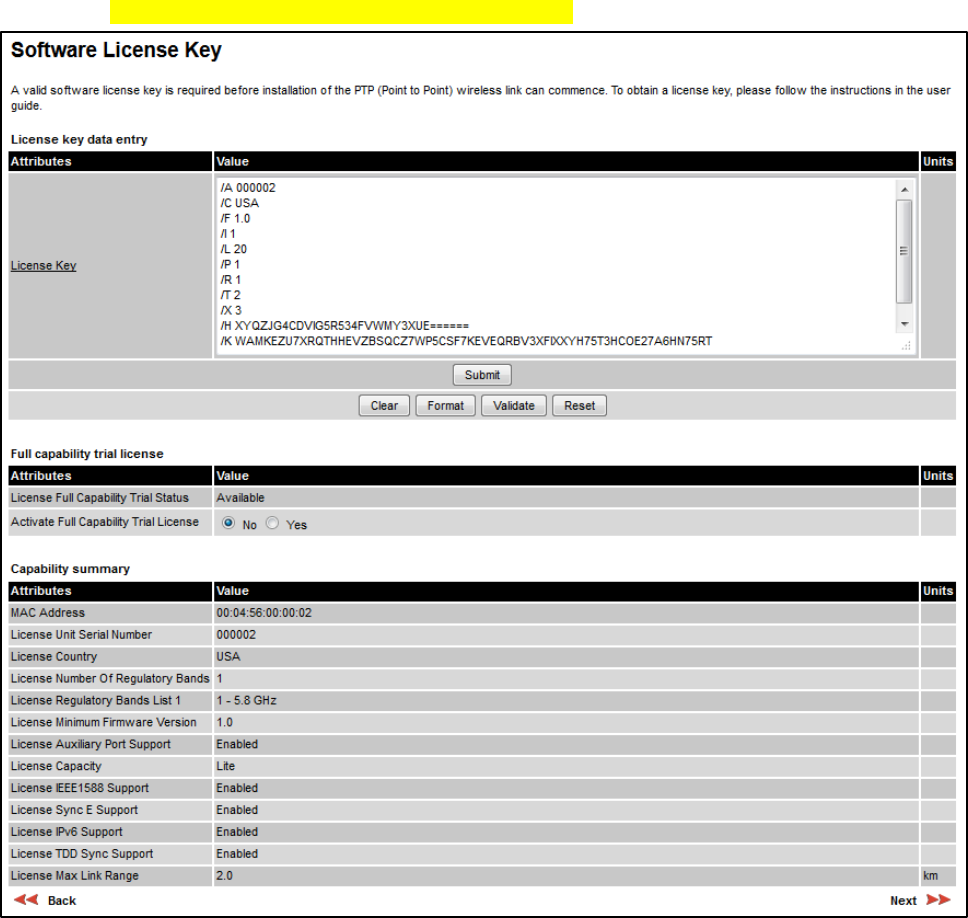
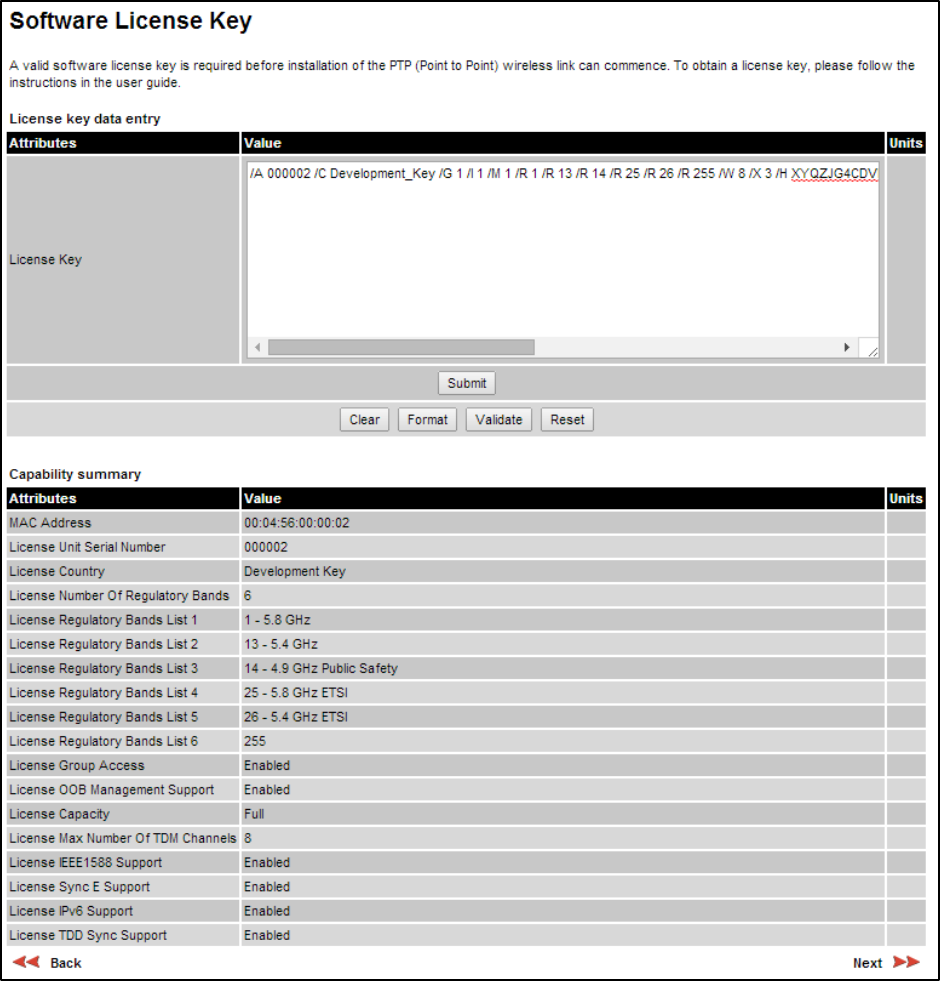
Software License Key page
Menu option:
Installation
. Use this page to configure the unit with a new License Key and to
review the capabilities of an installed License Key. The appearance of this page varies
depending upon which capabilities are enabled by the entered license key. For example, Figure
125 shows the licensed capabilities for a PTP 700 in the USA market with a Full Capability Trial
License, whereas Figure 126 shows TDM support, IPv6 and other capabilities. Use the
Cambium Networks License Key Generator to generate new License Keys (Generating license
keys on page 6-3).
Figure 125
Software License Key page (PTP 700 USA market)
Page 6-11
Chapter 6: Configuration and alignment Installation menu
Figure 126
Software License Key page (TDM, IPv6 and other capabilities)
Page 6-12
Chapter 6: Configuration and alignment Installation menu
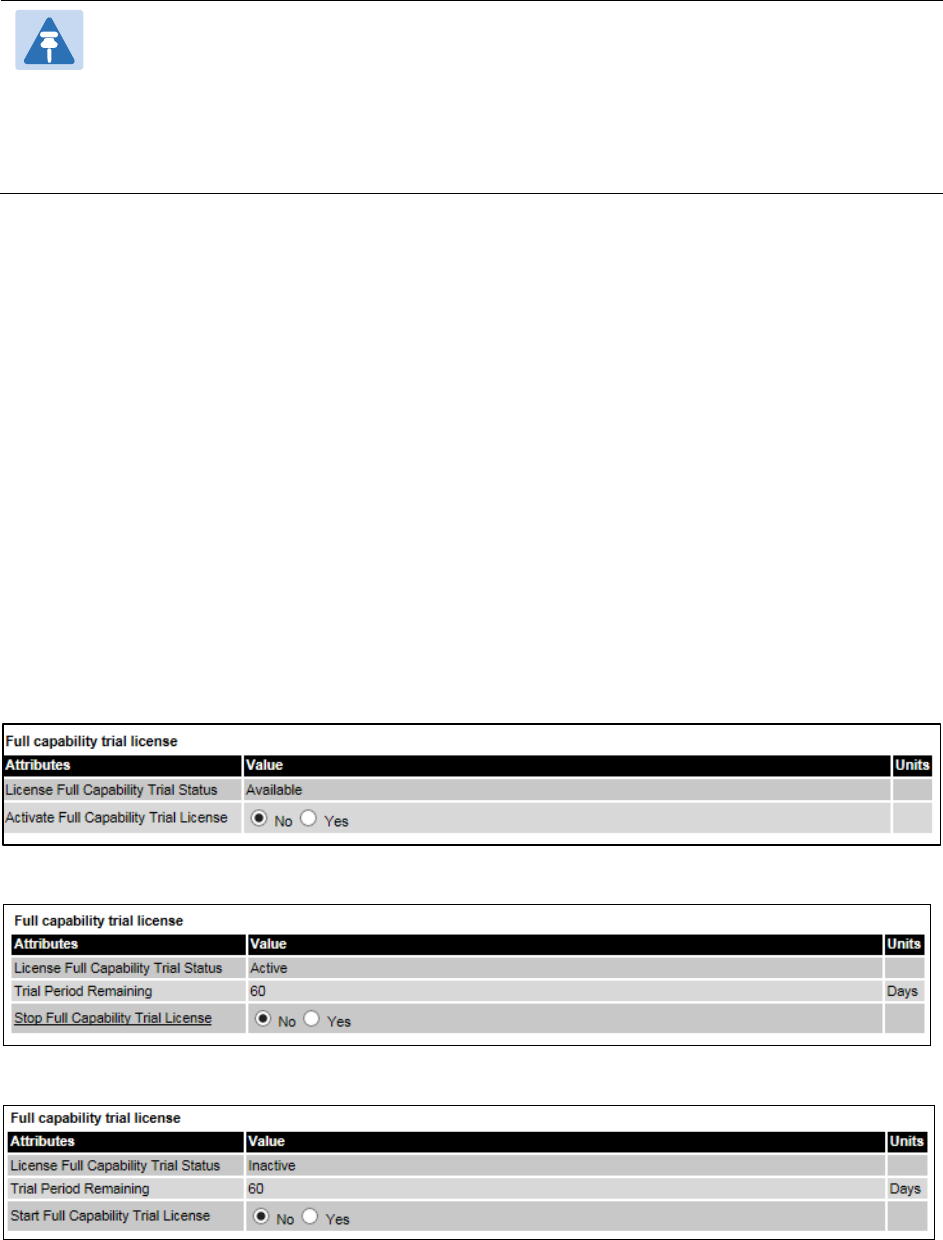
Procedures:
Note
Full capability is available only when both ODUs have the trial active or are already
licensed to operate with that capacity.
When the trial has started, the Software License Key page displays the Trial Period
Remaining attribute (Figure 128). This shows the number of days remaining before the
full capability trial period expires.
To enter a new License Key, proceed as follows:
• To clear the existing License Key (if present), click
Clear
.
• To format the new License Key: copy it from the Cambium notification email, paste it into
the License Key box and click
Format
. The page is redisplayed with the License Key
formatted.
• To enter the new License Key, click
Submit
. The page is redisplayed with the Capability
Summary updated.
To control the full capability trial (Lite license only), proceed as follows:
• If License Full Capability Trial Status is
Available
(Figure 127), start the full capability trial
period by setting Activate Full Capability Trial License to
Yes
.
• If License Full Capability Trial Status is
Active
(Figure 128), suspend the full capability trial
period by setting Stop Full Capability Trial License to
Yes
.
• If License Full Capability Trial Status is
Inactive
(Figure 129), resume the full capability trial
period by setting Start Full Capability Trial License to
Yes
.
To continue with the Installation Wizard, click
Next
.
Figure 127
Software License Key page (extract) with full capability trial available
Figure 128
Software License Key page (extract) with full capability trial active
Figure 129
Software License Key page (extract) with full capability trial inactive
Page 6-13

Chapter 6: Configuration and alignment Installation menu
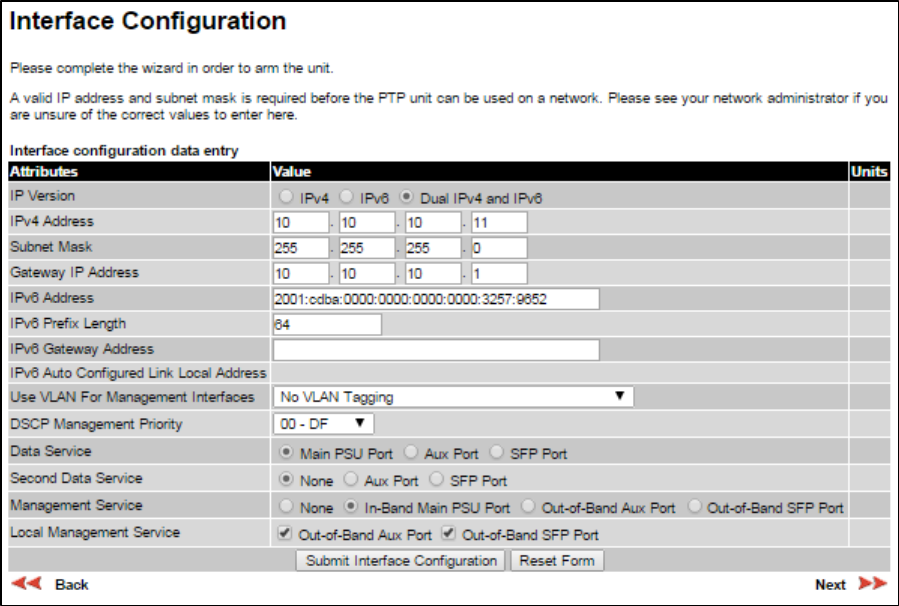
Interface Configuration page
Menu option:
Installation
. Use this page to update the IP interface attributes.
The appearance of this page varies depending upon which capabilities have been enabled by
license key. For example, Figure 130 shows the attributes that are displayed when IPv6, Aux
Port, SFP Port, Second Data Service and Out-of-Band Management support are enabled,
whereas Figure 131 shows the attributes that are displayed when IPv6 and TDM support are
enabled.
Caution
Before configuring a VLAN for management interfaces, ensure that the VLAN is
accessible, otherwise the unit will be inaccessible after the next reboot.
Note
TDM support is only available when the following are all true:
• An E1/T1 license key has been generated (Generating license keys on page 6-3)
and submitted (Software License Key page on page 6-11).
Note
NIDUs can be installed at both link ends without enabling TDM (set TDM Interface to
None
). LAN data will be bridged successfully, but TDM data will be ignored.
Note
Synchronous Ethernet and IEEE 1588 Transparent Clock are disabled when TDM is
enabled (LAN Configuration page on page 6-34).
Note
When TDM is enabled and connected at one link end, up to two minutes may elapse
before the TDM link is established (this is known as the settling period). Do not
attempt to change the TDM configuration during this settling period.
Procedure:
• Review and update the IP and VLAN attributes (Table 116).
• Review and update the TDM attributes (Table 117) (if available).
• To continue with the Installation Wizard, click
Next
or
Submit Interface Configuration
.
Page 6-14
Chapter 6: Configuration and alignment Installation menu
Figure 130
Interface Configuration page (IPv6, Aux, SFP, Second Data Service and OOB
support)
Page 6-15
Chapter 6: Configuration and alignment Installation menu
Figure 131
Interface Configuration page (TDM support)
Table 116
Interface Configuration attributes
Attribute
Meaning
IP Version The internet protocols to be supported by this ODU:
IPv4:
IPv4 protocols only. IPv4 attributes are displayed.
IPv6:
IPv6 protocols only. IPv6 attributes are displayed.
Dual IPv4 and IPv6:
Both IPv4 and IPv6 protocols. IPv4 and IPv6
attributes are displayed.
IPV4 Address The IPv4 internet protocol address. This address is used by the
family of Internet protocols to uniquely identify this unit on a
network.
Subnet Mask The address range of the connected IPv4 network.
Page 6-16

Chapter 6: Configuration and alignment Installation menu
Attribute
Meaning
Gateway IP Address The IPv4 address of a computer on the current network that acts
as an IPv4 gateway. A gateway acts as an entrance and exit to
frames from and to other networks.
IPv6 Address The IPv6 internet protocol address. This address is used by the
family of Internet protocols to uniquely identify this unit on a
network.
IPv6 Prefix Length Length of the IPv6 subnet prefix (default 64 bits).
IPv6 Gateway Address The IPv6 address of a computer on the current network that acts
as an IPv6 gateway. A gateway acts as an entrance and exit to
frames from and to other networks. It is usual to use the link-local
address of the gateway.
IPv6 Auto Configured
Link Local Address
The link-local address of the IPv6 gateway (displayed only, not
updateable).
Use VLAN For
Management Interfaces
VLAN tagging options for the management interfaces:
No VLAN Tagging
IEEE 802.1Q Tagged (C-Tag, Type 8100)
IEEE 802.1ad Tagged (S-Tag or B-Tag, Type 88a8)
Ensure that the configured VLAN is accessible, otherwise it will
not be possible to access the unit following the next reboot.
The PTP 700 management function is only compatible with single
VLAN tagged frames. Any management frame with two or more
tags will be ignored.
VLAN Management VID Only displayed when Use VLAN for Management Interfaces is not
set to
No VLAN Tagging
.
The VLAN VID (range 0 to 4094) that will be included in Ethernet
frames generated by the management interfaces.
VLAN Management
Priority
Only displayed when Use VLAN for Management Interfaces is not
set to
No VLAN Tagging
.
The VLAN priority (range 0 to 7) that will be included in Ethernet
frames generated by the management interfaces.
DSCP Management
Priority
Differentiated Services Code Point (DSCP) value to be inserted in
the IP header of all IP datagrams transmitted by the management
interface.
Page 6-17

Chapter 6: Configuration and alignment Installation menu
Attribute
Meaning
Data Service
The port selection for the Data Service:
Main PSU Port
: The Data Service is connected to the Main PSU
Port
Aux Port
: The Data Service is connected to the Aux Port
SFP Port
: The Data Service is connected to the SFP Port
The Aux Port and SFP Port options are displayed if these ports
are enabled in the license key.
The Data Service must always be assigned to one of the three
wired ports.
For more help Configuring port allocations, see on page 6-19.
Second Data Service The port allocation for the Second Data Service:
None:
The Second Data Service is disabled.
Main PSU Port
: The Second Data Service is connected to the
Main PSU Port
Aux Port
: The Second Data Service is connected to the Aux Port
SFP Port
: The Second Data Service is connected to the SFP Port
This attribute is only displayed when the Second Data Service
support is license key enabled.
The port allocated to the Data Service is not available for
allocation to the Second Data Service.
For more help, see Ethernet port allocation on page 3-36.
Management Service The port allocation for the end-to-end Management Service:
None:
The Management Service is disabled.
In-Band Main PSU Port, Out-of-Band Main PSU Port:
The
Management Service is connected to the Main PSU Port.
In-Band Aux Port, Out-of-Band Aux Port:
The Management
Service is connected to the Aux Port.
In-Band SFP Port, Out-of-Band SFP Port:
The Management
Service is connected to the SFP Port.
If a port is already connected to the Data Service or the Second
Data Service then the option will be displayed as In-Band…
otherwise the option will be displayed as Out-of-Band…
For more help, see Ethernet port allocation on page 3-36.
Local Management
Service
Any port not already selected to the Data, Second Data or
Management Service is available for connection as an out-of-
band port for the Local Management Service. Ports already
selected to the Data, Second Data or Management services are
not displayed as options.
For more help, see Ethernet port allocation on page 3-36.
Page 6-18

Chapter 6: Configuration and alignment Installation menu
Configuring port allocations with TDM
When TDM is enabled, the Data Service is mapped to the Main PSU Port with no other options
presented to the user. Mapping of the Second Data Service, Management Service and Local
Management Service have standard options consistent with the Data Service mapping.
Table 117
Interface Configuration TDM attributes
Attribute
Meaning
TDM Interface Only displayed when TDM is enabled by license key.
The type of TDM interface that is activated.
None
: TDM is disabled.
E1
: The E1 TDM interface is activated.
T1
: The T1 TDM interface is activated.
License Max Number of
TDM Channels
Only displayed when TDM Interface is set to
E1
or
T1
.
The maximum number of TDM channels (E1 or T1) allowed under
the installed license key.
TDM Enabled Channels Only displayed when TDM Interface is set to
E1
or
T1
.
Select the number of E1 or T1 channels that are to be enabled
over the wireless bridge (1 to 8).
TDM Channel Line Code
n
Only displayed when TDM Interface is set to
E1
or
T1
.
Select the line code of the transceiver connected to NIDU E1/T1
channel “n” (where “n” is in the range 1 to 8).
TDM Channel Cable
Length n
Only displayed when TDM Interface is set to
T1
.
This control compensates for the high frequency attenuation in T1
cables. Equalization is automatic in the E1 interface.
Select the nearest approximation to the length of cable
connecting the transceiver to NIDU T1 channel “n” (where “n” is
in the range 1 to 8).
Lowest TDM Modulation
Mode
Only displayed when TDM Interface is set to
E1
or
T1
.
The lowest modulation mode at which TDM data can be sent. If
the link cannot sustain TDM data in this mode then the effective
lowest modulation mode may differ.
In conjunction with the LINKPlanner tool, this setting may be used
to optimize the latency for links which operate in consistently
high modulation modes. High data rate links are able to support
lower latencies.
Configuring port allocations
The Interface Configuration page controls the allocation of the Main PSU Port, Aux Port and
SFP Port to the Data Service, Second Data Service, Management Service and Local
Management Service.
Page 6-19
Chapter 6: Configuration and alignment Installation menu
PTP 700 supports exactly one instance of the Data Service, and this service is always mapped
to one of the three wired ports. It is not possible to operate a link without any port selected to
the Data Service.
PTP 700 supports zero or one instances of the optional Second Data Service. The Second Data
Service is enabled by a license key field, and is automatically licensed in any unit with a Full
capacity license. The Second Data Service can be disabled or mapped to any available port,
except for the port already allocated to the Data Service.
PTP 700 supports zero or one instances of the optional Management Service. The Management
Service can be used to access the management agent at the local unit. If the wireless link is
established, the Management Service can also be used to access the management agent at the
remote unit and other devices connected in the remote management network. The
Management Service can be mapped to a port that is already used for the Data Service or
Second Data Service to provide In-Band Management. Alternatively, the Management Service
can be allocated to a dedicated port to provide Out-of-Band Management.
PTP 700 also supports an optional Local Management Service, providing a connection from a
wired port to the local management agent. Any port not already selected is available for
selection to the Local Management Service. The Local Management Service does not connect
across the wireless link.
The PTP 700 must always be manageable through one of three ports. Therefore it is not
possible to disable the Management Service unless at least one port is allocated to the Local
Management Service.
Page 6-20
Chapter 6: Configuration and alignment Installation menu
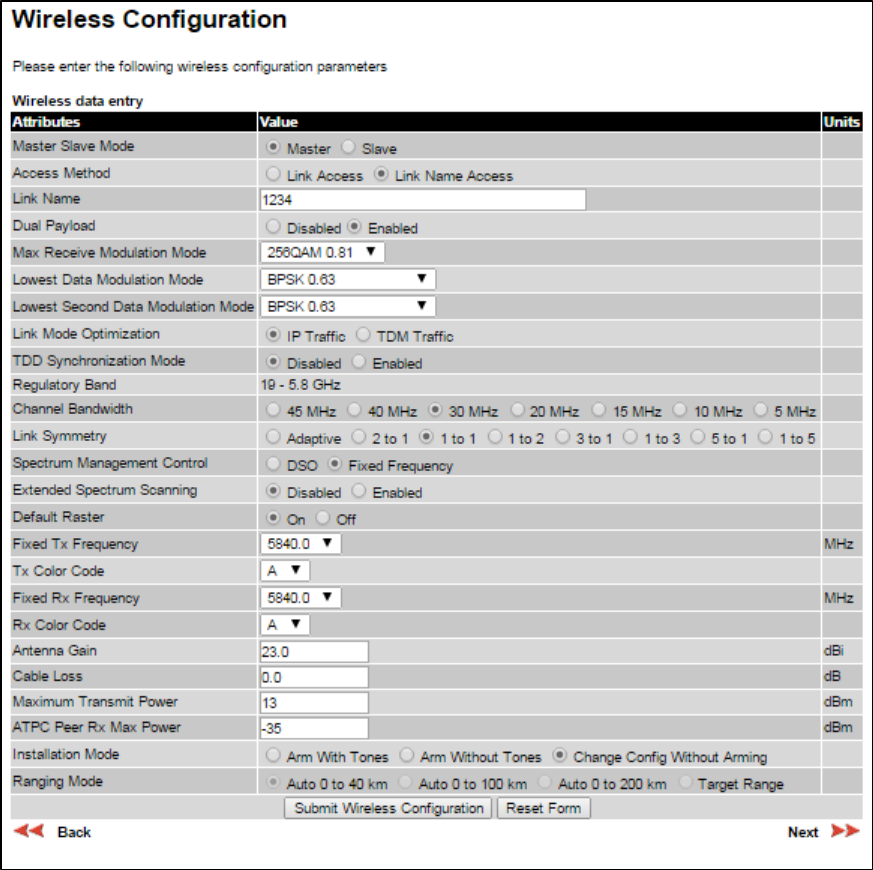
Wireless Configuration page
Menu option:
Installation
(Figure 132).
This page is part of the Installation Wizard. Use it to update the wireless attributes.
Figure 132
Wireless Configuration page
Procedure:
• Update the attributes (Table 118).
• To save any changes and continue with the Installation Wizard, click
Next
or click
Submit
Wireless Configuration
.
Page 6-21

Chapter 6: Configuration and alignment Installation menu
Warning
When installing the PTP 700 ATEX/HAZLOC product variants in hazardous locations,
follow the instructions contained in the PTP 700 Series Hazardous Location Guide
(supplied in box with the products), in addition to the instructions in this user guide.
Caution
The lower center frequency attribute must be configured to the same value for both
the Master and Slave, otherwise the wireless link will fail to establish. The only way to
recover from this situation is to modify the Lower Center Frequency attributes so that
they are identical on both the master and slave units.
Note
When configuring a linked pair of units, use the Master Slave Mode to ensure that one
unit is
Master
and the other is
Slave
.
Table 118
Wireless Configuration attributes
Attribute
Meaning
Master Slave Mode
Master:
The unit controls the point-to-point link and its maintenance. On
startup, the Master transmits until a link with the Slave is made.
Slave:
The unit listens for its peer and only transmits when the peer has
been identified.
Access Method ODUs must be configured in pairs before a link can be established. Access
Method determines how paired ODUs will recognize each other.
Link Access:
Each ODU must be configured with Target MAC Address
equal to the MAC Address of the other unit.
Link Name Access:
Both ODUs must be configured with the same Link
Name.
Group Access:
Only displayed when a Group Access license key has been
generated (Generating license keys on page 6-3) and submitted (Software
License Key page on page 6-11). Both ODUs must be configured with the
same Group ID attributes.
Target MAC Address Only displayed when Access Method is set to
Link Access
. This is the
MAC Address of the peer unit that will be at the other end of the wireless
link. This is used by the system to ensure the unit establishes a wireless
link to the correct peer. The MAC Address can be found embedded within
the serial number of the unit. The last six characters of the serial number
are the last three bytes of the unit’s MAC address.
Link Name Only displayed when Access Method is set to
Link Name Access
.
Link Name may consist of letters (A-Z and a-z), numbers (0-9), spaces, and
the following special characters: (),-.,:<=>[]_{}
Link Name must be same at both ends and different to site name.
Group Id Only displayed when Access Method is set to
Group Access
. A link can
only be established between units that have identical Group IDs.
Page 6-22

Chapter 6: Configuration and alignment Installation menu
Attribute
Meaning
Dual Payload
Disabled:
The link maximizes robustness against fading and interference.
Enabled:
The link attempts to reach maximum throughput at the expense
of robustness against fading and interference.
Max Receive
Modulation Mode
The maximum mode the unit will use as its adaptive modulation. By
default the Max Receive Modulation Mode is the highest mode available.
For minimum error rates, set the maximum modulation mode to the
minimum necessary to carry the required traffic.
Lowest Data
Modulation Mode
The lowest modulation mode that must be achieved before the link is
allowed to bridge customer data Ethernet frames. This does not affect the
bridging of management data: if out-of-band remote management is
enabled, this will continue regardless of modulation mode.
Lowest Second Data
Modulation Mode
The lowest modulation mode that must be achieved before the link is
allowed to bridge Ethernet frames in the Second Data Service. This
attribute is displayed when the Second Data Service is enabled.
Link Mode
Optimization
IP Traffic:
The link is optimized for IP traffic to provide the maximum
possible link capacity.
TDM Traffic:
The link is optimized for TDM traffic to provide the lowest
possible latency. This is the only available setting when TDM is enabled
(Interface Configuration page on page 6-14).
TDD
Synchronization
Mode
Disabled:
The link does not employ TDD synchronization.
Enabled:
The link employs TDD synchronization. This is configured in the
Installation Wizard; see TDD synchronization page (optional) on page 6-
27. For a basic description, see TDD synchronization on page 1-17.
When TDD Synchronization Mode is set to
Enabled
, the following
restrictions apply: Ranging Mode and Target Range are disabled, and Link
Symmetry is limited to
1 to 1
.
Regulatory Band The regulatory band selected from the list in the license key.
Channel Bandwidth Bandwidth of the transmit and receive radio channels.
Page 6-23

Chapter 6: Configuration and alignment Installation menu
Attribute
Meaning
Link Symmetry Only displayed when Master Slave Mode is set to
Master
.
Adaptive
: Allows link symmetry to vary dynamically in response to
offered traffic load. This is not supported in the following cases:
• Where radar avoidance is mandated in the region.
• Link Mode Optimization is set to
TDM Traffic
.
“5 to 1”
,
“3 to 1
,
“2 to 1”
, “
1 to 1”
, “
1 to 2”
,
“1 to 3”
or
“1 to 5”
: There is
a fixed division between transmit and receive time in the TDD frame of
the master ODU. The first number in the ratio represents the time allowed
for the transmit direction and the second number represents the time
allowed for the receive direction. The appropriate matching Link
Symmetry is set at the slave ODU automatically. For example, if Link
Symmetry is set to “
2 to 1”
at the master ODU, then the slave ODU will
be set automatically as “
1 to 2”
. In this example, the master-slave
direction has double the capacity of the slave-master direction.
When TDM is enabled (Interface Configuration page on page 6-14), Link
Symmetry is limited to “
1 to 1
”.
Spectrum
Management
Control
In regions that do not mandate DFS (radar detection), the options are:
DSO
Fixed Frequency
In regions that mandate DFS (radar detection), the options are:
DFS
DFS with DSO
This attribute is disabled if the regulatory requirement is fixed frequency
only.
Extended Spectrum
Scanning
Enables scanning of the entire frequency spectrum supported by the
device (4400 MHz to 5875 MHz).
Disabled:
The extended Spectrum Scanning is disabled.
Enabled:
The extended Spectrum Scanning is enabled.
Caution
Extended Spectrum Scanning increases DSO performance. Do
not leave Extended Spectrum Scanning enabled during normal
operation.
Lower Center
Frequency
The center frequency (MHz) of the lowest channel that may be used by
this link. Not displayed when Spectrum Management Control is set to
Fixed Frequency
.
Use this attribute to slide the available channels up and down the band.
Default Raster This is only displayed when Spectrum Management Control is set to
Fixed Frequency
. Limits frequency selection to the unit’s default raster
setting.
Page 6-24

Chapter 6: Configuration and alignment Installation menu
Attribute
Meaning
Fixed Tx Frequency,
Fixed Rx Frequency
This is only displayed when Spectrum Management Control is set to
Fixed Frequency
. The settings must be compatible at each end of the link.
Once configured, the spectrum management software will not attempt to
move the wireless link to a channel with lower co-channel or adjacent
channel interference. Therefore this mode of operation is only
recommended for deployments where the installer has a good
understanding of the prevailing interference environment.
Tx Color Code, Rx
Color Code
Tx Color Code and Rx Color Code may be used to minimize interference
in a dense network of synchronized PTP 700 units where some of the
units are operating on the same frequency. When this type of network is
designed, the Color Code values are normally specified in the link
planning report. In all other cases, Cambium Networks recommend that
Tx Color Code and Rx Color Code are left at the default value of
A
.
The value of Tx Color Code MUST always match the value of Rx Color
Code at the other end of the link.
Antenna Gain Only displayed when the ODU is connectorized.
Gain of the remote antenna.
Cable Loss Only displayed when the ODU is connectorized.
Loss in the ODU-antenna RF cable. If there is a significant difference in
length of the RF cables for the two antenna ports, then the average value
should be entered.
Maximum Transmit
Power
The maximum power (dBm) at which the unit will transmit, configurable
in steps of 1 dB. Its maximum value is controlled by the selected
combination of Regulatory Band, Bandwidth and (for connectorized units)
Antenna Gain and Cable Loss.
Set this attribute to the value specified in the installation report
(LINKPlanner).
Installation Mode
Arm With Tones
: Audio tones will be emitted during antenna alignment
(the recommended option).
Arm Without Tones
: Audio tones will not be emitted during antenna
alignment.
Change Config Without Arming
: Configuration changes will be made
without arming the ODU for alignment.
Page 6-25

Chapter 6: Configuration and alignment Installation menu
Attribute
Meaning
Ranging Mode This can only be modified if Installation Mode is
Arm With Tones
or
Arm
Without Tones
.
Auto..
: During alignment, the wireless units use algorithms to calculate
link range. To implement automatic ranging, select a value that
corresponds to the estimated maximum range of the link:
Auto 0 to 40 km
(0 to 25 miles).
Auto 0 to 100km
(0 to 62 miles).
Auto 0 to 200km
(0 to 125 miles).
Target Range
: During alignment, the wireless units use the approximate
link distance (entered in Target Range) to calculate link range. The main
advantage of Target Range mode is that it reduces the time taken by the
units to range.
If preferred, range functions can be configured to operate in miles, as
described in Webpage Properties page on page 6-67.
Target Range Only available when Ranging Mode is set to
Target Range
.
The approximate distance between the two wireless units to within
± 1 km. Enter the same value at both ends of the link.
Page 6-26
Chapter 6: Configuration and alignment Installation menu
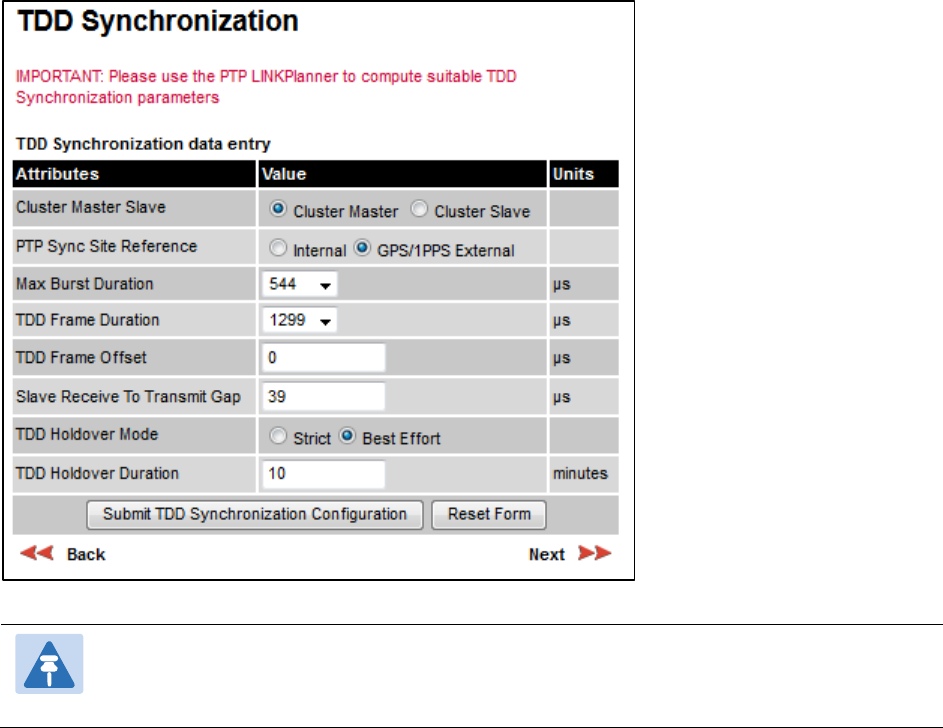
TDD synchronization page (optional)
If TDD Synchronization Mode is set to
Enabled
in the Step 2: Wireless Configuration page, the
Step 3: TDD Synchronization page (Figure 133) is the third Installation Wizard page.
For more information on the available options, refer to Configuration options for TDD
synchronization on page 3-31.
Procedure:
• Update the attributes (Table 119).
• Click
Next
.
Figure 133
Step 3: TDD Synchronization page
Note
The data required to populate this page is available in LINKPlanner.
Page 6-27

Chapter 6: Configuration and alignment Installation menu
Table 119
TDD Synchronization attributes
Attribute
Meaning
Cluster Master Slave
Cluster Master
: The first ODU in the synchronization chain.
Cluster Slave
: The second or subsequent ODU in the chain.
PTP-SYNC Site
Reference
Internal
: Standalone operation with no external timing reference.
GPS/1PPS External
: An external GPS receiver will provide a 1 pps timing
reference.
Max Burst Duration The maximum duration of the burst opportunity. Select a value in the range
544
to
2176
microseconds.
TDD Frame Duration Select a value in the range
1299
to
2747
microseconds.
TDD Frame Offset The delay of the start of the TDD frame from the epoch of the external timing
reference. This permits the design of synchronized networks in which the
phase of the TDD frame is independent of the master/slave function. Enter a
value in the range from zero to one microsecond less than the TDD Frame
Duration.
Slave Receive To
Transmit Gap
The duration of the gap between receive and transmit at the slave ODU.
TDD Holdover Mode Only displayed when Cluster Master Slave is set to
Cluster Master
.
Strict
: The unit will not transmit when synchronization is lost.
Best Effort
: The unit will synchronize when there is a reference signal, but
otherwise will operate in unsynchronized mode.
TDD Holdover
Duration
Only displayed when Cluster Master Slave is set to
Cluster Master
.
Specifies duration of holdover period following loss of the external timing
reference for TDD synchronization. Default value
10
minutes, maximum
60
minutes.
Page 6-28
Chapter 6: Configuration and alignment Installation menu
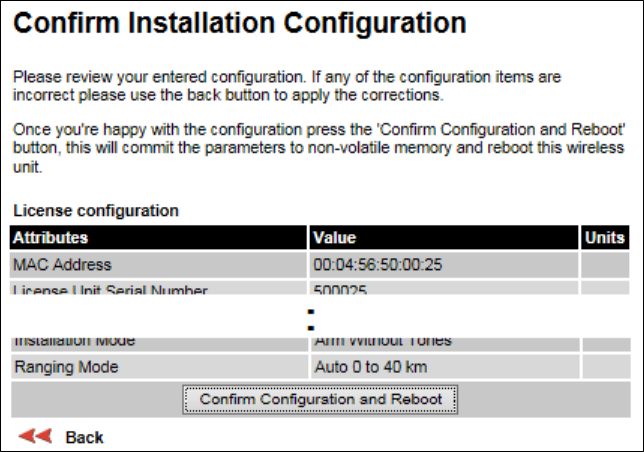
Confirm Installation Configuration page
Menu option:
Installation
(Figure 134). Use this page to review and confirm the updated
wireless configuration of the unit.
Figure 134
Confirm Installation Configuration page (top and bottom of page shown)
Procedure:
• To undo or correct any updates, click
Back
.
• To confirm the updates and arm the installation, click
Confirm Configuration and Reboot
and click
OK
to reboot the unit.
• If IP Address, Subnet Mask or Gateway IP Address have been changed: reconfigure the
local management PC to use an IP address that is valid for the network. Refer to
Configuring the management PC on page 6-4.
• If IP Address has been changed, use the new IP address to log into the unit.
Page 6-29
Chapter 6: Configuration and alignment System menu
System menu
This section describes how to configure the IP and Ethernet interfaces of the PTP 700 unit.
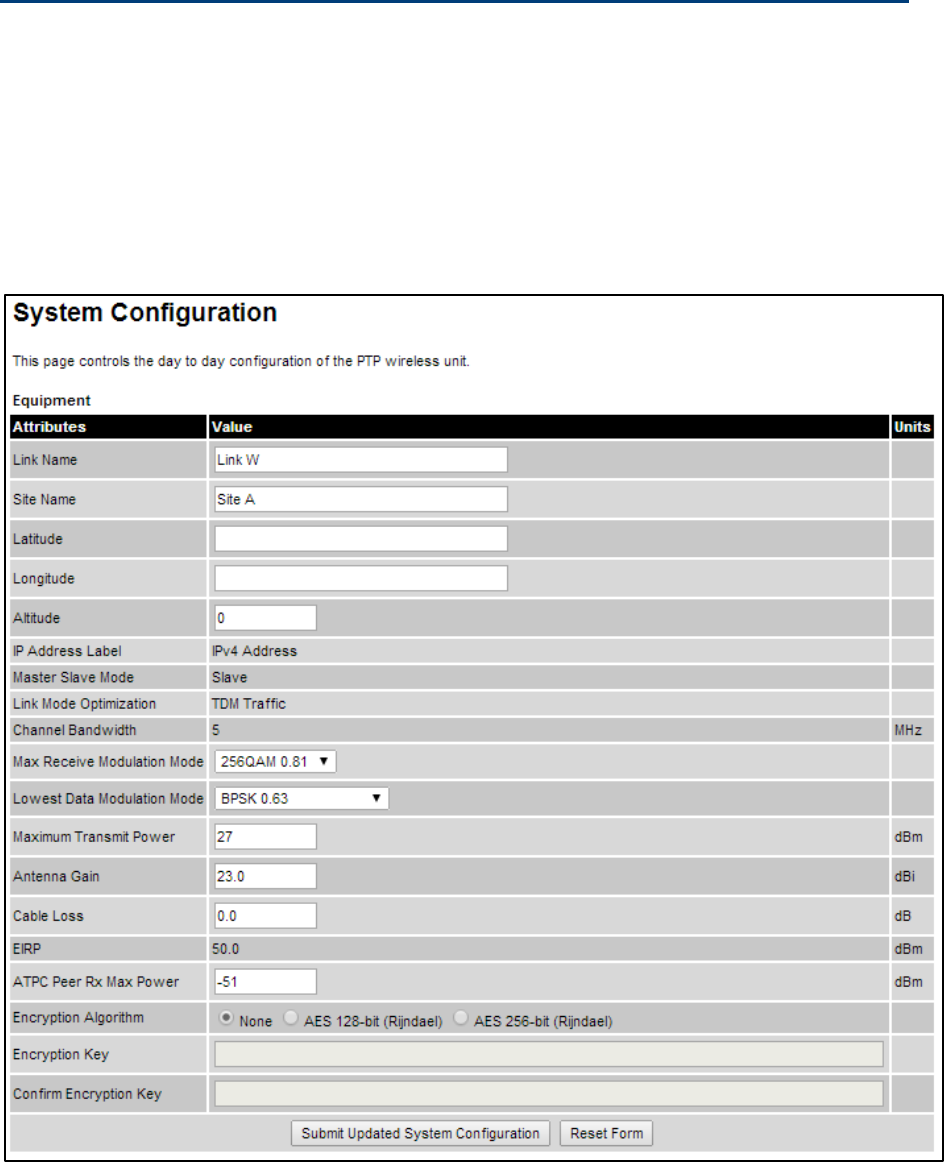
System Configuration page
Menu option:
System > Configuration
(Figure 135). Use this page to enable AES encryption and
to review and update key wireless attributes of the unit.
Figure 135
System Configuration page
If the ODU is a Master unit and Transmitter Mute Control is enabled (Webpage Properties page
on page 6-67), the Mute Transmitter control is displayed at the top of this page (Figure 136).
Page 6-30
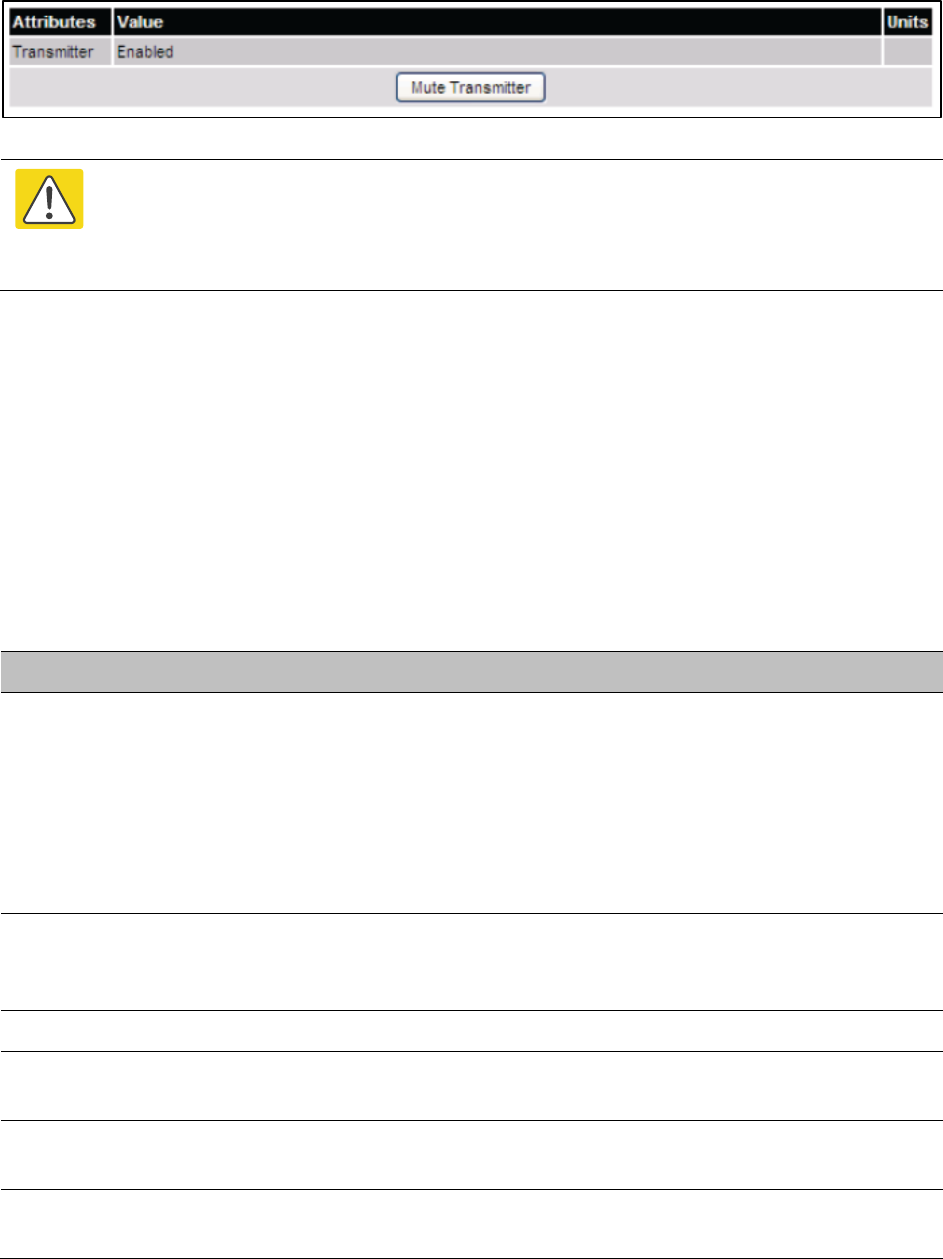
Chapter 6: Configuration and alignment System menu
Figure 136
Mute Transmitter control in
System Configuration page
Caution
Configuring link encryption over an operational link will necessitate a service outage.
Therefore, the configuration process should be scheduled during a period of low link
utilization.
Procedure:
• If AES encryption is required but the System Configuration page does not contain the
Encryption Algorithm or Encryption Key attributes, then order the necessary AES capability
upgrade, generate a license key and enter it on the Software License Key page (Software
License Key page on page 6-11).
• Update the attributes (Table 120).
• To save changes, click
Submit Updated System Configuration
.
• If a reboot request is displayed, click
Reboot Wireless Unit
and
OK
to confirm.
Table 120
System Configuration attributes
Attribute
Meaning
Transmitter Only displayed when the ODU is a Master unit and Transmitter Mute
Control is enabled. Use the
Mute Transmitter
control to toggle between
Muted
and
Enabled
.
Muted:
The ODU will not radiate and will not forward Ethernet frames
between the wireless interface and the Ethernet ports.
Enabled
: The ODU is allowed by the user to radiate and will forward
Ethernet frames between the wireless interface and the Ethernet ports.
Link Name Link Name may consist of letters (A-Z and a-z), numbers (0-9), spaces, and
the following special characters: (),-.,:<=>[]_{}. Link Name must be same at
both ends and different to site name.
Site Name User defined name for the site, with additional notes (if required).
Latitude The latitude of the ODU, measured in decimal degrees. This attribute has
no internal function.
Longitude The longitude of the ODU, measured in decimal degrees. This attribute
has no internal function.
Altitude The altitude of the ODU, measured in meters. This attribute has no
internal function.
Page 6-31

Chapter 6: Configuration and alignment System menu
Attribute
Meaning
IP Address Label Read only. The IP Address version used to identify the unit in SMTP
messages, fault logs and other system outputs.
IPv4
or
IPv6
: The unit is identified using its IPv4 or IPv6 Address.
These options are only available when IP Version is set to
Dual IPv4 and
IPv6
in the in the LAN Configuration page (Table 121).
Master Slave Mode
Master:
The unit is a Master, that is, it controls the point-to-point link and
its maintenance. On startup, the Master transmits until a link with the
Slave is made.
Slave:
The unit is a Slave, that is, it listens for its peer and only transmits
when the peer has been identified.
Read only.
Link Mode
Optimization
IP Traffic:
The link is optimized for IP traffic to provide the maximum
possible link capacity.
TDM Traffic:
The link is optimized for TDM traffic to provide the lowest
possible latency.
Read only.
Channel Bandwidth Bandwidth of the transmit and receive radio channels.
Read only.
Max Receive
Modulation Mode
The maximum mode the unit will use as its adaptive modulation. By
default the Max Receive Modulation Mode is the highest mode available.
For minimum error rates, set the maximum modulation mode to the
minimum necessary to carry the required traffic.
Lowest Data
Modulation Mode
The lowest modulation mode that must be achieved before the link is
allowed to bridge customer data Ethernet frames. This does not affect the
bridging of management data: if out-of-band remote management is
enabled, this will continue regardless of modulation mode.
Max Transmit
Power
The maximum power (dBm) at which the unit will transmit, configurable
in steps of 1 dB. Its maximum value is controlled by the combination of
the selected Regulatory Band, Bandwidth and (for connectorized units)
Antenna Gain and Cable Loss.
Set this attribute to the value specified in the installation report
(LINKPlanner).
Antenna Gain Only displayed when the ODU is connectorized. Gain of the remote
antenna.
Cable Loss Only displayed when the ODU is connectorized. Loss in the ODU-antenna
RF cable. If there is a significant difference in length of the RF cables for
the two antenna ports, then the average value should be entered.
Page 6-32

Chapter 6: Configuration and alignment System menu
Attribute
Meaning
EIRP Only displayed when the ODU is connectorized. Effective Isotropic
Radiated Power (EIRP) describes the strength of the radio signal leaving
the wireless unit. Use it to verify that the link configuration (Max Transmit
Power, Antenna Gain and Cable Loss) does not exceed any applicable
regulatory limit. Read only.
ATPC Peer Rx Max
Power
ATPC maximum receive power level at the remote ODU. In a radar
avoidance area this is calculated by the software and cannot be changed.
In a non-radar avoidance area this can be set manually.
Encryption
Algorithm
Only displayed when an AES encryption license key has been generated
(Generating license keys on page 6-3) and submitted (Software License
Key page on page 6-11).
Values are:
None
,
AES 128-bit
or
AES 256-bit
. Use the same setting at
both link ends.
Encryption Key Only displayed when AES encryption is enabled by license key.
The key consists of 32 or 64 case-insensitive hexadecimal characters. Use
the same key at both link ends.
Confirm Encryption
Key
Only displayed when AES encryption is enabled by license key.
Retype the Encryption Key.
Page 6-33

Chapter 6: Configuration and alignment System menu
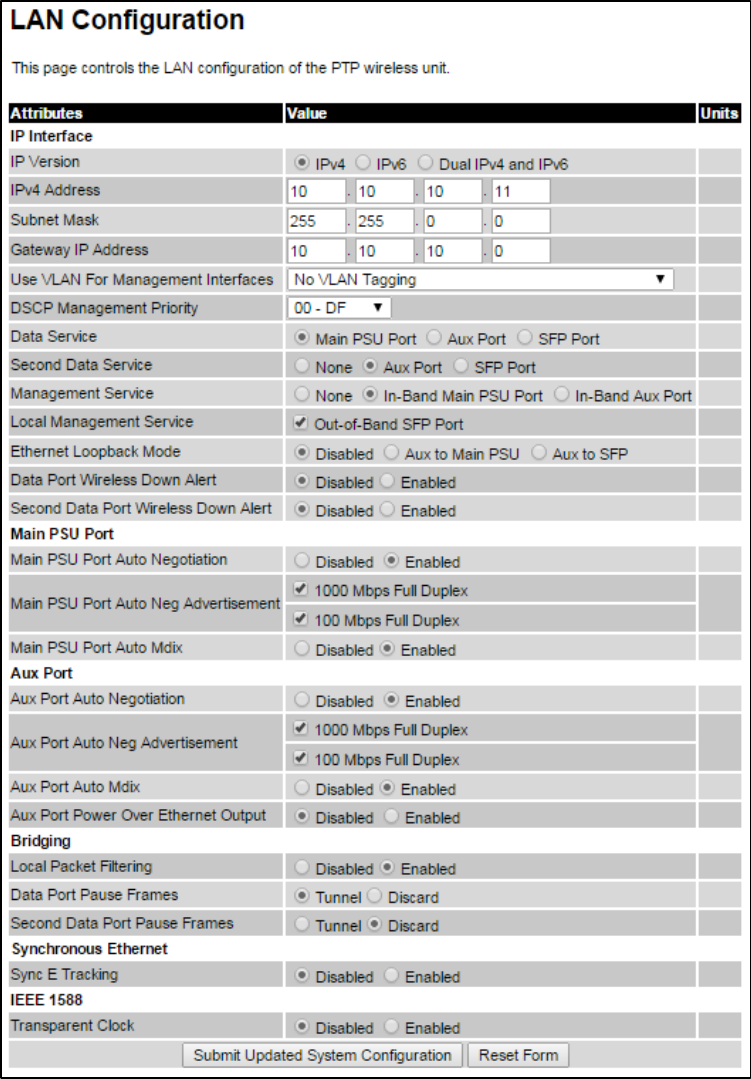
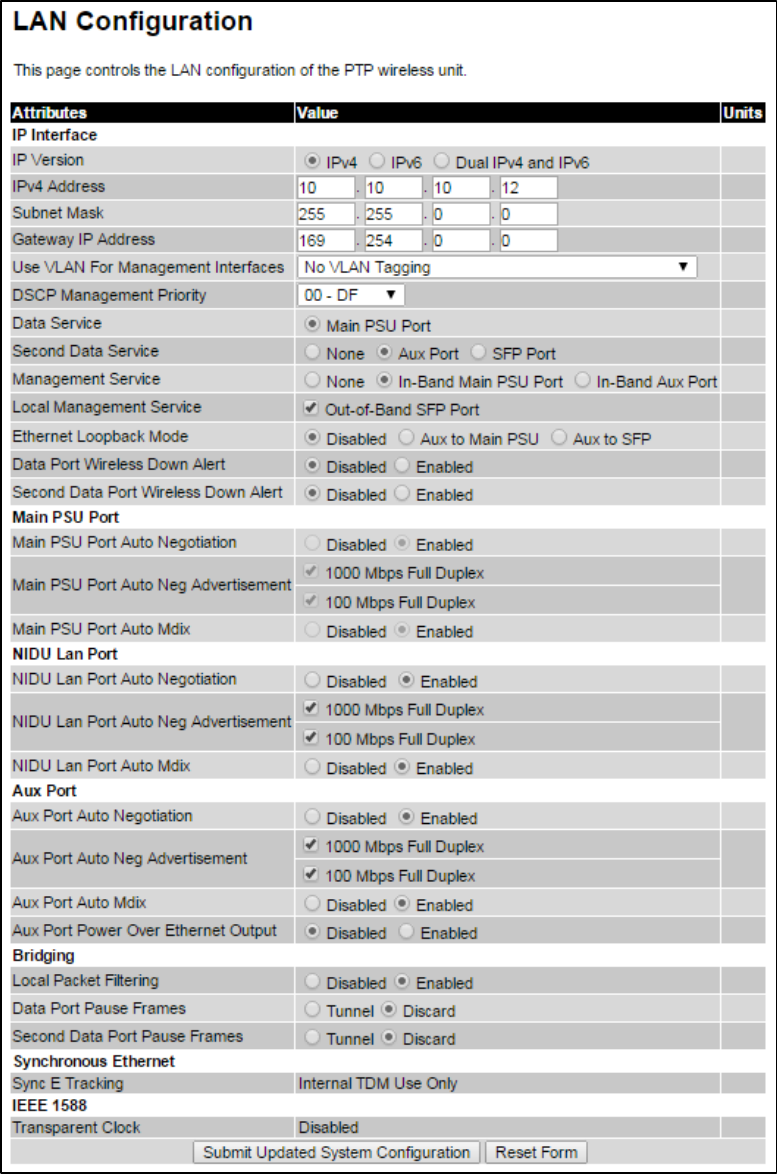
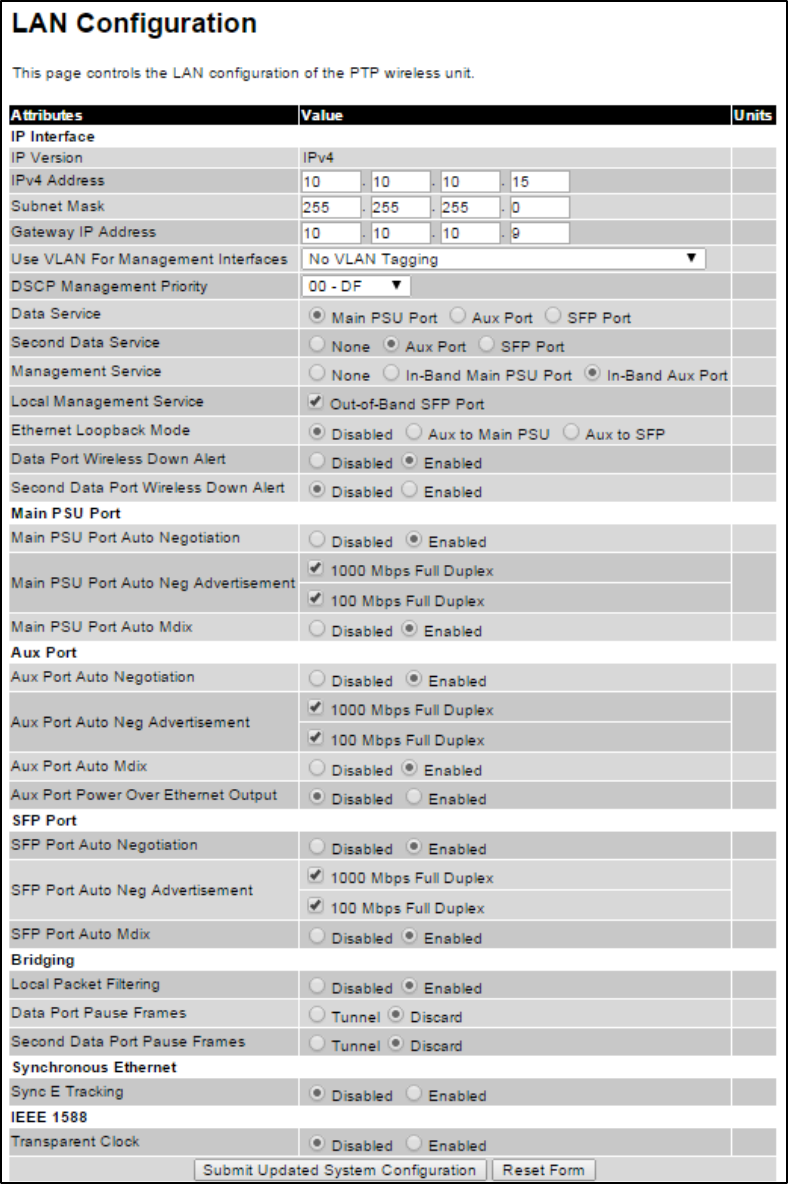
LAN Configuration page
Menu option:
System > Configuration > LAN Configuration
. Use this page to control how users
connect to the PTP 700 web interface, either from a locally connected computer or from a
management network.
The appearance of this page varies depending upon which features have been enabled by
license key. For example, Figure 137 shows the attributes that are displayed when Aux Port,
Second Data Service and Out-of-Band Management Service, support are enabled, whereas
Figure 138 shows the attributes that are displayed when TDM support is enabled.
Caution
Before configuring a VLAN for management interfaces, ensure that the VLAN is
accessible, otherwise the unit will be inaccessible after the next reboot.
Caution
Before configuring in-band management, ensure that the Master and Slave units are
configured with different IP addresses, otherwise the management agent will not be
able to distinguish the two units.
Caution
Auto-negotiation and forced Ethernet configuration:
• To operate an Ethernet link at a fixed speed, set Auto Negotiation to
Enabled
and
limit Auto Neg Advertisement to the desired speed. If constrained auto-negotiation
fails, set Auto Negotiation to
Disabled
(forced Ethernet configuration) as a last
resort.
• Both ends of an Ethernet link must be configured identically, because forced and
auto-negotiation are not compatible: a mixed configuration will cause a duplex
mismatch, resulting in greatly reduced data capacity.
• The Auto Neg Advertisement or Forced Configuration data rates must be within the
capability of the Ethernet link partner, otherwise loss of service will occur.
Note
When TDM is enabled (Interface Configuration page on page 6-14), the following
restrictions are automatically applied:
• Main PSU Port Auto Negotiation is set to
Enabled
.
• Main PSU Port Auto Neg Advertisement is set to
1000 Mbps Full Duplex
.
• Main PSU Port Auto MDIX is set to
Enabled
.
Page 6-34
Chapter 6: Configuration and alignment System menu
Figure 137
LAN Configuration page (Aux and OOB support)
Page 6-35
Chapter 6: Configuration and alignment System menu
Figure 138
LAN Configuration page (TDM support)
Page 6-36

Chapter 6: Configuration and alignment System menu
2
To save changes, click Submit Updated System Configuration
. The system may reboot.
3
If Main PSU Port is selected for Data Service
only (and not for
Management Service
), connect
management PC to the port (Aux or SFP) that was sele
cted for Management or Local
Management Service
4
If
IP Address, Subnet Mask or Gateway IP Address have been changed, reconfigure the local
management PC to use an IP address that is valid for the network. Refer to
Configuring the
management PC
on page 6-4.
5
If
IP Address has been changed, use the new IP address to log into the unit.
Table 121
IP interface attributes
Attribute
Meaning
IP Version Defined in Table 116.
IPv4 Address Defined in Table 116.
Subnet Mask Defined in Table 116.
Gateway IP Address Defined in Table 116.
IPv6 Address Defined in Table 116.
IPv6 Prefix Length Defined in Table 116.
IPv6 Gateway Address Defined in Table 116.
IPv6 Auto Configured
Link Local Address
Defined in Table 116.
Use VLAN For
Management
Interfaces
Defined in Table 116.
VLAN Management
VID
Defined in Table 116.
VLAN Management
Priority
Defined in Table 116.
DSCP Management
Priority
Defined in Table 116.
Data Service Defined in Table 116. For more help, see Ethernet port allocation on
page 3-36.
Second Data Service Defined in Table 116. For more help, see Ethernet port allocation on
page 3-36.
Management Service Defined in Table 116. For more help, see Ethernet port allocation on
page 3-36.
Local Management
Service
Defined in Table 116 For more help, see Ethernet port allocation on
page 3-36.
Page 6-38

Chapter 6: Configuration and alignment System menu
Attribute
Meaning
Ethernet Loopback
Mode
Sets a temporary loopback between the selected ports. The
loopback is disabled on a reboot. This mode is provided to allow
access to a device connected to the local ODU Aux port via either
the main PSU or SFP port. Loopback does not work with jumbo
frames: the maximum frame size is 1536 bytes in loopback.
Data Port Wireless
Down Alert
Disabled:
The data Ethernet link will not be dropped when the
wireless link drops.
Enabled:
The Data Ethernet link will be dropped briefly when the
wireless link drops. This signals to the connected network
equipment that this link is no longer available. Connected Ethernet
switches can be configured to forward Ethernet frames on an
alternative path identified using the Spanning Tree Protocol (STP).
When TDM is enabled, the link is dropped briefly at the NIDU LAN
port, and not at the ODU.
Second Data Port
Wireless Down Alert
Disabled:
The Second Data Ethernet link will not be dropped when
the wireless link drops.
Enabled:
The Second Data Ethernet link will be dropped briefly when
the wireless link drops. This signals to the connected network
equipment that this link is no longer available. Connected Ethernet
switches can be configured to forward Ethernet frames on an
alternative path identified using the Spanning Tree Protocol (STP).
When TDM is enabled, the link is dropped briefly at the NIDU LAN
port, and not at the ODU.
Management Port
Wireless Down Alert
Only displayed when an Out-of-Band Port is selected for
Management Service.
Disabled:
The management Ethernet link will not be dropped when
the wireless link drops.
Enabled:
The management Ethernet link will be dropped briefly
when the wireless link drops. This signals to the connected network
equipment that this link is no longer available. Connected Ethernet
switches can be configured to forward Ethernet frames on an
alternative path identified using the Spanning Tree Protocol (STP).
Management Network
Access Enabled
Only displayed when one of the Port selection attributes (Main PSU,
Aux or SFP) is set to
Out-of-Band Management Service
and
Second
Data Service
is disabled or set to None.
Yes:
The local out-of-band management interface can be used to
access the remote management network.
No
: The local out-of-band management interface cannot be used to
access the remote management network.
Table 122
Main PSU Port, NIDU LAN Port and Aux Port attributes
Attribute
Meaning
Page 6-39

Chapter 6: Configuration and alignment System menu
Attribute
Meaning
Auto Negotiation
Disabled:
Configuration of the Ethernet interface is forced.
Enabled:
Configuration of the Ethernet interface is automatically
negotiated (default). This is the preferred setting.
Use the same setting for the Ethernet link partner.
Auto Neg
Advertisement
Only displayed when Auto Negotiation is set to
Enabled
.
The data rate that the auto-negotiation mechanism will advertise as
available on the Ethernet interface (1000 Mbps or 100 Mbps Full
Duplex). Select a data rate that is within the capability of the Ethernet
link partner. Use the same setting for the Ethernet link partner.
Forced
Configuration
Only displayed when Auto Negotiation is set to
Disabled
.
This forces the speed and duplex setting of the Ethernet interface.
Over-the-air throughput will be capped to the rate of the Ethernet
interface at the receiving end of the link. Select a data rate that is within
the capability of the link partner. Use the same setting at both ends.
Auto Mdix
Disabled:
The Auto Medium Dependent Interface (MDI)/Medium
Dependent Interface Crossover (MDIX) capability is disabled.
Enabled:
The Auto Medium Dependent Interface (MDI)/Medium
Dependent Interface Crossover (MDIX) capability is enabled.
Power Over
Ethernet Output
Aux port only.
Disabled:
The ODU does not supply power to the auxiliary device.
Enabled:
The ODU supplies power to the auxiliary device.
Table 123
SFP Port (connected with copper module) attributes
Attribute
Meaning
SFP Port Auto
Negotiation
Disabled:
Configuration of the Ethernet interface is forced. This is to be
used as a last resort only if auto-negotiation fails.
Enabled:
Configuration of the Ethernet interface is automatically
negotiated (default). This is the preferred setting.
SFP Port Auto Neg
Advertisement
Only displayed when SFP Port Auto Negotiation is set to
Enabled
and
SFP port is connected with copper module.
The data rate that the auto-negotiation mechanism will advertise as
available on the Ethernet interface (1000 Mbps or 100 Mbps Full
Duplex). Select a data rate that is within the capability of the Ethernet
link partner. Use the same setting for the Ethernet link partner.
Page 6-40

Chapter 6: Configuration and alignment System menu
Attribute
Meaning
Forced
Configuration
Only displayed when SFP Port Auto Negotiation is set to
Disabled
and
SFP port is connected with copper module.
This forces the speed and duplex setting of the Ethernet interface.
Over-the-air throughput will be capped to the rate of the Ethernet
interface at the receiving end of the link. Select a data rate that is within
the capability of the Ethernet link partner. Use the same setting for the
Ethernet link partner.
Auto Mdix Only displayed when SFP port is connected with copper module.
Disabled:
The Auto Medium Dependent Interface (MDI)/Medium
Dependent Interface Crossover (MDIX) capability is disabled.
Enabled:
The Auto Medium Dependent Interface (MDI)/Medium
Dependent Interface Crossover (MDIX) capability is enabled.
Table 124
Bridging attributes
Attribute
Meaning
Local Packet
Filtering
Enabled:
The management agent learns the location of end stations
from the source addresses in received management frames. The agent
filters transmitted management frames to ensure that the frame is
transmitted at the Ethernet (data or management) port, or over the
wireless link. If the end station address is unknown, then management
traffic is transmitted at the Ethernet port and over the wireless link.
In the Local Management Service, management frames are not
transmitted over the wireless link, and so address learning is not
active.
Data Port Pause
Frames
Controls whether the bridge tunnels or discards Layer 2 pause frames
arriving at the Data port. Such frames are identified by the destination
MAC Address being equal to 01-80-C2-00-00-01.
Second Data Port
Pause Frames
Tunnel:
The Layer 2 pause frames arriving at the port selected for
Second Data Service will be bridged across to the port selected for
Second Data Service on remote device over the wireless link.
Discard
: The Layer 2 pause frames arriving at the port selected for
Second Data Service will be dropped.
Table 125
Synchronous Ethernet attributes
Attribute
Meaning
Page 6-41

Chapter 6: Configuration and alignment System menu
Attribute
Meaning
Sync E Tracking
Disabled
: The synchronous Ethernet feature is disabled.
Synchronization Status Messages received at the Main PSU port
will be discarded.
Enabled
: The synchronous Ethernet feature is enabled.
Internal TDM Use Only
: Sync E Tracking is enabled, but is being
used internally as part of the TDM feature. Sync E is not available
to relay synchronization between external network equipment.
Sync E Equipment Clock
EEC-Option 1
: Select this option if the equipment is operating in a
2048 kbit/s synchronisation hierarchy (ITU-T G.813 Option 1)
EEC-Option 2
: Select this option if the equipment is operating in a
1544 kbit/s synchronisation hierarchy (Type IV clock from ITU-T
G.812)
Main PSU Port QL Rx
Overwrite
This control provides the facility to overwrite the Quality Level
(QL) of received Synchronisation Status Messages (SSM). It may
be useful in a test environment, or for interworking with
equipment that does not generate SSMs.
Disabled:
The recommended setting, the QL of received SSMs is
unmodified.
“
QL-PRC
” or “
QL-SSU A / QL-TNC
” or “
QL-SSU B
” or “
QL-EEC1 /
QL-SEC
” or “
QL-DNU / QL-DUS
”: The overwritten value of the
QL. Where two QLs are given, the QL used is dependent upon the
setting of “Sync E Equipment Clock” type.
Main PSU Port SSM Tx
Disabled
: SSMs are not transmitted from the Main PSU port.
Disabling SSMs may be useful in a test environment.
Enabled
: SSMs are transmitted from the Main PSU port (normal
operation)
Aux Port SSM Tx
Disabled
: SSMs are not transmitted from the Aux Port. Disabling
SSMs may be useful in a test environment.
Enabled
: SSMs are transmitted from the Aux Port (normal
operation)
SFP Port SSM Tx
Disabled
: SSMs are not transmitted from the SFP port. Disabling
SSMs may be useful in a test environment.
Enabled
: SSMs are transmitted from the SFP port (normal
operation)
Table 126
IEEE 1588 attributes
Attribute
Meaning
Page 6-42

Chapter 6: Configuration and alignment System menu
Attribute
Meaning
Transparent Clock
Disabled
: The Transparent Clock function is disabled. IEEE 1588-
2008 event frames will be forwarded, but residence time
corrections will not be made.
Enabled
: The Transparent Clock function is enabled. Residence
time corrections will be made to IEEE 1588-2008 event frames.
Transparent Clock Port This specifies the transparent clock source port. It can be Main
PSU or SFP Fiber. Only the ports allocated for Data / Second Data
Path show up for selection.
Transparent Clock VLAN
All
: The recommended setting. Residence time corrections will be
made to all IEEE 1588-2008 event frames, regardless of any VLAN
encapsulation.
S-Tagged
: Residence time corrections are only made to event
frames tagged with a service tag equal to “Transparent Clock
VID”.
C-Tagged
: Residence time corrections are only made to event
frames double tagged and with a customer tag equal to
“Transparent Clock VID”.
Transparent Clock VID The VLAN Identifier (VID) used with “Transparent Clock VLAN” to
restrict residence time corrections to IEEE 1588-2008 event
frames in a specific VLAN.
Page 6-43
Chapter 6: Configuration and alignment System menu
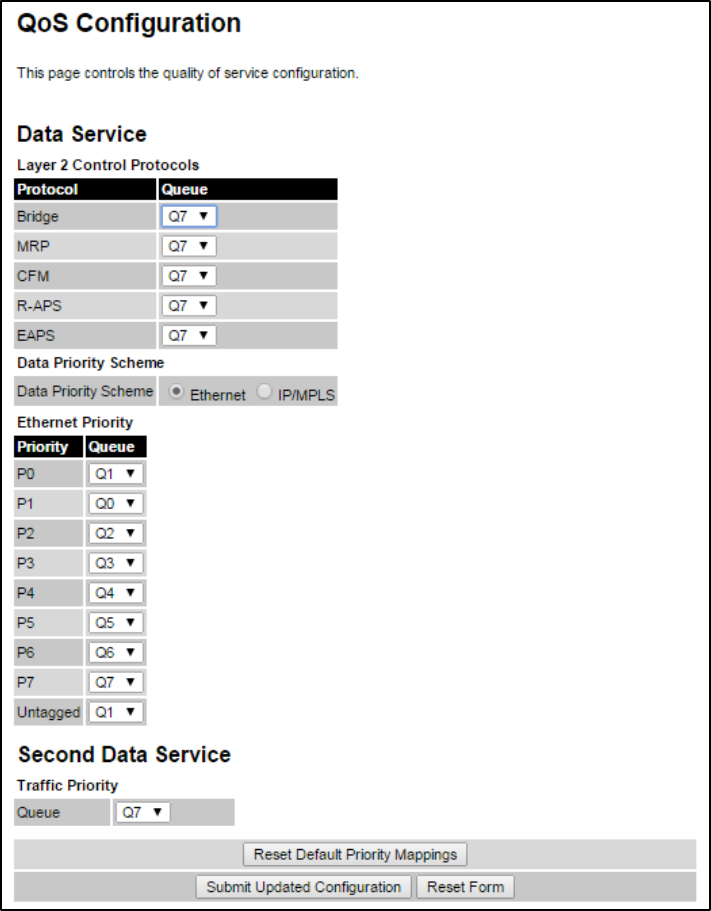
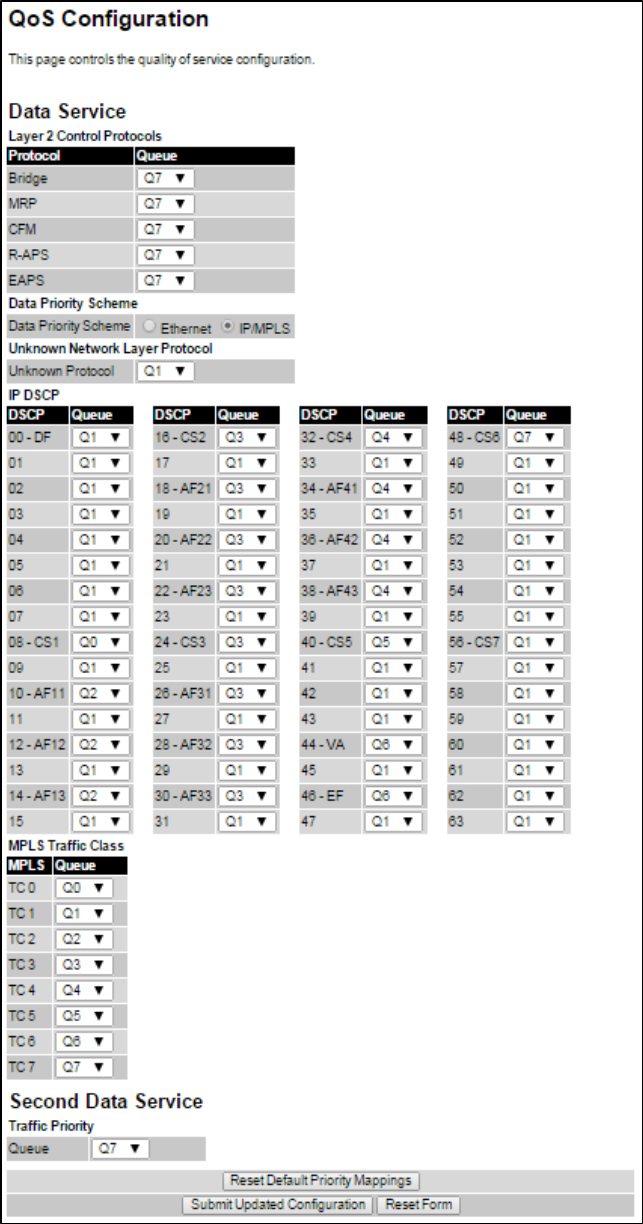
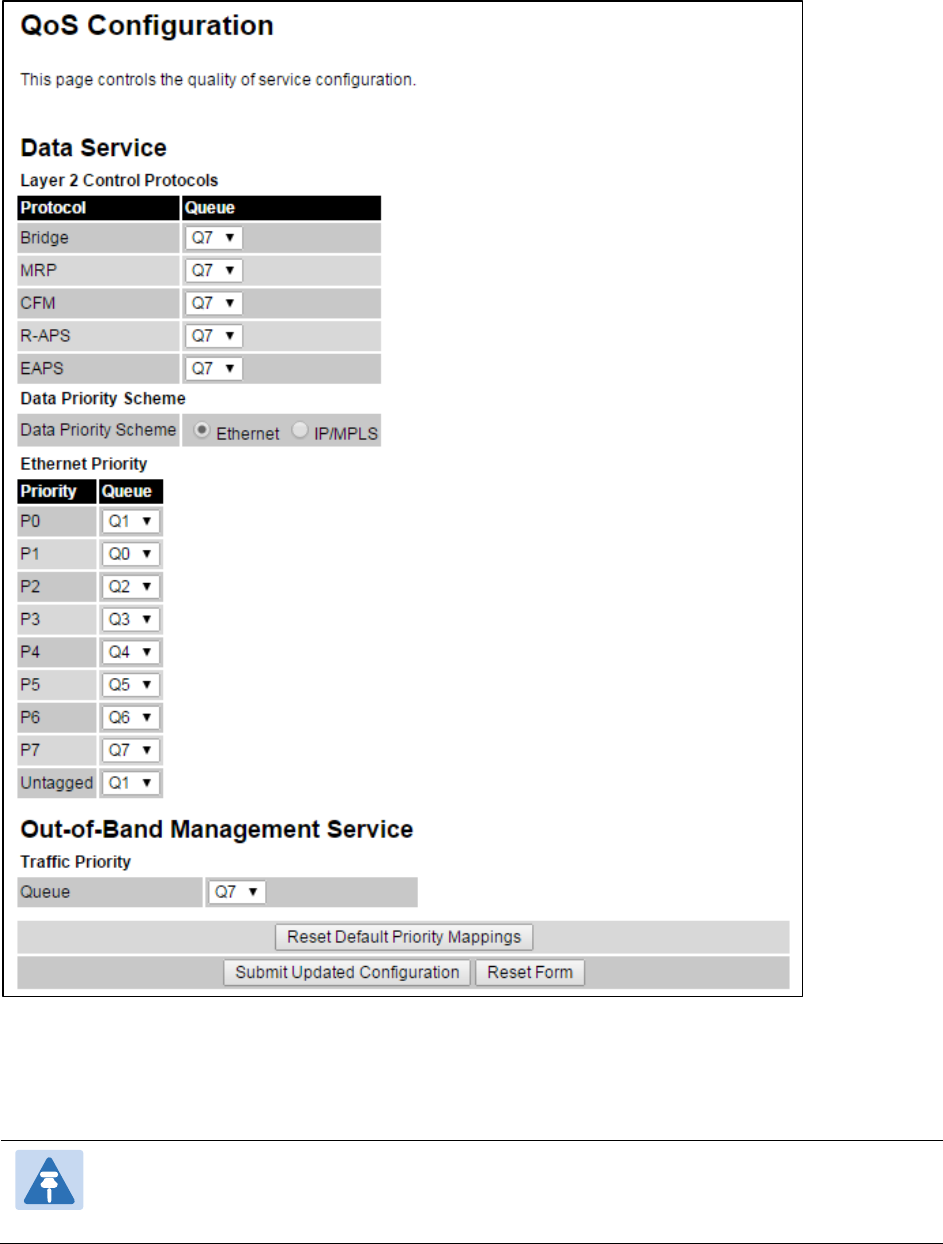
QoS Configuration page
Menu option:
System > Configuration > QoS Configuration
(Figure 140 or Figure 141 or Figure
142). Use this page to control the quality of service configuration. Classification may be based
on fields in the Ethernet header (Layer 2) or in the network header (Layer 3). The unit
recognizes two network layer protocols: IP and MPLS.
Figure 140
QoS Configuration page (Ethernet)
Page 6-44
Chapter 6: Configuration and alignment System menu
Figure 141
QoS Configuration page (IP/MPLS)
Page 6-45
Chapter 6: Configuration and alignment System menu
Figure 142
QoS Configuration page showing Out-of-Band Management
Procedures:
• Review and update the attributes (Table 127, Table 128 and Table 129).
• To use IEEE 802.1Q classification rules, click
Reset Default Priority Mappings
.
• To save changes, click:
Submit Updated Configuration
.
Note
Priority mapping must be configured the same at both Master and Slave units on the
wireless link.
Page 6-46

Chapter 6: Configuration and alignment System menu
Table 127
QoS Configuration attributes – Data Service
Attribute
Meaning
Bridge
MRP
CFM
R-APS
EAPS
The classification of each layer 2 control protocol (L2CP) to an egress
queue at the wireless port.
Data Priority
Scheme
Ethernet
: Classification is based on fields in the Ethernet header (Layer
2).
IP/MPLS
: Classification is based on fields in the network header (Layer 3).
IP includes IPv4 and IPv6.
Unknown
Protocol
Only displayed when Priority Scheme is
IP/MPLS
.
The classification of unknown network protocols (that is, not IP or MPLS)
to an egress queue at the wireless port.
Ethernet Priority Ethernet priority mapping to Queue
Table 128
QoS Configuration attributes – Second Data Service
Attribute
Meaning
Queue Set a priority egress queue for Second Data Service traffic classification
Table 129
QoS Configuration attributes –Out-of-Band Managment Service
Attribute
Meaning
Queue Only displayed when one ODU port is allocated to
Out-of-Band
Management
and
Second Data Service
port is not allocated (Configuring
port allocations on page 6-19).
The classification of out-of-band management traffic to an egress queue
at the wireless port.
SFP Configuration page
Menu option:
System > Configuration > SFP Configuration
.
This page is only available when the ODU detects an optical (Figure 143) or copper (Figure 144)
SFP module in the SFP port. Use it to configure the way in which the unit connects to the
network via the SFP interface.
Page 6-47
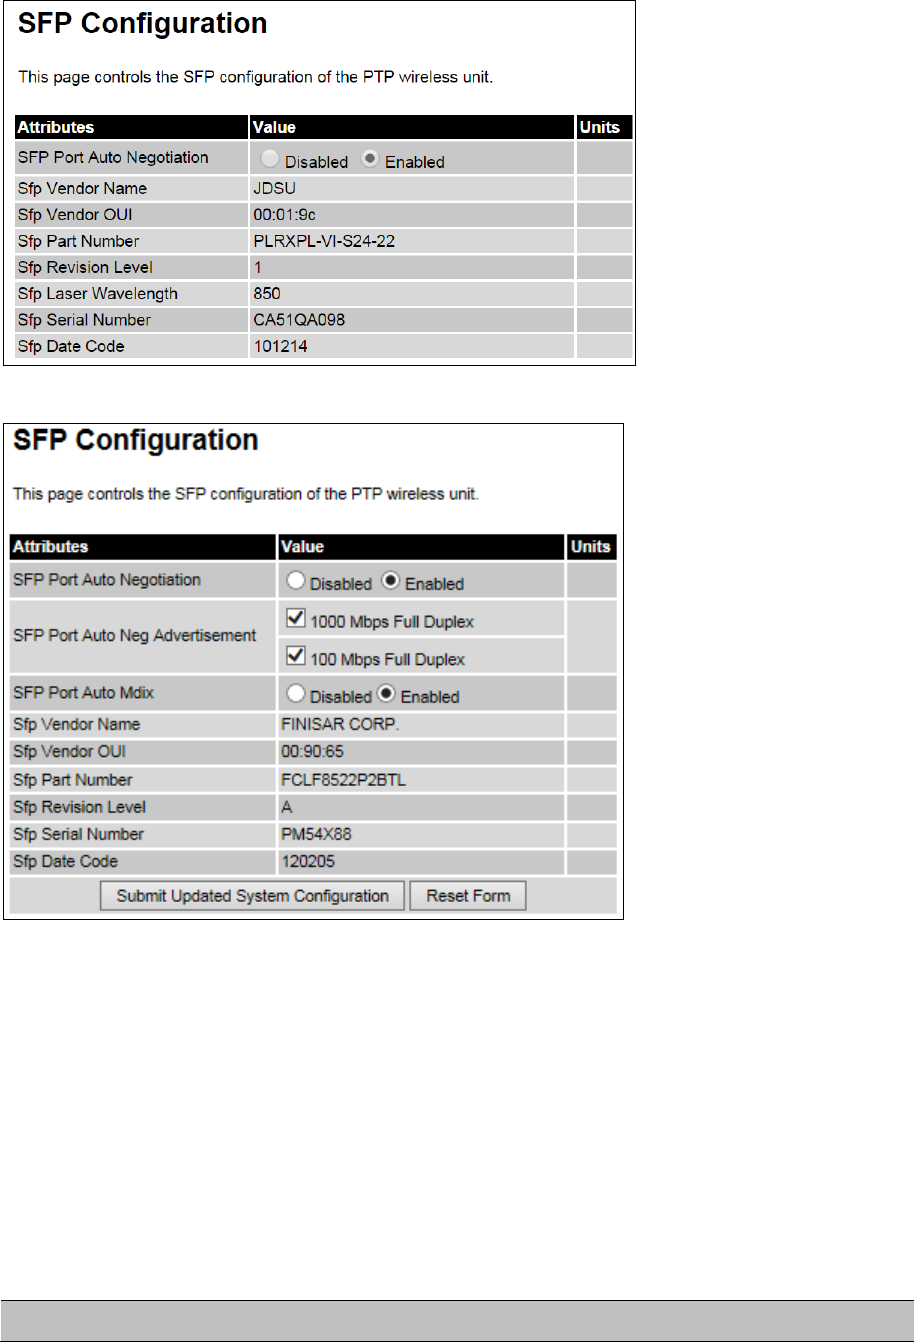
Chapter 6: Configuration and alignment System menu
Figure 143
SFP Configuration page (optical SFP module)
Figure 144
SFP Configuration page (copper SFP module)
Procedure
(only applies when copper SFP module is installed)
:
• Update the attributes
o When optical SFP module is installed (Table 133).
o When copper SFP module is installed (Table 131)
• To save changes, click
Submit Updated System Configuration
.
Table 130
SFP Configuration (Optical module) attributes
Attribute
Meaning
Page 6-48

Chapter 6: Configuration and alignment System menu
Attribute
Meaning
SFP Port Auto
Negotiation
Disabled:
Configuration of the Ethernet interface is forced. This is to be
used as a last resort only if auto-negotiation fails.
Enabled:
Configuration of the Ethernet interface is automatically
negotiated (default). This is the preferred setting.
Table 131
SFP Configuration (copper SFP module) attributes
Attribute
Meaning
SFP Port Auto
Negotiation
Disabled:
Configuration of the fiber interface is forced. This is to be
used as a last resort only if auto-negotiation fails.
Enabled:
Configuration of the fiber interface is automatically negotiated
(default). This is the preferred setting.
SFP Port Auto Neg
Advertisement
Only displayed when SFP Port Auto Negotiation is set to
Enabled
.
The data rate that the auto-negotiation mechanism will advertise as
available on the Ethernet interface (1000 Mbps or 100 Mbps Full
Duplex). Select a data rate that is within the capability of the Ethernet
link partner. Use the same setting for the Ethernet link partner.
Forced
Configuration
Only displayed when SFP Port Auto Negotiation is set to
Disabled
.
This forces the speed and duplex setting of the Ethernet interface.
Over-the-air throughput will be capped to the rate of the Ethernet
interface at the receiving end of the link. Select a data rate that is within
the capability of the Ethernet link partner. Use the same setting for the
Ethernet link partner.
Auto Mdix
Disabled:
The Auto Medium Dependent Interface (MDI)/Medium
Dependent Interface Crossover (MDIX) capability is disabled.
Enabled:
The Auto Medium Dependent Interface (MDI)/Medium
Dependent Interface Crossover (MDIX) capability is enabled.
Page 6-49
Chapter 6: Configuration and alignment System menu
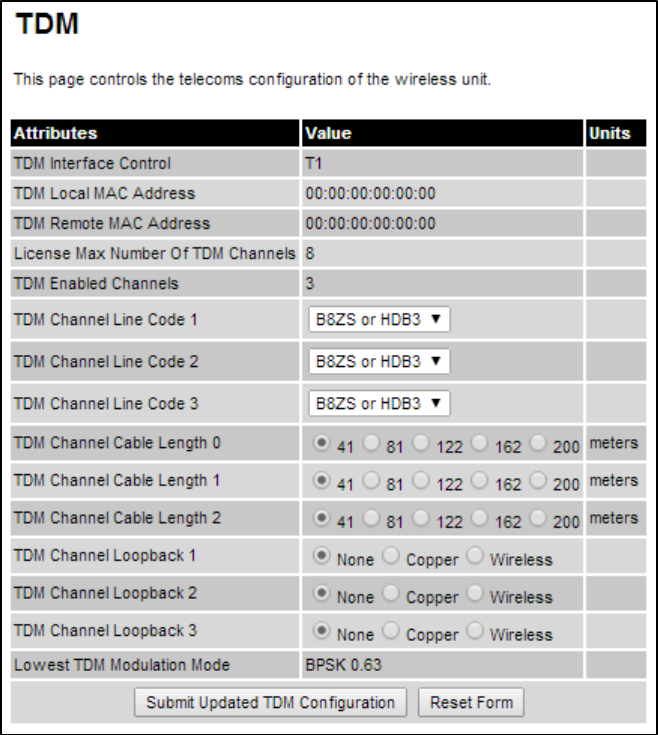
TDM Configuration page
Menu option:
System > Configuration > TDM Configuration
(Figure 145).
Use this page to control how the unit handles E1 or T1 channels over the wireless bridge.
This page is only available when the TDM interface is enabled and the unit is rebooted
(Interface Configuration page on page 6-14).
Procedure:
• Update the attributes (Table 132).
• To save changes, click
Submit Updated TDM Configuration
.
Figure 145
TDM Configuration page (T1 option shown)
Page 6-50

Chapter 6: Configuration and alignment System menu
Table 132
TDM Configuration attributes
Attribute
Meaning
TDM Interface Control Display only. Defined in Table 117.
TDM Local MAC Address Display only. MAC address of the local NIDU.
TDM Remote MAC
Address
Display only. MAC address of the remote NIDU.
License Max Number of
TDM Channels
Display only. Defined in Table 117.
TDM Enabled Channels Display only. Defined in Table 117.
TDM Channel Line Code
n
Defined in Table 117.
TDM Channel Cable
Length n
Defined in Table 117.
TDM Channel Loopback n Select the loopback status of TDM channel “n” (where “n” is in
the range 1 to 8).
None
: Normal operation, no testing is required.
Copper
: Sends the TDM data received from the local transceiver
and NIDU back on the same TDM channel. This may be used in
conjunction with a Bit Error Rate Tester to confirm that the correct
connections have been made between the transceiver, NIDU and
ODU. This mode cannot be used for resistance tests, as it is only
capable of looping back valid TDM signals.
Wireless
: Sends the TDM data received from the wireless link
back across the link on the same TDM channel. The link may be
checked using, for example, a Bit Error Rate Tester to ensure that
no errors are detected.
Lowest TDM Modulation
Mode
Display only. Defined in Table 117.
Page 6-51
Chapter 6: Configuration and alignment System menu
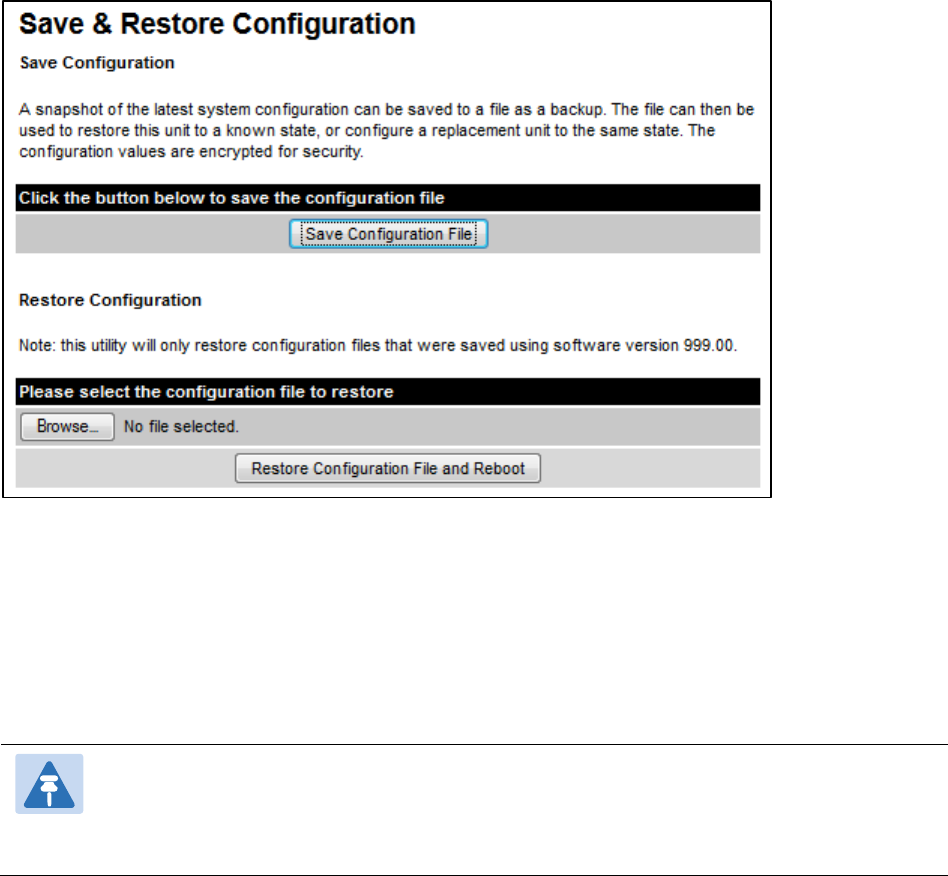
Save and Restore Configuration page
Menu option:
System > Configuration > Save And Restore
(Figure 146).
Use the Save & Restore Configuration page to take a snapshot of the latest system
configuration as a backup. The file can then be used to restore this unit to a known state, or to
configure a replacement unit to the same state. The configuration values are encrypted for
security.
Figure 146
Save & Restore Configuration page
Save the system configuration in the following situations:
• After a new unit has been fully configured as described in this chapter.
• After any change has been made to the configuration.
• Before upgrading the unit to a new software version.
• After upgrading the unit to a new software version.
Note
The restore is only guaranteed to work if the installed software version has not been
changed since the configuration file was saved. This is why the configuration should
always be saved immediately after upgrading the software version.
Page 6-52

Chapter 6: Configuration and alignment System menu
Note
The license key is restored automatically if the configuration file is saved and then
loaded on the same unit. However, the license key is not restored if the configuration
file is loaded on a different unit. Before restoring configuration to a different PTP 700
unit, ensure that a valid license key is installed (with optional capabilities enabled
where appropriate).
Most of the configuration can be restored from the backup. However, certain attributes that
were part of the configuration are not saved or restored automatically. Use the web interface to
reconfigure the following attributes:
• Usernames, passwords and roles for the web-based interface.
• Key of Keys
• HTTPS Entropy
• HTTPS Private Key
• HTTPS Public Key Certificate
• HTTP Access Enabled
• HTTPS Access Enabled
• Telnet Access Enabled
• HTTP Port Number
• HTTPS Port Number
• Telnet Port Number
• Encryption Algorithm
• Encryption Key
• SNMP Control Of HTTP And Telnet
• SNMP Control of Passwords
Procedures:
• To save the configuration:
o Click Save Configuration File.
o Save the file. The default filename is in the format
MAC-mm-mm-mm_IP-iii-iii-iii-iii.cfg
,
where
mm-mm-mm
is MAC address of unit and
iii-iii-iii-iii
is Internet address of unit.
• To restore the configuration:
o Click
Browse
and navigate to the PC folder containing the saved configuration file (.cfg).
o Click
Restore Configuration File and Reboot
.
o Click
OK
to confirm the restore. The configuration file is uploaded and used to
reconfigure the new unit to the same state as the old unit. On completion, the unit
reboots.
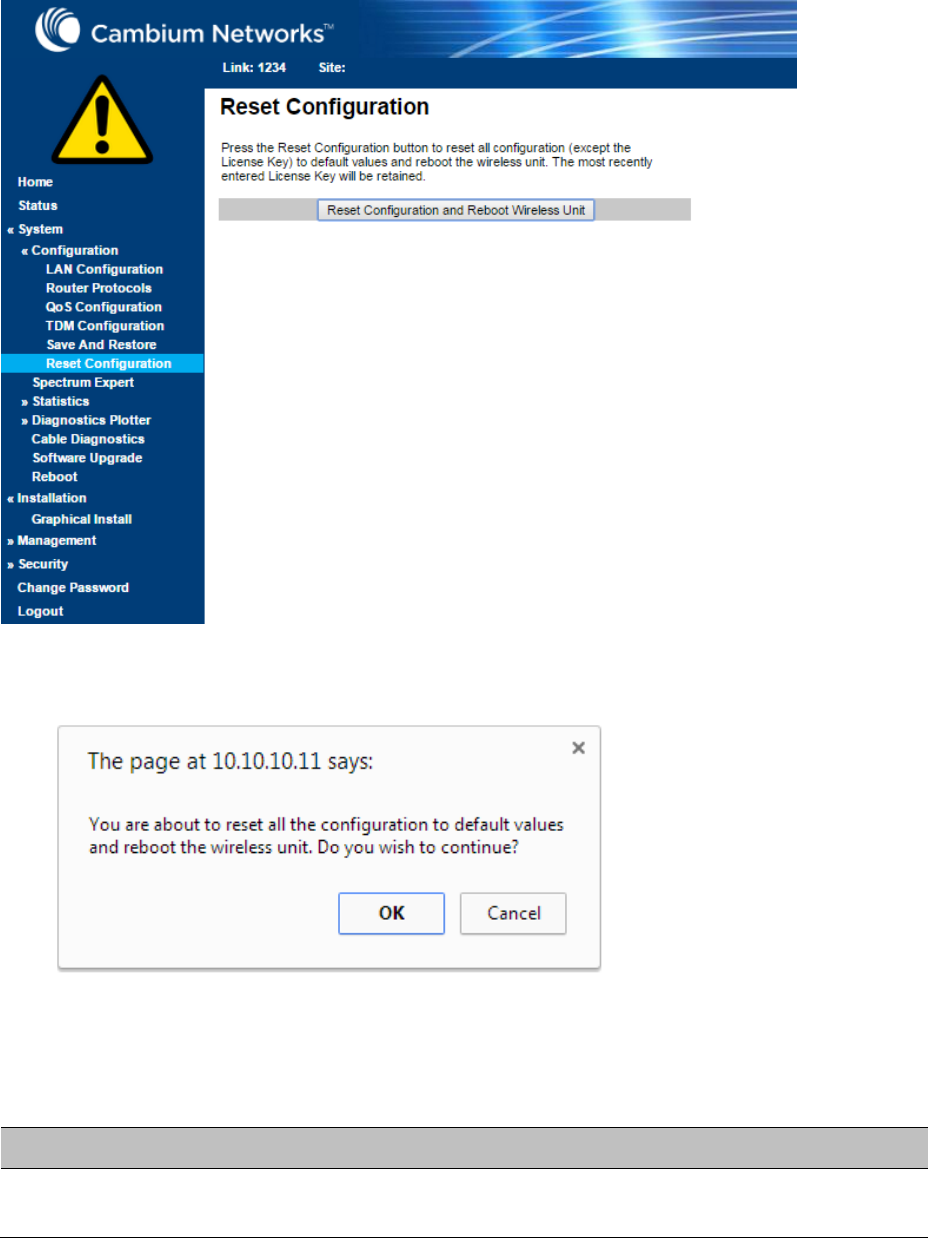
Reset Configuration page
Menu option:
System > Configuration > Reset Configuration
. Use this page to reset the ODU
configuration to default settings, retaining the most recently entered License Key (Figure 147).
Page 6-53
Chapter 6: Configuration and alignment System menu
The Reset Configuration page resets the configuration to default settings. After successful
execution of Reset Configuration, the ODU reboots and is then accessible via the default IP
address (i.e. 169.254.1.1).
Figure 147
Reset Configuration page
Procedure:
• Click
Reset Configuration
. The user pop up box is displayed to reconfirm:
• Click
OK
to restore configuration to the default settings and reboot of unit.
Further reading
For information about…
Refer to…
Erase Configuration Use this option to erase the entire configuration of the unit.
Refer to Resetting all configuration data on page 7-66.
Page 6-54
Chapter 6: Configuration and alignment System menu
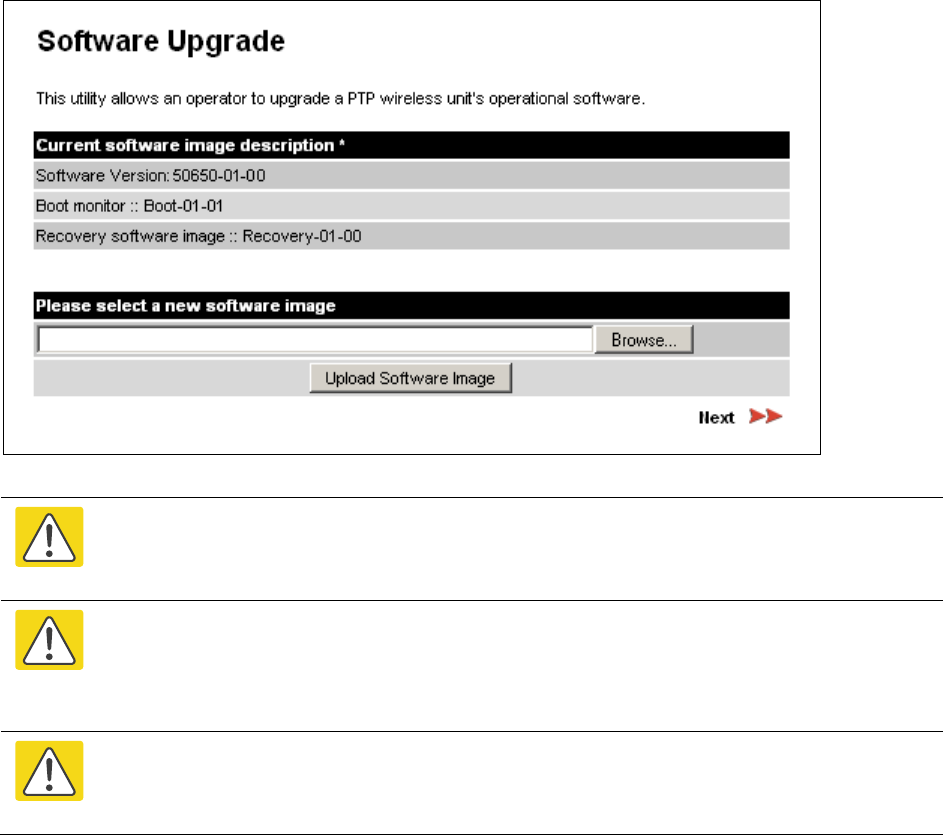
Software Upgrade page
Menu option:
System > Software Upgrade
(Figure 148).
Use this page to upgrade the unit to a new version of PTP 700 operational software.
Figure 148
Software Upgrade page
Caution
Ensure that the correct units are upgraded, as units cannot easily be downgraded
afterwards.
Caution
Software version must be the same at both ends of the link. Limited operation may
sometimes be possible with dissimilar software versions, but such operation is not
supported by Cambium Networks.
Caution
If the link is operational, upgrade the remote end of the link first, then upgrade the
local end. Otherwise, the remote end may not be accessible.
Preparation:
• Go to the Cambium Support web page (see Contacting Cambium Networks on page 1) and
navigate to
Point-to-Point Software and Documentation
,
PTP 700 Series
.
• If the support web page contains a later Software Version than that installed on the PTP 700
unit, perform the procedure below.
Procedure:
1
Save the system configuration
; see Save and Restore Configuration page on page 6-52.
Page 6-55
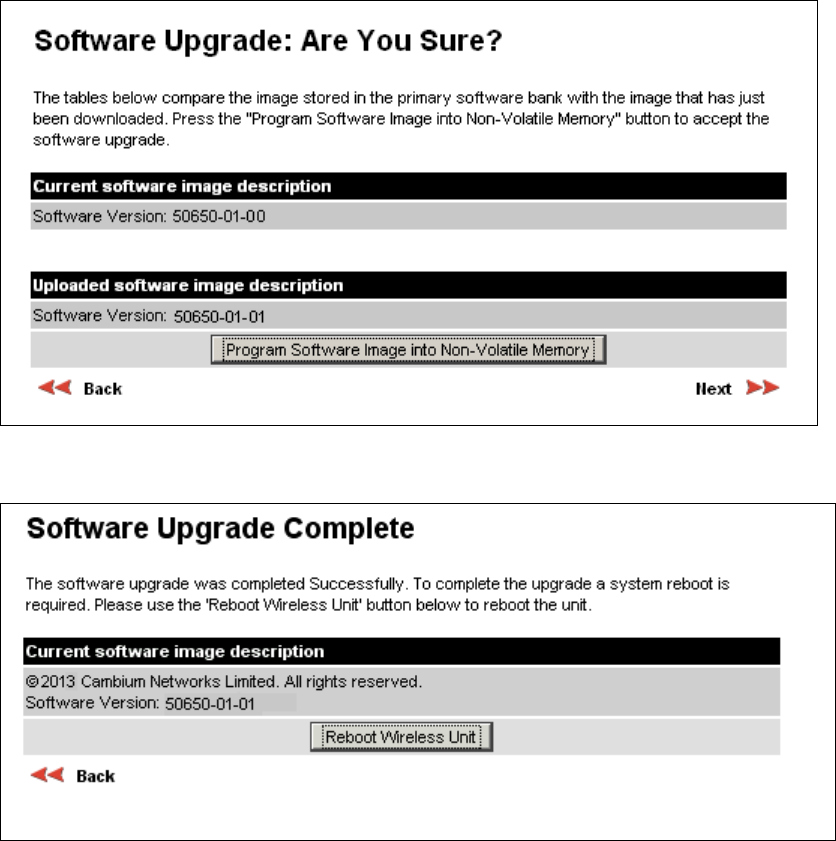
Chapter 6: Configuration and alignment System menu
2
On the Cambium Support web page
, select the latest PTP 700 software image (dld2 file) and
s
ave it to the local management PC.
3
On the Software U
pgrade page, click
Browse
. Navigate to the folder containing the
downloaded software image and click Open
.
4
Click Upload Software Image
. The Software Upgrade Confirmation page is displayed:
5
Click Program Software Image into Non-Volatile Memor
y. The Progress Tracker page is
displayed. On completion, the Software Upgrade Complete page is displayed:
6
Click Reboot Wireless Unit
, then click
OK
to confirm. The unit reboots with the new software
installed.
7
Save the post
-upgrade system configuration; see Save and Restore Configuration page on
page
6-52.
Page 6-56

Chapter 6: Configuration and alignment System menu
Note
The unit will not upload FIPS versions of the software unless the unit has the AES
encryption and FIPS licenses installed.
Note
CSPs are automatically zeroized if FIPS software is loaded in a unit to replace standard
(non-FIPS) software, or standard (non-FIPS) software is loaded in a unit to replace FIPS
software.
Page 6-57
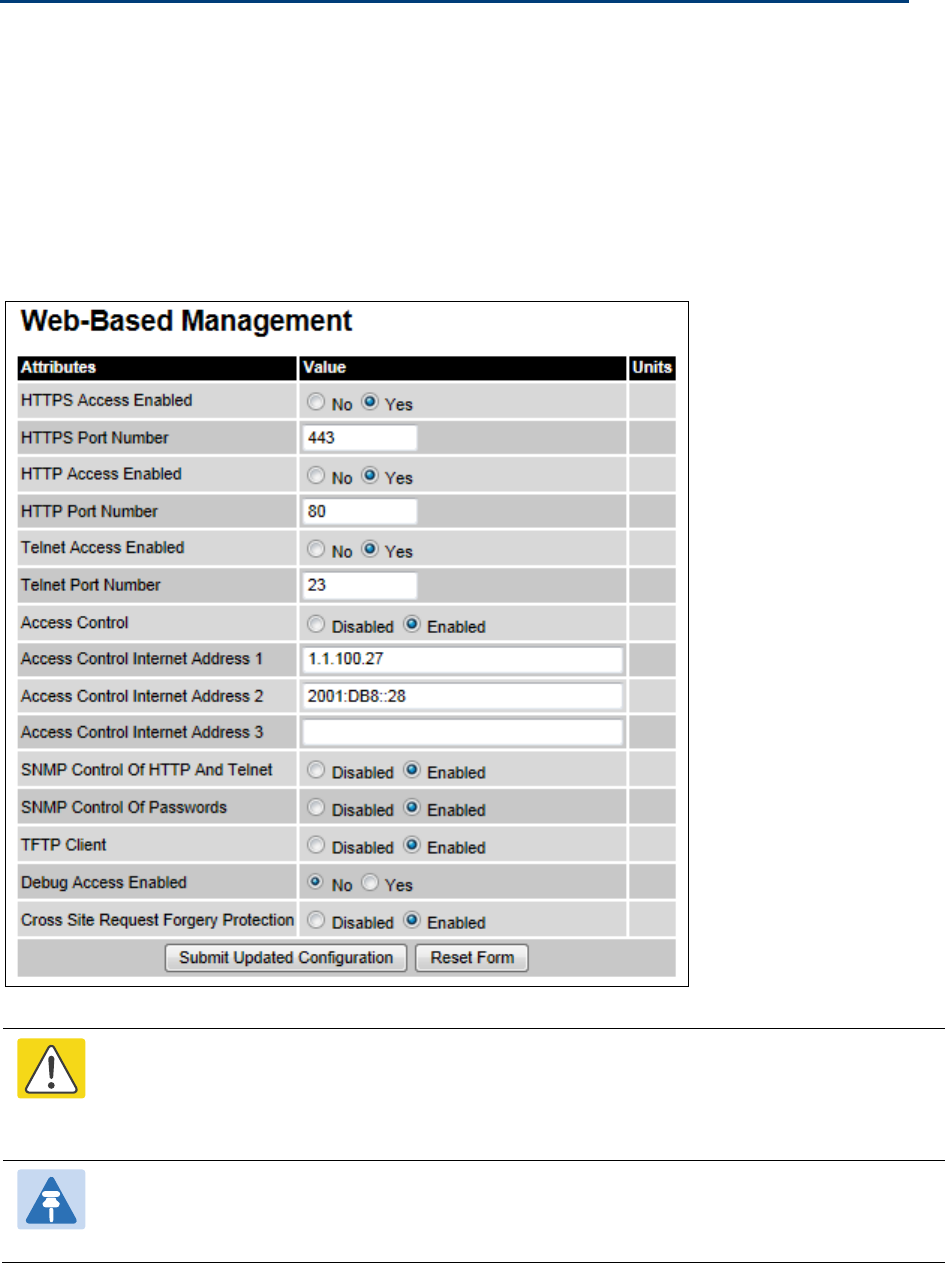
Chapter 6: Configuration and alignment Management menu
Management menu
This section describes how to configure web-based management of the PTP 700 unit.
Web-Based Management page
Menu option:
Management > Web
(Figure 149).
Use this page to configure web-based management of the unit.
Figure 149
Web-Based Management page
Caution
If the HTTP, HTTPS, Telnet and SNMP interfaces are all disabled, then it will be
necessary to use the Recovery image to reset IP & Ethernet Configuration back to
defaults to re-enable the interfaces.
Note
The HTTP and Telnet interfaces should be disabled if the HTTPS interface is
configured. (Preparing for HTTPS/TLS page 6-93).
Page 6-58

Chapter 6: Configuration and alignment Management menu
Procedure:
• Review and update the attributes (Table 133).
• To save changes, click
Submit Updated Configuration
.
Table 133
Web-Based Management attributes
Attribute
Meaning
HTTPS Access
Enabled
Only displayed when HTTPS is configured.
No:
The unit will not respond to any requests on the HTTPS port.
Yes:
The unit will respond to requests on the HTTPS port.
HTTPS Port Number Only displayed when HTTPS is configured. The port number for HTTPS
access. A value of zero means the wireless unit uses the default port.
HTTP Access
Enabled
No:
The unit will not respond to any requests on the HTTP port.
Yes:
The unit will respond to requests on the HTTP port.
Remote management via HTTPS is not affected by this setting.
HTTP Port Number The port number for HTTP access. A value of zero means the wireless
unit uses the default port.
Telnet Access
Enabled
No:
The unit will not respond to any requests on the Telnet port.
Yes:
The unit will respond to requests on the Telnet port.
Telnet Port Number The port number for Telnet access. A value of zero means the wireless
unit uses the default port.
Access Control Enables or disables access control to web-based management by
Internet Address.
Access Control
Internet Address
1/2/3
A list of up to three IPv4 or IPv6 Addresses permitted to perform web-
based management.
Only displayed when Access Control is set to
Enabled
.
SNMP Control of
HTTP And Telnet
Disabled:
Neither HTTP nor Telnet can be controlled remotely via SNMP.
Enabled:
Both HTTP and Telnet can be controlled remotely via SNMP.
SNMP Control of
Passwords
Enabled:
Passwords for identity-based user accounts in the web-based
interface can be updated via SNMP. This option can be used together
with SNMPv3 to provide a secure means to update passwords from a
central network manager.
Disabled
: Passwords for identity-based user accounts can be updated
only via the web-based interface (default).
TFTP Client
Disabled:
The unit will not respond to any TFTP software download
requests.
Enabled:
Software can be downloaded via TFTP, as described in
Upgrading software using TFTP on page 6-117.
Debug Access
Enabled
Yes:
Cambium Technical Support is allowed to access the system to
investigate faults.
Page 6-59

Chapter 6: Configuration and alignment Management menu
Attribute
Meaning
Cross Site Request
Forgery Protection
Enabled:
The system is protected against cross-site request forgery
attacks at the web-based interface.
Page 6-60
Chapter 6: Configuration and alignment Management menu
Local User Accounts page
Menu option:
Management > Web > Local User Accounts
.
The contents of this page depend upon the setting of Identity Based User Accounts:
Disabled
(Figure 150) or
Enabled
(Figure 151).
Use this page to ensure that user access to the web-based management interface is controlled
in accordance with the network operator’s security policy. The Identity Based User Accounts
option allows multiple users (from one to ten) to access the unit with one of three levels of
access: Security Officer, System Administrator and Read Only. If Identity Based User Accounts
are
Enabled
, this procedure may only be performed by a Security Officer.
Note
Local User Account Names, Roles and Passwords are critical security parameters that
can be rest from the Zeroize CSPs page (Zeroize CSPs page on page 6-104
).
Figure 150
Local User Accounts page (Identity Based User Accounts disabled)
Note
Identity Based User Accounts is automatically set to
Enabled
in the FIPS 140-2 secure
mode.
Page 6-61
Chapter 6: Configuration and alignment Management menu
Figure 151
Local User Accounts page (Identity Based User Accounts enabled)
Page 6-62

Chapter 6: Configuration and alignment Management menu
Procedure:
• Choose whether to set Identity Based User Accounts to
Disabled
or
Enabled
.
• Review and update the Local User Account Management attributes (Table 134).
• If Identity Based User Accounts is set to
Enabled:
o Review and update the Password Complexity Configuration attributes (Table 135). To
reset all attributes to the best practice values, click
Set Best Practice Complexity
. To
return to default values, click
Set Default Complexity.
o Review and update up to 10 identity-based user accounts (Table 136).
• If any attributes have been updated, click
Submit User Account Updates
.
Table 134
Local User Account Management attributes
Attribute
Meaning
Identity Based
User Accounts
Disabled
: Access to the web interface is controlled by a single system
administration password.
Enabled
: Up to 10 users may access the unit.
Auto Logout
Period
The time without user activity that elapses before a user is automatically
logged out (minutes). A value of zero disables this feature.
Minimum
Password
Change Period
The minimum time that elapses before a user is allowed to change a
password (minutes). A value of zero disables this feature.
Password Expiry
Period
The time that elapses before a password expires (days). A value of zero
disables this feature.
Maximum
Number of Login
Attempts
The maximum number of login attempts (with incorrect password) that are
allowed before a user is locked out.
Also, the maximum number of password change attempts before a user is
locked out.
Login Attempt
Lockout Action
Only displayed when Identity Based User Accounts is
Enabled
.
Timeout
: When a user is locked out, the user is allowed to log in again after
a specified period.
Disabled
: When a user is locked out, the user is disabled.
Login Attempt
Lockout Period
Only displayed when Identity Based User Accounts is
Disabled
.
The time that elapses before a locked out user is allowed to log in again
(minutes). Only displayed when Login Attempt Lockout Action is set to
Timeout
.
Password Expiry
Action
Only displayed when Identity Based User Accounts is
Enabled
.
The action to be taken by the PTP 700 when a password expires.
Table 135
Password Complexity Configuration attributes
Attribute
Meaning
Best
practice
Page 6-63

Chapter 6: Configuration and alignment Management menu
Attribute
Meaning
Best
practice
Minimum Password
Length
The minimum number of characters required in
passwords.
10
Password Can
Contain User Name
No
: Passwords must not contain the user name.
Yes
: Passwords may contain the user name.
No
Minimum Mandatory
Characters
The minimum number of lowercase, uppercase, numeric
and special characters required in passwords.
For example, if all values are set to
2
, then
FredBloggs
will
be rejected, but
FredBloggs(25)
will be accepted.
2
Maximum Repeated
Characters
The maximum number of consecutive repeated alphabetic,
numeric and special characters permitted in passwords.
For example, if all values are set to
2
, then
aaa
,
XXX
,
999
and
$$$
will be rejected, but
aa
,
XX
,
99
or
$$
will be
accepted.
2
Maximum
Consecutive
Characters
The maximum number of consecutive lowercase,
uppercase and numeric characters permitted in passwords.
For example, if all values are set to
5
, then
ALFRED
,
neuman
and
834030
will be rejected.
5
Maximum Sequential
Characters
The maximum number of alphabetic and numeric
characters permitted in passwords.
For example, if set to
3
, then
abcd
,
WXYZ
and
0123
will be
rejected, but
abc
,
xyz
and
123
will be accepted.
3
Maximum Repeated
Pattern Length
The maximum sequence of characters that can be repeated
consecutively in passwords.
For example, if set to
3
, then
BlahBlah
and
31st31st
will be
rejected, but
TicTicTock
and
GeeGee
will be accepted.
Blah-Blah
will be accepted because the two sequences are
not consecutive.
3
Match Reversed
Patterns
No
: Reversed patterns are not checked.
Yes
: Reversed patterns are checked.
For example, if Maximum Repeated Pattern Length is set to
3
and Match Reversed Patterns is set to
Yes
, then
AB1221BA
will be rejected.
Yes
Minimum Characters
That Must Change
The minimum number of password characters that must
change every time a password is updated.
4
Password Reuse
Permitted
: A user may reuse a previous password.
Prohibited
: A user must not reuse a previous password.
Prohibited
Special Characters User defined set of special characters used in password
construction. The only characters permitted in a password
are: (a-z), (A-Z), (0-9) and any of the special characters
entered here.
!"%&'()*+,-
./:;<=>?
Page 6-64

Chapter 6: Configuration and alignment Management menu
Note
Password Complexity must be set to Best Practice Complexity in FIPS 140-2 secure
mode.
Table 136
Identity-based user accounts attributes
Attribute
Meaning
Name Enter a user name.
Role Select a role from the list:
Security Officer, System Administrator
or
Read Only
.
Password Enter a password for the user. Passwords must comply with the
complexity rules (Table 135).
Password Confirm Retype the password to confirm.
Force Password
Change
Force this user to change their password when they next log on.
Disable Tick the box to disable a user account.
Note
At least one user must be assigned the Security Officer role. If RADIUS is enabled,
then this rule is relaxed, in which case the RADIUS server(s) SHOULD be configured
with at least one user with
Security Officer
privileges.
Page 6-65
Chapter 6: Configuration and alignment Management menu
RADIUS Configuration page
Menu option:
Management > Web > Radius Configuration
(Figure 152).
Use this page to configure RADIUS authentication. RADIUS authentication is only available
when PTP 700 is configured for Identity-based User Accounts and when RADIUS servers are
connected to the network.
Figure 152
RADIUS Configuration page
Note
Only users with
Security Officer
role are permitted to configure RADIUS authentication.
Note
When RADIUS is enabled, the Security Officer may disable all user accounts.
Note
At least one user with Security Officer privileges must exist and be enabled, in order to
disable the RADIUS client.
Procedure:
• Update the attributes (Table 137).
• Click
Submit RADIUS Configuration
.
Page 6-66

Chapter 6: Configuration and alignment Management menu
Table 137
RADIUS Authentication attributes
Attribute
Meaning
RADIUS Client
Enabled
Enabled:
PTP 700 users may be authenticated via the RADIUS servers.
Disabled
: RADIUS authentication is not used. This may only be selected
if at least one user with Security Officer privileges exists.
RADIUS Primary
Server
Specifies the primary server, determining the order in which the servers
are tried.
RADIUS Primary
Server Dead Time
Time (in minutes) to hold off trying to communicate with a previously
unavailable RADIUS server. Setting the value to zero disables the timer.
RADIUS Server
Retries
Number of times the PTP 700 will retry after a RADIUS server fails to
respond to an initial request.
RADIUS Server
Timeout
Time (in seconds) the PTP 700 will wait for a response from a RADIUS
server.
Authentication
Method
Method used by RADIUS to authenticate users.
Authentication Server 1 and 2:
RADIUS Server
Status
The status of the RADIUS server. This contains the time of the last test
and an indication of success or failure.
If the Authentication Server attributes are incorrect, the displayed status
is “server config not valid”.
RADIUS Server
Internet Address
IPv4 or IPv6 address of the RADIUS server.
RADIUS Server
Authentication Port
Network port used by RADIUS server for authentication services.
RADIUS Server
Shared Secret
Shared secret used in RADIUS server communications. May contain
alphabetic, numeric, special characters or spaces, but not extended
unicode characters. The maximum length is 127 characters.
RADIUS Server
Shared Secret
Confirm
Shared secret confirmation.
Webpage Properties page
Menu option:
Management > Web > Web Properties
(Figure 153).
Use this page to control the display of the web interface.
Page 6-67
Chapter 6: Configuration and alignment Management menu
Figure 153
Webpage Properties page
Procedure:
• Update the attributes (Table 138).
• Click Apply Properties.
Table 138
Webpage Properties attributes
Attribute
Meaning
Web Properties
View Summary and Status pages without login
:
• If ticked (the default setting), users can view the Summary and Status
web pages without entering a password.
• If not ticked, users must enter a password before viewing the
Summary and Status pages. This is only effective if the System
Administration Password has been set, see Change Password page
on page 7-16.
Distance Units
Metric:
Distances are displayed in kilometers or meters.
Imperial:
Distances are displayed in miles or feet.
Use Long Integer
Comma Formatting
Disabled:
Long integers are displayed thus: 1234567.
Enabled:
Long integers are displayed thus: 1,234,567.
Popup Help
Disabled:
Web page popup help is not displayed.
Enabled:
Web page popup help is displayed.
Transmitter Mute
Control
Disabled:
Hides the Enable Transmission attribute.
Enabled:
Shows the Enable Transmission attribute (System Configuration
page on page 6-30).
Page 6-68

Chapter 6: Configuration and alignment Management menu
Attribute
Meaning
Send HTTPS Close
Notify Alerts
Only displayed when HTTPS is configured.
Controls whether or not the HTTPS server sends TLS Close Notify Alerts
before it shuts down each socket.
Disabled
: TLS Close Notify Alerts are not sent before closing each socket.
This is the default because these alerts can cause problems with some
browsers (e.g. Internet Explorer)
Enabled
: TLS Close Notify Alerts are sent before closing each socket.
Auto Logout Period Only displayed if role-based user accounts are in use.
Automatic logout period in minutes. If there is no user activity within this
time, the user is required to log in again. Think this is only displayed
when not using identity based user accounts.
Browser Title By default, web browser tab titles display PTP 700 model, page title and
IP address in one of the following formats:
Cambium PTP 700 - <current page> (IP=<ipAddress>)
Cambium PTP 700 ATEX/HAZLOC - <current page> (IP=<ipAddress>)
To change the default text, enter simple text and optional variables
(prefixed with a $ character). The full list of variables is in Table 139.
Page 6-69

Chapter 6: Configuration and alignment Management menu
Table 139
Browser Title attribute variables
Variable
Meaning
$siteName Site Name, as set in the System Configuration page (Table 120).
$linkName Link Name, as set in the System Configuration page (Table 120).
$masterSlaveMode Master Slave Mode, as set in the Step 2: Wireless Configuration
page (Table 118).
$ipAddress IP Address currently used to identify the ODU, either IPv4 or IPv6
Address, depending upon the setting of IP Address Label in the
System Configuration page (Table 120):
•
IPv4
: $ipAddress = $ipv4Address
•
IPv6
: $ipAddress = $ipv6Address (if not blank) or
$ipv6LinkLocalAddress
$ipv4Address IPv4 Address of the ODU, as set in the LAN Configuration page
(Table 121).
$ipv6Address IPv6 Address of the ODU, as set in the LAN Configuration page
(Table 121).
$ipv6LinkLocalAddress IPv6 Auto Configured Link Local Address of the ODU. This cannot
be updated, but it can be viewed in the LAN Configuration page
(Table 121).
$sysName Sys Name for this SNMP managed node, as set in the Step 2:
SNMP MIB-II System Objects page (Table 145).
$productName The product variant, for example
Cambium PTP 700
or
Cambium
PTP 700 ATEX/HAZLOC
. Not updateable.
$pageName Name of the page currently being browsed.
Page 6-70
Chapter 6: Configuration and alignment Management menu
Email Configuration page
Menu option:
Management
>
Email
(Figure 154). Use this page to enable the PTP 700 to
generate Simple Mail Transfer Protocol (SMTP) email messages to notify the system
administrator when certain events occur.
Figure 154
Email Configuration page
Procedure:
• Update the attributes (Table 140).
• Click
Submit Updated Configuration
. The Configuration Change Reboot dialog is displayed.
• Click
Reboot Wireless Unit
and click
OK
. The reboot progress message is displayed. On
completion, the unit restarts.
Page 6-71

Chapter 6: Configuration and alignment Management menu
Table 140
Email Configuration attributes
Attribute
Meaning
SMTP Email Alert Controls the activation of the SMTP client.
SMTP Enabled
Messages
The SMTP Enabled Messages attribute controls which email alerts the
unit will send.
SMTP Server
Internet Address
The IPv4 or IPv6 Address of the networked SMTP server.
SMTP Server Port
Number
The SMTP Port Number is the port number used by the networked
SMTP server. By convention the default value for the port number is 25.
SMTP Source Email
Address
The email address used by the PTP 700 Series to log into the SMTP
server. This must be a valid email address that will be accepted by your
SMTP Server.
SMTP Destination
Email Address
The email address to which the PTP 700 Series will send the alert
messages.
Send SMTP Test
Email
Generate and send an email in order to test the SMTP settings. The tick
box will self-clear when
Submit
is clicked.
Page 6-72
Chapter 6: Configuration and alignment Management menu
Diagnostic Alarms page
Menu option:
Management
>
Diagnostic Alarms
(Figure 155).
Use this page to select which diagnostic alarms will be notified to the system administrator.
Figure 155
Diagnostic Alarms page
Procedure:
• Tick the required alarms. These alarms are described in Alarms on page 7-17.
• Click
Submit Updated Configuration
.
Page 6-73
Chapter 6: Configuration and alignment Management menu
Time Configuration page
Menu option:
Management > Time
(Figure 156 and Figure 157). Use this page to set the real-
time clock of the PTP 700.
Setting the real-time clock manually
Use this procedure to keep time without connecting to a networked time server.
If SNTP is disabled, it will be necessary to reset the time manually after each system reboot.
Procedure:
• Set SNTP State to
Disabled
(Figure 156).
• Review and update the manual clock attributes (Table 141).
• Click
Submit Updated Configuration
.
Figure 156
Time Configuration page (SNTP disabled)
Table 141
Manual clock attributes
Attribute
Meaning
SNTP State
Disabled:
the PTP 700 will keep time without connecting to a networked
time server.
Set Time Set hours, minutes and seconds.
Set Date Set year, month and day.
Time Zone Set the time zone offset from Greenwich Mean Time (GMT).
To set the clock to UTC time, set Time Zone to
GMT 00.00
.
Daylight Saving
Disabled:
There is no offset for daylight saving time.
Enabled:
System clock is moved forward one hour to adjust for daylight
saving time.
To set the clock to UTC time, set Daylight Saving to
Disabled
.
Setting the real-time clock to synchronize using SNTP
Use this procedure to synchronize the unit with a networked time server:
Page 6-74
Chapter 6: Configuration and alignment Management menu
Figure 157
Time Configuration page (SNTP enabled)
Page 6-76

Chapter 6: Configuration and alignment Management menu
Table 142
SNTP clock attributes
Attribute
Meaning
SNTP State
Enabled:
the ODU will obtain accurate date and time updates from a
networked time server.
SNTP Primary Server Specifies the primary SNTP server, determining the order in which the
servers are tried.
SNTP Primary Server
Dead Time
Time (in seconds) to wait before retrying communications with an
unresponsive primary SNTP server. Setting the value to zero disables
the timer.
SNTP Server Retries Number of times the PTP will retry after an SNTP server fails to
respond.
SNTP Server
Timeout
Time (in seconds) the PTP will wait for a response from an SNTP
server.
SNTP Poll Interval The SNTP server polling interval.
SNTP Server 1 and 2:
SNTP Server Status Status message reflecting the state of communications with the SNTP
server.
SNTP Server Internet
Address
The IPv4 or IPv6 Address of the networked SNTP server.
SNTP Server Port
Number
The port number of the networked SNTP server. By convention the
default value for the port number is 123.
SNTP Server
Authentication
Protocol
Authentication protocol to be used with this SNTP server (
None
or
MD5
).
SNTP Server Key
Identifier
SNTP key identifier.
A key of zeros is reserved for testing.
Server Key Key used to authenticate SNTP communications.
Server Key Confirm Must match the Server Key.
SNTP Sync This shows the current status of SNTP synchronization. If
No Sync
is
displayed, then review the SNTP Server Internet Address and Port
Number. A change of state may generate an SNMP trap or SMTP email
alert.
SNTP Last Sync This shows the date and time of the last SNTP synchronization.
System Clock This displays the local time, allowing for the Time Zone and Daylight
Saving settings.
Local Time Settings:
Time Zone Set the time zone offset from Greenwich Mean Time (GMT).
To set the clock to UTC time, set Time Zone to
GMT 00.00
.
Page 6-77
Chapter 6: Configuration and alignment Management menu
Attribute
Meaning
Daylight Saving
Disabled:
Daylight saving adjustments will not be applied to the time.
Enabled:
Daylight saving adjustments will be applied to the time,
according to local rules.
To set the clock to UTC time, set Daylight Saving to
Disabled
.
Syslog Configuration page
Menu option:
Management
>
Syslog
>
Syslog configuration
(Figure 158).
Use this page to configure system logging. Only users with
Security Officer
role are permitted
to configure the syslog client.
Figure 158
Syslog Configuration page
Note
To record Coordinated Universal Time (UTC time) in syslog messages, use the Time
Configuration page to set Time Zone to
GMT 00.00
and Daylight Saving to
Disabled
(Time Configuration page on page 6-74).
Page 6-78

Chapter 6: Configuration and alignment Management menu
Procedure:
• Update the attributes (Table 143).
• Click
Submit Updated Configuration
.
Table 143
Syslog Configuration attributes
Attribute
Meaning
Syslog State When system logging is enabled, log entries are added to the internal
log and (optionally) transmitted as UDP messages to one or two syslog
servers.
Syslog Client
Enabled:
Event messages are logged.
Disabled:
Event messages are not logged.
Syslog Client Port The client port from which syslog messages are sent.
Syslog Server 1 and 2:
Syslog Server
Internet Address
The IPv4 or IPv6 Address of the syslog server.
Delete the IP address to disable logging on the syslog server.
Syslog Server Port The server port at which syslog messages are received.
Page 6-79
Chapter 6: Configuration and alignment SNMP pages (for SNMPv3)
SNMP pages (for SNMPv3)
This section describes how to configure Simple Network Management Protocol version 3
(SNMPv3) traps using the SNMP Wizard.
Current SNMP Summary (for SNMPv3)
Menu option:
Management > SNMP
(Figure 159).
Use this page to review the current SNMP configuration and start the SNMP Wizard.
Figure 159
Current SNMP Summary page (when SNMP is disabled)
Procedure:
• Review the summary.
• If any updates are required, click
Continue to SNMP Wizard
.
Page 6-80
Chapter 6: Configuration and alignment SNMP pages (for SNMPv3)
Step 1: SNMP Configuration (for SNMPv3)
Menu option:
Management > SNMP
. Part of the SNMP Wizard (Figure 160).
Use this page to enable SNMP, select SNMPv3 and configure access to the SNMP server.
Figure 160
Step 1: SNMP Configuration page (for SNMPv3)
Procedure:
• Set SNMP State to
Enabled
.
• Set SNMP Version to
v3
. The page is redisplayed with SNMPv3 attributes.
• Update the attributes (Table 144).
• Click
Next
.
Page 6-81

Chapter 6: Configuration and alignment SNMP pages (for SNMPv3)
Table 144
Step 1: SNMP Configuration attributes (for SNMPv3)
Attribute
Meaning
SNMP Minimum
Privilege Level
Minimum security level which is permitted to administer SNMP security
settings.
Only displayed when Identity Based User Accounts are
Enabled
on the
User Accounts page (Table 134).
SNMP State Enables or disables SNMP.
SNMP Access
Control
Enables or disables access control to SNMP management by IP
address.
SNMP Access
Control Internet
Address 1/2/3
A list of up to three IPv4 or IPv6 Addresses permitted to perform SNMP
management.
Only displayed when SNMP Access Control is set to
Enabled
.
SNMP Version SNMP protocol version:
v1/2c
or
v3
.
SNMP Security
Mode
MIB-based
: SNMPv3 security parameters are managed via SNMP MIBs.
Web-based
: SNMPv3 security parameters are not available over SNMP,
but instead are configured using the SNMP Accounts page, as
described in Step 3: SNMP User Policy Configuration (for SNMPv3) on
page 6-84.
SNMP Engine ID
Format
Specifies whether the Engine ID is generated from the
MAC Address
,
IP4 Address
,
Text String
or
IPv6 Address
.
SNMP Engine ID
Text
Only enabled when SNMP Engine ID Format is set to
Text String
. Text
used to generate the SNMP Engine ID.
SNMP Port Number The port that the SNMP agent is listening to for commands from a
management system.
Page 6-82
Chapter 6: Configuration and alignment SNMP pages (for SNMPv3)
Step 2: SNMP MIB-II System Objects (for SNMPv3)
Menu option:
Management > SNMP
. Part of the SNMP Wizard (Figure 161).
Use this page to enter details of the SNMP managed node.
Figure 161
Step 2: SNMP MIB-II System Objects
page (for SNMPv3)
Procedure:
• Update the attributes (Table 145).
• Click
Next
.
• The next step depends upon which SNMP Security Mode was selected in the Step 1: SNMP
Configuration page:
o If
Web-based
, go to Step 3: SNMP User Policy Configuration (for SNMPv3) on page 6-
84.
o If
MIB-based
, go to Confirm SNMP Configuration (for SNMPv3) on page 6-88.
Table 145
Step 2: SNMP MIB-II System Objects attributes (for SNMPv3)
Attribute
Meaning
Sys Contact The name of the contact person for this managed node, together with
information on how to contact this person.
Sys Name An administratively-assigned name for this managed node. By
convention, this is the fully qualified domain name of the node.
Sys Location The physical location of this node, for example
Telephone closet, 3rd
floor
.
Page 6-83
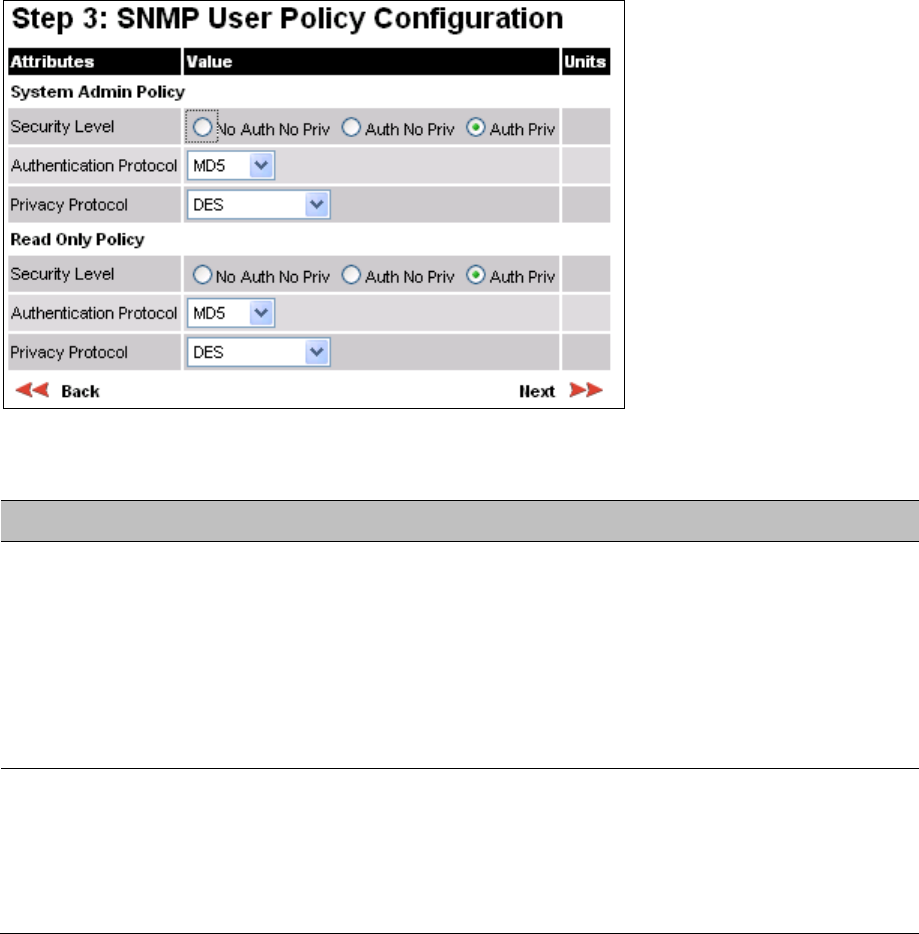
Chapter 6: Configuration and alignment SNMP pages (for SNMPv3)
Step 3: SNMP User Policy Configuration (for SNMPv3)
Menu option:
Management > SNMP
. Part of the SNMP Wizard (Figure 162).
This page is only displayed when SNMP Security Mode is set to
Web-based
in the Step 1:
SNMP Configuration page. Use this page to configure which authentication and privacy
protocols are required for SNMP users with roles
System administrator
and
Read only
.
Procedure:
• Update the attributes (Table 146).
• Click
Next
.
Figure 162
Step 3: SNMP User Policy Configuration page (for SNMPv3)
Table 146
Step 3: SNMP User Policy Configuration attributes (for SNMPv3)
Attribute
Meaning
Security Level Defines the security level and associated protocols that are required to
allow SNMP users to access the PTP 700.
No Auth No Priv
: Users are not required to use authentication or
privacy protocols.
Auth No Priv
: Users are required to use only authentication protocols.
Auth Priv
: Users are required to use both authentication and privacy
protocols.
Authentication
Protocol
The authentication protocol to be used to access the PTP 700 via SNMP.
This is disabled when Security Level is set to
Auth No Priv
.
MD5
: Message Digest Algorithm is used.
SHA
: NIST FIPS 180-1, Secure Hash Algorithm SHA-1 is used.
Page 6-84
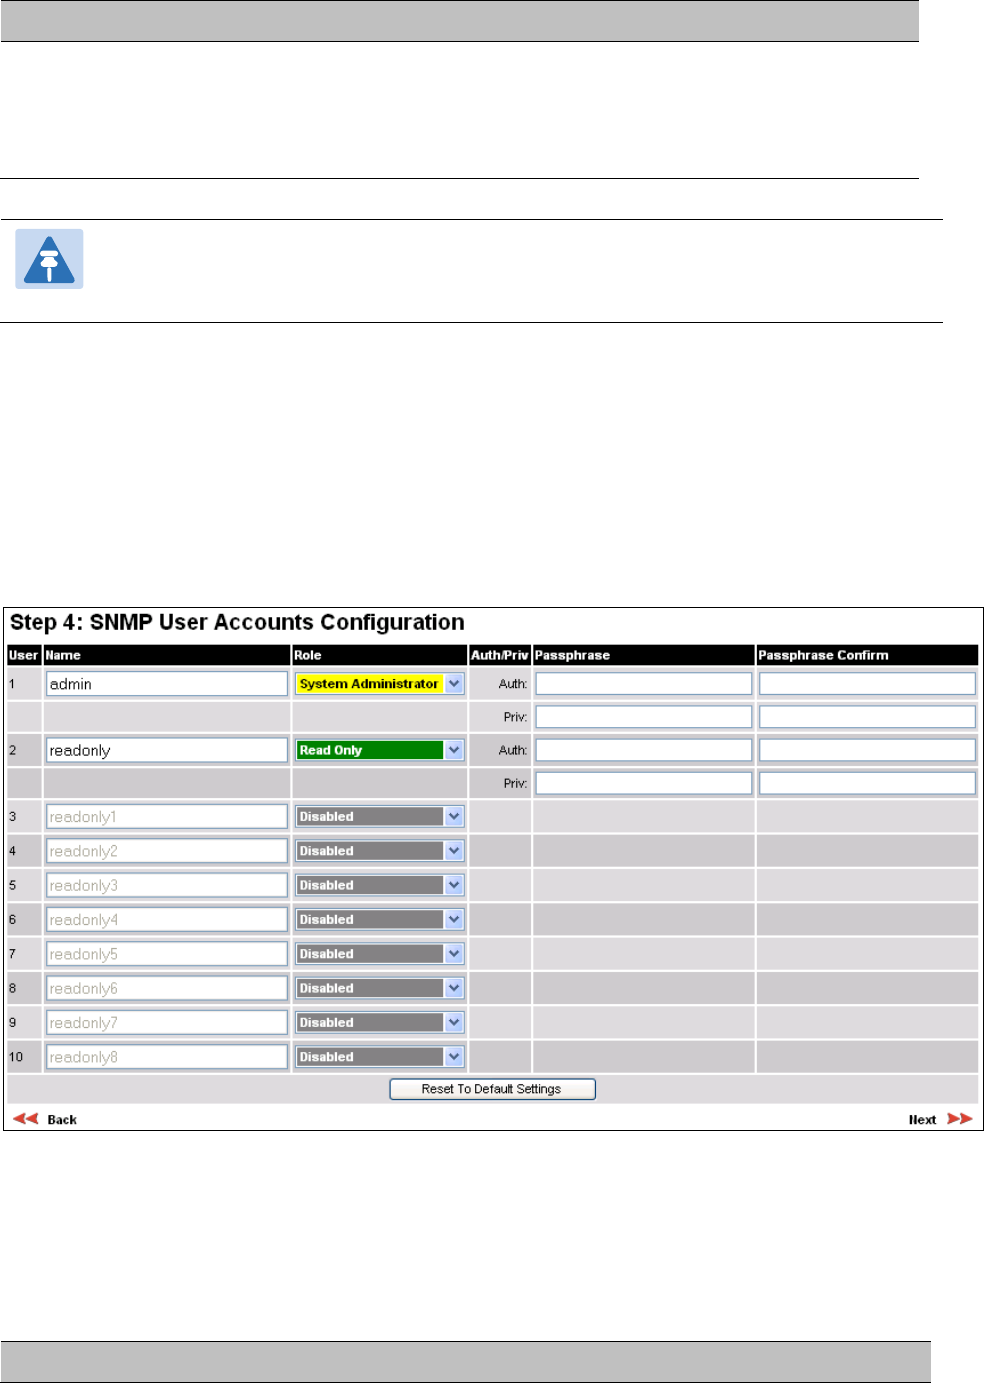
Chapter 6: Configuration and alignment SNMP pages (for SNMPv3)
Attribute
Meaning
Privacy Protocol The privacy protocol to be used to access the PTP 700 via SNMP. This is
disabled when Security Level is set to
No Auth No Priv
or
Auth No Priv
.
DES
: Data Encryption Standard (DES) symmetric encryption protocol.
AES
: Advanced Encryption Standard (AES) cipher algorithm.
Note
A user configured to use AES privacy protocol will not be able to transmit and receive
encrypted messages unless the license key enables the AES capability.
Step 4: SNMP User Accounts Configuration (for SNMPv3)
Menu option:
Management > SNMP
. Part of the SNMP Wizard (Figure 163).
This page is only displayed when SNMP Security Mode is set to
Web-based
in the Step 1:
SNMP Configuration page. Use this page to update the SNMP user accounts.
Figure 163
Step 4: SNMP User Accounts Configuration page (for SNMPv3)
Procedure:
• Update the individual user attributes (Table 147) for up to 10 SNMP users.
• Click
Next
.
Table 147
Step 4: SNMP User Accounts Configuration attributes (for SNMPv3)
Attribute
Meaning
Page 6-85

Chapter 6: Configuration and alignment SNMP pages (for SNMPv3)
Attribute
Meaning
Name Name to be used by the SNMP user to access the system.
Role Selects which of the two web-based security profiles are applied to this
user:
System administrator
or
Read only
.
Select
Disabled
to disable the SNMP account.
Auth/Priv Indicates whether the Passphrase applies to authentication or privacy
protocols.
Passphrase The phrase to be entered by this SNMP user to access the system using
an authentication or privacy protocol. Length must be between 8 and 32
characters. May contain spaces.
The Auth Passphrase is hidden when Security Level for this user’s Role
is set to
No Auth No Priv
.
The Priv Passphrase is hidden when Security Level for this user’s Role is
set to
No Auth No Priv
or
Auth No Priv
.
Passphrase Confirm Passphrase must be reentered to confirm it has been correctly typed.
Step 5: SNMP Trap Configuration (for SNMPv3)
Menu option:
Management > SNMP
. Part of the SNMP Wizard (Figure 164).
This page is only displayed when SNMP Security Mode is set to
Web-based
in the Step 1:
SNMP Configuration page. Use this page to configure the events that will generate SNMP traps
and to set up trap receivers.
Page 6-86
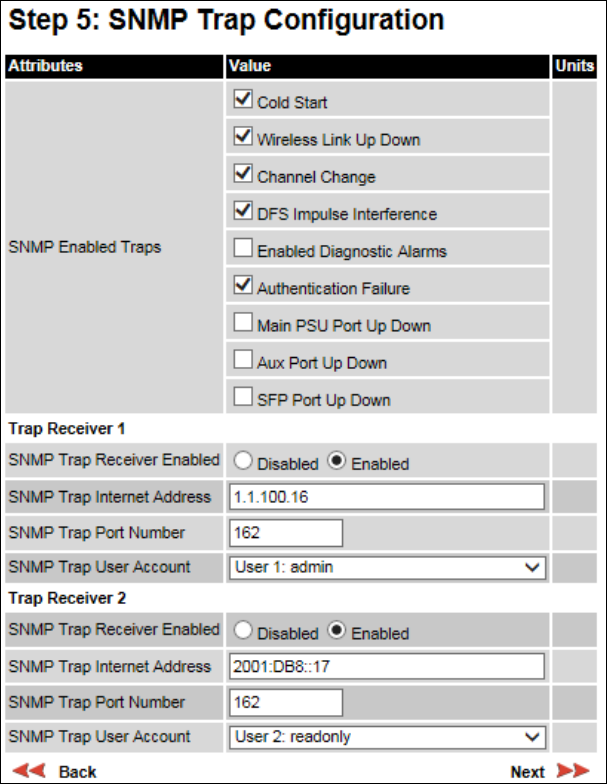
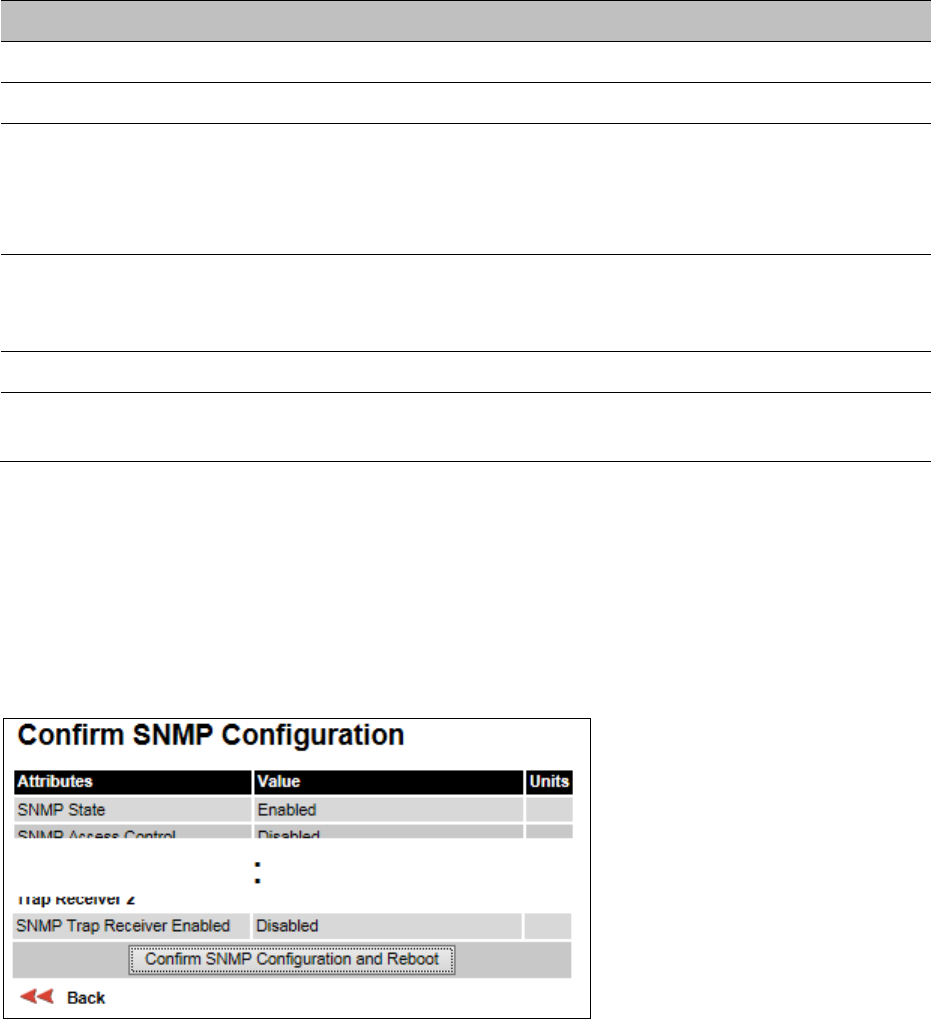
Chapter 6: Configuration and alignment SNMP pages (for SNMPv3)
Table 148
Step 5: SNMP Trap Configuration attributes (for SNMPv3)
Attribute
Meaning
SNMP Enabled Traps Select the events that will generate SNMP traps.
SNMP Trap Receiver 1 and SNMP Trap Receiver 2:
SNMP Trap Receiver
Enabled
Disabled
: SNMP traps are not sent to the corresponding SNMP
Trap Receiver (1 or 2).
Enabled
: SNMP traps are sent to the corresponding SNMP Trap
Receiver (1 or 2).
SNMP Trap Internet
Address
The IPv4 or IPv6 Address of the SNMP server (trap receiver). This is
normally the network management system, but it may be a
separate trap receiver.
SNMP Trap Port Number The server port at which SNMP traps are received.
SNMP Trap User Account The user name (and associated protocols) to use when sending
SNMP traps to the server.
Confirm SNMP Configuration (for SNMPv3)
Menu option:
Management > SNMP
. Part of the SNMP Wizard (Figure 165).
Use this page to review and confirm the updated SNMPv3 configuration of the unit.
Figure 165
Confirm SNMP Configuration page (for SNMPv3) (top and bottom of page shown)
Procedure:
• To ensure that the changes take effect, click
Confirm SNMP Configuration and Reboot
. The
unit reboots and the changes take effect.
Page 6-88
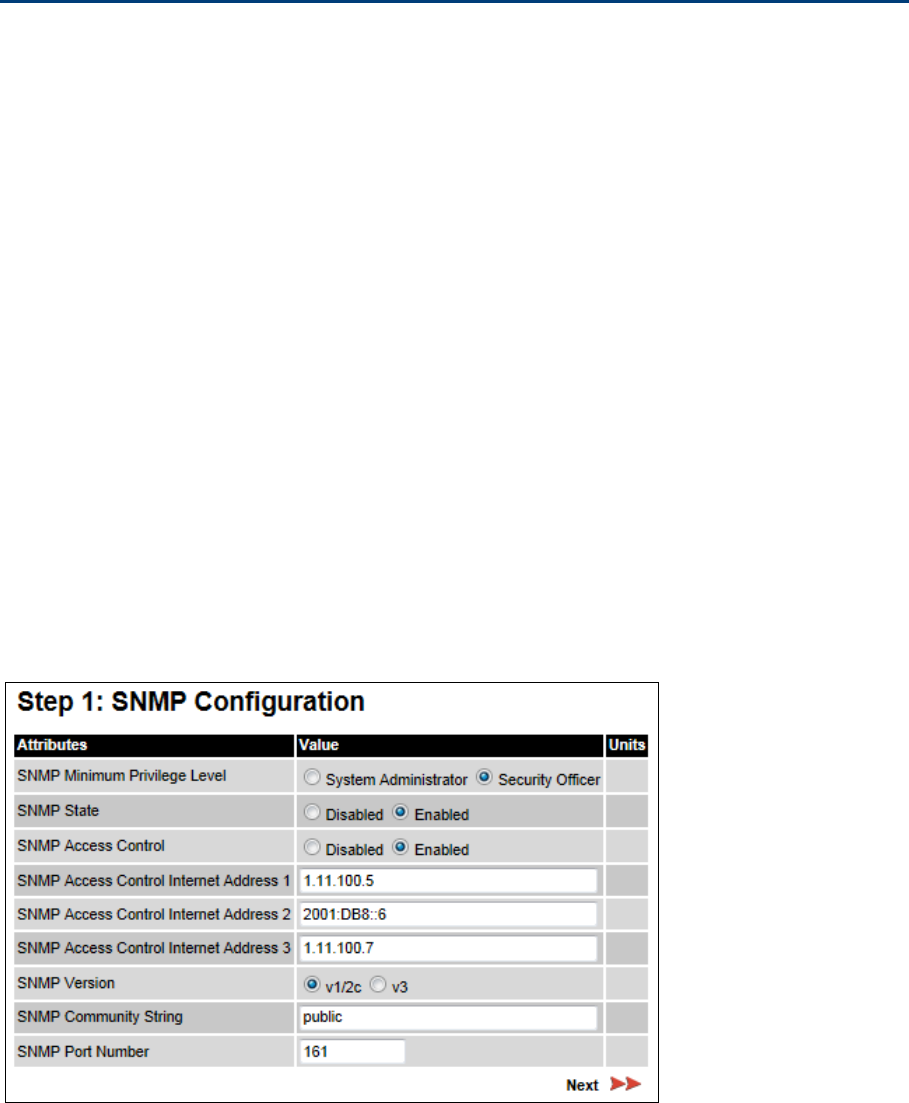
Chapter 6: Configuration and alignment SNMP pages (for SNMPv1/2c)
SNMP pages (for SNMPv1/2c)
This section describes how to configure Simple Network Management Protocol version 1 or 2c
(SNMPv1 or SNMPv2c) traps using the SNMP Wizard.
Current SNMP Summary (for SNMPv1/2c)
Menu option:
Management > SNMP
(Figure 159).
Use this page to review the current SNMP configuration and start the SNMP Wizard.
Procedure:
• Review the summary.
• If any updates are required, click
Continue to SNMP Wizard
.
Step 1: SNMP Configuration (for SNMPv1/2c)
Menu option:
Management > SNMP
. Part of the SNMP Wizard (Figure 166).
Use this page to enable SNMP, select SNMPv1/2c and configure access to the SNMP server.
Figure 166
Step 1: SNMP Configuration page (for SNMPv1/2c)
Page 6-89

Chapter 6: Configuration and alignment SNMP pages (for SNMPv1/2c)
Procedure:
• Set SNMP State to
Enabled
.
• Set SNMP Version to
v1/2c
. The page is redisplayed with SNMPv1/2c attributes.
• Update the attributes (Table 149).
• Click
Next
.
Table 149
Step 1: SNMP Configuration attributes (for SNMPv1/2c)
Attribute
Meaning
SNMP Minimum
Privilege Level
Minimum security level which is permitted to administer SNMP security
settings.
Only displayed when Identity Based User Accounts are
Enabled
on the
User Accounts page (Table 134).
SNMP State Enables or disables SNMP.
SNMP Access
Control
Enables or disables access control to SNMP management by IP address.
SNMP Access
Control Internet
Address 1/2/3
A list of up to three IPv4 or IPv6 Addresses permitted to perform SNMP
management.
Only displayed when SNMP Access Control is set to
Enabled
.
SNMP Version SNMP protocol version:
v1/2c
or
v3
.
SNMP Community
String
The SNMP community string acts like a password between the network
management system and the distributed SNMP clients (PTP 700 ODUs).
Only if the community string is configured correctly on all SNMP entities
can the flow of management information take place. By convention the
default value is set to
public
.
SNMP Port Number Enter the port that the SNMP agent is listening to for commands from a
management system.
Step 2: SNMP MIB-II System Objects (for SNMPv1/2c)
Menu option:
Management > SNMP
. Part of the SNMP Wizard (Figure 161). Use this page to
enter details of the SNMP managed node. Update the attributes (Table 145) and click
Next
.
Page 6-90
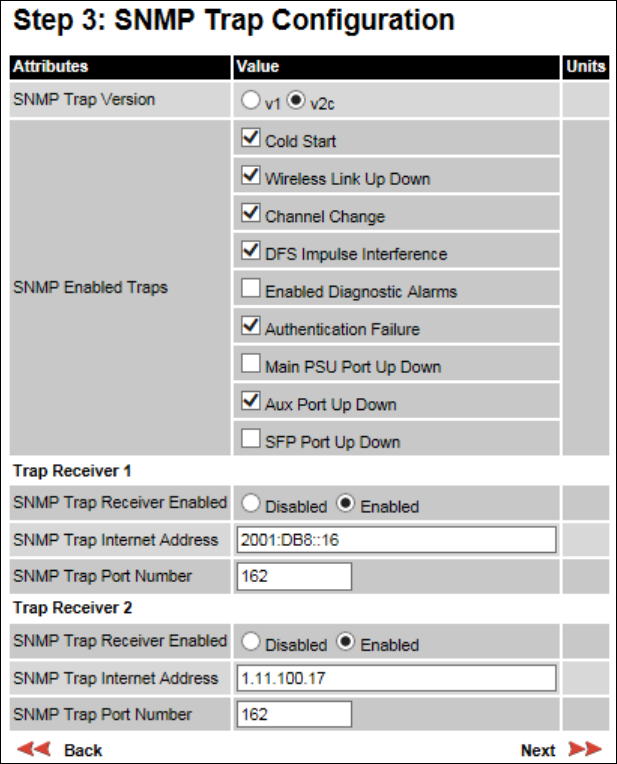
Chapter 6: Configuration and alignment SNMP pages (for SNMPv1/2c)
Step 3: SNMP Trap Configuration (for SNMPv1/2c)
Menu option:
Management > SNMP
. Part of the SNMP Wizard (Figure 167).
Figure 167
Step 3: SNMP Trap Configuration page (for SNMPv1/2c)
Procedure:
• Update the attributes (Table 150).
• Click
Next
.
Page 6-91
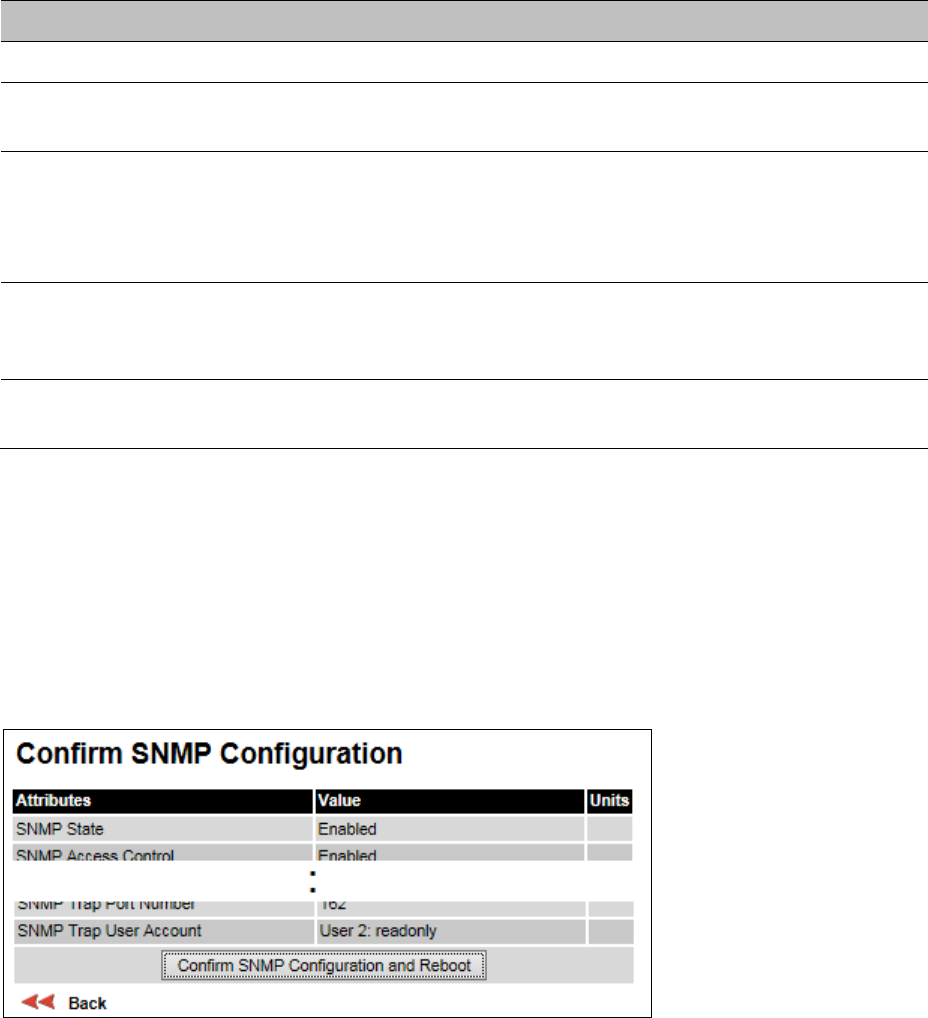
Chapter 6: Configuration and alignment SNMP pages (for SNMPv1/2c)
Table 150
Step 3: SNMP Trap Configuration attributes (for SNMPv1/2c)
Attribute
Meaning
SNMP Trap Version Select the SNMP protocol version to use for SNMP traps:
v1
or
v2c
.
SNMP Enabled
Traps
Select the events that will generate SNMP traps.
SNMP Trap
Receiver Enabled
Disabled
: SNMP traps are not sent to the corresponding SNMP Trap
Receiver (1 or 2).
Enabled
: SNMP traps are sent to the corresponding SNMP Trap Receiver
(1 or 2).
SNMP Trap Internet
Address
The IPv4 or IPv6 Address of the SNMP server (trap receiver). This is
normally the network management system, but it may be a separate trap
receiver.
SNMP Trap Port
Number
The server port at which SNMP traps are received.
Confirm SNMP Configuration (for SNMPv1/2c)
Menu option:
Management > SNMP
. Part of the SNMP Wizard (Figure 168).
Use this page to review and confirm the updated SNMPv1/2c configuration of the unit.
Figure 168
Confirm SNMP Configuration page (for SNMPv1/2c) (top and bottom of page
shown)
Procedure:
• To ensure that the changes take effect, click
Confirm SNMP Configuration and Reboot
. The
unit reboots and the changes take effect.
Page 6-92

Chapter 6: Configuration and alignment Security menu
Security menu
This section describes how to configure HTTPS/TLS security using the Security Wizard.
To configure security for the FIPS 140-2 approved mode, read this section and additionally read
Configuring security for FIPS 140-2 applications on page 6-105.
Caution
Ensure that the operator’s security requirements are configured before connecting the
PTP 700 to the network. Otherwise, security may be compromised.
Preparing for HTTPS/TLS
Before running the Security Configuration Wizard, obtain the necessary cryptographic material
and ensure that the unit has AES capability. For more information, refer to Planning for
HTTPS/TLS operation on page 3-51.
Procedure:
1
Ensure that the following cryptographic material has been generated:
• Key Of Keys
• TLS Private Key and Public Certificates (for the correct IP address)
• User Defined Security Banner
• Random Number Entropy Input
2
Order the necessary AES capability upgrade, generate a license key (Generating license
keys on page 6-3) and enter it on the Software License Key page (Software License Key
page on page 6-11).
3
Identify the Port numbers for HTTPS, HTTP and Telnet.
4
Ensure that the web browsers used are enabled for HTTPS/TLS operation.
5
On the Local User Accounts page (Local User Accounts page on page 6-61), check that:
• Either: Identity Based User Accounts are set to
Disabled
,
• Or: Identity Based User Accounts are set to
Enabled
and the current user's role is
Security Officer
.
Page 6-93
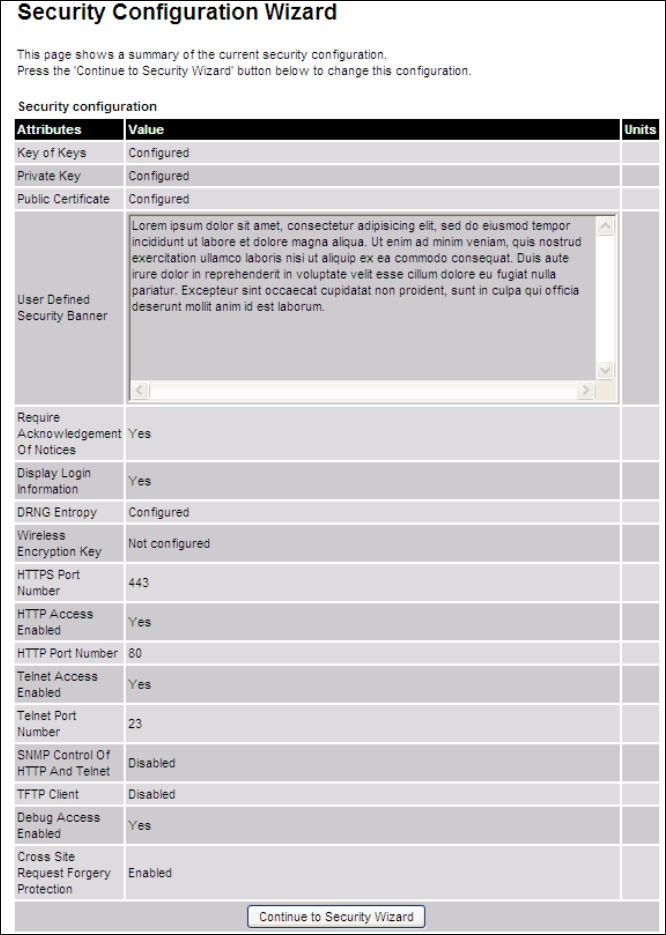
Chapter 6: Configuration and alignment Security menu
Security Configuration Wizard page
Menu option:
Security
. Displayed only when AES encryption is enabled by license key (Figure
169). Use this page to review the current security configuration of the unit.
Figure 169
Security Configuration Wizard page
Procedure:
• To continue with the Security Wizard, click
Continue to Security Wizard
.
Step 1: Enter Key of Keys
Menu option:
Security
. Part of the Security Wizard (Figure 170).
Page 6-94
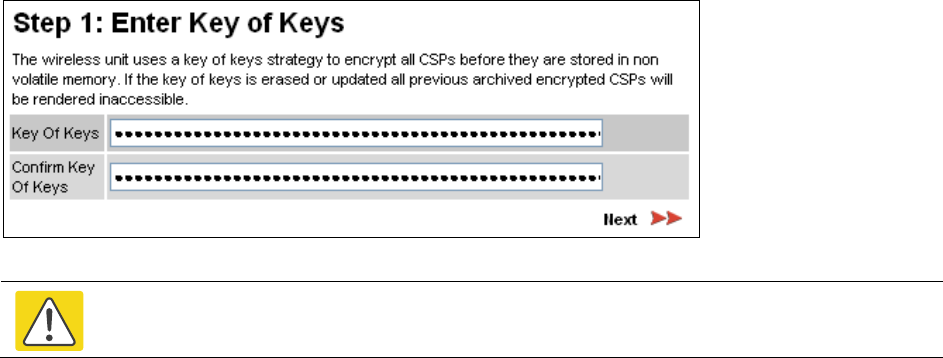
Chapter 6: Configuration and alignment Security menu
Use this page to enter a Key of Keys to encrypt all critical security parameters (CSPs) before
they are stored in non-volatile memory.
Figure 170
Step 1: Enter Key of Keys page
Caution
Erasing or changing the key of keys resets all CSPs.
Procedure:
• Enter and confirm the generated Key of Keys.
• Click
Next
.
Page 6-95
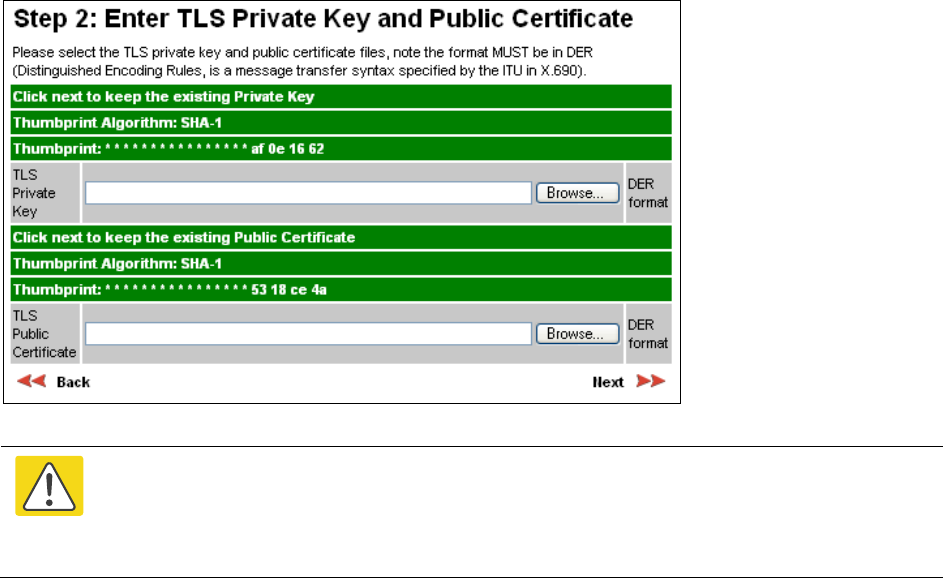
Chapter 6: Configuration and alignment Security menu
Step 2: Enter TLS Private Key and Public Certificate
Menu option:
Security
. Part of the Security Wizard (Figure 171).
Use this page to select and upload the TLS Private Key and Public Certificate files.
Figure 171
Step 2: Enter TLS Private Key and Public Certificate page
Caution
If the certificates expire, your web browser will display security warnings. Always
investigate the cause of security warnings, and rectify errors in the content or expiry of
certificates where necessary. Do not accept or ignore web browser security warnings.
Procedure:
• If a valid TLS private key exists, then an SHA-1 thumbprint of the key is displayed. If this
key is correct, then take no action. Otherwise, click
Browse
and select the generated private
key file (.der).
• If a valid TLS public certificate exists, then an SHA-1 thumbprint of the certificate is
displayed. If this certificate is correct, then take no action. Otherwise, click
Browse
and
select the generated certificate file (.der).
• Click
Next.
Page 6-96
Chapter 6: Configuration and alignment Security menu
Step 3: Enter User Security Banner
Menu option:
Security
. Part of the Security Wizard (Figure 172).
Use this page to enter a banner that will be displayed every time a user attempts to login to the
wireless unit.
Figure 172
Step 3: Enter User Security Banner page
Procedure:
• Update the User Defined Security Banner (optional).
• Set the Acknowledgement to
No
or
Yes
.
• Click
Next
.
Page 6-97
Chapter 6: Configuration and alignment Security menu
Step 4: Enter Login Information Settings
Menu option:
Security
. Part of the Security Wizard (Figure 173).
Use this page to choose whether or not to display information about previous login attempts
when the user logs into the web interface.
Figure 173
Step 4: Enter Login Information Settings page
Procedure:
• Set Display Login Information to
No
or
Yes
.
• Click
Next
.
Page 6-98
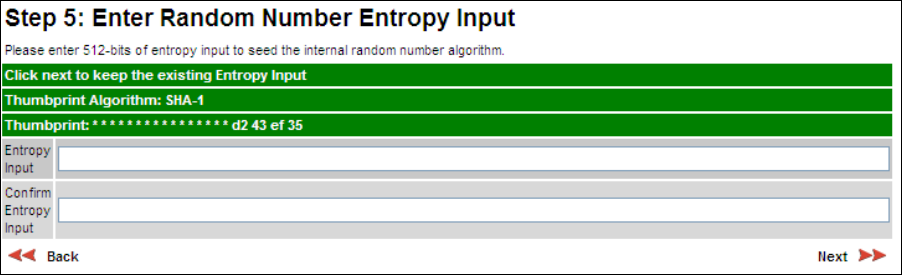
Chapter 6: Configuration and alignment Security menu
Step 5: Enter Random Number Entropy Input
Menu option:
Security
. Part of the Security Wizard (Figure 174).
Use this page to enter entropy input to seed the internal random number algorithm.
Figure 174
Step 5: Random Number Entropy Input page
Procedure:
• If valid entropy input exists, then an SHA-1 thumbprint of the input is displayed. If this
input is correct, then take no action. Otherwise, enter the generated input in the Entropy
Input and Confirm Entropy Input fields.
• Click
Next
.
Page 6-99
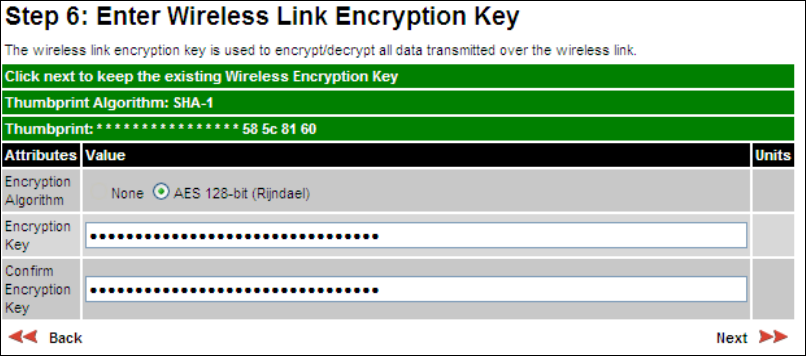
Chapter 6: Configuration and alignment Security menu
Step 6: Enter Wireless Link Encryption Key
Menu option:
Security
. Part of the Security Wizard (Figure 175).
Use this page to enable AES encryption and enter the encryption key. The wireless link
encryption key is used to encrypt all traffic over the PTP 700 wireless link.
Figure 175
Step 6: Enter Wireless Link Encryption Key page
Procedure:
• Select the applicable value in the Encryption Algorithm field. If a valid encryption key
exists, then an SHA-1 thumbprint of the key is displayed. If this key is correct, then take no
action. Otherwise, enter the generated key in the Wireless Link Encryption Key and Confirm
Wireless Link Encryption Key fields.
• Click
Next
.
Page 6-100
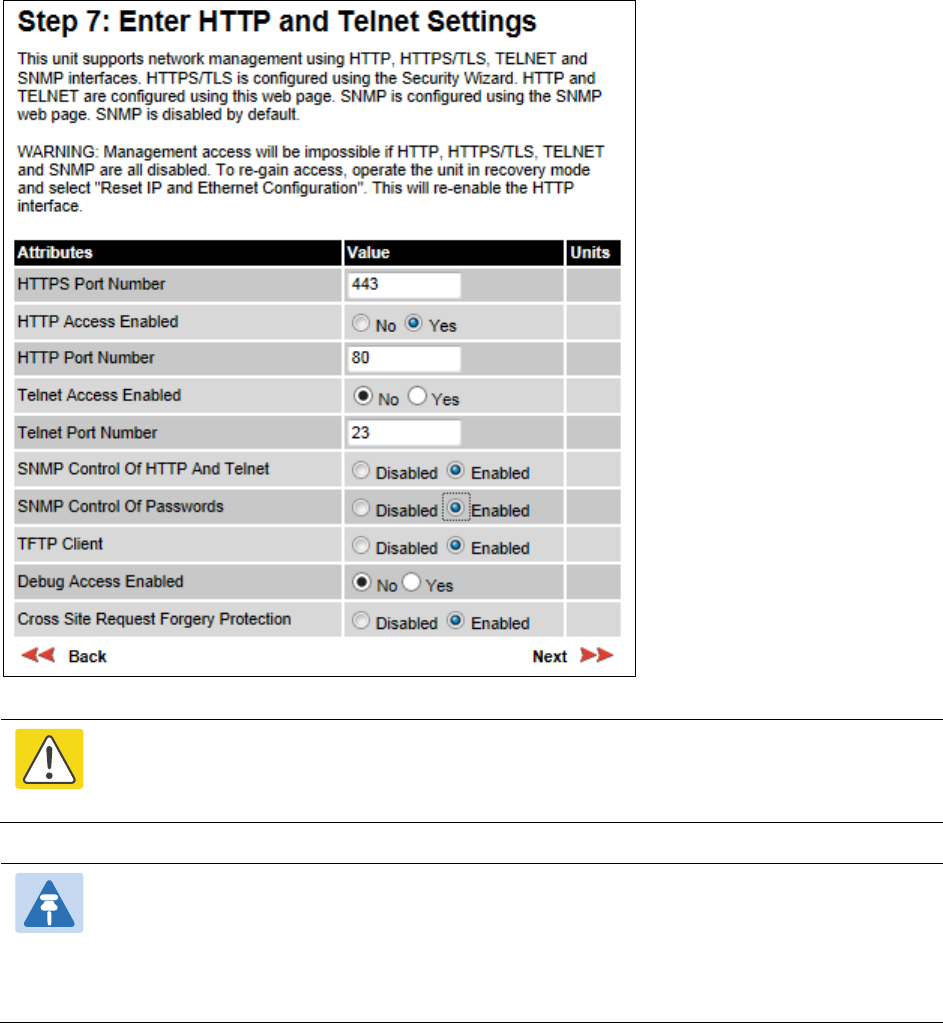
Chapter 6: Configuration and alignment Security menu
Step 7: Enter HTTP and Telnet Settings
Menu option:
Security
. Part of the Security Wizard (Figure 176).
Use this page to configure network management of the PTP 700 using one or more of the
following methods: HTTPS, HTTP, Telnet or SNMP.
Figure 176
Step 7: Enter HTTP and Telnet Settings page
Caution
If HTTPS, HTTP, Telnet and SNMP are all disabled, management access will be
impossible until the unit is placed in recovery mode.
Note
If HTTP, Telnet and SNMP are all disabled, the secure web server becomes the only
management tool for the ODU web interface. To reenter the web interface after Step 7
of the Security Wizard, use the URL
https://aa.bb.cc.dd
(where aa.bb.cc.dd is the IP
address of the unit).
Procedure:
• Review and update the HTTP and Telnet attributes (Table 151) and click
Next
.
Page 6-101

Chapter 6: Configuration and alignment Security menu
Table 151
HTTP and Telnet attributes
Attribute
Meaning
HTTPS Port Number The port number for HTTPS access. Zero means use the default port.
HTTP Access
Enabled
No
: The unit will not respond to any requests on the HTTP port.
Yes
: The unit will respond to requests on the HTTP port.
Remote management via HTTPS is not affected by this setting.
HTTP Port Number The port number for HTTP access. Zero means use the default port.
Telnet Access
Enabled
No
: The unit will not respond to any requests on the Telnet port.
Yes
: The unit will respond to requests on the Telnet port.
Telnet Port Number The port number for Telnet access. Zero means use the default port.
SNMP Control of
HTTP And Telnet
Disabled
: Neither HTTP nor Telnet can be controlled remotely via
SNMP.
Enabled
: Both HTTP and Telnet can be controlled remotely via SNMP.
SNMP Control of
Passwords
Enabled:
Passwords for identity-based user accounts in the web-based
interface can be updated via SNMP. Use this with SNMPv3 to provide
secure password updating from a central network manager. This option
is not available in FIPS 140-2 approved mode.
Disabled
: Passwords for identity-based user accounts can be updated
only via the web-based interface (default).
TFTP Client
Enabled
: The unit will respond to TFTP software download requests.
Debug Access
Enabled
Yes
: Cambium Technical Support is allowed to access the system to
investigate faults.
Cross Site Request
Forgery Protection
Enabled
: The system is protected against cross-site request forgery
attacks at the web-based interface.
Page 6-102
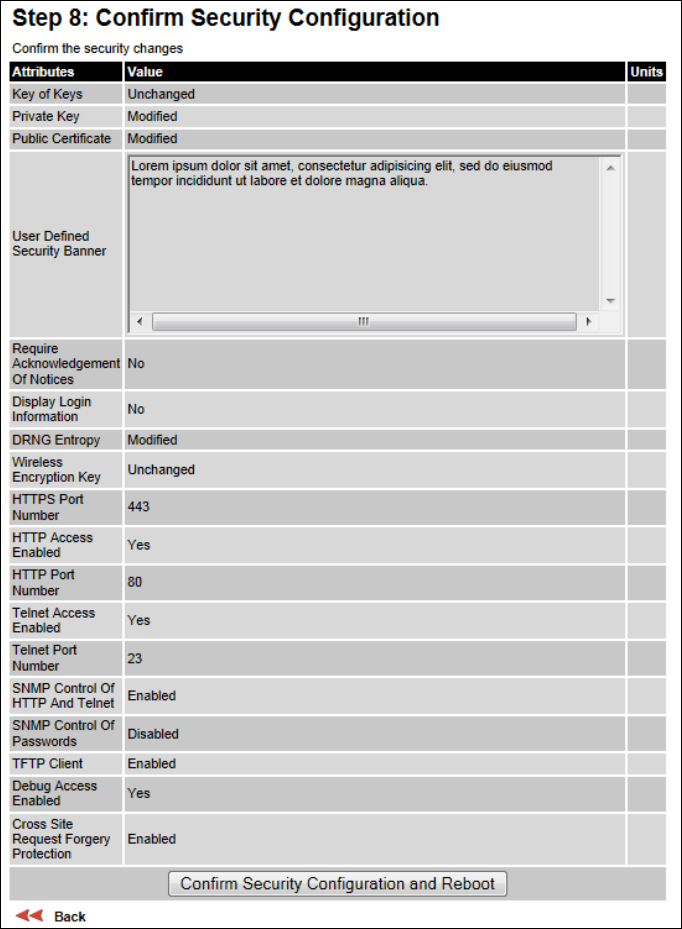
Chapter 6: Configuration and alignment Security menu
Step 8: Commit Security Configuration
Menu option:
Security
. Part of the Security Wizard (Figure 177).
Use this page to review and confirm the updated security configuration of the unit.
Figure 177
Step 8: Commit Security Configuration page
Page 6-103
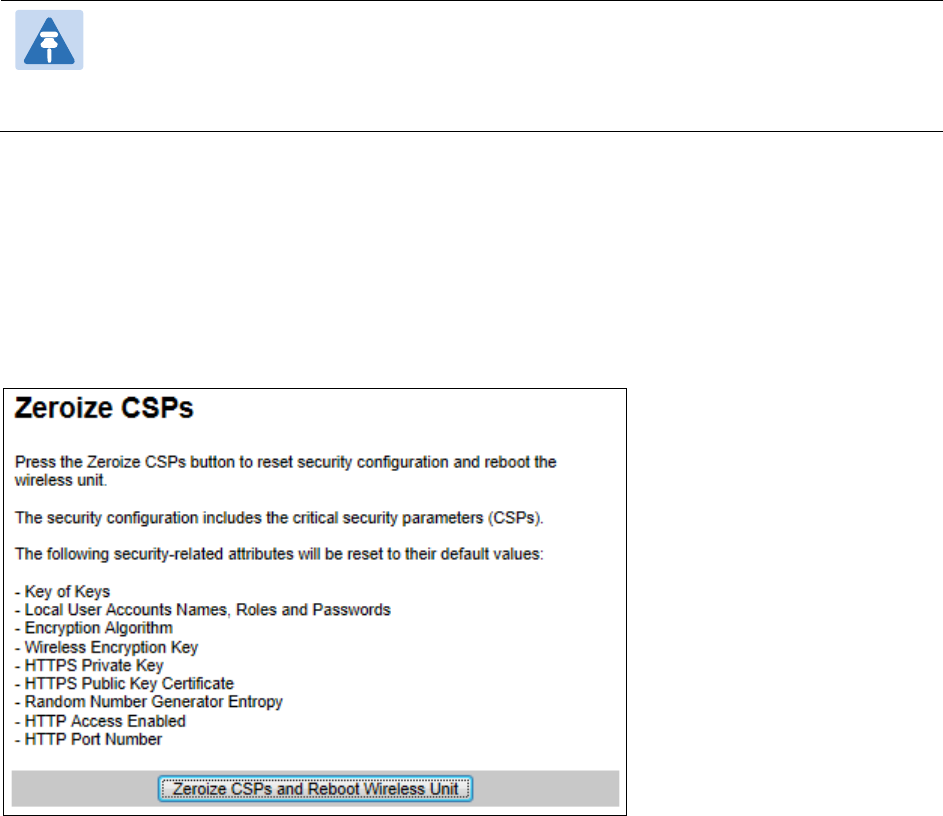
Chapter 6: Configuration and alignment Security menu
Procedure:
• Review all changes that have been made in the Security Wizard.
• To ensure that the changes take effect, click
Commit Security Configuration and Reboot
.
The unit reboots and the changes take effect.
Note
If the Key of keys is entered or modified in the Security Wizard, user accounts are reset
when
Commit Security Configuration and Reboot
is clicked. It is then necessary to
reconfigure them.
Zeroize CSPs page
Menu option:
Security
>
Zeroize CSPs
(Figure 178).
Use this page if it is necessary to reset the security configuration to default values.
Figure 178
Zeroize CSPs page
Procedure:
• Click
Zeroize CSPs and Reboot Wireless Unit
.
• Confirm the reboot.
Page 6-104

Chapter 6: Configuration and alignment Configuring security for FIPS 140-2 applications
Configuring security for FIPS 140-2 applications
This is a summary of all the configuration tasks that are necessary if the unit is to operate in
FIPS 140-2 approved mode. For more information, refer to FIPS 140-2 mode on page 1-53 and
Security planning on page 3-51.
The common steps for configuring security are described in Security menu on page 6-93.
Prerequisites for FIPS 140-2 configuration
Use this procedure to confirm that all prerequisites for FIPS 140-2 are ready.
Procedure:
1
Ensure that the following cryptographic material has been generated using a FIPS-approved
cryptographic generator:
• Key Of Keys
• TLS Private Key and Public Certificates (for the correct IP address)
• Entropy Input
• Wireless Link Encryption Key for AES
2
Identify the Port number for HTTPS.
3
Ensure that the web browsers used are enabled for HTTPS/TLS operation using FIPS-approved
cipher specifications.
4
On the
Management, Web
menu, click
Local User Accounts
and check that the current user's role
is
Security Officer
.
5
Ensure that the installed license key meets all requirements including FIPS 140-2 compatibility:
• Check that Security Level is “FIPS”.
• Check that Encryption Algorithm is “AES….”.
• If necessary, generate and enter a new license key with the above settings and install as
described in Software License Key page on page 6-11.
6
Ensure that the installed software version is prefixed “FIPS-”. If necessary, upgrade to the latest
FIPS validated image as described in Software Upgrade page on page 6-55.
Page 6-105
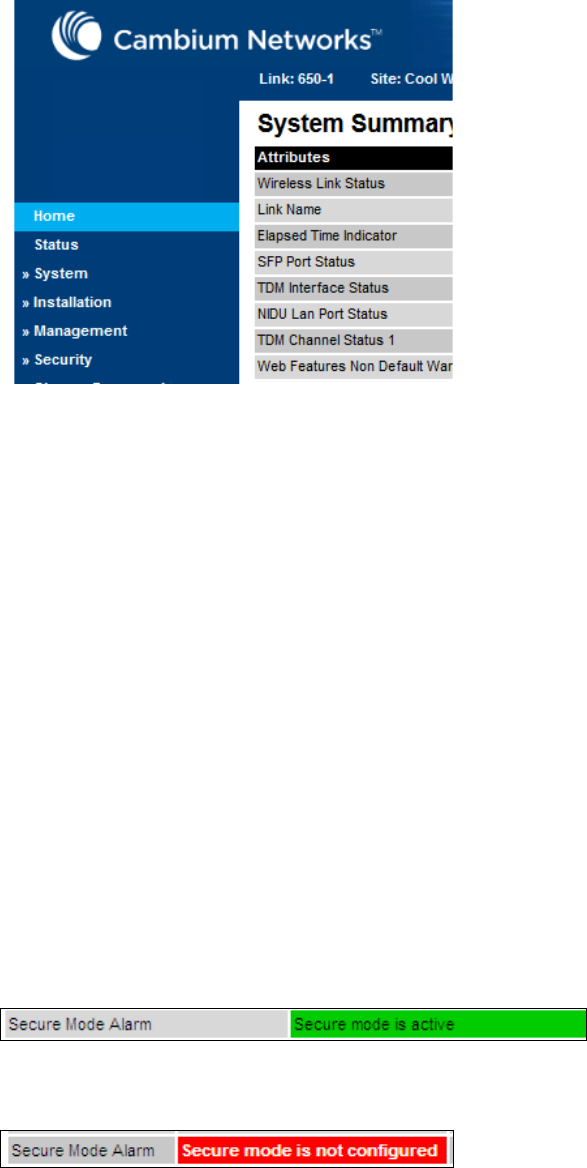
Chapter 6: Configuration and alignment Configuring security for FIPS 140-2 applications
7
To confirm that the above steps have been completed, check that the FIPS 140-2 logo is displayed
in the Navigation Bar:
Configuration procedures for FIPS 140-2
To operate the ODU in FIPS 140-2 secure mode:
• Perform the steps in Local User Accounts page on page 6-61, taking care to complete the
following additional settings:
o Click Set Best Practice Complexity.
o Configure appropriate identity-based user names and passwords.
• Perform the steps described in Security menu on page 6-93.
Checking that the unit is in the FIPS 140-2 operational state
Use this procedure to confirm that the unit is now in the FIPS 140-2 operational state:
Procedure:
1
On the menu, click
Security
and check the Secure Mode Alarm value.
2
If the alarm is “Secure mode is active”, the unit is in FIPS 140-2 secure mode and no
further action is needed.
3
If the alarm is “Secure mode is not configured”, return to Security menu on page 6-93
and check that all Security Wizard settings are correct for FIPS 140-2.
If this alarm is displayed, it is also displayed in the System Summary page.
FIPS 140-2
Page 6-106
Chapter 6: Configuration and alignment Configuring security for FIPS 140-2 applications
4
If the alarm is “Secure mode is configured, but not active”, return to Step 7:
Enter HTTP and Telnet Settings on page 6-101 check that HTTP Access Enabled is set to
No
.
If this alarm is displayed, it is also displayed in the System Summary page.
Note
If it is necessary to exit from FIPS 140 2 mode, refer to Managing security on page 7-
46.
Page 6-107

Chapter 6: Configuration and alignment Aligning antennas
Aligning antennas
This section describes how to align the antennas in a PTP 700 link, use the web interface to
assist with alignment, and check wireless performance after alignment.
Before performing this task, check that hardware installation is complete (apart from the
network connections) at both the Master and Slave sites.
Starting up the units
Use this procedure to connect one of the units to a management PC and start up both units.
Procedure:
1
Select the unit from which this process is to be controlled; either Master or Slave. This is the
“local” unit.
2
Check that the management PC is connected to the local unit, powered up and logged on as
described in Connecting to the unit on page 6-4.
4
Power up the remote unit.
5
Log into the local unit as described in Logging into the web interface on page 6-6.
Checking that the units are armed
Use this procedure to confirm that the units are in the armed state, ready for alignment.
In the armed state, the modulation mode is fixed at BPSK 0.63 Single, the TDD frame duration
is extended to allow the link to acquire at unknown range, and the transmit power is
automatically adjusted for optimum operation.
Procedure:
• Select menu option
Home
. The System Summary page is displayed.
• Check that the Install Arm State is set to
Armed
.
• If the units are not armed, execute the installation wizard as described in Installation menu
on page 6-9.
Page 6-108

Chapter 6: Configuration and alignment Aligning antennas
Aligning antennas
Use this procedure to align linked antennas (master and slave), whether integrated or
connectorized. The goal of antenna alignment is to find the center of the main beam. This is
done by adjusting the antennas while monitoring the receive signal level.
Preparation:
Ensure that the following parameters are available:
• Location of both sites (latitude and longitude).
• Bearing to the other end of the link for both sites.
• Prediction of receive signal level for both ends of the link.
• Prediction of link loss.
LINKPlanner provides all of these parameters in the form of an installation report.
If a connectorized ODU is installed at either site with two separate antennas for spatial
diversity, refer to Aligning separate antennas for spatial diversity on page 6-110 before starting
alignment.
Note
For improved radio performance, mount the integrated ODU at 45 degrees to the
vertical; this ensures that side-lobe levels are minimized for interference transmitted or
received at zero elevation.
To achieve best results, make small incremental changes to elevation and azimuth.
Caution
The action of tightening the mounting bolts can alter antenna alignment. This can be
helpful when fine-tuning alignment, but it can also lead to misalignment. To prevent
misalignment, continue to monitor receive signal level during final tightening of the
bolts.
Procedure:
1
At each end of the link, adjust the antenna to point a
t the other end of the link. This should be
done with the aid of a compass.
2
Without moving the master antenna, adjust the elevation and azimuth of the slave antenna to
achieve the
highest receive signal level using one of the following methods:
• ODU installation tones on page 6-111
• Graphical Install page on page 6-113
3
Without moving the Slave antenna, adjust the elevation and azimuth of the Master antenna to
achieve the
highest receive signal level (using one of the above methods).
4
Repeat steps 2 and 3 as necessary to fine
-tune the alignment to find the center of the beam.
Page 6-109
Chapter 6: Configuration and alignment Aligning antennas
5
When the antennas have been align
ed on the center of the beam, verify that the receive level
is within the predicted range (from the installation report). If this is not the case, go back to
step 2.
The current value of receive level can be verified by using the graphical installation met
hod
(see
Graphical Install page on page 6-113) or by selecting menu option
Status
and monitoring
the Receive Power attribute on the System Status page.
6
If after repeated attempts to
align, the receive level still does not lie within the predicted
range, this may be because the data provided to the prediction tool (such as LINKPlanner) is
inaccurate. For example estimates of path obstructions, antenna heights or site locations may
be
inaccurate. Check this data and update the prediction as necessary.
7
Once the antennas have been aligned correctly,
tighten the integrated ODU (or connectorized
antenna) mountings. To ensure that the action of tightening does not alter antenna alignment,
continue to monitor received signal level.
Aligning separate antennas for spatial diversity
Use this procedure if a connectorized ODU is installed at either site with two separate antennas
for spatial diversity.
Procedure:
1
Connect the horizontal polarization antenna to the ODU, disconnect the vertical polarization
antenna, then perform Aligning antennas on page 6-109.
2
Connect the vertical polarization antenna to the ODU, disconnect the horizontal polarization
antenna, then perform Aligning antennas on page 6-109.
3
Re-connect the horizontal polarization antennas. The received signal level should increase.
4
Weatherproof the antenna connections at the “H” and “V” interfaces of the ODUs, as
described in Weatherproofing an N type connector on page 5-60.
Page 6-110
Chapter 6: Configuration and alignment Aligning antennas
ODU installation tones
This is the first of two methods that may be used to monitor receive signal level during
antenna alignment.
The ODU emits audible tones during installation to assist with alignment. The pitch of the
alignment tone is proportional to the received power of the wireless signals. Adjust the
alignment of the unit in both azimuth and elevation until the highest pitch tone is achieved.
Note
When using ODU installation tones to align connectorized antennas, it may not be
possible to hear the tones. To overcome this problem, either use an assistant, or use a
stethoscope to give a longer reach.
The tones and their meanings are described in Table 152. In each of the states detailed in the
table, align the unit to give the highest pitch tone. The term “wanted signal” refers to that of
the peer unit being installed.
Table 152
ODU installation tones
State Name
Tone Description
State Description
Pitch Indication
Free Channel
Search
Regular beep Executing band scan N/A
Scanning Slow broken tone Not demodulating the wanted signal Rx Power
Synchronized Fast broken tone Demodulating the wanted signal Rx Power
Registered Solid tone Both Master and Slave units
exchanging Radio layer MAC
management messages
Rx Power
Caution
If, when in the Synchronized or Registered state, the tone varies wildly, there may be
interference or a fast fading link. Installing in this situation may not give a reliable link.
Investigate the cause of the problem.
Page 6-111
Chapter 6: Configuration and alignment Aligning antennas
During alignment, the installation tones should exhibit the following behavior:
•
Band scan:
When first started up and from time to time, the Master unit will carry out a
band scan to determine which channels are not in use. During this time, between 10 and 15
seconds, the Master unit will not transmit and as a consequence of this neither will the
Slave unit. During this time the installation tone on the master unit will drop back to the
band scan state, and the Slave unit will drop back to the Scanning state with the pitch of
the tone set to the background noise level. Alignment of the unit should cease during this
time.
•
Radar detection:
If the unit is operating where mandatory radar avoidance algorithms are
implemented, the ranging behavior may be affected. The Master has to monitor the initially
chosen channel for 60 seconds to make sure it is clear of radar signals before transmitting.
If a radar signal is detected during any of the installation phases, a further compulsory 60
seconds channel scan will take place as the master unit attempts to locate a new channel
that is free of radar interference.
•
Ranging:
The PTP 700 Series does not require the user to enter the link range. The Master
unit typically takes less than 60 seconds to determine the length of the link being installed.
The Master unit will remain in the Scanning state until the range of the link has been
established. The Master unit will only move to the Synchronized state when the range of
the link has been established.
The Slave unit does not have a ranging process. The slave unit will change to the
Synchronized state as soon as the wanted signal is demodulated.
•
Retrying same channel:
If, at the end of the ranging period, the Registered state is not
achieved due to interference or other reasons, the Master unit will retry twice more on the
same channel before moving to another available channel. Should this occur it may take a
number of minutes to establish a link in the Registered state.
Page 6-112
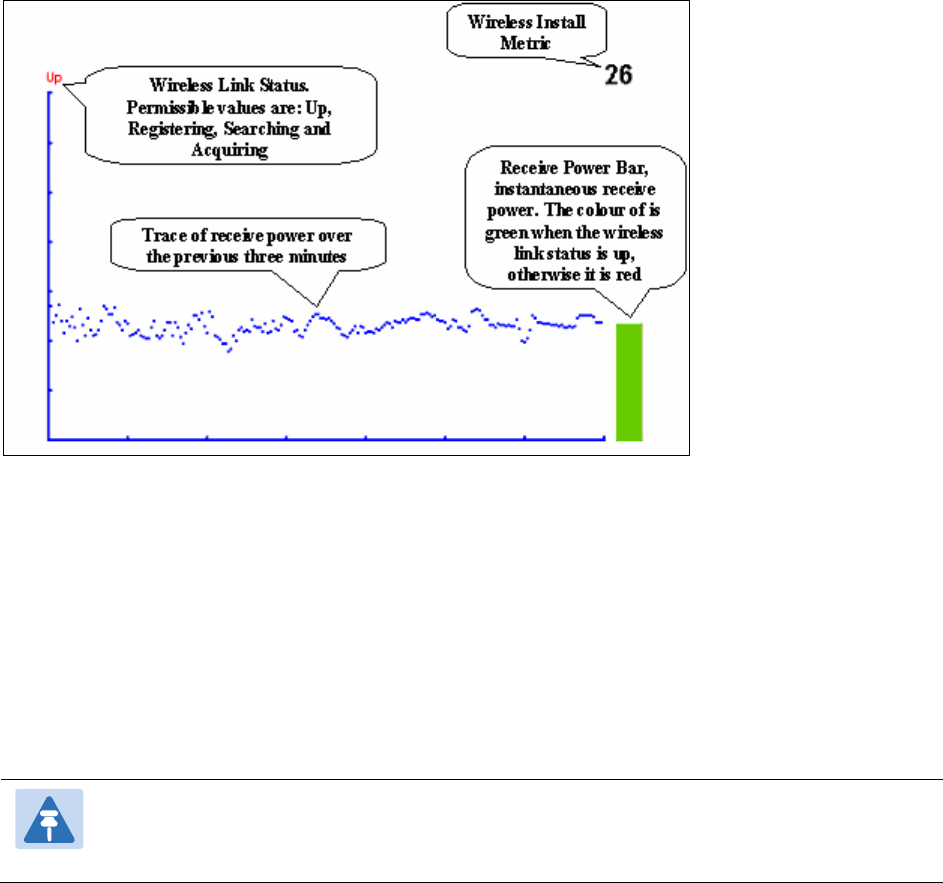
Chapter 6: Configuration and alignment Aligning antennas
Graphical Install page
Menu option:
Installation > Graphical Install
(Figure 179).
This is the second of two methods that may be used to monitor receive signal level during
antenna alignment.
Figure 179
Graphical Install page
Procedure:
• Check that Wireless Link Status (top left) is “Up”, “Registering”, “Searching” or
“Acquiring”.
• While slowly sweeping the antenna, monitor the trace of receive power over the last three
minutes.
• Monitor the Receiver Power Bar (bottom right). Green signifies that the wireless link is up
and red signifies all other states.
• Monitor the Wireless Install Metric (top right). This is the instantaneous receive power in
dBm + 110.
Note
To access the PDA version of the graphical installation tool, use this URL -
http://<ip-address>/pda.cgi
. This link is only available to system administrators.
Page 6-113
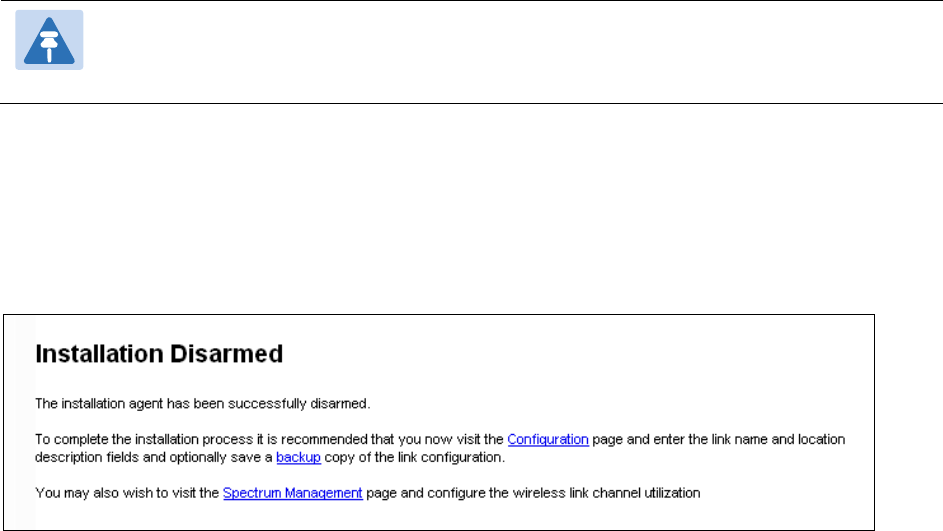
Chapter 6: Configuration and alignment Aligning antennas
Disarming the units
When antenna alignment is complete, use this procedure to disarm both units in the link in
order to:
• Turn off the audible alignment aid.
• Enable adaptive modulation.
• Fully enable spectrum management features (such as DSO, if configured).
• Clear unwanted installation information from the various systems statistics.
• Store the link range for fast link acquisition on link drop.
• Enable higher data rates.
Note
After 24 hours, the units will be disarmed automatically, provided that they are armed
and that the link is up.
Procedure:
• Select menu option
Installation
. The Disarm Installation page is displayed (Figure 123).
• Click
Disarm Installation Agent
. The confirmation page is displayed (Figure 180).
Figure 180
Optional post-disarm configuration
Page 6-114
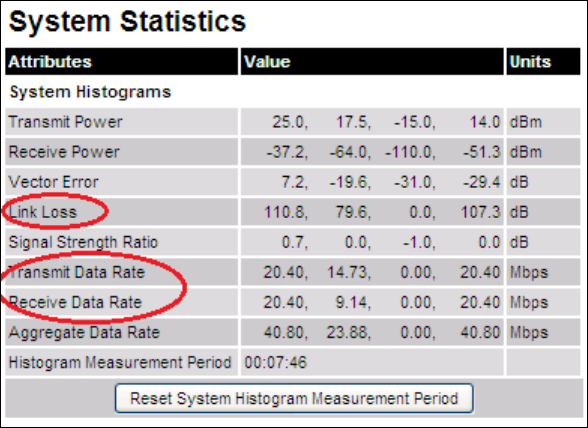
Chapter 6: Configuration and alignment Aligning antennas
Comparing actual to predicted performance
For at least one hour of operation after disarming, use this procedure to monitor the link to
check that it is achieving predicted levels of performance. LINKPlanner provides the prediction
in the form of an installation report.
Procedure:
• Select menu option
System > Statistics
. The System Statistic page is displayed (Figure
181).
• Monitor the following attributes:
o Link Loss
o Transmit Data Rate
o Receive Data Rate
Figure 181
Statistics to be monitored after alignment
For more information on the System Statistics page, refer to System Statistics page on page 7-
47.
Page 6-115

Chapter 6: Configuration and alignment Other configuration tasks
Other configuration tasks
This section describes other configuration tasks.
Connecting to the network
Use this procedure to complete and test network connections.
Procedure:
1
If a management PC is connected directly to the PTP 700, disconnect it.
2
Confirm that all ODU Ethernet interface cables (PSU, SFP and Aux) are connected to the
correct network terminating equipment or devices.
If Main PSU Port Allocation is set to
Disabled
in the LAN Configuration page), it is not
necessary to connect the PSU LAN port to network terminating equipment.
3
Test that the unit is reachable from the network management system by opening the web
interface to the management agent, or by requesting ICMP echo response packets using the
Ping application. For in-band management, test that both units are reachable from one PC.
If the network management system is remote from the sites, either ask co-workers at the
management center to perform this test, or use remote login to the management system.
4
Test the data network for correct operation across the wireless link. This may be by
requesting ICMP echo response packets between hosts in the connected network segments,
or by some more structured use of network testing tools.
5
Monitor the Ethernet ports and wireless link to confirm that they are running normally. For
instructions, see System Summary page on page 7-2 and System Status page on page 7-3.
Page 6-116

Chapter 6: Configuration and alignment Other configuration tasks
Upgrading software using TFTP
Use this procedure to upgrade software remotely using Trivial FTP (TFTP) triggered by SNMP.
Procedure:
1
Check that the TFTP client is enabled. Refer to Web-Based Management page on page 6-58.
2
Set tFTP attributes as described in Table 153.
3
Monitor tFTP attributes as described in Table 154.
4
Reboot the ODU as described in Rebooting the unit on page 7-68.
Table 153
Setting tFTP attributes
Attribute
Meaning
tFTPServerInternetAddress The IPv4 or IPv6 address of the TFTP server from which the TFTP
software upgrade file Name will be retrieved.
For example, to set the TFTP server IP address for the unit at
10.10.10.10 to the IPv4 address 10.10.10.1, enter this command:
snmpset_d.exe -v 2c -c public 10.10.10.10
.iso.3.6.1.4.1.17713.7.9.19.0 a 10.10.10.1
tFTPServerPortNumber This setting is optional. The port number of the TFTP server from
which the TFTP software upgrade file name will be retrieved
(default=69).
tFTPSoftwareUpgrade
FileName
The filename of the software upgrade to be loaded from the TFTP
server.
For example, to set the TFTP software upgrade filename on
10.10.10.10 to "B1095.dld", enter this command:
snmpset_d.exe -v 2c -c public 10.10.10.10
.iso.3.6.1.4.1.17713.7.9.7.0 s B1095.dld
tFTPStartSoftware
Upgrade
Write “1” to this attribute to start the TFTP software upgrade
process. The attribute will be reset to 0 when the upgrade
process has finished.
For example, enter this command:
snmpset_d.exe -v 2c -c public 10.10.10.10
.iso.3.6.1.4.1.17713.7.9.8.0 i 1
Page 6-117

Chapter 6: Configuration and alignment Other configuration tasks
Table 154
Monitoring tFTP attributes
Attribute
Meaning
tFTPSoftwareUpgradeStatus This is the current status of the TFTP software upgrade
process. Values:
idle(0)
uploadinprogress(1)
uploadsuccessfulprogrammingFLASH(2)
upgradesuccessfulreboottorunthenewsoftwareimage(3)
upgradefailed(4).
For example, enter this command:
snmpget_d.exe -v 2c -c public 10.10.10.10
.iso.3.6.1.4.1.17713.7.9.9.0
tFTPSoftwareUpgradeStatus
Text
This describes the status of the TFTP software upgrade
process, including any error details.
For example, enter this command:
snmpget_d.exe -v 2c -c public 10.10.10.10
.iso.3.6.1.4.1.17713.7.9.10.0
tFTPSoftwareUpgradeStatus
AdditionalText
This is used if tFTPSoftwareUpgradeStatusText is full and
there are more than 255 characters to report. It contains
additional text describing the status of the TFTP software
upgrade process, including any error details.
For example, enter this command:
snmpget_d.exe -v 2c -c public 10.10.10.10
.iso.3.6.1.4.1.17713.7.9.11.0
Page 6-118

Chapter 7: Operation
This chapter provides instructions for operators of the PTP 700 wireless Ethernet bridge.
The following topics are described in this chapter:
• System summary and status on page 7-2
• Rebooting and logging out on page 7-15
• Alarms, alerts and messages on page 7-17
• Spectrum Management on page 7-26
• Managing security on page 7-46
• System statistics on page 7-47
• Recovery mode on page 7-62.
Page 7-1
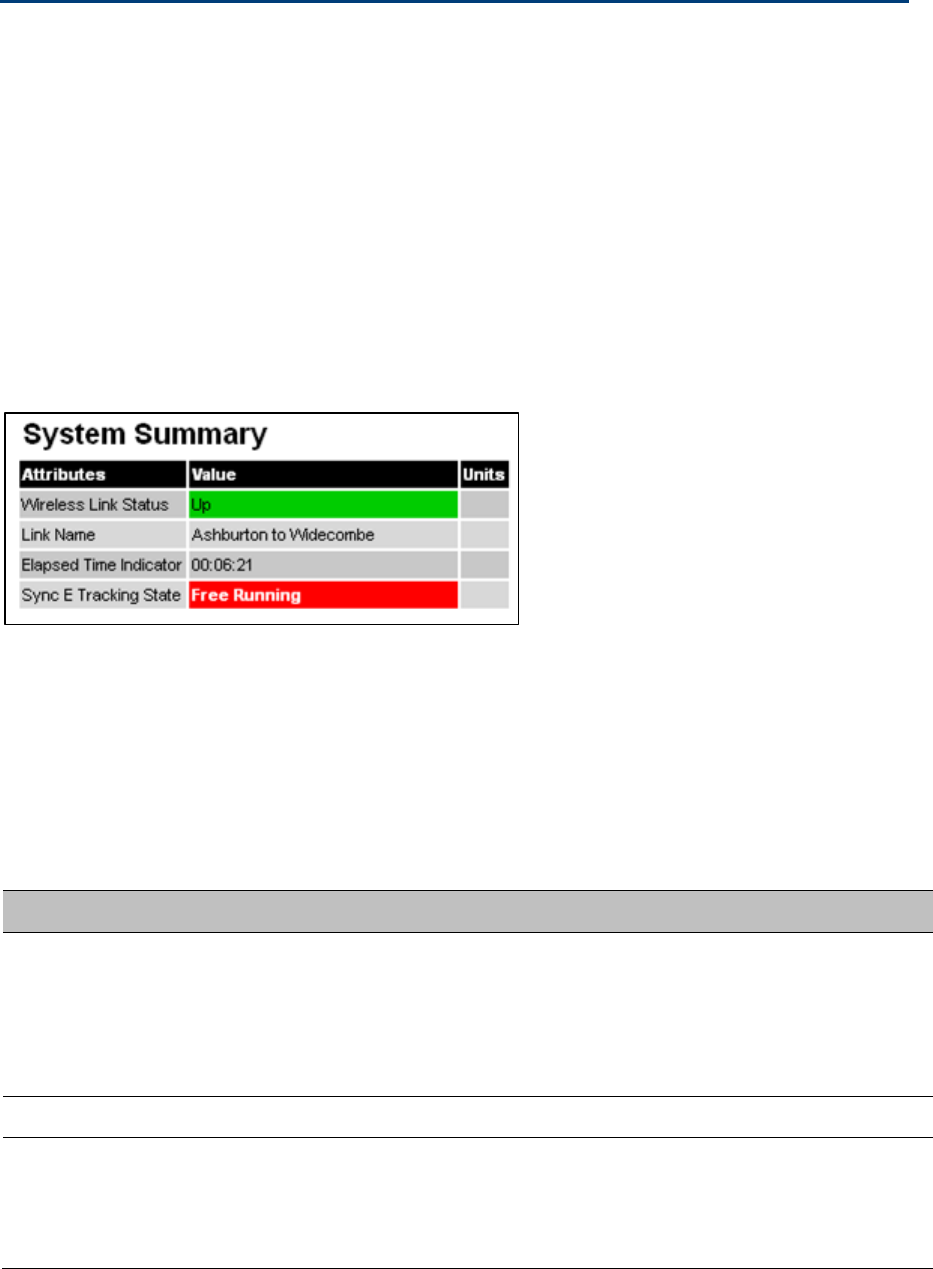
Chapter 7: Operation System summary and status
System summary and status
This section describes how to use the summary and status pages to monitor the status of the
Ethernet ports and wireless link.
System Summary page
Menu option:
Home
(Figure 182).
This page contains a high level summary of the status of the wireless link and associated
equipment. Whenever system alarms are outstanding, a yellow warning triangle is displayed
on the navigation bar, and the alarm condition is listed. In the example in Figure 182, there is
one alarm, and this is for the Sync E Tracking State.
Figure 182
System Summary page
Procedure:
• Review the attributes (Table 155).
• Check that the Wireless Link Status is “Up” on both units. If it is not “Up”, review any
uncleared system alarms: these are displayed below the System Clock attribute. For more
information, refer to Alarms on page 7-17.
Table 155
System Summary attributes
Attribute
Meaning
Wireless Link Status Current status of the wireless link.
A green background with status text “Up” means that the point-to-point
link is established.
A red background with suitable status text (for example “Searching”)
indicates that the link is not established.
Link Name The name of the PTP link, as set in the System Configuration page.
Elapsed Time
Indicator
The time (hh:mm:ss) that has elapsed since the last system reboot.
The system can reboot for several reasons, for example, commanded
reboot from the system reboot webpage, or a power cycle of the
equipment.
Page 7-2
Chapter 7: Operation System summary and status
Attribute
Meaning
System Clock The system clock presented as local time, allowing for zone and daylight
saving (if set).
System Status page
Menu option:
Status
(Figure 183). This page provides a detailed view of the operation of the
PTP 700 link from both the wireless and network perspectives.
Figure 183
System Status page
The two PTP 700 Series units are arranged in a master and slave relationship. The roles of the
units in this relationship are displayed in the page title. The master unit will always have the
title “- Master”, and the slave will always have “- Slave” appended to the “Systems
Status” page title.
Note
Link Symmetry is configured at the master ODU only. The appropriate matching Link
Symmetry is set at the slave ODU automatically. For example, if Link Symmetry is
configured as
2 to 1
at the master ODU, then the slave ODU will be set automatically
as
1 to 2
. In this example, the master-slave direction has double the capacity of the
slave-master direction.
If TDM is configured, the System Status page displays NIDU LAN Port and TDM attibutes
(Figure 184).
Page 7-3
Chapter 7: Operation System summary and status
Figure 184
System Status page with TDM configured
Procedures:
• Confirm that the Ethernet Link Status attributes are green and set to
Copper Link Up
or
Fiber Link Up
.
Equipment
The Equipment section of the System Status page contains the attributes described in Table
156.
Table 156
System Status attributes - Equipment
Attribute
Meaning
Link Name The link name is allocated by the system administrator and is used to
identify the equipment on the network. The link name attribute is limited
to a maximum size of 63 ASCII characters.
Page 7-4

Chapter 7: Operation System summary and status
Attribute
Meaning
Site Name The site name is allocated by the system administrator and can be used
as a generic scratch pad to describe the location of the equipment or any
other equipment related notes. The site name attribute is limited to a
maximum size of 63 ASCII characters.
Software Version The version of PTP 700 software installed on the equipment.
Hardware Version The PTP 700 hardware version. Formatted as “vvvv-C” or “vvvv-C+I”
where vvvv is the version of the printed circuit card. The “-C” suffix
indicates a PTP 700 Connectorized unit. The “-C+I” suffix indicates a PTP
700 Connectorized+Integrated unit.
Regulatory Band This is used by the system to constrain the wireless to operate within
regulatory regime of a particular band and country. The license key
provides the capability to operate in one or more regulatory bands. The
Installation Wizard is used to choose one of those bands.
Elapsed Time
Indicator
The elapsed time indicator attribute presents the total time in years,
days, hours, minutes and seconds since the last system restart. The
system can restart for several reasons, for example commanded reboot
from the system reboot web page, or a power cycle of the equipment.
Page 7-5

Chapter 7: Operation System summary and status
Ethernet / Internet
The Ethernet / Internet section of the System Status page contains the attributes described in
Table 157.
Table 157
System Status attributes – Ethernet / Internet
Attribute
Meaning
Main PSU Port
Status
The current status of the Ethernet link to the PSU port:
• Green “Copper Link Up”: The Ethernet link is established.
• Red “
Down
”: The Ethernet link is not established.
Main PSU Port
Speed and Duplex
The negotiated speed and duplex setting of the Ethernet link to the PSU
port. The speed setting is specified in Mbps.
NIDU LAN Port
Status
The current status of the Ethernet link to the NIDU LAN port:
• Green “Copper Link Up”: The Ethernet link is established.
• Red “
Down
”: The Ethernet link is not established.
NIDU LAN Port
Speed and Duplex
The negotiated speed and duplex setting of the Ethernet link to the NIDU
LAN port. The speed setting is specified in Mbps.
Aux Port Status The current status of the Ethernet link to the Aux port:
• Green “Copper Link Up”: The Ethernet link is established.
• Red “
Down
”: The Ethernet link is not established.
Aux Port Speed and
Duplex
The negotiated speed and duplex setting of the Ethernet link to the Aux
port. The speed setting is specified in Mbps.
SFP Port Status The current status of the Ethernet link to the SFP port:
• Green “Fiber Link Up”: The Ethernet link is established.
• Red “
Down
”: The Ethernet link is not established.
SFP Port Speed and
Duplex
The negotiated speed and duplex setting of the Ethernet link to the SFP
port. The speed setting is specified in Mbps.
MAC Address The MAC Address of this unit.
Remote MAC
Address
The MAC Address of the peer unit. If the link is down, this is set to “Not
available
”.
Remote Internet
Address
The Internet Address of the peer unit. To open the web interface of the
peer unit, click on the hyperlink. If the link is down, this is set to “Not
available”.
Depending on the settings of IP Version (Table 121) and IP Address Label
(Table 120), this may be either an IPv4 or an IPv6 address.
Page 7-6

Chapter 7: Operation System summary and status
Wireless
The Wireless section of the System Status page contains the attributes described in Table 158.
Table 158
System Status attributes – Wireless
Attribute
Meaning
Wireless Link Status The current status of the wireless link:
• Green “Up”: A point-to-point wireless link is established.
• Red “
Down
”: The wireless link is not established.
Maximum Transmit
Power
The maximum transmit power that the local wireless unit is permitted to
use to sustain a link.
Remote Maximum
Transmit Power
The maximum transmit power that the remote wireless unit is permitted
to use to sustain a link.
Transmit Power The maximum, mean, minimum and latest measurements of Transmit
Power (dBm). See System histograms on page 7-47.
Receive Power The maximum, mean, minimum and latest measurements of Receive
Power (dBm). See System histograms on page 7-47.
Vector Error The maximum, mean, minimum and latest measurements of Vector
Error (dB). See System histograms on page 7-47.
Vector Error compares the received signals In phase / Quadrature (IQ)
modulation characteristics to an ideal signal to determine the composite
error vector magnitude. The expected range for Vector Error is
approximately -2 dB (NLOS link operating at sensitivity limit on BPSK
0.67) to -33 dB (short LOS link running 256 QAM 0.83).
Link Loss The maximum, mean, minimum and latest measurements of Link Loss
(dB). See System histograms on page 7-47. The link loss is the total
attenuation of the wireless signal between the two point-to-point units.
The link loss calculation is:
xxxxxx
RTRTRTll
ccggPPP −−++−=
Where:
ll
P
= Link Loss (dB)
x
T
P
= Transmit power of the remote wireless unit (dBm)
x
R
P
= Received signal power at the local unit (dBm)
xx
RT
gg ,
= Antenna gain at the remote and local units respectively
(dBi). This is the gain of the integrated or connectorized antenna.
xx
RT
cc ,
= Cable loss at the remote and local units respectively (dB). It
is RF cable loss which connects ODU to Connectorized antenna.
For connectorized ODUs, the link loss calculation is modified to allow for
the increased antenna gains at each end of the link.
Page 7-7

Chapter 7: Operation System summary and status
Attribute
Meaning
Transmit Data Rate The maximum, mean, minimum and latest measurements of Transmit
Data Rate (Mbps). See System histograms on page 7-47.
Receive Data Rate The maximum, mean, minimum and latest measurements of Receive
Data Rate (Mbps). See System histograms on page 7-47.
Link Capacity
Variant
Indicates whether the installed license key is Lite or Full.
When a link is established, this attribute shows the lower of the license
keys at each end. For example, if this end is Full and the other end is Lite,
it shows “Lite”. To see the installed key, go to the Installation Wizard.
Link Capacity The maximum aggregate data rate capacity available for user traffic,
assuming the units have been connected using Gigabit Ethernet. The link
capacity is variable and depends on the prevailing wireless conditions as
well as the distance (range) between the two wireless units.
Transmit
Modulation Mode
The modulation mode currently being used on the transmit channel.
Receive Modulation
Mode
The modulation mode currently being used on the receive channel.
Link Symmetry A ratio that expresses the division between transmit and receive time in
the TDD frame. The first number in the ratio represents the time allowed
for the transmit direction and the second number represents the time
allowed for the receive direction.
Receive Modulation
Mode Detail
The receive modulation mode in use. For a list of values and their
meanings, see Table 159.
Range The range between the PTP 700 Series ODUs. This is displayed in
kilometers by default, but can be changed to miles by updating the
Distance Units attribute to imperial, as described in Webpage Properties
page on page 6-67.
Table 159
Receive Modulation Mode Detail values and meanings
Value
Meaning
Running At Maximum Receive
Mode The link is operating at maximum modulation mode in
this channel and maximum throughput has been
obtained.
Running At User-Configured
Max Modulation Mode The maximum modulation mode has been capped by
the user and the link is operating at this cap.
Restricted Because
Installation Is Armed The Installation Wizard has been run and the unit is
armed, forcing the link to operate in the lowest
modulation mode. To remove this restriction, re-run the
Installation Wizard to disarm the unit.
Page 7-8

Chapter 7: Operation System summary and status
Value
Meaning
Restricted Because Of Byte
Errors On The Wireless
Link
The receiver has detected data errors on the radio and
reduced the modulation mode accordingly. The radio
may achieve a higher modulation mode as shown by the
vector error, but there is some other error source,
probably RF interference.
Restricted Because Channel
Change Is In Progress This is a transient event where the modulation mode is
temporarily reduced during a channel change.
Limited By The Wireless
Conditions The radio is running at the maximum achievable
modulation mode given the current wireless conditions
shown by the vector error. The radio is capable of
reaching a higher modulation mode if wireless
conditions (vector error) improve.
Page 7-9

Chapter 7: Operation System summary and status
Synchronous Ethernet
The Synchronous Ethernet section of the System Status page contains the attributes described
in Table 160.
Table 160
System Status attributes – Synchronous Ethernet
Attribute
Meaning
Sync E Tracking
State
The state of frequency tracking in Synchronous Ethernet. For a list of
values and their meanings, see Table 161.
In normal operation, with the Synchronous Ethernet feature enabled and
a valid timing source present, one end of the link should be in the
“Locked Local, Holdover Acquired State”, the other end should
be in the “Locked Remote, Holdover Acquired” state.
Further status information for the Synchronous Ethernet features is
available in the Sync E Status page. See SyncE Status page on page 7-
57.
Table 161
Sync E Tracking State values and meanings
Value
Meaning
Disabled The synchronous Ethernet feature is disabled.
Acquiring Wireless Lock
Synchronous Ethernet is not operational because the
wireless link is establishing.
Free Running Synchronous Ethernet is operational, but with no timing
source or history. This is a temporary state.
Locked Local, Acquiring
Holdover Sync E tracking has locked to a synchronisation signal from a
cabled Ethernet port on the local ODU. This is a temporary
state until the unit has acquired holdover history.
Locked Local, Holdover
Acquired Sync E tracking has locked to a synchronisation signal from a
cabled Ethernet port on the local ODU and has acquired
holdover history.
Holdover There is currently no source for the tracking loop, but
previously the tracking loop was in a Locked, Holdover
Acquired state. The system is using the last known good
frequency.
Locked Remote,
Acquiring Holdover The tracking loop has locked to a synchronisation signal
from the remote ODU. This is a temporary state until the unit
has acquired holdover history.
Locked Remote, Holdover
Acquired The tracking loop has locked to a synchronisation signal
form the remote ODU and has acquired holdover history.
Page 7-10

Chapter 7: Operation System summary and status
TDD Synchronization
The TDD Synchronization section of the System Status page contains the attributes described
in Table 162.
Table 162
System Status attributes – TDD Synchronization
Attribute
Meaning
TDD
Synchronization
Status
The status of TDD synchronization. Displayed at a TDD Master if TDD
synchronization is active. For a list of values and their meanings, see
Table 163.
Table 163
TDD Synchronization Status values and meanings
Value
Meaning
Inactive TDD Synchronization has been administratively disabled.
This value is not displayed in the System Status page, but can
be determined from the SNMP MIB.
TDD Synchronization Status is always in the Inactive state at a
TDD Slave unit.
Cluster Timing Master The ODU has been configured as a Cluster Master with an
internal reference, and is communicating correctly with the
PTP SYNC unit.
Initialising The wireless link is down, and the master ODU is attempting to
synchronize the TDD frame structure with an external 1 pps
reference.
Synchronization proceeds more rapidly in this state than in the
Acquiring Lock state, because the TDD master does not need
to consider the ability of the TDD slave to track changes in
frame timing.
PTP-SYNC Not
Connected
The ODU is not able to communicate with the PTP SYNC unit.
Locked The master ODU has locked the TDD frame structure to the 1
pps reference received at the input of the PTP-SYNC unit.
The ODU may be a Cluster Master or a Cluster Slave.
The ODU is transmitting.
Holdover (No GPS Sync
In) The 1 pps reference has been lost at the input to the PTP-SYNC
unit, and the ODU in a free running state.
The ODU is transmitting.
If the reference input is not restored, the Holdover state will
terminate automatically after a period set by TDD Holdover
Duration.
Page 7-11

Chapter 7: Operation System summary and status
Value
Meaning
Holdover The ODU is a Cluster Slave and the 1 pps reference has been
lost at the input to an upstream PTP-SYNC unit. The ODU is
locked to an upstream ODU that is in the Holdover (No GPS
Sync In) state.
The ODU is transmitting.
If the reference input is not restored at the upstream PTP-
SYNC unit, the Holdover state will terminate automatically
after a period set by TDD Holdover Duration.
Not Synchronized (No
GPS Sync In) The 1 pps reference has been lost at the input to the PTP-SYNC
unit and the holdover period has expired.
If the ODU is configured for TDD Holdover Mode = Best Effort
then the ODU will be transmitting, otherwise it will be muted.
Not Synchronized The ODU is a Cluster Slave and the 1 pps reference has been
lost at the input to an upstream PTP-SYNC unit. The holdover
period has expired.
If the ODU is configured for TDD Holdover Mode = Best Effort
then the ODU will be transmitting, otherwise it will be muted.
Acquiring Lock The wireless link is up and the master ODU is attempting to
synchronize the TDD frame structure with an external 1 pps
reference. Frame timing changes at the TDD master are
constrained to allow for tracking by the TDD slave.
This state is not allowed when TDD Holdover Mode = Strict.
IEEE 1588 Transparent Clock
The IEEE 1588 Transparent Clock section of the System Status page contains the attributes
described in Table 164.
Table 164
System Status attributes – IEEE 1588 Transparent Clock
Attribute
Meaning
Transparent Clock Indicates if the IEEE 1588 transparent clock feature is enabled.
Page 7-12

Chapter 7: Operation System summary and status
TDM
The TDM section of the System Status page contains the attributes described in Table 165.
Note
When TDM is enabled and connected at one link end, up to two minutes may elapse
before the TDM link is established (this is known as the settling period). Do not
attempt to change the TDM configuration during this settling period.
Table 165
System Status attributes – TDM
Attribute
Meaning
TDM Interface
Control
The type of TDM interface that is activated (None, E1 or T1). This is set
on the Interface Configuration page.
TDM Interface
Status
The current status of the Ethernet link between the NIDU (ODU port) and
the ODU (PSU port) (OK or Not Connected).
• Green “OK”: The Ethernet link is established.
• Red “
Not Connected
”: The Ethernet link is not established.
TDM Single Payload
Lock
The current status of the single payload locking feature:
• “Enabled”: The ODU will prevent transition from Single Payload
modes to the higher Dual Payload modes. The ODU applies this lock
when it calculates that such a transition would pass through modes
which cannot carry telecoms data.
• “Applied”: The ODU is actively preventing these transitions.
• “Disabled”: The wireless will transition to the faster Dual Payload
modes as soon as the conditions are appropriate.
TDM Latency The end-to-end latency of the TDM service between TDM ports at the
NIDUs (µs).
TDM Channel
Status n
The current status of the TDM service between NIDU port "n" at the local
NIDU and the corresponding port at the remote NIDU. For a list of values
and their meanings, see Table 166.
Page 7-13

Chapter 7: Operation System summary and status
Table 166
TDM Channel Status values and meanings
Value
Meaning
Up TDM data is being bridged between the TDM ports on local and
remote NIDUs (green background).
No Signal (Local)
No TDM data is being received at the TDM port on the local NIDU.
No Signal (Remote) No TDM data is being received at the corresponding TDM port on
the remote NIDU.
No Signal (Local
and Remote) No TDM data is being received at the associated TDM ports on
local and remote NIDUs.
No Signal (Local
and Remote Timing) No TDM data is being received at the TDM port on the local NIDU.
TDM data is being received at the TDM port on the remote NIDU.
The modulation mode of the link is too low to support bridging of
TDM data in the remote to local direction, but the transmit clock at
TDM port of the local NIDU is synchronised to the clock received at
the TDM port on the remote NIDU.
Remote Timing TDM data is being received at the TDM port on the local and
remote NIDUs. The modulation mode of the link is too low to
support bridging of TDM data in either direction. The transmit
clocks at the TDM ports on local and remote NIDUs are
synchronized to the clocks received at the TDM ports on
(respectively) the remote and local NIDUs.
Disabled The TDM link is not established. This may be because the wireless
link is down, or because the TDM service is acquiring
synchronization.
Page 7-14
Chapter 7: Operation Rebooting and logging out
Rebooting and logging out
This section describes how to reboot the unit and log out of the web interface.
Login Information page
Menu option:
Management > Web > Login Information
(Figure 185).
Use this page to show recent successful and unsuccessful login attempts on this account.
Figure 185
Login Information page
Reboot Wireless Unit page
Menu option:
System > Reboot
(Figure 186).
Use this page to reboot the ODU or view a list of previous reboot reasons.
Figure 186
Reboot Wireless Unit page
Procedure:
• Use the drop-down list to view the Previous Reasons For Reset/Reboot.
• If a reboot is required:
o Click
Reboot Wireless Unit
. The Reboot Confirmation dialog is displayed (Figure 187).
Page 7-15
Chapter 7: Operation Rebooting and logging out
o Click
OK
. The reboot progress message is displayed. On completion, the unit restarts.
Figure 187
Reboot confirmation pop up
Change Password page
Menu option:
Change Password
(Figure 188). Use this page to change a personal password.
Figure 188
Change Password page (System Administration example)
A security officer can change the passwords of other users using the User Accounts page, as
described in Local User Accounts page on page 6-61.
Procedure:
• Enter and confirm the new password (the default is blank). The new password must comply
with the complexity rules (Table 135).
Logging out
To maintain security, always log out at the end of a session: on the menu, click
Logout
.
The unit will log out automatically if there is no user activity for a set time, but this depends
upon Auto Logout Period in the Webpage Properties page (Figure 153).
Page 7-16
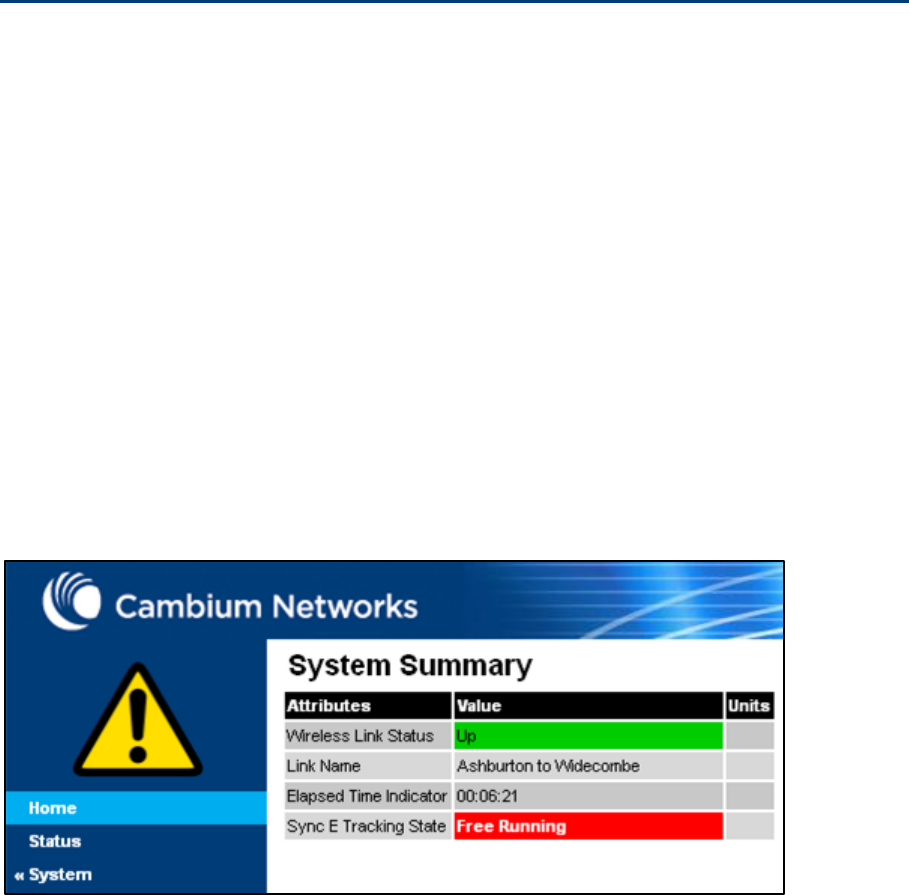
Chapter 7: Operation Alarms, alerts and messages
Alarms, alerts and messages
This section describes how to use alarms, alerts and syslog messages to monitor the status of
a PTP 700 link.
Alarms
Whenever system alarms are outstanding, a yellow warning triangle is displayed on the
navigation bar. The warning triangle is visible from all web pages.
Procedure:
• Click the warning triangle (or menu option
Home
) to return to the System Summary page
and view the alarms. If the warning triangle disappears when it is clicked, it indicates that
the outstanding alarms have been cleared.
The example in Figure 189 shows the warning triangle in the navigation bar and an alarm
displayed in the System Summary page. The alarms are defined in Table 167.
A change of state in most alarms generates an SNMP trap or an SMTP email alert.
Figure 189
Alarm warning triangle
Page 7-17

Chapter 7: Operation Alarms, alerts and messages
Table 167
System alarms
Alarm
Meaning
Aux Port Configuration Mismatch Ethernet fragments (runt packets) have been detected
when the Aux port is in full duplex. This indicates an auto-
negotiation or forced configuration mismatch.
Aux Port Disabled Warning The Aux port link has been administratively disabled via
the SNMP Interface.
Aux Port PoE Output Status The Aux port link is down. The most likely cause is that the
unit has no Ethernet cable plugged into its Aux port.
Aux Port Status The Aux port link is down. The most likely cause is that the
unit has no Ethernet cable plugged into its Aux port.
Cable Diagnostics Warning “Test In Progress“ means that the Cable Diagnostics
test has been initiated on one or more ports and is in
progress.
Capacity Variant Mismatch The link ends are different capability variants, for example,
one is Full and the other is Med.
Data Bridging Status This alarm depends on Lowest Data Modulation Mode.
“Disabled” means that the link has stopped bridging
Ethernet frames because the Lowest Data Modulation
Mode is not being achieved or because the wireless link is
down.
Second Data Bridging Status This alarm depends on Lowest Second Data Modulation
Mode.
“Disabled” means that the link has stopped bridging
Ethernet frames because the Lowest Second Data
Modulation Mode is not being achieved or because the
wireless link is down.
Install Status Signaling was received with the wrong MAC address. It is
very unusual to detect this, because units with wrongly
configured Target MAC Address will normally fail to
establish a wireless link. However, rare circumstances may
establish a partial wireless link and detect this situation.
Install Arm State A wireless unit is in installation mode. After installation,
the wireless unit should be disarmed. This will increase the
data-carrying capacity and stop the installation tone
generator. The wireless link is disarmed from the
“Installation” process, see Disarming the units on page 6-
114.
Incompatible Regulatory Bands The two linked units have different Regulatory Bands. To
clear this alarm, obtain and install license keys for the
correct country and select the same Regulatory Band at
each end of the link.
Page 7-18

Chapter 7: Operation Alarms, alerts and messages
Alarm
Meaning
Incompatible Master and Slave The master and slave ends of the wireless link are different
hardware products, or have different software versions. It
is very unusual to detect this because incompatible units
will normally fail to establish a wireless link. However,
some combinations may establish a partial wireless link
and detect this situation.
Link Mode Optimization
Mismatch
The Master and Slave ODUs are configured to use different
link mode optimization methods (one is set to IP and the
other TDM).
Main PSU Port Configuration
Mismatch
Ethernet fragments (runt packets) have been detected
when the PSU port is in full duplex. This indicates an auto-
negotiation or forced configuration mismatch.
Main PSU Port Disabled Warning The PSU port link has been administratively disabled via
the SNMP Interface.
Main PSU Port Status The PSU port link is down. The most likely cause is that the
unit has no Ethernet cable plugged into its Aux port.
NIDU LAN Port Status The Ethernet link between the NIDU (LAN port) and the
Ethernet network terminating equipment is not
established.
No Wireless Channel Available Spectrum Management was unable to locate a suitable
wireless channel to operate on.
Port Allocation Mismatch The local and remote ODUs have different services
configured.The following alarms are raised on the port
configuration mismatch -
•
Mismatch in Second Data Service:
The Second Data
Service is configured at the local unit but it is not
configured at the remote unit or vice versa.
•
Mismatch in Out of Band Remote Management
Service
: The Out of Band Management Service is
configured at the local unit but it is not configured at
the remote unit or vice versa.
Regulatory Band The installed license key contains an invalid Regulatory
Band. The wireless unit is prohibited from operating
outside the regulated limits.
Remaining Full Capacity Time
Trial
Time remaining on the full capability trial period. Activated
when seven days or less of the trial period remain.
Remote Transparent Clock
Compatibility
The local and remote units have different IEEE 1588
transparent clock configurations. Both units must have the
same configuration for the feature to work correctly.
Page 7-19

Chapter 7: Operation Alarms, alerts and messages
Alarm
Meaning
Secure Mode Alarm The unit is operating in the FIPS secure mode, but is not in
the operational state. To clear an alarm value of
Secure
mode is not configured
ensure that all settings are correct
for FIPS 140-4 in the Security Wizard. To clear an alarm
value of
Secure mode is configured, but not active
ensure
that HTTP Access Enabled is set to
No
.
SFP Error
A non-OK value indicates that the SFP link is down. There
are two possible causes:
• Either: the fiber link has been installed but disabled
(because the license key does not include SFP support),
• Or: the SFP link could not be established even though
an SFP carrier was detected (due perhaps to a cabling
fault or the link is disabled at the link partner).
SFP Port Configuration Mismatch Ethernet fragments (runt packets) have been detected
when the SFP port is in full duplex. This indicates an auto-
negotiation or forced configuration mismatch.
SFP Port Disabled Warning The SFP port link has been administratively disabled via
the SNMP Interface.
SFP Port Status The SFP port link is down. The most likely cause is that the
unit has no Ethernet cable plugged into its SFP port.
SNTP Synchronization failed SNTP has been enabled but the unit is unable to
synchronize with the specified SNTP server.
Sync E tracking state The state of the Synchronous Ethernet feature, if there is a
problem.
Syslog Client Enabled/Disabled
Warning
The local syslog client has been enabled or disabled.
Syslog Enabled/ Disabled
Warning
The local log of event messages has been enabled or
disabled.
Syslog Local Nearly Full The local log of event messages is nearly full.
Syslog Local Wrapped The local log of event messages is full and is now being
overwritten by new messages.
TDM Channel Status n The Ethernet link between the NIDU (E1/T1 port “n”) and
the local TDM transceiver is not established.
TDM Channel Loopback n TDM channel “n” is currently undergoing a loopback test.
Page 7-20

Chapter 7: Operation Alarms, alerts and messages
Alarm
Meaning
TDD Synchronization Alarm The reference signal for TDD Synchronization is absent and
the ODU is now in holdover with more than 80% of the
holdover period elapsed (
Reference Signal Lost
) or the
ODU has reached the end of the configured holdover
period and may not be correctly synchronized with the
remaining units in the wireless network (
Synchronization
Lost
).
If TDD Synchronization Alarm = Synchronization Lost and
TDD Holdover Mode = Strict, the ODU will be muted and
the wireless link will be down.
Transparent Clock Source Port
Alarm
If SFP was the selected transparent clock source port but
the media did not negotiate to Fiber.
Unit Out Of Calibration The unit is out of calibration and must be returned to the
factory using the RMA process for re-calibration.
Wireless Link Disabled Warning The wireless link has been administratively disabled via the
SNMP Interface. The wireless interface MIB-II
ifAdminStatus attribute has been set to
DOWN
. To enable
the Ethernet interface, set the ifAdminStatus attribute to
UP
.
Email alerts
The management agent can be configured to generate alerts by electronic mail when certain
events occur. The alerts are defined in Table 168.
Table 168
Email alerts
Alert
Meaning
Wireless Link Up Down There has been a change in the status of the wireless link.
Channel Change DFS has forced a change of channel.
DFS Impulse Interference DFS has detected impulse interference.
Enabled Diagnostic Alarms Diagnostic alarms have been enabled.
Main PSU Port Up Down There has been a change in the status of the PSU data port.
Aux Port Up Down There has been a change in the status of the Aux port.
SFP Port Up Down There has been a change in the status of the SFP port.
NIDU LAN Port Up Down There has been a change in the status of the NIDU LAN port.
Page 7-21
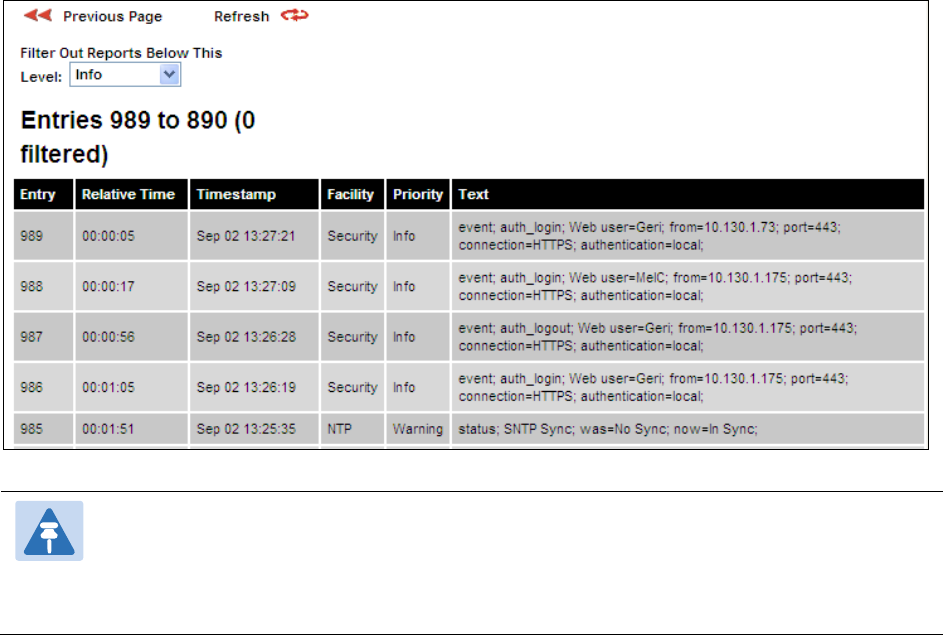
Chapter 7: Operation Alarms, alerts and messages
Syslog page
Menu option:
Management > Syslog
(Figure 190).
Use this page to view the local log of event messages.
Figure 190
Syslog local log
Note
For more information about system logging, refer to:
• System logging (syslog) on page 1-48 describes the system logging feature.
• Syslog Configuration page on page 6-78 describes how to enable system logging.
Format of syslog server messages
PTP 700 generates syslog messages in this format:
SP = “ ” = %x20
CO = “:” = %x3A
SC = “;” = %x3B
LT = “<” = %x3C
GT = “>” = %x3E
syslog = pri header SP message
pri = LT “1”-“182” GT
header = timestamp SP hostname
timestamp = month SP days SP hours “:” minutes “:” seconds
month = “Jan”|“Feb”|“Mar”|“Apr”|“May”|“Jun”|
“Jul”|“Aug”|“Sep”|“Oct”|“Nov”|“Dec”
days = “ 1”-“31”
hours = “00”-“23”
Page 7-22

Chapter 7: Operation Alarms, alerts and messages
minutes = seconds = “00”-“59”
hostname = “0.0.0.0”-“255.255.255.255”
message = “PTP700” CO SP (configuration | status | event)
configuration = “configuration” SC SP attribute-name SC SP (“Web
user”|“SNMP user”|“SNTP”) SC SP “was=” previous-value SC SP “now=”
new-value SC
status = “status” SC SP attribute-name SC SP “was=” previous-value
SC SP “now=” new-value SC
event = “event” SC SP identifier SC SP event-message-content SC
Configuration and status messages
Configuration and status messages contain all of the relevant attributes.
This is an example of a configuration message:
PTP700: configuration; IP Address; Web user; was=10.10.10.10;
now=169.254.1.1;
This is an example of a status message:
PTP700: status; Data Port Status; was=Down; now=Up;
Event messages
Event messages are listed in Table 169. Definition of abbreviations:
SC = ";"
SP = " "
This is an example of an event message:
PTP700: event; auth_login; web user=MarkT; from=169.254.1.1;
port=80;
connection=HTTP; authentication=local;
Table 169
Event messages
Facility
Severity
Identifier
Message content
security(4) warning(4) auth_idle "Web user=" user-name SC SP
"from=" IP-address SC SP
"port=" port-number SC SP
"connection=" ("HTTP" | "HTTPS") SC SP
"authentication=" ("local" | "RADIUS") SC
security(4) info(6) auth_login
security(4) warning(4) auth_login_failed
security(4) warning(4) auth_login_locked
security(4) info(6) auth_logout
kernel(0) warning(4) cold_start "PTP wireless bridge has reinitialized,
reason="
reset-reason SC
security(4) warning(4) License_update "License Key updated" SC
Page 7-23

Chapter 7: Operation Alarms, alerts and messages
Facility
Severity
Identifier
Message content
syslog(5) warning(4) log_full "Syslog local flash log is 90% full" SC
syslog(5) warning(4) log_wrap "Syslog local flash log has wrapped" SC
security(4) info(6) radius_auth "RADIUS user=" user-name SC SP
"server " ("1" | "2") " at " IP-address SP
"succeeded" SC
security(4) warning(4) radius_auth_fail "RADIUS user=" user-name SC SP
"server " ("1" | "2") " at " IP-address SP
("failed" | "succeeded" | "failed (no
response)") SC
security(4) alert(1) resource_low "Potential DoS attack on packet ingress "
("warning" | "cleared") SC
security(4) warning(4) sec_zeroize "Critical Security Parameters (CSPs)
zeroized" SC
local6(22) warning(4) snmpv3_asn1 "ASN.1 parse error" SC
security(4) warning(4) snmpv3_auth "Authentication failure" SC
local6(22) warning(4) snmpv3_decryption "Decryption failure" SC
local6(22) warning(4) snmpv3_engine_id "Unknown engine ID" SC
local6(22) warning(4) snmpv3_sec_level "Unknown security level" SC
kernel(0) warning(4) sys_reboot "System Reboot, reason=" reset-reason SC
security(4) warning(4) sys_software
_upgrade
"Software upgraded from " software-
version " to " software-version SC
local6(22) warning(4) telnet_idle "Telnet user=" user-name SC SP
"from=" IP-address SC SP
"port=" port-number SC
local6(22) info(6) telnet_login
local6(22) warning(4) telnet_login_failed
local6(22) info(6) telnet_logout
local6(22) info(6) tftp_complete "TFTP software upgrade finished" SC
local6(22) info(6) tftp_failure "TFTP software upgrade failed, reason="
reason SC
local6(22) info(6) tftp_start "TFTP software upgrade started" SC
NTP(12) info(6) time_auth "SNTP authentication succeeded at
IP-address=" IP-address SC SP
"port-number=" port SC
NTP(12) warning(4) time_auth_failed "SNTP authentication failed at IP-address="
IP-address SC SP "port-number=" port SC
Page 7-24

Chapter 7: Operation Alarms, alerts and messages
Facility
Severity
Identifier
Message content
NTP(12) warning(4) time_conn_failed "SNTP connection failed at IP-address="
IP-address SC SP "port-number=" port SC
SP
"reason=" reason SC
Page 7-25

Chapter 7: Operation Spectrum Management
Spectrum Management
Spectrum Expert
This section describes how to use the Spectrum Expert page to monitor the radio spectrum
usage of the PTP 700 link.
Note
Internet Explorer versions up to and including IE8 do not support the HTTP features
used in the Spectrum Expert page.
Menu option:
System > Spectrum Expert
This page is used to view and configure spectrum usage.
The Spectrum Expert page displays the following plots:
• The Local Receive Spectrum, and
• The Peer Receive Spectrum.
The Spectrum Expert page has two display modes:
• Standard Display mode – The ‘Standard’ Display mode is the mode which displays only the
operational subband channels (shown in Figure 191). In this mode, the Extended Spectrum
Scanning attribute could be Enabled but the Extended display box could be un-checked.
It has further two types of plot:
o Standard Display mode without realtime line
o Standard Display mode with realtime line
• Extended Display mode – The ‘Extended’ Display Mode shows the entire DSO Full Band
range of channels along with highlighted operational channels (shown in Figure 192). In
this mode, the Extended Spectrum Scanning attribute is Enabled.
This mode also has two types of plot:
o Extended Display mode without realtime line
o Extended Display mode with realtime line
The Extended display mode selection checkbox appears when the Extended Spectrum
Scanning attribute is set to Enabled.
See Interpreting the receive spectrum plot on page 7-32 for details on the how to interpret
these plots.
Caution
It is recommended not to leave the ODU with Extended Spectrum Scanning enabled
during normal operation due to reduction in DSO CAC response in the operating
band.
Page 7-26
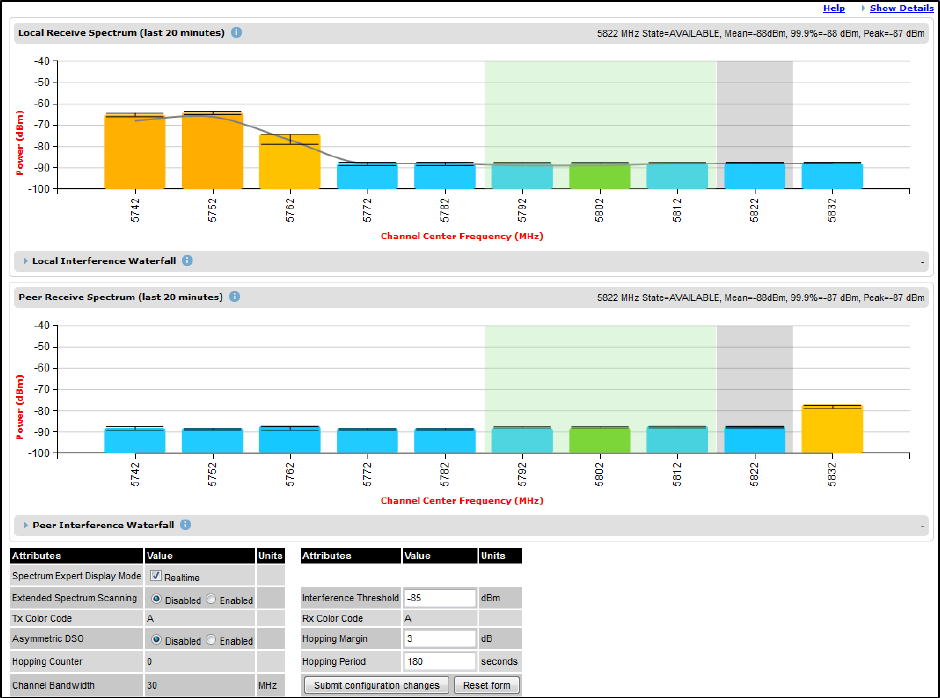
Chapter 7: Operation Spectrum Management
Standard Display mode
Figure 191
Spectrum Expert page – Standard
Display mode
Page 7-27
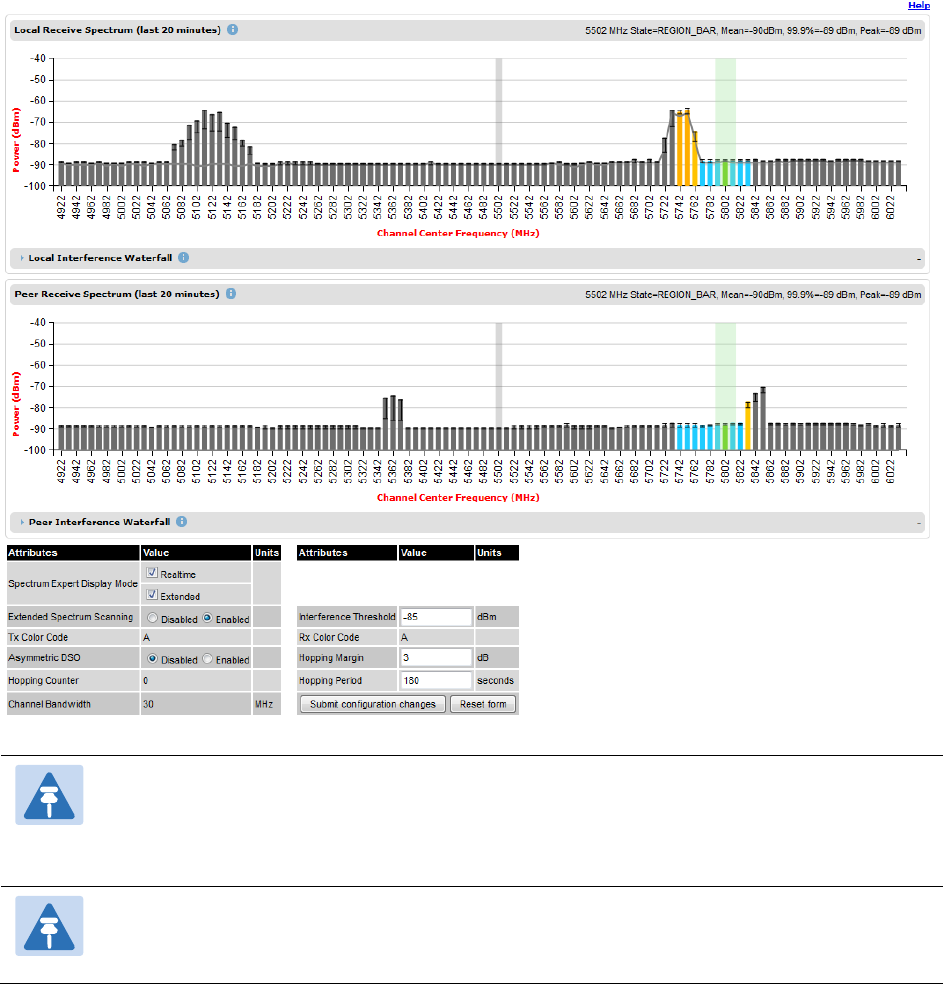
Chapter 7: Operation Spectrum Management
Extended Display Mode
Figure 192
Spectrum Expert page – Extended Display mode
Note
Figure 191 shows the default layout for a unit configured as a Master. On a unit
configured as Slave, some of the controls at the bottom of the page are not available.
In the remainder of this section, the screen shots shown are for the Master Unit.
Note
For Spectrum Expert Extended Display mode, Extended Spectrum Scanning is
Enabled and Display mode is set to Extended.
Standard Display with extended layout
The page layout may be changed from the compact layout to the extended layout by clicking
on the
Show Details
hyperlink on the top right of the page shown in Figure 191.
This hyperlink is only visible when the Extended Display checkbox in Spectrum Expert Display
Mode is not selected.
A screen shot of the Spectrum Expert page in the extended layout is shown in Figure 193. It
displays the following additional plots:
Page 7-28
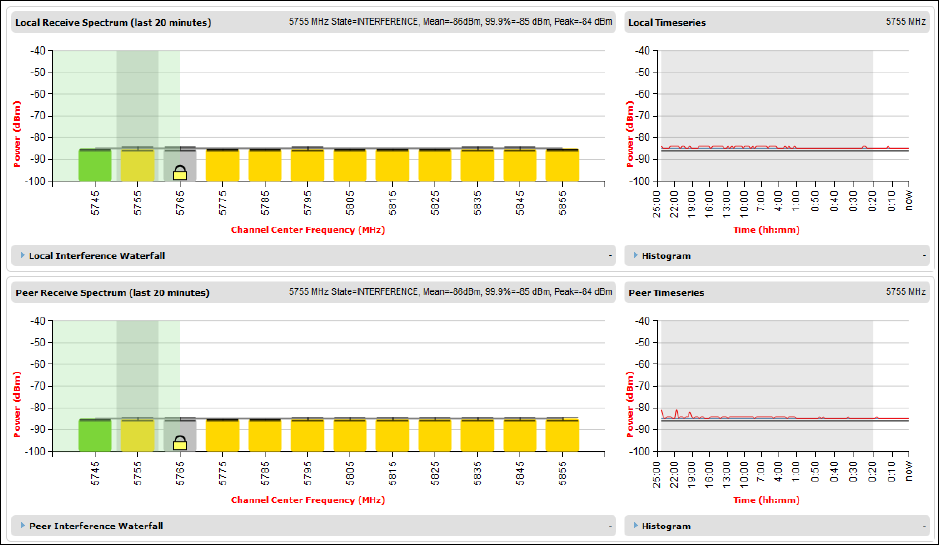
Chapter 7: Operation Spectrum Management
• The Local Timeseries, and
• The Peer Timeseries.
These plots are on the right of the corresponding Receive Spectrum plots. See Selecting a
Channel and a Time period on page 7-41 for details on the timeseries plots.
Clicking on the
Hide Details
hyperlink returns to the compact layout.
Figure 193
Spectrum Expert page with Receive Spectrum and Timeseries for both Local and
Peer
Full layout
The page layout may be extended further to give access to more information on either or both
the local and the peer interference spectra.
For the local interference spectrum, clicking on the
Local Interference Waterfall
hyperlink below
the Local Receive Spectrum plot shows:
• The Local Interference Waterfall plot, if the Local TimeSeries was not shown (Figure 194),
or
• The Local Interference Waterfall and the Histogram plots otherwise (Figure 195).
The same can be done for the peer section of the page.
Details on how to interpret the Interference Waterfall and Histogram plots are provided in
sections Interpreting the Interference Waterfall plot on page 7-43 and Interpreting the
histogram plot on page 7-45 respectively.
Page 7-29
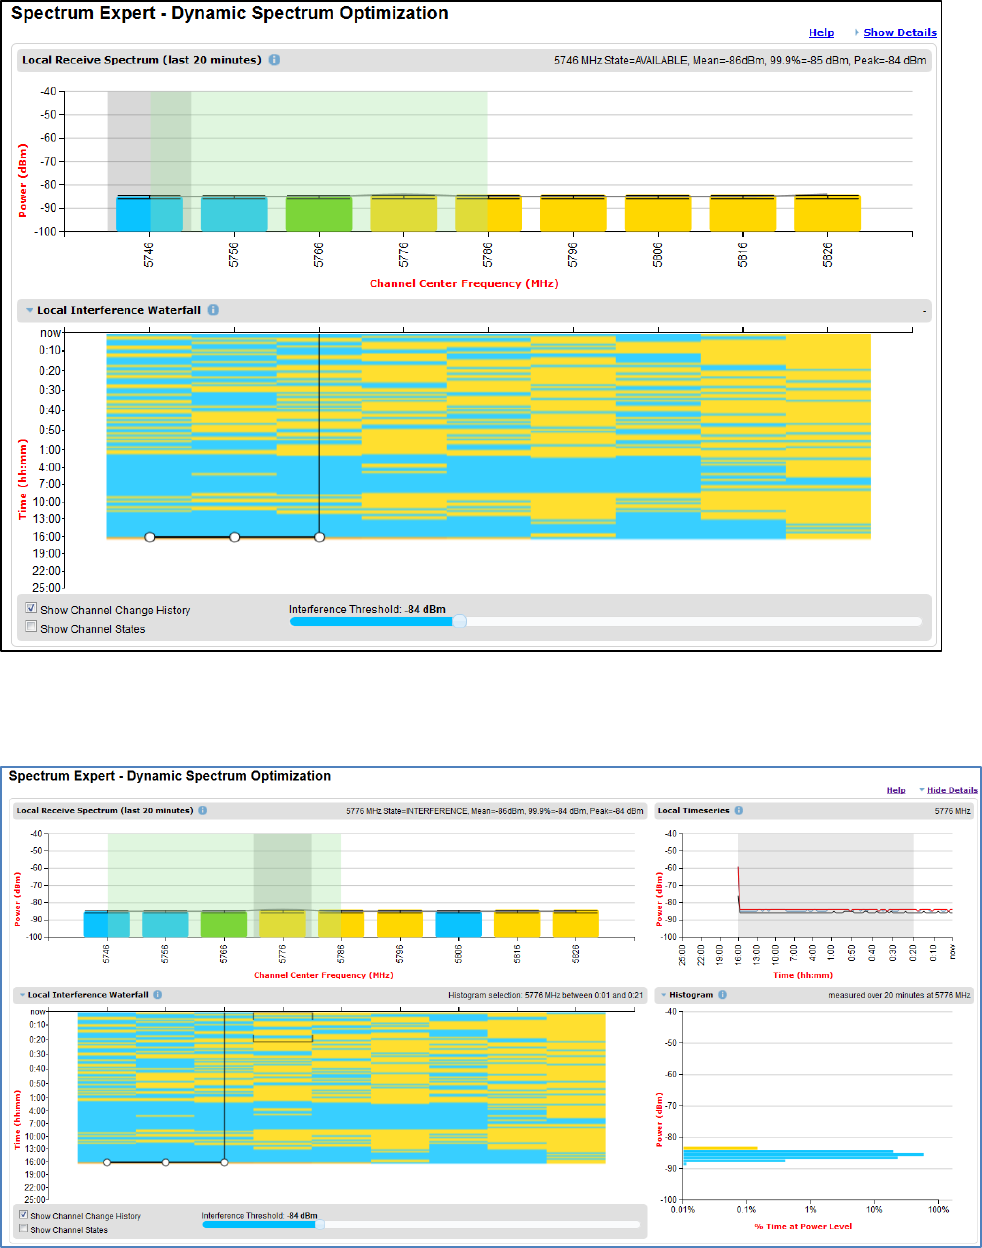
Chapter 7: Operation Spectrum Management
Figure 194
Spectrum Expert page showing the Receive Spectrum and Interference Waterfall
for the Local unit
Figure 195
Spectrum Expert page showing the Receive Spectrum, Timeseries, Interference
Waterfall and Histogram for the Local unit
Page 7-30

Chapter 7: Operation Spectrum Management
Spectrum Management Settings
All spectrum management configuration changes are applied at the master ODU only. These
changes are then sent from the master to the slave, so that both master and slave keep
identical copies of spectrum management configuration. It is therefore possible to swap master
and slave roles on an active PTP 700 link without modifying Spectrum Management
configuration.
The default channelization can be modified by varying the lower center frequency attribute in
the installation wizard, as described in Wireless Configuration page on page 6-21.
Note
Before attempting to improve the performance of the spectrum management
algorithm by changing the default configuration, consult the Cambium Point-to-Point
distributor or one of the system field support engineers.
Procedure:
• Review the configuration attributes (Table 170)
• Update the attributes as required. At the slave unit, only Page Refresh Period can be
updated.
• To save changes, click Submit configuration changes.
Table 170
Spectrum Management attributes
Attribute
Meaning
Spectrum Expert
Display Mode
Realtime:
When set to Realtime, an additional line appears on the
Receive Spectrum plots showing the most recent measurements of
interference level for every channel
Extended:
Extended Display mode is visible only when Extended
Scanning is enabled.
This control is available in the Spectrum Expert page only.
Extended Spectrum
Scanning
Enabled:
Enables scanning of entire DSO full band channels.
Disabled:
Only the operational subband channels are scanned.
This control is available in the Spectrum Expert page only.
Hopping Margin Uses this margin when making a channel hop decision. If the
interference level of the target channel is lower than that of the active
channel by at least the Hopping Margin, the link will hop to the target
channel. The default setting is 3 dB in non-radar regions, or 10 dB in
radar regions.
Page 7-31

Chapter 7: Operation Spectrum Management
Attribute
Meaning
Asymmetric DSO Only displayed in non-radar regions when DSO is enabled. The
default configuration of symmetric operation constrains the link to
operate symmetrically, using the same transmit and receive channels.
When in symmetric mode the slave unit will always follow the
master. If the master moves to a new channel the slave will hop to
the same channel. When the Point-to-Point link is configured as an
asymmetric link both the master and slave are free to select the best
channel from their own set of local interference metrics.
Spectrum
Management Control
Only displayed in radar regions. The options are
DFS
and
DFS with
DSO
.
Hopping Period The Spectrum Management algorithm evaluates the metrics every
“Hopping Period” seconds (180 seconds by default) looking for a
channel with lower levels of interference. If a better channel is
located, Spectrum Management performs an automated channel hop.
If SNMP or SMTP alerts are enabled an SNMP TRAP or an email alert
is sent warning the system administrator of the channel change.
Hopping Counter (not
configurable)
This is used to record the number of channel hops. The number in the
(+) brackets indicates the number of channel changes since the last
screen refresh.
Interference Threshold Spectrum Management uses the interference threshold to perform
instantaneous channel hops. If the measured interference on a
channel exceeds the specified threshold, then DSO will instruct the
wireless to immediately move to a better channel. If a better channel
cannot be found the PTP 700 Series will continue to use the current
active channel. (Default –85 dBm).
Channel Bandwidth
(not configurable)
This shows the value of the variable channel bandwidth selected.
Tx Color Code (not
configurable)
This shows the Tx Color Code selected during Installation.
Rx Color Code (not
configurable)
This shows the Rx Color Code selected during Installation.
Interpreting the receive spectrum plot
The Spectrum Expert page has two graphical plots:
• Local Receive Spectrum
• Peer Receive Spectrum
A more detailed example of one of these plots is shown in Figure 191.
For more information, select the
Help
hyperlink at the top right of the Spectrum Expert page
and follow the instructions.
Page 7-32

Chapter 7: Operation Spectrum Management
X axis and Y axis
The X-axis shows a stylized view of the selectable wireless channels. Note that the distance
between adjacent channels may be smaller than the channel bandwidth. If this is the case,
adjacent channels overlap. Channels are displayed separately for clarity. The axis is labeled
using the channel center frequencies in MHz. The Y-axis shows the interference power levels
from –100 to –40 dBm.
Channel states
The active channel (Channel 9 in Figure 191) is always marked using solid green on the
Spectrum Expert page. The width of the hatching is directly proportional the channel
bandwidth or spectral occupancy of the channel.
The individual channel metrics are displayed using a colored bar and an “I” bar. The colored
bar represents the channel state (Table 171).
Table 171
Channel states represented in the Spectrum Expert plot
Color
State
Meaning
Green Active The channel is currently in use, hosting the wireless link.
Orange Interference The channel has interference above the interference
threshold.
Blue Available The channel has an interference level below the interference
threshold and is considered by the Spectrum Management
algorithm suitable for hosting the Point-to-Point link.
Light Grey Barred The system administrator has barred this channel from use.
For improved visibility, an additional red “lock” symbol is
used to indicate that a channel is barred but The lock is not
shown in Extended view.
Red Radar
Detected
A radar signal has been detected and operation on this
channel is currently not allowed.
Dark Grey Region
Barred
Extended scanned channels outside the range of configured
operational subband channels
Key metrics
The “I” bar and top of the colored bar represent three key metrics (Table 172). The vertical part
of the “I” bar represents the statistical spread between the peak and the mean of the statistical
distribution.
The arithmetic mean is the true power mean and not the mean of the values expressed in dBm.
Spectrum Management uses the 99.9% Percentile as the prime interference measurement. All
subsequent references to interference level refer to this percentile measurement.
Table 172
Key metrics represented in the Spectrum Expert plot
Metric
Description
How represented
Page 7-33

Chapter 7: Operation Spectrum Management
Metric
Description
How represented
Peak of Means The largest mean interference measurement
encountered during the quantization period. The
peak of means is useful for detecting slightly
longer duration spikes in the interference
environment.
Upper horizontal
bar.
Mean of Means The arithmetic mean of the measured means
during a quantization period. The mean of means
is a coarse measure of signal interference and
gives an indication of the average interference
level measured during the quantization period.
The metric is not very good at predicting
intermittent interference and is included to show
the spread between the Mean of Means, the
99.9% Percentile and the Peak of Means.
Lower horizontal
bar.
99.9% Percentile
of the Means
The value of mean interference measurement
which 99.9% of all mean measurements fall
below, during the quantization period. The 99.9%
percentile metric is useful for detecting short
duration repetitive interference that by its very
nature has a minimal effect of the mean of means.
Top of the colored
bar.
Realtime
interference level
The arithmetic mean of the power measured
during the last quantization period. The
quantization period is two seconds.
Countinuous line.
Spectrum Expert page in fixed frequency mode
When the link is operating in fixed frequency mode, the Spectrum Expert page uses two visual
cues (Figure 196). The main page title has the “Fixed Frequency Mode” suffix and the
selected channels are identified by a red capital “F”.
Page 7-34
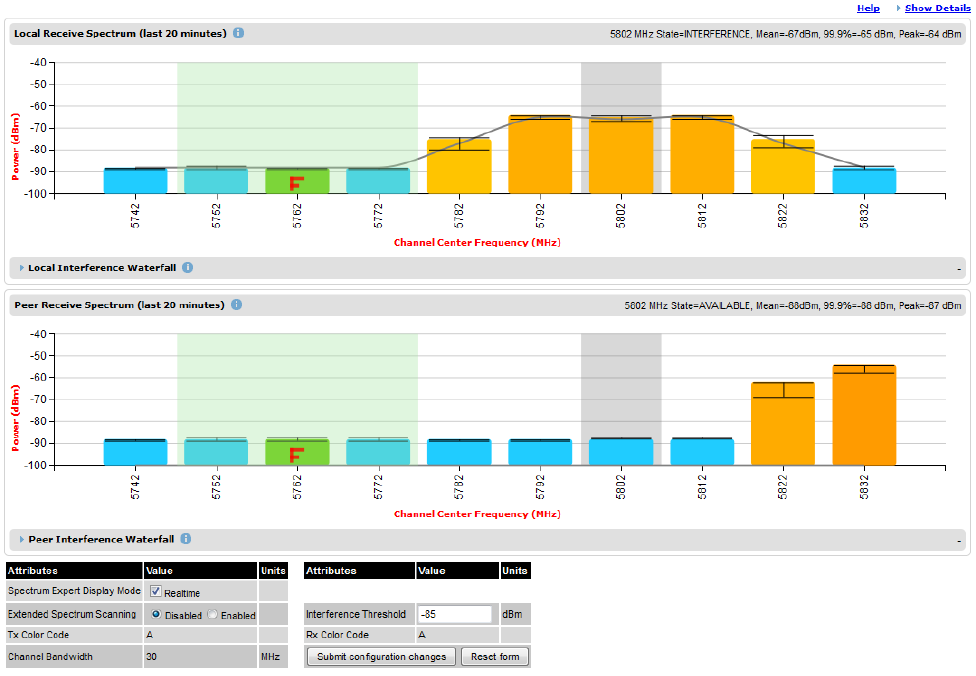
Chapter 7: Operation Spectrum Management
Figure 196
Spectrum Expert page for Fixed Frequency – Standard display mode
Page 7-35
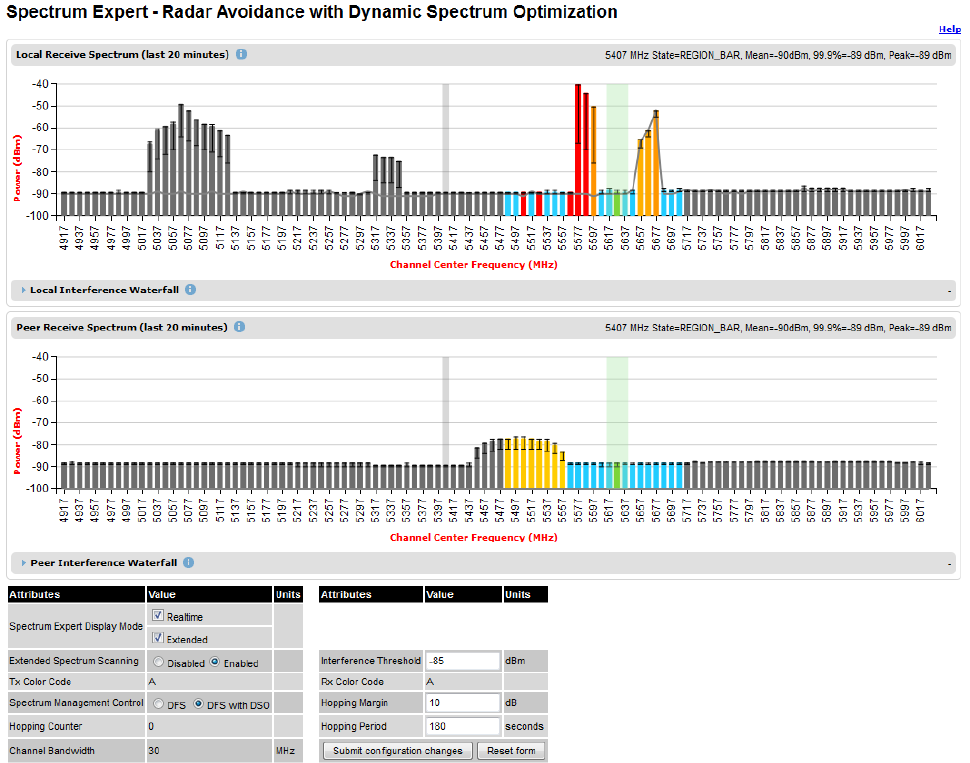
Chapter 7: Operation Spectrum Management
Figure 197
Spectrum Expert page for Fixed Frequency – Extended display mode
Channel barring is disabled in fixed frequency mode; it is not required as dynamic channel
hopping is prohibited in this mode.
The only controls available to the master are the Spectrum Expert Display Mode and
Interference Threshold attributes. They will have no effect on the operation of the wireless link
and will only effect the generation of the channel spectrum graphics.
Page 7-36
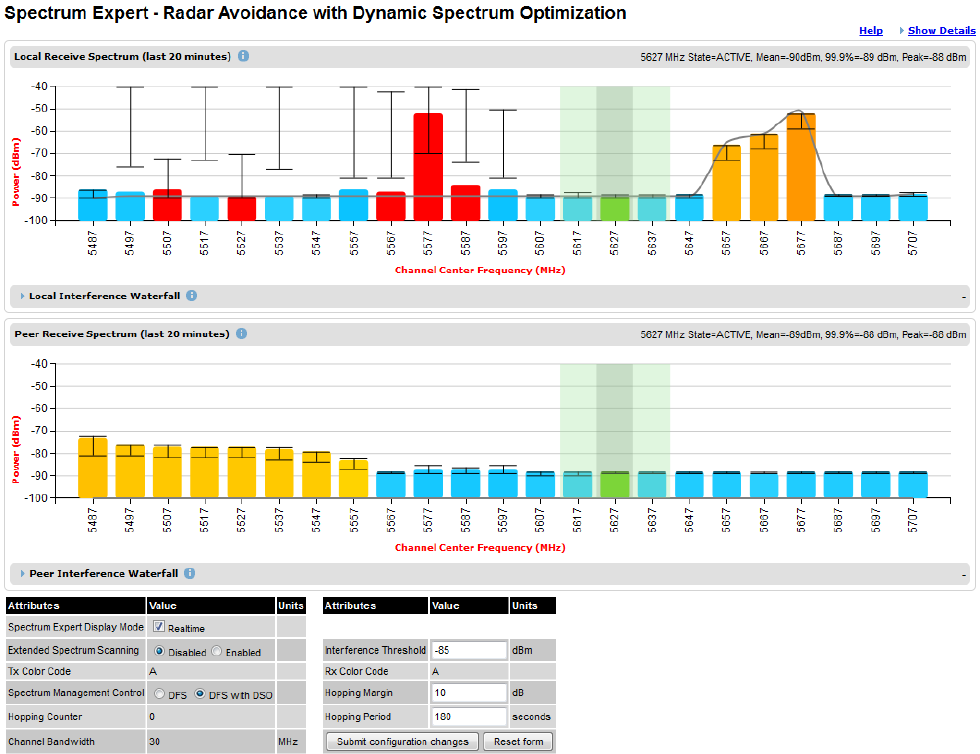
Chapter 7: Operation Spectrum Management
Spectrum Expert page in radar avoidance mode
When the link is operating in radar avoidance mode, the Spectrum Expert page (Figure 198)
contains the following additional information:
• The main page title has the “Radar Avoidance” suffix.
• The only controls available to the master are the Interference Threshold attribute. This has
no effect on the operation of the wireless link and will only affect the generation of the
channel spectrum graphics.
• Extra color coding of the interference histogram is provided (Table 173).
Figure 198
Spectrum Expert page with radar avoidance – Standard Display
Page 7-37
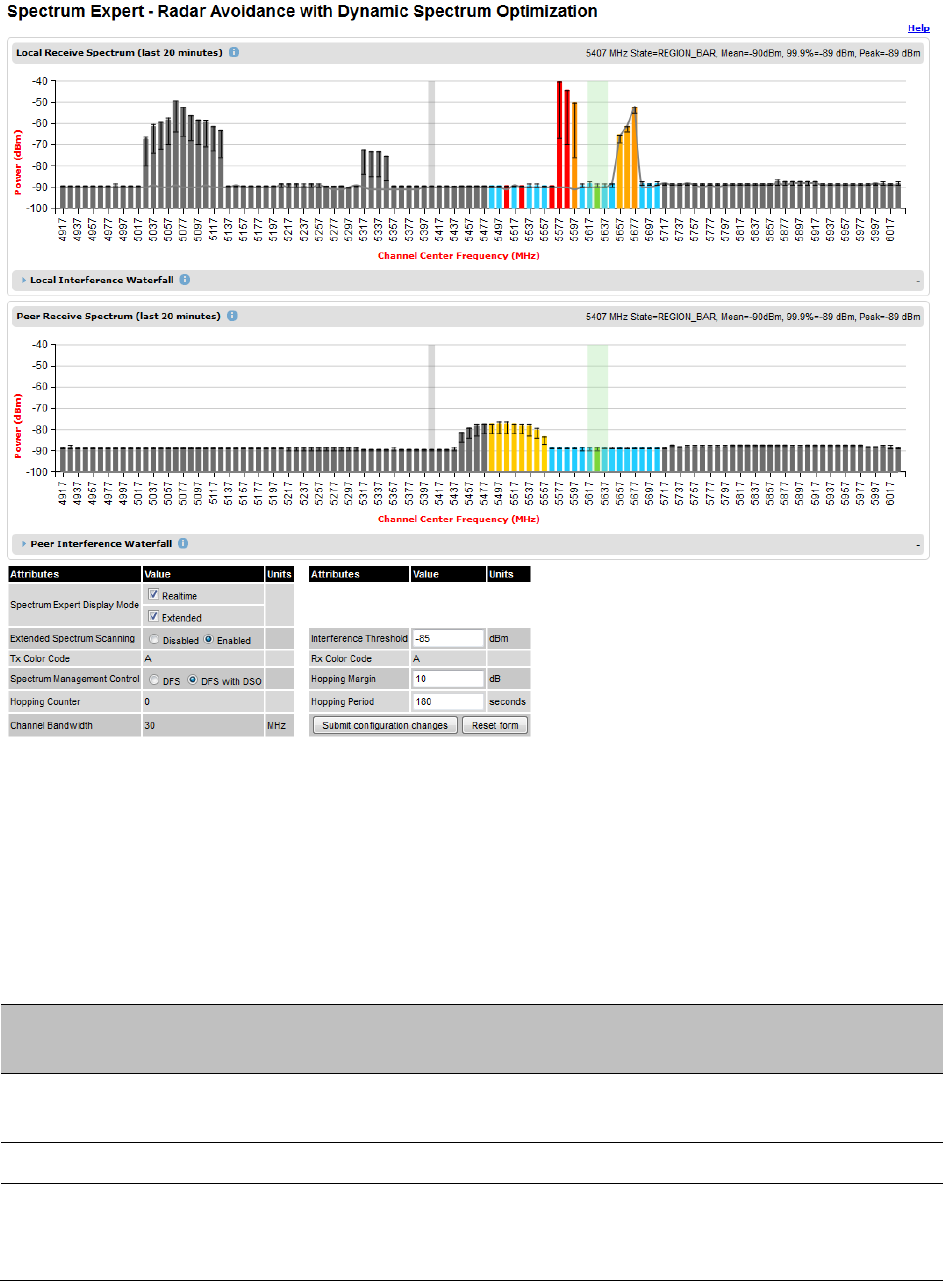
Chapter 7: Operation Spectrum Management
Figure 199
Spectrum Expert page with radar avoidance – Extended Display
When operating with RTTT (Road transport and Traffic Telematics) Avoidance enabled or other
regulatory restrictions on channel usage, all channels marked with a “no entry” symbol with
their associated statistics colored black are the prohibited channels. These channels are never
used to host the wireless link, but CAC measurements are still taken so that adjacent channel
biases can be calculated correctly and so the user can see if other equipment is in use.
Table 173
Channel states in the Spectrum Expert plot (radar avoidance)
Color
State and
color
Meaning
Green Active This channel is currently in use hosting the Point-to-Point wireless
link.
Orange Interference This channel has interference above the interference threshold
Blue Available This channel has an interference level below the interference
threshold and is considered by the Spectrum Management
algorithm suitable for hosting the Point-to-Point link
Page 7-38

Chapter 7: Operation Spectrum Management
Color
State and
color
Meaning
Dark grey Barred The system administrator has barred this channel from use.
Because the low signal levels encountered when a unit is
powered up in a laboratory environment prior to installation
(which makes the grey of the channel bar difficult to see). An
additional red “lock” symbol is used to indicate that a channel is
barred.
Light grey Unavailable This channel needs to be monitored for one minute and found
free of radar signal before it can be used for transmitting.
Red Radar
Detected
Impulsive Radar Interference has been detected on this channel
and the channel is unavailable for 30 minutes. At the end of the
30 minute period a Channel Availability Check is required to
demonstrate no radar signals remain on this channel before it can
be used for the radio link.
Black Region Bar This channel has been barred from use by the local region
regulator
Barring channels
To comply with FCC rules, bar any channels that may interfere with TDWR radars. This must be
done before the units are allowed to radiate on site. The system designer will have provided a
list of any affected channels, based on the instructions in Avoidance of weather radars (USA
only) on page 3-24.
Procedure:
• Log into the Master unit.
• Select menu option
System > Spectrum Expert
. The Spectrum Expert page is displayed.
• Double click on the appropriate channel center frequencies on the Local or Peer Receive
Spectrum plots. The example in Figure 200 shows how to bar one channel (5816 MHz).
• When the confirmation dialog is displayed, click
OK
.
Page 7-39
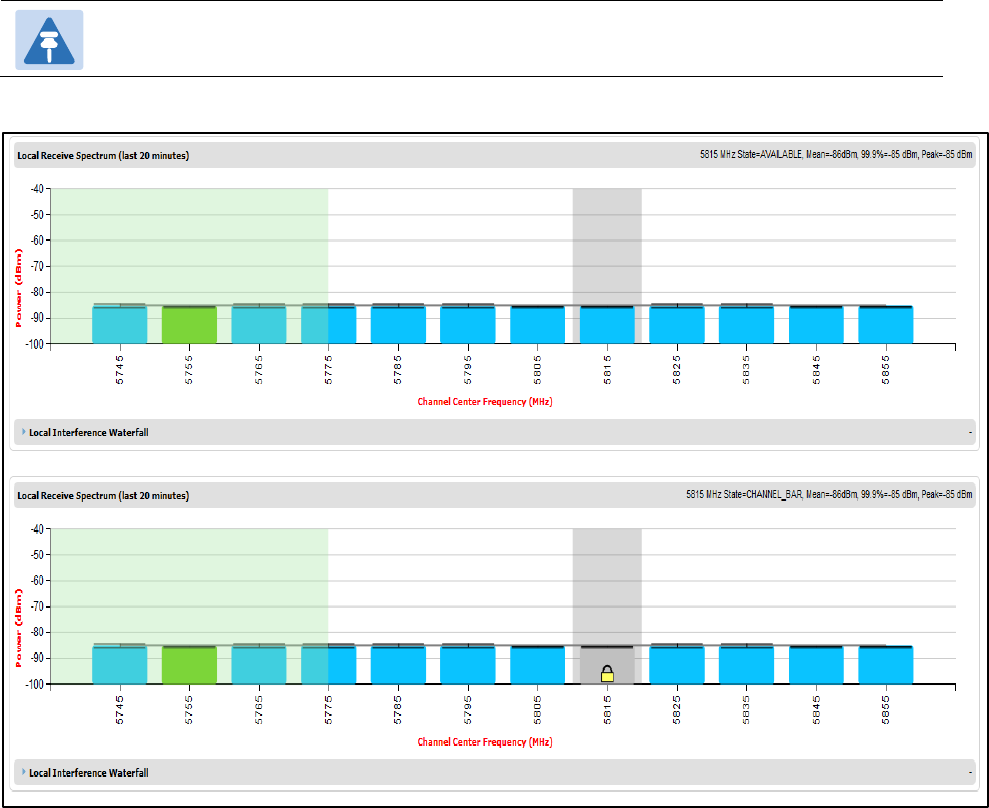
Chapter 7: Operation Spectrum Management
Note
The channels cannot be barred in the extended view.
Figure 200
Barring a channel
Page 7-40
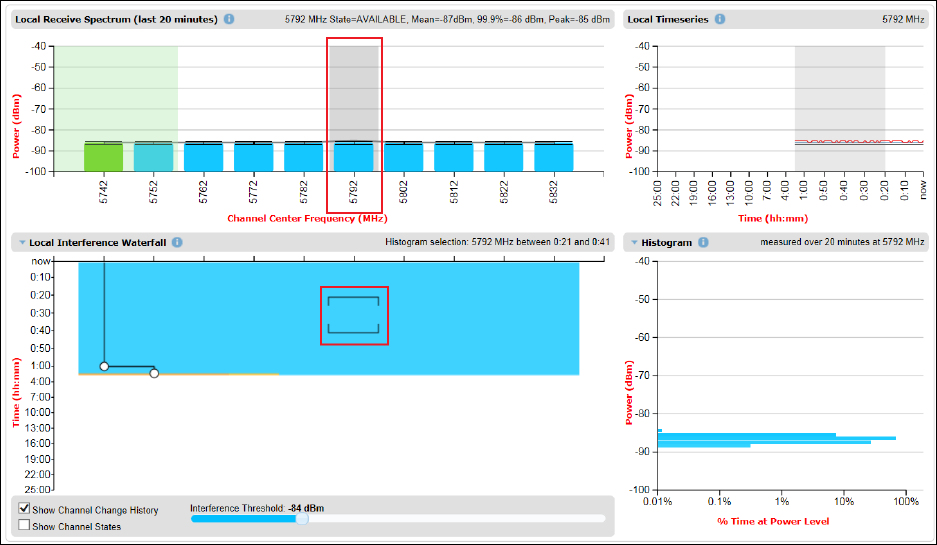
Chapter 7: Operation Spectrum Management
Selecting a Channel and a Time period
The Timeseries plot uses measurements for the selected channel. The Histogram plot uses
measurements for the selected channel and the selected measurement period.
To select a channel on the Receive Spectrum Page, click within the plot, move the cursor
horizontally to the channel you want to select and click to confirm the selection.
The Selected channel is shown with a grey background. The Selected Channel is centred on
5792 MHz in Figure 201.
Figure 201
Selecting a channel on the Receive Spectrum
To select a channel and a period on the Interference Waterfall, click within the plot, move the
cursor horizontally to the channel you want to select, and vertically to the period you want to
select, and click to confirm you selection.
The selected channel and period are shown graphically on the Interference Waterfall between
two horizontal brackets, as show in Figure 201. They are also indicated in text form right above
the Interference Waterfall.
Page 7-41
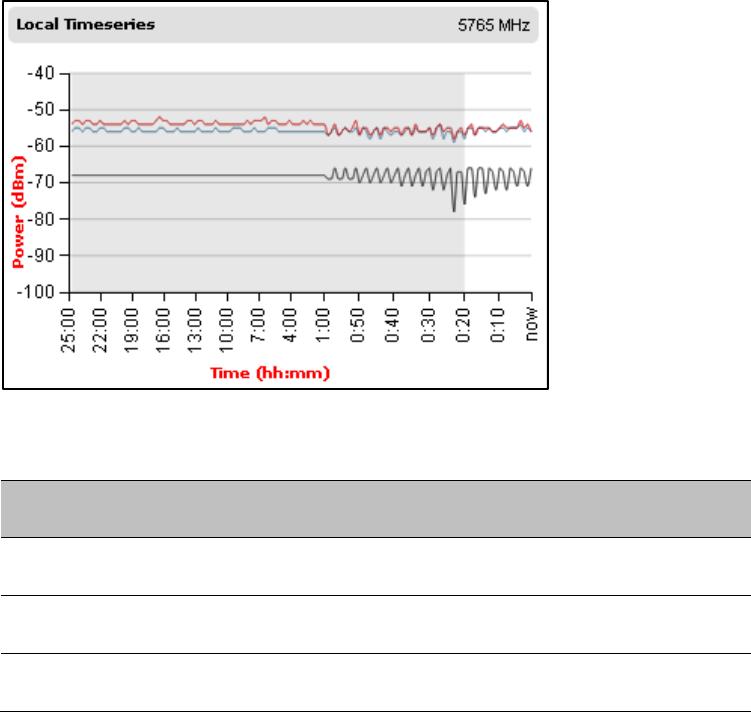
Chapter 7: Operation Spectrum Management
Interpreting the timeseries plot
This plot displays the interference measurements of all previous measurement quantization
periods for the selected channel, up to a maximum of 25 h (Figure 202).
The channel is selected as described in Selecting a Channel and a Time period. The center
frequency of the selected channel is indicated in MHz at the top right of the Timeseries plot.
The colored lines represent interference measurements, with the color map provided in Table
174.
A white background indicates the measurement period which is used to generate the Receive
Spectrum plot. Typically, only the last 20 min are used, although any period of time where the
wireless link has been down is excluded.
Figure 202
Spectrum Expert, Timeseries plot
Table 174
Interference represented in the time series plot
Color
Meaning
RED Peak of Means interference measurement
BLACK 99.9% percentile of means interference measurement
BLUE Mean of Means interference measurement
Page 7-42
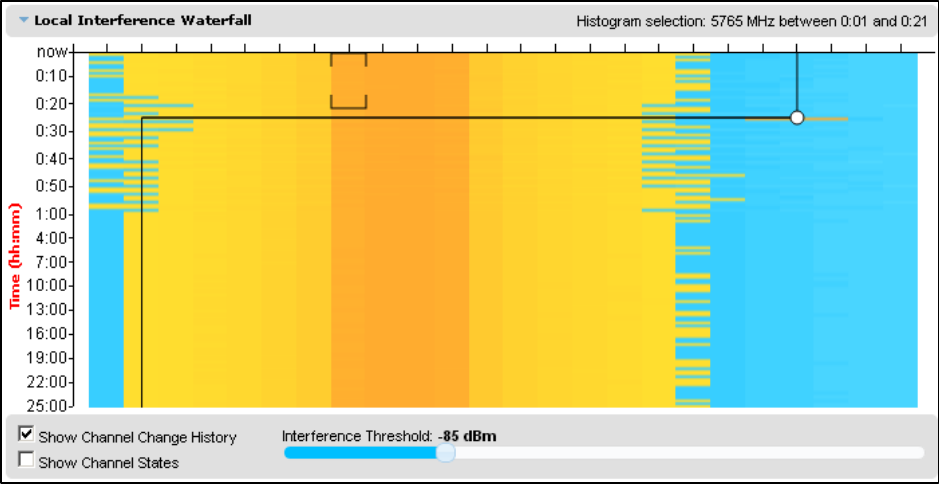
Chapter 7: Operation Spectrum Management
Interpreting the Interference Waterfall plot
The Interference Waterfall indicates the level of interference for all the channels in the band
over the last 25 h. Figure 203 shows a screen capture example.
The channel and measurement period are selected as described in Selecting a Channel and a
Time period on page 7-41 The center frequency of the selected channel and the time period are
indicated at the top right of the Interefrence Waterfall plot.
The X-axis corresponds to the channel center frequency and is horizontally aligned with the
Receive Spectrum plot.
The Y-axis corresponds to the time in the past in hours and minutes, with the most recent
period being at the top of the plot.
Each channel and measurement period is indicated using the color scale given in Table 171.
Figure 203
Spectrum Expert, Interference Waterfall plot
Setting the interference threshold
The interference threshold may be set using the sliding control located directly below the
Interference Waterfall plot. This is an alternative to the method described in Spectrum
Management Settings on page 7-31. For either method, the change to the Interference
Threshold is not taken into account until the Submit button is clicked.
Page 7-43
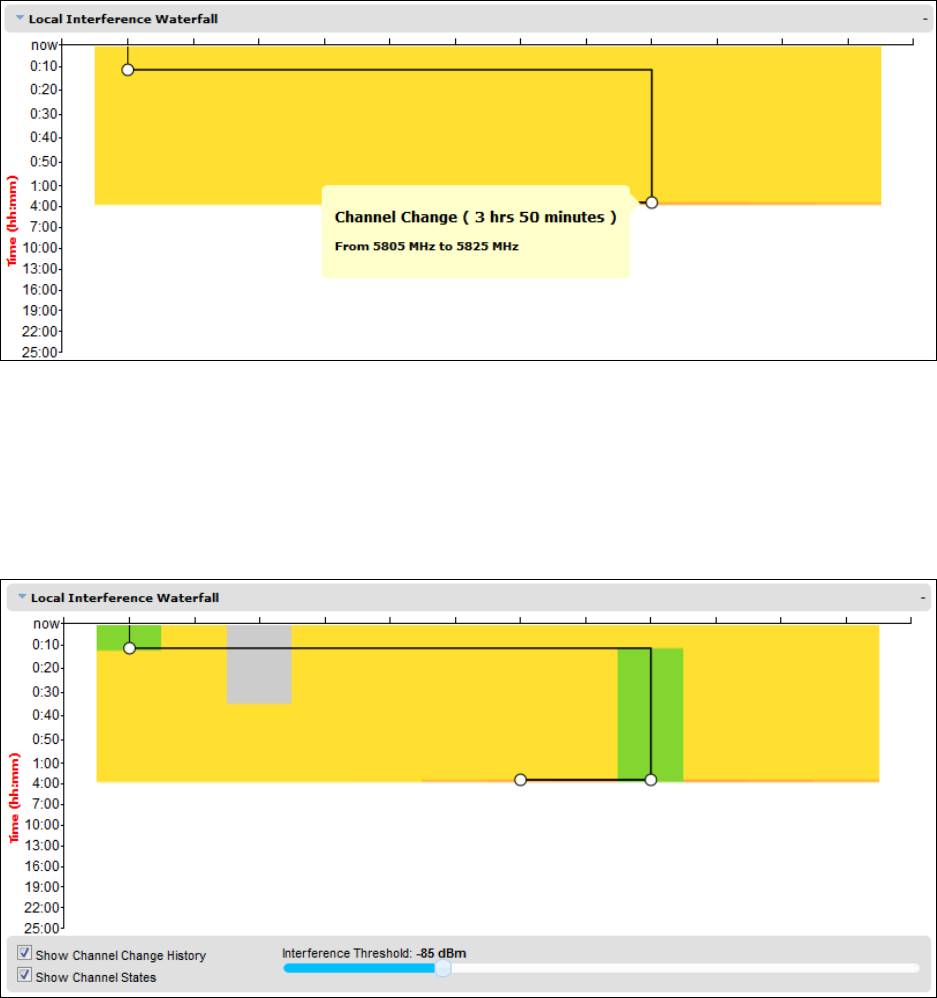
Chapter 7: Operation Spectrum Management
Viewing the active channel history
To display the active channel history, tick the Show Channel Change History control right
below the Interference Waterfall plot. The active channel history over the last 25 hours is
plotted as a black line overlay on the Interference Waterfall plot. A circle is displayed every time
the active channel has changed. By hovering above the circle, the reason for the channel
change is indicted, as shown in Figure 204.
Figure 204
Spectrum Expert, Interference Waterfall with active channel history
Viewing the channel states
To display the Channel States, tick the Show Channel State control right below the Interference
Waterfall plot. Figure 205 shows an example of the Interference Waterfall when the Channel
States are displayed. The colors used are defined in Channel states on page 7-33.
Figure 205
Spectrum Expert page, Interference Waterfall plot with
channel states
Page 7-44
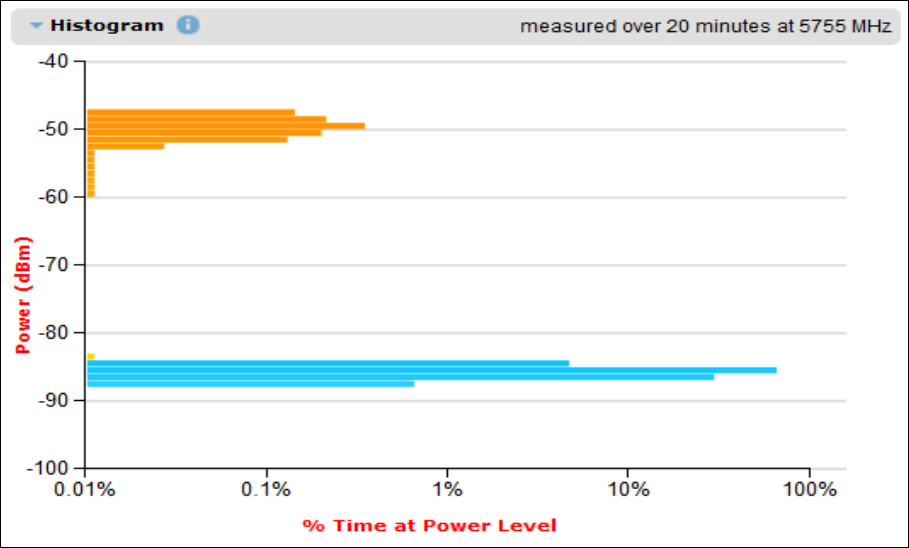
Chapter 7: Operation Spectrum Management
Interpreting the histogram plot
The histogram plot indicates the percentage of the measurements in the selected measurement
period where the interference level for the selected channel is at a given level (Figure 206).
The channel and measurement period are selected as described in Selecting a Channel and a
Time period on page 7-41 The combined selection is indicated graphically by a pair of brackets
in the Waterfall plot, and in text form on the top right of the Histogram plot, as shown in Figure
205.
The X-axis corresponds to a percentage of the measurements in the measurement period on a
logarithmic scale.
The Y-axis corresponds to actual interference level in dBm.
The bar for each each power level is of the same color as in the Interference Waterfall plot.
Figure 206
Spectrum Expert page, histogram plot
Page 7-45

Chapter 7: Operation Managing security
Managing security
This section describes the following procedures:
• Exiting FIPS 140-2 approved mode
• Zeroising critical security parameters
Other security configuration procedures are described in Security menu on page 6-93.
Exiting FIPS 140-2 approved mode
To exit from the FIPS 140-2 approved mode, install standard (non-FIPS) PTP 700 software.
Note
The critical security parameters (CSPs) are zeroized when the unit exits from the FIPS
140-2 approved mode.
Zeroizing critical security parameters
Use this procedure to zeroize Critical security parameters (CSPs) as follows:
• Key of keys.
• AES encryption keys for the wireless interface.
• Private key for the HTTPS/TLS interface.
• Entropy value for the HTTPS/TLS interface.
• User account passwords for the web-based interface.
Procedure:
• On the Security menu, click Zeroize CSPs.
• Click Select Zeroize CSPs and Reboot Wireless Unit.
• Confirm the reboot.
Note
Alternatively, select the Zeroize CSPs option in Recovery mode as described in Zeroize
Critical Security Parameters on page 7-67
Page 7-46
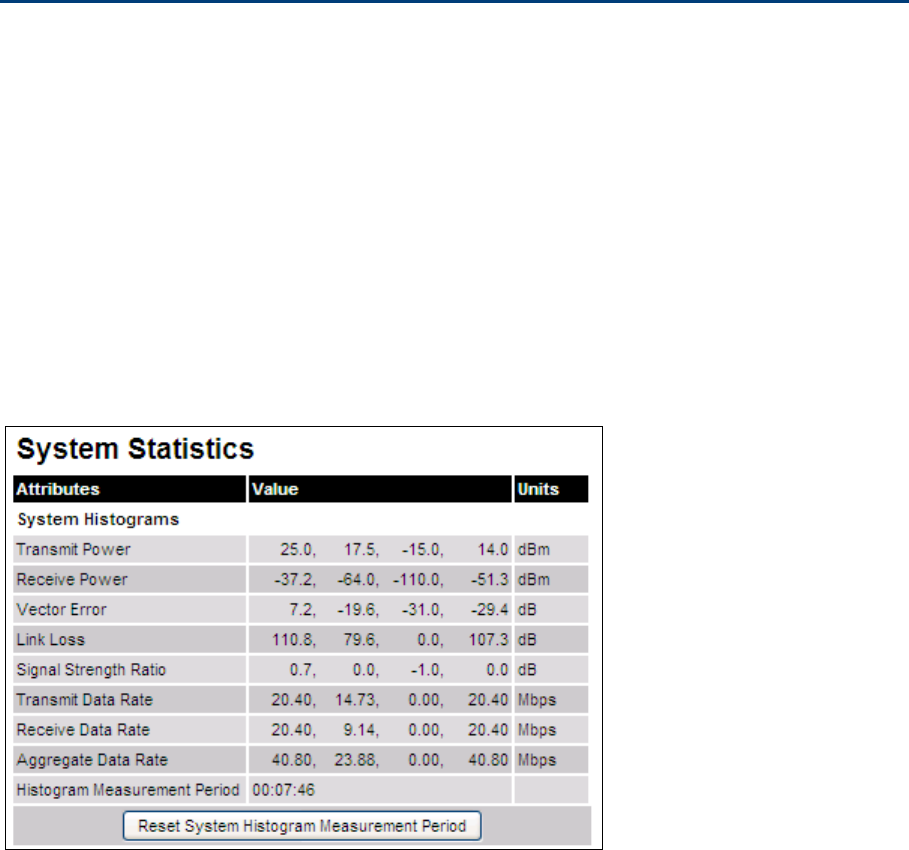
Chapter 7: Operation System statistics
System statistics
This section describes how to use the system statistics pages to manage the performance of
the PTP 700 link, use the following web pages:
System Statistics page
Menu option:
System > Statistics
. Use this page to check system statistics.
System histograms
The System Histograms section of the System Statistics page (Figure 207) contains eight
diagnostic attributes that are presented as arrays of four elements (Table 175).
Figure 207
System Histograms section of the System Statistics page
The element arrays represent the following:
• Max: The maximum value measured over the last hour.
• Mean: The mean of a set of values recorded at one second intervals over the last hour.
• Min: The minimum value measured over the last hour.
• Latest: The latest value measured.
The values are calculated over the time that has elapsed since the link was established or since
the measurement period was reset.
Use the Diagnostics Plotter page on page 7-59 to plot these attributes against time. Use the
Generate Downloadable Diagnostics page on page 7-60 to extract historical data for these
attributes to a CSV file.
Procedure:
• To reset and restart measurement, click
Reset System Histograms and Measurement
Period
.
Page 7-47

Chapter 7: Operation System statistics
Table 175
System Histogram attributes in the System Statistics page
Attribute
Meaning
Transmit Power The transmit power histogram, calculated over a one hour period.
Receive Power The receive power histogram, calculated over a one hour period.
Vector Error The vector error measurement compares (over a one hour period) the
received signal IQ modulation characteristics to an ideal signal to determine
the composite vector error magnitude.
Link Loss Link loss calculated (over a one hour period) as follows:
Peer_Tx_Power (dBm) – Local_Rx_Power (dBm) + 2 x Antenna_Pattern (dBi)
Signal Strength
Ratio
The Signal Strength Ratio (calculated over a one hour period) is:
Power received by the vertical antenna input (dB) ÷
Power received by the horizontal antenna input (dB)
This ratio is presented as: max, mean, min, and latest. The max, min and
latest are true instantaneous measurements; the mean is the mean of a set of
one second means.
Signal Strength Ratio is an aid to debugging a link. If it has a large positive or
negative value then investigate the following potential problems:
• An antenna coaxial lead may be disconnected.
• When spatial diversity is employed, the antenna with the lower value may
be pointing in the wrong direction.
• When a dual polar antenna is deployed, the antenna may be directed
using a side lobe rather than the main lobe.
When there is a reflection from water on the link and spatial diversity is
employed, then one expects large, slow swings in Signal Strength Ratio.
This indicates the antenna system is doing exactly as intended.
Transmit,
Receive and
Aggregate Data
Rates
The data rates in the transmit direction, the receive direction and in both
directions, expressed in Mbps (max, mean, min, and latest). The max, min
and latest are true instantaneous measurements. The mean is the mean of a
set of one second means.
Histogram
Measurement
Period
The time over which the system histograms were collected.
Page 7-48
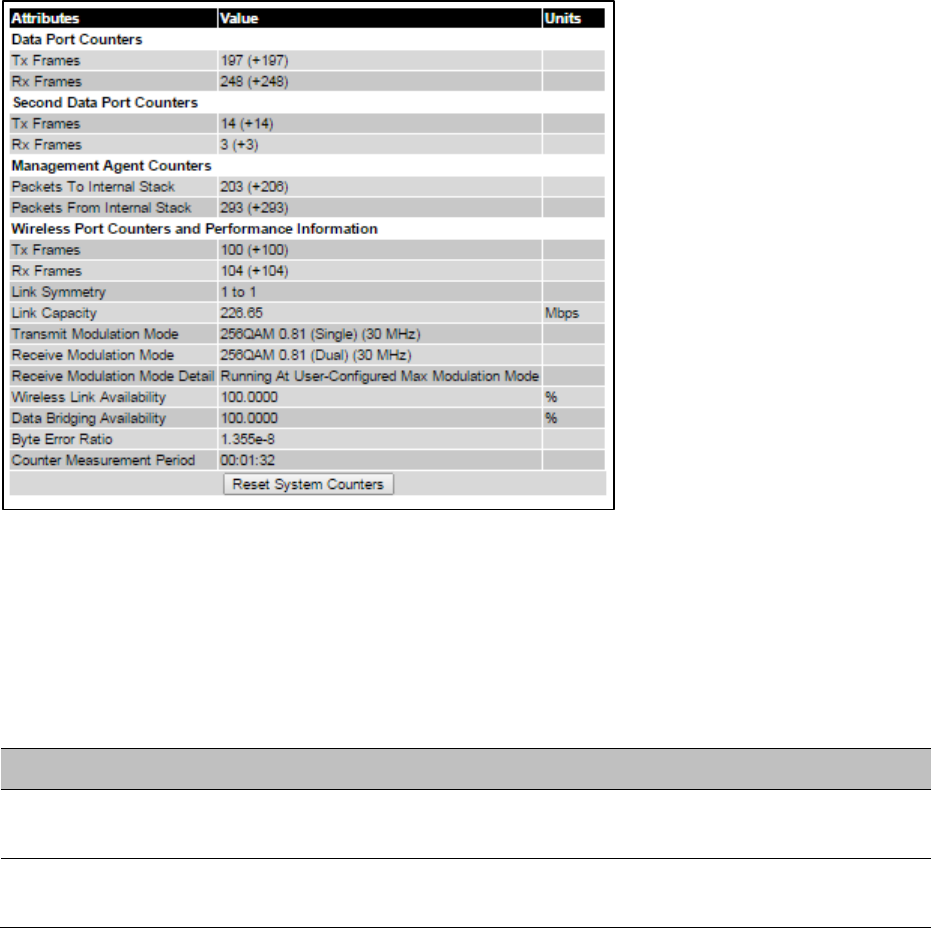
Chapter 7: Operation System statistics
System counters
The System Counters section of the System Statistics page (Figure 208) contains Data Port
Counters (Table 176), Management Agent Counters (Table 178) and Wireless Port Counters and
Performance Information (Table 179).
Figure 208
System Counters section of the System Statistics page
Procedure:
• To reset all system counters to zero, click
Reset System Counters
.
The packet counter attributes each contain a number in parentheses; this shows the number of
packets received since the last page refresh.
Table 176
Data Port Counters
Attribute
Meaning
Tx Frames The total number of good frames the bridge has sent for transmission
through the port selected for Data Service
Rx Frames The total number of good frames the bridge has received through the
port selected for Data Service
Page 7-49

Chapter 7: Operation System statistics
Table 177
Second Data Port Counters
Attribute
Meaning
Tx Frames The total number of good frames the bridge has sent for transmission
through the port selected for Second Data Service
Rx Frames The total number of good frames the bridge has received through the
port selected for Second Data Service
Table 178
Management Agent Counters
Attribute
Meaning
Packets To Internal
Stack
The total number of good packets the bridge has transmitted to the
internal stack (for example, ARP, PING and HTTP requests).
Packets From
Internal Stack
The total number of good packets the bridge has received from the
internal stack (ARP responses, PING replies, HTTP responses).
Table 179
Wireless Port Counters and Performance Information
Attribute
Meaning
Tx Frames Total number of good frames on the Data path, the bridge has sent for
transmission through the wireless interface.
Rx Frames Total number of good frames on the Data path, the bridge has received
from the wireless interface.
Tx Frame
Management
Total number of good managment frames, the bridge has sent for
transmission through the wireless interface
Tx Frame Second
Data
Total number of good frames on the Second Data path, the bridge has
sent for transmission through the wireless interface
Link Symmetry Ratio between transmit and receive time in the TDD frame. The first
number is the time allowed for the transmit direction and the second
number is the time allowed for the receive direction.
Link Capacity The maximum aggregate data capacity available for user traffic under
the current radio link conditions, assuming the units have been
connected using Gigabit Ethernet. The sum of the displayed Transmit
and Receive data rates may be lower than this figure if the link is not
fully loaded by the current traffic profile.
Transmit
Modulation Mode
The modulation mode currently being used on the transmit channel. The
number in brackets after the modulation mode and coding rate string is
the effective data rate available to all MAC layer protocols.
Receive Modulation
Mode
The modulation mode currently being used on the receive channel. The
number in brackets after the modulation mode and coding rate string is
the effective data rate available to all MAC layer protocols.
Page 7-50
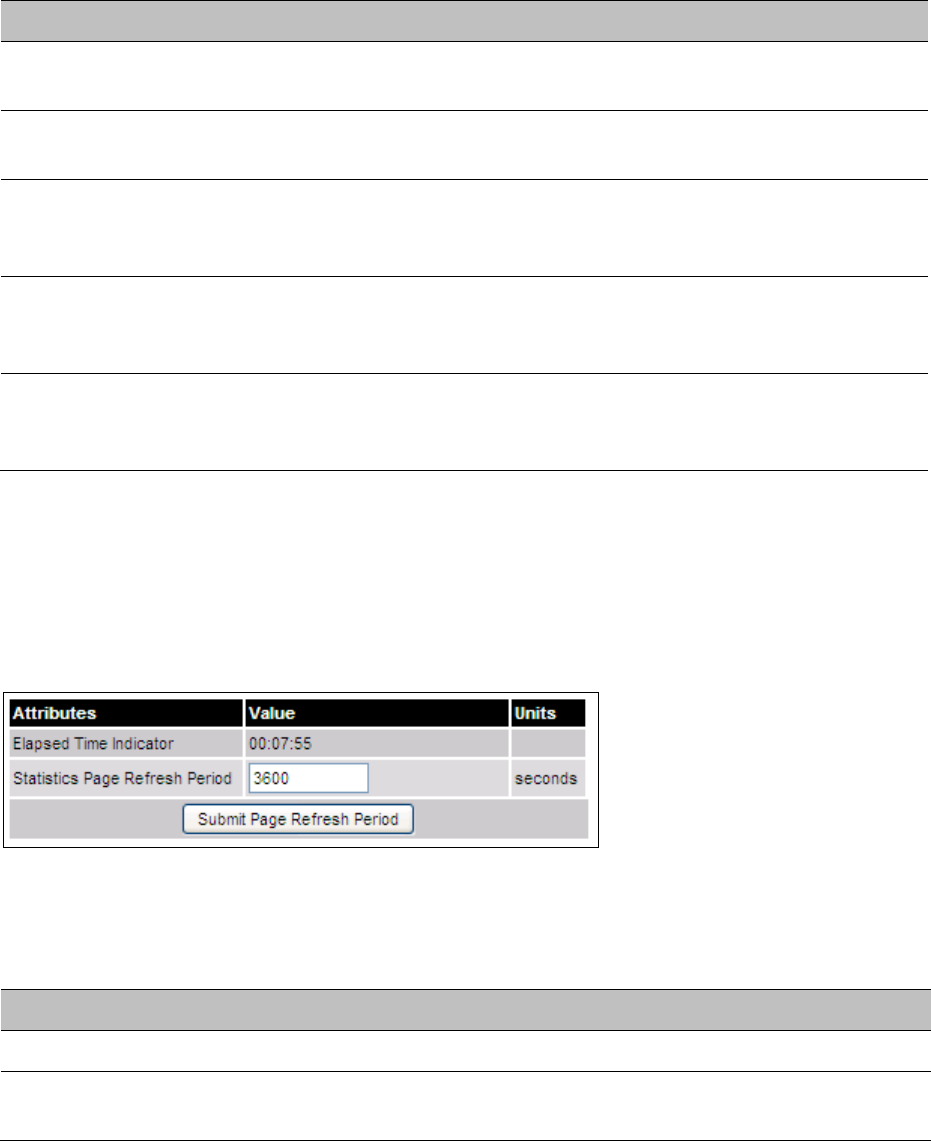
Chapter 7: Operation System statistics
Attribute
Meaning
Receive Modulation
Mode Detail
The receive modulation mode in use. For a list of values and their
meanings, see Table 159.
Wireless Link
Availability
Wireless link availability calculated since the last system counters reset.
Ethernet Bridging
Availability
Link availability for bridging Ethernet traffic calculated since the last reset
of the system counters. This is the percentage of time in which the
Ethernet Bridging Status attribute has been set to “
Enabled
”.
Byte Error Ratio The ratio of detected Byte errors to the total number of bytes since the
last system reboot. This measurement is made continually using null
frames when there is no user data to transport.
Counter
Measurement
Period
The time over which the system counters were collected.
Other attributes
The bottom section of the System Statistics page (Figure 209) contains two attributes (Table
180).
Figure 209
Other attributes section of the System Statistics page
Procedure:
• After updating the Statistics Page Refresh Period field, click
Submit Page Refresh Period
.
Table 180
Other attributes in the System Statistics page
Attribute
Meaning
Elapsed Time Indicator Elapsed time since the last system reboot.
Statistics Page Refresh Period The statistics page refreshes automatically according to the
setting entered here (in seconds).
Page 7-51
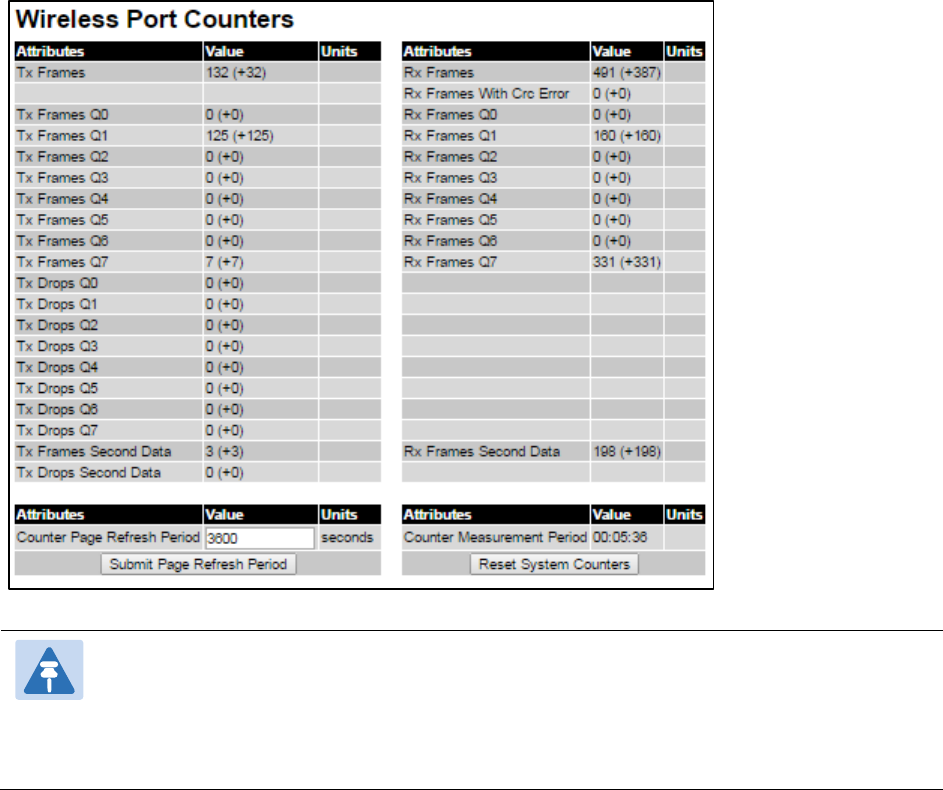
Chapter 7: Operation System statistics
Wireless Port Counters page
Menu option:
System > Statistics > Wireless Port Counters
(Figure 210).
Use this page to check the Ethernet performance of the wireless bridge.
Figure 210
Wireless Port Counters page
Note
If the ODU is configured for OOB Remote Management Service, the OOB Management
counters will be displayed instead of Second Data counters (i.e. Tx Frames
Management → Tx Frames Second Data, Tx Drops Management → Tx Drops Second
Data, and Rx Frames Management → Rx Frames Second Data)
Procedure:
• Review the attributes (Table 181).
• To change the refresh period, update the Counter Page Refresh Period attribute and click
Submit Page Refresh Period
.
• To reset all counters to zero, click
Reset System Counters
.
Page 7-52
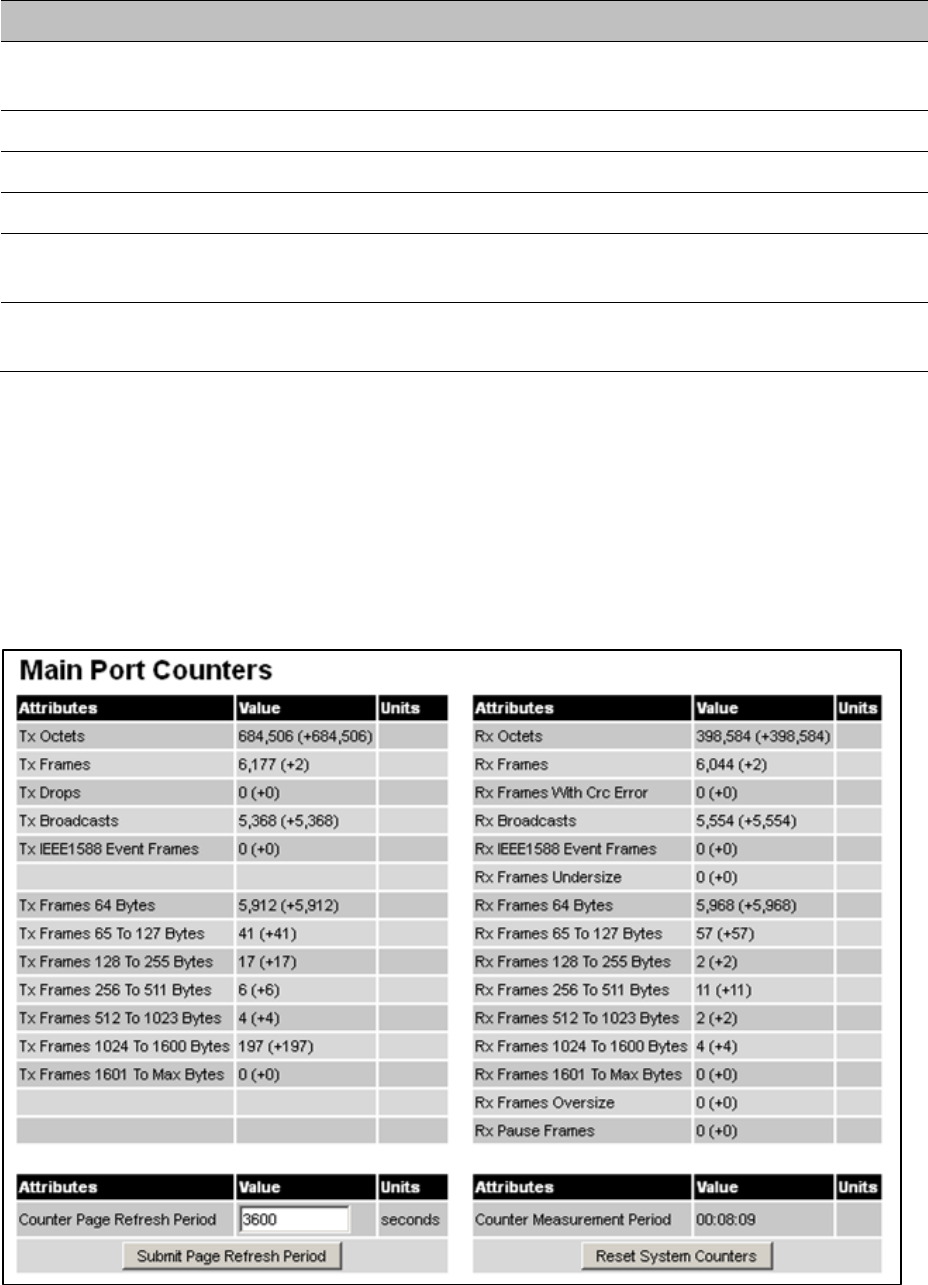
Chapter 7: Operation System statistics
Table 181
Wireless Port Counters attributes
Attribute
Meaning
Tx/Rx Frames Number of frames transmitted and received over the wireless
bridge.
Rx Frames With Crc Error Number of received frames with CRC errors.
Tx/Rx Frames Q0…Q7 Number of transmitted and received frames for each Traffic Class.
Tx Drops Q0…Q7 Number of transmitted frames dropped for each Traffic Class.
Rx Drops Q0…Q7 Total number of frames dropped due to the lack of sufficient
capacity in the receive buffer, for each Traffic Class.
Rx Frames Second Data Total number of frames received at the wireless port in the Out-of-
Band management queue
Main Port Counters page
Menu option:
System > Statistics > Main Port Counters
(Figure 211). Use this page to check the
Ethernet performance of the PSU port. The displayed counters vary depending on which port is
being used to bridge the traffic.
Figure 211
Main Port Counters page (when main port is bridging traffic)
Page 7-53

Chapter 7: Operation System statistics
Procedure
:
• Review the attributes (Table 182).
• To change the refresh period, update the Counter Page Refresh Period attribute and click
Submit Page Refresh Period
.
• To reset all counters to zero, click
Reset System Counters
.
Table 182
Main Port Counters attributes
Attribute
Meaning
Tx/Rx Octets Total number of octets (bytes) transmitted and received over the
interface.
Tx/Rx Frames Total number of frames transmitted and received over the interface. This
includes both good and bad frames.
Tx Drops Total number of transmit frames dropped.
Rx Frames With Crc
Error
Total number of received frames with CRC errors.
Tx/Rx Broadcasts Total number of good transmitted and received broadcast packets.
Tx/Rx IEEE1588
Event Frames
Only displayed when IEEE 1588 Transparent Clock is enabled.
Total number of transmitted or received IEEE 1588 Event frames
Tx/Rx Frames TDM Only displayed when TDM is enabled.
Total number of transmitted or received TDM (E1 or T1) frames.
Rx Frames
Undersize
Total number of frames received that are less than 64 bytes.
Tx/Rx Frames 64
Bytes
Total number 64 byte frames transmitted and received.
Tx/Rx Frames xxxx
to yyyy Bytes
Total number of frames transmitted and received in the size range xxxx
to yyyy bytes.
Tx/Rx Frames 1601
to Max bytes
Total number of frames transmitted and received in the size range 1601
to maximum bytes.
Rx Frames Oversize Total number of frames received that are greater than the maximum
number of bytes.
Rx Pause Frames Total number of received pause frames.
Page 7-54
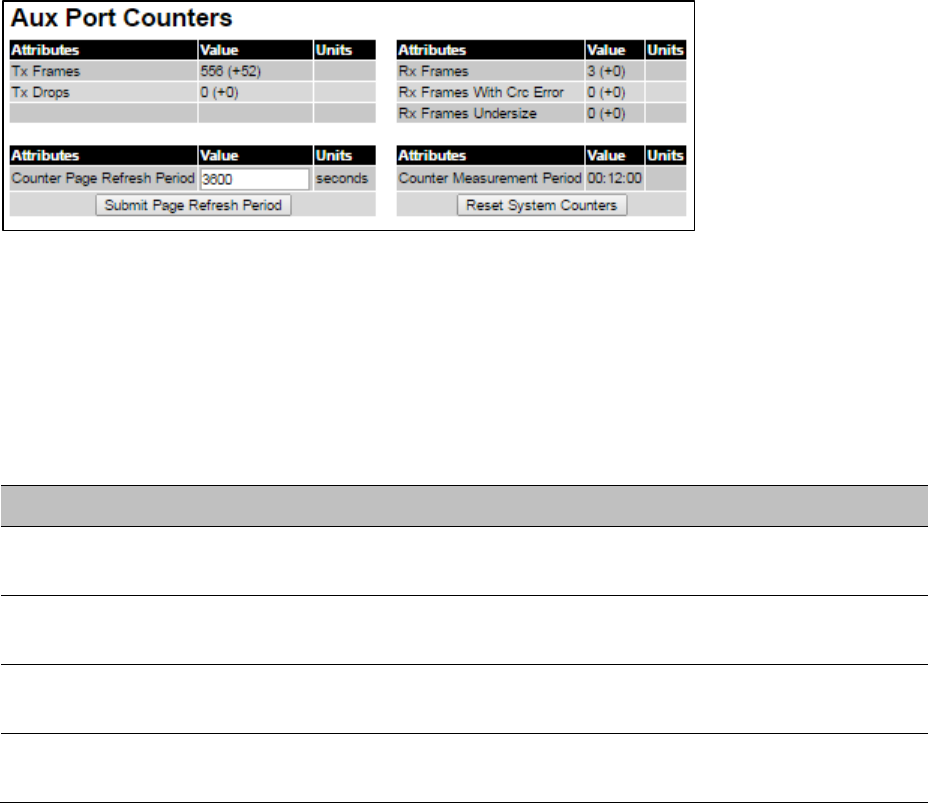
Chapter 7: Operation System statistics
Aux Port Counters page
Menu option: System > Statistics >
Aux Port Counters
(Figure 212).
Use this page to check the Ethernet performance of the Aux port.
Figure 212
Aux Port Counters page (when Aux port is is allocated to the Local Management
Service)
Procedure
:
• Review the attributes (Table 183).
• To change the refresh period, update the Counter Page Refresh Period attribute and click
Submit Page Refresh Period
.
• To reset all counters to zero, click
Reset System Counters
.
Table 183
Aux Port Counters attributes
Attribute
Meaning
Tx/Rx Frames Total number of frames transmitted and received over the interface. This
includes both good and bad frames.
Rx Frames With Crc
Error
Total number of received frames with CRC errors.
Tx Drops Number of frames dropped due to excessive collision, late collision or
frame ageing
Rx Frames
Undersize
Number of short frames (<64 Bytes) with or without a valid CRC
Page 7-55
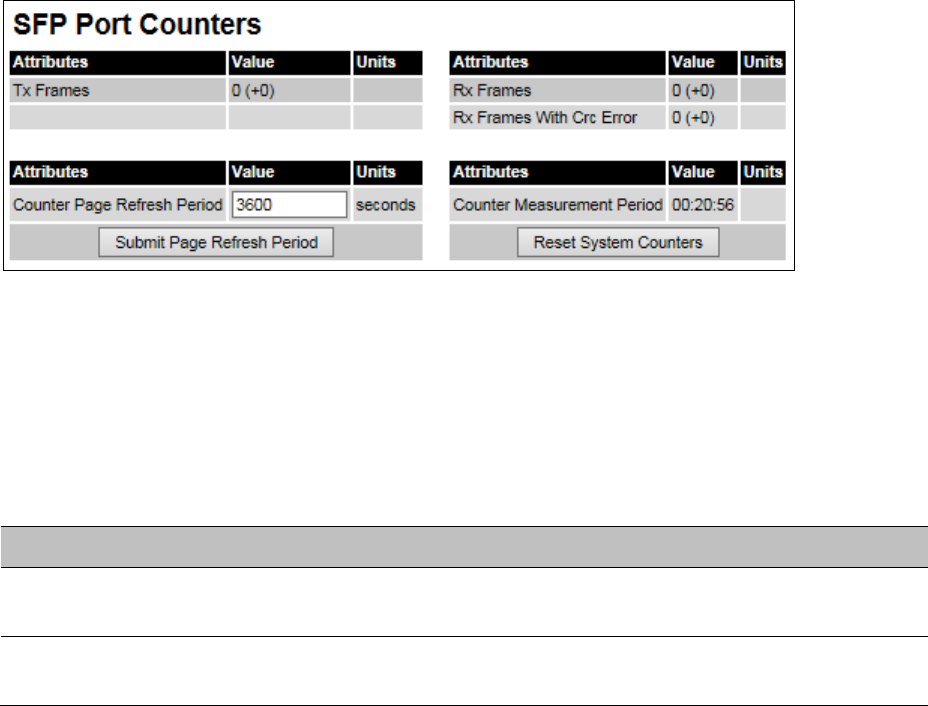
Chapter 7: Operation System statistics
SFP Port Counters page
Menu option: System > Statistics >
SFP Port Counters
(Figure 213).
Use this page to check the Ethernet performance of the SFP port.
Figure 213
SFP Port Counters page (when SFP port is allocated to the Local Management
Service)
Procedure
:
• Update the attributes (Table 184).
• To change the refresh period, update the Counter Page Refresh Period attribute and click
Submit Page Refresh Period
.
• To reset all counters to zero, click
Reset System Counters
.
Table 184
SFP Port Counters attributes
Attribute
Meaning
Tx/Rx Frames Total number of frames transmitted and received over the interface. This
includes both good and bad frames.
Rx Frames With Crc
Error
Total number of received frames with CRC errors.
Page 7-56
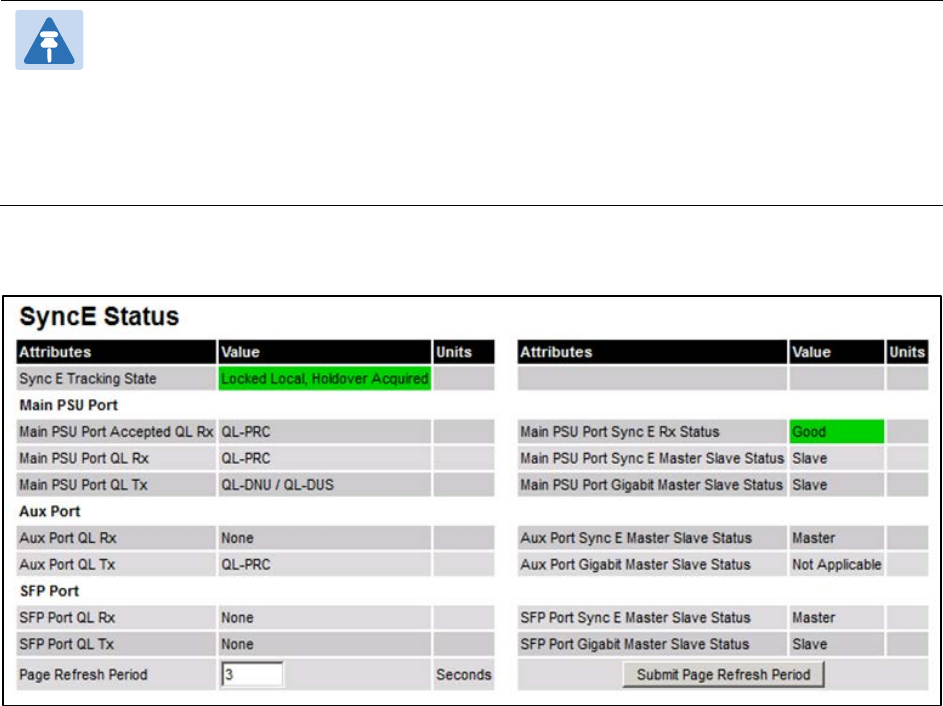
Chapter 7: Operation System statistics
SyncE Status page
Menu option: System > Statistics >
SyncE Status
Use this page to monitor the state of the Synchronous Ethernet function.
Note
When TDM is enabled (TDM Configuration page on page 6-50), the following
restrictions are automatically applied:
• The SyncE Status page is hidden.
• Main PSU Port Sync E Master Slave Status is set to
Master
.
• Main PSU Port Gigabit Master Slave Status is set to
Master
.
Figure 214
SyncE Status page
Procedure:
• Review the attributes
• To change the refresh period, update the Page Refresh Period attribute and click
Submit
Page Refresh Period
Page 7-57

Chapter 7: Operation System statistics
Table 185
Sync E Status attributes
Attribute
Meaning
Sync E Tracking State The state of the Synchronous Ethernet state machine. See
Table 186 for further details.
Main PSU Port Accepted QL
Rx
The “accepted” QL received by the Main PSU Port. This
should be the same as Main PSU Port QL Rx, unless:
• an “Overwrite” has been configured
• the system is starting up or recovering from an exception
Main PSU Port QL Rx The QL currently being received at the Main PSU Port
Main PSU Port QL Tx The QL currently being transmitted at the Main PSU Port
Main PSU Port SyncE Rx
Status
The overall status of the incoming synchronous Ethernet
signal on the Main PSU port. This port is available as a valid
synchronization source if the status is
Good
. The port may
potentially be a valid source in the near future if the status is
Wait-to-Restore
.
Main PSU Port Sync E Master
Slave Status
This attribute indicates if the Main PSU Port is operating as a
Synchronous Ethernet master (providing a source of timing
for downstream devices) or slave (receiving a source of timing
from an upstream device).
Main PSU Port Gigabit Master
Slave Status
This attribute indicates if the Main PSU Port’s Gigabit Ethernet
physical interface is operating as a master (generating a clock)
or slave (locking to a clock generated at the other end of the
Ethernet link).
Aux Port QL Rx The QL currently being received on the Aux Port
Aux Port Accepted QL Rx The “accepted” QL received by the Aux Port. This should be
the same as Aux Port QL Rx, unless the system is starting up
or recovering from an exception
Aux Port QL Tx The QL currently being transmitted at the Aux Port
Aux Port Sync E Master Slave
Status
The Aux Port operates as a Synchronous Ethernet master
(providing a source of timing for downstream devices).
Aux Port Gigabit Master Slave
Status
This attribute indicates if the Aux Port’s Gigabit Ethernet
physical interface is operating as a master (generating a clock)
or slave (locking to a clock generated at the other end of the
Ethernet link).
SFP Port QL Rx The QL currently being received on the SFP Port
SFP Port Accepted QL Rx The “accepted” QL received by the SFP Port. This should be
the same as SFP Port QL Rx, unless the system is starting up
or recovering from an exception
SFP Port QL Tx The QL currently being transmitted at the SFP Port
SFP Port Sync E Master Slave
Status
The Aux Port operates as a Synchronous Ethernet master
(providing a source of timing for downstream devices).
Page 7-58

Chapter 7: Operation System statistics
Attribute
Meaning
SFP Port Gigabit Master Slave
Status
This attribute indicates if the SFP Port’s Gigabit Ethernet
physical interface is operating as a master (generating a clock)
or slave (locking to a clock generated at the other end of the
Ethernet link).
The “Sync E Tracking State” attribute can take the following values:
Table 186
Sync E Tracking State
Value
Meaning
Disabled The synchronous Ethernet feature is disabled.
Acquiring Wireless Lock Synchronous Ethernet is not operational because real-time
clocks have not completed alignment.
Free Running Synchronous Ethernet is operational, but with no timing
source or history. This is a temporary state.
Locked Local, Acquiring
Holdover
Sync E tracking has locked to a synchronisation signal from a
cabled Ethernet port on the local ODU. This is a temporary
state until the unit has acquired holdover history.
Locked Local, Holdover
Acquired
Sync E tracking has locked to a synchronisation signal from a
cabled Ethernet port on the local ODU and has acquired
holdover history.
Holdover There is currently no source for the tracking loop, but
previously the tracking loop was in a Locked, Holdover
Acquired state. The system is using the last known good
frequency.
Locked Remote, Acquiring
Holdover
The tracking loop has locked to a synchronisation signal
from the remote ODU. This is a temporary state until the unit
has acquired holdover history.
Locked Remote, Holdover
Acquired
The tracking loop has locked to a synchronisation signal
form the remote ODU and has acquired holdover history.
In normal operation, with the Synchronous Ethernet feature enabled and a valid timing source
present, one end of the link should be in the “Locked Local, Holdover Acquired State”, the
other end should be in the “Locked Remote, Holdover Acquired” state.
The Sync E Tracking State attribute remains in the Acquiring Wireless Lock state for a period of
time after the wireless link has established whilst the two ODUs establish precise
synchronization. The duration of this period depends on channel bandwidth, varying from less
than one minute at 45 MHz, up to two minutes for 5 MHz.
Diagnostics Plotter page
Menu option:
System
>
Diagnostics Plotter
(Figure 215).
Page 7-59
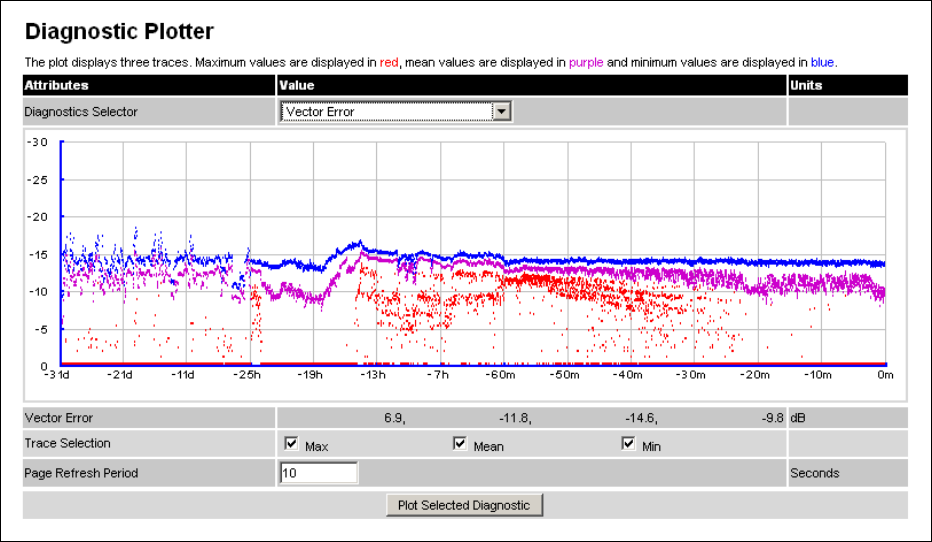
Chapter 7: Operation System statistics
Use this page to monitor the performance of an operational PTP 700 link over time.
Figure 215
Diagnostic Plotter page
Procedure:
• Select a diagnostic from the Diagnostics Selector drop-down list. These are the same as the
System Histogram attributes in the System Statistics page (Table 175).
• Tick the required Trace Selection boxes: Max, Mean and Min.
• Update the Page Refresh Period as required. The default period is 3600 seconds (1 hour).
To monitor the performance of a link in real time, select a much shorter period, for example
60 seconds.
• Click
Plot Selected Diagnostic
. The selected diagnostic trace is displayed in the graph.
Maximum values are displayed in red, mean values are displayed in purple and minimum
values are displayed in blue.
Generate Downloadable Diagnostics page
Menu option:
System > Diagnostics Plotter >
CSV Download
(Figure 216).
Use this page to download diagnostics data to a CSV file.
Page 7-60
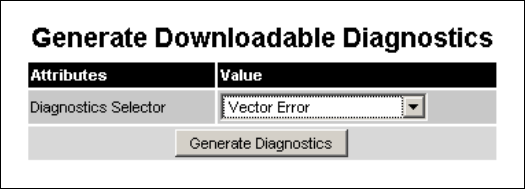
Chapter 7: Operation System statistics
Figure 216
Generate Downloadable Diagnostics page
Procedure:
• Select a diagnostic from the Diagnostics Selector drop-down list.
• Click
Generate Diagnostics
. The Generate Downloadable Diagnostics page is redisplayed
with the name of the generated CSV file.
• Click on the CSV file name and save the CSV file to the hard drive of the local computer.
• Open the CSV file in MS Excel and use it to generate reports and diagrams. The CSV file
contains at most 5784 entries, recorded over a 32 day period:
o 3600 entries recorded in the last hour.
o 1440 entries recorded in the previous 24 hours.
o 744 entries recorded in the previous 31 days.
Page 7-61
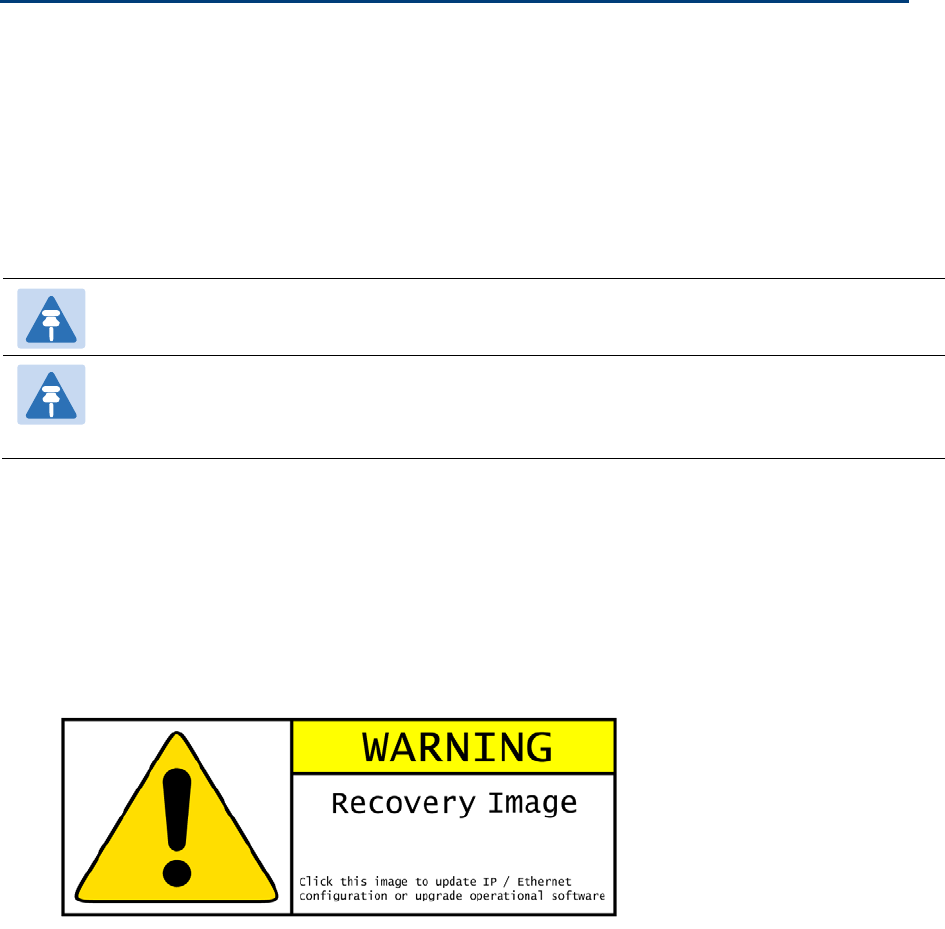
Chapter 7: Operation Recovery mode
Recovery mode
This section describes how to recover a PTP 700 unit from configuration errors or software
image corruption.
Entering recovery mode
Use this procedure to enter recovery mode manually.
Note
The unit may enter recovery mode automatically, in response to some failures.
Note
Once the unit has entered recovery, it will switch back to normal operation if no access
has been made to the recovery web page within 30 seconds.
Procedure:
1
Apply power to PSU for at least 10 seconds.
2
Remove power for
two seconds.
3
Re
-apply power to the PSU.
4
When the unit is in recovery mode, access the web interface by entering the default IP address
169.254.1.1
. The Recovery Image Warning page is displayed:
5
Click on the warning page image
. The Recovery Option Page is displayed (Figure 217).
6
Review the Software Version and Recovery Reason (
Table 187).
7
Select a
recovery option (Table 188).
Page 7-62
Chapter 7: Operation Recovery mode
Figure 217
Recovery Options page
Table 187
Recovery Options attributes
Attribute
Meaning
Software Version The software version of the recovery operating system permanently
installed during manufacture.
Recovery Reason The reason the unit is operating in Recovery mode, for example “Invalid
or corrupt image”.
“Unknown” usually means there has been a power outage.
MAC Address The MAC address of the unit programmed during manufacture.
Page 7-63
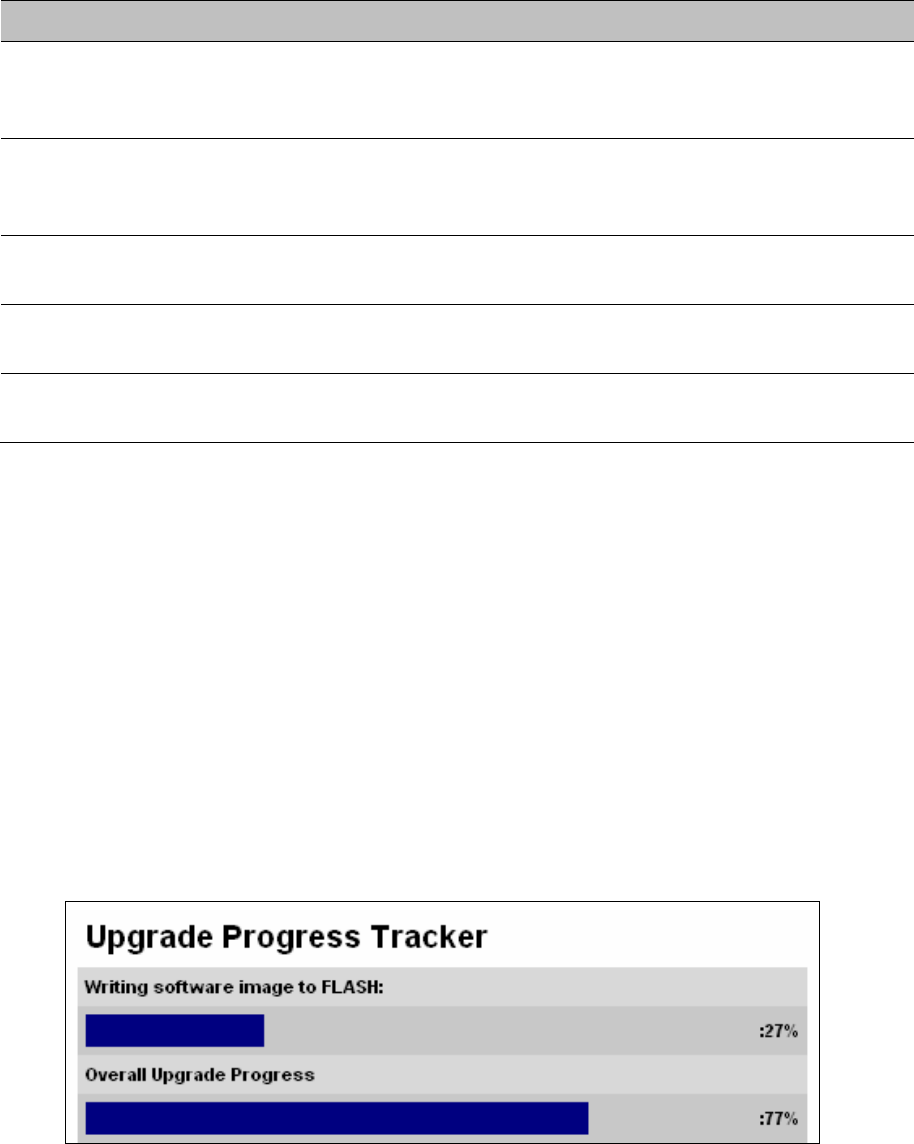
Chapter 7: Operation Recovery mode
Table 188
Recovery Options buttons
Button
Purpose
Upgrade Software
Image
Use this option to restore a working software version when software
corruption is suspected, or when an incorrect software image has
been loaded. Refer to Upgrading software image on page 7-64.
Reset IP & Ethernet
Configuration back
to factory defaults
Use this option to reset the IP and Ethernet attributes to factory
defaults. Refer to Resetting IP & Ethernet configuration on page 7-65.
Erase Configuration Use this option to reset the entire configuration of the unit to factory
defaults. Refer to Resetting all configuration data on page 7-66.
Zeroize Critical
Security Parameters
Use this option to reset the security configuration to default values.
Refer to Zeroize Critical Security Parameters on page 7-67.
Reboot Use this option to reboot the unit. Refer to Rebooting the unit on page
7-68.
Upgrading software image
Use this option to restore a working software image from the Recovery Options page (Figure
217).
Procedure:
1
Click
Browse
.
2
Navigate to the required software image. This may be the most recent image if software
corruption is suspected, or an older image if an incorrect image has just been loaded. Click on
the image and click
Open
.
3
Click
Upgrade Software Image
. The Confirmation page is displayed. Click
Program Software
Image into Non-Volatile Memory
. The Upgrade Progress Tracker page is displayed:
4
When the Software Upgrade Complete page is displayed, check that the correct image has
been downloaded:
Page 7-64
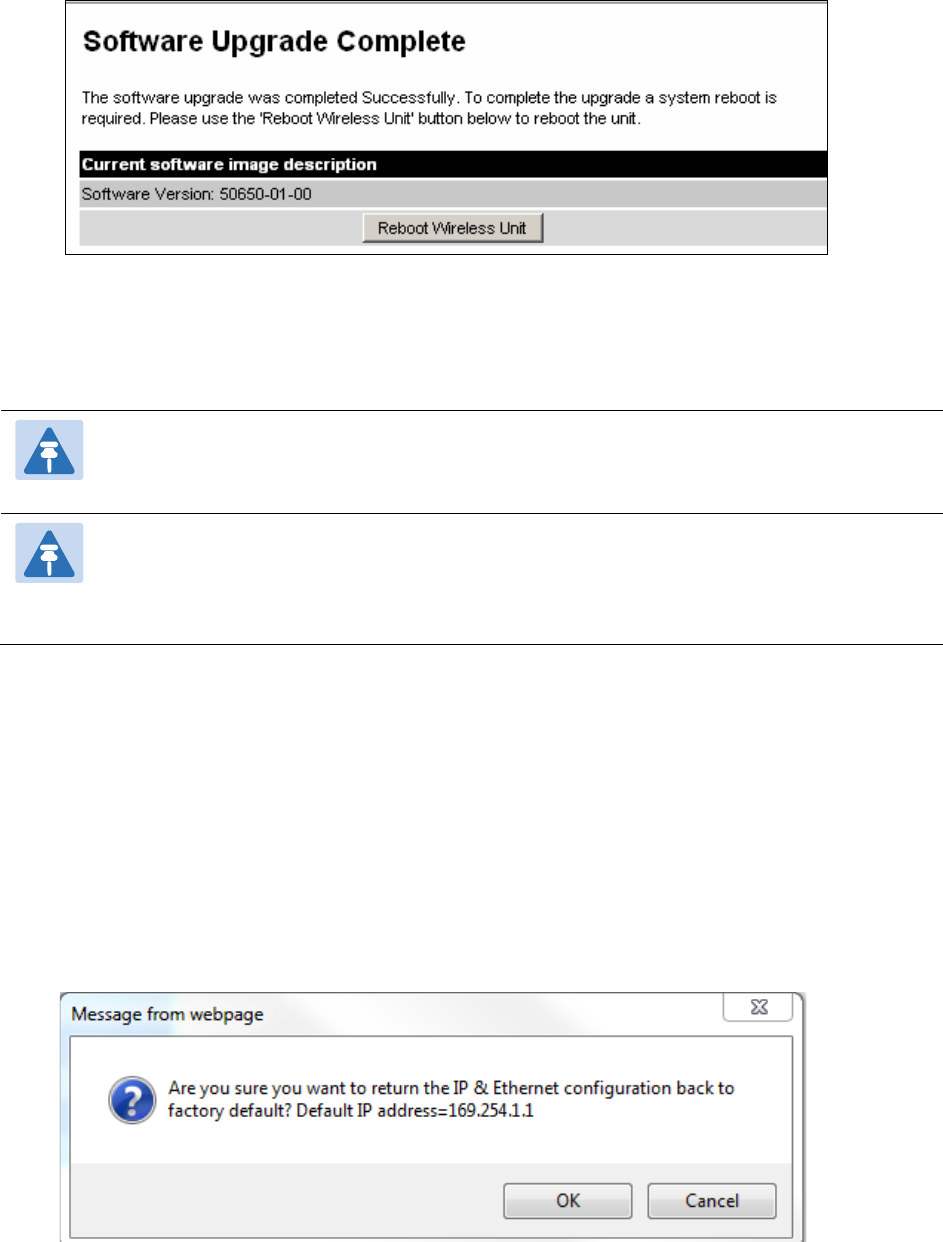
Chapter 7: Operation Recovery mode
5
Click
Reboot Wireless Unit
. When the “
Are you sure?
” message is displayed, click
OK
.
6
The unit will now reboot and restart in normal operational mode, and the link should recover.
If the unit or link fails to recover, refer to Testing link end hardware on page 8-7.
Note
The unit will not upload FIPS versions of the software unless the unit has the AES
encryption and FIPS licenses installed.
Note
CSPs are automatically zeroized if FIPS software is loaded in a unit to replace standard
(non-FIPS) software, or standard (non-FIPS) software is loaded in a unit to replace FIPS
software.
Resetting IP & Ethernet configuration
Use this option in the Recovery Options page to reset IPv4, IPv6 and Ethernet configuration to
default values (Figure 217). This procedure resets the IP Version attribute to
IPv4
. It also resets
the IPv6 configuration.
Procedure:
1
Click
Reset IP & Ethernet Configuration back to factory defaults
. The reset pop up box is
displayed:
2
Record the IP address, as it will be needed to log into the unit after recovery.
3
Click
OK
. The reset confirmation page is displayed:
Page 7-65
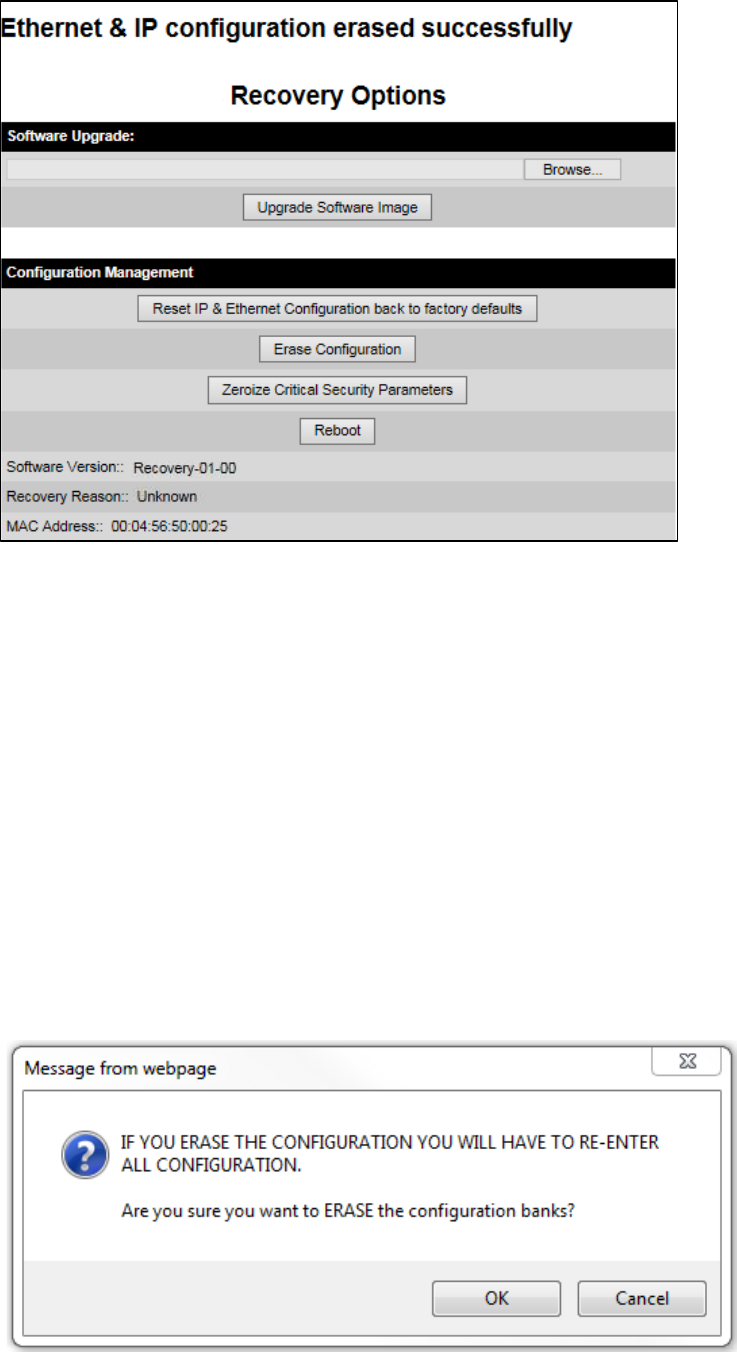
Chapter 7: Operation Recovery mode
4
Click
Reboot
. When the “Are you sure you want to REBOOT this unit?” message
is displayed, click
OK
.
5
The unit will now reboot. The unit should now start up in normal mode but with the IP and
Ethernet configuration reset to factory defaults. If the unit fails to recover, refer to Testing link
end hardware on page 8-7 and Cable Diagnostics on page 8-2.
Resetting all configuration data
Use this option in the Recovery Options page to reset the entire configuration of the unit
(including IP, Ethernet and CSPs) to default values (Figure 217).
Procedure:
1
Click
Erase Configuration
. The erase pop up box is displayed:
Page 7-66
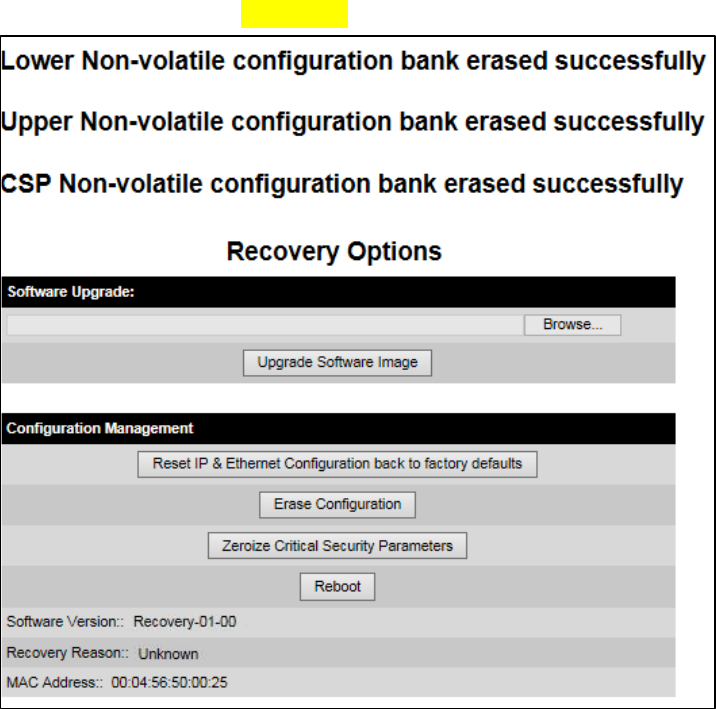
Chapter 7: Operation Recovery mode
2
Click
OK
. The erase confirmation page is displayed:
3
Click
Reboot
. When the confirmation message is displayed, click
OK
.
4
The unit reboots and starts up in normal mode but with all configuration reset to default
values. If the unit fails to start up, refer to Testing link end hardware on page 8-7 and and
Cable Diagnostics on page 8-2.
Zeroize Critical Security Parameters
Use this option in the Recovery Options page to reset the security configuration of the unit to
default values (Figure 217). This action includes the following attributes:
• Key of Keys
• Local User Accounts Names, Roles and Passwords
• Encryption Algorithm
• Wireless Encryption Key
• HTTPS Private Key
• HTTPS Public Key Certificate
• Random Number Generator Entropy
• HTTP Access Enabled
• HTTP Port Number
Page 7-67
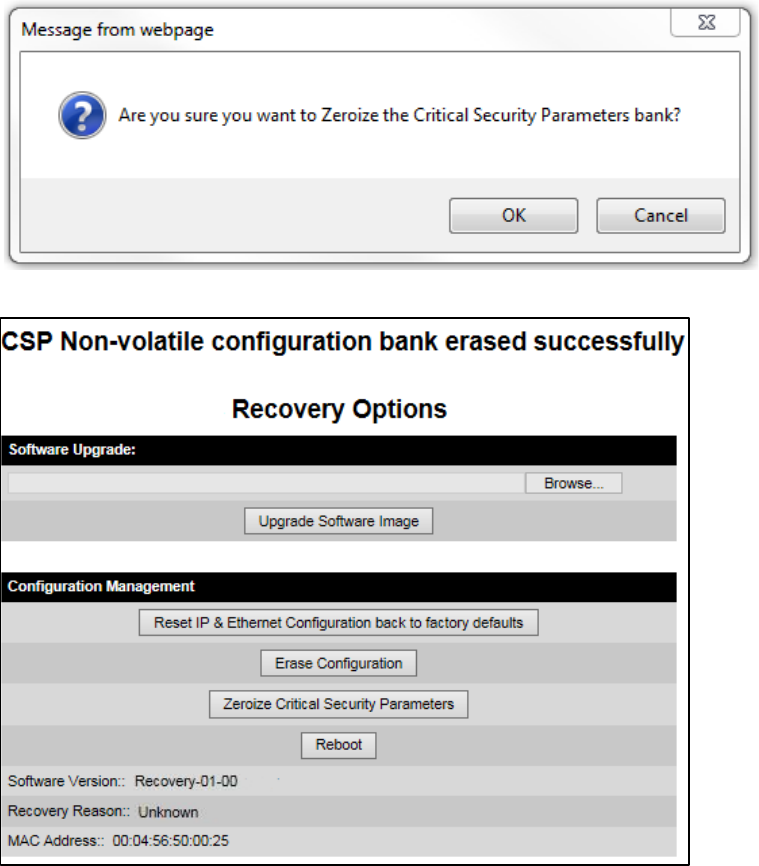
Chapter 7: Operation Recovery mode
Procedure:
1
Click
Zeroize Critical Security Parameters
. The confirmation pop up box is displayed:
2
Click
OK
. The zeroize CSPs confirmation page is displayed:
3
Click
Reboot
. When the “Are you sure you want to REBOOT this unit?”
message is displayed, click
OK
.
4
The unit will now reboot. The unit should now start up in normal mode but with the security
configuration reset to default values. If the unit fails to recover, refer to Testing link end
hardware on page 8-7 and Cable Diagnostics on page 8-2.
Rebooting the unit
Use this option to reboot the unit from the Recovery Options page (Figure 217).
Procedure:
• Click
Reboot
.
Page 7-68

Chapter 8: Troubleshooting
This chapter contains procedures for identifying and correcting faults in a PTP 700 link. These
procedures can be performed either on a newly installed link, or on an operational link if
communication is lost, or after a lightning strike.
The following topics are described in this chapter:
• Cable Diagnostics on page 8-2 describes how to perform cable diagnostics test to detect
cabling related faults.
• Testing link end hardware on page 8-7 describes how to test the link end hardware, either
when it fails on startup, or after a lightning strike.
• Testing the radio link on page 8-13 describes how to test the link when there is no radio
communication, or when it is unreliable, or when the data throughput rate is too low.
• Testing PTP-SYNC on page 8-15 describes how to test the PTP-SYNC unit and its
connections when the PTP-SYNC LEDs do not illuminate correctly, or when a
synchronization fault is suspected.
• Testing a TDM link on page 8-18 describes how to check the NIDU LEDs and how to
perform a TDM loopback test.
Page 8-1

Chapter 8: Troubleshooting Cable Diagnostics
Cable Diagnostics
This section describes how to diagnose cable faults.
The Cable Diagnostics feature may be used to test Ethernet cables connected to the Main PSU
port and the Aux port. The feature uses Time Domain Reflectometry (TDR) technology to test
individual twisted pairs in the cable, to identify open circuit and short circuit faults, and indicate
the approximate location of the fault:
• Open circuit – An open circuit is detected when the impedance is greater than 300 ohms.
• Short circuit – A short circuit is detected when the impedance is less than 33 ohms.
• Approximate location of the fault - The fault location is reported as a distance from the
ODU along the cable, and is accurate to +/- 2 meters (6.5 feet).
Note
• The cable diagnostics results are provided only as a guide.
• The feature reliably detects all open circuit and short circuit faults in cable pairs,
but it is not possible to reliably detect short circuit faults between wires in different
cable pairs. Except for that specific circumstance, an OK result for all pairs means
the cable is good.
• The presence of LPUs can affect the accuracy and reliability of the results.
Before initiating the test, confirm that all outdoor drop cables (that is those that connect the
ODU to equipment inside the building) are specified as supported, as defined in Outdoor
copper Cat5e Ethernet cable on page 2-33.
Test scenarios
The Cable Diagnostics test may be performed in following scenarios:
Scenarios
Actions
Main PSU port “Down” Check for physical Ethernet cable connectivity between Power over
Ethernet (PoE) and Customer Data Network (or LAN).
If the cable connectivity is OK, Perform Cable Diagnostics test.
Aux port “Down” Check for physical Ethernet cable connectivity between ODU and
Customer Data Network or Management Agent.
If the cable connectivity is OK, Perform Cable Diagnostics test.
Main PSU or Aux port is
“Up” but the Ethernet
speed is noticed slow
There is a possibility that one or more cable pairs have intermittent
contact with the RJ45 connector pin. This could result in intermittent
communication errors.
Follow procedure Ethernet packet test.
If Ethernet Rx Crc and Align counter is greater than ten (>10),
Perform Cable Diagnostics test.
If Packet Error Rate is greater than 1 in 1 million, Perform Cable
Page 8-2
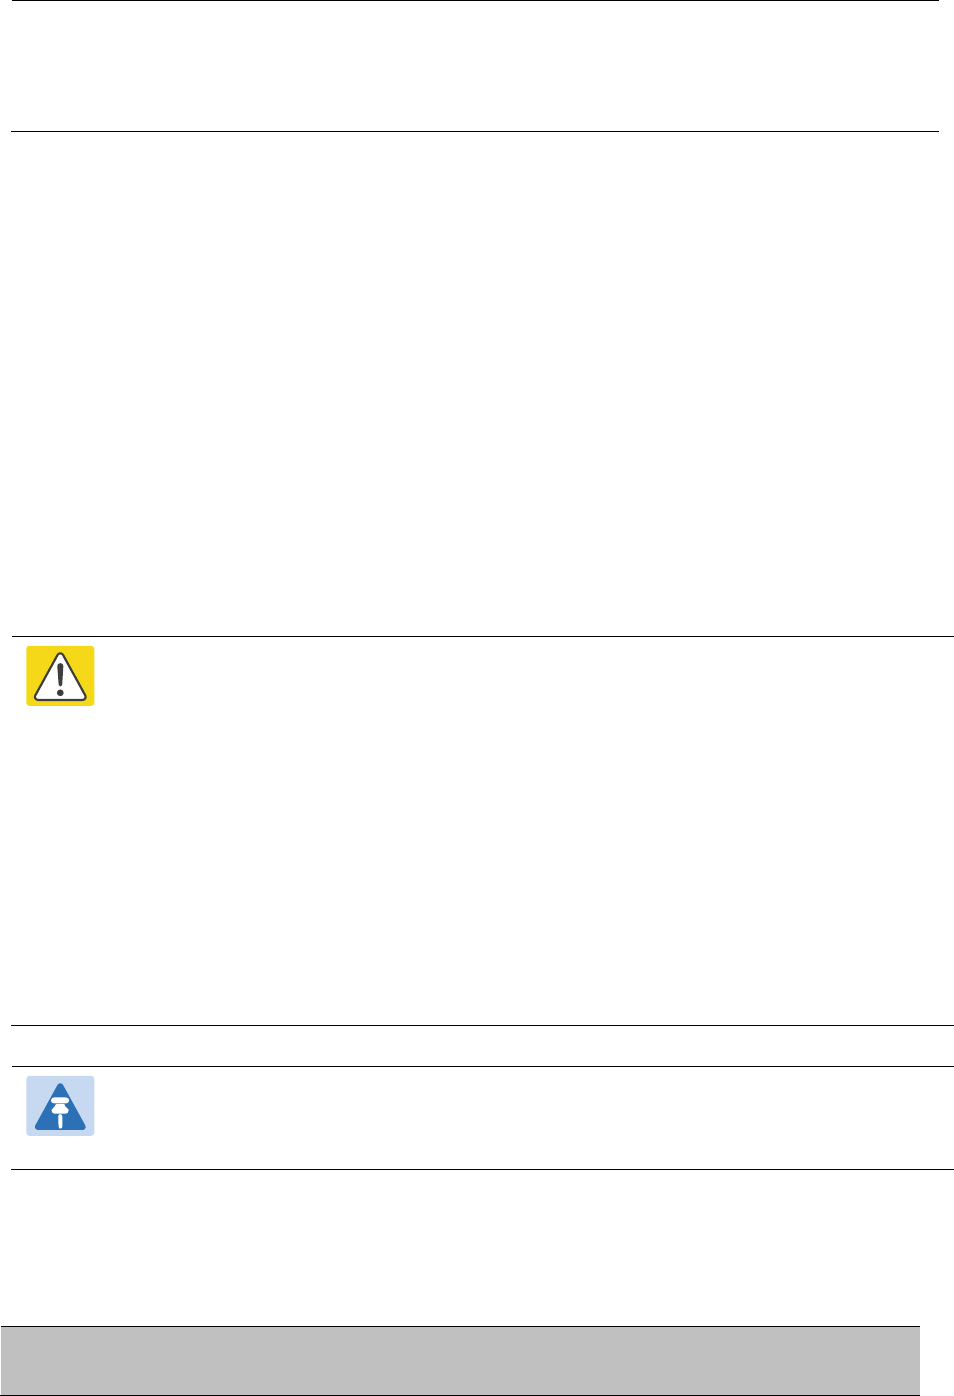
Chapter 8: Troubleshooting Cable Diagnostics
Diagnostics test.
If Number of lost packets are less than two (<2) after performing
Test ping packet loss, perform Cable Diagnostics test.
Otherwise check the ODU’s parameter configurations.
Cable Diagnostics test
Menu option:
System >
Cable Diagnostics
The Cable Diagnostics feature determines a fault in a cable and its approximate location based
on Time Domain Reflectometry (TDR).
When the test is initiated for the selected port(s), the ODU sends a known signal (+1V) over the
twisted pair cable. The transmitted signal will travel down the cable until it reflects off a fault.
The magnitude of the reflection and the time it takes for the reflection to come back can be
used to calculate the distance to the fault on the cable. For example, a +1V reflection will
indicate an open close to the PHY and a -1V reflection will indicate a short close to the PHY.
Based on the returned signal, the radio identifies the cable status and estimates the distance of
the fault. The result of the cable test will be displayed.
The cable diagnostics test can be carried out for Main PSU and AUX ports. This test is not
supported for SFP port.
Caution
• On the Main PSU port, the presence of LPUs can affect the accuracy of the cable
diagnostics results for some cable configurations. When a fault is detected, the
feature reports the distance corresponding to the final TDR signal reflection. In
configurations where there is a short cable from the ODU to the first LPU (< 2m),
and a moderately long cable to the second LPU (30m), the final TDR signal
reflection may come from one of the LPUs itself, rather than the fault. For
example, a fault in the first short cable may be reported at or near the second LPU.
• On the Aux port, the presence of LPUs can affect the reliability of the cable
diagnostics results for many cable configurations. Frequently, open circuit faults
may be reported when the cable is OK, and fault distances may be reported
corresponding to the LPU locations. Cable diagnostics tests on the Aux port
should be repeated a number of times to establish a pattern.
Note
All cable diagnostics results should be verified with an external cable tester before
remedial action is taken.
All four twisted pairs of the cable are tested separately and results are displayed for each pair.
The pin to pair mapping of a cable is shown in Table 189.
Table 189
Pin to pair mapping of a cable (T568B termination)
Pin
Pair
Wire
Color
(Supplied cable)
Color
(Conventional)
Pins on plug face
Page 8-3
Chapter 8: Troubleshooting Cable Diagnostics
1 2 1 Light Orange White/Orange
2 2 2 Orange Orange
3 3 1 Light Green White/Green
4 1 2 Blue Blue
5 1 1 Light Blue White/Blue
6 3 2 Green Green
7 4 1 Light Brown White/Brown
8 4 2 Brown Brown
Procedure
1
Select ports for cable diagnostics test:
2
Click “Start Test” button to begin the test:
3
The confirmation pop up box is displayed. Click the “OK” button to proceed with the test:
Note
The Local Management port connection will be lost when the local management port
is under test. However the management port will be accessible when the other ports
are under test.
Resubmit the web page after 10 seconds when testing the management port.
Page 8-4
Chapter 8: Troubleshooting Cable Diagnostics
4
On completion of the test, the results are displayed :
Note
The last test performed results are shown for user reference purpose.
Table 190
Cable Diagnostics attributes
Attribute
Meaning
Cable Diagnostics Ports Select ports on which Cable Diagnostics must be executed.
Last Test Time The date and time when a Cable Diagnostics test was last executed
successfully.
Cable Pair The result of the most recent execution of cable diagnostics on a
cable pair.
There are four twisted pairs in each Cat5 cable. The cable
diagnostics test is performed on each pair of the cable.
Results
OK
: Reported when the test is passed for a respective cable pair.
Open Circui
t: Reported when the impedance is greater than 330
ohms.
Short Circuit:
Reported when impedance is less than 33 ohms.
Distance The estimate of the distance from the ODU to the fault detected on
the cable pair during the most recent execution of Cable
Page 8-5

Chapter 8: Troubleshooting Cable Diagnostics
Diagnostics.
Fault in cables longer than 160 meters (525 feet) may not be
detected.
The error margin is +/- 2 meters (6.5 feet).
Units Unit of cable length in meters.
Page 8-6

Chapter 8: Troubleshooting Testing link end hardware
Testing link end hardware
This section describes how to test the link end hardware when it fails on startup or during
operation.
Before testing link end hardware, confirm that all outdoor drop cables, that is those that
connect the ODU to equipment inside the building, are of the supported type, as defined in
Outdoor copper Cat5e Ethernet cable on page 2-33.
AC+DC Enhanced power injector LED sequence
For the AC+DC Enhanced power injector, the expected power-up LED sequence is:
• The Power (green) LED illuminates steadily.
• After about 45 seconds, the Ethernet (yellow) LED blinks slowly 10 times.
• The Ethernet (yellow) LED illuminates steadily, then blinks randomly to show Ethernet
activity.
If this sequence does not occur, take appropriate action depending on the LED states:
• Power LED is off on page 8-7
• Power LED is blinking on page 8-7
• Ethernet LED did not blink 10 times on page 8-8
• Ethernet LED blinks ten times then stays off on page 8-8
• Ethernet LED blinks irregularly on page 8-9 (for example a short blink followed by a long
blink)
• Power LED is on, Ethernet LED blinks randomly on page 8-9
If a fault is suspected in the ODU-PSU drop cable, perform Test resistance in the drop cable on
page 5-23.
Power LED is off
Meaning
: Either the PSU is not receiving power from the AC/DC outlet, or there is a wiring fault
in the ODU cable.
Action
: Remove the ODU cable from the PSU and observe the effect on the Power LED:
• If the Power LED does not illuminate, confirm that the mains power supply is working, for
example, check the plug and fuse (if fitted). If the power supply is working, report a
suspected PSU fault to Cambium Networks.
• If the Power LED does illuminate, perform Test resistance in the drop cable on page 5-23.
Power LED is blinking
Meaning
: The PSU is sensing there is an overload on the ODU port; this could be caused by a
wiring error on the drop cable or a faulty ODU.
Action
: Remove the ODU cable from the PSU. Check that pins 4&5 and 7&8 are not crossed
with pins 1&2 and 3&6. Check that the resistance between pins 1&8 is greater than 100K ohms.
If either check fails, replace or repair the ODU cable.
Page 8-7
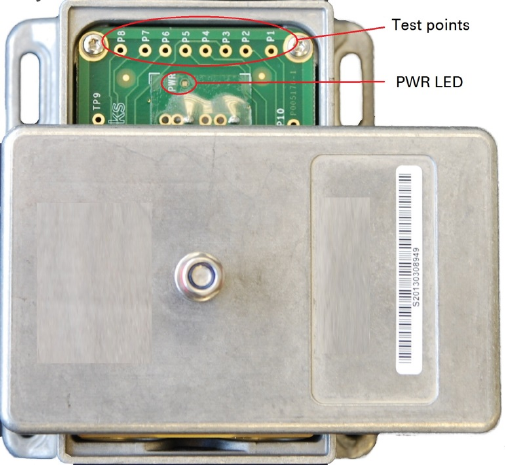
Chapter 8: Troubleshooting Testing link end hardware
Ethernet LED did not blink 10 times
Meaning
: The ODU flashes the LED on the AC+DC Enhanced Power Injector 10 times to show
that the ODU is powered and booted correctly.
Action
:
1
Remove the ODU cable from the PSU. Examine it for signs of damage. Check that the ODU
cable resistances are correct, as specified in Test resistance in the drop cable on page 5-23. If
the ODU cable is suspect, replace it.
2
Use the LPU (if installed) to check that power is available on the cable to the ODU. Access the
connections by rotating the LPU lid as shown (slacken the lid nut but do not remove it):
4
Check that test point P1 on the LPU PCB corresponds to pin 1 on the RJ45. Repeat for points
P2 to P8. This test is only valid if both the PSU and the ODU are disconnected.
5
Reconnect the ODU cable to the PSU.
6
Check that the PWR LED near the top right of the LPU PCB is illuminated to indicate power in
the Ethernet cable.
7
If any test fails, replace or repair the cable that connects the PSU to the LPU or ODU.
Ethernet LED blinks ten times then stays off
Meaning
: There is no Ethernet traffic between the PSU and ODU.
Action
: The fault may be in the LAN or ODU cable:
• Confirm that Ethernet traffic is connected to the AC+DC injector LAN port, confirm the cable
is not faulty, replace if necessary.
• If the LAN connection to the AC+DC power injector is working, check the drop cable is
correctly wired using a suitable cable tester. Repeat the drop cable tests on page Test
resistance in the drop cable on page 5-23.
Page 8-8
Chapter 8: Troubleshooting Testing link end hardware
Ethernet LED blinks irregularly
Meaning
: If the Ethernet LED blinks irregularly, for example two rapid blinks followed by a
longer gap, this indicates that the ODU has booted in recovery mode. The causes may be:
installation wiring, or a corrupt ODU software load, or sufficient time has not been allowed
between a repeat power up.
Action
: Refer to Recovery mode on page 7-62.
Power LED is on, Ethernet LED blinks randomly
Meaning
: Both LEDs are in their normal states, implying that the PSU is receiving power from
the AC/DC outlet and there is normal Ethernet traffic between the PSU and ODU.
Action
: If, in spite of this, a fault is suspected in the link end hardware:
• If the Ethernet connection to the network is only 100BASE-TX, when 1000BASE-T is
expected: remove the ODU cable from the PSU, examine it, and check that the wiring to
pins 4&5 and 7&8 is correct and not crossed.
• Perform Ethernet packet test on page 8-10.
Page 8-9

Chapter 8: Troubleshooting Testing link end hardware
Test Ethernet packet errors reported by ODU
Log into the unit and click
Administration
,
Statistics
,
Detailed Counters
. Click
Reset System
Counters
at the bottom of the page and wait until the Ethernet Rx Packets counter has
reached 1 million (the count will only update when the page is refreshed. If the counter does
not increment or increments too slowly, because for example the PTP 700 is newly installed
and there is no offered Ethernet traffic, then abandon this procedure and consider using
the procedure Test ping packet loss on page 8-11.
Read the Ethernet Rx Crc And Align counter. The test has passed if this is less than 10.
Test Ethernet packet errors reported by managed switch or router
If the ODU is connected to a managed Ethernet switch or router, it may be possible to monitor
the error rate of Ethernet packets. Please refer to the user guide of the managed network
equipment. The test has passed if the rate of packet errors reported by the managed Ethernet
switch or router is less than 10 in 1 million packets.
Test ping packet loss
Using a computer, it is possible to generate and monitor packets lost between the PSU and the
ODU. This can be achieved by executing the Command Prompt application which is supplied
as standard with Windows and MAC operating systems.
Caution
This procedure disrupt network traffic carried by the PTP 700 under test:
Procedure:
1
Ensure that the IP address of the computer is configured appropriately for connection to
the PTP 700 under test, and does not clash with other devices connected to the network.
2
If the PSU is connected to an Ethernet switch or router then connect the computer to a spare
port, if available.
3
If it is not possible to connect the computer to a spare port of an Ethernet switch or router,
then the PSU will need to be disconnected from the network in order to execute this test:
• Disconnect the PSU from the network.
• Connect the computer directly to the LAN port of the PSU.
4
On the computer, open the Command Prompt application.
Page 8-11
Chapter 8: Troubleshooting Testing link end hardware
5
Send 1000 ping packets of length 1500 bytes. The process will take 1000 seconds, which is
approximately 17 minutes.
If the computer is running a Windows operating system, this is achieved by typing (for an IPv6
address, use the ping6 command):
ping –n 1000 –l 1500 <ipaddress>
where <ipaddress> is the IP address of the PTP 700 ODU under test.
If the computer is running a MAC operating system, this is achieved by typing:
ping –c 1000 –s 1492 <ipaddress>
where <ipaddress> is the IP address of the PTP 700 ODU under test.
6
Record how many Ping packets have been lost. This is reported by Command Prompt on
completion of the test.
The test has passed if the number of lost packets is less than 2.
Page 8-12

Chapter 8: Troubleshooting Testing the radio link
Testing the radio link
This section describes how to test the link when there is no radio communication, when it is
unreliable, when the data throughput rate is too low, or when a unit is causing radio or TV
interference. It may be necessary to test the units at both ends of the link.
No activity
If there is no wireless activity, proceed as follows:
1
Check for Alarm conditions on Home page.
2
Check that the software at each end of the link is the same version.
3
Check that the Target Mac address is correctly configured at each end of the link.
4
Check Range.
5
Check Tx Power.
6
Check License keys to ensure that both units are the same product variant.
7
Check Master/Slave status for each unit and ensure that one unit is Master and the other unit
is slave.
8
Check that the link is not obstructed or the ODU misaligned.
9
Check the DFS page at each end of the link and establish that there is a quiet wireless channel
to use.
10
If there are no faults found in the configuration and there is absolutely no wireless signal,
retry the installation procedure.
11
If this does not work then report a suspected ODU fault to Cambium Networks.
Some activity
If there is some activity but the link is unreliable or does not achieve the data rates required,
proceed as follows:
1
Check that the interference has not increased using the DSO measurements.
2
If a quieter channel is available check that it is not barred.
3
Check that the path loss is low enough for the communication rates required.
4
Check that the ODU has not become misaligned.
Page 8-13
Chapter 8: Troubleshooting Testing the radio link
Radio and television interference
If a PTP 700 unit is interfering with radio or television reception (this can be determined by
turning the equipment off and on), attempt the following corrective actions:
• Realign or relocate the antenna.
• Increase the separation between the affected equipment and antenna.
• Connect the ODU and PSU power supply into a power outlet on a circuit different from that
to which the receiver is connected.
• Contact Cambium Point-to-Point for assistance.
Page 8-14

Chapter 8: Troubleshooting Testing PTP-SYNC
Testing PTP-SYNC
This section describes how to test the PTP-SYNC unit and its connections when the PTP-SYNC
LEDs do not illuminate correctly, or when a synchronization fault is suspected.
Checking the PTP-SYNC LEDs
If a fault is suspected in the PTP-SYNC or GPS hardware, check the PTP-SYNC LED states and
use Table 191 to choose the correct test procedure.
Table 191
PTP-SYNC indicator LED states
LED
State
Description and test procedure
GPS Off No GPS satellite data being received at the GPS/SYNC IN
port. Refer to GPS LED does not illuminate or blink on
clustered units on page 8-16.
On steady or blink GPS satellite data being received.
SYNC Off No data being received at the SYNC OUT port.
On steady or blink Data being received at the SYNC OUT port.
The SYNC LED does not normally illuminate, even in cluster
configurations.
STATUS Off No power. Refer to LEDs do not illuminate on page 8-15.
On steady Power but no satellite lock. Refer to STATUS LED is on
steady on page 8-16.
Blink Power and satellite lock at either the GPS/SYNC IN or 1PPS
IN port.
Double blink Possible fault in GPS/SYNC IN or 1PPS IN cables. Refer to
STATUS LED double-blinks on page 8-16.
ODU Off No signal being received from the ODU. Refer to ODU LED
does not illuminate within 90 seconds on page 8-16.
On Communication with the ODU is established.
Blink red Error in communication with ODU. Refer to ODU LED blinks
red on page 8-16,
LEDs do not illuminate
Meaning
: The PTP-SYNC unit is not powered up.
Action
: Ensure that there is a cable connection between the PSU ODU interface and the PIDU IN
interface of the PTP-SYNC unit. Confirm that the PSU is powered up.
Page 8-15

Chapter 8: Troubleshooting Testing PTP-SYNC
STATUS LED is on steady
Meaning
: There is power but no satellite lock. This probably indicates that a 1PPS
synchronization pulse is not detected by the PTP-SYNC unit.
Action
: Depending on system configuration, take one of the following actions:
• System using a GPS receiver module - Ensure that there is a cable connection between the
PTP-SYNC GPS/SYNC IN interface and the LPU, also that there is a cable connection
between the LPU and the GPS receiver module. Check that the GPS receiver module has an
uninterrupted view of the sky.
• System using an alternative 1PPS timing source - Ensure that there is a cable connection
between the PTP-SYNC GPS/SYNC IN or 1PPS IN interface and the 1PPS timing source.
• On cluster slave units – Ensure that there is a cable connection between the slave
GPS/SYNC IN interface and the SYNC OUT interface of the preceding unit in the chain.
STATUS LED double-blinks
Meaning:
There may be a fault in the GPS/SYNC IN or 1PPS IN cables.
Action:
Check the GPS wiring in accordance with Table 39.
ODU LED does not illuminate within 90 seconds
Meaning:
There may be no communication between PTP-SYNC and ODU.
Action:
Ensure that the PTP-SYNC ODU OUT interface is connected to the ODU (and LPUs if
installed) via the drop cable.
ODU LED blinks red
Meaning:
Error in communication with ODU. Possible causes are: fault in the ODU or PSU
cable, maximum recommended cable lengths exceeded, or TDD synchronization is not enabled
at the ODU.
Action:
Confirm that the ODU and PSU cables are not too long: see Ethernet standards and
cable lengths on page 2-32. Check the ODU cable wiring by following the procedure described
in Test resistance in the drop cable on page 5-23.
GPS LED does not illuminate or blink on clustered units
Meaning:
This indicates a fault only when the timing source is a GPS receiver.
Action:
Table 192 describes the action to be taken depending upon the behavior of the GPS
LEDs at the master and slave(s).
Table 192
Clustered PTP-SYNC units - GPS LEDs Fault-finding
Cluster timing source
GPS LED on
master
GPS LED on
slave(s)
Diagnosis
Page 8-16

Chapter 8: Troubleshooting Testing PTP-SYNC
Cluster timing source
GPS LED on
master
GPS LED on
slave(s)
Diagnosis
GPS receiver providing
NMEA data
Blink Blink OK
Off Any Fault in GPS unit or GPS cable
Blink Off Fault in daisy chain cable
Alternative 1PPS source,
no NMEA data
Off Off OK
Off On Fault in alternative 1PPS source
One ODU is cluster
timing master
Off Off OK
Page 8-17

Chapter 8: Troubleshooting Testing a TDM link
Testing a TDM link
This section describes how to check the NIDU LEDs and how to perform a TDM loopback test.
Checking the NIDU LEDs
If a fault is suspected in the NIDU, check the NIDU LED states and use Table 193 to choose the
correct test procedure.
Table 193
NIDU indicator LED states
Port
LED
State
Description and test procedure
LAN Green On steady Normal state: Ethernet 1000BaseT signal detected.
Off Abormal state: Ethernet signal detected but not 1000BaseT.
Amber Blink Normal state: data activity detected.
On steady Abormal state: alarm signal received.
ODU Green On steady Normal state: Ethernet 1000BaseT signal detected
Off Abormal state: Ethernet signal detected but not 1000BaseT.
Amber Blink Normal state: data activity detected.
On steady Abormal state: alarm signal received.
E1/T1 Green On steady Normal state: TDM signal detected
Amber Blink Normal state: TDM data activity detected.
Amber On steady Abnormal state: no TDM data activity detected.
Page 8-18

Chapter 8: Troubleshooting Testing a TDM link
Performing a TDM loopback test
The loopback test allows a TDM data stream to be looped back at the copper or wireless
interface. A typical T1 or E1 installation test includes a copper loopback on the local unit
followed by a wireless loopback on the remote unit.
Note
The TDM Configuration page is only available when the TDM interface is enabled and
the unit is rebooted (Interface Configuration page on page 6-14).
Procedure:
• Select menu option
System > Configuration > TDM Configuration
(Figure 145).
• Set the TDM Channel Loopback n attribute (where “n” is in the range 1 to 8) to
Copper
or
Wireless
(Table 132).
• Click
Submit Updated TDM Configuration
.
• Perform loopback tests. The System Summary page displays alarms indicating the
presence of loopbacks on each affected TDM channel (Alarms on page 7-17).
• Set the TDM Channel Loopback n attribute (where “n” is in the range 1 to 8) to
None
(Table
132).
• Click
Submit Updated TDM Configuration
.
Checking for 1000BASE-T operation
If the ODU port has negotiated a link at 100BASE-T, the NIDU will not send or receive TDM data
and will not bridge customer data traffic. Check that the Ethernet drop cable between the ODU
and the PSU, and the network cable between the PSU and the NIDU have successfully
negotiated operation at 1000BASE-T. On the System Status page, review Main PSU Port Speed
and Duplex (Figure 184) and confirm that it is set to
1000 Mbps Full Duplex
.
Page 8-19

Glossary
Term
Definition
AES Advanced Encryption Standard
ANSI American National Standards Institution
ARP Address Resolution Protocol
ATPC Automatic Transmit Power Control
Aux Auxiliary
BBDR Broadband Disaster Relief
BPSK Binary Phase Shift Keying
BW Bandwidth
CFM Connection Fault Management
CHAP Challenge Handshake Authentication Protocol
CSP Critical Security Parameter
DC Direct Current
DER Distinguished Encoding Rules
DES Data Encryption Standard
DFS Dynamic Frequency Selection
DHCP Dynamic Host Configuration Protocol
DSCP Differentiated Services Code Point
DSO Dynamic Spectrum Optimization
EAPS Ethernet Automatic Protection Switching
EIRP Equivalent Isotropic Radiated Power
EMC Electromagnetic Compatibility
EMD Electro-Magnetic Discharge
EPL Ethernet Private Line
ETSI European Telecommunications Standards Institute
EU European Union
FAQ Frequently Asked Question
FCC Federal Communications Commission
FIPS Federal Information Processing Standards
GARP Generic Attribute Registration Protocol
Page I

Glossary
Term
Definition
GE Gigabit Ethernet
GUI Graphical User Interface
HTTP Hypertext Transfer Protocol
IB In-Band
IC Industry Canada
ICMP Internet Control Message Protocol
ICNIRP International Commission on Non-Ionizing Radiation Protection
IEEE Institute of Electrical and Electronic Engineers
IP Internet Protocol
IPSec Internet Protocol Security
ISM Industrial Scientific and Medical
ITPE Initial Transmit Power Estimate
KDB Knowledge Database
L2CP Layer Two Control Protocols
LACP Link Aggregation Control Protocol
LLDP Link Layer Discovery Protocol
LAN Local Area Network
LOS Line-of-Sight (clear line-of-sight, and Fresnel zone is clear)
LPU Lightning Protection Unit
MAC Medium Access Control Layer
MDI (-X) Medium Dependent Interface (-Crossover)
MEF Metro Ethernet Forum
MIB Management Information Base
MIMO Multiple-Input Multiple-Output
MLD Multicast Listener Discovery
MPLS Multiprotocol Label Switching
MRP Multiple Registration Protocol
MSTP Multiple Spanning Tree Protocol
MTU Maximum Transmission Unit
NA Neighbor Advertisement
NIDU Network Indoor Unit
NLOS Non-Line-of-Sight
NMEA National Marine Electronics Association
Page II

Glossary
Term
Definition
NS Neighbor Solicitation
NTP Network Time Protocol
NUD Neighbor Un-reachability Detection
ODU Outdoor Unit
OFDM Orthogonal Frequency Division Multiplex
OOB Out-of-Band
PC IBM Compatible Personal Computer
PIDU Powered Indoor Unit
POE Power over Ethernet
PSU Power Supply Unit
PTP Point-to-Point
QAM Quadrature Amplitude Modulation
QoS Quality of Service
QPSK Quadrature Phase Shift Keying
R-APS Ring Automatic Protection Switching
RADIUS Remote Authentication Dial-In Service
RAM Random Access Memory
RF Radio Frequency
RFC Request for Comments
RoW Rest of World
RMA Return Material Authorization
RSSI Received Signal Strength Indication
RSTP Rapid Spanning Tree Protocol
SELV Safety Extra Low Voltage
SFP Small Form-factor Pluggable
SLAAC Stateless Address Auto-configuration
SMTP Simple Mail Transport Protocol
SNMP Simple Network Management Protocol
SNTP Simple Network Time Protocol
STP Spanning Tree Protocol
Syslog System Logging
TC Traffic Class
TCP Transmission Control Protocol
Page III

Glossary
Term
Definition
TDD Time Division Duplexing
TDM Time Division Multiplexing
TDWR Terminal Doppler Weather Radar
TGB Tower Ground Bus bar
TLS Transport Layer Security
UNII Unlicensed National Information Infrastructure
URL Universal Resource Location
USM User-based Security Model
UTC time Coordinated Universal Time
UTP Unshielded Twisted Pair
UV Ultraviolet
VACM View-based Access Control Model
VLAN Virtual Local Area Network
WEEE Waste Electrical and Electronic Equipment
Page IV