Extreme Networks AP3917E Wireless 802.11 a/ac+b/g/n Access Point User Manual WiNG 5 9 1 System Reference Guide Part 3
Extreme Networks, Inc. Wireless 802.11 a/ac+b/g/n Access Point WiNG 5 9 1 System Reference Guide Part 3
Contents
- 1. User Manual-AP3917e
- 2. User Manual-AP7662
- 3. User Manual-AP3917e R1
- 4. User Manual-AP7662 R1
- 5. WiNG 5.9.1 System Reference Guide Part 1
- 6. WiNG 5.9.1 System Reference Guide Part 2
- 7. WiNG 5.9.1 System Reference Guide Part 3
- 8. WiNG 5.9.1 System Reference Guide Part 4
- 9. WiNG 5.9.1 CLI Reference Guide Part 1
- 10. WiNG 5.9.1 CLI Reference Guide Part 2
- 11. Extreme Wireless V10.41.06 User Guide Part 1
- 12. AP3917 User Manual
- 13. AP7662 User Manual
WiNG 5.9.1 System Reference Guide Part 3
Management Access
Wireless Controller and Service Platform System Reference Guide 12 - 6
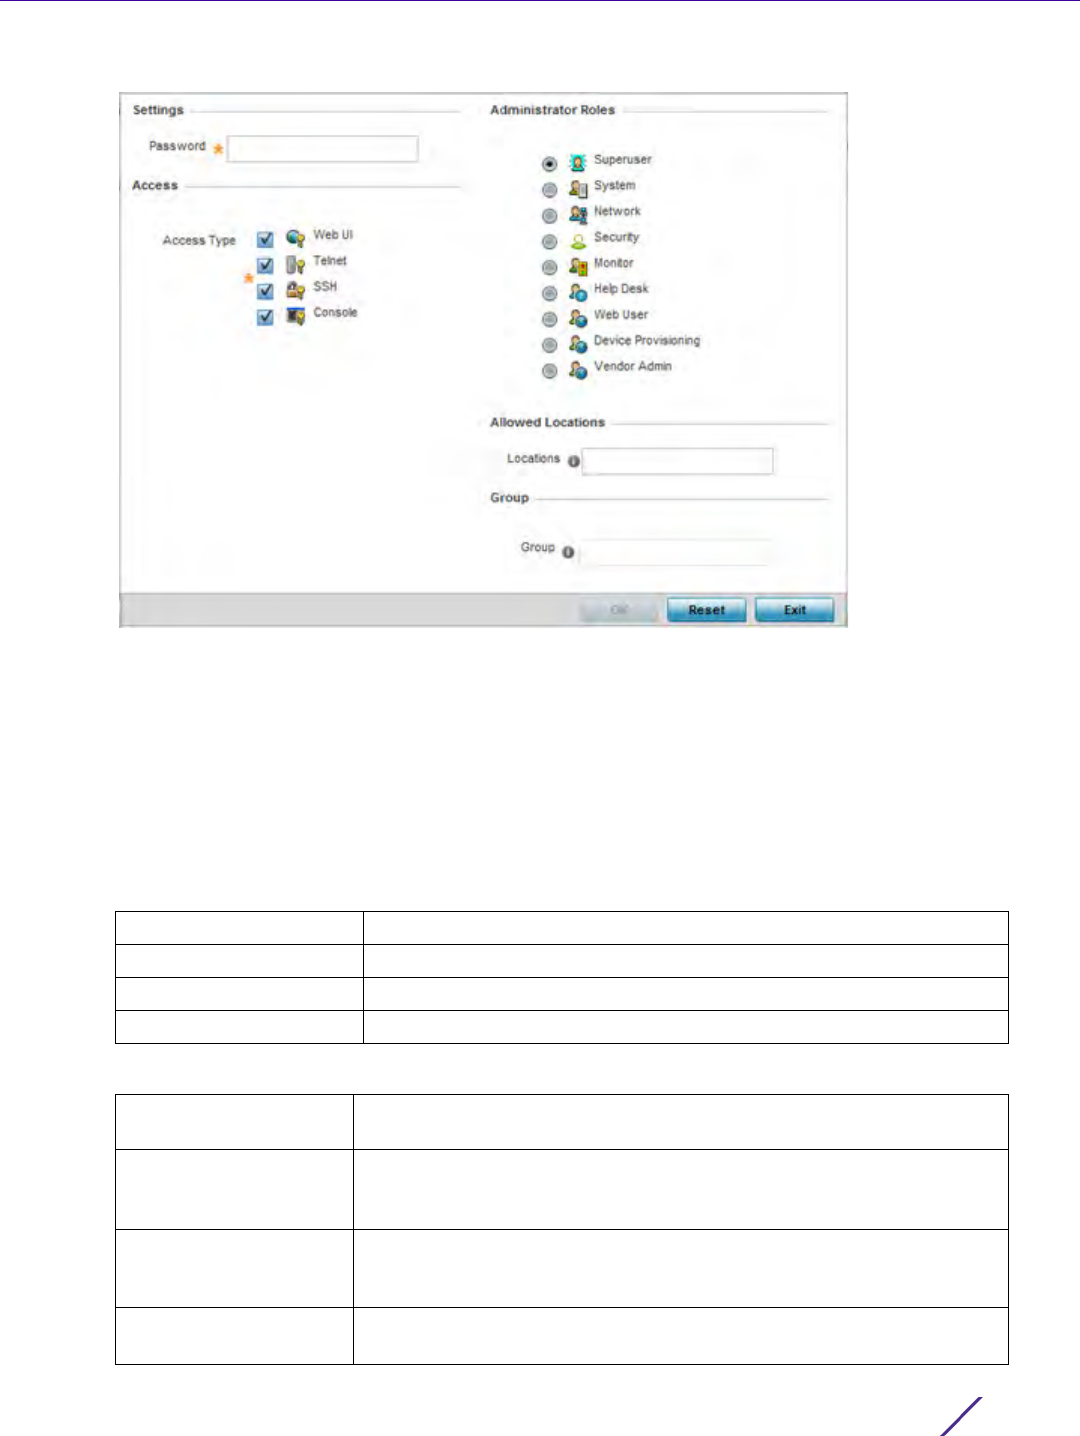
Figure 12-4 Administrators screen
3 If creating a new administrator, enter a user name in the User Name field. This is a mandatory field for new
administrators and cannot exceed 32 characters. Optimally assign a name representative of the user and role.
4 Provide a strong password for the administrator within the Password field, once provided, Reconfirm the
password to ensure its accurately entered. This is a mandatory field.
5Select
Access options to define the permitted access for the user. Access modes can be assigned to
management user accounts to restrict which management interfaces the user can access. A management user
can be assigned one or more access roles allowing access to multiple management interfaces. If required, all
four options can be selected and invoked simultaneously.
6 Select the Administrator Role for the administrator using this profile. Only one role can be assigned.
Web UI Select this option to enable access to the device’s Web User Interface.
Telnet Select this option to enable access to the device using TELNET.
SSH Select this option to enable access to the device using SSH.
Console Select this option to enable access to the device’s console.
Superuser Select this option to assign complete administrative rights to the user.
This entails all the roles listed for all the other administrative roles.
System The System role provides permissions to configure general settings like
NTP, boot parameters, licenses, perform image upgrades, auto install,
manager redundancy/clustering and control access.
Network The Network role provides privileges to configure all wired and wireless
parameters like IP configuration, VLANs, L2/L3 security, WLANs, radios,
and captive portal.
Security Select Security to set the administrative rights for a security
administrator allowing configuration of all security parameters.

Management Access
Wireless Controller and Service Platform System Reference Guide 12 - 7
7 Select the OK button to save the administrator’s configuration. Select Reset to revert to the last saved
configuration.
12.1.1.2 Setting an Allowed Location Configuration
Adding or Editing a Management Access Policy
Extreme Networks’ WiNG and NSight applications may have the same users with different permissions defined in
each application. Various user roles are supported in WiNG (superuser, system-admin, network-admin, security-
admin, device-provisioning-admin, helpdesk and monitor). With NSight, a user logging into the NSight UI should
also have an access control restriction based on the role they’re assigned. For example, a WiNG user with helpdesk
privileges should have access to only the site (RF Domain) in which the helpdesk is situated, and the location tree
should contain only one RF Domain. Similarly, when a user responsible for a set of sites logs in NSight, their
location tree needs to contain the RF Domains for which they’re responsible.
To set an allowed location configuration:
Monitor Select Monitor to assign permissions without any administrative rights.
The Monitor option provides read-only permissions.
Help Desk Assign this role to someone who typically troubleshoots and debugs
problems reported by the customer. The Help Desk manager typically
runs troubleshooting utilities (like a sniffer), executes service
commands, views/retrieves logs and reboots the controller or service
platform. However, Help Desk personnel are not allowed to conduct
controller or service platform reloads.
Web User Select Web User to assign the administrator privileges needed to add
users for authentication.
Device Provisioning Select Device Provisioning to assign an administrator privileges to
update (provision) device configuration files or firmware. Such updates
run the risk of overwriting and losing a device’s existing configuration
unless the configuration is properly archived.
Vendor Admin Select this option to create a vendor-admin user role group so this
particular user type can access offline device-registration portal data.
Vendors are assigned username/password credentials for securely on-
boarding devices. Devices are moved to a vendor allowed VLAN
immediately after this on-boarding process, so vendors do require
unique administration roles. When the Vendor-Admin role is selected,
provide the vendor’s Group name for RADIUS authentication. The
vendor's RADIUS group takes precedence over the statically configured
group for device registration.
Management Access
Wireless Controller and Service Platform System Reference Guide 12 - 8
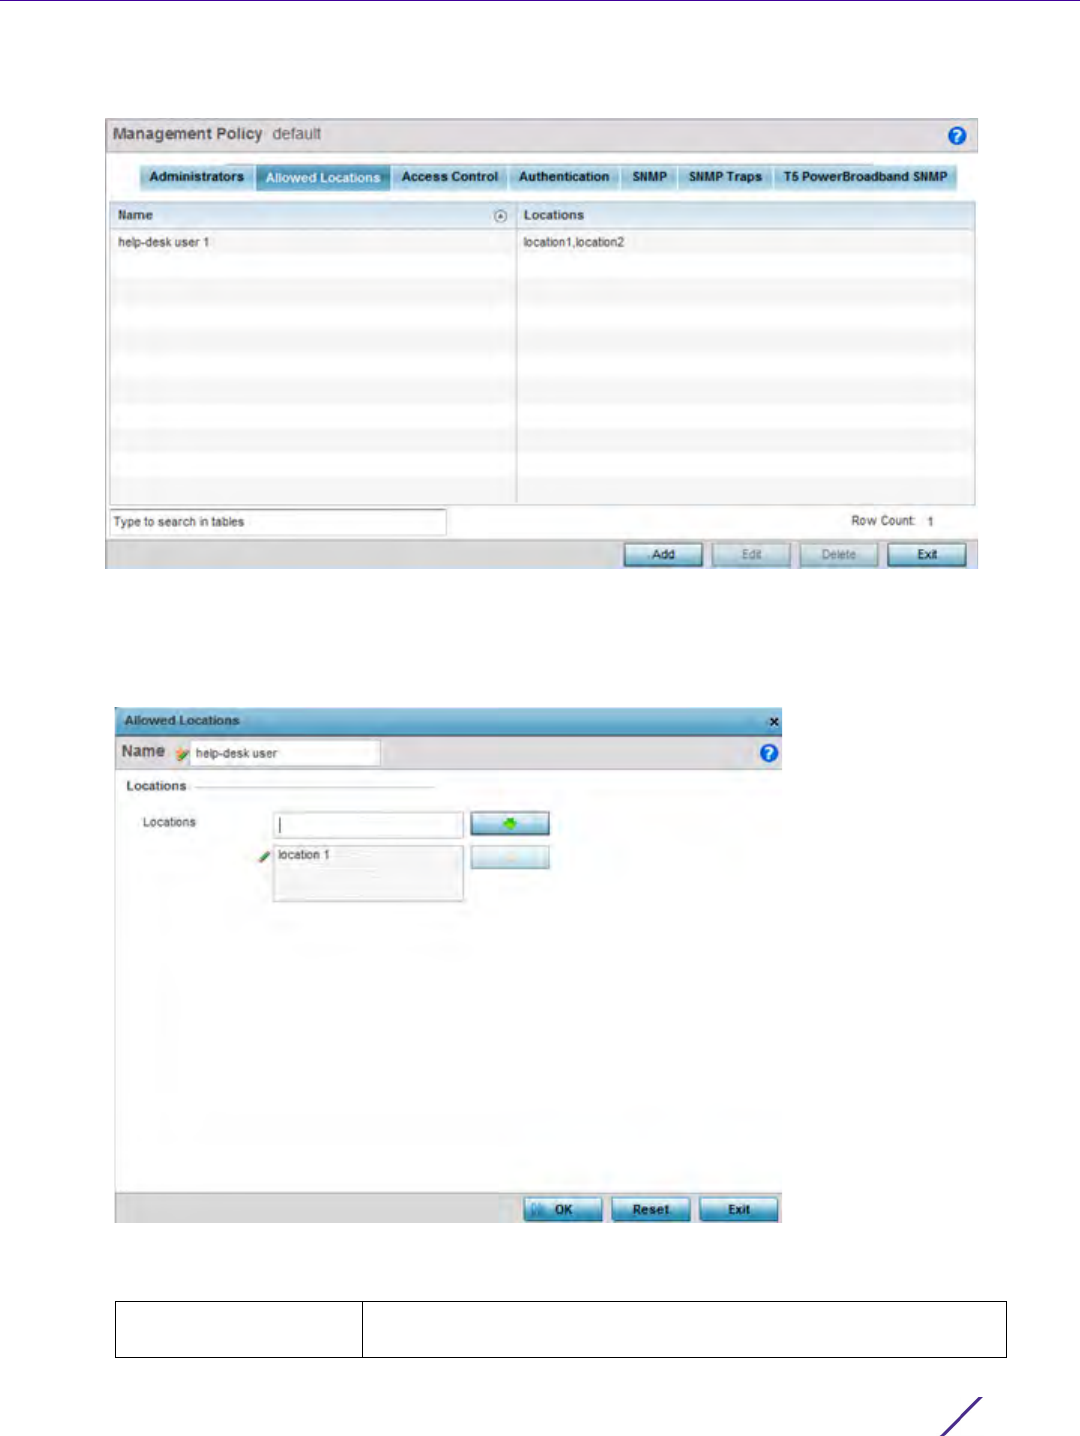
1 Select the Allowed Locations tab from the Management Policy screen.
Figure 12-5 Management Policy screen - Allowed Locations tab
The Allowed Locations screen lists existing users and their permitted locations.
2Select
Add to create a new allowed location, Edit to modify an existing location or Delete to permanently
remove a user name and location from the list of those available.
Figure 12-6 Adding Allowed Locations screen
3 Set the following allowed location parameters:
Name Define a 32 character maximum user name whose access is a mapped
to a specific site (RF Domain).

Management Access
Wireless Controller and Service Platform System Reference Guide 12 - 9
4Select
OK to update the allowed location configuration. Select Reset to the last saved configuration.
12.1.1.3 Setting the Access Control Configuration
Adding or Editing a Management Access Policy
Restricting remote access to a controller or service platform ensures only trusted hosts can communicate with
enabled management services. This ensures only trusted hosts can perform management tasks and provide
protection from brute force attacks from hosts attempting to break into the controller or service platform
managed network.
Administrators can permit management connections to be established on any IP interface on the controller or
service platform (including IP interfaces used to provide captive portal guest access). Administrators can restrict
management access by limiting access to a specific host (IP address), subnet, or ACL on the controller or service
platform.
Refer to the Access Control tab to allow/deny management access to the network using strategically selected
protocols (HTTP, HTTPS, Telnet, SSH or SNMP). Access options can be either enabled or disabled as required.
Disabling unused interfaces is recommended to close unnecessary security holes. The Access Control tab is not
meant to function as an ACL (in routers or other firewalls), where you can specify and customize specific IPs to
access specific interfaces.
•Source hosts - Management access can be restricted to one or more hosts by specifying their IP addresses
•Source subnets - Management access can be restricted to one or more subnets
•IP ACL - Management access can be based on the policies defined in an IP based ACL
In the following example, a controller has two IP interfaces defined with VLAN10 hosting management and
network services and VLAN70 providing guest services. For security the guest network is separated from all
trusted VLANs by a firewall.
By default, management services are accessible on both VLAN10 and VLAN70, and that’s not desirable to an
administrator. By restricting access to VLAN10, the controller only accepts management sessions on VLAN10.
Management access on VLAN70 is longer available.
Administrators can secure access to a controller or service platform by disabling less secure interfaces. By default,
the CLI, SNMP and FTP disable interfaces that do not support encryption or authentication. However, Web
management using HTTP is enabled. Insecure management interfaces such as Telnet, HTTP and SNMP should be
disabled, and only secure management interfaces, like SSH and HTTPS should be used to access the controller or
service platform managed network.
The following table demonstrates some interfaces provide better security than others:
Locations Create locations and use the navigation arrows to move them into the
list of those enabled once saved.
Interface Description IP Address Management
VLAN10 Services Yes Yes
VLAN70 Guest Yes No
Access Type Encrypted Authenticated Default State
Telnet No Yes Disabled
SNMPv2 No No Enabled
Management Access
Wireless Controller and Service Platform System Reference Guide 12 - 10
To set an access control configuration for the Management Access policy:
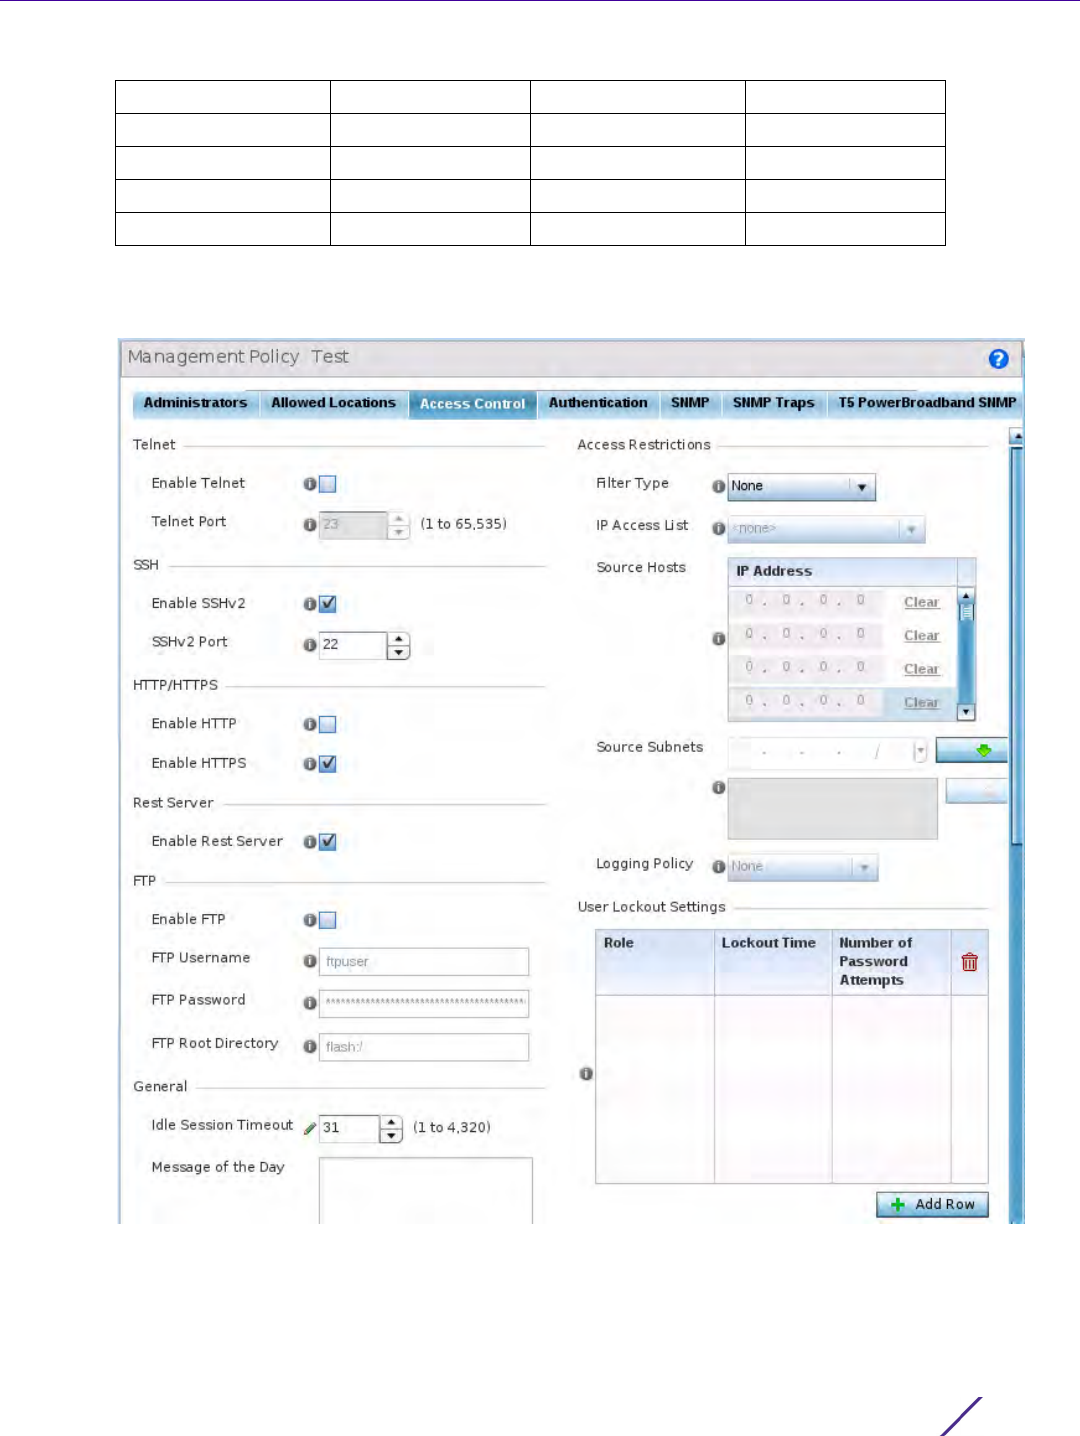
1 Select the Access Control tab from the Management Policy screen.
Figure 12-7 Management Policy screen - Access Control tab
SNMPv3 Yes Yes Enabled
HTTP No Yes Disabled
HTTPS Yes Yes Disabled
FTP No Yes Disabled
SSHv2 Yes Yes Disabled
Management Access
Wireless Controller and Service Platform System Reference Guide 12 - 11
2 Set the following parameters required for Telnet access:
3 Set the following parameters required for SSH access:
4 Set the following HTTP/HTTPS parameters:
5 Select the Enable Rest Server option, within the Rest Server field, to facilitate device on-boarding. When
selected, the REST server allows vendor-specific users access to the online device registration portal. All
requests and responses to and from the on-boarding portal are handled by the REST server through restful
Application Programming Interface (API) transactions. The REST server serves the Web pages used to associate
a device’s MAC address with a specific vendor group. This option is enabled by default.
6 Set the following parameters required for FTP access:
Enable Telnet Select the checkbox to enable Telnet device access. Telnet provides a
command line interface to a remote host over TCP. Telnet provides no
encryption, but it does provide a measure of authentication. Telnet
access is disabled by default.
Telnet Port Set the port on which Telnet connections are made (1 - 65,535). The
default port is 23. Change this value using the spinner control next to
this field or by entering the port number in the field.
Enable SSHv2 Select the checkbox to enable SSH device access. SSH (Secure Shell)
version 2, like Telnet, provides a command line interface to a remote
host. SSH transmissions are encrypted and authenticated, increasing
the security of transmission. SSH access is disabled by default.
SSHv2 Port Set the port on which SSH connections are made. The default port is
22. Change this value using the spinner control next to this field or by
entering the port number in the field.
Enable HTTP Select the checkbox to enable HTTP device access. HTTP provides
limited authentication and no encryption.
Enable HTTPS Select the checkbox to enable HTTPS device access. HTTPS
(Hypertext Transfer Protocol Secure) is more secure plain HTTP.
HTTPS provides both authentication and data encryption as opposed
to just authentication (as is the case with HTTP).
NOTE: If the a RADIUS server is not reachable, HTTPS or SSH management access
to the controller or service platform may be denied.
Enable FTP Select the checkbox to enable FTP device access. FTP (File Transfer
Protocol) is the standard protocol for transferring files over a TCP/IP
network. FTP requires administrators enter a valid username and
password authenticated locally. FTP access is disabled by default.
FTP Username Specify a username required when logging in to the FTP server. The
username cannot exceed 32 characters.
FTP Password Specify a password required when logging in to the FTP server.
Reconfirm the password in the field provided to ensure it has been
entered correctly. The password cannot exceed 63 characters.
FTP Root Directory Provide the complete path to the root directory in the space provided.
The default setting has the root directory set to flash:/

Management Access
Wireless Controller and Service Platform System Reference Guide 12 - 12
7 Set the following General parameters:
8 Set the following Access Restrictions parameters:
Idle Session Timeout Specify an inactivity timeout for management connection attempts (in
seconds) from 0 - 4,320.
Message of the Day Enter message of the day text (no longer then 255 characters)
displayed at login for clients connecting via the CLI.
Filter Type Select a filter type for access restriction. Options include IP Access
List, Source Address or None. To restrict management access to
specific hosts, select Source Address as the filter type and provide the
allowed addresses within the Source Hosts field.
IP Access List If the selected filter type is IP Access List, select an access list from
the drop-down menu or select the Create button to define a new one.
IP based firewalls function like Access Control Lists (ACLs) to filter/
mark packets based on the IP from which they arrive, as opposed to
filtering packets on layer 2 ports. IP firewalls implement uniquely
defined access control policies, so if you don't have an idea of what
kind of access to allow or deny, a firewall is of little value, and could
provide a false sense of network security.
Source Hosts If the selected filter type is Source Address, enter an IP Address or IP
Addresses for the source hosts. To restrict management access to
specific hosts, select Source Address as the filter type and provide the
allowed addresses within the Source Hosts field.
Source Subnets If the selected filter type is Source Address, enter a source subnet or
subnets for the source hosts. To restrict management access to
specific subnets, select Source Address as the filter type and provide
the allowed addresses within the Source Subnets field.
Logging Policy If the selected filter is Source Address, enter a logging policy for
administrative access. Options includes None, Denied Requests or All.

Management Access
Wireless Controller and Service Platform System Reference Guide 12 - 13
9Set the User Lockout Settings. Click the Add Row button and configure the following role-based user-account
lockout and unlock criteria:
10 Select OK to update the access control configuration. Select Reset to the last saved configuration.
12.1.1.4 Setting the Authentication Configuration
Adding or Editing a Management Access Policy
Refer to the Authentication tab to define how user credential validation is conducted on behalf of a Management
Access policy. If utilizing an external authentication resource, an administrator can optionally apply a TACACS
policy. Terminal Access Controller Access - Control System+ (TACACS+) is a protocol created by CISCO to provide
access control to network devices (routers, network access servers or other networked devices) through one or
more centralized servers. TACACS provides separate authentication, authorization, and accounting services running
on different servers.
To configure an external authentication resource:
Role Specify the user-role for which account lockout is to be enabled. The
options are:
• device-provisioning-admin
•helpdesk
•monitor
•network-admin
•security-admin
• system-admin
• vendor-admin
• web-suer-admin
Note, you can enable account lockout for multiple roles. After
specifying the role/roles, set the Lockout Time and Number of
Password Attempts.
User-account lockout is individually applied to each account within
the specified role/roles. For example, consider the ‘monitor’ role
having two users: ‘user1’ and ‘user2’. The Number of Password
Attempts and Lockout Time is set at ‘5’ attempts and ‘10’ minutes
respectively. In this scenario, user2 makes 5 consecutive, failed login
attempts, and the user2 account is locked out for 10 minutes.
However, during this lockout time the user1 account remains active.
Lockout Time Specify the maximum time for which an account remains locked.
Specify a value from 0 to 600 minutes. The value ‘0’ indicates that the
account is permanently locked.
Number of Password
Attempts
Specify the maximum number of consecutive, failed attempts allowed
before an account is locked. Specify a value from 1 to 100.
Management Access
Wireless Controller and Service Platform System Reference Guide 12 - 14
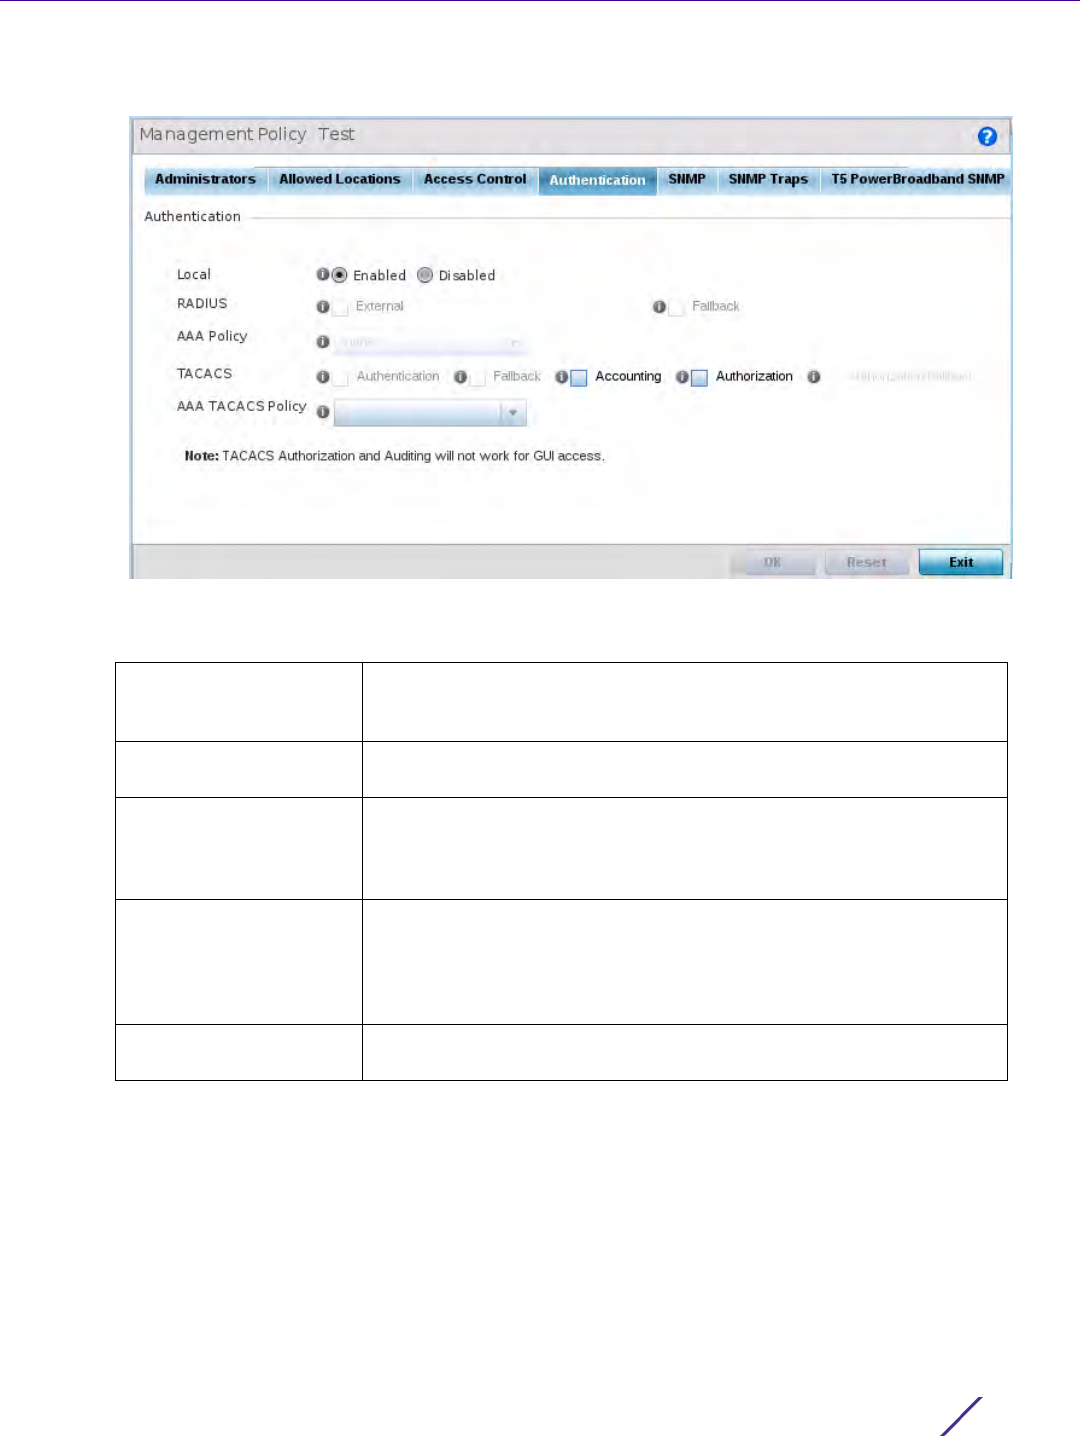
1 Select the Authentication tab from the Management Policy screen.
Figure 12-8 Management Policy screen - Authentication tab
2 Define the following settings to authenticate management access requests:
3Select
OK to update the authentication configuration. Select Reset to the last saved configuration.
12.1.1.5 Setting the SNMP Configuration
Adding or Editing a Management Access Policy
Optionally use the Simple Network Management Protocol (SNMP) to communicate with devices within the
network. SNMP is an application layer protocol that facilitates the exchange of management information between
the controller or service platform and a managed device. SNMP enabled devices listen on port 162 (by default) for
SNMP packets from the controller or service platform’s management server. SNMP uses read-only and read-write
community strings as an authentication mechanism to monitor and configure supported devices. The read-only
Local Select whether the authentication server resource is centralized
(local), or whether an external authentication resource is deployed for
validating user access. Local is enabled by default.
RADIUS If local authentication is disabled, define whether the RADIUS server is
External or Fallback.
AAA Policy Define the AAA policy used to authenticate user validation requests to
the controller or service platform managed network. Select the Create
icon as needed to define a new AAA policy or select the Edit icon to
modify an existing policy.
TACACS If local authentication is disabled, optionally select Authentication or
Fallback (only one authentication or fallback option can be selected)
or Accounting and Authorization. TACACS policies control user access
to devices and network resources while providing separate
accounting, authentication, and authorization services.
AAA TACACS Policy Select an existing AAA TACACS policy (if available), or select Create
to define a new policy or Edit to modify an existing one.
Management Access
Wireless Controller and Service Platform System Reference Guide 12 - 15
community string is used to gather statistics and configuration parameters from a supported wireless device. The
read-write community string is used by a management server to set device parameters. SNMP is generally used to
monitor a system’s performance and other parameters.
To configure SNMP Management Access:
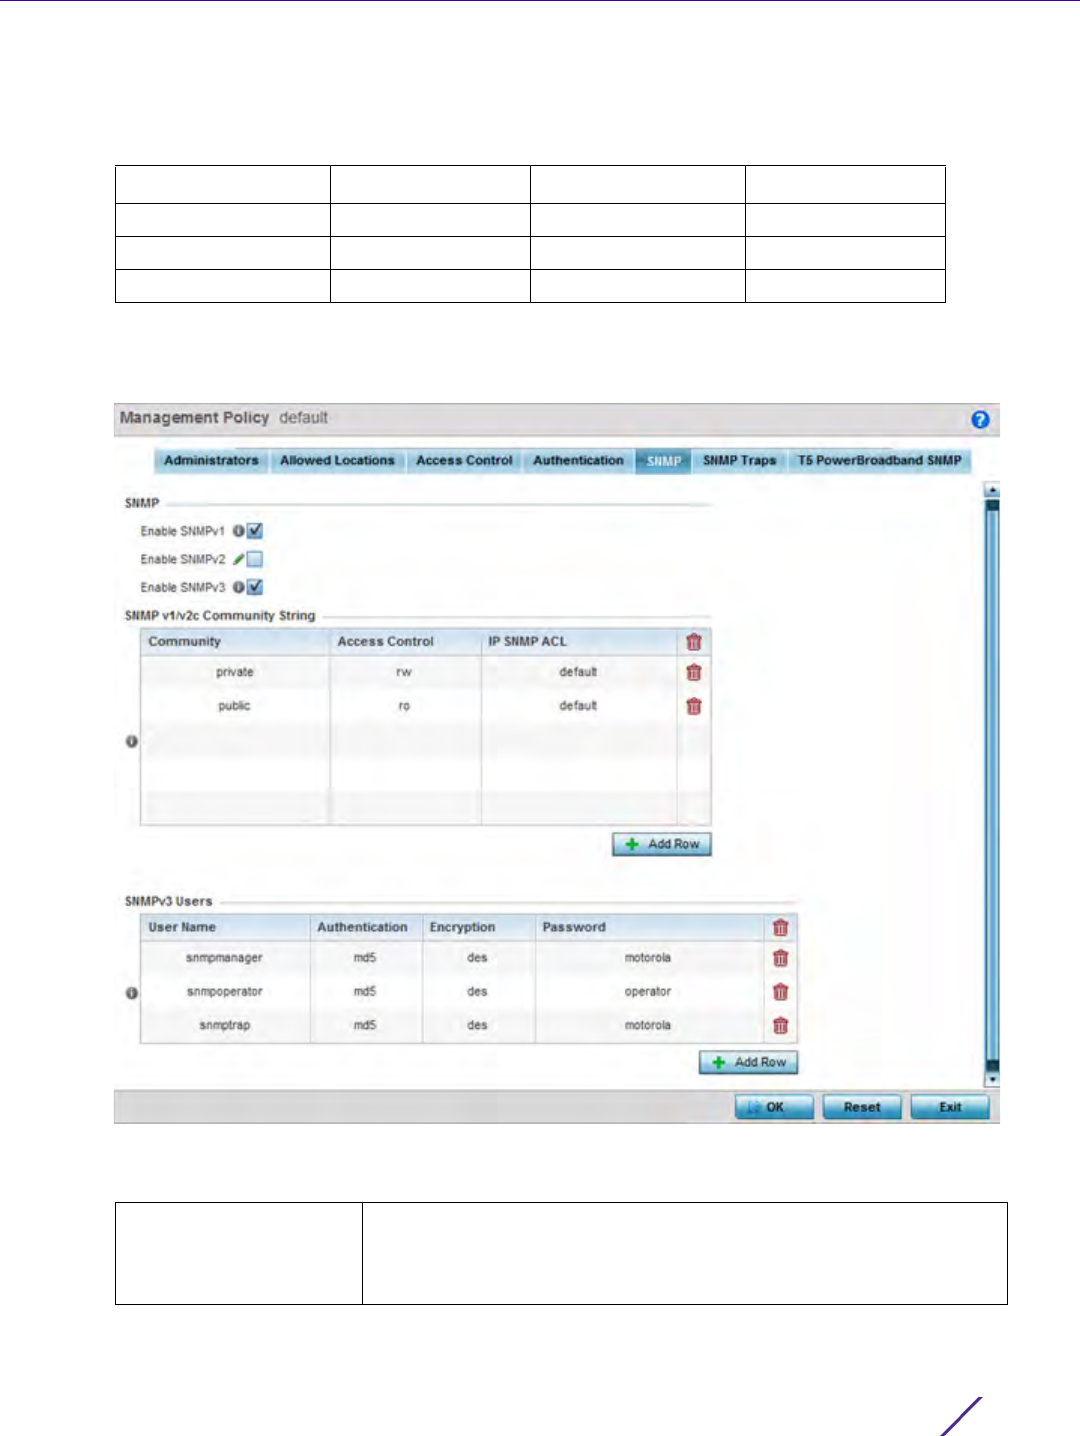
1 Select the SNMP tab from the Management Policy screen.
Figure 12-9 Management Policy screen - SNMP tab
2 Enable or disable SNMP v1, SNMPv2 and SNMPv3.
SNMP Version Encrypted Authenticated Default State
SNMPv1 No No Disabled
SNMPv2 No No Enabled
SNMPv3 Yes Yes Enabled
Enable SNMPv1 SNMP v1exposes a device’s management data so it can be managed
remotely. Device data is exposed as variables that can be accessed
and modified as text strings, with version 1 being the original
(rudimentary) implementation. SNMPv1 is enabled by default.

Management Access
Wireless Controller and Service Platform System Reference Guide 12 - 16
3Set the SNMP v1/v2 Community String configuration. Use the + Add Row function as needed to add additional
SNMP v1/2 community strings, or select an existing community string’s radio button and select the Delete icon
to remove it.
4Set the
SNMPv3 Users configuration. Use the + Add Row function as needed to add additional SNMPv3 user
configurations, or select a SNMP user’s radio button and select the Delete icon to remove the user.
5Select
OK to update the SNMP configuration. Select Reset to revert to the last saved configuration.
12.1.1.6 SNMP Trap Configuration
Adding or Editing a Management Access Policy
The managed network can use SNMP trap receivers for fault notifications. SNMP traps are unsolicited notifications
triggered by thresholds (or actions), and are therefore an important fault management tool.
A SNMP trap receiver is the destination of SNMP messages (external to the controller or service platform). A trap
is like a Syslog message, just over another protocol (SNMP). A trap is generated when a device consolidates event
Enable SNMPv2 Select the checkbox to enable SNMPv2 support. SNMPv2 provides
device management using a hierarchical set of variables. SNMPv2 uses
Get, GetNext, and Set operations for data management. SNMPv2 is
enabled by default.
Enable SNMPv3 Select the checkbox to enable SNMPv3 support. SNMPv3 adds
security and remote configuration capabilities to previous versions.
The SNMPv3 architecture introduces the user-based security model
(USM) for message security and the view-based access control model
(VACM) for access control. The architecture supports the concurrent
use of different security, access control and message processing
techniques. SNMPv3 is enabled by default.
Community Define a public or private community designation. By default, SNMPv2
community strings on most devices are set to public, for the read-only
community string, and private for the read-write community string.
Access Control Set the access permission for each community string used by devices
to retrieve or modify information. Available options include:
Read Only - Allows a remote device to retrieve information.
Read-Write - Allows a remote device to modify settings.
IP SNMP ACL Set the IP SNMP ACL used along with community string. Use the
drop-down menu to select an existing ACL. Use the Create icon to
create and add a new ACL. Select an existing ACL and the Edit icon to
update an existing ACL.
User Name Use the drop-down menu to define a user name of snmpmanager,
snmpoperator or snmptrap.
Authentication Displays the authentication scheme used with the listed SNMPv3 user.
The listed authentication scheme ensures only trusted and authorized
users and devices can access the network.
Encryption Displays the encryption scheme used with the listed SNMPv3 user.
Password Provide the user’s password in the field provided. Select the Show
check box to display the actual character string used in the password,
while leaving the check box unselected protects the password and
displays each character as “*”.
Management Access
Wireless Controller and Service Platform System Reference Guide 12 - 17
information and transmits the information to an external repository. The trap contains several standard items, such
as the SNMP version, community etc.
SNMP trap notifications exist for most controller or service platform operations, but not all are necessary for day-
to-day operation.
To define a SNMP trap configuration for receiving events at a remote destination:
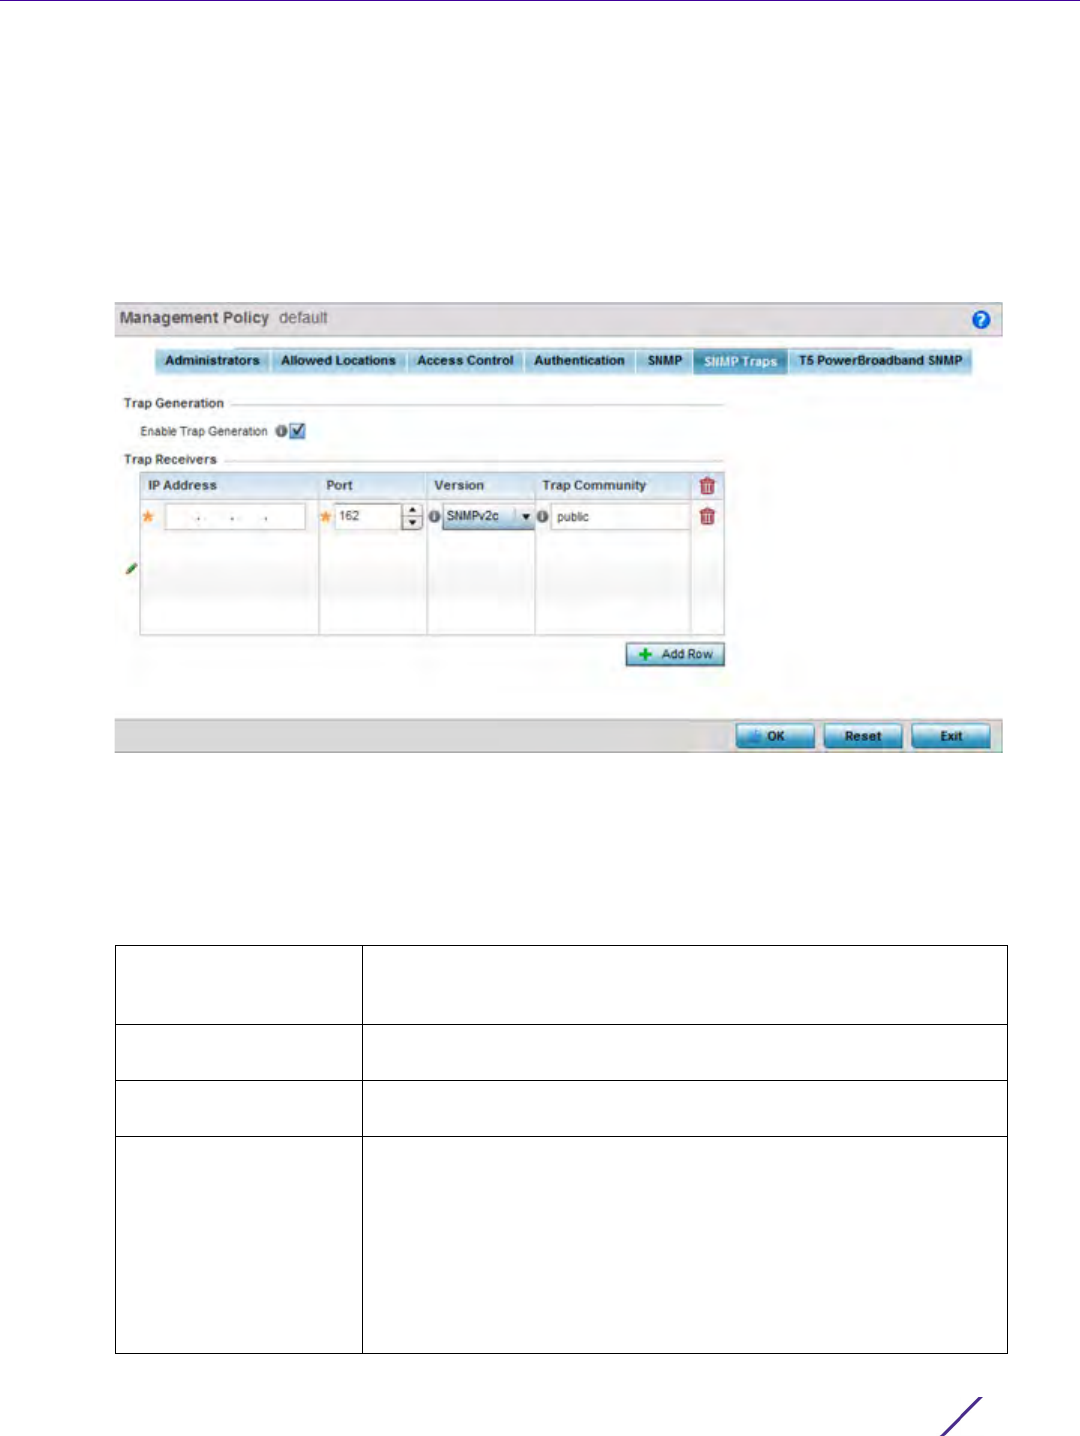
1 Select the SNMP Traps tab from the Management Policy screen.
Figure 12-10 Management Policy screen - SNMP Traps tab
2 Select the Enable Trap Generation checkbox to enable trap generation using the trap receiver configuration
defined. This feature is disabled by default.
3 Refer to the Trap Receiver table to set the configuration of the external resource dedicated to receiving trap
information. Select Add Row + as needed to add additional trap receivers. Select the Delete icon to
permanently remove a trap receiver.
IP Address Sets the IP address of the external server resource dedicated to
receiving the SNMP traps on behalf of the controller or service
platform.
Port Set the port of the server resource dedicated to receiving SNMP traps.
The default port is port 162.
Version Sets the SNMP version to use to send SNMP traps. SNMPv2 is the
default.
Trap Community Provide a 32 character maximum trap community string. The
community string functions like a user id or password allowing access
to controller or Access Point resources. If the community string is
correct, the controller or Access Point provides with the requested
information. If the community string is incorrect, the device controller
or Access Point discards the request and does not respond.
Community strings are used only by devices which support SNMPv1
and SNMPv2c. SNMPv3 uses username/password authentication,
along with an encryption key. The default setting is public.
Management Access
Wireless Controller and Service Platform System Reference Guide 12 - 18
4Select
OK to update the SNMP Trap configuration. Select Reset to revert to the last saved configuration.
12.1.1.7 T5 PowerBroadband SNMP
Adding or Editing a Management Access Policy
A T5 controller, once enabled as a supported external device, can provide data to WiNG to assist in a T5’s
management within a WiNG supported subnet populated by both types of devices.
To define a T5 controller power broadband SNMP configuration:
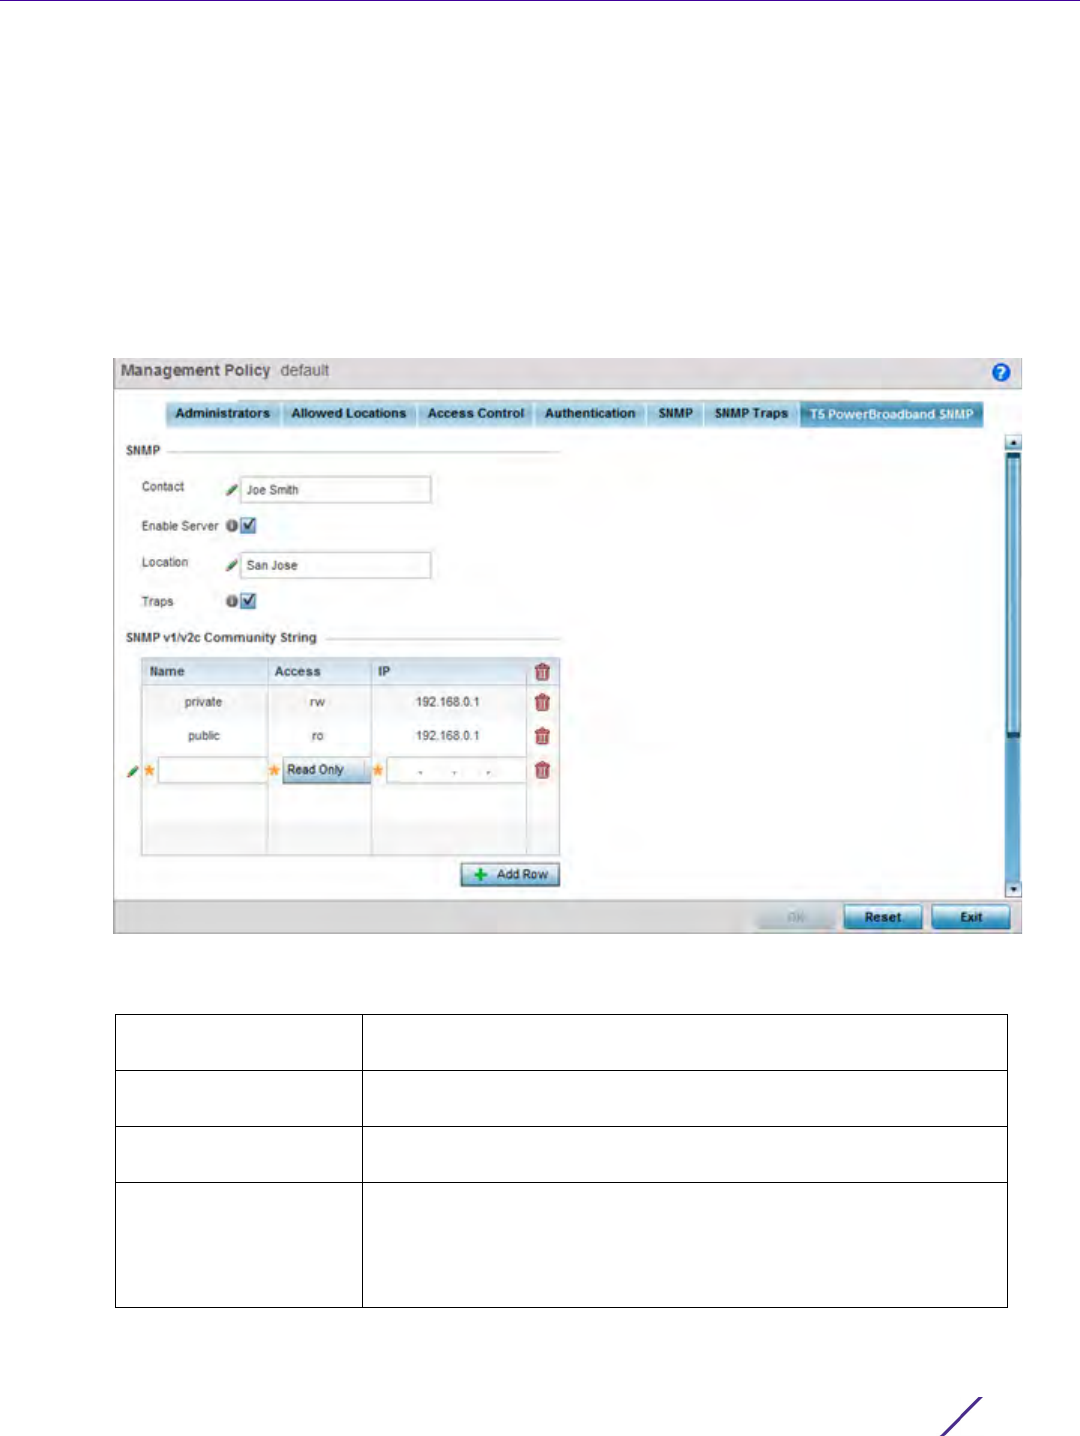
1 Select the T5 Power Broadband tab from the Management Policy screen.
Figure 12-11 Management Policy screen - T5 PowerBroadband tab
2 Set the following SNMP settings:
Contact Set a 64 character maximum contact name for the administration of
T5 controller SNMP events.
Enable Server Select this option to enable SNMP event management for the T5
controller. This setting is disabled by default.
Location Set a 64 character maximum location for the SNMP resource
dedicated to T5 controller support.
Traps Select this option for SNMP trap support for the T5 controller. A trap
is like a Syslog message, just over another protocol (SNMP). A trap is
generated when a device consolidates event information and
transmits the information to an external repository. The trap contains
several standard items, such as the SNMP version, community etc.
Management Access
Wireless Controller and Service Platform System Reference Guide 12 - 19
3Set the SNMP v1/v2c Community String configuration for T5 controller usage. Use the + Add Row function as
needed to add additional SNMP v1/2 community strings, or select an existing community string’s radio button
and select the Delete icon to remove it.
4Use the Host table to define up to 4 SNMP receiver resource IP addresses.
5Select
OK to update the configuration. Select Reset to revert to the last saved configuration.
12.2 EX3500 Management Policies
The EX3500 series switch is a Gigabit Ethernet Layer 2 switch with either 24 or 48 10/100/1000-BASE-T ports, and
four Small Form Factor Pluggable (SFP) transceiver slots for fiber connectivity. Each 10/100/1000 Mbps port
supports both the IEEE 802.3af and IEEE 802.3at-2009 PoE standards. Each EX3500 series switch includes an
SNMP-based management agent, which provides both in-band and out-of-band access for management. An
EX3500 series switch utilizes an embedded HTTP Web agent and command line interface (CLI) somewhat
different from the WiNG operating system, while still enabling the EX3500 series switch to provide WiNG
controllers PoE and port management resources.
Going forward NX9600, NX9500, NX7500, NX5500 WiNG managed services platforms and WiNG VMs can
discover, adopt and partially manage EX3500 series Ethernet switches, as DHCP option 193 has been added to
support external device adoption. DHCP option 193 is a simplified form of DHCP options 191 and 192 used by WiNG
devices currently. DHCP option 193 supports pool1, hello-interval and adjacency-hold-time parameters.
WiNG service platforms leave the proprietary operating system running the EX3500 switches unmodified, and
partially manage them utilizing standardized WiNG interfaces. WiNG service platforms use a translation layer to
communicate with EX3500 series switches.
To set EX3500 management settings for user EX3500 user group creation, authentication, password management
and SNMP:
1Select
Configuration.
2Select
Management.
3 Refer to the upper, left-hand, portion of the UI and select EX3500 Management Policy.
Community Set a 32 character maximum SNMP community string.
Access Set the access permission for each community string used by devices
to retrieve or modify information. Available options include:
Read Only - Allows a remote device to retrieve information.
Read-Write - Allows a remote device to modify settings.
IP Set the IP address of the SNMP manager.
NOTE: WiNG can partially manage an EX3500 without using DHCP option 193. In
this case the EX3500 must be directly configured to specify the IPv4 addresses of
potential WiNG adopters, using the EX3500 controller host ip address
CLI command.
Management Access
Wireless Controller and Service Platform System Reference Guide 12 - 20
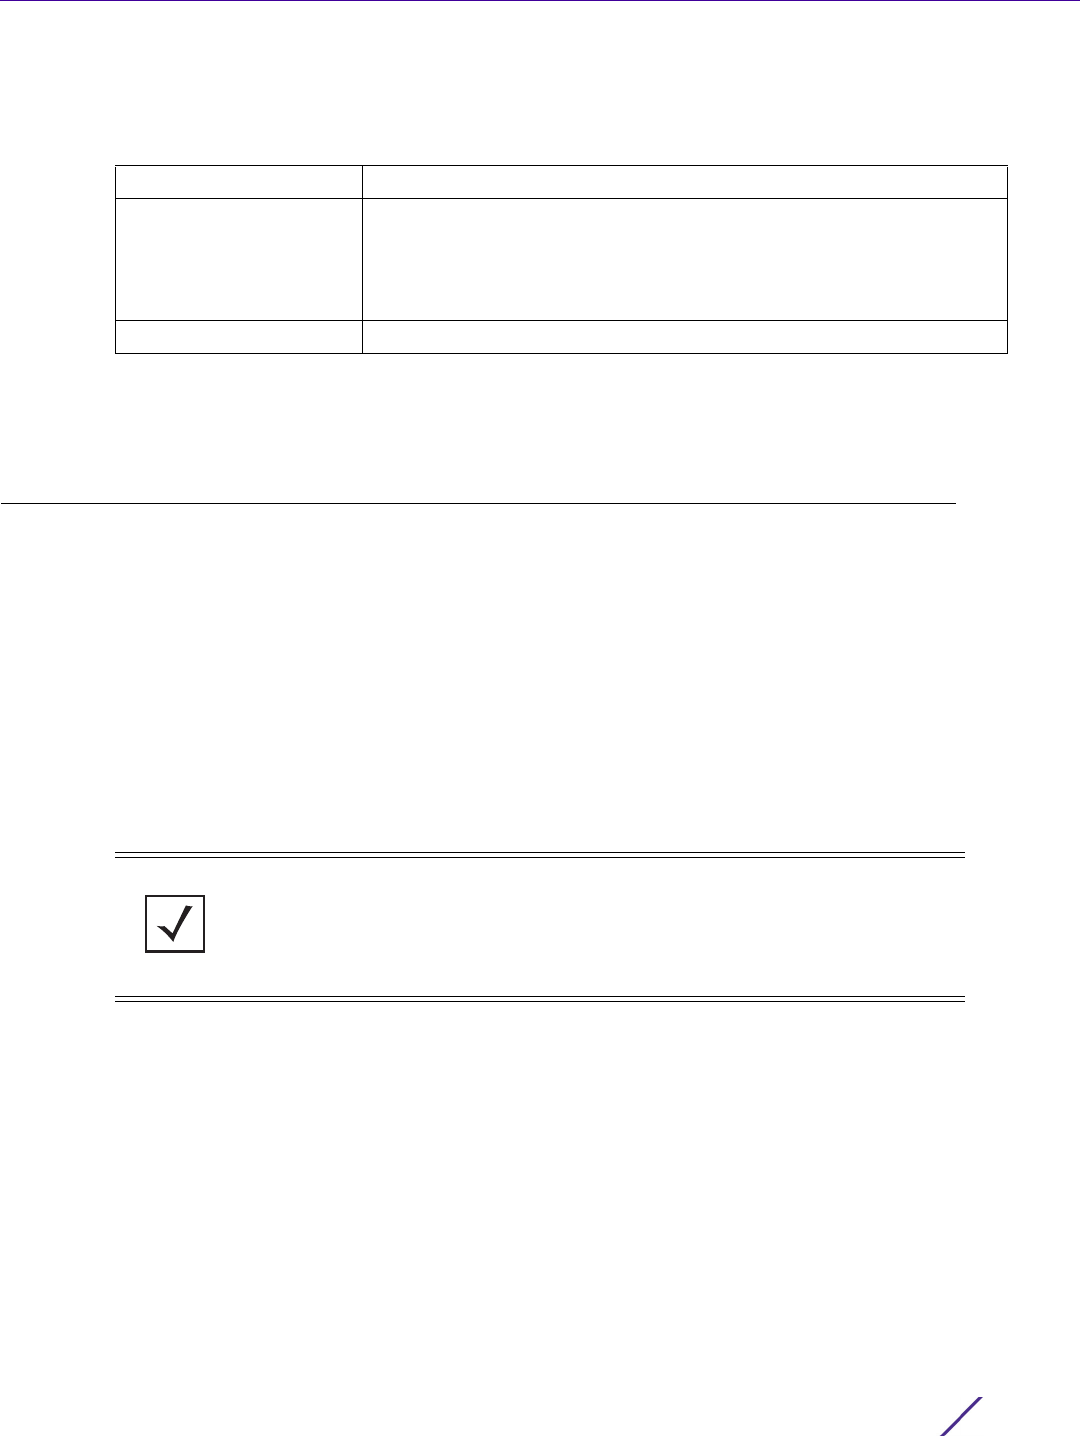
Figure 12-12 EX3500 Management Policy screen
The screen lists those EX3500 management policies created thus far. Select Add to create a new EX3500
management policy, Edit to modify the attributes of a policy or Delete to remove an obsolete list from those
available. Existing lists can be copied or renamed as needed.
For more information, refer to the following:
•EX3500 User Groups
•EX3500 Authentication
•EX3500 Exec Password Management
•EX3500 System Settings
•EX3500 SNMP Management
•EX3500 SNMP Users
12.2.1 EX3500 User Groups
EX3500 switch user groups are stored in a local database on the WiNG service platform. Each user group can be
assigned unique access levels and passswords to provide administrative priority.
To set an EX3500 user group configuration:
1Select
Configuration.
2Select
Management.
3 Refer to the upper, left-hand, portion of the UI and select EX3500 Management Policy.
4 The screen lists those EX3500 management policies created thus far. Select Add to create a new EX3500
management policy, Edit to modify an existing policy or Delete to remove an obsolete policy. Existing lists can
be copied or renamed as needed.
5 If creating a new EX35000 user group, assign it a Name up to 32 characters. Select Continue.
Management Access
Wireless Controller and Service Platform System Reference Guide 12 - 21
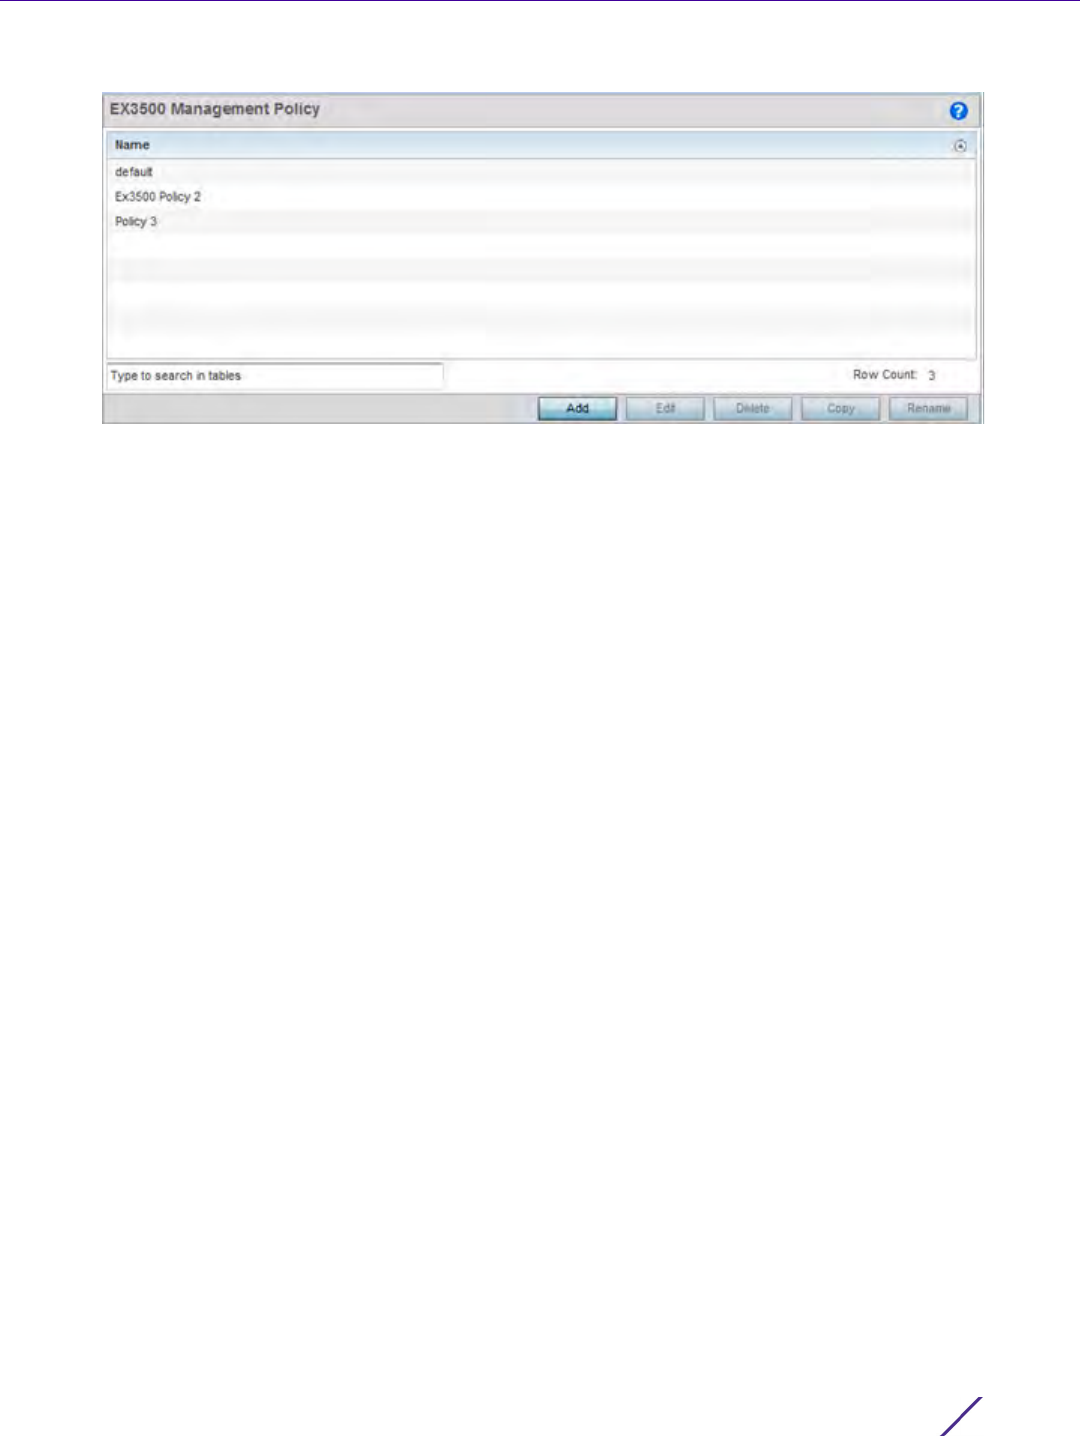
Figure 12-13 EX3500 Management Policy User Group screen
6Select Add to create a new EX3500 user group, Edit to modify an existing group or Delete to remove an
obsolete group. Set the following User Group attributes:
Figure 12-14 User Group Add/Edit screen
Access Level Use the spinner control to set an access level from 0 - 15 serving as the
access priority of each user group requesting access and interoperability
with an EX3500 switch. Access level 0 corresponds to a guest user with
minimal access to commands while access level 15 corresponds to an
administrator user with full access to all commands.
Management Access
Wireless Controller and Service Platform System Reference Guide 12 - 22
7Select
OK when completed to update the EX3500 user group configuration. Select Reset to revert the screen
back to its last saved configuration.
12.2.2 EX3500 Authentication
Management access to an EX3500 switch can be enabled/disabled as required using separate interfaces and
protocols (HTTP, SSH). Disabling un-used and insecure interfaces and unused management services can
dramatically reduce an attack footprint and free resources within an EX3500 management policy.
To authenticate an EX3500 management policy:
1Select
Configuration from the Web UI.
2Select
Management.
3 Refer to the upper, left-hand, portion of the UI and select EX3500 Management Policy.
4 The screen lists those EX3500 management policies created thus far. Select Add to create a new EX3500
management policy, Edit to modify an existing policy or Delete to remove an obsolete policy. Existing lists can
be copied or renamed as needed.
5 Select the Authentication tab.
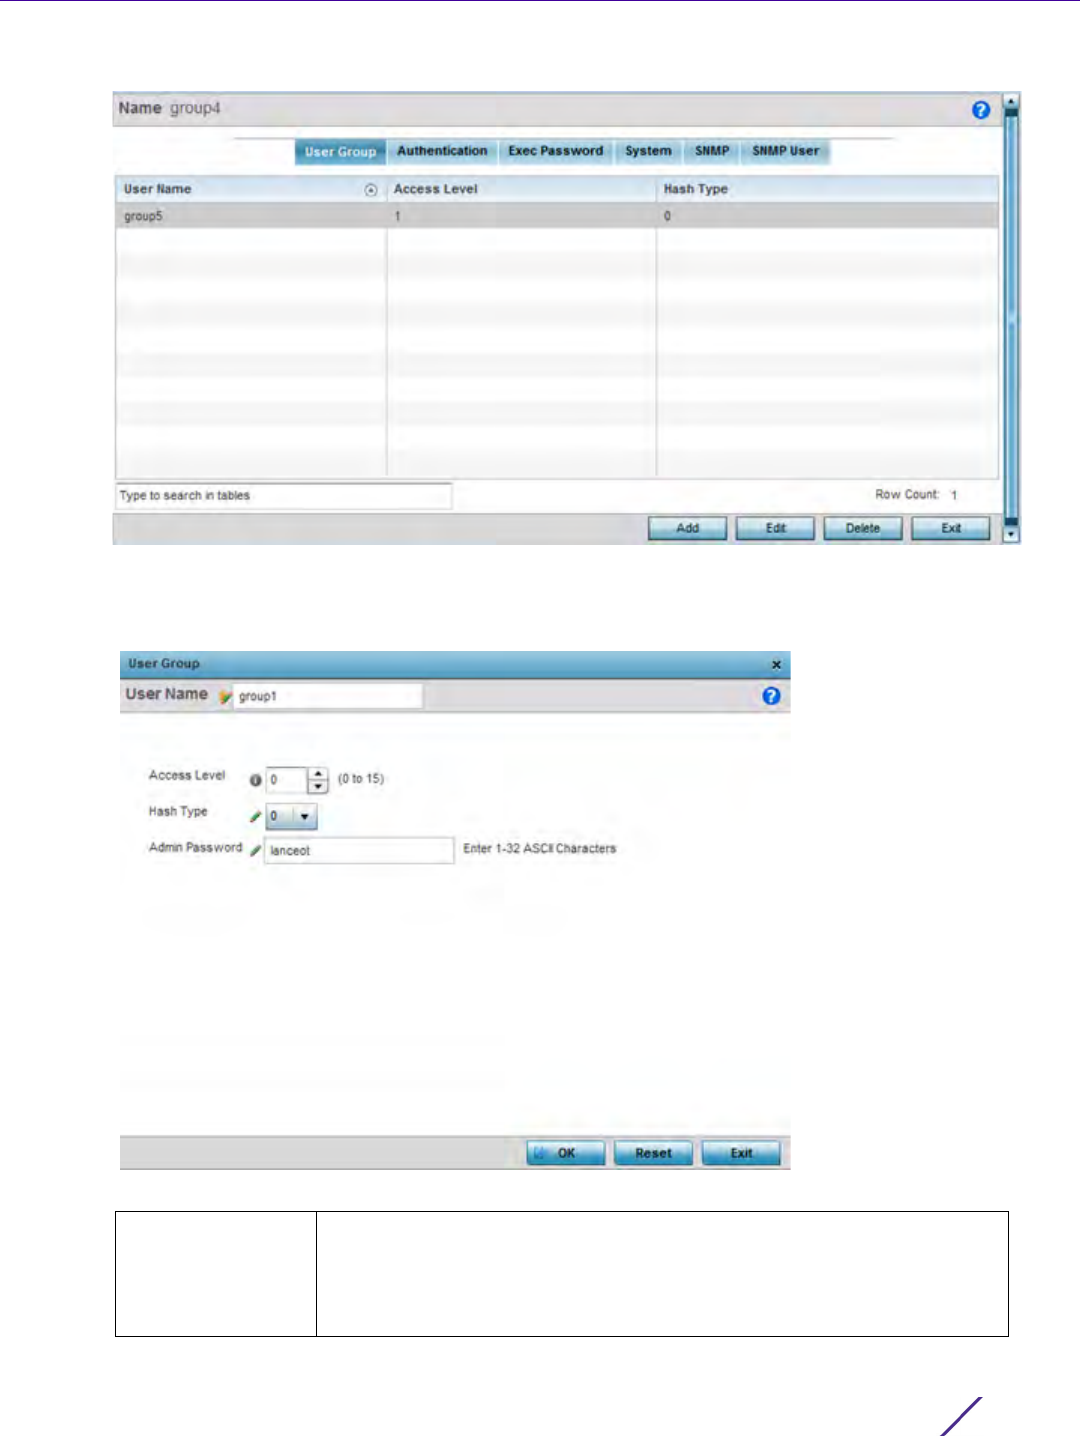
Figure 12-15 EX35000 Management Policy Authentication screen
6 Select the following HTTP server settings to authenticating a HTTP connection to an EX3500:
Hash Type Select either 0 or 7 to define the hash in plain text (0) or encrypted
characters (7).
Admin Password Create a 32 character maximum password for the EX3500 user group.
Server When selected, access the EX3500 using HTTP from any Windows PC,
Linux PC or other device that uses HTTP. This setting is enabled by default.
Port Set the HTTP port number from 1 - 65,535. The default port is 80.
Secure Server Select this option to secure HTTP over a designated secure port.

Management Access
Wireless Controller and Service Platform System Reference Guide 12 - 23
7 Select the following SSH server settings to authenticate a SSH connection to an EX3500:
8Select
OK when completed to update the EX3500 authentication configuration. Select Reset to revert the
screen back to its last saved configuration.
12.2.3 EX3500 Exec Password Management
Each EX3500 management policy can have a unique exec password with its own privilege level assigned. Utilize
these passwords as specific EX3500 management sessions require priority over others.
To administrate EX3500 management passwords and their privileges:
1Select
Configuration from the Web UI.
2Select
Management.
3 Refer to the upper, left-hand, portion of the UI and select EX3500 Management Policy.
4 The screen lists those EX3500 management policies created thus far. Select Add to create a new EX3500
management policy, Edit to modify an existing policy or Delete to remove an obsolete policy. Existing lists can
be copied or renamed as needed.
5 Select the Exec Password tab.
Secure Port Use the spinner control to select a secure port from 1 - 65, 535.
Server When selected, access the EX3500 using SSH from any Windows PC, Linux
PC or other device that uses SSH. This setting is enabled by default.
Retries for SSH Set the maximum number of retries, from 1 - 5, for connection to the SSH
server resource. The default setting is 3.
Server Key Set the SSH server key length from 512 - 1,024. The default length
is 768.
Time Out Set the inactivity timeout for the SSH server resource from 1 - 120 seconds.
When this setting is exceeded, the SSH server resource becomes
unreachable and must be reauthenticated. The default value is 120 seconds.
Management Access
Wireless Controller and Service Platform System Reference Guide 12 - 24
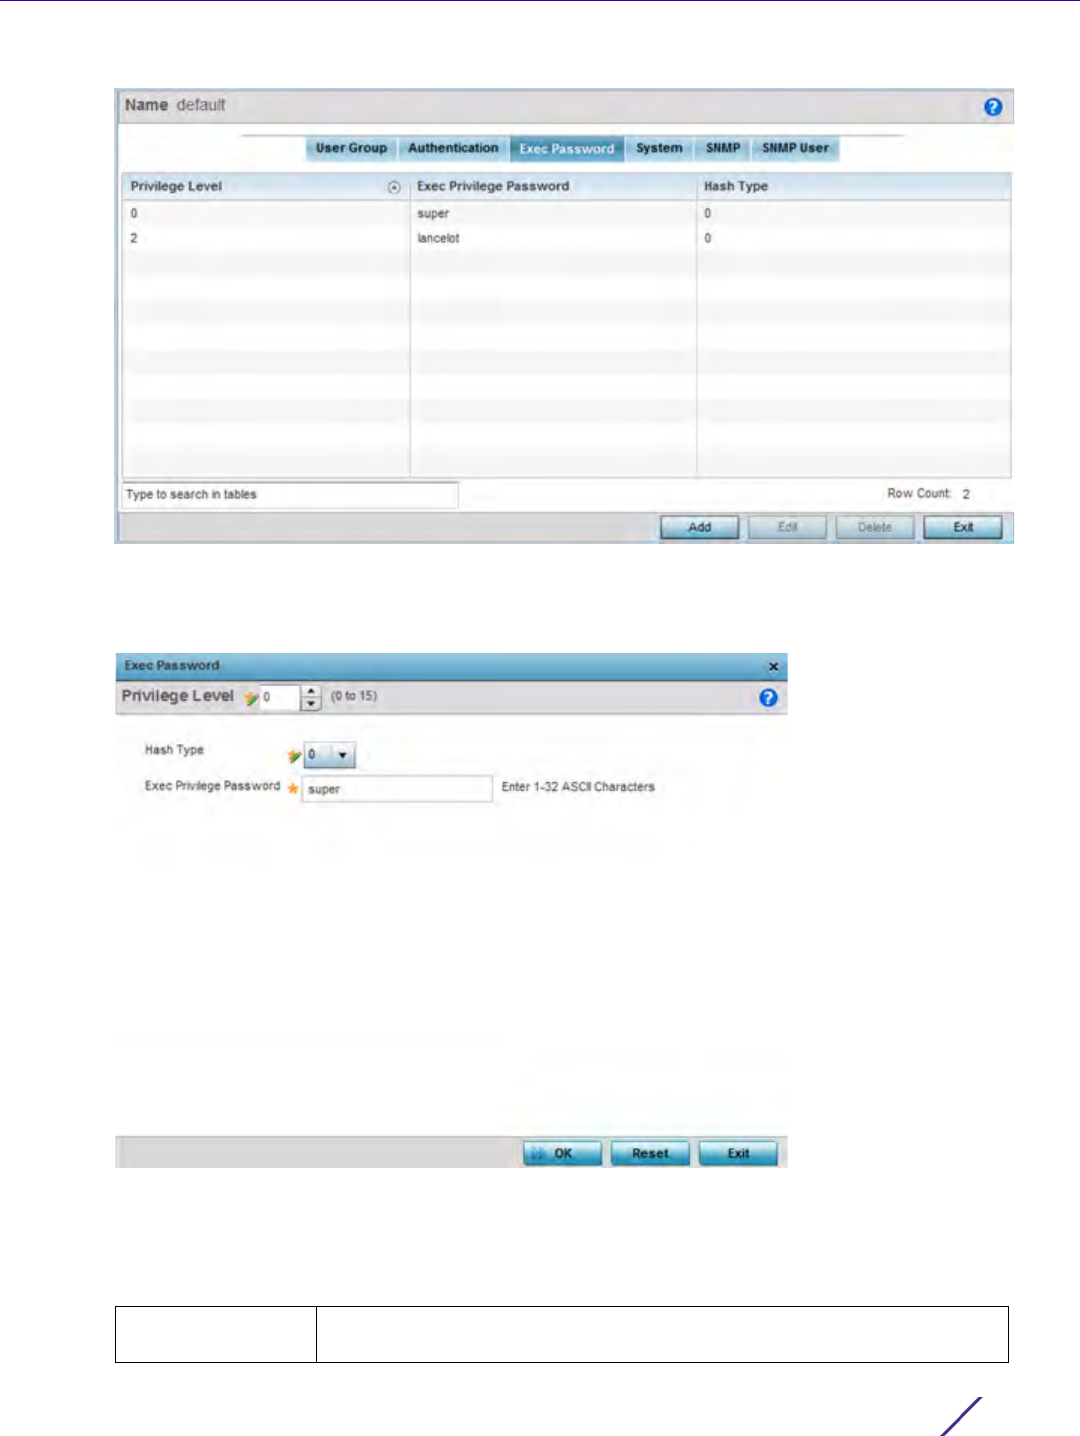
Figure 12-16 EX35000 Management Policy Exec Password screen
6Select Add to create a new EX3500 exec password, Edit to modify an existing password configuration or Delete
to remove an obsolete password.
Figure 12-17 EX35000 Management Policy Exec Password Add/Edit screen
7 Assign a privilege level from 0 - 15. 0 provides the least access, while level 15 provides the most access. The
commands available at each level vary.
8 Select the following Exec Password settings:
Hash Type Select either 0 or 7 to define the hash in plain text (0) or encrypted
characters (7).
Management Access
Wireless Controller and Service Platform System Reference Guide 12 - 25
9Select
OK when completed to update the EX3500 exec password. Select Reset to revert the screen back to its
last saved configuration.
12.2.4 EX3500 System Settings
An EX3500 management policy can be customized to include high and low alarm thresholds for EX3500 memory
and CPU utilization.
The Memory and CPU rising and falling thresholds control when the EX3500 generates SNMP traps if these
thresholds are exceeded. A trap is generated when the utilization exceeds the rising threshold, and another trap is
generated after the utilization drops below the falling threshold. These thresholds do not protect the resource, they
provide notification of an excessive use of the resource.
To administrate EX3500 management policy memory and CPU threshold settings:
1Select
Configuration from the Web UI.
2Select
Management.
3 Refer to the upper, left-hand, portion of the UI and select EX3500 Management Policy.
4 The screen lists those EX3500 management policies created thus far. Select Add to create a new EX3500
management policy, Edit to modify an existing policy or Delete to remove an obsolete policy. Existing lists can
be copied or renamed as needed.
5 Select the System tab.
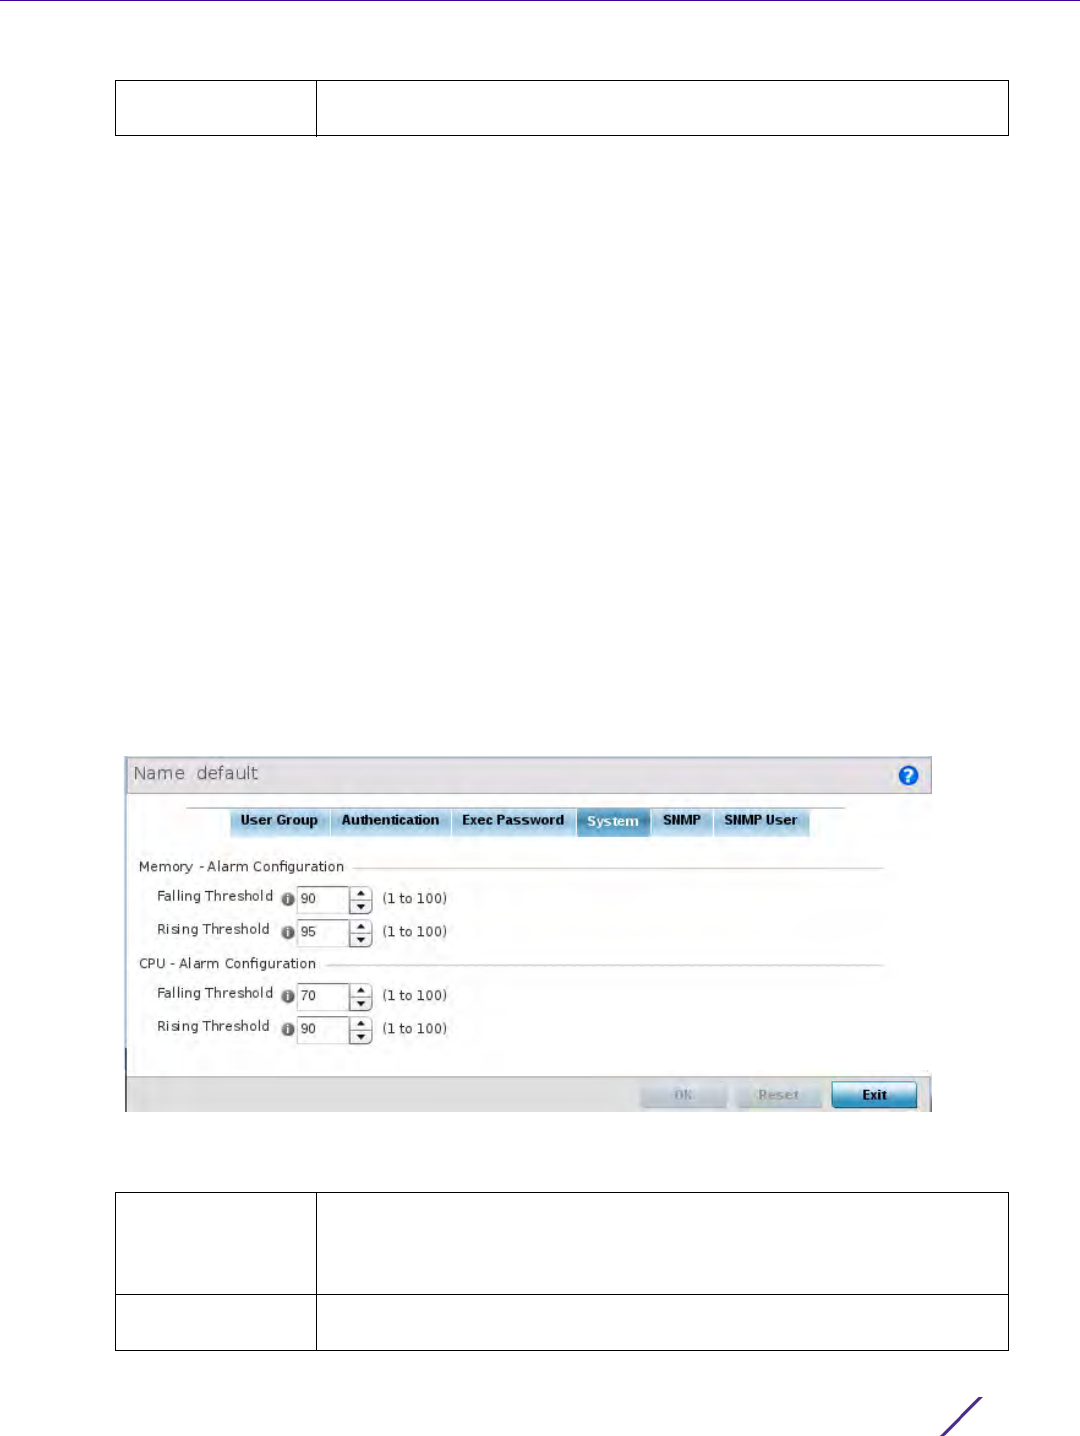
Figure 12-18 EX35000 Management Policy System screen
6 Set the following Memory - Alarm Configuration threshold settings:
Exec Privilege
Password
Create a 32 character maximum password for the EX3500 exec password.
Falling Threshold Set the threshold for clearing the EX3500 memory utilization alarm. Once
the rising threshold is exceeded, the memory utilization must drop below
this threshold for the alarm to clear. The threshold is set as a percentage
from 1 - 100, with a default of 90.
Rising Threshold Set the threshold for EX3500 memory utilization as too high. The threshold
is set as a percentage from 1 - 100, with a default of 95.

Management Access
Wireless Controller and Service Platform System Reference Guide 12 - 26
7 Set the following CPU - Alarm Configuration threshold settings:
8Select
OK when completed to update the EX3500 system threshold settings. Select Reset to revert the screen
back to its last saved configuration.
12.2.5 EX3500 SNMP Management
Optionally use the Simple Network Management Protocol (SNMP) with the EX3500 management policy for
statistics gathering, or to fully manage the EX3500. SNMP is an application layer protocol that facilitates the
exchange of management information between the controller or service platform and a managed device. SNMP
enabled devices listen on port 161 (by default) for SNMP packets from the controller or service platform’s
management server. SNMP uses read-only and read-write community strings as an authentication mechanism to
monitor and configure supported devices. The read-only community string is used to gather statistics and
configuration parameters from a supported wireless device. The read-write community string is used by a
management server to set device parameters. SNMP is generally used to monitor a system’s performance and
other parameters.
To the EX3500’s SNMP management policy configuration:
1Select
Configuration from the Web UI.
2Select
Management.
3 Refer to the upper, left-hand, portion of the UI and select EX3500 Management Policy.
4 The screen lists those EX3500 management policies created thus far. Select Add to create a new EX3500
management policy, Edit to modify an existing policy or Delete to remove an obsolete policy. Existing lists can
be copied or renamed as needed.
5 Select the SNMP tab.
Falling Threshold Set the threshold for clearing the EX3500 CPU (processor) utilization
alarm. Once the rising threshold is exceeded, the CPU (processor)
utilization must drop below this threshold for the alarm to clear. The
threshold is set as a percentage from 1 - 100, with a default of 70.
Rising Threshold Set the notification threshold for EX3500 CPU (processor) utilization as too
high. The threshold is set as a percentage from 1 - 100, with a default of 90.
Management Access
Wireless Controller and Service Platform System Reference Guide 12 - 27
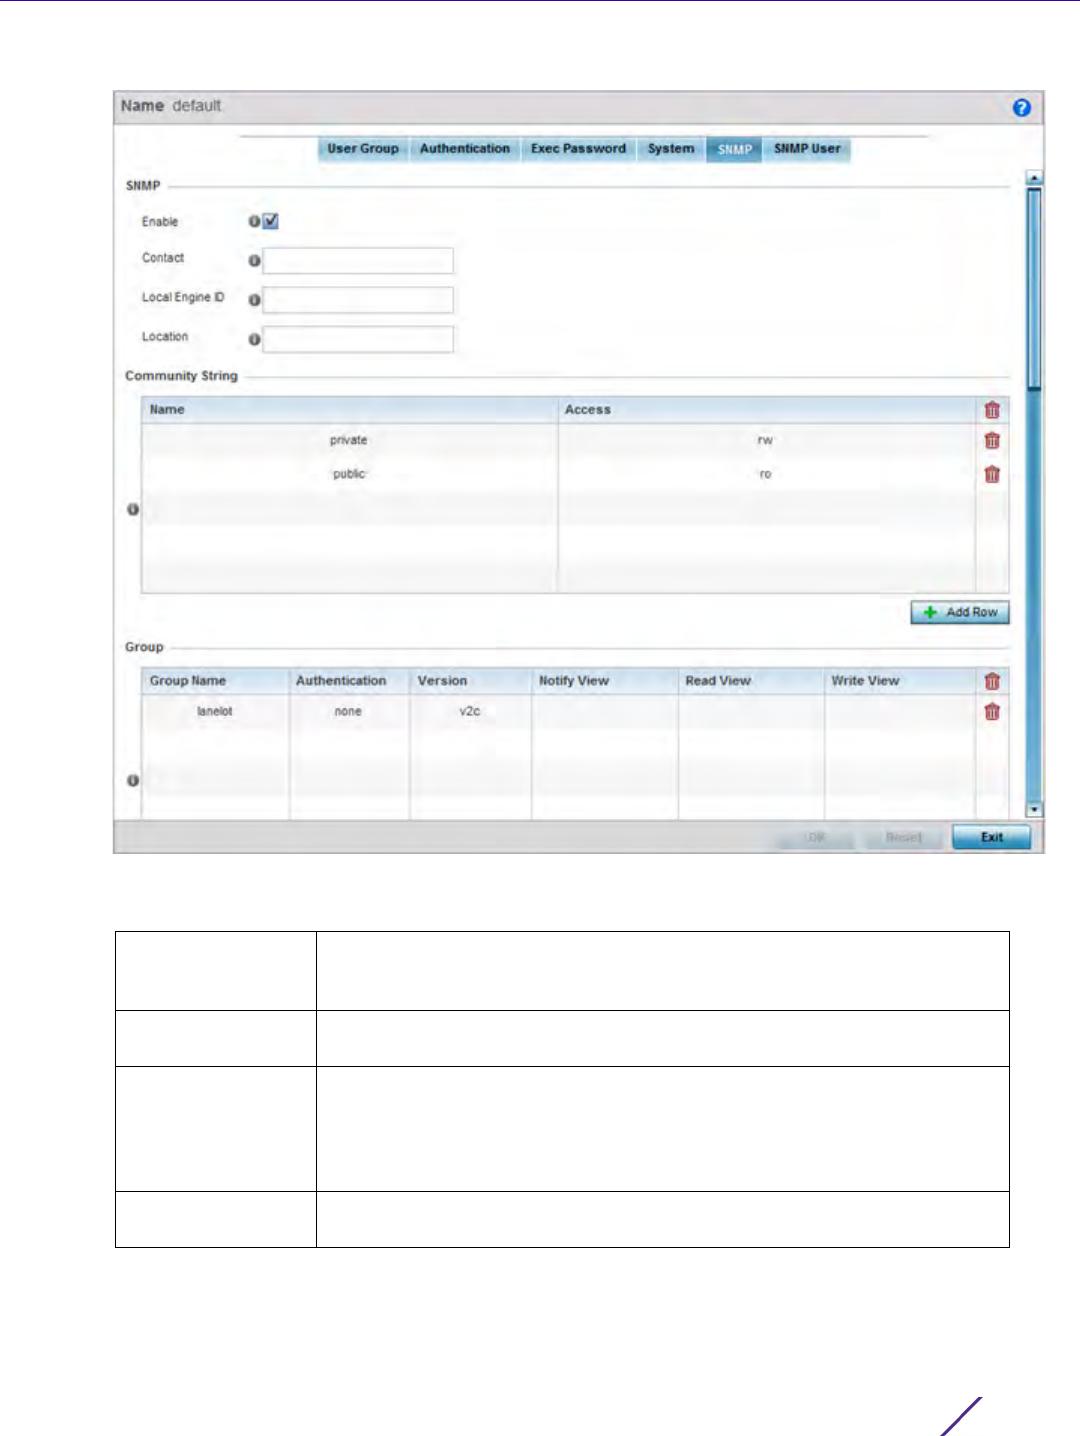
Figure 12-19 EX35000 Management Policy SNMP screen
6 Set the following SNMP settings:
Enable Select the checkbox to enable SNMPv1, SNMPv2 or SNMPv3 support. The
SNMP version utilized is selected and mapped to a user group within the
Group table.
Contact Define a 255 character maximum SNMP contact name for responsible for
the WiNG administration of the EX3500 switch.
Local Engine ID Set a 64 character maximum local engine ID. The local engine ID is the
administratively unique identifier of an SNMPv3 engine used for
identification, not addressing. There are two parts of an engine ID: prefix
and suffix. The prefix is formatted according to the specifications defined in
RFC 3411.
Location Assign a 255 character maximum EX3500 switch location reflecting the
switch’s physical deployment location.

Management Access
Wireless Controller and Service Platform System Reference Guide 12 - 28
7Select
+ Add Row and set the following Community Strings:
8Select
+ Add Row and set the following Group settings for SNMP management of the EX3500:
9 Set the following SNMP Traps for SNMP event management of the EX3500:
10 Refer to the SNMP View table and select + Add Row to include or exclude up to 31 SNMP views.
Name Define a public or private community designation. By default, SNMPv2
community strings on most devices are set to public, for the read-only
community string, and private for the read-write community string.
Access Set the access permission for each community string used by devices to
retrieve or modify information. Available options include:
Read Only - Allows a remote device to retrieve information.
Read-Write - Allows a remote device to modify settings.
Group Name Define a 32 character maximum name for this SNMP group. A maximum of
17 groups can be set for EX3500 model switches.
Authentication If utilizing SNMPv3 as the version for this group, select whether auth,
noauth or priv is applied to this group as a credential exchange and
validation mechanism. This setting is not enabled if utilizing either SNMPv1
or SNMPv2.
Version Apply either SNMPv1, SNMPv2 or SNMPv3 to this EX3500 SNMP group.
SNMP v2 is identical to version 1, but it adds support for 64 bit counters.
Most devices support SNMP v2c automatically. However, there are some
devices that require you to explicitly enable v2, and that poses no risk.
SNMP v3 adds security to the 64 bit counters provided with SNMP v2.
SNMP v3 adds both encryption and authentication, which can be used
together or separately. Its setup is more complex than just defining a
community string. But if you require security, SNMP v3 is recommended.
Notify View Set a 32 character maximum notify string to restrict and filter the objects in
the notification.
Read View Set an optional 32 character maximum string indicating that users who
belong to this group have read access to the EX3500 switch.
Write View Set an optional 32 character maximum string indicating that users who
belong to this group have write access to the EX3500 switch.
Authentication Select the checkbox to enable trap generation for user authentication
events when accessing a EX3500 switch from a WiNG managed controller.
This feature is disabled by default.
Enable SNMP Trap Select the checkbox to enable EX3500 MAC generation traps. When
enabled a trap is generated when a dynamic MAC address is added or
removed to/from the switch's address table. This feature is disabled by
default.
Link Up Down Select this option to generate a trap a when either a link is established or
broken between the EX3500 switch and a connected device (WiNG
managed or not).
View Name Enter a 32 alphanumeric character maximum name to identify the EX3500
SNMP MIB view. A view is a set of MIB view subtrees, or a family of
subtrees, where each is a subtree within the managed object naming tree.
Create MIB views to control the OID range that SNMPv3 users can access.

Management Access
Wireless Controller and Service Platform System Reference Guide 12 - 29
11 Refer to the Notify Filter table and select + Add Row to set up to 5 remote resources for archive and retrieval.
12 Refer to the Remote Engine table and select + Add Row to set up to 5 remote IDs and addresses.
13 Refer to the Host table and select + Add Row to set the trap receiver host configuration.
OID Tree Provide an OID string to include or exclude from the view. The OID string is
128 characters in length.
View Access Designate whether view access is included or excluded for the subtree or
family of subtrees from the MIB view. If creating an excluded view subtree,
consider creating a corresponding included entry with the same view name
to allow subtrees outside of the excluded subtree to be included.
Name Enter a 26 character maximum name for the filter. Notifications indicate
erroneous user authentication requests, restarts, connection closures,
connection loss to a neighbor router or other events.
Remote Host Provide a destination IP address for a remote server resource for trap
filters.
Remote Engine IP Enter a remote engine IP address for the remote SNMP agent of the device
where the user resides.
Remote Engine Id Provide an Id 9 - 64 characters in length. If configuring the EX3500
management for SNMP V3, is it necessary to configure an engine ID, as
passwords are localized using the SNMP ID of the SNMP engine. The
remote agent's SNMP engine ID is needed when computing authentication
from a password.
Authentication If using SNMPv3, define the authentication scheme for user credential
validation as either auth, noauth or priv.
Community String Provide the 1 - 32 character text community strings for accessing EX3500
switch configuration files. SNMP uses read-only and read-write community
strings as an authentication mechanism to monitor and configure
supported devices.
Inform Enable this option to enable an EX3500 switch to send inform requests to
SNMP managers.Traps are not as reliable than informs since an
acknowledgment is not sent from the receiving end when a trap is
received. A SNMP manager that receives an inform acknowledges the
message with an SNMP response.
IP Define the trap receiver’s IP address.
Retry Set the number of server connection retries (from 1 - 255). When no
response is received after the last retry attempt, the connection session is
terminated with the trap receiver IP address.
Timeout Configures the duration (in seconds) the host connection process is
shutdown temporarily before a reset of the process is attempted for the set
number of retries.
UDP Port Set the port of the server resource dedicated to receiving EX3500 switch
SNMP traps. The default port is port 162.
Management Access
Wireless Controller and Service Platform System Reference Guide 12 - 30
12.2.6 EX3500 SNMP Users
An EX3500 SNMP management session utilizes unique SNMP users with specific authentication and privacy
parameters.
To administrate EX3500 SNMP users and their permissions:
1Select
Configuration from the Web UI.
2Select
Management.
3 Refer to the upper, left-hand, portion of the UI and select EX3500 Management Policy.
4 The screen lists those EX3500 management policies created thus far. Select Add to create a new EX3500
management policy, Edit to modify an existing policy or Delete to remove an obsolete policy. Existing lists can
be copied or renamed as needed.
5 Select the SNMP User tab.
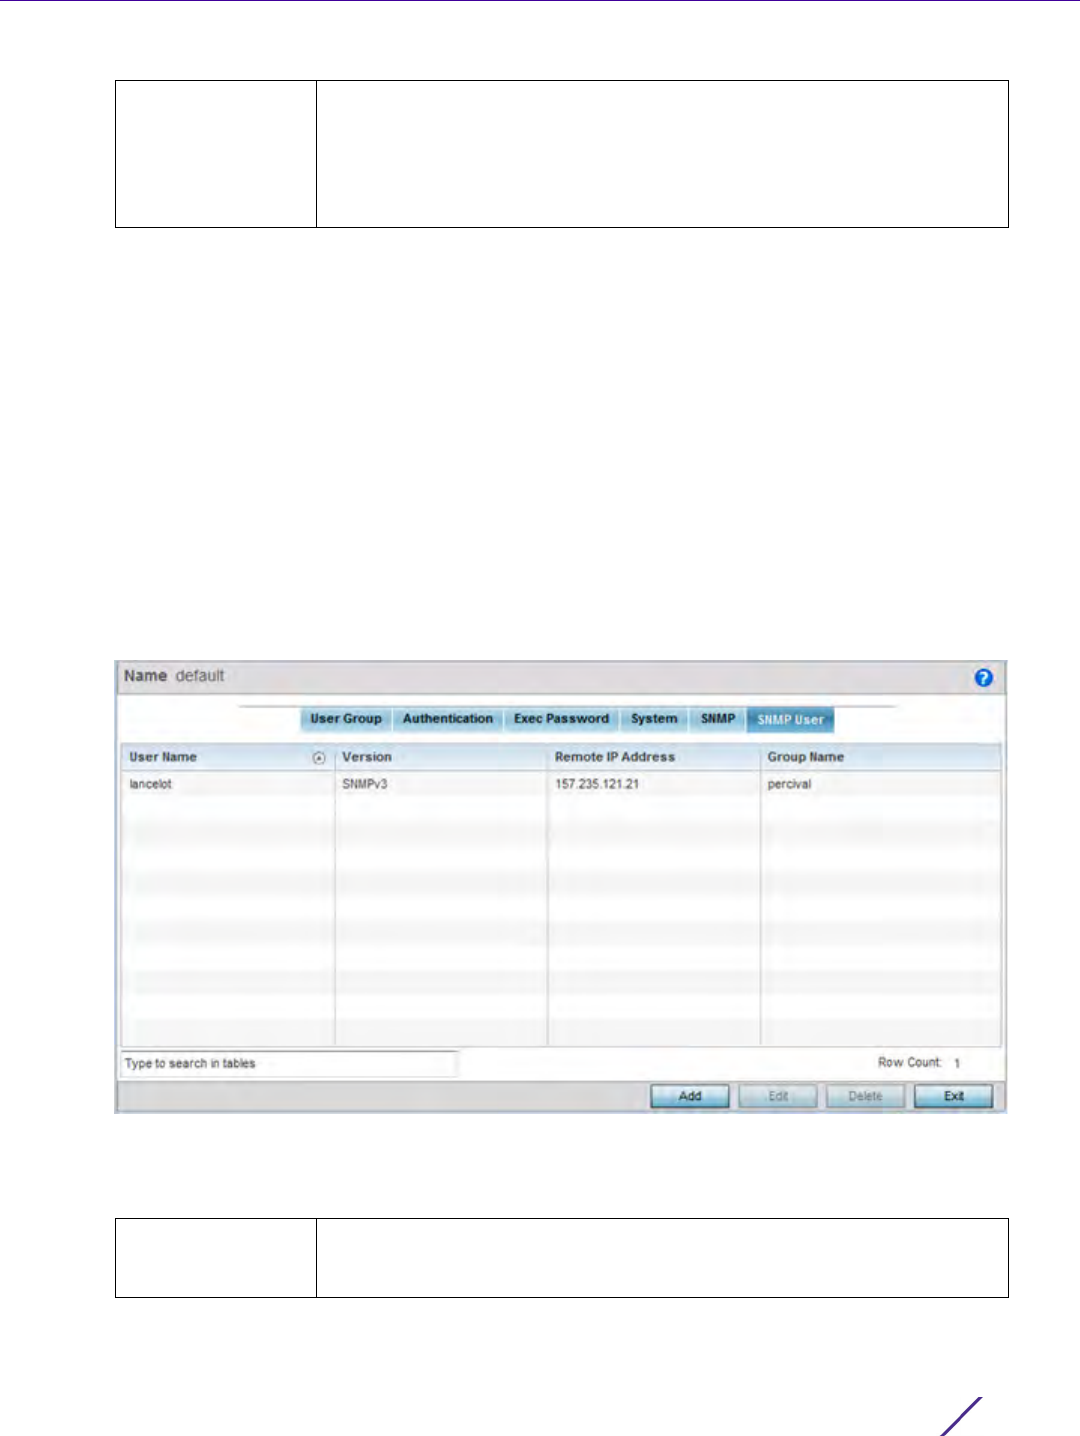
Figure 12-20 EX3500 SNMP User screen
6 Review the following EX3500 SNMP user credentials to determine whether a new user requires creation on an
existing user configuration needs modification:
Version Set whether SNMP version 1, 2 or 3 is used with this dedicated host.
Versions 1 and 2 provide no data security. SNMPv3 adds security and
remote configuration capabilities to previous versions. The SNMPv3
architecture introduces the user-based security model (USM) for message
security and the view-based access control model (VACM) for access
control.
User Name Displays the 32 character maximum SNMP user name assigned the specific
SNMP version and remote SNMP server resource listed. More than one user
can be assigned to the same EX3500 SNMP user group.
Management Access
Wireless Controller and Service Platform System Reference Guide 12 - 31
7Select
Add to create a new user configuration or Edit to modify the attributes of an existing EX3500 SNMP user
configuration.
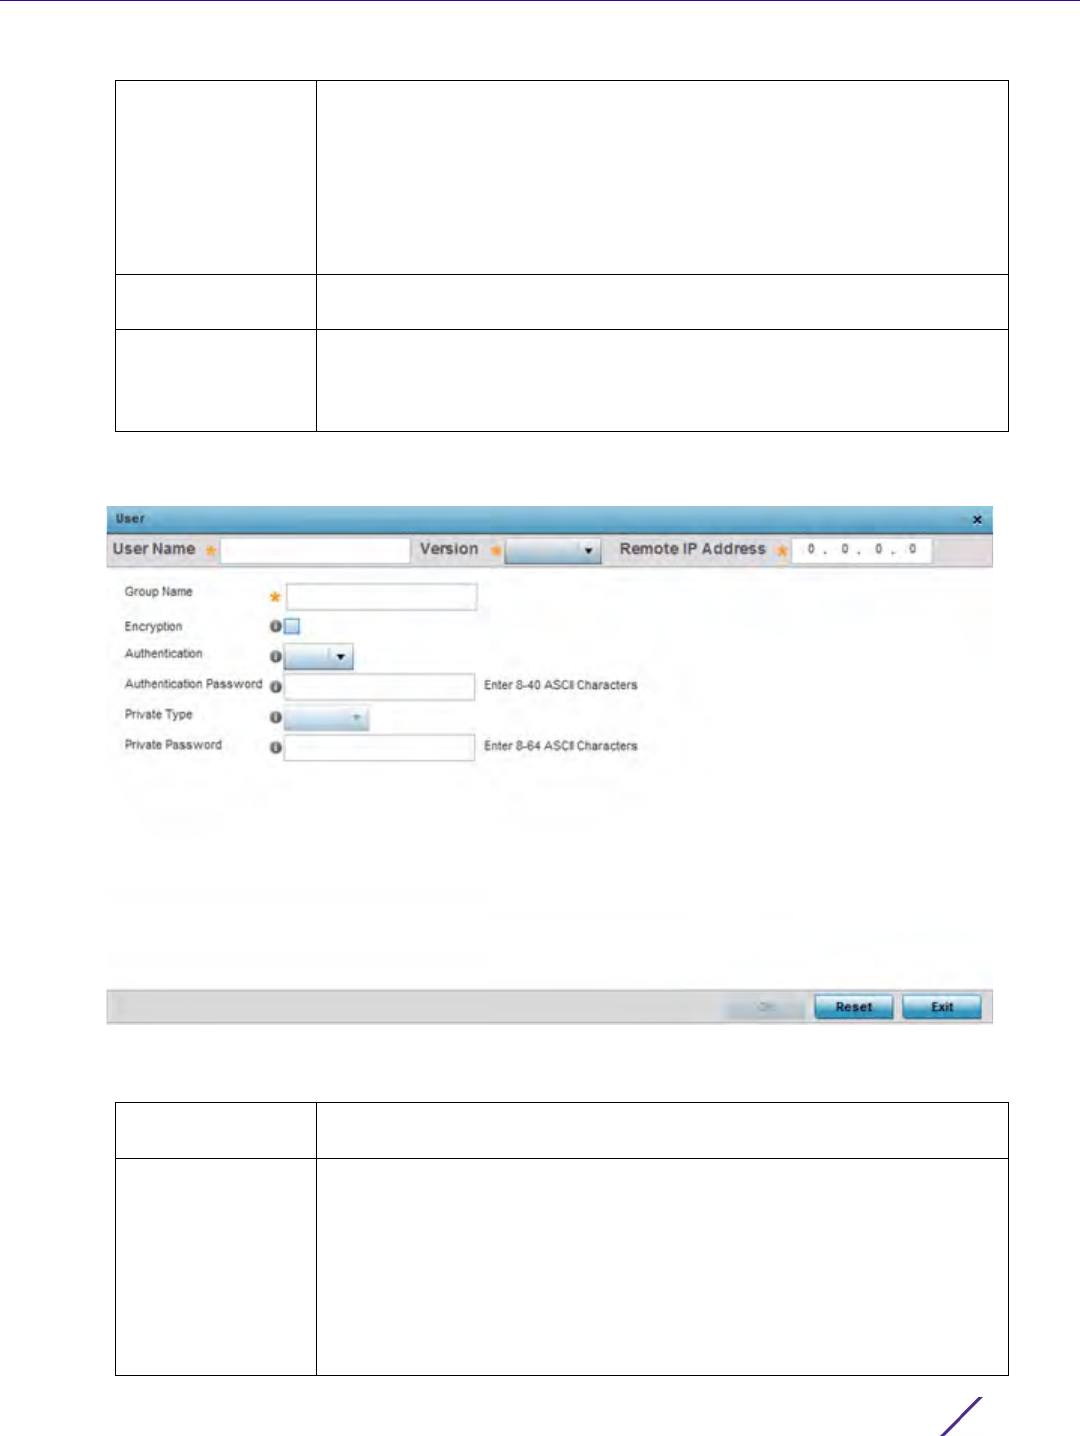
Figure 12-21 EX3500 SNMP User Add/Edit screen
8 Set the following SNMP user credentials for the EX3500 SNMP user:.
Version Lists whether SNMPv1, SNMPv2 or SNMPv3 is applied to this EX3500 SNMP
user. SNMP v2 is identical to version 1, but it adds support for 64 bit
counters. Most devices support SNMP v2c automatically. However, there are
some devices that require you to explicitly enable v2, and that poses no
risk. SNMP v3 adds security to the 64 bit counters provided with SNMP v2.
SNMP v3 adds both encryption and authentication, which can be used
together or separately. Its setup is more complex than just defining a
community string. But if you require security, SNMP v3 is recommended.
Remote IP Address Lists the remote server resource designated for receiving SNMP trap and
inform event messages for the listed SNMP user.
Group Name Lists the 32 character maximum name assigned to this SNMP group, as
SNMP access rights are organized by groups. The trap group name can be
any string and is embedded in the community name field of a trap. A
maximum of 17 groups can be set for EX3500 model switches.
User Name Enter a 32 character maximum SNMP user name for EX3500 SNMP session
management.
Version Use the drop-down menu to define whether SNMPv1, SNMPv2 or SNMPv3
is applied to this EX3500 SNMP user configuration. SNMP v2 is identical to
version 1, but it adds support for 64 bit counters. Most devices support
SNMP v2c automatically. However, there are some devices that require you
to explicitly enable v2, and that poses no risk. SNMP v3 adds security to
the 64 bit counters provided with SNMP v2. SNMP v3 adds both encryption
and authentication, which can be used together or separately. Its setup is
more complex than just defining a community string. But if you require
security, SNMP v3 is recommended.

Management Access
Wireless Controller and Service Platform System Reference Guide 12 - 32
9Select
OK when completed to update the EX3500 SNMP user settings. Select Reset to revert the screen back to
its last saved configuration.
12.3 Hierarchical Tree
Tree Setup is unique because it is not a policy (which is reused in other objects), but rather a global configuration
that represents the tree displayed for Dashboard, Operations and Statistics. However since it is set as a
configuration, it follows the standard configuration methods, and requires a Commit before it taking effect and a
Save to become persistent across reboots.
ADSP can run as a virtual machine on NX9500 and NX9510 model service platforms. WiNG communicates with
ADSP using a single sign-on (SSO) authentication mechanism. Once the user is logged in, WiNG gains access to
ADSP without being prompted to login again at ADSP. There is no synchronization between the WiNG and ADSP
databases. ADSP has its own user database stored locally within its virtual machine. This local database is
accessed if a user logs directly into ADSP.
WiNG and ADSP must be consistent in the manner events are reported up through a network hierarchy to ensure
optimal interoperability and event reporting. To provide such consistency, WiNG has added support for an ADSP-
like hierarchal tree. The tree resides within WiNG, and ADSP reads it from WiNG and displays the network
hierarchy in its own ADSP interface. The hierarchal tree can also be used to launch ADSP modules (like Spectrum
Analyzer) directly from WiNG.
WiNG uses the following containers within the tree to be consistent with ADSP’s hierarchy conventions:
Remote IP Address Set the remote server resource IP address designated for receiving SNMP
trap and inform event messages for this SNMP user.
Group Name Enter a 32 character maximum for a SNMP group. The group name can be
any string and is embedded in the community name field of a SNMP trap.
Encryption When using SNMPv3, the Encryption option becomes available to scramble
packet contents and prevent them from exposure to unauthorized sources.
Authentication When using SNMPv3, the Authentication option becomes available to
ensure messaging is from a valid source. SNMPv3 uses the user-based
security model (USM) for message security and the view-based access
control model (VACM) for access control. USM specifies authentication and
encryption. VACM specifies access-control rules.
Authentication
Password
Enter a 8 - 40 character ASCII authentication password. The selected
authentication password ensures only trusted and authorized users can
access an EX3500 SNMP management session.
Private Type Use the drop-down menu to specify the privacy type. The Advanced
Encryption Standard (AES) is utilized as one of the privacy protocol options
for SNMPv3 messages in either an aes128, aes192 or aes256 format and are
recommended. 3DES and des56 are also options, but are considered
somewhat insecure and vulnerable to brute-force-attacks.
Private Password Enter a 8 - 64 character ASCII password to secure the privacy type
selected.
NOTE: The Hierarchical tree is available on both controllers and service platforms,
but not Access Points.
Management Access
Wireless Controller and Service Platform System Reference Guide 12 - 33
•Country
•Region
•City
•Campus
Hierarchy rules are enforced in the containers. For example, a city can be created under a country or region, but
not vice versa. An RF Domain can be placed in any container. However, there cannot be any additional containers
under the RF Domain.
WiNG’s RF Domain’s already use areas and floors, and these will continue to work as they currently do. Floors are
also numbered to be consistent with ADSP’s usage.
To configure a hierarchal tree to use with ADSP:
1Select
Configuration.
2Select
Management.
3 Refer to the upper, left-hand, portion of the UI and select Tree Setup.
The Tree Setup screen displays with a System node that requires population with the containers to represent
the deployment shared between WiNG and ADSP.
The Country, Region, City and Campus containers can be defined in any order, but at least one of these
containers is required within the hierarchy before the RF Domain can be added and the hierarchy defined as
valid.
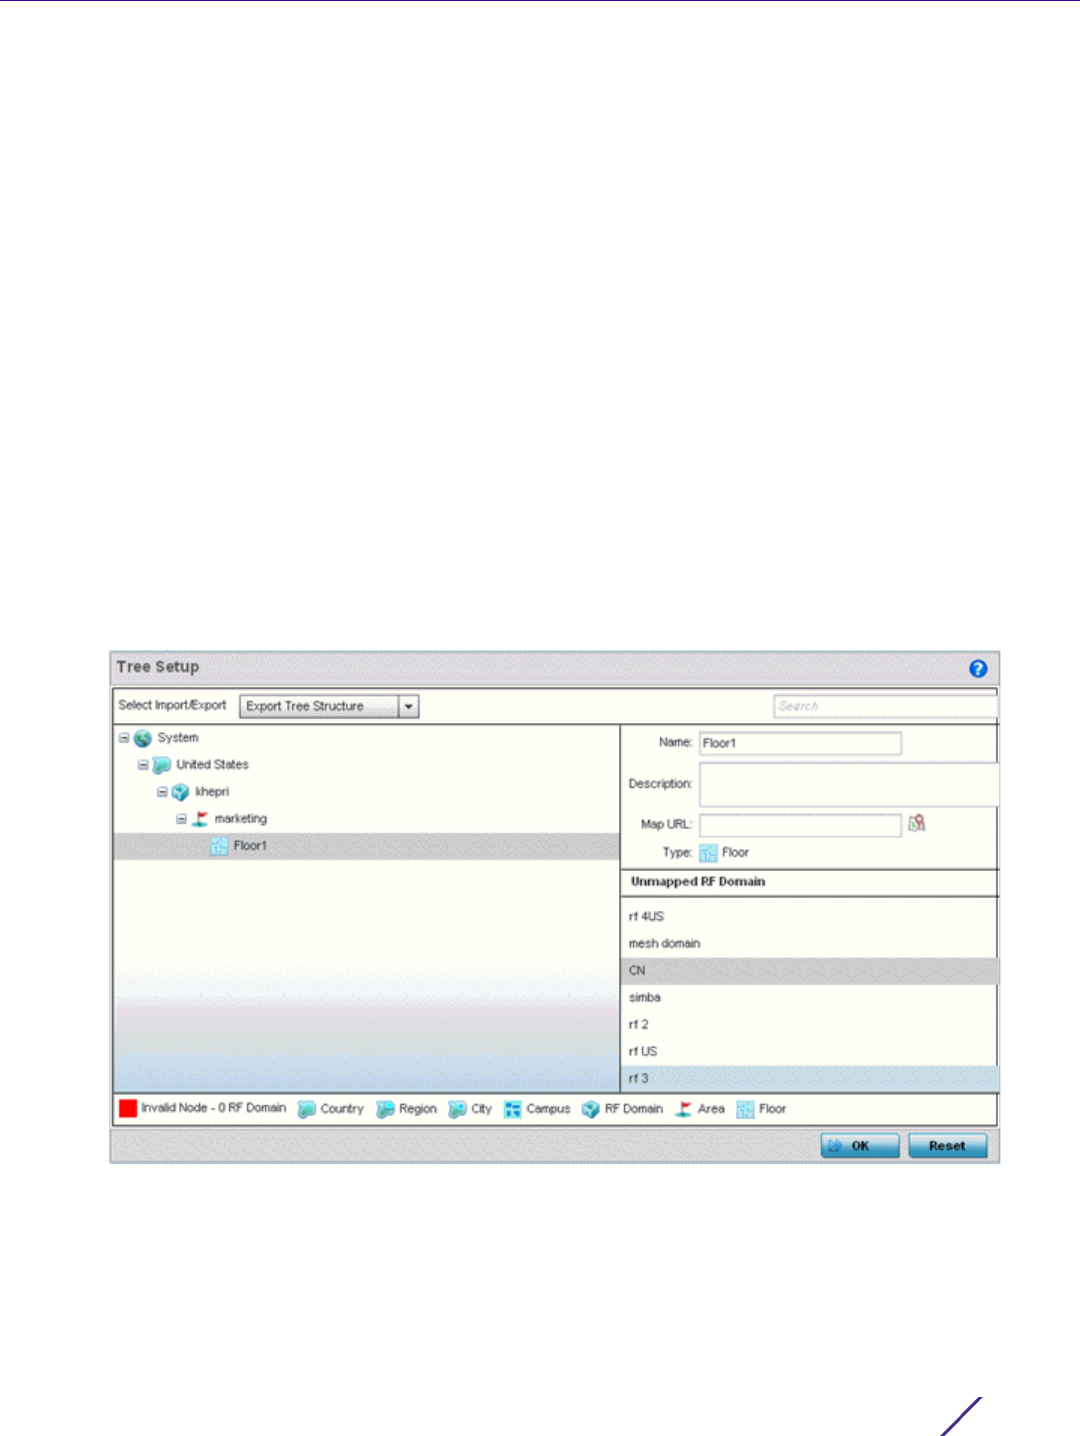
Figure 12-22 Hierarchal Tree screen
4 To add a Country, Region, City or Campus to the tree, select System from the upper, left-hand, portion of the
Tree Setup screen. An add child link displays on the right-hand side of the display.
If adding a Country, select a deployment country from the Type drop-down menu and use the Name drop-
down menu to scroll to the country of deployment where the RF Domain resides. Adding a country first is a
good idea since regions, city and campus can all be added as child items in the tree structure. However, the
selected country is an invalid tree node until a RF Domain is applied.
Management Access
Wireless Controller and Service Platform System Reference Guide 12 - 34
If adding a region, select Region from the Type drop-down menu and use the Name parameter to enter its
name. Select Add to display the region. A city and campus can be added as child items in the tree structure
under a region. An RF Domain can be mapped anywhere down the hierarchy for a region and not just directly
under a Country. For example, a region can have city and campus and one RF Domain mapped.
If adding a City, select City from the Type drop-down menu and use the Name parameter to enter its name.
Select Add to display the city. Only a campus can be added as a child item under a city. The city is an invalid
tree node until a RF Domain is applied somewhere within the directory tree.
If adding a Campus, select Campus from the Type drop-down menu and use the Name parameter to enter its
name. Select Add to display the campus. A Campus is the last node in the hierarchy before A RF Domain, and it
cannot be valid unless it has a RF Domain mapped to it.
5 Select the add RF Domain link at the right-hand side of any container to display an Unmapped RF Domain
screen.
6 Provide the default RF Domain name whose deployment area and floor is mapped graphically, and whose
events are shared between WiNG and ADSP. Select Add to display the RF Domain within its respective place in
the tree hierarchy. A default RF Domain can also be dragged into the tree from the right-hand side of the
screen.
Once the RF Domain is in the tree, select the add child link at the right-hand side of the RF Domain to display a
screen where the RF Domain deployment Area and Floor are defined. Once define, select Add to populate the
tree with the Area and Floor.
Provide the Map URL to upload the floor plan created under an Area. Each area can have multiple floors
7 Edit a tree node at any time by selecting it from amongst the Tree Setup screen, and referring to the right-hand
side of the screen where a field displays to modify the container.
8 Optionally, select Tree Import Export Template to upload a template.csv file if one is needed for container
configuration.
A sample of the tree template is provided here for reference.
Row Description
record type (folder),server,Name,Description,Type,Floor Number,Path(slash delimited),Command(add|delete)
Actual Row is CSV file
NOTE: If a complete tree configuration has been saved and exported for archive to
remote location, it can be imported back into the Tree Setup screen and utilized
without having to re-configure the containers and RF Domain of that tree. Select
Import to utilize and existing tree configuration.
NOTE: If a tree container (country, region, city or campus) has a red box around it, it
either has invalid attributes or a RF Domain requires addition.
NOTE: While the MAP URL graphic file represents the RF Domain’s physical device
deployment area, devices cannot be dragged into topology or manipulated. To
define a network topology that allows an administrator to add devices and
manipulate locations, refer to Network View on page 4-27.

Management Access
Wireless Controller and Service Platform System Reference Guide 12 - 35
folder,localhost,US,Country Description,Country,,
folder,localhost,Southeast,Region Description,Region,,US
folder,localhost,Alpharetta,City Description,City,,US/Southeast
folder,localhost,Sanctuary Park,Campus Description,Campus,,US/Southeast/Alpharetta
folder,localhost,The Falls 1125,Domain Description,RFDomain,,US/Southeast/Alpharetta/Sanctuary Park
folder,localhost,Queens,,Area,,US/Southeast/Alpharetta/Sanctuary Park/The Falls 1125
folder,localhost,FloorQLab,,Floor,1,US/Southeast/Alpharetta/Sanctuary Park/The Falls 1125/Queens
folder,localhost,FloorSLab,,Floor,2,US/Southeast/Alpharetta/Sanctuary Park/The Falls 1125/Queens
folder,localhost,FloorTLab,,Floor,3,US/Southeast/Alpharetta/Sanctuary Park/The Falls 1125/Queens
In the CSV file, configure specific tree node properties.
Index 1 : Record Type. This value is always 'folder'. Import/export allows the configuration of folder nodes only.
Leaf nodes cannot be configured like devices.
Index 2 : Server Name. This value is always 'localhost' as we are supporting the import/export from localhost
only.
Index 3 : Name. This configures the name/label of the tree node. This is the value which is visible to the user in
Tree node.
Index 4 : Description. This configures the additional information in form, which user wants to store with the
Tree node.
Index 5 : Type. This configures the type of the Tree node. Type can take one of the value "country, region, city,
campus, rfdomain, area, floor".
Index 6 : Floor Number. This is configures the floor number. This is applicable only for the floor node.
Index 7 : Path. This is /'(slash delimited) from the 'root'.
Index 8 : add|delete. Allows manipulation of the node. If no value is specified, the default is 'add' . If value is
'delete' then reference node is removed.
9Select
Import Tree Structure to optionally import a .csv file with pre-defined the containers and RF Domain.
Importing an existing tree saves an administrator from creating a new one from the beginning.
10 Once the tree topology is defined to your satisfaction, select Export Tree Structure to archive the tree topology
(in .csv file format) to a defined location.
The exported tree topology can be re-imported and automatically displayed within the Tree Setup screen at
any time.
11 Select OK to update the tree setup configuration. Select Reset to revert to the last saved configuration.
NOTE: Since the tree is set as a configuration, it follows standard configuration
methods, and requires a Commit before it taking effect and A Save to become
persistent across reboots.

Management Access
Wireless Controller and Service Platform System Reference Guide 12 - 36
12.4 Management Access Deployment Considerations
Before defining a access control configuration as part of a Management Access policy, refer to the following
deployment guidelines to ensure the configuration is optimally effective:
• Unused management protocols should be disabled to reduce a potential attack against managed resources. For
example, if a device is only being managed by the Web UI and SNMP, there is no need to enable CLI interfaces.
• Use management interfaces providing encryption and authentication. Management services like HTTPS, SSH
and SNMPv3 should be used when possible, as they provide both data privacy and authentication.
• By default, SNMPv2 community strings on most devices are set to public for the read-only community string
and private for the read-write community string. Legacy devices may use other community strings by default.
• SNMPv3 should be used for SNMP device management, as it provides both encryption, and authentication.
• Enabling SNMP traps can provide alerts for isolated attacks at both small managed radio deployments or
distributed attacks occurring across multiple managed sites.
• Whenever possible, centralized RADIUS management should be enabled. This provides better management and
control of management usernames and passwords and allows administrators to quickly change credentials in
the event of a security breach.
13 - 1
Wireless Controller and Service Platform System Reference Guide
13
Diagnostics
Resident diagnostic capabilities enable administrators to understand how devices are performing and troubleshoot
issues impacting device performance. Performance and diagnostic information is collected and measured on
controllers and service platforms for any anomalies potentially causing a key processes to fail.
Numerous tools are available within the Diagnostics menu. Some filter events, others allow you to view logs and
manage files generated when hardware or software issues are detected.
The diagnostics are managed as follows:
•Fault Management
•Crash Files
•Advanced Diagnostics
13.1 Fault Management
Fault management enables user's administering multiple sites to assess how individual devices are performing and
review issues impacting the network. Use the Fault Management screens to administrate errors generated by the
controller or service platform, Access Point or wireless client.
To assess the Fault Management configuration:
1Select
Diagnostics > Fault Management.
The Filter Events screen displays by default. Use this screen to configure how events are tracked. By default, all
events are enabled, and an administrator has to turn off events that do not require tracking.
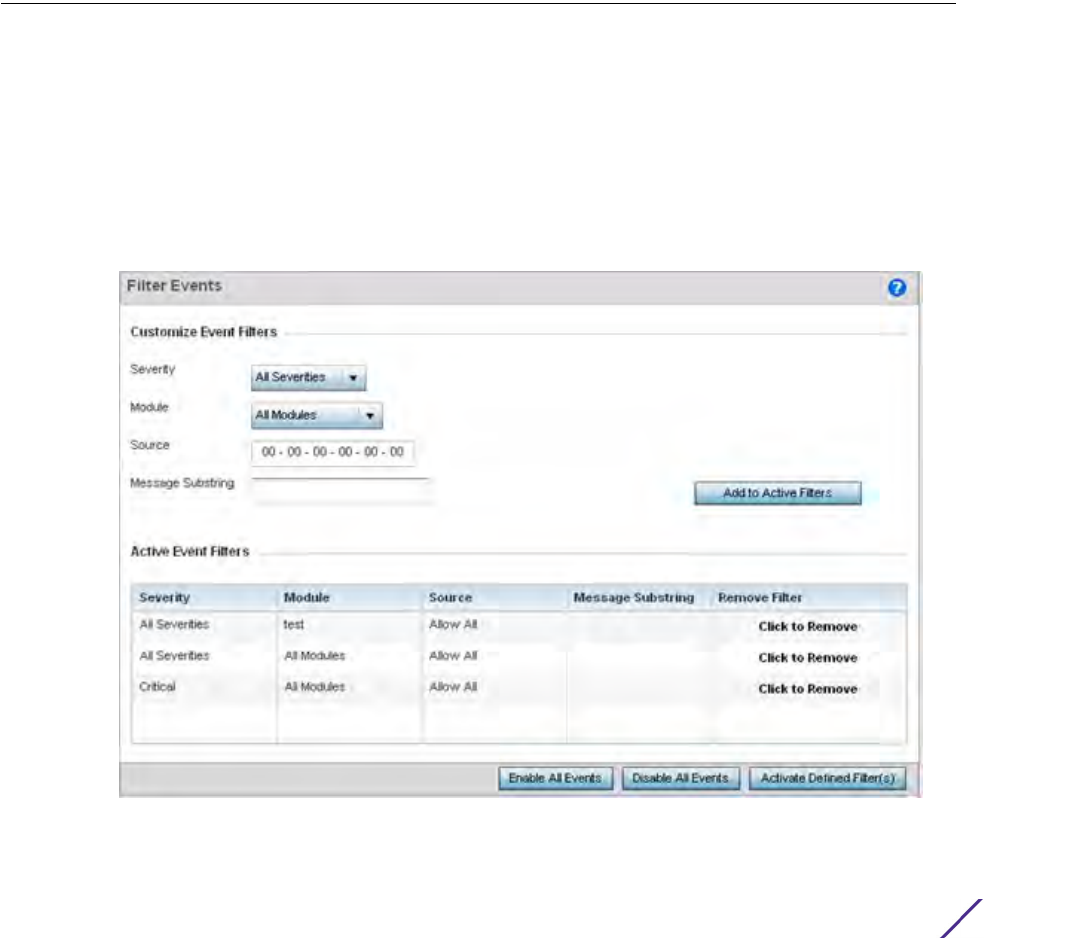
Figure 13-1 Fault Management Filter Events screen
Use the Filter Events screen to create filters for managing detected events. Events can be filtered based on
severity, module received, source MAC, device MAC and client MAC address.

Diagnostics
Wireless Controller and Service Platform System Reference Guide 13 - 2
2 Define the following Customize Event Filters parameters for the Fault Management configuration:
3 Select the Add to Active Filters button to create a new filter and add it to the Active Event Filters table. When
added, the filter uses the current configuration defined in the Customize Event Filters field.
4 Refer to the Active Event Filters table to set the following parameters for the Fault Management configuration:
a. To activate all the events in the Active Events Filters table, select the Enable All Events button. To stop event
generation, select Disable All Events.
b. To enable an event in the Active Event Filters table, click the event to select it. Then, select the Activate Defined
Filter(s) button.
5Select
View Events from the upper, left-hand, side of the Diagnostics > Fault Management menu.
Severity Set the filtering severity. Select from the following:
All Severities – All events are displayed, irrespective of their severity
Critical – Only critical events are displayed
Error – Only errors and above are displayed
Warning – Only warnings and above are displayed
Informational – Only informational and above events are displayed
Module Select the module from which events are tracked. When a module is
selected, events from other modules are not tracked. Remember this
when interested in events generated by a particular module. Individual
modules can be selected (such as TEST, LOG, FSM etc.) or all modules can
be tracked by selecting All Modules.
Source Set the MAC address of the source device to be tracked. Setting a MAC
address of 00:00:00:00:00:00 allows all devices to be tracked.
Message Substring Optionally append a text message (substring) to the event filter to assist
the administrator in distinguishing this filter from others with similar
attributes.
NOTE: Leave the fields to a default value of 00:00:00:00:00:00 to track all MAC
addresses.
NOTE: Filters cannot be persisted across sessions. They have to be created every
time a new session is established.
Diagnostics
Wireless Controller and Service Platform System Reference Guide 13 - 3
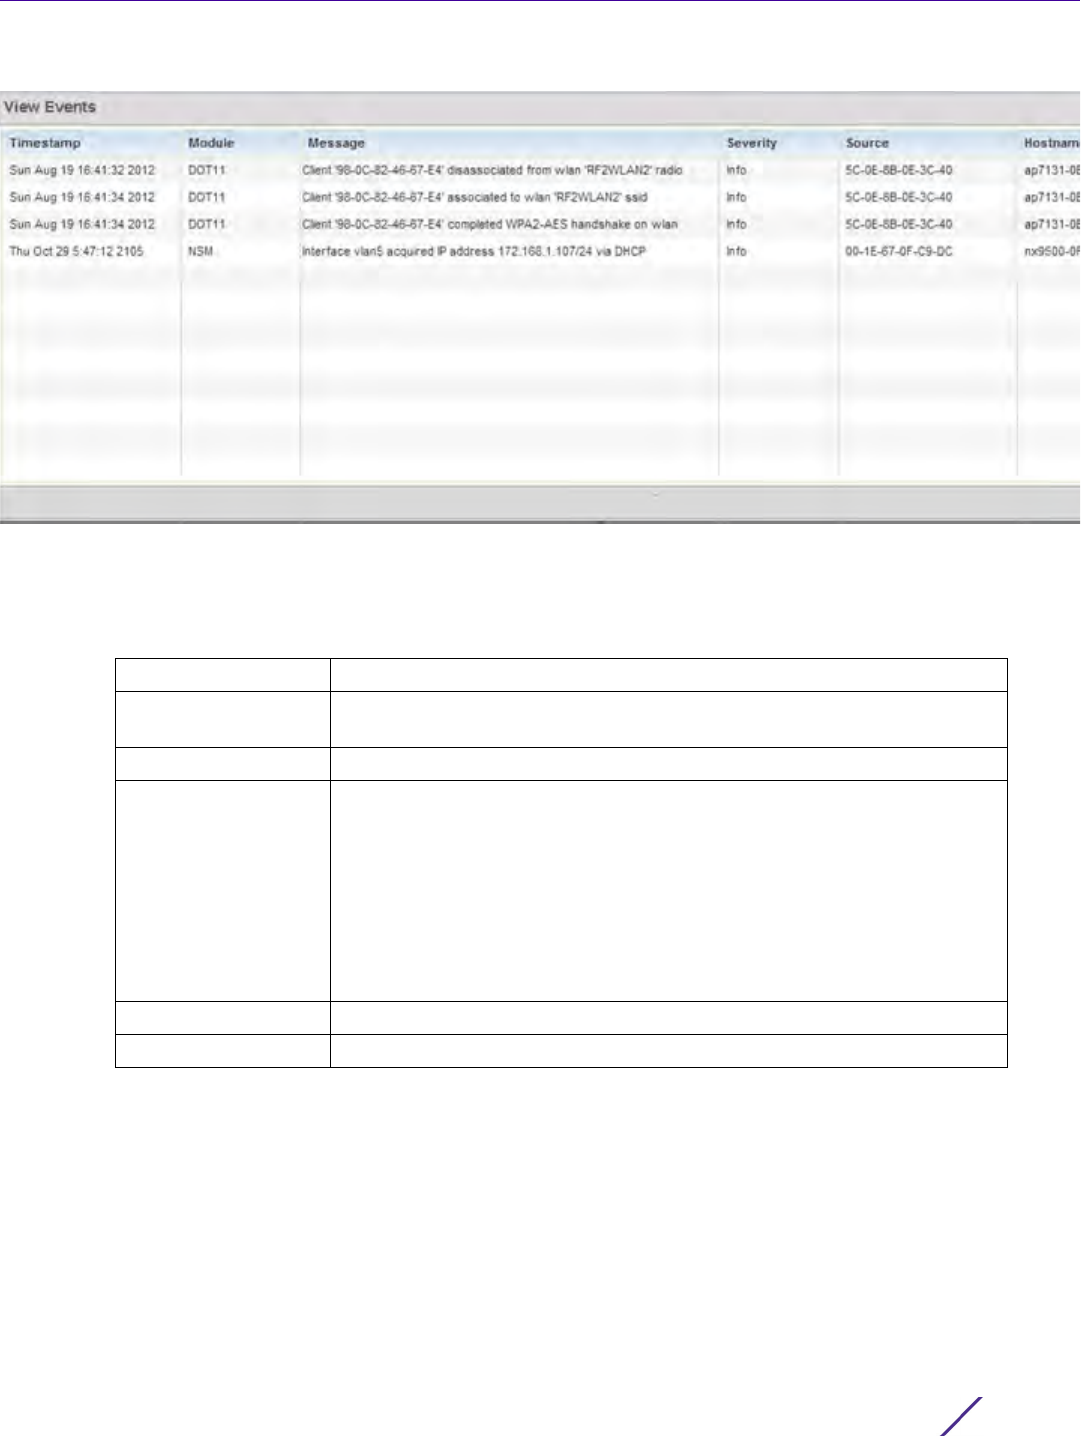
Figure 13-2 Fault Management View Events screen
Use the View Events screen to track and troubleshoot events using the source and severity levels defined in the
Configure events screen.
6 Define the following Customize Event Filters parameters for the Fault Management configuration:
7Select
Clear All to clear events and begin new event data gathering.
8Select
Event History from the upper, left-hand, side of the Diagnostics > Fault Management menu.
Timestamp Displays the Timestamp (time zone specific) when the fault occurred.
Module Displays the module used to track the event. Events detected by other
module are not tracked.
Message Displays error or status messages for each event listed.
Severity Displays the severity of the event as defined for tracking from the
Configuration screen. Severity options include:
All Severities – All events are displayed irrespective of their severity
Critical – Only critical events are displayed
Error – Only errors and above are displayed
Warning – Only warnings and above are displayed
Info – Only informational and above events are displayed
Source Displays the MAC address of the tracked source device.
Hostname Lists the administrator assigned hostname of the tracked source device.
Diagnostics
Wireless Controller and Service Platform System Reference Guide 13 - 4
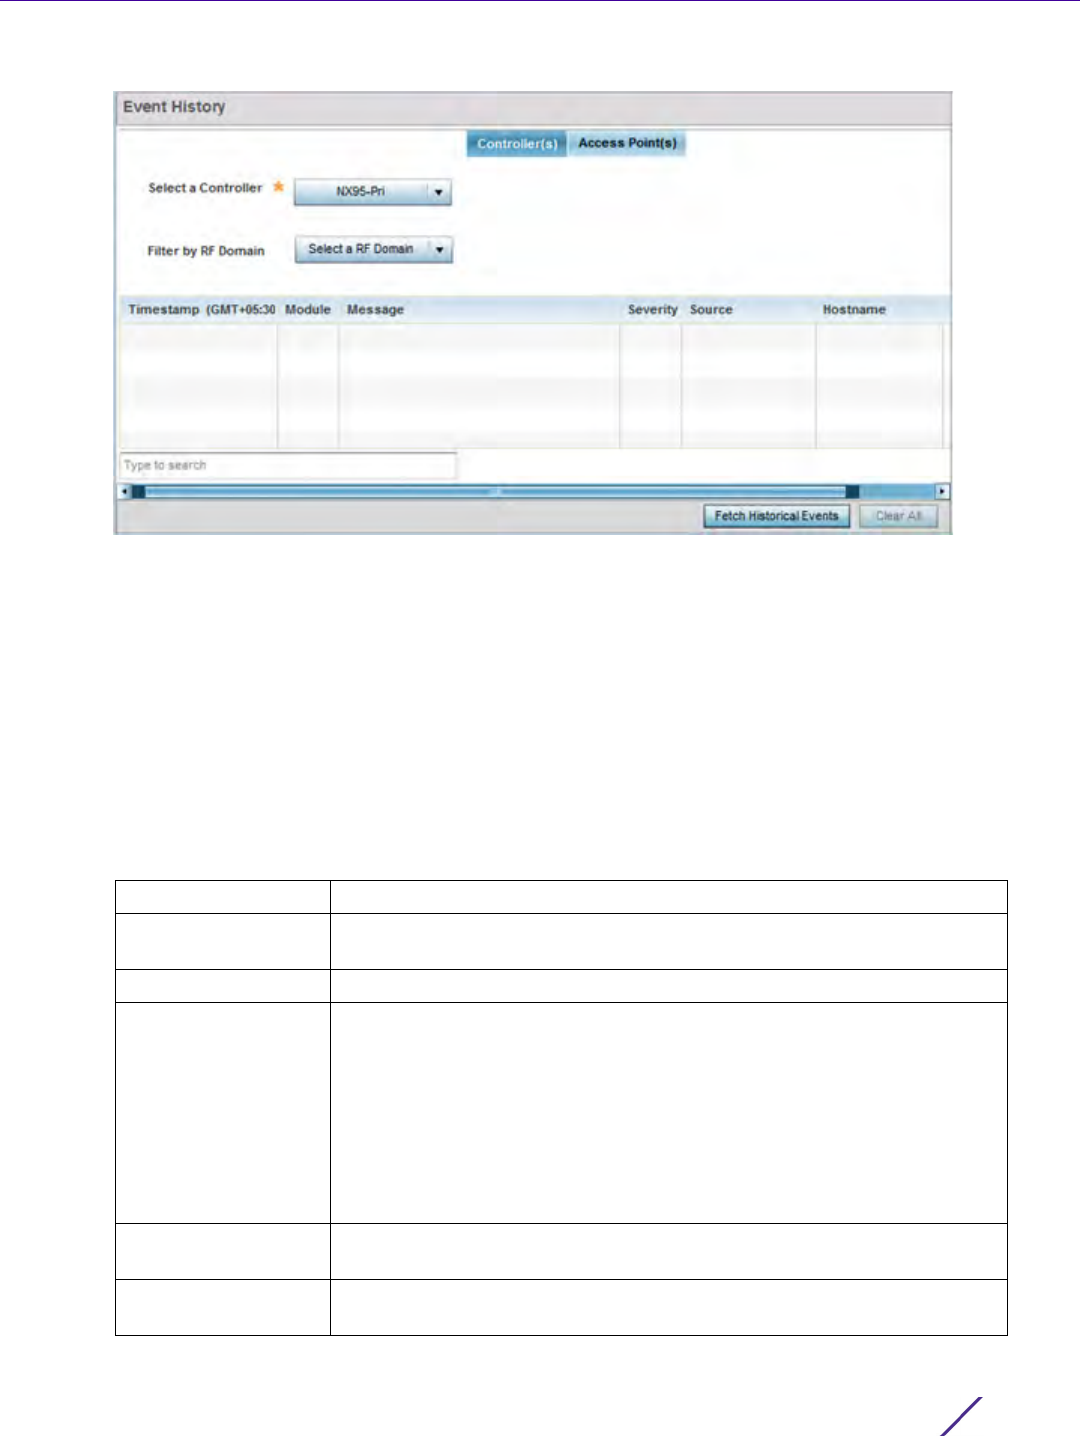
Figure 13-3 Fault Management Event History screen
The Event History screen displays events for controllers, service platforms and Access Points. The Controller(s)
tab displays by default. Information on this tab can be filtered by controllers and service platforms, then further
by a RF Domain. Similarly, the Access Point(s) tab displays information for each RF Domain on the Access
Point and this information can be further filtered on the devices adopted by this Access Point.
9 Within the Controller(s) tab, select the controller from the Select a Controller field to filter events to display. To
filter messages further, select a RF Domain from the Filter by RF Domain field.
10 Within the Access Point(s) tab, select the RF Domain from the Select a RF Domain field to filter events to
display. To filter messages further, select a device from the Filter by Device field.
11 Select Fetch Historical Events from the lower, right-hand, side of the UI to populate the table with either device
or RF Domain events. The following event data is fetched and displayed:
Timestamp Displays the Timestamp (time zone specific) when the fault occurred.
Module Displays the module used to track the event. Events detected by other
module are not tracked.
Message Displays error or status messages for each event listed.
Severity Displays the severity of the event as defined for tracking from the
Configuration screen. Severity options include:
All Severities – All events are displayed irrespective of their severity
Critical – Only critical events are displayed
Error – Only errors and above are displayed
Warning – Only warnings and above are displayed
Info – Only informational and above events are displayed
Source Displays the MAC address of the source device tracked by the selected
module.
Hostname Lists the administrator assigned hostname of the source device tracked
by the selected module.
Diagnostics
Wireless Controller and Service Platform System Reference Guide 13 - 5
12 Select Clear All to clear events and begin new event data gathering.
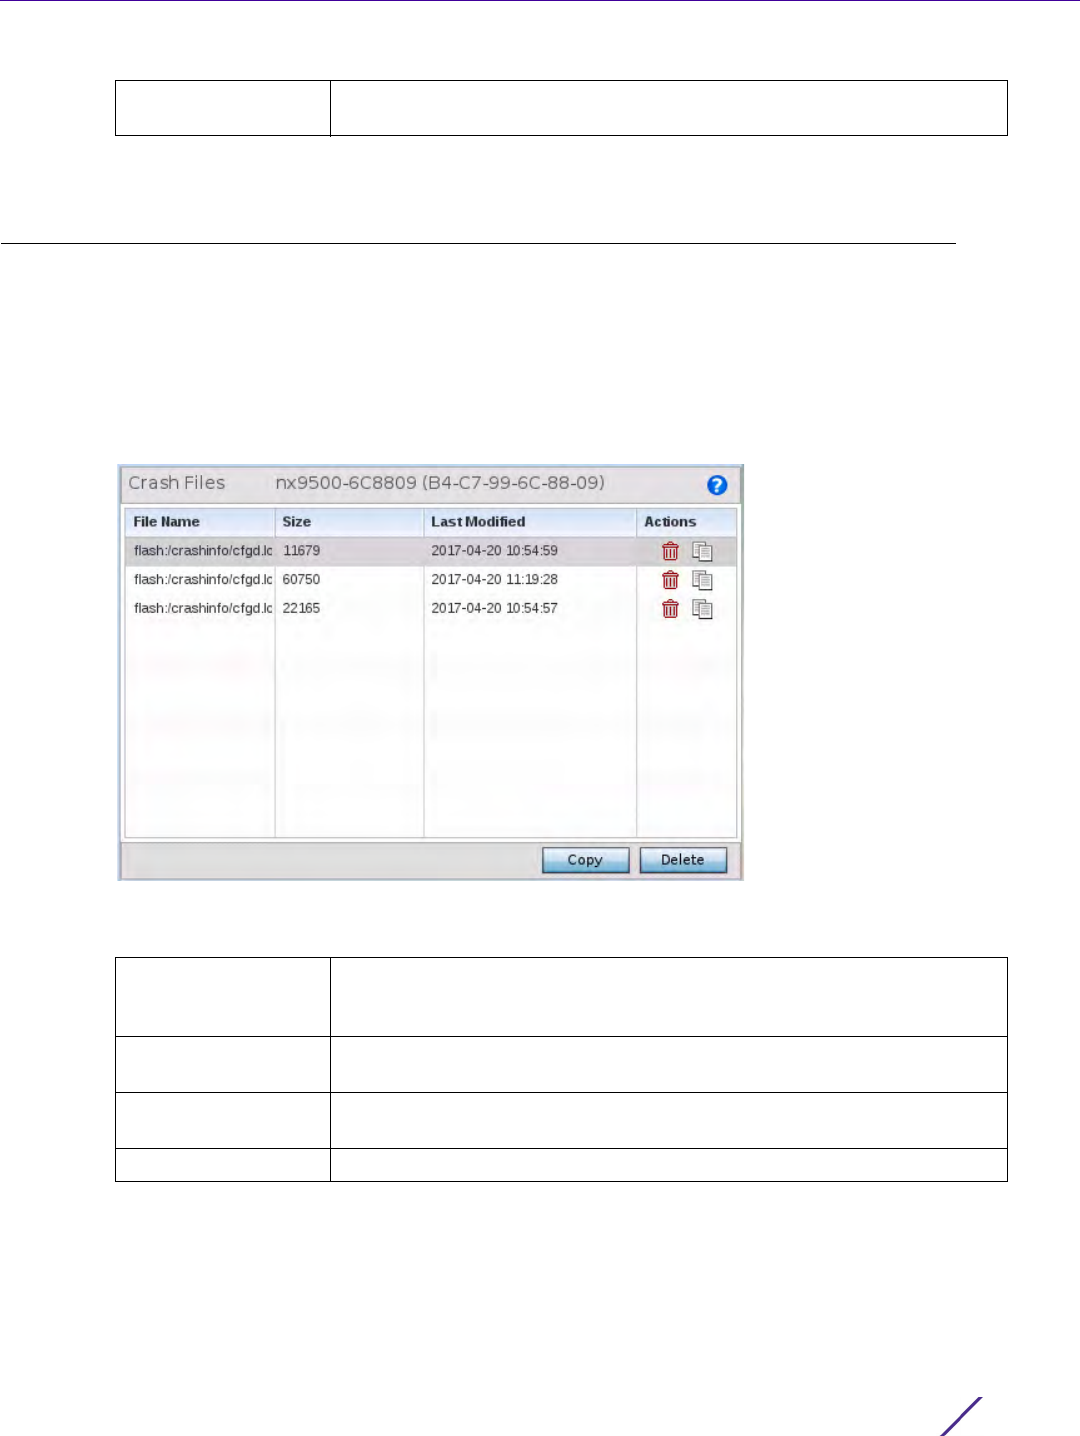
13.2 Crash Files
Use the Crash Files screen to review files created when a controller or service platform encounters a critical error
or malfunction. Use crash files to troubleshoot issues specific to the device on which a crash event was generated.
These are issues impacting the core (distribution layer). Once reviewed, files can be deleted or transferred for
archive. Crash files can be sent to a support team to expedite issues with the reporting device.
1Select
Diagnostics > Crash Files to display the crash file information.
Once a target device has been selected its crash file information displays in the viewer on the right.
Figure 13-4 Crash Files information
2 Refer to the following crash file information for the selected device.
3Select
Copy to copy a selected crash file to an external location. Select Delete to remove a selected crash file.
RF Domain Displays the RF Domain membership of the source device tracked by the
selected module.
File Name Displays the name of the file generated when a crash event occurred. This
is the file available for copy to an external location for archive and remote
administration.
Size Lists the size of the crash file, as this information is often needed when
copying files to an external location.
Last Modified Displays the Timestamp (time zone specific) when the most recent
update to the file occurred.
Actions Displays the action taken in direct response to the detected crash event.
Diagnostics
Wireless Controller and Service Platform System Reference Guide 13 - 6
13.3 Advanced Diagnostics
Refer to Advanced UI Diagnostics to review and troubleshoot any potential issue with the resident User Interface
(UI). The UI Diagnostics screen provides diagnostic tools to identify and correct issues with the UI. Diagnostics can
also be performed at the device level for the Access Point radios and connected clients.
13.3.1 UI Debugging
Advanced Diagnostics
Use the UI Debugging screen to view debugging information for a selected device.
To review device debugging information:
1Select
Diagnostics > Advanced > UI Debugging to display the UI Debugging menu options.
The UI debugging information displays within the NETCONF Viewer by default.
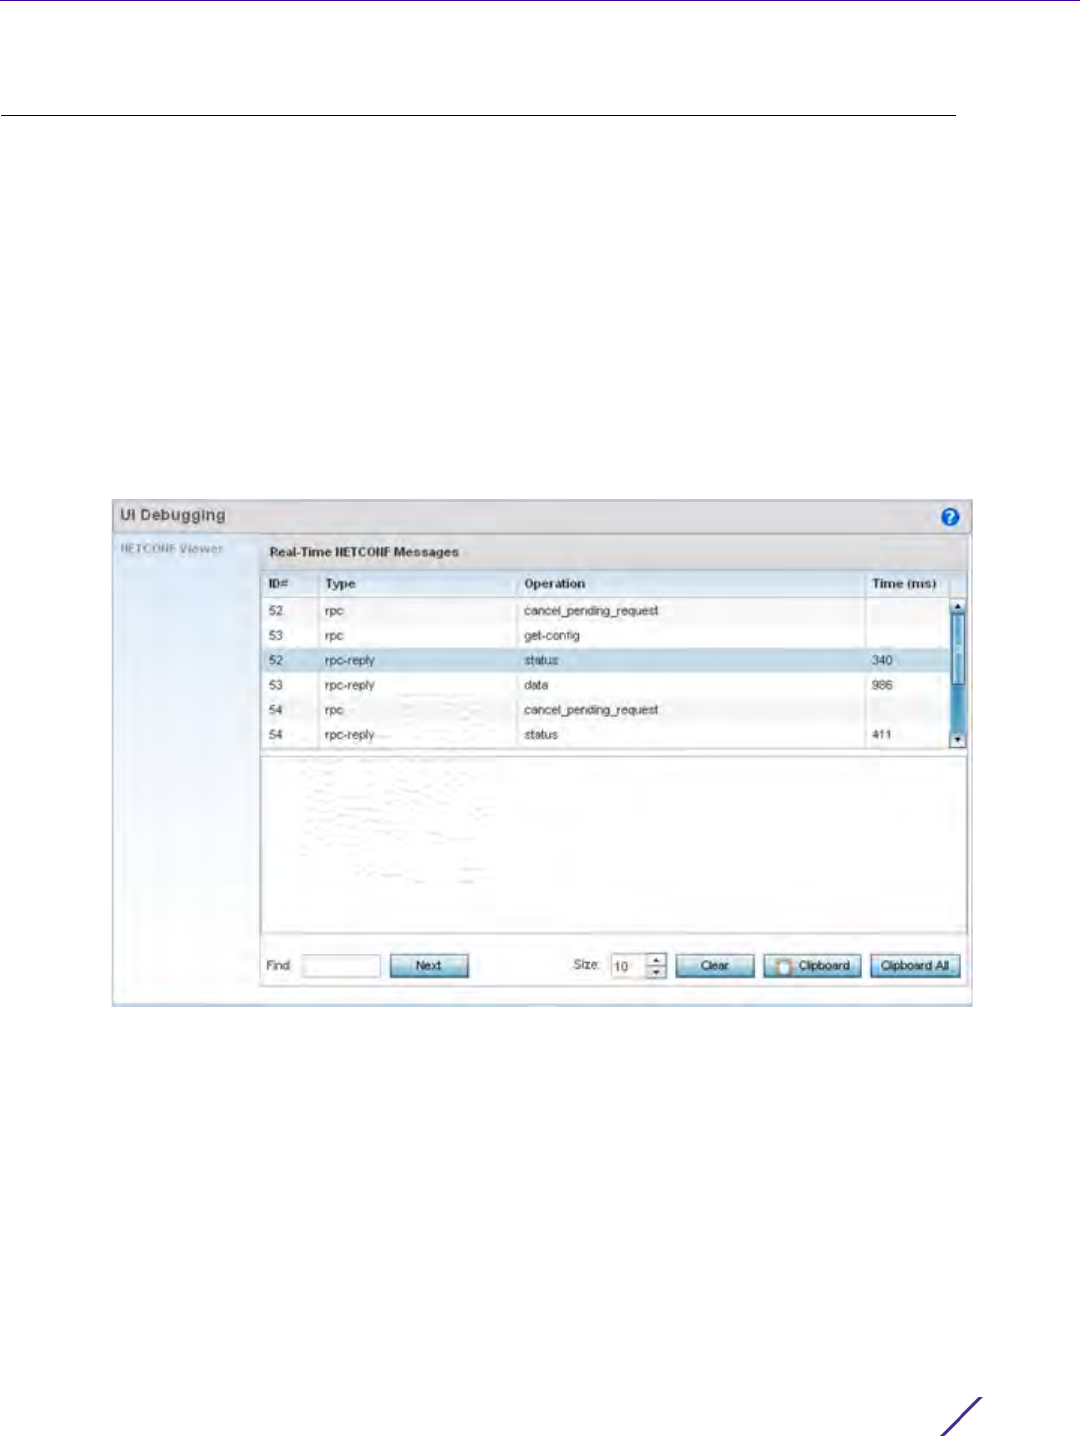
Figure 13-5 UI Debugging screen - NETCONF Viewer
2Use the NETCONF Viewer to review NETCONF information. NETCONF is a proprietary tag-based configuration
protocol for devices. Messages are exchanged using XML tags.
3The
Real Time NETCONF Messages area lists an XML representation of any message generated by the system.
The main display area of the screen is updated in real time.
4 Refer to the Request Response and Time Taken fields on the bottom of the screen to assess the time to receive
and respond to requests. The time is displayed in microseconds.
5Use the Clear button to clear the contents of the Real Time NETCONF Messages area. Use the Find parameter
and the Next button to search for message variables in the Real Time NETCONF Messages area.
Diagnostics
Wireless Controller and Service Platform System Reference Guide 13 - 7
13.3.2 Viewing UI Logs
Advanced Diagnostics
Use the UI logs to periodically assess user interface (UI) events by type, category and severity to assess whether
any administrative corrective actions are warranted.
To view UI log information:
1Select
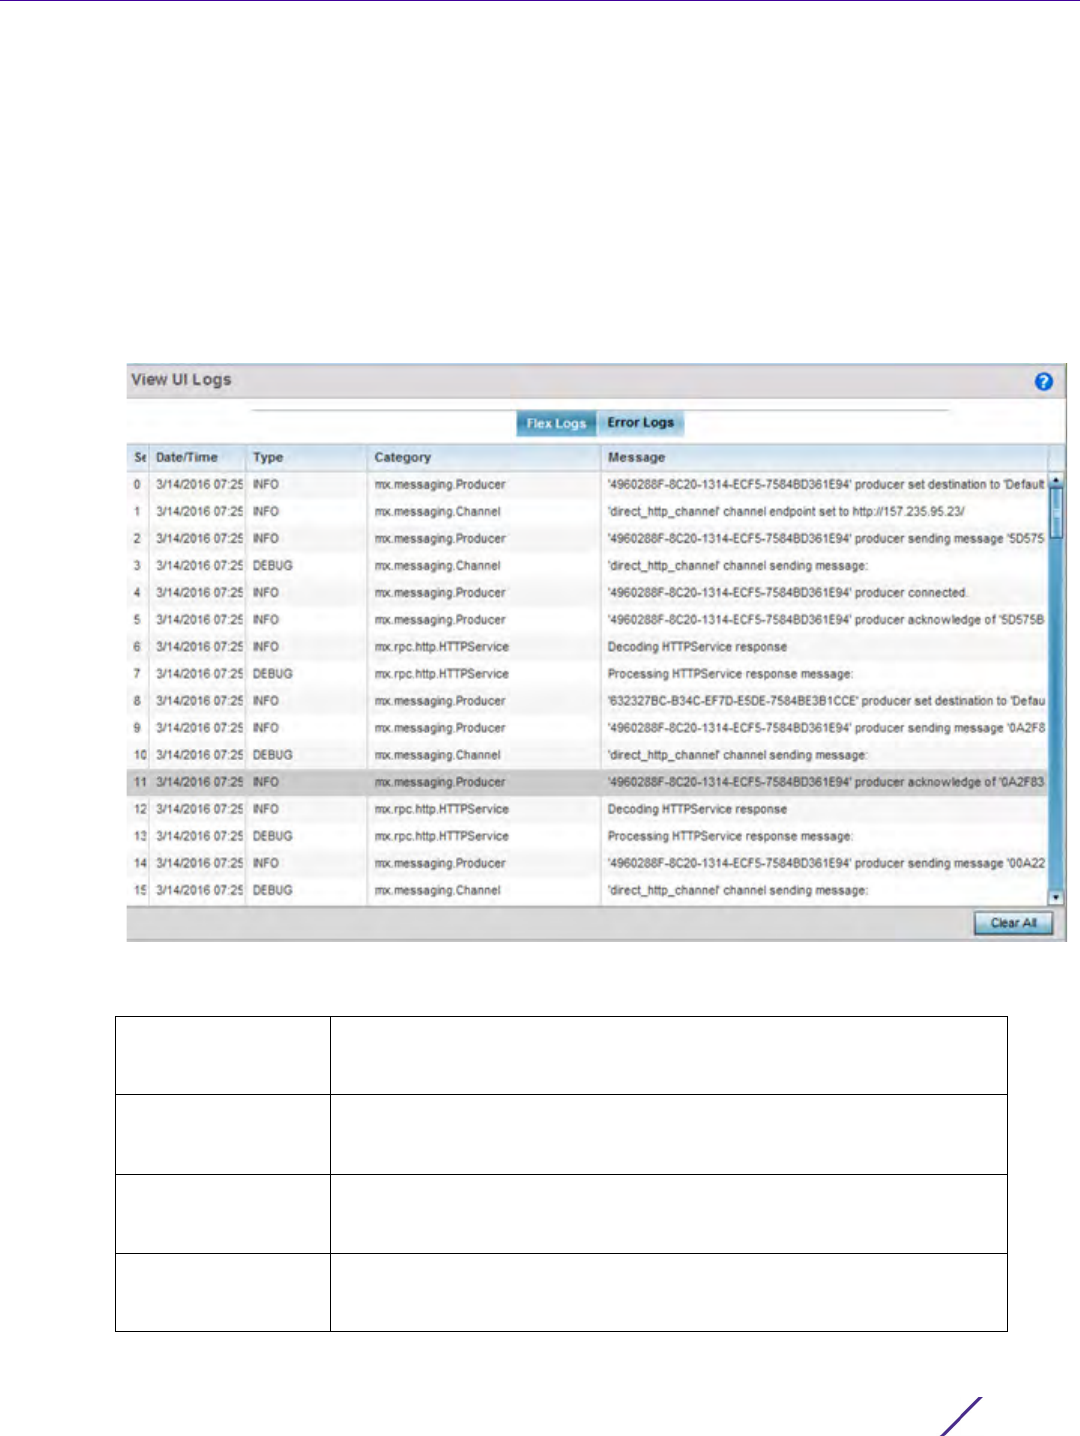
Diagnostics > Advanced > View UI Logs to display the Flex Logs and Error Logs screens. The Flex Logs
screen displays by default, but both tabs list the same information for either UI logs or UI error logs
respectively.
Figure 13-6 View UI Logs screen - Flex Logs tab
2 Refer to the following UI event or error log parameters:
Sequence Displays a numeric number for the generation of the listed UI events. If
changing the data display from a sequential display, these numbers can
be used to assess the chronology of the UI event generation.
Date/Time Lists the date and time when each listed UI log event occurred. Use this
information to assess whether time was factor in the generation of one or
more events and whether their timestamp increases their significance.
Type Displays each listed log entry’s event or error type. Some events are
DEBUG while others are INFO. Categorize collectively as specific events
warrant additional administration.
Category Lists each event or error’s system defined category as a means of further
filtering specific events or system collected error logs. This is helpful when
assess whether specific events or errors impact multiple UI functions.
Diagnostics
Wireless Controller and Service Platform System Reference Guide 13 - 8
3Select
Clear All to remove all the log or error entries from the screen and begin a new data collection.
13.3.3 Viewing UI Sessions
Advanced Diagnostics
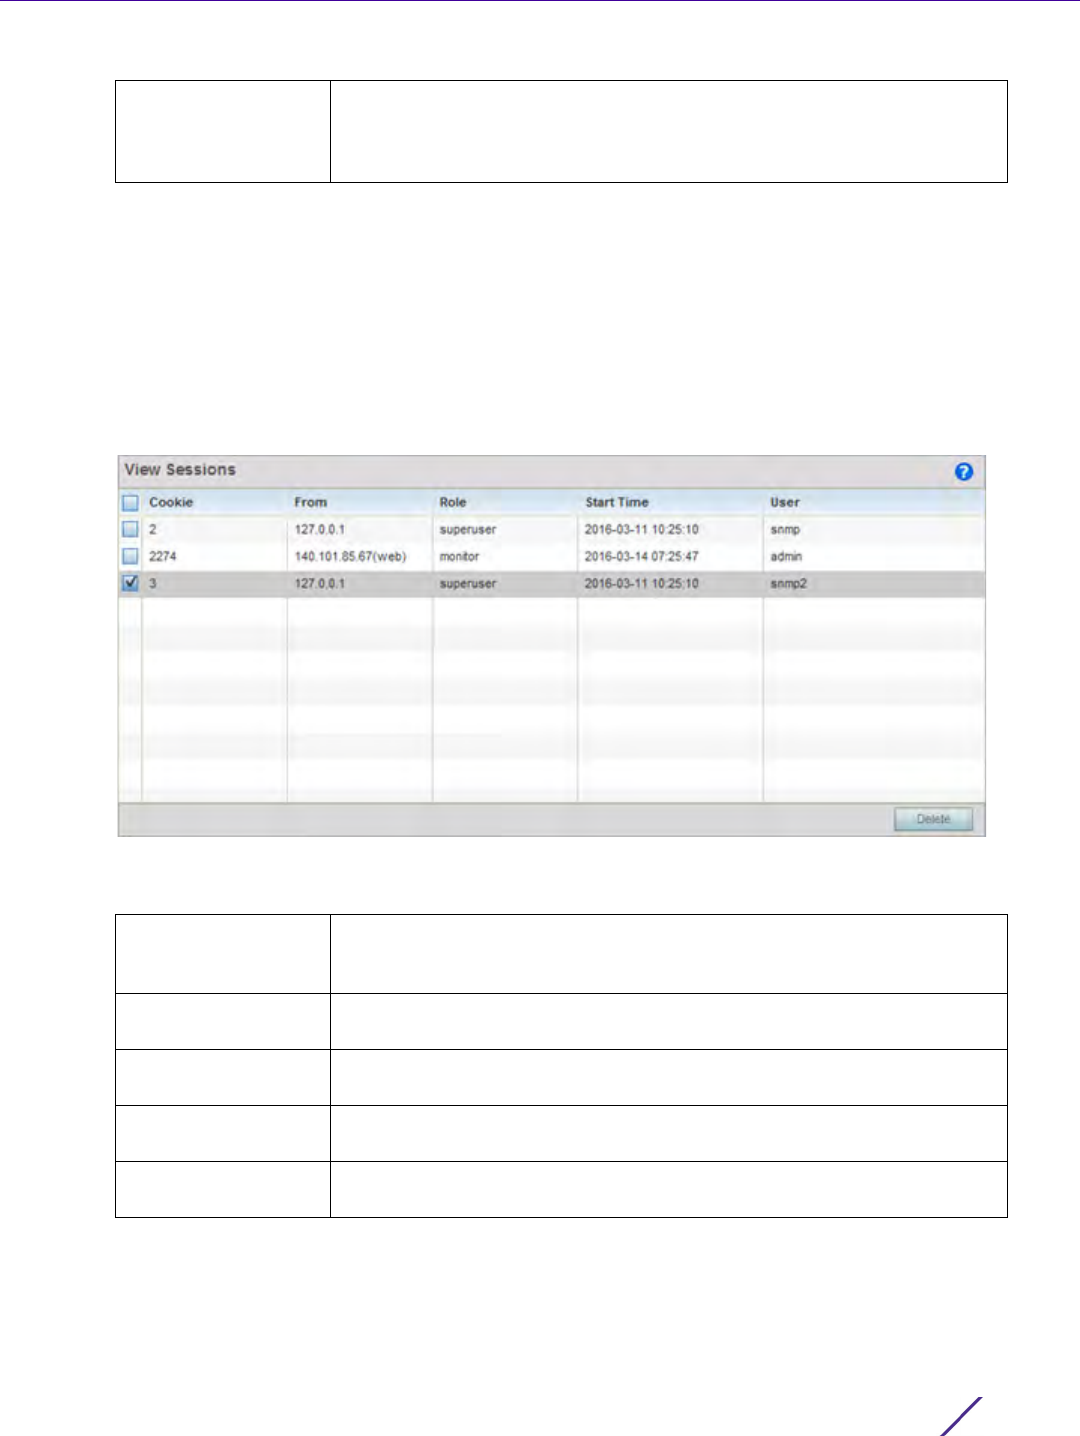
Refer to the View Sessions screen to assess specific user interface sessions by individual user.s
To view UI session information:
1Select
Diagnostics > Advanced > View Sessions.
Figure 13-7 View Sessions Screen
2 Refer to the following UI session data to assess its significance:
3 Select a specific user session and Delete to remove the selected session from those listed for administration.
Message Displays the system generated message for the functions impacted by
each listed UI or error. Use this data in combination with the date, type
and category to assess whether specific messages are related and their
significance worthy of immediate administration.
Cookie Displays a numeric session cookie which identifies the session
corresponding to it. This information can be used to further filter specific
user sessions to the network route used.
From Lists the numeric IP address used by each listed user as their network
identifier into the WiNG user interface.
Role Displays each user’s defined administrative role. Each role has different
access and administrative privileges.
Start Time Lists the time each listed user began their WiNG interface UI session.
Does this start time correspond to a known UI event or error condition?
User Displays each user’s SNMP administrative access protocol and their
session permissions.

1
Wireless Controller and Service Platform System Reference Guide
14
Operations
The functions within the controller or service platform’s Operations menu allow firmware and configuration files
management and certificate generation for managed devices. In a clustered environment, these operations can be
performed on one controller or service platform, then propagated to each member of the cluster and onwards to
the devices managed by each cluster member.
A certificate links identity information with a public key enclosed in the certificate. Device certificates can be
imported and exported to and from the controller or service platform to a secure remote location for archive and
retrieval as they are required for application to other managed devices.
Self Monitoring At Run Time RF Management (Smart RF) is an innovation designed to simplify RF configurations
for new deployments, while (over time) providing on-going deployment optimization and radio performance
improvements. The Smart RF functionality scans the managed network to determine the best channel and transmit
power for each managed Access Point radio. Smart RF policies can be applied to specific RF Domains, to add site
specific deployment configurations and self recovery values to groups of devices within pre-defined physical RF
coverage areas.
For more information, refer to the following:
•Device Operations
•Certificates
•Smart RF
14.1 Device Operations
Updated device firmware and configuration files are periodically released to the Support Web site. If an Access
Point’s (or its associated device’s) firmware is older than the version on the Web site, update to the latest firmware
version for full feature functionality and optimal controller or service platform utilization. Additionally, selected
devices can either have a primary or secondary firmware image applied or fallback to a selected firmware image if
an error occurs in the update process.
For more information, refer to the following:
•Operations Summary on page 14-1
•Adopted Device Upgrades
•Using the File Management Browser
•Restarting Adopted Devices
•Captive Portal Configuration
•Crypto CMP Certificate
•RAID Operations
•Re-elect Controller
14.1.1 Operations Summary
Device Operations
The Summary screen displays by default when Operations is selected from the controller or service platform’s main
menu bar.
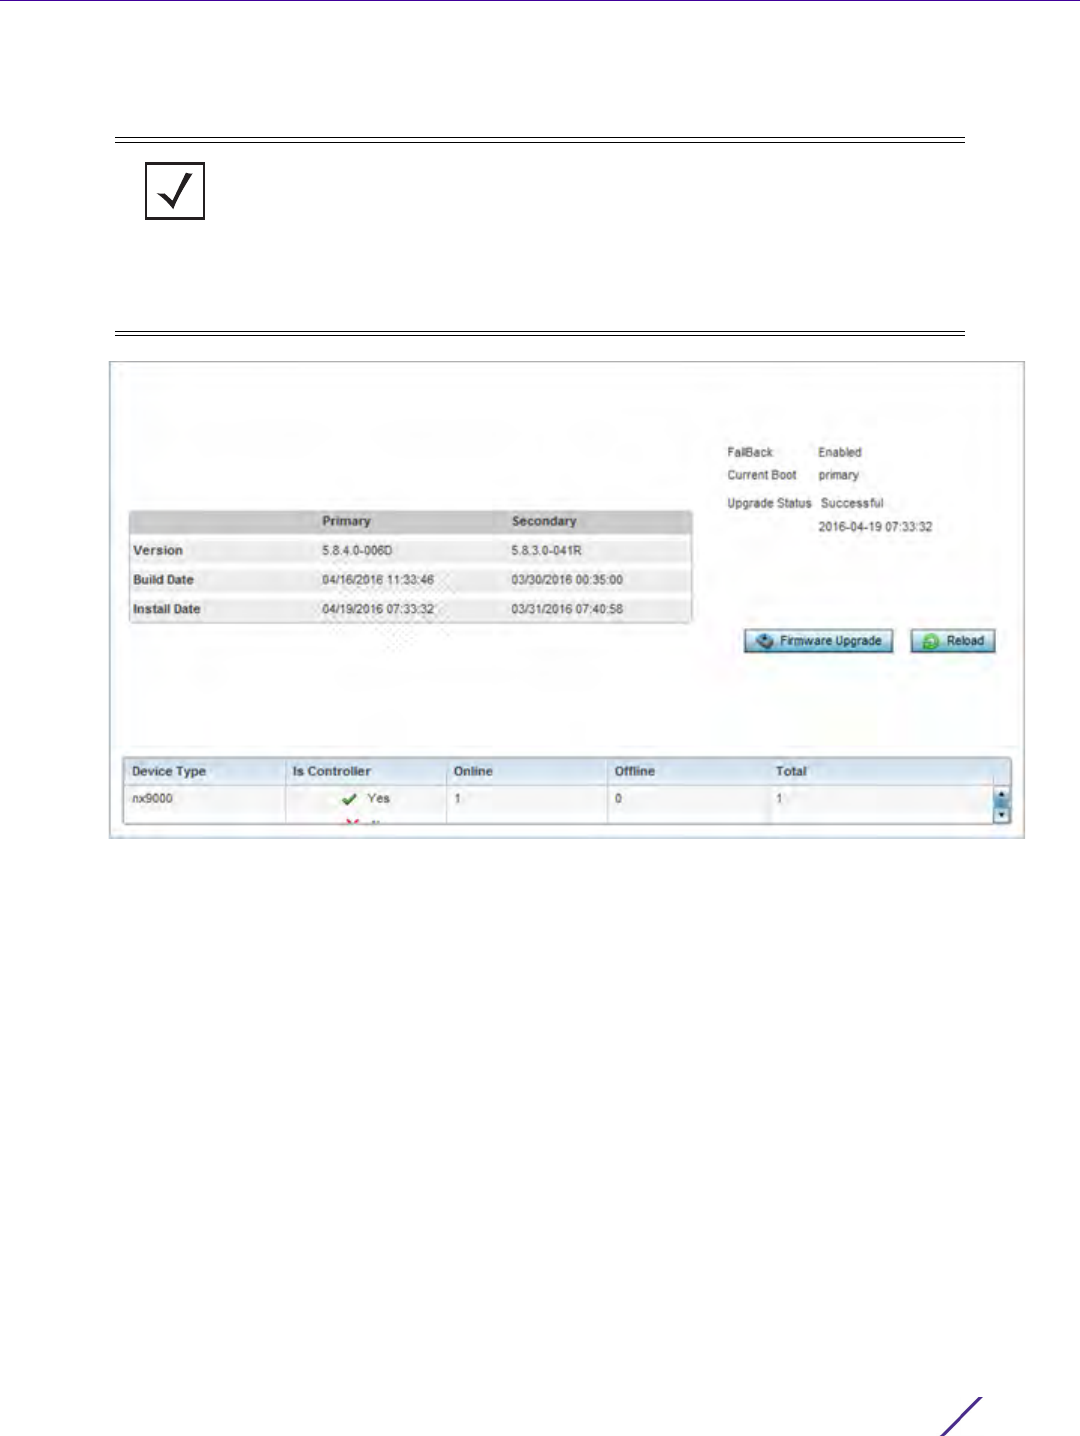
Operations
Wireless Controller and Service Platform System Reference Guide 2
The Summary screen displays firmware information for a specific device selected from either the RF Domain or
Network tabs on the left-hand side of the screen.
Figure 14-1 Device Details screen
NOTE: When displaying the Summary screen at the RF Domain level of the UI’s
hierarchal tree, the screen does not display a field for a device’s Primary and
Secondary firmware image. At the RF Domain level, the Summary screen just lists
the Hostname, MAC Address, Online status, Device Type and Is Controller
designations for the devices comprising the selected RF Domain. A RF Domain must
be selected from the hierarchal tree and expanded to list the devices comprising the
RF Domain. From there, individual controllers, service platforms and Access Points
can be selected and their properties modified.
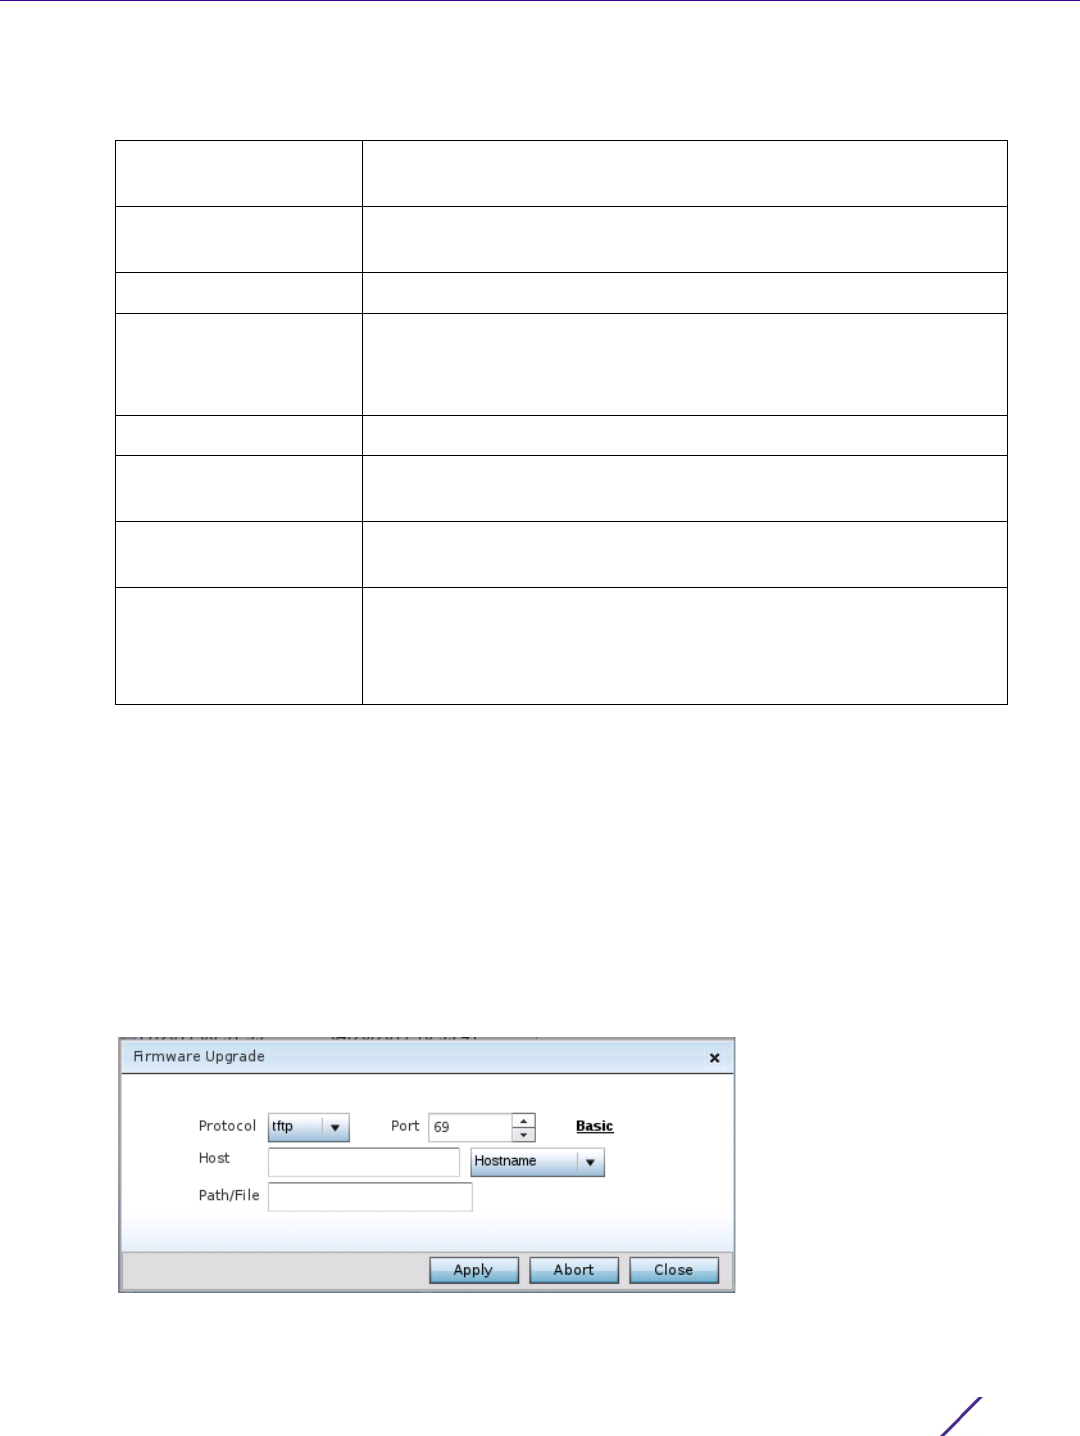
Operations
Wireless Controller and Service Platform System Reference Guide 3
1 Refer to the following to determine whether a firmware image needs to be updated for the selected device, or
a device requires a restart or revert to factory default settings.
2 Refer to the device table for basic information for known device types. The device table displays the Device
Type, Controller status, Online, Offline and Total device counts.
14.1.1.1 Upgrading Device Firmware
Operations Summary
Controllers and service platforms can conduct firmware updates on behalf of their managed devices.
To update the firmware of a managed device:
1 Select a device from the browser.
2 Select the Firmware Upgrade button.
Figure 14-2 Firmware Update screen
3 By default, the Firmware Upgrade screen displays the server parameters for the target device firmware file.
Version Displays the primary and secondary firmware image version from the
wireless controller.
Build Date Displays the date the primary and secondary firmware image was built
for the selected device.
Install Date Displays the date the firmware was installed for the selected device.
Fallback Lists whether fallback is currently enabled for the selected device.
When enabled, the device reverts back to the last successfully
installed firmware image if something were to happen in its next
firmware upgrade that would render the device inoperable.
Current Boot Lists firmware image for the device on the current boot.
Upgrade Status Displays the status of the last firmware upgrade performed for each
listed device managed by this controller or service platform.
Firmware Upgrade Select this option to display the firmware upgrade window for the
selected device. Select the Apply button to perform the function.
Reload Select this option to restart the selected device. Selecting this option
restarts the target device using the specified options in the settings
window. Restarting a device resets all data collection values to zero.
Select the Reload button to perform the function.

Operations
Wireless Controller and Service Platform System Reference Guide 4
4 Provide the following information to accurately define the location of the target device firmware file:
5Select
Apply to start the firmware update. Select Abort to terminate the firmware update. Select Close to close
the upgrade popup. The upgrade continues in the background.
14.1.2 Adopted Device Upgrades
Device Operations
An administrator can designate controllers, service platforms or Access Points as RF Domain managers capable of
receiving firmware files from the NOC (NX7500 or NX9000 series service platforms) then provisioning other
devices within their same RF Domain. Controllers, service platforms and Access Points can now all update the
firmware of different device models within their RF Domain. However, firmware updates cannot be made
simultaneously to devices in different site deployments.
To administer a device upgrade and administrate upgrade status and history:
1 Select the Operations.
2 Ensure Devices is selected from the Operations menu on the top, left-hand, side of the screen.
3 Expand the System node on the left-hand side of the screen, select a RF Domain and one of its member
devices.
4 Select the Adopted Device Upgrade tab. The screen displays with the Device Upgrade List selected by default.
Protocol Select the protocol used for updating the device firmware. Available
options include:
tftp
ftp
sftp
http
cf
usb1-4
Port Use the spinner control or manually enter the value to define the port
used by the protocol for firmware updates. This option is not valid for cf
or usb1-4.
Host Provide the hostname or numeric IPv4 or IPv6 formatted address of the
server used to update the firmware. This option is not valid for cf and
usb1-4. A hostname cannot contain an underscore.
User Name Define the user name used to access either a FTP or SFTP server.
Password Specify the password for the user account to access a FTP or a SFTP
server.
Path/File Specify the path to the firmware file. Enter the complete relative path to
the file on the server.
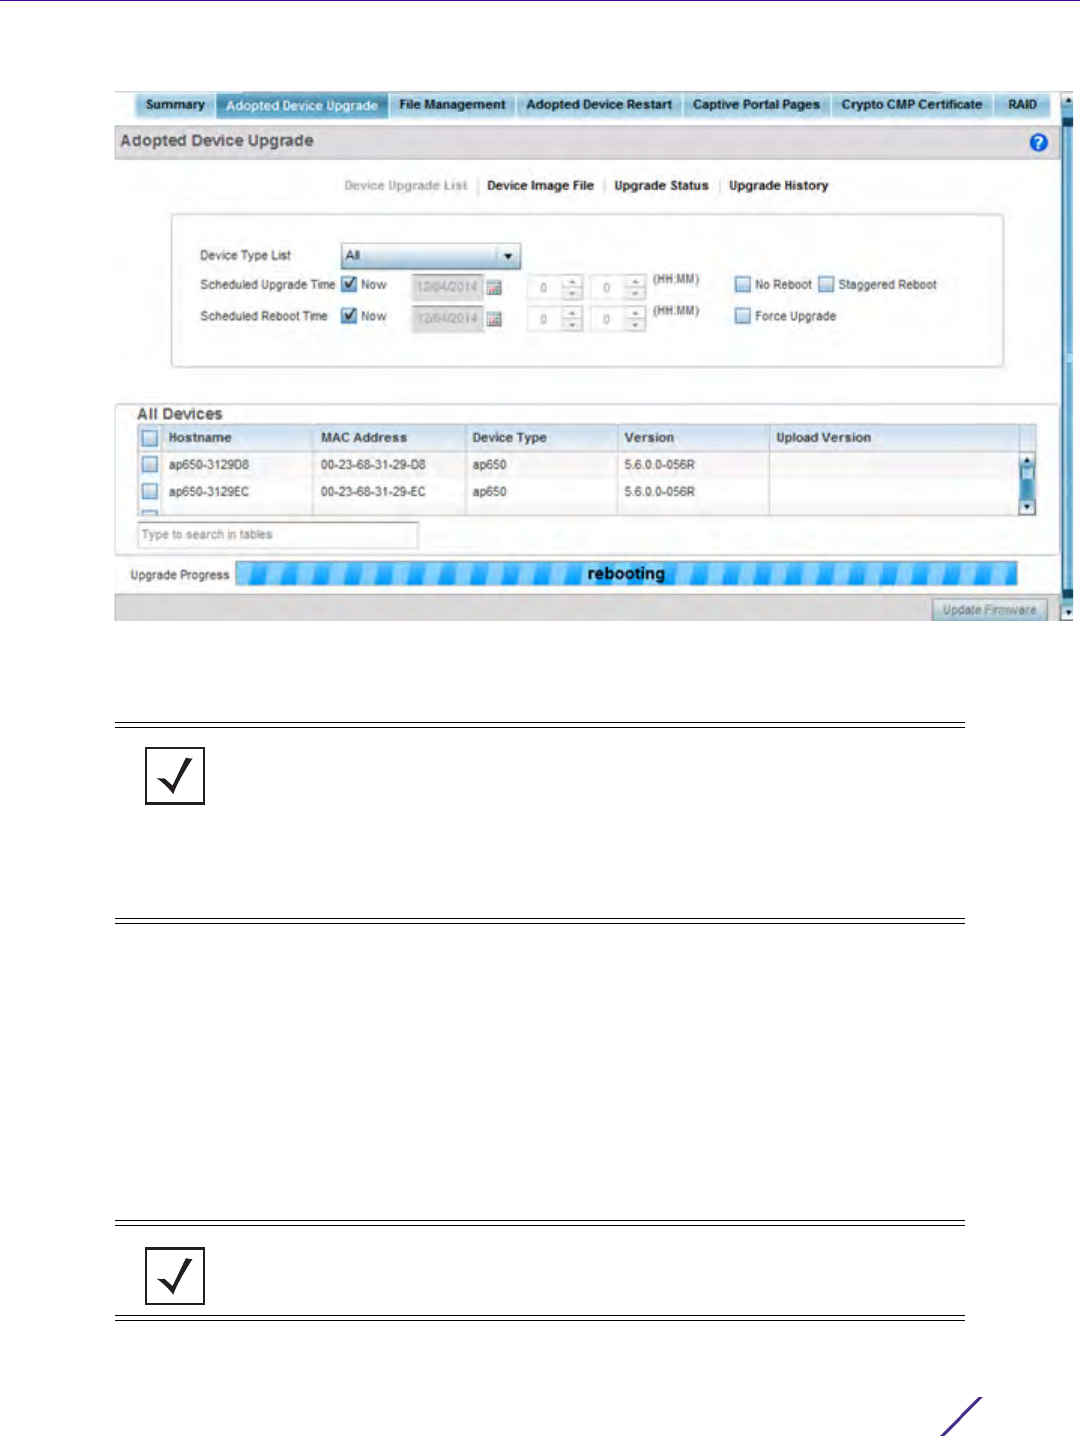
Operations
Wireless Controller and Service Platform System Reference Guide 5
Figure 14-3 Device Upgrade List screen
5 Select a controller, service platform or Access Point model from the Device Type List drop-down menu. This is
the device model intended to provision firmware to the devices selected within the All Devices table below.
6Use the Scheduled Upgrade Time option to set when the upgrade occurs. To perform an upgrade immediately,
select Now. To schedule the upgrade to take place at a specified time, enter a date and time in the appropriate
fields.
7 Refer to the Scheduled Reboot Time option to schedule when an updated device is rebooted to implement the
updated firmware. To reboot immediately, select Now. To schedule the reboot to take place at a future time to
keep the device in service, enter a date and time in the appropriate fields.
Use the No Reboot option to keep from rebooting after an upgrade. Select Staggered Reboot to avoid
upgrading devices simultaneously and risk bringing down the network. When selected, devices are rebooted
incrementally to preserve network availability. Select Force Upgrade to initiate an Access Point firmware
upgrade and reboot at the present time.
NOTE: If selecting the Device Upgrade screen from the RF Domain level of the UI’s
hierarchal tree, there’s an additional Upgrade from Controller option to the right of
the Device Type List. Select this option to provision selected device models within
the same RF Domain from this RF Domain manager. If expanding a RF Domain and
selecting a member device, the upgrade tab is entitled Adopted Device Upgrade,
as an upgrade is made from an elected RF Domain Manager device. There’s also an
additional Device Image File screen to select the device image type and set the
transfer protocol.
NOTE: The Scheduled Upgrade Time and Scheduled Reboot Time are your local
system’s time. They’re not the Access Point, controller, service platform or VX time
and are not synched with the device.
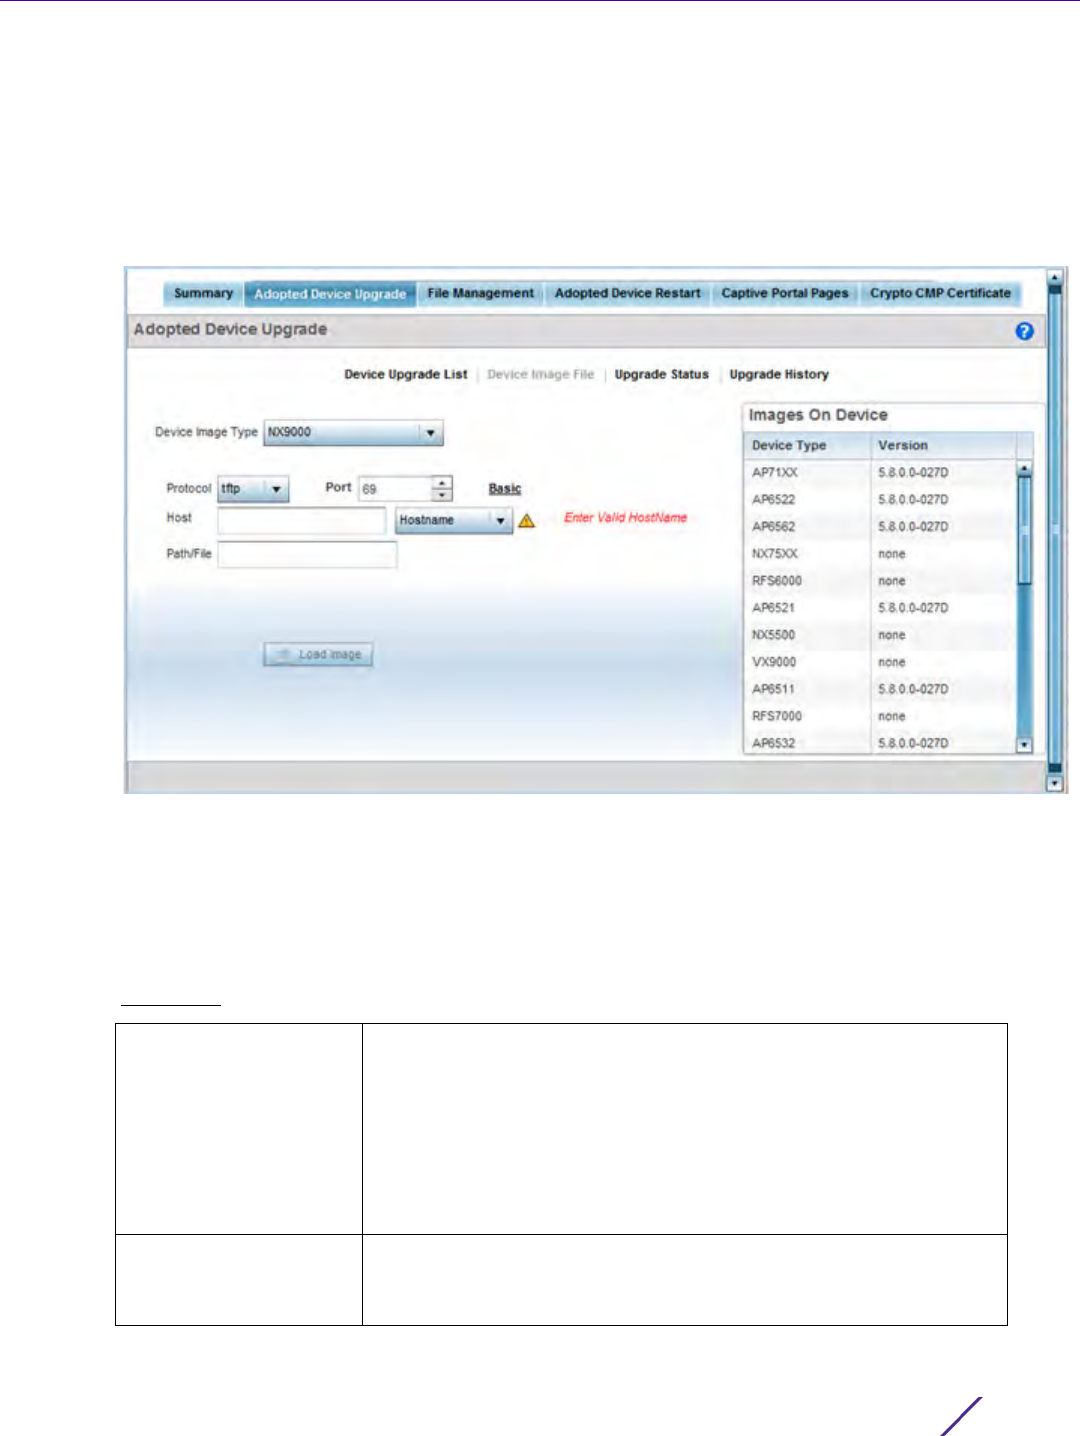
Operations
Wireless Controller and Service Platform System Reference Guide 6
Use the All Devices table to select controller, service platform and Access Point models for firmware updates
from the device model selected from the Device Type List.
Refer to the MAC Address and Device Type values to help determine the specific models available for upgrade
within the RF domain. Use the Version and Upload Version values to assess each listed device’s current
firmware as well as the firmware version available to a device upgrade.
8Select
Device Image File.
Figure 14-4 Device Image File screen
9 Select a controller, service platform or Access Point model from the Device Image Type drop-down menu.
Selecting All makes each controller, service platform and Access Point model images available for updates on
those specific models.
10 Select the Basic link to enter a URL pointing to the location of the controller, service platform or Access Point
image files for the device update(s).
11 Selecting Advanced lists additional options for the device’s firmware image file location:
Protocol Select the protocol for device firmware file management and transfer.
Available options include:
tftp
ftp
sftp
http
cf
Port Designate the port for transferring the firmware files used in the
upgrade operation. Enter the port number directly or use the spinner
control.
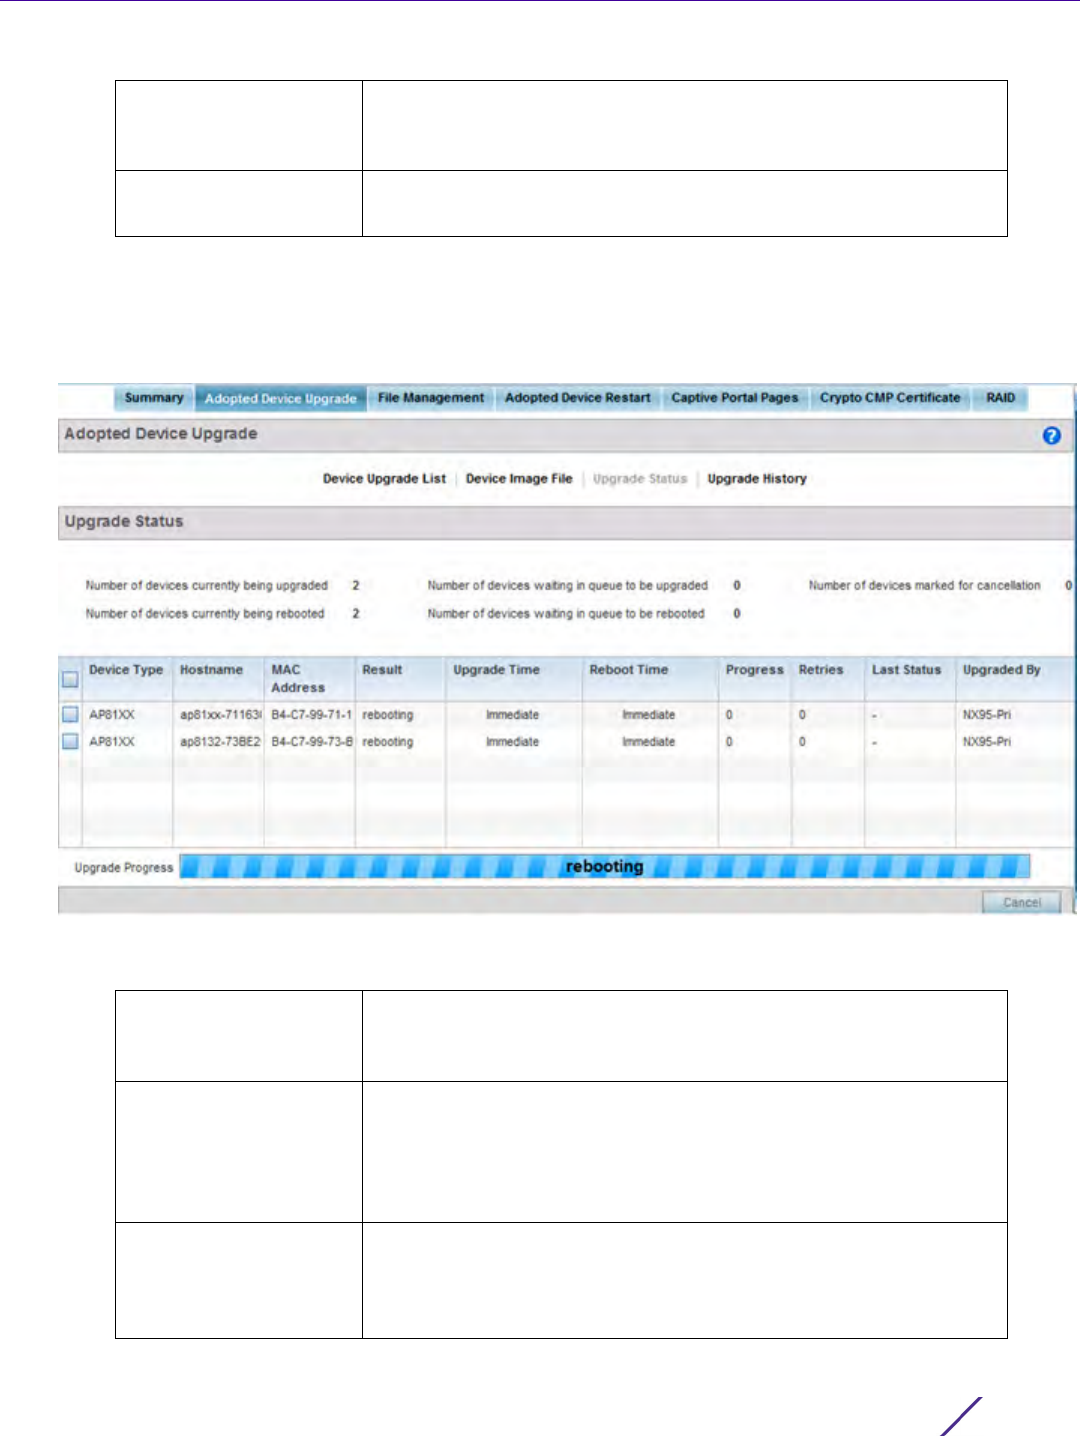
Operations
Wireless Controller and Service Platform System Reference Guide 7
12 Select the Load Image button to upload the device firmware in preparation of an upgrade.
The firmware image is loaded to the flash/upgrade directory (not the flash/cache directory). If the NOC pushes
the image, then it is loaded to flash/cache/upgrade.
13 Select Upgrade Status to assess the administration, scheduling and progress of device firmware updates.
Figure 14-5 Upgrade Status screen
14 Refer to the Upgrade Status field to assess the completion of in-progress upgrades.
Host Specify a numerical IP address or textual Hostname of the resource
used to transfer files to the devices designated for a firmware update. A
hostname cannot contain an underscore.
Path / File Define the path to the file on the file repository resource. Enter the
complete relative path to the file.
Number of devices
currently being
upgraded
Lists the number of firmware upgrades currently in-progress and
downloading for selected devices. Once the device has the image it
requires a reboot to implement the firmware image.
Number of devices
currently being booted
Lists the number devices currently booting after receiving an upgrade
image. The reboot is required to implement the new image and renders
the device offline during that period. Using the Device Upgrade List,
reboots can be staggered or placed on hold to ensure device remains in
service.
Number of devices
waiting in queue to be
upgraded
Lists the number of devices waiting to receive a firmware image from
their provisioning controller, service platform or Access Point. Each
device can have its own upgrade time defined, so the upgrade queue
could be staggered.

Operations
Wireless Controller and Service Platform System Reference Guide 8
15 Refer to the following status reported for each current or scheduled upgrade operation:
16 Optionally select Cancel (from the lower, right-hand corner of the screen) to cancel the upgrade of devices
under the selected RF Domain. The Cancel button is enabled only if there are device undergoing upgrade and
they’re are selected for cancellation.
17 Select Upgrade History.
Number of devices
waiting in queue to be
upgraded
Lists the number of devices waiting to reboot before actively utilizing its
upgraded image. The Device Upgrade List list allows an administrator to
disable or stagger a reboot time, so device reboots may not occur
immediately after an upgrade. The reboot operation renders the device
offline until completed so reboots can scheduled for periods of reduced
load.
Number of devices
marked for cancellation
Lists the number of upgrades that have been manually cancelled during
the upgrade operation.
Device Type Displays the model number of devices pending an upgrade. Each listed
device is provisioned an image file unique to that model.
Hostname Lists the factory encoded MAC address of a device either currently
upgrading or in the queue of scheduled upgrades.
MAC Address Lists the factory encoded MAC address of a device either currently
upgrading or in the queue of scheduled upgrades.
Result Lists the state of an upgrade operation (downloading, waiting for a
reboot etc.).
Upgrade Time Displays whether an upgrade is immediate or set by an administrator
for a specific time. Staggering upgrades is helpful to ensure a sufficient
number of devices remain in service at any given time while others are
upgrading.
Reboot Time Displays whether a reboot is immediate or time set by an administrator
for a specific time. Reboots render the device offline, so planning
reboots carefully is central to ensuring a sufficient number of devices
remain in service.
Progress Lists the number of specific device types currently upgrading.
Retries Displays the number of retries, if any, needed for an in-progress
firmware upgrade operation.
Last Status Lists the last reported upgrade and reboot status of each listed in
progress or planned upgrade operation.
Upgraded By Lists the model of the controller, service platform or Access Point RF
Domain manager that’s provisioning an image to a listed device.
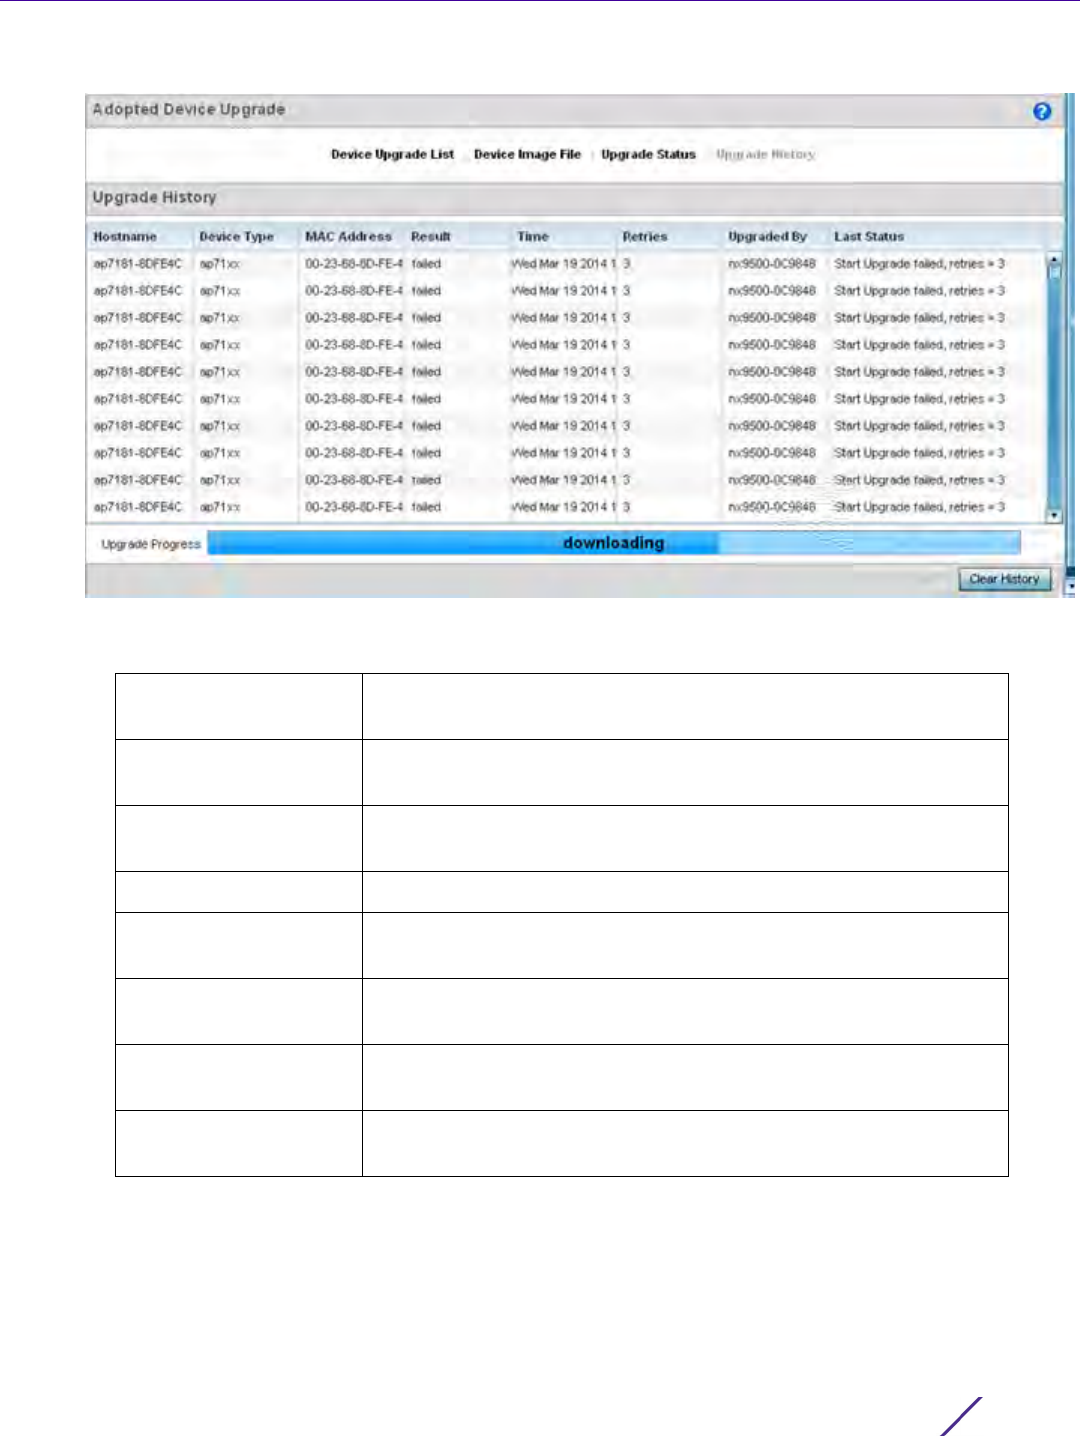
Operations
Wireless Controller and Service Platform System Reference Guide 9
Figure 14-6 Upgrade History screen
18 Refer to the following Upgrade History status:
19 Select the Clear History button to clear the current update information for each listed device and begin new
data collections.
Hostname Displays the administrator assigned Hostname for each listed controller,
service platform or Access Point that’s received an update.
Device Type Displays the controller, service platform or Access Point model
upgraded by a firmware update operation.
MAC Address Displays the device Media Access Control (MAC) or hardware address
for a device that’s received an update.
Result Displays the upgrade result for each listed device.
Time Displays the time and date of the last status received from an upgraded
device.
Retries Displays the number of retries, if any, needed for the firmware upgrade
operation.
Upgraded By Displays the administrator credentials responsible for initiating each
listed upgrade operation.
Last Status Displays the last status update received for devices that have been
upgraded.
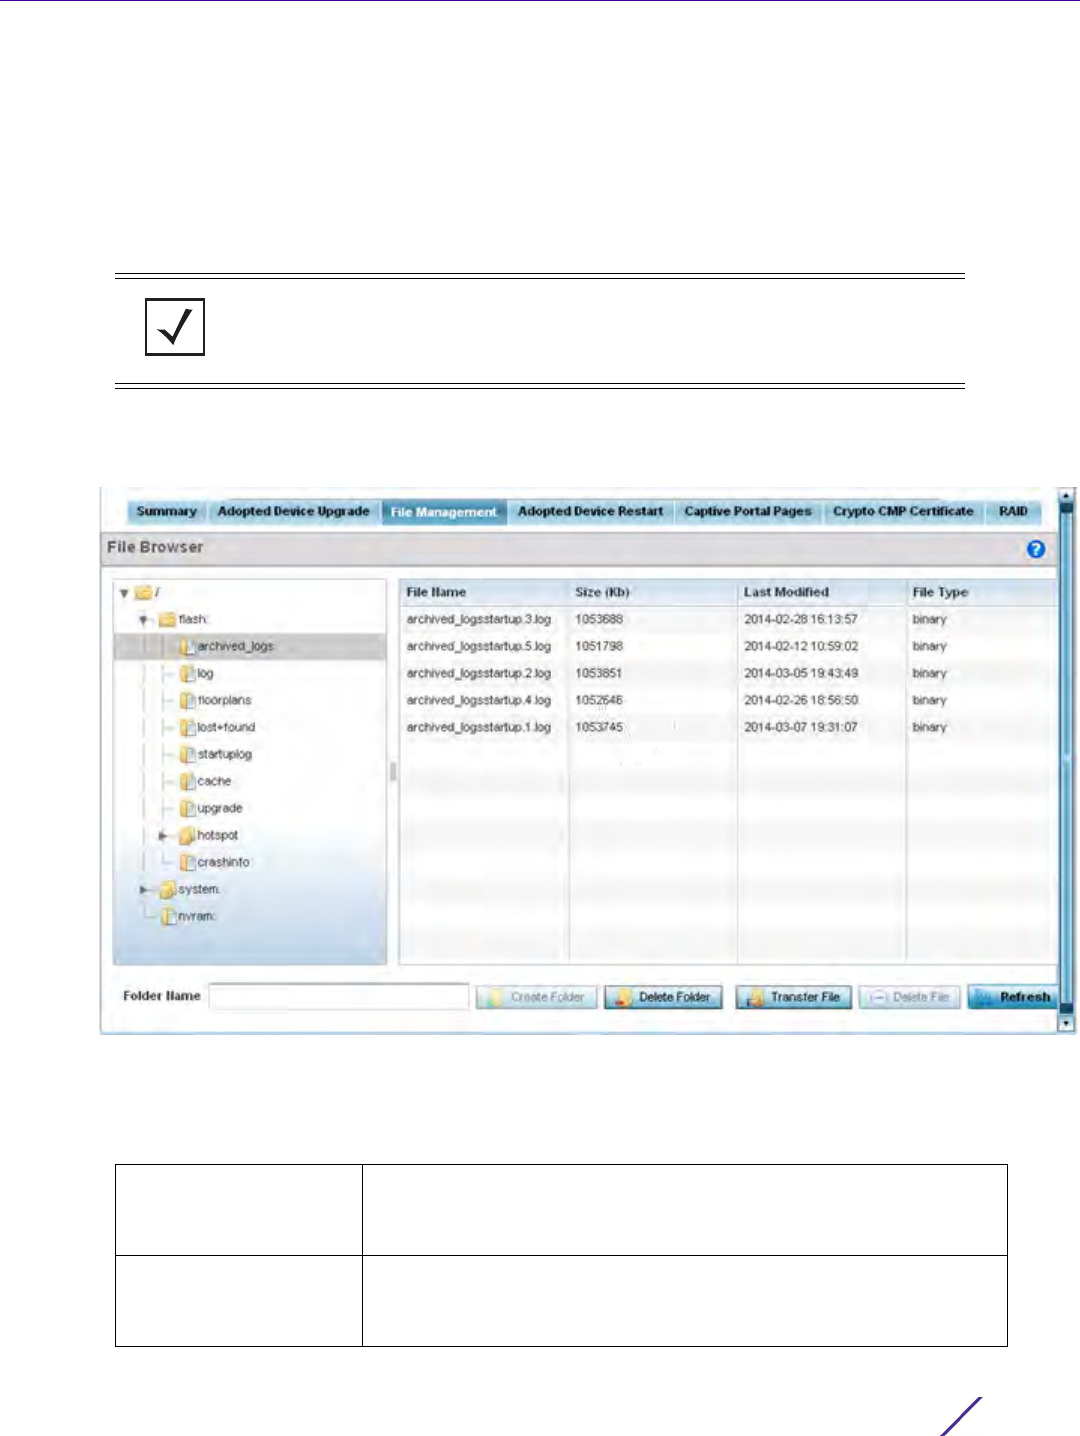
Operations
Wireless Controller and Service Platform System Reference Guide 10
14.1.3 Using the File Management Browser
Device Operations
Controllers and service platforms maintain a File Browser allowing an administrator to review the files residing on a
controller or service platform’s internal or external memory resource. Directories can be created and maintained for
each File Browser location and folders and files can be moved and deleted as an administrator interprets
necessary.
To administer files for managed devices and memory resources:
1 Select the Operations > Devices > File Management.
Figure 14-7 File Browser screen - flash
2 Refer to the following to determine whether a file needs to be deleted or included in a new folder for the
selected internal (flash, system, nvram) or external (cf, USB1-4) memory resource. The following display for each
available memory resource:
NOTE: The File Management tab is not available at the RF Domain level of the UI’s
hierarchal tree. A RF Domain must be selected and expanded to display the RF
Domain’s member devices. Once expanded, selected a RF Domain member device
to ensure the File Management UI option is available.
File Name Displays the name of the file residing on the selected flash, system,
nvram or usb1-4 location. The name cannot be modified from this
location.
Size (Kb) Displays the size of the file in kb. Use this information to help determine
whether the file should be moved or deleted in respect to available
system memory.
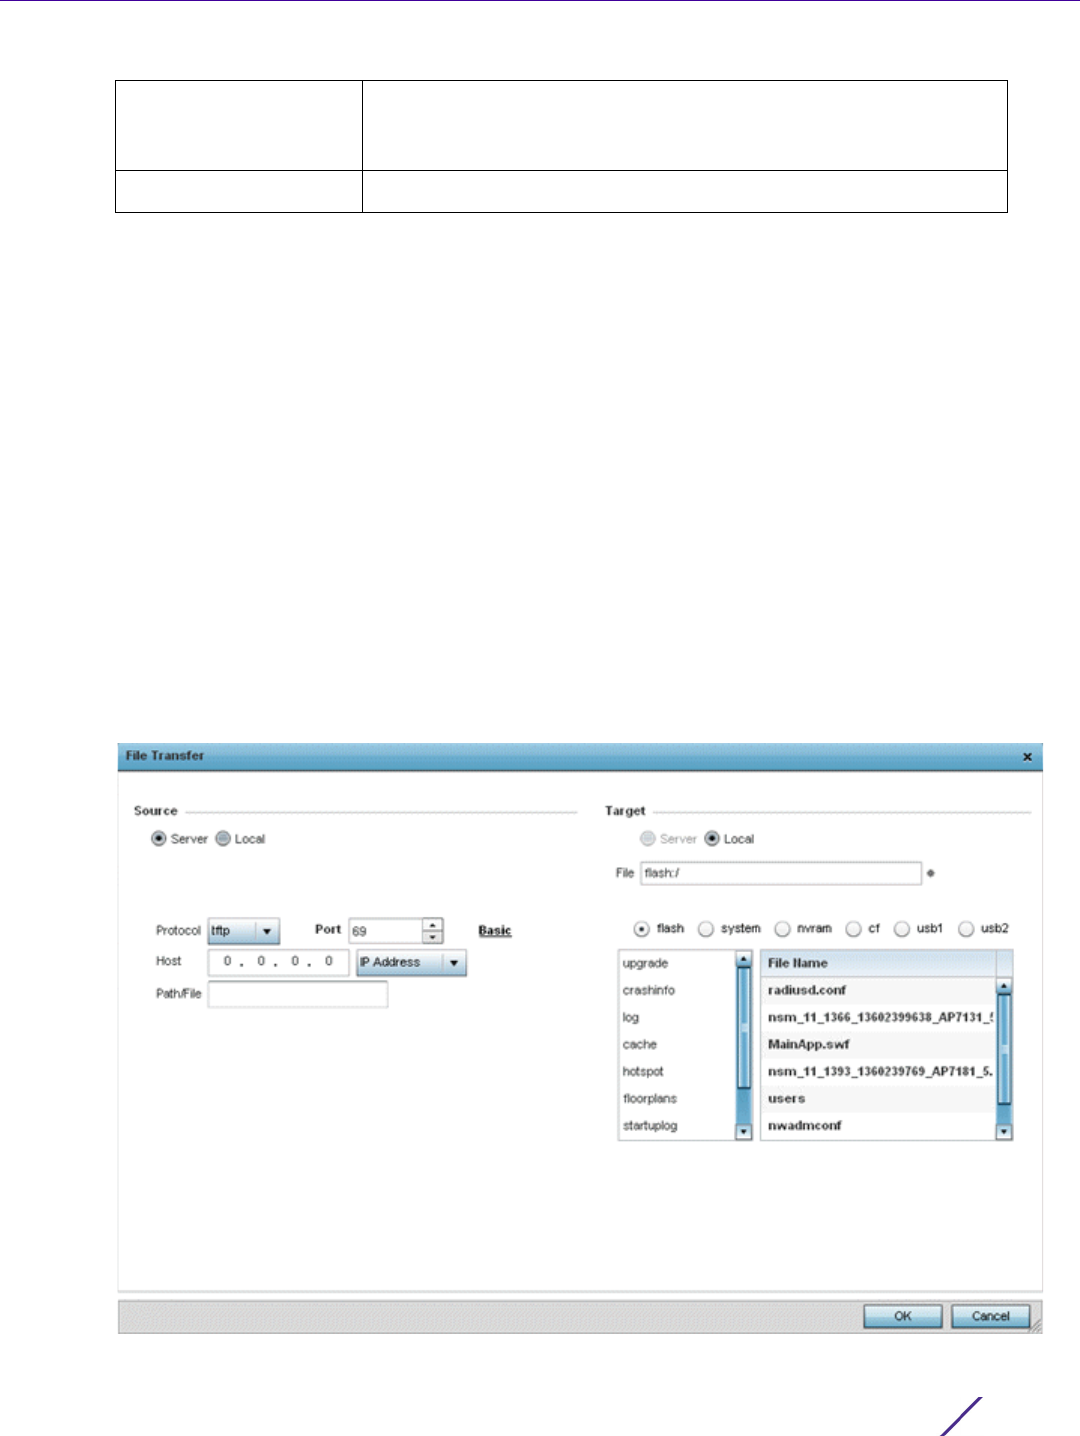
Operations
Wireless Controller and Service Platform System Reference Guide 11
3 If needed, use the Create Folder utility to create a folder that servers as a directory for some or all of the files
for a selected memory resource.
4Select
Transfer File to invoke a subscreen where the local or server file source and target (destination) are
defined as well as the file transfer protocol and external destination location or resource. For more information,
see Managing File Transfers on page 14-11.
5Optionally, use the
Delete Folder or Delete File buttons to remove a folder or file from within the controller,
service platform or Access Point’s current memory resource.
14.1.3.1 Managing File Transfers
Device Operations
Controllers and service platforms can administer files on managed devices. Transfer files from a device to this
controller, to a remote server or from a remote server to the controller. An administrator can transfer logs,
configurations and crash dumps.
To administer files for managed devices:
1 Select the Operations > Devices > File Management
2 Select the Transfer File button.
Figure 14-8 File Transfers screen
Last Modified Lists a timestamp for the last time each listed file was modified. Use this
information to determine the file’s relevance or whether it should be
deleted.
File Type Displays the type for each file including binary, text or empty.

Operations
Wireless Controller and Service Platform System Reference Guide 12
3 Set the following file management source and target directions as well as the configuration parameters of the
required file management activity:
4Select
Copy to begin the file transfer. Selecting Reset reverts the screen to its last saved configuration.
Source Select the source of the file transfer.
Select Server to indicate the source of the file is a remote server.
Select Local to indicate the source of the file is local to this controller or
service platform.
File If the source is Local, enter the name of the file to be transferred.
Protocol Select the protocol for file management. Available options include:
tftp
ftp
sftp
http
cf
usb1-4
This parameter is required only when Server is selected as the Source.
Port Specify the port for transferring files. This option is not available for cf,
and usb1-4. Enter the port number directly or use the spinner control.
This parameter is required only when Server is selected as the Source.
Host If needed, specify a hostname or numeric IP address of the serve
transferring the file. This option is not valid for cf and usb1-4. If a
hostname is provided, an IP Address is not needed. A hostname cannot
contain an underscore.
This field is only available when Server is selected in the From field.
User Name Provide a user name to access a FTP or a SFTP server.
This parameter is required only when Server is selected as the Source,
and the selected protocol is ftp or sftp.
Password Provide a password to access the FTP or SFTP server.
This parameter is required only when Server is selected as the Source,
and the selected protocol is ftp or sftp.
Path / File Define the path to the file on the server. Enter the complete relative
path to the file.
This parameter is required only when Server is selected as the Source.
Target Select the target destination to transfer the file.
Select Server if the destination is a remote server, then provide a URL to
the location of the server resource or select Advanced and provide the
same network address information described above.
Select Local if the destination is this controller or service platform.
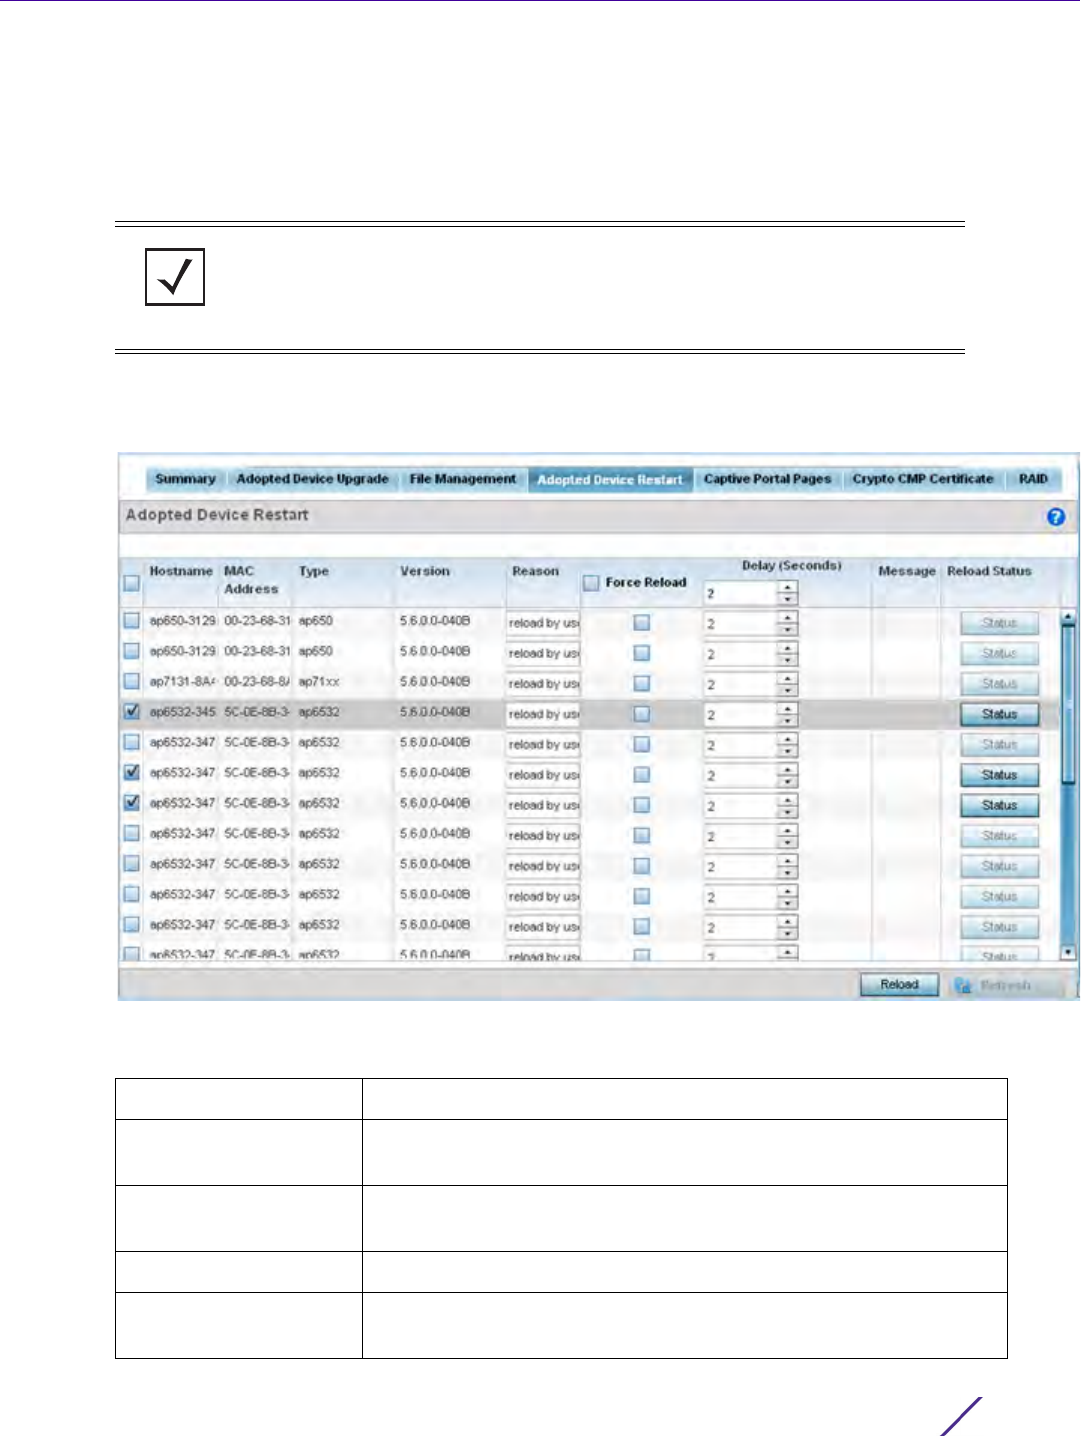
Operations
Wireless Controller and Service Platform System Reference Guide 13
14.1.4 Restarting Adopted Devices
Device Operations
Adopted devices may periodically require restarting to implement firmware updates or other maintenance
activities.
To restart controller or service platform adopted Access Points:
1 Select the Operations > Devices > Adopted Device Restart.
Figure 14-9 Adopted Device Restart screen
2The Adopted AP Restart table displays the following information for each Adopted AP:
NOTE: The Adopted Device Restart tab is not available at the RF Domain level of
the UI’s hierarchal tree. A RF Domain must be selected and expanded to display the
RF Domain’s member devices. Once expanded, selected a RF Domain member
device to ensure the Adopted Device Restart option is available.
Hostname Displays the specified Hostname for each known Access Point.
MAC Address Displays the primary Media Access Control (MAC) or hardware address
for each known Access Point.
Type Displays the Access Point model number for each adopted Access
Point.
Version Displays the current firmware version for each adopted Access Point.
Reason Lists the administrator defined reason an adopted device has been
queued for a restart.

Operations
Wireless Controller and Service Platform System Reference Guide 14
3 To restart an Access Point (or Access Points), select the checkbox to the left of each Access Point to restart and
configure the following options:
14.1.5 Captive Portal Configuration
Device Operations
A captive portal is an access policy that provides temporary and restrictive access to the controller or service
platform managed wireless network.
A captive portal policy provides secure authenticated access using a standard Web browser. Captive portals
provide authenticated access by capturing and re-directing a wireless user's Web browser session to a captive
portal login page where the user must enter valid credentials to access the wireless network. Once logged into the
captive portal, additional Terms and Agreement, Welcome, Fail and No Service pages provide the administrator
with a number of options on screen flow and appearance.
Captive portal authentication is used primarily for guest or visitor access to the network, but is increasingly used to
provide authenticated access to private network resources when 802.1X EAP is not a viable option. Captive portal
authentication does not provide end-user data encryption, but it can be used with static WEP, WPA-PSK or WPA2-
PSK encryption.
The Captive Portal Pages enable the management of the client access request pages and their transfer to the
controller or service platform managed wireless network.
To manage captive portal pages:
1 Select the Operations > Devices > Captive Portal Pages. The AP Upload List displays by default.
Use the AP Upload List to provide connected Access Points with specific captive portal configurations so they can
successfully provision login, welcome and condition pages to requesting clients attempting to access the wireless
network using a captive portal.
Force Reload To force a reload of an Access Point or Access Points, select the Force
Reload checkbox next to each AP.
Delay (Seconds) Specify the amount of time, in seconds, before the Access Point restart
should be executed. Delaying the restart may allow a selected Access
Point to complete its current duty cycle.
Message Displays any messages associated with each adopted Access Point
Reload Status Click the Reload Status button next to each adopted Access Point to
display their current status information.
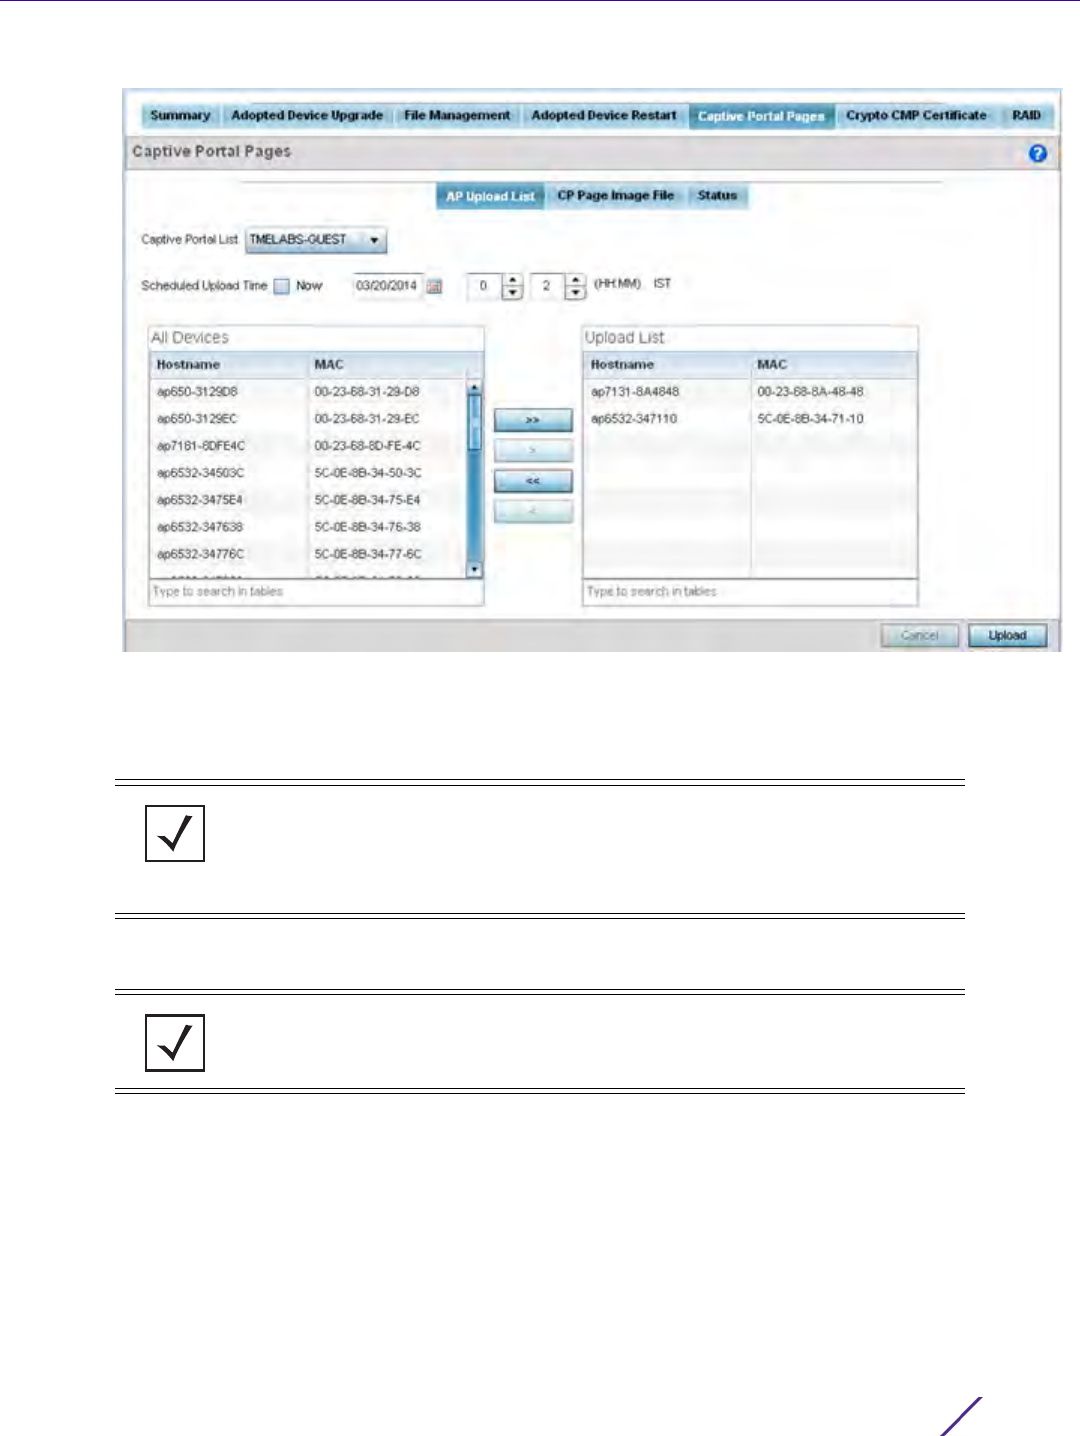
Operations
Wireless Controller and Service Platform System Reference Guide 15
Figure 14-10 Captive Portal Pages - AP Upload List screen
2Use the Captive Portal List drop-down menu to select an existing captive portal configuration to upload to an
Access Point and display to requesting client devices as they login and adhere to the terms required set for
access.
3Use
Scheduled Upload Time to set the time of the captive portal page upload. Select Now to immediately start.
Use the date, hour and minute spinner controls to set a future date and time for the upload.
The All Devices table lists the hostname and MAC address of devices adopted by this Access Point.
4 At the device level, use the arrow buttons (>> > < <<) to move selected devices from the All Devices table to
the Upload List table. The Upload List table displays the Access Points to which the captive portal pages are
applied.
5Select
Upload from the lower right-hand side of the screen to upload the captive portal pages to the
designated Access Points.
6 Select the CP Pages Image File tab.
NOTE: If selecting the Captive Portal Pages screen from the System and RF
Domain levels of the UI’s hierarchal tree, there’s an additional Upload from
Controller option to the right of the Captive Portal List drop-down menu. Select this
option to upload existing captive portal pages from this device’s managing
controller or service platform.
NOTE: The Scheduled Upload Time is your local system’s time. It’s not the Access
Point, controller, service platform or VX time and it is not synched with the device.
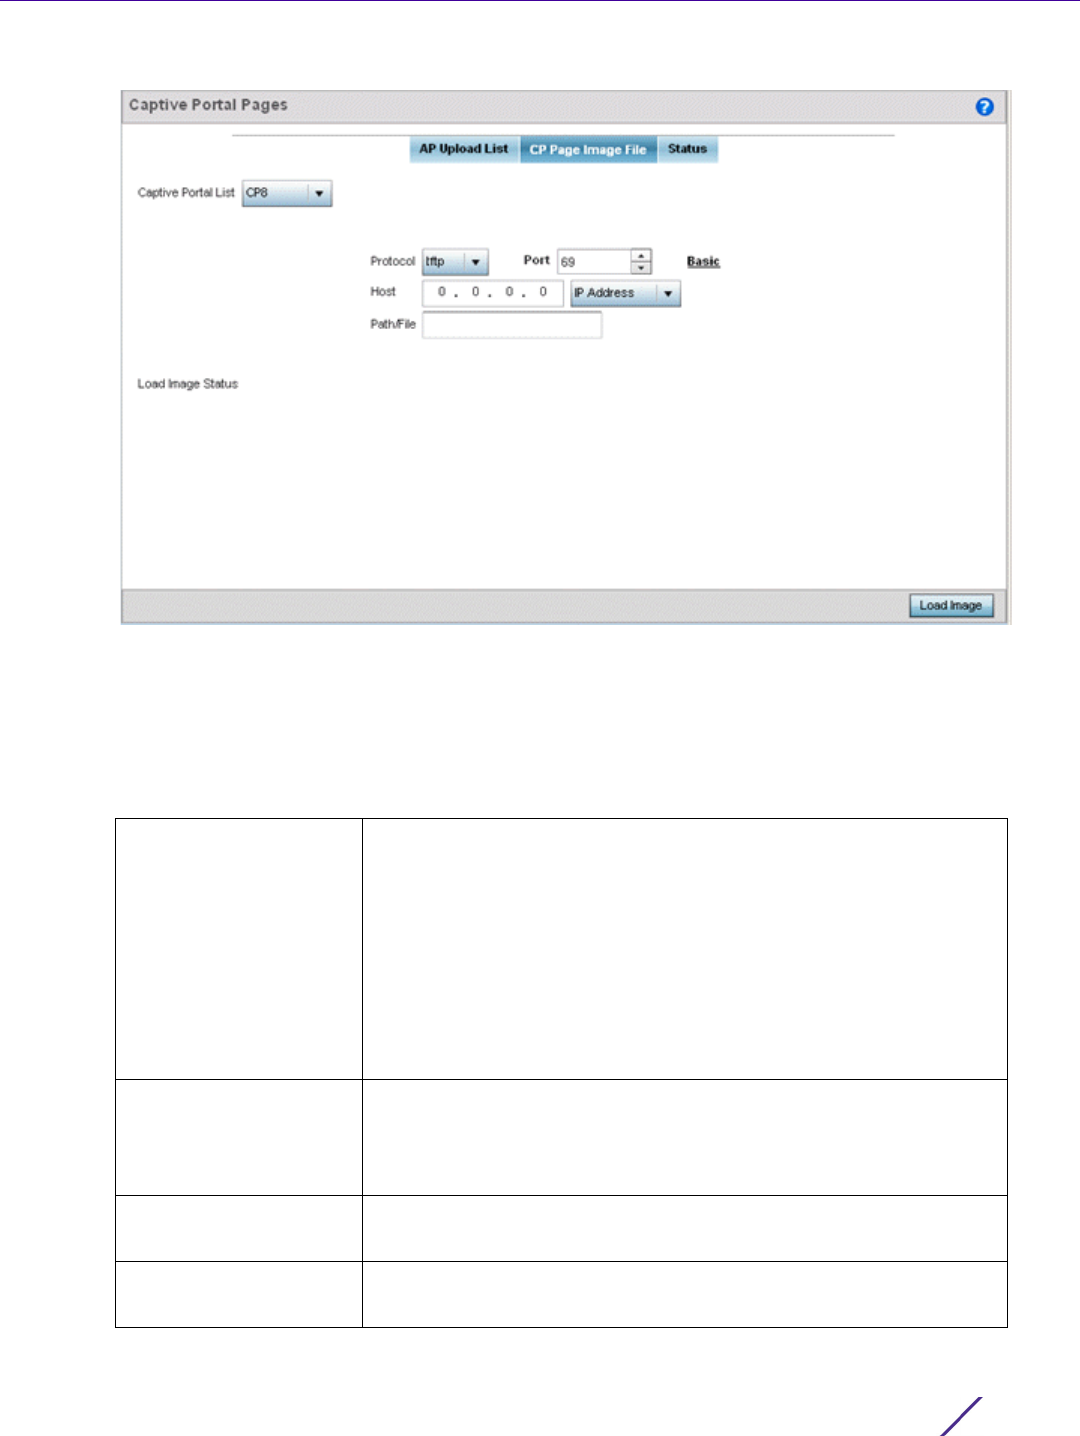
Operations
Wireless Controller and Service Platform System Reference Guide 16
Figure 14-11 Captive Portal Pages - CP Page Image File screen
7Use the Captive Portal List drop-down menu to select an existing policy. This policy contains the image (or set
of login and conditions pages) requesting clients will navigate and complete before granted access to the
network using the unique permissions of the captive portal.
8 Set the following protocols, ports and network address information for sending image files to captive portal
provisioning Access Points:
Protocol Define the protocol (transfer medium) used to forward the image files
to the Access Points provisioning captive portal files to requesting
clients. Available options include:
• tftp
• ftp
• sftp
• http
The protocol parameter is required only when Server is selected as the
Source and the Advanced option is used.
Host If needed, specify a Hostname of the server transferring the file. This
option is not valid for cf, usb1, and usb2. If a hostname is provided, an IP
Address is not needed. A hostname cannot contain an underscore. This
field is only available when Server is selected in the From field.
Port Specify the port for transferring files. Enter the port number directly or
use the spinner control.
User Name Provide a user name to access the FTP or SFTP server. This parameter
is required only when the selected protocol is ftp or sftp.
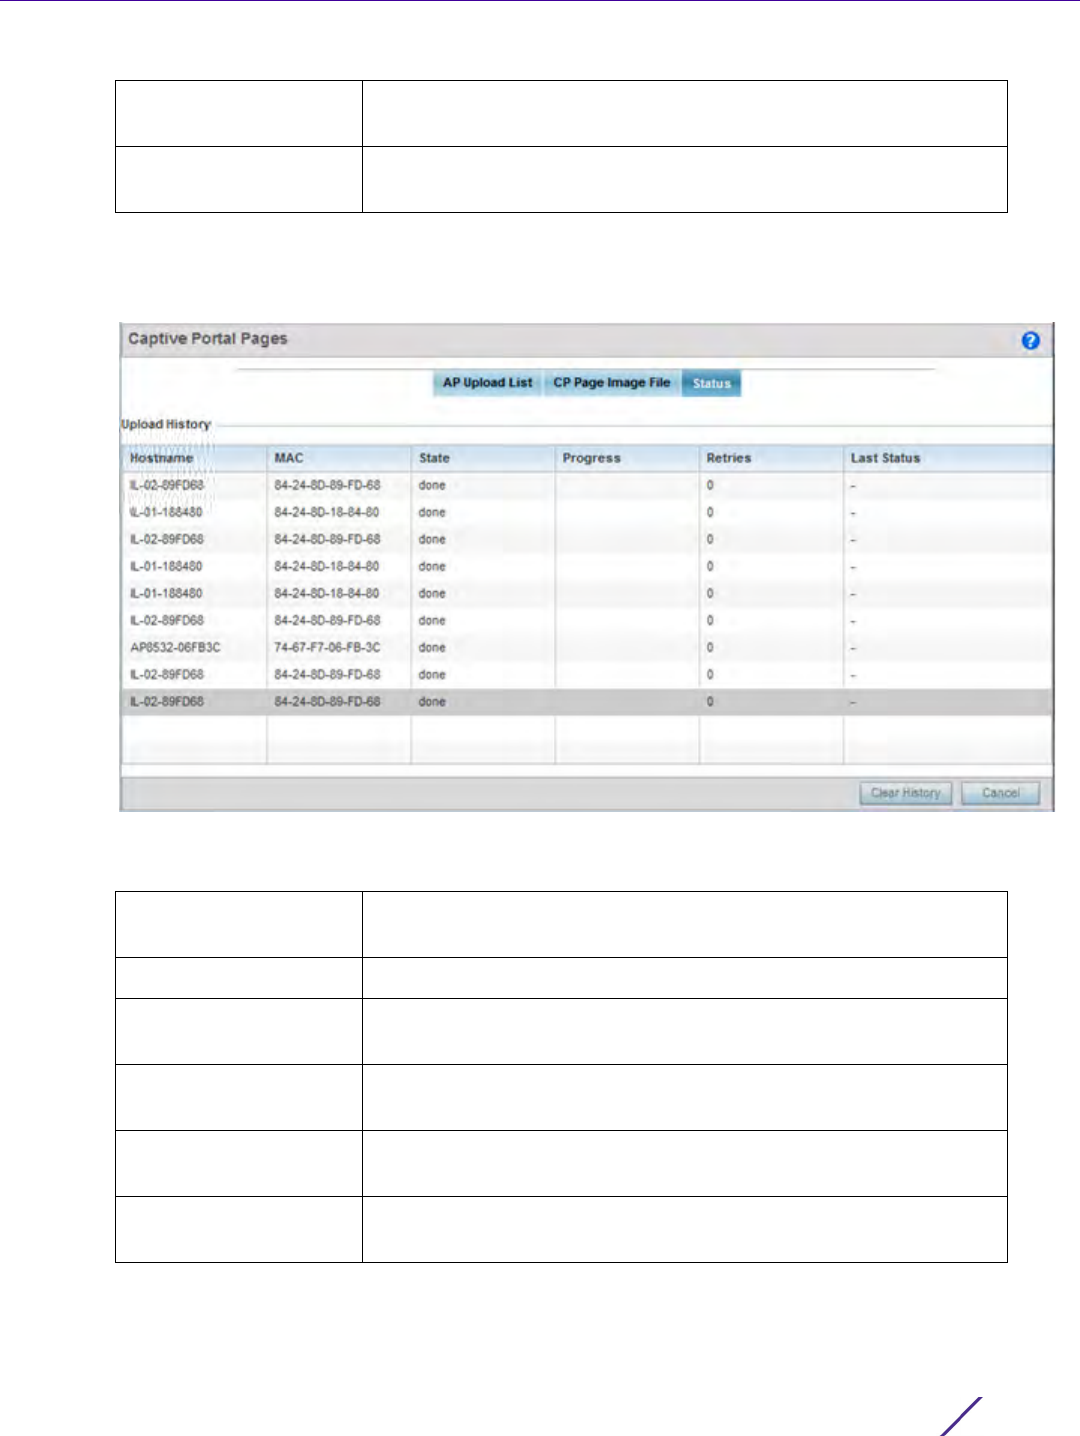
Operations
Wireless Controller and Service Platform System Reference Guide 17
9Select
Load Image to upload the image file. Optionally, refer to the Load Image Status field to review the status
of the current upload.
10 Select the Status tab.
Figure 14-12 Captive Portal Pages - Status screen
11 Refer to the Status tab to review the progress of Captive Portal Pages upload.
12 Select Clear History to clear the history displayed in the Status tab and begin new data collections.
Password Provide a password to access the FTP or SFTP server. This parameter is
required only when the selected protocol is ftp or sftp.
Path/File Define the path to the file on the server. Enter the complete relative path
to the file.
Hostname Displays the hostname of the recipient device to which the captive
portal files are directed.
MAC Displays the factory encoded MAC address of the recipient device.
State Displays the target device’s current operational state within the
controller or service platform managed network.
Progress Displays the completion progress of each captive portal upload
operation.
Retries Lists the number of retries needed to upload the captive portal files to
each listed device.
Last Status Displays the last known status of the captive portal page uploaded to
each listed device.
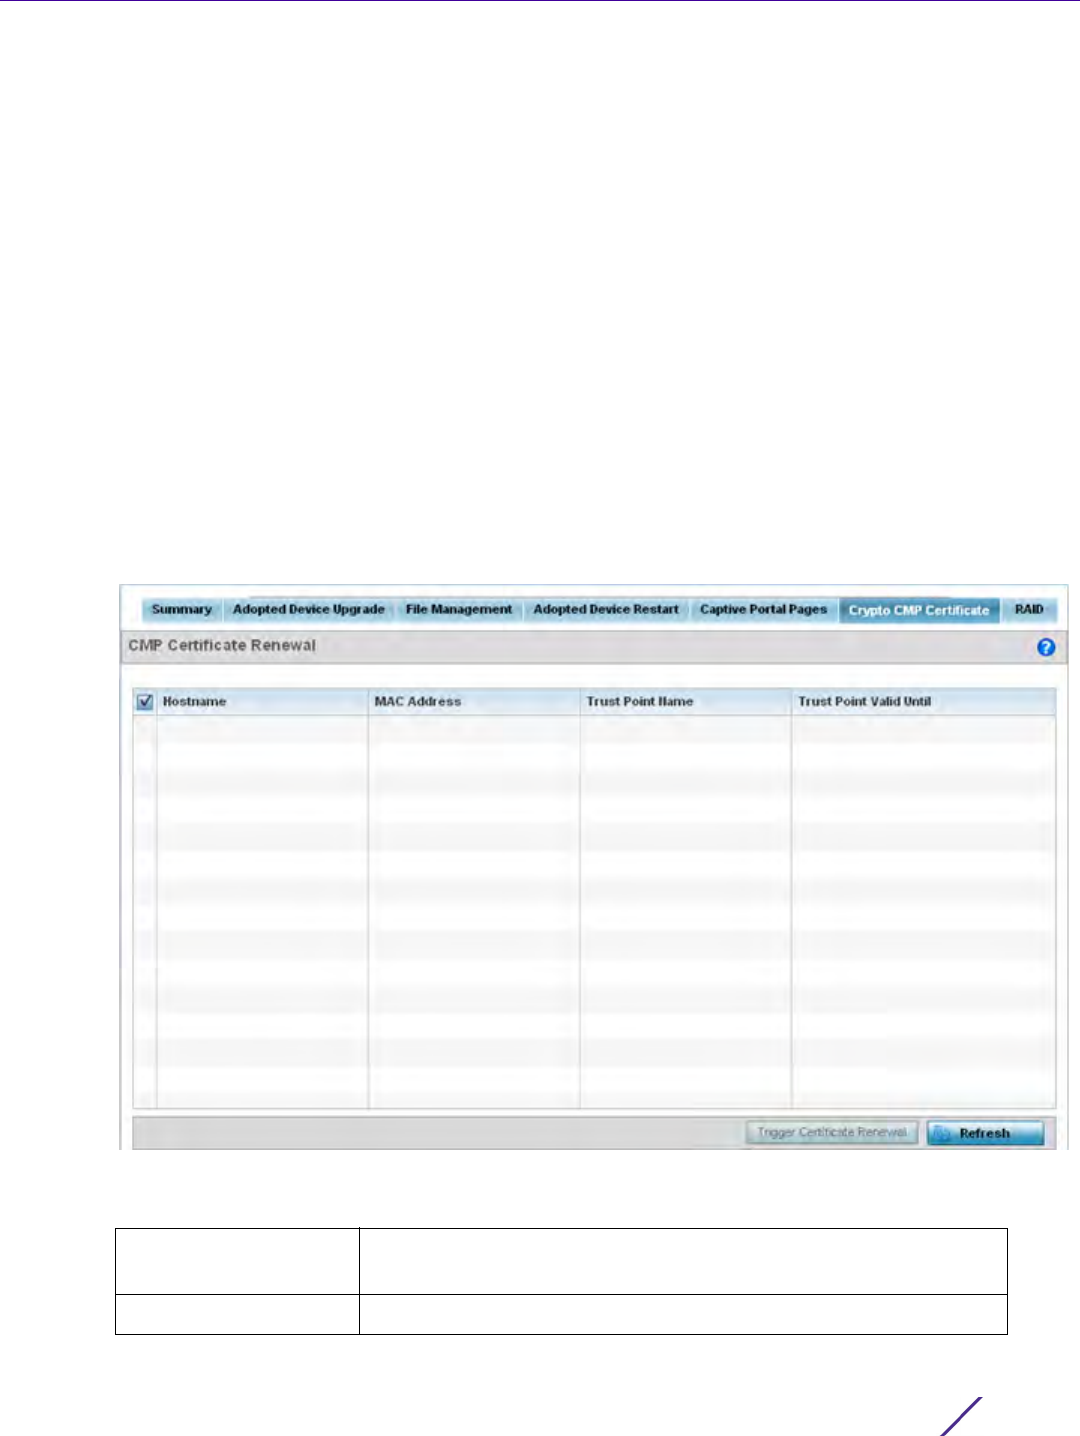
Operations
Wireless Controller and Service Platform System Reference Guide 18
14.1.6 Crypto CMP Certificate
Device Operations
Certificate Management Protocol (CMP) is an Internet protocol to obtain and manage digital certificates in a Public
Key Infrastructure (PKI) network. A Certificate Authority (CA) issues the certificates using the defined CMP.
Using CMP, a device can communicate to a CMP supported CA server, initiate a certificate request and download
the required certificates from the CA server. CMP supports multiple request options through for device
communicating to a CMP supported CA server. The device can initiate a request for getting the certificates from
the server. It can also auto update the certificates which are about to expire.
The CMP client on the controller, service platform or Access Point triggers a request for the configured CMS CA
server. Once the certificate is validated and confirmed from the CA server it is saved on the device and becomes
part of the trustpoint. During the creation of the CMP policy the trustpoint is assigned a name and client
information. An administrator can use a manually created trustpoint for one service (like HTTPs) and use the CMP
generated trustpoint for RADIUS EAP certificate based authentication.
To assess existing certificates and, if necessary, renew a certificate:
1Select
Operations > Devices > Crypto CMP Certificate. This option is selectable at the controller level.
Figure 14-13 Crypto CMP Certificate screen
2 Review the following Crypto CMP certificate information to assess whether a certificate requires renewal:
Hostname Lists the administrator assigned hostname of the CMP resource
requesting a certificate renewal from the CMP CA server.
MAC Address Lists the hardware encoded MAC address of the CMP server resource.

Operations
Wireless Controller and Service Platform System Reference Guide 19
3Select
Trigger Certificate Renewal to begin update the credentials of the certificate. If a renewal succeeds, the
newly obtained certificate overwrites an existing certificate. If the renewal fails, an error is logged.
4Select
Refresh to update the screen to the last saved configuration.
14.1.7 RAID Operations
Device Operations
An administrator can configure a NX7530 or a NX9000 series RAID supported service platform with respect to
both its collective drive array as well as individual drive behavior and diagnostics. The service platform’s array
alarm can be silenced, drive LEDs can be illuminated and stopped, drive consistency (integrity) checks can be
made and the array can be prepared for drive replacements.
To administrate the service platform’s drive array and its member drives:
Trust Point Name Lists the 32 character maximum name assigned to the target trustpoint.
A trustpoint represents a CA/identity pair containing the identity of the
CA, CA specific configuration parameters, and an association with an
enrolled identity certificate.
Trust Point Valid Until The expiration of the CMP certificate is checked once a day. When a
certificate is about to expire a certificate renewal can initiated with the
server via an existing IPsec tunnel. If the tunnel is not established, the
CMP renewal request is not sent.
NOTE: RAID controller drive arrays are available within NX7530 and NX9000 series
service platforms (NX9000, NX9500 and NX9510 models) only. However, they can
be administrated on behalf of a profile by a different model service platform or
controller.
NOTE: The RAID tab is not available at the RF Domain level of the UI’s hierarchal
tree. A RF Domain must be selected and expanded to display the RF Domain’s
member devices. Once expanded, selected a RF Domain member NX7530, NX9000,
NX9500 or NX9510 model device to ensure the RAID option is available.
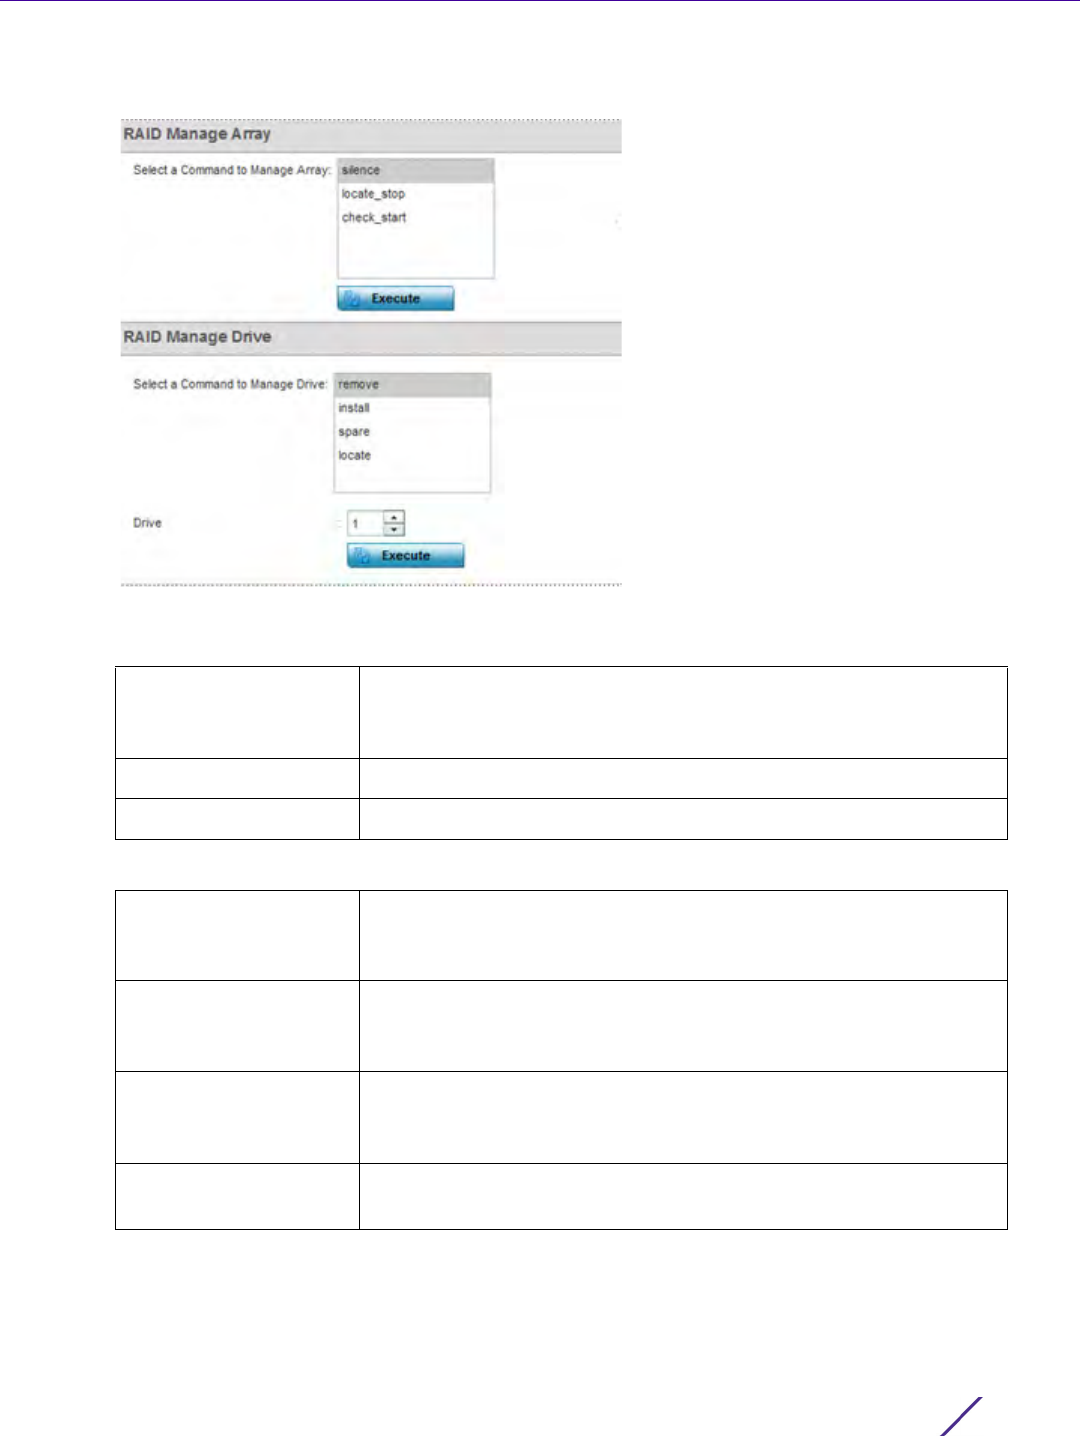
Operations
Wireless Controller and Service Platform System Reference Guide 20
1Select
Operations > Devices > RAID.
Figure 14-14 RAID screen
2 Conduct the following array diagnostic operations from within the RAID Manage Array field:
3 Conduct the following drive diagnostic operations from within the RAID Manage Drive field:
4Select
Execute to initiate the selected command from either the RAID Manage Array or RAID Manage Drive
fields.
To view the service platform’s current RAID array status, drive utilization and consistency check information,
refer to RAID Statistics on page 15-114.
silence Select silence to stop (silence) the service platform’s RAID controller
array alarm. When a drive is rendered offline for any reason, the service
platform’s array controller alarm is invoked.
locate-stop Select locate-stop to stop the LEDs of all the drives within the array.
check-start Select check-start to initiate a consistency check on the RAID array.
remove Select remove to prepare a selected drive for physically removing it from
the drive array. The remove command can be applied to either an online
or hot spare drive.
install Once a new drive is installed, it must be prepared for active array
utilization. Select install to dedicate a selected drive to repair a degraded
array and begin an array rebuild operation.
spare Select spare to define a selected unused drive as a hot spare that can be
dedicate as an active array drive if one of the two online array drives
were to fail.
locate Select locate to flash a selected drive’s LED so it can easily located
within the drive array.
Operations
Wireless Controller and Service Platform System Reference Guide 21
14.1.8 Re-elect Controller
Device Operations
Use the Controller Re-election screen to identity available Access Point resources within a selected RF Domain and
optionally make some, or all, of the Access Points available to initiate tunnel connections.
To re-elect controller adoption resources for tunnel establishment:
1Select
Operations.
2 Ensure a RF Domain is selected from the Operations menu on the top, left-hand, side of the screen. Otherwise,
the Re-elect Controller screen cannot be located, as it does not display at either the system or device levels of
the hierarchal tree.
3 Select the Re-elect Controller tab.
NOTE: Take care when selecting Access Points for controller re-election, as client
connections may be broken on upon re-election. Ensure an elected Access Point's
client load can be compensated by another Access Point in the same RF Domain.
NOTE: The Re-elect Controller tab is only available at the RF Domain level of the
UI’s hierarchal tree and is not available for individual controllers, service platforms
and Access Points.
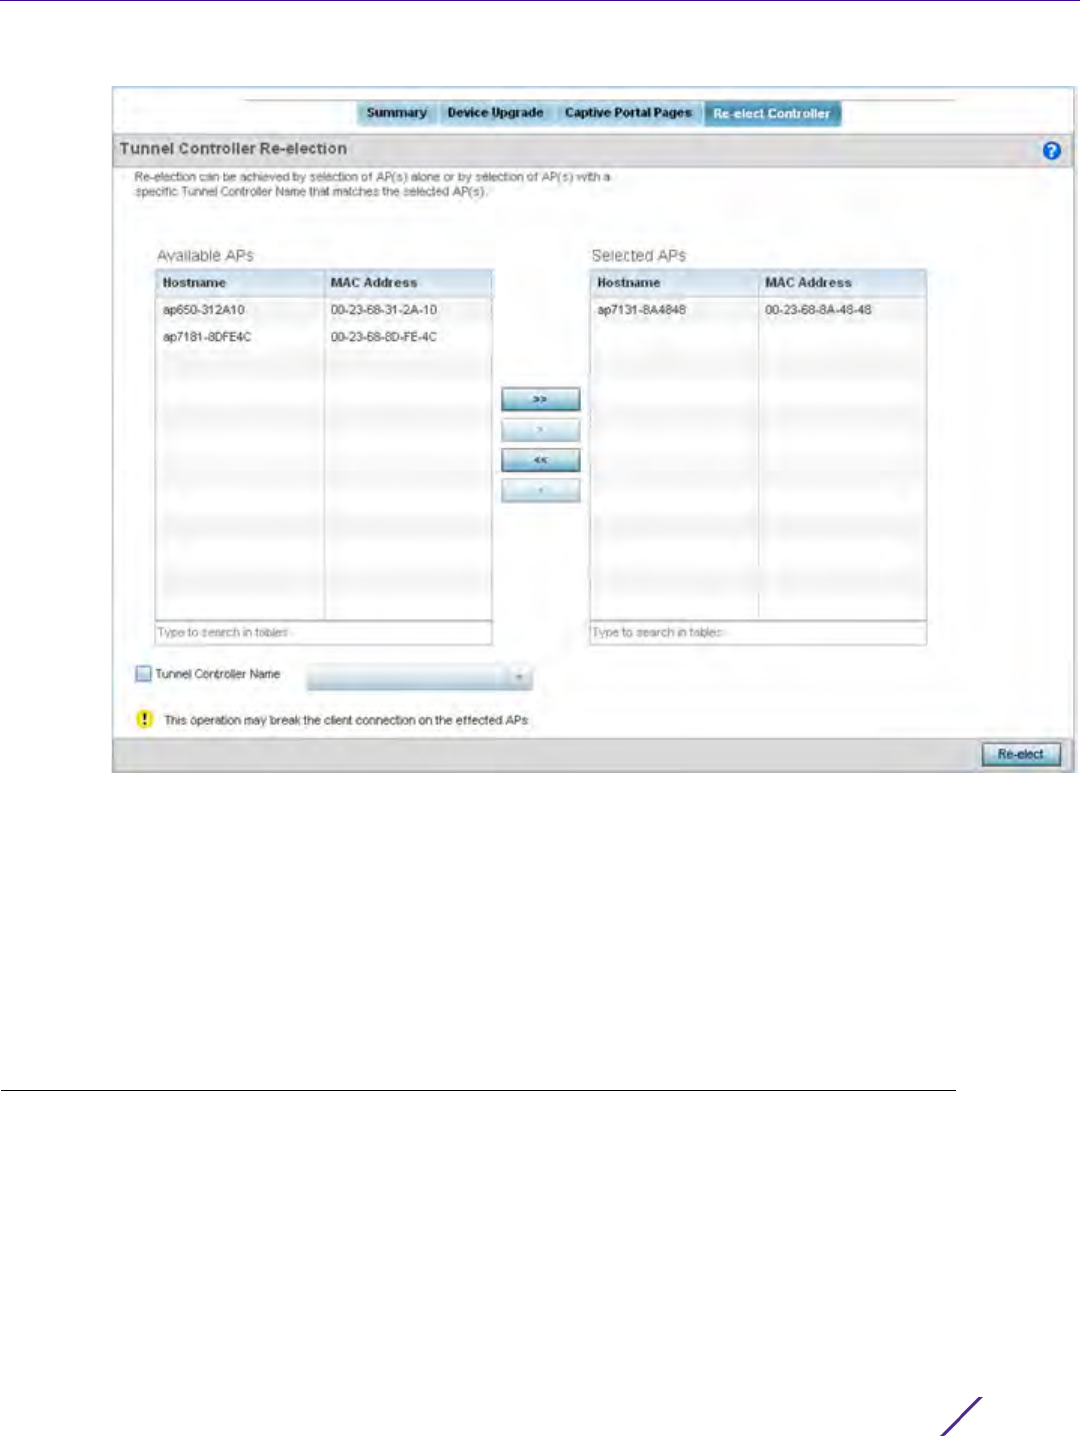
Operations
Wireless Controller and Service Platform System Reference Guide 22
Figure 14-15 Re-elect Controller screen
4 Refer to the Available APs column, and use the > button to move the selected Access Point into the list of
Selected APs available for RF Domain Manager candidacy. Use the >> button to move all listed Access Points
into the Selected APs table.
The re-election process can be achieved through the selection of an individual Access Point, or through the
selection of several Access Points with a specific Tunnel Controller Name matching the selected Access Points.
5Select
Re-elect to designate the Selected AP(s) as resources capable of tunnel establishment.
14.2 Certificates
A certificate links identity information with a public key enclosed in the certificate.
A certificate authority (CA) is a network authority that issues and manages security credentials and public keys for
message encryption. The CA signs all digital certificates it issues with its own private key. The corresponding public
key is contained within the certificate and is called a CA certificate. A browser must contain this CA certificate in
its Trusted Root Library so it can trust certificates signed by the CA's private key.
Depending on the public key infrastructure, the digital certificate includes the owner's public key, the certificate
expiration date, the owner's name and other public key owner information.

Operations
Wireless Controller and Service Platform System Reference Guide 23
Each certificate is digitally signed by a trustpoint. The trustpoint signing the certificate can be a certificate
authority, corporation or individual. A trustpoint represents a CA/identity pair containing the identity of the CA,
CA-specific configuration parameters and an association with an enrolled identity certificate.
SSH keys are a pair of cryptographic keys used to authenticate users instead of, or in addition to, a username/
password. One key is private and the other is public key. Secure Shell (SSH) public key authentication can be used
by a client to access managed resources, if properly configured. A RSA key pair must be generated on the client.
The public portion of the key pair resides with the controller or service platform, while the private portion remains
on a secure local area of the client.
For more information on the certification activities support by the controller or service platform, refer to the
following:
•Certificate Management
•RSA Key Management
•Certificate Creation
•Generating a Certificate Signing Request
14.2.1 Certificate Management
Certificates
If not wanting to use an existing certificate or key with a selected device, an existing stored certificate can be
leveraged from a different managed device for use with the target device. Device certificates can be imported and
exported to and from the controller or service platform to a secure remote location for archive and retrieval as
they are required for application to other managed devices.
To configure trustpoints for use with certificates:
1Select
Operations > Manage Certificates.
2 Select a device from amongst those displayed in either the RF Domain or Network panes on the left-hand side
of the screen.
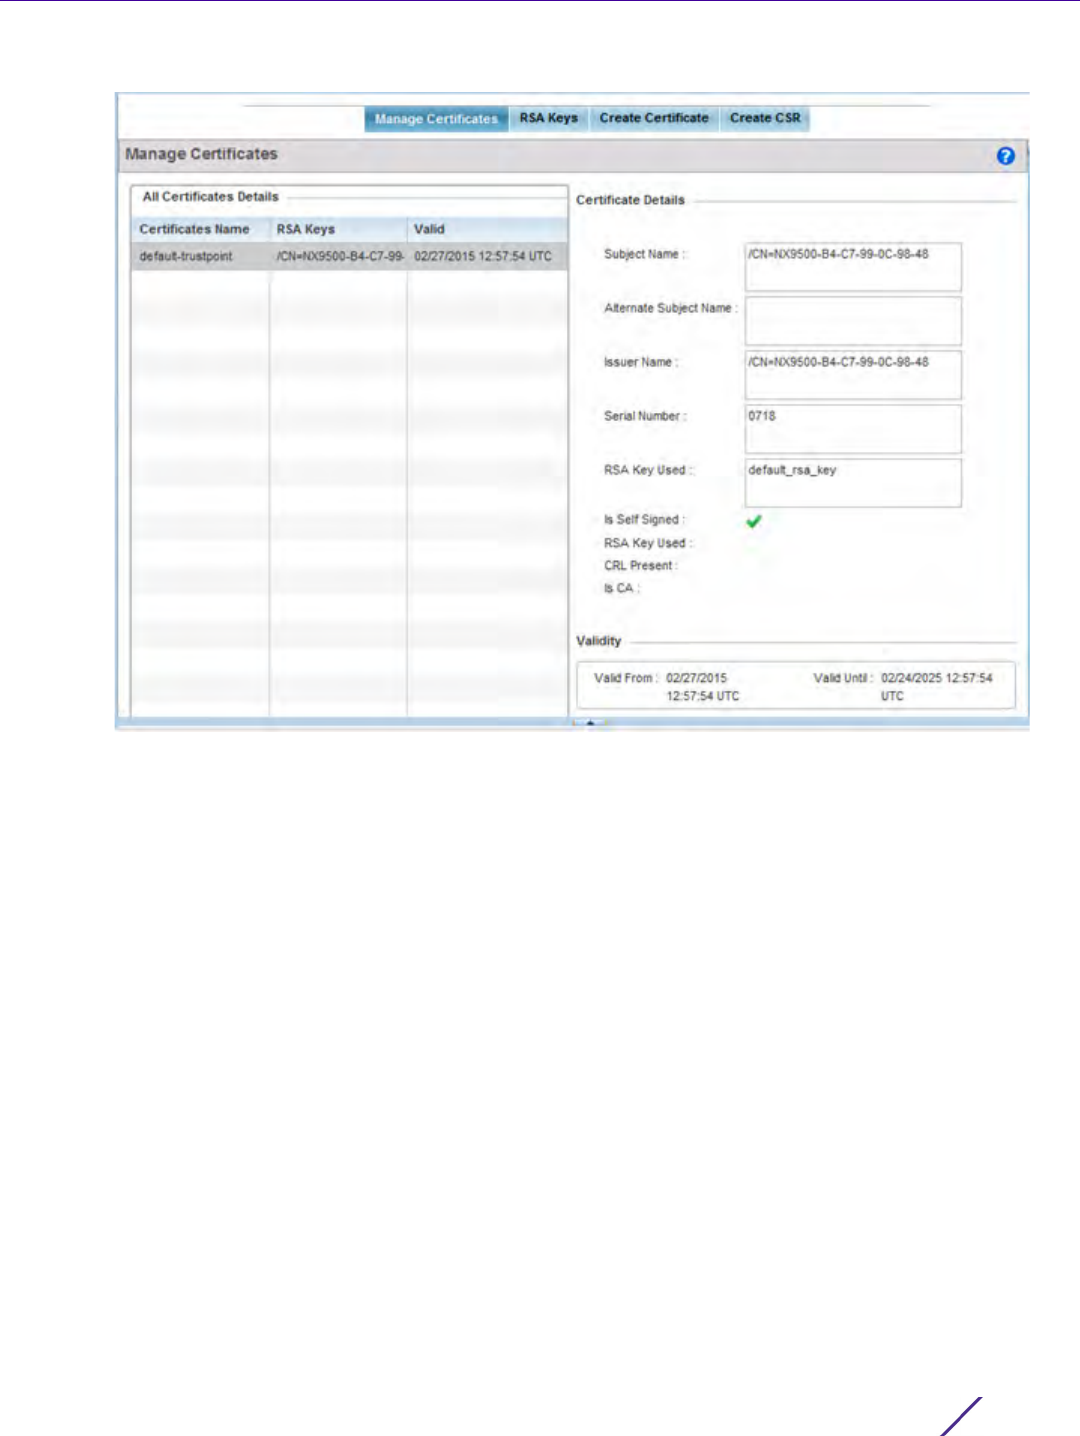
Operations
Wireless Controller and Service Platform System Reference Guide 24
Figure 14-16 Manage Certificates screen
3 Select a device from amongst those displayed to review its certificate usage within the controller or service
platform managed network.
4 Refer to the All Certificate Details to review the certificate’s properties, self-signed credentials, validity period
and CA information.
5 To import a certificate to the controller or service platform, select the Import button from the bottom of the
Manage Certificates screen.
An Import New Trustpoint screen displays where CA certificates, CRLs and signed certificates can optionally be
imported to the controller or service platform once the network credentials of the file transfer have been
defined.
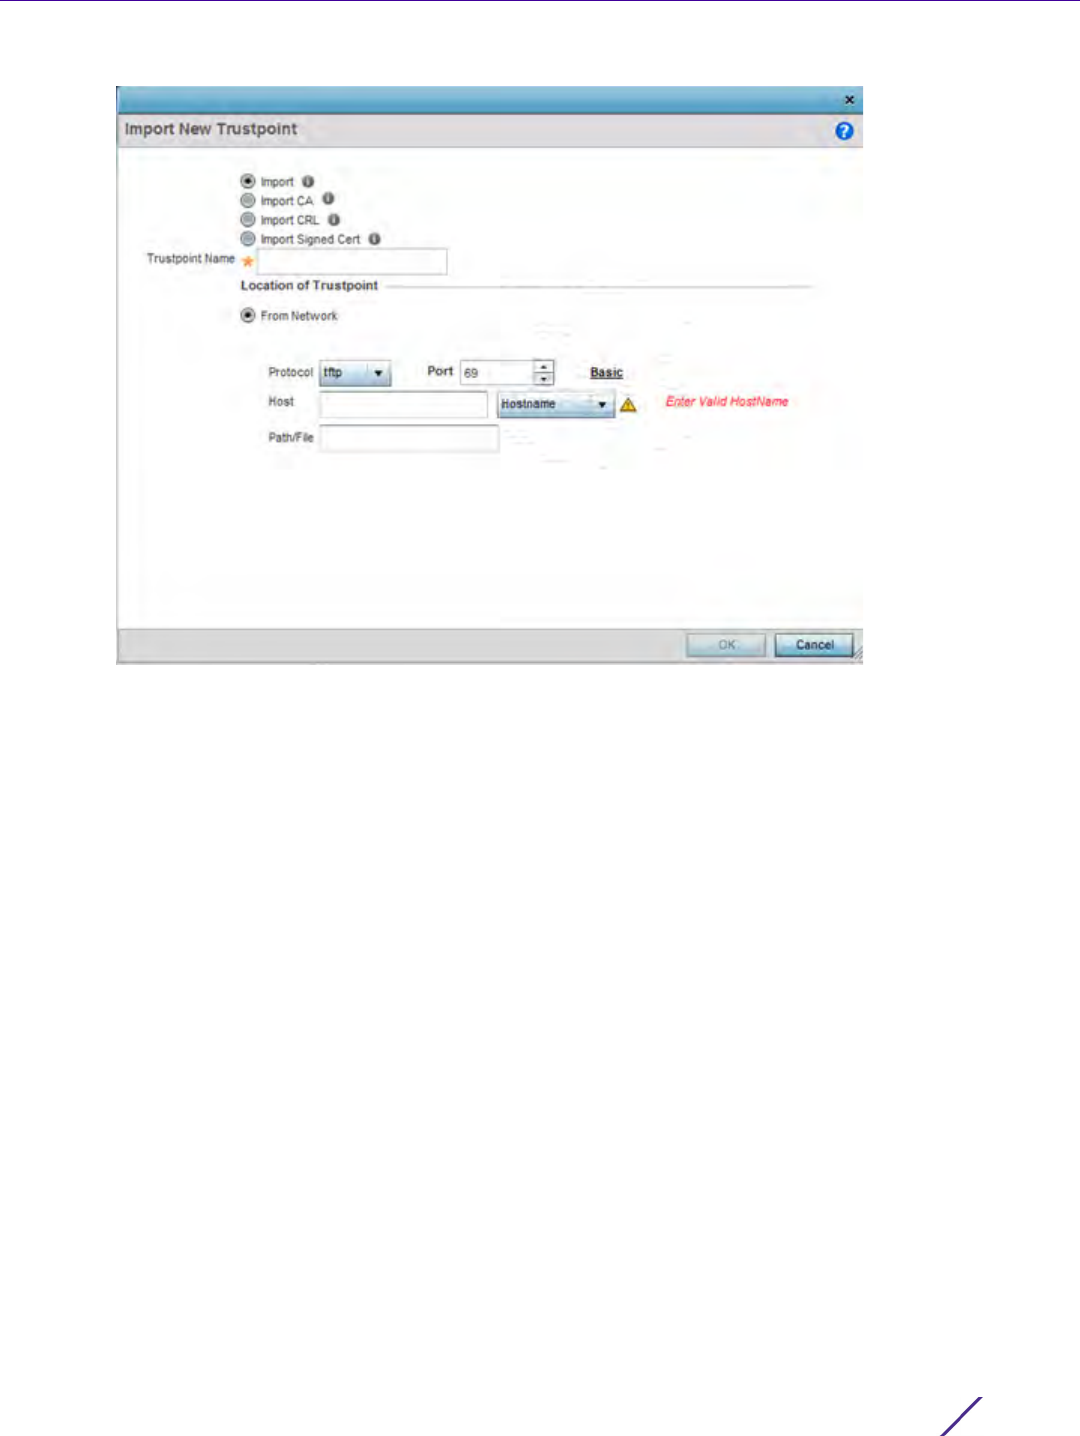
Operations
Wireless Controller and Service Platform System Reference Guide 25
Figure 14-17 Import New Trustpoint screen
6 To optionally import a CA certificate to the controller or service platform, select the Import CA button from the
Import New Trustpoint screen.
A CA is a network authority that issues and manages security credentials and public keys for message
encryption. The CA signs all digital certificates it issues with its own private key. The corresponding public key
is contained within the certificate and is called a CA certificate.
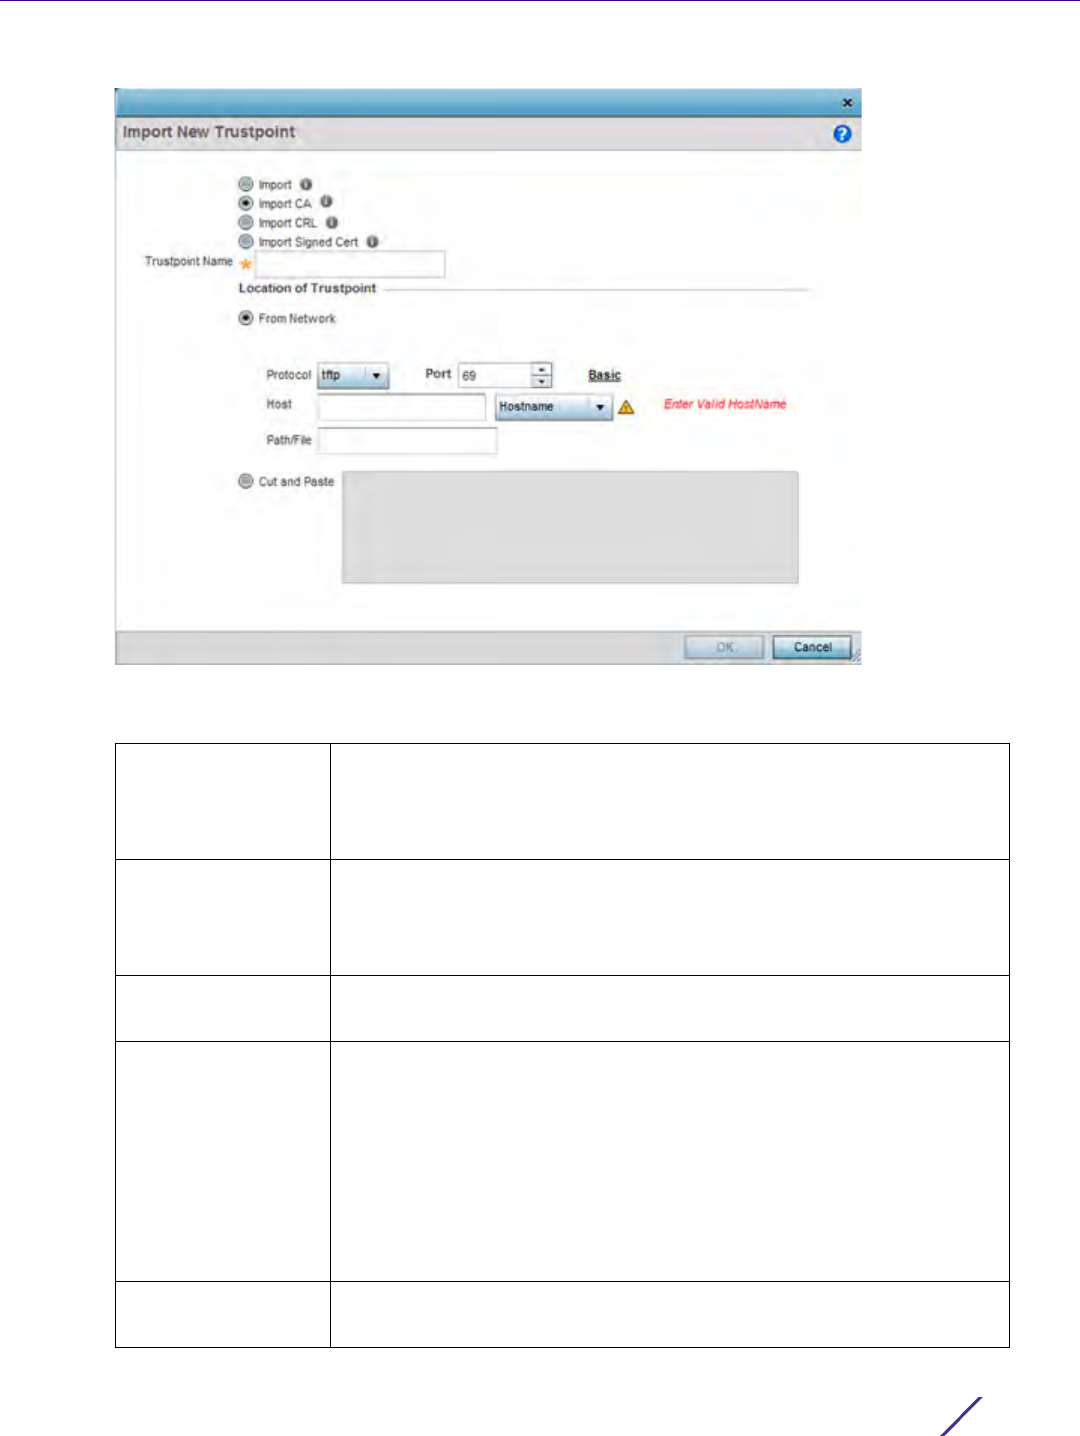
Operations
Wireless Controller and Service Platform System Reference Guide 26
Figure 14-18 Import New Trustpoint - Import CA screen
7 Define the following configuration parameters required for the Import CA of the CA certificate:
Trustpoint Name Enter the 32 character maximum name assigned to the target trustpoint
signing the certificate. A trustpoint represents a CA/identity pair containing
the identity of the CA, CA specific configuration parameters, and an
association with an enrolled identity certificate.
URL Provide the complete URL to the location of the trustpoint. If needed, select
Advanced to expand the dialog to display network address information to
the location of the target trustpoint. The number of additional fields
populating the screen is dependent on the selected protocol.
Advanced / Basic Click the Advanced or Basic link to switch between a basic URL and an
advanced location to specify trustpoint location.
Protocol Select the protocol used for importing the target CA certificate. Available
options include:
tftp
ftp
sftp
http
cf
usb 1-4
Port Use the spinner control to set the port. This option is not valid for cf and usb1
- 4.
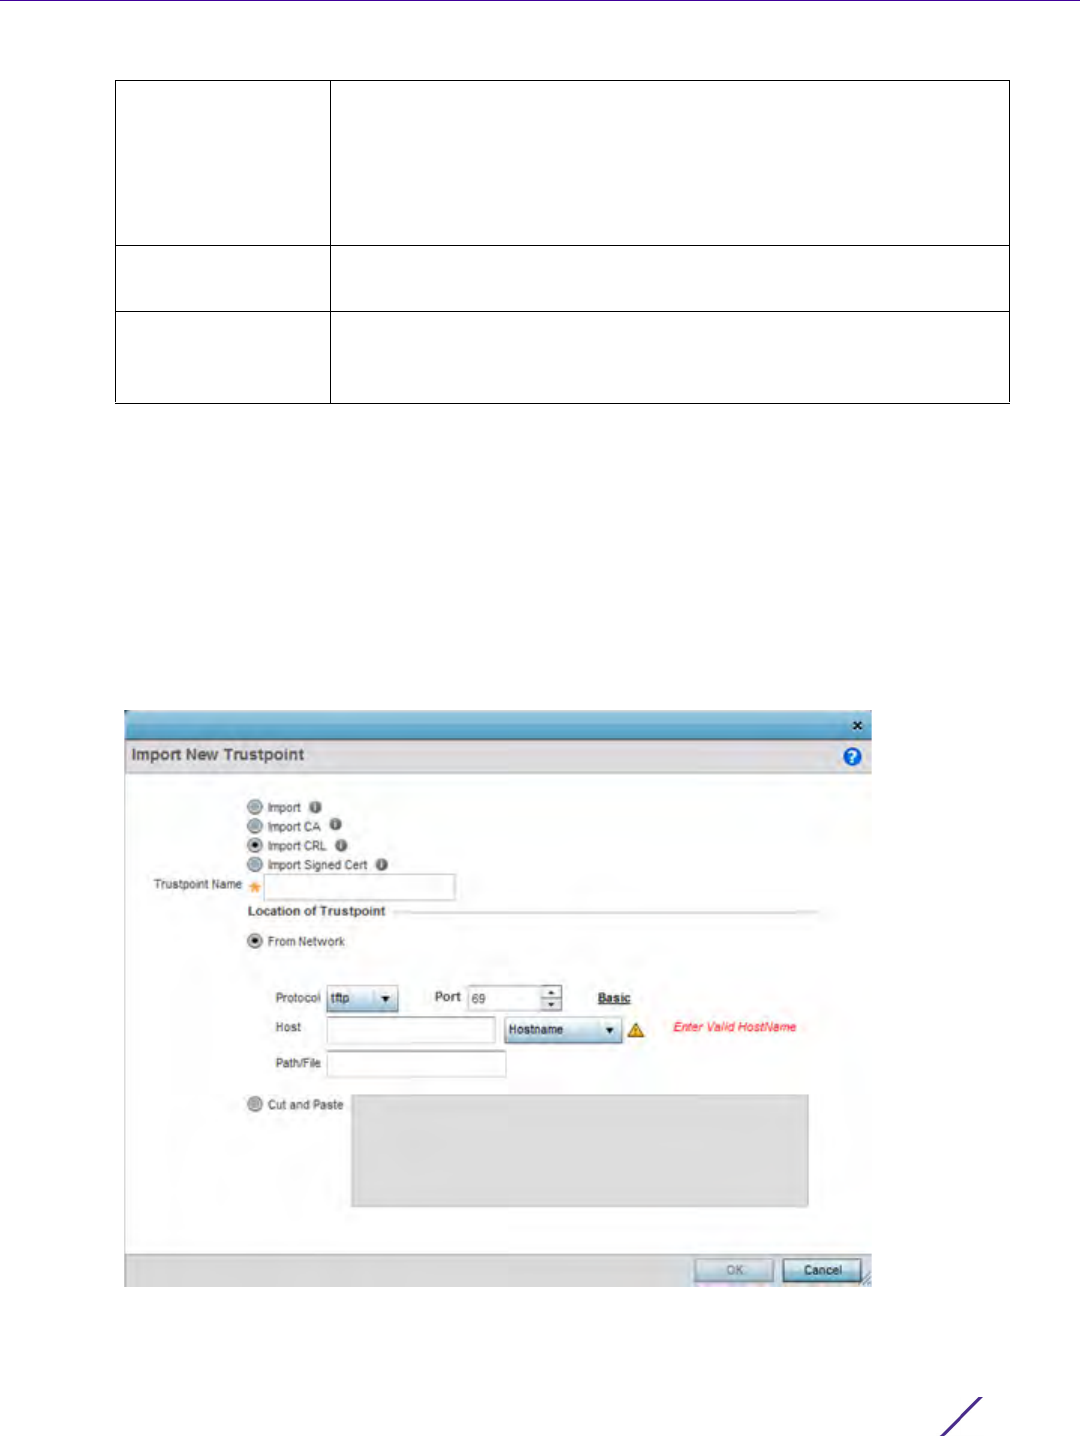
Operations
Wireless Controller and Service Platform System Reference Guide 27
8Select
OK to import the defined CA certificate. Select Cancel to revert the screen to its last saved configuration.
9 Select the Import CRL button from the Import New Trustpoint screen to optionally import a CRL to the
controller or service platform.
If a certificate displays within the Certificate Management screen with a CRL, that CRL can be imported into the
controller or service platform. A certificate revocation list (CRL) is a list of certificates that have been revoked
or are no longer valid. A certificate can be revoked if the CA had improperly issued a certificate, or if a private-
key is compromised. The most common reason for revocation is the user no longer being in sole possession of
the private key.
For information on creating a CRL to use with a trustpoint, refer to Setting the Profile’s Certificate Revocation
List (CRL) Configuration on page 8-166.
Figure 14-19 Import New Trustpoint - Import CRL screen
Host Provide the hostname or numeric IP4 or IPv6 formatted IP address of the
server used to export the trustpoint. IPV6 provides enhanced identification
and location information for computers on networks routing traffic across
the Internet. IPv6 addresses are composed of eight groups of four
hexadecimal digits separated by colons. Providing a host is not required for
cf and usb1-4. A hostname cannot contain an underscore.
Path/File Specify the path or filename of the CA certificate. Enter the complete
relative path to the file on the server.
Cut and Paste Select the Cut and Paste radio button to simply copy an existing trustpoint
into the cut and paste field. When pasting, no additional network address
information is required.

Operations
Wireless Controller and Service Platform System Reference Guide 28
10 Define the following configuration parameters required for the Import of the CRL:
11 Select OK to import the CRL. Select Cancel to revert the screen to its last saved configuration.
12 To import a signed certificate to the controller or service platform, select Import Signed Cert from the Import
New Trustpoint screen.
Signed certificates (or root certificates) avoid the use of public or private CAs. A self-signed certificate is an
identity certificate signed by its own creator, thus the certificate creator also signs off on its legitimacy. The
lack of mistakes or corruption in the issuance of self signed certificates is central.
Self-signed certificates cannot be revoked which may allow an attacker who has already gained access to
monitor and inject data into a connection to spoof an identity if a private key has been compromised. However,
CAs have the ability to revoke a compromised certificate, preventing its further use.
Trustpoint Name Enter the 32 character maximum name assigned to the target trustpoint
signing the certificate. A trustpoint represents a CA/identity pair containing
the identity of the CA, CA-specific configuration parameters, and an
association with an enrolled identity certificate.
From Network Select the From Network radio button to provide network address
information to the location of the target CRL. The number of additional
fields that populate the screen is also dependent on the selected protocol.
This is the default setting.
URL Provide the complete URL to the location of the CRL. If needed, select
Advanced to expand the dialog to display network address information to
the location of the CRL. The number of additional fields that populate the
screen is also dependent on the selected protocol.
Protocol Select the protocol used for importing the CRL. Available options include:
tftp
ftp
sftp
http
cf
usb1-4
Port Use the spinner control to set the port. This option is not valid for cf and
usb1-4.
Host Provide the hostname or numeric IP4 or IPv6 formatted IP address of the
server used to export the trustpoint. IPV6 provides enhanced identification
and location information for computers on networks routing traffic across
the Internet. IPv6 addresses are composed of eight groups of four
hexadecimal digits separated by colons. Providing a host is not required for
cf and usb1-4. A hostname cannot contain an underscore.
Path/File Specify the path to the CRL. Enter the complete relative path to the file on
the server.
Cut and Paste Select the Cut and Paste radio button to simply copy an existing CRL into
the cut and paste field. When pasting a CRL, no additional network address
information is required.
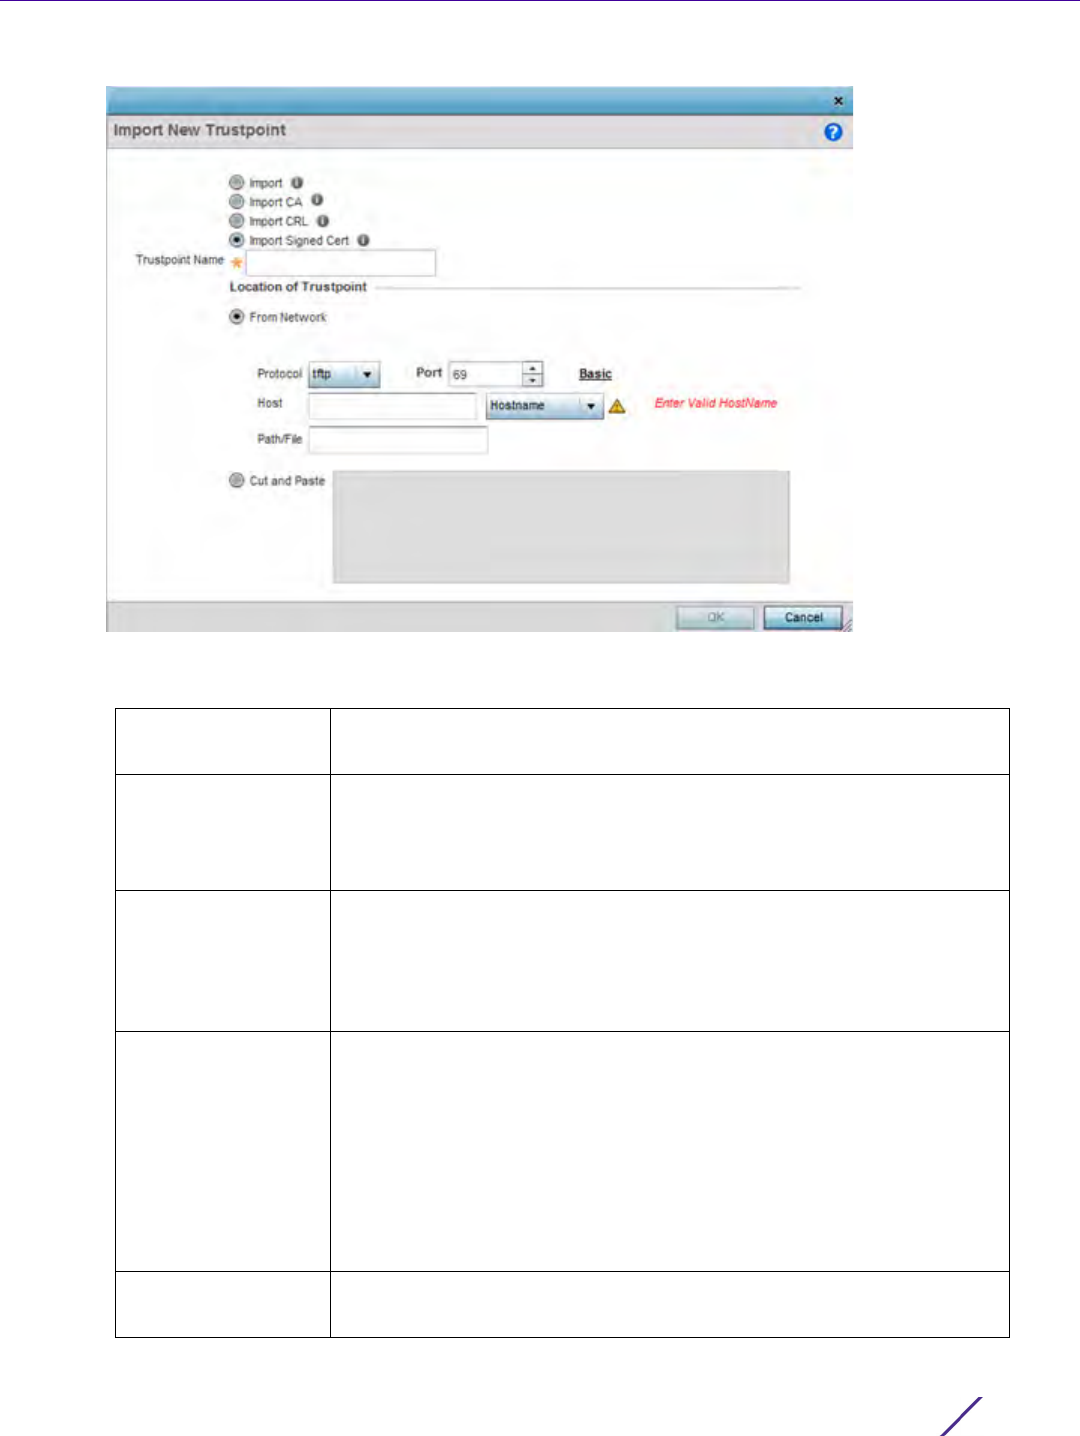
Operations
Wireless Controller and Service Platform System Reference Guide 29
Figure 14-20 Import New Trustpoint - Import Signed Cert
13 Define the following parameters required for the Import of the Signed Certificate:
Trustpoint Name Enter the 32 character maximum trustpoint name with which the certificate
should be associated.
From Network Select the From Network radio button to provide network address
information to the location of the signed certificate. The number of
additional fields that populate the screen is dependent on the selected
protocol. From Network is the default setting.
URL Provide the complete URL to the location of the signed certificate. If
needed, select Advanced to expand the dialog to display network address
information to the location of the signed certificate. The number of
additional fields populating the screen is dependent on the selected
protocol.
Protocol Select the protocol for importing the signed certificate. Available options
include:
tftp
ftp
sftp
http
cf
usb1-4
Port Use the spinner control to set the port. This option is not valid for cf and
usb1-4.
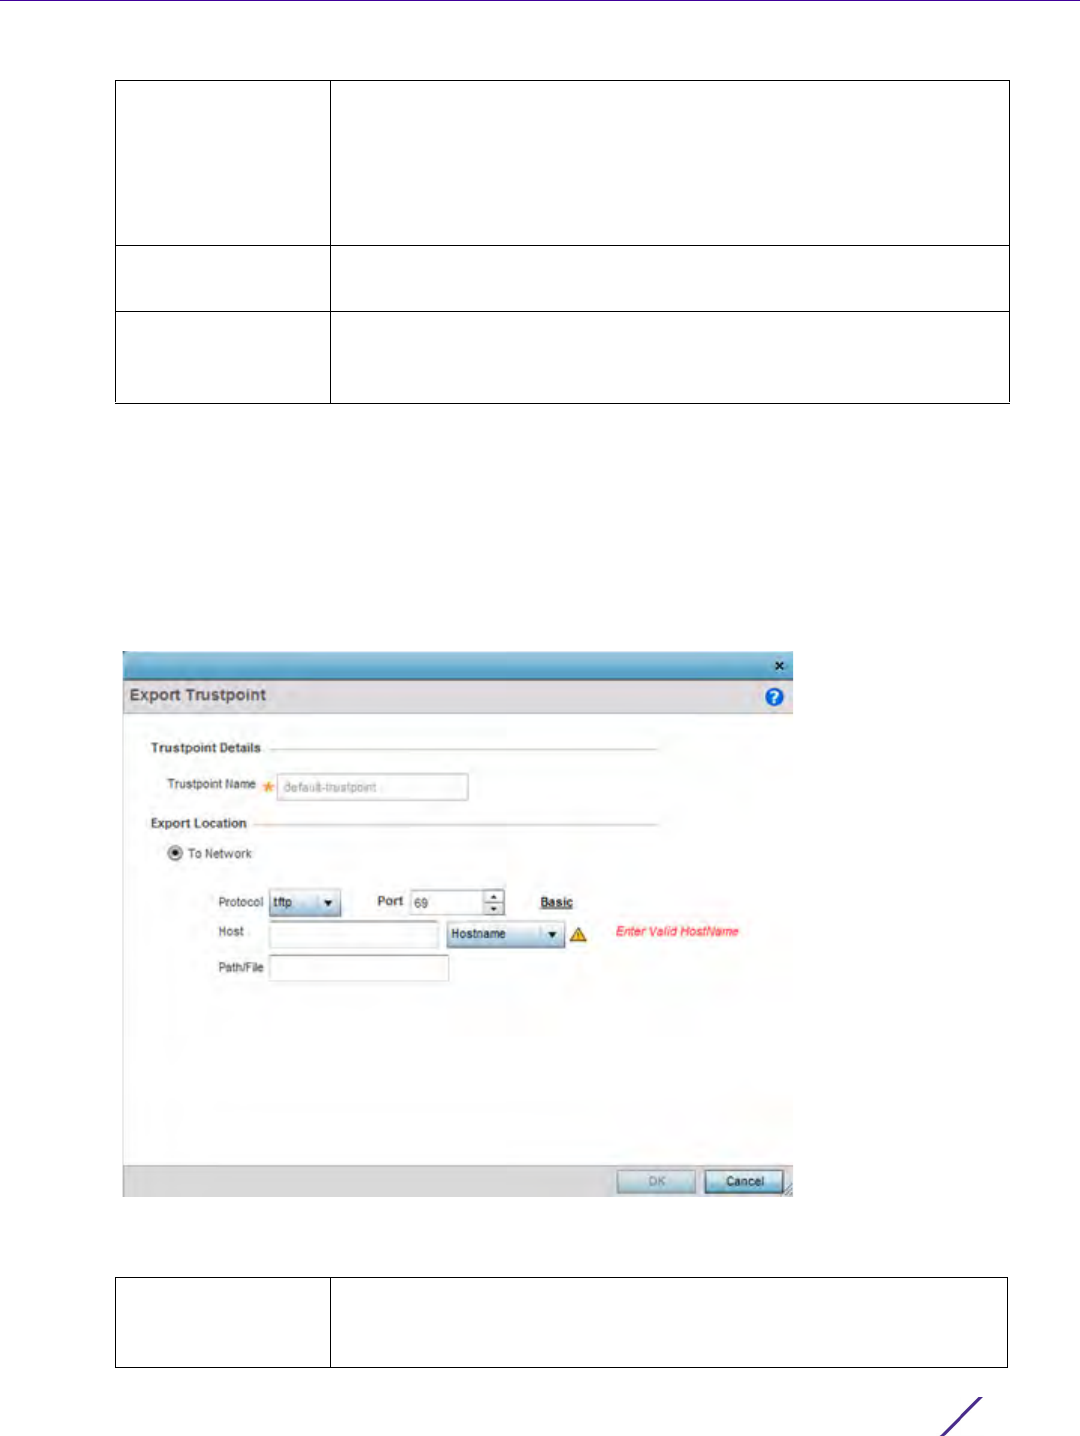
Operations
Wireless Controller and Service Platform System Reference Guide 30
14 Select OK to import the signed certificate. Select Cancel to revert the screen to its last saved configuration.
15 To optionally export a trustpoint from the controller or service platform to a remote location, select the Export
button from the Certificate Management screen.
Once a certificate has been generated on the controller or service platform’s authentication server, export the
self signed certificate. A digital CA certificate is different from a self signed certificate. The CA certificate
contains the public and private key pairs. The self certificate only contains a public key. Export the self
certificate for publication on a Web server or file server for certificate deployment or export it in to an active
directory group policy for automatic root certificate deployment.
Figure 14-21 Certificate Management - Export Trustpoint screen
16 Define the following configuration parameters required for the Export of the trustpoint.
Host Provide the hostname or numeric IP4 or IPv6 formatted IP address of the
server used to import the trustpoint. IPV6 provides enhanced identification
and location information for computers on networks routing traffic across
the Internet. IPv6 addresses are composed of eight groups of four
hexadecimal digits separated by colons. Providing a host is not required for
cf and usb1-4. A hostname cannot contain an underscore.
Path/File Specify the path to the signed certificate. Enter the complete relative path
to the file on the server.
Cut and Paste Select the Cut and Paste radio button to simply copy an existing signed
certificate into the cut and paste field. When pasting a signed certificate, no
additional network address information is required.
Trustpoint Name Enter the 32 character maximum name assigned to the trustpoint. The
trustpoint signing the certificate can be a certificate authority, corporation
or individual.

Operations
Wireless Controller and Service Platform System Reference Guide 31
17 Select OK to export the defined trustpoint. Select Cancel to revert the screen to its last saved configuration.
18 To optionally delete a trustpoint, select the Delete button from within the Certificate Management screen.
Provide the trustpoint name within the Delete Trustpoint screen and optionally select Delete RSA Key to
remove the RSA key along with the trustpoint. Select OK to proceed with the deletion, or Cancel to revert to
the Certificate Management screen.
14.2.2 RSA Key Management
Certificates
Refer to the RSA Keys screen to review existing RSA key configurations applied to managed devices. If an existing
key does not meet the needs of a pending certificate request, generate a new key or import/export an existing key
to and from a remote location.
Rivest, Shamir, and Adleman (RSA) is an algorithm for public key cryptography. It’s an algorithm that can be used
for certificate signing and encryption. When a device trustpoint is created, the RSA key is the private key used
with the trustpoint.
To review existing device RSA key configurations, generate additional keys or import/export keys to and from
remote locations:
URL Provide the complete URL to the location of the trustpoint. If needed, select
Advanced to expand the dialog to display network address information to
the location of the trustpoint. The number of additional fields that populate
the screen is dependent on the selected protocol.
Protocol Select the protocol used for exporting the target trustpoint. Available
options include:
tftp
ftp
sftp
http
cf
usb1-4
Port Use the spinner control to set the port. This option is not valid for cf and
usb1-4.
Host Provide the hostname or numeric IPv4 or IPv6 formatted address of the
server used to export the trustpoint. IPV6 provides enhanced identification
and location information for computers on networks routing traffic across
the Internet. IPv6 addresses are composed of eight groups of four
hexadecimal digits separated by colons. Providing a host is not required for
cf and usb1-4. A hostname cannot contain an underscore.
Path/File Specify the path to the trustpoint. Enter the complete relative path to the
file on the server.
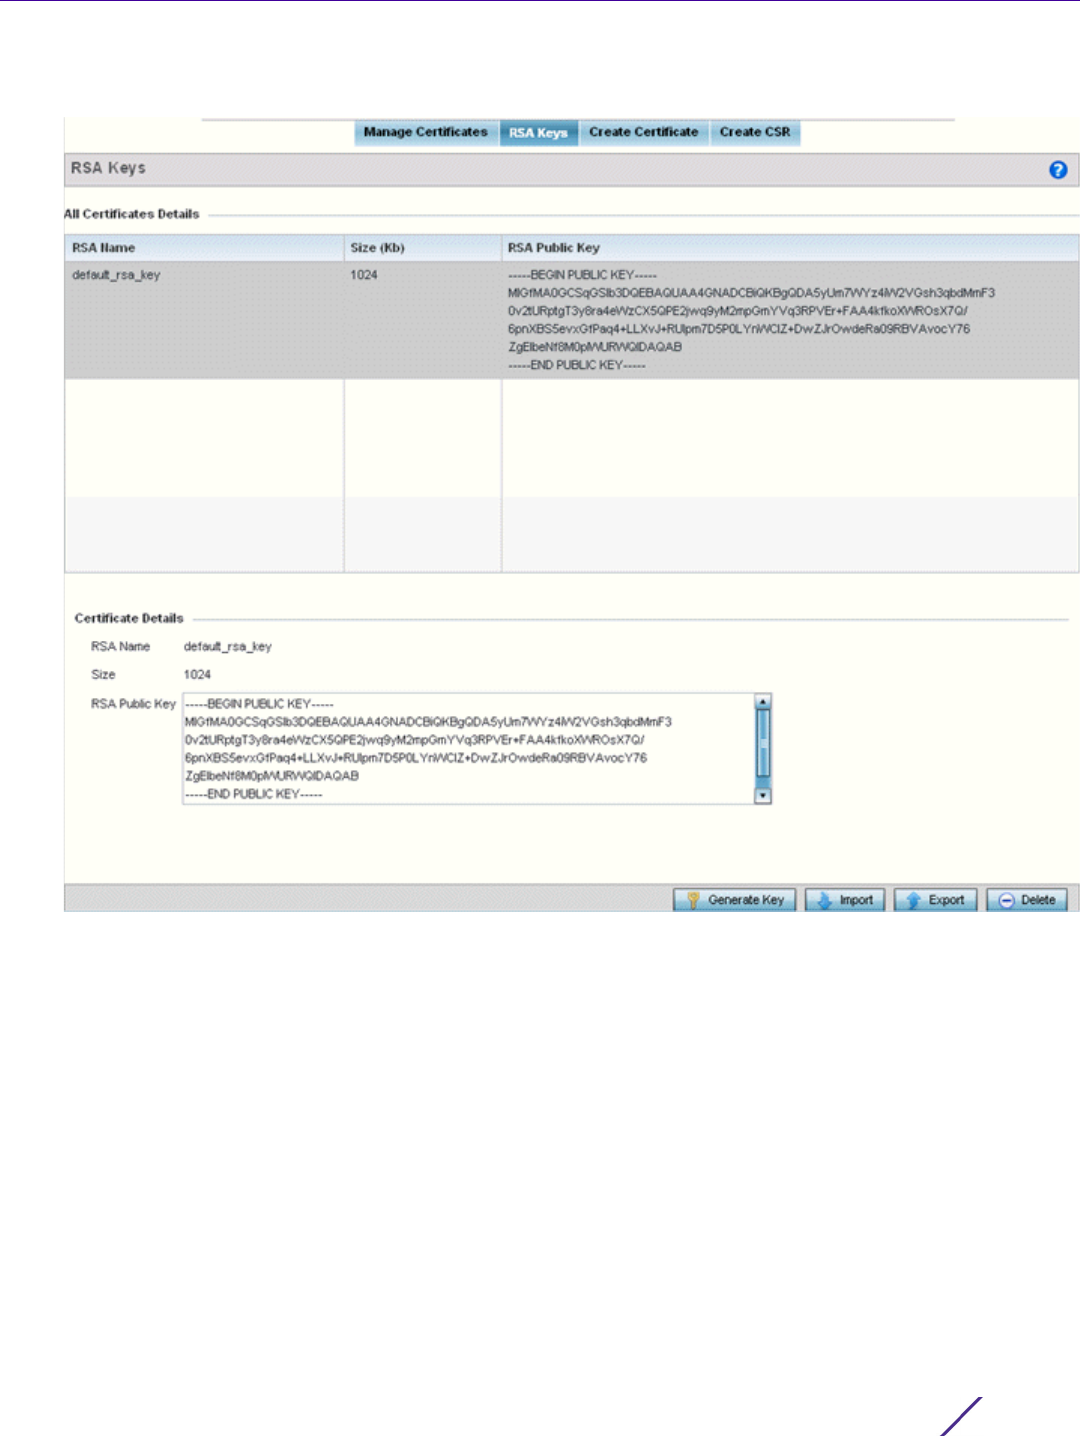
Operations
Wireless Controller and Service Platform System Reference Guide 32
1Select
RSA Keys tab from the Certificate Management screen.
Figure 14-22 Certificate Management - RSA Keys screen
2 Select a listed device to review its current RSA key configuration.
Each key can have its size and character syntax displayed. Once reviewed, optionally generate a new RSA key,
import a key from a selected device, export a key from the controller or service platform to a remote location
or delete a key from a selected device.
3Select
Generate Key to create a new key with a defined size.
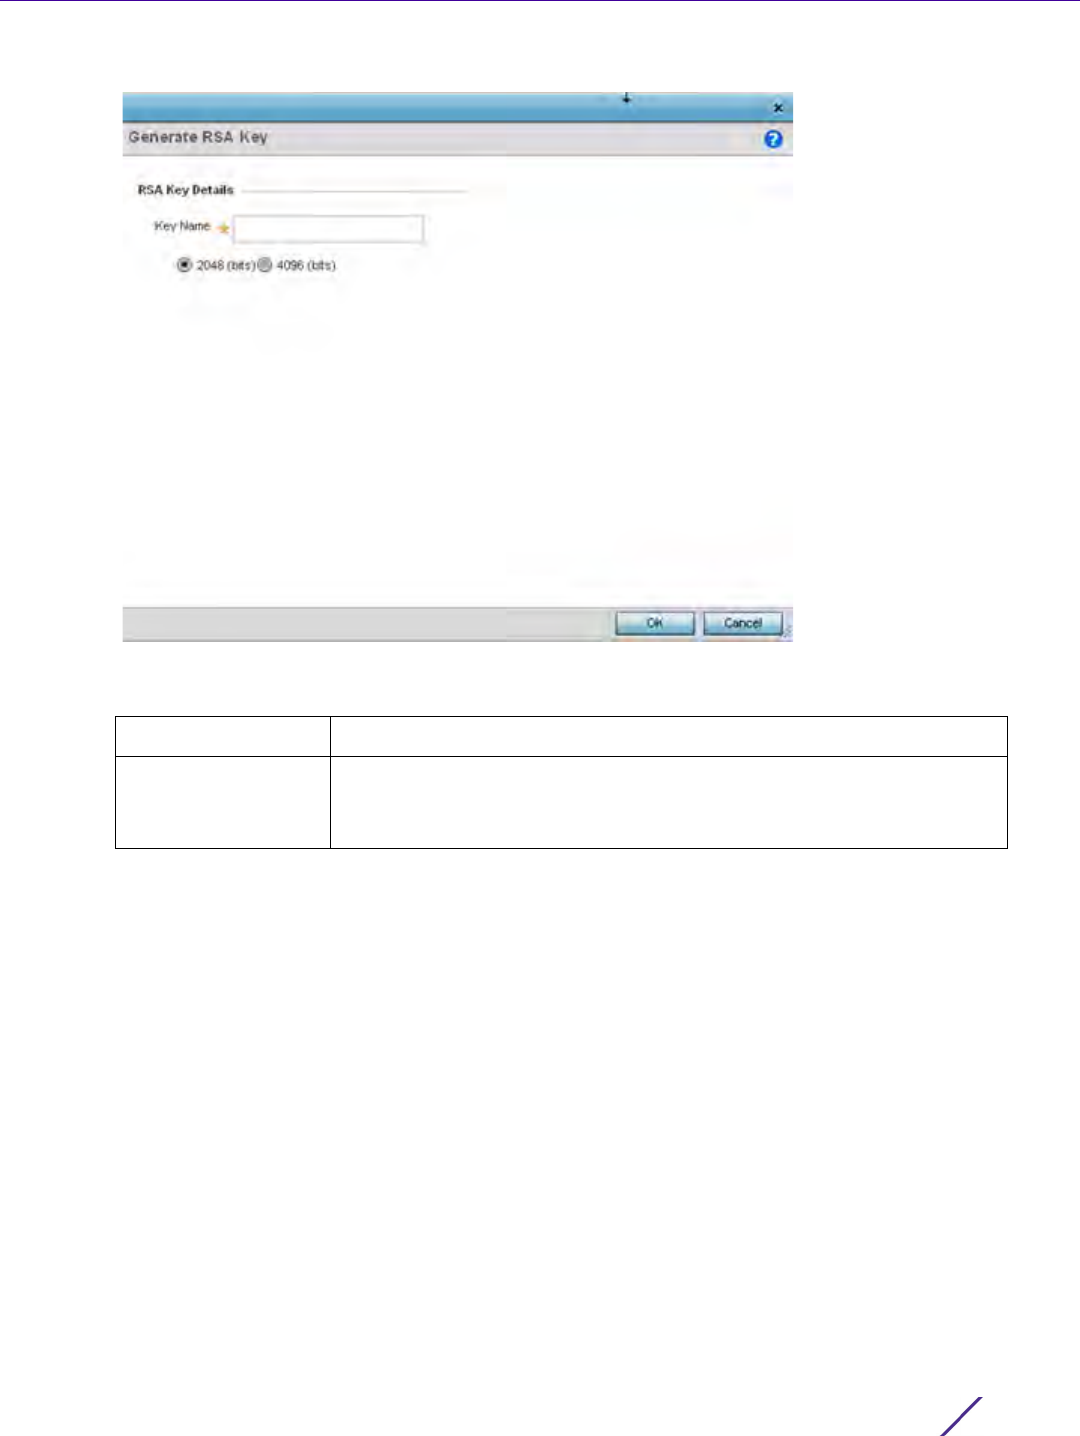
Operations
Wireless Controller and Service Platform System Reference Guide 33
Figure 14-23 Certificate Management - Generate RSA Keys screen
4 Define the following configuration parameters required for the Import of the key:
5Select
OK to generate the RSA key. Select Cancel to revert the screen to its last saved configuration.
6 To optionally import a CA certificate to the controller or service platform, select the Import button from the
Certificate Management > RSA Keys screen.
Key Name Enter the 32 character maximum name assigned to the RSA key.
Key Size Set the size of the key as either 2048 (bits) or 4096 (bits). Leaving this value
at the default setting of 2048 is recommended to ensure optimum
functionality.
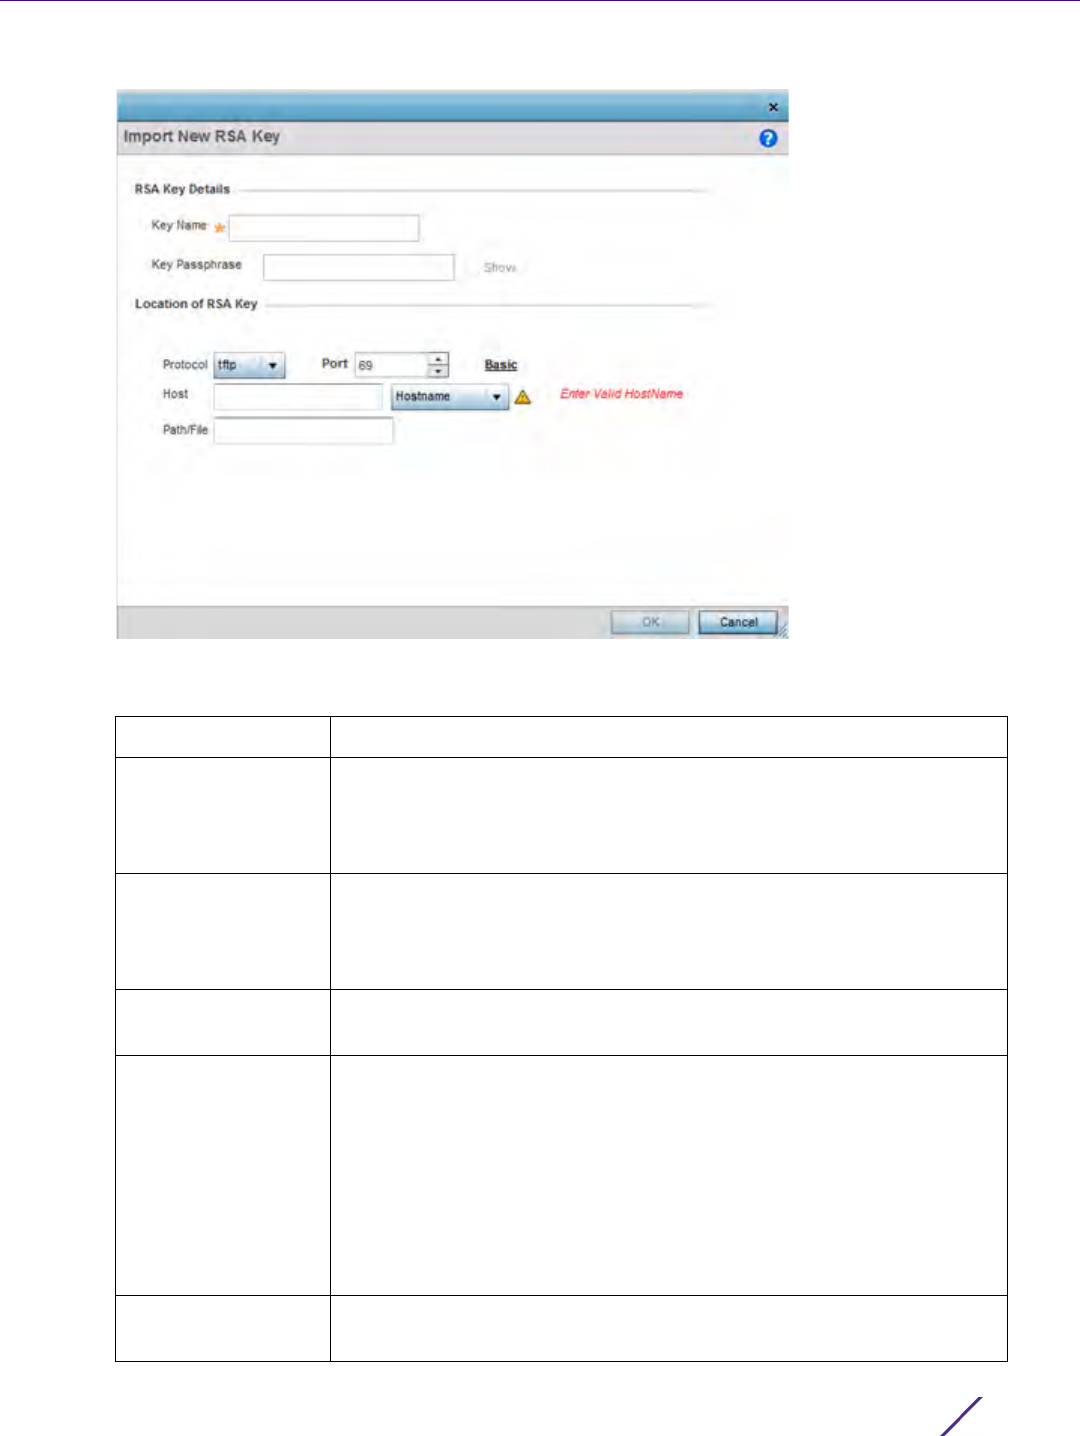
Operations
Wireless Controller and Service Platform System Reference Guide 34
Figure 14-24 Certificate Management - Import New RSA Key screen
7 Define the following parameters required for the Import of the RSA key:
Key Name Enter the 32 character maximum name assigned to identify the RSA key.
Key Passphrase Define the key used by both the controller or service platform and the
server (or repository) of the RSA key. Select the Show to expose the actual
characters used in the passphrase. Leaving the Show unselected displays
the passphrase as a series of asterisks “*”.
URL Provide the complete URL to the location of the RSA key. If needed, select
Advanced to expand the dialog to display network address information to
the location of the target key. The number of additional fields that populate
the screen is dependent on the selected protocol.
Advanced / Basic Select either the Advanced or Basic link to switch between a basic URL and
an advanced location to specify key location.
Protocol Select the protocol used for importing the target key. Available options
include:
tftp
ftp
sftp
http
cf
usb1-4
Port Use the spinner control to set the port. This option is not valid for cf and
usb1-4.
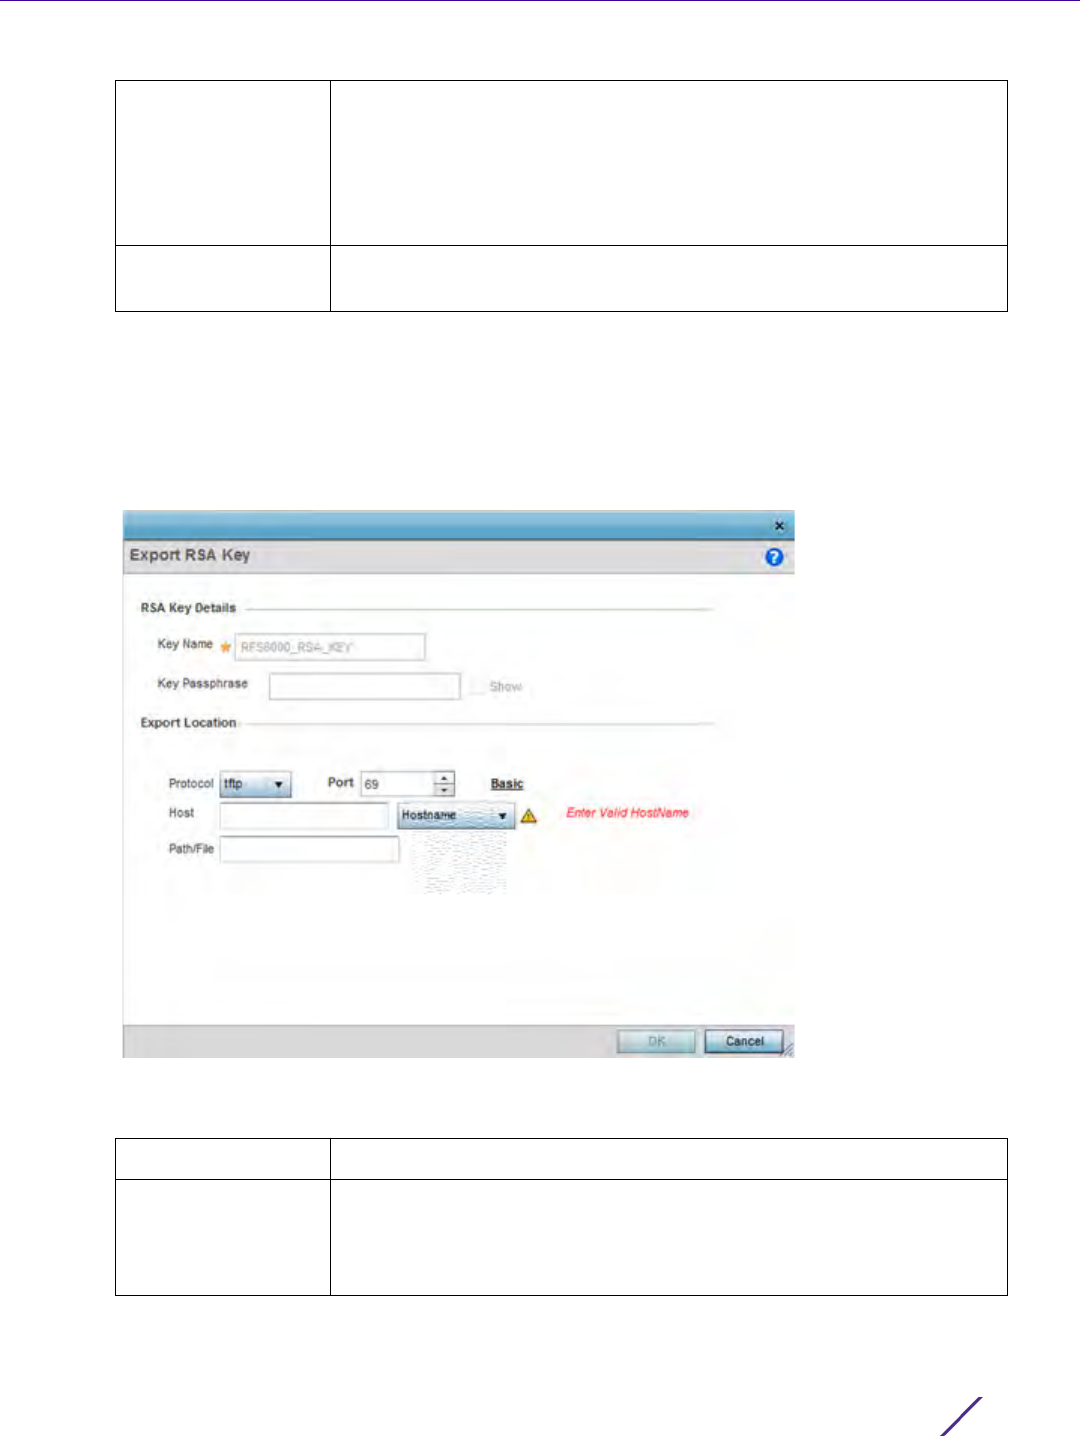
Operations
Wireless Controller and Service Platform System Reference Guide 35
8Select
OK to import the defined RSA key. Select Cancel to revert the screen to its last saved configuration.
9 To optionally export a RSA key from the controller or service platform to a remote location, select the Export
button from the Certificate Management > RSA Keys screen.
Export the key to a redundant RADIUS server to import it without generating a second key. If there’s more
than one RADIUS authentication server, export the certificate and don’t generate a second key unless you want
to deploy two root certificates.
Figure 14-25 Certificate Management - Export RSA Key screen
10 Define the following configuration parameters required for the Export of the RSA key.
Host Provide the hostname or numeric IPv4 or IPv6 formatted address of the
server used to import the RSA key. IPV6 provides enhanced identification
and location information for computers on networks routing traffic across
the Internet. IPv6 addresses are composed of eight groups of four
hexadecimal digits separated by colons. Providing a host is not required for
cf and usb1-4. A hostname cannot contain an underscore.
Path/File Specify the path to the RSA key. Enter the complete relative path to the key
on the server.
Key Name Enter the 32 character maximum name assigned to the RSA key.
Key Passphrase Define the key passphrase used by both the controller or service platform
and the server. Select Show to expose the actual characters used in the
passphrase. Leaving the Show unselected displays the passphrase as a
series of asterisks “*”.

Operations
Wireless Controller and Service Platform System Reference Guide 36
11 Select OK to export the defined RSA key. Select Cancel to revert the screen to its last saved configuration.
12 To optionally delete a key, select the Delete button from within the Certificate Management > RSA Keys screen.
Provide the key name within the Delete RSA Key screen and select Delete Certificates to remove the certificate.
Select OK to proceed with the deletion, or Cancel to revert back to the Certificate Management screen.
14.2.3 Certificate Creation
Certificates
The Create Certificate screen provides the facility for creating new self-signed certificates. Self signed certificates
(often referred to as root certificates) do not use public or private CAs. A self signed certificate is a certificate
signed by its own creator, with the certificate creator responsible for its legitimacy.
To create a self-signed certificate that can be applied to a managed device:
URL Provide the complete URL to the location of the key. If needed, select
Advanced to expand the dialog to display network address information to
the location of the target key. The number of additional fields that populate
the screen is dependent on the selected protocol.
Protocol Select the protocol used for exporting the RSA key. Available options
include:
tftp
ftp
sftp
http
cf
usb1-4
Port Use the spinner control to set the port. This option is not valid for cf and
usb1-4.
Host Provide the hostname or numeric IPv4 or IPv6 formatted address of the
server used to export the RSA key. IPV6 provides enhanced identification
and location information for computers on networks routing traffic across
the Internet. IPv6 addresses are composed of eight groups of four
hexadecimal digits separated by colons. Providing a host is not required for
cf and usb1-4. A hostname cannot contain an underscore.
Path/File Specify the path to the key. Enter the complete relative path to the key on
the server.
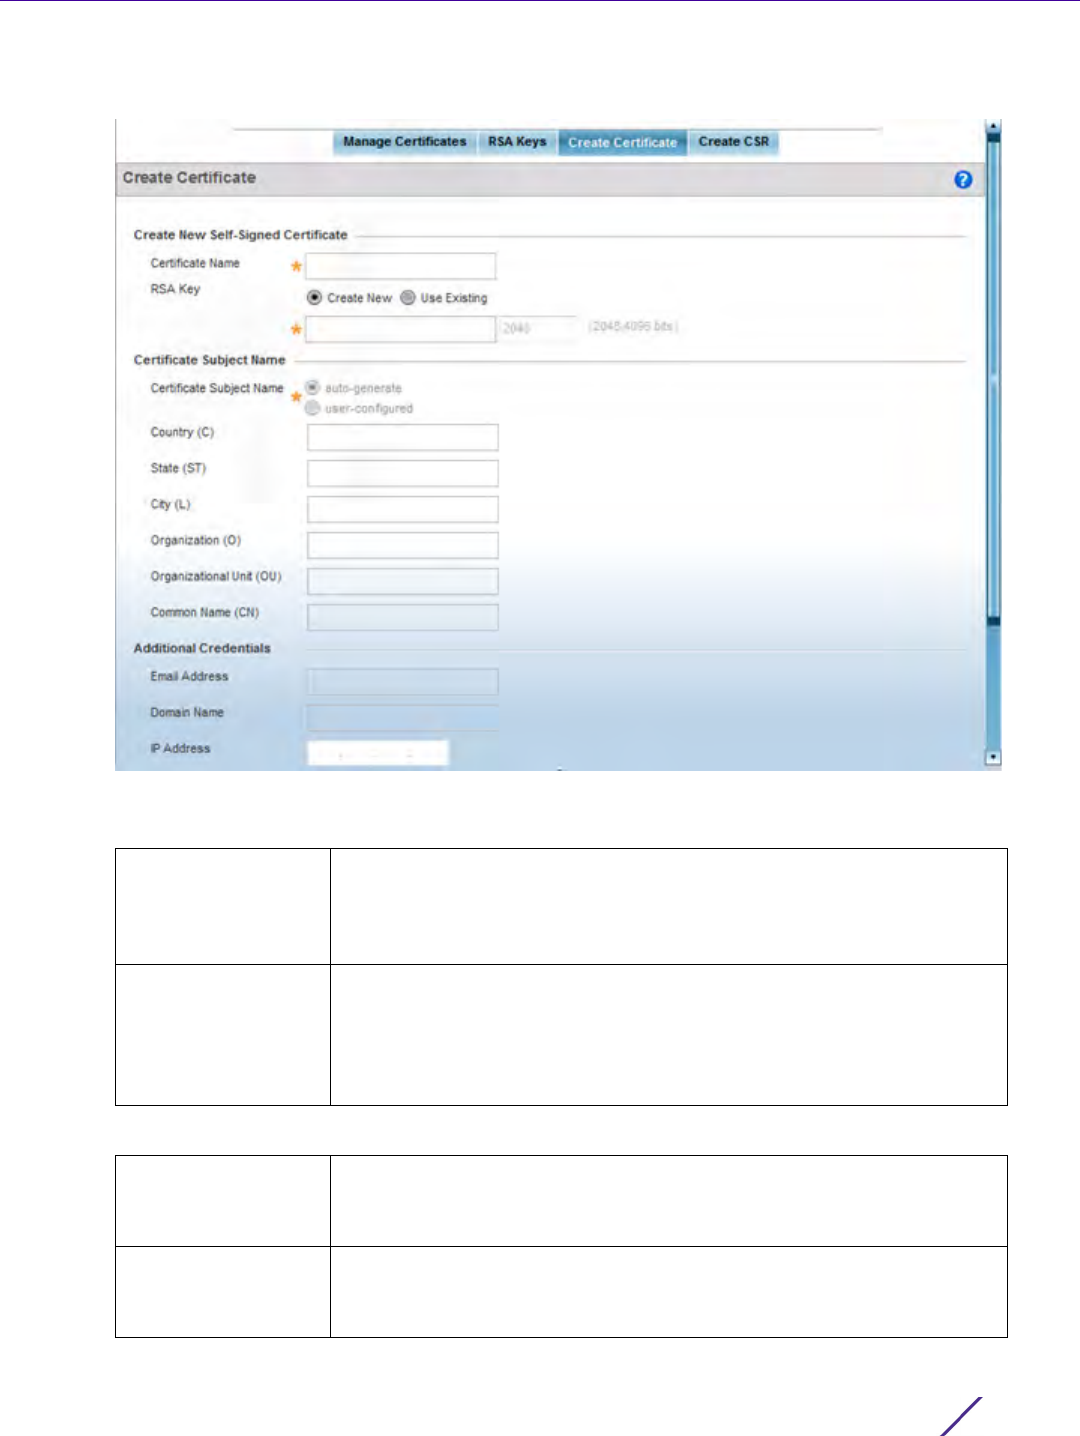
Operations
Wireless Controller and Service Platform System Reference Guide 37
1 Select the Create Certificate tab the Certificate Management screen.
Figure 14-26 Certificate Management - Create Certificate screen
2 Define the following configuration parameters required to Create New Self-Signed Certificate:
3 Set the following Certificate Subject Name parameters required for the creation of the certificate:
Certificate Name Enter the 32 character maximum name assigned to identify the name of the
trustpoint associated with the certificate. A trustpoint represents a CA/
identity pair containing the identity of the CA, CA-specific configuration
parameters, and an association with an enrolled identity certificate.
RSA Key To create a new RSA key, select Create New to define a 32 character
maximum name used to identify the RSA key. Set the size of the key (2048,
4096 bits). Leave this value at the default setting of 2048 to ensure
optimum functionality. To use an existing key, select Use Existing and select
a key from the drop-down menu.
Certificate Subject
Name
Select either auto-generate to automatically create the certificate's subject
credentials or user-configured to manually enter the credentials of the self
signed certificate. The default setting is auto-generate.
Country (C) Define the Country used in the certificate. The field can be modified by the
user to other values. This is a required field and must not exceed 2
characters.

Operations
Wireless Controller and Service Platform System Reference Guide 38
4 Select the following Additional Credentials required for the generation of the self signed certificate:
5 Select the Generate Certificate button at the bottom of the Create Certificate screen to produce the certificate.
14.2.4 Generating a Certificate Signing Request
Certificates
A certificate signing request (CSR) is a message from a requestor to a certificate authority to apply for a digital
identity certificate. The CSR is composed of a block of encrypted text generated on the server the certificate will
be used on. It contains information included in the certificate, including organization name, common name
(domain name), locality, and country.
A RSA key must be either created or applied to the certificate request before the certificate can be generated. A
private key is not included in the CSR, but is used to digitally sign the completed request. The certificate created
with a particular CSR only worked with the private key generated with it. If the private key is lost, the certificate is
no longer functional.The CSR can be accompanied by other identity credentials required by the certificate
authority, and the certificate authority maintains the right to contact the applicant for additional information.
If the request is successful, the CA sends an identity certificate digitally signed with the private key of the CA.
To create a CSR:
1Select
Operations > Certificates.
2 Select a device from amongst those displayed in either the RF Domain or Network panes on the left-hand side
of the screen.
3Select
Create CSR.
State (ST) Enter a State/Prov. for the state or province name used in the certificate.
This is a required field.
City (L) Enter a City to represent the city used in the certificate. This is a required
field.
Organization (O) Define an Organization for the organization represented in the certificate.
This is a required field.
Organizational Unit
(OU)
Enter an Org. Unit for the organization unit represented in the certificate.
This is a required field.
Common Name (CN) If there’s a common name (IP address) for the organizational unit issuing
the certificate, enter it here.
Email Address Provide an Email Address used as the contact address for issues relating to
this certificate request.
Domain Name Enter a fully qualified domain name (FQDN) is an unambiguous domain
name that specifies the node's position in the DNS tree hierarchy absolutely.
To distinguish an FQDN from a regular domain name, a trailing period is
added. For example, somehost.example.com. An FQDN differs from a
regular domain name by its absoluteness, since a suffix is not added.
IP Address Specify the IP address used as the destination for certificate requests.
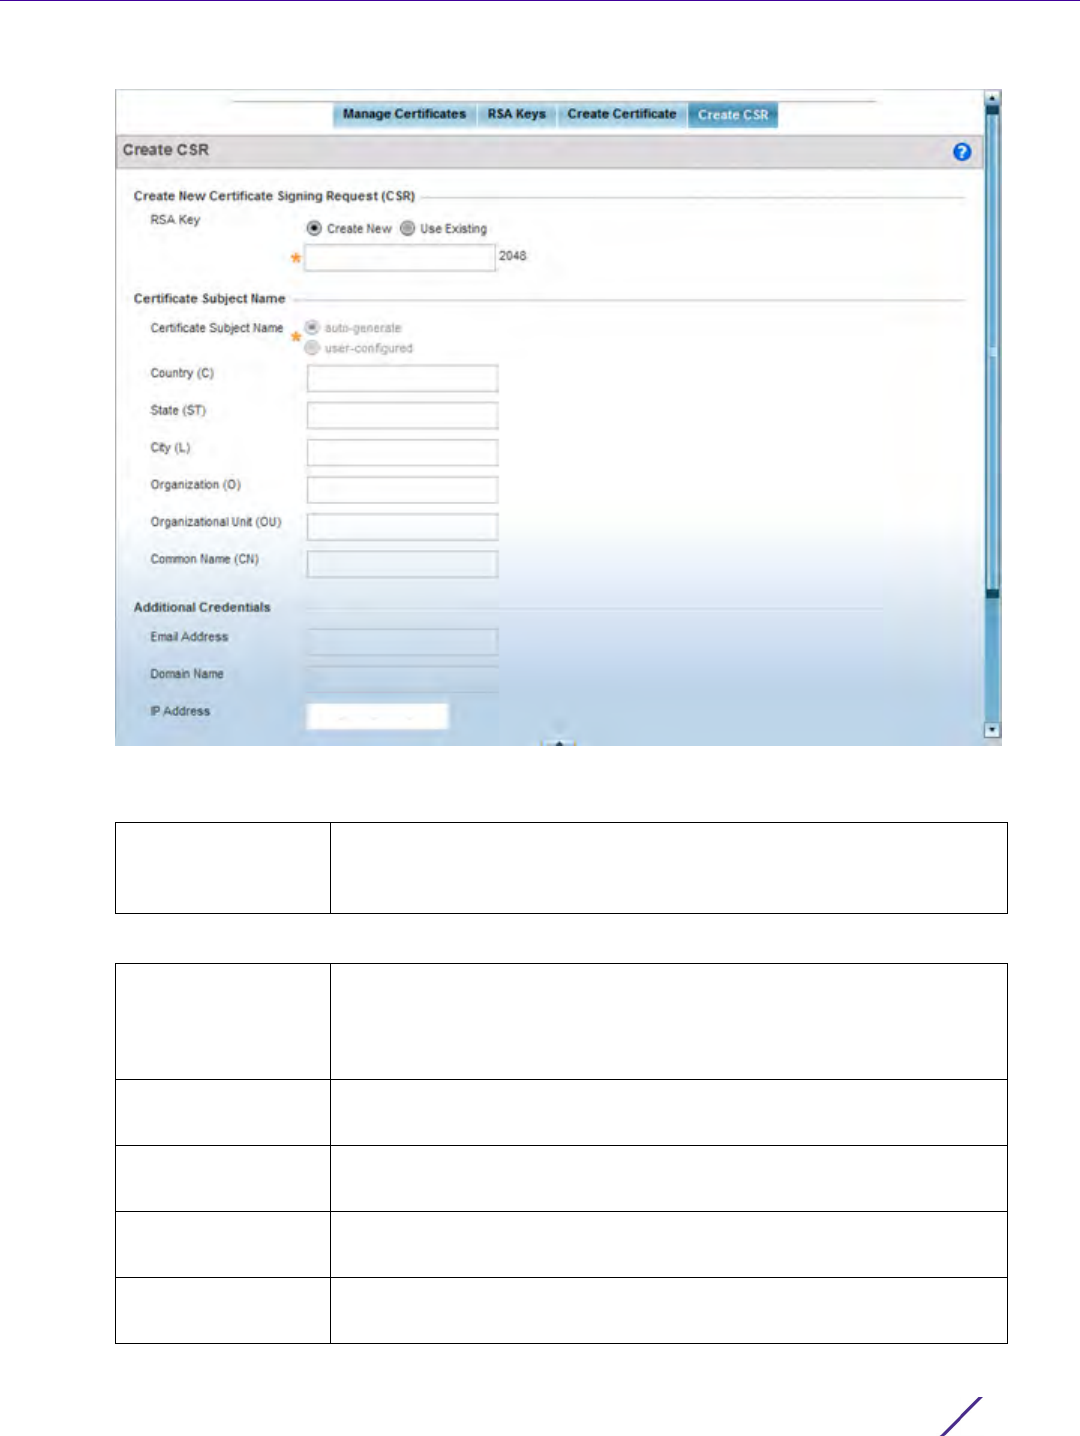
Operations
Wireless Controller and Service Platform System Reference Guide 39
Figure 14-27 Create CSR screen
4 Define the following configuration parameters required to Create New Certificate Signing Request (CSR):
5 Set the following Certificate Subject Name parameters:
RSA Key To create a new RSA key, select Create New to define a 32 character
maximum name used to identify the RSA key. Set a 2,048 bit key. To use an
existing key, select Use Existing and select a key from the drop-down menu.
Certificate Subject
Name
Select either the auto-generate radio button to automatically create the
certificate's subject credentials or select user-configured to manually enter
the credentials of the self signed certificate. The default setting is auto-
generate.
Country (C) Define the Country used in the CSR. The field can be modified by the user
to other values. This is a required field and must not exceed 2 characters.
State (ST) Enter a State/Prov. for the state or province name used in the CSR. This is a
required field.
City (L) Enter a City to represent the city name used in the CSR. This is a required
field.
Organization (O) Define an Organization for the organization used in the CSR. This is a
required field.

Operations
Wireless Controller and Service Platform System Reference Guide 40
6 Select the following Additional Credentials required for the generation of the CSR:
7 Select the Generate CSR button at the bottom of the screen to produce the CSR.
14.3 Smart RF
Self Monitoring At Run Time RF Management (Smart RF) is an innovation designed to simplify RF configurations
for new deployments, while (over time) providing on-going deployment optimization and radio performance
improvements.
The Smart RF functionality scans the managed network to determine the best channel and transmit power for
each wireless controller managed Access Point radio. Smart RF policies can be applied to specific RF Domains, to
apply site specific deployment configurations and self recovery values to groups of devices within pre-defined
physical RF coverage areas.
Smart RF also provides self recovery functions by monitoring the managed network in real-time and provides
automatic mitigation from potentially problematic events such as radio interference, coverage holes and radio
failures. Smart RF employs self recovery to enable a WLAN to better maintain wireless client performance and site
coverage during dynamic RF environment changes, which typically require manual reconfiguration to resolve.
Smart RF is supported in standalone and clustered environments. In standalone environments, the individual
controller or service platform manages the calibration and monitoring phases. In clustered environments, a single
controller or service platform is elected a Smart Scan master and the remaining cluster members operate as Smart
RF clients. In cluster operation, the Smart Scan master coordinates calibration and configuration and during the
monitoring phase receives information from the Smart RF clients. Smart RF calibration can be triggered manually
or continues at run-time, all the time.
Smart RF is supported on wireless controllers managing Access Points in either standalone or clustered
environments.
Within the Operations node, Smart RF is managed within selected RF Domains, using the Access Points that
comprise the RF Domain and their respective radio and channel configurations as the basis to conduct Smart RF
calibration operations.
Organizational Unit
(OU)
Enter an Org. Unit for the name of the organization unit used in the CSR.
This is a required field.
Common Name (CN) If there’s a common name (IP address) for the organizational unit issuing
the certificate, enter it here.
Email Address Provide an email address used as the contact address for issues relating to
this CSR.
Domain Name Enter a fully qualified domain name (FQDN) is an unambiguous domain
name that specifies the node's position in the DNS tree hierarchy absolutely.
A trailing period is added to distinguish an FQDN from a regular domain
name. For example, somehost.example.com. An FQDN differs from a
regular domain name by its absoluteness, since a suffix is not added.
IP Address Specify the IP address used as the controller or service platform destination
for certificate requests.
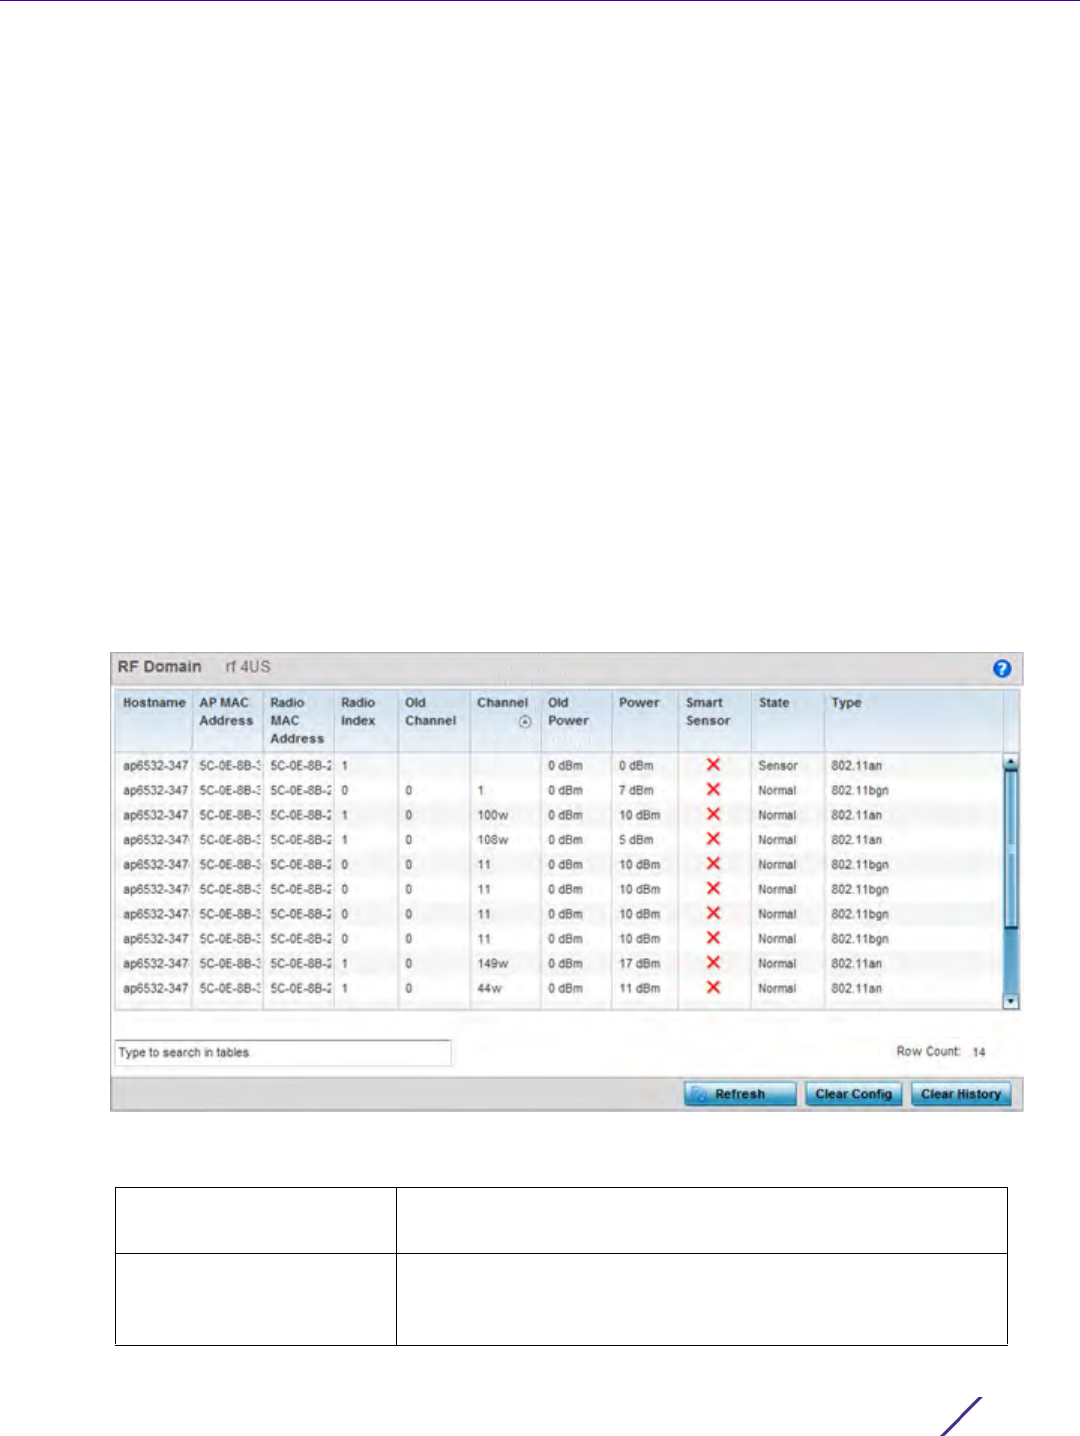
Operations
Wireless Controller and Service Platform System Reference Guide 41
14.3.1 Managing Smart RF for an RF Domain
Smart RF
When calibration is initiated, Smart RF instructs adopted radios (within a selected RF Domain) to beacon on a
specific legal channel, using a specific transmit power setting. Smart RF measures the signal strength of each
beacon received from both managed and unmanaged neighboring APs to define a RF map of the neighboring
radio coverage area. Smart RF uses this information to calculate each managed radio’s RF configuration as well as
assign radio roles, channel and power.
Within a well planned RF Domain, any associated radio should be reachable by at least one other radio. The Smart
RF feature records signals received from its neighbors. Access Point to Access Point distance is recorded in terms
of signal attenuation. The information is used during channel assignment to minimize interference.
To conduct Smart RF calibration for an RF Domain:
1Select
Operations > Smart RF.
2 Expand the System mode in the upper, left-hand, side of the user interface to display the RF Domains available
for Smart RF calibration.
3 Select a RF Domain from amongst those displayed.
The Smart RF screen displays information specific to the devices within the selected RF Domain using data
from the last interactive calibration.
Figure 14-28 Smart RF screen
4 Refer to the following to determine whether a Smart RF calibration or an interactive calibration is required:
Hostname Displays the assigned Hostname for each member of the RF
Domain.
AP MAC Address Displays the hardware encoded MAC address assigned to each
Access Point radio within the selected RF Domain. This value cannot
be modified as past of a calibration activity.

Operations
Wireless Controller and Service Platform System Reference Guide 42
5 Select the Refresh button to (as needed) to update the contents of the Smart RF screen and the attributes of
the devices within the selected RF Domain.
6 Select the Clear Config button to remove a displayed Smart RF configuration.
7 Select the Clear History button to revert the statistics counters to zero to begin a new assessment.
Radio MAC Address Displays the hardware encoded MAC address assigned to each
Access Point radio within the selected RF Domain. This value cannot
be modified as past of a calibration activity.
Radio Index Displays a numerical index assigned to each listed Access Point
radio when it was added to the managed network. This index helps
distinguish this radio from others within this RF Domain with similar
configurations. This value is not subject to change as a result of a
calibration activity, but each listed radio index can be used in Smart
RF calibration.
Old Channel Lists the channel originally assigned to each listed Access Point
MAC address within this RF Domain. This value may have been
changed as part an Interactive Calibration process applied to this RF
Domain. Compare this Old Channel against the Channel value to
right of it (in the table) to determine whether a new channel
assignment was warranted to compensate for a coverage hole.
Channel Lists the current channel assignment for each listed Access Point, as
potentially updated by an Interactive Calibration. Use this data to
determine whether a channel assignment was modified as part of
an Interactive Calibration. If a revision was made to the channel
assignment, a coverage hole was detected on the channel as a result
of a potentially failed or under performing Access Point radio within
this RF Domain.
Old Power Lists the transmit power assigned to each listed Access Point MAC
address within this RF Domain. The power level may have been
increased or decreased as part an Interactive Calibration process
applied to this RF Domain. Compare this Old Power level against the
Power value to right of it (in the table) to determine whether a new
power level was warranted to compensate for a coverage hole.
Power This column displays the transmit power level for the listed Access
Point MAC address after an Interactive Calibration resulted in an
adjustment. This is the new power level defined by Smart RF to
compensate for a coverage hole.
Smart Sensor Defines whether a listed Access Point is smart sensor on behalf of
the other Access Point radios comprising the RF Domain.
State Displays the current state of the Smart RF managed Access Point
radio. Possible states include: Normal, Offline and Sensor.
Type Displays the radio type (802.11an, 802.11bgn etc.) of each listed
Access Point radio within the selected RF Domain.

15 - 1
Wireless Controller and Service Platform System Reference Guide
15
Statistics
This chapter describes statistics displayed by the graphical user interface (GUI). Statistics are available for
controllers or service platforms and their managed devices.
A Smart RF statistical history is available to assess adjustments made to device configurations to compensate for
detected coverage holes or device failures.
Statistics display detailed information about controller or service platform peers, health, device inventories, wireless
clients associations, adopted AP information, rogue APs and WLANs.
Access Point statistics can be exclusively displayed to validate connected Access Points, their VLAN assignments
and their current authentication and encryption schemes.
Wireless client statistics are available for an overview of client health. Wireless client statistics includes RF quality,
traffic utilization and user details. Use this information to assess if configuration changes are required to improve
network performance.
Guest access statistics are also available for the periodic review of wireless clients requesting the required pass
code, authentication and access into the WiNG managed guest network.
For more information, see:
•System Statistics
•RF Domain Statistics
•Controller Statistics
•Access Point Statistics
•Wireless Client Statistics
•Guest Access Statistics
15.1 System Statistics
Statistics
The System screen displays information supporting managed devices or peer controllers. Use this information to
asses the overall state of the devices comprising the system. Systems data is organized as follows:
•Health
•Inventory
•Adopted Devices
•Pending Adoptions
•Offline Devices
•Device Upgrade
•Licenses
•WIPS Summary
NOTE: NOC controllers (NX9000, NX9500, NX9510, NX7500, and RFS6000) can
utilize an analytics developer interface as an additional tool available to
administrators to review specific APIs in granular detail. For more information, see
Analytics Developer Interface on page 15-332.
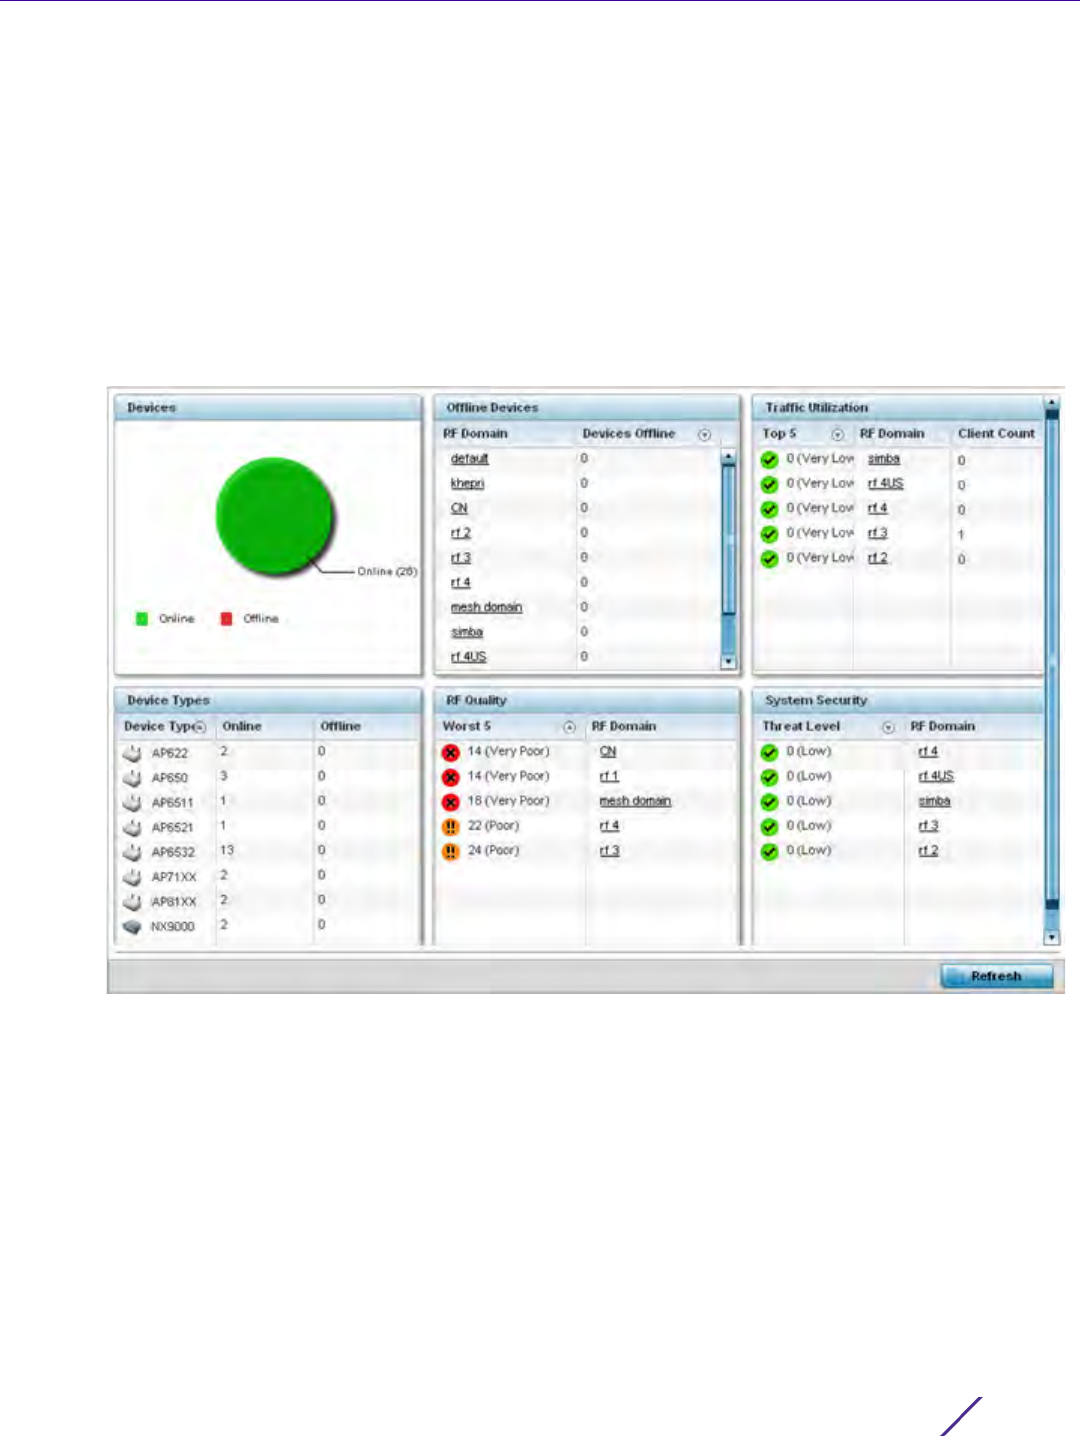
Statistics
Wireless Controller and Service Platform System Reference Guide 15 - 2
15.1.1 Health
System Statistics
The Health screen displays the overall performance of the controller or service platform managed network
(system). This includes device availability, overall RF quality, resource utilization and network threat perception.
To display the health of the wireless controller managed network:
1 Select the Statistics menu from the Web UI.
2 Select the System node from the left navigation pane.
3Select
Health from the left-hand side of the UI.
Figure 15-1 System - Health screen
4The Devices field displays the total number of devices in the controller or service platform managed network.
The pie chart is a proportional view of how many devices are functional and currently online. Green indicates
online devices and red offline devices detected within the controller or service platform managed network.
5The
Offline Devices table displays a list of detected devices in the network that are currently offline but
available as potential managed resources.
The table displays the number of offline devices within each impacted RF Domain. Assess whether the
configuration of a particular RF Domain is contributing to an excessive number of offline devices.

Statistics
Wireless Controller and Service Platform System Reference Guide 15 - 3
6The
Traffic Utilization table displays the top 5 RF Domains with the most effective resource utilization.
Utilization is dependent on the number of devices connected to the RF Domain.
7The
Device Types table displays the kinds of devices detected within the system. Each device type displays the
number currently online and offline.
8Use the
RF Quality table to isolate poorly performing radio devices within specific RF Domains. This information
is a starting point to improving the overall quality of the wireless controller managed network.The RF Quality
area displays the RF Domain performance. Quality indices are:
•0 – 50 (Poor)
•50 – 75 (Medium)
•75 – 100 (Good).
The RF Quality field displays the following:
9The
System Security table defines a Threat Level as an integer value indicating a potential threat to the system.
It’s an average of the threat indices of all the RF Domains managed by the wireless controller.
10 Select Refresh at any time to update the statistics counters to their latest values.
Top 5 Displays the top 5 RF Domains in terms of usage index. Utilization
index is a measure of how efficiently the domain is utilized. This value
is defined as a percentage of current throughput relative to the
maximum possible throughput. The values are:
0-20 – Very low utilization
20-40 – Low utilization
40-60 – Moderate utilization
60 and above – High utilization
RF Domain Displays the name of the RF Domain.
Client Count Displays the number of wireless clients associated with the RF Domain.
Worst 5 Displays five RF Domains with the lowest quality indices in the wireless
controller managed network. The value can be interpreted as:
0-50 – Poor quality
50-75 – Medium quality
75-100 – Good quality
RF Domain Displays the name of the RF Domain wherein system statistics are
polled for the poorly performing device.
Threat Level Displays the threat perception value. This value can be interpreted as:
0-2 – Low threat level
3-4 – Moderate threat level
5 – High threat level
RF Domain Displays the name of the target RF Domain for which the threat level
is displayed.
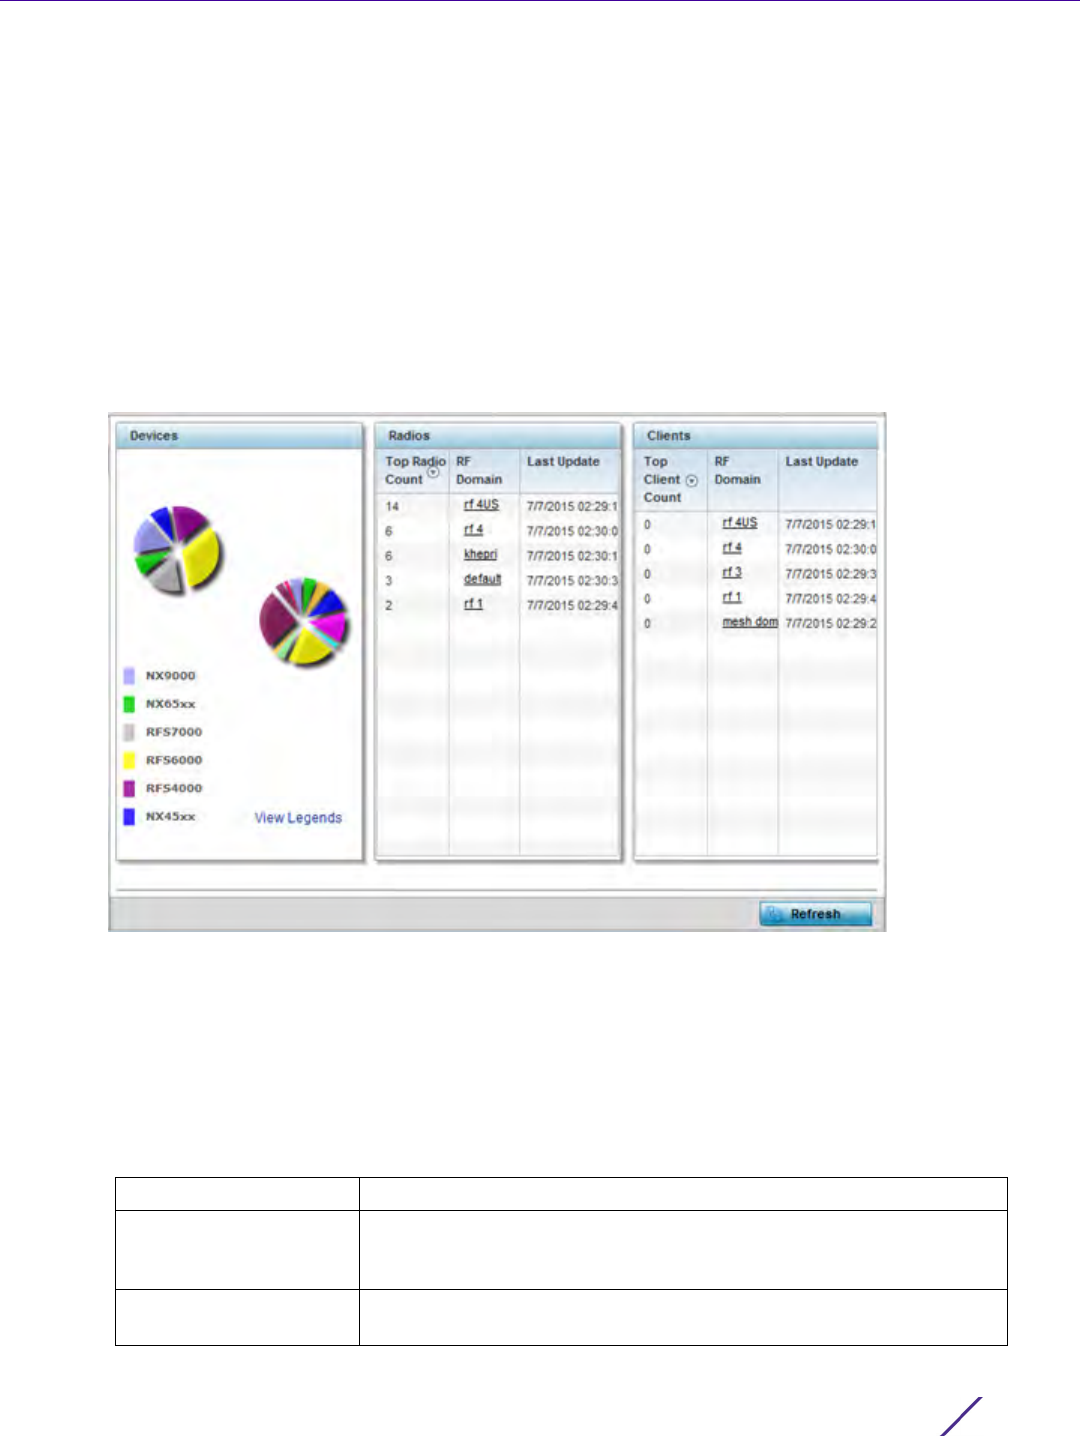
Statistics
Wireless Controller and Service Platform System Reference Guide 15 - 4
15.1.2 Inventory
System Statistics
The Inventory screen displays information about the physical hardware managed within the system by its member
controller or service platforms. Use this information to assess the overall performance of wireless controller
managed devices.
To display the inventory statistics:
1 Select the Statistics menu from the Web UI.
2 Select the System node from the left navigation pane.
3Select
Inventory from the left-hand side of the UI.
Figure 15-2 System - Inventory screen
4The Devices field displays an exploded pie chart depicting controller, service platform and Access Point device
type distribution by model. The device on the left displays managing controller models. Select View Legends to
assess connected Access Points. Use this information to assess whether these are the correct models for the
original deployment objective.
5The
Radios table displays radios deployed within the wireless controller managed network. This area displays
the total number of managed radios and top 5 RF Domains in terms of radio count. The Total Radios value is
the total number of radios in this system.
Top Radio Count Displays the radios index of each listed top radio.
RF Domain Displays the name of the RF Domain the listed radios belong. The RF
Domain displays as a link that can be selected to display configuration
and network address information in greater detail.
Last Update Displays the UTC timestamp when each listed client was last seen on
the network.
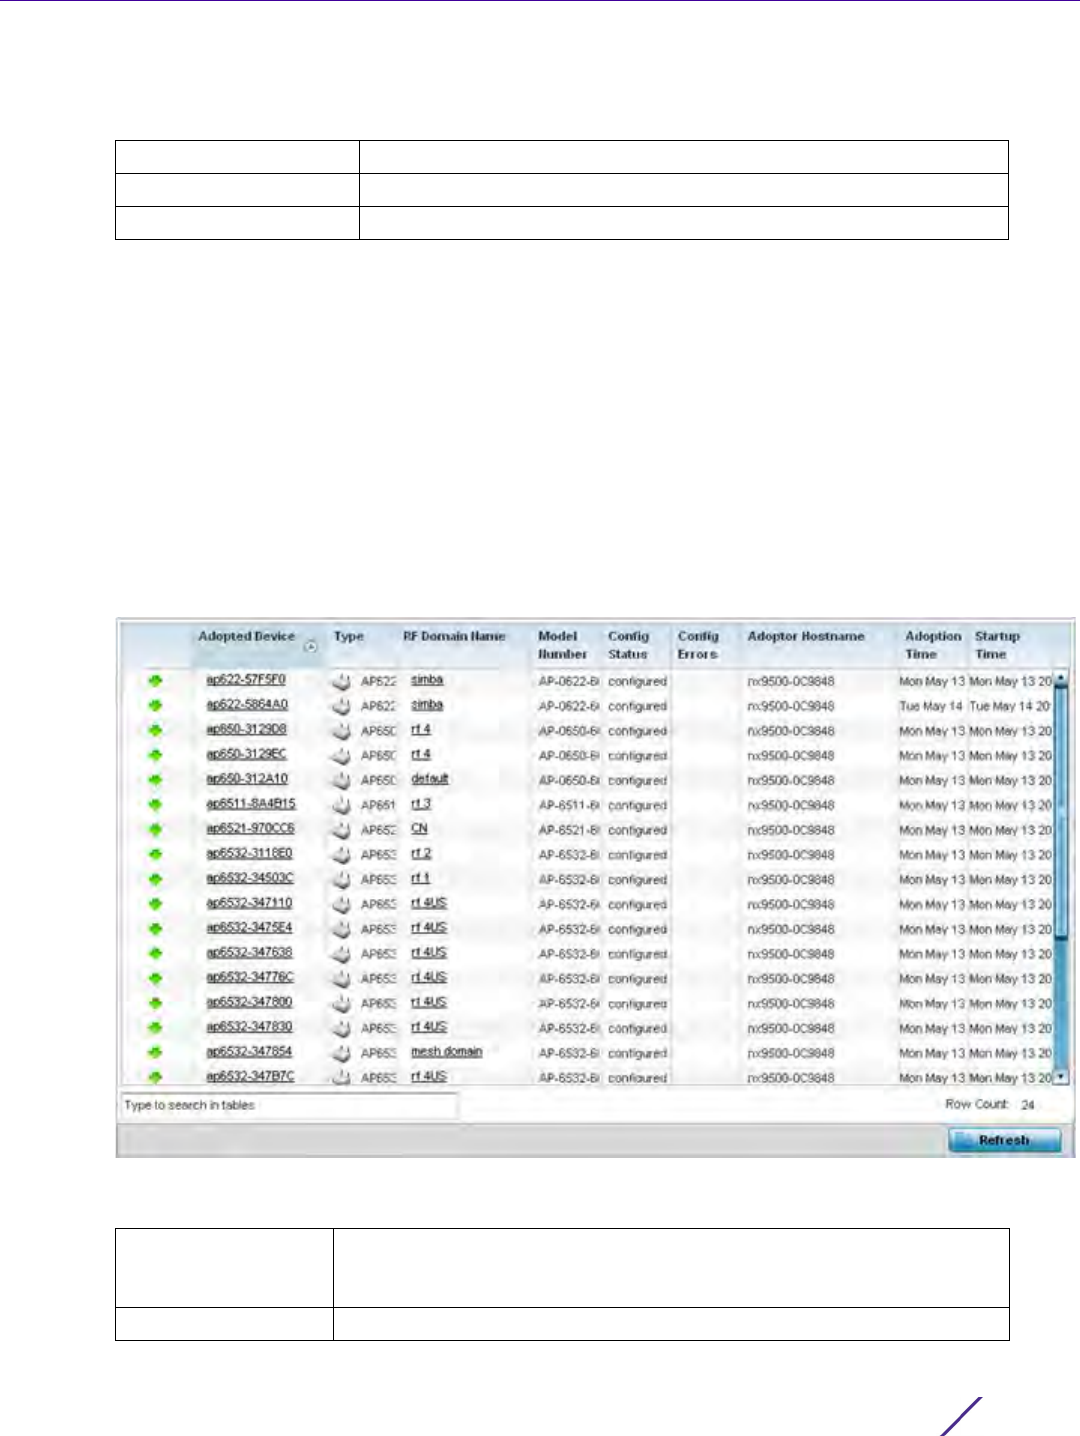
Statistics
Wireless Controller and Service Platform System Reference Guide 15 - 5
6The
Clients table displays the total number of wireless clients managed by the controller or service platform.
This Top Client Count table lists the top 5 RF Domains, in terms of the number of wireless clients adopted:
7Select
Refresh to update the statistics counters to their latest values.
15.1.3 Adopted Devices
System Statistics
The Adopted Devices screen displays a list of devices adopted to the wireless controller managed network (entire
system). Use this screen to view a list of devices and their current status.
To view adopted AP statistics:
1 Select the Statistics menu from the Web UI.
2 Select the System node from the left navigation pane.
3Select Adopted Devices from the left-hand side of the UI.
Figure 15-3 System - Adopted Devices screen
The Adopted Devices screen provides the following:
Top Client Count Displays the client index of each listed top performing client.
RF Domain Displays the name of the client RF Domain.
Last Update Displays the UTC timestamp when the client count was last reported.
Adopted Device Displays administrator assigned hostname of the adopted device. Select
the adopted device link to display configuration and network address
information in greater detail.
Type Displays the adopted Access Point’s model type.

Statistics
Wireless Controller and Service Platform System Reference Guide 15 - 6
15.1.4 Pending Adoptions
System Statistics
The Pending Adoptions screen displays those devices detected within the controller or service platform coverage
area, but have yet to be adopted by the controller or service platform. Review these devices to assess whether
they could provide radio coverage to wireless clients needing support.
To view pending AP adoptions to the controller or service platform:
1 Select the Statistics menu from the Web UI.
2 Select the System node from the left navigation pane.
3Select Pending Adoptions from the left-hand side of the UI.
RF Domain Name Displays the domain the adopted AP has been assigned to. Select the RF
Domain to display configuration and network address information in
greater detail.
Model Number Lists the model number of each AP that’s been adopted to the controller
or service platform since this screen was last refreshed.
Config Status Displays the configuration file version in use by each listed adopted
device. Use this information to determine whether an upgrade would
increase the functionality of the adopted device.
Config Errors Lists any errors encountered when the listed device was adopted by the
controller or service platform.
Adopter Hostname Lists the administrator hostname assigned to the adopting controller or
service platform.
Adoption Time Displays a timestamp for each listed device that reflects when the device
was adopted by the controller or service platform.
Startup Time Provides a date stamp when the adopted device was restarted post
adoption.
Refresh Select Refresh to update the statistics counters to their latest values.
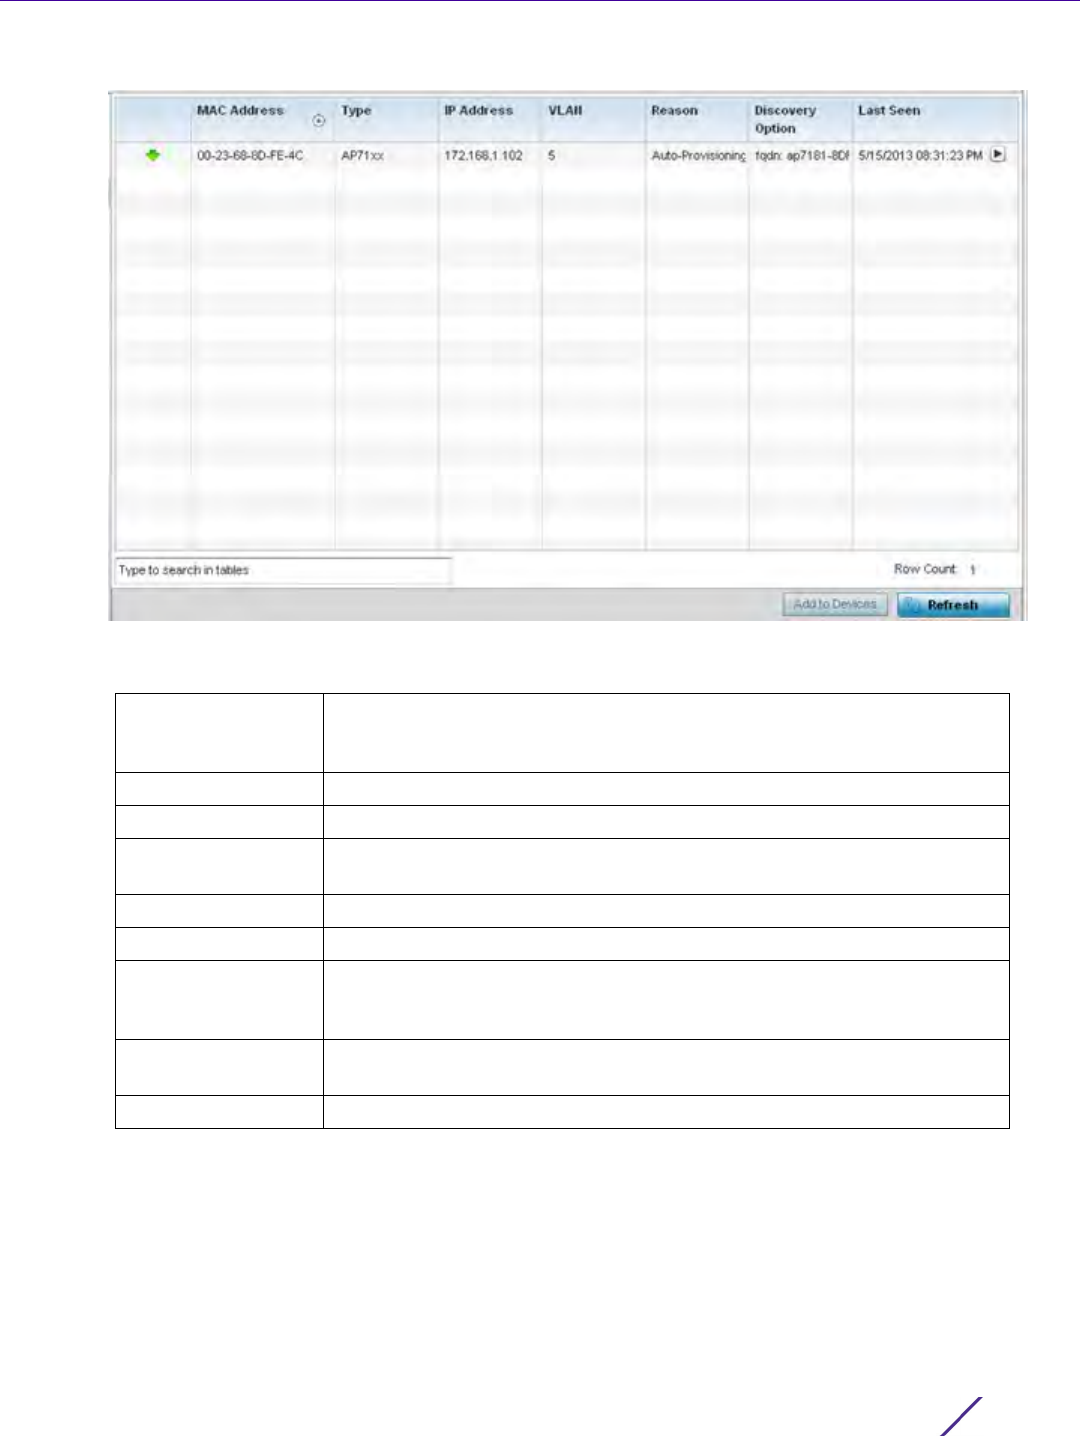
Statistics
Wireless Controller and Service Platform System Reference Guide 15 - 7
Figure 15-4 System - Pending Adoptions screen
The Pending Adoptions screen displays the following:
15.1.5 Offline Devices
System Statistics
The Offline Devices screen displays a list of devices in the controller or service platform managed network or RF
Domain that are currently offline. Review the contents of this screen to help determine whether an offline status is
still warranted.
To view offline device potentially available for adoption by the controller or service platform:
MAC Address Displays the MAC address of the device pending adoption. Select the MAC
address to view device configuration and network address information in
greater detail.
Type Displays the AP type.
IP Address Displays the current IP Address of the device pending adoption.
VLAN Displays the VLAN the device pending adoption will use as a virtual
interface with its adopting controller or service platform.
Reason Displays a status (reason) as to why the device is pending adoption.
Discovery Option Displays the discovery option code for each AP listed pending adoption.
Last Seen Displays the date and time stamp of the last time the device was seen.
Click the arrow next to the date and time to toggle between standard time
and UTC.
Add to Devices Select a listed AP and select the Add to Devices button to begin the
adoption process for this detected AP.
Refresh Click the Refresh button to update the list of pending adoptions.
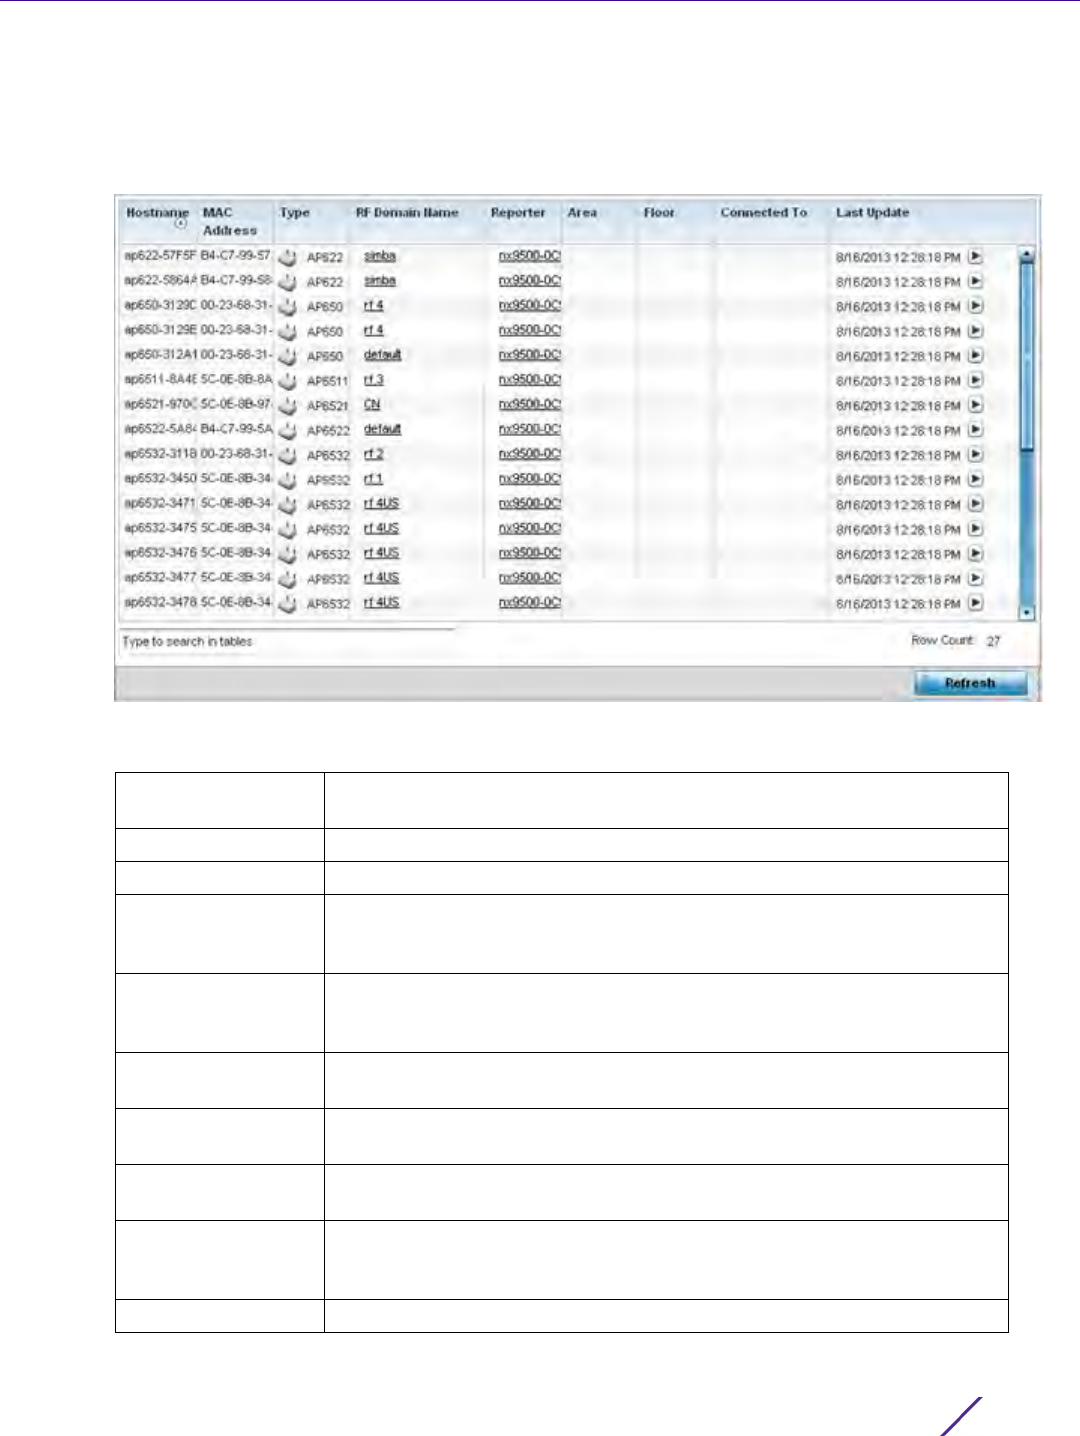
Statistics
Wireless Controller and Service Platform System Reference Guide 15 - 8
1 Select the Statistics menu from the Web UI.
2 Select the System node from the left navigation pane.
3Select Offline Devices from the left-hand side of the UI.
Figure 15-5 System - Offline Devices screen
The Ofp indentfline Devices screen provides the following:
Hostname Lists the administrator assigned hostname provided when the device was
added to the controller or service platform managed network.
MAC Address Displays the factory encoded MAC address of each listed offline device.
Type Displays the offline Access Point’s model type.
RF Domain Name Displays the name of the offline device’s RF Domain membership, if
applicable. Select the RF Domain to display configuration and network
address information in greater detail.
Reporter Displays the hostname of the device reporting the listed device as offline.
Select the reporting device name to display configuration and network
address information in greater detail.
Area Lists the administrator assigned deployment area where the offline device
has been detected.
Floor Lists the administrator assigned deployment floor where the offline device
has been detected.
Connected To Lists the offline’s device’s connected controller, service platform or peer
model Access Point.
Last Update Displays the date and time stamp of the last time the device was detected
within the controller or service platform managed network. Click the arrow
next to the date and time to toggle between standard time and UTC.
Refresh Select Refresh to update the statistics counters to their latest values.
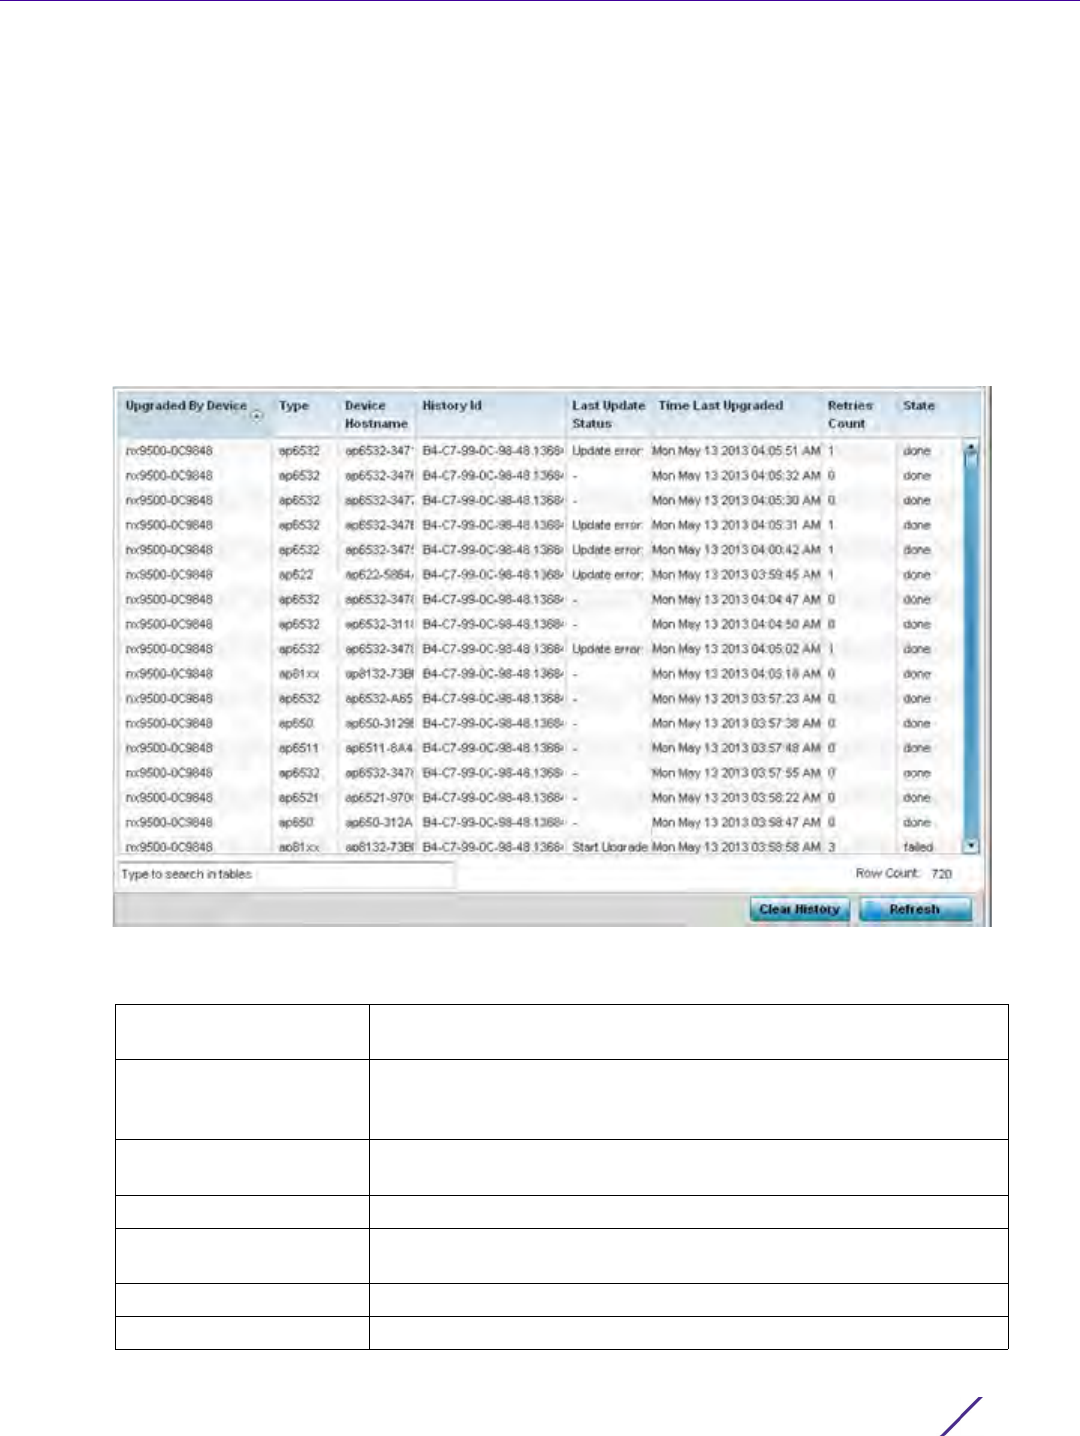
Statistics
Wireless Controller and Service Platform System Reference Guide 15 - 9
15.1.6 Device Upgrade
System Statistics
The Device Upgrade screen displays available licenses for devices within a cluster. It displays the total number of
AP licenses.
To view a licenses statistics within the controller or service platform managed network:
1 Select the Statistics menu from the Web UI.
2 Select the System node from the left navigation pane.
3Select
Device Upgrade from the left-hand side of the UI.
Figure 15-6 System - Device Upgrade screen
4Select Device Upgrade from the left-hand side of the UI.
Upgraded By Device Displays the MAC address of the controller, service platform or peer
model Access Point that performed an upgrade.
Type Displays the model type of the adopting controller, service platform
or Access Point. An updating Access Point must be of the same
model as the Access Point receiving the update.
Device Hostname List the administrator assigned hostname of the device receiving an
update.
History ID Displays a unique timestamp for the upgrade event.
Last Update Status Displays the initiation, completion or error status of each listed
upgrade operation.
Time Last Upgraded Lists the date and time of each upgrade operation.
Retries Count Displays the number of retries required in an update operation.
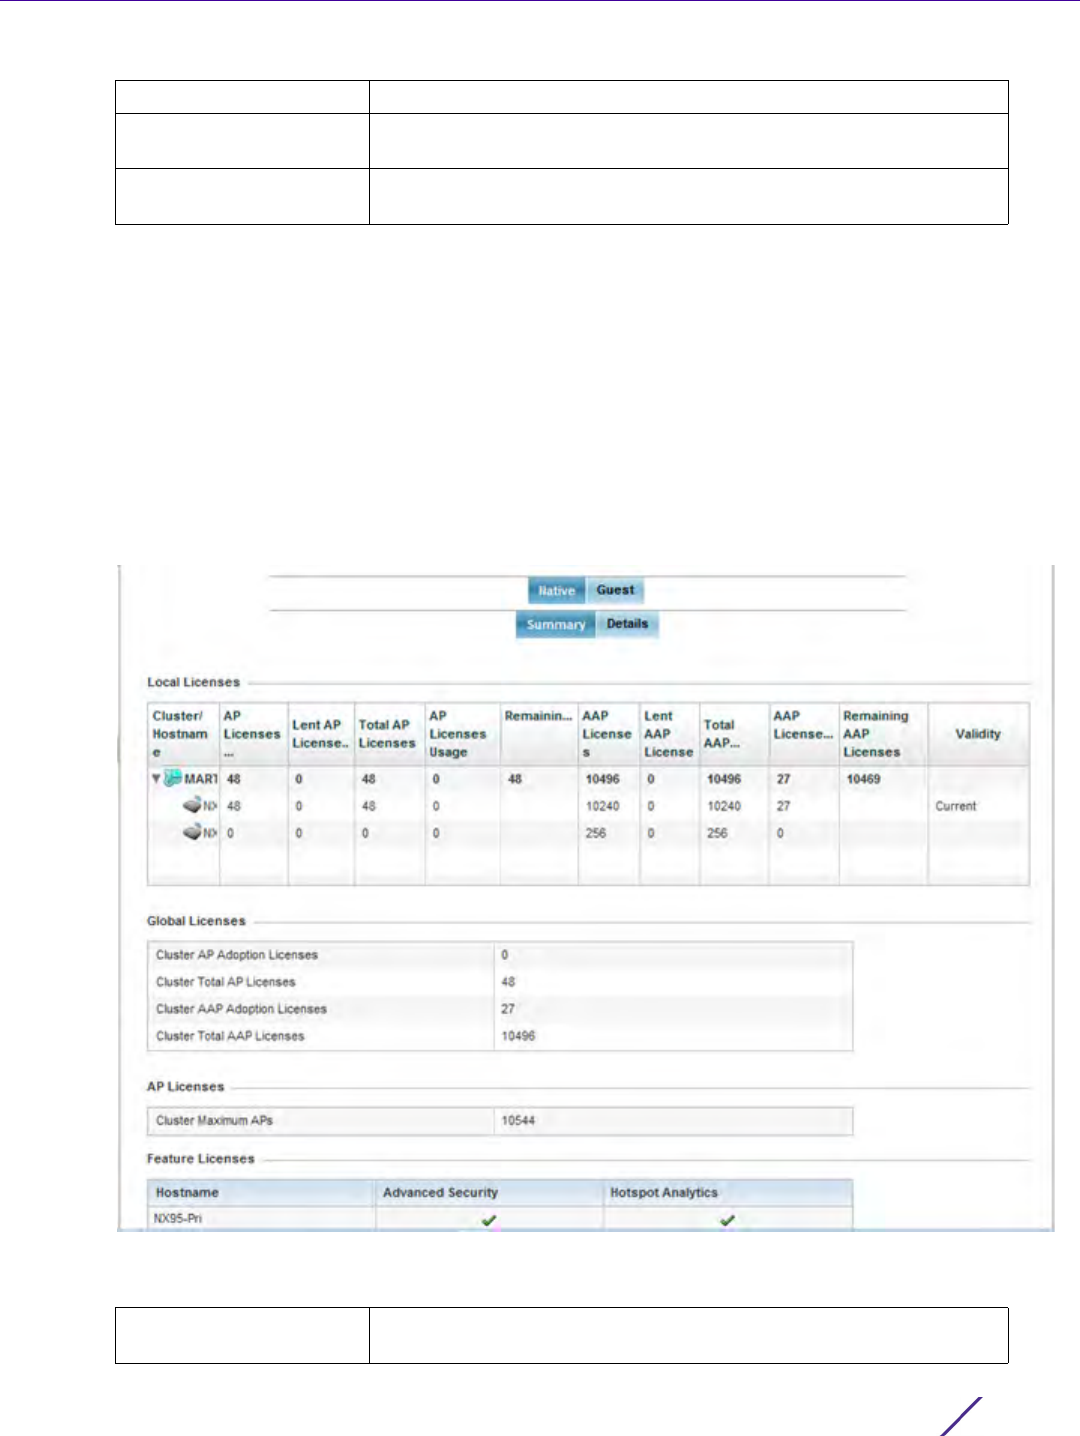
Statistics
Wireless Controller and Service Platform System Reference Guide 15 - 10
15.1.7 Licenses
System Statistics
The Licenses statistics screen displays available licenses for devices within a cluster. It displays the total number of
AP licenses. Native (local) and Guest license utilization can now be separately tracked as well.
To view a licenses statistics within the controller or service platform managed network:
1 Select the Statistics menu from the Web UI.
2 Select the System node from the left navigation pane.
3Select
Licenses from the left-hand side of the UI.
Figure 15-7 System - Licenses screen
4The Local Licenses table provides the following information:
State Displays the done or failed state of an upgrade operation.
Clear History Select Clear History to clear the screen of its current status and begin
a new data collection.
Refresh Select Refresh to update the screen’s statistics counters to their latest
values.
Cluster/Hostname Lists the administrator assigned cluster hostname whose license
count and utilization is tallied in this Local Licenses table.

Statistics
Wireless Controller and Service Platform System Reference Guide 15 - 11
5The
Global Licenses table provides the following information:
6The
AP Licenses table provides the following information:
7The
Featured Licenses area provides the following information:
AP Licenses Installed Lists the number of Access Point connections available to this
controller or service platform under the terms of the current license.
Lent AP Licenses Displays the number of Access Point licenses lent (from this
controller or service platform) to a cluster member to compensate for
an Access Point’s license deficiency.
Total AP Licenses Displays the total number of Access Point connection licenses
currently available to this controller or service platform.
AP License Usage Lists the number of Access Point connections currently utilized by
this controller or service platform out of the total available under the
terms of the current license.
Remaining AP Licenses Lists the remaining number of AP licenses available from the pooled
license capabilities of all the members of the cluster.
AAP Licenses Installed Lists the number of Adaptive Access Point connections available to
this controller or service platform under the terms of the current
license.
Lent AAP Licenses Displays the number of Adaptive Access Point licenses lent (from this
controller or service platform) to a cluster member to compensate for
an Access Point licenses deficiency.
Total AAP Licenses Displays the total number of Adaptive Access Point connection
licenses currently available to this controller or service platform.
AAP Licenses Usage Lists the number of Adaptive Access Point connections currently
utilized by this controller or service platform out of the total available
under the terms of the current license.
Remaining AAP Licenses Lists the remaining number of AAP licenses available from the pooled
license capabilities of all the members of the cluster.
Validity Displays validity information for the license’s legal usage with the
controller or service platform.
Cluster AP Adoption
Licenses
Displays the current number of Access Point adoption licenses utilized by
controller or service platform connected Access Points within a cluster.
Cluster Total AP Licenses Displays the total number of Access Point adoption licenses available to
controller or service platform connected Access Points within a cluster.
Cluster AAP Adoption
Licenses
Displays the current number of Adaptive Access Point adoption licenses
utilized by controller or service platform connected Access Points within a
cluster.
Cluster Total AAP
Licenses
Displays the total number of Adaptive Access Point adoption licenses
available to controller or service platform connected Access Points within
a cluster.
Cluster Maximum AP Lists the maximum number of Access Points permitted in a cluster under
the terms of the current license.
Hostname Displays the administrator assigned hostname of the controller, service
platform or Access Point whose potentially implemented a advanced
security, WIPS or Analytics feature licenses.

Statistics
Wireless Controller and Service Platform System Reference Guide 15 - 12
8 Select the Details tab.
Refer to the Details screen to further assess the total number of cluster member licenses available, cluster
memberships, current utilization versus total licenses available, borrowed licenses, remaining licenses and
license validity.
9 Refer to the following license utilization data:
15.1.8 WIPS Summary
System Statistics
The Wireless Intrusion Protection System (WIPS) provides continuous protection against wireless threats and acts
as an additional layer of security complementing wireless VPNs and existing encryption and authentication
policies. Controllers and service platforms support WIPS through the use of dedicated sensor devices, designed to
Advanced Security Displays whether the separately licensed Advanced Security application is
installed for each hostname.
Hotspot Analytics Displays whether a separately licensed Analytics application is installed
for supported NX9500 and NX9510 service platforms.
Cluster/Hostname Lists the administrator assigned cluster hostname whose license
count and utilization is listed and tallied for member controllers,
service platforms or Access Points.
AP Licenses Installed Lists the number of Access Point connections available to this
controller or service or peer Access Point under the terms of the
current license.
Borrowed AP Licenses Displays the number of Access Point licenses temporarily borrowed
from a cluster member to compensate for an AP license deficiency.
Total AP Licenses Displays the total number of Access Point connection licenses
currently available to clustered devices.
AP Licenses Usage Lists the number of Access Point connections currently utilized out of
the total available under the terms of current licenses.
Remaining AP Licenses Lists the remaining number of AP licenses available from the pooled
license capabilities of cluster members.
AAP Licenses Installed Lists the number of Adaptive Access Point connections available
under the terms of current licenses.
Borrowed AAP Licenses Displays the number of Adaptive Access Point licenses temporarily
borrowed from a cluster member to compensate for an AAP license
deficiency.
Total AAP Licenses Displays the total number of Adaptive Access Point connection
licenses currently available to clustered devices.
AAP Licenses Usage Lists the number of Adaptive Access Point connections currently
utilized out of the total available under the terms of the current
licenses.
Remaining AAP Licenses Lists the remaining number of AAP licenses available from the pooled
license capabilities of all the members of the cluster.
Validity Displays validity information for the license’s legal usage by cluster
member devices.
Refresh Select Refresh to update the screen’s statistics counters to their latest
values.
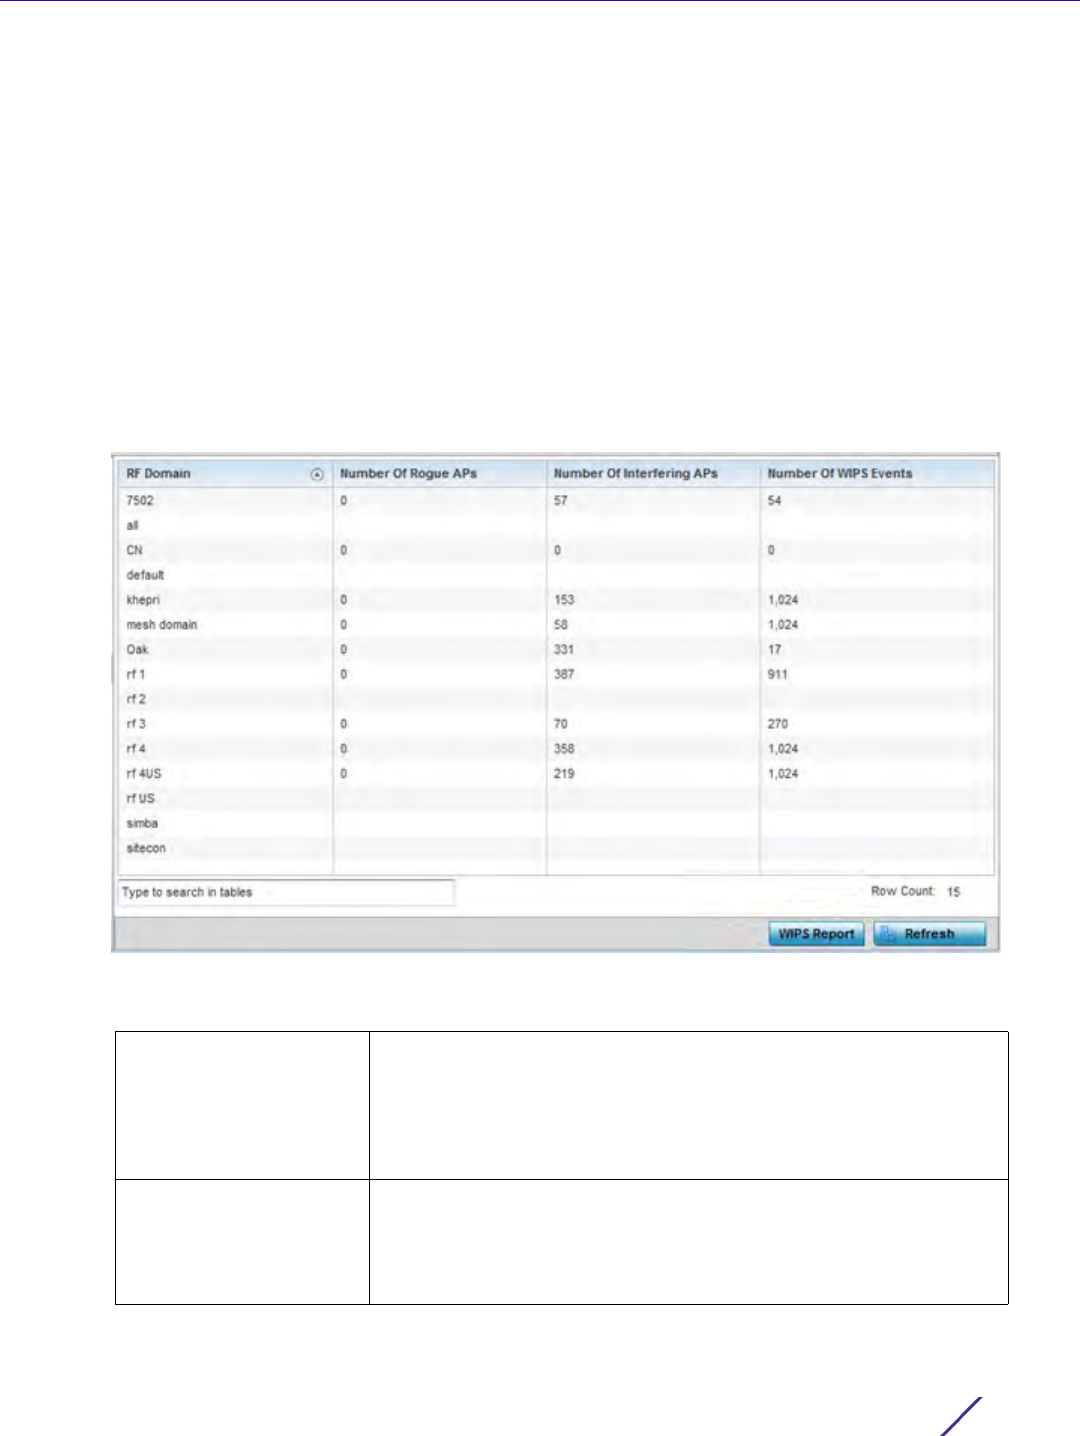
Statistics
Wireless Controller and Service Platform System Reference Guide 15 - 13
actively detect and locate unauthorized AP devices. After detection, they use mitigation techniques to block
devices using manual termination, air lockdown or port suppression.
The WIPS Summary screen lists RF Domains residing in the system and reports the number of unauthorized and
interfering devices contributing to the potential poor performance of the RF Domain’s network traffic. Additionally,
the number of WIPS events reported by each RF Domain is also listed to help an administrator better mitigate
risks to the network.
To review and assess the impact of rogue and interfering Access Points, as well as the occurrence of WIPS events
within the controller or service platform’s managed system:
1 Select the Statistics menu from the Web UI.
2 Select the System node from the left navigation pane.
3Select
WIPS Summary from the left-hand side of the UI.
Figure 15-8 System - WIPS Summary screen
4 Refer to the following WIPS data reported for each RF Domain in the system:
RF Domain Lists the RF Domain within the system reporting rogue and
interfering Access Point event counts. Use this information to assess
whether a particular RF Domain is reporting an excessive number of
events or a large number of potentially invasive rogue Access Points
versus the other RF Domains within the controller, service platform or
Access Point managed system.
Number of Rogue APs Displays the number of unsanctioned devices in each listed RF
Domain. Unsanctioned devices are those devices detected within the
listed RF Domain, but have not been deployed by a administrator as
a known and approved controller or service platform managed
device.
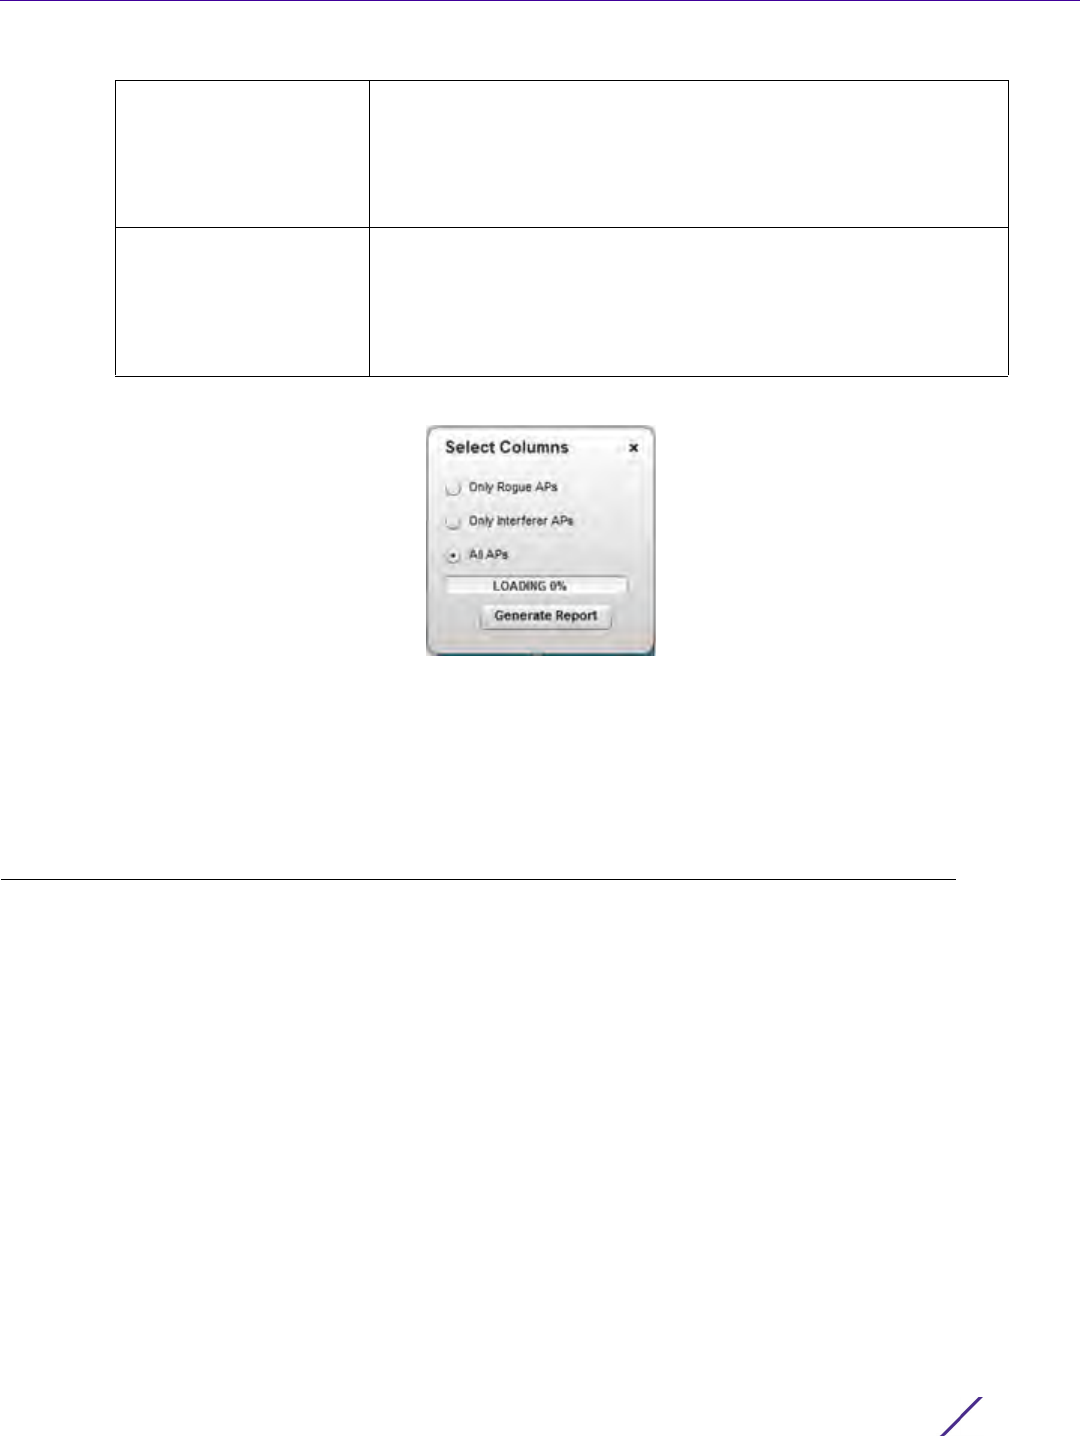
Statistics
Wireless Controller and Service Platform System Reference Guide 15 - 14
5 Select the WIPS Report button to launch a sub-screen to filter how WIPS reports are generated for the system.
Figure 15-9 System - WIPS Summary screen
Select Summary to capture all WIPS data or just select Only Rogue APs, Only Interferer APs for All APs to
refine event reporting to a specific type of WIPS activity. Select Generate Report to compile and archive the
results of the query.
6Select
Refresh to update the screen’s statistics counters to their latest values.
15.2 RF Domain Statistics
Statistics
The RF Domain screens display status for a selected RF domain. This includes the RF Domain health and device
inventory, wireless clients and Smart RF functionality. RF Domains allow administrators to assign regional,
regulatory and RF configuration to devices deployed in a common coverage area such as on a building floor, or
site. Each RF Domain contains regional, regulatory and sensor server configuration parameters and may also be
assigned policies that determine Access, SMART RF and WIPS configuration.
Use the following information to obtain an overall view of the performance of the selected RF Domain and
troubleshoot issues with the domain or any member device.
•Health
•Inventory
•Devices
•AP Detection
•Wireless Clients
•Device Upgrade
•Wireless LANs
Number of Interfering
APs
Displays the number of devices exceeding the interference threshold
in each listed RF Domain. Each RF Domain utilizes a WIPS policy with
a set interference threshold (from -100 to -10 dBm). When a device
exceeds this noise value, its defined as an interfering Access Point
capable of disrupting the signal quality of other sanctioned devices
operating below an approved RSSI maximum value.
Number of WIPS Events Lists the number of devices triggering a WIPS event within each
listed RF Domain.Each RF Domain utilizes a WIPS policy where
excessive, MU and AP events can have their individual values set for
event generation. An administrator can enable or disable the filtering
of each listed event and set the thresholds required for the
generation of the event notification and filtering action.

Statistics
Wireless Controller and Service Platform System Reference Guide 15 - 15
•Radios
•Bluetooth
•Mesh
•Mesh Point
•SMART RF
•WIPS
•Captive Portal
•Application Visibility (AVC)
•Coverage Hole Summary
•Coverage Hole Details
15.2.1 Health
RF Domain Statistics
The Health screen displays general status information for a selected RF Domain, including data polled from all its
members.
To display the health of a controller or service platform’s RF Domain:
1 Select the Statistics menu from the Web UI.
2 Select a RF Domain from under the System node on the top, left-hand side, of the screen.
3Select
Health from the RF Domain menu.
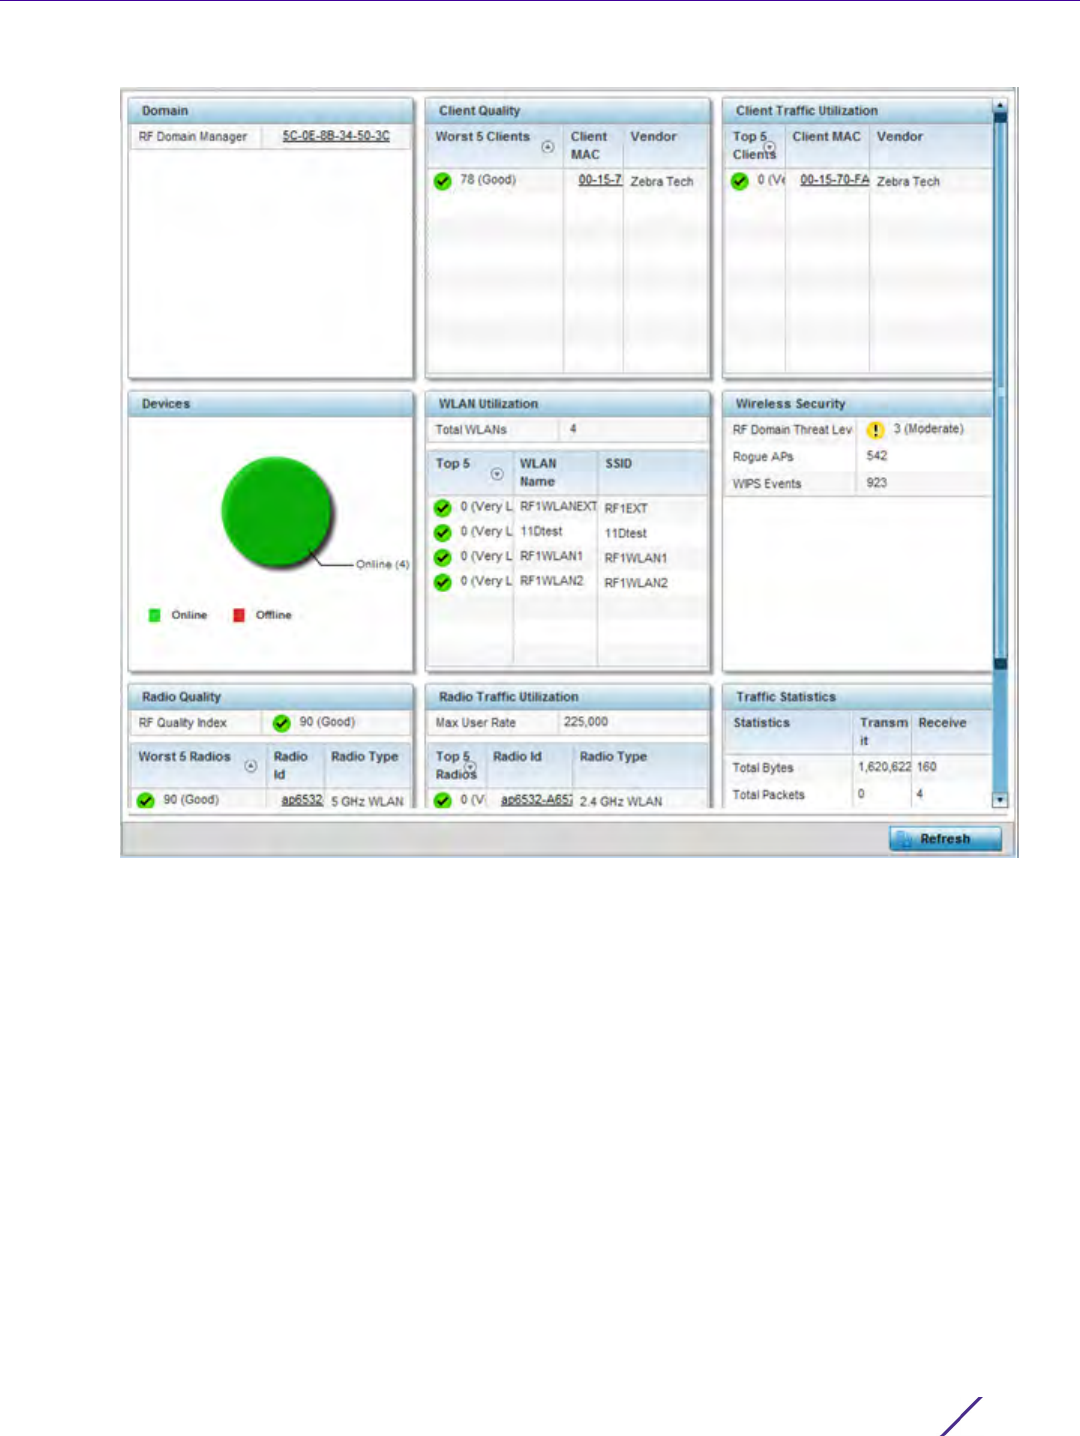
Statistics
Wireless Controller and Service Platform System Reference Guide 15 - 16
Figure 15-10 RF Domain - Health screen
4The Domain field displays the name of the RF Domain manager. The RF Domain manager is the focal point for
the radio system and acts as a central registry of applications, hardware and capabilities. It also serves as a
mount point for all the different pieces of the hardware system file.
5The
Devices field displays the total number of online versus offline devices in the RF Domain, and an exploded
pie chart depicts their status.
6The
Radio Quality field displays information on the RF Domain’s RF quality. The RF quality index is the overall
effectiveness of the RF environment as a percentage of the connect rate in both directions, as well as the retry
and error rate. This area also lists the worst 5 performing radios in the RF Domain.
The RF Quality Index can be interpreted as:
•0-20 – Very poor quality
•20-40 – Poor quality
•40-60 – Average quality
•60-100 – Good quality

Statistics
Wireless Controller and Service Platform System Reference Guide 15 - 17
7 Refer to the Radio Quality table for RF Domain member radios requiring administration to improve
performance:
8 Refer to the Client Quality table for RF Domain connected clients requiring administration to improve
performance:
9 Refer to the WLAN Utilization field to assess the following:
10 The Radio Traffic Utilization area displays the following:
11 Refer to the Client Traffic Utilization table:
12 The Wireless Security area indicates the security of the transmission between WLANs and the wireless clients
they support. This value indicates the vulnerability of the WLANs.
Worst 5 Radios Displays five radios with the lowest average quality in the RF Domain.
Radio ID Lists each radio’s administrator defined hostname and its radio
designation (radio 1, radio 2 or radio 3).
Radio Type Displays the radio type as either 5 GHz or 2.4 GHz.
Worst 5 Clients Displays the five clients having the lowest average quality indices.
Client MAC Displays the hardcoded radio MAC of the wireless client.
Vendor Displays the vendor name of the wireless client.
Total WLANs Displays the total number of WLANs managed by RF Domain member
Access Points.
Top 5 Displays the five RF Domain utilized WLANs with the highest average
quality indices.
WLAN Name Displays the WLAN Name for each of the Top 5 WLANs in the Access
Point RF Domain.
SSID Lists the SSD utilized by each listed top 5 performing RF Domain
WLANs.
Max. User Rate Displays the maximum recorded user rate in kbps.
Top 5 Radios Displays five radios with the best average quality in the RF Domain.
Radio ID Lists each radio’s administrator defined hostname and its radio
designation (radio 1, radio 2 or radio 3).
Radio Type Displays the radio type as either 5 GHz or 2.4 GHz.
Top 5 Clients Displays the five clients having the highest average quality indices.
Client MAC Displays the client’s hardcoded MAC address used a hardware
identifier.
Vendor Lists each client’s manufacturer.
RF Domain Threat Level Indicates the threat from the wireless clients trying to find network
vulnerabilities within the Access Point RF Domain. The threat level is
represented by an integer.

Statistics
Wireless Controller and Service Platform System Reference Guide 15 - 18
13 The Traffic Statistics statistics table displays the following information for transmitted and received packets:
14 The SMART RF Activity area displays the following:
15.2.2 Inventory
RF Domain Statistics
The Inventory screen displays an inventory of RF Domain member Access Points, connected wireless clients,
wireless LAN utilization and radio availability.
To display RF Domain inventory statistics:
1 Select the Statistics menu from the Web UI.
2 Select a RF Domain from under the System node on the top, left-hand side, of the screen.
3Select
Inventory from the RF Domain menu.
Rogue APs Lists the number of unauthorized Access Points detected by RF
Domain member devices.
WIPS Events Lists the number of WIPS events generated by RF Domain member
devices.
Total Bytes Displays the total bytes of data transmitted and received within the
Access Point RF Domain.
Total Packets Lists the total number of data packets transmitted and received within
the Access Point RF Domain.
User Data Rate Lists the average user data rate within the Access Point RF Domain.
Bcast/Mcast Packets Displays the total number of broadcast/multicast packets transmitted
and received within the Access Point RF Domain.
Management Packets This is the total number of management packets processed within the
Access Point RF Domain.
Tx Dropped Packets Lists total number of dropped data packets within the Access Point RF
Domain.
Rx Errors Displays the number of errors encountered during data transmission
within the Access Point RF Domain. The higher the error rate, the less
reliable the connection or data transfer.
Time Period Lists the time period when Smart RF calibrations or adjustments were
made to compensate for radio coverage holes or interference.
Power Changes Displays the total number of radio transmit power changes that have
been made using SMART RF within the Access Point RF Domain.
Channel Changes Displays the total number of radio transmit channel changes that have
been made using SMART RF within the Access Point RF Domain.
Coverage Changes Displays the total number of radio coverage area changes that have
been made using SMART RF within the Access Point RF Domain.
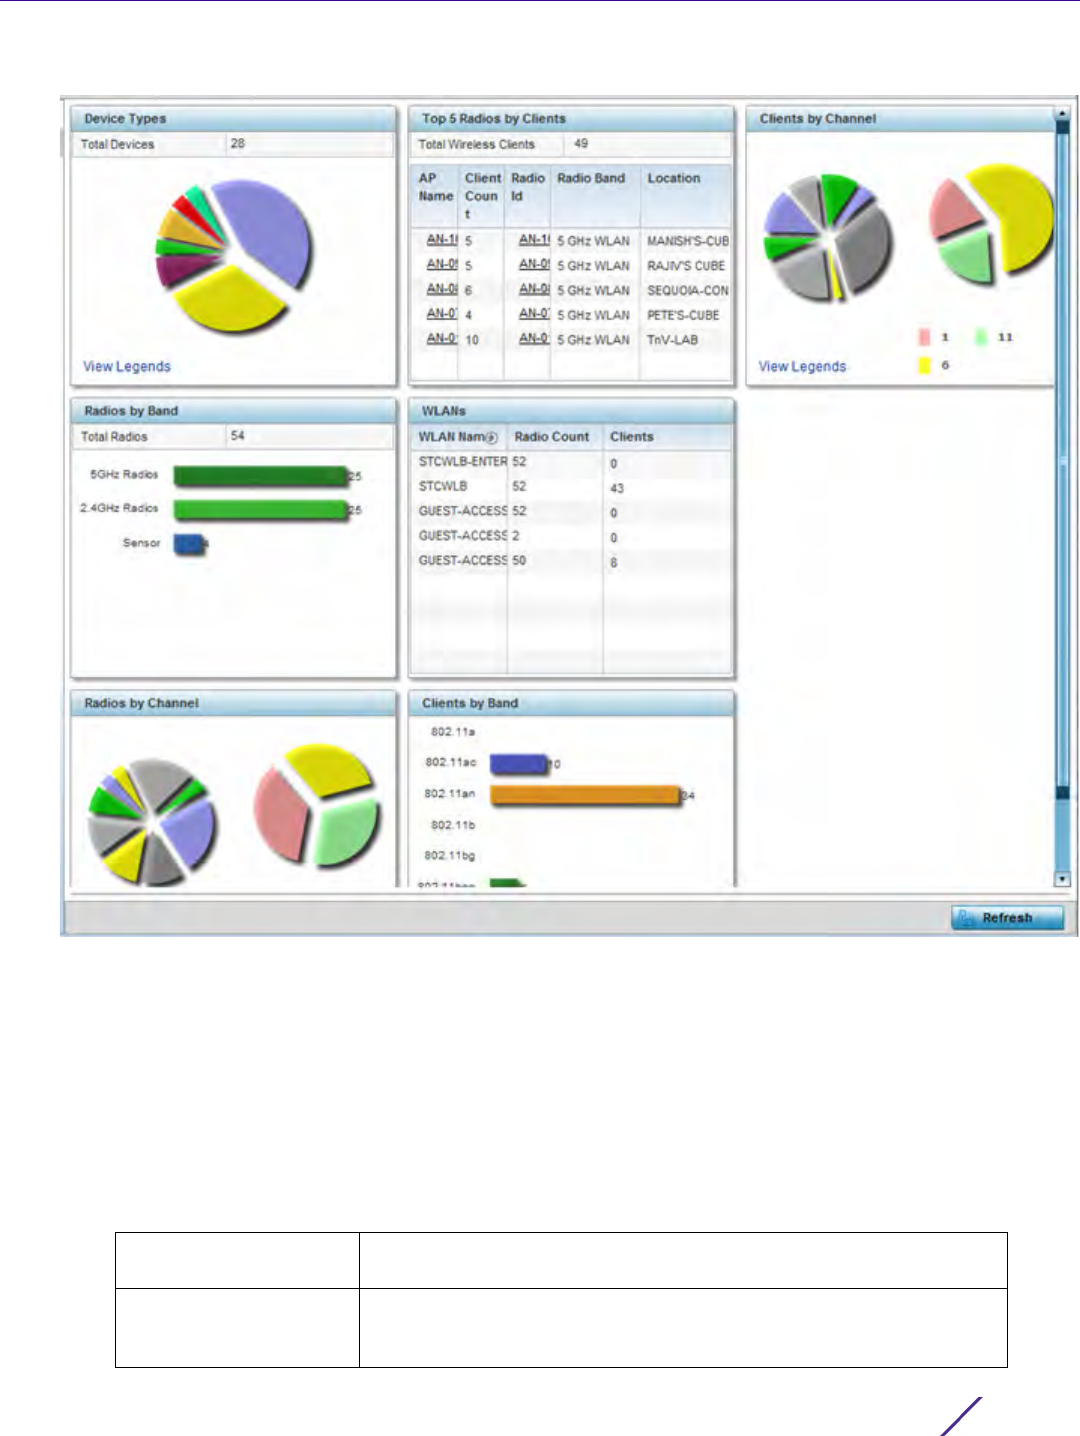
Statistics
Wireless Controller and Service Platform System Reference Guide 15 - 19
Figure 15-11 RF Domain - Inventory screen
4The Device Types table displays the total members in the RF Domain. The exploded pie chart depicts the
distribution of RF Domain members by controller and Access Point model type.
5The
Radios by Band field displays the total number of radios using 802.11an and 802.11bgn bands within the RF
Domain. The number of radios designated as sensors is also represented.
6The
Radios by Channel field displays the radio channels utilized by RF Domain member devices in two separate
charts. One chart displays for 5 GHz channels and the other for 2.4 GHz channels.
7The
Top 5 Radios by Clients table displays the highest 5 performing wireless clients connected to RF Domain
members.
Total Wireless Clients Displays the total number of clients connected to RF Domain
members.
AP Name Displays the clients connected and reporting Access Point. The name
displays as a link that can be selected to display Access Point data in
greater detail.

Statistics
Wireless Controller and Service Platform System Reference Guide 15 - 20
8 Refer to the WLANs table to review RF Domain WLAN, radio and client utilization. Use this information to help
determine whether the WLANs within this RF Domain have an optimal radio and client utilization.
9The
Clients by Band bar graph displays the total number of RF Domain member clients by their IEEE 802.11
radio type.
10 The Clients by Channel pie charts displays the channels used by RF Domain member clients using 5GHz and
2.4GHz radios.
11 Periodically select Refresh to update the contents of the screen to their latest values.
15.2.3 Devices
RF Domain Statistics
The Devices screen displays RF Domain member hardware data, connected client counts, radio data and network
IP address.
To display RF Domain member device statistics:
1 Select the Statistics menu from the Web UI.
2 Select a RF Domain from under the System node on the top, left-hand side, of the screen.
3Select
Devices from the RF Domain menu.
Client Count List the number of connected clients to each listed RF Domain
member Access Point.
Radio Id Lists each radio’s administrator defined hostname and its radio
designation (radio 1, radio 2 etc.). The name displays as a link that can
be selected to display Access Point data in greater detail.
Radio Band Lists each client’s operational radio band.
Location Displays system assigned deployment location for the client.
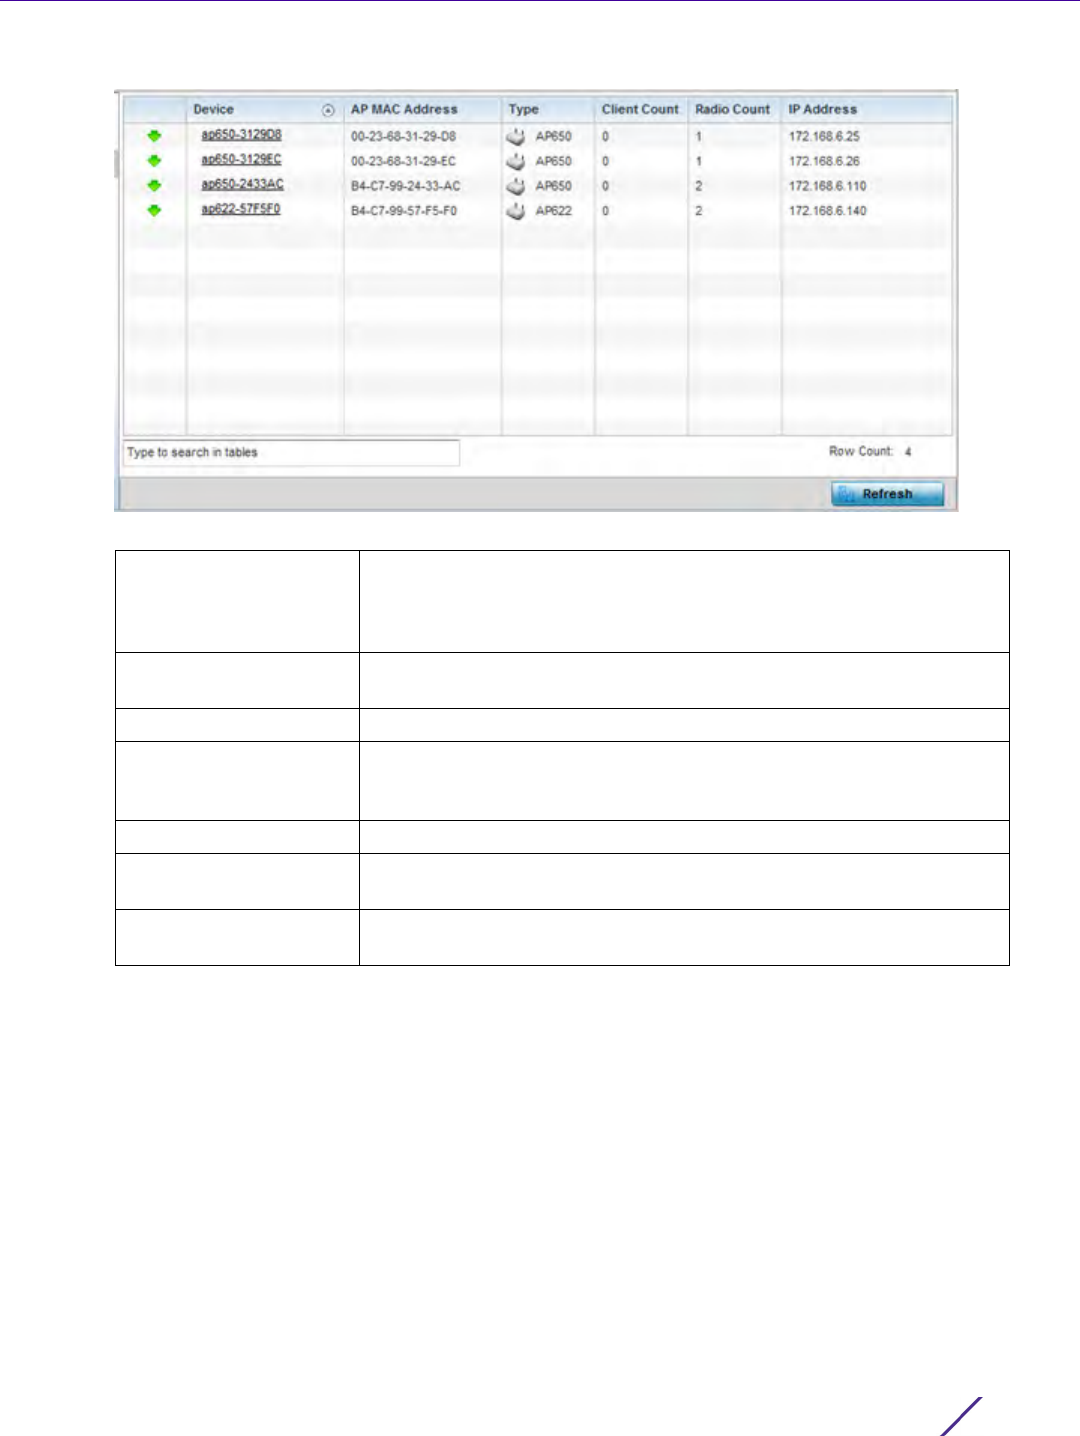
Statistics
Wireless Controller and Service Platform System Reference Guide 15 - 21
Figure 15-12 RF Domain - Devices screen
15.2.4 AP Detection
RF Domain Statistics
The AP Detection screen displays information about detected Access Points that are not members of a RF Domain.
They could be authorized devices or potential rogue devices.
To view device information on detected Access Points:
1 Select the Statistics menu from the Web UI.
2 Select a RF Domain from under the System node on the top, left-hand side, of the screen.
3Select
AP Detection from the RF Domain menu.
Device Displays the system assigned name of each device that’s a member of
the RF Domain. The name displays as a link that can be selected to
display configuration and network address information in greater
detail.
AP MAC Address Displays each device’s factory encoded MAC address as its hardware
identifier.
Type Displays each device model within the selected RF Domain.
Client Count Displays the number of clients connected with each listed device.
Supported Access Point models support up to 256 clients per Access
Point, with the exception of AP6521 model, which only supports 128.
Radio Count Displays the number of radios on each listed device.
IP Address Displays the IP address each listed device is using as a network
identifier.
Refresh Select the Refresh button to update the statistics counters to their
latest values.
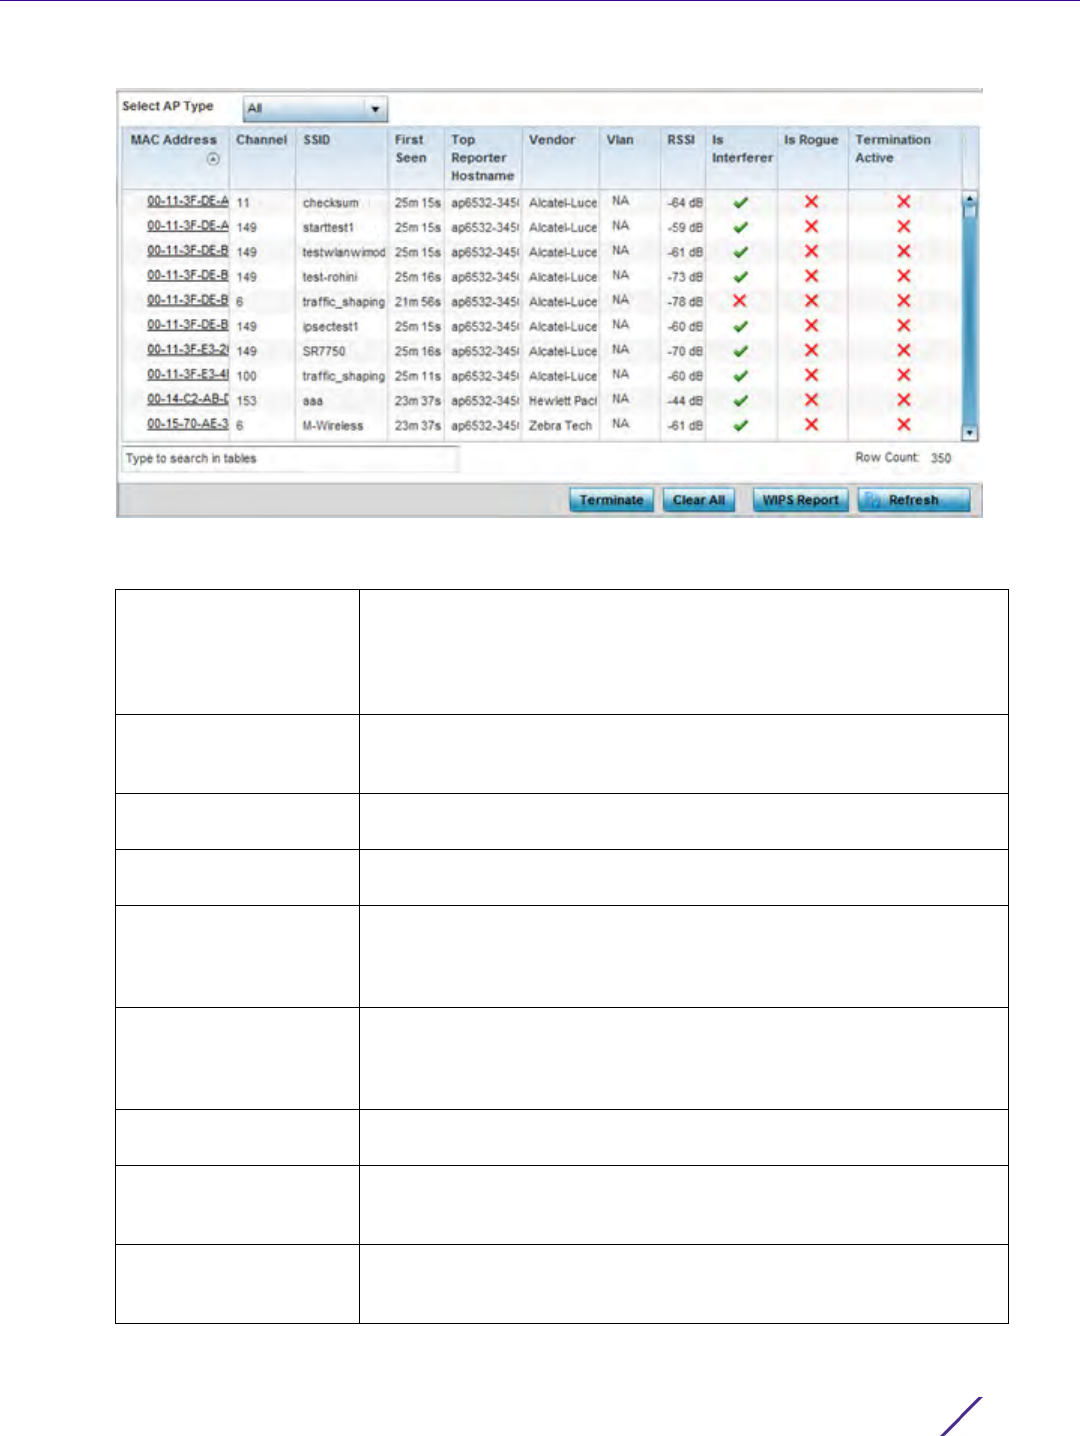
Statistics
Wireless Controller and Service Platform System Reference Guide 15 - 22
Figure 15-13 RF Domain - AP Detection screen
The AP Detection screen displays the following:
MAC Address Displays the hardware encoded MAC address of each listed Access
Point detected by a RF Domain member device. The MAC address is
set at the factory and cannot be modified via the management
software. The MAC address displays as a link that can be selected to
display RF Domain member device information in greater detail.
Channel Displays the channel of operation used by the detected Access Point.
The channel must be utilized by both the Access Point and its
connected client and be approved for the target deployment country.
SSID Displays the Service Set ID (SSID) of the network to which the
detected Access Point belongs.
First Seen Provides a timestamp when the detected Access Point was first
detected by a RF Domain member device.
Top Reporter Hostname Lists the administrator assigned hostname of the top performing RF
Domain member detecting the listed Access Point MAC address.
Consider this top performer the best resource for information on the
detected Access Point and its potential threat.
Vendor Lists the manufacturer of the detected Access Point as an additional
means of assessing its potential threat to the members of this RF
Domain and its potential for interoperability with RF Domain device
members.
VLAN Lists the numeric VLAN ID (virtual interface) the detected Access
Point was detected on by members of this RF Domain.
RSSI Displays the Received Signal Strength Indicator (RSSI) of the detected
Access Point. Use this variable to help determine whether a device
connection would improve network coverage or add noise.
Is Interferer Lists whether the detected device exceeds the administrator defined
RSSI threshold (from -100 to -10 dBm) determining whether a
detected Access Point is classified as an interferer.

Statistics
Wireless Controller and Service Platform System Reference Guide 15 - 23
15.2.5 Wireless Clients
RF Domain Statistics
The Wireless Clients screen displays device information for wireless clients connected to RF Domain member
Access Points. Review this content to determine whether a client should be removed from Access Point association
within the selected RF Domain.
To review a RF Domain’s connected wireless clients:
1 Select the Statistics menu from the Web UI.
2 Select a RF Domain from under the System node on the top, left-hand side, of the screen.
3Select
Wireless Clients from the RF Domain menu.
Is Rogue Displays whether the detected device has been classified as a rogue
device whose detection threatens the interoperation of RF Domain
member devices.
Termination Active Lists whether Air Termination is active and applied to the detected
Access Point. Air termination lets you terminate the connection
between your wireless LAN and any Access Point or client associated
with it. If the device is an Access Point, all clients dis-associated with
the Access Point. If the device is a client, its connection with the
Access Point is terminated. Air Termination is disabled by default.
Terminate Select the Terminate button to remove the selected Access Point from
RF Domain membership.
Clear All Select Clear All to reset the statistics counters to zero and begin a new
data collection.
WIPS Report Select WIPS Report launch a subscreen to save a WIPS report (in PDF
format) to a specified location. This is a recommended practice to
capture RF Domain member Access Point client connection
terminations in a format that can be archived externally.
Refresh Select the Refresh button to update the statistics counters to their
latest values.
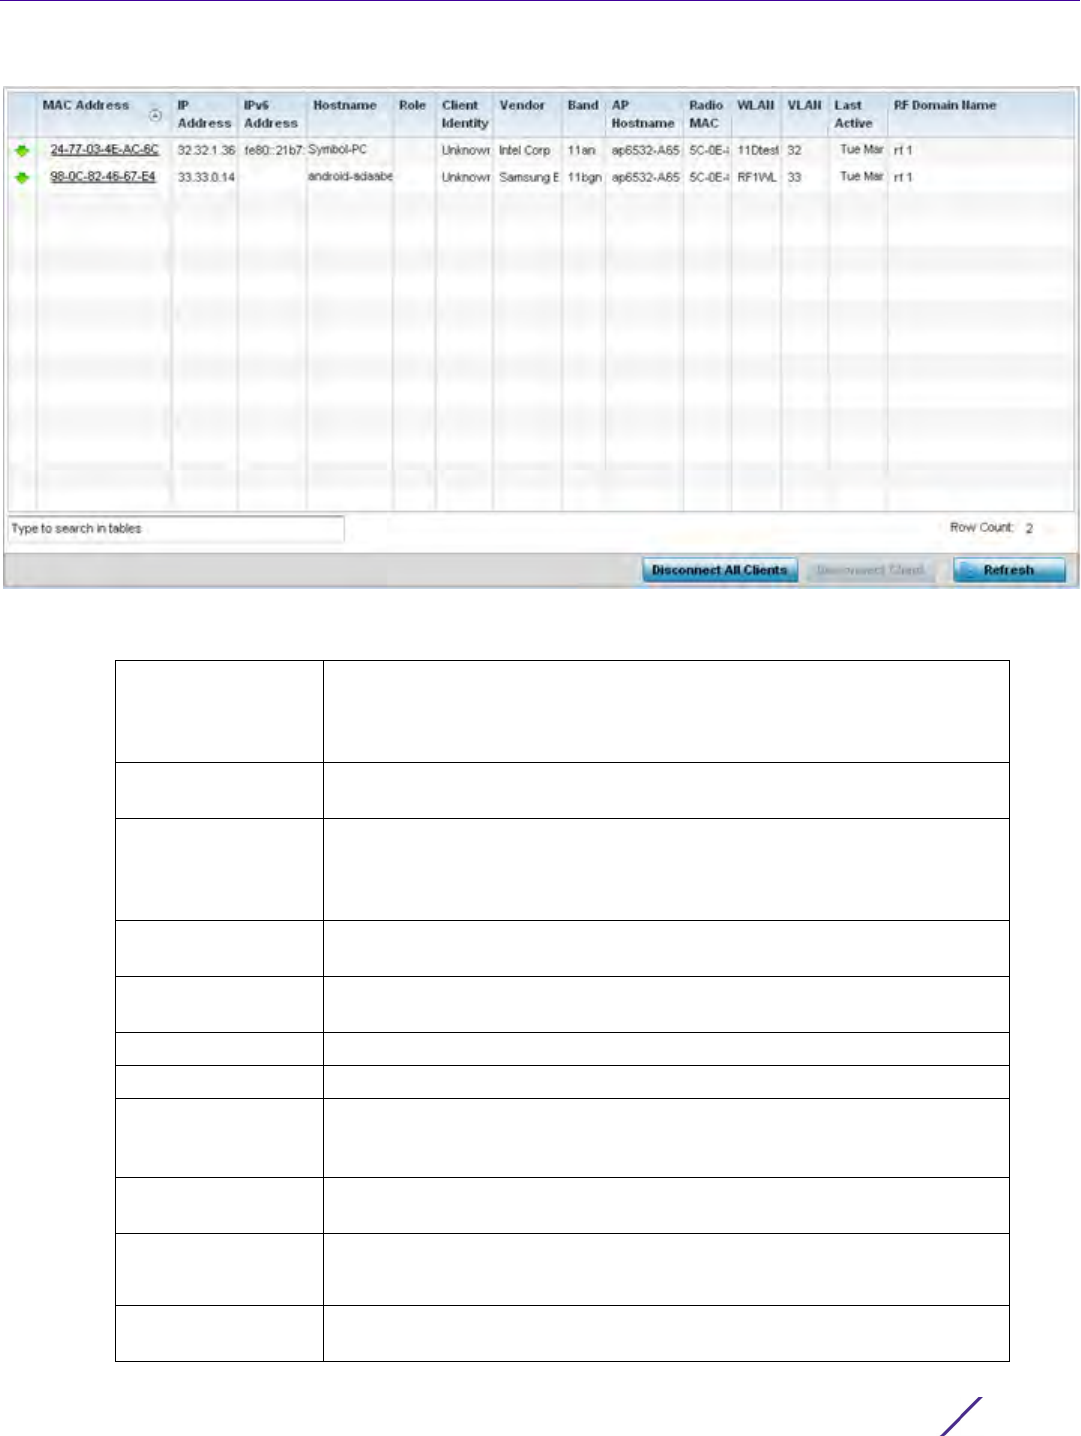
Statistics
Wireless Controller and Service Platform System Reference Guide 15 - 24
Figure 15-14 RF Domain - Wireless Clients screen
The Wireless Clients screen displays the following:
MAC Address Displays the hostname (MAC address) of each listed wireless client. This
address is hard-coded at the factory and can not be modified. The address
displays as a link that can be selected to display RF Domain member
device and network address information in greater detail.
IP Address Displays the current IP address the wireless client is using for a network
identifier.
IPv6 Address Displays the current IPv6 formatted IP address a listed wireless client is
using as a network identifier. IPv6 is the latest revision of the Internet
Protocol (IP) designed to replace IPv4. IPv6 addresses are composed of
eight groups of four hexadecimal digits separated by colons.
Hostname Displays the unique administrator assigned hostname when the client’s
configuration was originally set.
Role Lists the role assigned to each controller, service platform or Access Point
managed client.
Client Identity Lists the client’s operating system vendor identity (Android, Windows etc.)
Vendor Displays the vendor (or manufacturer) of the wireless client.
Band Lists the 2.4 or 5 GHz radio band the listed client is currently utilizing with
its connected Access Point, controller or service platform within the RF
Domain.
AP Hostname Displays the administrator assigned hostname of the Access Point to which
the client is connected.
Radio MAC Lists the hardware encoded MAC address of the Access Point radio to
which the client is currently connected within the RF Domain.
WLAN Displays the name of the WLAN the wireless client is currently using for its
interoperation within the RF Domain.
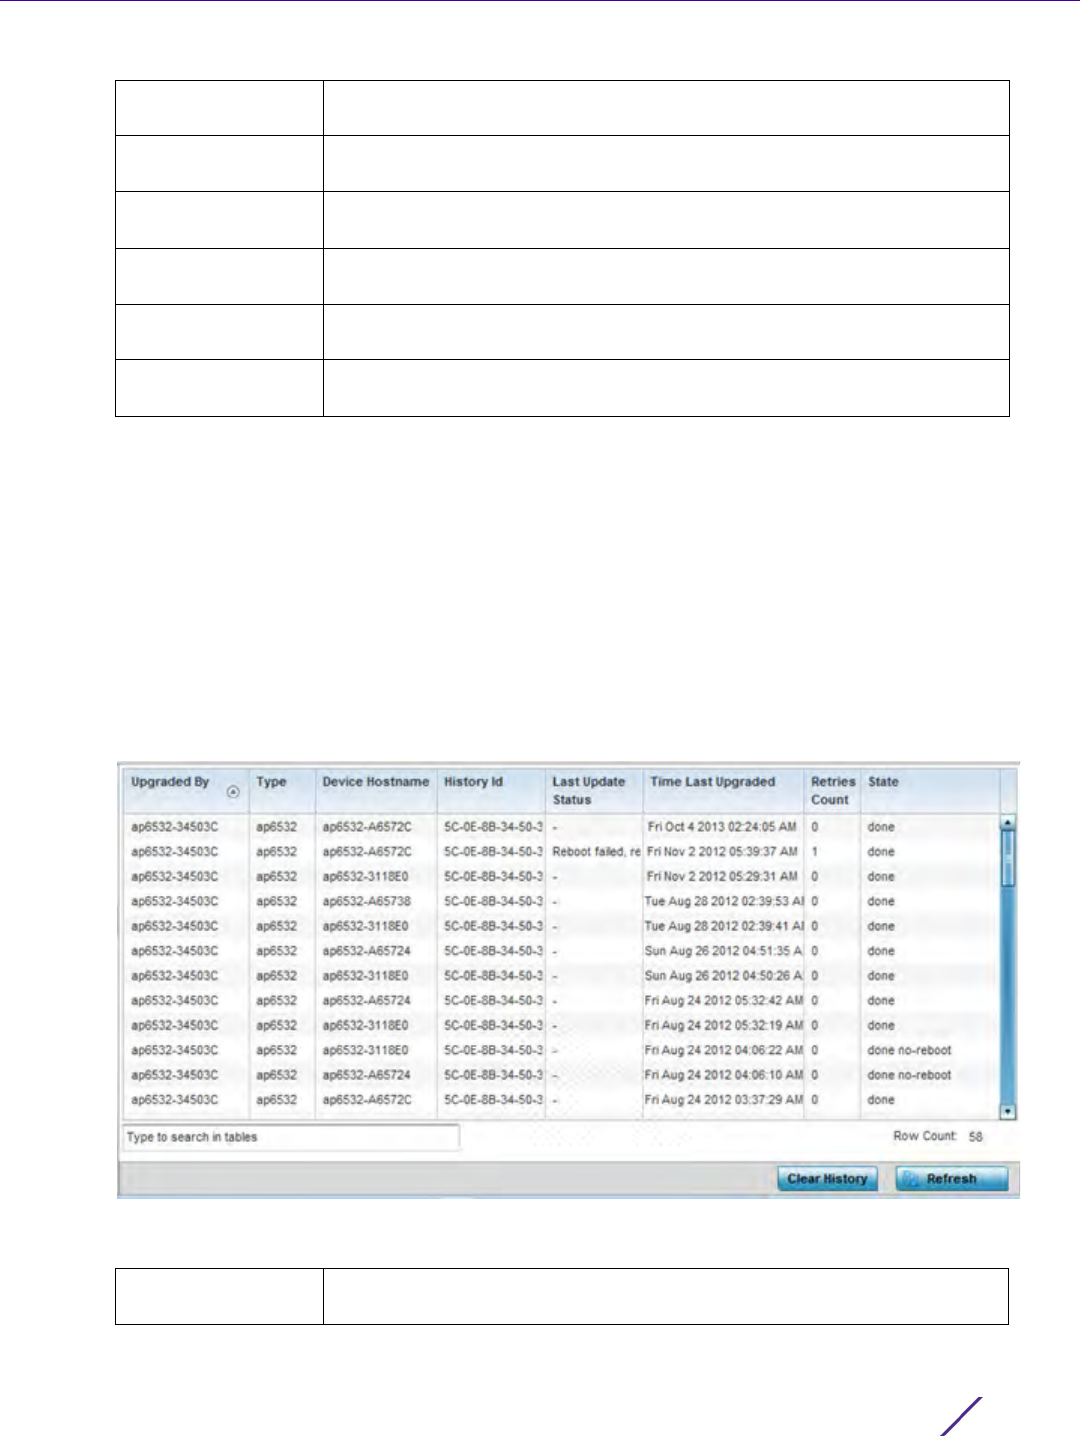
Statistics
Wireless Controller and Service Platform System Reference Guide 15 - 25
15.2.6 Device Upgrade
RF Domain Statistics
The Device Upgrade screen reports information about devices receiving updates the RF Domain member
provisioning the device. Use this screen to assess version data and upgrade status.
To view wireless device upgrade data for RF Domain members:
1 Select the Statistics menu from the Web UI.
2 Select a RF Domain from under the System node on the top, left-hand side, of the screen.
3Select
Device Upgrade from the RF Domain menu.
Figure 15-15 RF Domain - Device Upgrade screen
The Device Upgrade screen displays the following for RF Domain member devices:
VLAN Displays the VLAN ID the client’s connected Access Point has defined for
use as a virtual interface.
Last Active Displays the time when this wireless client was last detected by a RF
Domain member.
RF Domain Name Lists each client’s RF Domain membership as defined by its connected
Access Point and associated controller or service platform.
Disconnect All
Clients
Select the Disconnect All Clients button to terminate each listed client’s
connection and RF Domain membership.
Disconnect Client Select a specific client MAC address and select the Disconnect Client
button to terminate this client’s connection and RF Domain membership.
Refresh Select the Refresh button to update the statistics counters to their latest
values.
Upgraded By Lists the name of the device performing an update on behalf of a RF
Domain member peer device.

Statistics
Wireless Controller and Service Platform System Reference Guide 15 - 26
15.2.7 Wireless LANs
RF Domain Statistics
The Wireless LANs screen displays the name, network identification and radio quality information for the WLANs
currently being utilized by RF Domain members.
To view wireless LAN statistics for RF Domain members:
1 Select the Statistics menu from the Web UI.
2 Select a RF Domain from under the System node on the top, left-hand side, of the screen.
3Select
Wireless LANs from the RF Domain menu.
Type Displays the model of the device receiving an update. An updating Access
Point must be of the same model as the Access point receiving the
update.
Device Hostname Lists the administrator assigned hostname of each device receiving an
update from a RF Domain member.
History Id Lists the RF Domain member device’s MAC address along with a history ID
appended to it for each upgrade operation.
Last Update Status Displays the last status message from the RF Domain member device
performing the upgrade operation.
Time Last Upgrade Displays a timestamp for the last successful upgrade.
Retries Count Lists the number of retries needed for each listed RF Domain member
update operation.
State Lists whether the upgrade operation is completed, in-progress, failed or
whether an update was made without a device reboot.
Clear History Select Clear History to remove the upgrade records for RF Domain
member devices. Unlike the Refresh function (that updates existing data),
Clear History removes the update record from the screen.
Refresh Select the Refresh button to update the statistics counters to their latest
values.
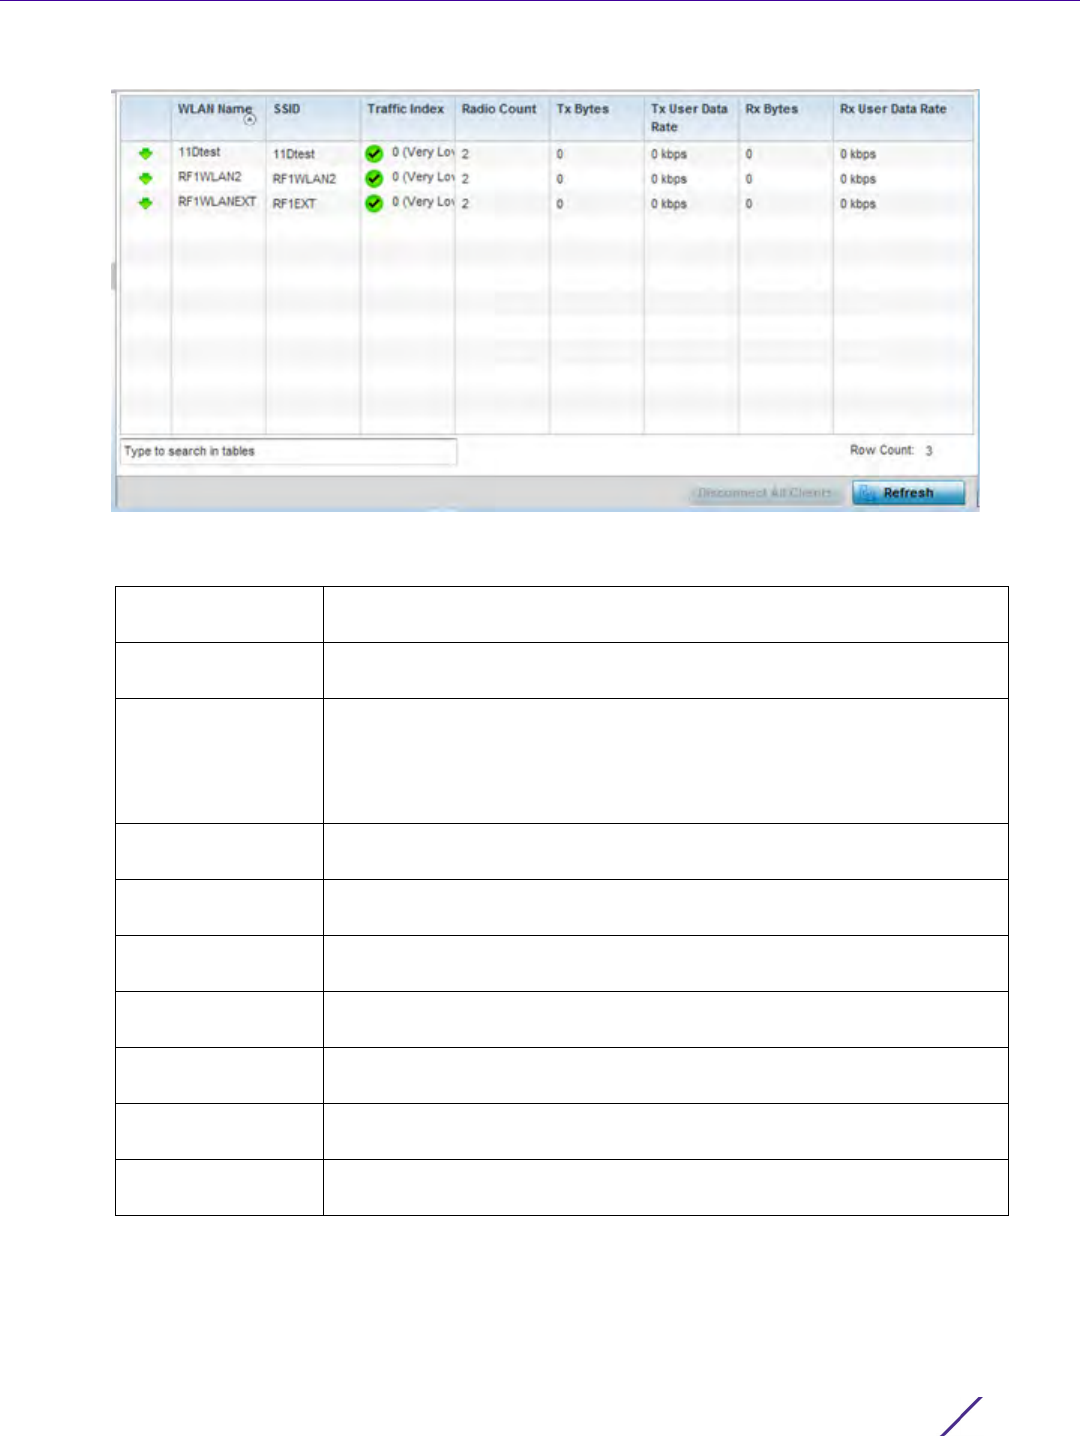
Statistics
Wireless Controller and Service Platform System Reference Guide 15 - 27
Figure 15-16 RF Domain - Wireless LANs screen
The Wireless LANs screen displays the following:
WLAN Name Displays the name assigned to each WLAN upon its creation within the
controller or service platform managed network.
SSID Displays the Service Set ID (SSID) assigned to the WLAN upon its creation
within the controller or service platform managed network.
Traffic Index Displays the traffic utilization index of each listed WLAN, which measures
how efficiently the traffic medium is used. It’s defined as the percentage of
current throughput relative to the maximum possible throughput. Traffic
indices are: 0 – 20 (very low utilization), 20 – 40 (low utilization), 40 – 60
(moderate utilization), and 60 and above (high utilization).
Radio Count Displays the number of radios deployed in each listed WLAN by RF
Domain member devices.
Tx Bytes Displays the average number of packets (in bytes) sent on each listed RF
Domain member WLAN.
Tx User Data Rate Displays the average data rate per user for packets transmitted on each
listed RF Domain member WLAN.
Rx Bytes Displays the average number of packets (in bytes) received on each listed
RF Domain member WLAN.
Rx User Data Rate Displays the average data rate per user for packets received on each listed
RF Domain member WLAN.
Disconnect All
Clients
Select the Disconnect All Clients button to terminate each listed client’s
WLAN membership from this RF Domain.
Refresh Select the Refresh button to update the statistics counters to their latest
values.
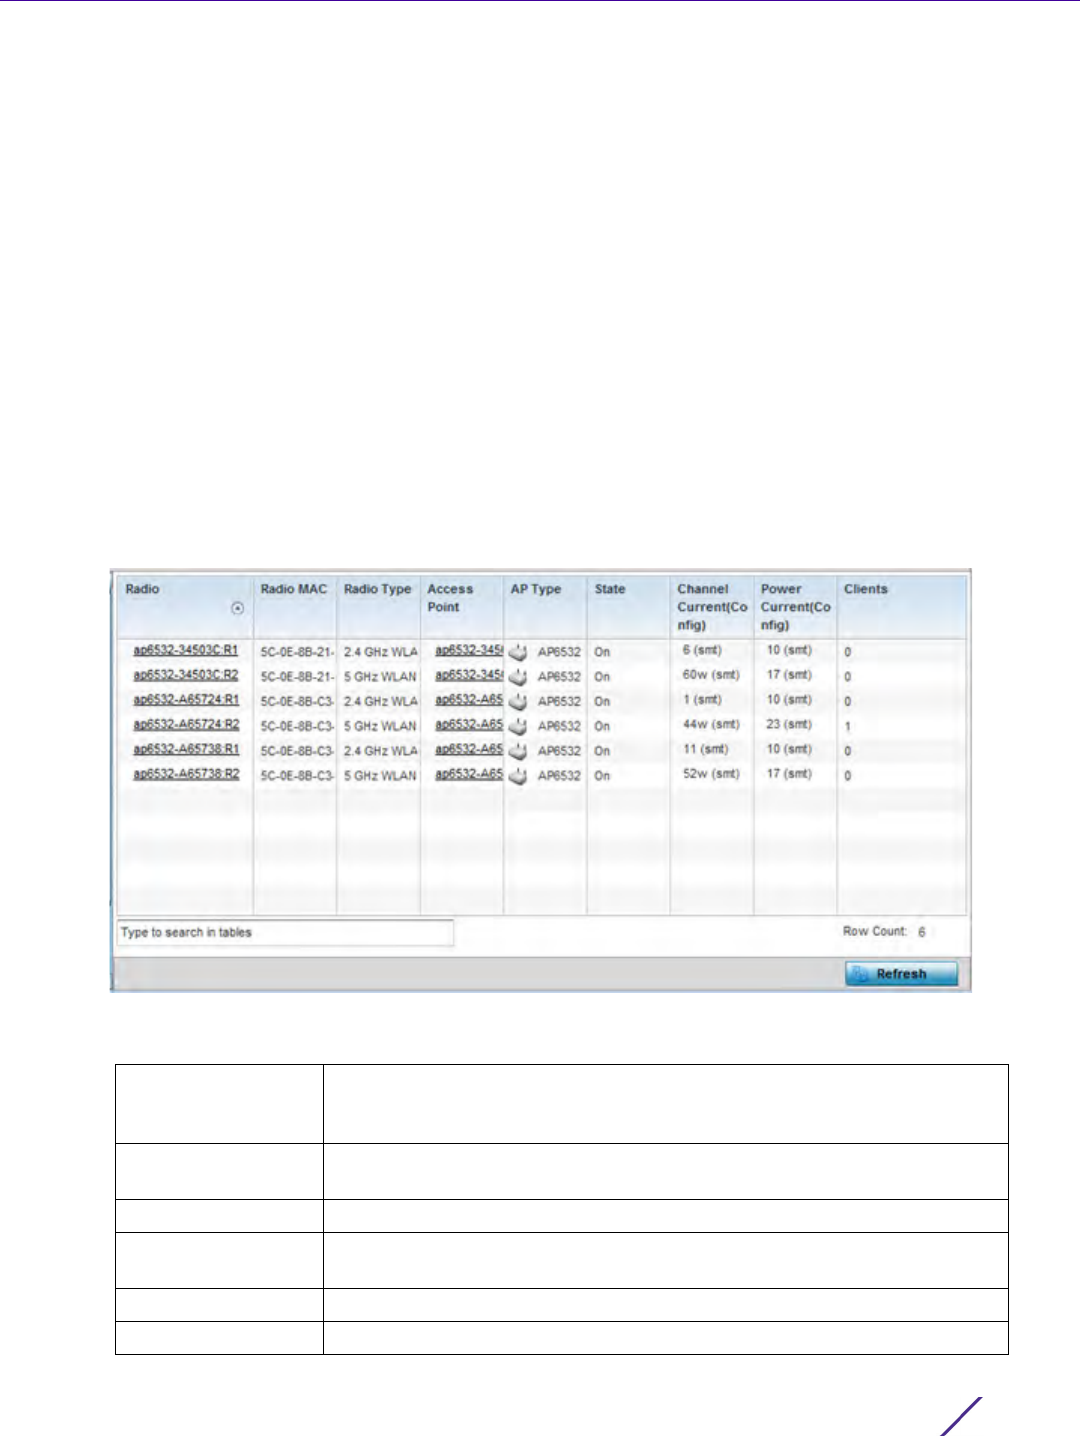
Statistics
Wireless Controller and Service Platform System Reference Guide 15 - 28
15.2.8 Radios
RF Domain Statistics
The Radio screens displays information on RF Domain member Access Point radios. Use these screens to
troubleshooting radio issues negatively impacting RF Domain performance.
For more information, refer to the following:
•Status
•RF Statistics
•Traffic Statistics
15.2.8.1 Status
To view the RF Domain radio statistics:
1 Select the Statistics menu from the Web UI.
2 Select a RF Domain from under the System node on the top, left-hand side, of the screen.
3Expand
Radios from the RF Domain menu and select Status.
Figure 15-17 RF Domain - Radio Status screen
The Radio Status screen displays the following:
Radio Displays the name assigned to each listed RF Domain member Access
Point radio. Each name displays as a link that can be selected to display
radio information in greater detail.
Radio MAC Displays the MAC address as a numerical value factory hardcoded to each
listed RF Domain member Access Point radio.
Radio Type Defines whether the radio is operating within the 2.4 or 5 GHz radio band.
Access Point Displays the user assigned name of the RF Domain member Access Point
to which the radio resides.
AP Type Lists the model type of each RF Domain member Access Point.
State Displays the radio’s current operational state.
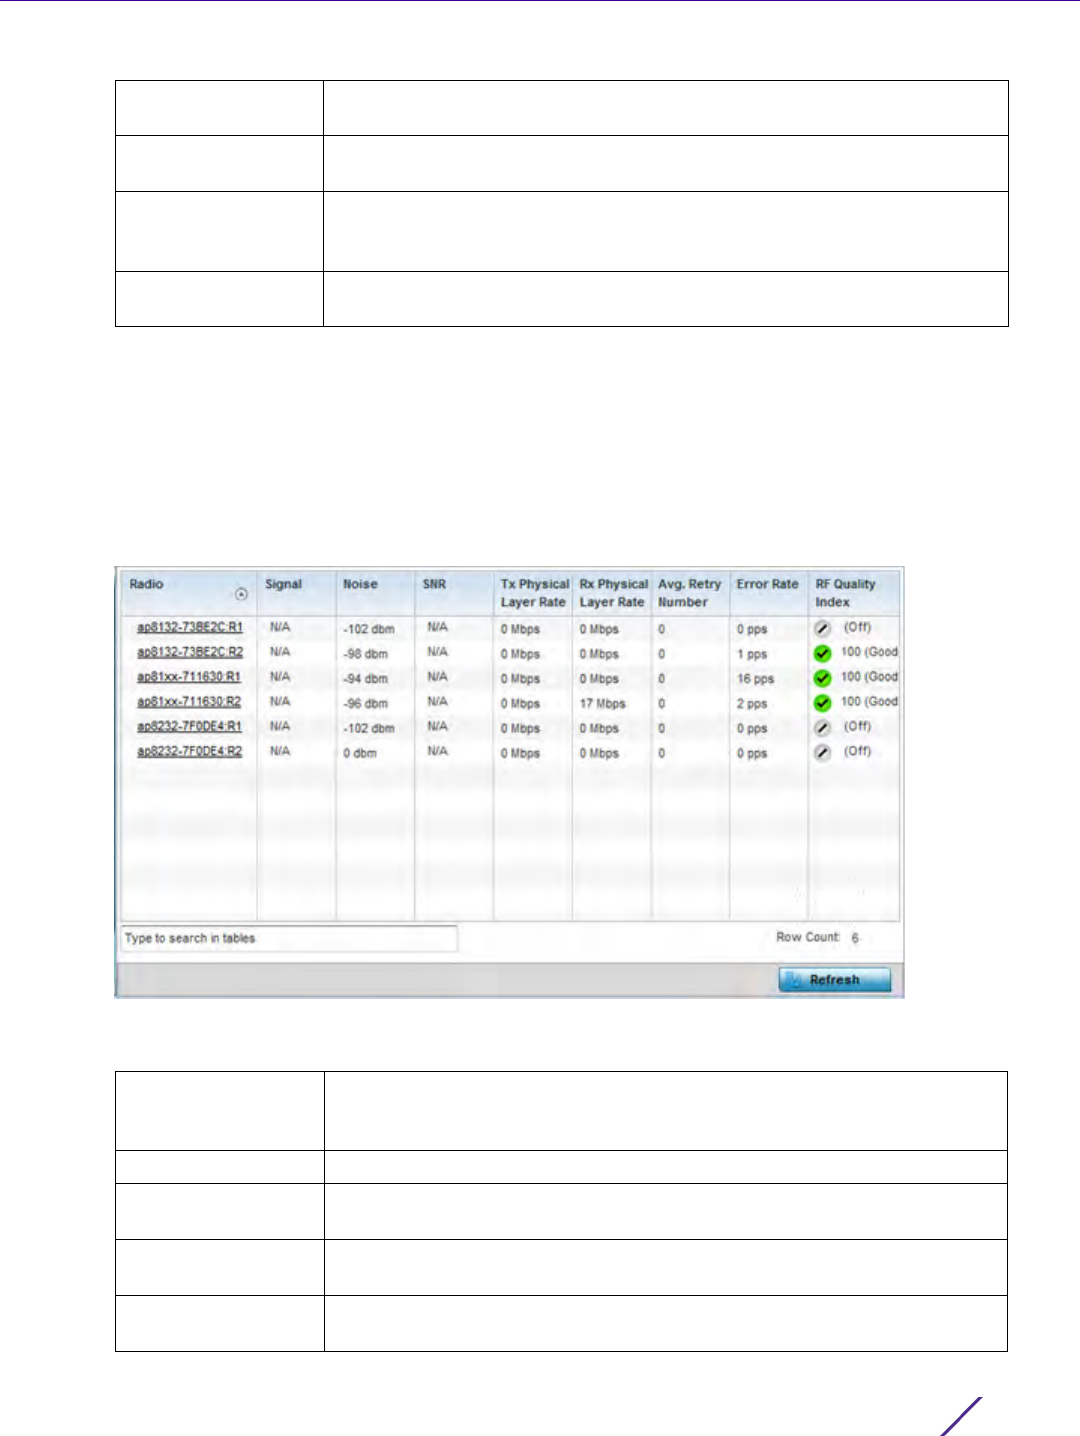
Statistics
Wireless Controller and Service Platform System Reference Guide 15 - 29
15.2.8.2 RF Statistics
To view the RF Domain radio statistics:
1 Select the Statistics menu from the Web UI.
2 Select a RF Domain from under the System node on the top, left-hand side, of the screen.
3Expand
Radios from the RF Domain menu and select RF Statistics.
Figure 15-18 RF Domain - Radio RF Statistics screen
The RF Statistics screen displays the following:
Channel Current
(Config)
Displays the current channel each listed RF Domain member Access Point
radio is broadcasting on.
Power Current
(Config)
Displays the current power level the radio is using for its transmissions.
Clients Displays the number of clients currently connected to each listed RF
Domain member Access Point radio. Supported models can manage up to
256 clients per radio.
Refresh Select the Refresh button to update the statistics counters to their latest
values.
Radio Displays the name assigned to each listed RF Domain member radio. Each
name displays as a link that can be selected to display radio information in
greater detail.
Signal Displays the power of listed RF Domain member radio signals in dBm.
Noise Lists the level of noise (in - X dbm format) reported by each listed RF
Domain member Access Point.
SNR Displays the signal to noise ratio (SNR) of each listed RF Domain member
radio.
Tx Physical Layer
Rate
Displays the data transmit rate for each RF Domain member radio’s
physical layer. The rate is displayed in Mbps.
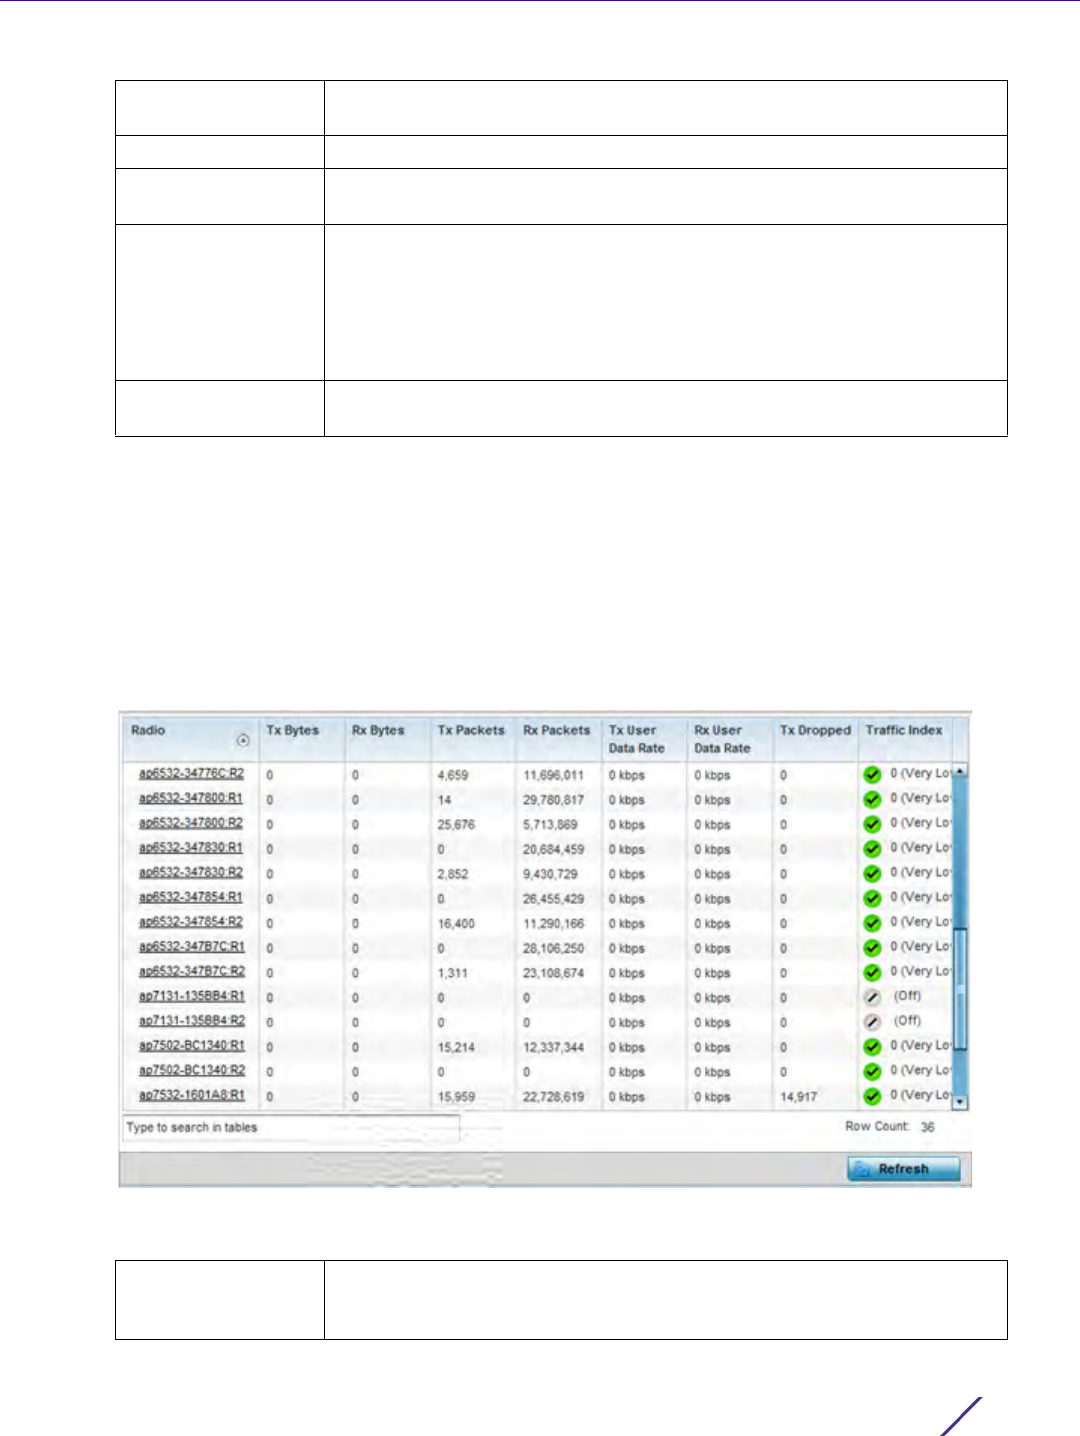
Statistics
Wireless Controller and Service Platform System Reference Guide 15 - 30
15.2.8.3 Traffic Statistics
The Traffic Statistics screen displays transmit and receive data as well as data rate and packet drop and error
information for RF Domain member radios. Individual RF Domain member radios can be selected and to
information specific to that radio as troubleshoot requirements dictate.
1 Select the Statistics menu from the Web UI.
2 Select a RF Domain from under the System node on the top, left-hand side, of the screen.
3Expand
Radios from the RF Domain menu and select Traffic Statistics.
Figure 15-19 RF Domain - Radio Traffic Statistics screen
The Radio Traffic screen displays the following:
Rx Physical Layer
Rate
Displays the data receive rate for each RF Domain member radio’s physical
layer. The rate is displayed in Mbps.
Avg Retry Number Displays the average number of retries for each RF Domain member radio.
Error Rate Displays the average number of retries per packet. A high number
indicates possible network or hardware problems.
RF Quality Index Displays an integer (and performance icon) that indicates the overall RF
performance for each listed radio. The RF quality indices are:
0 – 50 (Poor)
50 – 75 (Medium)
75 – 100 (Good)
Refresh Select the Refresh button to update the statistics counters to their latest
values.
Radio Displays the name assigned to each listed RF Domain member Access
Point radio. Each name displays as a link that can be selected to display
radio information in greater detail.

Statistics
Wireless Controller and Service Platform System Reference Guide 15 - 31
15.2.9 Bluetooth
RF Domain Statistics
AP-8432 and AP-8533 model Access Points utilize a built in Bluetooth chip for specific Bluetooth functional
behaviors in a WiNG managed network. AP-8432 and AP-8533 models support both Bluetooth classic and
Bluetooth low energy technology. These platforms can use their Bluetooth classic enabled radio to sense other
Bluetooth enabled devices and report device data (MAC address, RSSI and device calls) to an ADSP server for
intrusion detection. If the device presence varies in an unexpected manner, ADSP can raise an alarm.
AP-8432 and AP-8533 model Access Points support Bluetooth beaconing to emit either iBeacon or Eddystone-
URL beacons. The Access Point’s Bluetooth radio sends non-connectable, undirected low-energy (LE)
advertisement packets on a periodic basis. These advertisement packets are short, and sent on Bluetooth
advertising channels that conform to already-established iBeacon and Eddystone-URL standards.
To view Bluetooth radio statistics for RF Domain member Access Points:
1 Select the Statistics menu from the Web UI.
2 Select a RF Domain from under the System node on the top, left-hand side, of the screen.
Tx Bytes Displays the total number of bytes transmitted by each RF Domain
member Access Point radio. This includes all user data as well as any
management overhead data.
Rx Bytes Displays the total number of bytes received by each RF Domain member
Access Point radio. This includes all user data as well as any management
overhead data.
Tx Packets Displays the total number of packets transmitted by each RF Domain
member Access Point radio. This includes all user data as well as any
management overhead packets.
Rx Packets Displays the total number of packets received by each RF Domain
member Access Point radio. This includes all user data as well as any
management overhead packets.
Tx User Data Rate Displays the rate (in kbps) user data is transmitted by each RF Domain
member Access Point radio. This rate only applies to user data and does
not include any management overhead.
Rx User Data Rate Displays the rate (in kbps) user data is received by each RF Domain
member Access Point radio. This rate only applies to user data and does
not include any management overhead.
Tx Dropped Displays the total number of transmitted packets which have been
dropped by each RF Domain member Access Point radio. This includes all
user data as well as any management overhead packets that were
dropped.
Traffic Index Displays the traffic utilization index of RF Domain member Access Point
radios, which measures how efficiently the traffic medium is utilized within
this RF Domain. It’s defined as the percentage of current throughput
relative to the maximum possible throughput. Traffic indices are: 0 – 20
(very low utilization), 20 – 40 (low utilization), 40 – 60 (moderate
utilization) and 60 and above (high utilization).
Refresh Select the Refresh button to update the statistics counters to their latest
values.
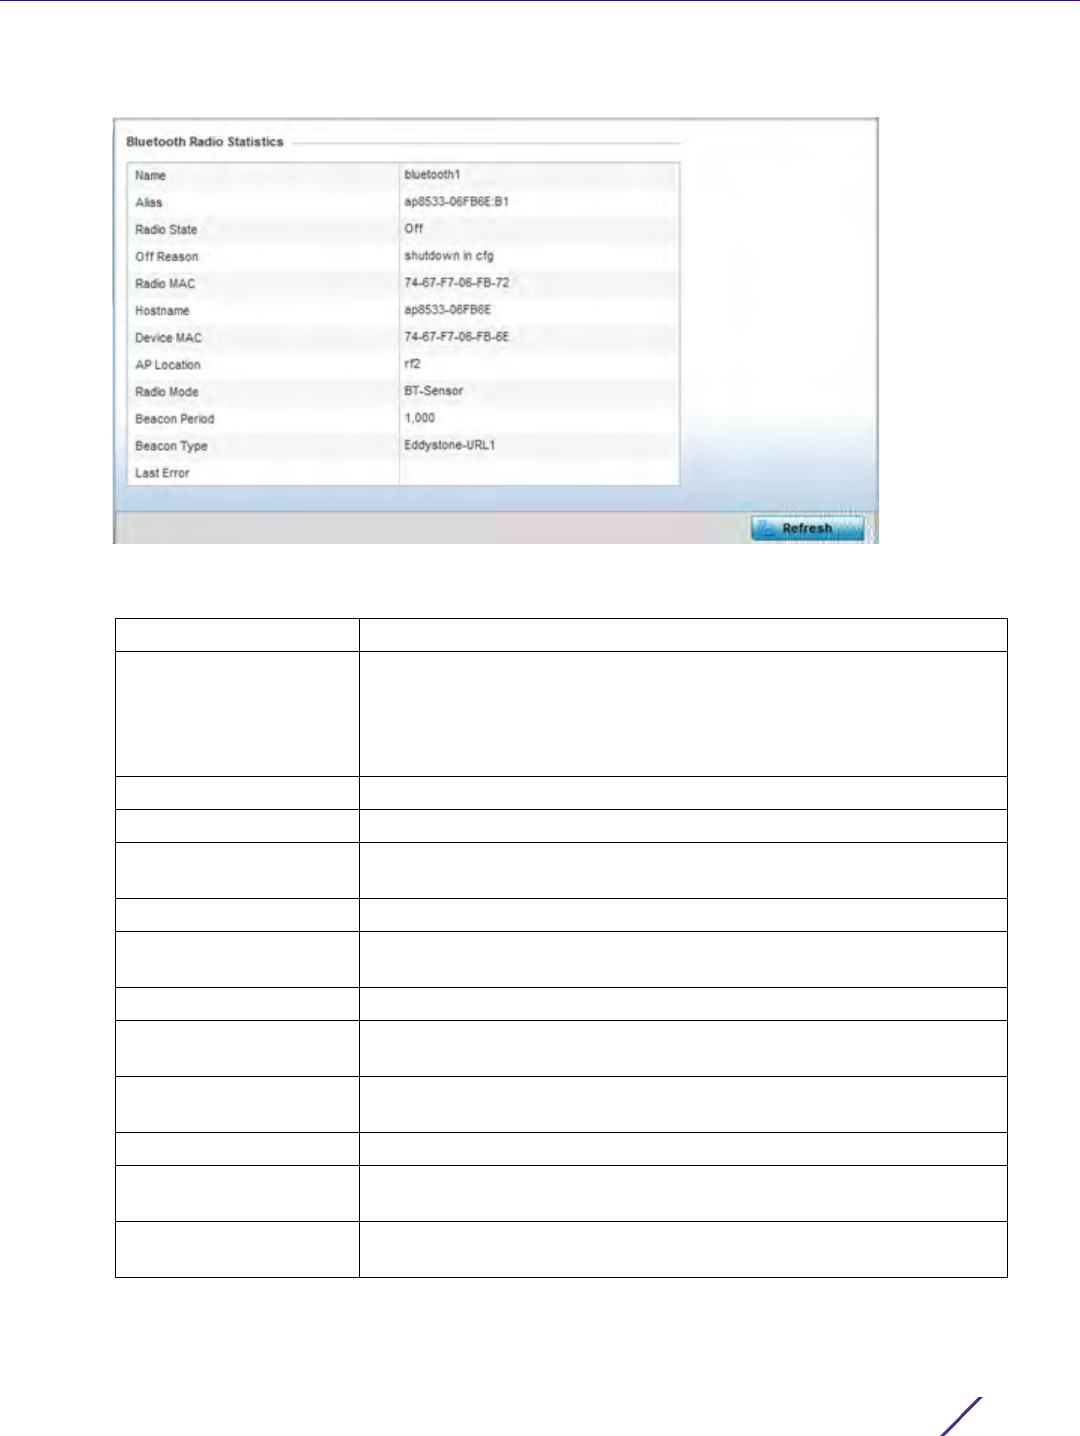
Statistics
Wireless Controller and Service Platform System Reference Guide 15 - 32
3Select Bluetooth.
Figure 15-20 RF Domain - Bluetooth screen
The RF Domain Bluetooth screen displays the following:
Name Lists the name of the Access Point’s Bluetooth radio.
Alias If an alias has been defined for the Access Point its listed here. The
alias value is expressed in the form of <hostname>:
B<Bluetooth_radio_number>. If the administrator has defined a
hostname for the Access Point, it’s used in place of the Access Point’s
default hostname.
Radio State Displays the current operational state (On/Off) of the Bluetooth radio.
Off Reason If the Bluetooth radio is offline, this field states the reason.
Radio MAC Lists the Bluetooth radio’s factory encoded MAC address serving as
this device’s hardware identifier on the network.
Hostname Lists the hostname set for the Access Point as its network identifier.
Device MAC Lists the Access Point’s factory encoded MAC address serving as this
device’s hardware identifier on the network.
AP Location Lists the Access Point’s administrator assigned deployment location.
Radio Mode Lists an Access Point’s Bluetooth radio functional mode as either bt-
sensor or le-beacon.
Beacon Period Lists the Bluetooth radio’s beacon transmission period from
100 -10,000 milliseconds.
Beacon Type Lists the type of beacon currently configured.
Last Error Lists descriptive text on any error that’s preventing the Bluetooth radio
from operating.
Refresh Select Refresh to update the screen’s statistics counters to their latest
values.
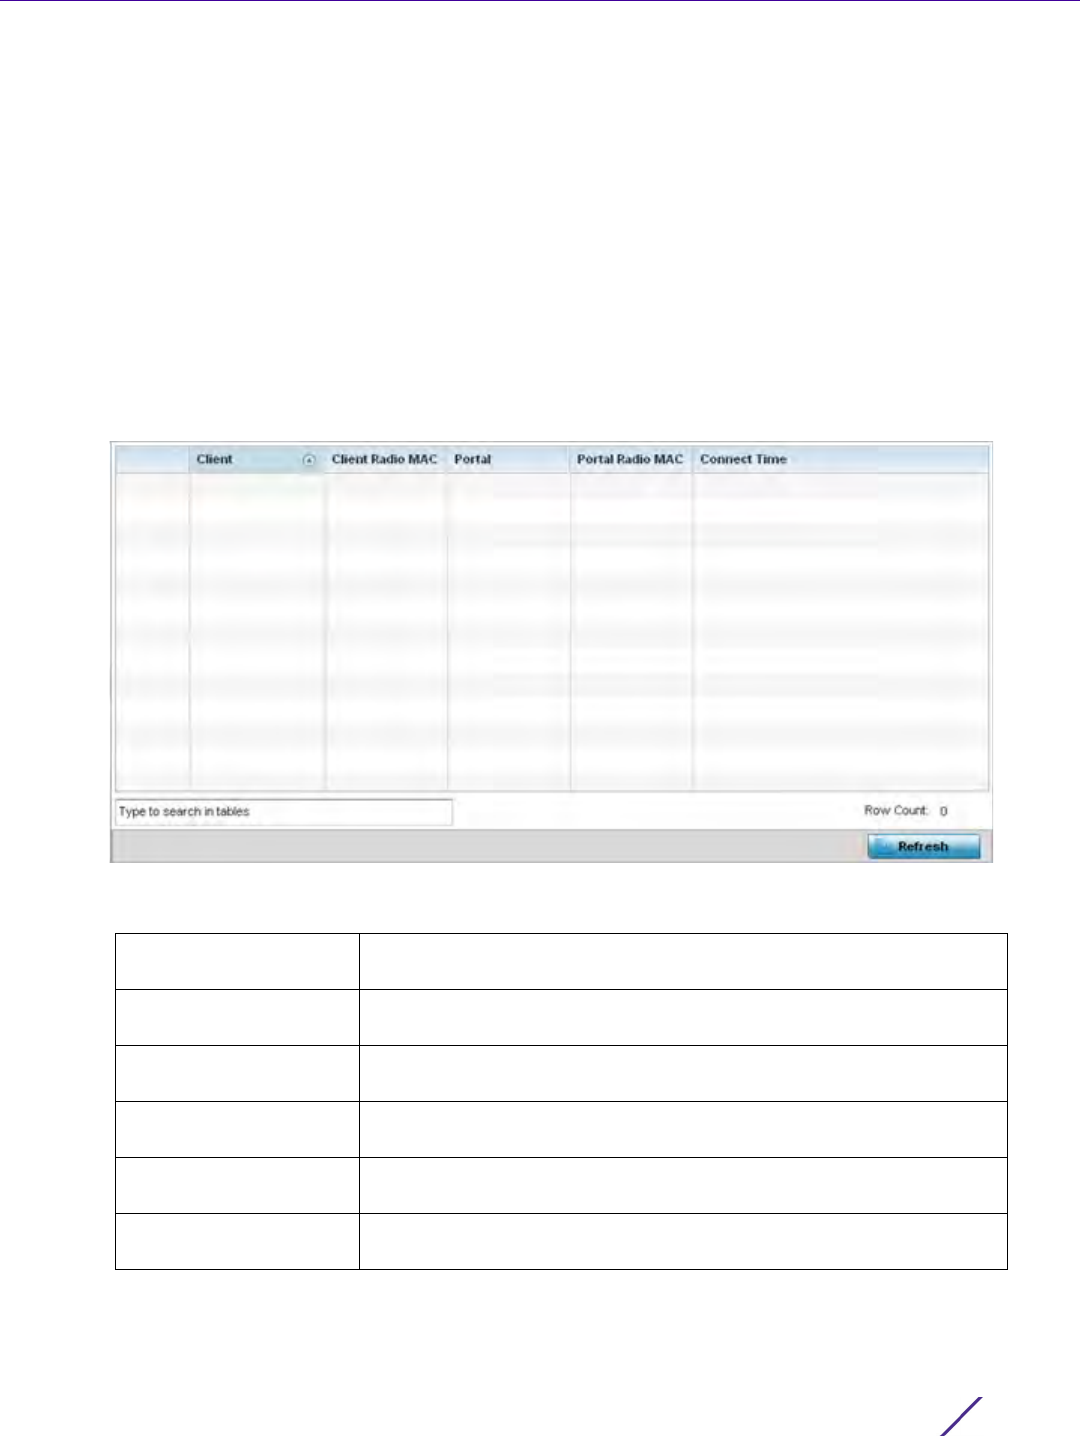
Statistics
Wireless Controller and Service Platform System Reference Guide 15 - 33
15.2.10 Mesh
RF Domain Statistics
Mesh networking enables users to wirelessly access broadband applications anywhere (even in a moving vehicle).
Initially developed for secure and reliable military battlefield communications, mesh technology supports public
safety, public access and public works. Mesh technology reduces the expense of wide-scale networks, by
leveraging Wi-Fi enabled devices already deployed.
To view Mesh statistics for RF Domain member Access Point and their connected clients:
1 Select the Statistics menu from the Web UI.
2 Select a RF Domain from under the System node on the top, left-hand side, of the screen.
3Select
Mesh.
Figure 15-21 RF Domain - Mesh screen
The RF Domain Mesh screen displays the following:
Client Displays the configured hostname for each mesh client connected to a
RF Domain member Access Point.
Client Radio MAC Displays the hardware encoded MAC address for each mesh client
connected to a RF Domain member Access Point.
Portal Displays a numerical portal Index ID for the each mesh client
connected to a RF Domain member Access Point.
Portal Radio MAC Displays the hardware encoded MAC address for each radio in the RF
Domain mesh network.
Connect Time Displays the total connection time for each listed client in the RF
Domain mesh network.
Refresh Select the Refresh button to update the statistics counters to their
latest values.
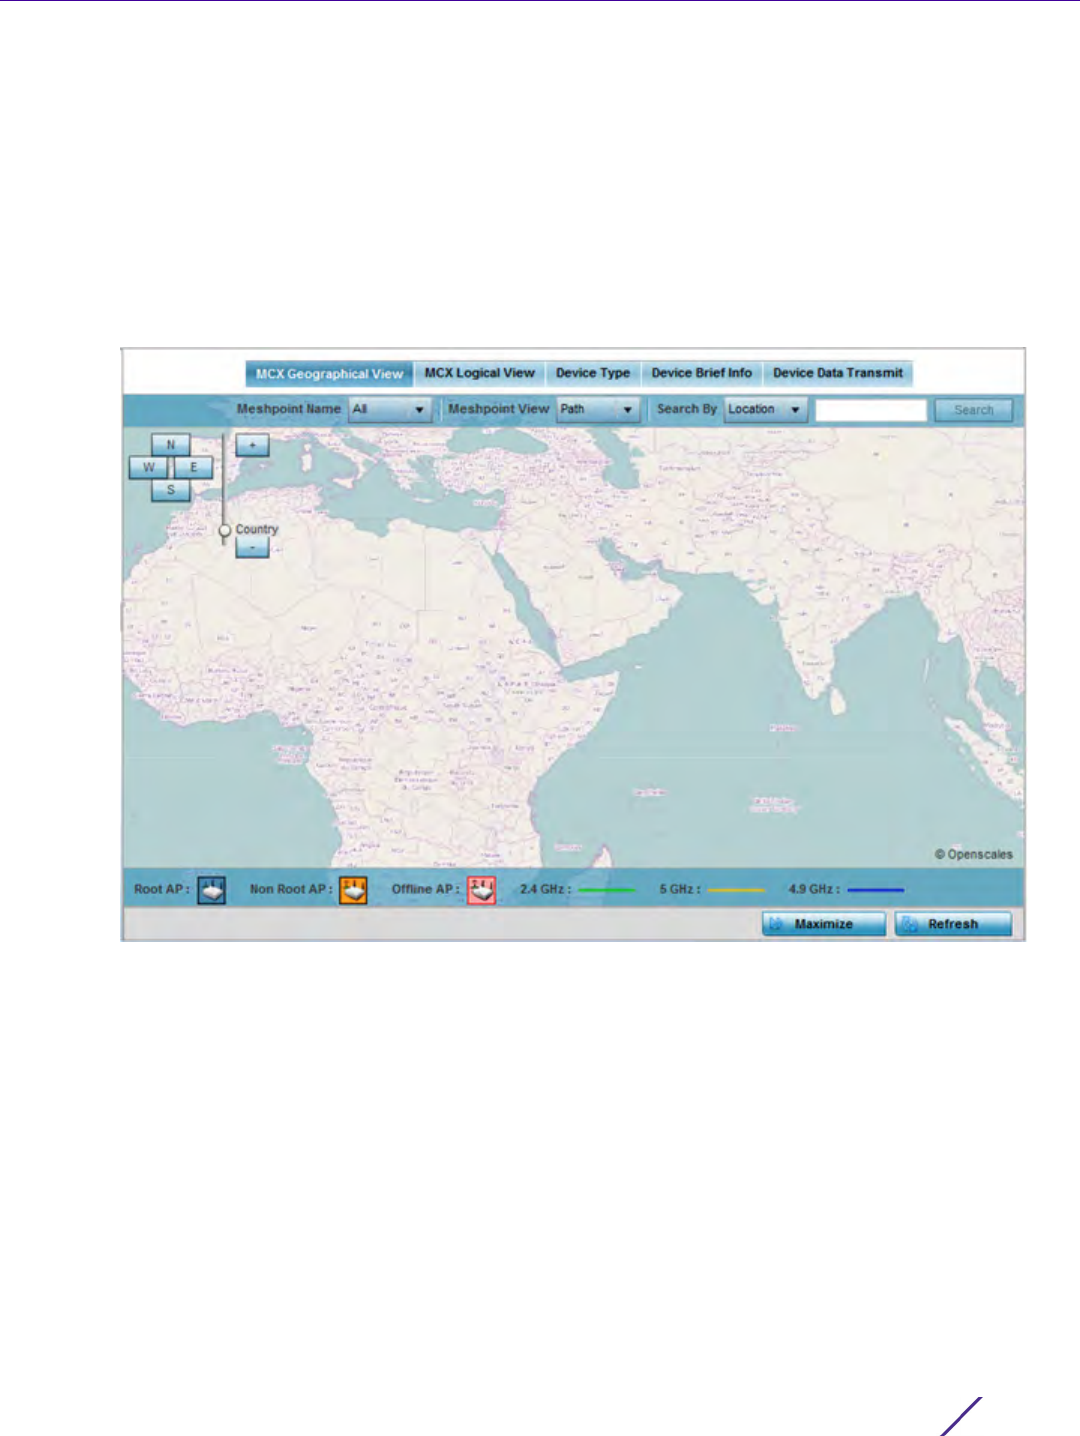
Statistics
Wireless Controller and Service Platform System Reference Guide 15 - 34
15.2.11 Mesh Point
RF Domain Statistics
To view Mesh Point statistics for RF Domain member Access Point and their connected clients:
1 Select the Statistics menu from the Web UI.
2 Select a RF Domain from under the System node on the top, left-hand side, of the screen.
3Select
Mesh Point.
The MCX Geographical View displays by default.
Figure 15-22 RF Domain - Mesh Point MCX Geographical View screen
The MCX Geographical View screen displays a map where icons of each device in the RF Domain are overlaid.
This provides a geographical overview of the location of each RF Domain member device.
4Use the N, W, S and E buttons to move the map in the North, West, South and East directions respectively. The
slider next to these buttons enables zooming in and out of the view. The available fixed zoom levels are World,
Country, State, Town, Street and House.
5Use the Maximize button to maximize this view to occupy the complete screen. Use the Refresh button to
update the status of the screen.
6 Select the MCX Logical View tab to view a logical representation of the Meshpoint.
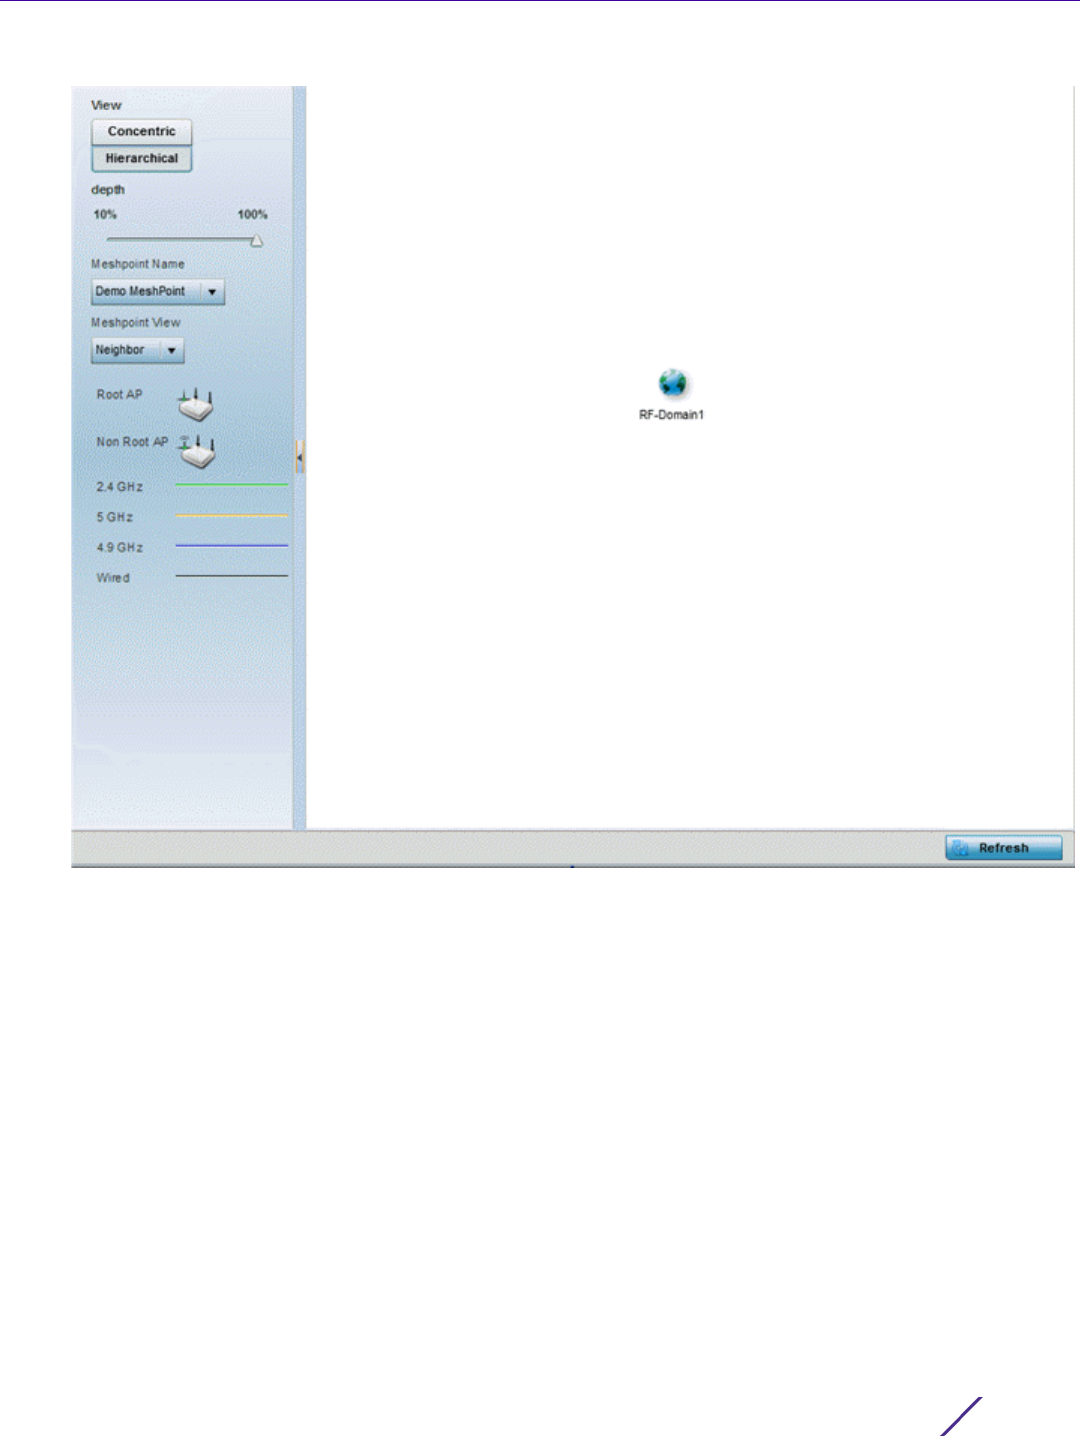
Statistics
Wireless Controller and Service Platform System Reference Guide 15 - 35
Figure 15-23 RF Domain - Mesh Point MCX Logical View screen
The Concentric and hierarchical buttons define how the mesh point is displayed in the MCX Logical View
screen. In the Concentric mode, the mesh is displayed as a concentric arrangement of devices with the root
mesh at the centre and the other mesh device arranged around it.
In the hierarchical arrangement, the root node of the mesh is displayed at the top of the mesh tree and the
relationship of the mesh nodes are displayed as such.
Use the Meshpoint Name drop down to select a mesh point to see the graphical representation of that mesh
point. The view can further be filtered based on the values Neighbor or Path selected in the Meshpoint View
field.
7 Select the Device Type tab.
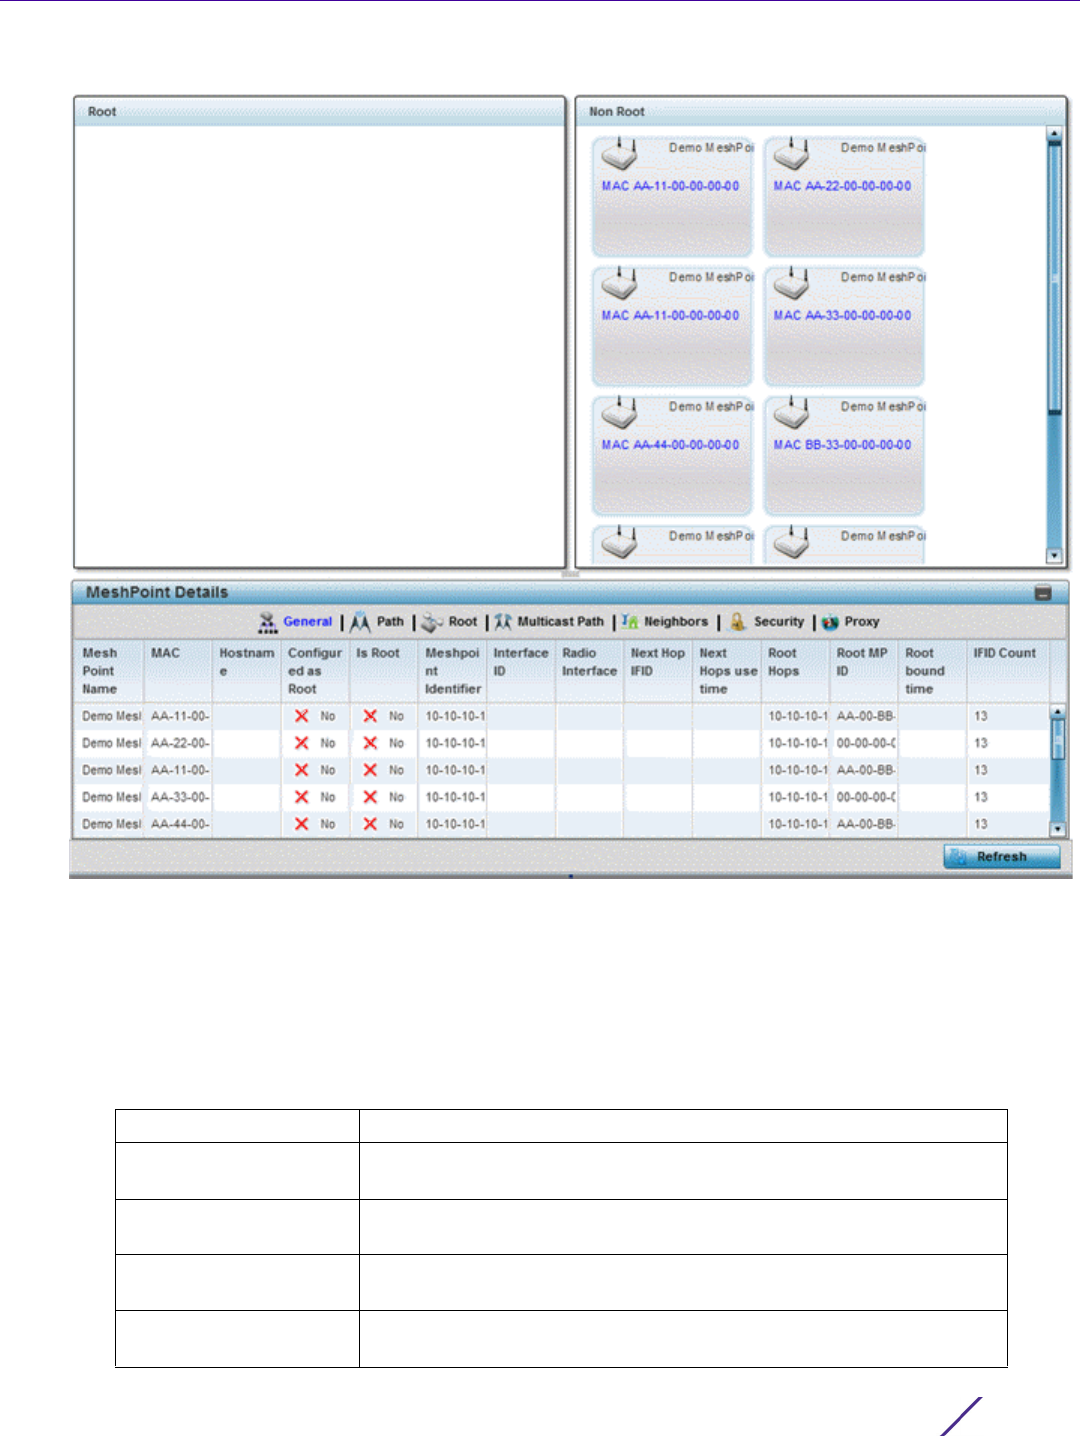
Statistics
Wireless Controller and Service Platform System Reference Guide 15 - 36
Figure 15-24 RF Domain - Mesh Point Device Type screen
The Root field displays the Mesh ID and MAC Address of the configured root mesh points in the RF Domain.
8The
Non Root field displays the Mesh ID and MAC Address of all configured non-root mesh points in the RF
Domain. displays the Mesh ID and MAC Address of all configured non-root mesh points in the RF Domain.
9The
Mesh Point Details field on the bottom portion of the screen displays tabs for General, Path, Root, Multicast
Path, Neighbors, Security and Proxy. Refer to the following:
The General tab displays the following:
Mesh Point Name Displays the name of each configured mesh point in the RF Domain.
MAC Displays the MAC Address of each configured mesh point in the RF
Domain.
Hostname Displays the administrator assigned hostname for each configured
mesh point in the RF Domain.
Configured As Root Indicates whether a mesh point is configured to act as a root device.
(Yes/No).
Is Root A root mesh point is defined as a mesh point connected to the WAN
and provides a wired backhaul to the network (Yes/No).

Statistics
Wireless Controller and Service Platform System Reference Guide 15 - 37
The Path tab displays the following:
Meshpoint Identifier The MP identifier is used to distinguish between other mesh points
both on the same device and on other devices. This is used by a user
to setup the preferred root configuration.
Interface ID The IFID uniquely identifies an interface associated with the MPID.
Each mesh point on a device can be associated with one or more
interfaces.
Radio Interface Uniquely identifies the radio interface on which the Mesh Point
operates.
Next Hop IFID Lists the ID of the interface on which the next hop for the mesh
network can be found.
Next Hops Use Time Lists the time when the next hop in the mesh network topology was
last utilized.
Root Hops Number of hops to a root and should not exceed 4 in general practice.
If using the same interface to both transmit and receive, then you will
get approximately half the performance every additional hop out.
Root MP ID Displays the ID of the root device for this mesh point.
Root Bound Time Displays the duration this mesh point has been connected to the mesh
root.
IFID Count Displays the number of Interface IDs (IFIDs) associated with all the
configured mesh points in the RF Domain.
Mesh Point Name Displays the name of each configured mesh point in the RF Domain.
Meshpoint Identifier The identifier is used to distinguish between other mesh points both
on the same device and on other devices. This is used by a user to
setup the preferred root configuration.
Destination Addr The destination is the endpoint of mesh path. It may be a MAC
address or a mesh point ID.
Next Hop IFID The Interface ID of the mesh point that traffic is being directed to.
Is Root A root mesh point is defined as a mesh point that is connected to the
WAN and provides a wired backhaul to the network (Yes/No).
MiNT ID Displays the MiNT Protocol ID for the global mint area identifier. This
area identifier separates two overlapping mint networks and need only
be configured if the administrator has two mint networks that share
the same packet broadcast domain.
Hops Number of hops to a root and should not exceed 4 in general practice.
If using the same interface to both transmit and receive, then you will
get approximately half the performance every additional hop out.
Mobility Displays whether the mesh point is a mobile or static node. Displays
True when the device is mobile and False when the device is not
mobile.
Metric A measure of the quality of the path. A lower value indicates a better
path.
State Indicates whether the path is currently Valid of Invalid.
Binding Indicates whether the path is bound or unbound.

Statistics
Wireless Controller and Service Platform System Reference Guide 15 - 38
The Root tab displays the following:
The Multicast Path tab displays the following:
The Neighbors tab displays the following:
Timeout The timeout interval in mili-seconds. The interpretation this value will
vary depending on the value of the state.
Sequence The sequence number also known as the destination sequence
number. It is updated whenever a mesh point receives new
information about the sequence number from RREQ, RREP, or RERR
messages that may be received related to that destination.
Mesh Point Name Displays the name of each configured mesh point in the RF Domain.
Recommended Displays the root that is recommended by the mesh routing layer.
Root MPID The MP identifier is used to distinguish between other mesh points
both on the same device and on other devices. This is used by a user
to setup the preferred root configuration.
Next Hop IFID The IFID of the next hop. The IFID is the MAC Address on the
destination device.
Radio Interface This indicates the interface that is used by the device to communicate
with this neighbor. The values are 2.4 and 5.8, indicating the frequency
of the radio that is used to communicate with the neighbor.
Bound Indicates whether the root is bound or unbound.
Metric Displays the computed path metric between the neighbor and their
root mesh point.
Interface Bias This field lists any bias applied because of the Preferred Root Interface
Index.
Neighbor Bias This field lists any bias applied because of the Preferred Root Next-
Hop Neighbor IFID.
Root Bias This field lists any bias applied because of the Preferred Root MPID.
Mesh Point Name Displays the name of each configured mesh point in the RF Domain.
Subscriber Name The identifier is used to distinguish between other mesh points both
on the same device and on other devices. This is used by a user to
setup the preferred root configuration.
Subscriber MPID Lists the subscriber ID to distinguish between other mesh point
neighbor devices in the RF Domain.
Group Address Displays the MAC address used for the Group in the mesh point.
Timeout The timeout interval in seconds. The interpretation this value will vary
depending on the value of the state. If the state is Init or In Progress,
the timeout duration has no significance. If the state is Enabled, the
timeout duration indicates the amount of time left before the security
validity check is initiated. If the state is Failed, the timeout duration is
the amount of time after which the system will retry.
Mesh Point Name Displays the name of each configured mesh point in the RF Domain.

Statistics
Wireless Controller and Service Platform System Reference Guide 15 - 39
Destination Addr Displays the MeshID (MAC Address) of each mesh point in the RF
Domain.
Neighbor MP ID The MAC Address that the device uses to define the mesh point in the
device that the neighbor is a part of. It is used to distinguish the
device that is the neighbor.
Neighbor IFID The MAC Address used by the interface on the neighbor device to
communicate with this device. This may define a particular radio or
Ethernet port that communicates with this device over the mesh.
Root MP ID The MAC Address of the neighbor's root mesh point.
Is Root A root mesh point is defined as a mesh point that is connected to the
WAN and provides a wired backhaul to the network. Yes if the mesh
point that is the neighbor is a root mesh point or No if the mesh point
that is the neighbor is not a root mesh point.
Mobility Displays whether the Mesh Point is a mobile or static node. Displays
True when the device is mobile and False when the device is not
mobile.
Radio Interface This indicates the interface that is used by the device to communicate
with this neighbor. The values are 2.4 and 5.8, indicating the frequency
of the radio that is used to communicate with the neighbor.
Mesh Root Hops The number of devices between the neighbor and its root mesh point.
If the neighbor is a root mesh point, this value will be 0. If the
neighbor is not a root mesh point but it has a neighbor that is a root
mesh point, this value will be 1. Each mesh point between the
neighbor and its root mesh point is counted as 1 hop.
Resourced Displays whether the mesh point has been resourced or not. The Mesh
Connex neighbor table can contain more neighbors than the AP
supports. If the neighbor is resourced, it will take away a one of the
resources for a wireless client device to be used for meshing. Displays
True when the device is resourced and False when the device is not.
Link Quality An abstract value depicting the quality of the mesh link between the
device and the neighbor. The range is from 0 (weakest) to 100
(strongest).
Link Metric This value shows the computed path metric from the device to the
neighbor mesh point using this interface. The lower the number the
better the possibility that the neighbor will be chosen as the path to
the root mesh point.
Root Metric The computed path metric between the neighbor and their root mesh
point.

Statistics
Wireless Controller and Service Platform System Reference Guide 15 - 40
The Security tab displays the following:
Rank The rank is the level of importance and is used for automatic resource
management.
8 – The current next hop to the recommended root.
7 – Any secondary next hop to the recommended root to has a good
potential route metric.
6 – A next hop to an alternate root node.
5 – A downstream node currently hopping through to get to the root.
4 – A downstream node that could hop through to get to the root, but
is currently not hopping through any node (look at authentication, as
this might be an issue).
3 – A downstream node that is currently hopping through a different
node to get to the root, but could potentially have a better route
metric if it hopped through this node.
2 – Reserved for active peer to peer routes and is not currently used.
1 - A neighbor bound to the same recommended root but does not
have a potential route metric as good as the neighbors ranked 8 and 7.
0 – A neighbor bound to a different root node.
-1 – Not a member of the mesh as it has a different mesh ID.
All client devices hold a rank of 3 and can replace any mesh devices
lower than that rank.
Age Displays the number of miliseconds since the mesh point last heard
from this neighbor.
Mesh Point Name Displays the name of each configured mesh point in the RF Domain.
Mesh Point Identifier The destination is the endpoint of mesh path. It may be a MAC
address or a mesh point ID.
Radio Interface This indicates the interface that is used by the device to communicate
with this neighbor. The values are 2.4 and 5.8, indicating the frequency
of the radio that is used to communicate with the neighbor.
Interface ID The IFID uniquely identifies an interface associated with the MPID.
Each mesh point on a device can be associated with one or more
interfaces.
State Displays the Link State for each mesh point:
Init - indicates the link has not been established or has expired.
Enabled - indicates the link is available for communication.
Failed - indicates the attempt to establish the link failed and cannot be
retried yet.
In Progress - indicates the link is being established but is not yet
available.
Timeout Displays the maximum value in seconds that the link is allowed to stay
in the In Progress state before timing out.

Statistics
Wireless Controller and Service Platform System Reference Guide 15 - 41
The Proxy tab displays the following:
10 Select the Device Brief Info tab from the top of the screen.
The Device Brief Info screen is divided into 2 fields, All Roots and Mesh Points and MeshPoint Details.
Keep Alive Yes indicates that the local MP will act as a supplicant to authenticate
the link and not let it expire (if possible). No indicates that the local
MP does not need the link and will let it expire if not maintained by
the remote MP.
Mesh Point Name Displays the name of each configured mesh point in the RF Domain.
Destination Addr The destination is the endpoint of mesh path. It may be a MAC
address or a mesh point ID.
Proxy Address Displays the MAC Address of the proxy used in the mesh point.
Age Displays the age of the proxy connection for each of the mesh points
in the RF Domain.
Proxy Owner The owner’s (MPID) is used to distinguish the neighbor device.
Persistence Displays the persistence (duration) of the proxy connection for each of
the mesh points in the RF Domain.
VLAN The VLAN ID used as a virtual interface with this proxy. A value of
4095 indicates that there is no VLAN ID.
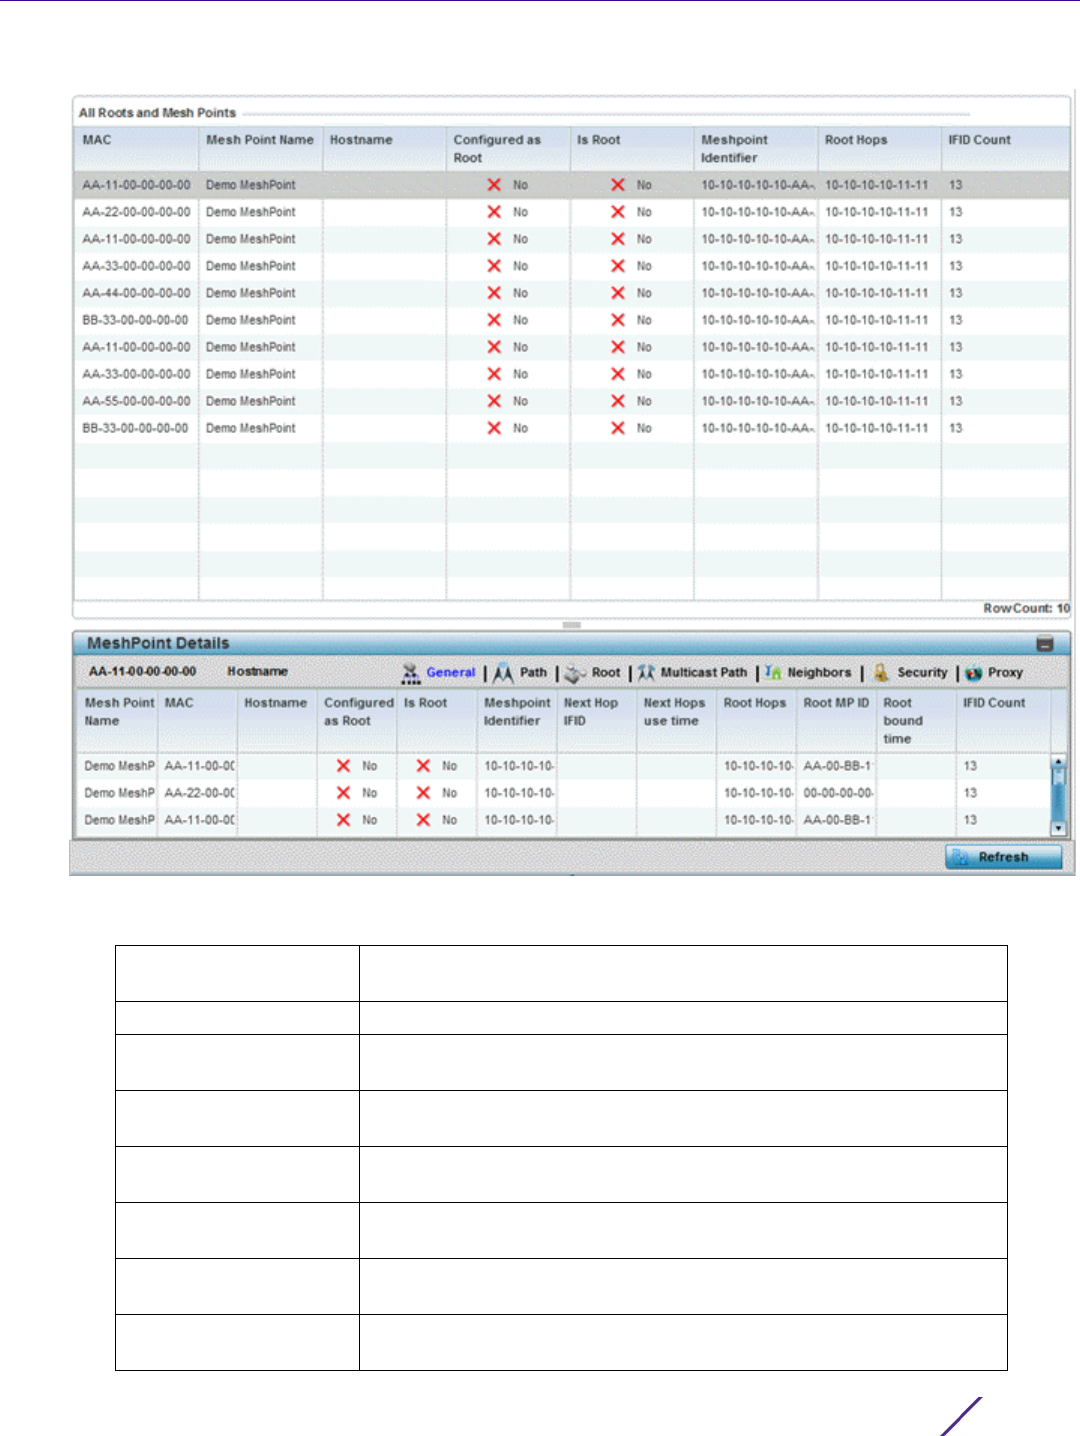
Statistics
Wireless Controller and Service Platform System Reference Guide 15 - 42
Figure 15-25 RF Domain - Mesh Point Device Brief Info screen
The All Roots and Mesh Points field displays the following:
MAC Displays the MAC Address of each configured mesh point in the RF
Domain.
Mesh Point Name Displays the name of each configured mesh point in the RF Domain.
Hostname Displays the administrator assigned hostname for each configured
mesh point in the RF Domain.
Configured as Root A root mesh point is defined as a mesh point connected to the WAN,
providing a wired backhaul to the network (Yes/No).
Is Root Indicates whether the current mesh point is a root meshpoint (Yes/
No).
Destination Addr The destination is the endpoint of mesh path. It may be a MAC
address or a mesh point ID.
Root Hops The number of devices between the selected mesh point and the
destination device.
IFID Count Displays the number of Interface IDs (IFIDs) associated with all the
configured mesh points in the RF Domain.

Statistics
Wireless Controller and Service Platform System Reference Guide 15 - 43
11 The MeshPoint Details field on the bottom portion of the screen displays tabs for General, Path, Root, Multicast
Path, Neighbors, Security and Proxy. Refer to the following:
The General tab displays the following:
The Path tab displays the following:
Mesh Point Name Displays the name of each configured mesh point in the RF Domain.
MAC Displays the MAC Address of each configured mesh point in the RF
Domain.
Hostname Displays the hostname for each configured mesh point in the RF
Domain.
Configured as Root A root mesh point is defined as a mesh point that is connected to the
WAN and provides a wired backhaul to the network (Yes/No).
Is Root A root mesh point is defined as a mesh point that is connected to the
WAN and provides a wired backhaul to the network (Yes/No).
Mesh Point Identifier The destination is the endpoint of mesh path. It may be a MAC
address or a mesh point ID.
Next Hop IFID Identifies the ID of the interface on which the next hop for the mesh
network can be found.
Next Hops Use Time Lists the time when the next hop in the mesh network topology was
last utilized.
Root Hops Number of hops to a root and should not exceed 4 in general practice.
If using the same interface to both transmit and receive, then you will
get approximately half the performance every additional hop out.
Root MP ID Lists the interface ID of the interface on which the next hop for the
mesh network can be found.
Root Bound time Displays the duration this mesh point has been connected to the mesh
root.
IFID Count Displays the number of Interface IDs (IFIDs) associated with all the
configured mesh points in the RF Domain.
Mesh Point Name Displays the name of each configured mesh point in the RF Domain.
Destination Addr The destination is the endpoint of mesh path. It may be a MAC address
or a mesh point ID.
Destination The MAC Address used by the interface on the neighbor device to
communicate with this device. This may define a particular radio or
Ethernet port that communicates with this device over the mesh.
Is Root A root mesh point is defined as a mesh point that is connected to the
WAN and provides a wired backhaul to the network (Yes/No).
MiNT ID Displays the MiNT Protocol ID for the global mint area identifier. This
area identifier separates two overlapping mint networks and need only
be configured if the administrator has two mint networks that share
the same packet broadcast domain.
Next Hop IFID The Interface ID of the mesh point that traffic is being directed to.
Hops Number of hops to a root and should not exceed 4 in general practice.
If using the same interface to both transmit and receive, then you will
get approximately half the performance every additional hop out.

Statistics
Wireless Controller and Service Platform System Reference Guide 15 - 44
The Root tab displays the following:
The Multicast Path tab displays the following:
Mobility Displays whether the mesh point is a mobile or static node. Displays
True when the device is mobile and False when the device is not
mobile.
Metric A measure of the quality of the path. A lower value indicates a better
path.
State Indicates whether the path is currently Valid of Invalid.
Binding Indicates whether the path is bound or unbound.
Timeout The timeout interval in seconds. The interpretation this value will vary
depending on the value of the state. If the state is Init or In Progress,
the timeout duration has no significance. If the state is Enabled, the
timeout duration indicates the amount of time left before the security
validity check is initiated. If the state is Failed, the timeout duration is
the amount of time after which the system will retry.
Sequence The sequence number also known as the destination sequence
number. It is updated whenever a mesh point receives new information
about the sequence number from RREQ, RREP, or RERR messages
that may be received related to that destination.
Mesh Point Name Displays the name of each configured mesh point in the RF Domain.
Recommended Displays the root that is recommended by the mesh routing layer.
Root MPID The MP identifier is used to distinguish between other mesh points
both on the same device and on other devices. This is used by a user
to setup the preferred root configuration.
Next Hop IFID The IFID of the next hop. The IFID is the MAC Address on the
destination device.
Radio Interface This indicates the interface that is used by the device to communicate
with this neighbor. The values are 2.4 and 5.8, indicating the frequency
of the radio that is used to communicate with the neighbor.
Bound Indicates whether the root is bound or unbound.
Metric Displays the computed path metric between the neighbor and their
root mesh point.
Interface Bias This field lists any bias applied because of the preferred root Interface
Index.
Neighbor Bias This field lists any bias applied because of the preferred root next-hop
Neighbor IFID.
Root Bias This field lists any bias applied because of the preferred root MPID.
Mesh Point Name Displays the name of each configured mesh point in the RF Domain.
Subscriber Name Lists the subscriber name is used to distinguish between other mesh
point neighbors both on the same device and on other devices.
Subscriber MPID Lists the subscriber ID to distinguish between other mesh point
neighbors both on the same device and on other devices.
Group Address Displays the MAC address used for the Group in the mesh point.

Statistics
Wireless Controller and Service Platform System Reference Guide 15 - 45
The Neighbors tab displays the following:
Path Timeout The timeout interval in seconds. The interpretation this value will vary
depending on the value of the state. If the state is Init or In Progress,
the timeout duration has no significance. If the state is Enabled, the
timeout duration indicates the amount of time left before the security
validity check is initiated. If the state is Failed, the timeout duration is
the amount of time after which the system will retry.
Mesh Point Name Displays the name of each configured mesh point in the RF Domain.
Mesh Point Identifier The destination is the endpoint of mesh path. It may be a MAC
address or a mesh point ID.
Neighbor MP ID The MAC Address that the device uses to define the mesh point in the
device that the neighbor is a part of. It is used to distinguish the
device that is the neighbor.
Neighbor IFID The MAC Address used by the interface on the neighbor device to
communicate with this device. This may define a particular radio or
Ethernet port that communicates with this device over the mesh.
Root MP ID The mesh point ID of the neighbor's root mesh point.
Is Root A root mesh point is defined as a mesh point that is connected to the
WAN and provides a wired backhaul to the network. Yes if the mesh
point that is the neighbor is a root mesh point or No if the mesh point
that is the neighbor is not a root mesh point.
Mobility Displays whether the mesh point is a mobile or static node. Displays
True when the device is mobile and False when the device is not
mobile.
Radio Interface This indicates the interface that is used by the device to communicate
with this neighbor. The values are 2.4 and 5.8, indicating the frequency
of the radio that is used to communicate with the neighbor.
Mesh Root Hops The number of devices between the neighbor and its root mesh point.
If the neighbor is a root mesh point, this value will be 0. If the
neighbor is not a root mesh point but it has a neighbor that is a root
mesh point, this value will be 1. Each mesh point between the
neighbor and its root mesh point is counted as 1 hop.
Resourced Displays whether the mesh point has been resourced or not. The Mesh
Connex neighbor table can contain more neighbors than the AP
supports. If the neighbor is resourced, it will take away a one of the
resources for a wireless client device to be used for meshing. Displays
True when the device is resourced and False when the device is not.
Link Quality An abstract value depicting the quality of the mesh link between the
device and the neighbor. The range is from 0 (weakest) to 100
(strongest).
Link Metric This value shows the computed path metric from the device to the
neighbor mesh point using this interface. The lower the number the
better the possibility that the neighbor will be chosen as the path to
the root mesh point.
Root Metric The computed path metric between the neighbor and their root mesh
point.

Statistics
Wireless Controller and Service Platform System Reference Guide 15 - 46
The Security tab displays the following:
Rank The rank is the level of importance and is used for automatic resource
management.
8 – The current next hop to the recommended root.
7 – Any secondary next hop to the recommended root to has a good
potential route metric.
6 – A next hop to an alternate root node.
5 – A downstream node currently hopping through to get to the root.
4 – A downstream node that could hop through to get to the root, but
is currently not hopping through any node (look at authentication, as
this might be an issue).
3 – A downstream node that is currently hopping through a different
node to get to the root, but could potentially have a better route
metric if it hopped through this node.
2 – Reserved for active peer to peer routes and is not currently used.
1 - A neighbor bound to the same recommended root but does not
have a potential route metric as good as the neighbors ranked 8 and 7.
0 – A neighbor bound to a different root node.
-1 – Not a member of the mesh as it has a different mesh ID.
All client devices hold a rank of 3 and can replace any mesh devices
lower than that rank.
Age Displays the number of miliseconds since the mesh point last heard
from this neighbor.
Mesh Point Name Displays the name of each configured mesh point in the RF Domain.
Mesh Point Identifier The destination is the endpoint of mesh path. It may be a MAC
address or a mesh point ID.
Radio Interface This indicates the interface that is used by the device to communicate
with this neighbor. The values are 2.4 and 5.8, indicating the frequency
of the radio that is used to communicate with the neighbor.
Interface ID The IFID uniquely identifies an interface associated with the MPID.
Each mesh point on a device can be associated with one or more
interfaces.
State Displays the Link State for each mesh point:
Init - indicates the link has not been established or has expired.
Enabled - indicates the link is available for communication.
Failed - indicates the attempt to establish the link failed and cannot be
retried yet.
In Progress - indicates the link is being established but is not yet
available.
Timeout Displays the maximum value in seconds that the link is allowed to stay
in the In Progress state before timing out.

Statistics
Wireless Controller and Service Platform System Reference Guide 15 - 47
The Proxy tab displays the following:
12 Select Device Data Transmit.
Keep Alive Yes indicates the local MP acts as a supplicant to authenticate the link
and not let it expire (if possible). No indicates that the local MP does
not need the link and will let it expire if not maintained by the remote
MP.
Mesh Point Name Displays the name of each configured mesh point in the RF Domain.
Mesh Point Identifier The destination is the endpoint of mesh path. It may be a MAC
address or a mesh point ID.
Proxy Address Displays the MAC Address of the proxy used in the mesh point.
Age Displays the age of the proxy connection for each of the mesh points
in the RF Domain.
Proxy Owner The owner (MPID) is used to distinguish the device that is the
neighbor.
VLAN The VLAN ID used as a virtual interface with this proxy. A value of
4095 indicates that there is no VLAN ID.
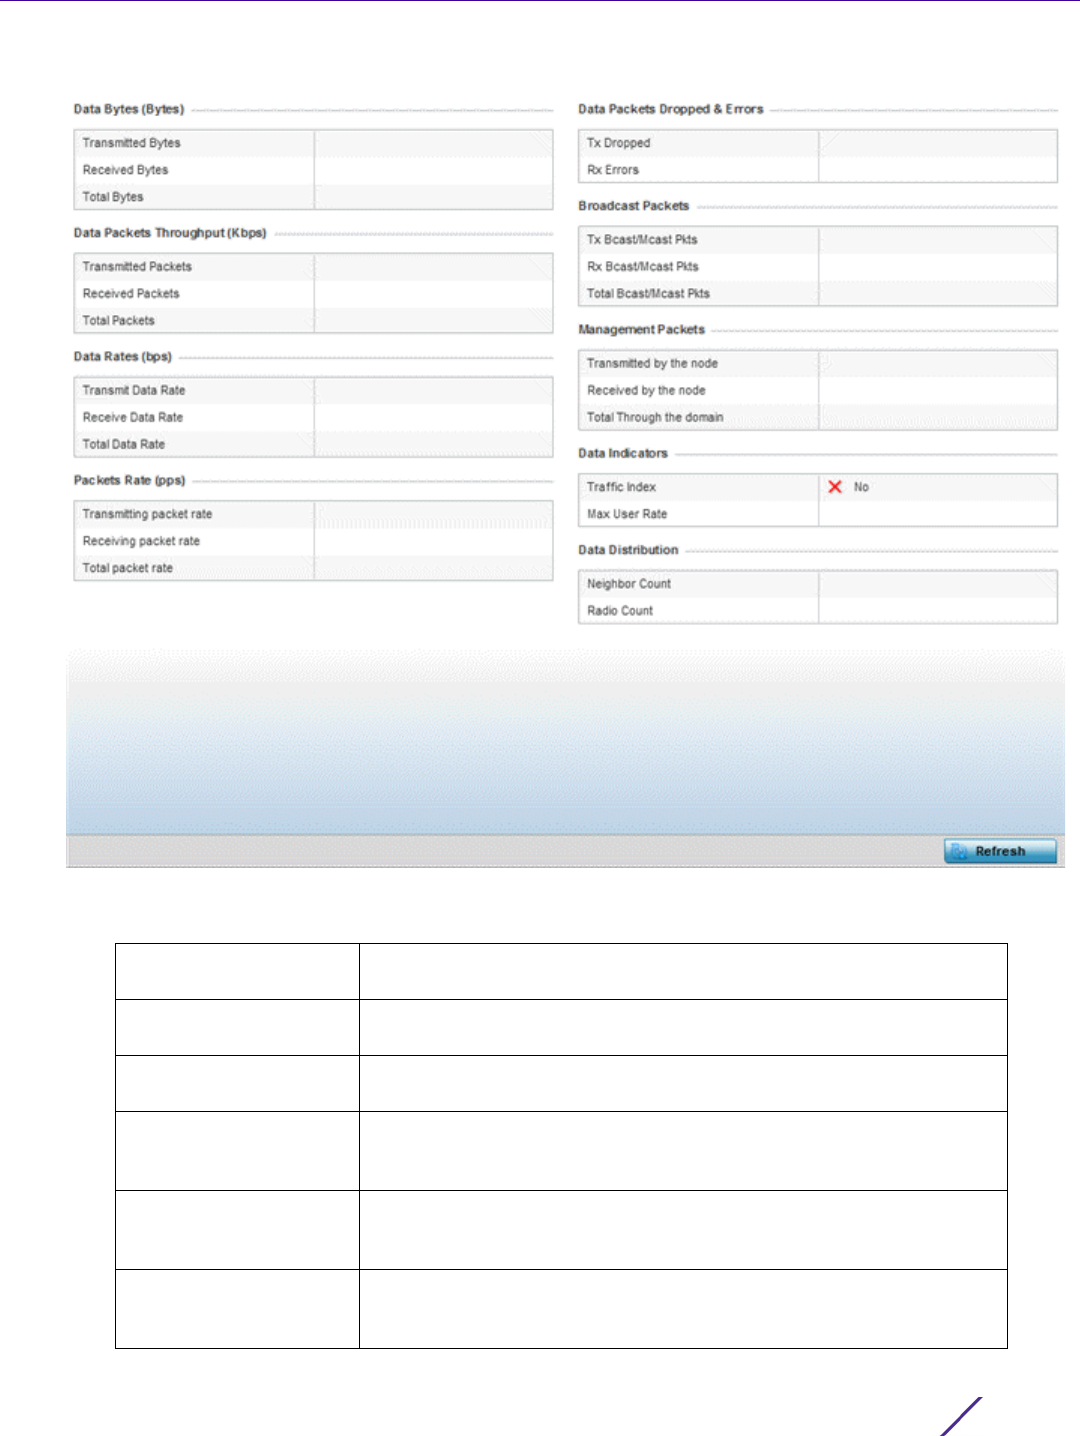
Statistics
Wireless Controller and Service Platform System Reference Guide 15 - 48
Figure 15-26 RF Domain - Mesh Point Device Data Transmit screen
13 Review the following transmit and receive statistics for Mesh nodes:
Data Bytes (Bytes):
Transmitted Bytes
Displays the total amount of data, in Bytes, transmitted by mesh
points in the RF Domain.
Data Bytes (Bytes):
Received Bytes
Displays the total amount of data, in Bytes, received by mesh points in
the RF Domain.
Data Bytes (Bytes):
Total Bytes
Displays the total amount of data, in Bytes, transmitted and received
by mesh points in the RF Domain.
Data Packets
Throughput (Kbps):
Transmitted Packets
Displays the total amount of data, in packets, transmitted by mesh
points in the RF Domain.
Data Packets
Throughput (Kbps):
Received Packets
Displays the total amount of data, in packets, received by mesh points
in the RF Domain.
Data Packets
Throughput (Kbps):
Total Packets
Displays the total amount of data, in packets, transmitted and received
by mesh points in the RF Domain.

Statistics
Wireless Controller and Service Platform System Reference Guide 15 - 49
15.2.12 SMART RF
RF Domain Statistics
When invoked by an administrator, Self-Monitoring At Run Time (Smart RF) instructs Access Point radios to
change to a specific channel and begin beaconing using the maximum available transmit power. Within a well-
planned deployment, any RF Domain member Access Point radio should be reachable by at least one other radio.
Smart RF records signals received from its neighbors as well as signals from external, un-managed radios. AP-to-
Data Rates (bps):
Transmit Data Rate
Displays the average data rate, in kbps, for all data transmitted by
mesh points in the RF Domain.
Data Rates (bps):
Receive Data Rate
Displays the average data rate, in kbps, for all data received by mesh
points in the RF Domain.
Data Rates (bps): Total
Data Rate
Displays the average data rate, in kbps, for all data transmitted and
received by mesh points in the RF Domain.
Packets Rate (pps):
Transmitting Packet rate
Displays the average packet rate, in packets per second, for all data
transmitted and received by mesh points in the RF Domain.
Packets Rate (pps):
Received Packet rate
Displays the average packet rate, in packets per second, for all data
received and received by mesh points in the RF Domain.
Packets Rate (pps):
Total Packet Rate
Displays the average data packet rate, in packets per second, for all
data transmitted and received by mesh points in the RF Domain.
Data Packets Dropped
and Errors: Tx Dropped
Displays the total number of transmissions that were dropped mesh
points in the RF Domain.
Data Packets Dropped
and Errors: Rx Errors
Displays the total number of receive errors from mesh points in the RF
Domain.
Broadcast Packets: Tx
Bcast/Mcast Pkts
Displays the total number of broadcast and multicast packets
transmitted from mesh points in the RF Domain.
Broadcast Packets: Rx
Bcast/Mcast Pkts
Displays the total number of broadcast and multicast packets received
from mesh points in the RF Domain.
Broadcast Packets: Total
Bcast/Mcast Pkts
Displays the total number of broadcast and multicast packets
transmitted and received from mesh points in the RF Domain.
Management Packets:
Transmitted by the node
Displays the total number of management packets transmitted
through the mesh point node.
Management Packets:
Received by the node
Displays the total number of management packets received through
the mesh point node.
Management Packets:
Total Through the
domain
Displays the total number of management packets that were
transmitted and received through the mesh point node.
Data Indicators: Traffic
Index
Displays True of False to indicate whether or not a traffic index is
present.
Data Indicators: Max
User Rate
Displays the maximum user throughput rate for mesh points in the RF
Domain.
Data Distribution:
Neighbor Count
Displays the total number of neighbors known to the mesh points in
the RF Domain.
Data Distribution: Radio
Count
Displays the total number of neighbor radios known to the mesh
points in the RF Domain.
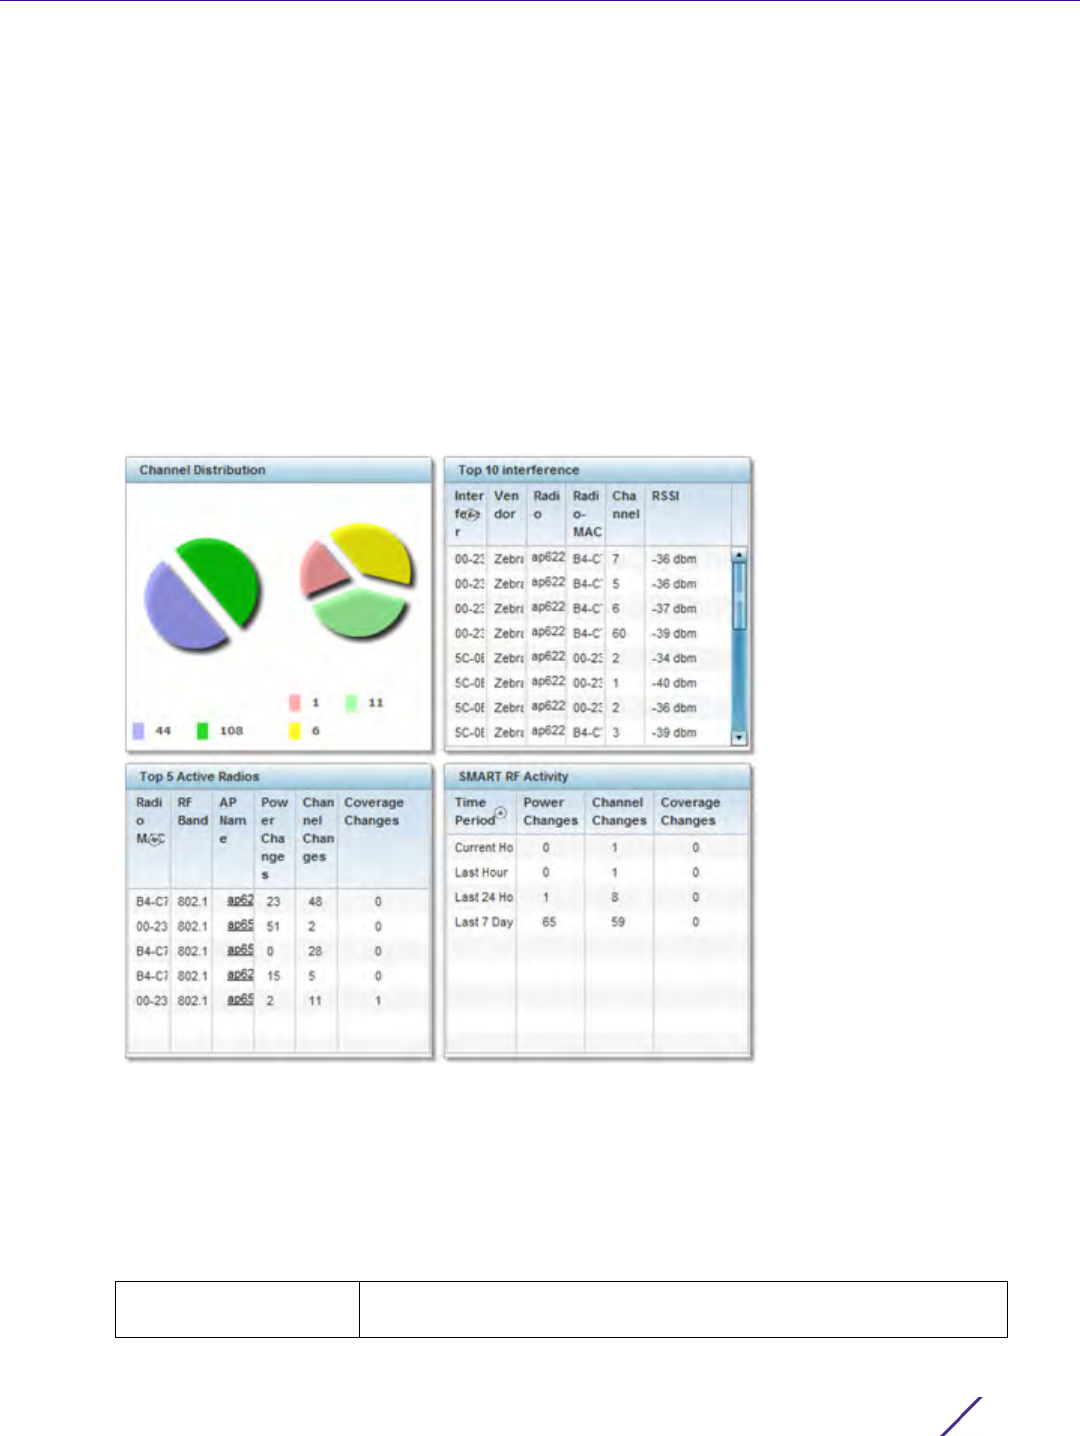
Statistics
Wireless Controller and Service Platform System Reference Guide 15 - 50
AP distance is recorded in terms of signal attenuation. The information from external radios is used during channel
assignment to minimize interference.
To view the Smart RF summary for RF Domain member Access Point radios:
1 Select the Statistics menu from the Web UI.
2 Select a RF Domain from under the System node on the top, left-hand side, of the screen.
3Select
SMART RF from the RF Domain menu.
4Expand the SMART RF menu and select Summary.
The summary screen enables administrators to assess the efficiency of RF Domain member device channel
distributions, sources of interference potentially requiring Smart RF adjustments, top performing RF Domain
member device radios and the number of power, channel and coverage changes required as part of a Smart
RF performance compensation activity.
Figure 15-27 RF Domain - Smart RF Summary screen
5The Channel Distribution field lists how RF Domain member devices are utilizing different channels to optimally
support connect devices and avoid congestion and interference with neighboring devices. Assess whether the
channel spectrum is being effectively utilized and whether channel changes are warranted to improve RF
Domain member device performance.
6Review the Top 10 interference table to assess RF Domain member devices whose level of interference exceeds
the threshold set (from -100 to -10 dBm) for acceptable performance.
Interferer Lists the administrator defined name of the interfering RF Domain
member device.

Statistics
Wireless Controller and Service Platform System Reference Guide 15 - 51
7Review the Top 5 Active Radios to assess the significance of any Smart RF initiated compensations versus their
reported top performance.
8 Refer to the SMART RF Activity table to view the trending of Smart RF compensations.
Vendor Displays the vendor name (manufacturer) of the interfering RF Domain
member device radio.
Radio Lists each offending device’s radio name contributing to the top 10
interference listing.
Radio MAC Displays the factory encoded hardware MAC address assigned to the
RF Domain member device radio.
Channel Displays the channel each of the 10 poorly performing RF Domain
member devices was detected on. Numerous interfering devices on
the same channel could define the need for better channel
segregation to reduce the levels of detected interference.
RSSI Lists a relative signal strength indication (RSSI) in dBm for those RF
Domain member devices falling into the poorest performing 10 devices
based on the administrator defined threshold value.
Radio MAC Lists the hardware encoded MAC address of each listed top
performing RF Domain member device radio.
RF Band Displays the top performing radio’s operation band. This may help
administrate whether more changes were required in the 2.4 GHz band
then 5 GHz or vice versa.
AP Name Lists the administrator assigned Access Point name used to
differentiate from other RF Domain member Access Point radios. The
name displays in the form of a link that can be selected to display
device information in greater detail.
Power Changes Displays the number of Smart RF initiated power level changes
reported for this top performing RF Domain member radio.
Channel Changes Displays the number of Smart RF initiated channel changes reported
for this top performing RF Domain member radio.
Coverage Changes Displays the number of Smart RF initiated coverage changes reported
for this top performing RF Domain member radio.
Time Period Lists the frequency Smart RF activity is trended for the RF Domain.
Trending periods include the Current Hour, Last 24 Hours or the Last
Seven Days. Comparing Smart RF adjustments versus the last seven
days enables an administrator to assess whether periods of
interference and poor performance were relegated to just specific
periods.
Power Changes Displays the number of Smart RF initiated power level changes needed
for RF Domain member devices during each of the three trending
periods. Determine whether power compensations were relegated to
known device outages or if compensations were consistent over the
course of a day or week.
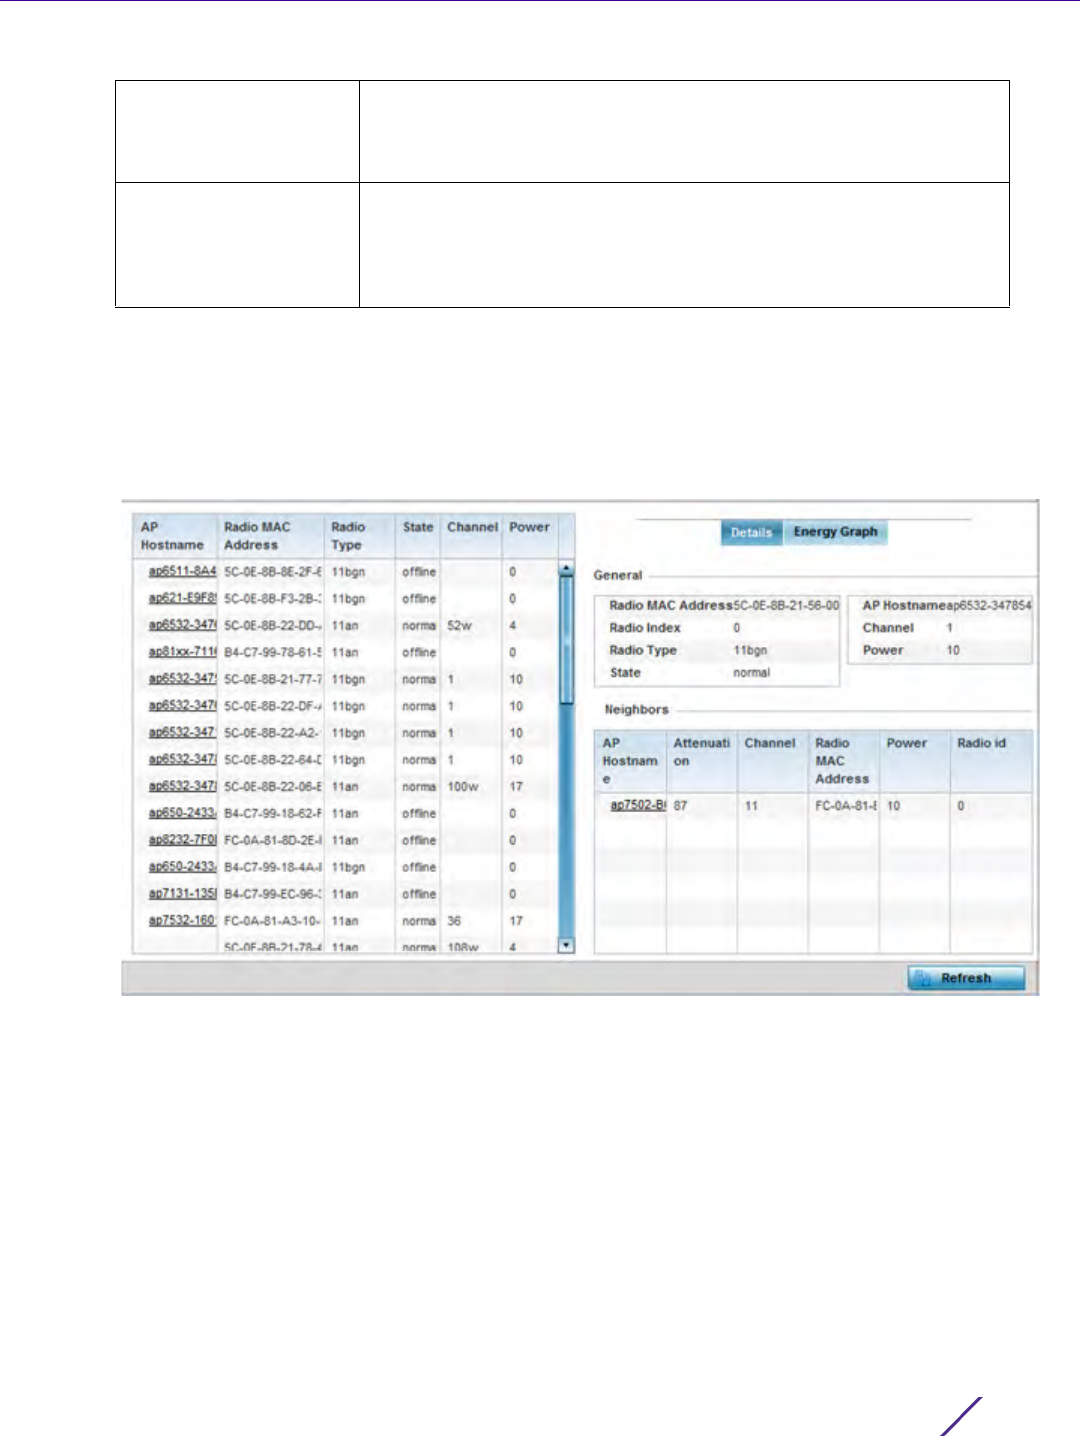
Statistics
Wireless Controller and Service Platform System Reference Guide 15 - 52
9Select Refresh to update the Summary to its latest RF Domain Smart RF information.
10 Select Details from the RF Domain menu.
Refer to the General field to review the radio's factory encoded hardware MAC address, the radio index
assigned by the administrator, the 802.11 radio type, its current operational state, the radio's AP hostname
assigned by an administrator, its current operating channel and power.
Figure 15-28 RF Domain - Smart RF Details screen
Refer to the Neighbors table to review the attributes of neighbor radio resources available for Smart RF radio
compensations for other RF Domain member device radios. Individual Access Point hostnames can be selected
and the RF Domain member radio can be reviewed in greater detail. Attenuation is a measure of the reduction
of signal strength during transmission. Attenuation is the opposite of amplification, and is normal when a signal
is sent from one point to another. If the signal attenuates too much, it becomes unintelligible. Attenuation is
measured in decibels. The radio's current operating channel is also displayed, as is the radio's hard coded MAC
address transmit power level and administrator assigned ID. Select Refresh at any time to update the Details
screen to its latest values.
11 Select the Energy Graph tab
Use the Energy Graph to review the radio’s operating channel, noise level and neighbor count. This information
helps assess whether Smart RF neighbor recovery is needed in respect to poorly performing radios.
Channel Changes Lists the number of Smart RF initiated channel changes needed for RF
Domain member devices during each of the three trending periods.
Determine if channel adjustments were relegated to known device
count increases or decreases over the course of a day or week.
Coverage Changes Displays the number of Smart RF initiated coverage changes needed
for RF Domain member devices during each of the three trending
periods. Determine if coverage changes were relegated to known
device failures or known periods of interference over the course of a
day or week.
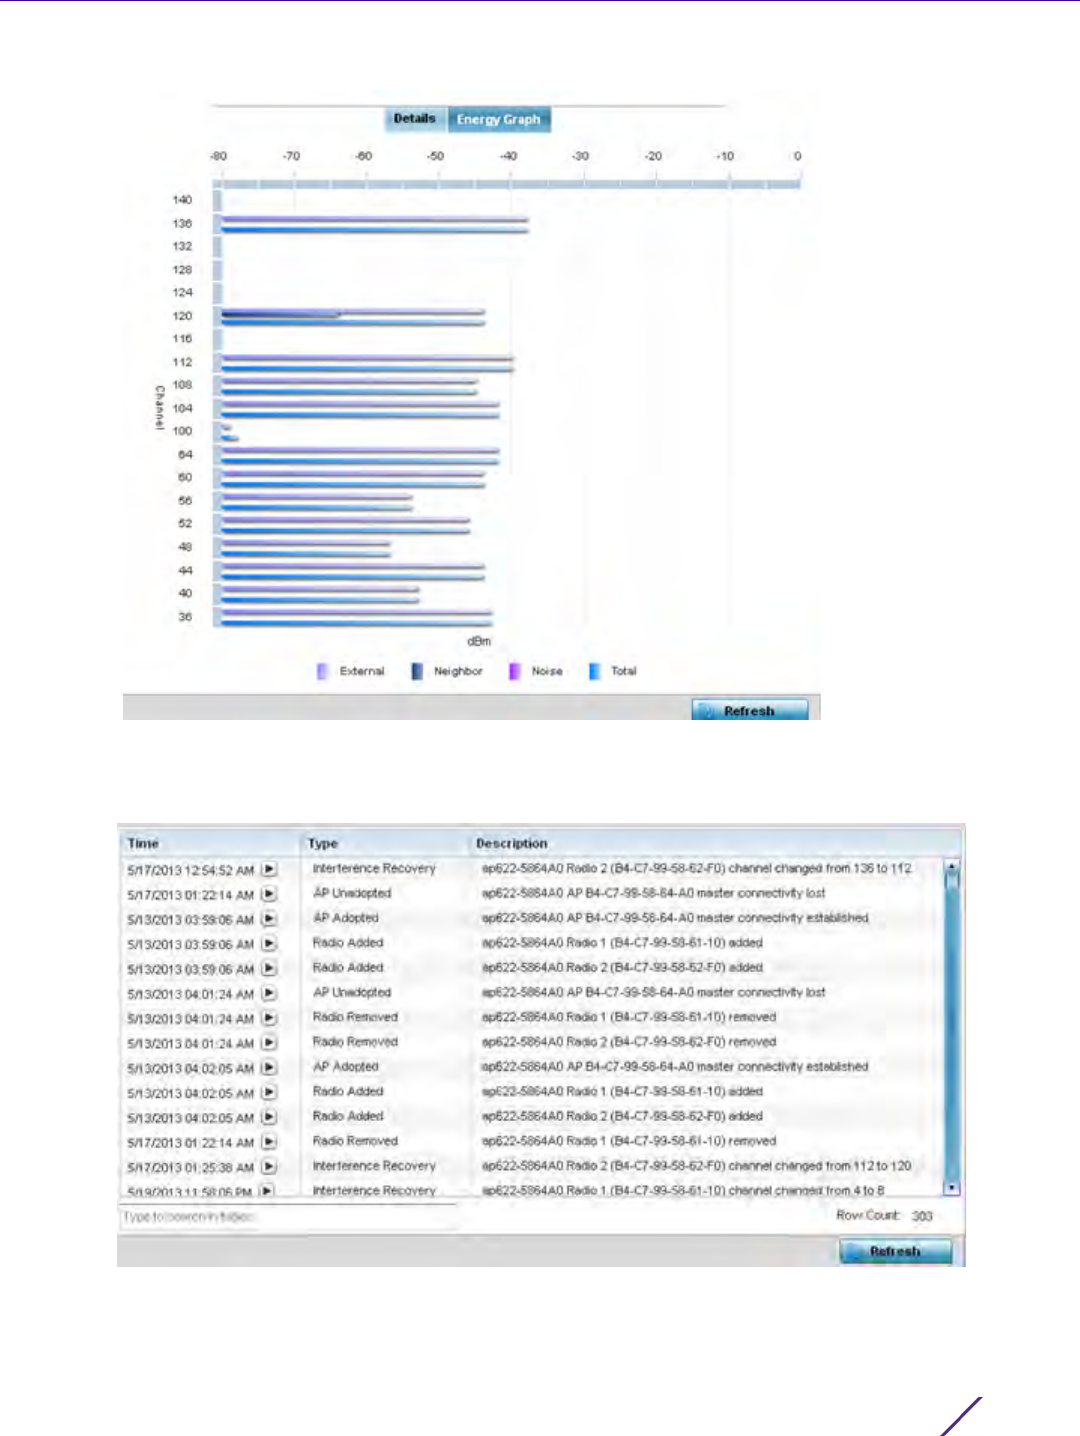
Statistics
Wireless Controller and Service Platform System Reference Guide 15 - 53
Figure 15-29 RF Domain - Smart RF Energy Graph
12 Select Smart RF History to review the descriptions and types of Smart RF events impacting RF Domain member
devices.
Figure 15-30 RF Domain - Smart RF History screen

Statistics
Wireless Controller and Service Platform System Reference Guide 15 - 54
The SMART RF History screen displays the following RF Domain member historical data:
15.2.13 WIPS
RF Domain Statistics
Refer to the Wireless Intrusion Protection Software (WIPS) screens to review a client blacklist and events reported
by a RF Domain member Access Point.
For more information, see:
•WIPS Client Blacklist
•WIPS Events
15.2.13.1 WIPS Client Blacklist
WIPS
The Client Blacklist displays clients detected by WIPS and removed from RF Domain utilization. Blacklisted clients
are not allowed to associate to RF Domain member Access Point radios.
To view the WIPS client blacklist:
1 Select the Statistics menu from the Web UI.
2 Select a RF Domain from under the System node on the top, left-hand side, of the screen.
3Expand the WIPS menu item and select Client Blacklist.
Time Displays a time stamp when Smart RF status was updated on behalf
of a Smart RF adjustment within the selected RF Domain.
Type Lists a high-level description of the Smart RF activity initiated for a RF
Domain member device.
Description Provides a more detailed description of the Smart RF event in respect
to the actual Smart RF calibration or adjustment made to compensate
for detected coverage holes and interference.
Refresh Select the Refresh button to update the statistics counters to their
latest values.
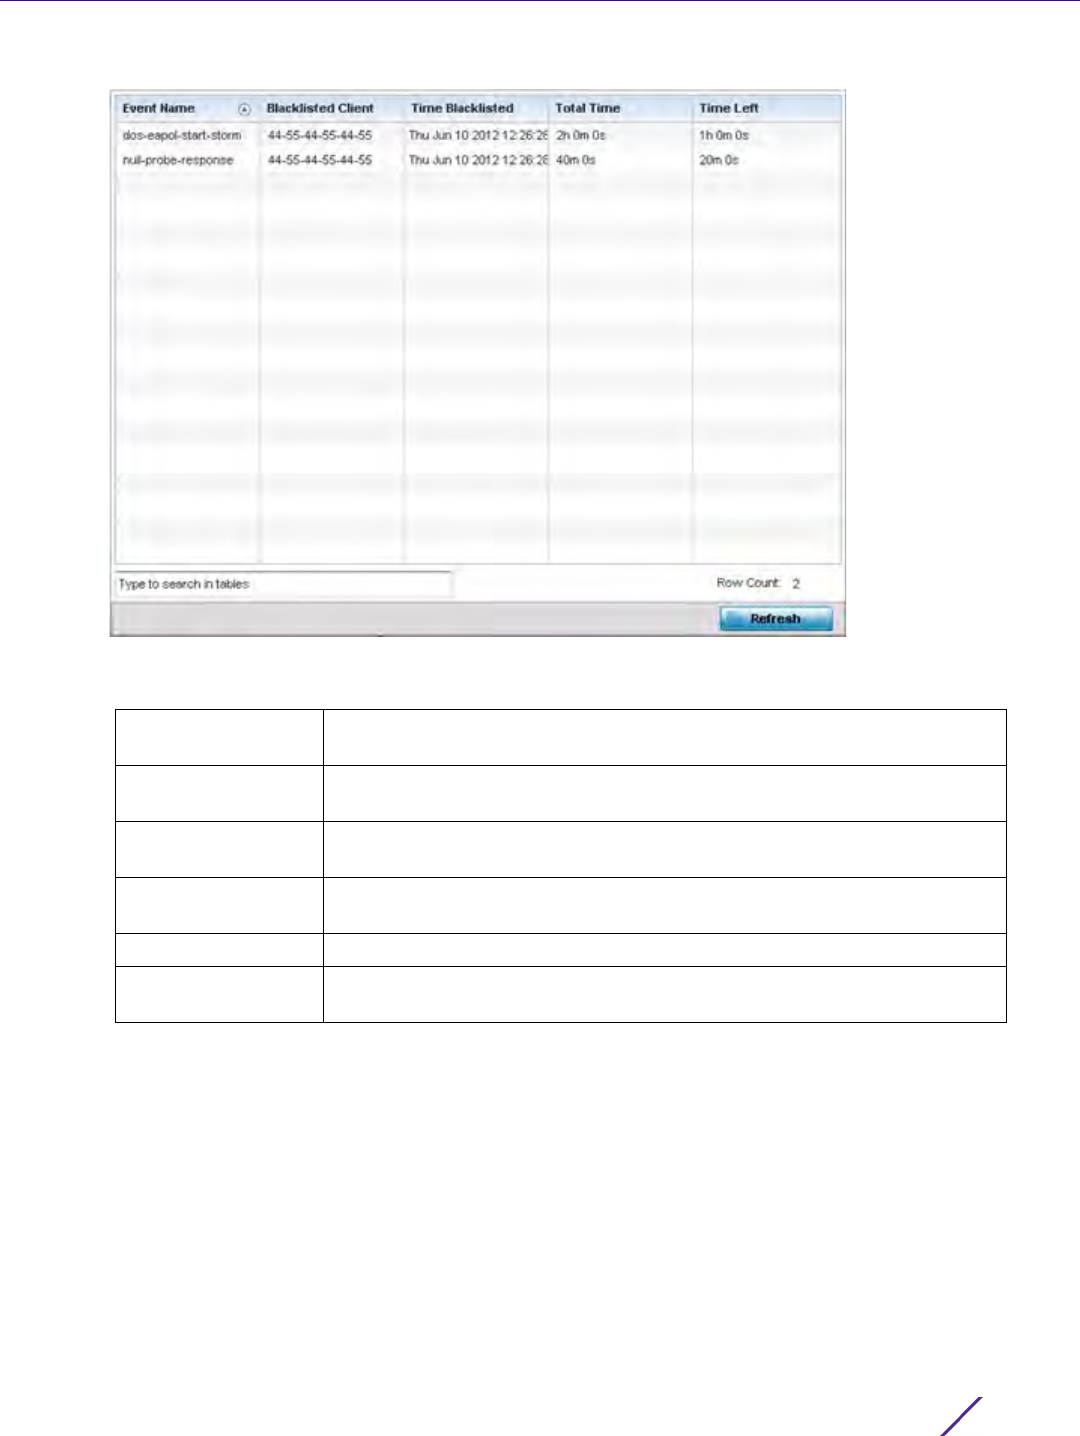
Statistics
Wireless Controller and Service Platform System Reference Guide 15 - 55
Figure 15-31 RF Domain - WIPS Client Blacklist screen
The WIPS Client Blacklist screen displays the following:
15.2.13.2 WIPS Events
WIPS
Refer to the WIPS Events screen to assess WIPS events detected by RF Domain member Access Point radios and
reported to the controller or service platform.
To view the rogue Access Point statistics:
1 Select the Statistics menu from the Web UI.
2 Select a RF Domain from under the System node on the top, left-hand side, of the screen.
3Expand the WIPS menu item and select WIPS Events.
Event Name Displays the name of the blacklisting wireless intrusion event detected by
a RF Domain member Access Point.
Blacklisted Client Displays the MAC address of the unauthorized (blacklisted) client
intruding the RF Domain.
Time Blacklisted Displays the time when the wireless client was blacklisted by a RF Domain
member Access Point.
Total Time Displays the time the unauthorized (now blacklisted) device remained in
the RF Domain.
Time Left Displays the time the blacklisted client remains on the list.
Refresh Select the Refresh button to update the statistics counters to their latest
values.
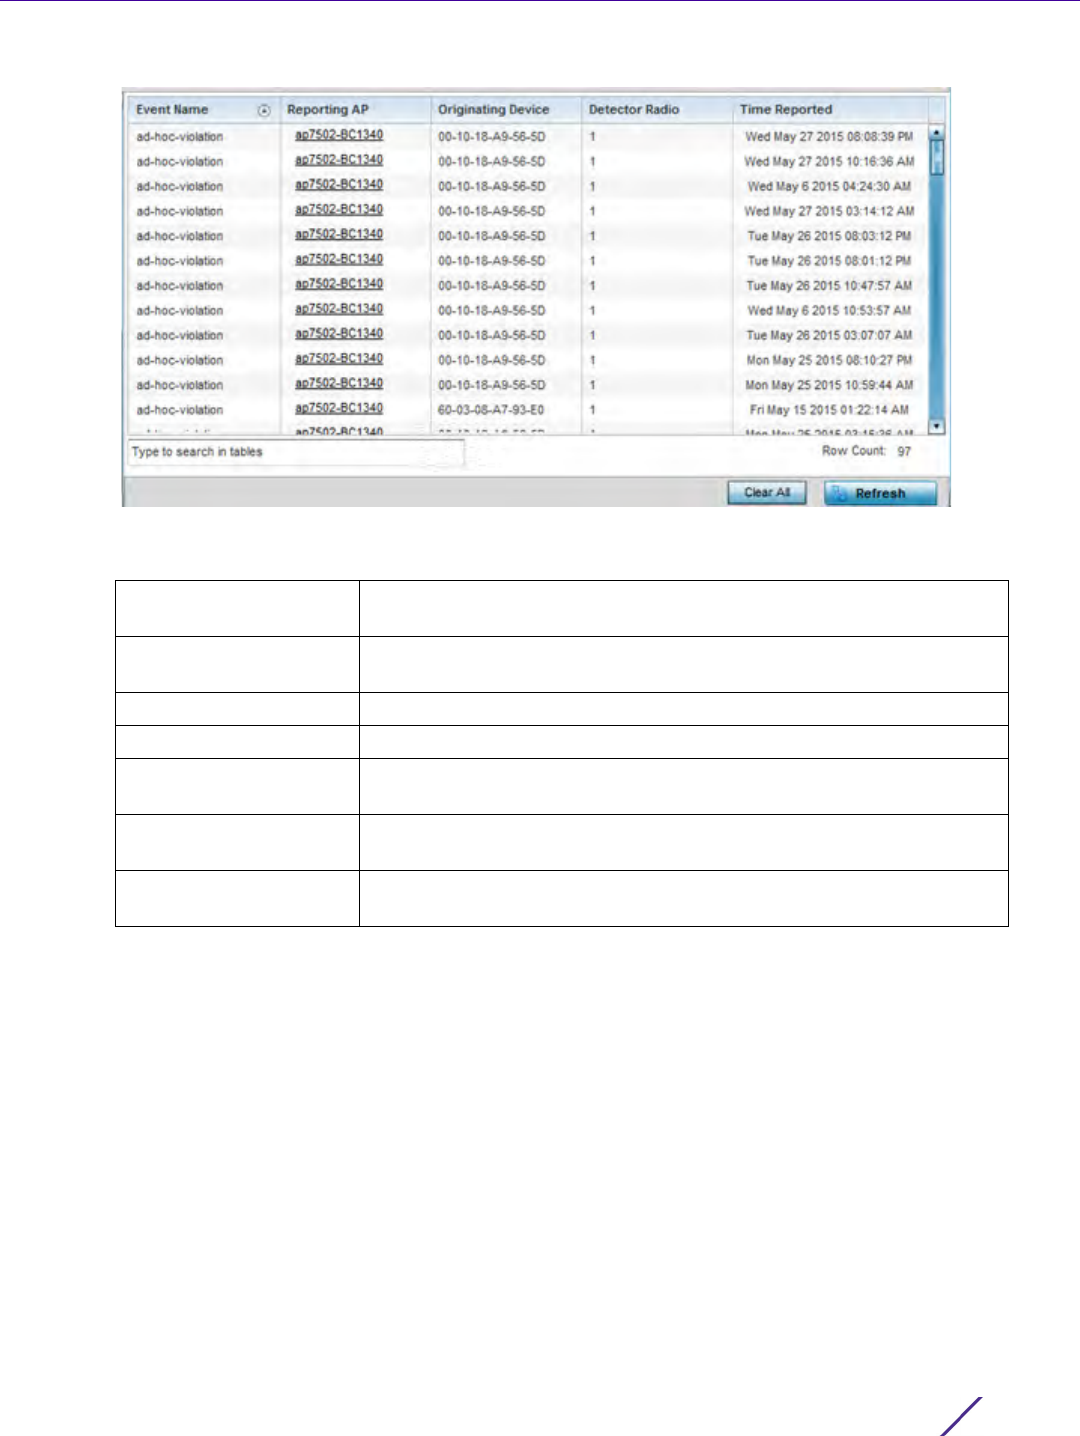
Statistics
Wireless Controller and Service Platform System Reference Guide 15 - 56
Figure 15-32 RF Domain - WIPS Events screen
The WIPS Events screen displays the following:
15.2.14 Captive Portal
RF Domain Statistics
A captive portal is guest access policy for providing guests temporary and restrictive access to the controller or
service platform managed wireless network. Captive portal authentication is used primarily for guest or visitor
access to the network, but is increasingly being used to provide authenticated access to private network resources
when 802.1X EAP is not a viable option. Captive portal authentication does not provide end-user data encryption,
but it can be used with static WEP, WPA-PSK or WPA2-PSK encryption.
To view the RF Domain captive portal statistics:
1 Select the Statistics menu from the Web UI.
2 Select a RF Domain from under the System node on the top, left-hand side, of the screen.
3Select
Captive Portal from the RF Domain menu.
Event Name Displays the event name of the intrusion detected by a RF Domain
member Access Point.
Reporting AP Displays the MAC address of the RF Domain member Access Point
reporting the event.
Originating Device Displays the MAC address of the device generating the event.
Detector Radio Displays the radio number detecting the WIPS event.
Time Reported Displays a time stamp of when the event was reported by the RF
Domain member Access Point radio.
Clear All Select the Clear All button to clear the statistics counters and begin a
new data collection.
Refresh Select the Refresh button to update the statistics counters to their
latest values.
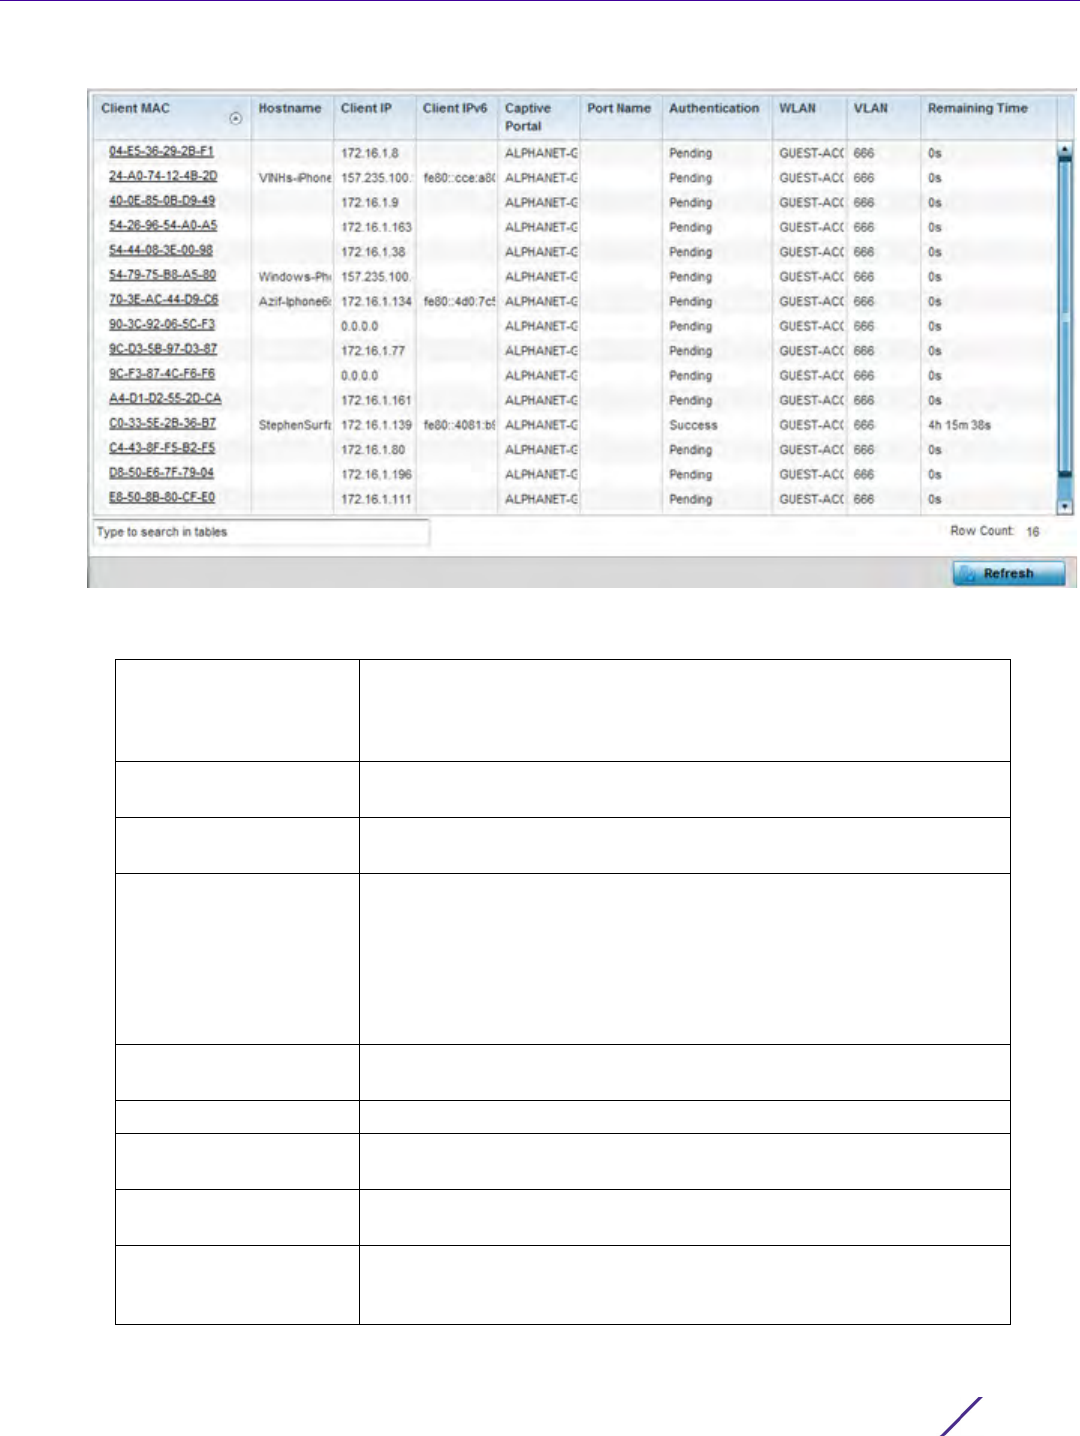
Statistics
Wireless Controller and Service Platform System Reference Guide 15 - 57
Figure 15-33 RF Domain - Captive Portal
The screen displays the following Captive Portal data for requesting clients:
Client MAC Displays the MAC address of each listed client requesting captive
portal access to the controller or service platform managed network.
This address can be selected to display client information in greater
detail.
Hostname Lists the administrator assigned hostname of the device requesting
captive portal access to network’s RF Domain resources.
Client IP Displays the IPv4 formatted address of each listed client using its
connected RF Domain member Access Point for captive portal access.
Client IPv6 Displays any IPv6 formatted address of any listed client using its
connected RF Domain member Access Point for captive portal access.
IPv6 is the latest revision of the Internet Protocol (IP) designed to
replace IPv4. IPV6 provides enhanced identification and location
information for computers on networks routing traffic across the
Internet. IPv6 addresses are composed of eight groups of four
hexadecimal digits separated by colons.
Captive Portal Lists the name of the RF Domain captive portal currently utilized by
each listed client.
Port Name Lists the name virtual port used for captive portal session direction.
Authentication Displays the authentication status of requesting clients attempting to
connect to the controller or service platform via the captive portal.
WLAN Displays the name of the WLAN the requesting client would use for
interoperation with the controller or service platform.
VLAN Displays the name of the VLAN the client would use as a virtual
interface for captive portal operation with the controller or service
platform.
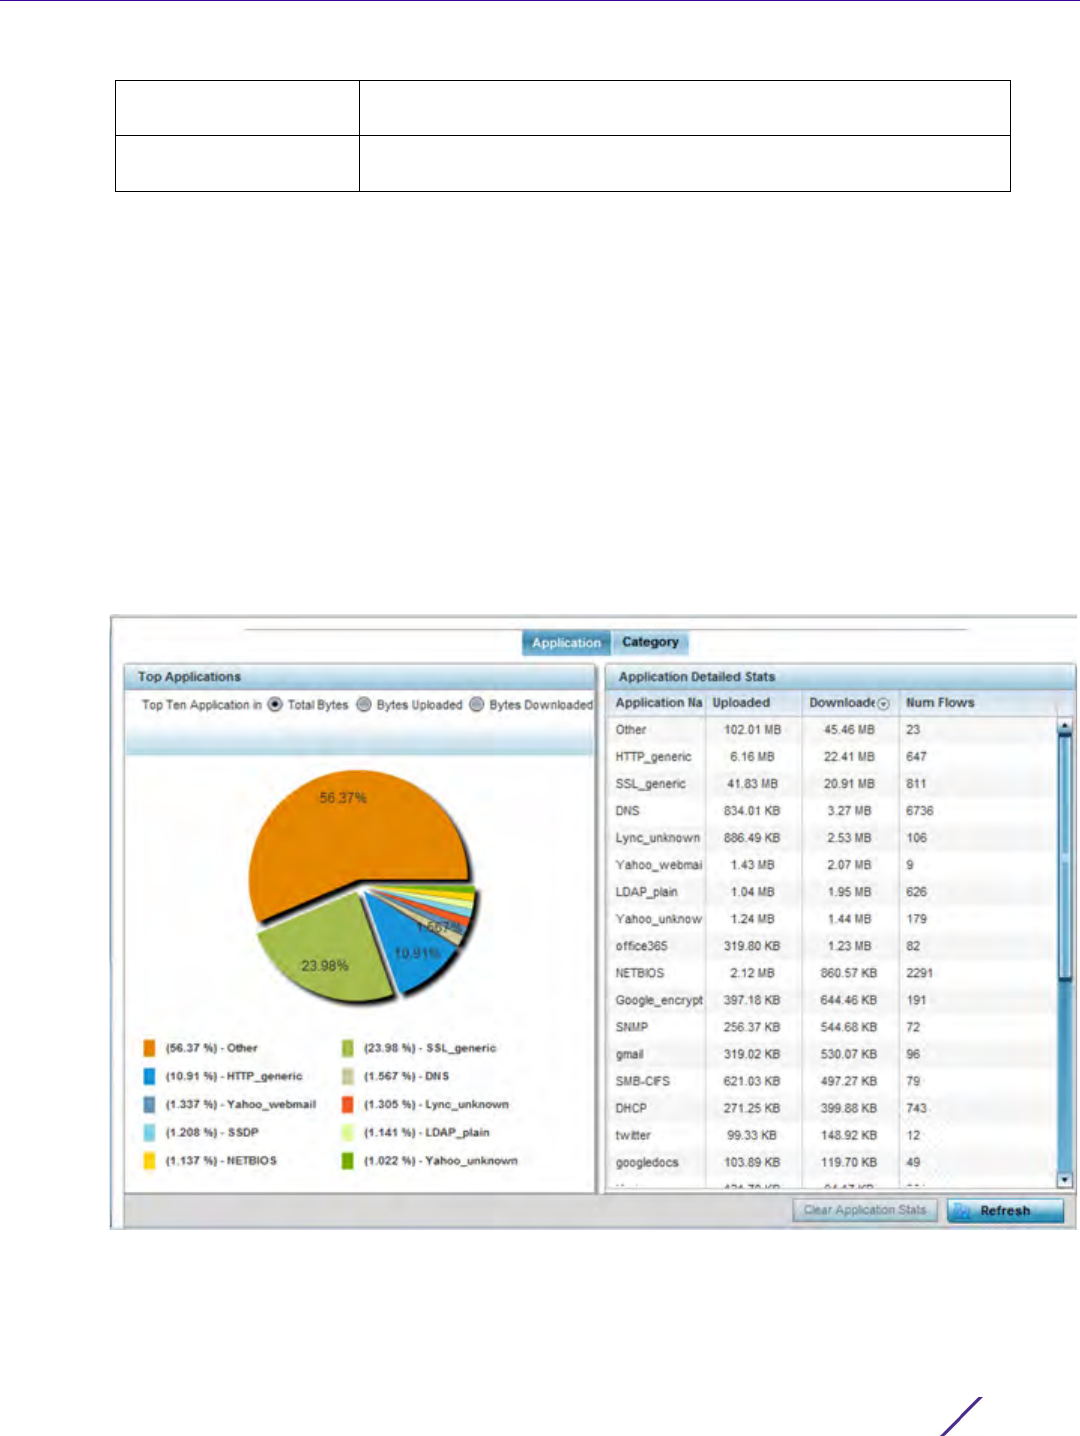
Statistics
Wireless Controller and Service Platform System Reference Guide 15 - 58
15.2.15 Application Visibility (AVC)
RF Domain Statistics
RF Domain member devices inspect every byte of each application header packet allowed to pass through the
WiNG managed network. When an application is recognized and classified by the WiNG application recognition
engine, administrator defined actions can be applied to that specific application. For information on categorizing,
filtering and logging the application data allowed to proliferate the WiNG managed network, refer to Application
Policy on page 7-54 and Application on page 7-58.
To view the RF Domain application utilization statistics:
1 Select the Statistics menu from the Web UI.
2 Select a RF Domain from under the System node on the top, left-hand side, of the screen.
3Select
Application Visibility (AVC) from the RF Domain menu.
Figure 15-34 RF Domain - Application Visibility
Remaining Time Displays the time after which a connected client is disconnected from
the captive portal.
Refresh Select the Refresh button to update the statistics counters to their
latest values.

Statistics
Wireless Controller and Service Platform System Reference Guide 15 - 59
4 Refer to the Top Applications graph to assess the most prolific, and allowed, application data passing through
RF Domain member devices.
5 Refer to the Application Detailed Stats table to assess specific application data utilization:
6 Select the Category tab.
Categories are existing WiNG or user defined application groups (video, streaming, mobile, audio etc.) that
assist administrators in filtering (allowing or denying) application data. For information on categorizing
application data, refer to Application Policy on page 7-54 and Application on page 7-58.
Total Bytes Displays the top ten RF Domain member utilized applications in
respect to total data bytes passing through the RF Domain member
WiNG managed network. These are only the administrator allowed
applications approved for proliferation within the RF Domain member
device.
Bytes Uploaded Displays the top ten RF Domain member applications in respect to
total data bytes uploaded through the RF Domain member WiNG
managed network. If this application data is not aligned with
application utilization expectations, consider allowing or denying
additional applications and categories or adjusting their precedence
(priority).
Bytes Downloaded Displays the top ten RF Domain member applications in respect to
total data bytes downloaded from the RF Domain member WiNG
managed network. If this application data is not aligned with
application utilization expectations, consider allowing or denying
additional applications and categories or adjusting their precedence
(priority).
Application Name Lists the RF Domain member allowed application name whose data
(bytes) are passing through the WiNG managed network.
Uploaded Displays the number of uploaded application data (in bytes) passing
the through the WiNG managed network.
Downloaded Displays the number of downloaded application data (in bytes)
passing the through the WiNG managed network.
Num Flows Lists the total number of application data flows passing through RF
Domain member devices for each listed application. An application
flow can consist of packets in a specific connection or media stream.
Application packets with the same source address/port and
destination address/port are considered one flow.
Clear Application Stats Select this option to clear the application assessment data counters
and begin a new assessment.
Refresh Select the Refresh button to update the statistics counters to their
latest values.
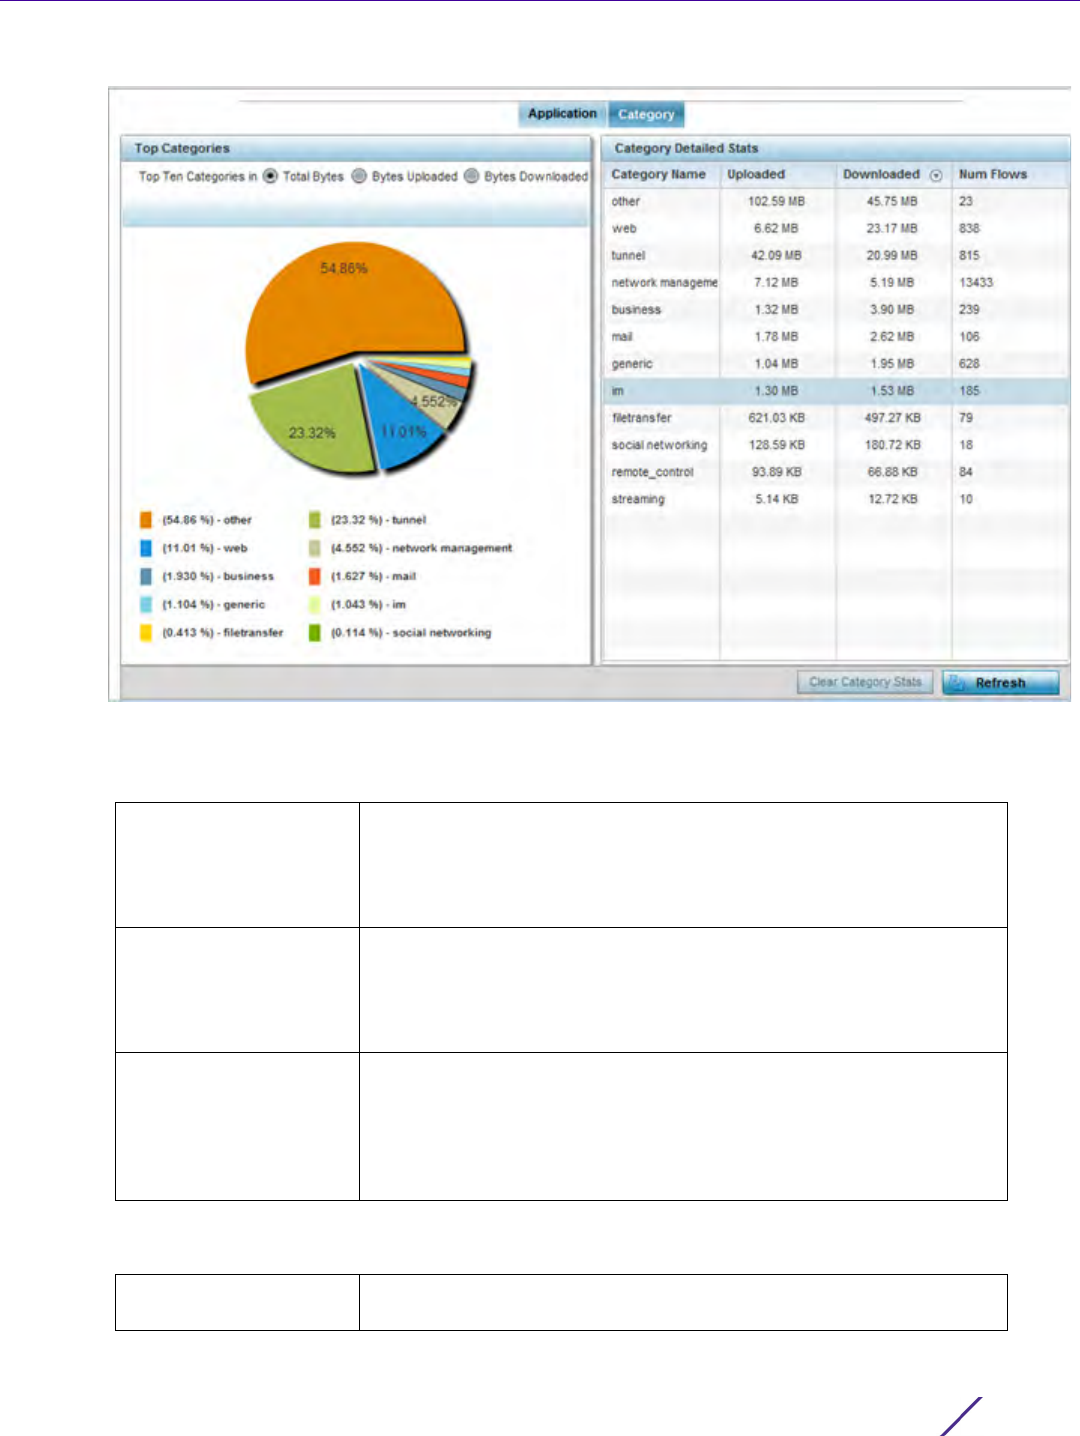
Statistics
Wireless Controller and Service Platform System Reference Guide 15 - 60
Figure 15-35 RF Domain - Application Category Visibility
7 Refer to the Top Categories graph to assess the most prolific, and allowed, application data categories utilized
by RF Domain member devices.
8 Refer to the Category Detailed Stats table to assess specific application category data utilization:
Total Bytes Displays the top ten RF Domain member application categories in
respect to total data bytes passing through the RF Domain member
WiNG managed network. These are only the administrator allowed
application categories approved for proliferation within the RF
Domain.
Bytes Uploaded Displays the top ten RF Domain member application categories in
respect to total data bytes uploaded through the RF Domain member
WiNG managed network. If this category data is not aligned with
application utilization expectations, consider allowing or denying
additional categories or adjusting their precedence (priority).
Bytes Downloaded Displays the top ten RF Domain member application categories in
respect to total data bytes downloaded from the RF Domain member
WiNG managed network. If this category data is not aligned with
application utilization expectations, consider allowing or denying
additional categories and categories or adjusting their precedence
(priority).
Category Name Lists the RF Domain member allowed category whose application data
(in bytes) is passing through the WiNG managed network.

Statistics
Wireless Controller and Service Platform System Reference Guide 15 - 61
15.2.16 Coverage Hole Summary
RF Domain Statistics
Periodically refer to a selected RF Domain’s coverage hole summary to assess the RF Domain member Access
Point radios reporting coverage hole adjustments. When coverage hole recovery is enabled and a deployment area
radio coverage hole is detected, Smart RF determines the radio’s power increase compensation required based on
a reporting client’s signal to noise (SNR) ratio. If a client’s SNR is above the administrator threshold, its connected
Access Point’s transmit power is increased until the noise rate falls below the threshold.
To view a RF Domain’s coverage hole summary:
1 Select the Statistics menu from the Web UI.
2 Select a RF Domain from under the System node on the top, left-hand side, of the screen.
3Select
Coverage Hole Detection from the RF Domain menu and expand this item to display its submenu
options.
4Select
Summary.
Uploaded Displays the number of uploaded application category data (in bytes)
passing the through the WiNG managed network.
Downloaded Displays the number of downloaded application category data (in
bytes) passing the through the WiNG managed network.
Num Flows Lists the total number of application category data flows passing
through RF Domain member devices. A category flow can consist of
packets in a specific connection or media stream. Packets with the
same source address/port and destination address/port are considered
one flow.
Clear Application Stats Select this option to clear the application category assessment data
counters and begin a new assessment.
Refresh Select the Refresh button to update the statistics counters to their
latest values.
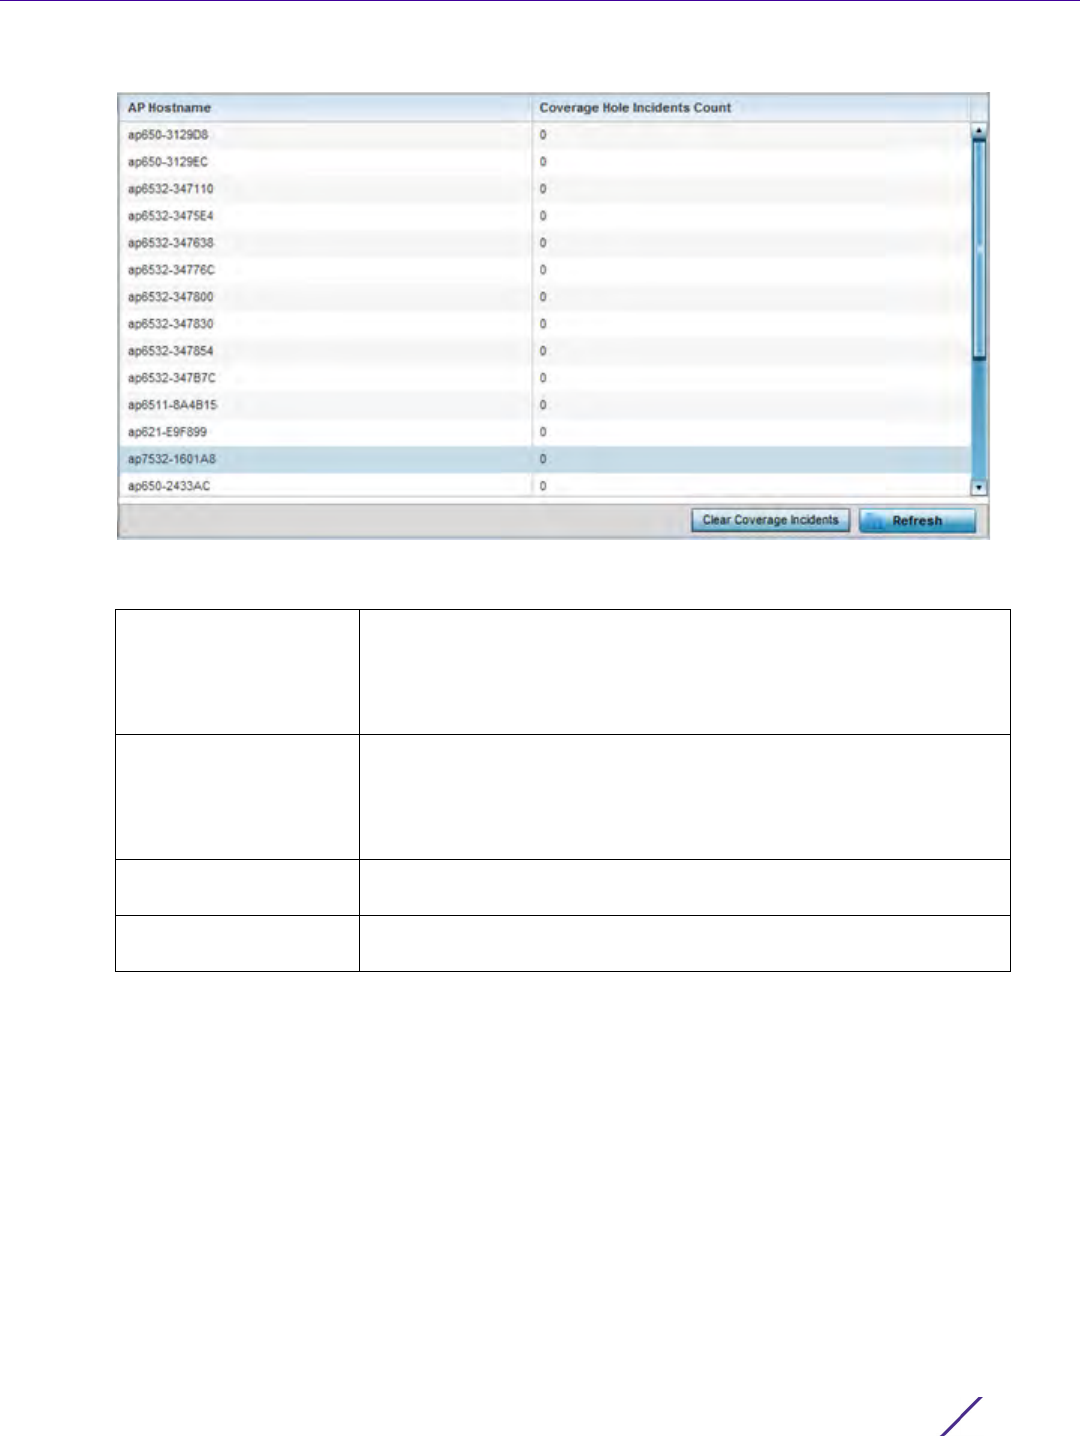
Statistics
Wireless Controller and Service Platform System Reference Guide 15 - 62
Figure 15-36 RF Domain - Coverage Hole Summary
The screen displays the following RF Domain coverage hole summarization data:
15.2.17 Coverage Hole Details
RF Domain Statistics
In addition to the RF Domain’s Coverage Hole Summary, a specific Access Point’s coverage hole history can be
reviewed in detail. Consider using different RF Domain member Access Points or their connected clients to help
validate the data reported before compensating for the coverage hole by increasing the radio transmit power of
neighboring Access Points.
To review specific RF Domain member Access Point coverage hole information:
1 Select the Statistics menu from the Web UI.
2 Select a RF Domain from under the System node on the top, left-hand side, of the screen.
AP Hostname Displays each RF Domain member Access Point hostname reporting a
coverage hole compensation event. This can be helpful in assessing
whether specific Access Points consistently report coverage holes and
whether additional Access Point placements are required to
compensate for poorly performing radios.
Coverage Hole Incidents
Count
Lists each reporting Access Point’s coverage hole incident count since
the screen was last cleared. Periodically assess whether a specific
Access Point’s high incident count over a trended repeatable period
warrants additional Access Point placements in that same radio
coverage area to reduce a coverage hole.
Clear Coverage
Incidents
Select this option to clear the statistics counters and begin a new
coverage hole summary for RF Domain member Access Point radios.
Refresh Select the Refresh button to update the statistics counters to their
latest values.
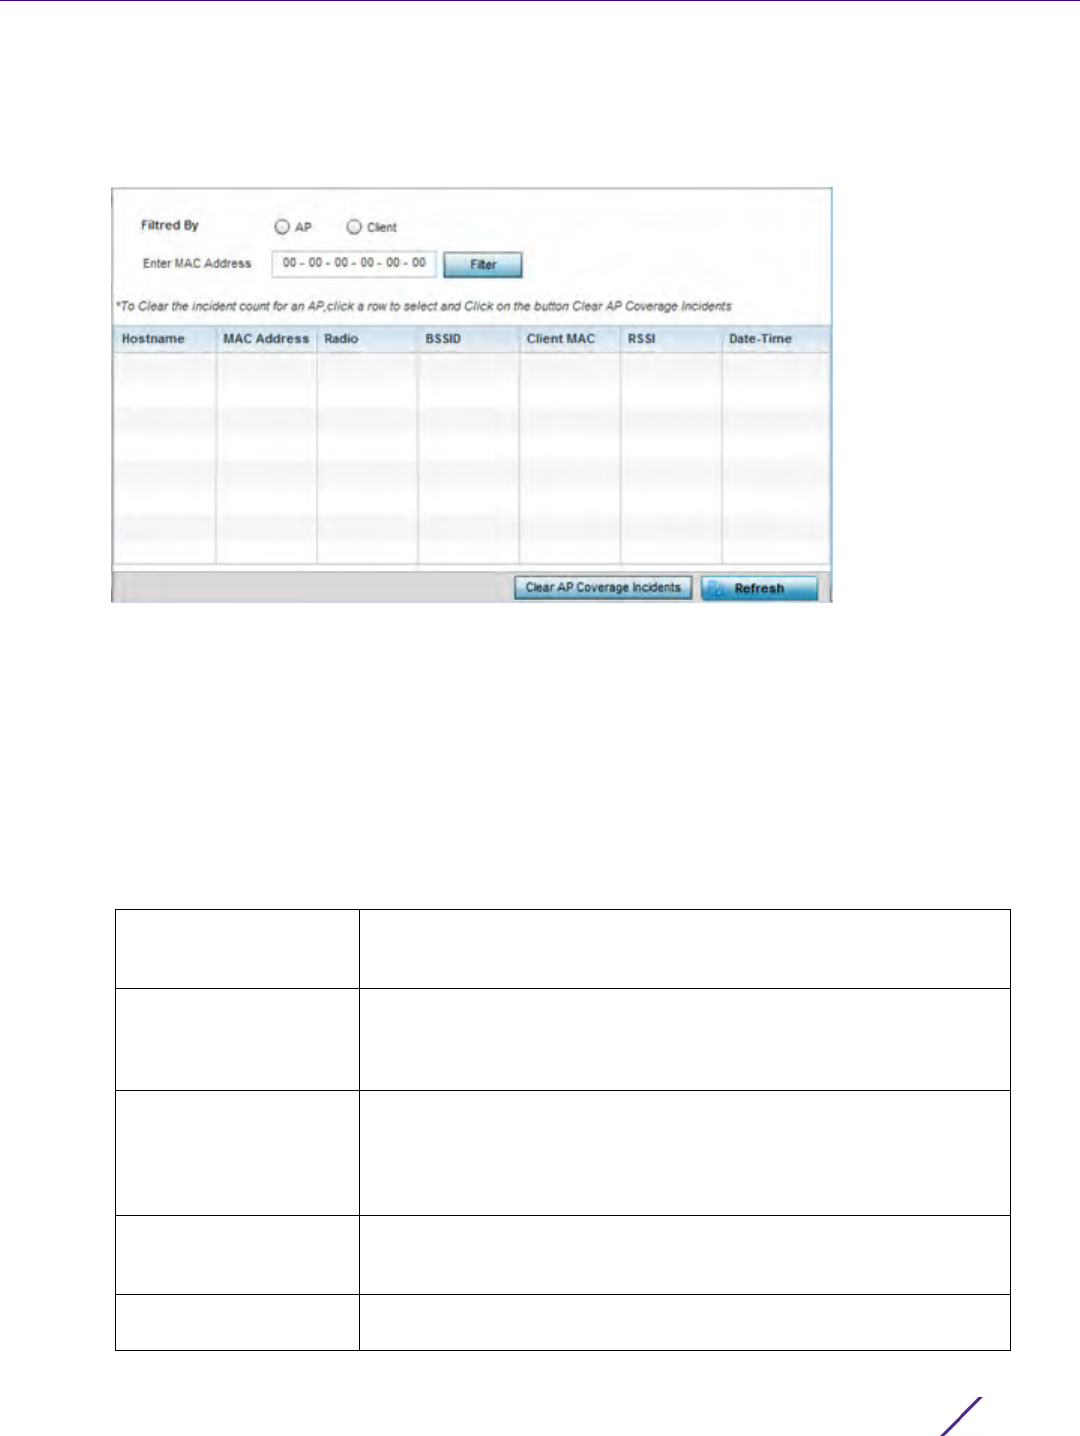
Statistics
Wireless Controller and Service Platform System Reference Guide 15 - 63
3Select
Coverage Hole Detection from the RF Domain menu and expand this item to display its submenu
options.
4Select
Detail.
Figure 15-37 RF Domain - Coverage Hole Details
5Use the Filtered By option to define whether the RF Domain’s coverage hole details are provided by a selected
Access Point (AP) or by a specific RF Domain member Access Point’s connected Client. Consider filtering by
different RF Domain member devices to validate the accuracy of a reported coverage hole before increasing the
transmit power of neighboring radios to compensate.
6 Refer to the Enter MAC Address parameter to define a RF Domain member Access Point MAC address or
Hostname or just a client MAC address. This is the selected device reporting coverage hole details to the listed
RF Domain member Access Point.
7Select
Filter to begin the coverage hole data collection using the Access Point or client details provided. Refer
to the following to review the data reported:
Hostname Lists the administrator assigned hostname used as each listed Access
Point’s network identifier. This is the Access Point whose client(s) are
reporting coverage hole RSSI data.
Radio Lists the Access Point radio receiving and reporting coverage hole RSSI
data from the listed client MAC. Each supported Access Point has at
least two radios, with the exception of AP6521 model, which is a single-
radio model.
BSSID Displays the basic service set identifier (BSSID) included in an Access
Point’s wireless packet transmissions. Packets need to go to their
correct destination. While a SSID keeps packets within the correct
WLAN there’s usually multiple Access Points within each WLAN. A
BSSID identifies the correct Access Point and its connected clients.
Client MAC Lists each connected client’s hardware encoded MAC address. This is
the client reporting coverage hole RSSI data to its connected Access
Point radio.
RSSI Displays the Received Signal Strength Indicator (RSSI) of the detecting
Access Radio or client.

Statistics
Wireless Controller and Service Platform System Reference Guide 15 - 64
15.3 Controller Statistics
Statistics
The Wireless Controller screen displays information about peer controllers or service platforms and their connected
Access Points. As members of a cluster, a controller or service platform manages its own network and is ready to
assume the load of an offline peer. The screen displays detailed statistics which include network health, inventory
of devices, wireless clients, adopted APs, rogue APs and WLANs. For more information, refer to the following:
•Health
•Device
•Cluster Peers
•Web-Filtering
•Application Visibility (AVC)
•Application Policy
•Device Upgrade
•Mirroring
•Adoption
•AP Detection
•Guest User
•Wireless LANs
•Policy Based Routing
•Radios
•Mesh
•Interfaces
•RAID Statistics
•Border Gateway Protocol (BGP) Statistics
•Power Status
•PPPoE
•OSPF
•L2TPv3
•VRRP
•Critical Resources
•LDAP Agent Status
•Mint Links
•Guest Users
•GRE Tunnels
•Dot1x
•Network
•DHCPv6 Relay & Client
Date-Time Displays the date and time when each listed Access Point received its
coverage hole indecent information.
Clear Coverage
Incidents
Select this option to clear the statistics counters and begin a new
coverage hole assessment for RF Domain member Access Point radios.
Refresh Select the Refresh button to update the statistics counters to their
latest values.

Statistics
Wireless Controller and Service Platform System Reference Guide 15 - 65
•DHCP Server
•Firewall
•VPN
•Viewing Certificate Statistics
•WIPS Statistics
•Sensor Server
•Bonjour Services
•Captive Portal Statistics
•Network Time
15.3.1 Health
Controller Statistics
The Health screen displays details such as hostname, device name, RF Domain name, radio RF quality and client
RF quality.
To view controller or service platform device health data:
1 Select the Statistics tab from the Web UI.
2 Select a Wireless Controller node from the left navigation pane.
3Select Health from the left-hand side of the UI.
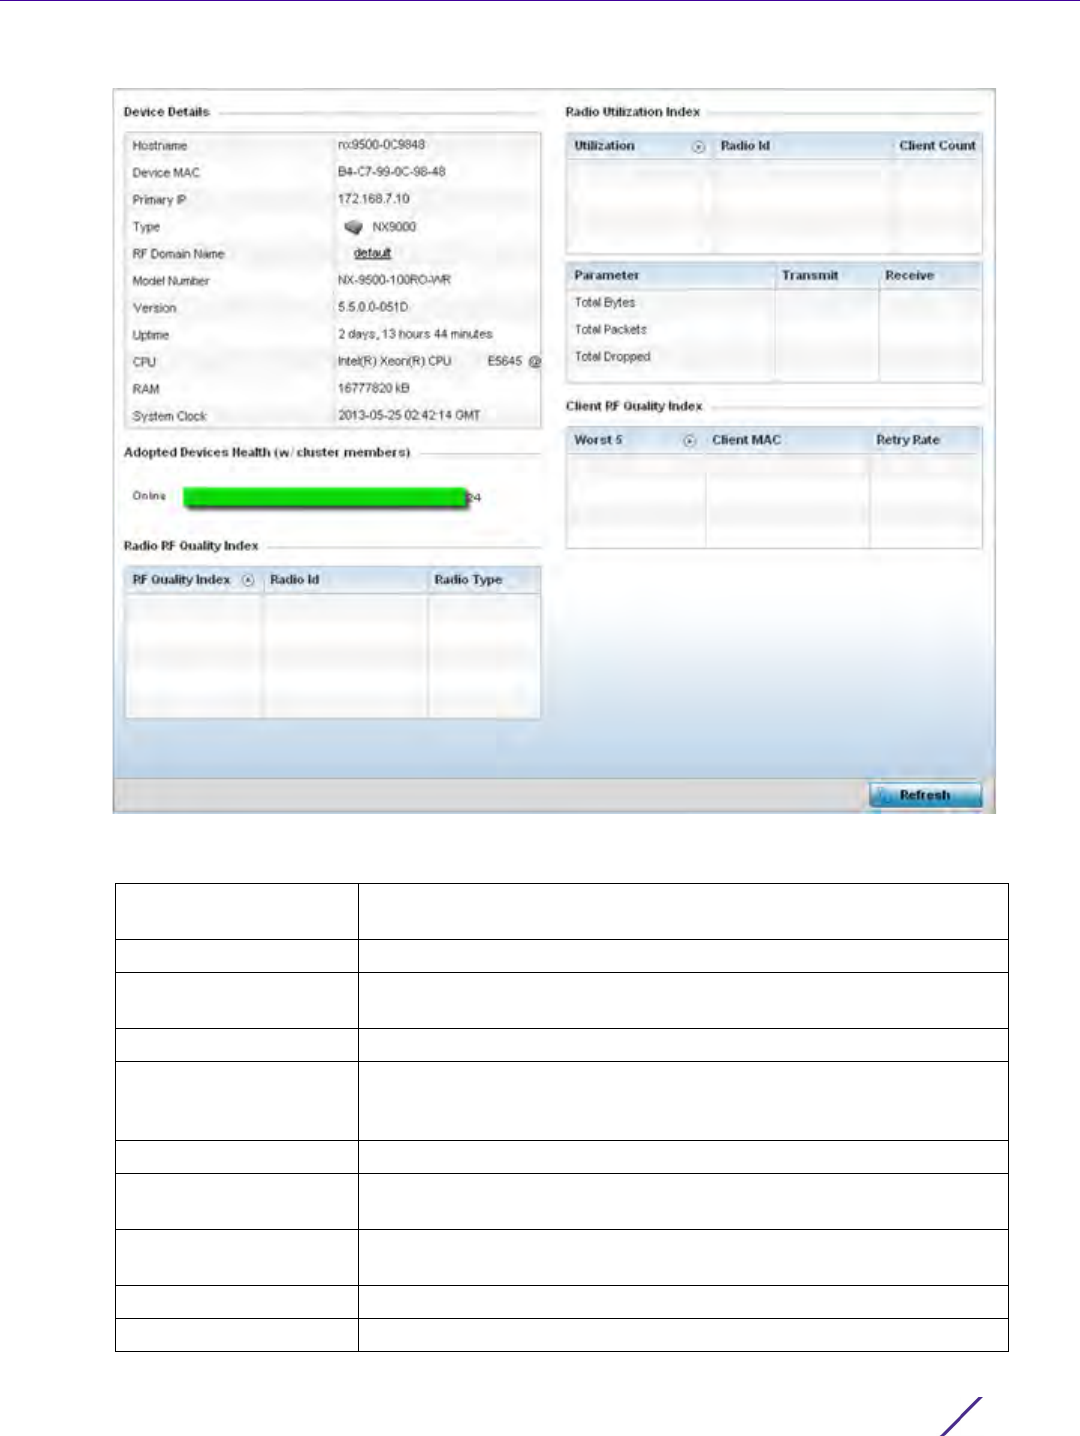
Statistics
Wireless Controller and Service Platform System Reference Guide 15 - 66
Figure 15-38 Wireless Controller - Health screen
The Device Details field displays the following:
Hostname Displays the administrator assigned hostname of the controller or
service platform.
Device MAC Displays the MAC address of the controller.
Primary IP Lists the network address used by this controller or service platform as
a network identifier.
Type Displays the RFS series controller or NX series service platform type.
RF Domain Name Displays the controller’s domain membership. The name displays in the
form of a link that can be selected to display a detailed description of
the RF Domain configuration.
Model Number Displays the RFS series controller or NX series service platform type.
Version Displays the version of the image running on the controller or service
platform.
Uptime Displays the cumulative time since the controller or service platform
was last rebooted or lost power.
CPU Displays the controller or service platform processor name.
RAM Displays the CPU memory in use.

Statistics
Wireless Controller and Service Platform System Reference Guide 15 - 67
The Access Point Health (w/ cluster members) chart shows how many Access Points are online and how many
are offline. These are APs with cluster members directly managed by the wireless controller. This data does not
include Access Points associated to other controllers or service platforms in the same cluster.
The Radio RF Quality Index field displays RF quality (overall effectiveness of the RF environment). Use this
table to assess radio performance for improvement ideas.
The RF Quality Index field displays the following:
The Radio Utilization Index field measures how efficiently the traffic medium is used. It’s defined as the
percentage of the current throughput relative to the maximum relative possible throughput:
The Client RF Quality Index field displays the RF quality of the clients. Use this table to troubleshoot radios not
optimally performing:
4Select
Refresh to update the statistics counters to their latest values.
15.3.2 Device
Controller Statistics
The Device statistics screen provides detailed information about the selected device.
To view controller or service platform device statistics:
1 Select the Statistics tab from the Web UI.
2 Select a Wireless Controller node from the left navigation pane.
3Select Device from the left-hand side of the UI.
System Clock Displays the system clock information.
RF Quality Index Displays the five radios with the lowest average quality.
Radio Id Displays the hardware encoded MAC address of the radio.
Radio Type Displays the radio type used by this Access Point.
Total Bytes Displays the total bytes of data transmitted and received by the
controller or service platform since the screen was last refreshed.
Total Packets Lists the total number of data packets transmitted and received by the
controller or service platform since the screen was last refreshed.
Total Dropped List the number of dropped data packets by a controller or service
platform managed Access Point radio since the screen was last
refreshed.
Worst 5 Displays the five client radios with the lowest quality indices.
Client MAC Displays the MAC address of the client.
Retry Rate Displays the excessive retry rate of each listed controller or service
platform managed client.
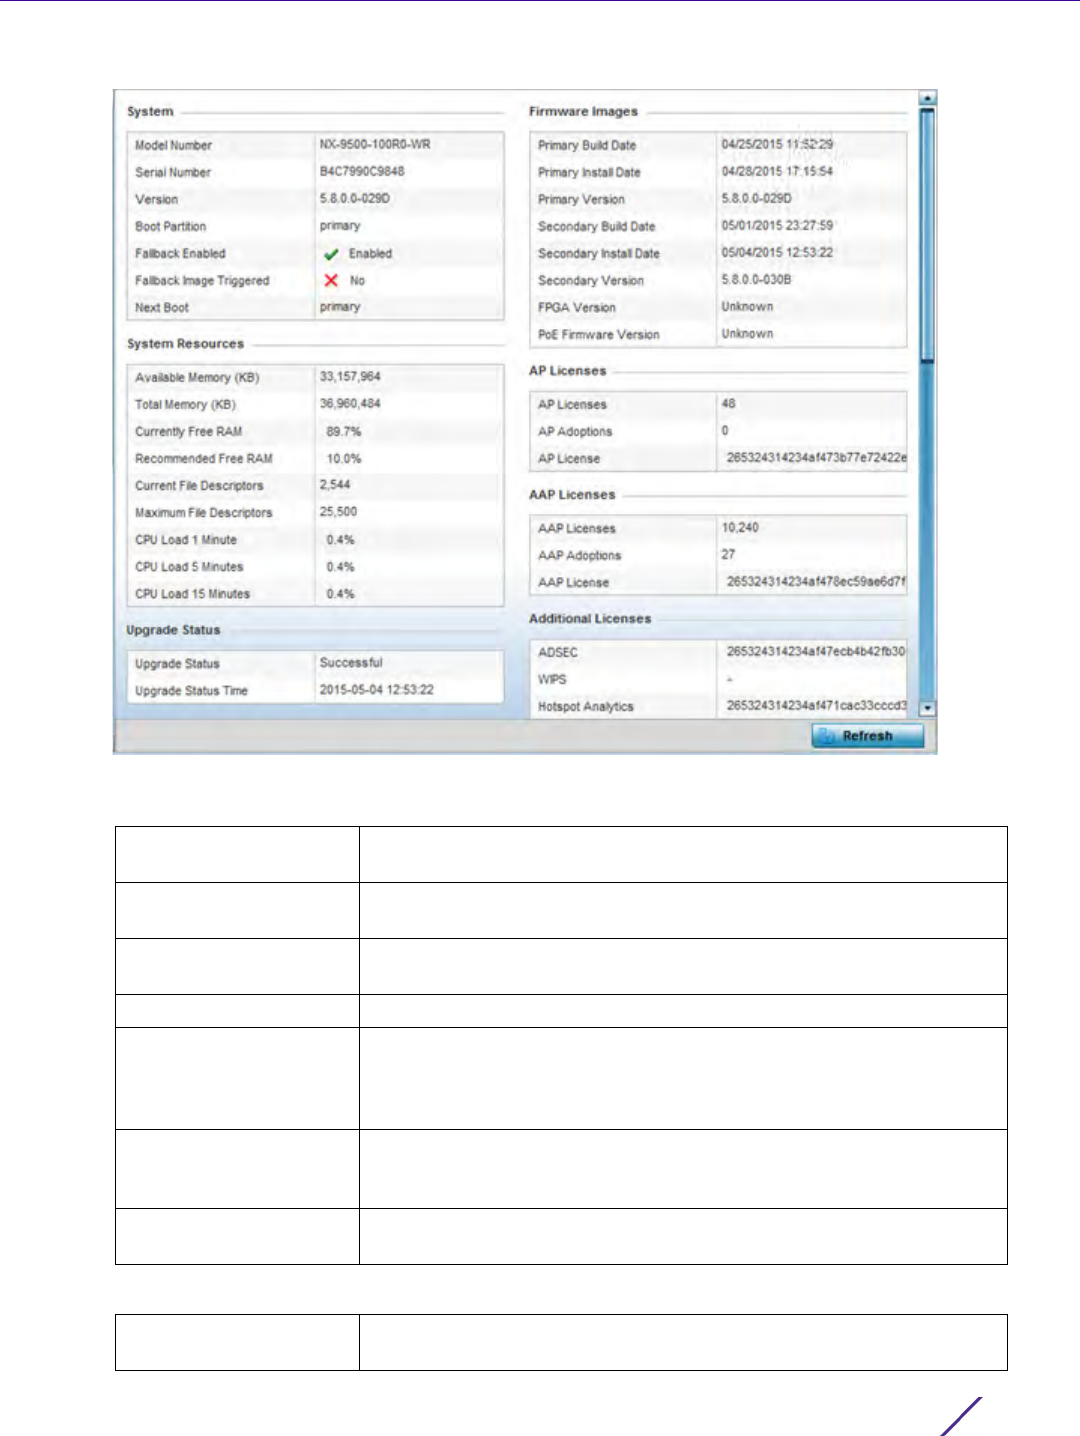
Statistics
Wireless Controller and Service Platform System Reference Guide 15 - 68
Figure 15-39 Wireless Controller - Device screen
The System field displays the following:
The System Resources field displays the following:
Model Number Displays the model number for the selected controller or service
platform.
Serial Number Displays the serial number factory encoded on the controller or service
platform at the factory.
Version Displays the unique alphanumeric firmware version name for the
controller or service platform firmware.
Boot Partition Displays the boot partitioning type.
Fallback Enabled Displays whether fallback is enabled. The fallback feature enables a
user to store both a legacy and new firmware version in memory. You
can test the new software and use an automatic fallback mechanism,
which loads the old version, if the new version fails.
Fallback Image
Triggered
Displays whether the fallback image has been triggered. The fallback is
a legacy software image stored in device memory. This allows an user
to test a new version and revert to the older version if needed.
Next Boot Designates this version as the version used the next time the controller
or service platform is booted.
Available Memory (MB) Displays the available memory (in MB) available on the selected
controller or service platform.

Statistics
Wireless Controller and Service Platform System Reference Guide 15 - 69
The Upgrade Status field displays firmware upgrade statistics. The table provides the following:
The IP Domain field displays the following:
The Fan Speed field displays the following:
The Temperature field displays the following:
The Kernal Buffers field displays the following:
Total Memory (MB) Displays the controller or service platform’s total memory.
Currently Free RAM Displays the Access Point’s free RAM space. If its very low, free up
some space by closing some processes.
Recommended Free
RAM
Displays the recommended RAM required for routine operation.
Current File Descriptors Displays the controller or service platform’s current file description.
Maximum File Current
File Descriptors
Displays the controller or service platform’s maximum file description.
CPU Load 1 Minute Lists the typical controller or service platform processor load over 1
minute.
CPU Load 5 Minutes Lists the typical controller or service platform processor load over 5
minutes.
CPU Load 15 Minutes Lists the typical controller or service platform processor load over 15
minutes.
Upgrade Status Displays whether the image upgrade was successful.
Upgrade Status Time Displays the time of the upgrade.
IP Domain Name Displays the name of the IP Domain service used with the selected
controller or service platform.
IP Domain Lookup state Lists the current state of the lookup operation.
Number Displays the number of fans supported on the this controller or service
platform.
Speed (Hz) Displays the fan speed in Hz.
Number Displays the number of temperature elements used by the controller or
service platform.
Temperature Displays the current temperature (in Celsius) to assess a potential
Access Point overheat condition.
Buffer Size Lists the sequential buffer size.
Current Buffers Displays the current buffers available to the selected controller or
service platform.
Maximum Buffers Lists the maximum buffers available to the selected controller or
service platform.

Statistics
Wireless Controller and Service Platform System Reference Guide 15 - 70
The Firmware Images field displays the following:
The AP Licenses field displays the following:
The AAP Licenses field displays the following:
The Additional Licenses area displays the following information:
The IP Name Servers table displays the following:
Primary Build Date Displays the build date when this version was created.
Primary Install Date Displays the date this version was installed on the controller or service
platform.
Primary Version Displays the primary version string.
Secondary Build Date Displays the build date when this secondary version was created.
Secondary Install Date Displays the date this secondary version was installed on the controller
or service platform.
Secondary Version Displays the secondary version string.
FGPA Version Displays the version of FGPA firmware used by the controller or
service platform.
PoE Version Firmware Lists the Power-Over-Ethernet (PoE) version firmware.
AP Licenses Displays the number of AP licenses currently available on the
controller or service platform. This value represents the maximum
number of licenses the controller or service platform can adopt.
AP Adoptions Displays the number of Access Points adopted by this controller or
service platform.
AP License Displays the license string of the AP.
AAP Licenses Displays the number of AAP licenses currently available on the
controller or service platform. This value represents the maximum
number of licenses the controller or service platform can adopt.
AAP Adoptions Displays the number of adaptive Access Points adopted by this
controller or service platform.
AAP License Displays the license string of the adaptive Access Point.
ADSEC Displays Advanced Security licenses. This enables the Role Based
firewall and increases the number of IP Sec VPN tunnels. The
maximum number of IP Sec VPN tunnels varies by platform.
WIPS Displays the number of WIPS licenses utilized by the controller or
service platform.
Hotspot Analytics Displays whether an advanced hotspot analytics license is in use and
applied to the controller or service platform.
Name Server Displays any custom Name Server mappings on the controller or
service platform.
Type Displays the type of DNS mapping, if any, on the controller or service
platform.

Statistics
Wireless Controller and Service Platform System Reference Guide 15 - 71
The IPv6 Name Servers table displays the following:
The IPv6v Hop Limit table displays the following:
The IPv6 Delegated Prefixes table displays the following:
15.3.3 Cluster Peers
Controller Statistics
Refer to the Cluster Peers screen to review device address and version information for peer devices within a
cluster.
To view controller or service platform cluster peer statistics:
1 Select the Statistics tab from the Web UI.
2 Select a Wireless Controller node from the left navigation pane.
3Select
Cluster Peers from the left-hand side of the UI.
Name Server Displays any custom IPv6 formatted IP address Name Server mappings
on the controller or service platform.
Type Displays the type of DNS mapping, if any, on the controller or service
platform.
Hop Limit Lists the maximum number of times IPv6 traffic can hop. The IPv6
header contains a hop limit field that controls the number of hops a
datagram can be sent before being discarded (similar to the TTL field
in an IPv4 header).
IPv6 Delegated Prefix If IPv6, prefix delegation is used to assign a network address prefix,
configuring the controller or service platform with the prefix.
Prefix Name Lists the 32 character maximum name for the IPv6 delegated prefix
used as an easy to remember alias for an entire IPv6 address.
DHCPv6 Client State Displays the current DHCPv6 client state as impacted by the IPv6
delegated prefix.
Interface Name Lists the interface over which IPv6 prefix delegation occurs.
T1 timer (seconds) Lists the amount of time in seconds before the DHCP T1 (delay before
renew) timer expires.
T2 timer (seconds) Lists the amount of time in seconds before the DHCP T2 (delay before
rebind) timer expires.
Last Refreshed
(seconds)
Lists the time, in seconds, since IPv6 prefix delegation has been
updated.
Preferred Lifetime
(seconds)
Lists is the time in seconds (relative to when the packet is sent) the
IPv6 formatted addresses remains in a preferred state on the selected
interface. The preferred lifetime must always be less than or equal to
the valid lifetime.
Valid Lifetime (seconds) Displays the time in seconds (relative to when the packet is sent) the
IPv6 formatted address remains in a valid state on the selected
interface. The valid lifetime must always be greater than or equal to
the preferred lifetime.
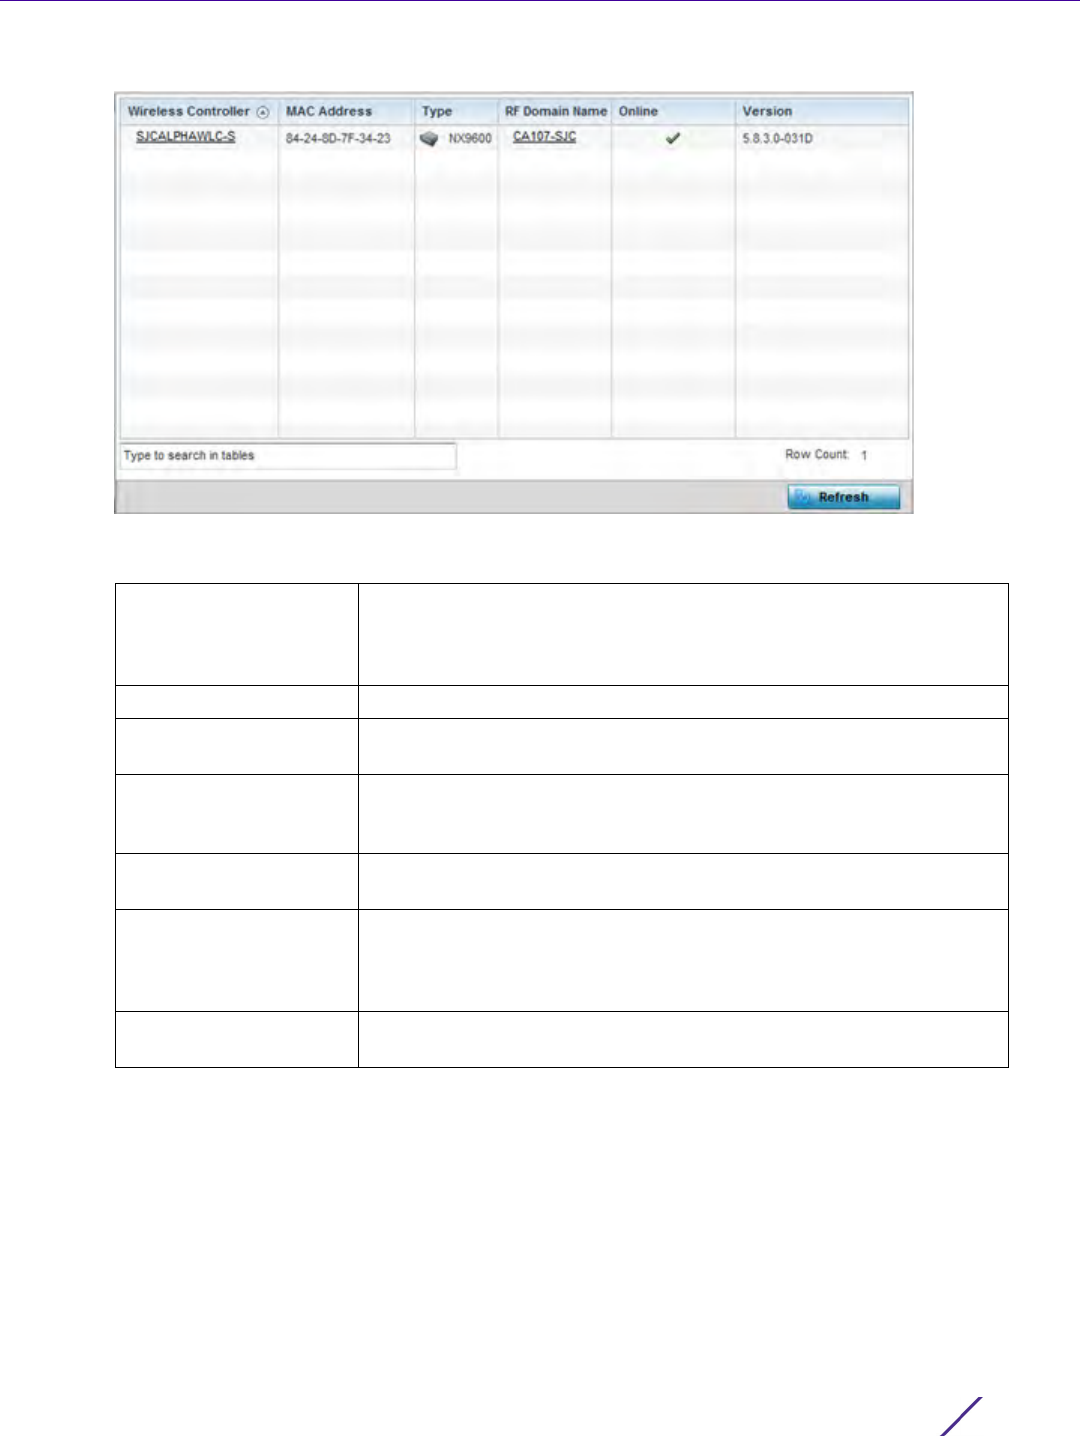
Statistics
Wireless Controller and Service Platform System Reference Guide 15 - 72
Figure 15-40 Wireless Controller - Cluster Peers screen
The Cluster Peers screen displays the following:
15.3.4 Web-Filtering
Controller Statistics
The Web-Filtering screen displays information on Web requests for content and whether the requests were
blocked or approved based on URL filter settings defined for the selected controller or service platform. A URL
filter is comprised of several filter rules. A whitelist bans all sites except the categories and URL lists defined in the
whitelist. The blacklist allows all sites except the categories and URL lists defined in the blacklist.
To view this controller’s Web filter statistics:
Wireless Controller Displays the IP addresses of current cluster member controller or
service platform. The name displays in the form of a link that can be
selected to display a detailed description of the controller or service
platform’s configuration.
MAC Address Displays the MAC addresses of current cluster members.
Type Displays the type of cluster peer (by controller or service platform
model).
RF Domain Name Displays each member’s RF Domain name. The name displays in the
form of a link that can be selected to display a detailed description of
the RF Domain’s configuration.
Online Displays whether a controller or service platform is online. If online, a
green check mark displays, if it is offline a red X displays.
Version Displays the numeric firmware version currently running on the
controller or service platform. Use this version as the basis for
comparison on whether newer versions are available from the support
site that may provide increased functionality and a broader feature set.
Refresh Select the Refresh button to update the screen’s statistics counters to
their latest values.
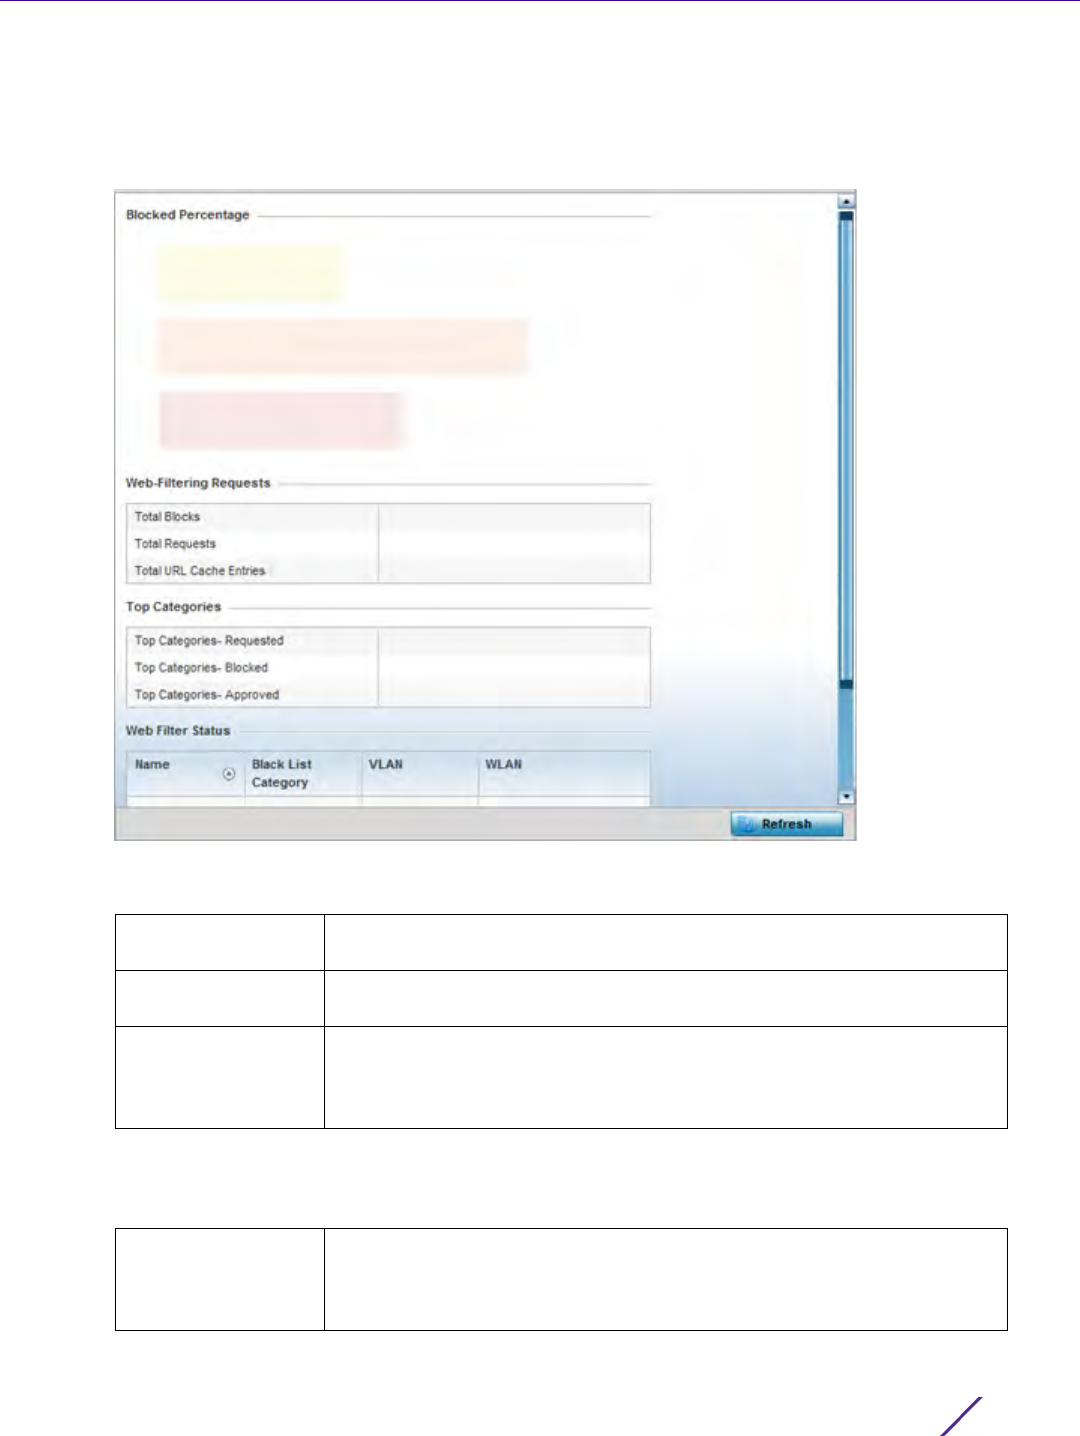
Statistics
Wireless Controller and Service Platform System Reference Guide 15 - 73
1 Select the Statistics menu from the Web UI.
2 Select a Wireless Controller node from the left navigation pane.
3Select
Web-Filtering.
Figure 15-41 Wireless Controller - Web Filtering screen
The Web-Filtering Requests field displays the following information:
The Top Categories field helps administrators assess the content most requested, blocked and approved based
on the defined whitelist and blacklist permissions:
Total Blocks Lists the number of Web request hits against content blocked in the URL
blacklist.
Total Requests Lists the total number of requests for URL content cached locally on this
controller or service platform.
Total URL Cache
Entries
Displays the number of chached URL data entries made on this controller
or service platform on the request of requesting clients requiring URL data
managed by the controller or service platform and their respective
whitelist or blacklist.
Top Categories -
Requested
Lists those Web content categories most requested by clients managed by
this controller or service platform. Use this information to assess whether
the permissions defined in the blacklist and whitelist optimally support
these client requests for cached Web content.

Statistics
Wireless Controller and Service Platform System Reference Guide 15 - 74
The Web Filter Status field displays the following information:
4 Periodically select Refresh to update this screen to its latest values.
15.3.5 Application Visibility (AVC)
Controller Statistics
Controllers and service platforms can inspect every byte of each application header packet allowed to pass their
managed radio devices. When an application is recognized and classified by the WiNG application recognition
engine, administrator defined actions can be applied to that specific application. For information on categorizing,
filtering and logging the application data allowed to proliferate the controller or service platform managed
network, refer to Application Policy on page 7-54 and Application on page 7-58.
To view controller or service platform application utilization statistics:
1 Select the Statistics menu from the Web UI.
2 Select a Wireless Controller node from the left navigation pane.
3Select
Application Visibility (AVC).
Top Categories -
Blocked
Lists those Web content categories blocked most often for requesting
clients managed by this controller or service platform. Use this information
to periodically assess whether the permissions defined in the blacklist and
whitelist still restrict the desired cached Web content from requesting
clients. Remember, a whitelist bans all sites except the categories and URL
lists defined in the whitelist. The blacklist allows all sites except the
categories and URL lists defined in the blacklist.
Top Categories -
Approved
Lists those Web content categories approved most often on behalf of
requesting clients managed by this controller or service platform.
Periodically review this information to assess whether this cached and
available Web content still adhere’s to your organization’s standards for
client access.
Name Displays the name of the filter whose URL rule set has been invoked.
Blacklist Category Lists the blacklist category whose URL filter rule set has caused data to be
filtered to a requesting client. Periodically assess whether these rules are
still relevant to the data requirements of requesting clients.
VLAN Lists the impacted controller or service platform VLAN whose Web data
traffic has been filtered based on the restrictions in the listed blacklist
category.
WLAN Lists the impacted controller or service platform WLAN whose Web data
traffic has been filtered based on the restrictions in the listed blacklist
category. Periodically assess whether clients are segregated to the correct
WLAN based on their cached Web data requirements and impending filter
rules.

Statistics
Wireless Controller and Service Platform System Reference Guide 15 - 75
Figure 15-42 Controller - Application Visibility
4 Refer to the Top Applications graph to assess the most prolific, and allowed, application data passing through
the controller and service platform.
5 Refer to the Application Detailed Stats table to assess specific application data utilization:
Total Bytes Displays the top ten utilized applications in respect to total data bytes
passing through the controller or service platform managed network.
These are only the administrator allowed applications approved for
proliferation within the controller or service platform managed
network.
Bytes Uploaded Displays the top ten applications in respect to total data bytes
uploaded through the controller or service platform managed network.
If this application data is not aligned with application utilization
expectations, consider allowing or denying additional applications and
categories or adjusting their precedence (priority).
Bytes Downloaded Displays the top ten applications in respect to total data bytes
downloaded from the controller or service platform managed network.
If this application data is not aligned with application utilization
expectations, consider allowing or denying additional applications and
categories or adjusting their precedence (priority).
Application Name Lists the allowed application name whose data (bytes) are passing
through the controller or service platform managed network
Uploaded Displays the number of uploaded application data (in bytes) passing
the through the controller or service platform managed network.
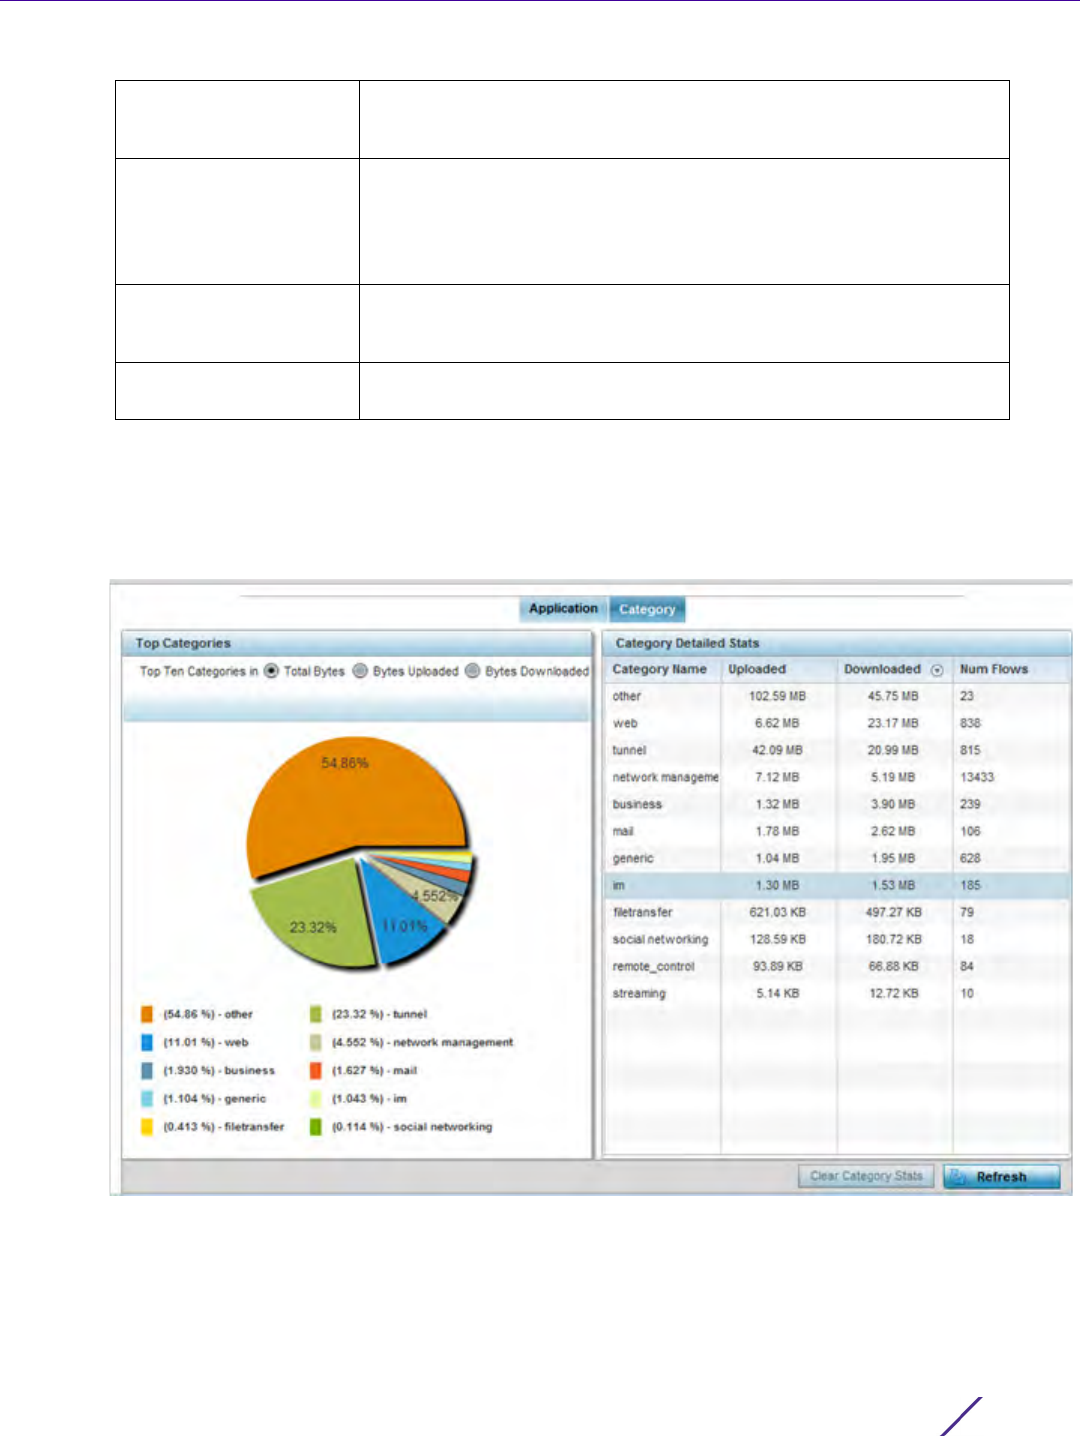
Statistics
Wireless Controller and Service Platform System Reference Guide 15 - 76
6 Select the Category tab.
Categories are existing WiNG or user defined application groups (video, streaming, mobile, audio etc.) that
assist administrators in filtering (allowing or denying) application data. For information on categorizing
application data, refer to Application Policy on page 7-54 and Application on page 7-58.
Figure 15-43 Controller - Application Category Visibility
Downloaded Displays the number of downloaded application data (in bytes)
passing the through the controller or service platform managed
network.
Num Flows Lists the total number of application data flows passing through the
controller or service platform for each listed application. An application
flow can consist of packets in a specific connection or media stream.
Application packets with the same source address/port and
destination address/port are considered one flow.
Clear Application Stats Select this option to clear the application assessment data counters
and begin a new assessment. Selecting this option will not clear
category stats, just application stats.
Refresh Select the Refresh button to update the statistics counters to their
latest values.

Statistics
Wireless Controller and Service Platform System Reference Guide 15 - 77
7 Refer to the Top Categories graph to assess the most prolific, and allowed, application data categories utilized
by the controller or service platform.
8 Refer to the Category Detailed Stats table to assess specific application category data utilization:
15.3.6 Application Policy
Controller Statistics
When an application is recognized and classified by the WiNG application recognition engine, administrator
defined actions can be applied to that specific application. An application policy defines the rules or actions
executed on recognized HTTP (Facebook), enterprise (Webex) and peer-to-peer (gaming) applications or
application-categories.
For each rule defined, a precedence is assigned to resolve conflicting rules for applications and categories. A deny
rule is exclusive, as no other action can be combined with a deny. An allow rule is redundant with other actions,
Total Bytes Displays the top ten application categories in respect to total data
bytes passing through the controller or service platform managed
network. These are only the administrator allowed application
categories approved for proliferation within the controller or service
platform managed network.
Bytes Uploaded Displays the top ten application categories in respect to total data
bytes uploaded through the controller or service platform managed
network. If this category data is not aligned with application utilization
expectations, consider allowing or denying additional categories or
adjusting their precedence (priority).
Bytes Downloaded Displays the top ten application categories in respect to total data
bytes downloaded from the controller or service platform managed
network. If this category data is not aligned with application utilization
expectations, consider allowing or denying additional categories and
categories or adjusting their precedence (priority).
Category Name Lists the allowed category whose application data (in bytes) is passing
through the controller or service platform network.
Uploaded Displays the number of uploaded application category data (in bytes)
passing the through the controller or service platform managed
network.
Downloaded Displays the number of downloaded application category data (in
bytes) passing the through the controller or service platform managed
network.
Num Flows Lists the total number of application category data flows passing
through controller or service platform managed devices. A category
flow can consist of packets in a specific connection or media stream.
Packets with the same source address/port and destination address/
port are considered one flow.
Clear Category Stats Select this option to clear the application category assessment data
counters and begin a new assessment. Selecting this option will not
clear application stats, just category stats.
Refresh Select the Refresh button to update the statistics counters to their
latest values.
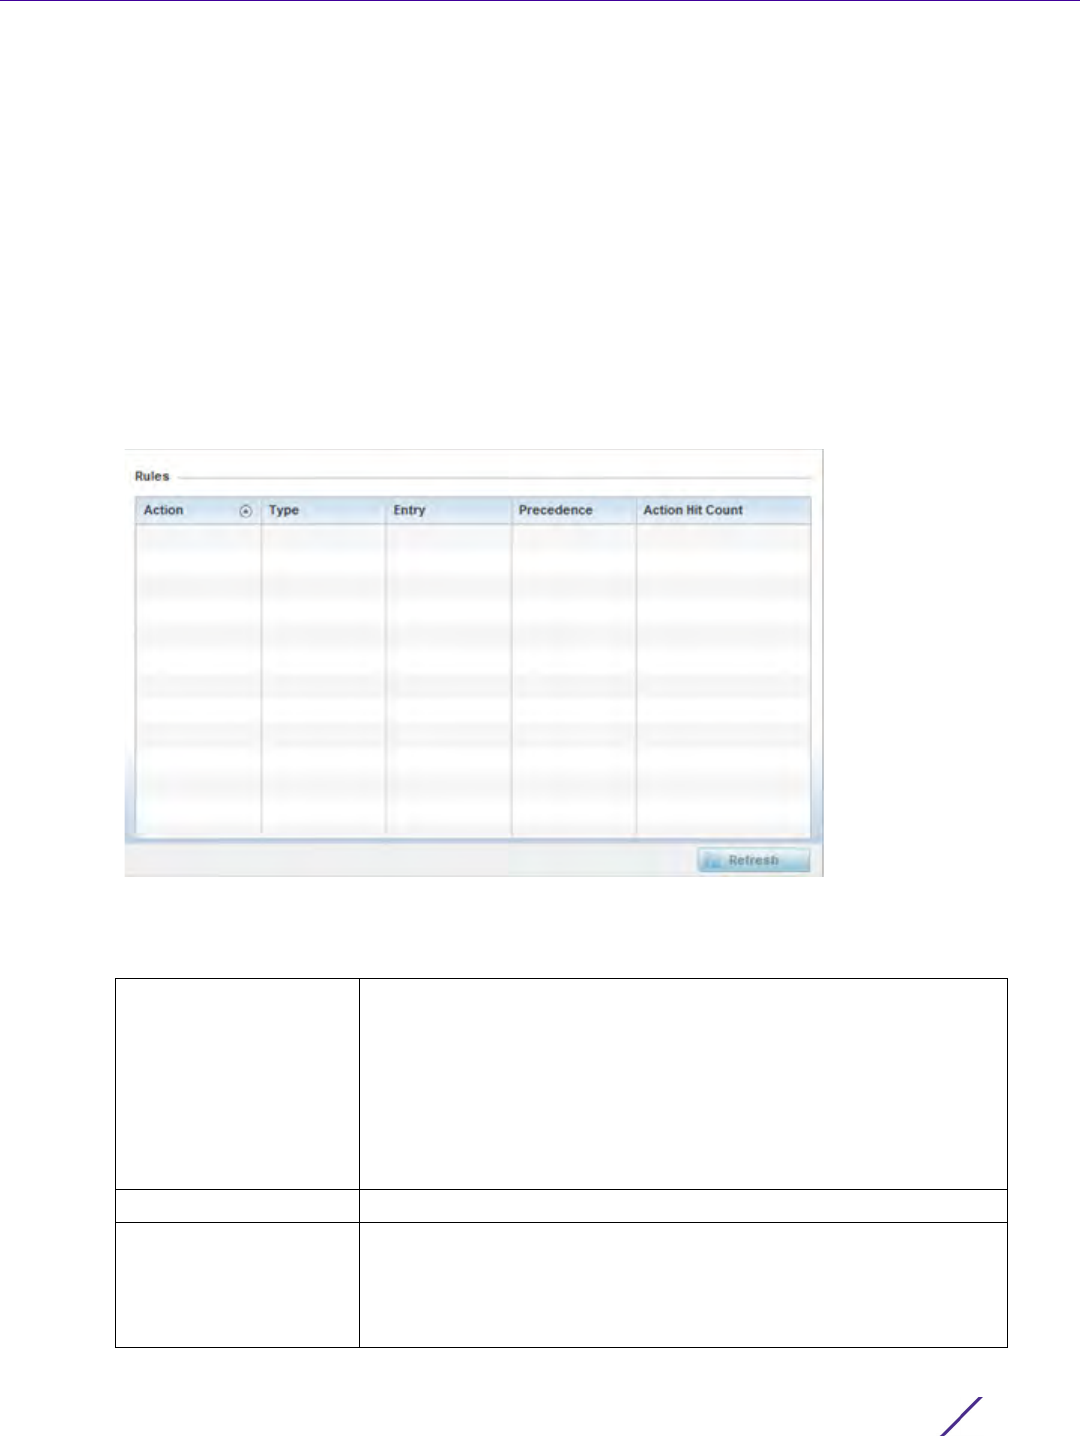
Statistics
Wireless Controller and Service Platform System Reference Guide 15 - 78
since the default action is allow. An allow rule is useful when wanting to deny packets for a category, but wanting
to allow a few applications in the same category to proceed. In such a cases, add an allow rule for applications
with a higher precedence then a deny rule for that category.
Mark actions mark packets for a recognized application and category with DSCP/8021p values used for QoS. Rate-
limits create a rate-limiter applied to packets recognized for an application and category. Ingress and egress rates
need to be specified for the rate-limiter, but both are not required. Mark and rate-limit are the only two actions
that can be combined for an application and category. All other combinations are invalid.
To view controller or service platform application policy statistics:
1 Select the Statistics menu from the Web UI.
2 Select a Wireless Controller node from the left navigation pane.
3Select
Application Policy.
Figure 15-44 Controller - Application Policy
4 Refer to the Rules table to review the results of the application policies put in place thus far from this managing
controller or service platform.
Action Displays the action executed on the listed application.
Allow - Allows packets for a specific application and its defined
category type (social networking etc.). This is the default
Deny - Denies (restricts) the action applied to a specific application or
a specific application category
Mark - Marks recognized packets with DSCP/8021p value
Rate-limit - Rate limits packets from specific application types.
Type Displays the application policy type applied.
Precedence Lists the priority (from 1 - 256) for the application policy rule. The
lower the value, the higher the priority assigned to this rule’s
enforcement action and the category and application assigned. A
precedence also helps resolve conflicting rules for applications and
categories.
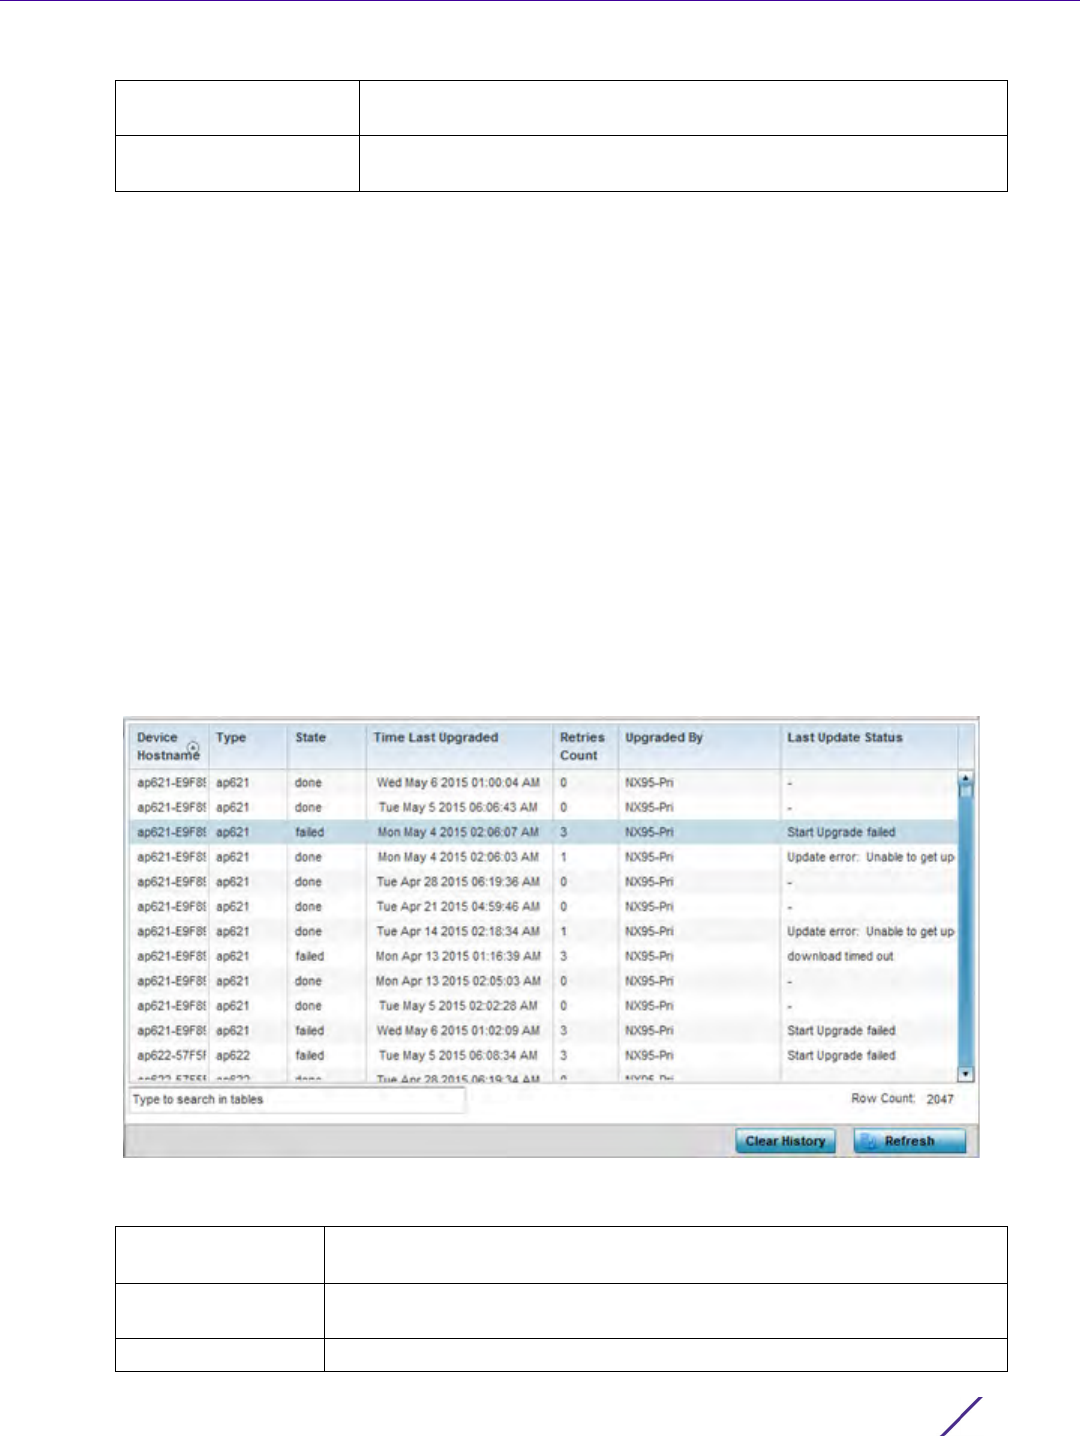
Statistics
Wireless Controller and Service Platform System Reference Guide 15 - 79
15.3.7 Device Upgrade
Controller Statistics
The Device Upgrade screen displays information about the devices receiving updates within the controller or
service platform managed network. Use this screen to gather version data, install firmware images, boot an image
and upgrade status.
Controllers, service platforms or Access Points can be RF domain managers capable of receiving device firmware
files from the NOC (NX7500 or NX9000 series service platforms) then provisioning other devices within their
same RF domain. Controllers, service platforms and Access Points can now all update the firmware of different
device models within their RF domain. However, firmware updates cannot be made simultaneously to devices in
different site deployments.
To view the upgrade statistics:
1 Select the Statistics menu from the Web UI.
2 Select a Wireless Controller node from the left navigation pane.
3Select
Device Upgrade.
Figure 15-45 Wireless Controller - Device Upgrade screen
The Upgrade screen displays the following information:
Action Hit Count Displays the number of times each listed application policy action has
been triggered.
Refresh Select the Refresh button to update the statistics counters to their
latest values.
Device Hostname Displays the administrator assigned hostname of the device receiving the
update.
Type Displays the model type of the device receiving a firmware update from
the provisioning controller or service platform.
State Displays the current state of the Access Point upgrade (done, failed etc.).
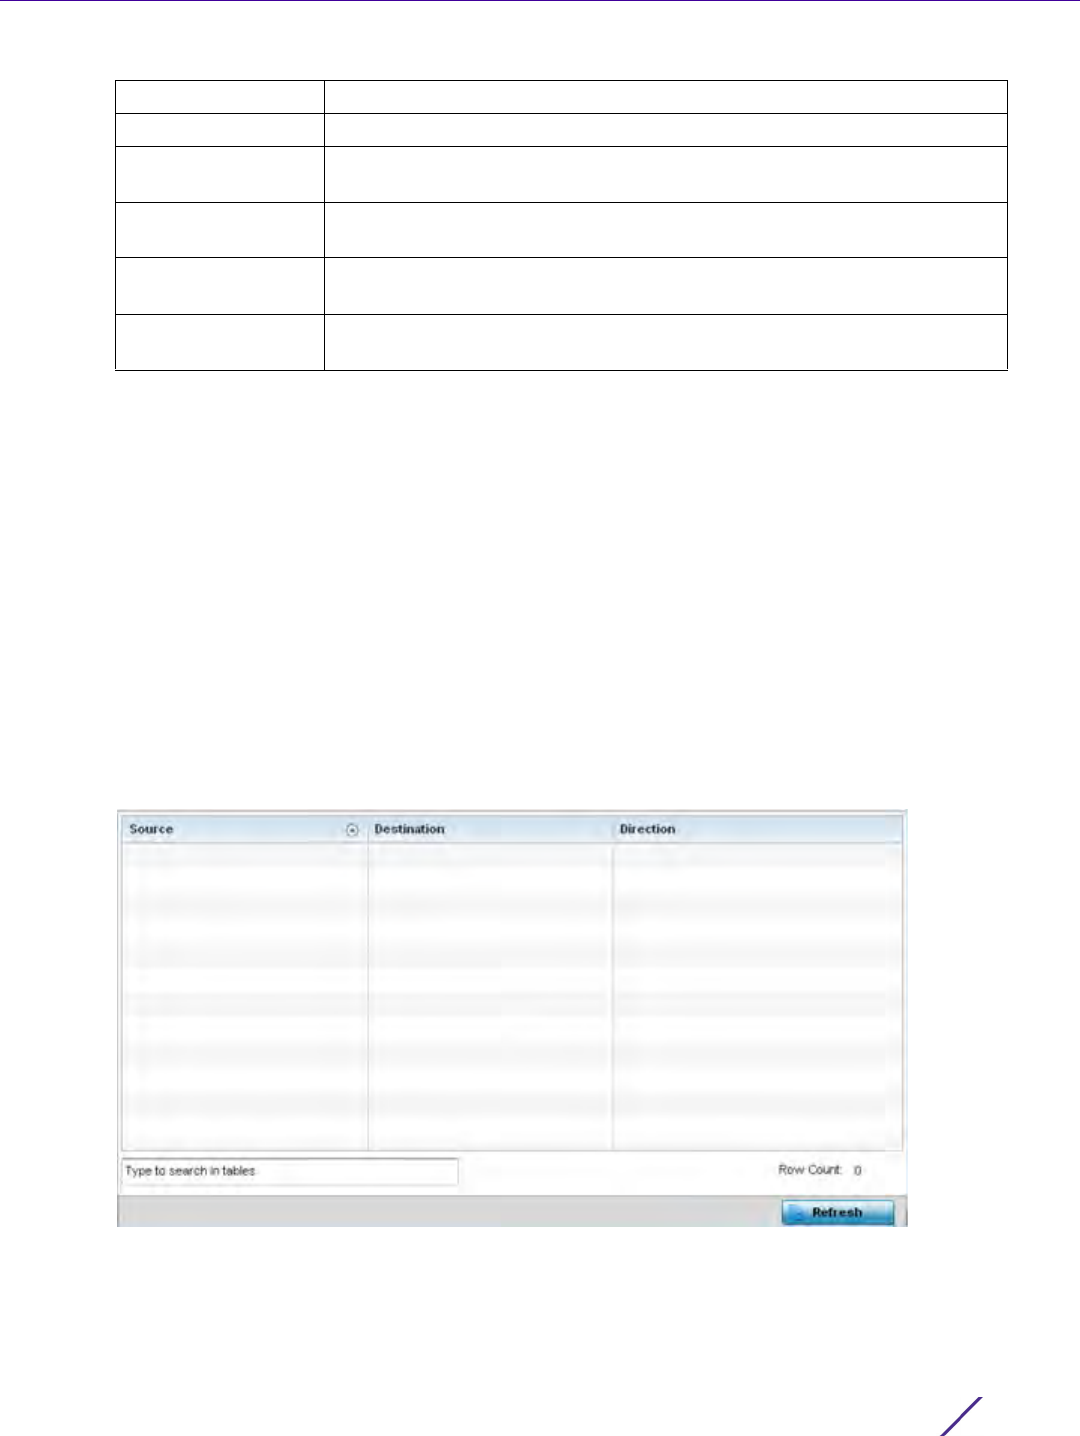
Statistics
Wireless Controller and Service Platform System Reference Guide 15 - 80
15.3.8 Mirroring
Controller Statistics
NX4524 and NX6524 model service platforms have the ability to mirror data packets transmitted or received on
any of their GE ports (GE port 1 - 24). Both transmit and receive packets can be mirrored from a source to a
destination port as needed to provide traditional spanning functionality on the 24 GE ports.
Port mirroring is not supported on NX4500 or NX6500 models, as they only utilize GE ports 1 - 2. Additionally,
port mirroring is not supported on uplink (up) ports or wired ports on any controller or service platform model.
To view NX4524 or NX6524 model service platform port mirroring statistics:
1 Select the Statistics tab from the Web UI.
2 Select a Wireless Controller node from the left navigation pane.
3Select
Mirroring from the left-hand side of the UI.
Figure 15-46 Wireless Controller - Mirroring screen
Time Last Upgraded Displays the date and time of the last successful upgrade operation.
Retries Count Displays the number of retries made in an update operation.
Upgraded By Displays the MAC address of the controller or service platform that
performed the upgrade operation.
Last Update Status Displays the status of the last upgrade operation (Start Upgrade, Update
error etc.).
Clear History Select the Clear History button to clear the screen of its current status and
begin a new data collection.
Refresh Select the Refresh button to update the screen’s statistics counters to their
latest values.

Statistics
Wireless Controller and Service Platform System Reference Guide 15 - 81
The Mirroring screen displays the following statistical data:
15.3.9 Adoption
Controller Statistics
The Adoption screens lists Access Points adopted by the controller or service platform, and includes model, RF
Domain membership, configuration status and device uptime information. For additional AP adoption information,
including an adoption history and pending adoptions, see:
•AP Adoption History
•Pending Adoptions
To view device adoption statistics:
1 Select the Statistics menu from the Web UI.
2 Select a Wireless Controller node from the left navigation pane.
3Select
Adoption > Adopted Devices from the left-hand side of the UI.
Source Lists the GE port (1 - 24) used as the data source to span packets to
the selected destination port. The packets spanned from the selected
source to the destination depend on whether Inbound, Outbound or
Any was selected as the direction. A source port cannot be a
destination port.
Destination Displays the GE port (1 - 24) used as the port destination to span
packets from the selected source. The destination port serves as a
duplicate image of the source port and can be used to send packets to
a network diagnostic without disrupting the behavior on the original
port. The destination port transmits only mirrored traffic and does not
forward received traffic. Additionally, address learning is disabled on
the destination port.
Direction Lists the direction data packets are spanned from the selected source
to the defined destination. Packets spanned from the source to the
destination depend on whether Inbound (received packets only),
Outbound (transmitted packets only) or Any (packets in either
direction) was selected.
Refresh Select the Refresh button to update the screen’s statistics counters to
their latest values.
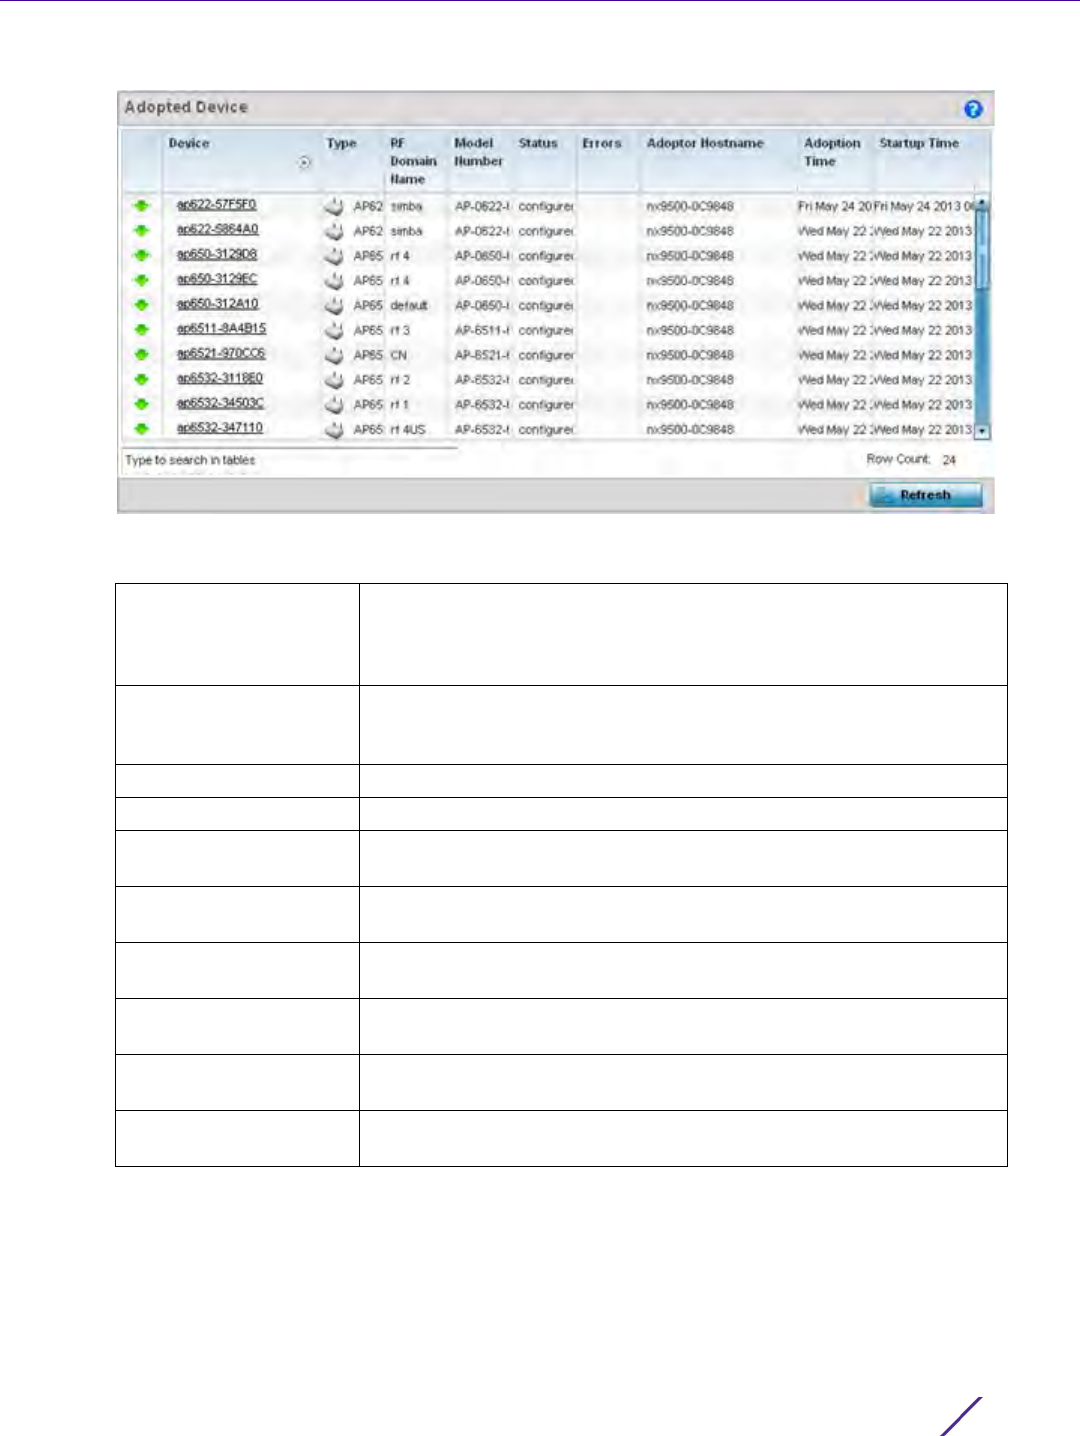
Statistics
Wireless Controller and Service Platform System Reference Guide 15 - 82
Figure 15-47 Wireless Controller - Adopted Devices screen
The Adopted Devices screen displays the following:
Device Displays the name assigned to the adopted device by the
management software. The Access Point name displays as a link that
can be selected to display configuration and network address
information in greater detail.
Type Lists the model type of each Access Point managed by the selected
controller or service platform (the controller or service platform listed
in the Adopter Hostname column).
RF Domain Name Displays the RF Domain memberships of each listed adopted device.
Model Number Displays the model number of the adopted device.
Status Lists whether an adopted Access Point has been configured
(provisioned) by its connected Access Point or service platform.
Errors Lists any errors encountered when the each listed Access Point was
adopted by the controller or service platform.
Adopter Hostname Lists the hostname assigned to the adopting controller or service
platform.
Adoption Time Displays a timestamp for each listed Access Point reflecting when the
device was adopted by the controller or service platform.
Startup Time Lists the time the adopted device was last started up and detected on
the network.
Refresh Select the Refresh button to update the screen’s statistics counters to
their latest values.
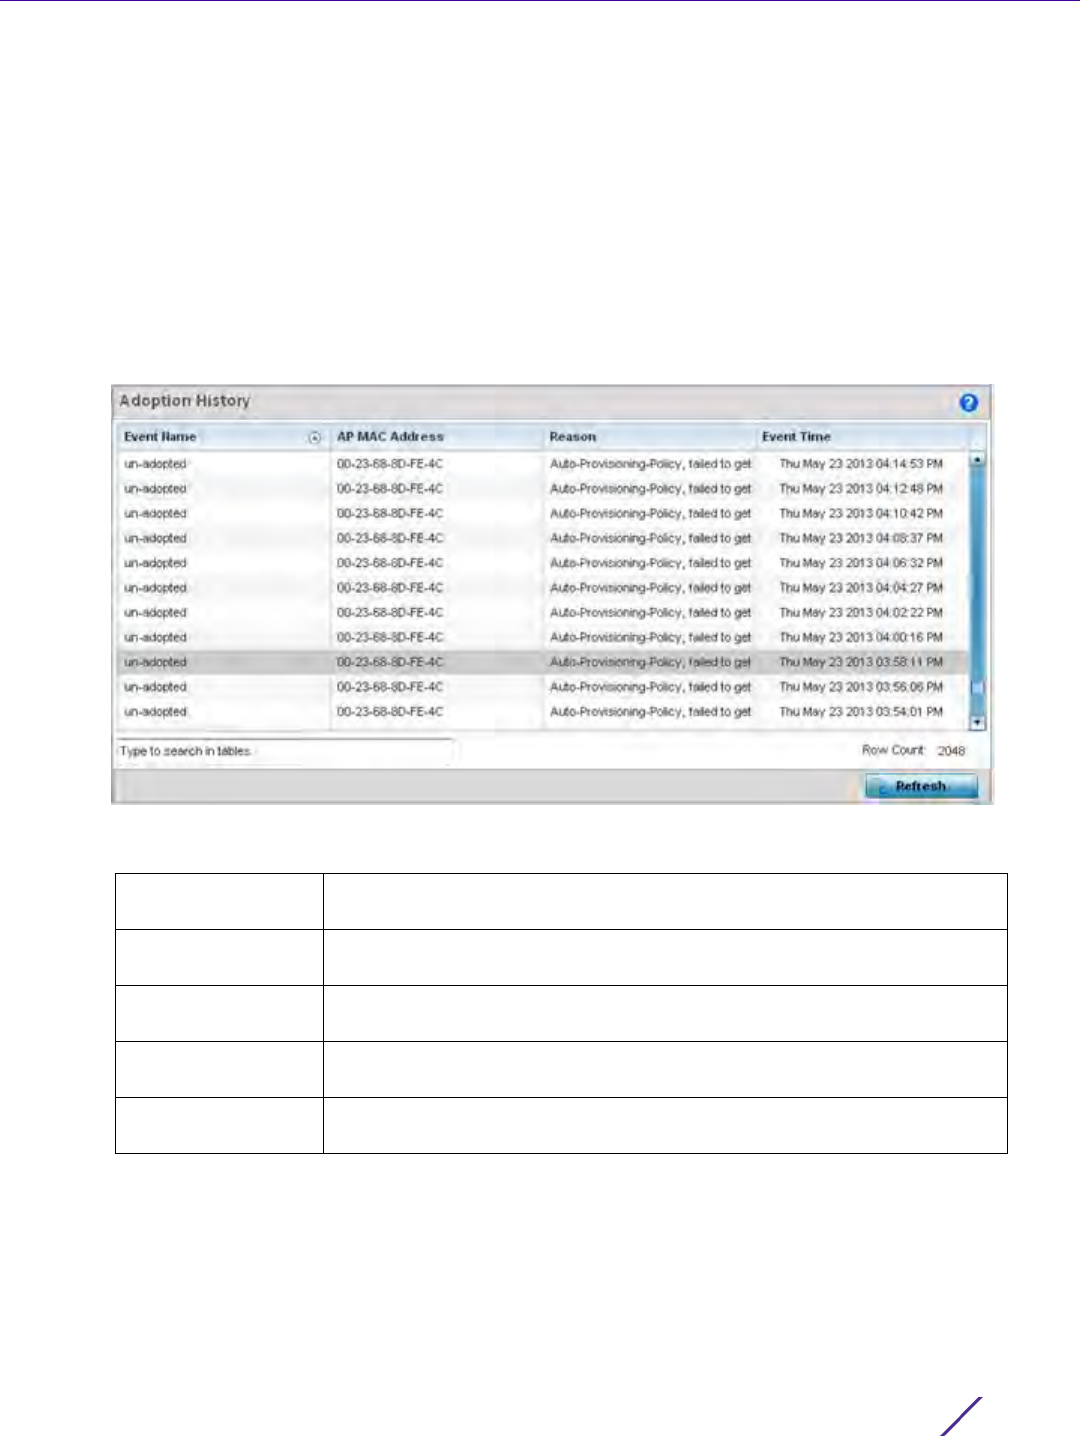
Statistics
Wireless Controller and Service Platform System Reference Guide 15 - 83
15.3.9.1 AP Adoption History
Controller Statistics
The AP Adoption History screen displays a list of devices adopted to the controller or service platform managed
network. Use this screen to view a list of devices and their current status.
To view adopted AP Adoption History statistics:
1 Select the Statistics menu from the Web UI.
2 Select a Wireless Controller node from the left navigation pane.
3Select
Adoption > AP Adoption History from the left-hand side of the UI.
Figure 15-48 Wireless Controller - AP Adoption History screen
The AP Adoption History screen displays the following
Event Name Displays the current adoption status of each AP as either adopted or un-
adopted.
AP MAC Address Displays the Media Access Control (MAC) address of each Access Point
that the controller or service platform has attempted to adopt.
Reason Displays the adoption reason message string for each event in the
adoption history statistics table.
Event Time Displays the day, date and time for each Access Point adoption attempt by
this controller or service platform.
Refresh Select the Refresh button to update the screen’s statistics counters to their
latest values.
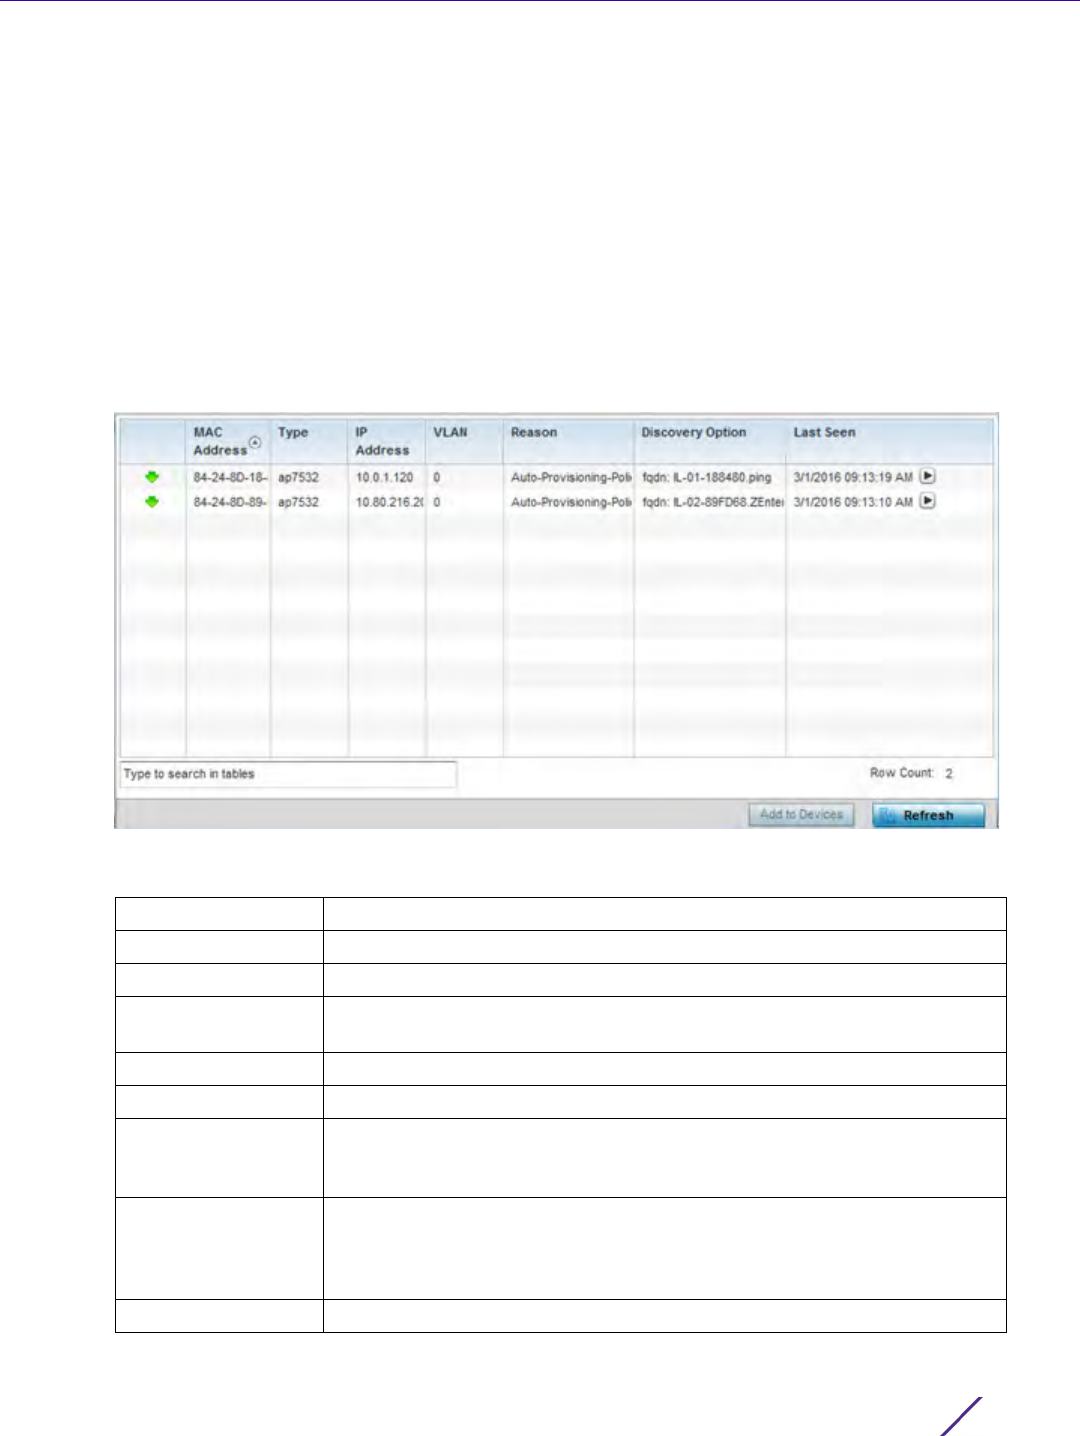
Statistics
Wireless Controller and Service Platform System Reference Guide 15 - 84
15.3.9.2 Pending Adoptions
Controller Statistics
The Pending Adoptions screen displays devices still pending (awaiting) adoption to the controller or service
platform managed network. Review this data to assess whether adoption is still beneficial and to troubleshoot
issues preventing adoption.
To view adopted AP statistics:
1 Select the Statistics menu from the Web UI.
2 Select a Wireless Controller node from the left navigation pane.
3Select
Adoption > Pending Adoptions from the left-hand side of the UI.
Figure 15-49 Wireless Controller - Pending Adoptions screen
The Pending Adoptions screen provides the following
MAC Address Displays the MAC address of the device pending adoption.
Type Displays the AP’s model type.
IP Address Displays the current IP address of the device pending adoption.
VLAN Displays the current VLAN number (virtual interface ID) of the device
pending adoption.
Reason Displays the status code as to why the device is still pending adoption.
Discovery Option Displays the discovery option code for each AP listed pending adoption.
Last Seen Displays the date and time stamp of the last time the device was seen.
Click the arrow next to the date and time to toggle between standard time
and UTC.
Add to Devices Select a device from amongst those displayed and select Add to Devices
to validate the adoption of the selected device and begin the process of
connecting the device to the controller or service platform managed
network.
Refresh Select Refresh to update the statistics counters to their latest values.
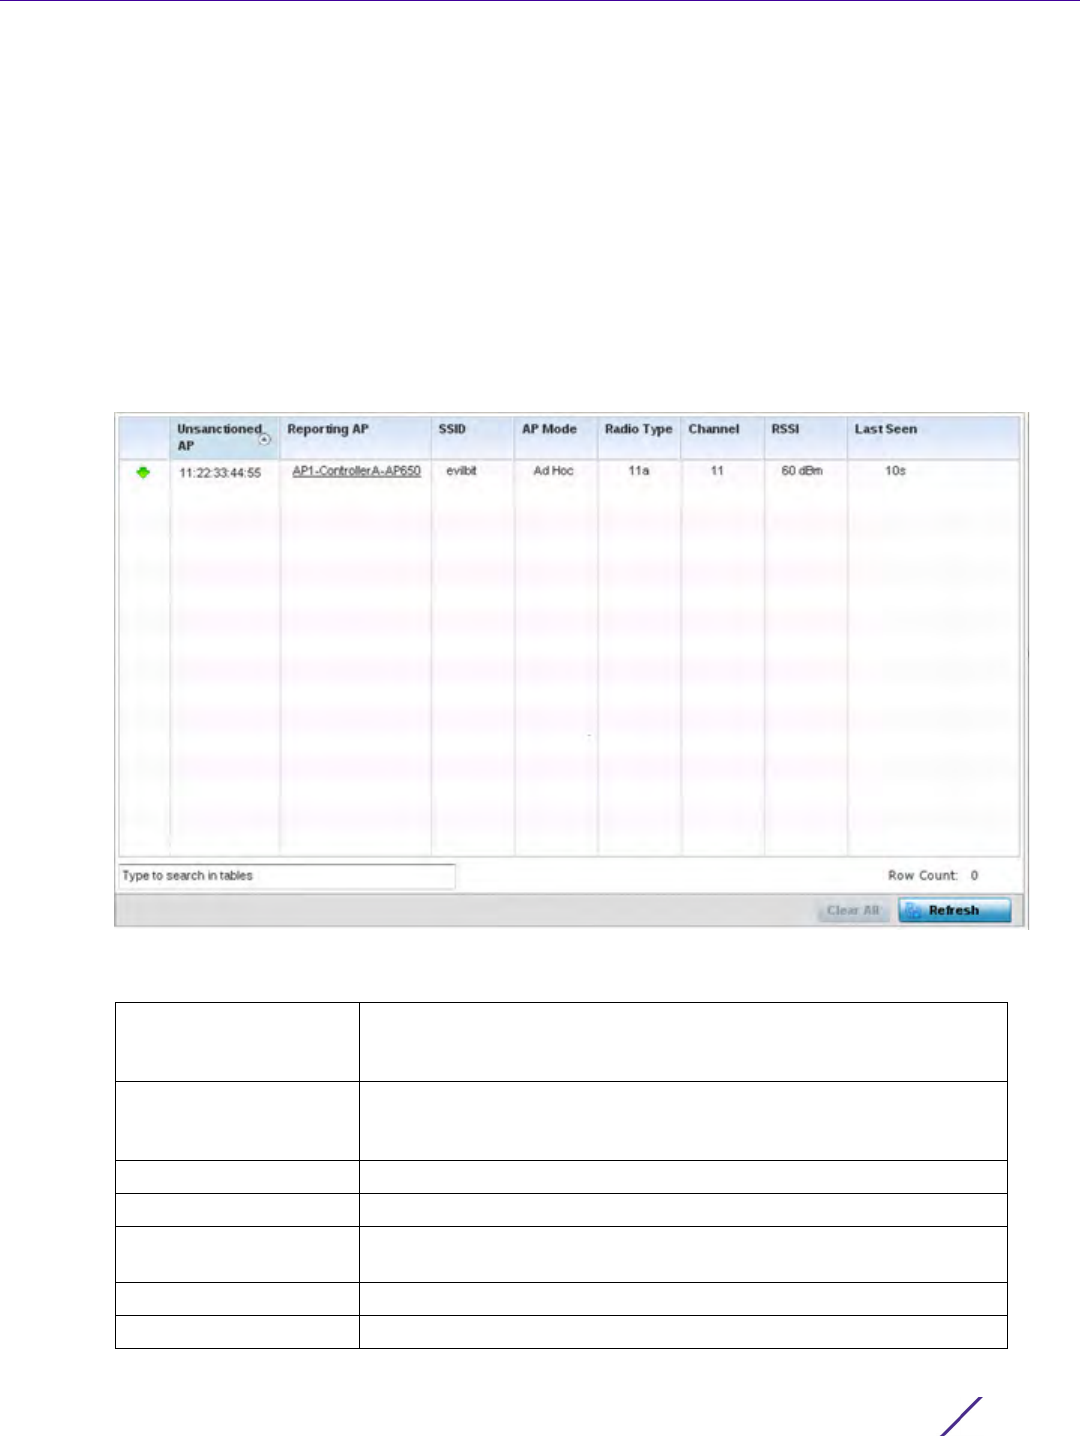
Statistics
Wireless Controller and Service Platform System Reference Guide 15 - 85
15.3.10 AP Detection
Controller Statistics
The AP Detection screen displays potentially hostile Access Points, their SSIDs, reporting AP, and so on.
Continuously revalidating the credentials of detected devices reduces the possibility of an Access Point hacking
into the controller or service platform managed network.
To view AP detection statistics:
1 Select the Statistics menu from the Web UI.
2 Select a Wireless Controller node from the left navigation pane.
3Select
AP Detection from the left-hand side of the UI.
Figure 15-50 Wireless Controller - AP Detection screen
The AP Detection screen displays the following:
Unsanctioned AP Displays the MAC address of unsanctioned APs detected within the
controller or service platform radio coverage area. Unsanctioned APs
are detected APs without deployment approval.
Reporting AP Lists the Access Point whose radio detected the unsanctioned AP. The
Access Point displays as a link that can be selected to display
configuration and network address information in greater detail.
SSID Displays the SSID of each unsanctioned AP.
AP Mode Displays the operating mode of the unsanctioned device.
Radio Type Displays the unsanctioned AP’s radio type. The radio can be 802.11b,
802.11bg, 802.1bgn, 802.11a or 802.11an.
Channel Displays the channel where the unsanctioned AP was detected.
RSSI Lists the Received Signal Strength Indicator (RSSI) for each listed AP.
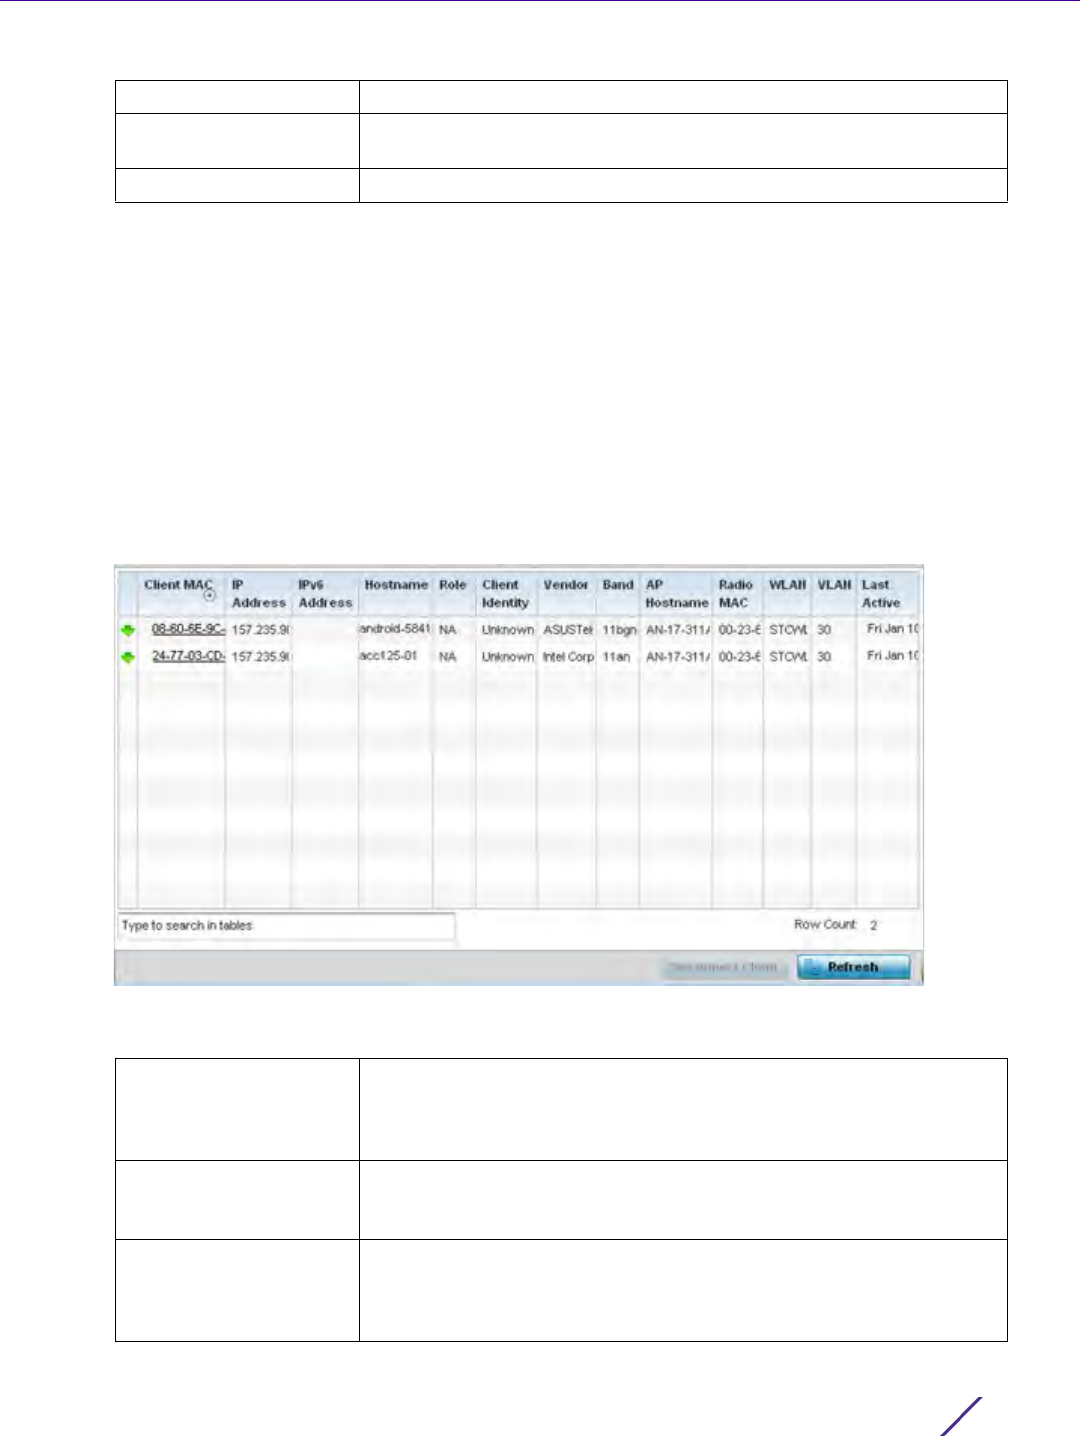
Statistics
Wireless Controller and Service Platform System Reference Guide 15 - 86
15.3.11 Guest User
Controller Statistics
The Guest User screen displays read only device information for guest clients associated with the selected
controller or service platform. Use this information to assess if configuration changes are required to improve
network performance.
To view a controller or service platform’s connected guest user client statistics:
1 Select the Statistics menu from the Web UI.
2 Select a Wireless Controller node from the left navigation pane.
3Select
Guest User from the left-hand side of the UI.
Figure 15-51 Wireless Controller - Guest User screen
The Guest User screen displays the following:
Last Seen Displays when the unsanctioned AP was last seen by the detecting AP.
Clear All Select Clear All to clear all the screen’s statistic counters and begin
detecting new Access Points.
Refresh Select Refresh to update the statistics counters to their latest values.
Client MAC Displays the hardcoded MAC address assigned to the guest client at
the factory and can not be modified. The address displays as a link
that can be selected to display configuration and network address
information in greater detail.
IP Address Displays the unique IP address of the guest client. Use this address as
necessary throughout the applet for filtering and device intrusion
recognition and approval.
IPv6 Address Displays the current IPv6 formatted IP address a listed guest client is
using as a network identifier. IPv6 is the latest revision of the Internet
Protocol (IP) designed to replace IPv4. IPv6 addresses are composed
of eight groups of four hexadecimal digits separated by colons.

Statistics
Wireless Controller and Service Platform System Reference Guide 15 - 87
15.3.12 Wireless LANs
Controller Statistics
The Wireless LANs statistics screen displays performance statistics for each controller or service platform managed
WLAN. Use this information to assess if configuration changes are required to improve connected Access Point
and client performance.
To view the wireless LAN statistics for the controller or service platform:
1 Select the Statistics menu from the Web UI.
2 Select a Wireless Controller node from the left navigation pane.
3Select
Wireless LANs from the left-hand side of the UI.
Hostname Displays the hostname (MAC addresses) of connected guest clients.
The hostname displays as a link that can be selected to display
configuration and network address information in greater detail.
Role Lists the guest client’s defined role within the controller or service
platform managed network.
Client Identity Displays the unique vendor identity of the listed device as it appears
to its adopting controller or service platform.
Vendor Displays the name of the client vendor (manufacturer).
Band Displays the 2.4 or 5 GHz radio band on which the listed guest client
operates.
AP Hostname Displays the administrator assigned hostname of the Access Point to
which this guest client is associated.
Radio MAC Displays the MAC address of the radio which the guest client is
connected.
WLAN Displays the name of the WLAN the guest client is currently assigned
for its Access Point interoperation.
VLAN Displays the VLAN ID the guest client’s connected Access Point has
defined as a virtual interface.
Last Active Displays the time when this guest client was last seen (or detected) by
a device within the controller or service platform managed network.
Disconnect Client Select a specific client and select the Disconnect Client button to
terminate this guest client’s connection to its controller or service
platform connected Access Point radio.
Refresh Select Refresh to update the statistics counters to their latest values.
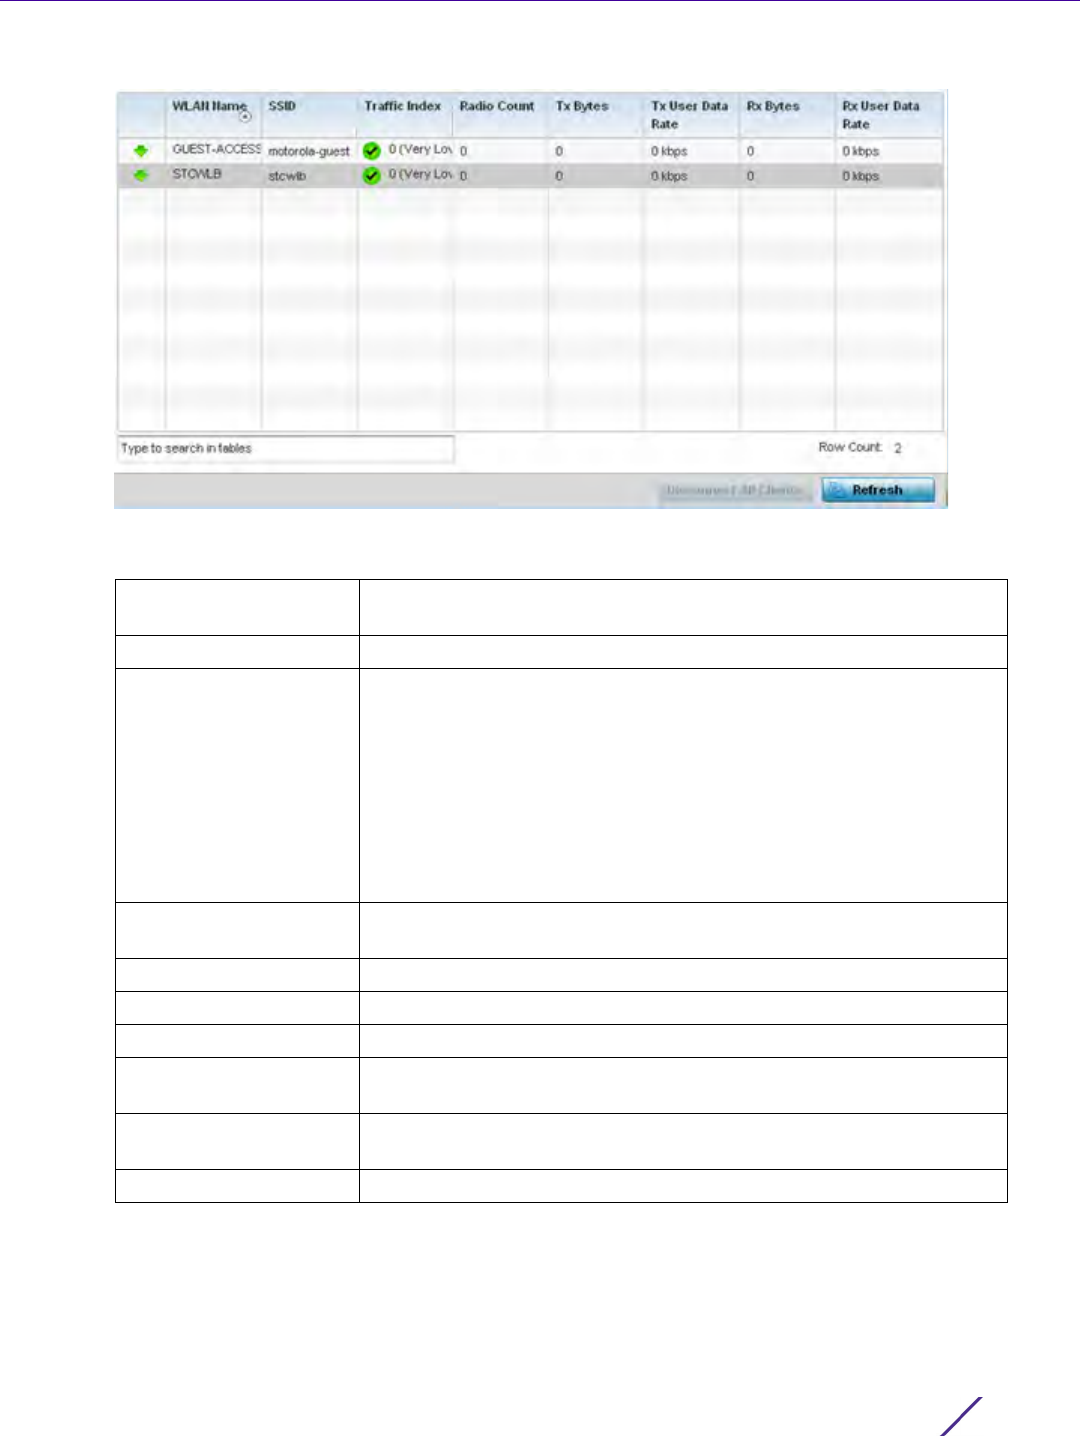
Statistics
Wireless Controller and Service Platform System Reference Guide 15 - 88
Figure 15-52 Wireless Controller - Wireless LANs screen
The Wireless LANs screen displays the following:
15.3.13 Policy Based Routing
Controller Statistics
The Policy Based Routing statistics screen displays statistics for selective path packet redirection. PBR can
optionally mark traffic for preferential services (QoS). PBR is applied to incoming routed packets, and a route-map
WLAN Name Displays the name of the WLANs the controller or service platform is
currently utilizing for client connections and QoS segregation.
SSID Displays the Service Set ID each listed WLAN is using as an identifier.
Traffic Index Displays the traffic utilization index, which measures how efficiently
the traffic medium is used. It’s defined as the percentage of current
throughput relative to the maximum possible throughput. Traffic
indices are:
0 – 20 (very low utilization)
20 – 40 (low utilization)
40 – 60 (moderate utilization)
60 and above (high utilization)
Radio Count Displays the number of radios currently in use by devices utilizing the
listed controller or service platform managed WLAN.
Tx Bytes Displays data transmit activity (in bytes) on each listed WLAN.
Tx User Data Rate Displays the average user data rate on each listed WLAN.
Rx Bytes Displays the data received in bytes on each listed WLAN.
Rx User Data Rate Displays the average user data rate for packets received by controller
or service platform connected devices using this WLAN.
Disconnect All Clients Select Disconnect All Clients to terminate the all client WLAN
memberships.
Refresh Select Refresh to update the statistics counters to their latest values.
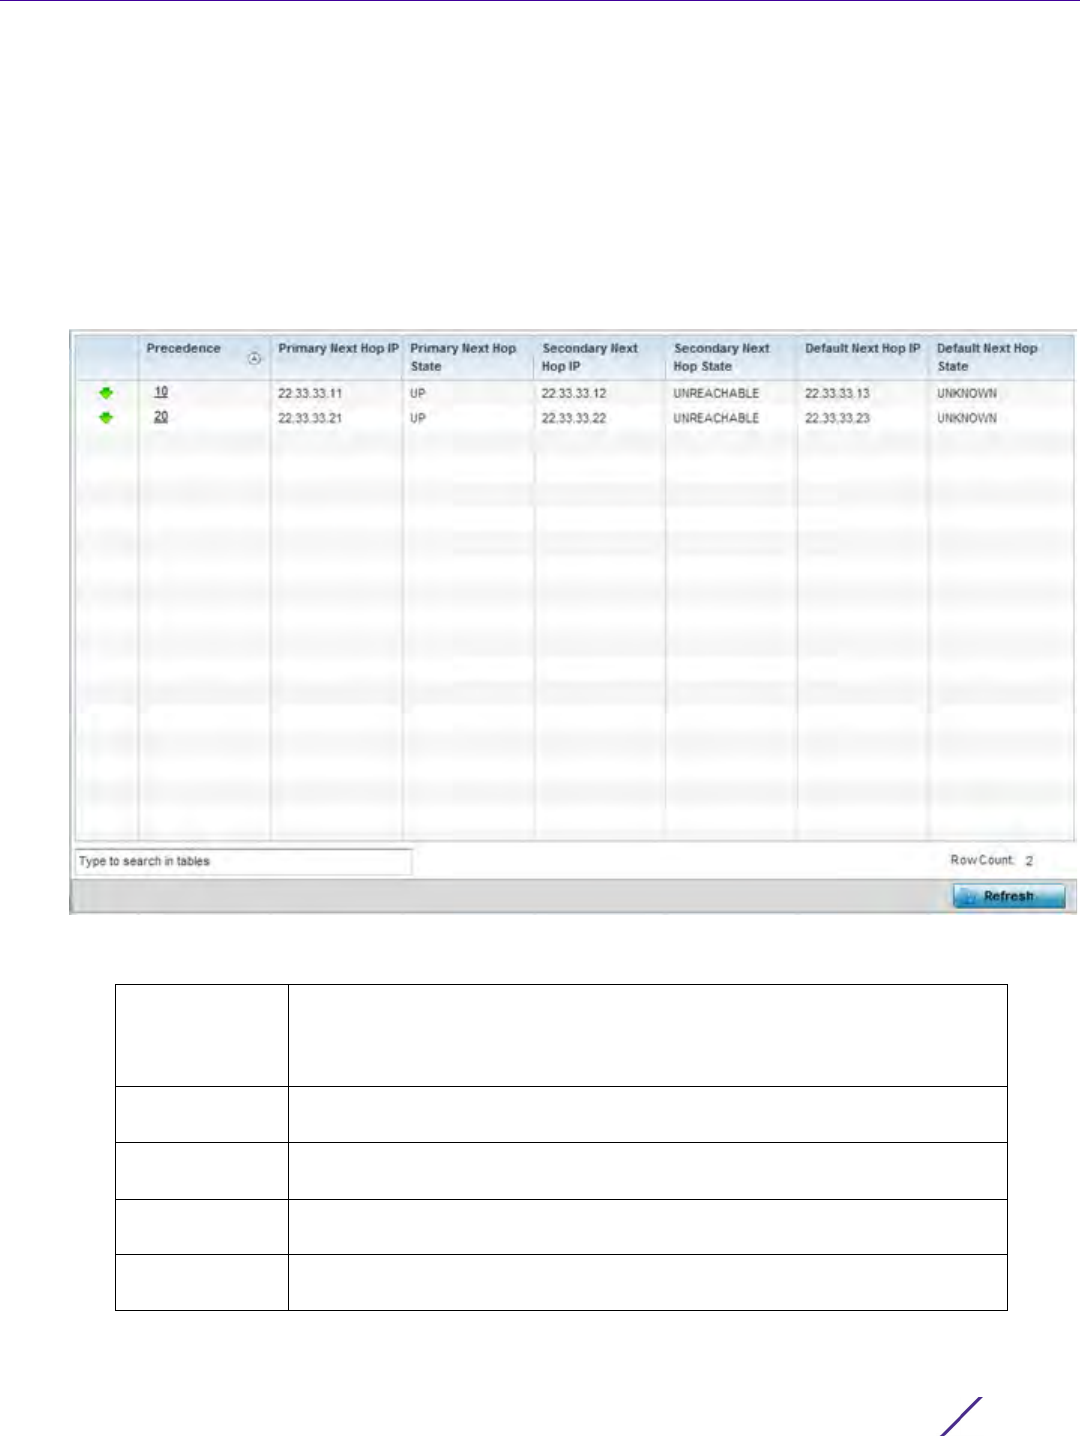
Statistics
Wireless Controller and Service Platform System Reference Guide 15 - 89
is created containing a set of filters and associated actions. Based on the actions defined in the route-map, packets
are forwarded to the next relevant hop. Route-maps are configurable under a global policy called routing-policy,
and applied to profiles and devices.
To review controller PBR statistics:
1 Select the Statistics menu from the Web UI.
2 Select a Wireless Controller node from the left navigation pane.
3Select
Policy Based Routing.
Figure 15-53 Wireless Controller - Policy Based Routing screen
The Policy Based Routing screen displays the following:
Precedence Lists the numeric precedence (priority) assigned to each listed PBR
configuration. A route-map consists of multiple entries, each carrying a
precedence value. An incoming packet is matched against the route-map with
the highest precedence (lowest numerical value).
Primary Next
Hop IP
Lists the IP address of the virtual resource that, if available, is used with no
additional route considerations.
Primary Next
Hop State
Displays whether the primary hop is being applied to incoming routed packets.
Secondary Next
Hop IP
If the primary hop is unavailable, a second resource is used. This column lists
the address set for the alternate route in the election process.
Secondary Next
Hop State
Displays whether the secondary hop is being applied to incoming routed
packets.
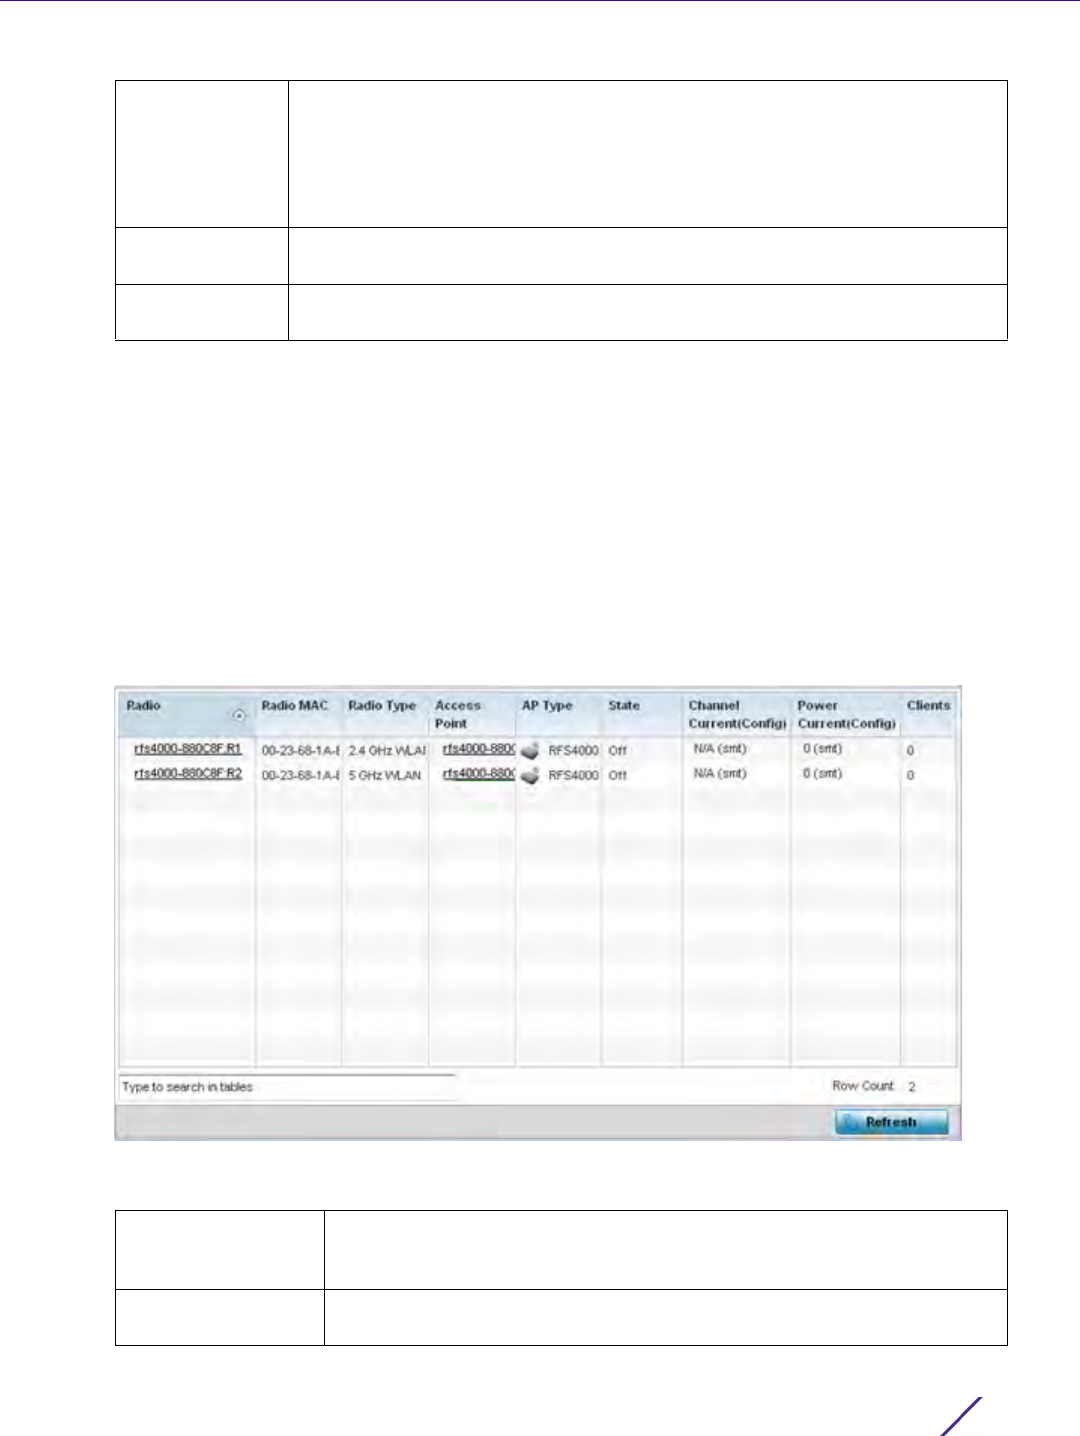
Statistics
Wireless Controller and Service Platform System Reference Guide 15 - 90
15.3.14 Radios
Controller Statistics
The radio Status screen provides radio association data, including radio ID, connected APs, radio type, quality index
and Signal to Noise Ratio (SNR).
To view the radio statistics:
1 Select the Statistics menu from the Web UI.
2 Select a Wireless Controller node from the left navigation pane.
3Select
Radio from the left-hand side of the UI.
Figure 15-54 Wireless Controller - Radio Status screen
The Radios Status screen provides the following information:
Default Next
Hop IP
If a packet subjected to PBR does not have an explicit route to the destination,
the configured default next hop is used. This is either the IP address of the
next hop or the outgoing interface. Only one default next hop is available. The
difference between the next hop and the default next-hop is in case of former,
PBR occurs first, then destination based routing. In case of the latter, the order
is reverse.
Default Next
Hop State
Displays whether the default hop is being applied to incoming routed packets.
Refresh Select the Refresh button to update the screen’s statistics counters to their
latest values.
Radio Displays the model and numerical value assigned to the radio as its unique
identifier. Optionally, select the listed radio (it displays as a link) to display
radio configuration information in greater detail.
Radio MAC Displays the MAC address assigned to the radio as its unique hardware
identifier.
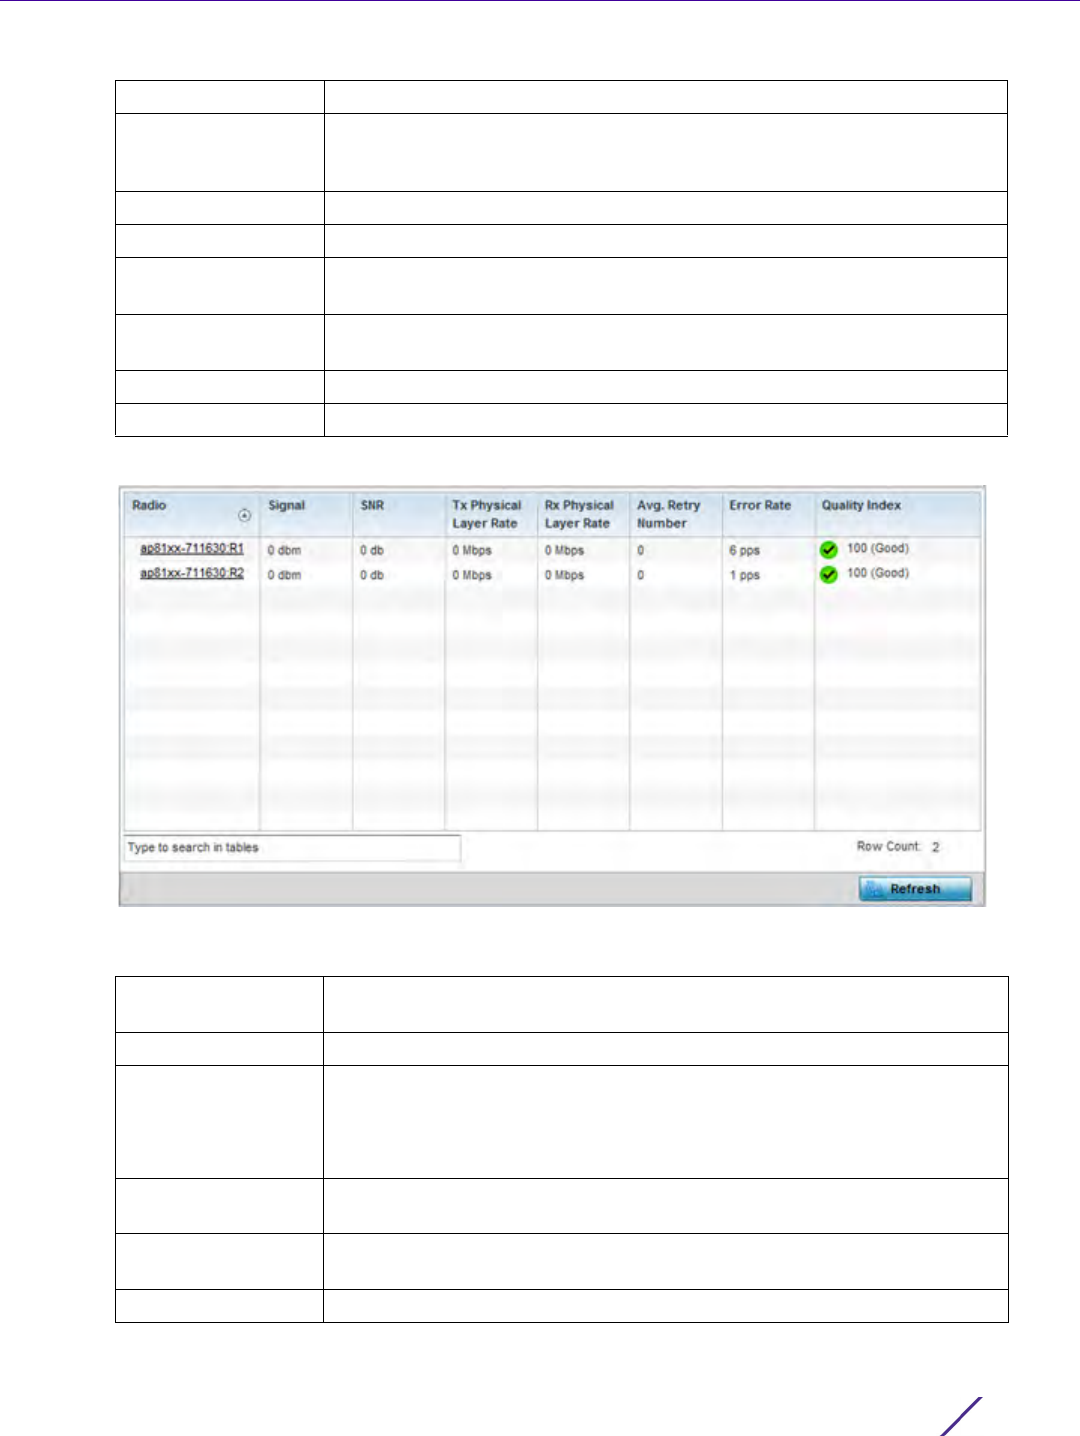
Statistics
Wireless Controller and Service Platform System Reference Guide 15 - 91
4Select
RF Statistics from the expanded Radios menu.
Figure 15-55 Wireless Controller - Radio RF Statistics screen
The RF Statistics screen provides the following information:
Radio Type Defines whether the radio is operating in the 2.4 GHz or 5 GHz radio band.
Access Point Displays the administrator assigned system name of each listed Access
Point. Optionally, select the listed Access Point to display Access Point
configuration information in greater detail.
AP Type Lists the model type of the Access Point housing the listed radio.
State Displays the current operational state (On/Off) of each radio.
Channel Current
(Config)
Displays the administrator configured channel each listed radio is
broadcasting on.
Power Current
(Config)
Displays the administrator configured power level the radio is using for its
transmissions.
Clients Displays the number of wireless clients associated with each listed radio.
Refresh Select Refresh to update the statistics counters to their latest values.
Radio Displays the name assigned to each listed radio. Each radio name displays
as a link that can be selected to display radio information in greater detail.
Signal Displays the power of each listed radio signal in dBm.
SNR Displays the signal to noise ratio (SNR) of each listed radio.
SNR is a measure that compares the level of a desired signal to the level of
background noise. It is defined as the ratio of signal power to the noise
power. A ratio higher than 1:1 indicates more signal than noise.
Tx Physical Layer
Rate
Displays the data transmit rate for each radio’s physical layer. The rate is
displayed in Mbps.
Rx Physical Layer
Rate
Displays the data receive rate for each radio’s physical layer. The rate is
displayed in Mbps.
Avg Retry Rate Displays the average number of retries for each radio.
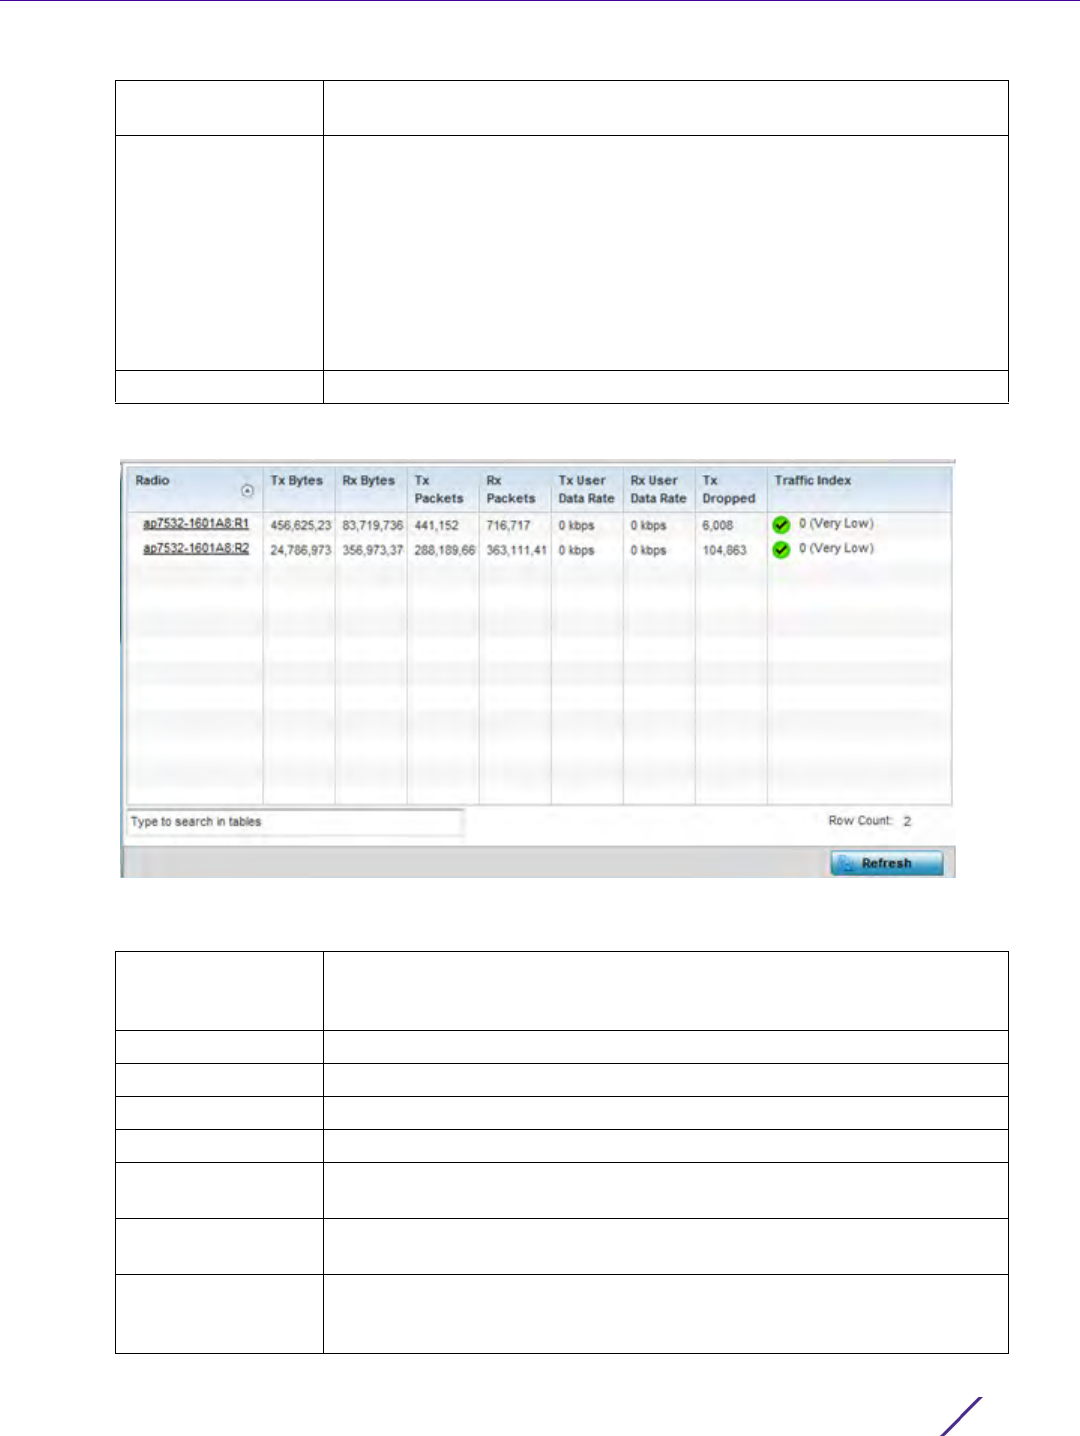
Statistics
Wireless Controller and Service Platform System Reference Guide 15 - 92
5Select Traffic Statistics from the expanded Radios menu.
Figure 15-56 Wireless Controller - Radio Traffic Statistics screen
The Traffic Statistics screen provides the following information:
Error Rate Displays the average number of retries per packet. A high number
indicates possible network or hardware problems.
Quality Index Displays the client’s RF quality. The RF quality index is the overall
effectiveness of the RF environment, as a percentage of the connect rate
in both directions as well as the retry rate and the error rate. RF quality
index value can be interpreted as:
0 – 20 - very poor quality
20 – 40 - poor quality
40 – 60 - average quality
60 – 100 - good quality
Refresh Select Refresh to update the statistics counters to their latest values.
Radio Displays the name assigned to each listed radio. Each radio name displays
as a link that can be selected to display radio configuration and network
address information in greater detail.
Tx Bytes Displays the amount of transmitted data in bytes for each radio.
Rx Bytes Displays the amount of received data in bytes for each radio.
Tx Packets Displays the amount of transmitted data in packets for each radio.
Rx Packets Displays the amount of received data in packets for each radio.
Tx User Data Rate Displays the average speed in kbps of data transmitted to users for each
radio.
Rx User Data Rate Displays the average speed (in kbps of data) received from users for each
radio.
Tx Dropped Displays the number of transmissions (packets) dropped by each listed
radio. An excessive number of drops and a high error rate could be an
indicator to lighten the radio’s current load.
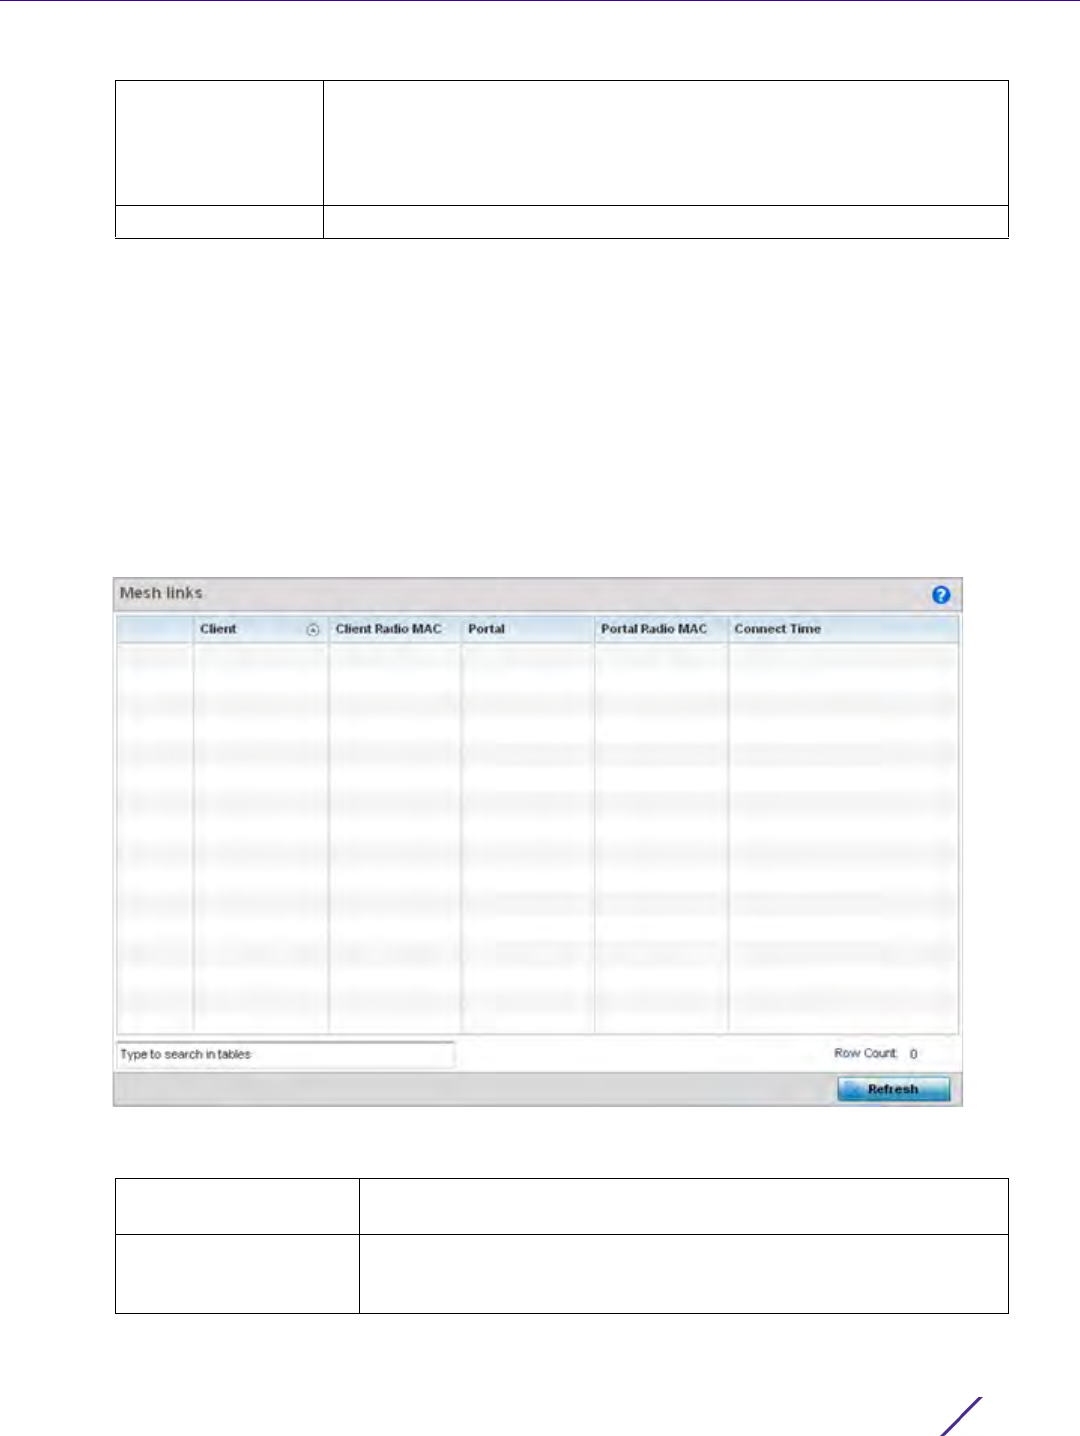
Statistics
Wireless Controller and Service Platform System Reference Guide 15 - 93
15.3.15 Mesh
Controller Statistics
The Mesh screen provides detailed statistics on each of Mesh capable client within the selected controller or
service platform’s radio coverage area.
To view Mesh statistics:
1 Select the Statistics menu from the Web UI.
2 Select a Wireless Controller node from the left navigation pane.
3Select
Mesh from the left-hand side of the UI.
Figure 15-57 Wireless Controller - Mesh screen
The Mesh screen displays the following:
Traffic Index Displays the traffic utilization index of each listed radio, which measures
how efficiently the traffic medium is used. It’s defined as the percentage of
current throughput relative to the maximum possible throughput. Traffic
indices are: 0 – 20 (very low utilization), 20 – 40 (low utilization), 40 – 60
(moderate utilization), and 60 and above (high utilization).
Refresh Select Refresh to update the statistics counters to their latest values.
Client Displays the name assigned to each mesh client when added to the
controller or service platform managed network.
Client Radio MAC Displays the factory encoded Media Access Control (MAC) address of
each device within the controller or service platform managed mesh
network.
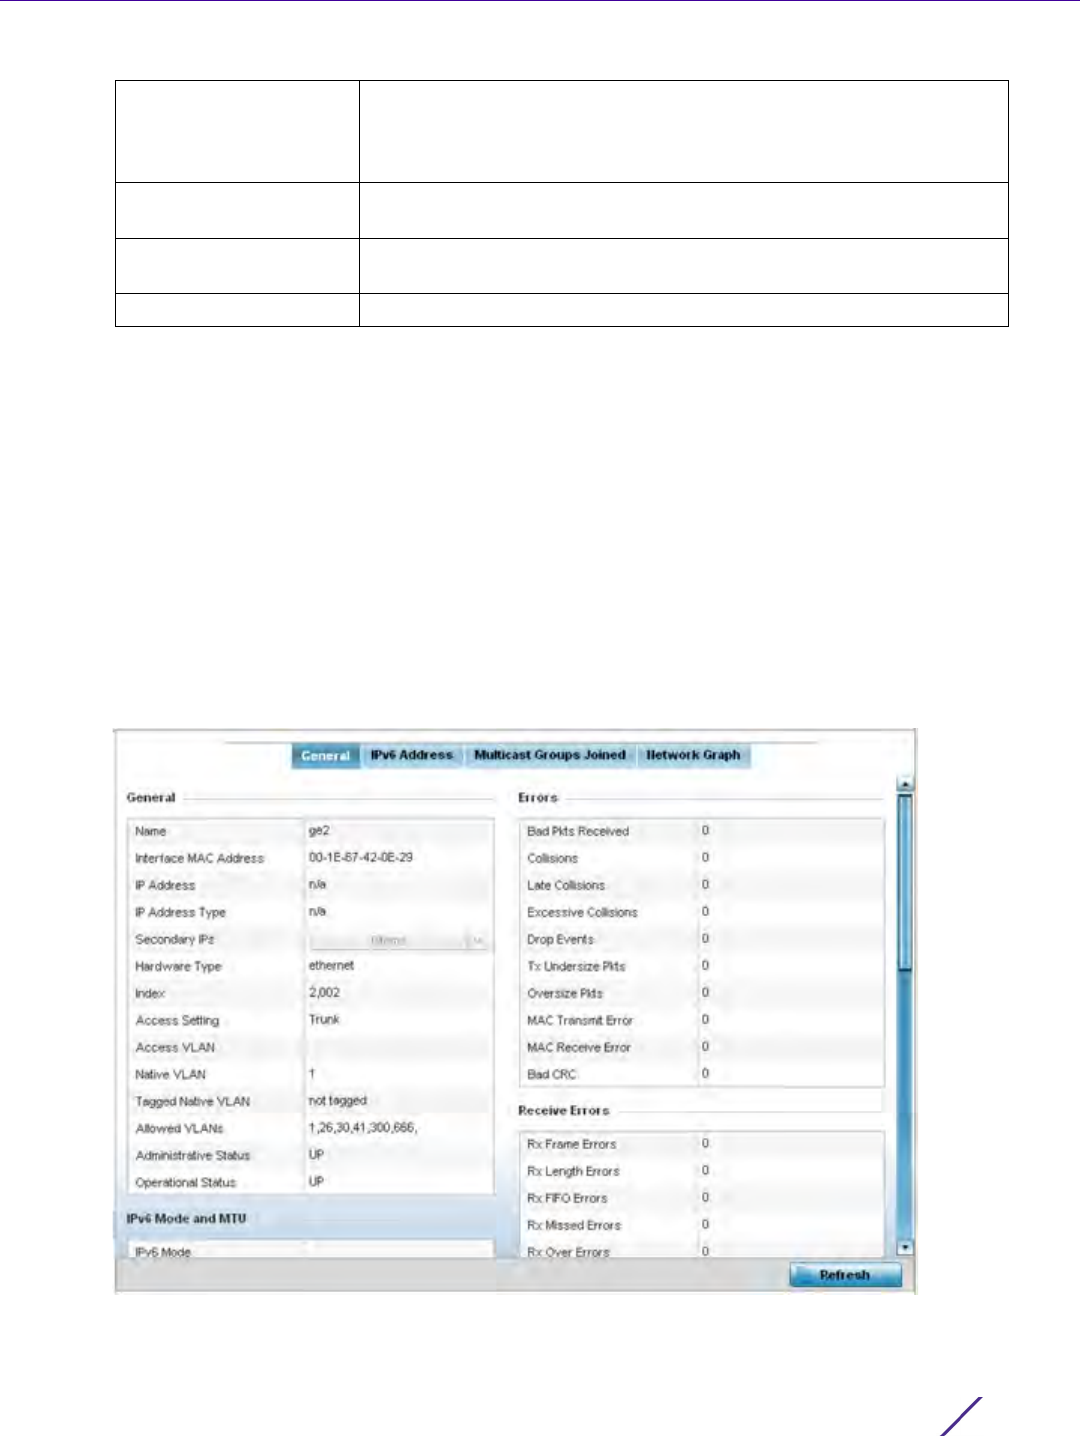
Statistics
Wireless Controller and Service Platform System Reference Guide 15 - 94
15.3.16 Interfaces
Controller Statistics
The Interface screen provides detailed statistics on each of the interfaces available on the selected controller or
service platform. Use this screen to review the statistics for each interface. Interfaces vary amongst supported
hardware model controllers and service platforms.
To review controller or service platform interface statistics:
1 Select the Statistics menu from the Web UI.
2 Select a Wireless Controller node from the left navigation pane.
3Expand the Interfaces menu from the left-hand side of the UI.
4Select
General.
Figure 15-58 Wireless Controller - General Interface screen
Interface Statistics support the following:
Portal Mesh portals are mesh enabled devices connected to an external
network that forward traffic in and out. Mesh devices must find paths
to a portal to access the Internet. When multiple portals exist, the
Mesh point must select one.
Portal Radio MAC Lists the MAC addresses of those Access Points serving as mesh
portals.
Connect Time Displays the total (elapsed) connection time for each client within the
controller or service platform managed mesh network.
Refresh Select Refresh to update the statistics counters to their latest value.

Statistics
Wireless Controller and Service Platform System Reference Guide 15 - 95
•General Interface Details
•IPv6 Address
•Multicast Groups Joined
•Network Graph
15.3.16.1 General Interface Details
Interfaces
The General tab provides information on a selected controller or service platform interface such as its MAC
address, type and TX/RX statistics.
The General table displays the following:
The IPv6 Mode and MTU table displays the following information:
Name Displays the name of the controller or service platform interface ge1,
up 1etc.
Interface MAC Address Displays the MAC address of the interface.
IP Address IP address of the interface.
IP Address Type Displays the IP address type, either IPv4 or IPv6.
Secondary IP Displays a list of secondary IP resources assigned to this interface.
Hardware Type Displays the networking technology.
Index Displays the unique numerical identifier for the interface.
Access Setting Displays the VLAN mode as either Access or Trunk.
Access VLAN Displays the tag assigned to the native VLAN.
Native VLAN The native VLAN allows an Ethernet device to associate untagged
frames to a VLAN when no 802.1Q frame is included in the frame.
Additionally, the native VLAN is the VLAN untagged traffic is directed
over when using a port in trunk mode.
Tagged Native VLAN When a frame is tagged, the 12 bit frame VLAN ID is added to the
802.1Q header so upstream Ethernet devices know which VLAN ID the
frame belongs to. The device reads the 12 bit VLAN ID and forwards
the frame to the appropriate VLAN. When a frame is received with no
802.1Q header, the upstream device classifies the frame using the
default or native VLAN assigned to the Trunk port. A native VLAN
allows an Ethernet device to associate untagged frames to a VLAN
when no 802.1Q frame is included in the frame.
Allowed VLANs Displays the list of allowed virtual interface(s) on this interface.
Administrative Status Displays whether the interface is currently UP or DOWN.
Operational Status Lists whether the selected interface is currently UP (operational) or
DOWN.
IPv6 Mode Lists the current IPv6 mode is utilized.
IPv6 MTU Lists the IPv6 formatted largest packet size that can be sent over the
interface.

Statistics
Wireless Controller and Service Platform System Reference Guide 15 - 96
The Specification table displays the following information:
The Traffic table displays the following:
Media Type Displays the physical connection type of the interface.
Medium types include:
Copper - Used on RJ-45 Ethernet ports
Optical - Used on fibre optic gigabit Ethernet ports
Protocol Displays the routing protocol used by the interface.
MTU Displays the maximum transmission unit (MTU) setting configured on
the interface. The MTU value represents the largest packet size that
can be sent over the interface. 10/100 Ethernet ports have a maximum
setting of 1500.
Mode The mode can be either:
Access – The Ethernet interface accepts packets only from native
VLANs.
Trunk – The Ethernet interface allows packets from a list of VLANs you
can add to the trunk.
Metric Displays the metric associated with the interface’s route.
Maximum Speed Displays the maximum speed the interface uses to transmit or receive
data.
Admin Speed Displays the speed the port can transmit or receive. This value can be
either 10, 100, 1000 or Auto. This value is the maximum port speed in
Mbps. Auto indicates the speed is negotiated between connected
devices.
Operator Speed Displays the current speed of data transmitted and received over the
interface.
Admin Duplex Setting Displays the administrator’s duplex setting.
Current Duplex Setting Displays the interface as either half duplex, full duplex or unknown.
Good Octets Sent Displays the number of octets (bytes) with no errors sent by the
interface.
Good Octets Received Displays the number of octets (bytes) with no errors received by the
interface.
Good Packets Sent Displays the number of good packets transmitted.
Good Packets Received Displays the number of good packets received.
Mcast Pkts Sent Displays the number of multicast packets sent through the interface.
Mcast Pkts Received Displays the number of multicast packets received through the
interface.
Ucast Pkts Sent Displays the number of unicast packets sent through the interface.
Ucast Pkts Received Displays the number of unicast packets received through the interface.
Bcast Pkts Sent Displays the number of broadcast packets sent through the interface.
Bcast Pkts Received Displays the number of broadcast packets received through the
interface.
Packet Fragments Displays the number of packet fragments transmitted or received
through the interface.

Statistics
Wireless Controller and Service Platform System Reference Guide 15 - 97
The Errors table displays the following:
The Receive Errors table displays the following:
Jabber Pkts Displays the number of packets transmitted through the interface
larger than the MTU.
Bad Pkts Received Displays the number of bad packets received through the interface.
Collisions Displays the number of collisions over the selected interface.
Late Collisions A late collision is any collision that occurs after the first 64 octets of
data have been sent. Late collisions are not normal, and usually the
result of out of specification cabling or a malfunctioning device.
Excessive Collisions Displays the number of excessive collisions. Excessive collisions occur
when the traffic load increases to the point a single Ethernet network
cannot handle it efficiently.
Drop Events Displays the number of dropped packets transmitted or received
through the interface.
Tx Undersize Pkts Displays the number of undersized packets transmitted through the
interface.
Oversize Pkts Displays the number of oversized packets transmitted through the
interface.
MAC Transmit Error Displays the number of failed transmits due to an internal MAC
sublayer error (that’s not a late collision), due to excessive collisions or
a carrier sense error.
MAC Receive Error Displays the number of received packets that failed due to an internal
MAC sublayer (that’s not a late collision), an excessive number of
collisions or a carrier sense error.
Bad CRC Displays the CRC error. The CRC is the 4 byte field at the end of every
frame. The receiving station uses it to interpret if the frame is valid. If
the CRC value computed by the interface does not match the value at
the end of frame, it is considered as a bad CRC.
Rx Frame Errors Displays the number of frame errors received at the interface. A frame
error occurs when data is received, but not in an expected format.
Rx Length Errors Displays the number of length errors received at the interface. Length
errors are generated when the received frame length was either less or
over the Ethernet standard.
Rx FIFO Errors Displays the number of FIFO errors received at the interface. First-in
First-out queueing is an algorithm that involves buffering and
forwarding of packets in the order of arrival. FIFO entails no priority.
There is only one queue, and all packets are treated equally. An
increase in FIFO errors indicates a probable hardware malfunction.
Rx Missed Errors Displays the number of missed packets. Packets are missed when the
hardware received FIFO has insufficient space to store an incoming
packet.
Rx Over Errors Displays the number of overflow errors received. Overflows occur
when a packet size exceeds the allocated buffer size.

Statistics
Wireless Controller and Service Platform System Reference Guide 15 - 98
The Transmit Errors field displays the following:
15.3.16.2 IPv6 Address
Interfaces
IPv6 is the latest revision of the Internet Protocol (IP) designed to replace IPv4. IPV6 provides enhanced
identification and location information for computers on networks routing traffic across the Internet. IPv6
addresses are composed of eight groups of four hexadecimal digits separated by colons.
To view controller or service platform IPv6 address utilization:
1 Select the Statistics menu from the Web UI.
2 Select a Wireless Controller node from the left navigation pane.
3Expand the Interfaces menu from the left-hand side of the UI.
4 Select the IPv6 Address tab.
Tx Errors Displays the number of packets with errors transmitted on the
interface.
Tx Dropped Displays the number of transmitted packets dropped from the
interface.
Tx Aborted Errors Displays the number of packets aborted on the interface because a
clear-to-send request was not detected.
Tx Carrier Errors Displays the number of carrier errors on the interface. This generally
indicates bad Ethernet hardware or bad cabling.
Tx FIFO Errors Displays the number of FIFO errors transmitted at the interface. First-
in First-Out queueing is an algorithm that involves the buffering and
forwarding of packets in the order of arrival. FIFO uses no priority.
There is only one queue, and all packets are treated equally. An
increase in the number of FIFO errors indicates a probable hardware
malfunction.
Tx Heartbeat Errors Displays the number of heartbeat errors. This generally indicates a
software crash, or packets stuck in an endless loop.
Tx Window Errors Displays the number of window errors transmitted. TCP uses a sliding
window flow control protocol. In each TCP segment, the receiver
specifies the amount of additional received data (in bytes) the receiver
is willing to buffer for the connection. The sending host can send only
up to that amount. If the sending host transmits more data before
receiving an acknowledgment, it constitutes a window error.
Refresh Select Refresh to update the statistics counters to their latest value.
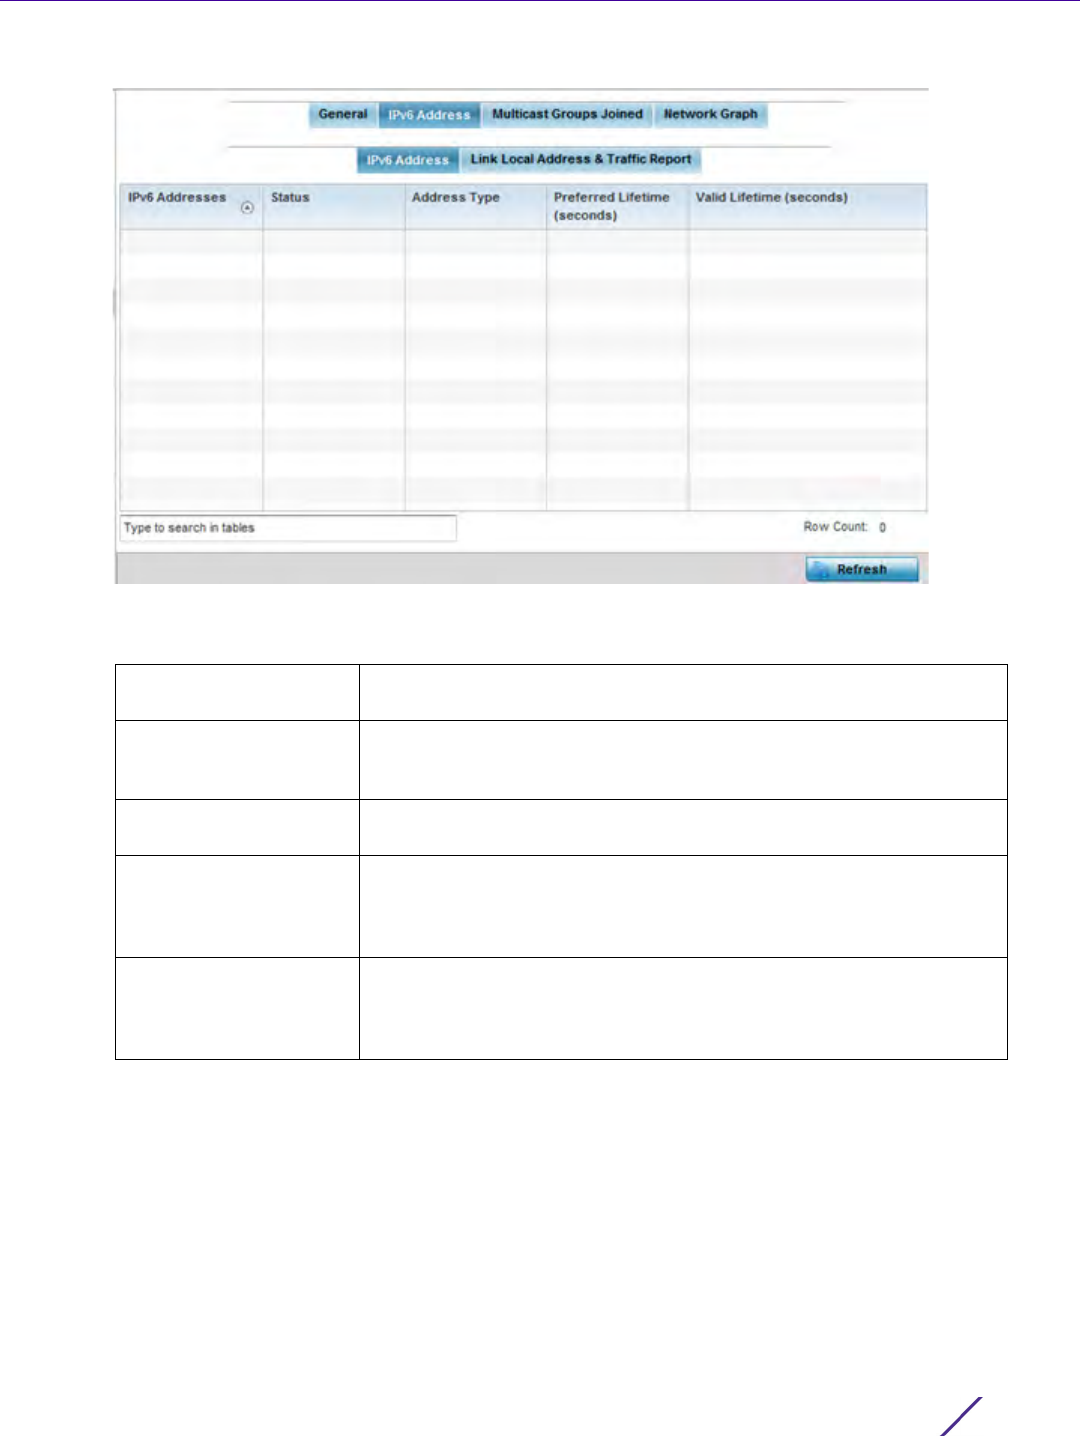
Statistics
Wireless Controller and Service Platform System Reference Guide 15 - 99
Figure 15-59 Wireless Controller - Interface IPv6 Address screen
5The IPv6 Addresses table displays the following:
6 Select the Link Local Address & Traffic Report tab to assess data traffic and errors discovered in transmitted
and received IPv6 formatted data packets.
IPv6 Addresses Lists the IPv6 formatted addresses currently utilized by the controller
or service platform in the selected interface.
Status Lists the current utilization status of each IPv6 formatted address
currently in use by this controller or service platform’s selected
interface.
Address Type Lists whether the address is unicast or multicast in its utilization over
the selected controller or service platform interface.
Preferred Lifetime
(seconds)
Lists is the time in seconds (relative to when the packet is sent) the
IPv6 formatted addresses remains in a preferred state on the selected
interface. The preferred lifetime must always be less than or equal to
the valid lifetime.
Valid Lifetime (seconds) Displays the time in seconds (relative to when the packet is sent) the
IPv6 formatted address remains in a valid state on the selected
interface. The valid lifetime must always be greater than or equal to
the preferred lifetime.

Statistics
Wireless Controller and Service Platform System Reference Guide 15 - 100
Figure 15-60 Wireless Controller - Interface IPv6 Address screen
7 Verify the following Local Link Address data for the IPv6 formatted address:
8 Verify the following IPv6 formatted Traffic data:
Address Lists the IPv6 local link address. IPv6 requires a link local address
assigned to every interface the IPv6 protocol is enabled on, even when
one or more routable addresses are assigned.
Status Lists the IPv6 local link address utilization status and its current
availability.
Preferred Lifetime
(seconds)
Lists is the time in seconds (relative to when the packet is sent) the
local link addresses remains in the preferred state on the selected
interface. The preferred lifetime must always be less than or equal to
the valid lifetime.
Valid Lifetime (seconds) Displays the time in seconds (relative to when the packet is sent) the
local link addresses remains in the valid state on the selected interface.
The valid lifetime must always be greater than or equal to the
preferred lifetime.
Packets In Lists the number of IPv6 formatted data packets received on the
selected controller or service platform interface since the screen was
last refreshed.
Packets Out Lists the number of IPv6 formatted data packets transmitted on the
selected controller or service platform interface since the screen was
last refreshed.
Bytes In Displays the number of octets (bytes) with no errors received by the
selected interface.
Bytes Out Displays the number of octets (bytes) with no errors sent by the
selected interface.

Statistics
Wireless Controller and Service Platform System Reference Guide 15 - 101
9 Review the following Receive Errors for IPv6 formatted data traffic:
10 Review the following Transmit Errors for IPv6 formatted data traffic:
Bad Packets Received Displays the number of bad IPv6 formatted packets received through
the interface.
Bad CRC Displays the CRC error. The CRC is the 4 byte field at the end of every
frame. The receiving station uses it to interpret if the frame is valid. If
the CRC value computed by the interface does not match the value at
the end of frame, it is considered as a bad CRC.
Collisions Displays the number of collisions over the selected interface. Excessive
collisions occur when the traffic load increases to the point a single
Ethernet network cannot handle it efficiently. A late collision is any
collision that occurs after the first 64 octets of data have been sent.
Late collisions are not normal, and usually the result of out of
specification cabling or a malfunctioning device.
Receive Length Errors Displays the number of IPv6 length errors received at the interface.
Length errors are generated when the received IPv6 frame length was
either less or over the Ethernet standard.
Receive Over Errors Displays the number of IPv6 overflow errors received. Overflows occur
when a packet size exceeds the allocated buffer size.
Receive Frame Errors Displays the number of IPv6 frame errors received at the interface. A
frame error occurs when data is received, but not in an expected
format.
Receive FIFO Errors Displays the number of IPv6 FIFO errors received at the interface.
First-in First-out queueing is an algorithm that involves buffering and
forwarding of packets in the order of arrival. FIFO entails no priority.
There is only one queue, and all IPv6 formatted packets are treated
equally. An increase in FIFO errors indicates a probable hardware
malfunction.
Receive Missed Errors Displays the number of missed IPv6 formatted packets. Packets are
missed when the hardware received FIFO has insufficient space to
store an incoming packet.
Transmit Errors Displays the number of IPv6 formatted data packets with errors
transmitted on the interface.
Transmit Aborted Errors Displays the number of IPv6 formatted packets aborted on the
interface because a clear-to-send request was not detected.
Transmit Carrier Errors Displays the number of IPv6 formatted carrier errors on the interface.
This generally indicates bad Ethernet hardware or bad cabling.
Transmit FIFO Errors Displays the number of IPv6 formatted FIFO errors transmitted at the
interface. First-in First-Out queueing is an algorithm that involves the
buffering and forwarding of packets in the order of arrival. FIFO uses
no priority. There is only one queue, and all packets are treated
equally. An increase in the number of FIFO errors indicates a probable
hardware malfunction.
Transmit Heartbeat
Errors
Displays the number of IPv6 formatted heartbeat errors. This generally
indicates a software crash, or packets stuck in an endless loop.

Statistics
Wireless Controller and Service Platform System Reference Guide 15 - 102
15.3.16.3 Multicast Groups Joined
Interfaces
Multicast groups scale to a larger set of destinations by not requiring prior knowledge of who or how many
destinations there are. Multicast devices uses their infrastructure efficiently by requiring the source to send a
packet only once, even if delivered to a large number of devices. Devices replicate a packet to reach multiple
receivers only when necessary.
Controllers and service platforms are free to join or leave a multicast group at any time. There are no restrictions
on the location or members in a multicast group. A host may be a member of more than one multicast group at
any given time and does not have to belong to a group to send messages to members of a group.
To view the controller or service platform multicast group memberships on the selected interface:
1 Select the Statistics menu from the Web UI.
2 Select a Wireless Controller node from the left navigation pane.
3Expand the Interfaces menu from the left-hand side of the UI.
4Select
Multicast Groups Joined.
Transmit Window Errors Displays the number of IPv6 formatted window errors transmitted.
TCP uses a sliding window flow control protocol. In each TCP segment,
the receiver specifies the amount of additional received data (in bytes)
the receiver is willing to buffer for the connection. The sending host
can send only up to that amount. If the sending host transmits more
data before receiving an acknowledgment, it constitutes a window
error.
Refresh Select Refresh to update the statistics counters to their latest value.
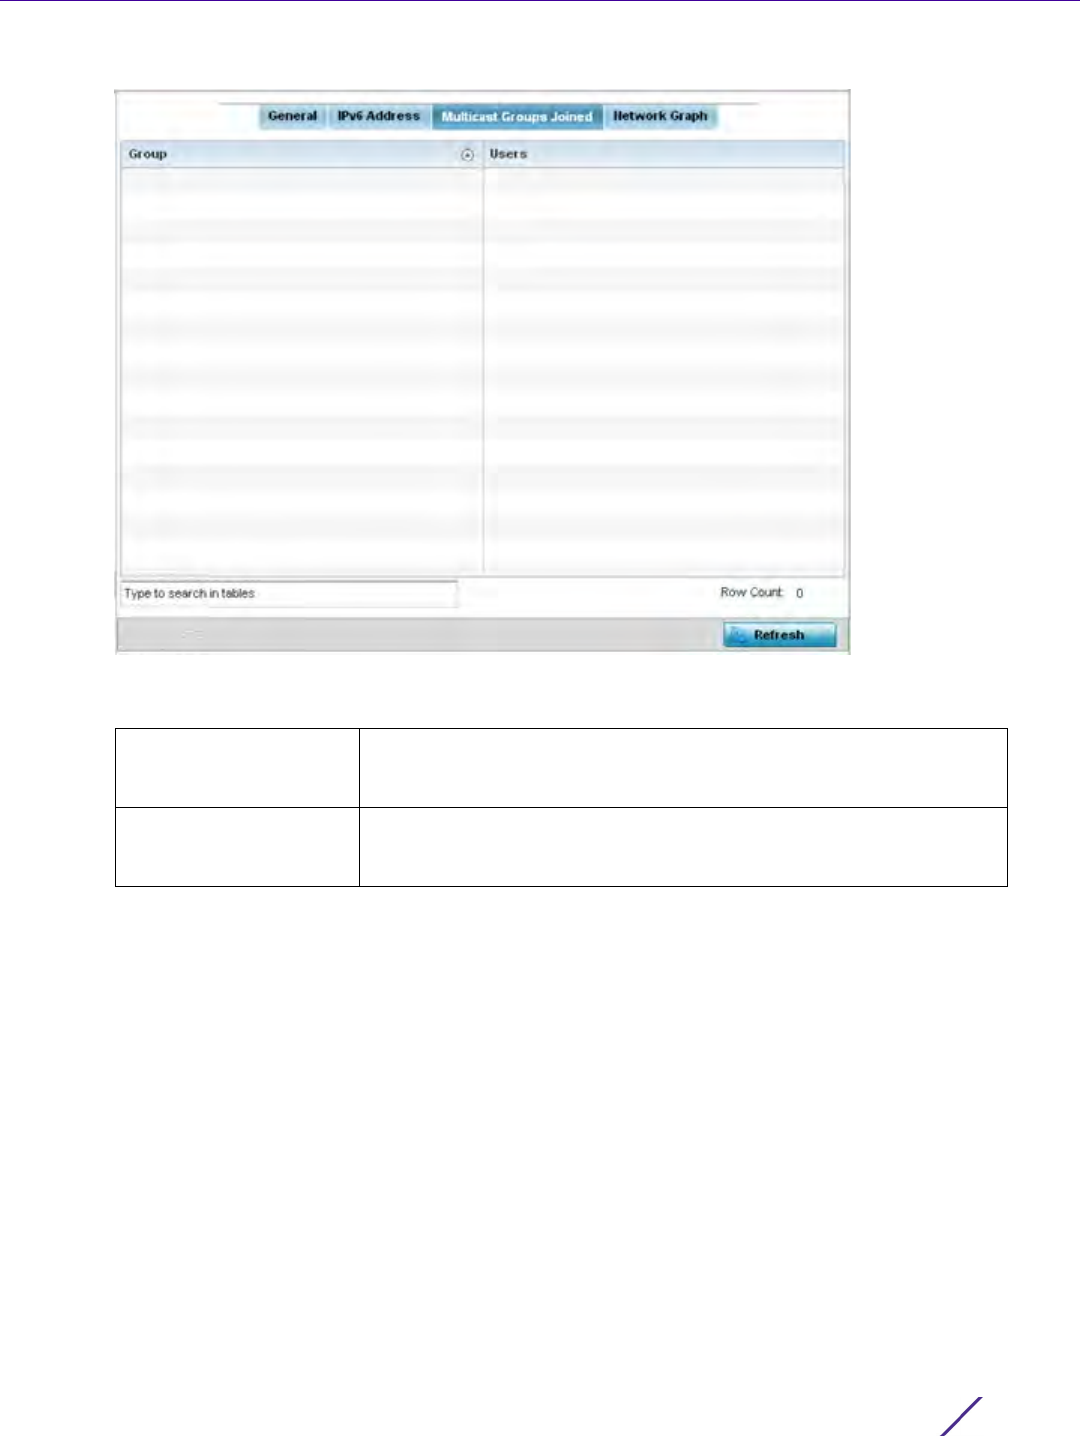
Statistics
Wireless Controller and Service Platform System Reference Guide 15 - 103
Figure 15-61 Wireless Controller - Interface Multicast Groups Joined screen
5 The screen displays the following:
6 Periodically select Refresh to update the screen’s counters to their latest values.
Group Lists the name of existing multicast groups whose current members
share multicast packets with one another on this selected interface as
a means of collective interoperation.
Users Lists the number of devices currently interoperating on this interface
in each listed multicast group. Any single device can be a member of
more then one group at a time.
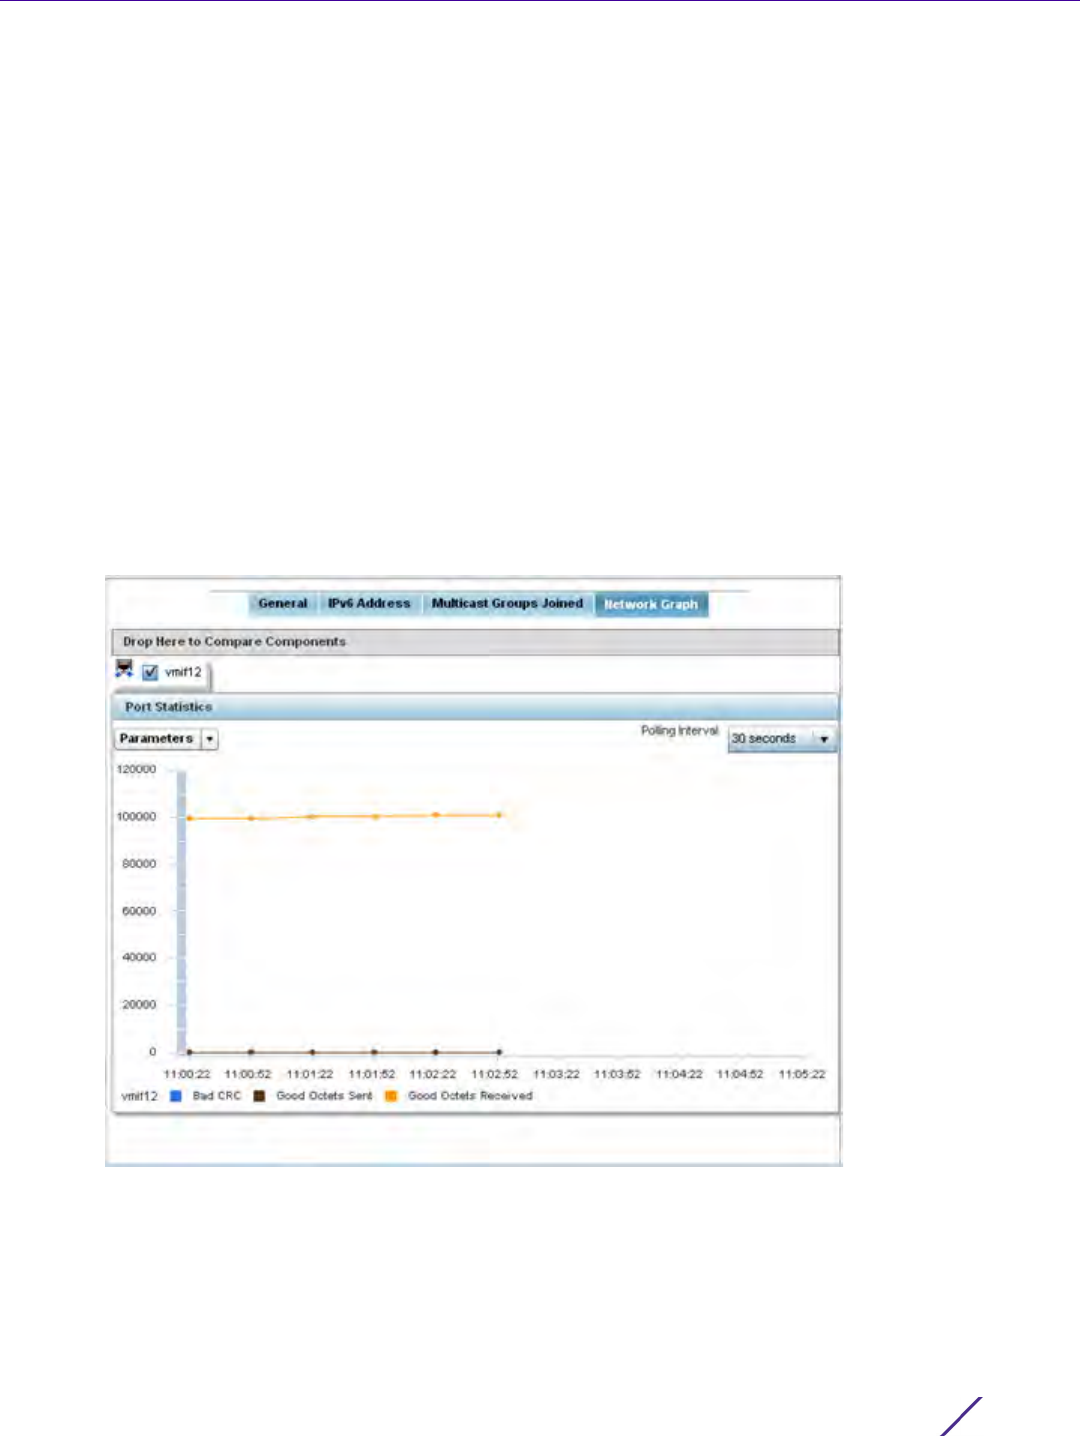
Statistics
Wireless Controller and Service Platform System Reference Guide 15 - 104
15.3.16.4 Network Graph
Interfaces
The Network Graph tab displays statistics the controller or service platform continuously collects for its interfaces.
Even when the interface statistics graph is closed, data is still collected. Display the interface statistics graph
periodically for assessing the latest interface information. Up to three different stats can be selected and displayed
within the graph.
To view a detailed graph for an interface, select an interface and drop it on to the graph. The graph displays Port
Statistics as the Y-axis and the Polling Interval as the X-axis. Use the Polling Interval from the drop-down menu to
define the intervals for which data is displayed on the graph.
To view the Interface Statistics graph:
1 Select the Statistics menu from the Web UI.
2 Select a Wireless Controller node from the left navigation pane.
3Expand the Interfaces menu from the left-hand side of the UI.
4Select
Network Graph. Use the Parameters drop-down menu to specify what’s trended in the graph.
Figure 15-62 Wireless Controller - Interface Network Graph screen

Statistics
Wireless Controller and Service Platform System Reference Guide 15 - 105
15.3.17 Border Gateway Protocol (BGP) Statistics
Controller Statistics
Border Gateway Protocol (BGP) is an inter-ISP routing protocol which establishes routes between ISPs. ISPs use
BGP to exchange routing and reachability information between Autonomous Systems (AS) on the Internet. BGP
makes routing decisions based on paths, network policies and/or rules configured by network administrators. The
primary role of a BGP system is to exchange network reachability information with other BGP peers. This
information includes information on AS that the reachability information traverses. This information is sufficient to
create a graph of AS connectivity from which routing decisions can be created and rules enforced.
An Autonomous System (AS) is a set of routers under the same administration that use Interior Gateway Protocol
(IGP) and common metrics to define how to route packets within the AS. AS uses inter-AS routing to route
packets to other ASs. For an external AS, an AS appears to have a single coherent interior routing plan and
presents a consistent picture of the destinations reachable through it.
Routing information exchanged through BGP supports only destination based forwarding (it assumes a router
forwards packets based on the destination address carried in the IP header of the packet).
BGP uses TCP as its transport protocol. This eliminates the need to implement explicit update fragmentation,
retransmission, acknowledgement, and sequencing. BGP listens on TCP port 179. The error notification mechanism
used in BGP assumes that TCP supports a graceful close (all outstanding data is delivered before the connection is
closed).
BGP statistics are available to assist an administrator in assessing the status of the service platforms’s BGP feature
and its neighbor BGP peers. Much of the configuration information can be filtered from the Route Filters screen.
To review BGP statistics:
1 Select the Statistics menu from the Web UI.
2 Select a Wireless Controller node from the left navigation pane.
3Select
BGP from the left-hand side of the UI. The BGP Summary tab displays by default.
NOTE: BGP is only supported on RFS6000 and NX9500 model controllers and
service platforms.
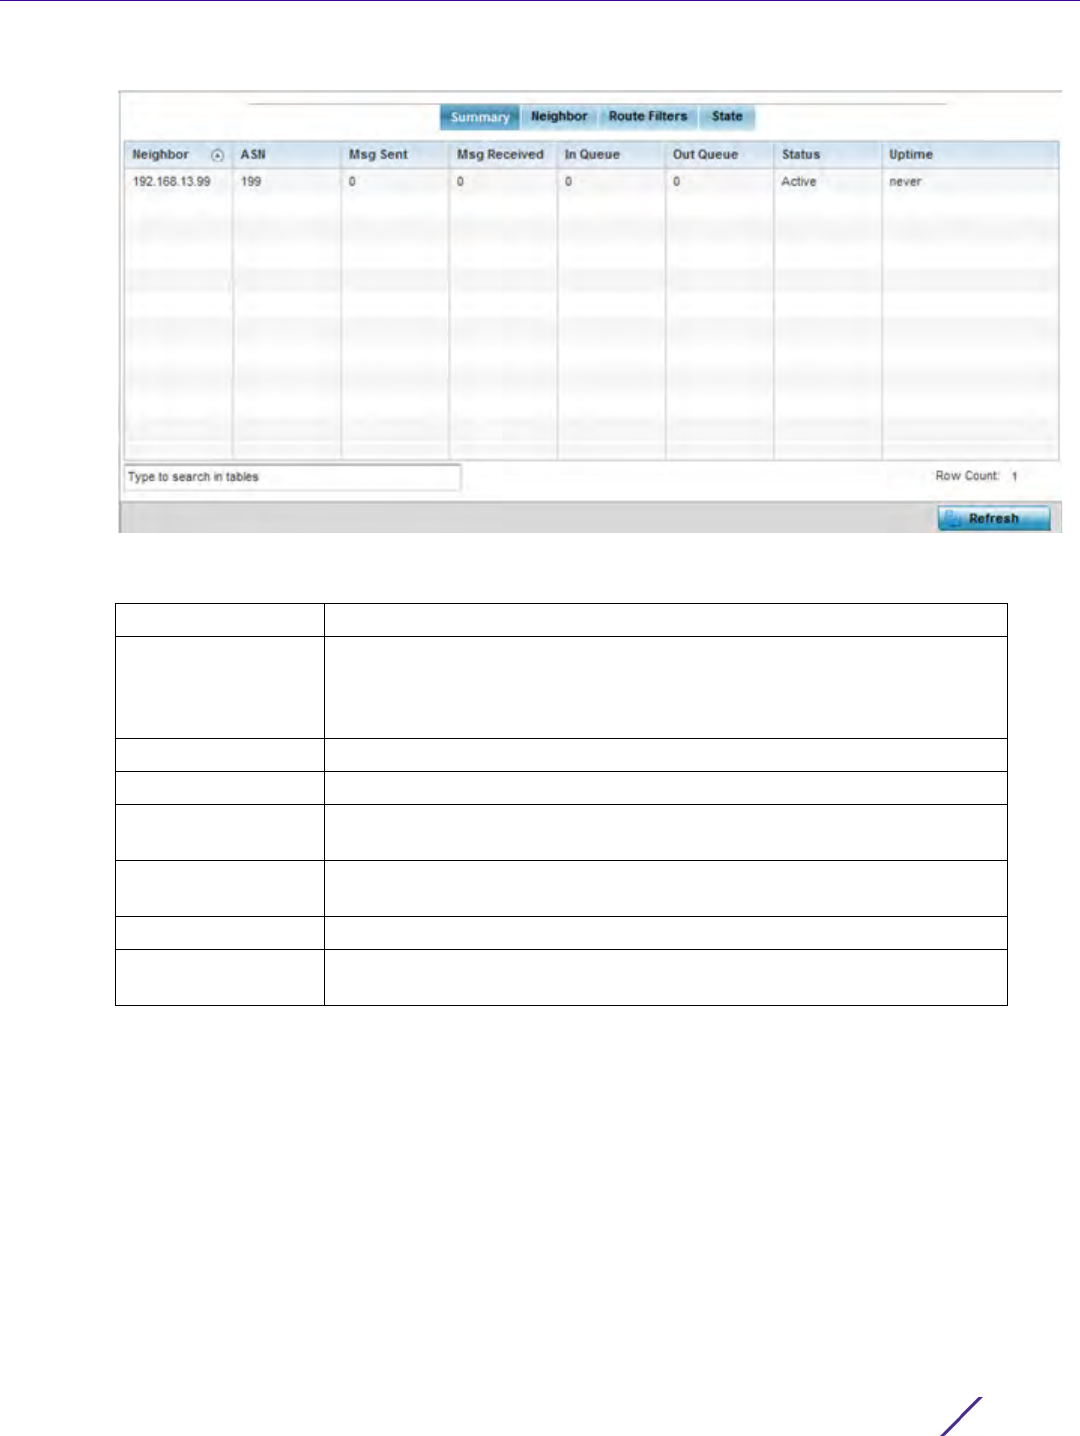
Statistics
Wireless Controller and Service Platform System Reference Guide 15 - 106
Figure 15-63 Wireless Controller - BGP - Summary screen
The Summary tab displays the following:
4 Periodically select Refresh to update the screen’s counters to their latest value.
5 Select the Neighbor tab.
Neighbor Lists the IP address of neighbor BGP supported devices.
ASN Lists the Autonomous System Number (ASN) assigned to each listed
neighbor BGP peer. ASN is a set of routers under the same administration
that use Interior Gateway Protocol (IGP) and common metrics to define
how to route packets
Msg Sent Lists the number of messages sent out of this BGP peer.
Msg Received Lists the number of messages received by this BGP peer.
In Queue Lists the number of messages in the controller or service platform queue
that have not yet been read (processed).
Out Queue Lists the number of messages in the controller or service platform queue
that have not yet been sent.
Status Displays the status of each listed BGP neighbor as Active or Disabled.
Uptime Displays the time duration in HH:MM:SS format since the connection to this
neighbor BGP peer was established.
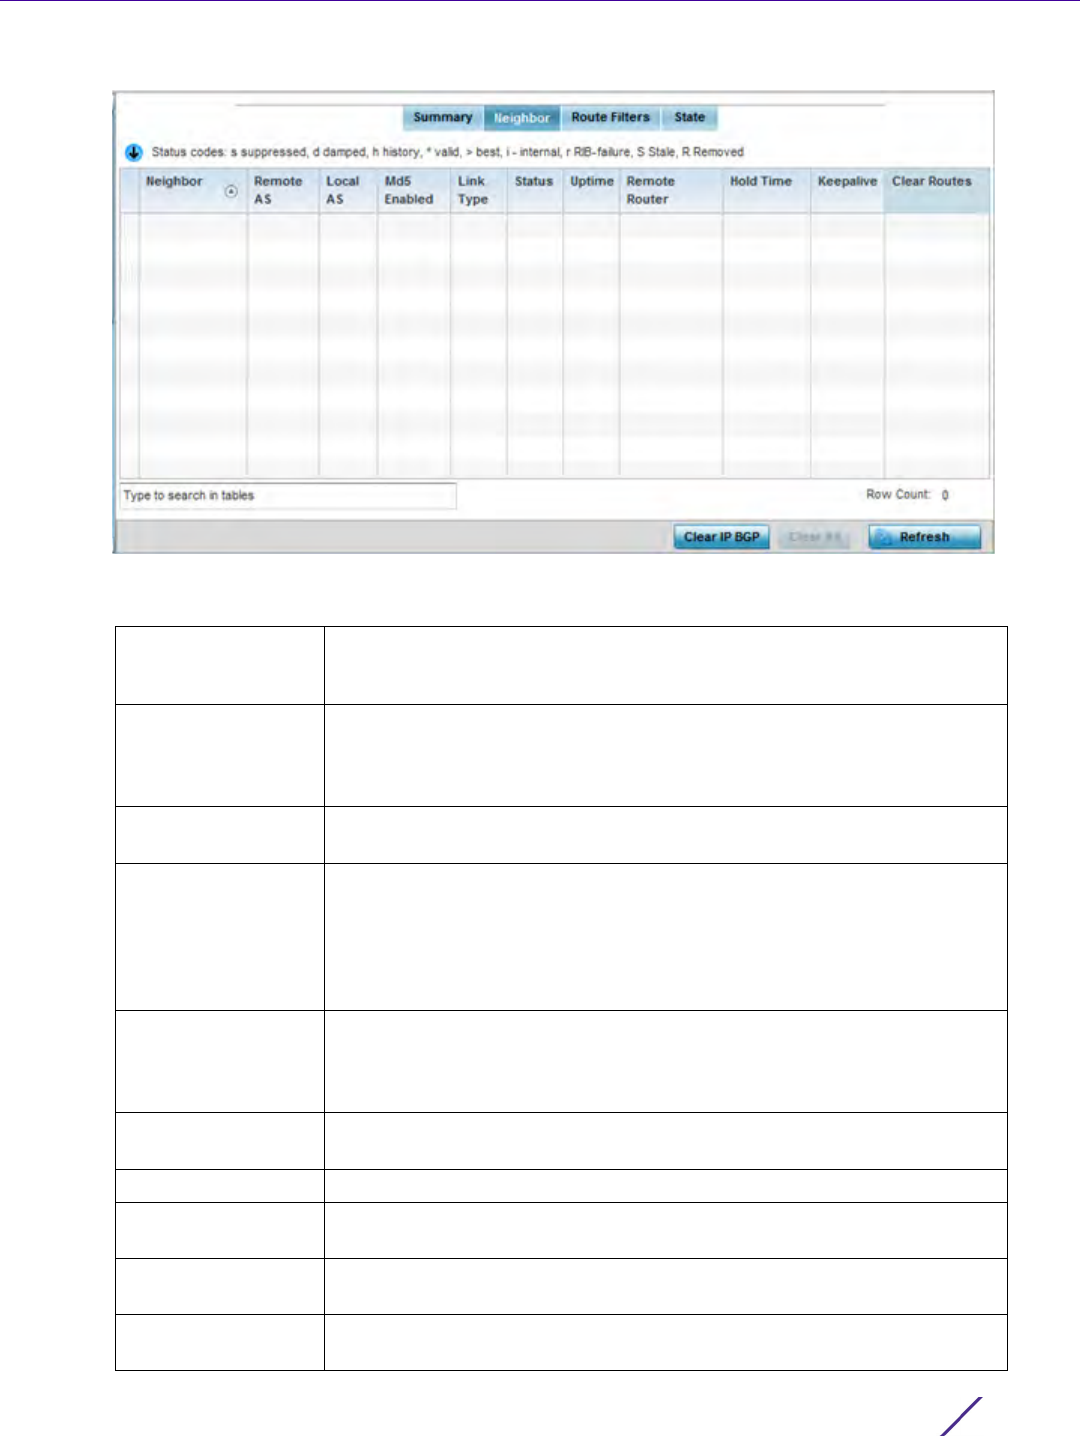
Statistics
Wireless Controller and Service Platform System Reference Guide 15 - 107
Figure 15-64 Wireless Controller - BGP - Neighbor screen
The Neighbor tab displays the following BGP neighbor information:
Neighbor Lists the IP address of neighbor BGP supported peer controllers or service
platforms. Each IP address displays as a link to display BGP supported
device data in greater detail.
Remote AS Lists the AS number configured on this BGP neighbor. An Autonomous
System (AS) is a set of routers under the same administration that use
Interior Gateway Protocol (IGP) and common metrics to define how to
route packets within the AS.
Local AS Lists the AS number (1 - 4,294,967,295) configured on this BGP wireless
controller or service platforms.
MD5 Enabled A green check defines MD5 authentication enabled on the listed BGP
neighbor. A red X means disabled. MD5 is a message digest algorithm
using a cryptographic hash producing a 128-bit (16-byte) hash value,
usually expressed in text as a 32 digit hexadecimal number. MD5 has been
utilized in a wide variety of cryptographic applications, and is also
commonly used to verify data integrity.
Link Type Lists the type of BGP link. Displays internal if the link type is iBGP. Displays
external if the link type is eBGP. iBGP exchanges routing table information
between routers within an autonomous system. eBGP exchanges routing
table information between hosts outside an autonomous system.
Status Displays the current Active or Inactive state of each listed BGP neighbor
device.
Uptime Displays the uptime for each listed BGP neighbor.
Remote Router Lists the IP address used by the BGP remote router resource as a network
identifier.
Hold Time Displays the duration, in seconds, for the hold (delay) of packet
transmissions to each listed BGP neighbor device.
Keepalive Displays the duration, in seconds, for the keep alive timer used to maintain
the connection to each listed BGP neighbor device.
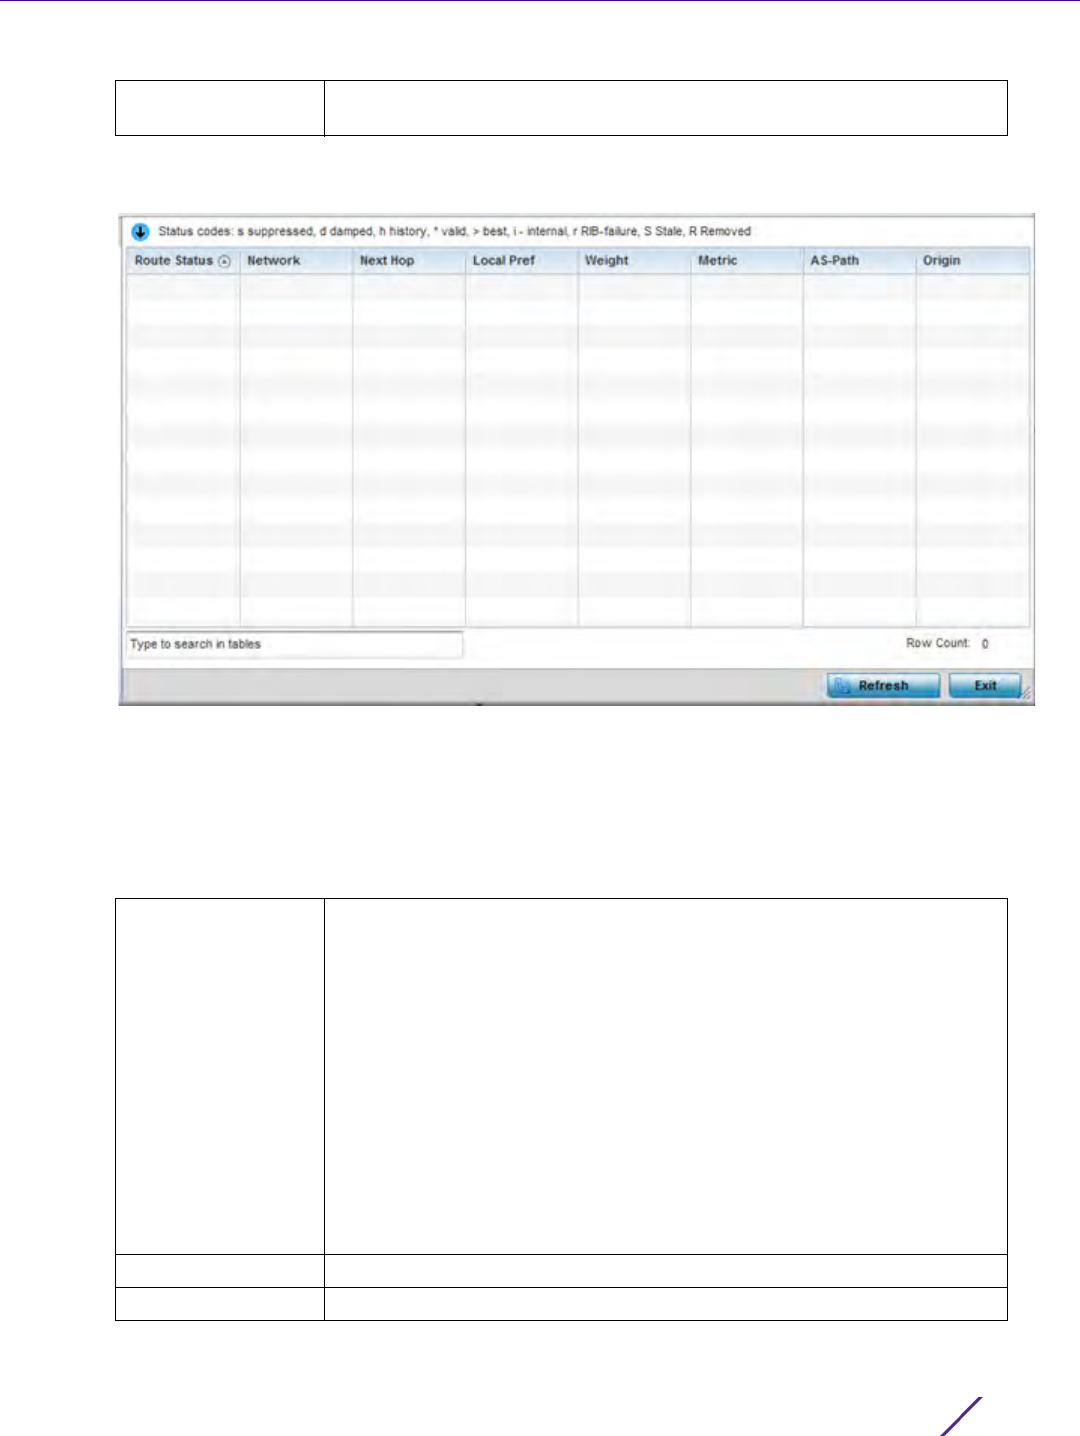
Statistics
Wireless Controller and Service Platform System Reference Guide 15 - 108
6 Optionally select the IP address of a listed BGP neighbor device to launch the following screen for more
granular device information for the selected peer device:
Figure 15-65 Wireless Controller - BGP - Neighbor - Statistics screen
The BGP neighbor Statistics screen displays route information for the following kinds of routes:
•Advertised – Displays route information for routes advertised to the selected neighbor device.
•Received – Displays route information for routes received from the selected neighbor device.
•Routes – Displays the route information for routes learned from the selected neighbor device.
7 Refer to the following for details on the displayed route. The fields are common to all the screens.
Clear Routes Select the Clear Retries item (within the table) this to reset and clear all
routes received from this BGP neighbor.
Route Status Displays the status of this route. Route statuses include:
Suppressed – This route has been suppressed.
Damped – This route has been damped due to flapping.
History - This route is kept in memory to retain flap-dampening statistics.
This route is not currently announced by the peer.
Valid – This route is a valid route.
Best – This route is the best route of all the routes utilized.
RIB Failure - A route with better administrative distance is already present,
a memory failure exists or the number of routes in VPN routing/forwarding
(VRF) exceeds the route-limit configured under the VRF instance.
Removed – This route has been removed from the routes list and is no
longer available to BGP supported neighbor devices.
Network Displays network information for this route.
Next Hop Displays the IP address of the next hop in this route.
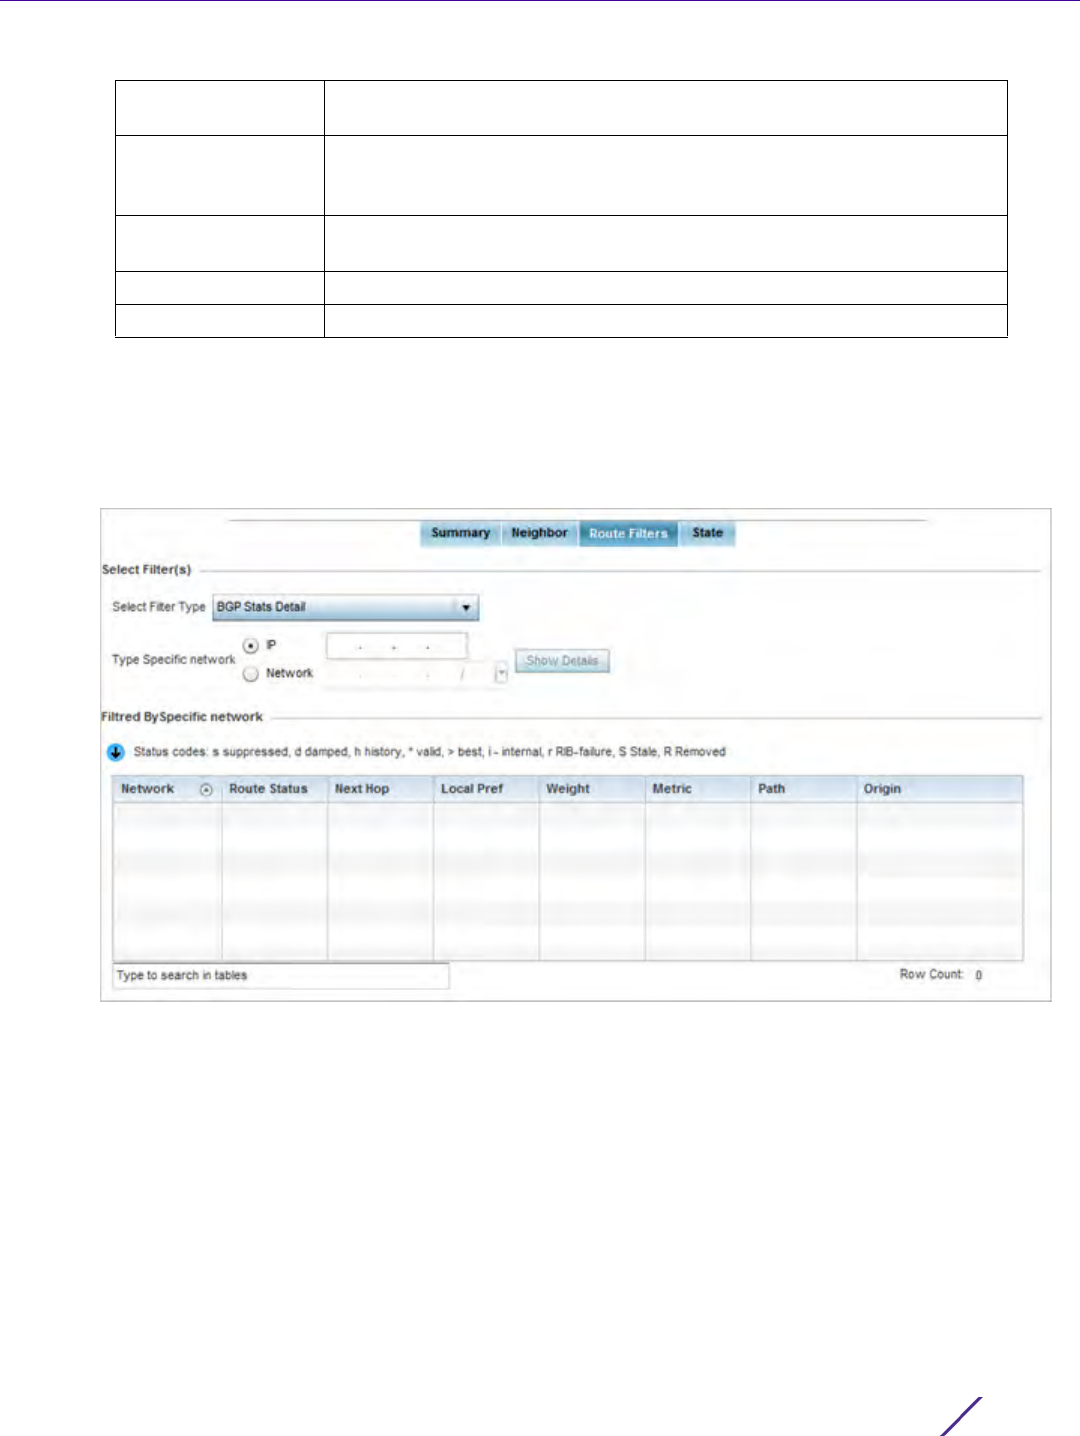
Statistics
Wireless Controller and Service Platform System Reference Guide 15 - 109
8 Select the Refresh button to update the information displayed in this screen to the latest values. Use the Exit
button to exit to the Neighbor screen.
9Select
Route Filters tab.
This screen provides eight (8) different filters for viewing route statistics. Route statistics can be filtered on
eight (8) different parameters.
Figure 15-66 Wireless Controller - BGP - Route Filter screen
The Route Filters tab supports the following route filters:
•BGP Stats Details – Routes are filtered on BGP statistics details.
•Community List – Routes are filtered on the community lists included in each route.
•Community – Routes are filtered on the community information included in each route,
•Expanded Community List – Routes are filtered on the expanded community information included in each
route.
•Prefix List – Routes are filtered on the prefix list included in each route.
•Filter List – Routes are filtered on the filter list included in each route.
•Regular Expression – Routes are filtered based on regular expressions.
•Route Map – Routes are filtered on the route map information included in each route.
10 Select BGP Stats Detail from the Select Filter Type list.
Local Pref Lists the IP address of this controller or service platform’s preferred next
hop for the route.
Weight Displays the weight assigned to this route. Weight is used to decide the
preferred route when the same route is learned from multiple neighbors.
The route with the highest weight is always chosen.
Metric Lists a measure (metric) of the quality of the path. A lower value indicates
a better path.
AS-Path Displays the AS Path information for this route.
Origin Displays the IP address of the route’s origin.

Statistics
Wireless Controller and Service Platform System Reference Guide 15 - 110
Figure 15-67 Wireless Controller - BGP - Route Filter - BGP Stats Detail
11 Use the Type Specific Network field to filter statistics based on the provided IP or Network information. Select
Show Details to display the list of filtered routes.
12 Select Community List from the Select Filter Type list.
Route Status Displays the status of this route. Route status options include:
Suppressed – This route has been suppressed.
Damped – This route has been damped due to flapping.
History - This route is kept in memory to retain flap-dampening statistics.
This route is not currently announced by the peer.
Valid – This route is a valid route.
Best – This route is the best route of all routes.
RIB Failure – A route with better administrative distance is already present,
a memory failure exists or the number of routes in VPN routing/forwarding
(VRF) exceeds the route-limit configured under the VRF instance.
Removed – This route has been removed from the routes list.
Network Displays network information for this route.
Next Hop Displays the IP address of the next hop resource utilized in this route.
Local Pref Lists the IP address of this controller or service platform’s preferred next
hop for this route. The local preference indicates the preferred path when
there are multiple paths to the same destination. The path having the
highest preference value is preferred. The preference value is sent to all
routers and access servers in the local AS.
Weight Displays the weight assigned to this route. Weight is used to decide the
preferred route when the same route is learned from multiple neighbors.
The route with the highest weight is always chosen.
Metric Lists a measure (metric) of the quality of the path. A lower value indicates
a better path. This value is the Multi Exit Discriminator (MED) evaluated by
BGP during the best path selection process.
Path Displays path information for this route.
Origin Displays the IP address of the origin for this route.
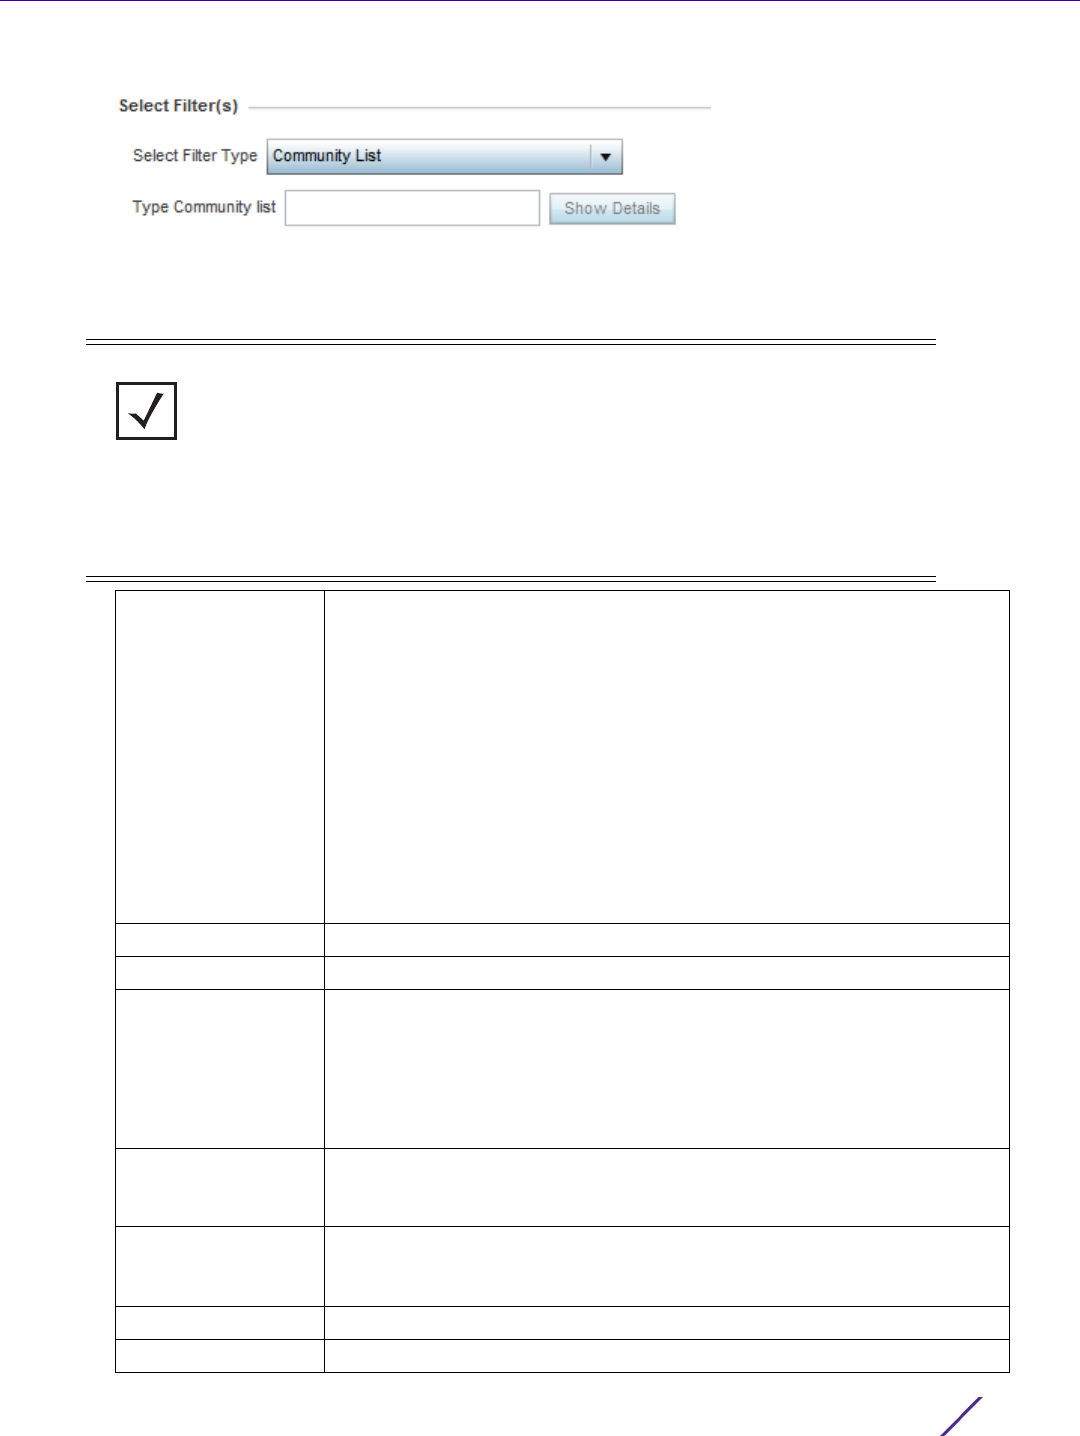
Statistics
Wireless Controller and Service Platform System Reference Guide 15 - 111
Figure 15-68 Wireless Controller - BGP - Route Filter - Community List
13 Use the Type Community List field to filter the statistics based on the community type of the route. Select
Show Details to display the list of filtered routes.
NOTE: The following table is common to these filter types:
Community List
Community
Prefix List
Filter List
Regular Expression
Route Map
Route Status Displays the status of this route. The route status could be one of:
Suppressed – This route has been suppressed.
Damped – This route has been damped due to flapping.
History - This route is kept in memory to retain flap-dampening statistics.
This route is not currently announced by the peer.
Valid – This route is a valid route.
Best – This route is the best route of all routes.
RIB Failure – A route with better administrative distance is already present,
a memory failure exists or the number of routes in VPN routing/forwarding
(VRF) exceeds the route-limit configured under the VRF instance.
Removed – This route has been removed from the routes list.
Network Displays network information for this route.
Next Hop Displays the IP address of the next hop in this route.
Local Pref Lists the IP address of this controller or service platform’s preferred next
hop for this route.
The local preference indicates the preferred path when there are multiple
paths to the same destination. The path having the highest preference
value is preferred. This preference value is sent to all routers and access
servers in the local AS.
Weight Displays the weight assigned to this route. Weight is used to decide the
preferred route when the same route is learned from multiple neighbors.
The route with the highest weight is always chosen.
Metric Lists a measure of the quality of the path. A lower value indicates a better
path. This value is the Multi Exit Discriminator (MED) evaluated by BGP
during the best path selection process.
AS-Path Displays AS path information for this route.
Origin Displays the IP address of the origin for this route.
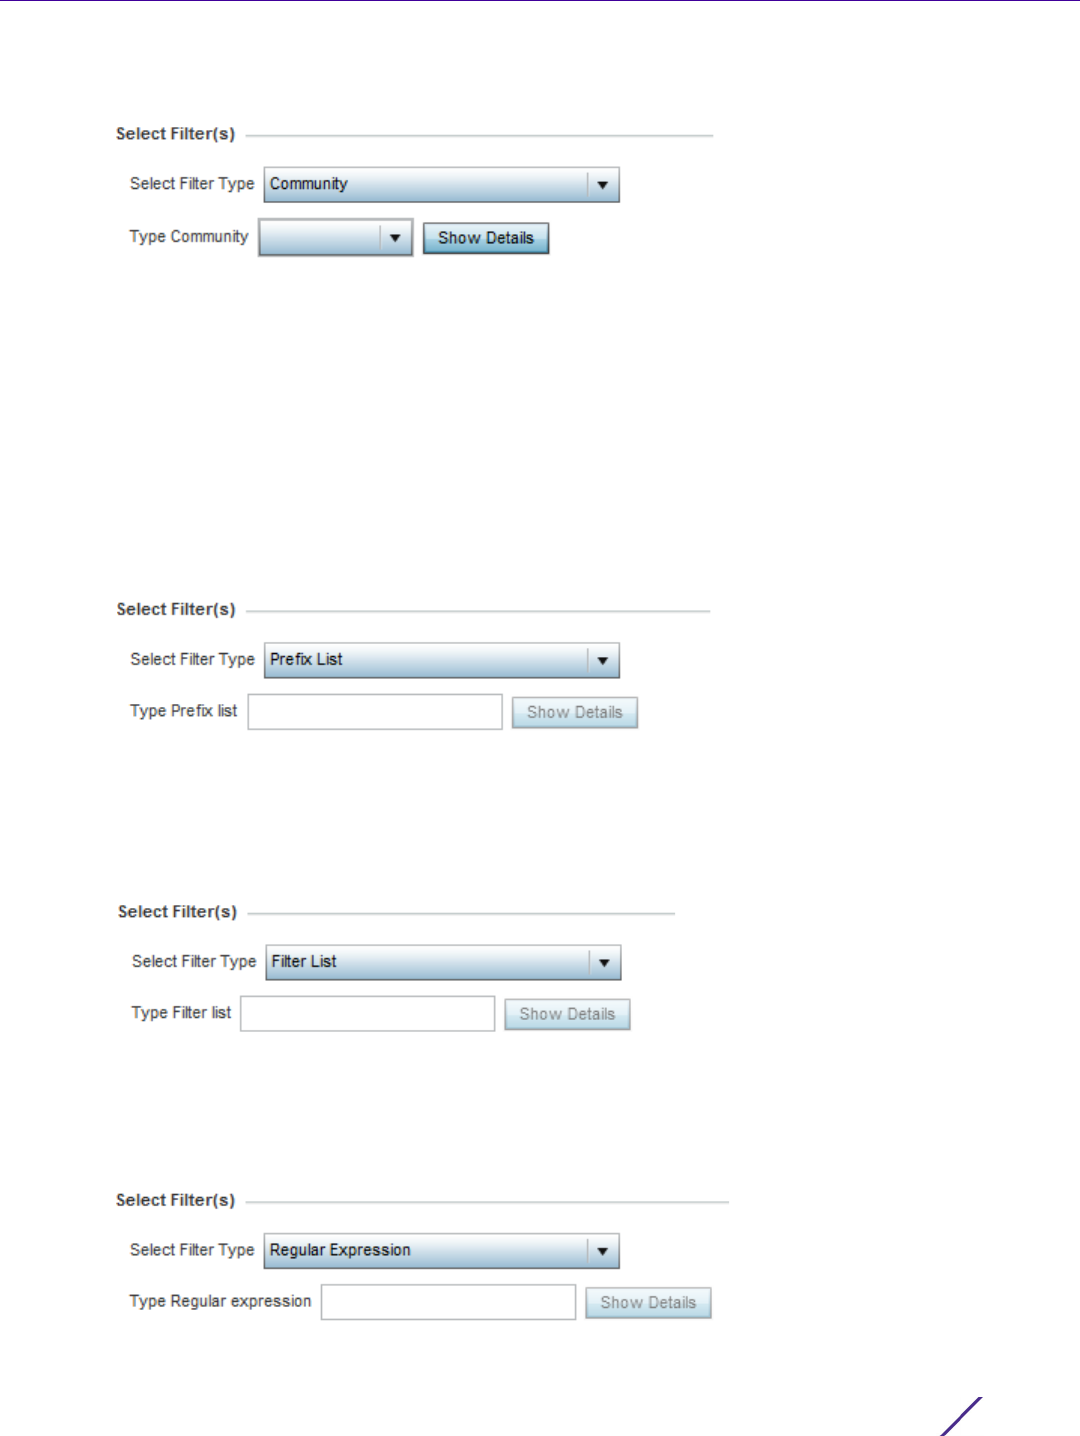
Statistics
Wireless Controller and Service Platform System Reference Guide 15 - 112
Select Community from the Select Filter Type list.
Figure 15-69 Wireless Controller - BGP - Route Filter - Community
14 Use the Type Community drop-down menu to filter the statistics based on the community of the route. Routes
can be filtered on:
•local-AS - Displays routes that prevent the transmission of packets outside the local AS.
•no-advertise - Displays routes not advertised to any peer, either internal or external.
•no-export - Displays routes not advertised to BGP peers, keeping this route within an AS.
•aa:nn - Filters routes based on the AS Number specified. The first part (aa) represents the AS number. The
second part (nn) represents a 2-byte number. Routes matching this number are filtered.
15 Select Show Details to display the list of filtered routes.
16 Select Prefix List from the Select Filter Type list.
Figure 15-70 Wireless Controller - BGP - Route Filter - Prefix List
17 Use the Type Prefix list field to filter the statistics based on the prefix of the route. Select Show Details to
display the list of filtered routes.
18 Select Filter List from the Select Filter Type list.
Figure 15-71 Wireless Controller - BGP - Route Filter - Filter List
19 Use the Type Filter List field to filter the statistics based on the filter list of the route. Select Show Details to
display the list of filtered routes.
20 Select Regular Expression from the Select Filter Type list.
Figure 15-72 Wireless Controller - BGP - Route Filter - Regular Expression
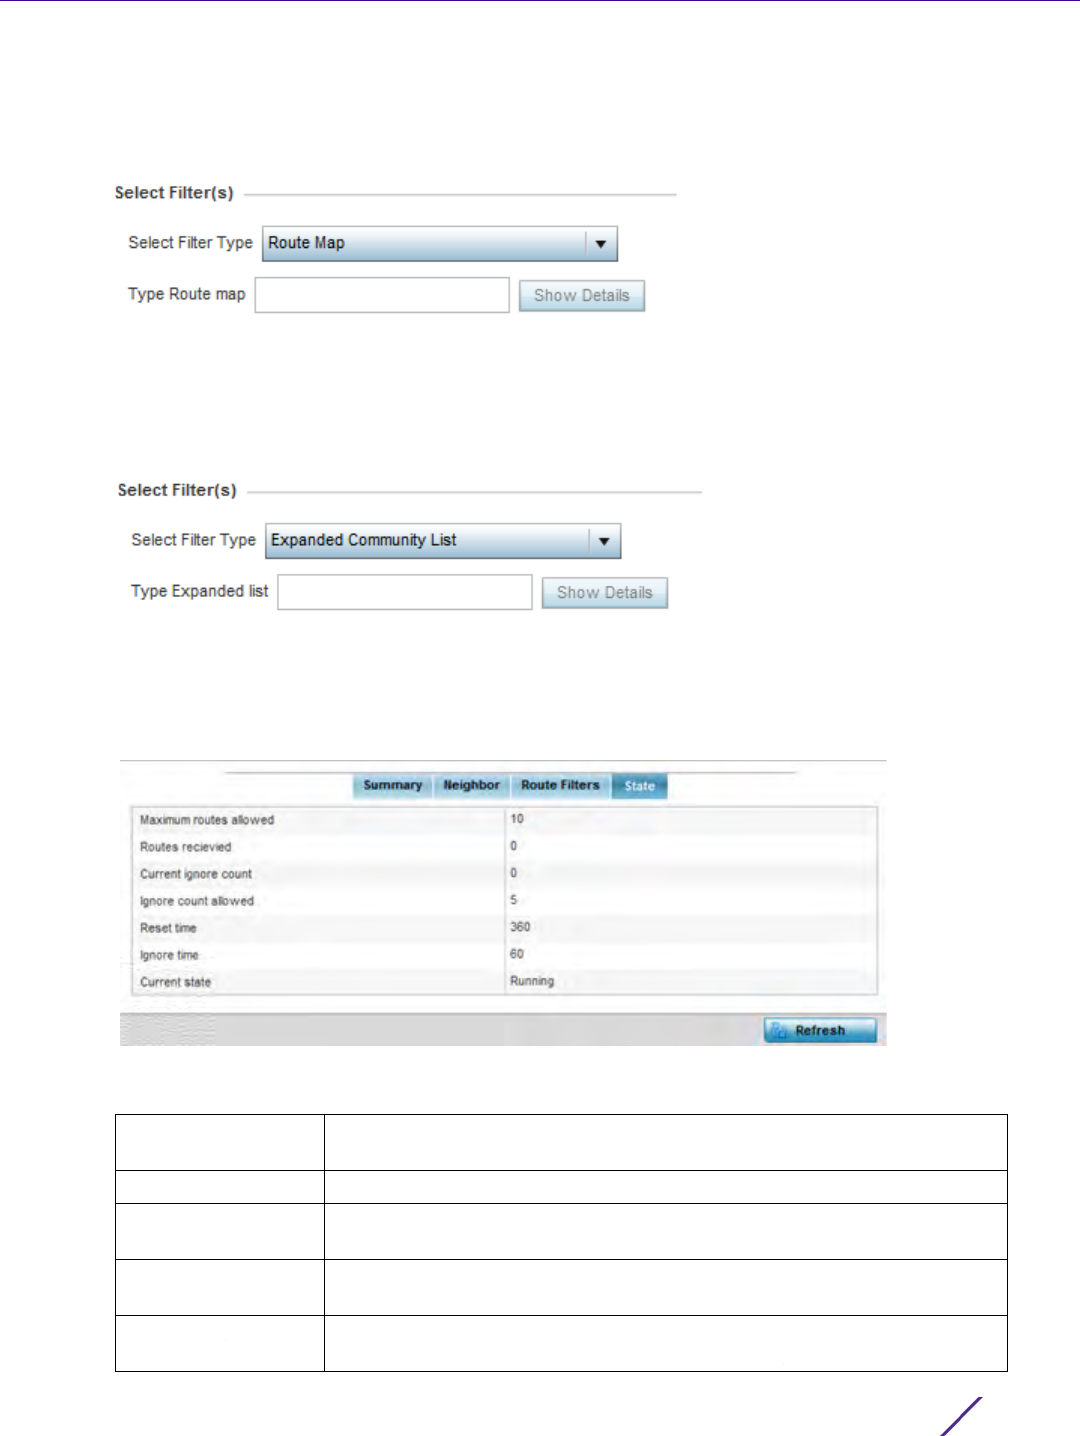
Statistics
Wireless Controller and Service Platform System Reference Guide 15 - 113
21 Use the Type Regular Expression field to filter the routes based on regular expressions. Select Show Details to
display the list of filtered routes.
22 Select Route Map from the Select Filter Type list.
Figure 15-73 Wireless Controller - BGP - Route Filter - Route Map
23 Use the Type Route Map field to filter the routes based on route maps (enhanced packet filters). Select Show
Details to display the list of filtered routes.
24 Select Expanded Community List from the Select Filter Type list.
Figure 15-74 Wireless Controller - BGP - Route Filter - Expanded Community
25 Use the Type Expanded list to filter routes based on route-maps. Select Show Details to display a list of filtered
routes.
26 Select State tab.
Figure 15-75 Wireless Controller - BGP - State
The State screen displays the following:
Maximum Routes
Allowed
Lists the maximum number of routes allowed on the selected BGP wireless
controller or service platforms.
Routes Received Lists the number of routes received from all the BGP peers.
Current Ignore
Count
Lists the number of times the BGP daemon has been put in the Ignore
state.
Ignore Count
Allowed
Lists the maximum number of times the BGP daemon can be put in an
Ignore state before entering permanent ignore state.
Reset Time Lists the time after which ignore state count is reset to 0 and BGP
daemon continues in the state it was in previously.

Statistics
Wireless Controller and Service Platform System Reference Guide 15 - 114
Select Refresh to update the statistic counters to their latest values.
15.3.18 RAID Statistics
Controller Statistics
RAID statistics are available to assist an administrator in assessing the status of the service platform’s RAID array,
including each physical drive. The information within the RAID statistics screen is polled by the service platform
from the RAID controller hardware, then forwarded to the WiNG operating system.
For information on setting the service platform drive array configuration as well as the diagnostic behavior of its
member drives, refer to RAID Operations on page 14-19.
To view RAI D statistics:
1 Select the Statistics menu from the Web UI.
2 Select a Wireless Controller node from the left navigation pane.
3Select
RAID from the left-hand side of the UI.
Ignore Time Lists the time duration after which BGP daemon shall exit the Ignore state.
Current State Lists the current state of this BGP route utilized on the wireless controller
or service platforms.
NOTE: RAID controller drive arrays are available within NX7500 and NX9000 series
service platforms (NX9000, NX9500 and NX9510 models) only. However, they can
be administrated on behalf of a profile by a different model service platform or
controller.
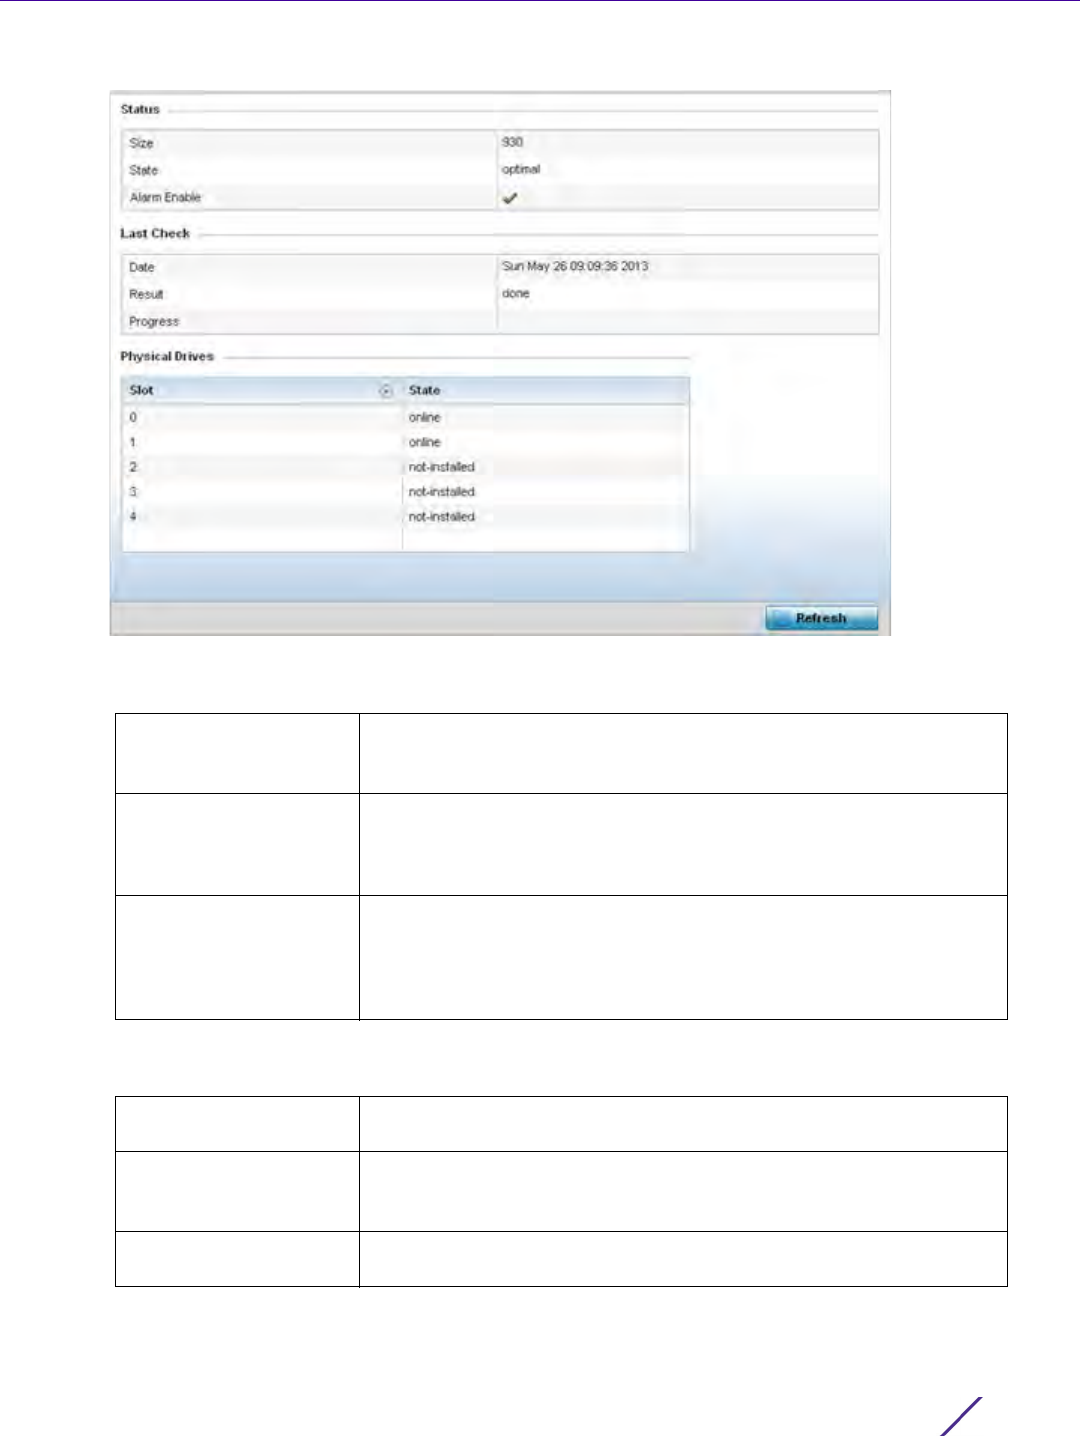
Statistics
Wireless Controller and Service Platform System Reference Guide 15 - 115
Figure 15-76 Wireless Controller - RAID Status screen
4The Status field displays the following:
5 Refer to the Last Check field to assess the time, progress and results of the RAID array’s most recent
consistency check:
Size Lists the size of the RAID drive array. The size is the total physical
memory space available on the two physical drives comprising the
active RAID controller.
State Displays whether the drive array is currently in an optimal operation
state or degraded, and in need of administration to perform
diagnostics and perhaps prepare a standby drive for hot spare
replacement.
Alarm Enable Displays whether the RAID alarm has been enabled to sound the
service platform’s chassis alarm upon detection of a RAID controller
degradation event. The RAID alarm is enabled by default. For
information on enabling or disabling the service platform RAID alarm,
see General Profile Configuration on page 8-5.
Date Lists the date and time of the RAID controller’s most recent
consistency check on the integrity of the drive array.
Result Displays true for a successful RAID array consistency check and false
for a failed consistency check. A false indication would trigger the
service platform’s chassis alarm if RAID alarm is enabled.
Progress Displays the progress of an in process consistency check in both
percentage complete and minutes utilized (for example, 78%/116min).

Statistics
Wireless Controller and Service Platform System Reference Guide 15 - 116
6Use the Physical Drives field to assess the RAID array’s drive utilization and whether the drives are currently
online:
7Select
Refresh at any time to update either the screen’s statistic counters to their latest value.
15.3.19 Power Status
Controller Statistics
Periodically review the controller or service platform power status to assess the power budget and PoE capability
(if supported).
PoE is supported on RFS4000 and RFS6000 model controllers.
To view Power Status statistics:
1 Select the Statistics menu from the Web UI.
2 Select a Wireless Controller node from the left navigation pane.
3Select
Power Status from the left-hand side of the UI.
Slot Lists RAID array’s drive slot utilization. Since there is only one RAID
array controller reporting status to the service platform, its important
to know if other drive slots house hot spare drives available as
additional resources should one of the dedicated drives fail.
State Displays whether a physical slot within the RAID array has a drive
installed, and whether the drive is currently online.
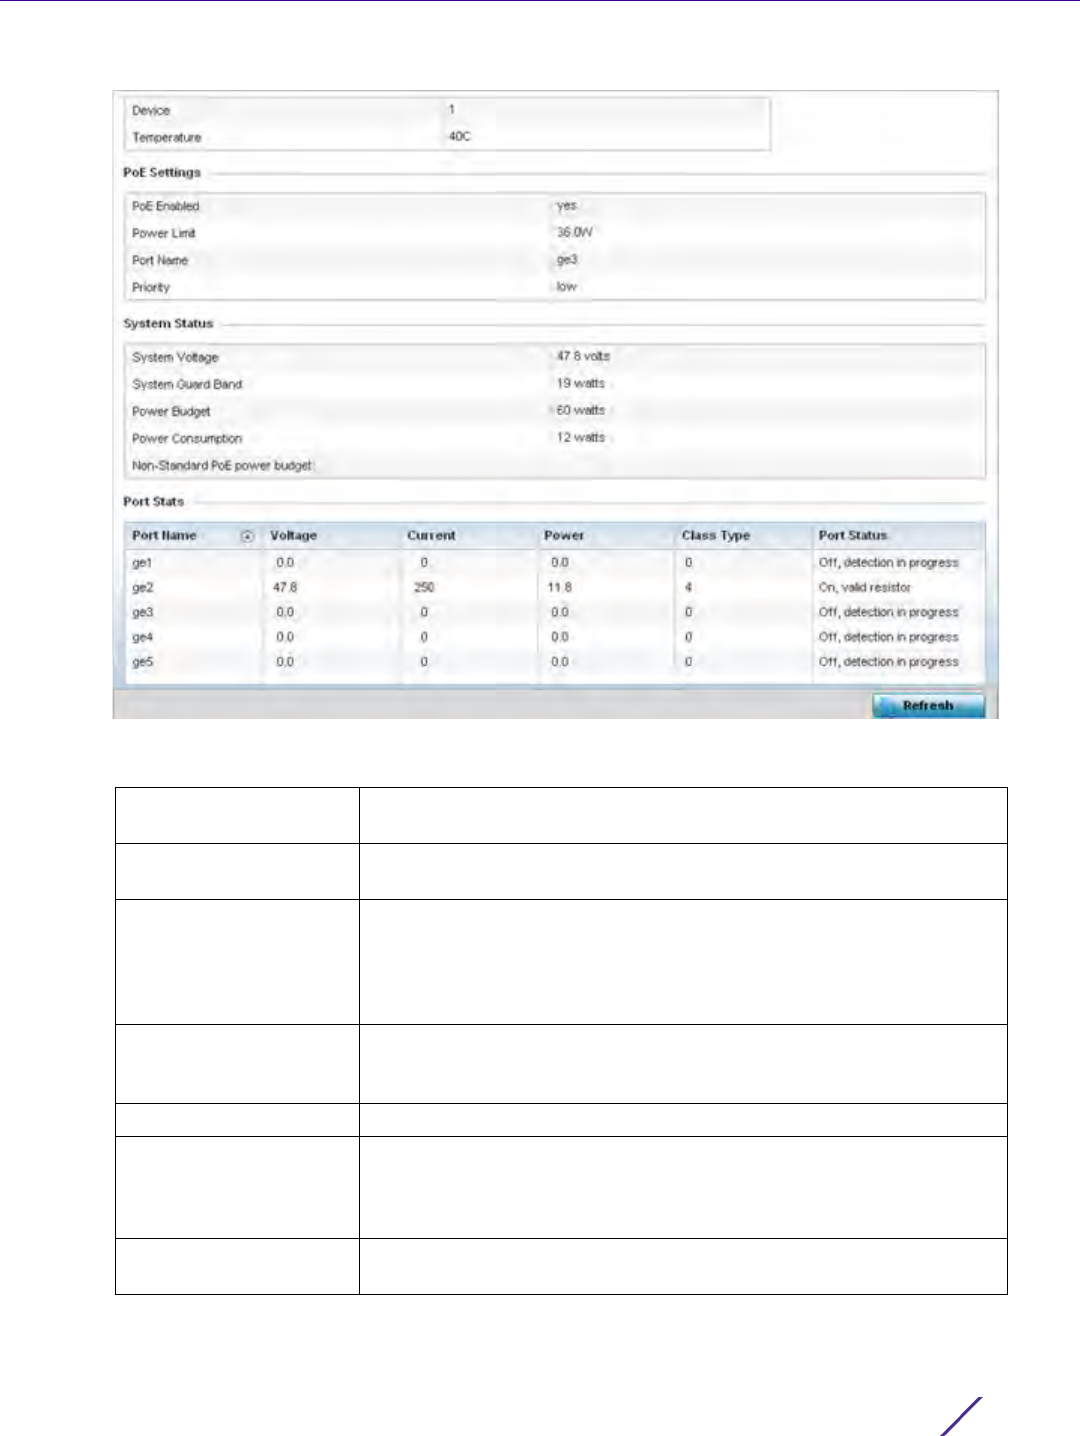
Statistics
Wireless Controller and Service Platform System Reference Guide 15 - 117
Figure 15-77 Wireless Controller - Power Status screen
The Power Status provides the following information for supported controllers or service platforms:
Device Displays the administrator assigned device name for the controller or
service platform.
Temperature Displays the internal system temperature for the controller or service
platform.
PoE Enabled Displays whether or not Power over Ethernet (PoE) is enabled for the
controller or service platform. When enabled, the controller or service
platform supports 802.3af PoE on each of its ge ports. The PoE allows
users to monitor port power consumption and configure power usage
limits and priorities for each ge port.
Power Limit Displays the total watts available for Power over Ethernet on the
controller or service platform. The value should be between 0 - 40
watts.
Port Name Displays the GE port name on the controller or service platform.
Priority Displays the power priority for the listed port as either Critical, High or
Low. This is the priority assigned to this port versus the power
requirements of the other supports available on the controller or
service platform.
System Voltage Displays the total current system voltage for the controller or service
platform.

Statistics
Wireless Controller and Service Platform System Reference Guide 15 - 118
15.3.20 PPPoE
Controller Statistics
The PPPoE statistics screen displays stats derived from the PPPoE capable controller or service platform’s access
to high-speed data and broadband networks. PPPoE uses standard encryption, authentication, and compression
methods as specified by the PPPoE protocol. PPPoE enables point-to-points connection to an ISP over existing
Ethernet interface.
Power over Ethernet is supported on RFS4000 and RFS6000 model controllers. When enabled, the controller
supports 802.3af PoE on each of its ge ports.
To review a selected controller or service platform’s PPPoE statistics:
1 Select the Statistics menu from the Web UI.
2 Select a Wireless Controller node from the left navigation pane.
3Select
PPPoE from the left-hand side of the UI.
System Guard Band Displays the amount of voltage allocated to a System Guard Band. A
System Guard Band is an amount of voltage allocated to prevent
power loss or cycling on connected PoE devices when the power draw
goes above the PoE Power Budget.
Power Budget Displays the total amount of voltage on the controller or service
platform allocated for use in Power over Ethernet.
Power Consumption Displays the current amount of power being consumed by PoE devices
on the controller or service platform.
Non-Standard PoE
power budget
Displays the amount of voltage allocated to non 802.3af or 802.3at
PoE devices.
Port Name Displays the GE port name for each PoE capable port on the controller
or service platform.
Voltage Displays the voltage in use by each PoE capable port on the controller
or service platform.
Current Displays the amount of current in milliwatts being used by each PoE
capable port on the controller or service platform.
Power Displays whether or not each PoE capable port on the controller or
service platform is providing power.
Class Type Displays the PoE class type including 802.3af, 802.3at and non-
standard PoE types.
Port Status Displays the status of each PoE capable port on the controller or
service platform. It will display either Enabled or Disabled.
Refresh Select Refresh to update the statistics counters to their latest value.
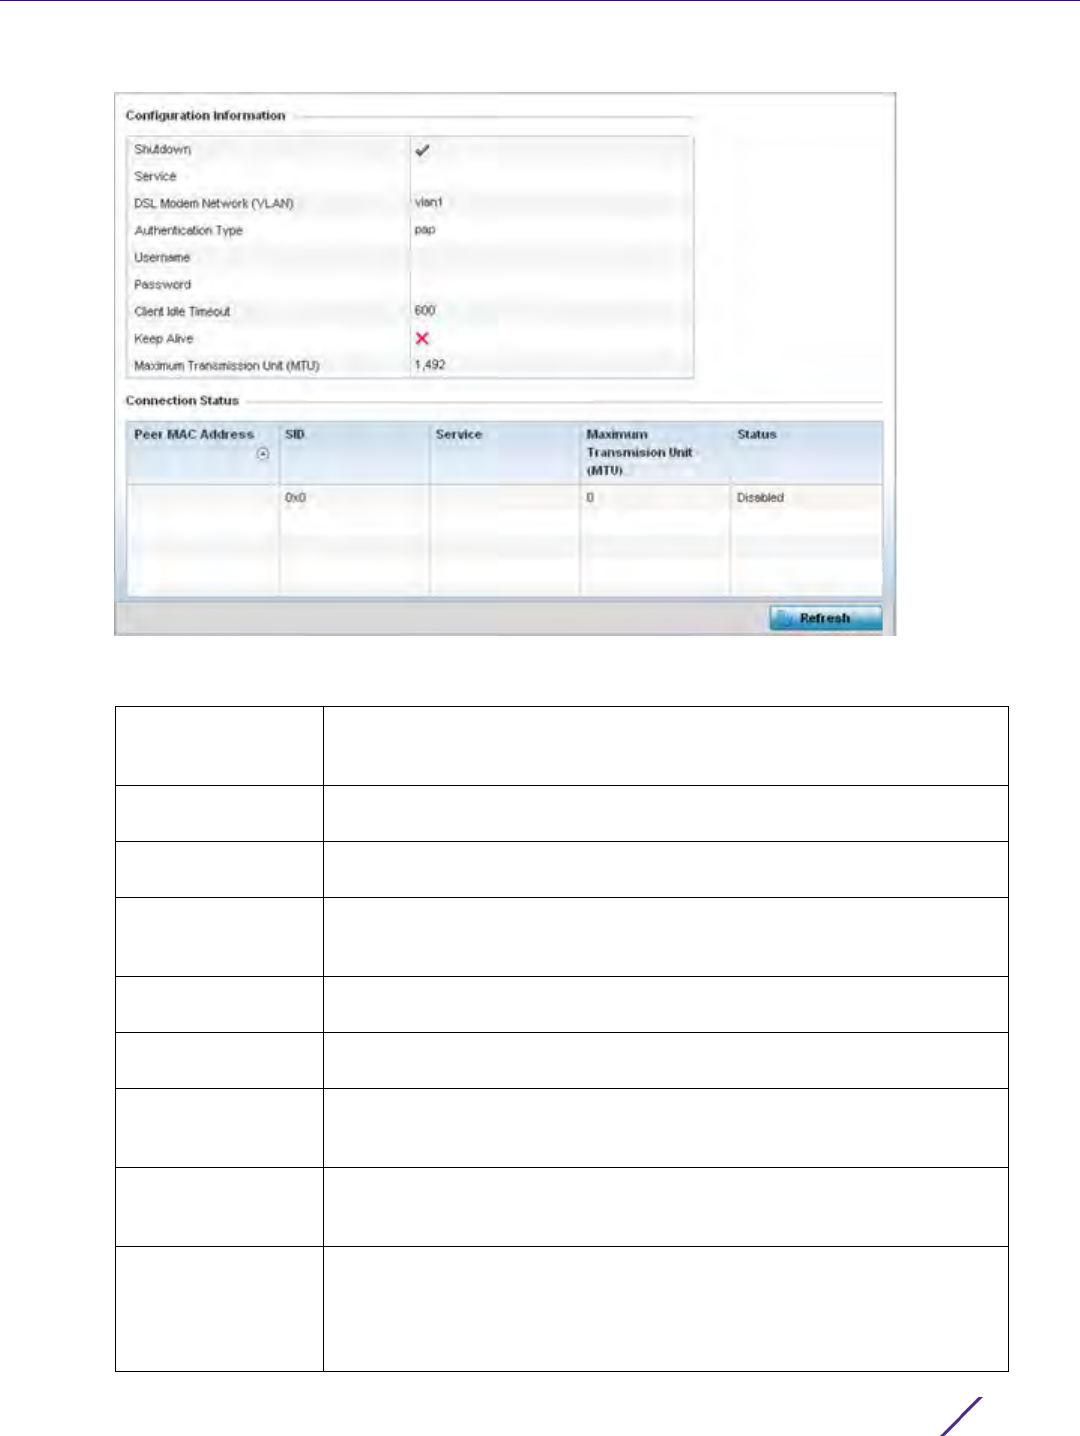
Statistics
Wireless Controller and Service Platform System Reference Guide 15 - 119
Figure 15-78 Wireless Controller - PPPoE screen
The Configuration Information field screen displays the following:
Shutdown Displays whether a high speed client mode point-to-point connection has
been enabled using the PPPoE protocol. A green checkmark defines the
connection as enabled. A red X defines the connection as shutdown.
Service Lists the 128 character maximum PPPoE client service name provided by
the service provider.
DSL Modem
Network (VLAN)
Displays the PPPoE VLAN (client local network) connected to the DSL
modem. This is the local network connected to DSL modem.
Authentication Type Lists authentication type used by the PPPoE client whose credentials must
be shared by its peer. Supported authentication options include None, PAP,
CHAP, MSCHAP, and MSCHAP-v2.
Username Displays the 64 character maximum username used for authentication
support by the PPPoE client.
Password Displays the 64 character maximum password used for authentication by
the PPPoE client.
Client Idle Timeout The controller or service platform uses the listed timeout so it does not sit
idle waiting for input from a PPPoE client and the server that may never
come.
Keep Alive If a keep alive is utilized (enabled displays a green checkmark, disabled a
red X) the point-to-point connect to the PPPoE client is continuously
maintained and not timed out.
Maximum
Transmission Unit
(MTU)
Displays the PPPoE client maximum transmission unit (MTU) from 500 -
1,492. The MTU is the largest physical packet size in bytes a network can
transmit. Any messages larger than the MTU are divided into smaller
packets before being sent. A PPPoE client should be able to maintain its
point-to-point connection for this defined MTU size.

Statistics
Wireless Controller and Service Platform System Reference Guide 15 - 120
4 Refer to the Connection Status field.
The Connection Status table lists the MAC address, SID, Service information, MTU and status of each route
destination peer. To provide this point-to-point connection, each PPPoE session learns the Ethernet address of
a remote PPPoE client, and establishes a session. PPPoE uses both a discover and session phase to identify a
client and establish a point-to-point connection. By using such a connection, a wireless WAN failover is
available to maintain seamless network access if the Wired WAN were to fail
5 Select the Refresh button to update the screen’s statistics counters to their latest values.
15.3.21 OSPF
Controller Statistics
Open Shortest Path First (OSPF) is a link-state interior gateway protocol (IGP). OSPF routes IP packets within a
single routing domain (autonomous system), like an enterprise LAN. OSPF gathers link state information from
neighbor routers and constructs a network topology. The topology determines the routing table presented to the
Internet Layer which makes routing decisions based solely on the destination IP address found in IP packets.
Refer to the following for detailed descriptions of the tabs available within the OSPF statistics screen:
•OSPF Summary
•OSPF Neighbors
•OSPF Area Details
•OSPF Route Statistics
•OSPF Interface
•OSPF State
15.3.21.1 OSPF Summary
OSPF
To view OSPF summary statistics:
1 Select the Statistics menu from the Web UI.
2 Select a Wireless Controller node from the left navigation pane.
3Select
OSPF from the left-hand side of the UI.
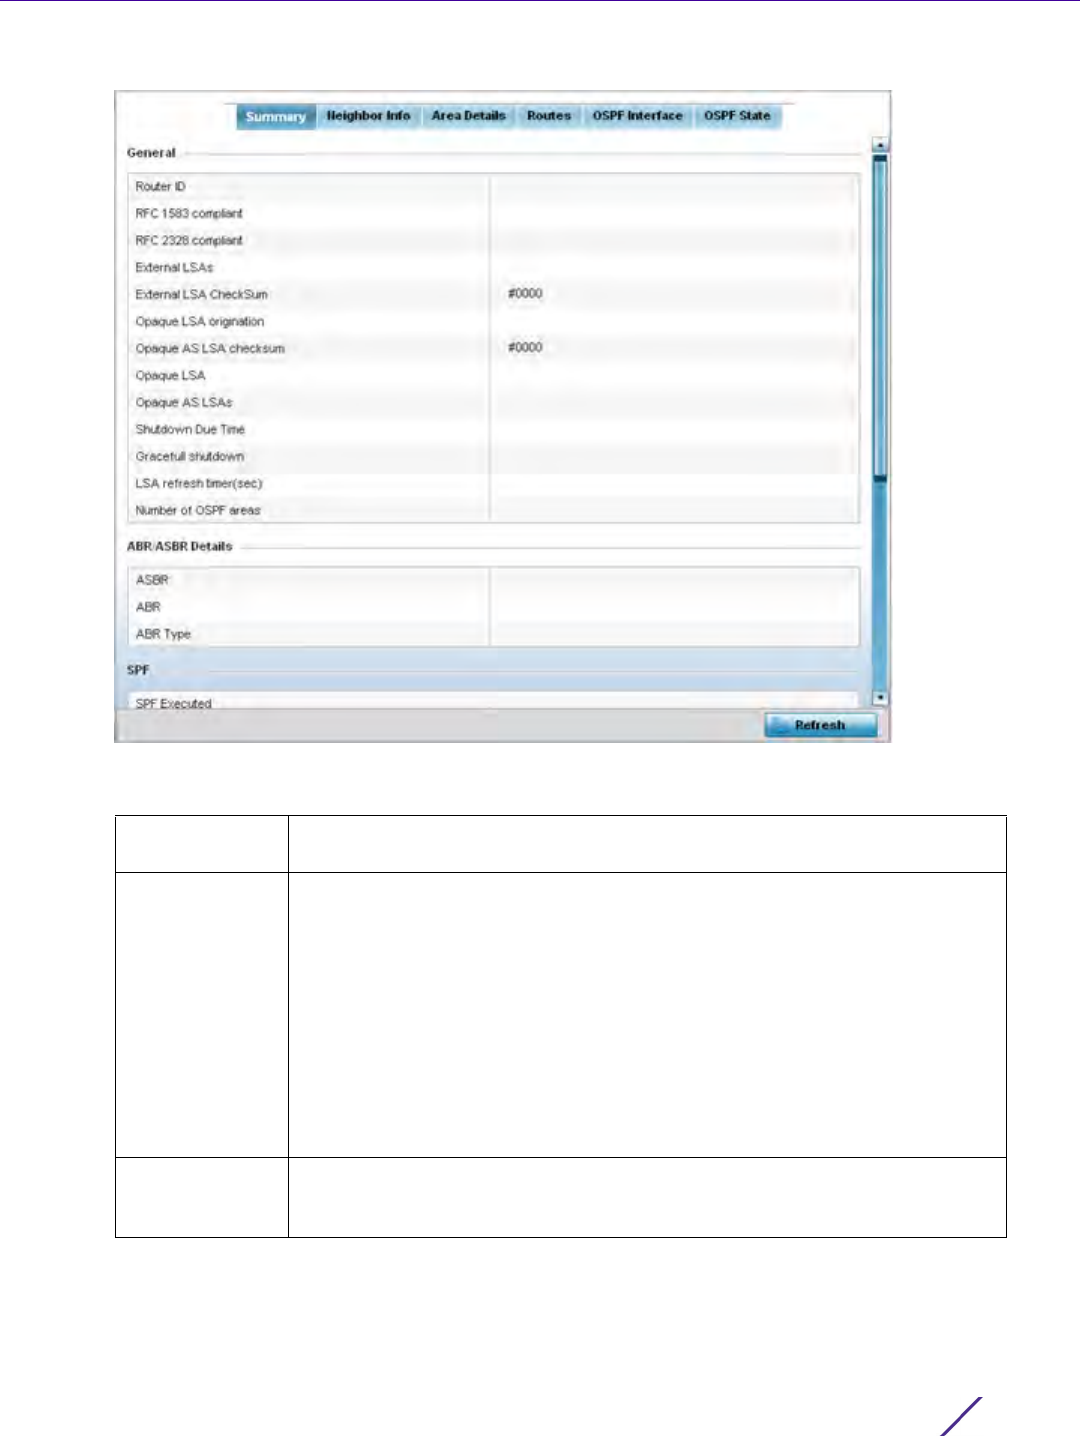
Statistics
Wireless Controller and Service Platform System Reference Guide 15 - 121
Figure 15-79 Wireless Controller - OSPF Summary tab
The Summary tab describes the following data fields:
General The general field displays the router ID assigned for this OSPF connection,
RFC compliance information and LSA data.
ABR/ASBR
Details
Lists Autonomous System Boundary Router (ASBR) data relevant to OSPF
routing, including the ASBR, ABR and ABR type. An Area Border Router
(ABR) is a router that connects one or more areas to the main backbone
network. It is considered a member of all areas it is connected to. An ABR
keeps multiple copies of the link-state database in memory, one for each area
to which that router is connected An ASBR is a router connected to more than
one Routing protocol and exchanges routing information with routers in other
protocols. ASBRs typically also run an exterior routing protocol (for example,
BGP), or use static routes, or both. An ASBR is used to distribute routes
received from other, external ASs throughout its own autonomous system.
Routers in other areas use ABR as next hop to access external addresses. Then
the ABR forwards packets to the ASBR announcing the external addresses
SPF Refer to the SPF field to assess the status of the shortest path forwarding
(SFF) execution, last SPF execution, SPF delay, SPF due in, SPF hold multiplier,
SPF hold time, SPF maximum hold time and SPF timer due flag.
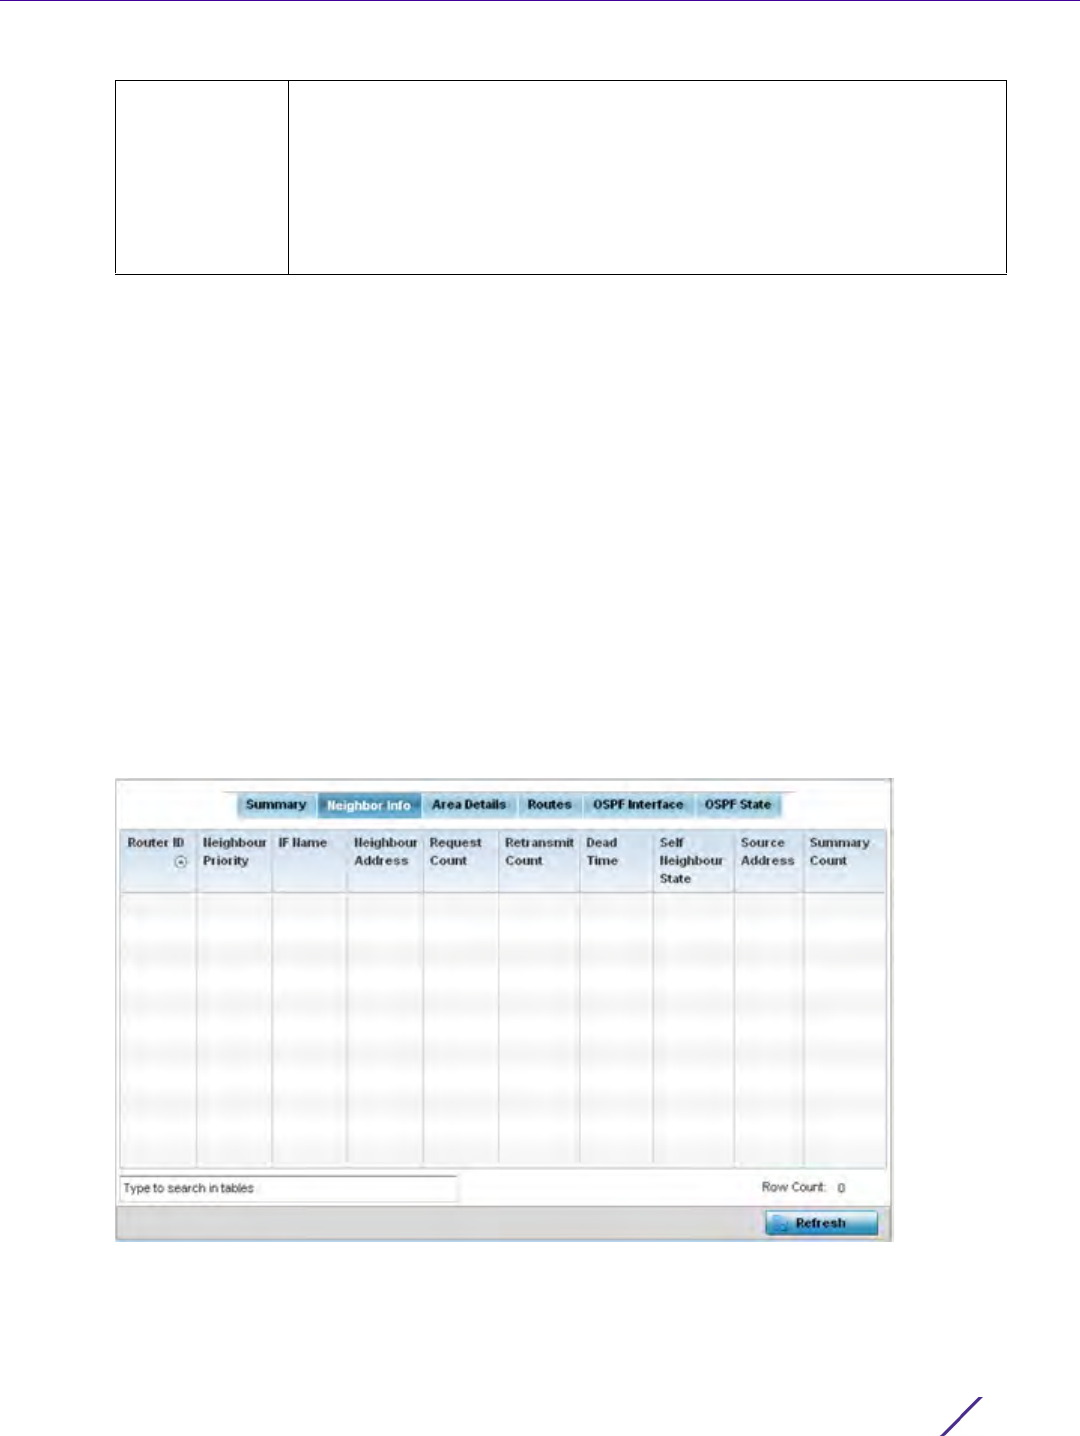
Statistics
Wireless Controller and Service Platform System Reference Guide 15 - 122
4 Select the Refresh button to update the statistics counters to their latest values.
15.3.21.2 OSPF Neighbors
OSPF
OSPF establishes neighbor relationships to exchange routing updates with other routers. A controller or service
platform supporting OSPF sends hello packets to discover neighbors and elect a designated router. The hello
packet includes link state information and list of neighbors. OSPF is savvy with layer 2 topologies. If on a point-to-
point link, OSPF knows it is sufficient, and the link stays up. If on a broadcast link, the router waits for election
before determining if the link is functional.
To view OSPF neighbor statistics:
1 Select the Statistics menu from the Web UI.
2 Select a Wireless Controller node from the left navigation pane.
3Select
OSPF from the left-hand side of the UI.
4 Select the Neighbor Info tab.
Figure 15-80 Wireless Controller - OSPF Neighbor Info tab
Stub Router The summary screen displays information relating to stub router
advertisements and shutdown and startup times. An OSPF stub router
advertisement allows a new router into a network without immediately routing
traffic through the new router and allows a graceful shut down or reload a
router without dropping packets that are destined for other networks. This
feature introduces three configuration options that allow you to configure a
router that is running the OSPF protocol to advertise a maximum or infinite
metric to all neighbors.

Statistics
Wireless Controller and Service Platform System Reference Guide 15 - 123
The Neighbor Info tab describes the following:
5 Select the Refresh button to update the statistics counters to their latest values.
15.3.21.3 OSPF Area Details
OSPF
An OSPF network is subdivided into routing areas (with 32 bit area identifiers) to simplify administration and
optimize traffic utilization. Areas are logical groupings of hosts and networks, including routers having interfaces
connected to an included network. Each area maintains a separate link state database whose information may be
summarized towards the rest of the network. An OSPF Area contains a set of routers exchanging Link State
Advertisements (LSAs) with others in the same area. Areas limit LSAs and encourage aggregate routes. Areas are
identified by 32-bit IDs, expressed either in decimal, or octet-based dot-decimal notation.
To view OSPF area statistics:
1 Select the Statistics menu from the Web UI.
2 Select a Wireless Controller node from the left navigation pane.
3Select
OSPF from the left-hand side of the UI.
Router ID Displays the router ID assigned for this OSPF connection. The router is a level
three Internet Protocol packet switch. This ID must be established in every
OSPF instance. If not explicitly configured, the highest logical IP address is
duplicated as the router identifier. However, since the router identifier is not an
IP address, it does not have to be a part of any routable subnet in the
network.
Neighbor
Priority
Displays each listed neighbor’s priority in respect to becoming the designated
router managing the OSPF connection. The designated router is the router
interface elected among all routers on a particular multi-access network
segment.
IF Name Lists the name assigned to the router interface used to support connections
amongst OSPF enabled neighbors.
Neighbor
Address
Lists the IP address of the neighbor sharing the router interface with each
listed router ID.
Request Count Lists the connection request count (hello packets) to connect to the router
interface, discover neighbors and elect a designated router.
Retransmit
Count
Lists the connection retransmission count attempted in order to connect to the
router interface, discover neighbors and elect a designated router. A
designated router (DR) is the router interface elected among all routers on a
particular multi-access network segment, generally assumed to be broadcast.
Dead Time Lists the dead time between neighbors in the network topology that are
currently utilizing the listed router ID.
Self Neighbor
State
Displays the self-neighbor status assessment used to discover neighbors and
elect a designated router.
Source Address Displays the single source address used by all neighbor routers to obtain
topology and connection status. This form of multicasting significantly reduces
network load.
Summary Count Routes that originate from other areas are called summary routes. Summary
routes are not flooded in a totally stubby or NSSA totally stubby area.
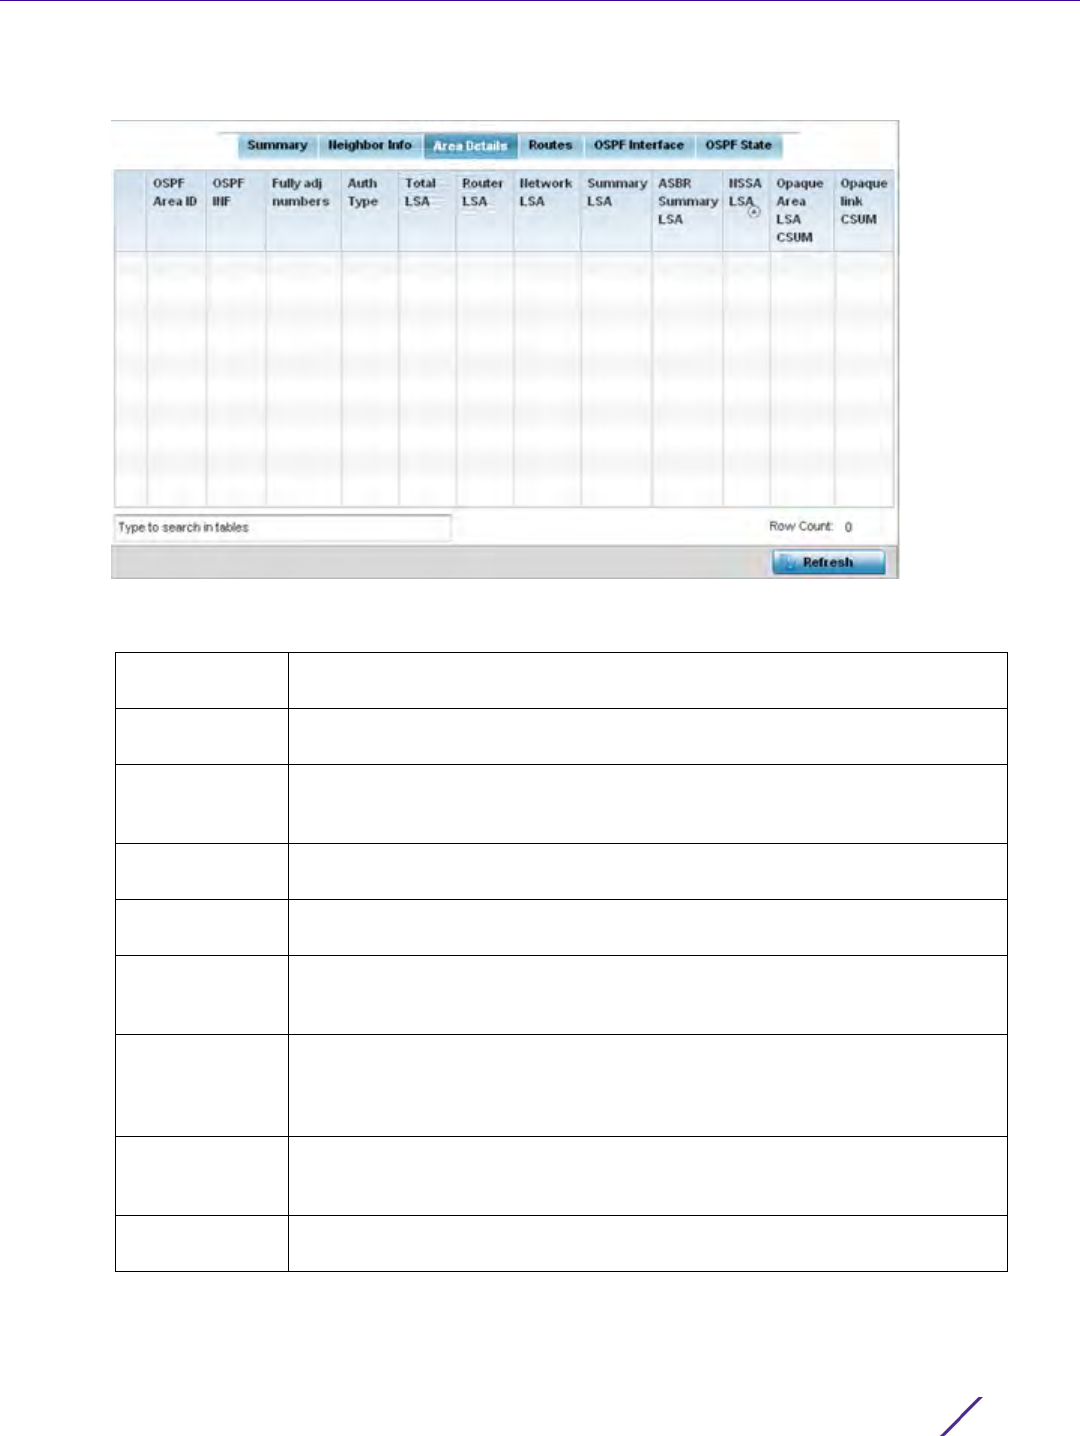
Statistics
Wireless Controller and Service Platform System Reference Guide 15 - 124
4 Select the Area Details tab.
Figure 15-81 Wireless Controller - OSPF Area Details tab
The Area Details tab describes the following:
OSPF Area ID Lists the connection request count (hello packets) to connect to the router
interface, discover neighbors and elect a designated router.
OSPF INF Lists the interface ID (virtual interface for dynamic OSPF routes) supporting
each listed OSPF area ID.
Fully adj
numbers
Fully adjusted numbers strip away the effects of other non OSPF and LSA
factors and events, leaving only relevant OSPF area network route events
counted.
Auth Type Lists the authentication schemes used to validate the credentials of dynamic
route connections and their areas.
Total LSA Lists the Link State Advertisements (LSAs) of all entities using the dynamic
route (in any direction) in the listed area ID.
Router LSA Lists the Link State Advertisements of the router supporting each listed area
ID. The router LSA reports active router interfaces, IP addresses, and
neighbors.
Network LSA Displays which routers are joined together by the designated router on a
broadcast segment (e.g. Ethernet). Type 2 LSAs are flooded across their own
area only. The link state ID of the type 2 LSA is the IP interface address of the
designated route.
Summary LSA The summary LSA is generated by ABR to leak area summary address info
into another areas. ABR generates more than one summary LSA for an area if
the area addresses cannot be properly aggregated by only one prefix.
ASBR Summary
LSA
Originated by ABRs when an ASBR is present to let other areas know where
the ASBR is. These are supported just like summary LSAs.

Statistics
Wireless Controller and Service Platform System Reference Guide 15 - 125
5 Select the Refresh button to update the statistics counters to their latest values.
15.3.21.4 OSPF Route Statistics
OSPF
Refer to the Routes tab to assess the status of OSPF Border Routes, External Routes, Network Routes and Router
Routes.
To view OSPF route statistics:
1 Select the Statistics menu from the Web UI.
2 Select a Wireless Controller node from the left navigation pane.
3Select
OSPF from the left-hand side of the UI.
4 Select the Routes tab. Border Routes display by default.
An area border router (ABR) connects (links) more than one area. Usually an ABR is used to connect non-
backbone areas to the backbone. If OSPF virtual links are used an ABR will also be used to connect the area
using the virtual link to another non-backbone area. Border routes use internal OSPF routing table entries to an
ABR or Autonomous System Boundary Router (ASBR). Border routers maintain an LSDB for each area
supported. They also participate in the backbone.
5 Refer to External Routes tab.
NSSA LSA Routers in a Not-so-stubby-area (NSSA) do not receive external LSAs from
Area Border Routers, but are allowed to send external routing information for
redistribution. They use type 7 LSAs to tell the ABRs about these external
routes, which the Area Border Router then translates to type 5 external LSAs
and floods as normal to the rest of the OSPF network.
Redistribution into an NSSA area creates a special type of LSA known as TYPE
7, which can exist only in an NSSA area. An NSSA ASBR generates this LSA,
and an NSSA ABR router translates it into type 5 LSA which gets propagated
into the OSPF domain.
Opaque Area
LSA CSUM
Displays the Type-10 opaque link area checksum with the complete contents
of the LSA.
Opaque link
CSUM
Displays the Type-10 opaque link checksum with the complete contents of the
LSA.
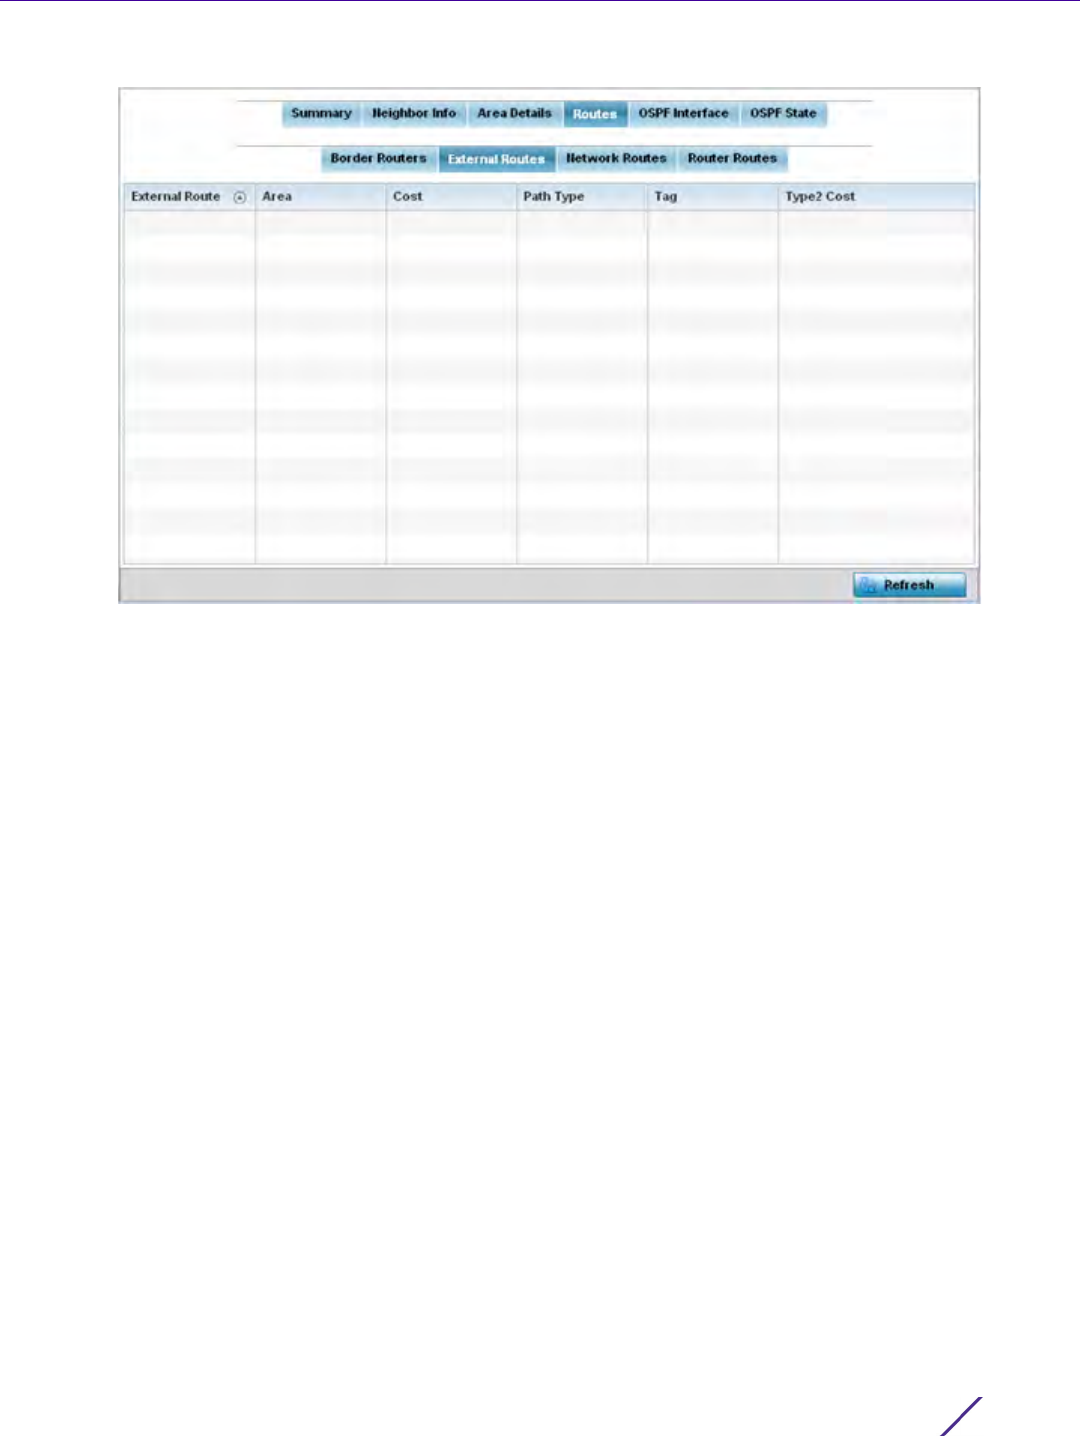
Statistics
Wireless Controller and Service Platform System Reference Guide 15 - 126
Figure 15-82 Wireless Controller - OSPF External Routes tab
External routes are external to area, originate from other routing protocols (or different OSPF processes) and
are inserted into OSPF using redistribution. A stub area is configured not to carry external routes. Each external
route can be tagged by the advertising router, enabling the passing of additional information between routers.
Each external route can also be tagged by the advertising router, enabling the passing of additional
information between routers on the boundary of the autonomous system.
The External route tab displays a list of external routes, the area impacted, cost, path type, tag and type 2 cost.
Cost factors may be the distance of a router (round-trip time), network throughput of a link, or link availability
and reliability, expressed as simple unit-less numbers. This provides a dynamic process of traffic load balancing
between routes of equal cost.
6 Refer to the Network Routes tab.
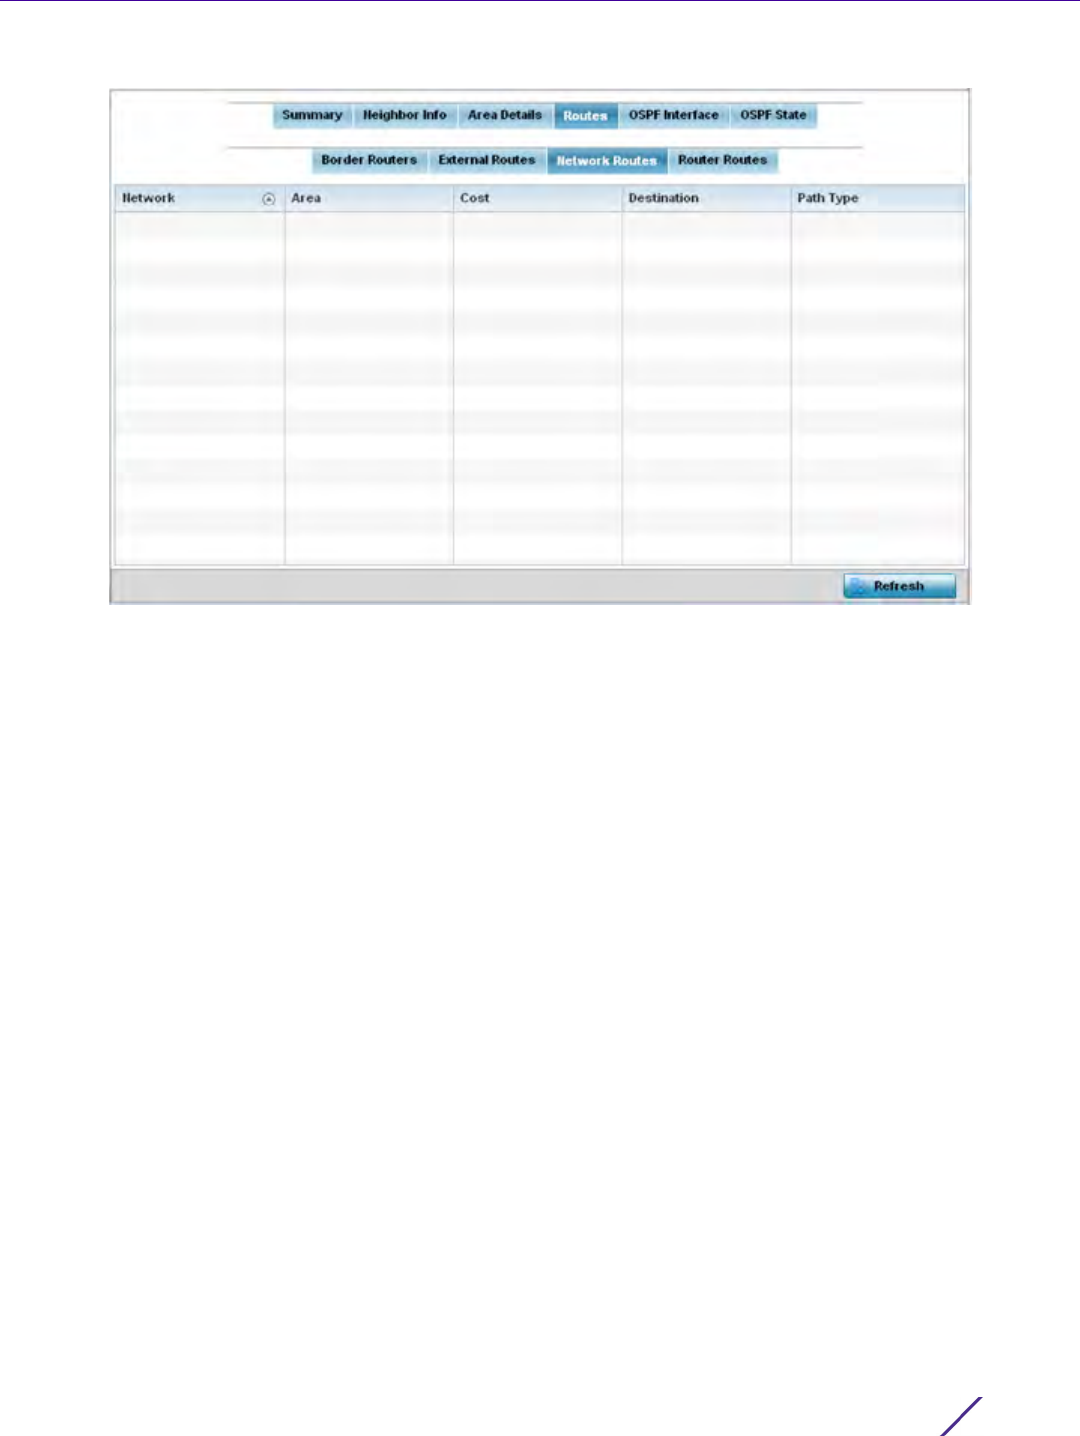
Statistics
Wireless Controller and Service Platform System Reference Guide 15 - 127
Figure 15-83 Wireless Controller - OSPF Network Routes tab
Network routes support more than two routers, with the capability of addressing a single physical message to
all attached routers (broadcast). Neighboring routers are discovered dynamically using OSPF hello messages.
This use of the hello protocol takes advantage of broadcast capability. An OSPF network route makes further
use of multicast capabilities, if they exist. Each pair of routers on the network is assumed to communicate
directly.
The network tab displays the network name, impacted OSPF area, cost, destination and path type.
7 Select the Router Routes tab.
Statistics
Wireless Controller and Service Platform System Reference Guide 15 - 128
Figure 15-84 Wireless Controller - OSPF Router Routes tab
An internal (or router) route connects to one single OSPF area. All of its interfaces connect to the area in which
it is located and does not connect to any other area.
8 Select the Refresh button (within any of the four OSPF Routes tabs) to update the statistics counters to their
latest values
15.3.21.5 OSPF Interface
OSPF
An OSPF interface is the connection between a router and one of its attached networks. An interface has state
information associated with it, which is obtained from the underlying lower level protocols and the routing
protocol itself. A network interface has associated a single IP address and mask (unless the network is an
unnumbered point-to-point network). An interface is sometimes also referred to as a link.
To view OSPF interface statistics:
1 Select the Statistics menu from the Web UI.
2 Select a Wireless Controller node from the left navigation pane.
3Select
OSPF from the left-hand side of the UI.
4 Select the OSPF Interface tab.
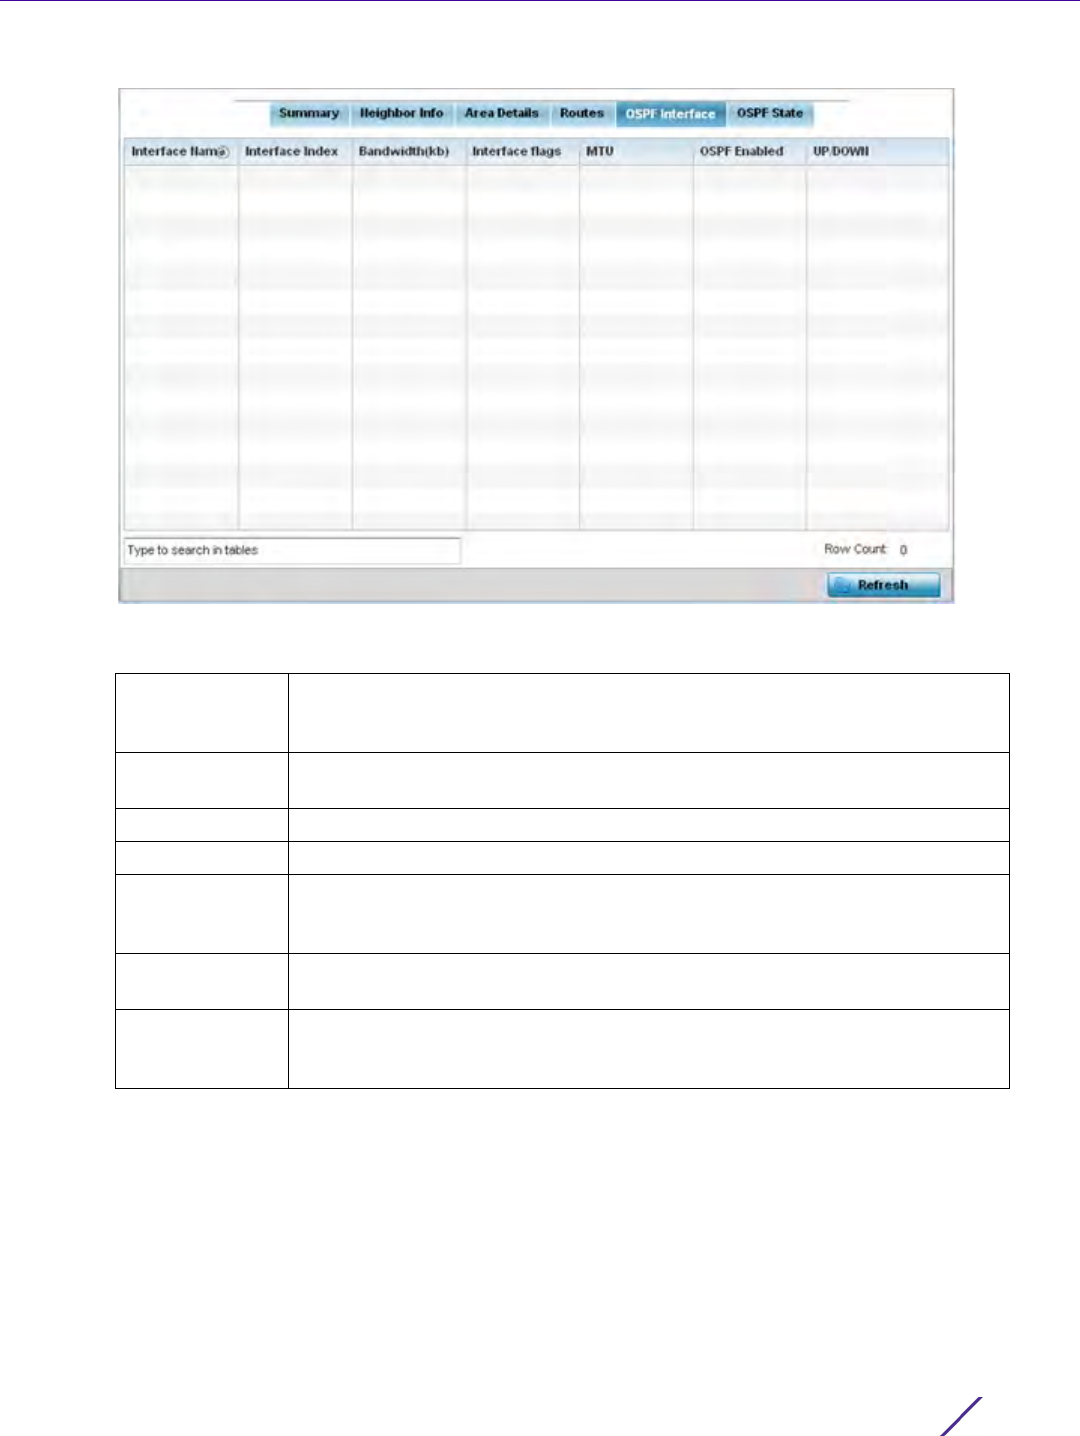
Statistics
Wireless Controller and Service Platform System Reference Guide 15 - 129
Figure 15-85 Wireless Controller - OSPF Interface tab
The OSPF Interface tab describes the following:
5 Select the Refresh button to update the statistics counters to their latest values.
15.3.21.6 OSPF State
OSPF
An OSPF enabled controller or service platform sends hello packets to discover neighbors and elect a designated
router for dynamic links. The hello packet includes link state data periodically updated on all OSPF members. The
controller or service platform tracks link state information to help assess the health of the OSPF dynamic route.
Interface Name Displays the IP addresses and mask defined as the virtual interface for
dynamic OSPF routes. Zero config and DHCP can be used to generate route
addresses, or a primary and secondary address can be manually provided.
Interface Index Lists the numerical index used for the OSPF interface. This interface ID is in the
hello packets establishing the OSPF network connection.
Bandwidth(kb) Lists the OSPF interface bandwidth (in Kbps) from 1 - 10,000,000.
Interface flags Displays the flag used to determine the interface status and how to proceed.
MTU Lists the OSPF interface maximum transmission unit (MTU) size. The MTU is
the largest physical packet size (in bytes) a network can transmit. Any packets
larger than the MTU are divided into smaller packets before being sent.
OSPF Enabled Lists whether OSPF has been enabled for each listed interface. OSPF is
disabled by default.
UP/DOWN Displays whether the OSPF interface (the dynamic route) is currently up or
down for each listed interface. An OSPF interface is the connection between a
router and one of its attached networks.
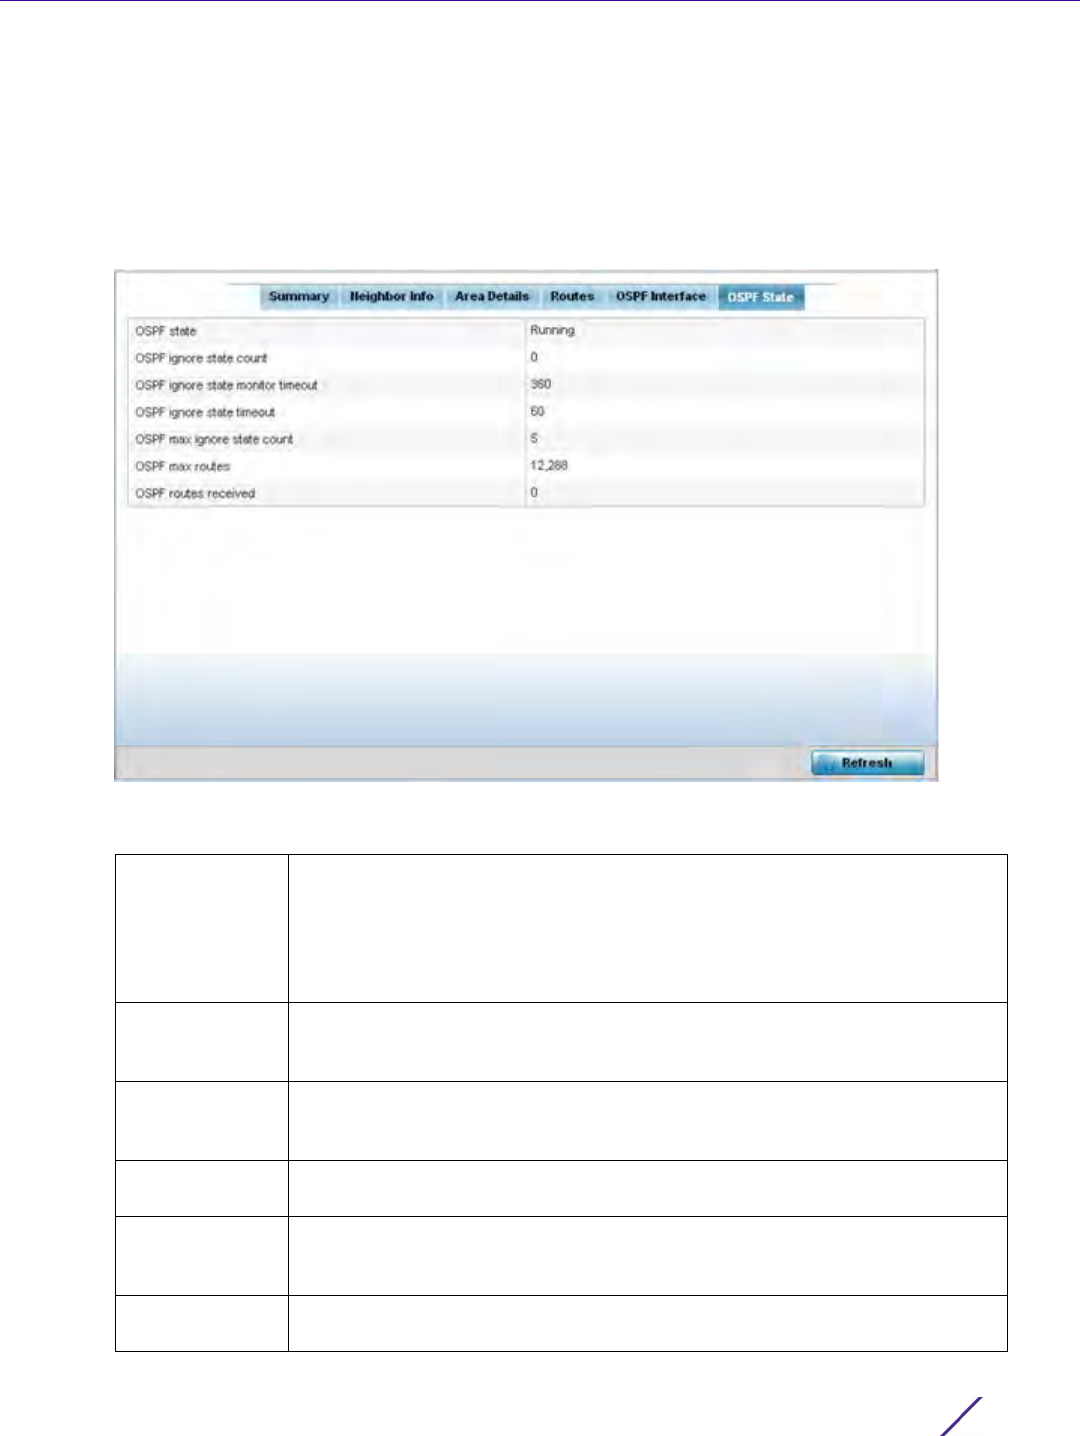
Statistics
Wireless Controller and Service Platform System Reference Guide 15 - 130
To view OSPF state statistics:
1 Select the Statistics menu from the Web UI.
2 Select a Wireless Controller node from the left navigation pane.
3Select
OSPF from the left-hand side of the UI.
4 Select the OSPF State tab.
Figure 15-86 Wireless Controller - OSPF State tab
The OSPF State tab describes the following:
OSPF state Displays the OSPF link state amongst neighbors within the OSPF topology.
Link state information is maintained in a link-state database (LSDB) which is a
tree image of the entire network topology. Identical copies of the LSDB are
periodically updated through flooding on all OSPF supported nodes. Flooding
is the part of the OSPF protocol that distributes and synchronizes the link-
state database between OSPF routers.
OSPF ignore
state count
Lists the number of times state requests have been ignored between the
controller or service platform and its peers within this OSPF supported
broadcast domain.
OSPF ignore
state monitor
timeout
Displays the timeout that, when exceeded, prohibits the controller or service
platform from detecting changes to the OSPF link state.
OSPF ignore
state timeout
Displays the timeout that, when exceeded, returns the controller or service
platform back to state assessment amongst neighbors in the OSPF topology.
OSPF max
ignore state
count
Displays whether an OSPF state timeout is being ignored and not utilized in
the transmission of state update requests amongst neighbors within the OSPF
topology.
OSPF max routes States the maximum number of routes negotiated amongst neighbors within
the OSPF topology.
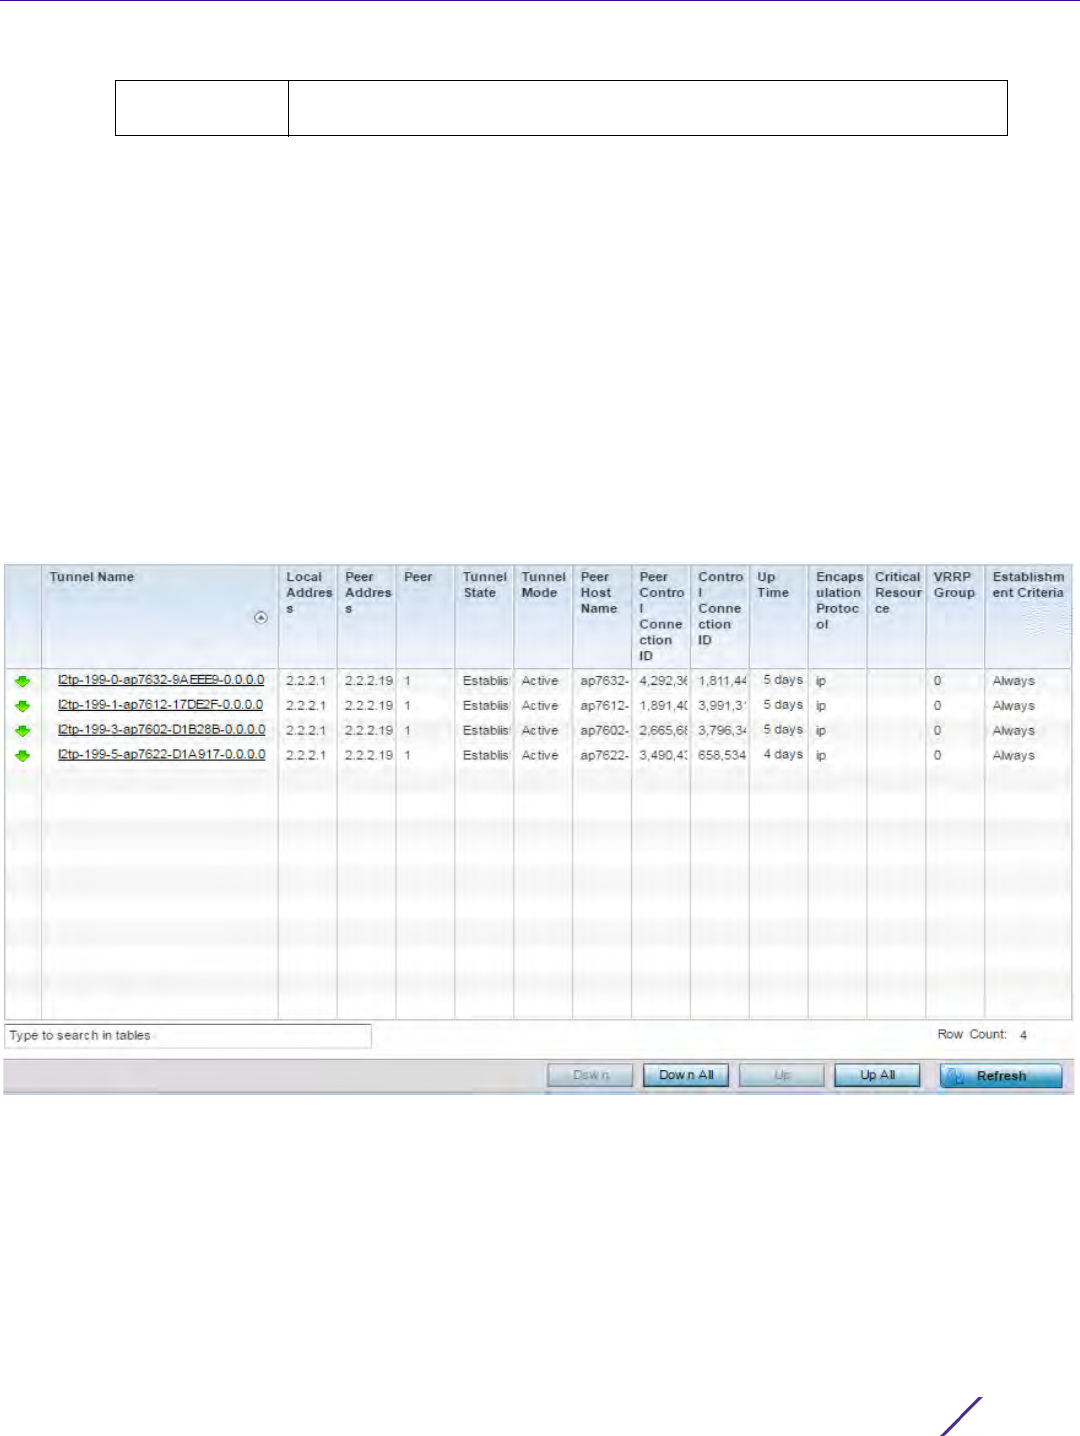
Statistics
Wireless Controller and Service Platform System Reference Guide 15 - 131
5 Select the Refresh button to update the statistics counters to their latest values.
15.3.22 L2TPv3
Controller Statistics
Use L2TP V3 to create tunnels for transporting layer 2 frames. L2TP V3 enables a controller or service platform to
create tunnels for transporting Ethernet frames to and from bridge VLANs and physical ports. L2TP V3 tunnels can
be defined between WING devices and other devices supporting the L2TP V3 protocol.
To review a selected controller or service platform’s L2TPv3 statistics:
6 Select the Statistics menu from the Web UI.
7Select a Wireless Controller node from the left navigation pane.
8Select
L2TPv3 Tunnels.
Figure 15-87 Wireless Controller - L2TPv3 screen
OSPF routes
received
Lists the routes received and negotiated amongst neighbors within the OSPF
topology.

Statistics
Wireless Controller and Service Platform System Reference Guide 15 - 132
The L2TPv3 screen displays the following:
Tunnel Name Displays the name of each listed L2TPv3 tunnel assigned upon creation. Each
listed tunnel name can be selected as a link to display session data specific to
that tunnel. The Sessions screen displays cookie size information as well as
psuedowire information specific to the selected tunnel. Data is also available to
define whether the tunnel is a trunk session and whether tagged VLANs are
used. The number of transmitted, received and dropped packets also display to
provide a throughput assessment of the tunnel connection. Each listed session
name can also be selected as a link to display VLAN information specific to that
session. The VLAN Details screen lists those VLANs used an interface in L2TP
tunnel establishment.
Local Address Lists the IP address assigned as the local tunnel end point address, not the
tunnel interface’s IP address. This IP is used as the tunnel source IP
address. If a local address is not specified, the source IP address is chosen
automatically based on the tunnel peer IP address.
Peer Address Lists the IP address of the L2TP tunnel peer establishing the tunnel
connection.
Tunnel State States whether the tunnel is Idle (not utilized by peers) or is currently
active.
Peer Host Name Lists the assigned peer hostname used as matching criteria in the tunnel
establishment process.
Peer Control
Connection ID
Displays the numeric identifier for the tunnel session. This is the peer
pseudowire ID for the session. This source and destination IDs are
exchanged in session establishment messages with the L2TP peer.
Control Connection
ID
Displays the router ID(s) sent in tunnel establishment messages with a
potential peer device.
Up Time Lists the amount of time the L2TP connection has remained established
amongst peers sharing the L2TPv3 tunnel connection. The Up Time is
displayed in a Days: Hours: Minutes: Seconds: format. If D:0 H:0 M:0 S:0 is
displayed, the tunnel connection is not currently established.
Encapsulation
Protocol
Displays either IP or UDP as the peer encapsulation protocol. The default
setting is IP. UDP uses a simple transmission model without implicit
handshakes. Tunneling is also called encapsulation. Tunneling works by
encapsulating a network protocol within packets carried by the second
network.
Critical Resource Displays monitored critical resources. Critical resources are device IP
addresses or interface destinations interopreted as critical to the health of
the network. Critical resources allow for the continuous monitoring of
these defined addresses. A critical resource, if not available, can result in
the network suffering performance degradation. A critical resource can be
a gateway, AAA server, WAN interface or any hardware or service on
which the stability of the network depends.
VRRP Group Lists a VRRP group ID (if utilized). A VRRP group is only enabled when
the establishment criteria is set to vrrp-master. A VRRP master responds
to ARP requests, forwards packets with a destination link MAC layer
address equal to the virtual router MAC layer address, rejects packets
addressed to the IP associated with the virtual router and accepts packets
addressed to the IP associated with the virtual router.
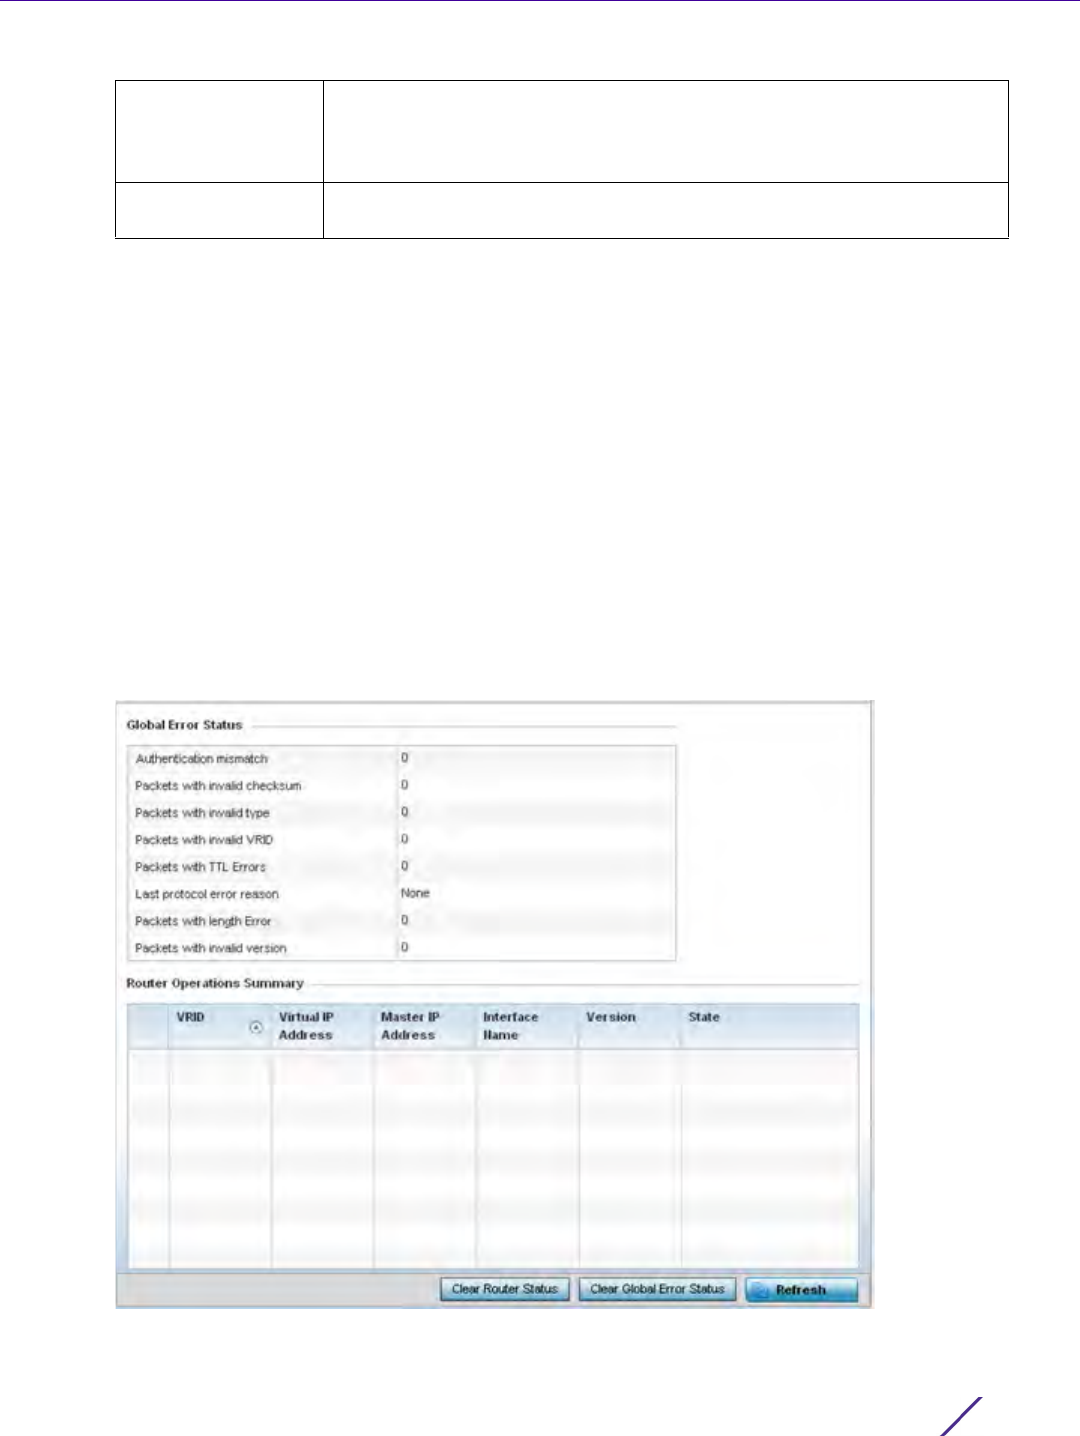
Statistics
Wireless Controller and Service Platform System Reference Guide 15 - 133
9 To view per-session statistics for a specific L2TPv3 tunnel, click the Tunnel Name link. The sessions for the
selected L2TPv3 tunnel are displayed.
10 Click the VLAN ID of the desired session to display session statistics.
15.3.23 VRRP
Controller Statistics
The VRRP statistics screen displays Virtual Router Redundancy Protocol (VRRP) configuration statistics supporting
router redundancy in a wireless network requiring high availability.
To review a selected controller or service platform’s VRRP statistics:
1 Select the Statistics menu from the Web UI.
2 Select a Wireless Controller node from the left navigation pane.
3Select
VRRP.
Figure 15-88 Wireless Controller - VRRP screen
Establishment
Criteria
Displays the tunnel establishment criteria for this tunnel. Tunnel
establishment involves exchanging 3 message types (SCCRQ, SCCRP and
SCCN) with the peer. Tunnel IDs and capabilities are exchanged during the
tunnel establishment with the host.
Refresh Select the Refresh button to update the screen’s statistics counters to their
latest value.

Statistics
Wireless Controller and Service Platform System Reference Guide 15 - 134
4 Refer to the Global Error Status field to review the various sources of packet errors logged during the
implementation of the virtual route.
Errors include the mismatch of authentication credentials, invalid packet checksums, invalid packet types,
invalid virtual route IDs, TTL errors, packet length errors and invalid (non matching) VRRP versions.
5 Refer to the Router Operations Summary for the following status:
6 Optionally select a VRID to list the ID’s VRRP information in greater detail.
VRID Lists a numerical index (1 - 254) used to differentiate VRRP configurations.
The index is assigned when a VRRP configuration is initially defined. This
ID identifies the virtual router a packet is reporting status for. The ID
displays as a link that can optionally selected to list the ID’s VRRP
information in greater detail.
Virtual IP Address Lists the virtual interface IP address used as the redundant gateway
address for the virtual route.
Master IP Address Displays the IP address of the elected VRRP master. A VRRP master (once
elected) responds to ARP requests, forwards packets with a destination
link layer MAC address equal to the virtual router MAC address, rejects
packets addressed to the IP address associated with the virtual router and
accepts packets addressed to the IP address associated with the virtual
router.
Interface Name Displays the interfaces selected to supply VRRP redundancy failover
support.
Version Display VRRP version 3 (RFC 5798) or 2 (RFC 3768) as selected to set the
router redundancy. Version 3 supports sub-second (centisecond) VRRP
failover and support services over virtual IP.
State Displays the current state of each listed virtual router ID.
Clear Router Status Select the Clear Router Status button to clear the Router Operations
Summary table values to zero and begin new data collections.
Clear Global Error
Status
Select the Clear Global Error Status button to clear the Global Error Status
table values to zero and begin new data collections.
Refresh Select the Refresh button to update the screen’s statistics counters to their
latest values.
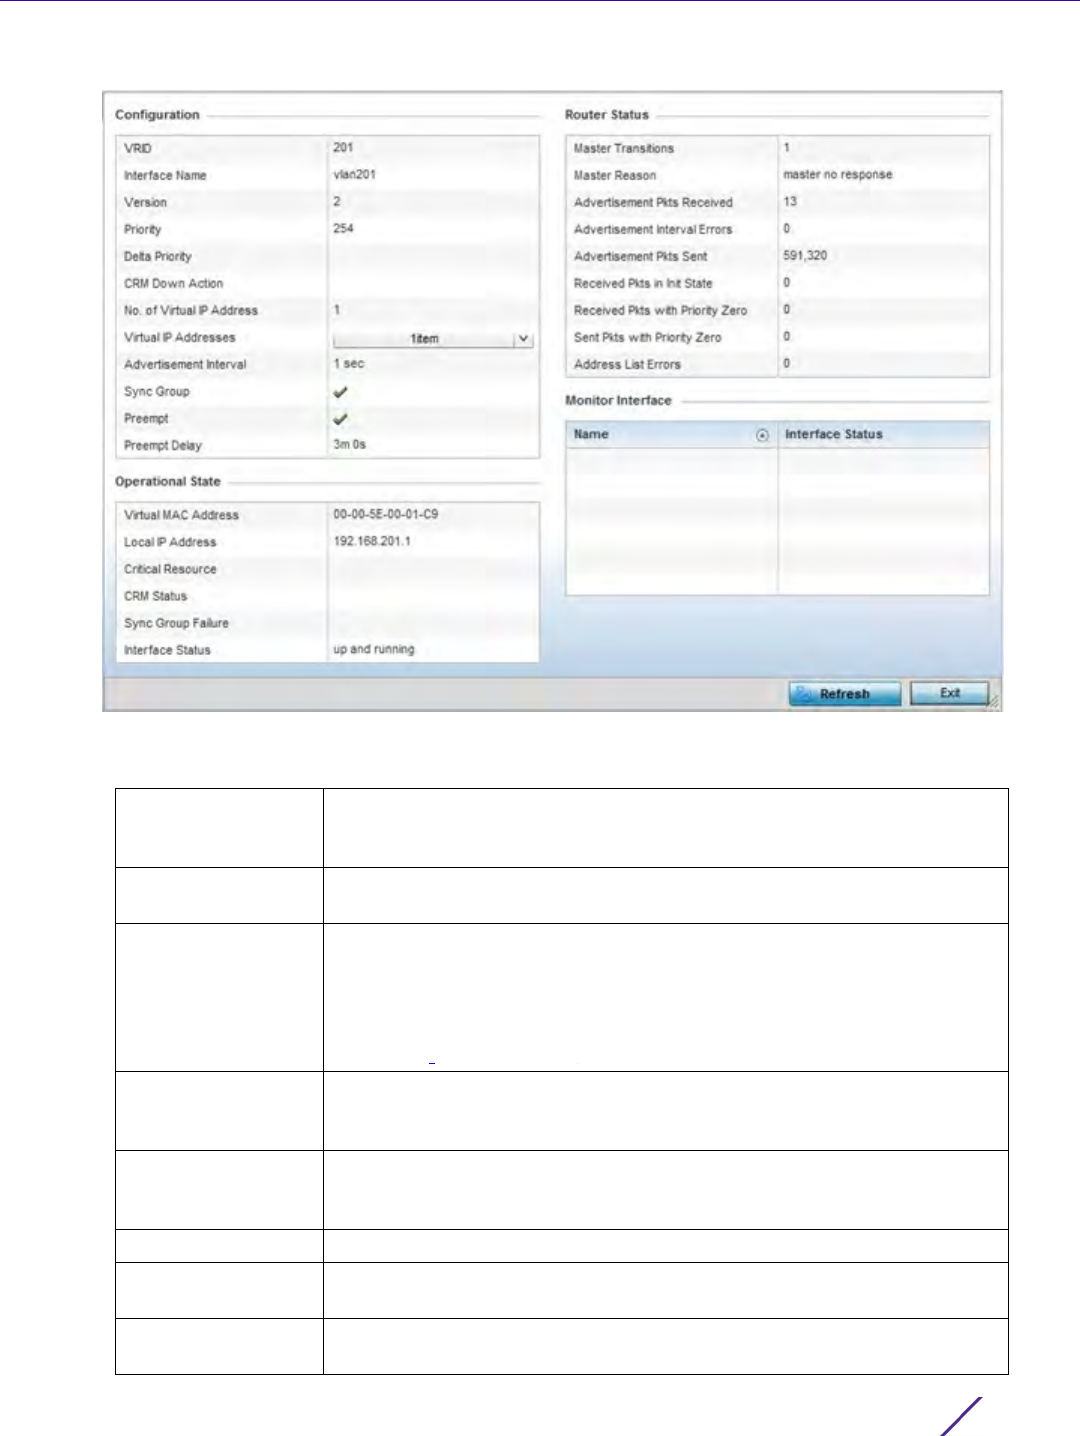
Statistics
Wireless Controller and Service Platform System Reference Guide 15 - 135
Figure 15-89 Wireless Controller - VRRP VRID Detail screen
7The Configuration field lists the following for the selected VRID:
VRID Lists this selected ID’s assigned ID. The index is assigned when a VRRP
configuration is initially defined. This ID identifies the virtual router a
packet is reporting status for.
Interface Displays the interfaces selected to supply VRRP redundancy failover
support.
Version Displays the VRRP version scheme used with the configuration. VRRP
version 3 (RFC 5798) and 2 (RFC 3768) are selectable to set the router
redundancy. Version 3 supports sub-second (centisecond) VRRP failover
and support services over virtual IP. For more information on the VRRP
protocol specifications (available publicly) refer to http://www.ietf.org/rfc/
rfc3768.txt (version 2) and http://www.ietf.org/rfc/rfc5798.txt (version 3).
Priority Lists the ID’s numerical value (from 1 - 254) used for the virtual router
master election process. The higher the numerical value, the higher the
priority in the election process.
Delta Priority Displays the configured priority (by the set value) when the monitored
interface is down. When critical resource monitoring, the configured value
is incremented by the value defined.
CRM Down Action Lists the critical resource down action applied to this listed VRID.
No. of Virtual IP
Address
Lists the number of virtual interface IP address used as the redundant
gateway address for the virtual route.
Virtual IP Addresses Lists the virtual interface IP address set as the redundant gateway address
for the virtual route.

Statistics
Wireless Controller and Service Platform System Reference Guide 15 - 136
8The Operational State field lists the following for the selected VRID:
9The
Router Status field lists the following router performance and error data:
Advertisement
Interval
Lists the interval for unsolicited router assignments.The advertisement
interval is the minimum interval between sending router updates. Sending
too many updates creates flapping of routes leading to possible
disruption.
Sync Group Lists whether a VRRP sync group is assigned to this VRRP ID’s group of
virtual IP addresses. This triggers VRRP failover if an advertisement is not
received from the virtual masters that are part of this VRRP sync group.
Preempt Lists whether preempt is enabled for the selected ID. Preempt ensures a
high priority backup router is available to preempt a lower priority backup
router resource. The default setting is enabled. When selected, the
preempt delay option becomes enabled to set the actual delay interval for
pre-emption. This setting determines if a node with a higher priority can
take over all the Virtual IPs from the nodes with a lower priority.
Preempt Delay If preempt is enabled, this item lists the delay interval (in seconds) for pre-
emption.
Virtual MAC Address Lists the alpha numeric virtual MAC address utilized by the selected VRID.
Local IP Address This address represents an alternative to an interface IP address. The last
byte of the address (XX) is the VRID, which is different for each virtual
router in the network
Critical Resource Displays the critical resource currently utilized by the selected VRID.
CRM Status Lists operational network status of the critical resource used by this VRID.
Sync Group Failure Lists any sync failures detected with the sync group of virtual IP addresses.
Interface Status Lists the operational network status of the interfaces selected to supply
VRRP redundancy failover support.
Master Transitions Lists the number of transitions to master router designation that have
occurred with this VRID’s router.
Master Reason Displays an event message in respect the dedicated VRRP router’s
availability.
Advertisement Pkts
Received
Lists the number of router advertisements received by this selected VRID.
Router advertisements are periodically sent to hosts or sent in response to
solicitation requests. Router advertisements contain prefixes used for link
determination, address configuration and maximum hop limits.
Advertisement
Interval Errors
Lists this VRID’s number of advertisement prefix errors for link
determination, address configuration and maximum hop limits.
Advertisement Pkts
Sent
Lists the number of router advertisements sent by this selected VRID.
Router advertisements are periodically sent to hosts or sent in response to
solicitation requests. Router advertisements contain prefixes used for link
determination, address configuration and maximum hop limits.
Received Pkts in Init
State
Lists the number of packets received by the selected VRID when a router
receives a hello packet but the local router ID is not listed in the received
neighbor field. This means bidirectional communication is not been
established.
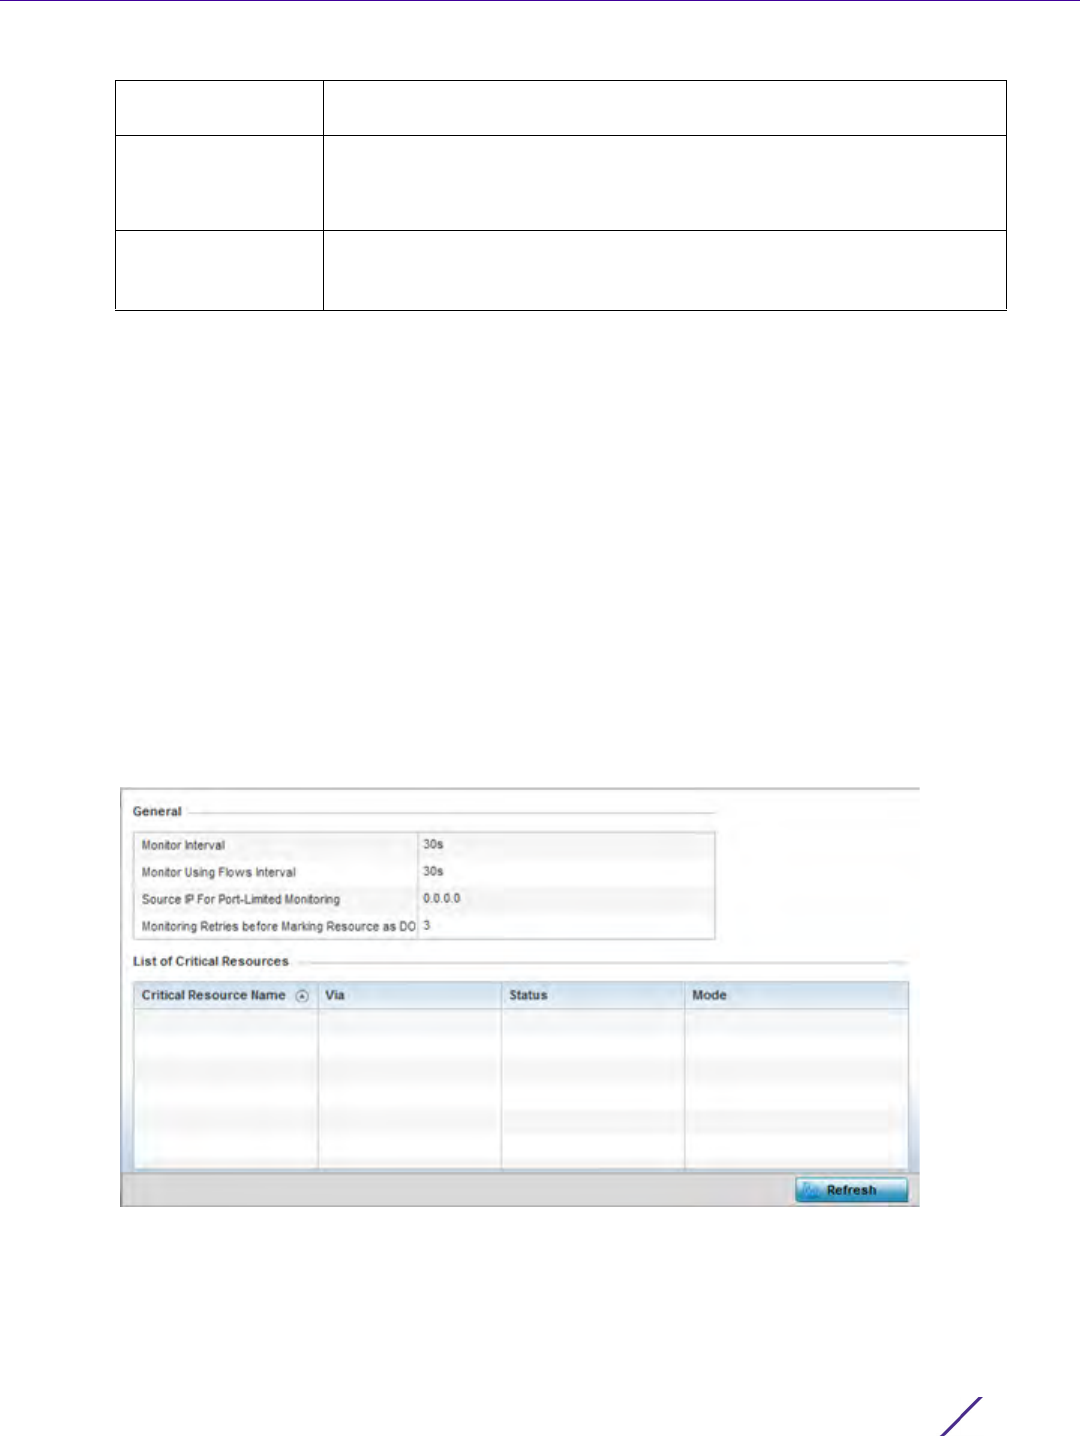
Statistics
Wireless Controller and Service Platform System Reference Guide 15 - 137
10 Refer to the Monitor Interface field to assess the names of this VRID’s interface utilization and their respective
statuses.
15.3.24 Critical Resources
Controller Statistics
The Critical Resources statistics screen displays a list of device IP addresses on the network (gateways, routers
etc.). These defined IP addresses are critical to the health of the controller or service platform managed network.
These device addresses are pinged regularly by the Access Point. If there is a connectivity issue, an event is
generated stating a critical resource is unavailable.
To view controller or service platform Critical Resource statistics:
1 Select the Statistics menu from the Web UI.
2 Select a Wireless Controller node from the left navigation pane.
3Select
Critical Resource from the left-hand side of the UI.
Figure 15-90 Wireless Controller - Critical Resource screen
4 Refer to the General field to assess the Monitor Interval and Monitor Using Flows Interval used to poll for
updates from the critical resource IP listed for Source IP For Port-Limited Monitoring. Monitoring Retries before
Marking Resource as DOWN are the number of retry connection attempts permitted before this listed resource
is defined as down (offline).
Received Pkts with
Priority Zero
Lists this VRID’s number of received packets with a value of zero.
Sent Pkts with
Priority Zero
Lists this VRID’s number of sent packets with a value of zero.
Address List Errors Lists the number of router event errors detected where an address that
could not be resolved and bidirectional communication could not be
established.
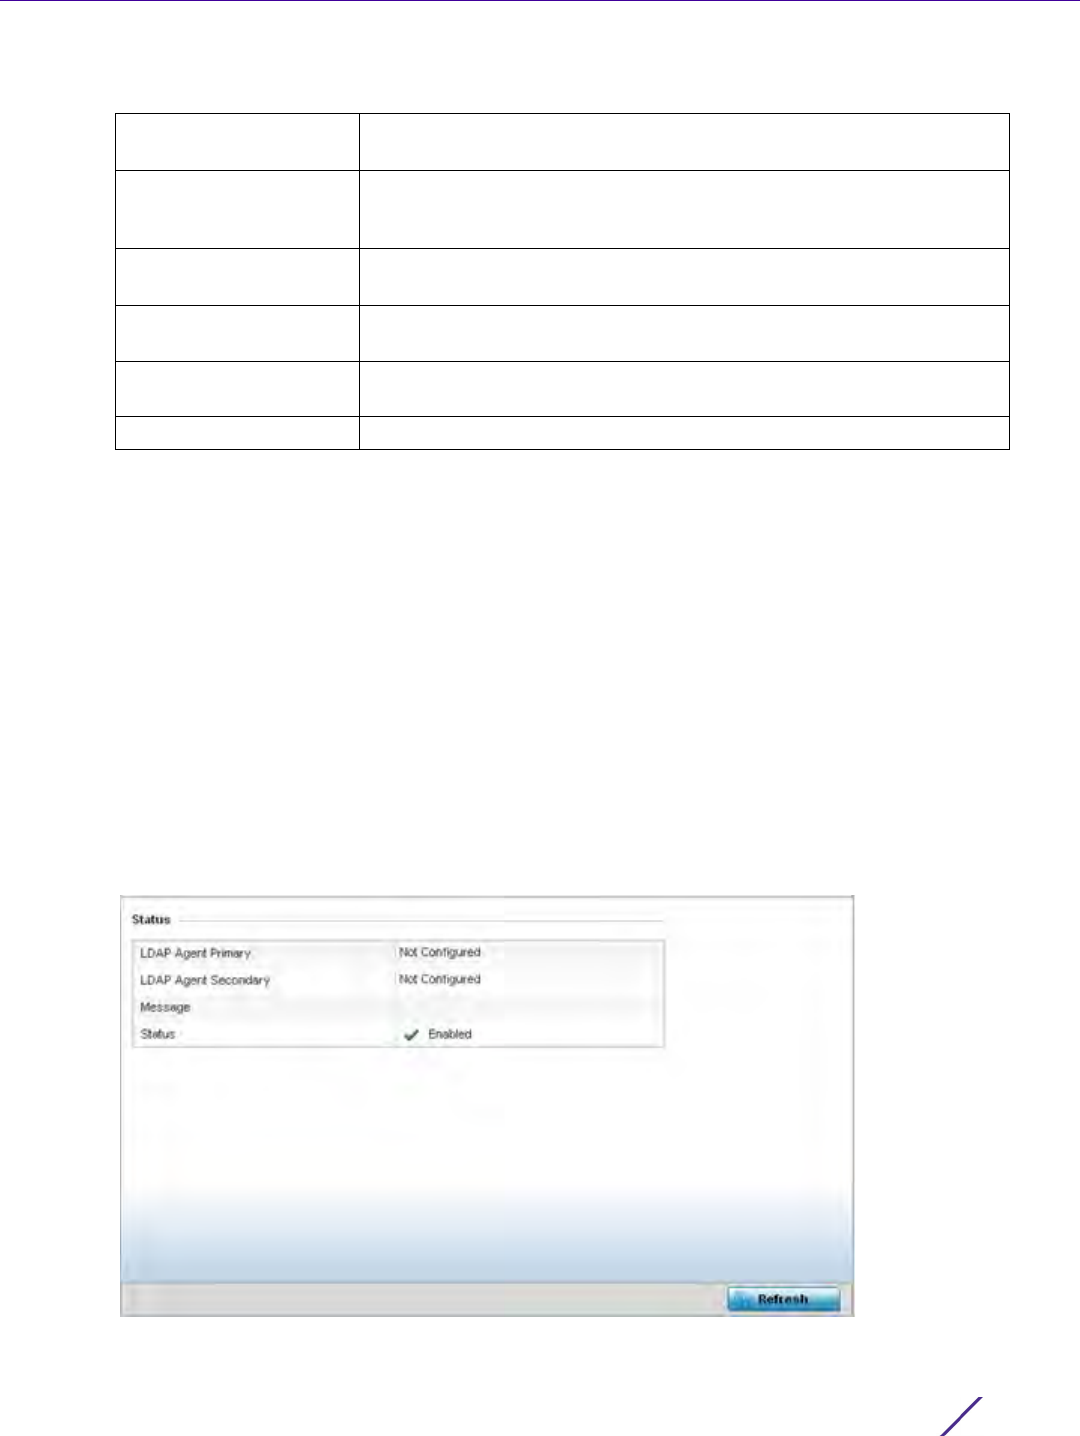
Statistics
Wireless Controller and Service Platform System Reference Guide 15 - 138
5 Refer to the following List of Critical Resources:
15.3.25 LDAP Agent Status
Controller Statistics
When LDAP has been specified as an external resource (as opposed to local RADIUS resources) to validate PEAP-
MS-CHAP v2 authentication requests, user credentials and password information needs to be made available
locally to successfully connect to the external LDAP server. Up to two LDAP Agents (primary and secondary
external resources) can be defined as external resources for PEAP-MS-CHAP v2 authentication requests. For more
information on setting LDAP agents as part of the RADIUS server policy, see Configuring RADIUS Server Policies
on page 11-57.
To view controller or service platform LDAP agent statistics:
1 Select the Statistics menu from the Web UI.
2 Select a Wireless Controller node from the left navigation pane.
3Select
LDAP Agent Status from the left-hand side of the UI.
Figure 15-91 Wireless Controller - LDAP Agent Status screen
Critical Resource Name Lists the name of the resource being monitored by the controller or
service platform.
Via Lists the VLAN used by the critical resource as a virtual interface. the
VLAN displays as a link than can be selected to list configuration and
network address information in greater detail.
Status Defines the operational state of each listed critical resource VLAN
interface (Up or Down).
Error Reason Provides an error status as to why the critical resource is not available
over its designated VLAN.
Mode Defines the operational state of each listed critical resource (up or
down).
Refresh Select Refresh to update the statistics counters to their latest values.

Statistics
Wireless Controller and Service Platform System Reference Guide 15 - 139
The LDAP Agent Status screen displays the following:
15.3.26 Mint Links
Controller Statistics
Wireless controllers and Access Points use the MiNT protocol as the primary means of device discovery and
communication for Access point adoption and management. MiNT provides a mechanism to discover neighbor
devices in the network, and exchange packets between devices regardless of how these devices are connected (L2
or L3).
MiNT provides the means to secure communications at the transport layer. Using MiNT, a device can be configured
to only communicate with other authorized (MiNT enabled) devices of the same model. MiNT links can be
established over a VLAN (Among Access Points on a VLAN) or IP (remote access point to controller).
MiNT Links are automatically created between controllers and Access Points during adoption using MLCP (MiNT
Link Creation Protocol). They can also be manually created between a controller and Access Point (or) between
Access Points. MiNT links are manually created between controllers while configuring a cluster.
Level 2 (or) remote MiNT links are controller aware links, and requires IP network for communication. This level 2
MiNT links at access points are intended for remote Adaptive AP deployment and management from NOC. With
Level2 MiNT links, access points are only aware of the controllers and not about other Access points. Level 2 MiNT
links also provide partitioning, between Access Points deployed at various remote sites.
To view controller or service platform Mint link statistics:
1 Select the Statistics menu from the Web UI.
2 Select a Wireless Controller node from the left navigation pane.
3Select
Mint Links from the left-hand side of the UI.
LDAP Agent Primary Lists the primary IP address of a remote LDAP server resource used by
the controller or service platform to validate PEAP-MS-CHAP v2
authentication requests. When a RADIUS server policy’s data source is
set to LDAP, this is the first resource for authentication requests.
LDAP Agent Secondary Lists the secondary IP address of a remote LDAP server resource used
by the controller or service platform to validate PEAP-MS-CHAP v2
authentication requests. When a RADIUS server policy’s data source is
set to LDAP, this is the second resource for authentication requests.
Message Displays any system message generated in the controller or service
platform’s connection with the primary or secondary LDAP agent. If
there’s a problem with the username and password used to connection
to the LDAP agent it would be listed here.
Status Displays whether the controller or service platform has successfully
joined the remote LDAP server domain designated to externally
validate PEAP-MS-CHAP v2 authentication requests.
Refresh Select Refresh to update the statistics counters to their latest values.

Statistics
Wireless Controller and Service Platform System Reference Guide 15 - 140
Figure 15-92 Wireless Controller - Mint Links screen
The Mint Links screen lists the name of the impacted VLAN or link in the form of a link that can be selected to
display more granular information about that VLAN. A green check mark or a red X defines whether the listed
VLAN is listening to traffic, forced to stay up or unused with the Mint link. The level column specifies whether the
listed Mint link is traditional switching link (level 2) or a routing link (level 3). The type column defines whether the
listed Mint link is a VLAN or an IPv4 or IPv6 type network address. The dis column lists how each link was
discovered.
Refer to the secure column to assess whether the listed links are isolated between peers. The local ip column lists
the IP address assigned as the link’s end point address, not the interface’s IP address. The natted column lists
whether the link is NAT enabled or disabled for modifying network address information in IP packet headers in
transit. The cost defines the cost for a packet to travel from its originating port to its end point destination.
The hello seq number and hello interval define the interval between hello keep alive messages between link end
points. While the adj hold time sets the time after the last hello packet when the connected between end points is
defined as lost.
The static and dynamic link columns state whether each listed link is static route using a manually configured route
entry, or a dynamic route characterized by its destination The rim column defines whether the listed link is
managed remotely. The control vlan column states whether the listed link has enabled as a control VLAN. Lastly,
the clustering column states whether listed link members discover and establish connections to other peers and
provide self-healing in the event of cluster member failure.
4 Periodically select Refresh to update the screen’s data counters to their latest values.
5 If needed, select a Mint link from the name column to display more granular information for that link.
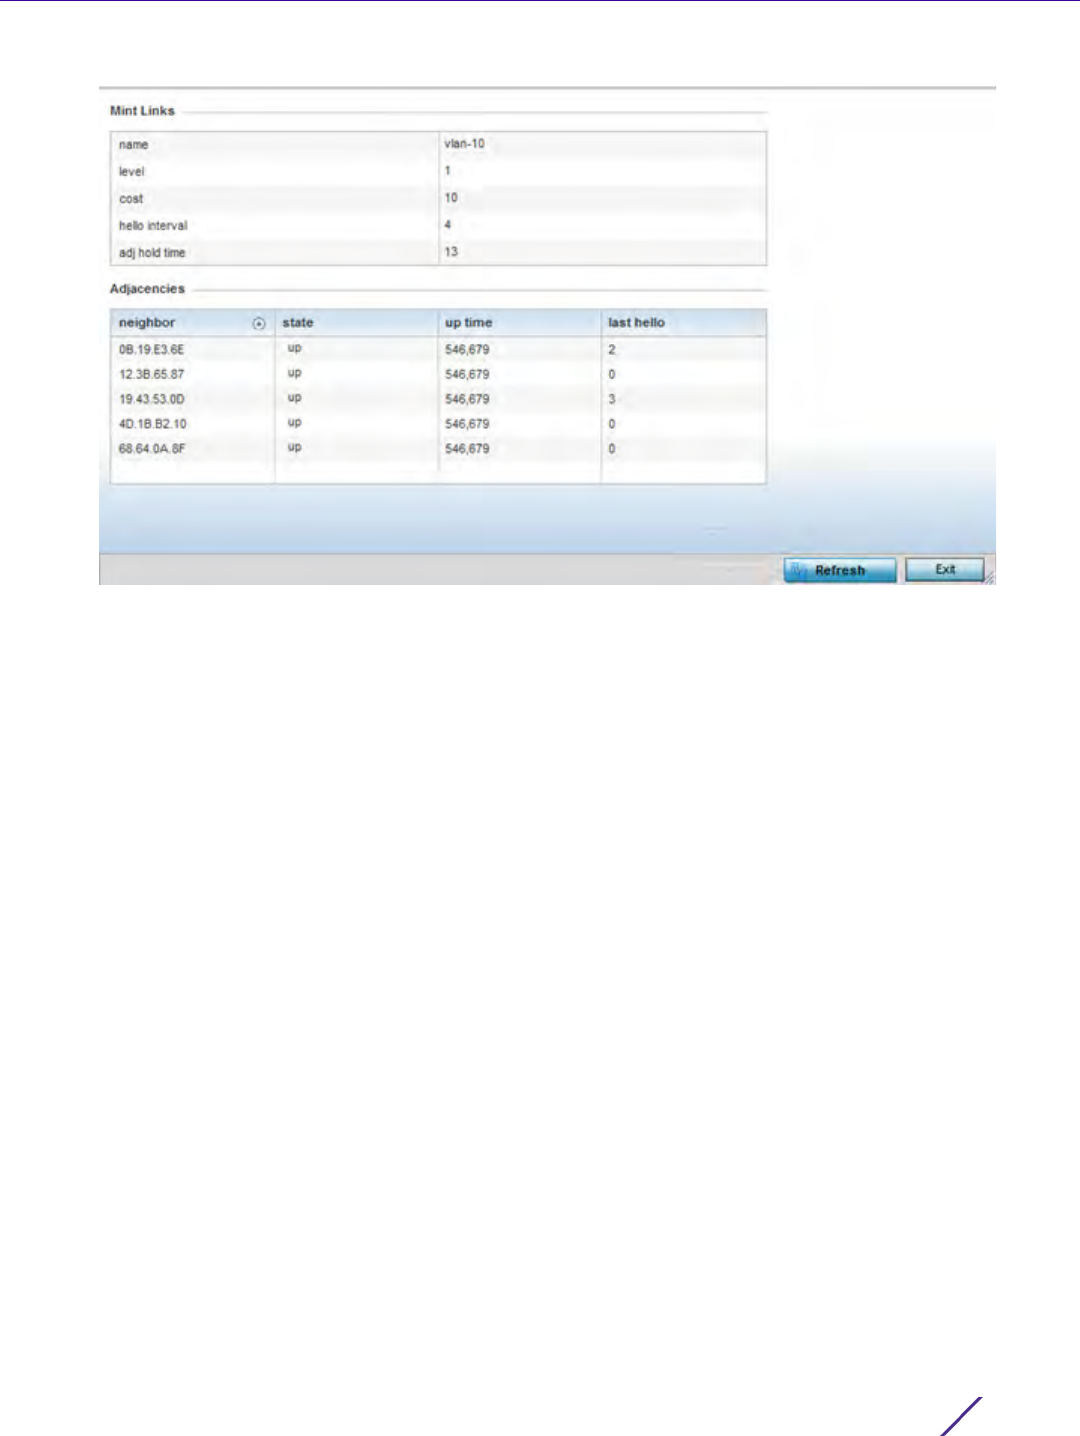
Statistics
Wireless Controller and Service Platform System Reference Guide 15 - 141
Figure 15-93 Wireless Controller - Mint Link Details screen
The first table lists the Mint link’s name and level specifying whether the Mint link is traditional switching link
(level 2) or a routing link (level 3). The cost defines the cost for a packet to travel from its originating port to its
end point destination. The hello interval lists the time between hello keep alive messages between link end
points. The adj hold time sets the time after the last hello packet when the connected between end points is
defined as lost.
The Adjacencies table lists neighbor devices by their hardware identifiers and operational state to help
determine their availability as Mint link end points and peers. The up time lists the selected link’s detection on
the network and the last hello lists when the last hello message was exchanged.
6 Periodically select Refresh to update the statistics counters to their latest values.
15.3.27 Guest Users
Controller Statistics
A captive portal is an access policy for providing guests temporary and restrictive access to the wireless network.
A captive portal configuration provides secure authenticated access using a standard Web browser. Captive portals
provide authenticated access by capturing and re-directing a wireless user's Web browser session to a captive
portal login page where the user must enter valid credentials to access to the network. Captive portals can have
their access durations set by an administrator to either provide temporary access to the controller or service
platform managed network or provide access without limitations.
For information on setting captive portal duration and authentication settings, refer to Configuring Captive Portal
Policies on page 11-1.
To view the controller or service platform guest user utilization:
1 Select the Statistics menu from the Web UI.
2 Select a Wireless Controller node from the left navigation pane.
3Select
Guest Users from the left-hand side of the UI.
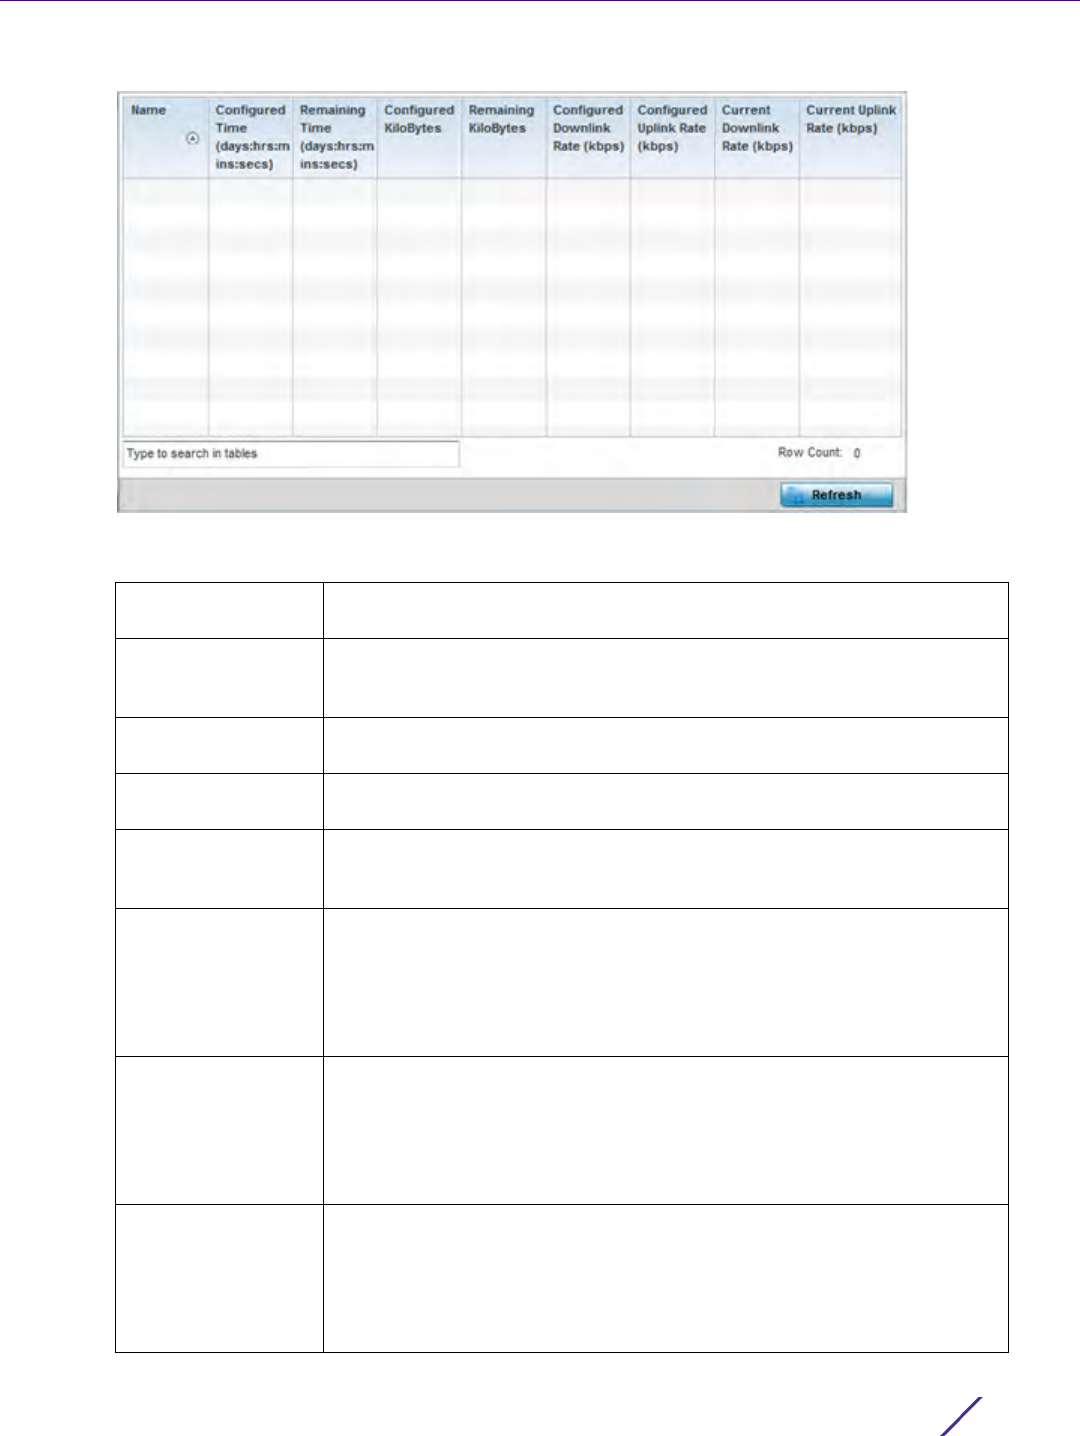
Statistics
Wireless Controller and Service Platform System Reference Guide 15 - 142
Figure 15-94 Wireless Controller – Guest Users screen
The Guest Users screen describes the following:
Name Lists the administrator assigned name of the client utilizing the controller
or service platform for guest access to the wireless network.
Configured Time
(days:hrs:mins:secs)
Displays the restricted permissions each listed client was initially
configured for their captive portal guest user session with this managing
controller or service platform.
Remaining Time
(days:hrs:mins:secs)
Displays the time each listed client has remaining in their captive portal
guest user session with this managing controller or service platform.
Configured
Kilobytes
Lists the maximum configured bandwidth consumable by the listed guest
user (in kilobytes).
Remaining Kilobytes Lists the remaining bandwidth available to the listed guest user (in
kilobytes). This is the difference between the configured (maximum)
bandwidth and the users’s current utilization.
Configured
Downlink Rate
(kbps)
Specifies the download speed configured for the listed guest user. When
bandwidth is available, the user can download data at the specified rate
(in kilobytes per second). If a guest user has a bandwidth based policy
and exceeds the specified data limit, their speed is throttled to the defined
reduced downlink rate. For more information, refer to Defining User Pools
on page 11-53.
Configured Uplink
Rate (kbps)
Specifies the upload speed dedicated to the listed guest user. When
bandwidth is available, the user is able to upload data at the specified rate
(in kilobytes per second). If a guest user has a bandwidth based policy
and exceeds the specified data limit, their speed is throttled to the
reduced uplink rate. For more information, refer to Defining User Pools on
page 11-53.
Current Downlink
Rate (Kbps)
Lists the listed guest user’s current downlink rate in kbps. Use this
information to assess whether this user’s configured downlink rate is
adequate for their session requirements and whether their reduced
downlink rate need adjustment if the configured downlink rate is
exceeded. For more information, refer to Defining User Pools on page 11-
53.
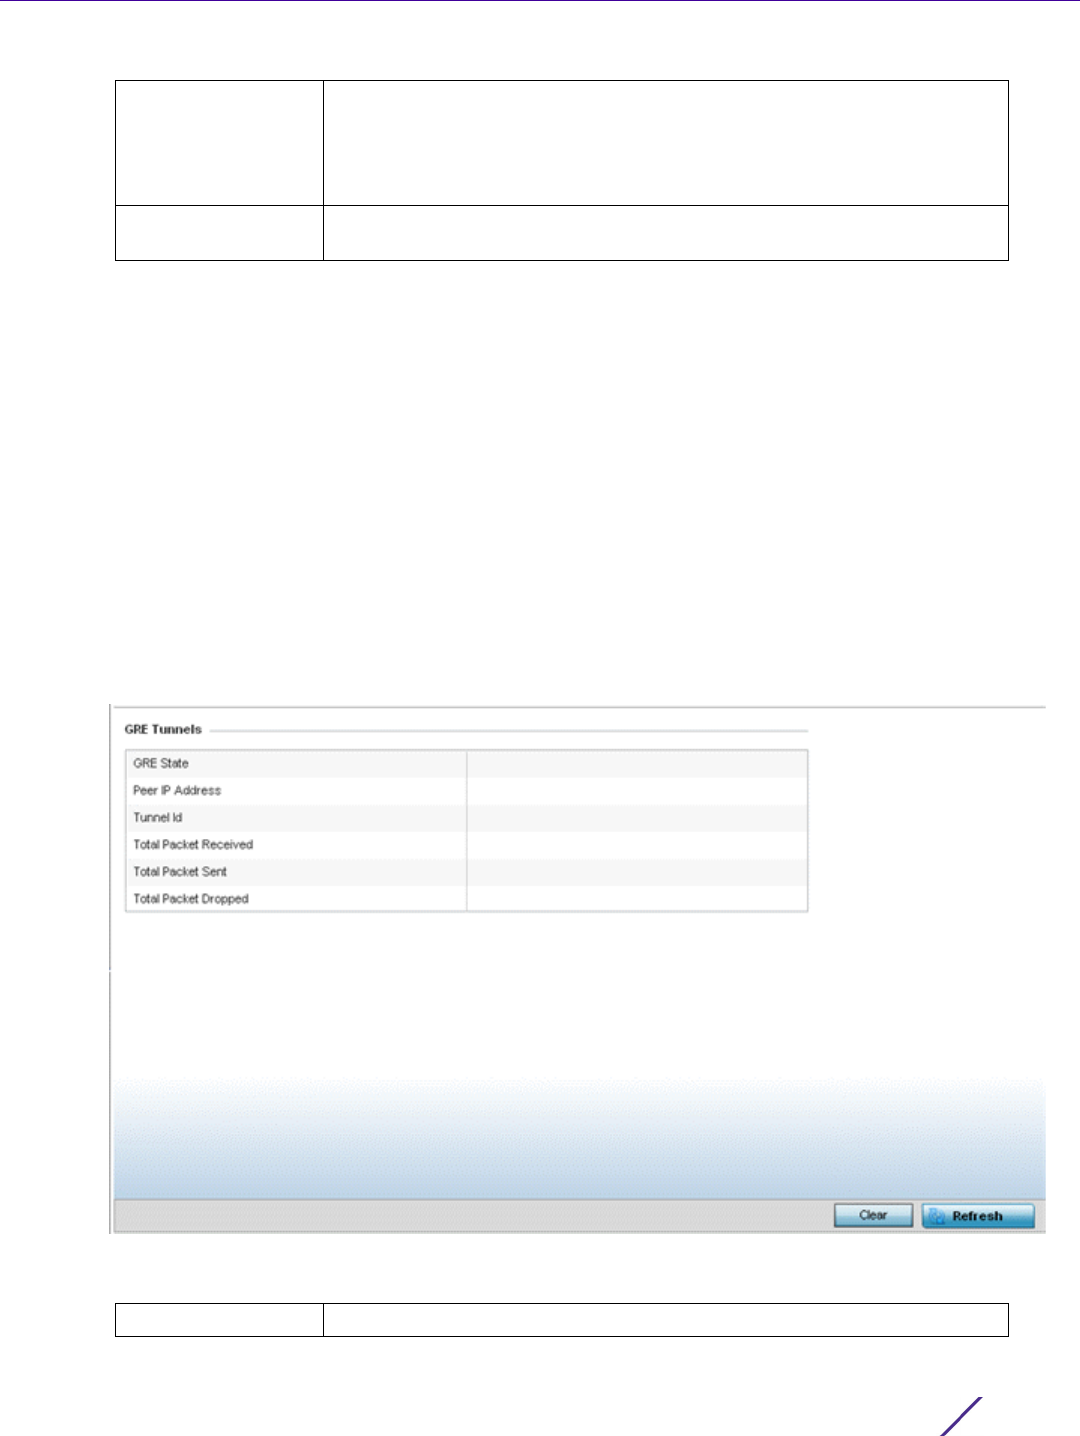
Statistics
Wireless Controller and Service Platform System Reference Guide 15 - 143
15.3.28 GRE Tunnels
Controller Statistics
Generic Routing Encapsulation (GRE) is one of the available tunneling mechanisms which uses IP as the transport
protocol and can be used for carrying many different passenger protocols. The tunnels behave as virtual point-to-
point links that have two endpoints identified by the tunnel source and tunnel destination addresses at each
endpoint.
Use the GRE Tunnel screen to view information on the traffic flow in a GRE tunnel.
To view the GRE Tunnel statistics:
1 Select the Statistics menu from the Web UI.
2 Select a Wireless Controller node from the left navigation pane.
3Select
GRE Tunnels from the left-hand side of the UI.
Figure 15-95 Wireless Controller – GRE Tunnel screen
The GRE Tunnels screen describes the following:
Current Uplink Rate
(Kbps)
Lists the listed guest user’s current uplink rate in kbps. Use this
information to assess whether this user’s configured uplink rate is
adequate for their session requirements and whether their reduced uplink
rate need adjustment if the configured uplink rate is exceeded. For more
information, refer to Defining User Pools on page 11-53.
Refresh Select the Refresh button to update the screen’s statistics counters to their
latest value.
GRE State Displays the current operational state of the GRE tunnel.

Statistics
Wireless Controller and Service Platform System Reference Guide 15 - 144
15.3.29 Dot1x
Controller Statistics
Dot1x (or 802.1x) is an IEEE standard for network authentication. Devices supporting Dot1x allow the automatic
provision and connection to the wireless network without launching a Web browser at login. When within range of
a Dot1x network, a device automatically connects and authenticates without needing to manually login.
To view the Dot1x statistics:
1 Select the Statistics menu from the Web UI.
2 Select the Wireless Controller node from the left navigation pane.
3Select
Dot1x from the left-hand side of the UI.
Peer IP Address Displays the IP address of the peer device on the remote end of the GRE
tunnel.
Tunnel Id Displays the session ID of an established GRE tunnel. This ID is only viable
while the tunnel is operational and does not carry to subsequent sessions.
Total Packets
Received
Displays the total number of packets received from a peer at the remote
end of the GRE tunnel.
Total Packets Sent Displays the total number of packets sent from this controller or service
platform to a peer at the remote end of the GRE tunnel.
Total Packets
Dropped
Lists the number of packets dropped from tunneled exchanges between
this controller or service platform and a peer at the remote end of the
VPN tunnel
Clear Select Clear to revert the screen counters to zero and begin a new data
collection.
Refresh Select the Refresh button to update the screen’s statistics counters to their
latest value.
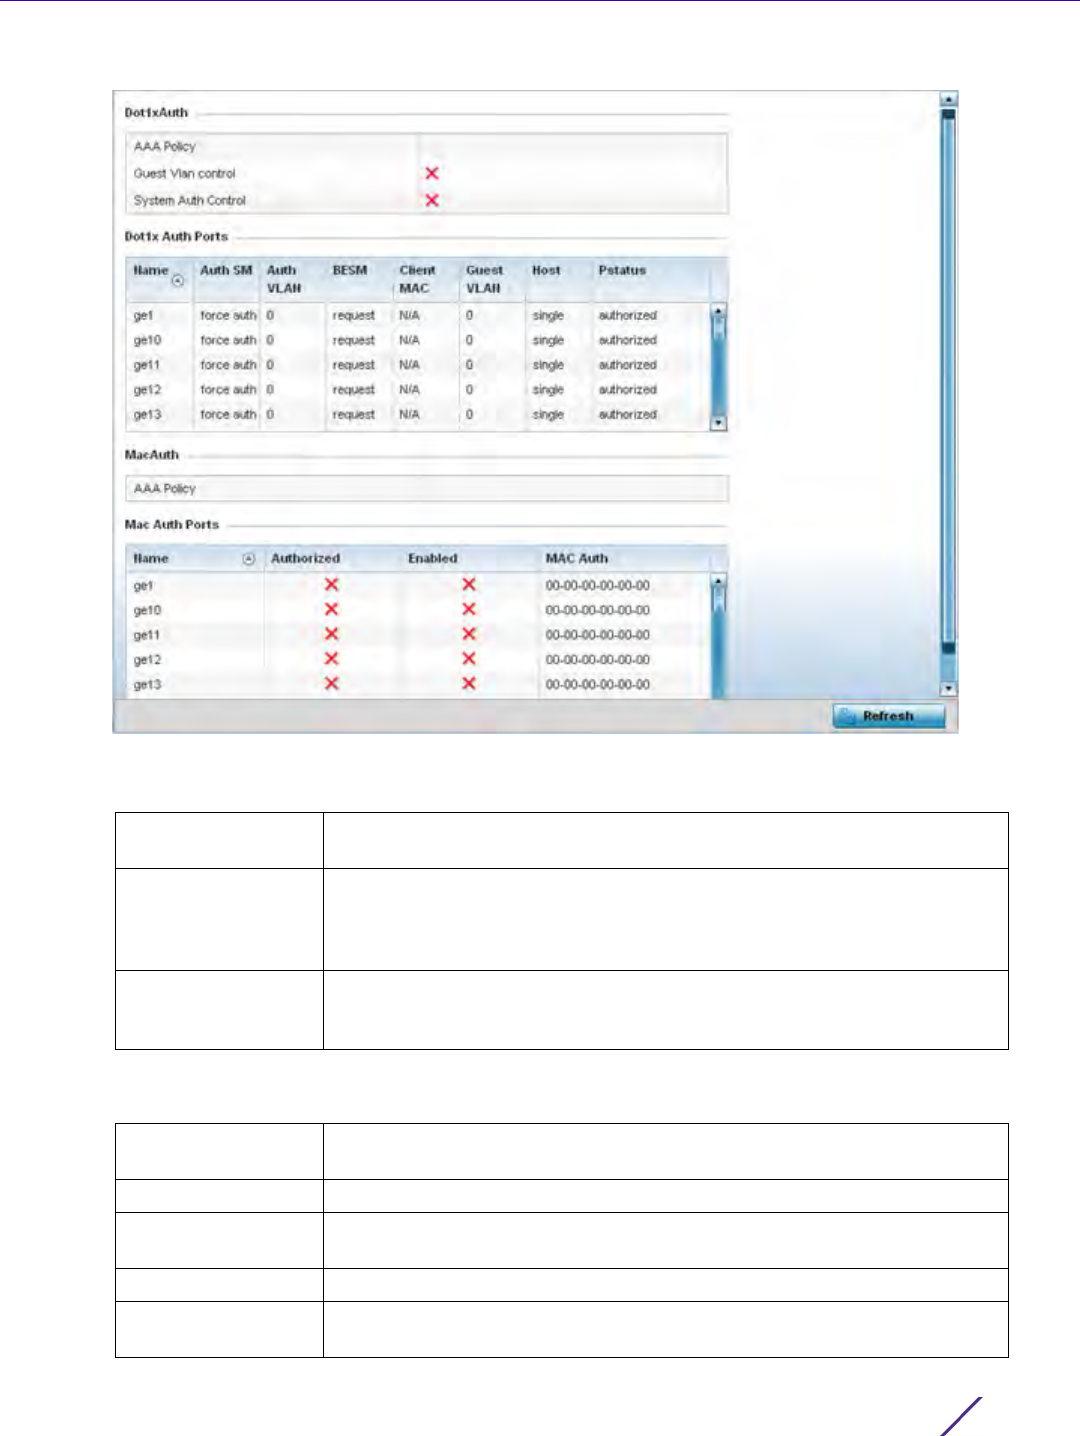
Statistics
Wireless Controller and Service Platform System Reference Guide 15 - 145
Figure 15-96 Wireless Controller – Dot1x screen
4 Refer to the following Dot1xAuth statistics:
5 Review the following Dot1x Auth Ports utilization information:
AAA Policy Lists the AAA policy currently being utilized for authenticating user
requests.
Guest Vlan Control Lists whether guest VLAN control has been allowed (or enabled). This is
the VLAN traffic is bridged on if the port is unauthorized and guest VLAN
globally enabled. A green checkmark designates guest VLAN control as
enabled. A red X defines guest VLAN control as disabled.
System Auth Control Lists whether Dot1x authorization is globally enabled for the controller or
service platform. A green checkmark designates Dot1x authorization
globally enabled. A red X defines Dot1x as globally disabled.
Name Lists the controller or service platform ge ports subject to automatic
connection and authentication using Dot1x.
Auth SM Lists whether Dot1x authentication is forced over the listed port.
Auth VLAN Lists the numeric VLAN ID used as a virtual interface for authentication
requests over the listed port.
BESM Lists whether an authentication request is pending on the listed port.
Client MAC Lists the MAC address of requesting clients seeking authentication over
the listed port.

Statistics
Wireless Controller and Service Platform System Reference Guide 15 - 146
6 Refer to the MacAuth table to assess the AAA policy applied to MAC authorization requests.
7 Review the following MAC Auth Ports utilization information:
8 Select the Refresh button to update the screen’s statistics counters to their latest value.
15.3.30 Network
Controller Statistics
Use the Network screen to view information for ARP, DHCP, Routing, MLD and Bridging. Each of these screens
provides enough data to troubleshoot issues related to the following:
•ARP Entries
•Route Entries
•Default Routes
•Bridge
•IGMP
•MLD
•LACP
•Traffic Shaping
•DHCP Options
•Cisco Discovery Protocol
•Link Layer Discovery Protocol
•IPv6 Neighbor Discovery
•MSTP
15.3.30.1 ARP Entries
Network
The Address Resolution Protocol (ARP) is a networking protocol for determining a network host’s hardware
address when its IP address or network layer address is known.
To view the ARP entries on the network statistics screen:
Guest VLAN Lists the guest VLAN utilized for the listed port. This is the VLAN traffic is
bridged on if the port is unauthorized and guest VLAN globally enabled.
Host Lists whether the host is a single entity or not.
Pstatus Lists whether the listed port has been authorized for Dot1x network
authentication.
Name Lists the controller or service platform ge ports subject to automatic
connection and MAC authentication using Dot1x.
Authorized Lists whether MAC authorization using Dot1x has been authorized
(permitted) on the listed ge port. A green checkmark designates Dot1x
authorization as permitted. A red X defines authorization as disabled.
Enabled Lists whether MAC authorization using Dot1x has been enabled on the
listed ge port. A green checkmark designates Dot1x authorization as
allowed. A red X defines authorization as disabled.
MAC Auth Lists the port’s factory encoded MAC address.
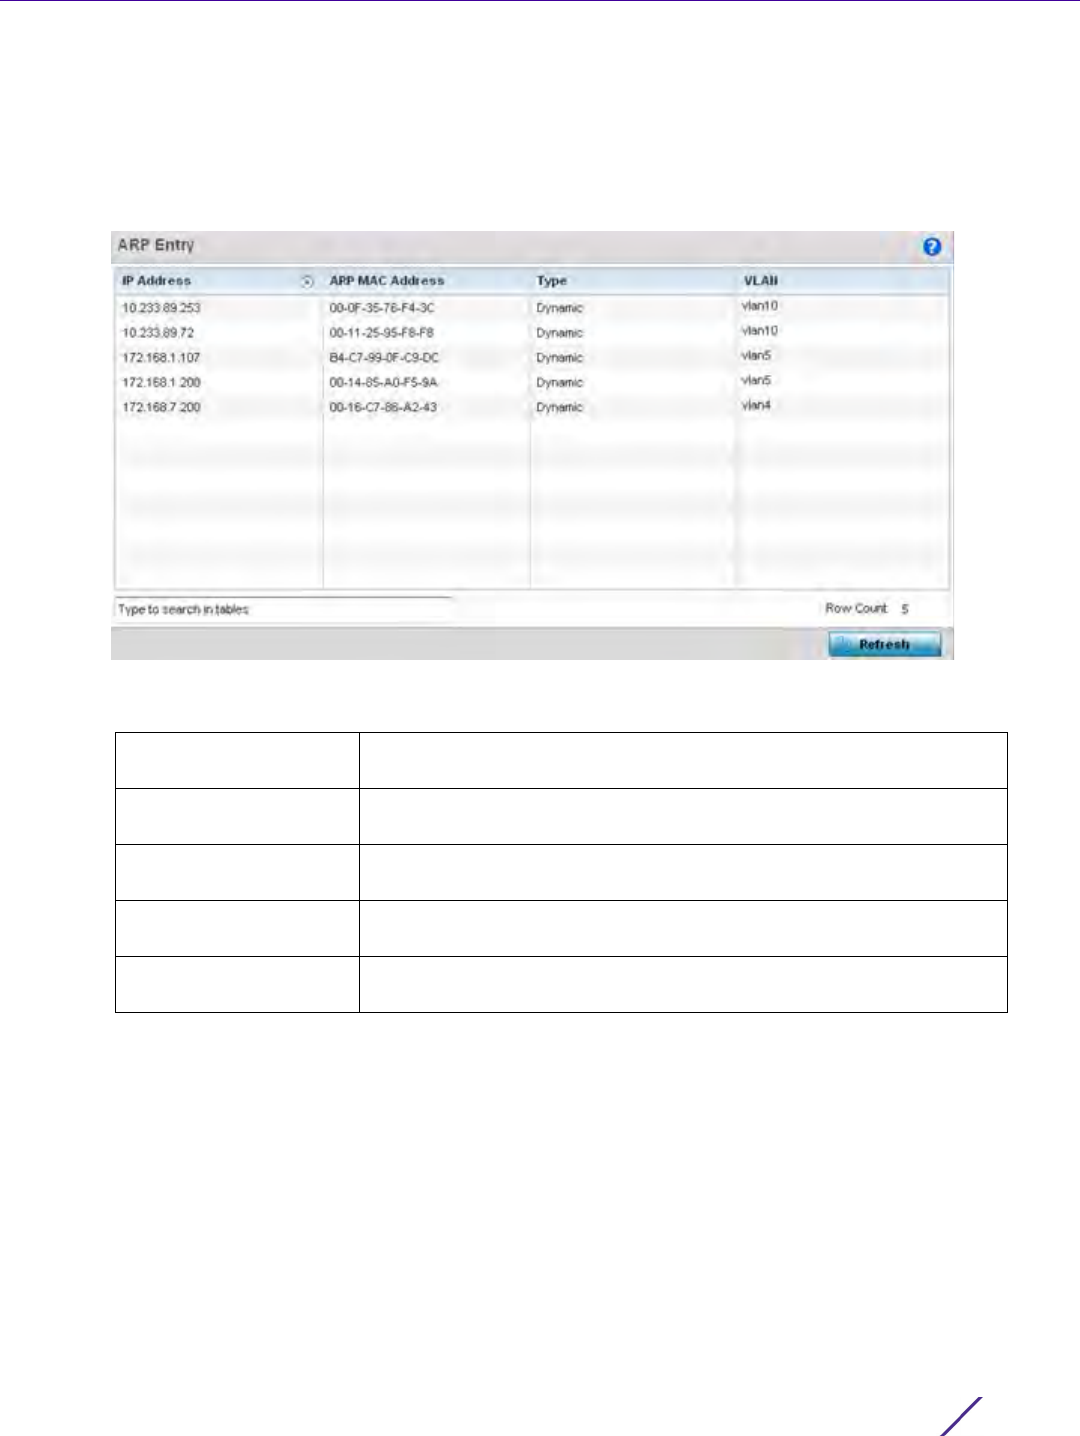
Statistics
Wireless Controller and Service Platform System Reference Guide 15 - 147
1 Select the Statistics menu from the Web UI.
2 Select a Wireless Controller node from the left navigation pane.
3Expand the Networks menu from the left-hand side of the UI.
4Select
ARP.
Figure 15-97 Wireless Controller - Network ARP screen
The ARP Entries screen displays the following:
15.3.30.2 Route Entries
Network
The Route Entries screen displays data for routing packets to a defined destination. When an existing destination
subnet does not meet the needs of the network, add a new destination subnet, subnet mask and gateway as
needed for either IPv4 or IPv6 formatted data packets.
IPv4 operates as a best effort delivery method, as it does not guarantee delivery, and does not ensure proper
sequencing or duplicate delivery (unlike (TCP). IPv4 hosts can use link local addressing to provide local
connectivity.
IP Address Displays the IP address of the client being resolved on behalf of the
controller or service platform.
ARP MAC Address Displays the MAC address of the device where an IP address is being
resolved.
Type Defines whether the entry was added statically or created dynamically
in respect to network traffic. Entries are typically static.
VLAN Displays the name of the virtual interface where the IP address was
found.
Refresh Select the Refresh button to update the screen’s statistics counters to
their latest values.
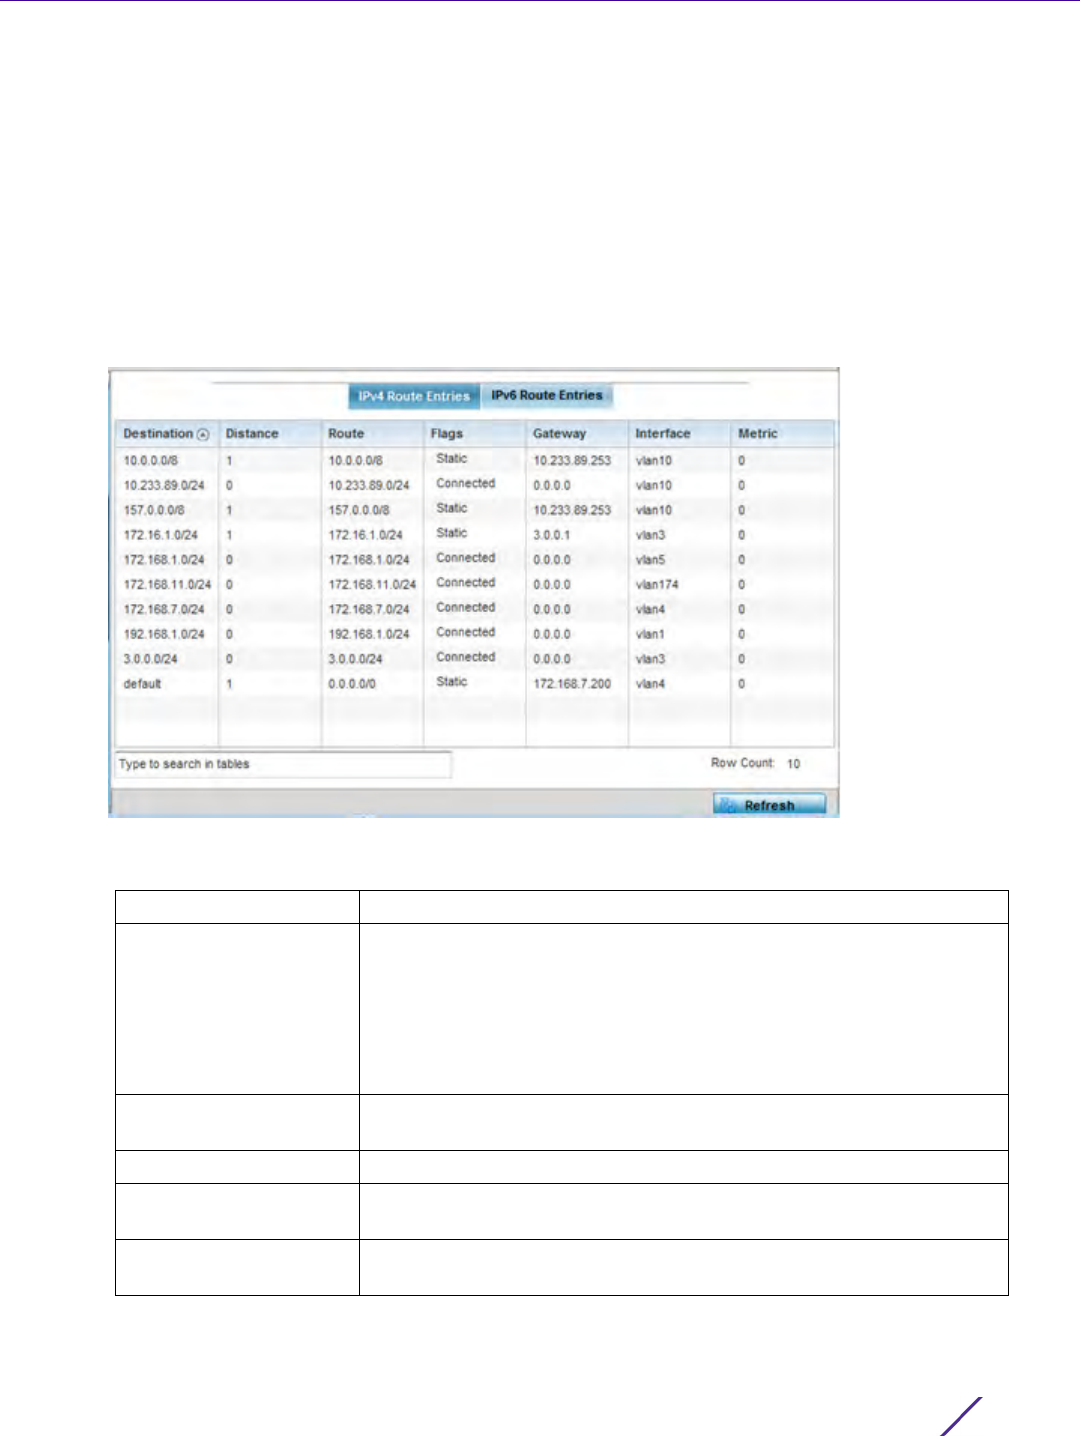
Statistics
Wireless Controller and Service Platform System Reference Guide 15 - 148
IPv6 is the latest revision of the Internet Protocol (IP) designed to replace IPv4. IPV6 provides enhanced
identification and location information for devices on networks routing traffic across the Internet. IPv6 addresses
are composed of eight groups of four hexadecimal digits separated by colons.
To view the route entries:
1 Select the Statistics menu from the Web UI.
2 Select a Wireless Controller node from the left navigation pane.
3Expand the Network menu from the left-hand side of the UI.
4Select
Route Entries. The IPv4 Route Entries tab displays by default.
Figure 15-98 Wireless Controller - IPv4 Route Entries screen
The IPv4 Route Entries screen provides the following information:
Destination Displays the IPv4 formatted address of the destination route address.
Distance Lists the hop distance to a desired route. Devices regularly send
neighbors their own assessment of the total cost to get to all known
destinations. A neighboring device examines the information and
compares it to their own routing data. Any improvement on what’s
already known is inserted in that device’s own routing tables. Over
time, each networked device discovers the optimal next hop for each
destination.
Route Lists the IPv4 formatted IP address used for routing packets to a
defined destination.
Flags The flag signifies the condition of the direct or indirect route.
Gateway Displays the gateway IP address used to route packets to the
destination subnet.
Interface Displays the name of the controller interface or VLAN utilized by the
destination subnet.
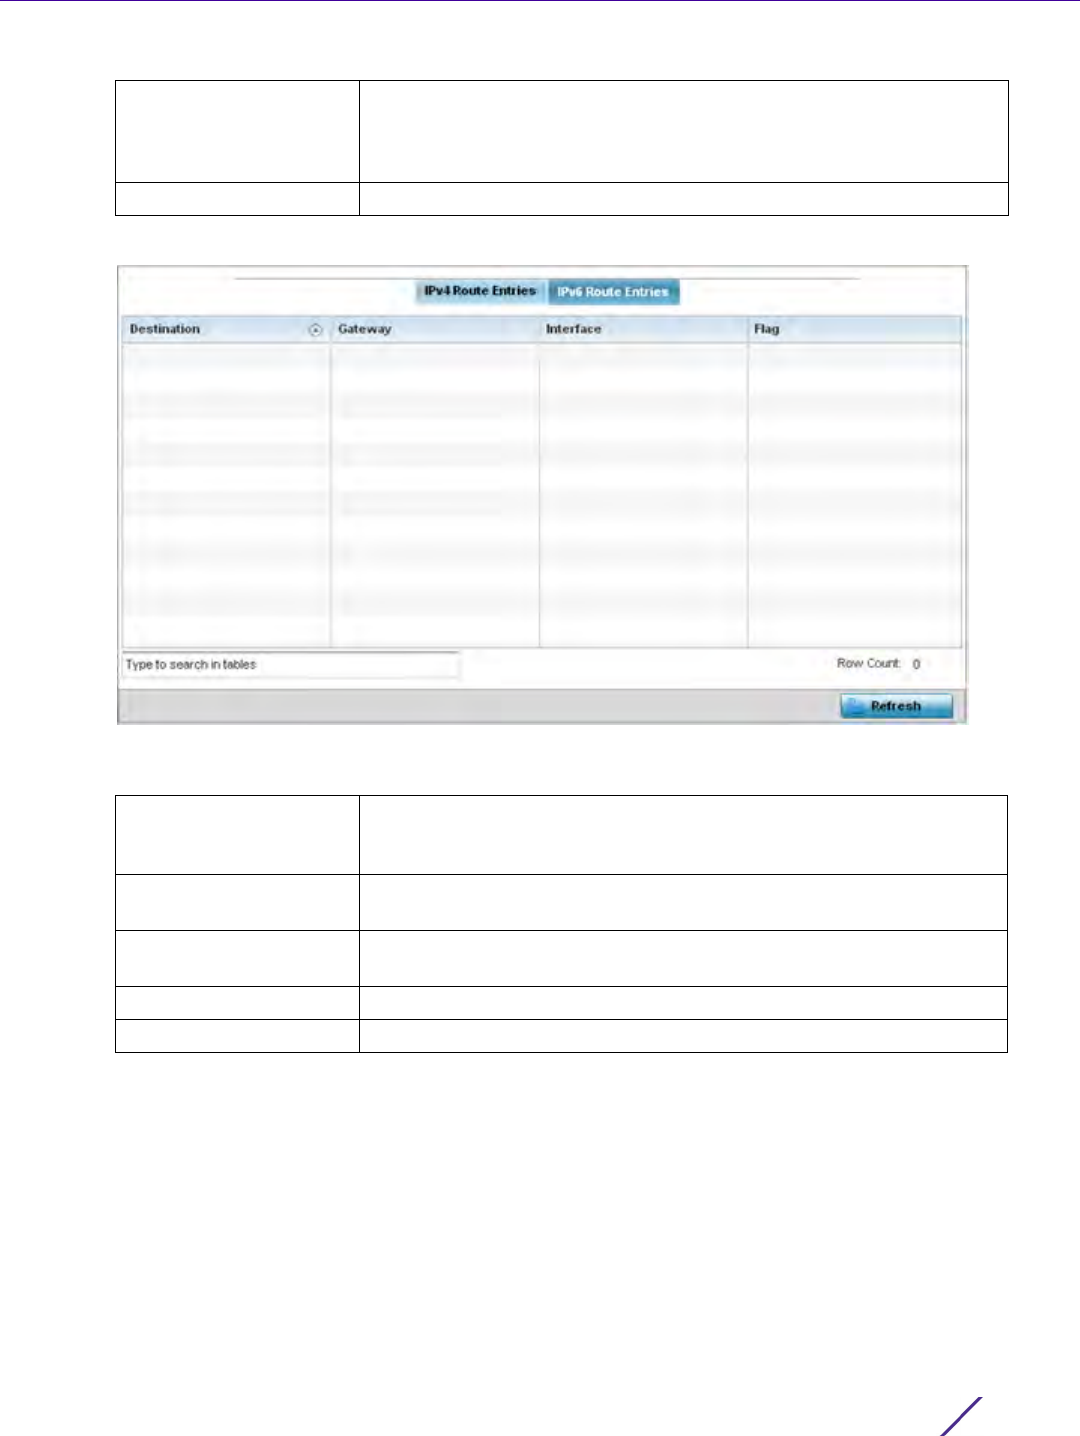
Statistics
Wireless Controller and Service Platform System Reference Guide 15 - 149
5 Select the IPv6 Route Entries tab to review route data for IPv6 formatted traffic.
Figure 15-99 Wireless Controller - IPv6Route Entries screen
The IPv6 Route Entries screen provides the following information:
15.3.30.3 Default Routes
Network
In an IPv6 supported environment unicast routing is always enabled. A controller or service platform routes IPv6
formatted traffic between interfaces as long as the interfaces are enabled for IPv6 and ACLs allow IPv6 formatted
traffic. However, an administrator can add a default routes as needed.
Static routes are manually configured. They work fine in simple networks. However, static routes with topology
changes require an administrator to manually configure and modify the corresponding route revisions. Default
routes are useful, as they forward packets that match no specific routes in the routing table.
Metric Lists the metric (or cost) of the route to select (or predict) the best
route. The metric is computed using a routing algorithm, and covers
information bandwidth, network delay, hop count, path cost, load,
MTU, reliability, and communication cost.
Refresh Select Refresh to update the display to the latest values.
Destination Displays the IPv6 formatted address of the destination route address.
IPv6 addresses are composed of eight groups of four hexadecimal
digits separated by colons.
Gateway Displays the gateway IP address used to route packets to the
destination subnet.
Interface Displays the name of the controller interface or VLAN utilized by the
destination subnet.
Flag The flag signifies the condition of the direct or indirect route.
Refresh Select Refresh to update the display to the latest values.
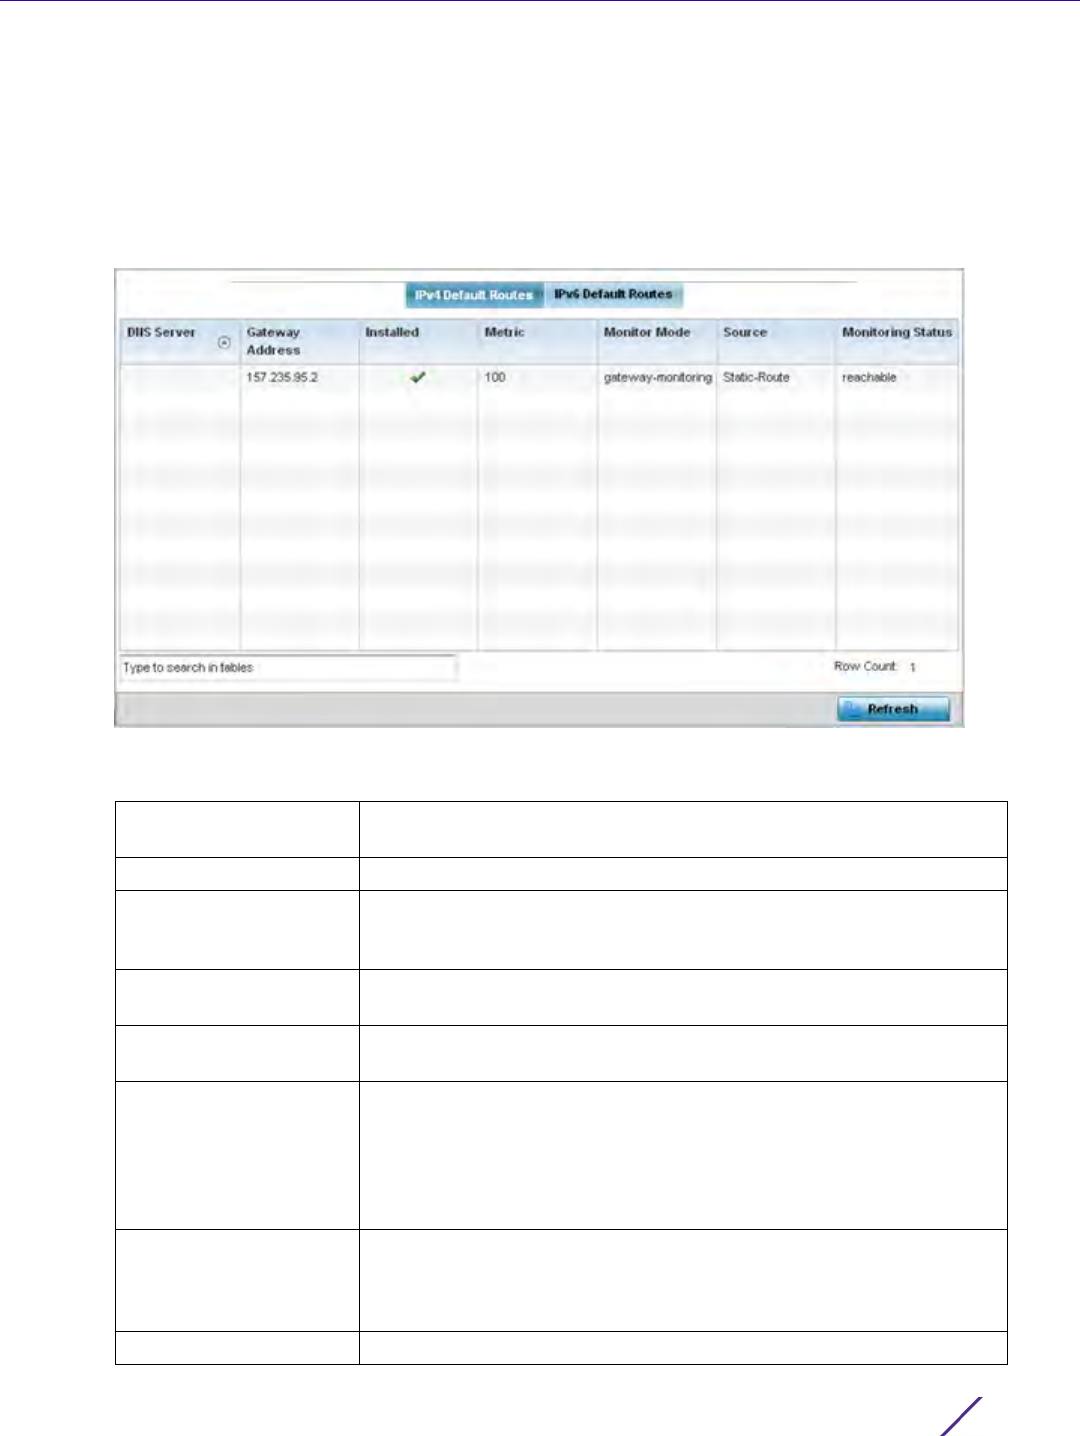
Statistics
Wireless Controller and Service Platform System Reference Guide 15 - 150
To view controller or service platform default routes:
1 Select the Statistics menu from the Web UI.
2 Select a Wireless Controller node from the left navigation pane.
3Expand the Network menu from the left-hand side of the UI.
4Select
Default Routes. The IPv4 Default Routes tab displays by default.
Figure 15-100 Wireless Controller - IPv4 Default Routes screen
The IPv4 Default Routes screen provides the following information:
DNS Server Lists the address of the DNS server providing IPv4 formatted address
assignments on behalf of the controller or service platform.
Gateway Address Lists the IP address of the gateway resource used with the listed route.
Installed A green checkmark defines the listed route as currently installed on
the controller or service platform. A red X defines the route as not
currently installed and utilized.
Metric The metric (or cost) could be the distance of a router (round-trip
time), link throughput or link availability.
Monitor Mode Displays where in the network the route is monitored for utilization
status.
Source Lists whether the route is static or an administrator defined default
route. Static routes are manually configured. Static routes work
adequately in simple networks. However, static routes with topology
changes require an administrator to manually configure and modify
the corresponding route revisions. Default routes are useful, as they
forward packets that match no specific routes in the routing table.
Monitoring Status Lists whether the defined IPv4 route is currently reachable on the
controller or service platform managed network. If not, perhaps a
topology change has occurred to a static route requiring a default
route be utilized.
Refresh Select Refresh to update the display to the latest values.
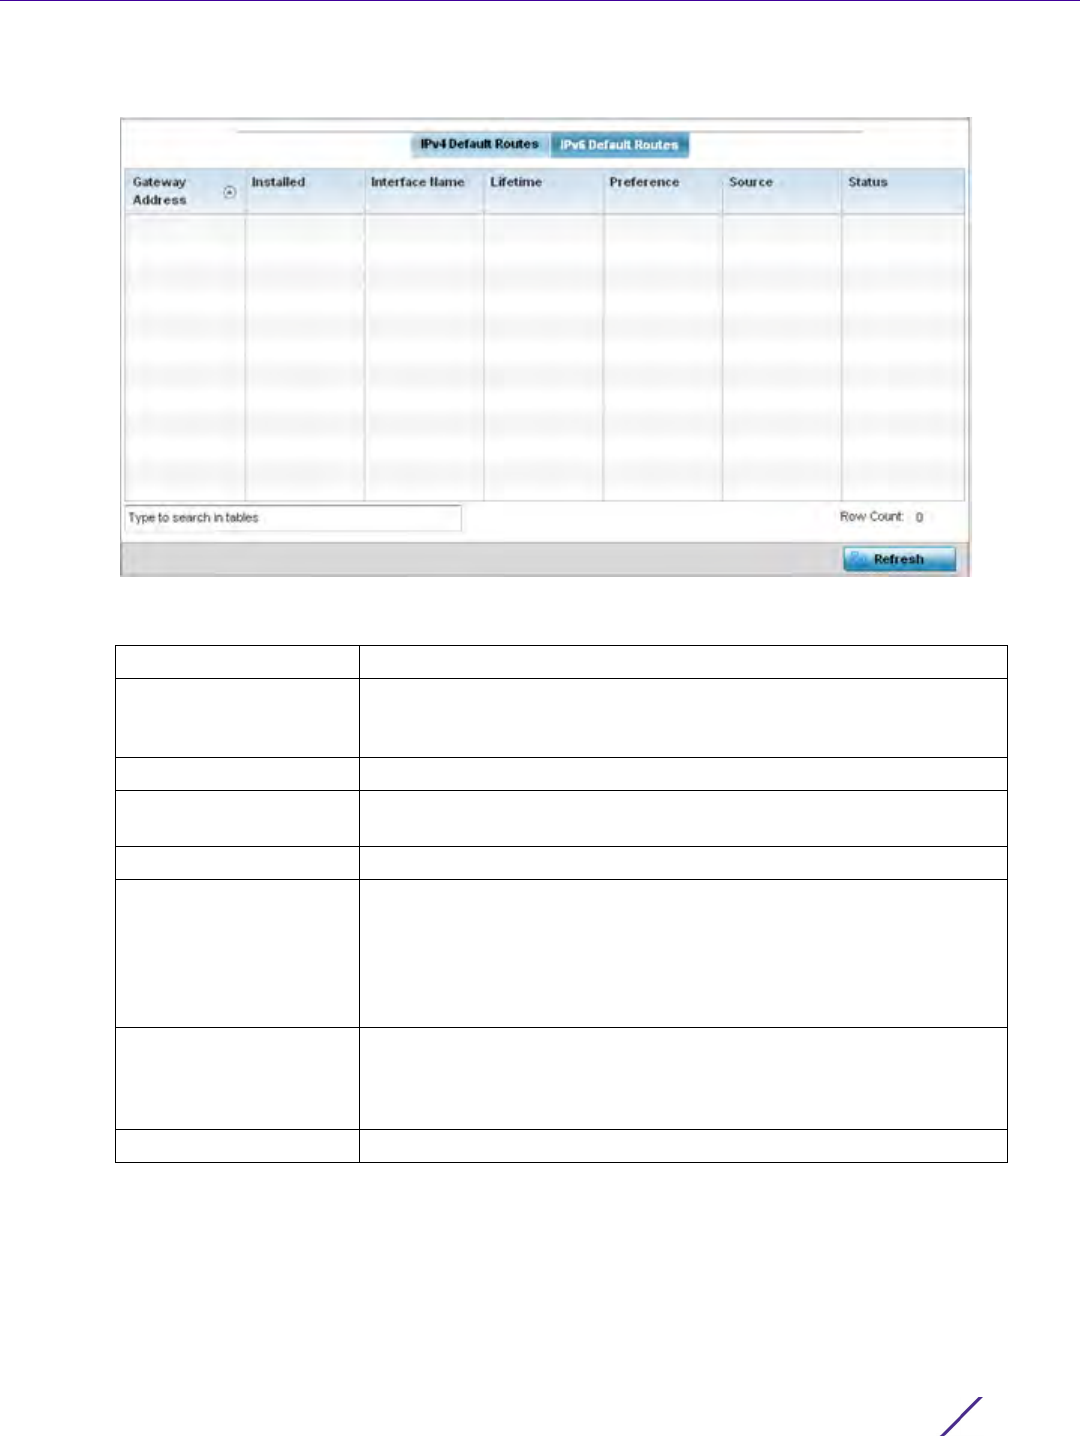
Statistics
Wireless Controller and Service Platform System Reference Guide 15 - 151
5 Select the IPv6 Default Routes tab to review default route availabilities for IPv6 formatted traffic.
Figure 15-101 Wireless Controller - IPv6 Default Routes screen
The IPv6 Default Routes screen provides the following information:
15.3.30.4 Bridge
Network
Bridging is a forwarding technique making no assumption about where a particular network address is located. It
depends on flooding and the examination of source addresses in received packet headers to locate unknown
devices. Once a device is located, its location is stored in a table to avoid broadcasting to that device again.
Gateway Address Lists the IP address of the gateway resource used with the listed route.
Installed A green checkmark defines the listed IPv6 default route as currently
installed on the controller or service platform. A red X defines the
route as not currently installed and utilized.
Interface Name Displays the interface on which the IPv6 default route is being utilized.
Lifetime Lists the lifetime representing the valid usability of the default IPv6
route.
Preference Displays the administrator defined IPv6 preferred route for IPv6 traffic.
Source Lists whether the route is static or an administrator defined default
route. Static routes are manually configured. Static routes work
adequately in simple networks. However, static routes with topology
changes require an administrator to manually configure and modify
the corresponding route revisions. Default routes are useful, as they
forward packets that match no specific routes in the routing table.
Status Lists whether the defined IPv6 route is currently reachable on the
controller or service platform managed network. If not, perhaps a
topology change has occurred to a static route requiring a default
route be utilized.
Refresh Select Refresh to update the display to the latest values.
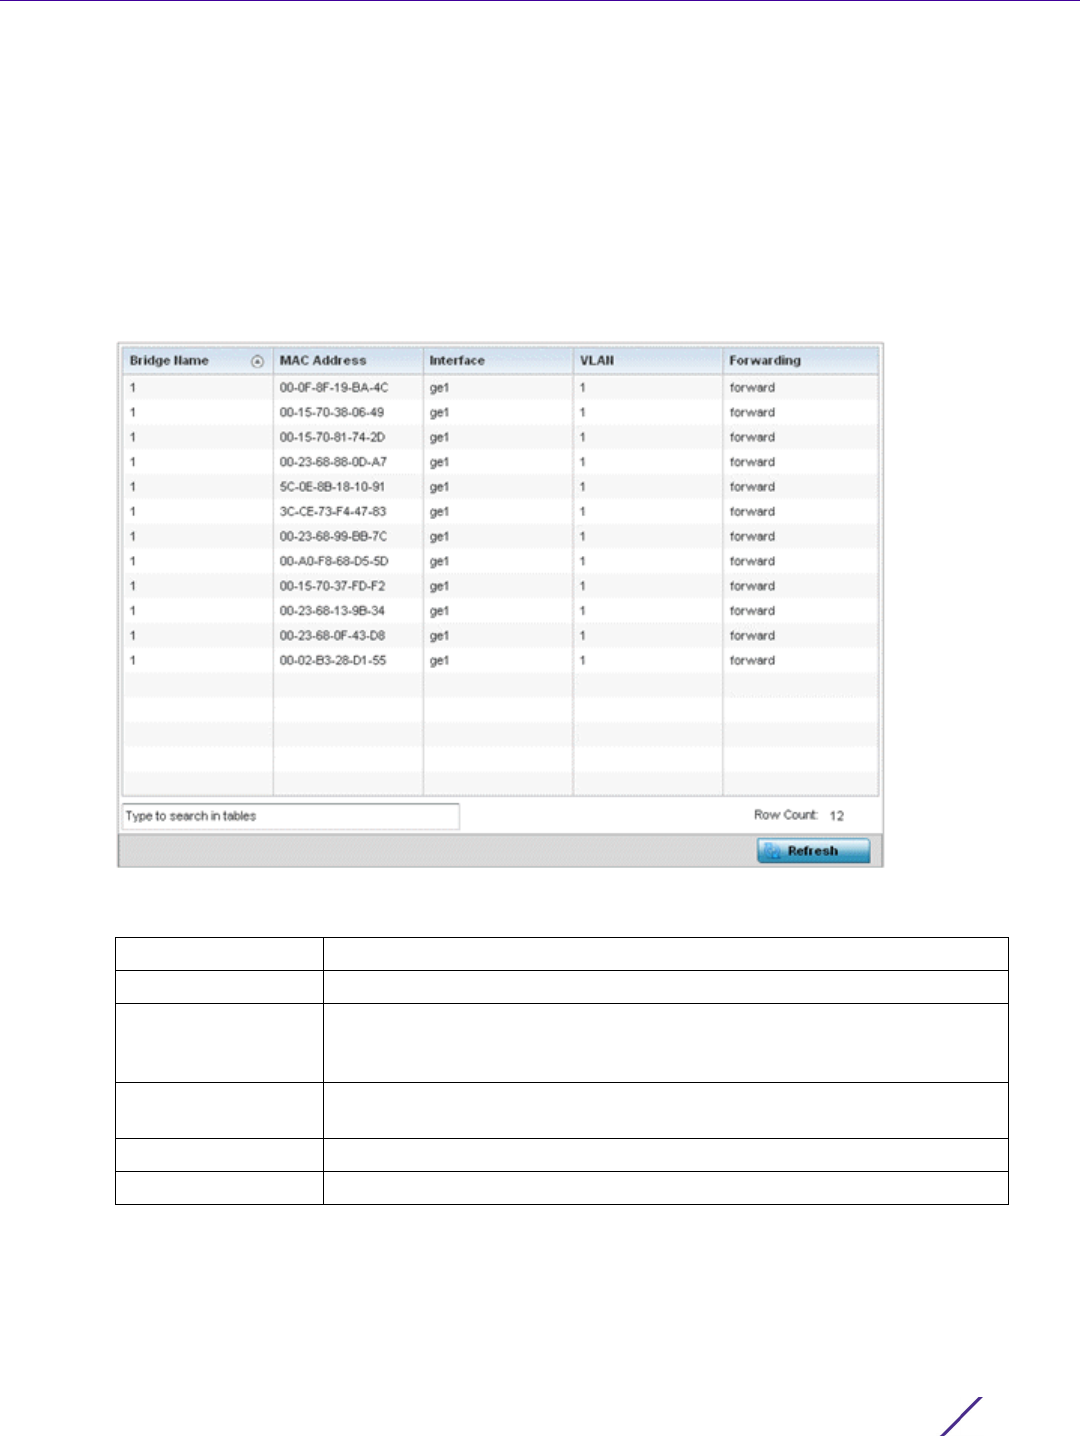
Statistics
Wireless Controller and Service Platform System Reference Guide 15 - 152
Bridging is limited by its dependency on flooding, and is used in local area networks only. A bridge and a controller
or service platform are very similar, since a controller or service platform is a bridge with a number of ports.
To view network bridge information:
1 Select the Statistics menu from the Web UI.
2 Select a Wireless Controller node from the left navigation pane.
3Expand the Network menu from the left-hand side of the UI.
4Select
Bridge.
Figure 15-102 Wireless Controller - Network Bridge screen
The Bridge screen displays the following:
15.3.30.5 IGMP
Network
Internet Group Management Protocol (IGMP) is a protocol used for managing members of IP multicast groups. The
Access Point listens to IGMP network traffic and forwards the IGMP multicast packets to radios on which the
Bridge Name Displays the numeric ID of the network bridge.
MAC Address Displays the MAC address of each listed bridge.
Interface Displays the controller or service platform physical port interface the
bridge uses to transfer packets. Interface availability is slightly different
amongst supported controller and service platform models.
VLAN Displays the VLAN the bridge is using as a virtual interface within the
controller or service platform managed network.
Forwarding Displays whether the bridge is forwarding packets.
Refresh Select Refresh to update the statistics counters to the latest values.
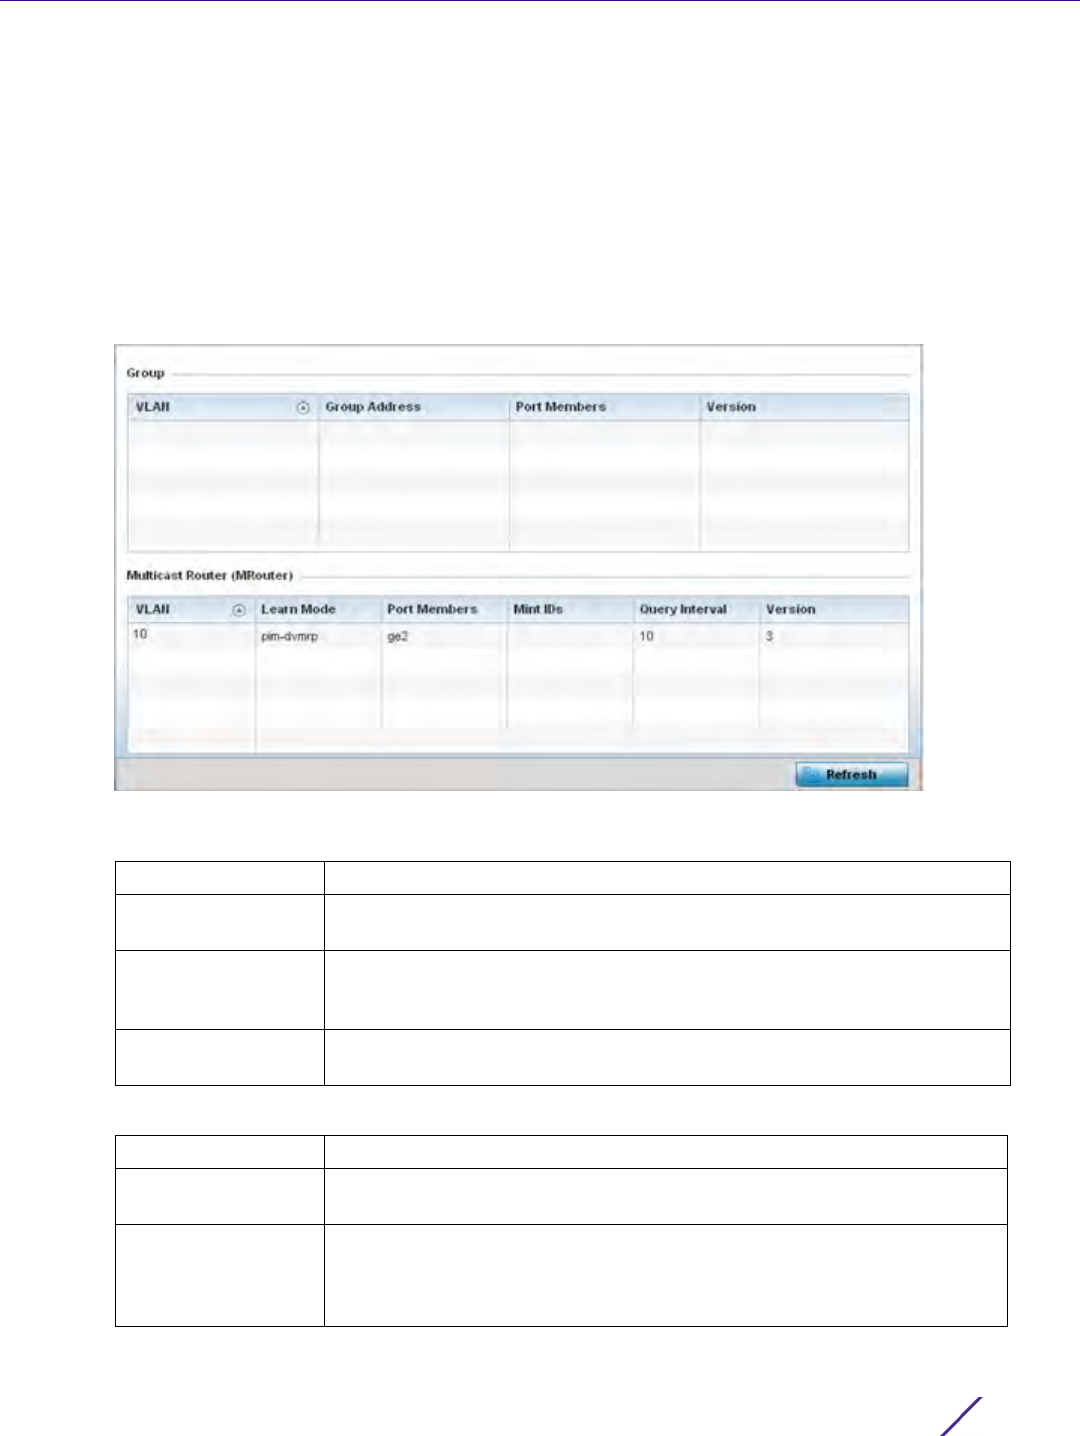
Statistics
Wireless Controller and Service Platform System Reference Guide 15 - 153
interested hosts are connected. On the wired side of the network, the Access Point floods all the wired interfaces.
This feature reduces unnecessary flooding of multicast traffic in the network.
To view network IGMP configuration options:
1 Select the Statistics menu from the Web UI.
2 Select a Wireless Controller node from the left navigation pane.
3Expand the Network menu from the left-hand side of the UI.
4Select
IGMP.
Figure 15-103 Wireless Controller - Network IGMP screen
The Group field describes the following:
The Multicast Router (MRouter) field describes the following:
VLAN Displays the group VLAN where the multicast transmission is conducted.
Group Address Displays the Multicast Group ID supporting the statistics displayed. This
group ID is the multicast address hosts are listening to.
Port Members Displays the ports on which multicast clients have been discovered. For
example, ge1, radio1, etc. Ports can vary somewhat amongst supported
controller and service platform models.
Version Displays each listed group IGMP version compatibility as either version 1, 2
or 3.
VLAN Displays the group VLAN where the multicast transmission is conducted.
Learn Mode Displays the learning mode used by the router as either Static or PIM-
DVMRP.
Port Members Displays the physical ports on which multicast clients have been
discovered by the multicast router. For example, ge1, radio1, etc. Ports can
vary somewhat amongst supported controller and service platform
models.

Statistics
Wireless Controller and Service Platform System Reference Guide 15 - 154
15.3.30.6 MLD
Network
Multicast Listener Discovery (MLD) snooping enables a controller, service platform or Access Point to examine MLD
packets and make forwarding decisions based on content. MLD is used by IPv6 devices to discover devices
wanting to receive multicast packets destined for specific multicast addresses. MLD uses multicast listener queries
and multicast listener reports to identify which multicast addresses have listeners and join multicast groups.
MLD snooping caps the flooding of IPv6 multicast traffic on controller, service platform or Access Point VLANs.
When enabled, MLD messages are examined between hosts and multicast routers and to discern which hosts are
receiving multicast group traffic. The controller, service platform or Access Point then forwards multicast traffic
only to those interfaces connected to interested receivers instead of flooding traffic to all interfaces.
To view network MLD configuration options:
1 Select the Statistics menu from the Web UI.
2 Select a Wireless Controller node from the left navigation pane.
3Expand the Network menu from the left-hand side of the UI.
4Select
MLD.
MiNT IDs Lists MiNT IDs for each listed VLAN. MiNT provides the means to secure
Access Point profile communications at the transport layer. Using MiNT, an
Access Point can be configured to only communicate with other
authorized (MiNT enabled) Access Points of the same model.
Query Interval Lists the IGMP query interval implemented when the querier functionality
is enabled. The default value is 60 seconds.
Version Lists the multicast router IGMP version compatibility as either version 1, 2
or 3. The default setting is 3.
Refresh Select the Refresh button to update the screen’s statistics counters to their
latest values.
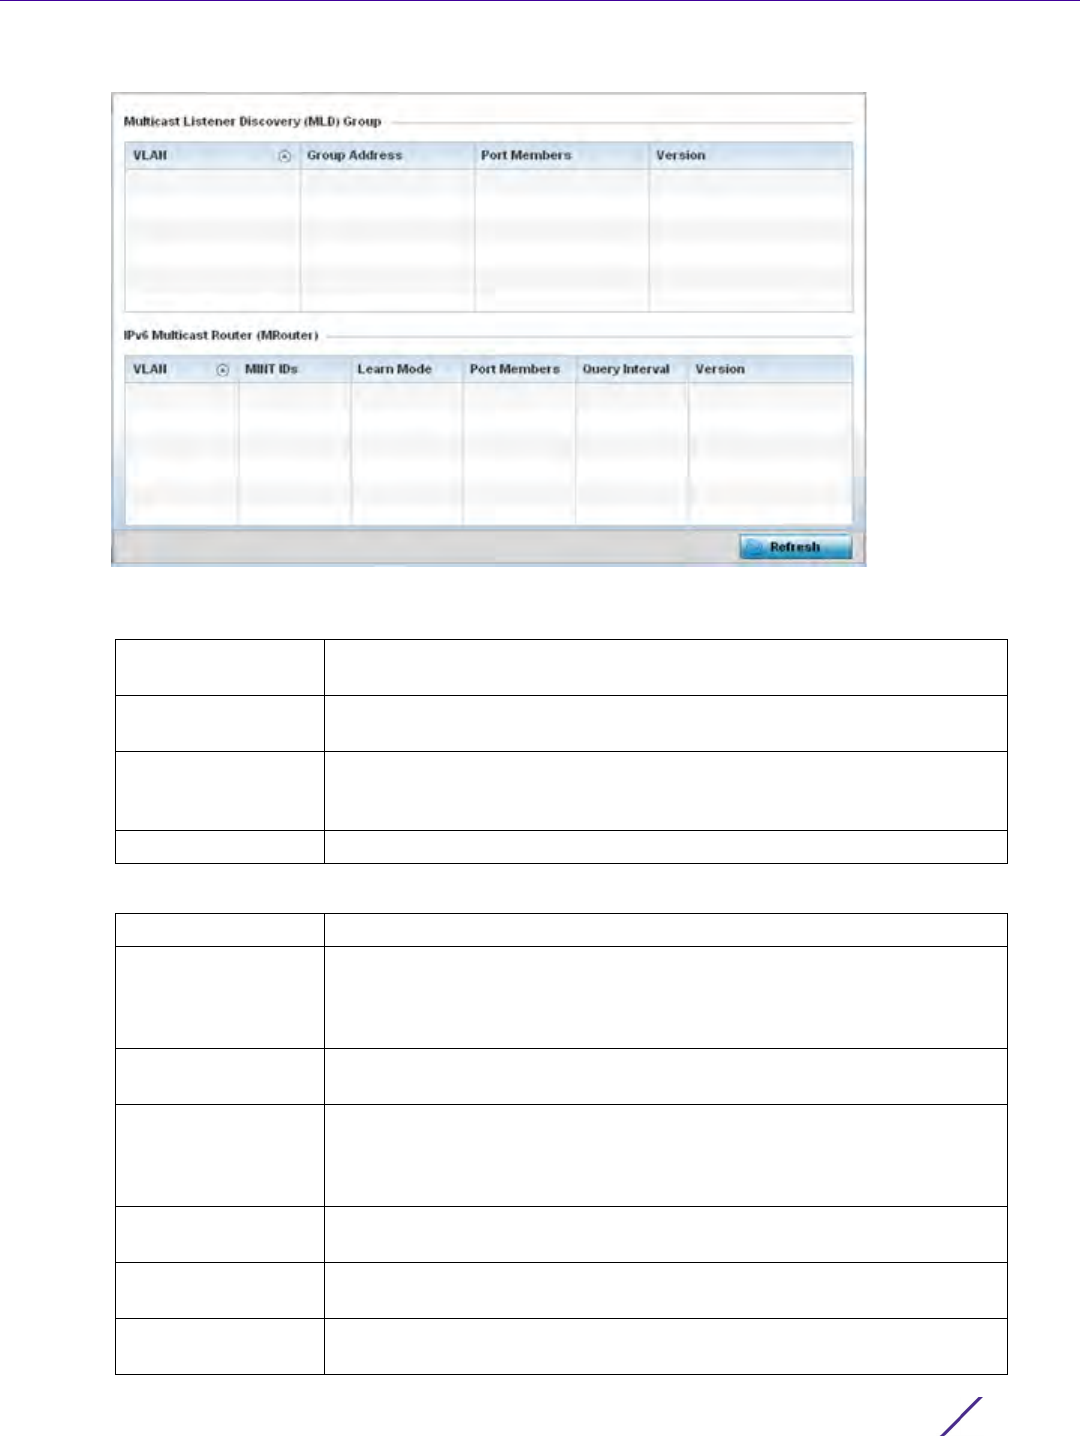
Statistics
Wireless Controller and Service Platform System Reference Guide 15 - 155
Figure 15-104 Wireless Controller - Network MLD screen
The Multicast Listener Discovery (MLD) Group field describes the following:
The IPv6 Multicast Router (MRouter) field describes the following:
VLAN Displays the group VLAN where the MLD groups multicast transmission is
conducted.
Group Address Displays the Multicast Group ID supporting the statistics displayed. This
group ID is the multicast address hosts are listening to.
Port Members Displays the ports on which MLD multicast clients have been discovered.
For example, ge1, radio1, etc. Ports can vary somewhat amongst supported
controller and service platform models.
Version Displays each listed group’s version compatibility as either version 1, 2 or 3.
VLAN Displays the group VLAN where the multicast transmission is conducted.
MiNT IDs Lists MiNT IDs for each listed VLAN. MiNT provides the means to secure
communications at the transport layer. Using MiNT, a controller or service
platform can be configured to only communicate with other authorized
(MiNT enabled) devices.
Learn Mode Displays the learning mode used by the router as either Static or PIM-
DVMRP.
Port Members Displays the physical ports on which multicast clients have been
discovered by the multicast router. For example, ge1, radio1, etc. Ports can
vary somewhat amongst supported controller and service platform
models.
Query Interval Lists the query interval implemented when the querier functionality is
enabled. The default value is 60 seconds.
Version Lists the multicast router version compatibility as either version 1, 2 or 3.
The default setting is 3.
Refresh Select the Refresh button to update the screen’s statistics counters to their
latest values.
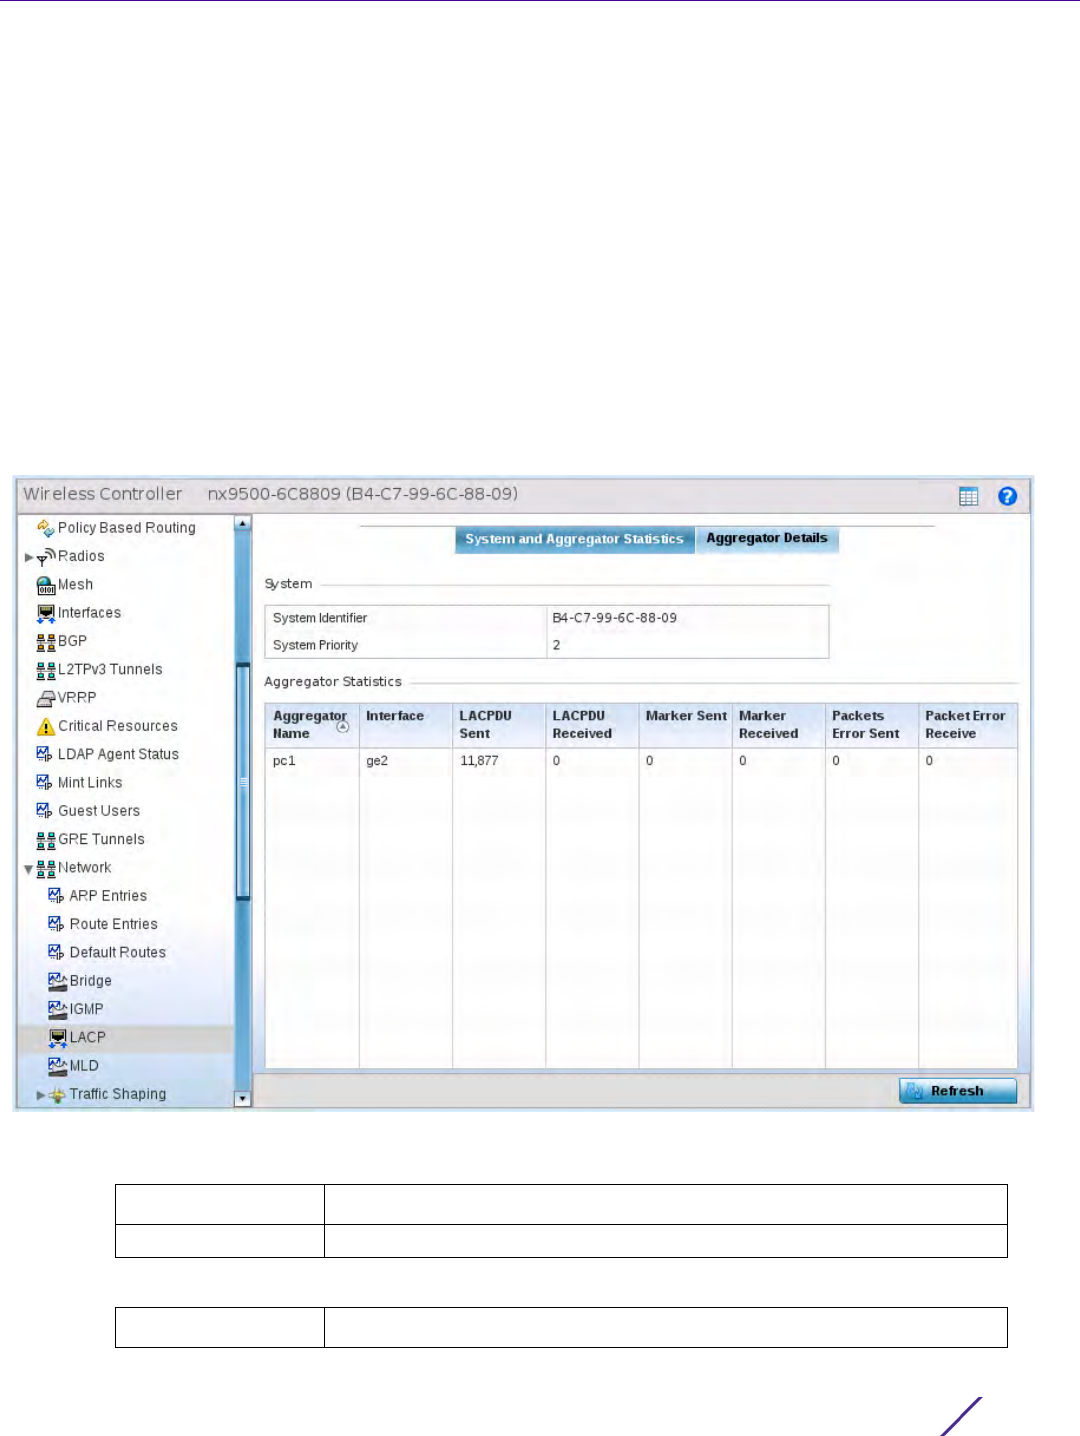
Statistics
Wireless Controller and Service Platform System Reference Guide 15 - 156
15.3.30.7 LACP
Network
Link Aggregation Control Protocol (LACP) is used to dynamically determine if link aggregation is possible and then to
automatically configure the aggregation. LACP is a part of the IEEE 802.1ad standard and allows the switch to
dynamically reconfigure the link aggregation groups (LAGs). A LAG is enabled only if the LACP determines that
the remote device is also using LACP and is able to join the LAG.
To view network LACP statistics:
1 Select the Statistics menu from the Web UI.
2 Select a Wireless Controller node from the left navigation pane.
3Expand the Network menu from the left-hand side of the UI.
4Select
LACP. The System and Aggregator Statistics tab displays by default.
Figure 15-105 Wireless Controller - Network LACP - System And Aggregator Statistics screen
The System field describes the following:
The Aggregator Statistics field describes the following:
System Identifier Displays the MAC address of the device.
System Priority Displays the system’s LACP priority value.
Aggregator Name Displays the name of the port channel configured on this device.
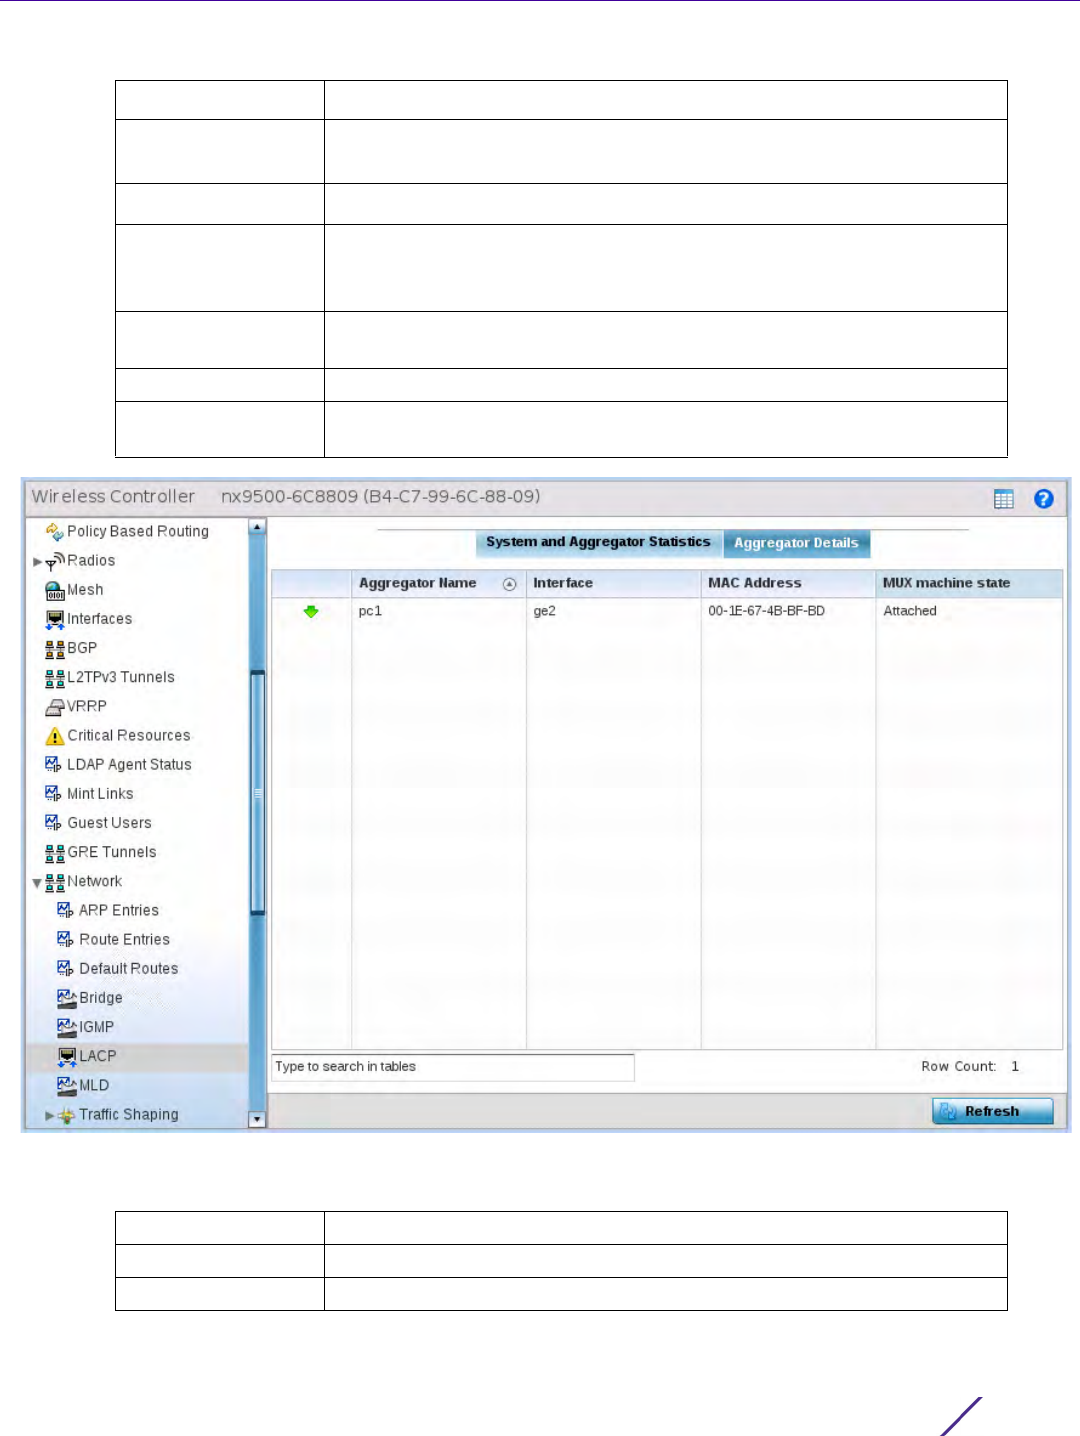
Statistics
Wireless Controller and Service Platform System Reference Guide 15 - 157
Figure 15-106 Wireless Controller - Network LACP screen - Aggregator Details tab
5 Select the Aggregator Details tab. This field describes the following:
Interface Displays the name of the interface for which these statistics are being displayed.
LACPDU Sent Displays the number of Link Aggregation Control Protocol Data Units
(LACPDUs) sent from this device.
LACPDU Received Displays the number of LACPDUs received by this device.
Marker Sent Displays the number of marker packets sent. Marker packets are sent to the
remote device to ensure that all frames transmitted through the link have been
received.
Marker Received Displays the number of marker packet responses received from the remote
device.
Packets Error Sent Displays the total number packets transmitted with error
Packets Error
Received
Displays the total number packets received with error
Aggregator Name Displays the name of the link aggregator (LAG).
Interface Displays the name of the interface that is a member of the LAG.
MAC Address Displays the MAC address of the physical interface.

Statistics
Wireless Controller and Service Platform System Reference Guide 15 - 158
15.3.30.8 Traffic Shaping
Network
Traffic shaping regulates network data transfers to ensure a specific performance level. Traffic shaping delays the
flow of packets defined as less important than prioritized traffic streams. Traffic shaping enables traffic control out
an interface to match its flow to the speed of a remote target’s interface and ensure traffic conforms applied
policies. Traffic can be shaped to meet downstream requirements and eliminate network congestion when data
rates are in conflict.
Apply traffic shaping to specific applications to apply application categories. When application and ACL rules are
conflicting, an application takes precedence over an application category, then ACLs.
To view network the controller or service platform’s traffic shaping configuration:
1 Select the Statistics menu from the Web UI.
2 Select a Wireless Controller node from the left navigation pane.
3Expand the Network menu from the left-hand side of the UI.
4Select
Traffic Shaping. The Status screen displays by default, and lists the controller or service platform’s traffic
shaping status.
MUX machine state Displays the state of the multiplexer state machine for the aggregation
port. The values are:
• attached – Displays the state as attached, when the multiplexer state
machine is initiating the process of attaching the port to the selected
aggregator.
• detached – Displays the state as detached, when the multiplexer state
machine is initiating the process of detaching the port from the
aggregator.
• collecting/distributing – Displays the state as collecting/distributing.
Collecting and distributing states are merged together to form a combined
state (coupled control). Because independent control is not possible, the
coupled control state machine does not wait for the partner to signal that
collection has started before enabling both collection and distribution.
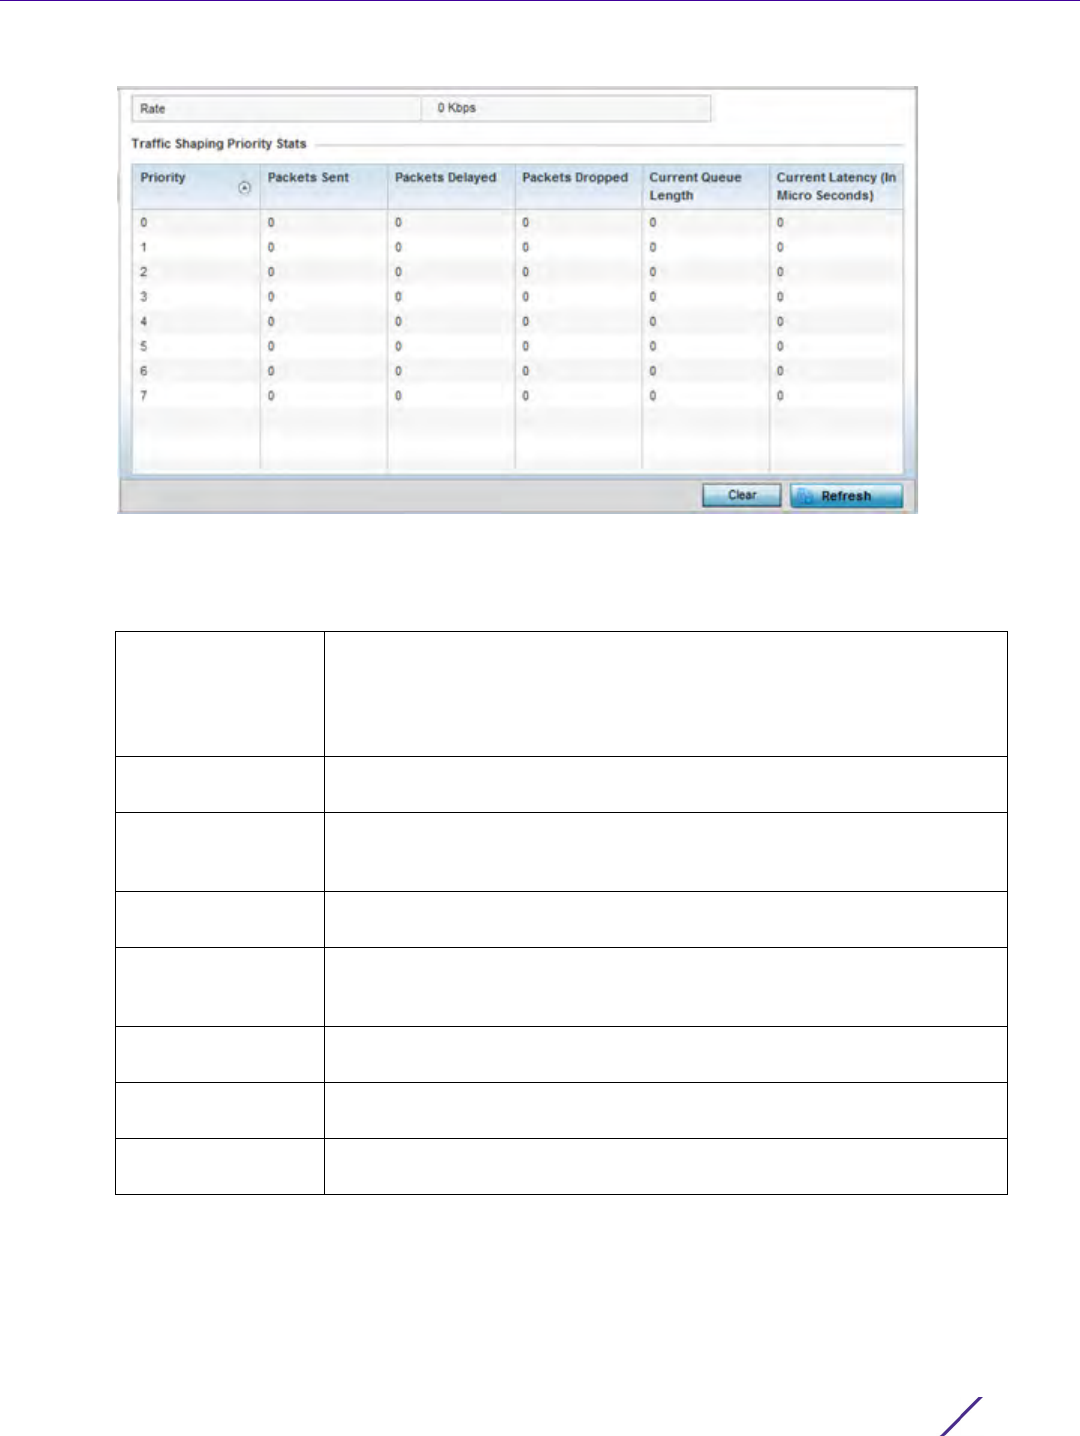
Statistics
Wireless Controller and Service Platform System Reference Guide 15 - 159
Figure 15-107 Wireless Controller - Network Traffic Shaping screen
5Select Statistics.
6 Refer to the following Traffic Shaping statistics:
15.3.30.9 DHCP Options
Network
Controllers and service platforms contain an internal Dynamic Host Configuration Protocol (DHCP) server. The
DHCP server can provide the dynamic assignment of IP addresses automatically from existing address pools. This
Rate The rate configuration controls the maximum traffic rate sent or received
on an interface. Consider this form of rate limiting on interfaces at the
edge of a network to limit traffic into or out of the network. Traffic within
the set limit is sent and traffic exceeding the set limit is dropped or sent
with a different priority.
Priority Lists the traffic shaper queue priority. There are 8 queues (0 - 7), and
traffic is queued in each based on incoming packets 802.1p markings.
Packets Sent Provides a baseline of the total number of packets sent to assess packet
delays and drops as a result of the filter rules applied in the traffic shaping
configuration.
Packets Delayed Lists the packets defined as less important than prioritized traffic streams
and delayed as a result of traffic shaping filter rules applied.
Packets Dropped Lists the packets defined as less important than prioritized traffic streams,
delayed and eventually dropped as a result of traffic shaping filter rules
applied.
Current Length Lists the packet length of the data traffic shaped to meet downstream
requirements.
Current Latency Traffic shaping latency is the time limit after which packets start dropping
as a result of the traffic prioritization filter rules applied.
Refresh Select the Refresh button to update the screen’s statistics counters to their
latest values.
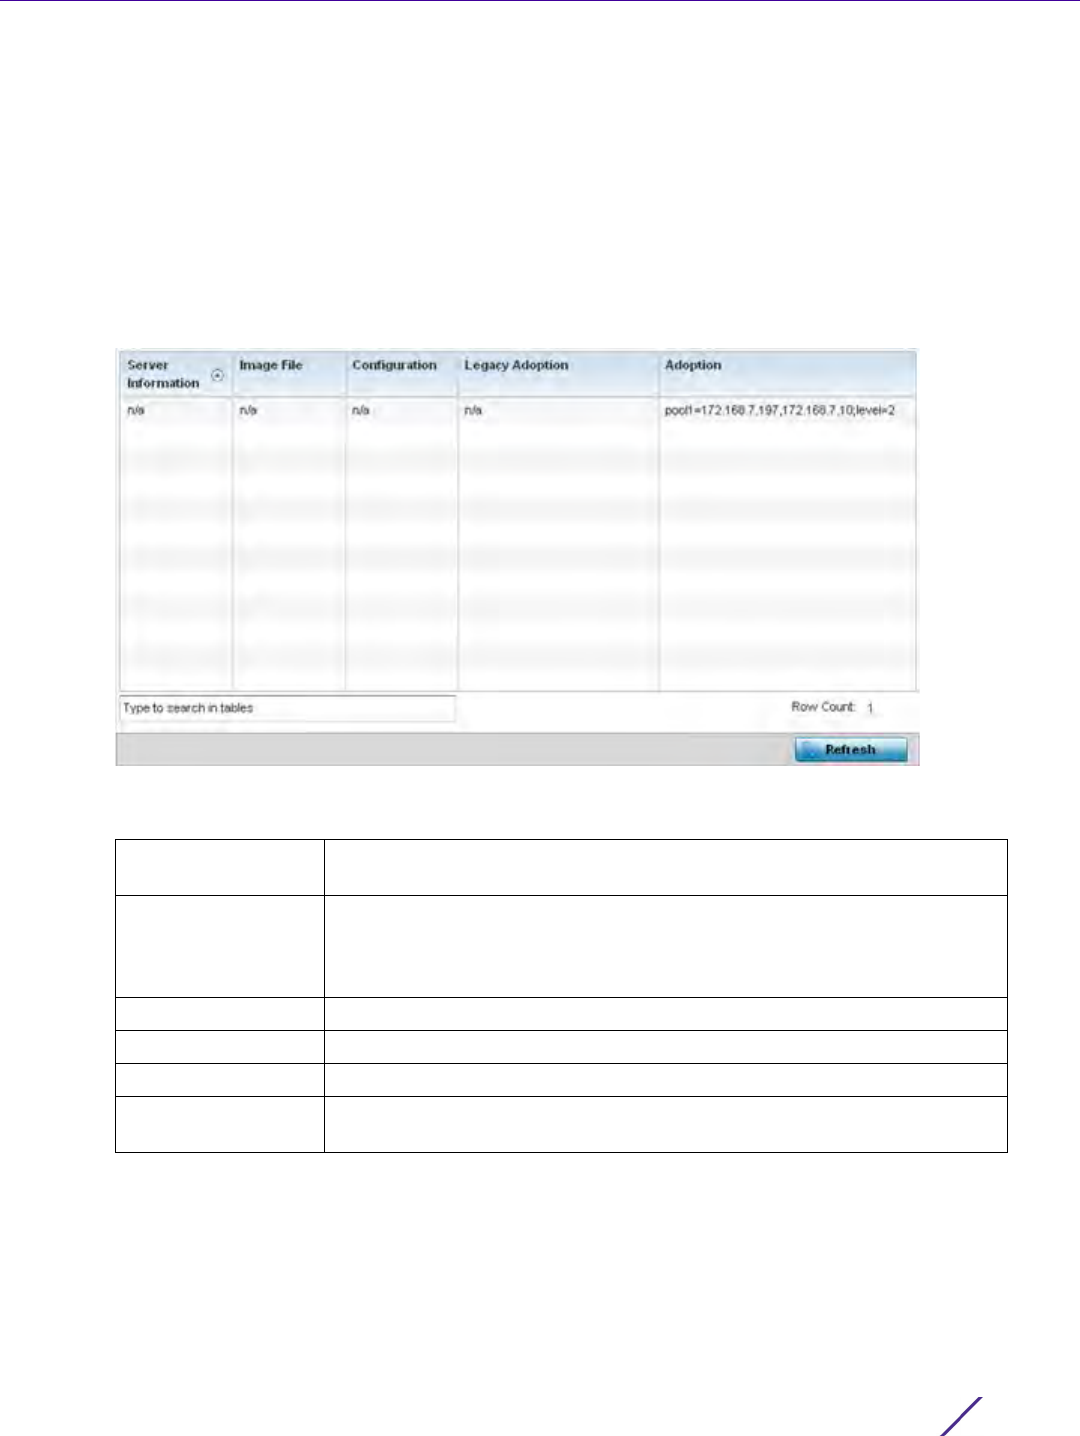
Statistics
Wireless Controller and Service Platform System Reference Guide 15 - 160
is a protocol that includes IP address allocation and delivery of host-specific configuration parameters from a
DHCP server to a host. Some of these parameters include IP address, gateway and network mask.
To view network DHCP options:
1 Select the Statistics menu from the Web UI.
2 Select a Wireless Controller node from the left navigation pane.
3Expand the Network menu from the left-hand side of the UI.
4Select
DHCP Options.
Figure 15-108 Wireless Controller - Network DHCP Options screen
The DHCP Options screen describes the following:
15.3.30.10 Cisco Discovery Protocol
Network
The Cisco Discovery Protocol (CDP) is a proprietary Data Link Layer network protocol implemented in Cisco
networking equipment and used to share information about network devices.
To view a controller or service platform’s CDP Statistics:
Server Information Lists server information specific to each DHCP server resource available to
requesting clients for the dynamic assignment of IP addresses.
Image File Displays the image file name. BOOTP or the bootstrap protocol can be
used to boot diskless clients. An image file is sent from the boot server.
The file contains the operating system image. DHCP servers can be
configured to support BOOTP.
Configuration Displays the name of the configuration file on the DHCP server.
Legacy Adoption Displays legacy (historical) device adoption information.
Adoption Displays pending (current) adoption information.
Refresh Select the Refresh button to update the screen’s statistics counters to their
latest values.
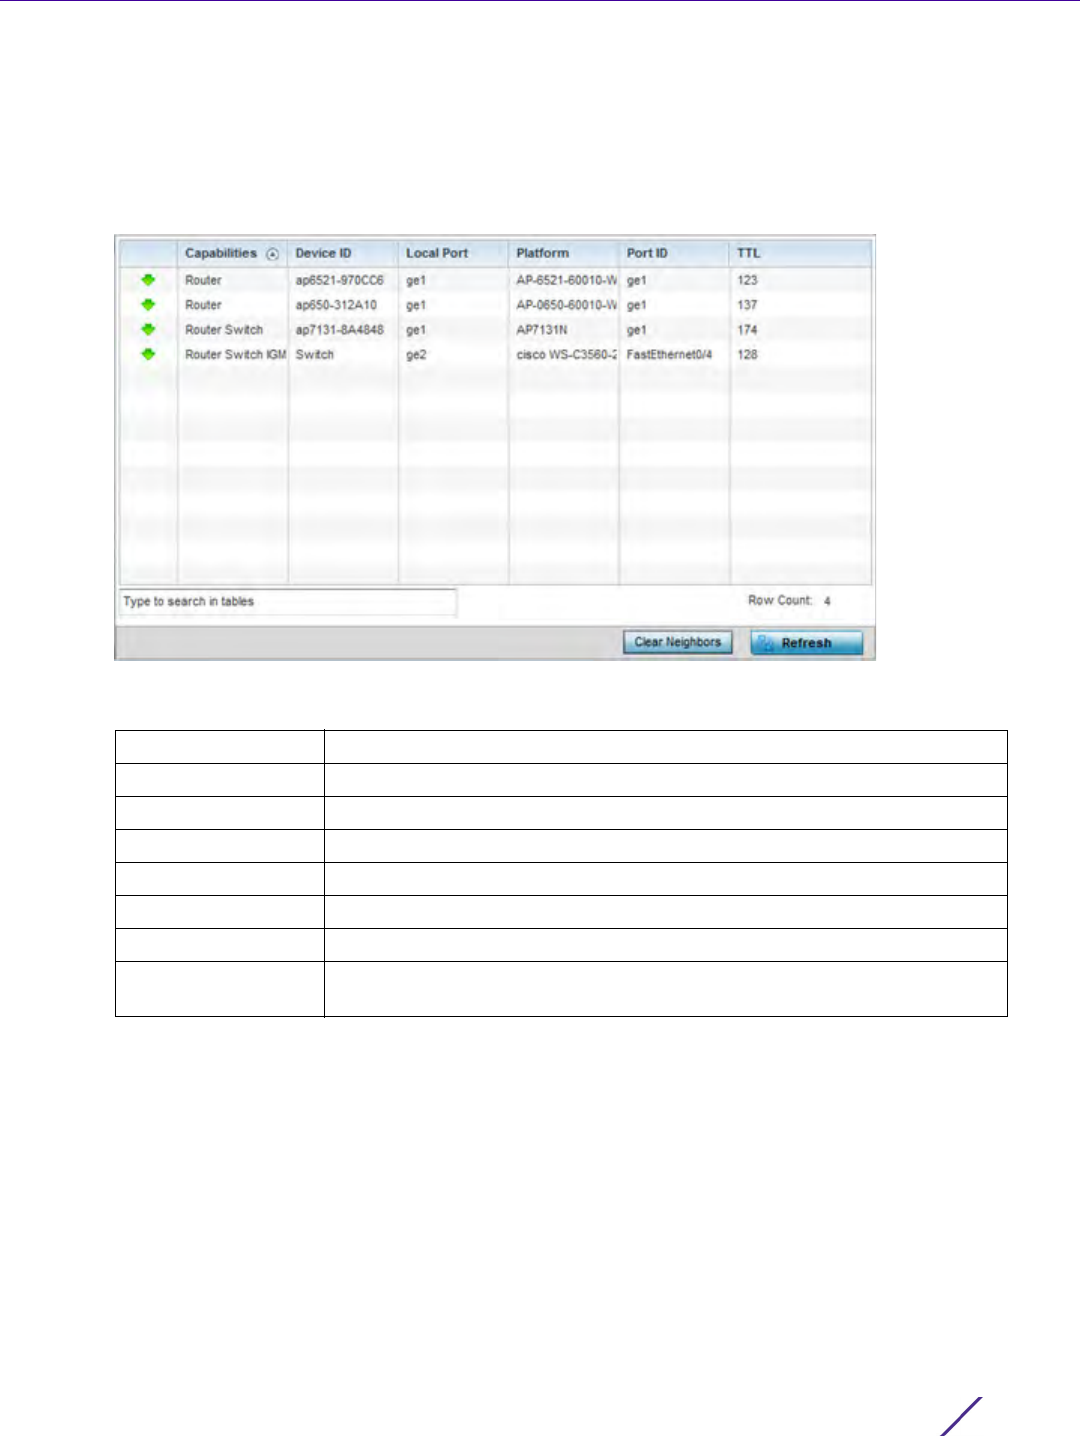
Statistics
Wireless Controller and Service Platform System Reference Guide 15 - 161
1 Select the Statistics menu from the Web UI.
2 Select a Wireless Controller node from the left navigation pane.
3Expand the Network menu from the left-hand side of the UI.
4Select
Cisco Discovery Protocol.
Figure 15-109 Wireless Controller - Network CDP screen
The Cisco Discovery Protocol screen displays the following:
15.3.30.11 Link Layer Discovery Protocol
Network
The Link Layer Discovery Protocol (LLDP) or IEEE 802.1AB is a vendor-neutral data link layer protocol used by
network devices for advertising of (announcing) their identity, capabilities, and interconnections on a IEEE 802
LAN network. The protocol is formally referred to by the IEEE as Station and Media Access Control Connectivity
Discovery.
To view a controller or service platform’s Link Layer Discovery Protocol statistics:
1 Select the Statistics menu from the Web UI.
2 Select a Wireless Controller node from the left navigation pane.
Capabilities Displays the capabilities code for Cisco neighbors.
Device ID Displays the configured device ID or name for each device in the table.
Local Port Displays the local port name for each CDP capable device.
Platform Displays the model number of the CDP capable device.
Port ID Displays the identifier for the local port.
TTL Displays the time to live (TTL) for each CDP connection.
Clear Neighbors Click Clear Neighbors to remove all known CDP neighbors from the table.
Refresh Select the Refresh button to update the screen’s statistics counters to their
latest values.
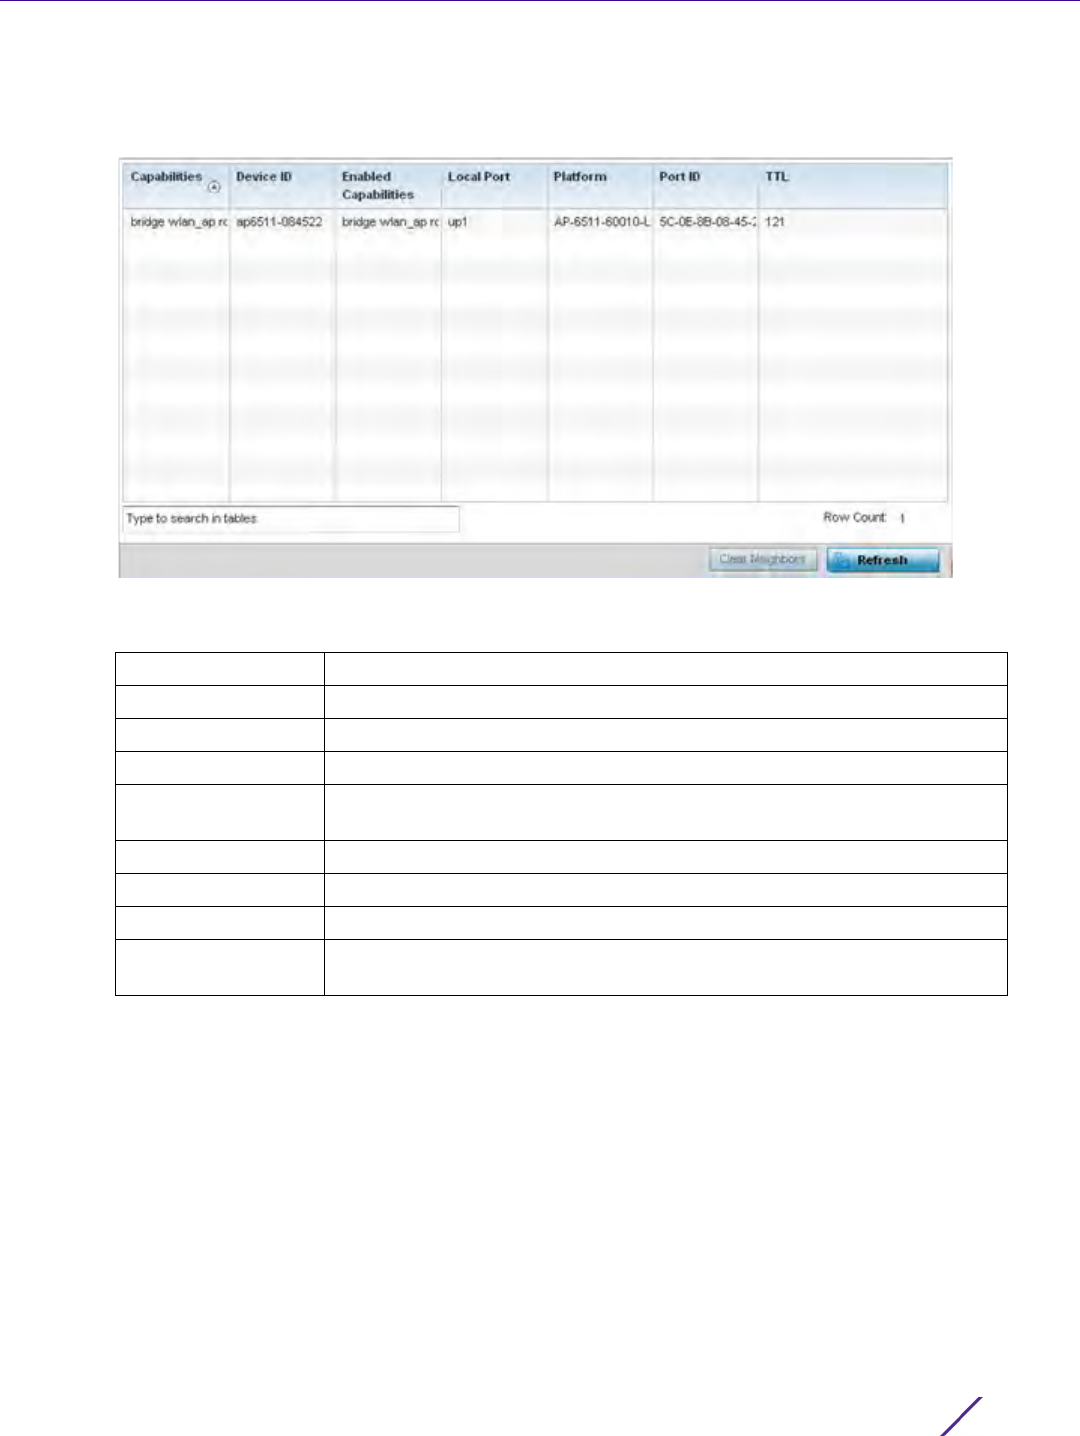
Statistics
Wireless Controller and Service Platform System Reference Guide 15 - 162
3Expand the Network menu from the left-hand side of the UI.
4Select
Link Layer Discovery Protocol.
Figure 15-110 Wireless Controller - Network LLDP screen
The Link Layer Discovery Protocol screen displays the following:
15.3.30.12 IPv6 Neighbor Discovery
Network
IPv6 neighbor discovery uses ICMP messages and solicited multicast addresses to find the link layer address of a
neighbor on the same local network, verify the neighbor’s reachability and track neighboring devices.
Upon receiving a neighbor solicitation message, the destination replies with neighbor advertisement (NA). The
source address in the advertisement is the IPv6 address of the device sending the message. The destination
address in the advertisement message is the IPv6 address of the device sending the neighbor solicitation. The data
portion of the NA includes the link layer address of the node sending the neighbor advertisement.
Neighbor solicitation messages also verify the availability of a neighbor once its the link layer address is identified.
When a node wants to verify the reachability of a neighbor, the destination address in a neighbor solicitation
message is the unicast address of the neighbor.
Capabilities Displays the Access Point capabilities code.
Device ID Displays the configured device ID or name for each device in the table.
Enabled Capabilities Displays which LLDP capabilities are currently utilized by the listed device.
Local Port Displays the physical local port name for each LLDP capable device.
Platform Displays the model number of the LLDP capable device and its firmware
load.
Port ID Displays the identifier for the local port.
TTL Displays the time to live (TTL) for each LLDP connection.
Clear Neighbors Click Clear Neighbors to remove all known LLDP neighbors from the table.
Refresh Select the Refresh button to update the screen’s statistics counters to their
latest values.
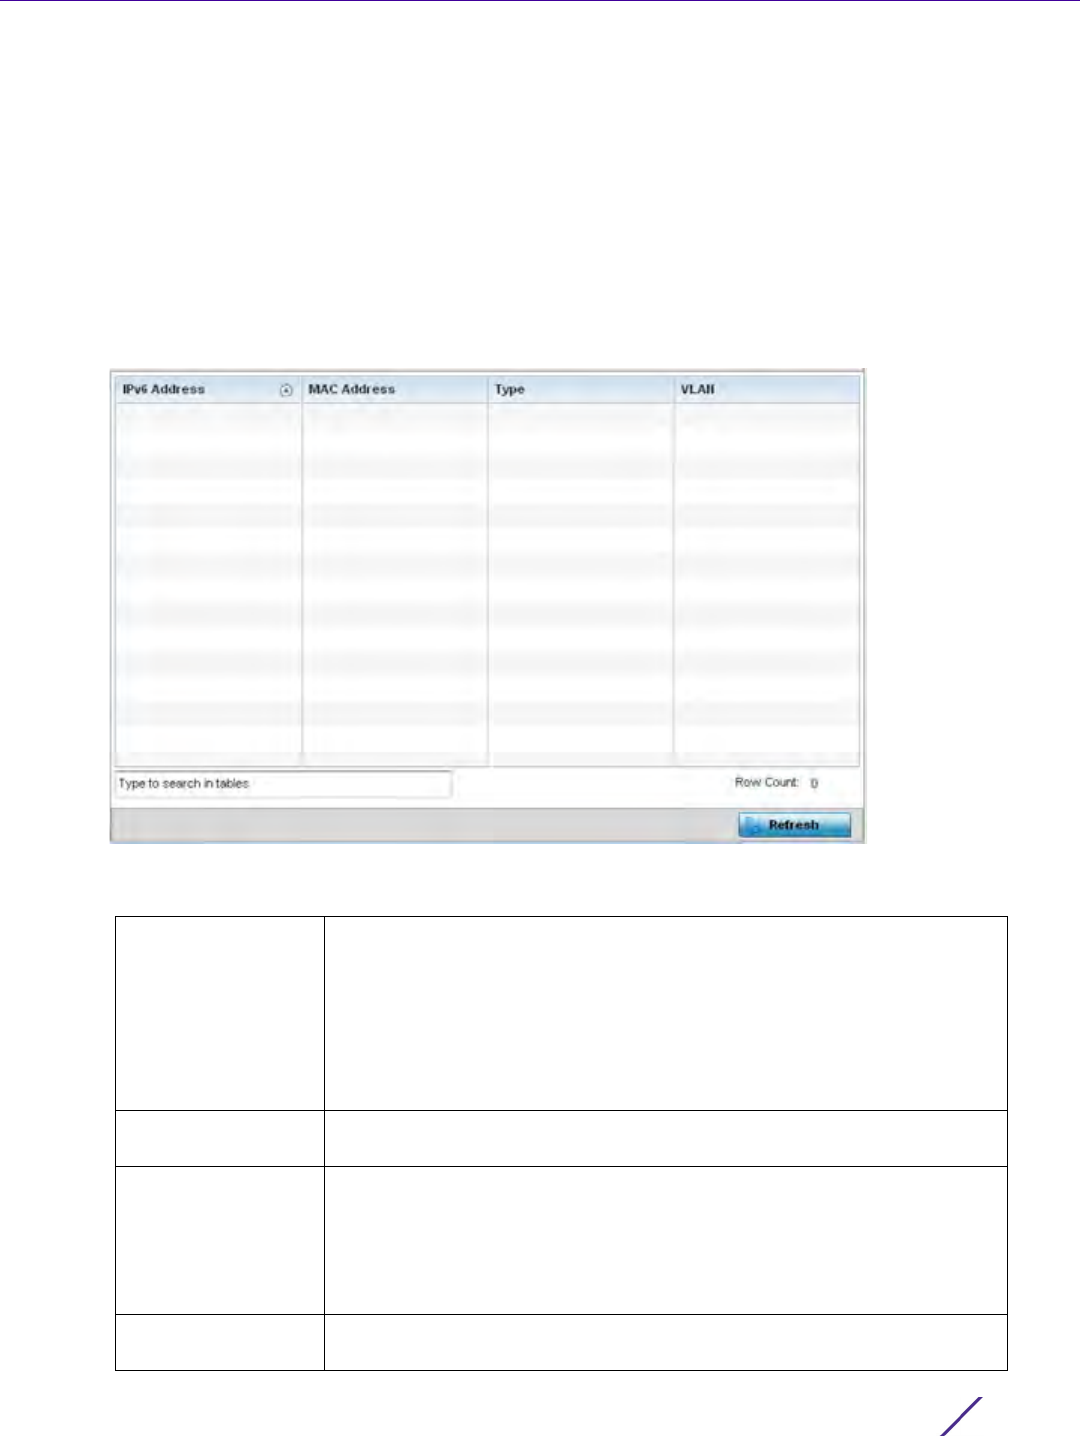
Statistics
Wireless Controller and Service Platform System Reference Guide 15 - 163
A neighbor is interpreted as reachable when an acknowledgment is returned indicating packets have been
received and processed. If packets are reaching the device, they’re also reaching the next hop neighbor, providing
a confirmation the next hop is reachable.
To view a controller or service platform’s IPv6 neighbor statistics:
1 Select the Statistics menu from the Web UI.
2 Select a Wireless Controller node from the left navigation pane.
3Expand the Network menu from the left-hand side of the UI.
4Select
IPv6 Neighbor Discovery.
Figure 15-111 Wireless Controller - Network IPv6 Neighbor screen
The IPv6 Neighbor screen displays the following:
IPv6 Address Lists an IPv6 IP address for neighbor discovery. IPv6 hosts can configure
themselves automatically when connected to an IPv6 network using the
neighbor discovery protocol via CMPv6 router discovery messages. When
first connected to a network, a host sends a link-local router solicitation
multicast request for its configuration parameters; routers respond to such
a request with a router advertisement packet that contains Internet Layer
configuration parameters. IPv6 addresses are composed of eight groups of
four hexadecimal digits separated by colons.
MAC Address Lists the factory encoded hardware MAC address of the neighbor device
using an IPv6 formatted IP address as its network identifier.
Type Displays the device type for the neighbor solicitation. Neighbor
solicitations request the link layer address of a target node while providing
the sender’s own link layer address to the target. Neighbor solicitations are
multicast when the node needs to resolve an address and unicast when
the node seeks to verify the reachability of a neighbor. Options include
Host, Router and DHCP Server.
VLAN Lists the virtual interface (from 1 - 4094) used for the required neighbor
advertisements and solicitation messages used for neighbor discovery.

Statistics
Wireless Controller and Service Platform System Reference Guide 15 - 164
15.3.30.13 MSTP
Network
The Multiple Spanning Tree Protocol (MSTP) provides an extension to RSTP to optimize the usefulness of VLANs.
MSTP allows for a separate spanning tree for each VLAN group, and blocks all but one of the possible alternate
paths within each spanning tree topology.
If there’s just one VLAN in the Access Point managed network, a single spanning tree works fine. However, if the
network contains more than one VLAN, the network topology defined by single STP would work, but it’s possible
to make better use of the alternate paths available by using an alternate spanning tree for different VLANs or
groups of VLANs.
MSTP includes all of its spanning tree information in a single Bridge Protocol Data Unit (BPDU) format. BPDUs are
used to exchange information bridge IDs and root path costs. Not only does this reduce the number of BPDUs
required to communicate spanning tree information for each VLAN, but it also ensures backward compatibility
with RSTP. MSTP encodes additional region information after the standard RSTP BPDU as well as a number of
MSTI messages. Each MSTI messages conveys spanning tree information for each instance. Each instance can be
assigned a number of configured VLANs. The frames assigned to these VLANs operate in this spanning tree
instance whenever they are inside the MST region. To avoid conveying their entire VLAN to spanning tree mapping
in each BPDU, the Access Point encodes an MD5 digest of their VLAN to an instance table in the MSTP BPDU. This
digest is used by other MSTP supported devices to determine if the neighboring device is in the same MST region
as itself.
To view a controller or service platform’s MSTP statistics:
1 Select the Statistics menu from the Web UI.
2 Select a Wireless Controller node from the left navigation pane.
3Expand the Network menu from the left-hand side of the UI.
4Select
MSTP.
Refresh Select the Refresh button to update the screen’s statistics counters to their
latest values.
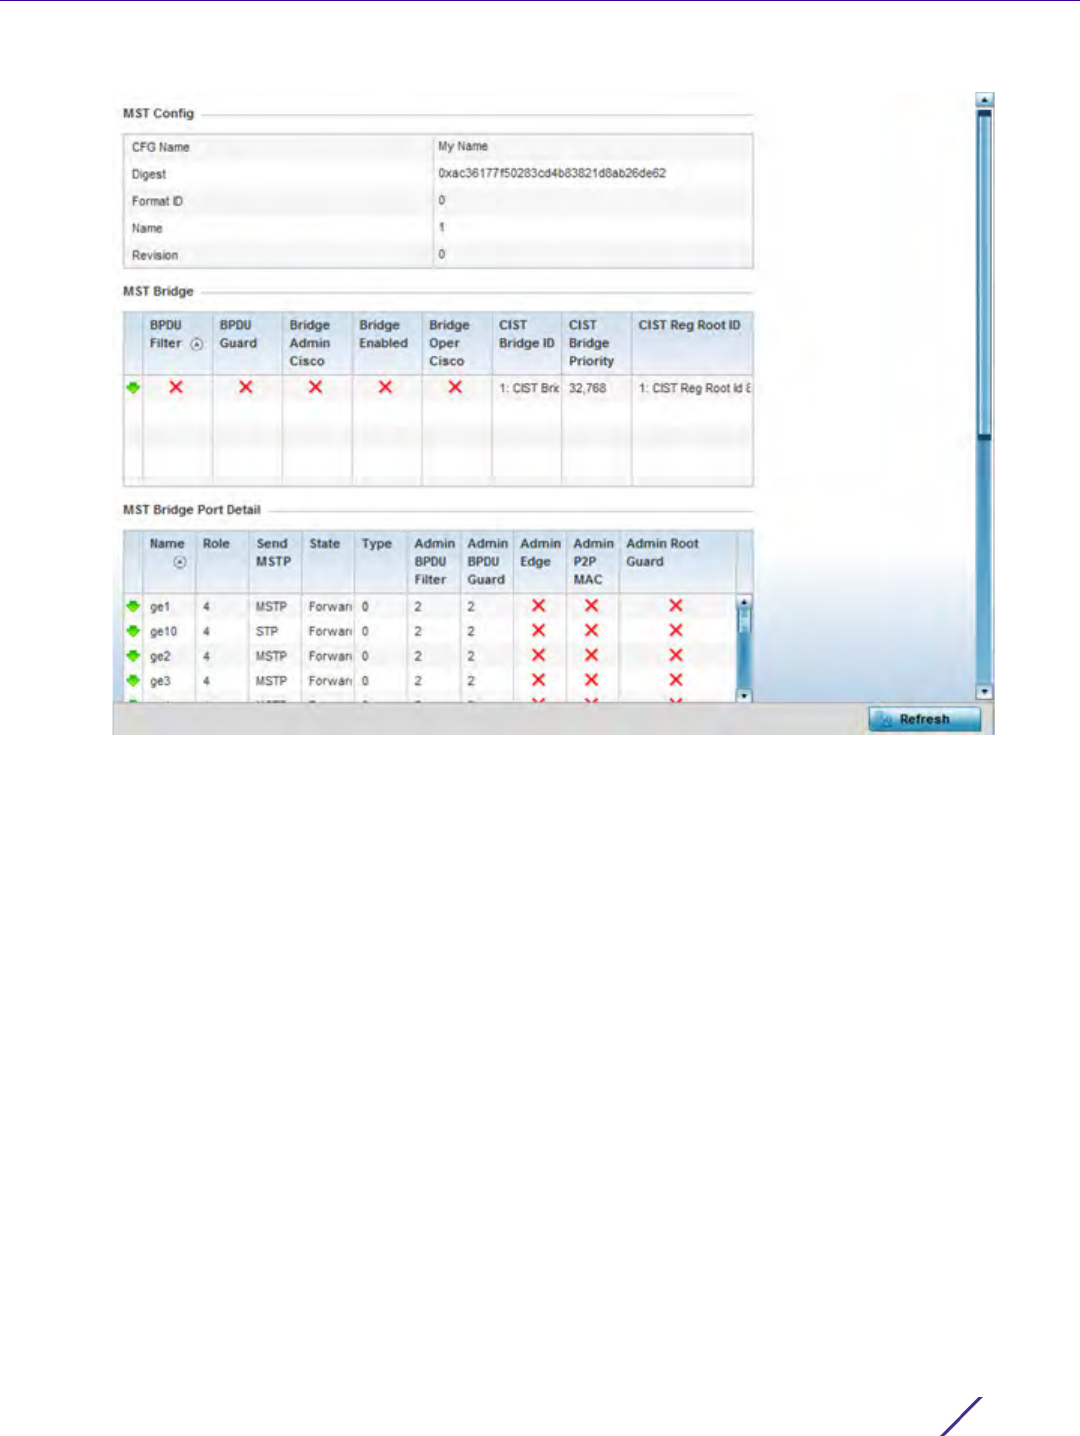
Statistics
Wireless Controller and Service Platform System Reference Guide 15 - 165
Figure 15-112 Wireless Controller - Network MSTP screen
The MST Config field displays the name assigned to the MSTP configuration, its digest, format ID, name and
revision.
The MST Bridge field lists the filters and guards that have been enabled and whether Cisco interoperability if
enabled.
The MST Bridge Port Detail field lists specific controller or service platform port status and their current state.
15.3.31 DHCPv6 Relay & Client
Controller Statistics
DHCPv6 is a networking protocol for configuring IPv6 hosts with IP addresses, IP prefixes or other configuration
attributes required on an IPv6 network. DHCPv6 relay agents receive messages from clients and forward them a
DHCPv6 server. The server sends responses back to the relay agent and the relay agent sends the responses to the
client on the local link.
To assess the DHCPv6 relay configuration:
1 Select the Statistics menu from the Web UI.
2 Select a Wireless Controller node from the left navigation pane.
3Select
DHCP Relay & Client from the left-hand side of the UI.
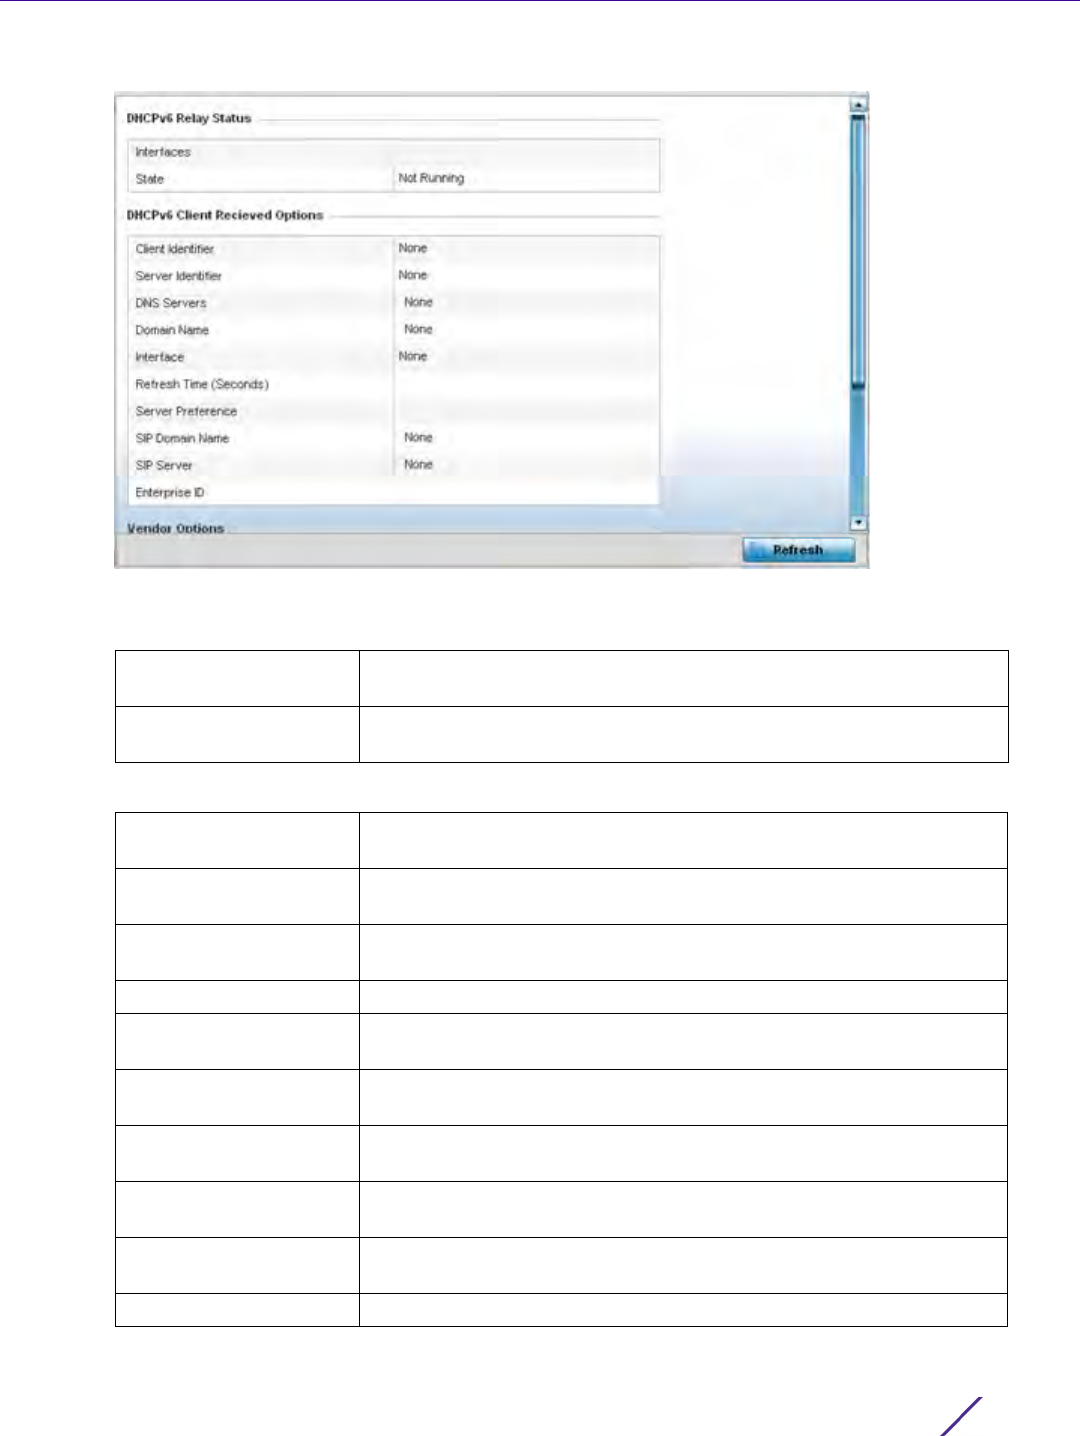
Statistics
Wireless Controller and Service Platform System Reference Guide 15 - 166
Figure 15-113 Wireless Controller - DHCPv6 Relay and Client screen
4The DHCPv6 Relay Status tables defines the following:
5The DHCPv6 Client Received Options tables defines the following:
Interfaces Displays the controller or service platform interface used for DHCPv6
relay.
State Displays the current operational state of the DHCPv6 server to assess
its availability as a viable IPv6 provisioning resource.
Client Identifier Lists whether the reporting client is using a hardware address or client
identifier as its identifier type within requests to the DHCPv6 server.
Server Identifier Displays the server identifier supporting client DHCPv6 relay message
reception.
DNS Servers Lists the DNS server resources supporting relay messages received
from clients.
Domain Name Lists the domain to which the remote server resource belongs.
Interface Displays the interfaces dedicated to client DHCPv6 relay message
reception.
Refresh Time (Seconds) Lists the time (in seconds) since the data populating the DHCPv6
client received options table has been refreshed.
Server Preference Lists the preferred DHCPv6 server resource supporting relay messages
received from clients.
SIP Domain Name Lists the SIP domain name supporting DHCPv6 client telephone
extensions or voice over IP systems.
SIP Server Displays the SIP server name supporting DHCPv6 telephone
extensions or voice over IP systems.
Enterprise ID Lists the enterprise ID associated with DHCPv6 received client options.
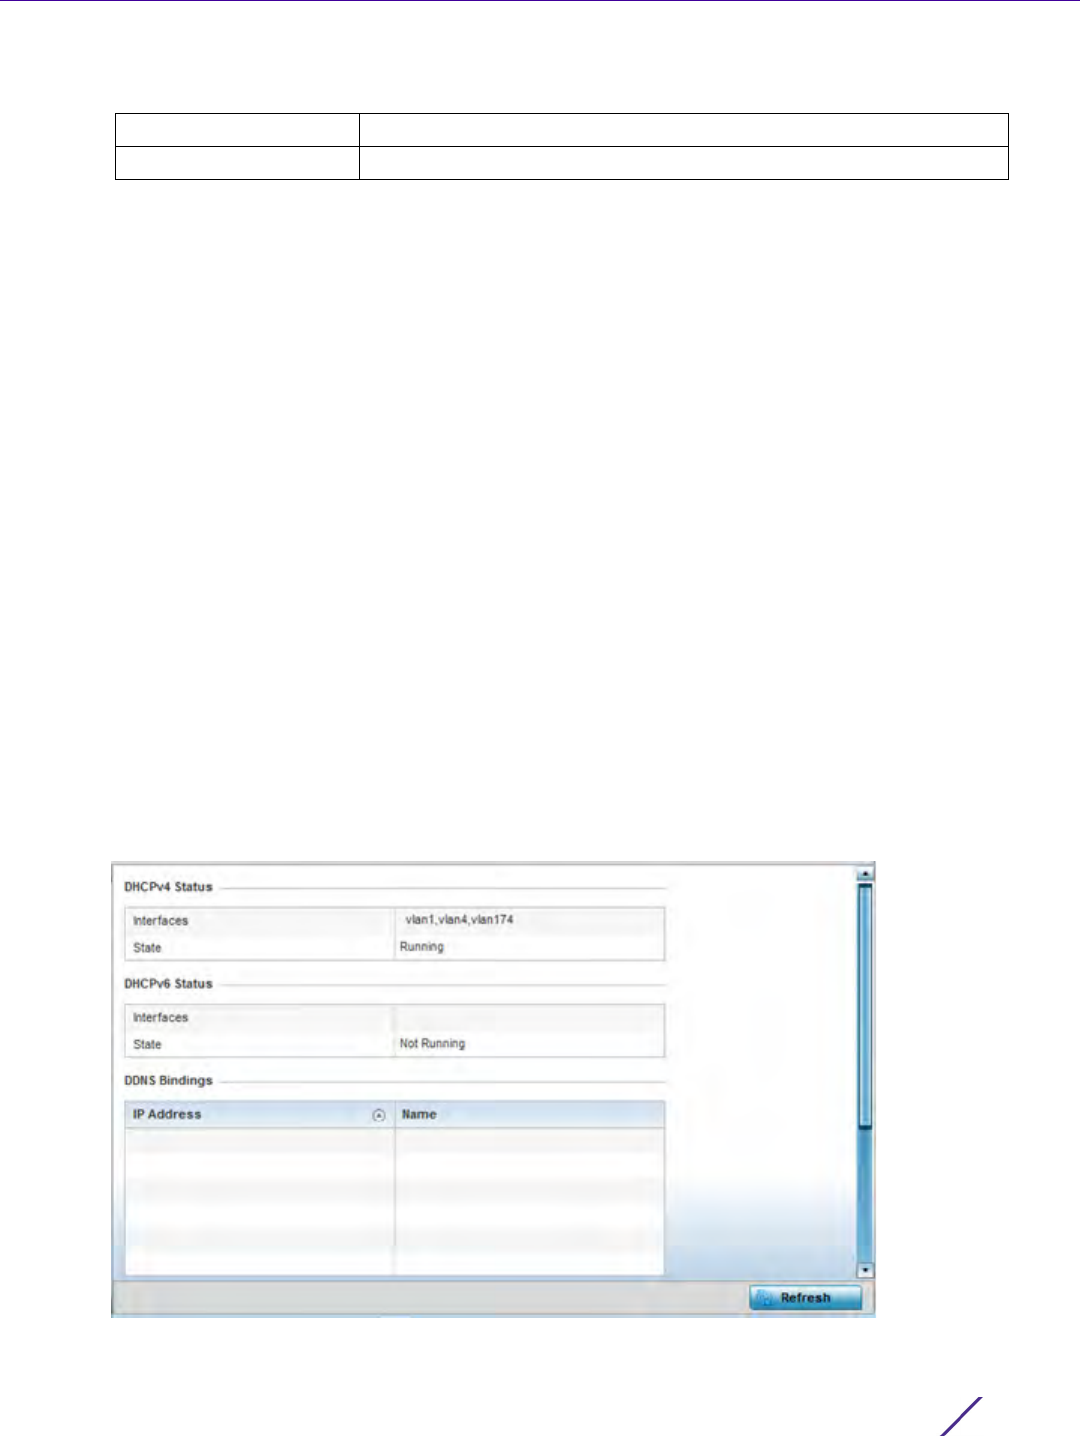
Statistics
Wireless Controller and Service Platform System Reference Guide 15 - 167
6 Refer to the Vendor Options table for the following:
7 Select the Refresh button to update the screen’s statistics counters to their latest values.
15.3.32 DHCP Server
Controller Statistics
Controllers and service platforms contain an internal Dynamic Host Configuration Protocol (DHCP) server. DHCP
can provide IP addresses automatically. DHCP is a protocol that includes mechanisms for IP address allocation and
delivery of host-specific configuration parameters (IP address, network mask gateway etc.) from a DHCP server to
a host.
To review DHCP server statistics, refer to the following:
•Viewing General DHCP Information
•Viewing DHCP Binding Information
•Viewing DHCP Server Networks Information
15.3.32.1 Viewing General DHCP Information
DHCP Server
To view General DHCP status and binding information for both DHCPv4 and DHCPv6:
1 Select the Statistics menu from the Web UI.
2 Select a Wireless Controller from the left navigation pane.
3Expand the DHCP Server menu from the left-hand side of the UI.
4Select
General.
Figure 15-114 Wireless Controller - DHCP Server General screen
Code Lists the relevant numeric DHCP vendor code.
Data Lists the supporting data relevant to the listed DHCP vendor code.

Statistics
Wireless Controller and Service Platform System Reference Guide 15 - 168
5The DHCPv4 Status and DHCPv6 Status tables defines the following:
6The
DDNS Bindings table displays the following:
7The
DHCP Manual Bindings table displays the following:
8 Select the Refresh button to update the screen’s statistics counters to their latest values.
15.3.32.2 Viewing DHCP Binding Information
DHCP Server
The DHCP Binding screen displays DHCP binding information such as expiry time, client IP addresses and their
MAC address.
Controllers and service platforms build and maintain a DHCP snooping table (DHCP binding database). A
controller or service platform uses the snooping table to identify and filter untrusted messages. The DHCP binding
database keeps track of DHCP addresses assigned to ports, as well as filtering DHCP messages from untrusted
ports. Incoming packets received on untrusted ports, are dropped if the source MAC address does not match the
MAC in the binding table.
To view the DHCP binding information:
1 Select the Statistics menu from the Web UI.
2 Select a Wireless Controller node from the left navigation pane.
3Expand the DHCP Server menu from the left-hand side of the UI.
4Select
Bindings.
Interfaces Displays the controller or service platform interface used with the
DHCPv4 or DHCPv6 resource for IP address provisioning.
State Displays the current operational state of the DHCPv4 or DHCPv6
server to assess its availability as a viable IP provisioning resource.
IP Address Displays the IP address assigned to the requesting client.
Name Displays the domain name mapping corresponding to the listed IP
address.
IP Address Displays the IP address for clients requesting DHCP provisioning
resources.
Client Id Displays the client’s ID used to differentiate requesting clients.
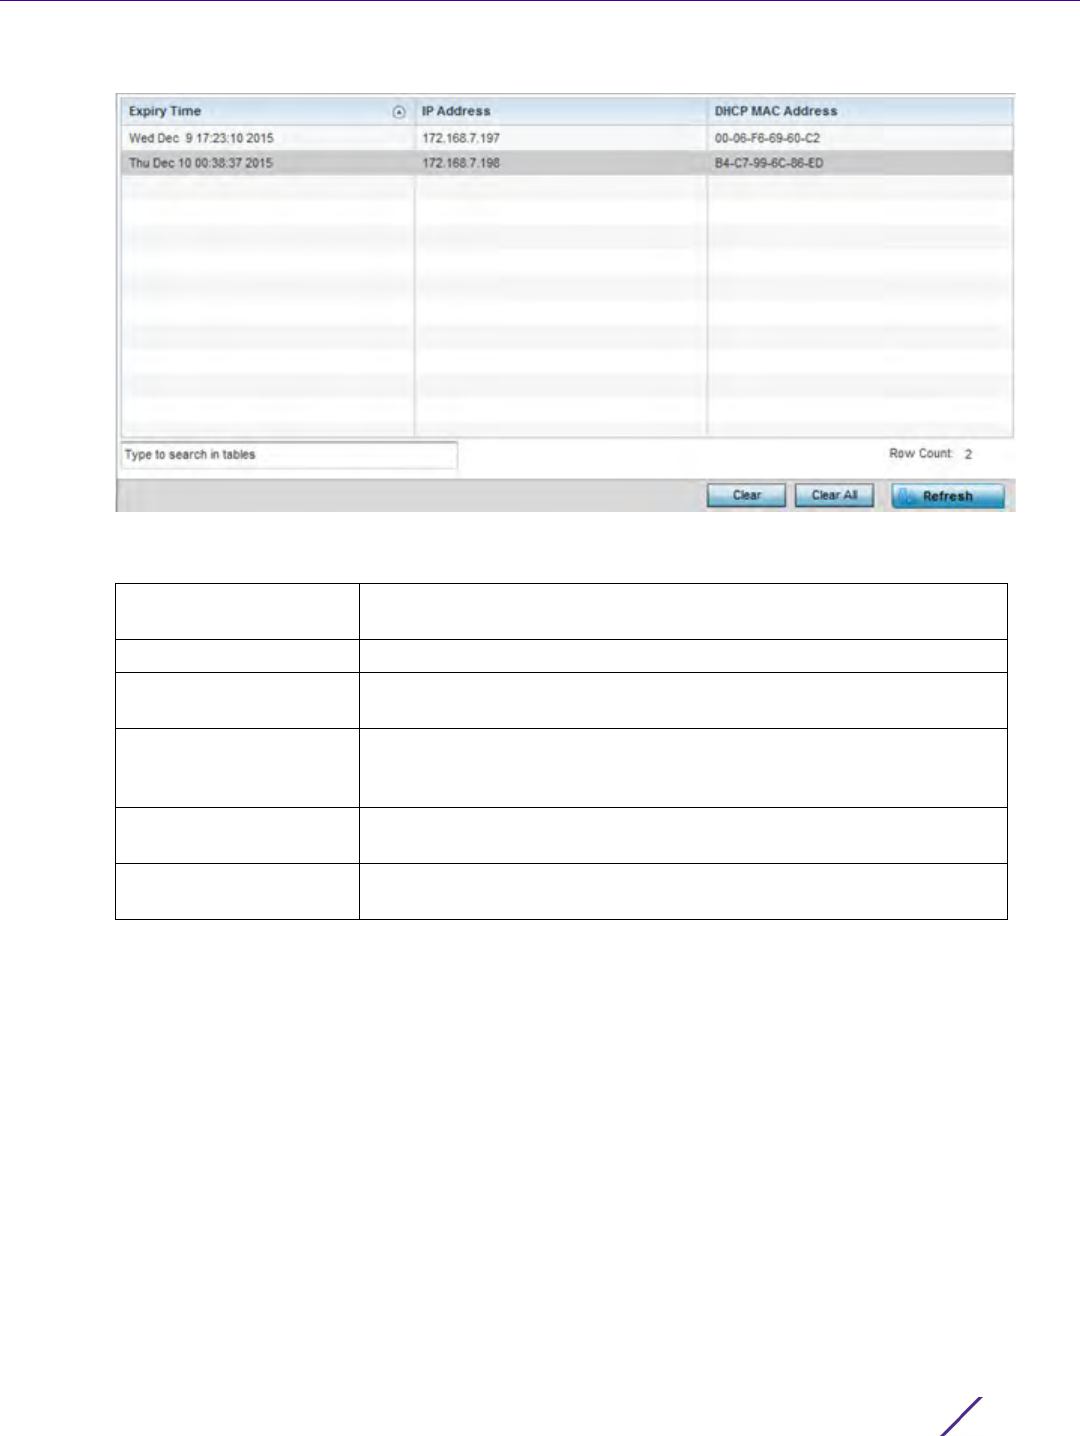
Statistics
Wireless Controller and Service Platform System Reference Guide 15 - 169
Figure 15-115 Wireless Controller - DHCP Server Bindings screen
The Bindings screen displays the following:
15.3.32.3 Viewing DHCP Server Networks Information
DHCP Server
The DHCP server maintains a pool of IP addresses and client configuration parameters (default gateway, domain
name, name servers etc). On receiving a valid client request, the server assigns the requestor an IP address, a lease
(the validity of time), and other IP configuration parameters.
The Networks screen provides network pool information such as the subnet for the addresses you want to use
from the pool, the pool name, the used addresses and the total number of addresses.
To view the DHCP Server Networks information:
1 Select the Statistics menu from the Web UI.
2 Select a Wireless Controller node from the left navigation pane.
3Expand the DHCP Server menu from the left-hand side of the UI.
4Select
Networks.
Expiry Time Displays the expiration of the lease used by the client for controller or
service platform DHCP resources.
IP Address Displays the IP address of each listed client requesting DHCP services.
DHCP MAC Address Displays the MAC address of each listed client requesting DHCP
services.
Clear Select a table entry and select Clear to remove the client from the list
of devices requesting DHCP services from the controller or service
platform.
Clear All Select Clear All to remove all listed clients from the list of requesting
clients.
Refresh Select the Refresh button to update the screen’s statistics counters to
their latest values.
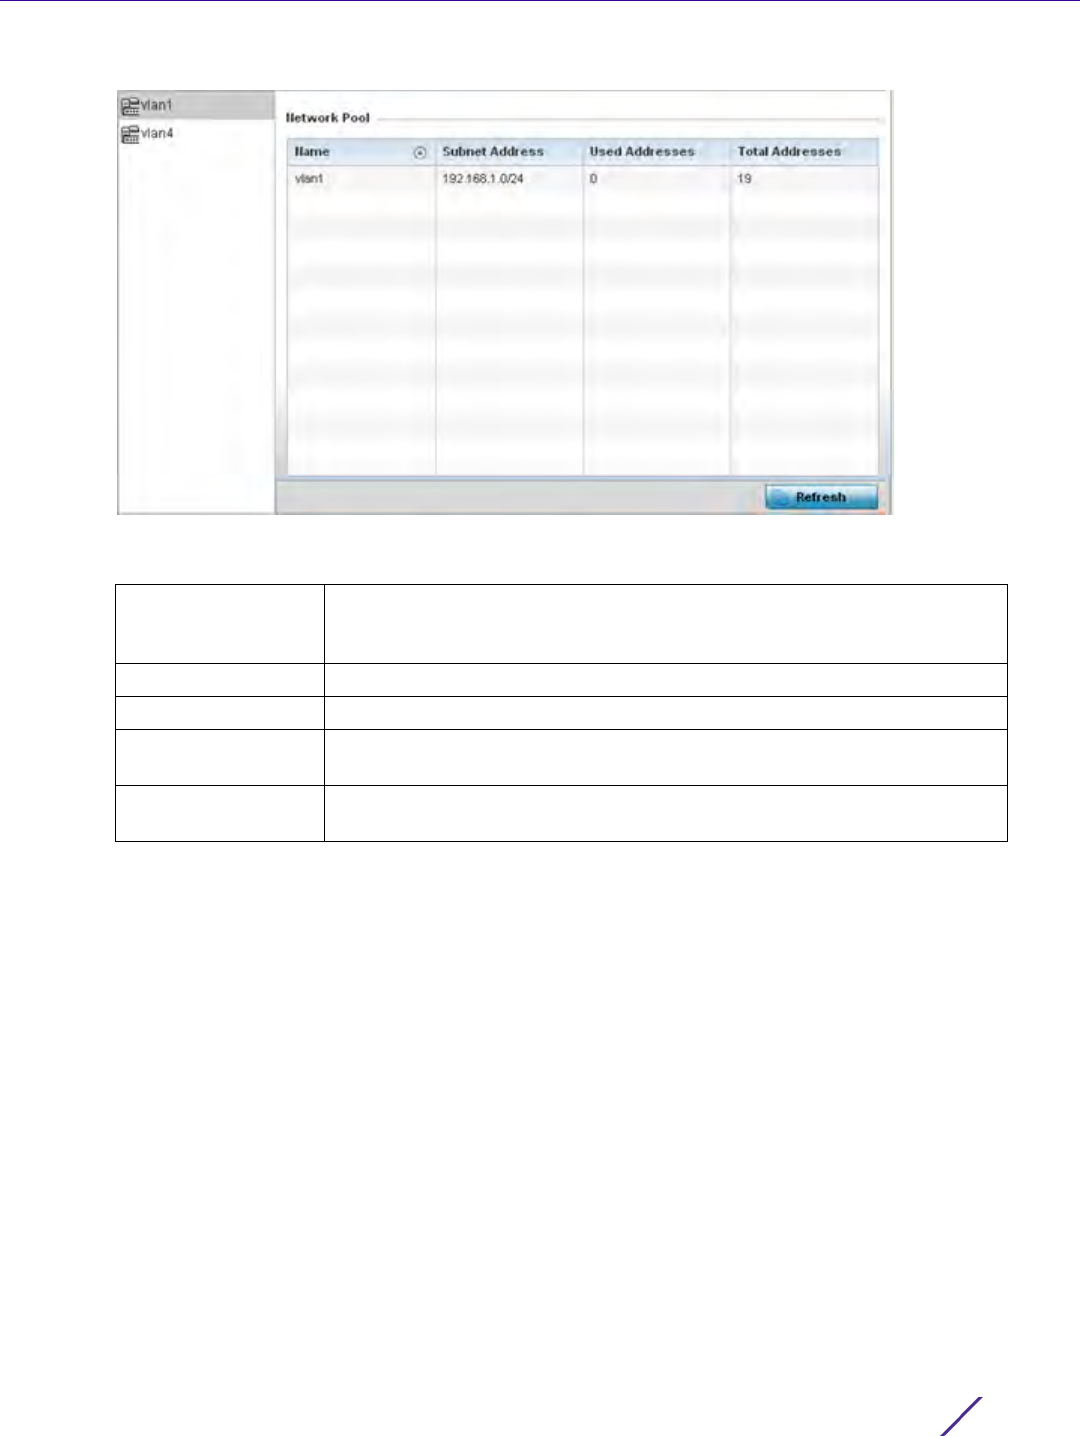
Statistics
Wireless Controller and Service Platform System Reference Guide 15 - 170
Figure 15-116 Wireless Controller - DHCP Server Networks screen
The Networks screen displays the following:
15.3.33 Firewall
Controller Statistics
A firewall is designed to block unauthorized access while permitting authorized communications. It’s a device or a
set of devices configured to permit or deny computer applications based on a set of rules. For more information,
refer to the following:
•Viewing Packet Flow Statistics
•Viewing Denial of Service Statistics
•IP Firewall Rules
•IPv6 Firewall Rules
•MAC Firewall Rules
•NAT Translations
•Viewing DHCP Snooping Statistics
•IPv6 Neighbor Snooping
Name Displays the name of the virtual network (VLAN) from which IP addresses
can be issued to DHCP client requests on the listed controller or service
platform interface.
Subnet Address Displays the subnet for the IP addresses used from the network pool.
Used Addresses Displays the number of host IP addresses allocated by the DHCP server.
Total Addresses Displays the total number of IP addresses available in the network pool for
requesting clients.
Refresh Select the Refresh button to update the screen’s statistics counters to their
latest values.
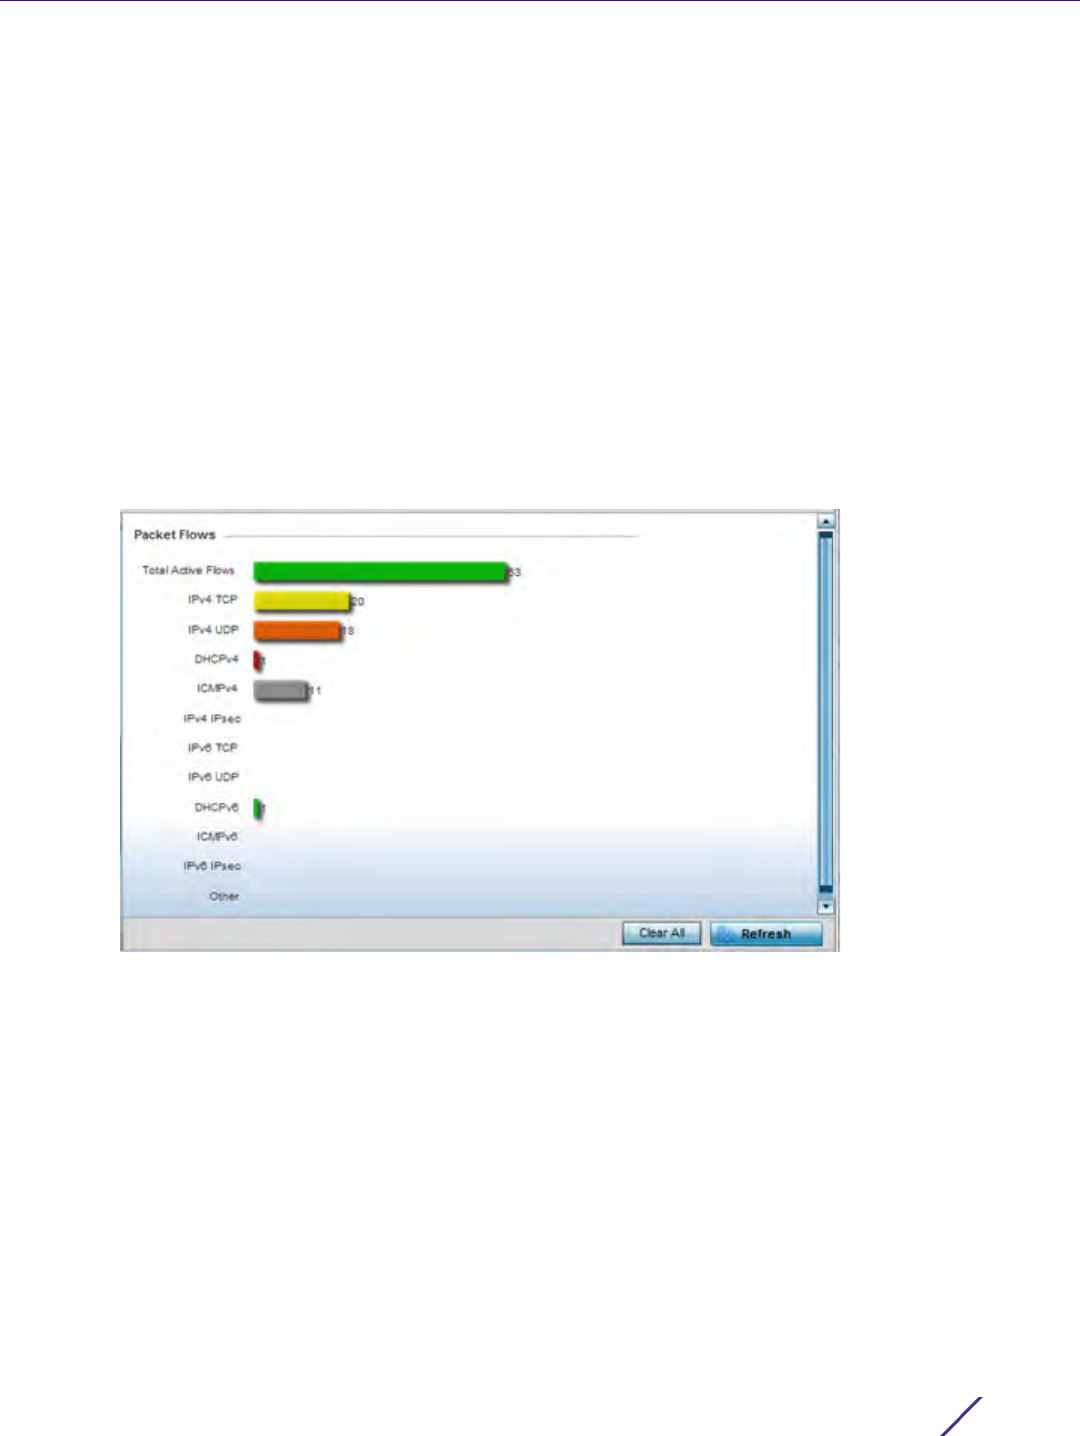
Statistics
Wireless Controller and Service Platform System Reference Guide 15 - 171
15.3.33.1 Viewing Packet Flow Statistics
Firewall
The Packet Flows screen displays data traffic packet flow utilization. The chart lists the different protocol flows
supported, and displays a proportional view of the flows in respect to their percentage of data traffic utilized. The
Total Active Flows field displays the total number of flows supported by the controller or service platform.
To view the packet flow statistics:
1 Select the Statistics menu from the Web UI.
2 Select a Wireless Controller node from the left navigation pane.
3Expand the Firewall menu from the left-hand side of the UI.
4Select
Packets Flows.
Select Clear All to revert the statistics counters to zero and begin a new data collection, or select Refresh to
update the display to the latest values.
Figure 15-117 Firewall Packet Flows
15.3.33.2 Viewing Denial of Service Statistics
Firewall
A denial-of-service attack (DoS attack), or distributed denial-of-service attack, is an attempt to make a computer
resource unavailable to its intended users. Although the means to carry out a DoS attack may vary, it generally
consists of a concerted effort to prevent an Internet site or service from functioning efficiently.
One common attack involves saturating the target’s (victim’s) machine with external communications requests,
such that it cannot respond to legitimate traffic, or responds so slowly as to be rendered effectively unavailable.
DoS attacks are implemented by either forcing the targeted computer(s) to reset, or consuming its resources so
that it can no longer provide its intended service.
The Denial of Service screen displays attack type, number of occurrences, and time of last occurrence.
To view the denial of service statistics:
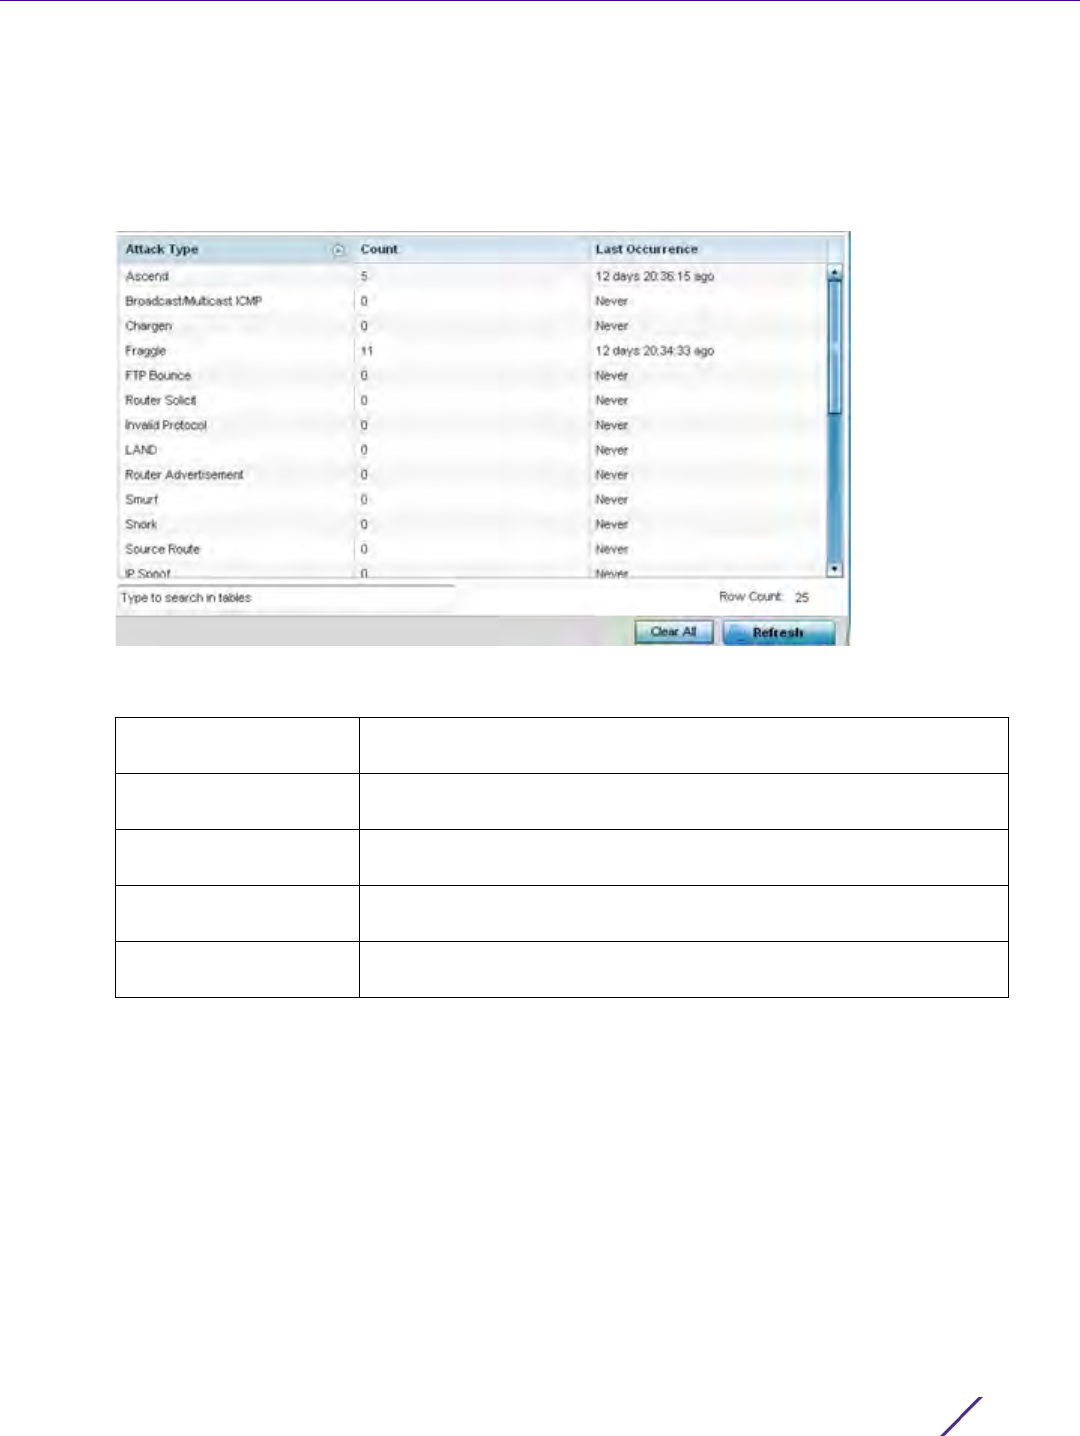
Statistics
Wireless Controller and Service Platform System Reference Guide 15 - 172
1 Select the Statistics menu from the Web UI.
2 Select a Wireless Controller node from the left navigation pane.
3Expand the Firewall menu from the left-hand side of the UI.
4Select
Denial of Service.
Figure 15-118 Wireless Controller - Firewall DoS screen
The Denial of Service screen displays the following:
15.3.33.3 IP Firewall Rules
Firewall
Create firewall rules to let any computer send IPv4 traffic to, or receive traffic from, programs, system services,
computers or users. Firewall rules can be created to provide one of the three actions listed below that match the
rule’s criteria:
•Allow a connection
•Allow a connection only if it is secured through the use of Internet Protocol security
•Block a connection
Rules can be created for either inbound or outbound traffic.
To view existing IPv4 firewall rules:
Attack Type Displays the DoS attack type. The controller or service platform
supports enabling or disabling 24 different DoS attack filters.
Count Displays the number of times each DoS attack was observed by the
controller or service platform’s firewall.
Last Occurrence Displays the amount of time since the DoS attack has been observed
by the controller or service platform’s firewall.
Clear All Select Clear All to revert the statistics counters to zero and begin a
new data collection.
Refresh Select the Refresh button to update the screen’s statistics counters to
their latest values.
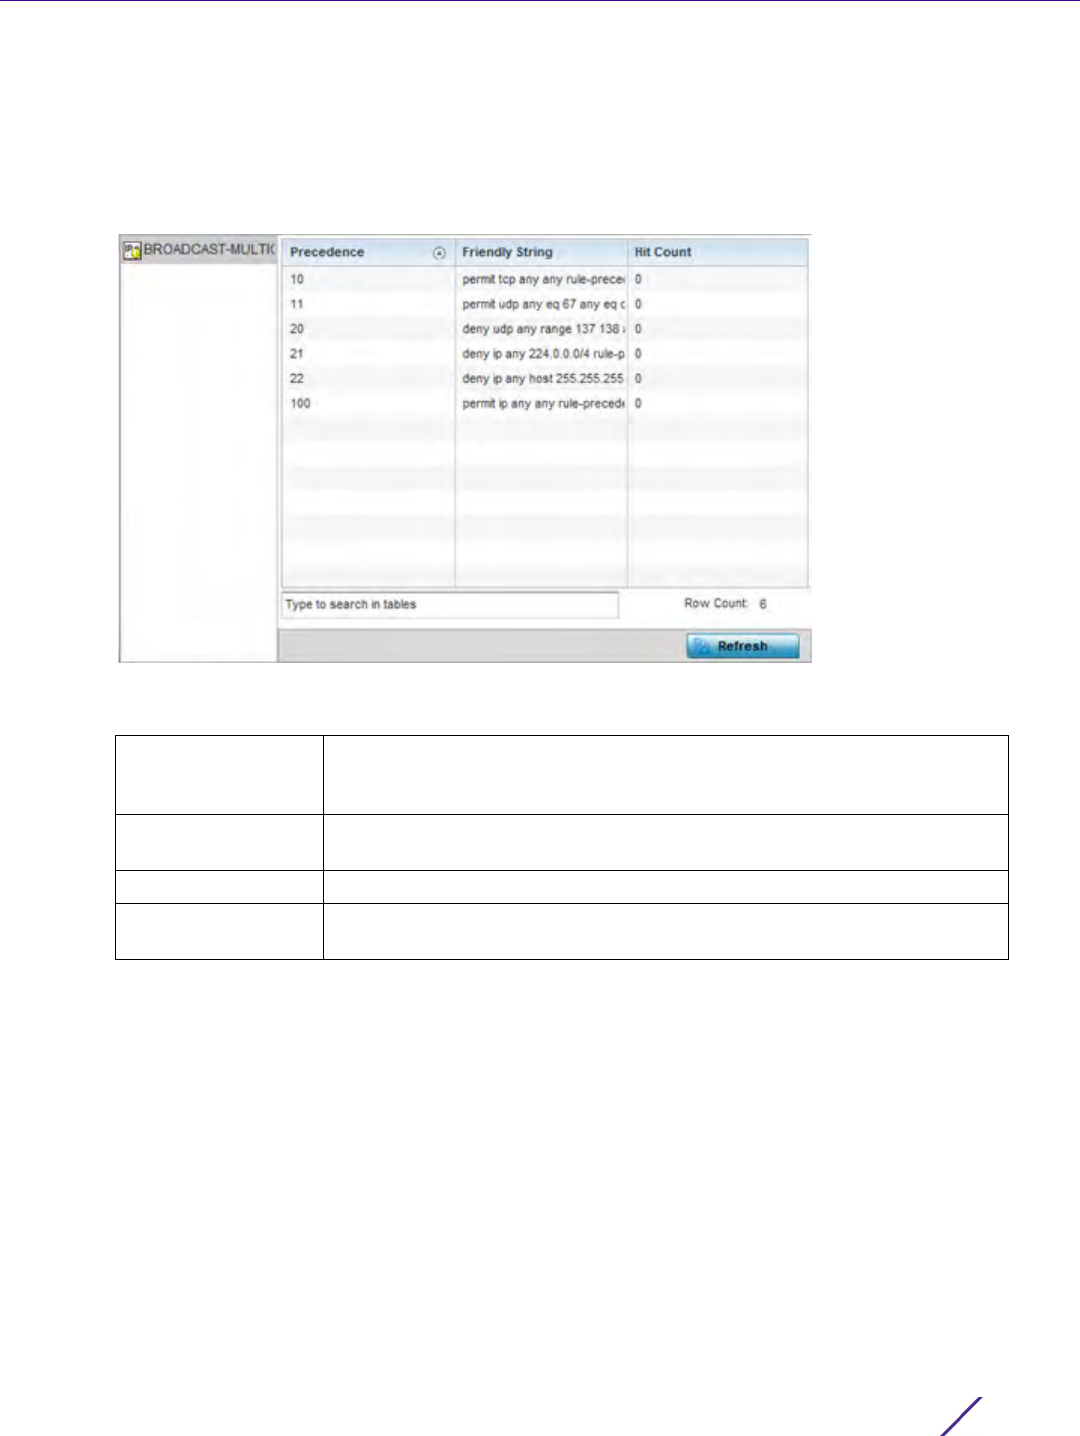
Statistics
Wireless Controller and Service Platform System Reference Guide 15 - 173
1 Select the Statistics menu from the Web UI.
2 Select a Wireless Controller node from the left navigation pane.
3Expand the Firewall menu from the left-hand side of the UI.
4Select
IP Firewall Rules.
Figure 15-119 Wireless Controller - Firewall IP Firewall Rules screen
The IP Firewall Rules screen displays the following:
15.3.33.4 IPv6 Firewall Rules
Firewall
IPV6 provides enhanced identification and location information for computers on networks routing traffic across
the Internet. These hosts require firewall packet protection unique to IPv6 traffic, as IPv6 addresses are composed
of eight groups of four hexadecimal digits separated by colons. IPv6 hosts can configure themselves automatically
when connected to an IPv6 network using the neighbor discovery (ND) protocol via ICMPv6 router discovery
messages. When first connected to a network, a host sends a link-local router solicitation multicast request for its
configuration parameters; routers respond to such a request with a router advertisement packet that contains
Internet layer configuration parameters.
•Allow an IPv6 formatted connection
•Allow a connection only if it is secured through the use of IPv6 security
•Block a connection and exchange of IPv6 formatted packets
Precedence Displays the precedence (priority) applied to packets. Every rule has a
unique precedence value between 1 - 5000. You cannot add two rules with
the same precedence value.
Friendly String This is a string that provides more information as to the contents of the
rule. This is for information purposes only.
Hit Count Displays the number of times each IP ACL has been triggered.
Refresh Select the Refresh button to update the screen’s statistics counters to their
latest values.
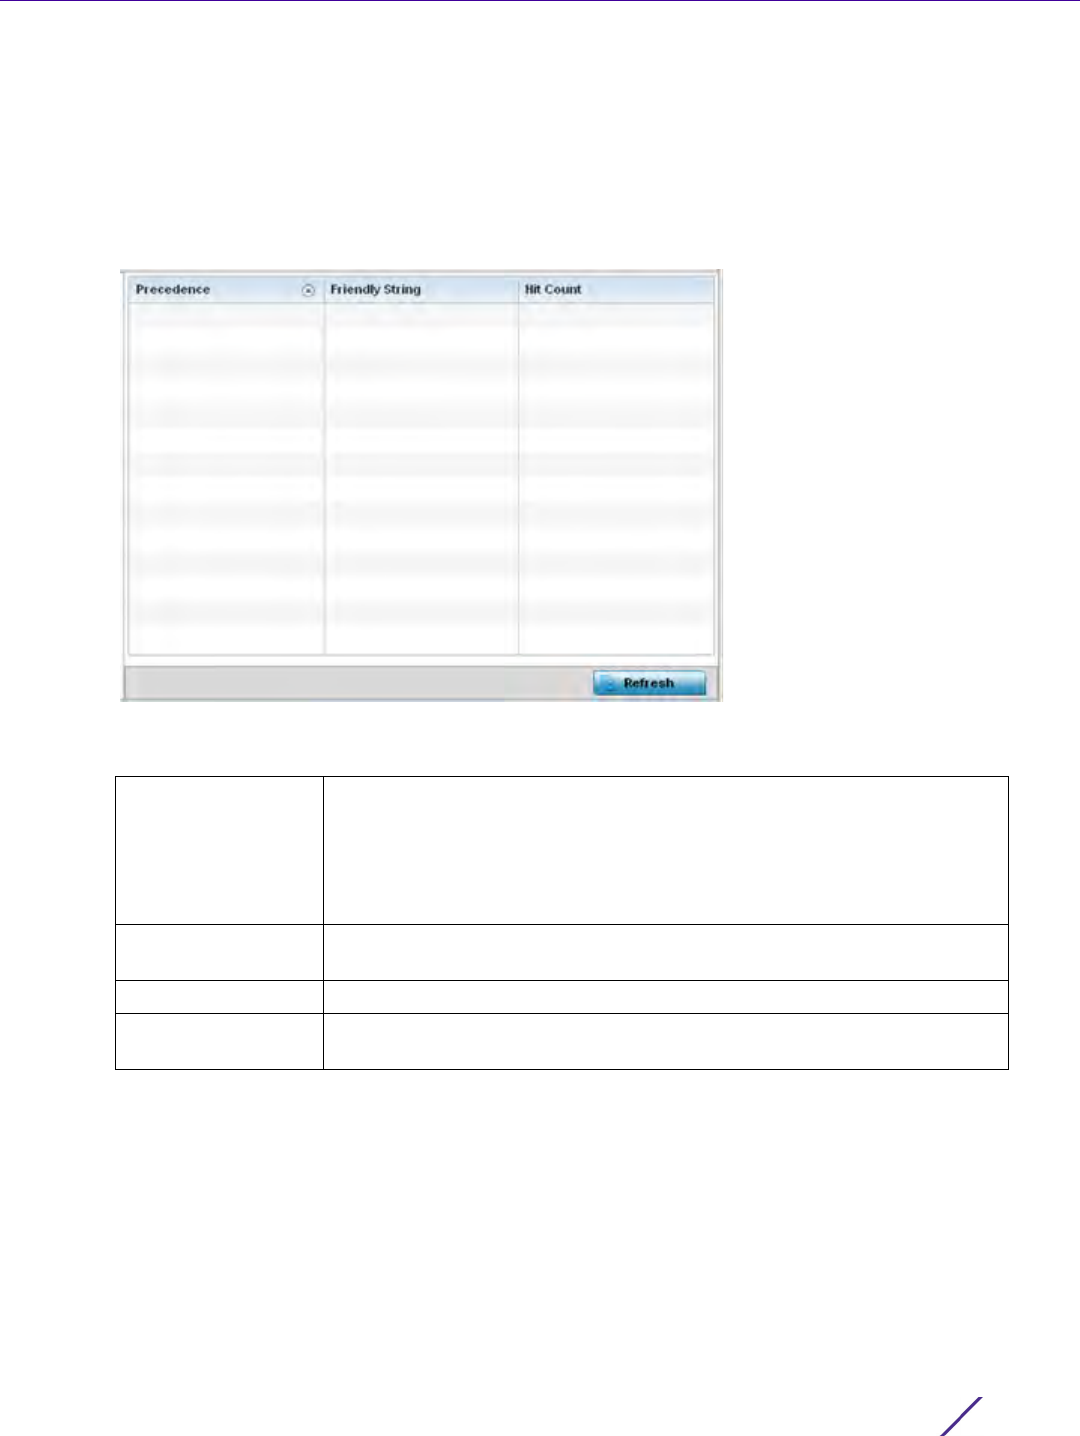
Statistics
Wireless Controller and Service Platform System Reference Guide 15 - 174
To view existing IPv6 firewall rules:
1 Select the Statistics menu from the Web UI.
2 Select a Wireless Controller node from the left navigation pane.
3Expand the Firewall menu from the left-hand side of the UI.
4Select
IPv6 Firewall Rules.
Figure 15-120 Wireless Controller - Firewall IPv6 Firewall Rules screen
The IPv6 Firewall Rules screen displays the following:
15.3.33.5 MAC Firewall Rules
Firewall
The ability to allow or deny client access by MAC address ensures malicious or unwanted users are unable to
bypass security filters. Firewall rules can use one of the three following actions based on a rule criteria:
•Allow a connection
•Allow a connection only if it is secured through the MAC firewall security
•Block a connection
To view MAC firewall rules:
Precedence Displays the precedence (priority) applied to IPV6 formatted packets.
Unlike IPv4, IPV6 provides enhanced identification and location
information for computers on networks routing traffic across the Internet.
IPv6 addresses are composed of eight groups of four hexadecimal digits
separated by colons. Every rule has a unique precedence value between 1 -
5000. You cannot add two rules with the same precedence value.
Friendly String This is a string that provides more information as to the contents of the
IPv6 specific IP rule. This is for information purposes only.
Hit Count Displays the number of times each IPv6 ACL has been triggered.
Refresh Select the Refresh button to update the screen’s statistics counters to their
latest values.
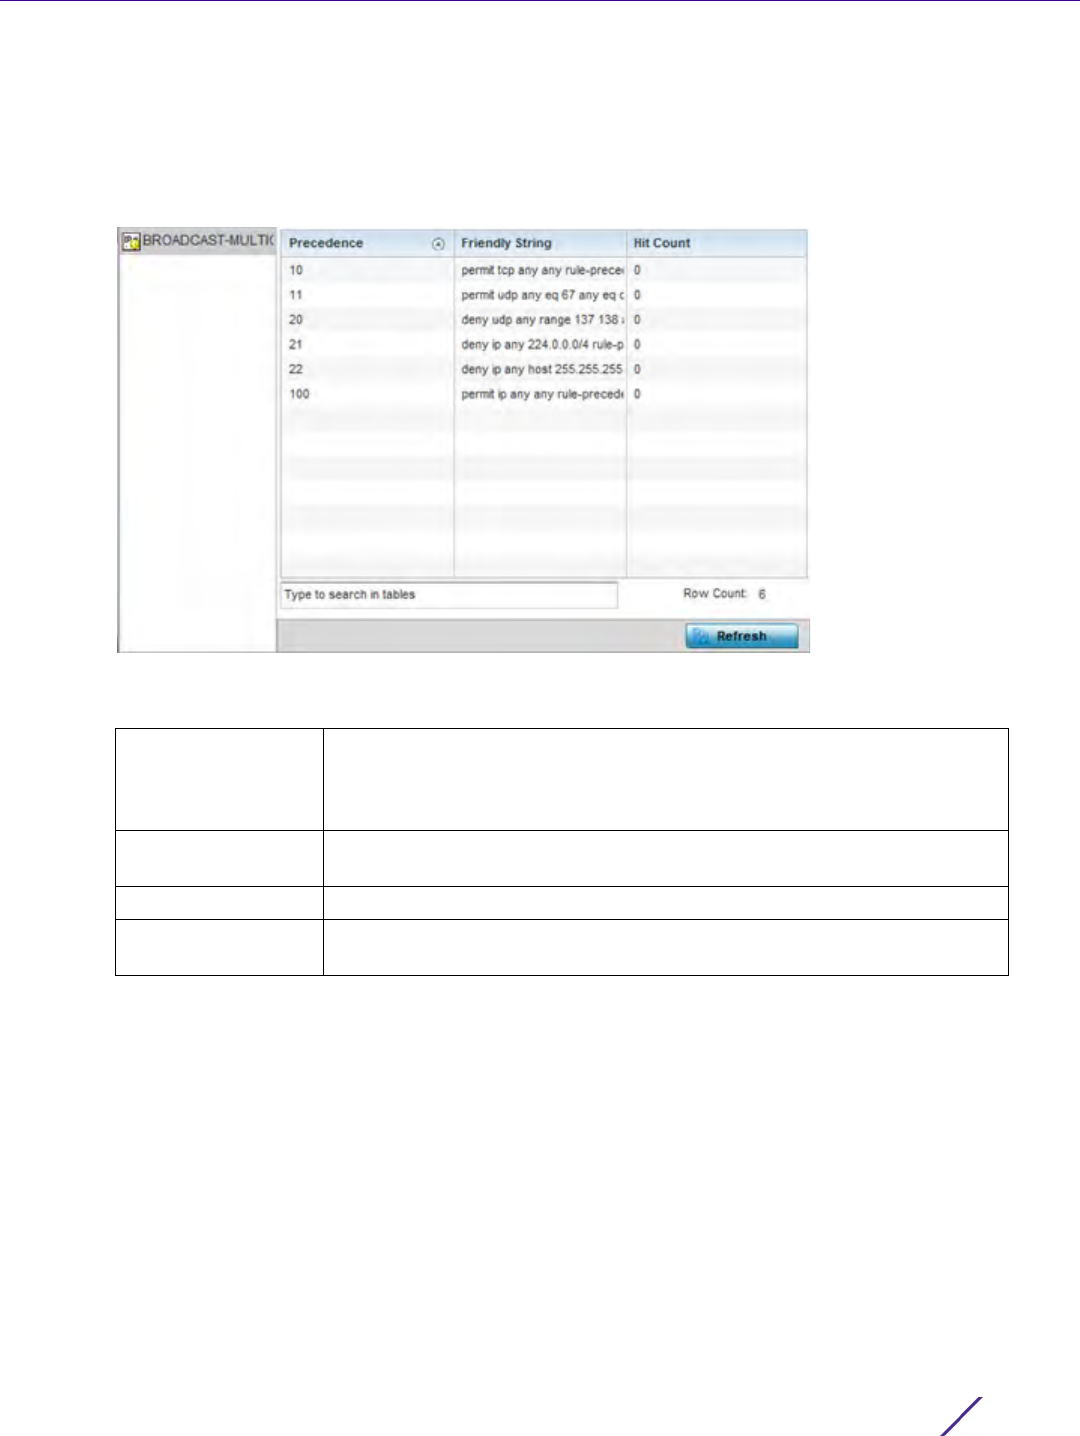
Statistics
Wireless Controller and Service Platform System Reference Guide 15 - 175
1 Select the Statistics menu from the Web UI.
2 Select a Wireless Controller node from the left navigation pane.
3Expand the Firewall menu from the left-hand side of the UI.
4Select
MAC Firewall Rules.
Figure 15-121 Wireless Controller - Firewall MAC Firewall Rules screen
The MAC Firewall Rules screen displays the following:
15.3.33.6 NAT Translations
Firewall
Network Address Translation (NAT) is a technique to modify network address information within IP packet headers
in transit. This enables mapping one IP address to another to protect wireless controller managed network address
credentials. With typical deployments, NAT is used as an IP masquerading technique to hide private IP addresses
behind a single, public facing, IP address.
NAT can provide a profile outbound Internet access to wired and wireless hosts connected to either an Access
Point or a wireless controller. Many-to-one NAT is the most common NAT technique for outbound Internet access.
Many-to-one NAT allows an Access Point or wireless controller to translate one or more internal private IP
addresses to a single, public facing, IP address assigned to a 10/100/1000 Ethernet port or 3G card.
To assess the controller or service platform’s NAT configuration and statistics.
Precedence Displays the precedence (priority) applied to packets. The rules within an
Access Control Entries (ACL) list are based on their precedence values.
Every rule has a unique precedence value between 1 and 5000. You
cannot add two rules with the same precedence value.
Friendly String This string provides more information as to the contents of the rule. This is
for information purposes only.
Hit Count Displays the number of times each WLAN ACL has been triggered.
Refresh Select the Refresh button to update the screen’s statistics counters to their
latest values.
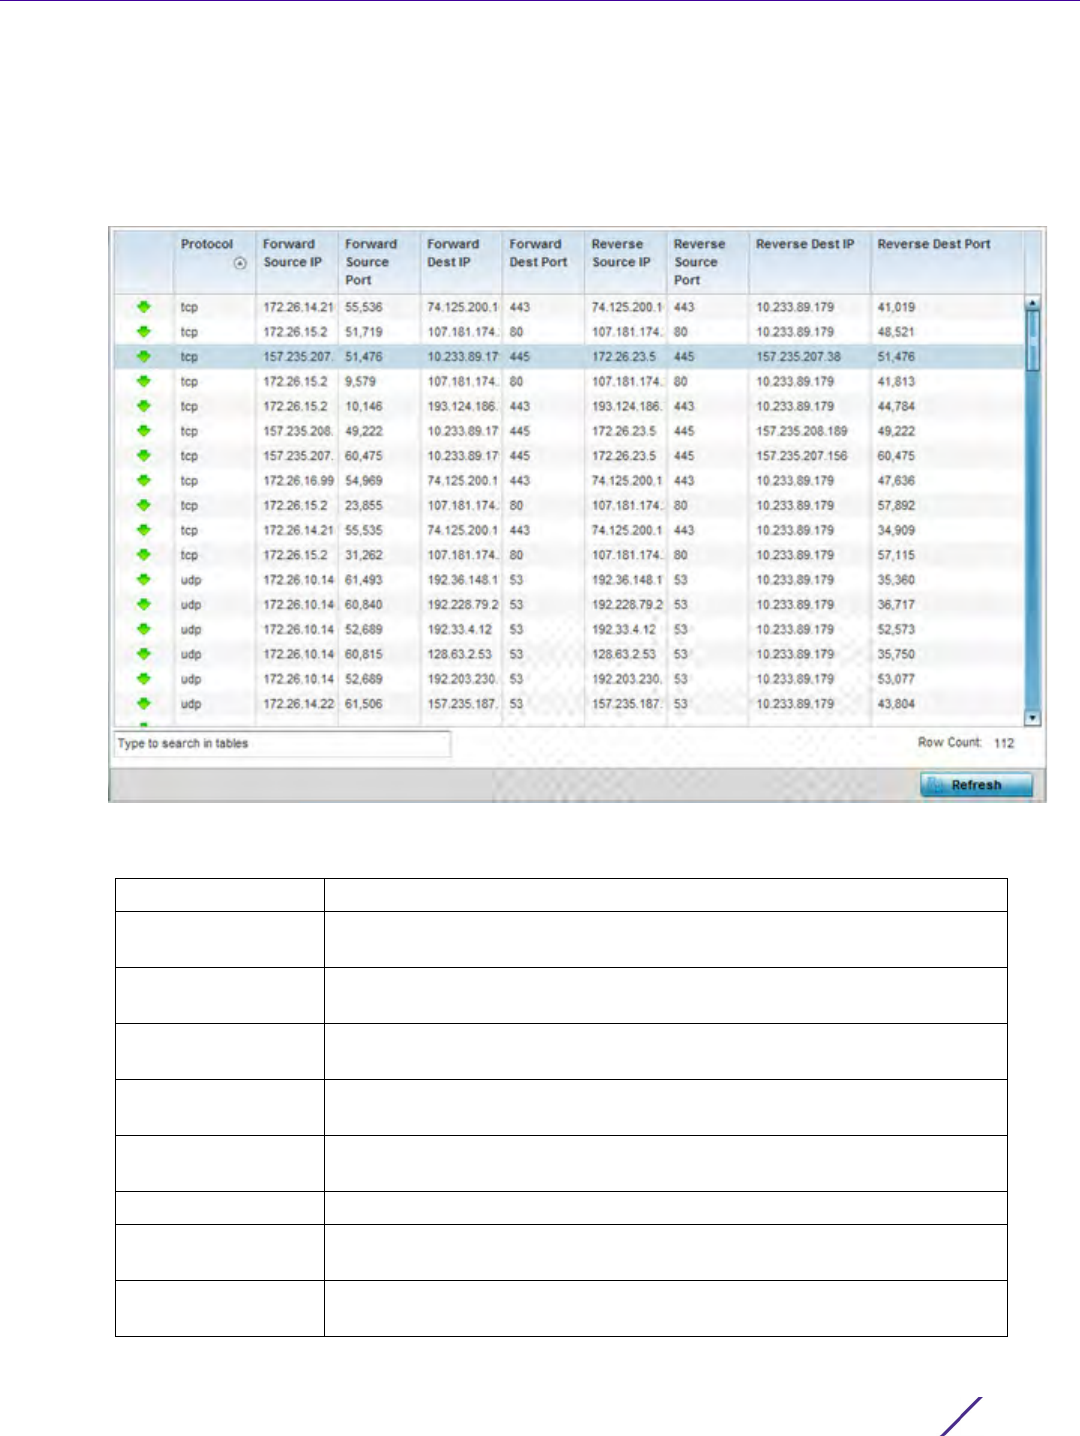
Statistics
Wireless Controller and Service Platform System Reference Guide 15 - 176
1 Select the Statistics menu from the Web UI.
2 Select an Access Point node from the left navigation pane.
Expand the Firewall menu from the left-hand side of the UI.
3Select
NAT Translations.
Figure 15-122 Wireless Controller - Firewall NAT Translation screen
4The NAT Translations screen displays the following:
Protocol Displays the translation protocol as either TCP, UDP or ICMP.
Forward Source IP Displays the internal network IP address for forward facing NAT
translations.
Forward Source Port Displays the internal network (virtual) port for forward facing NAT
translations.
Forward Dest IP Displays the external network destination IP address for forward facing
NAT translations.
Forward Dest Port Displays the external network destination port for forward facing NAT
translations.
Reverse Source IP Displays the internal network IP address for reverse facing NAT
translations.
Reverse Source Port Displays the internal network port for reverse facing NAT translations.
Reverse Dest IP Displays the external network destination IP address for reverse facing
NAT translations.
Reverse Dest Port Displays the external network destination port for reverse facing NAT
translations.
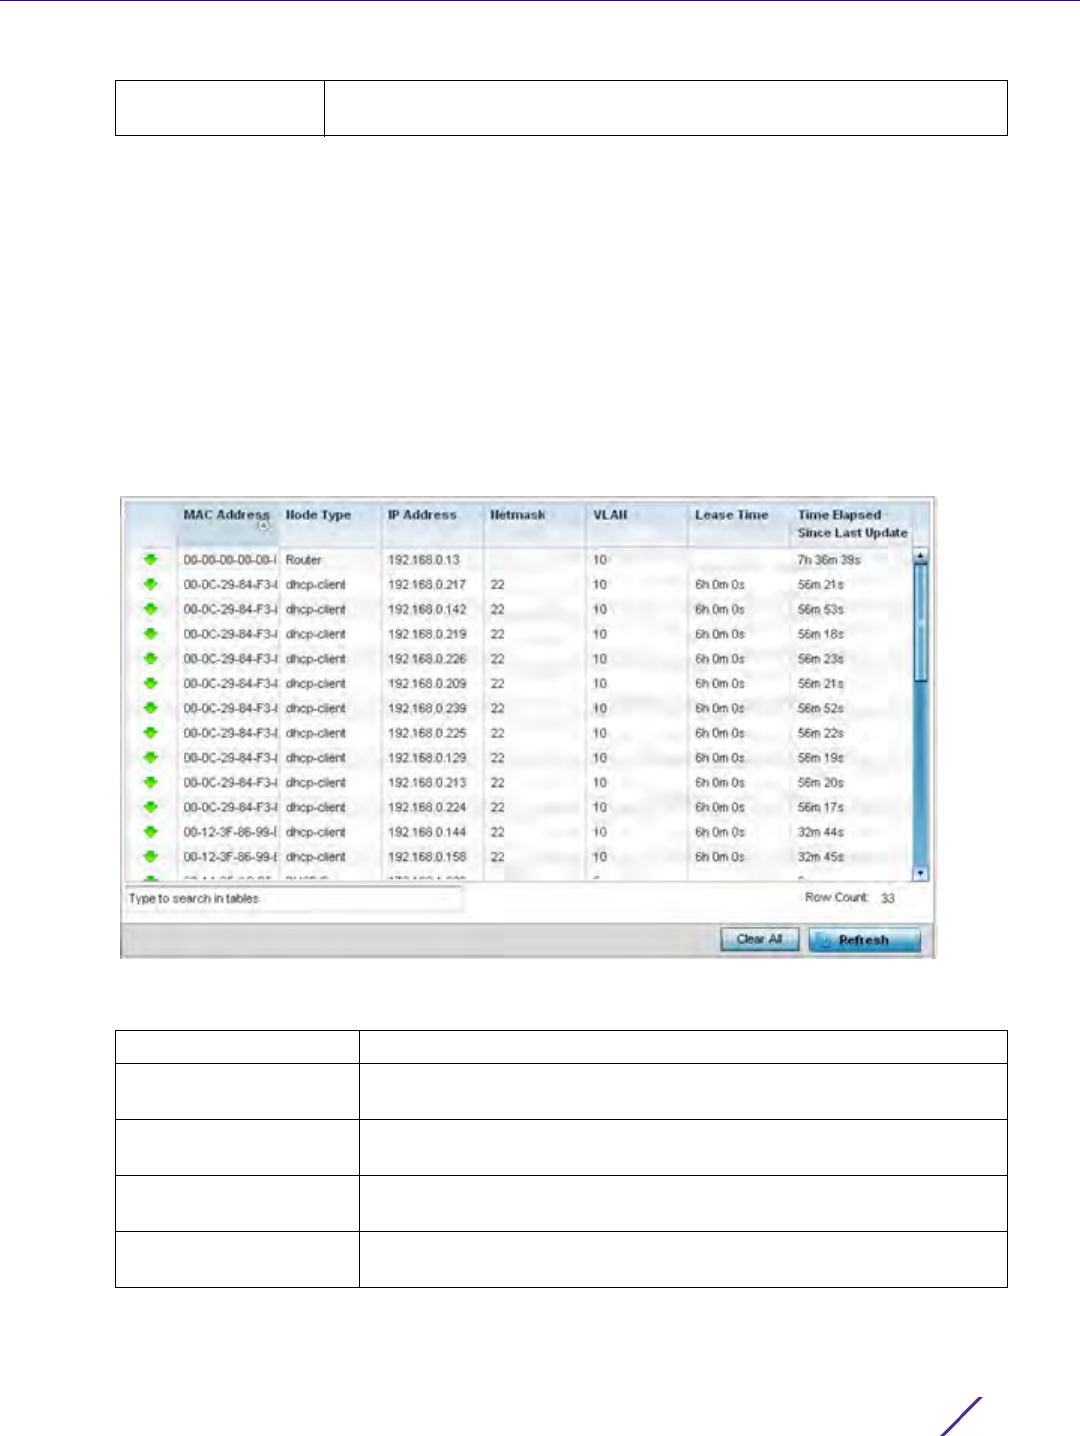
Statistics
Wireless Controller and Service Platform System Reference Guide 15 - 177
15.3.33.7 Viewing DHCP Snooping Statistics
Firewall
When DHCP servers are allocating IP addresses to the clients, DHCP snooping can strengthen the security on the
LAN allowing only clients with specific IP/MAC addresses.
To view the DHCP snooping statistics:
1 Select the Statistics menu from the Web UI.
2 Select a Wireless Controller node from the left navigation pane.
3Expand the Firewall menu from the left-hand side of the UI.
4Select
DHCP Snooping.
Figure 15-123 Wireless Controller - Firewall DHCP Snooping screen
The DHCP Snooping screen displays the following:
Refresh Select the Refresh button to update the screen’s statistics counters to their
latest values.
MAC Address Displays the MAC address of the client.
Node Type Displays the NetBios node with an IP pool from which IP addresses
can be issued to client requests on this interface.
IP Address Displays the IP address used for DHCP discovery and requests
between the DHCP server and DHCP clients.
Netmask Displays the subnet mask used for DHCP discovery and requests
between the DHCP server and DHCP clients.
VLAN Displays the controller or service platform virtual interface ID used for
a new DHCP configuration.

Statistics
Wireless Controller and Service Platform System Reference Guide 15 - 178
15.3.33.8 IPv6 Neighbor Snooping
Firewall
IPv6 snooping bundles layer 2 IPv6 hop security features, such as IPv6 neighbor discovery (ND) inspection, IPv6
address gleaning and IPv6 device tracking. When IPv6 ND is configured on a device, packet capture instructions
redirect the ND protocol and DHCP for IPv6 traffic up to the controller for inspection.
A database of connected IPv6 neighbors is created from the IPv6 neighbor snoop. The database is used by IPv6 to
validate the link layer address, IPv6 address and prefix binding of the neighbors to prevent spoofing and potential
redirect attacks.
To review IPv6 neighbor snooping statistics:
1 Select the Statistics menu from the Web UI.
2 Select a Wireless Controller node from the left navigation pane.
3Expand the Firewall menu from the left-hand side of the UI.
4Select
IPv6 Neighbor Snooping.
Lease Time When a DHCP server allocates an address for a DHCP client, the client
is assigned a lease (which expires after a designated interval defined
by the administrator). The lease is the time an IP address is reserved
for re-connection after its last use. Using short leases, DHCP can
dynamically reconfigure networks in which there are more computers
than available IP addresses. This is useful, for example, in education
and customer environments where client users change frequently. Use
longer leases if there are fewer users.
Time Elapsed Since
Last Update
Displays the amount of time elapsed since the DHCP server was last
updated.
Clear All Select Clear All to revert the counters to zero and begin a new data
collection.
Refresh Select the Refresh button to update the screen’s counters to their
latest values.
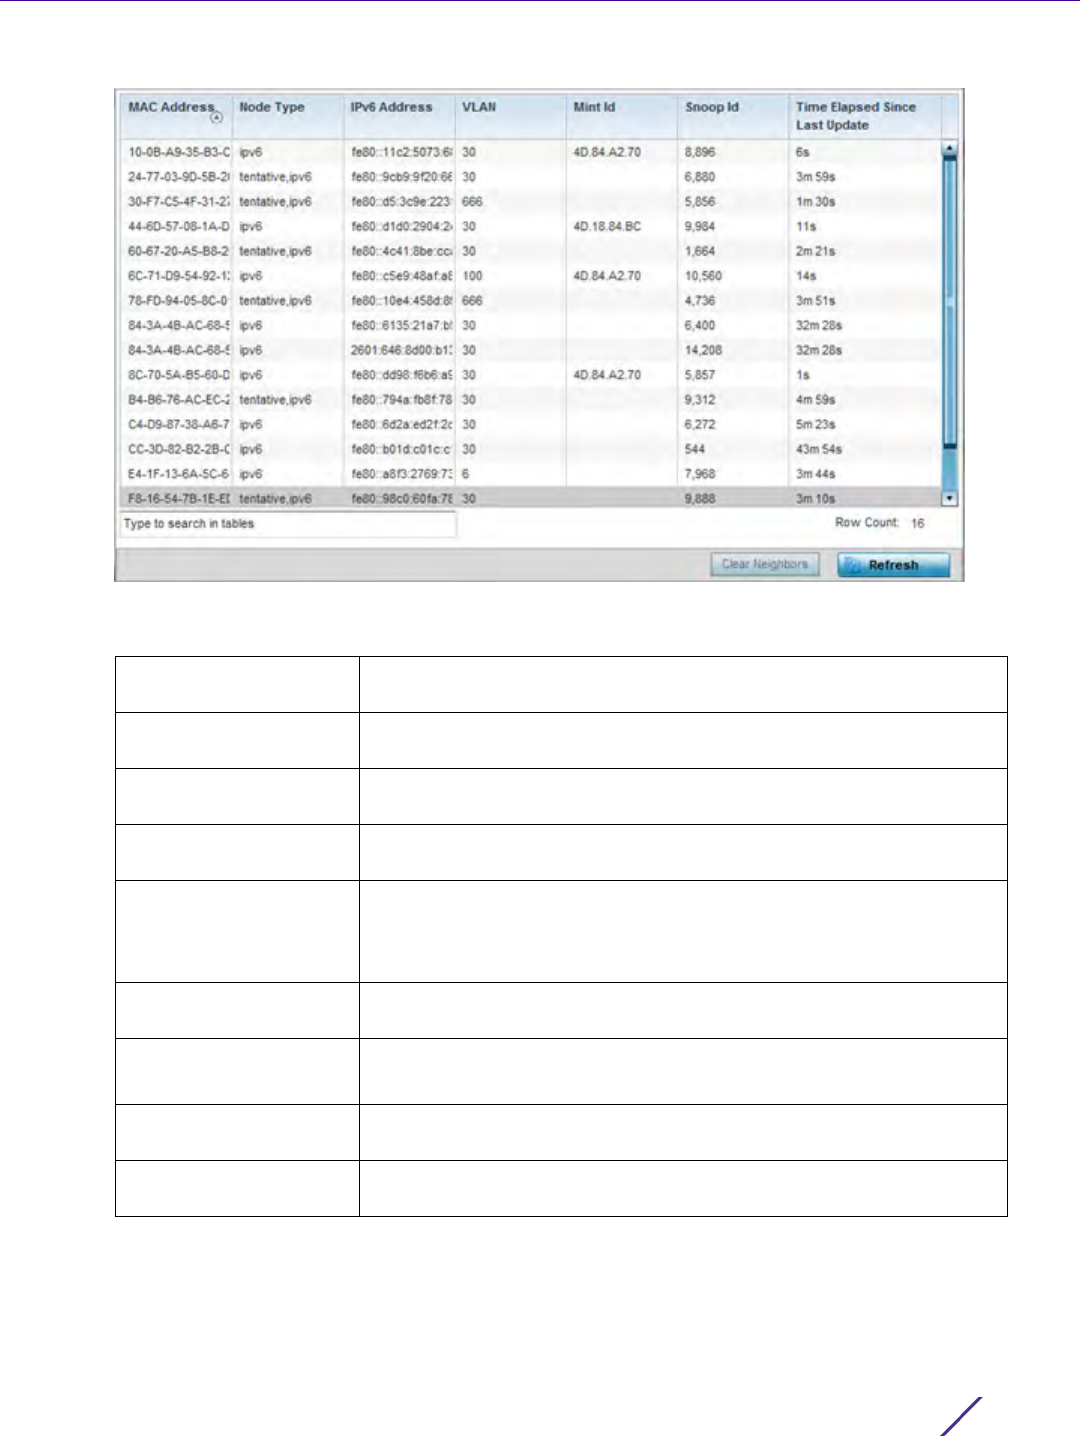
Statistics
Wireless Controller and Service Platform System Reference Guide 15 - 179
Figure 15-124 Wireless Controller - Firewall IPv6 Neighbor Snooping screen
The IPv6 Neighbor Snooping screen displays the following:
MAC Address Displays the hardware encoded MAC address of an IPv6 client
reporting to the controller or service platform.
Node Type Displays the NetBios node type from an IPv6 address pool from which
IP addresses can be issued to requesting clients.
IPv6 Address Displays the IPv6 address used for DHCPv6 discovery and requests
between the DHCPv6 server and DHCP clients.
VLAN Displays the controller or service platform virtual interface ID used for
a new DHCPv6 configuration.
Mint Id Lists MiNT IDs for each listed VLAN. MiNT provides the means to
secure communications at the transport layer. Using MiNT, a device
can be configured to only communicate with other authorized (MiNT
enabled) devices of the same model.
Snoop Id Lists a numeric snooping ID associated with each packet inspection
snooping session conducted by the controller or service platform.
Time Elapsed Since
Last Update
Displays the amount of time elapsed since the DHCPv6 server was last
updated.
Clear Neighbors Select Clear Neighbors to revert the counters to zero and begin a new
data collection.
Refresh Select the Refresh button to update the screen’s counters to their
latest values.

Statistics
Wireless Controller and Service Platform System Reference Guide 15 - 180
15.3.34 VPN
Controller Statistics
IPSec VPN provides a secure tunnel between two networked peer controllers or service platforms. Administrators
can define which packets are sent within the tunnel, and how they are protected. When a tunnelled peer sees a
sensitive packet, it creates a secure tunnel and sends the packet through the tunnel to its remote peer destination.
Tunnels are sets of security associations (SA) between two peers. SAs define the protocols and algorithms applied
to sensitive packets and specify the keying mechanisms used by tunnelled peers. SAs are unidirectional and exist
in both the inbound and outbound direction. SAs are established per the rules and conditions of defined security
protocols (AH or ESP).
Crypto maps combine the elements comprising IPSec SAs. Crypto maps also include transform sets. A transform
set is a combination of security protocols, algorithms and other settings applied to IPSec protected traffic. One
crypto map is utilized for each IPsec peer, however for remote VPN deployments one crypto map is used for all
the remote IPsec peers.
Internet Key Exchange (IKE) protocol is a key management protocol standard used in conjunction with IPSec. IKE
enhances IPSec by providing additional features, flexibility, and configuration simplicity for the IPSec standard. IKE
automatically negotiates IPSec SAs, and enables secure communications without time consuming manual pre-
configuration.
VPN statistics are partitioned into the following:
•IKESA
•IPSec
15.3.34.1 IKESA
VPN
The IKESA screen allows for the review of individual peer security association statistics.
1 Select the Statistics menu from the Web UI.
2 Select a Wireless Controller node from the left navigation pane.
3Select
VPN and expand the menu to reveal its sub menu items.
4Select
IKESA.
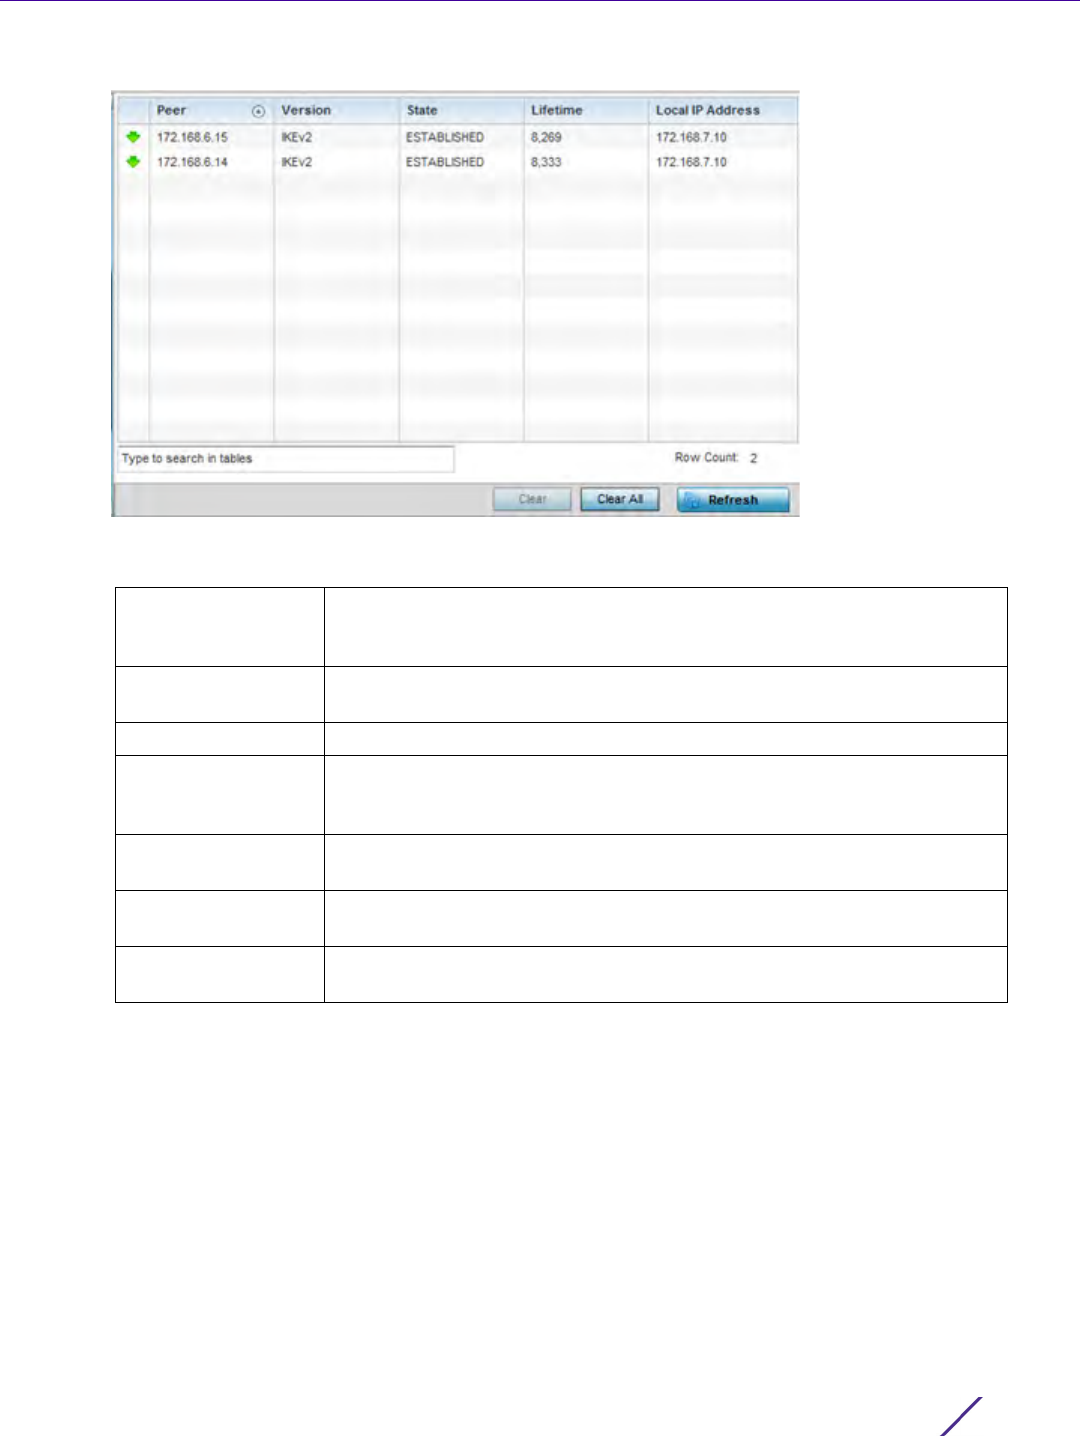
Statistics
Wireless Controller and Service Platform System Reference Guide 15 - 181
Figure 15-125 Wireless Controller - VPN IKESA screen
Review the following VPN peer security association statistics:
Peer Lists IDs for peers sharing security associations (SA) for tunnel
interoperability. When a peer sees a sensitive packet, it creates a secure
tunnel and sends the packet through the tunnel to its destination.
Version Displays each peer’s IKE version used for auto IPSec secure authentication
with the IPSec gateway and other controllers or service platforms.
State Lists the online or offline state of each listed peer’s SA.
Lifetime Displays the lifetime for the duration of each listed peer IPSec VPN
security association. Once the set value is exceeded, the association is
timed out.
Local IP Address Displays each listed peer’s local tunnel end point IP address. This address
represents an alternative to an interface IP address.
Clear/Clear All Select Clear to remove a selected peer. Select the Clear All button to clear
each peer of its current status and begin a new data collection.
Refresh Select the Refresh button to update the screen’s statistics counters to their
latest values.
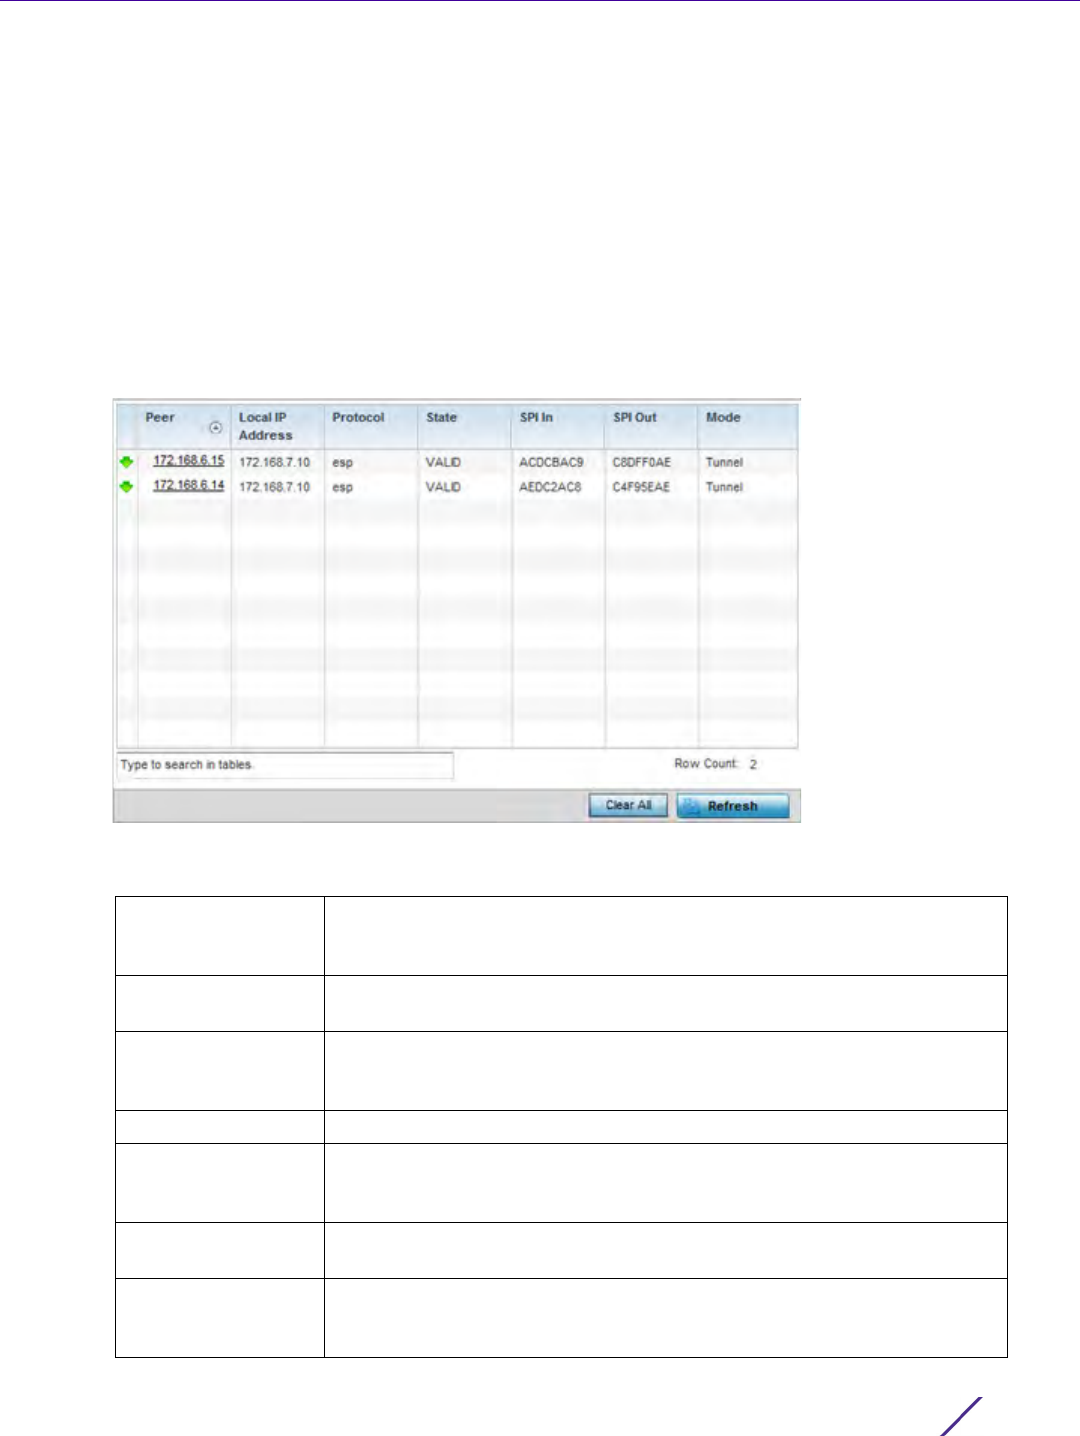
Statistics
Wireless Controller and Service Platform System Reference Guide 15 - 182
15.3.34.2 IPSec
VPN
Use the IPSec VPN screen to assess tunnel status between networked peers.
To view IPSec VPN status for tunnelled peers:
1 Select the Statistics menu from the Web UI.
2 Select a Wireless Controller node from the left navigation pane.
3Select
VPN and expand the menu to reveal its sub menu items.
4Select
IPSec.
Figure 15-126 Wireless Controller - VPN IPSec screen
Review the following VPN peer security association statistics:
Peer Lists IP addresses for peers sharing security associations (SA) for tunnel
interoperability. When a peer sees a sensitive packet, it creates a secure
tunnel and sends the packet through the tunnel to its destination.
Local IP Address Displays each listed peer’s local tunnel end point IP address. This address
represents an alternative to an interface IP address.
Protocol Lists the security protocol used with the VPN IPSec tunnel connection.
SAs are unidirectional, existing in each direction and established per
security protocol. Options include ESP and AH.
State Lists the state of each listed peer’s security association.
SPI In Lists stateful packet inspection (SPI) status for incoming IPSec tunnel
packets. SPI tracks each connection traversing the IPSec VPN tunnel and
ensures they are valid.
SPI Out Lists SPI status for outgoing IPSec tunnel packets. SPI tracks each
connection traversing the IPSec VPN tunnel and ensures they are valid.
Mode Displays the IKE mode. IPSEC has two modes in IKEv1 for key exchanges.
Aggressive mode requires 3 messages be exchanged between the IPSEC
peers to setup the SA, Main requires 6 messages

Statistics
Wireless Controller and Service Platform System Reference Guide 15 - 183
15.3.35 Viewing Certificate Statistics
Controller Statistics
The Secure Socket Layer (SSL) protocol is used to ensure secure transactions between Web servers and browsers.
This protocol uses a third-party, a certificate authority, to identify one end or both ends of the transactions. A
browser checks the certificate issued by the server before establishing a connection.
For more information, see:
•Viewing Trustpoints Statistics
•Viewing the RSA Key Details
15.3.35.1 Viewing Trustpoints Statistics
Viewing Certificate Statistics
Each certificate is digitally signed by a trustpoint. The trustpoint signing the certificate can be a certificate
authority, corporate or individual. A trustpoint represents a CA/identity pair containing the identity of the CA, CA-
specific configuration parameters and an association with an enrolled identity certificate.
To view controller or service platform trustpoint statistics:
1 Select the Statistics menu from the Web UI.
2 Select a Wireless Controller node from the left navigation pane.
3Select
Certificate and expand the menu to reveal its sub menu items.
4Select
Trustpoint.
Clear All Select the Clear All button to clear each peer of its current status and
begin a new data collection.
Refresh Select the Refresh button to update the screen’s statistics counters to their
latest values.
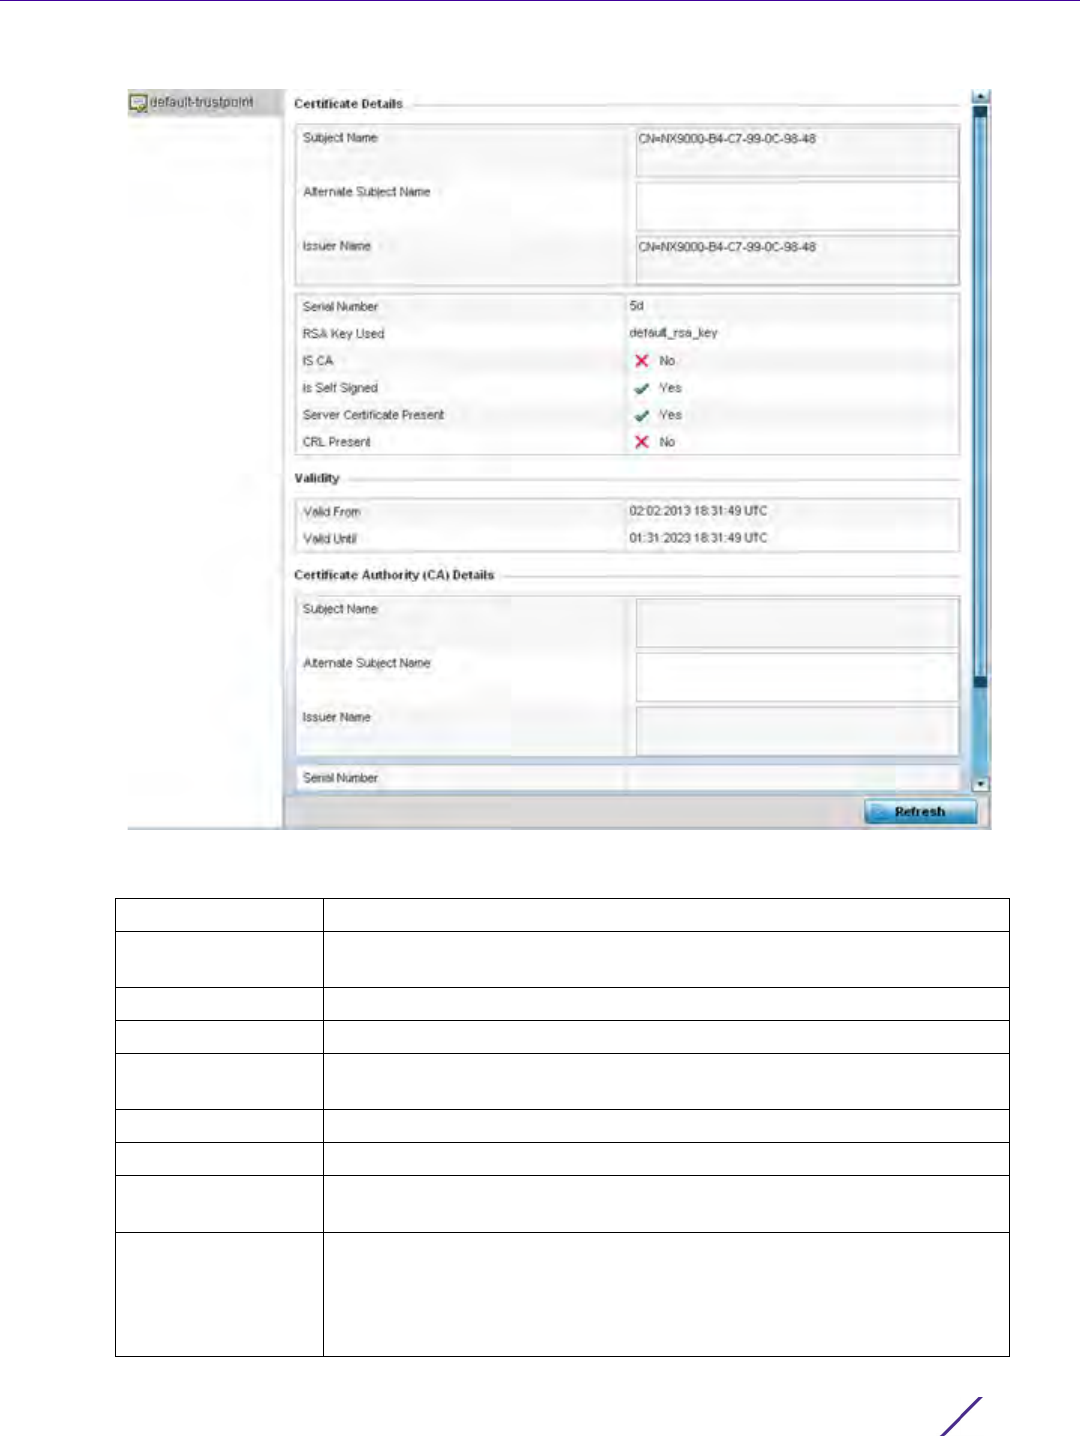
Statistics
Wireless Controller and Service Platform System Reference Guide 15 - 184
Figure 15-127 Wireless Controller - Certificates Trustpoint screen
The Certificate Details field displays the following:
Subject Name Describes the entity to which the certificate is issued.
Alternate Subject
Name
Lists alternate subject information about the certificate as provided to the
certificate authority.
Issuer Name Displays the name of the organization issuing the certificate.
Serial Number Lists the unique serial number of the certificate.
RSA Key Used Displays the name of the key pair generated separated, or automatically
when selecting a certificate.
IS CA Indicates whether this certificate is an authority certificate (Yes/No).
Is Self Signed Displays whether the certificate is self-signed (Yes/No).
Server Certification
Present
Displays whether a server certification is present or not (Yes/No).
CRL Present Displays whether a Certificate Revocation List (CRL) is present (Yes/No). A
CRL contains a list of subscribers paired with digital certificate status. The
list displays revoked certificates along with the reasons for revocation. The
date of issuance and the entities that issued the certificate are also
included.

Statistics
Wireless Controller and Service Platform System Reference Guide 15 - 185
The Validity field displays the following:
The Certificate Authority (CA) Details field displays the following:
The Certificate Authority Validity field displays the following:
5 Select the Refresh button to update the screen’s statistics counters to their latest values.
15.3.35.2 Viewing the RSA Key Details
Viewing Certificate Statistics
Rivest, Shamir, and Adleman (RSA) is an algorithm for public key cryptography. It’s the first algorithm known to be
suitable for signing as well as encryption.
The RSA Keys screen displays a list of RSA keys installed in the selected Access Point. RSA Keys are generally used
for establishing a SSH session, and are a part of the certificate set used by RADIUS, VPN and HTTPS.
To view the RSA Key details:
1 Select the Statistics menu from the Web UI.
2 Select a Wireless Controller node from the left navigation pane.
3Select
Certificate and expand the menu to reveal its sub menu items.
4Select
RSA Keys.
Valid From Displays the certificate’s issue date stating the beginning of the
certificate’s validity.
Valid Until Displays the certificate’s expiration date.
Subject Name Displays information about the entity to which the certificate is issued.
Alternate Subject
Name
This section provides alternate information about the certificate as
provided to the certificate authority. This field is used to provide more
information that supports information provided in the Subject Name field.
Issuer Name Displays the organization issuing the certificate.
Serial Number Lists the unique serial number of each certificate issued.
Validity From Displays the date when the validity of a CA begins.
Validity Until Displays the date when the validity of a CA expires.
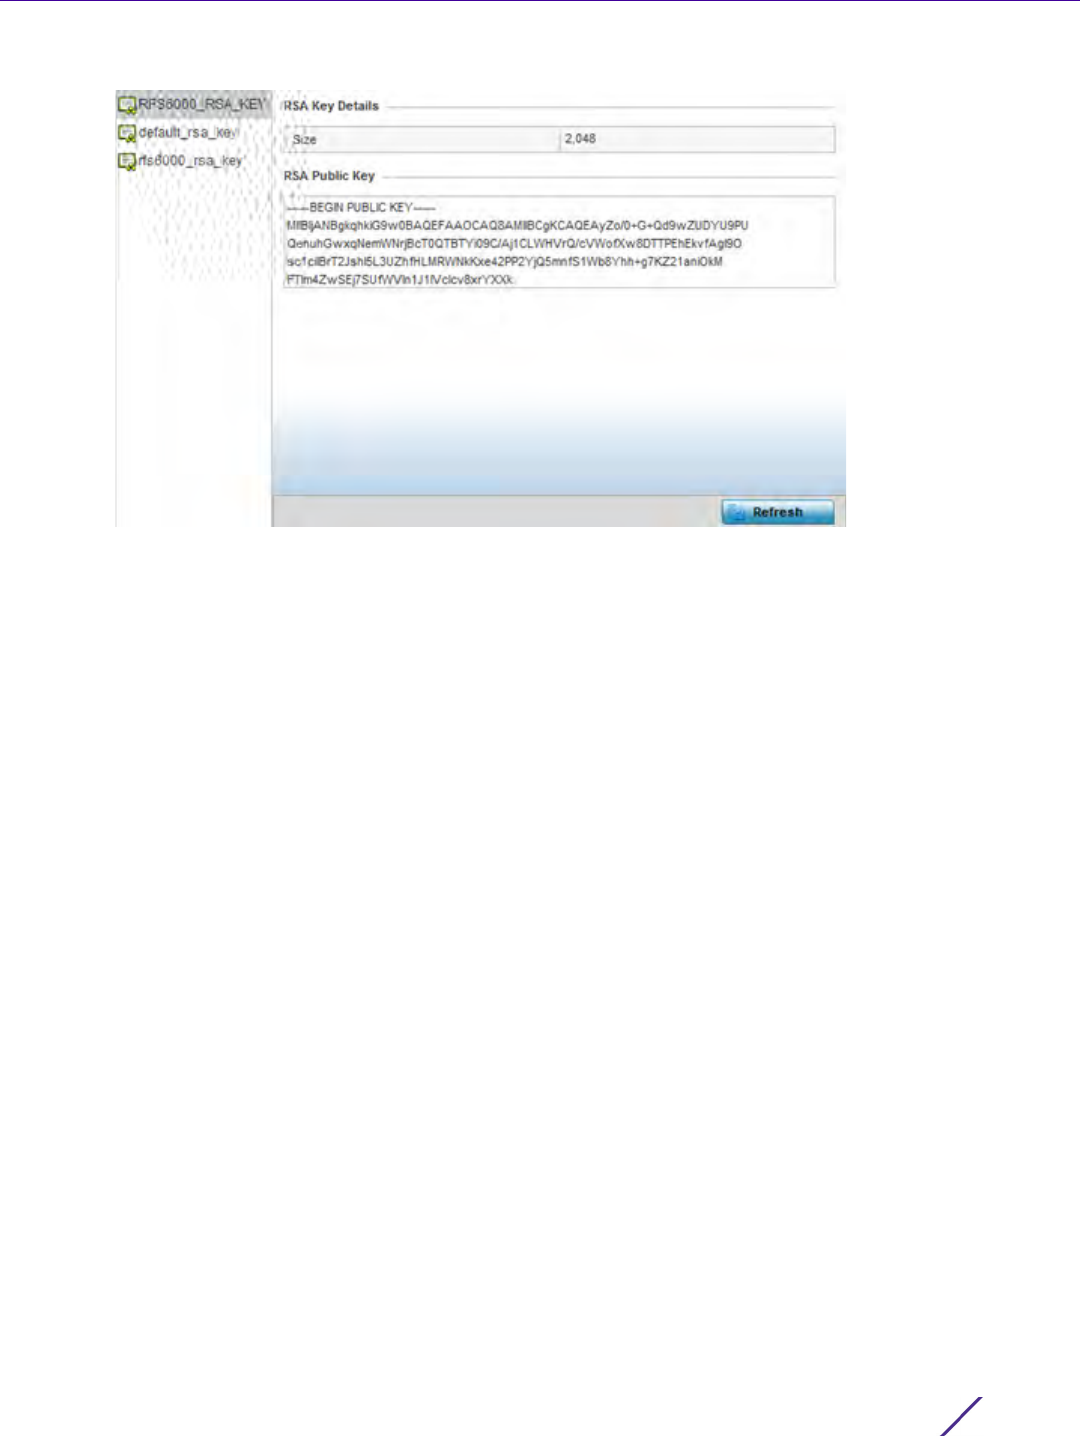
Statistics
Wireless Controller and Service Platform System Reference Guide 15 - 186
Figure 15-128 Wireless Controller - Certificates RSA Keys screen
The RSA Key Details field describes the size (in bits) of the desired key. If not specified, a default key size of
1024 is used.
The RSA Public Key field describes the public key’s character set used for encrypting messages. This key is
known to everyone.
5 Select the Refresh button to update the screen’s statistics counters to their latest values.
15.3.36 WIPS Statistics
Controller Statistics
Wireless Intrusion Protection System (WIPS) detects the presence of unauthorized Access Points. Unauthorized
attempts to access the WLAN is generally accompanied by intruding clients finding network vulnerabilities. Basic
forms of this behavior can be monitored and reported without a dedicated WIPS deployment. When the
parameters exceed a configurable threshold, the controller or service platform generates a SNMP trap and reports
the result via the management interfaces. Basic WIPS functionality does not require monitoring APs and does not
perform off-channel scanning.
For more information, see:
•Viewing the Client Blacklist
•Viewing WIPS Event Statistics
15.3.36.1 Viewing the Client Blacklist
WIPS Statistics
This Client Blacklist displays blacklisted clients detected using WIPS. Blacklisted clients are not allowed to associate
to connected devices within the controller or service platform managed network.
To view the client blacklist screen:
1 Select the Statistics menu from the Web UI.
2 Select a Wireless Controller node from the left navigation pane.
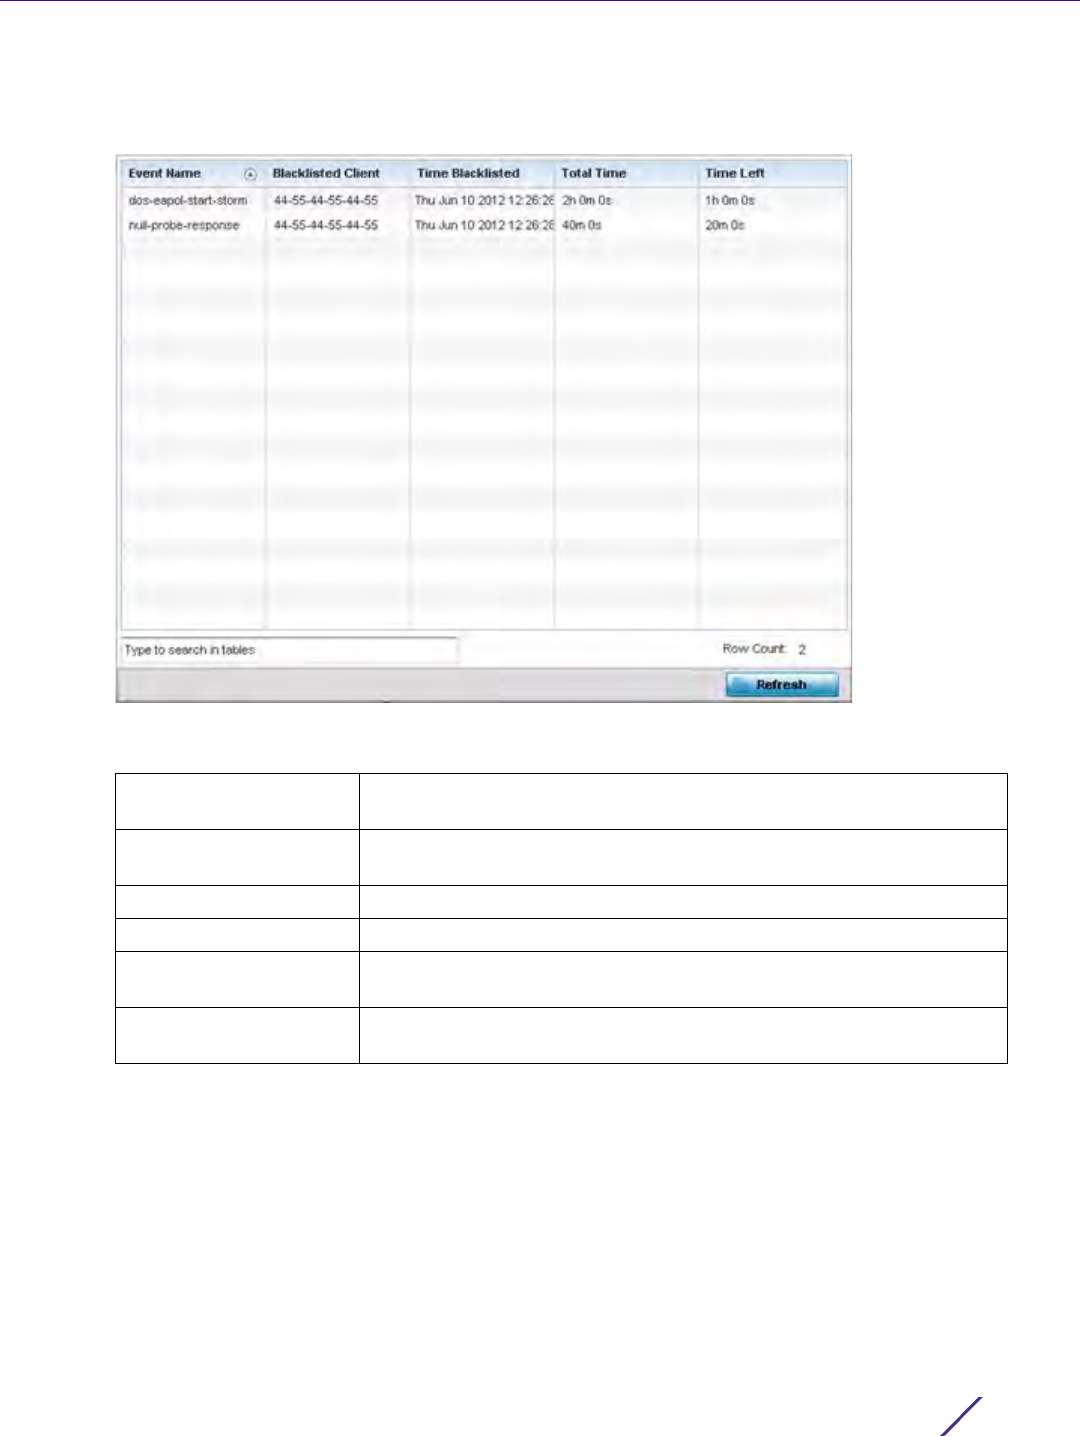
Statistics
Wireless Controller and Service Platform System Reference Guide 15 - 187
3Select
WIPS and expand the menu to reveal its sub menu items.
4Select
Client Blacklist.
Figure 15-129 Wireless Controller - WIPS Client Blacklist screen
The Client Blacklist screen displays the following:
15.3.36.2 Viewing WIPS Event Statistics
The WIPS Events screen displays event information for rogue Access Point intrusions within the controller or
service platform managed network.
To view WIPS event statistics:
1 Select the Statistics menu from the Web UI.
2 Select a Wireless Controller node from the left navigation pane.
3Select
WIPS and expand the menu to reveal its sub menu items.
Event Name Displays the name of the detected wireless intrusion resulting in a
blacklisting of the client from controller or service platform resources.
Blacklisted Client Displays the MAC address of the intruding client device pending
exclusion from the controller or service platform managed network.
Time Blacklisted Displays the time this client was blacklisted.
Total Time Displays the duration the unauthorized device remained in the WLAN.
Time Left Displays the duration after which the blacklisted client is removed from
the blacklist.
Refresh Select the Refresh button to update the screen’s statistics counters to
their latest values.
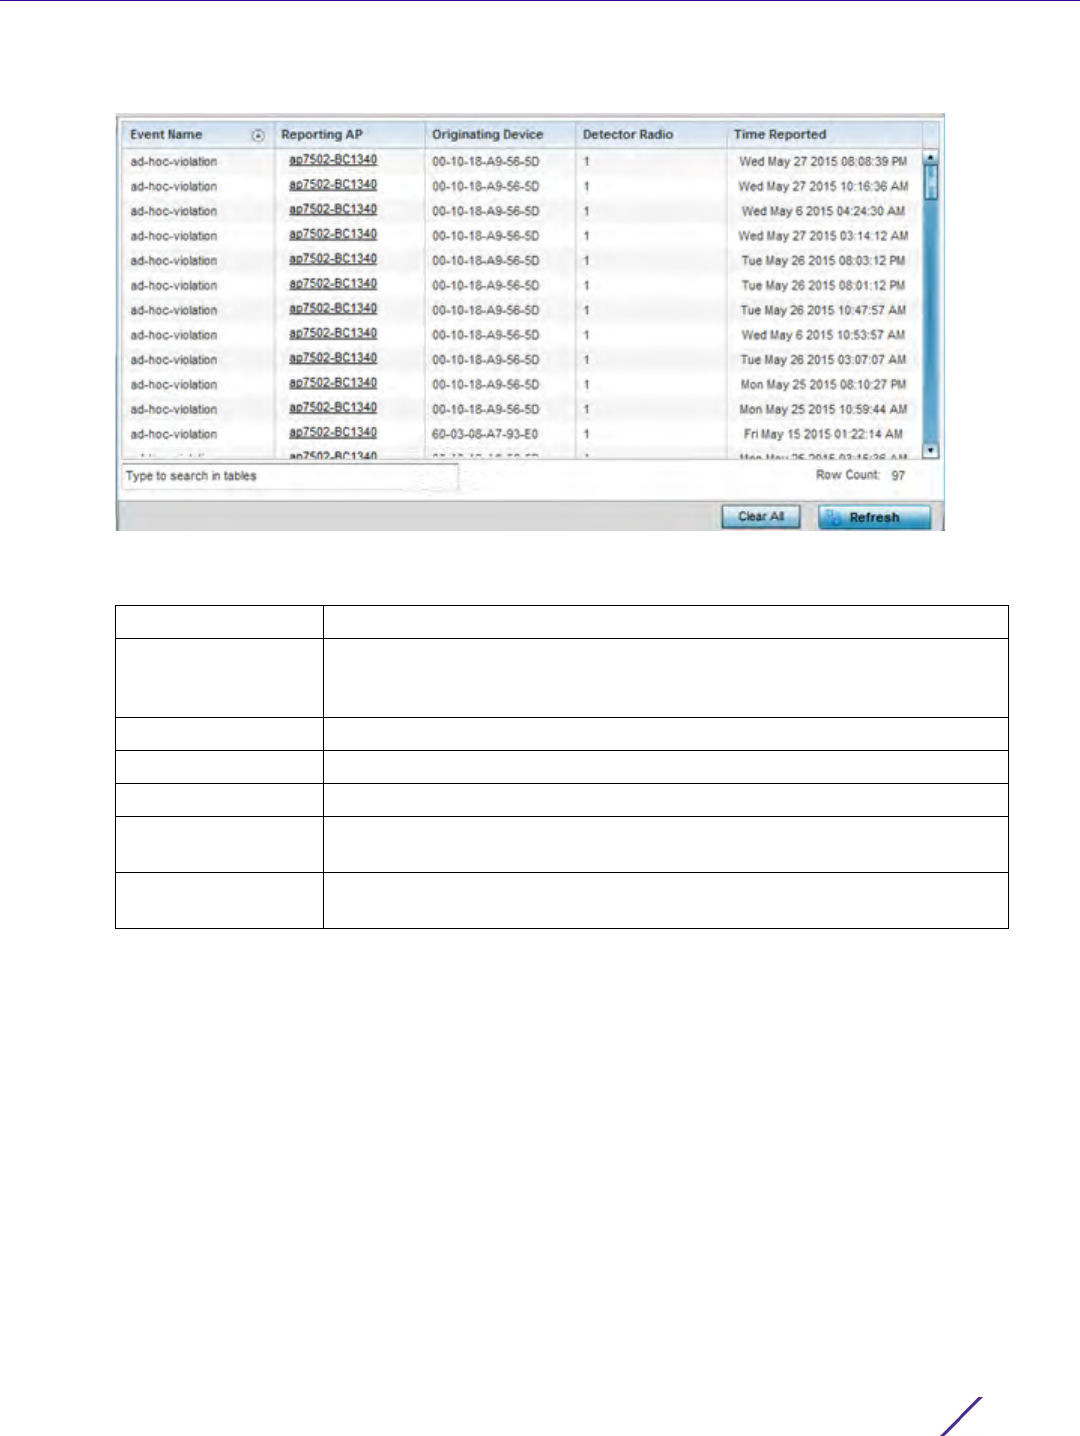
Statistics
Wireless Controller and Service Platform System Reference Guide 15 - 188
4Select WIPS Events
Figure 15-130 Wireless Controller - WIPS Events screen
The WIPS Events screen displays the following:
15.3.37 Sensor Server
Controller Statistics
Sensor servers allow the monitor and download of data from multiple sensors and remote locations using
Ethernet, TCP/IP or serial communication. Repeaters are available to extend the transmission range and combine
sensors with various frequencies on the same receiver.
To view the Sensor Server statistics:
1 Select the Statistics menu from the Web UI.
2 Select a Wireless Controller node from the left navigation pane.
3Select
Sensor Servers from the left-hand side of the controller or service platform UI.
Event Name Displays the name of the detected intrusion event.
Reporting AP Displays the hostname of the AP reporting each intrusion. The Access
Point displays as a link that can be selected to provide configuration and
network address information in greater detail.
Originating Device Displays the MAC address of the intruder AP.
Detector Radio Displays which AP radio is making the intrusion detection.
Time Reported Displays the time when the intruding AP was detected.
Clear All Select Clear All to reset the statistics counters to zero and begin a new
data collection.
Refresh Select the Refresh button to update the screen’s statistics counters to their
latest values.
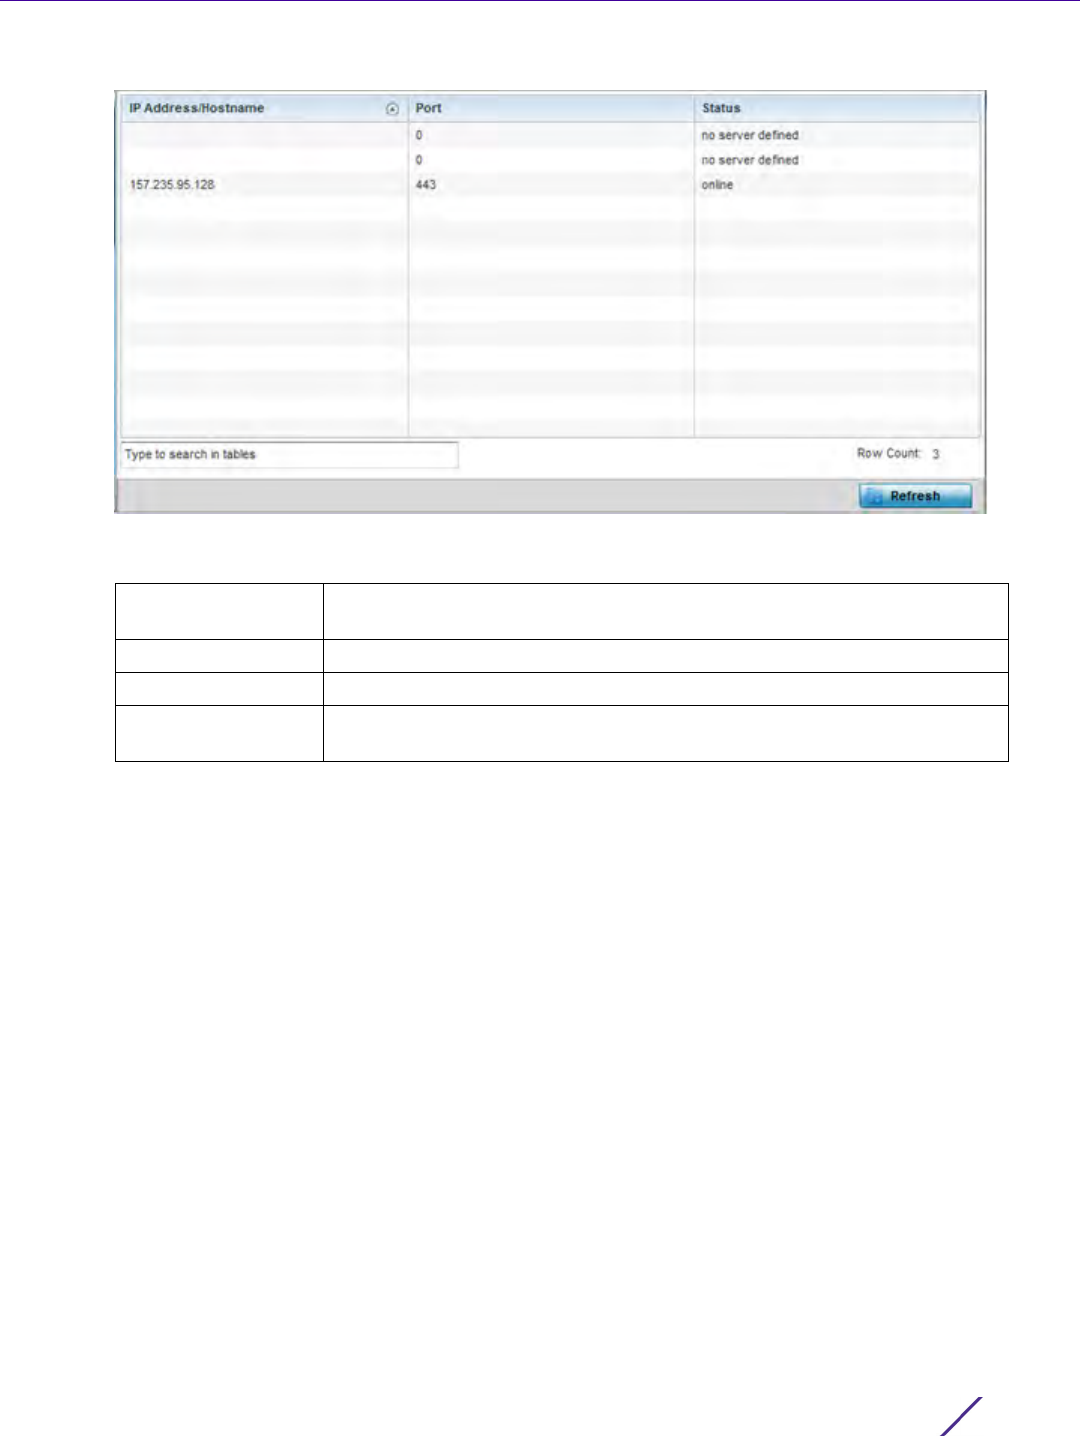
Statistics
Wireless Controller and Service Platform System Reference Guide 15 - 189
Figure 15-131 Wireless Controller - Sensor Server screen
The Sensor Servers screen displays the following:
15.3.38 Bonjour Services
Controller Statistics
Bonjour is Apple’s zero-configuration networking (Zeroconf) implementation. Zeroconf is a group of technologies
including service discovery, address assignment and hostname resolution. Bonjour locates the devices (printers,
computers etc.) and services these computers provide over a local network.
Bonjour provides a method to discover services on a LAN. Bonjour allows users to set up a network without any
configuration. Services such as printers, scanners and file-sharing servers can be found using Bonjour. Bonjour only
works within a single broadcast domain. However, with a special DNS configuration, it can be extended to find
services across broadcast domains.
To view the Bonjour service statistics:
1 Select the Statistics menu from the Web UI.
2 Select a Wireless Controller node from the left navigation pane.
3Select
Bonjour Services from the left-hand side of the controller or service platform UI.
IP Address/
Hostname
Displays a list of sensor server IP addresses. These are sensor resources
available to the controller or service platform.
Port Displays the port on which this server is listening.
Status Displays whether the server is connected or not connected.
Refresh Select the Refresh button to update the screen’s statistics counters to their
latest values.
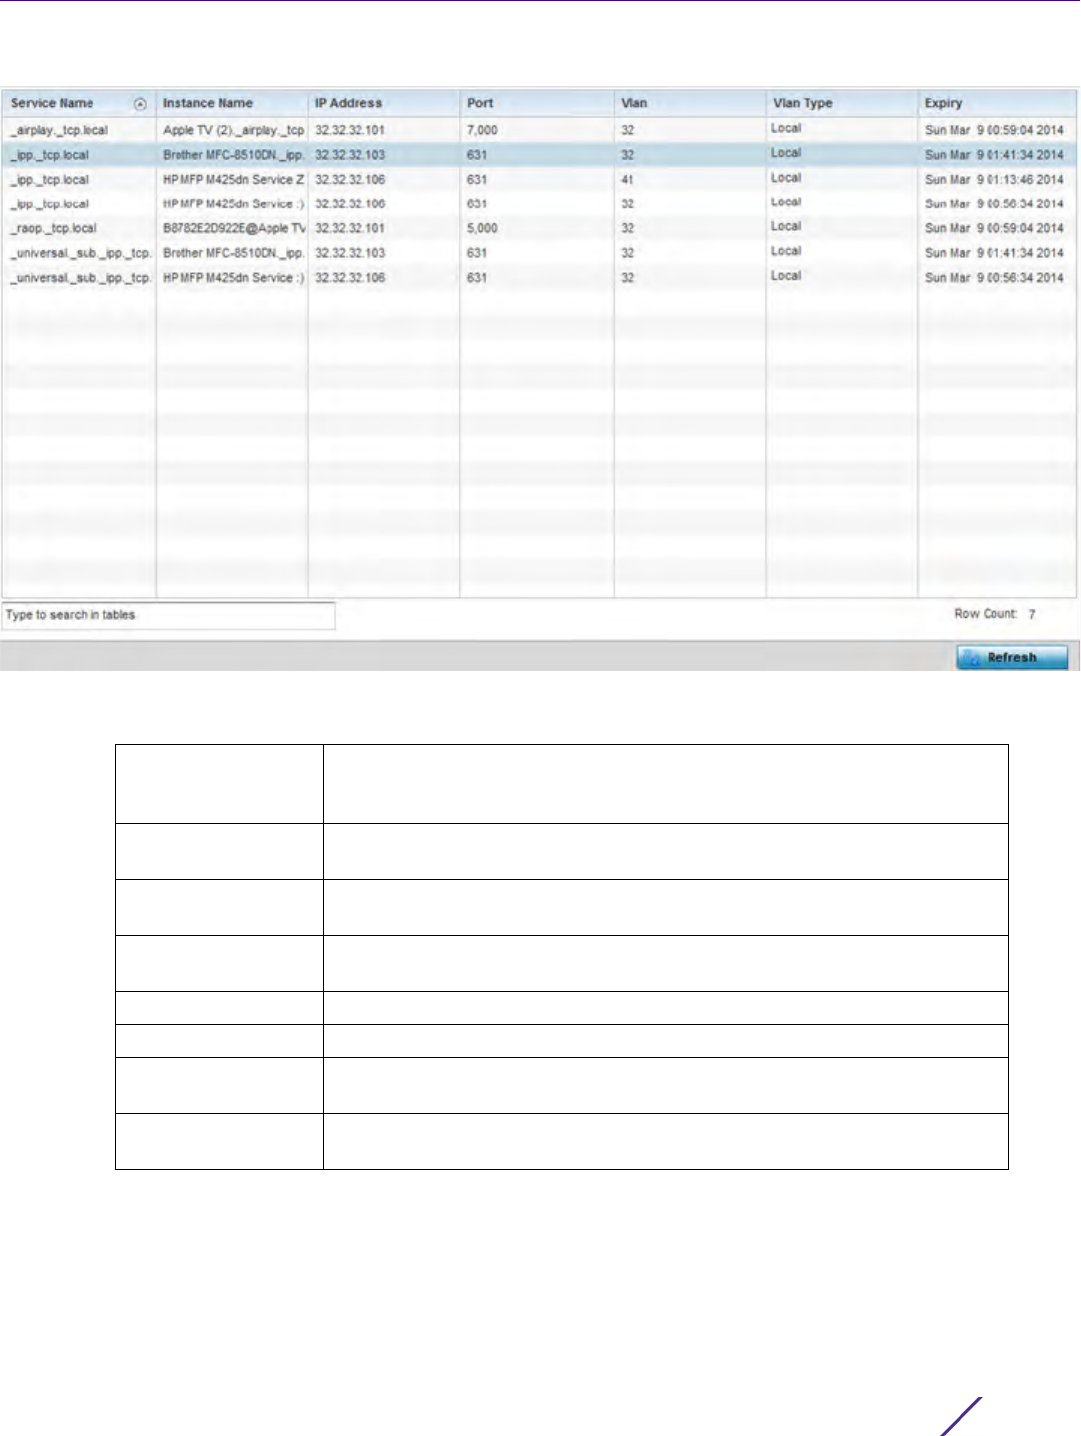
Statistics
Wireless Controller and Service Platform System Reference Guide 15 - 190
Figure 15-132 Wireless Controller - Bonjour Services screen
Refer to the following Bonjour service utilization stats:
15.3.39 Captive Portal Statistics
Controller Statistics
A captive portal redirects an HTTP client to a Web page (usually for authentication purposes) before
authenticating for Internet access. A captive portal turns a Web browser into an authenticator. This is done by
Service Name Lists the services discoverable by the Bonjour gateway. Services can either
be pre-defined Apple services (scanner, printer etc.) or an alias not
available on the predefined list.
Instance Name Lists the name of each Bonjour service instance (session) utilized by the
controller or service platform.
IP Address Lists the network IP address utilized by the listed Bonjour service
providing resources to the controller or service platform.
Port Displays the port used to secure a connection with the listed Bonjour
service.
Vlan Lists the VLAN(s) on which a listed Bonjour service is routable.
Vlan Type Lists the VLAN type as either a local bridging mode or a shared tunnel.
Expiry Lists the expiration date of the listed Bonjour service, and its availability to
discover resources on the LAN.
Refresh Select the Refresh button to update the screen’s statistics counters to their
latest values.
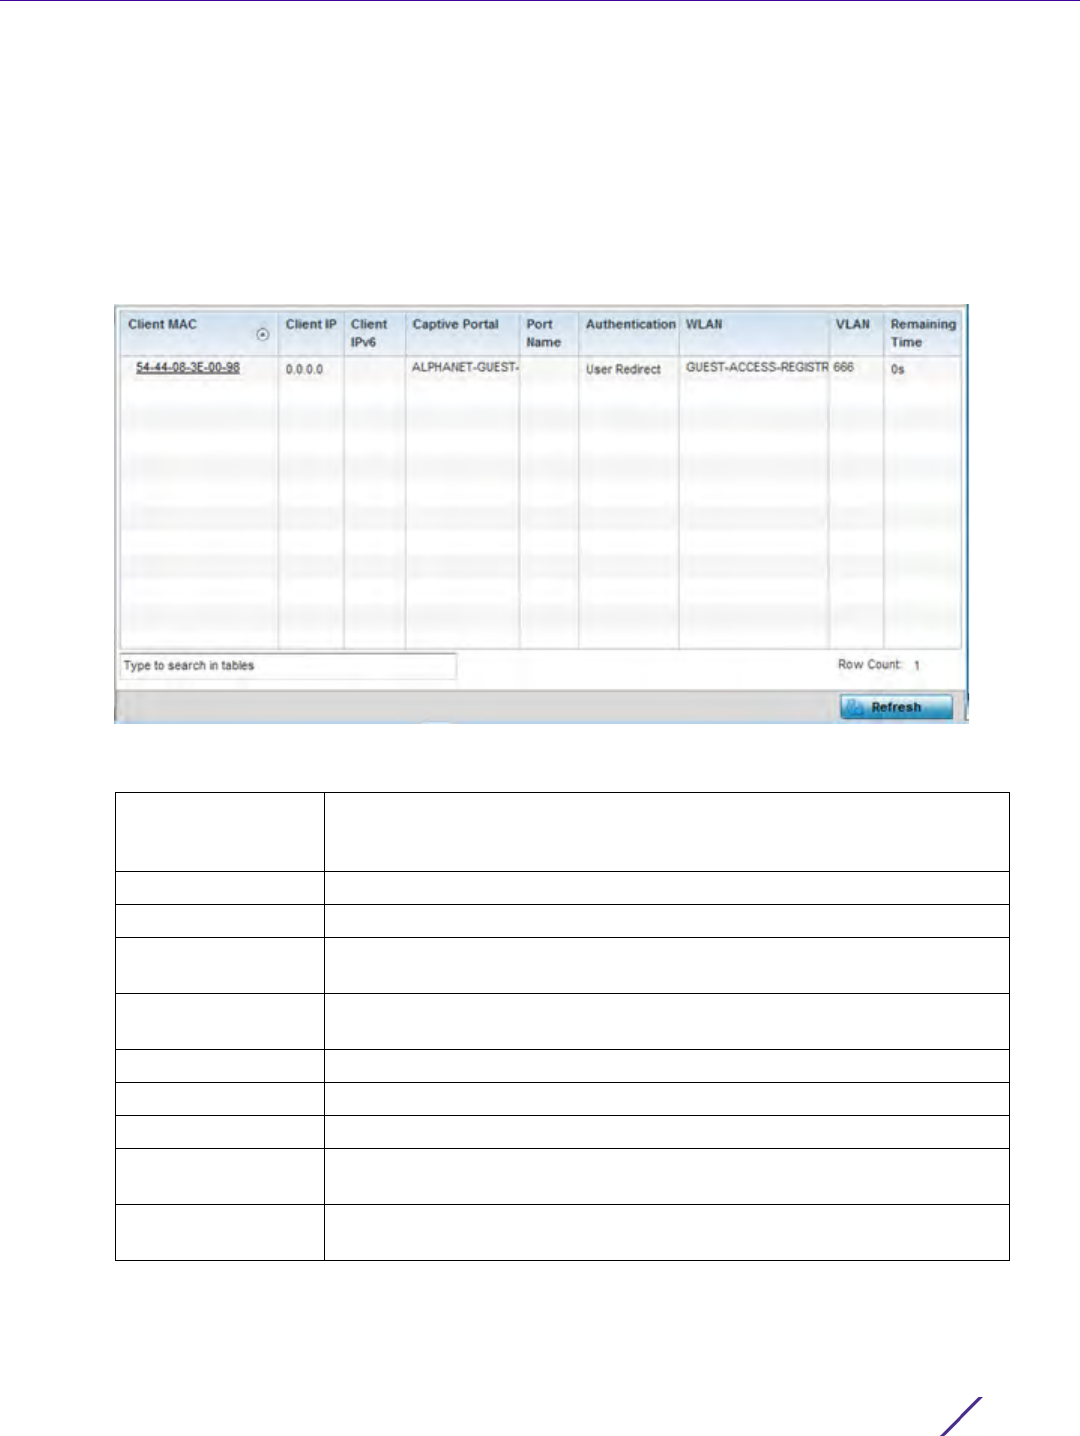
Statistics
Wireless Controller and Service Platform System Reference Guide 15 - 191
intercepting packets (regardless of the address or port) until the user opens a browser and attempts to access the
Internet. At that time, the browser is redirected to a Web page requiring authentication.
To view the controller or service platform captive portal statistics:
1 Select the Statistics tab from the Web UI.
2 Select a Wireless Controller node from the left navigation pane.
3Select
Captive Portal from the left-hand side of the controller or service platform UI.
Figure 15-133 Wireless Controller - Captive Portal screen
The Captive Portal screen displays the following:
Client MAC Displays the requesting client’s MAC address. The MAC displays as a link
that can be selected to display client configuration and network address
information in greater detail.
Client IP Displays the requesting client’s IPv4 formatted IP address.
Client IPv6 Displays the requesting client’s IPv6 formatted IP address.
Captive Portal Displays the captive portal name that each listed client is utilizing for guest
access to controller resources.
Port Name Lists the controller or service platform port name supporting the captive
portal connection with the listed client MAC address.
Authentication Displays the authentication status of the requesting client.
WLAN Displays the name of the WLAN the client belongs to.
VLAN Displays the name of the requesting client’s VLAN interface.
Remaining Time Displays the time after which the client is disconnected from the captive
portal managed Internet.
Refresh Select the Refresh button to update the screen’s statistics counters to their
latest values.
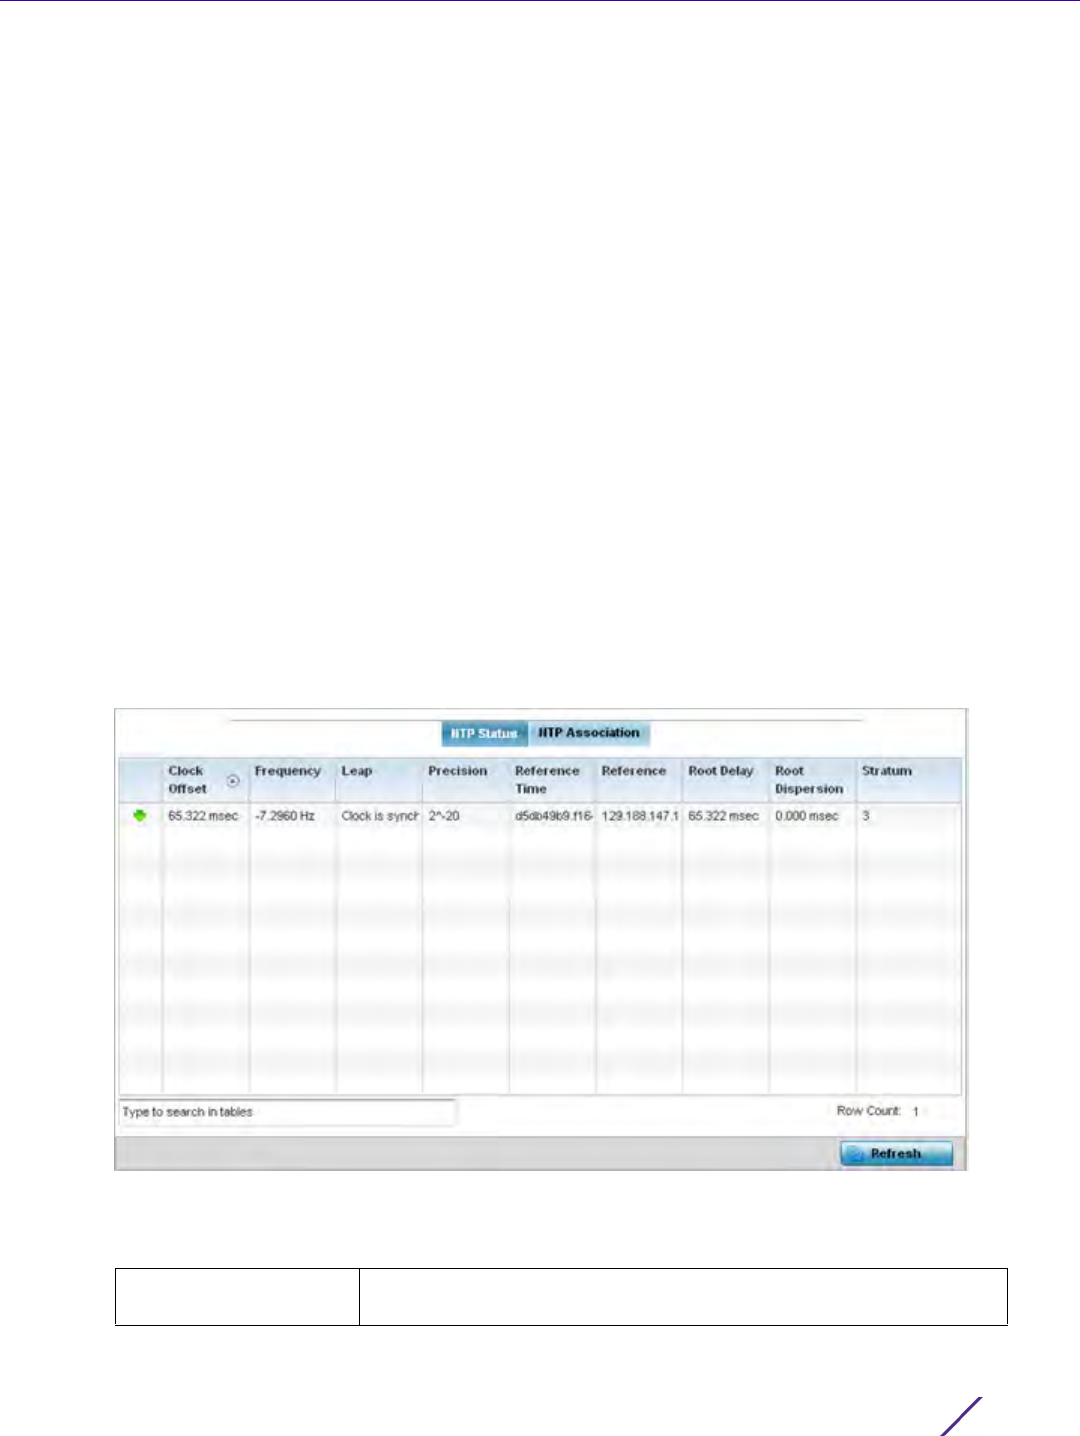
Statistics
Wireless Controller and Service Platform System Reference Guide 15 - 192
15.3.40 Network Time
Controller Statistics
Network Time Protocol (NTP) is central to networks that rely on their controller or service platform to supply
system time. Without NTP, system time is unpredictable, which can result in data loss, failed processes and
compromised security. With network speed, memory, and capability increasing at an exponential rate, the
accuracy, precision, and synchronization of network time is essential in a controller or service platform managed
network. The controller or service platform can use a dedicated server to supply system time. The controller or
service platform can also use several forms of NTP messaging to sync system time with authenticated network
traffic.
15.3.40.1 Viewing NTP Status
Network Time
The NTP Status screen displays performance (status) information relative to the NTP association status. Verify the
NTP status to assess the controller or service platform’s current NTP resource.
To view the NTP status of a managed network:
1 Select the Statistics menu from the Web UI.
2 Select a Wireless Controller node from the left navigation pane.
3Select
Network Time.
4Select
NTP Status.
Figure 15-134 Wireless Controller - NTP Status screen
Refer to the NTP Status table to review the accuracy and performance of the controller or service platform’s
synchronization with an NTP server.
Clock Offset Displays the time differential between the controller or service
platform time and the NTP resource.

Statistics
Wireless Controller and Service Platform System Reference Guide 15 - 193
15.3.40.2 Viewing NTP Associations
Network Time
The interaction between the controller or service platform and an SNTP server constitutes an association. SNTP
associations can be either peer associations (the controller or service platform synchronizes to another system or
allows another system to synchronize to it), or a server associations (only the controller or service platform
synchronizes to the SNTP resource, not the other way around).
To view the NTP associations:
1 Select the Statistics menu from the Web UI.
2 Select a Wireless Controller node from the left navigation pane.
3Select
Network Time.
4Select
NTP Associations.
Frequency An SNTP server clock’s skew (difference) for the controller or service
platform and the dedicated NTP resource.
Leap Indicates if a second is added or subtracted to SNTP packet
transmissions, or if transmissions are synchronized.
Precision Displays the precision of the controller’s time clock (in Hz). The values
that normally appear in this field range from -6 for mains-frequency
clocks to -20 for microsecond clocks.
Reference Time Displays the time stamp the local clock was last set or corrected.
Reference Displays the address of the time source the controller or service
platform is synchronized to.
Root Delay The total round-trip delay in seconds. This variable can take on both
positive and negative values, depending on relative time and
frequency offsets. The values that normally appear in this field range
from negative values (a few milliseconds) to positive values (several
hundred milliseconds).
Root Dispersion The difference between the time on the root NTP server and it’s
reference clock. The reference clock is the clock used by the NTP
server to set its own clock.
Stratum Displays how many hops the controller or service platform is from its
current NTP resource.
Refresh Select the Refresh button to update the screen’s statistics counters to
their latest values.
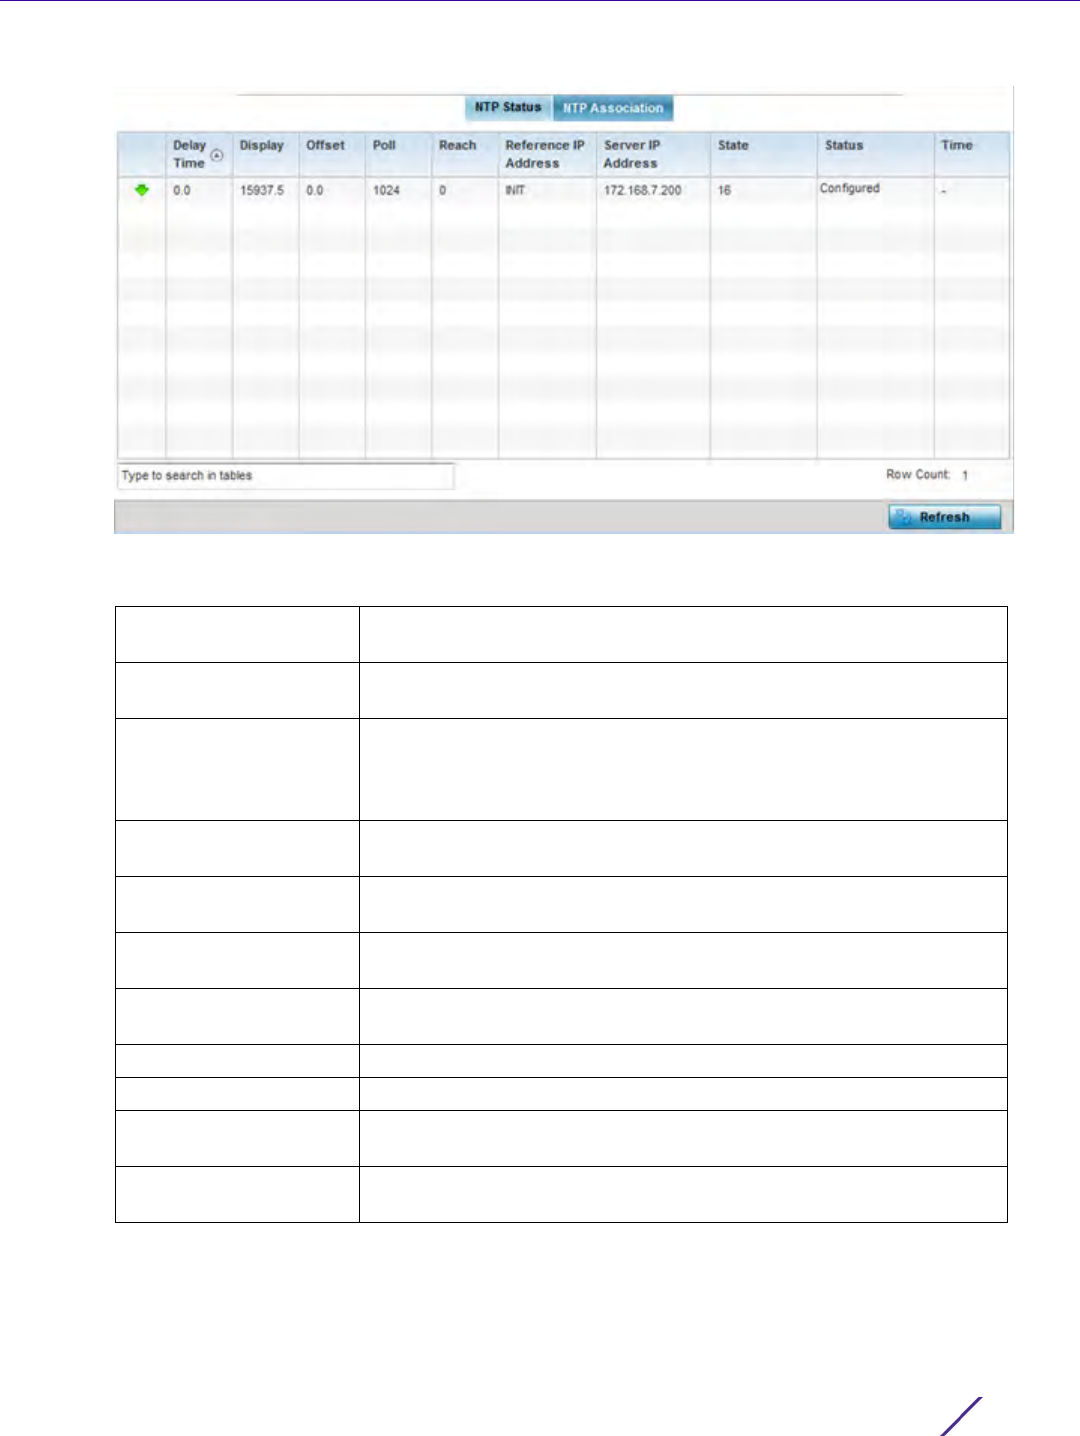
Statistics
Wireless Controller and Service Platform System Reference Guide 15 - 194
Figure 15-135 Wireless Controller - NTP Association screen
The NTP Associations screen provides the controller or service platform’s current NTP associations:
Delay Time Displays the round-trip delay (in seconds) for SNTP broadcasts
between the SNTP server and the controller or service platform.
Display Displays the time difference between the peer NTP server and the
onboard wireless controller clock.
Offset Displays the calculated offset between the controller or service
platform and the SNTP server. The controller or service platform
adjusts its clock to match the server’s time. The offset gravitates
towards zero overtime, but never completely reduces its offset to zero.
Poll Displays the maximum interval between successive messages (in
seconds) to the nearest power of two.
Reach Displays the status of the last eight SNTP messages. If an SNTP packet
is lost, the lost packet is tracked over the next eight SNTP messages.
Reference IP Address Displays the address of the time source the controller or service
platform is synchronized to.
Server IP Address Displays the numerical IP address of the SNTP resource (server)
providing SNTP updates to the controller.
State Displays the NTP association status code.
Status Displays the NTP peer’s current status.
Time Displays the timestamp of the last NTP packet received from the NTP
peer.
Refresh Select the Refresh button to update the screen’s statistics counters to
their latest values.

Statistics
Wireless Controller and Service Platform System Reference Guide 15 - 195
15.4 Access Point Statistics
Statistics
The Access Point statistics screens displays controller or service platform connected Access Point performance,
health, version, client support, radio, mesh, interface, DHCP, firewall, WIPS, sensor, captive portal, NTP and load
information. Access point statistics consists of the following:
•Health
•Device
•Web-Filtering
•Application Visibility (AVC)
•Device Upgrade
•Adoption
•AP Detection
•Guest User
•Wireless LANs
•Policy Based Routing
•Radios
•Mesh
•Interfaces
•RTLS
•PPPoE
•Bluetooth
•OSPF
•L2TPv3 Tunnels
•VRRP
•Critical Resources
•LDAP Agent Status
•Mint Links
•Guest Users
•GRE Tunnels
•Dot1x
•Network
•DHCPv6 Relay & Client
•DHCP Server
•Firewall
•VPN
•Certificates
•WIPS
•Sensor Servers
•Bonjour Services
•Captive Portal
•Network Time
•Load Balancing
•Environmental Sensors (AP8132 Models Only)
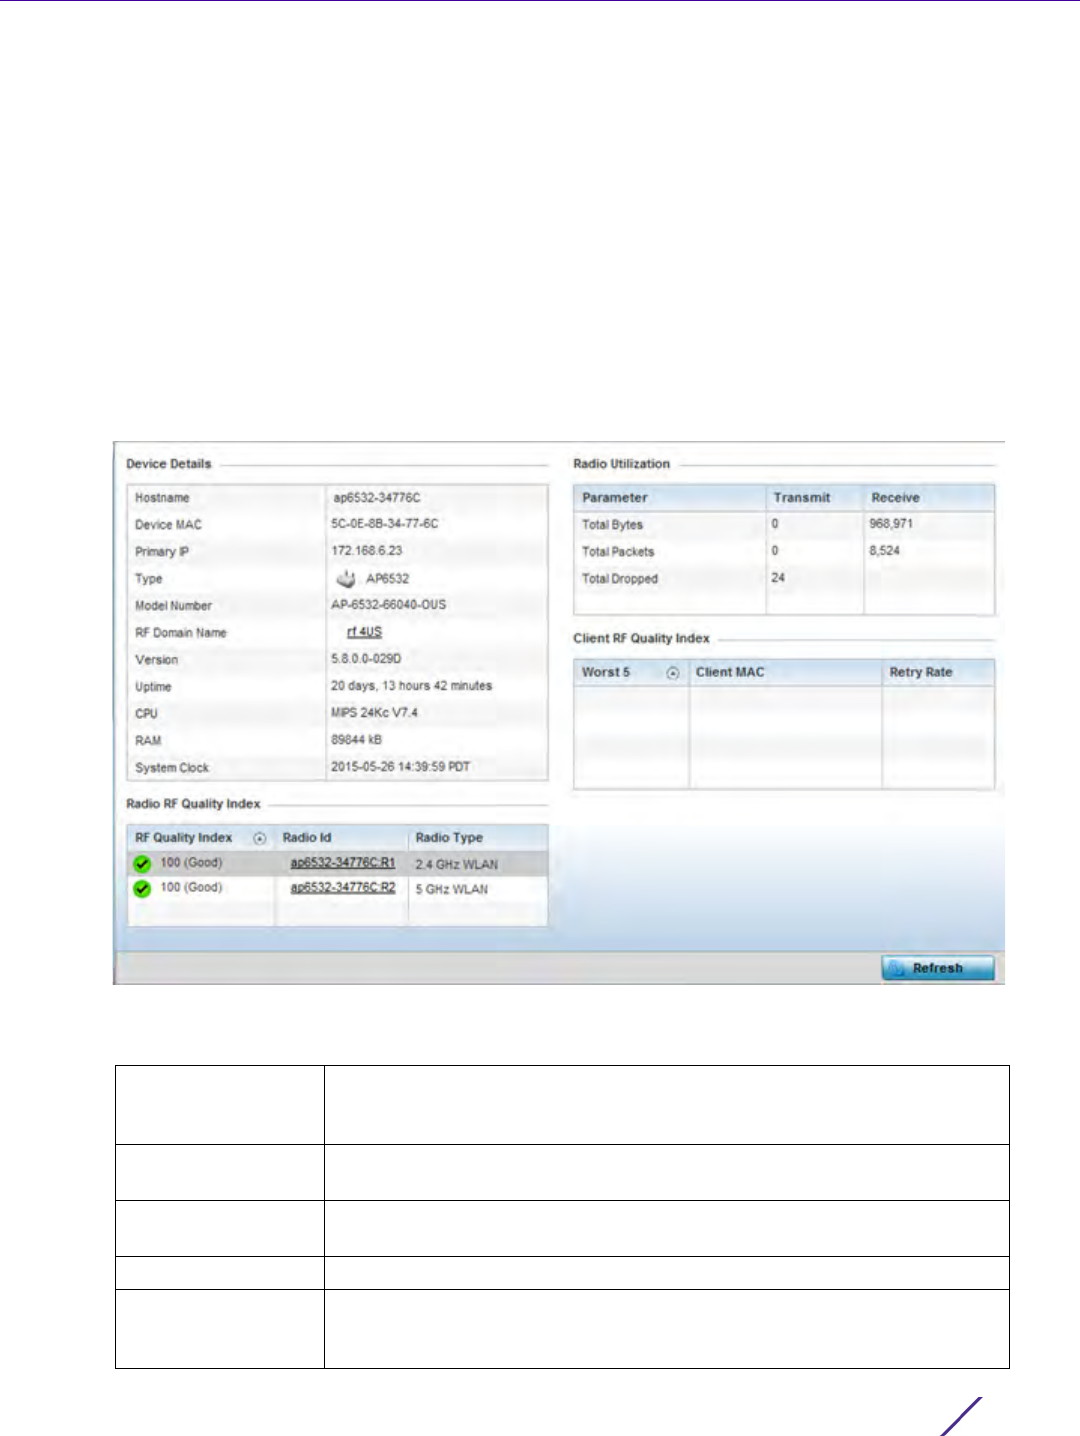
Statistics
Wireless Controller and Service Platform System Reference Guide 15 - 196
15.4.1 Health
Access Point Statistics
The Health screen displays a selected Access Point’s hardware version and software version. Use this information
to fine tune the performance of an Access Point. This screen should also be the starting point for troubleshooting
an Access Point since it’s designed to present a high level display of Access Point performance efficiency.
To view the Access Point health:
1 Select the Statistics menu from the Web UI.
2Select
System from the navigation pane (on the left-hand side of the screen). Expand a RF Domain, select a
controller or service platform, and select one of its connected Access Points.
3Select
Health.
Figure 15-136 Access Point - Health screen
The Device Details field displays the following information:
Hostname Displays the AP’s unique name as assigned within the controller or service
platform managed network. A hostname is assigned to a device connected
to a computer network.
Device MAC Displays the MAC address of the AP. This is factory assigned and cannot
be changed.
Primary AP Displays the IP address of assigned to this device either through DHCP or
through static IP assignment.
Type Displays the Access Point’s model type.
Model Number Displays the Access Point’s model number to help further differentiate the
Access Point from others of the same model series and defined country of
operation.

Statistics
Wireless Controller and Service Platform System Reference Guide 15 - 197
The Radio RF Quality Index field displays the following:
The Radio Utilization Index field displays the following:
The Client RF Quality Index field displays the following:
4 Select the Refresh button as needed to update the screen’s statistics counters to their latest values.
15.4.2 Device
Access Point Statistics
The Device screen displays basic information about the selected Access Point. Use this screen to gather version
information, such as the installed firmware image version, the boot image and upgrade status.
RF Domain Name Displays the Access Point’s RF Domain membership. Unlike a controller or
service platform, an Access Point can only belong to one RF Domain
based on its model. The domain name appears as a link that can be
selected to show RF Domain utilization in greater detail.
Version Displays the Access Point’s current firmware version. Use this information
to assess whether an upgrade is required for better compatibility.
Uptime Displays the cumulative time since the Access Point was last rebooted or
lost power.
CPU Displays the processor core.
RAM Displays the free memory available with the RAM.
System Clock Displays the system clock information.
RF Quality Index Displays Access Point radios and their quality indices. RF quality index
indicates the overall RF performance. The RF quality indices are:
0 – 50 (poor)
50 – 75 (medium)
75 – 100 (good)
Radio Id Displays a radio’s hardware encoded MAC address The ID appears as a link
that can be selected to show radio utilization in greater detail.
Radio Type Identifies whether the radio is a 2.4 or 5 GHz.
Total Bytes Displays the total bytes of data transmitted and received by the Access
Point since the screen was last refreshed.
Total Packets Lists the total number of data packets transmitted and received by the
Access Point since the screen was last refreshed.
Total Dropped List the number of dropped data packets by an Access Point radio since
the screen was last refreshed.
Worst 5 Displays clients having lowest RF quality within the network.
Client MAC Displays the MAC addresses of the clients with the lowest RF indices.
Retry Rate Displays the average number of retries per packet. A high number
indicates possible network or hardware problems.
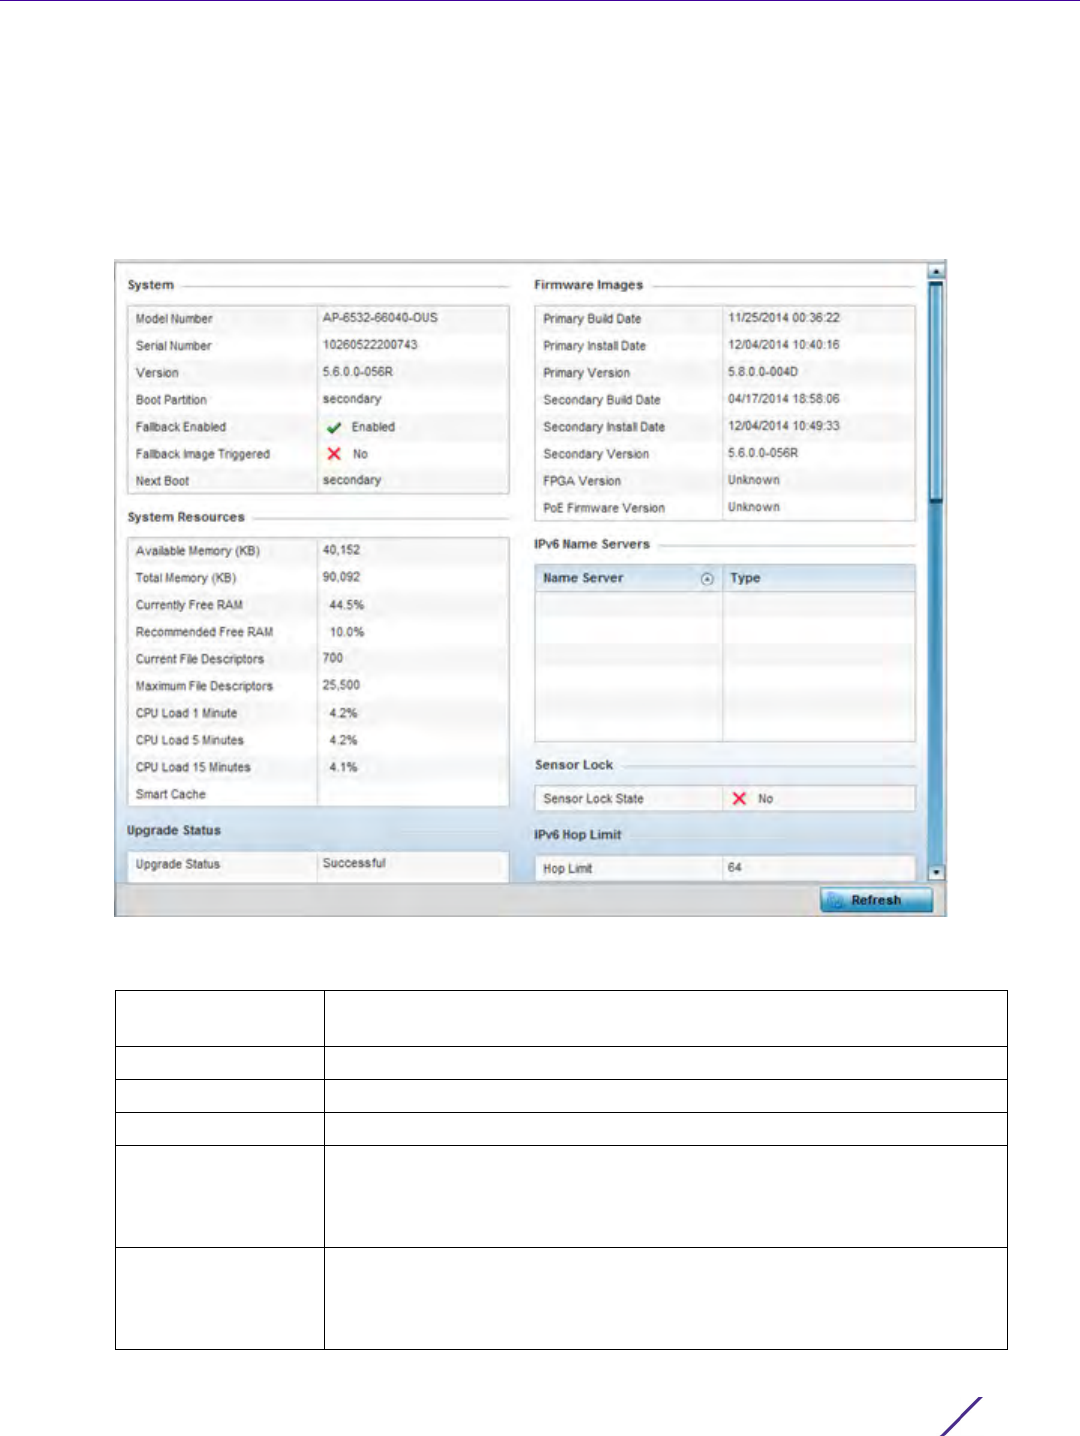
Statistics
Wireless Controller and Service Platform System Reference Guide 15 - 198
To view the device statistics:
1 Select the Statistics menu from the Web UI.
2Select
System from the navigation pane (on the left-hand side of the screen). Expand a RF Domain, select a
controller or service platform, and select one of its connected Access Points.
3Select
Device.
Figure 15-137 Access Point - Device screen
The System field displays the following:
Model Number Displays the model of the selected Access Point to help distinguish its
exact SKU and country of operation.
Serial Number Displays the numeric serial number set for the Access Point.
Version Displays the software (firmware) version on the Access Point.
Boot Partition Displays the boot partition type.
Fallback Enabled Displays whether this option is enabled. This method enables a user to
store a known legacy version and a new version in device memory. The
user can test the new software, and use an automatic fallback, which loads
the old version on the Access Point if the new version fails.
Fallback Image
Triggered
Displays whether the fallback image was triggered. The fallback image is
an old version of a known and operational software stored in device
memory. This allows a user to test a new version of software. If the new
version fails, the user can use the old version of the software.

Statistics
Wireless Controller and Service Platform System Reference Guide 15 - 199
The System Resources field displays the following:
The Upgrade Status field displays the following:
The Fan Speed field displays the following:
The Temperature field displays the following:
The Kernal Buffers field displays the following:
The IP Domain field displays the following:
Next Boot Designates this version as the version used the next time the AP is booted.
Available Memory
(MB)
Displays the available memory (in MB) available on the Access Point.
Total Memory (MB) Displays the Access Point’s total memory.
Currently Free RAM Displays the Access Point’s free RAM space. If its very low, free up some
space by closing some processes.
Recommended Free
RAM
Displays the recommended RAM required for routine operation.
Current File
Descriptors
Displays the Access Point’s current file description.
Maximum File
Descriptors
Displays the Access Point’s maximum file description.
CPU Load 1 Minute Lists this Access Point’s CPU utilization over a 1 minute span.
CPU Load 5 Minutes Lists this Access Point’s CPU utilization over a 5 minute span.
CPU Load 15 Minutes Lists this Access Point’s CPU utilization over a 15 minute span.
Upgrade Status Displays the status of the last firmware upgrade performed by this
controller or service platform.
Upgrade Status Time Lists a time stamp defining the occurrence of the most recent upgrade
operation.
Number Displays the number of fans supported on the this Access Point.
Speed (Hz) Displays the fan speed in Hz.
Number Displays the number of temperature elements used by the Access Point.
Temperature Displays the current temperature (in Celsius) to assess a potential Access
Point overheat condition.
Buffer Size Lists the sequential buffer size.
Current Buffers Displays the current buffers available to the selected Access Point.
Maximum Buffers Lists the maximum buffers available to the selected Access Point.
Number Displays the number of fans supported on the this Access Point.

Statistics
Wireless Controller and Service Platform System Reference Guide 15 - 200
The IP Name Servers field displays the following:
The Firmware Images field displays the following:
The IPv6 Name Servers field displays the following:
The Sensor Lock field displays the following:
The Power Management field displays the following:
Speed (Hz) Displays the fan speed in Hz.
Name Server Displays the names of the servers designated to provide DNS resources to
this Access Point.
Type Displays the type of server for each server listed.
Primary Build Date Displays the build date when this Access Point firmware version was
created.
Primary Install Date Displays the date this version was installed.
Primary Version Displays the primary version string.
Secondary Build Date Displays the build date when this version was created.
Secondary Install Date Displays the date this secondary version was installed.
Secondary Version Displays the secondary version string.
FPGA Version Displays whether a FPGA supported firmware load is being utilized.
PoE Firmware Version Displays whether a PoE supported firmware load is being utilized.
Name Server List the IPv6 name server hosting a network service for providing
responses to queries against a directory. The IPv6 name server maps a
human recognizable identifier to a system’s internal identifier. This
service is performed by the server in response to a network service
protocol request.
Type Lists the type of IPv6 name server mapping a human readable
identifier to system identifier.
Sensor Lock Displays whether a lock has been applied to Access Point sensor
capabilities.
Power Management
Mode
Displays the power mode currently invoked by the selected Access
Point.
Power Management
Status
Lists the power status of the Access Point.
Ethernet Power Status Displays the Access Point’s Ethernet power status.
Radio Power Status Displays the power status of the Access Point’s radios.

Statistics
Wireless Controller and Service Platform System Reference Guide 15 - 201
The IPv6v Hop Limit table displays the following:
The IPv6 Delegated Prefixes table displays the following:
4Select
Refresh to update the statistics counters to their latest values.
15.4.3 Web-Filtering
Access Point Statistics
The Web-Filtering screen displays information on Web requests for content and whether the requests were
blocked or approved based on URL filter settings defined for the selected Access Point. A URL filter is comprised
of several filter rules. A whitelist bans all sites except the categories and URL lists defined in the whitelist. The
blacklist allows all sites except the categories and URL lists defined in the blacklist.
To view this Access Point’s Web filter statistics:
1 Select the Statistics menu from the Web UI.
2Select
System from the navigation pane (on the left-hand side of the screen). Expand a RF Domain, select a
controller or service platform, and select one of its connected Access Points.
3Select
Web-Filtering.
Hop Limit Lists the maximum number of times IPv6 traffic can hop. The IPv6
header contains a hop limit field that controls the number of hops a
datagram can be sent before being discarded (similar to the TTL field
in an IPv4 header).
IPv6 Delegated Prefix In IPv6, prefix delegation is used to assign a network address prefix,
configuring the controller or service platform with the prefix.
Prefix Name Lists the name assigned to the IPv6 delegated prefix.
DHCPv6 Client State Displays the current DHCPv6 client state as impacted by the IPv6
delegated prefix.
Interface Name Lists the interface over which IPv6 prefix delegation occurs.
T1 timer (seconds) Lists the amount of time in seconds before the DHCP T1 (delay before
renew) timer expires.
T2 timer (seconds) Lists the amount of time in seconds before the DHCP T2 (delay before
rebind) timer expires.
Last Refreshed
(seconds)
Lists the time, in seconds, since IPv6 prefix delegation has been
updated.
Preferred Lifetime
(seconds)
Lists is the time in seconds (relative to when the packet is sent) the
IPv6 formatted addresses remains in a preferred state on the selected
interface. The preferred lifetime must always be less than or equal to
the valid lifetime.
Valid Lifetime (seconds) Displays the time in seconds (relative to when the packet is sent) the
IPv6 formatted address remains in a valid state on the selected
interface. The valid lifetime must always be greater than or equal to
the preferred lifetime.
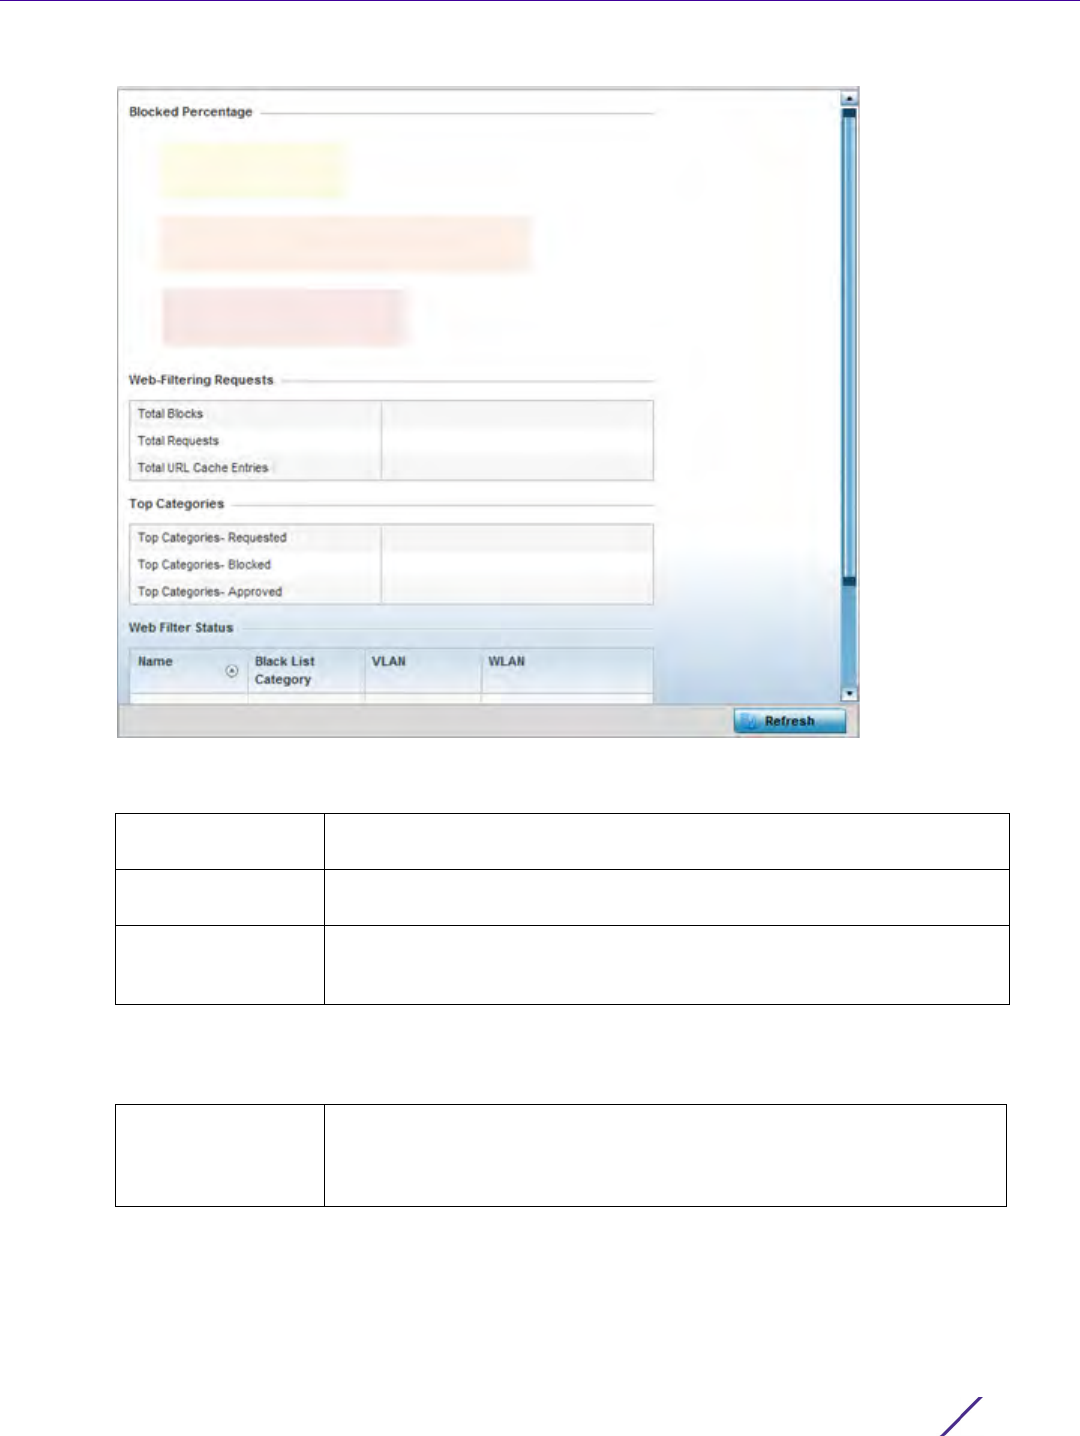
Statistics
Wireless Controller and Service Platform System Reference Guide 15 - 202
Figure 15-138 Access Point - Web Filtering screen
The Web-Filtering Requests field displays the following information:
The Top Categories field helps administrators assess the content most requested, blocked or approved based
on the defined whitelist and blacklist permissions:
Total Blocks Lists the number of Web request hits against content blocked in the URL
blacklist.
Total Requests Lists the total number of requests for URL content cached locally on this
Access Point.
Total URL Cache
Entries
Displays the number of chached URL data entries made on this Access
Point on the request of requesting clients requiring URL data managed by
the Access Point and their respective whitelist or blacklist.
Top Categories -
Requested
Lists those Web content categories most requested by clients managed
by this Access Point. Use this information to assess whether the
permissions defined in the blacklist and whitelist optimally support these
client requests for cached Web content.

Statistics
Wireless Controller and Service Platform System Reference Guide 15 - 203
The Web Filter Status field displays the following information:
4 Periodically select Refresh to update this screen to its latest values.
15.4.4 Application Visibility (AVC)
Access Point Statistics
Access Points can inspect every byte of each application header packet allowed to pass to their connected clients.
When an application is recognized and classified by the WiNG application recognition engine, administrator
defined actions can be applied to that specific application. For information on categorizing, filtering and logging
the application data allowed to proliferate the WiNG network, refer to Application Policy on page 7-54 and
Application on page 7-58.
To view Access Point application utilization statistics:
1 Select the Statistics menu from the Web UI.
2Select
System from the navigation pane (on the left-hand side of the screen). Expand a RF Domain, select a
controller or service platform, and select one of its connected Access Points.
3Select
Application Visibility (AVC).
Top Categories -
Blocked
Lists those Web content categories blocked most often for requesting
clients managed by this Access Point. Use this information to periodically
assess whether the permissions defined in the blacklist and whitelist still
restrict the desired cached Web content from requesting clients.
Remember, a whitelist bans all sites except the categories and URL lists
defined in the whitelist. The blacklist allows all sites except the categories
and URL lists defined in the blacklist.
Top Categories -
Approved
Lists those Web content categories approved most often on behalf of
requesting clients managed by this Access Point. Periodically review this
information to assess whether this cached and available Web content still
adhere’s to your organization’s standards for client access.
Name Displays the name of the filter whose URL rule set has been invoked.
Blacklist Category Lists the blacklist category whose URL filter rule set has caused data to be
filtered to a requesting client. Periodically assess whether these rules are
still relevant to the data requirements of requesting clients.
VLAN Lists the impacted Access Point VLAN whose Web data traffic has been
filtered based on the restrictions in the listed blacklist category.
WLAN Lists the impacted Access Point WLAN whose Web data traffic has been
filtered based on the restrictions in the listed blacklist category.
Periodically assess whether clients are segregated to the correct WLAN
based on their cached Web data requirements and impending filter rules.
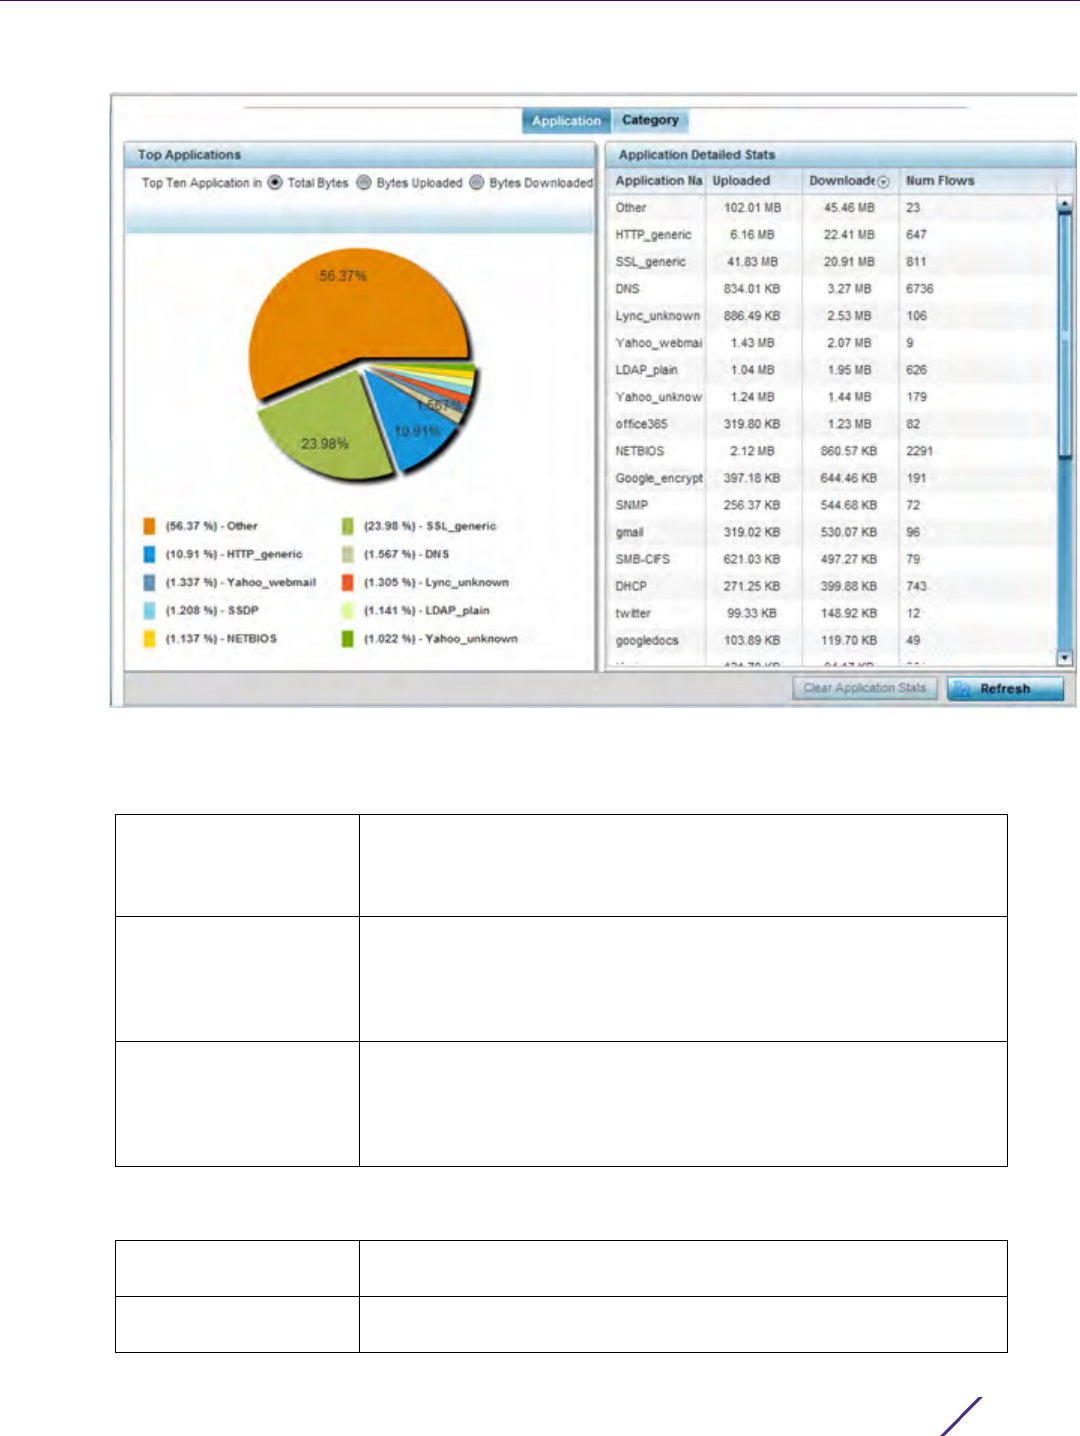
Statistics
Wireless Controller and Service Platform System Reference Guide 15 - 204
Figure 15-139 Access Point - Application Visibility
4 Refer to the Top Applications graph to assess the most prolific, and allowed, application data passing through
the Access Point.
5 Refer to the Application Detailed Stats table to assess specific application data utilization:
Total Bytes Displays the top ten utilized applications in respect to total data bytes
passing through the Access Point. These are only the administrator
allowed applications approved for proliferation within the Access Point
managed network.
Bytes Uploaded Displays the top ten applications in respect to total data bytes
uploaded through the Access Point managed network. If this
application data is not aligned with application utilization expectations,
consider allowing or denying additional applications and categories or
adjusting their precedence (priority).
Bytes Downloaded Displays the top ten applications in respect to total data bytes
downloaded from the Access Point managed network. If this
application data is not aligned with application utilization expectations,
consider allowing or denying additional applications and categories or
adjusting their precedence (priority).
Application Name Lists the allowed application name whose data (bytes) are passing
through the Access Point managed network.
Uploaded Displays the number of uploaded application data (in bytes) passing
the through the Access Point managed network.
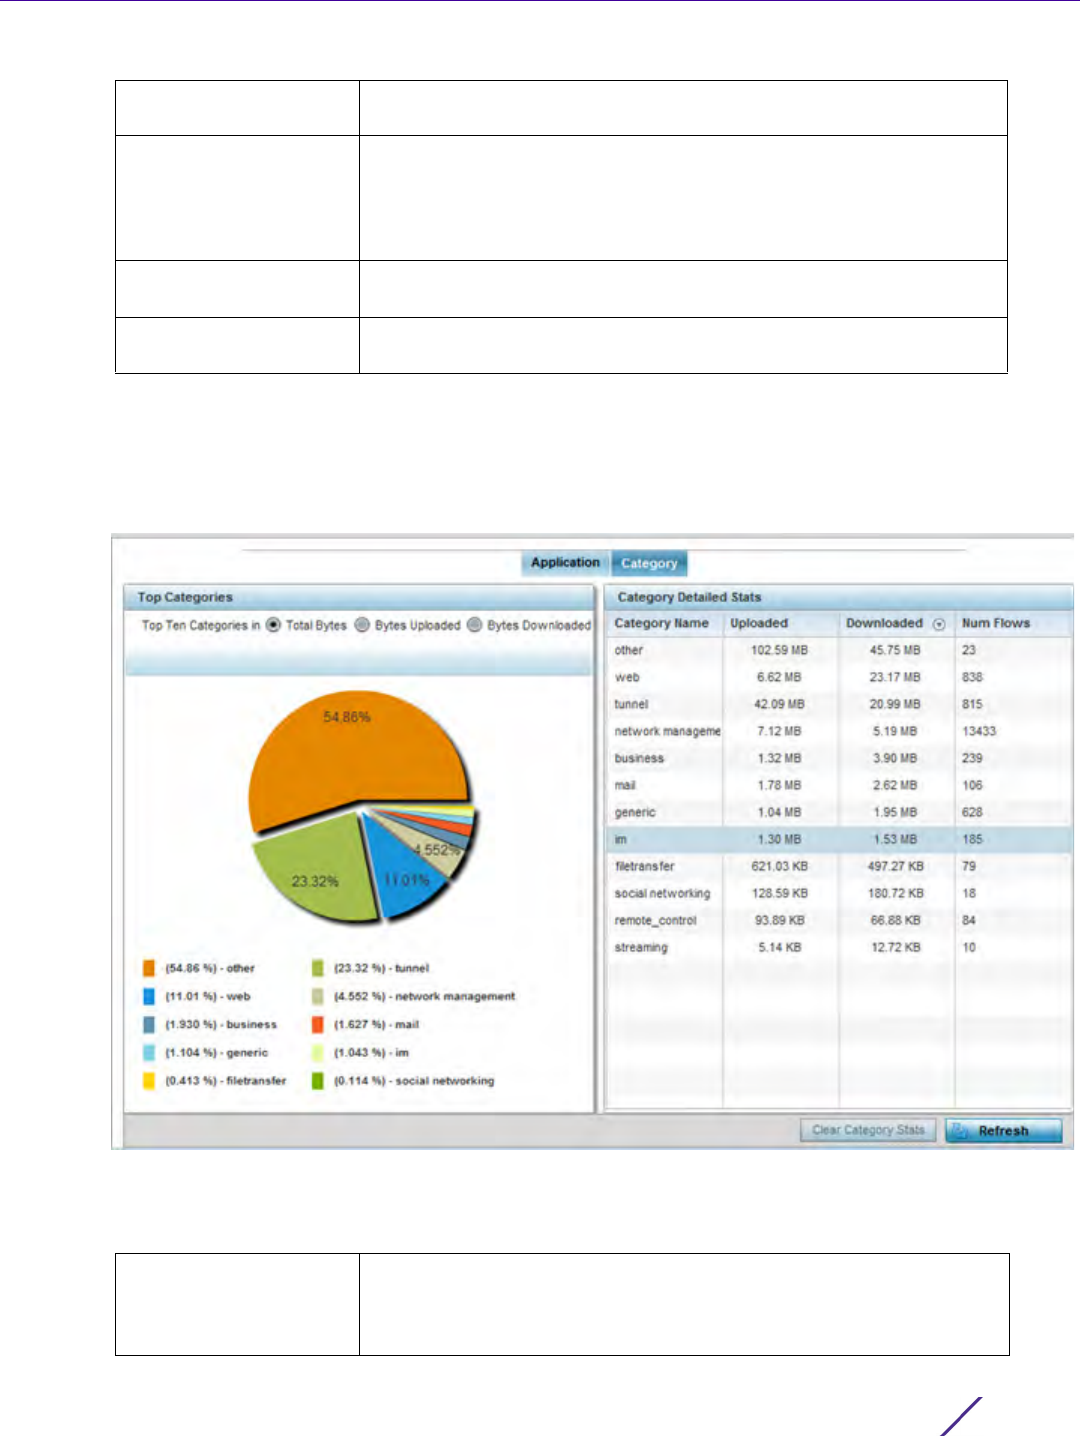
Statistics
Wireless Controller and Service Platform System Reference Guide 15 - 205
6 Select the Category tab.
Categories are existing WiNG or user defined application groups (video, streaming, mobile, audio etc.) that
assist administrators in filtering (allowing or denying) application data. For information on categorizing
application data, refer to Application Policy on page 7-54 and Application on page 7-58.
Figure 15-140 Access Point - Application Category Visibility
7 Refer to the Top Categories graph to assess the most prolific, and allowed, application data categories utilized
by the Access Point.
Downloaded Displays the number of downloaded application data (in bytes)
passing the through the Access Point managed network.
Num Flows Lists the total number of application data flows passing through the
Access Point for each listed application. An application flow can
consist of packets in a specific connection or media stream.
Application packets with the same source address/port and
destination address/port are considered one flow.
Clear Application Stats Select this option to clear the application assessment data counters
and begin a new assessment.
Refresh Select the Refresh button to update the statistics counters to their
latest values.
Total Bytes Displays the top ten application categories in respect to total data
bytes passing through the Access Point managed network. These are
only the administrator allowed application categories approved for
proliferation within the Access Point managed network.

Statistics
Wireless Controller and Service Platform System Reference Guide 15 - 206
8 Refer to the Category Detailed Stats table to assess specific application category data utilization:
15.4.5 Device Upgrade
Access Point Statistics
The Device Upgrade screen displays information about devices receiving updates and the devices used to provision
them. Use this screen to gather version data, install firmware images, boot an image and upgrade status.
To view the device upgrade statistics:
1 Select the Statistics menu from the Web UI.
2Select
System from the navigation pane (on the left-hand side of the screen). Expand a RF Domain, select a
controller or service platform, and select one of its connected Access Points.
3Select
Device Upgrade.
Bytes Uploaded Displays the top ten application categories in respect to total data
bytes uploaded through the controller or service platform managed
network. If this category data is not aligned with application utilization
expectations, consider allowing or denying additional categories or
adjusting their precedence (priority).
Bytes Downloaded Displays the top ten application categories in respect to total data
bytes downloaded from the Access Point managed network. If this
category data is not aligned with application utilization expectations,
consider allowing or denying additional categories and categories or
adjusting their precedence (priority).
Category Name Lists the allowed category whose application data (in bytes) is passing
through the Access Point managed network.
Uploaded Displays the number of uploaded application category data (in bytes)
passing the through the Access Point managed network.
Downloaded Displays the number of downloaded application category data (in
bytes) passing the through the Access Point managed network.
Num Flows Lists the total number of application category data flows passing
through Access Point connected clients. A category flow can consist of
packets in a specific connection or media stream. Packets with the
same source address/port and destination address/port are considered
one flow.
Clear Application Stats Select this option to clear the application category assessment data
counters and begin a new assessment.
Refresh Select the Refresh button to update the statistics counters to their
latest values.
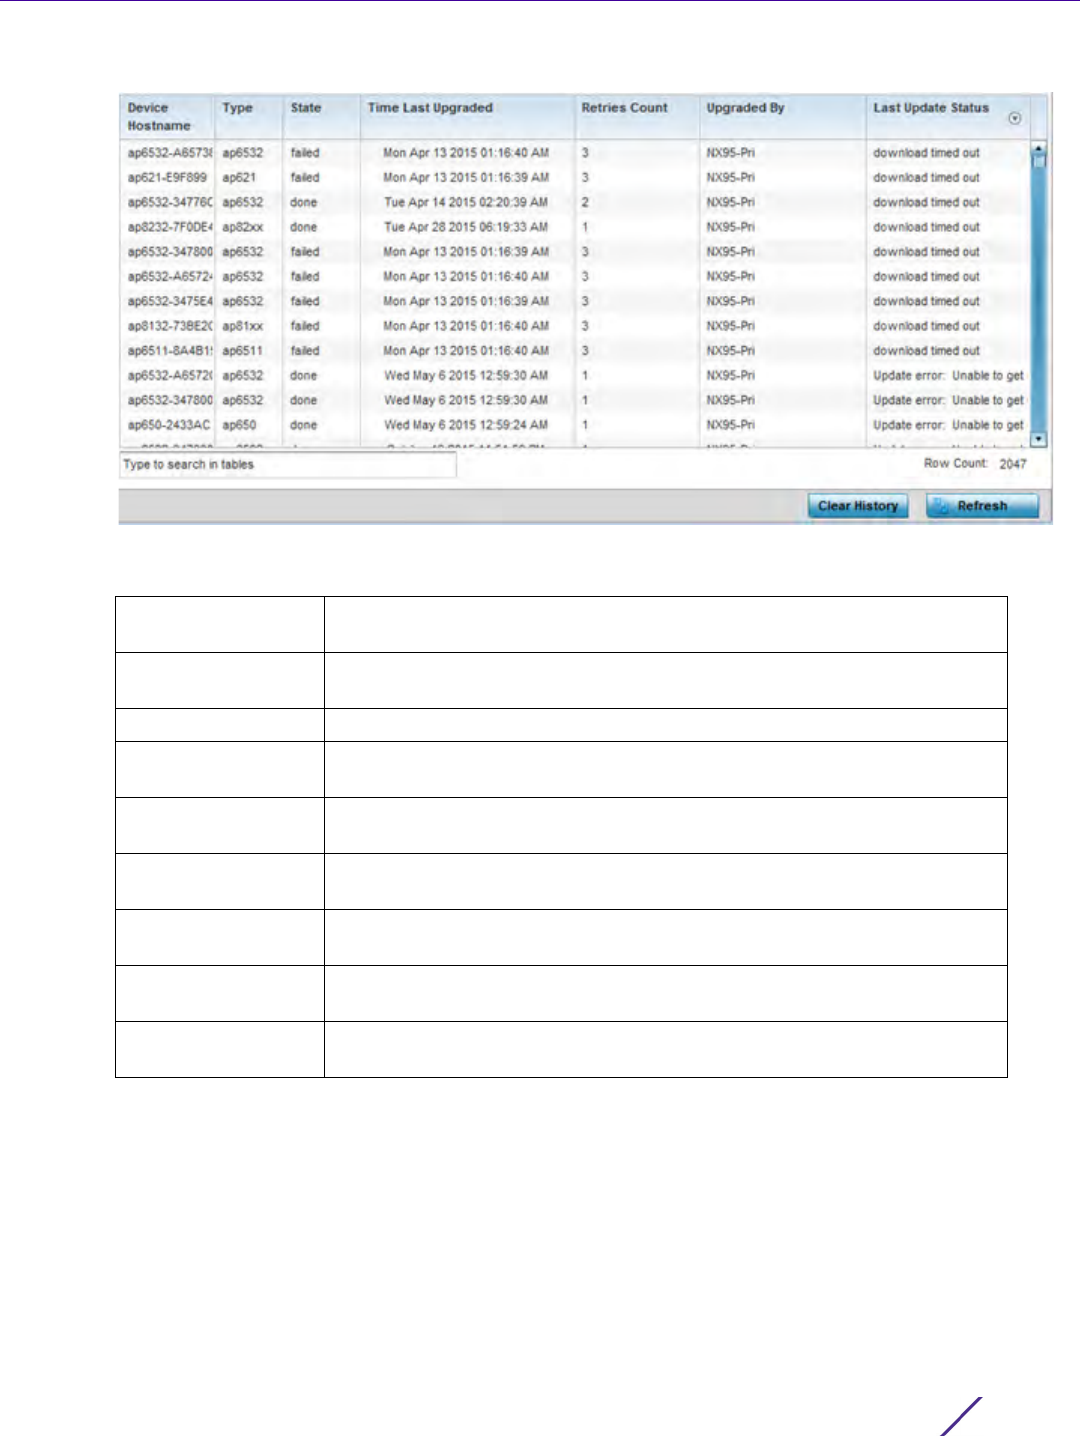
Statistics
Wireless Controller and Service Platform System Reference Guide 15 - 207
Figure 15-141 Access Point - Device Upgrade screen
The Upgrade screen displays the following information:
Device Hostname Displays the administrator assigned hostname of the Access Point
receiving the update.
Type Displays the Access Point model type of the device receiving a firmware
update from the provisioning Access Point.
State Displays the current state of the Access Point upgrade (done, failed etc.).
Time Last Upgraded Displays the date and time of the last successful Access Point firmware
upgrade operation.
Retries Count Displays the number of retries made in an Access Point firmware update
operation.
Upgraded By Displays the MAC address of the Access Point that performed the upgrade
operation.
Last Update Status Displays the status of the last upgrade operation (Start Upgrade, Update
Error etc.).
Clear History Select the Clear History button to clear the screen of its current status and
begin a new data collection.
Refresh Select the Refresh button to update the screen’s statistics counters to their
latest values.
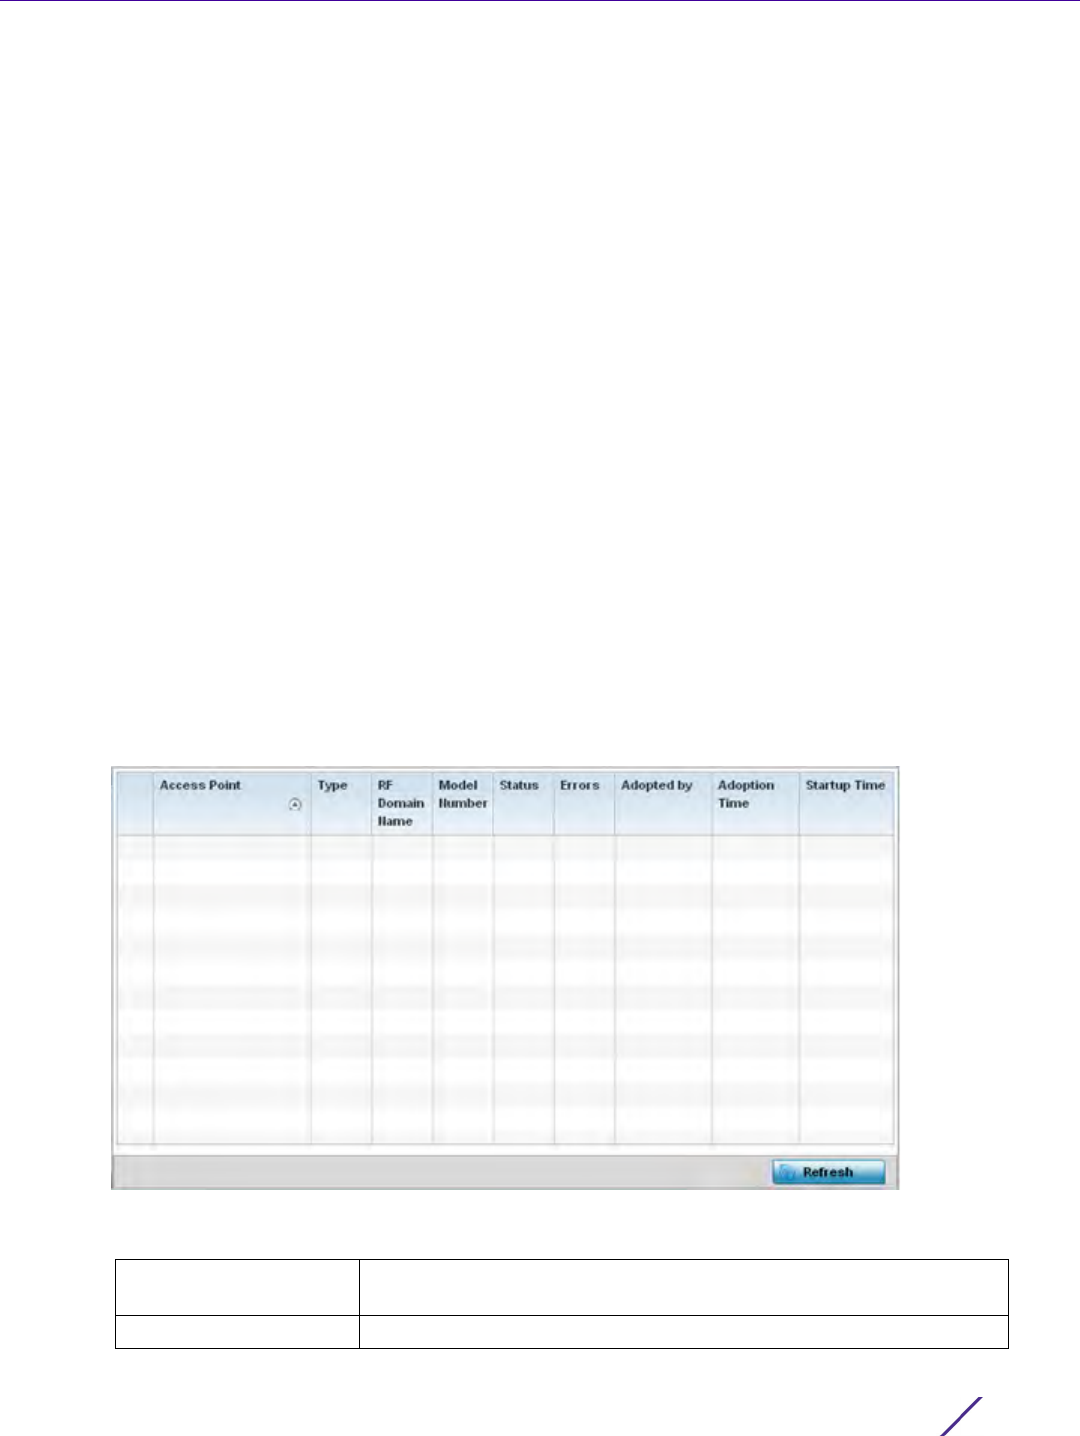
Statistics
Wireless Controller and Service Platform System Reference Guide 15 - 208
15.4.6 Adoption
Access Point Statistics
Access point adoption stats are available for both currently adopted and Access Points pending adoption.
Historical data can be also be fetched for adopted Access Points.
For more information, refer to the following:
•Adopted APs
•AP Adoption History
•AP Self Adoption History
•Pending Adoptions
15.4.6.1 Adopted APs
Adoption
The Adopted APs screen lists Access Points adopted by the selected Access Point, their RF Domain memberships
and network service information.
To view adopted Access Point statistics:
1 Select the Statistics menu from the Web UI.
2Select
System from the navigation pane (on the left-hand side of the screen). Expand a RF Domain, select a
controller or service platform, and select one of its connected Access Points.
3Expand the Adoption menu item.
4Select
Adopted APs.
Figure 15-142 Access Point - Adopted APs screen
The Adopted APs screen displays the following:
Access Point Displays the name assigned to the adopted Access Point as part of its
device configuration.
Type Lists the each listed Access Point type adopted by this Access Point.
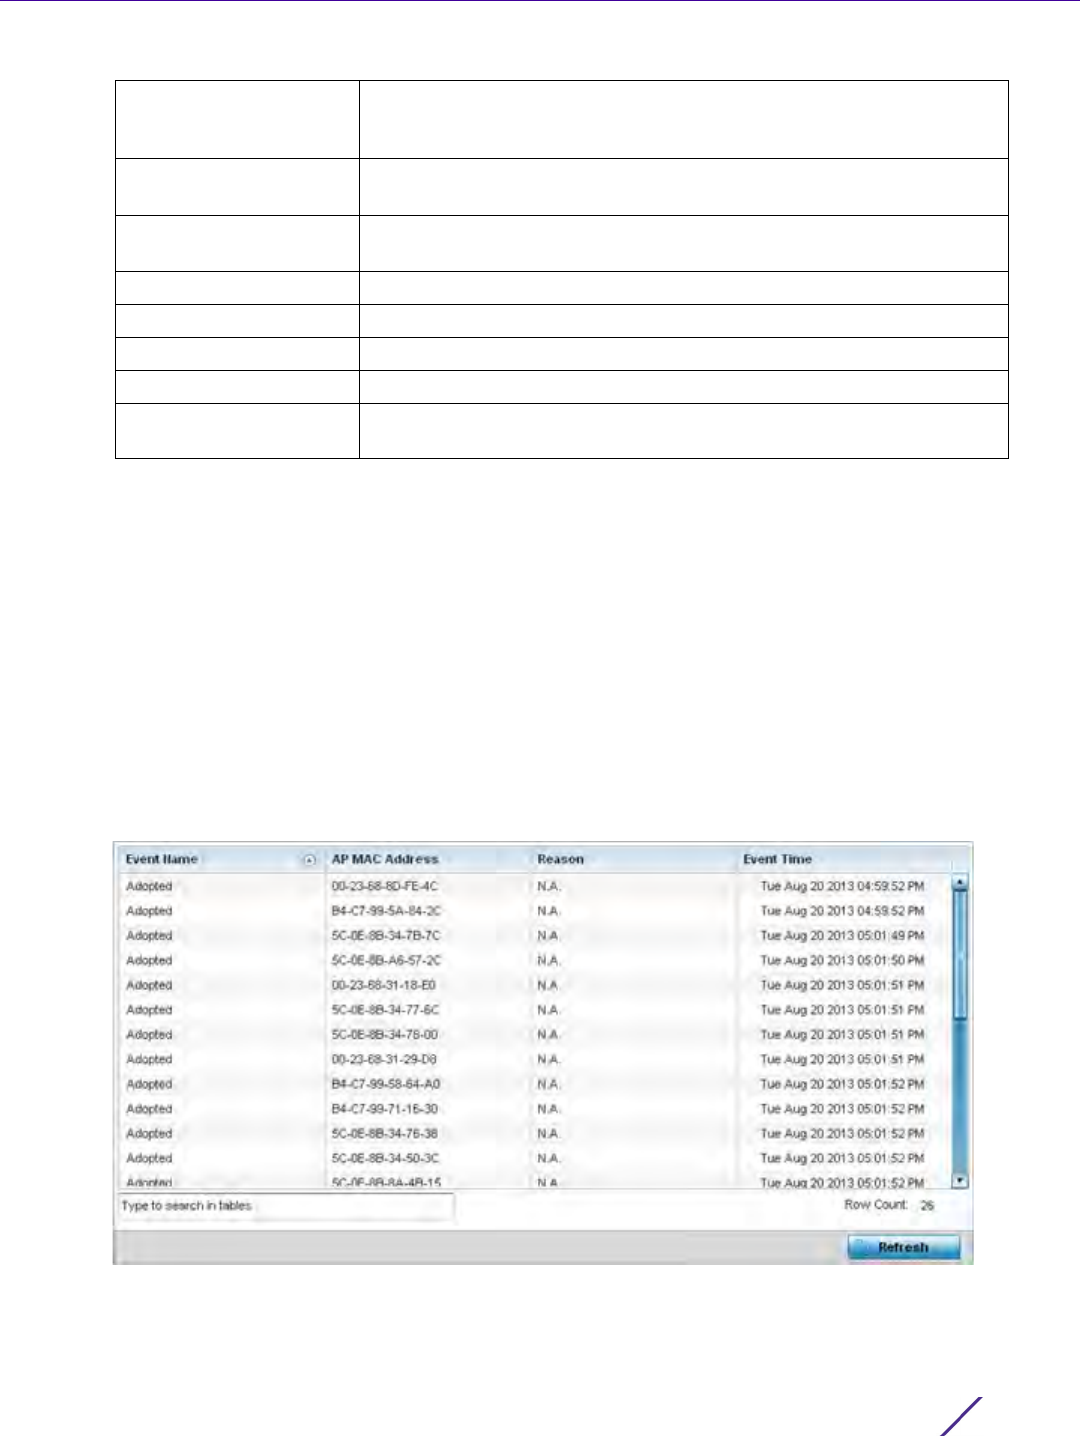
Statistics
Wireless Controller and Service Platform System Reference Guide 15 - 209
15.4.6.2 AP Adoption History
Adoption
The AP Adoption History screen displays a list of peer Access Points and their adoption event status.
To review a selected Access Point’s adoption history:
1 Select the Statistics menu from the Web UI.
2Select
System from the navigation pane (on the left-hand side of the screen). Expand the a RF Domain, select a
controller or service platform, and select one of its connected Access Points.
3Expand the Adoption menu item.
4Select
AP Adoption History.
Figure 15-143 Access Point - AP Adoption History screen
RF Domain Name Displays each Access Point’s RF Domain membership. An Access Point
can only share RF Domain membership with other Access Points of
the same model.
Model Number Displays each listed Access Point’s numeric model (AP6532, AP6562,
etc.).
Status Displays each listed Access Point’s configuration status to help
determine its service role.
Errors Lists any configuration errors that may be hindering a clean adoption.
Adopted By Lists the adopting Access Point.
Adoption time Displays each listed Access Point’s time of adoption.
Startup Time Displays each listed Access Point’s in service time since last offline.
Refresh Select the Refresh button to update the screen’s statistics counters to
their latest values.
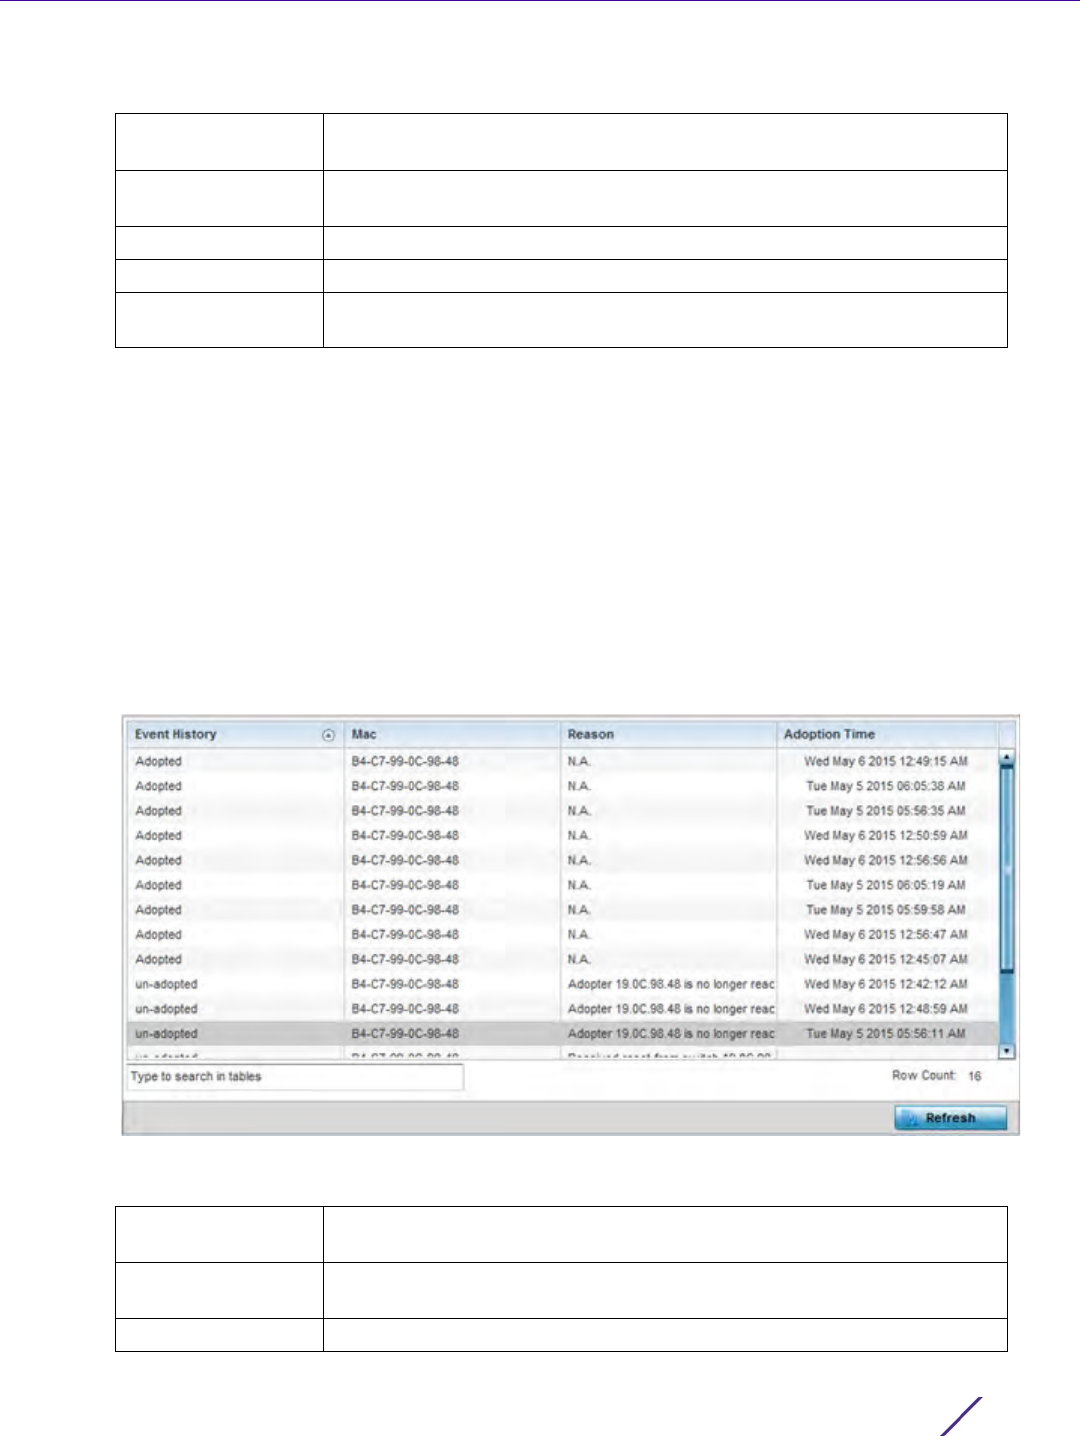
Statistics
Wireless Controller and Service Platform System Reference Guide 15 - 210
The Adopted Devices screen describes the following historical data for adopted Access Points:
15.4.6.3 AP Self Adoption History
Adoption
The AP Self Adoption History displays an event history of peer Access Points that have adopted to the selected
Access Point.
1 Select the Statistics menu from the Web UI.
2Select
System from the navigation pane (on the left-hand side of the screen). Expand the a RF Domain, select a
controller, and select one of its connected Access Points.
3Expand the Adoption menu item.
4Select
AP Self Adoption History.
Figure 15-144 Access Point - AP Self Adoption History screen
The AP Self Adoption History screen describes the following historical data for adopted Access Points:
Event Name Displays the adoption status of each listed Access Point as either adopted
or un-adopted.
AP MAC Address Displays the MAC address of each Access Point this Access Point has
attempted to adopt.
Reason Displays the reason code for each event listed.
Event Time Displays day, date and time for each Access Point adoption attempt.
Refresh Select the Refresh button to update the screen’s statistics counters to their
latest values.
Event History Displays the self adoption status of each AP as either Adopted or un-
adopted.
MAC Displays the hardware encoded Media Access Control (MAC) of the auto
adopted Access Point.
Reason Displays the adoption reason code for an Access Point’s auto adoption.
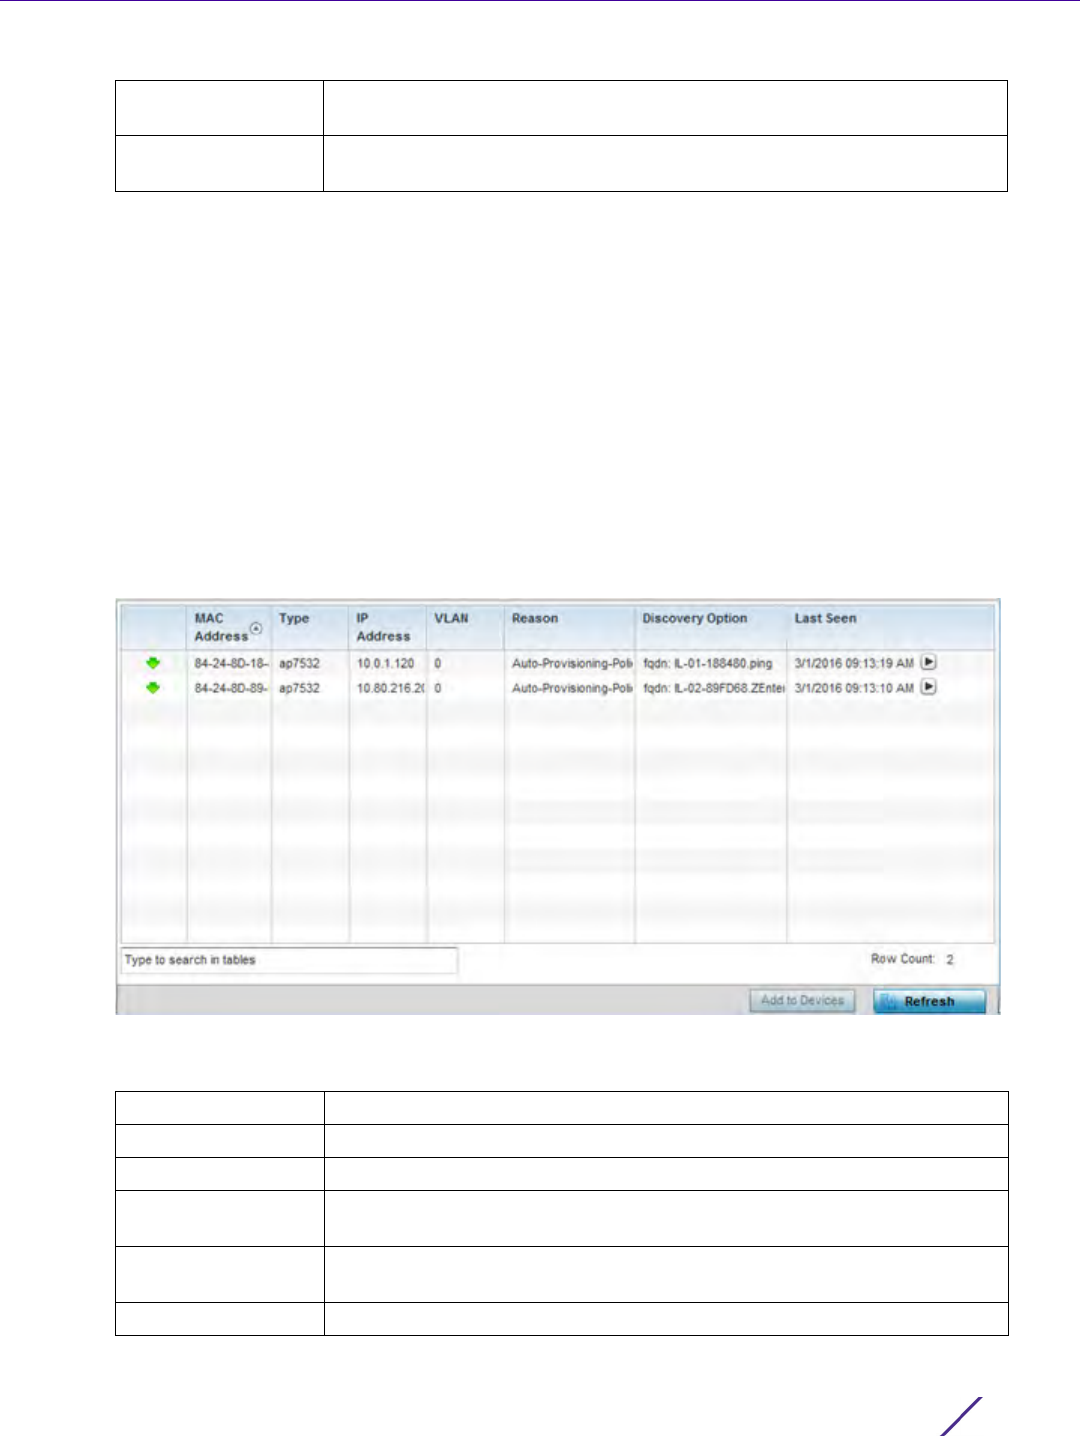
Statistics
Wireless Controller and Service Platform System Reference Guide 15 - 211
15.4.6.4 Pending Adoptions
Adoption
The Pending Adoptions screen displays a list of devices yet to be adopted to this peer Access Point, or Access
Points in the process of adoption.
To view pending Access Point statistics:
1 Select the Statistics menu from the Web UI.
2Select
System from the navigation pane (on the left-hand side of the screen). Expand the a RF Domain, select a
controller or service platform, and select one of its connected Access Points.
3Expand the Adoption menu item.
4Select
Pending Adoptions.
Figure 15-145 Access Point - Pending Adoptions screen
The Pending Adoptions screen provides the following:
Adoption Time Displays a timestamp for the Access Point’s auto-adoption by the
controller or service platform.
Refresh Select the Refresh button to update the screen’s statistics counters to their
latest values.
MAC Address Displays the MAC address of the device pending adoption.
Type Displays the Access Point’s model type.
IP Address Displays the current network IP Address of the device pending adoption.
VLAN Displays the current VLAN used as a virtual interface by device pending
adoption.
Reason Displays the status as to why the device is still pending adoption and has
not yet successfully connected to this Access Point.
Discovery Option Displays the discovery option code for each AP listed pending adoption.
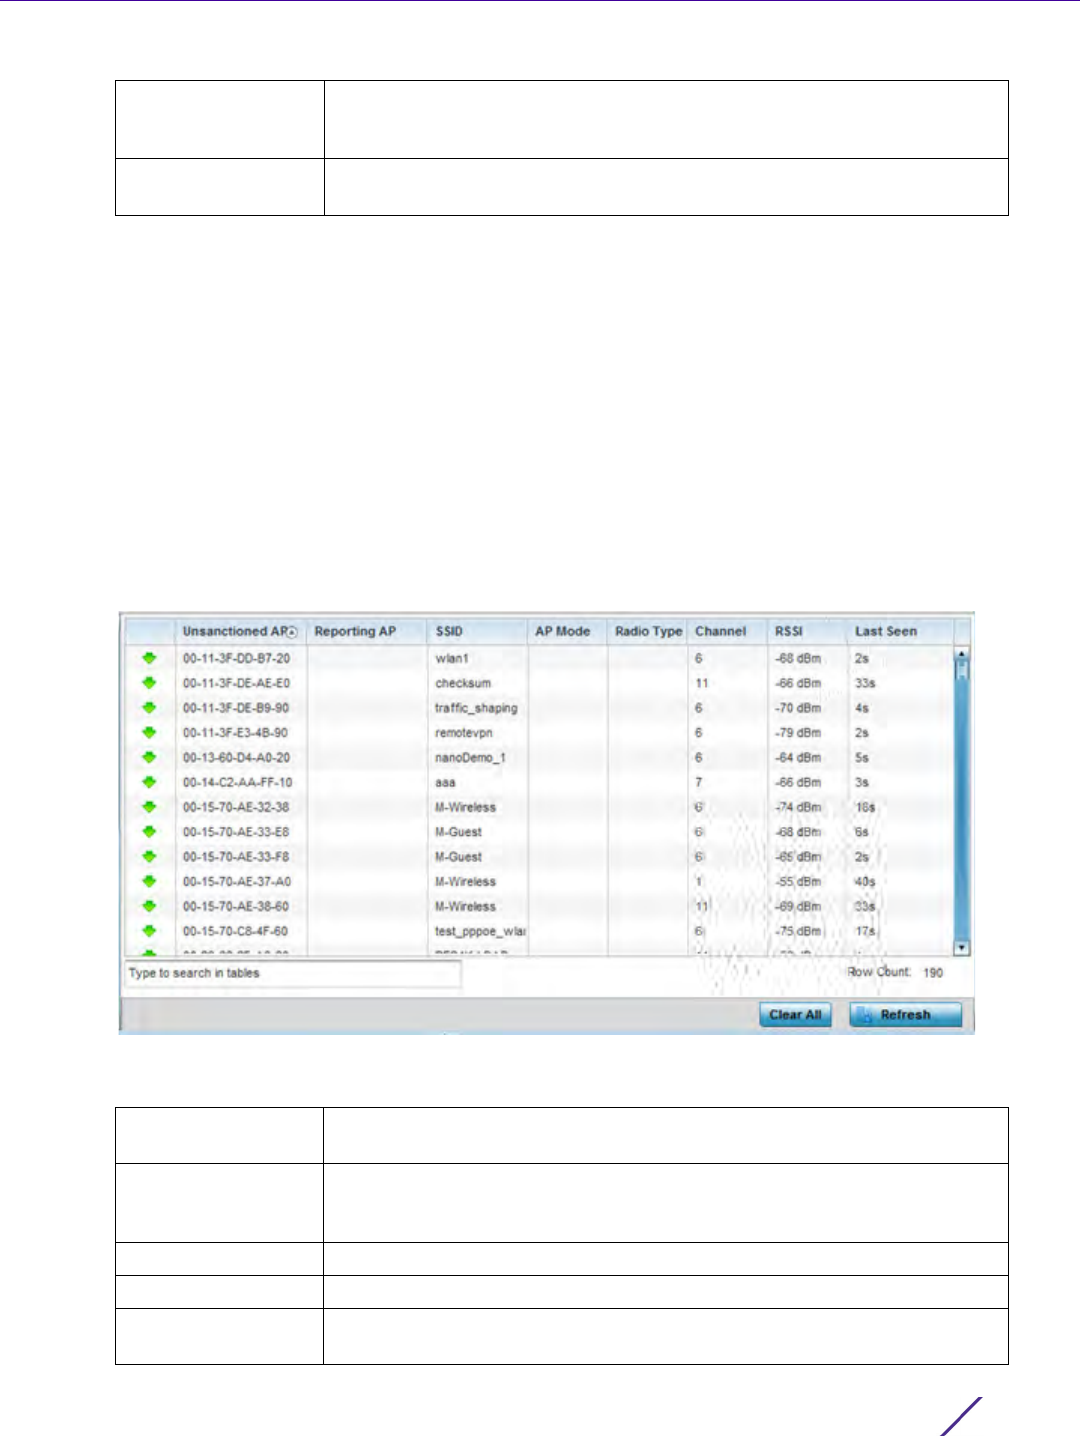
Statistics
Wireless Controller and Service Platform System Reference Guide 15 - 212
15.4.7 AP Detection
Access Point Statistics
The AP Detection screen displays potentially hostile Access Points, their SSIDs, reporting AP, and so on.
Continuously revalidating the credentials of detected devices reduces the possibility of an Access Point hacking
into the network.
To view the AP detection statistics:
1 Select the Statistics menu from the Web UI.
2Select
System from the navigation pane (on the left-hand side of the screen). Expand a RF Domain, select a
controller or service platform, and select one of its connected Access Points.
3Select
AP Detection.
Figure 15-146 Access Point - AP Detection
The AP Detection screen displays the following:
Last Seen Displays the date and time stamp of the last time the device was seen.
Click the arrow next to the date and time to toggle between standard time
and UTC.
Refresh Select the Refresh button to update the screen’s statistics counters to their
latest values.
Unsanctioned AP Displays the MAC address of a detected Access Point that is yet to be
authorized for interoperability within the Access Point managed network.
Reporting AP Displays the hardware encoded MAC address of the radio used by the
detecting Access Point. Select an Access Point to display configuration
and network address information in greater detail.
SSID Displays the WLAN SSID the unsanctioned Access Point was detected on.
AP Mode Displays the operating mode of the unsanctioned Access Point.
Radio Type Displays the type of the radio on the unsanctioned Access Point. The radio
can be 802.11b, 802.11bg, 802.1bgn, 802.11a or 802.11an.
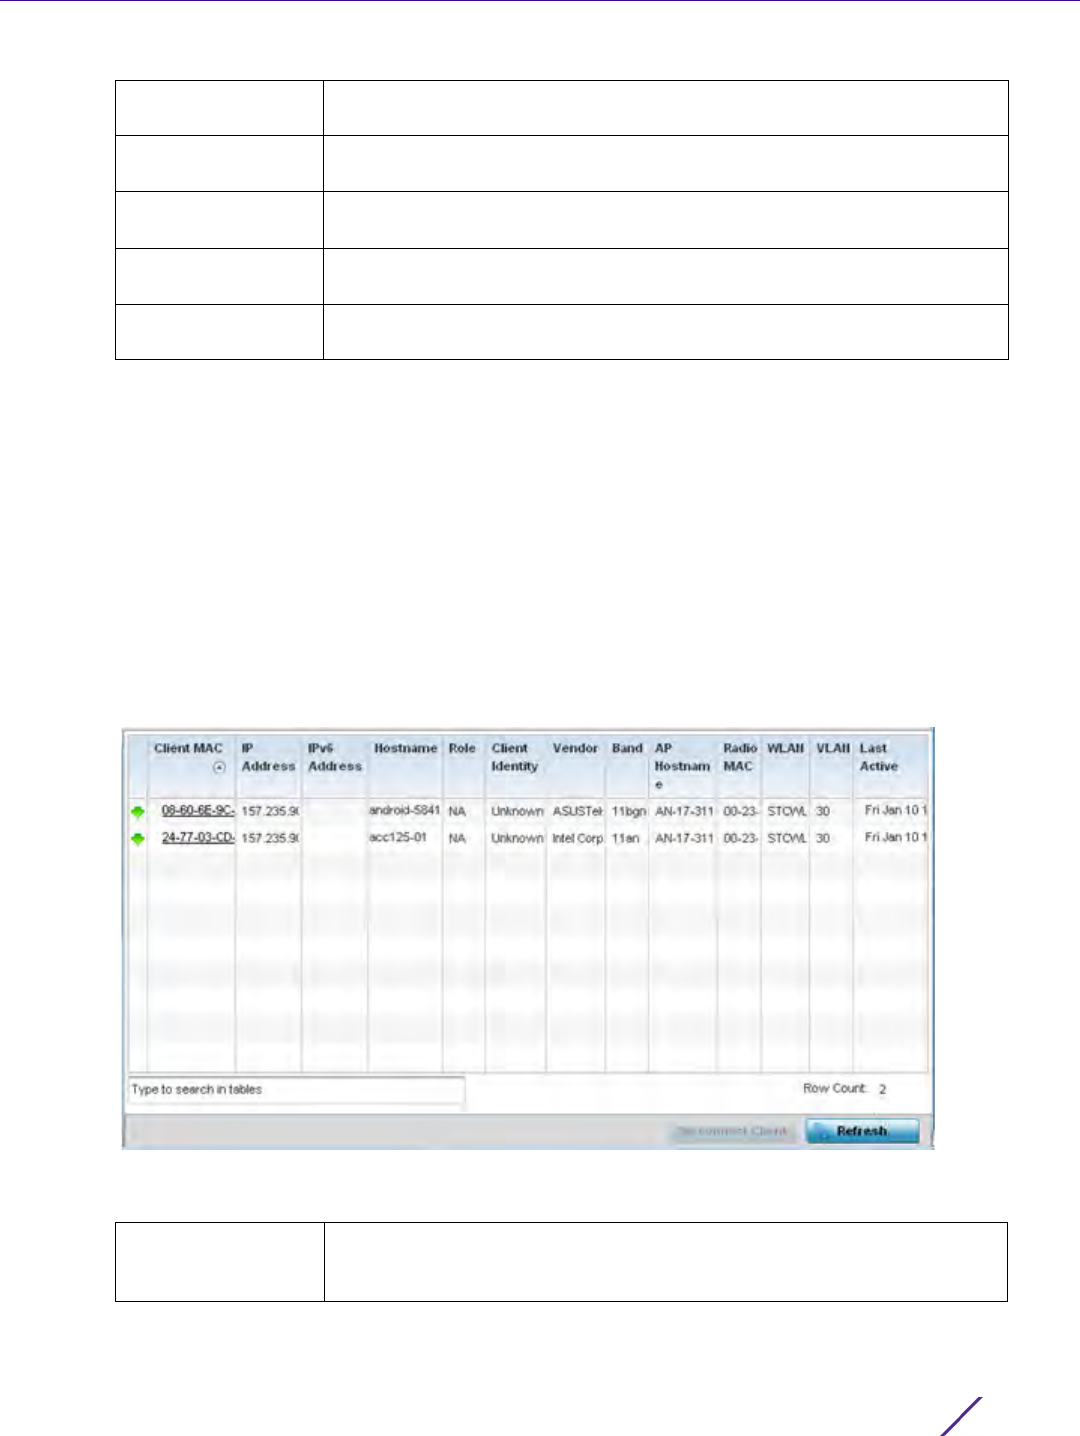
Statistics
Wireless Controller and Service Platform System Reference Guide 15 - 213
15.4.8 Guest User
Access Point Statistics
The Guest User screen displays credential information for wireless clients associated with an Access Point. Use this
information to assess if configuration changes are required to improve network performance.
To view guest user statistics:
1 Select the Statistics menu from the Web UI.
2Select
System from the navigation pane (on the left-hand side of the screen). Expand a RF Domain, select a
controller or service platform, and select one of its connected Access Points.
3Select
Guest User.
Figure 15-147 Access Point - Guest User screen
The Guest User screen displays the following client information:
Channel Displays the channel the unsanctioned Access Point is currently
transmitting on.
RSSI Lists a relative signal strength indication (RSSI) for a detected (and
perhaps unsanctioned) Access Point.
Last Seen Displays the time (in seconds) the unsanctioned Access Point was last
seen on the network.
Clear All Select the Clear All button to clear the screen of its current status and
begin a new data collection.
Refresh Select the Refresh button to update the screen’s statistics counters to their
latest values.
Client MAC Displays the hardcoded MAC address assigned to the guest client at the
factory. The address displays as a link that can be selected to display
configuration and network address information in greater detail.

Statistics
Wireless Controller and Service Platform System Reference Guide 15 - 214
15.4.9 Wireless LANs
Access Point Statistics
The Wireless LANs screen displays an overview of Access Point WLAN utilization. This screen displays Access Point
WLAN assignment, SSIDs, traffic utilization, number of radios the Access Point is utilizing on the WLAN and
transmit and receive statistics.
To review a selected Access Point’s WLAN statistics:
1 Select the Statistics menu from the Web UI.
2Select
System from the navigation pane (on the left-hand side of the screen). Expand a RF Domain, select a
controller or service platform, and select one of its connected Access Points.
3Select
Wireless LANs.
IP Address Displays the unique IP address of the guest client. Use this address as
necessary throughout the applet for filtering and device intrusion
recognition and approval.
IPv6 Address Displays the current IPv6 formatted IP address a listed guest client is using
as a network identifier. IPv6 is the latest revision of the Internet Protocol
(IP) designed to replace IPv4. IPv6 addresses are composed of eight
groups of four hexadecimal digits separated by colons.
Hostname Displays the hostname (MAC addresses) of connected guest clients. The
hostname displays as a link that can be selected to display configuration
and network address information in greater detail.
Role Lists the guest client’s defined role within the Access Point managed
network.
Client Identity Displays the unique identity of the listed guest client as it appears to its
adopting Access Point.
Vendor Displays the name of the client vendor (manufacturer).
Band Displays the 802.11 radio band on which the listed guest client operates.
AP Hostname Displays the administrator assigned hostname of the Access Point to
which this Access Point is adopted.
Radio MAC Displays the MAC address of the radio which the wireless client is using.
WLAN Displays the name of the WLAN the Access Point's using with each listed
guest client. Use this information to determine if the client's WLAN
assignment best suits its intended deployment in respect to the WLAN's
QoS objective.
VLAN Displays the VLAN ID each listed guest client is currently mapped to as a
virtual interface for Access Point interoperability.
Last Active Displays the time when this guest client was last seen (or detected) by a
device within the Access Point managed network.
Disconnect Client Select a specific client MAC address and select the Disconnect Client
button to terminate this client’s connection to its Access Point.
Refresh Select the Refresh button to update the screen's statistics counters to their
latest values.
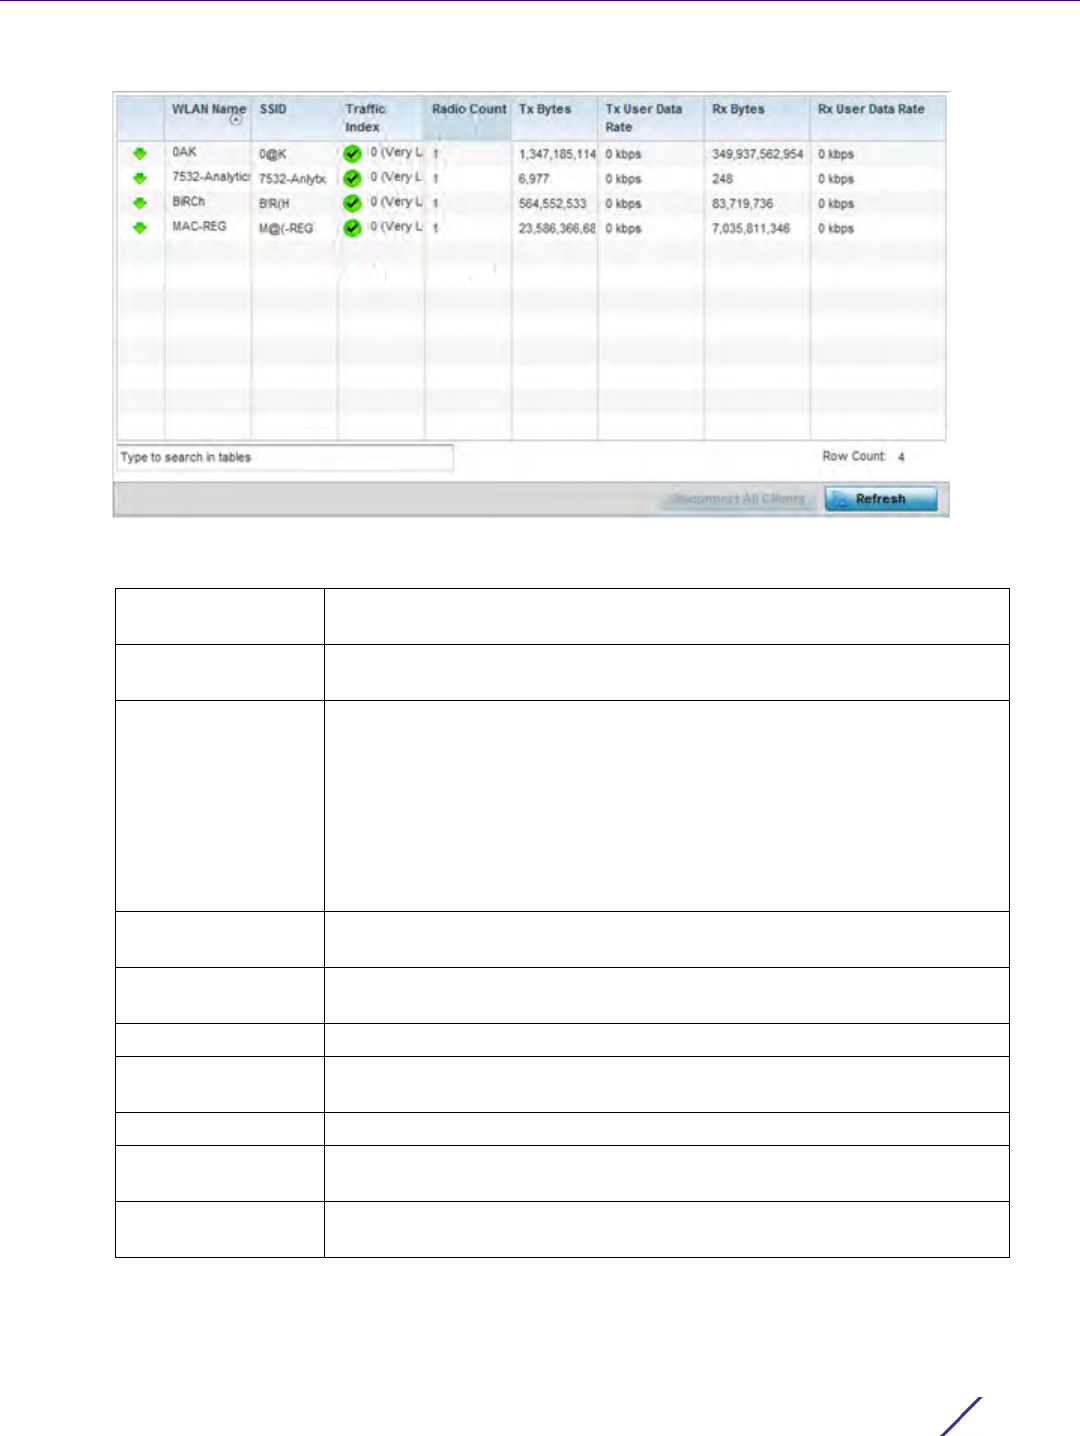
Statistics
Wireless Controller and Service Platform System Reference Guide 15 - 215
Figure 15-148 Access Point - Wireless LANs screen
The Wireless LANs screen displays the following:
WLAN Name Displays the name of the WLAN the Access Point is currently using for
client transmissions.
SSID Displays each listed WLAN’s Service Set ID (SSID) used as the WLAN’s
network identifier.
Traffic Index Displays the traffic utilization index, which measures how efficiently the
WLAN’s traffic medium is used. It’s defined as the percentage of current
throughput relative to maximum possible throughput. Traffic indices are:
0 – 20 (very low utilization)
20 – 40 (low utilization)
40 – 60 (moderate utilization)
60 and above (high utilization)
Radio Count Displays the cumulative number of peer Access Point radios deployed
within each listed WLAN.
Tx Bytes Displays the average number of transmitted bytes sent on each listed
WLAN.
Tx User Data Rate Displays the transmitted user data rate in kbps for each listed WLAN.
Rx Bytes Displays the average number of packets in bytes received on each listed
WLAN.
Rx User Data Rate Displays the received user data rate on each listed WLAN.
Disconnect All
Clients
Select an WLAN then Disassociate All Clients to terminate the client
connections within that WLAN.
Refresh Select the Refresh button to update the screen’s statistics counters to their
latest values.
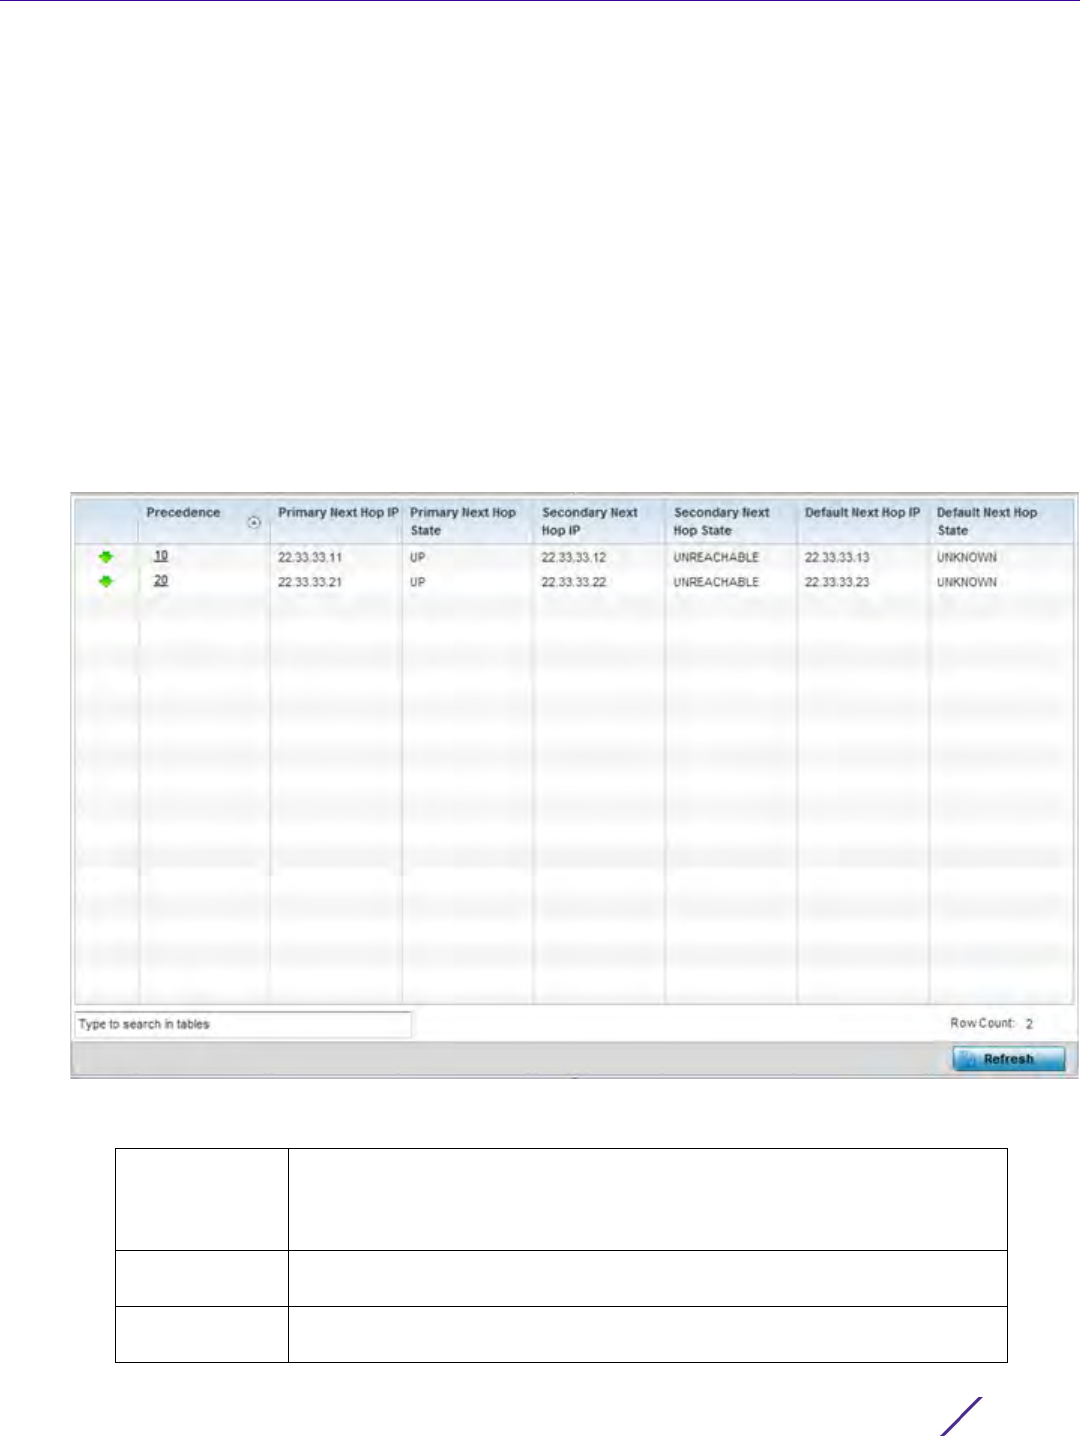
Statistics
Wireless Controller and Service Platform System Reference Guide 15 - 216
15.4.10 Policy Based Routing
Access Point Statistics
The Policy Based Routing statistics screen displays statistics for selective path packet redirection. PBR can
optionally mark traffic for preferential services (QoS). PBR is applied to incoming routed packets, and a route-map
is created containing a set of filters and associated actions. Based on the actions defined in the route-map, packets
are forwarded to the next relevant hop. Route-maps are configurable under a global policy called routing-policy,
and applied to profiles and devices.
To review Access Point PBR statistics:
1 Select the Statistics menu from the Web UI.
2Select
System from the navigation pane (on the left-hand side of the screen). Expand a RF Domain, select a
controller or service platform, and select one of its connected Access Points.
3Select
Policy Based Routing.
Figure 15-149 Access Point - Policy Based Routing screen
The Policy Based Routing screen displays the following:
Precedence Lists the numeric precedence (priority) assigned to each listed PBR
configuration. A route-map consists of multiple entries, each carrying a
precedence value. An incoming packet is matched against the route-map with
the highest precedence (lowest numerical value).
Primary Next
Hop IP
Lists the IP address of the virtual resource that, if available, is used with no
additional route considerations.
Primary Next
Hop State
Displays whether the primary hop is applied to incoming routed packets (UP/
UNREACHABLE).

Statistics
Wireless Controller and Service Platform System Reference Guide 15 - 217
15.4.11 Radios
Access Point Statistics
The Radio statistics screens display information on Access Point radios. The actual number of radios depend on
the Access Point model and type. This screen displays information on a per radio basis. Use this information to
refine and optimize the performance of each radio and therefore improve network performance.
The Access Point’s radio statistics screens provide details about associated radios. It provides radio ID, radio type,
RF quality index etc. Use this information to assess the overall health of radio transmissions and Access Point
placement.
Each of these screens provide enough statistics to troubleshoot issues related to the following three areas:
•Status
•RF Statistics
•Traffic Statistics
Individual Access Point radios display as selectable links within each of the three Access Point radio screens. To
review a radio’s configuration in greater detail, select the link within the Radio column of either the Status, RF
Statistics or Traffic Statistics screens.
Additionally, navigate the Traffic, WMM TSPEC, Wireless LANs and Graph options available on the upper, left-hand
side, of the screen to review radio traffic utilization, WMM QoS settings, WLAN advertisement and radio graph
information in greater detail. This information can help determine whether the radio is properly configured in
respect to its intended deployment objective.
Secondary Next
Hop IP
If the primary hop is unavailable, a second resource is used. This column lists
the address set for the alternate route in the election process.
Secondary Next
Hop State
Displays whether the secondary hop is applied to incoming routed packets
(UP/UNREACHABLE).
Default Next
Hop IP
If a packet subjected to PBR does not have an explicit route to the destination,
the configured default next hop is used. This is either the IP address of the
next hop or the outgoing interface. Only one default next hop is available. The
difference between the next hop and the default next-hop is in case of former,
PBR occurs first, then destination based routing. In case of the latter, the order
is reverse.
Default Next
Hop State
Displays whether the default hop is being applied to incoming routed packets.
Refresh Select the Refresh button to update the screen’s statistics counters to their
latest values.
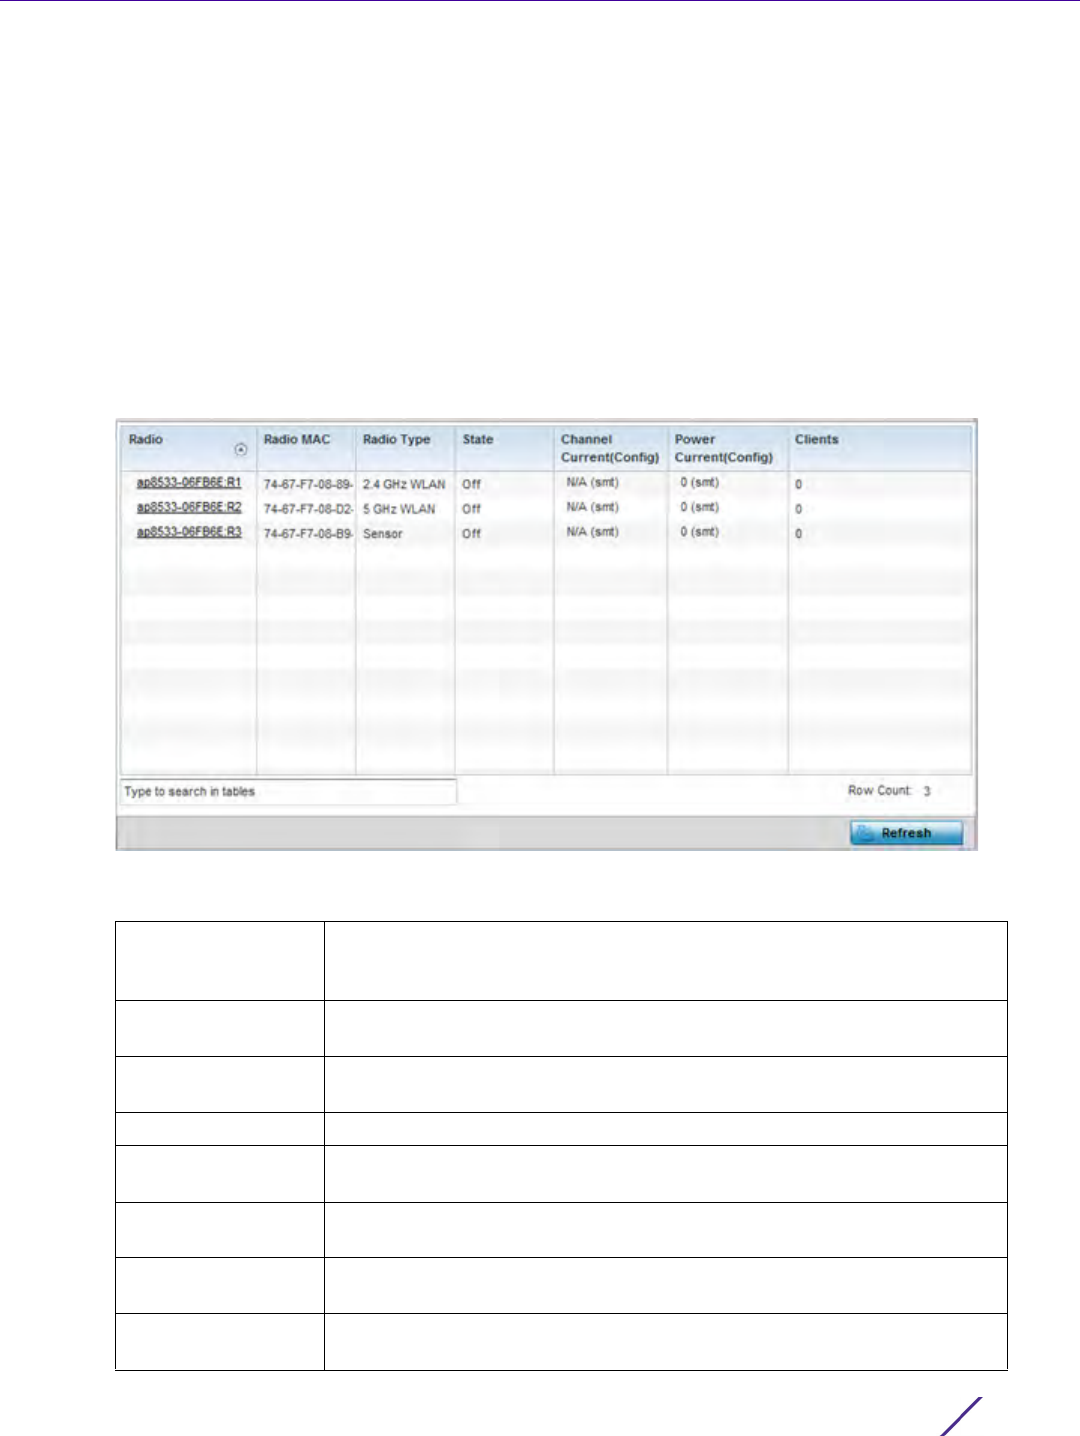
Statistics
Wireless Controller and Service Platform System Reference Guide 15 - 218
15.4.11.1 Status
Use the Status screen to review Access Point radio stats in detail. Use the screen to assess radio type, operational
state, operating channel and current power to assess whether the radio is optimally configured.
To view Access Point radio statistics:
1 Select the Statistics menu from the Web UI.
2Select
System from the navigation pane (on the left-hand side of the screen). Expand a RF Domain, select a
controller or service platform, and select one of its connected Access Points.
3Expand the Radios menu item.
4Select
Status.
Figure 15-150 Access Point - Radio Status screen
The radio Status screen provides the following information:
Radio Displays the name assigned to the radio as its unique identifier. The name
displays in the form of a link that can be selected to launch a detailed
screen containing radio throughout data.
Radio MAC Displays the factory encoded hardware MAC address assigned to the
radio.
Radio Type Displays the radio as supporting the 2.4 or 5 GHZ radio band or
functioning as a sensor device.
State Lists a radio’s On/Off operational designation.
Channel Current
(Config)
Displays the configured channel each listed radio is set to transmit and
receive on.
Power Current
(Config)
Displays the configured power each listed radio is using to transmit and
receive.
Clients Displays the number of connected clients currently utilizing the listed
Access Point radio.
Refresh Select the Refresh button to update the screen’s statistics counters to their
latest values.
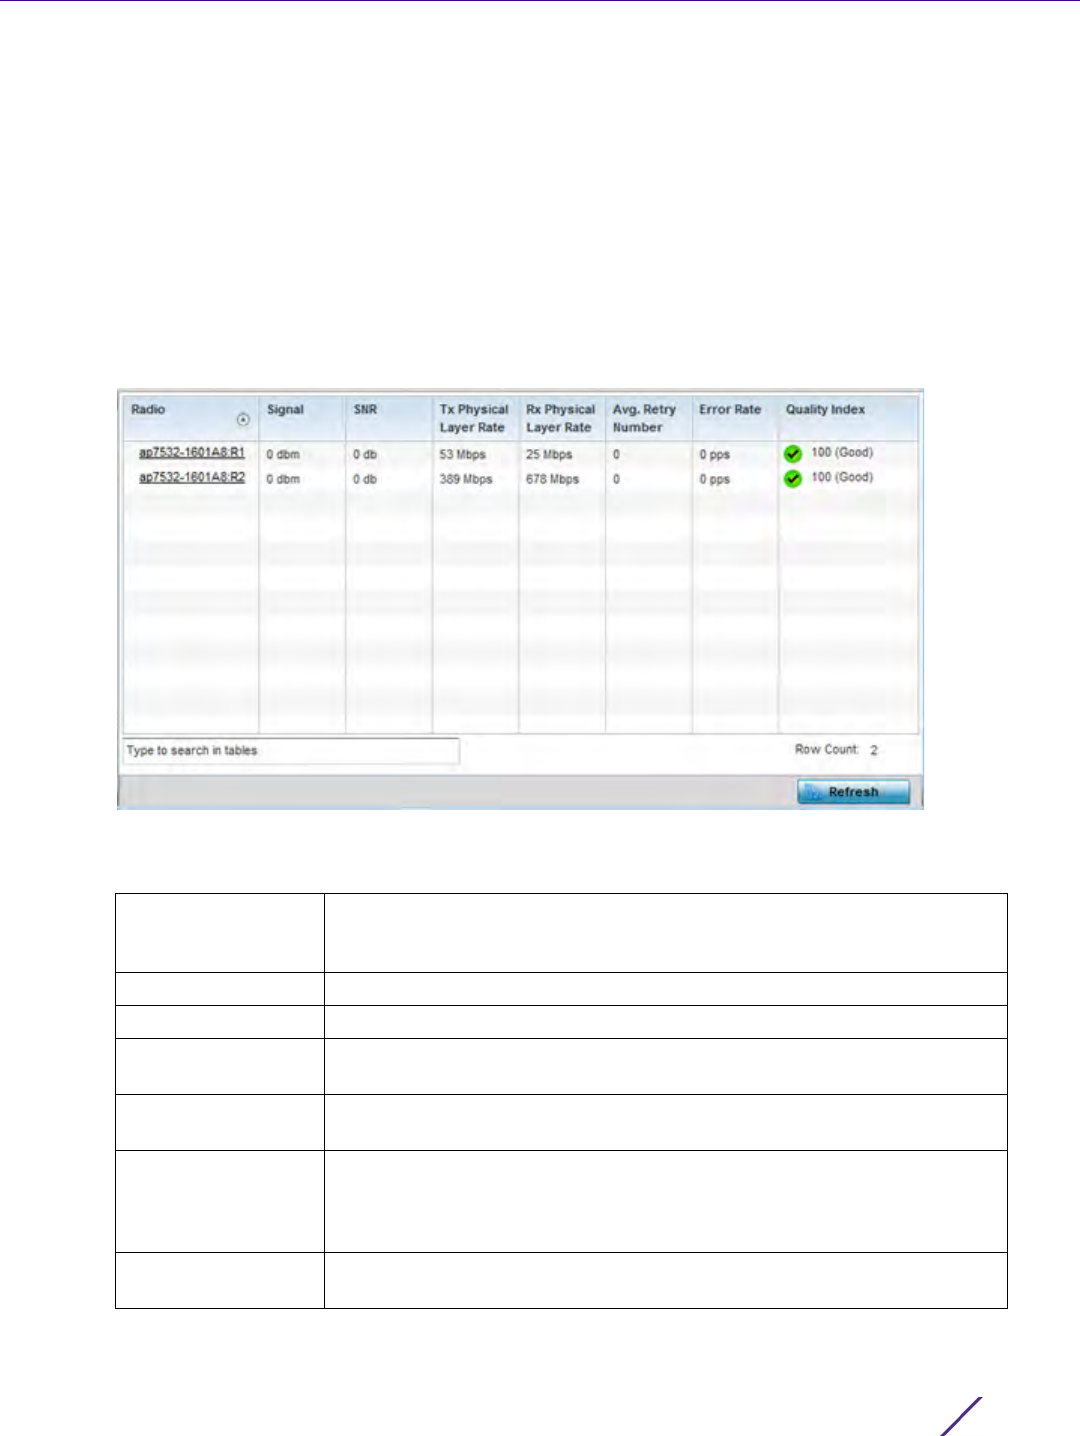
Statistics
Wireless Controller and Service Platform System Reference Guide 15 - 219
15.4.11.2 RF Statistics
Use the RF Statistics screen to review Access Point radio transmit and receive statistics, error rate and RF quality.
To view Access Point radio RF statistics:
1 Select the Statistics menu from the Web UI.
2Select
System from the navigation pane (on the left-hand side of the screen). Expand a RF Domain, select a
controller or service platform, and select one of its connected Access Points.
3Expand the Radios menu item.
4Select
RF Statistics.
Figure 15-151 Access Point - Radio RF Statistics screen
The RF Statistics screen lists the following:
Radio Displays the name assigned to the radio as its unique identifier. The name
displays in the form of a link that can be selected to launch a detailed
screen containing radio throughout data.
Signal Displays the radio’s current power level in - dBm.
SNR Displays the signal to noise ratio of the radio’s associated wireless clients.
Tx Physical Layer
Rate
Displays the data transmit rate for the radio’s physical layer. The rate is
displayed in Mbps.
Rx Physical Layer
Rate
Displays the data receive rate for the radio’s physical layer. The rate is
displayed in Mbps.
Avg Retry Number Displays the average number of retries per packet. A high number
indicates possible network or hardware problems. Assess the error rate in
respect to potentially high signal and SNR values to determine whether
the error rate coincides with a noisy signal.
Error Rate Displays the total number of received packets which contained errors for
the listed radio.
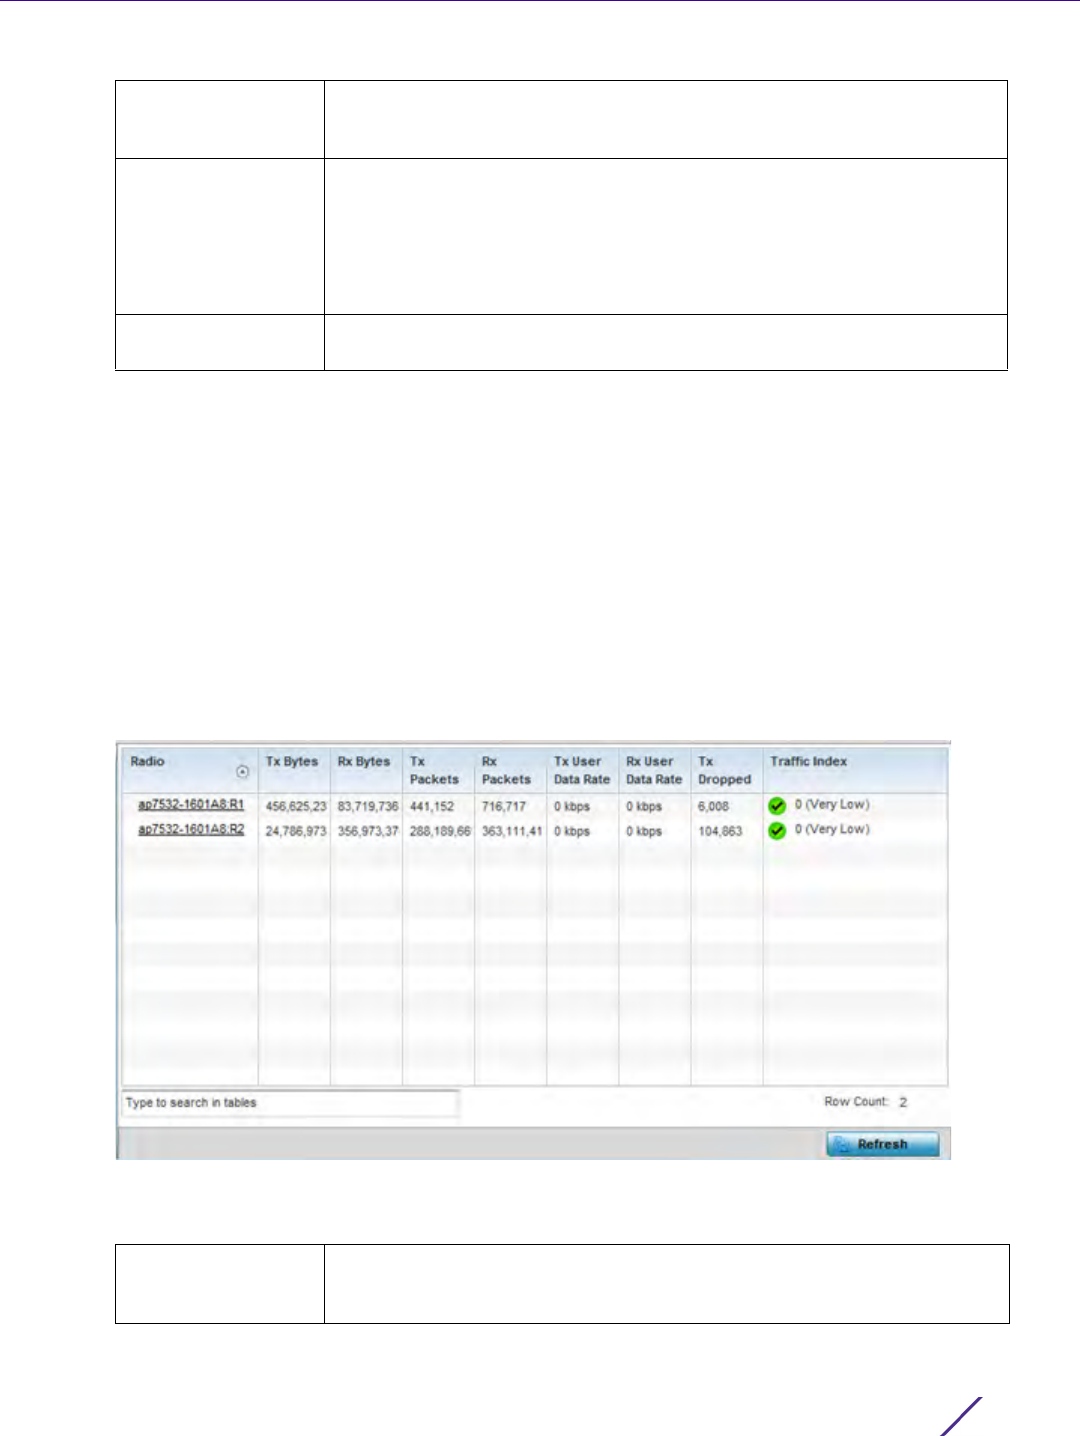
Statistics
Wireless Controller and Service Platform System Reference Guide 15 - 220
15.4.11.3 Traffic Statistics
Refer to the Traffic Statistics screen to review Access Point radio transmit and receive statistics, data rate, and
packets dropped during both transmit and receive operations.
To view the Access Point radio traffic statistics:
1 Select the Statistics menu from the Web UI.
2Select
System from the navigation pane (on the left-hand side of the screen). Expand a RF Domain, select a
controller or service platform, and select one of its connected Access Points.
3Expand
Radios.
4Select
Traffic Statistics.
Figure 15-152 Access Point - Radio Traffic Statistics screen
The Traffic Statistics screen displays the following:
Quality Index Displays the traffic utilization index of the radio. This is expressed as an
integer value. 0 – 20 indicates very low utilization, and 60 and above
indicate high utilization.
Quality Index Displays an integer that indicates overall RF performance. The RF quality
indices are:
0 – 50 (poor)
50 – 75 (medium)
75 – 100 (good)
Refresh Select the Refresh button to update the screen’s statistics counters to their
latest values.
Radio Displays the name assigned to the radio as its unique identifier. The name
displays in the form of a link that can be selected to launch a detailed
screen containing radio throughout data.

Statistics
Wireless Controller and Service Platform System Reference Guide 15 - 221
15.4.12 Mesh
Access Point Statistics
The Mesh screen provides detailed statistics on each Mesh capable client available within the selected Access
Point’s radio coverage area.
To view the Mesh statistics:
1 Select the Statistics menu from the Web UI.
2Select
System from the navigation pane (on the left-hand side of the screen). Expand a RF Domain, select a
controller or service platform, and select one of its connected Access Points.
3Select
Mesh.
Tx Bytes Displays the total number of bytes transmitted by each listed radio. This
includes all user data as well as any management overhead data.
Rx Bytes Displays the total number of bytes received by each listed radio. This
includes all user data as well as any management overhead data.
Tx Packets Displays the total number of packets transmitted by each listed radio. This
includes all user data as well as any management overhead packets.
Rx Packets Displays the total number of packets received by each listed radio. This
includes all user data as well as any management overhead packets.
Tx User Data Rate Displays the rate (in kbps) user data is transmitted by each listed radio.
This rate only applies to user data and does not include management
overhead.
Rx User Data Rate Displays the rate (in kbps) user data is received by the radio. This rate only
applies to user data and does not include management overhead.
Tx Dropped Displays the total number of transmitted packets dropped by each listed
radio. This includes all user data as well as management overhead packets
that were dropped.
Traffic Index This area displays the traffic index, which measures how efficiently the
traffic medium is utilized. It’s defined as the percentage of current
throughput relative to the maximum possible throughput.The indices
include:
0 – 20 (Very low utilization)
20 – 40 (Low utilization)
40 – 60 (Moderate utilization)
60 and above (High utilization)
Refresh Select the Refresh button to update the screen’s statistics counters to their
latest values.
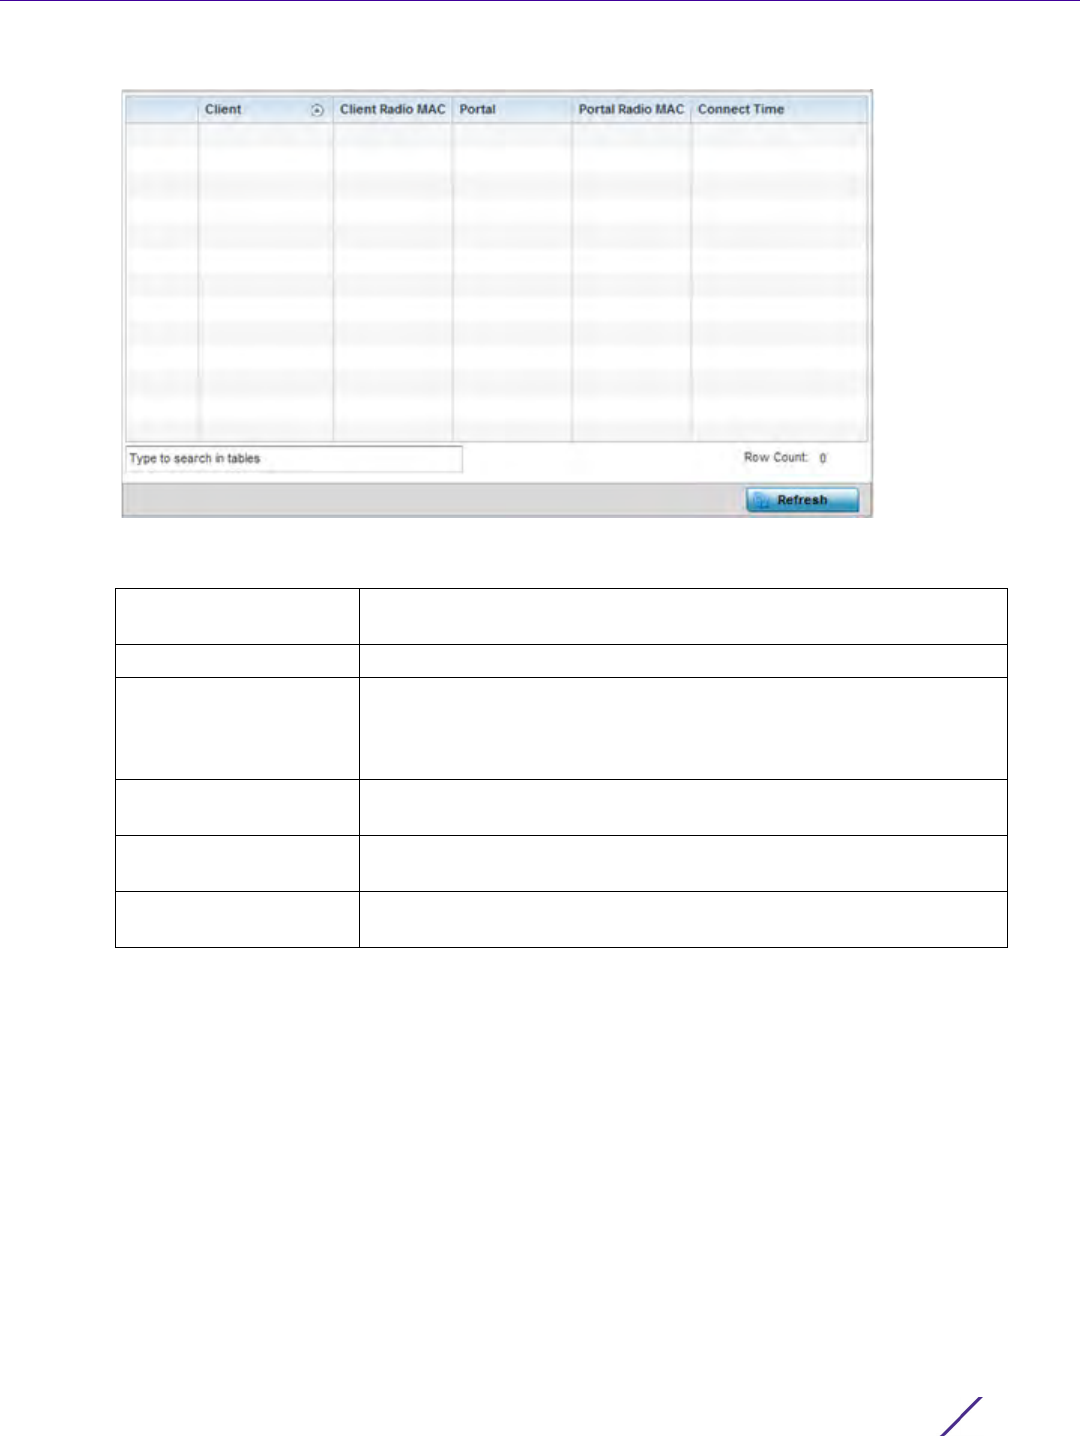
Statistics
Wireless Controller and Service Platform System Reference Guide 15 - 222
Figure 15-153 Access Point - Mesh screen
The Mesh screen describes the following:
15.4.13 Interfaces
Access Point Statistics
The Interface screen provides detailed statistics on each of the interfaces available on the selected Access Point.
Use this screen to review the statistics for each interface. Interfaces vary amongst supported Access Point models.
To review Access Point interface statistics:
1 Select the Statistics menu from the Web UI.
2Select
System from the navigation pane (on the left-hand side of the screen). Expand a RF Domain, select a
controller or service platform, and select one of its connected Access Points.
3Select
Interfaces.
The General tab displays by default.
Client Displays the system assigned name of each member of the mesh
network.
Client Radio MAC Displays the MAC address of each client radio in the mesh network.
Portal Mesh points connected to an external network and forward traffic in
and out are Mesh Portals. Mesh points must find paths to a Portal to
access the Internet. When multiple Portals exist, the Mesh point must
select one.
Portal Radio MAC Lists the MAC addresses of those Access Points serving as mesh
portals.
Connect Time Displays the elapsed connection time for each listed client in the mesh
network.
Refresh Select the Refresh button to update the screen’s statistics counters to
their latest values.
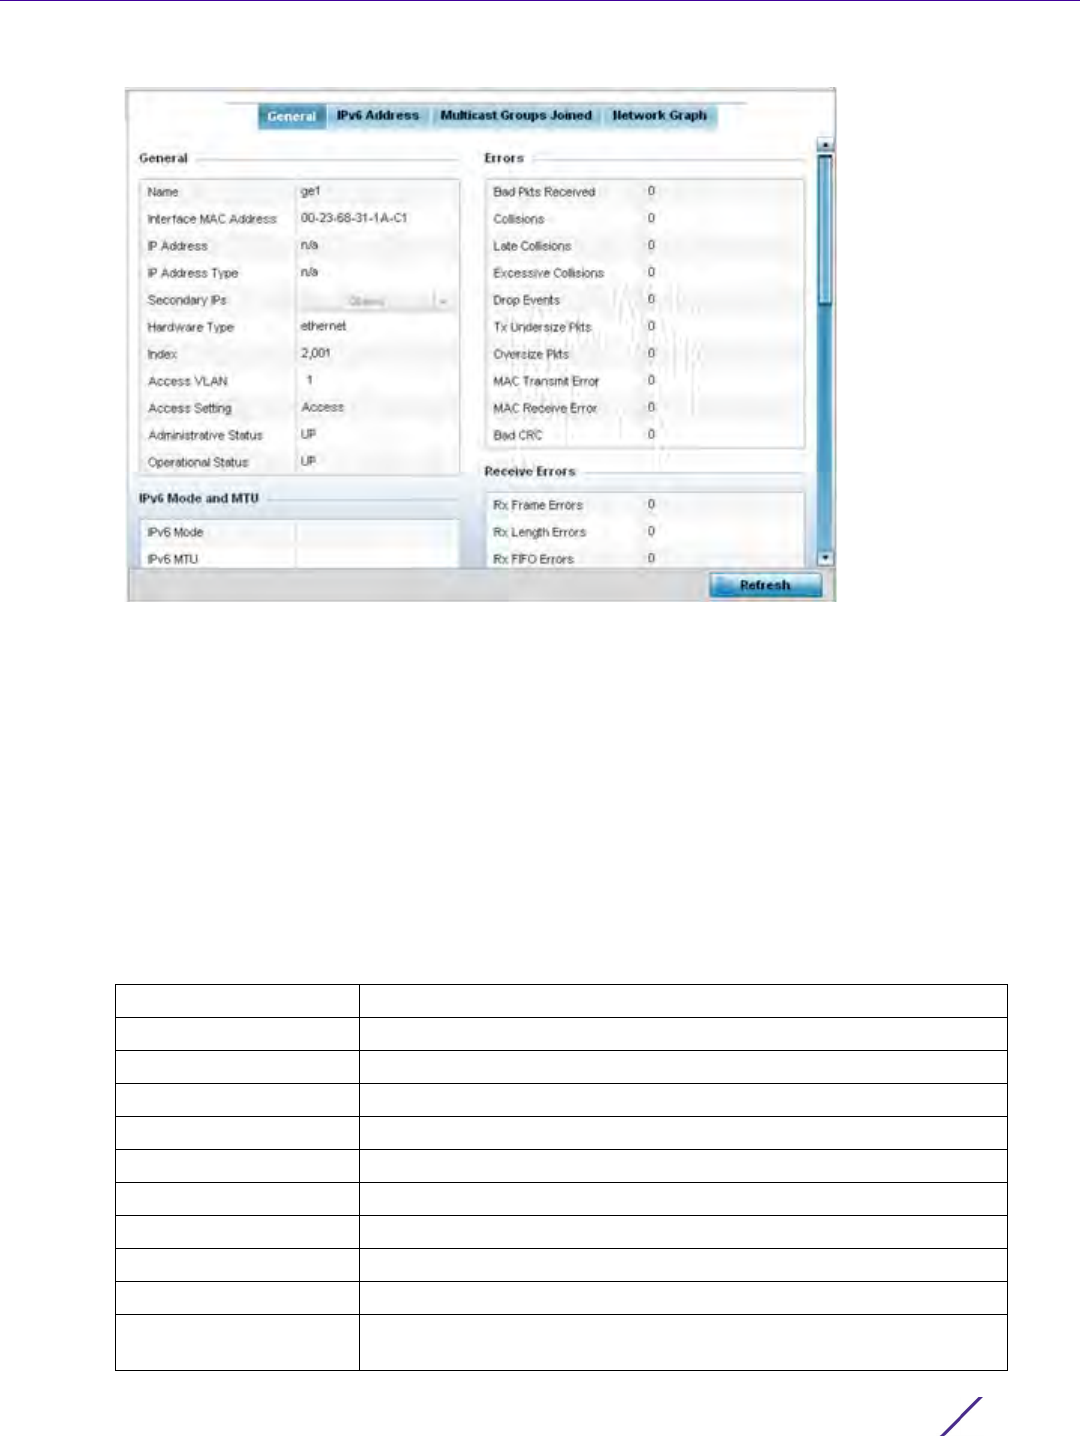
Statistics
Wireless Controller and Service Platform System Reference Guide 15 - 223
Figure 15-154 Access Point- General Interface screen
Interface Statistics support the following:
•General Interface Details
•IPv6 Address
•Multicast Groups Joined
•Network Graph
15.4.13.1 General Interface Details
Interfaces
The General tab provides information on a selected Access Point interface such as its MAC address, type and TX/
RX statistics.
The General table displays the following:
Name Displays the name of the Access Point interface ge1, vlan1 etc.
Interface MAC Address Displays the MAC address of the interface.
IP Address IP address of the interface.
IP Address Type Displays the IP address type, either IPv4 or IPv6.
Secondary IP Displays a list of secondary IP resources assigned to this interface.
Hardware Type Displays the networking technology.
Index Displays the unique numerical identifier for the interface.
Access VLAN Displays the tag assigned to the native VLAN.
Access Setting Displays the VLAN mode as either Access or Trunk.
Administrative Status Displays whether the interface is currently UP or DOWN.
Operational Status Lists whether the selected interface is currently UP (operational) or
DOWN.

Statistics
Wireless Controller and Service Platform System Reference Guide 15 - 224
The IPv6 Mode and MTU table displays the following:
The Specification table displays the following information:
The Traffic table displays the following:
IPv6 Mode Lists the current IPv6 mode utilized.
IPv6 MTU Lists the IPv6 formatted largest packet size that can be sent over the
interface.
Media Type Displays the physical connection type of the interface.
Medium types include:
Copper - Used on RJ-45 Ethernet ports
Optical - Used on fibre optic gigabit Ethernet ports
Protocol Displays the routing protocol used by the interface.
MTU Displays the maximum transmission unit (MTU) setting configured on
the interface. The MTU value represents the largest packet size that
can be sent over a link. 10/100 Ethernet ports have a maximum setting
of 1500.
Mode Lists whether traffic on the listed port is Layer 2 or Layer 3.
Metric Displays the metric associated with the interface’s route.
Maximum Speed Displays the maximum speed the interface uses to transmit or receive
data.
Admin Speed Displays the speed the port can transmit or receive. This value can be
either 10, 100, 1000 or Auto. This value is the maximum port speed in
Mbps. Auto indicates the speed is negotiated between connected
devices.
Operator Speed Displays the current speed of data transmitted and received over the
interface.
Admin Duplex Setting Displays the administrator’s duplex setting.
Current Duplex Setting Displays the interface as either half duplex, full duplex or unknown.
Good Octets Sent Displays the number of octets (bytes) with no errors sent by the
interface.
Good Octets Received Displays the number of octets (bytes) with no errors received by the
interface.
Good Packets Sent Displays the number of good packets transmitted.
Good Packets Received Displays the number of good packets received.
Mcast Pkts Sent Displays the number of multicast packets sent through the interface.
Mcast Pkts Received Displays the number of multicast packets received through the
interface.
Ucast Pkts Sent Displays the number of unicast packets sent through the interface.
Ucast Pkts Received Displays the number of unicast packets received through the interface.
Bcast Pkts Sent Displays the number of broadcast packets sent through the interface.
Bcast Pkts Received Displays the number of broadcast packets received through the
interface.

Statistics
Wireless Controller and Service Platform System Reference Guide 15 - 225
The Errors table displays the following:
The Receive Errors table displays the following:
Packet Fragments Displays the number of packet fragments transmitted or received
through the interface.
Jabber Pkts Displays the number of packets transmitted through the interface
larger than the MTU.
Bad Pkts Received Displays the number of bad packets received through the interface.
Collisions Displays the number of collisions over the selected interface.
Late Collisions A late collision is any collision that occurs after the first 64 octets of
data have been sent. Late collisions are not normal, and usually the
result of out of specification cabling or a malfunctioning device.
Excessive Collisions Displays the number of excessive collisions. Excessive collisions occur
when the traffic load increases to the point a single Ethernet network
cannot handle it efficiently.
Drop Events Displays the number of dropped packets transmitted or received
through the interface.
Tx Undersize Pkts Displays the number of undersized packets transmitted through the
interface.
Oversize Pkts Displays the number of oversized packets transmitted through the
interface.
MAC Transmit Error Displays the number of failed transmits due to an internal MAC
sublayer error (that’s not a late collision), due to excessive collisions or
a carrier sense error.
MAC Receive Error Displays the number of received packets that failed due to an internal
MAC sublayer (that’s not a late collision), an excessive number of
collisions or a carrier sense error.
Bad CRC Displays the CRC error. The CRC is the 4 byte field at the end of every
frame. The receiving station uses it to interpret if the frame is valid. If
the CRC value computed by the interface does not match the value at
the end of frame, it is considered as a bad CRC.
Rx Frame Errors Displays the number of frame errors received at the interface. A frame
error occurs when data is received, but not in an expected format.
Rx Length Errors Displays the number of length errors received at the interface. Length
errors are generated when the received frame length was either less or
over the Ethernet standard.
Rx FIFO Errors Displays the number of FIFO errors received at the interface. First-in
First-out queueing is an algorithm that involves buffering and
forwarding of packets in the order of arrival. FIFO entails no priority.
There is only one queue, and all packets are treated equally. An
increase in FIFO errors indicates a probable hardware malfunction.
Rx Missed Errors Displays the number of missed packets. Packets are missed when the
hardware received FIFO has insufficient space to store an incoming
packet.
Rx Over Errors Displays the number of overflow errors received. Overflows occur
when a packet size exceeds the allocated buffer size.

Statistics
Wireless Controller and Service Platform System Reference Guide 15 - 226
The Transmit Errors field displays the following:
4 Select the Refresh button to update the screen’s statistics counters to their latest values.
15.4.13.2 IPv6 Address
Interfaces
IPv6 is the latest revision of the Internet Protocol (IP) designed to replace IPv4. IPV6 provides enhanced
identification and location information for computers on networks routing traffic across the Internet. IPv6
addresses are composed of eight groups of four hexadecimal digits separated by colons.
To view IPv6 address utilization:
1 Select the Statistics menu from the Web UI.
2Select
System from the navigation pane (on the left-hand side of the screen). Expand a RF Domain, select a
controller or service platform, and select one of its connected Access Points.
3Expand the Interfaces menu from the left-hand side of the UI.
4Select
IPv6 Address.
Tx Errors Displays the number of packets with errors transmitted on the
interface.
Tx Dropped Displays the number of transmitted packets dropped from the
interface.
Tx Aborted Errors Displays the number of packets aborted on the interface because a
clear-to-send request was not detected.
Tx Carrier Errors Displays the number of carrier errors on the interface. This generally
indicates bad Ethernet hardware or bad cabling.
Tx FIFO Errors Displays the number of FIFO errors transmitted at the interface. First-
in First-Out queueing is an algorithm that involves the buffering and
forwarding of packets in the order of arrival. FIFO uses no priority.
There is only one queue, and all packets are treated equally. An
increase in the number of FIFO errors indicates a probable hardware
malfunction.
Tx Heartbeat Errors Displays the number of heartbeat errors. This generally indicates a
software crash, or packets stuck in an endless loop.
Tx Window Errors Displays the number of window errors transmitted. TCP uses a sliding
window flow control protocol. In each TCP segment, the receiver
specifies the amount of additional received data (in bytes) the receiver
is willing to buffer for the connection. The sending host can send only
up to that amount. If the sending host transmits more data before
receiving an acknowledgment, it constitutes a window error.
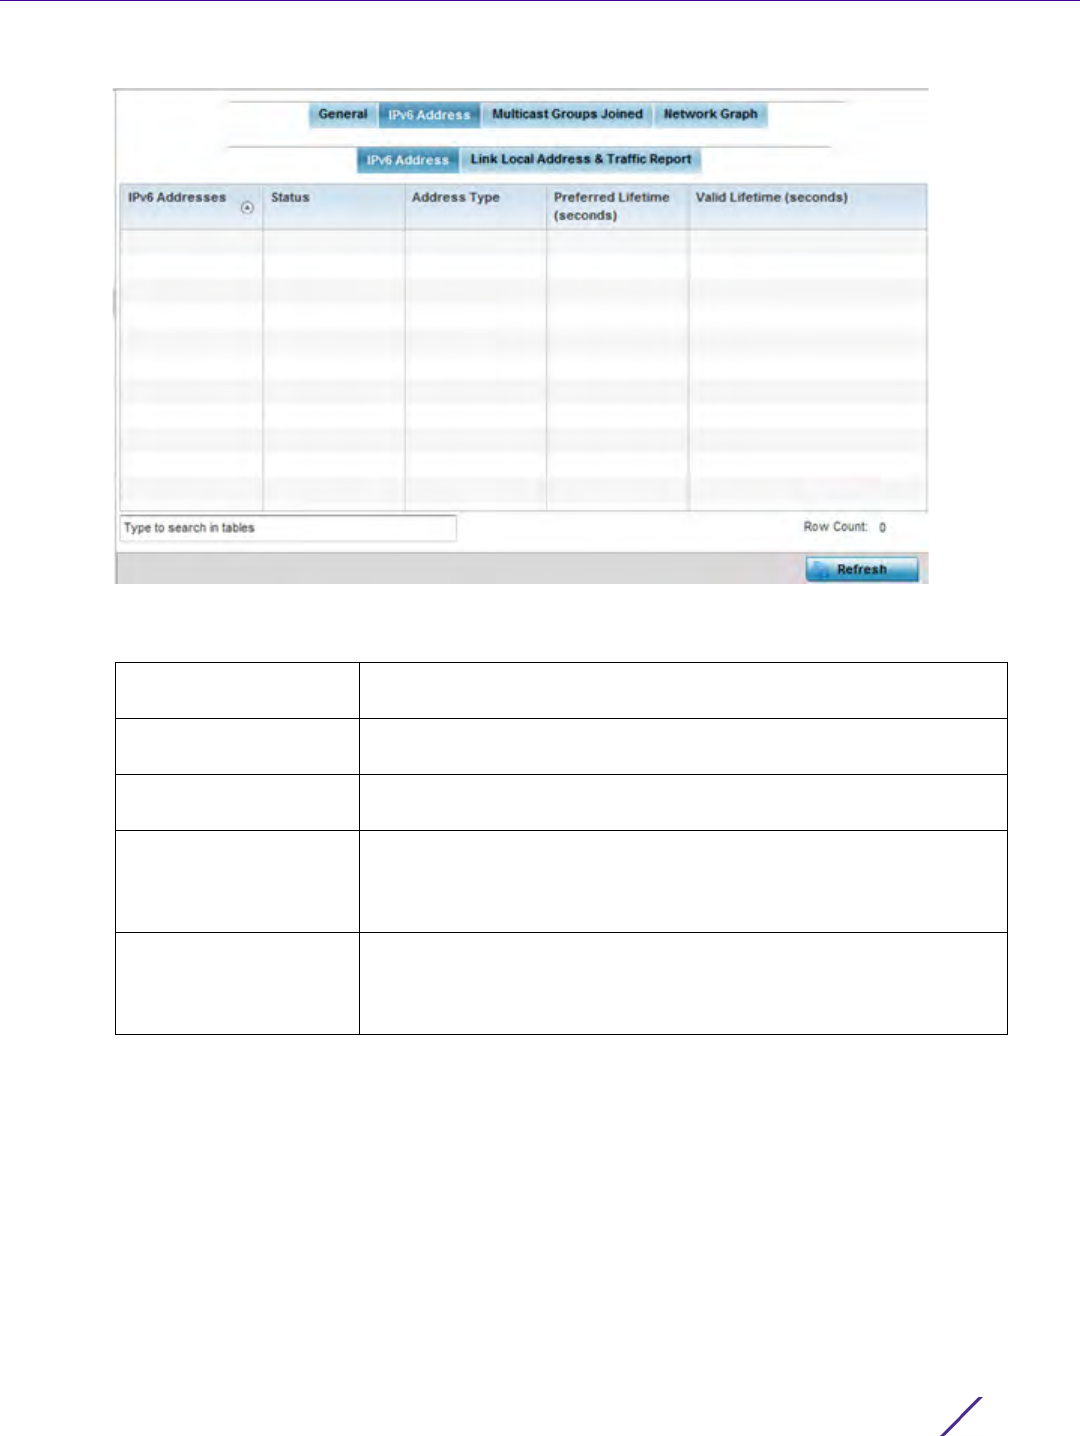
Statistics
Wireless Controller and Service Platform System Reference Guide 15 - 227
Figure 15-155 Access Point - Interface IPv6 Address screen
5The IPv6 Addresses table displays the following:
6 Select the Link Local Address & Traffic Report tab to assess data traffic and errors discovered in transmitted
and received IPv6 formatted data packets.
IPv6 Addresses Lists the IPv6 formatted addresses currently utilized by the Access
Point on the selected interface.
Status Lists the current utilization status of each IPv6 formatted address
currently in use by this controller or Access Point’s selected interface.
Address Type Lists whether the address is unicast or multicast in its utilization over
the selected Access Point interface.
Preferred Lifetime
(seconds)
Lists is the time in seconds (relative to when the packet is sent) the
IPv6 formatted addresses remains in a preferred state on the selected
interface. The preferred lifetime must always be less than or equal to
the valid lifetime
Valid Lifetime (seconds) Displays the time in seconds (relative to when the packet is sent) the
IPv6 formatted address remains in a valid state on the selected
interface. The valid lifetime must always be greater than or equal to
the preferred lifetime.
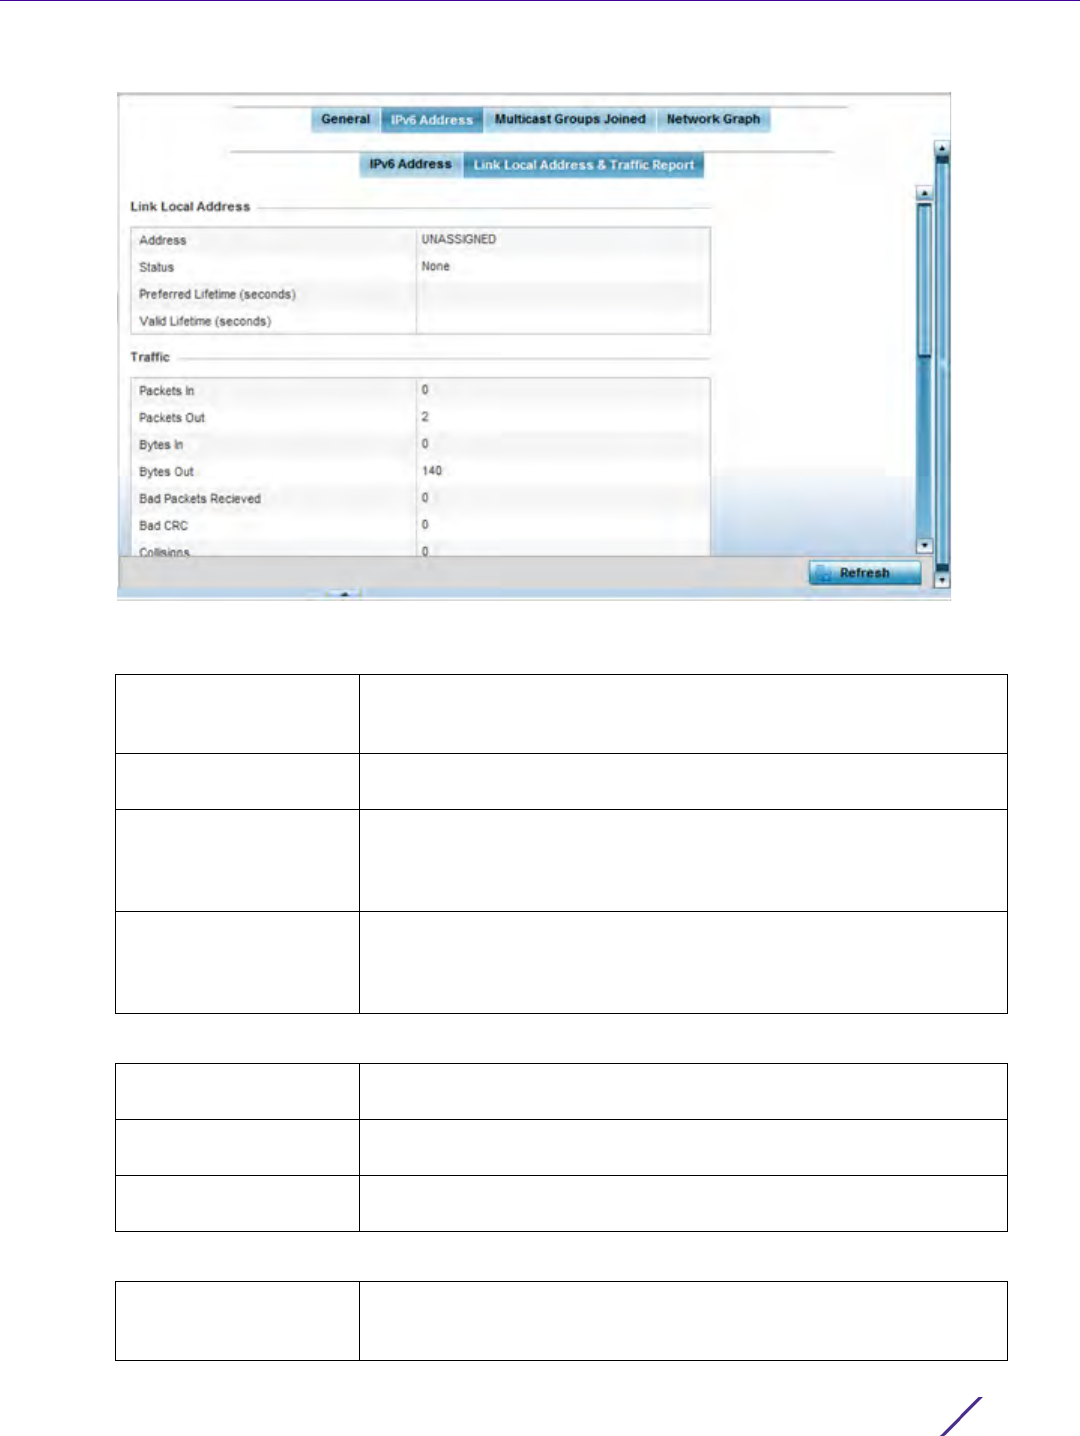
Statistics
Wireless Controller and Service Platform System Reference Guide 15 - 228
Figure 15-156 Access Point - Interface IPv6 Address screen
7 Verify the following Local Link Address data for the IPv6 formatted address:
8 Verify the following IPv6 formatted Traffic data:
9 Review the following Receive Errors for IPv6 formatted data traffic:
Address Lists the IPv6 local link address. IPv6 requires a link local address
assigned to every interface the IPv6 protocol is enabled on, even when
one or more routable addresses are assigned.
Status Lists the IPv6 local link address utilization status and its current
availability.
Preferred Lifetime
(seconds)
Lists is the time in seconds (relative to when the packet is sent) the
local link addresses remains in the preferred state on the selected
interface. The preferred lifetime must always be less than or equal to
the valid lifetime.
Valid Lifetime (seconds) Displays the time in seconds (relative to when the packet is sent) the
local link addresses remains in the valid state on the selected interface.
The valid lifetime must always be greater than or equal to the
preferred lifetime.
Packets In Lists the number of IPv6 formatted data packets received on the
selected Access Point interface since the screen was last refreshed.
Packets Out Lists the number of IPv6 formatted data packets transmitted on the
selected Access Point interface since the screen was last refreshed.
Refresh Periodically select Refresh to update the screen’s counters to their
latest values.
Receive Length Errors Displays the number of IPv6 length errors received at the interface.
Length errors are generated when the received IPv6 frame length was
either less or over the Ethernet standard.

Statistics
Wireless Controller and Service Platform System Reference Guide 15 - 229
10 Review the following Transmit Errors for IPv6 formatted data traffic:
15.4.13.3 Multicast Groups Joined
Interfaces
Multicast groups scale to a larger set of destinations by not requiring prior knowledge of who or how many
destinations there are. Multicast devices uses their infrastructure efficiently by requiring the source to send a
packet only once, even if delivered to a large number of devices. Devices replicate a packet to reach multiple
receivers only when necessary.
Access Points are free to join or leave a multicast group at any time. There are no restrictions on the location or
members in a multicast group. A host may be a member of more than one multicast group at any given time and
does not have to belong to a group to send messages to members of a group.
Receive Over Errors Displays the number of IPv6 overflow errors received. Overflows occur
when a packet size exceeds the allocated buffer size.
Receive Frame Errors Displays the number of IPv6 frame errors received at the interface. A
frame error occurs when data is received, but not in an expected
format.
Receive FIFO Errors Displays the number of IPv6 FIFO errors received at the interface.
First-in First-out queueing is an algorithm that involves buffering and
forwarding of packets in the order of arrival. FIFO entails no priority.
There is only one queue, and all IPv6 formatted packets are treated
equally. An increase in FIFO errors indicates a probable hardware
malfunction.
Receive Missed Errors Displays the number of missed IPv6 formatted packets. Packets are
missed when the hardware received FIFO has insufficient space to
store an incoming packet.
Transmit Errors Displays the number of IPv6 formatted data packets with errors
transmitted on the interface.
Transmit Aborted Errors Displays the number of IPv6 formatted packets aborted on the
interface because a clear-to-send request was not detected.
Transmit Carrier Errors Displays the number of IPv6 formatted carrier errors on the interface.
This generally indicates bad Ethernet hardware or bad cabling.
Transmit FIFO Errors Displays the number of IPv6 formatted FIFO errors transmitted at the
interface. First-in First-Out queueing is an algorithm that involves the
buffering and forwarding of packets in the order of arrival. FIFO uses
no priority. There is only one queue, and all packets are treated
equally. An increase in the number of FIFO errors indicates a probable
hardware malfunction.
Transmit Heartbeat
Errors
Displays the number of IPv6 formatted heartbeat errors. This generally
indicates a software crash, or packets stuck in an endless loop.
Transmit Window Errors Displays the number of IPv6 formatted window errors transmitted.
TCP uses a sliding window flow control protocol. In each TCP segment,
the receiver specifies the amount of additional received data (in bytes)
the receiver is willing to buffer for the connection. The sending host
can send only up to that amount. If the sending host transmits more
data before receiving an acknowledgment, it constitutes a window
error.
Refresh Select Refresh to update the statistics counters to their latest value.
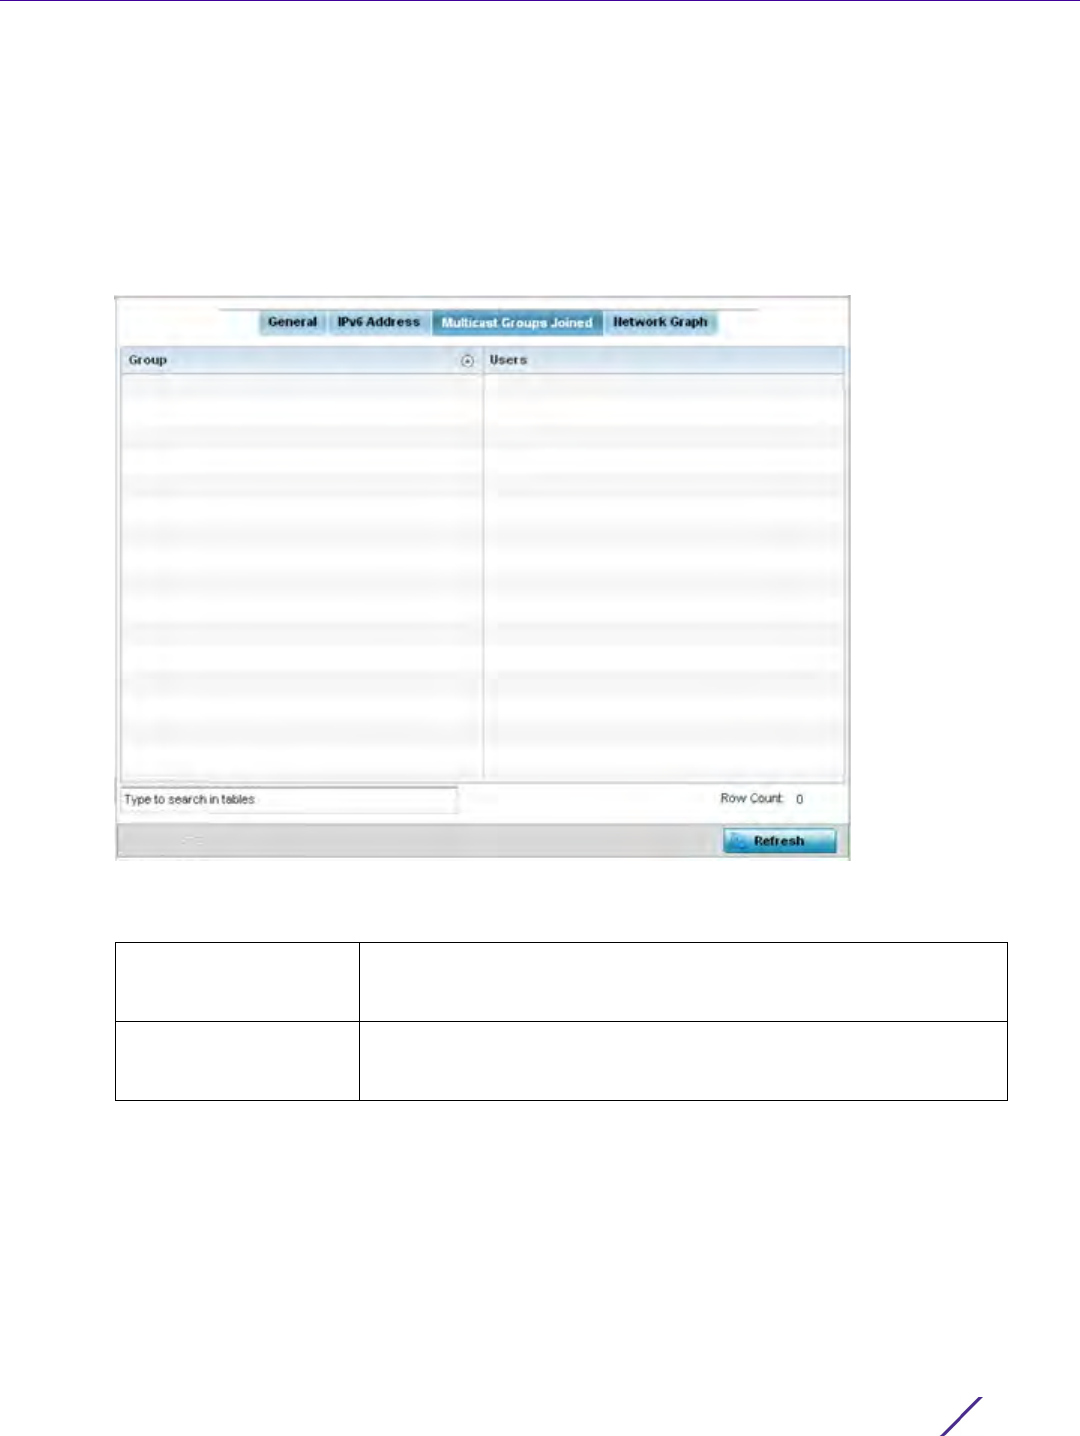
Statistics
Wireless Controller and Service Platform System Reference Guide 15 - 230
To view the Access Point’s multicast group memberships on the selected interface:
1 Select the Statistics menu from the Web UI.
2Select
System from the navigation pane (on the left-hand side of the screen). Expand a RF Domain, select a
controller or service platform, and select one of its connected Access Points.
3Select
Interfaces.
4Select
Multicast Groups Joined.
Figure 15-157 Access Point - Interface Multicast Groups Joined screen
5 The screen displays the following:
6 Periodically select Refresh to update the screen’s counters to their latest values.
Group Lists the name of existing multicast groups whose current members
share multicast packets with one another on this selected interface as
a means of collective interoperation.
Users Lists the number of devices currently interoperating on this interface
in each listed multicast group. Any single device can be a member of
more then one group at a time.
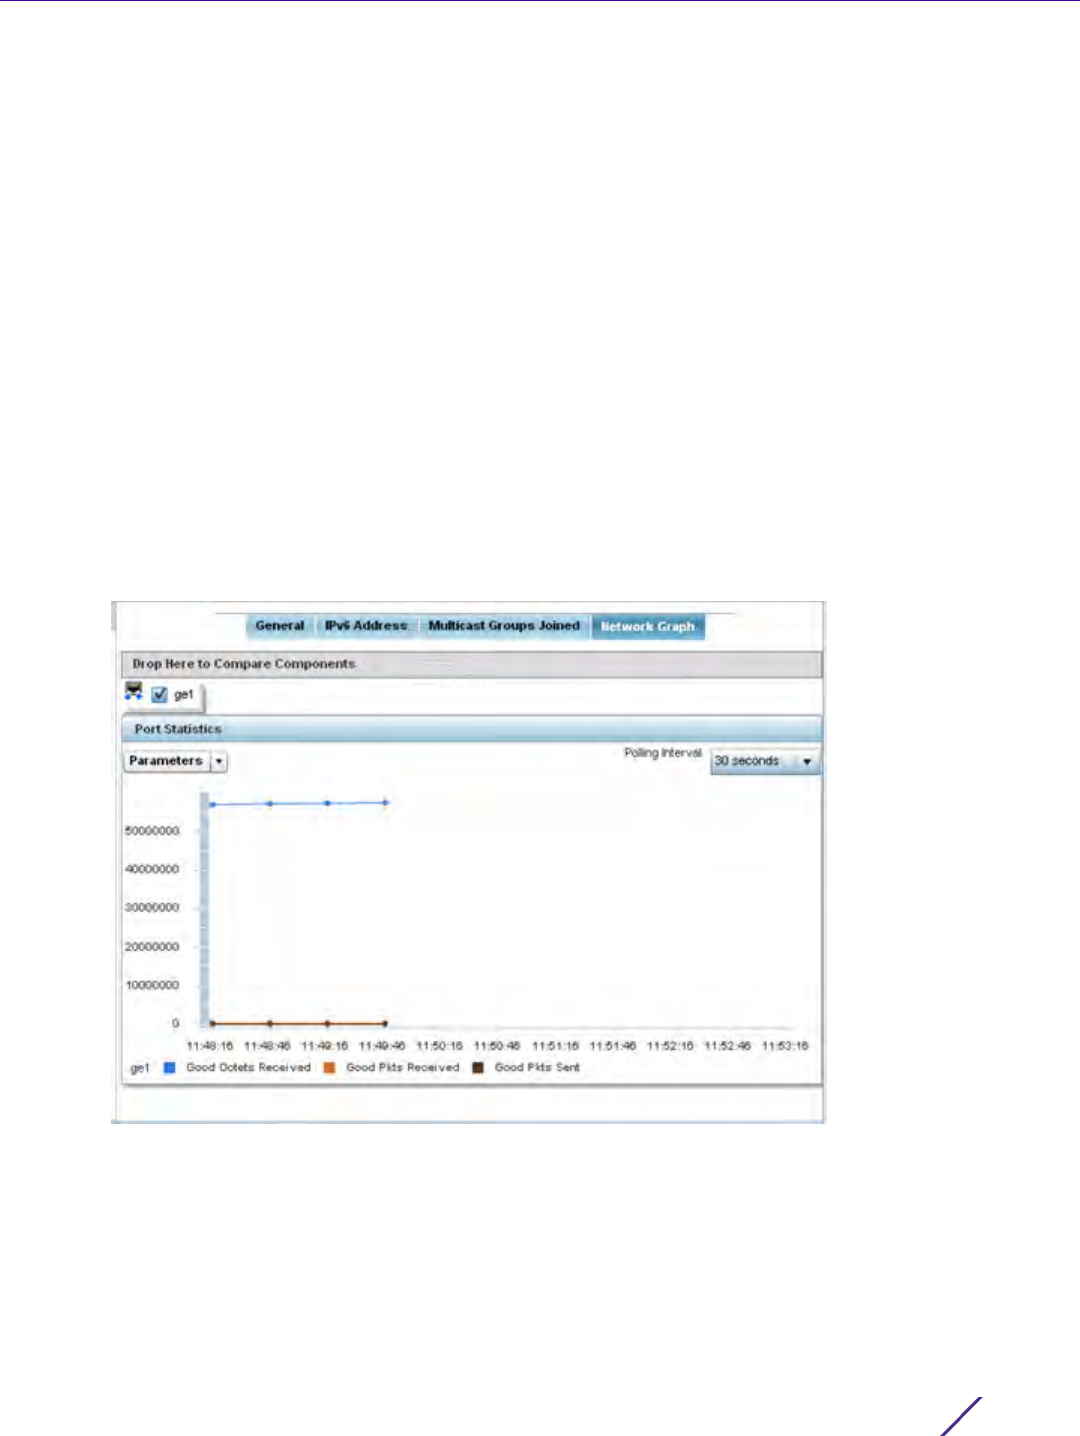
Statistics
Wireless Controller and Service Platform System Reference Guide 15 - 231
15.4.13.4 Network Graph
Interfaces
The Network Graph displays statistics the Access Point continuously collects for its interfaces. Even when the
interface statistics graph is closed, data is still collected. Display the interface statistics graph periodically for
assessing the latest interface information. Up to three different stats can be selected and displayed within the
graph.
To view a detailed graph for an interface, select an interface and drop it on to the graph. The graph displays Port
Statistics as the Y-axis and the Polling Interval as the X-axis. Use the Polling Interval from the drop-down menu to
define the intervals data is displayed on the graph.
To view the Interface Statistics graph:
1 Select the Statistics menu from the Web UI.
2Select
System from the navigation pane (on the left-hand side of the screen). Expand a RF Domain, select a
controller or service platform, and select one of its connected Access Points.
3Select
Interfaces.
4Select
Network Graph. Use the Parameters drop-down menu to specify interface values to trend.
Figure 15-158 Access Point- Interface Network Graph screen
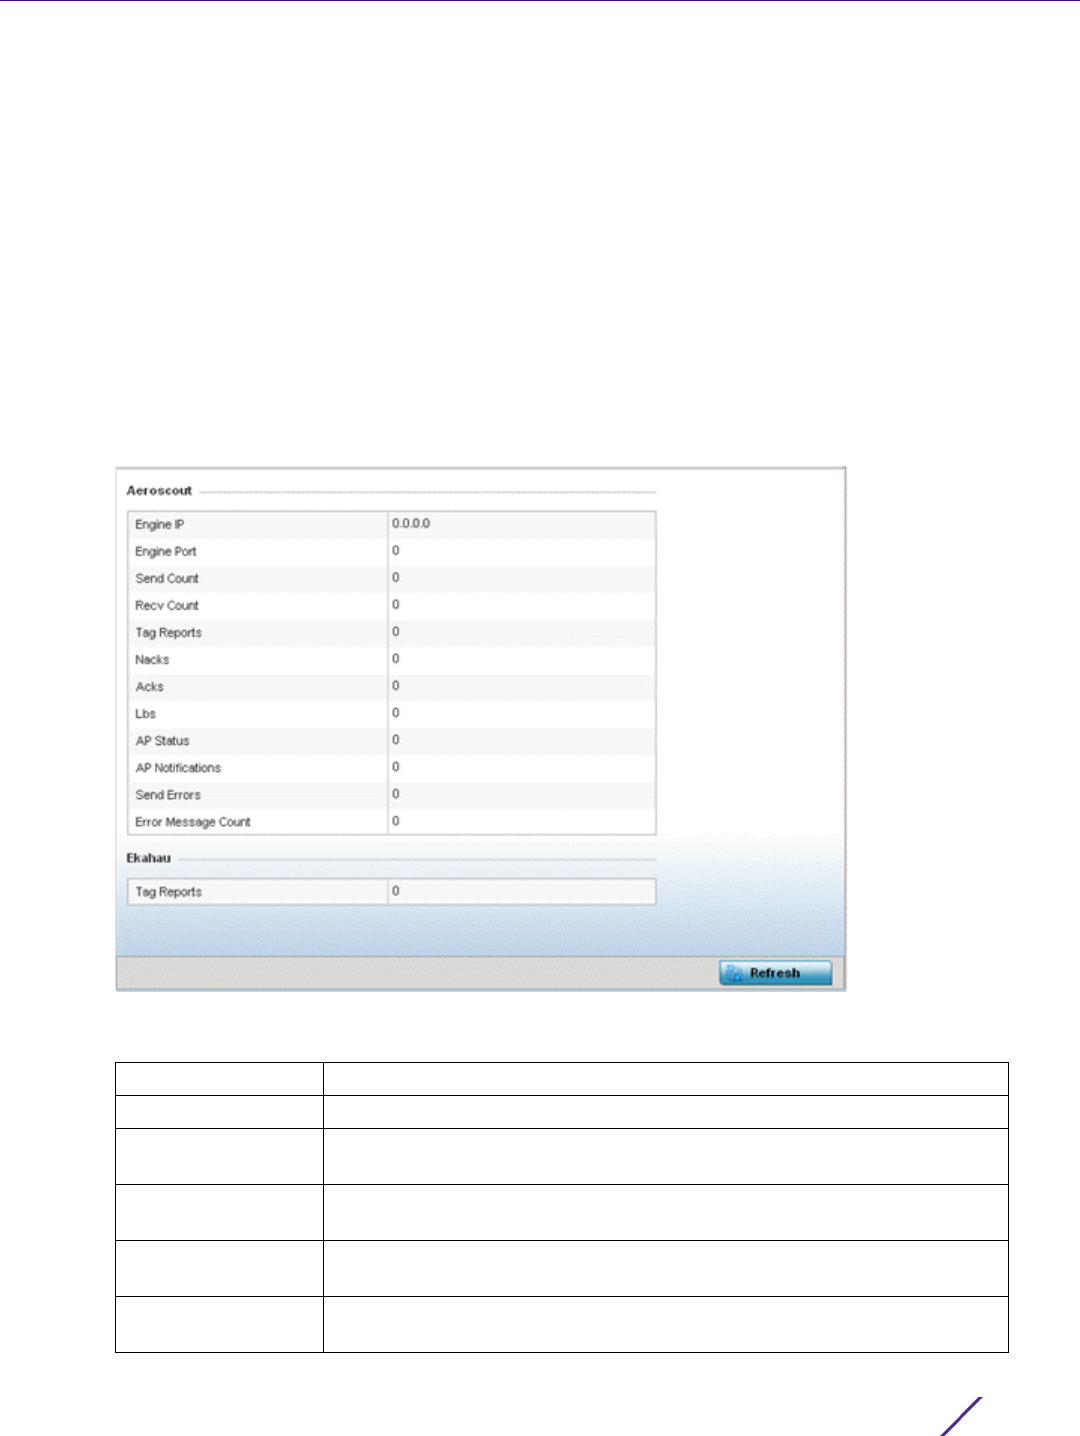
Statistics
Wireless Controller and Service Platform System Reference Guide 15 - 232
15.4.14 RTLS
Access Point Statistics
The real time locationing system (RTLS) enables accurate location determination and presence detection
capabilities for Wi-Fi-based devices, Wi-Fi-based active RFID tags and passive RFID tags. While the operating
system does not support locationing locally, it does report the locationing statistics of both Aeroscout and Ekahau
tags.
To review a selected Access Point’s RTLS statistics:
1 Select the Statistics menu from the Web UI.
2Select
System from the navigation pane (on the left-hand side of the screen). Expand a RF Domain, select a
controller or service platform, and select one of its connected Access Points.
3Select
RTLS.
Figure 15-159 Access Point - RTLS screen
The Access Point RTLS screen displays the following for Aeroscout tags:
Engine IP Lists the IP address of the Aeroscout locationing engine.
Engine Port Displays the port number of the Aeroscout engine.
Send Count Lists the number location determination packets sent by the locationing
engine.
Recv Count Lists the number location determination packets received by the
locationing engine.
Tag Reports Displays the number of tag reports received from locationing equipped
radio devices supporting RTLS.
Nacks Displays the number of Nack (no acknowledgement) frames received from
RTLS supported radio devices providing locationing services.

Statistics
Wireless Controller and Service Platform System Reference Guide 15 - 233
The Access Point RTLS screen displays the following for Ekahau tags:
4 Select the Refresh button to update the screen’s statistics counters to their latest values.
15.4.15 PPPoE
Access Point Statistics
The PPPoE statistics screen displays stats derived from the AP’s access to high-speed data and broadband
networks. PPPoE uses standard encryption, authentication, and compression methods as specified by the PPPoE
protocol. PPPoE enables Access Points to establish a point-to-point connection to an ISP over existing Ethernet
interface.
To review a selected Access Point’s PPPoE statistics:
1 Select the Statistics menu from the Web UI.
2Select
System from the navigation pane (on the left-hand side of the screen). Expand a RF Domain, select a
controller or service platform, and select one of its connected Access Points.
3Select
PPPoE.
Acks Displays the number of Ack (acknowledgment) frames received from RTLS
supported radio devices providing locationing services.
Lbs Displays the number of location based service (LBS) frames received from
RTLS supported radio devices providing locationing services.
AP Status Provides the status of peer APs providing locationing assistance.
AP Notifications Displays a count of the number of notifications sent to Access Points that
may be available to provide RTLS support.
Send Errors Lists the number of send errors received by the RTLS initiating Access
Point.
Error Message Count Displays a cumulative count of error messages received from RTLS
enabled Access Point radios.
Tag Reports Displays the number of tag reports received from locationing equipped
radio devices supporting RTLS.
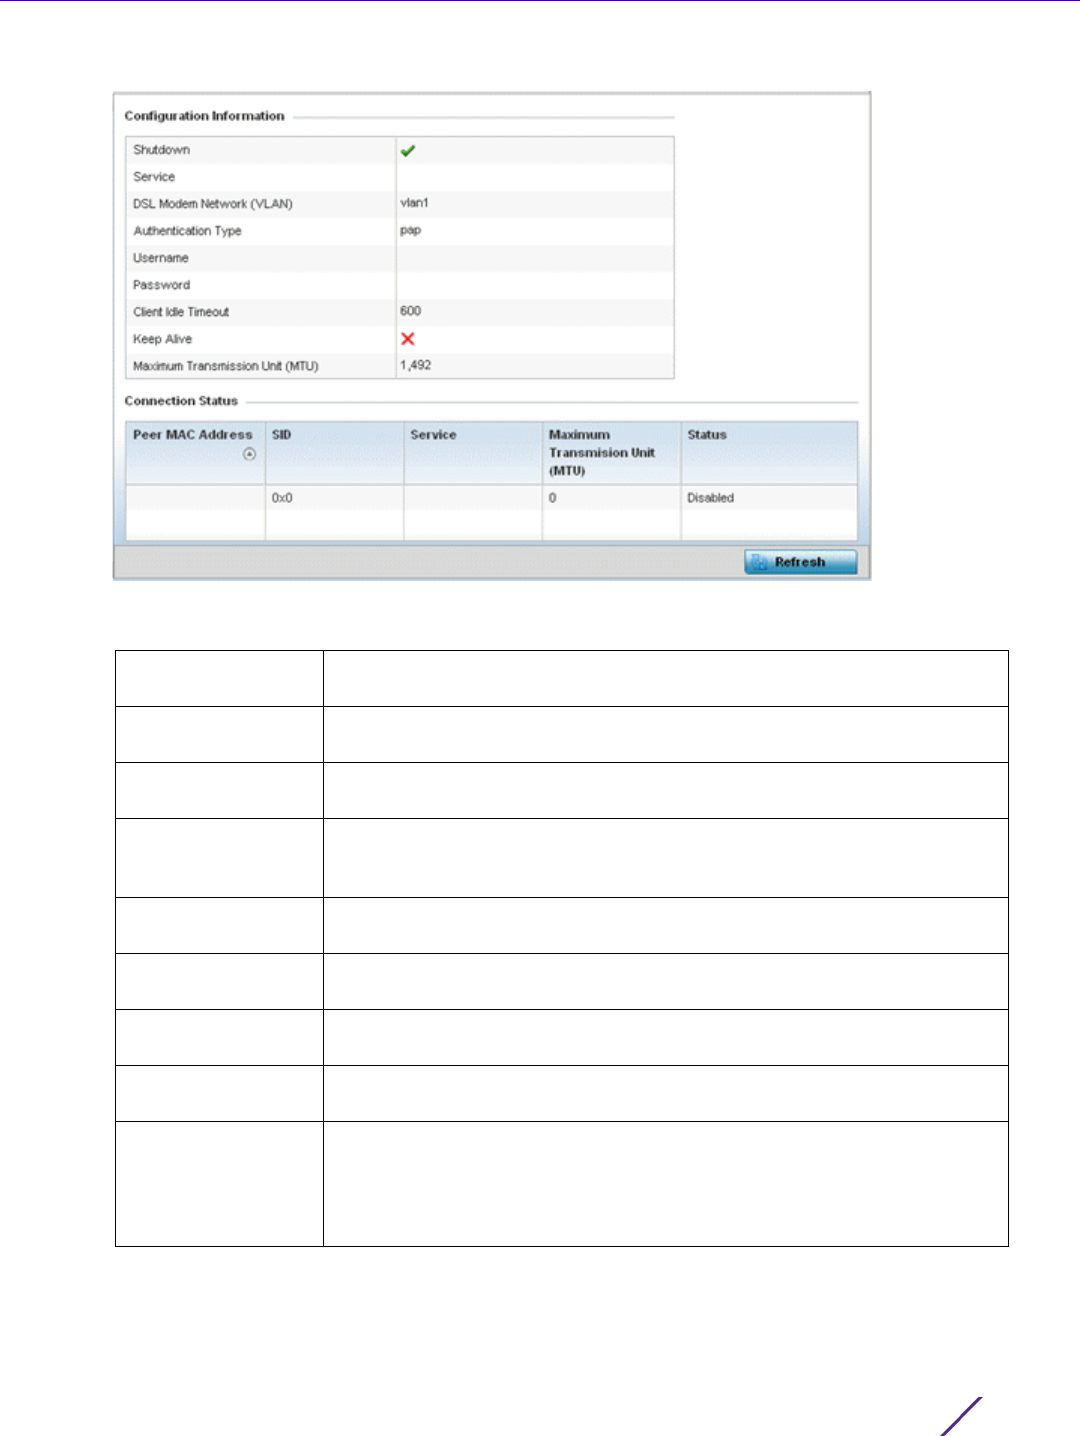
Statistics
Wireless Controller and Service Platform System Reference Guide 15 - 234
Figure 15-160 Access Point - PPPoE screen
The Configuration Information field screen displays the following:
4 Refer to the Connection Status field.
The Connection Status table lists the MAC address, SID, Service information, MTU and status of each route
destination peer. To provide this point-to-point connection, each PPPoE session learns the Ethernet address of
Shutdown Displays whether a high speed client mode point-to-point connection has
been enabled using the PPPoE protocol.
Service Lists the 128 character maximum PPPoE client service name provided by
the service provider.
DSL Modem
Network (VLAN)
Displays the PPPoE VLAN (client local network) connected to the DSL
modem. This is the local network connected to DSL modem.
Authentication Type Lists authentication type used by the PPPoE client whose credentials must
be shared by its peer Access Point. Supported authentication options
include None, PAP, CHAP, MSCHAP, and MSCHAP-v2.
Username Displays the 64 character maximum username used for authentication
support by the PPPoE client.
Password Displays the 64 character maximum password used for authentication by
the PPPoE client.
Client Idle Timeout The Access Point uses the listed timeout so it does not sit idle waiting for
input from the PPPoE client and the server, that may never come.
Keep Alive If a keep alive is utilized, the point-to-point connect to the PPPoE client is
continuously maintained and not timed out.
Maximum
Transmission Unit
(MTU)
Displays the PPPoE client maximum transmission unit (MTU) from 500 -
1,492. The MTU is the largest physical packet size in bytes a network can
transmit. Any messages larger than the MTU are divided into smaller
packets before being sent. A PPPoE client should be able to maintain its
point-to-point connection for this defined MTU size.
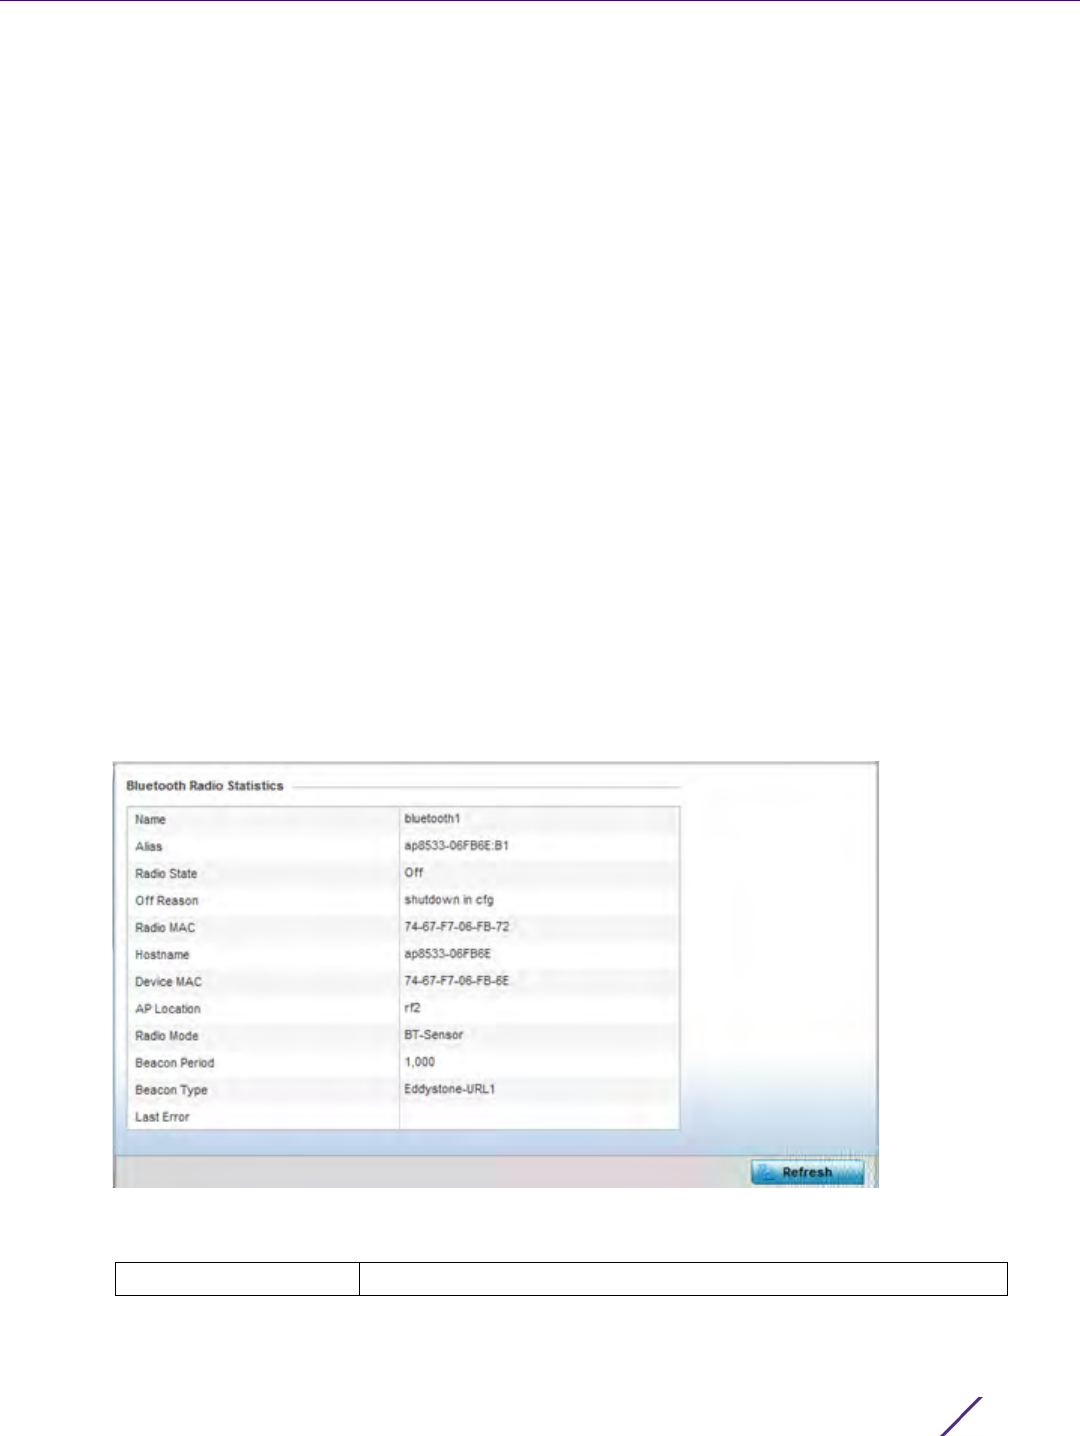
Statistics
Wireless Controller and Service Platform System Reference Guide 15 - 235
a remote PPPoE client, and establishes a session. PPPoE uses both a discover and session phase to identify a
client and establish a point-to-point connection. By using such a connection, a Wireless WAN failover is
available to maintain seamless network access if the Access Point’s Wired WAN were to fail.
5 Select the Refresh button to update the screen’s statistics counters to their latest values.
15.4.16 Bluetooth
Access Point Statistics
AP-8432 and AP-8533 model Access Points utilize a built in Bluetooth chip for specific Bluetooth functional
behaviors in a WiNG managed network. AP-8432 and AP-8533 models support both Bluetooth classic and
Bluetooth low energy technology. These platforms can use their Bluetooth classic enabled radio to sense other
Bluetooth enabled devices and report device data (MAC address, RSSI and device calls) to an ADSP server for
intrusion detection. If the device presence varies in an unexpected manner, ADSP can raise an alarm.
AP-8432 and AP-8533 model Access Points support Bluetooth beaconing to emit either iBeacon or Eddystone-
URL beacons. The Access Point’s Bluetooth radio sends non-connectable, undirected low-energy (LE)
advertisement packets on a periodic basis. These advertisement packets are short, and sent on Bluetooth
advertising channels that conform to already-established iBeacon and Eddystone-URL standards.
To view Bluetooth radio statistics for an Access Point:
1 Select the Statistics menu from the Web UI.
2Select
System from the navigation pane (on the left-hand side of the screen). Expand a RF Domain, select a
controller or service platform, and select one of its connected Access Point
3Select
Bluetooth.
Figure 15-161 Access Point - Bluetooth screen
The Access Point’s Bluetooth screen displays the following:
Name Lists the name of the Access Point’s Bluetooth radio.

Statistics
Wireless Controller and Service Platform System Reference Guide 15 - 236
15.4.17 OSPF
Access Point Statistics
Open Shortest Path First (OSPF) is a link-state interior gateway protocol (IGP). OSPF routes IP packets within a
single routing domain (autonomous system), like an enterprise LAN. OSPF gathers link state information from
neighbor routers and constructs a network topology. The topology determines the routing table presented to the
Internet Layer which makes routing decisions based solely on the destination IP address found in IP packets.
Refer to the following for detailed descriptions of the tabs available within the OSPF statistics screen:
•OSPF Summary
•OSPF Neighbors
•OSPF Area Details
•OSPF Route Statistics
•OSPF Route Statistics
•OSPF State
Alias If an alias has been defined for the Access Point its listed here. The
alias value is expressed in the form of <hostname>:
B<Bluetooth_radio_number>. If the administrator has defined a
hostname for the Access Point, it’s used in place of the Access Point’s
default hostname.
Radio State Displays the current operational state (On/Off) of the Bluetooth radio.
Off Reason If the Bluetooth radio is offline, this field states the reason.
Radio MAC Lists the Bluetooth radio’s factory encoded MAC address serving as
this device’s hardware identifier on the network.
Hostname Lists the hostname set for the Access Point as its network identifier.
Device MAC Lists the Access Point’s factory encoded MAC address serving as this
device’s hardware identifier on the network.
AP Location Lists the Access Point’s administrator assigned deployment location.
Radio Mode Lists an Access Point’s Bluetooth radio functional mode as either bt-
sensor or le-beacon.
Beacon Period Lists the Bluetooth radio’s beacon transmission period from
100 -10,000 milliseconds.
Beacon Type Lists the type of beacon currently configured.
Last Error Lists descriptive text on any error that’s preventing the Bluetooth radio
from operating.
Refresh Select Refresh to update the screen’s statistics counters to their latest
values.
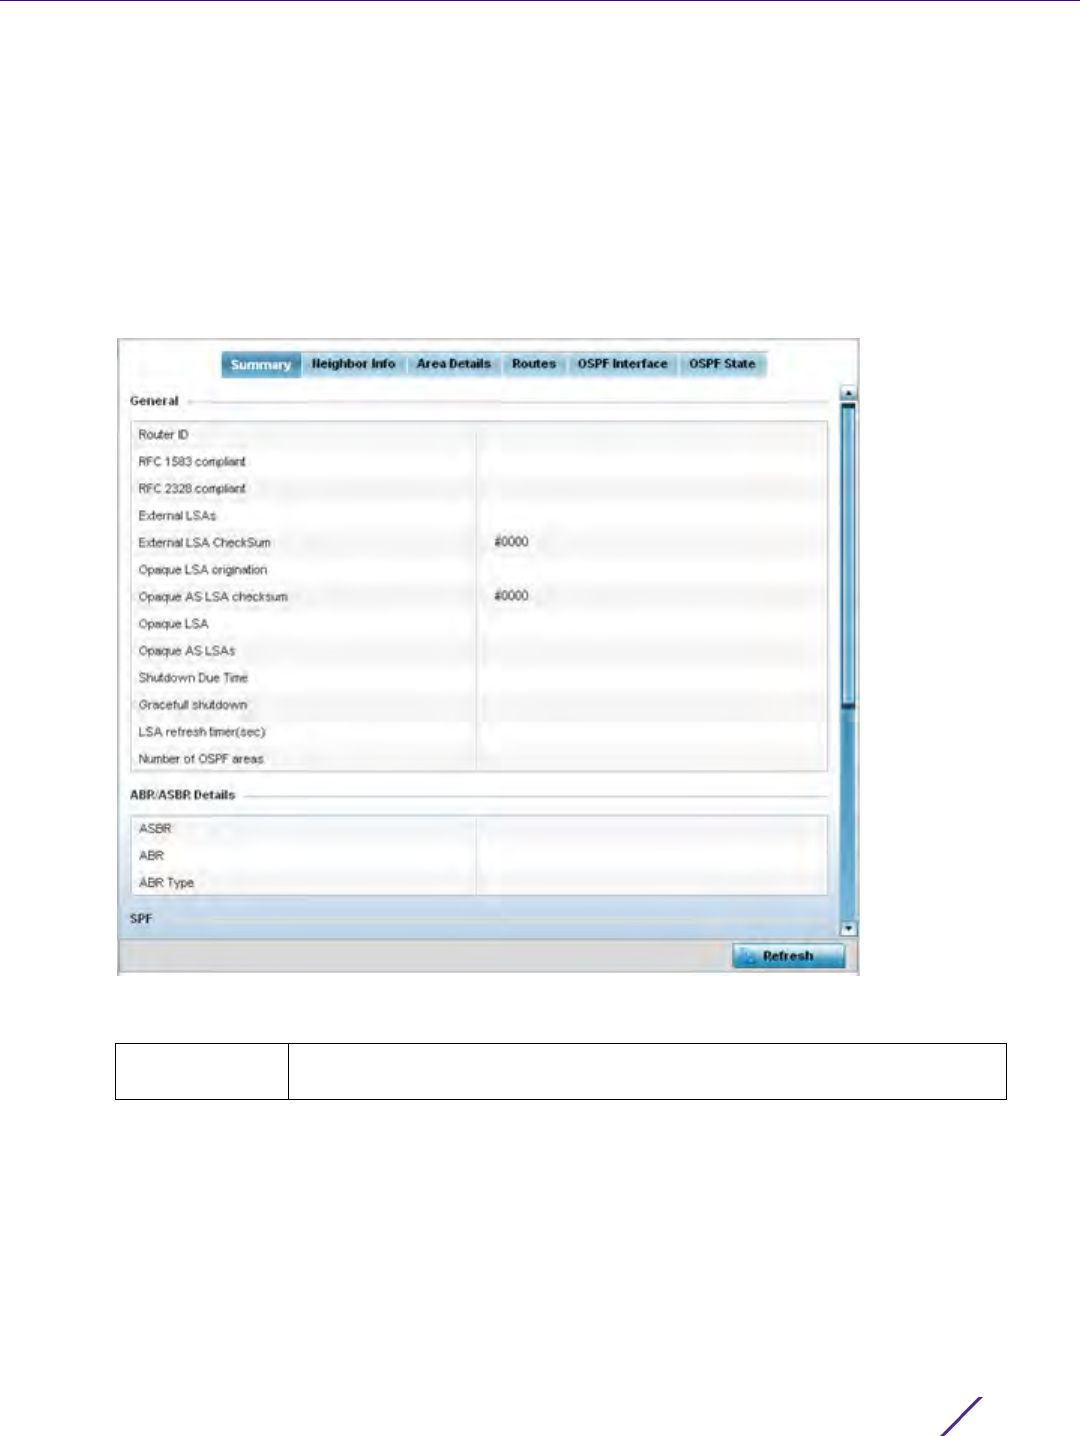
Statistics
Wireless Controller and Service Platform System Reference Guide 15 - 237
15.4.17.1 OSPF Summary
OSPF
To view OSPF summary statistics:
1 Select the Statistics menu from the Web UI.
2Select
System from the navigation pane (on the left-hand side of the screen), expand the default node and
select an Access Point for statistical observation.
3Select
OSPF. The Summary tab displays by default.
Figure 15-162 Access Point - OSPF Summary tab
The Summary tab describes the following information fields:
General The general field displays the router ID assigned for this OSPF connection,
RFC compliance information and LSA data.

Statistics
Wireless Controller and Service Platform System Reference Guide 15 - 238
4 Select the Refresh button to update the statistics counters to their latest values.
15.4.17.2 OSPF Neighbors
OSPF
OSPF establishes neighbor relationships to exchange routing updates with other routers. An Access Point
supporting OSPF sends hello packets to discover neighbors and elect a designated router. The hello packet
includes link state information and list of neighbors. OSPF is savvy with layer 2 topologies. If on a point-to-point
link, OSPF knows it is sufficient, and the link stays up. If on a broadcast link, the router waits for election before
determining if the link is functional.
To view OSPF neighbor statistics:
1 Select the Statistics menu from the Web UI.
2Select
System from the navigation pane (on the left-hand side of the screen), expand the default node and
select an Access Point for statistical observation.
3Select
OSPF.
4 Select the Neighbor Info tab.
ABR/ASBR
Details
Lists Autonomous System Boundary Router (ASBR) data relevant to OSPF
routing, including the ASBR, ABR and ABR type. An Area Border Router
(ABR) is a router that connects one or more areas to the main backbone
network. It is considered a member of all areas it is connected to. An ABR
keeps multiple copies of the link-state database in memory, one for each area
to which that router is connected An ASBR is a router connected to more than
one Routing protocol and exchanges routing information with routers in other
protocols. ASBRs typically also run an exterior routing protocol (for example,
BGP), or use static routes, or both. An ASBR is used to distribute routes
received from other, external ASs throughout its own autonomous system.
Routers in other areas use ABR as next hop to access external addresses. Then
the ABR forwards packets to the ASBR announcing the external addresses.
SPF Refer to the SPF field to assess the status of the shortest path forwarding
(SFF) execution, last SPF execution, SPF delay, SPF due in, SPF hold multiplier,
SPF hold time, SPF maximum hold time and SPF timer due flag.
Stub Router The summary screen displays information relating to stub router
advertisements and shutdown and startup times. An OSPF stub router
advertisement allows a new router into a network without immediately routing
traffic through the new router and allows a graceful shut down or reload a
router without dropping packets that are destined for other networks. This
feature introduces three configuration options that allow you to configure a
router that is running the OSPF protocol to advertise a maximum or infinite
metric to all neighbors.
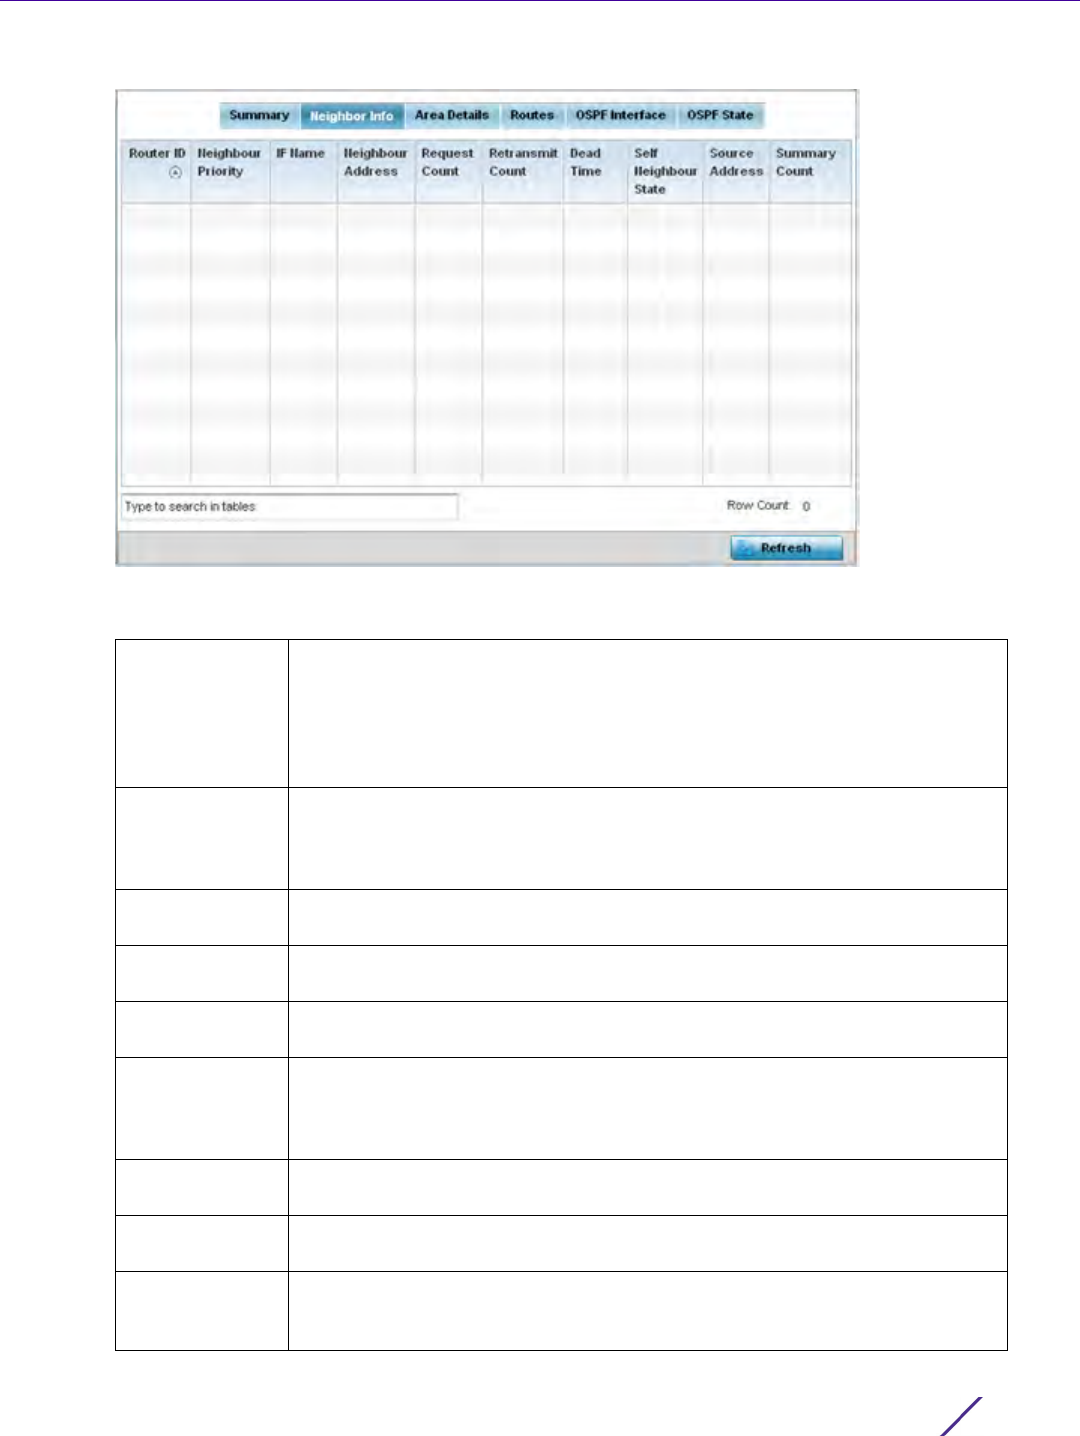
Statistics
Wireless Controller and Service Platform System Reference Guide 15 - 239
Figure 15-163 Access Point - OSPF Neighbor Info tab
The Neighbor Info tab describes the following:
Router ID Displays the router ID assigned for this OSPF connection. The router is a level
three Internet Protocol packet switch. This ID must be established in every
OSPF instance. If not explicitly configured, the highest logical IP address is
duplicated as the router identifier. However, since the router identifier is not an
IP address, it does not have to be a part of any routable subnet in the
network.
Neighbor
Priority
Displays each listed neighbor’s priority in respect to becoming the designated
router managing the OSPF connection. The designated router is the router
interface elected among all routers on a particular multi-access network
segment.
IF Name Lists the name assigned to the router interface used to support connections
amongst OSPF enabled neighbors.
Neighbor
Address
Lists the IP address of the neighbor sharing the router interface with each
listed router ID.
Request Count Lists the connection request count (hello packets) to connect to the router
interface, discover neighbors and elect a designated router.
Retransmit
Count
Lists the connection retransmission count attempted in order to connect to the
router interface, discover neighbors and elect a designated router. A
designated router (DR) is the router interface elected among all routers on a
particular multi-access network segment, generally assumed to be broadcast.
Dead Time Lists the dead time between neighbors in the network topology that are
currently utilizing the listed router ID.
Self Neighbor
State
Displays the self-neighbor status assessment used to discover neighbors and
elect a designated router.
Source Address Displays the single source address used by all neighbor routers to obtain
topology and connection status. This form of multicasting significantly reduces
network load.
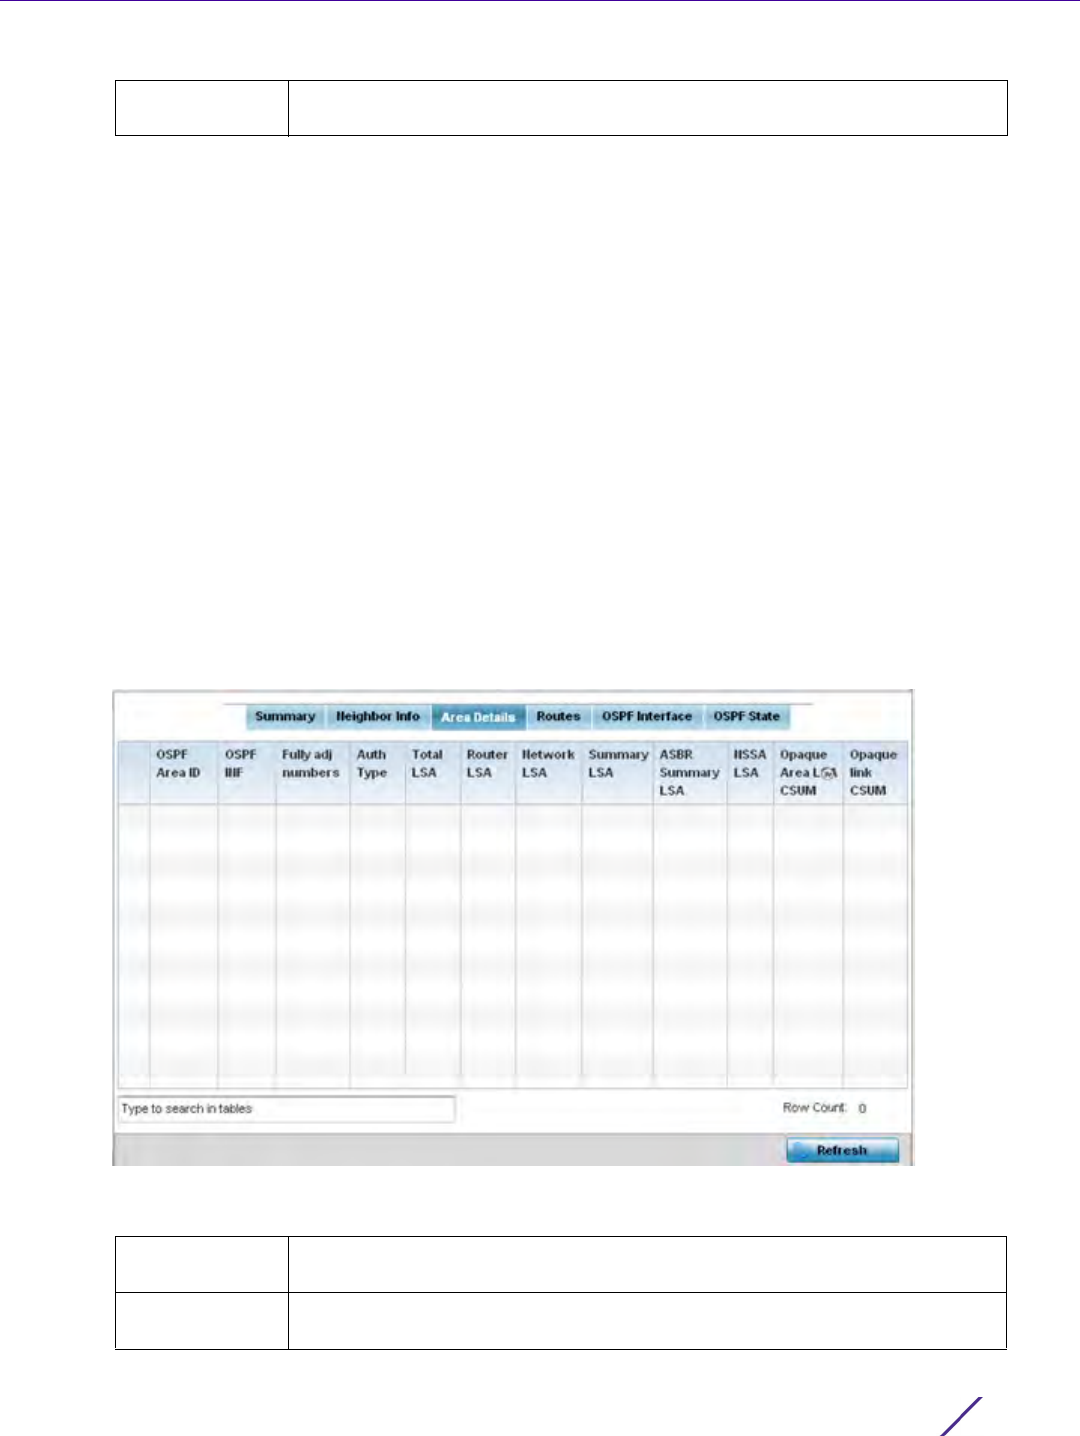
Statistics
Wireless Controller and Service Platform System Reference Guide 15 - 240
5 Select the Refresh button to update the statistics counters to their latest values.
15.4.17.3 OSPF Area Details
OSPF
An OSPF network is subdivided into routing areas (with 32 bit area identifiers) to simplify administration and
optimize traffic utilization. Areas are logical groupings of hosts and networks, including routers having interfaces
connected to an included network. Each area maintains a separate link state database whose information may be
summarized towards the rest of the network. An OSPF Area contains a set of routers exchanging Link State
Advertisements (LSAs) with others in the same area. Areas limit LSAs and encourage aggregate routes. Areas are
identified by 32-bit IDs, expressed either in decimal, or octet-based dot-decimal notation.
To view OSPF area statistics:
1 Select the Statistics menu from the Web UI.
2Select
System from the navigation pane (on the left-hand side of the screen), expand the default node and
select an Access Point for statistical observation.
3Select
OSPF.
4 Select the Area Details tab.
Figure 15-164 Access Point - OSPF Area Details tab
The Area Details tab describes the following:
Summary Count Routes that originate from other areas are called summary routes. Summary
routes are not flooded in a totally stubby or NSSA totally stubby area.
OSPF Area ID Displays either the integer (numeric ID) or IP address assigned to the OSPF
area as a unique identifier.
OSPF INF Lists the interface ID (virtual interface for dynamic OSPF routes) supporting
each listed OSPF area ID.

Statistics
Wireless Controller and Service Platform System Reference Guide 15 - 241
5 Select the Refresh button to update the statistics counters to their latest values.
15.4.17.4 OSPF Route Statistics
OSPF
Refer to the Routes tab to assess the status of OSPF Border Routes, External Routes, Network Routes and Router
Routes.
To view OSPF route statistics:
1 Select the Statistics menu from the Web UI.
2Select
System from the navigation pane (on the left-hand side of the screen), expand the default node and
select an Access Point for statistical observation.
3Select
OSPF.
Fully adj
numbers
Fully adjusted numbers strip away the effects of other non OSPF and LSA
factors and events, leaving only relevant OSPF area network route events
counted.
Auth Type Lists the authentication schemes used to validate the credentials of dynamic
route connections and their areas.
Total LSA Lists the Link State Advertisements (LSAs) of all entities using the dynamic
route (in any direction) in the listed area ID.
Router LSA Lists the Link State Advertisements of the router supporting each listed area
ID. The router LSA reports active router interfaces, IP addresses, and
neighbors.
Network LSA Displays which routers are joined together by the designated router on a
broadcast segment (e.g. Ethernet). Type 2 LSAs are flooded across their own
area only. The link state ID of the type 2 LSA is the IP interface address of the
designated route.
Summary LSA The summary LSA is generated by ABR to leak area summary address info
into another areas. ABR generates more than one summary LSA for an area if
the area addresses cannot be properly aggregated by only one prefix.
ASBR Summary
LSA
Originated by ABRs when an ASBR is present to let other areas know where
the ASBR is. These are supported just like summary LSAs.
NSSA LSA Routers in a Not-so-stubby-area (NSSA) do not receive external LSAs from
Area Border Routers, but are allowed to send external routing information for
redistribution. They use type 7 LSAs to tell the ABRs about these external
routes, which the Area Border Router then translates to type 5 external LSAs
and floods as normal to the rest of the OSPF network.
Redistribution into an NSSA area creates a special type of LSA known as TYPE
7, which can exist only in an NSSA area. An NSSA ASBR generates this LSA,
and an NSSA ABR router translates it into type 5 LSA which gets propagated
into the OSPF domain.
Opaque Area
LSA CSUM
Displays the Type-10 opaque link area checksum with the complete contents
of the LSA. Type-10 Opaque LSAs are not flooded beyond the borders of their
associated area.
Opaque link
CSUM
Displays the Type-10 opaque link checksum with the complete contents of the
LSA.
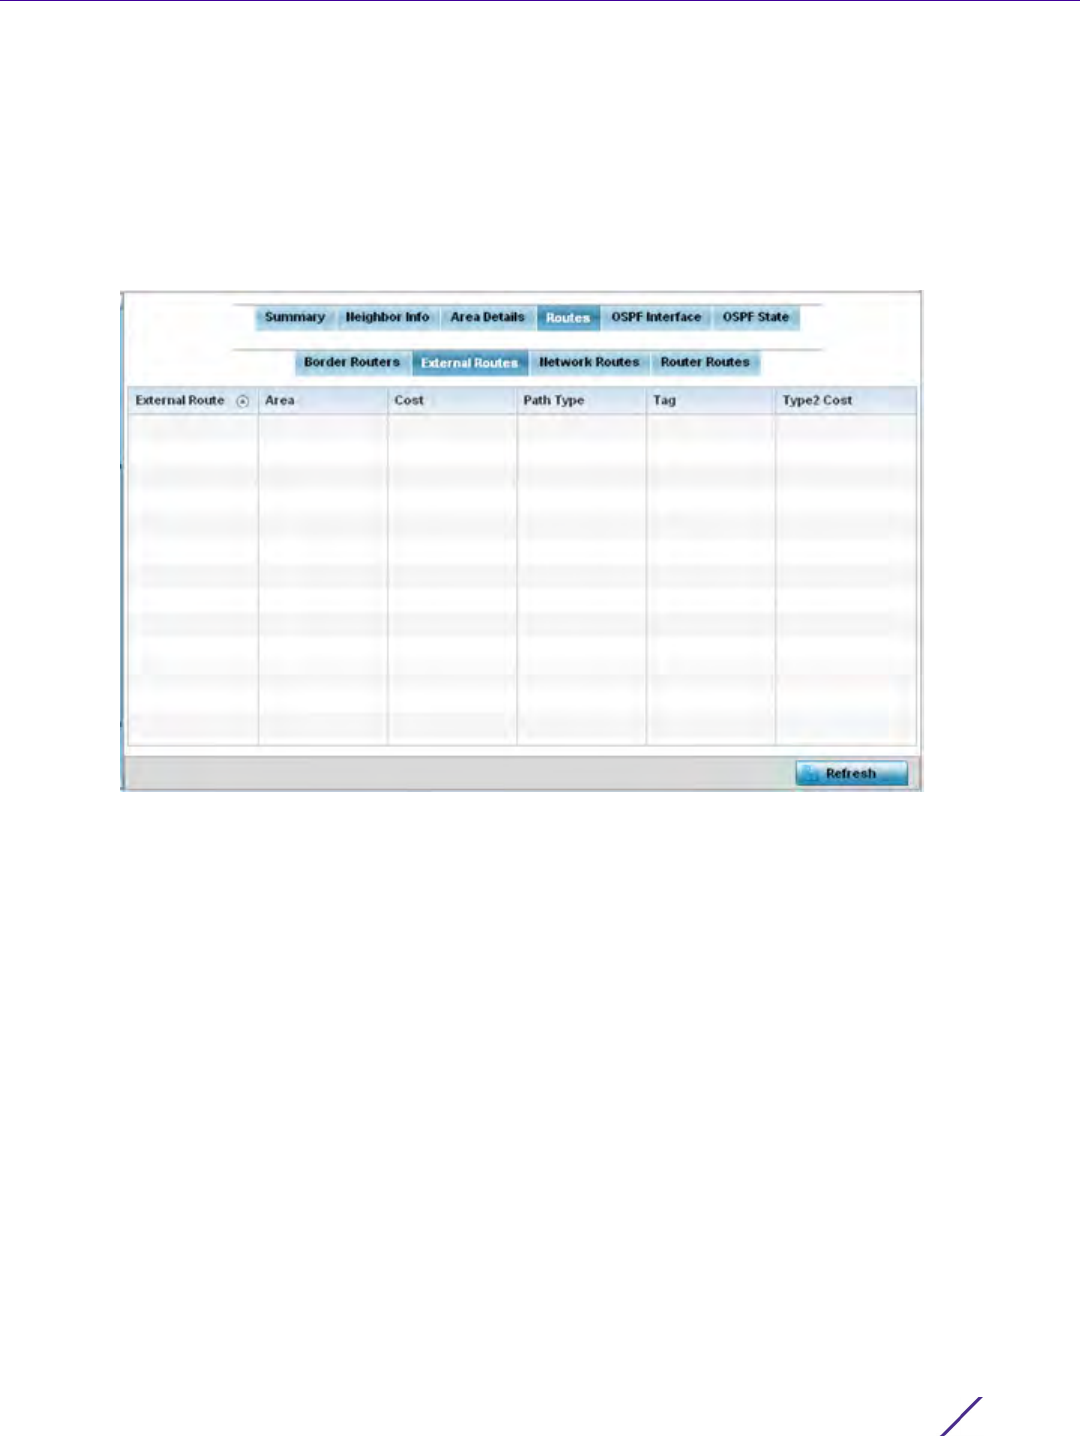
Statistics
Wireless Controller and Service Platform System Reference Guide 15 - 242
4 Select the Routes tab. The Border Routers tab display by default.
An area border router (ABR) connects (links) more than one area. Usually an ABR is used to connect non-
backbone areas to the backbone. If OSPF virtual links are used an ABR will also be used to connect the area
using the virtual link to another non-backbone area. Border routes use internal OSPF routing table entries to an
ABR or Autonomous System Boundary Router (ASBR). Border routers maintain an LSDB for each area
supported. They also participate in the backbone.
5 Refer to External Routes tab.
Figure 15-165 Access Point - OSPF External Routes tab
External routes are external to area, originate from other routing protocols (or different OSPF processes) and
are inserted into OSPF using redistribution. A stub area is configured not to carry external routes. Each external
route can be tagged by the advertising router, enabling the passing of additional information between routers.
Each external route can also be tagged by the advertising router, enabling the passing of additional
information between routers on the boundary of the autonomous system.
The External route tab displays a list of external routes, the area impacted, cost, path type, tag and type 2 cost.
Cost factors may be the distance of a router (round-trip time), network throughput of a link, or link availability
and reliability, expressed as simple unit-less numbers. This provides a dynamic process of traffic load balancing
between routes of equal cost.
6 Refer to the Network Routes tab.
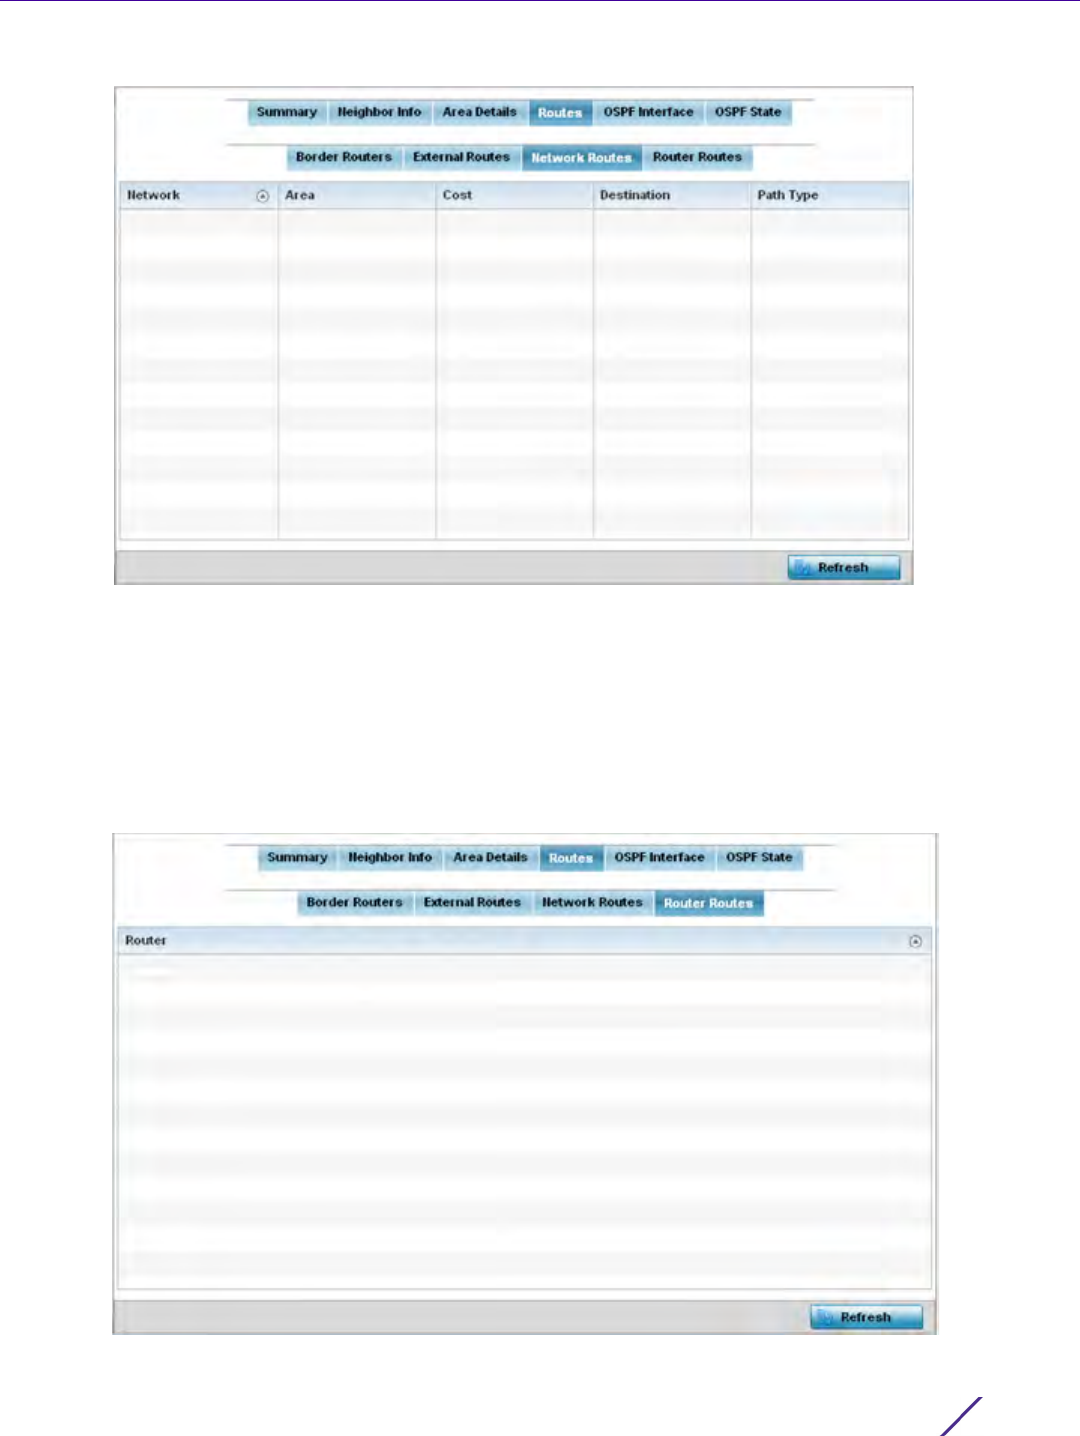
Statistics
Wireless Controller and Service Platform System Reference Guide 15 - 243
Figure 15-166 Access Point - OSPF Network Routes tab
Network routes support more than two routers, with the capability of addressing a single physical message to
all attached routers (broadcast). Neighboring routers are discovered dynamically using OSPF hello messages.
This use of the hello protocol takes advantage of broadcast capability. An OSPF network route makes further
use of multicast capabilities, if they exist. Each pair of routers on the network is assumed to communicate
directly.
The network tab displays the network name, impacted OSPF area, cost, destination and path type.
7 Select the Router Routes tab.
Figure 15-167 Access Point - OSPF Router Routes tab
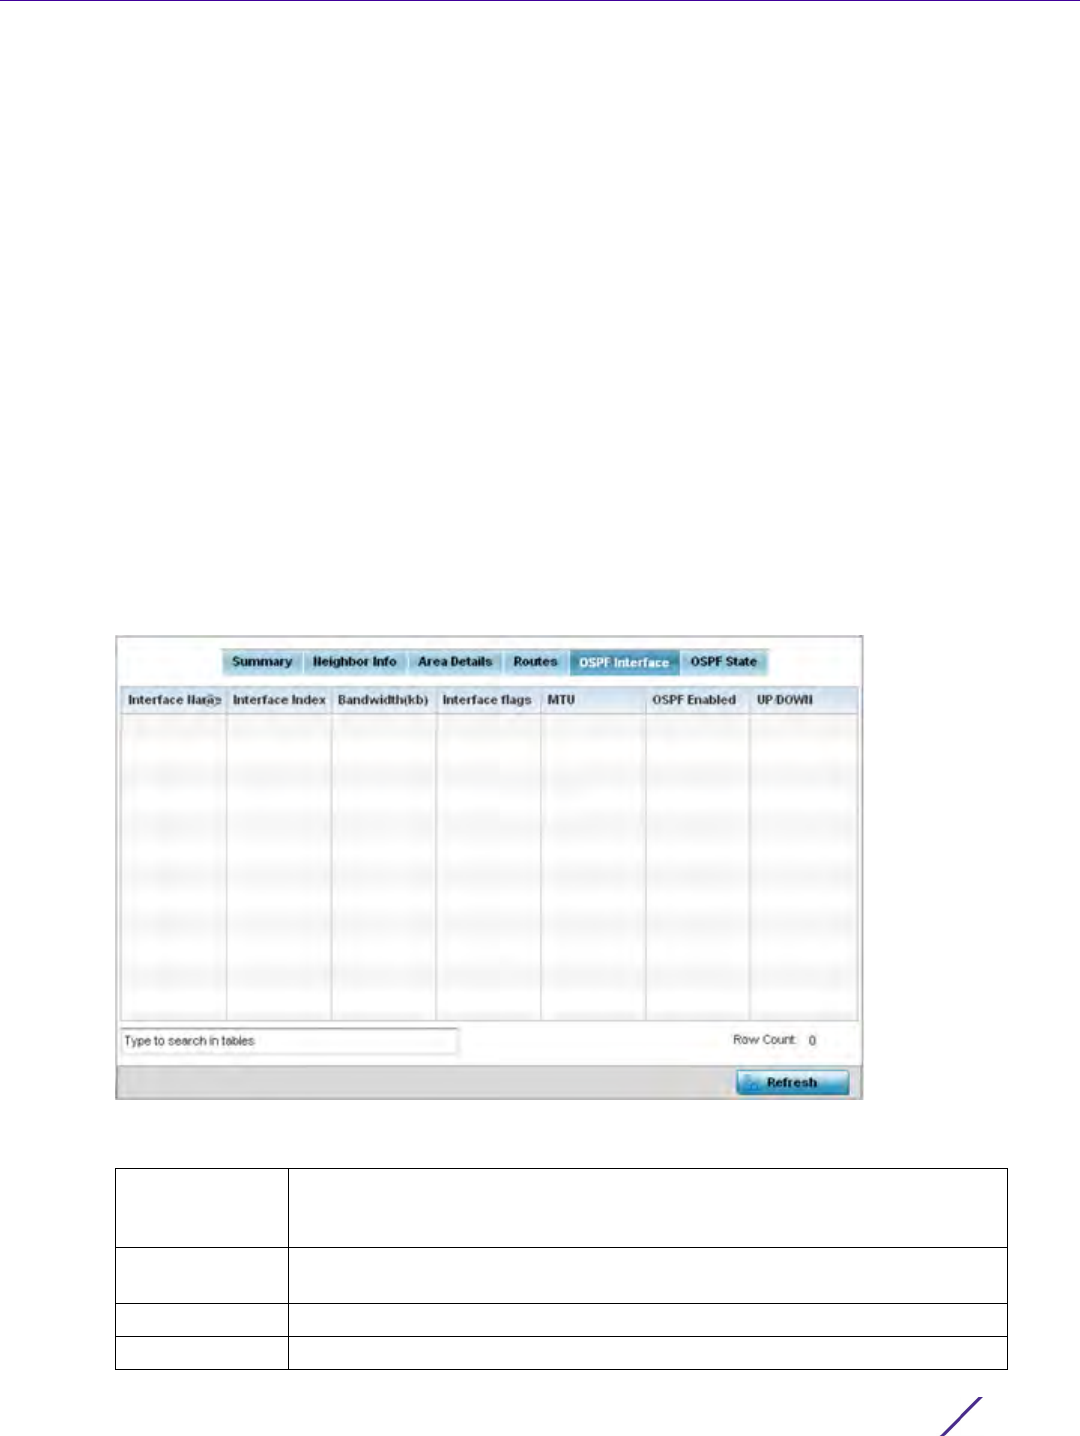
Statistics
Wireless Controller and Service Platform System Reference Guide 15 - 244
An internal (or router) route connects to one single OSPF area. All of its interfaces connect to the area in which
it is located and does not connect to any other area.
8 Select the Refresh button (within any of the four OSPF Routes tabs) to update the statistics counters to their
latest values.
15.4.17.5 OSPF Interface
OSPF
An OSPF interface is the connection between a router and one of its attached networks. An interface has state
information associated with it, which is obtained from the underlying lower level protocols and the routing
protocol itself. A network interface has associated a single IP address and mask (unless the network is an
unnumbered point-to-point network). An interface is sometimes also referred to as a link.
To view OSPF interface statistics:
1 Select the Statistics menu from the Web UI.
2Select
System from the navigation pane (on the left-hand side of the screen), expand the default node and
select an Access Point for statistical observation.
3Select
OSPF.
4 Select the OSPF Interface tab.
Figure 15-168 Access Point - OSPF Interface tab
The OSPF Interface tab describes the following:
Interface Name Displays the IP addresses and mask defined as the virtual interface for
dynamic OSPF routes. Zero config and DHCP can be used to generate route
addresses, or a primary and secondary address can be manually provided.
Interface Index Lists the numerical index used for the OSPF interface. This interface ID is in the
hello packets establishing the OSPF network connection.
Bandwidth (kb) Lists the OSPF interface bandwidth (in Kbps) in the range of 1 - 10,000,000.
Interface Flags Displays the flag used to determine the interface status.
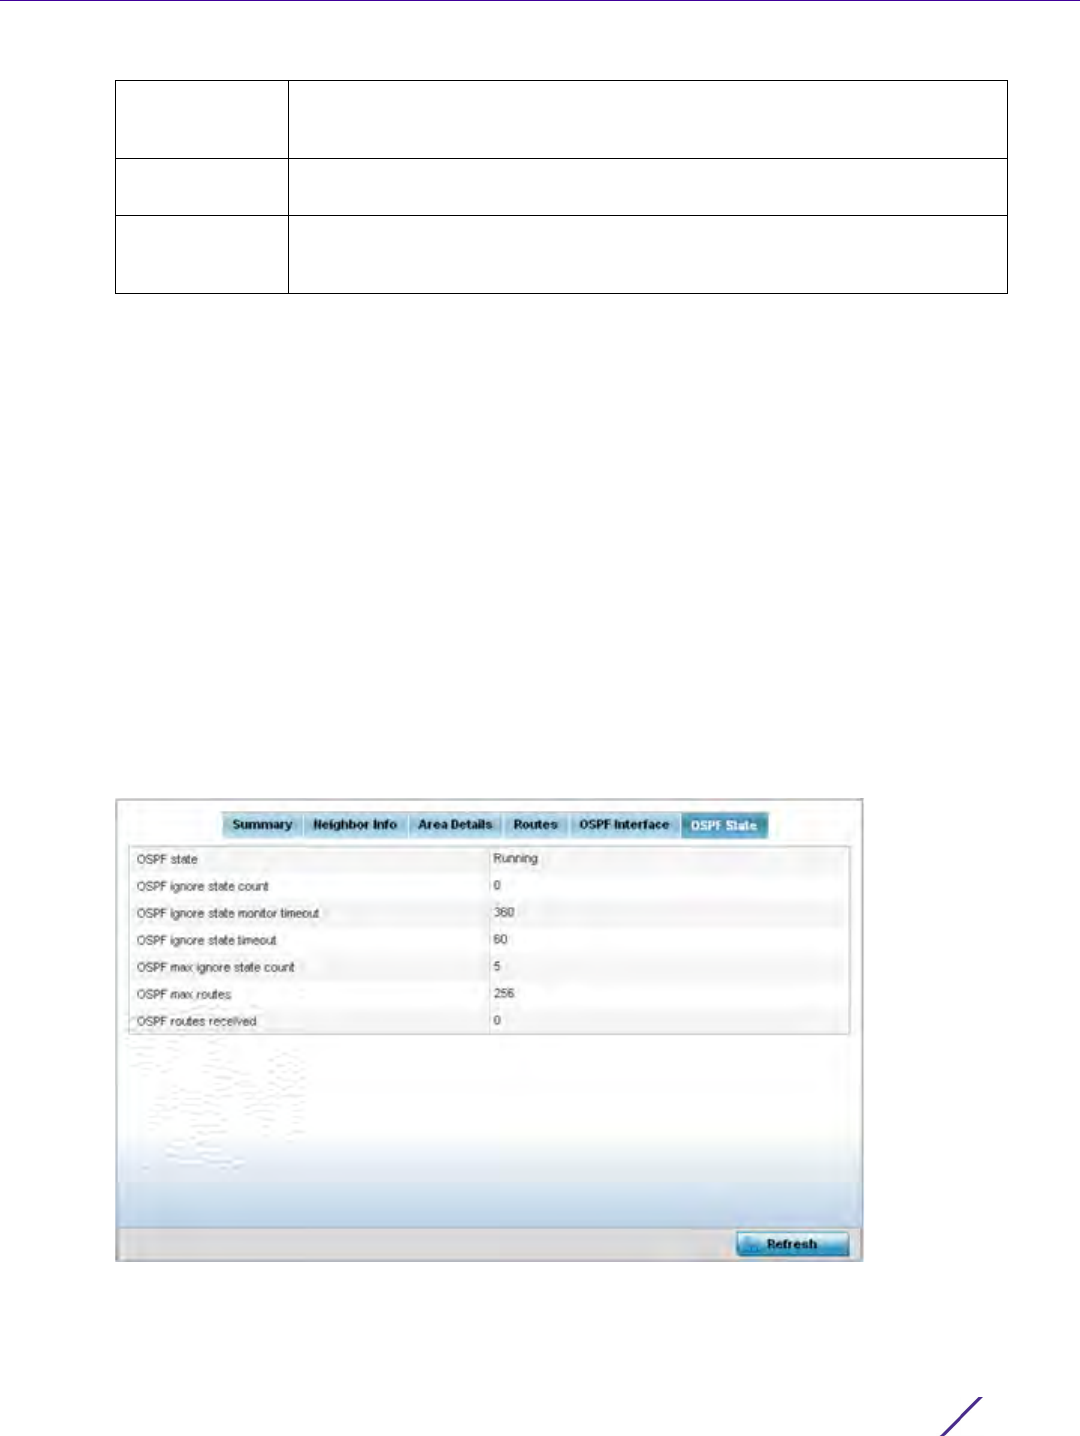
Statistics
Wireless Controller and Service Platform System Reference Guide 15 - 245
5 Select the Refresh button to update the statistics counters to their latest values.
15.4.17.6 OSPF State
OSPF
An OSPF enabled Access Point sends hello packets to discover neighbors and elect a designated router for
dynamic links. The hello packet includes link state data maintained on each Access Point and is periodically
updated on all OSPF members. The Access Point tracks link state information to help assess the health of the
OSPF dynamic route.
To view OSPF state statistics:
1 Select the Statistics menu from the Web UI.
2Select
System from the navigation pane (on the left-hand side of the screen), expand the default node and
select an Access Point for statistical observation.
3Select
OSPF.
4 Select the OSPF State tab.
Figure 15-169 Access Point OSPF - State tab
MTU Lists the OSPF interface maximum transmission unit (MTU) size. The MTU is
the largest physical packet size (in bytes) a network can transmit. Any packets
larger than the MTU are divided into smaller packets before being sent.
OSPF Enabled Lists whether OSPF has been enabled for each listed interface. OSPF is
disabled by default.
UP/DOWN Displays whether the OSPF interface (the dynamic route) is currently up or
down for each listed interface. An OSPF interface is the connection between a
router and one of its attached networks.

Statistics
Wireless Controller and Service Platform System Reference Guide 15 - 246
The OSPF State tab describes the following:
5 Select the Refresh button to update the statistics counters to their latest values.
15.4.18 L2TPv3 Tunnels
Access Point Statistics
Access Points use L2TP V3 to create tunnels for transporting layer 2 frames. L2TP V3 enables an Access Point to
create tunnels for transporting Ethernet frames to and from bridge VLANs and physical ports. L2TP V3 tunnels can
be defined between WING devices and other devices supporting the L2TP V3 protocol.
To review a selected Access Point’s L2TPv3 statistics:
1 Select the Statistics menu from the Web UI.
2Select
System from the navigation pane (on the left-hand side of the screen). Expand a RF Domain, select a
controller or service platform, and select one of its connected Access Points.
3Select
L2TPv3.
OSPF state Displays the OSPF link state amongst neighbors within the OSPF topology.
Link state information is maintained in a link-state database (LSDB) which is a
tree image of the entire network topology. Identical copies of the LSDB are
periodically updated through flooding on all OSPF supported nodes. Flooding
is the part of the OSPF protocol that distributes and synchronizes the link-
state database between OSPF routers.
OSPF ignore
state count
Lists the number of times state requests have been ignored between the
Access Point and its peers within this OSPF supported broadcast domain.
OSPF ignore
state monitor
timeout
Displays the timeout that, when exceeded, prohibits the Access Point from
detecting changes to the OSPF link state.
OSPF ignore
state timeout
Displays the timeout that, when exceeded, returns the Access Point back to
state assessment amongst neighbors in the OSPF topology.
OSPF max
ignore state
count
Displays whether an OSPF state timeout is being ignored and not utilized in
the transmission of state update requests amongst neighbors within the OSPF
topology.
OSPF max routes States the maximum number of routes negotiated amongst neighbors within
the OSPF topology.
OSPF routes
received
Lists the routes received and negotiated amongst neighbors within the OSPF
topology.
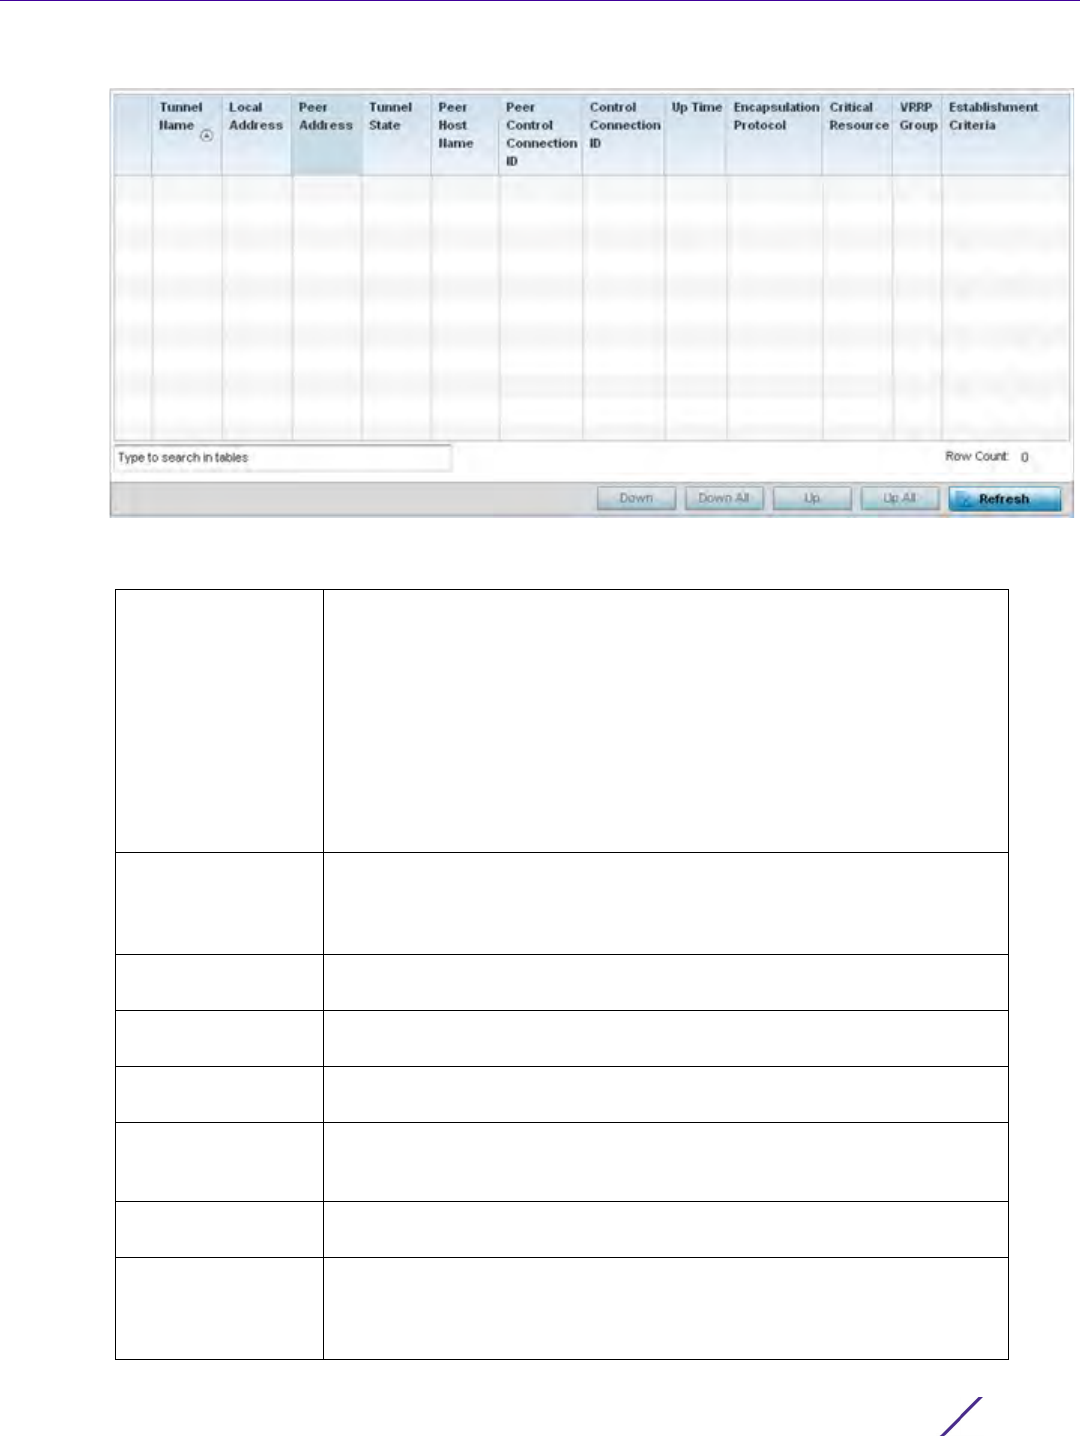
Statistics
Wireless Controller and Service Platform System Reference Guide 15 - 247
Figure 15-170 Access Point - L2TPv3 screen
The Access Point L2TPv3 Tunnels screen displays the following:
Tunnel Name Displays the name of each listed L2TPv3 tunnel assigned upon creation.
Each listed tunnel name can be selected as a link to display session data
specific to that tunnel. The Sessions screen displays cookie size
information as well as psuedowire information specific to the selected
tunnel. Data is also available to define whether the tunnel is a trunk
session and whether tagged VLANs are used. The number of transmitted,
received and dropped packets also display to provide a throughput
assessment of the tunnel connection. Each listed session name can also be
selected as a link to display VLAN information specific to that session. The
VLAN Details screen lists those VLANs used an Access Point interface in
L2TP tunnel establishment.
Local Address Lists the IP address assigned as the local tunnel end point address, not the
tunnel interface’s IP address. This IP is used as the tunnel source IP
address. If a local address is not specified, the source IP address is chosen
automatically based on the tunnel peer IP address.
Peer Address Lists the IP address of the L2TP tunnel peer establishing the tunnel
connection.
Tunnel State States whether the tunnel is Idle (not utilized by peers) or is currently
active.
Peer Host Name Lists the assigned peer hostname used as matching criteria in the tunnel
establishment process.
Peer Control
Connection ID
Displays the numeric identifier for the tunnel session. This is the peer
pseudowire ID for the session. This source and destination IDs are
exchanged in session establishment messages with the L2TP peer.
CTRL Connection ID Displays the router ID(s) sent in tunnel establishment messages with a
potential peer device.
Up Time Lists the amount of time the L2TP connection has remained established
amongst peers sharing the L2TPv3 tunnel connection. The Up Time is
displayed in a Days: Hours: Minutes: Seconds: format. If D:0 H:0 M:0 S:0 is
displayed, the tunnel connection is not currently established.

Statistics
Wireless Controller and Service Platform System Reference Guide 15 - 248
15.4.19 VRRP
Access Point Statistics
The VRRP statistics screen displays Virtual Router Redundancy Protocol (VRRP) configuration statistics supporting
router redundancy in a wireless network requiring high availability.
To review a selected Access Point’s VRRP statistics:
1 Select the Statistics menu from the Web UI.
2Select
System from the navigation pane (on the left-hand side of the screen). Expand a RF Domain, select a
controller or service platform, and select one of its connected Access Points.
3Select
VRRP.
Encapsulation
Protocol
Displays either IP or UDP as the peer encapsulation protocol. The default
setting is IP. UDP uses a simple transmission model without implicit
handshakes. Tunneling is also called encapsulation. Tunneling works by
encapsulating a network protocol within packets carried by the second
network.
Critical Resource Lists critical resources for this tunnel. Critical resources are device IP
addresses on the network (gateways, routers etc.). These IP addresses are
critical to the health of the network. These device addresses are pinged
regularly by Access Points. If there’s a connectivity issue, an event is
generated stating a critical resource is unavailable.
VRRP Group Displays the VRRP group name if configured. VRRP configurations support
router redundancy in a wireless network requiring high availability.
Establishment
Criteria
Displays the tunnel establishment criteria for this tunnel. Tunnel
establishment involves exchanging 3 message types (SCCRQ, SCCRP and
SCCN) with the peer. Tunnel IDs and capabilities are exchanged during the
tunnel establishment with the host.
Refresh Select the Refresh button to update the screen’s statistics counters to their
latest value.
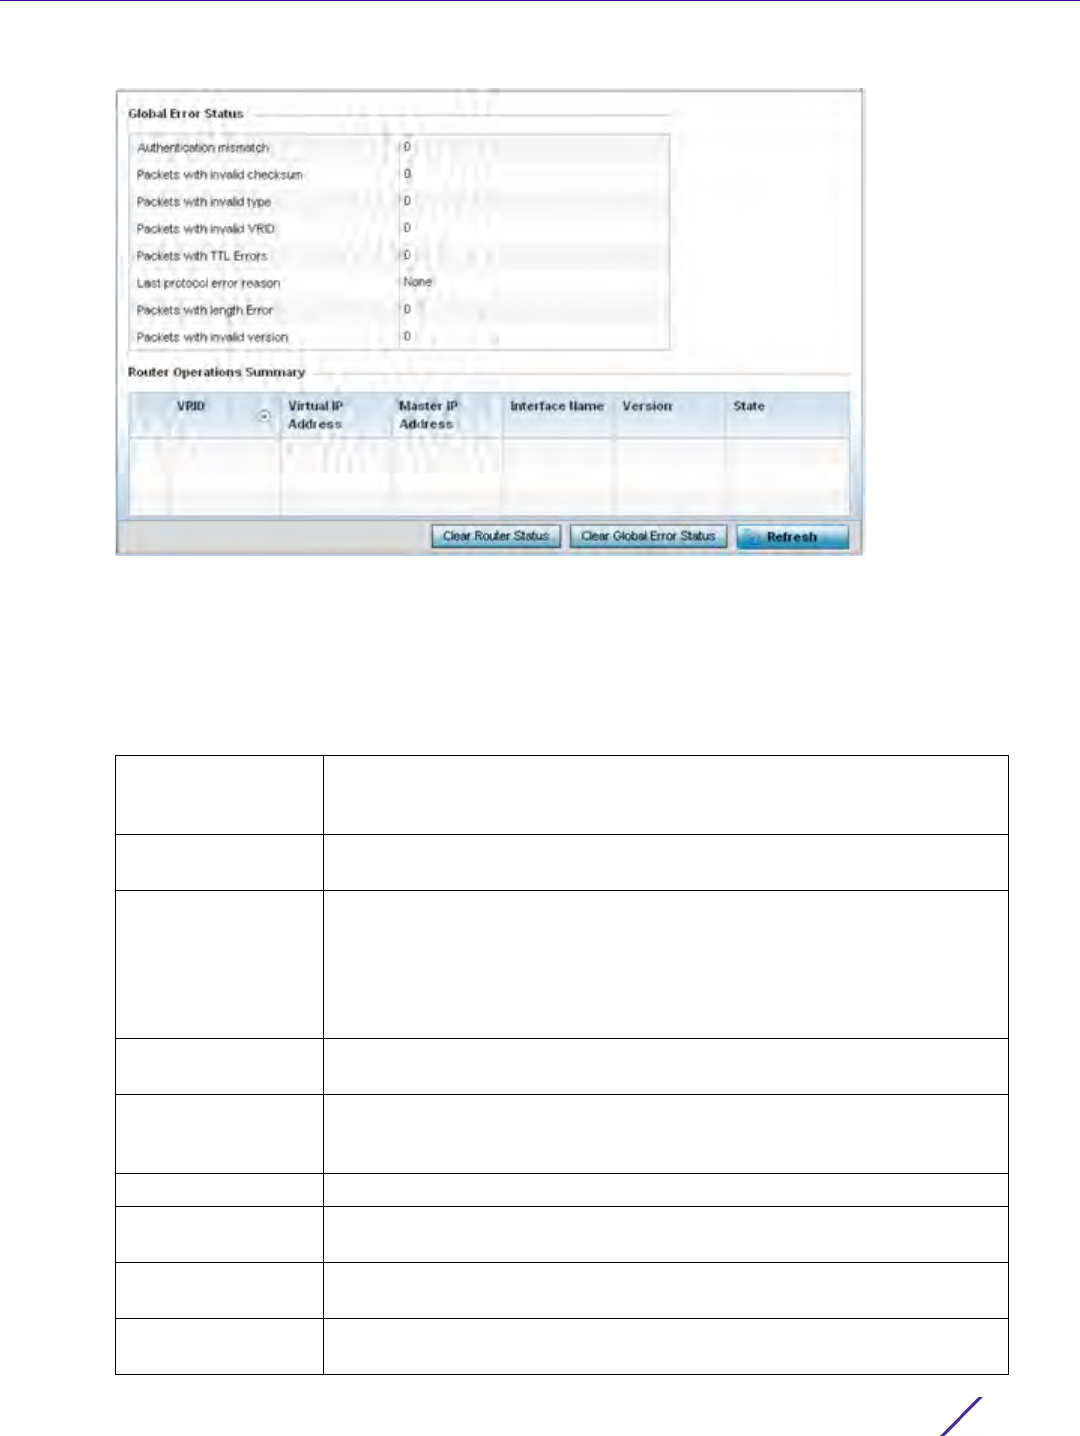
Statistics
Wireless Controller and Service Platform System Reference Guide 15 - 249
Figure 15-171 Access Point - VRRP screen
4 Refer to the Global Error Status field to review the various sources of packet errors logged during the
implementation of the virtual route.
Errors include the mismatch of authentication credentials, invalid packet checksums, invalid packet types,
invalid virtual route IDs, TTL errors, packet length errors and invalid (non matching) VRRP versions.
5 Refer to the Router Operations Summary for the following status:
VRID Lists a numerical index (1 - 254) used to differentiate VRRP configurations.
The index is assigned when a VRRP configuration is initially defined. This
ID identifies the virtual router a packet is reporting status for.
Virtual IP Address Lists the virtual interface IP address used as the redundant gateway
address for the virtual route.
Master IP Address Displays the IP address of the elected VRRP master. A VRRP master (once
elected) responds to ARP requests, forwards packets with a destination
link layer MAC address equal to the virtual router MAC address, rejects
packets addressed to the IP address associated with the virtual router and
accepts packets addressed to the IP address associated with the virtual
router.
Interface Name Displays the interfaces selected on the Access Point to supply VRRP
redundancy failover support.
Version Display VRRP version 3 (RFC 5798) or 2 (RFC 3768) as selected to set the
router redundancy. Version 3 supports sub-second (centisecond) VRRP
failover and support services over virtual IP.
State Displays the current state of each listed virtual router ID.
Clear Router Status Select the Clear Router Status button to clear the Router Operations
Summary table values to zero and begin new data collections.
Clear Global Error
Status
Select the Clear Global Error Status button to clear the Global Error Status
table values to zero and begin new data collections.
Refresh Select the Refresh button to update the screen’s statistics counters to their
latest values.
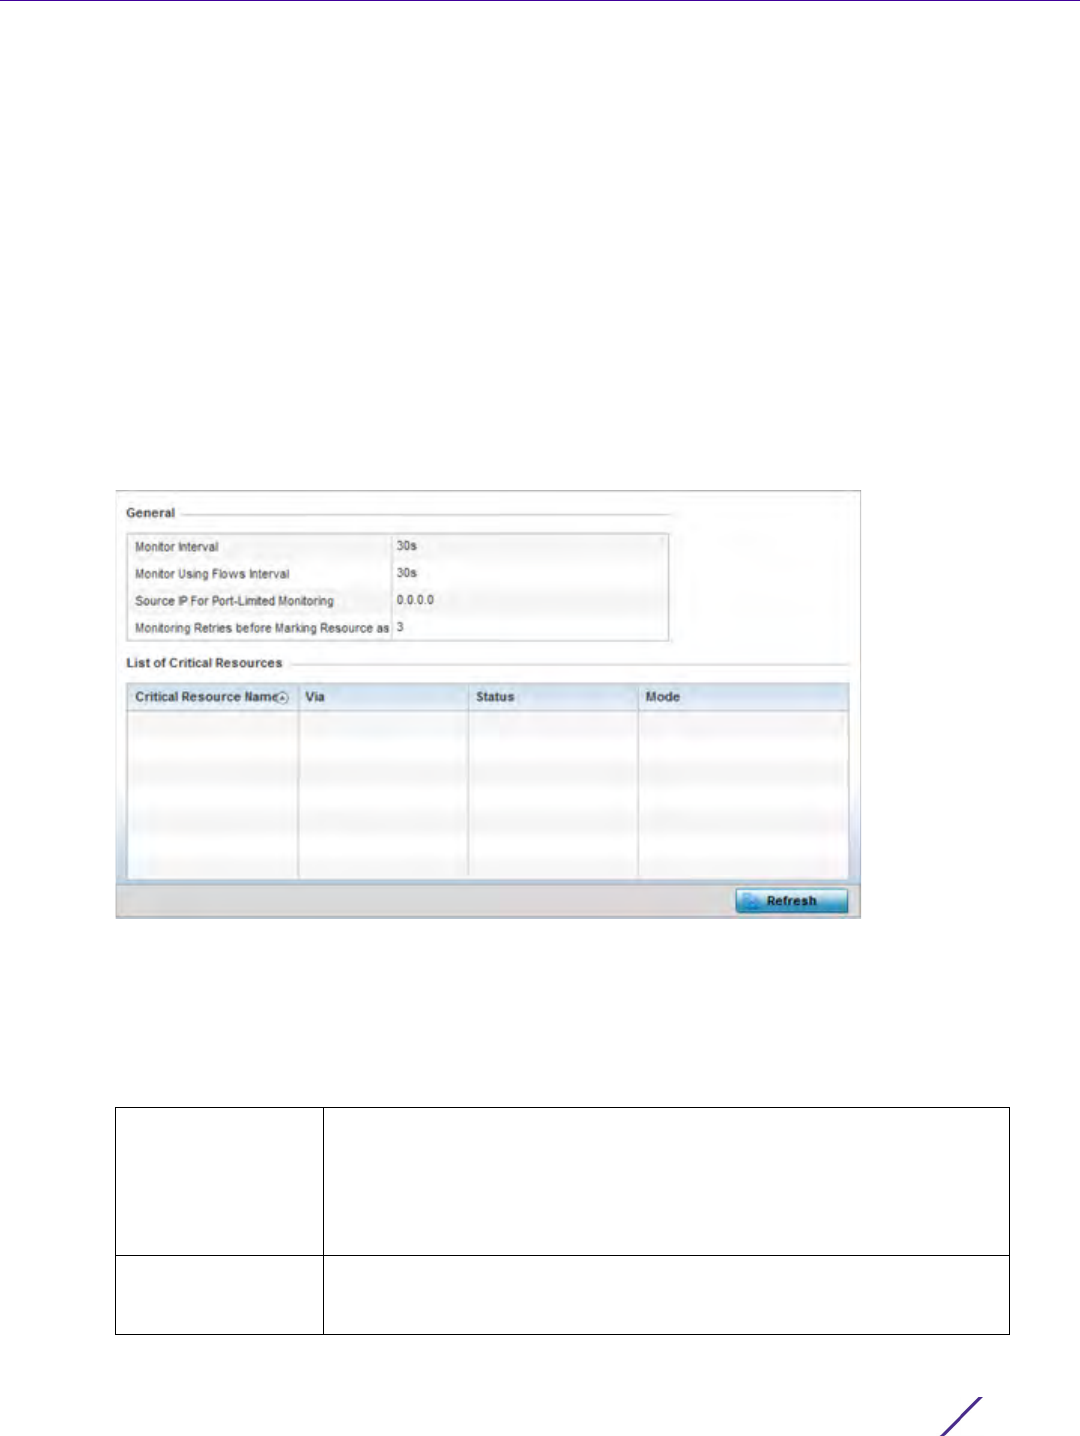
Statistics
Wireless Controller and Service Platform System Reference Guide 15 - 250
15.4.20 Critical Resources
Access Point Statistics
The Critical Resources statistics screen displays a list of device IP addresses on the network (gateways, routers
etc.). These IP addresses are critical to the health of the controller or service platform managed network. These
device addresses are pinged regularly by managed Access Points. If there’s a connectivity issue, an event is
generated stating a critical resource is unavailable. Thus, each device’s VLAN, ping mode and state is displayed for
the administrator.
To review a selected Access Point’s critical resource statistics:
1 Select the Statistics menu from the Web UI.
2Select
System from the navigation pane (on the left-hand side of the screen). Expand a RF Domain, select a
controller or service platform, and select one of its connected Access Points.
3Select
Critical Resources.
Figure 15-172 Access Point - Critical Resources screen
4 Refer to the General field to assess the Monitor Interval and Monitor Using Flows Interval used to poll for
updates from the critical resource IP listed for Source IP For Port-Limited Monitoring. Monitoring Retries before
Marking Resource as DOWN are the number of retry connection attempts permitted before this listed resource
is defined as down (offline).
The Access Point Critical Resource screen displays the following:
Critical Resource
Name
Lists the name of the critical resource monitored by the Access Point.
Critical resources are device IP addresses on the network (gateways,
routers etc.). These IP addresses are critical to the health of the network.
These device addresses are pinged regularly by Access Points. If there’s a
connectivity issue, an event is generated stating a critical resource is
unavailable.
Via Lists the VLAN used by the critical resource as a virtual interface. The
critical resource displays as a link than can be selected to list configuration
and network address information in greater detail.
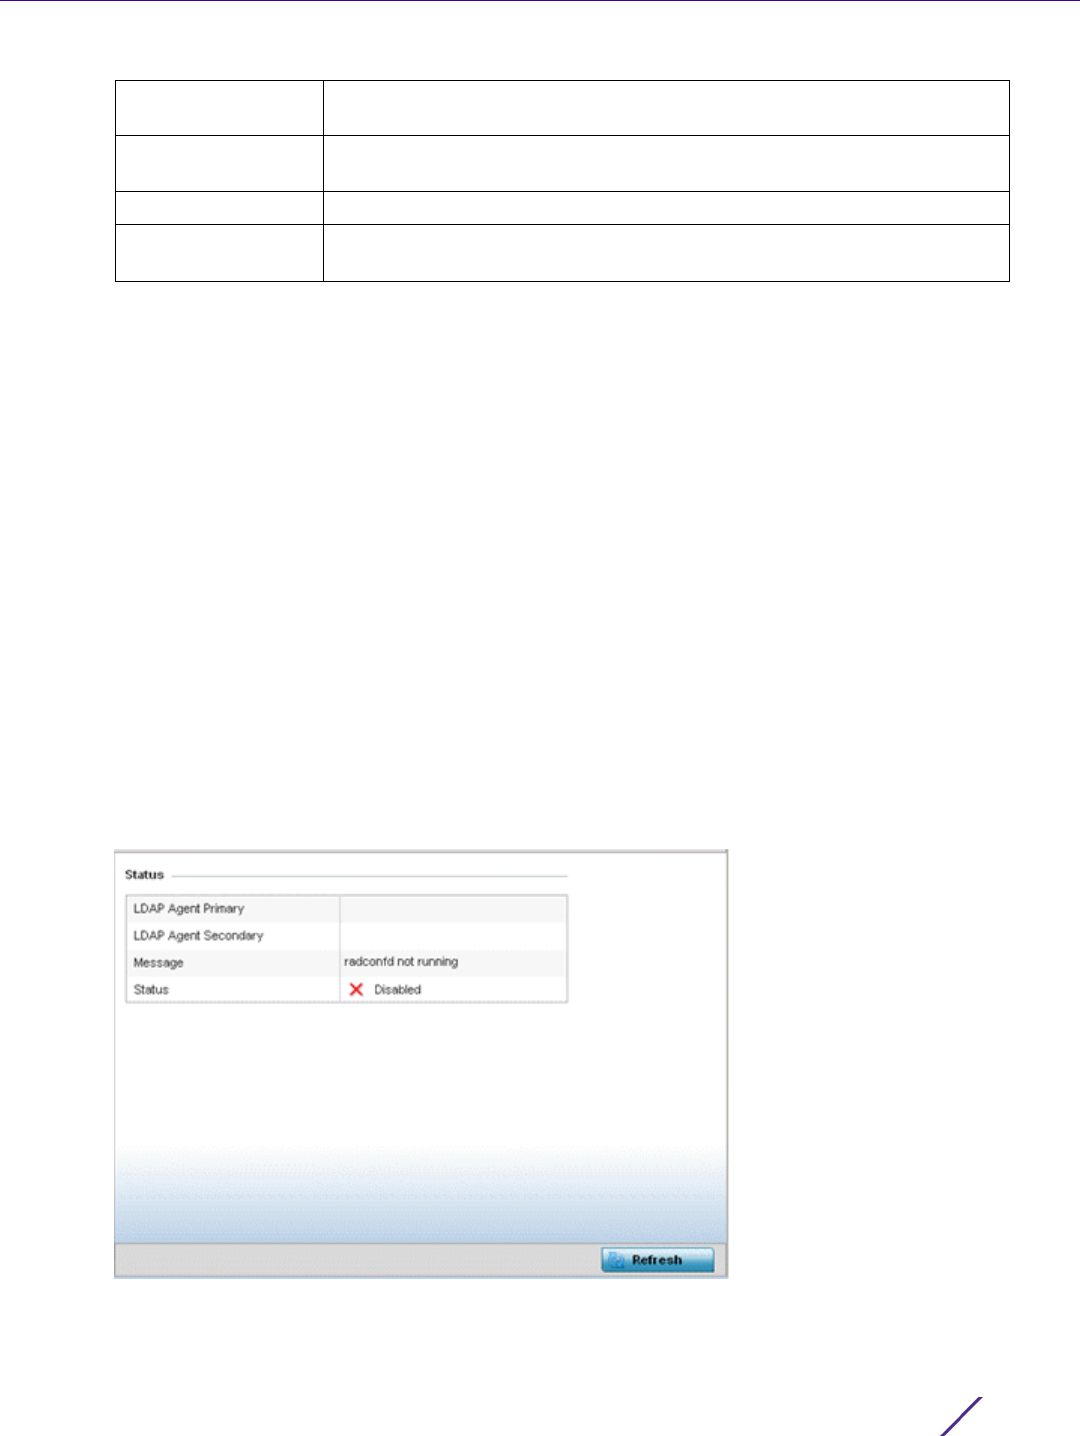
Statistics
Wireless Controller and Service Platform System Reference Guide 15 - 251
15.4.21 LDAP Agent Status
Access Point Statistics
When LDAP has been specified as an external resource (as opposed to local Access Point RADIUS resources) to
validate PEAP-MS-CHAP v2 authentication requests, user credentials and password information needs to be made
available locally to successfully connect to the external LDAP server. Up to two LDAP Agents (primary and
secondary external resources) can be defined as external resources for PEAP-MS-CHAP v2 authentication requests.
AP6521 model Access Point does not support this feature in Standalone AP or Controller AP mode. However,
AP6521 model is supported when adopted and managed by a controller or service platform.
For more information on setting LDAP agents as part of the RADIUS server policy, see Configuring RADIUS Server
Policies on page 11-57.
To view Access Point LDAP agent statistics:
1 Select the Statistics menu from the Web UI.
2Select
System from the navigation pane (on the left-hand side of the screen). Expand a RF Domain, select a
controller or service platform, and select one of its connected Access Points.
3Select
LDAP Agent Status.
Figure 15-173 Access Point - LDAP Agent Status screen
Status Defines the operational state of each listed critical resource VLAN interface
(either Up or Down).
Error Reason Provides an error status as to why the critical resource is not available over
its designated VLAN.
Mode Displays the operational mode of each listed critical resource.
Refresh Select the Refresh button to update the screen’s statistics counters to their
latest values.

Statistics
Wireless Controller and Service Platform System Reference Guide 15 - 252
The LDAP Agent Status screen displays the following:
15.4.22 Mint Links
Access Point Statistics
Wireless controllers and Access Points use the MiNT protocol as the primary means of device discovery and
communication for Access point adoption and management. MiNT provides a mechanism to discover neighbor
devices in the network, and exchange packets between devices regardless of how these devices are connected (L2
or L3).
MiNT provides the means to secure communications at the transport layer. Using MiNT, a device can be configured
to only communicate with other authorized (MiNT enabled) devices of the same model. MiNT links can be
established over a VLAN (Among Access Points on a VLAN) or IP (remote access point to controller).
MiNT Links are automatically created between controllers and Access Points during adoption using MLCP (MiNT
Link Creation Protocol). They can also be manually created between a controller and Access Point (or) between
Access Points. MiNT links are manually created between controllers while configuring a cluster.
Level 2 (or) remote MiNT links are controller aware links, and requires IP network for communication. This level 2
MiNT links at access points are intended for remote Adaptive AP deployment and management from NOC. With
Level2 MiNT links, access points are only aware of the controllers and not about other Access points. Level 2 MiNT
links also provide partitioning, between Access Points deployed at various remote sites.
To view an Access Point’s Mint links:
1 Select the Statistics menu from the Web UI.
2Select
System from the navigation pane (on the left-hand side of the screen). Expand a RF Domain, select a
controller or service platform, and select one of its connected Access Points.
3Select
Mint Links from the left-hand side of the UI.
LDAP Agent Primary Lists the primary IP address of a remote LDAP server resource used by
the Access Point to validate PEAP-MS-CHAP v2 authentication
requests. When a RADIUS server policy’s data source is set to LDAP,
this is the first resource for authentication requests.
LDAP Agent Secondary Lists the secondary IP address of a remote LDAP server resource used
by the Access Point to validate PEAP-MS-CHAP v2 authentication
requests. When a RADIUS server policy’s data source is set to LDAP,
this is the second resource for authentication requests.
Message Displays any system message generated in the Access Point’s
connection with the primary or secondary LDAP agent. If there’s a
problem with the username and password used to connection to the
LDAP agent, it would be listed here.
Status Displays whether the Access Point has successfully joined the remote
LDAP server domain designated to externally validate PEAP-MS-CHAP
v2 authentication requests.
Refresh Select Refresh to update the statistics counters to their latest values.
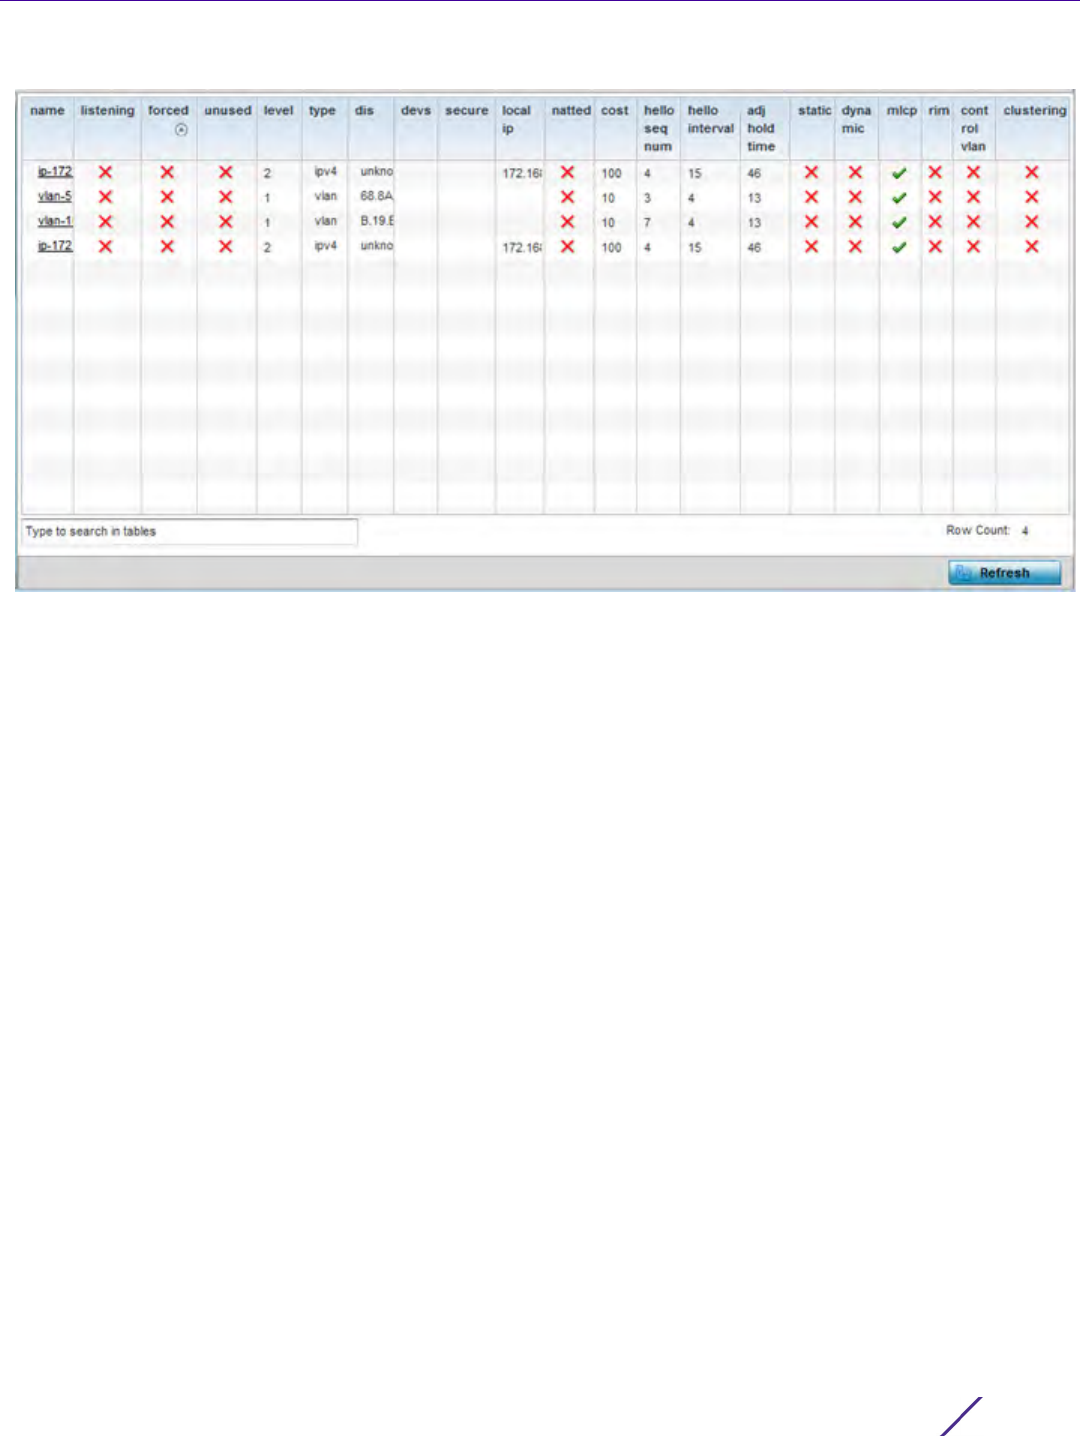
Statistics
Wireless Controller and Service Platform System Reference Guide 15 - 253
Figure 15-174 Access Point - Mint Links screen
The Mint Links screen lists the name of the impacted VLAN or link in the form of a link that can be selected to
display more granular information about that VLAN. A green check mark or a red X defines whether the listed
VLAN is listening to traffic, forced to stay up or unused with the Mint link. The level column specifies whether the
listed Mint link is traditional switching link (level 2) or a routing link (level 3). The type column defines whether the
listed Mint link is a VLAN or an IPv4 or IPv6 type network address. The dis column lists how each link was
discovered.
Refer to the secure column to assess whether the listed links are isolated between peers. The local ip column lists
the IP address assigned as the link’s end point address, not the interface’s IP address. The natted column lists
whether the link is NAT enabled or disabled for modifying network address information in IP packet headers in
transit. The cost defines the cost for a packet to travel from its originating port to its end point destination.
The hello seq number and hello interval define the interval between hello keep alive messages between link end
points. While the adj hold time sets the time after the last hello packet when the connected between end points is
defined as lost.
The static and dynamic link columns state whether each listed link is static route using a manually configured route
entry, or a dynamic route characterized by its destination The rim column defines whether the listed link is
managed remotely. The control vlan column states whether the listed link has enabled as a control VLAN. Lastly,
the clustering column states whether listed link members discover and establish connections to other peers and
provide self-healing in the event of cluster member failure.
4 Periodically select Refresh to update the screen’s data counters to their latest values.
5 If needed, select a Mint link from the name column to display more granular information for that link.

Statistics
Wireless Controller and Service Platform System Reference Guide 15 - 254
Figure 15-175 Access Point - Mint Link Details screen
The first table lists the Mint link’s name and level specifying whether the Mint link is traditional switching link
(level 2) or a routing link (level 3). The cost defines the cost for a packet to travel from its originating port to its
end point destination. The hello interval lists the time between hello keep alive messages between link end
points. The adj hold time sets the time after the last hello packet when the connected between end points is
defined as lost.
The Adjacencies table lists neighbor devices by their hardware identifiers and operational state to help
determine their availability as Mint link end points and peers. The up time lists the selected link’s detection on
the network and the last hello lists when the last hello message was exchanged.
6 Periodically select Refresh to update the statistics counters to their latest values.
15.4.23 Guest Users
Access Point Statistics
A captive portal is an access policy for providing guests temporary and restrictive access to the wireless network.
A captive portal configuration provides secure authenticated access using a standard Web browser. Captive portals
provide authenticated access by capturing and re-directing a wireless user's Web browser session to a captive
portal login page where the user must enter valid credentials to access to the network. Captive portals can have
their access durations set by an administrator to either provide temporary access to the Access Point managed
network or provide access without limitations.
For information on setting captive portal duration and authentication settings, refer to Configuring Captive Portal
Policies on page 11-1.
To view current Access Point guest user utilization:
1 Select the Statistics menu from the Web UI.
2Select
System from the navigation pane (on the left-hand side of the screen). Expand a RF Domain, select a
controller or service platform, and select one of its connected Access Points.
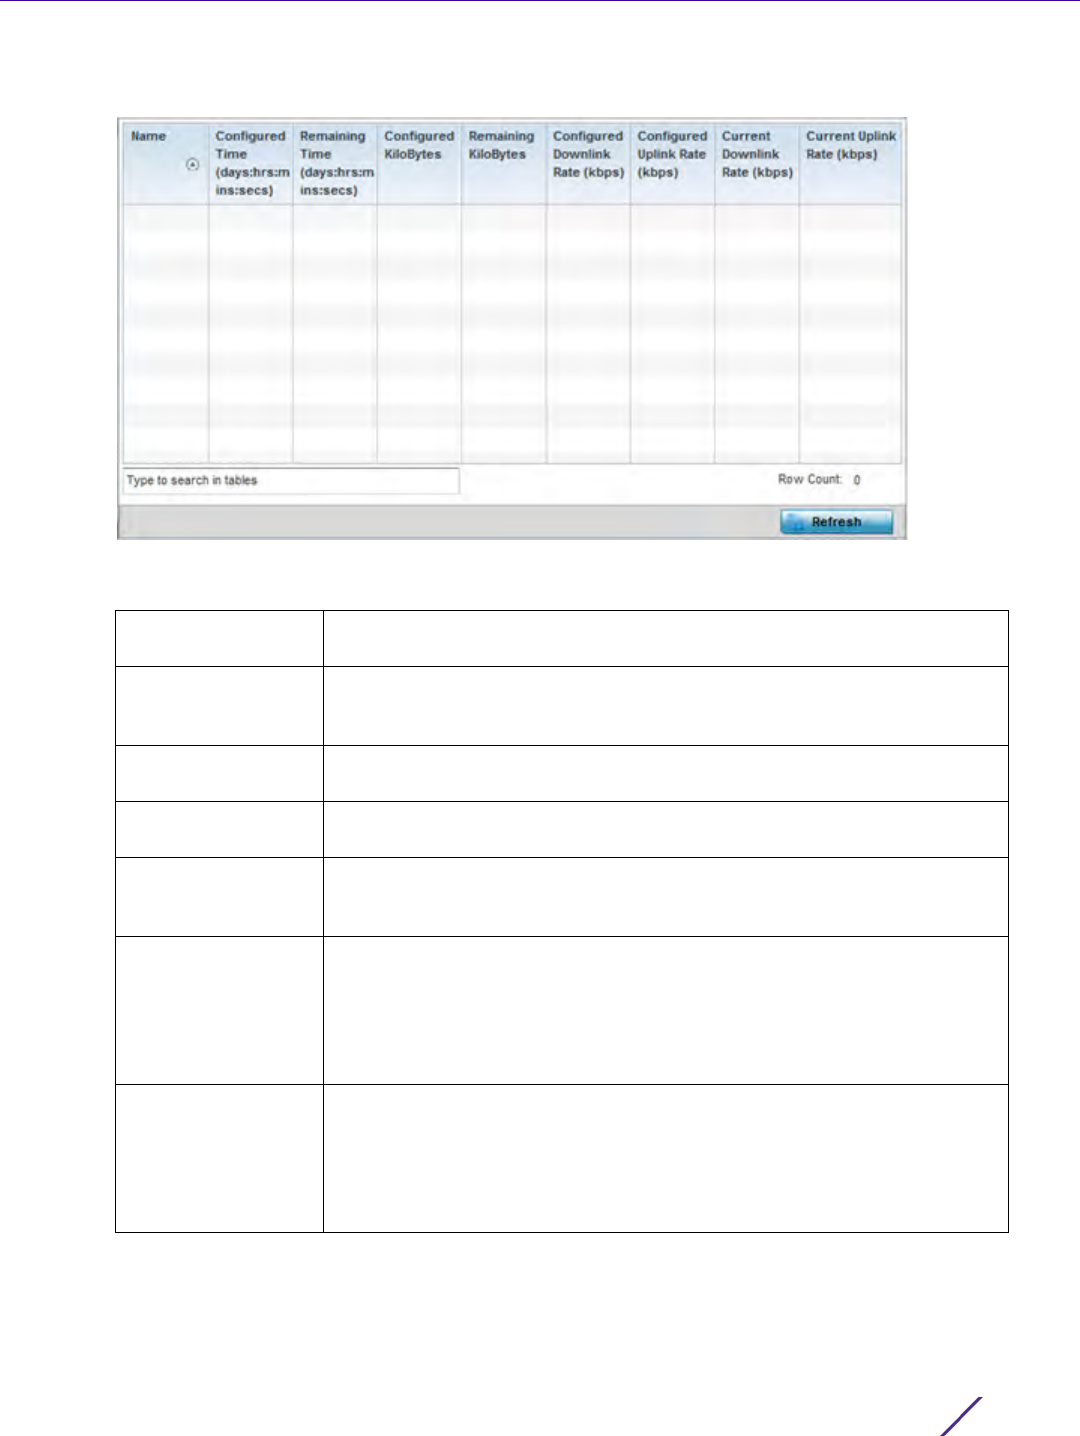
Statistics
Wireless Controller and Service Platform System Reference Guide 15 - 255
3Select
Guest Users.
Figure 15-176 Access Point – Guest Users screen
The Guest Users screen describes the following:
Name Lists the administrator assigned name of the client utilizing the Access
Point for guest access to the WiNG managed wireless network.
Configured Time
(days:hrs:mins:secs)
Displays the restricted permissions each listed client was initially
configured for their captive portal guest user session with this managing
Access Point.
Remaining Time
(days:hrs:mins:secs)
Displays the time each listed client has remaining in their captive portal
guest user session with this Access Point.
Configured
Kilobytes
Lists the maximum configured bandwidth consumable by the listed guest
user (in kilobytes).
Remaining Kilobytes Lists the remaining bandwidth available to the listed guest user (in
kilobytes). This is the difference between the configured (maximum)
bandwidth and the users’s current utilization.
Configured
Downlink Rate
(kbps)
Specifies the download speed configured for the listed guest user. When
bandwidth is available, the user can download data at the specified rate
(in kilobytes per second). If a guest user has a bandwidth based policy
and exceeds the specified data limit, their speed is throttled to the defined
reduced downlink rate. For more information, refer to Defining User Pools
on page 11-53.
Configured Uplink
Rate (kbps)
Specifies the upload speed dedicated to the listed guest user. When
bandwidth is available, the user is able to upload data at the specified rate
(in kilobytes per second). If a guest user has a bandwidth based policy
and exceeds the specified data limit, their speed is throttled to the
reduced uplink rate. For more information, refer to Defining User Pools on
page 11-53.

Statistics
Wireless Controller and Service Platform System Reference Guide 15 - 256
15.4.24 GRE Tunnels
Access Point Statistics
Generic Routing Encapsulation (GRE) is one of the available tunneling mechanisms which uses IP as the transport
protocol and can be used for carrying many different passenger protocols. The tunnels behave as virtual point-to-
point links that have two endpoints identified by the tunnel source and tunnel destination addresses at each
endpoint.
To review a selected Access Point’s GRE statistics:
1 Select the Statistics menu from the Web UI.
2Select
System from the navigation pane (on the left-hand side of the screen). Expand a RF Domain, select a
controller or service platform, and select one of its connected Access Points.
3Select
GRE Tunnels.
Current Downlink
Rate (Kbps)
Lists the listed guest user’s current downlink rate in kbps. Use this
information to assess whether this user’s configured downlink rate is
adequate for their session requirements and whether their reduced
downlink rate need adjustment if the configured downlink rate is
exceeded. For more information, refer to Defining User Pools on page 11-
53.
Current Uplink Rate
(Kbps)
Lists the listed guest user’s current uplink rate in kbps. Use this
information to assess whether this user’s configured uplink rate is
adequate for their session requirements and whether their reduced uplink
rate need adjustment if the configured uplink rate is exceeded. For more
information, refer to Defining User Pools on page 11-53.
Refresh Select the Refresh button to update the screen’s statistics counters to their
latest value.
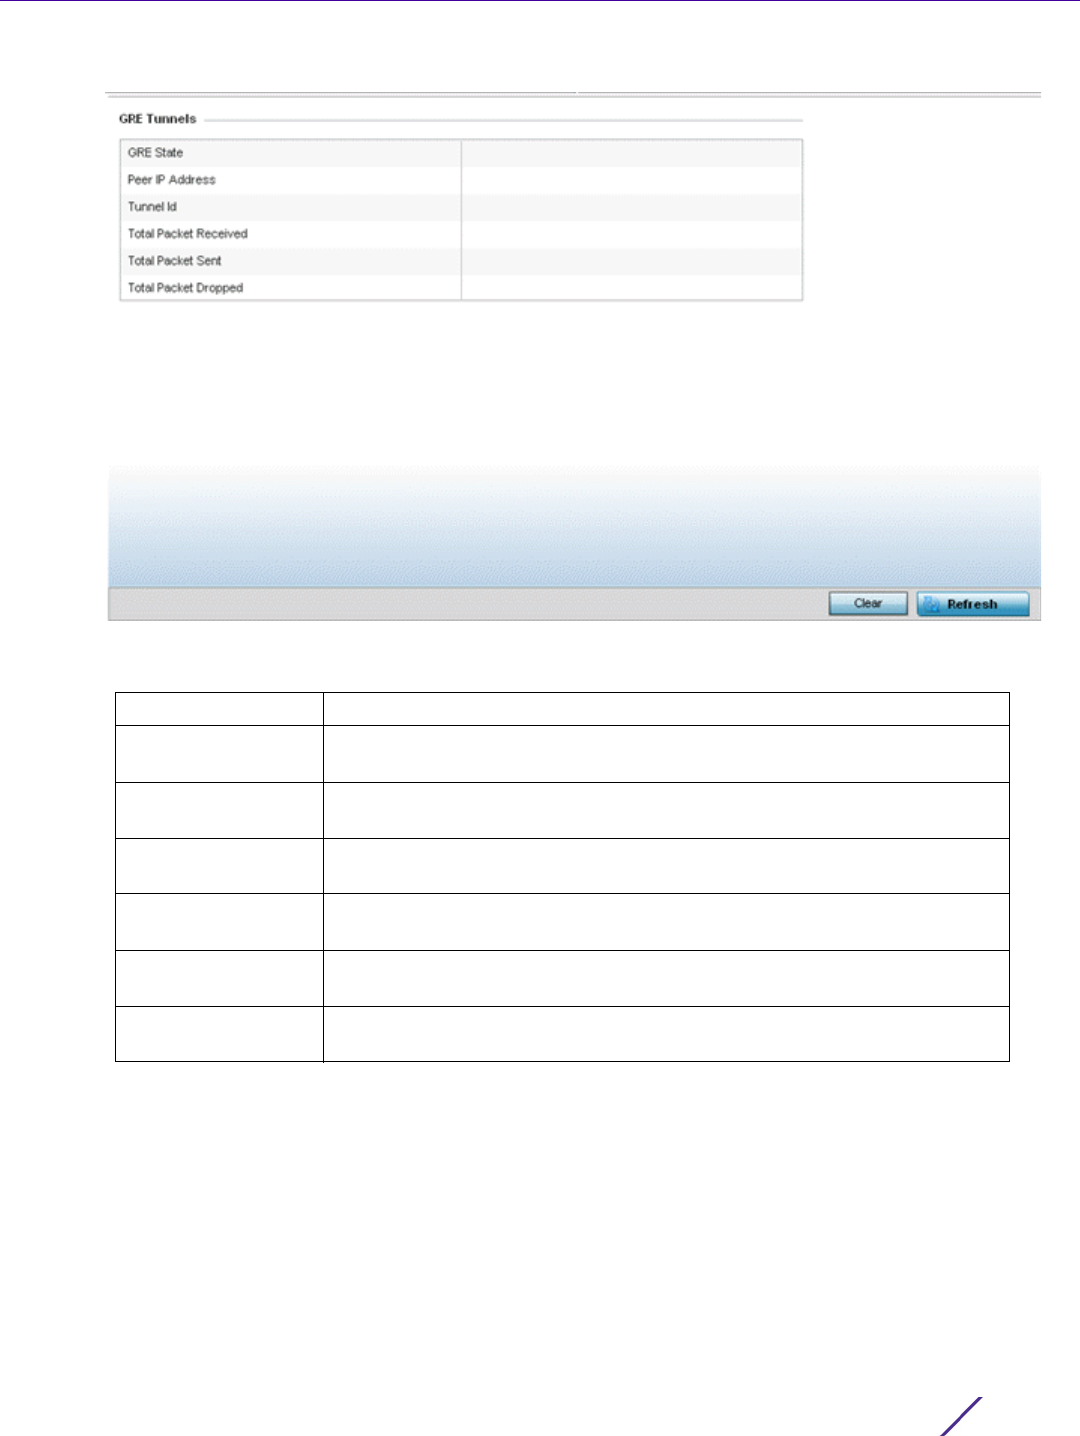
Statistics
Wireless Controller and Service Platform System Reference Guide 15 - 257
Figure 15-177 Access Point - GRE Tunnels screen
The Access Point GRE Tunnels screen displays the following:
15.4.25 Dot1x
Access Point Statistics
Dot1x (or 802.1x) is an IEEE standard for network authentication. Devices supporting Dot1x allow the automatic
provision and connection to the wireless network without launching a Web browser at login. When within range of
a Dot1x network, a device automatically connects and authenticates without needing to manually login.
To view the Dot1x statistics:
GRE State Displays the current operational state of the GRE tunnel.
Peer IP Address Displays the IP address of the peer device on the remote end of the GRE
tunnel.
Tunnel Id Displays the session ID of an established GRE tunnel. This ID is only viable
while the tunnel is operational.
Total Packets
Received
Displays the total number of packets received from a peer at the remote
end of the GRE tunnel.
Total Packets Sent Displays the total number of packets sent from this Access Point to a peer
at the remote end of the GRE tunnel.
Total Packets
Dropped
Lists the number of packets dropped from tunneled exchanges between
this Access Point and a peer at the remote end of the VPN tunnel
Refresh Select the Refresh button to update the screen’s statistics counters to their
latest value.
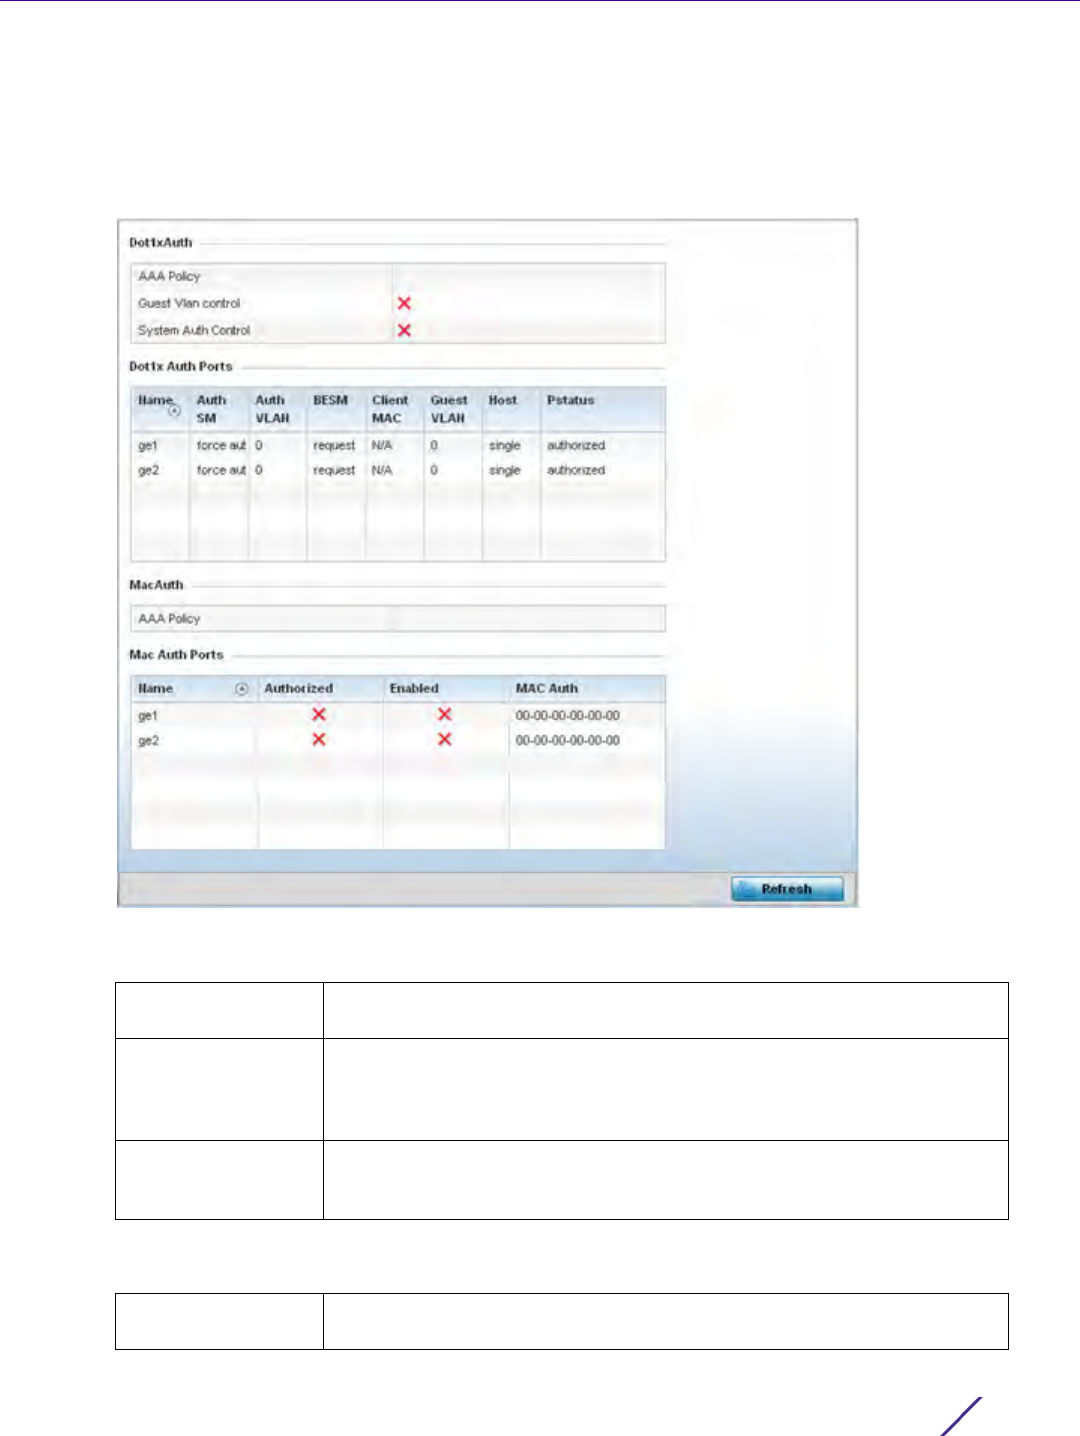
Statistics
Wireless Controller and Service Platform System Reference Guide 15 - 258
1 Select the Statistics menu from the Web UI.
2Select
System from the navigation pane (on the left-hand side of the screen). Expand a RF Domain, select a
controller or service platform, and select one of its connected Access Points.
3Select
Dot1x from the left-hand side of the UI.
Figure 15-178 Access Point – Dot1x screen
4 Refer to the following Dot1xAuth statistics:
5 Review the following Dot1x Auth Ports utilization information:
AAA Policy Lists the AAA policy currently being utilized for authenticating user
requests.
Guest Vlan Control Lists whether guest VLAN control has been allowed (or enabled). This is
the VLAN traffic is bridged on if the port is unauthorized and guest VLAN
globally enabled. A green checkmark designates guest VLAN control as
enabled. A red X defines guest VLAN control as disabled.
System Auth Control Lists whether Dot1x authorization is globally enabled for the Access Point.
A green checkmark designates Dot1x authorization globally enabled. A red
X defines Dot1x as globally disabled.
Name Lists the Access Point ge ports subject to automatic connection and
authentication using Dot1x.

Statistics
Wireless Controller and Service Platform System Reference Guide 15 - 259
6 Refer to the MacAuth table to assess the AAA policy applied to MAC authorization requests.
7 Review the following MAC Auth Ports utilization information:
8 Select the Refresh button to update the screen’s statistics counters to their latest value.
15.4.26 Network
Access Point Statistics
Use the Network screen to view information for performance statistics for ARP, DHCP, Routing and Bridging.For
more information, refer to the following:
•ARP Entries
•Route Entries
•Default Routes
•Bridge
•IGMP
•MLD
•Traffic Shaping
•DHCP Options
•Cisco Discovery Protocol
•Link Layer Discovery Protocol
•IPv6 Neighbor Discovery
•MSTP
Auth SM Lists the current authentication state of the listed port.
Auth VLAN Lists the virtual interface utilized post authentication.
BESM Lists whether an authentication request is pending on the listed port.
Client MAC Lists the MAC address of requesting clients seeking authentication over
the listed port.
Guest VLAN Lists the guest VLAN utilized for the listed port. This is the VLAN traffic is
bridged on if the port is unauthorized and guest VLAN globally enabled.
Host Lists whether the host is a single entity or not.
Pstatus Lists whether the listed port has been authorized for Dot1x network
authentication.
Name Lists the Access Point ge ports subject to automatic connection and MAC
authentication using Dot1x.
Authorized Lists whether MAC authorization using Dot1x has been authorized
(permitted) on the listed ge port. A green checkmark designates Dot1x
authorization as authorized. A red X defines authorization as disabled.
Enabled Lists whether MAC authorization using Dot1x has been enabled on the
listed ge port. A green checkmark designates Dot1x authorization as
allowed. A red X defines authorization as disabled.
MAC Auth Lists the MAC address corresponding to the listed Access Point port
interface on which authentication requests are made.
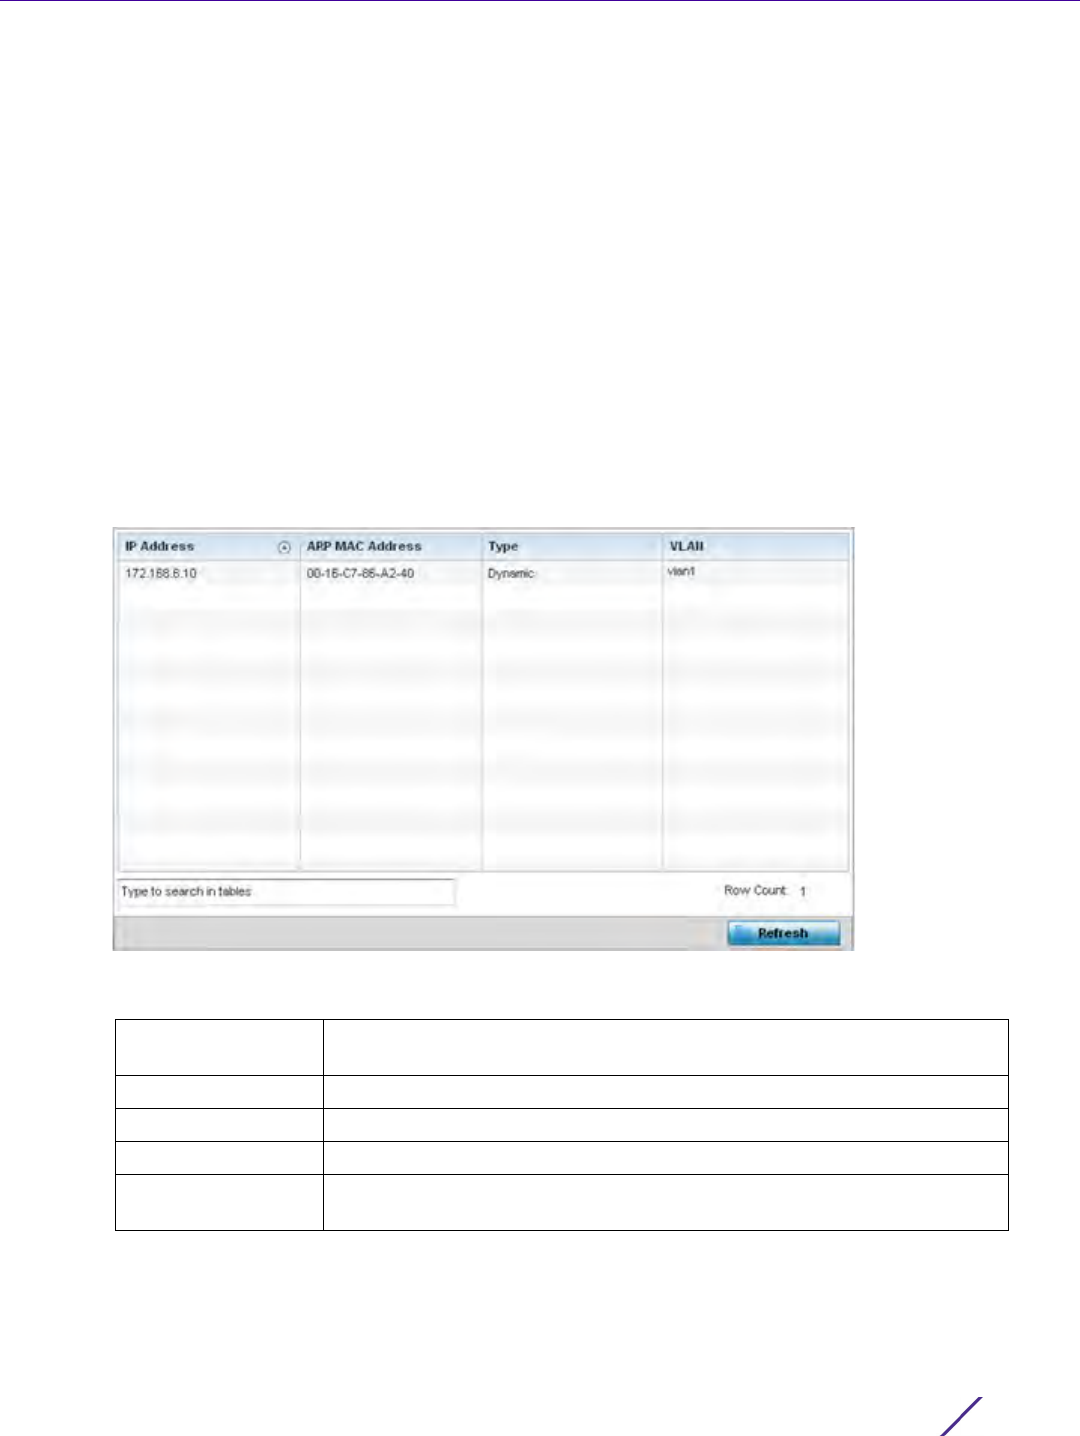
Statistics
Wireless Controller and Service Platform System Reference Guide 15 - 260
15.4.26.1 ARP Entries
Network
Address Resolution Protocol (ARP) is a protocol for mapping an IP address to a device address recognized in the
local network. An address is 32 bits long. In an Ethernet local area network, however, addresses for attached
devices are 48 bits long. (The physical machine address is also known as a MAC address.) A table, usually called
the ARP cache, is used to maintain a correlation between each MAC address and its corresponding IP address.
ARP provides the protocol rules for making this correlation and providing address conversion in both directions.
To view an Access Point’s ARP statistics:
1 Select the Statistics menu from the Web UI.
2Select
System from the navigation pane (on the left-hand side of the screen). Expand a RF Domain, select a
controller or service platform, and select one of its connected Access Points.
3Select
Network and expand the menu to reveal its submenu items.
4Select
ARP Entries.
Figure 15-179 Access Point - Network ARP screen
The ARP Entries screen describes the following:
IP Address Displays the IP address of the client resolved on behalf of the Access
Point.
ARP MAC Address Displays the MAC address corresponding to the IP address being resolved.
Type Lists the type of ARP entry.
VLAN Displays the system assigned VLAN ID where an IP address was found.
Refresh Select the Refresh button to update the screen’s statistics counters to their
latest values.
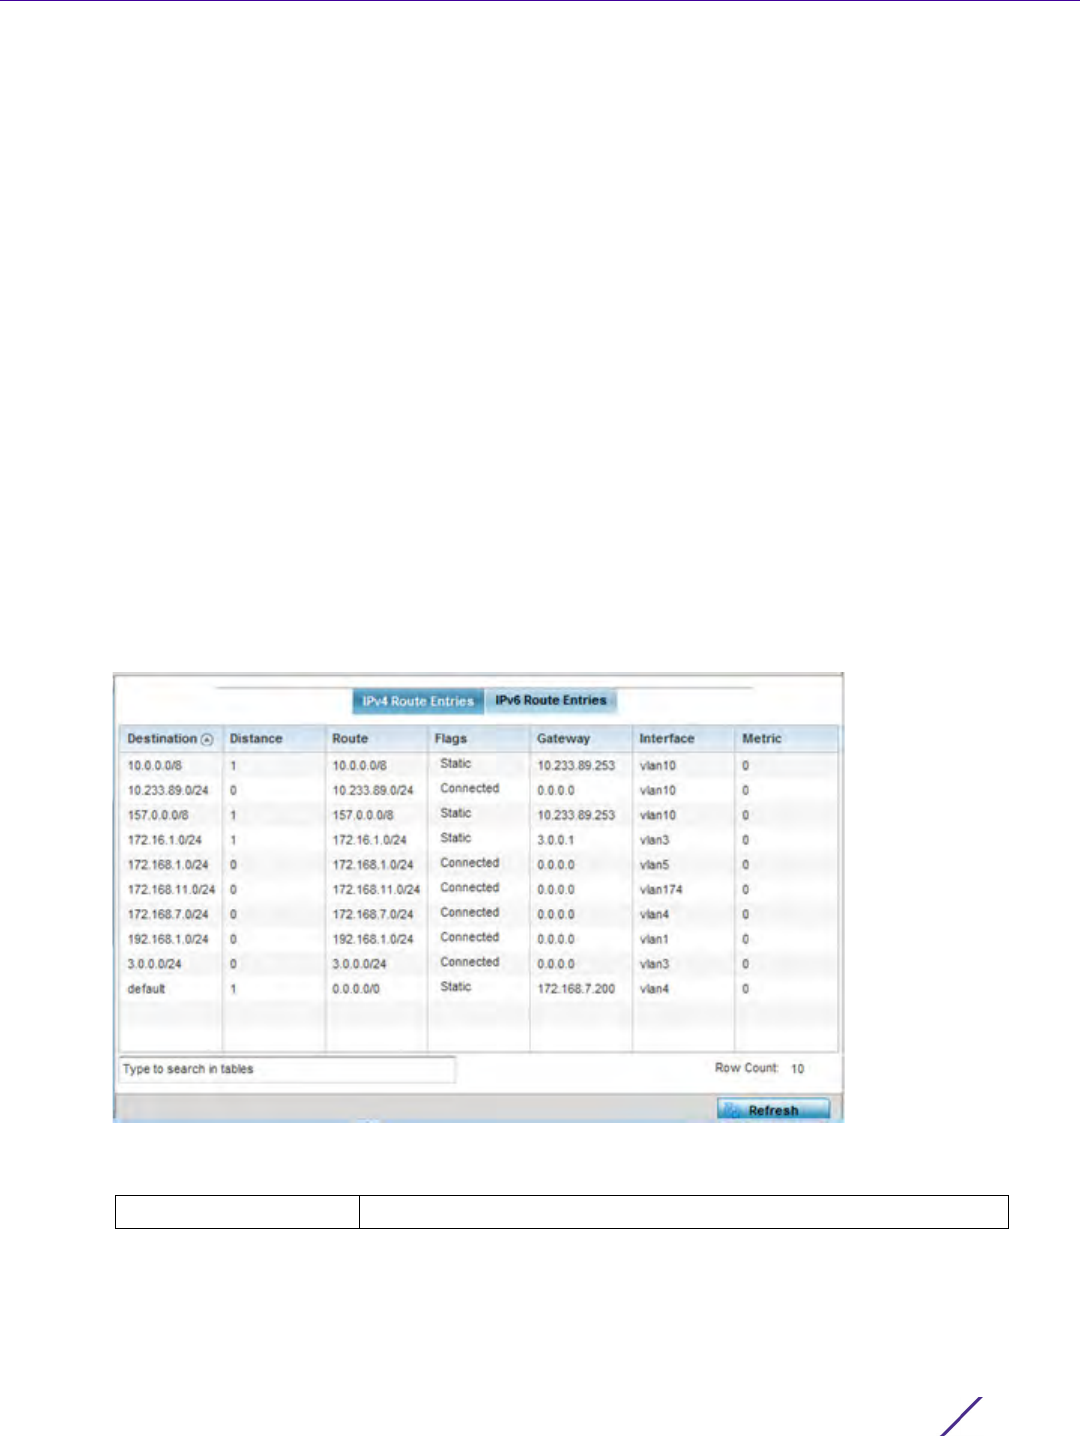
Statistics
Wireless Controller and Service Platform System Reference Guide 15 - 261
15.4.26.2 Route Entries
Network
The Route Entries screen displays data for routing packets to a defined destination. When an existing destination
subnet does not meet the needs of the network, add a new destination subnet, subnet mask and gateway as
needed for either IPv4 or IPv6 formatted data packets.
IPv4 operates as a best effort delivery method, as it does not guarantee delivery, and does not ensure proper
sequencing or duplicate delivery (unlike (TCP). IPv4 hosts can use link local addressing to provide local
connectivity.
IPv6 is the latest revision of the Internet Protocol (IP) designed to replace IPv4. IPV6 provides enhanced
identification and location information for devices on networks routing traffic across the Internet. IPv6 addresses
are composed of eight groups of four hexadecimal digits separated by colons.
To view IPv4 and IPv6 route entries:
1 Select the Statistics menu from the Web UI.
2Select
System from the navigation pane (on the left-hand side of the screen). Expand a RF Domain, select a
controller or service platform, and select one of its connected Access Points.
3Select
Network and expand the menu to reveal its sub menu items.
4Select
Route Entries. The IPv4 Route Entries tab displays by default.
Figure 15-180 Access Point - Network IPv4 Route Entries screen
The IPv4 Route Entries screen lists the following:
Destination Displays the IPv4 formatted address of the destination route address.
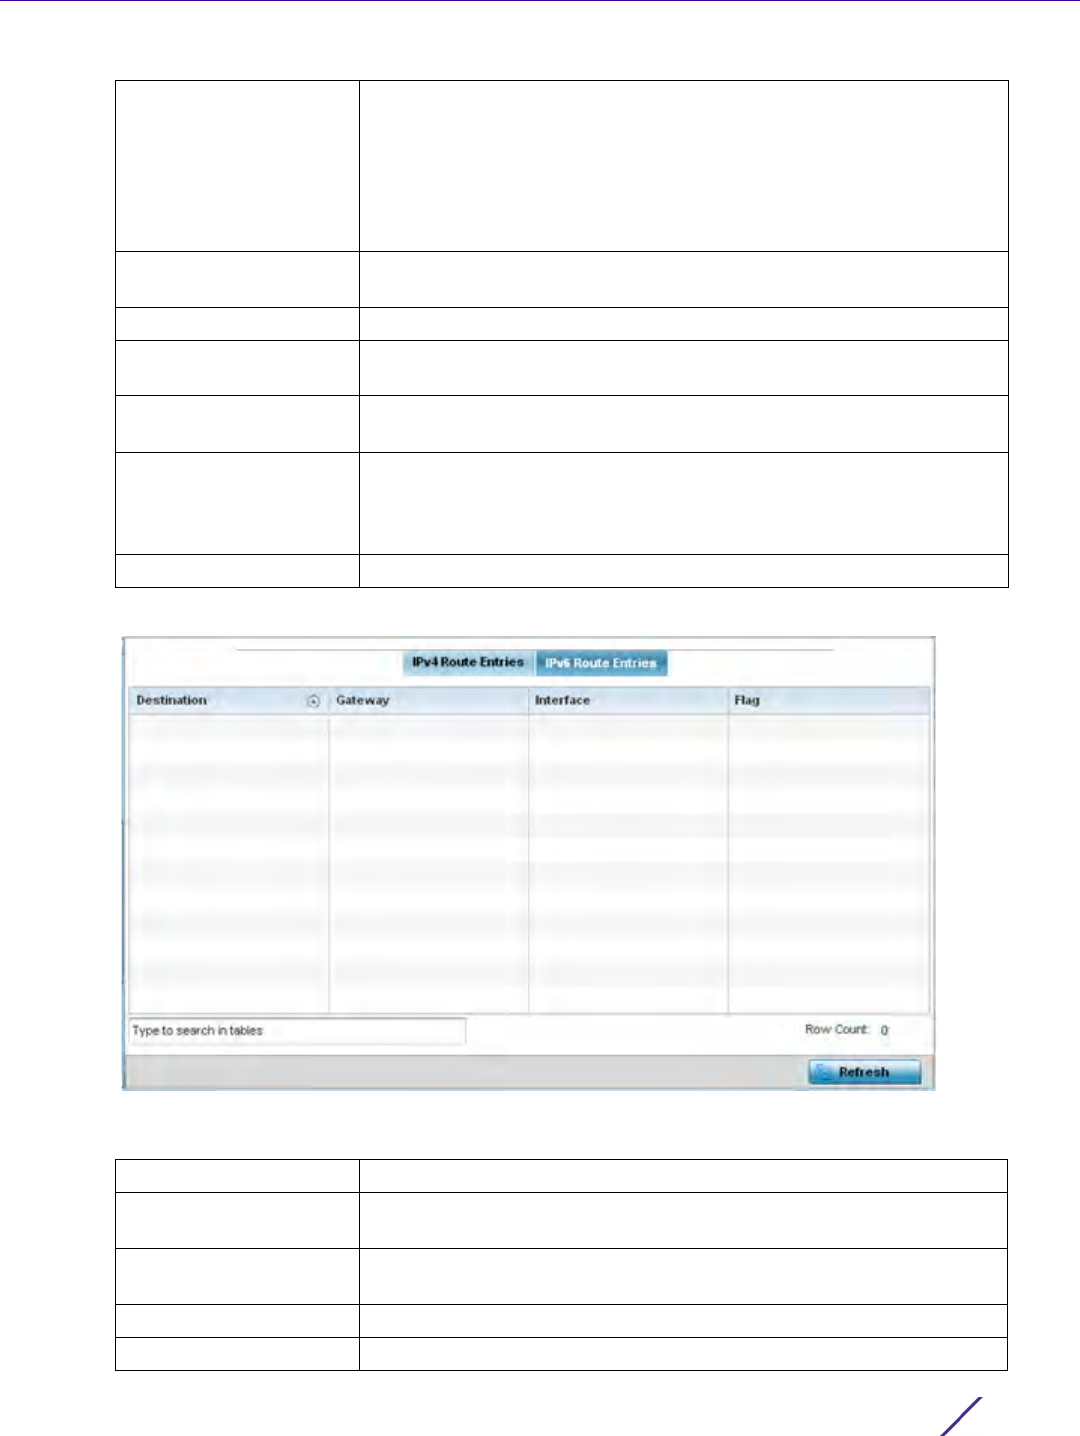
Statistics
Wireless Controller and Service Platform System Reference Guide 15 - 262
5 Select the IPv6 Route Entries tab to review route data for IPv6 formatted traffic.
Figure 15-181 Wireless Controller - IPv6 Route Entries screen
The IPv6 Route Entries screen lists the following:
Distance Lists the hop distance to a desired route. Devices regularly send
neighbors their own assessment of the total cost to get to all known
destinations. A neighboring device examines the information and
compares it to their own routing data. Any improvement on what’s
already known is inserted in that device’s own routing tables. Over
time, each networked device discovers the optimal next hop for each
destination.
Route Lists the IPv4 formatted IP address used for routing packets to a
defined destination.
Flags The flag signifies the condition of the direct or indirect route.
Gateway Displays the gateway IP address used to route packets to the
destination subnet.
Interface Displays the name of the controller interface or VLAN utilized by the
destination subnet.
Metric Lists the metric (or cost) of the route to select (or predict) the best
route. The metric is computed using a routing algorithm, and covers
information bandwidth, network delay, hop count, path cost, load,
MTU, reliability, and communication cost.
Refresh Select Refresh to update the display to the latest values.
Destination Displays the IPv6 formatted address of the destination route address.
Gateway Displays the gateway IP address used to route packets to the
destination subnet.
Interface Displays the name of the controller interface or VLAN utilized by the
destination subnet.
Flag The flag signifies the condition of the direct or indirect route.
Refresh Select Refresh to update the display to the latest values.
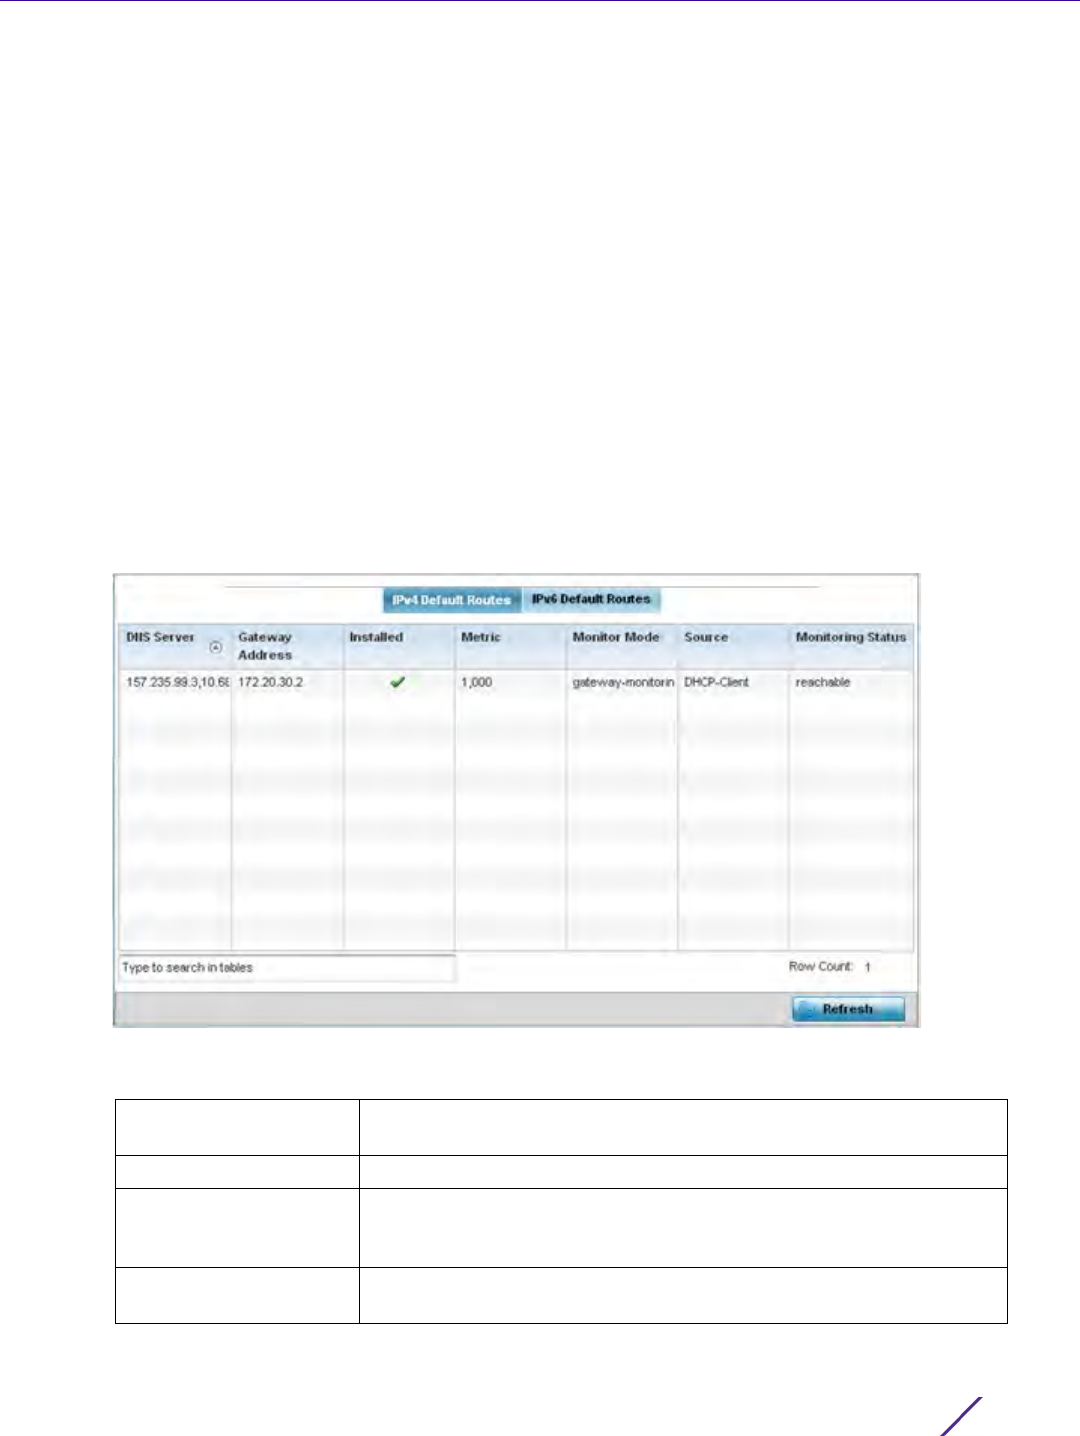
Statistics
Wireless Controller and Service Platform System Reference Guide 15 - 263
15.4.26.3 Default Routes
Network
In an IPv6 supported environment unicast routing is always enabled. A controller or service platform routes IPv6
formatted traffic between interfaces as long as the interfaces are enabled for IPv6 and ACLs allow IPv6 formatted
traffic. However, an administrator can add a default routes as needed.
Static routes are manually configured. They work fine in simple networks. However, static routes with topology
changes require an administrator to manually configure and modify the corresponding route revisions. Default
routes are useful, as they forward packets that match no specific routes in the routing table.
To view Access Point default routes:
1 Select the Statistics menu from the Web UI.
2Select
System from the navigation pane (on the left-hand side of the screen). Expand a RF Domain, select a
controller or service platform, and select one of its connected Access Points.
3Select
Network and expand the menu to reveal its sub menu items.
4Select
Default Routes. The IPv4 Default Routes tab displays by default.
Figure 15-182 Access Point - IPv4 Default Routes screen
The IPv4 Default Routes screen provides the following information:
DNS Server Lists the address of the DNS server providing IPv4 formatted address
assignments on behalf of the Access Point.
Gateway Address Lists the IP address of the gateway resource used with the listed route.
Installed A green checkmark defines the listed route as currently installed on
the Access Point. A red X defines the route as not currently installed
and utilized.
Metric The metric (or cost) could be the distance of a router (round-trip
time), link throughput or link availability.
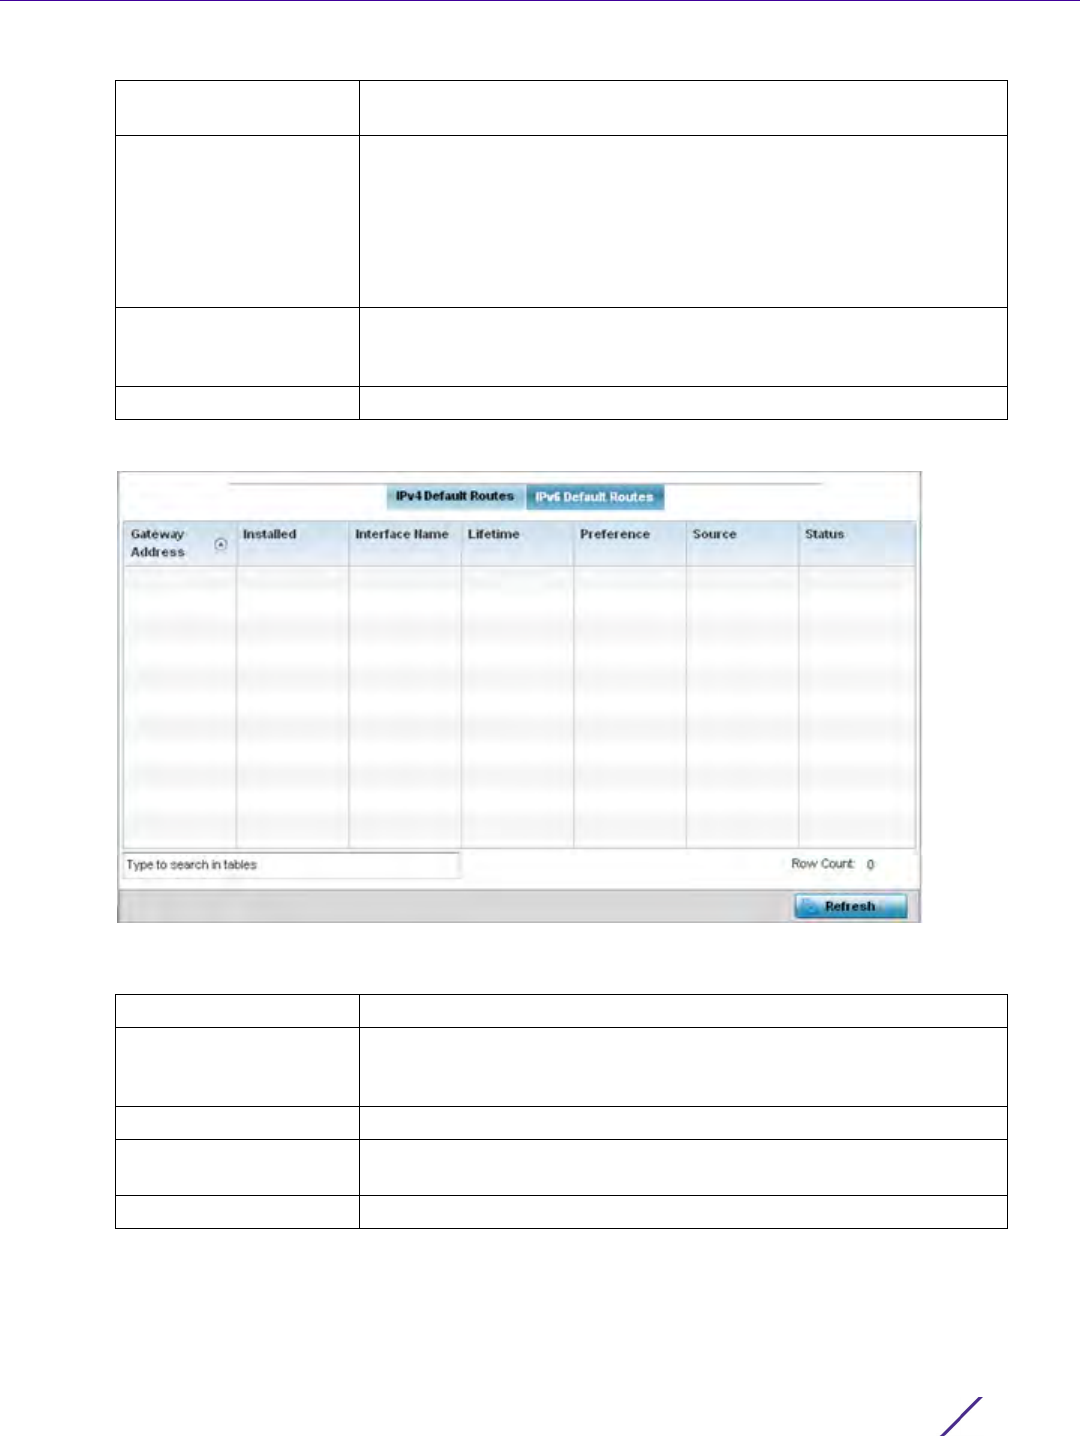
Statistics
Wireless Controller and Service Platform System Reference Guide 15 - 264
5 Select the IPv6 Default Routes tab to review default route availabilities for IPv6 formatted traffic.
Figure 15-183 Wireless Controller - IPv6 Default Routes screen
The IPv6 Default Routes screen provides the following information:
Monitor Mode Displays where in the network the route is monitored for utilization
status.
Source Lists whether the route is static, a DHCP-Client or an administrator
defined default route. Static routes are manually configured. Static
routes work adequately in simple networks. However, static routes
with topology changes require an administrator to manually configure
and modify the corresponding route revisions. Default routes are
useful, as they forward packets that match no specific routes in the
routing table.
Monitoring Status Lists whether the defined IPv4 route is currently reachable on the
Access Point managed network. If not, perhaps a topology change has
occurred to a static route requiring a default route be utilized.
Refresh Select Refresh to update the display to the latest values.
Gateway Address Lists the IP address of the gateway resource used with the listed route.
Installed A green checkmark defines the listed IPv6 default route as currently
installed on the Access Point. A red X defines the route as not
currently installed and utilized.
Interface Name Displays the interface on which the IPv6 default route is being utilized.
Lifetime Lists the lifetime representing the valid usability of the default IPv6
route.
Preference Displays the administrator defined IPv6 preferred route for IPv6 traffic.

Statistics
Wireless Controller and Service Platform System Reference Guide 15 - 265
15.4.26.4 Bridge
Network
Bridging is a forwarding technique used in networks. Bridging makes no assumption about where a particular
address is located. It relies on the flooding and examination of source addresses in received packet headers to
locate unknown devices. Once a device is located, its location is stored in a table to avoid broadcasting to that
device again. Bridging is limited by its dependency on flooding, and is used in local area networks only. A bridge
and an Access Point are very much alike, as an Access Point can be viewed as a bridge with a number of ports.
The Bridge screen provides details about the Integrate Gateway Server (IGS), which is a router connected to an
Access Point. The IGS performs the following:
• Issues IP addresses
• Throttles bandwidth
• Permits access to other networks
• Times out old logins
The Bridging screen also provides information about the Multicast Router (MRouter), which is a router program
that distinguishes between multicast and unicast packets and how they should be distributed along the Multicast
Internet. Using an appropriate algorithm, a multicast router instructs a switching device what to do with the
multicast packet.
To view an Access Point’s Bridge statistics:
1 Select the Statistics menu from the Web UI.
2Select
System from the navigation pane (on the left-hand side of the screen). Expand a RF Domain, select a
controller or service platform, and select one of its connected Access Points.
3Select
Network and expand the menu to reveal its sub menu items.
4Select
Bridge.
Source Lists whether the route is static or an administrator defined default
route. Static routes are manually configured. Static routes work
adequately in simple networks. However, static routes with topology
changes require an administrator to manually configure and modify
the corresponding route revisions. Default routes are useful, as they
forward packets that match no specific routes in the routing table.
Status Lists whether the defined IPv6 route is currently reachable on the
Access Point managed network. If not, perhaps a topology change has
occurred to a static route requiring a default route be utilized.
Refresh Select Refresh to update the display to the latest values.
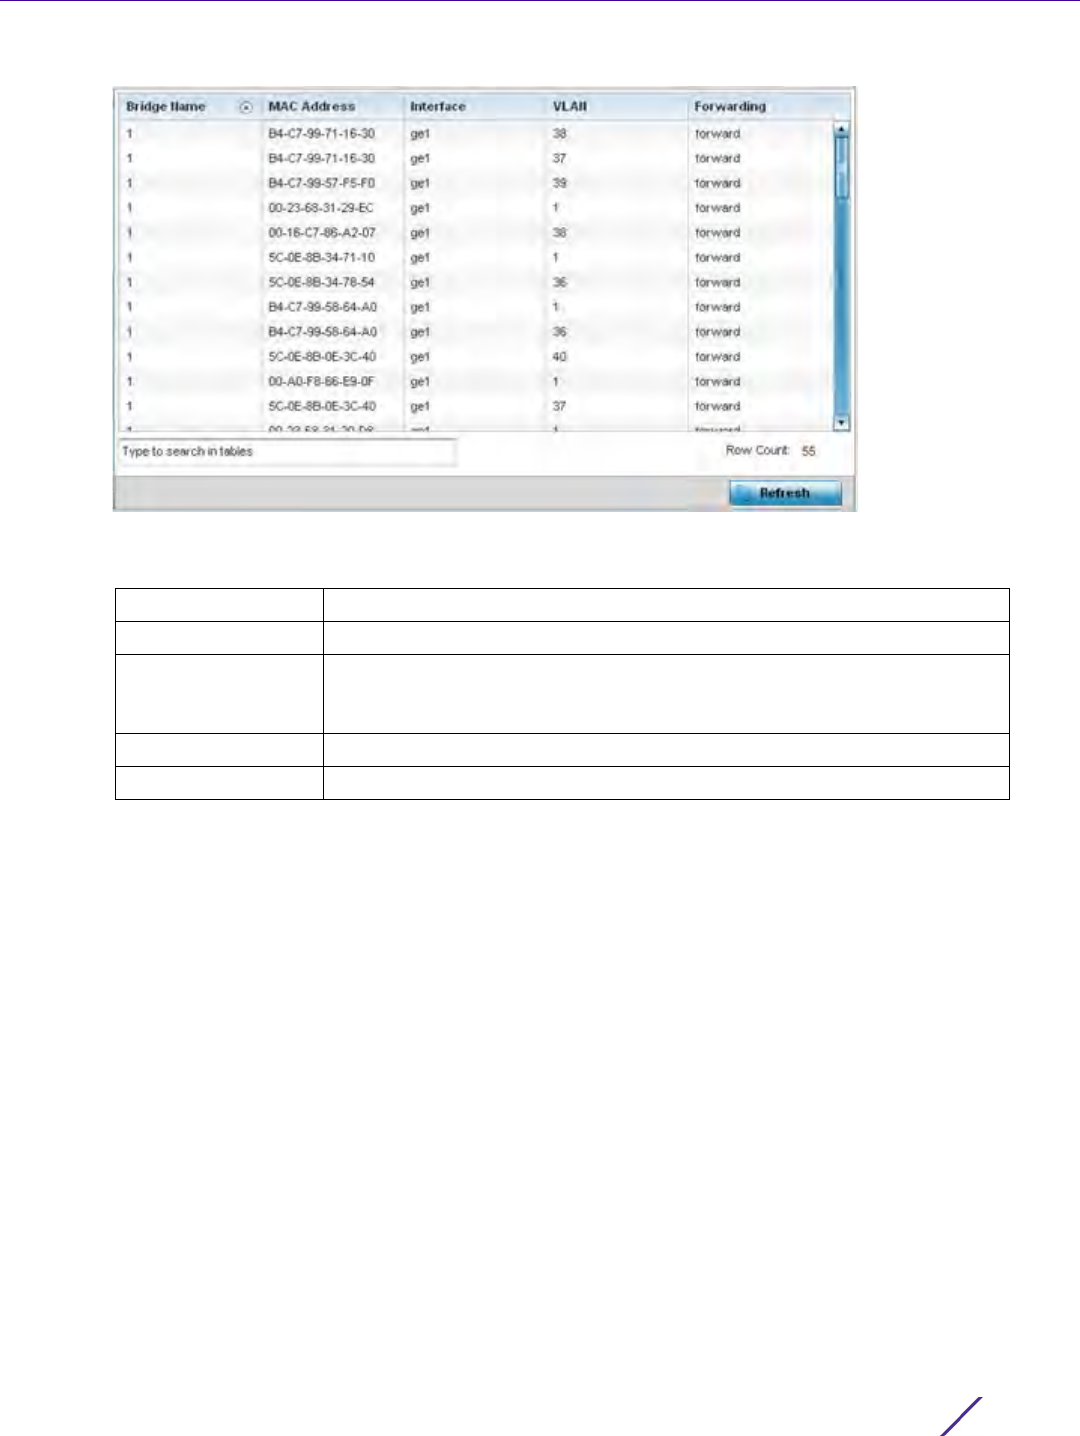
Statistics
Wireless Controller and Service Platform System Reference Guide 15 - 266
Figure 15-184 Access Point - Network Bridge screen
5 Review the following bridge configuration attributes:
6Select
Refresh to update the counters to their latest values.
15.4.26.5 IGMP
Network
Internet Group Management Protocol (IGMP) is a protocol used for managing members of IP multicast groups. The
Access Point listens to IGMP network traffic and forwards the IGMP multicast packets to radios on which the
interested hosts are connected. On the wired side of the network, the Access Point floods all the wired interfaces.
This feature reduces unnecessary flooding of multicast traffic in the network
To view a network’s IGMP configuration:
1 Select the Statistics menu from the Web UI.
2Select
System from the navigation pane (on the left-hand side of the screen). Expand a RF Domain, select a
controller or service platform, and select one of its connected Access Points.
3Select
Network and expand the menu to reveal its sub menu items.
4Select
IGMP.
Bridge Name Displays the numeric ID of the network bridge.
MAC Address Displays the MAC address of the bridge selected.
Interface Displays the interface (Access Point physical port name) where the bridge
transferred packets. Supported Access Points models have different port
configurations.
VLAN Displays the VLAN the bridge uses a virtual interface.
Forwarding Displays whether the bridge is forwarding packets.
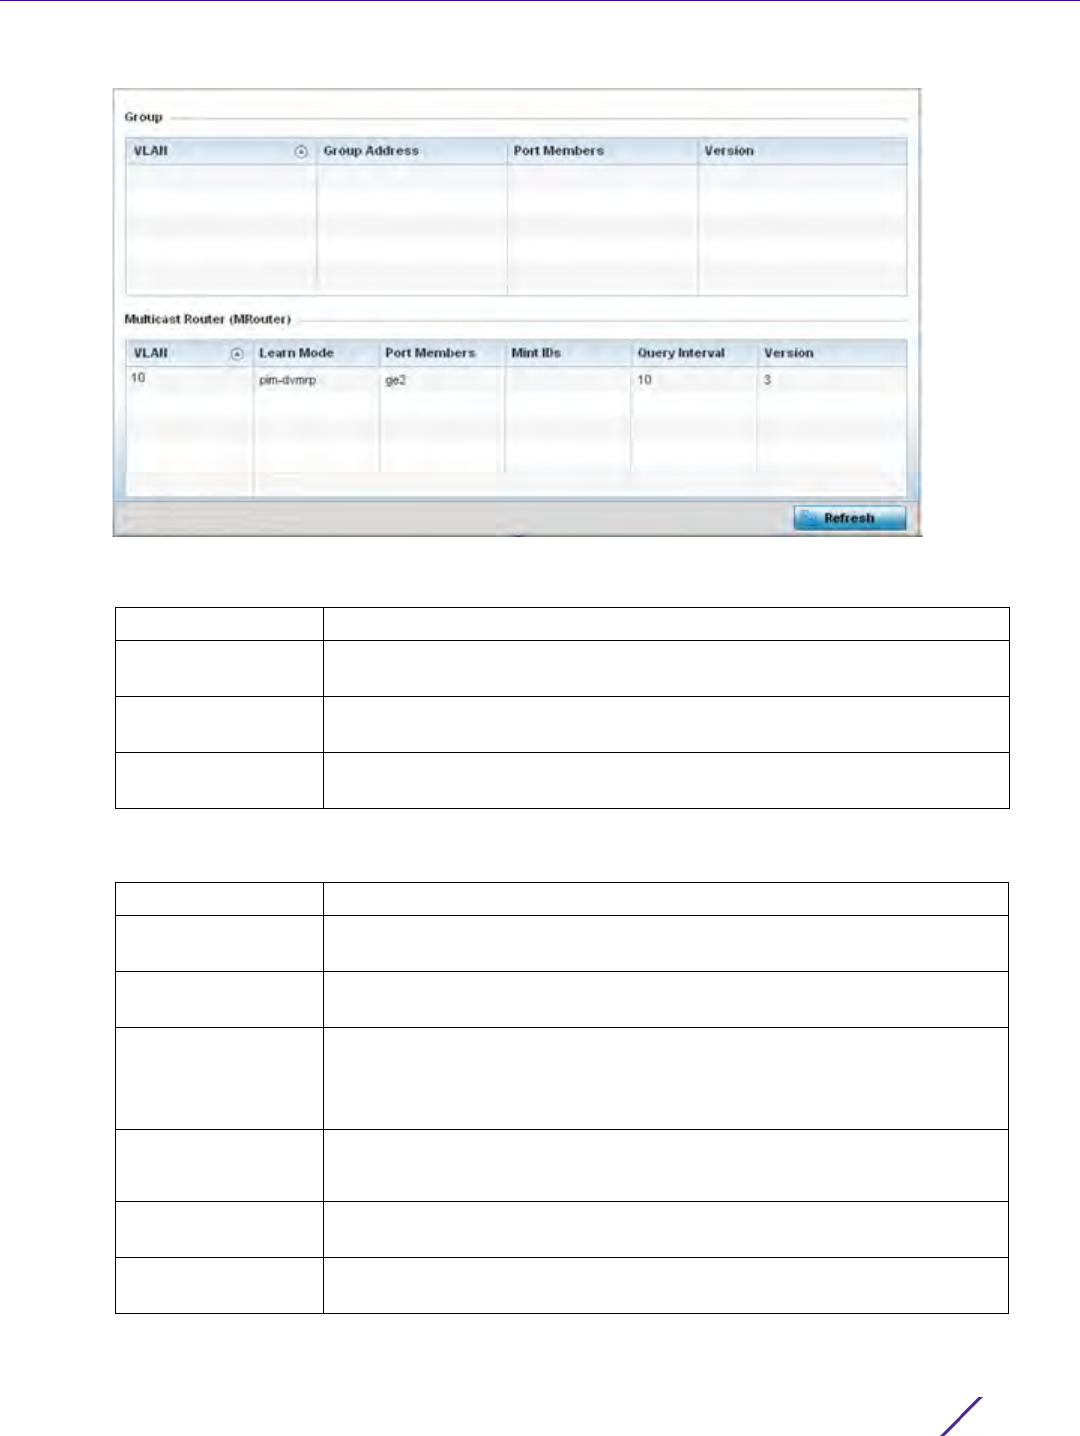
Statistics
Wireless Controller and Service Platform System Reference Guide 15 - 267
Figure 15-185 Access Point - Network IGMP screen
The Group field displays the following:
The Multicast Router (MRouter) field displays the following:
VLAN Displays the group VLAN where the multicast transmission is conducted.
Group Address Displays the Multicast Group ID supporting the statistics displayed. This
group ID is the multicast address that hosts are listening to.
Port Members Displays the ports on which multicast clients have been discovered by the
Access Point. For example, ge1, radio1, etc.
Version Displays each listed group IGMP version compatibility as either version 1, 2
or 3.
VLAN Displays the group VLAN where the multicast transmission is conducted.
Learn Mode Displays the learning mode used by the router as either Static or
PIM-DVMRP.
Port Members Displays the ports on which multicast clients have been discovered by the
multicast router. For example, ge1, radio1, etc.
MiNT IDs Lists MiNT IDs for each listed VLAN. MiNT provides the means to secure
Access Point profile communications at the transport layer. Using MiNT, an
Access Point can be configured to only communicate with other
authorized (MiNT enabled) Access Points of the same model.
Query Interval Lists the IGMP query interval implemented when the querier functionality
is enabled. The default value is 60 seconds.
Version Lists the multicast router IGMP version compatibility as either version 1, 2
or 3. The default setting is 3.
Refresh Select the Refresh button to update the screen’s statistics counters to their
latest values.
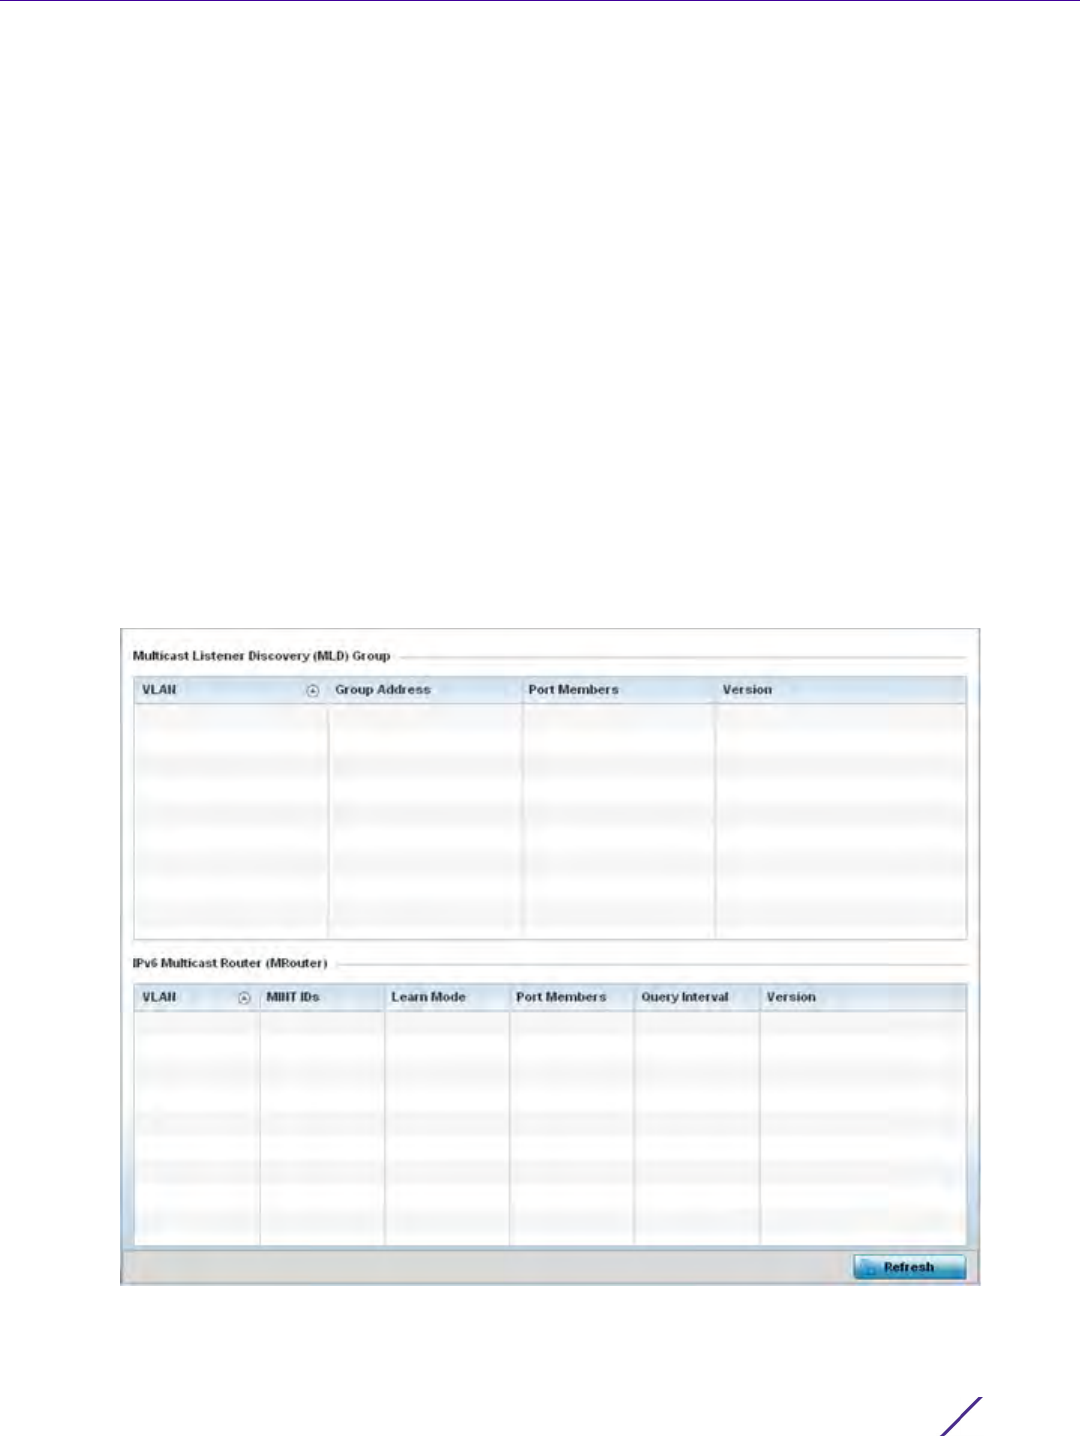
Statistics
Wireless Controller and Service Platform System Reference Guide 15 - 268
15.4.26.6 MLD
Network
Multicast Listener Discovery (MLD) snooping enables a controller, service platform or Access Point to examine MLD
packets and make forwarding decisions based on content. MLD is used by IPv6 devices to discover devices
wanting to receive multicast packets destined for specific multicast addresses. MLD uses multicast listener queries
and multicast listener reports to identify which multicast addresses have listeners and join multicast groups.
MLD snooping caps the flooding of IPv6 multicast traffic on controller, service platform or Access Point VLANs.
When enabled, MLD messages are examined between hosts and multicast routers and to discern which hosts are
receiving multicast group traffic. The controller, service platform or Access Point then forwards multicast traffic
only to those interfaces connected to interested receivers instead of flooding traffic to all interfaces.
To view network MLD configuration options:
1 Select the Statistics menu from the Web UI.
2Select
System from the navigation pane (on the left-hand side of the screen). Expand a RF Domain, select a
controller or service platform, and select one of its connected Access Points.
3Select
Network and expand the menu to reveal its sub menu items.
4Select MLD.
Figure 15-186 Access Point - Network MLD screen

Statistics
Wireless Controller and Service Platform System Reference Guide 15 - 269
The Multicast Listener Discovery (MLD) Group field describes the following:
The IPv6 Multicast Router (MRouter) field describes the following:
15.4.26.7 Traffic Shaping
Network
Traffic shaping regulates network data transfers to ensure a specific performance level. Traffic shaping delays the
flow of packets defined as less important than prioritized traffic streams. Traffic shaping enables traffic control out
an interface to match its flow to the speed of a remote target’s interface and ensure traffic conforms applied
policies. Traffic can be shaped to meet downstream requirements and eliminate network congestion when data
rates are in conflict.
Apply traffic shaping to specific applications to apply application categories. When application and ACL rules are
conflicting, an application takes precedence over an application category, then ACLs.
To view network Access Point traffic shaping configuration:
1 Select the Statistics menu from the Web UI.
2Select
System from the navigation pane (on the left-hand side of the screen). Expand a RF Domain, select a
controller or service platform, and select one of its connected Access Points.
3Expand the Network menu from the left-hand side of the UI.
4Select
Traffic Shaping. The Status screen displays by default, and lists the Access Point’s traffic shaping status.
VLAN Displays the group VLAN where the MLD groups multicast transmission is
conducted.
Group Address Displays the Multicast Group ID supporting the statistics displayed. This
group ID is the multicast address hosts are listening to.
Port Members Displays the ports on which MLD multicast clients have been discovered.
For example, ge1, radio1, etc. Ports can vary somewhat amongst supported
Access Point models.
Version Displays each listed group’s version compatibility as either version 1, 2 or 3.
VLAN Displays the group VLAN where the multicast transmission is conducted.
MiNT IDs Lists MiNT IDs for each listed VLAN. MiNT provides the means to secure
communications at the transport layer. Using MiNT, an Access Point can be
configured to only communicate with other authorized (MiNT enabled)
devices.
Learn Mode Displays the learning mode used by the router as either Static or PIM-
DVMRP.
Port Members Displays the physical ports on which multicast clients have been
discovered by the multicast router. For example, ge1, radio1, etc. Ports can
vary somewhat amongst supported Access Point models.
Query Interval Lists the query interval implemented when the querier functionality is
enabled. The default value is 60 seconds.
Version Lists the multicast router version compatibility as either version 1, 2 or 3.
The default setting is 3.
Refresh Select the Refresh button to update the screen’s statistics counters to their
latest values.
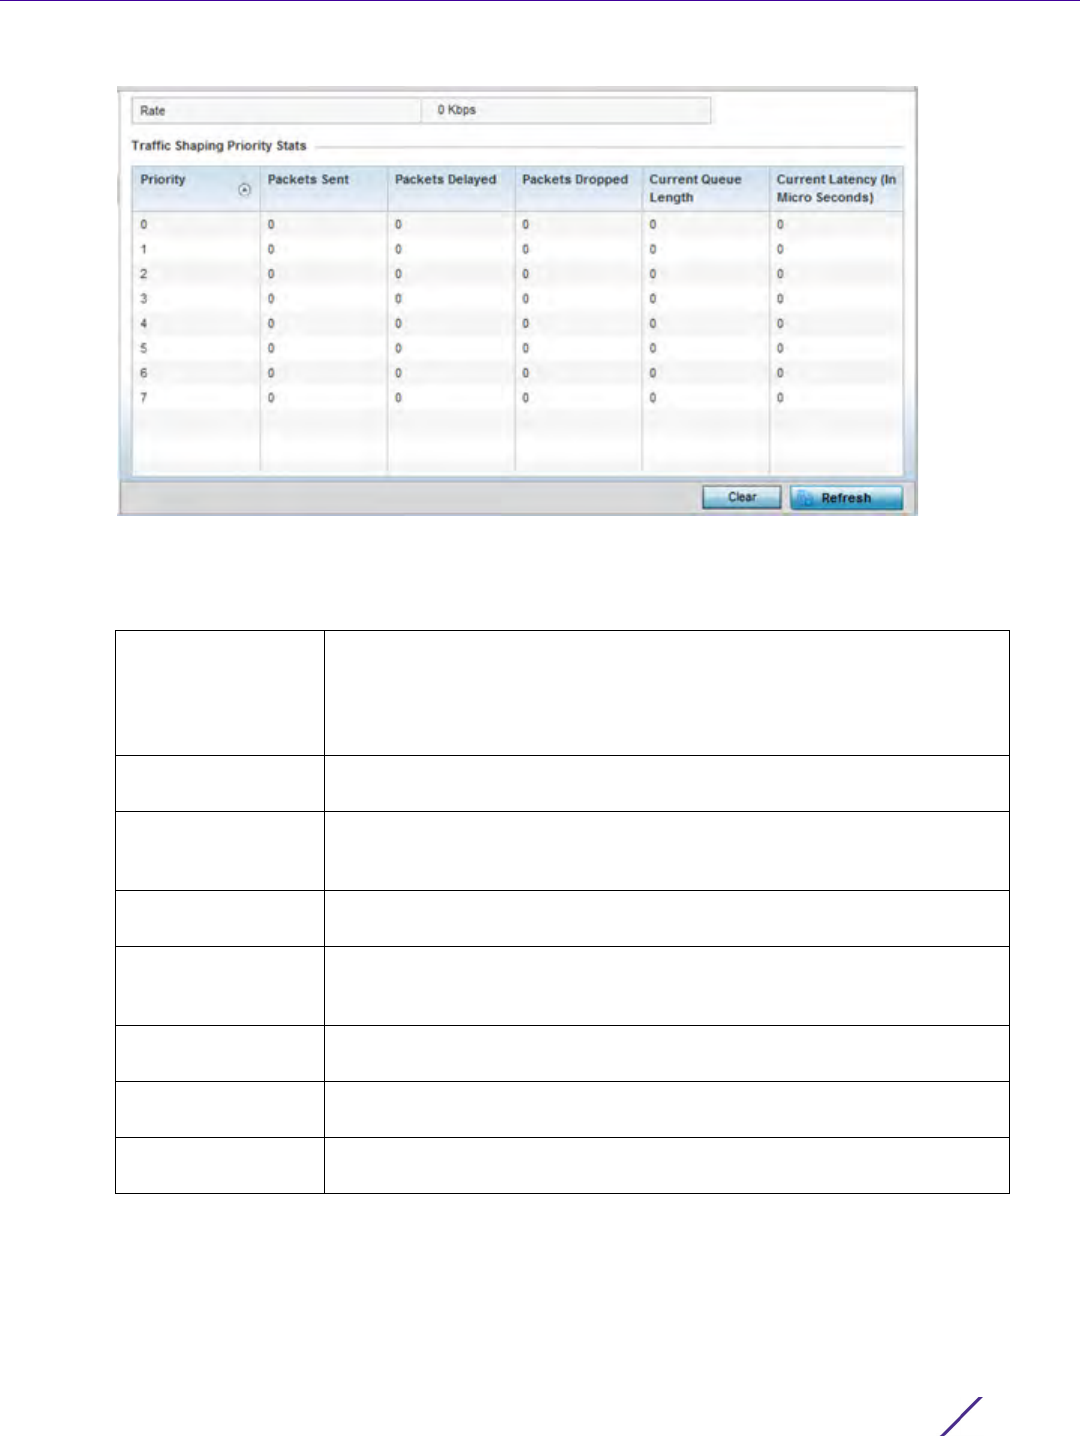
Statistics
Wireless Controller and Service Platform System Reference Guide 15 - 270
Figure 15-187 Access Point - Network Traffic Shaping Statistics screen
5Select Statistics.
6 Refer to the following Traffic Shaping statistics:
15.4.26.8 DHCP Options
Network
Supported Access Points can use a DHCP server resource to provide the dynamic assignment of IP addresses
automatically. This is a protocol that includes IP address allocation and delivery of host-specific configuration
parameters from a DHCP server to a host. Some of these parameters are IP address, gateway and network mask.
Rate The rate configuration controls the maximum traffic rate sent or received
on an interface. Consider this form of rate limiting on interfaces at the
edge of a network to limit traffic into or out of the network. Traffic within
the set limit is sent and traffic exceeding the set limit is dropped or sent
with a different priority.
Priority Lists the traffic shaper queue priority. There are 8 queues (0 - 7), and
traffic is queued in each based on incoming packets 802.1p markings.
Packets Sent Provides a baseline of the total number of packets sent to assess packet
delays and drops as a result of the filter rules applied in the traffic shaping
configuration.
Packets Delayed Lists the packets defined as less important than prioritized traffic streams
and delayed as a result of traffic shaping filter rules applied.
Packets Dropped Lists the packets defined as less important than prioritized traffic streams,
delayed and eventually dropped as a result of traffic shaping filter rules
applied.
Current Length Lists the packet length of the data traffic shaped to meet downstream
requirements.
Current Latency Traffic shaping latency is the time limit after which packets start dropping
as a result of the traffic prioritization filter rules applied.
Refresh Select the Refresh button to update the screen’s statistics counters to their
latest values.
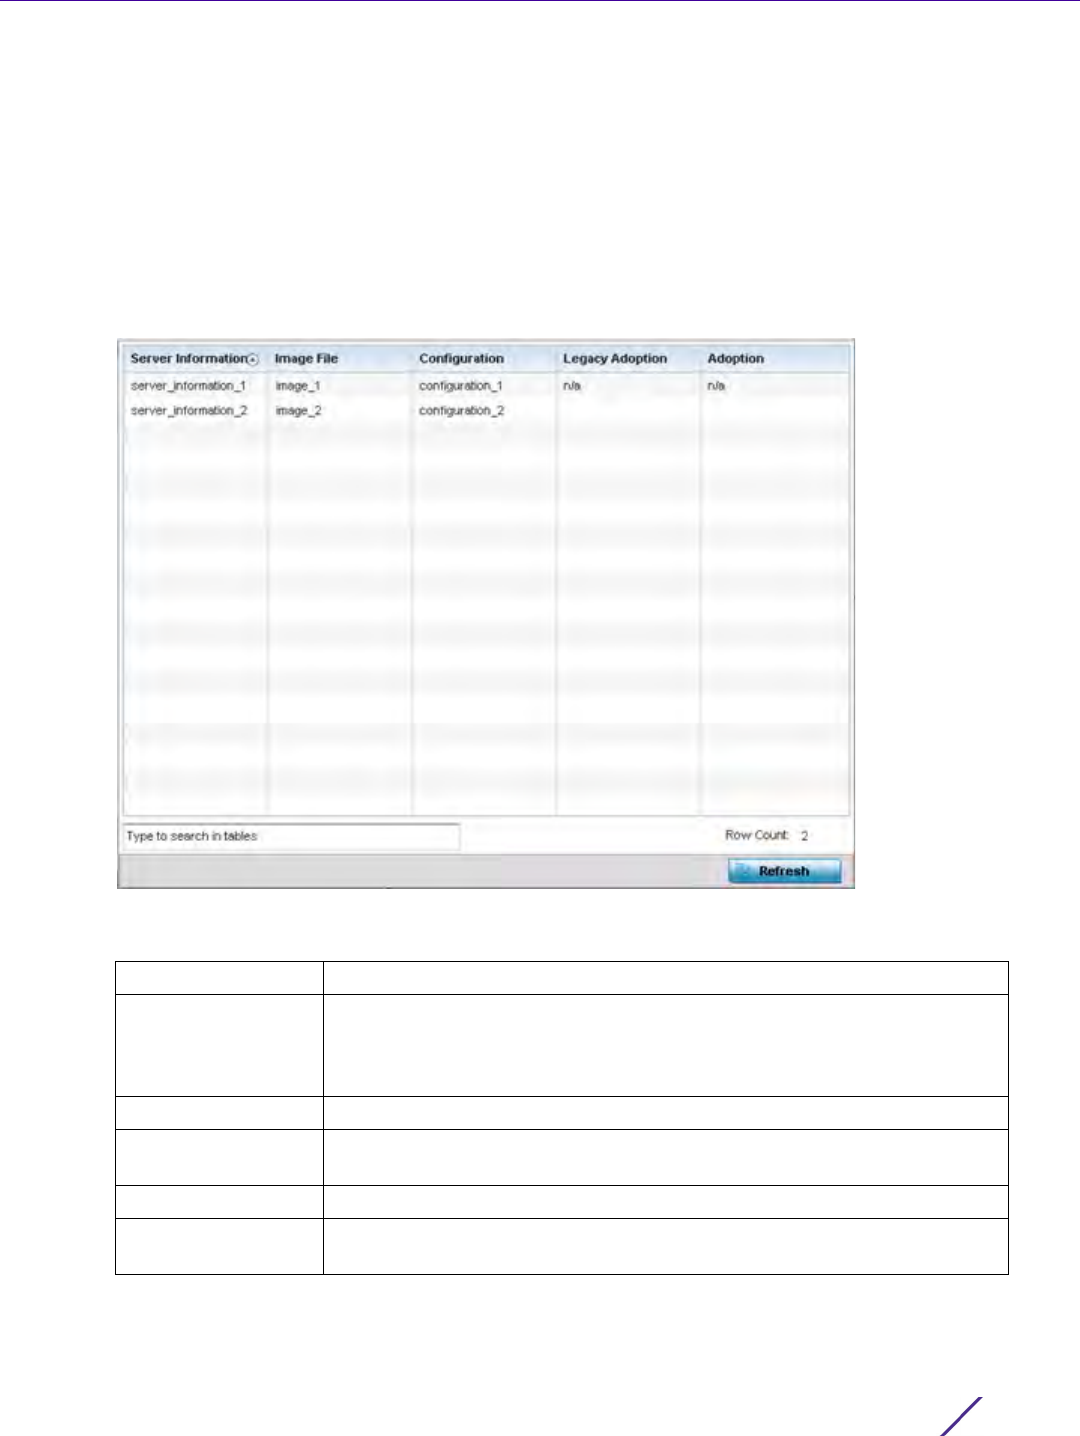
Statistics
Wireless Controller and Service Platform System Reference Guide 15 - 271
The DHCP Options screen provides the DHCP server name, image file on the DHCP server, and its configuration.
To view a network’s DHCP Options:
1 Select the Statistics menu from the Web UI.
2Select
System from the navigation pane (on the left-hand side of the screen). Expand a RF Domain, select a
controller or service platform, and select one of its connected Access Points.
3Select
Network and expand the menu to reveal its sub menu items.
4Select
DHCP Options.
Figure 15-188 Access Point - Network DHCP Options screen
The DHCP Options screen displays the following:
Server Information Displays the DHCP server hostname used on behalf of the Access Point.
Image File Displays the image file name. BOOTP or the bootstrap protocol can be
used to boot diskless clients. An image file is sent from the boot server.
The image file contains the image of the operating system the client will
run. DHCP servers can be configured to support BOOTP.
Configuration Displays the name of the configuration file on the DHCP server.
Legacy Adoption Displays historical device adoption information on behalf of the Access
Point.
Adoption Displays adoption information on behalf of the Access Point.
Refresh Select the Refresh button to update the screen’s statistics counters to their
latest values.
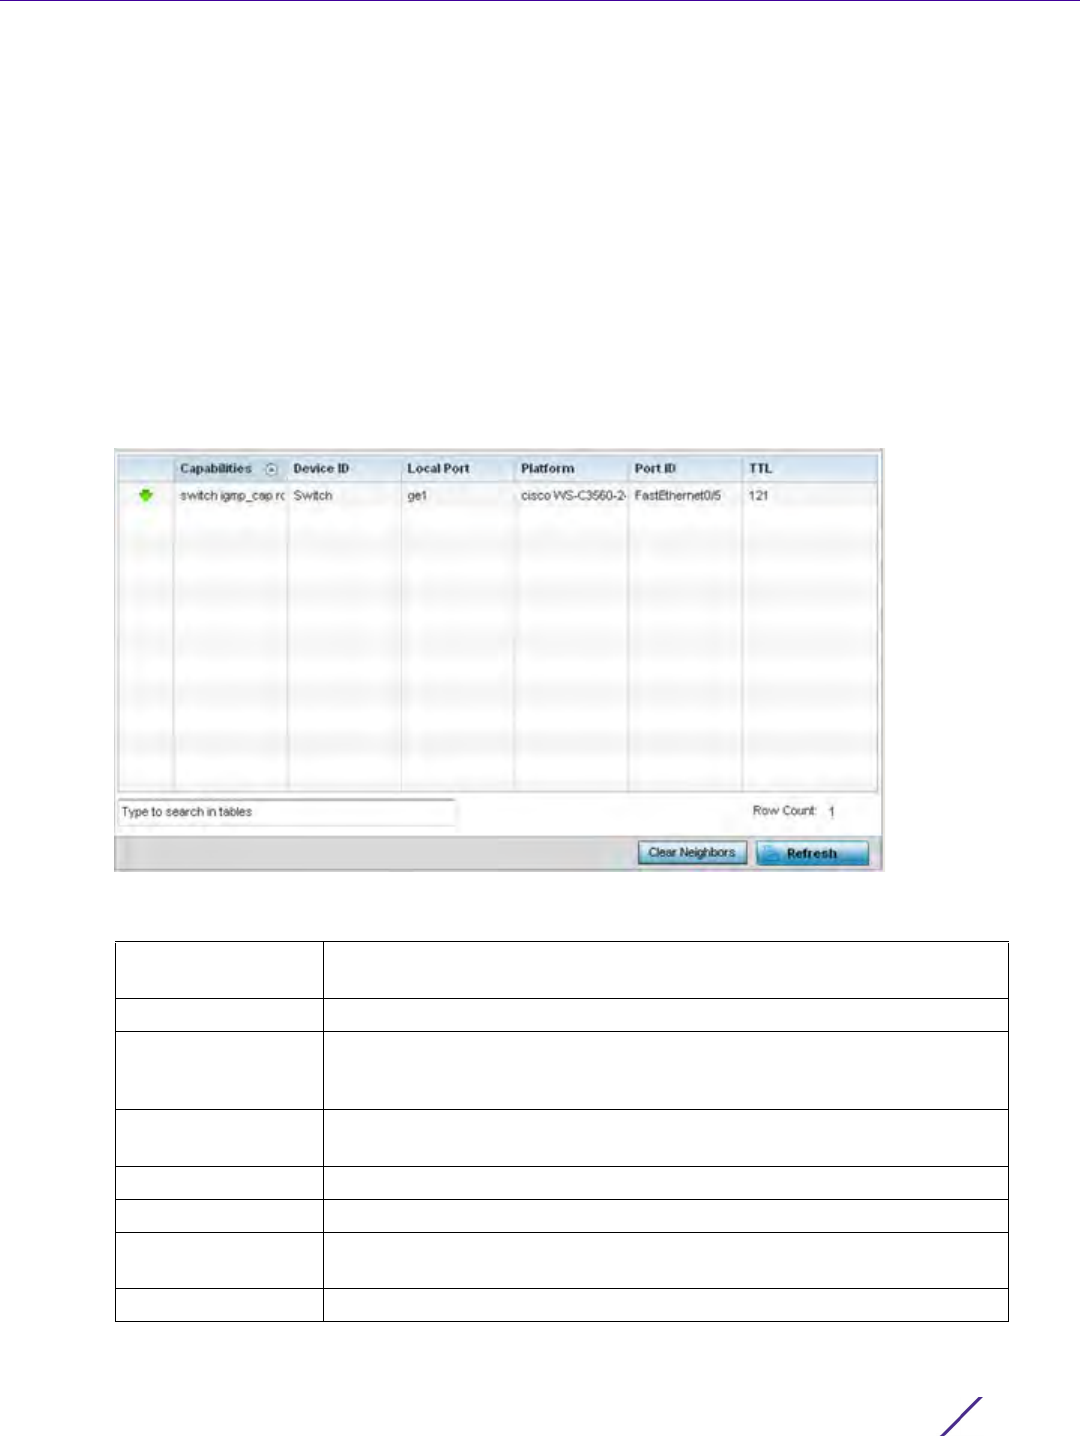
Statistics
Wireless Controller and Service Platform System Reference Guide 15 - 272
15.4.26.9 Cisco Discovery Protocol
Network
The Cisco Discovery Protocol (CDP) is a proprietary Data Link Layer network protocol implemented in Cisco
networking equipment and used to share information about network devices.
To view an Access Point’s CDP statistics:
1 Select the Statistics menu from the Web UI.
2Select
System from the navigation pane (on the left-hand side of the screen). Expand a RF Domain, select a
controller or service platform, and select one of its connected Access Points.
3Select Network and expand the menu to reveal its sub menu items.
4Select
Cisco Discovery Protocol.
Figure 15-189 Access Point - Network CDP screen
The Cisco Discovery Protocol screen displays the following:
Capabilities Displays the capabilities code for the device as either Router, Trans Bridge,
Source Route Bridge, Host, IGMP or Repeater.
Device ID Displays the configured device ID or name for each listed device.
Local Port Displays the local port name (Access Point physical port) for each CDP
capable device. Supported Access Point models have unique port
configurations.
Platform Displays the model number of the CDP capable device interoperating with
the Access Point.
Port ID Displays the Access Point’s numeric identifier for the local port.
TTL Displays the time to live (TTL) for each CDP connection.
Clear Neighbors Select Clear Neighbors to remove CDP neighbors from the table and begin
a new data collection.
Refresh Select Refresh to update the statistics counters to their latest values.
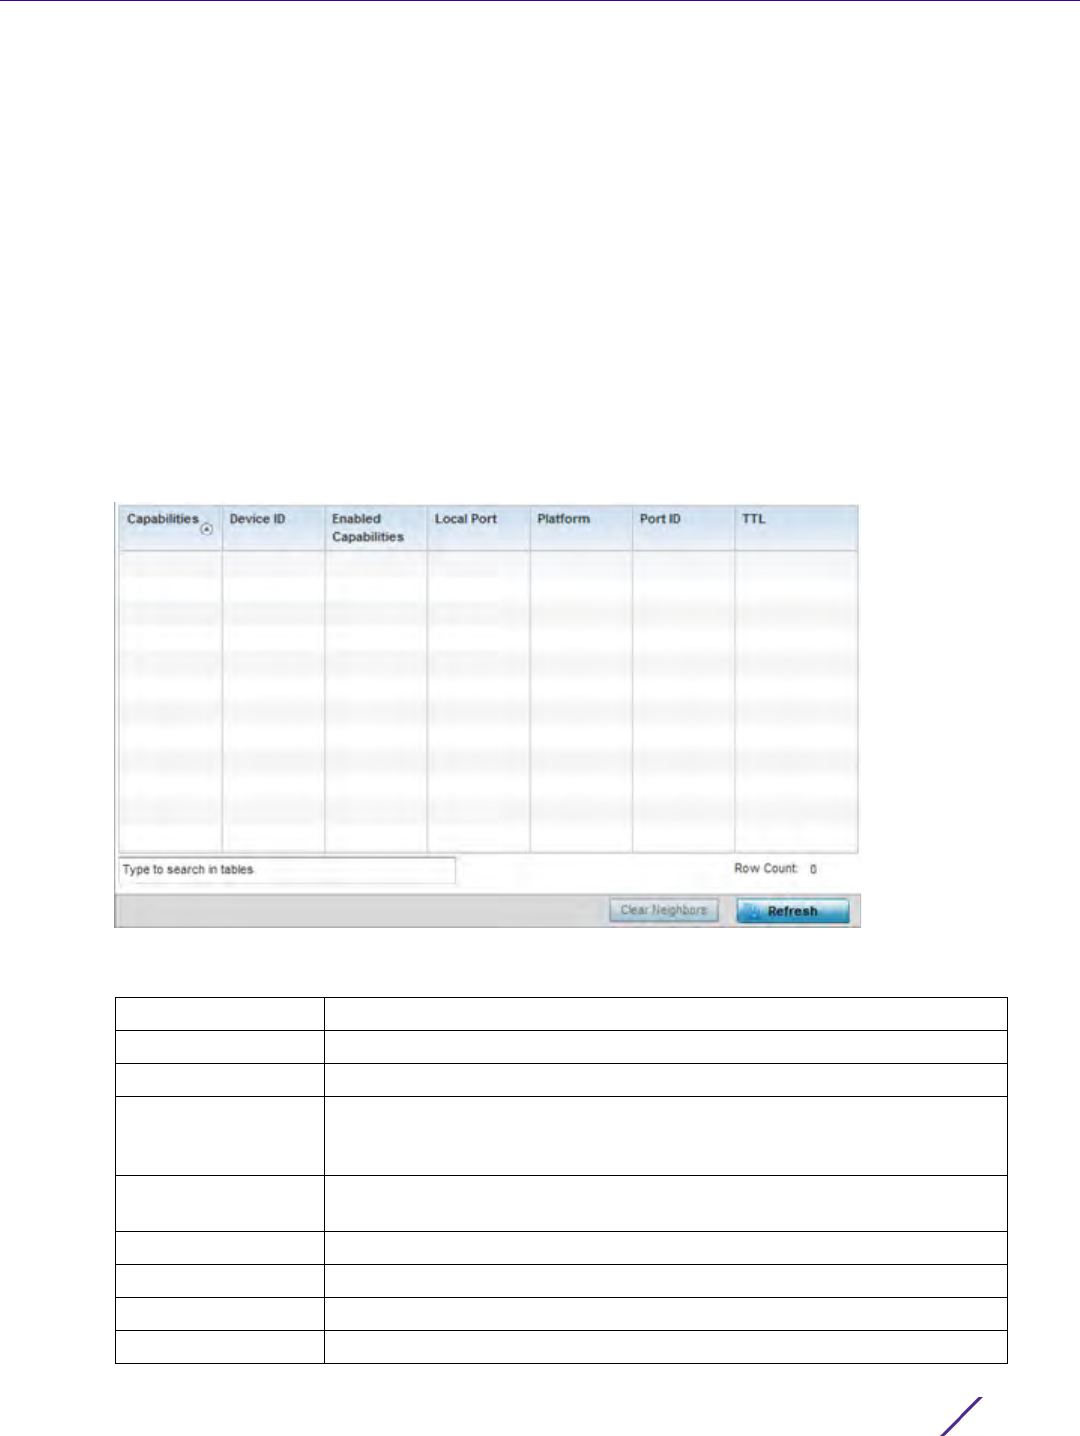
Statistics
Wireless Controller and Service Platform System Reference Guide 15 - 273
15.4.26.10 Link Layer Discovery Protocol
Network
The Link Layer Discovery Protocol (LLDP) or IEEE 802.1AB is a vendor-neutral Data Link Layer protocol used by
network devices for advertising of (announcing) their identity, capabilities, and interconnections on a IEEE 802
LAN network. The protocol is formally referred to by the IEEE as Station and Media Access Control Connectivity
Discovery.
To view a network’s Link Layer Discovery Protocol statistics:
1 Select the Statistics menu from the Web UI.
2Select
System from the navigation pane (on the left-hand side of the screen). Expand a RF Domain, select a
controller or service platform, and select one of its connected Access Points.
3Select
Network and expand the menu to reveal its sub menu items.
4Select
Link Layer Discovery.
Figure 15-190 Access Point - Network LLDP screen
The Link Layer Discovery Protocol screen displays the following:
Capabilities Displays the capabilities code for the device.
Device ID Displays the configured device ID or name for each device in the table.
Enabled Capabilities Displays which device capabilities are currently enabled.
Local Port Displays the local port name (Access Point physical port) for each LLDP
capable device. Supported Access Point models have unique port
configurations.
Platform Displays the model number of the LLDP capable device interoperating
with the Access Point.
Port ID Displays the identifier for the local port.
TTL Displays the time to live (TTL) for each LLDP connection.
Clear Neighbors Select Clear Neighbors to remove all known LDP neighbors from the table.
Refresh Select Refresh to update the statistics counters to their latest values.
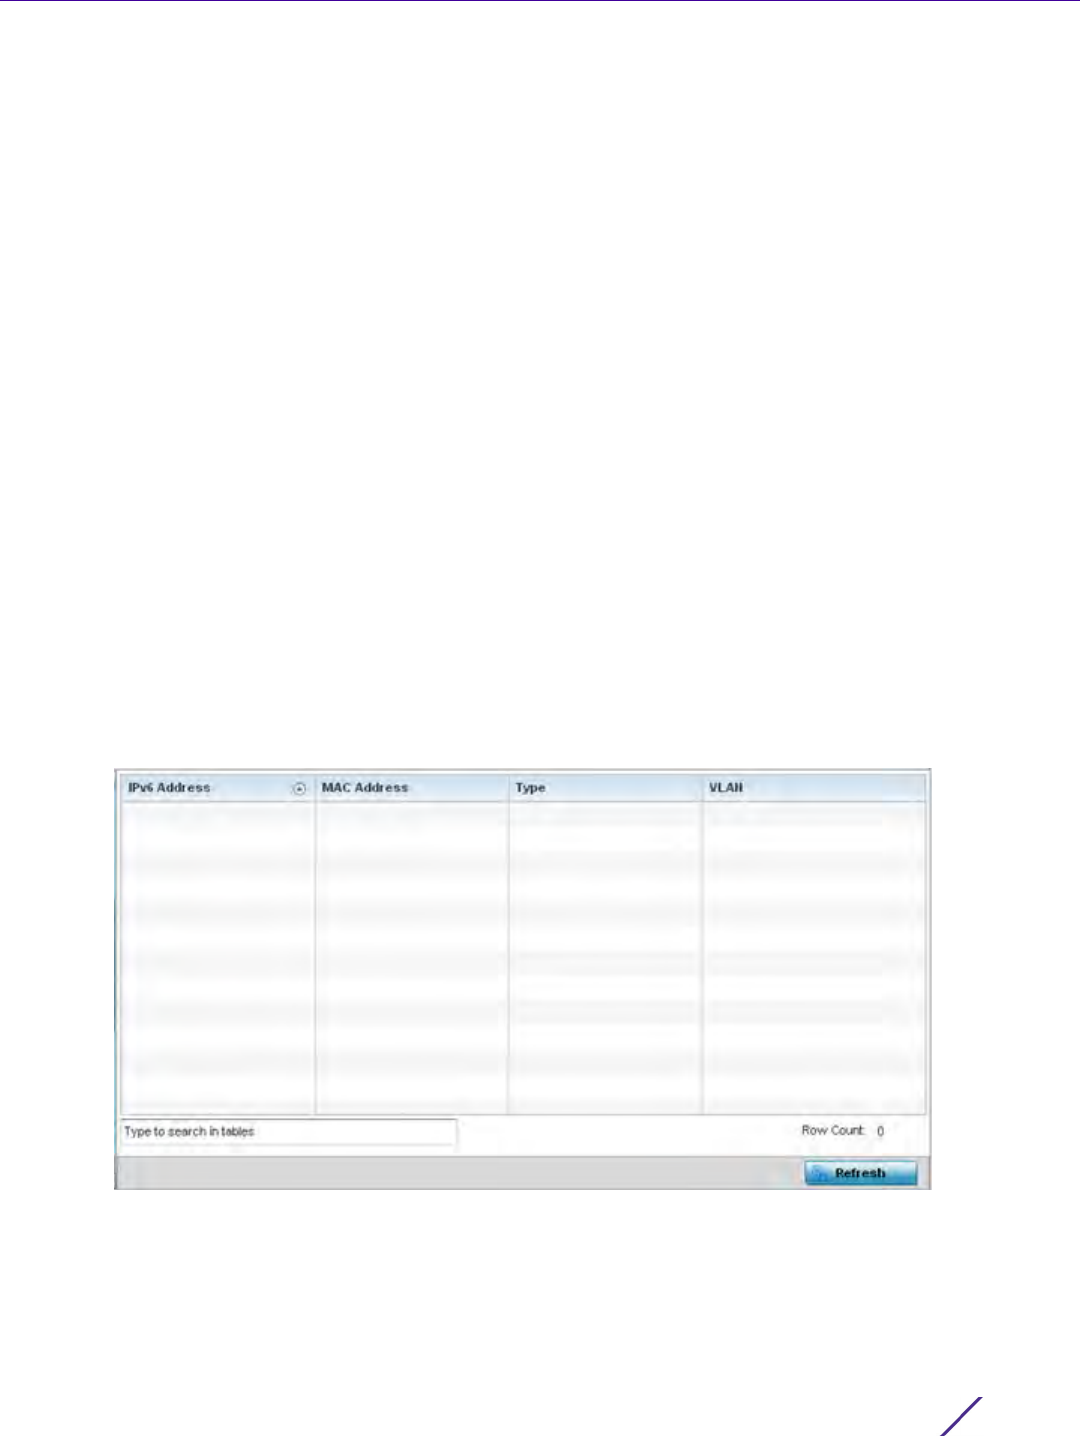
Statistics
Wireless Controller and Service Platform System Reference Guide 15 - 274
15.4.26.11 IPv6 Neighbor Discovery
Network
IPv6 neighbor discovery uses ICMP messages and solicited multicast addresses to find the link layer address of a
neighbor on the same local network, verify the neighbor’s reachability and track neighboring devices.
Upon receiving a neighbor solicitation message, the destination replies with neighbor advertisement (NA). The
source address in the advertisement is the IPv6 address of the device sending the message. The destination
address in the advertisement message is the IPv6 address of the device sending the neighbor solicitation. The data
portion of the NA includes the link layer address of the node sending the neighbor advertisement.
Neighbor solicitation messages also verify the availability of a neighbor once its the link layer address is identified.
When a node wants to verify the reachability of a neighbor, the destination address in a neighbor solicitation
message is the unicast address of the neighbor.
A neighbor is interpreted as reachable when an acknowledgment is returned indicating packets have been
received and processed. If packets are reaching the device, they’re also reaching the next hop neighbor, providing
a confirmation the next hop is reachable.
To view an Access Point’s IPv6 neighbor statistics:
1 Select the Statistics menu from the Web UI.
2Select
System from the navigation pane (on the left-hand side of the screen). Expand a RF Domain, select a
controller or service platform, and select one of its connected Access Points.
3Expand the Network menu from the left-hand side of the UI.
4Select
IPv6 Neighbor Discovery
Figure 15-191 Access Point - Network IPv6 Neighbor screen

Statistics
Wireless Controller and Service Platform System Reference Guide 15 - 275
The IPv6 Neighbor screen displays the following:
15.4.26.12 MSTP
Network
The Multiple Spanning Tree Protocol (MSTP) provides an extension to RSTP to optimize the usefulness of VLANs.
MSTP allows for a separate spanning tree for each VLAN group, and blocks all but one of the possible alternate
paths within each spanning tree topology.
If there’s just one VLAN in the Access Point managed network, a single spanning tree works fine. However, if the
network contains more than one VLAN, the network topology defined by single STP would work, but it’s possible
to make better use of the alternate paths available by using an alternate spanning tree for different VLANs or
groups of VLANs.
MSTP includes all of its spanning tree information in a single Bridge Protocol Data Unit (BPDU) format. BPDUs are
used to exchange information bridge IDs and root path costs. Not only does this reduce the number of BPDUs
required to communicate spanning tree information for each VLAN, but it also ensures backward compatibility
with RSTP. MSTP encodes additional region information after the standard RSTP BPDU as well as a number of
MSTI messages. Each MSTI messages conveys spanning tree information for each instance. Each instance can be
assigned a number of configured VLANs. The frames assigned to these VLANs operate in this spanning tree
instance whenever they are inside the MST region. To avoid conveying their entire VLAN to spanning tree mapping
in each BPDU, the Access Point encodes an MD5 digest of their VLAN to an instance table in the MSTP BPDU. This
digest is used by other MSTP supported devices to determine if the neighboring device is in the same MST region
as itself.
To view a controller or service platform’s MSTP statistics:
1 Select the Statistics menu from the Web UI.
2Select
System from the navigation pane (on the left-hand side of the screen). Expand a RF Domain, select a
controller or service platform, and select one of its connected Access Points.
IPv6 Address Lists an IPv6 IP address for neighbor discovery. IPv6 hosts can configure
themselves automatically when connected to an IPv6 network using the
neighbor discovery protocol via CMPv6 router discovery messages. When
first connected to a network, a host sends a link-local router solicitation
multicast request for its configuration parameters; routers respond to such
a request with a router advertisement packet that contains Internet Layer
configuration parameters. IPv6 addresses are composed of eight groups of
four hexadecimal digits separated by colons.
MAC Address Lists the factory encoded hardware MAC address of the neighbor device
using an IPv6 formatted IP address as its network identifier.
Type Displays the device type for the neighbor solicitation. Neighbor
solicitations request the link layer address of a target node while providing
the sender’s own link layer address to the target. Neighbor solicitations are
multicast when the node needs to resolve an address and unicast when
the node seeks to verify the reachability of a neighbor. Options include
Host, Router and DHCP Server.
VLAN Lists the virtual interface (from 1 - 4094) used for the required neighbor
advertisements and solicitation messages used for neighbor discovery.
Refresh Select the Refresh button to update the screen’s statistics counters to their
latest values.
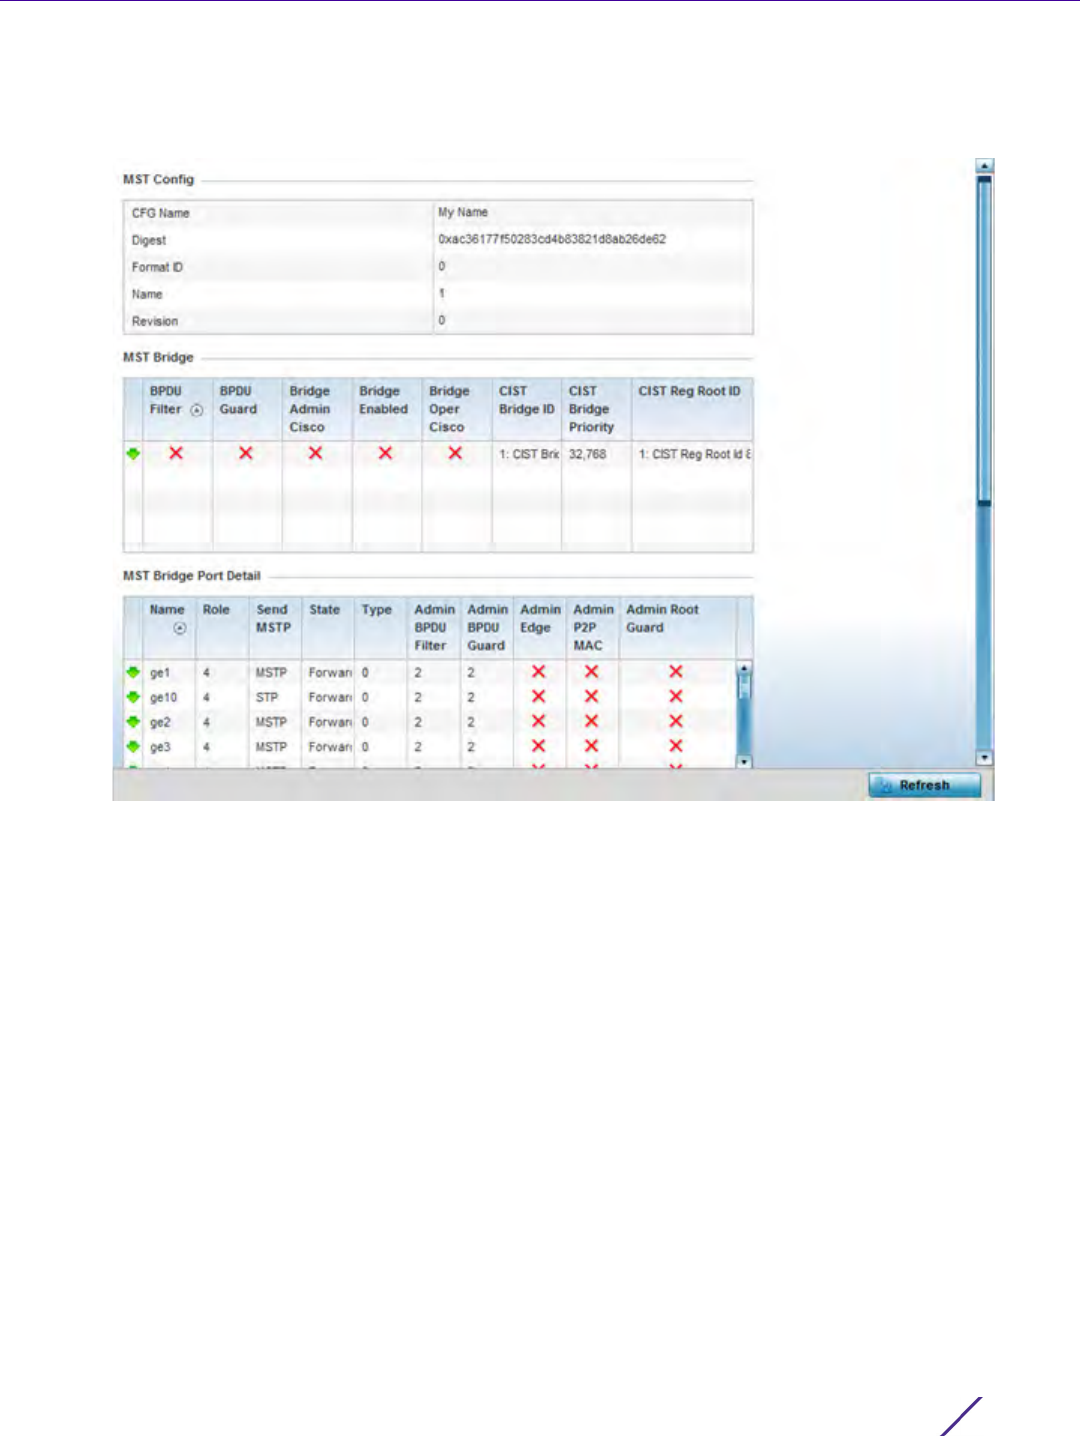
Statistics
Wireless Controller and Service Platform System Reference Guide 15 - 276
3Expand the Network menu from the left-hand side of the UI.
4Select
MSTP.
Figure 15-192 Access Point- Network MSTP screen
The MST Config field displays the name assigned to the MSTP configuration, its digest, format ID, name and
revision.
The MST Bridge field lists the filters and guards that have been enabled and whether Cisco interoperability if
enabled.
The MST Bridge Port Detail field lists specific Access Point port status and their current state.
15.4.27 DHCPv6 Relay & Client
Access Point Statistics
DHCPv6 is a networking protocol for configuring IPv6 hosts with IP addresses, IP prefixes or other configuration
attributes required on an IPv6 network. DHCPv6 relay agents receive messages from clients and forward them a
DHCPv6 server. The server sends responses back to the relay agent, and the relay agent sends the responses to
the client on the local link
To assess an Access Point’s DHCPv6 relay configuration:
1 Select the Statistics menu from the Web UI.
2Select
System from the navigation pane (on the left-hand side of the screen). Expand a RF Domain, select a
controller or service platform, and select one of its connected Access Points.
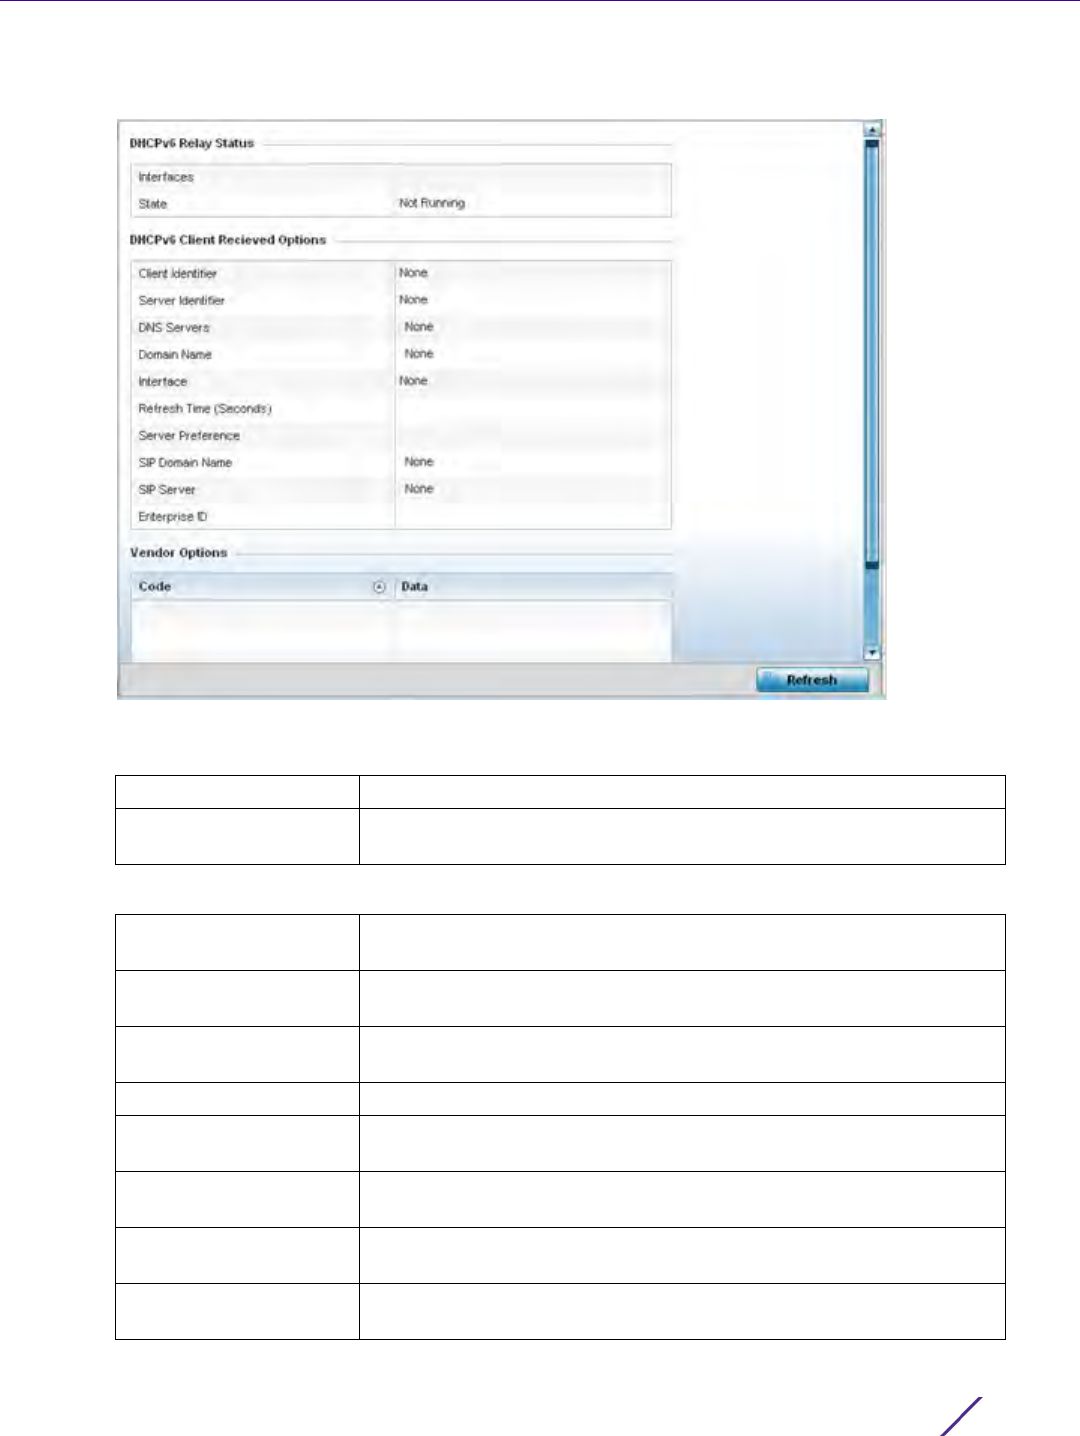
Statistics
Wireless Controller and Service Platform System Reference Guide 15 - 277
3Select
DHCP Relay & Client from the left-hand side of the UI.
Figure 15-193 Access Point - DHCPv6 Relay and Client screen
4The DHCPv6 Status tables defines the following:
5The DHCPv6 Status tables defines the following:
Interfaces Displays the Access Point interface used for DHCPv6 relay.
State Displays the current operational state of the DHCPv6 server to assess
its availability as a viable IPv6 provisioning resource.
Client Identifier Lists whether the reporting client is using a hardware address or client
identifier as its identifier type within requests to the DHCPv6 server.
Server Identifier Displays the server identifier supporting client DHCPv6 relay message
reception.
DNS Servers Lists the DNS server resources supporting relay messages received
from clients.
Domain Name Lists the domain to which the remote server resource belongs.
Interface Displays the interfaces dedicated to client DHCPv6 relay message
reception.
Refresh Time (Seconds) Lists the time (in seconds) since the data populating the DHCPv6
client received options table has been refreshed.
Server Preference Lists the preferred DHCPv6 server resource supporting relay messages
received from clients.
SIP Domain Name Lists the SIP domain name supporting DHCPv6 client telephone
extensions or voice over IP systems.

Statistics
Wireless Controller and Service Platform System Reference Guide 15 - 278
6 Refer to the Vendor Options table for the following:
15.4.28 DHCP Server
Access Point Statistics
Access Point’s utilize an internal Dynamic Host Configuration Protocol (DHCP) server. DHCP can provide IP
addresses automatically. DHCP is a protocol that includes mechanisms for IP address allocation and delivery of
host-specific configuration parameters (IP address, network mask gateway etc.) from a DHCP server to a host.
To review DHCP server statistics, refer to the following:
•Viewing General DHCP Information
•Viewing DHCP Binding Information
•Viewing DHCP Server Networks Information
15.4.28.1 Viewing General DHCP Information
DHCP Server
To view General DHCP status and binding information for both DHCPv4 and DHCPv6:
1 Select the Statistics menu from the Web UI.
2Select
System from the navigation pane (on the left-hand side of the screen). Expand a RF Domain, select a
controller or service platform, and select one of its connected Access Points.
3Expand the DHCP Server menu from the left-hand side of the UI.
4Select
General.
SIP Server Displays the SIP server name supporting DHCPv6 telephone
extensions or voice over IP systems.
Enterprise ID Lists the enterprise ID associated with DHCPv6 received client options.
Code Lists the relevant numeric DHCP vendor code.
Data Lists the supporting data relevant to the listed DHCP vendor code.
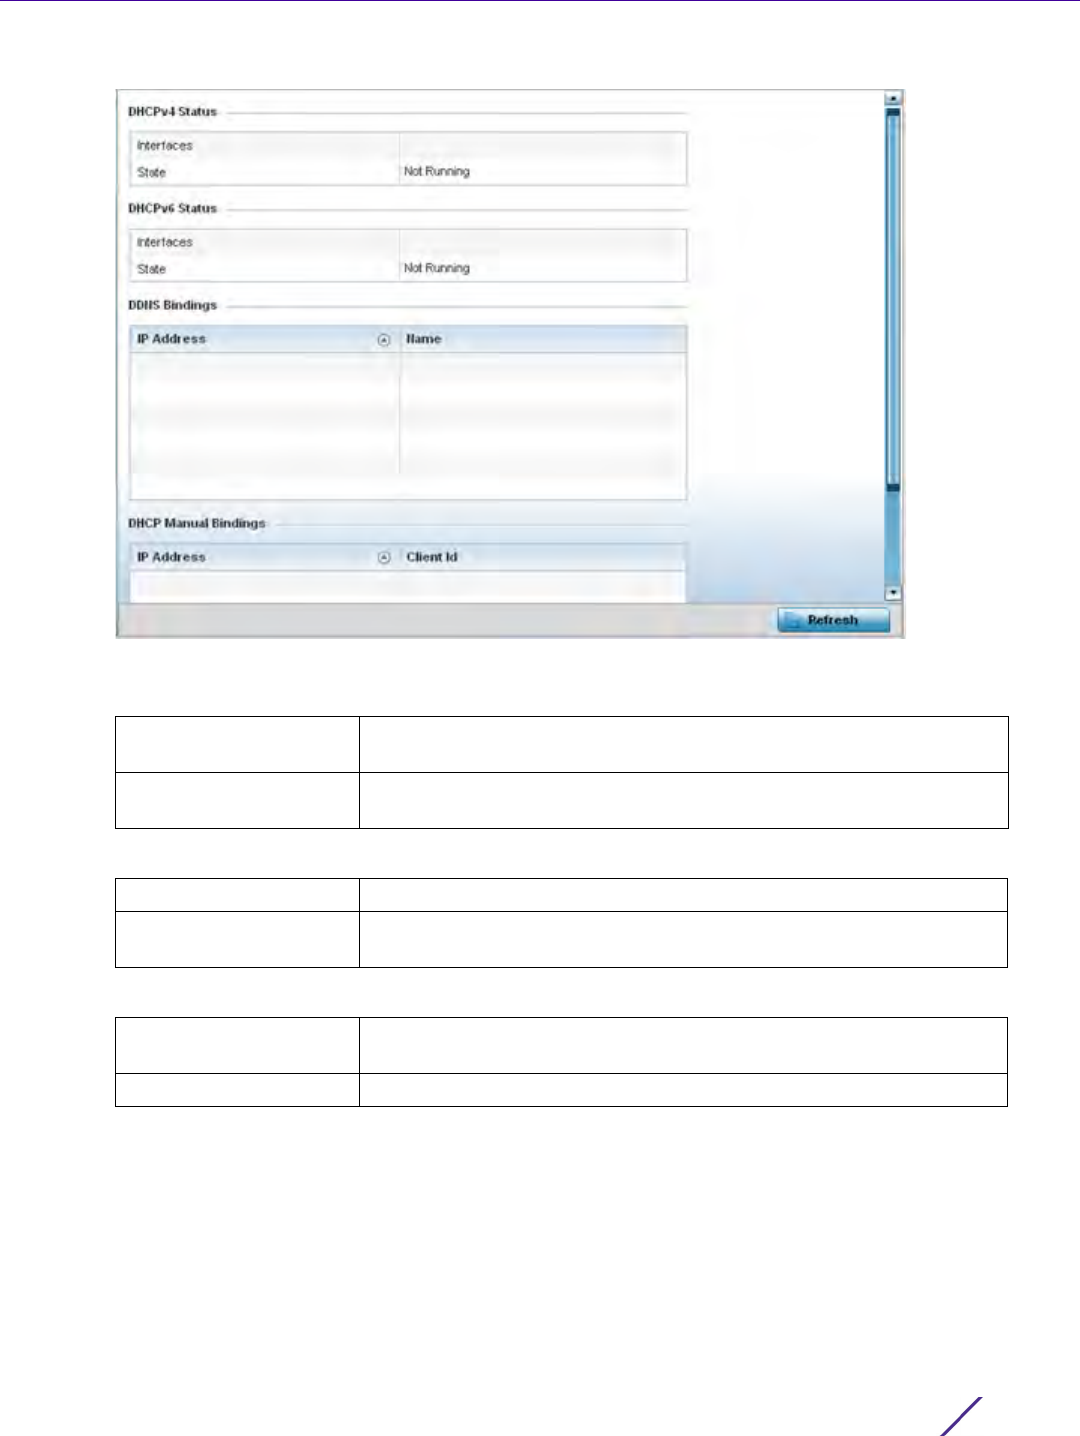
Statistics
Wireless Controller and Service Platform System Reference Guide 15 - 279
Figure 15-194 Access Point - DHCP Server General screen
5The DHCPv4 Status and DHCPv6 Status tables defines the following:
6The
DDNS Bindings table displays the following:
7The
DHCP Manual Bindings table displays the following:
8 Select the Refresh button to update the screen’s statistics counters to their latest values.
15.4.28.2 Viewing DHCP Binding Information
DHCP Server
The DHCP Binding screen displays DHCP binding information such as expiry time, client IP addresses and their
MAC address.
Access Points build and maintain a DHCP snooping table (DHCP binding database). An Access Point uses the
snooping table to identify and filter untrusted messages. The DHCP binding database keeps track of DHCP
Interfaces Displays the Access Point interface used with the DHCPv4 or DHCPv6
resource for IP address provisioning.
State Displays the current operational state of the DHCPv4 or DHCPv6
server to assess its availability as a viable IP provisioning resource.
IP Address Displays the IP address assigned to the requesting client.
Name Displays the domain name mapping corresponding to the listed IP
address.
IP Address Displays the IP address for clients requesting DHCP provisioning
resources.
Client Id Displays the client’s ID used to differentiate requesting clients.
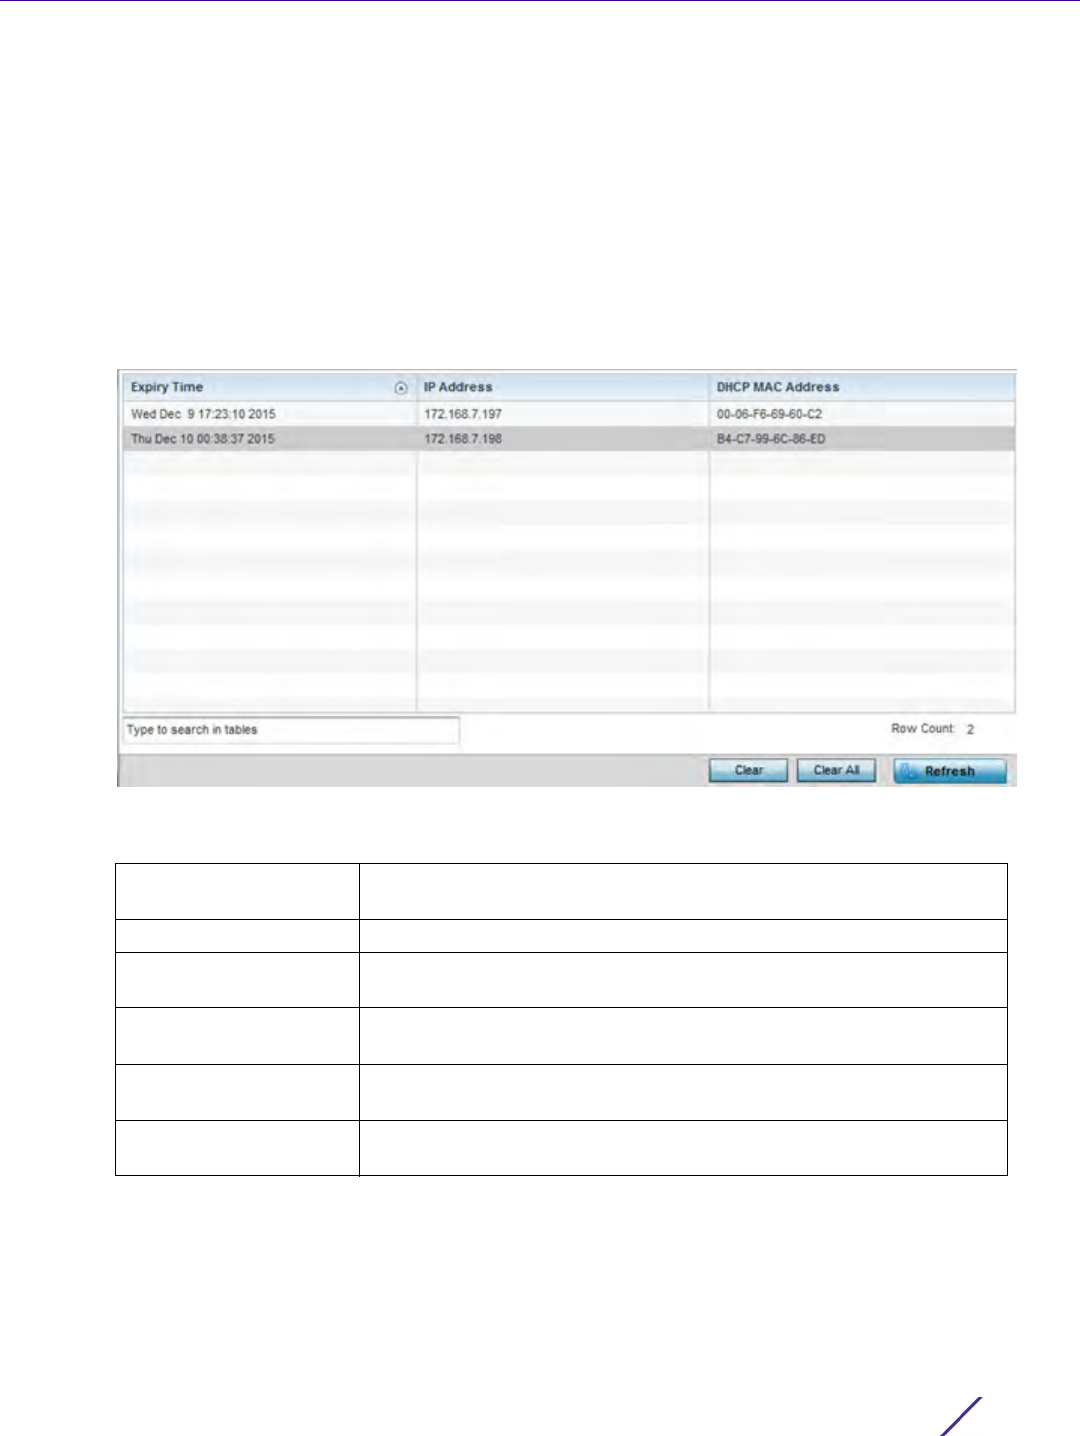
Statistics
Wireless Controller and Service Platform System Reference Guide 15 - 280
addresses assigned to ports, as well as filtering DHCP messages from untrusted ports. Incoming packets received
on untrusted ports, are dropped if the source MAC address does not match the MAC in the binding table.
To view the DHCP binding information:
1 Select the Statistics menu from the Web UI.
2Select
System from the navigation pane (on the left-hand side of the screen). Expand a RF Domain, select a
controller or service platform, and select one of its connected Access Points.
3Expand the DHCP Server menu from the left-hand side of the UI.
4Select
Bindings.
Figure 15-195 Access Point - DHCP Server Bindings screen
The Bindings screen displays the following:
15.4.28.3 Viewing DHCP Server Networks Information
DHCP Server
The DHCP server maintains a pool of IP addresses and client configuration parameters (default gateway, domain
name, name servers etc). On receiving a valid client request, the server assigns the requestor an IP address, a lease
(the validity of time), and other IP configuration parameters.
Expiry Time Displays the expiration of the lease used by the client for Access Point
DHCP resources.
IP Address Displays the IP address of each listed client requesting DHCP services.
DHCP MAC Address Displays the MAC address of each listed client requesting DHCP
services.
Clear Select a table entry and select Clear to remove the client from the list
of devices requesting DHCP services from the Access Point.
Clear All Select Clear All to remove all listed clients from the list of requesting
clients.
Refresh Select the Refresh button to update the screen’s statistics counters to
their latest values.
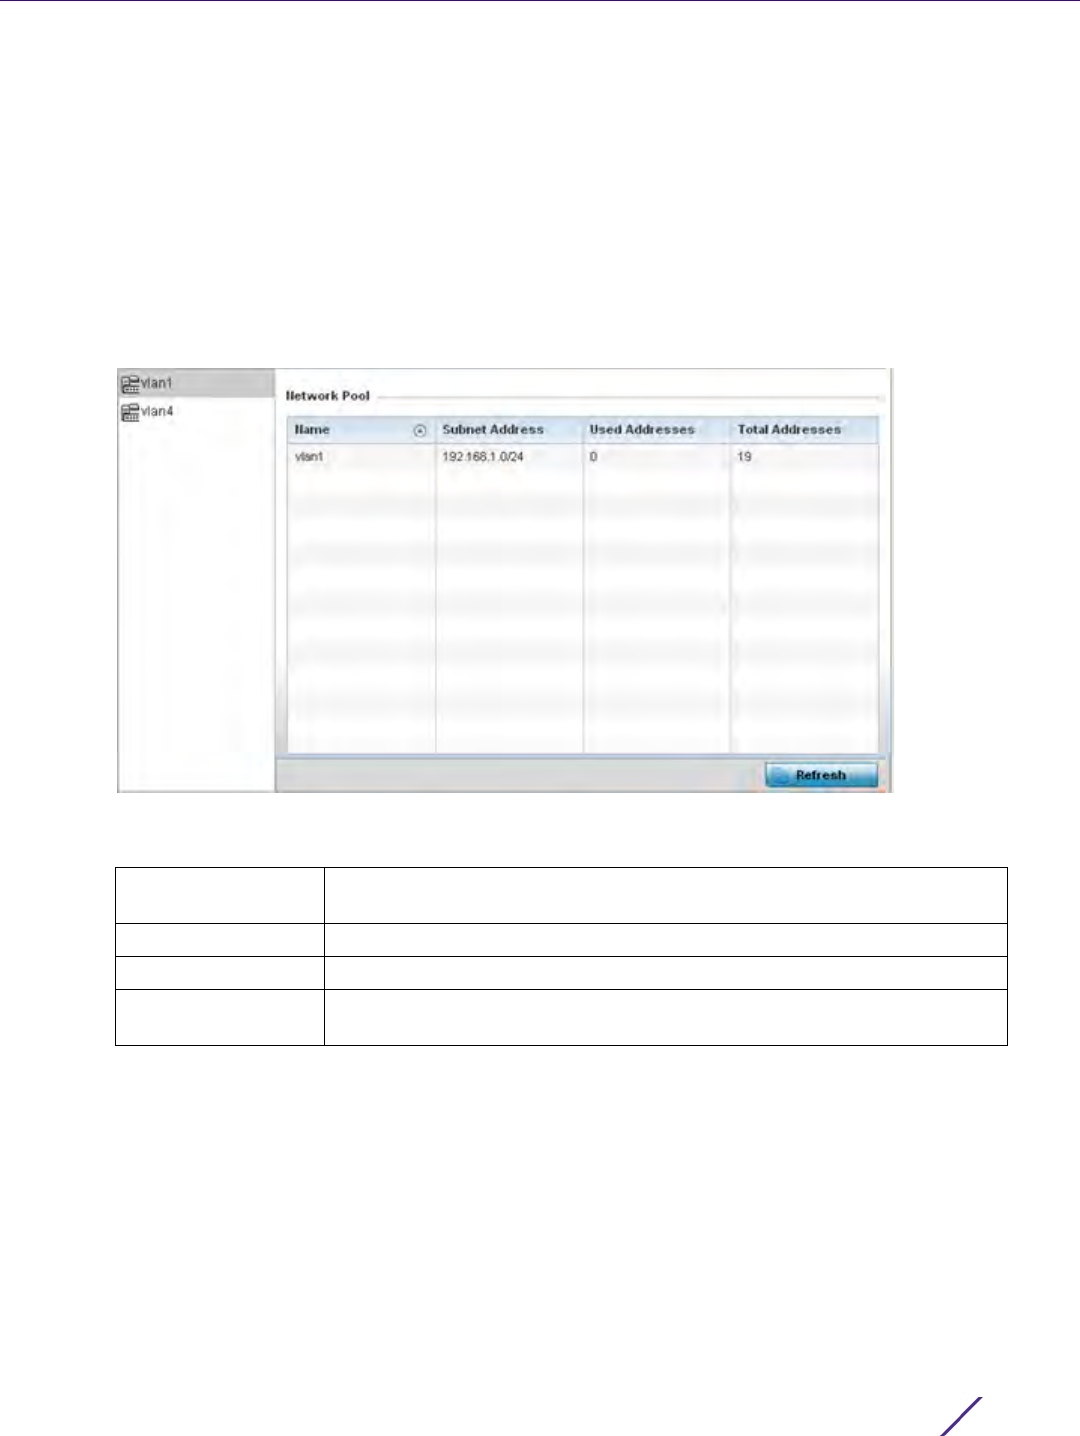
Statistics
Wireless Controller and Service Platform System Reference Guide 15 - 281
The Networks screen provides network pool information such as the subnet for the addresses you want to use
from the pool, the pool name, the used addresses and the total number of addresses.
To view the DHCP Server Networks information:
1 Select the Statistics menu from the Web UI.
2Select
System from the navigation pane (on the left-hand side of the screen). Expand a RF Domain, select a
controller or service platform, and select one of its connected Access Points.
3Expand the DHCP Server menu from the left-hand side of the UI.
4Select
Networks.
Figure 15-196 Access Point - DHCP Server Networks screen
The Networks screen displays the following:
5 Select the Refresh button to update the screen’s statistics counters to their latest values.
15.4.29 Firewall
Access Point Statistics
A firewall is a part of a computer system or network designed to block unauthorized access while permitting
authorized communications. It’s a device or set of devices configured to permit or deny access to the controller or
service platform managed network based on a defined set of rules.
This screen is partitioned into the following:
•Packet Flows
Name Displays the name of the virtual network (VLAN) from which IP addresses
can be issued to DHCP client requests on the listed Access Point interface.
Subnet Address Displays the subnet for the IP addresses used from the network pool.
Used Addresses Displays the number of host IP addresses allocated by the DHCP server.
Total Addresses Displays the total number of IP addresses available in the network pool for
requesting clients.
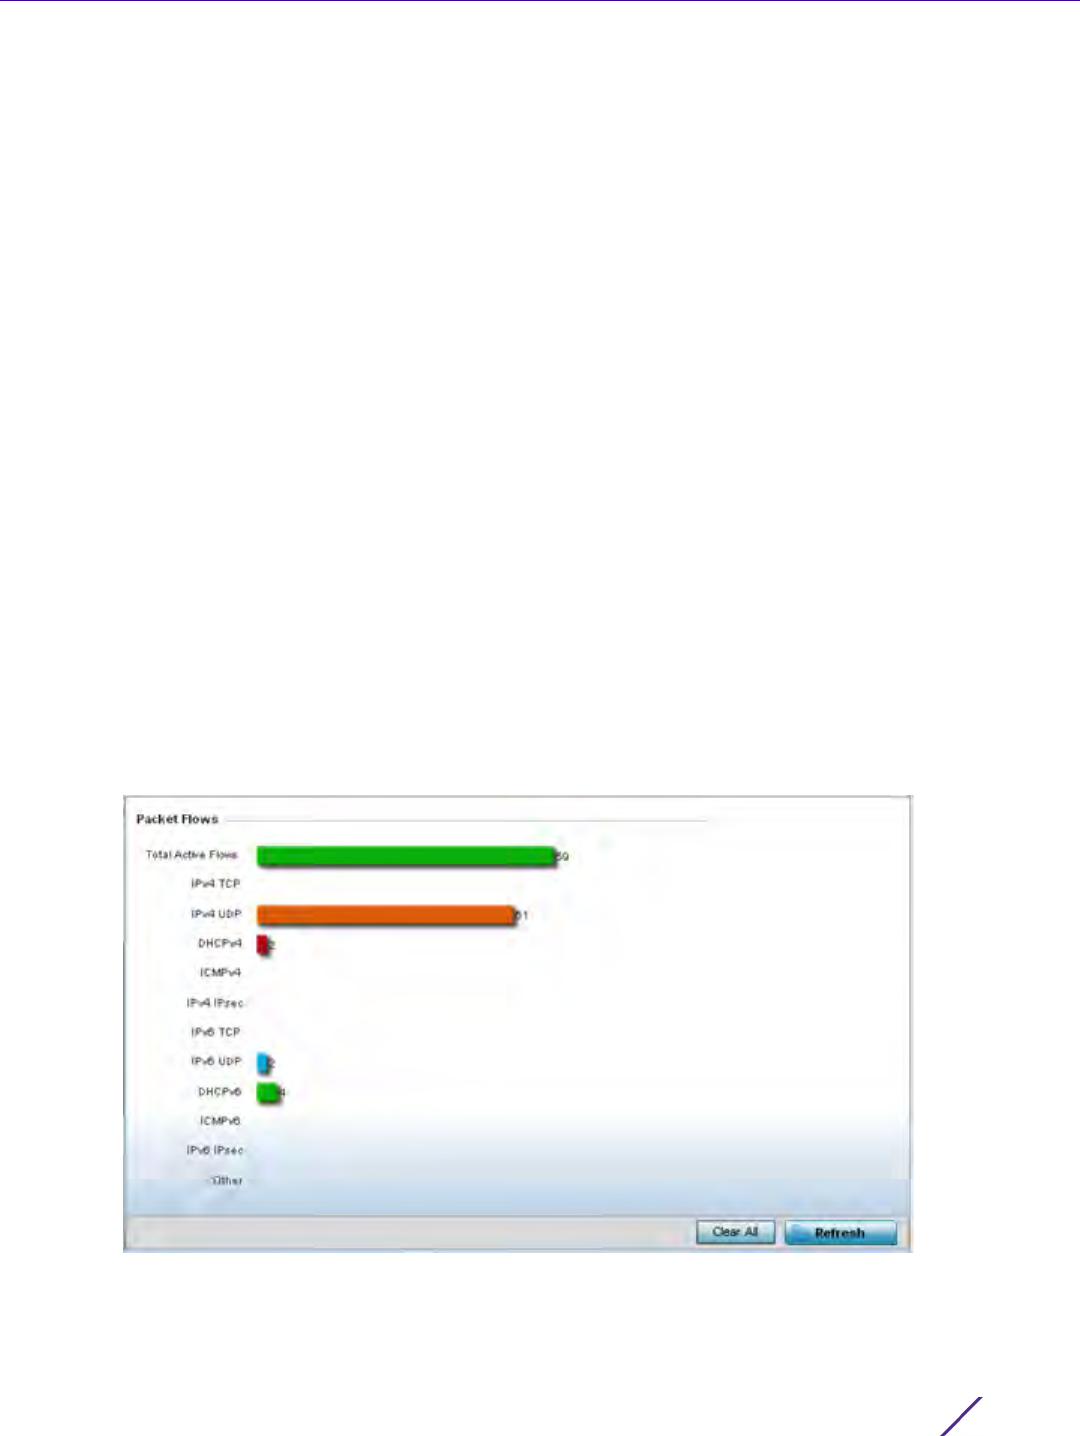
Statistics
Wireless Controller and Service Platform System Reference Guide 15 - 282
•Denial of Service
•IP Firewall Rules
•IPv6 Firewall Rules
•MAC Firewall Rules
•NAT Translations
•DHCP Snooping
•IPv6 Neighbor Snooping
15.4.29.1 Packet Flows
Firewall
The Packet Flows screen displays data traffic packet flow utilization. The chart represents the different protocol
flows supported, and displays a proportional view of the flows in respect to their percentage of data traffic utilized.
The Total Active Flows graph displays the total number of flows supported. Other bar graphs display for each
individual packet type.
To view Access Point packet flows statistics:
1 Select the Statistics menu from the Web UI.
2Select
System from the navigation pane (on the left-hand side of the screen). Expand a RF Domain, select a
controller or service platform, and select one of its connected Access Points.
3Select
Firewall and expand the menu to reveal its sub menu items.
4Select
Packet Flows.
5 Periodically select Refresh to update the statistics counters to their latest values. Clear All clears all the statistics
counters and begins a new data collection.
Figure 15-197 Access Point - Firewall Packet Flows screen
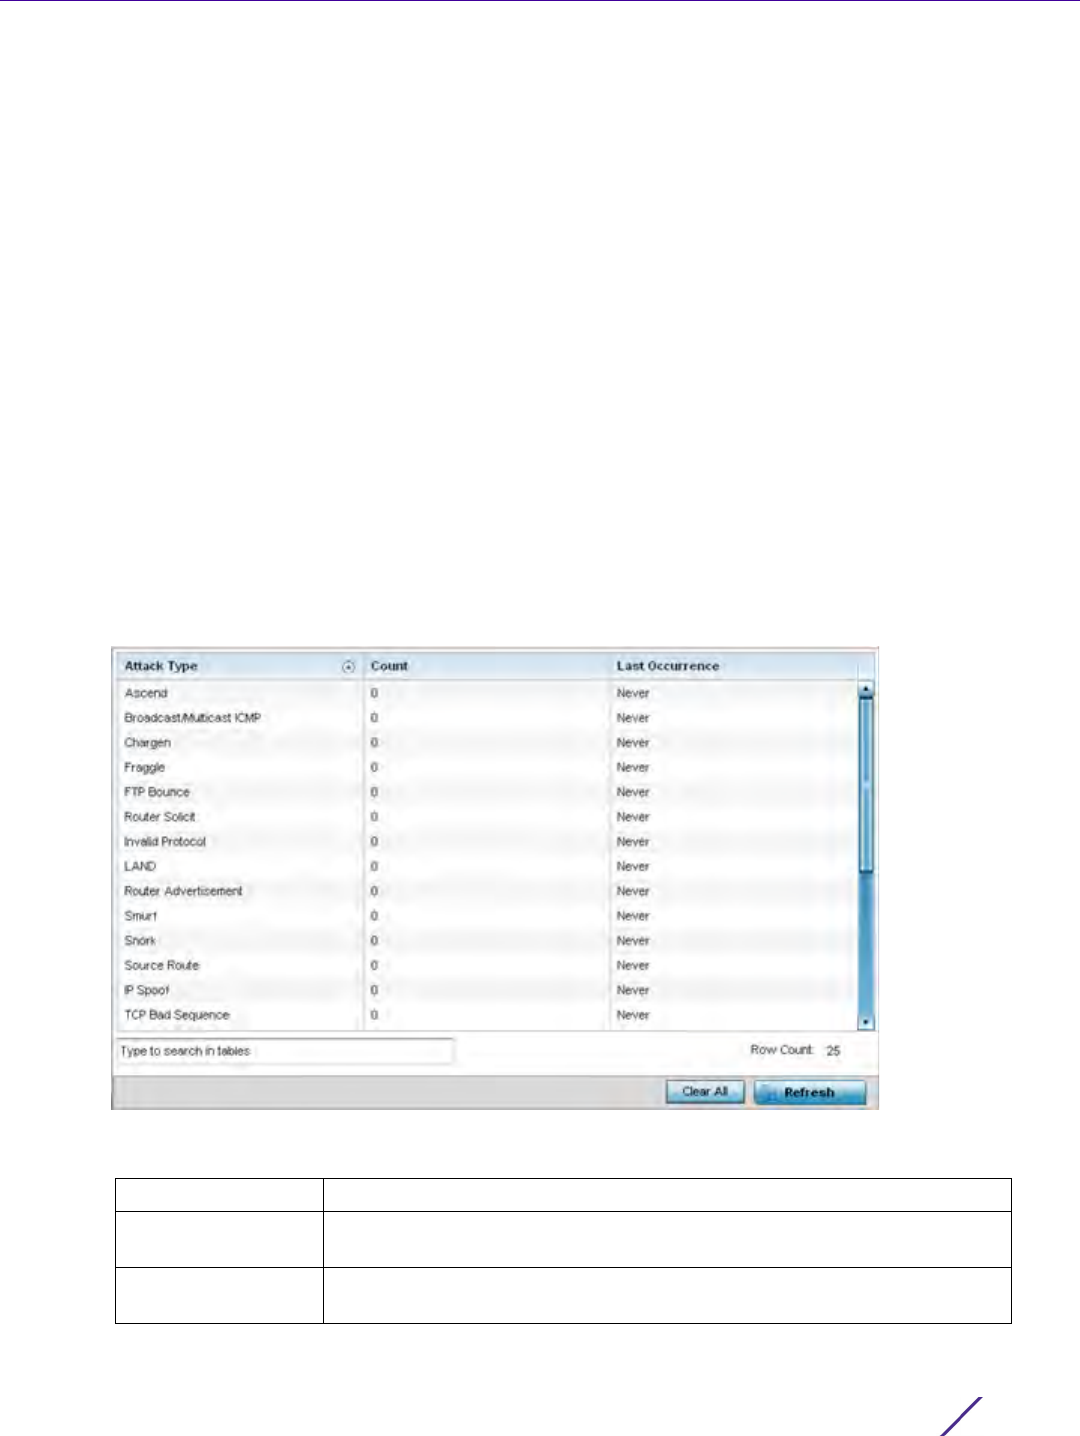
Statistics
Wireless Controller and Service Platform System Reference Guide 15 - 283
15.4.29.2 Denial of Service
Firewall
A denial-of-service attack (DoS attack) or distributed denial-of-service attack is an attempt to make a computer
resource unavailable to its intended users. Although the means to carry out a DoS attack may vary, it generally
consists of concerted efforts to prevent an Internet site or service from functioning efficiently.
One common method involves saturating the target’s machine with external communications requests, so it cannot
respond to legitimate traffic or responds so slowly as to be rendered effectively unavailable. DoS attacks are
implemented by either forcing the targeted computer(s) to reset, or consume its resources so it can’t provide its
intended service.
The DoS screen displays the types of attack, number of times it occurred and the time of last occurrence.
To view Access Point DoS attack information:
1 Select the Statistics menu from the Web UI.
2Select
System from the navigation pane (on the left-hand side of the screen). Expand a RF Domain, select a
controller or service platform, and select one of its connected Access Points.
3Select
Firewall and expand the menu to reveal its sub menu items.
4Select
Denial of Service.
Figure 15-198 Access Point - Firewall Denial of Service screen
The Denial of Service screen displays the following:
Attack Type Displays the Denial of Service (DoS) attack type.
Count Displays the number of times the Access Point’s firewall has detected each
listed DoS attack.
Last Occurrence Displays the when the attack event was last detected by the Access Point
firewall.
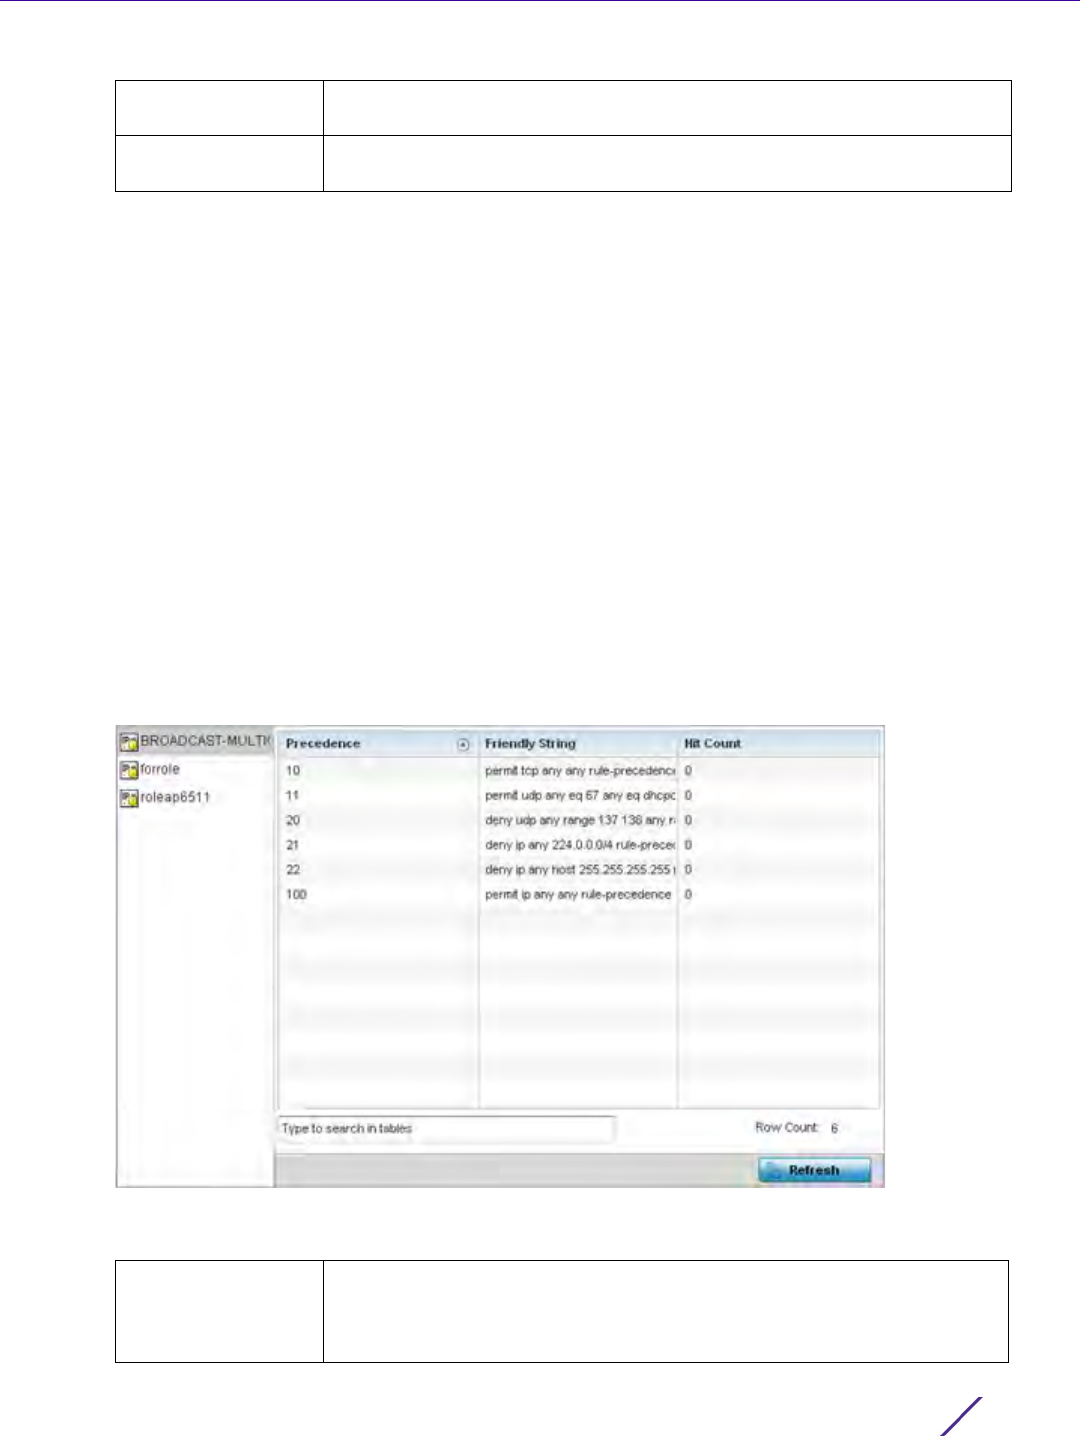
Statistics
Wireless Controller and Service Platform System Reference Guide 15 - 284
15.4.29.3 IP Firewall Rules
Firewall
Create firewall rules to let any computer to send IPv4 formatted traffic to, or receive traffic from, programs, system
services, computers or users. Firewall rules can be created to take one of the three actions listed below that match
the rule’s criteria:
•Allow an IPv4 connection
•Allow an IPv4 connection only if it is secured through the use of Internet Protocol security
•Block a connection
Rules can be created for either inbound or outbound IPv4 formatted packet traffic. To view IPv4 firewall rules:
1 Select the Statistics menu from the Web UI.
2Select
System from the navigation pane (on the left-hand side of the screen). Expand a RF Domain, select a
controller or service platform, and select one of its connected Access Points.
3Select
Firewall and expand the menu to reveal its sub menu items.
4Select
IP Firewall Rules.
Figure 15-199 Access Point - Firewall IP Firewall Rules screen
The IP Firewall Rules screen displays the following:
Clear All Select the Clear All button to clear the screen of its current status and
begin a new data collection.
Refresh Select the Refresh button to update the screen’s statistics counters to their
latest values.
Precedence Displays the precedence value applied to packets. The rules within an
Access Control Entries (ACL) list are based on precedence values. Every
rule has a unique precedence value between 1 and 5000. You cannot add
two rules with the same precedence.
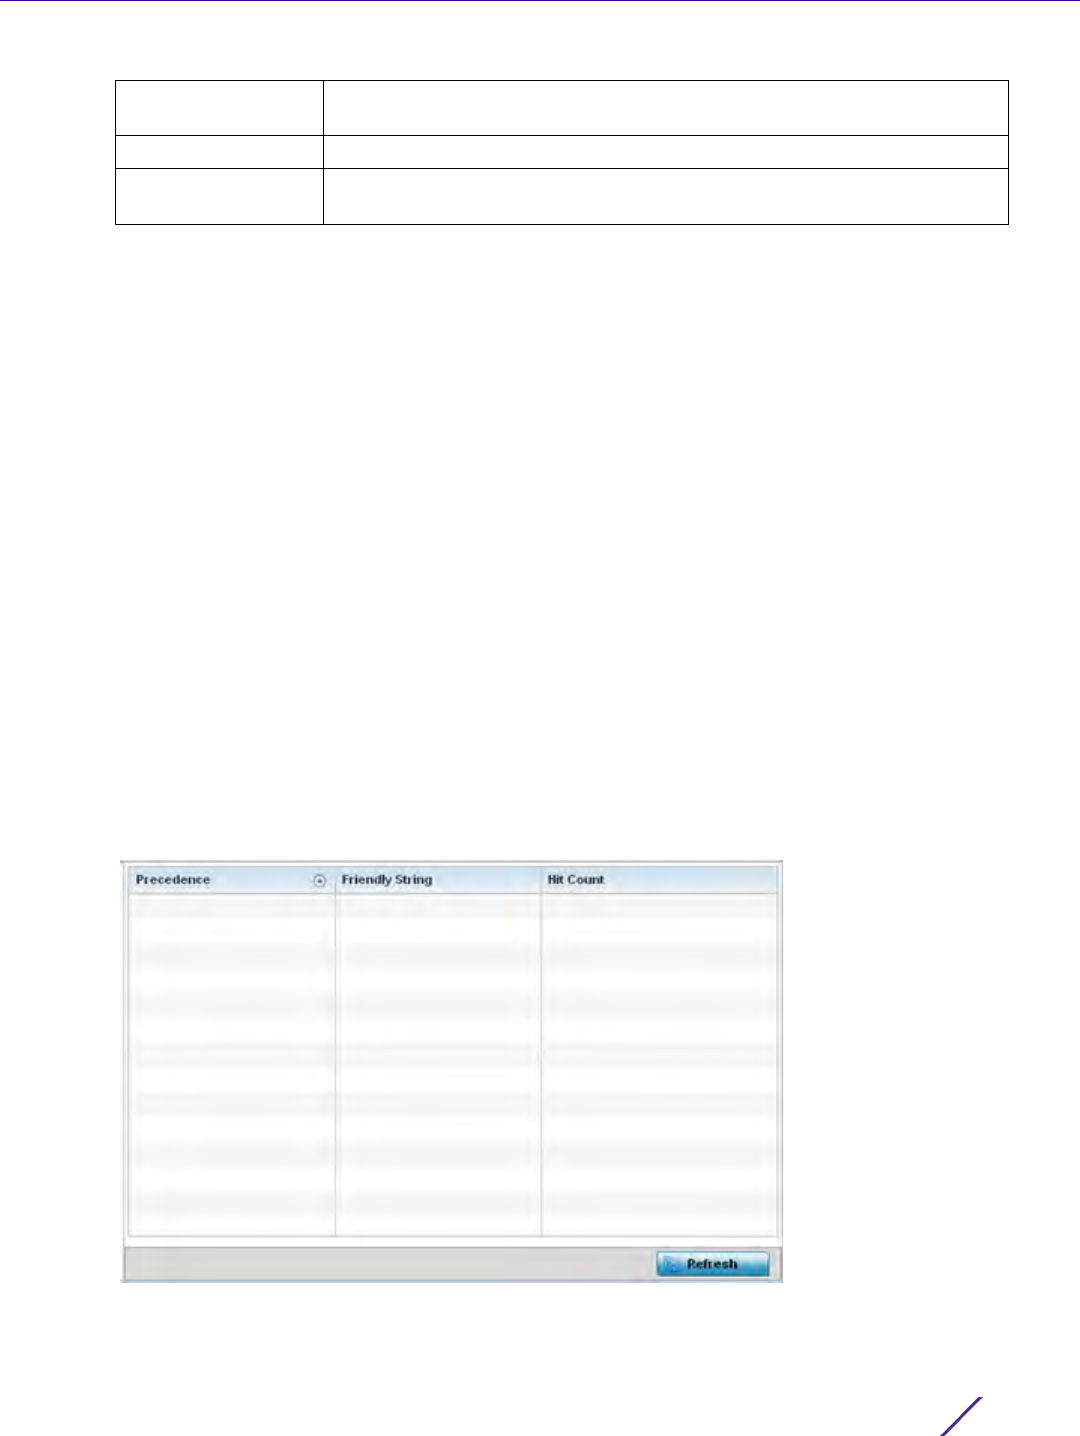
Statistics
Wireless Controller and Service Platform System Reference Guide 15 - 285
15.4.29.4 IPv6 Firewall Rules
Firewall
IPV6 provides enhanced identification and location information for computers on networks routing traffic across
the Internet. These hosts require firewall packet protection unique to IPv6 traffic, as IPv6 addresses are composed
of eight groups of four hexadecimal digits separated by colons. IPv6 hosts can configure themselves automatically
when connected to an IPv6 network using the neighbor discovery (ND) protocol via ICMPv6 router discovery
messages. When first connected to a network, a host sends a link-local router solicitation multicast request for its
configuration parameters; routers respond to such a request with a router advertisement packet that contains
Internet layer configuration parameters.
•Allow an IPv6 formatted connection
•Allow a connection only if it is secured through the use of IPv6 security
•Block a connection and exchange of IPv6 formatted packets
To view existing IPv6 firewall rules:
1 Select the Statistics menu from the Web UI.
2Select
System from the navigation pane (on the left-hand side of the screen). Expand a RF Domain, select a
controller or service platform, and select one of its connected Access Points.
3Expand the Firewall menu from the left-hand side of the UI.
4Select
IPv6 Firewall Rules.
Figure 15-200 Access Point- Firewall IPv6 Firewall Rules screen
Friendly String The friendly string provides information as to which firewall the rules
apply.
Hit Count Displays the number of times each firewall rule has been triggered.
Refresh Select the Refresh button to update the screen’s statistics counters to their
latest values.

Statistics
Wireless Controller and Service Platform System Reference Guide 15 - 286
The IPv6 Firewall Rules screen displays the following:
15.4.29.5 MAC Firewall Rules
Firewall
The ability to allow or deny Access Point connectivity by client MAC address ensures malicious or unwanted clients
are unable to bypass the Access Point’s security filters. Firewall rules can be created to support one of the three
actions listed below that match the rule’s criteria:
•Allow a connection
•Allow a connection only if it’s secured through the MAC firewall security
•Block a connection
To view the Access Point’s MAC Firewall Rules:
1 Select the Statistics menu from the Web UI.
2Select
System from the navigation pane (on the left-hand side of the screen). Expand a RF Domain, select a
controller or service platform, and select one of its connected Access Points.
3Select
Firewall and expand the menu to reveal its sub menu items.
4Select
MAC Firewall Rules.
Precedence Displays the precedence (priority) applied to IPV6 formatted packets.
Unlike IPv4, IPV6 provides enhanced identification and location
information for computers on networks routing traffic across the Internet.
IPv6 addresses are composed of eight groups of four hexadecimal digits
separated by colons. Every rule has a unique precedence value between 1 -
5000. You cannot add two rules with the same precedence value.
Friendly String This is a string that provides more information as to the contents of the
IPv6 specific IP rule. This is for information purposes only.
Hit Count Displays the number of times each IPv6 ACL has been triggered.
Refresh Select the Refresh button to update the screen’s statistics counters to their
latest values.
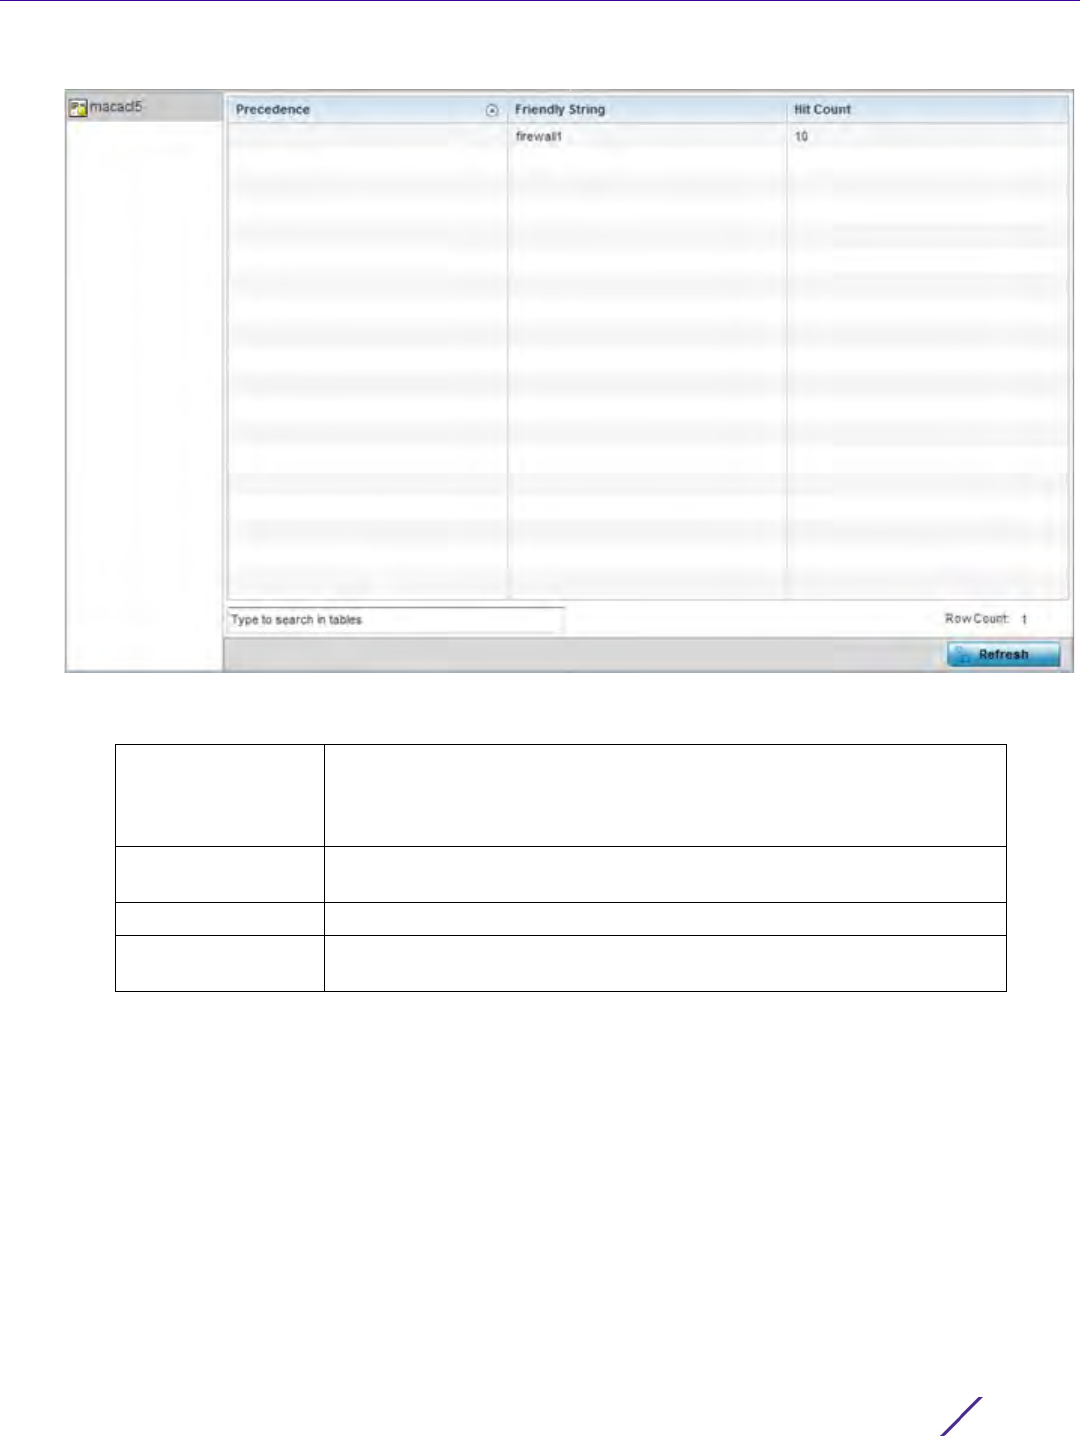
Statistics
Wireless Controller and Service Platform System Reference Guide 15 - 287
Figure 15-201 Access Point - Firewall MAC Firewall Rules screen
The MAC Firewall Rules screen displays the following information:
15.4.29.6 NAT Translations
Firewall
Network Address Translation (NAT) is a technique to modify network address information within IP packet headers
in transit. This enables mapping one IP address to another to protect wireless controller managed network address
credentials. With typical deployments, NAT is used as an IP masquerading technique to hide private IP addresses
behind a single, public facing, IP address.
NAT can provide a profile outbound Internet access to wired and wireless hosts connected to either an Access
Point or a wireless controller. Many-to-one NAT is the most common NAT technique for outbound Internet access.
Many-to-one NAT allows an Access Point or wireless controller to translate one or more internal private IP
addresses to a single, public facing, IP address assigned to a 10/100/1000 Ethernet port or 3G card.
Precedence Displays a precedence value, which are applied to packets. The rules
within an Access Control Entries (ACL) list are based on their precedence.
Every rule has a unique precedence between 1 and 5000. You cannot add
two rules with the same precedence value.
Friendly String This is a string that provides information as to which firewall the rules
apply.
Hit Count Displays the number of times each WLAN ACL has been triggered.
Refresh Select the Refresh button to update the screen’s statistics counters to
their latest values.
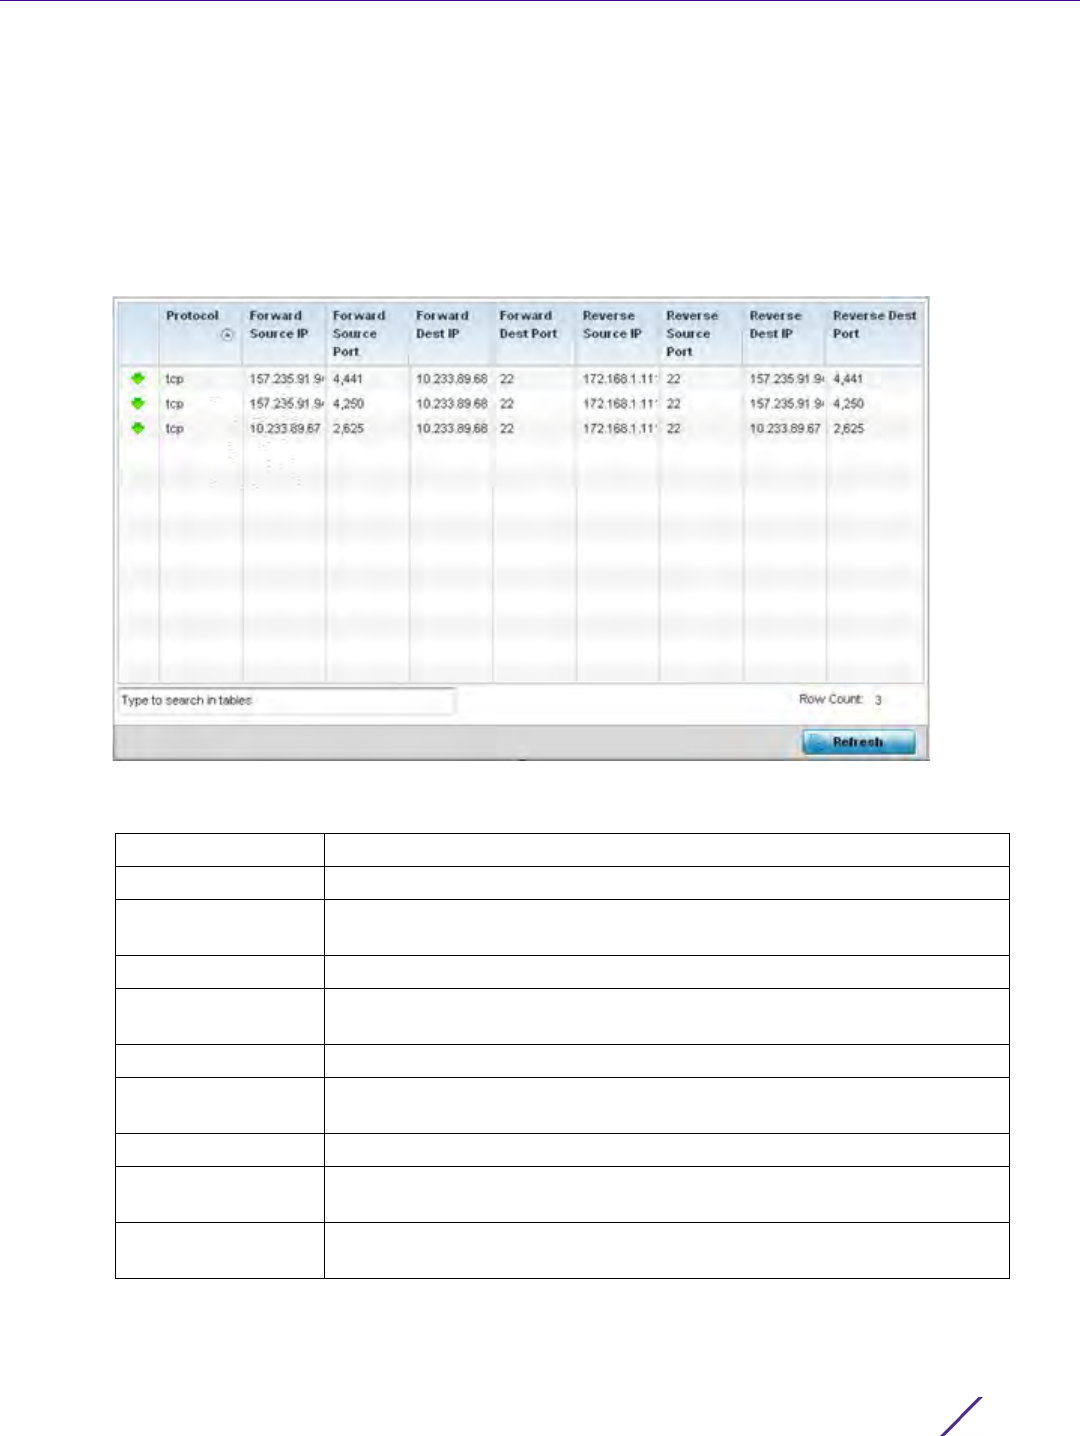
Statistics
Wireless Controller and Service Platform System Reference Guide 15 - 288
To view the Firewall’s NAT translations:
1 Select the Statistics menu from the Web UI.
2Select
System from the navigation pane (on the left-hand side of the screen). Expand a RF Domain, select a
controller or service platform, and select one of its connected Access Points.
3Select
Firewall and expand the menu to reveal its sub menu items.
4Select
NAT Translations.
Figure 15-202 Access Point - Firewall NAT Translation screen
The NAT Translations screen displays the following:
Protocol Lists the NAT translation IP protocol as either TCP, UDP or ICMP.
Forward Source IP Displays the source IP address for the forward NAT flow.
Forward Source Port Displays the source port for the forward NAT flow (contains ICMP ID if it is
an ICMP flow).
Forward Dest IP Displays the destination IP address for the forward NAT flow.
Forward Dest Port Destination port for the forward NAT flow (contains ICMP ID if it is an ICMP
flow).
Reverse Source IP Displays the source IP address for the reverse NAT flow.
Reverse Source Port Displays the source port for the reverse NAT flow (contains ICMP ID if it is
an ICMP flow).
Reverse Dest IP Displays the destination IP address for the reverse NAT flow.
Reverse Dest Port Displays the destination port for the reverse NAT flow (contains ICMP ID if
it is an ICMP flow).
Refresh Select the Refresh button to update the screen’s statistics counters to their
latest values.
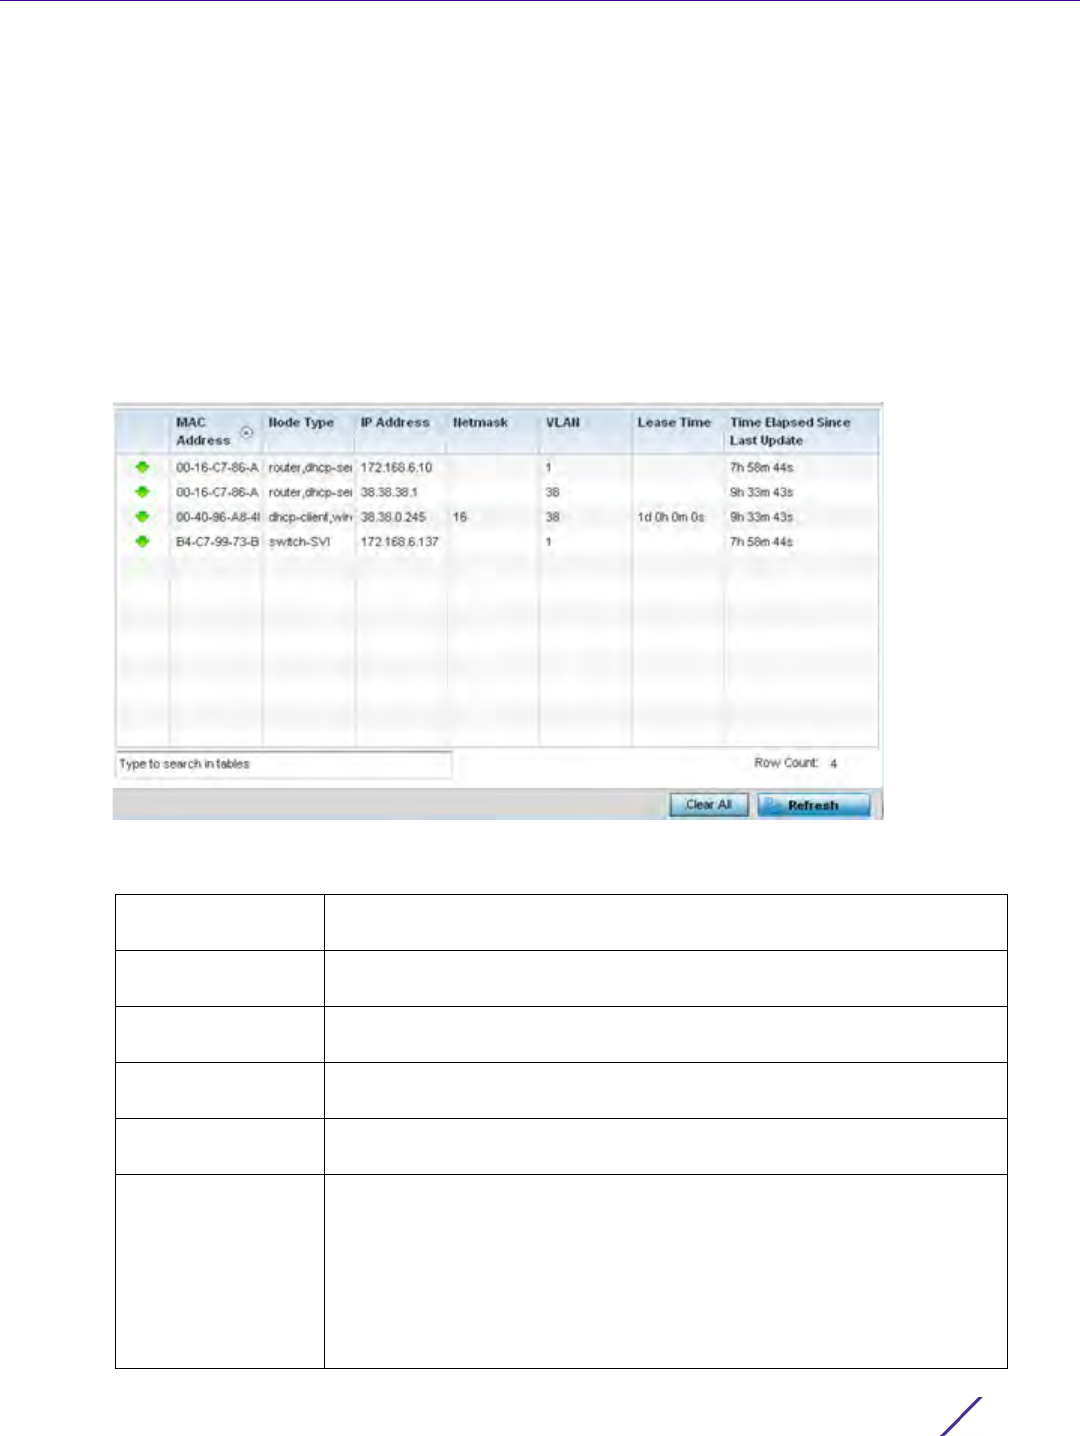
Statistics
Wireless Controller and Service Platform System Reference Guide 15 - 289
15.4.29.7 DHCP Snooping
Firewall
When DHCP servers are allocating IP addresses to clients on the LAN, DHCP snooping can be configured to better
enforce the security on the LAN to allow only clients with specific IP/MAC addresses.
1 Select the Statistics menu from the Web UI.
2Select
System from the navigation pane (on the left-hand side of the screen). Expand a RF Domain, select a
controller or service platform, and select one of its connected Access Points.
3Select
Firewall and expand the menu to reveal its sub menu items.
4Select
DHCP Snooping.
Figure 15-203 Access Point - Firewall DHCP Snooping screen
The DHCP Snooping screen displays the following:
MAC Address Displays the MAC address of the client requesting DHCP resources from
the controller or service platform.
Node Type Displays the NetBios node from which IP addresses can be issued to client
requests on this interface.
IP Address Displays the IP address used for DHCP discovery, and requests between
the DHCP server and DHCP clients.
Netmask Displays the subnet mask used for DHCP discovery, and requests between
the DHCP server and DHCP clients.
VLAN Displays the VLAN used as a virtual interface for the newly created DHCP
configuration.
Lease Time When a DHCP server allocates an address for a DHCP client, the client is
assigned a lease (which expires after a designated interval defined by the
administrator). The lease time is the time an IP address is reserved for re-
connection after its last use. Using very short leases, DHCP can
dynamically reconfigure networks in which there are more computers than
there are available IP addresses. This is useful, for example, in education
and customer environments where client users change frequently. Use
longer leases if there are fewer users.
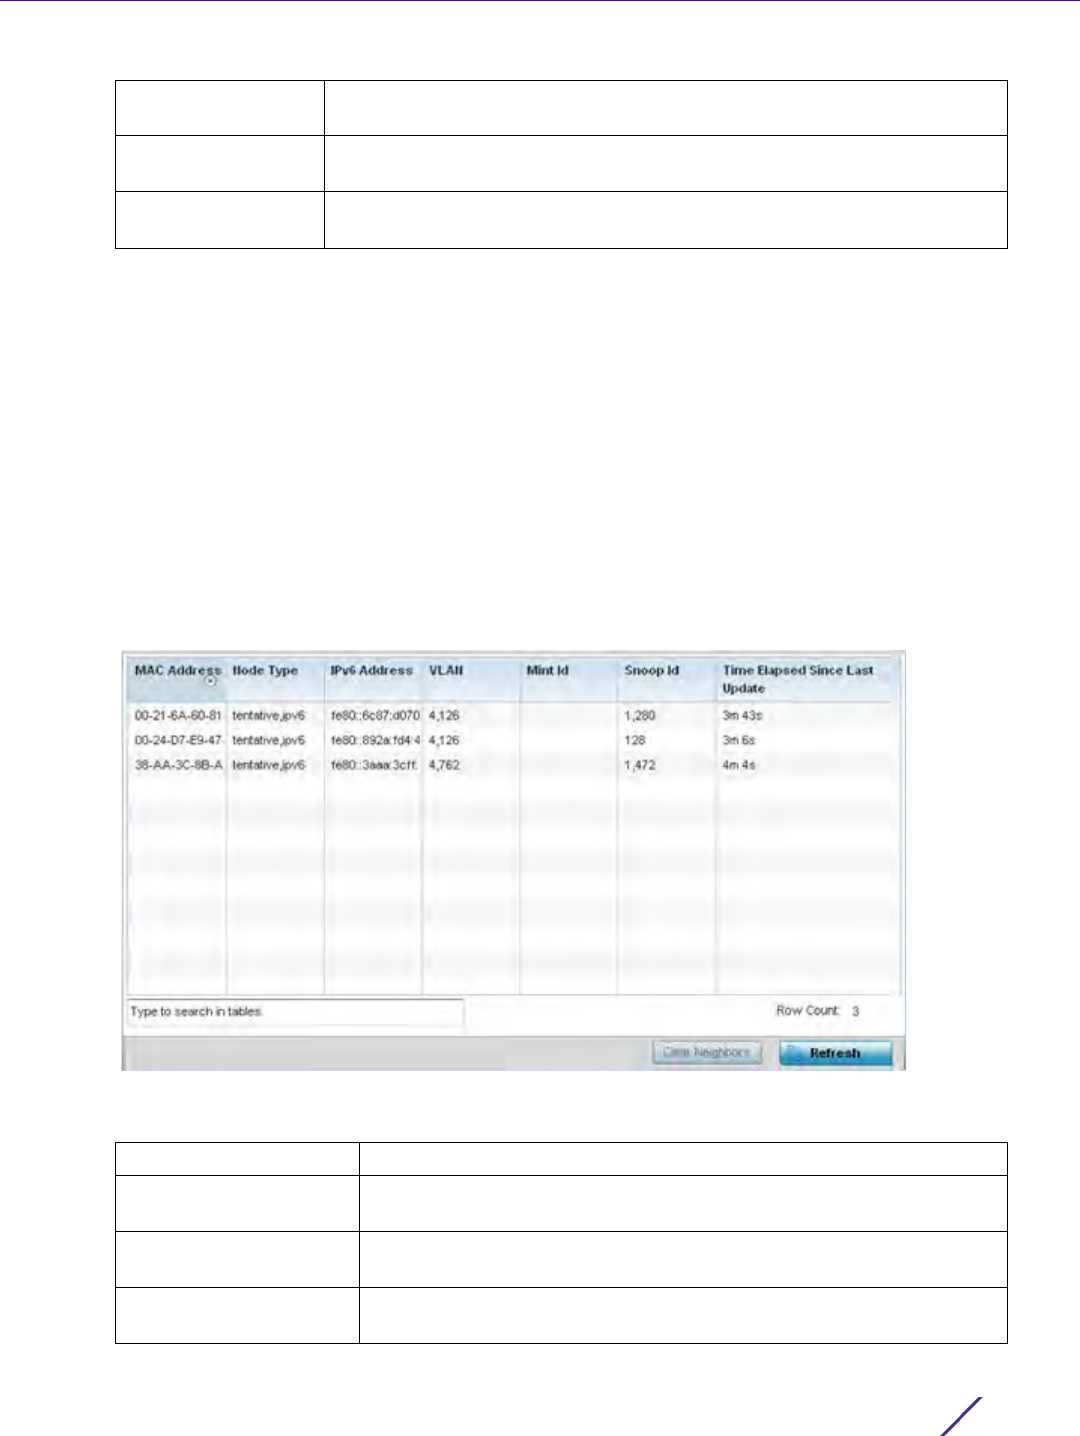
Statistics
Wireless Controller and Service Platform System Reference Guide 15 - 290
15.4.29.8 IPv6 Neighbor Snooping
Firewall
Access Points listen to IPv6 formatted network traffic and forward IPv6 packets to radios on which the interested
hosts are connected.
To review IPv6 neighbor snooping statistics:
1 Select the Statistics menu from the Web UI.
2Select
System from the navigation pane (on the left-hand side of the screen). Expand a RF Domain, select a
controller or service platform, and select one of its connected Access Points.
3Expand the Firewall menu from the left-hand side of the UI.
4Select
IPv6 Neighbor Snooping.
Figure 15-204 Access Point- Firewall IPv6 Neighbor Snooping screen
The IPv6 Neighbor Snooping screen displays the following:
Time Elapsed Since
Last Updated
Displays the time the server was last updated.
Clear All Select the Clear All button to clear the screen of its current status and
begin a new data collection.
Refresh Select the Refresh button to update the screen’s statistics counters to their
latest values.
MAC Address Displays the MAC address of the IPv6 client.
Node Type Displays the NetBios node with an IPv6 address pool from which IP
addresses can be issued to client requests on this interface.
IPv6 Address Displays the IPv6 address used for DHCPv6 discovery and requests
between the DHCPv6 server and DHCP clients.
VLAN Displays an Access Point virtual interface ID used for a new DHCPv6
configuration.

Statistics
Wireless Controller and Service Platform System Reference Guide 15 - 291
15.4.30 VPN
Access Point Statistics
IPSec VPN provides a secure tunnel between two networked peer controllers or service platforms. Administrators
can define which packets are sent within the tunnel, and how they are protected. When a tunnelled peer sees a
sensitive packet, it creates a secure tunnel and sends the packet through the tunnel to its remote peer destination.
Tunnels are sets of security associations (SA) between two peers. SAs define the protocols and algorithms applied
to sensitive packets and specify the keying mechanisms used by tunnelled peers. SAs are unidirectional and exist
in both the inbound and outbound direction. SAs are established per the rules and conditions of defined security
protocols (AH or ESP).
Crypto maps combine the elements comprising IPSec SAs. Crypto maps also include transform sets. A transform
set is a combination of security protocols, algorithms and other settings applied to IPSec protected traffic. One
crypto map is utilized for each IPsec peer, however for remote VPN deployments one crypto map is used for all
the remote IPsec peers.
Internet Key Exchange (IKE) protocol is a key management protocol standard used in conjunction with IPSec. IKE
enhances IPSec by providing additional features, flexibility, and configuration simplicity for the IPSec standard. IKE
automatically negotiates IPSec SAs, and enables secure communications without time consuming manual pre-
configuration.
VPN statistics are partitioned into the following:
IKESA
IPSec
15.4.30.1 IKESA
VPN
The IKESA screen allows for the review of individual peer security association statistics.
1 Select the Statistics menu from the Web UI.
2Select
System from the navigation pane (on the left-hand side of the screen). Expand a RF Domain, select a
controller or service platform, and select one of its connected Access Points.
Mint Id Lists MiNT IDs for each listed VLAN. MiNT provides the means to
secure communications at the transport layer. Using MiNT, a device
can be configured to only communicate with other authorized (MiNT
enabled) devices of the same model.
Snoop Id Lists the numeric snooping session ID generated when Access Points
listen to IPv6 formatted network traffic and forward IPv6 packets to
radios.
Time Elapsed Since
Last Update
Displays the amount of time elapsed since the DHCPv6 server was last
updated.
Clear Neighbors Select Clear Neighbors to revert the counters to zero and begin a new
data collection.
Refresh Select the Refresh button to update the screen’s counters to their
latest values.
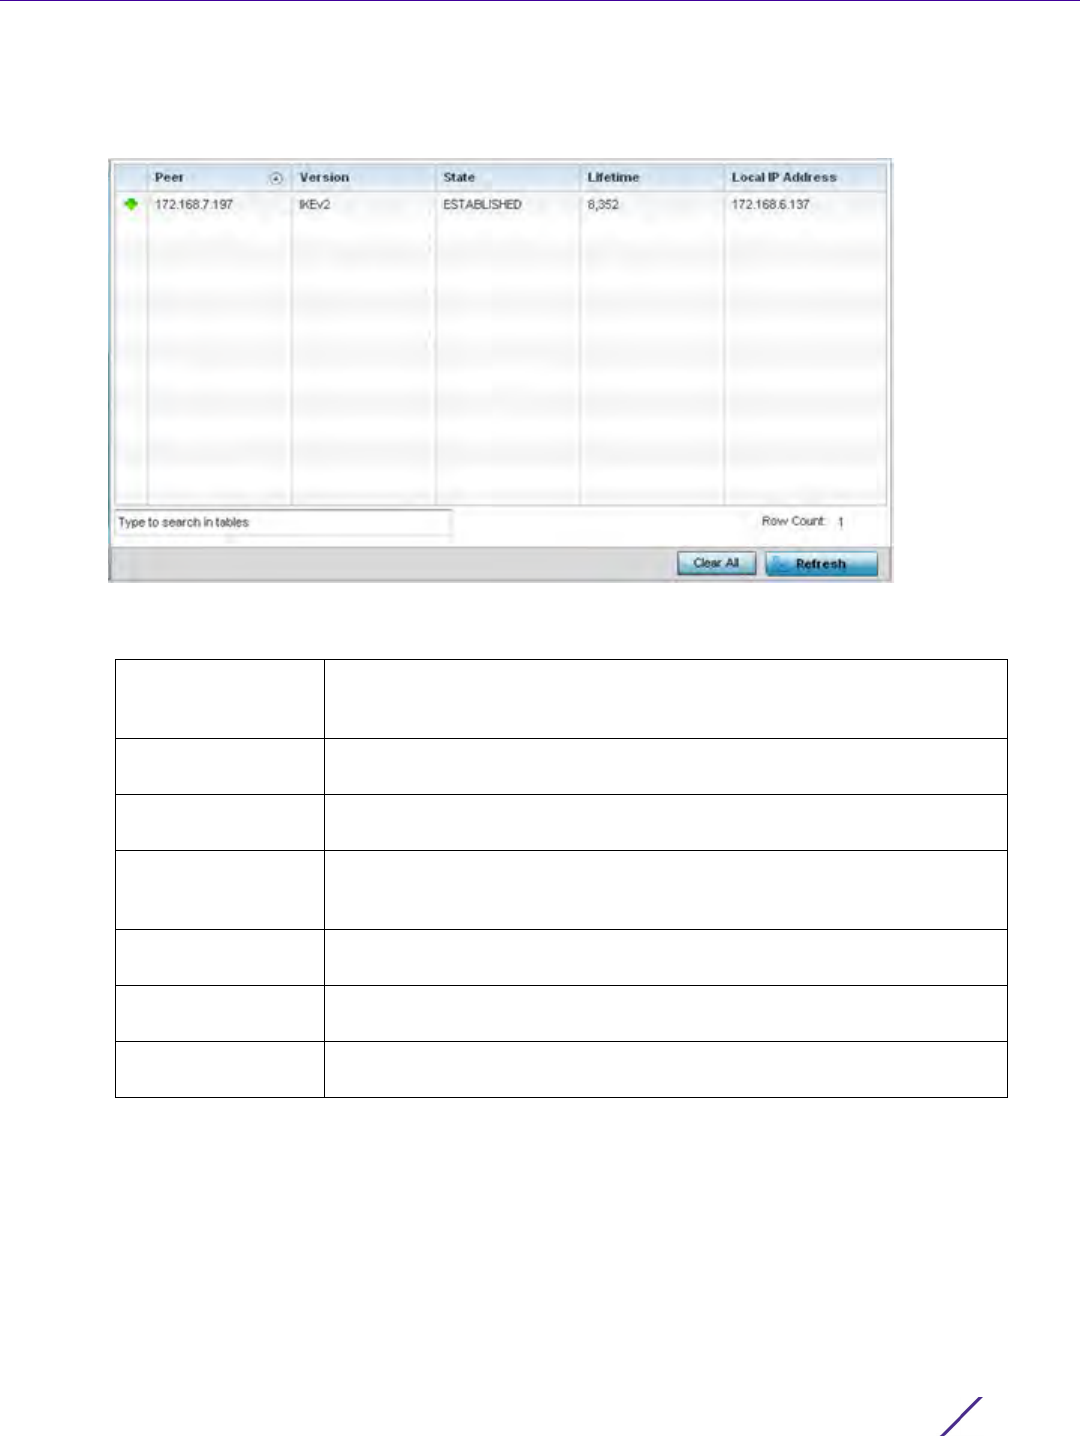
Statistics
Wireless Controller and Service Platform System Reference Guide 15 - 292
3Select VPN and expand the menu to reveal its sub menu items.
4Select
IKESA.
Figure 15-205 Access Point - VPN IKESA screen
5 Review the following VPN peer security association statistics:
15.4.30.2 IPSec
VPN
Use the IPSec VPN screen to assess tunnel status between networked peers.
To view IPSec VPN status for tunnelled peers:
Peer Lists peer IDs for peers sharing security associations (SA) for tunnel
interoperability. When a peer sees a sensitive packet, it creates a secure
tunnel and sends the packet through the tunnel to its destination.
Version Displays each peer’s IKE version used for auto IPSec secure authentication
with the IPSec gateway and other controllers or service platforms.
State Lists the state of each listed peer’s security association (whether
established or not).
Lifetime Displays the lifetime for the duration of each listed peer IPSec VPN
security association. Once the set value is exceeded, the association is
timed out.
Local IP Address Displays each listed peer’s local tunnel end point IP address. This address
represents an alternative to an interface IP address.
Clear All Select the Clear All button to clear each peer of its current status and
begin a new data collection.
Refresh Select the Refresh button to update the screen’s statistics counters to their
latest values.
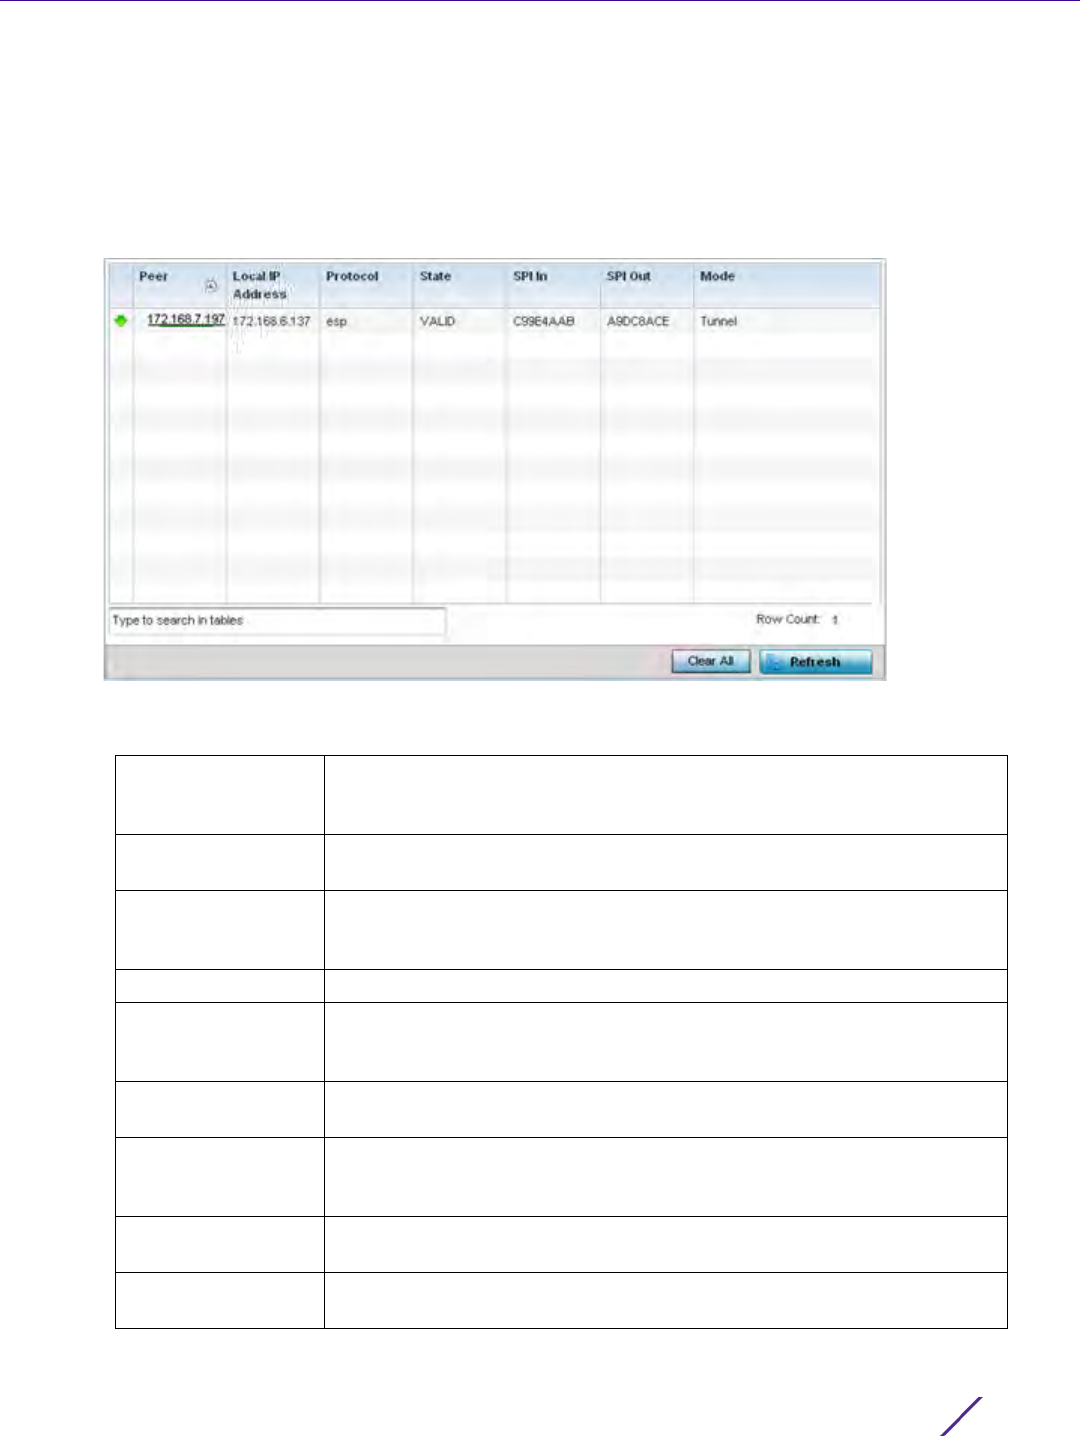
Statistics
Wireless Controller and Service Platform System Reference Guide 15 - 293
1 Select the Statistics menu from the Web UI.
2Select
System from the navigation pane (on the left-hand side of the screen). Expand a RF Domain, select a
controller or service platform, and select one of its connected Access Points
3Select
VPN and expand the menu to reveal its sub menu items.
4Select
IPSec.
Figure 15-206 Access Point - VPN IPSec screen
5 Review the following VPN peer security association statistics:
Peer Lists IP addresses for peers sharing security associations (SAs) for tunnel
interoperability. When a peer sees a sensitive packet, it creates a secure
tunnel and sends the packet through the tunnel to its destination.
Local IP Address Displays each listed peer’s local tunnel end point IP address. This address
represents an alternative to an interface IP address.
Protocol Lists the security protocol used with the VPN IPSec tunnel connection.
SAs are unidirectional, existing in each direction and established per
security protocol. Options include ESP and AH.
State Lists the state of each listed peer’s security association.
SPI In Lists stateful packet inspection (SPI) status for incoming IPSec tunnel
packets. SPI tracks each connection traversing the IPSec VPN tunnel and
ensures they are valid.
SPI Out Lists SPI status for outgoing IPSec tunnel packets. SPI tracks each
connection traversing the IPSec VPN tunnel and ensures they are valid.
Mode Displays the IKE mode. IPSEC has two modes in IKEv1 for key exchanges.
Aggressive mode requires 3 messages be exchanged between the IPSEC
peers to setup the SA, Main requires 6 messages.
Clear All Select the Clear All button to clear each peer of its current status and
begin a new data collection.
Refresh Select the Refresh button to update the screen’s statistics counters to their
latest values.

Statistics
Wireless Controller and Service Platform System Reference Guide 15 - 294
15.4.31 Certificates
Access Point Statistics
The Secure Socket Layer (SSL) protocol ensures secure transactions between Web servers and browsers. SSL uses
a third-party certificate authority to identify one (or both) ends of a transaction. A browser checks the certificate
issued by the server before establishing a connection.
This screen is partitioned into the following:
•Trustpoints
•RSA Keys
15.4.31.1 Trustpoints
Certificates
Each certificate is digitally signed by a trustpoint. The trustpoint signing the certificate can be a certificate
authority, corporate or individual. A trustpoint represents a CA/identity pair containing the identity of the CA, CA-
specific configuration parameters and an association with an enrolled identity certificate.
1 Select the Statistics menu from the Web UI.
2Select
System from the navigation pane (on the left-hand side of the screen). Expand a RF Domain, select a
controller or service platform, and select one of its connected Access Points
3Select
Certificates and expand the menu to reveal its sub menu items.
4Select
Trustpoints.
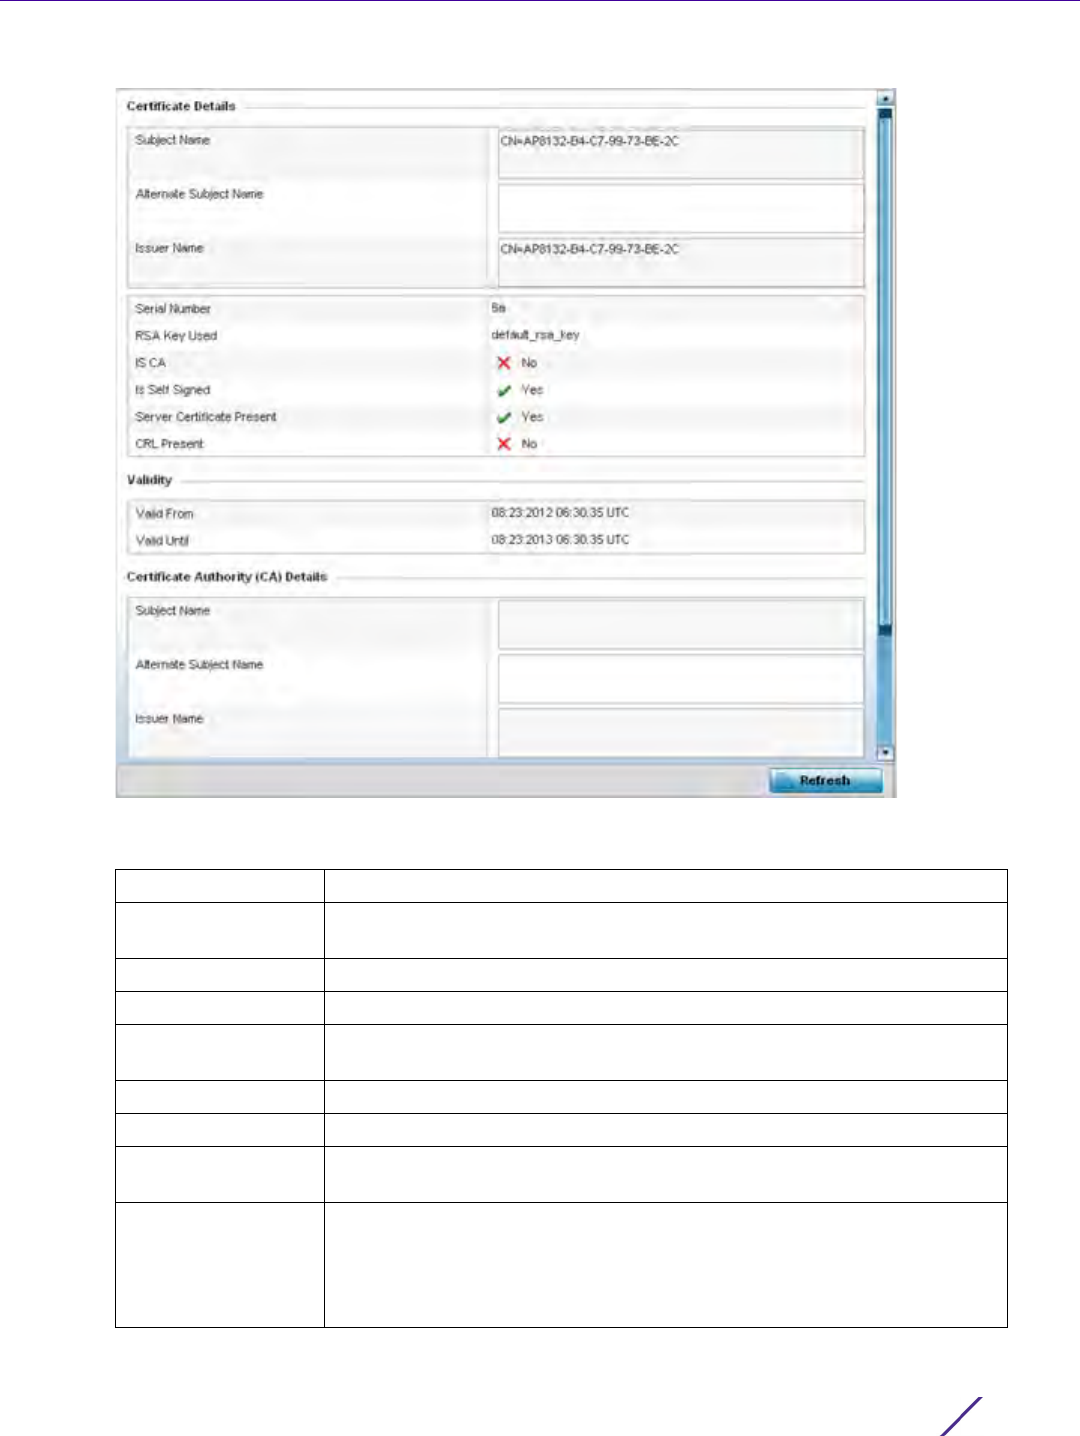
Statistics
Wireless Controller and Service Platform System Reference Guide 15 - 295
Figure 15-207 Access Point - Certificate Trustpoint screen
The Certificate Details field displays the following:
Subject Name Lists details about the entity to which the certificate is issued.
Alternate Subject
Name
Displays alternative details to the information specified under the Subject
Name field.
Issuer Name Displays the name of the organization issuing the certificate.
Serial Number The unique serial number of the certificate issued.
RSA Key Used Displays the name of the key pair generated separately, or automatically
when selecting a certificate.
IS CA Indicates whether this certificate is an authority certificate (Yes/No).
Is Self Signed Displays whether the certificate is self-signed (Yes/No).
Server Certificate
Present
Displays whether a server certification is present or not (Yes/No).
CRL Present Displays whether a Certificate Revocation List (CRL) is present (Yes/No). A
CRL contains a list of subscribers paired with digital certificate status. The
list displays revoked certificates along with the reasons for revocation. The
date of issuance and the entities that issued the certificate are also
included.
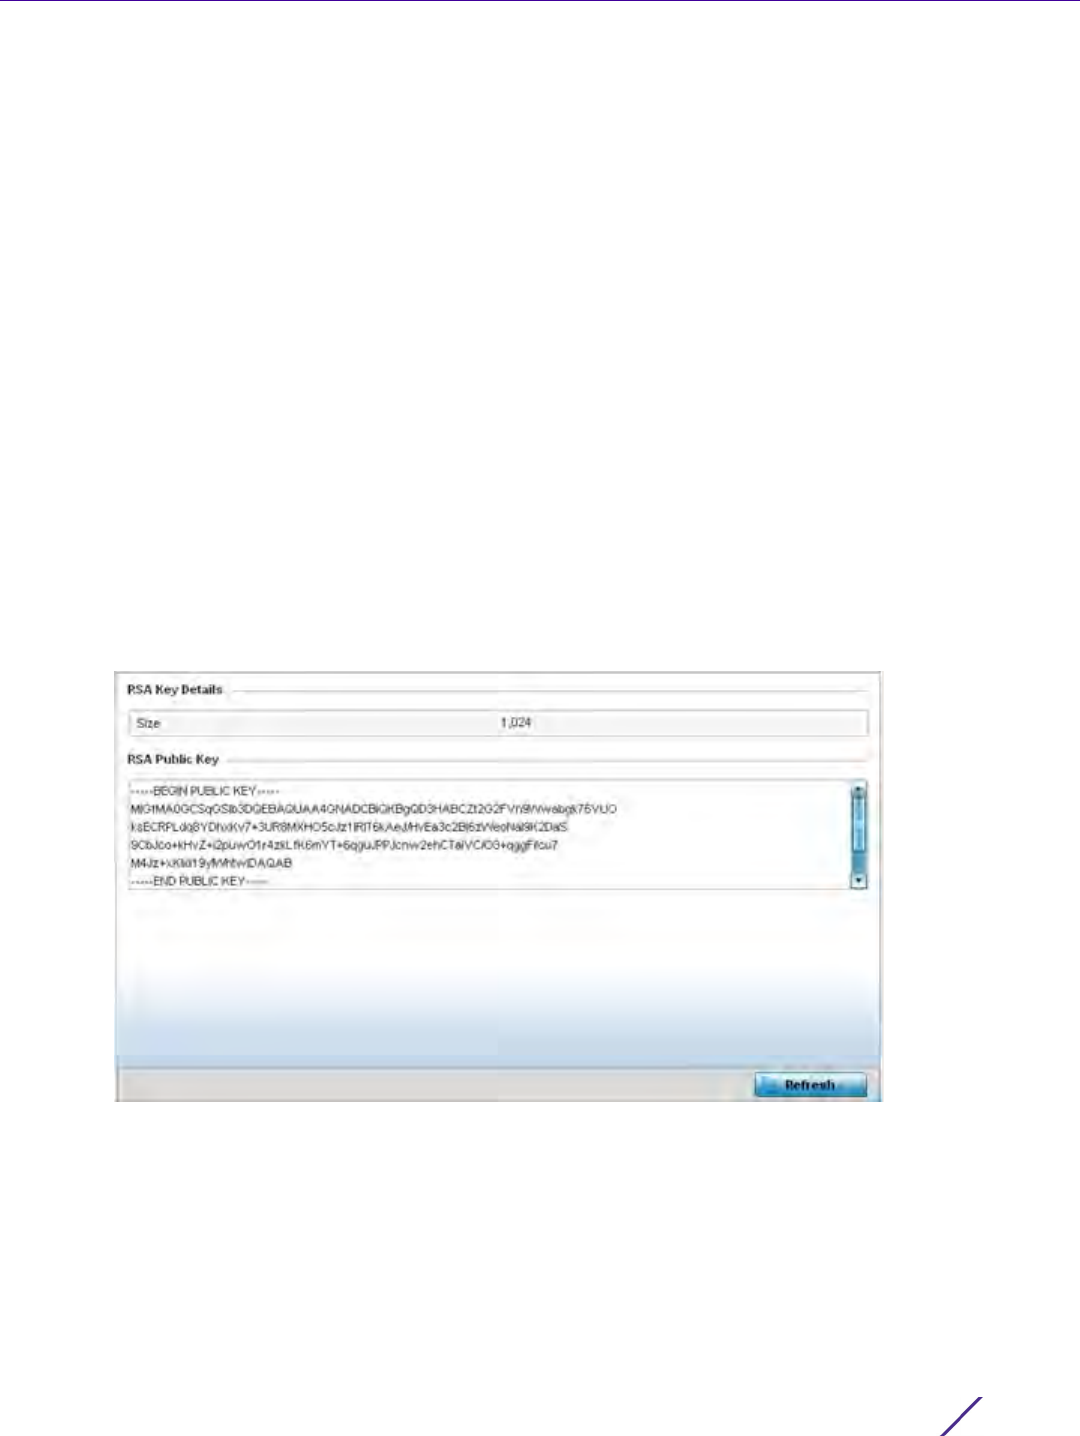
Statistics
Wireless Controller and Service Platform System Reference Guide 15 - 296
5 Refer to the Validity field to assess the certificate duration beginning and end dates.
6Review the Certificate Authority (CA) Details and Validity information to assess the subject and certificate
duration periods.
7 Periodically select the Refresh button to update the screen’s statistics counters to their latest values.
15.4.31.2 RSA Keys
Certificates
Rivest, Shamir, and Adleman (RSA) is an algorithm for public key cryptography. It’s the first algorithm known to be
suitable for signing, as well as encryption.
The RSA Keys screen displays a list of RSA keys installed in the selected Access Point. RSA Keys are generally used
for establishing a SSH session, and are a part of the certificate set used by RADIUS, VPN and HTTPS.
To view the RSA Key details:
1 Select the Statistics menu from the Web UI.
2Select
System from the navigation pane (on the left-hand side of the screen). Expand a RF Domain, select a
controller or service platform, and select one of its connected Access Points
3Select
Certificates and expand the menu to reveal its sub menu items.
4Select
RSA Keys.
Figure 15-208 Access Point - Certificate RSA Keys screen
The RSA Key Details field displays the size (in bits) of the desired key. If not specified, a default key size of 1024
is used.
The RSA Public Key field lists the public key used for encrypting messages.
5 Periodically select the Refresh button to update the screen’s statistics counters to their latest values.
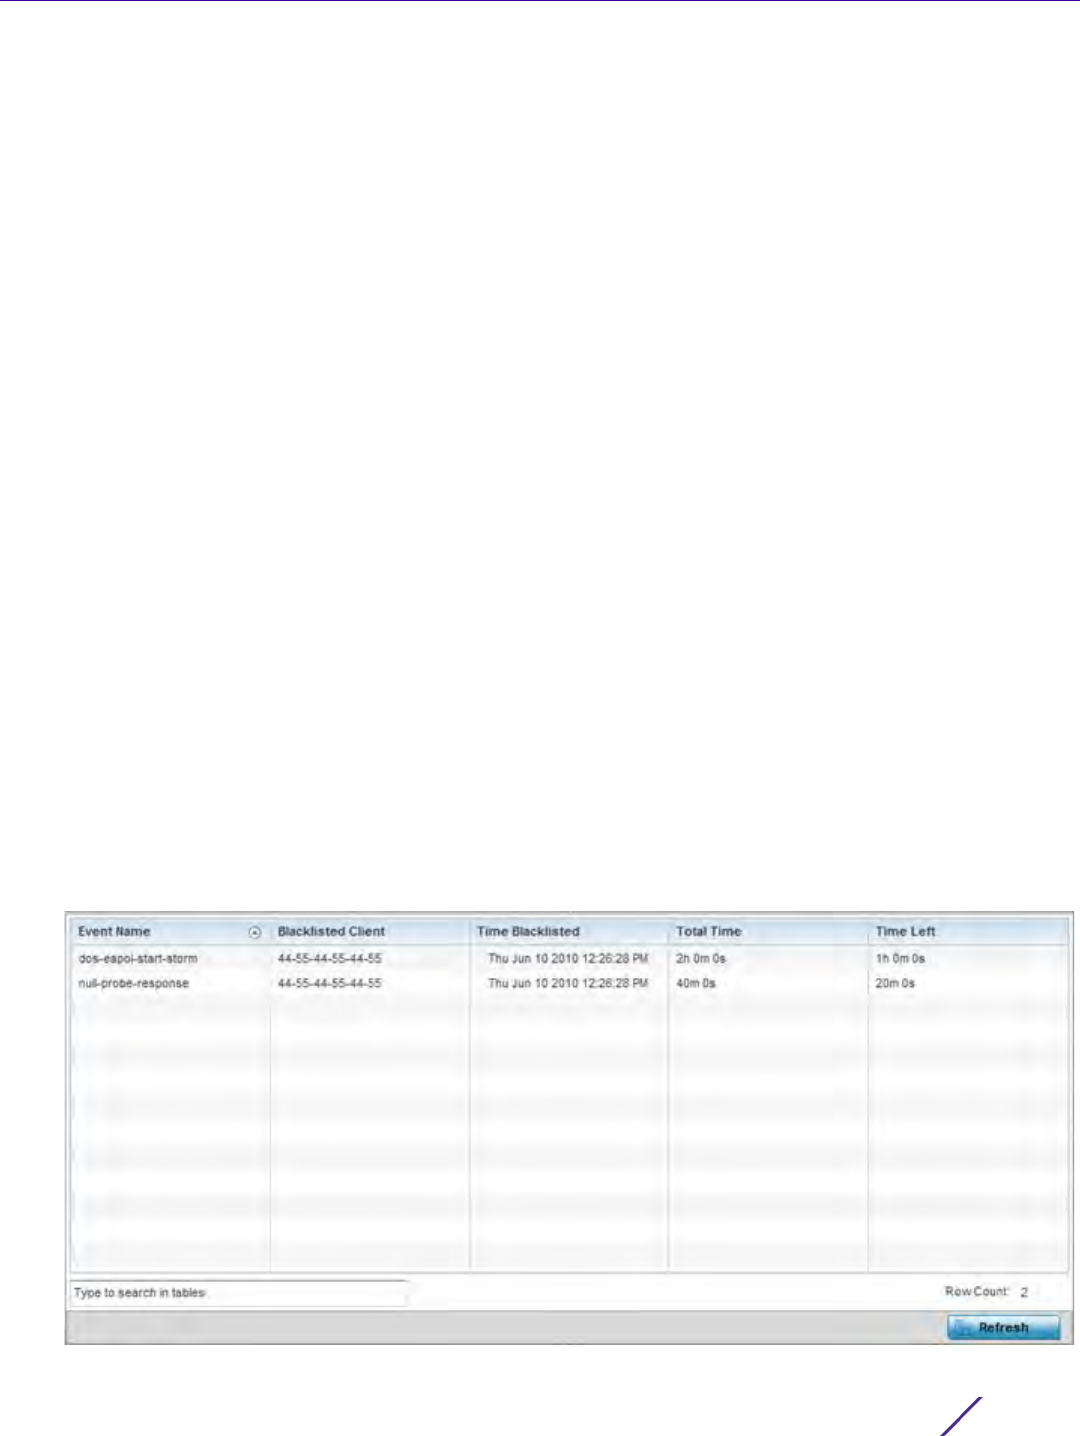
Statistics
Wireless Controller and Service Platform System Reference Guide 15 - 297
15.4.32 WIPS
Access Point Statistics
A Wireless Intrusion Prevention System (WIPS) monitors the radio spectrum for the presence of unauthorized
Access Points and take measures to prevent an intrusion. Unauthorized attempts to access a controller or service
platform managed WLAN is generally accompanied by anomalous behavior as intruding clients try to find network
vulnerabilities. Basic forms of this behavior can be monitored and reported without a dedicated WIPS. When the
parameters exceed a configurable threshold, a SNMP trap is generated that reports the results via management
interfaces.
The WIPS screens provide details about the blacklisted clients (unauthorized Access Points) intruded into the
network. Details include the name of the blacklisted client, the time when the client was blacklisted, the total time
the client remained in the network, etc. The screen also provides WIPS event details.
For more information, see:
•WIPS Client Blacklist
•WIPS Events
15.4.32.1 WIPS Client Blacklist
WIPS
This Client Blacklist displays blacklisted clients detected by this Access Point using WIPS. Blacklisted clients are not
allowed to associate to this Access Points.
To view the WIPS client blacklist for this Access Point:
1 Select the Statistics menu from the Web UI.
2Select
System from the navigation pane (on the left-hand side of the screen). Expand a RF Domain, select a
controller or service platform, and select one of its connected Access Points.
3Select
WIPS and expand the menu to reveal its sub menu items.
4Select
Client Blacklist.
Figure 15-209 Access Point - WIPS Client Blacklist screen
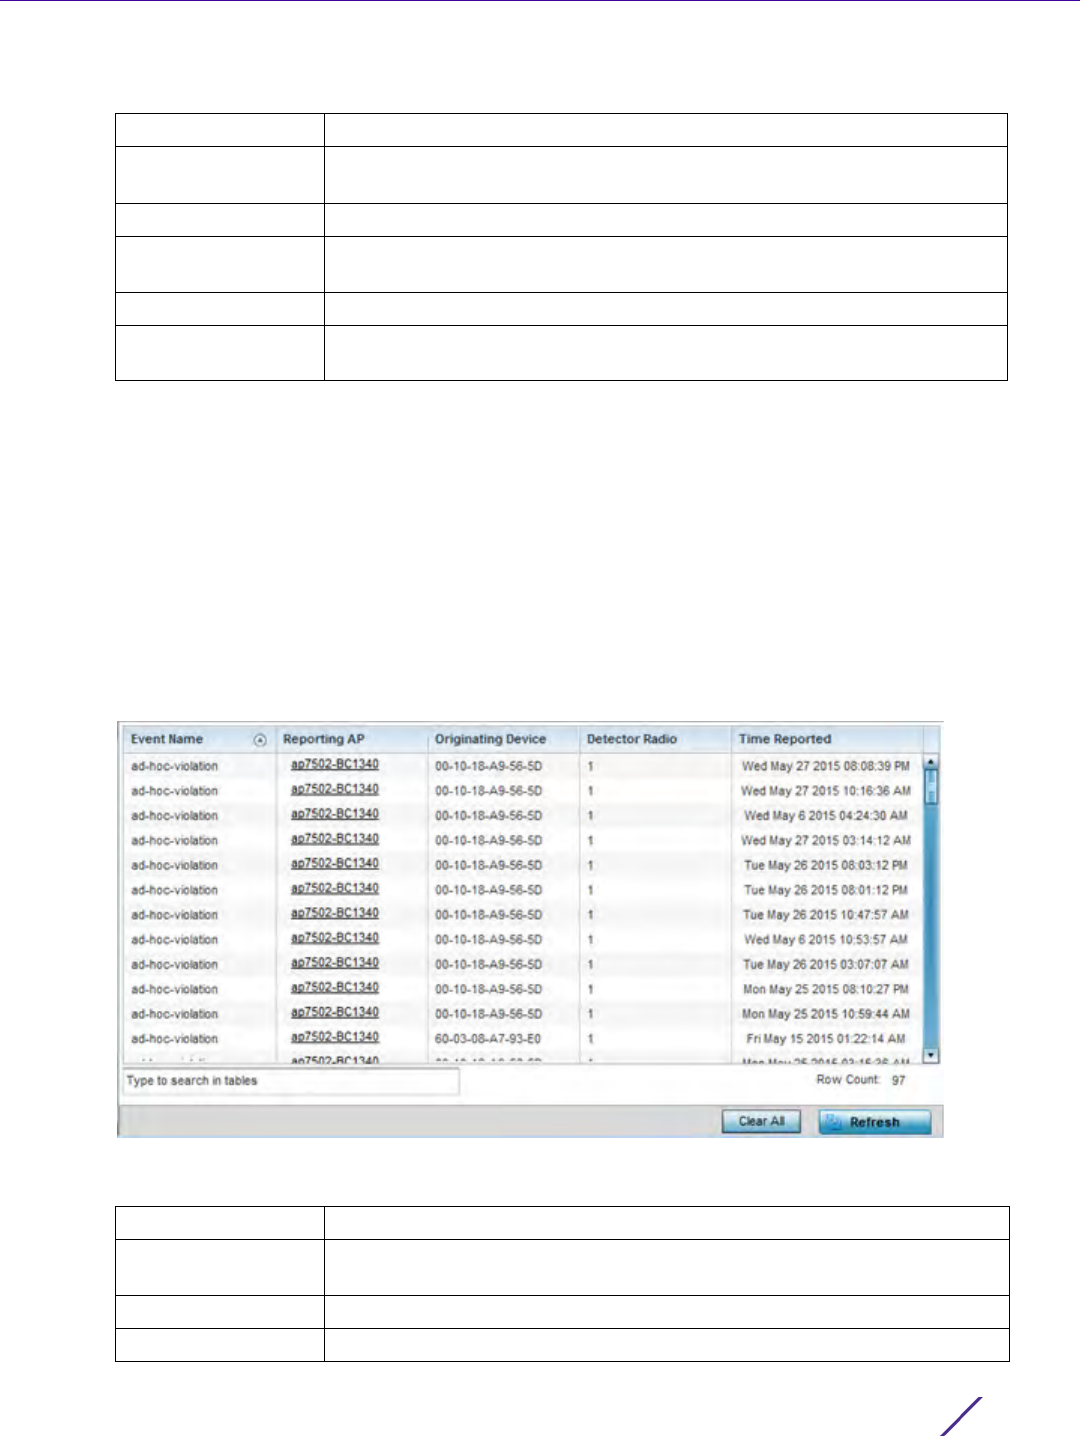
Statistics
Wireless Controller and Service Platform System Reference Guide 15 - 298
The WIPS Client Blacklist screen displays the following:
15.4.32.2 WIPS Events
WIPS
To view the WIPS events statistics:
1 Select the Statistics menu from the Web UI.
2Select
System from the navigation pane (on the left-hand side of the screen). Expand a RF Domain, select a
controller or service platform, and select one of its connected Access Points.
3Select
WIPS and expand the menu to reveal its sub menu items.
4Select
WIPS Events.
Figure 15-210 Access Point - WIPS Events screen
The WIPS Events screen provides the following:
Event Name Displays the name of the event that resulted in the blacklisting.
Blacklisted Client Displays the MAC address of the unauthorized and blacklisted device
intruding this Access Point’s radio coverage area.
Time Blacklisted Displays the time when the client was blacklisted by this Access Point.
Total Time Displays the time the unauthorized (now blacklisted) device remained in
this Access Point’s WLAN.
Time Left Displays the time the blacklisted client remains on the list.
Refresh Select the Refresh button to update the statistics counters to their latest
values.
Event Name Displays the name of the detected wireless intrusion event.
Reporting AP Displays the MAC address of the Access Point reporting the listed
intrusion.
Originating Device Displays the MAC address of the intruding device.
Detector Radio Displays the number of the detecting Access Point radio.
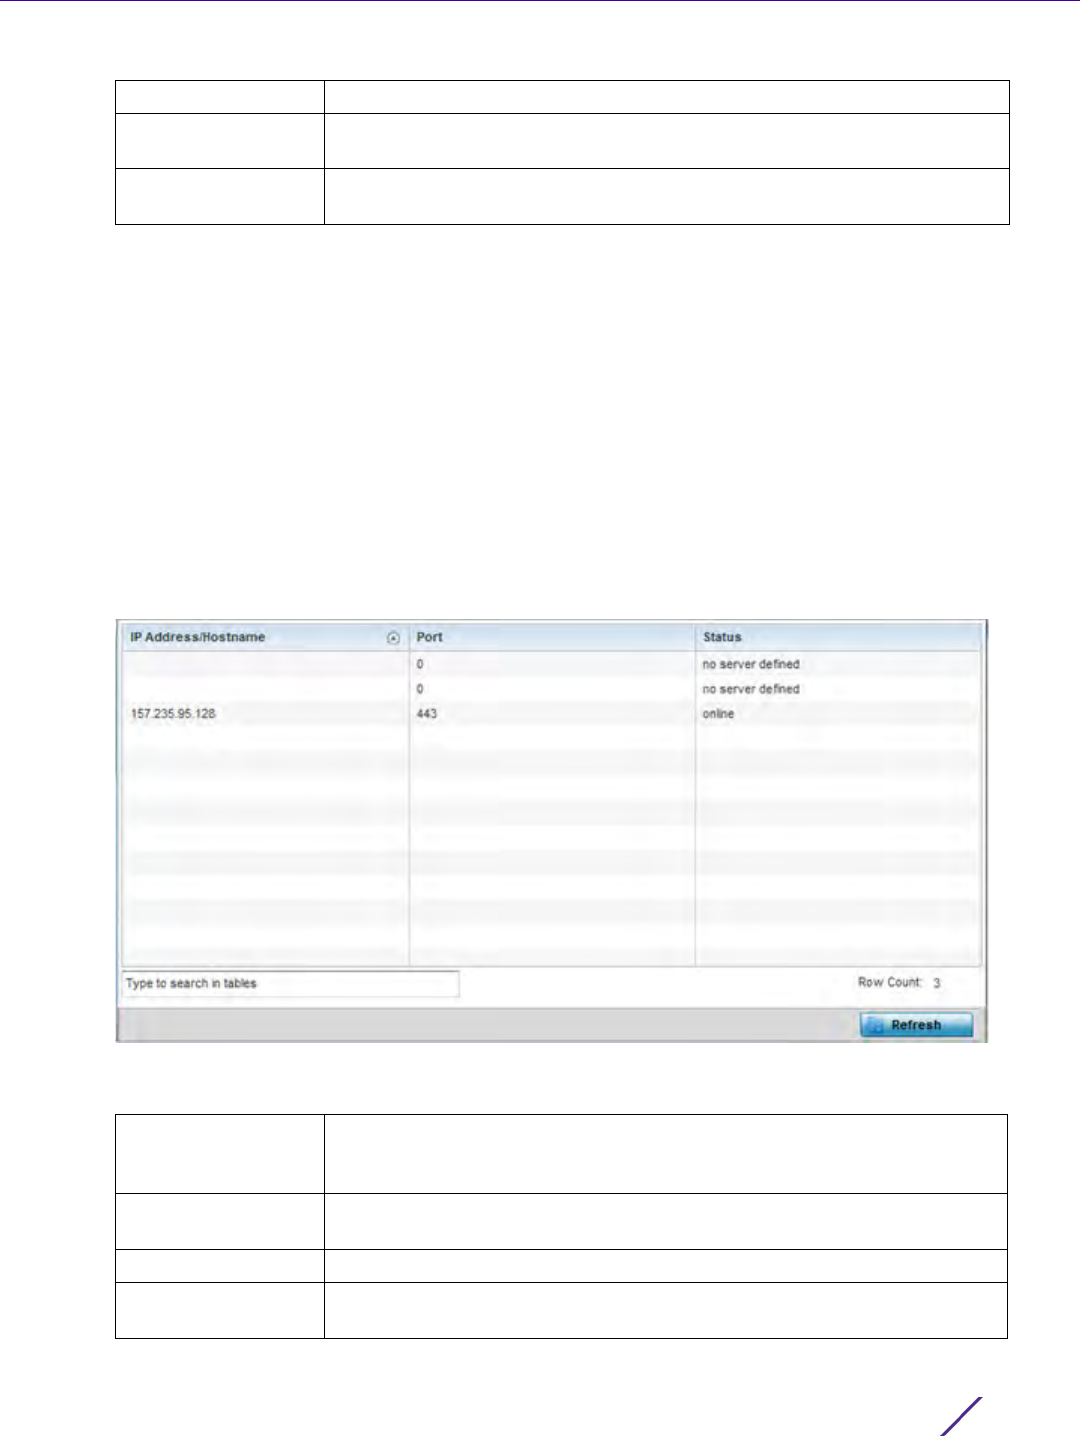
Statistics
Wireless Controller and Service Platform System Reference Guide 15 - 299
15.4.33 Sensor Servers
Access Point Statistics
Sensor servers allow the monitor and download of data from multiple sensors and remote locations using Ethernet
TCP/IP or serial communication. Repeaters are available to extend the transmission range and combine sensors
with various frequencies on the same receiver.
To view the network address and status information of the sensor server resources available to the Access Point:
1 Select the Statistics menu from the Web UI.
2Select
System from the navigation pane (on the left-hand side of the screen). Expand a RF Domain, select a
controller or service platform, and select one of its connected Access Points.
3Select
Sensor Servers.
Figure 15-211 Access Point - Sensor Servers screen
The Sensor Servers screen displays the following:
Time Reported Displays the time when the intrusion event was detected.
Clear All Select the Clear All button to clear the screen of its current status and
begin a new data collection.
Refresh Select the Refresh button to update the screen’s statistics counters to their
latest values.
IP Address/
Hostname
Displays a list of sensor server IP addresses or administrator assigned
hostnames. These are the server resources available to the Access Point
for the management of data uploaded from dedicated sensors.
Port Displays the numerical port where the sensor server is listening.
Unconnected server resources are not able to provide sensor reporting.
Status Displays whether the server resource is connected or not.
Refresh Select the Refresh button to update the screen’s statistics counters to their
latest values.
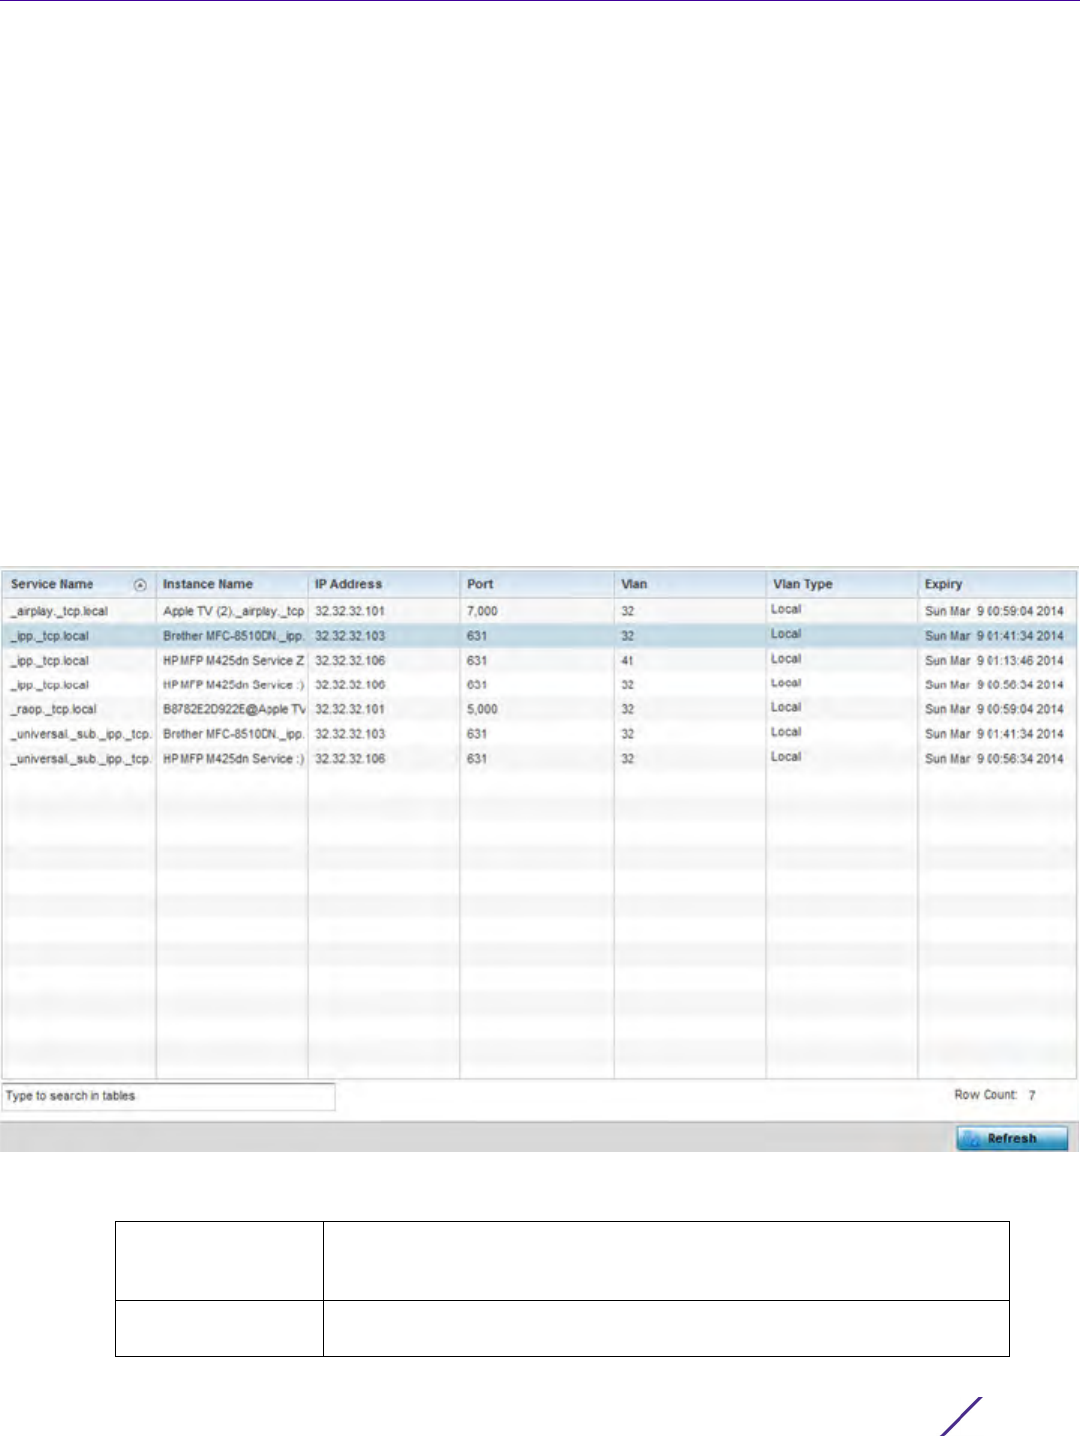
Statistics
Wireless Controller and Service Platform System Reference Guide 15 - 300
15.4.34 Bonjour Services
Access Point Statistics
Bonjour is Apple’s zero-configuration networking (Zeroconf) implementation. Zeroconf is a group of technologies
that include service discovery, address assignment and hostname resolution. Bonjour locates the devices (printers,
computers etc.) and services these computers provide over a local network.
Bonjour provides a method to discover services on a LAN. Bonjour allows users to set up a network without any
configuration. Services such as printers, scanners and file-sharing servers can be found using Bonjour. Bonjour only
works within a single broadcast domain. However, with a special DNS configuration, it can be extended to find
services across broadcast domains.
To view the Bonjour service statistics:
1 Select the Statistics menu from the Web UI.
2Select
System from the navigation pane (on the left-hand side of the screen). Expand a RF Domain, select a
controller or service platform, and select one of its connected Access Points.
3Select
Bonjour Services from the left-hand side of the Access Point UI.
Figure 15-212 Access Point - Bonjour Services screen
Refer to the following Bonjour service utilization stats.:
Service Name Lists the services discoverable by the Bonjour gateway. Services can either
be pre-defined Apple services (scanner, printer etc.) or an alias not
available on the predefined list.
Instance Name Lists the name of each Bonjour service instance (session) utilized by the
Access Point.
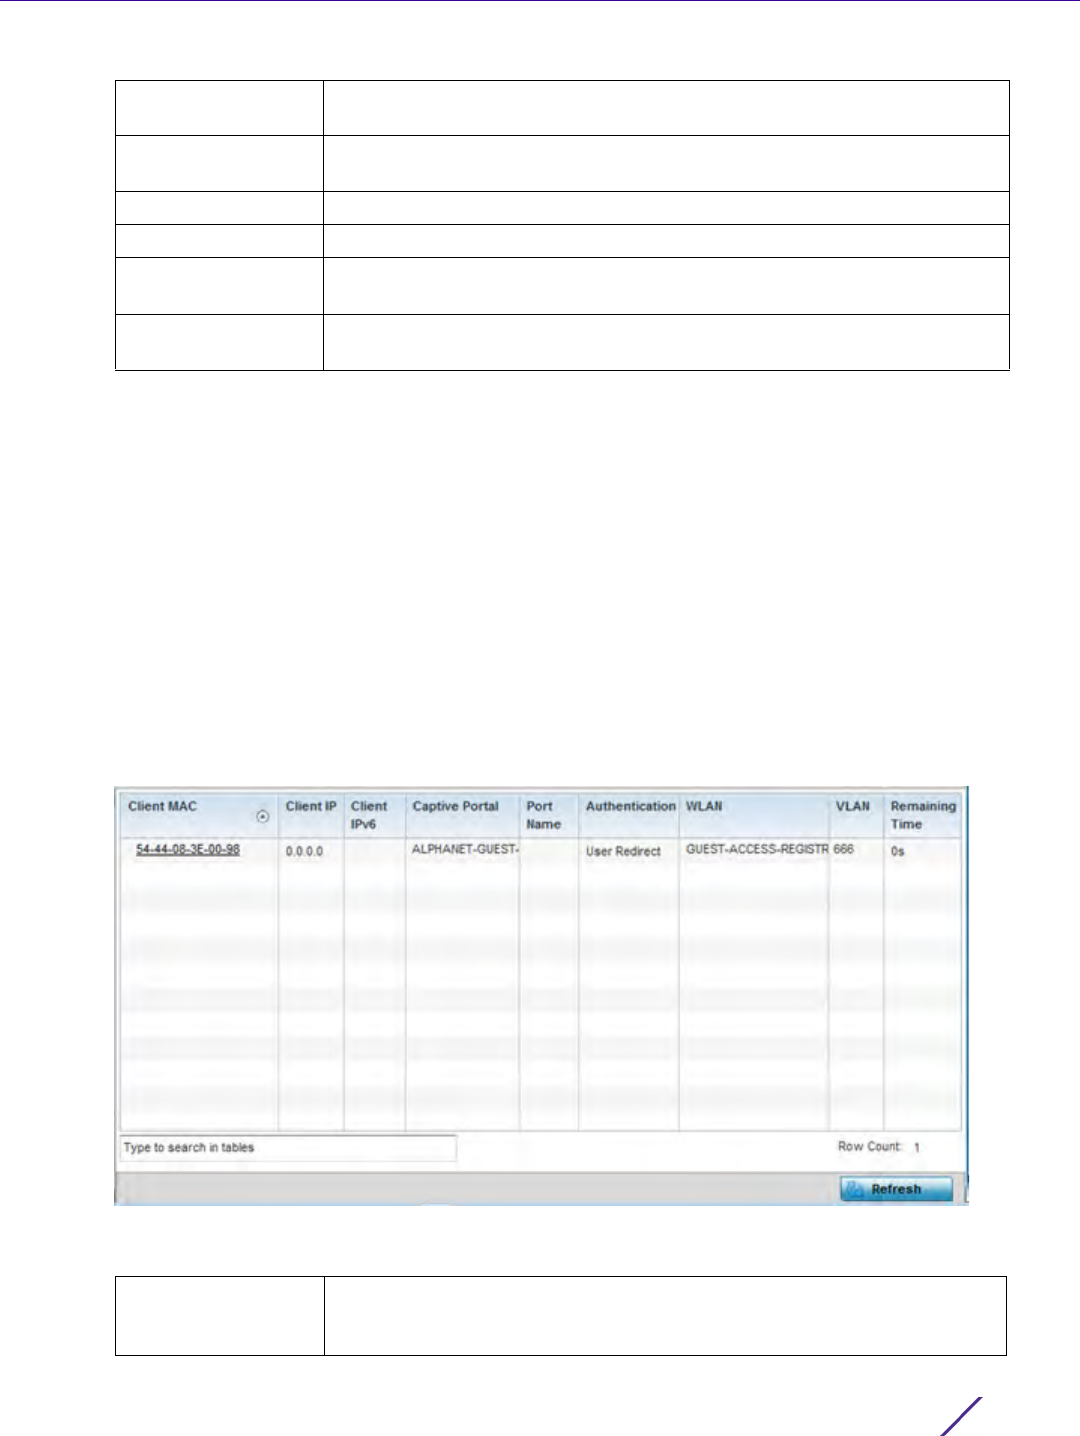
Statistics
Wireless Controller and Service Platform System Reference Guide 15 - 301
15.4.35 Captive Portal
Access Point Statistics
A captive portal forces a HTTP client to use a special Web page for authentication before using the Internet. A
captive portal turns a Web browser into a client authenticator. This is done by intercepting packets regardless of
the address or port, until the user opens a browser and tries to access the Internet. At that time, the browser is
redirected to a Web page.
To view the captive portal statistics of an Access Point:
1 Select the Statistics menu from the Web UI.
2Select
System from the navigation pane (on the left-hand side of the screen). Expand a RF Domain, select a
controller or service platform, and select one of its connected Access Points.
3Select
Captive Portal.
Figure 15-213 Access Point - Captive Portal screen
The Captive Portal screen displays the following:
IP Address Lists the network IP address utilized by the listed Bonjour service providing
resources to the Access Point.
Port Displays the port used to secure a connection with the listed Bonjour
service.
Vlan Lists the VLAN(s) on which a listed Bonjour service is routable.
Vlan Type Lists the VLAN type as either a local bridging mode or a shared tunnel.
Expiry Lists the expiration date of the listed Bonjour service, and its availability to
discover resources on the LAN.
Refresh Select the Refresh button to update the screen’s statistics counters to their
latest values.
Client MAC Displays the requesting client’s MAC address. The MAC displays as a link
that can be selected to display client configuration and network address
information in greater detail.

Statistics
Wireless Controller and Service Platform System Reference Guide 15 - 302
15.4.36 Network Time
Access Point Statistics
Network Time Protocol (NTP) is central to networks that rely on their Access Point(s) to supply system time.
Without NTP, Access Point supplied network time is unpredictable, which can result in data loss, failed processes,
and compromised security. With network speed, memory, and capability increasing at an exponential rate, the
accuracy, precision, and synchronization of network time is essential in an Access Point managed enterprise
network. The Access Point can use a dedicated server to supply system time. The Access Point can also use several
forms of NTP messaging to sync system time with authenticated network traffic.
The Network Time screen provides detailed statistics of an associated NTP Server of an Access Point. Use this
screen to review the statistics for each Access Point.
The Network Time statistics screen consists of two tabs:
•NTP Status
•NTP Association
15.4.36.1 NTP Status
Network Time
To view the Network Time statistics of an Access Point:
1 Select the Statistics menu from the Web UI.
2Select
System from the navigation pane (on the left-hand side of the screen). Expand a RF Domain, select a
controller or service platform, and select one of its connected Access Points.
3Select
Network Time.
Client IP Displays the requesting client’s IPv4 formatted IP address.
Client IPv6 Displays the requesting client’s IPv6 formatted IP address.
Captive Portal Displays the captive portal name that each listed client is utilizing for
guest access to Access Point resources.
Port Name Lists the Access Point port name supporting the captive portal connection
with the listed client MAC address.
Authentication Displays the authentication status of the requesting client.
WLAN Displays the name of the WLAN the client belongs to.
VLAN Displays the name of the requesting client’s VLAN interface.
Remaining Time Displays the time after which the client is disconnected from the captive
portal managed Internet.
Refresh Select the Refresh button to update the screen’s statistics counters to
their latest values.
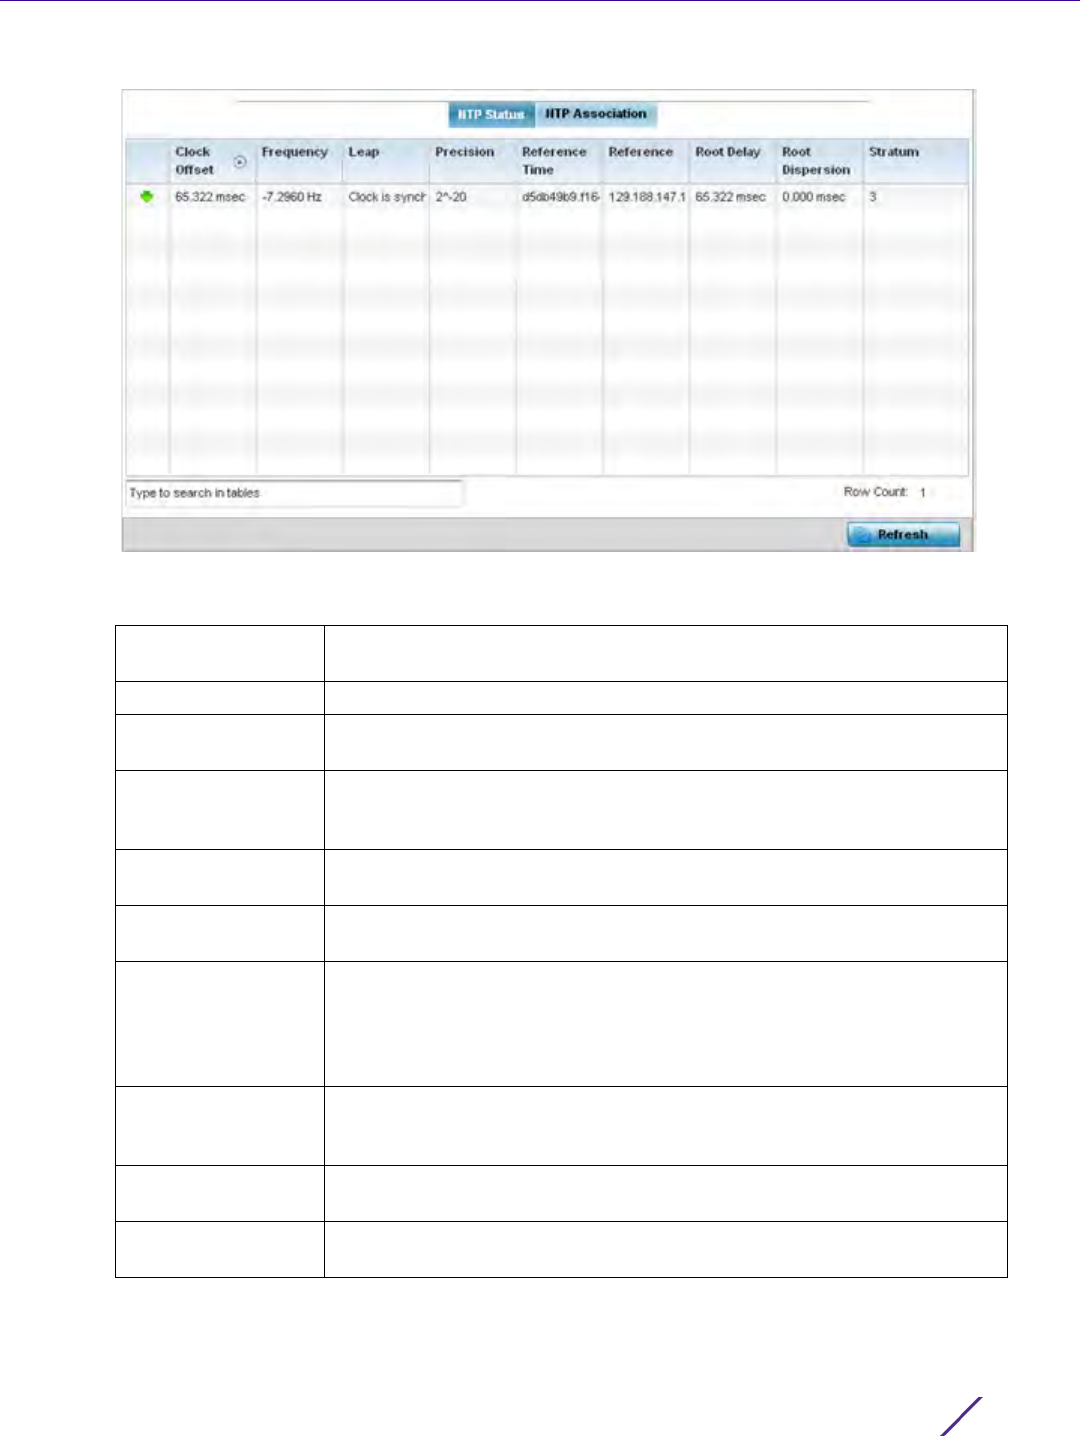
Statistics
Wireless Controller and Service Platform System Reference Guide 15 - 303
Figure 15-214 Access Point - NTP Status screen
The NTP Status tab displays by default with the following information:
Clock Offset Displays the time differential between the Access Point’s time and its NTP
resource’s time.
Frequency Indicates the SNTP server clock’s skew (difference) for the Access Point.
Leap Indicates if a second is added or subtracted to SNTP packet transmissions,
or if transmissions are synchronized.
Precision Displays the precision of the time clock (in Hz). The values that normally
appear in this field range from -6, for mains-frequency clocks, to -20 for
microsecond clocks.
Reference Time Displays the time stamp the Access Point’s clock was last synchronized or
corrected.
Reference Displays the address of the time source the Access Point is synchronized
to.
Root Delay The total round-trip delay in seconds. This variable can take on both
positive and negative values, depending on relative time and frequency
offsets. The values that normally appear in this field range from negative
values (a few milliseconds) to positive values (several hundred
milliseconds).
Root Dispersion The difference between the time on the root NTP server and its reference
clock. The reference clock is the clock used by the NTP server to set its
own clock.
Stratum Displays how many hops the Access Point is from its current NTP time
resource.
Refresh Select the Refresh button to update the screen’s statistics counters to their
latest values.
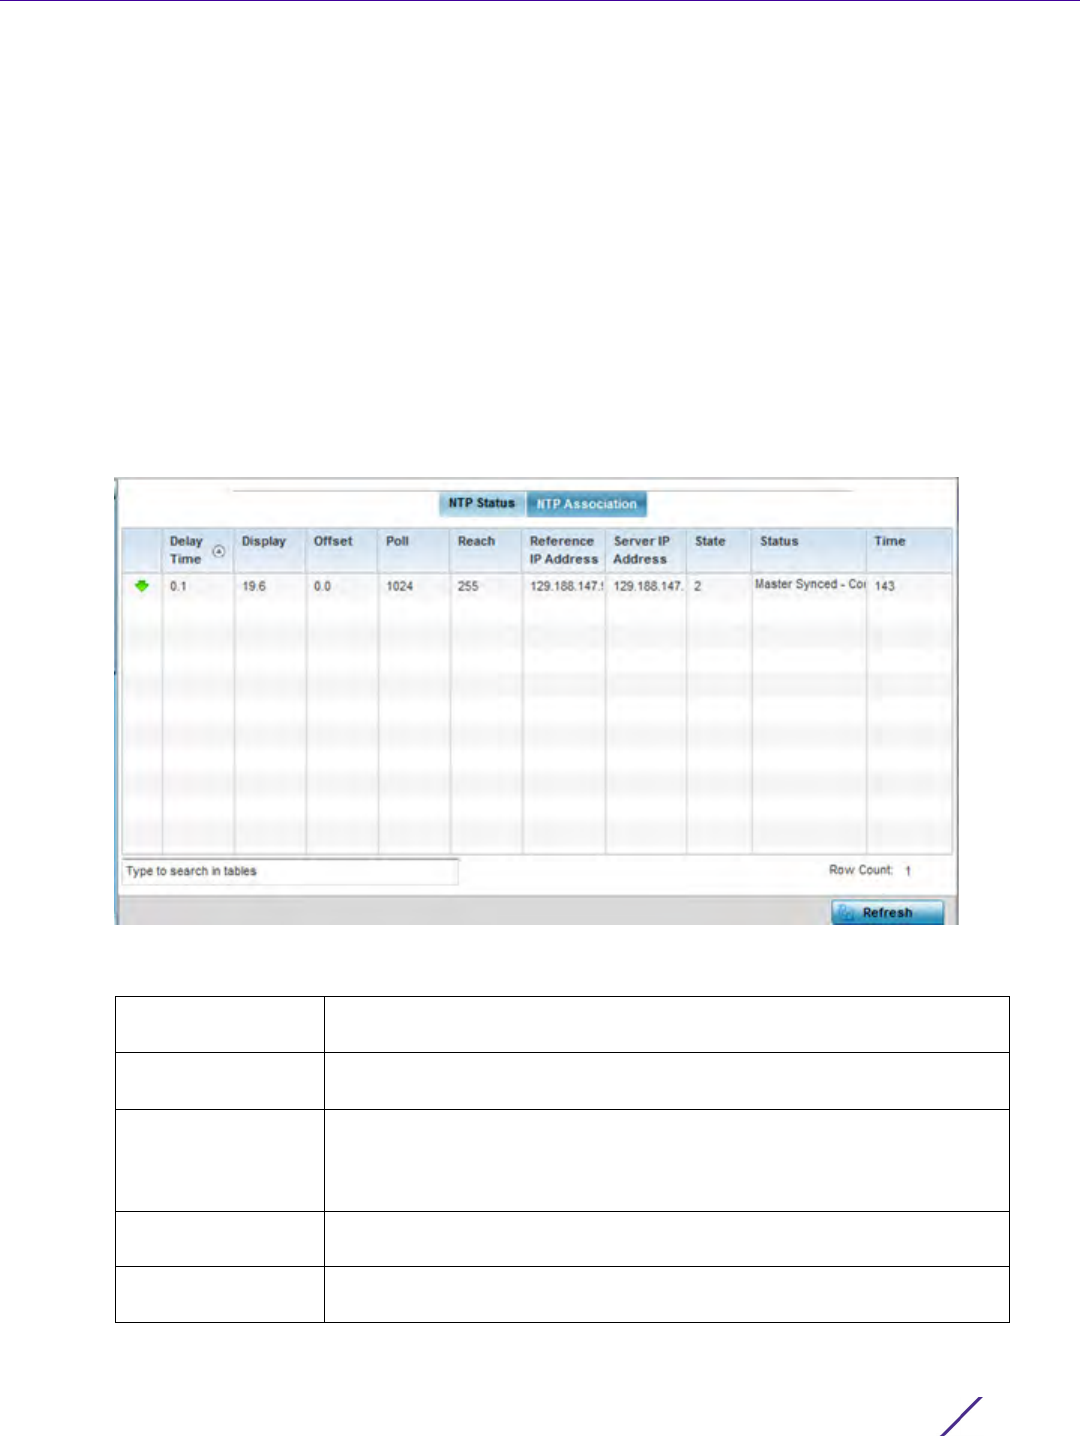
Statistics
Wireless Controller and Service Platform System Reference Guide 15 - 304
15.4.36.2 NTP Association
Network Time
The interaction between the Access Point and an NTP server constitutes an association. NTP associations can be
either peer associations (the Access Point synchronizes to another system or allows another system to synchronize
to it), or a server associations (only the Access Point synchronizes to the NTP resource, not the other way around).
To view the Access Point’s NTP association statistics:
1 Select the Statistics menu from the Web UI.
2Select
System from the navigation pane (on the left-hand side of the screen). Expand a RF Domain, select a
controller or service platform, and select one of its connected Access Points.
3Select
Network Time.
4 Select the NTP Association tab.
Figure 15-215 Access Point - NTP Association screen
The NTP Association screen displays the following:
Delay Time Displays the round-trip delay (in seconds) for broadcasts between the NTP
server and the Access Point.
Display Displays the time difference between the peer NTP server and the Access
Point’s clock.
Offset Displays the calculated offset between the Access Point and the NTP
server. The Access Point adjusts its clock to match the server’s time value.
The offset gravitates towards zero, but never completely reduces its offset
to zero.
Poll Displays the maximum interval between successive messages (in seconds)
to the nearest power of two.
Reach Displays the status of the last eight SNTP messages. If an SNTP packet is
lost, the lost packet is tracked over the next eight SNTP messages.

Statistics
Wireless Controller and Service Platform System Reference Guide 15 - 305
15.4.37 Load Balancing
Access Point Statistics
An Access Point load can be viewed in a graph and filtered to display different load attributes. The Access Point’s
entire load can be displayed, as well as the separate loads on the 2.4 and 5 GHz radio bands. The channels can
also be filtered for display. Each element can either be displayed individually or collectively in the graph.
To view the Access Point’s load balance in a filtered graph format:
1 Select the Statistics menu from the Web UI.
2Select
System from the navigation pane (on the left-hand side of the screen). Expand a RF Domain, select a
controller or service platform, and select one of its connected Access Points.
3Select
Load Balancing.
Reference IP
Address
Displays the address of the time source the Access Point is synchronized
to.
Server IP Address Displays the numerical IP address of the SNTP resource (server) providing
SNTP updates to the Access Point.
State Displays the NTP association status code.
Status Displays how many hops the Access Point is from its current NTP time
source.
Time Displays the time of the last statistics update.
Refresh Select the Refresh button to update the screen’s statistics counters to their
latest values.
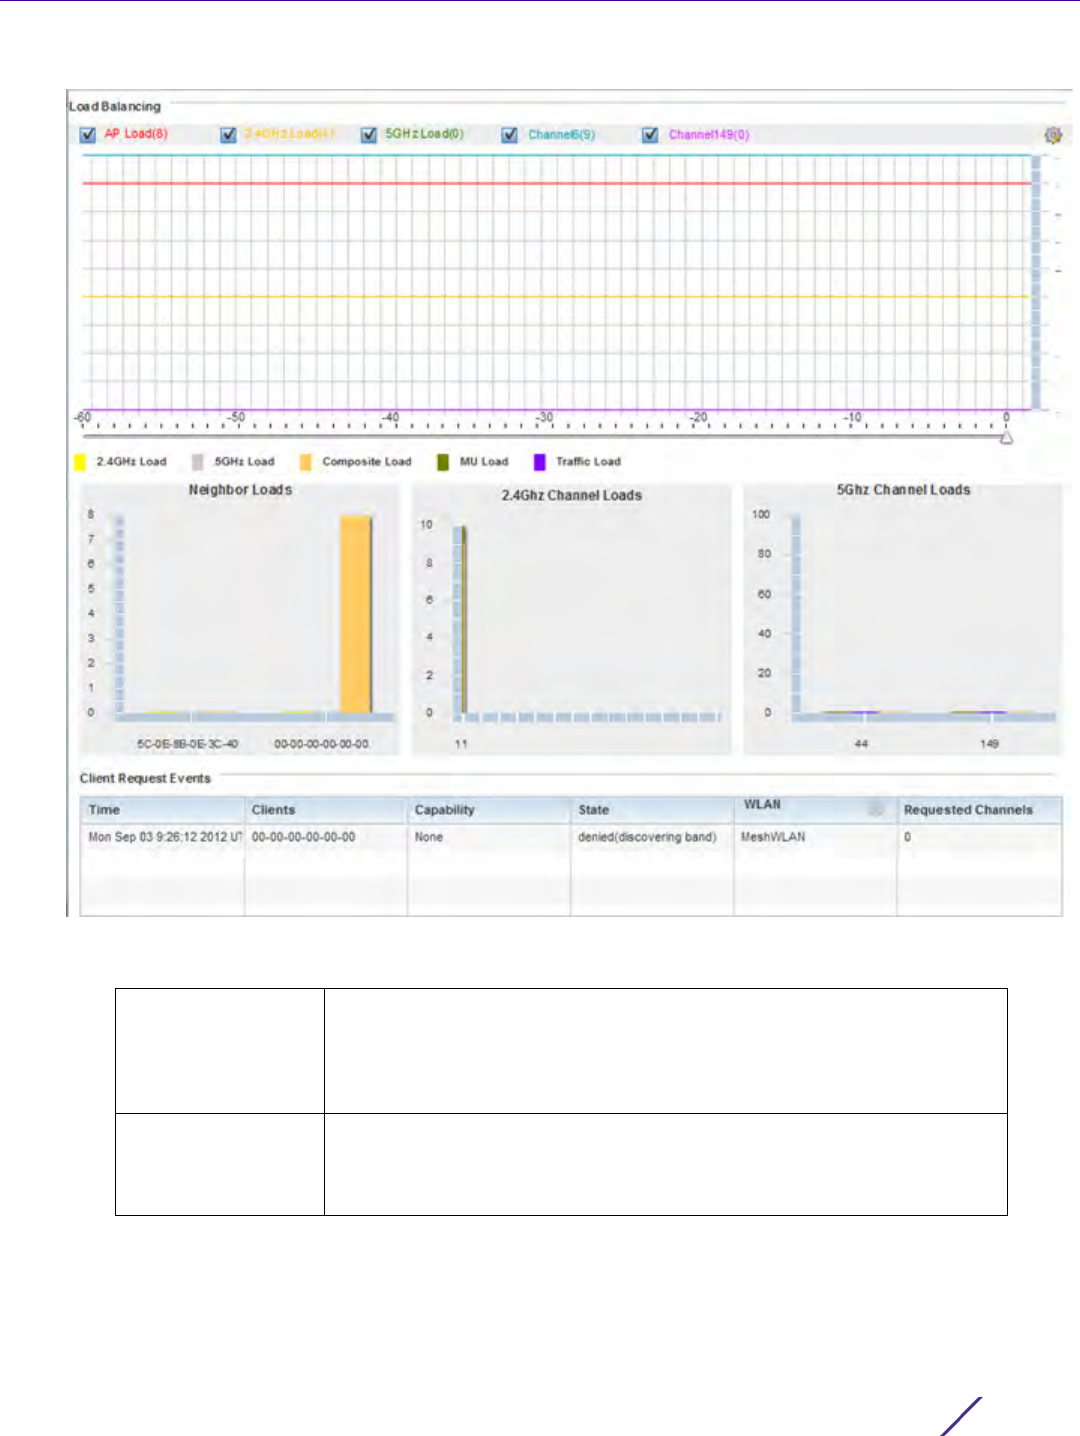
Statistics
Wireless Controller and Service Platform System Reference Guide 15 - 306
Figure 15-216 Access Point - Load Balancing screen
The Load Balancing screen displays the following:
Load Balancing Select any of the options to display any or all of the following information
in the graph below: AP Load, 2.4GHz Load, 5GHz Load, and Channel. The
graph section displays the load percentages for each of the selected
variables over a period of time, which can be altered using the slider
below the upper graph.
Client Requests
Events
The Client Request Events displays the Time, Client, Capability, State,
WLAN and Requested Channels for all client request events on the Access
Point. Supported Access Points can support up to 256 clients per Access
Point.
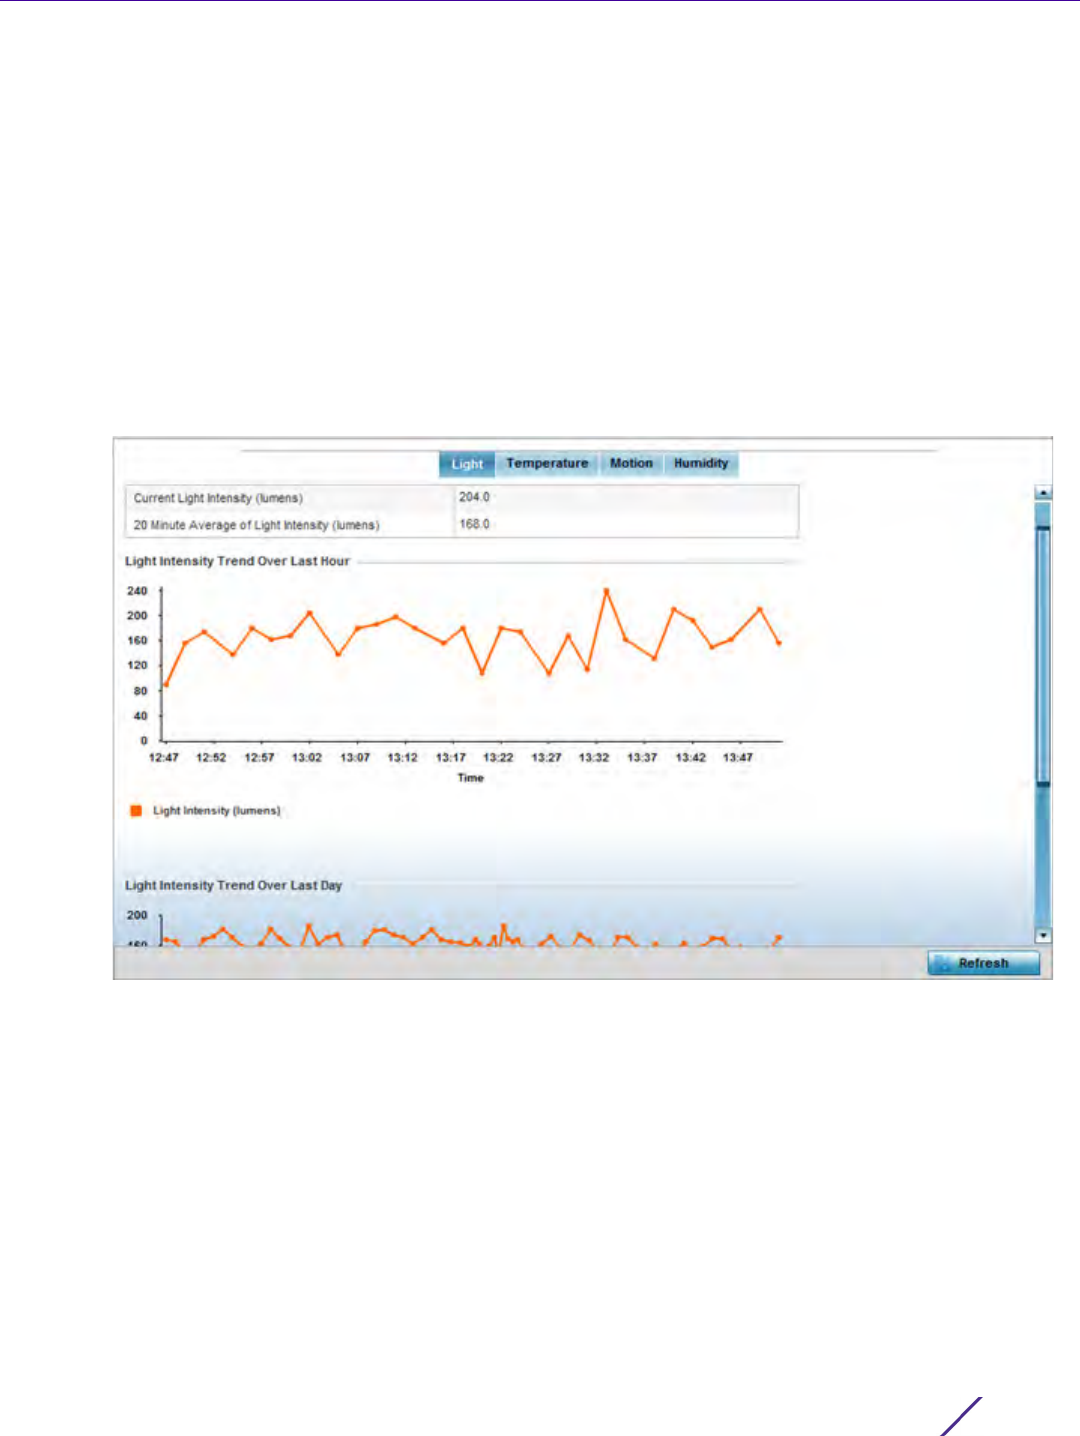
Statistics
Wireless Controller and Service Platform System Reference Guide 15 - 307
15.4.38 Environmental Sensors (AP8132 Models Only)
Access Point Statistics
A sensor module is a USB environmental sensor extension to an AP8132 model Access Point. It provides a variety
of sensing mechanisms, allowing the monitoring and reporting of the radio coverage area. The output of the
sensor's detection mechanisms are viewable using either the Environmental Sensor screen.
To view an AP8132 model Access Point’s environmental statistics:
1 Select the Statistics menu from the Web UI.
2Select
System from the navigation pane (on the left-hand side of the screen). Expand a RF Domain, select a
controller or service platform, and select one of its connected Access Points.
3Select
Environment.
Figure 15-217 Access Point - Environmental Sensor screen (Light tab)
The Light tab displays by default, with additional Temperature, Motion and Humidity tabs available for unique
sensor reporting. Each of these sensor measurements helps the administrator determine whether the immediate
deployment area is occupied by changes in the Access Point's environment.
4 Refer to the Light table to assess the sensor's detected light intensity within the Access Point’s immediate
deployment area.
Light intensity is measured by the sensor in lumens. The table displays the Current Light Intensity (lumens) and
a 20 Minute Average of Light Intensity (lumens). Compare these two items to determine whether the
deployment location remains consistently lit, as an administrator can power off the Access Point’s radios when
no activity is detected in the immediate deployment area. For more information, see Profile Environmental
Sensor Configuration (AP8132 Only) on page 8-222.
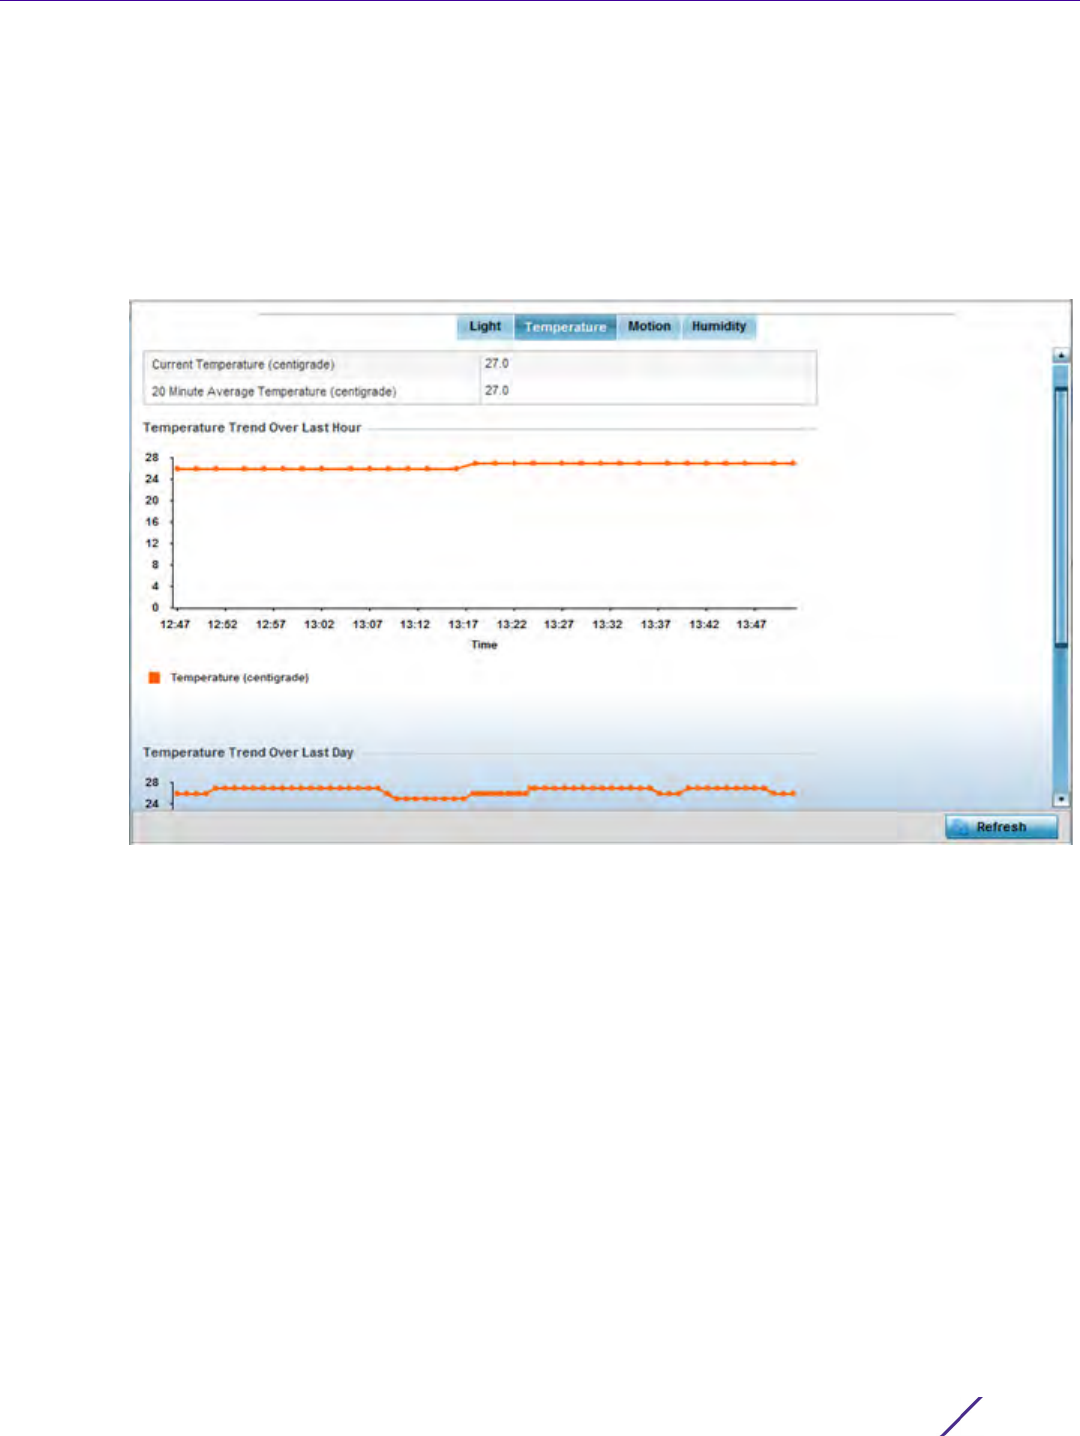
Statistics
Wireless Controller and Service Platform System Reference Guide 15 - 308
5 Refer to the Light Intensity Trend Over Last Hour graph to assess the fluctuation in lighting over the last hour.
Use this graph to assess the deployment areas light intensity of particular hours of the day as needed to
conjunction with the daily graph immediately below it.
6 Refer to the Light Intensity Trend Over Last Day graph to assess whether lighting is consistent across specific
hours of the day. Use this information to help determine whether the Access Point can be upgraded or powered
off during specific hours of the day.
7 Select the Temperature tab.
Figure 15-218 Access Point - Environmental Sensor screen (Temperature tab)
8 Refer to the Temperature table to assess the sensor's detected temperature within the Access Point’s
immediate deployment area.
Temperature is measured in centigrade. The table displays the Current Temperature (centigrade) and a 20
Minute Average Temperature (centigrade). Compare these two items to determine whether the deployment
location remains consistently heated. For more information on enabling the sensor, see Profile Environmental
Sensor Configuration (AP8132 Only) on page 8-222.
9 Refer to the Temperature Trend Over Last Hour graph to assess the fluctuation in ambient temperature over the
last hour. Use this graph in combination with the Light and Motions graphs (in particular) to assess the
deployment area’s activity level.
10 Refer to the Temperature Trend Over Last Day graph to assess whether deployment area temperature is
consistent across specific hours of the day. Use this information to help determine whether the Access Point
can be upgraded or powered off during specific hours of the day.
11 Select the Motion tab.
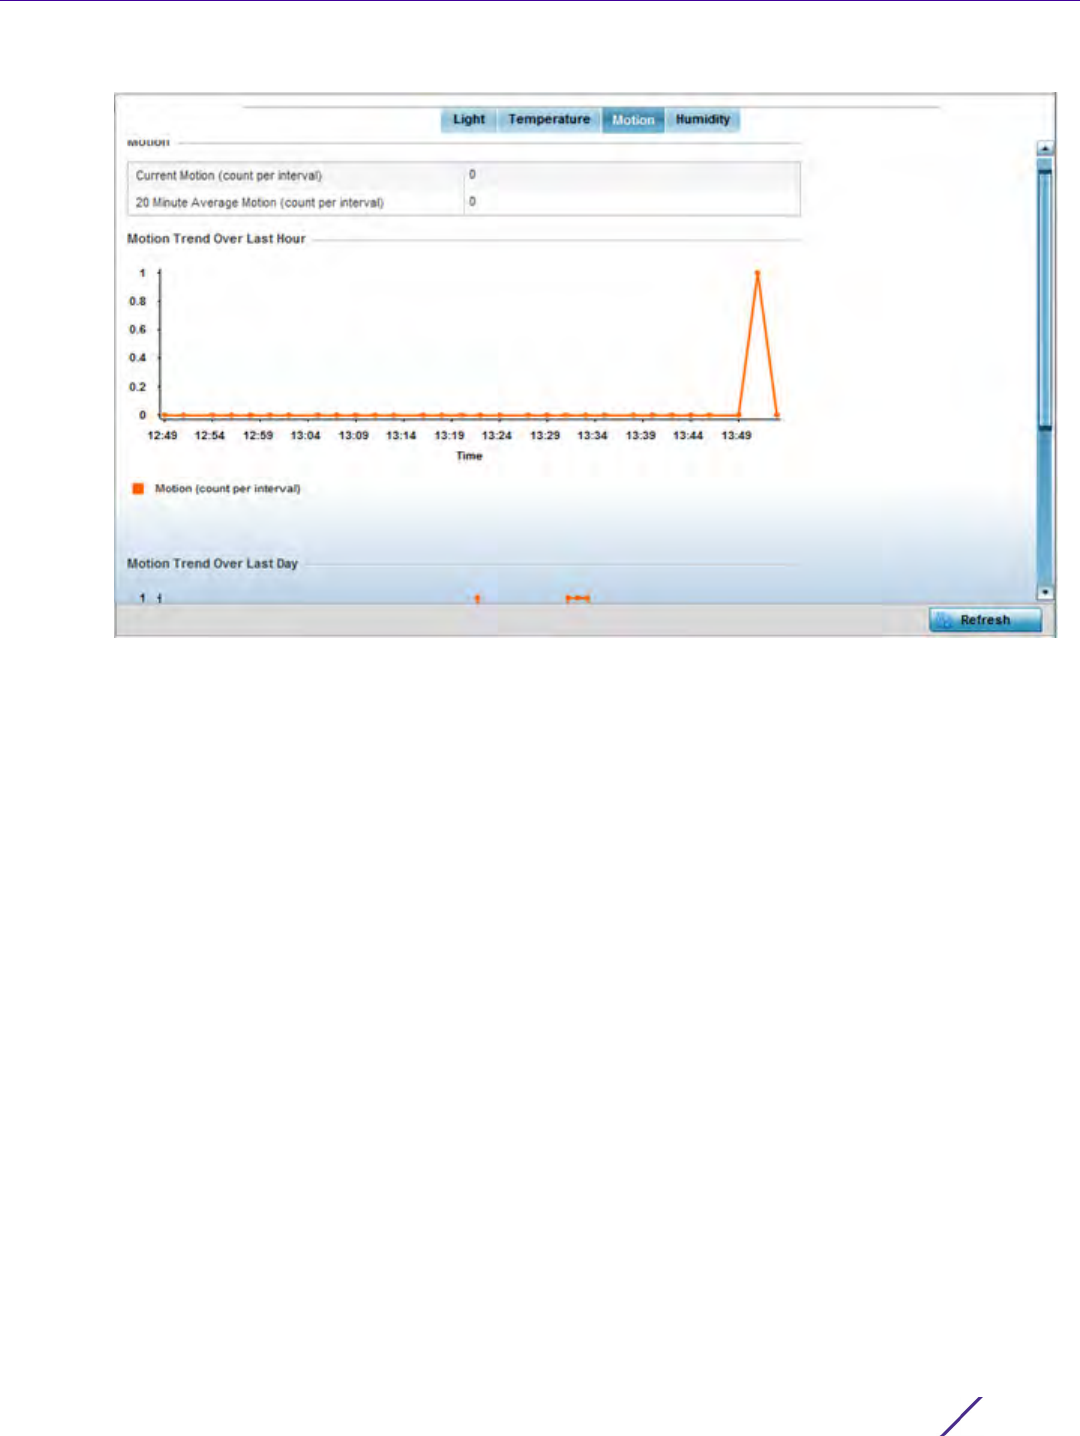
Statistics
Wireless Controller and Service Platform System Reference Guide 15 - 309
Figure 15-219 Access Point - Environmental Sensor screen (Motion tab)
12 Refer to the Motion table to assess the sensor's detected movement within the Access Point’s immediate
deployment area.
Motion is measured in intervals. The table displays the Current Motion (count per interval) and a 20 Minute
Average Motion (count per interval). Compare these two items to determine whether the Access Point’s
deployment location remains consistently occupied by client users. For more information on enabling the
sensor, see Profile Environmental Sensor Configuration (AP8132 Only) on page 8-222.
13 Refer to the Motion Trend Over Last Hour graph to assess the fluctuation in user movement over the last hour.
Use this graph in combination with the Light and Temperature graphs (in particular) to assess the deployment
area’s activity level.
14 Refer to the Motion Trend Over Last Day graph to assess whether deployment area user movement is
consistent across specific hours of the day. Use this information to help determine whether the Access Point
can be upgraded or powered off during specific hours of the day.
15 Select the Humidity tab.
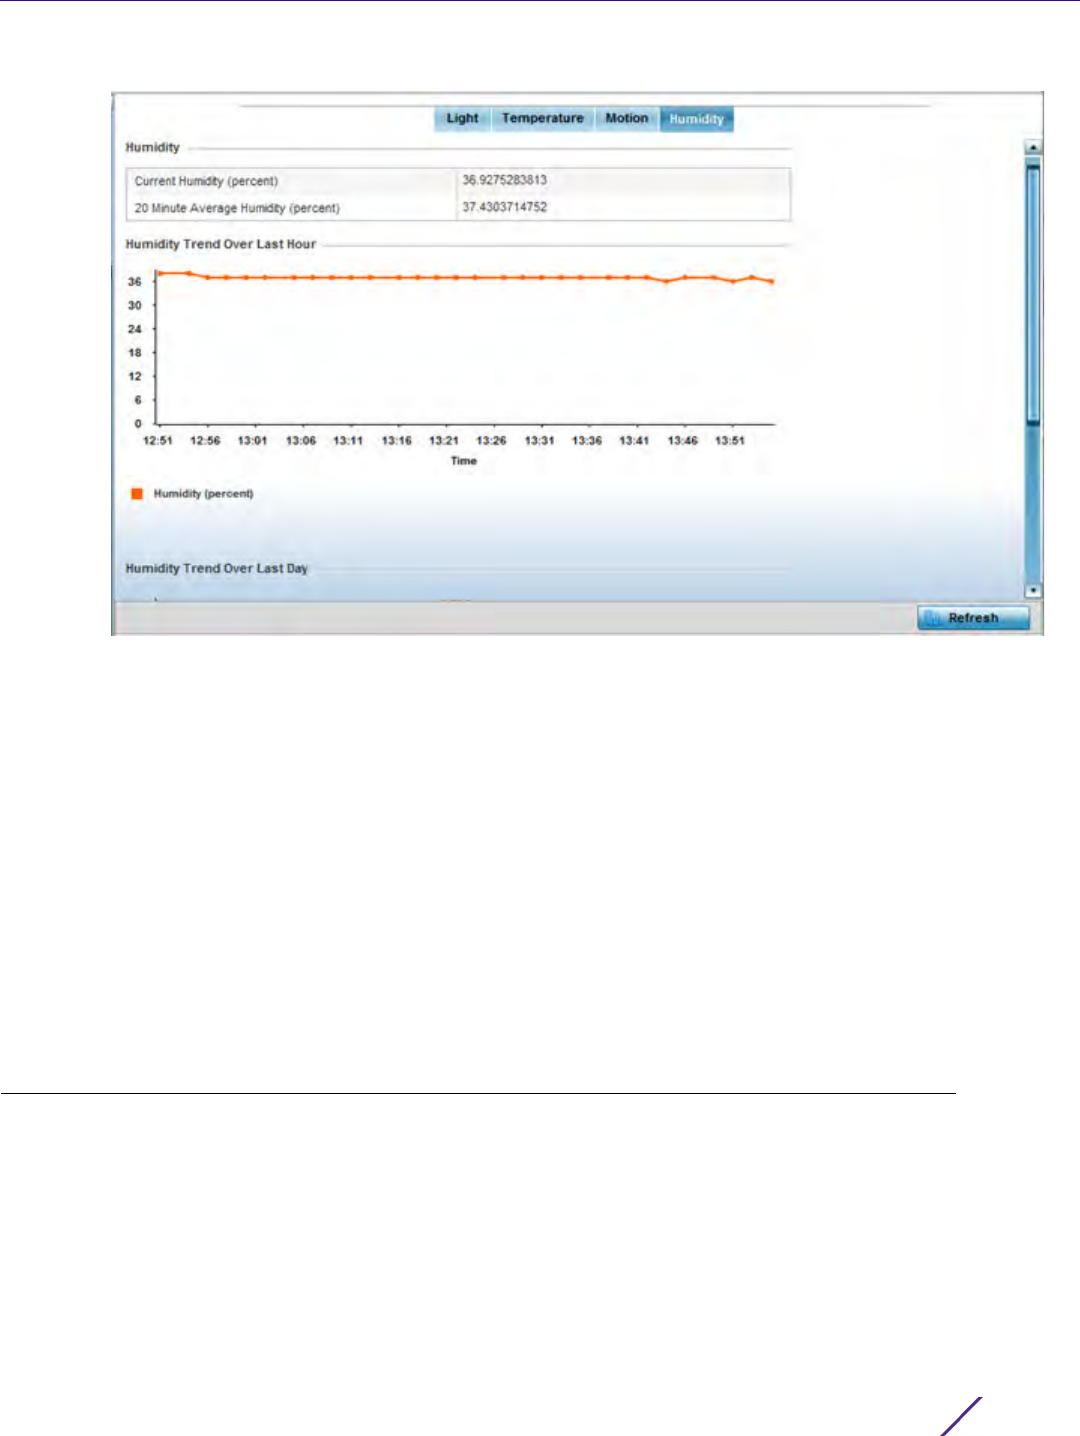
Statistics
Wireless Controller and Service Platform System Reference Guide 15 - 310
Figure 15-220 Access Point - Environmental Sensor screen (Humidity tab)
16 Refer to the Humidity table to assess the sensor's detected humidity fluctuations within the Access Point’s
immediate deployment area.
Humidity is measured in percentage. The table displays the Current Humidity (percent) and a 20 Minute
Average Humidity (percent). Compare these two items to determine whether the deployment location remains
consistently humid (often a by-product of temperature). For more information on enabling the sensor, see
Profile Environmental Sensor Configuration (AP8132 Only) on page 8-222.
17 Refer to the Humidity Trend Over Last Hour graph to assess the fluctuation in humidity over the last hour. Use
this graph in combination with the Temperature and Motions graphs (in particular) to assess the deployment
area’s activity levels.
18 Refer to the Humidity Trend Over Last Day graph to assess whether deployment area humidity is consistent
across specific hours of the day. Use this information to help determine whether the Access Point can be
upgraded or powered off during specific hours of the day.
15.5 Wireless Client Statistics
Statistics
The wireless client statistics display read-only statistics for a client selected from within its connected Access Point
and controller or service platform directory. It provides an overview of the health of wireless clients in the
controller or service platform managed network. Use this information to assess if configuration changes are
required to improve client performance.
Wireless clients statistics can be assessed using the following criteria:
•Health
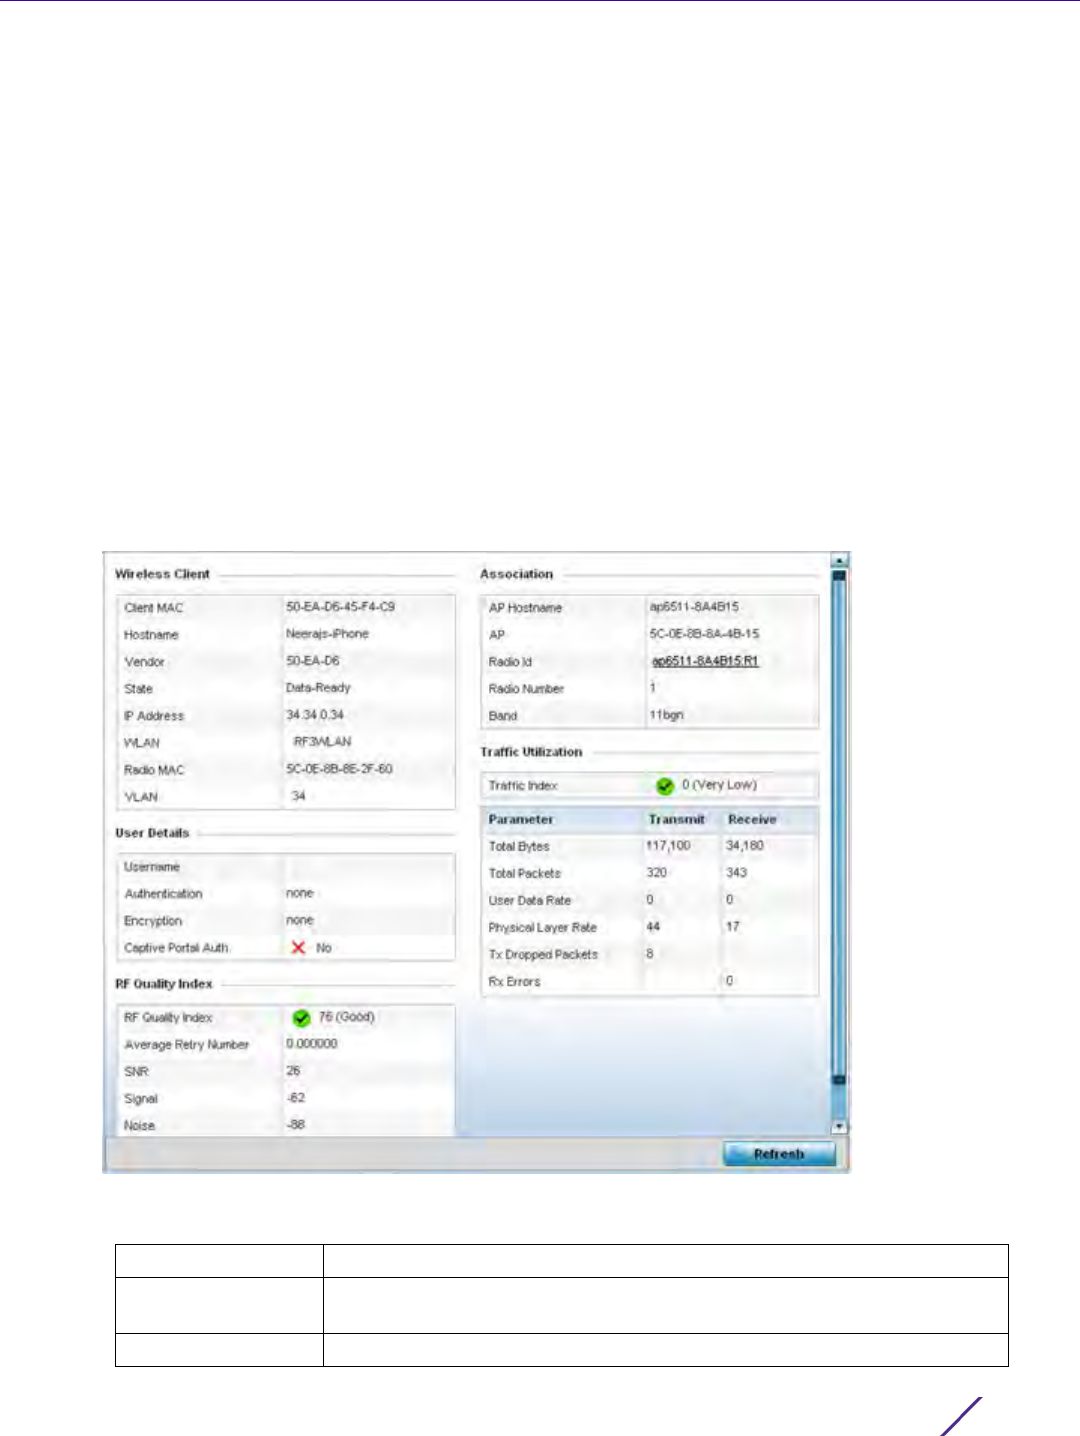
Statistics
Wireless Controller and Service Platform System Reference Guide 15 - 311
•Details
•Traffic
•WMM TSPEC
•Association History
•Graph
15.5.1 Health
Wireless Client Statistics
The Health screen displays information on the overall performance of a selected wireless client.
To view the health of a wireless client:
1 Select the Statistics menu from the Web UI.
2Select
System from the navigation pane (on the left-hand side of the screen). Expand a RF Domain, select a
controller or service platform, an Access Point, then a connected client.
3Select
Health.
Figure 15-221 Wireless Client - Health screen
The Wireless Client field displays the following:
Client MAC Displays the factory encoded MAC address of the selected wireless client.
Hostname Lists the hostname assigned to the client when initially managed by the
controller, service platform or Access Point.
Vendor Displays the vendor name (manufacturer) of the wireless client.

Statistics
Wireless Controller and Service Platform System Reference Guide 15 - 312
The User Details field displays the following:
The RF Quality Index field displays the following:
The Association field displays the following:
State Displays the current operational state of the wireless client. The client’s
state can be idle, authenticated, roaming, associated or blacklisted.
IP Address Displays the IP address the selected wireless client is currently utilizing as
a network identifier.
WLAN Displays the client’s connected Access Point WLAN membership. This is
the WLAN whose QoS settings should account for the clients’s radio traffic
objective.
Radio MAC Displays the Access Point radio MAC address the wireless client is
connected to on the network.
VLAN Displays the VLAN ID the Access Point has defined for use as a virtual
interface with the client.
Username Displays the unique name of the administrator or operator managing the
client’s connected Access Point, controller or service platform.
Authentication Lists the authentication scheme applied to the client for interoperation
with the Access Point.
Encryption Lists the encryption scheme applied to the client for interoperation with
the Access Point.
Captive Portal Auth. Displays whether captive portal authentication is enabled for the client as
a guest access medium to the controller or service platform managed
network.
RF Quality Index Displays information on the RF quality for the selected wireless client. The
RF quality index is the overall effectiveness of the RF environment as a
percentage of the connect rate in both directions, as well as the retry and
error rate. RF quality index can be interpreted as:
0 – 20 (Very poor quality)
20 – 40 (Poor quality)
40 – 60 (Average quality)
60 – 100 (Good quality)
Average Retry
Number
Displays the average number of retries per packet. A high number
indicates possible network or hardware problems.
SNR Displays the signal to noise (SNR) ratio of the connected wireless client.
Signal Displays the power of the radio signals in - dBm.
Noise Displays the disturbing influences on the signal by interference of signals
in - dBm.
Error Rate Displays the number of received bit rates altered due to noise, interference
and distortion. It’s a unitless performance measure.
AP Hostname Lists the administrator assigned device name of the client’s connected
Access Point.

Statistics
Wireless Controller and Service Platform System Reference Guide 15 - 313
4The
Traffic Utilization field displays statistics on the traffic generated and received by the selected client. This
area displays the traffic index, which measures how efficiently the traffic medium is utilized. It’s defined as the
percentage of current throughput relative to the maximum possible throughput.
Traffic indices are:
•0 – 20 (Very low utilization)
•20 – 40 (Low utilization)
•40 – 60 (Moderate utilization)
•60 and above (High utilization)
The Traffic Utilization table displays the following:
5 Select the Refresh button to update the screen’s statistics counters to their latest values.
15.5.2 Details
Wireless Client Statistics
The Details screen provides granular performance information for a selected wireless client.
To view the details screen of a connected wireless client:
1 Select the Statistics menu from the Web UI.
2Select
System from the navigation pane (on the left-hand side of the screen). Expand a RF Domain, select a
controller or service platform, an Access Point, then a connected client.
3Select
Details.
AP Displays the MAC address of the client’s connected Access Point.
Radio Lists the target Access Point that houses the radio. Select the Access Point
to view performance information in greater detail.
Radio ID Lists the hardware encoded MAC address the radio uses as a hardware
identifier that further distinguishes the radio from others within the same
device.
Radio Number Displays the Access Point’s radio number (either 1, 2 or 3) to which the
selected client is associated.
Radio Type Displays the radio type. The radio can be 802.11b, 802.11bg, 802.11bgn,
802.11a or 802.11an.
Total Bytes Displays the total bytes processed by the Access Point’s connected
wireless client.
Total Packets Displays the total number of packets processed by the wireless client.
User Data Rate Displays the average user data rate in both directions.
Physical Layer Rate Displays the average packet rate at the physical layer in both directions.
Tx Dropped Packets Displays the number of packets dropped during transmission.
Rx Errors Displays the number of errors encountered during data transmission. The
higher the error rate, the less reliable the connection or data transfer
between the client and connected Access Point.
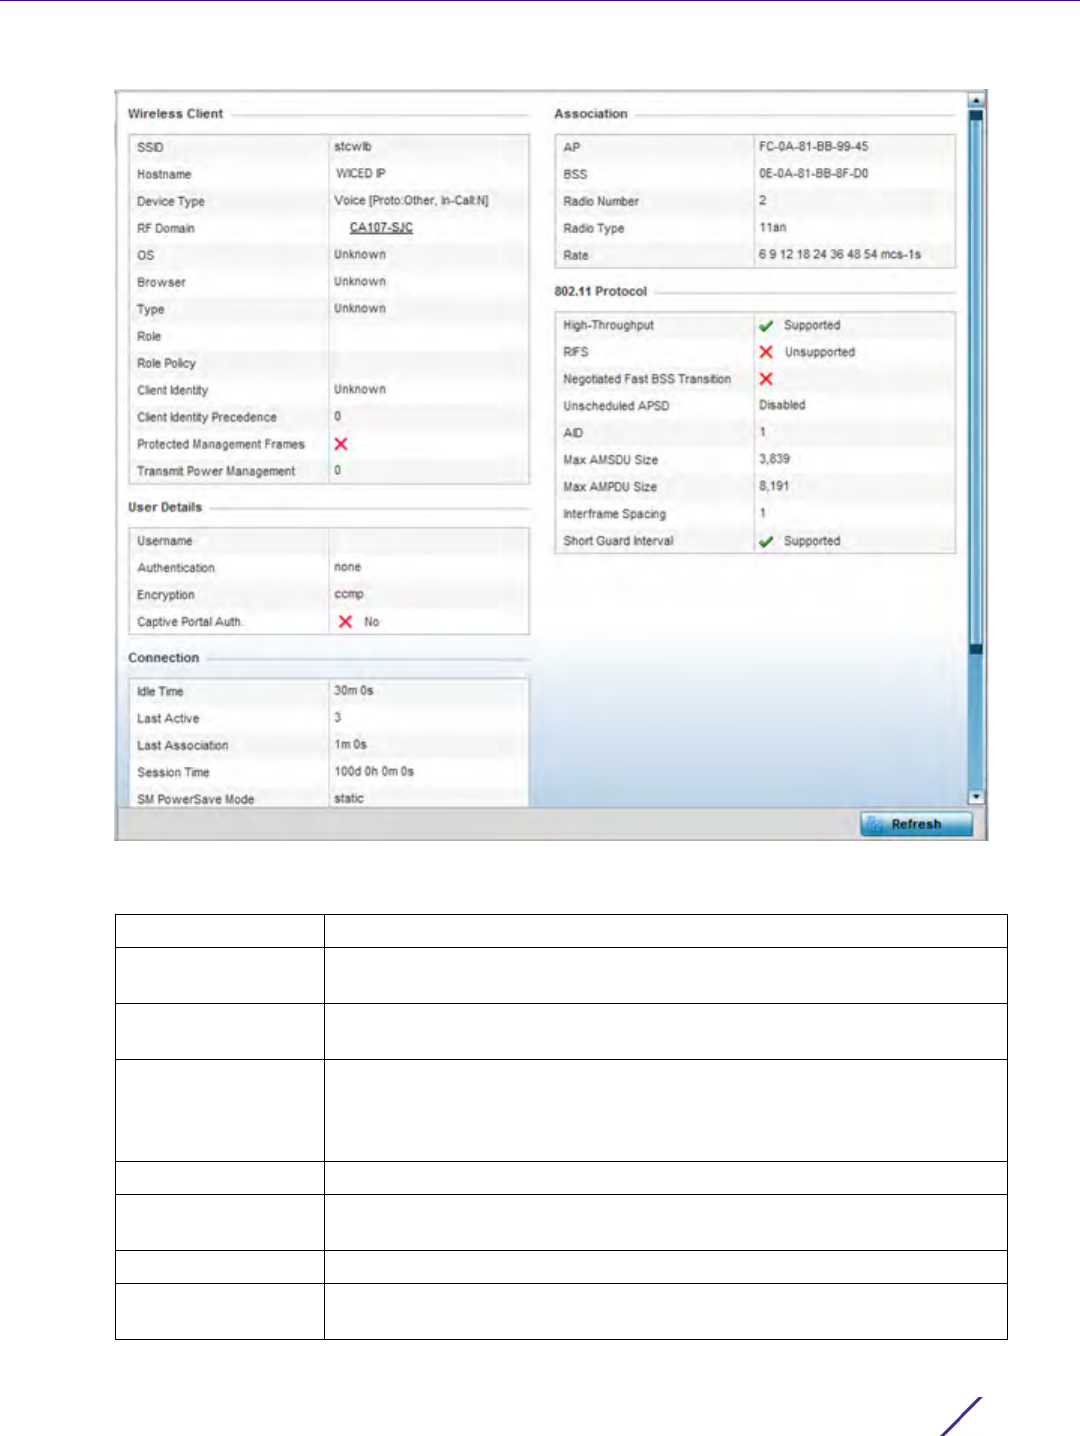
Statistics
Wireless Controller and Service Platform System Reference Guide 15 - 314
Figure 15-222 Wireless Client - Details screen
The Wireless Client field displays the following:
SSID Displays the client’s Service Set ID (SSID).
Hostname Lists the hostname assigned to the client when initially managed by the
controller, service platform or Access Point managed network.
Device Type Displays the client device type providing the details to the operating
system.
RF Domain Displays the RF Domain to which the connected client is a member via its
connected Access Point, controller or service platform. The RF Domain
displays as a link that can be selected to display configuration and
network address information in greater detail.
OS Lists the client’s operating system (Android etc.).
Browser Displays the browser type used by the client to facilitate its wireless
connection.
Type Lists the client manufacturer (or vendor).
Role Lists the client’s defined role in the controller, service platform or Access
Point managed network.

Statistics
Wireless Controller and Service Platform System Reference Guide 15 - 315
The User Details field displays the following:
The Connection field displays the following:
Role Policy Lists the user role set for the client as it became a controller, service
platform or Access Point managed device.
Client Identity Displays the unique vendor identity of the listed device as it appears to its
adopting controller or service platform.
Client Identity
Precedence
Lists the numeric precedence this client uses in establishing its identity
amongst its peers.
Protected
Management Frames
A green checkmark defines management frames as protected between
this client and its associated Access Point radio. A red X states that
management frames are disabled for the client and its connected radio.
Transmit Power
Management
Lists the number power management frames exchanged between this
client and its connected Access Point radio. Lists zero when disabled.
Username Displays the unique name of the administrator or operator managing the
client’s connected Access Point.
Authentication Lists the authentication scheme applied to the client for interoperation
with its connected Access Point radio.
Encryption Lists the encryption scheme applied to the client for interoperation with its
connected Access Point radio.
Captive Portal Auth. Displays whether captive portal authentication is enabled. When enabled,
a restrictive set of access permissions may be in effect.
Idle Time Displays the time for which the wireless client remained idle.
Last Active Displays the time in seconds the wireless client was last interoperating
with its connected Access Point.
Last Association Displays the duration the wireless client was in association with its
connected Access Point.
Session Time Displays the duration for which a session can be maintained by the
wireless client without it being dis-associated from the Access Point.
SM Power Save
Mode
Displays whether this feature is enabled on the wireless client. The spatial
multiplexing (SM) power save mode allows an 802.11n client to power
down all but one of its radios. This power save mode has two sub modes
of operation: static operation and dynamic operation.
Power Save Mode Displays whether this feature is enabled or not. To prolong battery life, the
802.11 standard defines an optional Power Save Mode, which is available on
most 80211 clients. End users can simply turn it on or off via the card
driver or configuration tool. With power save off, the 802.11 network card is
generally in receive mode listening for packets and occasionally in transmit
mode when sending packets. These modes require the 802.11 NIC to keep
most circuits powered-up and ready for operation.
WMM Support Displays whether WMM is enabled or not in order to provide data packet
type prioritization between the Access Point and connected client.
40 MHz Capable Displays whether the wireless client has 802.11n channels operating at 40
MHz.

Statistics
Wireless Controller and Service Platform System Reference Guide 15 - 316
The Association field displays the following:
The 802.11 Protocol field displays the following:
Max Physical Rate Displays the maximum data rate at the physical layer.
Max User Rate Displays the maximum permitted user data rate.
MC2UC Streams Lists the number or multicast to unicast data streams detected.
AP Displays the MAC address of the client’s connected Access Point.
BSS Displays the Basic Service Set (BSS) the Access Point belongs to. A BSS is
a set of stations that can communicate with one another.
Radio Number Displays the Access Point radio the wireless client is connected to.
Radio Type Displays the radio type. The radio can be 802.11b, 802.11bg, 802.11bgn,
802.11a or 802.11an.
Rate Displays the permitted data rate for Access Point and client interoperation.
High-Throughput Displays whether high throughput is supported. High throughput is a
measure of the successful packet delivery over a communication channel.
RIFS Displays whether this feature is supported. RIFS is a required 802.11n
feature that improves performance by reducing the amount of dead time
between OFDM transmissions.
Negotiated Fast BSS
Transition
Lists whether Fast BSS transition is negotiated. This indicates support for a
seamless fast and secure client handoff between two Access Points,
controllers or service platforms.
Unscheduled APSD Displays whether APSD is supported. APSD defines an unscheduled
service period, which is a contiguous period of time during which the
Access Point is expected to be awake.
AID Displays the Association ID (AID) established by an AP. 802.11 association
enables the Access Point to allocate resources and synchronize with a
client. A client begins the association process by sending an association
request to an Access Point. This association request is sent as a frame. This
frame carries information about the client and the SSID of the network it
wishes to associate. After receiving the request, the Access Point considers
associating with the client, and reserves memory space for establishing an
AID for the client.
Max AMSDU Size Displays the maximum size of AMSDU. AMSDU is a set of Ethernet frames
to the same destination that are wrapped in a 802.11n frame. This values is
the maximum AMSDU frame size in bytes.
Max AMPDU Size Displays the maximum size of AMPDU. AMPDU is a set of Ethernet frames
to the same destination that are wrapped in an 802.11n MAC header.
AMPDUs are used in a very noisy environment to provide reliable packet
transmission. This value is the maximum AMPDU size in bytes.
Interframe Spacing Displays the interval between two consecutive Ethernet frames.
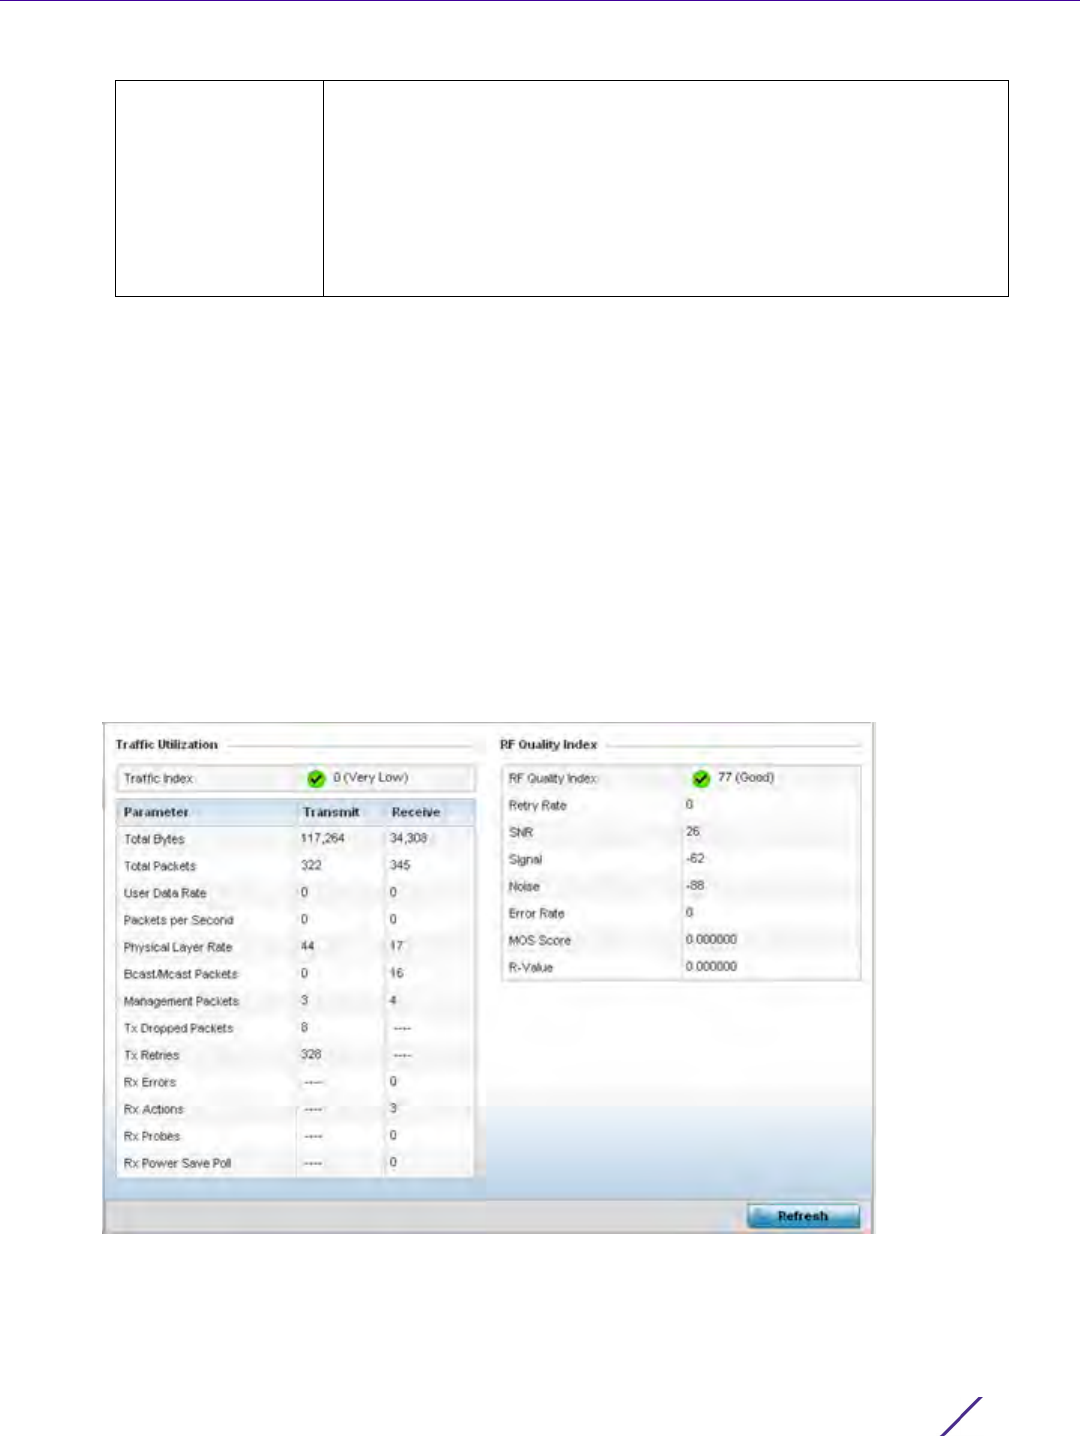
Statistics
Wireless Controller and Service Platform System Reference Guide 15 - 317
4 Select the Refresh button to update the screen’s statistics counters to their latest values.
15.5.3 Traffic
Wireless Client Statistics
The traffic screen provides an overview of client traffic utilization in both the transmit and receive directions. This
screen also displays a RF quality index.
To view the traffic statistics of a wireless clients:
1 Select the Statistics menu from the Web UI.
2Select
System from the navigation pane (on the left-hand side of the screen). Expand a RF Domain, select a
controller or service platform, an Access Point, then a connected client.
3Select
Traffic.
Figure 15-223 Wireless Client - Traffic screen
Traffic Utilization statistics employ an index, which measures how efficiently the traffic medium is used. It’s
defined as the percentage of current throughput relative to the maximum possible throughput.
Traffic indices are:
Short Guard Interval Displays the guard interval in micro seconds. Guard intervals prevent
interference between data transmissions. The guard interval is the space
between characters being transmitted. The guard interval eliminates inter-
symbol interference (ISI). ISI occurs when echoes or reflections from one
character interfere with another character. Adding time between
transmissions allows echo's and reflections to settle before the next
character is transmitted. A shorter guard interval results in shorter
character times which reduces overhead and increases data rates by up to
10%.

Statistics
Wireless Controller and Service Platform System Reference Guide 15 - 318
• 0 – 20 (Very low utilization)
• 20 – 40 (Low utilization)
• 40 – 60 (Moderate utilization)
• 60 and above (High utilization)
This screen also provides the following:
The RF Quality Index area displays the following information:
Total Bytes Displays the total bytes processed (in both directions) by the Access
Point’s connected client.
Total Packets Displays the total number of data packets processed (in both directions)
by the Access Point’s connected wireless client.
User Data Rate Displays the average user data rate.
Packets per Second Displays the packets processed per second.
Physical Layer Rate Displays the data rate at the physical layer level.
Bcast/Mcast Packets Displays the total number of broadcast/multicast packets processed by
the client.
Management
Packets
Displays the number of management (overhead) packets processed by the
client.
Tx Dropped Packets Displays the client’s number of dropped packets while transmitting to its
connected Access Point.
Tx Retries Displays the total number of client transmit retries with its connected
Access Point.
Rx Errors Displays the errors encountered by the client during data transmission. The
higher the error rate, the less reliable the connection or data transfer
between client and connected Access Point.
Rx Actions Displays the number of receive actions during data transmission with the
client’s connected Access Point.
Rx Probes Displays the number of probes sent. A probe is a program or other device
inserted at a key juncture in a for network for the purpose of monitoring
or collecting data about network activity.
Rx Power Save Poll Displays the power save using the Power Save Poll (PSP) mode. Power
Save Poll is a protocol, which helps to reduce the amount of time a radio
needs to powered. PSP allows the WiFi adapter to notify the Access Point
when the radio is powered down. The Access Point holds any network
packet to be sent to this radio.
RF Quality Index Displays information on the RF quality of the selected wireless client. The
RF quality index is the overall effectiveness of the RF environment as a
percentage of the connect rate in both directions as well as the retry rate
and the error rate. The RF quality index value can be interpreted as:
0 – 20 (Very low utilization)
20 – 40 (Low utilization)
40 – 60 (Moderate utilization)
60 and above (High utilization)
Retry Rate Displays the average number of retries per packet. A high number
indicates possible network or hardware problems.

Statistics
Wireless Controller and Service Platform System Reference Guide 15 - 319
4 Select the Refresh button to update the screen’s statistics counters to their latest values.
15.5.4 WMM TSPEC
Wireless Client Statistics
The 802.11e Traffic Specification (TSPEC) provides a set of parameters that define the characteristics of the traffic
stream, (operating requirement and scheduling etc.). The sender TSPEC specifies parameters available for packet
flows. Both sender and the receiver use TSPEC.
The TSPEC screen provides information about TSPEC counts and TSPEC types utilized by the selected wireless
client.
To view the TSPEC statistics:
1 Select the Statistics menu from the Web UI.
2Select
System from the navigation pane (on the left-hand side of the screen). Expand a RF Domain, select a
controller or service platform, an Access Point, then a connected client.
3Select
WMM TSPEC.
SNR (dBm) Displays the connected client’s signal to noise ratio (SNR). A high SNR
could warrant a different Access Point connection to improve performance.
Signa (dBm) Displays the power of the radio signals in - dBm.
Noise (dBm) Displays the disturbing influences on the signal in - dBm.
Error Rate (ppm) Displays the number of received bit rates altered due to noise, interference
and distortion. It’s a unitless performance measure.
MOS Score Displays average voice call quality using the Mean Opinion Score (MOS)
call quality scale. The MOS scale rates call quality on a scale of 1-5, with
higher scores being better. If the MOS score is lower than 3.5, it’s likely
users will not be satisfied with the voice quality of their call.
R-Value R-value is a number or score used to quantitatively express the quality of
speech in communications systems. This is used in digital networks that
carry Voice over IP (VoIP) traffic. The R-value can range from 1 (worst) to
100 (best) and is based on the percentage of users who are satisfied with
the quality of a test voice signal after it has passed through a network
from a source (transmitter) to a destination (receiver). The R-value scoring
method accurately portrays the effects of packet loss and delays in digital
networks carrying voice signals.
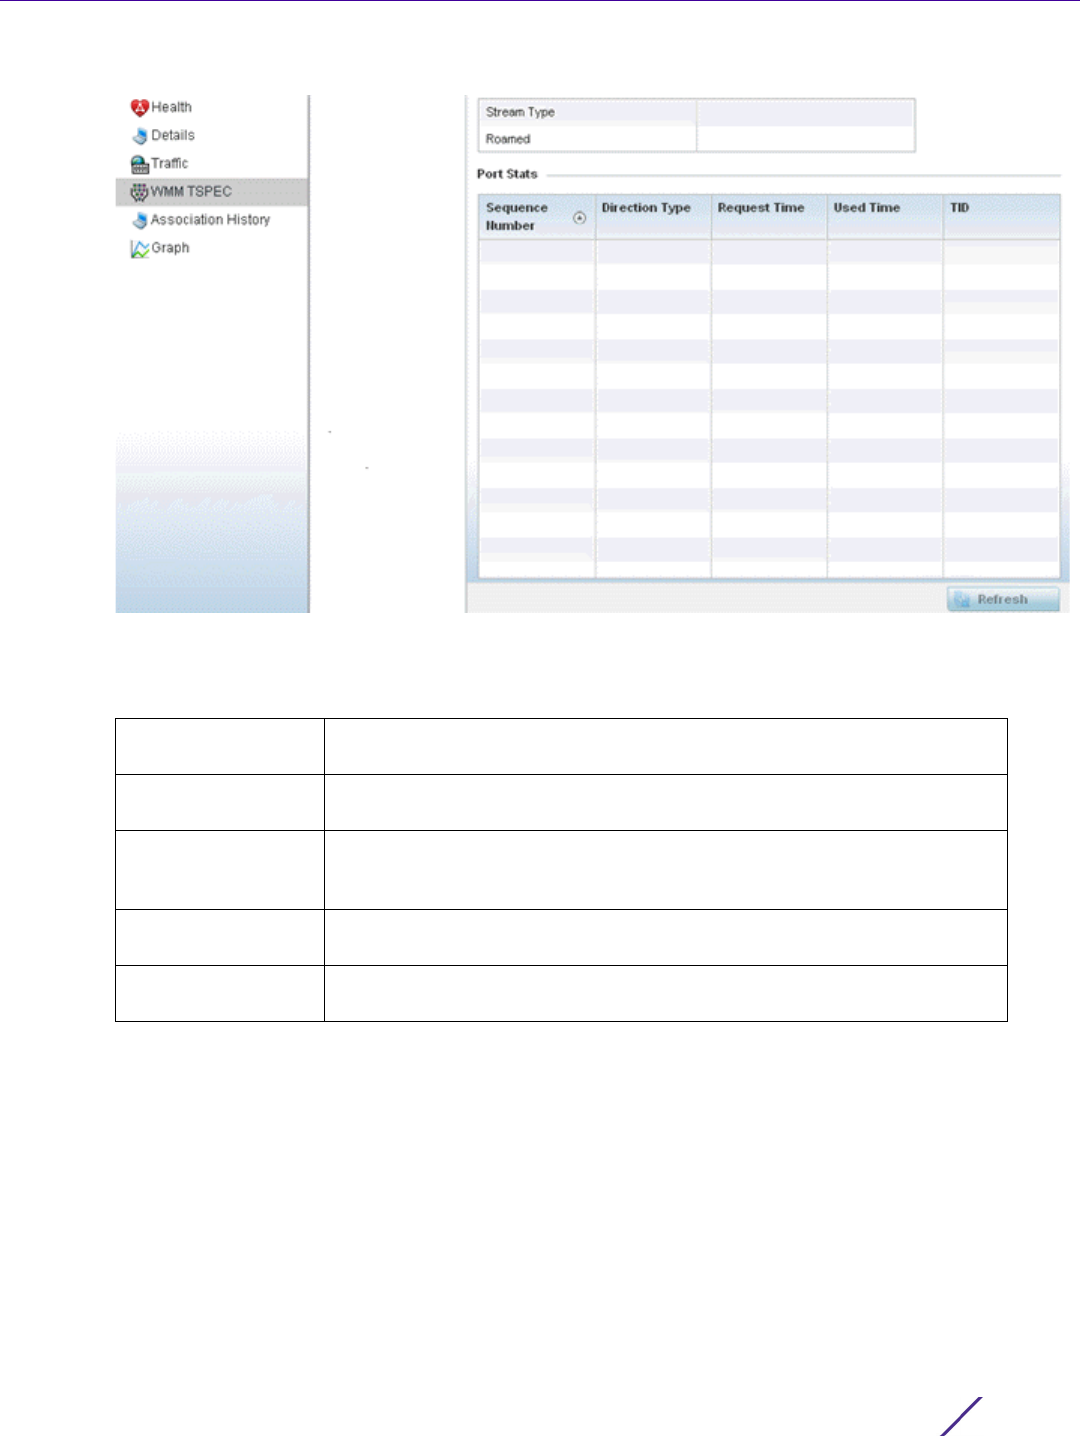
Statistics
Wireless Controller and Service Platform System Reference Guide 15 - 320
Figure 15-224 Wireless Client - WMM TSPEC screen
The top portion of the screen displays the TSPEC stream type and whether the client has roamed.
The Ports Stats field displays the following:
4 Periodically select Refresh to update the screen to its latest values.
15.5.5 Association History
Wireless Client Statistics
Refer to the Association History screen to review this client’s Access Point connections. Hardware device
identification, operating channel and GHz band data is listed for each Access Point. The Association History can
help determine whether the client has connected to its target Access Point and maintained its connection, or has
roamed and been supported by unplanned Access Points in the controller or service platform managed network.
To view a selected client’s association history:
Sequence Number Lists a sequence number that’s unique to this WMM TSPEC uplink or
downlink data stream.
Direction Type Displays whether the WMM TSPEC data stream is in the uplink or downlink
direction.
Request Time Lists each sequence number’s request time for WMM TSPEC traffic in the
specified direction. This is time allotted for a request before packets are
actually sent.
Used Time Displays the time the client used TSPEC. The client sends a delete traffic
stream (DELTS) message when it has finished communicating.
TID Displays the parameter for defining the traffic stream. TID identifies data
packets as belonging to a unique traffic stream.
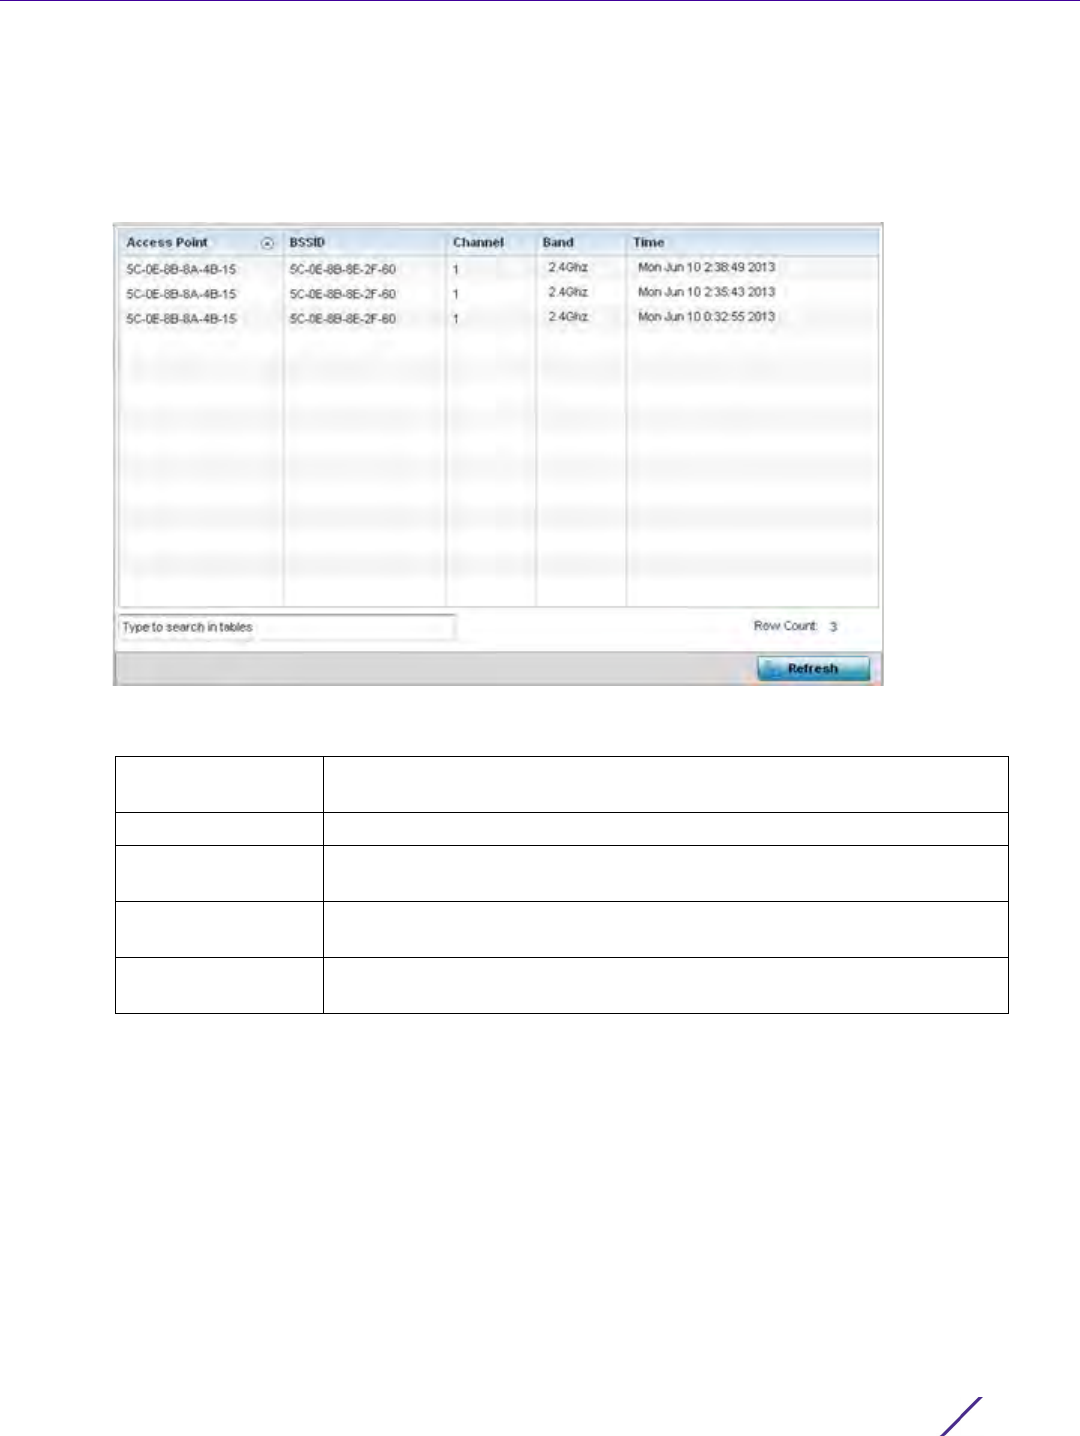
Statistics
Wireless Controller and Service Platform System Reference Guide 15 - 321
1 Select the Statistics menu from the Web UI.
2Select
System from the navigation pane (on the left-hand side of the screen). Expand a RF Domain, select a
controller or service platform, an Access Point, then a connected client.
3Select
Association History.
Figure 15-225 Wireless Client - Association History screen
Refer to the following to discern this client’s Access Point association history:
4Select
Refresh to update the screen to its latest values.
15.5.6 Graph
Wireless Client Statistics
Use the client Graph to assess a connected client’s radio performance and diagnose performance issues that may
be negatively impact performance. Up to three selected performance variables can be charted at one time. The
graph uses a Y-axis and a X-axis to associate selected parameters with their performance measure.
To view a graph of this client’s statistics:
Access Point Lists the Access Point MAC address this client has connected to, and is
being managed by.
BSSID Displays the BSSID of each previously connected Access Point.
Channel Lists the channel shared by both the Access Point and client for
interoperation, and to avoid congestion with adjacent channel traffic.
Band Lists the 2.4 or 5GHz radio band this clients and its connect Access Point
are using for transmit and receive operations.
Time Lists the historical connection time between each listed Access Point and
this client.
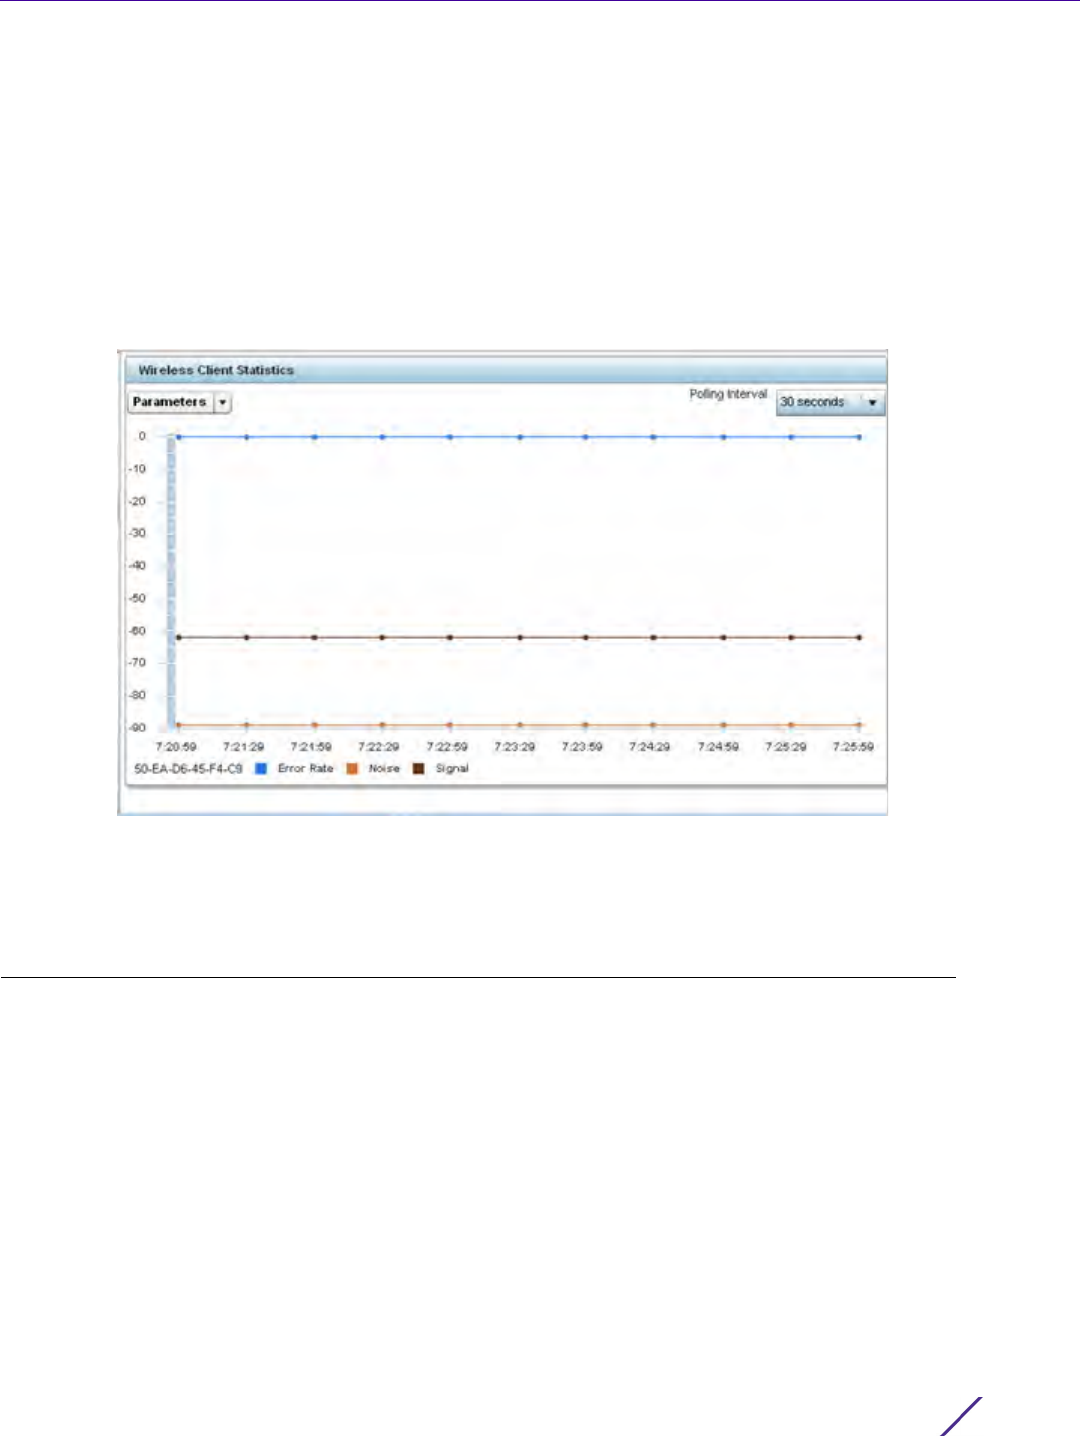
Statistics
Wireless Controller and Service Platform System Reference Guide 15 - 322
1 Select the Statistics menu from the Web UI.
2Select
System from the navigation pane (on the left-hand side of the screen). Expand a RF Domain, select a
controller or service platform, an Access Point then a connected client.
3Select
Graph.
4Use the
Parameters drop down menu to define from 1- 3 variables assessing client signal noise, transmit or
receive values.
5Use the Polling Interval drop-down menu to define the interval the chart is updated. Options include 30
seconds, 1 minute, 5 minutes, 20 minutes or 1 hour. 30 seconds is the default value.
Figure 15-226 Wireless Client - Graph
6 Select an available point in the graph to list the selected performance parameter, and display that parameter’s
value and a time stamp of when it occurred.
15.6 Guest Access Statistics
Statistics
Guest client statistics are uniquely available for wireless clients requesting the required pass code, authentication
and access into the WiNG managed guest client network
Guest Access statistics can be assessed for the following:
•Guest Access Cumulative Statistics
•Social Media Statistics
•Reports
•Notifications
•Guest Access Database
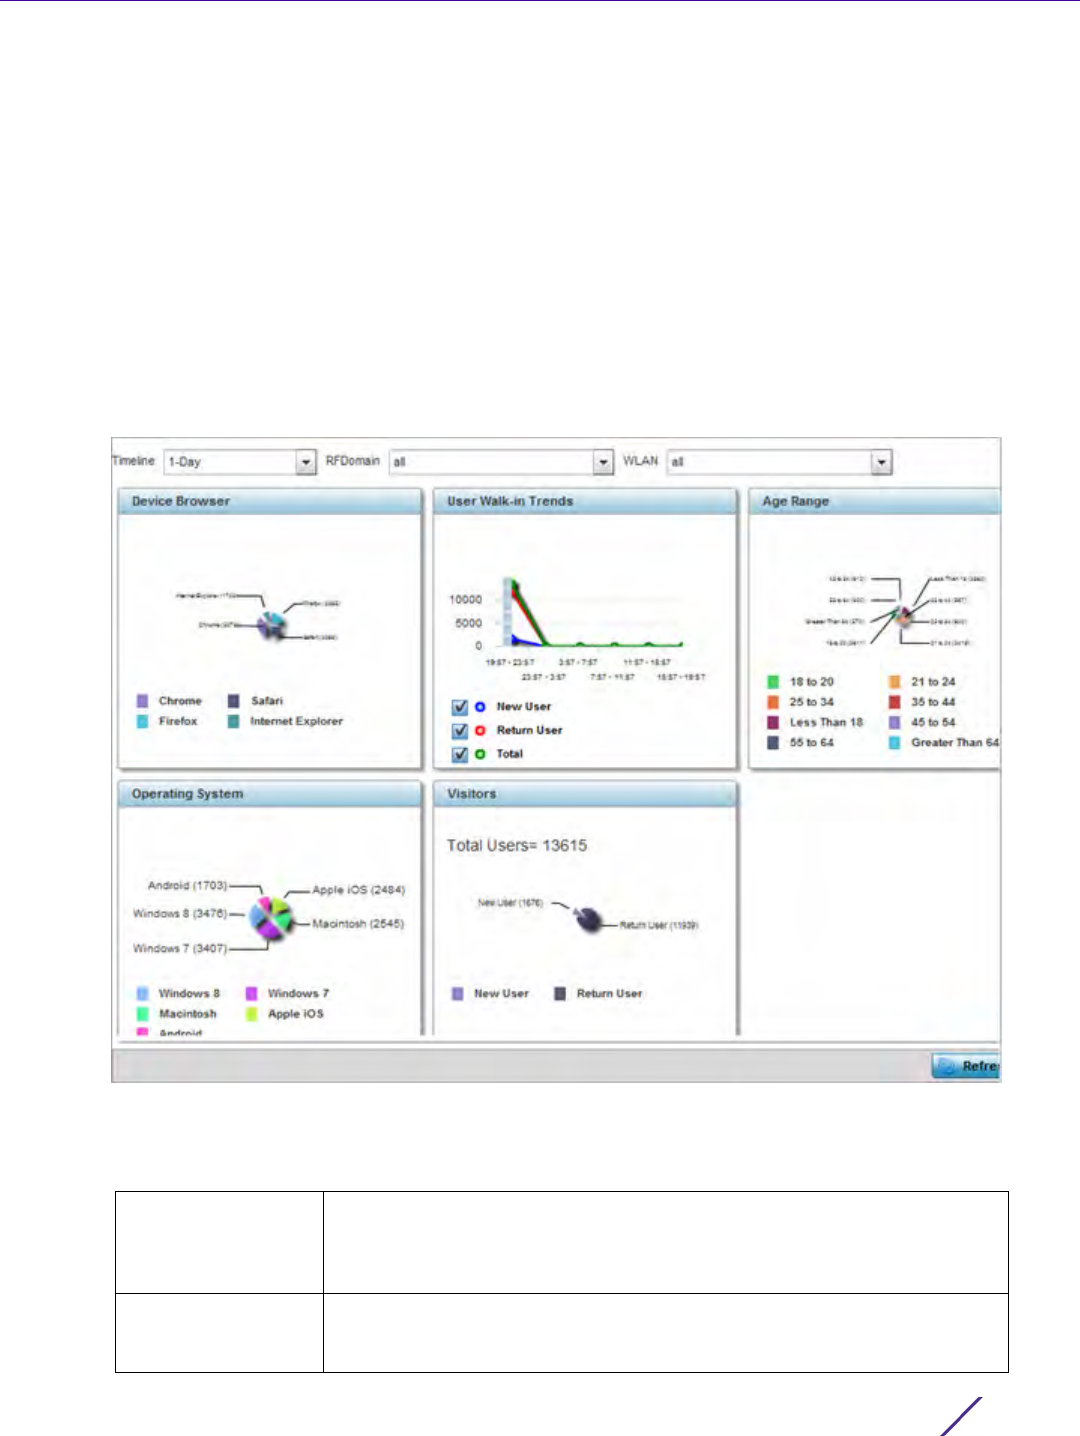
Statistics
Wireless Controller and Service Platform System Reference Guide 15 - 323
15.6.1 Guest Access Cumulative Statistics
Guest Access Statistics
The Statistics screen displays information on the WiNG managed guest client network. Its includes browser
utilization, new versus returning user trends, client user age, client operating system, device type proliferation and
gender trending.
To view a cumulative set of client guest access statistics:
1 Select the Statistics menu from the Web UI.
2Select
Guest Access above the navigation pane (on the upper left-hand side of the screen, directly to the right
of System).
3Select
Statistics.
Figure 15-227 Guest Access - Statistics screen
4 Refer to the top of the screen to configure how the following trending periods and user filters are set for guest
access statistics trending and reporting:
Timeline Use the drop-down menu to specify whether statistics are gathered for 1-
Day, 1-Month, 1-Week, 2-Hours, 30-Mins or 5-Hours. Timelines support the
latest time period from present. For example, specifying 30-Mins displays
statistics for the most recent 30 minutes trended.
RF Domain Use the drop-down menu to select a single RF Domain from which to filter
guest access statistics. Optionally select All to include data from each RF
Domain supported.

Statistics
Wireless Controller and Service Platform System Reference Guide 15 - 324
5 Refer to the following to assess guest client browser, operating system, age, gender and new versus returning
status to assess whether guest client utilization is in line with WiNG guest access deployment objectives:
WLAN Use the drop down menu to filter guest access statistics to a specific
WLAN. A single WLAN can belong to more then one RF Domain.
Device Browser Displays guest user browser utilization in pie-chart format. Each client
browser type (Chrome, Firefox, Safari and Internet Explorer) detected
within the defined trending period displays uniquely in its own color for
easy differentiation. The number of guest clients utilizing each browser
also displays numerically.
User Walk-in Trends Walk-in trending enables an administrator to filter new guest access
clients versus return guest clients out of the total reported for the
trending period and selected RF Domain and WLAN. New guest users
(blue), return guests (red) or total guests can either be collectively
displayed or individually displayed by selecting one, two or all three of the
options.
Age Range Displays guest user age differentiation in pie-chart format. Age ranges are
uniquely color coded as Less Than 18, 18 to 20, 21 to 24, 25 to 34, 35 to 44,
45 to 54, 55 to 64 and Greater Than 64. Each age group detected within
the trending period displays uniquely in its own color for easy
differentiation. Each age range also displays numerically. Periodically
assess whether the age ranges meet expectations for guest client access
within the WiNG managed guest network.
Operating System Displays guest client operating system utilization in pie-chart format. Each
client operating system type (Android, Windows 7, Windows 8, Apple iOS
and Macintosh) displays uniquely in its own color for easy differentiation.
The number of guest clients utilizing each operating system also displays
numerically.
Visitors Displays return guest clients versus new guest clients in pie-chart format.
Both new and returning clients display uniquely in their own color for easy
differentiation. Periodically assess whether the number of returning guest
clients is line with the guest network’s deployment objectives in respect to
the RF Domain(s) and WLAN(s) selected for trending.
Customer Loyalty
App
Graphically displays the number of guest clients with loyalty application
presence enabled. Loyalty application detection occurs on the Access
Point to which the client is associated, allowing a retail administrator to
assess whether a captive portal client is using specific retail (loyalty)
applications in their captive portal. This setting is enabled by default.
Devices Displays guest client device type utilization in pie-chart format. Each client
device type (Windows PC, Macintosh, Apple iPad, Android Mobile and
Motorola Droid) displays uniquely in its own color for easy differentiation.
The number of each device type detected also displays numerically to
help assess their proliferation with WiNG managed guest network.
Gender Displays guest client gender in pie-chart format. Detected male and
female guest users display uniquely in their own color for easy
differentiation. Guest clients whose gender is unspecified also displays to
help assess the undetermined gender client count out of total. The
number of male, female and unspecified guest clients also displays
numerically.
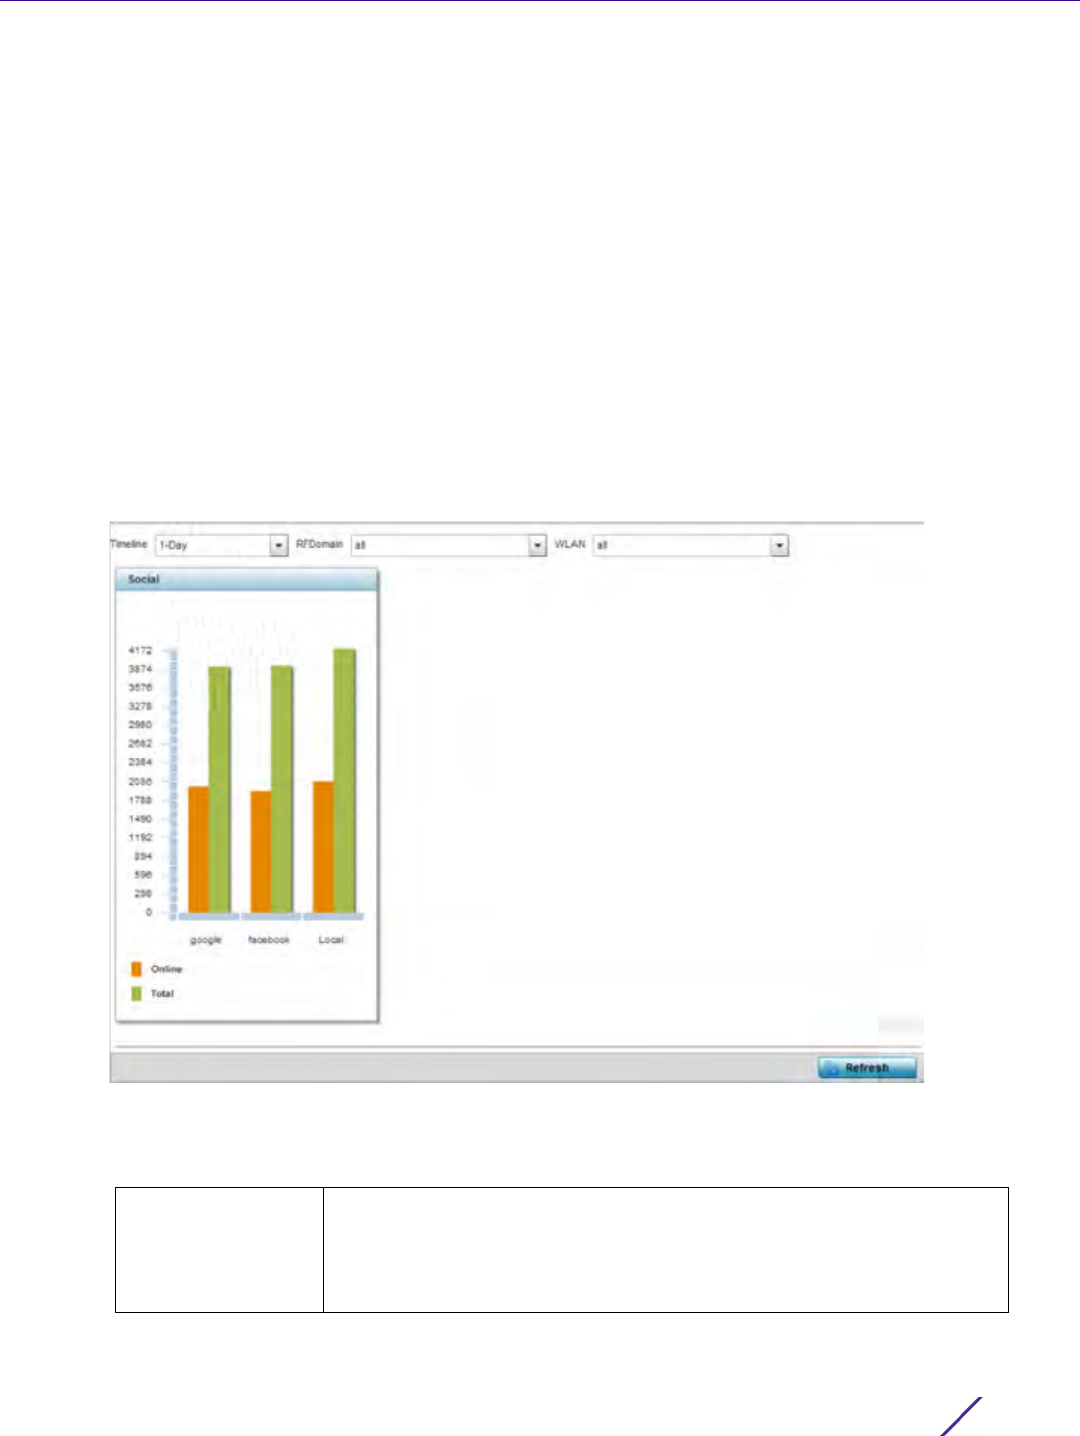
Statistics
Wireless Controller and Service Platform System Reference Guide 15 - 325
6 Select the Refresh button to update the screen’s statistics counters to their latest values.
15.6.2 Social Media Statistics
Guest Access Statistics
Device registration using social media login credentials requires user validation through the guest user's social
media account. The guest user authenticates with an administrator configured social media server like Facebook or
Google. Upon successful authentication, the guest user's social media profile data (collected from the social media
server) is registered on the device.
To view guest access social media utilization for guest clients:
1 Select the Statistics menu from the Web UI.
2Select
Guest Access above the navigation pane (on the upper left-hand side of the screen, directly to the right
of System).
3Select
Social.
Figure 15-228 Guest Access - Social screen
4 Refer to the top of the screen to configure how the following trending periods and user filters are set for guest
access social media trending:
Timeline Use the drop-down menu to specify whether social media statistics are
gathered for 1-Day, 1-Month, 1-Week, 2-Hours, 30-Mins or 5-Hours.
Timelines support the latest time period from present. For example,
specifying 30-Mins displays statistics for the most recent 30 minutes
trended.
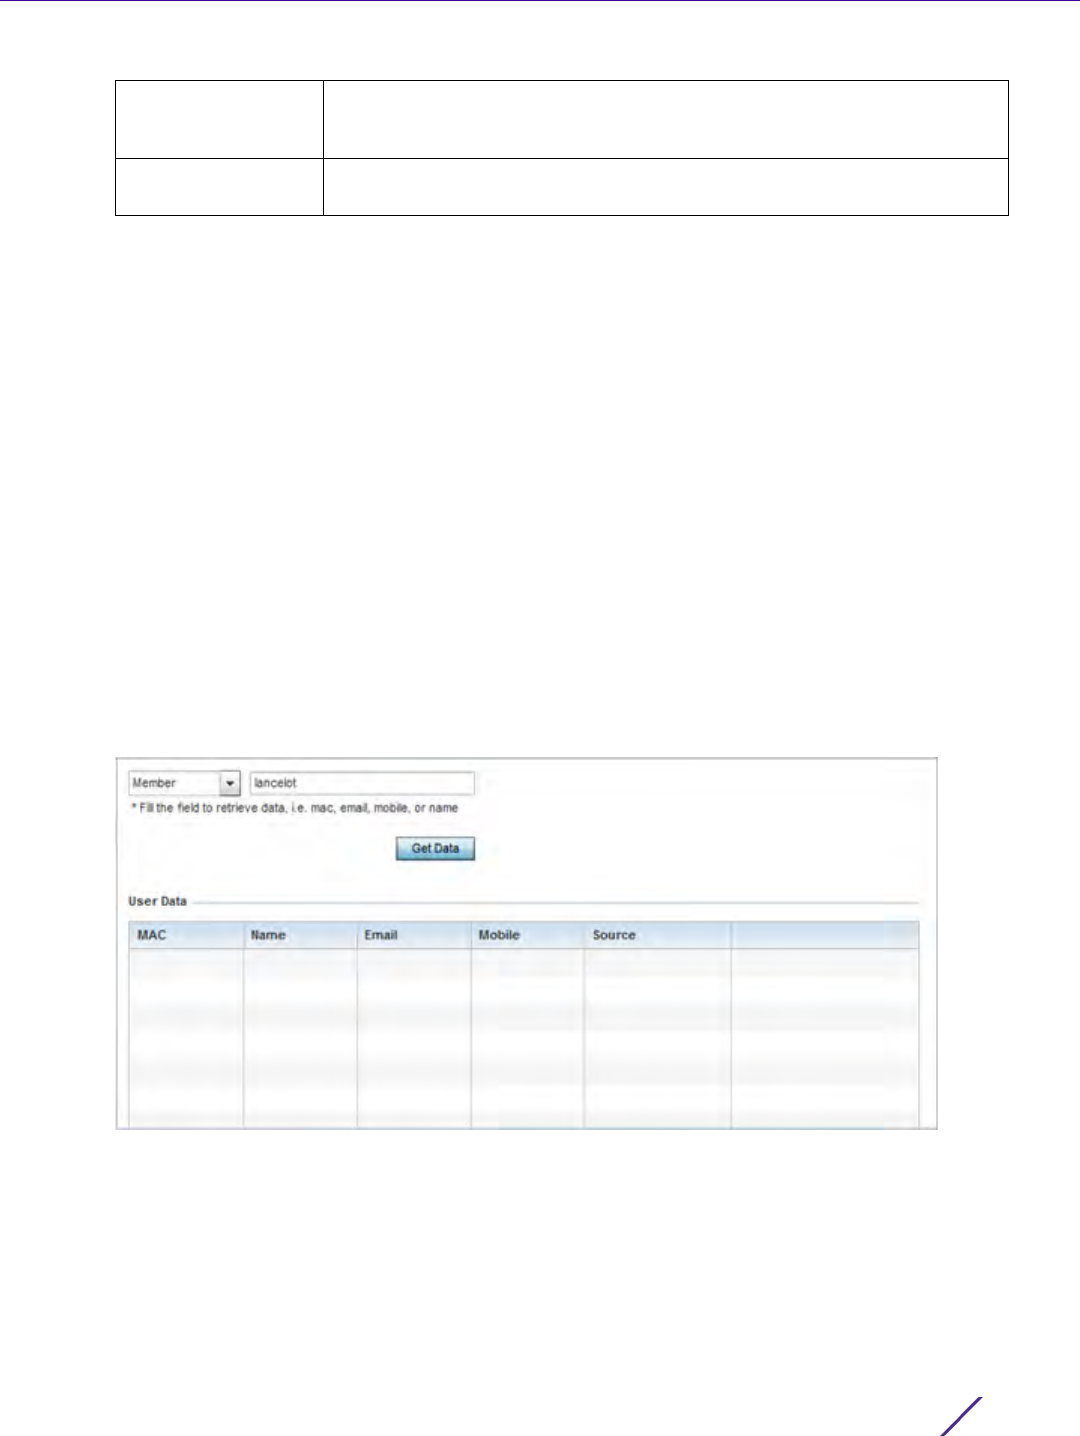
Statistics
Wireless Controller and Service Platform System Reference Guide 15 - 326
The data displays in bar graph format, with the total number of social media authenticating clients listed in
green, and those currently online displayed in orange for both Google and Facebook authenticating clients.
Refer to the Local graph to assess those clients requiring captive portal authentication as a fallback mechanism
for guest registration through social media authentication.
5 Periodically select Refresh to update the statistics counters to their latest values.
15.6.3 Reports
Guest Access Statistics
Report queries can be filtered and run to obtain information on targeted guest clients within the WiNG guest
network.
To generate customized guest client reports:
1 Select the Statistics menu from the Web UI.
2Select
Guest Access above the navigation pane (on the upper left-hand side of the screen, directly to the right
of System).
3Select
Reports.
Figure 15-229 Guest Access - Reports screen
4 Select the drop-down menu at the top, left-hand, side of the screen to define whether the guest client’s report
data is fetched based on its MAC, Name, Mobile, Email, Member or Time. Once provided, enter an appropriate
search string to generate a report for the target guest client. When completed with the report’s search strings,
select Get Data.
RF Domain Use the drop-down menu to select a single RF Domain from which to filter
social media guest access statistics. Optionally select All to include data
from each RF Domain supported.
WLAN Use the drop down menu to filter guest access social media statistics to a
specific WLAN. A single WLAN can belong to more then one RF Domain.

Statistics
Wireless Controller and Service Platform System Reference Guide 15 - 327
5 Refer to the User Data table to review the following report output:
15.6.4 Notifications
Guest Access Statistics
For each registered guest user, a passcode is sent by E-mail, SMS or both. A guest management policy defines E-
mail host and SMS gateway commands, along with credentials required for sending a passcode to guest client via
E-mail and SMS Users can configure up to 32 different guest management policies. Each policy enables the user to
configure the SMS gateway, SMS message body, E-mail SMTP server, E-mail subject contents and E-mail message
body. There can be only one guest management policy active per device at any one time.
The short message service (SMS) is the text messaging service component of phone, E-Mail and mobile systems.
SMS uses standardized communications protocols to allow fixed or mobile phone devices to exchange text
messages.
To review guest client notification statistics:
1 Select the Statistics menu from the Web UI.
2Select
Guest Access above the navigation pane (on the upper left-hand side of the screen, directly to the right
of System).
3Select
Notification.
MAC Displays the factory encoded hardware MAC address assigned to this
guest client at the factory by the manufacturer. This is the guest client’s
hardware identifier added to the guest user database. If the guest client
requests access later, this MAC address is validated against the guest user
database, and the client is allowed access to the WiNG managed guest
network.
Name Lists the name used for guest access authentication and pass code
generation.
Email Lists the E-Mail address used for guest access authentication and the
receipt of the required passcode.
Mobile Lists the guest client’s registered mobile number used for guest access
authentication requests and the receipt of the required passcode.
Source Lists the source (Facebook, Google) whose username and password were
used as the clients’s social media authenticator.
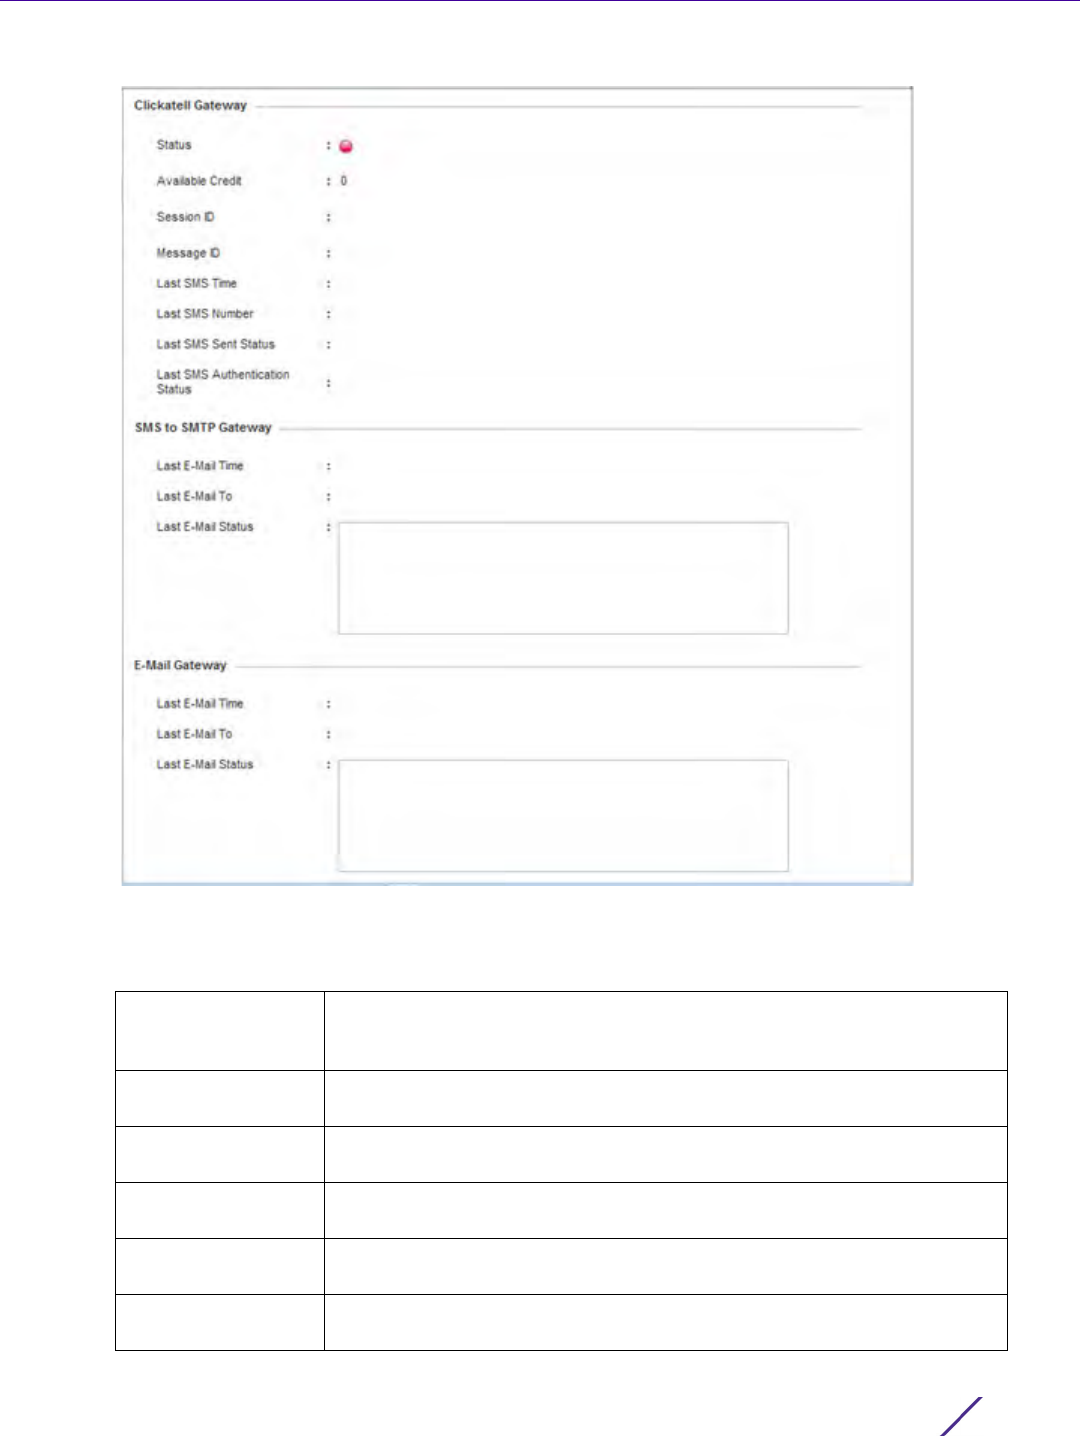
Statistics
Wireless Controller and Service Platform System Reference Guide 15 - 328
Figure 15-230 Guest Access - Notification screen
4 Review the following Clickatell Gateway information. By default, clickatell is the host SMS gateway server
resource for guest access.
Status Displays an icon as a visual indicator of the gateway status. Green defines
the gateway as available. Red indicates the gateway is down and
unavailable.
Session ID Lists an event ID for the clickatell gateway session credential and passcode
exchange.
Message ID Lists the unique SMS message ID created for the successful message
exchange with the clickatell host SMS gateway server.
Last SMS Time Lists the timestamp appended to the sent time of the clickatell SMS
gateway message.
Last SMS Number Lists the numeric status code returned in response to a SMS gateway
server guest access request.
Last SMS Sent Status Lists the associated status strings returned in response to a SMS gateway
server guest access request.

Statistics
Wireless Controller and Service Platform System Reference Guide 15 - 329
5 Review the following SMS to SMTP Gateway information.
6 Review the following Email Gateway information.
15.6.5 Guest Access Database
Guest Access Statistics
Refer to the Database screen to periodically import or export guest access information to and from a WiNG
managed device. The import or export of the guest access database is supported in JSON format only. Archiving
guest access utilization data is a good way to assess periods of high and low utilization and better plan for client
guest access consumption of controller or Access Point network resources.
To administrate the guest access database:
1 Select the Statistics menu from the Web UI.
2Select
Guest Access above the navigation pane (on the upper left-hand side of the screen, directly to the right
of System).
3Select
Database.
Last SMS
Authentication
Status
Lists the SMS authentication credential and validation message exchange
status for the listed clieckatell gateway session ID.
Last E-Mail Time Displays the most recent E-Mailed passcode to a guest via SMS. SMS
enables guest users to register with their E-Mail or mobile device ID as the
primary key for authentication.
Last E-Mail To Lists the recipient of the most recent SMS to SMTP server credential E-mail
exchange containing the required passcode for the registered guest.
Last E-Mail Status Lists the completion status of the most recent server SMS to SMTP
gateway credential exchange containing the required passcode for the
authenticating guest client.
Last E-Mail Time Displays the time of the most recent E-Mailed passcode to a guest access
requesting client. Guest users can register with their E-mail credentials as
the primary means of authentication.
Last E-Mail To Lists the recipient of this session’s server E-Mail credential exchange
containing the required passcode for the authenticating guest client.
Last E-Mail Status Lists the completion status of the most recent server E-Mail credential
exchange containing the required passcode for the authenticating guest
client.
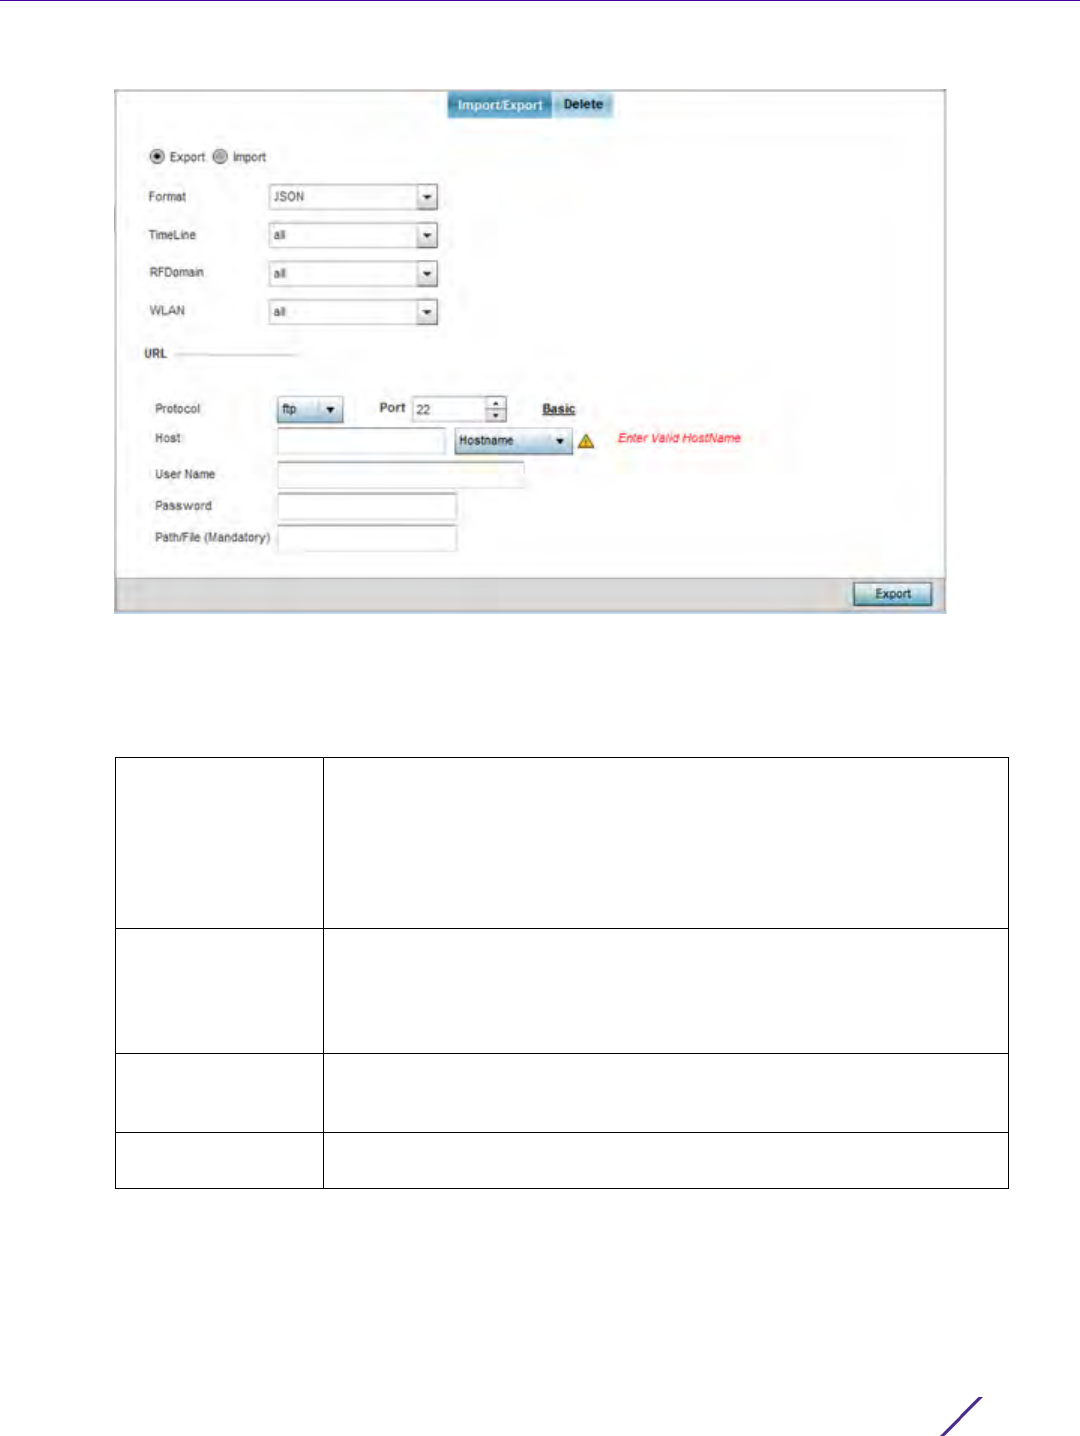
Statistics
Wireless Controller and Service Platform System Reference Guide 15 - 330
Figure 15-231 Guest Access - Database Import/Export screen
4Select Export to archive guest access data (in JSON or CSV format) to a designated remote location, or Import
to upload guest access utilization data back to the WiNG managed controller, service platform or Access Point.
5 If conducting an Export operation, provide the following to refine the data exported:
Format Define whether the guest access data is exported in JSON or CSV format.
JavaScript Object Notation (JSON) is an open standard format using text
to export data objects consisting of attribute value pairs. A comma-
separated values (CSV) file stores tabular data in plain text. Plain text
means that the file is interpreted a sequence of characters, so that it is
human-readable with a standard text editor. Each line of the file is a data
record. Each record consists of one or more fields, separated by commas.
Timeline Use the drop-down menu to specify whether guest access statistics are
exported for the previous 1-Day, 1-Month, 1-Week, 2-Hours, 30-Mins or 5-
Hours. Timelines support the latest time period from present. For example,
specifying 30-Mins exports statistics trended over the most recent 30
minutes.
RF Domain Use the drop-down menu to select a single RF Domain from which to filter
social media guest access statistics. Optionally select All to include data
from each RF Domain supported.
WLAN Use the drop down menu to filter guest access social media statistics to a
specific WLAN. A single WLAN can belong to more then one RF Domain.

Statistics
Wireless Controller and Service Platform System Reference Guide 15 - 331
6 When exporting or importing guest access data (regardless or format), provide the following URL data to
accurately configure the remote host.
7 When the URL data is accurately entered, select the Export or Import button respectively to initiate the
operation.
8 Optionally select the Delete tab to purge either all or part of the guest user database.
Figure 15-232 Guest Access - Database Deletion screen
Format Select the data transfer protocol used for exporting or importing guest
access data. Available options include:
tftp
ftp
sftp
Port Use the spinner control to set the virtual port for the for the export or
import operation.
Host Provide a textual hostname or numeric IP address of the server used for
guest access data transfer operations. Hostnames cannot include an
underscore character.
Select IPv4 Address to use an IPv4 formatted address as the host. Select
IPv6 Address to use an IPv6 formatted address as the host. IPV6 provides
enhanced identification and location information for computers on
networks routing traffic across the Internet. IPv6 addresses are composed
of eight groups of four hexadecimal digits separated by colons.
User Name If using FTP or SFTP and the data transfer protocol, enter the username
required by the remote FTP or SFTP server resource.
Password If using FTP or SFTP and the data transfer protocol, enter the password
required by the remote FTP or SFTP server resource.
Path/File Specify the path to the server resource where guest access data is either
exported or imported. Enter the complete relative path to the file on the
server. If electing to use SFTP as the file transfer protocol, its
recommended the path/file be set using the command line interface (CLI).
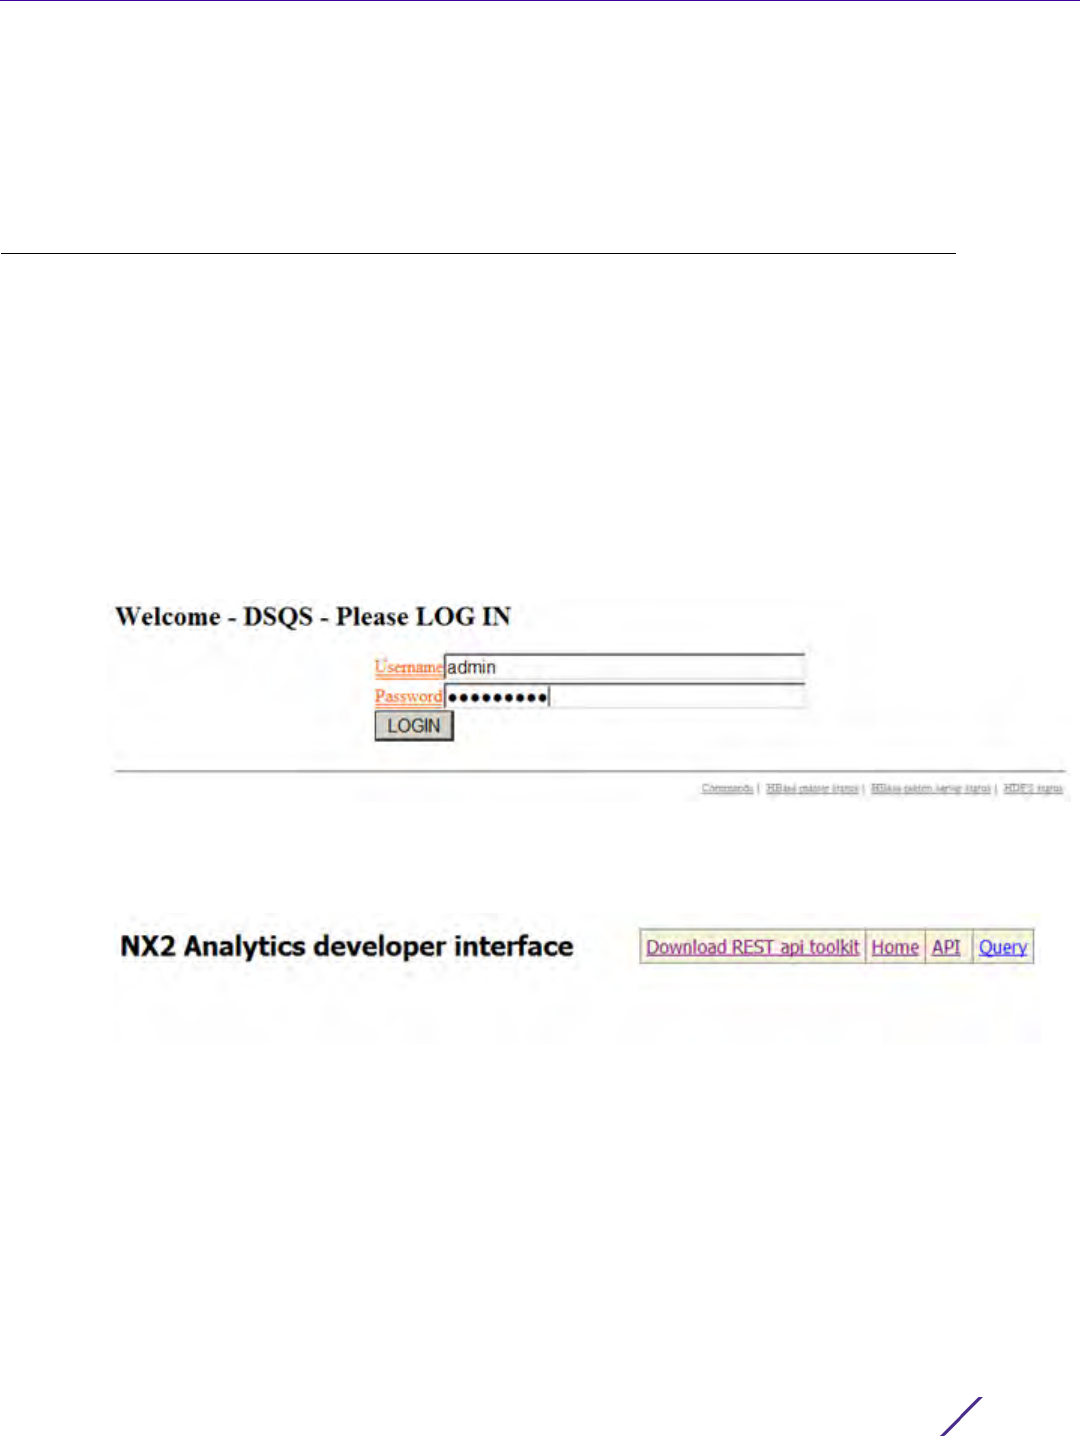
Statistics
Wireless Controller and Service Platform System Reference Guide 15 - 332
9Select All to remove the contents of the entire database. Select Any to invoke a drop-down menu where Mac,
Name, Mobile, Email or a WLAN can be selected to refine the database removal to just a selected entity. Enter
the name of the MAC address, user, mobile number or WLAN you wish to remove from the database, then
select Delete.
15.7 Analytics Developer Interface
Statistics
The analytics developer interface is an additional tool available to administrators to review specific APIs in granular
detail. The developer interface is available to elected NOC controllers or service platforms capable of provisioning
all of its peer controllers, service platforms and adopted devices. NOC controllers include NX9000, NX9500,
NX9510, NX7500, and RFS6000 models.
To access the developer interface:
1 Connect to controller using its existing IP address, but append /stats to the end of the IP address as follows:
http://<CONTROLLER_IP_ADDRESS>/stats or https://<CONTROLLER_IP_ADDRESS>/stats
The following login screen displays for the developer interface:
Figure 15-233 Developer Interface - Login screen
2Provide the same Username and Password credentials you’re currently utilizing for a typical controller login.
Once the login credentials are successfully entered, the following screen displays:
Figure 15-234 Developer Interface - Main screen
Refer to the following for more detailed descriptions of the functionality available to administrators using the
analytics developer interface:
•Download REST API Toolkit
•API Assessment
15.7.1 Download REST API Toolkit
Analytics Developer Interface
Sample Representational State Transfer (REST) code can be downloaded from the toolkit. REST is a software
design schema for Web application development.
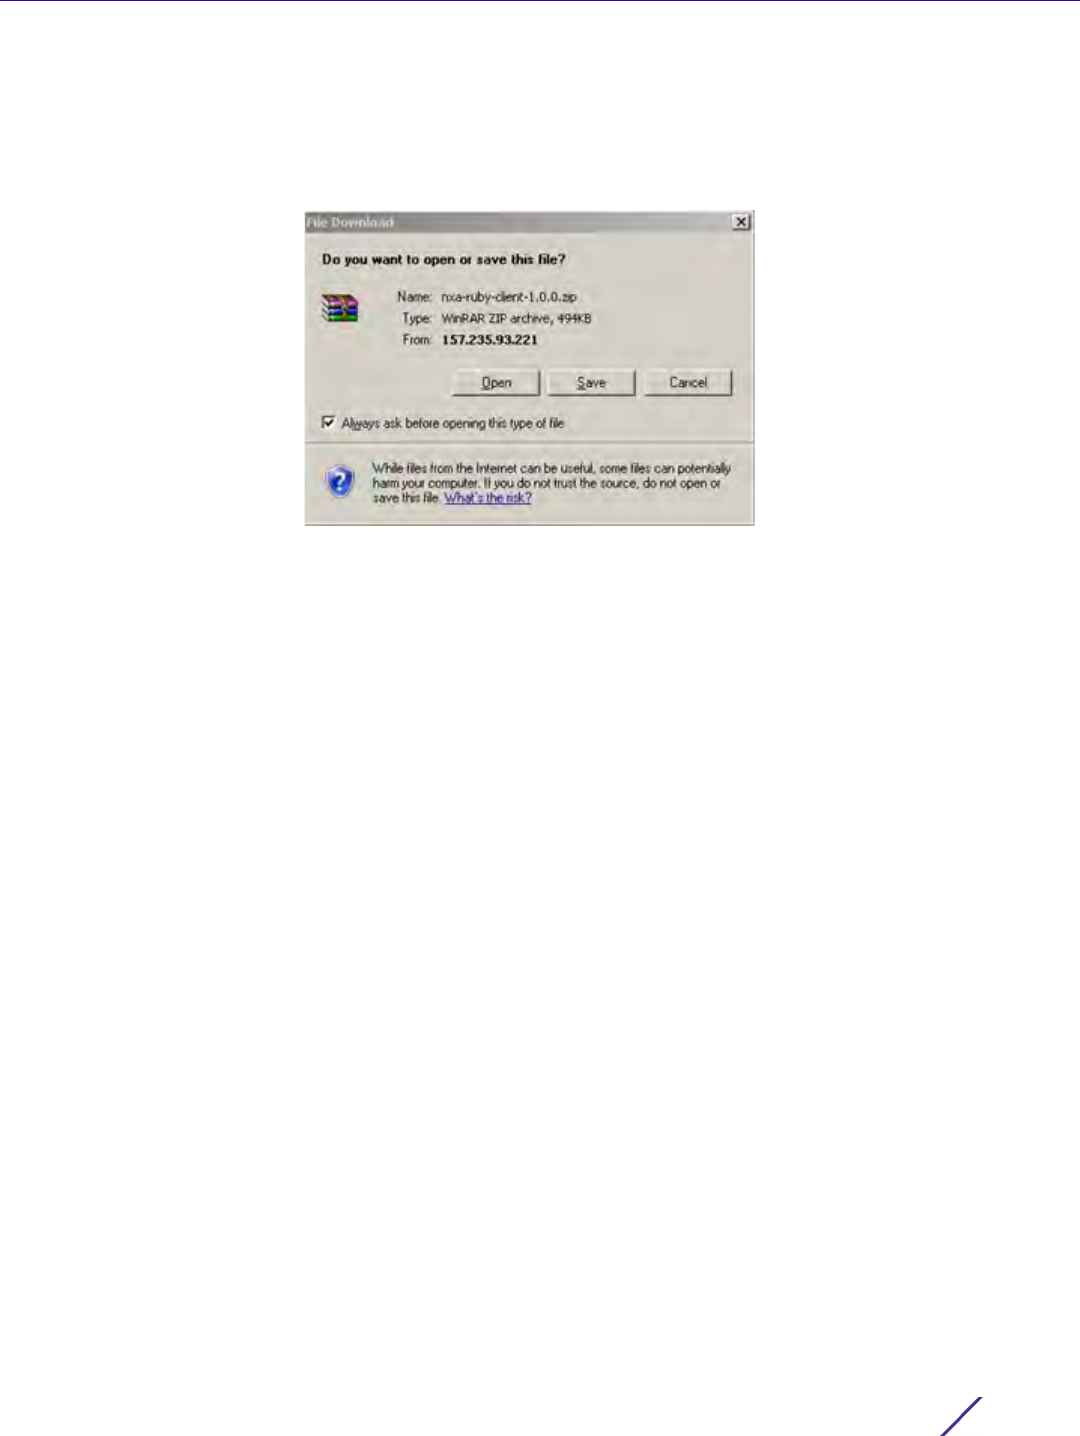
Statistics
Wireless Controller and Service Platform System Reference Guide 15 - 333
To download sample REST API code:
1Select
Download REST api toolkit from the Web UI.
A File Download screen displays prompting for the desired location of the download or whether the files
should be opened directly.
Figure 15-235 Developer Interface -File Download screen
2 Open the zip archive and review the Readme file to assess the contents and how they can be leveraged for API
creation and modification.
Sample Ruby Client
A sample ruby client is provided as part of this package. The Ruby client can be used as a sample to pull statistics
data from NXAnalytics. The response from NXAnalytics is in JSON format.
Contents
Readme.txt file.
Ruby script files:
NXAStatsClient.rb
NXARESTClient.rb
NXAResultsJSONParser.rb
NXALogin.rb
NXAException.rb
NXAConstants.rb
NXAConnectionParams.rb

Statistics
Wireless Controller and Service Platform System Reference Guide 15 - 334
Requirements To Run Sample Ruby Client
Ruby 2.0 or above. The sample has been tested with Ruby 2.0. To download Ruby use the following:
https://www.ruby-lang.org/en/downloads/or http://rubyinstaller.org/
Additional Ruby Gems needed to run the sample client are the following.
- ipaddress
- json
- rest-client
Please install the gems before running the sample client.
How To Run the Program From Command Line
ruby NXAStatsClient <IPAddress Of Controller>
<Protocol[http|https]> <Port [8080|443]>
<Stats_Type>[wlan | rfdomain | radio | client | captive-portal | client-assoc-disassoc]
<lookback_duration_in_seconds [ 1 - 2592000]>
<username> <password>
<number_of_results_to_return [ 1 - 100]>
Sample:
ruby NXAStatsClient 172.20.33.45 https 443 rfdomain 600 admin admin 30
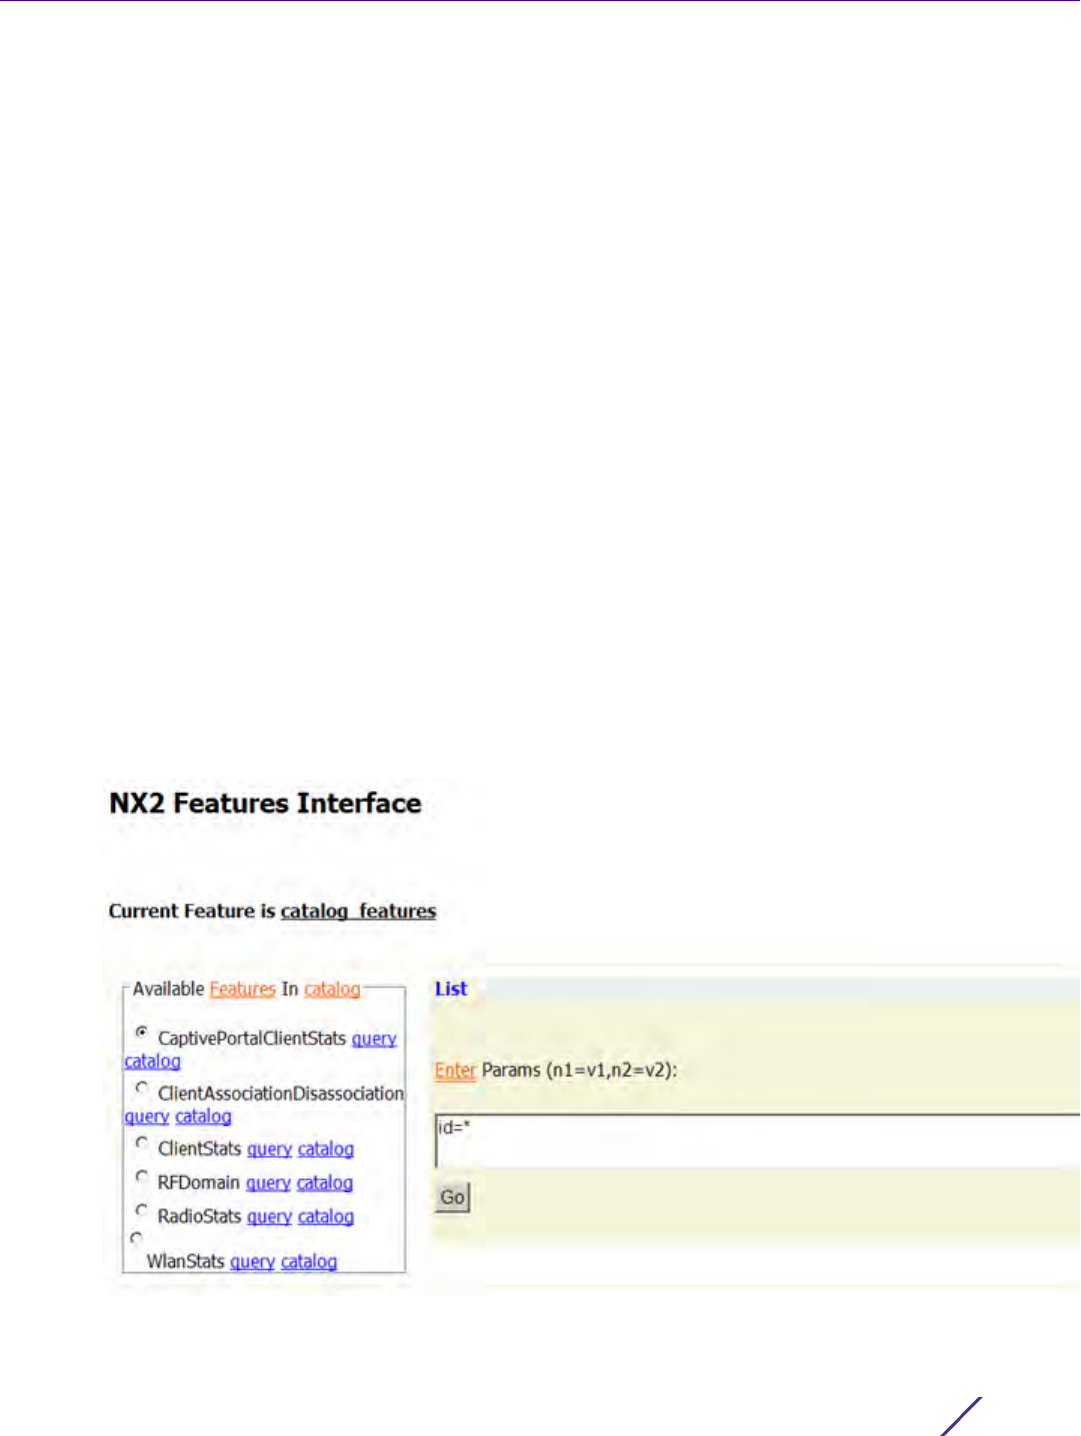
Statistics
Wireless Controller and Service Platform System Reference Guide 15 - 335
How To Run the Program From IDE
If you are using Eclipse or APTANA or any other IDE please do the following.
- Choose appropriate network proxy settings
- Configure IDE to choose appropriate Ruby interpreter
- Create a Ruby project
- Copy the Ruby files as part of package to the new Ruby project
- Define the arguments required for the main Ruby program
- Run the main Ruby program
15.7.2 API Assessment
Analytics Developer Interface
Refer to the toolkit’s API functionality to review a collection of APIs for specific feature groups, including captive
portals, client associations and disassociations, client stats, RF Domains.
To review the toolkit’s built-in set of APIs:
1Select
API from the Web UI.
Figure 15-236 Developer Interface - API
2 Select an available feature from the catalog of features.
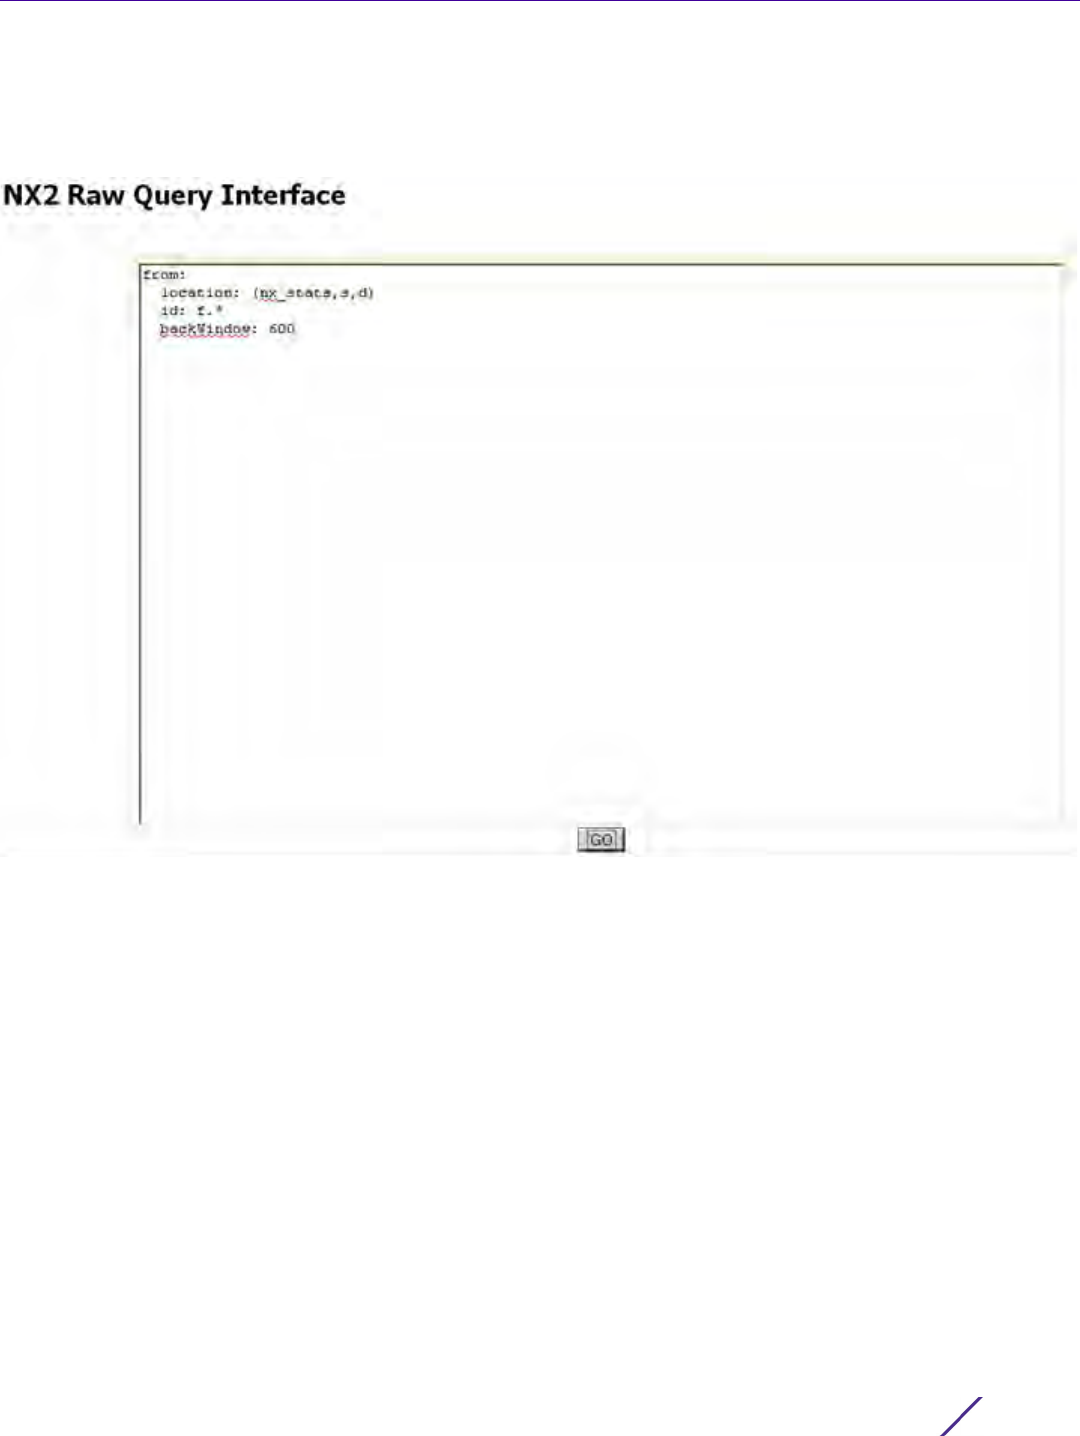
Statistics
Wireless Controller and Service Platform System Reference Guide 15 - 336
An administrator can either launch a query for a selected feature or select catalog to expose the schema for a
selected feature.
3Select
query to display the NX2 Raw Query Interface.
Figure 15-237 Developer Interface - API Raw Query Interface
4Select Go to initiate the query for the selected item.

Statistics
Wireless Controller and Service Platform System Reference Guide 15 - 337
Figure 15-238 Developer Interface - API Raw Query Results
The results of the query display the values currently set for the selected feature. This information cannot be
manipulated as a configurable API attribute, though this information can be utilized as criteria for API attribute
creation.
5 From the NX2 Features Interface, select a feature from those available and select catalog.
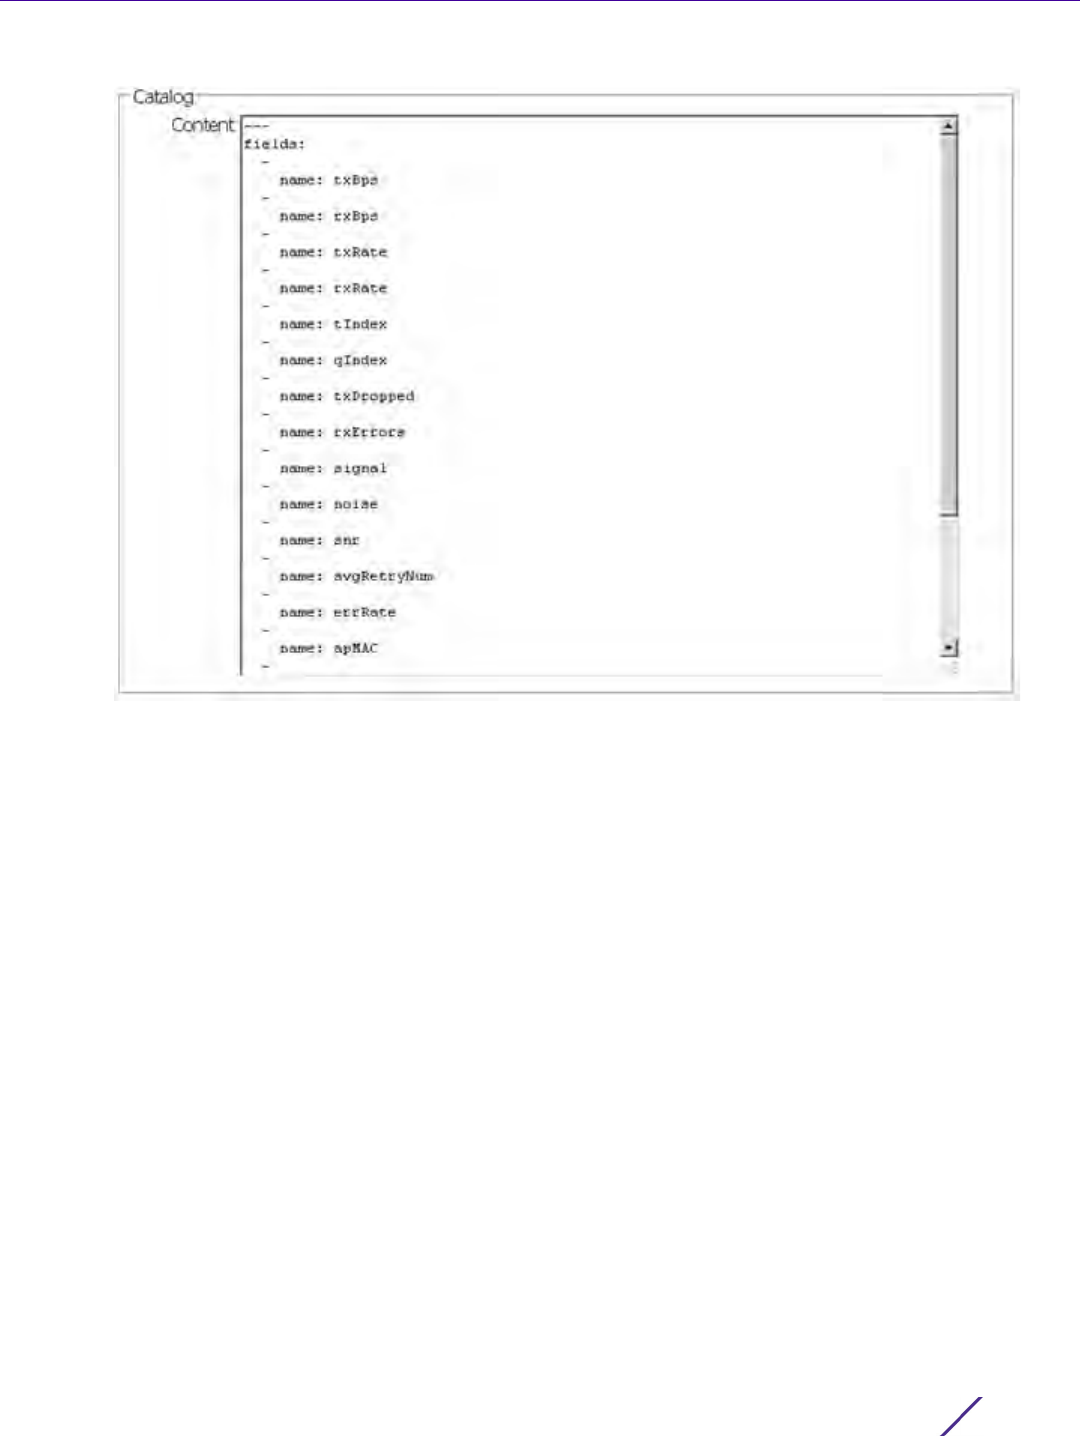
Statistics
Wireless Controller and Service Platform System Reference Guide 15 - 338
Figure 15-239 Developer Interface - API Catalog
The catalog item selection displays the values currently set for the selected feature. As with queries, this
information cannot be manipulated as a configurable API attribute, though this information can be utilized as
criteria for API attribute creation.

16 - 1
Wireless Controller and Service Platform System Reference Guide
16
Analytics
A NX9500 and NX9510 model service platforms can provide granular and robust analytic reporting for a RFS4000
and RFS6000 controller managed network. Using analytics, data is collected and reported at varying intervals.
Analytic data is culled from WLANs at either the system, RF Domain, controller/service platform or Access Point
level.
Analytics can parse and process events within the NOC managed network as events are received.
The analytics display resembles the Health and Inventory pages available to controllers and Access Points, though
Analytics provides performance information at a far more granular level.
The analytics user interface populates information within a data store, with multiple displays partitioned by
performance function. The data store is a customizable display managed with just the content the administrator
wants viewed. The data store is purged after 90 days if no administration is conducted sooner.
A separate analytics license is enforced at the NOC. The license restricts the number of Access Point streams
processed at the NOC or forwarded to partner systems for further processing. The analytics feature can be turned
on at select APs by enabling them in configuration. This way the customer can enable analytics on a select set of
APs and not the entire system as long as the number of APs on which it is enabled is less than or equal to the
total number of AP analytics licenses available at the NOC controller.
For more information, see:
•System Analytics
•RF Domain Analytics
•Wireless Controller Analytics
•Access Point Analytics
•Analytic Event Monitoring
16.1 System Analytics
Analytics can be administrated at the system level to include all RF Domains, their controller or service platform
memberships, adopted Access Points and their connected clients. For information on monitoring analytic events,
refer to Analytic Event Monitoring.
To administrate analytics system-wide:
1Select
Statistics from the Web UI.
2 Select the Analytics menu item directly to the right of the System menu item within Statistics.
The analytics screen displays with Captive Portal data displayed by default.
Refer to the arrow icon located in the top, right-hand, side of each panel to define whether the display is in
Chart format, a Table or whether you would like the output for that parameter saved as a PDF report at a user
specified location.
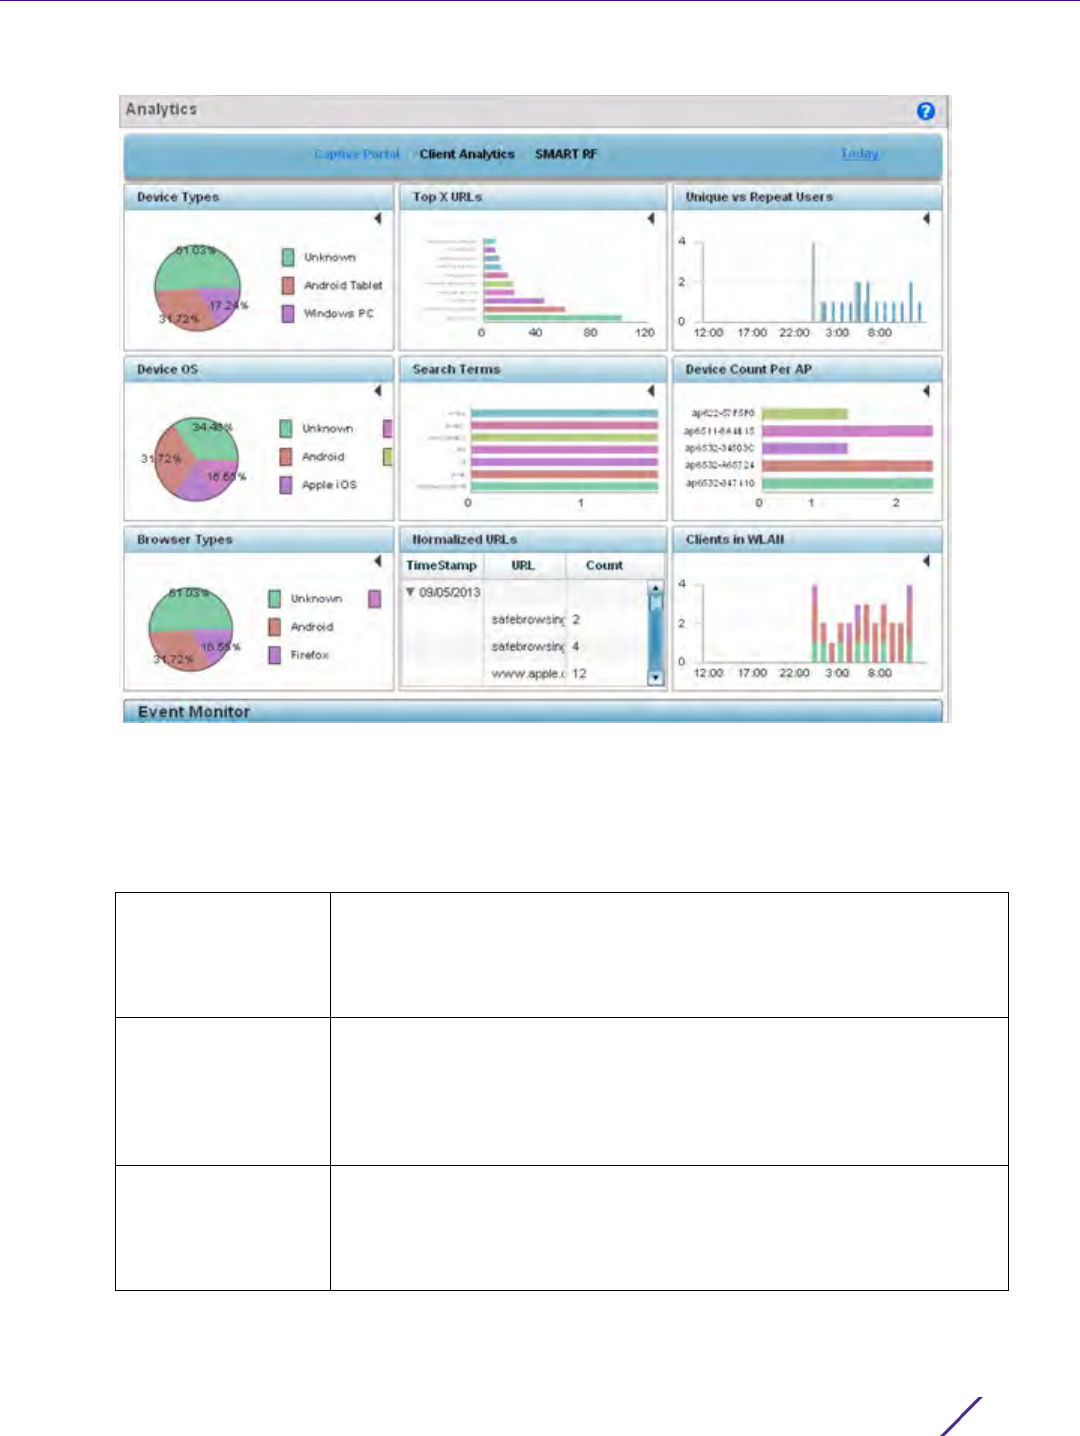
Analytics
Wireless Controller and Service Platform System Reference Guide 16 - 2
Figure 16-1 System Analytics - Captive Portal screen
3 Refer to the upper, right-hand, portion of the analytics interface and define the trending period for the data
displayed. Options include Last 1 Day, Last 3 Days, Last 1 Week, Last 2 Weeks, Last 3 Weeks, Last 1 Month, Last 2
Months or Last 3 Months. Today is the default setting for trending analytics data.
4 Refer to the following Captive Portal analytic data trended and reported in real-time on the selected interval:
Device Types Displays a pie chart (by default) of the captive portal clients (smart
phones, tablets, laptops etc.). Select the table icon from the top, right-
hand, side of the field to display the data in table format. Both the pie
chart and table display the device type and the percentage of those
devices only within the captive portal.
Device OS Displays a pie chart (by default) of connected devices (using captive
portal authentication), differentiated by their operating system (Windows,
Linux, Android etc.). Select the table icon from the top, right-hand, side of
the field to display the data in table format. Both the pie chart and table
display the OS type and the percentage of that device OS type only
within the captive portal.
Browser Types Displays a pie chart (by default) of the browser types utilized by captive
portal authenticated devices. Select the table icon from the top, right-
hand, side of the field to display the data in table format. Both the pie
chart and table display the OS type by percentage of utilization only
within the captive portal.

Analytics
Wireless Controller and Service Platform System Reference Guide 16 - 3
5Select
Client Analytics to display analytic level data for connected wireless clients.
Top X URLs Reports the top visited URLs by connected clients using captive portal
authentication. Use the spinner control to refine the number of URLs
reported, then select Reload to update the display. Set whether the
content is displayed as a chart or as a table.
Search Terms Lists the number of unique clients who searched for using a search term.
Each display option lists the search term and the number of times each
term was searched by a connected captive portal client. For example, if
there’s two clients (clients A and B), and client A searched for
"extremenetworks" 5 times and B searched for "extremenetworks" 2
times. The count would be 2 and not 7. As with URLs, search terms are
normalized (aggregated daily).
Normalized URLs Reports URLs visited most often, normalized (aggregated daily), by
devices using captive portal authentication. Select the arrow to the left of
each listed URL timestamp to populate the URL and Count columns with
the specific URLs visited and the number of times they’ve been visited.
Unique vs Repeat
Users
Displays a breakdown of repeat versus new users to the captive portal.
Both a chart and a table display are available, each with a timestamp of
when the data was collected.
Device Count Per AP Displays the number of top performing Access Points reporting
connected client counts using captive portal authentication.
Clients in WLAN Displays the number of managed WLANs reporting connected client
counts. Client analytics are trended every 75 minutes.
NOTE: Be sure to select the Search button adjacent to the Search for Wireless
Client parameter to ensure the tables are populated and refreshed with detected
wireless clients. Client analytics are trended every 75 minutes.
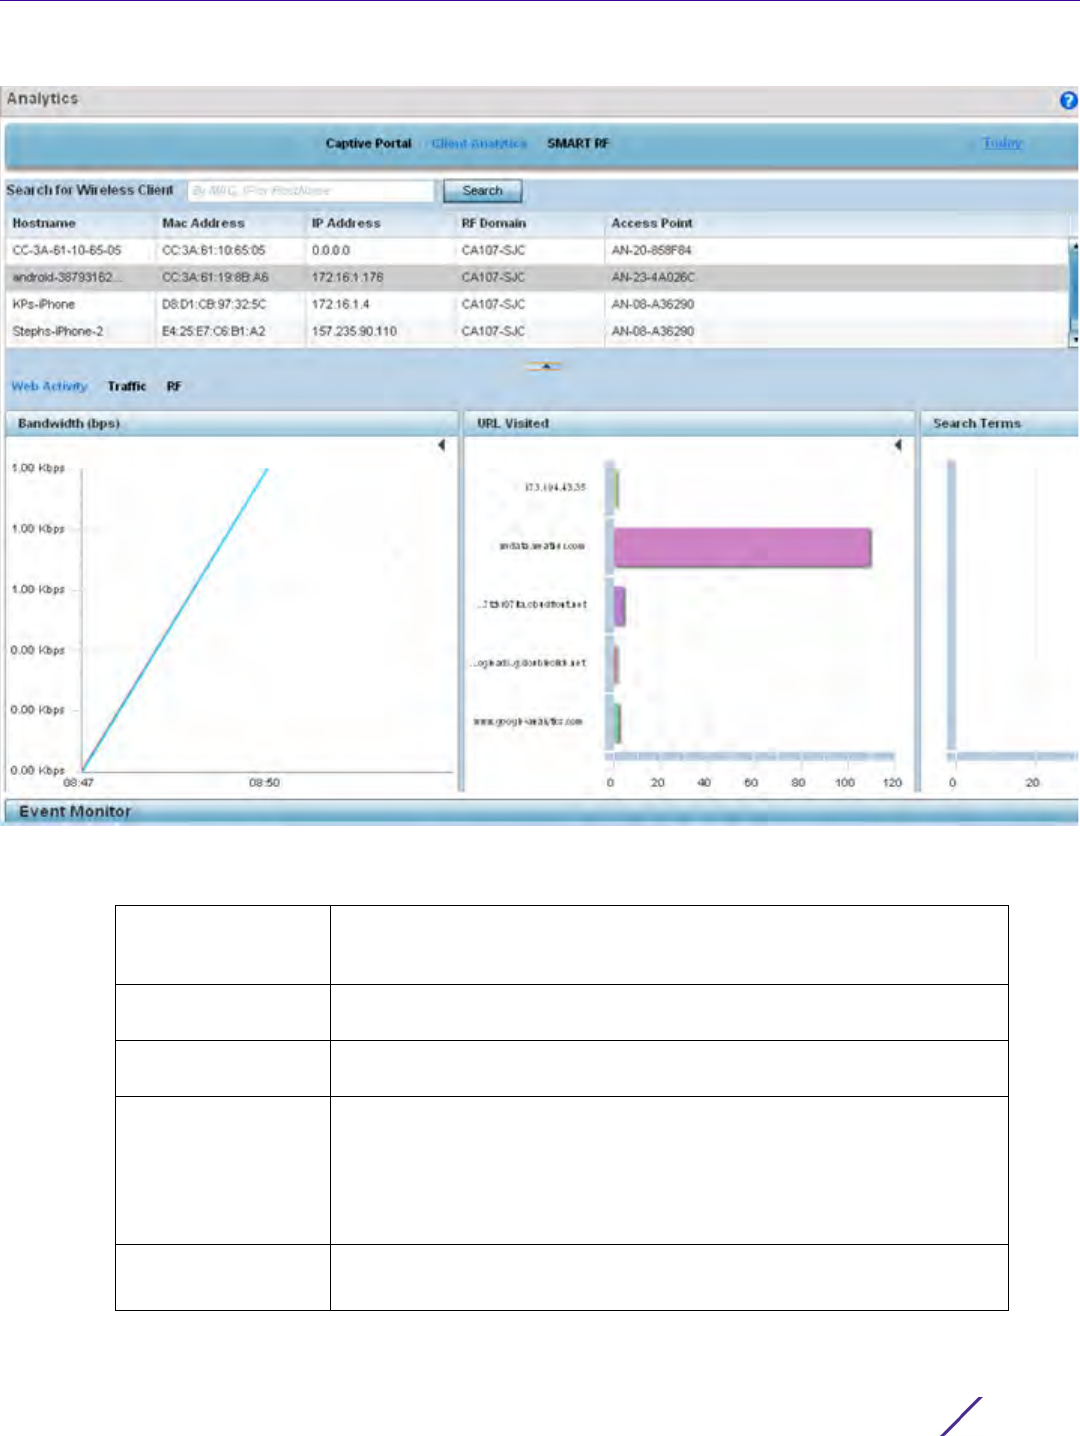
Analytics
Wireless Controller and Service Platform System Reference Guide 16 - 4
Figure 16-2 System Analytics - Client Analytics screen
6 Refer to the following Client Analytics trended at the selected interval:
Hostname Lists the administrator assigned hostname set for each listed client when
connected to the controller, service platform or Access Point managed
network.
Mac Address Displays the factory encoded MAC address for the listed client as a
hardware manufacturing ID.
IP Address Lists the IP addresses the client is using as a wireless network identifier
within the controller, service platform or Access Point managed network.
RF Domain Lists the client’s current RF Domain membership. RF Domains allow
administrators to assign regional, regulatory and RF configuration to
devices deployed in a common coverage area such as on a building floor,
or site. Each RF Domain contains regional, regulatory and sensor server
configuration parameters and may also be assigned policies that
determine access, Smart RF and WIPS configuration.
Access Point Displays an administrator assigned hostname for each listed Access Point
whose radio is providing a network connection for the wireless network.
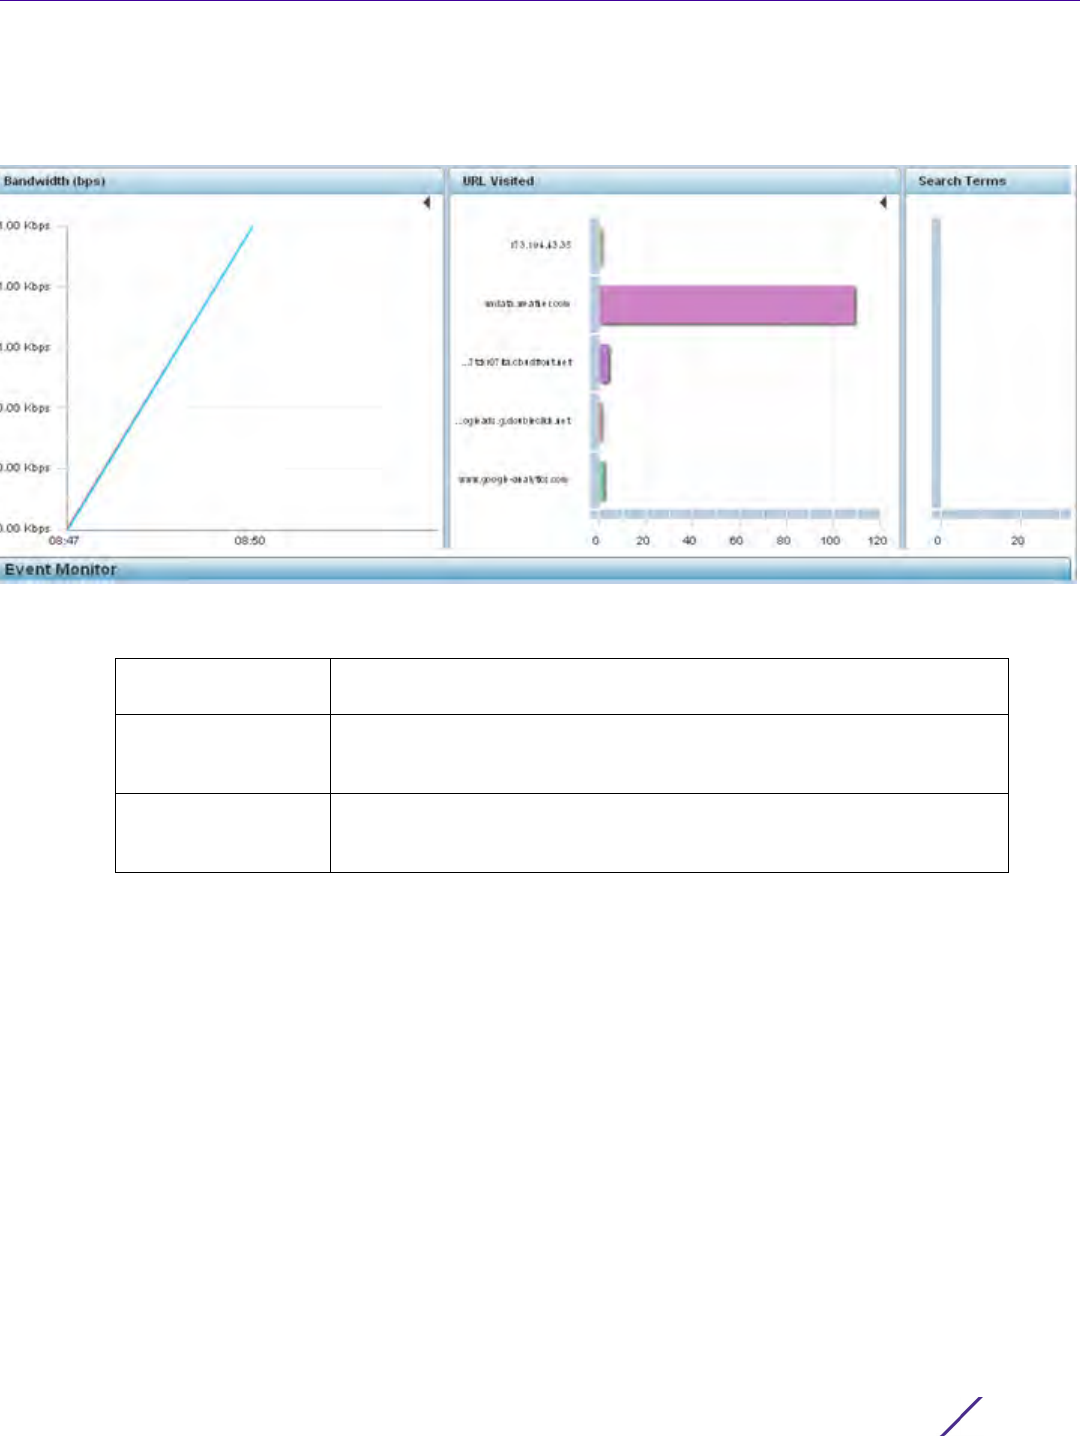
Analytics
Wireless Controller and Service Platform System Reference Guide 16 - 5
The Client Analytics screen contains Web Activity, Traffic and RF displays within the lower half of the screen.
Each of these analytics display an administrator’s choice of graphical or tabled data for the client’s Web
activity, SNR, network interference, signal quality and packet retries.
Figure 16-3 System Analytics - Client Web Activity screen
7The Web Activity field displays by default with the following content trended in the selected interval:
8Select
Traffic.
Bandwidth Displays the client’s Web activity bandwidth utilization in Bits per second
(Bps) in either chart or table format.
URL Visited Displays URLs visited by a selected client in either chart or table format.
Either display contains the Web destination URL and the number of times
the URL was accessed by the client.
Search Terms Displays terms used as search Web search criteria by connected clients in
either chart or table format. Either display contains the search item and
the number of times the term was searched by the client.
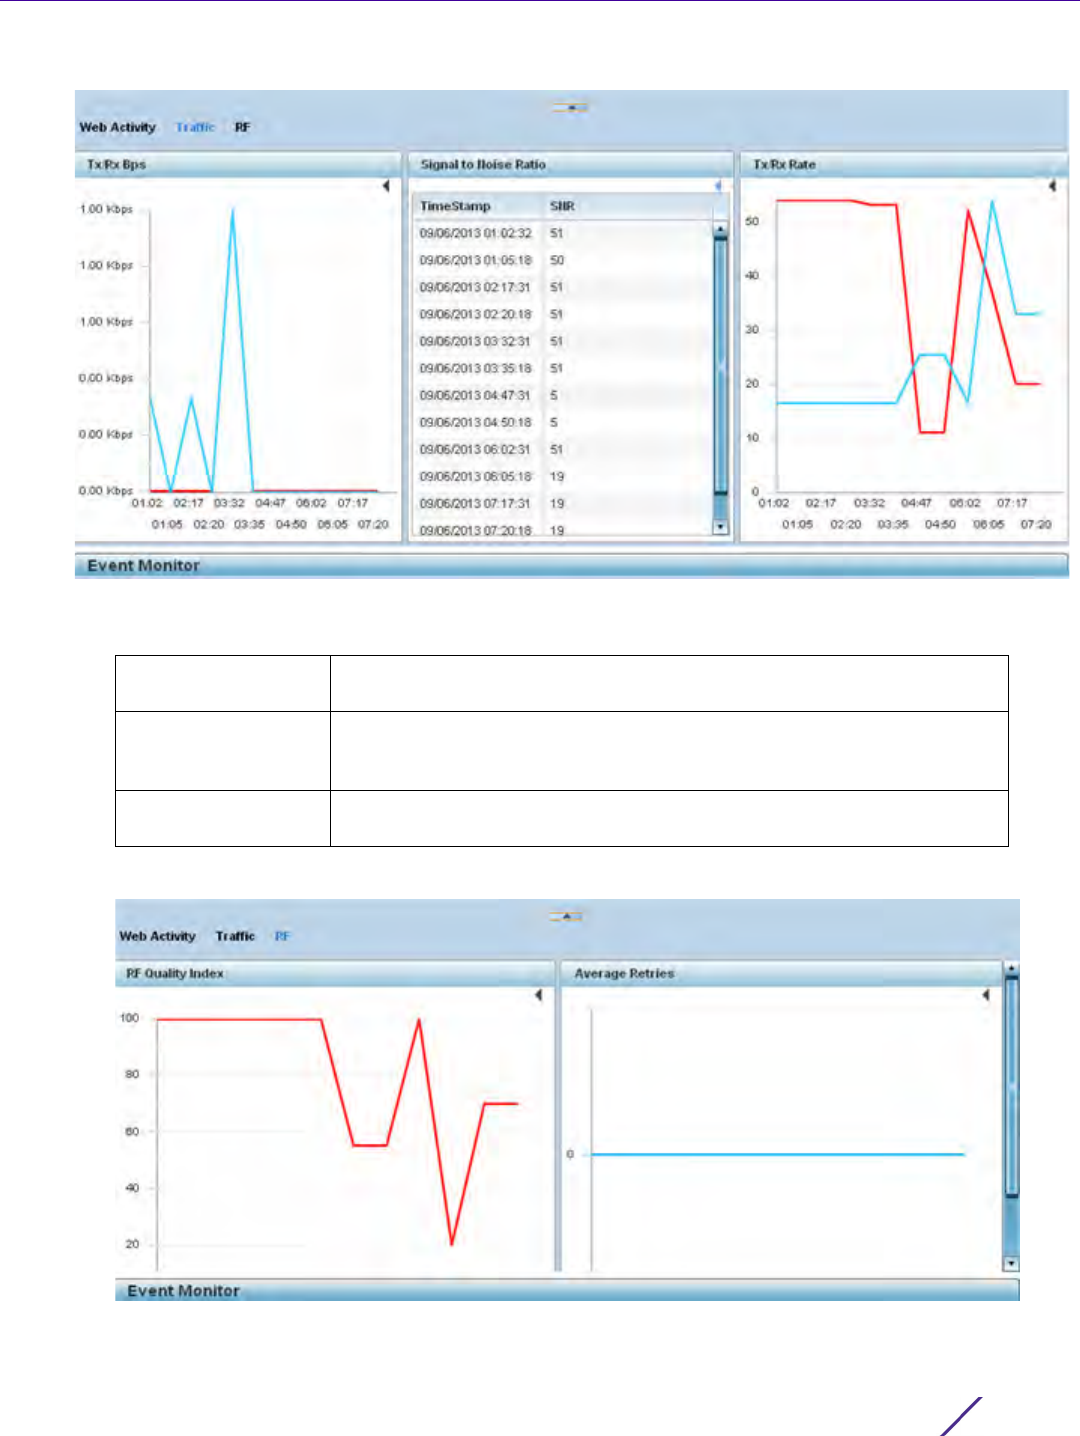
Analytics
Wireless Controller and Service Platform System Reference Guide 16 - 6
Figure 16-4 System Analytics - Client Traffic screen
9 Refer to the following client Traffic analytics trended at the selected interval:
10 Select RF.
Figure 16-5 System Analytics - Client RF screen
Tx/Rx Bps Displays the Bits per second (Bps) speed of data both transmitted from
and received at the listed client, in either chart or table format.
Signal to Noise Ratio Displays the connected client’s signal to noise ratio (SNR) and a time
stamp of its reporting. A high SNR could warrant a different Access Point
connection to improve performance.
Tx/Rx Rate Displays the connected client’s transmit and receive data rate in either
chart or table format.
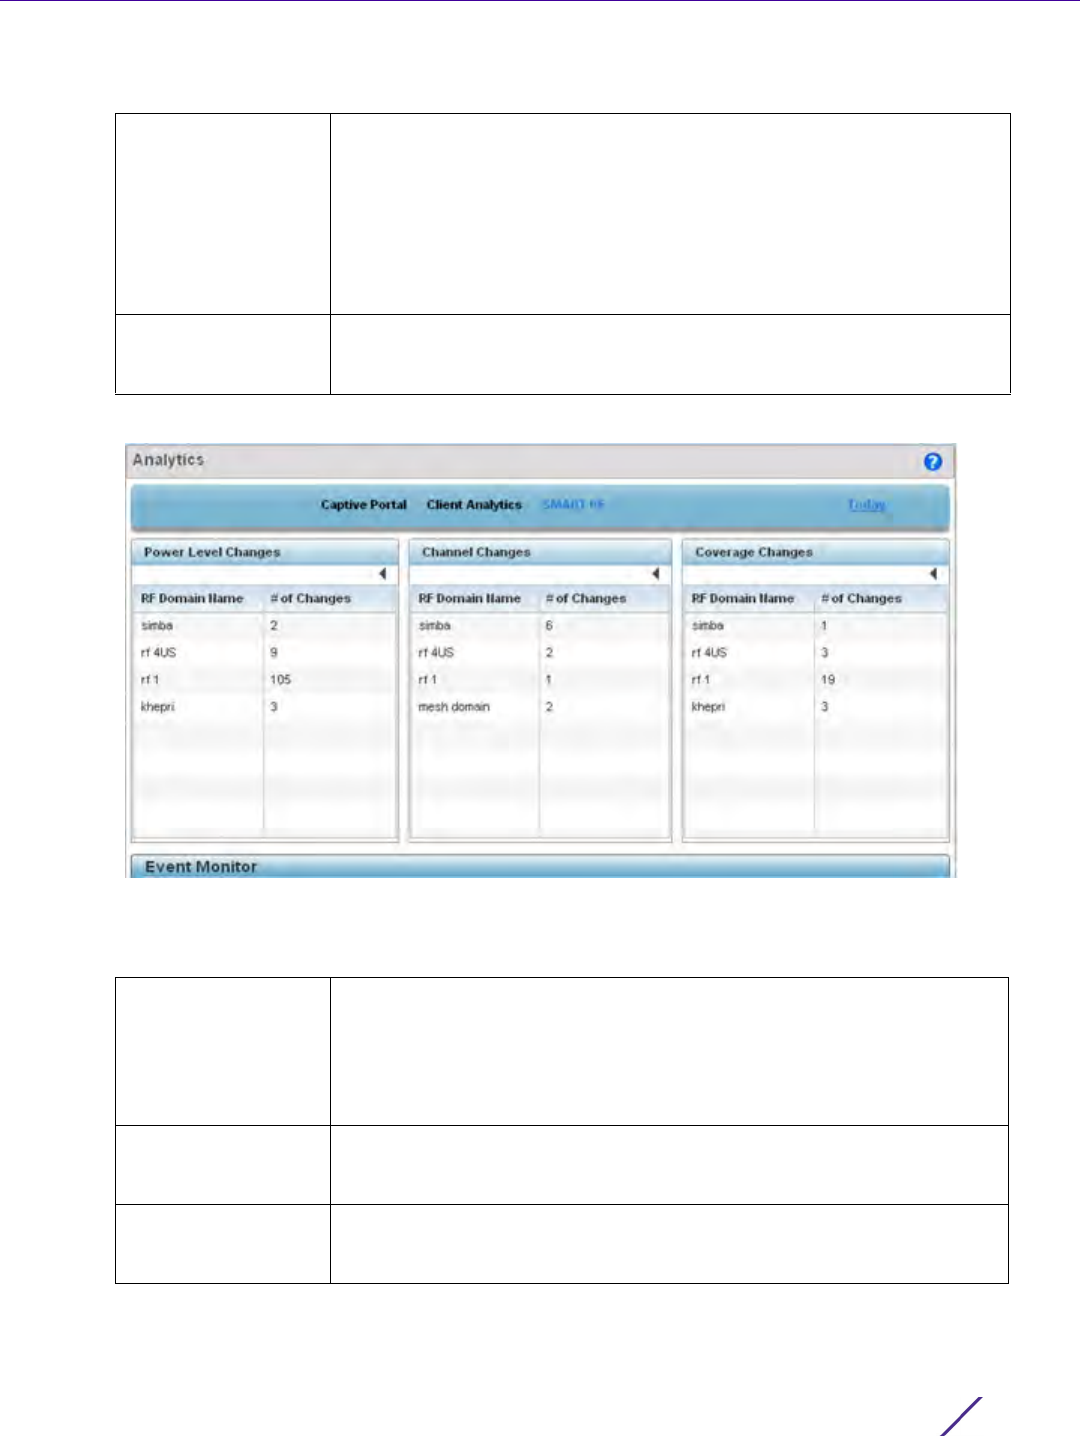
Analytics
Wireless Controller and Service Platform System Reference Guide 16 - 7
11 Refer to the following client RF analytics trended in the selected interval:
12 Select Smart RF to display system-level power and channel compensation analytics:
Figure 16-6 System Analytics - Smart RF screen
13 Refer to the following system-wide power level, channel and coverage Smart RF analytics trended in real-time
at the administrator defined interval:
RF Quality Index Displays the overall effectiveness of the system-wide RF environment as a
percentage of the connect rate in both directions. The RF quality index
value can be interpreted as:
0 – 20 (Very low utilization)
20 – 40 (Low utilization)
40 – 60 (Moderate utilization)
60 and above (High utilization)
Average Retries Displays the rate of client connection retry attempts and a timestamp of
their occurrence in either chart or table format. A high number indicates
potential network or hardware issues.
Power Level Changes Displays the number of Smart RF power level compensations made for
the system’s RF Domains during the defined analytic reporting interval.
This helps an administrator assess the device power changes needed to
accommodate a potentially failed or poorly performing device and
provides an overall insight into the overall duty cycle requirements of a
particular RF Domain.
Channel Changes Displays the number of Smart RF channel change compensations made
for the system’s RF Domains during the defined analytic reporting
interval.
Coverage Changes Displays the number of Smart RF coverage change compensations made
for the system’s RF Domains during the defined analytic reporting
interval.

Analytics
Wireless Controller and Service Platform System Reference Guide 16 - 8
16.2 RF Domain Analytics
Additional analytics are available at the RF Domain level of the user interface for trending data for specific groups
of RF Domain member devices. RF Domain analytics are trended every 60 minutes. For information on monitoring
analytic events, refer to Analytic Event Monitoring.
To administrate RF Domain level analytics:
1Select
Statistics from the Web UI.
2 Select the Analytics menu item directly to the right of the System menu item within Statistics.
3 Expand the System hierarchy on the left-hand side of the user interface and select a RF Domain.
The Analytics screen displays with the Captive Portal tab displayed by default. This is the same data presented
at the system level of the user interface. For more information on captive portal analytics, see System Analytics
on page 16-1.
4Select
Traffic to assess throughput and bandwidth utilization information reported collectively for selected RF
Domain member devices. Use the WLAN drop-down menu to refine whether traffic statistics are reported for a
particular RD Domain WLAN or reported collectively for all WLANs.
Refer to the arrow icon located in the top, right-hand, side of each panel to define whether the display is in
Chart format, a Table or whether you would like the output for that parameter saved as a PDF report at a user
specified location.
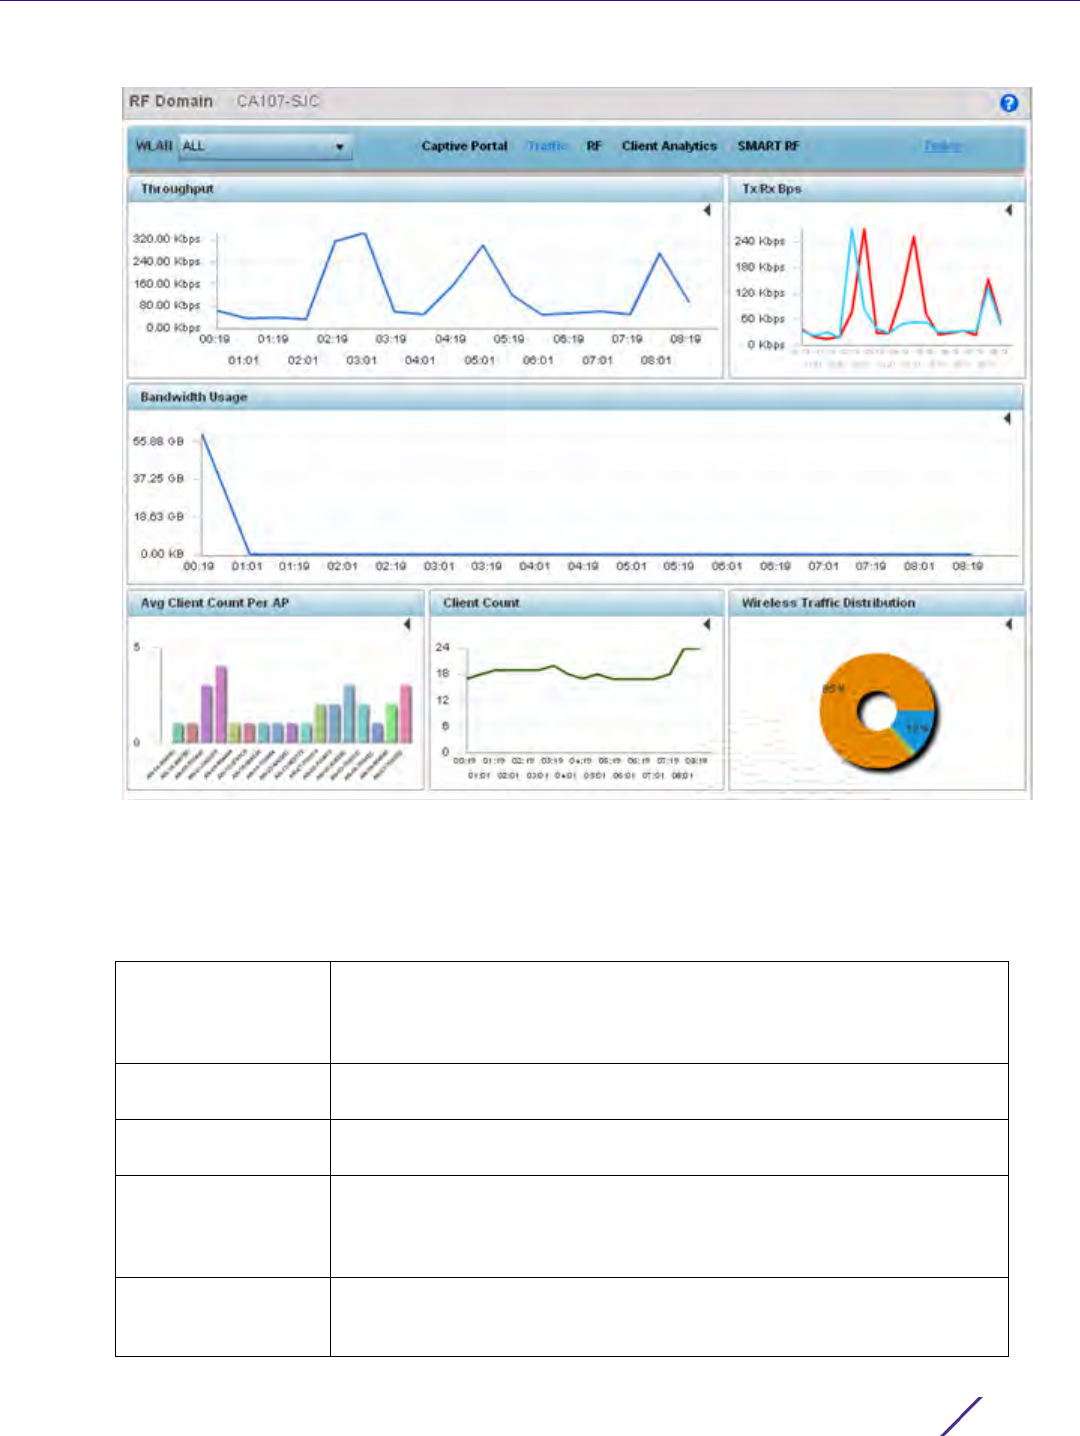
Analytics
Wireless Controller and Service Platform System Reference Guide 16 - 9
Figure 16-7 RF Domain Analytics - Traffic screen
5 Refer to the upper, right-hand, portion of the analytics interface and define the trending period for the data
displayed. Options include Yesterday, Last 24 Hours, Last 3 Days, Last 1 Week, Last 2 Weeks, Last 3 Weeks, Last 1
Month, Last 2 Months or Last 3 Months. Today is the default setting for trending analytics data.
6 Refer to the following Traffic analytic data trended and reported for RF Domain member devices:
Throughput Lists RF Domain member device throughput (in Mbps) as an overall
indicator of RF traffic activity of all RF Domain member devices. Assess
whether specific times of the day require additional RF domain member
device support to adequately support RF traffic requirements.
Tx/Rx Bps Displays transmit and receive data (in Bps) for RF Domain member
devices over the listed trending period.
Bandwidth Usage Lists RF Domain member bandwidth utilization (in Kbps) to help an
administrator assess periods os sustainable versus unsustainable activity.
Average Client Count
per AP
Displays RF Domain member Access Points and their connected client
counts. Assess whether particular client counts are excessive, and whether
loads can be better distributed amongst RF Domain member Access
Points. Client analytics are trended every 75 minutes.
Client Count Lists RF Domain member Access Point connected client counts. Use the
trending data to assess periods of high versus low client connection
activity. Client analytics are trended every 75 minutes.
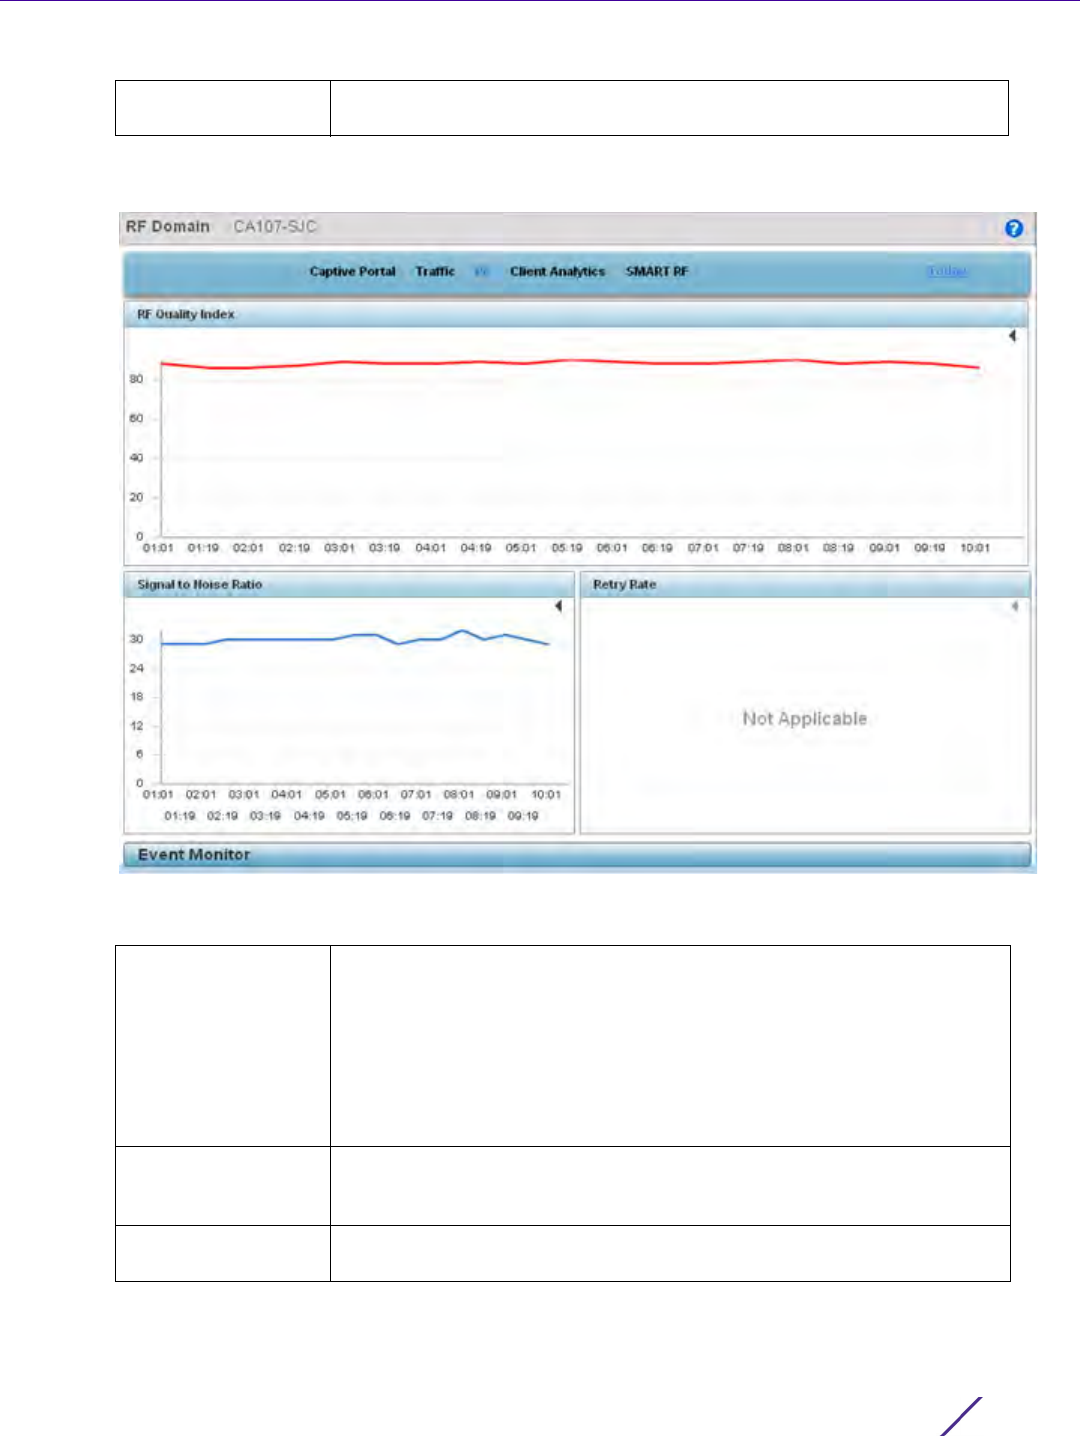
Analytics
Wireless Controller and Service Platform System Reference Guide 16 - 10
7Select
RF to display RF Domain member device RF quality, detected network interference (noise) and device
connection retries.
Figure 16-8 RF Domain Analytics - RF screen
8 Refer to the following RF analytics trended for a selected RF Domain:
Wireless Traffic
Distribution
Displays a chart of unicast versus management frames transmitted by RF
Domain member devices.
RF Quality Index Displays the trended graph of the effectiveness of a selected RF Domain’s
RF environment as a percentage of the connect rate in both directions.
The RF quality index value can be interpreted as:
0 – 20 (Very low utilization)
20 – 40 (Low utilization)
40 – 60 (Moderate utilization)
60 and above (High utilization).
Signal to Noise Ratio Displays a selected RF Domain’s connected client signal to noise ratio
(SNR) and a time stamp of its reporting. A high SNR could warrant power
compensation to account for poorly performing radios.
Retry Rate Lists the number of retry attempts for requesting client connections to RF
Domain member device radios.