Japan Radio NKE2632 Solid State S-Band Marine Radar User Manual Instruction Manual Funtion Part 6
Japan Radio Co Ltd. Solid State S-Band Marine Radar Instruction Manual Funtion Part 6
Contents
- 1. Installation Manual Part 1
- 2. Installation Manual Part 2
- 3. Installation Manual Part 3
- 4. Installation Manual Part 4
- 5. Installation Manual Part 5
- 6. Installation Manual Part 6
- 7. Installation Manual Part 7
- 8. Installation Manual Part 8
- 9. Installation Manual Part 9
- 10. Installation Manual Part 10
- 11. Installation Manual Part 11
- 12. Instruction Manual Operation Part 1
- 13. Instruction Manual Operation Part 2
- 14. Instruction Manual Operation Part 3
- 15. Instruction Manual Operation Part 4
- 16. Instruction Manual Funtion Part 1
- 17. Instruction Manual Funtion Part 2
- 18. Instruction Manual Funtion Part 3
- 19. Instruction Manual Funtion Part 4
- 20. Instruction Manual Funtion Part 5
- 21. Instruction Manual Funtion Part 6
Instruction Manual Funtion Part 6
14-55 Section 14 Creating a User Map/ Updating a Chart Manually
1
2
3
4
5
6
7
8
9
10
11
12
13
14
15
16
17
18
19
20
21
22
23
24
25
26
27
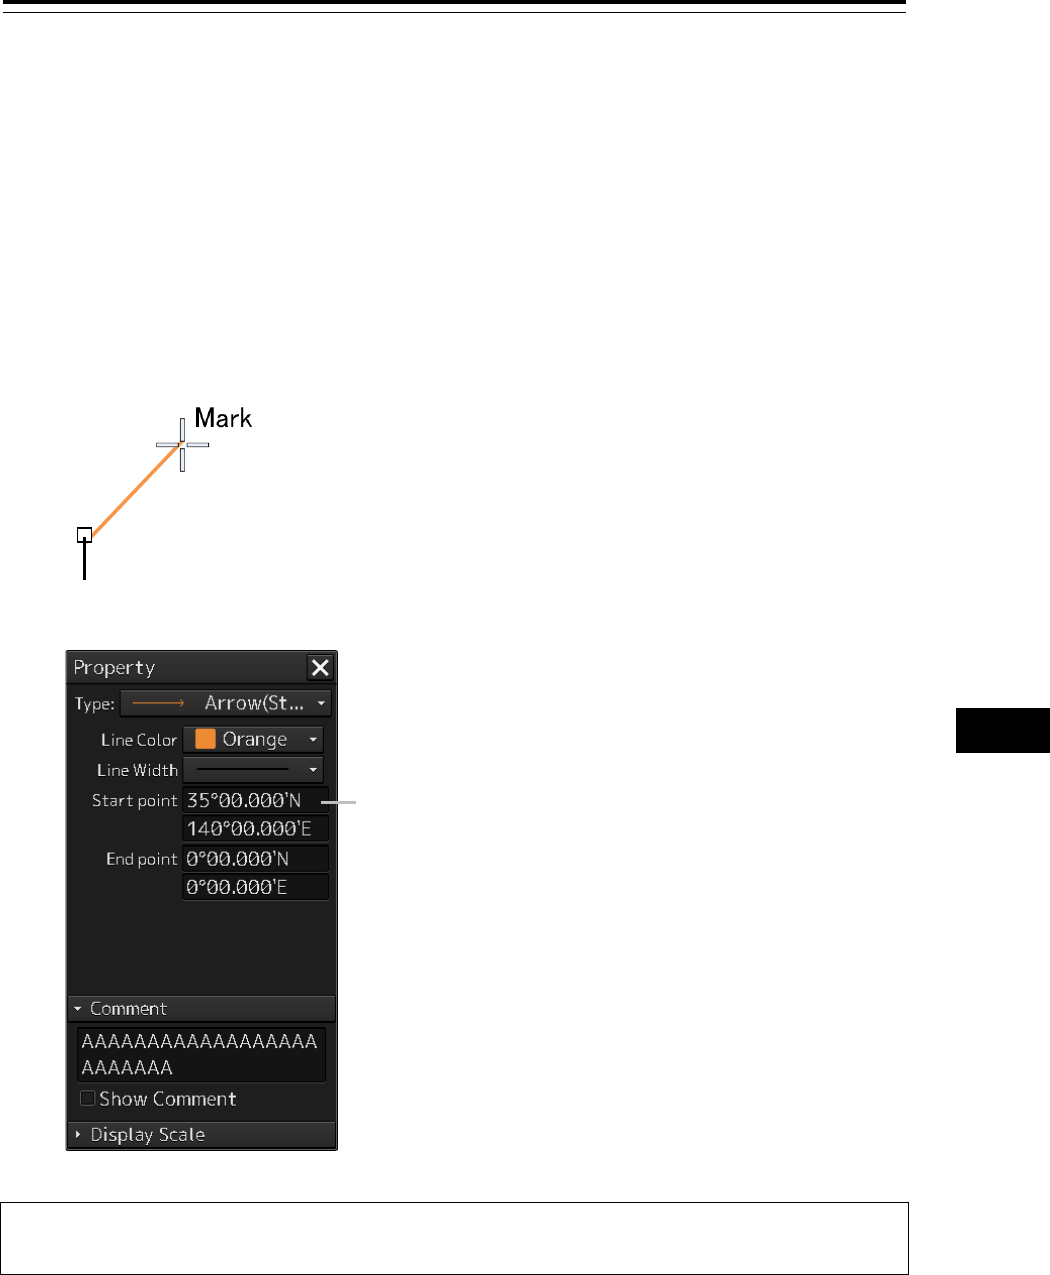
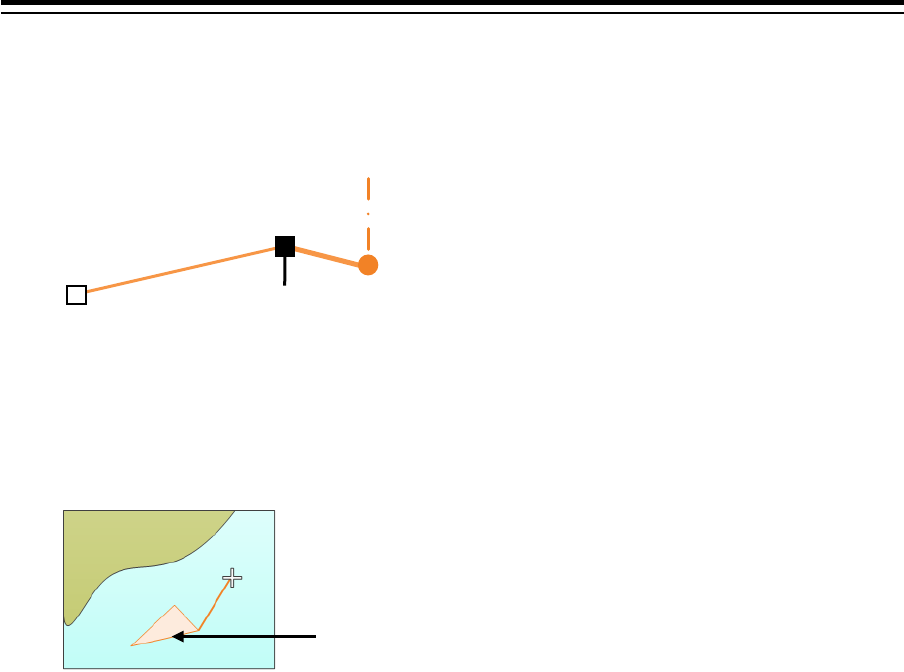
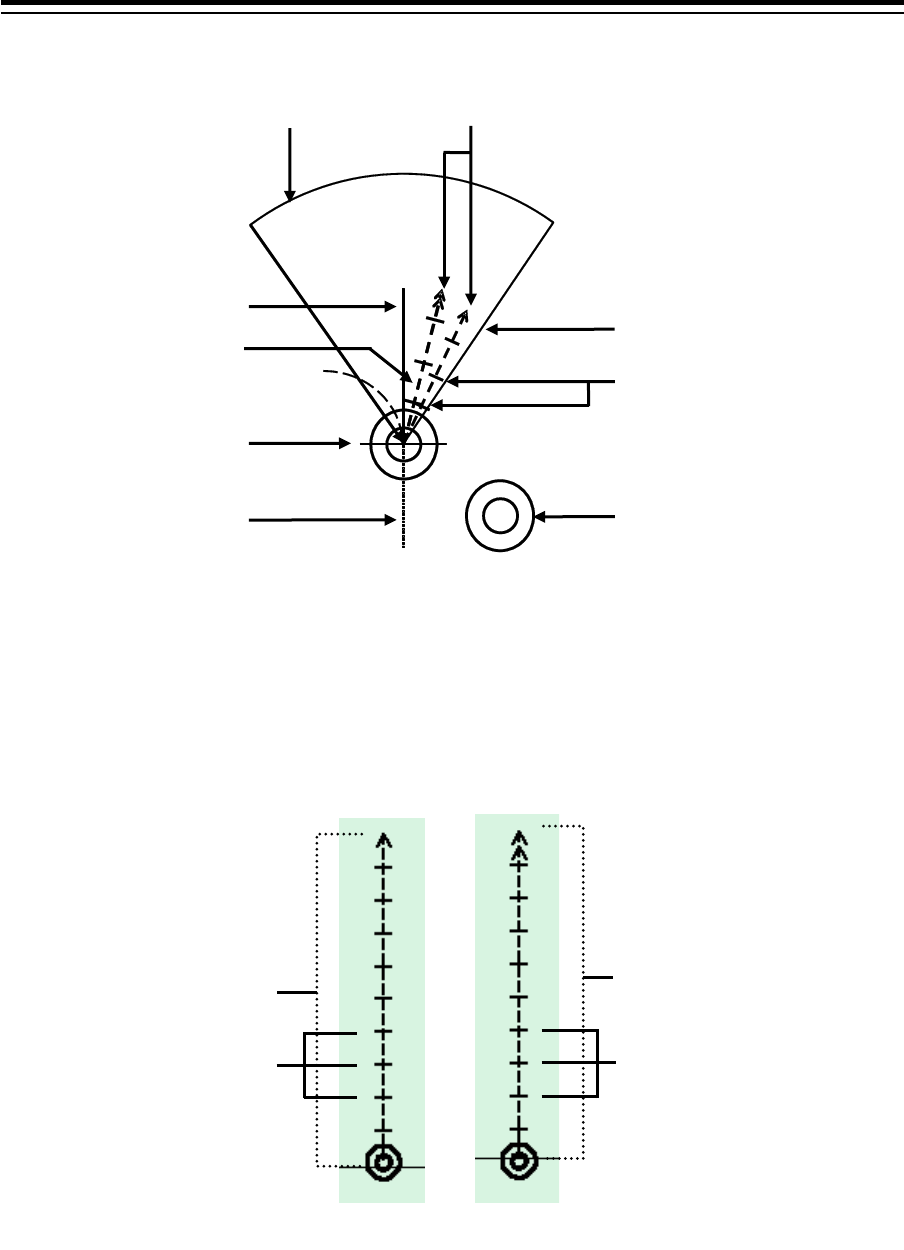
14.5.7 Creating an arrow (Line object)
An arrow can be displayed on the user map or chart.
1 Click on the [Type] button on the drawing toolbar.
An icon list is displayed.
2 Select the arrow icon. (Refer to "14.2.3 Selecting an object type")
3 Click on the starting position with the cursor.
A starting point is created and the property information of the starting point is displayed on the
object property dialog box.
Note
The color, line type, and line width of a starting point cannot be changed.
Starting
point
Latitude and longitude of starting point
Section 14 Creating a User Map/ Updating a Chart Manually 14-56
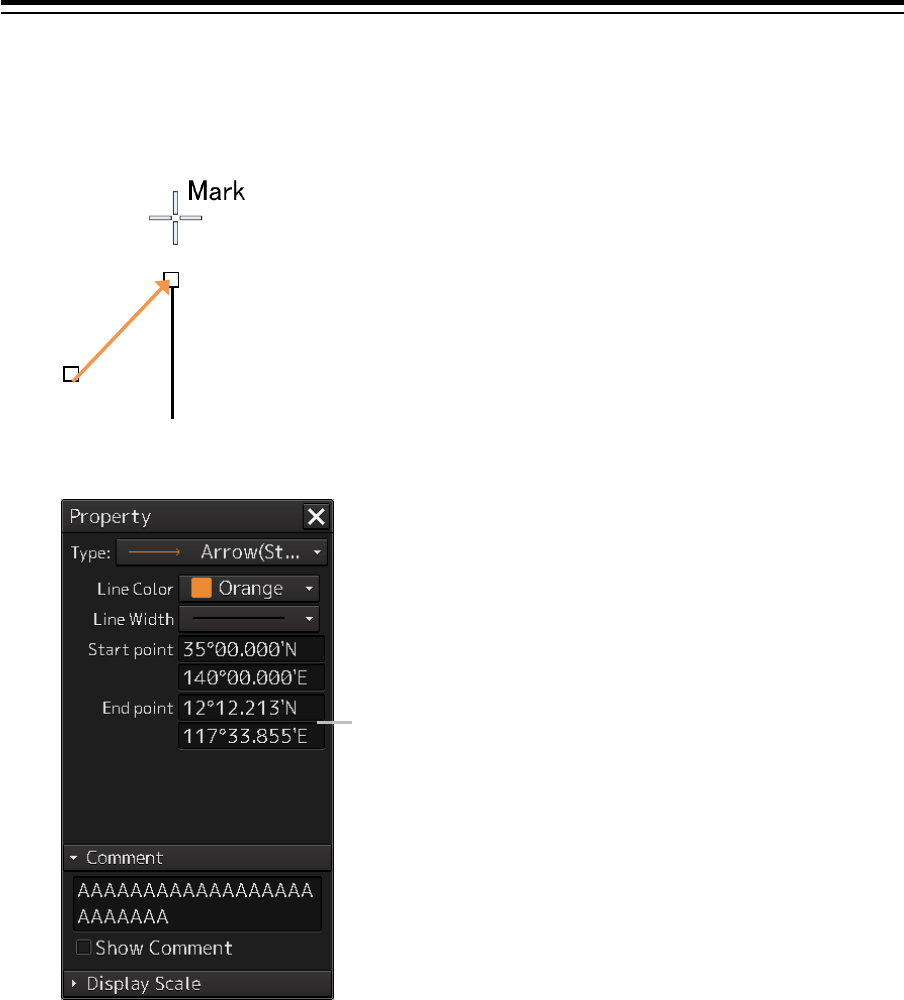
4 Click on the position of the ending point with the cursor.
An ending point is created and the property information of the ending point is displayed on the
object property dialog box.
5 Adjust the parameters on the object property dialog box.
6 To create an object on another position continuously, repeat Steps to 3 to 5.
14.5.7.1 Creating an object by specifying the starting point/ending
point position coordinates
1 Click on the [Enter POSN] button on the drawing toolbar.
The "Enter Position" dialog box appears (Refer to "14.2.6 Creating an object by specifying
latitude and longitude").
2 Enter the coordinates of the starting point and click on the [Enter] button.
A starting point of the arrow is created on the position of the specified coordinates and the
property information is reflected in the object property dialog box. (Refer to "14.2.8 Object
property dialog box").
Ending
point
Latitude and longitude
of ending point
14-57 Section 14 Creating a User Map/ Updating a Chart Manually
1
2
3
4
5
6
7
8
9
10
11
12
13
14
15
16
17
18
19
20
21
22
23
24
25
26
27
3 Enter the coordinates of the ending point and click on the [Enter] button.
An ending point of the arrow is created on the position of the specified coordinates and the
property information is reflected in the object property dialog box.
4 To create an object on another position continuously, repeat Steps 1 to 3.
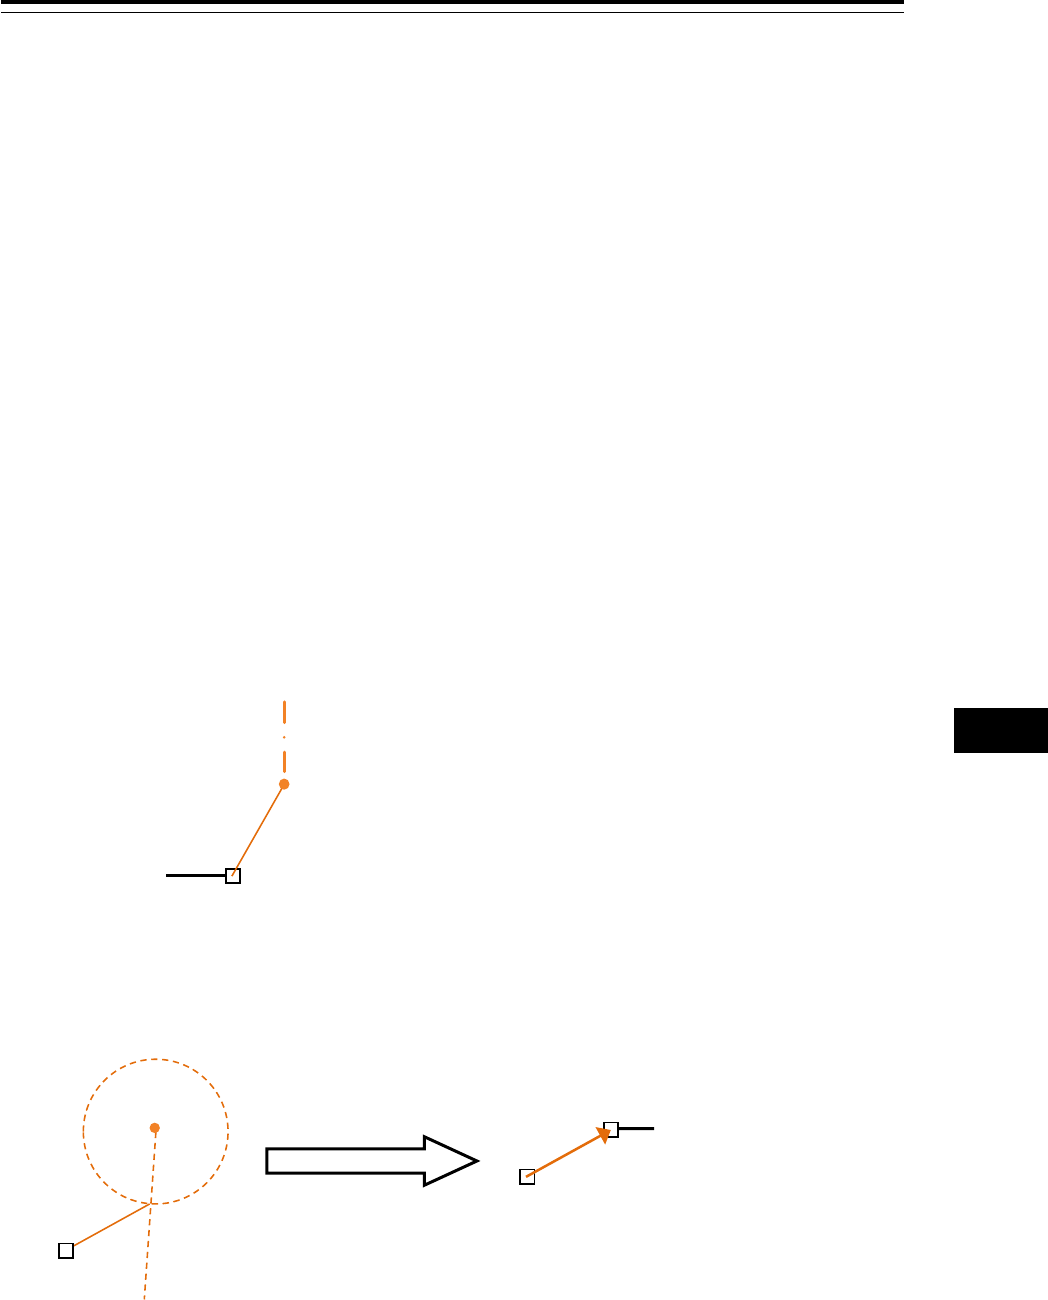
14.5.7.2 Drawing an object with EBL/VRM operation
1 Click on the [EBL/VRM] button on the drawing toolbar.
The cursor changes to the EBL/VRM reference point cursor. (Refer to "14.2.5 Creating an
object in the EBL/VRM mode").
2 Click on the position of the reference point of the EBL/VRM marker.
The EBL/VRM marker is displayed.
3 Place the EBL/VRM marker on the position of the starting point and click the button.
4 Click on the reference position of the EBL/VRM marker.
A starting point is created on the position on which the button was clicked and the property
information is displayed on the object property dialog box. (Refer to "14.2.8 Object property
dialog box").
5 Place the EBL/VRM marker on the position of the ending point and click the button.
An ending point is created on the position on which the button was clicked and the property
information is displayed on the object property dialog box. (Refer to "14.2.8 Object property
dialog box").
6 To create an object on another position continuously, repeat Steps 2 to 5.
Starting point
Click
Ending point

Section 14 Creating a User Map/ Updating a Chart Manually 14-58
14.5.8 Creating Mariner's Mark/Line drawing objects
(ECDIS screen only)
At user map creation, the following Mariner's Mark/Line drawing objects can be created.
• Information Mark
• Clearing Line
• Tidal Stream mark
• Highlight mark
1 Click on the [Type] button on the drawing toolbar.
An icon list is displayed.
2 Click on the [Mariner's Mark/Line] button on the icon list.
Mariner's Mark/Line drawing objects are displayed on the icon list.
3 Select an object to be created and specify a creation position.
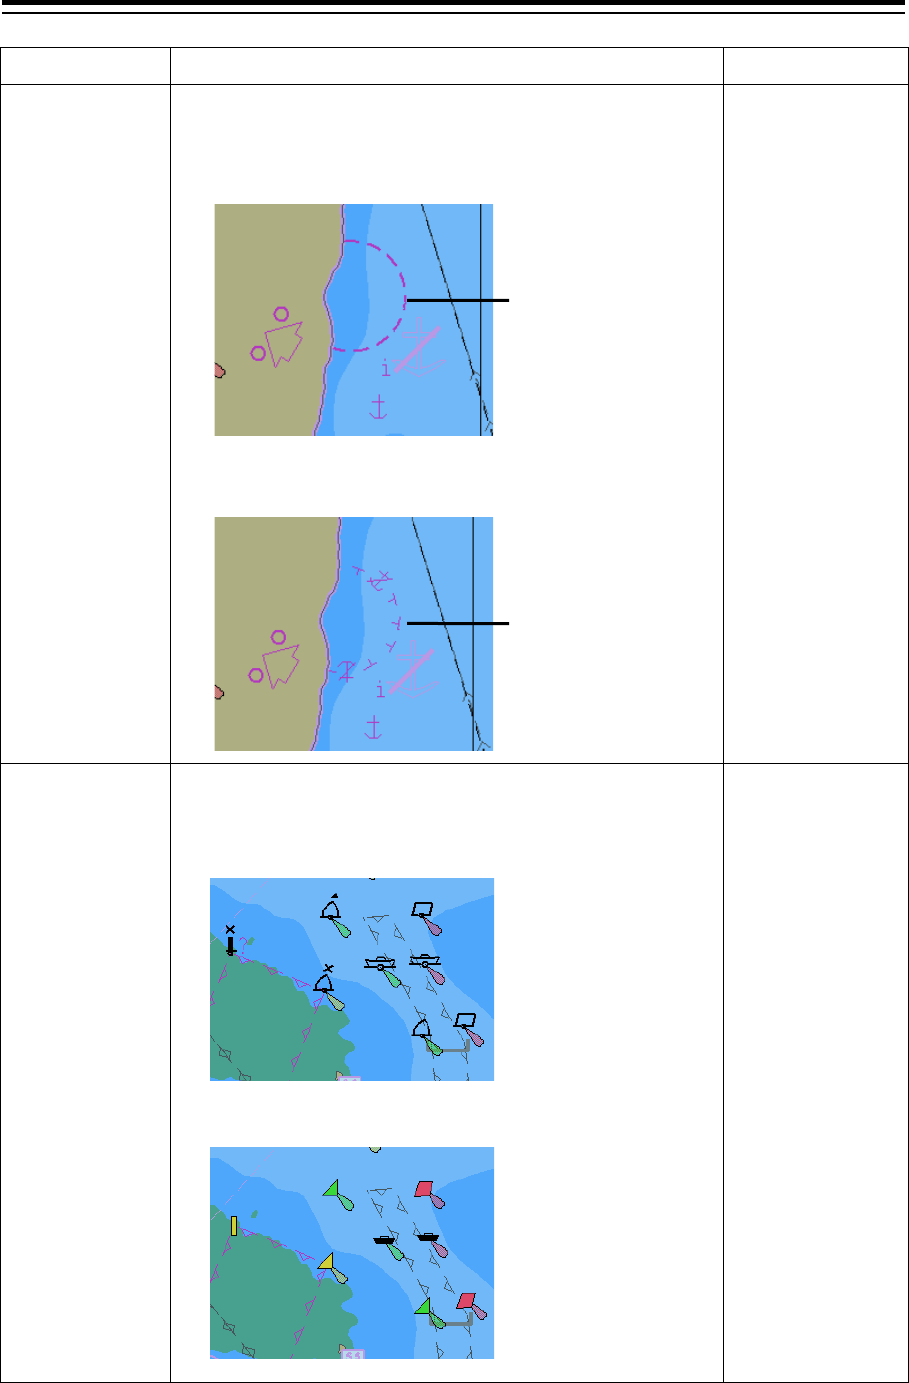
14.5.8.1 Information mark
An information mark can be created on any position of the chart. An information mark is used for
comments and so on.
1 Click on the [Type] button on the drawing toolbar.
An icon list is opened.
Select the icon of information mark. (Refer to "14.2.3 Selecting an object type").
i
Information
Mark
14-59 Section 14 Creating a User Map/ Updating a Chart Manually
1
2
3
4
5
6
7
8
9
10
11
12
13
14
15
16
17
18
19
20
21
22
23
24
25
26
27
2 Click on the position on which the information mark is to be created with the cursor.
The information mark is displayed on the position on which the button was clicked and the
parameters of the information mark are displayed on the object property dialog box.
3 Adjust the parameters on the object property dialog box.
4 To create an object on another position continuously, repeat Steps 2 and 3.
Creating an object by specifying the latitude and longitude
1 Click on the [Enter POSN] button on the drawing toolbar.
The "Enter Position" dialog box appears (Refer to "14.2.6 Creating an object by specifying
latitude and longitude").
2 Enter the latitude and longitude of the position on which an object is to be created and
click on the [Enter] button.
An object is created on the position of the specified latitude and longitude and the property
information is reflected in the object property dialog box. (Refer to "14.2.8 Object property
dialog box").
3 Adjust the parameters on the object property dialog box.
4 To create an object on another position continuously, repeat Steps 2 and 3.
i
Latitude and longitude of the
information mark creation position
Section 14 Creating a User Map/ Updating a Chart Manually 14-60
Creating an object with EBL/VRM operation
1 Click on the [EBL/VRM] button on the drawing toolbar.
The cursor changes to the EBL/VRM reference point cursor. (Refer to "14.2.5 Creating an
object in the EBL/VRM mode").
2 Click on the position of the reference point of the EBL/VRM marker.
The EBL/VRM marker is displayed.
3 Place the EBL/VRM marker on the position on which an object is to be created and
click the button.
An object is created on the position on which the button was clicked and the property
information reflected in the object property dialog box. (Refer to "14.2.8 Object property dialog
box").
4 Adjust the parameters on the object property dialog box.
5 To create an object on another position continuously, repeat Steps 2 to 4.
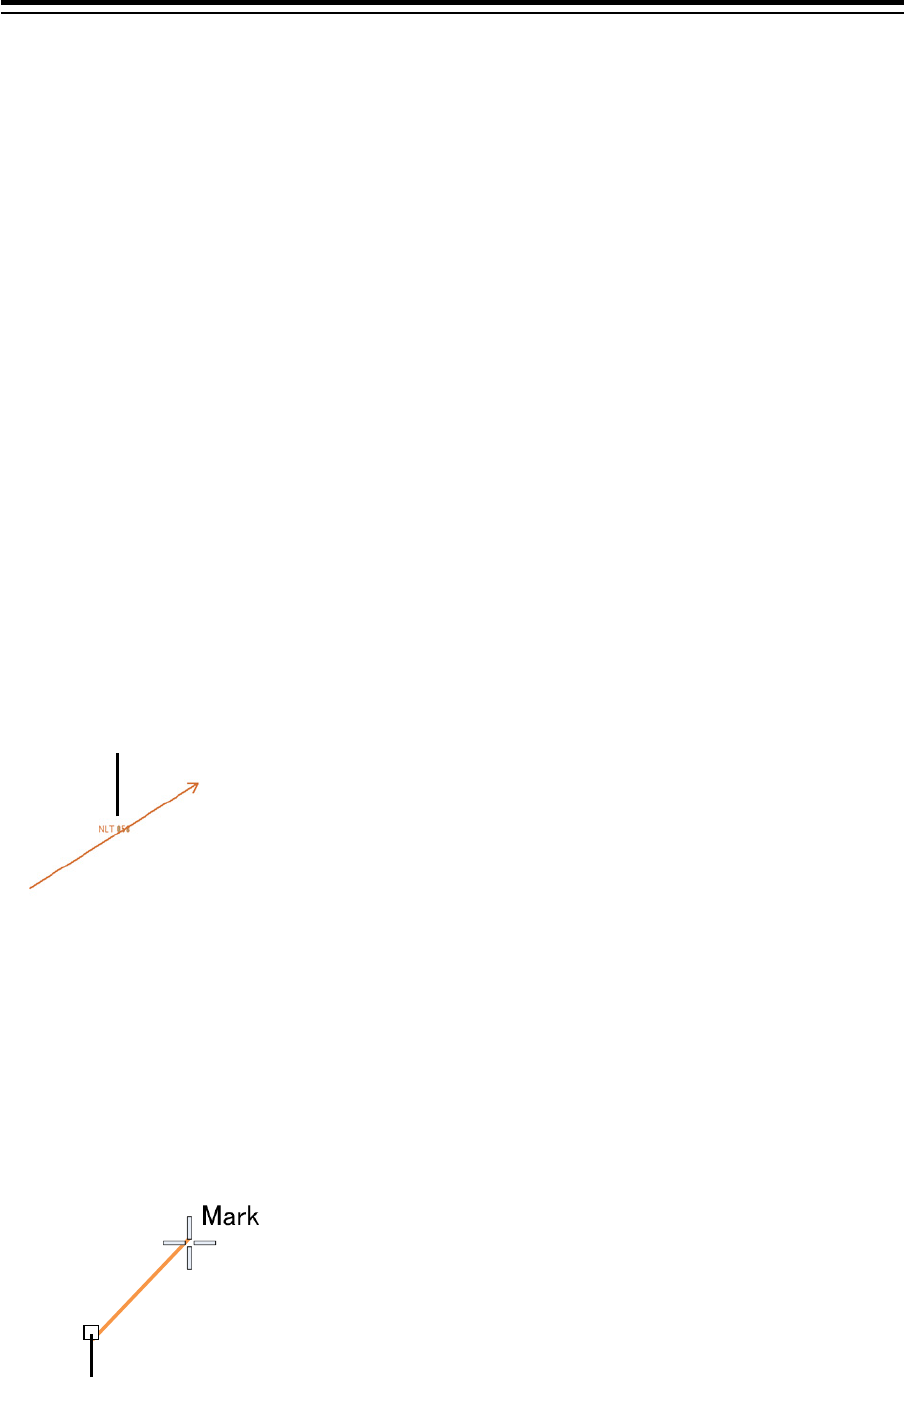
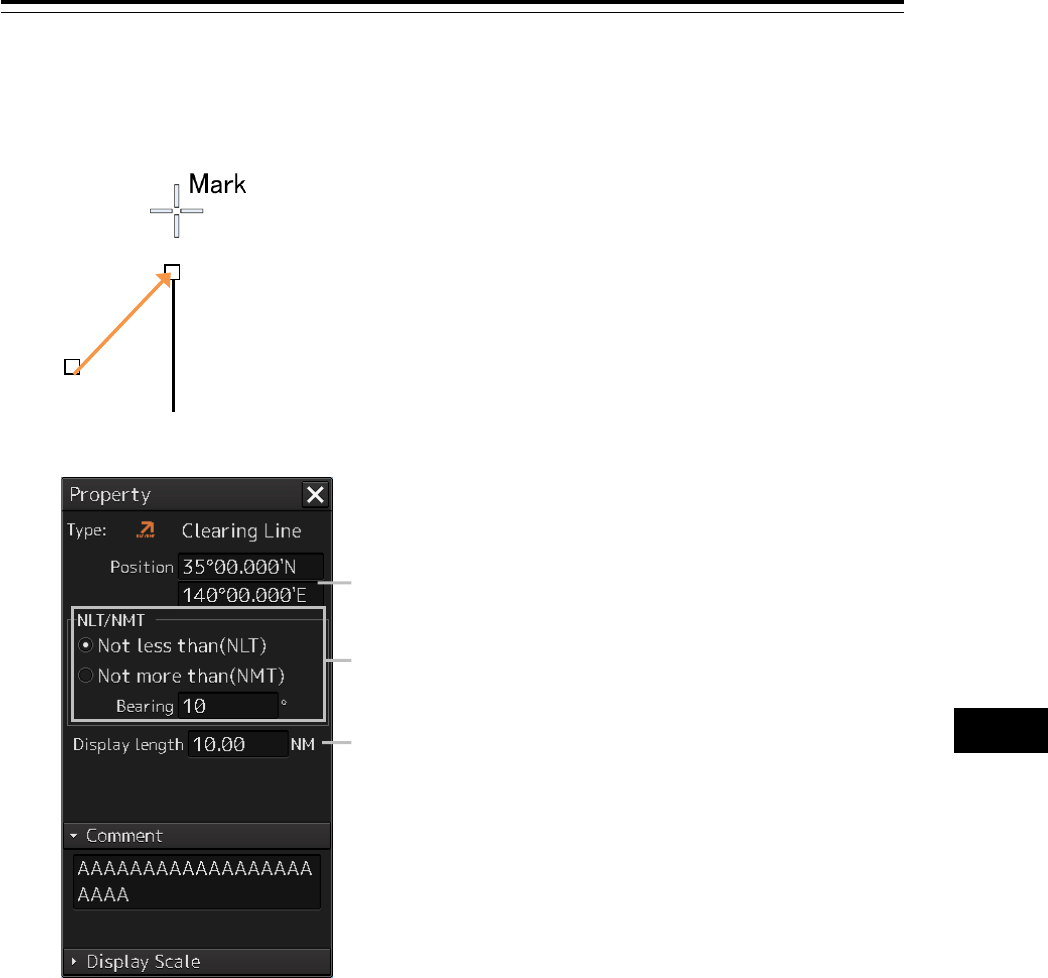
14.5.8.2 Clearing line
A clearing line can be created on a chart. It is possible to select an angle and either Not Less Than
(NLT) or Not More Than (NMT) for a clearing line on the object property dialog box.
1 Click on the [Type] button on the drawing toolbar.
Open the icon list and select an icon of clearing line. (Refer to "14.2.3 Selecting an object
type").
2 Click on the position of a starting point with the cursor.
A starting point is created and the property information of the clearing line is displayed on the
object property dialog box.
Angle of the clearing line (either NLT or NMT can be selected)
Clearing line
Starting
point
14-61 Section 14 Creating a User Map/ Updating a Chart Manually
1
2
3
4
5
6
7
8
9
10
11
12
13
14
15
16
17
18
19
20
21
22
23
24
25
26
27
3 Click on the position of the ending point with the cursor.
An ending point is created and the property information in the object property dialog box is
updated.
4 Adjust the parameters on the object property dialog box.
• Specifying an angle of a clearing line: Display a numeric value input keyboard by clicking
on the [Bearing] input box and enter an angle (0 to 359°).
• Specifying a length of a clearing line: Display a numeric value input keyboard by clicking
on the [Display length] input box and enter a length (0 to 999.99).
• Selecting Not Less Than (NLT)/Not More Than (NMT): Set Not Less Than (NLT) or Not
More Than (NMT) to On by clicking on the button.
When Not Less Than (NLT) is selected, "NLTxx" is displayed for the clearing line, indicating
that the line must not be below "xx". When Not More Than (NMT) is selected, "NMT xx" is
displayed for the clearing line, indicating that the line must not exceed "xx".
For the method of using the numeric value input keyboard, refer to "3.15.2 Name and function
of each section of the keyboard".
5 To create an object on another position continuously, repeat Steps 2 to 4.
Ending
point
Select Not Less Than (NLT)/Not More Than
(NMT).
Latitude and longitude of the starting point
Specify the length of the clearing line.
Section 14 Creating a User Map/ Updating a Chart Manually 14-62
Creating position coordinates of the starting point
1 Click on the [Enter POSN] button on the drawing toolbar.
The "Enter Position" dialog box appears (Refer to "14.2.6 Creating an object by specifying
latitude and longitude").
2 Enter the coordinates of a starting point and click on the [Enter] button.
3 To create an object on another position continuously, repeat Steps 1 and 2.
Drawing an object with EBL/VRM operation
1 Click on the [EBL/VRM] button on the drawing toolbar.
The cursor changes to the EBL/VRM reference point cursor. (Refer to "14.2.5 Creating an
object in the EBL/VRM mode").
2 Click on the position of the reference point of the EBL/VRM marker.
The EBL/VRM marker is displayed.
3 Place the EBL/VRM marker on the starting point position and click the button.
A starting point is created on the position on which the button was clicked and the property
information is reflected in the object property dialog box. (Refer to "14.2.8 Object property
dialog box").
4 Place the EBL/VRM marker on the ending point position and click the button.
An ending point is created on the position on which the button was clicked and the property
information is reflected in the object property dialog box. (Refer to "14.2.8 Object property
dialog box").
5 To create an object on another position continuously, repeat Steps 2 to 4.
Starting point
Click
Ending point
14-63 Section 14 Creating a User Map/ Updating a Chart Manually
1
2
3
4
5
6
7
8
9
10
11
12
13
14
15
16
17
18
19
20
21
22
23
24
25
26
27
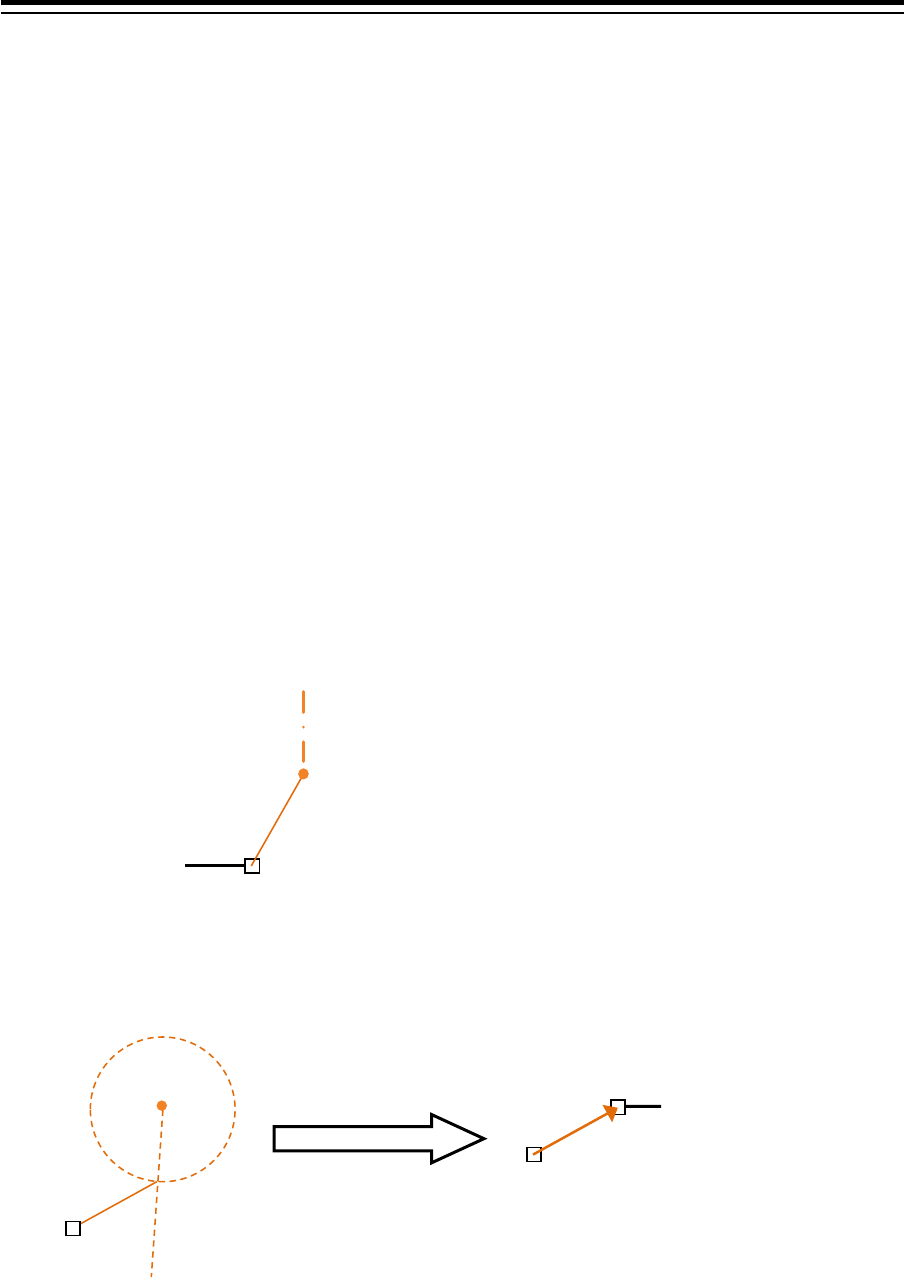
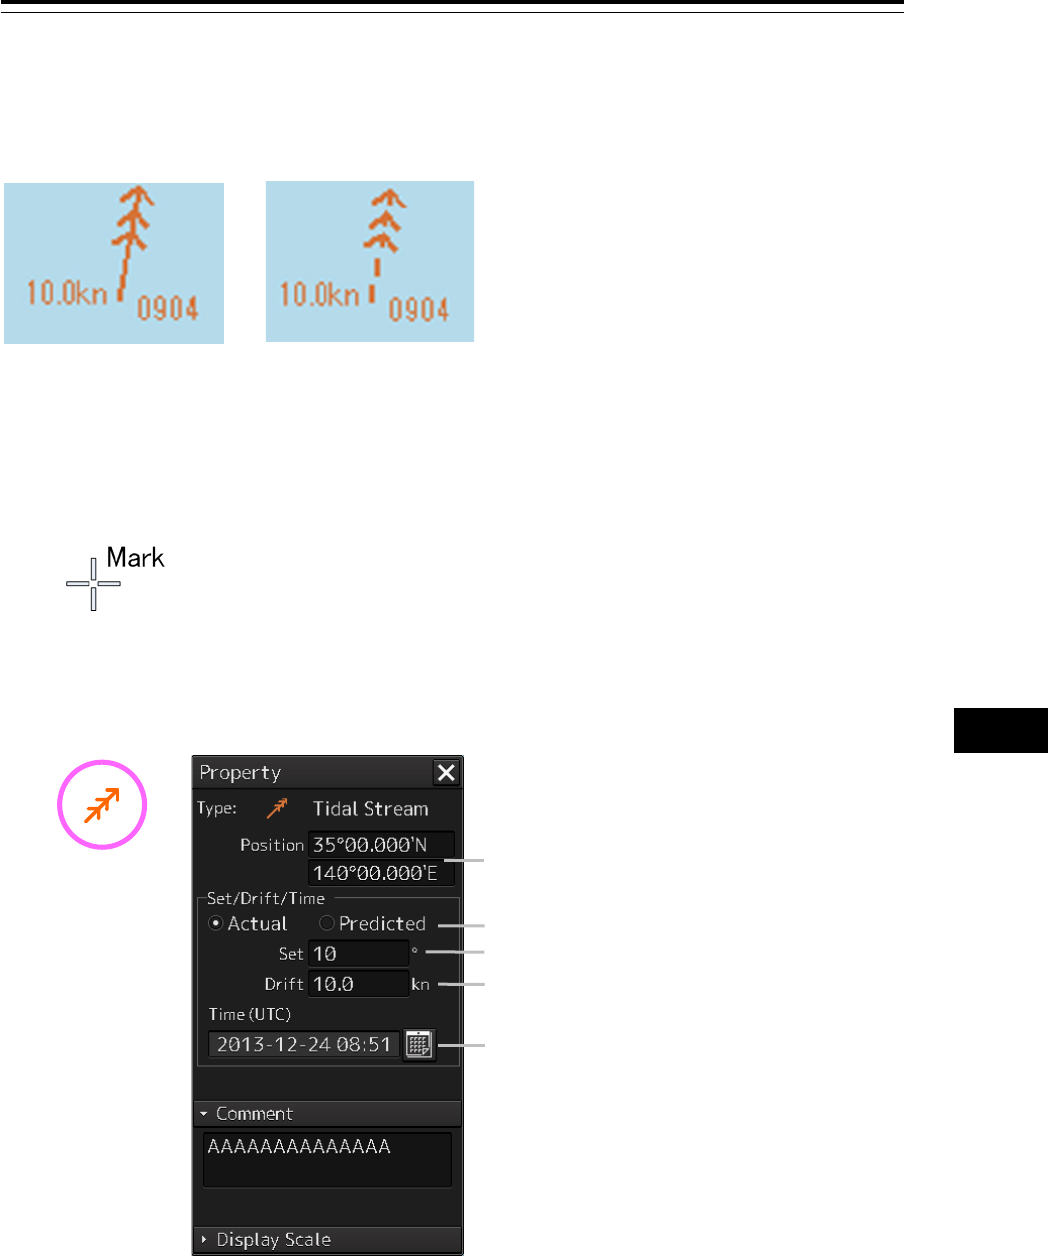
14.5.8.3 Tidal Stream mark
A current drift and a bearing can be input for a tidal stream mark. Edit the current drift (Drift) and the
bearing (Set) after creating a tidal stream mark on the object property dialog box.
1 Click on the [Type] button on the drawing toolbar.
An icon list is opened.
Select the icon of a tidal stream mark. (Refer to "14.2.3 Selecting an object type").
2 Click on the position on which a tidal drift mark is to be created with the cursor.
A tidal stream mark is displayed on the position on which the button was clicked and the
parameters of the tidal channel mark that was created are displayed on the object property
dialog box.
Actual
Predicted
Latitude and longitude of the starting point
Select Actual/Predicted.
Specify a bearing.
Specify a current drift.
Specify date/time.

Section 14 Creating a User Map/ Updating a Chart Manually 14-64
3 Adjust the parameters on the object property dialog box.
• Specifying a bearing: Display a numeric value input keyboard by clicking on the [Set] input
box and enter a bearing (0 to 359°).
• Specifying a current drift: Display a numeric value input keyboard by clicking on the [Drift]
input box and enter a current drift (0 to 99.9).
• Selecting Actual/Predicted: Select the check box of either Actual or Predicted.
When Actual is selected, a tidal stream mark of a solid line is displayed. When Predicted is
selected, a tidal mark of a broken line is displayed.
• Specifying date/time: Display a calendar + time picker by clicking on the calendar button
and enter a date and a time in the [Time(UTC)] input box.
For the method of using a numeric value input keyboard, refer to "3.15.2 Name and function of
each section of the keyboard" and for the method of using a calendar + time picker, refer to
"3.16 Setting a Date and a Time [Calendar Operation)".
4 To create an object on another position continuously, repeat Steps 2 and 3.
Moving a tidal stream mark
1 Click the right mouse button on the tidal stream mark that is set.
The menu is displayed.
2 Click on [Move this object].
3 Click on the required destination position.
Creating an object by specifying the latitude and longitude
1 Click on the [Enter POSN] button on the drawing toolbar.
The "Enter Position" dialog box appears (Refer to "14.2.6 Creating an object by specifying
latitude and longitude").
2 Enter the latitude and longitude of the position on which an object is to be created and
click on the [Enter] button.
An object is created on the position of the specified latitude and longitude and the property
information is reflected in the object property dialog box. (Refer to "14.2.8 Object property
dialog box").
3 Adjust the parameters on the object property dialog box.
4 To create an object on another position continuously, repeat Steps 2 and 3.
14-65 Section 14 Creating a User Map/ Updating a Chart Manually
1
2
3
4
5
6
7
8
9
10
11
12
13
14
15
16
17
18
19
20
21
22
23
24
25
26
27
Creating an object with EBL/VRM operation
1 Click on the [EBL/VRM] button on the drawing toolbar.
The cursor changes to the EBL/VRM reference point cursor. (Refer to "14.2.5 Creating an
object in the EBL/VRM mode").
2 Click on the position of the reference point of the EBL/VRM marker.
The EBL/VRM marker is displayed.
3 Place the EBL/VRM marker on the position on which an object is to be created and
click the button.
An object is created on the position on which the button was clicked and the property
information reflected in the object property dialog box. (Refer to "14.2.8 Object property dialog
box").
4 Adjust the parameters on the object property dialog box.
5 To create an object on another position continuously, repeat Steps 2 to 4.
14.5.8.4 Highlighted display
Highlighted display can be set by creating an area of a polygon on a chart. Use highlighted display for
attaching a comment on the chart or so on.
1 Click on the [Type] button on the drawing toolbar.
An icon list is opened.
Select an icon of highlighted display. (Refer to "14.2.3 Selecting an object type").
Highlighted
display
Section 14 Creating a User Map/ Updating a Chart Manually 14-66
2 Click on the position of a starting point with the cursor.
A starting point is created and the property information of vertex 1 is displayed on the object
property dialog box.
3 Move the cursor to the next vertex.
The latitude and longitude of the cursor are displayed near the cursor.
The latitude and longitude of the starting point (vertex
1) is displayed.
14-67 Section 14 Creating a User Map/ Updating a Chart Manually
1
2
3
4
5
6
7
8
9
10
11
12
13
14
15
16
17
18
19
20
21
22
23
24
25
26
27
4 Click on the position on which the 2nd vertex is to be created.
A vertex is created and the latitude and longitude of the 2nd vertex are displayed on the object
property dialog box.
5 Click on the position on which the 3rd vertex is to be created.
A triangle is created by connecting three vertices. The preview screen is displayed, enabling to
check the object fill status.
The latitude and longitude of the 3rd vertex are displayed on the object property dialog box.
Resetting the
selection of the
starting point
Mark
Add the 2nd vertex
The number of
vertices
becomes 2.
The coordinates
of the
2nd vertex
are entered.
The preview of the result of filling the object is displayed.
Section 14 Creating a User Map/ Updating a Chart Manually 14-68
6 To add another vertex continuously, click on the position on which the vertex is to be
created.
When not adding another vertex, determine the object by double-clicking or clicking the right
button on the object.
7 Adjust the parameters on the object property dialog box.
8 To create an object on another position continuously, click on the [New] button in the
"Enter Position" dialog and repeat Steps from 2 to 7.
The number of
vertices becomes 3.
The coordinates of
the 3rd vertex are
entered.
When the 4th vertex is determined, the preview display is
updated.

14-69 Section 14 Creating a User Map/ Updating a Chart Manually
1
2
3
4
5
6
7
8
9
10
11
12
13
14
15
16
17
18
19
20
21
22
23
24
25
26
27
Creating a vertex by entering the position
1 Click on the [Enter POSN] button on the drawing toolbar.
The "Enter Position" dialog box appears.
2 Enter the values of latitude and longitude of the vertex of the object in the [Position]
box and click on the [Enter] button.
The position of one vertex of the object is determined.
The [Bearing] box and the [Distance] box are enabled.
3 Enter the values of latitude and longitude of the next vertex of the object in the
[Position] box. Alternatively, enter the bearing from the vertex that was determined
immediately previously in the [Bearing] box and the [Distance] input box.
4 Click on the [Enter] button.
5 Determine the positions of 3 or more vertices by repeating Steps 2 to 4.
6 Adjust the parameters on the object property dialog box.
7 To create an object on another position continuously, repeat Steps 2 to 6.
Creating an object with EBL/VRM operation
1 Click on the [EBL/VRM] button on the drawing toolbar.
The cursor changes to the EBL/VRM reference point cursor. (Refer to "14.2.5 Creating an
object in the EBL/VRM mode").
2 Click on the position of the reference point of the EBL/VRM marker.
The EBL/VRM marker is displayed.
3 Placing the EBL/VRM marker on the position of the starting point and click the button.
A vertex is created on the position on which the button was clicked, and the property
information is displayed on the object property dialog box. (Refer to "14.2.8 Object property
dialog box").
4 Click on the reference point.
The EBL/VRM marker is displayed to determine the 2nd vertex.
Starting point
Section 14 Creating a User Map/ Updating a Chart Manually 14-70
5 Place the EBL/VRM marker on the position of the 2nd vertex and click the button.
A vertex is created on the position on which the button was clicked and the property information
is reflected in the object property dialog box. (Refer to "14.2.8 Object property dialog box".)
The EBL/VRM marker is reset to the EBL/VRM reference point cursor.
6 Place the EBL/VRM marker on the position of the 3rd vertex and click the button.
A triangle is created by connecting the three vertices. A preview screen is displayed, enabling
the checking of the fill status of the polygon and the Warning area.
7 Adjust the parameters on the object property dialog box.
8 To create an object on another position continuously, repeat Steps 1 to 7.
2nd vertex
The preview of the result of filling the area is displayed.
14-71 Section 14 Creating a User Map/ Updating a Chart Manually
1
2
3
4
5
6
7
8
9
10
11
12
13
14
15
16
17
18
19
20
21
22
23
24
25
26
27
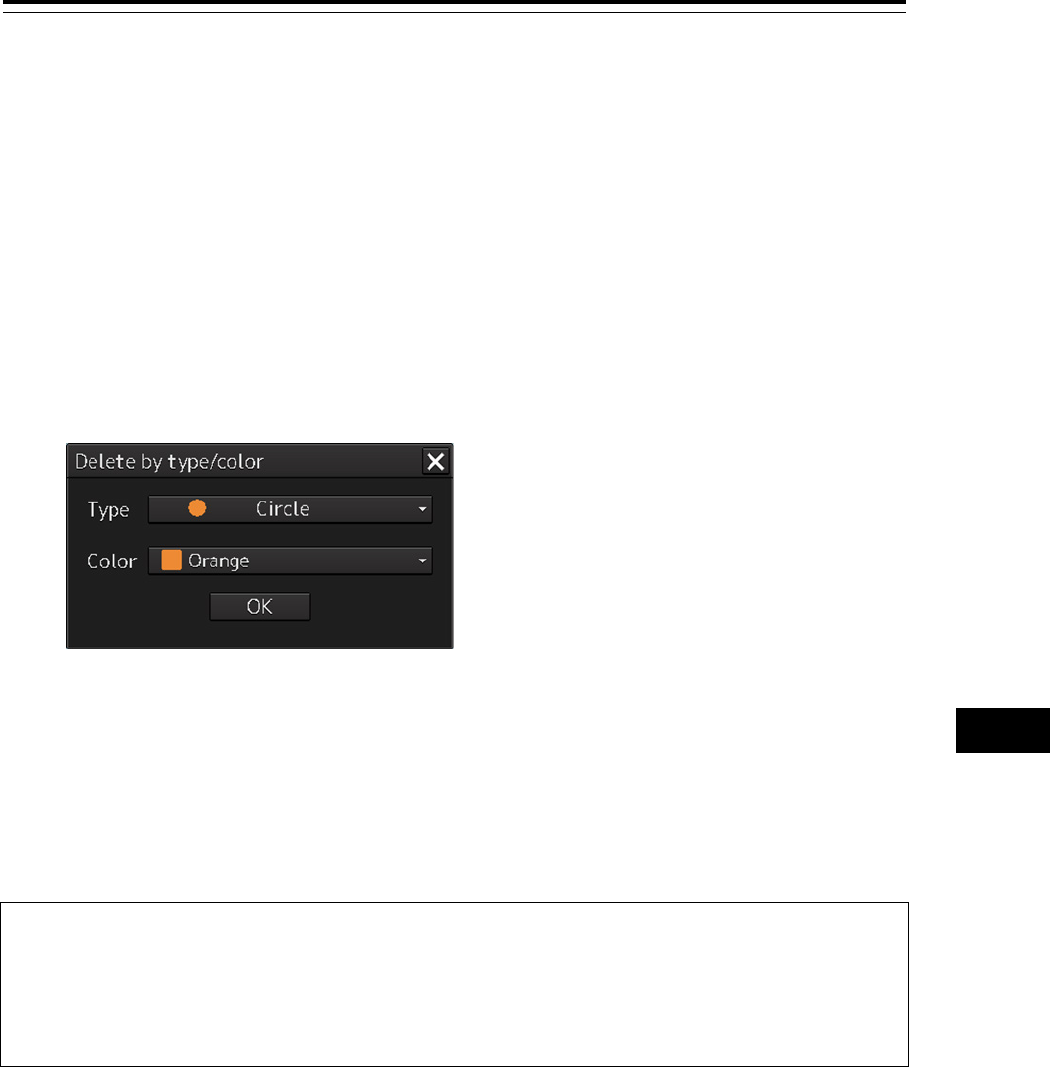
14.6 Collective Deletion of Objects [Delete
by Type/Color]
Objects of the same shape and color can be deleted collectively by "Delete by Type/Color".
1 Click on the [Menu] button on the left toolbar.
The menu is displayed.
2 Click on the [User Map] button on the menu.
3 Click on the [Delete by Type/Color] on the submenu.
The "Delete by type/color" dialog box appears.
4 Elect the common parameters for the objects to be deleted from the lists of the [Type]
combo box and the [Color] box.
When [All] is selected, all the objects are deleted.
5 Click the [OK] button.
Note
• If the color that is specified in the [Color] box matches any of the point color, line color and area
color of the object, the object is targeted for deletion.
•
When a Warning line is selected in the [Type] combo box, the [Color] box is displayed as
Disabled.
"Delete by type/color" dialog box
Section 14 Creating a User Map/ Updating a Chart Manually 14-72
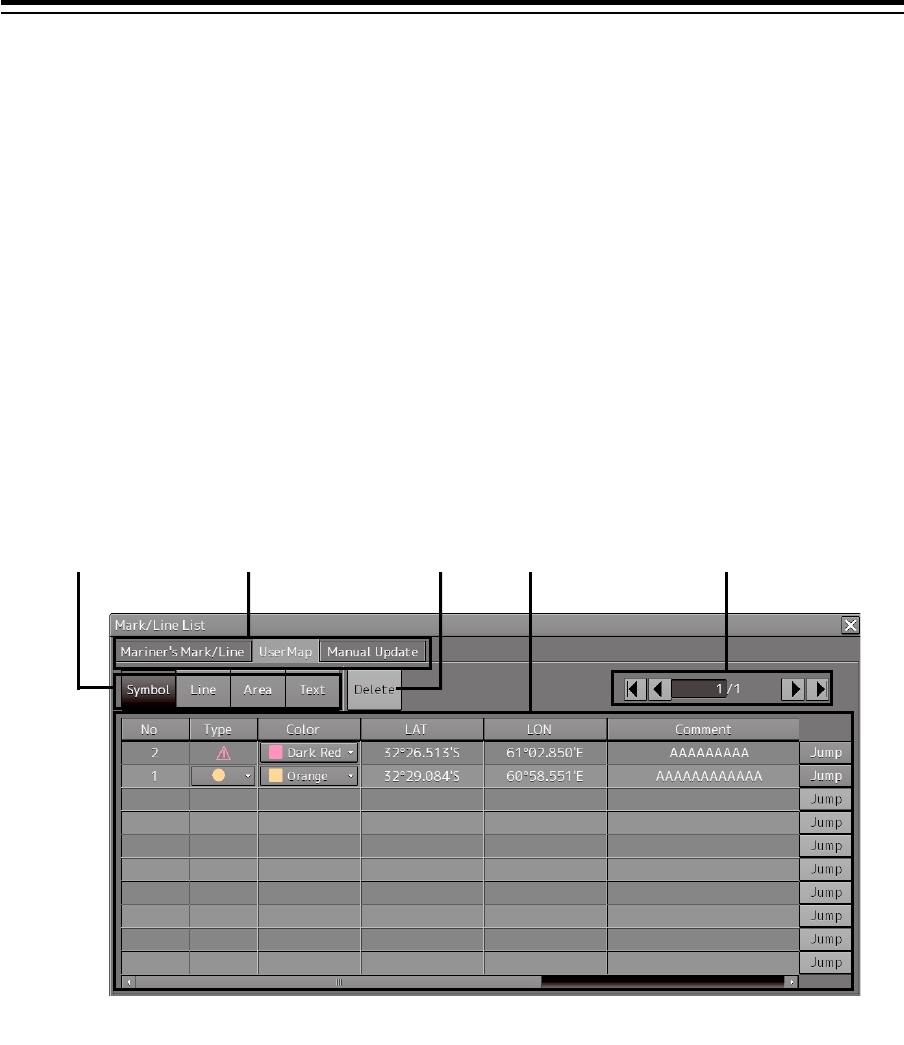
14.7 Managing/Editing Objects [Mark
Line/List]
User maps and manually updated objects can be managed/edited through [Mark/Line List].
14.7.1 Displaying the "Mark/Line List" dialog box
1 Click on the [Menu] button on the left toolbar.
The menu is displayed.
2 Click on the [User Map] button on the menu.
3 Click on the [Mark/Line List] on the submenu.
The "Mark/Line List" dialog box appears.
Tab display
Category button
Page switching section
Operation button
section
Object list
"Mark/Line List" dialog box (Display example of [User Map] tab)
14-73 Section 14 Creating a User Map/ Updating a Chart Manually
1
2
3
4
5
6
7
8
9
10
11
12
13
14
15
16
17
18
19
20
21
22
23
24
25
26
27
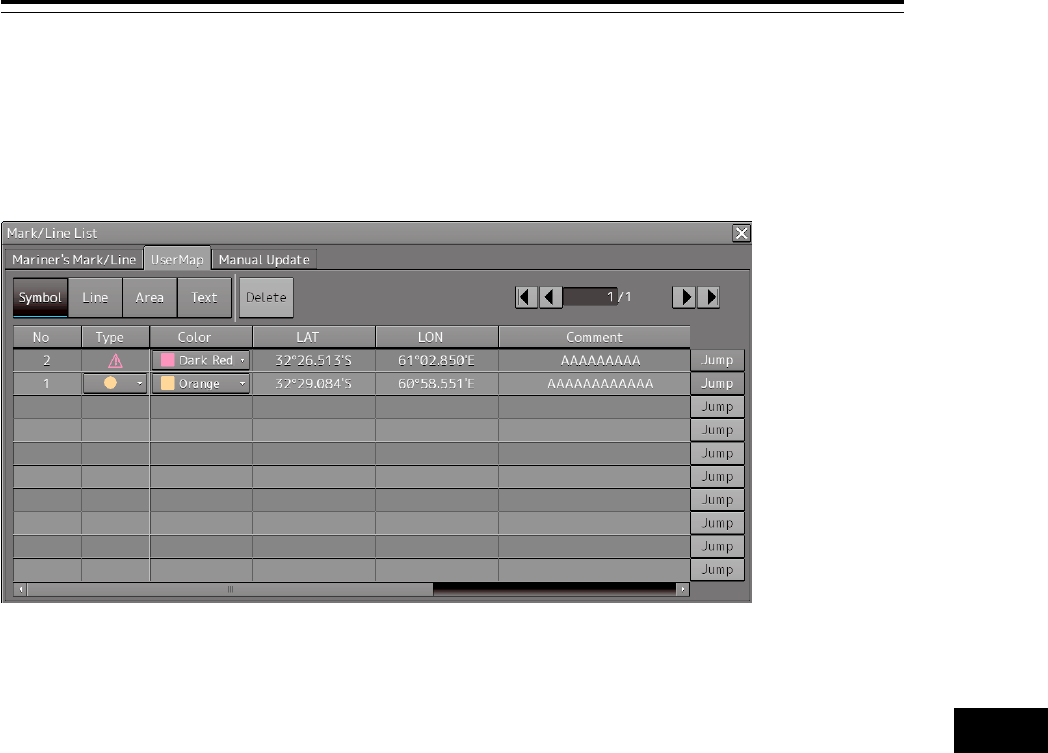
14.7.2 Displaying a user map list
The [User Map] tab displays a list of the user maps that are currently displayed.
The display of each category can be switched by clicking on the [Symbol] button/[Line] button/[Area]
button/[Text] button.
The tabs in the "Mark/Line List" dialog box consist of the following.
• [User Map] tab
- Symbol
- Line
- Area
- Text
• [Mariner's Mark/Line] tab (only the ECDIS screen and at creation of user map only)
- Event Mark
- Information Mark
- Tidal Stream
- Highlight (highlighted display)
- Clearing Line
(Refer to "14.7.3 Displaying a Mariner's Mark/Line List (ECDIS screen only)").
• [Manual Update] tab (ECDIS screen only)
- Symbol
- Line
- Area
- Text
14.7.2.1 Displaying an object on a chart
Click on the [Jump] button on the row of the object to be displayed on the chart.
[User Map] tab (example at selection of [Symbol])
Section 14 Creating a User Map/ Updating a Chart Manually 14-74
14.7.2.2 Deleting an object
Select the row of the object to be deleted and click on the [Delete] button.
Note
As soon as the [Delete] button is clicked on, the object is deleted. Re-check whether the object can
be deleted before clicking on the [Delete] button.
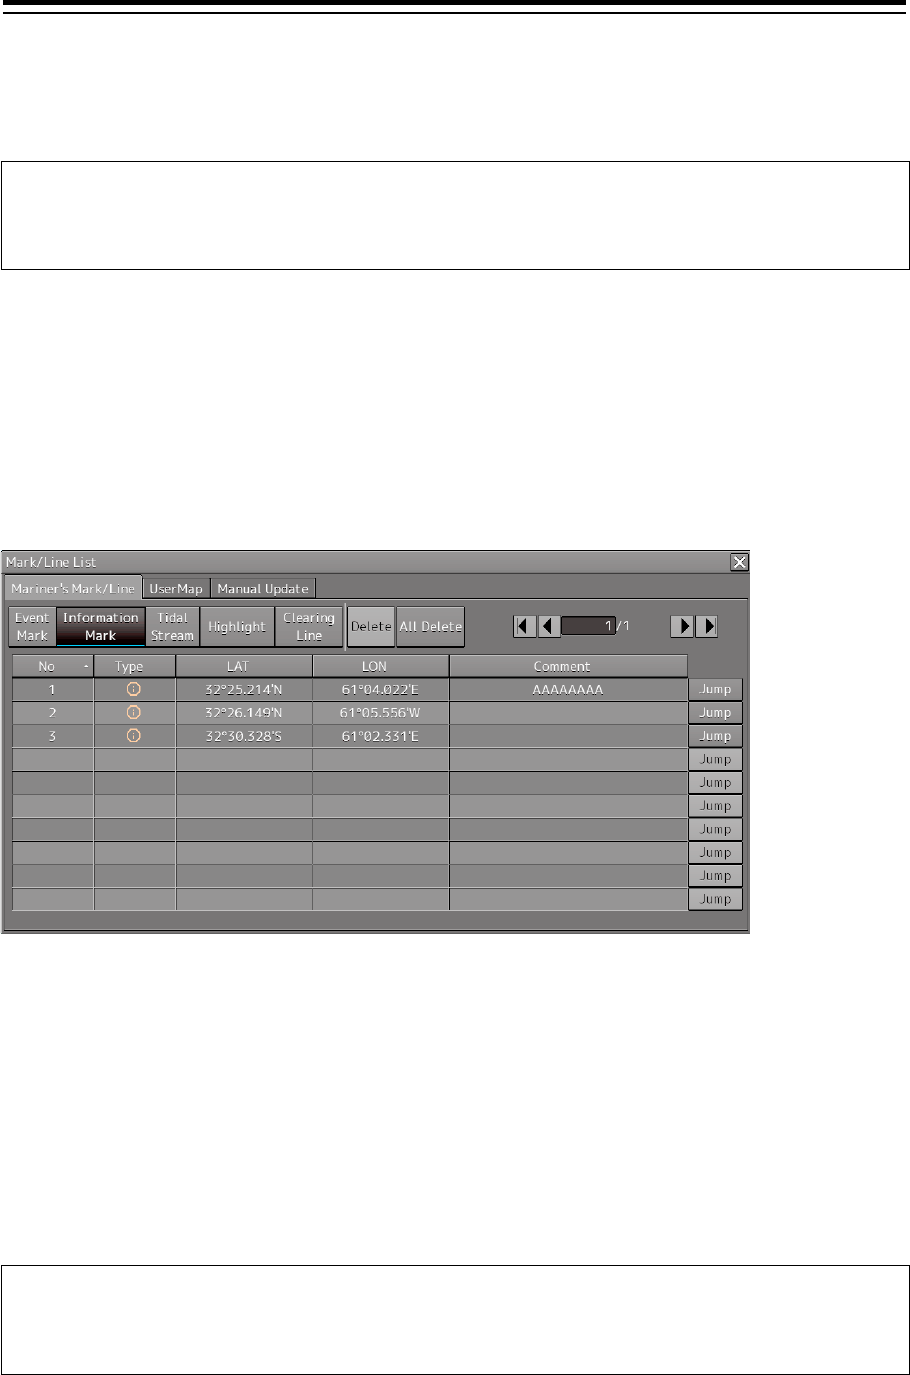
14.7.3 Displaying a Mariner's Mark/Line List (ECDIS
screen only)
A Mariner's Mark/Line can be displayed by using the [Mariner's Mark/Line] tab.
Display of each category can be switched by clicking on the [Event Mark] button/[Information
Mark]button/[Tidal Stream] button/[Highlight] button/[Clearing Line] button.
14.7.3.1 Displaying an object on a chart
Click on the [Jump] button on the row of the object to be displayed on the chart.
14.7.3.2 Deleting an object
Select a line of the object to be deleted and click on the [Delete] button.
Note
As soon as the [Delete] button is clicked on, the object is deleted. Re-check whether the object can
be deleted before clicking on the [Delete] button.
[Mariner's Mark/Line] tab (example at selection of [Information Mark]
14-75 Section 14 Creating a User Map/ Updating a Chart Manually
1
2
3
4
5
6
7
8
9
10
11
12
13
14
15
16
17
18
19
20
21
22
23
24
25
26
27
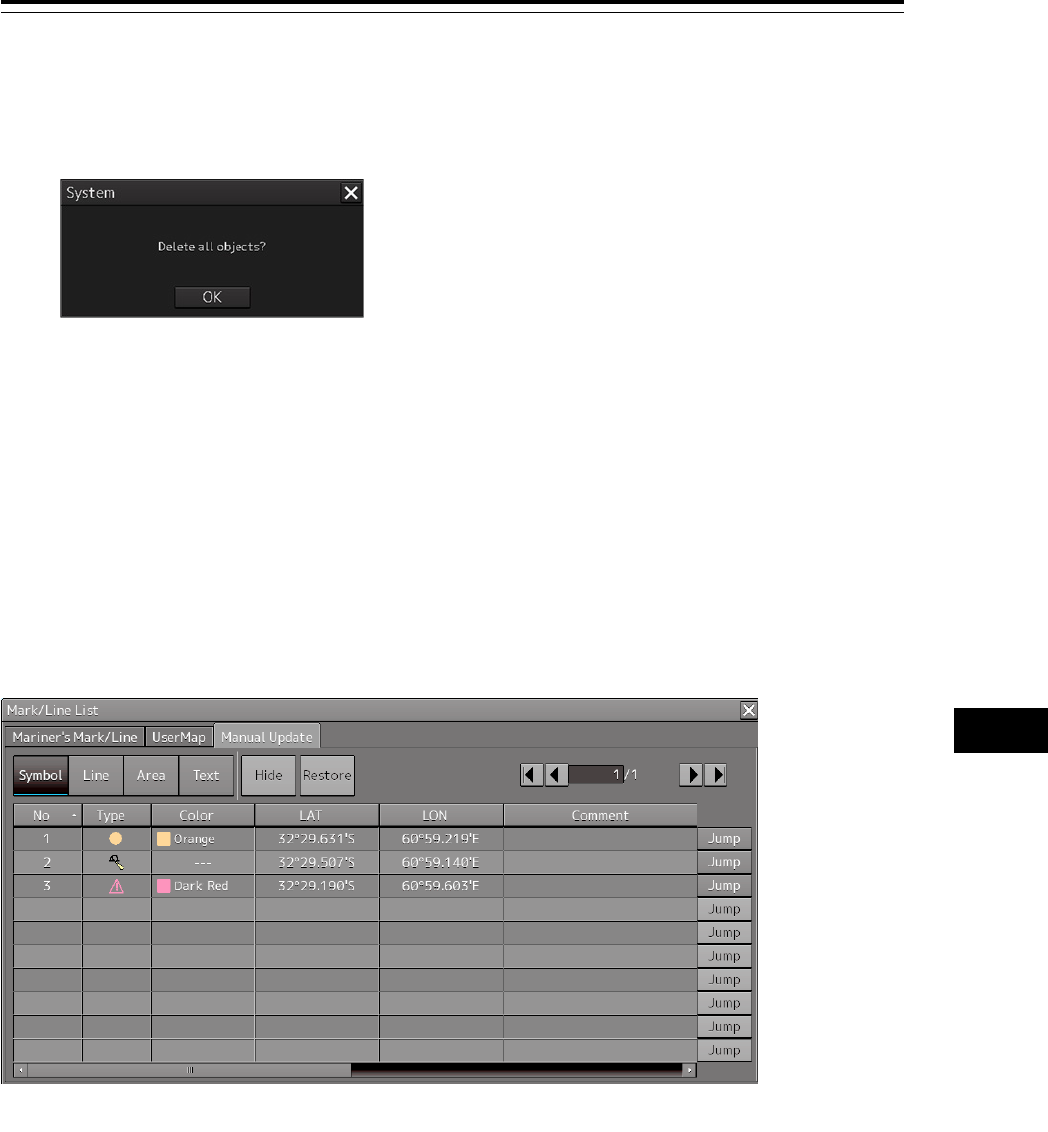
14.7.3.3 Deleting objects collectively from an object list
1 Click on the [All Delete] button.
A message dialog box for confirming deletion appears.
2 To execute deletion, click on the [OK] button. To cancel deletion, click on the [X]
button.
14.7.4 Displaying a manual update list (ECDIS
screen only)
A manual update list can be displayed by using the [Manual Update] tab.
Display of each category can be switched by clicking on the [Symbol] button/[Line] button/[Area]
button/[Text] button.
14.7.4.1 Displaying an object on a chart
1 Click on the [Jump] button on the row of the object to be displayed on the chart.
[Manual Update] tab (Selecting [Symbol] example)

Section 14 Creating a User Map/ Updating a Chart Manually 14-76
14.7.4.2 Hiding an object
1 Select a line of the object to be hidden and click on the [Hide] button.
The [Status] of the object to be hidden changes from [Normal] to [Hidden].
When the chart that uses the object that is set to Hide is updated, the expiration date (90 days after the
date when the object is created) of the object is displayed as [Expiration Date].
When the expiration date is reached, the object is deleted.
14.7.4.3 Redisplaying an object
Select a line of the object that has been set to Hide and click on the [Restore] button.
The [Status] of the object that is re-displayed changes from [Hidden] to [Normal].
The date of [Expiration Date] of the object is deleted.
15-1 Section 15 Logbook
1
2
3
4
5
6
7
8
9
10
11
12
13
14
15
16
17
18
19
20
21
22
23
24
25
26
27
付録
Section 15
Logbook
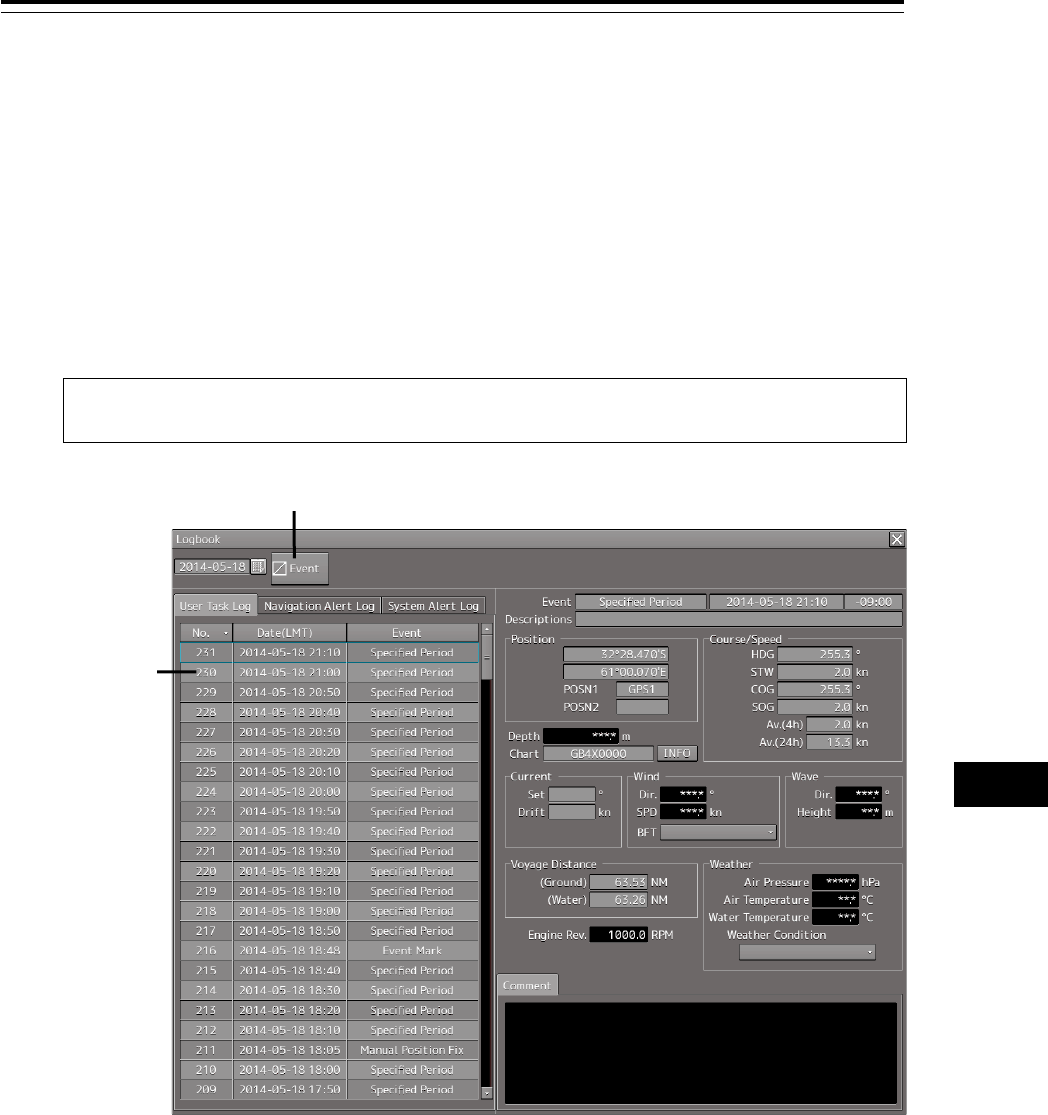
Various types of information (events) during the voyage can be recorded/displayed in a logbook.
15.1 Browsing a Logbook
1 Click on the [Menu] button on the left toolbar.
The menu is displayed.
2 Click on [Logbook] on the menu.
The "Logbook" dialog box appears.
Memo
Events that are recorded/displayed in a logbook can be changed by using the [Settings] menu. For
the details, refer to "18.16 Setting Logbook".
Event group
tab
Date selection
box
Event list
Event detail information

Section 15 Logbook 15-2
The following events are recorded in a logbook.
• At Noon: Recorded at 12:00 (LMT) every day.
• Specified Period: Recorded at any time interval.
• Event Mark: Recorded at marking an event mark.
• Manual Position Fix: Recorded at fixing a position manually.
• Chart Manual Updating: Recorded at updating a chart manually.
• System Start: Recorded at the start of the system.
• System Exit: Recorded at the termination of the system.
• Route Alert: Recorded at the occurrence of a Route-related alert.
• Chart Alert: Recorded at the occurrence of a Chart-related alert.
• Auto Sail Alert: Recorded at the occurrence of an automatic sailing related-alert and
sensor alarm
• System Alert: Recorded at the occurrence of an alert that does not belong to the types
that are indicated above
Searching an event based on the date
Enter a date and time in the date selection box.
The events of the date and time that were input are searched. The event list is scrolled and the line of
the first event is highlighted in blue.
Sorting events
When turning on the power, events are registered in the event list starting from the event of the latest
date.
When any of the items of the title line in the event list is clicked on, the events can be sorted based on
the item. Whenever the item is clicked on, the events are sorted in the ascending order or descending
order.
Switching the event groups
Events are classified into the following three event groups. When any of these tabs is clicked, the
associated evens are displayed.
• [User Task Log] tab: Displays the events relating to user operations.
• [Navigation Alert Log] tab: Displays the events relating to navigation alerts.
• [System Alert Log] tab: Displays the events relating to system alerts.
15-3 Section 15 Logbook
1
2
3
4
5
6
7
8
9
10
11
12
13
14
15
16
17
18
19
20
21
22
23
24
25
26
27
付録
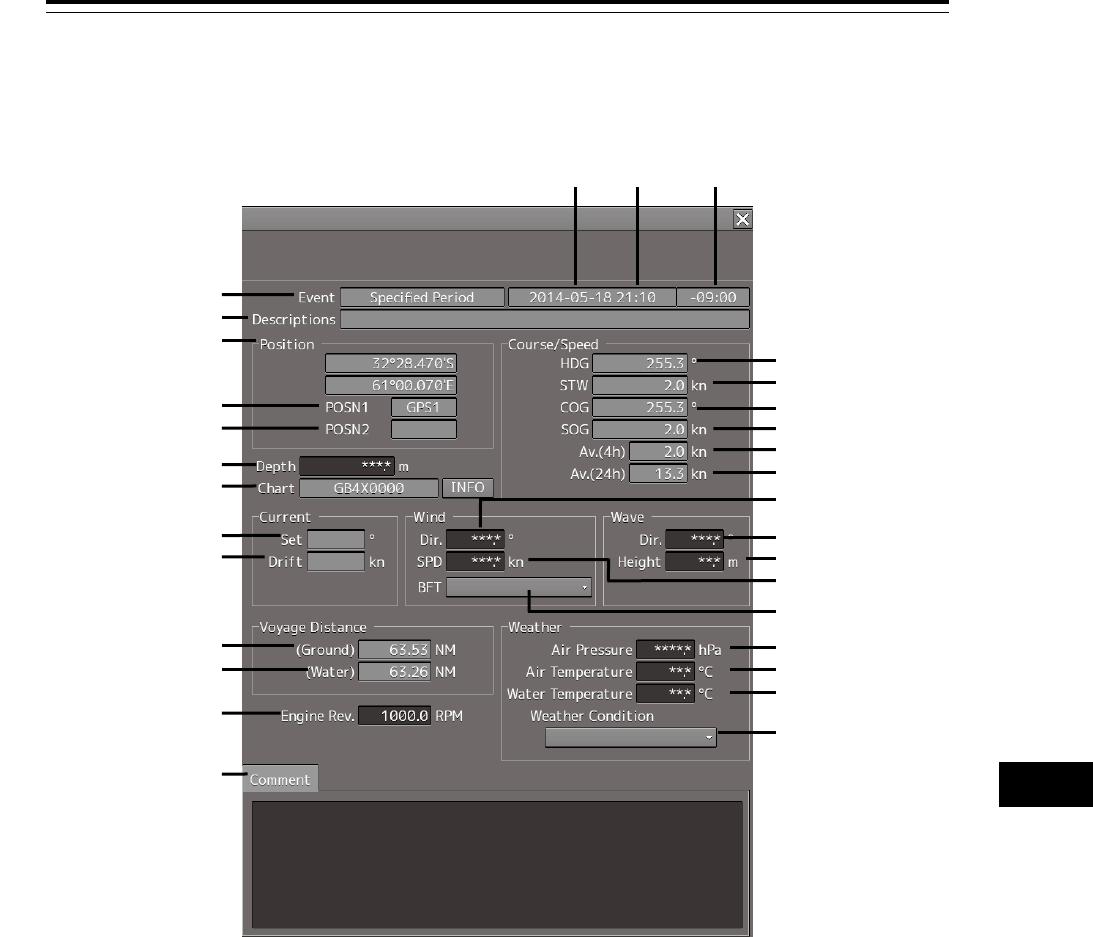
15.1.1 Event detail information
Navigation record data is displayed as event detail information.
Detail information that can be edited
The information below can be edited during browsing.
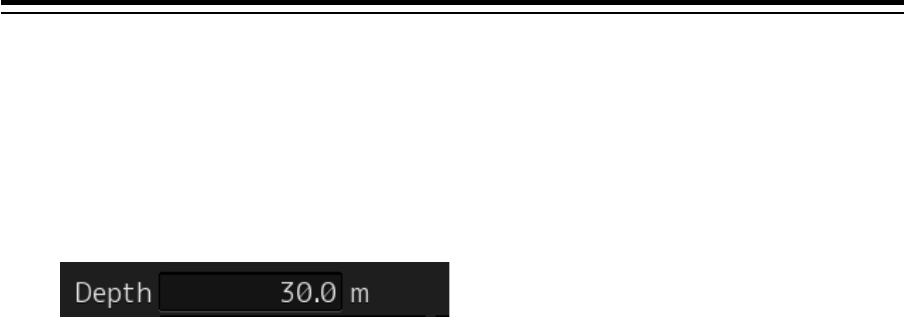
[Depth] (Water depth): Enter a value within the range from 0 to 999.9 m.
[Engine Rev.] (Engine revolution): Enter a value within the range from -9999.9 to 9999.9 RPM.
[Wind Dir.] (Wind direction): Enter a value within the range from 0 to 359.9°.
[Wind SPD] (Wind speed): Enter a value within the range from 0 to 200.0 kn.
[Wave Dir.] (Wave direction): Enter a value within the range from 0 to 359.9°.
[Wave Height] (Wave height): Enter a value within the range from 0 to 50.0 m.
[Air Press.] (Air pressure): Enter a value within the range from 0 to 2000.0 hPa.
[Air Temp.] (Air temperature): Enter a value within the range from -50.0 to 99.9°C.
[Water Temp.] (Water temperature): Enter a value within the range from -10.0 to 50.0°C.
Time difference
Time
Date
Event name
Event descriptions
Own ship's position
Position sensor type 1
Position sensor type 2
Chart name
Current direction
Current speed
Water depth
Voyage distance (ground)
Voyage distance (water)
Engine revolution
Comment
Speed through the water
Speed over the ground
Ship's heading
24-hour average of SOG
Wind direction
4-hour average of SOG
Course over the ground
Wave direction
Wind speed
Beaufort scale
Wave height
Air pressure
Air temperature
Water temperature
Weather condition

Section 15 Logbook 15-4
The information below can be input manually. The setting can be selected from the list.
[Beaufort scale]
0: Calm
1: Light air
2: Light breeze
3: Gentle breeze
4: Moderate breeze
5: Fresh breeze
6: Strong breeze
7: Near gale
8: Gale
9: Strong gale
10: Storm
11: Violent storm
12: Hurricane
[Weather condition]
b: Blue sky
bc: Fine but cloudy
c: Cloudy
o: Overcast
r: Rainy
q: Squalls
s: Snow
f: Foggy
A comment can be input in the [Comment] box by using up to 1000 characters.
15-5 Section 15 Logbook
1
2
3
4
5
6
7
8
9
10
11
12
13
14
15
16
17
18
19
20
21
22
23
24
25
26
27
付録
15.2 Editing a Logbook
15.2.1 Adding an event
1 Click on the [Event] button.
An event mark is plotted at the own ship’s position. An event called "Event Mark" is created with
the current time and is registered in the top line of the event list.
The navigation data that has been acquired automatically is displayed as event detail
information.
Memo
The data that is not automatically acquired is displayed as blank space.
Deleting an event mark
For deletion of event marks, refer to "8.12 Marking the Position of Own Ship with an Event Mark".
[Event] button
Created event
Section 15 Logbook 15-6
15.2.2 Editing event detail information
Use the procedure that is shown below to edit the event detail information that can be edited.
For the detail information that can be edited, refer to "Detail information that can be edited" in "15.1.1
Event detail information".
1 Click on the box of the data that can be edited.
2 Edit the information by using the software keyboard.
3 Click on the [Enter] key.
The editing is determined and the data is stored.
15-7 Section 15 Logbook
1
2
3
4
5
6
7
8
9
10
11
12
13
14
15
16
17
18
19
20
21
22
23
24
25
26
27
付録
15.3 Outputting Event Data
By selecting an event, the detail information can be output as a file.
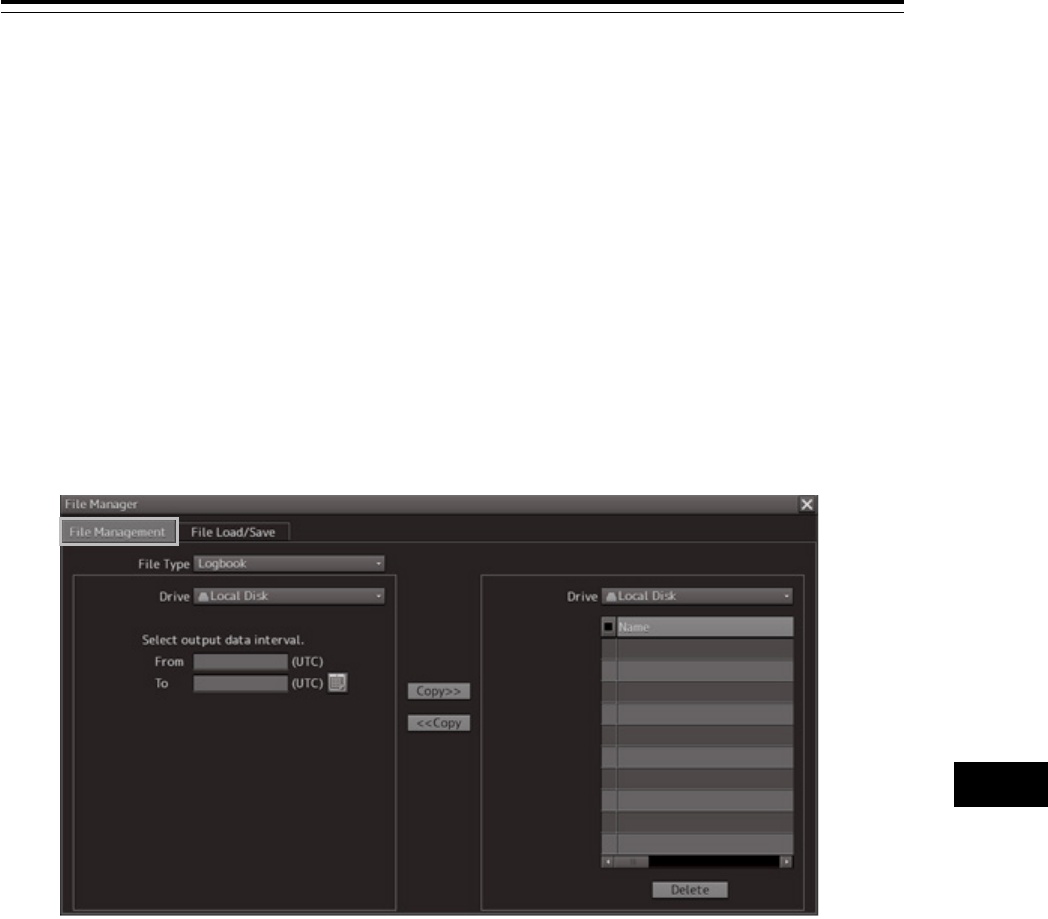
15.3.1 Outputting a logbook as a file
A logbook data can be output with "File Manager".
1 Click on the [Menu] button on the left toolbar.
The menu is displayed.
2 Click on the [Tools] - [File Manager] on the menu.
The "File Manager" dialog box appears.
3 Click on the [File Management] tab.
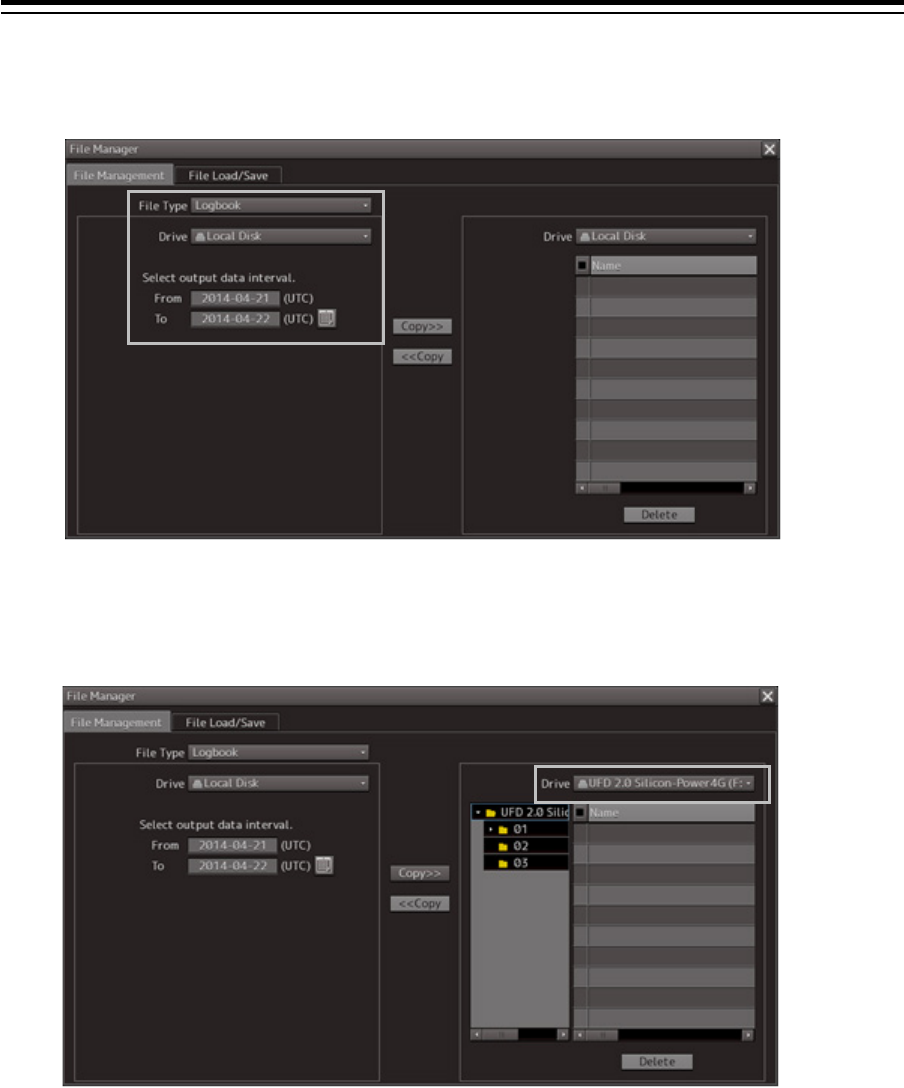
4 Select the [Logbook] from the [File Type] combo box.
5 Select the drive containing logbook data from the [Drive] combo box.
Section 15 Logbook 15-8
6 Input the period of the logbook data to be output in [From] and [To] of [Select output
data interval.].
The [Copy] button is enabled.
7 Select the storage destination of the logbook data from the [Drive] combo box of the
output destination.
15-9 Section 15 Logbook
1
2
3
4
5
6
7
8
9
10
11
12
13
14
15
16
17
18
19
20
21
22
23
24
25
26
27
付録
8 Click on the [Copy] button.

Section 15 Logbook 15-10
16-1 Section 16 Setting up Screen View
1
2
3
4
5
6
7
8
9
10
11
12
13
14
15
16
17
18
19
20
21
22
23
24
25
26
27
付録
Section 16
Setting up Screen View
Screen display detail is set through the [View] menu.
The display procedure of the View setup dialog box is as follows.
1 Click on the [Menu] button on the left toolbar.
The menu is displayed.
2 Click on the [View] button on the menu.
The submenu is displayed.
The submenu contents vary between RADAR and ECDIS.
[RADAR]
[ECDIS]
Section 16 Setting up Screen View 16-2
When submenu buttons are clicked, their respective setup dialog boxes are displayed.
Button
Dialog box
Reference
Multi View
Mode
16.1 Setting Chart
Display Mode (Multi
View Mode) (ECDIS
only)
Options
*The setting items may vary between RADAR and ECDIS.
16.2 Setting Screen
Display Options
16-3 Section 16 Setting up Screen View
1
2
3
4
5
6
7
8
9
10
11
12
13
14
15
16
17
18
19
20
21
22
23
24
25
26
27
付録
16.1 Setting Chart Display Mode (Multi
View Mode) (ECDIS only)
In the "View-Multi View Mode" dialog box, chart display modes can be set.
16.1.1 Setting Multi-Screen
For details about how to use the multi-screen, refer to "8.10.1 Display of multi view."
1 Click on the [Menu] button on the left toolbar.
The menu is displayed.
2 Click on [View] - [Multi View Mode] on the menu.
The "View-Multi View Mode" dialog box appears.
You can select a chart display mode from the following four modes.
• [Single View] Mode: Displays a chart in full screen.
• [Top-Bottom] Mode: Divides the screen into top and bottom sections; the same or
different charts can be displayed in two views of View 1 and
View 2.
• [Right-Left] Mode: Divides the screen into left and right sections; the same or
different charts can be displayed in two views of View 1 and
View 2.
• [Picture in Picture] Mode: Displays the chart in View 2 on top of the chart in View 1 as a
child dialog box.
1 Click on the icon of the chart display mode to be used.
A selection frame appears on the icon of the selected mode.
2 Click on the [Select Area from View1 for View2] button.
The button is highlighted.
3 On the chart in View 1, select an area you want to display in View 2.
The selected area is displayed in View 2.
Section 16 Setting up Screen View 16-4
16.2 Setting Screen Display Options
In the "View-Options" dialog box, the screen display options can be set.
Take the following steps to display the "View-Options" dialog box.
1 Click on the [Menu] button on the left toolbar.
The menu is displayed.
2 Click on the [View] - [Options] on the menu.
The "View-Options" dialog box appears.
The "View-Options" dialog box consists of the classification pane and edit pane.
Click on the Disclosure button to hide the classification pane.
1 Click on the screen view of which you want to set up the options in the classification
pane.
The Option setup dialog box for the screen view you have selected appears in the edit pane.
2 Set up in the edit pane.
Edit pane
Classification pane
Disclosure button
16-5 Section 16 Setting up Screen View
1
2
3
4
5
6
7
8
9
10
11
12
13
14
15
16
17
18
19
20
21
22
23
24
25
26
27
付録
Display targets for classification pane
The classification pane displayed in RADAR and ECDIS and reference of the explanation are
as follows.
Classification pane
Display target
Reference
RADAR
ECDIS
Own Ship
16.2.1 Setting up the display of Own Ship symbol
Own Track - 16.2.2 Setting up the display of ECDIS own ship’s
track
Route
16.2.3 Setting up the display of Route Monitoring
User Map
16.2.4 Setting up the display of User Map
Mariner’s Mark/Line
-
16.2.5 Setting up the display of Mariner's Mark/Line
RADAR 16.2.6 Setting up Radar Overlay and Transparency
of Echo/Trails
Target
16.2.7 Setting up the display of TT/AIS Target
Target Track
16.2.8 Setting up the display of Other Ship’s Track
Chart Common
16.2.9 Setting up the display of Chart Common
Chart View
-
16.2.10 Setting up the display of RADAR Chart
Chart View
-
16.2.11 Setting up the display of ECDIS Chart
AIO
16.2.12 Setting up AIO display
Tool 16.2.13 Setting up the display of range/bearing
measurement function
Unit 16.2.14 Setting up the display of Unit of Setting
Value
Control 16.2.15 Setting up display of Own Ship Track
Control, display format of Own Ship/Cursor Position
and display of Sub-Information dialog
Depth Graph 16.2.16 Setting up the Water Depth display
Rudder Graph 16.2.17 Setting up the Rudder graph
Gyro/Rudder Graph 16.2.18 Setting up the Gyro/Rudder graph
Engine Graph 16.2.19 Setting up the Engine Graph
ROT 16.2.20
Setting up the graph range of the ROT slide
bar
Section 16 Setting up Screen View 16-6
Screen display set in the "View-Options" dialog box
In the "View-Options" dialog box, the following screen display is set.
Target category Item
Graphical Objects Own Ship
Own Track
Route
User Map
Mariner’s Mark/Line
RADAR
Target
Target Track
GPS Buoy
Chart Common
Chart View
AIO
Tools
Unit Unit
Control Control
16-7 Section 16 Setting up Screen View
1
2
3
4
5
6
7
8
9
10
11
12
13
14
15
16
17
18
19
20
21
22
23
24
25
26
27
付録
16.2.1 Setting up the display of Own Ship symbol
When you select [Own Ship] in the classification pane, the "Own Ship" dialog is displayed in the edit
pane.
Configure the setting for own ship symbols.
The edit pane is divided into two dialogs.
To advance to the next dialog: Click on the [Next] button.
To return to the previous dialog: Click on the [Back] button.
Section 16 Setting up Screen View 16-8
Vector display at primary position
In the own ship symbol, COG (Course Over the Ground) vector, HDG (Heading) vector, and heading
line can be displayed. The COG or HDG vector can also be displayed by the length proportionate to
the current ship speed in minute by the setting. For example, when the vector length is set to 10
minutes, the vector tip is at the predicted position after 10 minutes if the ship is assumed to navigate at
the current speed.
• To display the COG (Course Over the Ground) vector, check [Ground Stabilised Vector] in [Vector].
• To display the HDG (Heading) vector, check [Sea Stabilised Vector] in [Vector].
• To display the heading line, check [Heading and Beam Line].
For details on the setting of type and length of the vector to be displayed, refer to the following table.
AIS Filter
Stabilisation Indicator
Sea Stabilised Vector
POS2 Symbol
Ground Stabilised Vector
Beam Line
Vector Time Mark
Heading Line
Stern Line
COG vector
HDG vector
Vector Time Mark
(Vector time mark)
Time (own ship’s vector length)
Time (own ship’s vector length)
Vector Time Mark
(Vector time mark)
16-9 Section 16 Setting up Screen View
1
2
3
4
5
6
7
8
9
10
11
12
13
14
15
16
17
18
19
20
21
22
23
24
25
26
27
付録
The descriptions of settings are shown in the table below.
Setting Item Description of Setting Setting Value
Type Select an own ship symbol from the combo box (symbols
of other ships are also linked).
: Auto
: Simplified Symbol
: Outline
: Minimized Symbol
*In Auto, the display is switched between Outline and
Minimized Symbol depending on the size of the symbol.
When the beam side of the Outline symbol is 6mm or
more, the symbol is displayed in Outline and when the
symbol is less than 6mm, it is displayed in Minimized
Symbol.
The beam side is 6mm or more
For RADAR:
AUTO
Outline
Minimized Symbol
[default]
For ECDIS:
Simplified Symbol
[default]
Outline
Heading and
Beam Line
(Heading
line/beam line
display)
Selecting this enables to display heading lines and beam
lines.
Note
This item can only be set on the ECDIS screen.
To enable: Select.
To disable: Clear.
Stern Line Selecting this enables to display a stern line.
Note
This item can only set in the RADAR screen.
To enable: Select.
To disable: Clear.
Ground Stabilised
Vector
Selecting this enables to display a ground stabilised
vector.
To enable: Select.
To disable: Clear.
Sea Stabilised
Vector
Selecting this enables to display a sea stabilised vector. To enable: Select.
To disable: Clear.
Time
(Length of own
ship's vector)
Enter the own ship's vector length in the box. 0 to 120
Stabilization
Indicator
Selecting this enables to display the stabilization
indicator.
Note
When both the Ground Stabilised Vector and the Sea
Stabilised Vector are effective, this automatically takes
effect.
To enable: Select.
To disable: Clear.
Vector Time Mark Selecting this enables the interval of the vector time
mark.
To enable: Select.
To disable: Clear.
Section 16 Setting up Screen View 16-10
Setting Item Description of Setting Setting Value
Interval (vector
time mark
interval)
Select a vector time mark interval from the pull-down
menu when Vector Time Mark is valid.
1 to 6 min
POS2 Symbol Selecting this enables to display the POS2 symbol.
Note
This item may not be displayed depending on the
equipment setting. The setting is not possible on the
RADAR screen.
To enable: Select.
To disable: Clear.
Shortcuts
Click on any of available shortcuts to display the related dialog box.
Shortcut Setup Dialog
Setting of AIS Filter "AIS Filter Setting" dialog box
Settings of AZ "AZ Setting" dialog box
Settings of Anti-Grounding Vector/Sector "Anti-Grounding Vector/Sector Setting" dialog box
16-11 Section 16 Setting up Screen View
1
2
3
4
5
6
7
8
9
10
11
12
13
14
15
16
17
18
19
20
21
22
23
24
25
26
27
付録
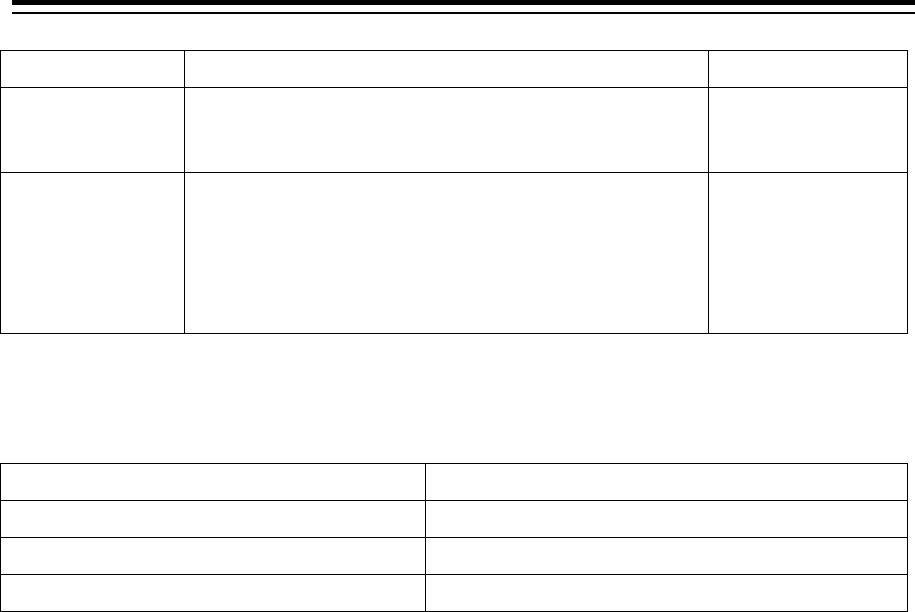
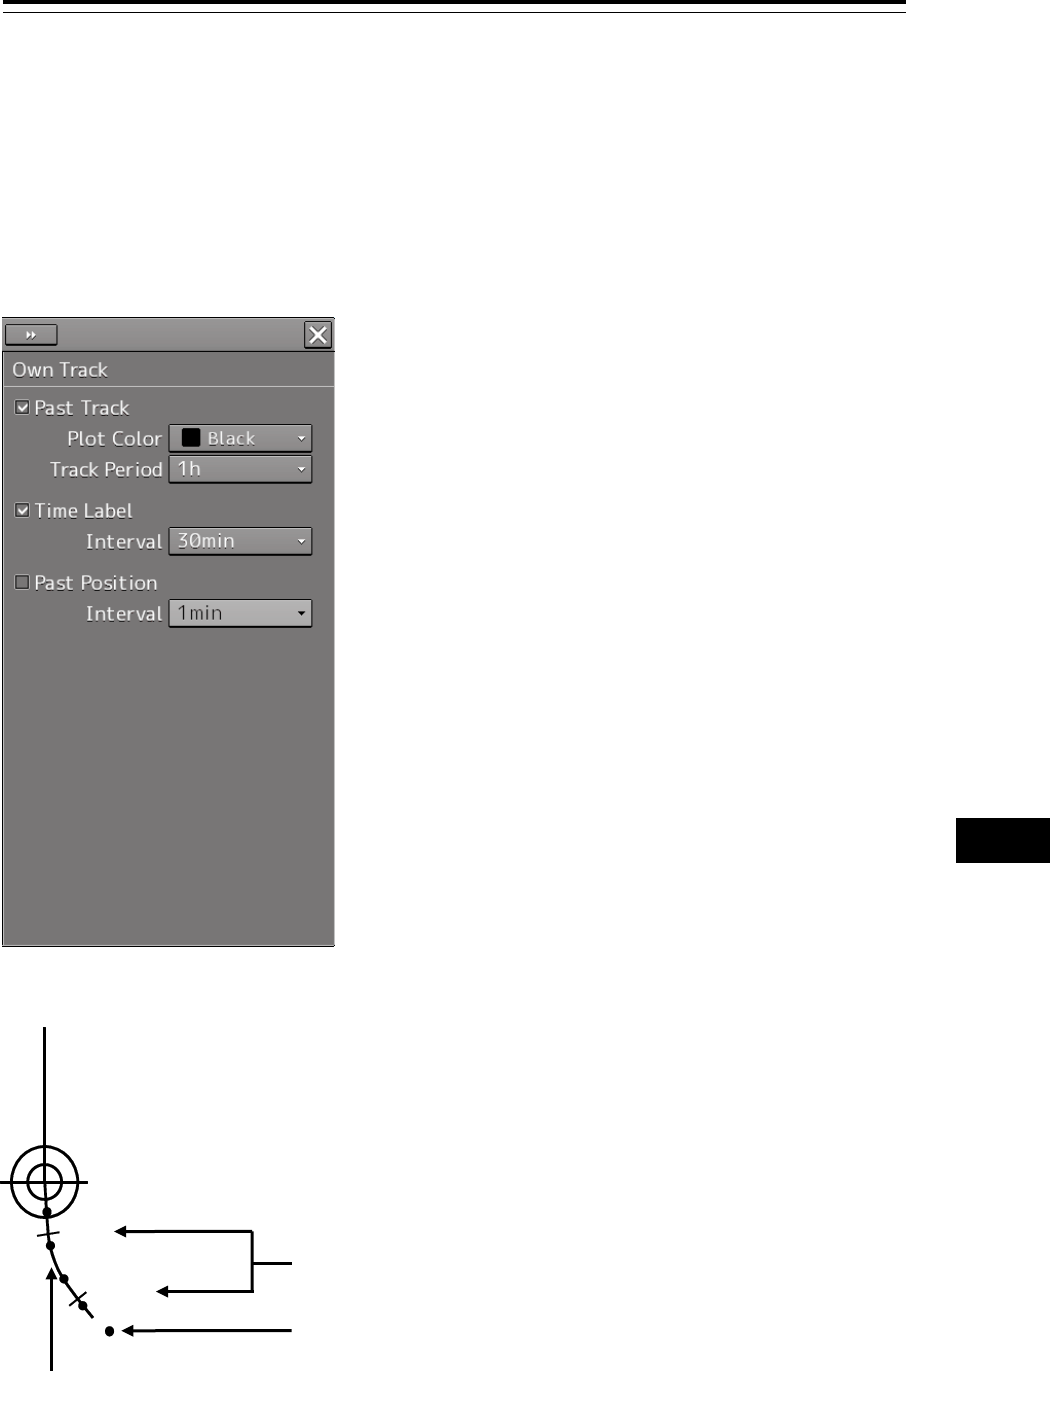
16.2.2 Setting up the display of ECDIS own ship’s
track
When you select [Own Track] in the classification pane, the "Own Track" dialog is displayed in the edit
pane.
Configure the settings for own tracks.
Information of own tracks is recorded in the SSD at every second. Information of a maximum of 24
hours is displayed on a chart as own tracks.
10
1400
Time Label
Past Track
Past Position
Section 16 Setting up Screen View 16-12
The descriptions of settings are shown in the table below.
Setting Item Description of Setting Setting Value
Past Track Selecting this enables to display the past
track.
To enable: Select.
To disable: Clear.
Plot Color (plot
color of track)
When Past Track is enabled, select a
plot color of the track from the list
(preview not supported).
White (Black), Gray, Pink, Magenta,
Blue, Cyan, Green, Yellow, Orange,
Dark Red
Note
When the background of the screen
is being set to Day1 or Day2, Black
can be selected instead of White.
Track Period When Past Track is enabled, select a
track period from the list (preview not
supported).
1, 2, 4, 6, 8, 12, 16, 24 h
Time Label Selecting this enables to display the time
label interval.
To enable: Select.
To disable: Clear.
Interval (time label
interval)
When Time Label is enabled, select a
time label interval from the list (preview
not supported).
1, 3, 5, 10, 30, 60 min
Past Position Selecting this enables to display the past
position.
To enable: Select.
To disable: Clear.
Interval
(past position
interval)
When Past Position is enabled, select an
interval of track points from the list
(preview not supported).
0.5 min, 1 min, 2 min, 4 min, 0.1
NM, 0.2 NM, 0.5 NM, 1 NM
16-13 Section 16 Setting up Screen View
1
2
3
4
5
6
7
8
9
10
11
12
13
14
15
16
17
18
19
20
21
22
23
24
25
26
27
付録
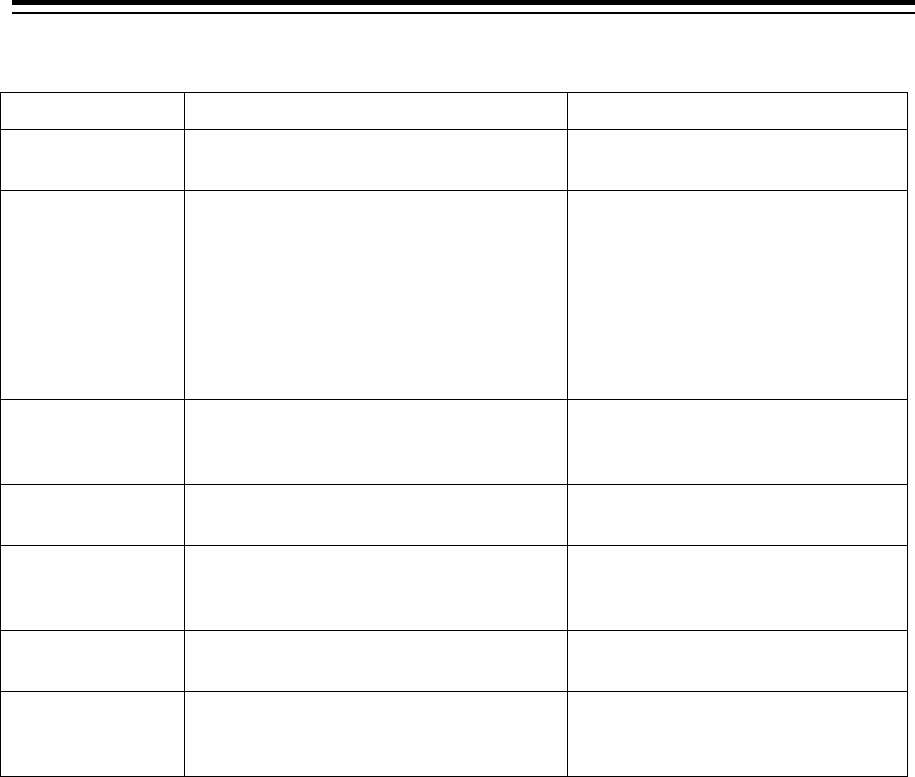
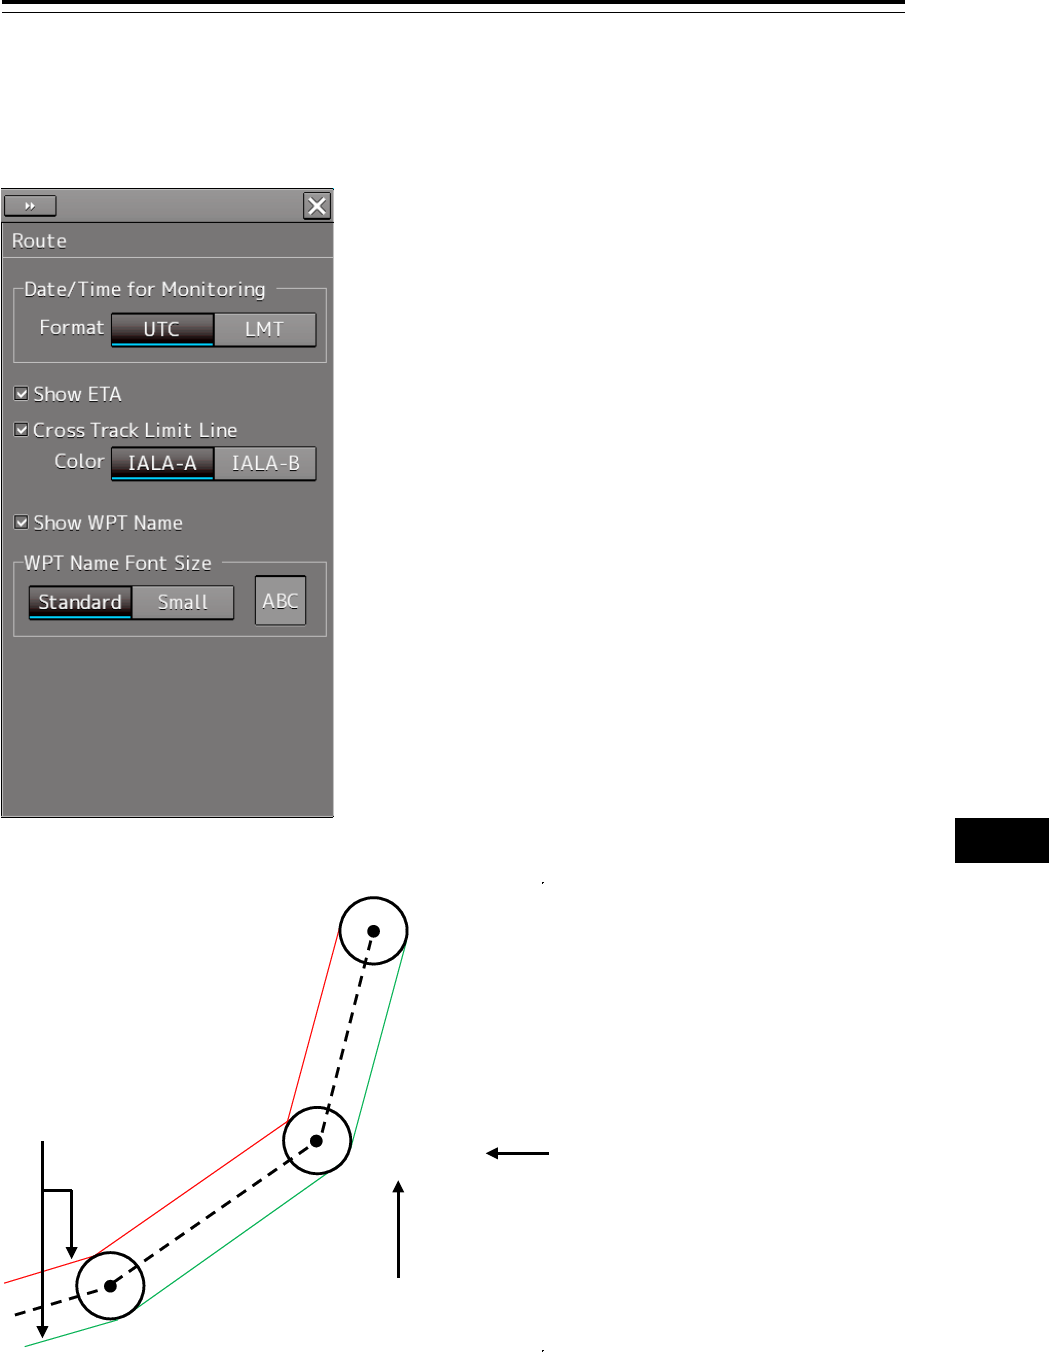
16.2.3 Setting up the display of Route Monitoring
When you select [Route] in the classification pane, the "Route" dialog is displayed in the edit pane.
Configure the settings for route monitoring.
W002 Comment
04:24U
W003 Comment
06:12U
W001 Comment
02:54U
ETA
Comment
Cross Track Limit Line
Section 16 Setting up Screen View 16-14
The descriptions of settings are shown in the table below.
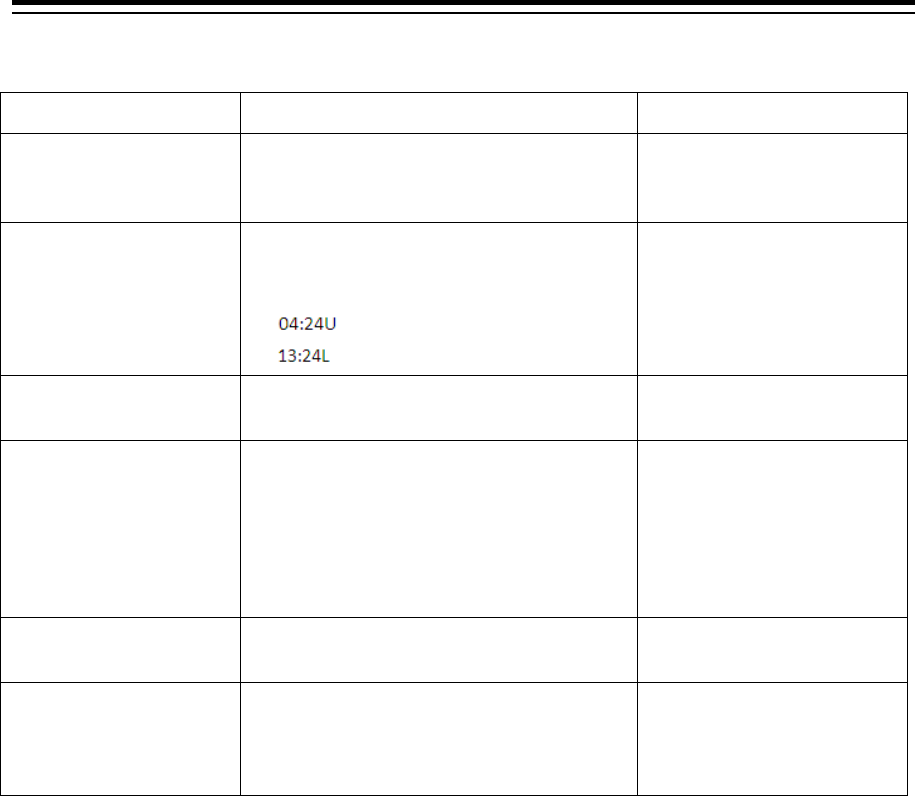
Setting Item Description of Setting Setting Value
Show ETA Selecting this enables to display the ETA
(estimated time of arrival at WPT) while
route monitoring.
To enable: Select.
To disable: Clear.
Format When ETA is enabled, select a display
format of the ETA while route monitoring
by clicking on the corresponding button.
: UTC
: LMT
UTC/LMT
Cross Track Limit Line Selecting this enables to display cross
track limit lines.
To enable: Select.
To disable: Clear.
Color When Cross Track Limit Line is enabled,
select a display color of cross track limit
lines by clicking on the corresponding
button.
IALA-A: Starboard - green, Port - red
IALA-B: Starboard - red, Port - green
IALA-A, IALA-B
Show WPT Name
(Comment display)
Selecting this enables to display a
comment on the vicinity of the target.
To enable: Select.
To disable: Clear.
WPT Name Font Size
(Comment font size)
When Show WPT Name is enabled, select
a font size of comments by clicking on the
corresponding button (preview not
supported).
Standard, Small
16-15 Section 16 Setting up Screen View
1
2
3
4
5
6
7
8
9
10
11
12
13
14
15
16
17
18
19
20
21
22
23
24
25
26
27
付録
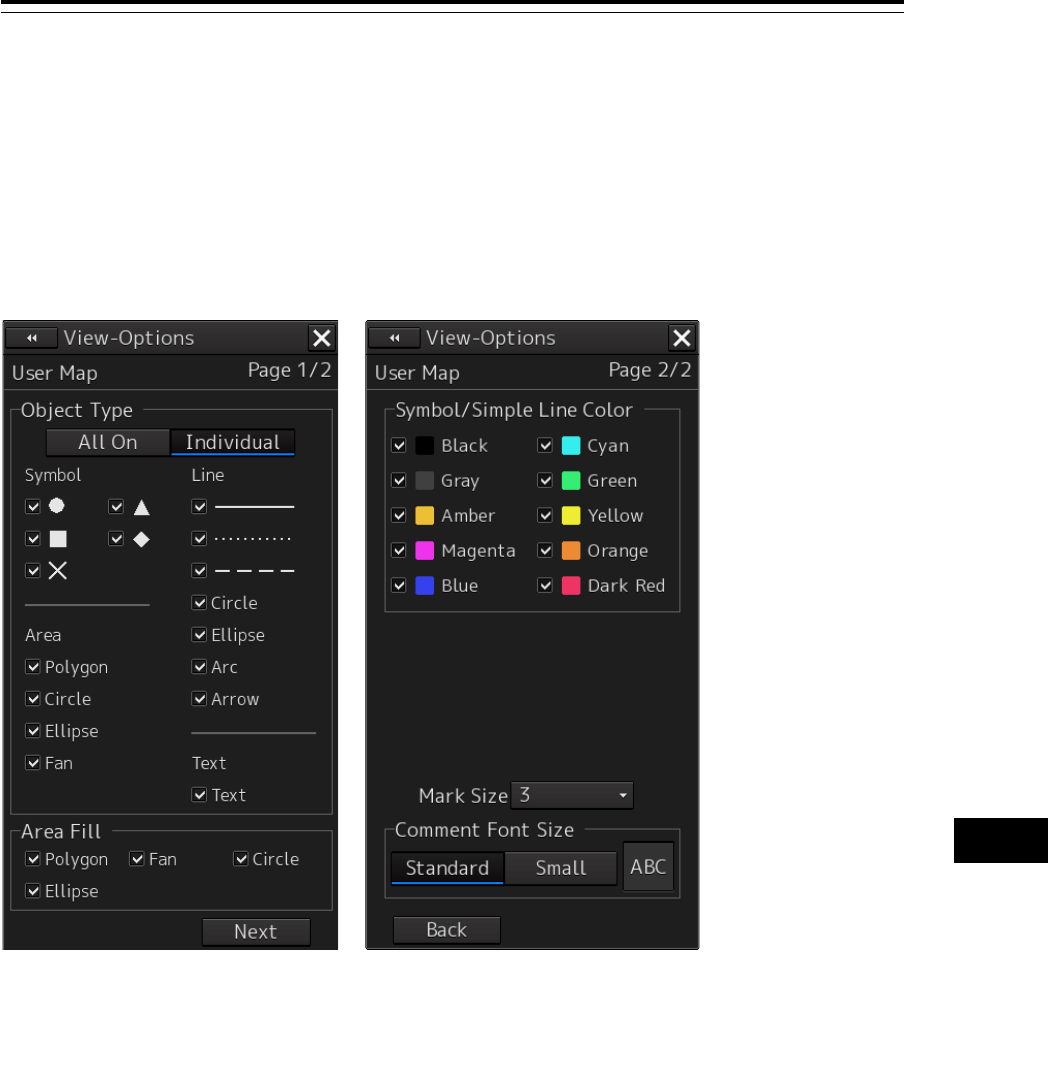
16.2.4 Setting up the display of User Map
When you select [User Map] in the classification pane, the "User Map" dialog is displayed in the edit
pane.
Set up the display of User Map.
The edit pane is divided into two dialogs.
To advance to the next dialog: Click on the [Next] button.
To return to the previous dialog: Click on the [Back] button.
Section 16 Setting up Screen View 16-16
The descriptions of settings are shown in the table below.
Area
Description of Setting
Setting Value
Object Type
(Object display condition)
Click on the button to specify
whether to display or hide the
object mark, and select the mark
to be displayed.
All On: Displays all marks.
Individual: Displays selected
marks.
All On/Individual
Types of selectable marks
Symbol: , , , , ×
Area: Polygon, Circle, Ellipse, Fan
Line: Solid Line, Dotted Line,
Dashed Line, Circle, Ellipse, Arc,
Arrow
Text: Text
Area Fill
(Fill)
Set the fill color display to
On/Off. Check the On mark.
Off/On
Symbol/Simple Line Color
(Symbol and Simple Line
Color)
Set to On/Off the display of the
color that targets the symbol
and simple line. Check the color
that is to be set to On.
Off/On
Mark Size
(Mark size)
Set the mark display size. 1 (Minimum) /2/3/4/5 (Maximum)
Comment Font Size
(Comment font size)
Set the font size of the
comment.
Standard/Small
16-17 Section 16 Setting up Screen View
1
2
3
4
5
6
7
8
9
10
11
12
13
14
15
16
17
18
19
20
21
22
23
24
25
26
27
付録
16.2.5 Setting up the display of Mariner's Mark/Line
When you select [Mariner’s Mark/Line] in the classification pane, the "Mariner’s Mark/Line" dialog is
displayed in the edit pane.
Select mariner’s marks and lines you want to display on the user map by selecting the corresponding
check boxes.
You can select the following marks and lines.
• Clearing Line
• Tidal Stream
• Information Mark
• Highlighting
• Event Mark
• Plotted Position
Section 16 Setting up Screen View 16-18
16.2.6 Setting up Radar Overlay and Transparency
of Echo/Trails
When you select [RADAR] in the classification pane, the "RADAR" dialog is displayed in the edit pane.
The descriptions of settings are shown in the table below.
Setting Item Description of Setting Setting Value
RADAR Overlay The radar overlay display turns ON by
selecting the [RADAR Overlay]
Select the required radar system from
the pull-down menu.
Note
- When this is turned OFF, even the
alerts related to the radar will not be
displayed.
- This item is displayed on the ECDIS
screen if RADAR interface is available.
Without interswitch setting
RADAR1/RADAR2
With interswitch setting
RADAR1 to 8
Transparency of
Echo/Trails
Click on the control on the slider and set
up the transparency of echoes/trails.
0 to 15
0 = Opaque (Nontransparent)
15 = Transparent (Completely
transparent)
16-19 Section 16 Setting up Screen View
1
2
3
4
5
6
7
8
9
10
11
12
13
14
15
16
17
18
19
20
21
22
23
24
25
26
27
付録
16.2.7 Setting up the display of TT/AIS Target
When you select [Target] in the classification pane, the "Target" dialog is displayed in the edit pane.
Configure the settings for TT/AIS targets.
ECDIS screen RADAR screen
10
100
AIS Symbol
TT Symbol
AIS Target ID
TT Target ID
10
100
20
TT Target ID
AIS Target ID
AIS Symbol
TT Vector
TT1 Symbol
TT2 Symbol
TT Target ID
Section 16 Setting up Screen View 16-20
The descriptions of settings are shown in the table below.
Setting Item Description of Setting Setting Value
AIS Symbol Selecting this enables to display the AIS
symbol.
To enable: Select.
To disable: Clear.
TT Symbol Select this item to enable the TT symbol.
For the ECDIS screen, select the TT
Symbol to be used from the combo box.
TT1 Symbol
TT2 Symbol
TT1 Symbol indicates the TT target
information that is received from RADAR1
and the TT Target ID is displayed as “T1-***”
(*** indicates the target number or ship
name).
TT2 Symbol indicates the TT target
information that is received from RADAR2
and the TT Target ID is displayed as “T2-***”
(*** indicates the target number or ship
name).
To enable: Select.
To disable: Clear.
TT Vector Selecting this enables to display the TT
vector.
Note
This item takes effect only on the ECDIS
screen.
To enable: Select.
To disable: Clear.
TT Target ID Select a display mode of the TT target ID
from the combo box.
Off: Hide
On: Show
TT Track: Displays only the target that
shows other ship's track.
Display
Ship's Name: When the ship’s name has
been input in the "TT Target INFO" (property
of tracked target) dialog, that ship name is
displayed. If the ship’s name has not been
input, the identification number is displayed.
Display
Off, On, TT Track
16-21 Section 16 Setting up Screen View
1
2
3
4
5
6
7
8
9
10
11
12
13
14
15
16
17
18
19
20
21
22
23
24
25
26
27
付録
Setting Item Description of Setting Setting Value
AIS Target ID Select a display mode of the AIS target ID
from the combo box.
Off: Hide
On: Show
AIS Track: Displays only the target that
shows other ship's track (target track).
Ship's Name: When a ship‘s name is input
in the “AIS Target INFO” (property of AIS
target) dialog, the ship’s name is displayed.
When no ship’s name is input, the ID is
displayed.
Display
Off, On, AIS Track, Ship's
Name
Section 16 Setting up Screen View 16-22
16.2.8 Setting up the display of Other Ship’s Track
When you select [Target Track] in the classification pane, the "Target Track" dialog is displayed in the
edit pane.
The "Target Track" dialog consists of the [Display], [Plot] and [Clear] tabs.
[Display] tab
On the [Display] tab, set up the display of other ship’s tracks.
10(10)
15(5)
Target Track
16-23 Section 16 Setting up Screen View
1
2
3
4
5
6
7
8
9
10
11
12
13
14
15
16
17
18
19
20
21
22
23
24
25
26
27
付録
The descriptions of settings are shown in the table below.
Setting Item
Description of Setting
Setting Value
Target Track Display
(display of other
ship’s tracks)
Select to show/hide target tracks by clicking on
the corresponding buttons and then specify the
target tracks you want to display by checking
them.
All On: Shows all of target tracks.
All Off: Hides all of target tracks.
Individual: Shows selected target tracks.
All On, All Off
When Individual is
selected:
Select from Tracks 1 to 10
and from Tracks 11 to 20.
Shortcut
Click on any of available shortcuts to display the related dialog box.
Shortcut Setup Dialog Box
File Load/Save "File Load/Save" dialog box in File Manager
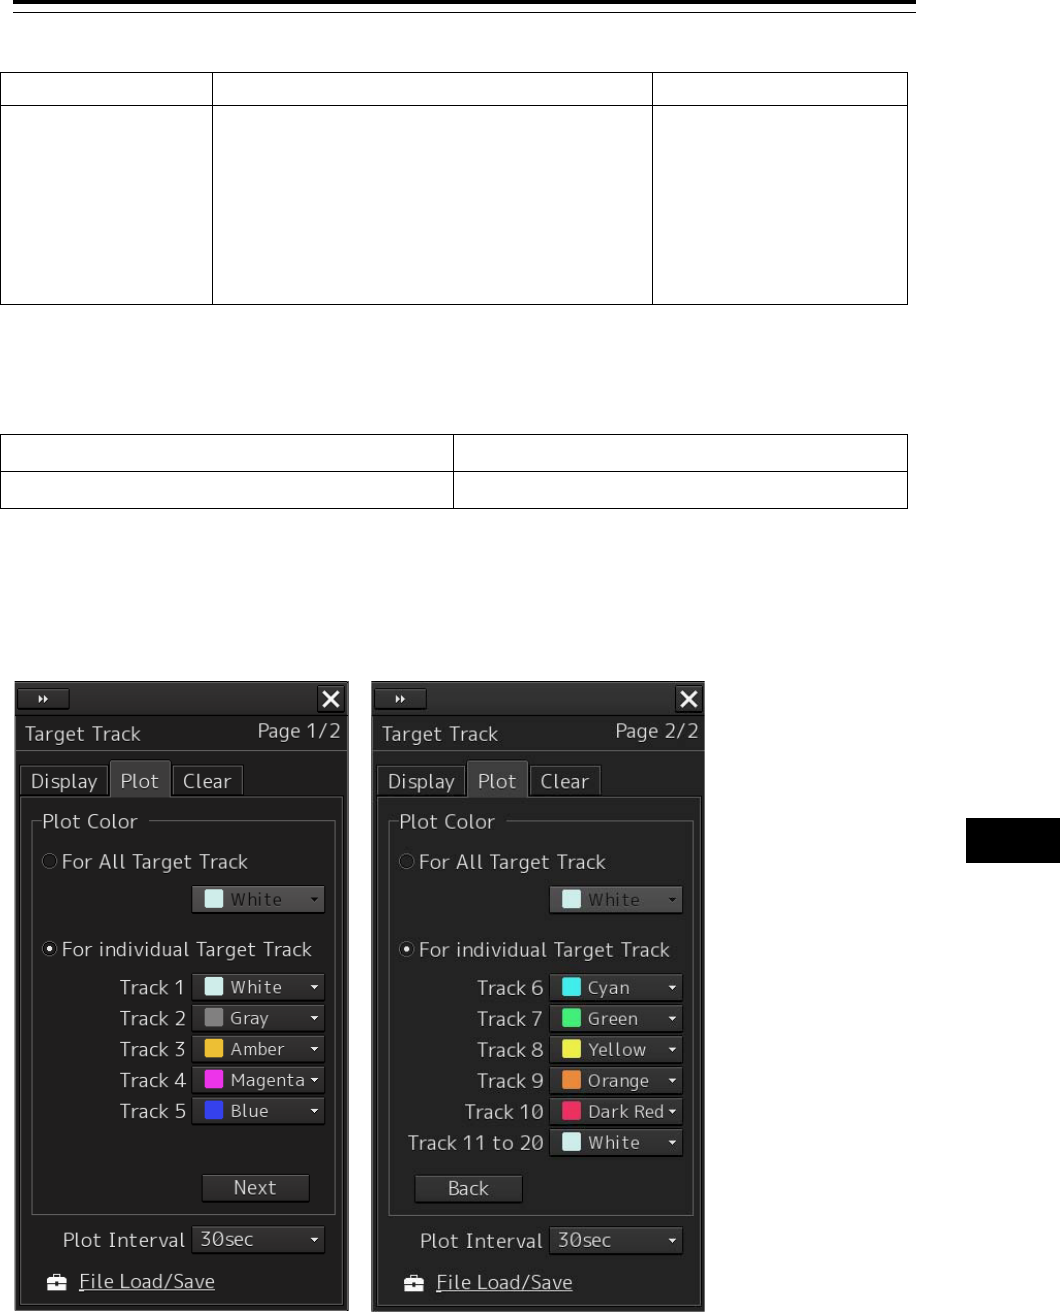
[Plot] tab
The edit pane of the [Plot] tab is divided into two dialogs.
To advance to the next dialog: Click on the [Next] button.
To return to the previous dialog: Click on the [Back] button.
Section 16 Setting up Screen View 16-24
The descriptions of settings are shown in the table below.
Setting Item Description of Setting Setting Value
For All Target Track Click on the check box and select a
plot color of target tracks from the
list.
White (Black), Gray, Amber,
Magenta, Blue, Cyan, Green,
Yellow, Orange and Dark Red
For Individual Target Track Click on the check box and select
plot colors of individual target
tracks (Tracks 1 to 10 and Tracks
11 to 20) from the list.
White (Black), Gray, Amber,
Magenta, Blue, Cyan, Green,
Yellow, Orange and Dark Red
Plot Interval Select a plot interval of target
tracks from the combo box.
Off, 3s, 5s, 10s, 30s, 1 min, 3
min, 5 min,
10 min, 30 min, 60 min, 1 NM,
3 NM, 5 NM, 10 NM, 0.1 NM,
0.2 NM, 0.3 NM, 0.5 NM
* White/Black interchanges under the following conditions.
RADAR screen: Always White
ECDIS screen: Black at Day1/Day2 (or Day), white at Day3/Dusk/Night
Shortcut
Click on any of available shortcuts to display the related dialog box.
Shortcut Setup Dialog Box
File Load/Save "File Load/Save" dialog box in File Manager
16-25 Section 16 Setting up Screen View
1
2
3
4
5
6
7
8
9
10
11
12
13
14
15
16
17
18
19
20
21
22
23
24
25
26
27
付録
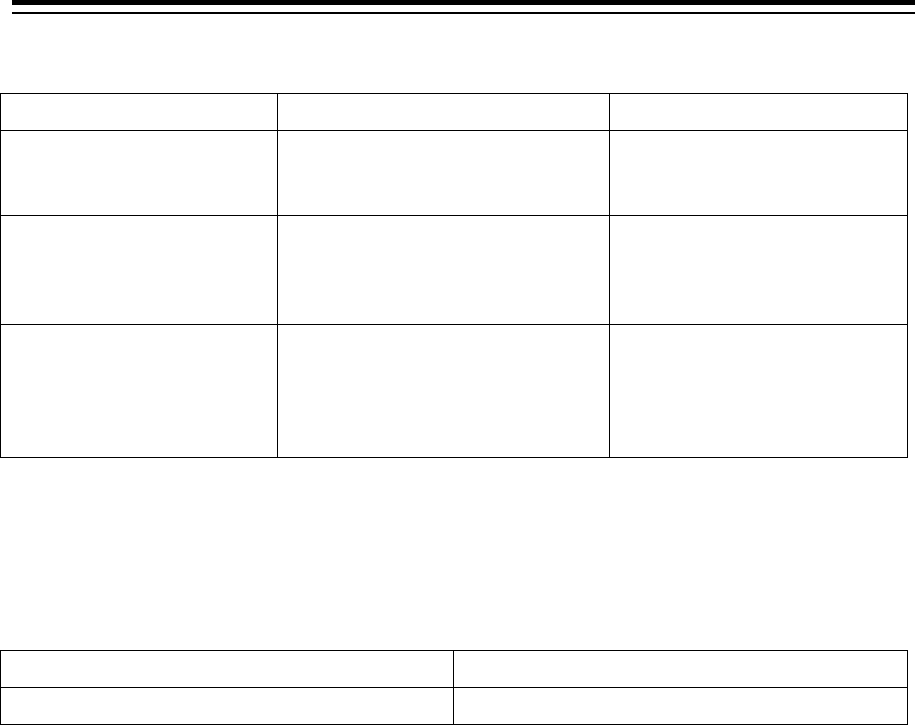
[Clear] tab
To erase tracks by specifying a color
1 Select the color of other ship’s track to be erased from the [Track Color] combo box.
You can select from All, White, Gray, Amber, Magenta, Blue, Cyan, Green, Yellow, Orange and
Dark Red.
* White/Black interchanges under the following conditions.
RADAR screen: Always White
ECDIS screen: Black at Day1/Day2 (or Day), white at Day3/Dusk/Night
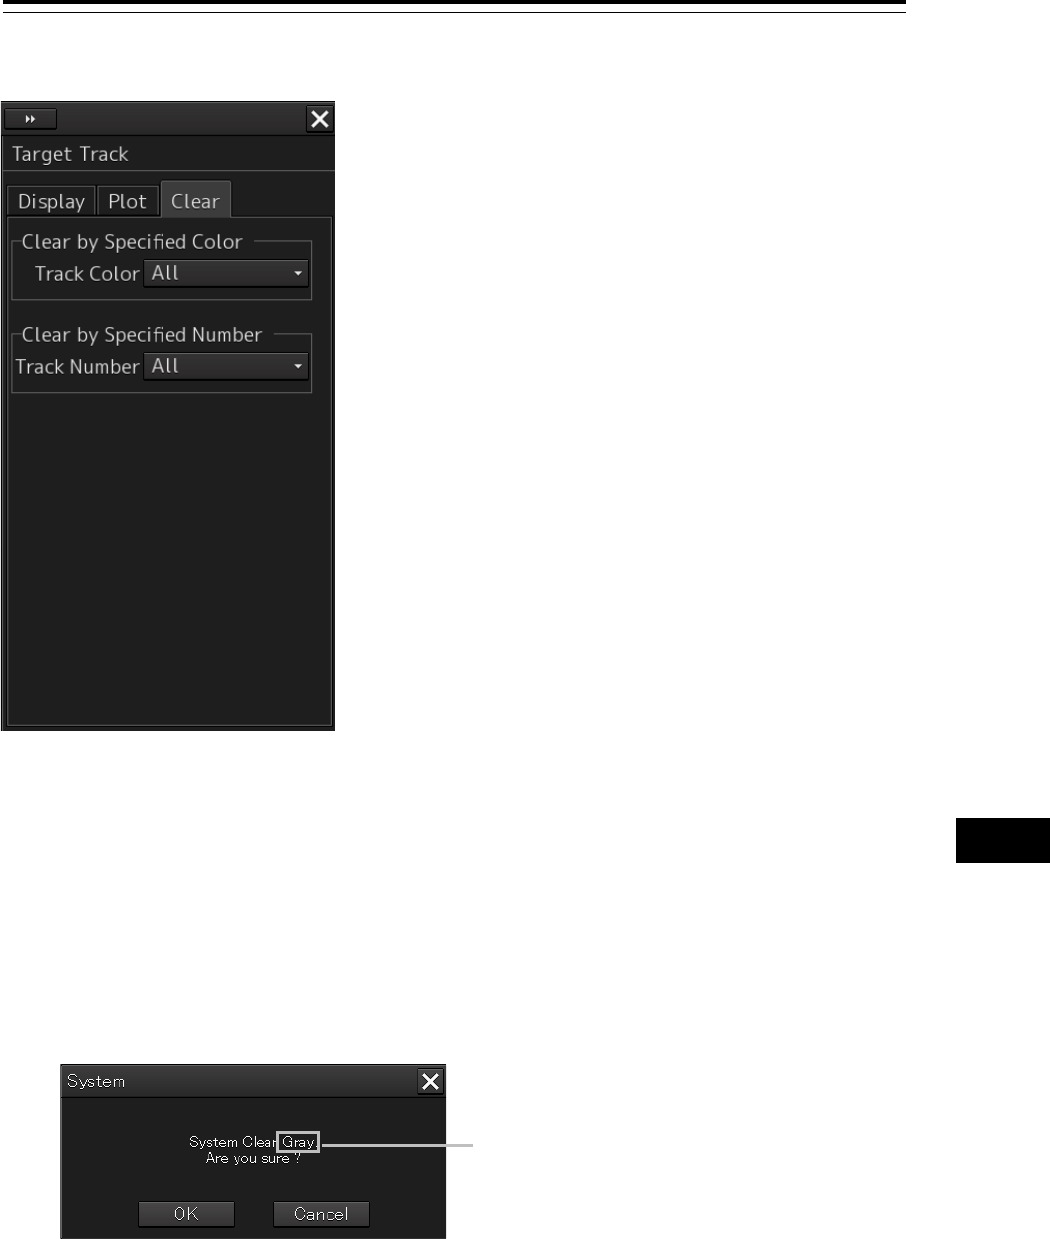
A message dialog box prompting you to confirm erasing appears.
2 To execute erasing, click on the [OK] button. To cancel erasing, click on the [Cancel]
button or the [X] button.
Color you selected
Section 16 Setting up Screen View 16-26
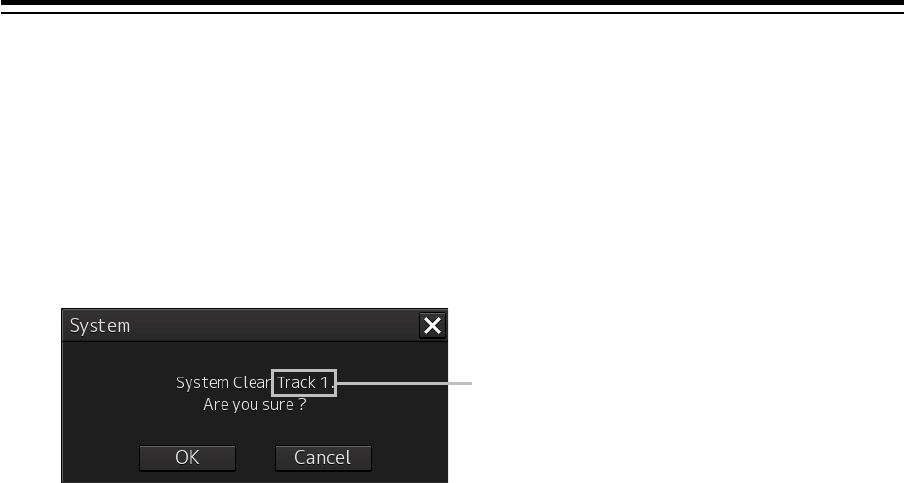
Erasing by specifying a track number
1 Select the number of other ship’s track to be erased from the [Track Number] combo
box.
Options of the track to be erased include All, Track 1, Track 2, Track 3,Track 4, Track 5,Track 6,
Track 7, Track 8, Track 9, Track 10, and Track 11 – 20. When a target track is erased by
specifying the number, the setting of the target track color is set to Off.
An erase confirmation message dialog is displayed.
2 To execute erase, click the [OK] button. To cancel erase, click the [Cancel] button or
the [x] button.
Selected track number
16-27 Section 16 Setting up Screen View
1
2
3
4
5
6
7
8
9
10
11
12
13
14
15
16
17
18
19
20
21
22
23
24
25
26
27
付録
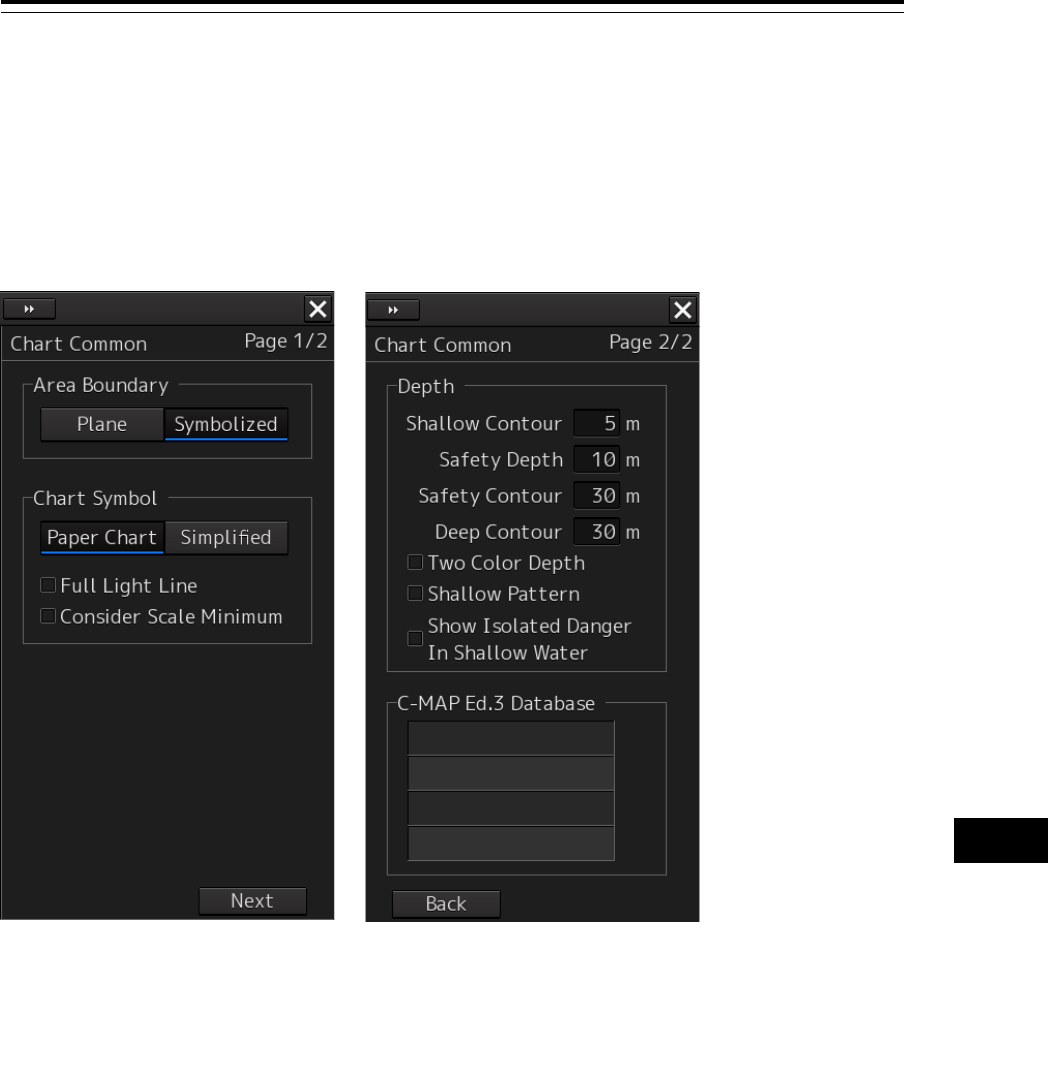
16.2.9 Setting up the display of Chart Common
When you select [Chart Common] in the classification pane, the "Chart Common" dialog is displayed in
the edit pane.
The edit pane is divided into two dialogs.
To advance to the next dialog: Click on the [Next] button.
To return to the previous dialog: Click on the [Back] button.
Section 16 Setting up Screen View 16-28
Setting Item Description of Setting Setting Value
Area Boundary Select a display method of area boundary by clicking on the
corresponding button.
Plane: Displays a plane boundary (an area boundary
is indicated by dotted lines).
Symbolized: Displays a symbol boundary (an area
boundary is indicated by symbol lines).
Plane,
Symbolized
Chart Symbol Select a type of chart symbols you want to use on the chart
by clicking on the corresponding button.
Paper Chart: The same symbols on paper charts are used
as symbols for lighthouses, etc.
Simplified: Colored symbols are displayed.
Paper Chart,
Simplified
Area boundary
Area boundary
16-29 Section 16 Setting up Screen View
1
2
3
4
5
6
7
8
9
10
11
12
13
14
15
16
17
18
19
20
21
22
23
24
25
26
27
付録
Setting Item Description of Setting Setting Value
Full Light Line When selected, display of maximum length of full light line is
enabled.
When [Full Light Line] is enabled
When [Full Light Line] is disabled.
To enable: Select.
To disable: Clear.
Consider Scale
Minimum
When selected, scale display smaller than the minimum
scale setting value is disabled.
When [Consider Scale When [Consider Scale
Minimum]is enabled Minimum] is disabled
To enable: Select.
To disable: Clear.
Depth
Refer to "Depth."
C-MAP Ed.3
Database
Select this to show a chart database chart.
*Only the imported chart databases can be selected.
Shown: Selected
Hidden: Clear
Light range of lighthouse
Section 16 Setting up Screen View 16-30
Depth
Use [Depth] items to set up the depth.
Setting Item
Description of Setting
Setting Value
Shallow Contour The shallow contour displayed on the chart is displayed at
the set depth.
For the display example, refer to "(1) Example of displaying
Shallow Contour/Safety Contour/Deep Contour."
0 to 200
Safety Depth
The spot depth that is lower than the set value is highlighted
for display.
0 to 200
Safety Contour The set depth value on the chart (or depth that is lower than
the set value) is highlighted for display.
In the sea area that is shallower than the set value, an alarm
occurs.
*If the safety contour appropriate to the set depth is not
provided on the chart, the safety contour that is deeper than
the set value is displayed.
For the display example, refer to "(1) Example of displaying
Shallow Contour/Safety Contour/Deep Contour."
0 to 200
Deep Contour
The deep contour displayed on the chart is displayed at the
set depth.
For the display example, refer to "(1) Example of displaying
Shallow Contour/Safety Contour/Deep Contour."
0 to 200
Two Color Depth Normally, the sea is displayed on the chart by four colors at
each depth. When [Two Color Depth] is enabled, the sea is
displayed by two colors with [Safety Contour] as a boundary.
This item is set to clearly separate the sea into the safe area
and the area where navigation requires caution.
For the display example, refer to "(2) Example of Displaying
Two Color Depth."
To enable: Select.
To disable: Clear.
Shallow Pattern Of depth that can be set at 4 levels, a lattice-like line is
added to the shallow sea set in [Shallow Contour] and
[Safety Contour].
This item is set to display the area where navigation
requires caution conspicuously.
For the display example, refer to "(3) Example of Displaying
Shallow Pattern."
To enable: Select.
To disable: Clear.
Show Isolated
Danger In
Shallow Water
A dangerous route obstacle existing in the sea area that is
shallower than safety contour is displayed by mark.
For the display example, refer to "(4) Show Isolated Danger
In Shallow Water."
To enable: Select.
To disable: Clear.
16-31 Section 16 Setting up Screen View
1
2
3
4
5
6
7
8
9
10
11
12
13
14
15
16
17
18
19
20
21
22
23
24
25
26
27
付録
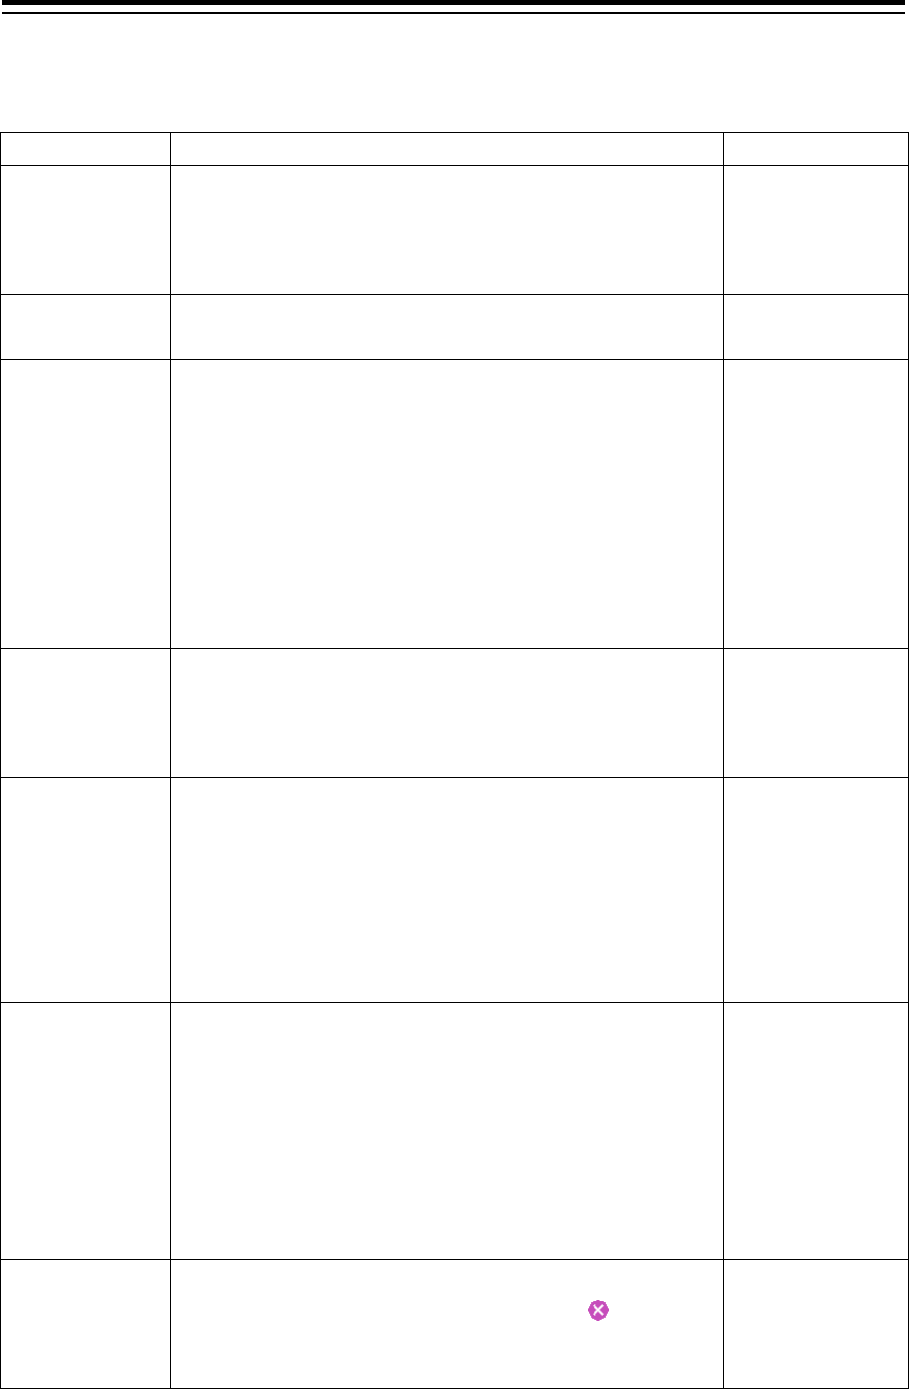
(1) Example of displaying Shallow Contour/Safety Contour/Deep Contour
(2) Example of displaying Two Color Depth
When [Two Color Depth] is disabled (the sea area is displayed by four colors.)
Safety Contour
Deep
Slightly deep
Slightly shallow
Deep Contour
Shallow Contour
Land
Shallow
Land
Shallow Contour
Safety Contour
Safety Depth
Deep Contour
Section 16 Setting up Screen View 16-32
When [Two Color Depth] is enabled (the sea area is displayed by two colors.)
(3) Example of displaying Shallow Pattern
When [Shallow Pattern] is enabled (the shallow pattern is displayed)
Shallow Pattern
16-33 Section 16 Setting up Screen View
1
2
3
4
5
6
7
8
9
10
11
12
13
14
15
16
17
18
19
20
21
22
23
24
25
26
27
付録
When [Shallow Pattern] is disabled (the shallow pattern is not displayed)
(4) Example of displaying Isolated Danger In Shallow Water
Dangerous course
obstacle
Safety Contour
When Isolated Danger In Shallow Water is enabled
Dangerous course
obstacle
Safety Contour
When Isolated Danger In Shallow Water is disabled

Section 16 Setting up Screen View 16-34
Restrictions on [Safety Contour] and [Deep Contour]
1) When entering in [Shallow Contour]
If “Safety Contour < Shallow Contour ≤ Deep Contour”, the Safety Contour value is corrected to the
Shallow Contour value.
If “Safety Depth < Shallow Contour ≤ Deep Contour”, the Safety Contour is corrected to the
Shallow Contour value.
If Safety Contour, Safety Depth ≤ Deep Contour < Shallow Contour”, the Safety Contour, Safety
Depth, and Deep Contour values are corrected to the Shallow Contour value.
2) When entering in [Deep Contour]
If “Shallow Contour ≤ Deep Contour < Safety Contour”, the Safety Contour value is corrected to the
Deep Contour value.
If “Shallow Contour ≤ Deep Contour < Safety Depth”, the Safety Depth value is corrected to the
Deep Contour value.
If “Deep Contour < Shallow Contour ≤ Safety Contour, Safety Depth”, the Safety Contour, Safety
Depth, and Shallow Contour values are corrected to the Deep Contour values.
3) When entering in [Safety Contour]
If “Shallow Contour ≤ Deep Contour < Safety Contour”, the Deep Contour value is corrected to the
Safety Contour value.
If “Safety Contour < Shallow Contour ≤ Deep Contour”, the Shallow Contour value is corrected to
the Safety Contour value.
4) When entering [Safety Depth]
If “Shallow Contour ≤ Deep Contour < Safety Depth”, the Deep Contour value is corrected to the
Safety Depth value.
If “Safety Depth < Shallow Contour ≤ Deep Contour”, the Shallow Contour value is corrected to the
Safety Depth value.
The compensated setting values are flashed temporarily.
16-35 Section 16 Setting up Screen View
1
2
3
4
5
6
7
8
9
10
11
12
13
14
15
16
17
18
19
20
21
22
23
24
25
26
27
付録
16.2.10 Setting up the display of RADAR Chart
When you select [Chart View] in the classification pane, the "Chart View" dialog is displayed in the edit
pane.
The edit pane is divided into two dialogs.
To advance to the next dialog: Click on the [Next] button.
To return to the previous dialog: Click on the [Back] button.
The chart information uses the same reference and display mode as the radar / AIS, including CCRP,
geodetic datum, display scale, motion mode, and bearing mode.
Section 16 Setting up Screen View 16-36
The descriptions of settings are shown in the table below.
Setting Item Description of Setting Setting Value
Chart Type Select a type of charts to be displayed
by click on the corresponding button.
S-57: Shows S-57 charts.
C-Map 3: Shows C-Map Ed3 charts.
S-57/C-Map 3
Text Size Drag the control on the slider and set
up the text size (7 levels).
Clicking on the [Def.] (factory
presetting) button resets the current
value to the default value.
0 to 6
Primary Chart INFO.
Set*1
Select to enable to show Primary Chart
INFO. Set, and then select the items
you want to display.
To enable: Select.
To disable: Clear.
Display items
Coastline, Safety Contour,
Dangers To Navigation, Fixed and
Floating Aids to Navigation
Land Area Selecting this enables to display land
areas.
To enable: Select.
To disable: Clear.
Depth Contour Selecting this enables to display depth
contours.
To enable: Select.
To disable: Clear.
Scale Boundary Selecting this enables the display of
scale boundary.
To enable: Select.
To disable: Clear.
Sounding Selecting this enables the display of
sounding.
To enable: Select.
To disable: Clear.
Text Selecting this enables to display text. To enable: Select.
To disable: Clear.
Other Objects Select a display method of objects
other than land, depth contour and text
from the combo box.
Off: Hides other objects.
Base: Shows objects other than
the above which are
included in the display
category [Base].
Standard: Shows objects other than
the above which are
included in the display
category [Standard].
Off/Base, Standard
*1 The primary chart information set is chart features and symbols defined in source documents of IMO
Resolution A.817(19) and IEC 61174.
16-37 Section 16 Setting up Screen View
1
2
3
4
5
6
7
8
9
10
11
12
13
14
15
16
17
18
19
20
21
22
23
24
25
26
27
付録
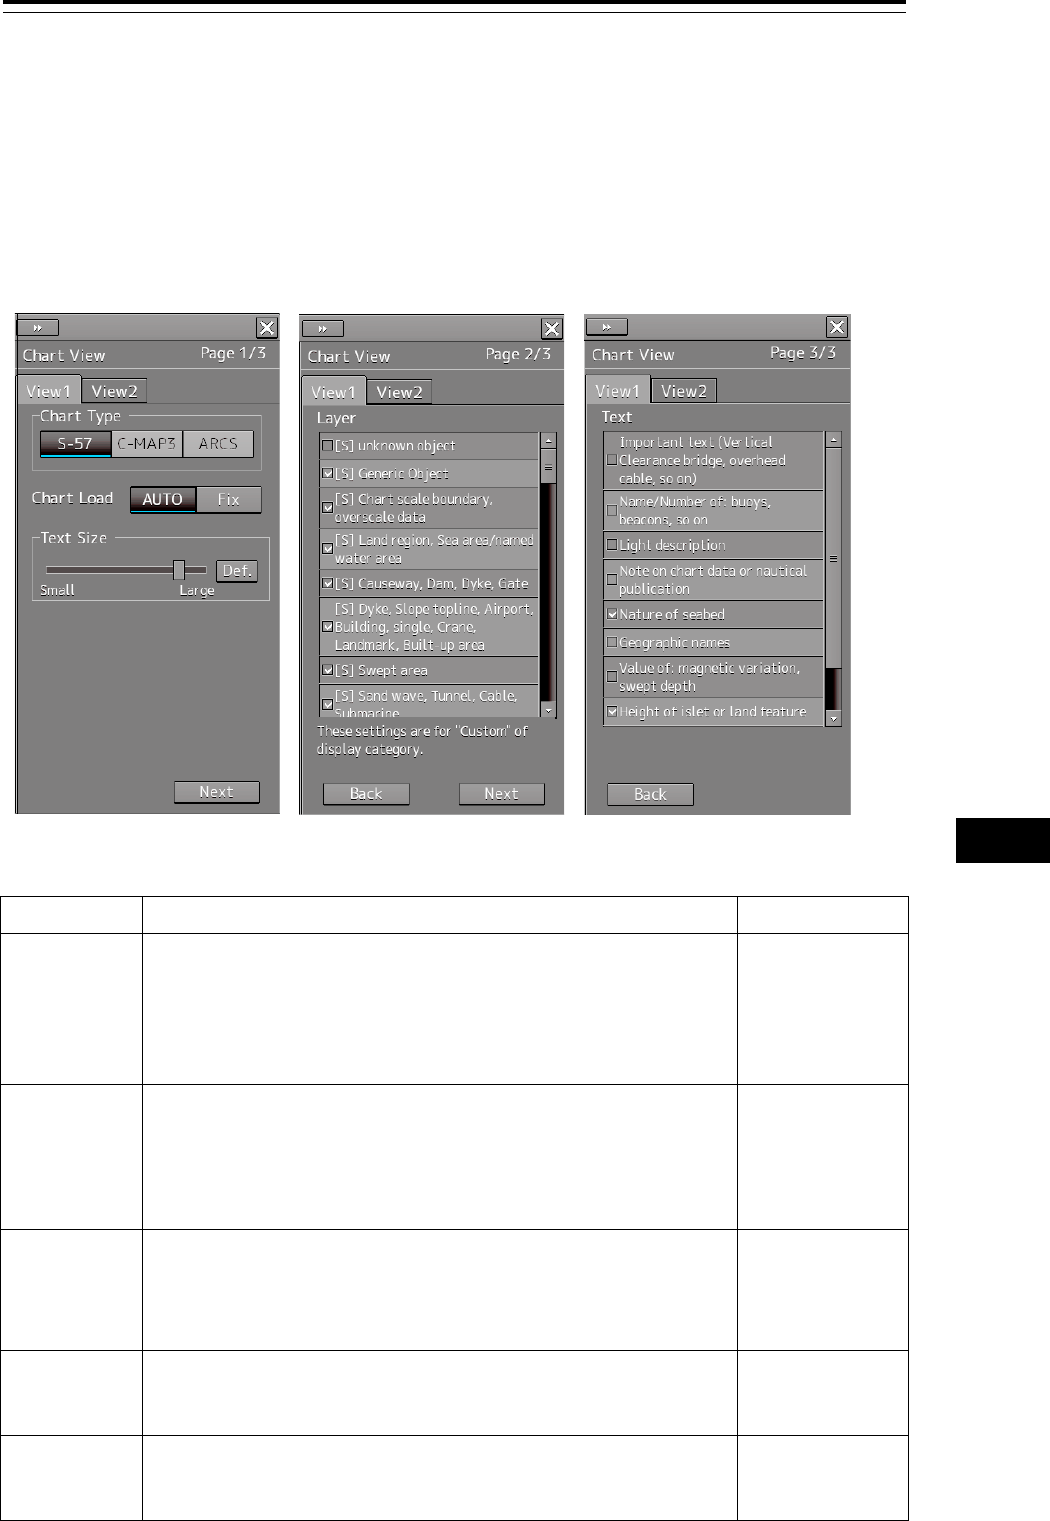
16.2.11 Setting up the display of ECDIS Chart
When you select [Chart View] in the classification pane, the "Chart View" dialog is displayed in the edit
pane.
The edit pane is divided into three dialogs.
To advance to the next dialog: Click on the [Next] button.
To return to the previous dialog: Click on the [Back] button.
You can set up the same values on both the [View1] and [View2] tabs.
The descriptions of settings are shown in the table below.
Setting Item Description of Setting Setting Value
Chart Type Select a type of charts to be displayed by clicking on the corresponding
button.
S-57: Shows S-57 charts.
C-Map 3: Shows C-Map Ed3 charts.
ARCS: Shows ARCS charts.
S-57, C-Map 3,
ARCS
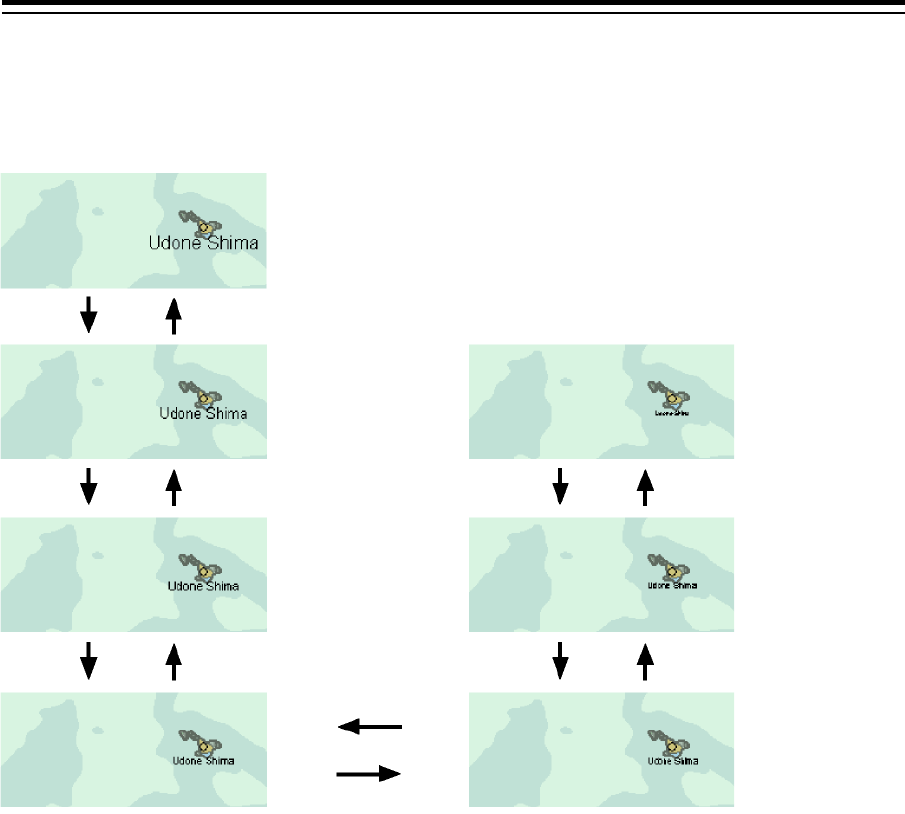
Text Size Drag the control on the slider and set up the text size (7 levels).
Clicking on the [Def.] (Factory settings) button resets the text size to the
factory preset value.
For the details of the examples of changing text size, refer to “Example
of changing text size”.
0 to 6
Chart Load
Select a display switching mode for the S-57 chart by clicking on the
button.
[AUTO]: Automatically switches and shows charts.
[Fix]: Fixes and shows the chart being currently displayed.
AUTO, Fix
Layer When showing S-57/C-MAP charts, select the objects you want to
display by selecting the check boxes of desired objects.
Refer to "Contents
to be displayed as
layers".
Text When showing S-57/C-MAP charts, select the texts you want to display
by selecting the check boxes of desired texts.
Refer to "Contents
to be displayed as
texts".
Section 16 Setting up Screen View 16-38
Example of changing text size
Standard
Small
Large
Small
Large
Small
Large
Large
Small
Small
Small
Large
Large
16-39 Section 16 Setting up Screen View
1
2
3
4
5
6
7
8
9
10
11
12
13
14
15
16
17
18
19
20
21
22
23
24
25
26
27
付録
Contents to be displayed as layers
Set up the items to be displayed when the chart display category is [Custom].
There are three types of layers: [-], [S] and [A].
[-]: Items whose display categories are none of [BASE], [STD] nor [All].
[S]: Items to be displayed when the display category is [STD].
[A]: Items to be displayed when the display category is [All].
Type ENC layer
[S] unknown object
Generic Object
Chart scale boundary, overscale data
Land region, Sea area/named water area
Causeway, Dam, Dyke, Gate
Dyke, Slope topline, Airport, Building, single, Crane, Landmark, Built-up area
Swept area
Sand wave, Tunnel, Cable, Submarine
Navigation line
Recommended track
Ferry route
Radar range, Radar line, Radio calling in point
Restricted area
Ferry route, Military practice area, Offshore production area
Caution area, Fairway
Fishing ground, Marine farm/ aquaculture
Anchorage area, Anchor berth
Cable area, Pipeline area
Dumping ground, Cargo transshipment area, Incineration area
Archipelagic sea lane
Buoy, Beacon, Light float, Mooring buoy, Light Vessel
Daymark
Navigational system mark
topmarks
light
Fog signal, Retro-reflector, Radar transponder beacon, Radar reflector
Pilot boarding place, Signal station, Traffic, Signal station, Warning
Section 16 Setting up Screen View 16-40
Type ENC layer
[A] Quality of data, Low accuracy data
Nautical publication information
Coverage, Compilation scale of data
Local magnetic anomaly, Magnetic variation
Sloping ground, Land elevation, Slope topline
Vegetation, Lake, Rapids, River, Water fall, Tideway
Building, Fortified structure, Land mark, Silo/Tank, Airport, Road, Railway
Check point, Harbor facility
Distance mark
Berth, Crane, Drydock, Mooring/Warping facility, Gate
Sounding
Depth area, Depth counter, Label for contour
Water turbulence, Tide..., Current-non-gravitational
Seabed area, Weed/Kelp, Spring
Fishing-facility
Obstruction, Wreck, Underwater/Awash rock
Cable, Submarine, Pipeline, Submarine/on land
Continental shelf area
Custom zone, Free port area, Harbor area
Fishery zone
Administration area, Contiguous zone, Exclusive economic zone
Radar station, Radio station, Coastguard station, Rescue station
ENC edition date
most recent chart update number
graticule
[-] Updated Objects
16-41 Section 16 Setting up Screen View
1
2
3
4
5
6
7
8
9
10
11
12
13
14
15
16
17
18
19
20
21
22
23
24
25
26
27
付録
Type C-MAP Ed.3 Layer
[S] Generic Object
Chart scale boundary, overscale data
Land region, Sea area/named water area
Causeway, Dam, Dyke, Gate
Dyke, Slope topline, Airport, Building, single, Crane, Landmark, Built-up area
Swept area
Sand wave, Tunnel, Cable, Submarine
Navigation line
Recommended track
Ferry route
Radar range, Radar line, Radio calling in point
Restricted area
Ferry route, Military practice area, Offshore production area
Caution area, Fairway
Fishing ground, Marine farm/aquaculture
Anchorage area, Anchor berth
Cable area, Pipeline area
Dumping ground, Cargo transshipment area, Incineration area
Archipelagic sea lane
Buoy, Beacon, Light float, Mooring buoy, Light Vessel
Daymark
Navigational system mark
Fog signal, Retro-reflector, Radar transponder beacon, Radar reflector
Pilot boarding place, Signal station, Traffic, Signal station, Warning
Section 16 Setting up Screen View 16-42
Type C-MAP Ed.3 Layer
[A] Quality of data, Low accuracy data
Nautical publication information
Coverage, Compilation scale of data
Local magnetic anomaly, Magnetic variation
Sloping ground, Land elevation, Slope topline
Vegetation, Lake, Rapids, River, Water fall, Tideway
Building, Fortified structure, Land mark, Silo/Tank, Airport, Road, Railway
Check point, Harbor facility
Distance mark
Berth, Crane, Drydock, Mooring/Warping facility, Gate
Sounding
Depth area, Depth counter, Label for contour
Water turbulence, Tide..., Current-non-gravitational
Seabed area, Weed/Kelp, Spring
Fishing-facility
Obstruction, Wreck, Underwater/Awash rock
Cable, Submarine, Pipeline, Submarine/on land
Continental shelf area
Custom zone, Free port area, Harbor area
Fishery zone
Administration area, Contiguous zone, Exclusive economic zone
Radar station, Radio station, Coastguard station, Rescue station
graticule
Contents to be displayed as texts
ENC Text
Important text (Vertical Clearance bridge, overhead cable, so on)
Name/Number of: Buoys, beacons, so on
Light description
Note on chart data or nautical publication
Nature of seabed
Geographic names
Value of: magnetic variation, swept depth
Height of islet or land feature
Berth number
National language
16-43 Section 16 Setting up Screen View
1
2
3
4
5
6
7
8
9
10
11
12
13
14
15
16
17
18
19
20
21
22
23
24
25
26
27
付録
C-MAP Ed.3 Text
Important text(Vertical Clearance bridge, overhead cable, so on)
Other text (Name of building so on)
Light description
Note on chart data or nautical publication
Geographic names
National language
16.2.12 Setting up AIO display
When you select [AIO] in the classification pane, the "AIO" dialog box appears in the edit pane.
The descriptions of settings are shown in the table below.
Setting Item Description of Setting Setting Value
All AIO Objects Select and enable the display of all AIO
objects.
To enable: Select.
To disable: Clear.
Temporary Notice (T) Select and enable the display associated
with Temporary Notice (T).
To enable: Select.
To disable: Clear.
Preliminary Notice (P) Select and enable the display associated
with Preliminary Notice (P).
To enable: Select.
To disable: Clear.
ENC Preliminary Notice
(EP)
Select and enable the display associated
with ENC Preliminary Notice (EP).
To enable: Select.
To disable: Clear.
No Information Objects Select and enable the display associated
with No Information Objects.
To enable: Select.
To disable: Clear.
Section 16 Setting up Screen View 16-44
16.2.13 Setting up the display of range/bearing
measurement function
When you select [Tools] in the classification pane, the "Tools" dialog is displayed in the edit pane.
The descriptions of settings are shown in the table below.
Setting Item Description of Setting Setting Value
Range Rings Selecting this enables to display range
rings.
To enable: Select.
To disable: Clear.
Bearing Scale Selecting this enables to display the
bearing scale.
Note
This item is displayed on the ECDIS
screen only. This item is enabled only
when overlay is set to On.
To enable: Select.
To disable: Clear.
EBL1/EBL2 Selecting this enables to display the
EBL1/EBL2 markers.
To enable: Select.
To disable: Clear.
VRM1/VRM2 Selecting this enables to display the
VRM1/VRM2 markers.
To enable: Select.
To disable: Clear.
PI (parallel line cursor) Select this to enable to display the PI
cursors, and then select the PI cursors
you want to display by selecting them.
To enable: Select.
To disable: Clear.
PI cursor selections
Index Line 1 to Index Line 8
Node Fixed EBL/VRM Selecting this enables to display the
node fixed EBL/VRM.
To enable: Select.
To disable: Clear.
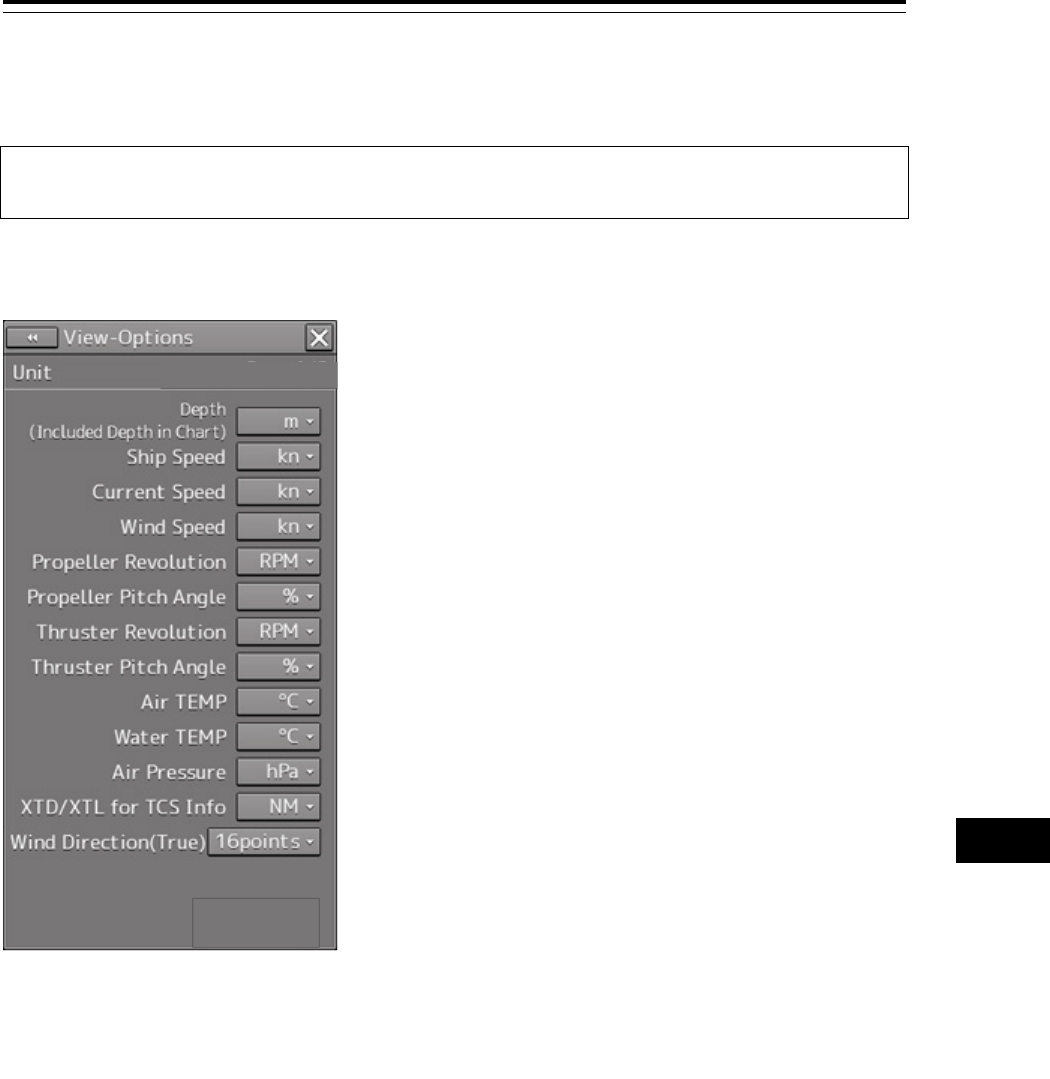
16-45 Section 16 Setting up Screen View
1
2
3
4
5
6
7
8
9
10
11
12
13
14
15
16
17
18
19
20
21
22
23
24
25
26
27
付録
16.2.14 Setting up the display of Unit of Setting
Value
Note
Some items may not be displayed depending on the installation setting.
When you select [Unit] in the classification pane, the "Unit" dialog is displayed in the edit pane.
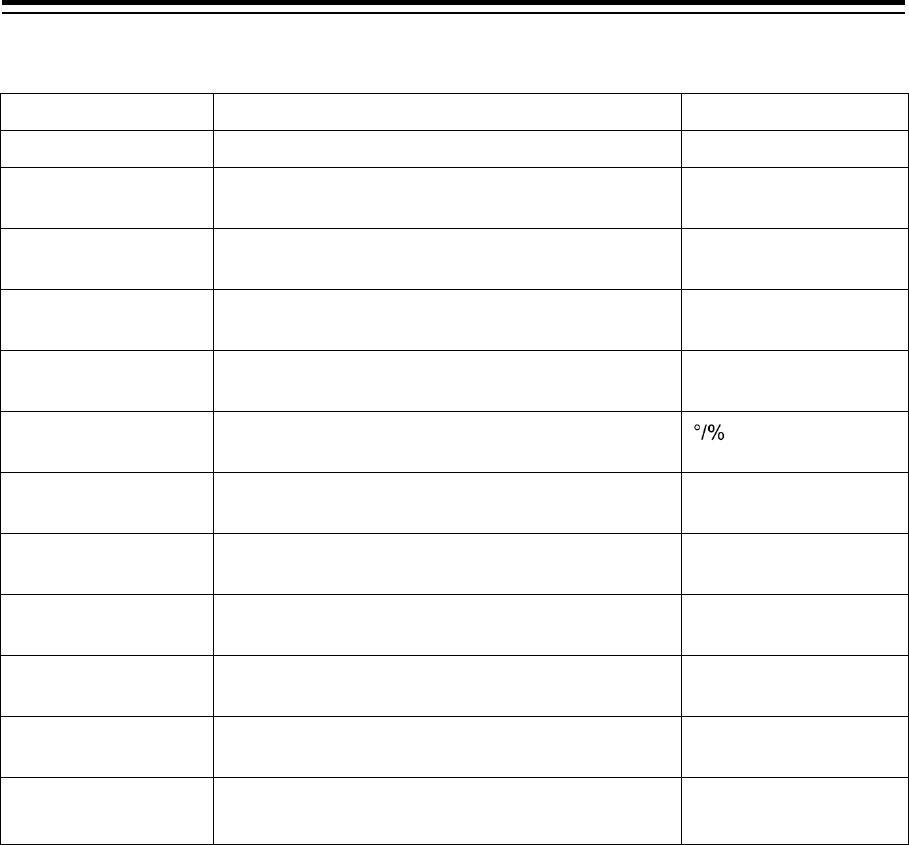
Section 16 Setting up Screen View 16-46
The descriptions of settings are shown in the table below.
Setting Item Description of Setting Setting Value
Depth (water depth) Select a unit of water depth from the combo box. m, ft, fm
Ship Speed Select a unit of the ship speed from the combo
box.
kn, m/s, km/h
Current Speed Select a unit of the current speed from the combo
box.
kn, m/s, km/h
Wind Speed Select a unit of the wind speed from the combo
box.
kn, m/s, km/h
Propeller Revolution Select a unit of the propeller's revolution per
minute from the combo box.
RPM, min-1
Propeller Pitch Angle Select a unit of the propeller's pitch angle from the
combo box.
Thruster Revolution Select a unit of the thruster's revolution per minute
from the combo box.
RPM, min-1
Thruster Pitch Angle Select a unit of the thruster's pitch angle from the
combo box.
°, %
Air TEMP Select a unit of the air temperature from the
combo box.
°C, °F
Water TEMP Select a unit of the water temperature from the
combo box.
°C, °F
Air Pressure Select a unit of the air pressure from the combo
box.
hPa, mbar
Wind Direction(True)
Select a wind direction (true) display method from
the combo box.
16points, Degree
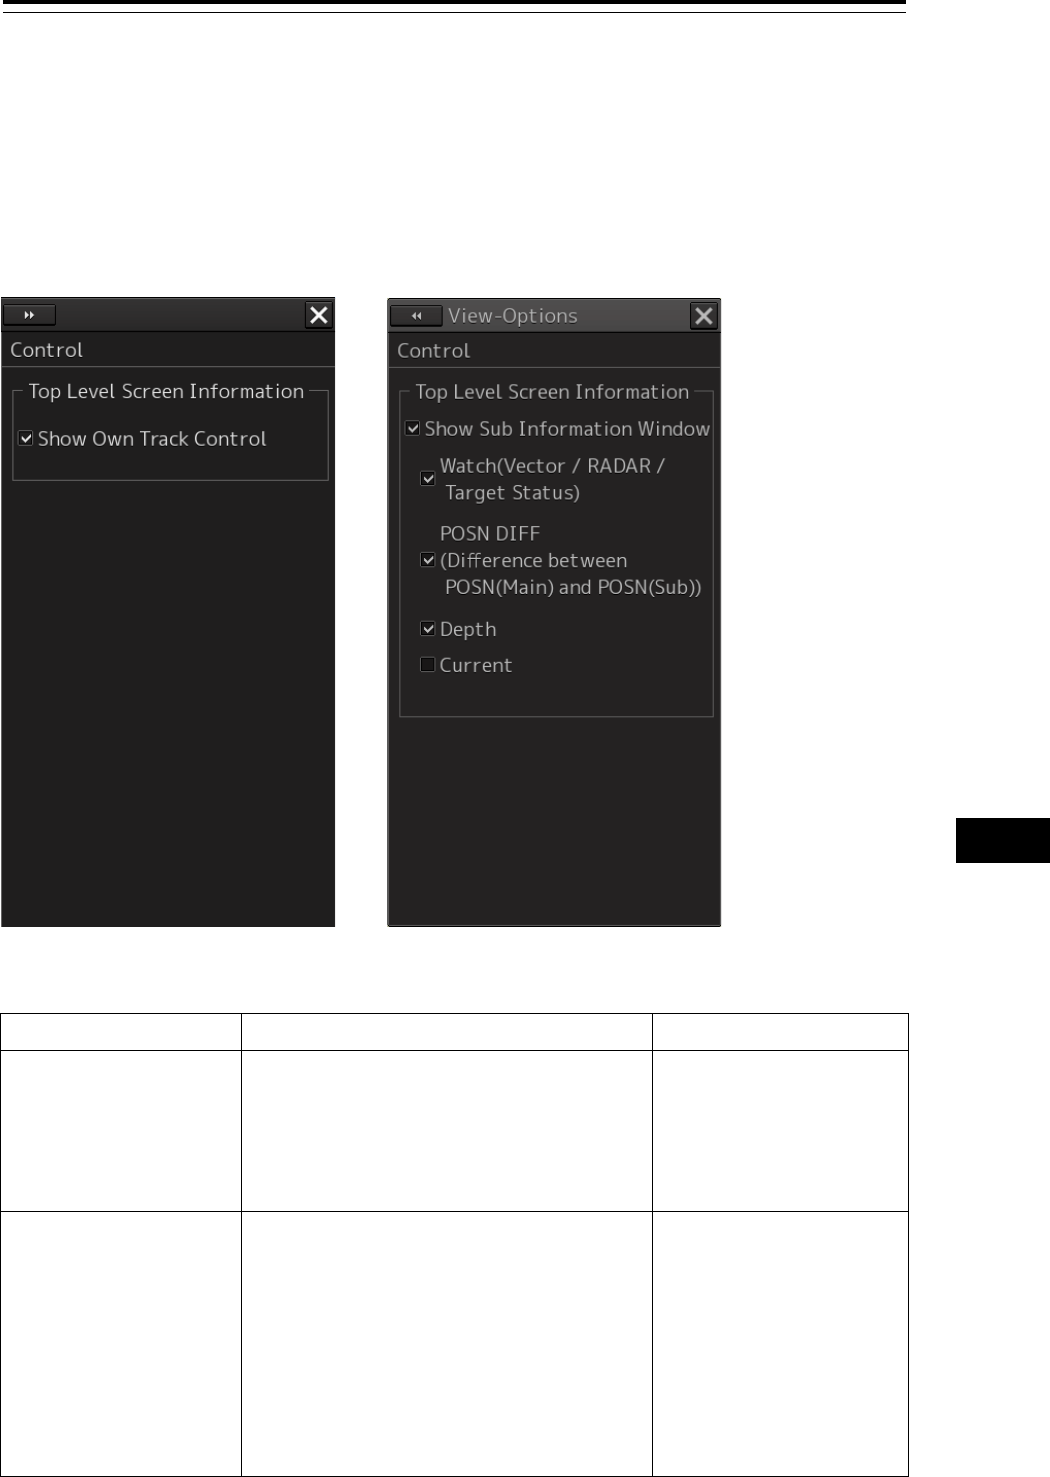
16-47 Section 16 Setting up Screen View
1
2
3
4
5
6
7
8
9
10
11
12
13
14
15
16
17
18
19
20
21
22
23
24
25
26
27
付録
16.2.15 Setting up display of Own Ship Track Control,
display format of Own Ship/Cursor Position
and display of Sub-Information dialog
When you select [Control] in the classification pane, the "Control" dialog is displayed in the edit pane.
[RADAR Screen] [ECDIS Screen]
The descriptions of settings are shown in the table below.
Setting Item Description of Setting Setting Value
Show Own Track
Control
Selecting this enables to display own track
control.
Note
This item takes effect only on the RADAR
screen.
To enable: Select.
To disable: Clear.
Show Sub Information
Window (sub information
dialog box display)
Select this to enable to display the sub
information dialog box, and then select the
tab(s) you want to display.
Note
The [Depth] tab can only be selected when
equipped with a water depth sensor.
The [Current] tab can only be selected when
equipped with a GPS, a gyro and a log
sensor.
To enable: Select.
To disable: Clear.
Tab selections
Watch(Vector / Radar /
Target status), POSN
DIFF(Difference between
POSN(Main) and
POSN(Sub)), Depth,
Current
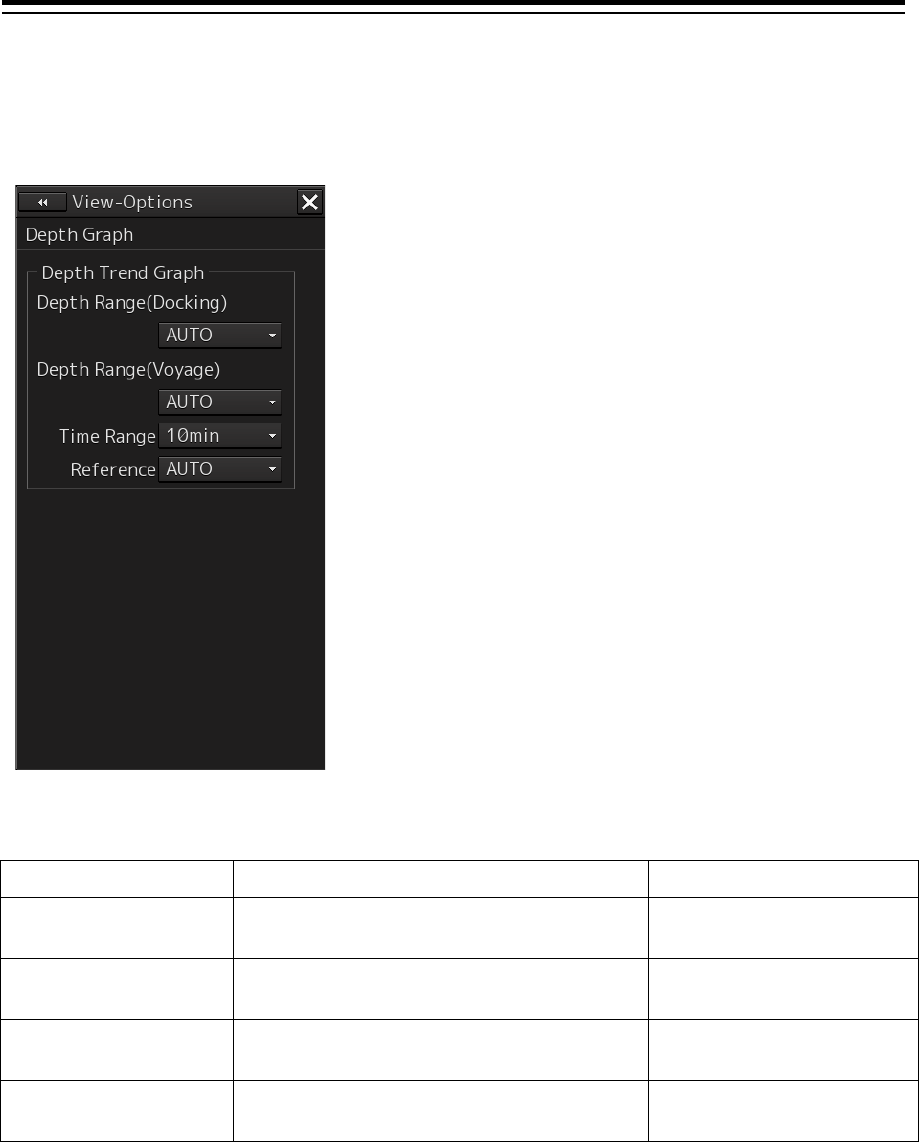
Section 16 Setting up Screen View 16-48
16.2.16 Setting up the Water Depth display
When [Depth Graph] is selected on the classification pain, the [Depth Graph] dialog is shown on the
Edit pain.
v
The following table shows the setting details:
Setting item Description Setting values
Depth Range(Docking) Select a depth range for the docking depth
graph from the combo box.
AUTO, 10 m, 25 m, 50 m
Depth Range(Voyage) Select a depth range for the route depth
graph from the combo box.
AUTO, 50 m, 100 m, 250 m
Time Range Select a time range for the depth graph from
the combo box.
10 min, 15 min, 30 min,
60 min, 12 hours
Reference Select a reference for depth display from the
combo box.
AUTO, Keel
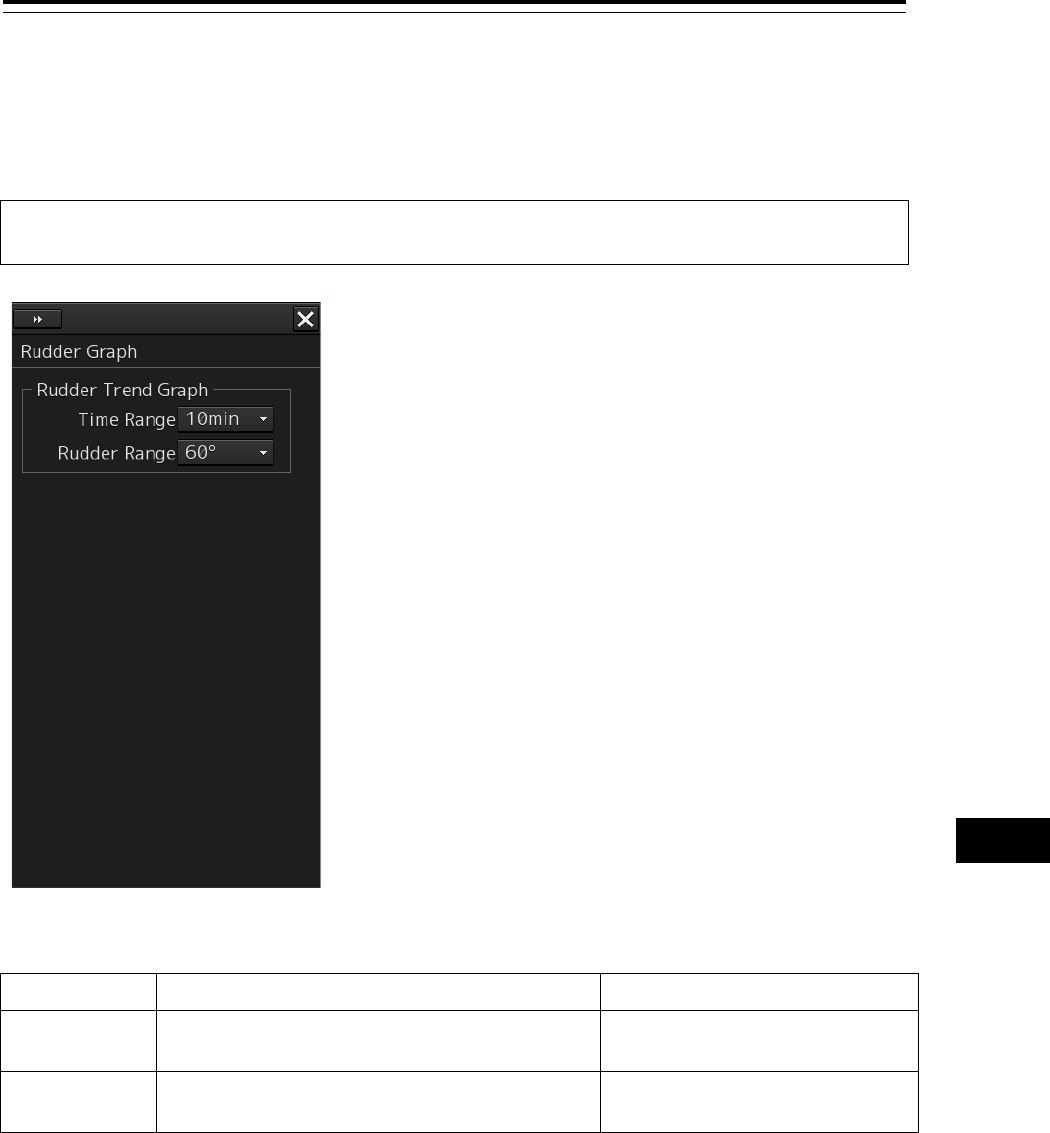
16-49 Section 16 Setting up Screen View
1
2
3
4
5
6
7
8
9
10
11
12
13
14
15
16
17
18
19
20
21
22
23
24
25
26
27
付録
16.2.17 Setting up the Rudder graph
When [Rudder Graph] is selected on the classification pain, the [Rudder Graph] dialog is displayed on
the edit pain.
Note
This dialog may not be displayed depending on the equipment setting.
The following table shows the setting details:
Setting item Setting Setting value
Time Range Select a time range for the Rudder graph from
the combo box.
5 min, 10 min, 15 min, 30 min
Rudder Range Select a rudder angle for the Rudder graph from
the combo box.
30°, 40°, 50°, 60°, 70°, 80°
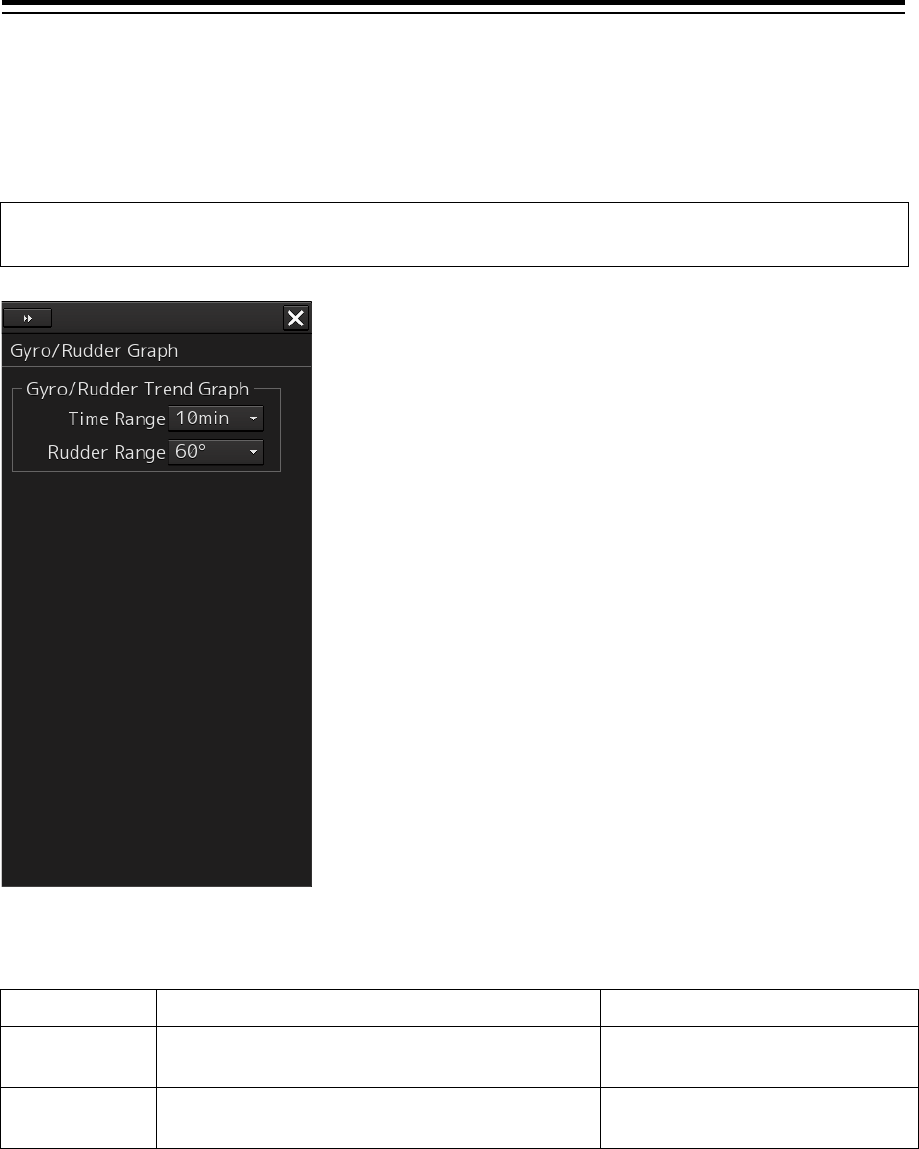
Section 16 Setting up Screen View 16-50
16.2.18 Setting up the Gyro/Rudder graph
When [Gyro/Rudder Graph] is selected on the classification pain, the [Gyro/Rudder Graph] dialog is
displayed on the edit pain.
Note
This dialog may not be displayed depending on the equipment setting.
The following table shows the setting details:
Setting item Setting Setting value
Time Range Select a time range for the Gyro/Rudder graph
from the combo box.
5 min, 10 min, 15 min, 30 min
Rudder Range Select a rudder angle for the Gyro/Rudder
graph from the combo box.
30°, 40°, 50°, 60°, 70°, 80°
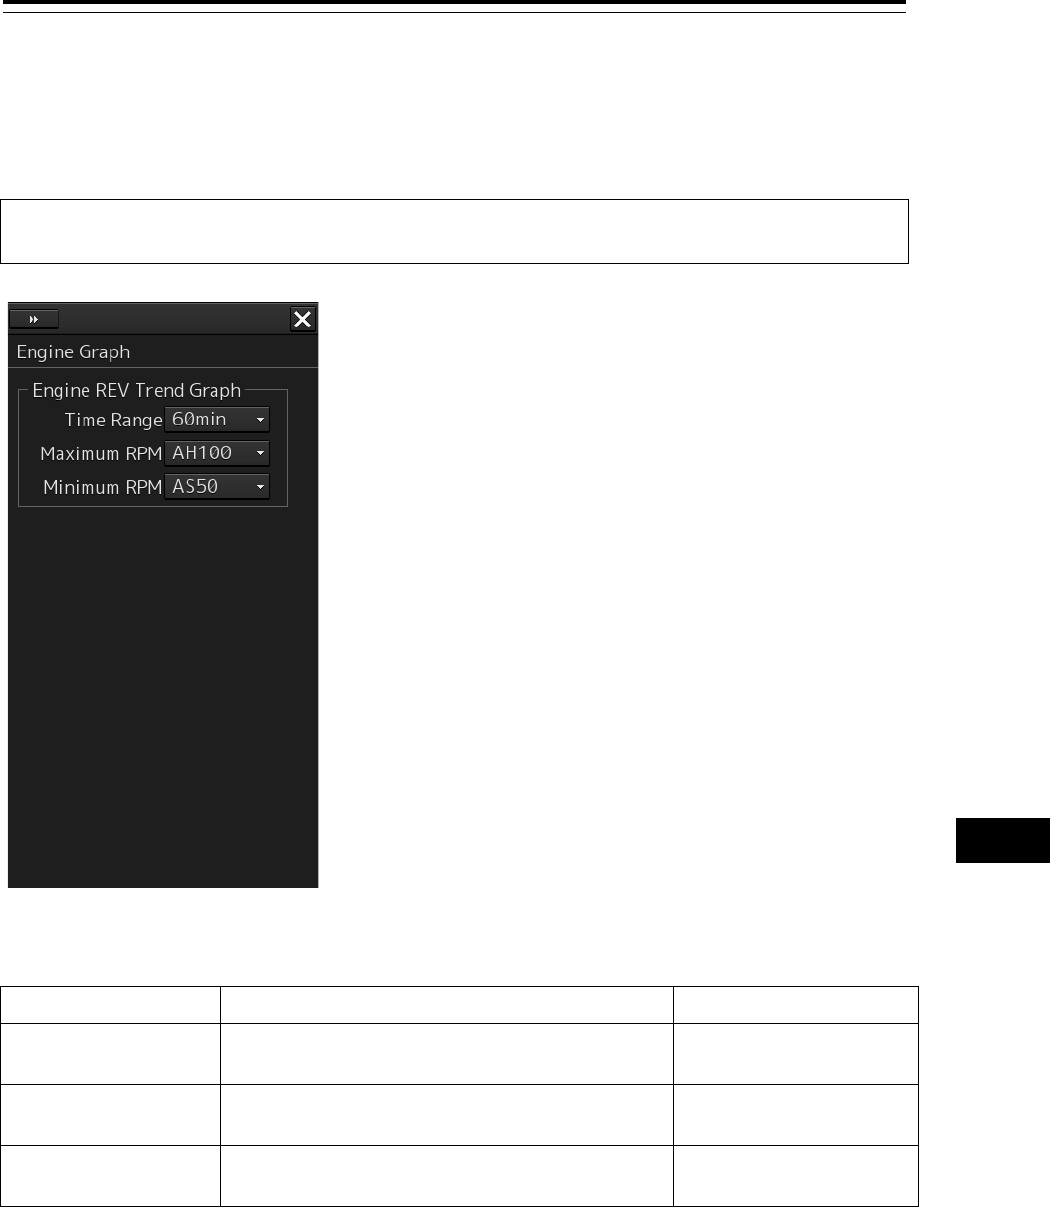
16-51 Section 16 Setting up Screen View
1
2
3
4
5
6
7
8
9
10
11
12
13
14
15
16
17
18
19
20
21
22
23
24
25
26
27
付録
16.2.19 Setting up the Engine Graph
When [Engine Graph] is selected on the classification pain, the "Engine Graph" dialog is displayed on
the edit pain.
Note
This dialog may not be displayed depending on the equipment setting.
The following table shows the setting details:
Setting item Setting Setting value
Time Range Select a time range for the engine speed graph
form the combo box.
10 min, 15 min, 30 min,
60 min
Maximum RPM Select an engine speed on the Ahead side form
the combo box.
AH100, AH200, AH300,
AH500, AH1000
Minimum RPM Select an engine speed on the Astern side form
the combo box.
0, AS50, AS100
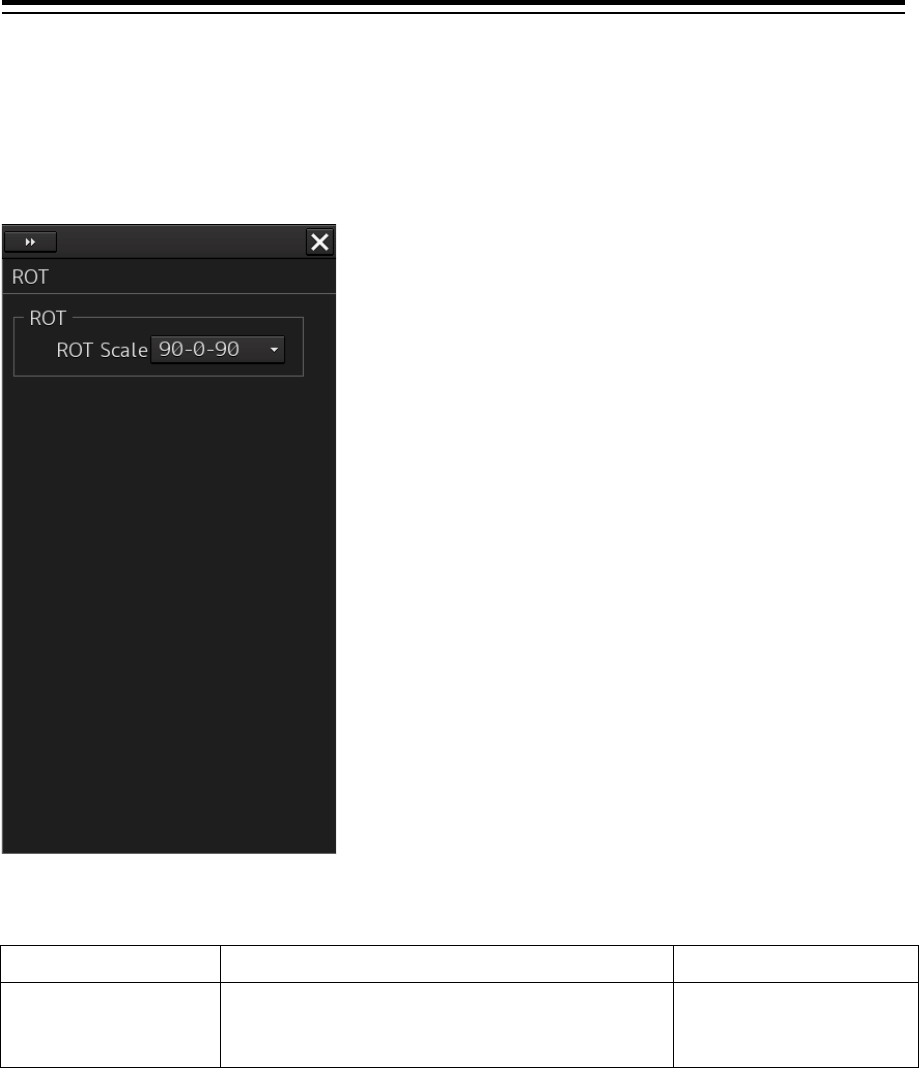
Section 16 Setting up Screen View 16-52
16.2.20 Setting up the graph range of the ROT slide
bar
When [ROT] is selected on the classification pain, the "ROT" dialog is displayed on the edit pain.
The following table shows the setting details:
Setting item Setting Setting value
ROT Scale Select a graph range for the ROT slide bar from
the combo box.
30-0-30, 60-0-60,
90-0-90, 120-0-120,
150-0-150, 300-0-300