Cambium Networks 50450I Fixed Outdoor Point to Multipoint Transceiver User Manual 450 Platform User Guide

Cambium Networks Limited Fixed Outdoor Point to Multipoint Transceiver 450 Platform User Guide

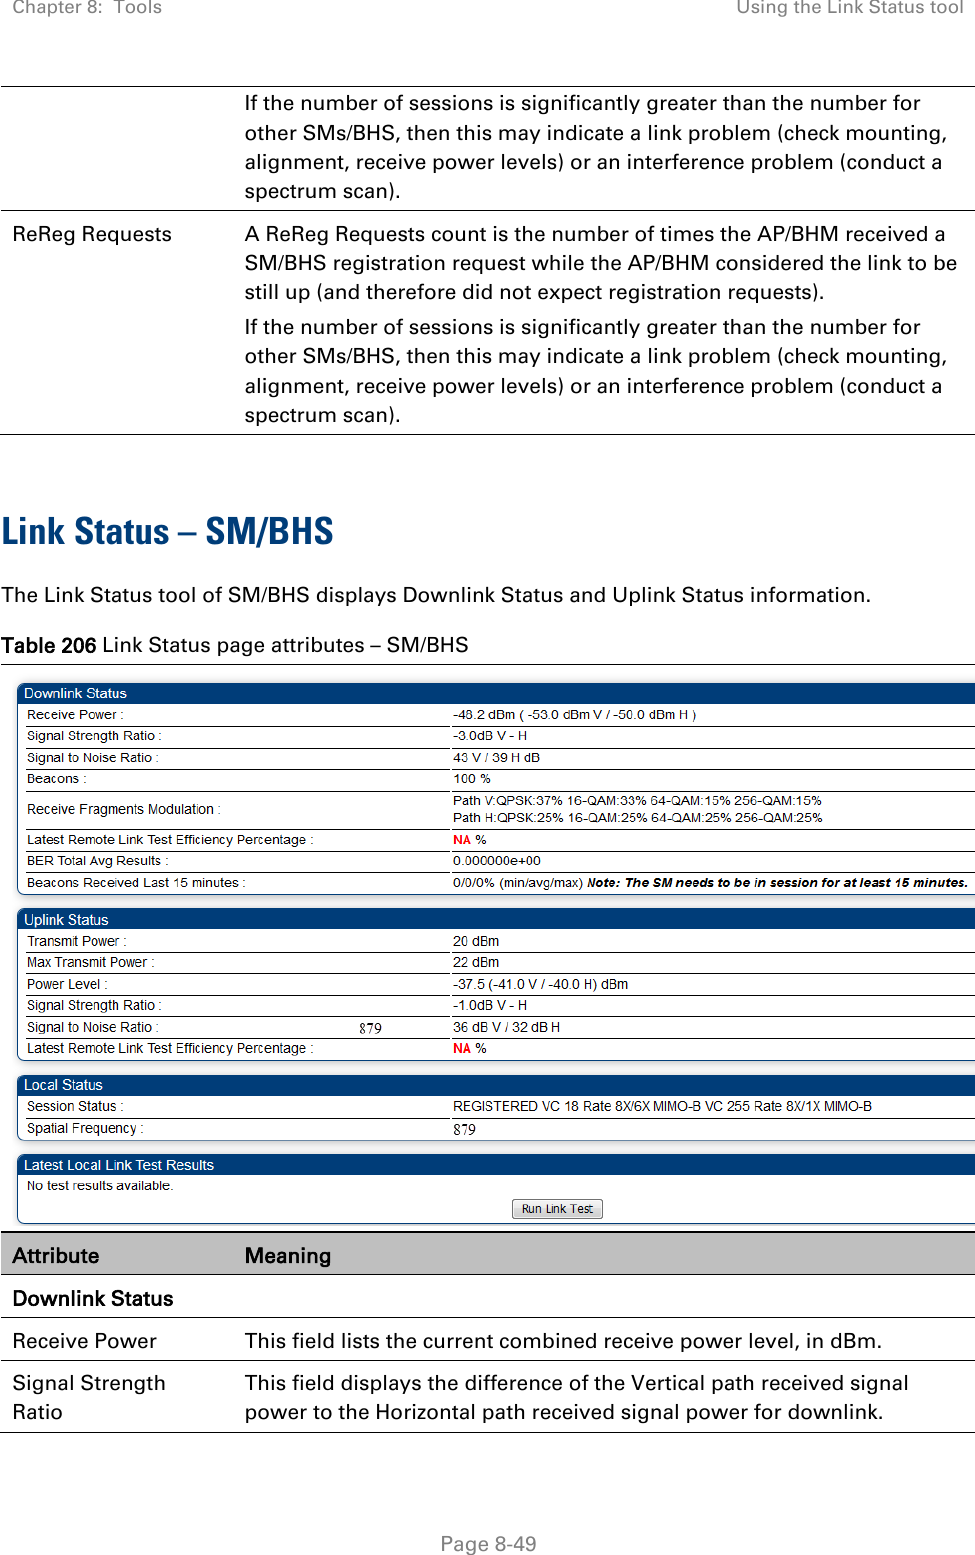
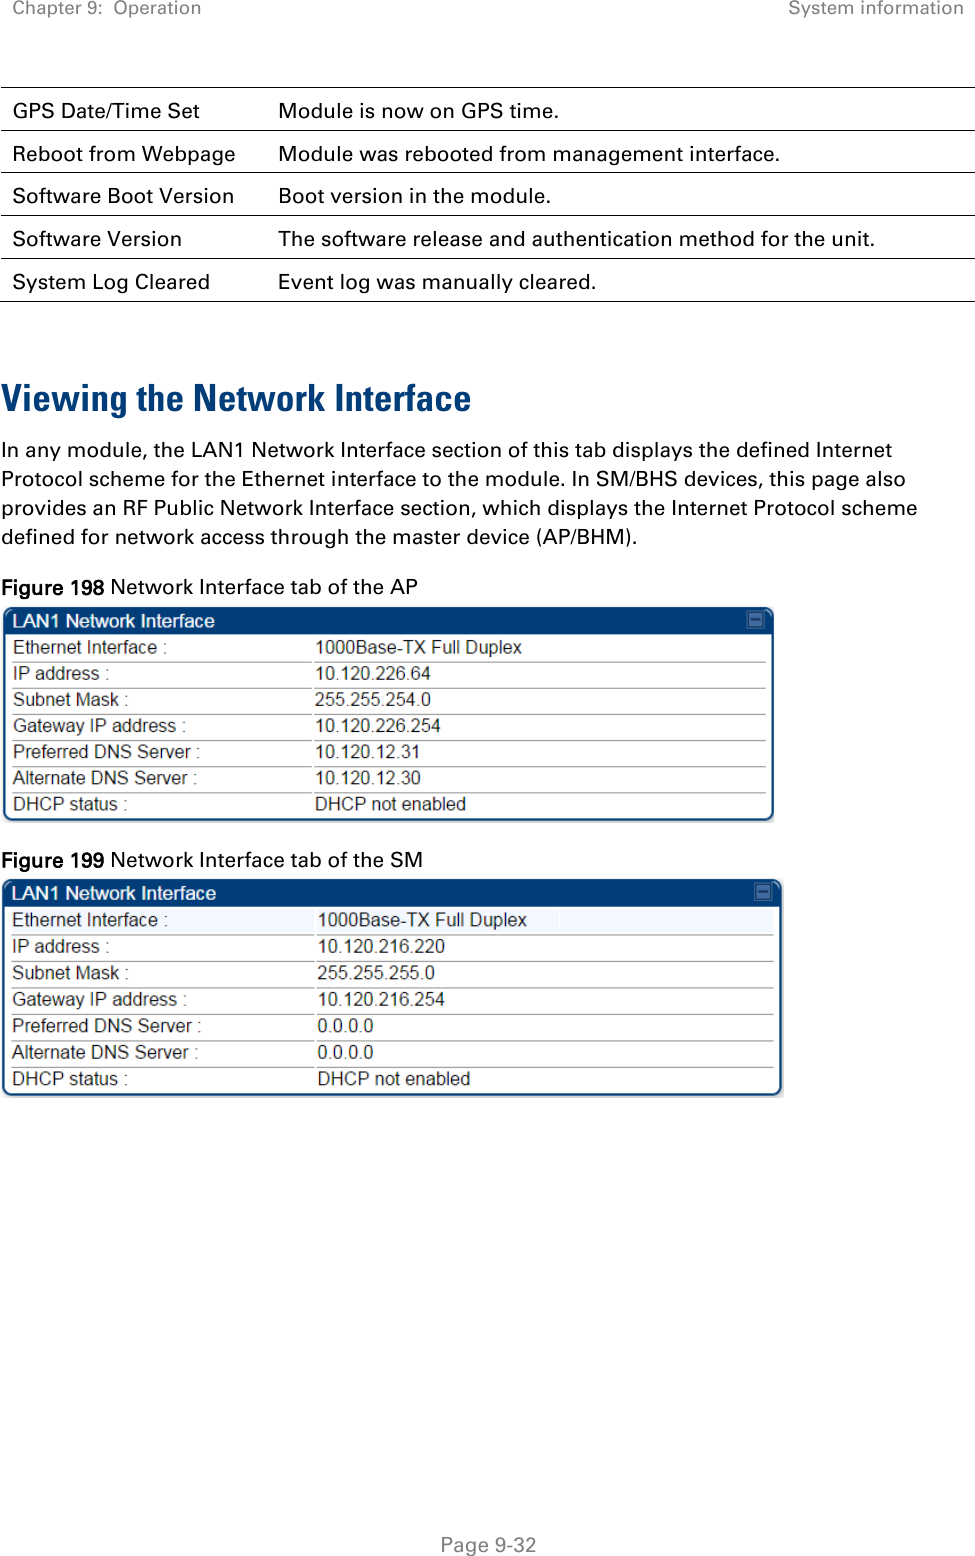
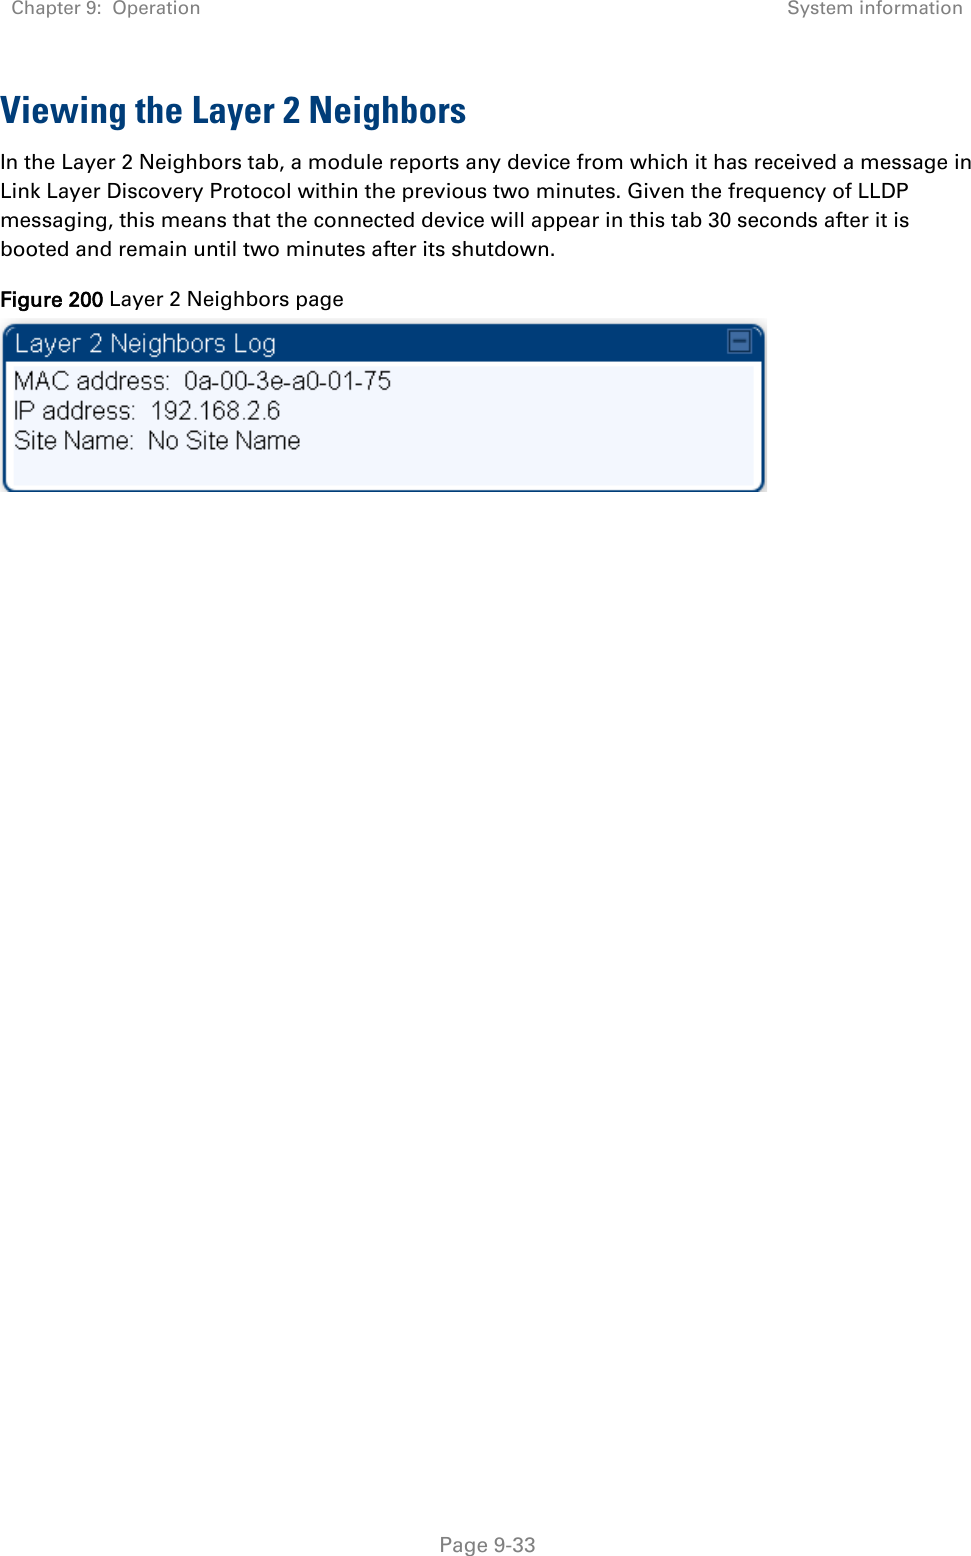
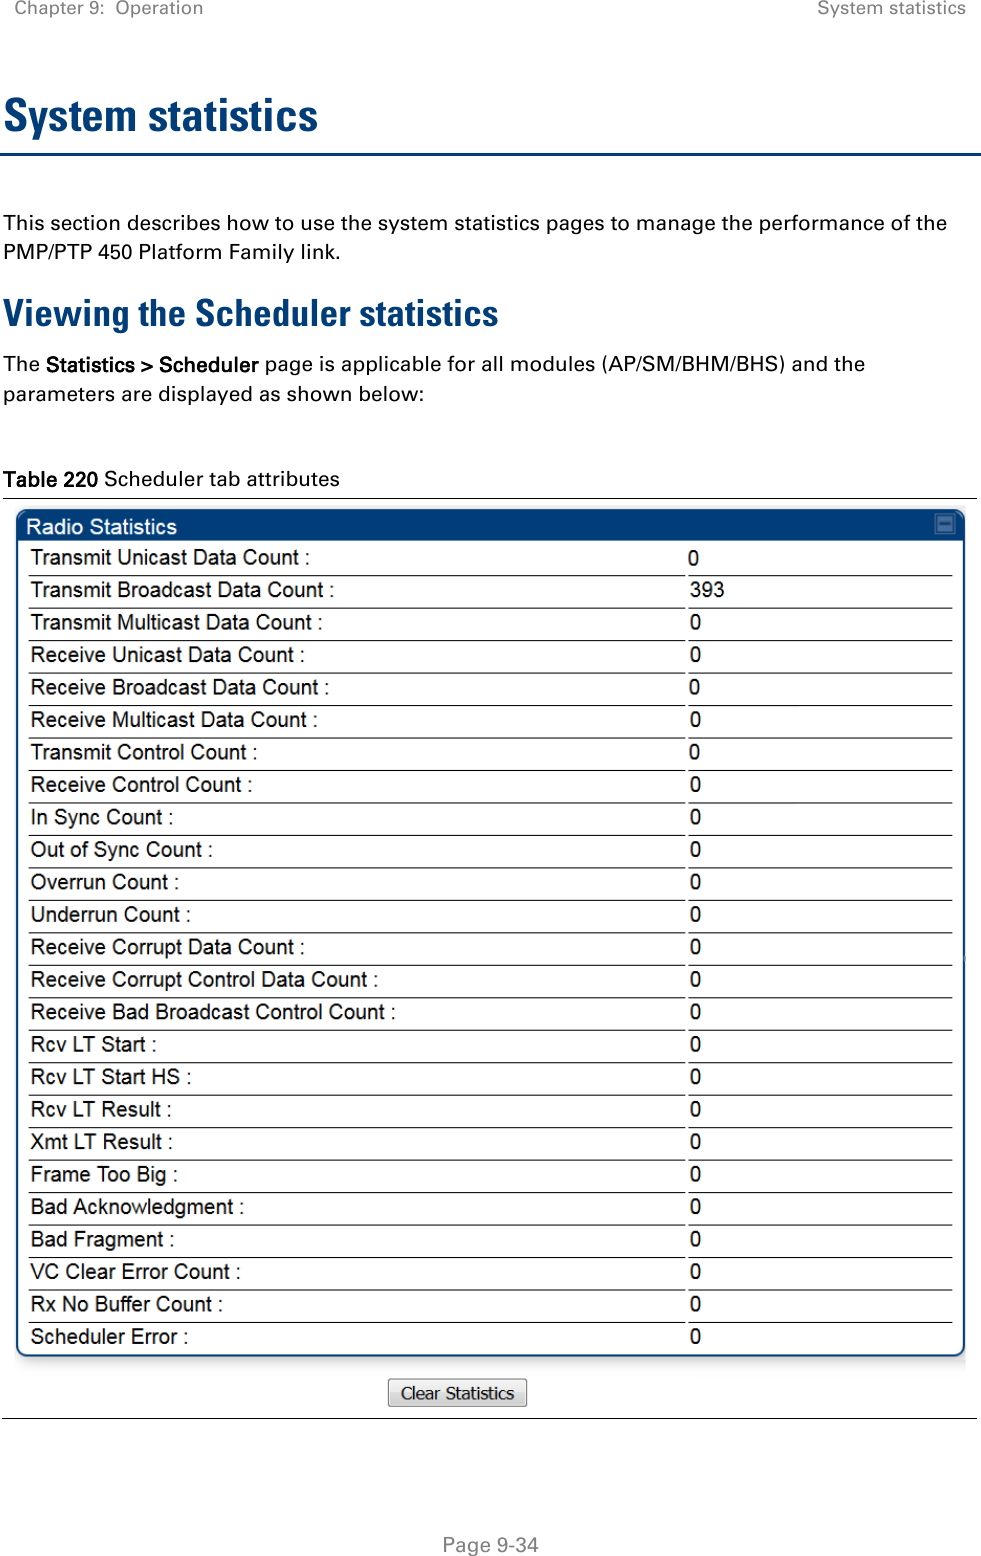
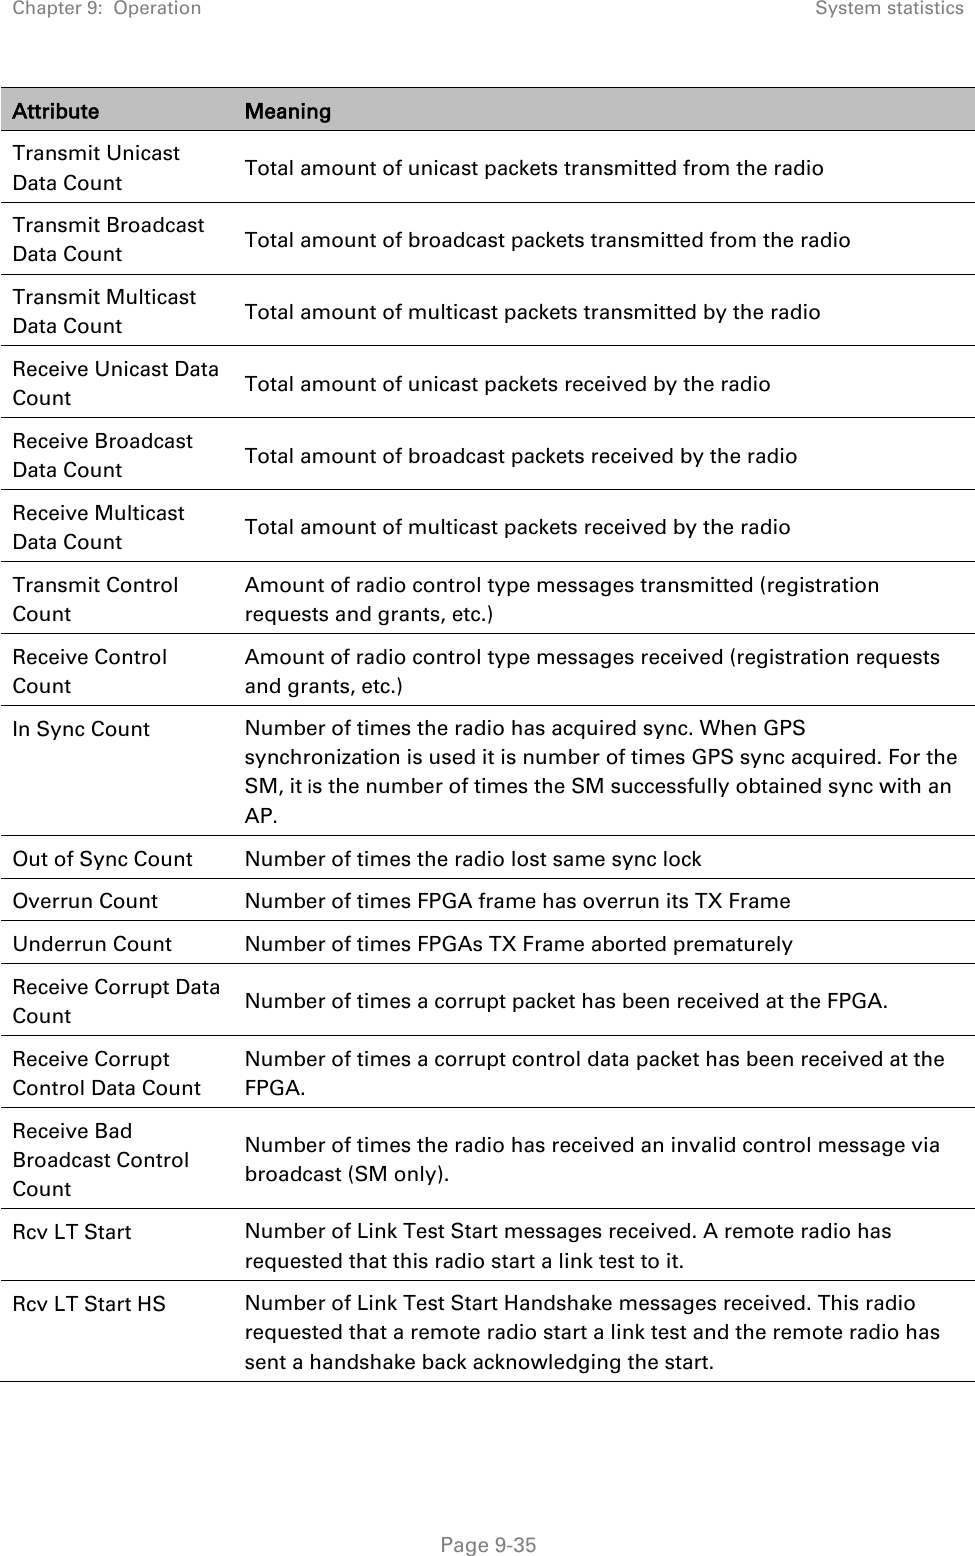
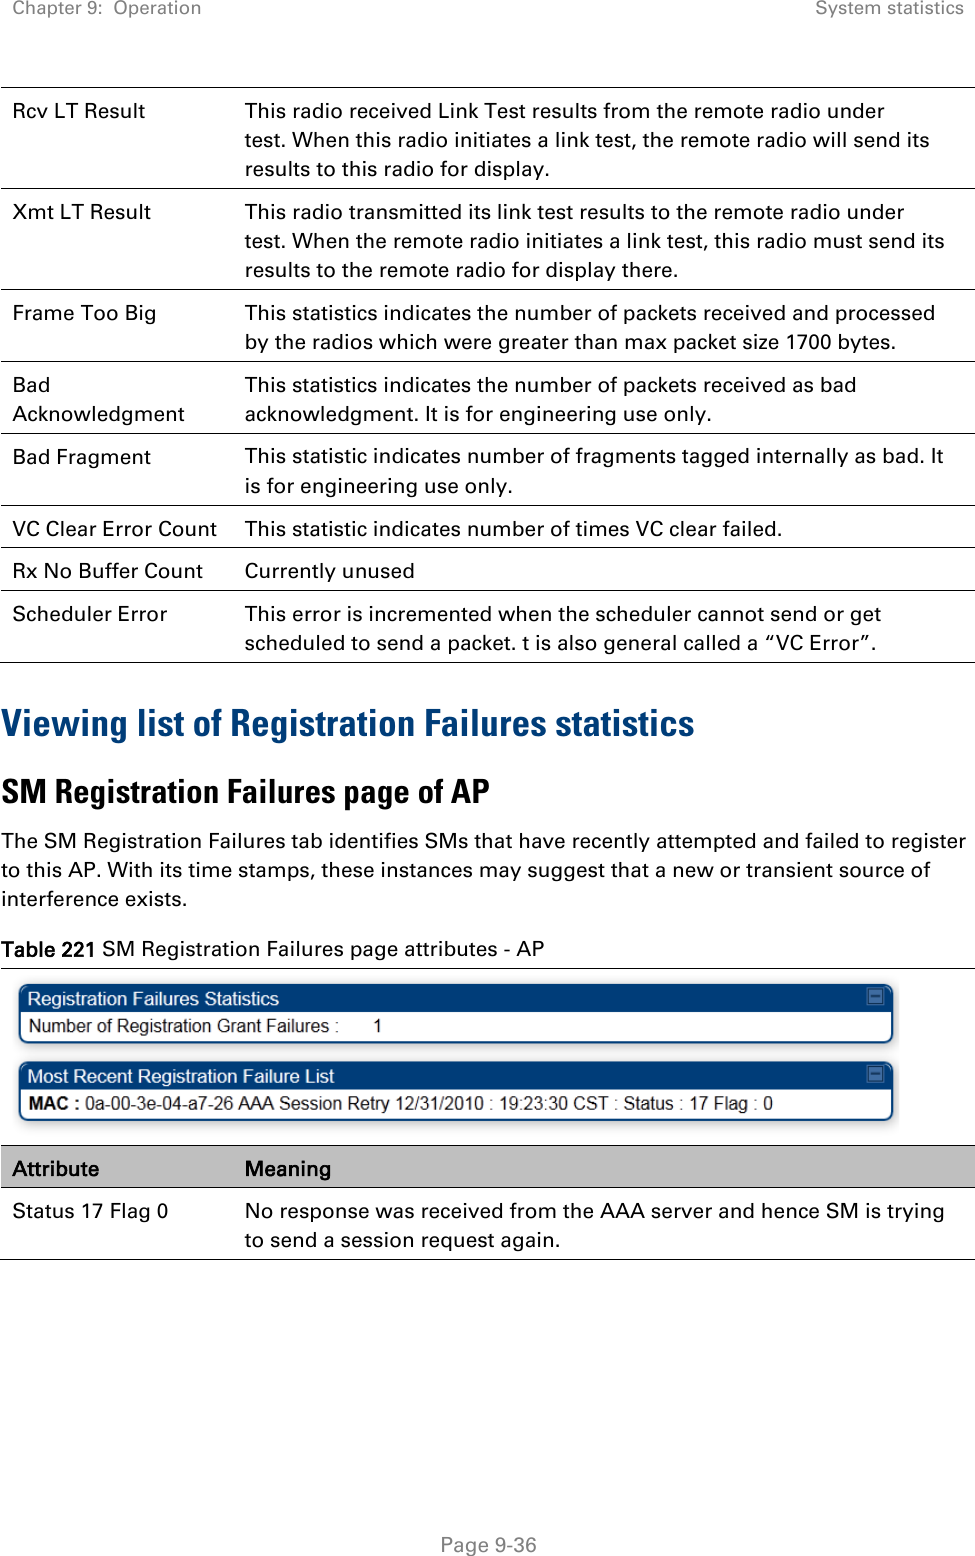
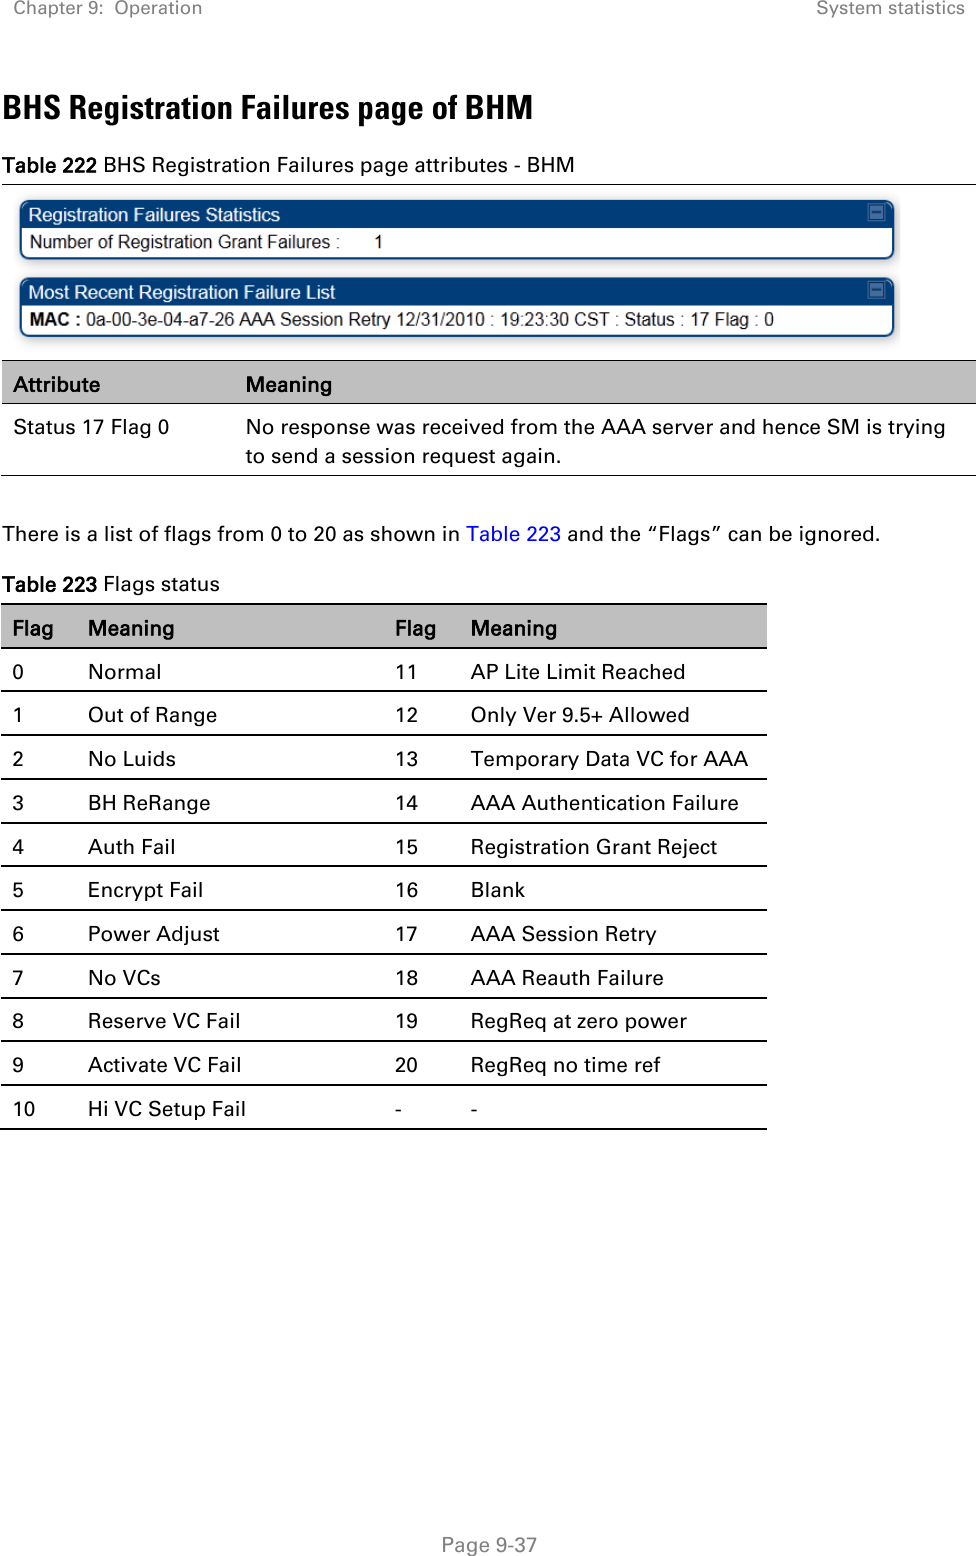
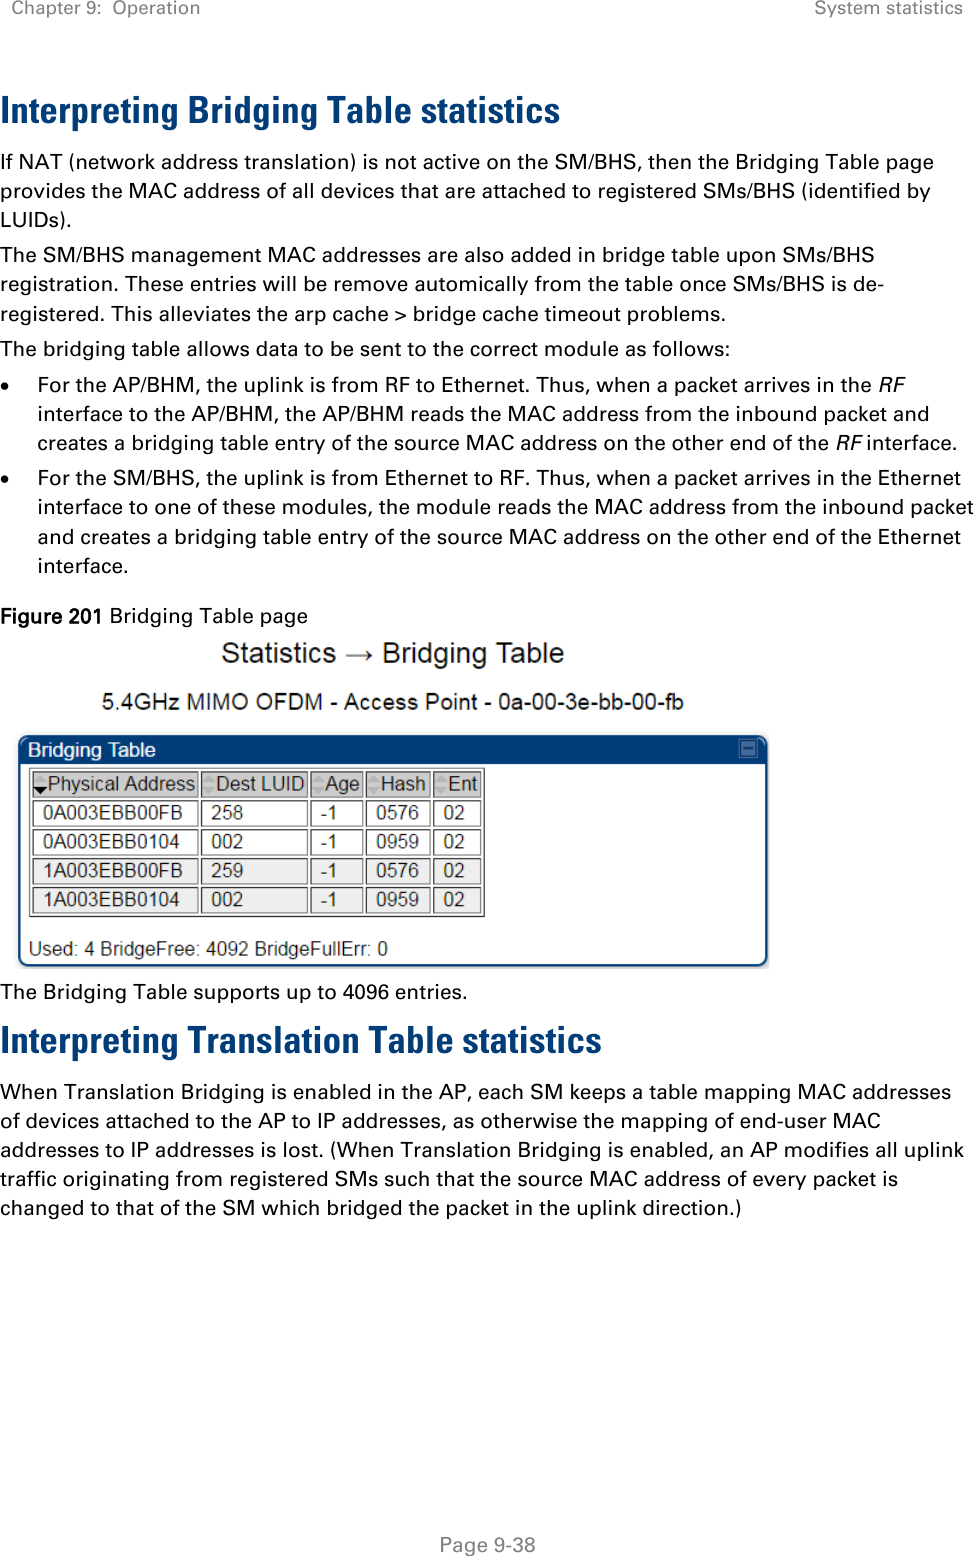
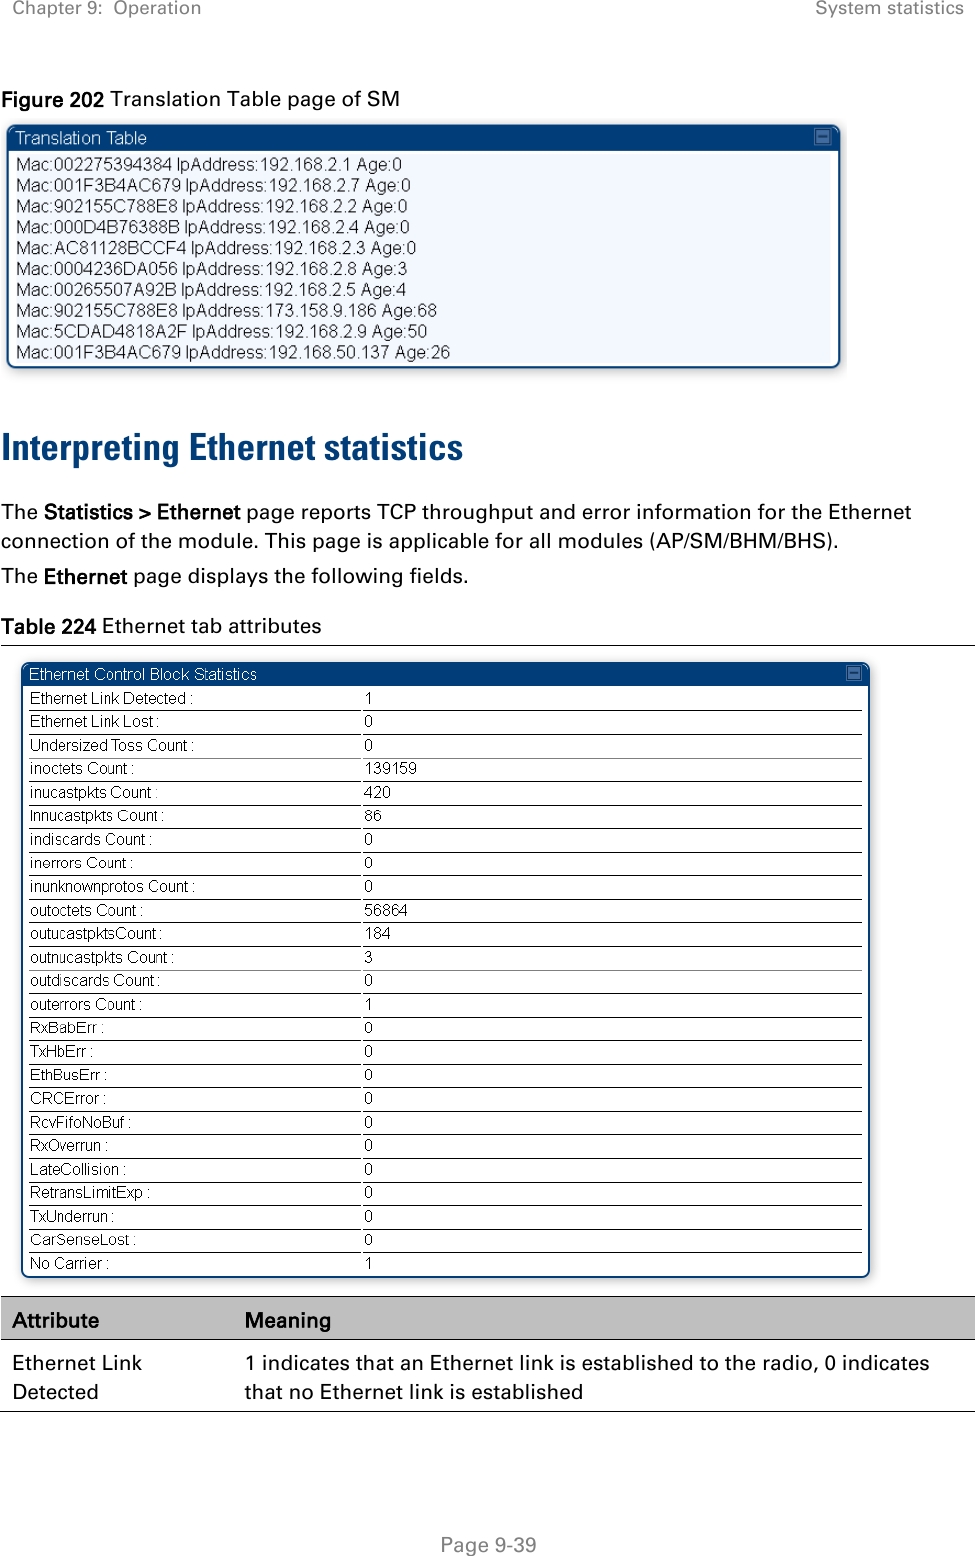
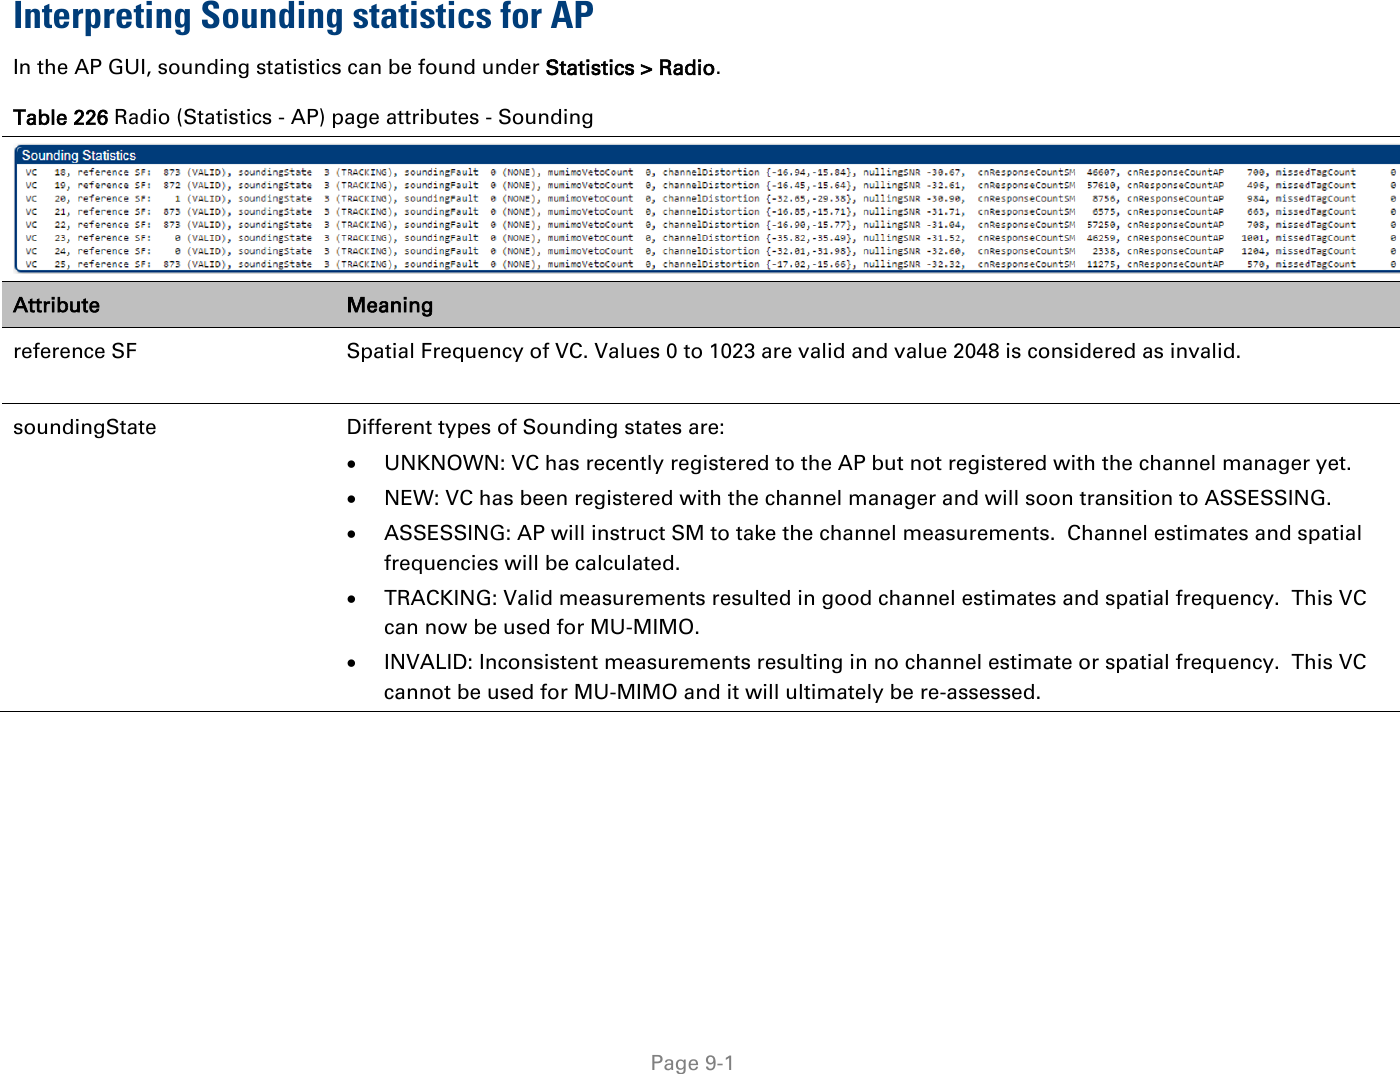
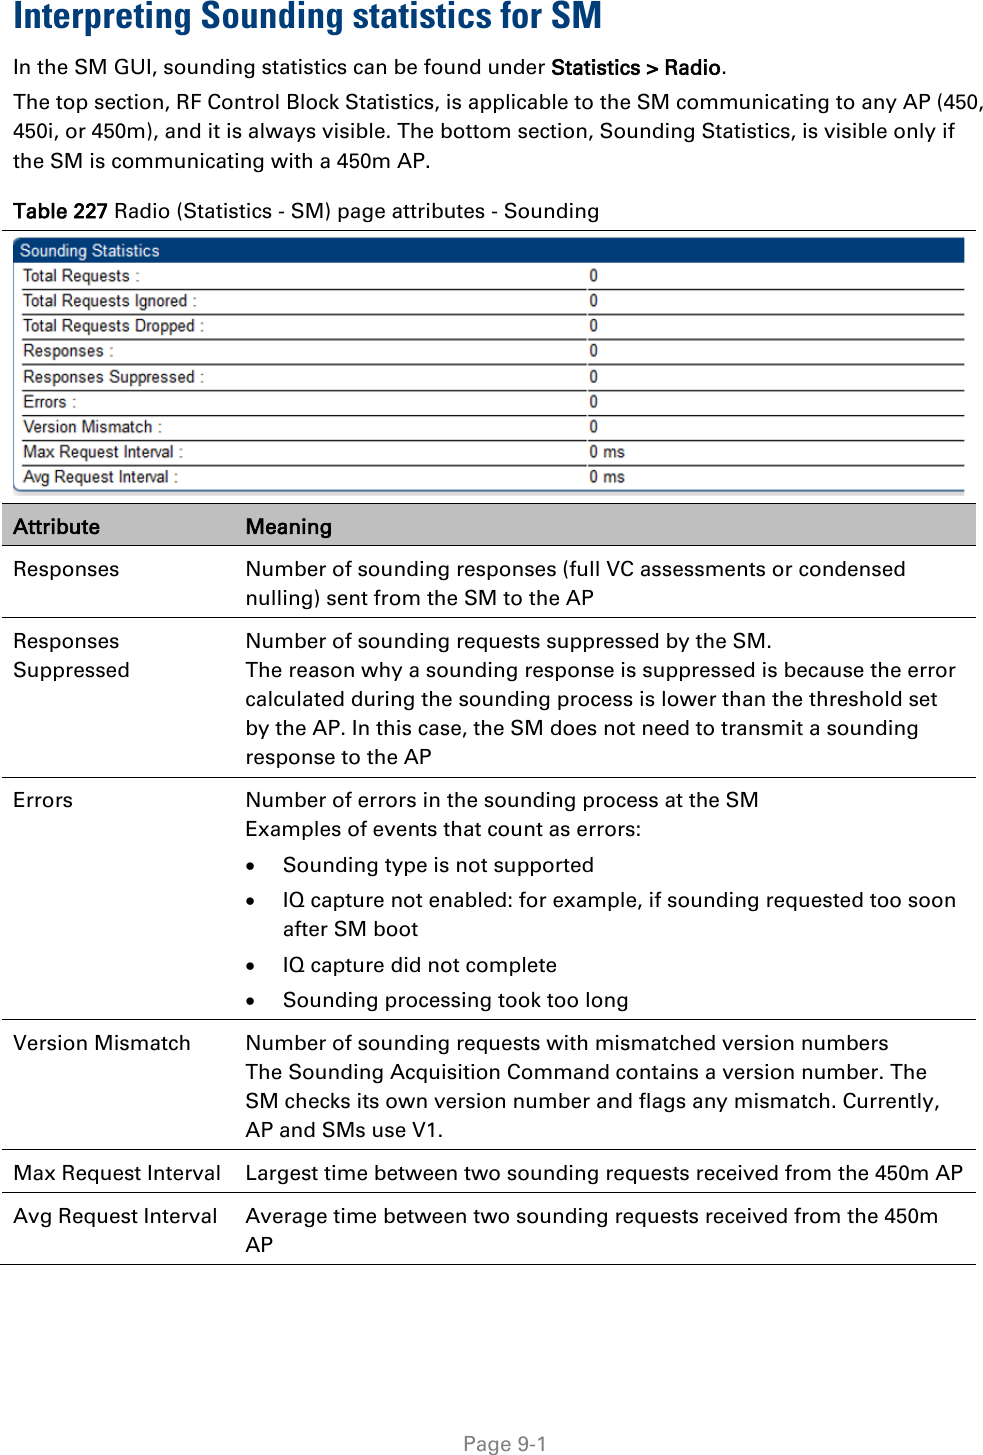
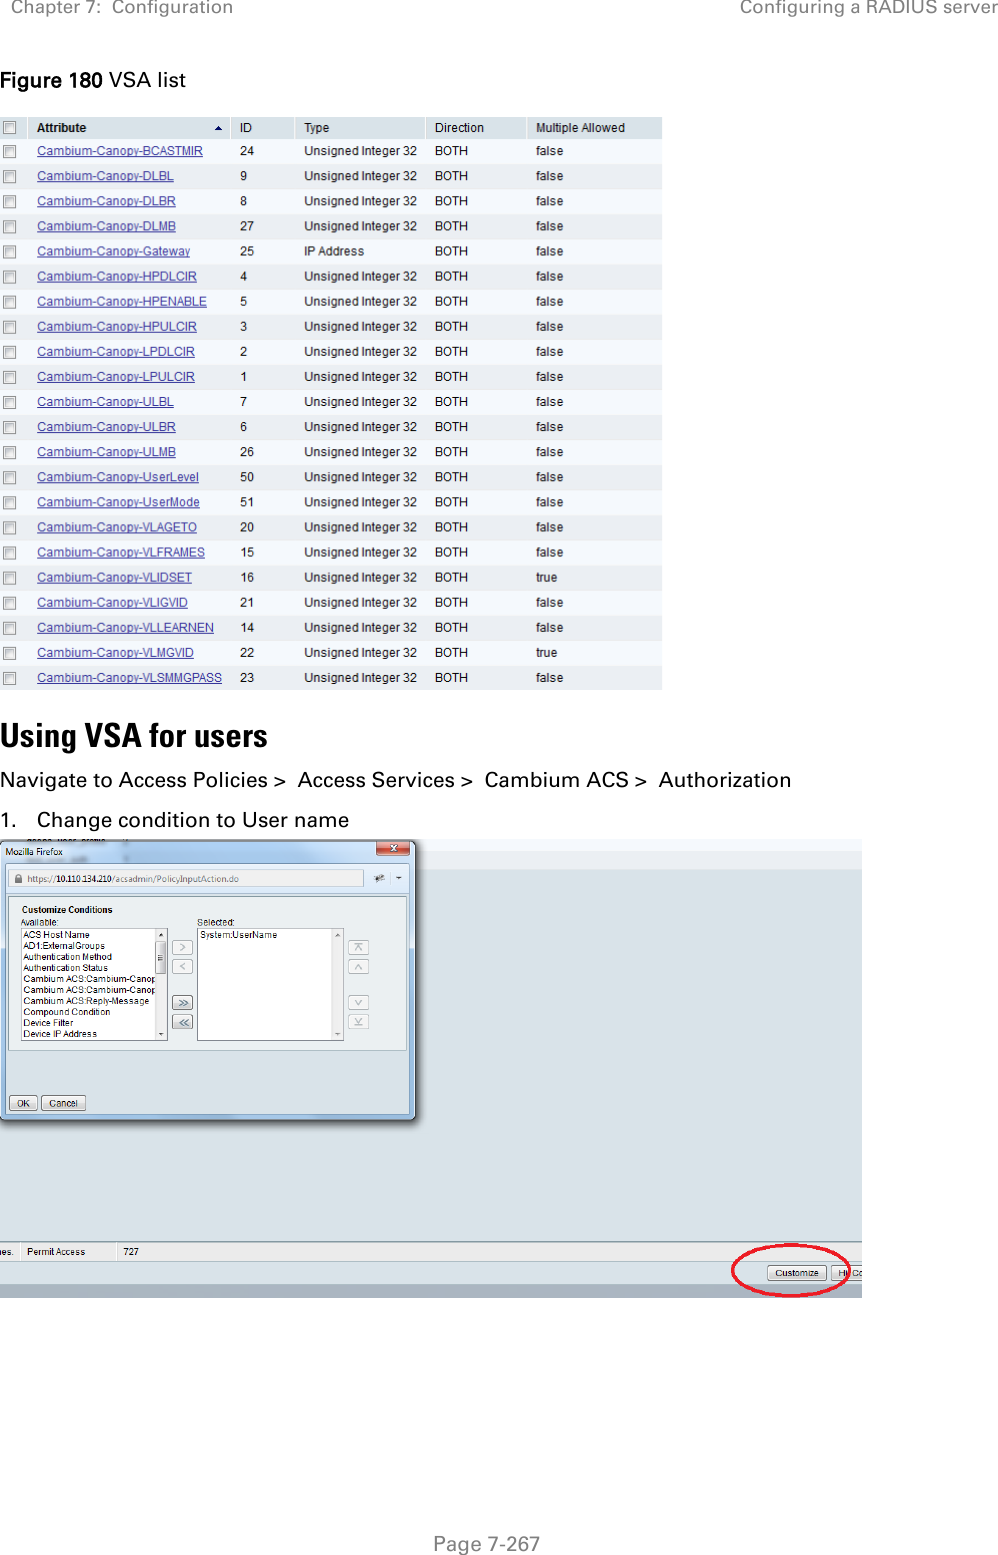
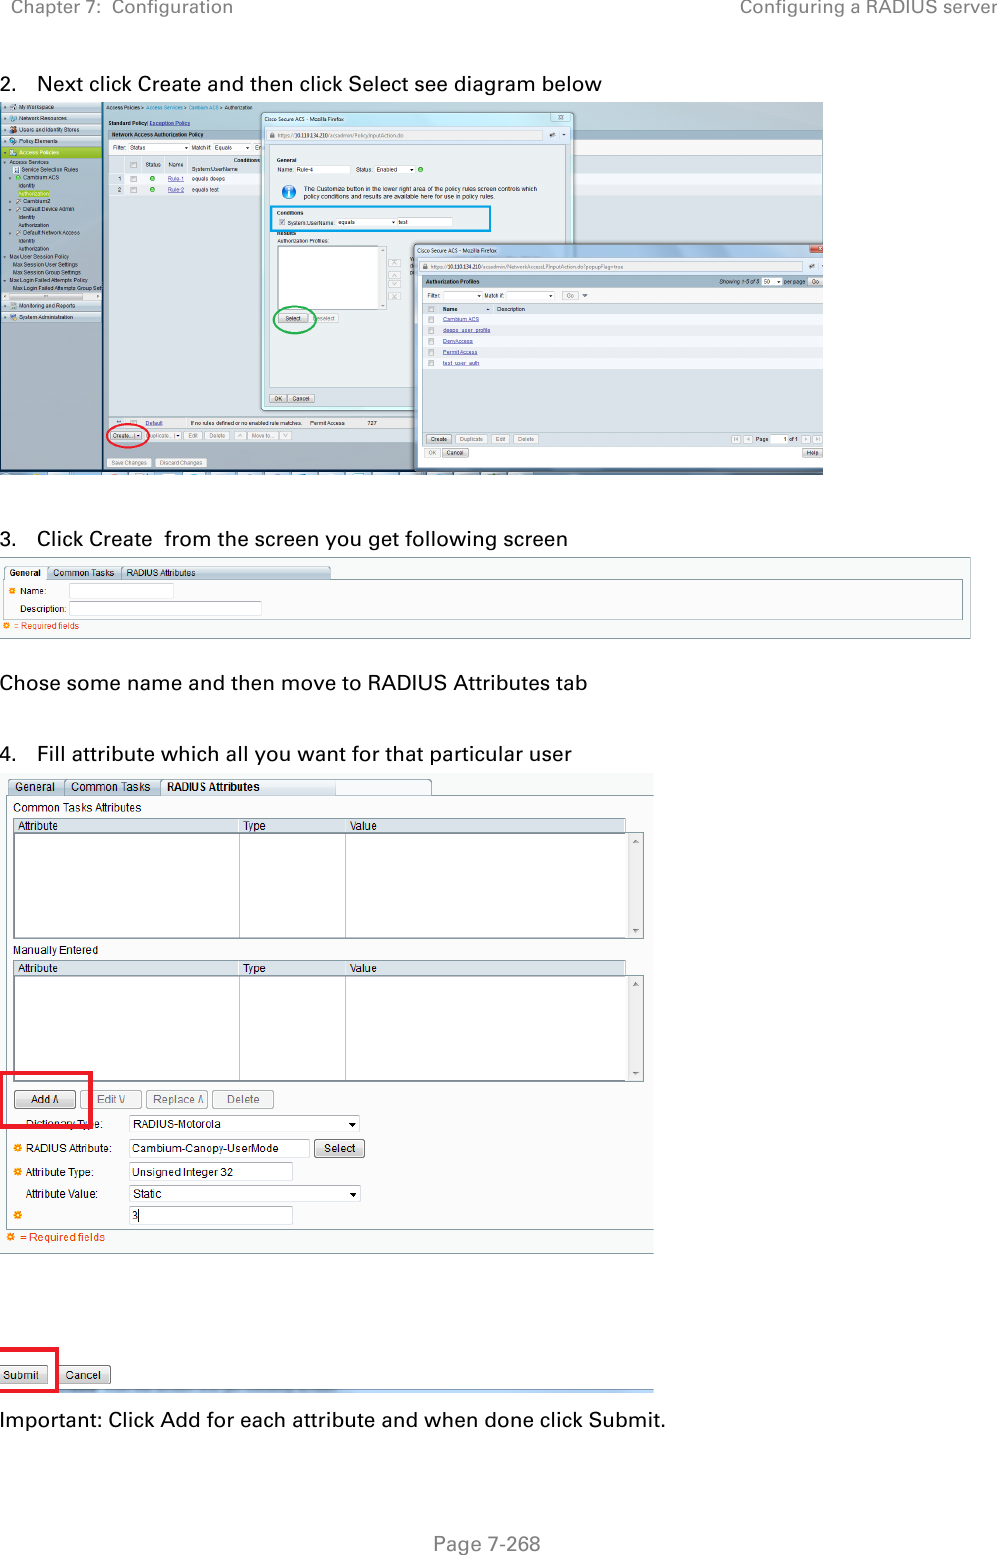
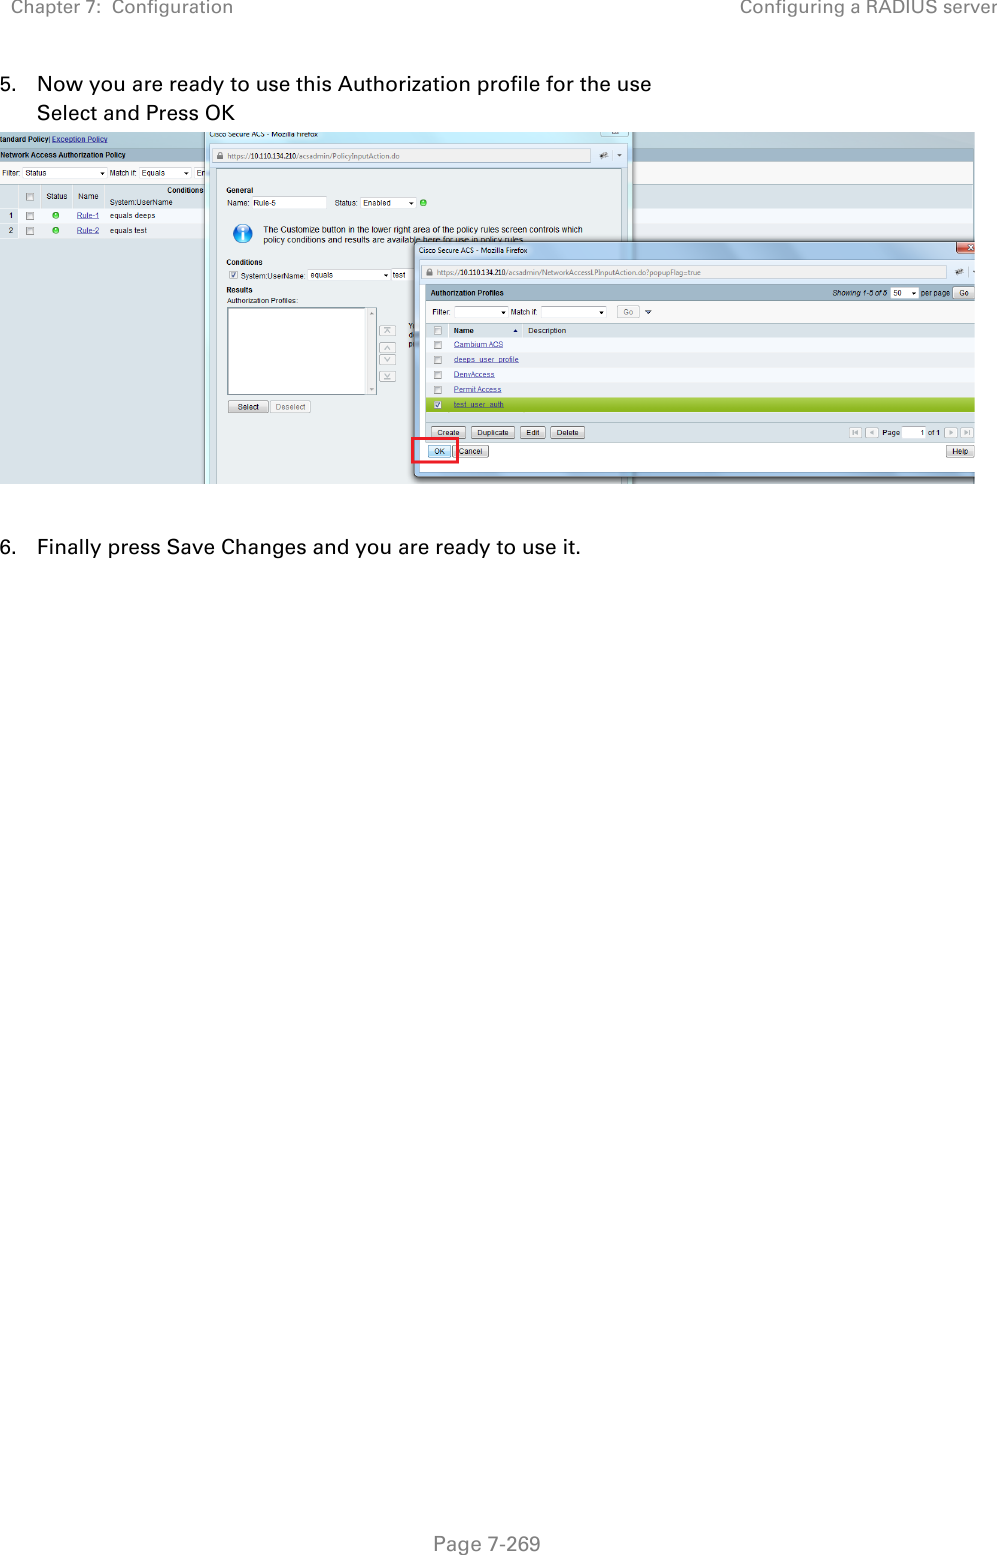
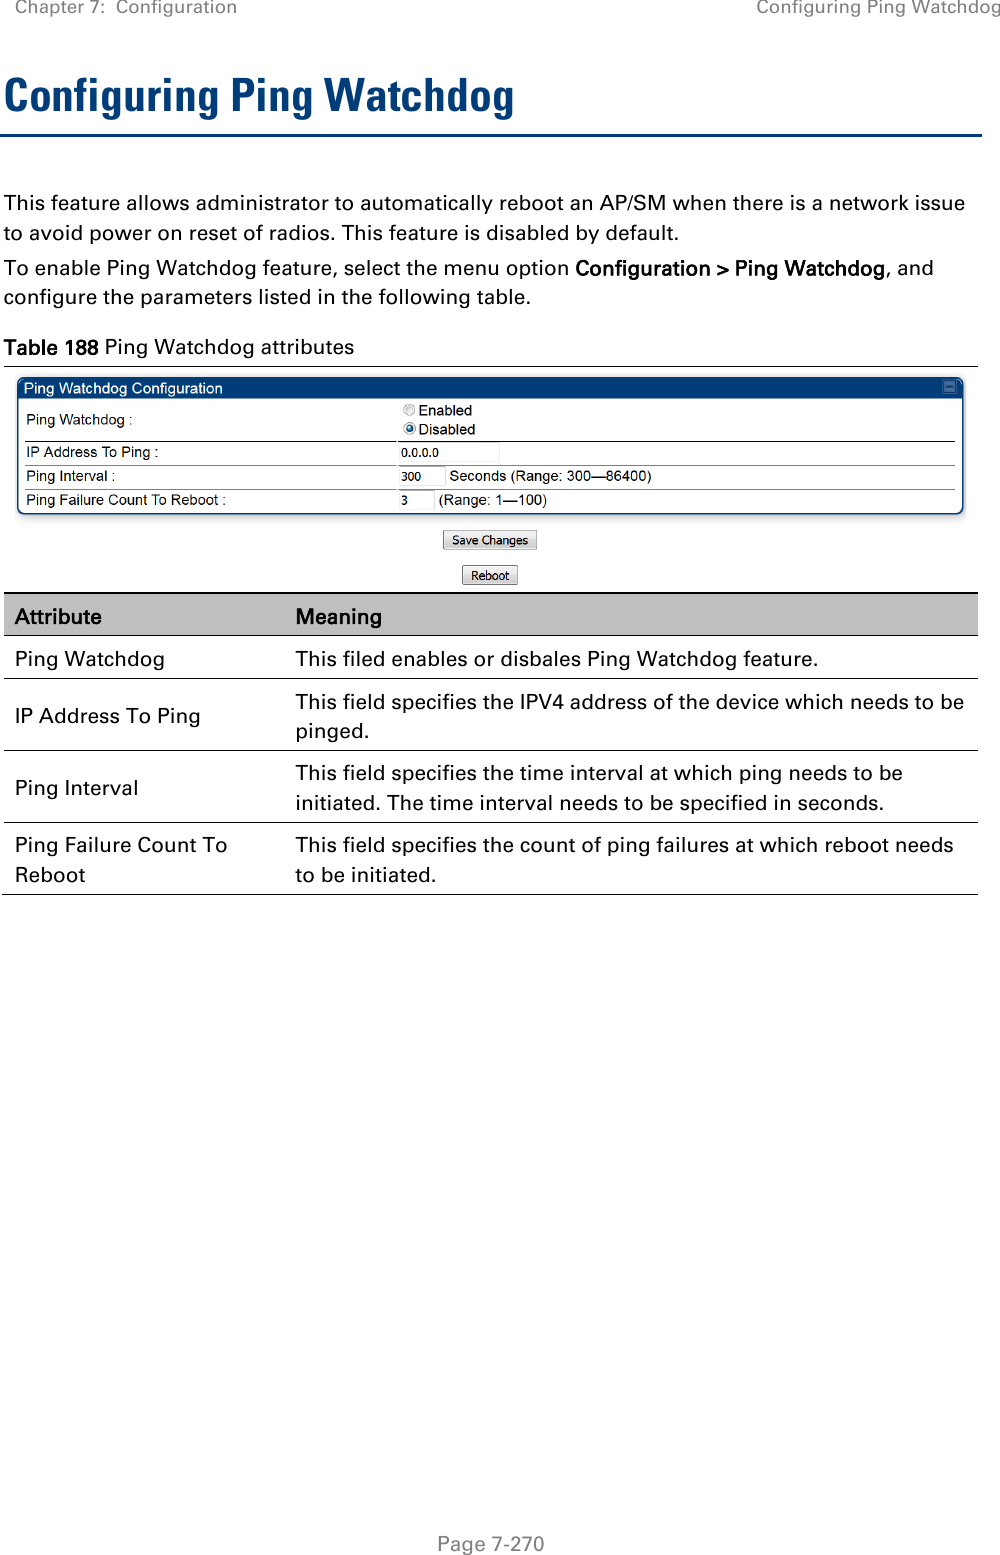
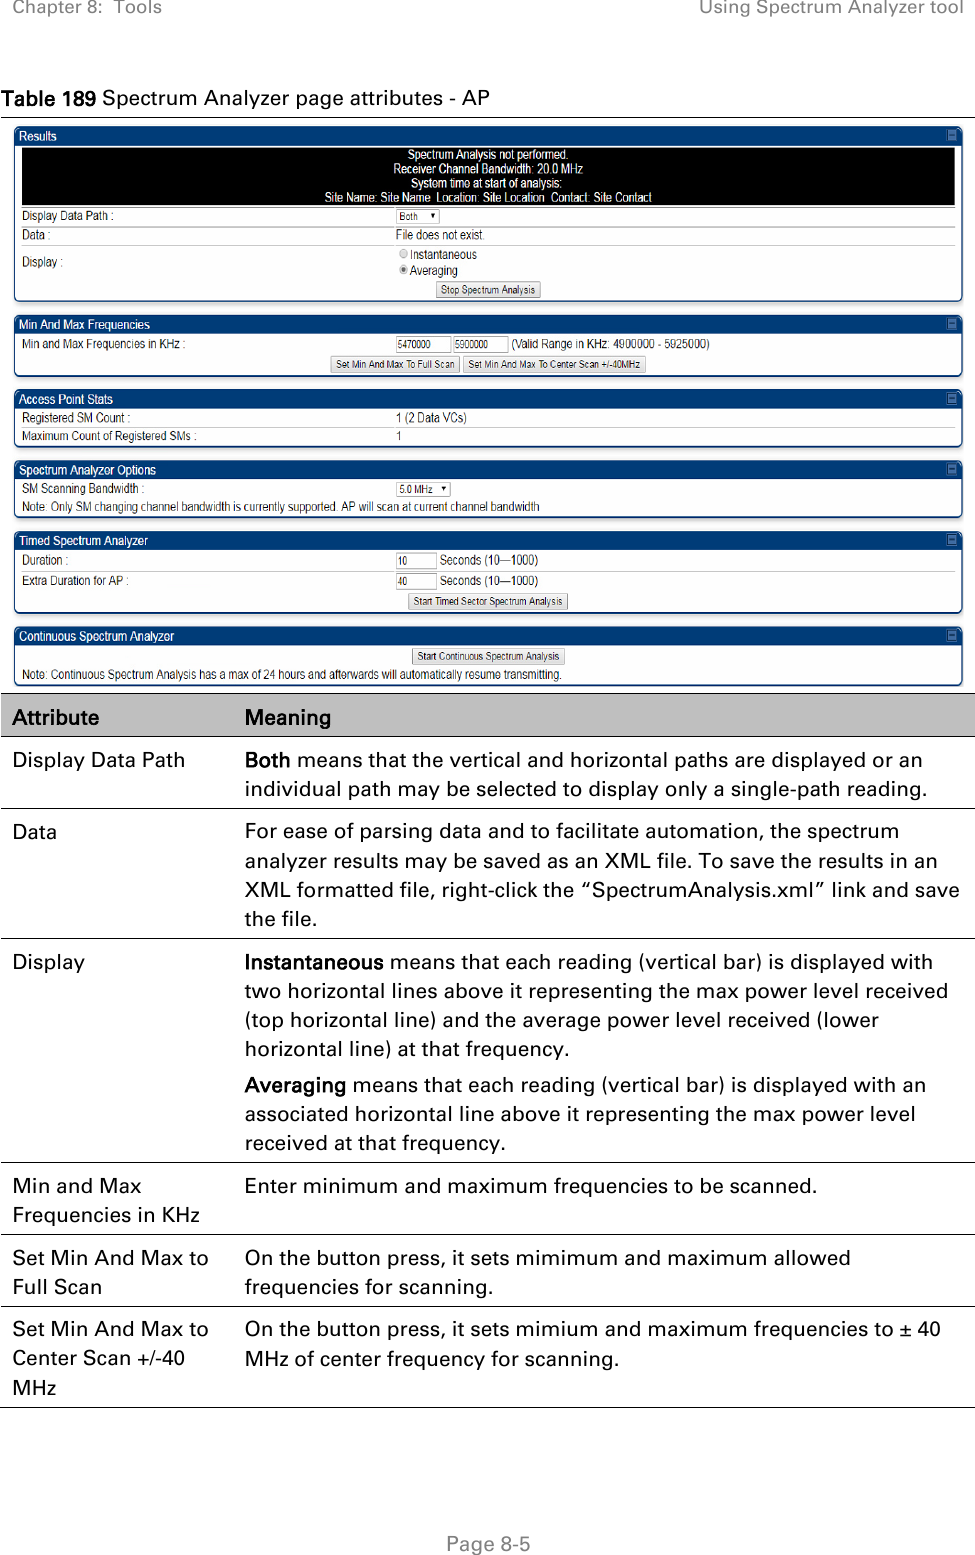
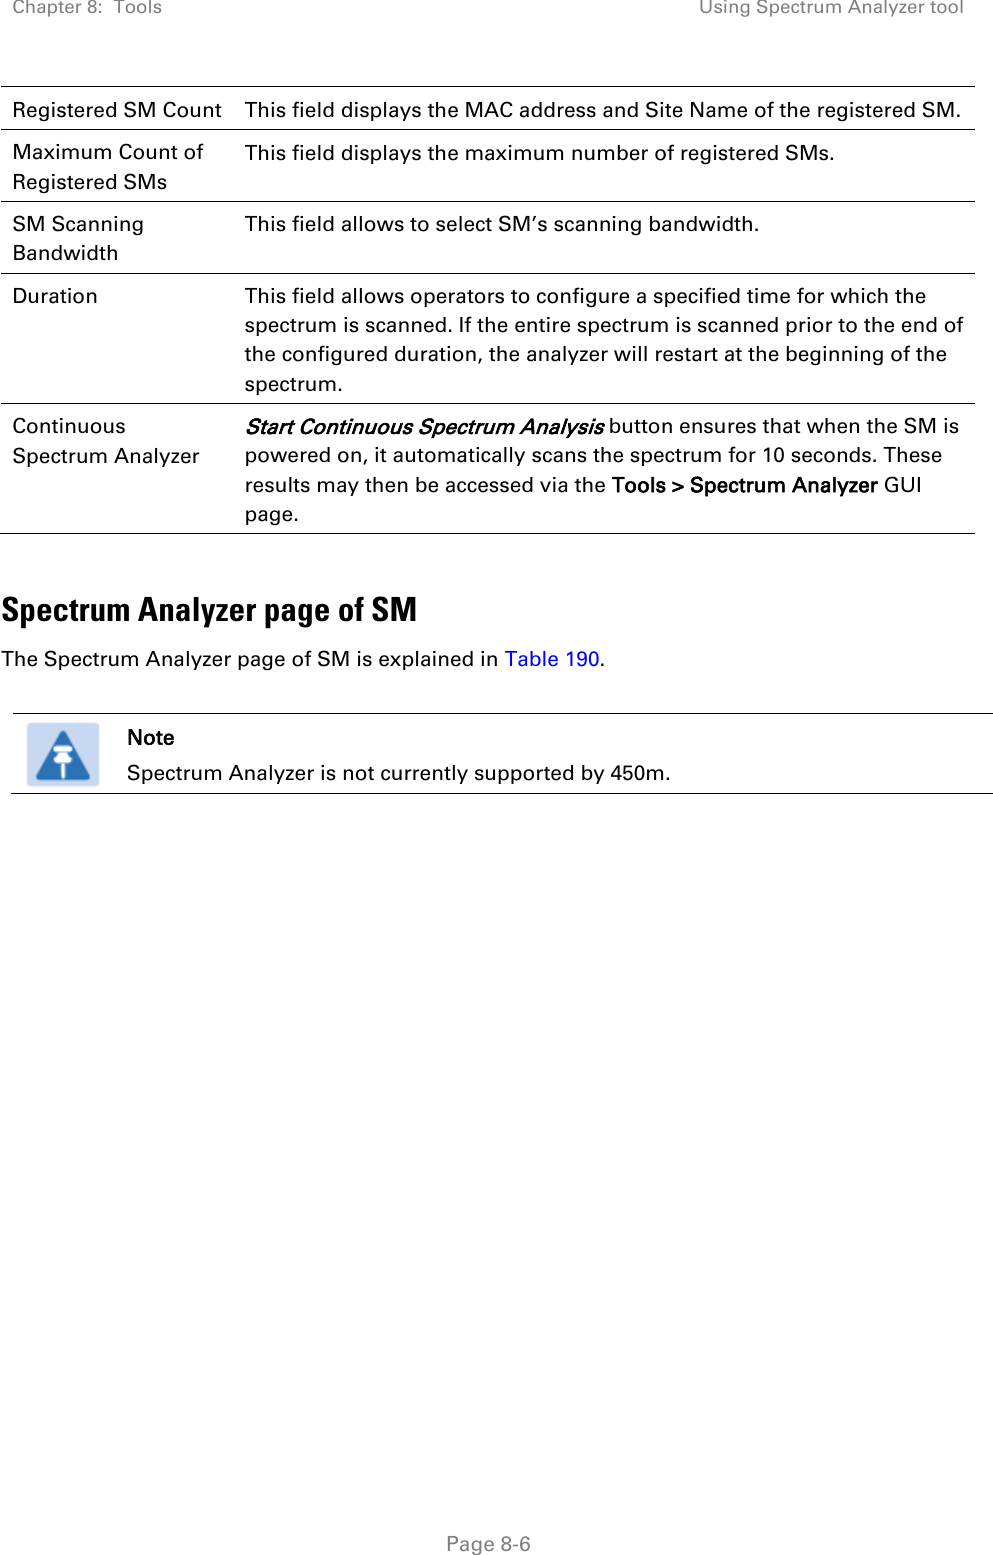
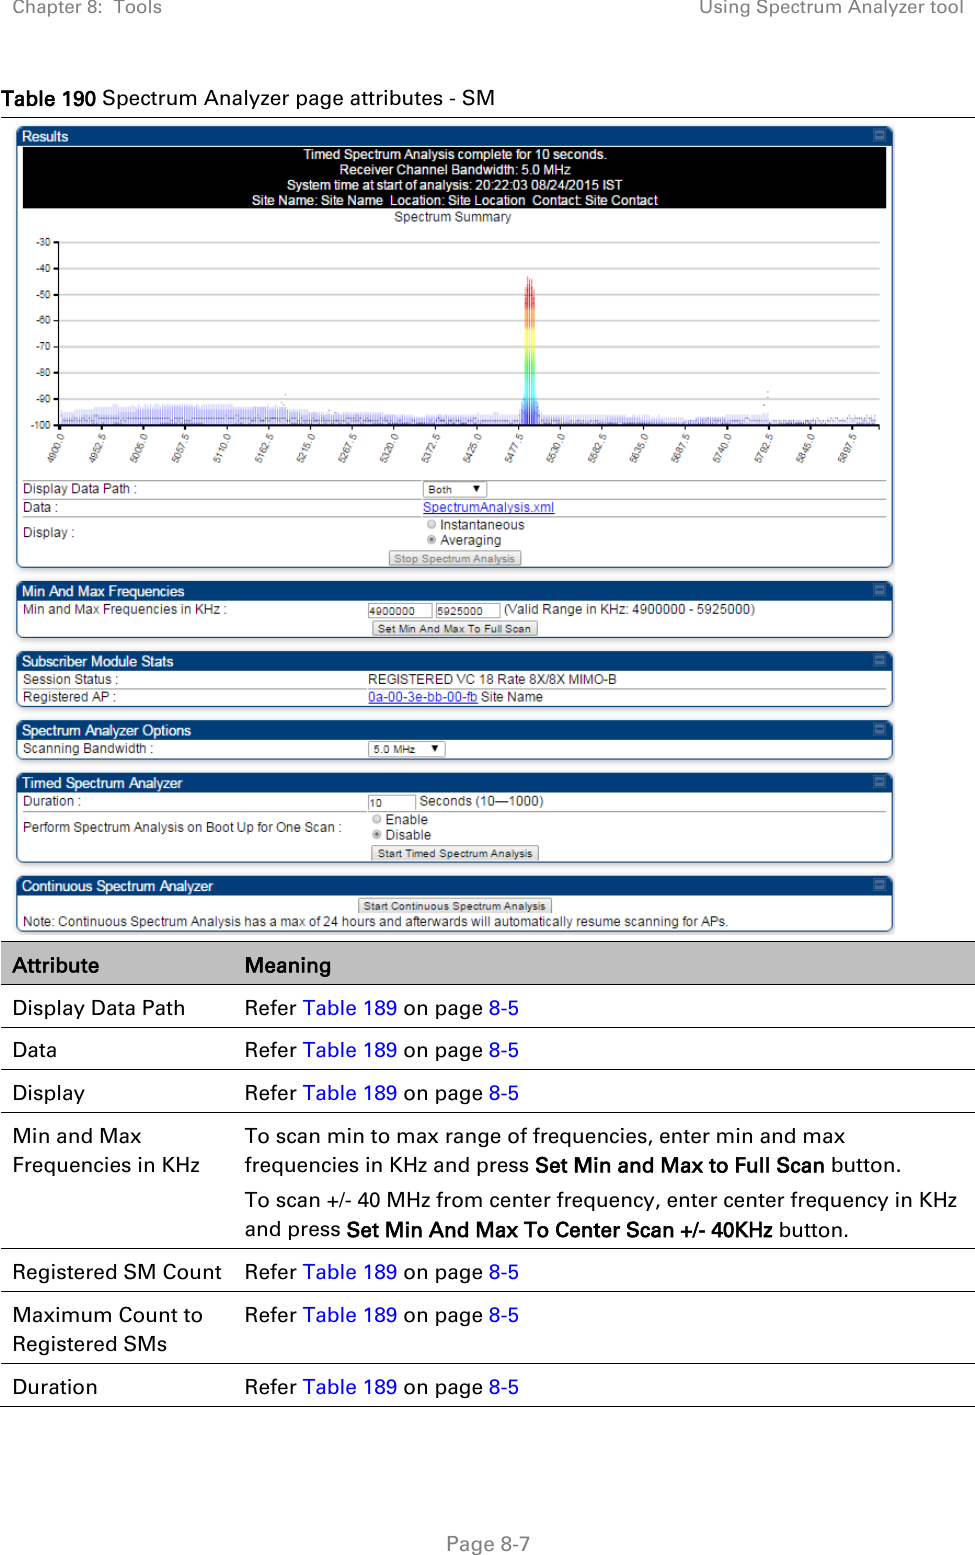
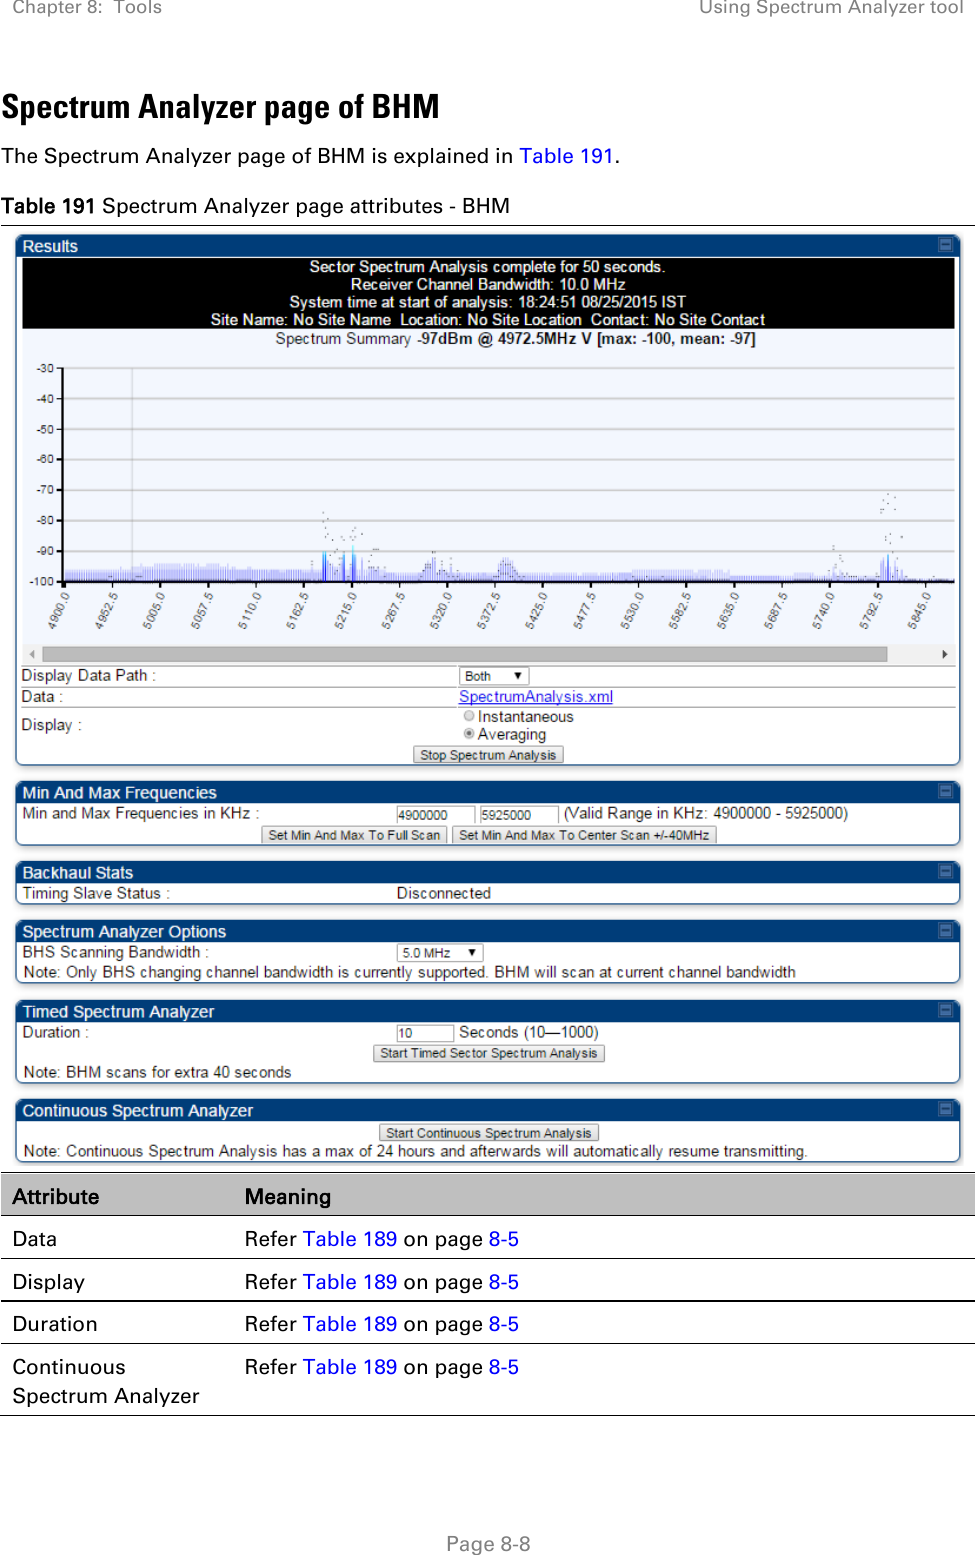
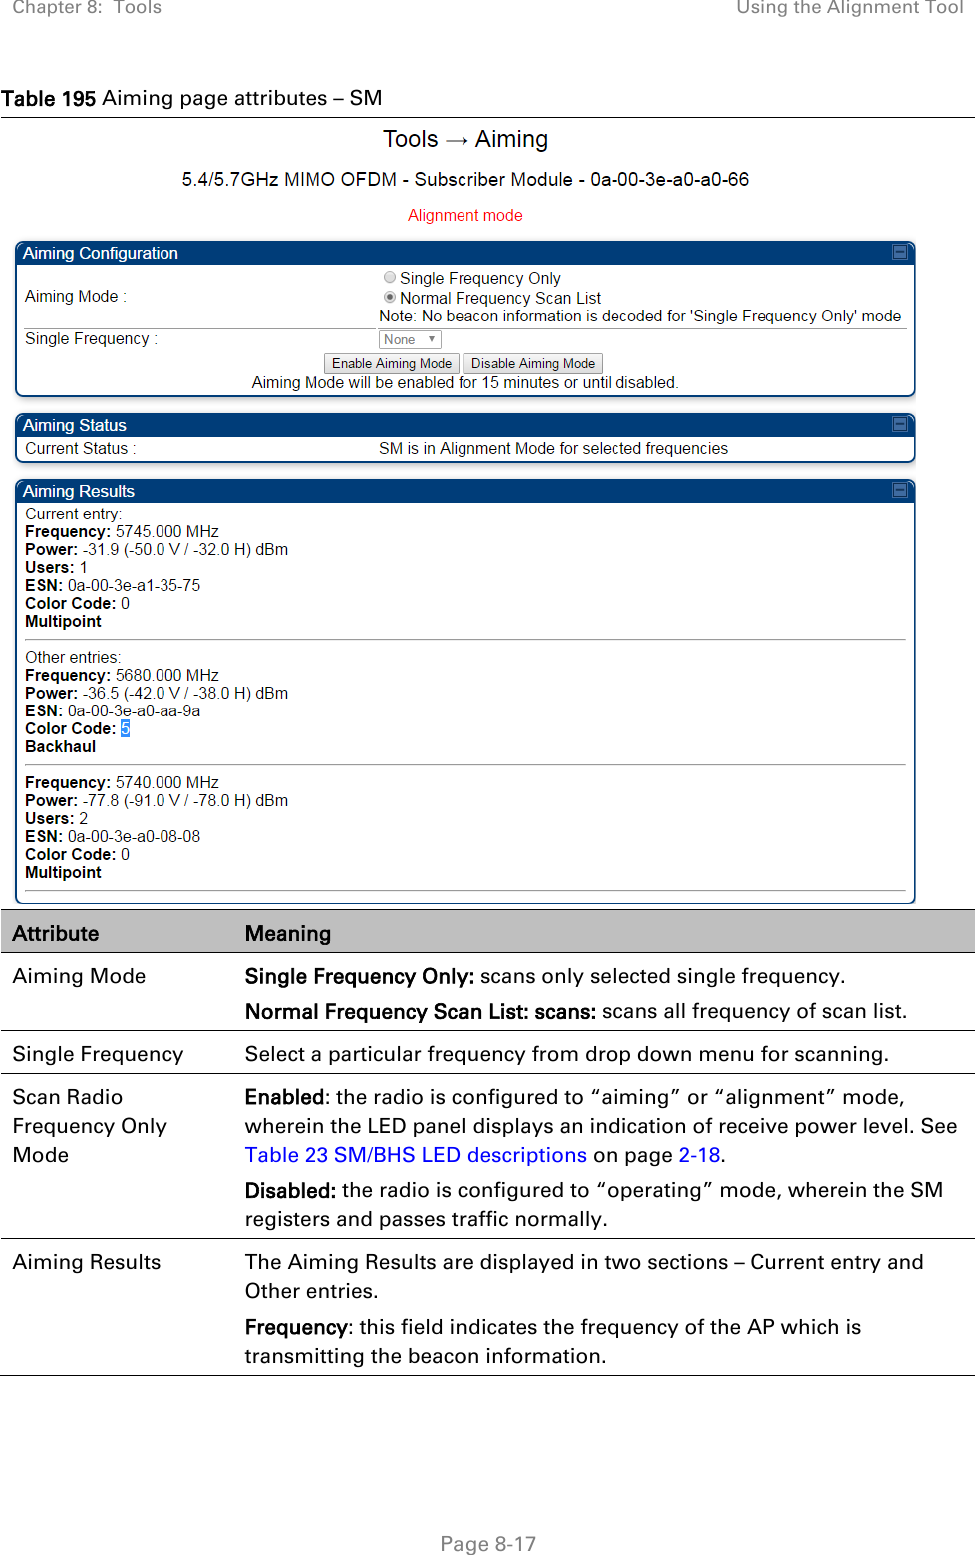
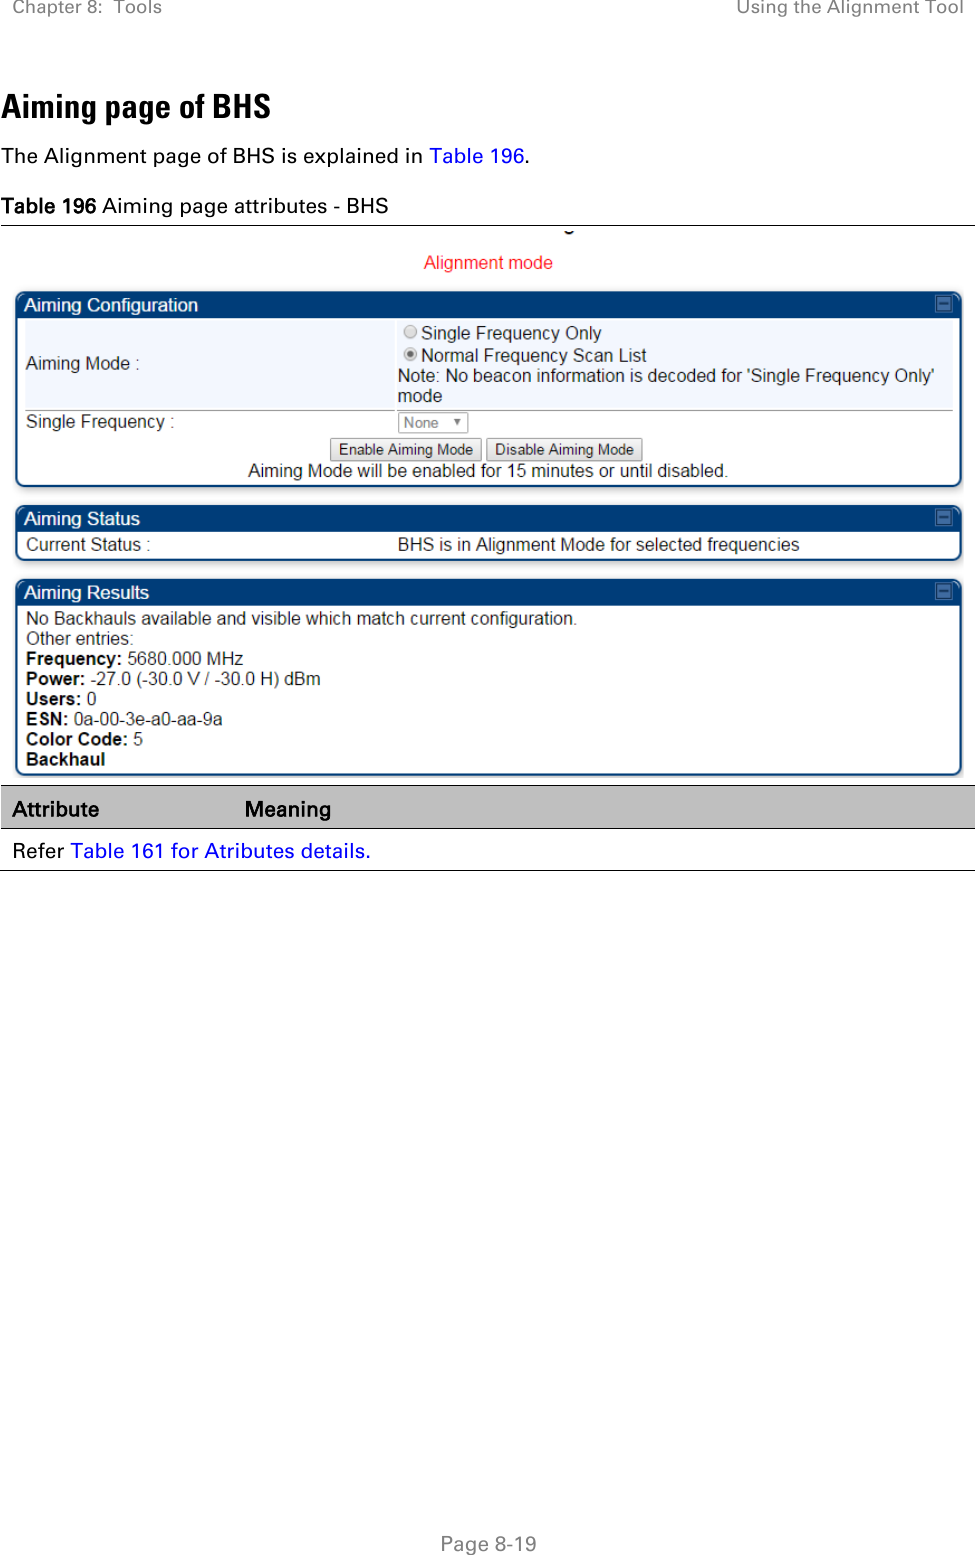
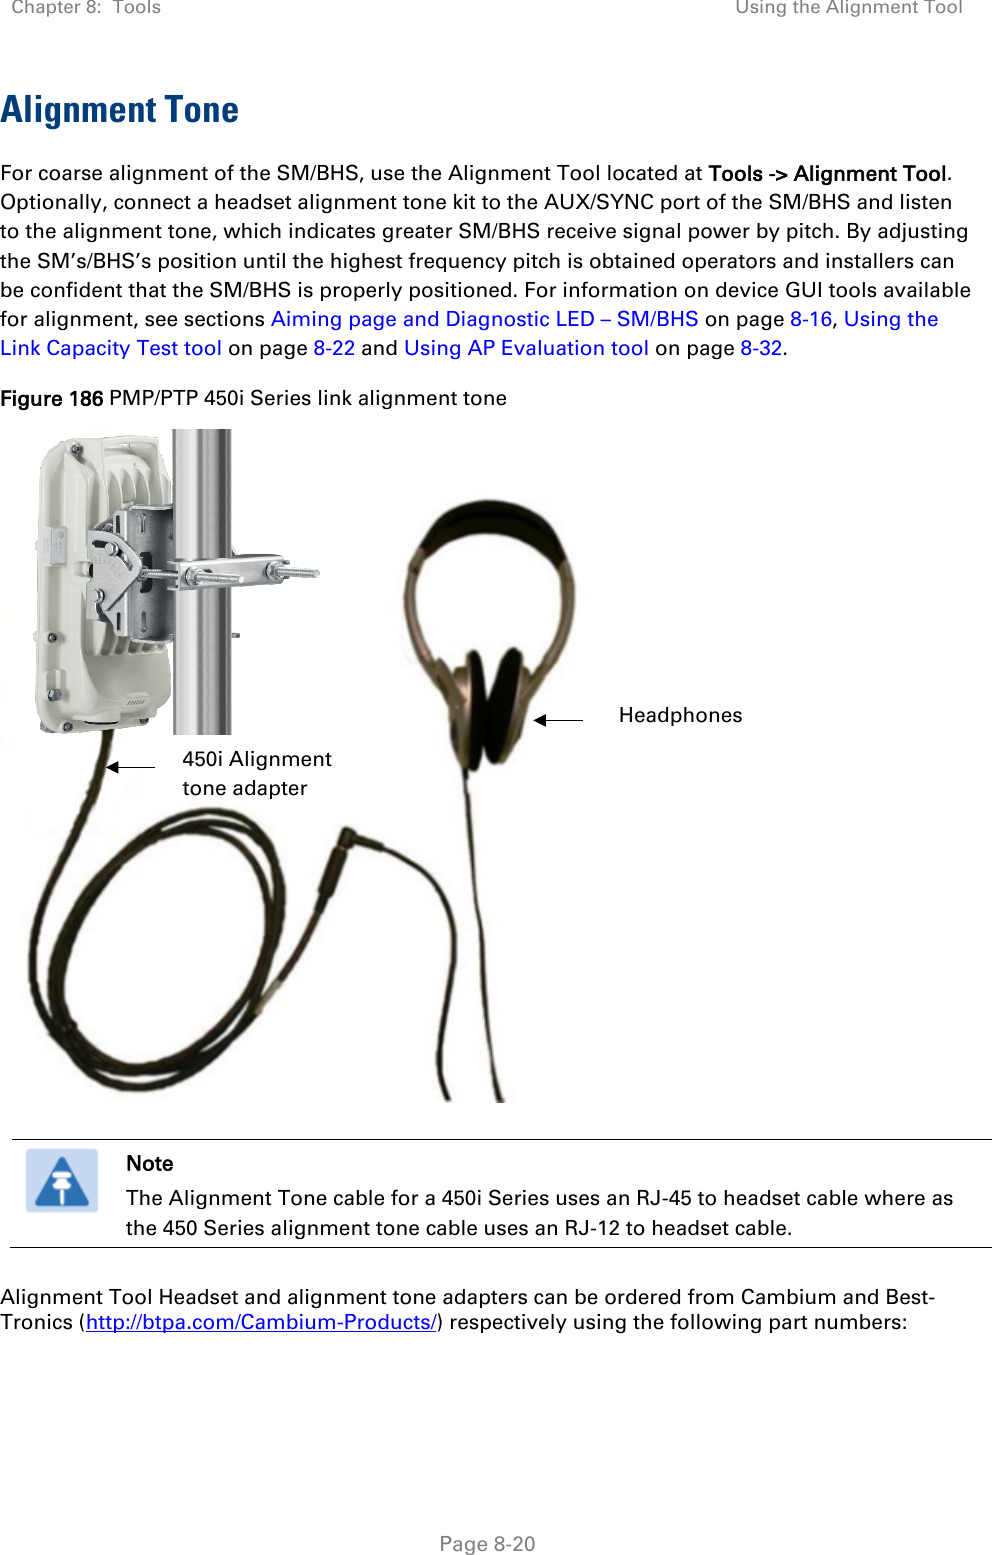
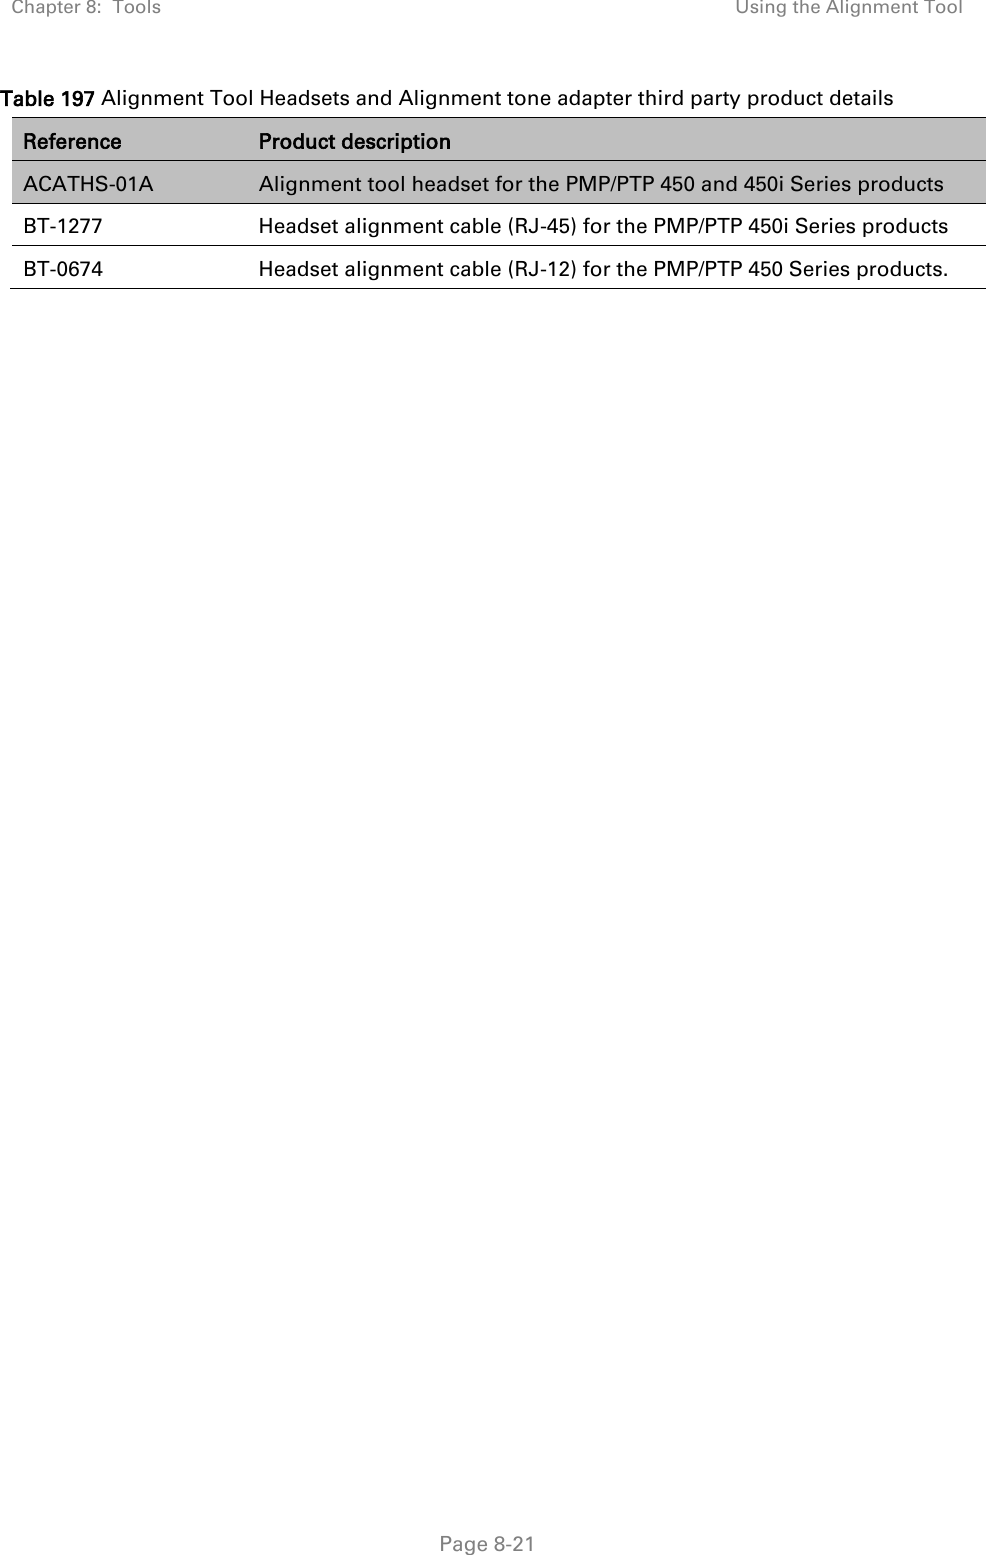
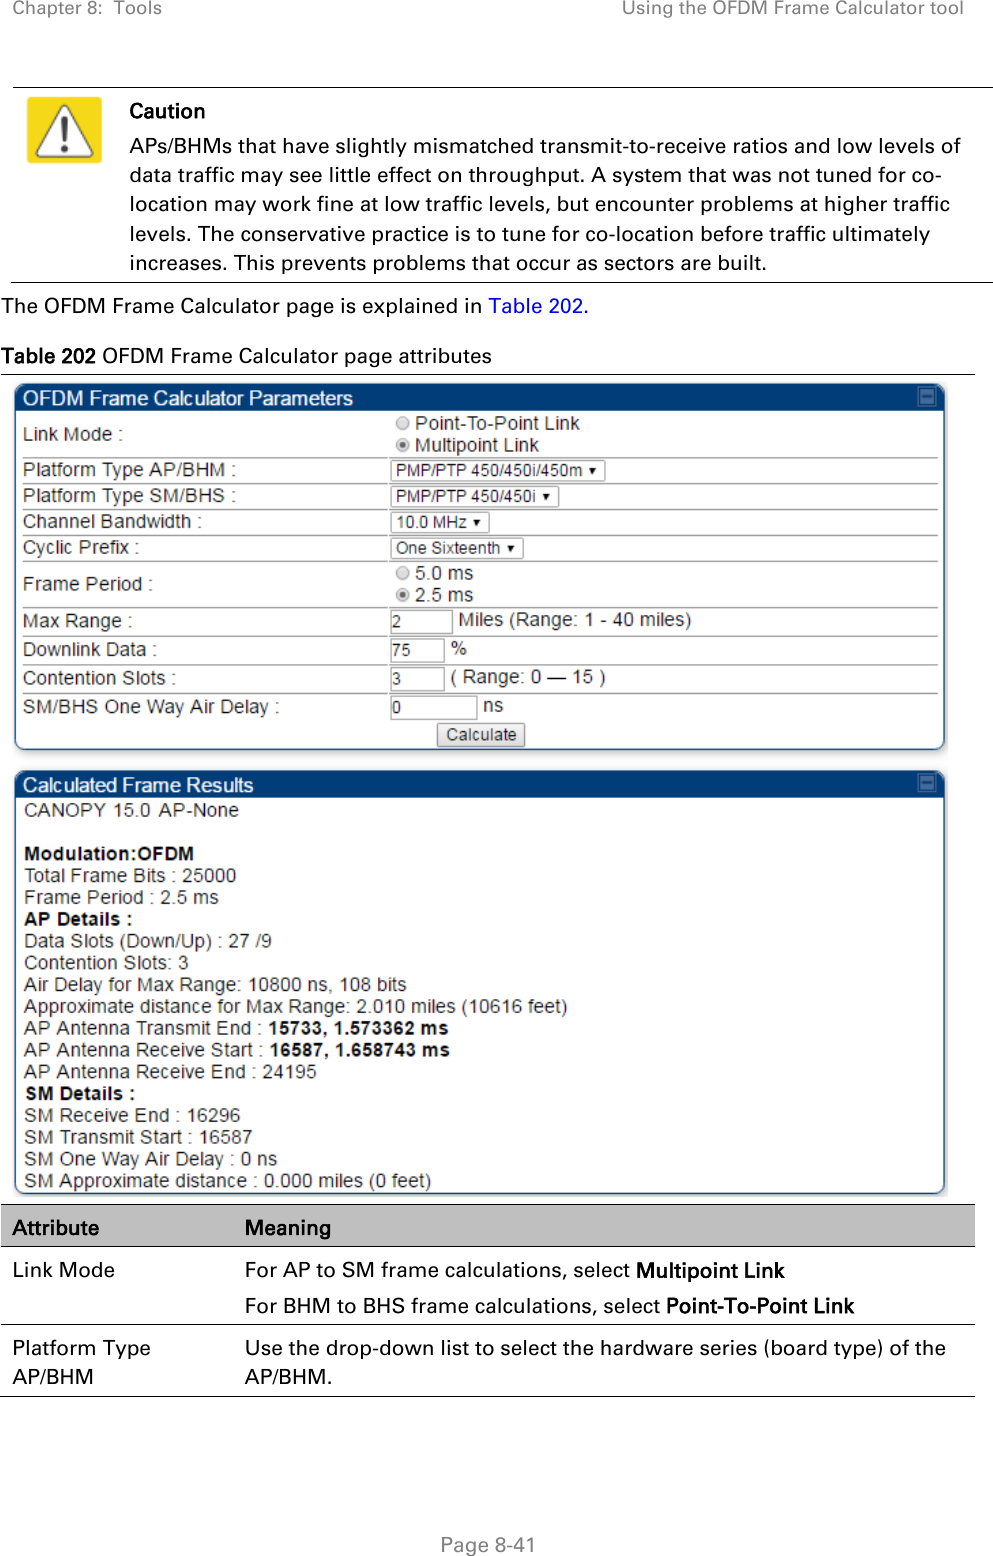
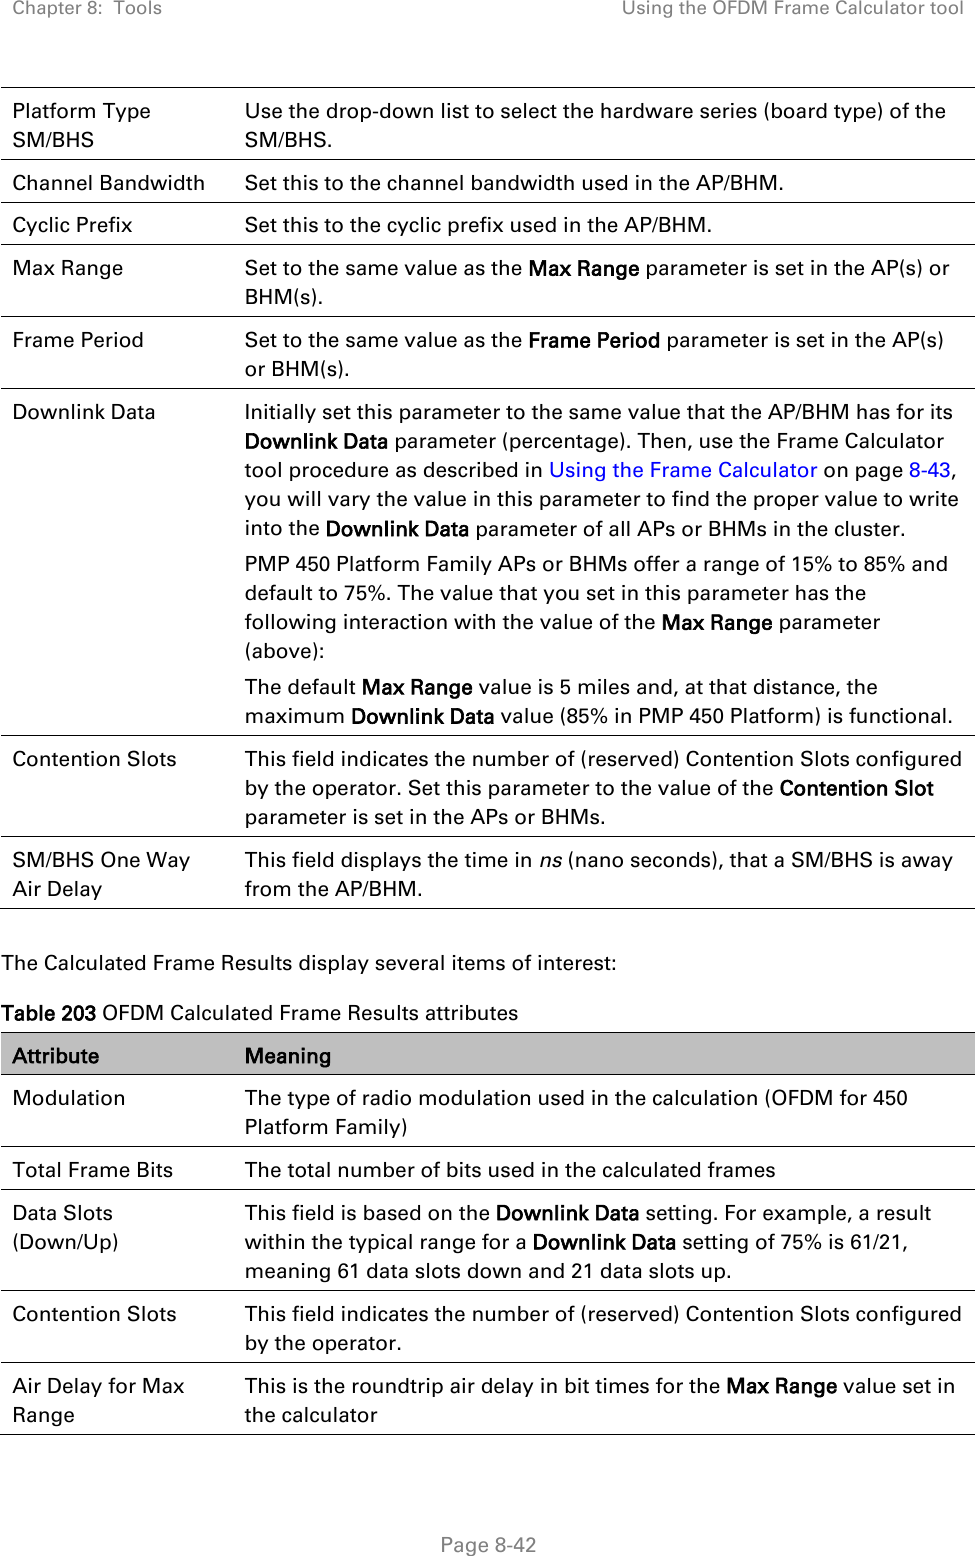
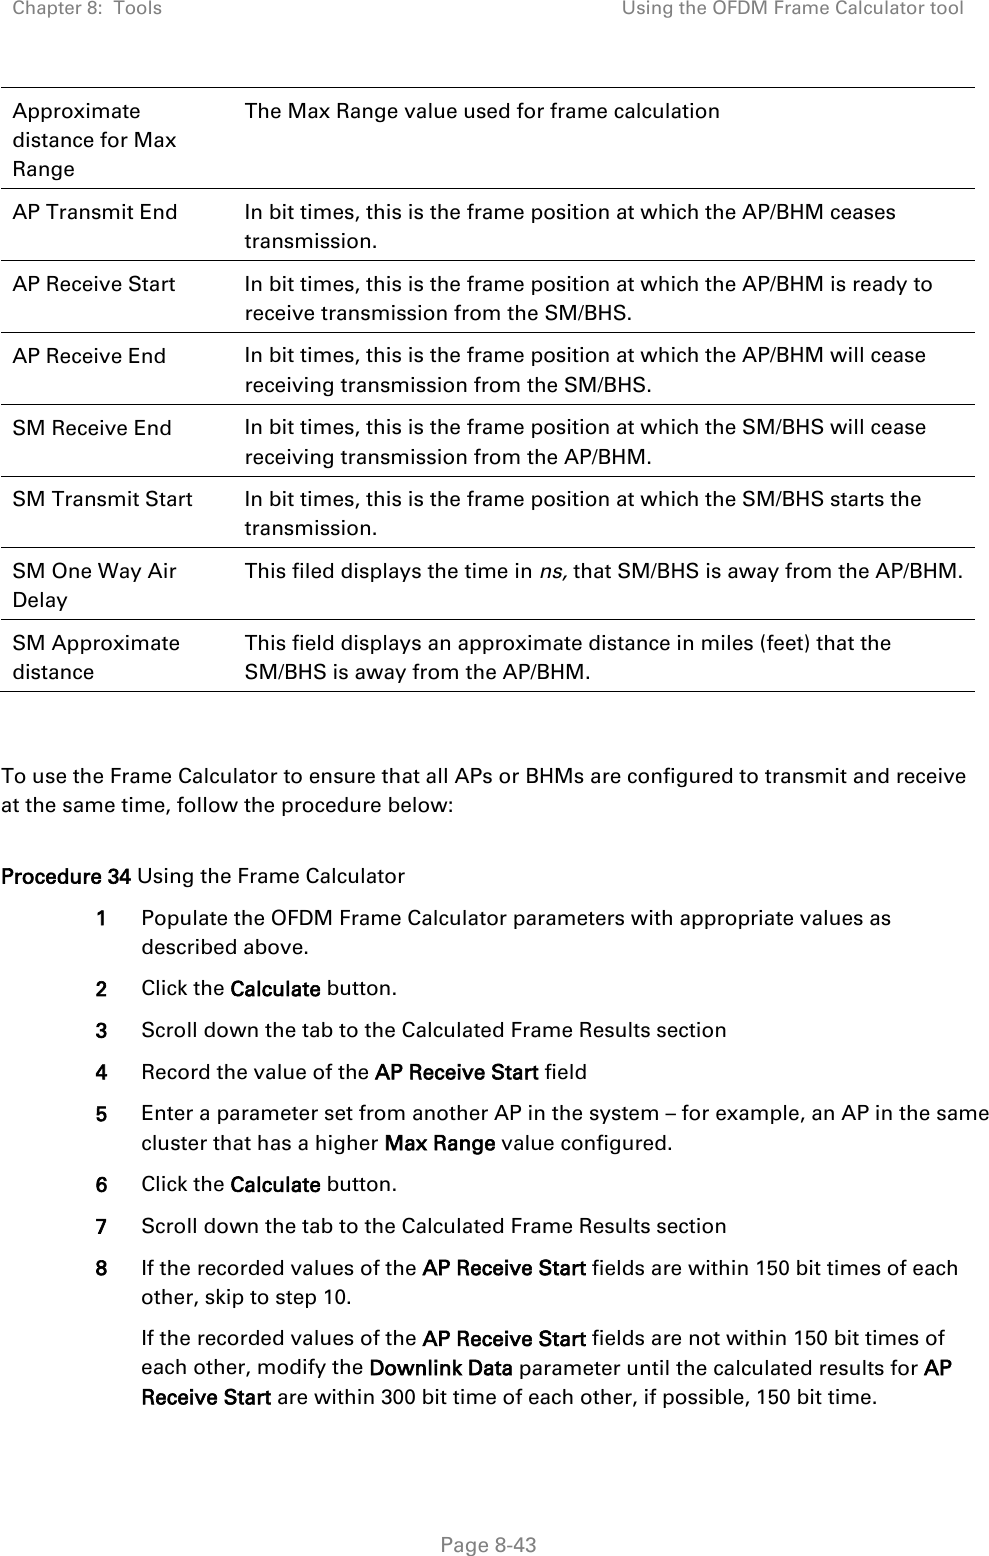
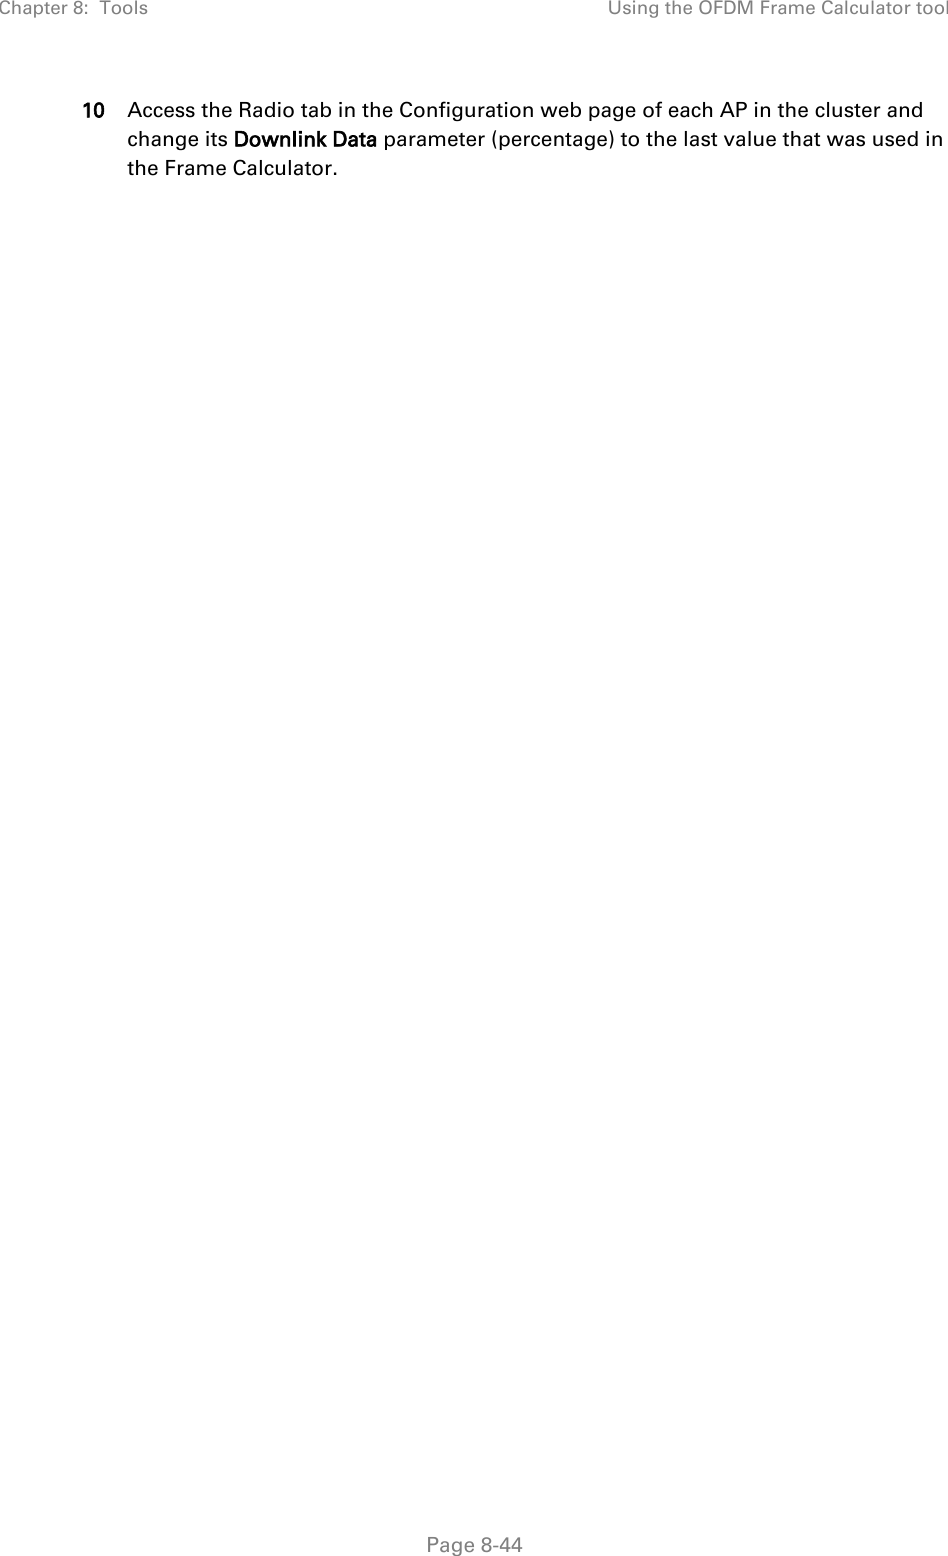
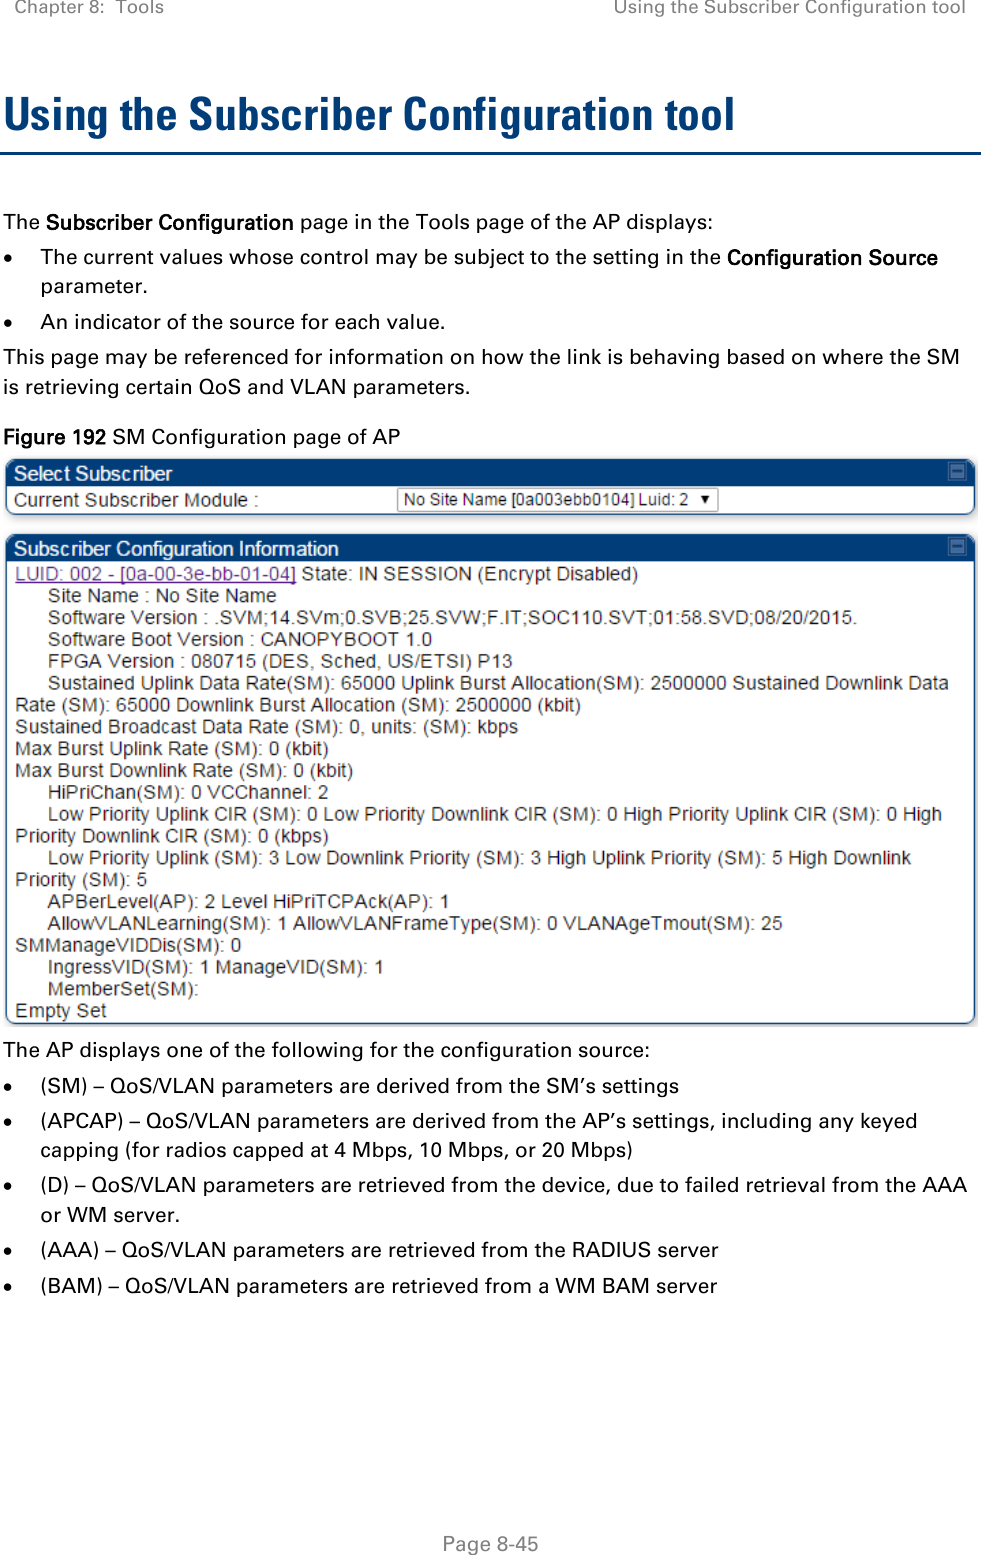
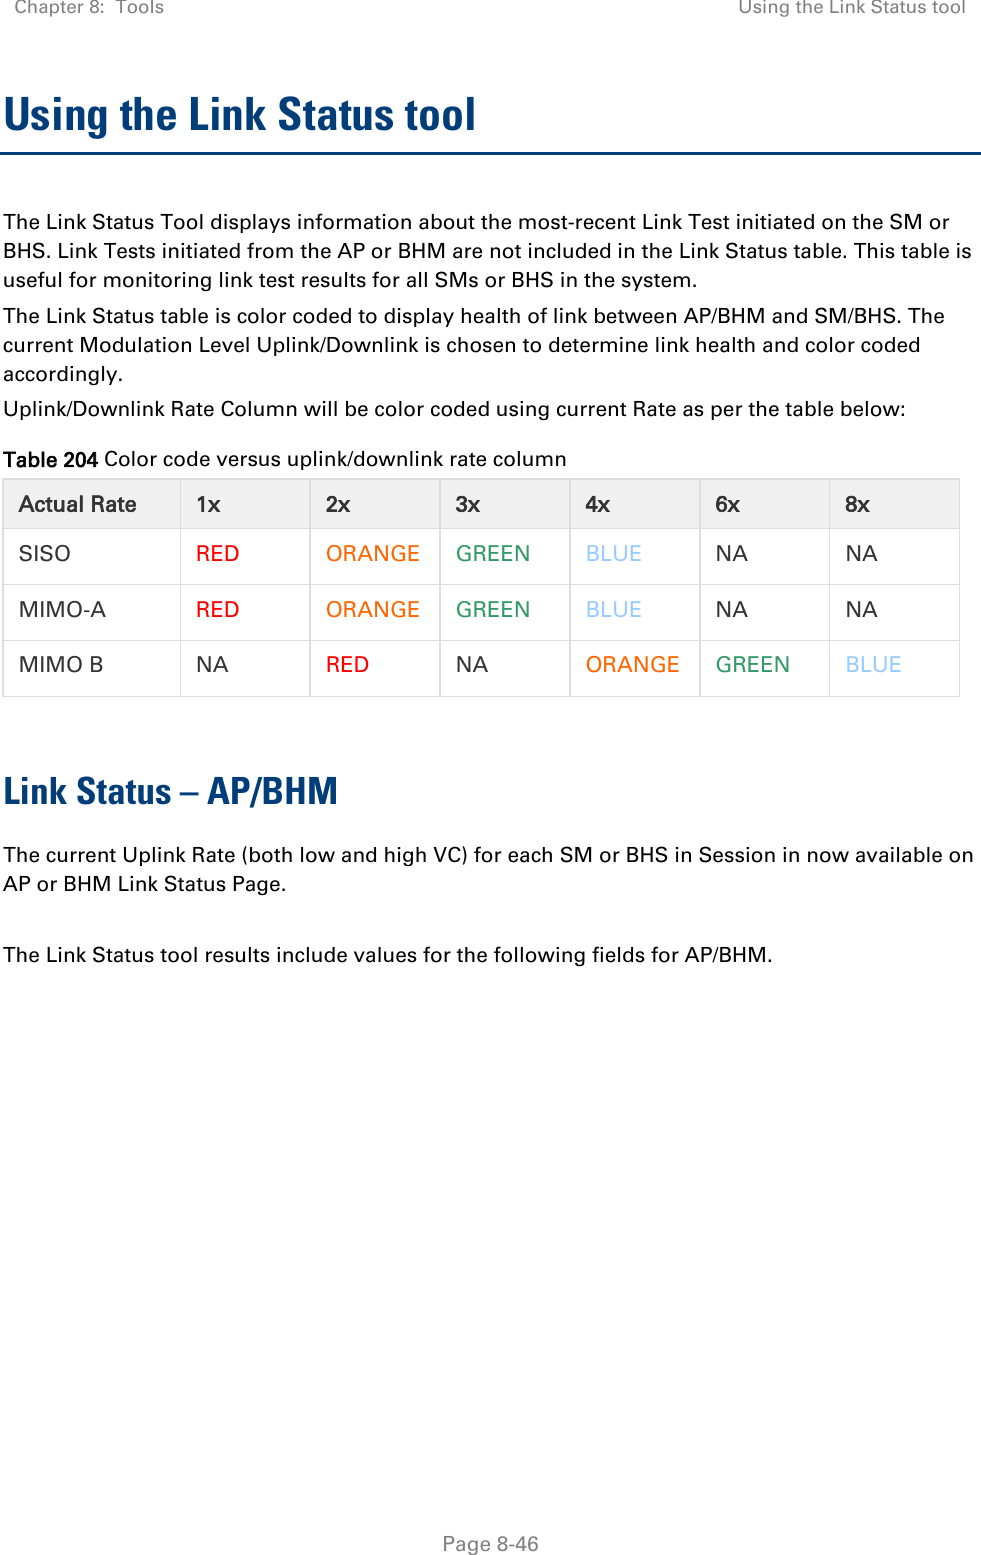
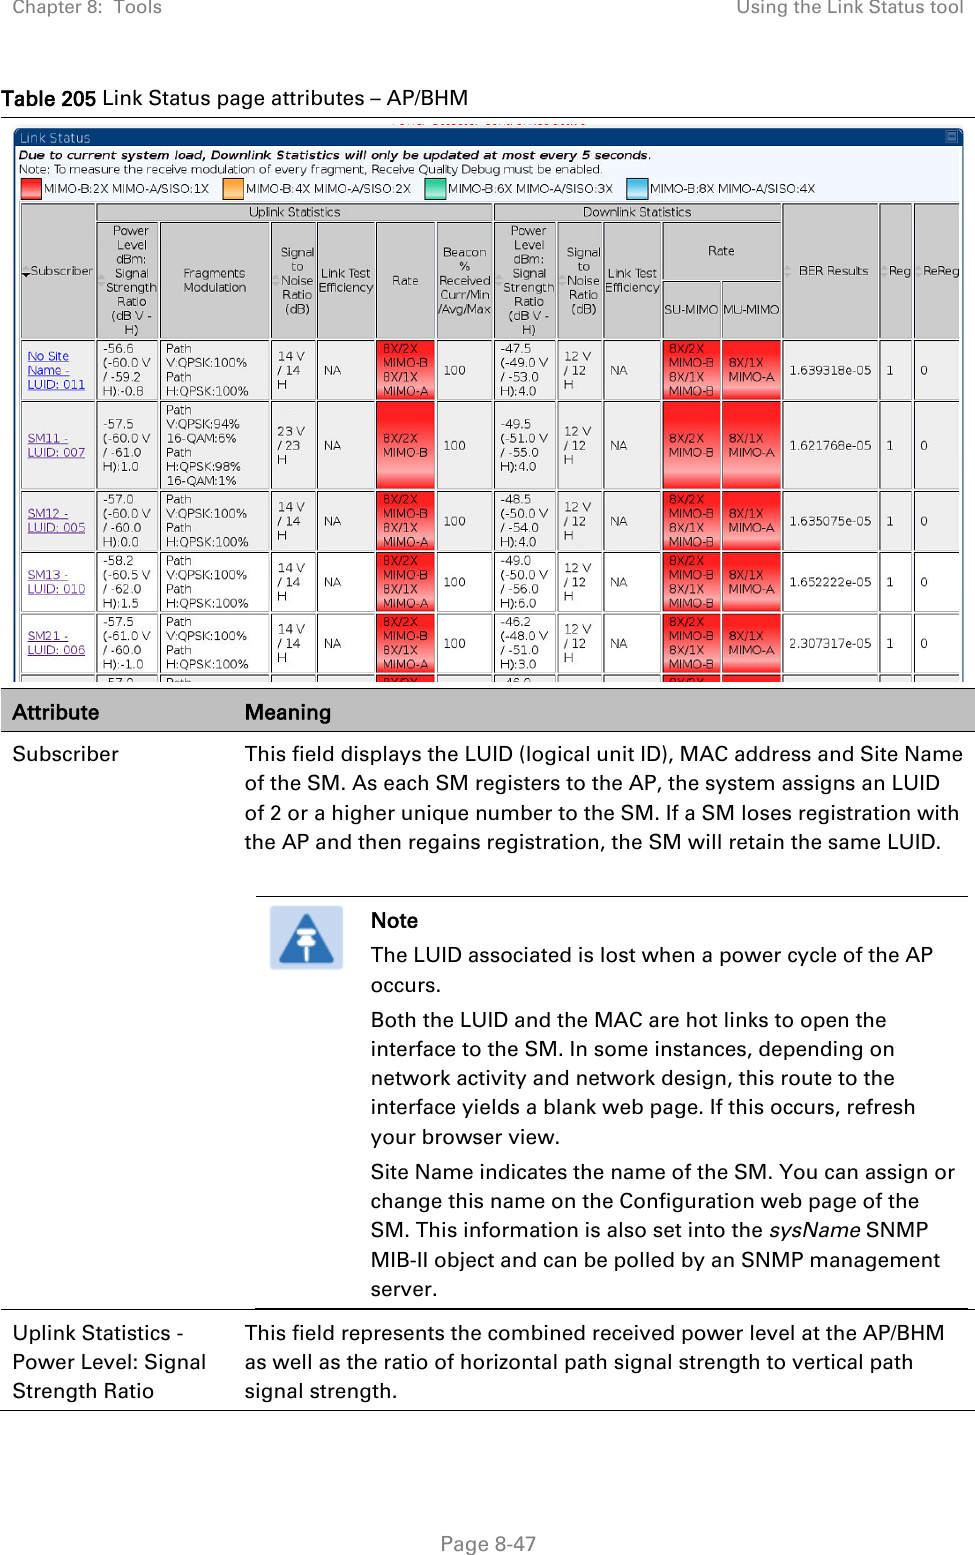
Users Manual - Part 6
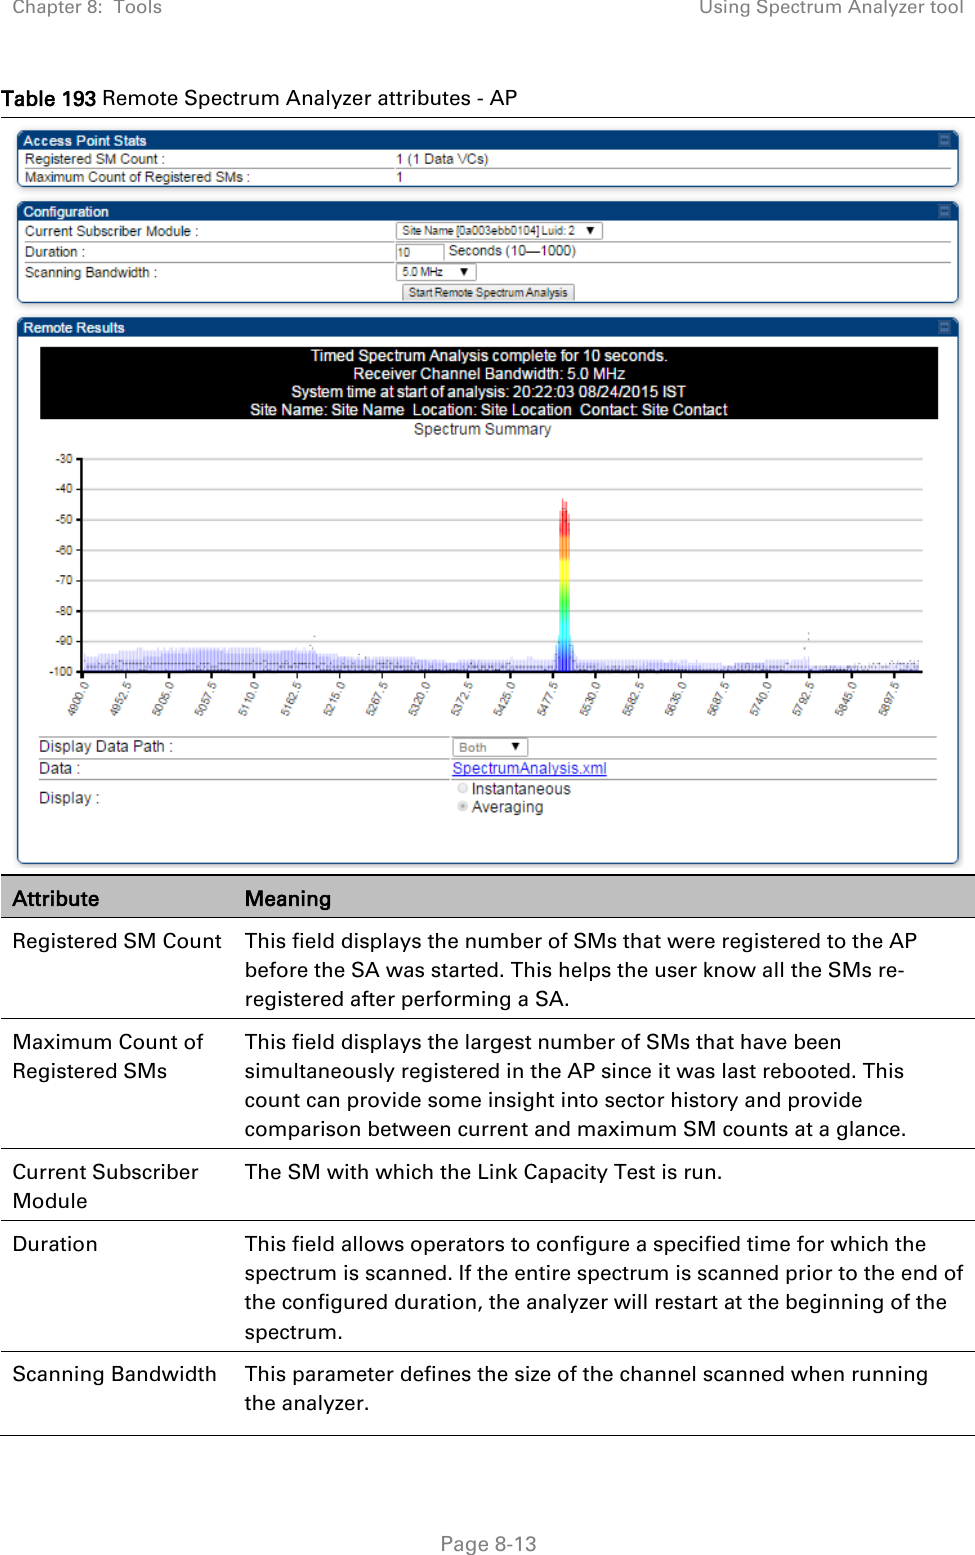
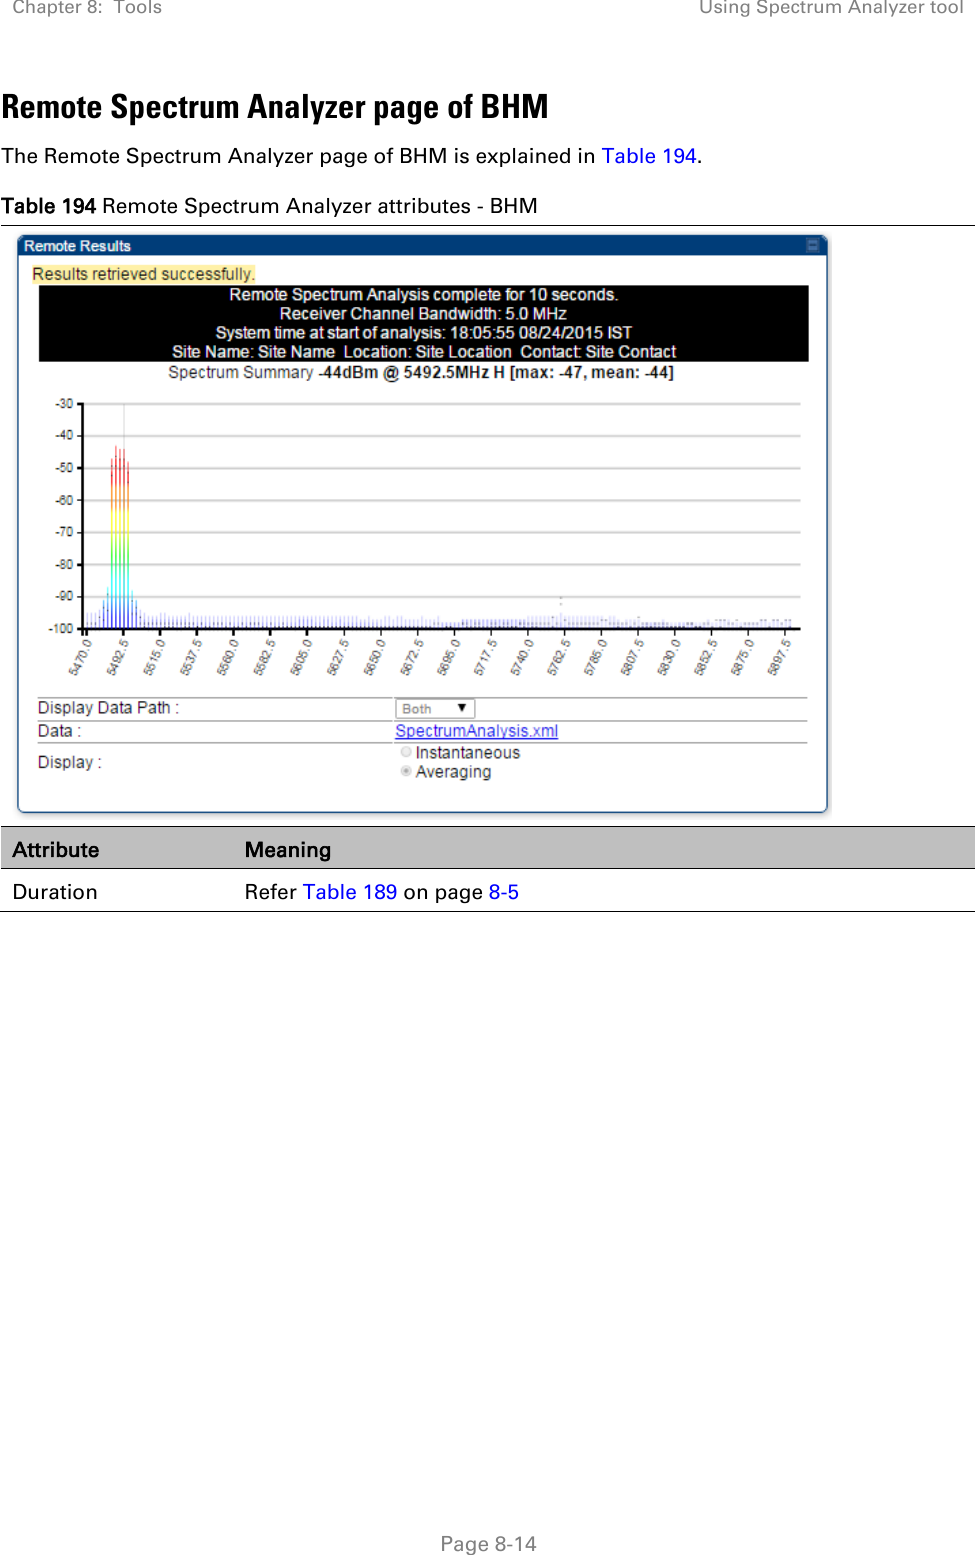
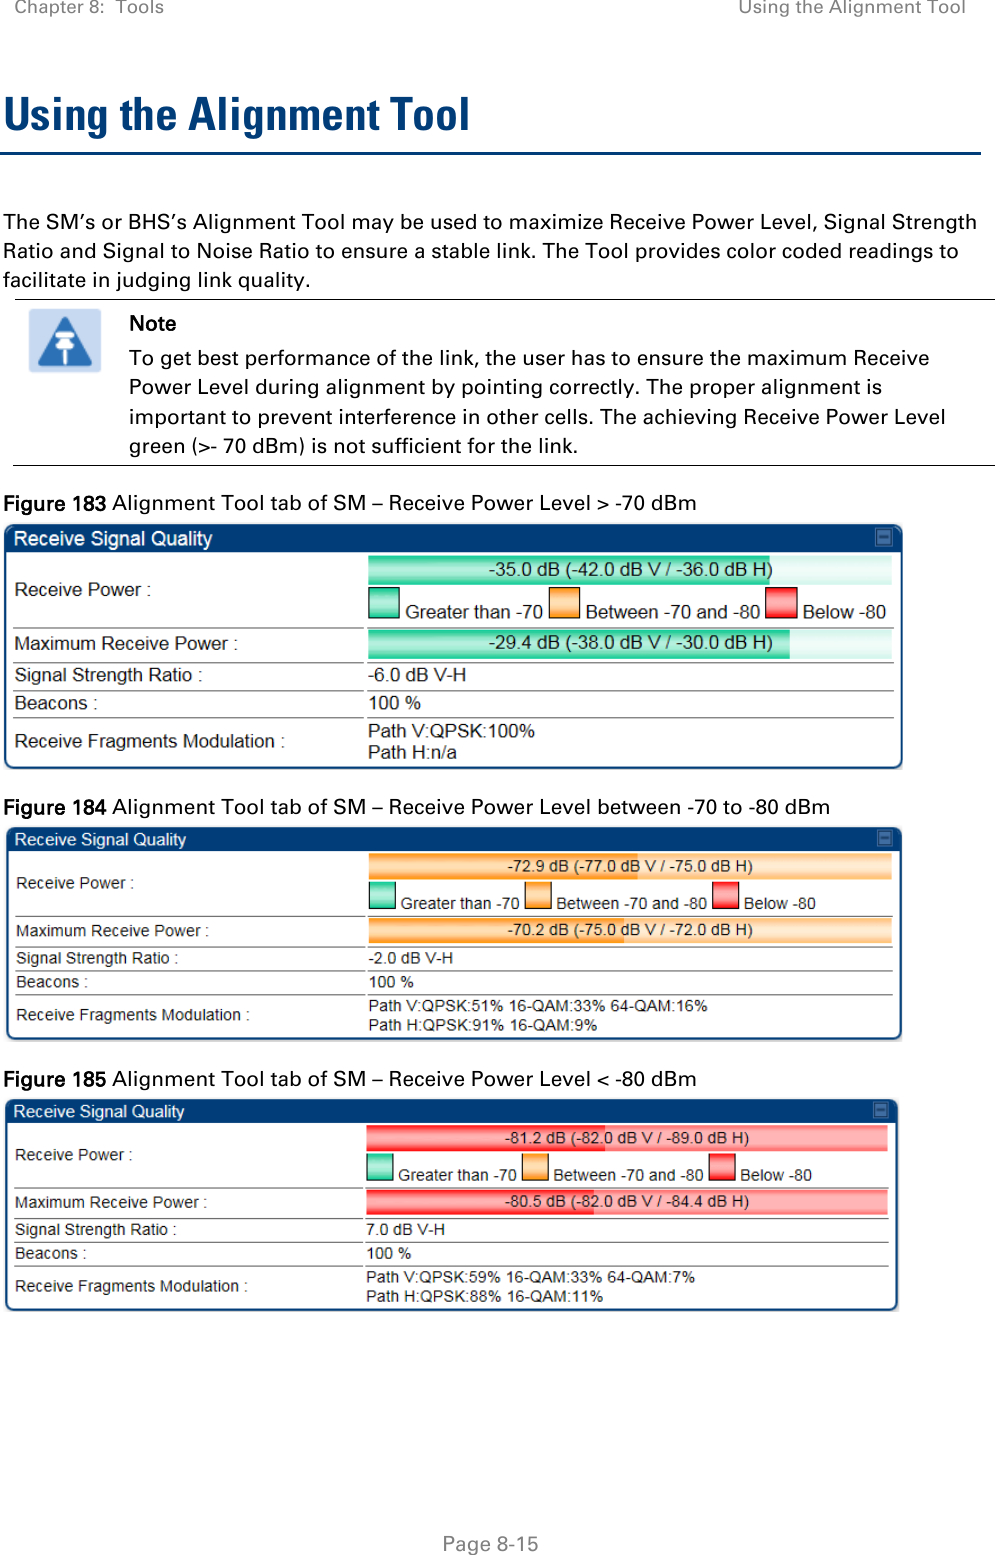
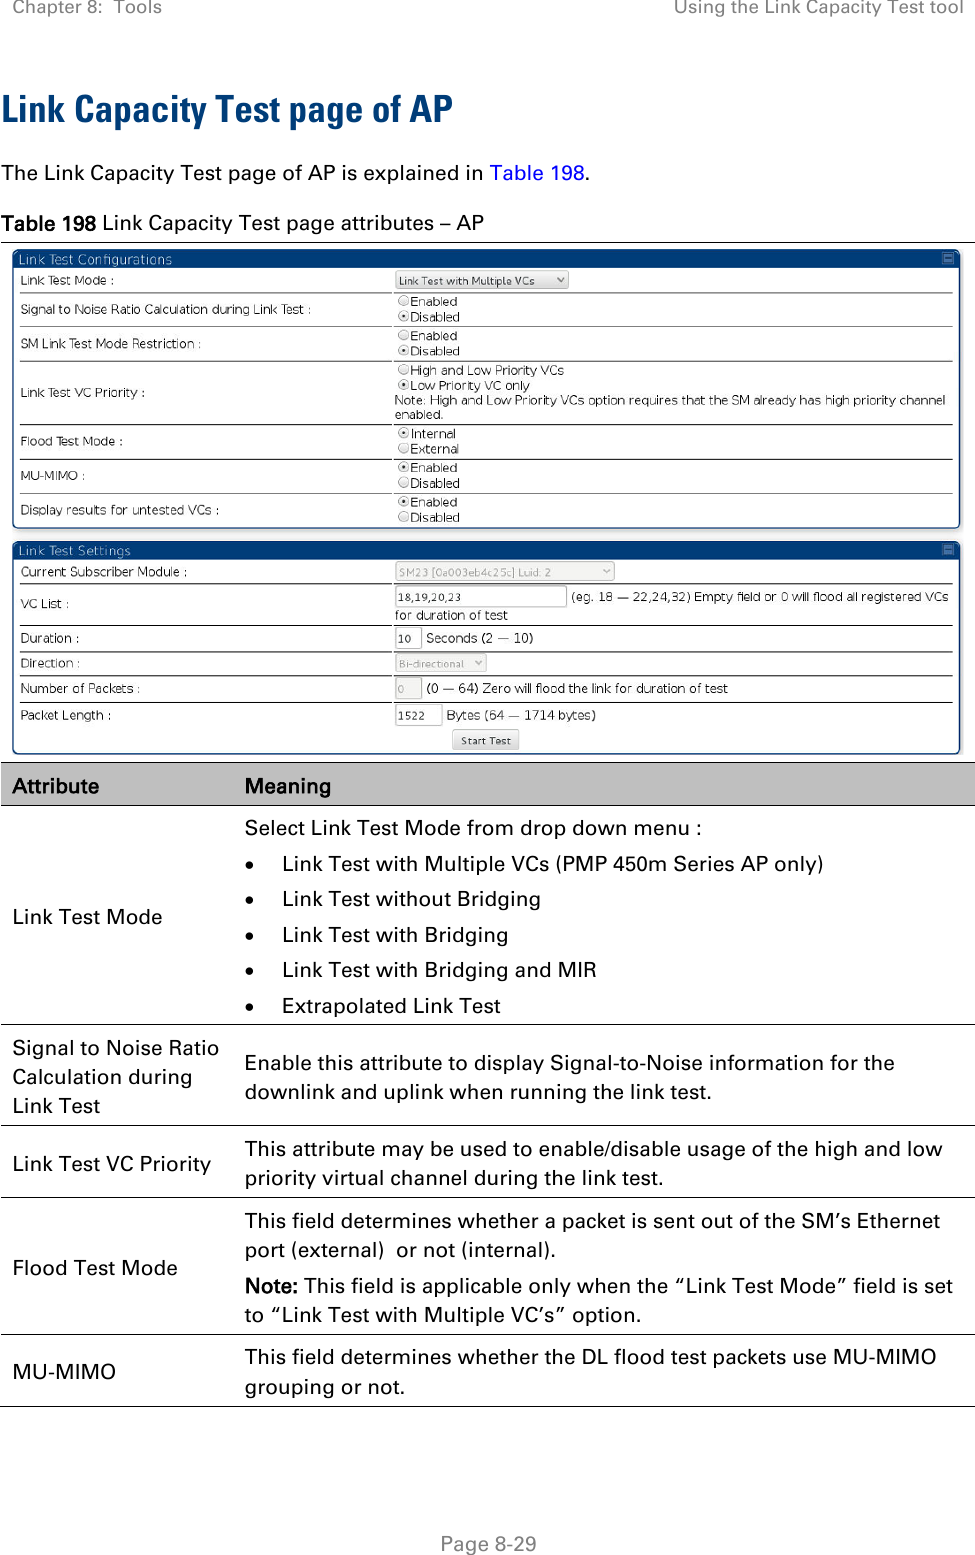
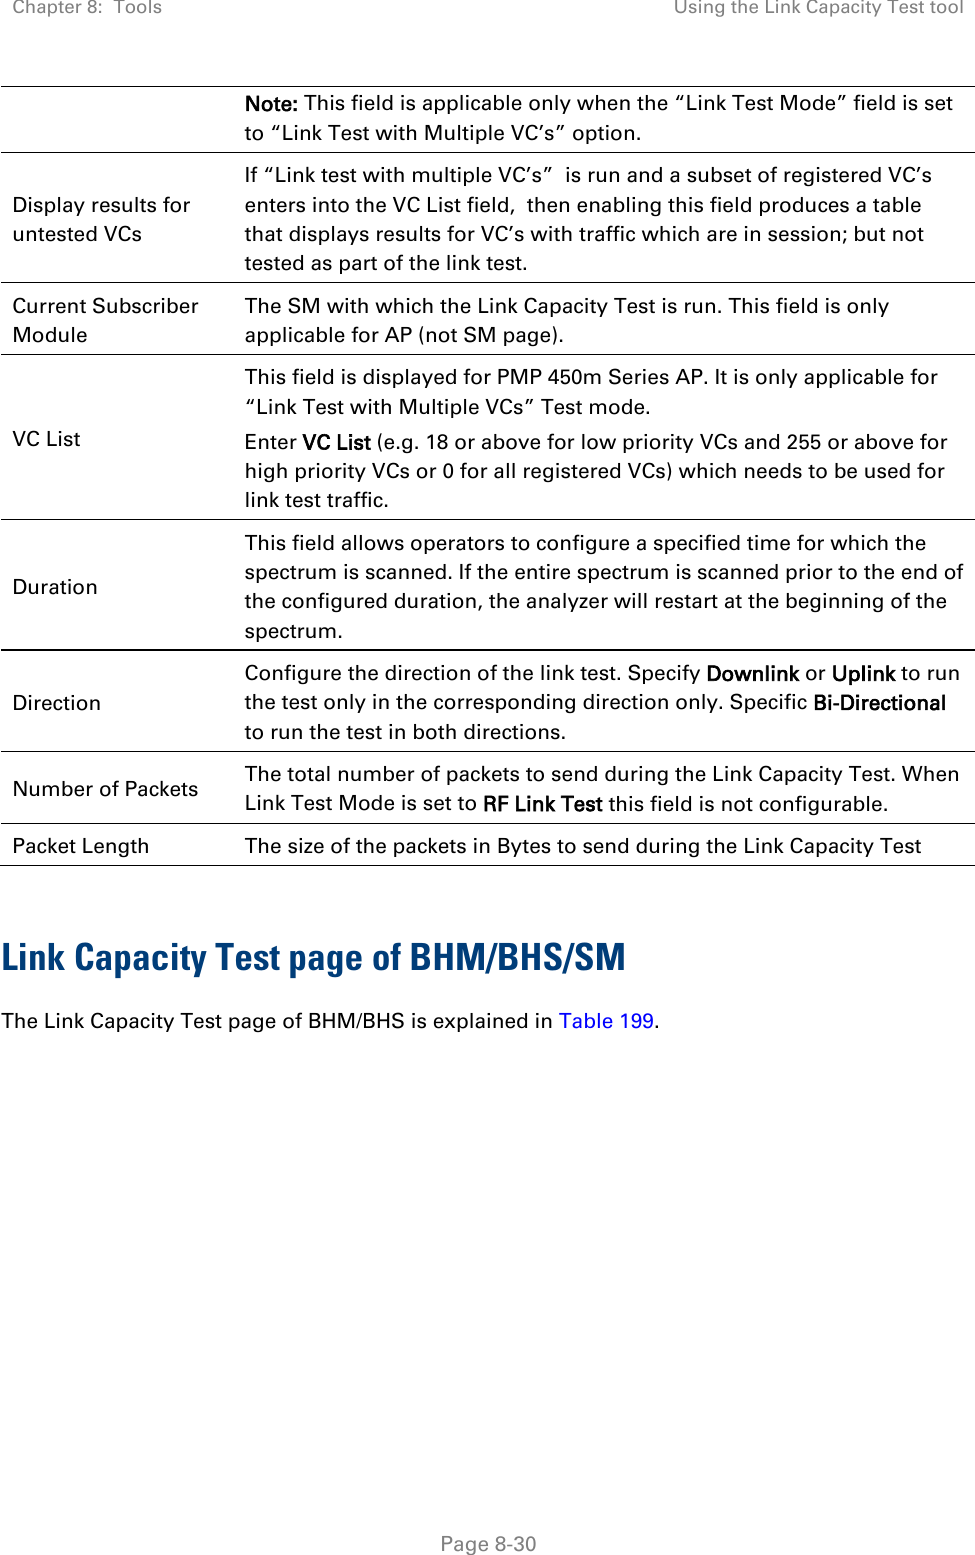
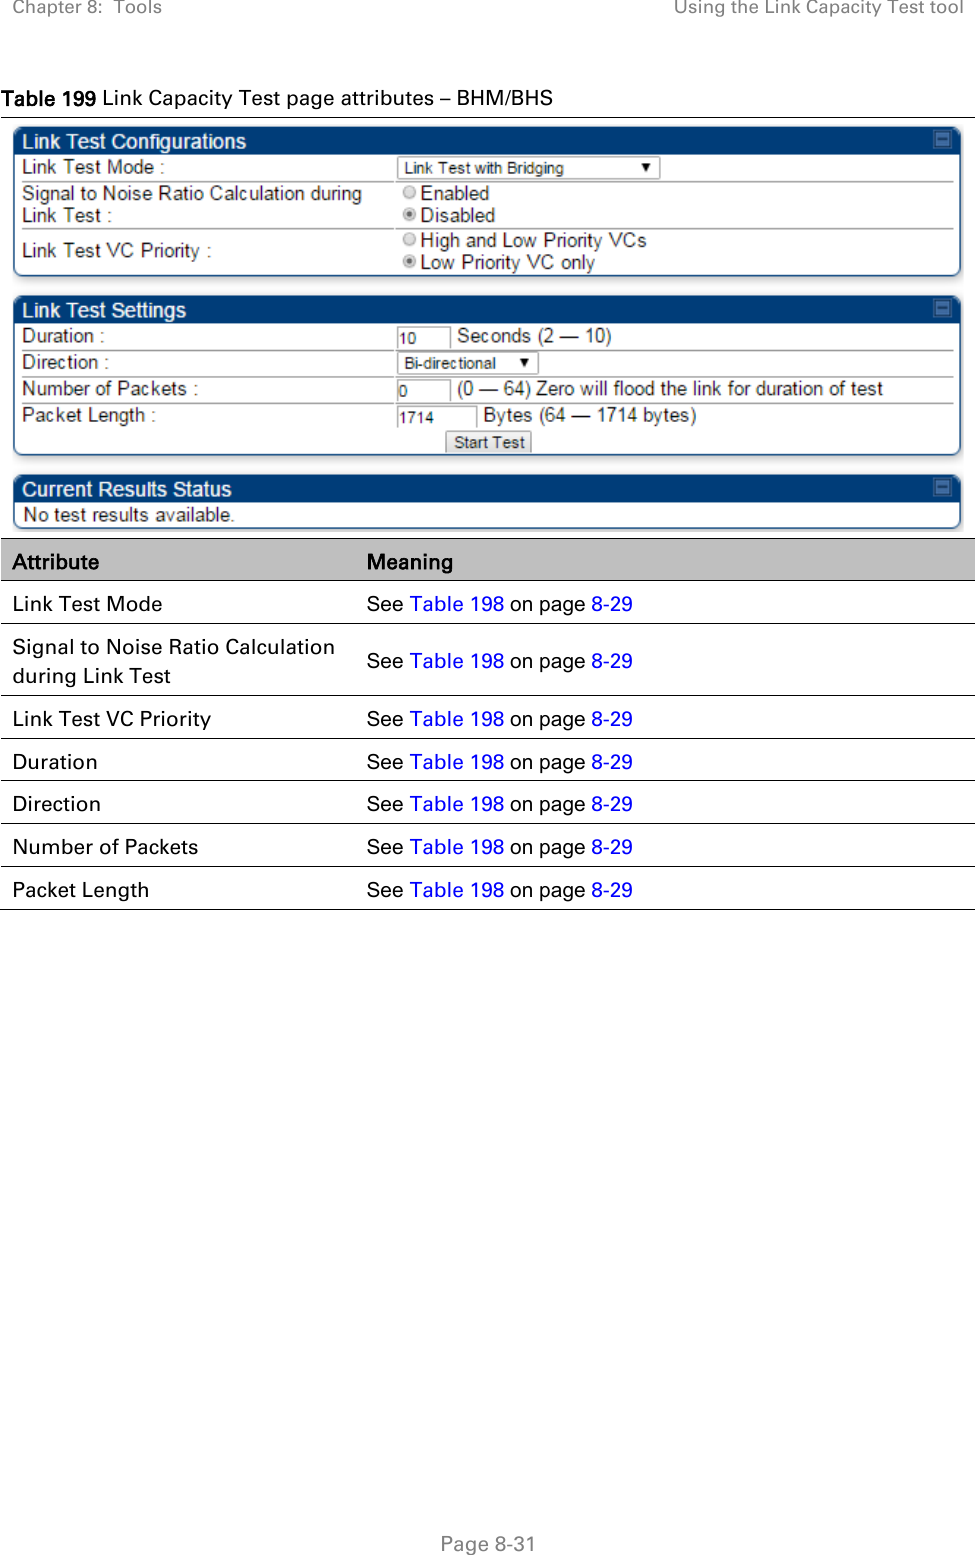
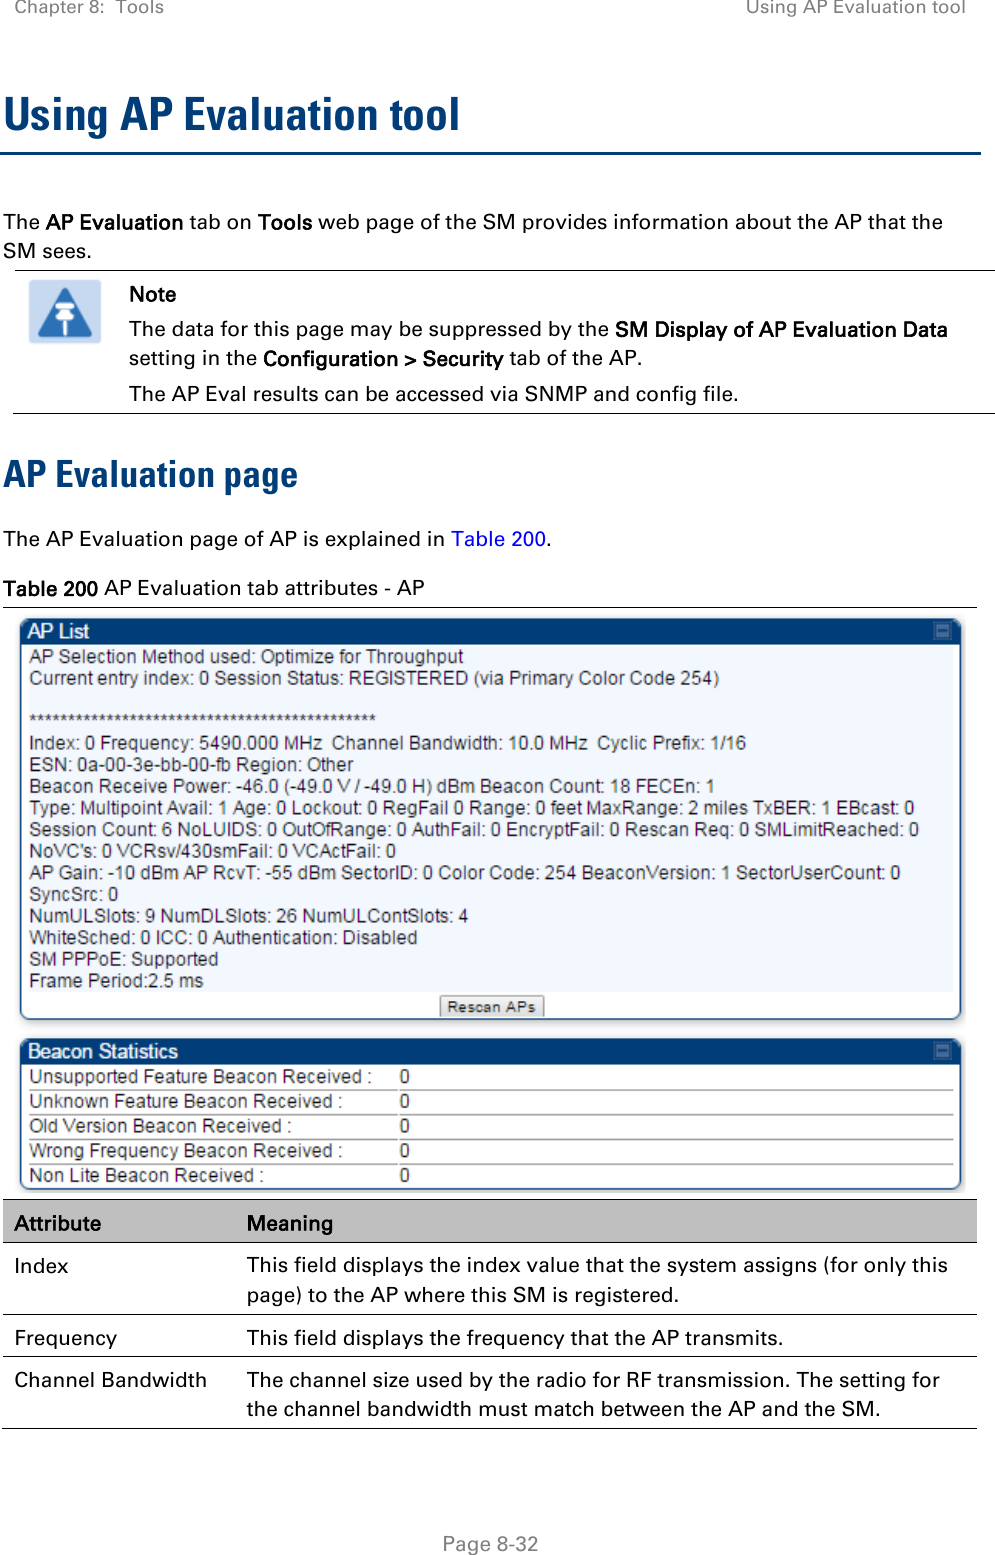
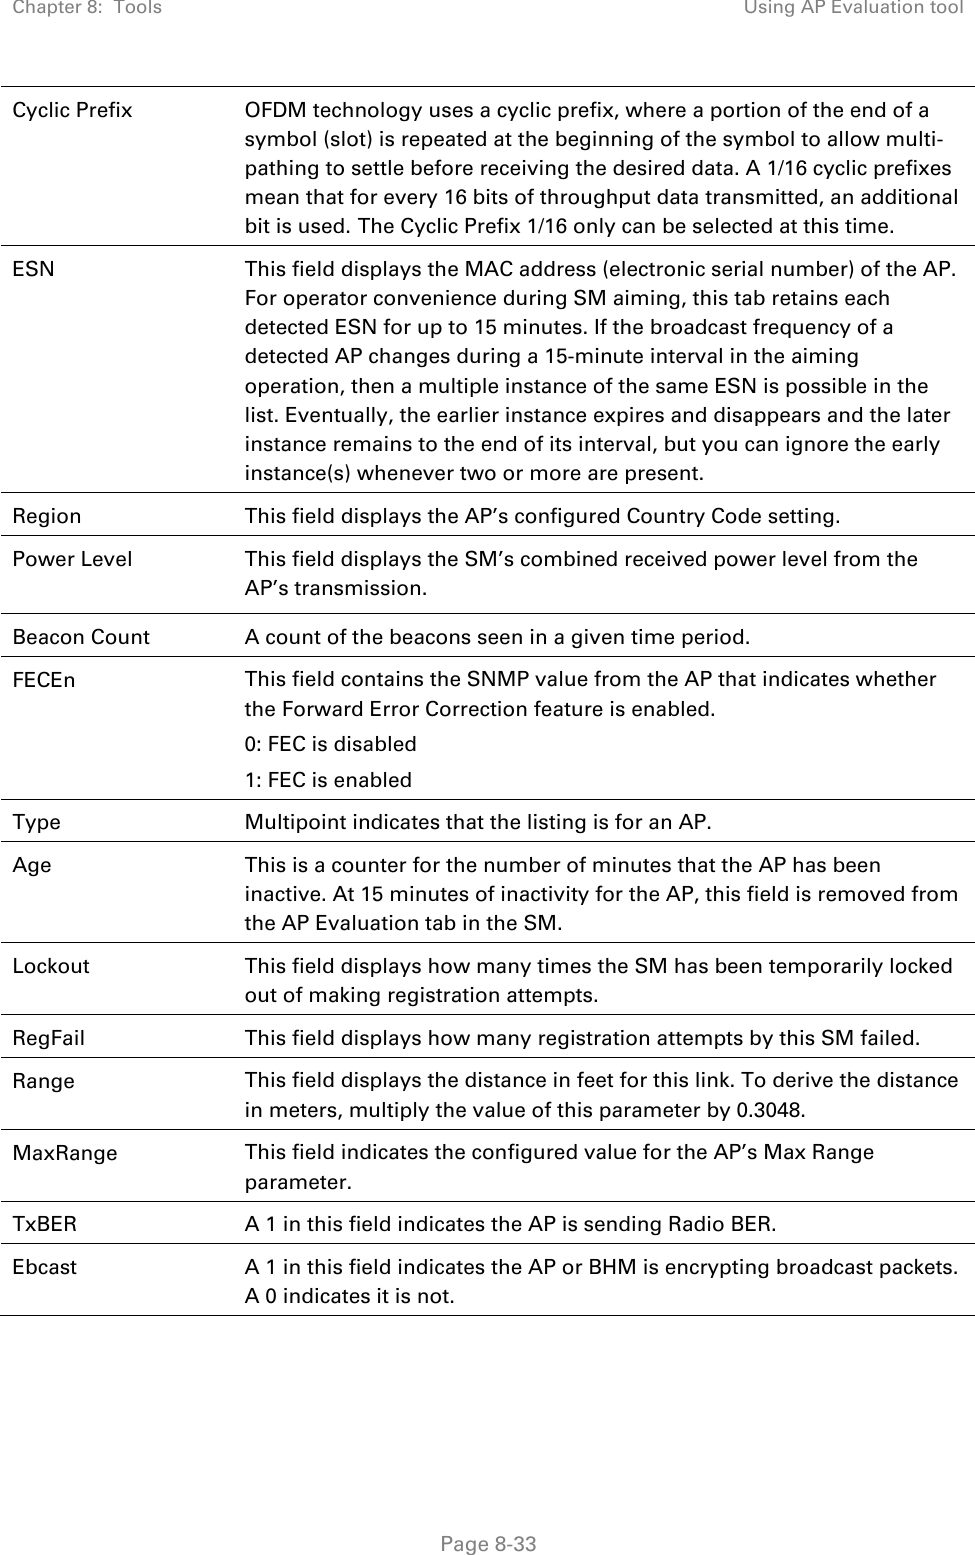
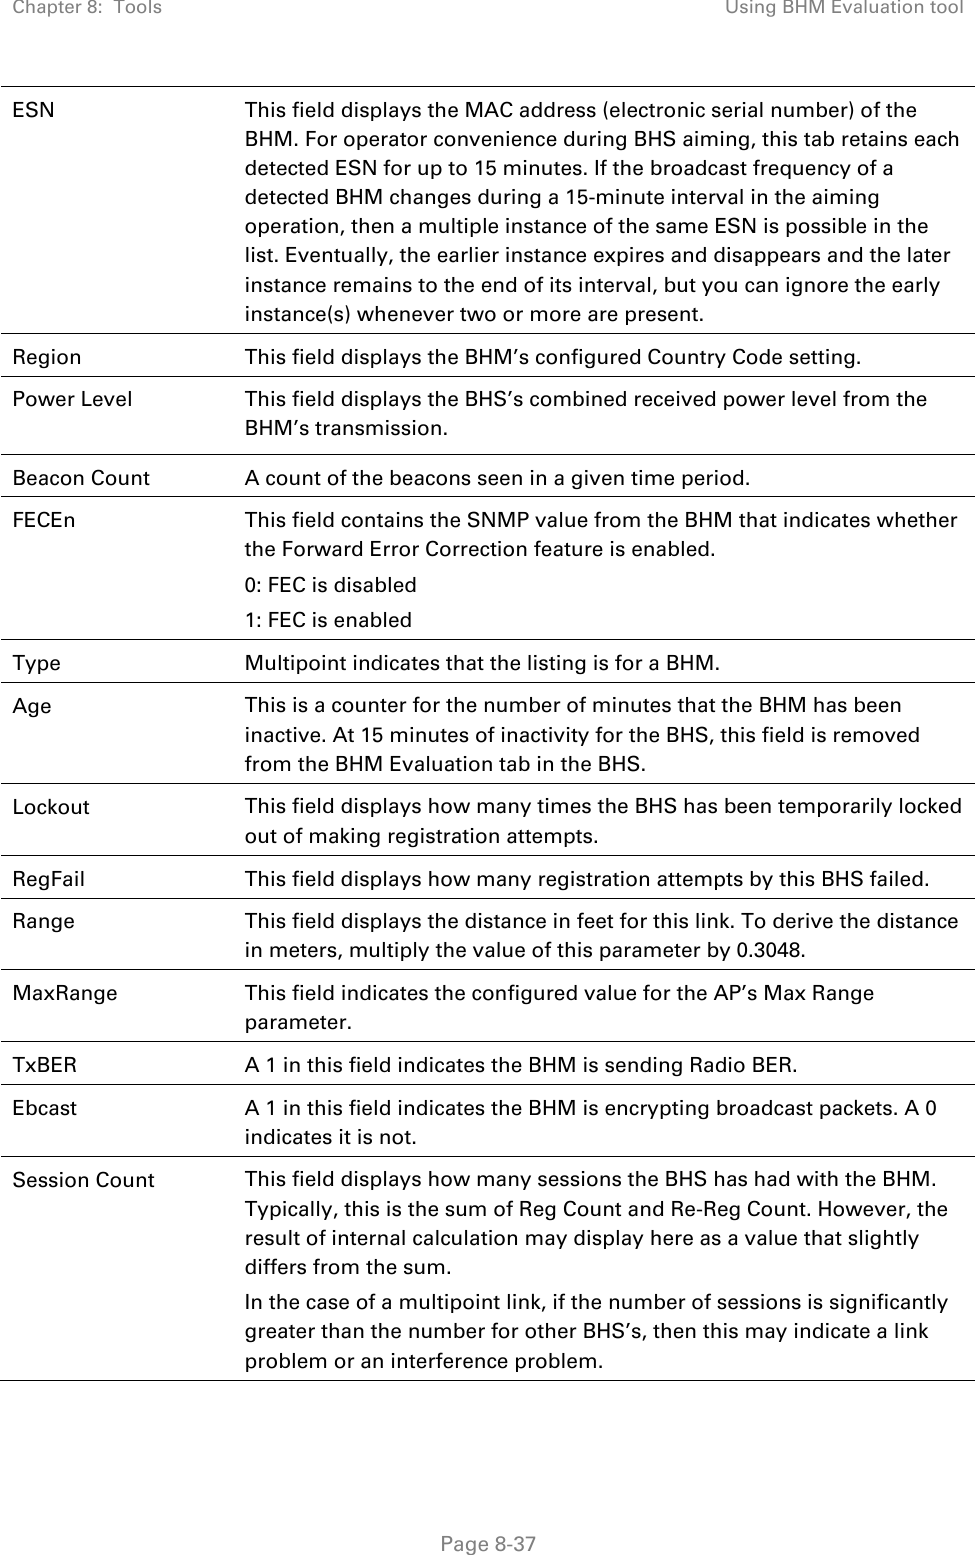
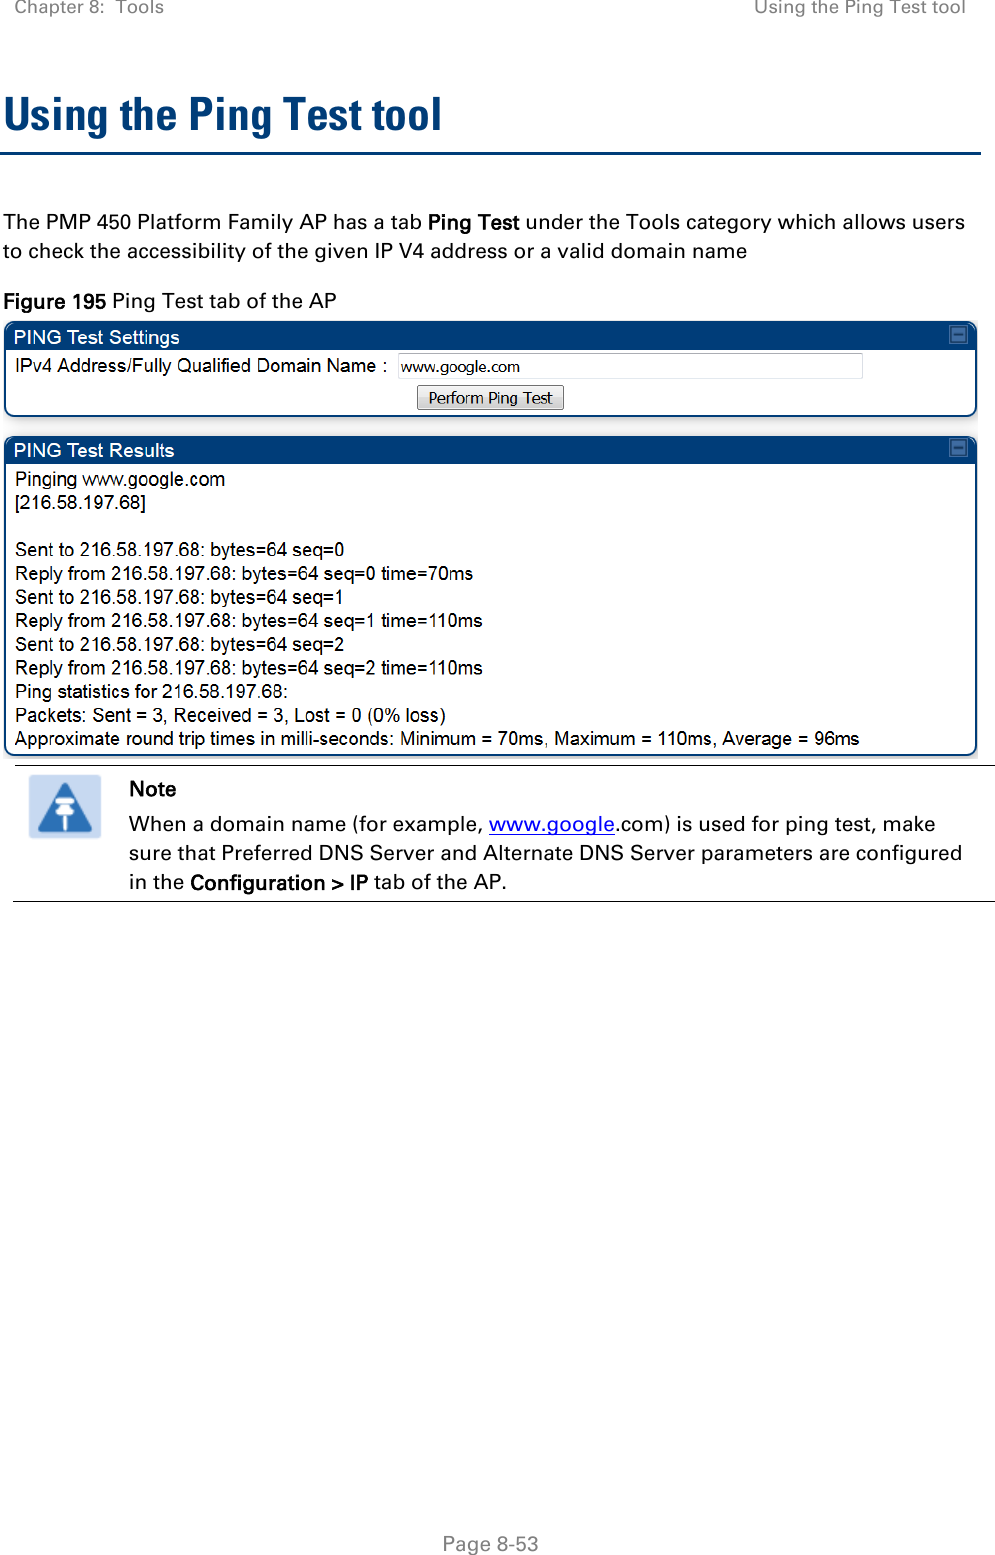
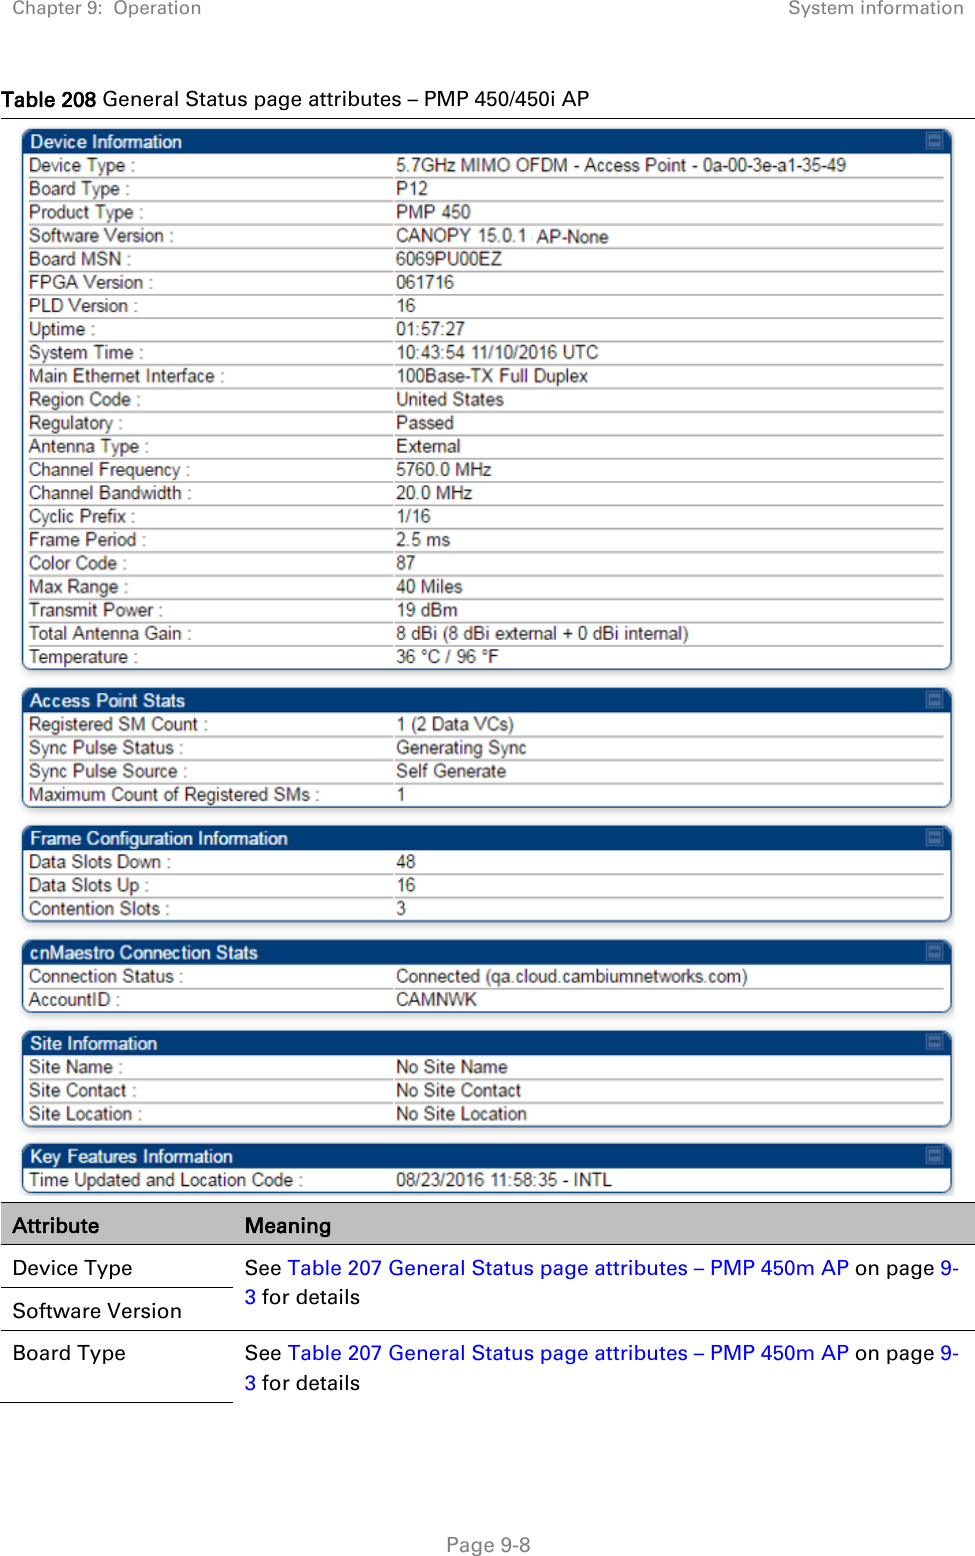
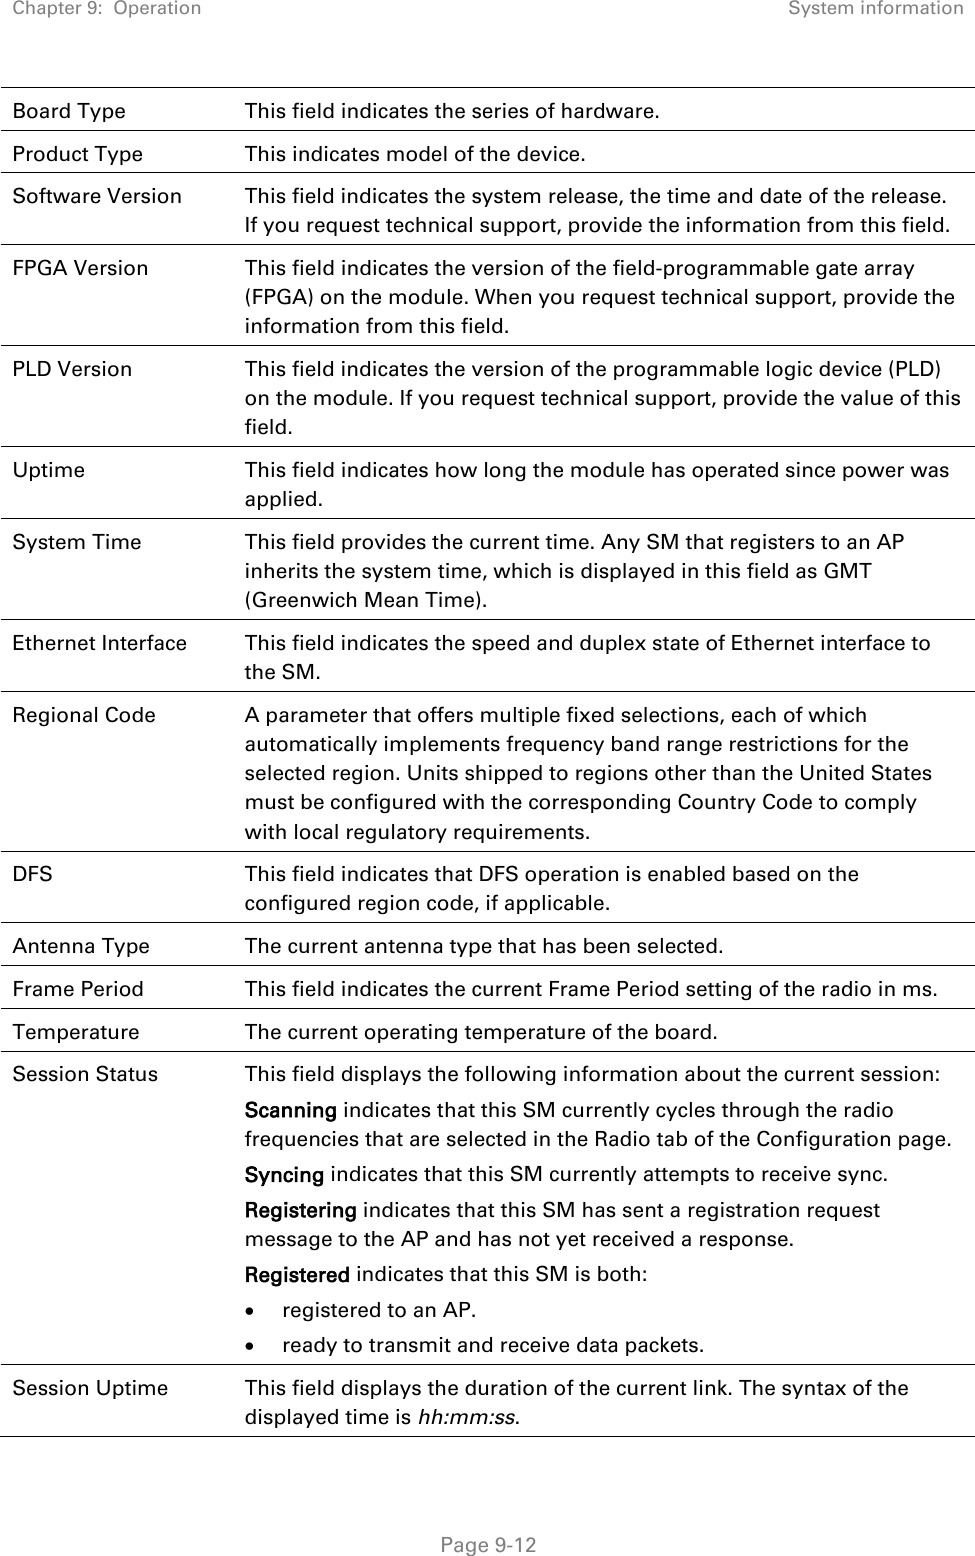
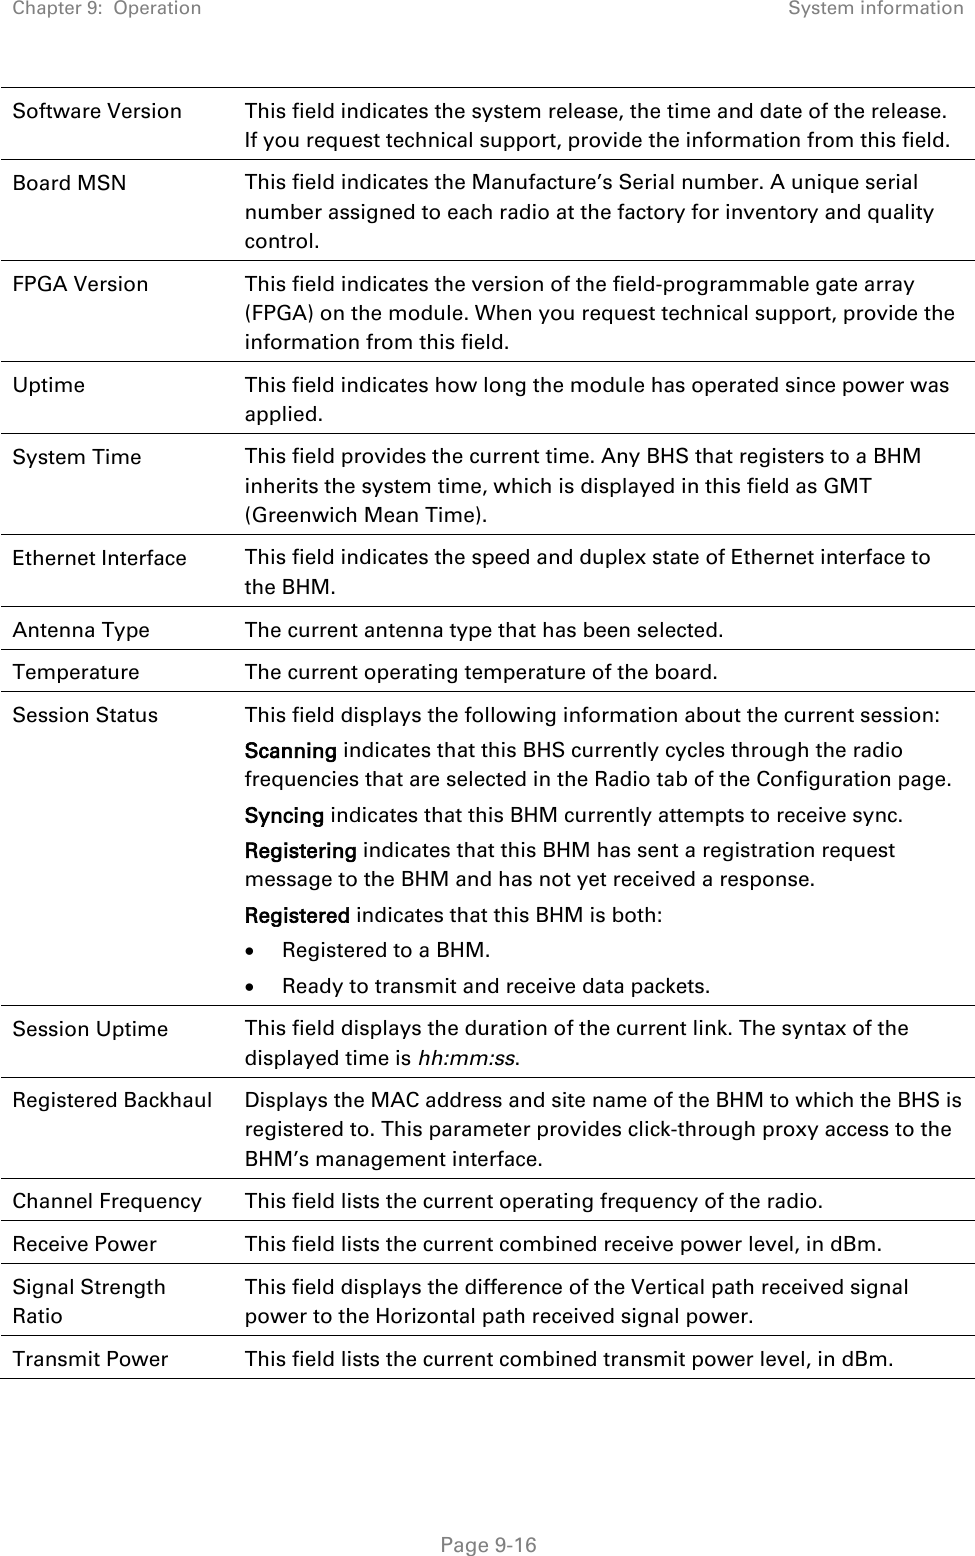
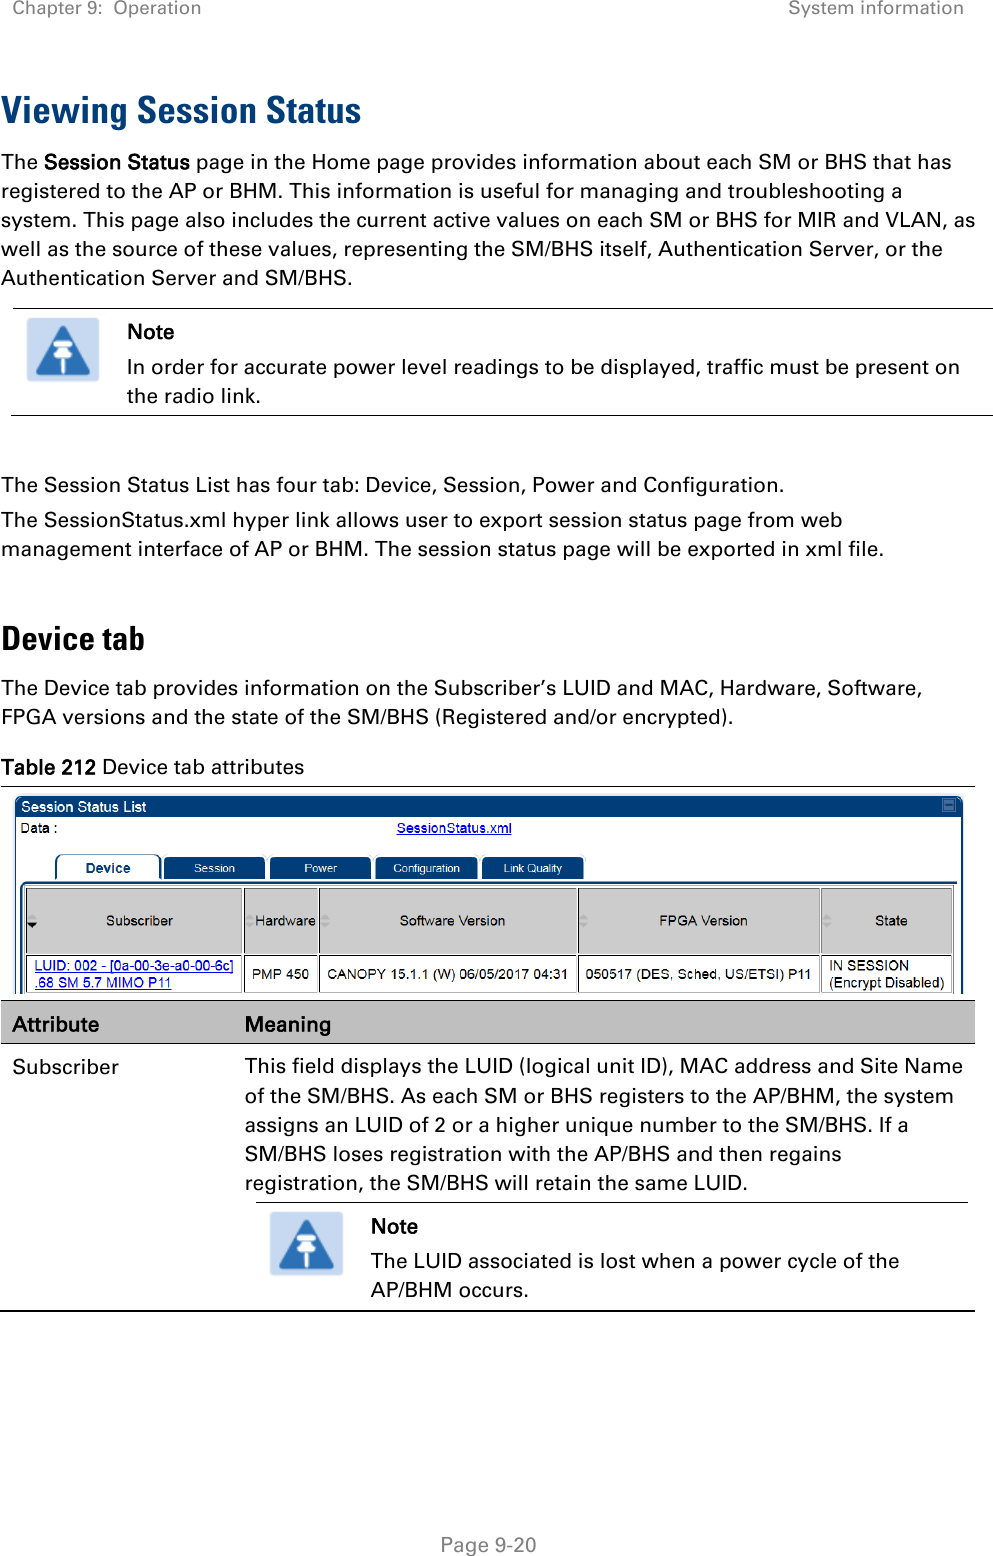
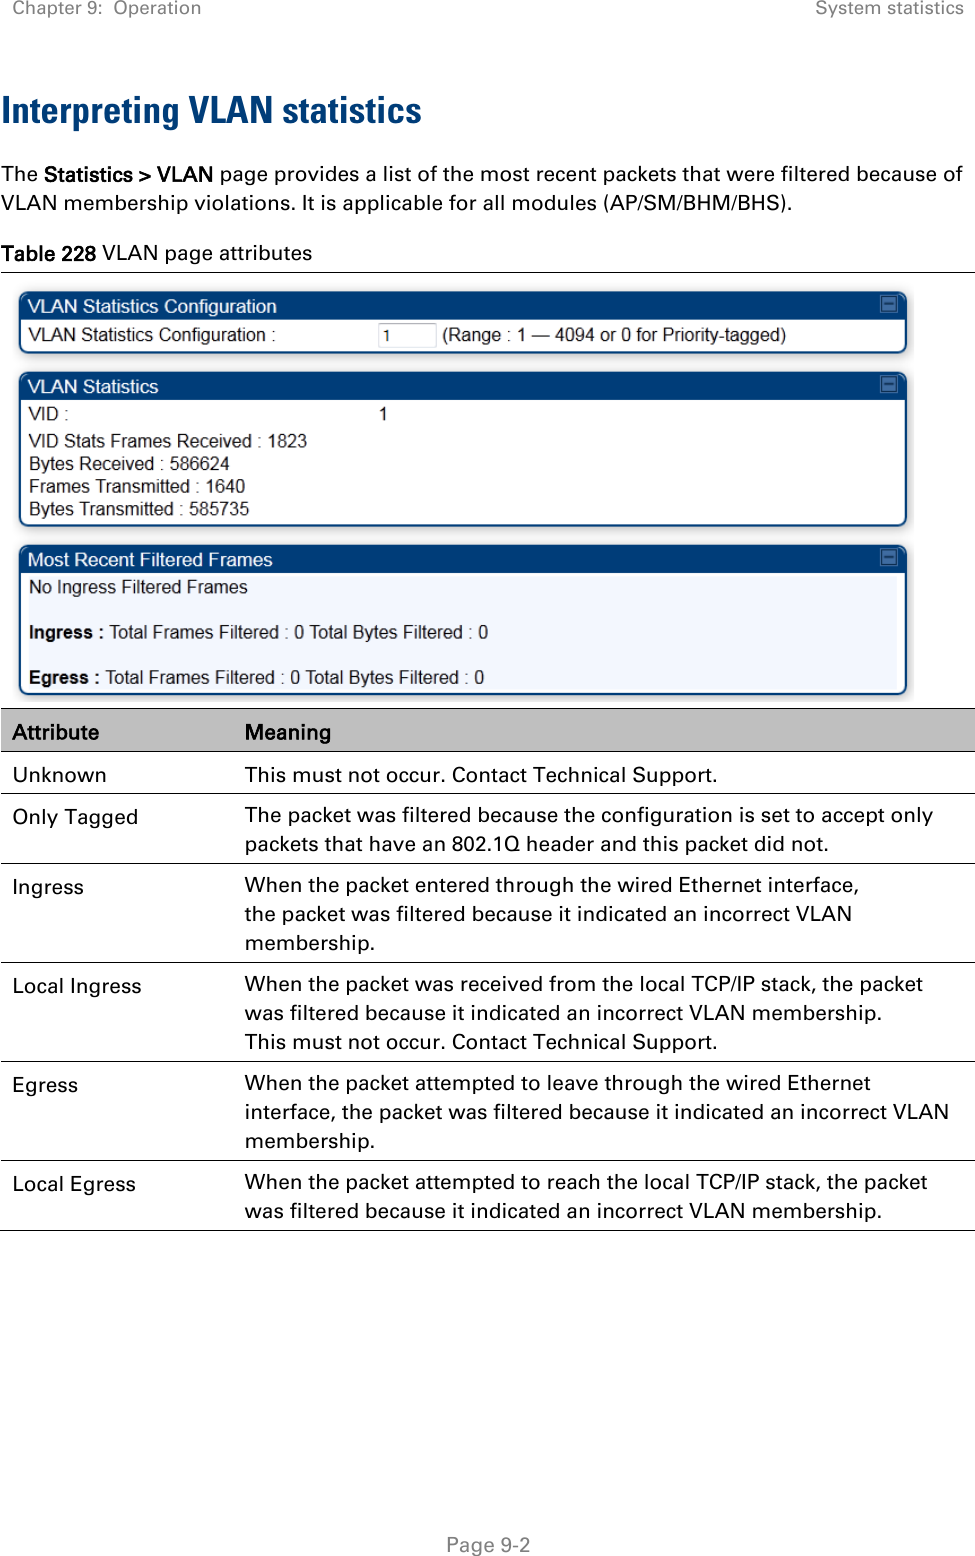
Chapter 7:  Configuration Configuring a RADIUS server   Page 7-265 Service selection Figure 176 Service selection  Adding Trusted CA Figure 177 Adding Trusted CA  Note that certificate has to be in DER form, so if you have in PEM format convert using openssl.  Openssl.exe x509 -in <path-to->/cacert_aaasvr.pem  -outform DER -out <path-to>/cacert_aaasvr.der  Installing Server Certificate After installing trusted CA, you need to add a server certificate which will be used for TLS tunnel. Generally you have to install same certificate which is installed in your AP, so that AP can trust the radius server. Figure 178 Installing Server Certificate
Chapter 7:  Configuration Configuring a RADIUS server   Page 7-266 Monitoring Logs Figure 179 Monitoring logs  Configuring VSA Before using VSA , user has to add Cambium Vendor Specific Attribute Navigate to System Administration > Configuration > Dictionaries > Protocols > RADIUS > RADIUS VSA > Motorola If Motorola is not present you can create Vendor  with ID 161 and add all the VSA one by one.
Chapter 7:  Configuration Configuring a RADIUS server   Page 7-267 Figure 180 VSA list  Using VSA for users Navigate to Access Policies >  Access Services >  Cambium ACS >  Authorization 1. Change condition to User name
Chapter 7:  Configuration Configuring a RADIUS server   Page 7-268 2. Next click Create and then click Select see diagram below   3. Click Create  from the screen you get following screen  Chose some name and then move to RADIUS Attributes tab  4. Fill attribute which all you want for that particular user  Important: Click Add for each attribute and when done click Submit.
Chapter 7:  Configuration Configuring a RADIUS server   Page 7-269 5. Now you are ready to use this Authorization profile for the use Select and Press OK   6. Finally press Save Changes and you are ready to use it.
Chapter 7:  Configuration Configuring Ping Watchdog   Page 7-270 Configuring Ping Watchdog This feature allows administrator to automatically reboot an AP/SM when there is a network issue to avoid power on reset of radios. This feature is disabled by default. To enable Ping Watchdog feature, select the menu option Configuration > Ping Watchdog, and configure the parameters listed in the following table. Table 188 Ping Watchdog attributes  Attribute Meaning Ping Watchdog This filed enables or disbales Ping Watchdog feature. IP Address To Ping This field specifies the IPV4 address of the device which needs to be pinged. Ping Interval This field specifies the time interval at which ping needs to be initiated. The time interval needs to be specified in seconds. Ping Failure Count To Reboot This field specifies the count of ping failures at which reboot needs to be initiated.
    Page 8-1   Chapter 8:  Tools The AP and SM GUIs provide several tools to analyze the operating environment, system performance and networking, including: • Using Spectrum Analyzer tool on page 8-2 • Using the Alignment Tool on page 8-15 • Using the Link Capacity Test tool on page 8-22 • Using AP Evaluation tool on page 8-32 • Using BHM Evaluation tool on page 8-36 • Using the OFDM Frame Calculator tool on page 8-40 • Using the Subscriber Configuration tool on page 8-45 • Using the Link Status tool on page 8-46 • Using BER Results tool on page 8-51 • Using the Sessions tool on page 8-52 • Using the Ping Test tool on page 8-53
Chapter 8:  Tools Using Spectrum Analyzer tool   Page 8-2 Using Spectrum Analyzer tool  The integrated spectrum analyzer can be very useful as a tool for troubleshooting and RF planning, but is not intended to replicate the accuracy and programmability of a high-end spectrum analyzer, which sometime can be used for other purposes. The AP/BHM and SM/BHS perform spectrum analysis together in the Sector Spectrum Analyzer tool.  Caution On start of the Spectrum Analyzer on a module, it enters a scan mode and drops any RF connection it may have had. When choosing Start Timed Spectrum Analysis, the scan is run for the amount of time specified in the Duration configuration parameter. When choosing Start Continuous Spectrum Analysis, the scan is run continuously for 24 hours, or until stopped manually (using the Stop Spectrum Analysis button).  Any module can be used to see the frequency and power level of any detectable signal that is within, just above, or just below the frequency band range of the module.   Note Vary the days and times when you analyze the spectrum in an area. The RF environment can change throughout the day or throughout the week.  Mapping RF Neighbor Frequencies The neighbor frequencies can be analyzed using Spectrum Analyzer tool. Following modules allow user to: • Use a BHS or BHM for PTP and SM or AP for PMP as a Spectrum Analyzer. • View a graphical display that shows power level in RSSI and dBm at 5 MHz increments throughout the frequency band range, regardless of limited selections in the Custom Radio Frequency Scan Selection List parameter of the SM/BHS. • Select an AP/BHM channel that minimizes interference from other RF equipment.  Caution The following procedure causes the SM/BHS to drop any active RF link. If a link is dropped when the spectrum analysis begins, the link can be re-established when either a 15 minute interval has elapsed or the spectrum analyzer feature is disabled.
Chapter 8:  Tools Using Spectrum Analyzer tool   Page 8-3 Temporarily deploy a SM/BHS for each frequency band range that need to monitor and access the Spectrum Analyzer tab in the Tools web page of the module.  • Using Spectrum Analyzer tool • Using the Remote Spectrum Analyzer tool Spectrum Analyzer tool Analyzing the spectrum To use the built-in spectrum analyzer functionality of the AP/SM/BH, proceed as follows: Procedure 30 Analyzing the spectrum 1 Predetermine a power source and interface that works for the AP/SM/BH in the area to be analyzed. 2 Take the AP/SM/BH, power source and interface device to the area. 3 Access the Tools web page of the AP/SM/BH. 4 Enter Duration in Timed Spectrum Analyzer Tab. Default value is 10 Seconds 5 Click Start Timed Sector Spectrum Analysis 6 The results are displayed: Figure 181 Spectrum analysis - Results   Note AP/SM/BH scans for extra 40 seconds in addition to configured Duration  7 Travel to another location in the area to BHS. 8 Click Start Timed Spectrum Analysis
Chapter 8:  Tools Using Spectrum Analyzer tool   Page 8-4 9 Repeat Steps 4 and 6 until the area has been adequately scanned and logged.  As with any other data that pertains to your business, a decision today to put the data into a retrievable database may grow in value to you over time.   Note Wherever the operator find the measured noise level is greater than the sensitivity of the radio that is plan to deploy, use the noise level (rather than the link budget) for your link feasibility calculations. The AP/SM/BH perform spectrum analysis together in the Sector Spectrum Analyzer feature.  Graphical spectrum analyzer display The AP/SM/BH display the graphical spectrum analyzer. An example of the Spectrum Analyzer page is shown in Figure 181. The navigation feature includes: • Results may be panned left and right through the scanned spectrum by clicking and dragging the graph left and right • Results may be zoomed in and out using mouse When the mouse is positioned over a bar, the receive power level, frequency, maximum and mean receive power levels are displayed above the graph To keep the displayed data current, either set “Auto Refresh” on the module’s Configuration > General. Spectrum Analyzer page of AP The Spectrum Analyzer page of AP is explained in Table 189.
Chapter 8:  Tools Using Spectrum Analyzer tool   Page 8-5 Table 189 Spectrum Analyzer page attributes - AP  Attribute Meaning Display Data Path Both means that the vertical and horizontal paths are displayed or an individual path may be selected to display only a single-path reading. Data For ease of parsing data and to facilitate automation, the spectrum analyzer results may be saved as an XML file. To save the results in an XML formatted file, right-click the “SpectrumAnalysis.xml” link and save the file. Display Instantaneous means that each reading (vertical bar) is displayed with two horizontal lines above it representing the max power level received (top horizontal line) and the average power level received (lower horizontal line) at that frequency. Averaging means that each reading (vertical bar) is displayed with an associated horizontal line above it representing the max power level received at that frequency. Min and Max Frequencies in KHz Enter minimum and maximum frequencies to be scanned. Set Min And Max to Full Scan On the button press, it sets mimimum and maximum allowed frequencies for scanning. Set Min And Max to Center Scan +/-40 MHz On the button press, it sets mimium and maximum frequencies to ± 40 MHz of center frequency for scanning.
Chapter 8:  Tools Using Spectrum Analyzer tool   Page 8-6 Registered SM Count This field displays the MAC address and Site Name of the registered SM. Maximum Count of Registered SMs This field displays the maximum number of registered SMs.  SM Scanning Bandwidth This field allows to select SM’s scanning bandwidth. Duration  This field allows operators to configure a specified time for which the spectrum is scanned. If the entire spectrum is scanned prior to the end of the configured duration, the analyzer will restart at the beginning of the spectrum. Continuous Spectrum Analyzer  Start Continuous Spectrum Analysis button ensures that when the SM is powered on, it automatically scans the spectrum for 10 seconds. These results may then be accessed via the Tools > Spectrum Analyzer GUI page.  Spectrum Analyzer page of SM The Spectrum Analyzer page of SM is explained in Table 190.   Note Spectrum Analyzer is not currently supported by 450m.
Chapter 8:  Tools Using Spectrum Analyzer tool   Page 8-7 Table 190 Spectrum Analyzer page attributes - SM  Attribute Meaning Display Data Path Refer Table 189 on page 8-5 Data Refer Table 189 on page 8-5 Display Refer Table 189 on page 8-5 Min and Max Frequencies in KHz To scan min to max range of frequencies, enter min and max frequencies in KHz and press Set Min and Max to Full Scan button. To scan +/- 40 MHz from center frequency, enter center frequency in KHz and press Set Min And Max To Center Scan +/- 40KHz button. Registered SM Count Refer Table 189 on page 8-5 Maximum Count to Registered SMs Refer Table 189 on page 8-5 Duration  Refer Table 189 on page 8-5
Chapter 8:  Tools Using Spectrum Analyzer tool   Page 8-8 Spectrum Analyzer page of BHM The Spectrum Analyzer page of BHM is explained in Table 191. Table 191 Spectrum Analyzer page attributes - BHM  Attribute Meaning Data Refer Table 189 on page 8-5 Display Refer Table 189 on page 8-5 Duration   Refer Table 189 on page 8-5 Continuous Spectrum Analyzer Refer Table 189 on page 8-5
Chapter 8:  Tools Using Spectrum Analyzer tool   Page 8-9   Spectrum Analyzer page of BHS The Spectrum Analyzer page of BHS is explained in Table 192. Table 192 Spectrum Analyzer page attributes - BHS  Attribute Meaning Data Refer Table 189 on page 8-5 Display Refer Table 189 on page 8-5 Session Status This field displays current session status and rates. The session states can be Scanning, Syncing, Registering or Registered.
Chapter 8:  Tools Using Spectrum Analyzer tool   Page 8-10 Registered Backhaul This field displays MAC address of BHM and PTP model number Duration   Refer Table 189 on page 8-5 Perform Spectrum Analysis on Boot Up for one scan This field allows to Enable or Disable to start Spectrum Analysis on boot up of module for one scan. Continuous Spectrum Analyzer Refer Table 189 on page 8-5
Chapter 8:  Tools Using Spectrum Analyzer tool   Page 8-11 Spectrum Analyzer page result of PMP 450 SM Figure 182 Spectrum Analyzer page result – PMP 450 SM
Chapter 8:  Tools Using Spectrum Analyzer tool   Page 8-12 Remote Spectrum Analyzer tool  The Remote Spectrum Analyzer tool in the AP/BHM provides additional flexibility in the use of the spectrum analyzer in the SM/BHS. Set the duration of 10 to 1000 seconds, then click the Start Remote Spectrum Analysis button to launch the analysis from that SM/BHS.  In PMP configuration, a SM has to be selected from the drop-down list before launching Start Remote Spectrum Analysis.  Analyzing the spectrum remotely Procedure 31 Remote Spectrum Analyzer procedure 1 The AP/BHM de-registers the target SM/BHS. 2 The SM/BHS scans (for the duration set in the AP/BHM tool) to collect data for the bar graph. 3 The SM/BHS re-registers to the AP/BHM. 4 The AP/BHM displays the bar graph. The bar graph is an HTML file, but can be changed to an XML file, which is then easy to analyze through the use of scripts that you may write for parsing the data. To transform the file to XML, click the “SpectrumAnalysis.xml” link below the spectrum results. Although the resulting display appears mostly unchanged, the bar graph is now coded in XML. You can now right-click on the bar graph for a Save Target As option to save the Spectrum Analysis.xml file.  Remote Spectrum Analyzer page of AP The Remote Spectrum Analyzer page of AP is explained in Table 193.
Chapter 8:  Tools Using Spectrum Analyzer tool   Page 8-13 Table 193 Remote Spectrum Analyzer attributes - AP  Attribute Meaning Registered SM Count This field displays the number of SMs that were registered to the AP before the SA was started. This helps the user know all the SMs re-registered after performing a SA. Maximum Count of Registered SMs This field displays the largest number of SMs that have been simultaneously registered in the AP since it was last rebooted. This count can provide some insight into sector history and provide comparison between current and maximum SM counts at a glance. Current Subscriber Module The SM with which the Link Capacity Test is run. Duration  This field allows operators to configure a specified time for which the spectrum is scanned. If the entire spectrum is scanned prior to the end of the configured duration, the analyzer will restart at the beginning of the spectrum. Scanning Bandwidth This parameter defines the size of the channel scanned when running the analyzer.
Chapter 8:  Tools Using Spectrum Analyzer tool   Page 8-14 Remote Spectrum Analyzer page of BHM The Remote Spectrum Analyzer page of BHM is explained in Table 194. Table 194 Remote Spectrum Analyzer attributes - BHM  Attribute Meaning Duration  Refer Table 189 on page 8-5
Chapter 8:  Tools Using the Alignment Tool   Page 8-15 Using the Alignment Tool The SM’s or BHS’s Alignment Tool may be used to maximize Receive Power Level, Signal Strength Ratio and Signal to Noise Ratio to ensure a stable link. The Tool provides color coded readings to facilitate in judging link quality.  Note To get best performance of the link, the user has to ensure the maximum Receive Power Level during alignment by pointing correctly. The proper alignment is important to prevent interference in other cells. The achieving Receive Power Level green (>- 70 dBm) is not sufficient for the link. Figure 183 Alignment Tool tab of SM – Receive Power Level > -70 dBm  Figure 184 Alignment Tool tab of SM – Receive Power Level between -70 to -80 dBm  Figure 185 Alignment Tool tab of SM – Receive Power Level < -80 dBm
Chapter 8:  Tools Using the Alignment Tool   Page 8-16 Aiming page and Diagnostic LED – SM/BHS The SM’s/BHS’s Alignment Tool (located in GUI Tools -> Aiming) may be used to configure the SM’s/BHS’s LED panel to indicate received signal strength and to display decoded beacon information/power levels. The SM/BHS LEDs provide different status based on the mode of the SM/BHS. A SM/BHS in “operating” mode will register and pass traffic normally. A SM/BHS in “aiming” mode will not register or pass traffic, but will display (via LED panel) the strength of received radio signals (based on radio channel selected via Tools ->Aiming). See SM/BHS LEDs on page 2-17.   Note In order for accurate power level readings to be displayed, traffic must be present on the radio link.  Refer Table 23 SM/BHS LED descriptions on page 2-18 for SM/BHS LED details. Aiming page of SM The Aiming page is similar to Spectrum Analyzer where it scans the spectrum but it does not establish any session with any APs. It has two modes – Single Frequency Only and Normal Frequency Scan List. The Aiming page of SM is explained in Table 195.
Chapter 8:  Tools Using the Alignment Tool   Page 8-17 Table 195 Aiming page attributes – SM   Attribute Meaning Aiming Mode Single Frequency Only: scans only selected single frequency. Normal Frequency Scan List: scans: scans all frequency of scan list. Single Frequency Select a particular frequency from drop down menu for scanning.  Scan Radio Frequency Only Mode Enabled: the radio is configured to “aiming” or “alignment” mode, wherein the LED panel displays an indication of receive power level. See Table 23 SM/BHS LED descriptions on page 2-18. Disabled: the radio is configured to “operating” mode, wherein the SM registers and passes traffic normally. Aiming Results The Aiming Results are displayed in two sections – Current entry and Other entries. Frequency: this field indicates the frequency of the AP which is transmitting the beacon information.
Chapter 8:  Tools Using the Alignment Tool   Page 8-18 Power: This field indicates the current receive power level (vertical channel) for the frequency configured in parameter Radio Frequency. Users: This field indicates the number of SMs currently registered to the AP which is transmitting the beacon information. ESN: This field indicates the MAC, or hardware address of the AP/BHM which is transmitting the beacon information. Color Code: This field displays a value from 0 to 254 indicating the AP’s configured color code. For registration to occur, the color code of the SM and the AP must match. Color code is not a security feature. Instead, color code is a management feature, typically for assigning each sector a different color code.  Color code allows you to force a SM to register to only a specific AP, even where the SM can communicate with multiple APs. The default setting for the color code value is 0. This value matches only the color code of 0 (not all 255 color codes). Multipoint or Backhaul: this field indicates type of configuration - point-Multipoint(PMP) or Backhaul (PTP).
Chapter 8:  Tools Using the Alignment Tool   Page 8-19 Aiming page of BHS The Alignment page of BHS is explained in Table 196. Table 196 Aiming page attributes - BHS  Attribute Meaning Refer Table 161 for Atributes details.
Chapter 8:  Tools Using the Alignment Tool   Page 8-20 Alignment Tone For coarse alignment of the SM/BHS, use the Alignment Tool located at Tools -> Alignment Tool. Optionally, connect a headset alignment tone kit to the AUX/SYNC port of the SM/BHS and listen to the alignment tone, which indicates greater SM/BHS receive signal power by pitch. By adjusting the SM’s/BHS’s position until the highest frequency pitch is obtained operators and installers can be confident that the SM/BHS is properly positioned. For information on device GUI tools available for alignment, see sections Aiming page and Diagnostic LED – SM/BHS on page 8-16, Using the Link Capacity Test tool on page 8-22 and Using AP Evaluation tool on page 8-32.  Figure 186 PMP/PTP 450i Series link alignment tone       Note The Alignment Tone cable for a 450i Series uses an RJ-45 to headset cable where as the 450 Series alignment tone cable uses an RJ-12 to headset cable.  Alignment Tool Headset and alignment tone adapters can be ordered from Cambium and Best-Tronics (http://btpa.com/Cambium-Products/) respectively using the following part numbers:  Headphones 450i Alignment tone adapter
Chapter 8:  Tools Using the Alignment Tool   Page 8-21 Table 197 Alignment Tool Headsets and Alignment tone adapter third party product details Reference Product description ACATHS-01A Alignment tool headset for the PMP/PTP 450 and 450i Series products BT-1277 Headset alignment cable (RJ-45) for the PMP/PTP 450i Series products  BT-0674 Headset alignment cable (RJ-12) for the PMP/PTP 450 Series products.
Chapter 8:  Tools Using the Link Capacity Test tool   Page 8-22 Using the Link Capacity Test tool The Link Capacity Test tab allows you to measure the throughput and efficiency of the RF link between two modules. Many factors, including packet length, affect throughput.  The Link Capacity Test tool has following modes: • Link Test with Multiple VCs: Tests radio-to-radio communication across selected or all registered VCs, but does not bridge traffic (PMP 450m Series AP only). • Link Test without Bridging: Tests radio-to-radio communication, but does not bridge traffic. • Link Test with Bridging: Bridges traffic to “simulated” Ethernet ports, providing a status of the bridged link. • Link Test with Bridging and MIR: Bridges the traffic during test and also adheres to any MIR (Maximum Information Rate) settings for the link. • Extrapolated Link Test:  Estimates the link capacity by sending few packets and measuring link quality.  The Link Capacity Test tab contains the settable parameter Packet Length with a range of 64 to 1714 bytes. This allows you to compare throughput levels that result from various packet sizes. The Current Results Status also displayed date and time of last performed Link Capacity Test. If there is any change in time zone, the date and time will be adjusted accordingly.   Note The Extrapolated Link Test can be run by Read-Only login also.  Performing Link Test The link test is a tool that allows the user to test the performance of the RF link. Packets are added to one or more queues in the AP in order to fill the frame. Throughput and efficiency are then calculated during the test. The 450 and 450i APs offer link test options to one SM at a time. The 450m AP offers the option of a link test to multiple VCs at the same time. This allows the user to test throughput in MU-MIMO mode, in which multiple SMs are served at the same time. This new link test can be found under Tools > Link Capacity Test
Chapter 8:  Tools Using the Link Capacity Test tool   Page 8-23 Link Test with Multiple VCs  Note The “Link Test with Multiple VCs” Link Capacity Test is supported for PMP 450m Series AP only. Figure 187 Link Capacity Test – PMP 450m Series AP   Procedure 32 Performing a Link Capacity Test - Link Test with Multiple VCs Link Test Configurations parameters 1 Access the Link Capacity Test tab in the Tools web page of the module. 2 Select Link Test Mode – Options are: Link Test with Multiple VCs, Link Test without Bridging, Link Test with Bridging, Link Test with Bridging and MIR, Extrapolated Link Test All options except for the Link Test with Multiple VCs are available also for the 450 and 450i APs. 3 Set the SM Link Test Mode Restriction attribute to enable or disable. Setting this to enabled, prevents activation of SM initated link tests. 4 Set Signal to Noise Ratio Calculation during Link Test attribute to enable or disable. 5 Set Link Test VC Priority attribute to either High and Low Priority VCs or Low Priority VC only.
Chapter 8:  Tools Using the Link Capacity Test tool   Page 8-24 6 Select Flood Test Mode – Options are: Internal and External Default is Internal. When set to Internal, packets are sent from AP -> SM over RF.  When set to External, packets will all flow out the Ethernet port.   7 Set MU-MIMO attribute to enable or disable . Note: The MU-MIMO feature is enabled on the Low Priority VC only Link Test Settings parameters 6 Select the subscriber module to test using the Current Subscriber Module parameter. Note: This parameter is not available in BHM. 7 Enter VC List (applicable for PMP 450m AP only) The Current Subscriber Module and VC List are valid only when selecting Link Test with Multiple VCs. • Current Subscriber Module: select the VC to perform the link test with • VC list: select a list or range of VCs to include in the link test with multiple VCs If left blank, all VCs will be included in the link test 8 Type into the Duration field how long (in seconds) the RF link must be tested. 9 Select the Direction – Bi-directional, Uplink Only or Downlink Only. 10 Type into the Number of Packets field a value of 0 to flood the link for the duration of the test. 11 Type into the Packet Length field a value of 1714 to send 1714-byte packets during the test. 12 Click the Start Test button.
Chapter 8:  Tools Using the Link Capacity Test tool   Page 8-25 Figure 188 Link Test with Multiple VCs (1518-byte packet length)  Link Test without Bridging, Link Test with Bridging or Link Test with Bridging and MIR Figure 189 Link Capacity Test – PMP 450/450i Series AP
Chapter 8:  Tools Using the Link Capacity Test tool   Page 8-26  Refer Link Test with Multiple VCs on page 8-23 for Link Test procedure. Figure 190 Link Test without Bridging (1714-byte packet length)
Chapter 8:  Tools Using the Link Capacity Test tool   Page 8-27 Performing Extrapolated Link Test The Extrapolated Link Test estimates the link capacity by sending few packets and measuring link quality. Once the test is initiated, the radio starts session at the lower modulation, 1X, as traffic is passed successfully across the link, the radio decides to try the next modulation, 2X. This process repeats until it find best throughput to estimate capacity of link.   Note It is recommended to run Extrapolated Link Test where the session must have been up and have traffic present on it in order to get accurate test results. This is essential for the radio to modulate up to get an accurate measurement. Running the Extrapolated test just after establishing session will not provide accurate results.  The procedure for performing Extrapolated Link Test is as follows: Procedure 33 Performing an Extrapolated Link Test 1 Access the Link Capacity Test tab in the Tools web page of the module. 2 Select Link Test Mode Extrapolated Link Test 3 Click the Start Test button. 4 In the Current Results Status block of this tab, view the results of the test.
Chapter 8:  Tools Using the Link Capacity Test tool   Page 8-28 Figure 191 Extrapolated Link Test results
Chapter 8:  Tools Using the Link Capacity Test tool   Page 8-29 Link Capacity Test page of AP The Link Capacity Test page of AP is explained in Table 198. Table 198 Link Capacity Test page attributes – AP  Attribute Meaning Link Test Mode Select Link Test Mode from drop down menu : • Link Test with Multiple VCs (PMP 450m Series AP only) • Link Test without Bridging • Link Test with Bridging • Link Test with Bridging and MIR  • Extrapolated Link Test Signal to Noise Ratio Calculation during Link Test Enable this attribute to display Signal-to-Noise information for the downlink and uplink when running the link test.  Link Test VC Priority This attribute may be used to enable/disable usage of the high and low priority virtual channel during the link test. Flood Test Mode This field determines whether a packet is sent out of the SM’s Ethernet port (external)  or not (internal).   Note: This field is applicable only when the “Link Test Mode” field is set to “Link Test with Multiple VC’s” option. MU-MIMO This field determines whether the DL flood test packets use MU-MIMO grouping or not.
Chapter 8:  Tools Using the Link Capacity Test tool   Page 8-30 Note: This field is applicable only when the “Link Test Mode” field is set to “Link Test with Multiple VC’s” option. Display results for untested VCs If “Link test with multiple VC’s”  is run and a subset of registered VC’s enters into the VC List field,  then enabling this field produces a table that displays results for VC’s with traffic which are in session; but not tested as part of the link test. Current Subscriber Module The SM with which the Link Capacity Test is run. This field is only applicable for AP (not SM page). VC List This field is displayed for PMP 450m Series AP. It is only applicable for “Link Test with Multiple VCs” Test mode. Enter VC List (e.g. 18 or above for low priority VCs and 255 or above for high priority VCs or 0 for all registered VCs) which needs to be used for link test traffic. Duration This field allows operators to configure a specified time for which the spectrum is scanned. If the entire spectrum is scanned prior to the end of the configured duration, the analyzer will restart at the beginning of the spectrum. Direction Configure the direction of the link test. Specify Downlink or Uplink to run the test only in the corresponding direction only. Specific Bi-Directional to run the test in both directions. Number of Packets The total number of packets to send during the Link Capacity Test. When Link Test Mode is set to RF Link Test this field is not configurable. Packet Length The size of the packets in Bytes to send during the Link Capacity Test  Link Capacity Test page of BHM/BHS/SM The Link Capacity Test page of BHM/BHS is explained in Table 199.
Chapter 8:  Tools Using the Link Capacity Test tool   Page 8-31 Table 199 Link Capacity Test page attributes – BHM/BHS  Attribute Meaning Link Test Mode See Table 198 on page 8-29 Signal to Noise Ratio Calculation during Link Test See Table 198 on page 8-29 Link Test VC Priority See Table 198 on page 8-29 Duration  See Table 198 on page 8-29 Direction See Table 198 on page 8-29 Number of Packets See Table 198 on page 8-29 Packet Length See Table 198 on page 8-29
Chapter 8:  Tools Using AP Evaluation tool   Page 8-32 Using AP Evaluation tool The AP Evaluation tab on Tools web page of the SM provides information about the AP that the SM sees.   Note The data for this page may be suppressed by the SM Display of AP Evaluation Data setting in the Configuration > Security tab of the AP. The AP Eval results can be accessed via SNMP and config file. AP Evaluation page  The AP Evaluation page of AP is explained in Table 200. Table 200 AP Evaluation tab attributes - AP  Attribute Meaning Index  This field displays the index value that the system assigns (for only this page) to the AP where this SM is registered. Frequency  This field displays the frequency that the AP transmits. Channel Bandwidth The channel size used by the radio for RF transmission. The setting for the channel bandwidth must match between the AP and the SM.
Chapter 8:  Tools Using AP Evaluation tool   Page 8-33 Cyclic Prefix OFDM technology uses a cyclic prefix, where a portion of the end of a symbol (slot) is repeated at the beginning of the symbol to allow multi-pathing to settle before receiving the desired data. A 1/16 cyclic prefixes mean that for every 16 bits of throughput data transmitted, an additional bit is used. The Cyclic Prefix 1/16 only can be selected at this time. ESN This field displays the MAC address (electronic serial number) of the AP. For operator convenience during SM aiming, this tab retains each detected ESN for up to 15 minutes. If the broadcast frequency of a detected AP changes during a 15-minute interval in the aiming operation, then a multiple instance of the same ESN is possible in the list. Eventually, the earlier instance expires and disappears and the later instance remains to the end of its interval, but you can ignore the early instance(s) whenever two or more are present. Region  This field displays the AP’s configured Country Code setting. Power Level  This field displays the SM’s combined received power level from the AP’s transmission. Beacon Count A count of the beacons seen in a given time period. FECEn  This field contains the SNMP value from the AP that indicates whether the Forward Error Correction feature is enabled. 0: FEC is disabled 1: FEC is enabled Type  Multipoint indicates that the listing is for an AP. Age  This is a counter for the number of minutes that the AP has been inactive. At 15 minutes of inactivity for the AP, this field is removed from the AP Evaluation tab in the SM. Lockout  This field displays how many times the SM has been temporarily locked out of making registration attempts. RegFail This field displays how many registration attempts by this SM failed. Range  This field displays the distance in feet for this link. To derive the distance in meters, multiply the value of this parameter by 0.3048. MaxRange This field indicates the configured value for the AP’s Max Range parameter. TxBER  A 1 in this field indicates the AP is sending Radio BER. Ebcast A 1 in this field indicates the AP or BHM is encrypting broadcast packets. A 0 indicates it is not.
Chapter 8:  Tools Using AP Evaluation tool   Page 8-34 Session Count  This field displays how many sessions the SM (or BHS) has had with the AP (or BHM). Typically, this is the sum of Reg Count and Re-Reg Count. However, the result of internal calculation may display here as a value that slightly differs from the sum.  In the case of a multipoint link, if the number of sessions is significantly greater than the number for other SMs, then this may indicate a link problem or an interference problem. NoLUIDs  This field indicates how many times the AP has needed to reject a registration request from a SM because its capacity to make LUID assignments is full. This then locks the SM out of making any valid attempt for the next 15 minutes. It is extremely unlikely that a non-zero number would be displayed here. OutOfRange  This field indicates how many times the AP has rejected a registration request from a SM because the SM is a further distance away than the range that is currently configured in the AP. This then locks the SM out of making any valid attempt for the next 15 minutes. AuthFail  This field displays how many times authentication attempts from this SM have failed in the AP. EncryptFail  This field displays how many times an encryption mismatch has occurred between the SM and the AP. Rescan Req This field displays how many times a re-range request has occurred for the BHM that is being evaluated in the AP Eval page of a BHS. SMLimitReached This field displays 0 if additional SMs may be registered to the AP. If a 1 is displayed, the AP will not accept additional SM registrations. NoVC’s This counter is incremented when the SM is registering to an AP which determines that no VC resources are available for allocation. This could be a primary data VC or a high priority data VC. VCRsvFail This counter is incremented when the SM is registering to an AP which has a VC resource available for allocation but cannot reserve the resource for allocation. VCActFail This counter is incremented when the SM is registering to an AP which has a VC resource available for allocation and has reserved the VC, but cannot activate the resource for allocation. AP Gain This field displays the total external gain (antenna) used by the AP. RcvT This field displays the AP’s configured receive target for receiving SM transmissions (this field affects automatic SM power adjust). Sector ID This field displays the value of the Sector ID field that is provisioned for the AP.
Chapter 8:  Tools Using AP Evaluation tool   Page 8-35 Color Code This field displays a value from 0 to 254 indicating the AP’s configured color code. For registration to occur, the color code of the SM and the AP must match. Color code is not a security feature. Instead, color code is a management feature, typically for assigning each sector a different color code.  Color code allows you to force a SM to register to only a specific AP, even where the SM can communicate with multiple APs. The default setting for the color code value is 0. This value matches only the color code of 0 (not all 255 color codes). BeaconVersion This field indicates that the beacon is OFDM (value of 1). Sector User Count This field displays how many SMs are registered on the AP. NumULHalfSlots  This is the number of uplink slots in the frame for this AP.  NumDLHalfSlots  This is the number of downlink slots in the frame for this.  NumULContSlots  This field displays how many Contention Slots are being used in the uplink portion of the frame. WhiteSched  Flag to display if schedule whitening is supported via FPGA ICC This field lists the SMs that have registered to the AP with their Installation Color Code (ICC), Primary CC, Secondary CC or Tertiary CC. SM PPPoE This filed provides information to the user whether the SM is supporting PPPoE or not. Frame Period This field displays the configured Frame Period of the radio.
Chapter 8:  Tools Using BHM Evaluation tool   Page 8-36 Using BHM Evaluation tool The BHM Evaluation tab on Tools web page of the BHS provides information about the BHM that the BHS sees. BHM Evaluation page of BHS The BHM Evaluation page of BHS is explained in Table 201. Table 201 BHM Evaluation tab attributes - BHS  Attribute Meaning Index  This field displays the index value that the system assigns (for only this page) to the BHM where this BHS is registered. Frequency  This field displays the frequency that the BHM transmits. Channel Bandwidth The channel size used by the radio for RF transmission. The setting for the channel bandwidth must match between the BHM and the BHS.  Cyclic Prefix OFDM technology uses a cyclic prefix, where a portion of the end of a symbol (slot) is repeated at the beginning of the symbol to allow multi-pathing to settle before receiving the desired data. A 1/16 cyclic prefixes mean that for every 16 bits of throughput data transmitted, an additional bit is used.
Chapter 8:  Tools Using BHM Evaluation tool   Page 8-37 ESN This field displays the MAC address (electronic serial number) of the BHM. For operator convenience during BHS aiming, this tab retains each detected ESN for up to 15 minutes. If the broadcast frequency of a detected BHM changes during a 15-minute interval in the aiming operation, then a multiple instance of the same ESN is possible in the list. Eventually, the earlier instance expires and disappears and the later instance remains to the end of its interval, but you can ignore the early instance(s) whenever two or more are present. Region  This field displays the BHM’s configured Country Code setting. Power Level  This field displays the BHS’s combined received power level from the BHM’s transmission. Beacon Count A count of the beacons seen in a given time period. FECEn  This field contains the SNMP value from the BHM that indicates whether the Forward Error Correction feature is enabled. 0: FEC is disabled 1: FEC is enabled Type  Multipoint indicates that the listing is for a BHM. Age  This is a counter for the number of minutes that the BHM has been inactive. At 15 minutes of inactivity for the BHS, this field is removed from the BHM Evaluation tab in the BHS. Lockout  This field displays how many times the BHS has been temporarily locked out of making registration attempts. RegFail This field displays how many registration attempts by this BHS failed. Range  This field displays the distance in feet for this link. To derive the distance in meters, multiply the value of this parameter by 0.3048. MaxRange This field indicates the configured value for the AP’s Max Range parameter. TxBER  A 1 in this field indicates the BHM is sending Radio BER. Ebcast A 1 in this field indicates the BHM is encrypting broadcast packets. A 0 indicates it is not. Session Count  This field displays how many sessions the BHS has had with the BHM. Typically, this is the sum of Reg Count and Re-Reg Count. However, the result of internal calculation may display here as a value that slightly differs from the sum.  In the case of a multipoint link, if the number of sessions is significantly greater than the number for other BHS’s, then this may indicate a link problem or an interference problem.
Chapter 8:  Tools Using BHM Evaluation tool   Page 8-38 NoLUIDs  This field indicates how many times the BHM has needed to reject a registration request from a BHS because its capacity to make LUID assignments is full. This then locks the BHS out of making any valid attempt for the next 15 minutes. It is extremely unlikely that a non-zero number would be displayed here. OutOfRange  This field indicates how many times the BHM has rejected a registration request from a BHS because the BHS is a further distance away than the range that is currently configured in the BHM. This then locks the BHS out of making any valid attempt for the next 15 minutes. AuthFail  This field displays how many times authentication attempts from this SM have failed in the BHM. EncryptFail  This field displays how many times an encryption mismatch has occurred between the BHS and the BHM. Rescan Req This field displays how many times a re-range request has occurred for the BHM that is being evaluated in the BHM Eval page of a BHM. SMLimitReached This field displays 0 if additional BHSs may be registered to the BHM. If a 1 is displayed, the BHM will not accept additional BHS registrations. NoVC’s This counter is incremented when the BHS is registering to a BHM which determines that no VC resources are available for allocation. This could be a primary data VC or a high priority data VC. VCRsvFail This counter is incremented when the BHS is registering to a BHM which has a VC resource available for allocation but cannot reserve the resource for allocation. VCActFail This counter is incremented when the BHS is registering to a BHM which has a VC resource available for allocation and has reserved the VC, but cannot activate the resource for allocation. AP Gain This field displays the total external gain (antenna) used by the BHM. RcvT This field displays the AP’s configured receive target for receiving BHS transmissions (this field affects automatic BHS power adjust). Sector ID This field displays the value of the Sector ID field that is provisioned for the BHM. Color Code This field displays a value from 0 to 254 indicating the BHM’s configured color code. For registration to occur, the color code of the BHS and the BHM must match. Color code is not a security feature. Instead, color code is a management feature, typically for assigning each sector a different color code.  Color code allows you to force a BHS to register to only a specific BHM, even where the BHS can communicate with multiple BHMs. The default setting for the color code value is 0. This value matches only the color code of 0 (not all 255 color codes).
Chapter 8:  Tools Using BHM Evaluation tool   Page 8-39 BeaconVersion This field indicates that the beacon is OFDM (value of 1). Sector User Count This field displays how many BHS’s are registered on the BHM. NumULHalfSlots  This is the number of uplink slots in the frame for this BHM.  NumDLHalfSlots  This is the number of downlink slots in the frame for this.  NumULContSlots  This field displays how many Contention Slots are being used in the uplink portion of the frame. WhiteSched  Flag to display if schedule whitening is supported via FPGA ICC This field lists the BHSs that have registered to the BHM with their Installation Color Code (ICC), Primary CC, Secondary CC or Tertiary CC. SM PPPoE This filed provides information to the user whether the BHS is supporting PPPoE or not. Frame Period This field displays the configured Frame Period of the radio.
Chapter 8:  Tools Using the OFDM Frame Calculator tool   Page 8-40 Using the OFDM Frame Calculator tool The first step to avoid interference in wireless systems is to set all APs/BHMs to receive timing from a synchronization source (Cluster Management Module, or Universal Global Positioning System). This ensures that the modules are in sync and start transmitting at the same time each frame. The second step to avoid interference is to configure parameters on all APs/BHMs of the same frequency band in proximity such that they have compatible transmit/receive ratios (all stop transmitting each frame before any start receiving). This avoids the problem of one AP/BHM attempting to receive the signal from a distant SM/BHS while a nearby AP transmits, which could overpower that signal. The following parameters on the AP determine the transmit/receive ratio: • Max Range • Frame Period • Downlink Data percentage • (reserved) Contention Slots If OFDM (PMP 430, PMP 450, PTP 230) and FSK (PMP 1x0) APs/BHMs of the same frequency band are in proximity, or if APs/BHMs set to different parameters (differing in their Max Range values, for example), then operator must use the Frame Calculator to identify compatible settings. The frame calculator is available on the Frame Calculator tab of the Tools web page. To use the Frame Calculator, type various configurable parameter values into the calculator for each proximal AP and then record the resulting AP/BHM Receive Start value. Next vary the Downlink Data percentage in each calculation and iterate until the calculated AP/BHM Receive Start for all collocated AP/BHMs where the transmit end does not come before the receive start. The calculator does not use values in the module or populate its parameters. It is merely a convenience application that runs on a module. For this reason, you can use any FSK module (AP, SM, BHM, BHS) to perform FSK frame calculations for setting the parameters on an FSK AP and any OFDM module (AP, SM, BHM, BHS) to perform OFDM frame calculations for setting the parameters on an OFDM AP/BHM. For more information on PMP/PTP 450 Platform co-location, see  http://www.cambiumnetworks.com/solution-papers  The co-location is also supported for 900 MHz PMP 450i APs (OFDM) and PMP 100 APs (FSK). Please refer Co-location of PMP 450 and PMP 100 systems in the 900 MHz band and migration recommendations document for details.
Chapter 8:  Tools Using the OFDM Frame Calculator tool   Page 8-41  Caution APs/BHMs that have slightly mismatched transmit-to-receive ratios and low levels of data traffic may see little effect on throughput. A system that was not tuned for co-location may work fine at low traffic levels, but encounter problems at higher traffic levels. The conservative practice is to tune for co-location before traffic ultimately increases. This prevents problems that occur as sectors are built. The OFDM Frame Calculator page is explained in Table 202. Table 202 OFDM Frame Calculator page attributes  Attribute Meaning Link Mode For AP to SM frame calculations, select Multipoint Link For BHM to BHS frame calculations, select Point-To-Point Link Platform Type AP/BHM Use the drop-down list to select the hardware series (board type) of the AP/BHM.
Chapter 8:  Tools Using the OFDM Frame Calculator tool   Page 8-42 Platform Type SM/BHS Use the drop-down list to select the hardware series (board type) of the SM/BHS. Channel Bandwidth Set this to the channel bandwidth used in the AP/BHM. Cyclic Prefix Set this to the cyclic prefix used in the AP/BHM. Max Range Set to the same value as the Max Range parameter is set in the AP(s) or BHM(s). Frame Period Set to the same value as the Frame Period parameter is set in the AP(s) or BHM(s). Downlink Data Initially set this parameter to the same value that the AP/BHM has for its Downlink Data parameter (percentage). Then, use the Frame Calculator tool procedure as described in Using the Frame Calculator on page 8-43, you will vary the value in this parameter to find the proper value to write into the Downlink Data parameter of all APs or BHMs in the cluster.  PMP 450 Platform Family APs or BHMs offer a range of 15% to 85% and default to 75%. The value that you set in this parameter has the following interaction with the value of the Max Range parameter (above): The default Max Range value is 5 miles and, at that distance, the maximum Downlink Data value (85% in PMP 450 Platform) is functional. Contention Slots This field indicates the number of (reserved) Contention Slots configured by the operator. Set this parameter to the value of the Contention Slot parameter is set in the APs or BHMs. SM/BHS One Way Air Delay This field displays the time in ns (nano seconds), that a SM/BHS is away from the AP/BHM.  The Calculated Frame Results display several items of interest: Table 203 OFDM Calculated Frame Results attributes Attribute Meaning Modulation  The type of radio modulation used in the calculation (OFDM for 450 Platform Family) Total Frame Bits The total number of bits used in the calculated frames Data Slots (Down/Up) This field is based on the Downlink Data setting. For example, a result within the typical range for a Downlink Data setting of 75% is 61/21, meaning 61 data slots down and 21 data slots up. Contention Slots This field indicates the number of (reserved) Contention Slots configured by the operator. Air Delay for Max Range This is the roundtrip air delay in bit times for the Max Range value set in the calculator
Chapter 8:  Tools Using the OFDM Frame Calculator tool   Page 8-43 Approximate distance for Max Range The Max Range value used for frame calculation AP Transmit End In bit times, this is the frame position at which the AP/BHM ceases transmission. AP Receive Start In bit times, this is the frame position at which the AP/BHM is ready to receive transmission from the SM/BHS. AP Receive End In bit times, this is the frame position at which the AP/BHM will cease receiving transmission from the SM/BHS. SM Receive End In bit times, this is the frame position at which the SM/BHS will cease receiving transmission from the AP/BHM. SM Transmit Start In bit times, this is the frame position at which the SM/BHS starts the transmission. SM One Way Air Delay This filed displays the time in ns, that SM/BHS is away from the AP/BHM. SM Approximate distance This field displays an approximate distance in miles (feet) that the SM/BHS is away from the AP/BHM.   To use the Frame Calculator to ensure that all APs or BHMs are configured to transmit and receive at the same time, follow the procedure below:  Procedure 34 Using the Frame Calculator 1 Populate the OFDM Frame Calculator parameters with appropriate values as described above. 2 Click the Calculate button. 3 Scroll down the tab to the Calculated Frame Results section 4 Record the value of the AP Receive Start field 5 Enter a parameter set from another AP in the system – for example, an AP in the same cluster that has a higher Max Range value configured. 6 Click the Calculate button. 7 Scroll down the tab to the Calculated Frame Results section 8 If the recorded values of the AP Receive Start fields are within 150 bit times of each other, skip to step 10.  If the recorded values of the AP Receive Start fields are not within 150 bit times of each other, modify the Downlink Data parameter until the calculated results for AP Receive Start are within 300 bit time of each other, if possible, 150 bit time.
Chapter 8:  Tools Using the OFDM Frame Calculator tool   Page 8-44 10 Access the Radio tab in the Configuration web page of each AP in the cluster and change its Downlink Data parameter (percentage) to the last value that was used in the Frame Calculator.
Chapter 8:  Tools Using the Subscriber Configuration tool   Page 8-45 Using the Subscriber Configuration tool The Subscriber Configuration page in the Tools page of the AP displays: • The current values whose control may be subject to the setting in the Configuration Source parameter. • An indicator of the source for each value. This page may be referenced for information on how the link is behaving based on where the SM is retrieving certain QoS and VLAN parameters.  Figure 192 SM Configuration page of AP  The AP displays one of the following for the configuration source: • (SM) – QoS/VLAN parameters are derived from the SM’s settings • (APCAP) – QoS/VLAN parameters are derived from the AP’s settings, including any keyed capping (for radios capped at 4 Mbps, 10 Mbps, or 20 Mbps) • (D) – QoS/VLAN parameters are retrieved from the device, due to failed retrieval from the AAA or WM server. • (AAA) – QoS/VLAN parameters are retrieved from the RADIUS server • (BAM) – QoS/VLAN parameters are retrieved from a WM BAM server
Chapter 8:  Tools Using the Link Status tool   Page 8-46 Using the Link Status tool The Link Status Tool displays information about the most-recent Link Test initiated on the SM or BHS. Link Tests initiated from the AP or BHM are not included in the Link Status table. This table is useful for monitoring link test results for all SMs or BHS in the system. The Link Status table is color coded to display health of link between AP/BHM and SM/BHS. The current Modulation Level Uplink/Downlink is chosen to determine link health and color coded accordingly. Uplink/Downlink Rate Column will be color coded using current Rate as per the table below: Table 204 Color code versus uplink/downlink rate column Actual Rate 1x 2x   3x 4x 6x 8x SISO RED ORANGE GREEN BLUE NA NA MIMO-A RED ORANGE GREEN BLUE NA NA MIMO B NA RED NA ORANGE GREEN BLUE  Link Status – AP/BHM The current Uplink Rate (both low and high VC) for each SM or BHS in Session in now available on AP or BHM Link Status Page.  The Link Status tool results include values for the following fields for AP/BHM.
Chapter 8:  Tools Using the Link Status tool   Page 8-47 Table 205 Link Status page attributes – AP/BHM  Attribute Meaning Subscriber  This field displays the LUID (logical unit ID), MAC address and Site Name of the SM. As each SM registers to the AP, the system assigns an LUID of 2 or a higher unique number to the SM. If a SM loses registration with the AP and then regains registration, the SM will retain the same LUID.    Note The LUID associated is lost when a power cycle of the AP occurs. Both the LUID and the MAC are hot links to open the interface to the SM. In some instances, depending on network activity and network design, this route to the interface yields a blank web page. If this occurs, refresh your browser view. Site Name indicates the name of the SM. You can assign or change this name on the Configuration web page of the SM. This information is also set into the sysName SNMP MIB-II object and can be polled by an SNMP management server.  Uplink Statistics - Power Level: Signal Strength Ratio This field represents the combined received power level at the AP/BHM as well as the ratio of horizontal path signal strength to vertical path signal strength.
Chapter 8:  Tools Using the Link Status tool   Page 8-48 Uplink Statistics – Fragments Modulation This field represents the percentage of fragments received at each modulation state, per path (polarization). Uplink Statistics – Signal to Noise Ratio This field represents the signal to noise ratio for the uplink (displayed when parameter Signal to Noise Ratio Calculation during Link Test is enabled) expressed for both the horizontal and vertical channels. Uplink Statistics – Link Test Efficiency This field displays the efficiency of the radio link, expressed as a percentage, for the radio uplink. Downlink Statistics – Beacon % Received Curr/Min/Max/Avg This field displays a count of beacons received by the SM in percentage. This value must be between 99-100%. If it is lower than 99%, it indicates a problematic link. This statistic is updated every 16 seconds. Downlink Statistics – Power Level: Signal Strength Ratio This field represents the received power level at the SM/BHS as well as the ratio of horizontal path signal strength to vertical path signal strength at the SM/BHS. Downlink Statistics – Signal to Noise Ratio This field represents the signal to noise ratio for the downlink (displayed when parameter Signal to Noise Ratio Calculation during Link Test is enabled) expressed for both the horizontal and vertical channels. Downlink Statistics – Link Test Efficiency This field displays the efficiency of the radio link, expressed as a percentage, for the radio downlink. Downlink Statistics – SU-MIMO Rate The SU-MIMO rate applies to all AP platforms. For 450m, this field indicates the rate being used for symbols where this particular VC is not being MU-MIMO grouped with other SMs.  For 450 and 450i platforms, there is no grouping and this field indicates the modulation rate for all symbols. Downlink Statistics – MU-MIMO Rate The MU-MIMO rate applies only to the 450m AP. This field indicates the modulation rate used for symbols where this particular low priority VC is MU-MIMO scheduled by grouping it in the same slot with other low priority VC’s. BER Results This field displays the over-the-air Bit Error Rates for each downlink. (The ARQ [Automatic Resend 8-48equest] ensures that the transport BER [the BER seen end-to-end through a network] is essentially zero.) The level of acceptable over-the-air BER varies, based on operating requirements, but a reasonable value for a good link is a BER of 1e-4 (1 x 10⁻⁴) or better, approximately a packet resend rate of 5%.  BER is generated using unused bits in the downlink. During periods of peak load, BER data is not updated as often, because the system puts priority on transport rather than on BER calculation.  Reg Requests A Reg Requests count is the number of times the SM/BHS registered after the AP/BHM determined that the link had been down.
Chapter 8:  Tools Using the Link Status tool   Page 8-49 If the number of sessions is significantly greater than the number for other SMs/BHS, then this may indicate a link problem (check mounting, alignment, receive power levels) or an interference problem (conduct a spectrum scan). ReReg Requests A ReReg Requests count is the number of times the AP/BHM received a SM/BHS registration request while the AP/BHM considered the link to be still up (and therefore did not expect registration requests). If the number of sessions is significantly greater than the number for other SMs/BHS, then this may indicate a link problem (check mounting, alignment, receive power levels) or an interference problem (conduct a spectrum scan).  Link Status – SM/BHS The Link Status tool of SM/BHS displays Downlink Status and Uplink Status information. Table 206 Link Status page attributes – SM/BHS  Attribute Meaning Downlink Status  Receive Power This field lists the current combined receive power level, in dBm. Signal Strength Ratio This field displays the difference of the Vertical path received signal power to the Horizontal path received signal power for downlink.
Chapter 8:  Tools Using the Link Status tool   Page 8-50 Signal to Noise Ratio This field lists the current signal-to-noise level, an indication of the separation of the received power level vs. noise floor for downlink. Beacons Displays a count of beacons received by the SM in percentage. This value must be typically between 99-100%. If lower than 99%, it indicates a problematic link. This statistic is updated every 16 seconds. Received Fragments Modulation This field represents the percentage of fragments received at each modulation state, per path (polarization) Latest Remote Link Test Efficiency Percentage This field is not applicable. BER Total Avg Results This field displays the over-the-air average Bit Error Rates (BER) for downlink. Beacons Received Last 15 minutes The beacon count on the SM can be used to estimate the interference in the channel. The min/avg/max beacon percentage displayed based on this value for the last 15 mins. Uplink Status  Transmit Power This field displays the current combined transmit power level, in dBm. Max Transmit Power This field displays the maximum transmit power of SM. Power Level This field indicates the combined power level at which the SM is set to transmit, based on the Country Code and Antenna Gain settings. Signal Strength Ratio This field displays the difference of the Vertical path received signal power to the Horizontal path received signal power for uplink. Signal to Noise Ratio This field lists the current signal-to-noise level, an indication of the separation of the received power level vs. noise floor for uplink. Latest Remote Link Test Efficiency Percentage This field is not applicable. Session Status This field displays the current state, Virtual channel, high-priority/ low priority channel rate adaptation and MIMO-A/MIMO-B/SISO status of SM. Spatial Frequency This filed displays the spatial frequency value of the VC or SM. Run Link Test  See Exploratory Test section of Performing Extrapolated Link Test on page 8-27
Chapter 8:  Tools Using BER Results tool   Page 8-51 Using BER Results tool Radio BER data represents bit errors at the RF link level. Due to CRC checks on fragments and packets and ARQ (Automatic Repeat 8-51equest), the BER of customer data is essentially zero. Radio BER gives one indication of link quality. Other important indications to consider includes the received power level, signal to noise ratio and link tests.  BER is only instrumented on the downlink and is displayed on the BER Results tab of the Tools page in any SM. Each time the tab is clicked, the current results are read and counters are reset to zero.  The BER Results tab can be helpful in troubleshooting poor link performance.  The link is acceptable if the value of this field is less than 10−4. If the BER is greater than 10−4, re-evaluate the installation of both modules in the link. The BER test signal is broadcast by the AP/BHM (and compared to the expected test signal by the SM/BHS) only when capacity in the sector allows it. This signal is the lowest priority for AP/BHM transmissions. Figure 193 BER Results tab of the SM
Chapter 8:  Tools  Using the Sessions tool   Page 8-52 Using the Sessions tool The PMP 450 Platform Family AP has a tab Sessions under the Tools category which allows operators to drop one or all selected SM sessions and force a SM re-registration. This operation is useful to force QoS changes for SMs without losing AP logs or statistics. This operation may take 5 minutes to regain all SM registrations. Figure 194 Sessions tab of the AP
Chapter 8:  Tools Using the Ping Test tool   Page 8-53 Using the Ping Test tool The PMP 450 Platform Family AP has a tab Ping Test under the Tools category which allows users to check the accessibility of the given IP V4 address or a valid domain name Figure 195 Ping Test tab of the AP   Note When a domain name (for example, www.google.com) is used for ping test, make sure that Preferred DNS Server and Alternate DNS Server parameters are configured in the Configuration > IP tab of the AP.
    Page 9-1   Chapter 9:  Operation This chapter provides instructions for operators of the 450 Platform Family wireless Ethernet Bridge. The following topics are described in this chapter: • System information on page 9-2 o Viewing General Status on page 9-2 o Viewing Session Status on page 9-20 o Viewing Remote Subscribers on page 9-29 o Interpreting messages in the Event Log on page 9-29 o Viewing the Network Interface on page 9-32 o Viewing the Layer 2 Neighbors on page 9-33 • System statistics on page 9-34 o Viewing the Scheduler statistics on page 9-34 o Viewing list of Registration Failures statistics on page 9-36 o Interpreting Bridging Table statistics on page 9-38 o Interpreting Translation Table statistics on page 9-38 o Interpreting Ethernet statistics on page 9-39 o Interpreting RF Control Block statistics on page 9-42 o Interpreting VLAN statistics on page 9-2 o Interpreting Data VC statistics on page 9-3 o Interpreting MIR/Burst statistics on page 9-5 o Interpreting Overload statistics on page 9-11 o Interpreting DHCP Relay statistics on page 9-13 o Interpreting Filter statistics on page 9-14 o Viewing ARP statistics on page 9-15 o Viewing NAT statistics on page 9-15 o Viewing NAT DHCP Statistics on page 9-17 o Interpreting Sync Status statistics on page 9-18 o Interpreting PPPoE Statistics for Customer Activities on page 9-19 o Interpreting Bridge Control Block statistics on page 9-21 o Interpreting Pass Through Statistics on page 9-24 o Interpreting SNMPv3 Statistics on page 9-25 o Interpreting syslog statistics on page 9-27 o Interpreting Frame Utilization statistics on page 9-27 • Radio Recovery  on page 9-39
Chapter 9:  Operation System information   Page 9-2 System information This section describes how to use the summary and status pages to monitor the status of the Ethernet ports and wireless link. • Viewing General Status on page 9-2 • Viewing Session Status on page 9-20 • Viewing Remote Subscribers on page 9-29 • Interpreting messages in the Event Log on page 9-29 • Viewing the Network Interface on page 9-32 • Viewing the Layer 2 Neighbors on page 9-33  Viewing General Status The General Status tab provides information on the operation of this AP/BHM and SM/BHS. This is the page that opens by default when you access the GUI of the radio.
Chapter 9:  Operation System information   Page 9-3 General Status page of AP The General Status page of PMP 450m AP is explained in Table 207 The General Status page of PMP 450/450i AP is explained in Table 208. Table 207 General Status page attributes – PMP 450m AP
Chapter 9:  Operation System information   Page 9-4  Attribute Meaning Device Type This field indicates the type of the module. Values include the frequency band of the device, its module type and its MAC address. Board Type  This field indicates the series of hardware.  Software Version This field indicates the system release, the time and date of the release and whether communications involving the module are secured by DES or AES encryption. If you request technical support, provide the information from this field. Bootloader Version This field indicates the version of Uboot running on the 450m AP platform.  Product Type The field indicates model number of 450m device. The 450m Series has two model variants. • PMP 450m: This model works in SU-MIMO mode which is default “limited” mode. The MU-MIMO license can be purchased from Cambium Networks and applied. • MU-MIMO: This model works in MU-MIMO mode. Board MSN This field indicates the Manufacture’s Serial number. A unique serial number assigned to each radio at the factory for inventory and quality control. FPGA Version This field indicates the version of the field-programmable gate array (FPGA) on the module. If you request technical support, provide the value of this field. Uptime  This field indicates how long the module has operated since power was applied. System Time This field provides the current time. If the AP is connected to a CMM4, then this field provides GMT (Greenwich Mean Time). Any SM that registers to the AP inherits the system time. Last NTP Time Update This field displays when the AP last used time sent from an NTP server. If the AP has not been configured in the Time tab of the Configuration page to request time from an NTP server, then this field is populated by 00:00:00 00/00/00.
Chapter 9:  Operation System information   Page 9-5 Main Ethernet Interface This field indicates the speed and duplex state of the Ethernet interface to the AP.  Aux Ethernet Interface This field displays Aux Ethernet Data and PoE-out interface enable/disable status. It is not supported in current release of PMP 450m Seriea AP. Region Code A parameter that offers multiple fixed selections, each of which automatically implements frequency band range for the selected region. Units shipped to regions other than restrictions the United States must be configured with the corresponding Region Code to comply with local regulatory requirements. Regulatory  This field indicates whether the configured Country Code and radio frequency are compliant with respect to their compatibility. 450 Platform Family products shipped to the United States is locked to a Country Code setting of “United States”. Units shipped to regions other than the United States must be configured with the corresponding Country Code to comply with local regulatory requirements. Channel Frequency This field indicates the current operating center frequency, in MHz. Channel Bandwidth This field indicates the current size of the channel band used for radio transmission. Cyclic Prefix OFDM technology uses a cyclic prefix, where a portion of the end of a symbol (slot) is repeated at the beginning of the symbol to allow multi-pathing to settle before receiving the desired data. A 1/16 cyclic prefix means that for every 16 bits of throughput data transmitted, an additional bit is used. Frame Period This field indicates the current Frame Period setting of the radio in ms. Color Code This field displays a value from 0 to 254 indicating the AP’s configured color code. For registration to occur, the color code of the SM and the AP must match. Color code is not a security feature. Instead, color code is a management feature, typically for assigning each sector a different color code.  Color code allows you to force a SM to register to only a specific AP, even where the SM can communicate with multiple APs. The default setting for the color code value is 0. This value matches only the color code of 0 (not all 255 color codes). Max Range This field indicates the setting of the Max Range parameter, which contributes to the way the radio transmits. Verify that the Max Range parameter is set to a distance slightly greater than the distance between the AP and the furthest SM that must register to this AP. EIRP This field indicates the combined power level at which the AP will transmit, based on the Country Code.
Chapter 9:  Operation System information   Page 9-6 Temperature  This field indicates the current operating temperature of the device board. Registered SM Count This field indicates how many SMs are registered to the AP. Sync Pulse Status  This field indicates the status of synchronization as follows: Generating Sync indicates that the module is set to generate the sync pulse. Receiving Sync indicates that the module is set to receive a sync pulse from an outside source and is receiving the pulse. No Sync Since Boot up / ERROR: No Sync Pulse indicates that the module is set to receive a sync pulse from an outside source and is not receiving the pulse.  Note When this message is displayed, the AP transmitter is turned off to avoid self-interference within the system.  Sync Pulse Source This field indicates the status of the synchronization source: Searching indicates that the unit is searching for a GPS fix Timing Port/UGPS indicates that the module is receiving sync via the timing AUX/SYNC timing port Power Port indicates that the module is receiving sync via the power port (Ethernet port). On-board GPS indicates that the module is receiving sync via the unit’s internal GPS module Maximum Count of Registered SMs This field displays the largest number of SMs that have been simultaneously registered in the AP since it was last rebooted. This count can provide some insight into sector history and provide comparison between current and maximum SM counts at a glance. Data Slots Down This field indicates the number of frame slots that are designated for use by data traffic in the downlink (sent from the AP to the SM). The AP calculates the number of data slots based on the Max Range, Downlink Data and (reserved) Contention Slots configured by the operator.  Data Slots Up  This field indicates the number of frame slots that are designated for use by data traffic in the uplink (sent from the SM to the AP). The AP calculates the number of data slots based on the Max Range, Downlink Data and (reserved) Contention Slots configured by the operator.  Contention Slots This field indicates the number of (reserved) Contention Slots configured by the operator. See Contention slots on page7-178. Connection Status This field indicates the device connectivity to cnMaestro (Cambium’s cloud-based network management system).
Chapter 9:  Operation System information   Page 9-7 Account ID This field shows Account ID which is registered with Cambium Networks and it allows operator to manage devices using cnMaestro.  Site Name This field indicates the name of the physical module. You can assign or change this name in the SNMP tab of the AP Configuration page. This information is also set into the sysName SNMP MIB-II object and can be polled by an SNMP management server.  Site Contact  This field indicates contact information for the physical module. You can provide or change this information in the SNMP tab of the AP Configuration page. This information is also set into the sysName SNMP MIB-II object and can be polled by an SNMP management server. Site Location This field indicates site information for the physical module. You can provide or change this information in the SNMP tab of the AP Configuration page. MU-MIMO Mode This field displays information about MU-MIMO mode. If AP is keyed as MU-MIMO, it will display “MU-MIMO”(Multi User - MIMO) otherwise it will display “SU-MIMO”(Single User - MIMO).  Time Updated and Location Code This field displays information about the keying of the radio.
Chapter 9:  Operation System information   Page 9-8 Table 208 General Status page attributes – PMP 450/450i AP     Attribute Meaning Device Type See Table 207 General Status page attributes – PMP 450m AP on page 9-3 for details Software Version Board Type See Table 207 General Status page attributes – PMP 450m AP on page 9-3 for details
Chapter 9:  Operation System information   Page 9-9 Product Type This indicates model of the device.  FPGA Version See Table 207 General Status page attributes – PMP 450m AP on page 9-3 for details  PLD Version Uptime System Time Main Ethernet Interface Aux Ethernet Interface It is not supported for PMP 450 Series devices. See Table 207 General Status page attributes – PMP 450m AP on page 9-3 for details Region Code See Table 207 General Status page attributes – PMP 450m AP on page 9-3 for details Regulatory Antenna Type Channel Center Frequency Channel Bandwidth Cyclic Prefix Frame Period Color Code Max Range Transmitter Output Power This field indicates the combined power level at which the AP is set to transmit, based on the Country Code and Antenna Gain settings.  Temperature  See Table 207 General Status page attributes – PMP 450m AP on page 9-3 for details 802.3at Type 2 PoE Status The field displays whether PoE Classification functionality is enabled or disabled. It is only applicable for 450i Series devices. Registered SM Count See Table 207 General Status page attributes – PMP 450m AP on page 9-3 for details      Sync Pulse Status Sync Pulse Source Maximum Count of Registered SMs Data Slots Down Data Slots Up
Chapter 9:  Operation System information   Page 9-10 Contention Slots Connection Status Account ID See Table 207 General Status page attributes – PMP 450m AP on page 9-3 for details    Site Name Site Contact Site Location Time Updated and Location Code
Chapter 9:  Operation System information   Page 9-11 General Status page - SM The SM’s General Status page is explained in Table 209.   Note In order for accurate power level readings to be displayed, traffic must be present on the radio link. Table 209 General Status page attributes - SM  Attribute Meaning Device Type  This field indicates the type of the module. Values include the frequency band of the SM, its module type and its MAC address.
Chapter 9:  Operation System information   Page 9-12 Board Type This field indicates the series of hardware.  Product Type This indicates model of the device.  Software Version This field indicates the system release, the time and date of the release. If you request technical support, provide the information from this field. FPGA Version This field indicates the version of the field-programmable gate array (FPGA) on the module. When you request technical support, provide the information from this field. PLD Version This field indicates the version of the programmable logic device (PLD) on the module. If you request technical support, provide the value of this field. Uptime  This field indicates how long the module has operated since power was applied. System Time This field provides the current time. Any SM that registers to an AP inherits the system time, which is displayed in this field as GMT (Greenwich Mean Time). Ethernet Interface This field indicates the speed and duplex state of Ethernet interface to the SM.  Regional Code  A parameter that offers multiple fixed selections, each of which automatically implements frequency band range restrictions for the selected region. Units shipped to regions other than the United States must be configured with the corresponding Country Code to comply with local regulatory requirements. DFS This field indicates that DFS operation is enabled based on the configured region code, if applicable. Antenna Type The current antenna type that has been selected.  Frame Period This field indicates the current Frame Period setting of the radio in ms. Temperature  The current operating temperature of the board. Session Status  This field displays the following information about the current session: Scanning indicates that this SM currently cycles through the radio frequencies that are selected in the Radio tab of the Configuration page. Syncing indicates that this SM currently attempts to receive sync.  Registering indicates that this SM has sent a registration request message to the AP and has not yet received a response. Registered indicates that this SM is both: • registered to an AP. • ready to transmit and receive data packets. Session Uptime This field displays the duration of the current link. The syntax of the displayed time is hh:mm:ss.
Chapter 9:  Operation System information   Page 9-13 Registered AP Displays the MAC address and site name of the AP to which the SM is registered to. This parameter provides click-through proxy access to the AP’s management interface. Color Code This field displays a value from 0 to 254 indicating the SM’s configured color code. For registration to occur, the color code of the SM and the AP must match. Color code is not a security feature. Instead, color code is a management feature, typically for assigning each sector a different color code.  Color code allows you to force a SM to register to only a specific AP, even where the SM can communicate with multiple APs. The default setting for the color code value is 0. This value matches only the color code of 0 (not all 255 color codes). Channel Frequency This field lists the current operating frequency of the radio. Channel Bandwidth The size in MHz of the operating channel. Cyclic Prefix OFDM technology uses a cyclic prefix, where a portion of the end of a symbol (slot) is repeated at the beginning of the symbol to allow multi-pathing to settle before receiving the desired data. A 1/16 cyclic prefix means that for every 16 bits of throughput data transmitted, an additional bit is used. Air Delay This field displays the distance in feet between this SM and the AP. To derive the distance in meters, multiply the value of this parameter by 0.3048. Distances reported as less than 200 feet (61 meters) are unreliable. Receive Power This field lists the current combined receive power level, in dBm. Signal Strength Ratio This field displays the difference of the Vertical path received signal power to the Horizontal path received signal power. Signal to Noise Ratio This field lists the current signal-to-noise level, an indication of the separation of the received power level vs. noise floor. Beacons Displays a count of beacons received by the SM in percentage. This value must be typically between 99-100%. If lower than 99%, it indicates a problematic link. This statistic is updated every 16 seconds. Transmit Power This field lists the current combined transmit power level, in dBm.  Note The red SM message “target power exceeded maximum” does not necessarily indicate a problem.
Chapter 9:  Operation System information   Page 9-14 In this case, the AP is requesting the SM to transmit at a higher power level, but the SM is restricted due to EIRP limits or hardware capabilities.  This message can be an indication that the SM is deployed further from the AP than optimal, causing the AP to adjust the SM to maximum transmit power.  Data Slots Down This field lists the number of slots used for downlink data transmission. Data Slots Up  This field lists the number of slots used for uplink data transmission. Contention Slots This field indicates the number of (reserved) Contention Slots configured by the operator. See Contention slots on page7-178. Site Name This field indicates the name of the physical module. You can assign or change this name in the SNMP tab of the SM Configuration page. This information is also set into the sysName SNMP MIB-II object and can be polled by an SNMP management server.  Site Contact This field indicates contact information for the physical module. You can provide or change this information in the SNMP tab of the SM Configuration page. This information is also set into the sysName SNMP MIB-II object and can be polled by an SNMP management server. Site Location This field indicates site information for the physical module. You can provide or change this information in the SNMP tab of the SM Configuration page. Maximum Throughput This field indicates the limit of aggregate throughput for the SM and is based on the default (factory) limit of the SM and any floating license that is currently assigned to it. Time Updated and Location Code This field displays information about the keying of the radio.   Note For PMP 450 SM 900 MHz, there is additional parameter Path Info (under Subscriber Module Stats) which displays polarization path(A & B) information.
Chapter 9:  Operation System information   Page 9-15 General Status page of BHM The BHM’s General Status page is explained in Table 210. Table 210 General Status page attributes - BHM  Attribute Meaning Device Type  This field indicates the type of the module. Values include the frequency band of the BHM, its module type and its MAC address. Board Type This field indicates the series of hardware.  Product Type This indicates model of the device.
Chapter 9:  Operation System information   Page 9-16 Software Version This field indicates the system release, the time and date of the release. If you request technical support, provide the information from this field. Board MSN This field indicates the Manufacture’s Serial number. A unique serial number assigned to each radio at the factory for inventory and quality control. FPGA Version This field indicates the version of the field-programmable gate array (FPGA) on the module. When you request technical support, provide the information from this field. Uptime  This field indicates how long the module has operated since power was applied. System Time This field provides the current time. Any BHS that registers to a BHM inherits the system time, which is displayed in this field as GMT (Greenwich Mean Time). Ethernet Interface This field indicates the speed and duplex state of Ethernet interface to the BHM.  Antenna Type The current antenna type that has been selected.  Temperature  The current operating temperature of the board. Session Status  This field displays the following information about the current session: Scanning indicates that this BHS currently cycles through the radio frequencies that are selected in the Radio tab of the Configuration page. Syncing indicates that this BHM currently attempts to receive sync.  Registering indicates that this BHM has sent a registration request message to the BHM and has not yet received a response. Registered indicates that this BHM is both: • Registered to a BHM. • Ready to transmit and receive data packets. Session Uptime This field displays the duration of the current link. The syntax of the displayed time is hh:mm:ss. Registered Backhaul  Displays the MAC address and site name of the BHM to which the BHS is registered to. This parameter provides click-through proxy access to the BHM’s management interface. Channel Frequency This field lists the current operating frequency of the radio. Receive Power This field lists the current combined receive power level, in dBm. Signal Strength Ratio This field displays the difference of the Vertical path received signal power to the Horizontal path received signal power. Transmit Power This field lists the current combined transmit power level, in dBm.
Chapter 9:  Operation System information   Page 9-17 Signal to Noise Ratio This field lists the current signal-to-noise level, an indication of the separation of the received power level vs. noise floor. Beacons Displays a count of beacons received by the BHM in percentage. This value must be typically between 99-100%. If lower than 99%, it indicates a problematic link. This statistic is updated every 16 seconds. Air Delay This field displays the distance in feet between this BHS and the BHM. To derive the distance in meters, multiply the value of this parameter by 0.3048. Distances reported as less than 200 feet (61 meters) are unreliable. Data Slots Down This field lists the number of slots used for downlink data transmission. Data Slots Up This field lists the number of slots used for uplink data transmission. Regional Code  A parameter that offers multiple fixed selections, each of which automatically implements frequency band range restrictions for the selected region. Units shipped to regions other than the United States must be configured with the corresponding Country Code to comply with local regulatory requirements. Site Name This field indicates the name of the physical module. Assign or change this name in the Configuration > SNMP page. This information is also set into the sysName SNMP MIB-II object and can be polled by an SNMP management server.
Chapter 9:  Operation System information   Page 9-18 General Status page of BHS The BHS’s General Status page is explained in Table 211. Table 211 General Status page attributes - BHS
Chapter 9:  Operation System information   Page 9-19 Attribute Meaning Device Type  See Table 211 on page 9-18 Board Type Software Version Board MSN FPGA Version Uptime See Table 211 on page 9-18 System Time Ethernet Interface Antenna Type Temperature Session Status Session Uptime Registered Backhaul Channel Frequency Receive Power Signal Strength Ratio Transmit Power Signal to Noise Ratio Beacons Air Delay Data Slots Down Data Slots Up Regional Code Site Name Site Contact Site Location Time Updated and Location Code
Chapter 9:  Operation System information   Page 9-20 Viewing Session Status  The Session Status page in the Home page provides information about each SM or BHS that has registered to the AP or BHM. This information is useful for managing and troubleshooting a system. This page also includes the current active values on each SM or BHS for MIR and VLAN, as well as the source of these values, representing the SM/BHS itself, Authentication Server, or the Authentication Server and SM/BHS.  Note In order for accurate power level readings to be displayed, traffic must be present on the radio link.  The Session Status List has four tab: Device, Session, Power and Configuration. The SessionStatus.xml hyper link allows user to export session status page from web management interface of AP or BHM. The session status page will be exported in xml file.  Device tab The Device tab provides information on the Subscriber’s LUID and MAC, Hardware, Software, FPGA versions and the state of the SM/BHS (Registered and/or encrypted). Table 212 Device tab attributes  Attribute Meaning Subscriber  This field displays the LUID (logical unit ID), MAC address and Site Name of the SM/BHS. As each SM or BHS registers to the AP/BHM, the system assigns an LUID of 2 or a higher unique number to the SM/BHS. If a SM/BHS loses registration with the AP/BHS and then regains registration, the SM/BHS will retain the same LUID.   Note The LUID associated is lost when a power cycle of the AP/BHM occurs.
Chapter 9:  Operation System information   Page 9-21 Both the LUID and the MAC are hot links to open the interface to the SM/BHS. In some instances, depending on network activity and network design, this route to the interface yields a blank web page. If this occurs, refresh your browser view. Site Name indicates the name of the SM/BHS. Change this name on the Configuration web page of the SM/BHS. This information is also set into the sysName SNMP MIB-II object and can be polled by an SNMP management server. Hardware  This field displays the SMs or BHS hardware type.  Software Version This field displays the software release that operates on the SM/BHS, the release date and time of the software. FPGA Version This field displays the version of FPGA that runs on the SM/BHS State  This field displays the current status of the SM/BHS as either • IN SESSION to indicate that the SM/BHS is currently registered to the AP/BHM. • IDLE to indicate that the SM/BHS was registered to the AP/BHM at one time, but now is not. This field also indicates whether the encryption scheme in the module is enabled.  Session tab The Session tab provides information on the SMs or BHS Session Count, Reg Count, Re-Reg Count, Uptime, Air delay, PPPoE State and Timeouts. Table 213 Session tab attributes  Attribute Meaning Subscriber  See Table 212 on page 9-20. Count  This field displays how many sessions the SM/BHS has had with the AP/BHM. Typically, this is the sum of Reg Count and Re-Reg Count. However, the result of internal calculation may display here as a value that slightly differs from the sum.
Chapter 9:  Operation System information   Page 9-22 If the number of sessions is significantly greater than the number for other SMs or BHS, then this may indicate a link problem or an interference problem. Reg Count When a SM/BHS makes a Registration Request, the AP/BHM checks its local session database to see whether it was registered earlier. If the AP/BHM concludes that the SM/BHS is not currently in session database and it is valid Registration Request, then the request increments the value of this field. In ideal situation, the Reg Count indicates total number of connected SMs to an AP.   Note The user can clear Reg Count by dropping all current sessions of SM (or BHS) from Configuration > Tools > Sessions menu.  Re-Reg Count  When a SM/BHS makes a Registration Request, the AP/BHM checks its local session database to see whether it was registered earlier. If the AP/BHM concludes that the SM/BHS is currently in session database, then the request increments the value of this field.  Typically, a Re-Reg is the case where both: • SM/BHS attempts to reregister for having lost communication with the AP/BHM. • AP/BHM has not yet observed the link to the SM/BHS as being down. It is possible for a small period of time if there is no downlink traffic and AP/BHM still assumes the session is up, but the SM/BHS, loses session and quickly re-connects before the AP/BHM knew the session had dropped. This is how a re-registration happens. If the number of sessions is significantly greater than the number for other SMs or BHS, then this may indicate a link problem (check mounting, alignment, receive power levels) or an interference problem (conduct a spectrum scan). Uptime  Once a SM/BHS successfully registers to an AP/BHM, this timer is started. If a session drops or is interrupted, this timer is reactivated once re-registration is complete. CC Priority The field displays Color Code Priority (ICC, Primary, Secondary or Tertiary) of all connected SM. AirDelay This field displays the distance of the SM/BHS from the AP/BHM in meters, nanoseconds and bits. At close distances, the value in this field is unreliable. PPPoE state This field displays the current PPPoE state (whether configured) of the SM/BHS.
Chapter 9:  Operation System information   Page 9-23 Timeout  This field displays the timeout in seconds for management sessions via HTTP, ftp access to the SM/BHS. 0 indicates that no limit is imposed.  Power tab Table 214 Power tab attributes  Attribute Meaning Subscriber  See Table 212 on page 9-20. Hardware  This field displays the SMs or BHS hardware type.  Downlink Rate  SU-MIMO This field displays whether the high-priority channel is enabled in the SM/BHS and the status of rate adapt. For example, if “8X/4X” is listed, the radio is capable of operating at 8X but is currently operating at 4X, due to RF conditions. This field also states whether it is MIMO-A or MIMO-B radio e.g. “8X/8X MIMO-B” indicates MIMO-B and “8X/4X MIMO-A” indicates MIMO-A. A VC starts at its lowest modulation and slowly rate adapts up, as traffic is successfully transmitted over the VC. It is normal for one VC to have a different modulation rate than another VC, if only one VC has traffic on it. For example if High Priority VC is enabled, but only low priority VC has traffic the reading will show: REGISTERED VC 18 Rate 8X/8X MIMO-B VC 255 Rate 8X/1X MIMO-B Note: The SU-MIMO rate applies to all AP platforms. For 450m, this field indicates the rate being used for symbols where this particular VC is not being MU-MIMO grouped with other SM’s. Downlink Rate  MU-MIMO The MU-MIMO rate applies only to the 450m AP. This rate indicates the modulation used for symbols where this particular low priority VC is MU-MIMO scheduled, by grouping it in the same slot with other low priority VC’s AP Rx Power (dBm) This field indicates the AP’s or BHM’s combined receive power level for the listed SM/BHS.
Chapter 9:  Operation System information   Page 9-24 Signal Strength Ratio (dB) This field displays the ratio of the Vertical path received signal power to the Horizontal path received signal power. This ratio can be useful for determining multipathing conditions (high vertical to horizontal ratio) for Uplink. Signal to Noise Ratio (dB) This field lists the current signal-to-noise level, an indication of the separation of the received power level vs. noise floor. In other words, it indicates signal to noise ratio for Uplink.
Chapter 9:  Operation System information   Page 9-25 Configuration tab The Configuration tab provides information on the SMs or BHS Uplink or Downlink (UL/DL) Sustained Data Rate, UL/DL Burst Allocation, UL/DL Burst Rate, UL/DL Low Priority CIR, UL/DL High CIR, UL/DL High Priority Queue Information and the UL/DL Broadcast or Multicast Allocation. This data is refreshed based on the Web Page Auto Update setting on the AP’s or BHS’s General Configuration page.  Table 215 Configuration tab attributes  Attribute Meaning Subscriber  See Table 212 on page 9-20. Sustained Data Rate Cap (kbps) This field specifies the maximum sustained data rate between SM/BHS and AP/BHM. If this field displays “Uncapped”, then there is no limit set for data rate. If this field displays 4000, then the maximum sustained data rate between SM/BHS and AP/BHM is limited to 4000 kbps. Sustained Data Rate (kbps) - Uplink This field displays the value that is currently in effect for the SM/BHS, with the source of that value in parentheses. This is the specified rate at which each SM/BHS registered to this AP/BHM is replenished with credits for transmission. The configuration source of the value is indicated in parentheses.  See Maximum Information Rate (MIR) Parameters on page 7-201. Sustained Data Rate (kbps) - Downlink This field displays the value that is currently in effect for the SM/BHS, with the source of that value in parentheses. This is the specified the rate at which the AP/BHM should be replenished with credits (tokens) for transmission to each of the SMs/BHS’s in its sector. The configuration source of the value is indicated in parentheses.  See Maximum Information Rate (MIR) Parameters on page 7-201.
Chapter 9:  Operation System information   Page 9-26 Burst Allocation (kbit) - Uplink This field displays the value that is currently in effect for the SM/BHS, with the source of that value in parentheses. This is the specified maximum amount of data that each SM/BHS is allowed to transmit before being recharged at the Sustained Uplink Data Rate with credits to transmit more. The configuration source of the value is indicated in parentheses.  See Interaction of Burst Allocation and Sustained Data Rate Settings on page 7-203 Burst Allocation (kbit) - Downlink This field displays the value that is currently in effect for the SM/BHS, with the source of that value in parentheses. This is the specified the rate at which the AP/BHM should be replenished with credits (tokens) for transmission to each of the SMs/BHS’s in its sector. The configuration source of the value is indicated in parentheses.  See Interaction of Burst Allocation and Sustained Data Rate Settings on page 7-203 Max Burst Rate (kbit) - Uplink The data rate at which an SM/BHS is allowed to burst (until burst allocation limit is reached) before being recharged at the Sustained Uplink Data Rate with credits to transit more. When set to 0 (default), the burst rate is unlimited. See Interaction of Burst Allocation and Sustained Data Rate Settings on page 7-203 Max Burst Rate (kbit) - Downlink The data rate at which an SM/BHS is allowed to burst (until burst allocation limit is reached) before being recharged at the Sustained Downlink Data Rate with credits to transit more. When set to 0 (default), the burst rate is unlimited.  See Interaction of Burst Allocation and Sustained Data Rate Settings on page 7-203 Low Priority CIR This field indicates the minimum rate at which low priority traffic is sent over the uplink and downlink (unless CIR is oversubscribed or RF link quality is degraded). High CIR This field indicates the minimum rate at which high priority traffic is sent over the uplink and downlink (unless CIR is oversubscribed or RF link quality is degraded).  Broadcast/Multicast Allocation This field displays the data rate at which Broadcast and Multicast traffic is sent via the radio link.  RADIUS Authentication Reply This field displays whether RADIUS server is reachable or not.
Chapter 9:  Operation System information   Page 9-27 RADIUS Authentication Server This field displays the associated RADIUS Authentication Server for each SM where it was authenticated. This information is useful when there are multiple RADIUS servers (maximum three servers supported by Cambium). If one server is not reachable, other configured servers are tried in sequential order as a fall-back. In this scenario, the Session Status is useful to identify associate RADIUS Authentication Server for all connected SMs.  Table 216 Session Status > Configuration CIR configuration denotations Attribute Meaning (SM) QoS/VLAN parameters are derived from the SM’s/BHS’s settings (APCAP) QoS/VLAN parameters are derived from the AP’s settings, including any keyed capping (for radios capped at 4 Mbps, 10 Mbps, or 20 Mbps) (D) QoS/VLAN parameters are retrieved from the device, due to failed retrieval from the AAA or WM server. (AAA) QoS/VLAN parameters are retrieved from the RADIUS server (BAM) QoS/VLAN parameters are retrieved from a WM BAM server
Chapter 9:  Operation System information   Page 9-28 Link Quality tab The Link Quality tab provides information on the Subscriber’s UID, Link quality, Downlink, Uplink, Beacon, ReReg, and the Uptime. This data is refreshed based on the Link Quality Update Interval parameter configuration under the Sessions Status page.   The Link Quality tab displays the calculated Link Quality Indicator (LQI) for the configured interval (Link Quality Update Interval parameter). Table 217 Link Quality tab attributes   Attribute Meaning Subscriber  See Table 212 on page 9-20. Link Quality Indicator This field displays quality of the link. It is calculated based on receive power, modulation rate, re-registrations and beacon percentage. Downlink - Quality Index This field displays the downlink quality in percentage. It is calculated based on Downlink receiver power, modulation rate, and beacon percentage. Downlink -Actual Average Rate This field displays the average Downlink modulation rate. For 450m, this field specifies the SU-MIMO Modulation Rate. Downlink - Expected Rate This field displays the expected modulation rate based on receive power in Downlink. Uplink - Quality Index This field displays the uplink quality in percentage. It is calculated based on Uplink receiver power and modulation rate. Uplink -Actual Average Rate This field displays the average Uplink modulation rate.
Chapter 9:  Operation System information   Page 9-29 Uplink - Expected Rate This field displays the expected modulation rate based on receive power in Uplink. Beacon - Quality Index This field displays the beacon quality index. It is calculated based on beacon percentage. Beacon - Received Percent This field displays the received beacon percentage. Re-Reg - Quality Index This field displays the re-registration quality. It is calculated based on the re-registration count. Re-Reg Count This field displays the number of re-registrations. Uptime  This field displays the uptime of the device.  Viewing Remote Subscribers This page allows to view the web pages of registered SMs or BHS over the RF link. To view the pages for a selected SM/BHS, click its link. The General Status page of the SM opens. Figure 196 Remote Subscribers page of AP   Interpreting messages in the Event Log Each line in the Event Log of a module Home page begins with a time and date stamp. However, some of these lines wrap as a combined result of window width, browser preferences and line length. You may find this tab easiest to use if you expand the window till all lines are shown beginning with time and date stamp. Time and Date Stamp The time and date stamp reflect one of the following: • GPS time and date directly or indirectly received from the CMM4. • NTP time and date from a NTP server (CMM4 may serve as an NTP server) • The running time and date that you have set in the Time & Date web page.
Chapter 9:  Operation System information   Page 9-30  Note In the Time & Date web page, if you have left any time field or date field unset and clicked the Set Time and Date button, then the time and date default to 00:00:00 UT : 01/01/00. A reboot causes the preset time to pause or, in some cases, to run in reverse. Additionally, a power cycle resets the running time and date to the default 00:00:00 UT : 01/01/00. Thus, whenever either a reboot or a power cycle has occurred, must reset the time and date in the Time & Date web page of any module that is not set to receive sync.  Event Log Data Collection The collection of event data continues through reboots and power cycles. When the buffer allowance for event log data is reached, the system adds new data into the log and discards an identical amount of the oldest data. Each line that contains the expression WatchDog flags an event that was both: • considered by the system software to have been an exception • recorded in the preceding line.  Conversely, a Fatal Error () message flags an event that is recorded in the next line. Some exceptions and fatal errors may be significant and require either operator action or technical support. Figure 197 Event log data
Chapter 9:  Operation System information   Page 9-31 Messages that Flag Abnormal Events The messages listed below flag abnormal events and, case by case, may signal the need for corrective action or technical support. Table 218 Event Log messages for abnormal events Event Message Meaning Expected LUID = 6            Actual LUID = 7 Something is interfering with the control messaging of the module. Also ensure that you are using shielded cables to minimize interference. Consider trying different frequency options to eliminate or reduce interference. FatalError()  The event recorded on the line immediately beneath this message triggered the Fatal Error (). Loss of GPS Sync Pulse  Module has lost GPS sync signal. Machine Check Exception This is a symptom of a possible hardware failure. If this is a recurring message, begin the RMA process for the module. RcvFrmNum = 0x00066d ExpFrmNum = 0x000799 Something is interfering with the control messaging of the module. Also ensure that you are using shielded cables to minimize interference. Consider trying different frequency options to eliminate or reduce interference. System Reset Exception -- External Hard Reset The unit lost power or was power cycled. System Reset Exception -- External Hard Reset WatchDog The event recorded on the preceding line triggered this WatchDog message.  Messages that Flag Normal Events The messages listed below record normal events and typically do not signal a need for any corrective action or technical support. Table 219 Event Log messages for normal events Event Message Meaning Acquired GPS Sync Pulse.  Module has acquired GPS sync signal. FPGA Features Type of encryption. FPGA Version FPGA (JBC) version in the module.
Chapter 9:  Operation System information   Page 9-32 GPS Date/Time Set Module is now on GPS time. Reboot from Webpage Module was rebooted from management interface. Software Boot Version  Boot version in the module. Software Version The software release and authentication method for the unit. System Log Cleared Event log was manually cleared.   Viewing the Network Interface In any module, the LAN1 Network Interface section of this tab displays the defined Internet Protocol scheme for the Ethernet interface to the module. In SM/BHS devices, this page also provides an RF Public Network Interface section, which displays the Internet Protocol scheme defined for network access through the master device (AP/BHM). Figure 198 Network Interface tab of the AP  Figure 199 Network Interface tab of the SM
Chapter 9:  Operation System information   Page 9-33 Viewing the Layer 2 Neighbors In the Layer 2 Neighbors tab, a module reports any device from which it has received a message in Link Layer Discovery Protocol within the previous two minutes. Given the frequency of LLDP messaging, this means that the connected device will appear in this tab 30 seconds after it is booted and remain until two minutes after its shutdown.  Figure 200 Layer 2 Neighbors page
Chapter 9:  Operation System statistics   Page 9-34 System statistics This section describes how to use the system statistics pages to manage the performance of the PMP/PTP 450 Platform Family link. Viewing the Scheduler statistics The Statistics > Scheduler page is applicable for all modules (AP/SM/BHM/BHS) and the parameters are displayed as shown below:  Table 220 Scheduler tab attributes
Chapter 9:  Operation System statistics   Page 9-35 Attribute Meaning Transmit Unicast Data Count Total amount of unicast packets transmitted from the radio Transmit Broadcast Data Count Total amount of broadcast packets transmitted from the radio Transmit Multicast Data Count Total amount of multicast packets transmitted by the radio Receive Unicast Data Count  Total amount of unicast packets received by the radio Receive Broadcast Data Count Total amount of broadcast packets received by the radio Receive Multicast Data Count Total amount of multicast packets received by the radio Transmit Control Count Amount of radio control type messages transmitted (registration requests and grants, etc.) Receive Control Count Amount of radio control type messages received (registration requests and grants, etc.)  In Sync Count Number of times the radio has acquired sync. When GPS synchronization is used it is number of times GPS sync acquired. For the SM, it is the number of times the SM successfully obtained sync with an AP. Out of Sync Count Number of times the radio lost same sync lock Overrun Count  Number of times FPGA frame has overrun its TX Frame Underrun Count Number of times FPGAs TX Frame aborted prematurely Receive Corrupt Data Count  Number of times a corrupt packet has been received at the FPGA. Receive Corrupt Control Data Count Number of times a corrupt control data packet has been received at the FPGA. Receive Bad Broadcast Control Count Number of times the radio has received an invalid control message via broadcast (SM only). Rcv LT Start Number of Link Test Start messages received. A remote radio has requested that this radio start a link test to it. Rcv LT Start HS Number of Link Test Start Handshake messages received. This radio requested that a remote radio start a link test and the remote radio has sent a handshake back acknowledging the start.
Chapter 9:  Operation System statistics   Page 9-36 Rcv LT Result This radio received Link Test results from the remote radio under test. When this radio initiates a link test, the remote radio will send its results to this radio for display. Xmt LT Result This radio transmitted its link test results to the remote radio under test. When the remote radio initiates a link test, this radio must send its results to the remote radio for display there. Frame Too Big This statistics indicates the number of packets received and processed by the radios which were greater than max packet size 1700 bytes. Bad Acknowledgment This statistics indicates the number of packets received as bad acknowledgment. It is for engineering use only. Bad Fragment This statistic indicates number of fragments tagged internally as bad. It is for engineering use only. VC Clear Error Count This statistic indicates number of times VC clear failed. Rx No Buffer Count Currently unused Scheduler Error This error is incremented when the scheduler cannot send or get scheduled to send a packet. t is also general called a “VC Error”. Viewing list of Registration Failures statistics SM Registration Failures page of AP The SM Registration Failures tab identifies SMs that have recently attempted and failed to register to this AP. With its time stamps, these instances may suggest that a new or transient source of interference exists. Table 221 SM Registration Failures page attributes - AP  Attribute Meaning Status 17 Flag 0 No response was received from the AAA server and hence SM is trying to send a session request again.
Chapter 9:  Operation System statistics   Page 9-37 BHS Registration Failures page of BHM Table 222 BHS Registration Failures page attributes - BHM  Attribute Meaning Status 17 Flag 0 No response was received from the AAA server and hence SM is trying to send a session request again.  There is a list of flags from 0 to 20 as shown in Table 223 and the “Flags” can be ignored.  Table 223 Flags status Flag Meaning Flag Meaning 0  Normal  11 AP Lite Limit Reached 1  Out of Range 12 Only Ver 9.5+ Allowed 2  No Luids 13 Temporary Data VC for AAA 3  BH ReRange 14 AAA Authentication Failure 4  Auth Fail 15 Registration Grant Reject 5  Encrypt Fail 16 Blank 6  Power Adjust 17 AAA Session Retry 7  No VCs 18 AAA Reauth Failure 8  Reserve VC Fail 19 RegReq at zero power 9  Activate VC Fail 20 RegReq no time ref 10 Hi VC Setup Fail  -  -
Chapter 9:  Operation System statistics   Page 9-38 Interpreting Bridging Table statistics If NAT (network address translation) is not active on the SM/BHS, then the Bridging Table page provides the MAC address of all devices that are attached to registered SMs/BHS (identified by LUIDs).  The SM/BHS management MAC addresses are also added in bridge table upon SMs/BHS registration. These entries will be remove automically from the table once SMs/BHS is de-registered. This alleviates the arp cache > bridge cache timeout problems. The bridging table allows data to be sent to the correct module as follows: • For the AP/BHM, the uplink is from RF to Ethernet. Thus, when a packet arrives in the RF interface to the AP/BHM, the AP/BHM reads the MAC address from the inbound packet and creates a bridging table entry of the source MAC address on the other end of the RF interface. • For the SM/BHS, the uplink is from Ethernet to RF. Thus, when a packet arrives in the Ethernet interface to one of these modules, the module reads the MAC address from the inbound packet and creates a bridging table entry of the source MAC address on the other end of the Ethernet interface. Figure 201 Bridging Table page    The Bridging Table supports up to 4096 entries. Interpreting Translation Table statistics When Translation Bridging is enabled in the AP, each SM keeps a table mapping MAC addresses of devices attached to the AP to IP addresses, as otherwise the mapping of end-user MAC addresses to IP addresses is lost. (When Translation Bridging is enabled, an AP modifies all uplink traffic originating from registered SMs such that the source MAC address of every packet is changed to that of the SM which bridged the packet in the uplink direction.)
Chapter 9:  Operation System statistics   Page 9-39 Figure 202 Translation Table page of SM  Interpreting Ethernet statistics The Statistics > Ethernet page reports TCP throughput and error information for the Ethernet connection of the module. This page is applicable for all modules (AP/SM/BHM/BHS). The Ethernet page displays the following fields. Table 224 Ethernet tab attributes  Attribute Meaning Ethernet Link Detected 1 indicates that an Ethernet link is established to the radio, 0 indicates that no Ethernet link is established
Chapter 9:  Operation System statistics   Page 9-40 Ethernet Link Lost This field indicates a count of how many times the Ethernet link was lost. Undersized Toss Count This field indicates the number of packets that were too small to process and hence discarded. inoctets Count This field displays how many octets were received on the interface, including those that deliver framing information. inucastpkts Count This field displays how many inbound subnetwork-unicast packets were delivered to a higher-layer protocol. Innucastpkts Count This field displays how many inbound non-unicast (subnetwork-broadcast or subnetwork-multicast) packets were delivered to a higher-layer protocol. indiscards Count This field displays how many inbound packets were discarded without errors that would have prevented their delivery to a higher-layer protocol. (Some of these packets may have been discarded to increase buffer space.) inerrors Count This field displays how many inbound packets contained errors that prevented their delivery to a higher-layer protocol. inunknownprotos Count This field displays how many inbound packets were discarded because of an unknown or unsupported protocol. outoctets Count This field displays how many octets were transmitted out of the interface, including those that deliver framing information. outucastpkts Count This field displays how many packets for which the higher-level protocols requested transmission to a subnetwork-unicast address. The number includes those that were discarded or not sent. outnucastpkts Count This field displays how many packets for which the higher-level protocols requested transmission to a non-unicast (subnetwork-broadcast or subnetwork-multicast) address. The number includes those that were discarded or not sent. outdiscards Count This field displays how many outbound packets were discarded without errors that would have prevented their transmission. (Some of these packets may have been discarded to increase buffer space.) outerrrors Count This field displays how many outbound packets contained errors that prevented their transmission. RxBabErr  This field displays how many receiver babble errors occurred. TxHbErr  This field displays how many transmit heartbeat errors have occurred. EthBusErr  This field displays how many Ethernet bus errors occurred on the Ethernet controller. CRCError  This field displays how many CRC errors occurred on the Ethernet controller.
Chapter 9:  Operation System statistics   Page 9-41 RcvFifoNoBuf  This field displays the number of times no FIFO buffer space was able to be allocated.  Note: PMP 450 AP running in Gigabit Ethernet Mode displays error “RcfFifoNoBuf” which indicates packet loss. For 450 AP platforms, if ethernet auto-negotation is set to Gigabit, then it is a known limitation that “RcfFifoNoBuf” error will be seen. This issue is not seen if autonegotation is set to 100Mbps or lower, and the issue is not seen on 450i or 450m AP's.  RxOverrun  This field displays how many receiver overrun errors occurred on the Ethernet controller. Late Collision  This field displays how many late collisions occurred on the Ethernet controller. A normal collision occurs during the first 512 bits of the frame transmission. A collision that occurs after the first 512 bits is considered a late collision.   Caution A late collision is a serious network problem because the frame being transmitted is discarded. A late collision is most commonly caused by a mismatch between duplex configurations at the ends of a link segment.  RetransLimitExp This field displays how many times the retransmit limit has expired. TxUnderrun  This field displays how many transmission-underrun errors occurred on the Ethernet controller. CarSenseLost This field displays how many carrier sense lost errors occurred on the Ethernet controller.  No Carrier This field displays how many no carrier errors occurred on the Ethernet controller.
Chapter 9:  Operation System statistics   Page 9-42 Interpreting RF Control Block statistics  The Statistics > Radio page is applicable for all module (AP/SM/BHM/BHS). The Radio page of the Statistics page displays the following fields. Table 225 Radio (Statistics) page attributes – RF Control Block  Attribute Meaning inoctets Count This field displays how many octets were received on the interface, including those that deliver framing information. inucastpkts Count This field displays how many inbound subnetwork-unicast packets were delivered to a higher-layer protocol. Innucastpkts Count  This field displays how many inbound non-unicast (subnetwork-broadcast or subnetwork-multicast) packets were delivered to a higher-layer protocol. indiscards Count This field displays how many inbound packets were discarded without errors that would have prevented their delivery to a higher-layer protocol. This stat is pegged whenever corrupt data is received by software or whenever the RF Software Bridge queue is full.  Corrupt data is a very unusual event because all packets are CRC checked by hardware before being passed into software.  The likely case for indiscards is if the RF bridge queue is full. If this is the case the radio is most likely PPS limited due to excessive small packet traffic or a problem at the Ethernet interface. If there is a problem at the Ethernet interface there is likely to be discards at the Ethernet as well. inerrors Count This field displays how many inbound packets contained errors that prevented their delivery to a higher-layer protocol. inunknownprotos Count This field displays how many inbound packets were discarded because of an unknown or unsupported protocol.
Chapter 9:  Operation System statistics   Page 9-43 outoctets Count This field displays how many octets were transmitted out of the interface, including those that deliver framing information. outucastpkts Count  This field displays how many packets for which the higher-level protocols requested transmission to a subnetwork-unicast address. The number includes those that were discarded or not sent. outnucastpkts Count This field displays how many packets for which the higher-level protocols requested transmission to a non-unicast (subnetwork-broadcast or subnetwork-multicast) address. The number includes those that were discarded or not sent. outdiscards Count This field displays how many outbound packets were discarded without errors that would have prevented their transmission. (Some of these packets may have been discarded to increase buffer space.) outerrrors Count This field displays how many outbound packets contained errors that prevented their transmission.
    Page 9-1   Interpreting Sounding statistics for AP In the AP GUI, sounding statistics can be found under Statistics > Radio. Table 226 Radio (Statistics - AP) page attributes - Sounding  Attribute Meaning reference SF Spatial Frequency of VC. Values 0 to 1023 are valid and value 2048 is considered as invalid. soundingState  Different types of Sounding states are: • UNKNOWN: VC has recently registered to the AP but not registered with the channel manager yet. • NEW: VC has been registered with the channel manager and will soon transition to ASSESSING. • ASSESSING: AP will instruct SM to take the channel measurements.  Channel estimates and spatial frequencies will be calculated. • TRACKING: Valid measurements resulted in good channel estimates and spatial frequency.  This VC can now be used for MU-MIMO. • INVALID: Inconsistent measurements resulting in no channel estimate or spatial frequency.  This VC cannot be used for MU-MIMO and it will ultimately be re-assessed.
Chapter 9:  Operation System statistics   Page 9-2 soundingFault  Generally if VC is UNTRUSTED, this means something went wrong. The fault codes can help to describe what is wrong with this channel (If VC is TRACKING this will generally indicate 0 (SOUNDING_FAULT_NONE)).  Error codes are: • SOUNDING_FAULT_VC_CEST: Channel Estimate Error, could be due to issues with the channel.. • SOUNDING_FAULT_NULLING_SNR:  Channel Estimate Error, could be due to issues with the channel. • SOUNDING_FAULT_SM_ERROR: SM returned Error code when taking channel measurements. • SOUNDING_FAULT_CHANNEL_DISTORTION: Channel Distortion is beyond tolerance, could be due to issues with the channel. • SOUNDING_FAULT_UNSTABLE_SF: Inconsistent Spatial Frequency, could be due to issues with the channel. • SOUNDING_FAULT_SF_DEVIATION: Inconsistent Spatial Frequency, could be due to issues with the channel. • SOUNDING_FAULT_INTERNAL_ERROR: Could be due to incompatible software (AP – SM), or other catastrophic software issue. mumimoVetoCount  If excessive channel distortion is observed during condensed nulling (tracking state) this count will increment and VC will transition back to assessing state. channelDistortion  Channel distortion readings. nullingSNR  Signal to noise ratio of condensed nulling error response. cnResponseCountSM  The SM adds a counter to the CN (Condensed Nulling) response. This indicates how many responses were sent by that SM. cnResponseCountAP  The AP increments a count for each CN response received.
Chapter 9:  Operation System statistics   Page 9-3 missedTagCount  This is the number of CN responses transmitted by SM but not received at AP.
    Page 9-1   Interpreting Sounding statistics for SM In the SM GUI, sounding statistics can be found under Statistics > Radio. The top section, RF Control Block Statistics, is applicable to the SM communicating to any AP (450, 450i, or 450m), and it is always visible. The bottom section, Sounding Statistics, is visible only if the SM is communicating with a 450m AP. Table 227 Radio (Statistics - SM) page attributes - Sounding  Attribute Meaning Responses  Number of sounding responses (full VC assessments or condensed nulling) sent from the SM to the AP Responses Suppressed Number of sounding requests suppressed by the SM. The reason why a sounding response is suppressed is because the error calculated during the sounding process is lower than the threshold set by the AP. In this case, the SM does not need to transmit a sounding response to the AP Errors  Number of errors in the sounding process at the SM Examples of events that count as errors: • Sounding type is not supported • IQ capture not enabled: for example, if sounding requested too soon after SM boot • IQ capture did not complete • Sounding processing took too long Version Mismatch Number of sounding requests with mismatched version numbers The Sounding Acquisition Command contains a version number. The SM checks its own version number and flags any mismatch. Currently, AP and SMs use V1. Max Request Interval Largest time between two sounding requests received from the 450m AP Avg Request Interval Average time between two sounding requests received from the 450m AP
Chapter 9:  Operation System statistics   Page 9-2 Interpreting VLAN statistics The Statistics > VLAN page provides a list of the most recent packets that were filtered because of VLAN membership violations. It is applicable for all modules (AP/SM/BHM/BHS). Table 228 VLAN page attributes  Attribute Meaning Unknown  This must not occur. Contact Technical Support. Only Tagged The packet was filtered because the configuration is set to accept only packets that have an 802.1Q header and this packet did not. Ingress  When the packet entered through the wired Ethernet interface, the packet was filtered because it indicated an incorrect VLAN membership. Local Ingress When the packet was received from the local TCP/IP stack, the packet was filtered because it indicated an incorrect VLAN membership. This must not occur. Contact Technical Support. Egress  When the packet attempted to leave through the wired Ethernet interface, the packet was filtered because it indicated an incorrect VLAN membership. Local Egress When the packet attempted to reach the local TCP/IP stack, the packet was filtered because it indicated an incorrect VLAN membership.
Chapter 9:  Operation System statistics   Page 9-3 Interpreting Data VC statistics The Statistics > Data VC page displays information about Virtual Channel (VC) used in data communications. This page is applicable for all modules (AP/SM/BHM/BHS). The Data VC tab displays the fields as explained in Table 229. Table 229 Data VC page attributes  Attribute Meaning Subscriber  This field displays the LUID (logical unit ID), MAC address and Site Name of the SM/BHS. As each SM or BHS registers to the AP/BHM, the system assigns an LUID of 2 or a higher unique number to the SM/BHS. If a SM/BHS loses registration with the AP/BHM and then regains registration, the SM/BHS retains the same LUID.  VC This field displays the virtual channel number. Low priority channels start at VC18 and count up. High priority channels start at VC255 and count down. If one VC is displayed, the high-priority channel is disabled. If two are displayed, the high-priority channel is enabled. CoS This field displays the Class of Service for the virtual channel. The low priority channel is a CoS of 00 and the high priority channel is a CoS of 01. CoS of 02 through 07 are not currently used. Inbound Statistics, octets This field displays how many octets were received on the interface, including those that deliver framing information. Inbound Statistics, ucastpkts This field displays how many inbound subnetwork-unicast packets were delivered to a higher-layer protocol. Inbound Statistics, nucastpkts This field displays how many inbound non-unicast (subnetwork-broadcast or subnetwork-multicast) packets were delivered to a higher-layer protocol.

Navigation menu