Trio Datacom ER450-XXF01 Remote Radio Data Modem User Manual temp warning E Series R3
Trio Datacom Pty Ltd (a wholly owned company of Schneider Electric) Remote Radio Data Modem temp warning E Series R3
Contents
Installation Guide Part 2
Page 51
E Series Data Radio – User Manual
© Copyright 2002 Trio DataCom Pty. Ltd.
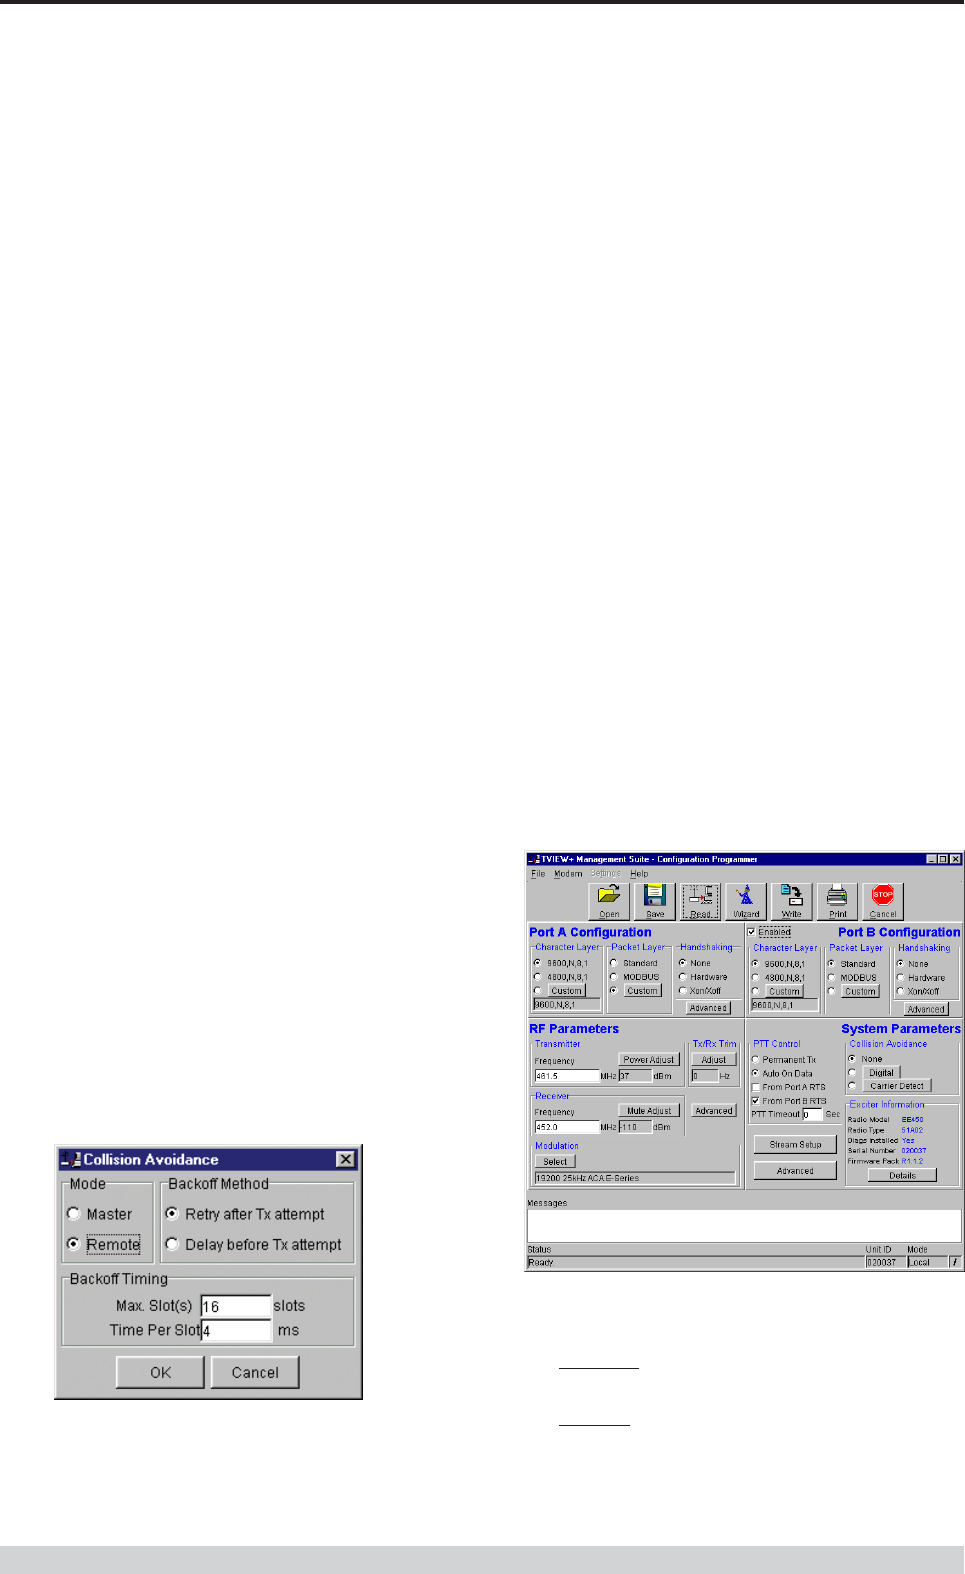
• Mode – “Master” or “Remote”. When the master unit receives
a valid transmission from a remote unit it sets the channel busy
indication bit. This busy bit is interpreted by the other remotes to
not transmit. Once the transmission from the first remote ends
the master unit resets the busy bit to indicate the channel is
now clear to transmit on. The master unit, which is normally a
base station, takes about 5ms to detect a transmission from a
remote unit and set the channel busy indication bit on the radio
channel. During this period collision of remote transmissions
can still occur and is unavoidable. NOTE: The master can
only be a full duplex unit.
• Backoff Method – “Retry after Tx Attempt” or “Delay before Tx
Attempt”. The method chosen is system dependent and can
only be configured if the mode is “remote”. The former is best
used when data responses from remotes are largely
asynchronous. The latter is best used when this is not the
case.
• Backoff Timing – “Maximum Slots”, “Time per Slot”. This can
only be configured if the mode is “remote”. When a remote is
ready to transmit data but it finds the busy bit from the master
set it holds back its transmission for a random “backoff” time
after which it tries to transmit data again. This ensures that
modems waiting to be allowed to transmit do not re-attempt to
do so at the same time. The “Maximum Slots” (1 to 16) and
the “Time per Slot” (1 to 255ms) are used to calculate the
backoff time by multiplying the slot time by a random number
between 1 and the maximum slot number. For example if the
time per slot is 30ms and the maximum slots is 4, the random
backoff times can be 30, 60, 90 or 120ms.
As the channel busy indication bit is critical for reliable operation default
interpretation of this bit is defined in the remote units. If the master
modem stops transmission (or has not yet started) the remote will
interpret that the channel is busy and will not transmit until the master
comes on line.
Carrier Detect
This method of collision avoidance utilises a carrier transmitted to all
remotes to indicate that the radio channel is busy. When selected a
dialogue box appears and several options must be configured:
• Mode – “Master” or “Remote”. When the master unit receives
a valid transmission from a remote unit it transmits a carrier
signal to indicate busy. Of course the master will also initiate a
transmission if it has data to send. The transmitted carrier is
interpreted by the other remotes to not transmit. Once the
transmission from the first remote ends the master unit stops
transmission to indicate the channel is now clear to transmit on.
The master unit, which is normally a base station, takes about
5ms to detect a transmission from a remote unit and transmit a
carrier signal. During this period collision of remote
transmissions can still occur and is unavoidable.
NOTE: The master can only be a full duplex unit and cannot be
permanently transmitting. For half duplex and simplex systems
all units should be set as “Remote” (no Master).
• Backoff Timing – “Maximum Slots”, “Time per Slot”. This can
only be configured if the mode is “remote”. When a remote is
ready to transmit data but it detects a carrier signal from the
master set it holds back its transmission for a random “backoff”
time after which it tries to transmit data again. This ensures that
modems waiting to be allowed to transmit do not re-attempt to
do so at the same time. The “Maximum Slots” (1 to 16) and
the “Time per Slot” (1 to 255ms) are used to calculate the
backoff time by multiplying the slot time by a random number
between 1 and the maximum slot number. For example if the
time per slot is 30ms and the maximum slots is 4, the random
backoff times can be 30, 60, 90 or 120ms.
Unit Information
Part I TVIEW+ Management Suite - Programmer
The information displayed is intended to assist the user to identify the
radio modem as well as support should their services be needed.
Radio Model refers to the type of unit. The ER450 is a remote
unit and the EE450 is a exciter inside a base station unit.
Radio Type refers to the frequency band supported by the radio
as well as the channel bandwidth. For example 51A02 is a type
51 band with a 25kHz channel.
Page 52
E Series Data Radio – User Manual
© Copyright 2002 Trio DataCom Pty. Ltd.
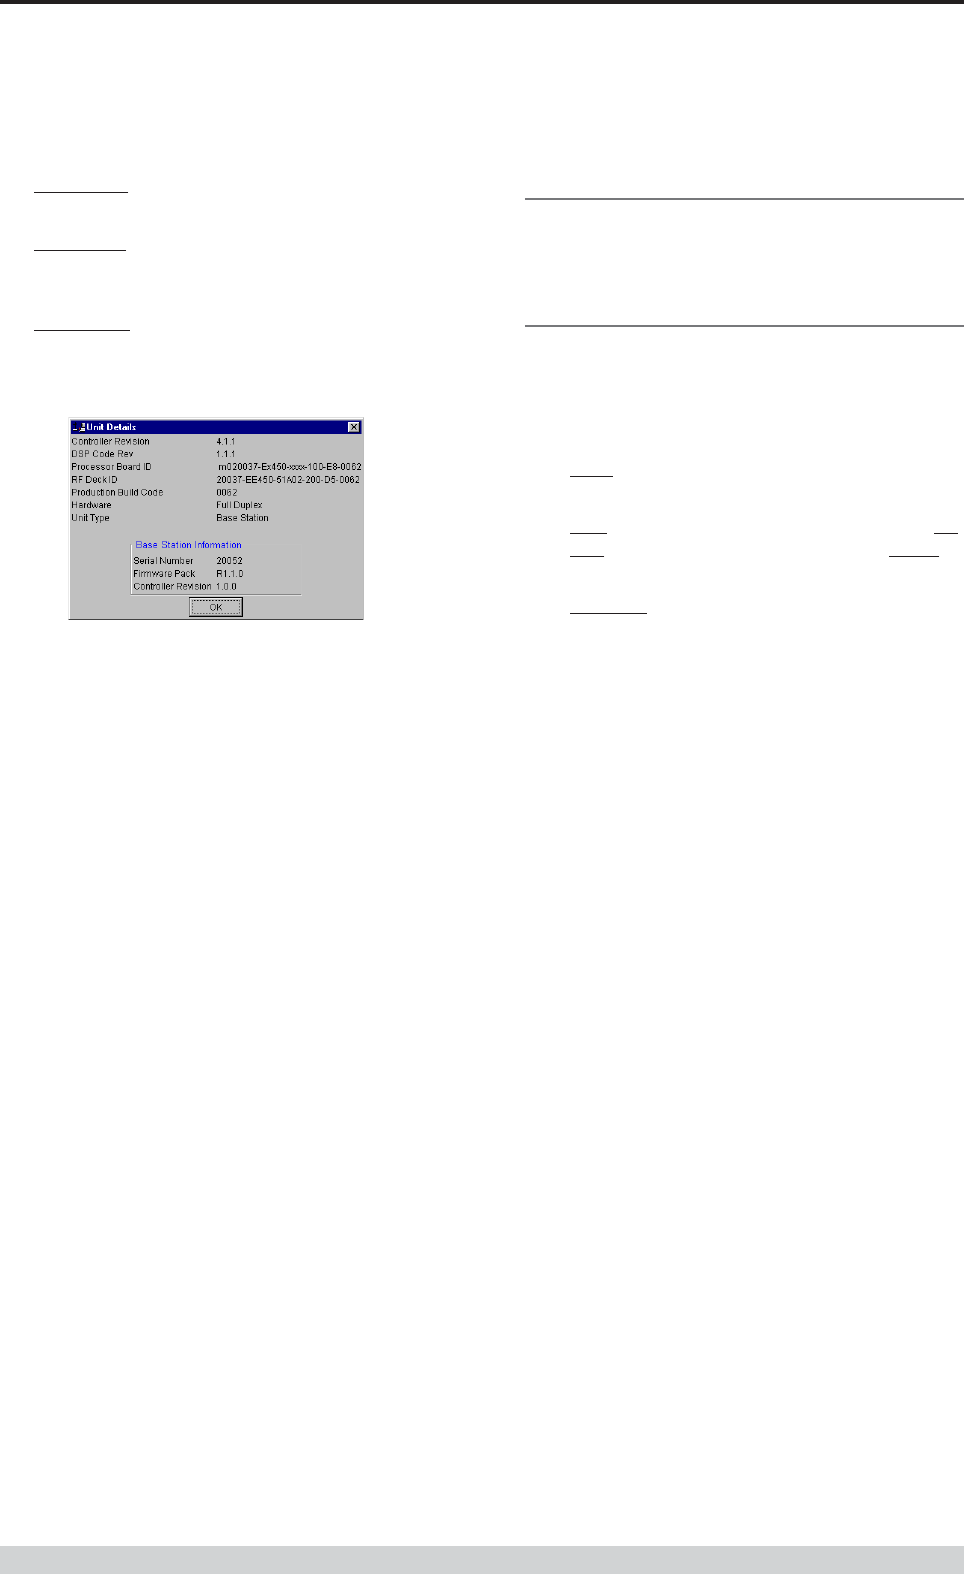
Unit Information - Details
More detailed information is also available to assist in identifying
components installed in the unit (remote, base station or hot standby).
The additional information provided is:
• Controller Rev refers to the microcontroller firmware component
version for the radio.
• DSP Code Rev refers to the DSP firmware component
version for the radio.
• Processor Board ID refers to the processor board identification
number and hardware revision information for the radio.
• RF Deck ID refers to the RF deck board identification number
and hardware revision information inside the radio.
• Production Build Code refers to the automated production test
and calibration sequence used during manufacture of the radio.
• Hardware indicates whether the radio is half or full duplex.
• Unit Type indicates whether the unit is recognised as a remote
or base station.
In the case of a base station unit the following additional information is
provided:
• Base Firmware Pack refers to the firmware package version
installed in the base station (front panel) controller which is
separate to the radio installed. There are several components
associated with this firmware package and a single version
number is used to identify them.
• Base Controller Rev refers to the microcontroller firmware
component version for the base station.
Messages
The message window provides a log of error messages occurring
during use of the programmer utility. Several error messages may
occur as a result of a selection.
Status Bar
The status bar is located at the bottom of the main window and
provides information regarding communication actions occurring with
the radio data modem.
Additional fields located on the status bar include:
•Unit ID refers to the identification label used by the diagnostics
utility. This is currently the same as the unit’s serial number.
•Mode refers to the type of session established. It can be a File,
Local indicating a local port connection to the unit or Remote
indicating communications is via a radio channel.
•Rotating bar progress indicator showing data is being
transferred to or received from a unit.
Part I TVIEW+ Management Suite - Programmer
Diags Installed is set to yes or no depending on whether the
diagnostics key has been set in the unit.
Serial Number is unique to each unit and is set within the unit at
time of production as well as included on the label fixed to the
unit.
Firmware Pack refers to the firmware package version installed
in the radio. There are several components associated with
microcontroller and DSP firmware installed and a single version
number is used to identify them.

Page 53
E Series Data Radio – User Manual
© Copyright 2002 Trio DataCom Pty. Ltd.
Part J TVIEW+ Management Suite - Remote Diagnostics & Network Controller
Introduction
This section covers the operation of the Remote Diagnostic and
Network Management Controller Software Version 3.7.X or greater.
Overview
The Diagnostic Controller is a Windows© based program, that can be
run on a standard desktop or laptop PC.
The software runs in the 32 bit Windows environment and offers many
options and configurations which are easily accessible via pop-up
windows. These include group or timed polling, remote switching of
duplicated base stations, viewing of databases, logging and trending of
real time parameters , etc.
The Diagnostic Controller can be installed to run as a stand-alone
package, or as part of the TView+ Management Suite.
It is for use in conjunction with the D & E Series of data radio modems
and can be used for simple point-to-point links, or for more complex
point-to-multipoint and multilayer link systems.
The diagnostic facilities allow retrieval of packet statistics from each
radio modem. These statistics are used to calculate Packet and Bit
Error Rates, a units’ condition/health, network efficiency and
bandwidth utilisation.
The use of the diagnostics facilities provided by the controller gives the
radio modem system designer and operator a powerful tool for both the
maintenance and continuing reliability of their system.
The general operating parameters that can be obtained from remote
modem units are:-
• Last RSSI level.
• Last transmitted power level.
• Receive frequency offset.
• Power supply voltage level.
• Current internal temperature.
These are displayed on the controllers screen in a “quick read” format
of bar graphs, as well as detailed response listings.
For the E Series radio modems to operate with the diagnostic
controller, they must be factory preset to include the diagnostics
response facilities or installed at a later stage (in the field) via the
programmer. Contact you supply for details.
The diagnostics data stream operates “alongside” the main user data
stream. No interference between the two streams occurs, so as far
as the primary user of the data system is concerned, the diagnostics
data does not exist.
Features
• 32 Bit Windows Based User Software.
• Full graphical presentation.
• Full SCADA style features such as database, trending,
networking, etc.
• Able to interrogate and display important operating parameters
of each radio modem.
• Provides performance data of any unit - good frames received,
bad frames received, packet error rate, transmitted packet
sizes, channel usage, etc.
• Provides statistical Packet Error Rate (PER) performance
calculations for any unit.
• Provides powerful network tools such as channel occupancy
statistics, average received transmission duration, etc.
• Can be set to background poll radio system for continuous
system monitoring and logging.
• Provides full time/date stamped Status and Alarm logging/
reporting. A relational database is created and managed using
Microsoft Jet database engine Ver3.5. The database file, which
is an “.mdb” file, can be accessed with external programs
such as Microsoft Access.
System Description
General
The diagnostics process is based on a series of polls being transmitted
to the remote modem units with each modem having its own unique
assigned address which is factory preset.
When a diagnostic poll is received by a modem it checks to see if it is
addressed to itself, and if so, it responds with its diagnostic data back
to the controller. If it is not addressed to the modem, the modem
simply “passes the message on”, and does not respond to the
controller.
In a multilayer system, several “pass on’s” may occur before the
destination modem is reached.
The modem’s diagnostic response message is addressed to the
controller, and as each modem in the “chain” decodes this message it
will “pass it back”, eventually the message reaches the controller for
processing.
The controller software provides a database to hold the modem units
associated data (i.e. Serial number, assigned name, location, alarm
limits, SID code address, base station pairing information, status poll
response data, alarms, etc).
The units’ address is the serial number of the unit which is factory
preset. The name is any mnemonic that the user wishes to attach to
the modem. This name is then used to address the unit for access to
diagnostic facilities.
Part J TVIEW+ Management Suite -
Remote Diagnostics & Network Controller
Page 54
E Series Data Radio – User Manual
© Copyright 2002 Trio DataCom Pty. Ltd.
The responses from the modem have boundary limits placed on them.
If a response is outside these limits then an alarm is raised. For
instance, the DC supply volts can have a lower limit of 12V, and an
upper limit of 16V. Should a response to a poll received show that the
DC volts is at 11V, then an alarm is reported.
A unit can be excluded from a poll sequence by removing it from the
poll group.
Intensive polling of a single unit is possible using the Individual polling
facility.
A poll “run” can be set up. A time can be designated for the controller
to poll each of the modems in the system. This may be useful for
systems that have a low traffic period where diagnostics can be
“slotted in”, thereby spreading the data throughput of the system more
efficiently.
The screen is divided into three main scrolling sections - Status Polls,
Alarms and Base Station Activities. The status poll section displays
current poll activity while the alarm section displays any polls alarms
which have been reported. The Base Station activity section displays
any changeovers that have occurred to Hot Standby Base Units - if
no Hot Standby Base Stations are employed within the system, this
section will remain blank.
If base stations are employed in the system, then the two exciter units
contained in one base unit can be paired together. The exciters
operate in a mutually exclusive environment i.e. only one is active at
a time. When the exciters are to be polled, only the active one will be
sent a poll.
The base exciters can be toggled, so as the other exciter unit in the
base can be polled if required.
A relational database is created and managed using Microsoft Jet
database engine Ver3.5. The database file, which is an “.mdb” file,
can be accessed with external programs such as Microsoft Access.
All polls and alarms are time and date stamped and saved to the
database. All database entries can be sorted and printed.
For some multilayer systems, Stream Identifier (SID) Codes may
have to be added to the diagnostic data packets. Each modem can be
assigned a SID address (the default is 00) and the SID code feature
enabled.
Refer to Appendix A “Technical Notes” for further details of SID code
addressing.
The diagnostic core of each radio (Firmware Version 2.4.0 and above)
stores packet statistics for later retrieval. The Diagnostic controller
software uses these statistics to calculate packet and bit error rates,
network efficiency, bandwidth utilisation, and radio link integrity. These
network analysis features are an invaluable tool for larger networks.
In the transmit direction, each radio modem can report the number of:-
• data bytes transmitted (TxByteCnt).
• frames transmitted (TxFrameCnt).
With these counters one can then calculate average frame size,
average frame rate and channel utilisation.
In the receive direction, each radio modem can report the:-
• Data bytes received (GoodByteCnt).
• Good frames received (GoodFrameCnt).
• Bad frames received (BadFramCnt).
• Total time the radio has received signal (RSSIgoodTicker).
• Lost synchronization count (LostSynchCnt).
• Lost RSSI count (LostRSSICnt).
These counters can be used to calculate average frame size, average
frame rate, channel occupancy, channel utilisation and link integrity.
Radio modems with Firmware Revisions 2.4.x and above have the
advanced statistical counters as noted above. Firmware revisions
below this (i.e. 2.3.x) only have Good Frame count, Bad Frame
count, Lost RSSI count and Lost Synch Count available. The
diagnostic controller will detect which firmware the radio has, and only
report the available counters.
All these features combine to provide a powerful tool for the system
operator.
Modem Connection
The diagnostics controller normally connects via a COM port on the
controller PC and the “System Port” on the radio modem (Port “A &
B” can be used if required).
NOTE: The controller can connect to any port of any data radio
modem within the system as long as the data radio port is configured
accordingly. When “Settings” is selected, the controller will interogate
the computers coms ports and display the available ports. Possible
valid com ports are 1-16 or “None”. Choose the desired port. None
allows you to free the com port for use with other programs without
exiting the diagnostic.
The modem port must have its SID codes enabled, and have the SID
code set to the system diags SID (normally this is set to “00”).
The data format used is the SLIP protocol, running at 9600 baud, No
parity, 8 data bits and 1 stop bit. Appendix B “SLIP Protocol”
contains a detailed definition of the SLIP Protocol.
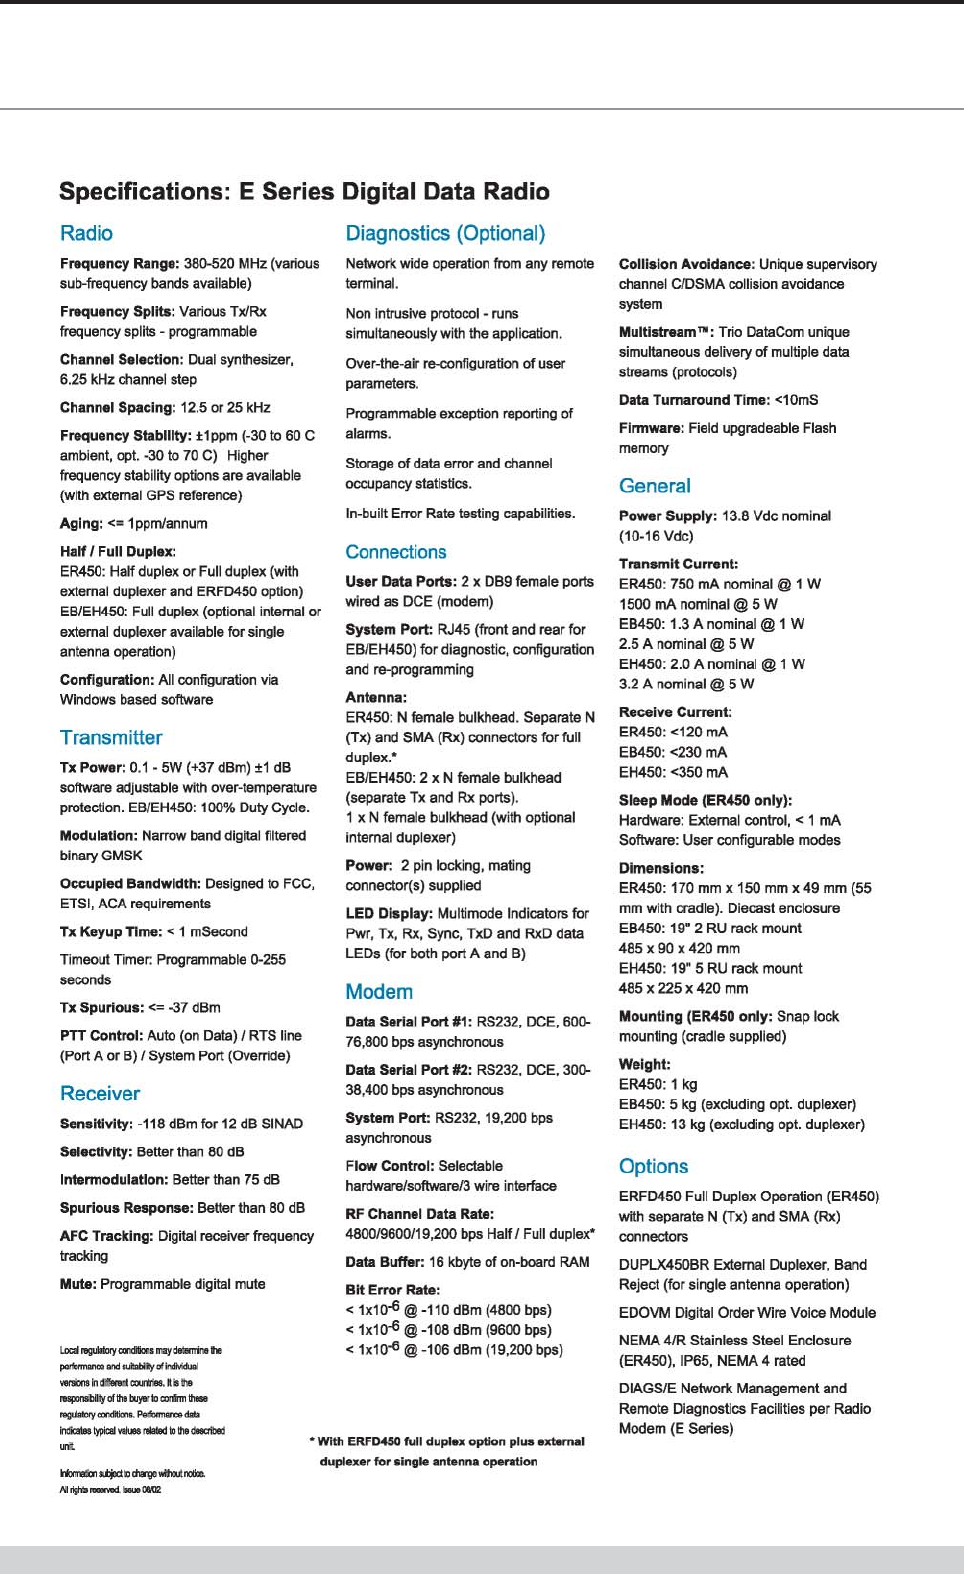
COM1 of the controller PC is to be directly connected to the 9 way D-
Min of the modem using a 3 wire interface (see drawing below).
Should the PC have a 25 way connector, then the standard RS232,
25 way to 9 way conversion should be used.
Part J TVIEW+ Management Suite - Remote Diagnostics & Network Controller
Page 55
E Series Data Radio – User Manual
© Copyright 2002 Trio DataCom Pty. Ltd.
Operating Instructions
General
When the Diagnostic controller starts, a presentation screen is
displayed which will then lead you into the main diagnostics screen.
This is where all the major functions of the controller are accessed.
The main screen presents the operator with the typical Windows pull
down type menu bars - “File”, “Settings”, etc. Icons of the most
commonly used selections are also provided across the top of the
screen.
This screen is divided into 3 main sections:-
1. Status Polls screen which displays all poll results obtained.
2. Alarms screen which displays any alarms that occur.
3. Base Station Activity screen which displays any
changeovers that occur with Hot Standby Base Stations within
the system.
The line above Status Polls is a “Processing Status Bar”. It will
display messages about errors, warnings and poll processing.
The bottom row of the screen also displays a summary of the
configured parameters such as which com port is being used, whether
SID codes are on or off, whether polling is enabled or disabled, current
database path and file name, etc.
Menu Selection
File Menu
To utilise the Remote Diagnostics facilities, a database must be created
which includes the individual serial numbers, alarm parameters and
various other parameters of each unit.
The file menu allows the operator to create a New database, Open an
existing database, Add/Edit/Delete a database or View an existing
database. All such database tools utilise standard Windows type
formats for file selections as shown.
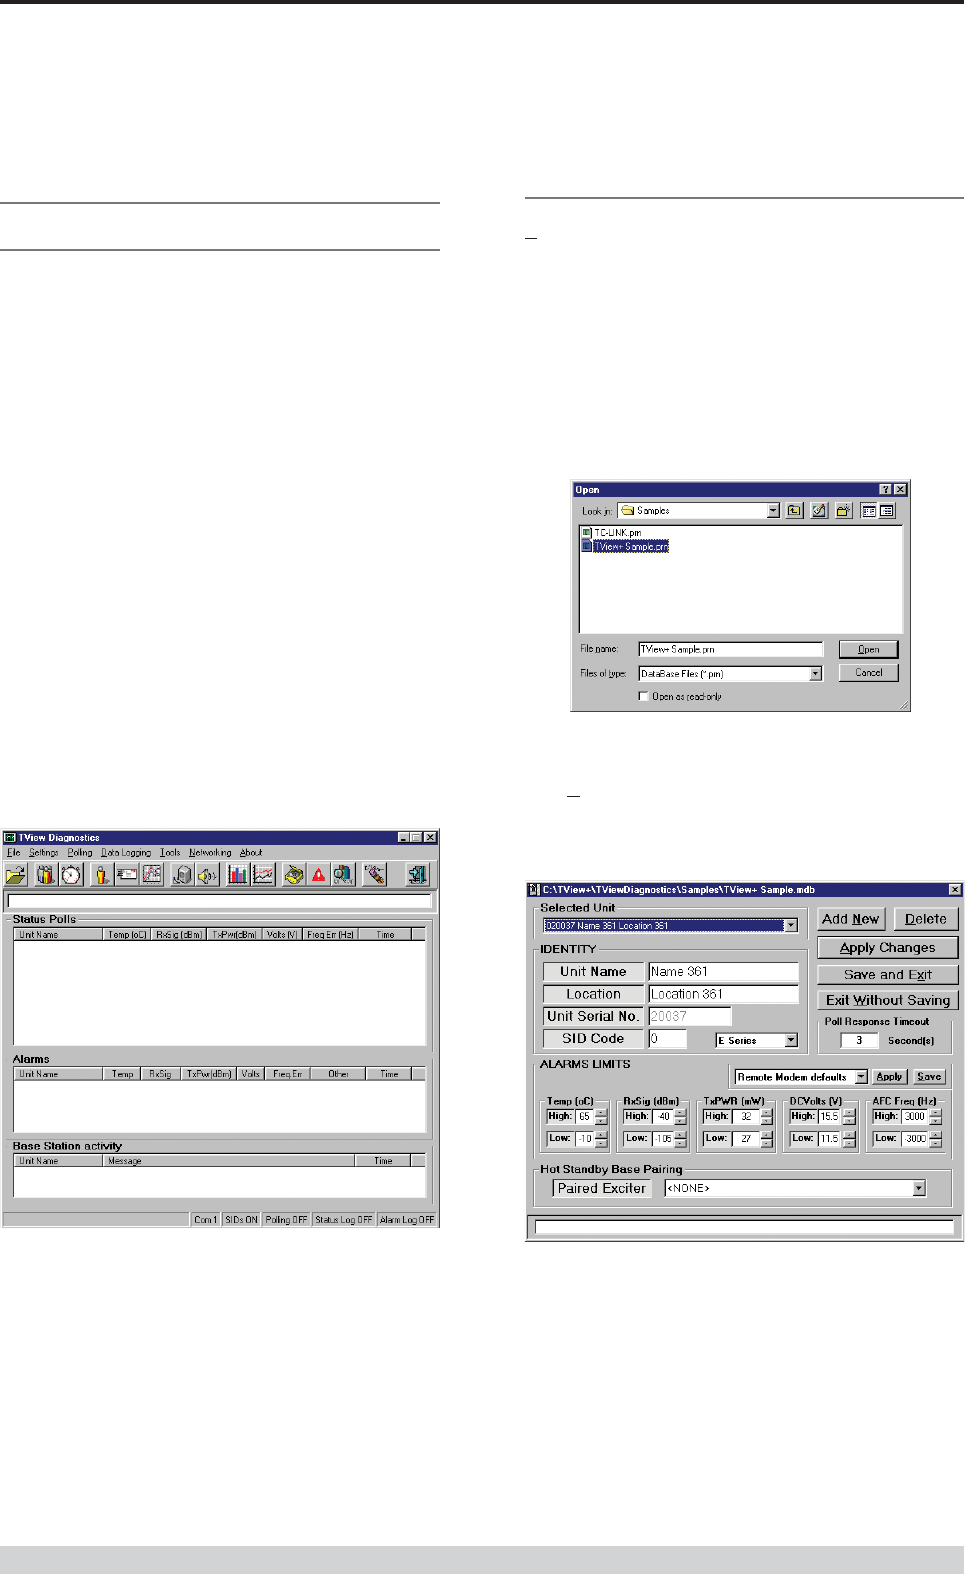
File - Add/Edit/Delete
After creating a New database or Opening an existing database, the
Add/Edit/Delete menu can be accessed.
Selected Unit
Selected unit is a pull down selection box, for selecting a unit to view
or edit.
The bottom line is a “Processing Status Bar”. It will display
messages about errors, warnings and poll processing.
Part J TVIEW+ Management Suite - Remote Diagnostics & Network Controller

Page 56
E Series Data Radio – User Manual
© Copyright 2002 Trio DataCom Pty. Ltd.
Unit Name and Location
Unit name is required and must be unique(max. 20 character).
Location allows the user to enter descriptions of sites and their
locations (optional, (max. 20 character).
Unit Serial Number
Is the factory preset unique serial number of the unit. This is obtained
from the label located on the unit or read from the unit using the
Programmer. On base stations the exciter serial numbers must be
read from the lid label or electronically with the programmer.
SID Code (Diagnostic Stream Identifier)
Is the SID code address number being used by the unit for the
diagnostics stream. This is normally set to 0. Check the radio units
programmed configuration for confirmation and or system configuration.
Unit Series
Default to “E Series”, option on pull down box to select “ D Series”
Poll Response Timeout
Is the time in seconds the Diagnostic controller will wait for a response
from the remote unit. When a time out occurs, the controller will retry.
If three poll attempts fail then the poll request is terminated, and a No
Acknowledge (No Ack) message will appear in the alarms window.
One second is usually more than enough “wait” time. In a multilayer
system, longer response times may be necessary.
Alarm Limits
Allows the user to set thresholds for each unit which, when exceeded,
will report an alarm. Default settings are provided for remote devices
and base stations. These are selected by clicking on the appropriate
buttons presented.
If the controller receives a status poll parameter result which is outside
any of the threshold settings, it will immediately retry, in case it was
an erroneous measurement. If the next received poll result is still
outside the threshold, the retries will continue until it has received a
status poll within the threshold settings, or three status polls. If three
polls outside the required threshold are received, the average of these
polls is displayed in the status poll window and the offending
parameter(s) appear as alarms in the Alarms window.
Defaults drop down box
Choose either “Remote Modem Defaults” or “Base Modem Defaults”
from the drop down list. Click “Apply” to set the alarm limits to the
selected defaults. Click “Save” to save custom default values.
Hot Standby Base Pairing
Is used when a Hot Standby Base is employed within the system.
The two exciters contained in each base unit need to be “paired”
together. Since only one of the exciter-modems can be active (on-
line) at any time, only one can answer a poll. Thus the two should be
paired together so they are treated as mutually exclusive.
This selection allows the user to pair the two radio modems, by
selecting the other exciter with which the currently selected exciter is
to be paired with. The two units must of course exist in the database
as independent serial numbers before they can be paired.
Add New Button
Click this button to add a new radio modem to the database. The
Selected Unit, Name, Location, Unit Serial numbers and Hot Standby
Base Pairing fields will be cleared, ready for the entry of a new unit.
After filling in the details click the “Apply” button to complete entry.
Apply Button
Applies changes to selected units or complete the “add new” radios to
the data base. Additions and changes made on the screen do not result
in changes to the database unless this button is activated. This must
be done before selecting a new serial number/unit. Note that the newly
changed database will not be saved to disk until the Save and Exit
button is activated.
Delete Button
Allows deletion of units from the database. NOTE: Deleting a unit
from the database will delete all it’s associated status poll and alarm
history.
Click and a selection list of serial numbers will appear. Select one at
a time and then press the “Delete” button on the selection box.
Save and Exit Button
Press this button to save the newly chnaged database and then exit.
Additions and changes to the database will be saved to disk as long
as the “Apply” button was pushed.
Exit without Saving Button
Press this button to exit without saving the newly changed database.
Part J TVIEW+ Management Suite - Remote Diagnostics & Network Controller
Page 57
E Series Data Radio – User Manual
© Copyright 2002 Trio DataCom Pty. Ltd.
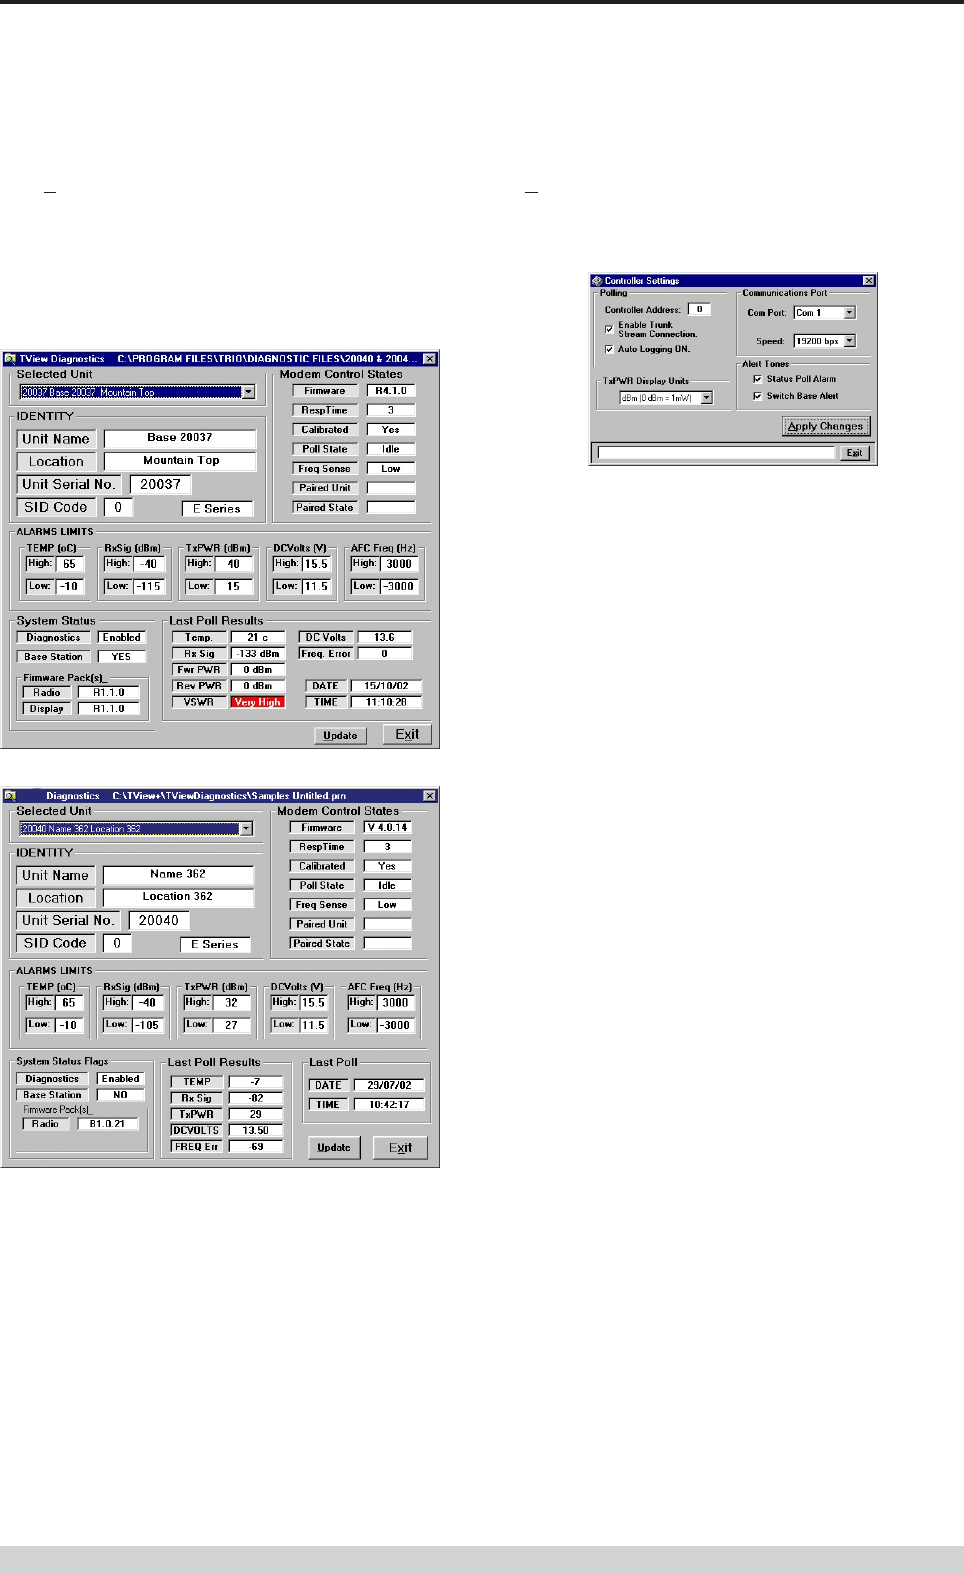
File - View (view only)
The View Screen shows the unit alarm limits, current control states,
calibration constants, last poll results for firmware and system
information.
Note: The View window is different for Remote radios and Base
Stations as well as for D Series.
Settings
The settings menu allows the user to configure various setup
parameters. These include:-
Base Station - E Series
Remote Radio - E Series
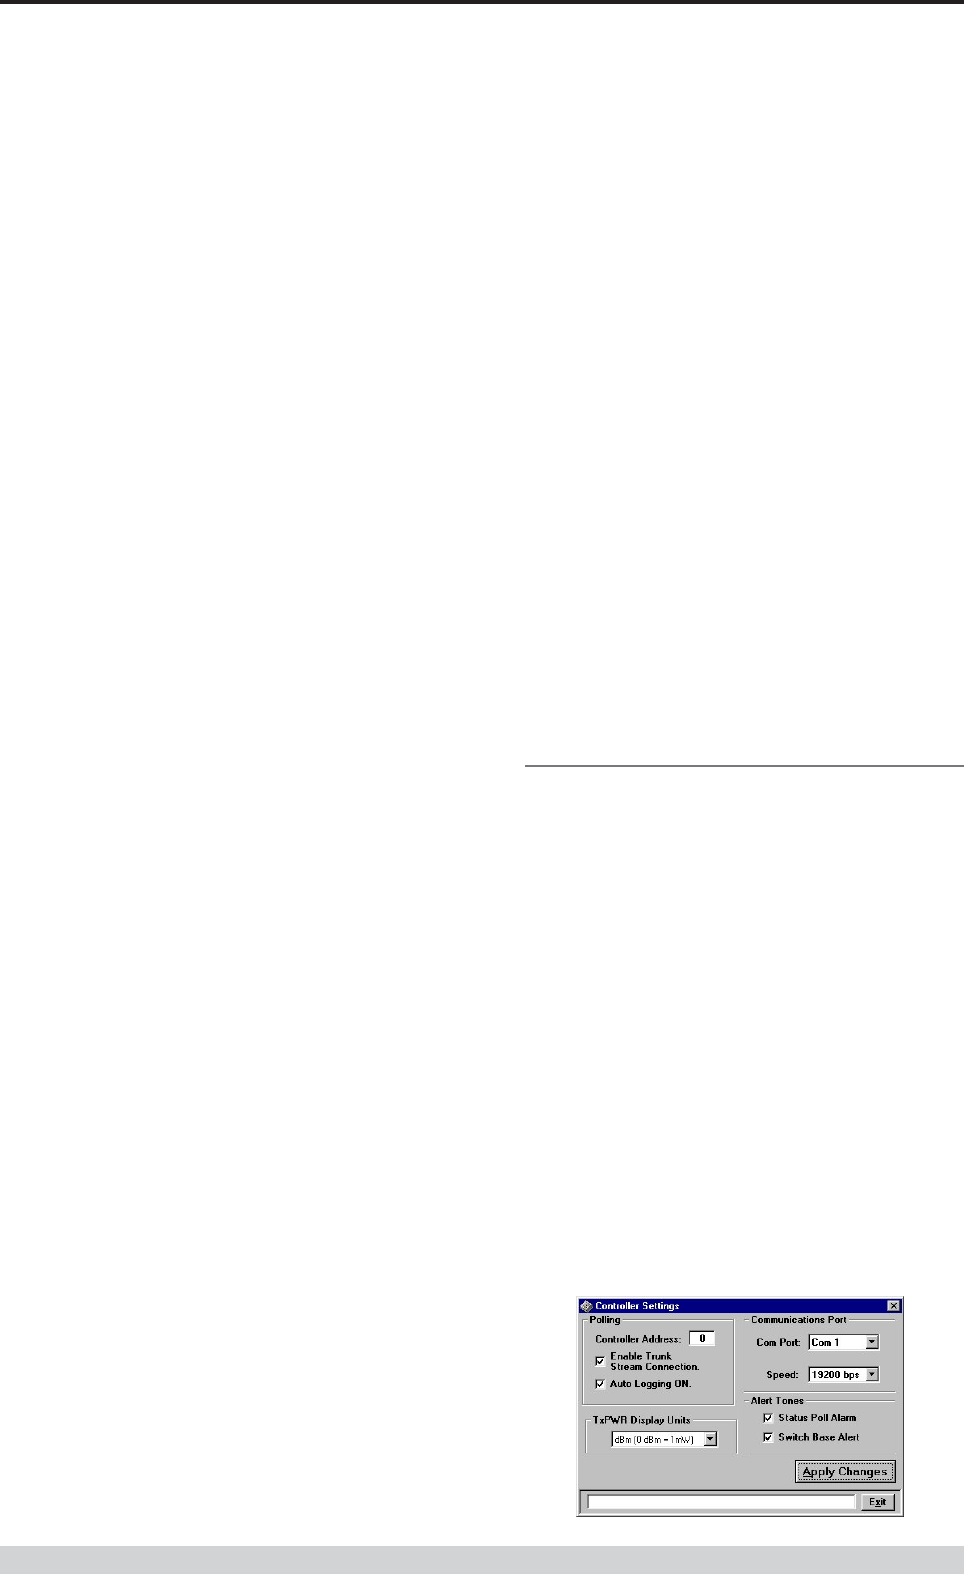
Communications Port
With the pull down box, select the required communications port.
Com 1 to Com 16. Select the required com port speed (9k6 or
19k2bps). Default is 19k2bps.
Controller Address
Normally set to 0. Networks which have multiple controllers active,
should use different controller addresses, so responses from remotes
are ignored if the poll was not sent by that controller.
Enable SID Codes
Enabled or disabled (Default enabled). In some systems, external
application of SID codes is used as a method of giving the modems in
the system specific data addresses. The modems are placed into the
“stream routing” mode, and the user (e.g. Diagnostic controller)
supplies the SID code at the start of each data packet to be
transmitted. In this way the user can “steer” the data flow through the
given network path.
Should the diagnostics controller be used in such a network then it too
needs to append the data addresses or SID codes to the beginning of
all data messages sent.
In the controllers database record for each modem, a field is supplied
where the user can select the SID code for that particular modem. By
selecting the Diagnostic SID code that suits the system topology, the
diagnostics data messages can be routed successfully to the correct
destination.
Auto Logging ON
When enabled all logging functions will be activated when polling is
turned on.
Alert Tones
When enabled will emit a tone from the PC speaker or sound card
when Status poll alarms occur and/or Base Station change overs
occur.
Tx Power Display Units
Select either “dBm” or “milli Watts” as the display units. Power will
be displayed throughout the system in the selected power
measurement unit.
Note: Power will always be stored in the database file as milli-watts
Part J TVIEW+ Management Suite - Remote Diagnostics & Network Controller
Page 58
E Series Data Radio – User Manual
© Copyright 2002 Trio DataCom Pty. Ltd.
Polling
In order to obtain diagnostics information, the diagnostics controller
provides a number of automatic polling facilities, which include: Group
polling, Timed polling and Individual polling. The Group and Timed poll
facilities will automatically cycle through a selected group of units at a
predetermined interval (in seconds). The Individual poll facility permits
intensive polling of a single unit at a selectable rate, independent of any
Group polling that may be active at the time.
When the modem is polled for the first time, the controller will poll (ask)
the radio for its calibration constants and firmware revision (these can
be viewed in the “View” window under the File menu). When this
initialisation procedure is complete, status polling can commence. If
the radio were to perform a “cold boot” for what ever reason (eg loss
of power, cold boot command received, etc), the controller will detect
this and initiate the above initialisation procedure again and display
“cold boot” alarm in “other”.
If Hot-Standby base stations are employed in the system, then only
the “on-line” unit will be polled. If a hot standby changeover occurs at
the base, then the new “on-line” modem will be polled and the off-line
unit removed from the poll sequence. A “Changeover” alarm will be
displayed in the Base Station Activity screen.
The status poll requests that are reported and displayed on the main
screen are;
• Temperature
• Received Signal Strength
• Transmitter Power
• DC Supply Volts
• Received Frequency Error
• Time and dat stamped
The line above Status Polls is a “Processing Status Bar”. It will
display messages about errors, warnings and poll processing.
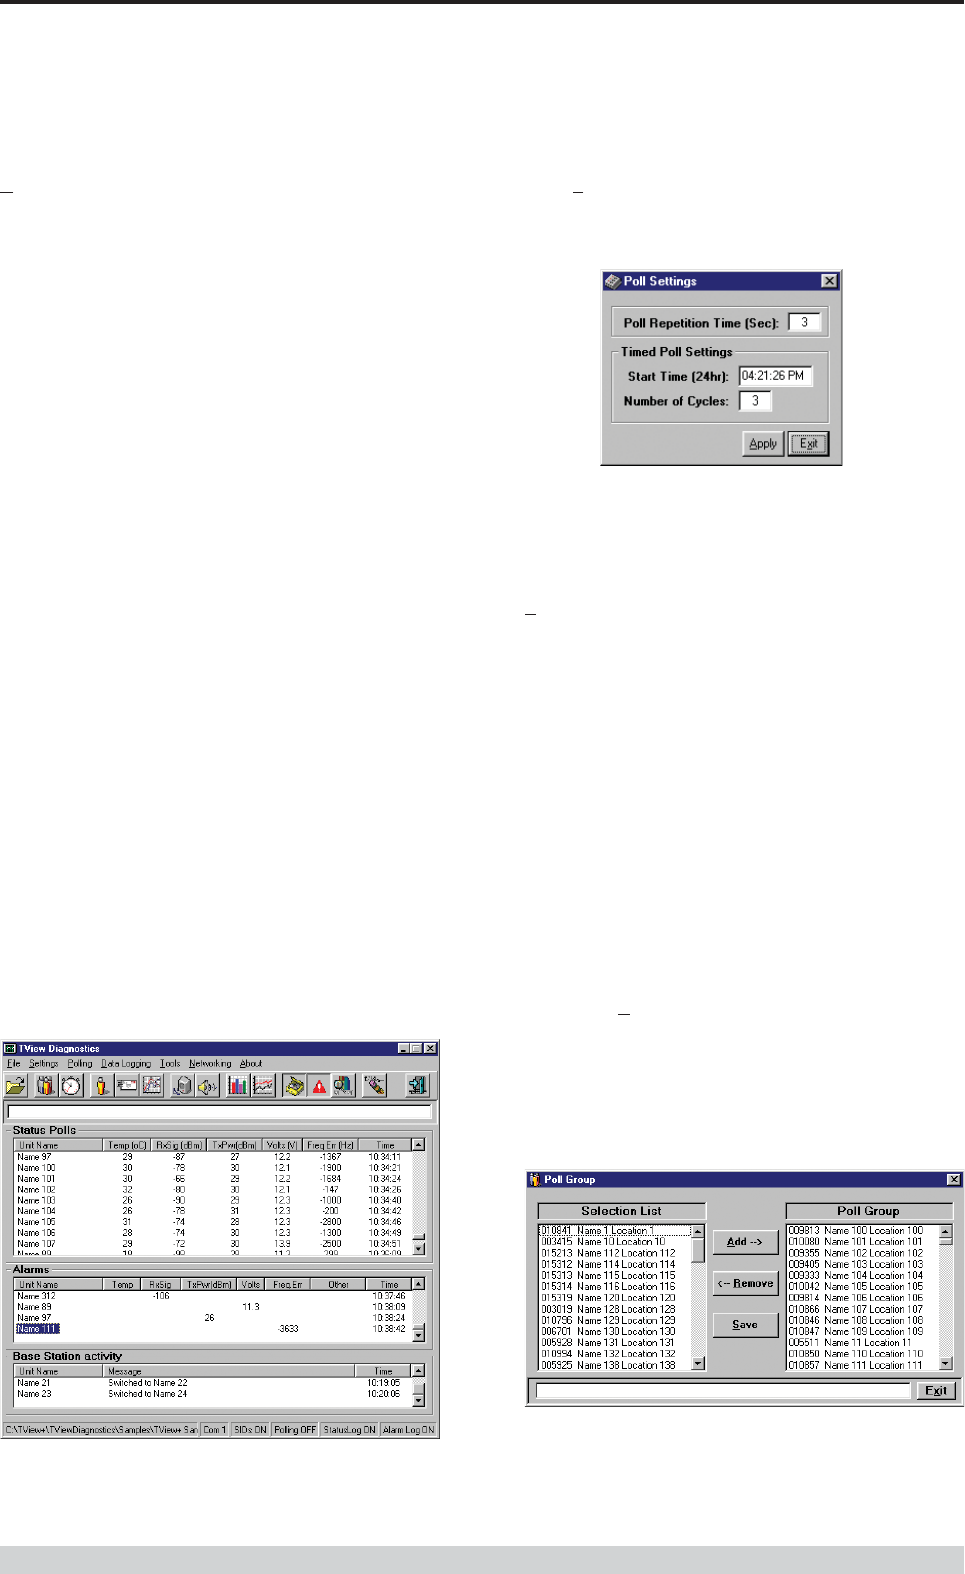
Poll Setup (Settings)
Under the Polling menu option, choose “Setup...” The Poll Settings
dialog box will appear. Here you can set :
Poll Repetition Time
Is the time in seconds (2 to 3600 secs) between each status poll of the
group poll cycle. Each unit in the poll group will be polled in turn, at
this time interval.
Timed Polling
Allows the user to schedule a period when the group poll will
commence. This is a useful feature for systems that have times of
little traffic loading such as the early hours of the morning.
Start Time
Time at which the Timed poll cycle will commence. The time format
will be as per the regional settings.
Number of Cycles
This is the number of times the controller will cycle through the poll
group when the Timed Group poll commences. Each unit in the poll
group will be polled this number of times.
Apply Button
Click “Apply” to initiate any changes made in this dialog box.
Poll Group Select
Under the Polling menu, select “Poll Group Select...”
This dialog box enables Adding/Removing of radios to/from the
automatic poll group. Units in the Selection list box are available for
adding to the poll group. These units will not be polled during a group
poll cycle.
Units in the Poll Group list box will be polled during a group poll
cycle.
Clicking the Save button will save any changes in the poll group to
the database.
Part J TVIEW+ Management Suite - Remote Diagnostics & Network Controller
Page 59
E Series Data Radio – User Manual
© Copyright 2002 Trio DataCom Pty. Ltd.
Group Polling
This is the standard mode of operation. The diagnostic controller will
continuously cycle through the poll group, unit by unit at the poll
repetition time( 2 to 3600 secs).
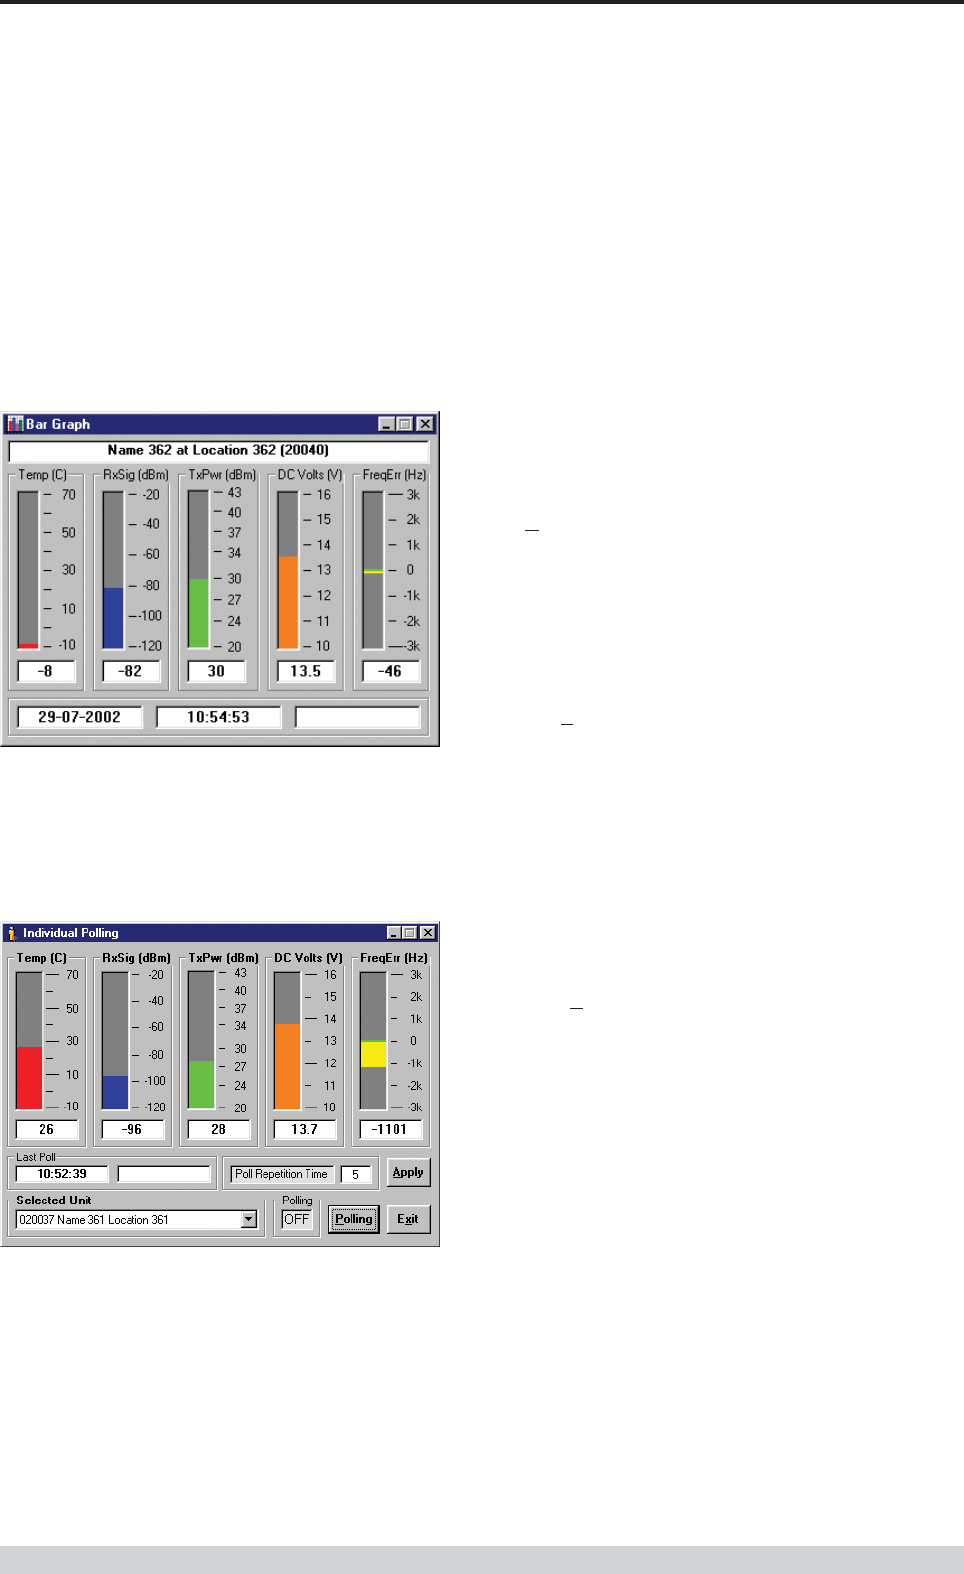
Bar Graph
Display Bar Graph can be selected which displays all polls on the
“Bar Graph”. If a unit alarms, the measurement in question will have
a red background in the Text box.
Individual Poll
Allows intensive polling of a single unit, independently of any group
polling that may be active. The individual poll window provides a bar
graph display for rapid visual recognition of the radio modems
parameter levels.
The line above Status Polls is a “Processing Status Bar”. It will
display messages about errors, warnings and poll processing.
Polling Button
The selected unit will be removed from the poll group, then polled at
the selectable rate (Poll Repetition time) by clicking the Polling button.
Poll Repetition Time (2 to 3600 Sec)
Is the rate at which individual status polling will occur. Click on the
“Apply” button to apply any change made to the poll repetition time.
Switch Exciter
Only visable if the selected unit is a “Hot Standby Base station” then
a switch base facility is provided for remote switching of the exciter
units. With polling on, click on the “Switch Exciter” button. The
changeover may take a number of seconds. The active unit will be
displayed in the “Active unit” field.
NOTE: The hot standby base station has a minimum “toggle” time of 1
minute. This is to avoid rapid switching between exciter units, should
a fault be detected in both modems.
Data Logging
Status poll and Alarm data can be logged to a database file for viewing
at a later date. A relational database is created and managed using
Microsoft Jet database engine Ver3.5. The database file, which is an
“.mdb” file, can be accessed with external programs such as
Microsoft Access. You have the option of enabling logging of Status
polls only, Alarms only or both.
Log Status Polls
To log Status polls either select “Log Status polls” under the Data
Logging menu item or click the corresponding toolbar button.
Log Alarms
To log Alarms either select “Log Alarms” under the Data Logging menu
item or click the corresponding toolbar button.
NOTE: If “Auto Logging ON” is enabled in the settings dialog box,
then Status Poll logging and Alarm logging will automatically be turned
on when Group or Individual polling is turned on.
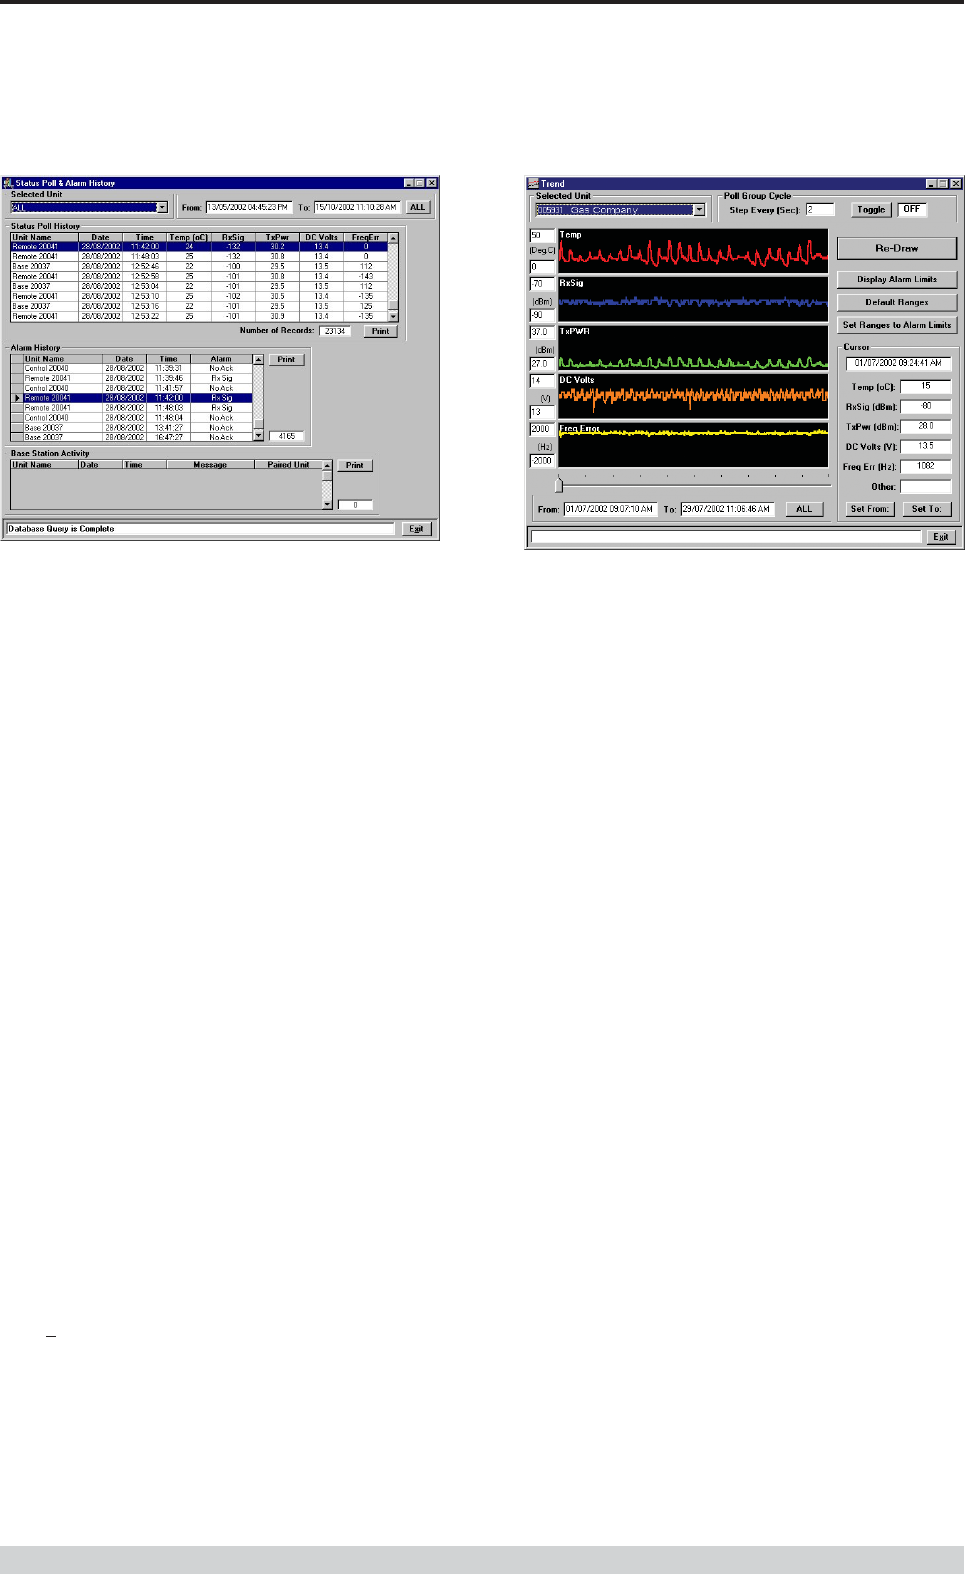
View History
Status poll history may be viewed using the Status Poll & Alarm
History window. This window has three tables: Status Poll History,
Alarm History and Base Station Activity. Each table has a “Number
of Records” box to indicate how big the selection is.
You may select “ALL” to see every units poll results, or view an
individual units poll results.
Part J TVIEW+ Management Suite - Remote Diagnostics & Network Controller
Page 60
E Series Data Radio – User Manual
© Copyright 2002 Trio DataCom Pty. Ltd.
The line above Status Polls is a “Processing Status Bar”. It will
display messages about errors, warnings and poll processing.
From To or ALL Fields
These fields determine the time span you wish to view. For example,
if you have collected several months of data, and only wish to view a
24 hour period, then adjust the From: and To: fields accordingly and
select the unit.
When the History window first appears, the From: and To: fields will
contain the last 24 hours of data.
If “ALL” is selected it will display the start and end dates of the
database.
The Date/Time format will be as per the regional settings short date
format.
NOTE: The smaller the time span you select, the faster the database
search will be. This will also depend on the poll rate that was used
during that time span.
Sorting
Each of these tables can be sorted in ascending order by: unit, date or
poll parameter. To sort, just click on the required column header.
To show the full status of a single report in the “Alarm History” click on
the box at the left by the unit name. Note this only works on valid poll
results not “NoAck”.
Printing
A printout of each table is possible by clicking on the associated Print
button. The table data will be sent to the default printer and formatted
as per your default printer configuration set up.
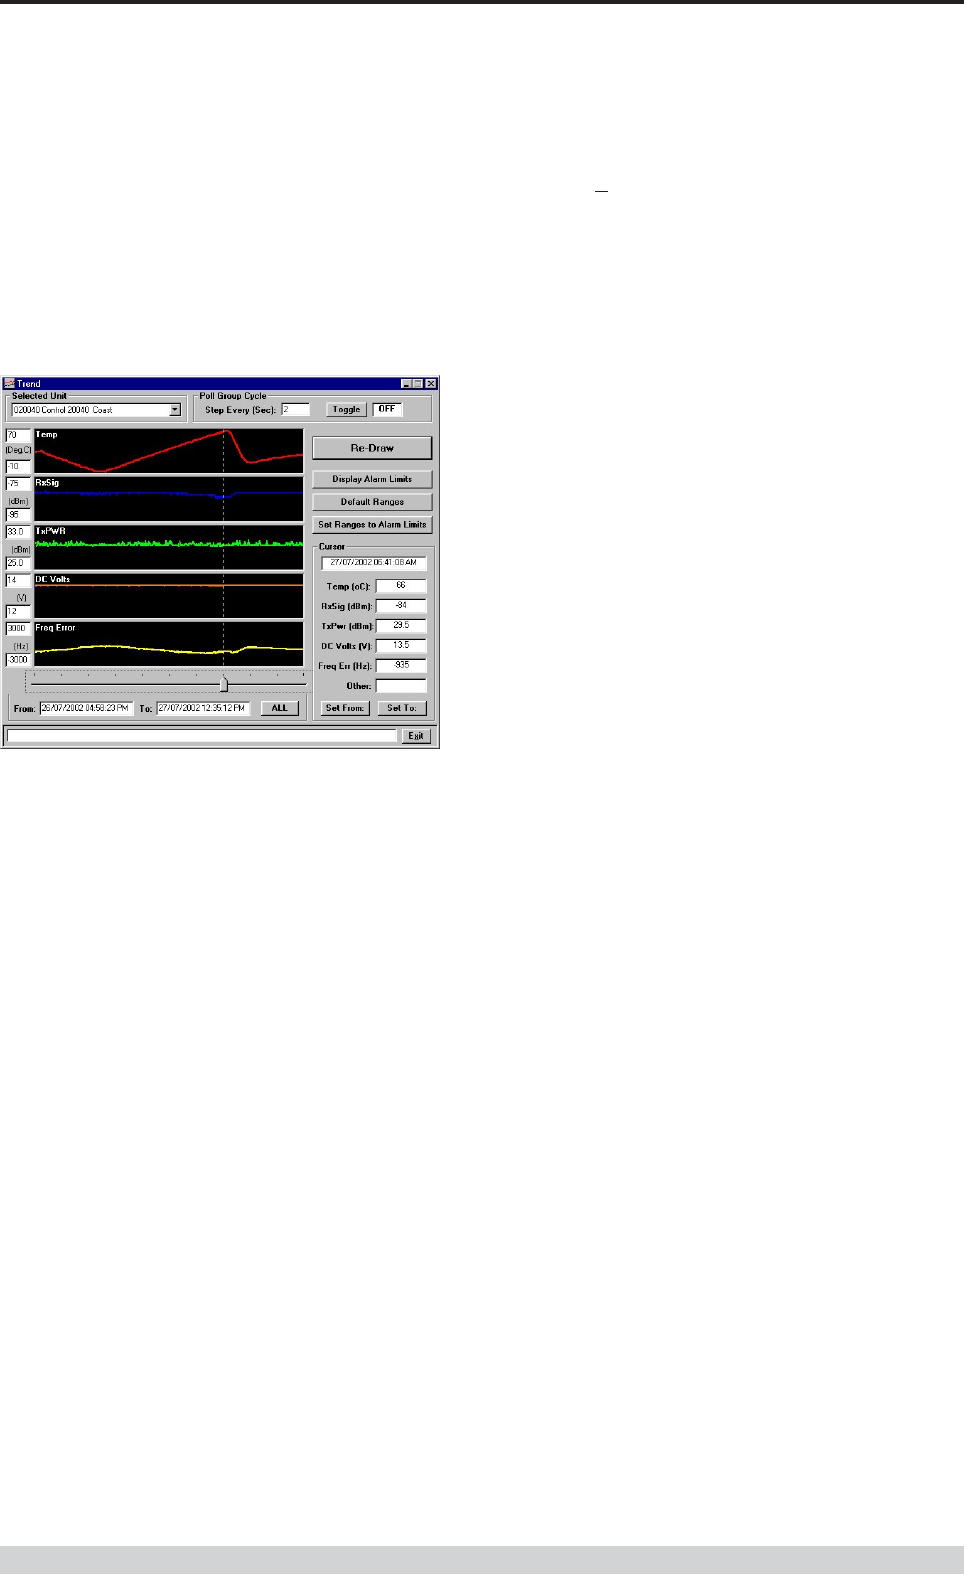
View Trend
The logged status poll data can be viewed in graph format, which
allows viewing of status trends over selectable time spans. This
provides a very effective and fast method of analysing a units’
operating parameters over time.
Select “View Trend” under the Data Logging menu item or click the
associated toolbar button.
Features available include:
• Scaling of graph(s).
• View individual poll results using the cursor.
• Automatically scroll through the group poll database, unit by
unit at a selectable time interval.
• No Acknowledge messages are displayed by a gap in the
graphed data and a “NoAck” in other on the Time Line.
The line above Status Polls is a “Processing Status Bar”. It will
display messages about errors, warnings and poll processing.
Vertical Scale Setting
• Manually set the vertical scales by simple typing in the new
level(s), then either press “Enter” or click on the “Re Draw”
button, or select a new unit.
• Click the “Default Ranges” button to set all the vertical scales
back to the default levels.
• Click the “Set Ranges to Alarm Limits” button to set the vertical
scale limits to the selected unit alarm limits.
From: & To: Fields
These fields determine the time span you wish to view. For example,
if you have collected several months of data, and only wish to view a
24 hour period, then adjust the From: and To: fields accordingly.
When the Trending window first appears, the From: and To: fields will
contain the last 24 hours of data.
If “ALL” is selected it will display the start and end dates of the
database.
NOTE: The smaller the time span you select, the faster the database
search and draw. This will also depend on the poll rate that was used
during that time span.
Use the ALL button to set the From: and To: fields to the maximum
and minimum dates found in the data in the database.
Part J TVIEW+ Management Suite - Remote Diagnostics & Network Controller
Page 61
E Series Data Radio – User Manual
© Copyright 2002 Trio DataCom Pty. Ltd.
Poll Group Cycle
When toggled ON, this will step through each radio in the poll group
and display the trend graph. Set the step interval in the “Step Every
(Sec)” field. Default = 2 seconds
Cursor: Use the slider control, found at the bottom of the display to
move the cursor. The cursor box displays the parameter data of the
status poll at the current cursor position.
Use the “Set From” button to set the From: field to the current cursor
position.
Use the “Set To” button to set the To: field to the current cursor
position.
Part J TVIEW+ Management Suite - Remote Diagnostics & Network Controller
Tools - Statistical Performance
The diagnostic core of radios with Firmware V2.4.X and above have 6
counters which store packet statistics for later retrieval. They are:-
• Lost Synch.
• Lost RxSig.
• Good Frames.
• Bad Frames.
• Time Ticker.
• RSSI Ticker.
The Diagnostic controller software uses these statistics to calculate
packet and bit error rates, network efficiency, bandwidth utilisation and
radio link integrity. These network analysis features are an invaluable
tool for larger networks.
Statistical Performance Formulae
Timers:
Time Ticker (10mS): (RRT) = timer that increments by one every
10mSec
Elapsed Time: = Total elapsed time in hh:mm:ss from
reset calculated from RRT
RSSI Ticker (10mS): = timer that increments by one every
10mSec when RxSig present.
(Virtual connection to RxSig LED)
Transmit Channel:
Tx Frames: = Number of Tx HDLC frames.
Tx Byte: = Number of Tx Bytes
Average Frame Size: = TxByteCnt / TxFrameCnt
Average Frame Rate (mSec): = TxFrameCnt / RTT * 0.01
Channel Utilisation (%): = (TxByteCnt * 8) / (RTT *
RFChannelBitRate)
where RFChannelBitRate is 9600 or
4800 Bits per sec.
Receive Channel:
Good Frames: = Good Frames Rx’d
Bad Frames: = Bad Frames Rx’d. Rx HDLC frame
error.
Good Bytes: = Good Bytes Rx’d
Average Frame Size: = GoodByteCnt / GoodFrameCnt
Average Frame Rate (mSec): = (GoodFrameCnt + BadFrameCnt) /
RTT * 0.01
Channel Occupancy (%): = RSSIgoodTicker / RTT * 100
(Average from reset)
Page 62
E Series Data Radio – User Manual
© Copyright 2002 Trio DataCom Pty. Ltd.
Click the Log Counters OFF/ON button to log the counters every
time they are updated. These can be viewed on the “Counter Poll
History” Tab.
Notes:
• The controller will attempt a series of polls when either resetting
or retrieving the counters. You should monitor the status
window to ensure that the poll process completes. If errors
occur, they may be due to conditions like packet collisions on a
busy network, diagnostic controller trying to perform too many
poll functions (i.e. group polling, individual polling), etc.
• E Series data radios have 32 bit counters and will count for 1
year, 4 months & 10 days if not reset occurs.
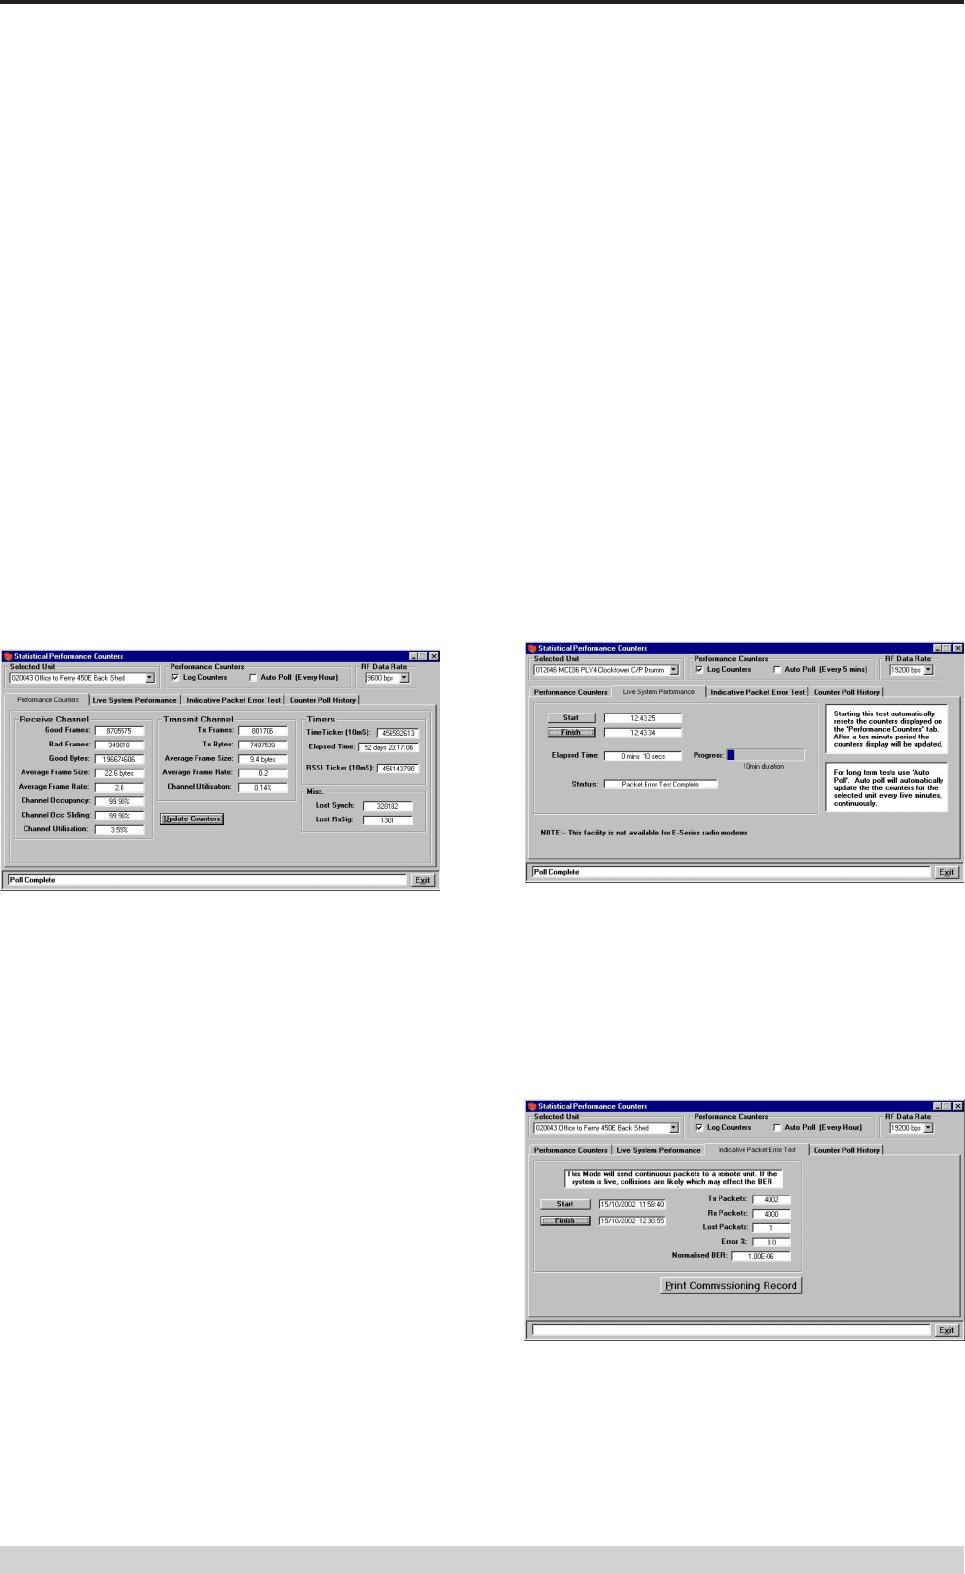
Live System Performance Tab
This provides an automatic test facility which will automatically reset
all the radio modems counters, and then after a 10 minute period
retrieve the new counter values. View the Performance counters tab
to see the result.
Indicative Packet Error Test Tab with Commissioning Record
This Tab provides a simple link test facility. When this is running,
continuous Poll/Response diagnostic messages will be transmitted to
and from the unit and Packet Error Rate results recorded. If a
response is not received within the Poll Response Timeout period,
then an error (last Packet) is recorded. If the system is live, collisions
are likely and may effect Error results.
Channel Occ Sliding: = RSSIgoodTicker / RTT * 100
(Average from last update)
Channel Utilisation (%): = (GoodByteCnt * 8) / (RTT *
RFChannelBitRate)
Miscellaneous:
Lost Synch: = Increments on lost synch, must be
validated with RxSig. (Virtual
connection to Synch LED)
Lost RSSI: = Increments on lost RxSig (Virtual
connection to RxSig LED)
Radio modems with Firmware Revisions 2.4.x and above have the
advanced statistical counters as noted above. Firmware revisions
below this (i.e. 2.3.x) only have Good Frame count, Bad Frame
count, Lost RSSI count and Lost Synch Count available. The
diagnostic controller will detect which firmware the radio has, and only
report the available counters.
Statistical Performance Counters Window
Selected Unit
When a unit is selected, the controller will confirm that the firmware
revision has been received. If not, it will attempt to poll the radio
automatically to retrieve the revision number.
RF Data Rate
Select from the pull down menu 4800, 9600 or 19200 bps, depending
on your system settings
Status Bar
Reports any poll processing in progress or errors that may have
occurred.
Performance Counters Tab
This is the main statistical performance tool used for assessing
network performance.
• Make sure “log counters” is checked on
• Click the Update Counters button to retrieve the current
statistical performance results.
• Click the Auto Poll OFF/ON button to automatically update
the counters every hour for selected unit.
Part J TVIEW+ Management Suite - Remote Diagnostics & Network Controller
Page 63
E Series Data Radio – User Manual
© Copyright 2002 Trio DataCom Pty. Ltd.
Part J TVIEW+ Management Suite - Remote Diagnostics & Network Controller
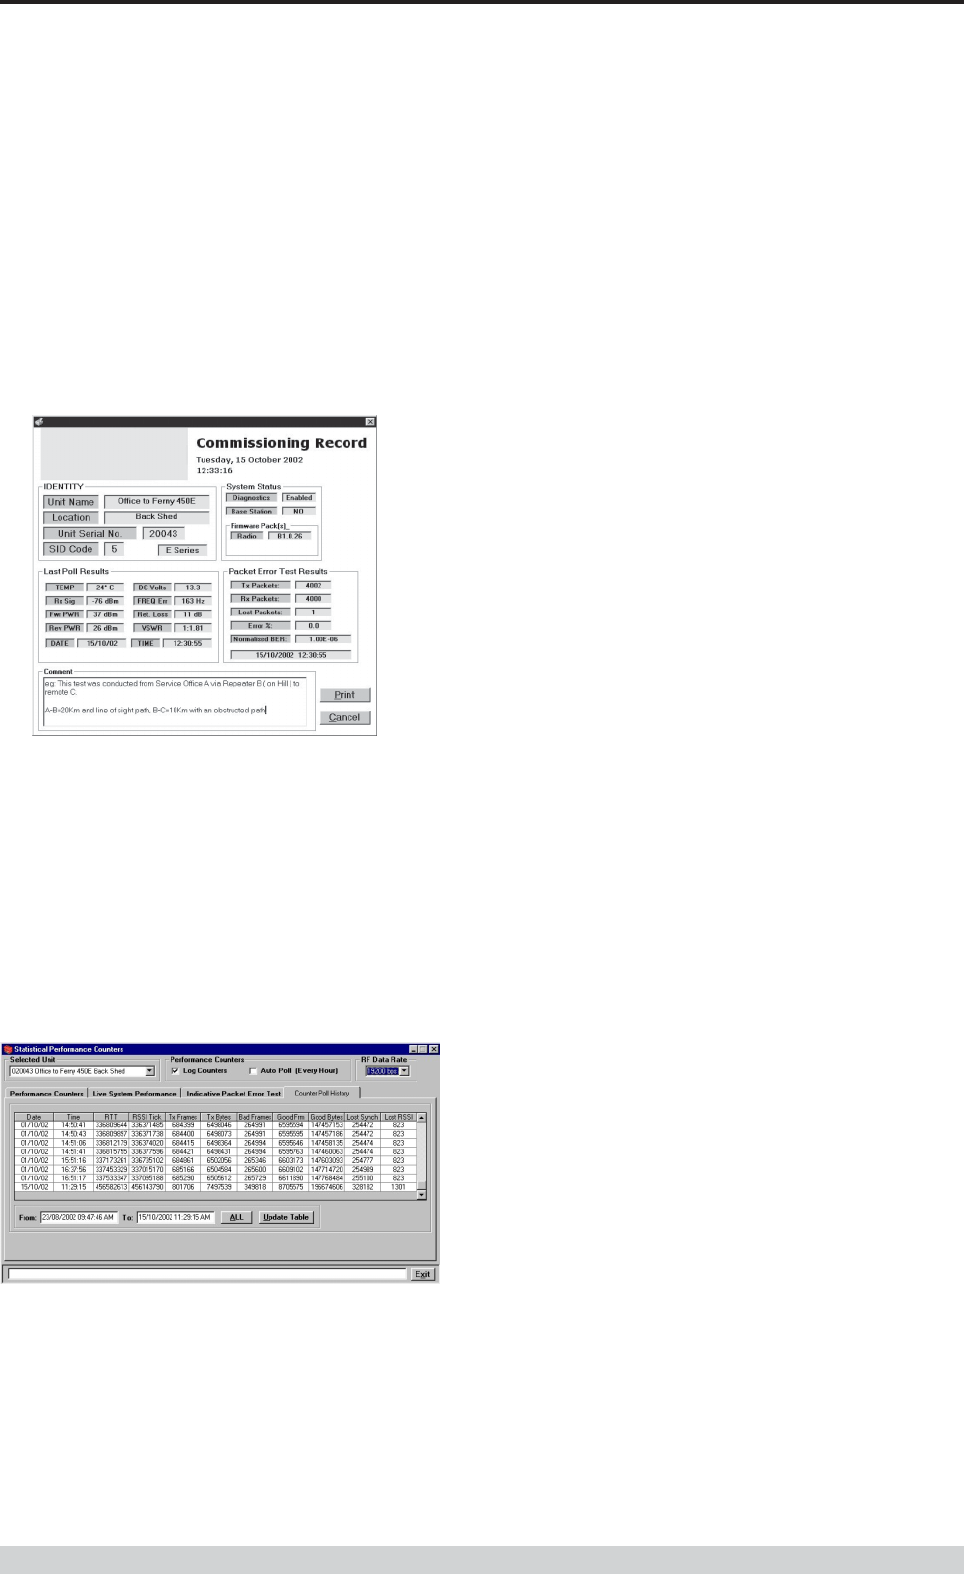
Print Commissioning Record
From the “Indicative Packet Error test” a commissioning sheet can be
printed to file (eg: using Adobe PDF write or similar), or printed
directly.
After running the test for the desired time (best results with no user
data), the test can be stopped with the “Finish” button. Select “Print
Commissioning Record” button and a page appears with the results
and also the unit identity, last poll results, system status and date/time
stamp for each record.
On this page there is also a facility to type in a “Comment” field. This
is useful for recording information such as where the test was
conducted and through what part of the system the test was
conducted. eg: via a repeater.
Press “Print” button when ready to send to the default printer.
Counter Poll History Tab
This is a database viewing facility. When logging is enabled “Log
Counters”, each time the counters are retrieved they will be written to
the database. Adjust the From: & To: fields to view a specified time
span or press ALL to obtain complete database period.
Page 64
E Series Data Radio – User Manual
© Copyright 2002 Trio DataCom Pty. Ltd.
Networking
Monitoring the radio network from other workstations on a LAN
network is made easy with the networking facilities provided by the
Diagnostics Controller. The radio network controller can be configured
as either a Server or Client. The Server will send poll information to
each attached client, depending on their access rights.
Client groups can be set up. Each Client can be assigned to one
client group. Each radio modem can be assigned to one or more
Client groups.
A default Client group called “ALL” is automatically set up containing
all radio units in the database.
Client Groups Example:
All Pumps Test
Test Unit 1 Pump 1 Test Unit 1
Test Unit 2 Pump 2 Test Unit 2
Test Unit 3 Pump 3 Test Unit 3
Pump 1
Pump 2
Pump 3
In the above example, there are three client groups, ALL (the default),
Pumps, and Test. A Radio modem can be a member of more than
one group.
Client Examples:
• Central - This is the Diagnostic Server which
is attached to the radio network.
• Test Client - This is a Diags controller in client
mode.
• Pump Monitor - This is a Diags controller in client
mode.
In the above example, the Central workstation, running Diagnostics in
Server mode, is polling all the radios in the network and distributing the
received messages to the attached clients.
The Test Client and Pump Monitor are receiving Status poll and alarm
information from the Central server. The Test Client will only receive
poll information for radios found in the “Test Client Group” i.e. Test
Units 1, 2 and 3. The Pump Monitor will only receive poll information
for radios found in the “Pumps Client Group” i.e. Pumps 1, 2 and 3.
Networking - Setting
The Server should be configured properly first before any connection
attempts are made by clients. It will always be safer to stop any
polling that may be in progress when making changes to the Server
client set up.
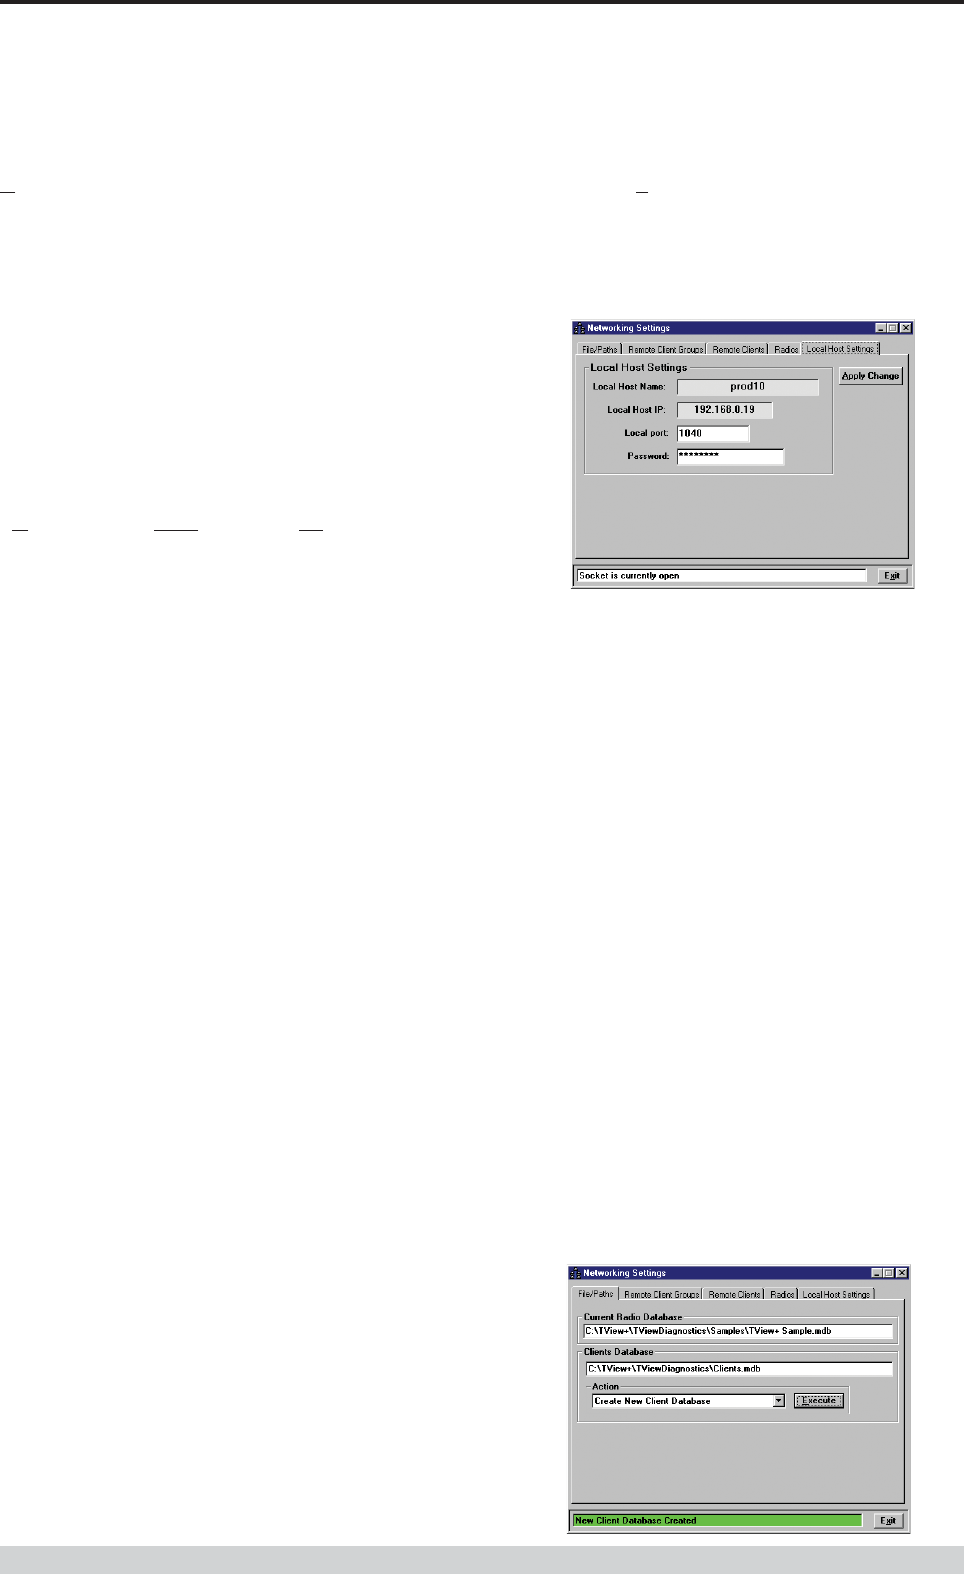
Local Host Settings Tab
It is assumed that the workstation is running Windows, and has been
configured with the TCP/IP network protocol.
• Open or create a radio database.
• Under the Networking menu bar select “Settings” from the
menu bar.
• In the Networking window click the “Local Host Settings”
button.
• The Local Host settings will appear, which contains the Server
Host Name, IP address, Local Port and Password.
• The Local Port is the socket number. Select an unused socket
number. Usually a number between 1000 and 2000 would be
safe.
• Enter a password. This is required when in client mode, to
access incoming data from the server.
• Apply Change.
Creating Client Database- File/Paths Tab
When in Server mode the Diagnostic controller uses an additional
database file (.mdb) to store Client information. This file is linked to the
main radio Database file. The link is managed by the Microsoft Jet
database engine. This separate linked file configuration permits
archiving of the main radio database (.mdb) without losing client
configuration data.
Part J TVIEW+ Management Suite - Remote Diagnostics & Network Controller
Page 65
E Series Data Radio – User Manual
© Copyright 2002 Trio DataCom Pty. Ltd.
• In the Networking window click the “File/Paths” button.
• The “Current Radio Database” is displayed if open.
• Select “Create New Client Database” from the Action drop
down list.
• Click “Execute” to create and link the client database.
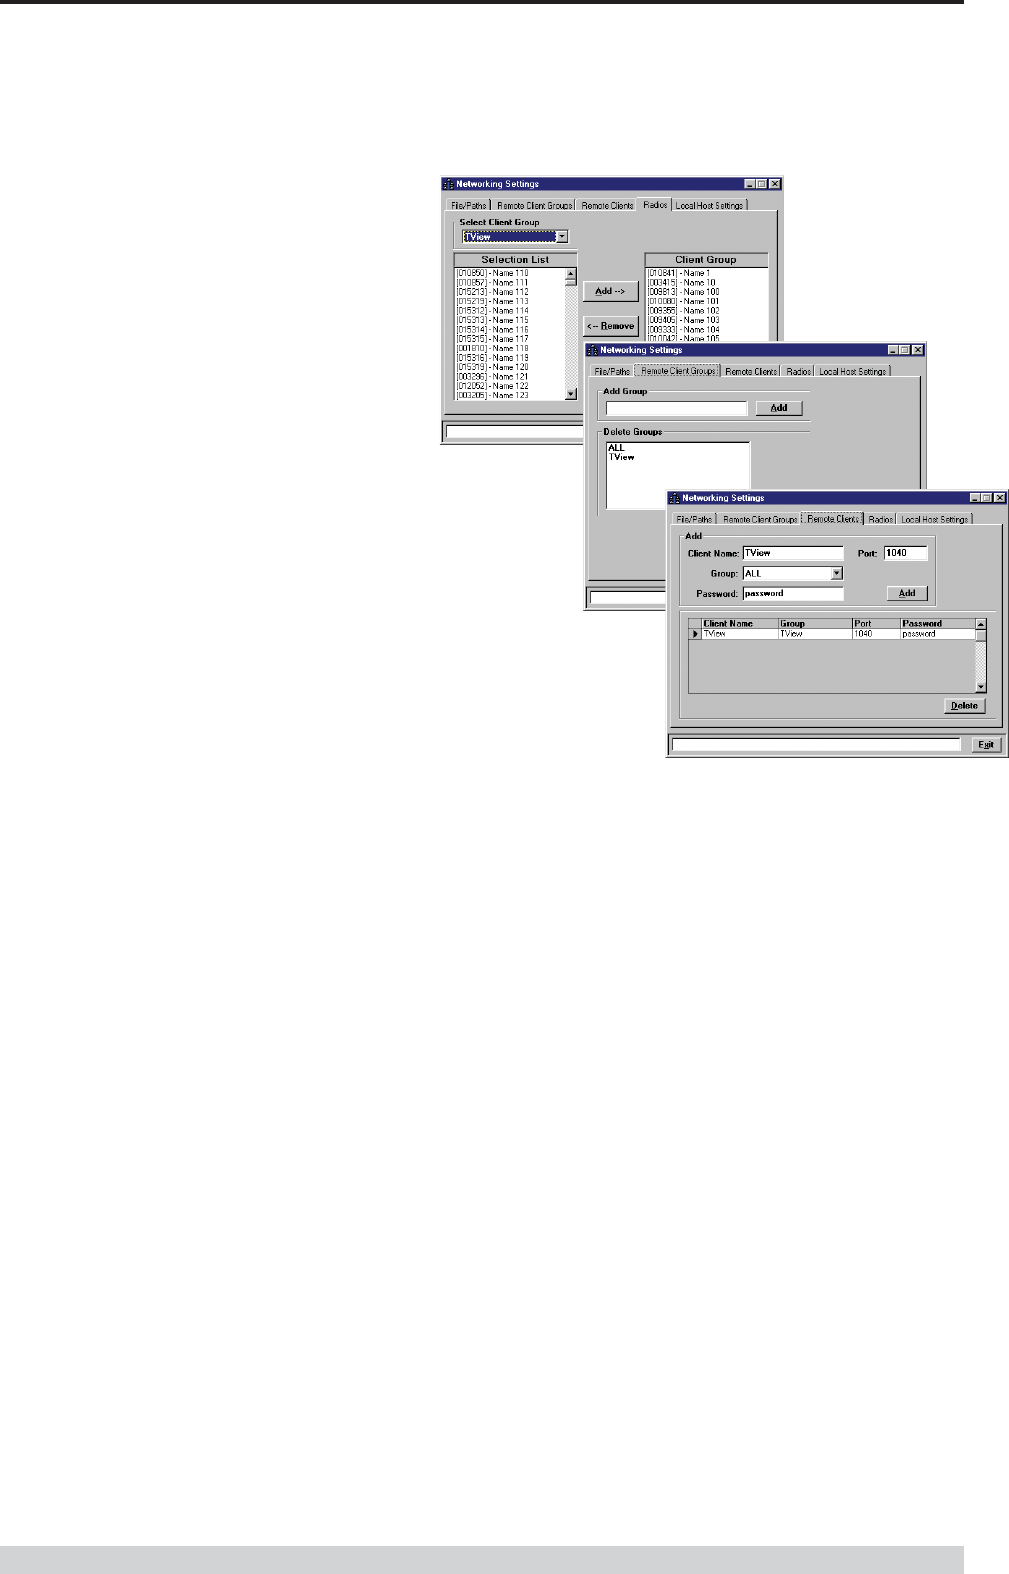
Adding Client Group(s)
• Click the Remote Client Groups tab.
• Enter the group name in the field provided.
• Click on the Add button to add the group name to the database.
Deleting a Client Group
• Click on the “Remote Client Groups” tab.
• Select the group you wish to delete.
• Click on the “Delete” button to delete the group name from the
database.
Adding a Client
• Click on the Remote Clients tab.
• Enter Client Name. This can be either the remote clients Host
name or IP address. Entering the client Host name requires
extra processing to resolve the name into an IP address.
Entering the IP address directly in the Client name field is more
efficient, although more cryptic.
• Select a client group.
• Enter the clients password.
• Enter the client Port. This is the socket number used at the
remote client.
• Click the Add button to add the client to the database.
Deleting a Client
• On the Remote Client Tab, select a client to delete by clicking
on the record selector (left most column).
• Click the delete button to delete the client from the database.
Adding Radio(s) to a Client group
• On the Radios tab select a Client Group.
• Using the “Add and/or Remove” buttons to add or remove
radios from the Client Group.
• Under Networking on the menu bar, Select the “Server Mode”
button. This will place the diagnostic controller into Server
mode.
• The Diagnostic Controller Server is now ready distribute
messages to client workstations.
Setting Up a Client
In Client mode, the diagnostics controller basically just mirrors the
display of the server. Poll information can not be stored locally, polling
functions are not available via the remote server, and most of the tools
normally provided are disabled.
It is assumed that the workstation is running Win95/98/NT, has been
configured with the TCP/IP network protocol and has been added to
the Diagnostic Server’s Client Groups.
• Under Networking on the menu bar, select “Settings”.
• The Network settings window will appear, which contains the
Client Host Name and IP address, which are view only.
• Enter the Client password as stored at the Diagnostic
Controller Server.
• Enter the Local Port Address (socket number) as stored in
the Diagnostic Controller Server database.
• Click the “Apply Change” button.
• Under Networking on the menu bar, Select the “Client Mode”
button. This will place the diagnostic controller into client mode.
A local Diagnostic session can be operated while in client mode, both
status messages will appear on screen.
Diags Client
A Client only version of this software is also available. This must be
used in conjunction with standard software running in “Server Mode”.
Local Com ports are disabled permanently in this version.
Part J TVIEW+ Management Suite - Remote Diagnostics & Network Controller

Page 66
E Series Data Radio – User Manual
© Copyright 2002 Trio DataCom Pty. Ltd.
Interpreting Poll Results
General
The results returned by the poll requests give an indication of system
performance. When a new modem is added to the database, default
values are assigned for the limits of the returned results. The user can
assign different values to these limits as required, which is determined
by the fault tolerance level of their systems.
RSSI
The default RSSI limits are set at -30 to -105 dBm(-110 dBm for Base/
Repeater Station). Above -30 dBm the front end of the receiver will
saturate and it is unlikely that signal levels much higher than this will
ever be reported. Below -105/-110 dBm the error rate may become
too high for some applications. In the modem the RSSI measurement
is made periodically each 100mS, while R F carrier is being detected.
Transmitter power
The transmitter power limits are set at between 0mW and 20,000mW.
The modems will normally be operating at a power level of 1 watt.
The above limits are set to ±3dB of the nominal (3dB represents a
factor of 2 for power measurements).
The effect of a change in transmittal power can be transposed to the
receiver BER curves (3dB down at the transmitter is 3dB down at the
receiver). The amount of variation tolerated will be determined by the
RF path loss of the data link being used.
If the modem is set to low power, then the transmittal power will be
nominally 200mW. Suggested limits for this would be 100mW and
400mW (±3dB).
For base station units or remote units set to high power, the nominal
transmitter power is 5 watts. Suggested limits on these would be 2.5
watts to 10 watts (±3dB).
In the modem the reported transmit power measurement is given from
a measurement made of the last transmission made by the modems.
When the PTT is ON a periodic measurement is made of the transmit
power. The modem stores this away and reports it when requested.
Temperature
The modem is specified to operate within the temperature range of -
30°C to 65°C. The defaults limits are set to -30°C and 60°C. At
65°C the modem goes into a high temperature foldback mode, when
the power is reduced to the low power mode. This is to reduce the
risk of damage to the final stage of the transmitter at excessive
temperatures.
The modem will operate outside this temperature range but it is not
recommended.
Supply Voltage
The modem is specified to operate over a DC supply range of 11V to
16V. The default levels are set to 11.5V to 15.5V. The modem will not
operate correctly outside these bounds and damage may occur with
high voltage levels being applied.
Frequency
The frequency limits are set to ±3000Hz. This is basically the
difference between the different ends of a data link. If the difference
gets much greater than this, data errors may occur (the modem will
have a degree of long term frequency drift of 1ppm / annum due to the
physical properties of internal components).
Part J TVIEW+ Management Suite - Remote Diagnostics & Network Controller
Notes:
1. Remote Tx power measurements will vary due to power setting variation which can have an
initial error of +/- 0.5 dB and final error of +/- 0.2 dB
2. Base Tx power measurements will vary due to power setting variation by the exciter which can
have an initial/final error of +/- 0.2 dB and overshoot by the PA <1 dB.
Parameter Resolution Absolute
accuracy @ RT
Drift over
Temp. range Notes
Temperature 0.1 degC +/- 4 degC +/- 1 degC
Supply Voltage 0.1 volts +/- 0.5V +/- 0.08V +/- 0.45%
Rx Signal Strength 0.1 dBm +/- 3 dB +/- 2 dB
Frequency Error 1Hz +/- 200Hz +/- 2500Hz
Tx Power (Remote) 0.1 dBm +/- 1.5 dB +/- 0.3 dB Note 1
Tx Reverse Power(Remote) 0.1 dBm +/- 3 dB +/- 1 dB
Tx Power (Base) 0.1 dBm +/- 0.8 dB +/- 1 dB Note 2
Tx Reverse Power (Base) 0.1 dBm

Page 67
E Series Data Radio – User Manual
© Copyright 2002 Trio DataCom Pty. Ltd.
Appendix A - Application and
Technical Notes
TN-4 Remote Diagnostics
AN-D3 SID Code Addressing Scheme for Small to
Medium Sized Data Radio Systems
AN-D4 Trunked Multi-Stream Applications of the D Series
Product Range
Part K Appendices
Part K Appendices
Appendix B - Slip Protocol
The SLIP protocol, is a data transport protocol, originated and used
extensively in UNIX(tm) based systems, and thus also closely
associated with TCP/IP networked systems. Although not truly a
“standard” it is so widely used that it has become the defacto standard
for serial interface in UNIX and many other networked systems.
SLIP is a method of framing messages containing binary data, on
asynchronous channels. The asynchronous serial channel is
configured for eight bit character size, no parity, and one stop.
A specific binary code called FEND (Frame End, hexadecimal
value=C0) is reserved to define a frame boundary. Should this same
code occur in the data message to be transferred across the channel
controlled under SLIP, then an escape sequence is used so that the
message byte will not be confused for a FEND. This escape
sequence, involves replacing the message hexadecimal C0 code
with a two byte sequence FESC, TFEND. FESC (Frame Escape)
is the binary code hexadecimal DB, and TFEND (Transposed FEND)
is binary code hexadecimal DC. Likewise, if the FESC character
ever appears in the user data, it is replaced with the two character
sequence FESC, TFESC (Transposed FESC). The TFESC is the
binary code hexadecimal DD. The following table clarifies this.
Abbreviation Description Hex.Value
FEND Frame end C0
FESC Frame escape DB
TFEND Transposed frame end DC
TFESC Transposed frame escape DD
As characters arrive at the SLIP receiver, they are appended to a
buffer containing the current frame. Receiving a FEND marks the end
of the frame, and consequently, succeeding bytes are considered part
of the next frame.
Receipt of a FESC code puts the SLIP receiver into “escaped mode”,
causing it to translate a following TFESC or TFEND back to a FESC
or FEND code, appending it to the buffer, and resuming it’s normal
state. Receipt of any byte other than TFESC or TFEND while in
escaped mode, is an error. No translation occurs, and the SLIP
receiver leaves escaped mode. A TFESC or TFEND received while
not in escaped mode is treated as an ordinary character and stored
accordingly. Reception of consecutive FEND characters, causes no
action to be taken (i.e. is not interpreted as zero length frames).
An example of a typical SLIP frame is shown below. The message
consists of the string DA,C4,C0,C5,DB,20,BD,DC,DD. The SLIP
frame will be:-
DA,C4,<FESC>,<TFEND>,C5,<FESC>,<TFESC>,20,BD,DC,DD,<FEND>
==> DA,C4,DB,DC,C5,DB,DD,20,BD,DC,DD,C0
Page 68
E Series Data Radio – User Manual
© Copyright 2002 Trio DataCom Pty. Ltd.
Part K Appendices
Appendix C - Firmware Updates
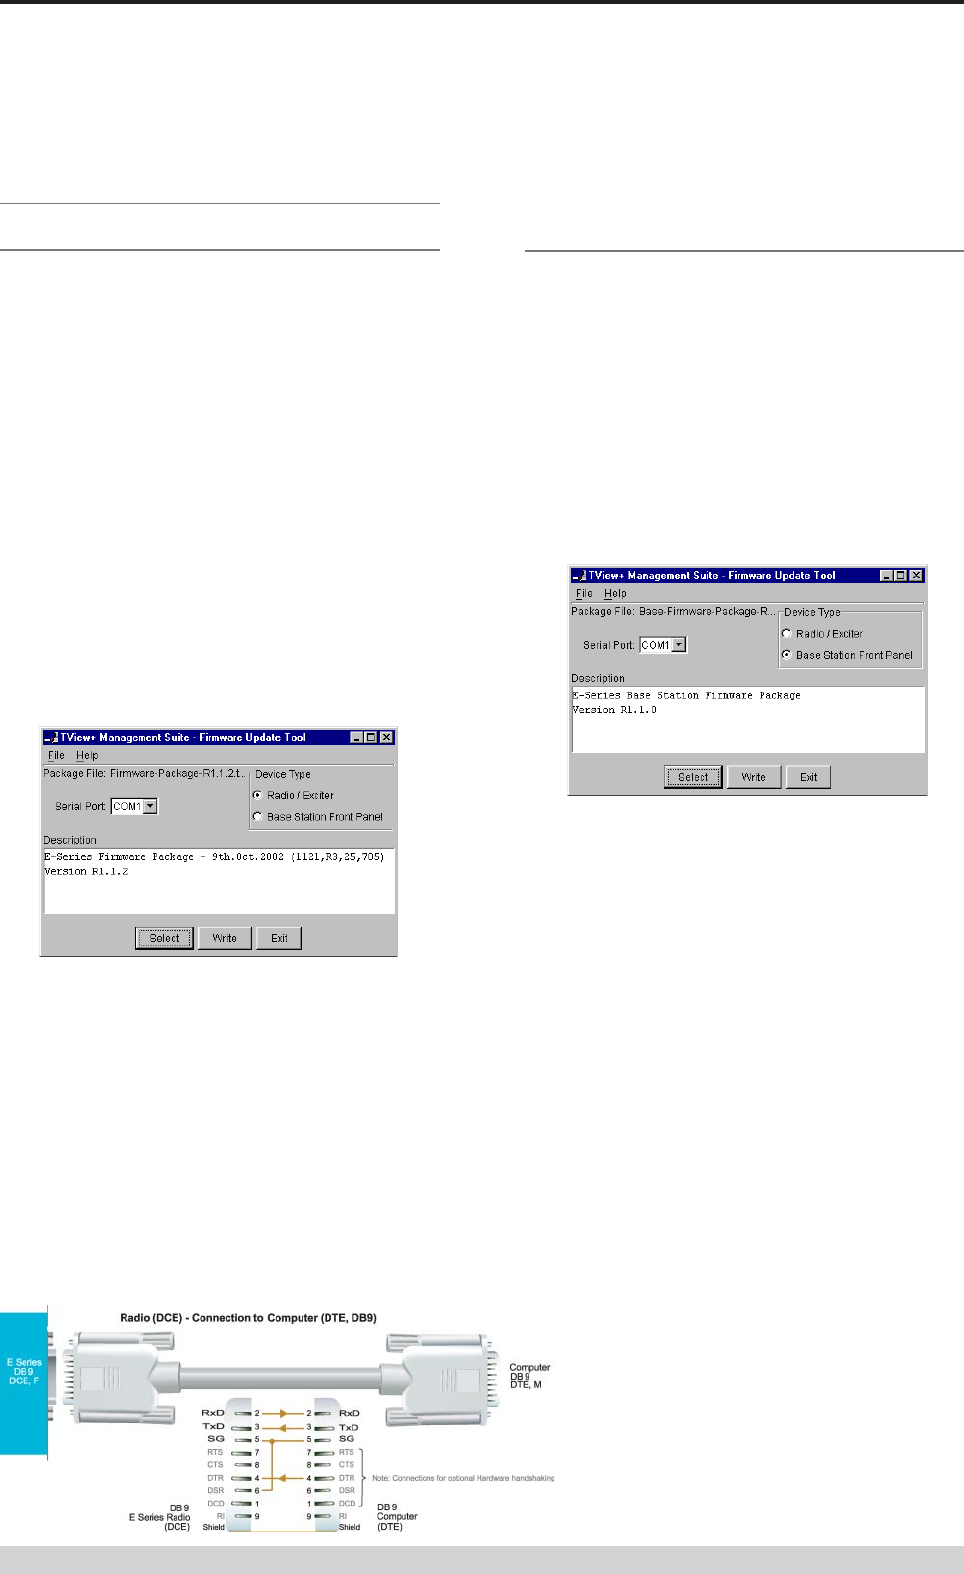
Radio/Base Firmware Update
Firmware update is performed on a unit connected locally to the PC. It
is recommended that all cabling to the unit be disconnected prior to
commencing firmware update to minimise any interruption to the
process or disturbances of signals on cables still connected. All other
TVIEW+ Management Suite utilities should also be exited during the
firmware update process. The steps to update the firmware as follows:
1. Start the firmware update utility from the TView+ front panel.
2. Disconnect power from the unit by turning off the power supply
or removing the power connector to the unit.
3. Connect the serial cable from the PC to Port B on the unit
4. Select the unit type from the options on the top right of the
firmware update main window. Please note that “Exciter”
refers to the radio contained inside the base station.
5. Select the file containing the firmware update package using the
“Select” button at the bottom of the main window. After opening
the file the browse window will close and a description of the
firmware package will appear in the main window.
6. Initiate the firmware updating process using the “Write” button at
the bottom of the main window. Another logging window will
appear.
7. Reconnect power to the unit when prompted in the logging
window. The status LEDs on the unit including power should all
be extinguished and the transfer of firmware should commence.
If this does not occur steps 6 & 7 should be repeated.
8. The logging window will display the progress of each firmware
block transferred and when complete a success dialogue box
appears. Type OK to close this dialogue box and type “Exit” in
the main window to exit the firmware update utility.
9. Disconnect the cable from Port B and re power the unit to
enable the new firmware.
Base Station Display Firmware Update
Installation Instructions:
1. Update of the front panel firmware uses the firmware update
utility supplied with the TVIEW+ Management Suite.
2. Start the firmware update utility from the TVIEW+ front panel.
3. In the firmware update utility select device type as “Base
Station Front Panel”
4. Select the file containing the firmware update package using the
“select” button at the bottom of the main window. After opening
the file the browse window will close and a description of the
firmware package will appear in the main window.
5. Ensure that the base station is powered.
6. Connect the “TVIEW+ cable” to the front or rear system port of
the base station.
7. On the base station front panel depress and hold the “Display
On/Off” button, then momentarily depress the firmware update
switch using a suitable probe before releasing the “Display On/
Off” button. The firmware update switch is located behind the
small hole (not labelled) in the front panel below the “Display
On/Off” button.
8. Initiate the firmware update process using the “Write” button at
the bottom of the main window. Another logging window will
appear.
9. The logging window will display the progress of each firmware
block transferred and when complete a success dialogue box
appears. Click OK to close this dialogue box and click “Exit”
in the main window to exit the firmware update utility.
10. Repower the base station to enable the new firmware.
Page 69
E Series Data Radio – User Manual
© Copyright 2002 Trio DataCom Pty. Ltd.
Part L Specifications
Part L Specifications

Page 70
E Series Data Radio – User Manual
© Copyright 2002 Trio DataCom Pty. Ltd.
Part M Support Options
Website Information
The Trio DataCom website support contains links to e-mail and
telephone support, tech notes, manuals, software updates.
Please go to www.trio.com.au/support.htm.
E-mail Technical Support
E-mail your questions to support@trio.com.au.
When e-mailing questions to our support staff, make sure you tell us
the exact model number (and serial number if possible) of the Trio
equipment you are working with. Include as much detail as possible
about the situation, and any tests that you have done which may help
us to better understand the issue. If possible, please include your
telephone contact information should we wish to further clarify any
issues.
Telephone Technical Support
Telephone support is available at our head office telephone number
Aus: (+61) 3 9775 0505 during Eastern Australian business hours
(9am-5pm).
Contacting the Service
Department
The Service department may be contacted by e-mail to
service@trio.com.au , or by telephone during Eastern Australian
business hours.
Part M Support Options
Page 71
E Series Data Radio – User Manual
© Copyright 2002 Trio DataCom Pty. Ltd.
T +613 9775 0505
F +613 9775 0606
E support@trio.com.au
www.trio.com.au
TRIO DATACOM GROUP
41 Aster Avenue
Carrum Downs VIC
Australia 3201
Innovative and sophisticated
digital communications
designs products and solutions Information subject to change without notice.
© Copyright 2002 Trio DataCom Pty Ltd. All rights reserved.
Issue 4: May 03