Trio Datacom ER450-XXF01 Remote Radio Data Modem User Manual temp warning E Series R3

Trio Datacom Pty Ltd (a wholly owned company of Schneider Electric) Remote Radio Data Modem temp warning E Series R3

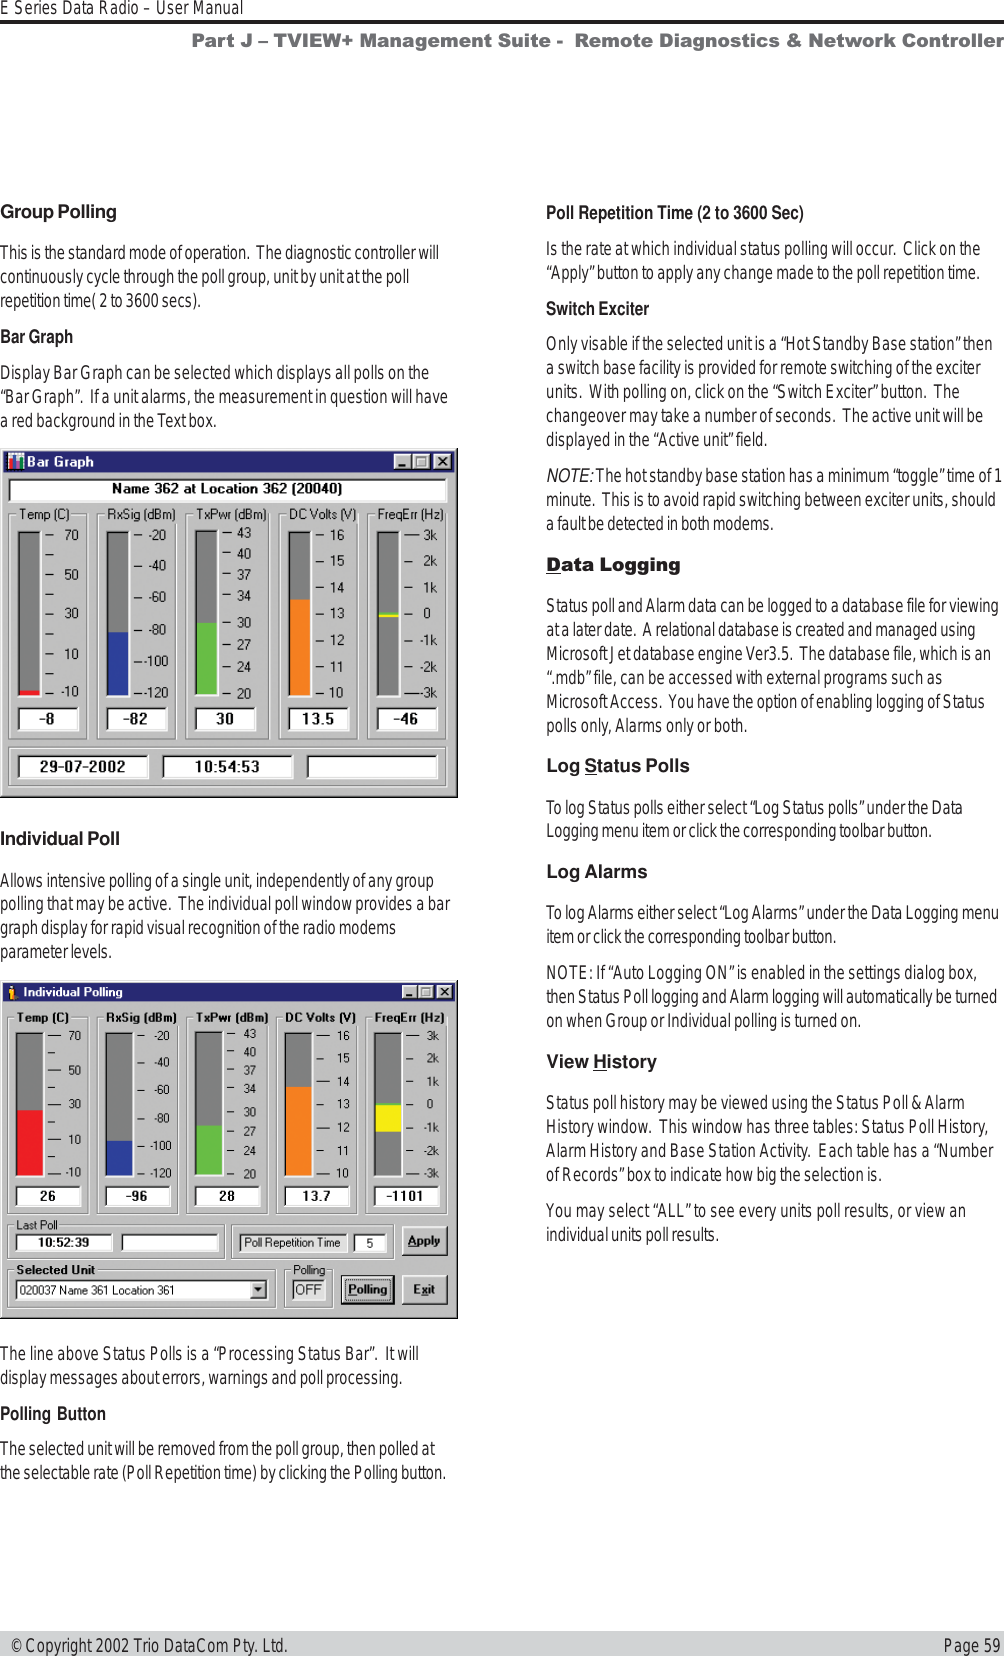
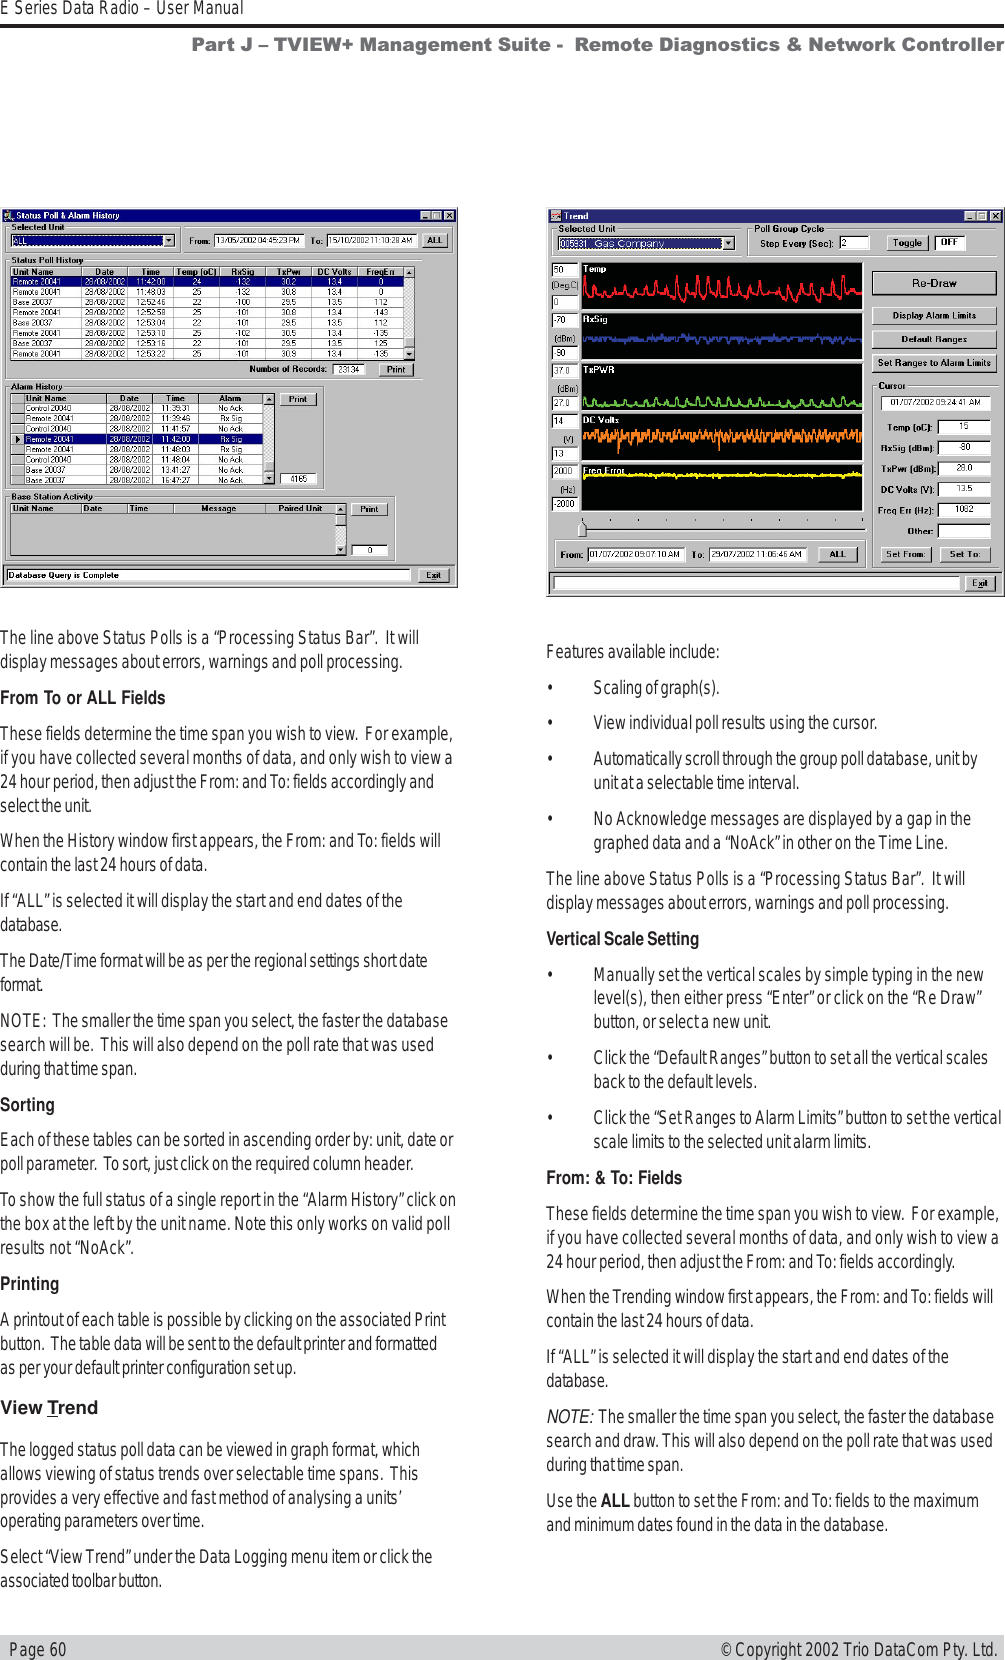
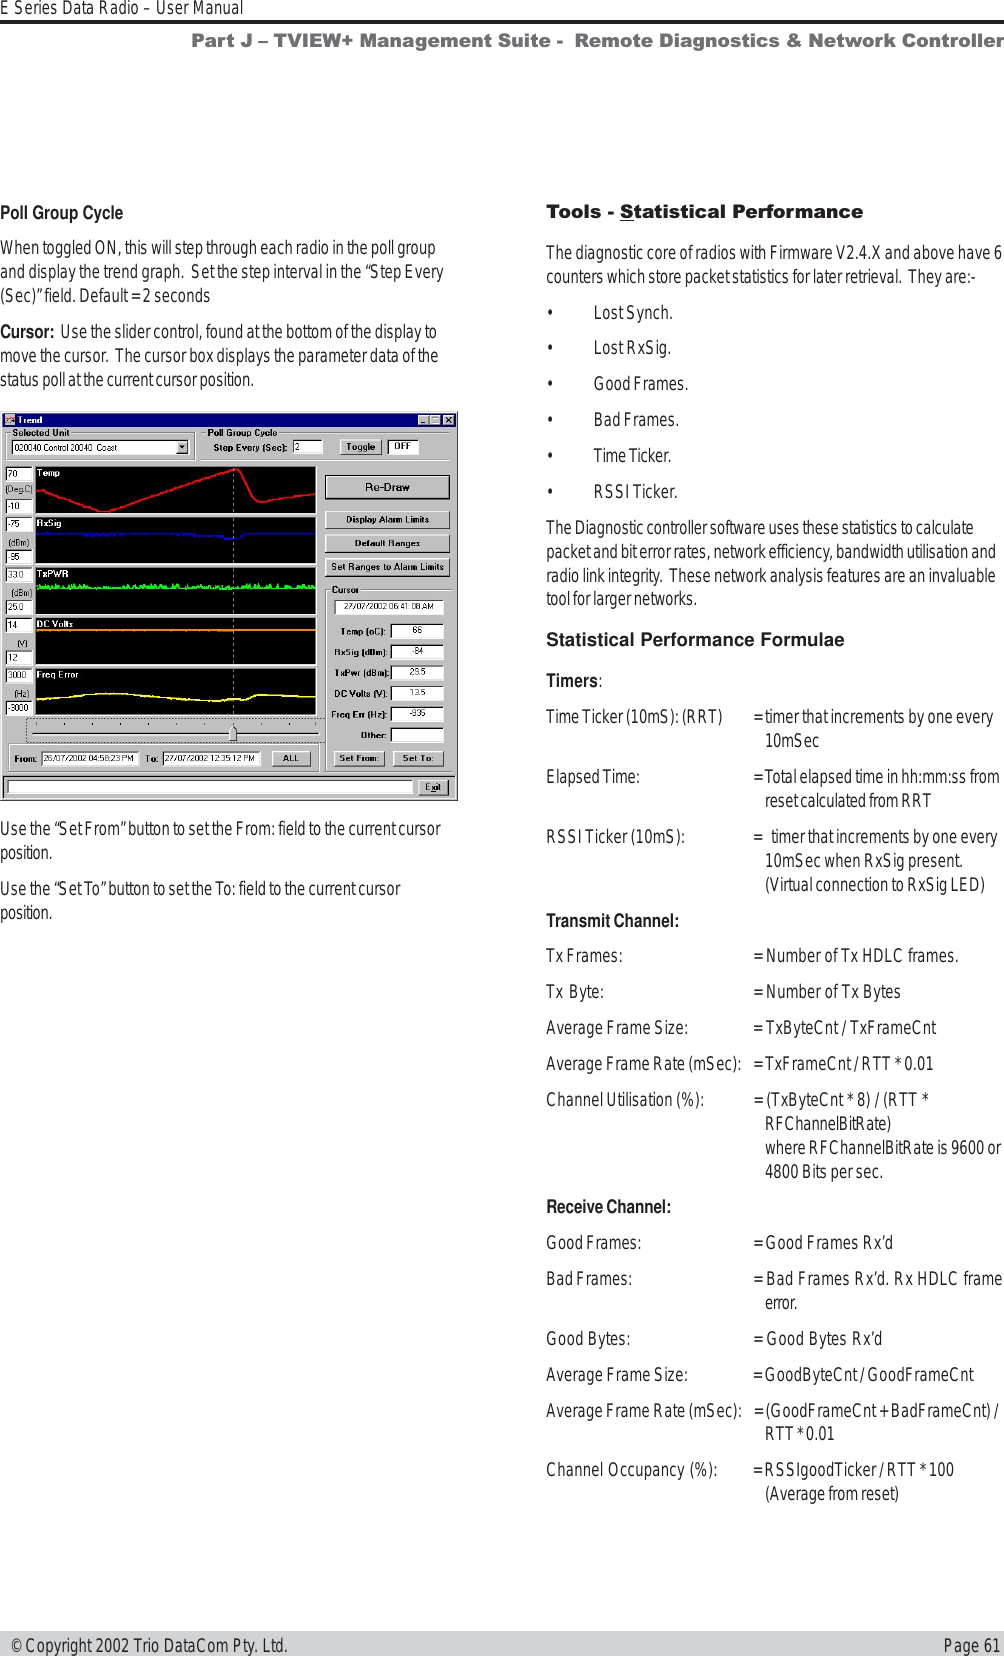
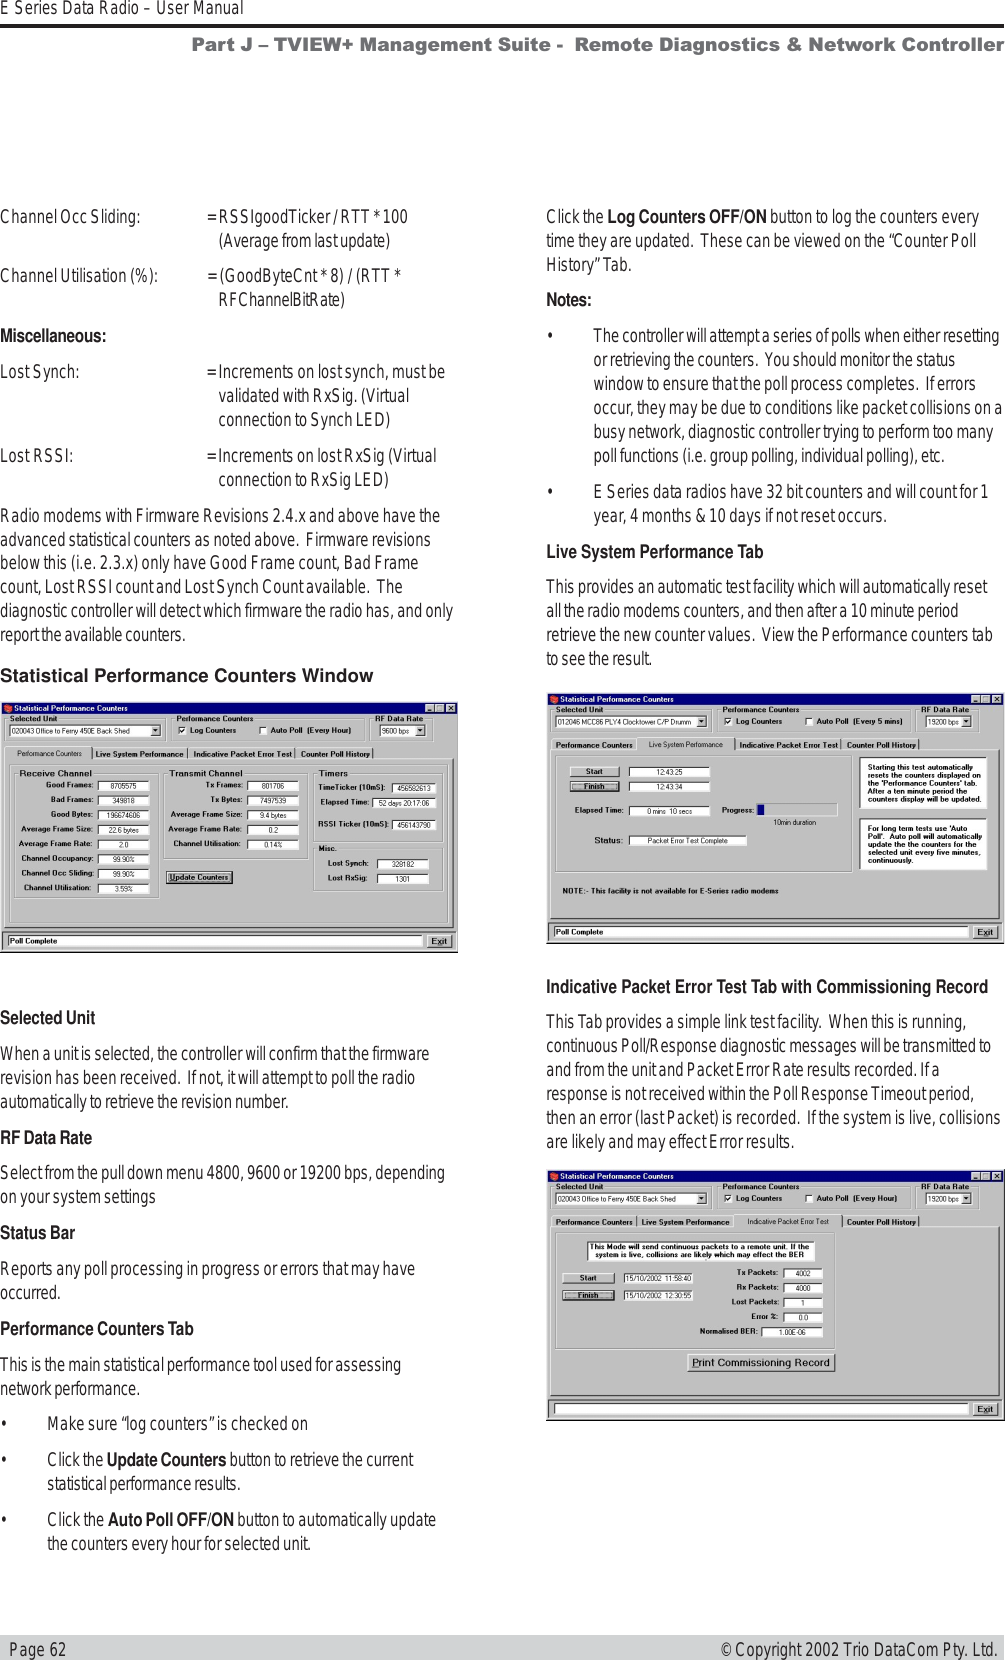
Installation Guide Part 2

Page 51E Series Data Radio – User Manual © Copyright 2002 Trio DataCom Pty. Ltd.• Mode – “Master” or “Remote”. When the master unit receivesa valid transmission from a remote unit it sets the channel busyindication bit. This busy bit is interpreted by the other remotes tonot transmit. Once the transmission from the first remote endsthe master unit resets the busy bit to indicate the channel isnow clear to transmit on. The master unit, which is normally abase station, takes about 5ms to detect a transmission from aremote unit and set the channel busy indication bit on the radiochannel. During this period collision of remote transmissionscan still occur and is unavoidable. NOTE: The master canonly be a full duplex unit.• Backoff Method – “Retry after Tx Attempt” or “Delay before TxAttempt”. The method chosen is system dependent and canonly be configured if the mode is “remote”. The former is bestused when data responses from remotes are largelyasynchronous. The latter is best used when this is not thecase.• Backoff Timing – “Maximum Slots”, “Time per Slot”. This canonly be configured if the mode is “remote”. When a remote isready to transmit data but it finds the busy bit from the masterset it holds back its transmission for a random “backoff” timeafter which it tries to transmit data again. This ensures thatmodems waiting to be allowed to transmit do not re-attempt todo so at the same time. The “Maximum Slots” (1 to 16) andthe “Time per Slot” (1 to 255ms) are used to calculate thebackoff time by multiplying the slot time by a random numberbetween 1 and the maximum slot number. For example if thetime per slot is 30ms and the maximum slots is 4, the randombackoff times can be 30, 60, 90 or 120ms.As the channel busy indication bit is critical for reliable operation defaultinterpretation of this bit is defined in the remote units. If the mastermodem stops transmission (or has not yet started) the remote willinterpret that the channel is busy and will not transmit until the mastercomes on line.Carrier DetectThis method of collision avoidance utilises a carrier transmitted to allremotes to indicate that the radio channel is busy. When selected adialogue box appears and several options must be configured:• Mode – “Master” or “Remote”. When the master unit receivesa valid transmission from a remote unit it transmits a carriersignal to indicate busy. Of course the master will also initiate atransmission if it has data to send. The transmitted carrier isinterpreted by the other remotes to not transmit. Once thetransmission from the first remote ends the master unit stopstransmission to indicate the channel is now clear to transmit on.The master unit, which is normally a base station, takes about5ms to detect a transmission from a remote unit and transmit acarrier signal. During this period collision of remotetransmissions can still occur and is unavoidable.NOTE: The master can only be a full duplex unit and cannot bepermanently transmitting. For half duplex and simplex systemsall units should be set as “Remote” (no Master).• Backoff Timing – “Maximum Slots”, “Time per Slot”. This canonly be configured if the mode is “remote”. When a remote isready to transmit data but it detects a carrier signal from themaster set it holds back its transmission for a random “backoff”time after which it tries to transmit data again. This ensures thatmodems waiting to be allowed to transmit do not re-attempt todo so at the same time. The “Maximum Slots” (1 to 16) andthe “Time per Slot” (1 to 255ms) are used to calculate thebackoff time by multiplying the slot time by a random numberbetween 1 and the maximum slot number. For example if thetime per slot is 30ms and the maximum slots is 4, the randombackoff times can be 30, 60, 90 or 120ms.Unit InformationPart I  TVIEW+ Management Suite - ProgrammerThe information displayed is intended to assist the user to identify theradio modem as well as support should their services be needed.Radio Model refers to the type of unit. The ER450 is a remoteunit and the EE450 is a exciter inside a base station unit.Radio Type refers to the frequency band supported by the radioas well as the channel bandwidth. For example 51A02 is a type51 band with a 25kHz channel.
  Page 52E Series Data Radio – User Manual© Copyright 2002 Trio DataCom Pty. Ltd.Unit Information - DetailsMore detailed information is also available to assist in identifyingcomponents installed in the unit (remote, base station or hot standby).The additional information provided is:• Controller Rev refers to the microcontroller firmware componentversion for the radio.• DSP Code Rev refers to the DSP firmware componentversion for the radio.• Processor Board ID refers to the processor board identificationnumber and hardware revision information for the radio.• RF Deck ID refers to the RF deck board identification numberand hardware revision information inside the radio.• Production Build Code refers to the automated production testand calibration sequence used during manufacture of the radio.• Hardware indicates whether the radio is half or full duplex.• Unit Type indicates whether the unit is recognised as a remoteor base station.In the case of a base station unit the following additional information isprovided:• Base Firmware Pack refers to the firmware package versioninstalled in the base station (front panel) controller which isseparate to the radio installed. There are several componentsassociated with this firmware package and a single versionnumber is used to identify them.• Base Controller Rev refers to the microcontroller firmwarecomponent version for the base station.MessagesThe message window provides a log of error messages occurringduring use of the programmer utility. Several error messages mayoccur as a result of a selection.Status BarThe status bar is located at the bottom of the main window andprovides information regarding communication actions occurring withthe radio data modem.Additional fields located on the status bar include:•Unit ID refers to the identification label used by the diagnosticsutility. This is currently the same as the unit’s serial number.•Mode refers to the type of session established. It can be a File,Local indicating a local port connection to the unit or Remoteindicating communications is via a radio channel.•Rotating bar progress indicator showing data is beingtransferred to or received from a unit.Part I  TVIEW+ Management Suite - ProgrammerDiags Installed is set to yes or no depending on whether thediagnostics key has been set in the unit.Serial Number is unique to each unit and is set within the unit attime of production as well as included on the label fixed to theunit.Firmware Pack refers to the firmware package version installedin the radio. There are several components associated withmicrocontroller and DSP firmware installed and a single versionnumber is used to identify them.
Page 53E Series Data Radio – User Manual © Copyright 2002 Trio DataCom Pty. Ltd.Part J  TVIEW+ Management Suite -  Remote Diagnostics & Network ControllerIntroductionThis section covers the operation of the Remote Diagnostic andNetwork Management Controller Software Version 3.7.X or greater.OverviewThe Diagnostic Controller is a Windows© based program, that can berun on a standard desktop or laptop PC.The software runs in the 32 bit Windows environment and offers manyoptions and configurations which are easily accessible via pop-upwindows.  These include group or timed polling, remote switching ofduplicated base stations, viewing of databases, logging and trending ofreal time parameters , etc.The Diagnostic Controller can be installed to run as a stand-alonepackage, or as part of the TView+ Management Suite.It is for use in conjunction with the D & E Series of data radio modemsand can be used for simple point-to-point links, or for more complexpoint-to-multipoint and multilayer link systems.The diagnostic facilities allow retrieval of packet statistics from eachradio modem.  These statistics are used to calculate Packet and BitError Rates, a units’ condition/health, network efficiency andbandwidth utilisation.The use of the diagnostics facilities provided by the controller gives theradio modem system designer and operator a powerful tool for both themaintenance and continuing reliability of their system.The general operating parameters that can be obtained from remotemodem units are:-• Last RSSI level.• Last transmitted power level.• Receive frequency offset.• Power supply voltage level.• Current internal temperature.These are displayed on the controllers screen in a “quick read” formatof bar graphs, as well as detailed response listings.For the E Series radio modems to operate with the diagnosticcontroller, they must be factory preset to include the diagnosticsresponse facilities or installed at a later stage (in the field) via theprogrammer. Contact you supply for details.The diagnostics data stream operates “alongside” the main user datastream.  No interference between the two streams occurs, so as faras the primary user of the data system is concerned, the diagnosticsdata does not exist.Features• 32 Bit Windows Based User Software.• Full graphical presentation.• Full SCADA style features such as database, trending,networking, etc.• Able to interrogate and display important operating parametersof each radio modem.• Provides performance data of any unit - good frames received,bad frames received, packet error rate, transmitted packetsizes, channel usage, etc.• Provides statistical Packet Error Rate (PER) performancecalculations for any unit.• Provides powerful network tools such as channel occupancystatistics, average received transmission duration, etc.• Can be set to background poll radio system for continuoussystem monitoring and logging.• Provides full time/date stamped Status and Alarm logging/reporting.  A relational database is created and managed usingMicrosoft Jet database engine Ver3.5.  The database file, whichis an “.mdb” file, can be accessed with external programssuch as Microsoft Access.System DescriptionGeneralThe diagnostics process is based on a series of polls being transmittedto the remote modem units with each modem having its own uniqueassigned address which is factory preset.When a diagnostic poll is received by a modem it checks to see if it isaddressed to itself, and if so, it responds with its diagnostic data backto the controller.  If it is not addressed to the modem, the modemsimply “passes the message on”, and does not respond to thecontroller.In a multilayer system, several “pass on’s” may occur before thedestination modem is reached.The modem’s diagnostic response message is addressed to thecontroller, and as each modem in the “chain” decodes this message itwill “pass it back”, eventually the message reaches the controller forprocessing.The controller software provides a database to hold the modem unitsassociated data (i.e. Serial number, assigned name, location, alarmlimits, SID code address, base station pairing information, status pollresponse data, alarms, etc).The units’ address is the serial number of the unit which is factorypreset.  The name is any mnemonic that the user wishes to attach tothe modem.  This name is then used to address the unit for access todiagnostic facilities.Part J  TVIEW+ Management Suite -Remote Diagnostics & Network Controller
  Page 54E Series Data Radio – User Manual© Copyright 2002 Trio DataCom Pty. Ltd.The responses from the modem have boundary limits placed on them.If a response is outside these limits then an alarm is raised.  Forinstance, the DC supply volts can have a lower limit of 12V, and anupper limit of 16V.  Should a response to a poll received show that theDC volts is at 11V, then an alarm is reported.A unit can be excluded from a poll sequence by removing it from thepoll group.Intensive polling of a single unit is possible using the Individual pollingfacility.A poll “run” can be set up.  A time can be designated for the controllerto poll each of the modems in the system.  This may be useful forsystems that have a low traffic period where diagnostics can be“slotted in”, thereby spreading the data throughput of the system moreefficiently.The screen is divided into three main scrolling sections - Status Polls,Alarms and Base Station Activities.  The status poll section displayscurrent poll activity while the alarm section displays any polls alarmswhich have been reported.  The Base Station activity section displaysany changeovers that have occurred to Hot Standby Base Units - ifno Hot Standby Base Stations are employed within the system, thissection will remain blank.If base stations are employed in the system, then the two exciter unitscontained in one base unit can be paired together.  The excitersoperate in a mutually exclusive environment i.e. only one is active ata time.  When the exciters are to be polled, only the active one will besent a poll.The base exciters can be toggled, so as the other exciter unit in thebase can be polled if required.A relational database is created and managed using Microsoft Jetdatabase engine Ver3.5.  The database file, which is an “.mdb” file,can be accessed with external programs such as Microsoft Access.All polls and alarms are time and date stamped and saved to thedatabase.  All database entries can be sorted and printed.For some multilayer systems, Stream Identifier (SID) Codes mayhave to be added to the diagnostic data packets.  Each modem can beassigned a SID address (the default is 00) and the SID code featureenabled.Refer to Appendix A “Technical Notes” for further details of SID codeaddressing.The diagnostic core of each radio (Firmware Version 2.4.0 and above)stores packet statistics for later retrieval.  The Diagnostic controllersoftware uses these statistics to calculate packet and bit error rates,network efficiency, bandwidth utilisation, and radio link integrity.  Thesenetwork analysis features are an invaluable tool for larger networks.In the transmit direction, each radio modem can report the number of:-• data bytes transmitted (TxByteCnt).• frames transmitted (TxFrameCnt).With these counters one can then calculate average frame size,average frame rate and channel utilisation.In the receive direction, each radio modem can report the:-• Data bytes received (GoodByteCnt).• Good frames received (GoodFrameCnt).• Bad frames received (BadFramCnt).• Total time the radio has received signal (RSSIgoodTicker).• Lost synchronization count (LostSynchCnt).• Lost RSSI count (LostRSSICnt).These counters can be used to calculate average frame size, averageframe rate, channel occupancy, channel utilisation and link integrity.Radio modems with Firmware Revisions 2.4.x and above have theadvanced statistical counters as noted above.  Firmware revisionsbelow this (i.e. 2.3.x) only have Good Frame count, Bad Framecount, Lost RSSI count and Lost Synch Count available.  Thediagnostic controller will detect which firmware the radio has, and onlyreport the available counters.All these features combine to provide a powerful tool for the systemoperator.Modem ConnectionThe diagnostics controller normally connects via a COM port on thecontroller PC and the “System Port” on the radio modem (Port “A &B” can be used if required).NOTE: The controller can connect to any port of any data radiomodem within the system as long as the data radio port is configuredaccordingly. When “Settings” is selected, the controller will interogatethe computers coms ports and display the available ports. Possiblevalid com ports are 1-16 or “None”. Choose the desired port. Noneallows you to free the com port for use with other programs withoutexiting the diagnostic.The modem port must have its SID codes enabled, and have the SIDcode set to the system diags SID (normally this is set to “00”).The data format used is the SLIP protocol, running at 9600 baud, Noparity, 8 data bits and 1 stop bit.  Appendix B “SLIP Protocol”contains a detailed definition of the SLIP Protocol.COM1 of the controller PC is to be directly connected to the 9 way D-Min of the modem using a 3 wire interface (see drawing below).Should the PC have a 25 way connector, then the standard RS232,25 way to 9 way conversion should be used.Part J  TVIEW+ Management Suite -  Remote Diagnostics & Network Controller
Page 55E Series Data Radio – User Manual © Copyright 2002 Trio DataCom Pty. Ltd.Operating  InstructionsGeneralWhen the Diagnostic controller starts, a presentation screen isdisplayed which will then lead you into the main diagnostics screen.This is where all the major functions of the controller are accessed.The main screen presents the operator with the typical Windows pulldown type menu bars - “File”, “Settings”, etc.  Icons of the mostcommonly used selections are also provided across the top of thescreen.This screen is divided into 3 main sections:-1. Status Polls screen which displays all poll results obtained.2. Alarms screen which displays any alarms that occur.3. Base Station Activity screen which displays anychangeovers that occur with Hot Standby Base Stations withinthe system.The line above Status Polls is a “Processing Status Bar”.  It willdisplay messages about errors, warnings and poll processing.The bottom row of the screen also displays a summary of theconfigured parameters such as which com port is being used, whetherSID codes are on or off, whether polling is enabled or disabled, currentdatabase path and file name, etc.Menu SelectionFile MenuTo utilise the Remote Diagnostics facilities, a database must be createdwhich includes the individual serial numbers, alarm parameters andvarious other parameters of each unit.The file menu allows the operator to create a New database, Open anexisting database, Add/Edit/Delete a database or View an existingdatabase.  All such database tools utilise standard Windows typeformats for file selections as shown.File - Add/Edit/DeleteAfter creating a New database or Opening an existing database, theAdd/Edit/Delete menu can be accessed.Selected UnitSelected unit is a pull down selection box, for selecting a unit to viewor edit.The bottom line is a “Processing Status Bar”.  It will displaymessages about errors, warnings and poll processing.Part J  TVIEW+ Management Suite -  Remote Diagnostics & Network Controller
  Page 56E Series Data Radio – User Manual© Copyright 2002 Trio DataCom Pty. Ltd.Unit Name and LocationUnit name is required and must be unique(max. 20 character).Location allows the user to enter descriptions of sites and theirlocations (optional, (max. 20 character).Unit Serial NumberIs the factory preset unique serial number of the unit.  This is obtainedfrom the label located on the unit or read from the unit using theProgrammer.  On base stations the exciter serial numbers must beread from the lid label or electronically with the programmer.SID Code (Diagnostic Stream Identifier)Is the SID code address number being used by the unit for thediagnostics stream.  This is normally set to 0.  Check the radio unitsprogrammed configuration for confirmation and or system configuration.Unit SeriesDefault to “E Series”, option on pull down box to select “ D Series”Poll Response TimeoutIs the time in seconds the Diagnostic controller will wait for a responsefrom the remote unit.  When a time out occurs, the controller will retry.If three poll attempts fail then the poll request is terminated, and a NoAcknowledge (No Ack) message will appear in the alarms window.One second is usually more than enough “wait” time.  In a multilayersystem, longer response times may be necessary.Alarm LimitsAllows the user to set thresholds for each unit which, when exceeded,will report an alarm. Default settings are provided for remote devicesand base stations.  These are selected by clicking on the appropriatebuttons presented.If the controller receives a status poll parameter result which is outsideany of the threshold settings, it will immediately retry, in case it wasan erroneous measurement.  If the next received poll result is stilloutside the threshold, the retries will continue until it has received astatus poll within the threshold settings, or three status polls.  If threepolls outside the required threshold are received, the average of thesepolls is displayed in the status poll window and the offendingparameter(s) appear as alarms in the Alarms window.Defaults drop down boxChoose either “Remote Modem Defaults” or “Base Modem Defaults”from the drop down list.  Click “Apply” to set the alarm limits to theselected defaults.  Click “Save” to save custom default values.Hot Standby Base PairingIs used when a Hot Standby Base is employed within the system.The two exciters contained in each base unit need to be “paired”together.  Since only one of the exciter-modems can be active (on-line) at any time, only one can answer a poll.  Thus the two should bepaired together so they are treated as mutually exclusive.This selection allows the user to pair the two radio modems, byselecting the other exciter with which the currently selected exciter isto be paired with.  The two units must of course exist in the databaseas independent serial numbers before they can be paired.Add New ButtonClick this button to add a new radio modem to the database.  TheSelected Unit, Name, Location, Unit Serial numbers and Hot StandbyBase Pairing fields will be cleared, ready for the entry of a new unit.After filling in the details click the “Apply” button to complete entry.Apply ButtonApplies changes to selected units or complete the “add new” radios tothe data base. Additions and changes made on the screen do not resultin changes to the database unless this button is activated. This mustbe done before selecting a new serial number/unit. Note that the newlychanged database will not be saved to disk until the Save and Exitbutton is activated.Delete ButtonAllows deletion of units from the database.  NOTE: Deleting a unitfrom the database will delete all it’s associated status poll and alarmhistory.Click and a selection list of serial numbers will appear.  Select one ata time and then press the “Delete” button on the selection box.Save and Exit ButtonPress this button to save the newly chnaged database and then exit.Additions and changes to the database will be saved to disk as longas the “Apply” button was pushed.Exit without Saving ButtonPress this button to exit without saving the newly changed database.Part J  TVIEW+ Management Suite -  Remote Diagnostics & Network Controller
Page 57E Series Data Radio – User Manual © Copyright 2002 Trio DataCom Pty. Ltd.File - View (view only)The View Screen shows the unit alarm limits, current control states,calibration constants, last poll results for firmware and systeminformation.Note: The View window is different for Remote radios and BaseStations as well as for D Series.SettingsThe settings menu allows the user to configure various setupparameters.  These include:-Base Station - E SeriesRemote Radio - E SeriesCommunications PortWith the pull down box, select the required communications port.Com 1 to Com 16. Select the required com port speed (9k6 or19k2bps). Default is 19k2bps.Controller AddressNormally set to 0.  Networks which have multiple controllers active,should use different controller addresses, so responses from remotesare ignored if the poll was not sent by that controller.Enable SID CodesEnabled or disabled (Default enabled).  In some systems, externalapplication of SID codes is used as a method of giving the modems inthe system specific data addresses.  The modems are placed into the“stream routing” mode, and the user (e.g. Diagnostic controller)supplies the SID code at the start of each data packet to betransmitted.  In this way the user can “steer” the data flow through thegiven network path.Should the diagnostics controller be used in such a network then it tooneeds to append the data addresses or SID codes to the beginning ofall data messages sent.In the controllers database record for each modem, a field is suppliedwhere the user can select the SID code for that particular modem.  Byselecting the Diagnostic SID code that suits the system topology, thediagnostics data messages can be routed successfully to the correctdestination.Auto Logging ONWhen enabled all logging functions will be activated when polling isturned on.Alert TonesWhen enabled will emit a tone from the PC speaker or sound cardwhen Status poll alarms occur and/or Base Station change oversoccur.Tx Power Display UnitsSelect either “dBm” or “milli Watts” as the display units.  Power willbe displayed throughout the system in the selected powermeasurement unit.Note: Power will always be stored in the database file as milli-wattsPart J  TVIEW+ Management Suite -  Remote Diagnostics & Network Controller
  Page 58E Series Data Radio – User Manual© Copyright 2002 Trio DataCom Pty. Ltd.PollingIn order to obtain diagnostics information, the diagnostics controllerprovides a number of automatic polling facilities, which include: Grouppolling, Timed polling and Individual polling.  The Group and Timed pollfacilities will automatically cycle through a selected group of units at apredetermined interval (in seconds).  The Individual poll facility permitsintensive polling of a single unit at a selectable rate, independent of anyGroup polling that may be active at the time.When the modem is polled for the first time, the controller will poll (ask)the radio for its calibration constants and firmware revision (these canbe viewed in the “View” window under the File menu).  When thisinitialisation procedure is complete, status polling can commence.  Ifthe radio were to perform a “cold boot” for what ever reason (eg lossof power, cold boot command received, etc), the controller will detectthis and initiate the above initialisation procedure again and display“cold boot” alarm in “other”.If Hot-Standby base stations are employed in the system, then onlythe “on-line” unit will be polled.  If a hot standby changeover occurs atthe base, then the new “on-line” modem will be polled and the off-lineunit removed from the poll sequence.  A “Changeover” alarm will bedisplayed in the Base Station Activity screen.The status poll requests that are reported and displayed on the mainscreen are;• Temperature• Received Signal Strength• Transmitter Power• DC Supply Volts• Received Frequency Error• Time and dat stampedThe line above Status Polls is a “Processing Status Bar”.  It willdisplay messages about errors, warnings and poll processing.Poll Setup (Settings)Under the Polling menu option, choose “Setup...”  The Poll Settingsdialog box will appear.  Here you can set :Poll Repetition TimeIs the time in seconds (2 to 3600 secs) between each status poll of thegroup poll cycle.  Each unit in the poll group will be polled in turn, atthis time interval.Timed PollingAllows the user to schedule a period when the group poll willcommence.  This is a useful feature for systems that have times oflittle traffic loading such as the early hours of the morning.Start TimeTime at which the Timed poll cycle will commence.  The time formatwill be as per the regional settings.Number of CyclesThis is the number of times the controller will cycle through the pollgroup when the Timed Group poll commences.  Each unit in the pollgroup will be polled this number of times.Apply ButtonClick “Apply” to initiate any changes made in this dialog box.Poll Group SelectUnder the Polling menu, select “Poll Group Select...”This dialog box enables Adding/Removing of radios to/from theautomatic poll group.  Units in the Selection list box are available foradding to the poll group.  These units will not be polled during a grouppoll cycle.Units in the Poll Group list box will be polled during a group pollcycle.Clicking the Save button will save any changes in the poll group tothe database.Part J  TVIEW+ Management Suite -  Remote Diagnostics & Network Controller
Page 59E Series Data Radio – User Manual © Copyright 2002 Trio DataCom Pty. Ltd.Group PollingThis is the standard mode of operation.  The diagnostic controller willcontinuously cycle through the poll group, unit by unit at the pollrepetition time( 2 to 3600 secs).Bar GraphDisplay Bar Graph can be selected which displays all polls on the“Bar Graph”.  If a unit alarms, the measurement in question will havea red background in the Text box.Individual PollAllows intensive polling of a single unit, independently of any grouppolling that may be active.  The individual poll window provides a bargraph display for rapid visual recognition of the radio modemsparameter levels.The line above Status Polls is a “Processing Status Bar”.  It willdisplay messages about errors, warnings and poll processing.Polling ButtonThe selected unit will be removed from the poll group, then polled atthe selectable rate (Poll Repetition time) by clicking the Polling button.Poll Repetition Time (2 to 3600 Sec)Is the rate at which individual status polling will occur.  Click on the“Apply” button to apply any change made to the poll repetition time.Switch ExciterOnly visable if the selected unit is a “Hot Standby Base station” thena switch base facility is provided for remote switching of the exciterunits.  With polling on, click on the “Switch Exciter” button.  Thechangeover may take a number of seconds.  The active unit will bedisplayed in the “Active unit” field.NOTE: The hot standby base station has a minimum “toggle” time of 1minute.  This is to avoid rapid switching between exciter units, shoulda fault be detected in both modems.Data LoggingStatus poll and Alarm data can be logged to a database file for viewingat a later date.  A relational database is created and managed usingMicrosoft Jet database engine Ver3.5.  The database file, which is an“.mdb” file, can be accessed with external programs such asMicrosoft Access.  You have the option of enabling logging of Statuspolls only, Alarms only or both.Log Status PollsTo log Status polls either select “Log Status polls” under the DataLogging menu item or click the corresponding toolbar button.Log AlarmsTo log Alarms either select “Log Alarms” under the Data Logging menuitem or click the corresponding toolbar button.NOTE: If “Auto Logging ON” is enabled in the settings dialog box,then Status Poll logging and Alarm logging will automatically be turnedon when Group or Individual polling is turned on.View HistoryStatus poll history may be viewed using the Status Poll & AlarmHistory window.  This window has three tables: Status Poll History,Alarm History and Base Station Activity.  Each table has a “Numberof Records” box to indicate how big the selection is.You may select “ALL” to see every units poll results, or view anindividual units poll results.Part J  TVIEW+ Management Suite -  Remote Diagnostics & Network Controller
  Page 60E Series Data Radio – User Manual© Copyright 2002 Trio DataCom Pty. Ltd.The line above Status Polls is a “Processing Status Bar”.  It willdisplay messages about errors, warnings and poll processing.From To or ALL FieldsThese fields determine the time span you wish to view.  For example,if you have collected several months of data, and only wish to view a24 hour period, then adjust the From: and To: fields accordingly andselect the unit.When the History window first appears, the From: and To: fields willcontain the last 24 hours of data.If “ALL” is selected it will display the start and end dates of thedatabase.The Date/Time format will be as per the regional settings short dateformat.NOTE:  The smaller the time span you select, the faster the databasesearch will be.  This will also depend on the poll rate that was usedduring that time span.SortingEach of these tables can be sorted in ascending order by: unit, date orpoll parameter.  To sort, just click on the required column header.To show the full status of a single report in the “Alarm History” click onthe box at the left by the unit name. Note this only works on valid pollresults not “NoAck”.PrintingA printout of each table is possible by clicking on the associated Printbutton.  The table data will be sent to the default printer and formattedas per your default printer configuration set up.View TrendThe logged status poll data can be viewed in graph format, whichallows viewing of status trends over selectable time spans.  Thisprovides a very effective and fast method of analysing a units’operating parameters over time.Select “View Trend” under the Data Logging menu item or click theassociated toolbar button.Features available include:• Scaling of graph(s).• View individual poll results using the cursor.• Automatically scroll through the group poll database, unit byunit at a selectable time interval.• No Acknowledge messages are displayed by a gap in thegraphed data and a “NoAck” in other on the Time Line.The line above Status Polls is a “Processing Status Bar”.  It willdisplay messages about errors, warnings and poll processing.Vertical Scale Setting• Manually set the vertical scales by simple typing in the newlevel(s), then either press “Enter” or click on the “Re Draw”button, or select a new unit.• Click the “Default Ranges” button to set all the vertical scalesback to the default levels.• Click the “Set Ranges to Alarm Limits” button to set the verticalscale limits to the selected unit alarm limits.From: & To: FieldsThese fields determine the time span you wish to view.  For example,if you have collected several months of data, and only wish to view a24 hour period, then adjust the From: and To: fields accordingly.When the Trending window first appears, the From: and To: fields willcontain the last 24 hours of data.If “ALL” is selected it will display the start and end dates of thedatabase.NOTE:  The smaller the time span you select, the faster the databasesearch and draw. This will also depend on the poll rate that was usedduring that time span.Use the ALL button to set the From: and To: fields to the maximumand minimum dates found in the data in the database.Part J  TVIEW+ Management Suite -  Remote Diagnostics & Network Controller
Page 61E Series Data Radio – User Manual © Copyright 2002 Trio DataCom Pty. Ltd.Poll Group CycleWhen toggled ON, this will step through each radio in the poll groupand display the trend graph.  Set the step interval in the “Step Every(Sec)” field. Default = 2 secondsCursor:  Use the slider control, found at the bottom of the display tomove the cursor.  The cursor box displays the parameter data of thestatus poll at the current cursor position.Use the “Set From” button to set the From: field to the current cursorposition.Use the “Set To” button to set the To: field to the current cursorposition.Part J  TVIEW+ Management Suite -  Remote Diagnostics & Network ControllerTools - Statistical PerformanceThe diagnostic core of radios with Firmware V2.4.X and above have 6counters which store packet statistics for later retrieval.  They are:-• Lost Synch.• Lost RxSig.• Good Frames.• Bad Frames.• Time Ticker.• RSSI Ticker.The Diagnostic controller software uses these statistics to calculatepacket and bit error rates, network efficiency, bandwidth utilisation andradio link integrity.  These network analysis features are an invaluabletool for larger networks.Statistical Performance FormulaeTimers:Time Ticker (10mS): (RRT) = timer that increments by one every10mSecElapsed Time: = Total elapsed time in hh:mm:ss fromreset calculated from RRTRSSI Ticker (10mS): = timer that increments by one every10mSec when RxSig present.(Virtual connection to RxSig LED)Transmit Channel:Tx Frames: = Number of Tx HDLC frames.Tx Byte: = Number of Tx BytesAverage Frame Size: = TxByteCnt / TxFrameCntAverage Frame Rate (mSec): = TxFrameCnt / RTT * 0.01Channel Utilisation (%): = (TxByteCnt * 8) / (RTT *RFChannelBitRate)where RFChannelBitRate is 9600 or4800 Bits per sec.Receive Channel:Good Frames: = Good Frames Rx’dBad Frames: = Bad Frames Rx’d. Rx HDLC frameerror.Good Bytes: = Good Bytes Rx’dAverage Frame Size: = GoodByteCnt / GoodFrameCntAverage Frame Rate (mSec): = (GoodFrameCnt + BadFrameCnt) /RTT * 0.01Channel Occupancy (%): = RSSIgoodTicker / RTT * 100(Average from reset)
  Page 62E Series Data Radio – User Manual© Copyright 2002 Trio DataCom Pty. Ltd.Click the Log Counters OFF/ON button to log the counters everytime they are updated.  These can be viewed on the “Counter PollHistory” Tab.Notes:• The controller will attempt a series of polls when either resettingor retrieving the counters.  You should monitor the statuswindow to ensure that the poll process completes.  If errorsoccur, they may be due to conditions like packet collisions on abusy network, diagnostic controller trying to perform too manypoll functions (i.e. group polling, individual polling), etc.• E Series data radios have 32 bit counters and will count for 1year, 4 months & 10 days if not reset occurs.Live System Performance TabThis provides an automatic test facility which will automatically resetall the radio modems counters, and then after a 10 minute periodretrieve the new counter values.  View the Performance counters tabto see the result.Indicative Packet Error Test Tab with Commissioning RecordThis Tab provides a simple link test facility.  When this is running,continuous Poll/Response diagnostic messages will be transmitted toand from the unit and Packet Error Rate results recorded. If aresponse is not received within the Poll Response Timeout period,then an error (last Packet) is recorded.  If the system is live, collisionsare likely and may effect Error results.Channel Occ Sliding: = RSSIgoodTicker / RTT * 100(Average from last update)Channel Utilisation (%): = (GoodByteCnt * 8) / (RTT *RFChannelBitRate)Miscellaneous:Lost Synch: = Increments on lost synch, must bevalidated with RxSig. (Virtualconnection to Synch LED)Lost RSSI: = Increments on lost RxSig (Virtualconnection to RxSig LED)Radio modems with Firmware Revisions 2.4.x and above have theadvanced statistical counters as noted above.  Firmware revisionsbelow this (i.e. 2.3.x) only have Good Frame count, Bad Framecount, Lost RSSI count and Lost Synch Count available.  Thediagnostic controller will detect which firmware the radio has, and onlyreport the available counters.Statistical Performance Counters WindowSelected UnitWhen a unit is selected, the controller will confirm that the firmwarerevision has been received.  If not, it will attempt to poll the radioautomatically to retrieve the revision number.RF Data RateSelect from the pull down menu 4800, 9600 or 19200 bps, dependingon your system settingsStatus BarReports any poll processing in progress or errors that may haveoccurred.Performance Counters TabThis is the main statistical performance tool used for assessingnetwork performance.• Make sure “log counters” is checked on• Click the Update Counters button to retrieve the currentstatistical performance results.• Click the Auto Poll OFF/ON button to automatically updatethe counters every hour for selected unit.Part J  TVIEW+ Management Suite -  Remote Diagnostics & Network Controller
Page 63E Series Data Radio – User Manual © Copyright 2002 Trio DataCom Pty. Ltd.Part J  TVIEW+ Management Suite -  Remote Diagnostics & Network ControllerPrint Commissioning RecordFrom the “Indicative Packet Error test” a commissioning sheet can beprinted to file (eg: using Adobe PDF write or similar), or printeddirectly.After running the test for the desired time (best results with no userdata), the test can be stopped with the “Finish” button. Select “PrintCommissioning Record” button and a page appears with the resultsand also the unit identity, last poll results, system status and date/timestamp for each record.On this page there is also a facility to type in a “Comment” field. Thisis useful for recording information such as where the test wasconducted and through what part of the system the test wasconducted. eg: via a repeater.Press “Print” button when ready to send to the default printer.Counter Poll History TabThis is a database viewing facility.  When logging is enabled “LogCounters”, each time the counters are retrieved they will be written tothe database.  Adjust the From: & To: fields to view a specified timespan or press ALL to obtain complete database period.
  Page 64E Series Data Radio – User Manual© Copyright 2002 Trio DataCom Pty. Ltd.NetworkingMonitoring the radio network from other workstations on a LANnetwork is made easy with the networking facilities provided by theDiagnostics Controller.  The radio network controller can be configuredas either a Server or Client.  The Server will send poll information toeach attached client, depending on their access rights.Client groups can be set up.  Each Client can be assigned to oneclient group.  Each radio modem can be assigned to one or moreClient groups.A default Client group called “ALL” is automatically set up containingall radio units in the database.Client Groups Example:All Pumps TestTest Unit 1 Pump 1 Test Unit 1Test Unit 2 Pump 2 Test Unit 2Test Unit 3 Pump 3 Test Unit 3Pump 1Pump 2Pump 3In the above example, there are three client groups, ALL (the default),Pumps, and Test.  A Radio modem can be a member of more thanone group.Client Examples:• Central - This is the Diagnostic Server whichis attached to the radio network.• Test Client - This is a Diags controller in clientmode.• Pump Monitor - This is a Diags controller in clientmode.In the above example, the Central workstation, running Diagnostics inServer mode, is polling all the radios in the network and distributing thereceived messages to the attached clients.The Test Client and Pump Monitor are receiving Status poll and alarminformation from the Central server.  The Test Client will only receivepoll information for radios found in the “Test Client Group” i.e. TestUnits 1, 2 and 3.  The Pump Monitor will only receive poll informationfor radios found in the “Pumps Client Group” i.e. Pumps 1, 2 and 3.Networking - SettingThe Server should be configured properly first before any connectionattempts are made by clients.  It will always be safer to stop anypolling that may be in progress when making changes to the Serverclient set up.Local Host Settings TabIt is assumed that the workstation is running Windows, and has beenconfigured with the TCP/IP network protocol.• Open or create a radio database.• Under the Networking menu bar select “Settings” from themenu bar.• In the Networking window click the “Local Host Settings”button.• The Local Host settings will appear, which contains the ServerHost Name, IP address, Local Port and Password.• The Local Port is the socket number.  Select an unused socketnumber.  Usually a number between 1000 and 2000 would besafe.• Enter a password.  This is required when in client mode, toaccess incoming data from the server.• Apply Change.Creating Client Database- File/Paths TabWhen in Server mode the Diagnostic controller uses an additionaldatabase file (.mdb) to store Client information.  This file is linked to themain radio Database file.  The link is managed by the Microsoft Jetdatabase engine.  This separate linked file configuration permitsarchiving of the main radio database (.mdb) without losing clientconfiguration data.Part J  TVIEW+ Management Suite -  Remote Diagnostics & Network Controller
Page 65E Series Data Radio – User Manual © Copyright 2002 Trio DataCom Pty. Ltd.• In the Networking window click the “File/Paths” button.• The “Current Radio Database” is displayed if open.• Select “Create New Client Database” from the Action dropdown list.• Click “Execute” to create and link the client database.Adding Client Group(s)• Click the Remote Client Groups tab.• Enter the group name in the field provided.• Click on the Add button to add the group name to the database.Deleting a Client Group• Click on the “Remote Client Groups” tab.• Select the group you wish to delete.• Click on the “Delete” button to delete the group name from thedatabase.Adding a Client• Click on the Remote Clients tab.• Enter Client Name.  This can be either the remote clients Hostname or IP address.  Entering the client Host name requiresextra processing to resolve the name into an IP address.Entering the IP address directly in the Client name field is moreefficient, although more cryptic.• Select a client group.• Enter the clients password.• Enter the client Port.  This is the socket number used at theremote client.• Click the Add button to add the client to the database.Deleting a Client• On the Remote Client Tab, select a client to delete by clickingon the record selector (left most column).• Click the delete button to delete the client from the database.Adding Radio(s) to a Client group• On the Radios tab select a Client Group.• Using the “Add and/or Remove” buttons to add or removeradios from the Client Group.• Under Networking on the menu bar, Select the “Server Mode”button.  This will place the diagnostic controller into Servermode.• The Diagnostic Controller Server is now ready distributemessages to client workstations.Setting Up a ClientIn Client mode, the diagnostics controller basically just mirrors thedisplay of the server.  Poll information can not be stored locally, pollingfunctions are not available via the remote server, and most of the toolsnormally provided are disabled.It is assumed that the workstation is running Win95/98/NT, has beenconfigured with the TCP/IP network protocol and has been added tothe Diagnostic Server’s Client Groups.• Under Networking on the menu bar, select  “Settings”.• The Network settings window will appear, which contains theClient Host Name and IP address, which are view only.• Enter the Client password as stored at the DiagnosticController Server.• Enter the Local Port Address (socket number) as stored inthe Diagnostic Controller Server database.• Click the “Apply Change” button.• Under Networking on the menu bar, Select the “Client Mode”button.  This will place the diagnostic controller into client mode.A local Diagnostic session can be operated while in client mode, bothstatus messages will appear on screen.Diags ClientA Client only version of this software is also available.  This must beused in conjunction with standard software running in “Server Mode”.Local Com ports are disabled permanently in this version.Part J  TVIEW+ Management Suite -  Remote Diagnostics & Network Controller
  Page 66E Series Data Radio – User Manual© Copyright 2002 Trio DataCom Pty. Ltd.Interpreting Poll ResultsGeneralThe results returned by the poll requests give an indication of systemperformance.  When a new modem is added to the database, defaultvalues are assigned for the limits of the returned results.  The user canassign different values to these limits as required, which is determinedby the fault tolerance level of their systems.RSSIThe default RSSI limits are set at -30 to -105 dBm(-110 dBm for Base/Repeater Station).  Above -30 dBm the front end of the receiver willsaturate and it is unlikely that signal levels much higher than this willever be reported. Below -105/-110 dBm the error rate may becometoo high for some applications.  In the modem the RSSI measurementis made periodically each 100mS, while R F carrier is being detected.Transmitter powerThe transmitter power limits are set at between 0mW and 20,000mW.The modems will normally be operating at a power level of 1 watt.The above limits are set to ±3dB of the nominal (3dB represents afactor of 2 for power measurements).The effect of a change in transmittal power can be transposed to thereceiver BER curves (3dB down at the transmitter is 3dB down at thereceiver).  The amount of variation tolerated will be determined by theRF path loss of the data link being used.If the modem is set to low power, then the transmittal power will benominally 200mW. Suggested limits for this would be 100mW and400mW (±3dB).For base station units or remote units set to high power, the nominaltransmitter power is 5 watts.  Suggested limits on these would be 2.5watts to 10 watts (±3dB).In the modem the reported transmit power measurement is given froma measurement made of the last transmission made by the modems.When the PTT is ON a periodic measurement is made of the transmitpower.  The modem stores this away and reports it when requested.TemperatureThe modem is specified to operate within the temperature range of -30°C to 65°C.  The defaults limits are set to -30°C and 60°C.  At65°C the modem goes into a high temperature foldback mode, whenthe power is reduced to the low power mode.  This is to reduce therisk of damage to the final stage of the transmitter at excessivetemperatures.The modem will operate outside this temperature range but it is notrecommended.Supply VoltageThe modem is specified to operate over a DC supply range of 11V to16V.  The default levels are set to 11.5V to 15.5V.  The modem will notoperate correctly outside these bounds and damage may occur withhigh voltage levels being applied.FrequencyThe frequency limits are set to ±3000Hz.  This is basically thedifference between the different ends of a data link.  If the differencegets much greater than this, data errors may occur (the modem willhave a degree of long term frequency drift of 1ppm / annum due to thephysical properties of internal components).Part J  TVIEW+ Management Suite -  Remote Diagnostics & Network ControllerNotes:1. Remote Tx power measurements will vary due to power setting variation which can have an    initial error of +/- 0.5 dB and final error of +/- 0.2 dB2. Base Tx power measurements will vary due to power setting variation by the exciter which can    have an initial/final error of +/- 0.2 dB and overshoot by the PA <1 dB.Parameter Resolution Absolute accuracy @ RTDrift over Temp. range NotesTemperature 0.1 degC +/- 4 degC +/- 1 degCSupply Voltage 0.1 volts +/- 0.5V +/- 0.08V +/- 0.45%Rx Signal Strength 0.1 dBm +/- 3 dB +/- 2 dBFrequency Error 1Hz +/- 200Hz +/- 2500HzTx Power (Remote) 0.1 dBm +/- 1.5 dB +/- 0.3 dB Note 1Tx Reverse Power(Remote) 0.1 dBm +/- 3 dB +/- 1 dBTx Power (Base) 0.1 dBm +/- 0.8 dB +/- 1 dB Note 2Tx Reverse Power (Base) 0.1 dBm
Page 67E Series Data Radio – User Manual © Copyright 2002 Trio DataCom Pty. Ltd.Appendix A - Application andTechnical NotesTN-4 Remote DiagnosticsAN-D3 SID Code Addressing Scheme for Small toMedium Sized Data Radio SystemsAN-D4 Trunked Multi-Stream Applications of the D SeriesProduct RangePart K  AppendicesPart K  AppendicesAppendix B - Slip ProtocolThe SLIP protocol, is a data transport protocol, originated and usedextensively in UNIX(tm) based systems, and thus also closelyassociated with TCP/IP networked systems.  Although not truly a“standard” it is so widely used that it has become the defacto standardfor serial interface in UNIX and many other networked systems.SLIP is a method of framing messages containing binary data, onasynchronous channels.  The asynchronous serial channel isconfigured for eight bit character size, no parity, and one stop.A specific binary code called FEND (Frame End, hexadecimalvalue=C0) is reserved to define a frame boundary.  Should this samecode occur in the data message to be transferred across the channelcontrolled under SLIP, then an escape sequence is used so that themessage byte will not be confused for a FEND.  This escapesequence, involves replacing the message hexadecimal C0 codewith a two byte sequence FESC, TFEND.  FESC (Frame Escape)is the binary code hexadecimal DB, and TFEND (Transposed FEND)is binary code hexadecimal DC.  Likewise, if the FESC characterever appears in the user data, it is replaced with the two charactersequence FESC, TFESC (Transposed FESC).  The TFESC is thebinary code hexadecimal DD.  The following table clarifies this.Abbreviation Description Hex.ValueFEND Frame end C0FESC Frame escape DBTFEND Transposed frame end DCTFESC Transposed frame escape DDAs characters arrive at the SLIP receiver, they are appended to abuffer containing the current frame.  Receiving a FEND marks the endof the frame, and consequently, succeeding bytes are considered partof the next frame.Receipt of a FESC code puts the SLIP receiver into “escaped mode”,causing it to translate a following TFESC or TFEND back to a FESCor FEND code, appending it to the buffer, and resuming it’s normalstate.  Receipt of any byte other than TFESC or TFEND while inescaped mode, is an error.  No translation occurs, and the SLIPreceiver leaves escaped mode.  A TFESC or TFEND received whilenot in escaped mode is treated as an ordinary character and storedaccordingly.  Reception of consecutive FEND characters, causes noaction to be taken (i.e. is not interpreted as zero length frames).An example of a typical SLIP frame is shown below.  The messageconsists of the string DA,C4,C0,C5,DB,20,BD,DC,DD.  The SLIPframe will be:-DA,C4,<FESC>,<TFEND>,C5,<FESC>,<TFESC>,20,BD,DC,DD,<FEND>     ==>            DA,C4,DB,DC,C5,DB,DD,20,BD,DC,DD,C0
  Page 68E Series Data Radio – User Manual© Copyright 2002 Trio DataCom Pty. Ltd.Part K  AppendicesAppendix C - Firmware UpdatesRadio/Base Firmware UpdateFirmware update is performed on a unit connected locally to the PC. Itis recommended that all cabling to the unit be disconnected prior tocommencing firmware update to minimise any interruption to theprocess or disturbances of signals on cables still connected. All otherTVIEW+ Management Suite utilities should also be exited during thefirmware update process. The steps to update the firmware as follows:1. Start the firmware update utility from the TView+ front panel.2. Disconnect power from the unit by turning off the power supplyor removing the power connector to the unit.3. Connect the serial cable from the PC to Port B on the unit4. Select the unit type from the options on the top right of thefirmware update main window. Please note that “Exciter”refers to the radio contained inside the base station.5. Select the file containing the firmware update package using the“Select” button at the bottom of the main window. After openingthe file the browse window will close and a description of thefirmware package will appear in the main window.6. Initiate the firmware updating process using the “Write” button atthe bottom of the main window. Another logging window willappear.7. Reconnect power to the unit when prompted in the loggingwindow. The status LEDs on the unit including power should allbe extinguished and the transfer of firmware should commence.If this does not occur steps 6 & 7 should be repeated.8. The logging window will display the progress of each firmwareblock transferred and when complete a success dialogue boxappears. Type OK to close this dialogue box and type “Exit” inthe main window to exit the firmware update utility.9. Disconnect the cable from Port B and re power the unit toenable the new firmware.Base Station Display Firmware UpdateInstallation Instructions:1. Update of the front panel firmware uses the firmware updateutility supplied with the TVIEW+ Management Suite.2. Start the firmware update utility from the TVIEW+ front panel.3. In the firmware update utility select device type as “BaseStation Front Panel”4. Select the file containing the firmware update package using the“select” button at the bottom of the main window. After openingthe file the browse window will close and a description of thefirmware package will appear in the main window.5. Ensure that the base station is powered.6. Connect the “TVIEW+ cable” to the front or rear system port ofthe base station.7. On the base station front panel depress and hold the “DisplayOn/Off” button, then momentarily depress the firmware updateswitch using a suitable probe before releasing the “Display On/Off” button. The firmware update switch is located behind thesmall hole (not labelled) in the front panel below the “DisplayOn/Off” button.8. Initiate the firmware update process using the “Write” button atthe bottom of the main window. Another logging window willappear.9. The logging window will display the progress of each firmwareblock transferred and when complete a success dialogue boxappears. Click OK to close this dialogue box and click “Exit”in the main window to exit the firmware update utility.10. Repower the base station to enable the new firmware.
Page 69E Series Data Radio – User Manual © Copyright 2002 Trio DataCom Pty. Ltd.Part L  SpecificationsPart L  Specifications
  Page 70E Series Data Radio – User Manual© Copyright 2002 Trio DataCom Pty. Ltd.Part M  Support OptionsWebsite  InformationThe Trio DataCom website support  contains links to e-mail andtelephone support, tech notes, manuals, software updates.Please go to www.trio.com.au/support.htm.E-mail Technical SupportE-mail your questions to support@trio.com.au.When e-mailing questions to our support staff, make sure you tell usthe exact model number (and serial number if possible) of the Trioequipment you are working with. Include as much detail as possibleabout the situation, and any tests that you have done which may helpus to better understand the issue. If possible, please include yourtelephone contact information should we wish to further clarify anyissues.Telephone  Technical  SupportTelephone support is available at our head office telephone numberAus: (+61) 3 9775 0505 during Eastern Australian business hours(9am-5pm).Contacting the ServiceDepartmentThe Service department may be contacted by e-mail toservice@trio.com.au , or by telephone during Eastern Australianbusiness hours.Part M  Support Options
Page 71E Series Data Radio – User Manual © Copyright 2002 Trio DataCom Pty. Ltd.T +613 9775 0505F +613 9775 0606E support@trio.com.auwww.trio.com.auTRIO DATACOM GROUP41 Aster AvenueCarrum Downs VICAustralia 3201Innovative and sophisticateddigital communicationsdesigns products and solutions Information subject  to change without notice.© Copyright 2002 Trio DataCom Pty Ltd. All rights reserved.Issue 4: May 03

Navigation menu