Trio Datacom ER450-XXF01 Remote Radio Data Modem User Manual E Series
Trio Datacom Pty Ltd (a wholly owned company of Schneider Electric) Remote Radio Data Modem E Series
UserManual.wiki
>
Trio Datacom
>
ER450-XXF01 User Manual
>
Users Manual Part 3
Contents
1.
Advertising Material
2.
ER Quick Start Guide
3.
Installation Guide Part 1
4.
Installation Guide Part 2
5.
Users Manual Part 1
6.
Users Manual Part 2
7.
Users Manual Part 3
8.
USERS MANUAL 1
9.
USERS MANUAL 2
Users Manual Part 3
Navigation menu
Upload a User Manual
Namespaces
Wiki Guide
HTML
PDF
Info
Views
User Manual
Discussion / Help
Navigation
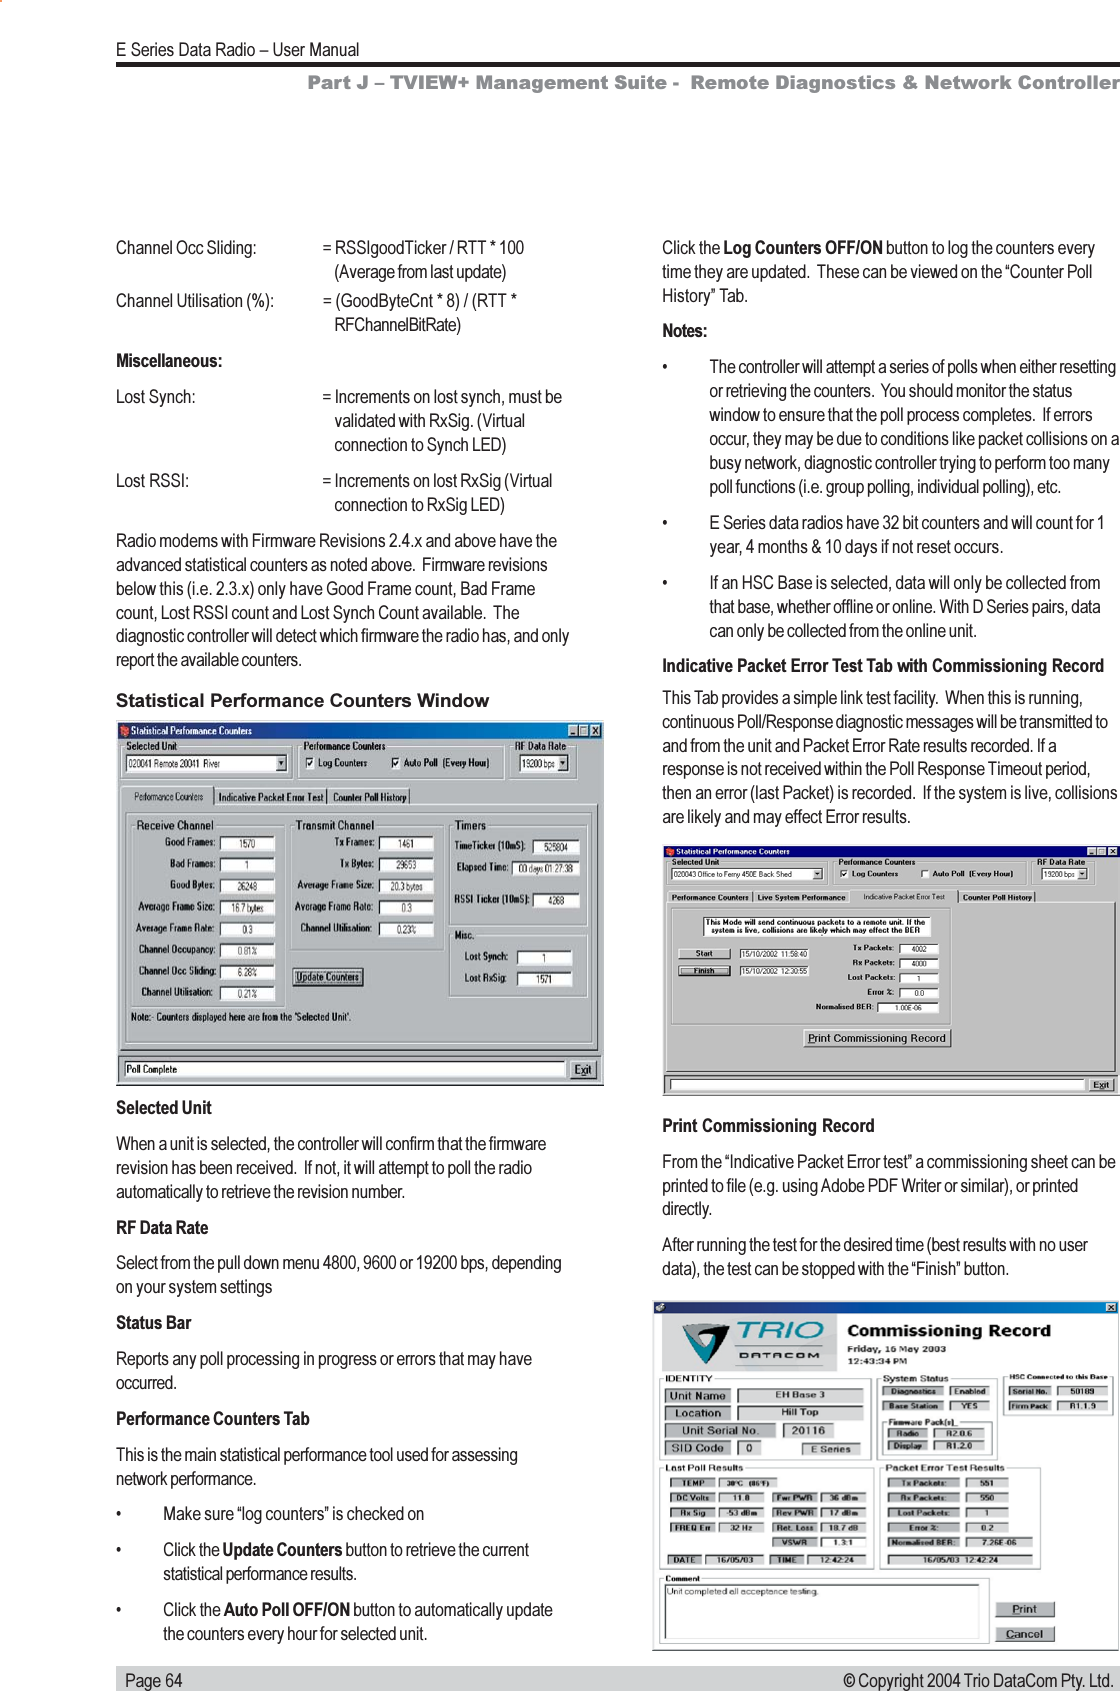
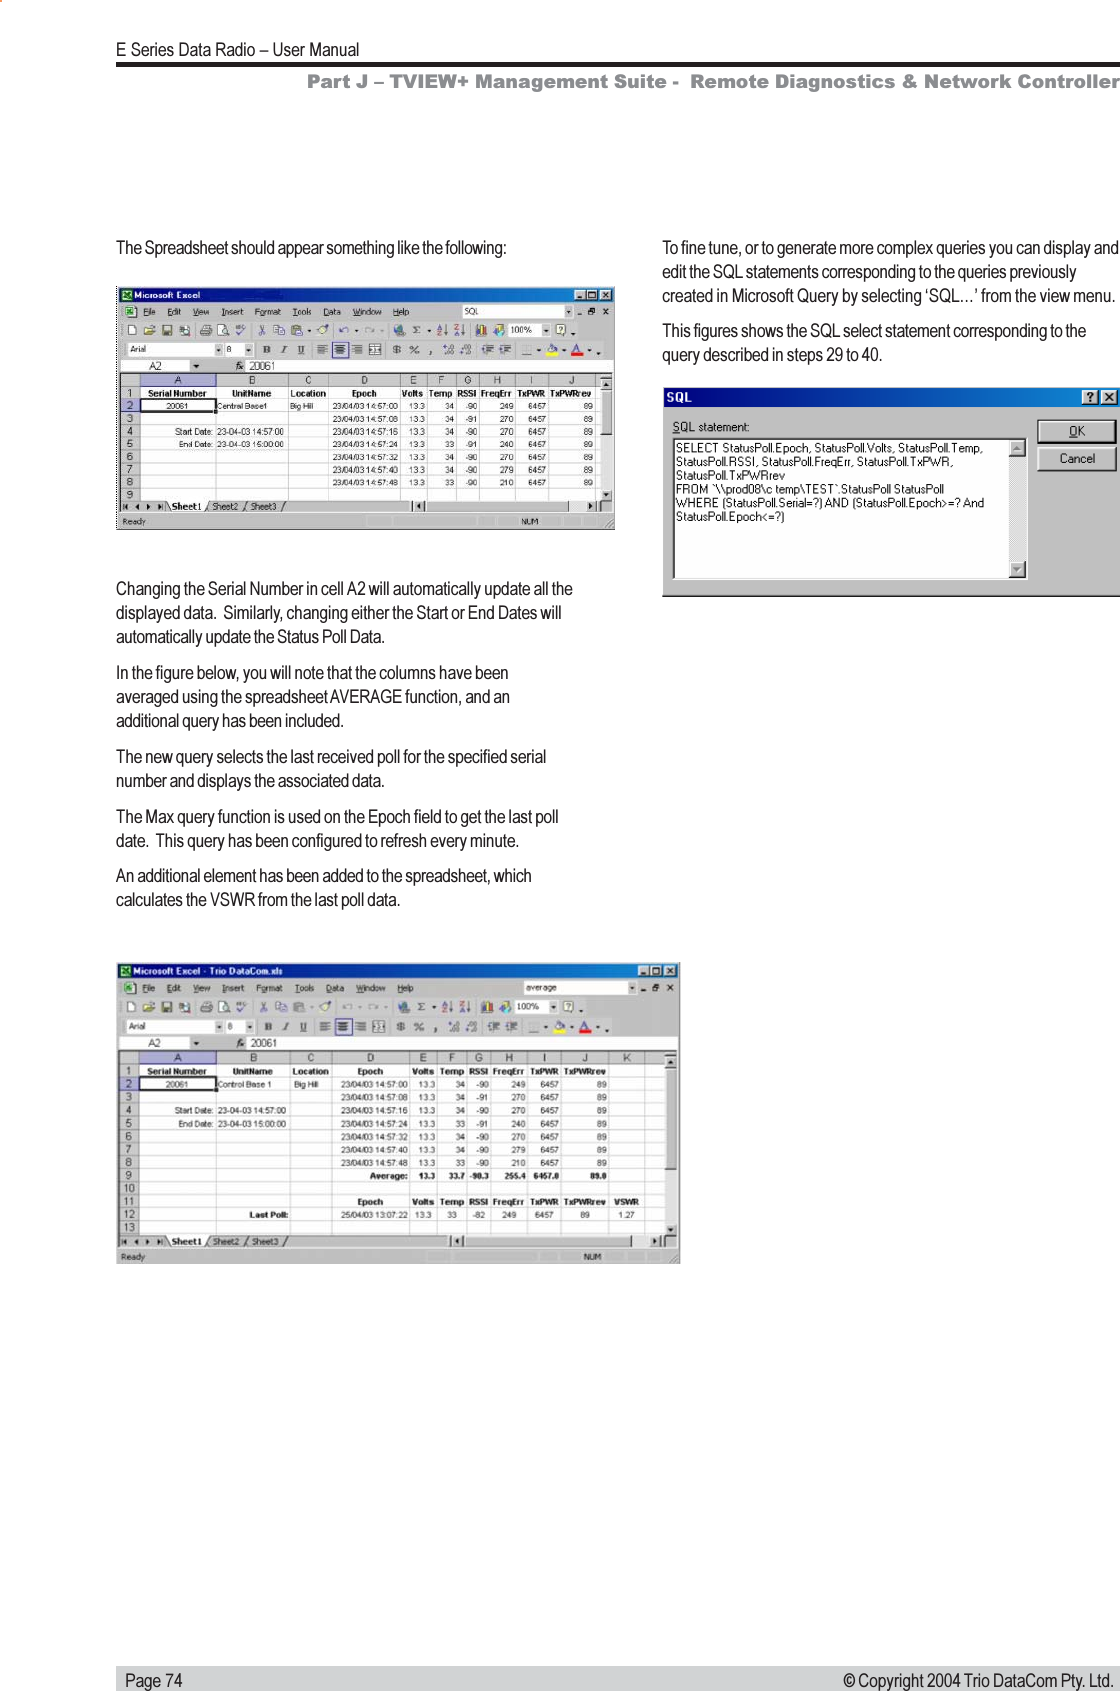
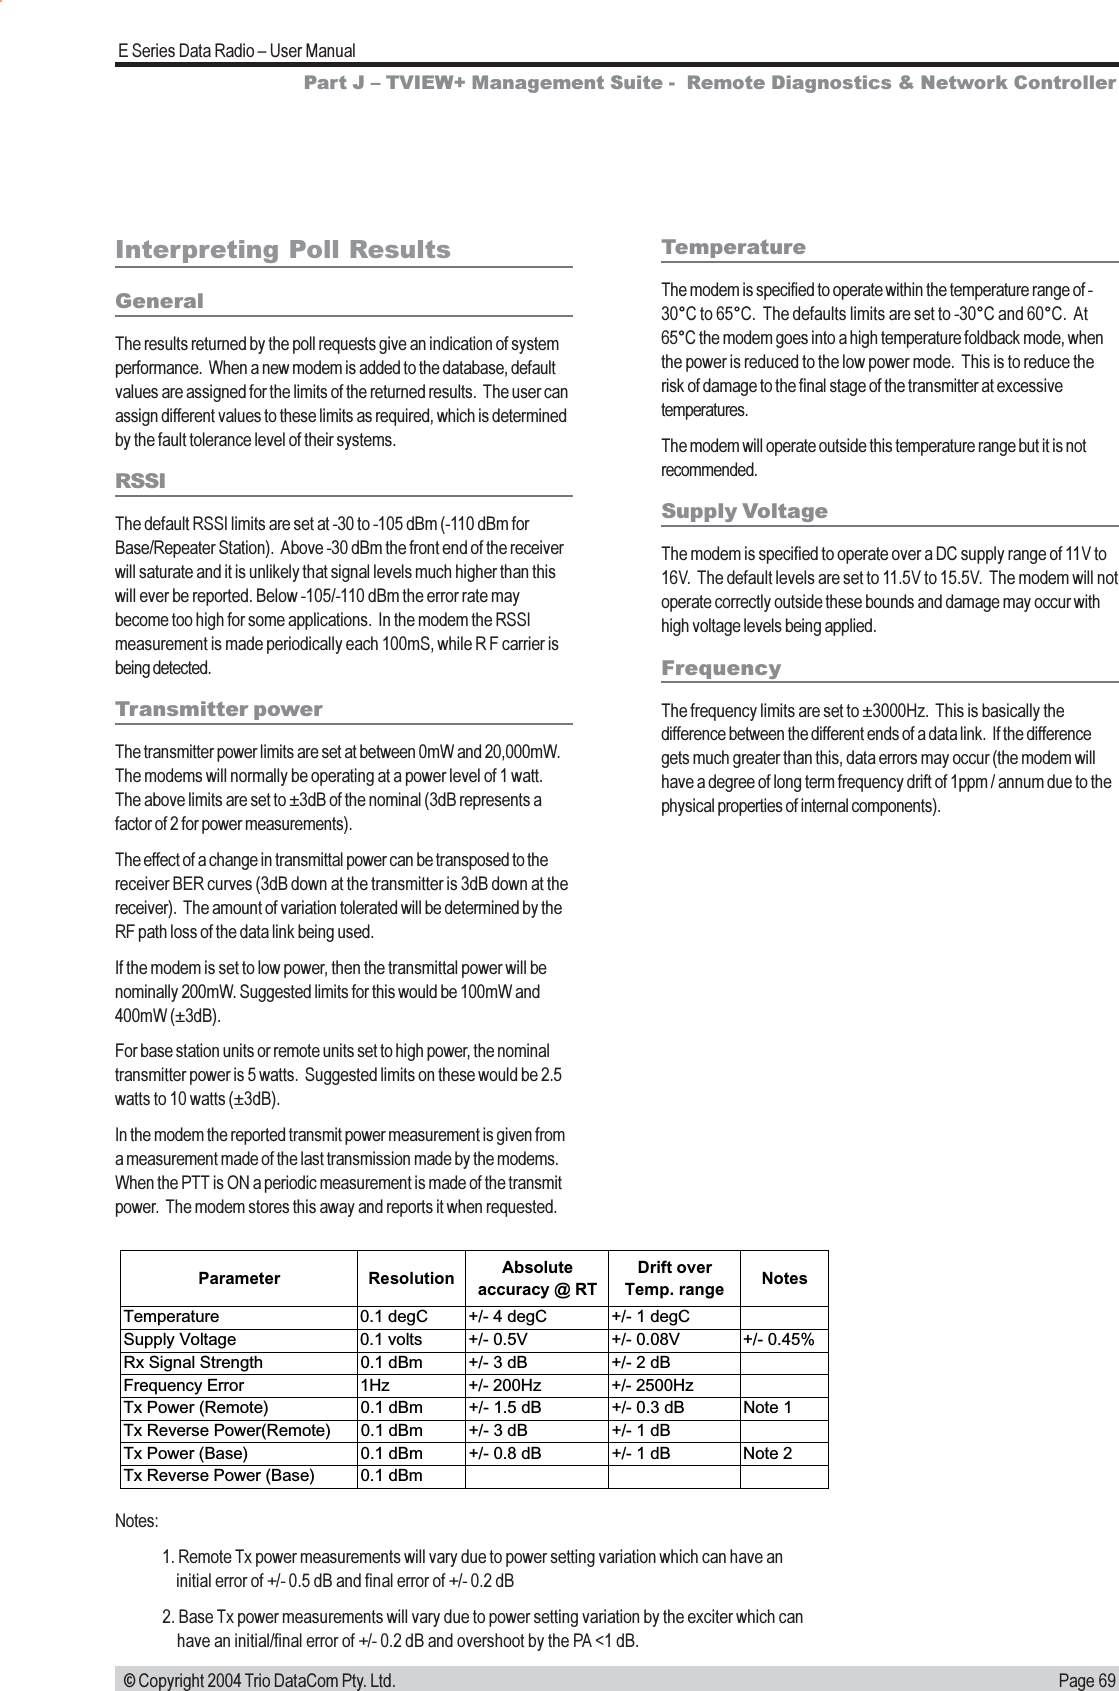
![Page 66E Series Data Radio User Manual© Copyright 2004 Trio DataCom Pty. Ltd.Part J TVIEW+ Management Suite - Remote Diagnostics & Network ControllerReset Alarms on HSCPressing this button will clear the change over event counter and thealarms displayed by both the HSC and the diagnostics controller.Digital I/O StatusDisplays digital I/O input and output status.Digital I/O Toggle ButtonsClicking these buttons will toggle the associated output state.Toggling the outputs of a HSC is a good way to determine if the HSChas failed. If the toggled output state doesnt change, this will beindicated in the status message bar at the bottom of the HSC window.Logging ToggleWhen logging is ON, all status data including digital I/O is stored in thedatabase. See database structure document.HSC Status MessagesStatus Messages CommentsNo Acknowledge 3 attempts to communicate with the HSChave failed. In most cases, both bases aretried 3 times each.Re-Booted The online Base connected to the HSC hasbeen re-booted. This unit is a remote, not abase. The Unit has been entered in thedatabase as a Base, but is factory set as aRemote.Unknown ErrorCheck Error LogUnforeseen error events are captured, withany relevant data stored in the Error.log file.<Base Name> [<Serial>] is Forced Online by switchWhen a base is forced online by the switch,remote switching of bases is not possibleusing Tview+ Diagnostics.Base1/Base2 already forced onlineAn attempt was made to force a base onlinethat has already been forced online remotelyby Tview+ Diagnostics.Already in Auto mode The Auto button was pressed when the HSCwas already in automode.Output Toggle Process Failed. HSC may have failed.When attempting to toggle an output on theHSC, the output state didnt change. Thiswould indicate that the HSC has failed.Changeover Pending. Wait up to one minute.A change over attempt has been made byeither the HSC or a remote Tview+ Diagnosticcontroller within one minute of a previouschange over event. A change over to theoffline unit will not occur until the one minutetime period has expired.Base 1 and Base 2 connection state corrected. (Note names display).Up until the first time an HSC iscommunicated with, the Diagnostic controllerdoesnt know which of the paired bases inconnected to HSC ports One and Two.So the paired Bases are displayed inalphanumeric order. The display is correctedon reception of the first message from eitherBase.Base/Repeater Digital I/OThe base/repeater digital I/O window operates in a similar manner tothe HSC window.](https://usermanual.wiki/Trio-Datacom/ER450-XXF01.Users-Manual-Part-3/User-Guide-481017-Page-6.png)
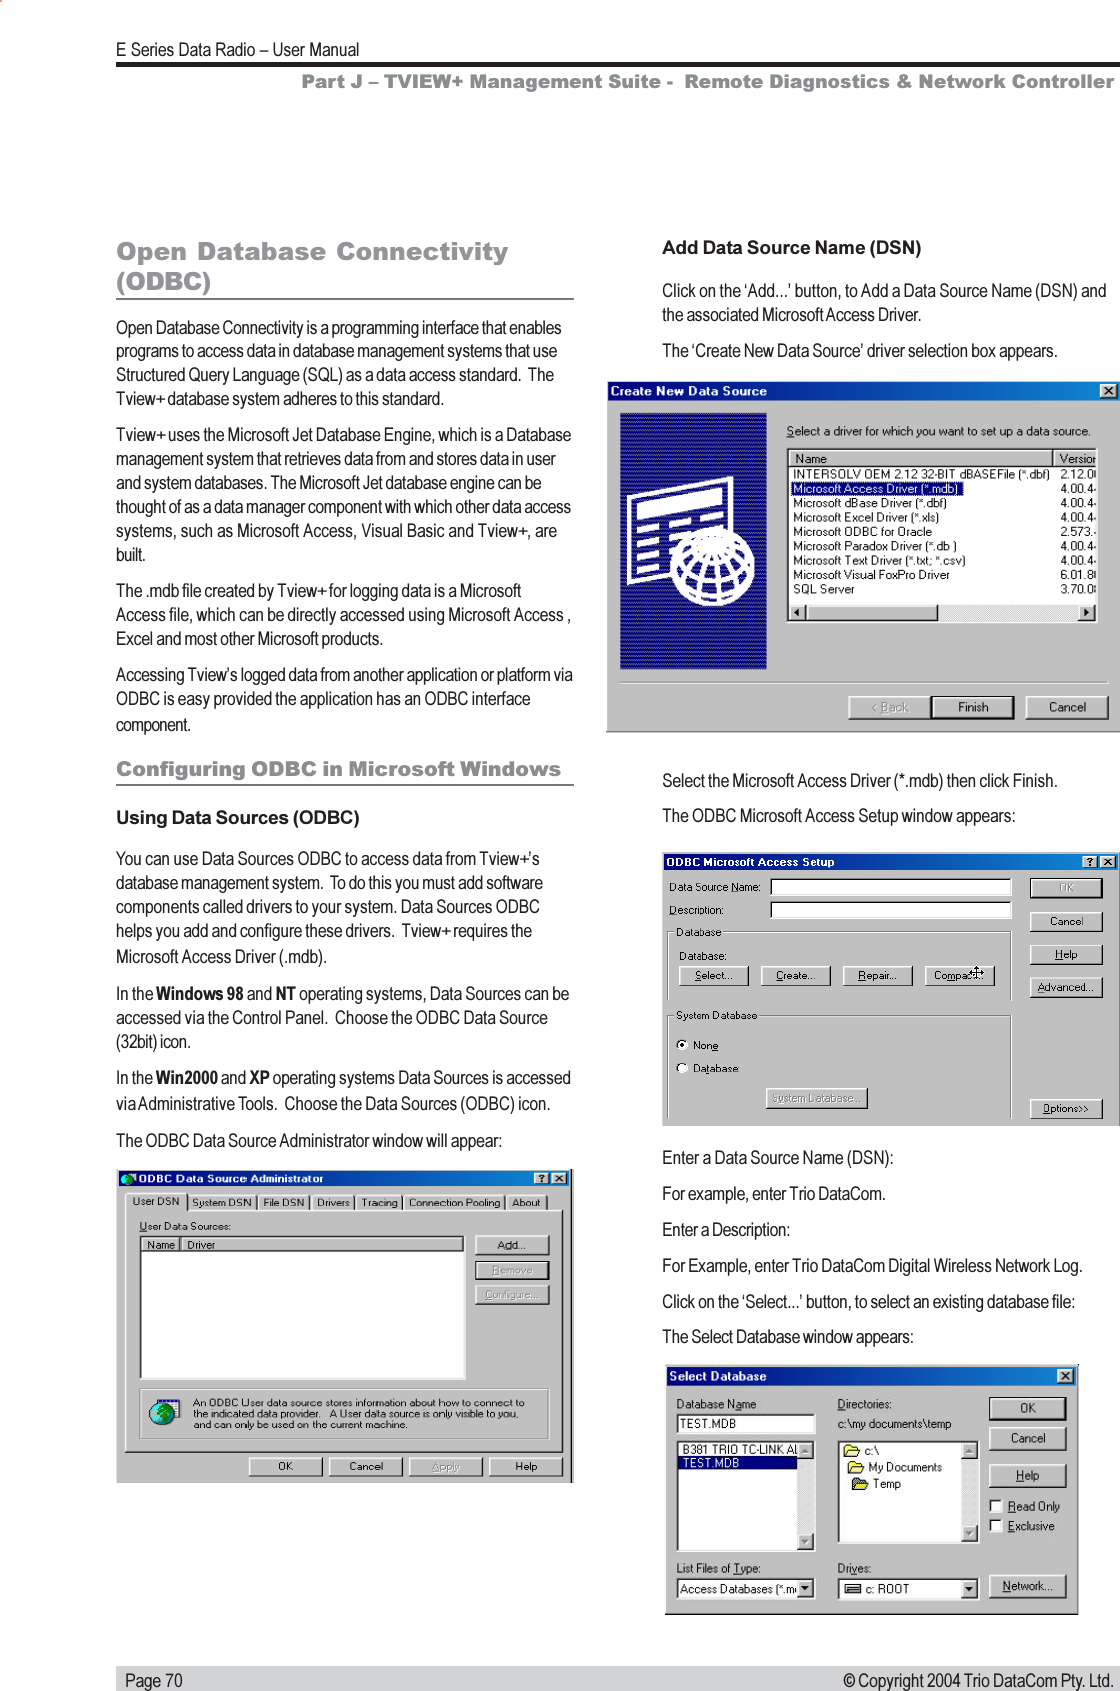
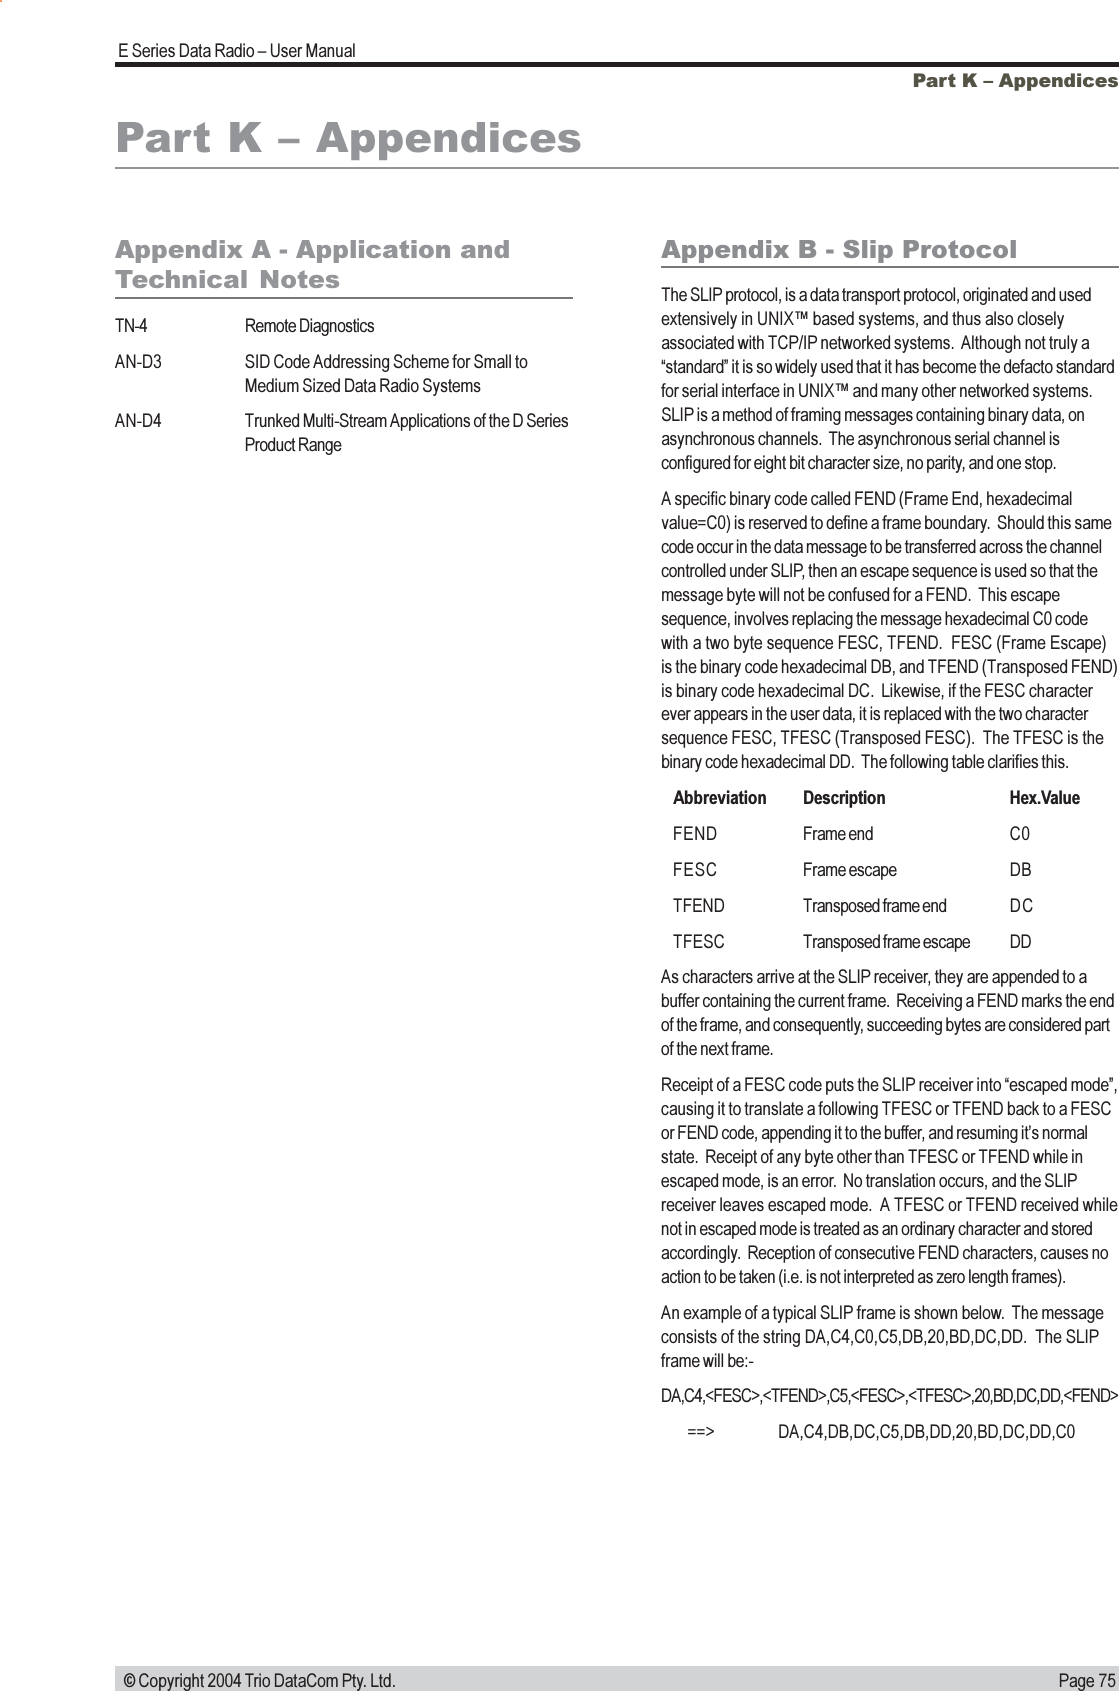
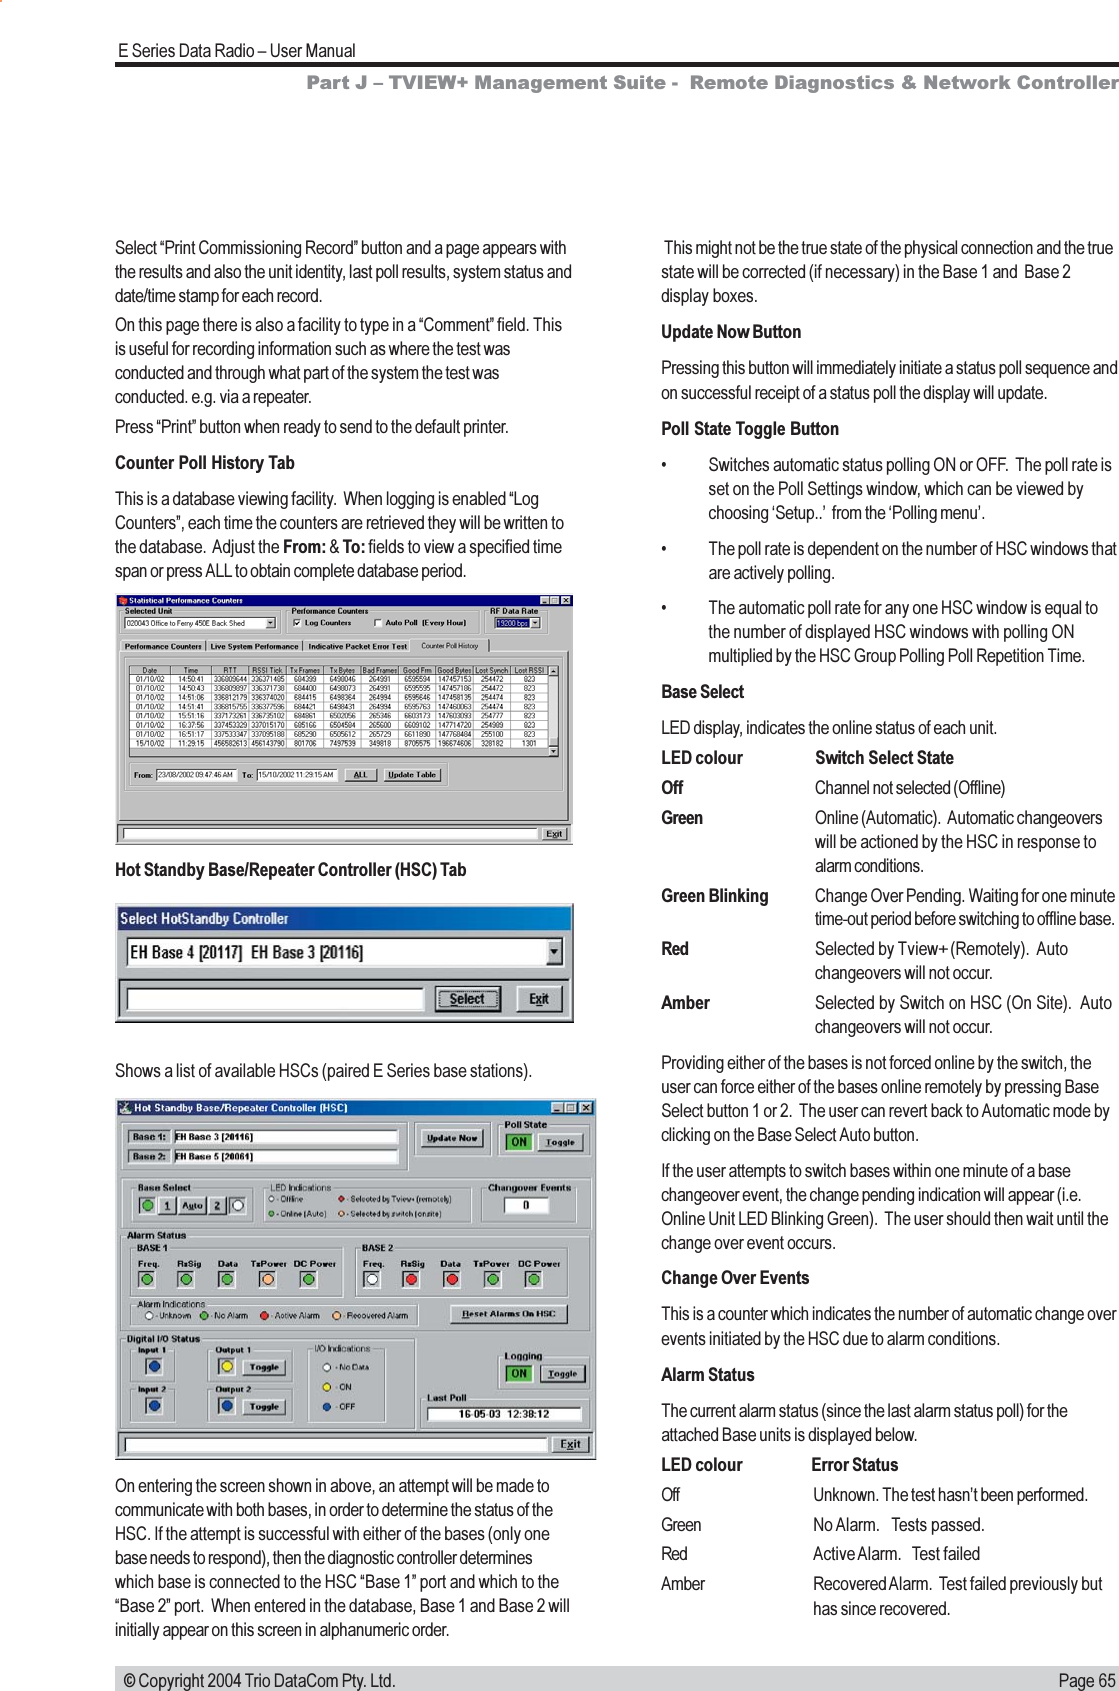
![Page 72E Series Data Radio User Manual© Copyright 2004 Trio DataCom Pty. Ltd.12. Click OK. The Microsoft Query Application appears, with theAdd Tables selection box on top.13. Select and Add the Radio table.The Radio Table will appear on the Microsoft Query screen.14. Click on the Close button.15. In the Radio table, find the UnitName field and double clickon it to add this field to the query.16. Similarly, add the Location field to the query.17. From the view menu select Criteria, to view the criteriawindow.18. In the criteria field of the first column, enter field name Serial(use the pull down selection list).19. In the value field, enter the following text: [Enter serialNumber]. When the query is run, a prompt will appearcontaining this message. You need to enter an existing serialnumber for the query to work.20. From the Records menu choose Query Now to run thequery. Your screen should appear something like this:21. Save the query as Get Radio Detail.dqy22. From the File menu select Return Data to Microsoft Excel25. Click on the Get the value from the following cell button.26. Place the cursor on the serial number in cell A2.27. Make sure the Refresh automatically when cell valuechanges check box is ticked, then press OK.28. Press OK on the Import Data window. The Spreadsheetshould appear something like the following:You can do another query with a different serial number simply bychanging the number in cell A2. The Unit Name and Location datawill automatically update.Part J TVIEW+ Management Suite - Remote Diagnostics & Network Controller23. Back at the spreadsheet, an Import Data window appearsprompting for a cell location. Put the cursor in cell B1.24. Click on the Parameters button.](https://usermanual.wiki/Trio-Datacom/ER450-XXF01.Users-Manual-Part-3/User-Guide-481017-Page-12.png)
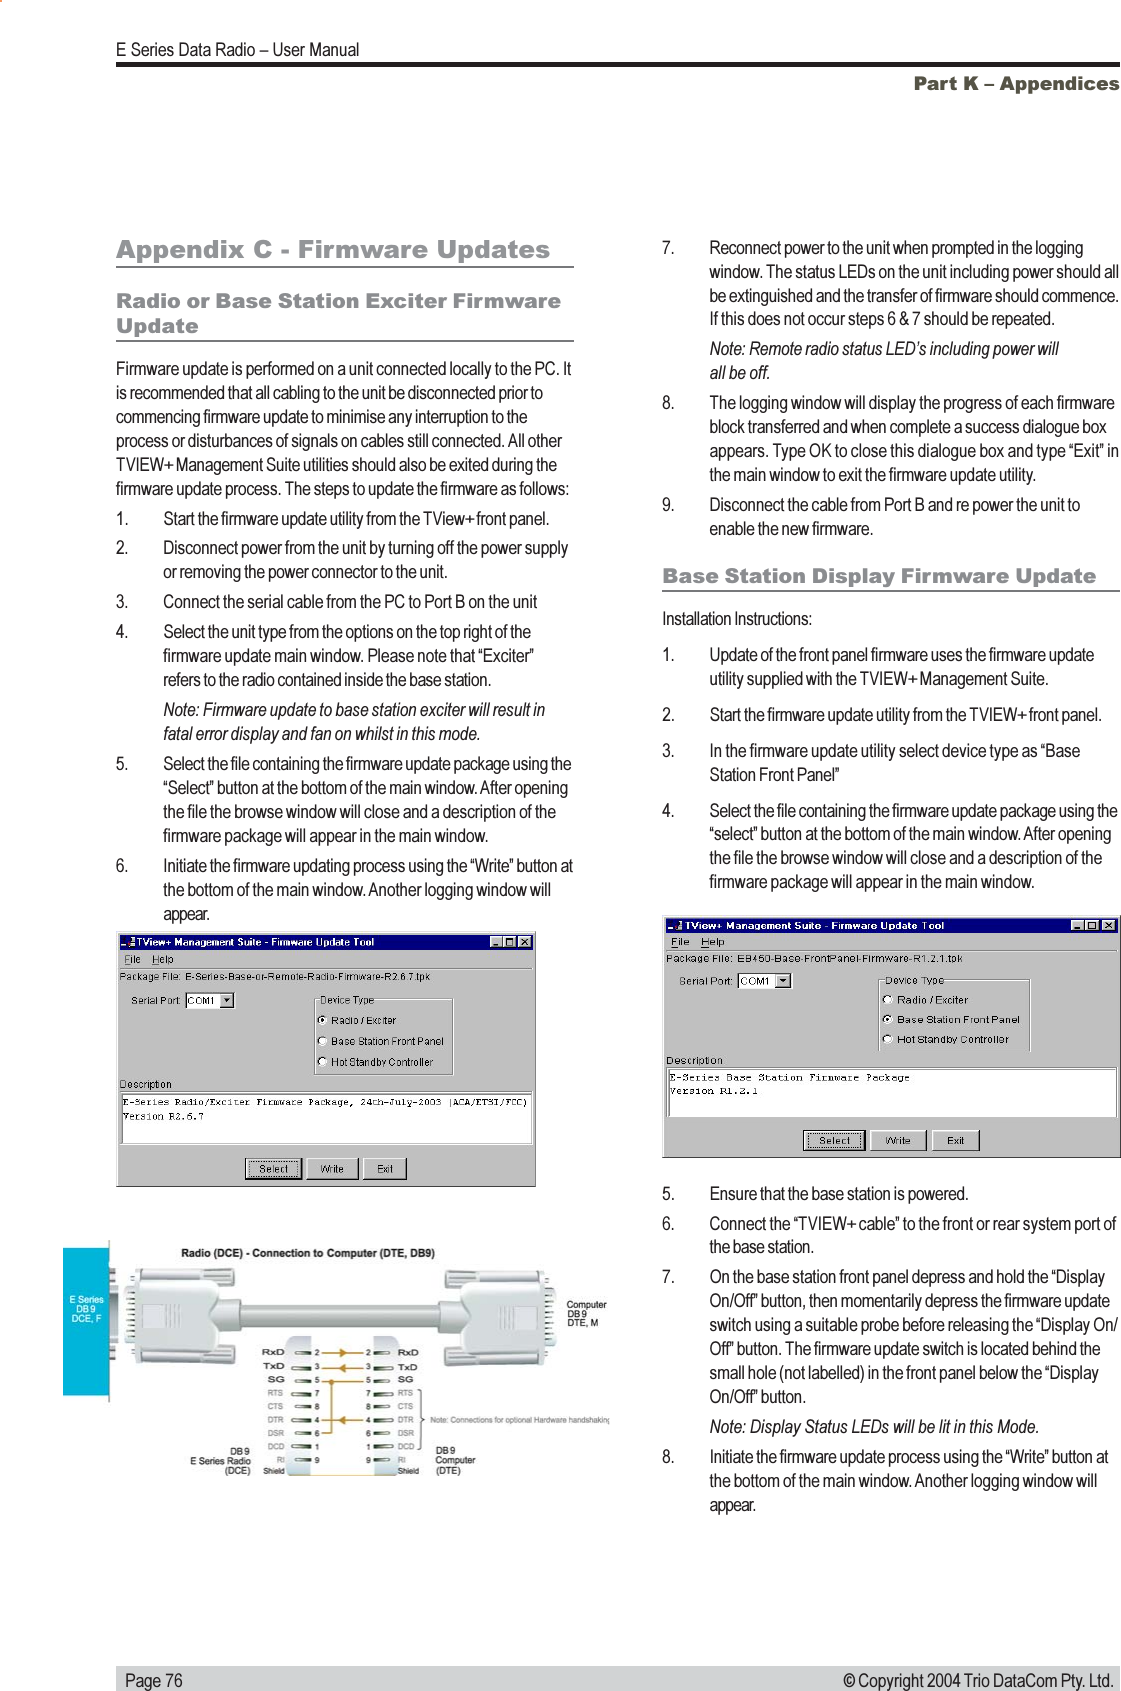
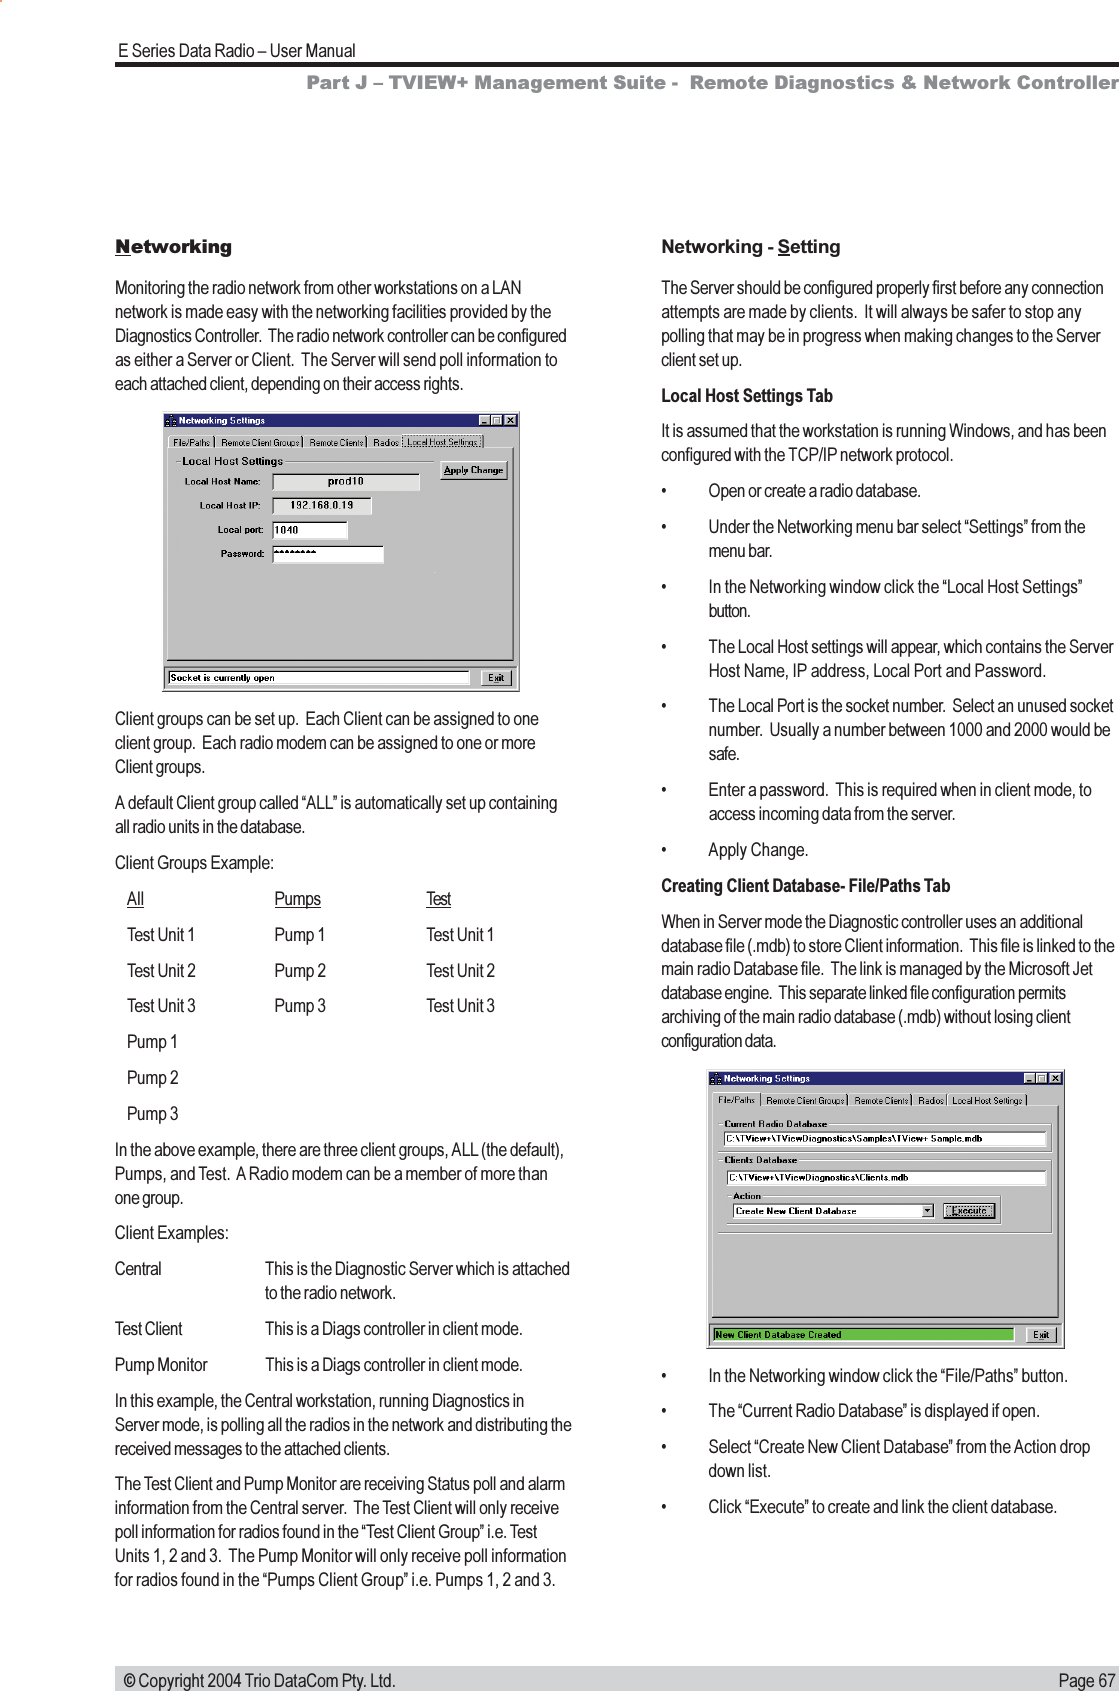
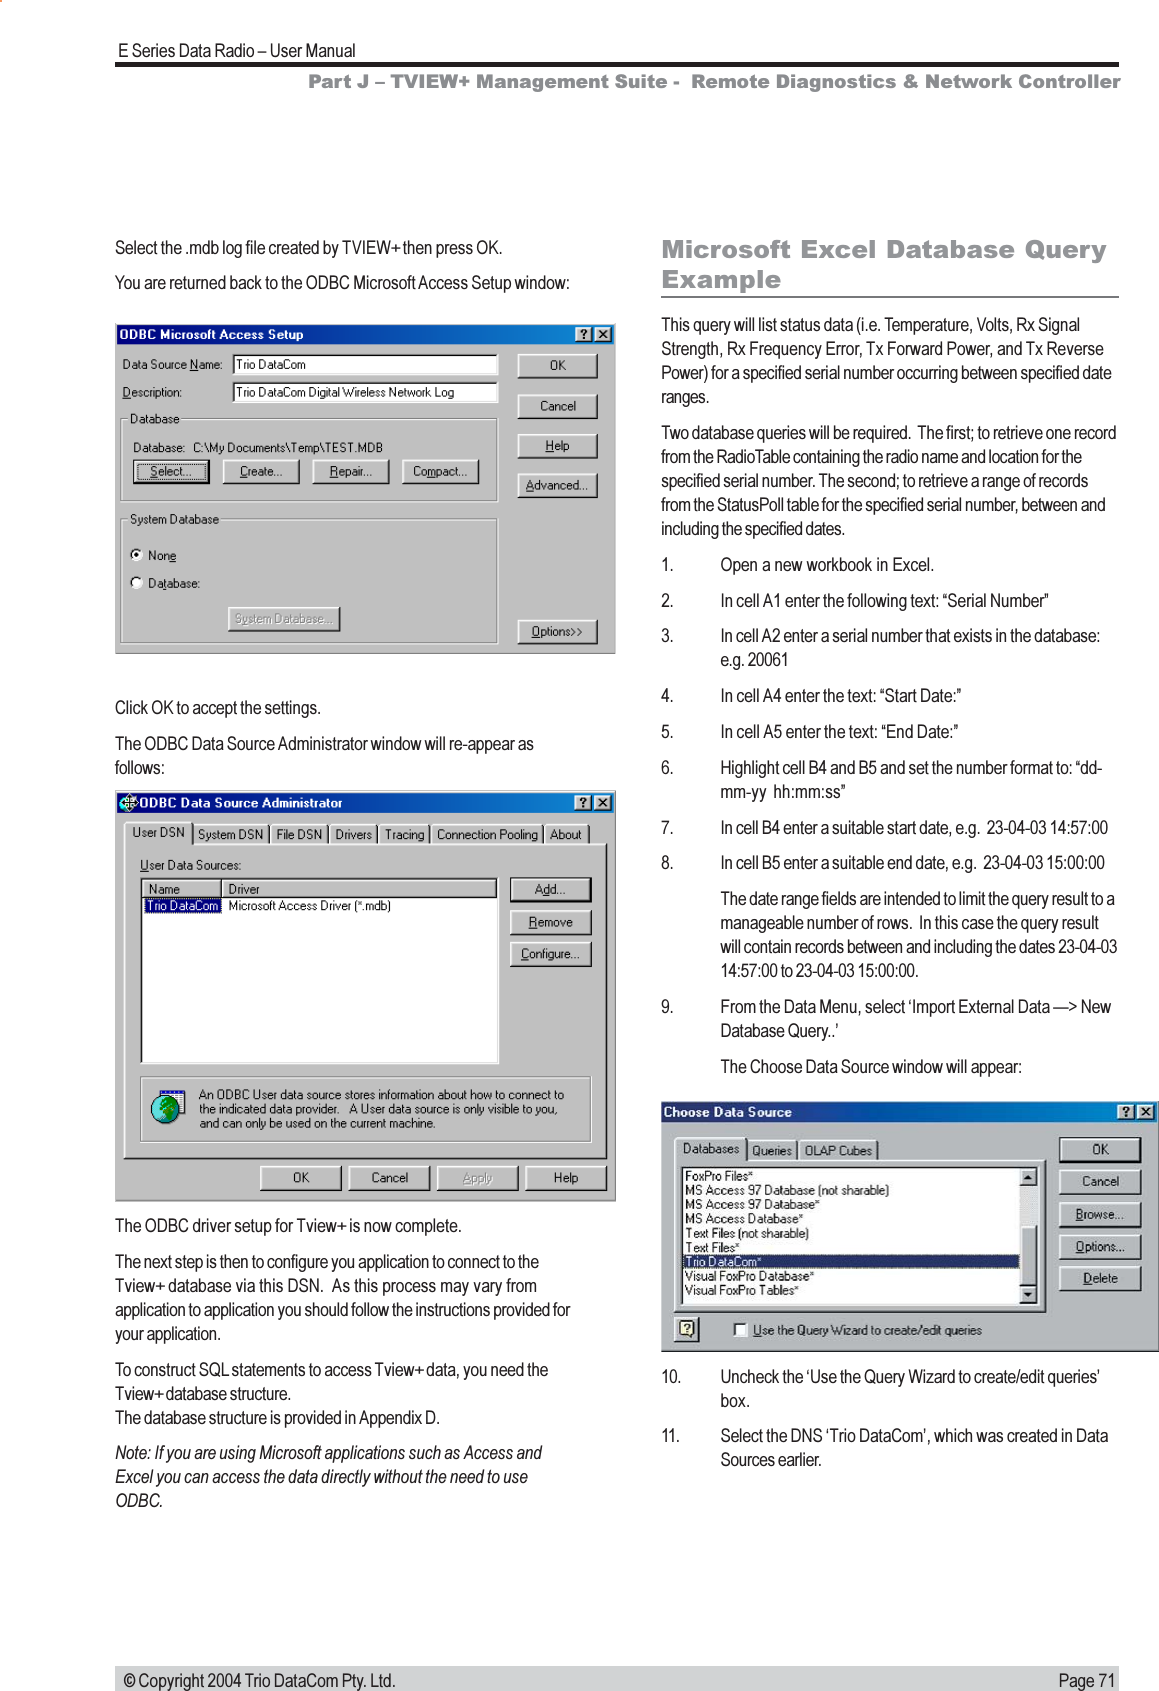
![Page 73E Series Data Radio User Manual © Copyright 2004 Trio DataCom Pty. Ltd.Query StatusPoll dataThe next Query will list the status data for the unit serial number in A2,occurring between and including the dates specified in cells B4 andB5.1. To query the StatusPoll table, return to step 9 and follow eachstep until you have completed step 12, then return here. TheMicrosoft Query Application appears, with the Add Tablesselection box on top.12. Save the query as Get Status Data.dqy13. From the File menu select Return Data to Microsoft Excel14. Back at the spreadsheet, an Import Data window appears,prompting for a cell location. Put the cursor in cell D1.15. Click on the Parameters button.2. Select and Add the StatusPoll table. The StatusPoll Tablewill appear on the Microsoft Query screen.3. Click on the Close button.4. In the StatusPoll table, find the Epoch field and double clickon it to add this field to the query.5. Similarly, add the Volts, Temp, RSSI, FreqErr, TxPWR andTxPWRrev fields to the query.6. From the view menu select Criteria, to view the criteriawindow.7. In the criteria field of the first column, enter field name Serial(use the pull down selection list).8. In the value field, enter the following text: [Enter SerialNumber].9. In the criteria field of the second column, enter field nameEpoch10. In the value field under Epoch, enter the following text:>=[Enter First Date] AND <=[Enter Last Date]11. From the Records menu choose Query Now to run thequery. You will be prompted for an existing serial number,start date, and end date.Your screen should appear something like this:16. Select Enter Serial Number from selection list box.a. Click on the Get the value from the following cell.b. Place the cursor on the serial number in cell A2 andselect.17. Select Enter First Date from selection list box.a. Click on the Get the value from the following cell.b. Place the cursor on the date in cell B4 and select.18. Select Enter Last Date from selection list box.a. Click on the Get the value from the following cell.b. Place the cursor on the date in cell B5 and select.19. Make sure the Refresh automatically when cell valuechanges check box is ticked for each field, then press OK.20. Place the cursor in cell D1, then press OK.Part J TVIEW+ Management Suite - Remote Diagnostics & Network Controller](https://usermanual.wiki/Trio-Datacom/ER450-XXF01.Users-Manual-Part-3/User-Guide-481017-Page-13.png)