Cisco Systems 2484-B8415-R1 WiMAX Base Station, Broadband Wireless, 2.5/2.6 GHz User Manual Installation manual Part 5
Cisco Systems, Inc WiMAX Base Station, Broadband Wireless, 2.5/2.6 GHz Installation manual Part 5
Contents
- 1. Installation manual Part 1
- 2. Installation manual Part 2
- 3. Installation manual Part 3
- 4. Installation manual Part 4
- 5. Installation manual Part 5
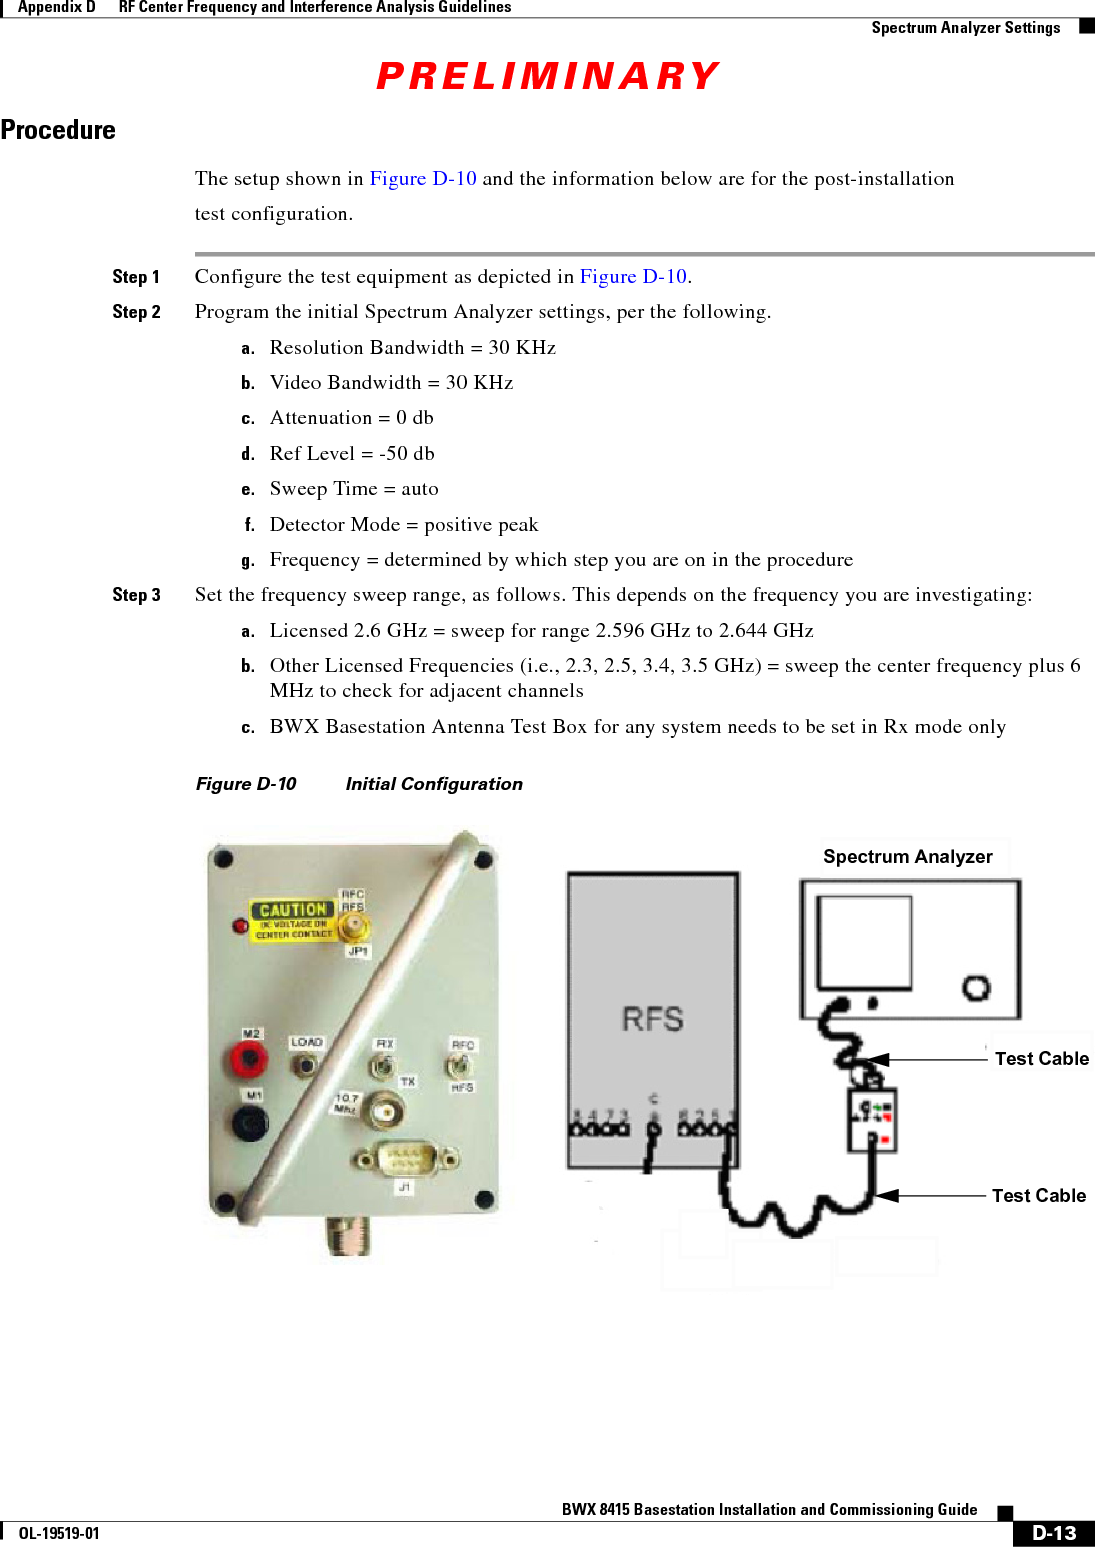
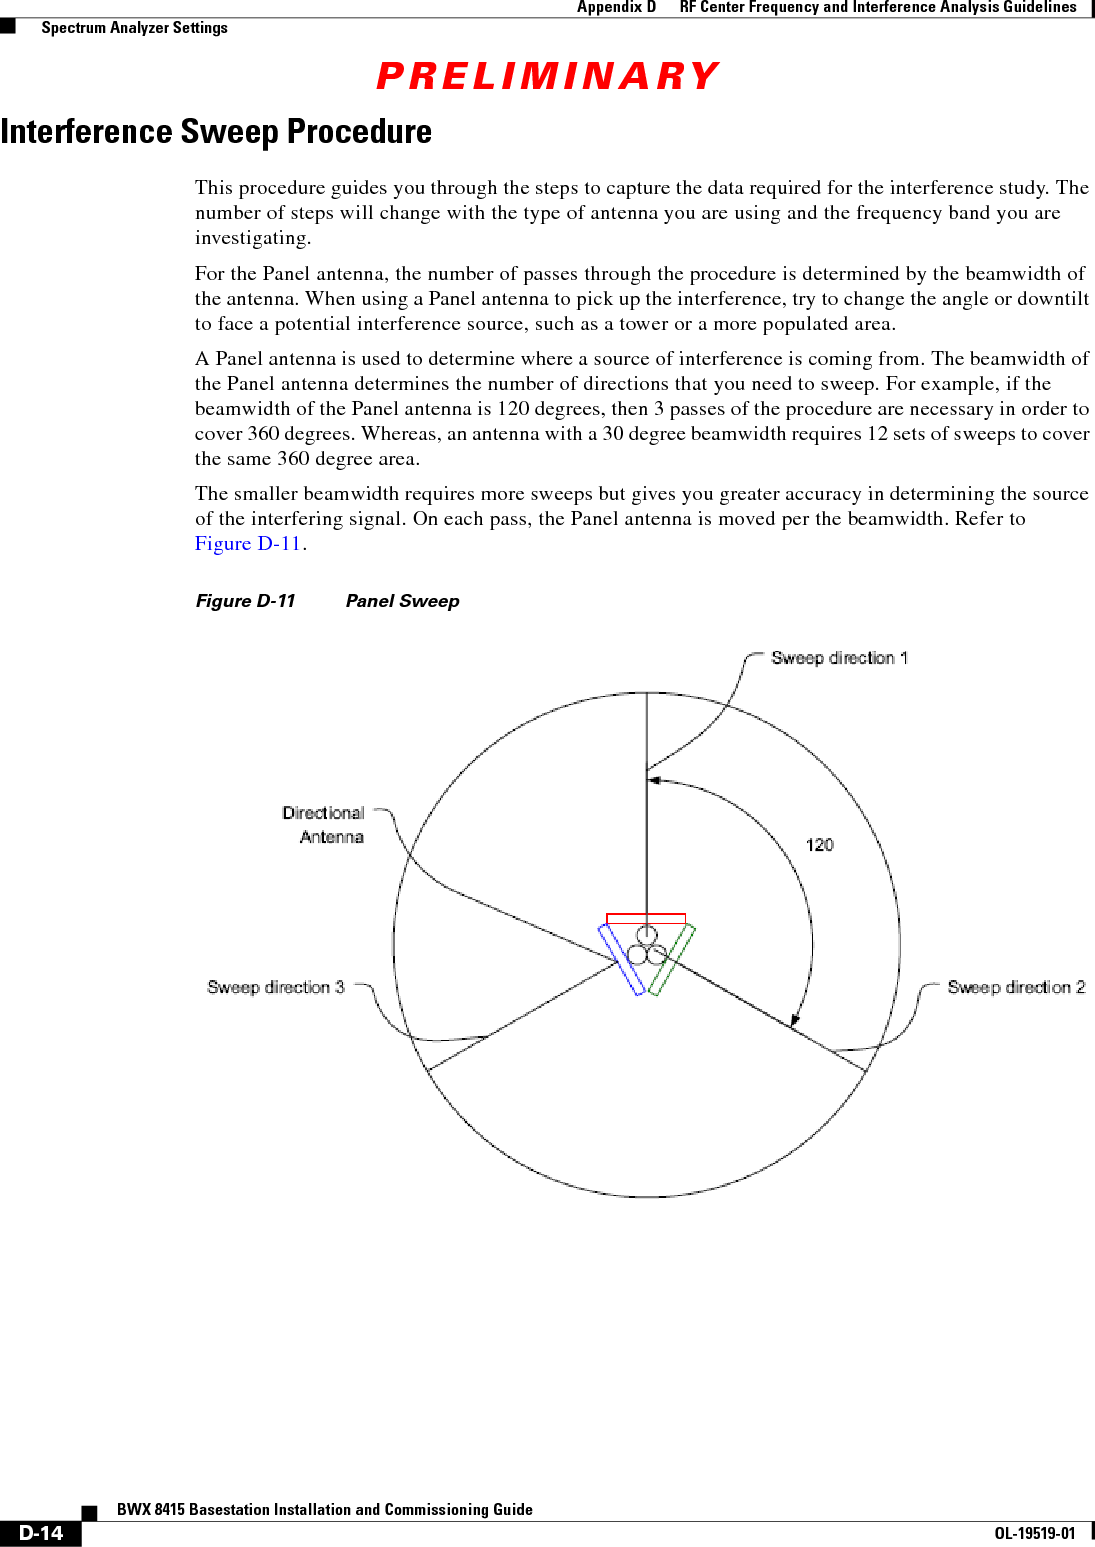
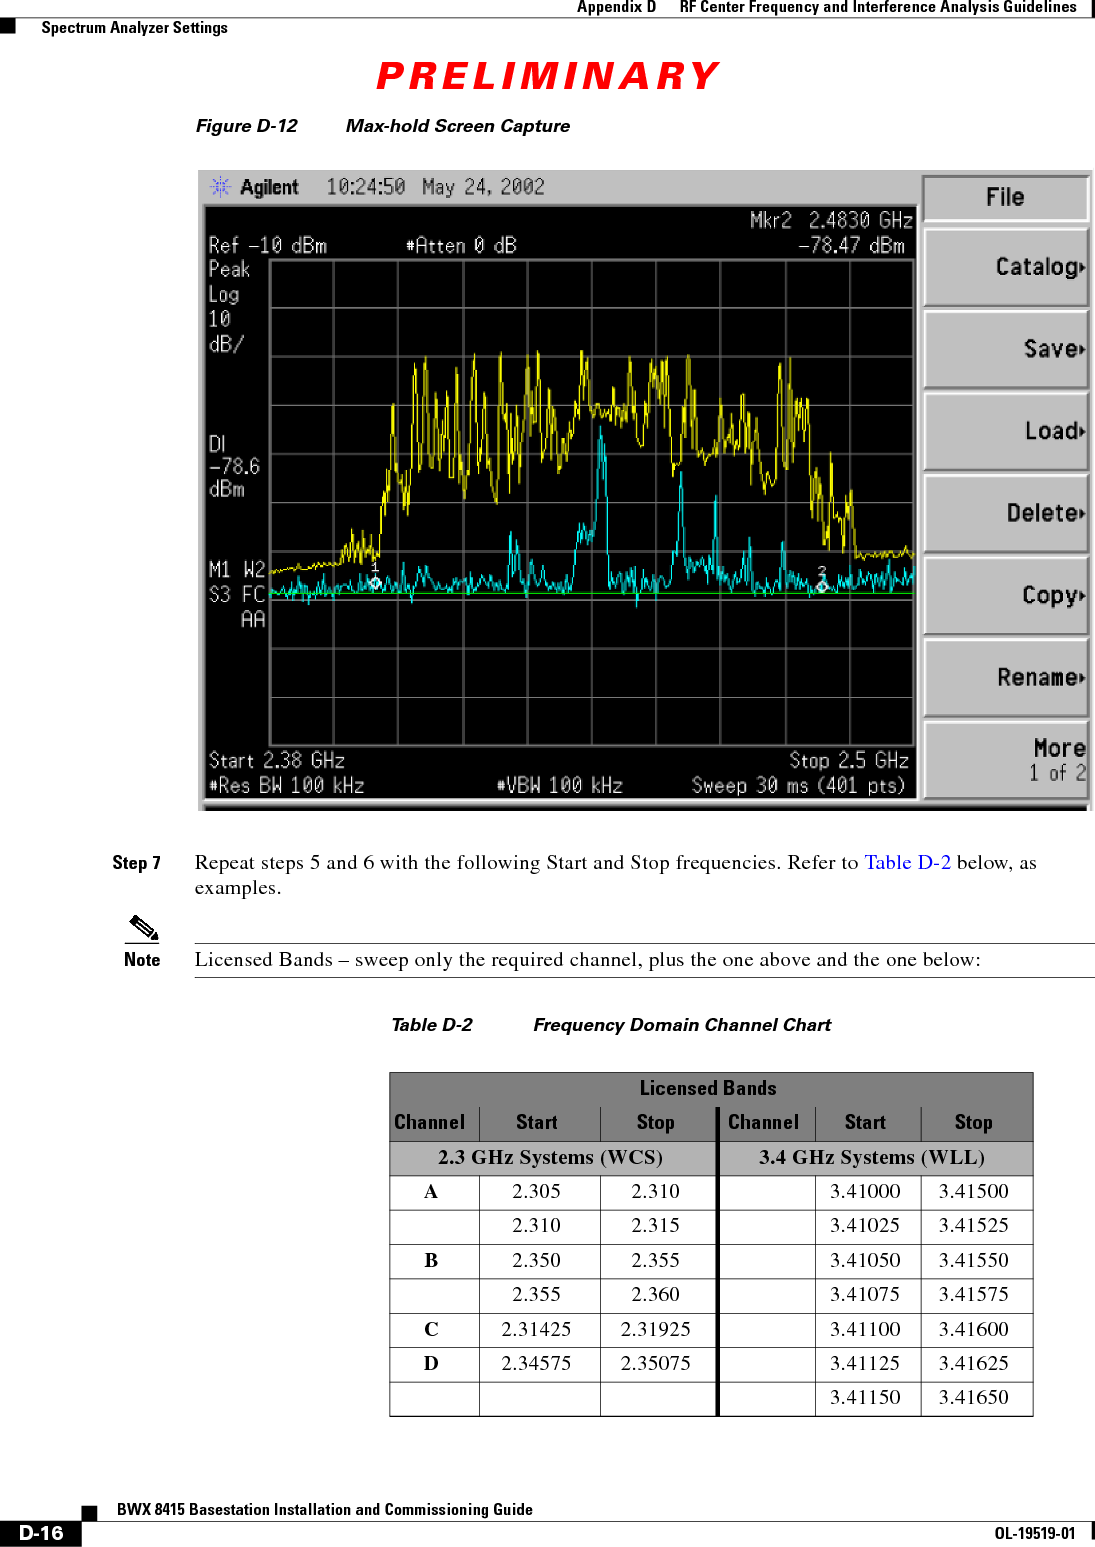
Installation manual Part 5