Cisco Systems 2484-B8415-R1 WiMAX Base Station, Broadband Wireless, 2.5/2.6 GHz User Manual Installation manual Part 5
Cisco Systems, Inc WiMAX Base Station, Broadband Wireless, 2.5/2.6 GHz Installation manual Part 5
Contents
- 1. Installation manual Part 1
- 2. Installation manual Part 2
- 3. Installation manual Part 3
- 4. Installation manual Part 4
- 5. Installation manual Part 5
Installation manual Part 5
PRELIMINARY
D-1
BWX 8415 Basestation Installation and Commissioning Guide
OL-19519-01
APPENDIX
D
RF Center Frequency and Interference Analysis
Guidelines
Reference: RF Center Frequency and Interference Analysis
These guidelines are intended for an experienced and Cisco qualified specialist Field Engineer to gather
data for RF Engineering purposes. The procedures that are described are performed in order to make a
determination of basestation center frequency and possible interference points. Please refer to all
regulatory information for your region prior to performing these procedures.
Before You Start
Overview
An RF interference analysis is usually called for under two conditions. One is when it is used for
evaluating a candidate BWX 8415 Basestation (BS) site prior to deployment of equipment. We refer to
the interference testing under these circumstances as a Pre-installation Test. The second is the
Post-installation Test, when data is collected to determine (a) if there is any interference in the area at
all; or (b) the source, or cause, of known interference in the area of the installed and operational site. As
is obvious from the name of this test, it occurs after the basestation has been deployed and turned up.
The instructions in this document assume the Field Engineer is at the BS site where the testing will take
place. The data the Field Engineer gathers using the Interference Sweep procedure in this document will
be evaluated and used in the calibration of the basestation. The data will help verify and plan for noise
in the area.
To get the most benefit from this procedure, we suggest you follow these high-level steps:
Step 1: Read the entire procedure.
Step 2: Choose the correct Test configuration setup, per this procedure.
Step 3: Perform the Interference Sweep procedure.
Step 4: Send the results to Cisco or your RF Engineer.
PRELIMINARY
D-2
BWX 8415 Basestation Installation and Commissioning Guide
OL-19519-01
Appendix D RF Center Frequency and Interference Analysis Guidelines
Spectrum Analyzer Settings
Required Equipment
You will need the equipment shown in Table D-1 to complete the interference testing.
Ta b l e D-1 Required Equipment
Spectrum Analyzer Settings
There are two types of interference tests conducted under either the Pre-installation or Post-installation
situation: Frequency Domain test and Time Domain test. The following section explains some specific
settings on the Spectrum analyzer, and what effects they will have on these tests.
Frequency Domain Test
The Frequency Domain test is a measurement of the amplitude of an incoming signal across a given
frequency span. Setup for the Spectrum Analyzer:
• Frequency = the channel to be tested (refer to frequency charts later in procedure)
• Bandwidth (BW) = 100 KHz or lower
• Reference Level = –50 dBm
• Attenuation = 0 dB
• Preamp, if available = on
• Span = determined by the start and stop frequencies
For the Frequency Domain test, the two parameters most frequently configured incorrectly are Reference
Level and Bandwidth. To help the user determine the best settings, this section gives a short description
as to what changes will be seen on the display if the parameter is changed.
Equipment Comments
HP4404B, FSH3, or FSH6 Spectrum Analyzer (or
equivalent)
NOTE 1: If checking for 3.4/3.5 GHz spectrum,
make sure the Spectrum Analyzer reads up to 4
GHz.
NOTE 2: An equivalent analyzer must have the
following functions: Screen Save abilities,
Max-hold function, Peak search, and ability to
operate in the required frequency range
BWX Basestation Antenna Test Box
QMA, N Type Connectors, and different RF
cables to make the connections
Test antenna in the given frequency range Cisco BWX Basestation Antenna
LNA in the given frequency range - With a standard antenna you need an additional
30 dB of gain
PRELIMINARY
D-3
BWX 8415 Basestation Installation and Commissioning Guide
OL-19519-01
Appendix D RF Center Frequency and Interference Analysis Guidelines
Spectrum Analyzer Settings
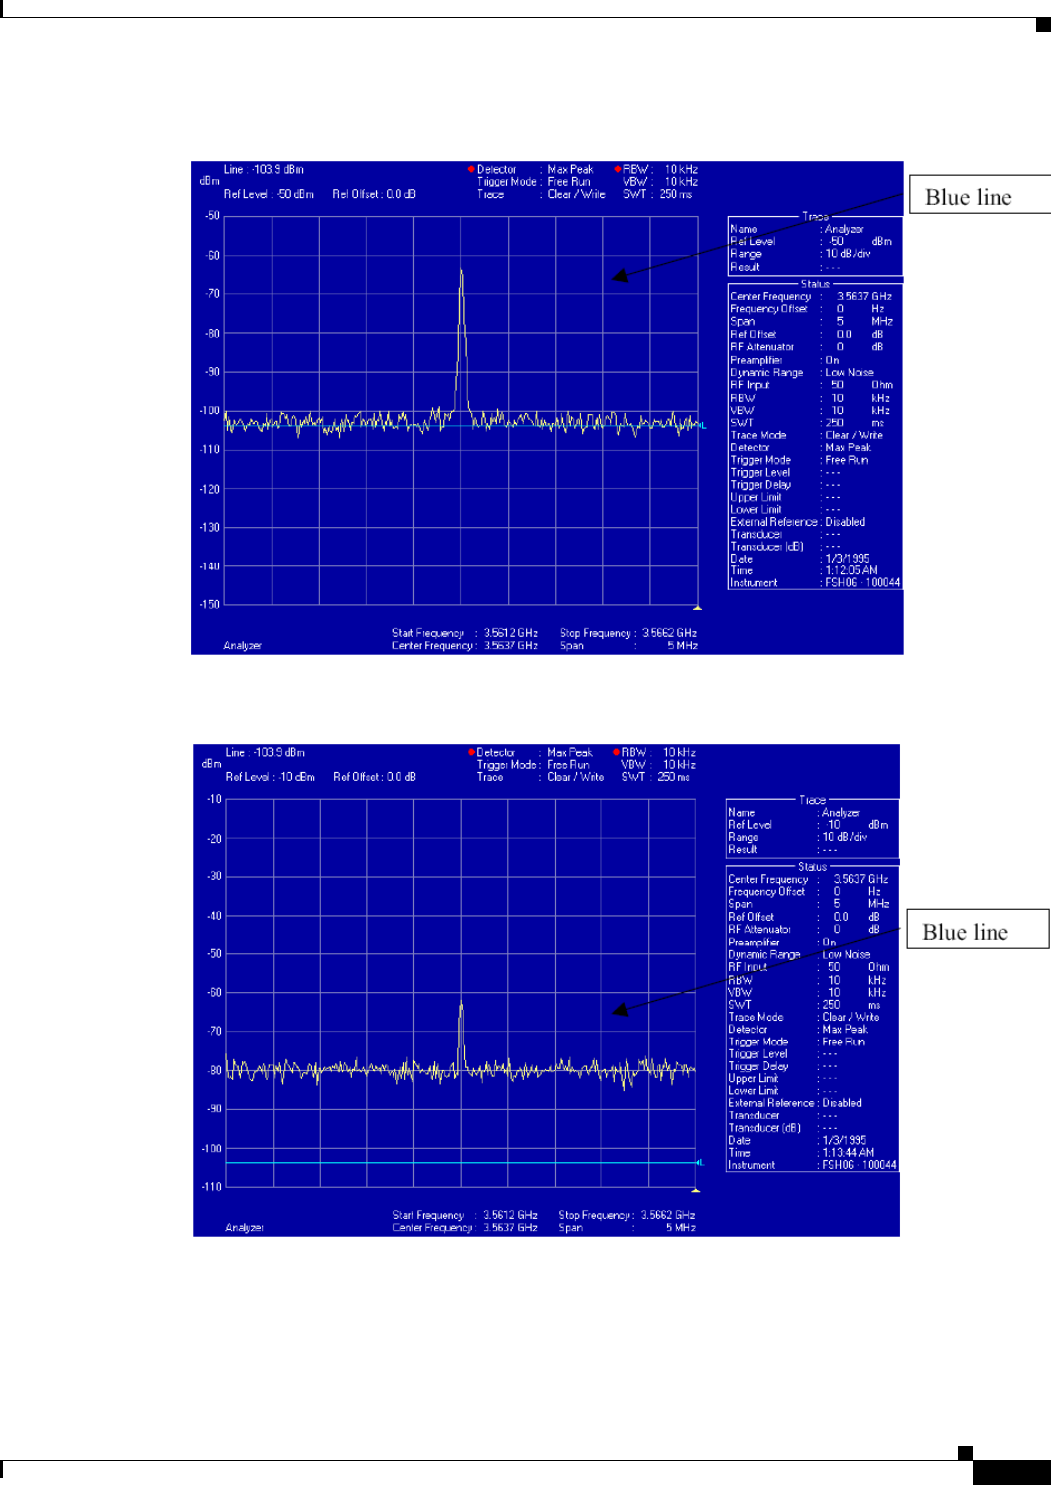
Reference Level
This parameter sets the level of the top line of the Spectrum analyzer display (Figure D-1). Figure E-1
shows a display with the reference level set to –50 dB and the noise floor at –104 dB. The Blue line is a
display line showing a level of –103.9 dB.
As you can see, the top-level line displays –50dB. On most Spectrum Analyzers the RF noise floor is
coupled with the Reference Level line. A Spectrum Analyzer will try and display the noise floor on
screen. If the reference level is set at a level that is too high for the Spectrum Analyzer to display the
noise floor, it will automatically change the displayed level for the noise floor (Figure D-2).
Figure D-1 -50 Reference Level
l
PRELIMINARY
D-4
BWX 8415 Basestation Installation and Commissioning Guide
OL-19519-01
Appendix D RF Center Frequency and Interference Analysis Guidelines
Spectrum Analyzer Settings
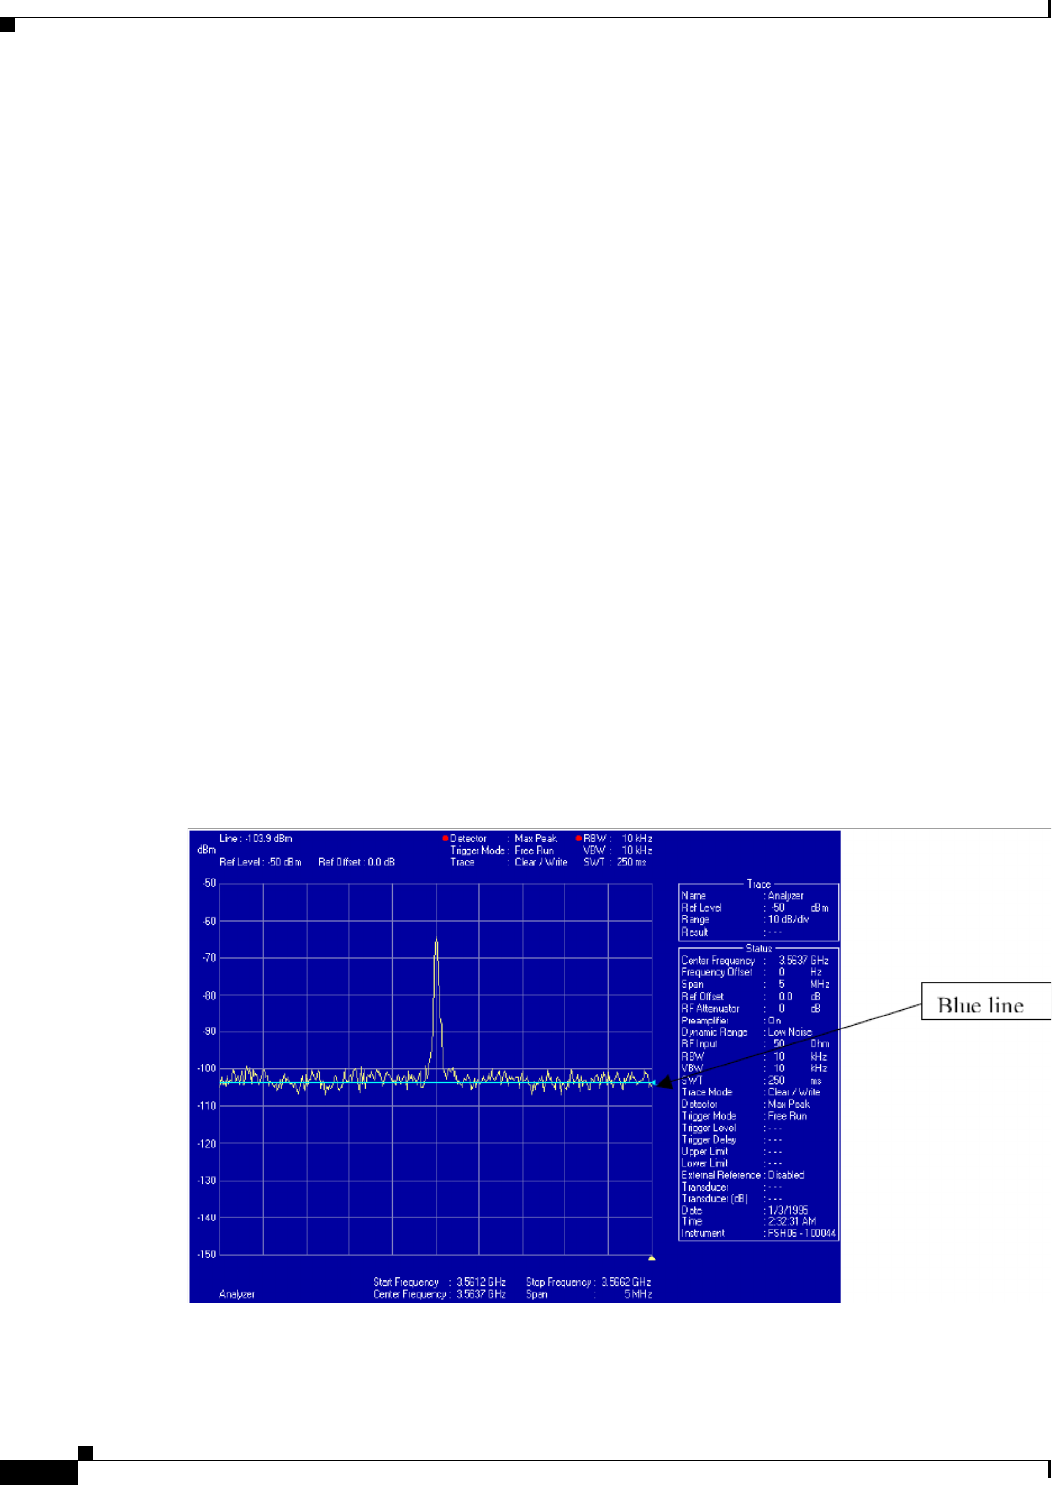
Figure D-2 -10 Reference Level
Bandwidth
Figure D-2 shows a reference level setting that was manually raised in the Spectrum Analyzer to –10.
The blue line is the display line that was set with the original noise floor at the –50 reference level. When
the reference level was raised from –50 to –10 the displayed noise floor also raised approximately 25 dB
By setting the reference level to a lower value, the Spectrum Analyzer is able to display a noise floor
that is closer to the actual digital noise floor of the equipment.
Figure D-3 and Figure D-4 show the reason the reference level is important for capturing data for
interference measurements. In Figure D-3, the reference was set at –50 dB level. A –65 dB signal was
injected into the Spectrum Analyzer. In Figure D-4 the same –65 dB signal level was injected into the
Spectrum Analyzer, but the reference level was changed from –50 dB to –10 dB.
Figure D-4 still shows the –65 dB signal but only at 18 above the noise floor; whereas Figure D-3 shows
the –65 dB signal at 40 dB above the noise floor. While measuring interference, if the reference level
were set to –10 dB the Spectrum Analyzer would not display any signal levels below the displayed noise
floor level, effectively masking any interference in that area.
PRELIMINARY
D-5
BWX 8415 Basestation Installation and Commissioning Guide
OL-19519-01
Appendix D RF Center Frequency and Interference Analysis Guidelines
Spectrum Analyzer Settings
Figure D-3 -50 dB Reference Level with Injected Signal
Figure D-4 -10 dB Reference Level with Injected Signal
PRELIMINARY
D-6
BWX 8415 Basestation Installation and Commissioning Guide
OL-19519-01
Appendix D RF Center Frequency and Interference Analysis Guidelines
Spectrum Analyzer Settings
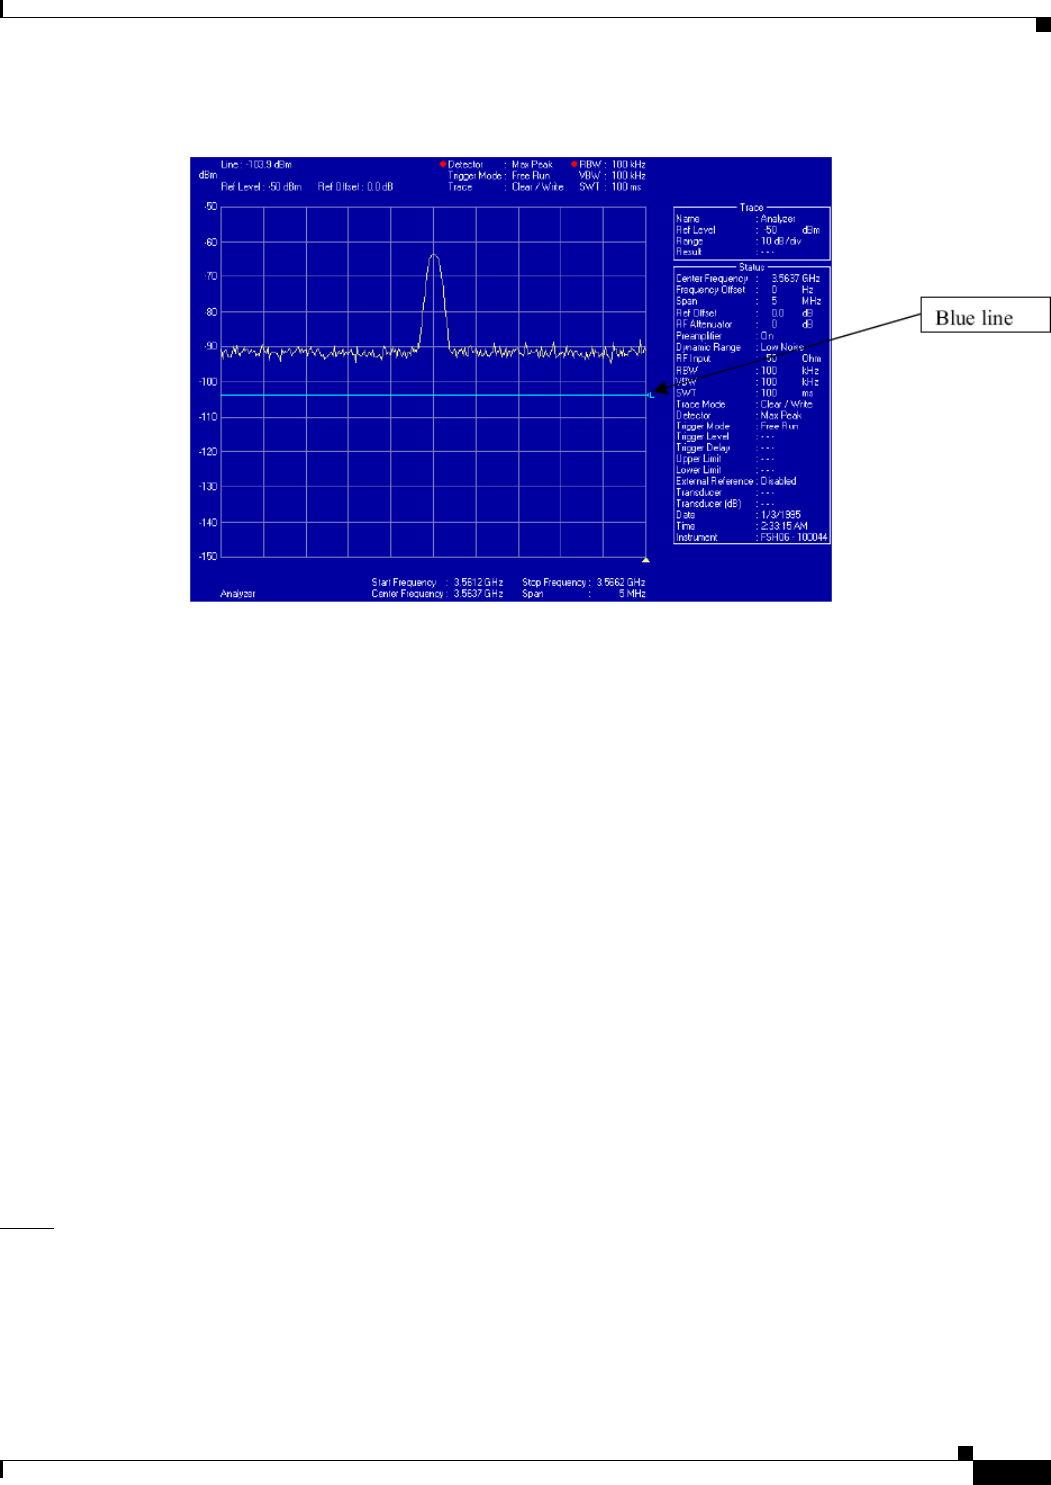
The bandwidth parameter is used for the measurement and display of the signal level across a given range
or span of frequencies. Within a given bandwidth there are 2 settings — one is Resolution bandwidth,
and the other is Video bandwidth. To discuss bandwidth, an understanding of the Spectrum Analyzer
display is needed. The display is broken out into frequencies and signal strength levels. Frequencies are
displayed left to right, which is called the Span. The signal level is displayed from top to bottom and is
shown with a signal strength level on the left side of the display.
Bandwidth in the Frequency Domain test is tied to the span function. Resolution bandwidth is the
measurement steps or slices that the Spectrum Analyzer uses while sweeping across the span of
frequencies. The Video bandwidth is the steps that the Spectrum Analyzer displays to the screen as it
sweeps across the span of frequencies.
Two different bandwidths are used in the following examples. One is 10 KHz in a 5 MHz span
(Figure D-5), and the second is 100 KHz in a 5 MHz span (Figure D-6). With the 10 KHz bandwidth,
the Spectrum Analyzer will make 500 steps to sweep the 5 MHz span, whereas on the 100 KHz
bandwidth only 50 steps are made.
With a wider bandwidth (100 KHz) the receiver front-end of the Spectrum Analyzer is opened wider,
allowing for more noise to be input. With the smaller bandwidth (10 KHz) the Spectrum Analyzer
receiver is narrower and less susceptible to outside noise, thus giving a more accurate measurement. The
drawback to a smaller bandwidth is the sweep time for the Spectrum Analyzer to step across the span.
The sweep time increases, affecting the amount of time to perform the tests.
Figure D-5 and Figure D-6 show the effect on the noise floor by increasing the bandwidth from 10 KHz
up to 100 KHz. The setup in Figure D-5 is a 10 KHz resolution and video bandwidth, and a span of 5
MHz. In Figure D-6 the bandwidth was increased from 10 KHz to 100 KHz. By raising the bandwidth
in Figure D-6, more noise was seen by the Spectrum Analyzer, in effect raising the noise floor and hiding
over 10 dB of signal from view. When measuring for interference, this configuration can result in
measurement error, giving the view that the interference is not as bad as it truly is.
Figure D-5 10KHz Bandwidth Setting
PRELIMINARY
D-7
BWX 8415 Basestation Installation and Commissioning Guide
OL-19519-01
Appendix D RF Center Frequency and Interference Analysis Guidelines
Spectrum Analyzer Settings
Figure D-6 100KHz Bandwidth Setting
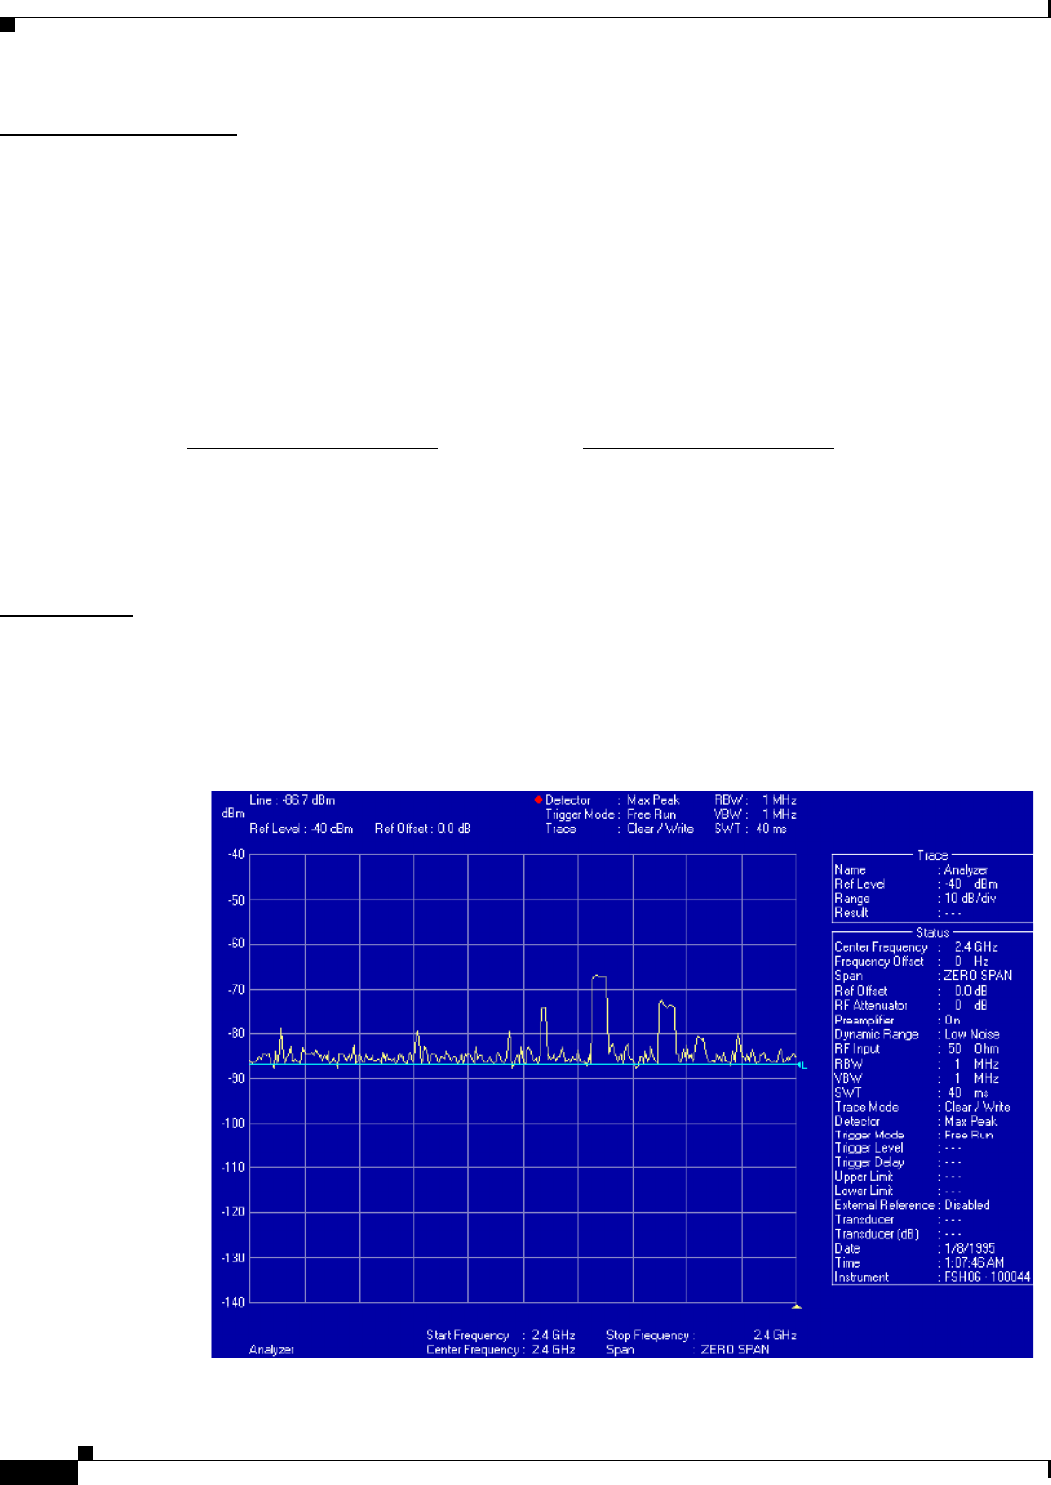
Time Domain Test
The Time Domain test (Figure D-7) is a measurement of the duration of an incoming signal across a
given bandwidth. The duration of an incoming signal affects the number of packet errors that are
generated over a given period of time. The longer the duration of the signal the more packet errors are
generated. The number of packet errors will directly affect the data throughput rates of the system.
Setups for the Spectrum Analyzer are as follows:
• Frequency = center frequency to be tested
• Span = 0 Hz
• Video Bandwidth = 1 MHz
• Resolution Bandwidth = 1 MHz or 5 MHz
• Sweep Time = 40 ms and 400 ms
• Preamp if available = on
• Attenuation = 0 dB
• Reference Level = -40 dB
The following is a description of the parameters of the Spectrum Analyzer during the Time Domain test
versus the Frequency Domain test, and what effects they will have if they are changed for the testing.
Span
The span function in the Frequency Domain test determines the start and stop range that the Spectrum
Analyzer looks at for a given sweep time. By setting the Span to 0 Hz for the Time Domain test the
Spectrum Analyzer looks at one specific frequency for a given amount of time.
PRELIMINARY
D-8
BWX 8415 Basestation Installation and Commissioning Guide
OL-19519-01
Appendix D RF Center Frequency and Interference Analysis Guidelines
Spectrum Analyzer Settings
Resolution Bandwidth
The resolution bandwidth parameter for the Time Domain test acts similarly to the span function in the
Frequency Domain test. The bandwidth parameter opens up the receiver of the Spectrum Analyzer to
look at all signals across that bandwidth for the given sweep time. The smaller the bandwidth, the more
accurate the readings displayed.
This parameter also determines the frequencies that are to be tested for a given range. The BS uses a 5
MHz channel. If the Spectrum Analyzer can be programmed with a bandwidth of 5 MHz, then the center
frequency to be tested is every 5 MHz. Some analyzers are only able to be programmed to 1 MHz,
resulting in a center frequency test step of 1 MHz. This results in more frequencies to be tested, but a
more accurate indication of where the interference is located in the spectrum.
Frequency examples:
5 MHz Resolution Bandwidth 1 MHz Resolution Bandwidth
3.4025 GHz 3.4GHz
3.4075 GHz 3.401GHz
3.4125 GHz 3.402GHz
Sweep Time
The sweep time parameter is the amount of time that it takes the analyzer to scan the set bandwidth. One
transmit and receive frame on the Cisco system is 10 ms, so a sweep time of 40 ms shows 4 frames, and
400 ms shows 40 frames.
Figure D-7 Example of a Time Domain Test

PRELIMINARY
D-9
BWX 8415 Basestation Installation and Commissioning Guide
OL-19519-01
Appendix D RF Center Frequency and Interference Analysis Guidelines
Spectrum Analyzer Settings
Test Configurations
There are two configuration scenarios used for interference testing:
• Pre-installation Testing Configuration
• Post-installation Testing Configuration
Pre-installation Testing covers the initial equipment configurations when testing for interference at a site
in order to determine whether or not the site is a good candidate for placing the BS. It describes the
interference measurements prior to the installation of any BS equipment. The Post installation Testing
section covers the measurements using the BWX Basestation Antenna after it has been installed on the
radio tower or building. Use whichever configuration setting is appropriate to the type of data you are
trying to collect, prior to performing the Interference Sweep procedure.
Pre-installation Test
Following is the setup of the interference test equipment prior to the installation of the BS equipment.
This test is used to help determine if the site that has been selected is usable for the Cisco equipment,
and what possible frequencies can be used after the installation.
Required Equipment
• Spectrum Analyzer (4404 or R&S FSH)
• Testing antenna
• RF cable
• LNA as required
Setup
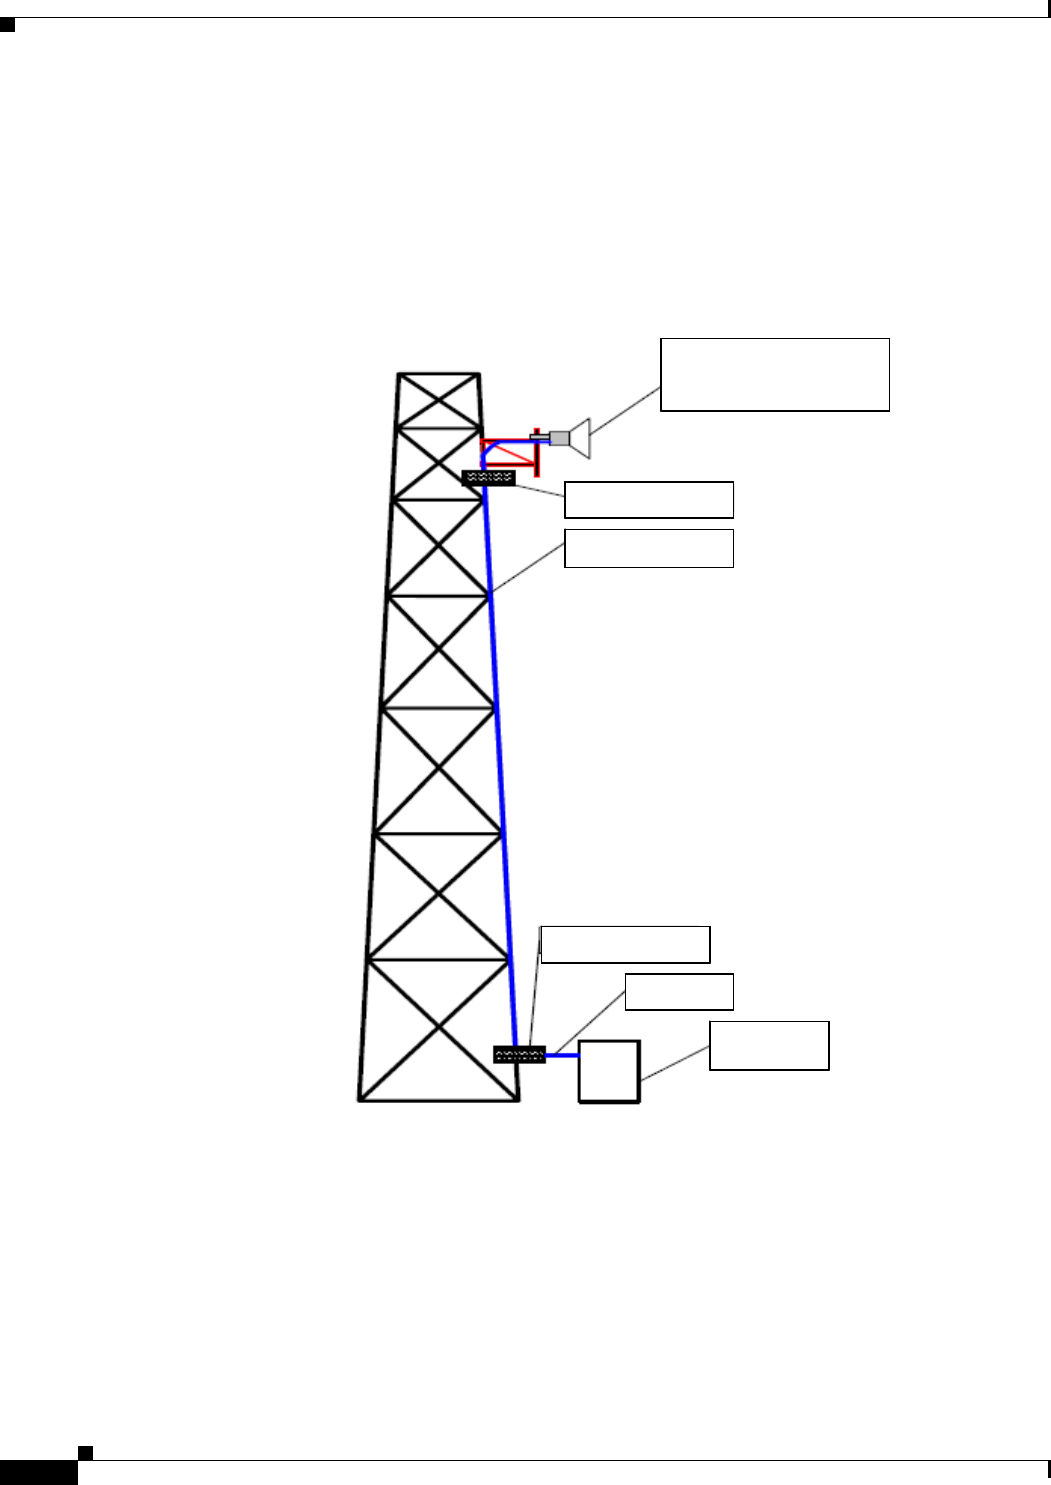
Refer to Figure D-8 for the setup. The Test antenna on the tower is at the proposed installation elevation
for the BWX Basestation Antenna. The RF cable will run from the Test antenna to the Low Noise
Amplifier (LNA) or Spectrum Analyzer. The LNA may be required in order to add gain to the system to
compensate for any losses that are added to the test by the RF cable or Spectrum Analyzer. The typical
loss for a Spectrum Analyzer is around 30 dB. The RF cable losses will vary depending on the size and
type of cable and on the length of the cable. In the example below, the total system loss would be 39 dB.
Example:
- Antenna Gain: 0 dB
- Cable Loss: 9 dB
- Loss in Spectrum Analyzer: 30 dB
PRELIMINARY
D-10
BWX 8415 Basestation Installation and Commissioning Guide
OL-19519-01
Appendix D RF Center Frequency and Interference Analysis Guidelines
Spectrum Analyzer Settings
In the example above, there is 39 dB of loss. In order for the interference measurements to give an
accurate indication of the environmental noise, an additional gain of over 39 dBi would need to be
injected into the test. The best location for the optional LNA would be at the top of the tower prior to the
main run of RF cable. In this location the noise will be amplified prior to the loss through the RF cable.
If the optional LNA is only installed at the lower end of the tower, the noise is reduced by the loss in the
cable and would lose 9 dB of resolution.
Figure D-8 Pre-Installation Test Setup
Procedure
The setup shown in Figure D-8 and the information below are for the initial (pre-installation)
configuration. It gives you a starting point for this procedure. During the later steps, the configuration
will change. Configure the test equipment and antenna as depicted in Figure D-8.
Test antenna at
Elevation BWX Basestation
Antenna will be installed
Opti on al LNA
RF C able
Optional LNA
Spectr um
Analyz er
RF Cable
Test antenna at
Elevation BWX Basestation
Antenna will be installed
Test antenna at
Elevation BWX Basestation
Antenna will be installed
Opti on al LNAOpti on al LNA
RF C ableRF C able
Optional LNAOpti onal LNA
Spectr um
Analyz er
Spectr um
Analyz er
RF CableRF Cable

PRELIMINARY
D-11
BWX 8415 Basestation Installation and Commissioning Guide
OL-19519-01
Appendix D RF Center Frequency and Interference Analysis Guidelines
Spectrum Analyzer Settings
Step 1 Program the initial Spectrum Analyzer settings, per the following:
a. Resolution Bandwidth = 30 KHz
b. Video Bandwidth = 30 KHz
c. Attenuation = 0 db
d. Ref Level = -50 db
e. Sweep Time = auto
f. Detector Mode = positive peak
g. Frequency = determined by which step you are on in the procedure
Step 2 Set the frequency sweep range, as follows. This depends on the frequency you are investigating.
a. Licensed 2.6 GHz = sweep for range 2.596 GHz to 2.644 GHz
b. Other Licensed Frequencies (i.e., 2.3, 2.5, 3.4, 3.5 GHz) = sweep the center frequency plus 6
MHz to check for adjacent channels
Step 3 Proceed to the “Interference Sweep Procedure” section of this document.
Post-installation Test
The post-installation test is used to help verify the operational frequency that the BS will use. If the
system performance has degraded, this test can determine if there is another carrier causing problems in
the RF environment.
Required Equipment
• Spectrum Analyzer (4404 or R&S FSH)
• BWX Basestation antenna
• RF cable connected to antenna
• RFS Test Box
• External LNA, as required
Set-up
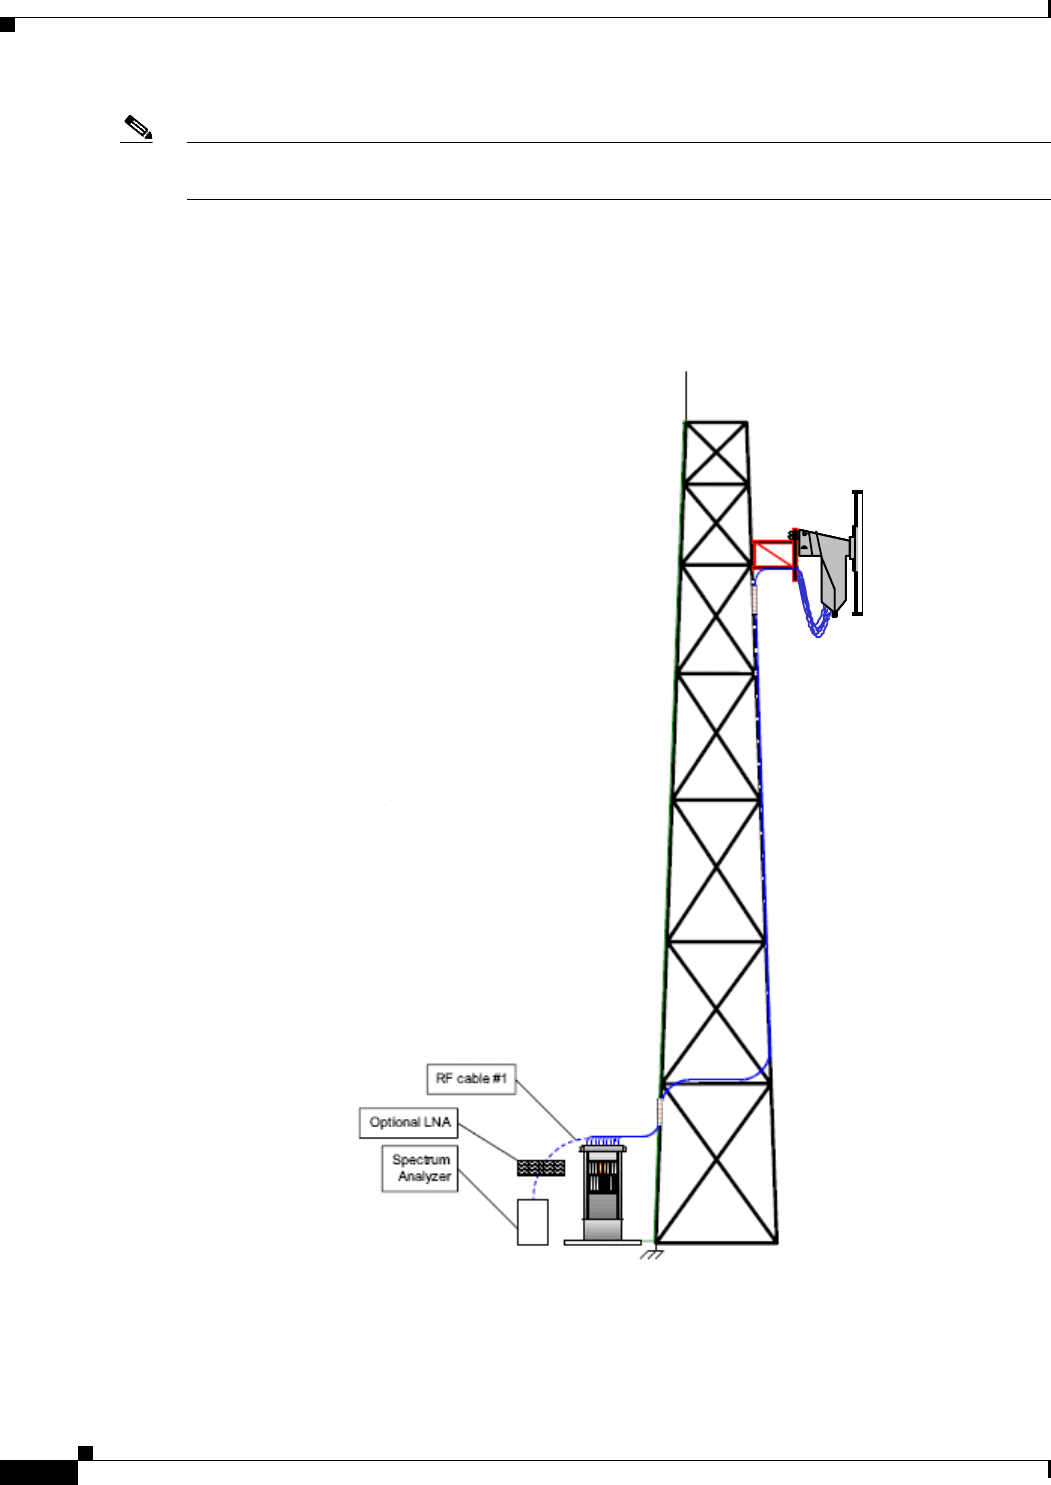
Refer to Figure D-9 for the setup. In this setup, the BWX Basestation antenna is installed on the tower
or building. The RF main feeder cable connects to the optional LNA or to the Spectrum Analyzer. The
LNA may be required to add gain to the system to compensate for any losses that are added to the test
by the RF cable or Spectrum Analyzer. The typical loss for a Spectrum Analyzer is around 30 dB. The
RF cable losses will vary depending on the size and type of cable and on the length of the cable. In this
example, the total system loss would be 19 dB.
Example:
- Antenna Gain: 20 dBi
- Cable Loss: 9 dB
- Loss in Spectrum Analyzer: 30 dB
Using this example, with a loss of 19 dB, in order for the interference measurements to give an accurate
indication of the environmental noise, an additional gain of over 19 dBi needs to be injected into the test.
PRELIMINARY
D-12
BWX 8415 Basestation Installation and Commissioning Guide
OL-19519-01
Appendix D RF Center Frequency and Interference Analysis Guidelines
Spectrum Analyzer Settings
Note When you are calculating whether you need to add additional LNA, you need to have the following
information.
• 3.4 and 3.5 TTA LNA ~45 gain
• Most Spectrum Analyzers have an internal noise figure of –30
Figure D-9 Post-Installation Test Setup
PRELIMINARY
D-13
BWX 8415 Basestation Installation and Commissioning Guide
OL-19519-01
Appendix D RF Center Frequency and Interference Analysis Guidelines
Spectrum Analyzer Settings
Procedure
The setup shown in Figure D-10 and the information below are for the post-installation
test configuration.
Step 1 Configure the test equipment as depicted in Figure D-10.
Step 2 Program the initial Spectrum Analyzer settings, per the following.
a. Resolution Bandwidth = 30 KHz
b. Video Bandwidth = 30 KHz
c. Attenuation = 0 db
d. Ref Level = -50 db
e. Sweep Time = auto
f. Detector Mode = positive peak
g. Frequency = determined by which step you are on in the procedure
Step 3 Set the frequency sweep range, as follows. This depends on the frequency you are investigating:
a. Licensed 2.6 GHz = sweep for range 2.596 GHz to 2.644 GHz
b. Other Licensed Frequencies (i.e., 2.3, 2.5, 3.4, 3.5 GHz) = sweep the center frequency plus 6
MHz to check for adjacent channels
c. BWX Basestation Antenna Test Box for any system needs to be set in Rx mode only
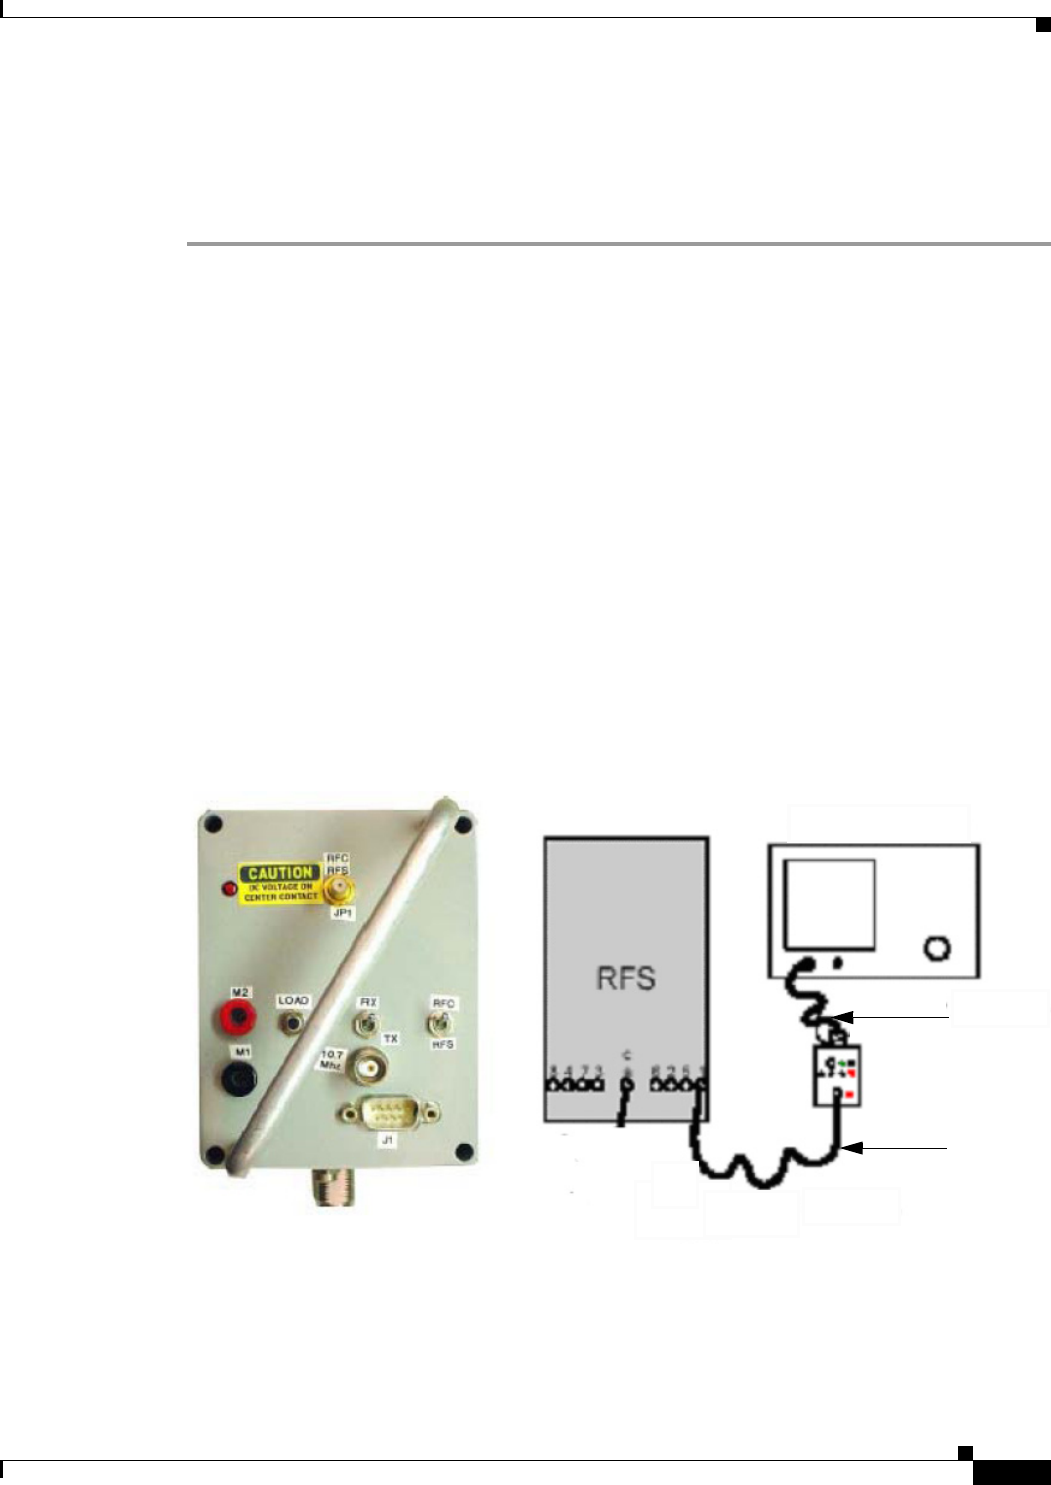
Figure D-10 Initial Configuration
Spectrum Analyzer
Test Cable
Test Cable

PRELIMINARY
D-14
BWX 8415 Basestation Installation and Commissioning Guide
OL-19519-01
Appendix D RF Center Frequency and Interference Analysis Guidelines
Spectrum Analyzer Settings
Interference Sweep Procedure
This procedure guides you through the steps to capture the data required for the interference study. The
number of steps will change with the type of antenna you are using and the frequency band you are
investigating.
For the Panel antenna, the number of passes through the procedure is determined by the beamwidth of
the antenna. When using a Panel antenna to pick up the interference, try to change the angle or downtilt
to face a potential interference source, such as a tower or a more populated area.
A Panel antenna is used to determine where a source of interference is coming from. The beamwidth of
the Panel antenna determines the number of directions that you need to sweep. For example, if the
beamwidth of the Panel antenna is 120 degrees, then 3 passes of the procedure are necessary in order to
cover 360 degrees. Whereas, an antenna with a 30 degree beamwidth requires 12 sets of sweeps to cover
the same 360 degree area.
The smaller beamwidth requires more sweeps but gives you greater accuracy in determining the source
of the interfering signal. On each pass, the Panel antenna is moved per the beamwidth. Refer to
Figure D-11.
Figure D-11 Panel Sweep

PRELIMINARY
D-15
BWX 8415 Basestation Installation and Commissioning Guide
OL-19519-01
Appendix D RF Center Frequency and Interference Analysis Guidelines
Spectrum Analyzer Settings
Try to determine the polarization of the interfering signals during each sweep. To do this, flip the antenna
90 degrees. All captured measurements are with the antenna in the vertical polarization position.
The frequency band to be investigated is determined by the range of the BS that is purchased by a
customer. For example, the 2.6 GHz MMDS band is a licensed band, and the customer purchasing the
equipment will have a license for a given 6 MHz channel.
The sweeps for licensed spectrum are performed to verify that there is not another carrier infringing on
the given licensed channel. If you are performing the sweeps for a licensed channel, it will greatly reduce
the number of steps that you will need to perform. For a licensed spectrum system you only need to look
at 3 channels for the spectrum. You will sweep the licensed channel, as well as the channels above and
below the licensed band.
For ex a m p le:
If you have an E3 license (2.620 GHz – 2.626 GHz), you will sweep E3 plus F2 (2.614 GHz–
2.620 GHz) and F3 (2.626 GHz – 2.632 GHz).
You will only need the Max-hold portion of the procedure for licensed spectrum systems.
Frequency Domain (Max-hold) Test Procedure
Step 1 Check the direction of the antenna with a compass. Record the results.
Step 2 Set the “Start Frequency” to the minimum sweep range for the spectrum you are testing.
Step 3 Set the “Stop Frequency” to the maximum sweep range for the spectrum you are testing.
Step 4 Replace the antenna with a terminator to get a noise floor level. Save a screen capture.
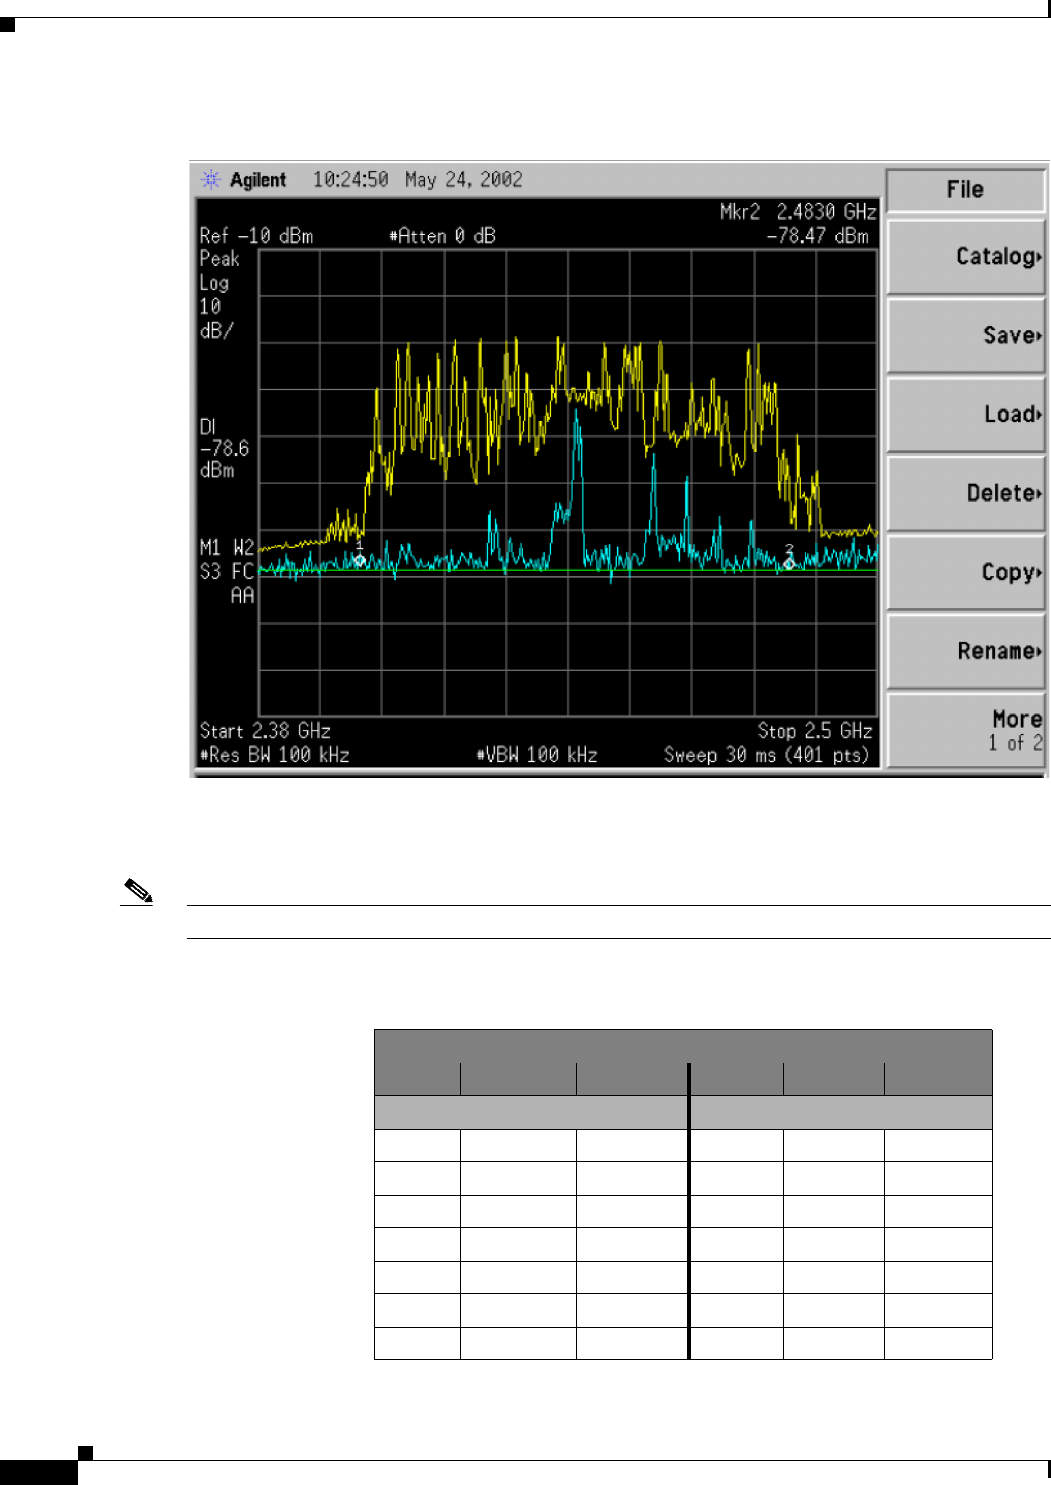
Step 5 Turn on the “Max-hold” feature and acquire the signal for two minutes, and again for 30 seconds. Save
a screen capture in Tiff or Gif format.
Step 6 Run “Single Sweep” 2 times, saving the screen captures for both sweeps. This gives a reference for the
worst case that is shown with the “Max-hold” in Step 5. You can save time on this step if the Spectrum
Analyzer is equipped with a Dual Trace option. Turn on Trace 2 to constant sweep and Trace 1 on
Max-hold. After the Max-hold has acquired a signal for two minutes, press the single sweep. Save the
screen capture. Refer to Figure D-12, Max-hold Screen Capture.
PRELIMINARY
D-16
BWX 8415 Basestation Installation and Commissioning Guide
OL-19519-01
Appendix D RF Center Frequency and Interference Analysis Guidelines
Spectrum Analyzer Settings
Figure D-12 Max-hold Screen Capture
Step 7 Repeat steps 5 and 6 with the following Start and Stop frequencies. Refer to Table D-2 below, as
examples.
Note Licensed Bands – sweep only the required channel, plus the one above and the one below:
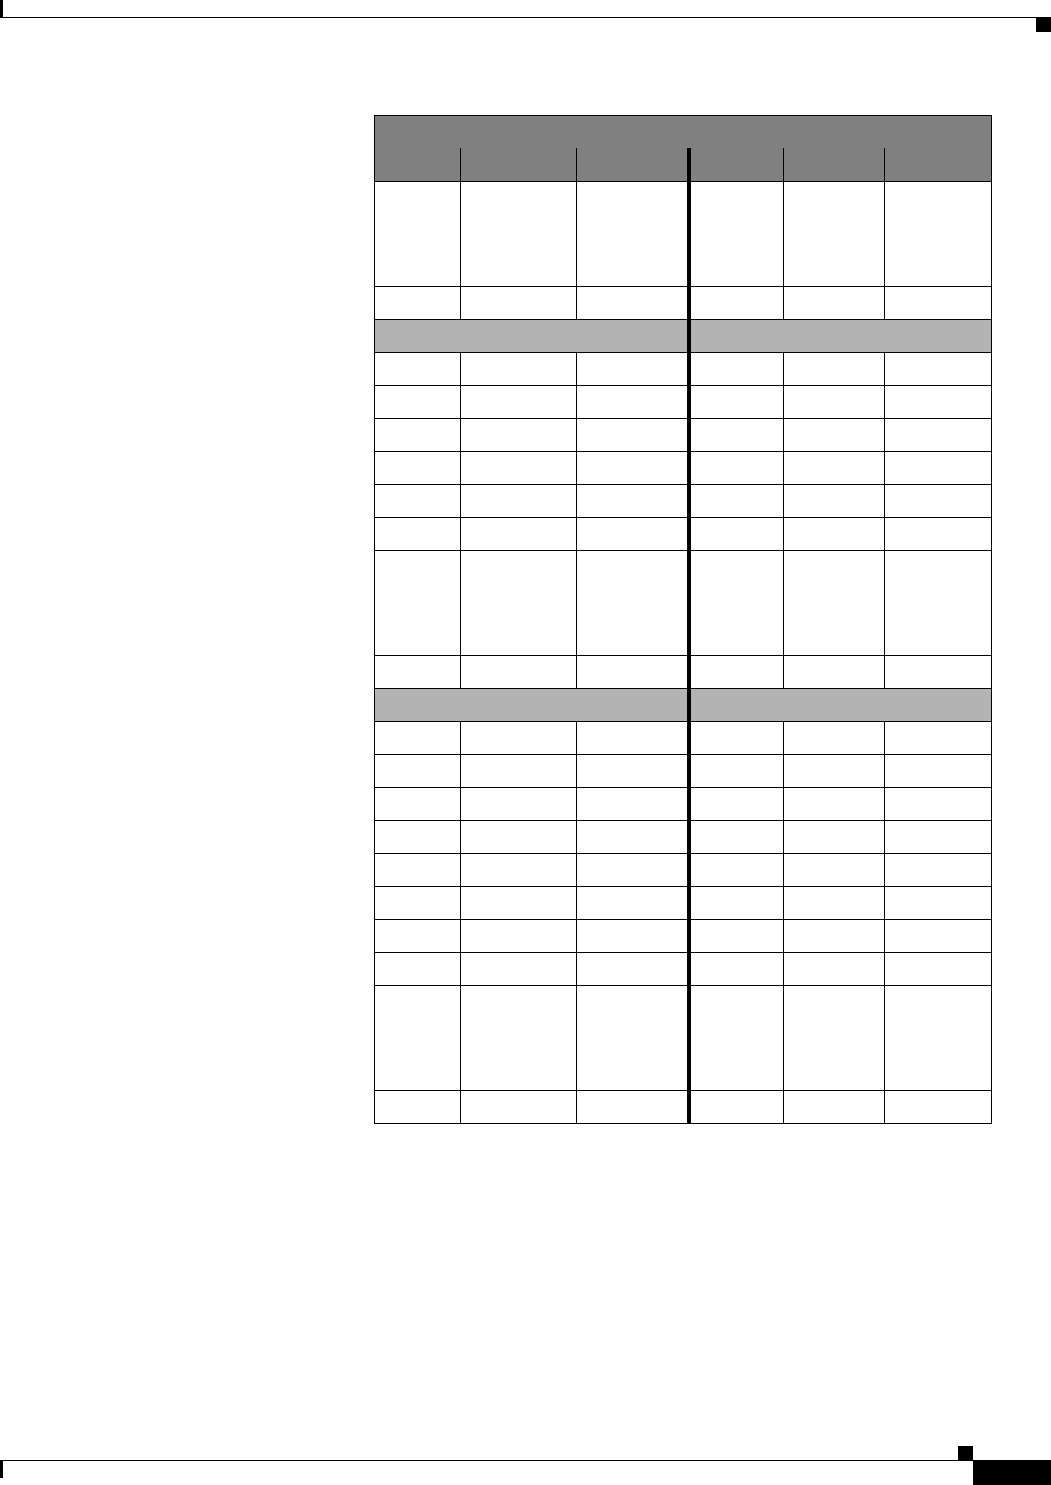
Ta b l e D-2 Frequency Domain Channel Chart
Licensed Bands
Channel Start Stop Channel Start Stop
2.3 GHz Systems (WCS) 3.4 GHz Systems (WLL)
A2.305 2.310 3.41000 3.41500
2.310 2.315 3.41025 3.41525
B2.350 2.355 3.41050 3.41550
2.355 2.360 3.41075 3.41575
C2.31425 2.31925 3.41100 3.41600
D2.34575 2.35075 3.41125 3.41625
3.41150 3.41650
PRELIMINARY
D-17
BWX 8415 Basestation Installation and Commissioning Guide
OL-19519-01
Appendix D RF Center Frequency and Interference Analysis Guidelines
Spectrum Analyzer Settings
.
.
.
-.0025
.
.
.
+.0025
3.52000 3.52500
2.5 GHz Systems (MMDS) 3.5 GHz Systems (WLL)
2.5005 2.5055 3.50000 3.50500
2.5065 2.5115 3.50025 3.50525
2.5125 2.5175 3.50050 3.50550
2.5185 2.5235 3.50100 3.50575
2.5245 2.5295 3.50100 3.50600
2.5305 2.5355 3.50125 3.50625
.
.
.
-.0025
.
.
.
+.0025
.
.
.
-.0025
.
.
.
+.0025
2.6 GHz Systems (MMDS)
E1 2.596GHz 2.602GHz
F1 2.602GHz 2.608GHz
E2 2.608GHz 2.614GHz
F2 2.614GHz 2.62GHz
E3 2.62GHz 2.626GHz
F3 2.626GHz 2.632GHz
E4 2.632GHz 2.638GHz
F4 2.638GHz 2.644GHz
.
.
.
-.0025
.
.
.
+.0025
2.6805 2.6855
Licensed Bands
Channel Start Stop Channel Start Stop

PRELIMINARY
D-18
BWX 8415 Basestation Installation and Commissioning Guide
OL-19519-01
Appendix D RF Center Frequency and Interference Analysis Guidelines
Spectrum Analyzer Settings
Frequency Domain Interference Sweeps Analysis
The Frequency Domain Interference Sweep has two kinds of measurements, Max-hold and Single
Sweep. First, we have to determine the theoretical noise floor. We will use the theoretical noise floor to
interpret the Max-hold sweeps data.
Calculating the Theoretical Noise Floor
All analysis of interference is done from the theoretical noise floor. This is the best-case noise floor in
a perfectly clean environment. The following algorithm is used to determine the noise floor.
Theoretical noise floor (NF) = Thermal NF @ 1 Hz and 20° C + sub-carrier
channel energy + Cisco BWX Mobile WiMAX system noise figure
Thermal NF @ 1 Hz and 20° C = -174
Sub-carrier channel energy = 10log(500 KHz) = +57 dB
Cisco BWX Mobile WiMAX system noise figure = +5 dB
Resulting theoretical noise floor
-174+57+5 = -112 dBm
If the setting on the Spectrum Analyzer was 30 KHz and not 500 KHz, there would be a 12 dB difference
in the setting, which means the thermal noise floor for 30 KHz @ 20° C would be –124 dBm.
Analyzing the Max-hold Sweeps
The BWX Basestation is able to correct for a specified level of interference. This level will vary
depending on the type of system or software load that is running on the BWX Basestation.
• Licensed systems (2.3, 2.5, 2.6, 3.5 GHz) +5 dB over theoretical noise floor
This means that any signals on the capture for the Max-hold sweeps above –107 dBm for licensed bands
(0 through –106.9) or –97 for unlicensed bands (0 through –96.9) are not acceptable for spectrum usage
This is summarized below:
• -112 + 5 dB = -107 dB for licensed systems
Note If using 30 KHz for the bandwidth setting on the Spectrum Analyzer, the levels will need to be increased
by 12 dB: -119 dB for licensed systems.
Evaluating the Signal with Additional Gain
So far all of the values that have been discussed – noise floor, signal levels, etc. – have been with no
gains or losses in the test set-up. This will not be the case in the real world. In the data capture, additional
gain was added to the set-up to overcome any losses that are in the system due to cable or connection
losses. When analyzing the interference signals, this additional gain must be removed to determine the
actual interference signal level.

PRELIMINARY
D-19
BWX 8415 Basestation Installation and Commissioning Guide
OL-19519-01
Appendix D RF Center Frequency and Interference Analysis Guidelines
Spectrum Analyzer Settings
Time Domain Interference Sweeps Analysis
The Time Domain sweeps capture how the interference sources behave, if the interference is constantly
there or operating in a hopping method. Time Domain sweeps are typically used for the unlicensed 2.4
GHz systems’ interference measurements.
Calculating the Theoretical Noise Floor
All analysis of interference is done from the theoretical noise floor. This is the best-case noise floor in
a perfectly clean environment. The following algorithm is used to determine the noise floor.
Theoretical noise floor (NF) = thermal NF @ 1 Hz and 20° C + sub-carrier
channel energy + Cisco BWX Mobile WiMAX system noise figure
Thermal NF @ 1 Hz and 20° C = -174
Sub-carrier channel energy = 10log(500 KHz) = +57 dB
Cisco BWX Mobile WiMAX system noise figure = +5 dB
Resulting theoretical noise floor
-174+57+5 = -112 dBm
If the setting on the spectrum analyzer was 30 KHz and not 500 KHz, there would be a 12 dB difference
in the setting, which means the thermal noise floor for 30 KHz @ 20° C would be –124 dBm. If the
setting on the spectrum analyzer is set for 1 MHz and not 500 KHz, there is a 3 dB difference in the noise
floor, meaning that the theoretical noise for 1 MHz @ 20° C is –109 dBm.
Analyze the Time Domain Sweeps
The BS is able to compensate for 320 μs per each 10 ms frame. This 320 μs timeframe only comes into
play when the signal level of the interferer is above the levels determined in the Max-hold section. The
320 μs duration is an additive duration throughout the 10 ms timeframe. If all of the interference signals
above the determined signal level add up to be longer than 320 μs, then that frame is unusable.

PRELIMINARY
D-20
BWX 8415 Basestation Installation and Commissioning Guide
OL-19519-01
Appendix D RF Center Frequency and Interference Analysis Guidelines
Spectrum Analyzer Settings