Japan Radio Co NKE2632 Solid State S-Band Marine Radar User Manual Instruction Manual Funtion Part 5
Japan Radio Co Ltd. Solid State S-Band Marine Radar Instruction Manual Funtion Part 5
Contents
- 1. Installation Manual Part 1
- 2. Installation Manual Part 2
- 3. Installation Manual Part 3
- 4. Installation Manual Part 4
- 5. Installation Manual Part 5
- 6. Installation Manual Part 6
- 7. Installation Manual Part 7
- 8. Installation Manual Part 8
- 9. Installation Manual Part 9
- 10. Installation Manual Part 10
- 11. Installation Manual Part 11
- 12. Instruction Manual Operation Part 1
- 13. Instruction Manual Operation Part 2
- 14. Instruction Manual Operation Part 3
- 15. Instruction Manual Operation Part 4
- 16. Instruction Manual Funtion Part 1
- 17. Instruction Manual Funtion Part 2
- 18. Instruction Manual Funtion Part 3
- 19. Instruction Manual Funtion Part 4
- 20. Instruction Manual Funtion Part 5
- 21. Instruction Manual Funtion Part 6
Instruction Manual Funtion Part 5
10-17 Section 10 Route Monitoring
1
2
3
4
5
6
7
8
9
10
11
12
13
14
15
16
17
18
19
20
21
22
23
24
25
26
27
10.5 Comparing the Data between the
Planned Route and the Actual Route
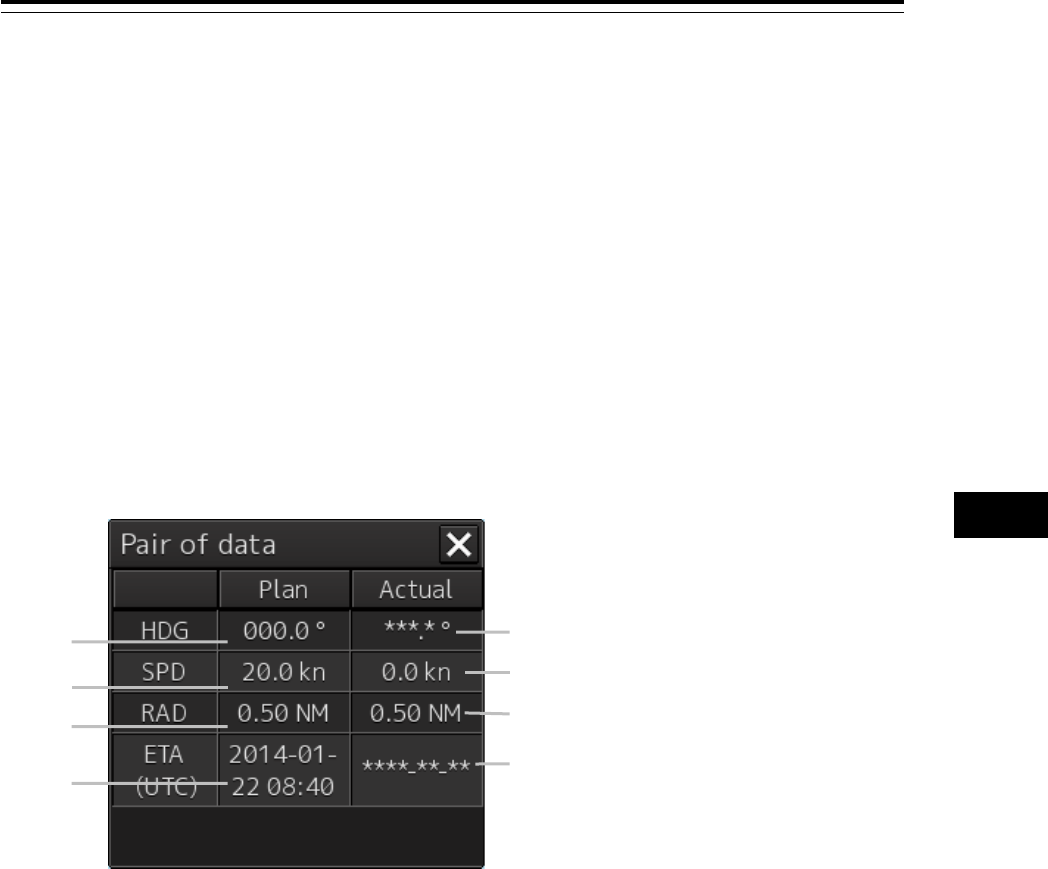
The "Pair of data" dialog box enables comparison of data between the planned route and the actual
route.
Use the following procedure as below to open the "Pair of data" dialog box.
1 Click on the [Menu] button on the left toolbar.
The menu is displayed.
2 Click on the [Route Monitoring] button on the menu.
The "Route Monitoring" dialog box appears.
3 Click on the [Pair of data] button.
The "Pair of data" dialog box appears.
Planned data is displayed in [Plan] (route plan) and the actual route data is displayed in
[Actual] (actual route) in the dialog.
[1] Planned course
Displays a planned course.
[2] Planned ship's speed
Displays a planned ship’s speed.
[3] Planned turn radius
Displays a planned turn radius.
[4] Planned ETA
Displays a planned expected time of arrival.
[5] Actual ship’s heading
Displays an actual ship’s heading.
[5]
[6]
[7]
[8]
[1]
[2]
[3]
[4]

Section 10 Route Monitoring 10-18
[6] Actual speed
Displays an actual ship’s speed.
[7] Actual turn radius
Displays an actual turn radius.
[8] Actual ETA
Displays an expected time of arrival (ETA) that is calculated from the actual ship’s speed.
10-19 Section 10 Route Monitoring
1
2
3
4
5
6
7
8
9
10
11
12
13
14
15
16
17
18
19
20
21
22
23
24
25
26
27
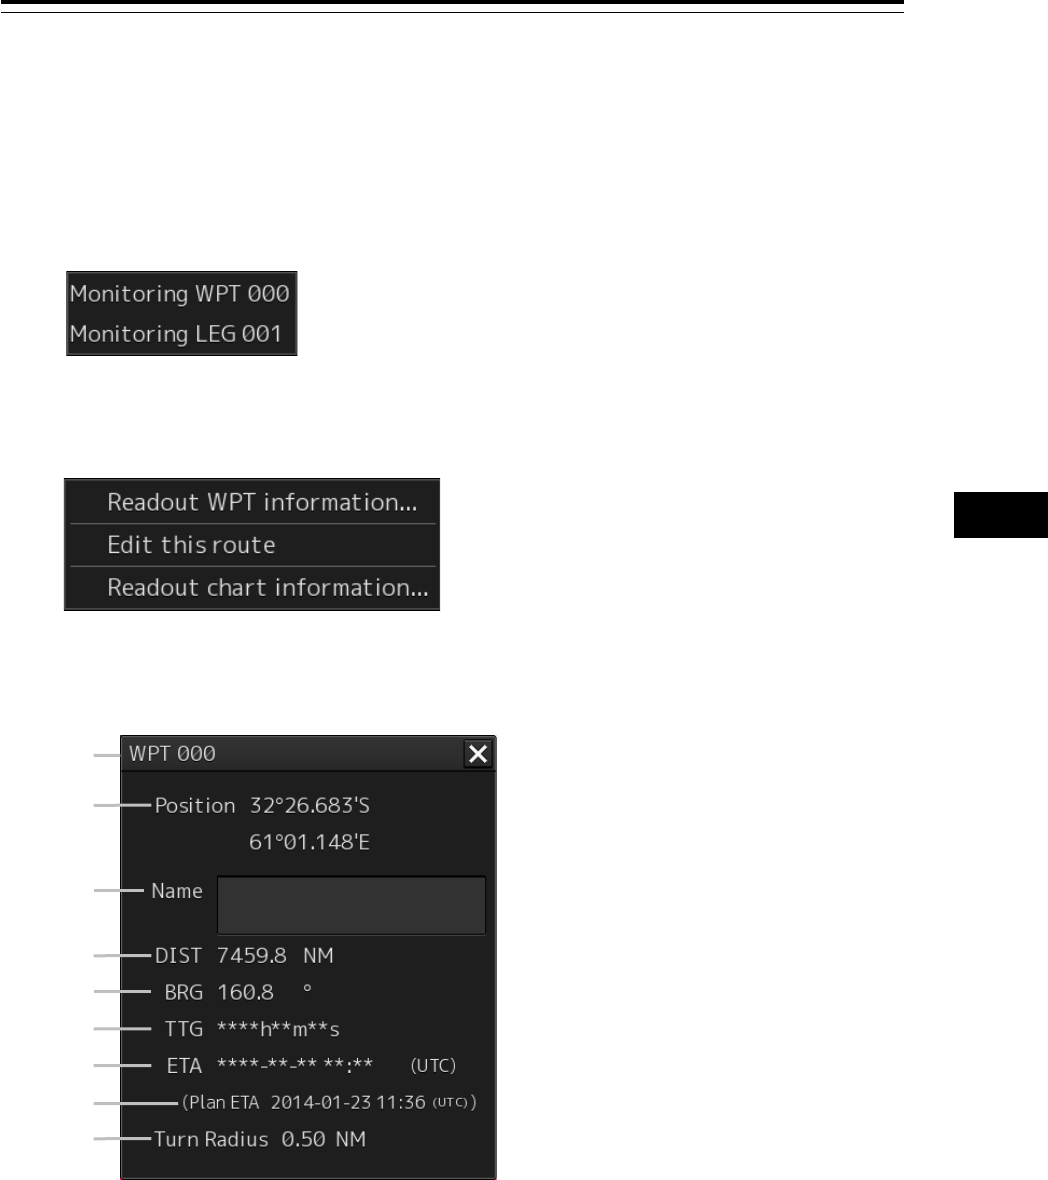
10.6 Verifying Detail Information of WPT
Detail information of each WPT on the route can be verified.
Use the following procedure to display the detail information of WPT.
1 Right-click on [WPT].
The context menu is displayed.
2 Click on the WPT to be verified from the context menu.
The context menu is displayed.
3 Click on [Readout WPT information...].
The detail information dialog of the WPT is displayed.
[1] WPT number
Displays a WPT number.
[2] [Position] (WPT position)
Displays the latitude/longitude of WPT.
[3] [Name] (WPT name)
Displays a WPT name.
[2]
[1]
[3]
[4]
[5]
[6]
[7]
[8]
[9]

Section 10 Route Monitoring 10-20
[4] [DIST] (Distance between own ship and WPT)
Displays a distance from the own ship’s position to WPT.
[5] [BRG] (Bearing between own ship and WPT)
Displays a bearing from the own ship to WPT.
[6] [TTG] (Expected time required to reach WTP)
Displays a time required to reach WPT based on the own ship’s speed (SOG) and the
distance.
[7] [ETA] (Expected time of arrival at WPT)
Displays an expected time of arrival at WPT based on the own ship’s speed (SOG) and the
distance.
[8] [Plan ETA] (Expected time of arrival at WPT)
Displays an expected time of arrival based on route planning.
[9] [Turn Radius] (Turn radius)
Displays a WPT turn radius.
11-1 Section 11 Monitoring a Dragging Anchor
1
2
3
4
5
6
7
8
9
10
11
12
13
14
15
16
17
18
19
20
21
22
23
24
25
26
27
付録
Section 11 Monitoring a Dragging
Anchor
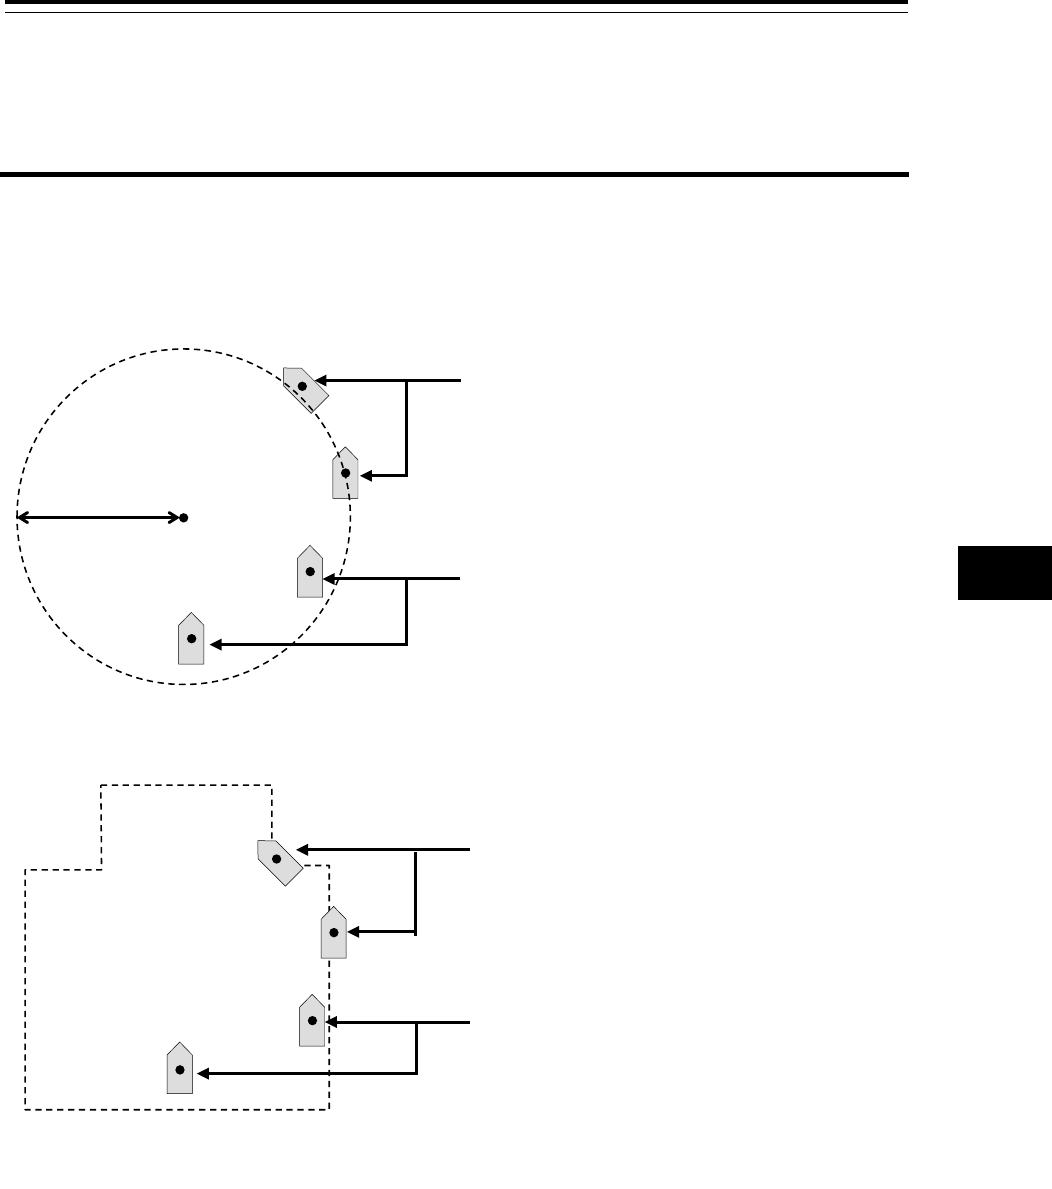
Anchor Watch is a function that sets a circular or polygonal dragging anchor monitoring area around
the own ship and realizes safe voyage by generating an anchor alarm when a part of the outline of the
own ship exceeded the monitoring area.
Dangerous based on the judgment
Generates a dragging anchor monitoring
alarm
Safe based on the judgment
Center of
monitoring circle
Radius of monitoring
circle
Generates a dragging anchor
monitoring alarm
Safe based on the judgment
Dangerous based on the judgment
Polygonal area
Dragging Anchor Monitoring Area
Section 11 Monitoring a Dragging Anchor 11-2
11.1 Setting a Dragging Anchor
Monitoring Area
This section describes the setting of a dragging anchor monitoring area.
The setting varies depending on whether the shape of the dragging anchor area is a circle or a
polygon.
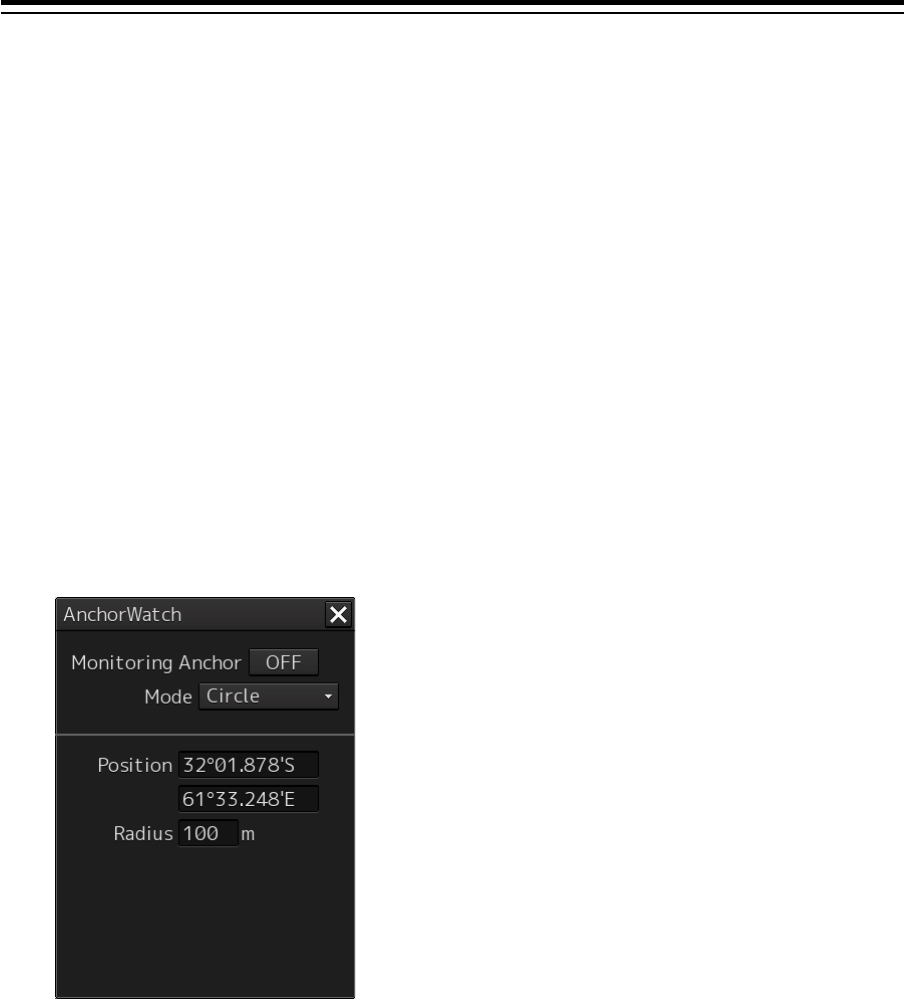
11.1.1 Setting a dragging anchor monitoring circle
1 Click on the [Menu] button on the left toolbar.
The menu is displayed.
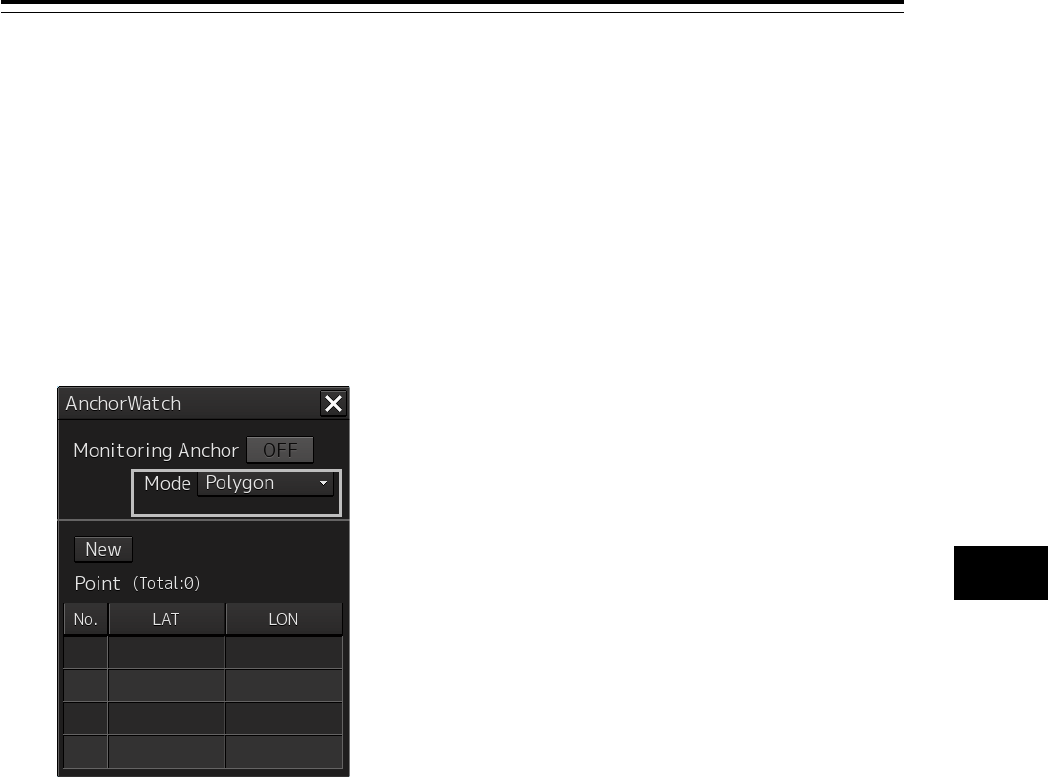
2 Click on the [Anchor Watch] button on the menu.
The "Anchor Watch" dialog box appears.
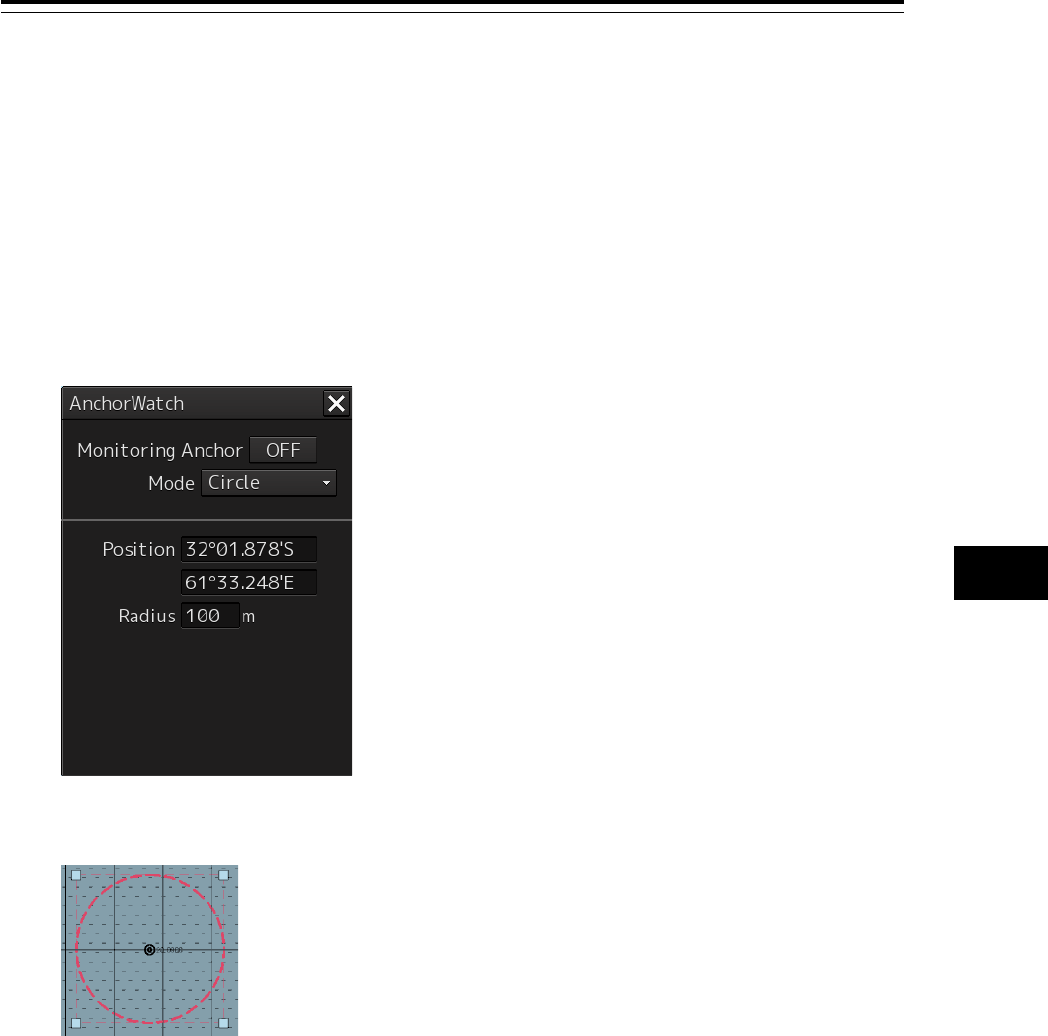
3 Select [Circle] from the [Mode] (dragging anchor monitoring mode selection) combo
box.
4 Enter the center position and size of the dragging anchor monitoring area.
[Position] (Input of the center position of the dragging anchor monitoring circle)
[Radius] (Radius of the dragging anchor monitoring circle)
Input range
10 to 1500 m
11-3 Section 11 Monitoring a Dragging Anchor
1
2
3
4
5
6
7
8
9
10
11
12
13
14
15
16
17
18
19
20
21
22
23
24
25
26
27
付録
11.1.2 Setting a dragging anchor monitoring
polygon
1 Click on the [Menu] button on the left toolbar.
The menu is displayed.
2 Click on the [Anchor Watch] button on the menu.
The "Anchor Watch" dialog box appears.
3 Select [Polygon] from the [Mode] (dragging anchor monitoring mode selection) combo
box.
4 Click on the [New] button.
The data of the [Point] (vertex) list is cleared.
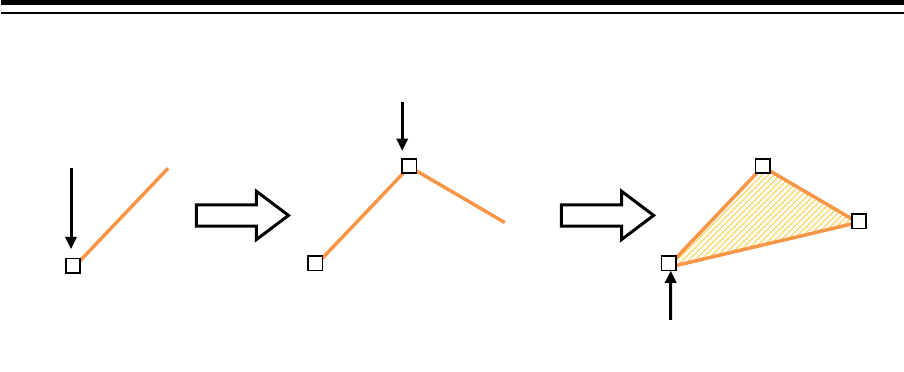
5 Place the cursor on the chart.
6 Create a polygon by dragging the cursor on the chart.
By inputting position coordinates (longitude and latitude) of the vertex position of the polygon in
the [Point] list, the vertex position can be changed.
When a polygon is created, the number of vertices is displayed in [(Total:)]. Up to 360 vertices
can be set.
Section 11 Monitoring a Dragging Anchor 11-4
Creation example:
Click (vertex 1)
Click (vertex 2)
Click the right mouse button or
double
-click on the ending point
11-5 Section 11 Monitoring a Dragging Anchor
1
2
3
4
5
6
7
8
9
10
11
12
13
14
15
16
17
18
19
20
21
22
23
24
25
26
27
付録
11.2 Starting and Ending Dragging
Anchor Monitoring
11.2.1 Starting dragging anchor monitoring
1 Click on the [Menu] button on the left toolbar.
The menu is displayed.
2 Click on the [Anchor Watch] button on the menu.
The "Anchor Watch" dialog box appears.
The preview of dragging anchor monitoring area that was set is displayed (broken line).
When the dialog is displayed, the own ship’s position is placed at the center of the circle.
Section 11 Monitoring a Dragging Anchor 11-6
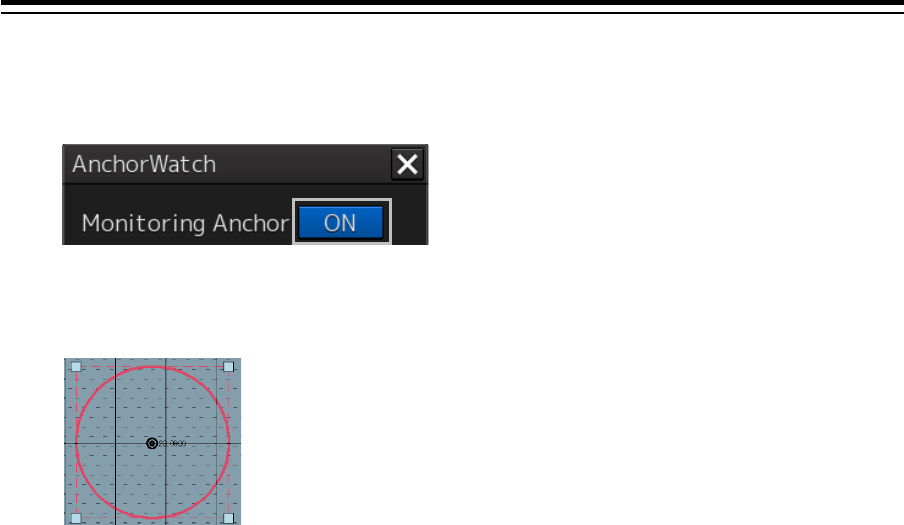
3 Set dragging anchor monitoring to ON by clicking on the [Monitoring Anchor] button.
Dragging anchor monitoring starts based on the setting.
The dragging anchor monitoring area on the chart is changed to a solid line.
When own ship exits from the dragging anchor monitoring area, the "Dragging anchor" alarm is
displayed.
11.2.2 Ending dragging anchor monitoring
Set the button display to [OFF] by clicking on the [Monitoring Anchor] button.
Alternatively, use the following procedure.
1 Click the dragging anchor monitoring circle.
A context menu is displayed.
2 Click [Finish Monitoring Anchor] on the context menu.
The [Monitoring Anchor] button display is changed to [OFF] and the display of the dragging
anchor monitoring area on the chart is changed to the broken line display.
11-7 Section 11 Monitoring a Dragging Anchor
1
2
3
4
5
6
7
8
9
10
11
12
13
14
15
16
17
18
19
20
21
22
23
24
25
26
27
付録
11.3 Moving/Editing/Deleting a Dragging
Anchor Monitoring Area on the
Chart
A dragging anchor monitoring area can be moved to any position or the size or shape can be changed
or deleted on the chart.
These operations are also available on the context menu.
These operations can be performed either before or after starting dragging anchor monitoring.
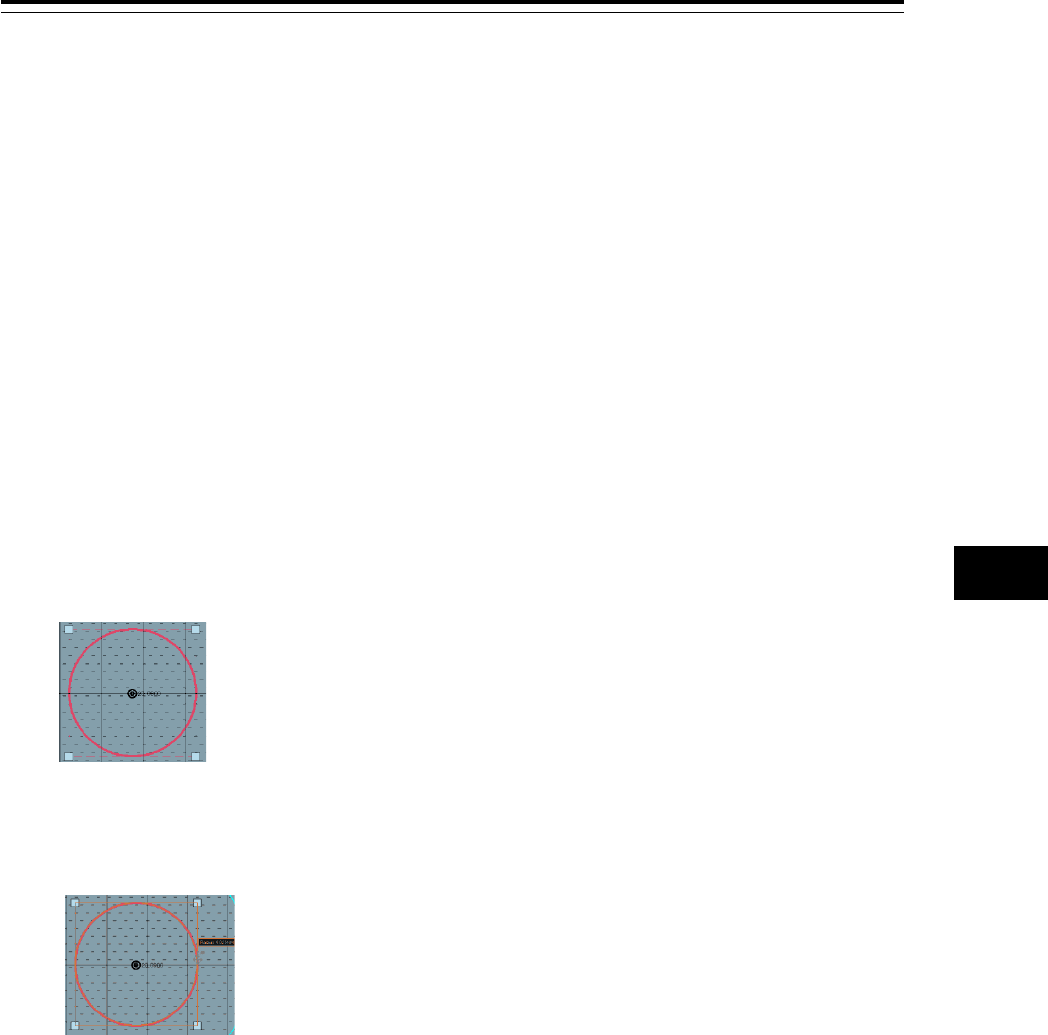
11.3.1 Moving a dragging anchor monitoring circle
on the chart
1 Click on the dragging anchor monitoring circle.
A square enclosing the dragging anchor monitoring circle is displayed.
2 Click on the dragging anchor monitoring circle.
The cursor is set to the Edit cursor.
3 Move the cursor to any position and click the mouse button.
The dragging anchor monitoring circle is moved.
Section 11 Monitoring a Dragging Anchor 11-8
11.3.2 Moving a dragging anchor monitoring circle
on the context menu
The moving of a dragging anchor monitoring circle can also be executed from the context menu.
1 Click on the dragging anchor monitoring cirlce.
A square enclosing the dragging anchor monitoring circle is displayed.
2 Click the right mouse button on the dragging anchor monitoring circle.
The context menu is displayed.
3 Click on [Move this object] on the context menu.
The cursor is set to the Edit cursor.
4 Move the cursor to any position and click the mouse button.
The dragging anchor monitoring circle is moved.
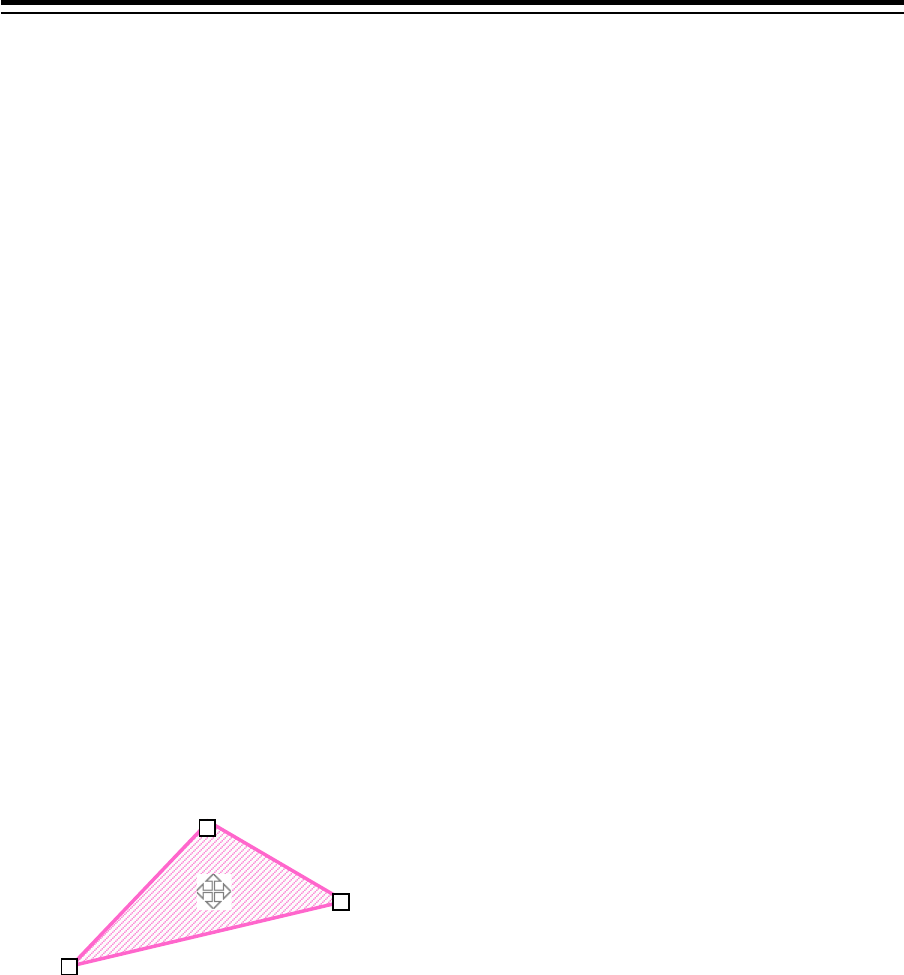
11.3.3 Moving a dragging anchor monitoring
polygon on the chart
1 Click the mouse button inside of the dragging anchor monitoring polygon.
The "Anchor Watch" (dragging anchor monitoring) dialog box appears.
2 Click the mouse button inside of the dragging anchor monitoring polygon.
The cursor is set to the Edit cursor.
3 Move the cursor to any position and click the mouse button.
The dragging anchor monitoring polygon is moved.
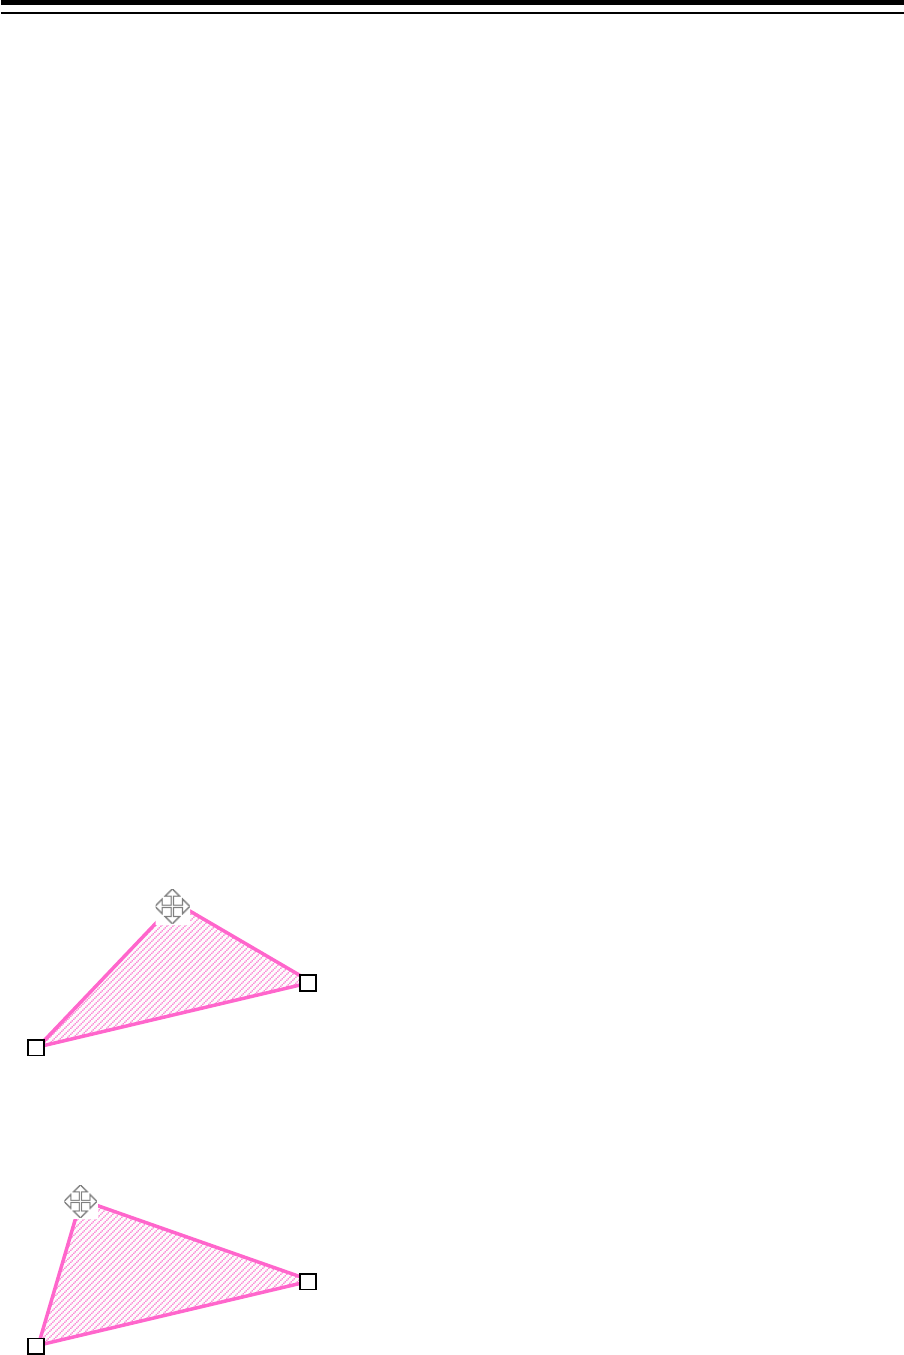
11.3.4 Moving a dragging anchor monitoring
ploygon on the context menu
The moving of a dragging anchor monitoring polygon can also be executed from the context menu.
1 Click the right mouse button on a line of the dragging anchor monitoring polygon.
A context menu is displayed.
2 Click on [Move this object] on the context menu.
The cursor is set to the Edit cursor.
3 Move the cursor to any position and click the mouse button.
The dragging anchor monitoring polygon is moved.
Edit
11-9 Section 11 Monitoring a Dragging Anchor
1
2
3
4
5
6
7
8
9
10
11
12
13
14
15
16
17
18
19
20
21
22
23
24
25
26
27
付録
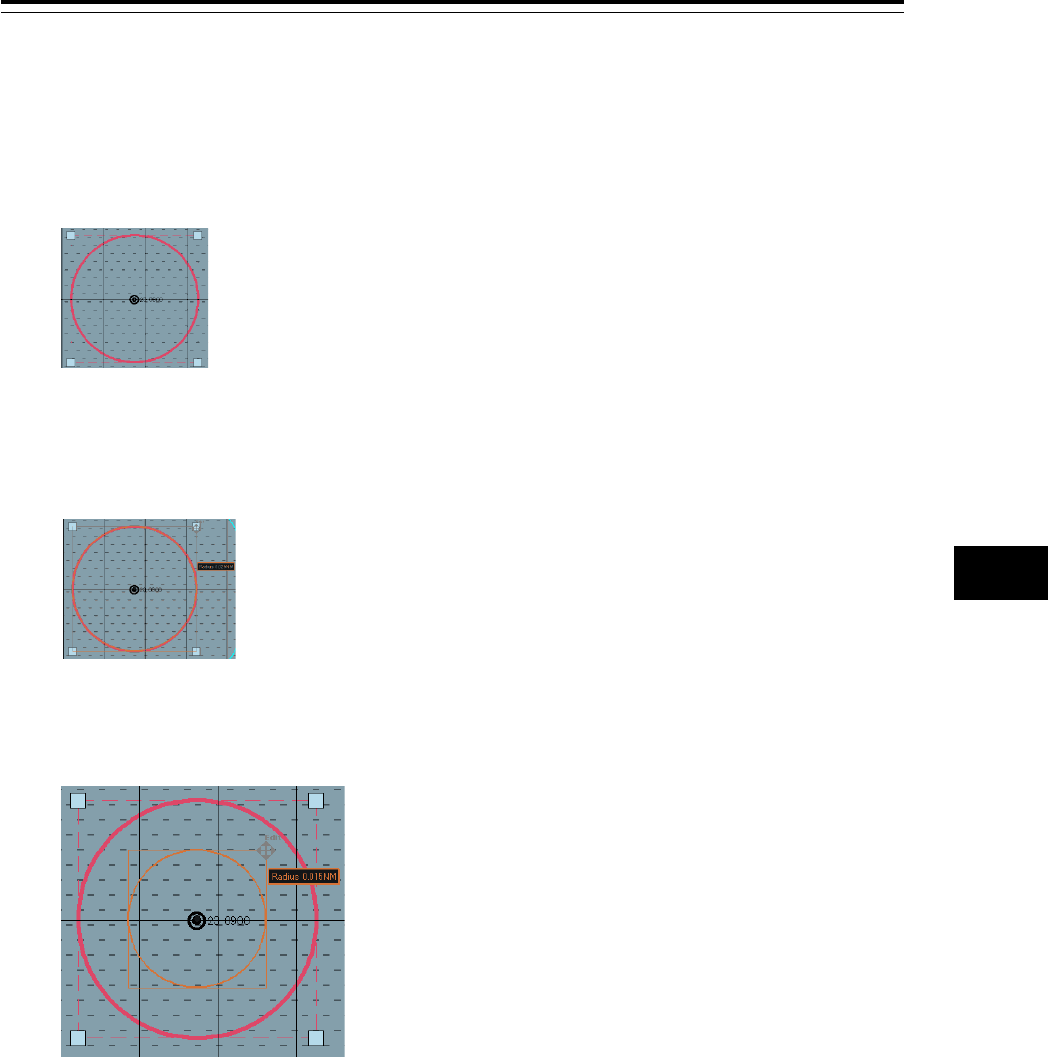
11.3.5 Changing a size of a dragging anchor
monitoring circle on the chart
1 Click on the dragging anchor monitoring circle.
A square enclosing the dragging anchor monitoring circle is displayed.
2 Click on any of the vertices of the square enclosing the dragging anchor monitoring
circle.
The cursor changes to the arrow cursor.
3 Move the cursor until the dragging anchor monitoring circle becomes a required size
and click the mouse button.
The size of the dragging anchor monitoring cicle is changed.
Section 11 Monitoring a Dragging Anchor 11-10
11.3.6 Changing a size of a dragging anchor
monitoring circle on the context menu
Change of a dragging anchor monitoring circle can also be executed from the context menu.
1 Click on the dragging anchor monitoring circle.
A square enclosing the dragging anchor monitoring circle is displayed.
2 Click on any of the vertexes of the square enclosing the dragging anchor monitoring
circle.
A context menu is displayed.
3 Click on [Change radius] on the context menu.
The cursor is set to the Arrow cursor.
4 Move the cursor until the dragging anchor monitoring circle becomes a required size
and click the mouse button.
The size of the dragging anchor monitoring circle is changed.
11.3.7 Changing a shape of a dragging anchor
monitoring polygon on the chart
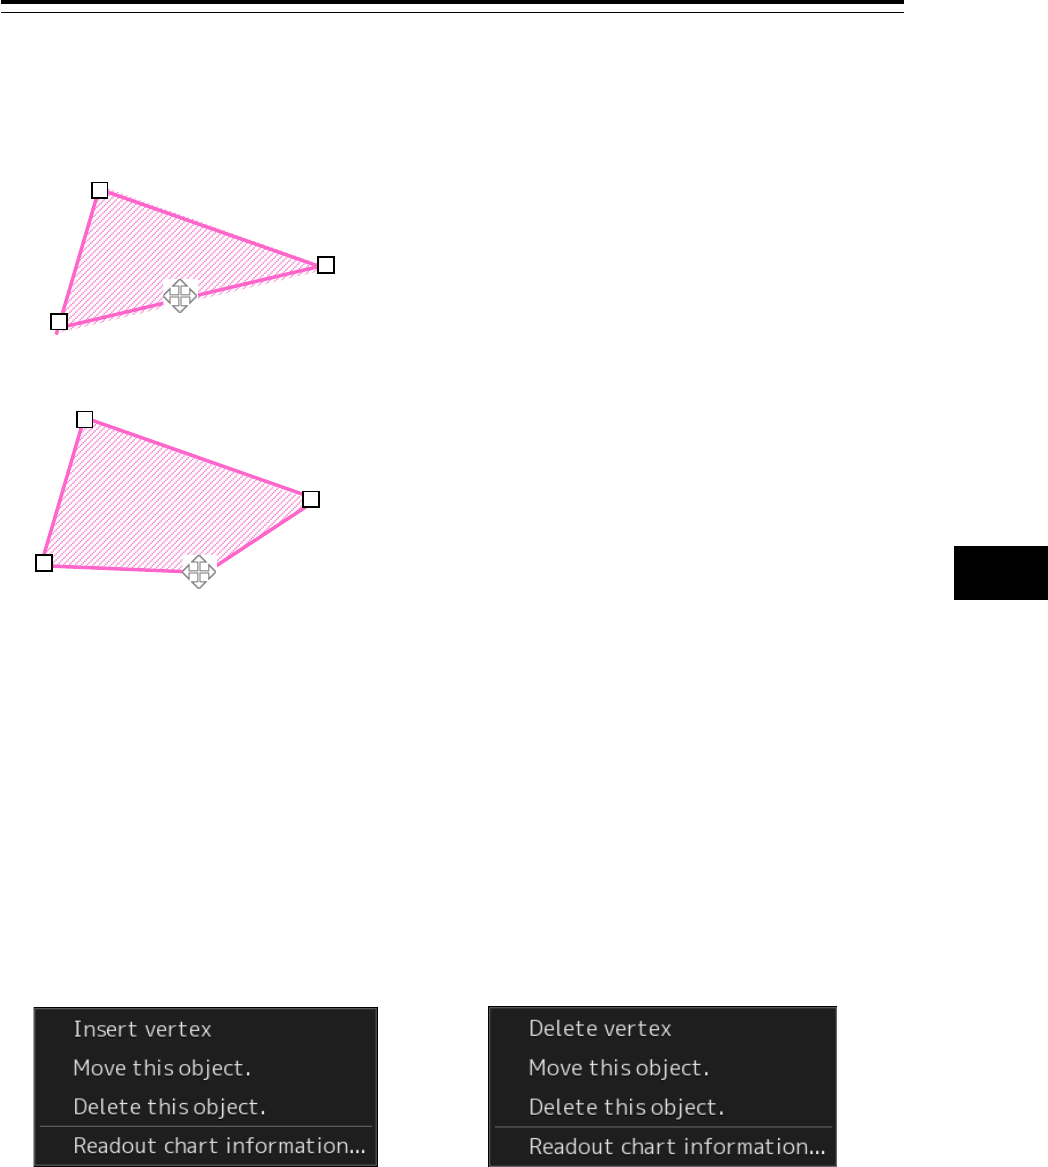
Changing a vertex
1 Click on the vertex of the dragging anchor monitoring polygon to be changed.
The cursor is set to the Edit cursor.
2 Move the cursor to the required vertex position of the dragging anchor monitoring
polygon and click the mouse button.
The position of the vertex is changed.
Edit
Edit
11-11 Section 11 Monitoring a Dragging Anchor
1
2
3
4
5
6
7
8
9
10
11
12
13
14
15
16
17
18
19
20
21
22
23
24
25
26
27
付録
Adding a vertex
1 Click the mouse button on the position where a vertex to be added.
The cursor is set to the Edit cursor.
2 Move the cursor to the position where a vertex is to be set and click the mouse button.
A new vertex is added.
11.3.8 Changing a shape of a dragging anchor
monitoring polygon on the context menu
The following operation can be performed on the context menu that is displayed by clicking the right
mouse button on the dragging anchor monitoring polygon.
Each function is as follows.
[Insert vertex] (Addition of a vertex)
Adds a vertex at the position where the mouse button is clicked on.
[Delete vetex] (Deletion of a vertex)
Deletes the selected vertex.
[Move this object] (Moving an object)
Moves the selected dragging anchor monitoring polygon to any position.
[Delete this object] (Deletion of an object)
Deletes a selected dragging anchor monitoring polygon.
Edit
Edit
[Clicking the right mouse button on the line
other than vertices of the dragging anchor
monitoring polygon]
[Clicking the right mouse button on a vertex of
a dragging anchor monitoring polygon]
Section 11 Monitoring a Dragging Anchor 11-12
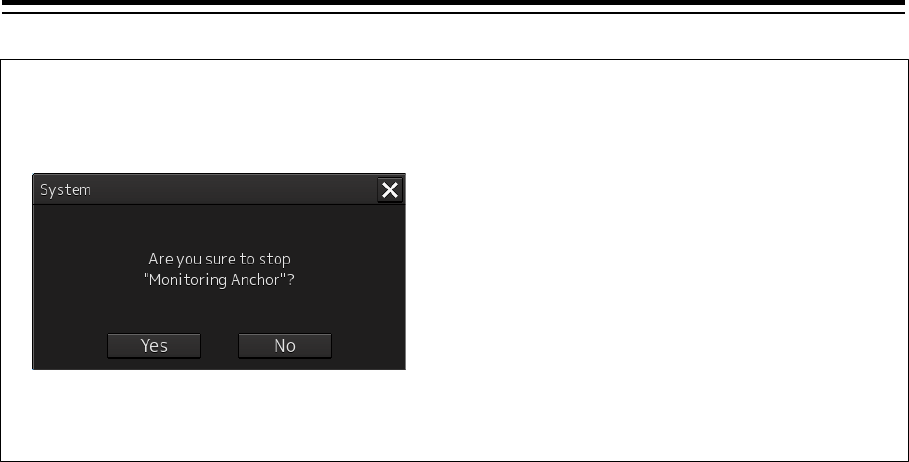
Note
When deletion of a dragging anchor monitoring polygon is attempted during execution of dragging
anchor monitoring, the following message dialog box is displayed.
To execute deletion, click on the [Yes] button. The monitoring area is deleted and dragging
anchor
monitoring is terminated.
12-1 Section 12 Automatic Sailing (Option)
1
2
3
4
5
6
7
8
9
10
11
12
13
14
15
16
17
18
19
20
21
22
23
24
25
26
27
付録
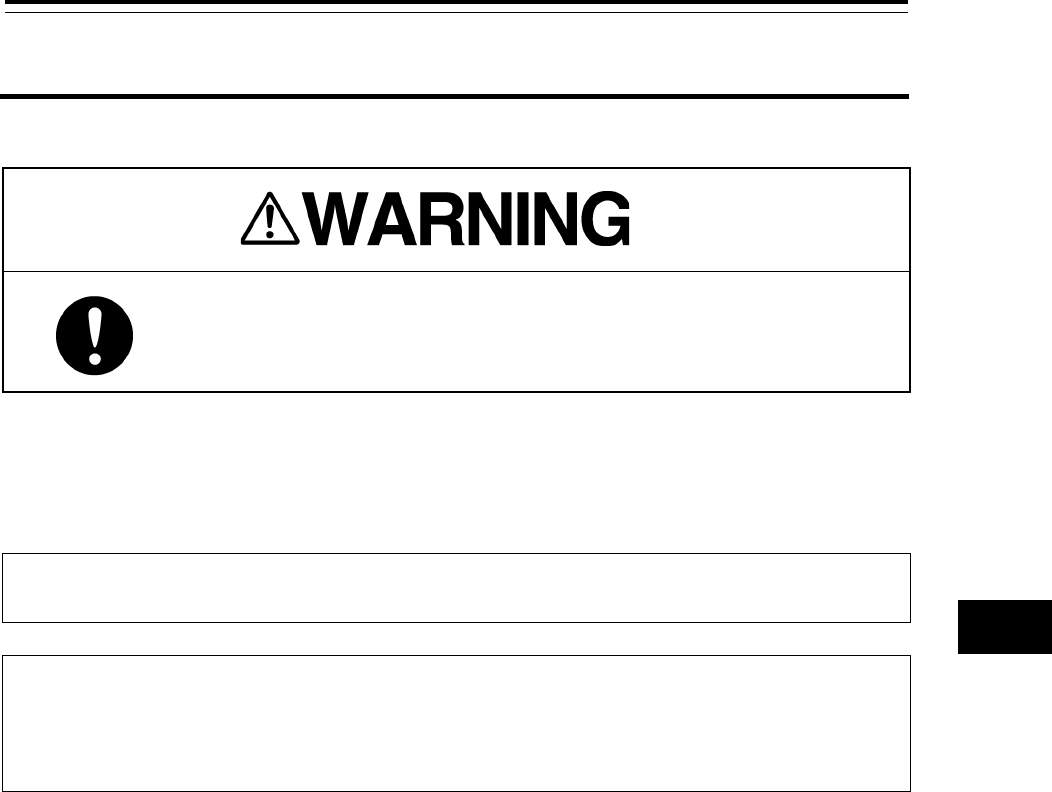
Section 12 Automatic Sailing (Option)
When automatic sailing is performed, the operator must confirm the
safety of the route and the safety at crossing of a safety contour line.
Otherwise, an accident may occur.
When Auto Pilot is connected to this equipment, it is possible to calculate the course to steer from the
planned route and the own ship’s position and guide the ship automatically according to the planned
route by outputting the course to steer to Auto Pilot.
Note
The ECDIS screen cannot be terminated during automatic sailing.
Memo
For the details of the principle and setting of automatic sailing, refer to "18.13 Setting Automatic
Sailing Parameter Values".
For the details of the Auto Pilot operation, refer to the Auto Pilot Instruction Manual.
Section 12 Automatic Sailing (Option) 12-2
12.1 Flow of Starting Automatic Sailing
1 Click on the [Menu] button on the left toolbar.
The menu is displayed.
2 Click on the [Auto Sail] - [Start] on the menu.
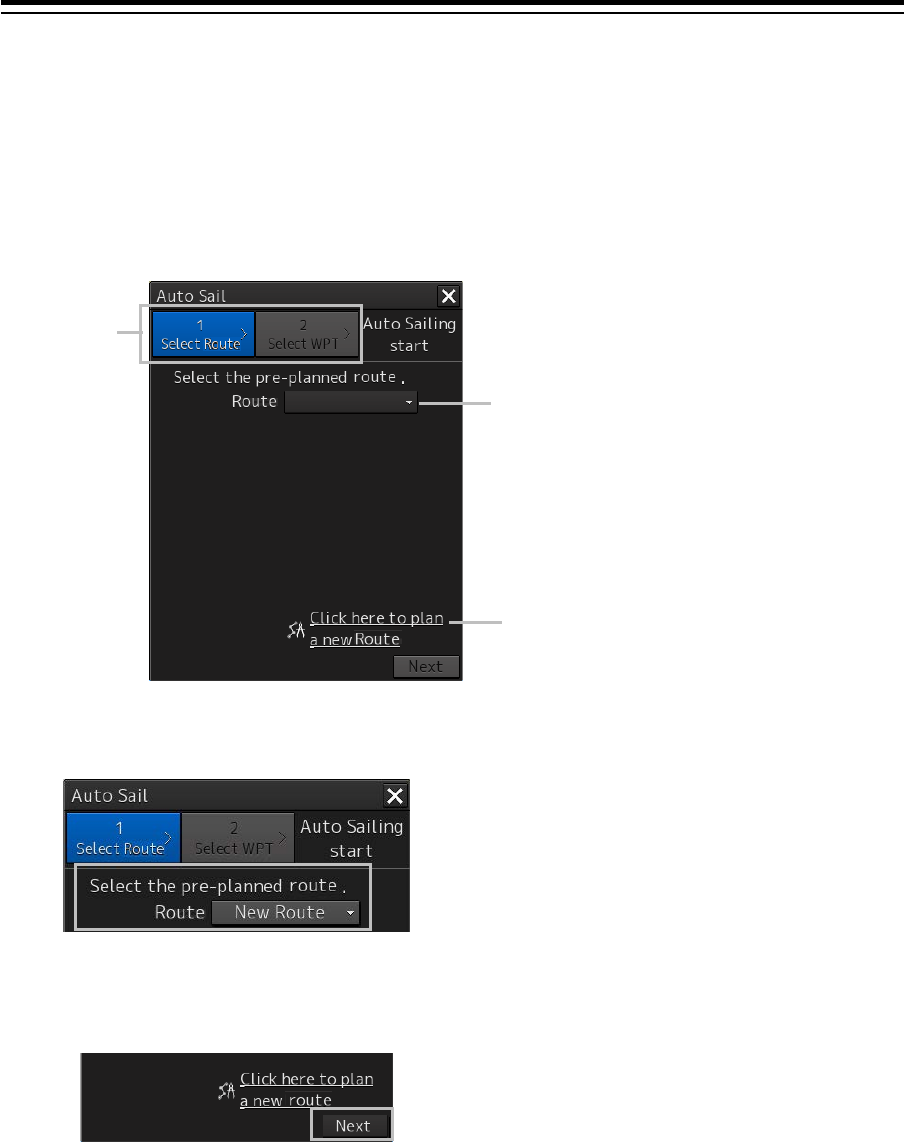
The automatic sailing starting wizard ("Auto Sail" dialog box) appears.
3 Click a planned route file to be used from the [Route] combo box of Procedure tab 1.
4 After checking a route, click on the [Next] button.
Procedure
tabs
[Route] combo box
New route planning link
12-3 Section 12 Automatic Sailing (Option)
1
2
3
4
5
6
7
8
9
10
11
12
13
14
15
16
17
18
19
20
21
22
23
24
25
26
27
付録
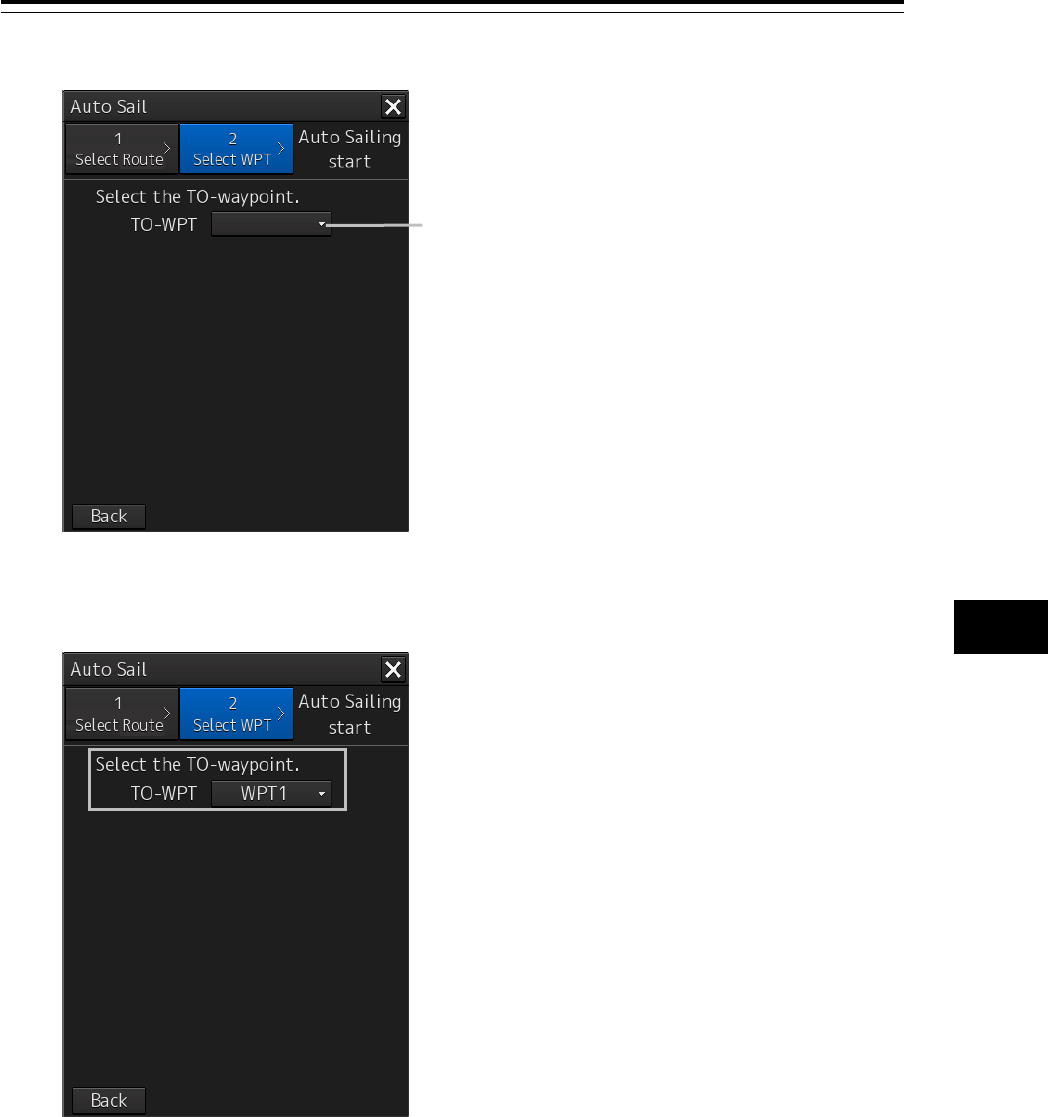
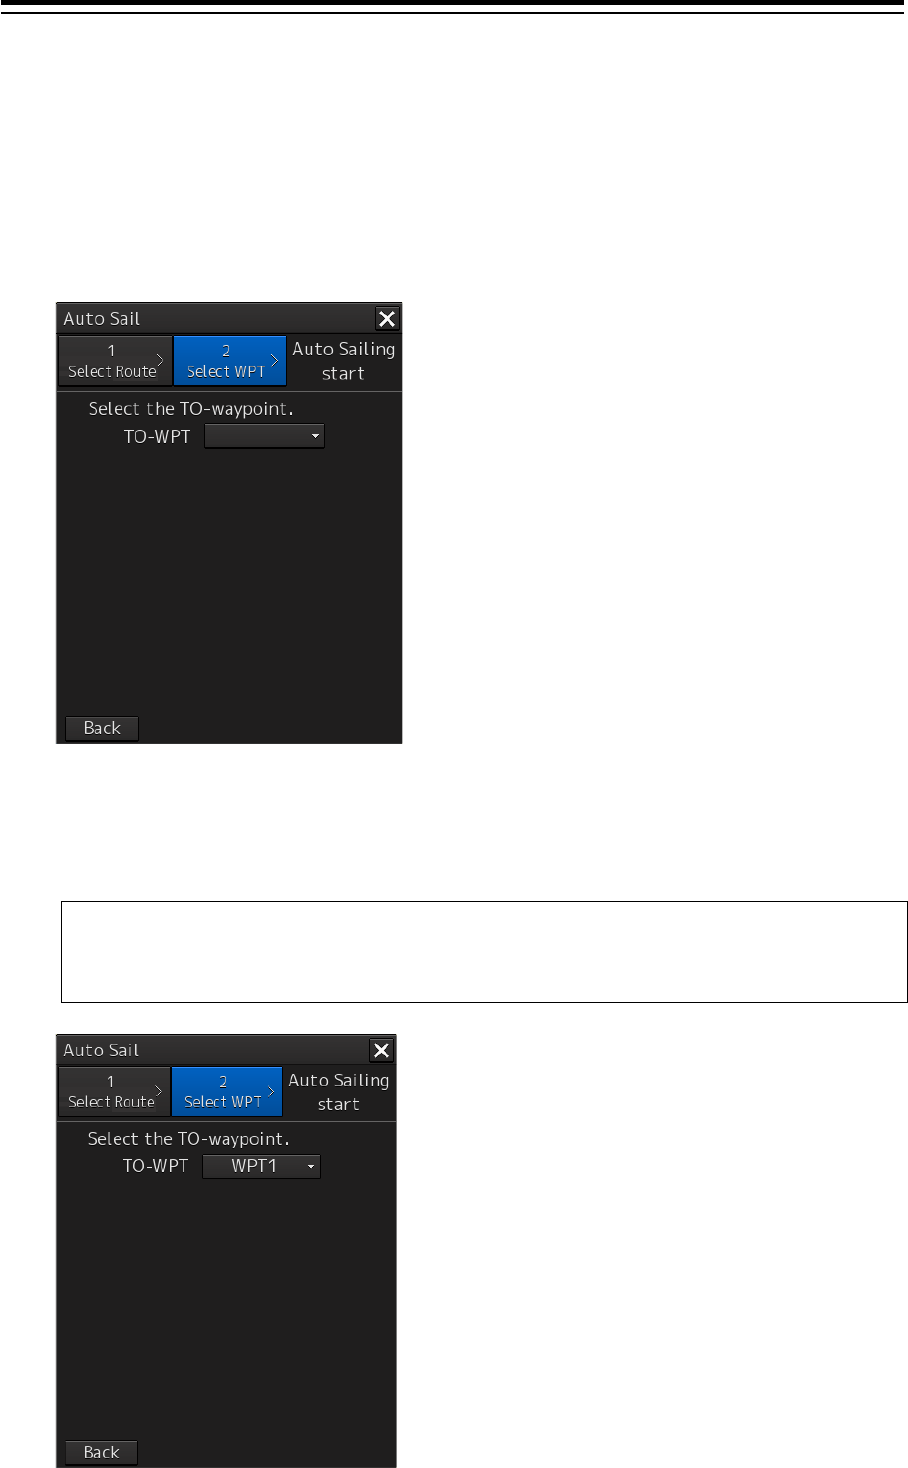
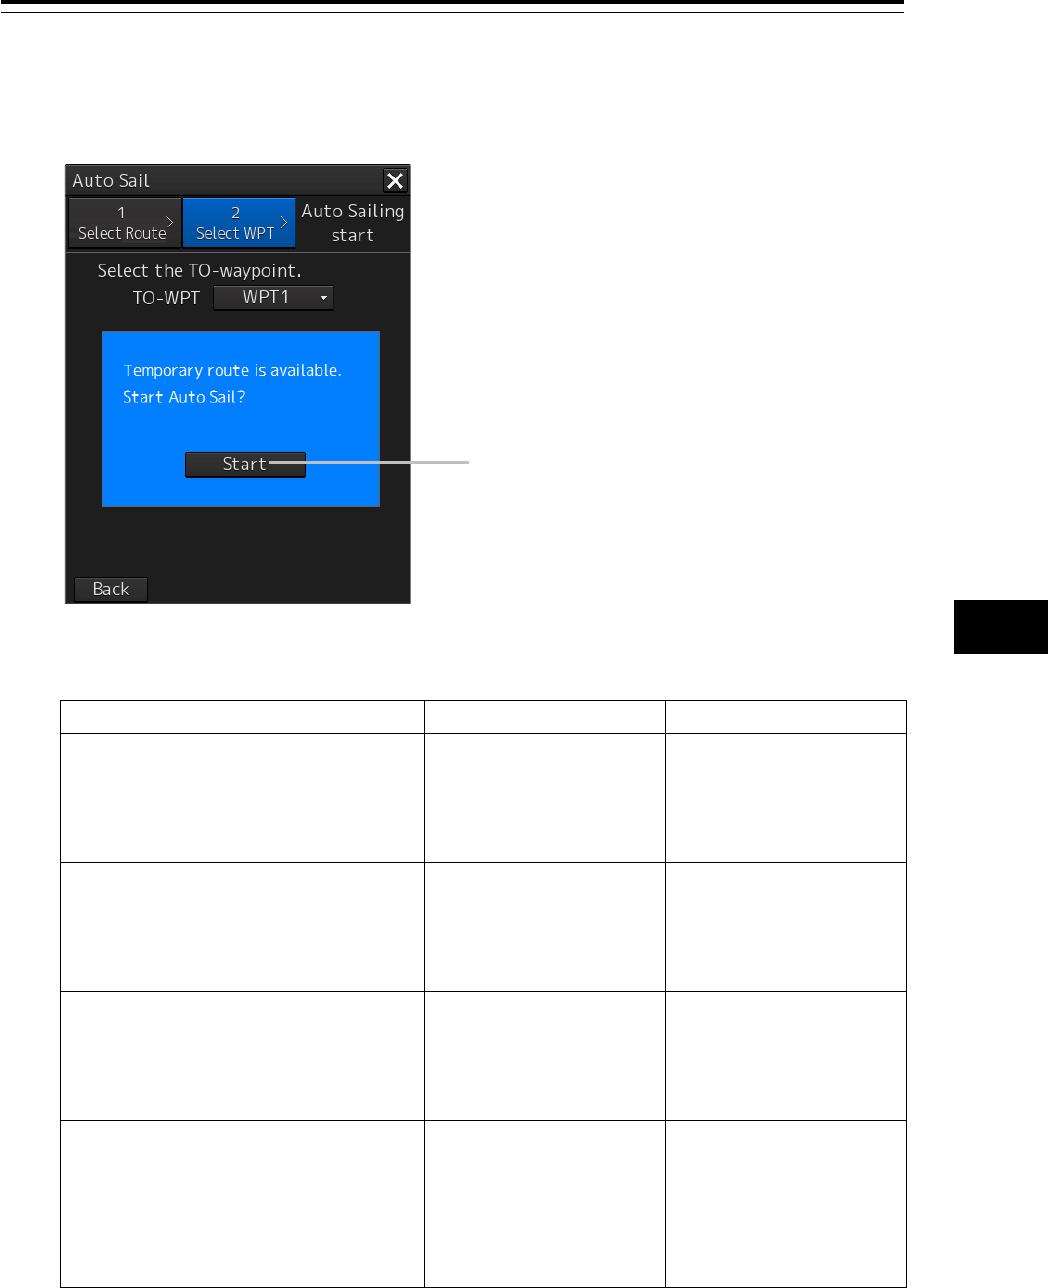
The dialog of Procedure tab 2 is displayed.
5 Click on the waypoint from which Auto Sail is to start from the [TO-WPT] (waypoint)
combo box.
[TO-WPT] combo box
Section 12 Automatic Sailing (Option) 12-4
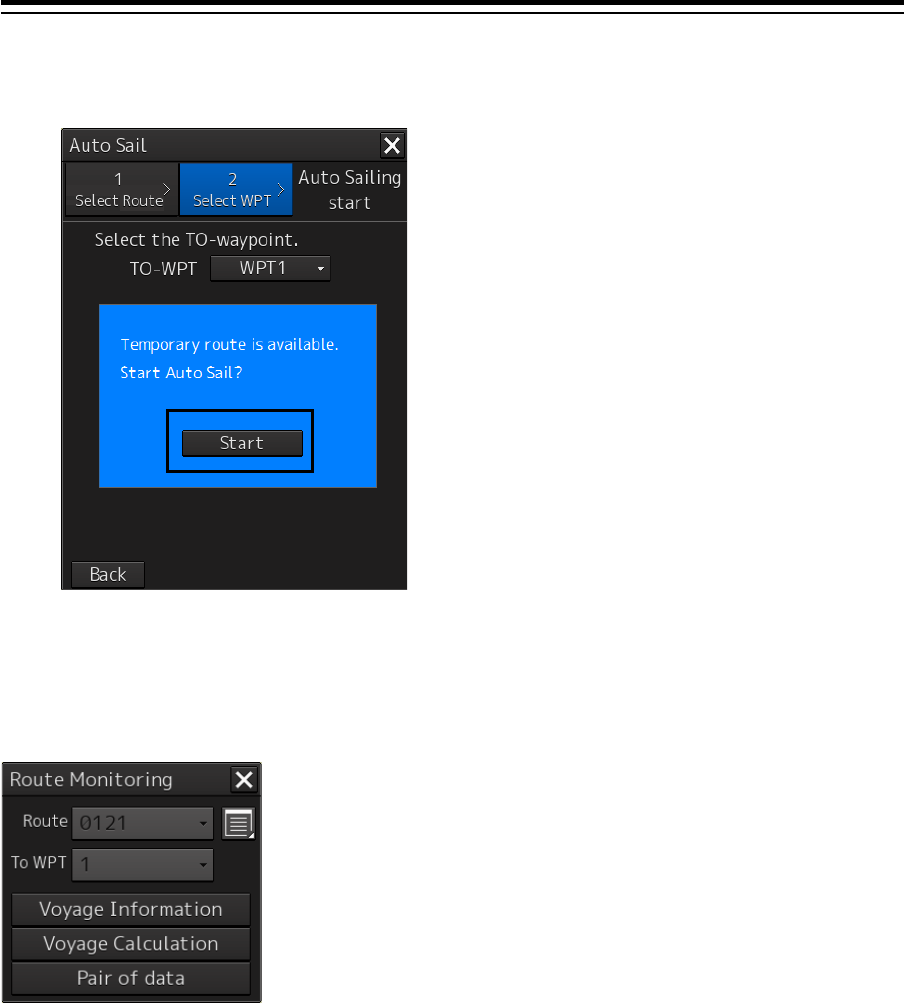
6 Start automatic sailing by clicking on the [Start] button.
During route monitoring
During route monitoring, the name of the planned route that is currently used is displayed in the [Route]
combo box.
To use another planned route for automatic sailing, re-select a planned route.
12-5 Section 12 Automatic Sailing (Option)
1
2
3
4
5
6
7
8
9
10
11
12
13
14
15
16
17
18
19
20
21
22
23
24
25
26
27
付録
Occurrence of an error
The following message dialog box appears.
When the above error occurs, automatic sailing cannot be started.
Cancel the alert by closing the dialog box by clicking on the [X] (Close) button.
For the details of the alerts that are displayed during automatic sailing, refer to "12.6 Alerts at
Automatic Sailing".
Creating a new route
1 Click on the [Click here to plan a new route] link.
The "Route Planning" dialog box appears.
For the details, refer to "12.2.2 Creating a new route".
Section 12 Automatic Sailing (Option) 12-6
12.2 Selecting a Route
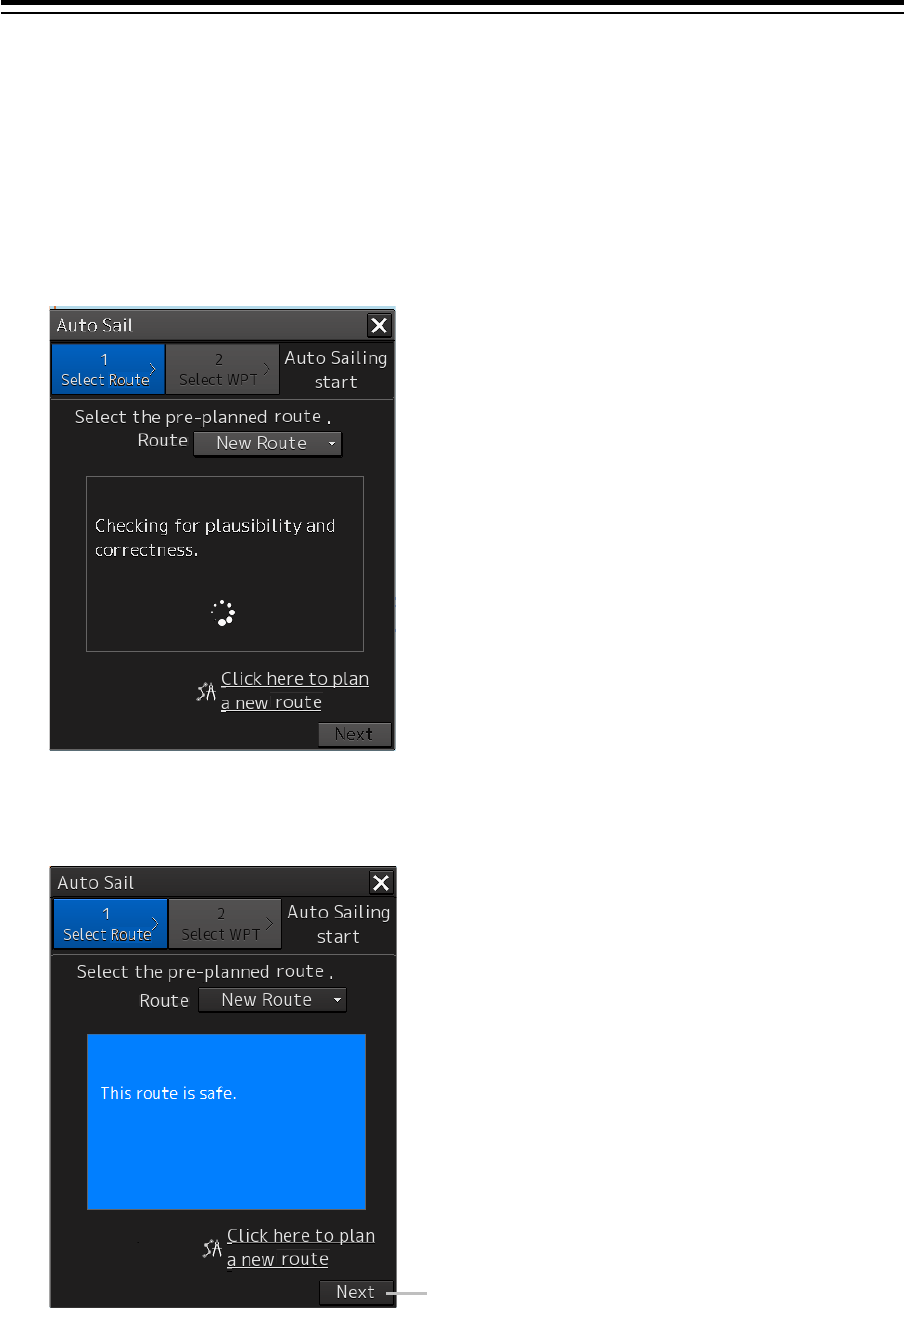
12.2.1 Using the existing planned route
1 To use the existing planned track for automatic sailing, select the planned route file to
be used from the [Route] combo box.
Checking of the selected route starts.
If there is no problem in the route, a route safety confirmation message is displayed and the
[Next] button is enabled.
[Next] button
12-7 Section 12 Automatic Sailing (Option)
1
2
3
4
5
6
7
8
9
10
11
12
13
14
15
16
17
18
19
20
21
22
23
24
25
26
27
付録
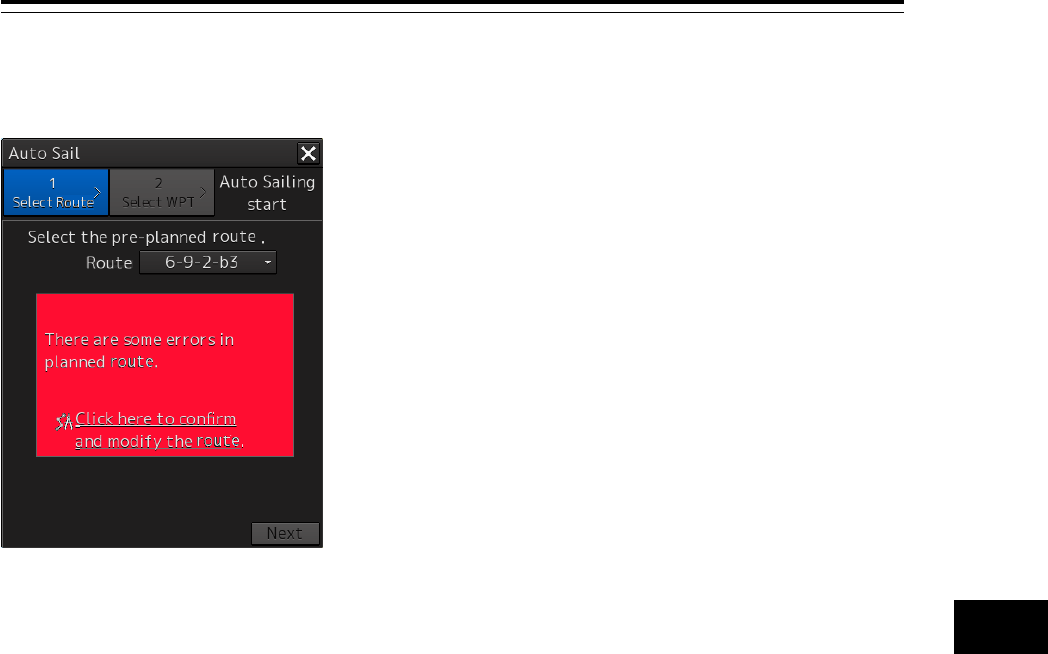
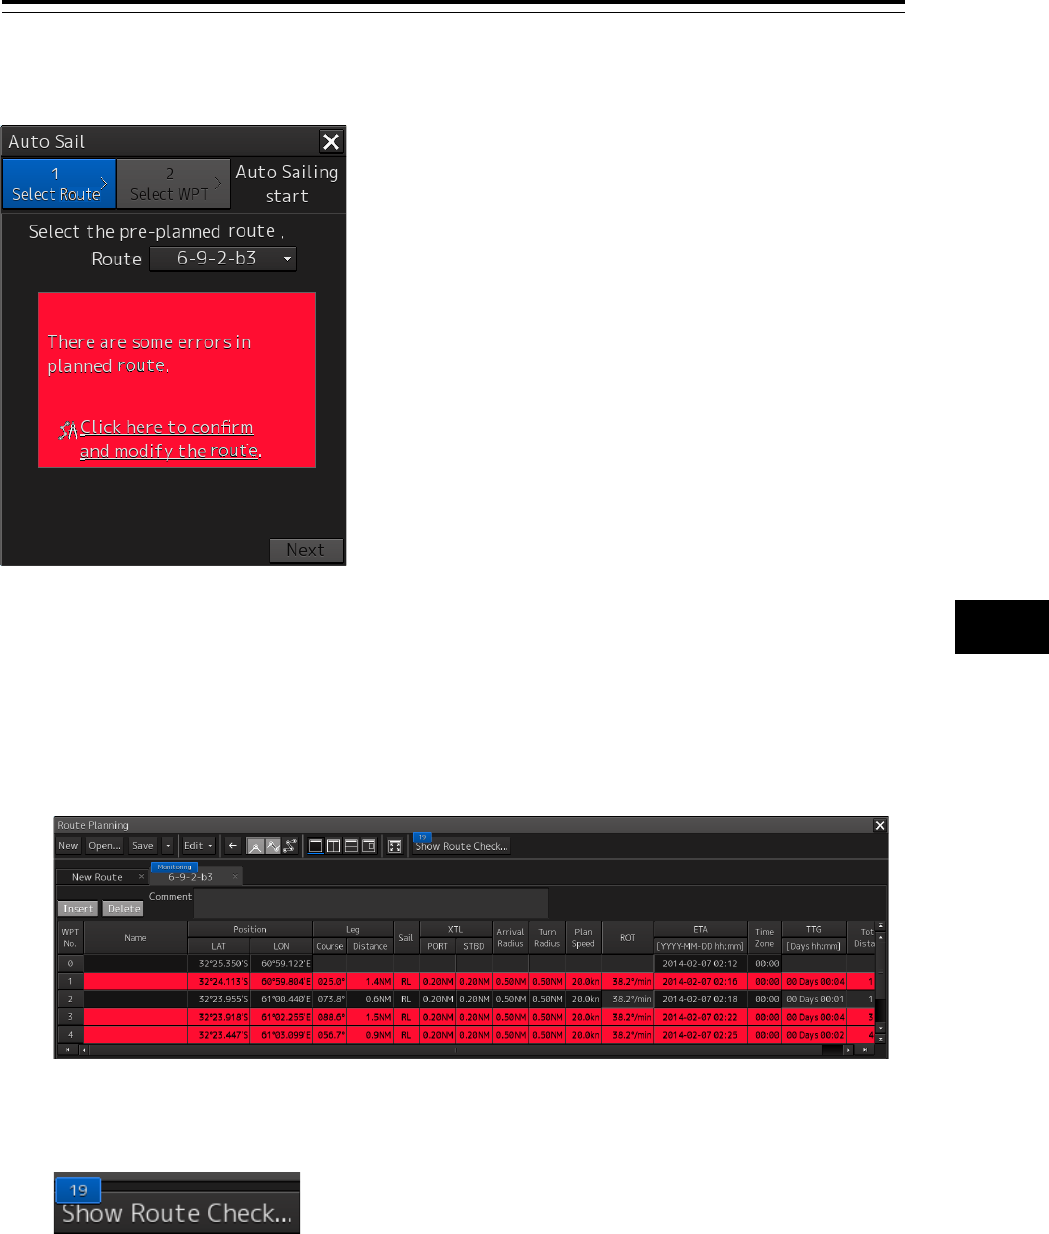
Detecting an error
When an error is detected as a result of checking the route, an error message is displayed.
Change the route file or modify the selected route.
Use the following procedure for modifying a route.
1 Click on the [Click here to confirm and modify the route] (confirmation and
modification of route) link.
The "Route Planning" dialog box is opened.
When an error occurred in the planned route, a badge indicating the number of errors is
displayed on the [Show Route Check…] (route checking screen display) button.
Section 12 Automatic Sailing (Option) 12-8
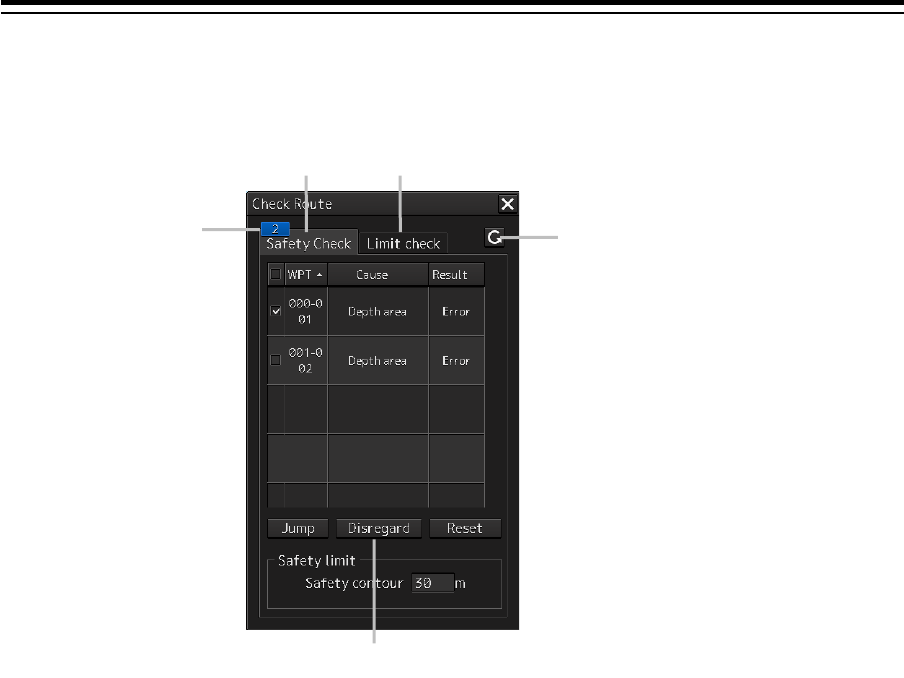
2 Click on the [Show Route Check…] button.
The "Check Route" dialog box that displays the result of the route checking appears.
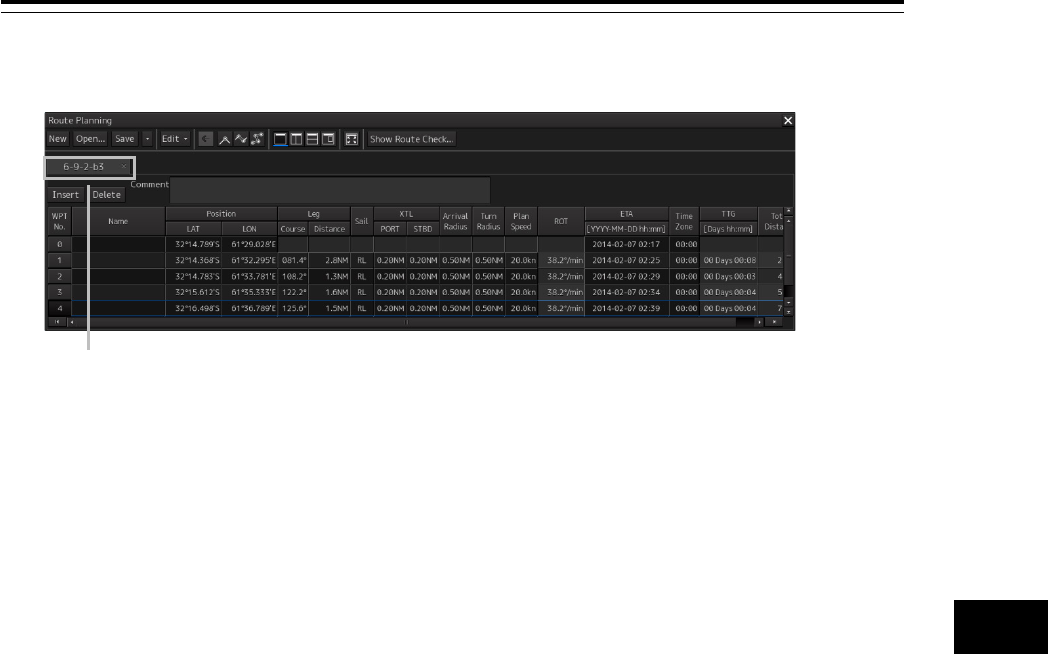
3 Modify the route, save the file by overwriting, and close the "Route Planning" dialog
box.
The route safety confirmation message is displayed.
For the details of the route planning operation, refer to "Section 9 Route Planning"
12.2.2 Creating a new route
A new planned route to be used for automatic sailing can be created.
1 Click on the [Click here to plan a new route] link.
The "Route Planning" dialog box is opened.
Re-check button
Limit check tab
Safety check tab
Error count badge
[Disregard] button
12-9 Section 12 Automatic Sailing (Option)
1
2
3
4
5
6
7
8
9
10
11
12
13
14
15
16
17
18
19
20
21
22
23
24
25
26
27
付録
2 Create and save a new planned route and close the "Route Planning" dialog box.
For the details of "Route Planning", refer to "Section 9b Route Planning".
3 Use the newly created planned route by referring to "12.2.1 Using the existing planned
route".
When the four route files have been opened
If four route files are already opened, no new edit tab can be opened unless the route edit tab that is
already open is deleted once.
Route editing tab
Section 12 Automatic Sailing (Option) 12-10
12.3 Selecting a Waypoint at which
Automatic Sailing Starts
Select a WPT (waypoint) at which automatic sailing starts.
1 Click on Procedure tab 2.
When selecting Procedure tab 1, click on the [Next] button.
When the [Back] button is clicked on, control returns to the route selection screen, enabling
re-selection of a route.
2 Click on the waypoint at which automatic sailing starts from the [TO-WPT] combo box.
Note
When the "Auto Sail" dialog box is activated during route monitoring, WPT that has been
passed through cannot be selected.
12-11 Section 12 Automatic Sailing (Option)
1
2
3
4
5
6
7
8
9
10
11
12
13
14
15
16
17
18
19
20
21
22
23
24
25
26
27
付録
Creation of the temporary route to the selected WPT starts.
When the temporary route is created, a completion message and the [Start] button are
displayed.
When a temporary route cannot be created, the following error message is displayed.
Error message
Cause
Measures
Cannot create the temporary route
because the course is inappropriate.
Turn the course toward the planned
course.
The temporary route
could not be created due
to the inappropriate
course.
Approximate the ship’s
heading to the planned
route.
Cannot create the temporary route
because the XTD exceed XTD MAX.
Move own ship toward the planned
route.
Since XTD is too large,
the temporary route
could not be created.
Approximate own ship to
the planned route.
Cannot create the temporary route
because own ship may pass through
the WOL. Select the TO-Waypoint
again.
Since own ship may
pass through the WOL,
the temporary route
could not be created.
Re-select TO-WPT.
Cannot create the temporary route
because own ship may pass through
the planned route leg. Select the
TO-Waypoint again.
Since own ship may
pass through the
planned route leg, the
temporary route could
not be created.
Re-select TO-WPT.
[Start] button
Section 12 Automatic Sailing (Option) 12-12
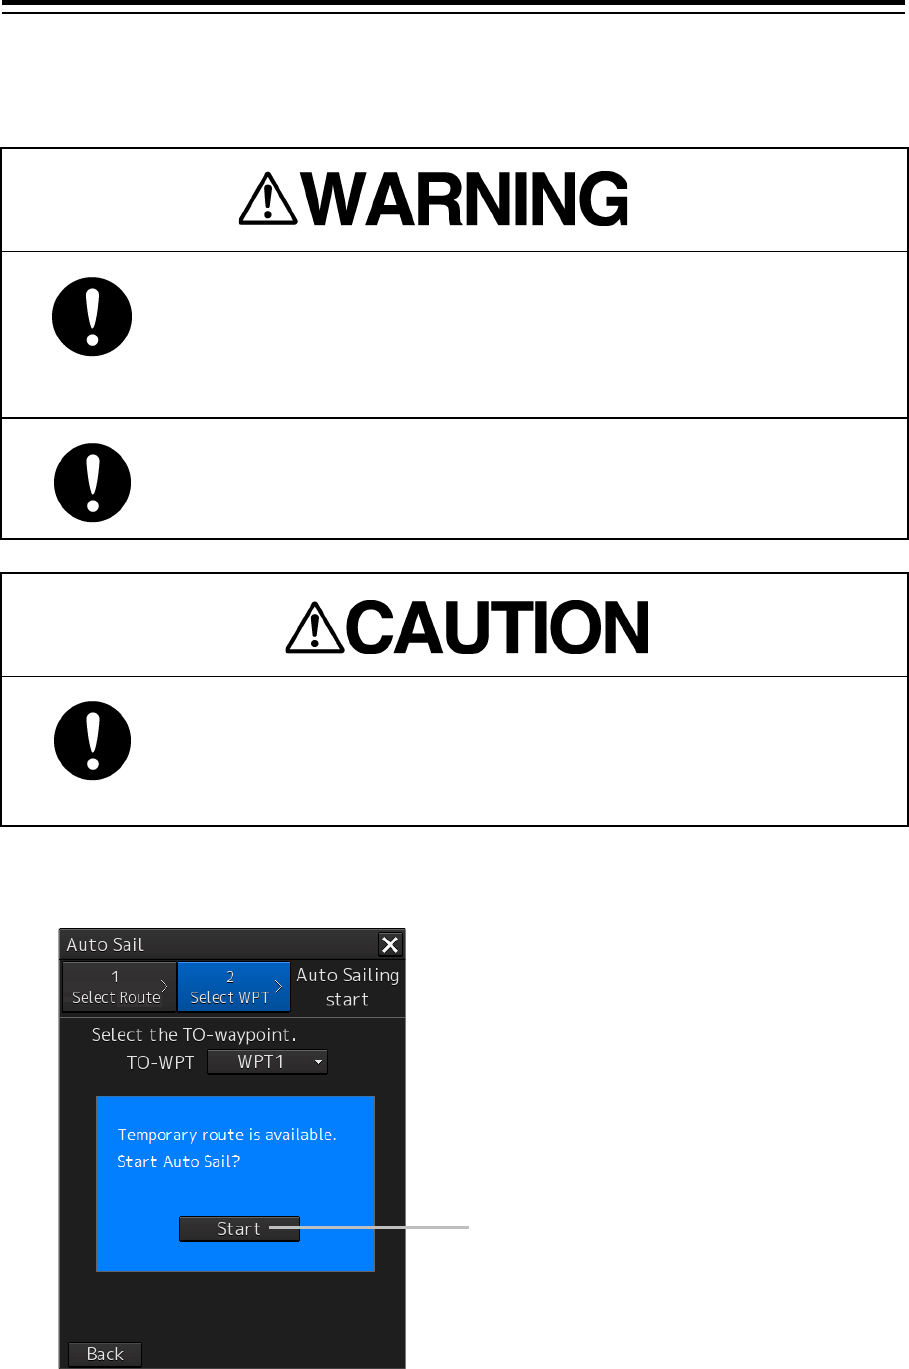
12.4 Starting Automatic Sailing
If your ship has reached a veering circle during the automatic navigation,
make sure that the safety check and veering operation are made by the
ship operator himself.
If veering operation is not made, regression bearing will be maintained
without veering. This may cause an accident.
Input the ship’s parameter accurately according to the specification of the
ship.
Otherwise, accidents may result.
Do not neglect confirmation of the position and the bearing of own ship
during sailing regardless of whether automatic sailing is set to ON or
OF F.
Otherwise, an accident may occur.
1 Click on the [Start] button of Procedure tab 2.
[Start] button
12-13 Section 12 Automatic Sailing (Option)
1
2
3
4
5
6
7
8
9
10
11
12
13
14
15
16
17
18
19
20
21
22
23
24
25
26
27
付録
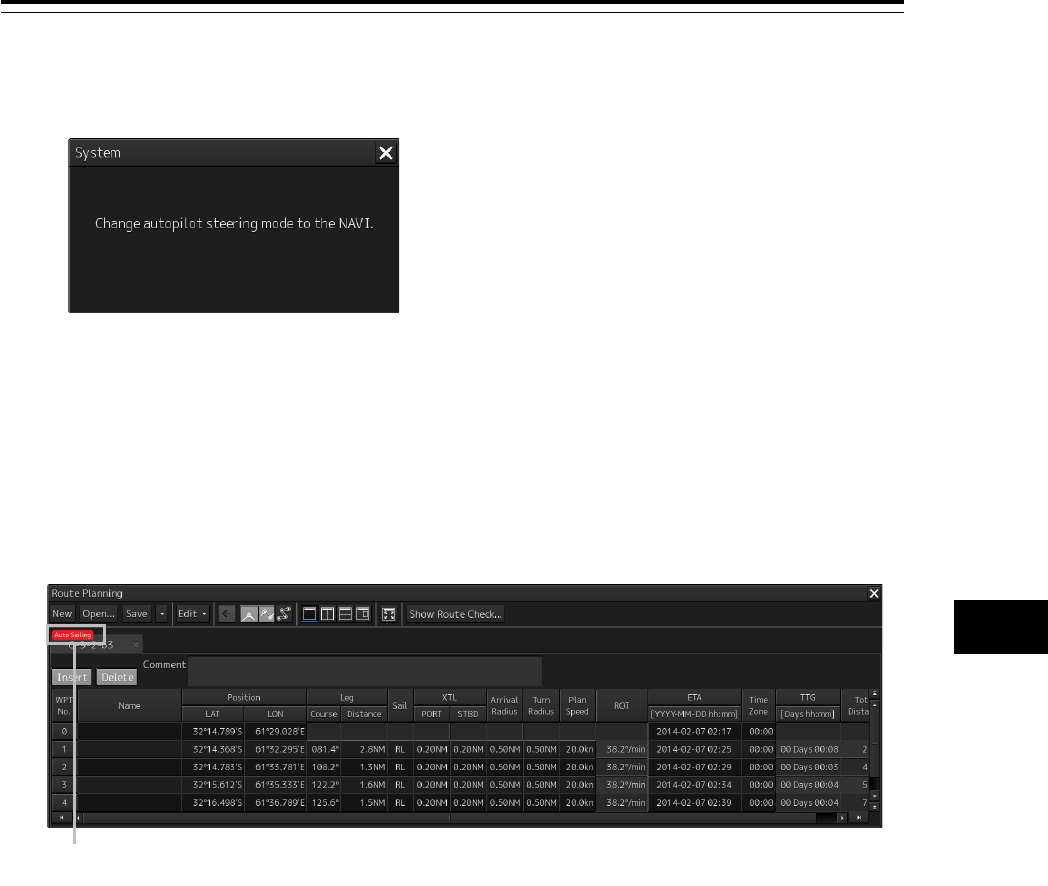
The "Auto sail" dialog box is closed and the Autopilot steering mode switching message is
displayed. Switch the Autopilot steering mode to the NAVI mode.
The selected planned route is displayed on the chart and the “Voyage Information” dialog is
displayed.
When the "Route Planning" dialog box is opened during automatic sailing, the [Autosailing]
(during automatic sailing) indicator is displayed on the tab of the planned route that is currently
used.
[Auto Sailing] indicator
Section 12 Automatic Sailing (Option) 12-14
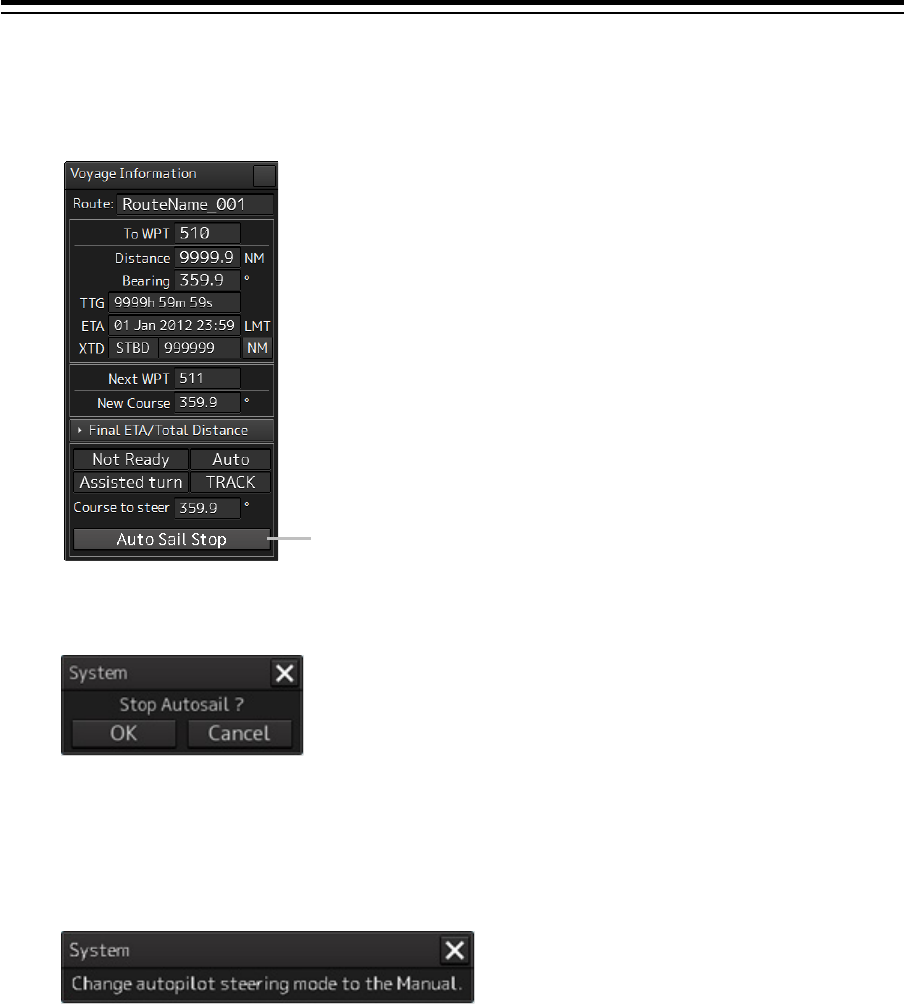
12.5 Stopping Automatic Sailing
1 Click on the [Auto Sail Stop] button of the auto pilot information.
The automatic sailing stopping confirmation dialog box appears.
2 Click on the [OK] button.
Auto Sail stops and an auto pilot steering mode switching confirmation dialog box appears.
Change the Autopilot steering mode to the Manual mode.
3 Click on [×] (Close).
The auto pilot steering mode switching confirmation dialog box is closed.
[Auto Sail Stop] button
12-15 Section 12 Automatic Sailing (Option)
1
2
3
4
5
6
7
8
9
10
11
12
13
14
15
16
17
18
19
20
21
22
23
24
25
26
27
付録
12.6 Alerts at Automatic Sailing
The following sailing monitoring alerts may occur during automatic sailing.
Type Occurring condition Automatic sailing Countermeasure
Course
difference(heading
deviates from
track course)
The difference between
the ship’s heading and
the leg bearing during
sailing exceeded the limit
value.
Can be continued -
Cross Track Own ship exceeded the
set route width.
Can be continued -
Heading(Sensor
Failure)
An error occurred in the
gyro compass.
Stops Switch the steering mode of
AUTO PILOT to AUTO or
HAND. Otherwise, the
current rudder angle is
retained for AUTO PILOT
(for details, refer to the
AUTO PILOT instruction
manual).
POSN1(Sensor
Failure)
An error occurred in the
primary position.
Performs dead
reckoning for 10
minutes and stops
automatic sailing.
Switch the steering mode of
AUTO PILOT to AUTO or
HAND. Otherwise, the
current course is retained for
AUTO PILOT (for details,
refer to the AUTO PILOT
instruction manual).
Speed(Sensor
Failure)
An error occurred in the
ship speed through water
sensor.
Stops after
performing
automatic sailing
for 10 minutes.
Position Monitor The system position
jumped exceeding the
limit value.
Can be continued -
ACCA 30 seconds before
reaching WOL
Can be continued -
End Of Track 1 to 5 minutes before the
arrival at the destination
when sailing the final leg.
Stops automatic
sailing after
passing the final
destination.
After passing the final
destination, switch the
steering mode of AUTO
PILOT to AUTO or HAND.
Otherwise, the current
course is retained for AUTO
PILOT (for details, refer to
the AUTO PILOT instruction
manual).
Low Speed The ship speed through
water dropped below the
set value.
Can be continued -
Section 12 Automatic Sailing (Option) 12-16
Autopilot(Unavailable)
Autopilot(Communicati
on Failed, Main LAN)
A communication error
occurred between Autopilot
and ECDIS
Stops Switch the steering mode
of AUTO PILOT to AUTO
or HAND. Otherwise, the
current course is retained
for AUTO PILOT (for
details, refer to the AUTO
PILOT instruction
manual).
An Autopilot failure
occurred.
Switch the steering mode
of AUTO PILOT to AUTO
or HAND. Otherwise, the
current rudder angle is
retained for AUTO PILOT
(for details, refer to the
AUTO PILOT instruction
manual).
Track Control Stopped After 10 minutes of DR
sailing following the
occurrence of POSN1
(Sensor Failure)
Performs dead
reckoning for
10 minutes
and stops
automatic
sailing.
Switch the steering mode
of AUTO PILOT to AUTO
or HAND. Otherwise, the
current course is retained
for AUTO PILOT (for
details, refer to the AUTO
PILOT instruction
manual).
Speed (Sensor Failure)
occurred.
Stops after
performing
automatic
sailing for 10
minutes.
Heading (Sensor Failure)
occurred.
Stops Switch the steering mode
of AUTO PILOT to AUTO
or HAND. Otherwise, the
current rudder angle is
retained for AUTO PILOT
(for details, refer to the
AUTO PILOT instruction
manual).
A communication error
occurred between
Autopilot and ECDIS,
causing the following
errors:
Autopilot(Unavailable),
Autopilot(Communication
Failed, Main LAN)
Stops
Switch the steering mode
of AUTO PILOT to AUTO
or HAND. Otherwise, the
current course is retained
for AUTO PILOT (for
details, refer to the AUTO
PILOT instruction
manual).
12-17 Section 12 Automatic Sailing (Option)
1
2
3
4
5
6
7
8
9
10
11
12
13
14
15
16
17
18
19
20
21
22
23
24
25
26
27
付録
An autopilot failure
occurred causing the
following errors:
Autopilot(Unavailable),
Autopilot
(Communication Failed,
Main LAN).
Stops Switch the steering mode
of AUTO PILOT to AUTO
or HAND. Otherwise, the
current rudder angle is
retained for AUTO PILOT
(for details, refer to the
AUTO PILOT instruction
manual).
ACCA(Back-up
Navigator Call)
An ACC alarm unconfirmed
state continued for 30
seconds.
Can be
continued
-
End Of Track (Back-up
Navigator Call)
An End of Track alarm
unconfirmed state
continued for 30 seconds.
Stops
automatic
sailing after
passing the
final
destination.
Switch the steering mode
of AUTO PILOT to AUTO
or HAND. Otherwise, the
current course is retained
for AUTO PILOT (for
details, refer to the AUTO
PILOT instruction
manual).
Track Control
Stopped(Back-up
Navigator Call)
A Track Control Stopped
alarm unconfirmed state
continued for 30 seconds.
Stops Varies depending on the
occurrence condition.
Refer to the description of
Track Control Stopped.
Heading(Sensor
Failure, Back-up
Navigator Call)
A Heading (Sensor Failure)
alarm unconfirmed state
continued for 30 seconds.
Stops Switch the steering mode
of AUTO PILOT to AUTO
or HAND. Otherwise, the
current rudder angle is
retained for AUTO PILOT
(for details, refer to the
AUTO PILOT instruction
manual).
POSN1(Sensor
Failure, Back-up
Navigator Call)
A POSN1 (Sensor Failure)
alarm unconfirmed state
continued for 30 seconds.
Performs dead
reckoning for
10 minutes
and stops
automatic
sailing.
Switch the steering mode
of AUTO PILOT to AUTO
or HAND. Otherwise, the
current course is retained
for AUTO PILOT (for
details, refer to the AUTO
PILOT instruction
manual).
Speed(Sensor Failure,
Back-up Navigator
Call)
Speed (Sensor Failure)
alarm unconfirmed state
continued for 30 seconds.
Stops after
performing
automatic
sailing for 10
minutes.

Section 12 Automatic Sailing (Option) 12-18
13-1 Section 13 Operating a Chart (option)
1
2
3
4
5
6
7
8
9
10
11
12
13
14
15
16
17
18
19
20
21
22
23
24
25
26
27
付録
Section 13
Operating a Chart (option)
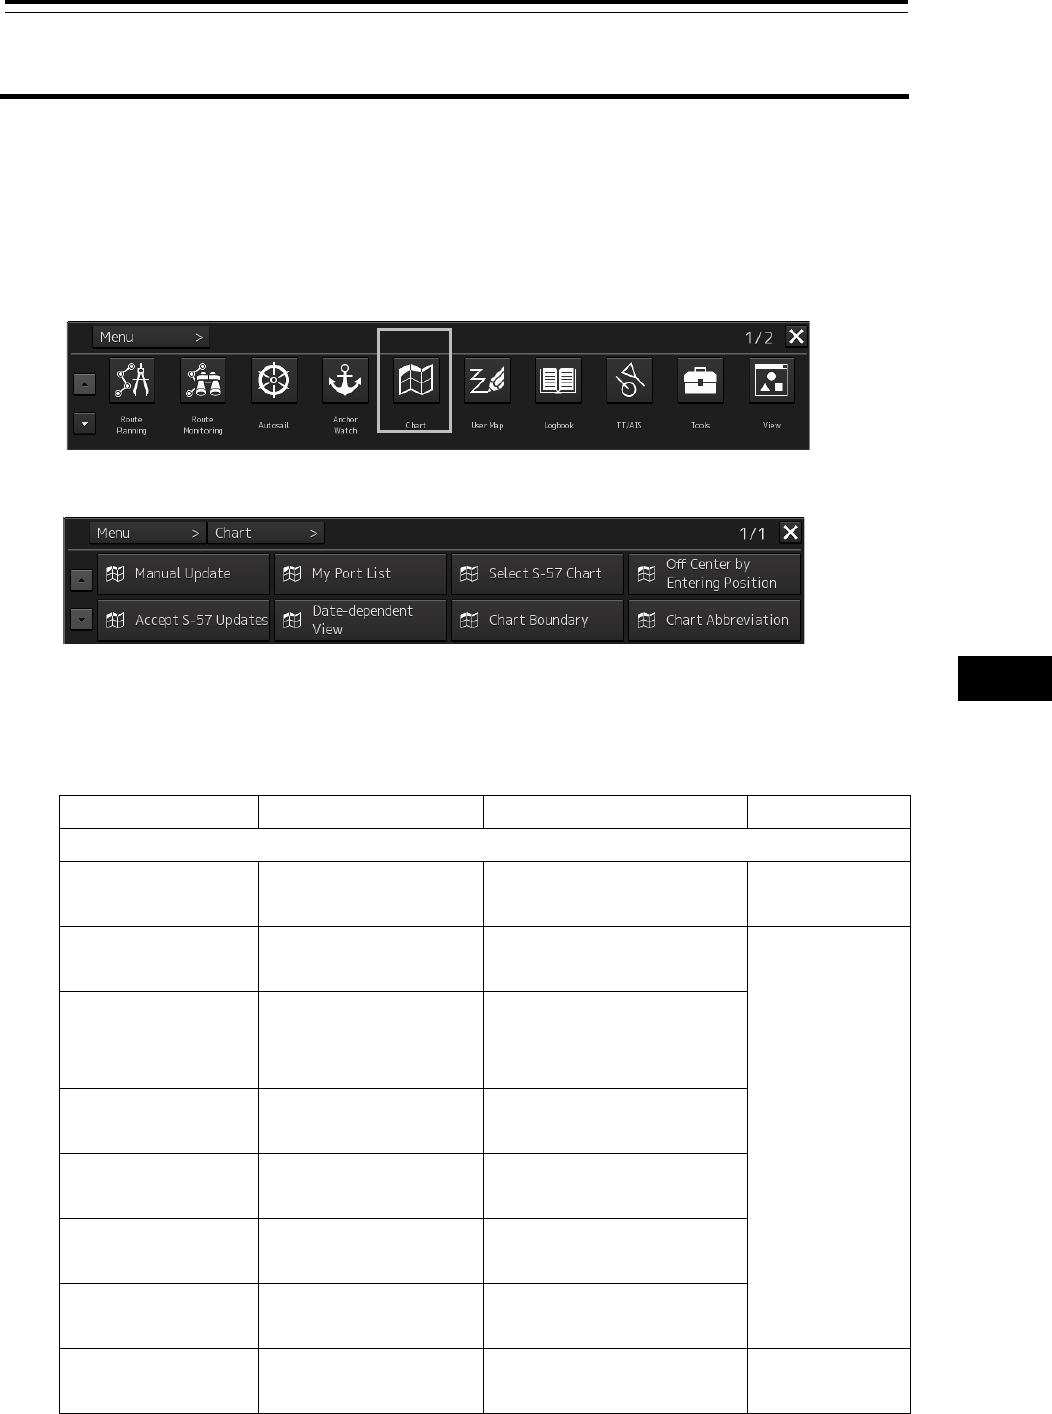
Use the [Chart] menu for chart operations.
1 Click on the [Menu] button on the left toolbar.
The menu is displayed
2 Click on the [Chart] button on the menu.
The submenu is displayed.
It is possible using the page switching buttons to switch to the first page and the second page of
the submenu screen.
Click each button of the submenu screen to display the relevant function dialog.
Button name
Function
Related section
Target
First page
Manual Update Updates a chart
manually
13.1 Updating a Chart
Manually
ECDIS, CHART
RADAR
My Port List Operates a port name
list
8.7 My Port List ECDIS
Select S-57 Chart Selects an S-57 chart 13.2 Displaying/Searching
an S-57 Chart [Select S-57
Chart]
Off Center by
Entering Position
Moves the display
center
13.3 Displaying a Chart by
Inputting a Position
Accept S-57
Updates
Accepts the updated
S-57 chart
13.4 Confirming/Accepting
an S-57 Updated Chart
Date-dependent
View
Displays a
date-dependent object
13.5 Displaying a
Date-dependent Object
Chart Boundary Displays a chart
boundary
13.6 Displaying a Chart
Boundary
Chart Abbreviation Chart abbreviation 13.9 Displaying a Chart
Abbreviation List
ECDIS, CHART
RADAR
Section 13 Operating a Chart (option) 13-2
Button name
Function
Related section
Target
Second page
T & P (ARCS) Enables verification of
temporary/preliminary
information of the
ARCS chart
13.7 Confirming
Temporary/Preliminary
Information of an ARCS
Chart (ARCS Only)
ECDIS
Datum Offset
(ARCS)
Offsets ARCS chart
data
13.8 Adjusting an ARCS
Chart Position (ARCS
Only)
Datum
Transformation
(ARCS)
Transforms any
position of the ARCS
chart and geodetic
datum of the own
ship’s position to those
of the WGS-84
13.8.2 Transforming a
geodetic datum of an
ARCS chart to WGS-84
ECDIS, CHART
RADAR

13-3 Section 13 Operating a Chart (option)
1
2
3
4
5
6
7
8
9
10
11
12
13
14
15
16
17
18
19
20
21
22
23
24
25
26
27
付録
13.1 Updating a Chart Manually
The chart can be updated manually by selecting [Chart] - [Manual Update] (chart manual update) on
the menu.
For the details of manual update of a chart, refer to "14.3 Updating a Chart Manually (ECDIS Screen
Only)".
Section 13 Operating a Chart (option) 13-4
13.2 Displaying/Searching an S-57 Chart
[Select S-57 Chart]
13.2.1 Displaying a chart
Select S-57 Chart enables selection and display of any chart.
1 Click on the [Menu] button on the left toolbar.
The menu is displayed
2 Click on the [Chart] - [Select S-57 Chart] on the menu.
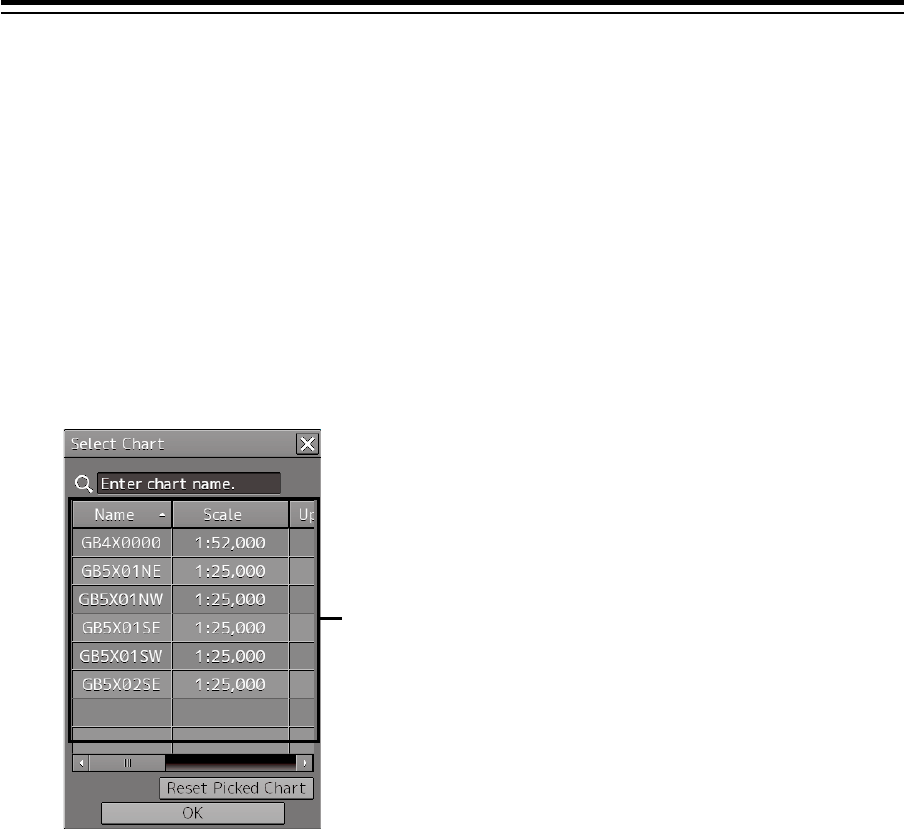
The "Select Chart" dialog box appears.
An S-57 chart list contains chart names (Name), original scales (Scale), Updating numbers (Up
No.), issuing dates (Issue date), last update dates (Last Update), and update acceptance
statuses (Accepted, Yes: Accepted/No: Not accepted).
3 Click on the line of the chart to be displayed from the S-57 chart list.
The chart is selected.
4 Click on the [OK] button.
The selected chart is displayed on the screen.
S-57 chart list
13-5 Section 13 Operating a Chart (option)
1
2
3
4
5
6
7
8
9
10
11
12
13
14
15
16
17
18
19
20
21
22
23
24
25
26
27
付録
13.2.2 Search a chart
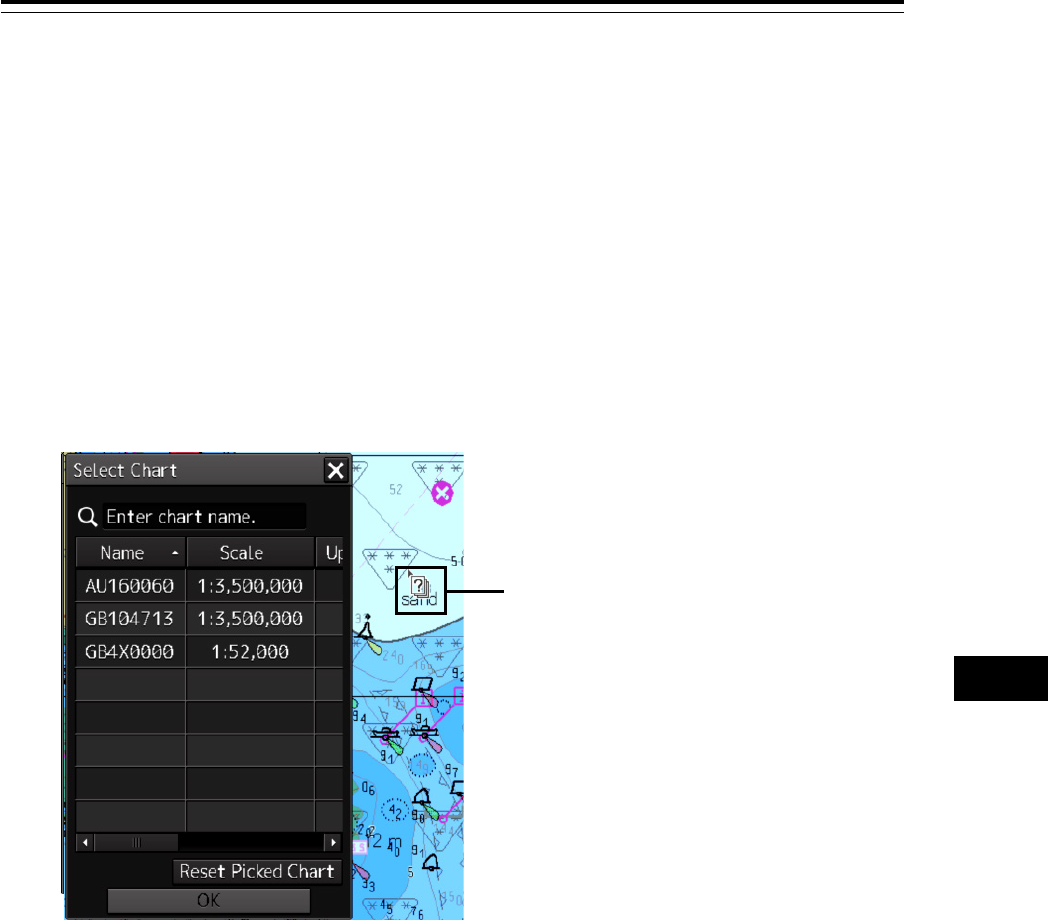
13.2.2.1 Searching the position that is clicked on by the cursor
1 Click on the [Menu] button on the left toolbar.
The menu is displayed
2 Click on the [Chart] - [Select S-57 Chart] on the menu.
The "Select Chart" dialog box appears.
3 Move the cursor to the position to be searched and click the mouse button.
The chart that is set at the position specified by clicking the mouse button is displayed in the
S-57 chart list.
Clearing search results
Click on the [Reset Picked Chart] (chart selection reset) button.
Click.
Section 13 Operating a Chart (option) 13-6
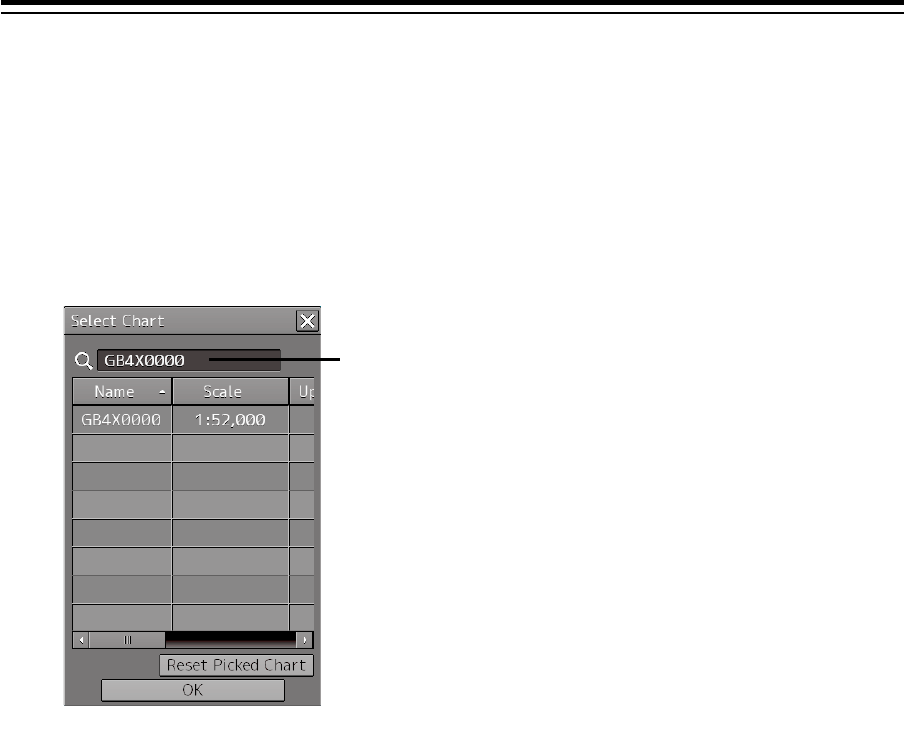
13.2.2.2 Searching by using a chart name
1 Click on the [Menu] button on the left toolbar.
The menu is displayed
2 Click on the [Chart] - [Select S-57 Chart] on the menu.
The "Select Chart" dialog box appears.
3 Enter a chart name in the search box
Clearing search results
Clear by using the [DEL] key on the software keyboard.
Search box
The chart is displayed.
13-7 Section 13 Operating a Chart (option)
1
2
3
4
5
6
7
8
9
10
11
12
13
14
15
16
17
18
19
20
21
22
23
24
25
26
27
付録
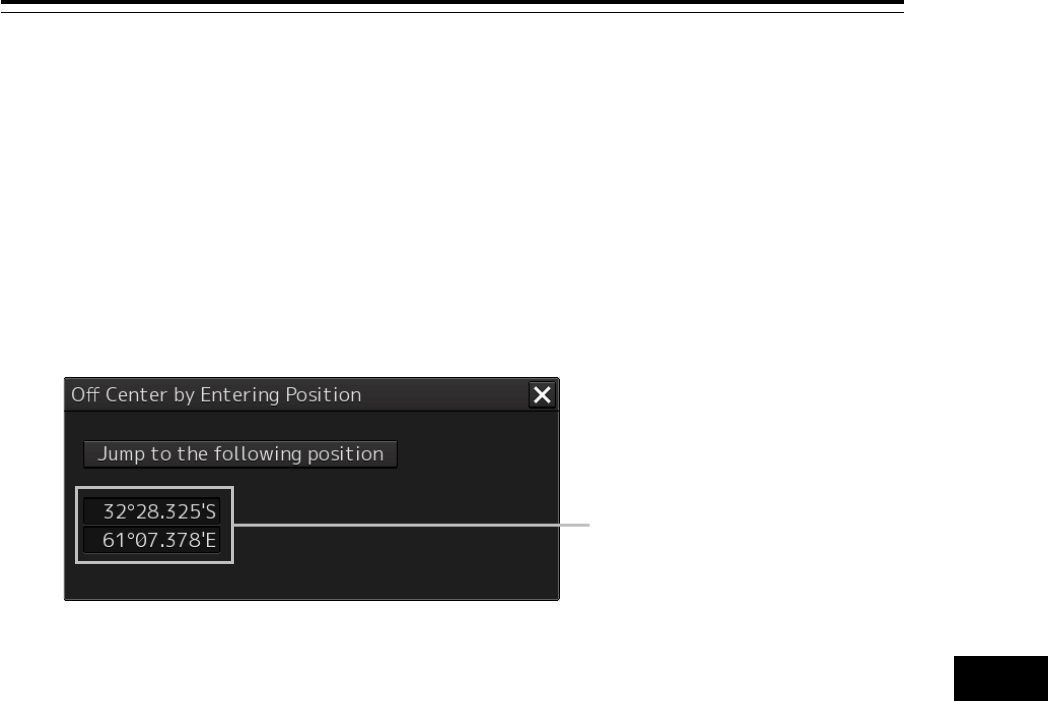
13.3 Displaying a Chart by Inputting a
Position
By inputting a position, the chart of the position that was input can be displayed.
1 Click on the [Menu] button on the left toolbar.
The menu is displayed
2 Click on the [Chart] - [Off Center by Entering Position] on the menu.
The "Off Center by Entering Position" dialog box appears.
3 Enter a position of the chart to be displayed in the latitude/longitude input box.
4 Click on the [Jump to the Following Position] button.
The chart of the specified position is displayed.
Latitude/longitude input box
Section 13 Operating a Chart (option) 13-8
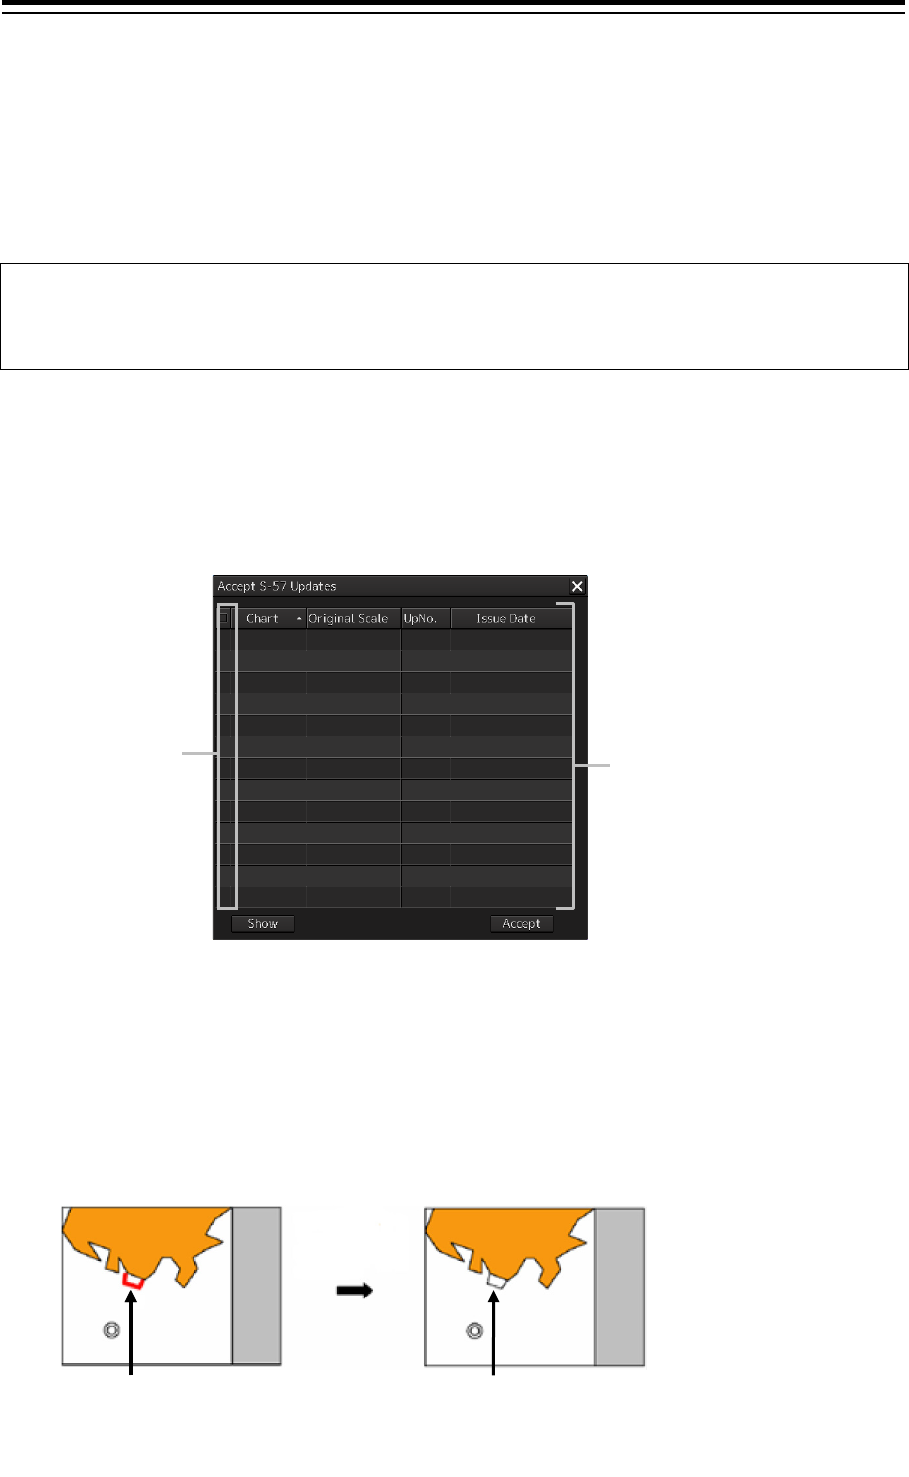
13.4 Confirming/Accepting an S-57
Updated Chart
The update contents of an S-57 updated chart can be confirmed.
By accepting an updated chart, the updated chart can be integrated into the original chart.
Note
Check that the display category of the chart is [Standard] or [All].
When the display category is set to [Base], the updated chart may not be displayed.
1 Click on the [Menu] button on the left toolbar.
The menu is displayed.
2 Click on the [Chart] - [Accept S-57 Updates] on the menu.
The "Accept S-57 Updates" dialog box appears.
3 To confirm the update contents of the updated chart, select the check box of the chart
and click on the [Show] (display) button.
The selected updated chart is displayed. The updated chart is displayed on the original chart in
red.
4 Click on the [Accept] button to accept the updated chart.
The updated chart is integrated into the original chart.
Chart
selection
check box
Updated S-57 chart
list
Clicking on the [Accept] button:
The object is a
pproved and is
displayed in the same color as for
the original chart.
Clicking on the [Show] button:
The updated chart that overlaps the
orig
inal chart is displayed in red.
13-9 Section 13 Operating a Chart (option)
1
2
3
4
5
6
7
8
9
10
11
12
13
14
15
16
17
18
19
20
21
22
23
24
25
26
27
付録
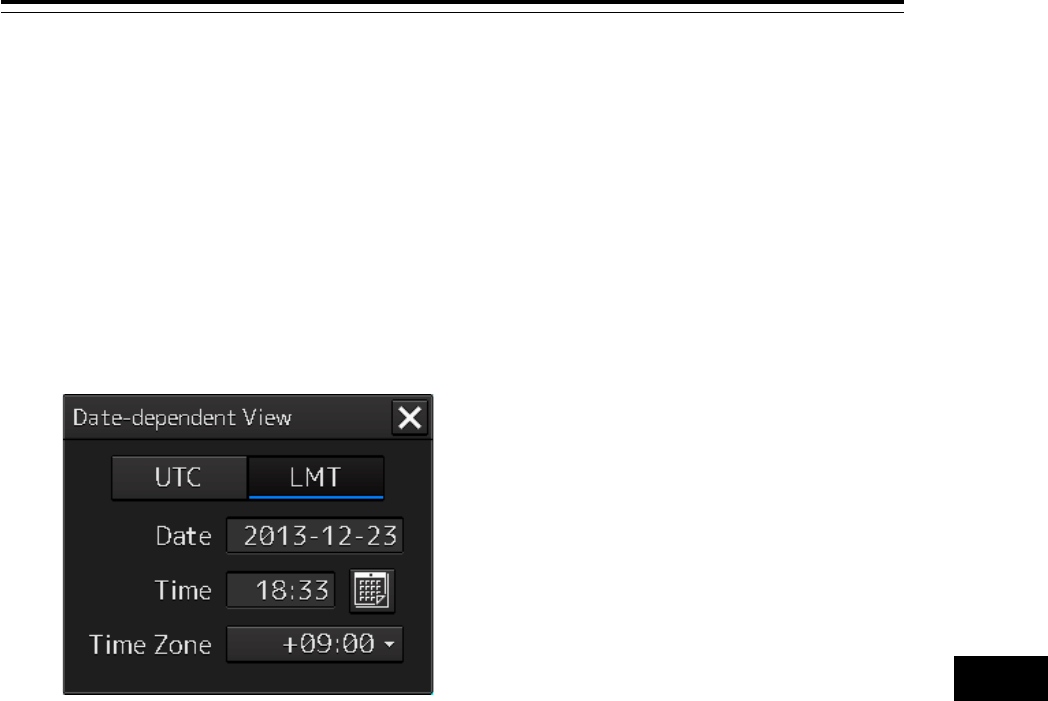
13.5 Displaying a Date-dependent Object
A chart object of the specified date and time can be displayed.
For instance, it is possible to display a date-dependent chart such as displaying a chart at the arrival
time of the arrival schedule at the navigation planning.
1 Click on the [Menu] button on the left toolbar.
The menu is displayed
2 Click on the [Chart] - [Date-dependent View] on the menu.
The "Date-dependent View" dialog box appears.
3 Set the [UTC] (Universal Time Coordinated) button or [LMT] (Local Mean Time) button
to On by clicking on the button.
4 Enter a date in the [Date] input box within the range from 1980-01-01 to 2099-12-31.
5 Enter a time (24-hour system) in the [Time] input box.
6 When [LMT] is set to On in Step 3, enter a time difference in [Time Zone] box within the
range from -13:30 to +13:30.
The object displayed on the chart is updated when information is input in any of the steps from
Step 4 to Step 6.
7 Close the "Date-dependent View" dialog box.
The current time is displayed on the chart again.
Section 13 Operating a Chart (option) 13-10
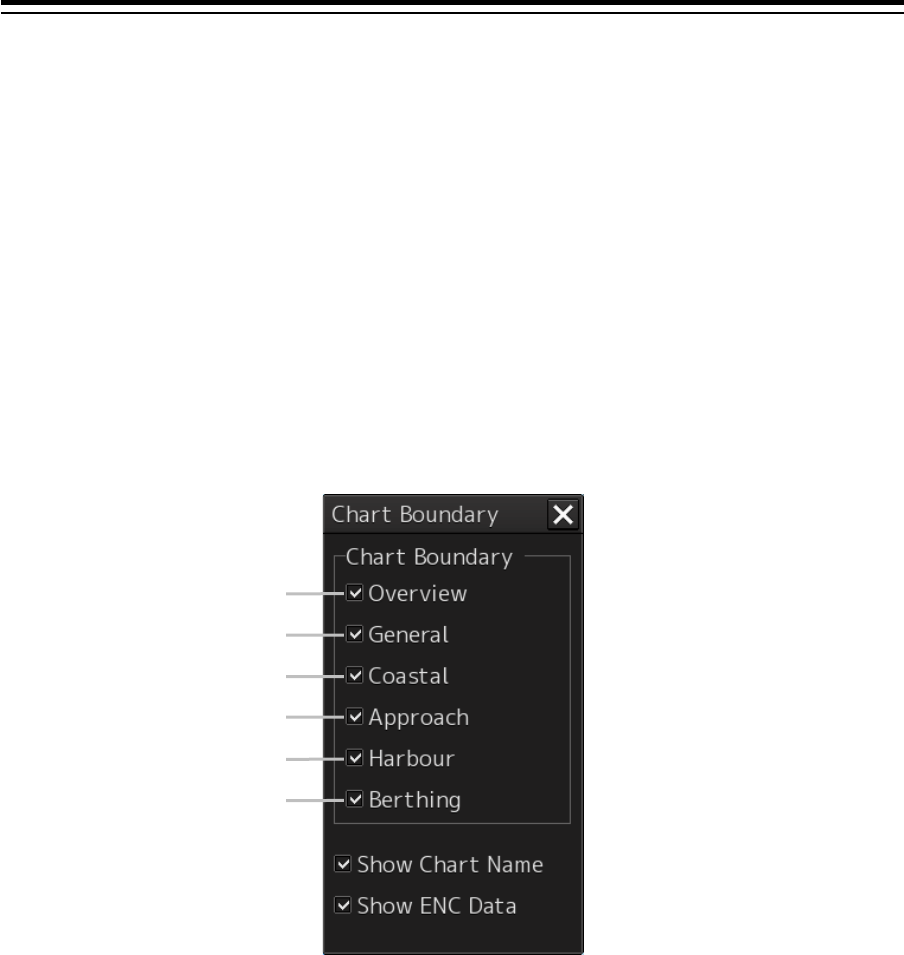
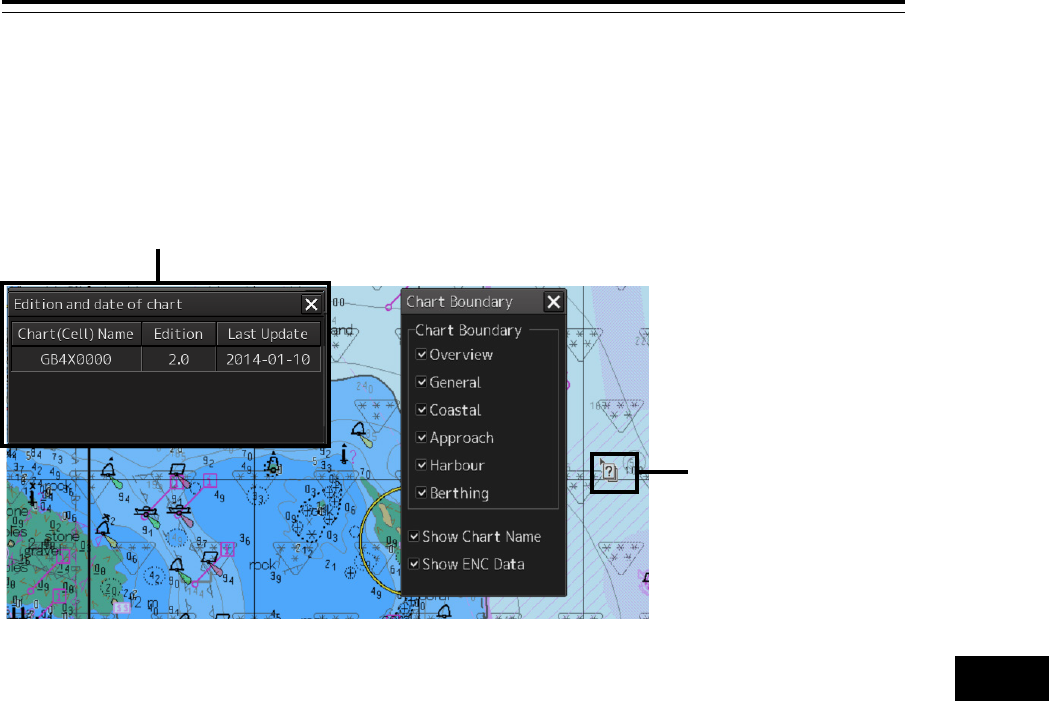
13.6 Displaying a Chart Boundary
The boundary of the chart on the position on which the button was clicked is displayed.
13.6.1 Setting a boundary to be displayed on the
chart
A chart boundary can be displayed.
1 Click on the [Menu] button on the left toolbar.
The menu is displayed.
2 Click on the [Chart] - [Chart Boundary] on the menu.
The "Chart Boundary" dialog box appears.
3 Select the chart whose boundary is to be displayed among the [Chart Boundary] check
boxes.
4 To display the chart name in addition to the boundary, select [Show Chart Name].
5 To display ordinary chart information in addition to the boundary, select [Show ENC
Data] (displaying chart information).
When this item is not selected, the background chart is displayed.
Overview chart
General chart
Coastal chart
Approach chart
Harbour chart
Berthing chart
13-11 Section 13 Operating a Chart (option)
1
2
3
4
5
6
7
8
9
10
11
12
13
14
15
16
17
18
19
20
21
22
23
24
25
26
27
付録
13.6.2 Displaying chart information
When the chart is clicked on while the "Chart Boundary" dialog box is displayed, the chart information
on the location that was clicked on is displayed in "Edition and date of chart".
Click
Information of the chart of the location that was clicked on
Section 13 Operating a Chart (option) 13-12
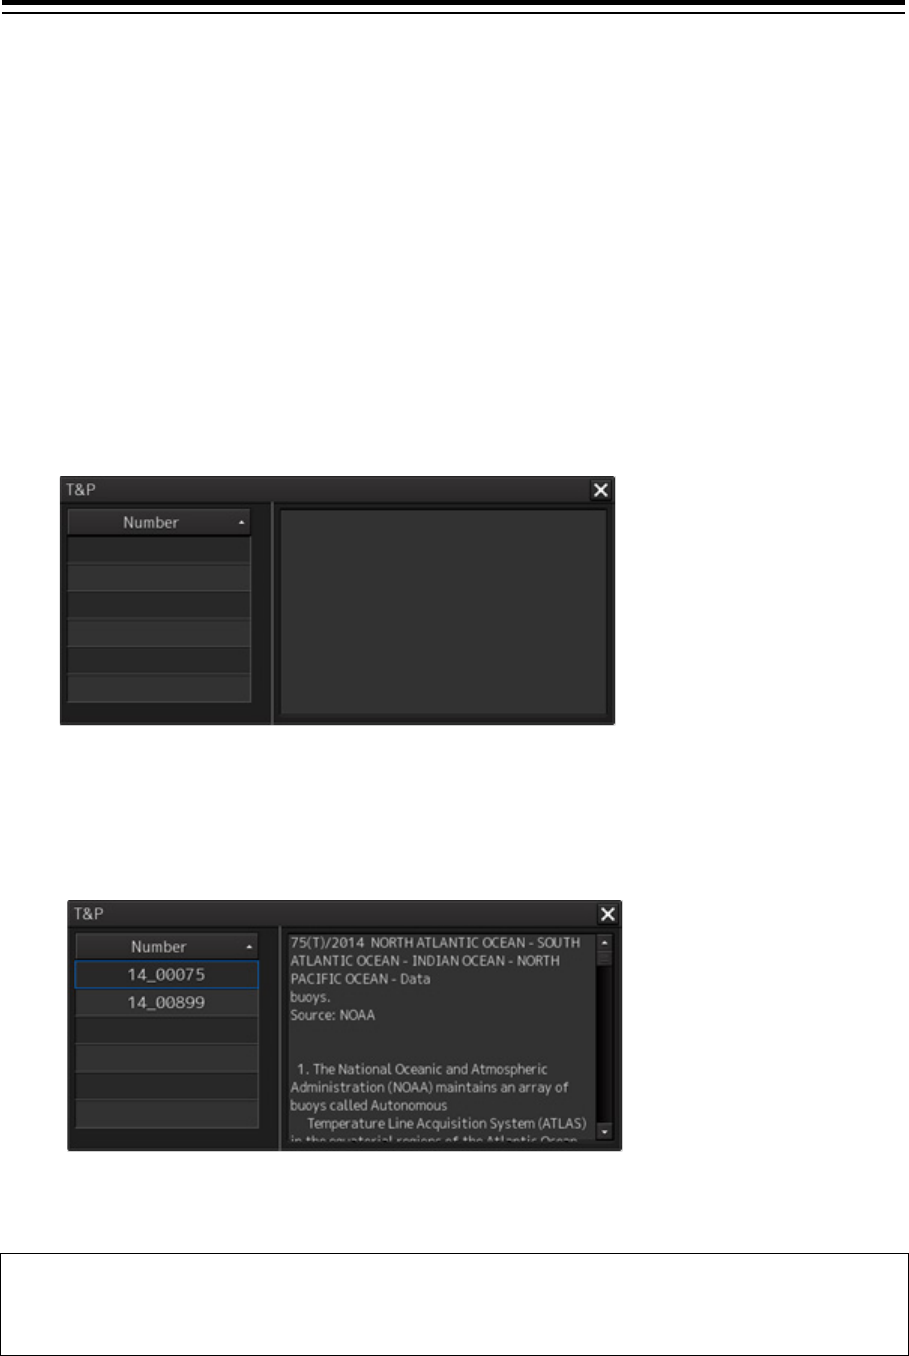
13.7 Confirming Temporary/Preliminary
Information of an ARCS Chart (ARCS
Only)
Temporary/preliminary information (T&P: Temporary and Preliminary Notices) of an ARCS chart can be
confirmed.
1 Click on the [Menu] button on the left toolbar.
The menu is displayed.
2 Click on the [Chart] - [T & P] on the menu.
The "T & P" dialog box appears.
3 Click on the number whose contents are to be confirmed on the [Number] list.
The temporary/preliminary information of the chart of the specified number is displayed on the
right side.
The list can be sorted by clicking on any item of the title column.
Note
Temporary/preliminary information is included in the ARCS chart itself. Since the information may
not be included depending on the chart, the information may not be displayed.
13-13 Section 13 Operating a Chart (option)
1
2
3
4
5
6
7
8
9
10
11
12
13
14
15
16
17
18
19
20
21
22
23
24
25
26
27
付録
13.8 Adjusting an ARCS Chart Position
(ARCS Only)
Note
Adjust the offet only when the geodetic datum of the chart is a local geodetic datum and the
display position is not adjusted correctly.
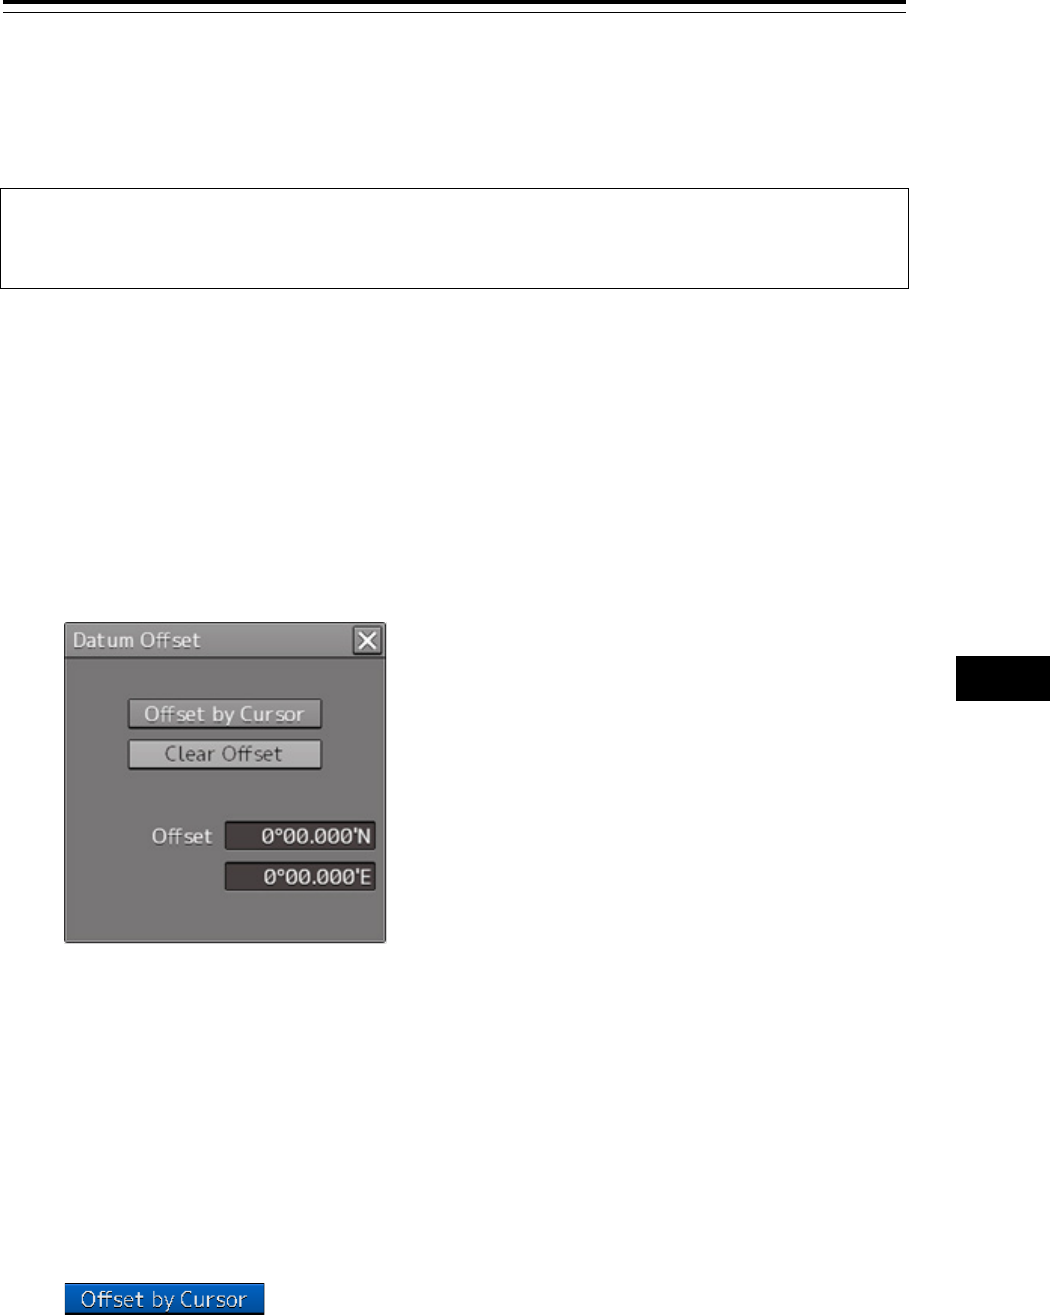
13.8.1 Offsetting an ARCS chart
Move the chart by entering offset values (latitude and longitude) or using the cursor.
1 Click on the [Menu] button on the left toolbar.
The menu is displayed.
2 Click on the [Chart] - [Datum Offset] (geodetic offset) on the menu.
The [Datum Offset] (geodetic offset) dialog box appears.
When the previous setting values are displayed in the [Off set] box, the values can be cleared
by clicking on the [Clear Offset] button.
To set offset of a chart, use the cursor or enter offset values.
Offsetting a chart with the cursor
1 Click on the [Offset by Cursor] button.
The button display changes to On and the offset function is enabled.
2 Set the cursor to the reference point and click the mouse button.
To clear the offset values, set the button to Off by clicking on the [Offset by Cursor] button.
Section 13 Operating a Chart (option) 13-14
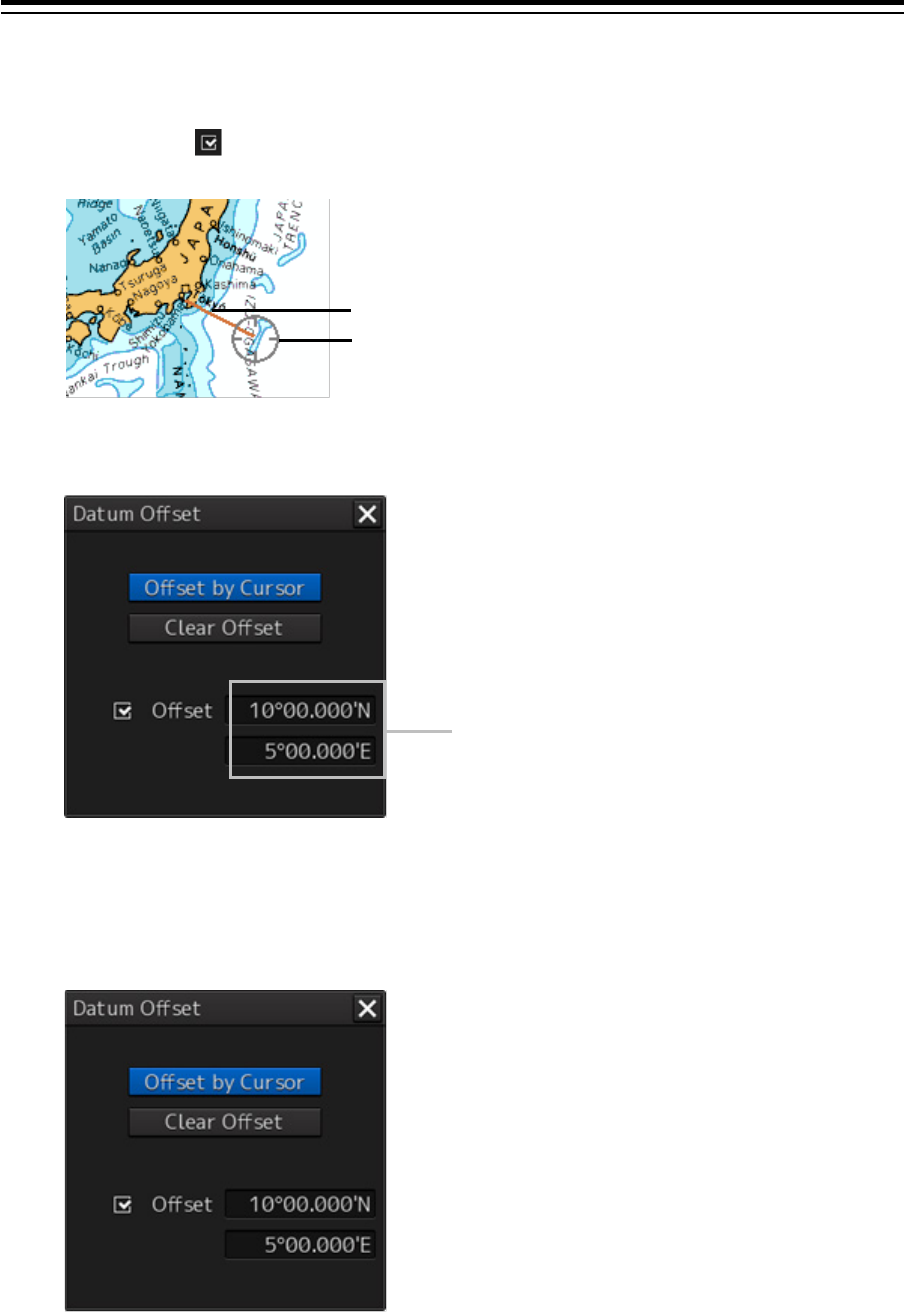
3 Place the cursor on the offset position and click the mouse button.
The reference point moves to the offset position.
A check mark ( ) is displayed on the [Offset] display (start of offset).
Offsetting a chart by entering an offset value
1 Enter offset values (latitude/longitude) in the [Offset] box.
The chart is offset.
Cursor
Orange line
Offset amount
13-15 Section 13 Operating a Chart (option)
1
2
3
4
5
6
7
8
9
10
11
12
13
14
15
16
17
18
19
20
21
22
23
24
25
26
27
付録
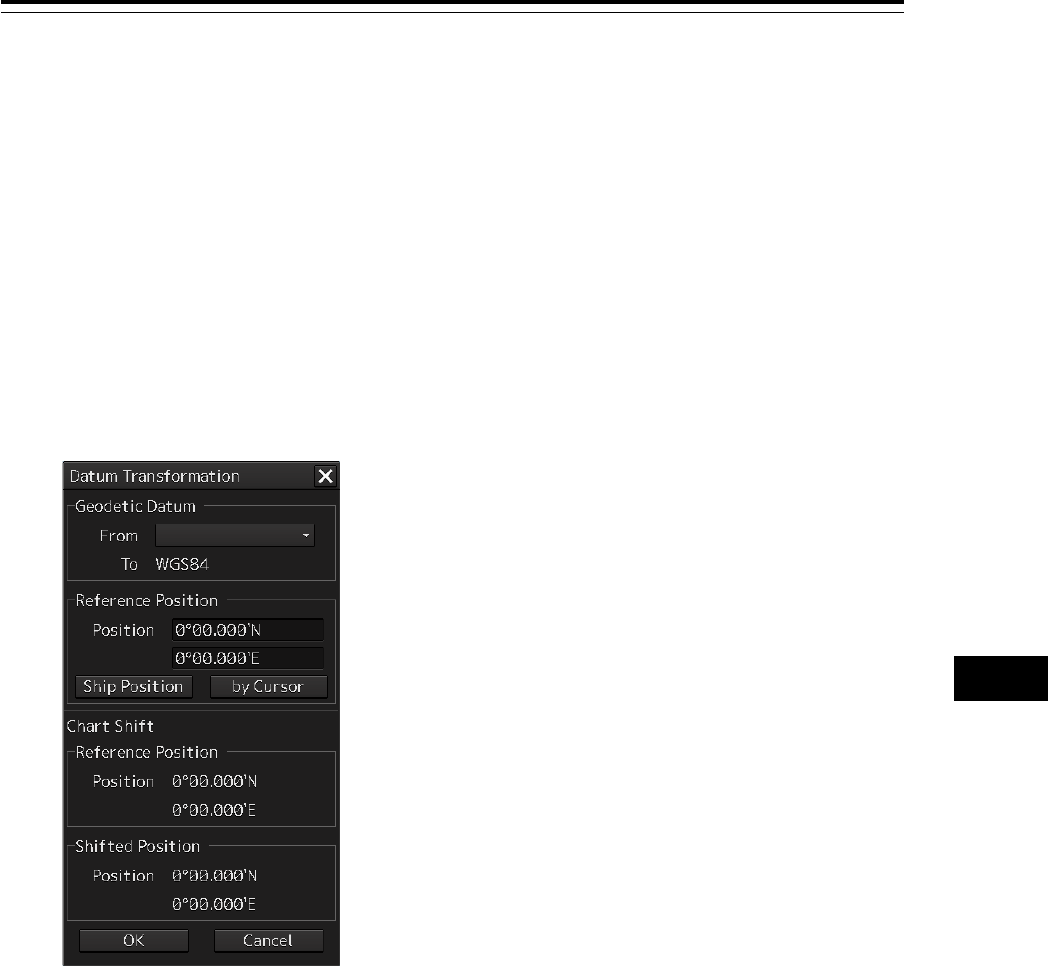
13.8.2 Transforming a geodetic datum of an ARCS
chart to WGS-84
A geodetic datum of an ARCS chart can be transformed to WGS-84 based on any position and the own
ship’s position.
1 Click on the [Menu] button on the left toolbar.
The menu is displayed.
2 Click on the [Chart] - [Datum Transformation] (geodetic datum transformation) on the
menu.
The [Datum Transformation] (geodetic datum transformation) dialog box appears.
Section 13 Operating a Chart (option) 13-16
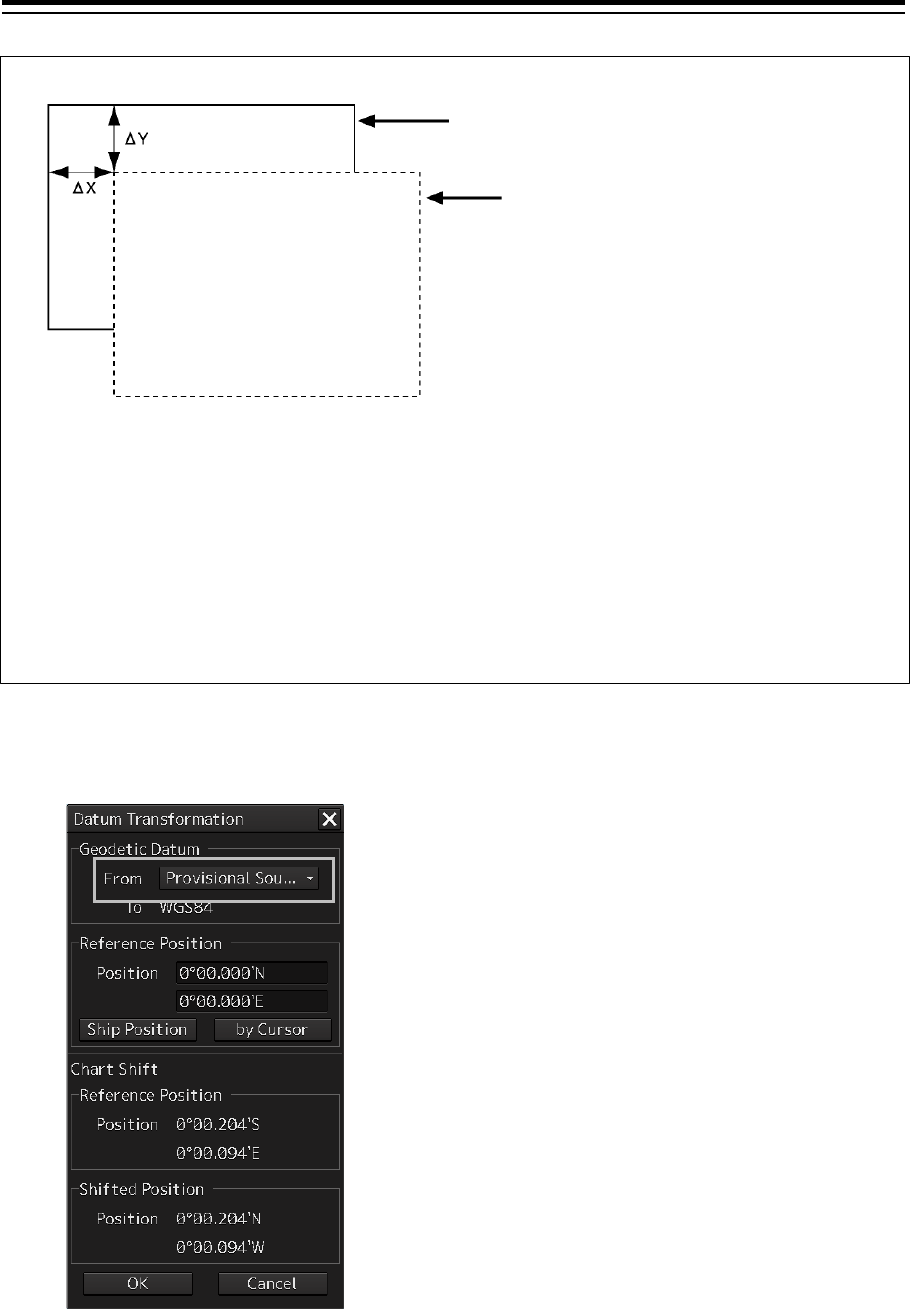
3 Select a geodetic system from the [From] combo box of [Geodetic Datum].
Note
Chart display position in the
WGS84 geodetic datum
Chart display position in
the local geodetic datum
X and
Y: Offset amount to WGS84
When X and Y are included in the chart information, the system automatically offsets the
amount to WGS84 and displays the result.
In this case, a check mark is attached to RNC Offset
of "Chart Information Area (RNC)" and "Chart Shift to WGS84" is displayed in the alert
notification area.
As shown above, even if the offset amount is determined in the "Datum Transformation" dialog
box for the chart that is displayed under WGS-
84 and the [OK] button is clicked on, this function
is disabled and the message, "The Datum is already WGS-84", is displayed.
13-17 Section 13 Operating a Chart (option)
1
2
3
4
5
6
7
8
9
10
11
12
13
14
15
16
17
18
19
20
21
22
23
24
25
26
27
付録
The following geodetic datums are displayed.
No. Name No. Name
0
WGS 84
24
Hayford 1910
1
WGS 72
25
Hjorsey 1955
2
Tokyo
26
Indian
3
North American 1927(USA)
27
Ireland 1965
4
North American 1927(Canada & Alaska)
28
Kertau 1948
5
European 1950
29
L. C. 5 Astro 1961
6
Australian Geodetic 1966
30
Liberia 1964
7
Ordnance Survey of Great Britain
31
Luzon
8
North American 1983
32
Merchich
9
No Use
33
Minna
10
No Use
34
Nahrwan
11
Adindan
35
Naparima, BWl
12
Arc 1950
36
Old Egyptian 1907
13
Australian Geodetic 1984
37
Old Hawaiian
14
Bermuda 1957
38
Pico de las Nieves
15
Bogota Observatory
39
Provisional South American 1956
16
Campo Inchauspe
40
Provisional South Chilean 1963
17
Chatam Island Astro 1971
41
Puerto Rico
18
Chua Astro
42
Qornoq
19
Corrego Alegre
43
RT 90
20
Djakarta
44
Sao Braz
21
European 1979
45
South American 1969
22
Geodetic Datum 1949
46
Graciosa Base SW 1948
23
Guam 1963
47
Timbalai 1948
Section 13 Operating a Chart (option) 13-18
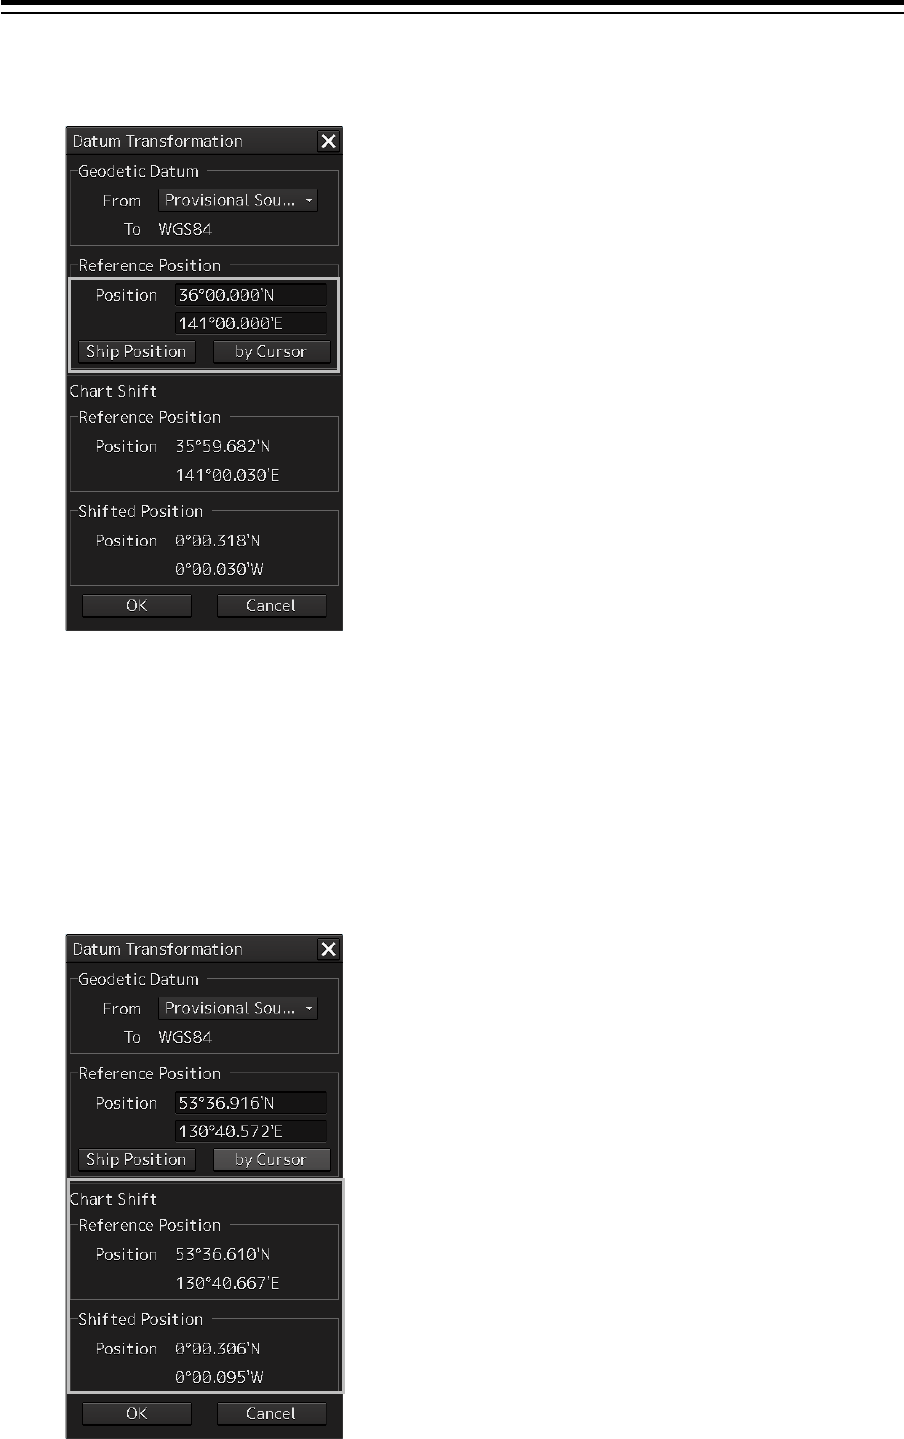
4 Enter a latitude and a longitude in the [Position] input boxes of [Reference Position].
When the [Ship Position] button is clicked on, the latitude and the longitude of the own ship’s
position is displayed in the [Position] input boxes.
When the [by Cursor] button is clicked on, the cursor changes to the offset cursor. When the
mouse button is clicked on the chart, the latitude and longitude of the point on which the mouse
button was clicked is displayed in the input boxes.
Information after transformation is displayed on [Chart Shift].

13-19 Section 13 Operating a Chart (option)
1
2
3
4
5
6
7
8
9
10
11
12
13
14
15
16
17
18
19
20
21
22
23
24
25
26
27
付録
The position shifted after geodetic datum transformation is displayed in [Reference Position].
The offset amount after geodetic datum transformation is displayed in [Shifted Position].
5 Click on the [OK] button.
The transformation is determined.
Section 13 Operating a Chart (option) 13-20
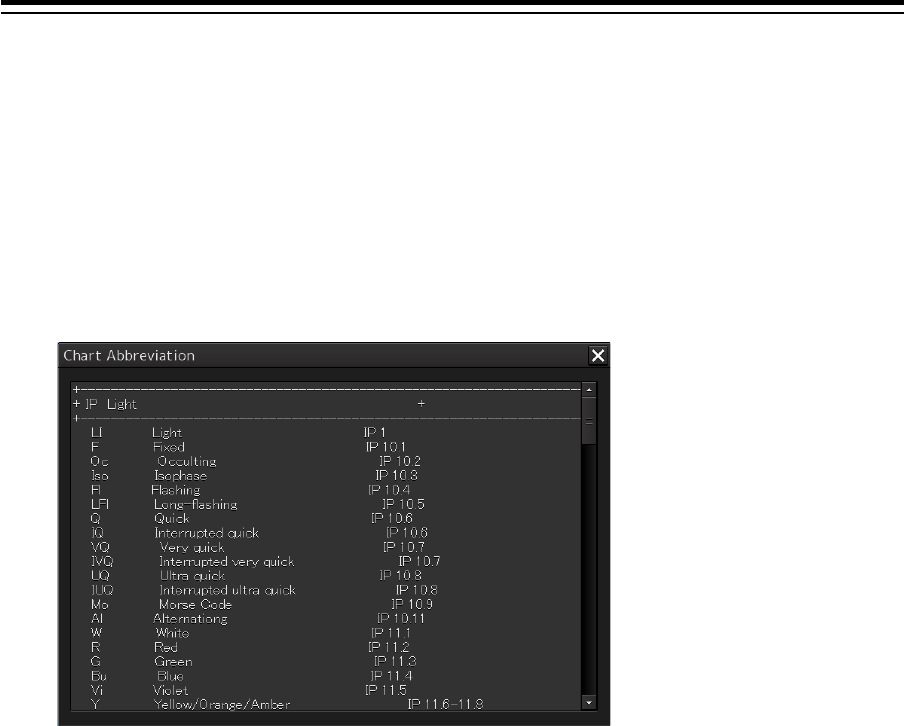
13.9 Displaying a Chart Abbreviation List
A list describing chart abbreviations can be displayed.
1 Click on the [Menu] button on the left toolbar.
The menu is displayed.
2 Click on the [Chart] - [Chart Abbreviation] on the menu.
The "Chart Abbreviation" dialog box appears.
13-21 Section 13 Operating a Chart (option)
1
2
3
4
5
6
7
8
9
10
11
12
13
14
15
16
17
18
19
20
21
22
23
24
25
26
27
付録
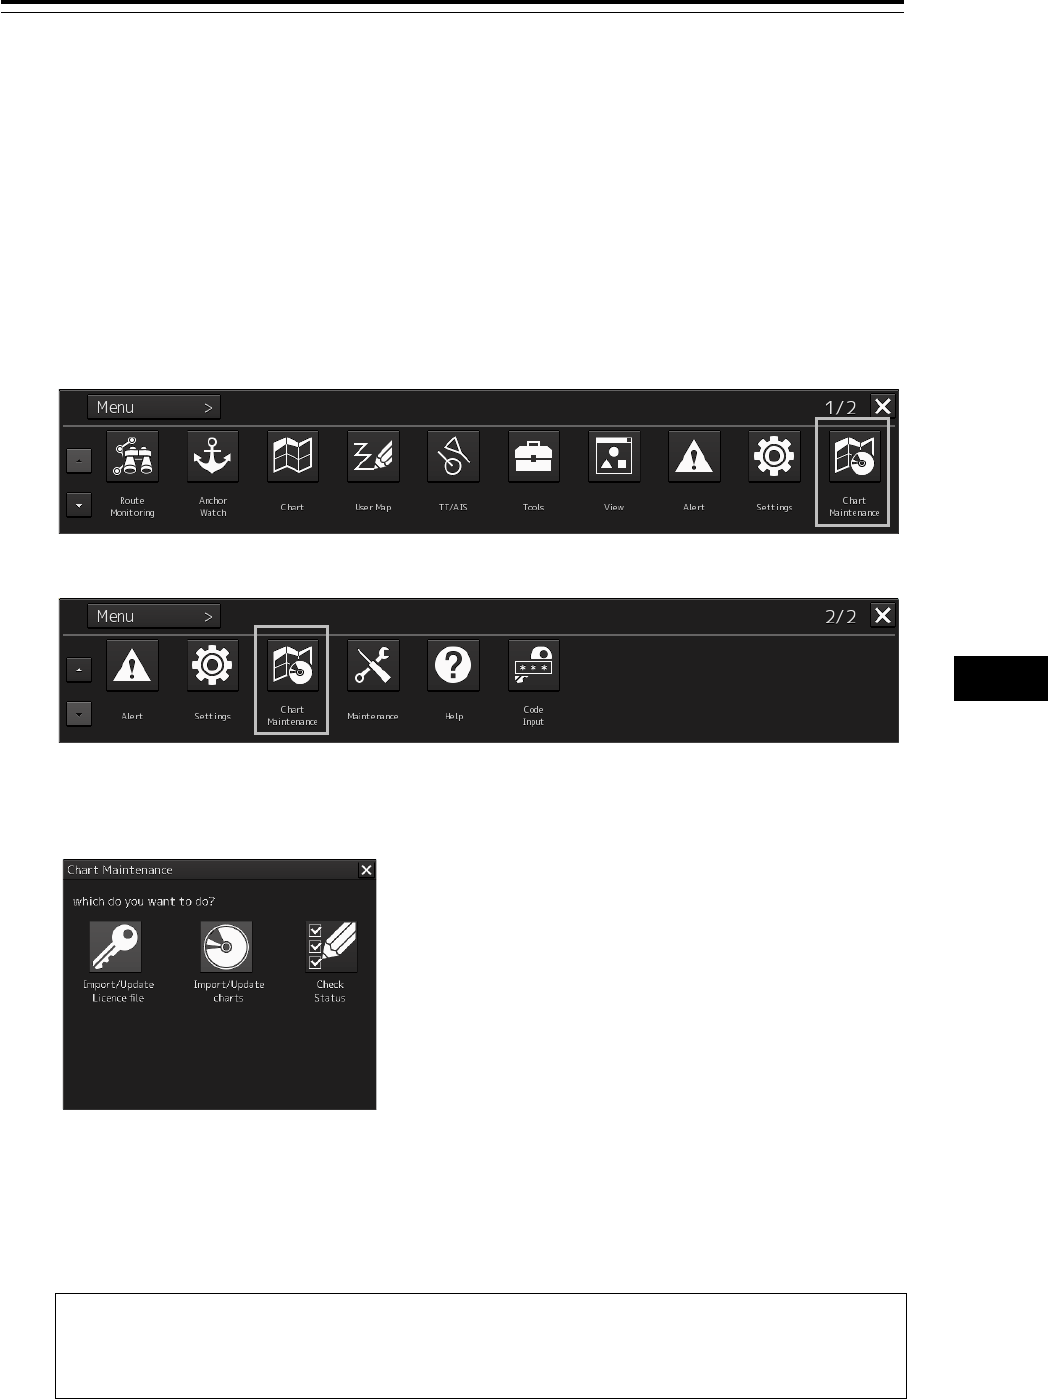
13.10 Maintaining a Chart
Use the Chart Maintenance menu for management of chart data.
1 Click on the [Menu] button on the left toolbar.
The menu is displayed.
In the case of ECDIS:
Change over to the second page using the page switching button.
2 Click on the [Chart Maintenance] button on the menu.
RADAR
ECDIS
The "Chart Maintenance" dialog box appears.
Three icons are assigned in the "Chart Maintenance" dialog box. Only the Check Status icon
can be clicked.
Click on the Check Status icon when checking the status of the chart.
Note
"Import/Update Licence file" and "Import/Update charts" dialogs can also be operated by
clicking from the "Chart Maintenance" dialog box started in the task menu.
Section 13 Operating a Chart (option) 13-22
Icon
Operation
Import/Update Licence file Imports/updates the license file for importing a chart.
Import/Update charts Imports/updates chart data.
Check Status Checks chart status.
For the operation of the Chart Maintenance menu, refer to a separate manual, "Additional
Instruction Manual for Introducing Chart".
14-1 Section 14 Creating a User Map/ Updating a Chart Manually
1
2
3
4
5
6
7
8
9
10
11
12
13
14
15
16
17
18
19
20
21
22
23
24
25
26
27
Section 14 Creating a User Map/
Updating a Chart
Manually
This section describes the procedures for creating a user map and updating a chart manually.
User map
A user specific map can be created by drawing various objects (symbol, line, area, and text) that are
not displayed on the existing chart. The created user map can also be updated by editing.
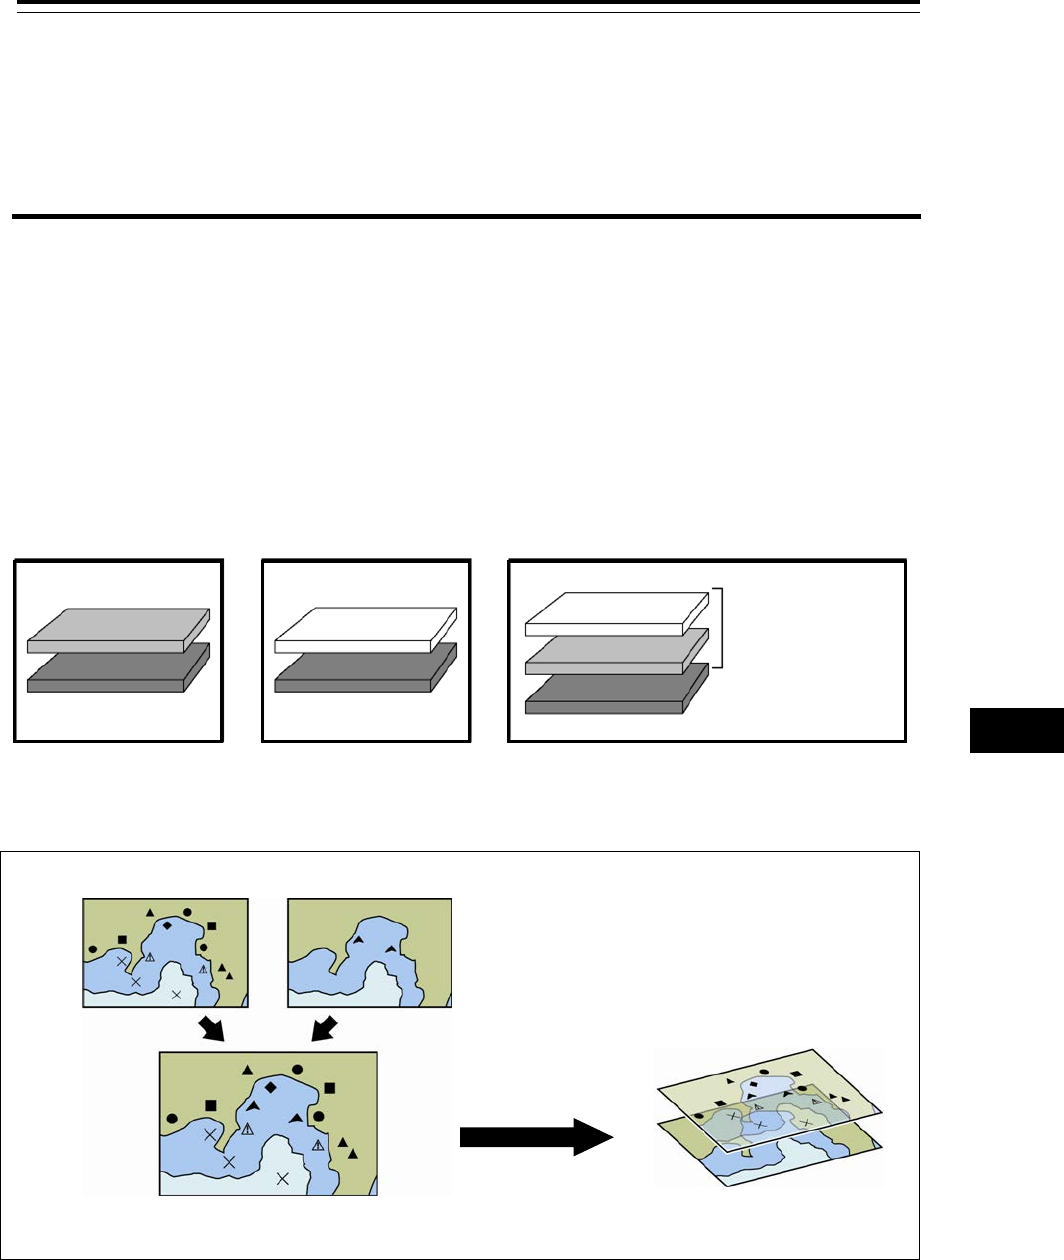
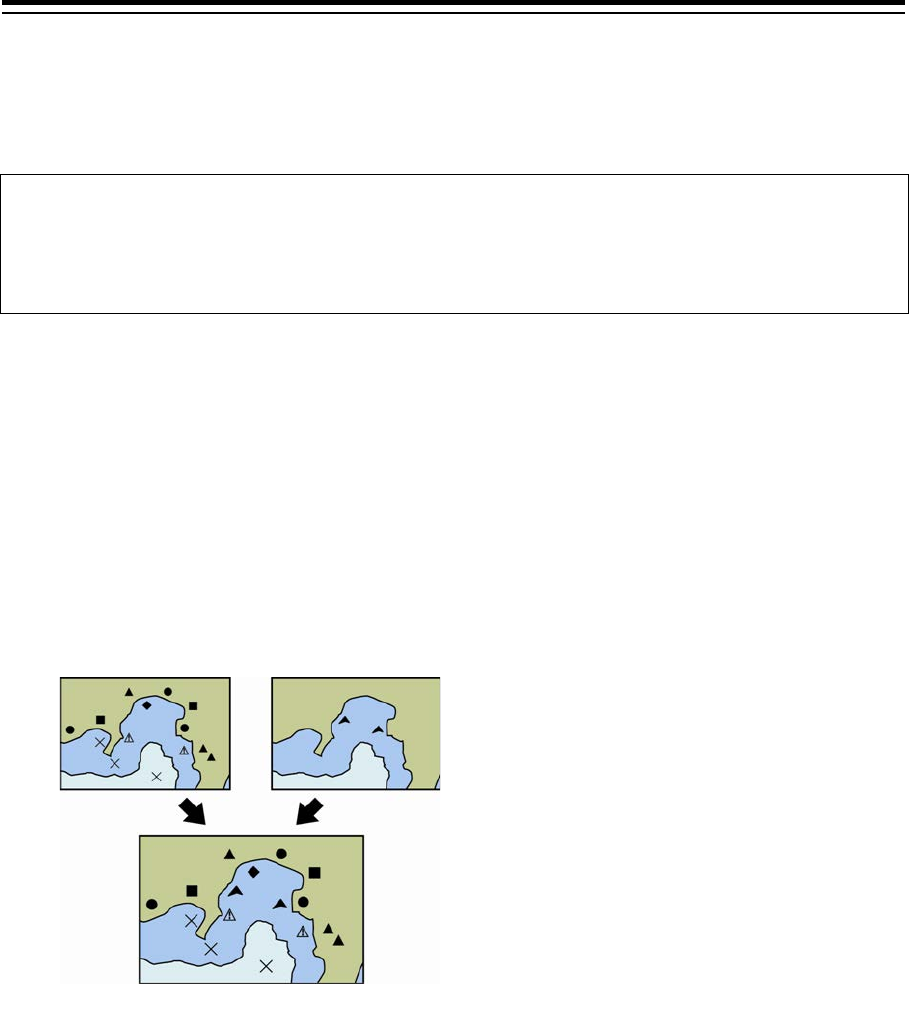
A user map can be displayed by overlapping on a chart. A user map can be created by merging two
user maps.
The following diagrams show how to use user maps.
Example: User maps 1 and 2 are merged and displayed on a chart by overlaying.
Multiple user maps
can be displayed
concurrently
User map 1
User map 2
User map 2
Chart
Chart
User map 1
Chart
Display example 1
Display example 2
Display example 3
Chart
User map 3
User map 1
User map 2
Merge user
maps 1 and 2.
User map 3
Display user map 3 on
the chart by overlaying.

Section 14 Creating a User Map/ Updating a Chart Manually 14-2
Manual Update (ECDIS screen only)
A chart can be updated manually by creating objects (symbols, lines, areas, and texts) on the
specifying chart.
In the manually updated chart, objects are linked to the chart itself, unlike user maps. Therefore,
although the manually updated objects can be hidden, they cannot be deleted easily.
For the details of hiding objects, refer to "14.4.1 Deleting or hiding an object".
14-3 Section 14 Creating a User Map/ Updating a Chart Manually
1
2
3
4
5
6
7
8
9
10
11
12
13
14
15
16
17
18
19
20
21
22
23
24
25
26
27
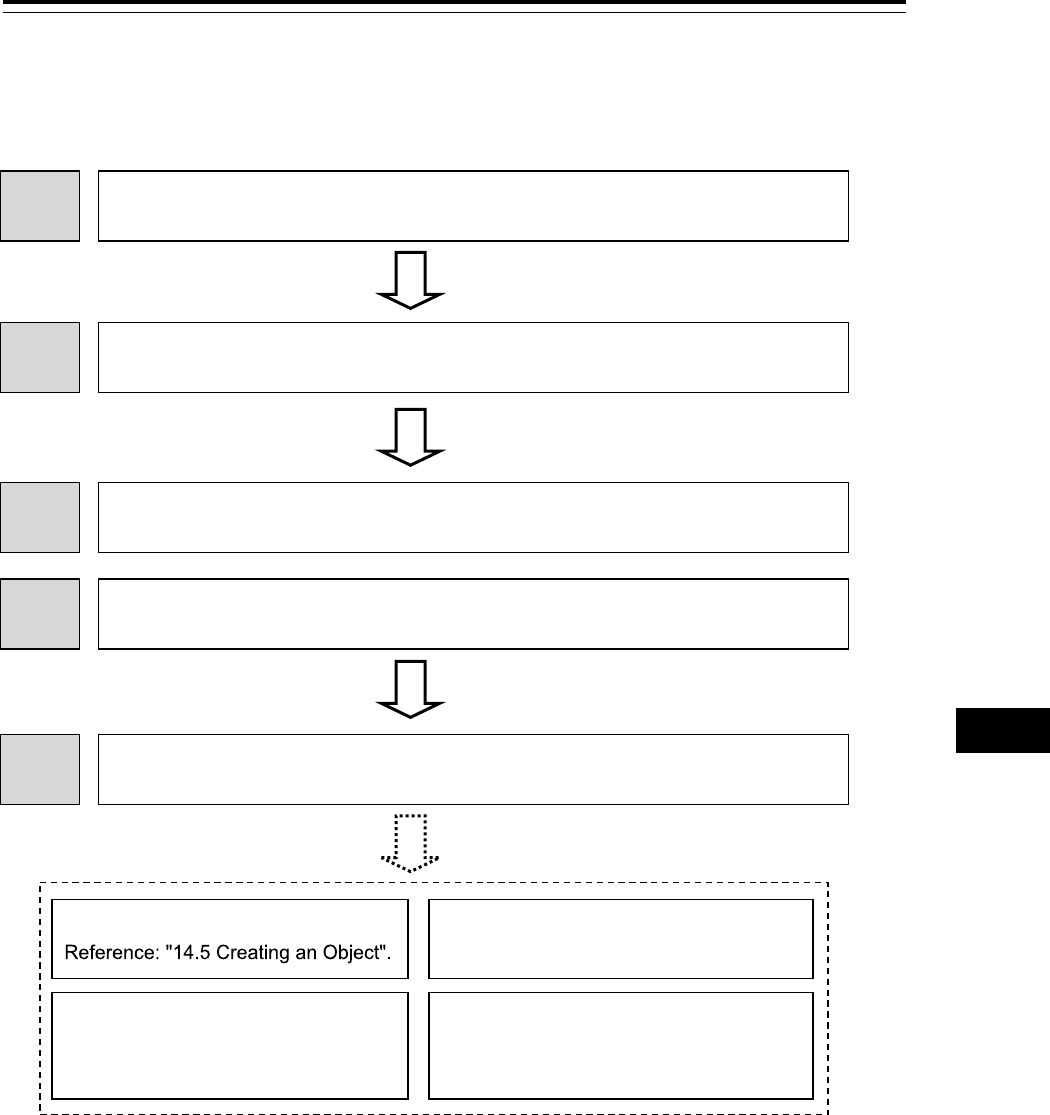
14.1 Creating/Editing a User Map
Use the following procedure to create/edit a user map.
1 Displaying the "User Map" menu.
Reference: "14.1.1 Display the "User Map" menu".
2 Displaying the "File Operation" submenu.
Reference: "14.1.2 Display the File Operation submenu".
3 Registering a new user map file.
Reference: "14.1.3 Creating a new user map".
3 Invoking an existing user map file.
Reference: "14.1.4 Editing the existing user map".
4 Creating/editing a user map by using map creation tools.
Reference: "14.2 Using Map Creation Tools (User Map Creation/Editing)".
Creating an object
Deleting an object
Reference: "14.6 Collective Deletion
of Objects [Delete by Type/Color]".
Managing/editing an object
Reference: "14.7 Managing/Editing
Objects [Mark Line/List]".
Moving an object
Reference: "14.2.10 Moving an object".
Section 14 Creating a User Map/ Updating a Chart Manually 14-4
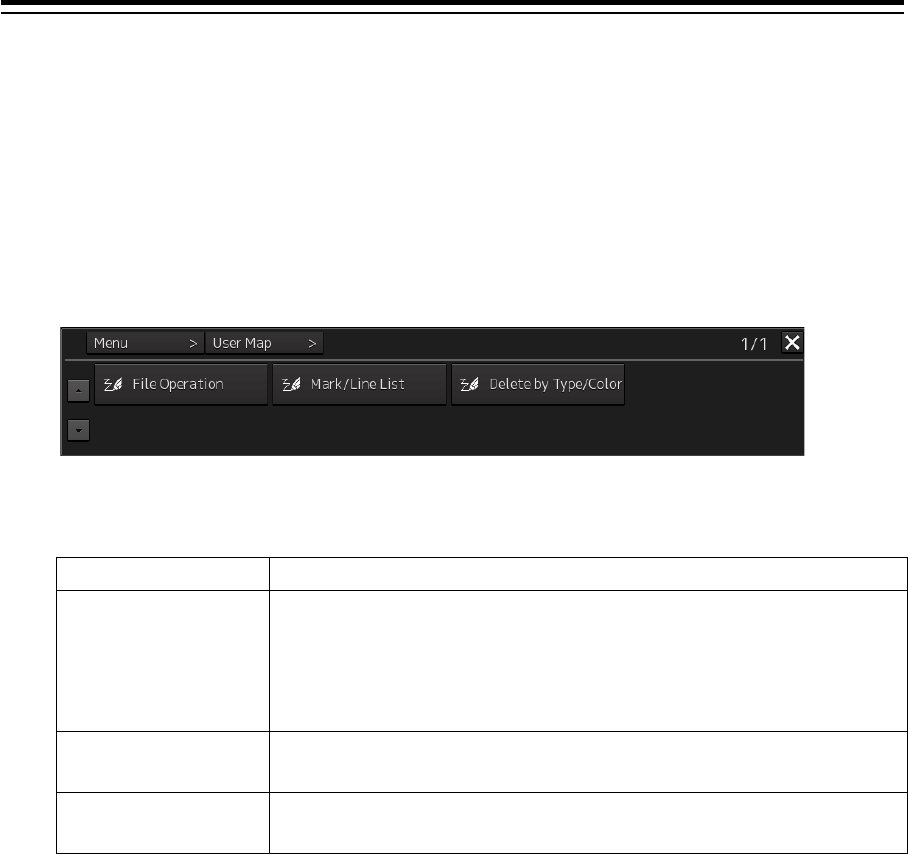
14.1.1 Display the "User Map" menu.
When creating/editing a user map, use the "User Map" menu.
1 Click on the [Menu] button on the left toolbar.
The menu is displayed.
2 Click on the [User Map] button on the menu.
The submenu is displayed.
The User Map menu comprises the following submenus.
Submenu Function
File Operation • Managing user map files (new creation, loading, copying, deletion,
import/export, geodetic conversion)
• Displaying/editing a user map
• Merging user map files
Refer to "14.1.6 Operating a user map file".
Delete by Type/Color Deleting objects collectively
Refer to "14.6 Collective Deletion of Objects [Delete by Type/Color]".
Mark Line/List Managing/editing objects
Refer to "14.7 Managing/Editing Objects [Mark Line/List]".
14-5 Section 14 Creating a User Map/ Updating a Chart Manually
1
2
3
4
5
6
7
8
9
10
11
12
13
14
15
16
17
18
19
20
21
22
23
24
25
26
27
14.1.2 Display the File Operation submenu
1 Click on the [Menu] button on the left toolbar.
The menu is displayed.
2 Click on the [User Map] button on the menu.
3 Click on the [File Operation] button on the submenu.
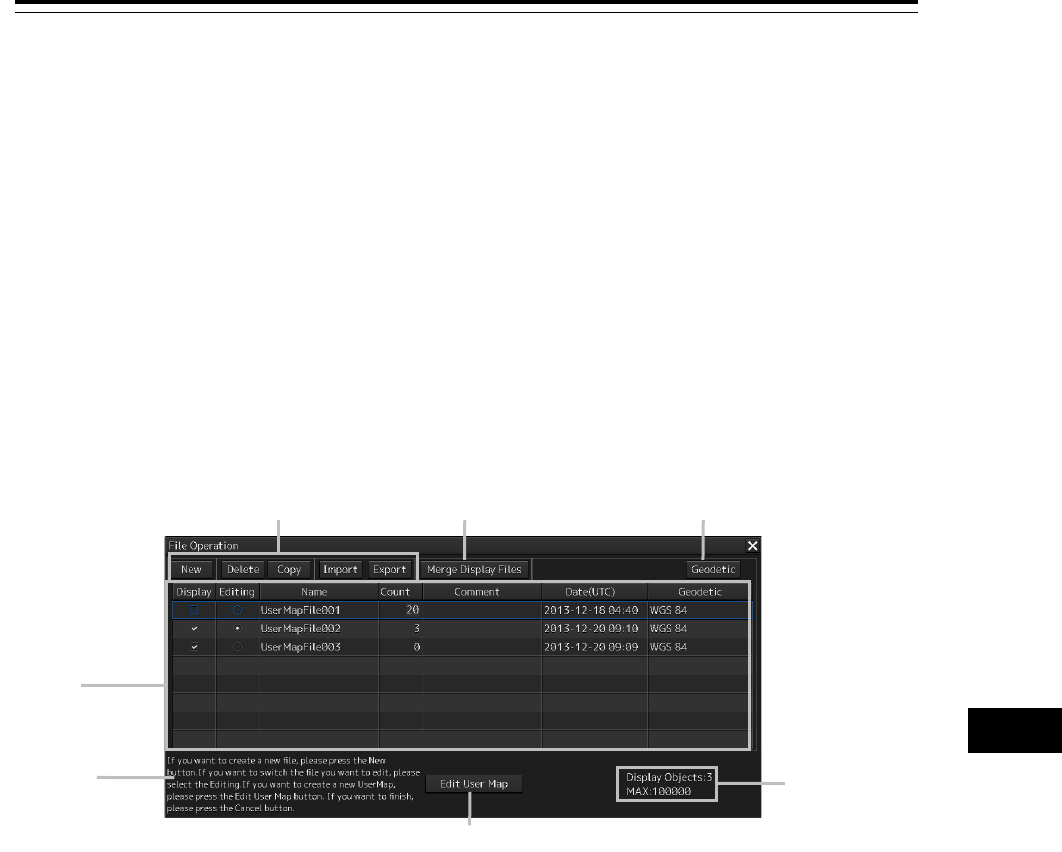
The "File Operation" operation dialog box appears.
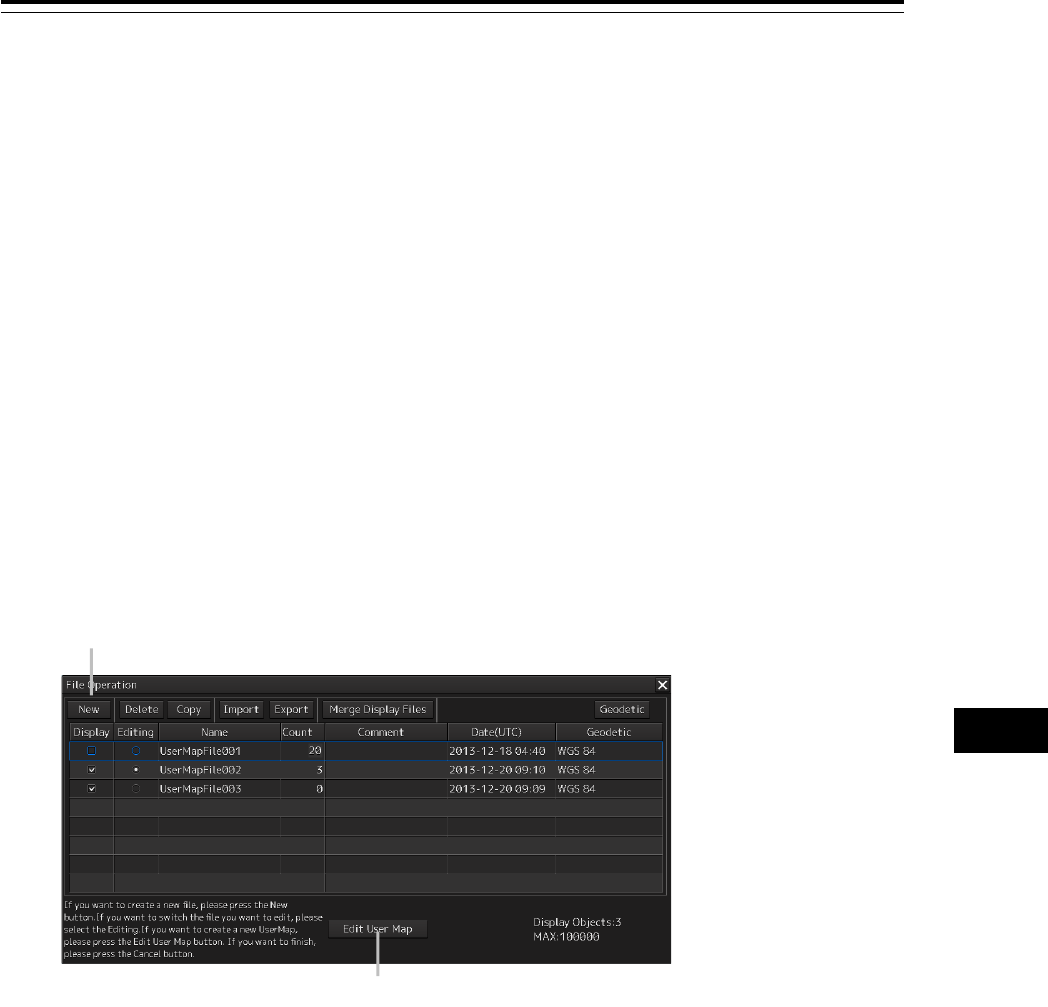
14.1.2.1 "File Operation" dialog box
Manage the file at user map creation and display and edit the user map on the "File Operation" dialog
box.
The user map files that are currently saved are displayed in the file list.
The number of objects that are displayed is indicated at the bottom right corner of the dialog.
File list
Operation
guide
No. of objects
displayed
[Merge Display Files] button
[Geodetic] button
File operation button
[Edit User Map] button
Section 14 Creating a User Map/ Updating a Chart Manually 14-6
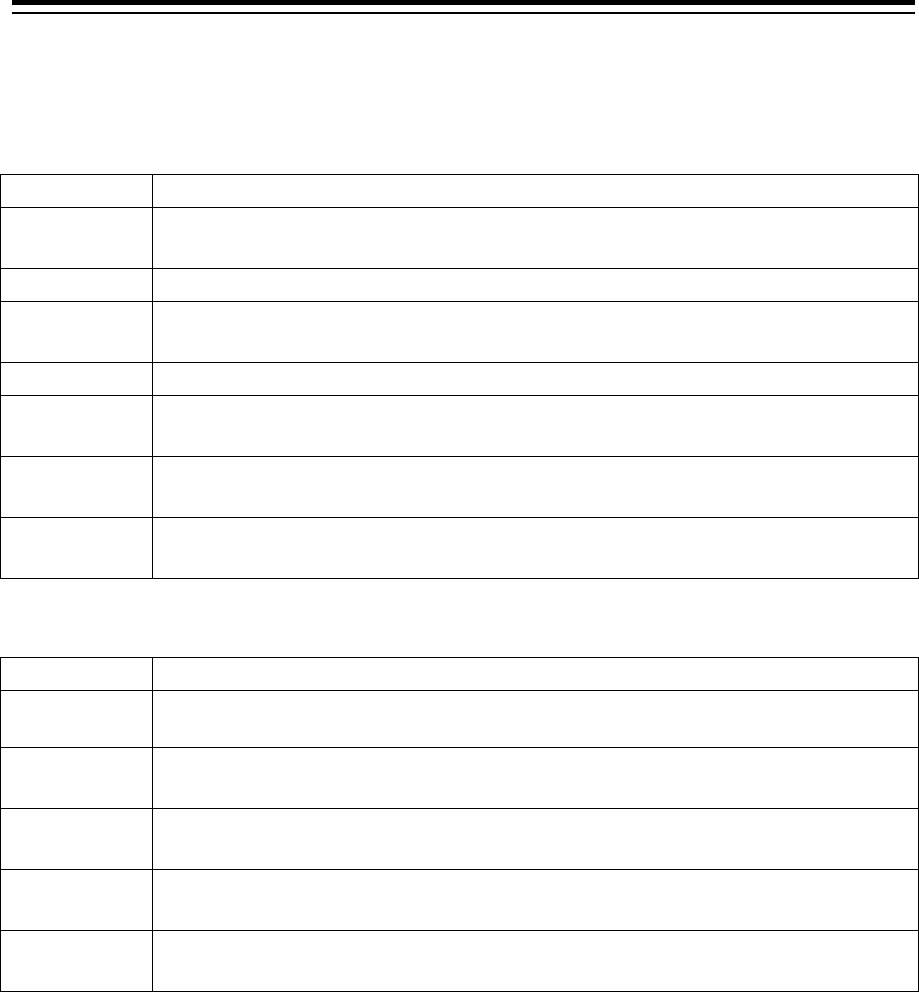
File list
Up to 500 user map files (.uchm) can be registered in a file list. The following information is displayed
for the user map files that are currently saved.
Item Information
[Name]
Indicates the name of the user map file (up to 64 characters).
The name can be changed by clicking on the name in the list.
[Count]
Indicates the total number of objects that are registered in the user map file.
[Comment]
Indicates the comment on the user map file (up to 64 characters).
The comment can be changed by clicking on the comment in the list.
[Date]
Last update date of the user map file
[Geodetic]
Displays the geodetic datum of the user map file.
To change the geodetic datum, refer to "14.1.6.6 Performing geodetic datum conversion".
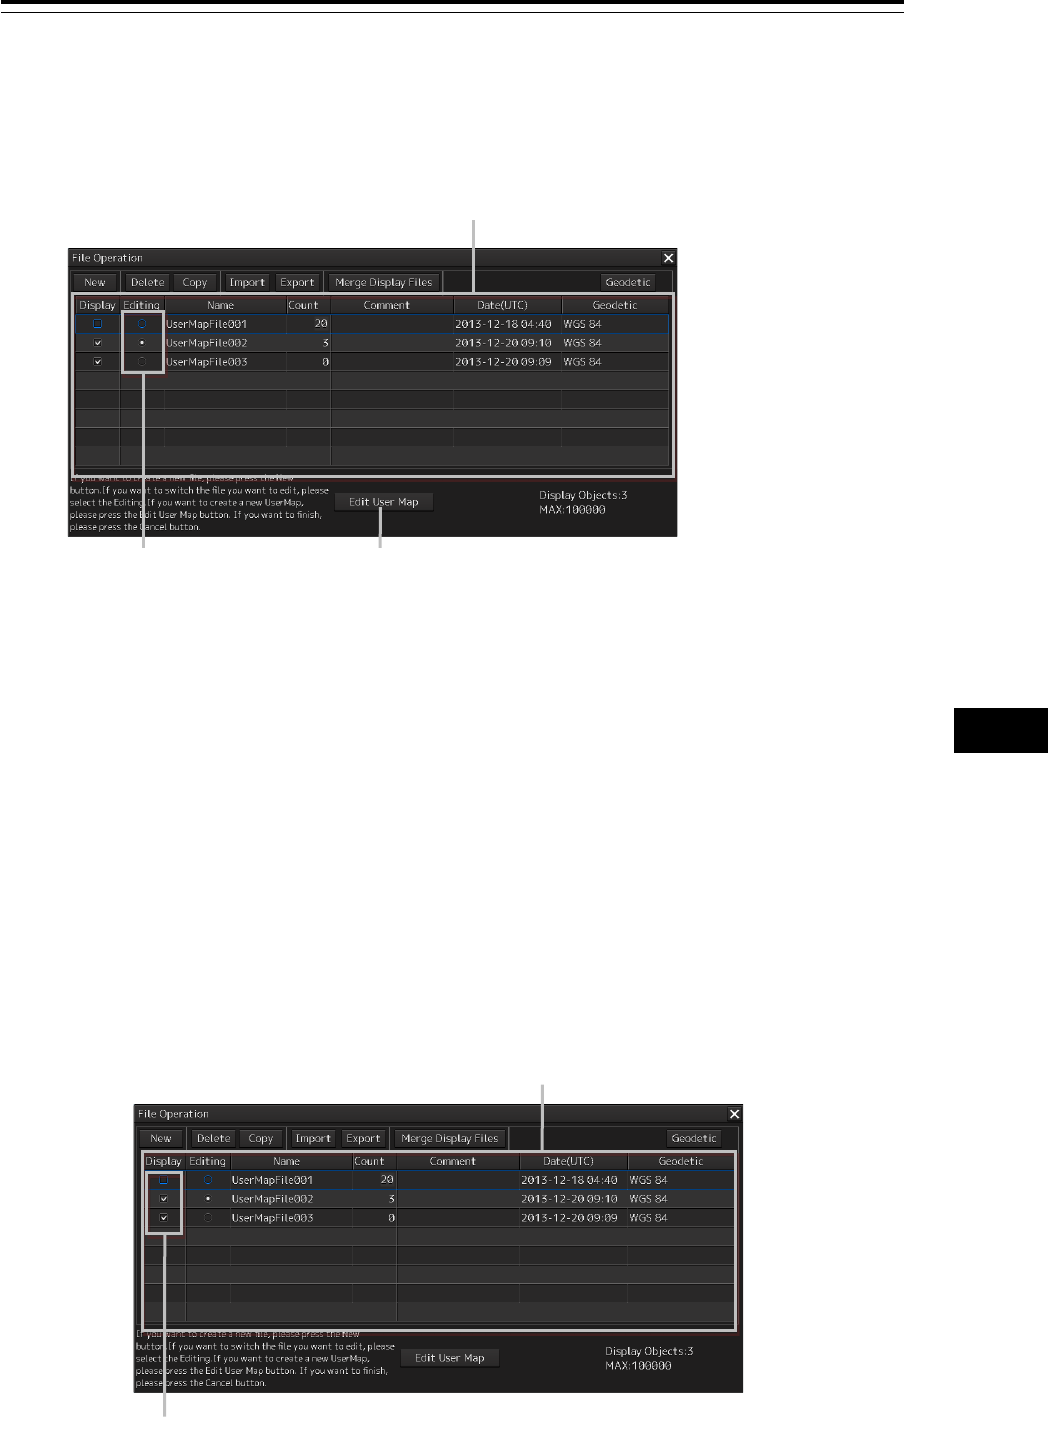
[Display]
The [Display] check box is checked for the user map file that is displayed.
For the method of using the [Display] check box, refer to "14.1.5 Displaying a user map".
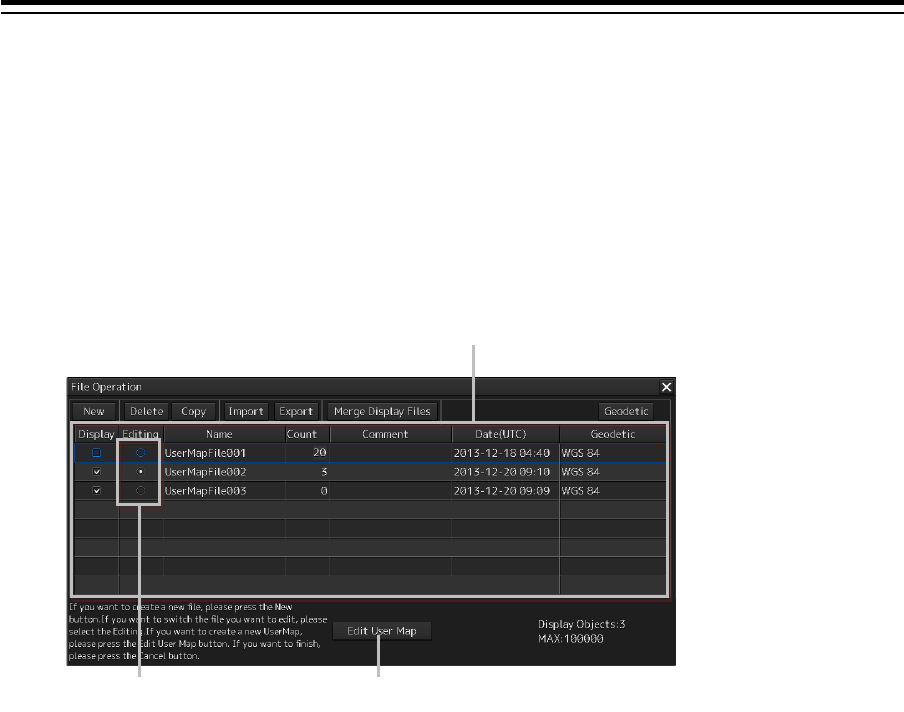
[Editing]
The [Editing] button is set to ON for the user map file that is being created or edited.
For the method of using the [Editing] button, refer to "14.1.4 Editing the existing user map".
File operation buttons
Button name Function
[New] Creates a new user map file.
For the details, refer to "14.1.3 Creating a new user map".
[Delete] Deletes a user map file.
For the details, refer to "14.1.6.1 Deleting a user map file".
[Copy] Copies a user map file
For the details, refer to "14.1.6.2 Copying a user map file".
[Import] Imports a user map file from an external medium.
For the details, refer to "14.1.6.3 Importing a user map file".
[Export] Exports the user map that was created to an external medium.
For the details, refer to "14.1.6.4 Exporting a user map file".
[Merge Display Files] button
This button merges the selected user map files.
For the details, refer to "14.1.6.5 Merging multiple user map files".
14-7 Section 14 Creating a User Map/ Updating a Chart Manually
1
2
3
4
5
6
7
8
9
10
11
12
13
14
15
16
17
18
19
20
21
22
23
24
25
26
27
[Geodetic] button
This button selects the geodetic datum of the user map file.
For the details, refer to "14.1.6.6 Performing geodetic datum conversion".
[Edit User Map] button
This button edits the existing user map file.
For the details, refer to "14.1.4 Editing the existing user map".
14.1.3 Creating a new user map
1 Click on the [Menu] button on the left toolbar.
The menu is displayed.
2 Click on the [User Map] button on the menu.
3 Click on the [File Operation] button on the submenu.
The "File Operation" operation dialog box appears.
4 Click on the [New] button.
The new user map file is registered in the file list.
The file name can be changed by clicking on the file name that is displayed in the [Name]
column in the file list.
5 Click on the [Edit User Map] button in the [File Operation] dialog box.
The map creation tool is displayed.
Create or edit the user map by using the map creation tool. (Refer to "14.2 Using Map Creation
Tools (User Map Creation/Editing)").
[New] button
[Edit User Map] button
Section 14 Creating a User Map/ Updating a Chart Manually 14-8
14.1.4 Editing the existing user map
1 Click on the [Menu] button on the left toolbar.
The menu is displayed.
2 Click on the [User Map] button on the menu.
3 Click on the [File Operation] button on the submenu.
The "File Operation" operation dialog box appears.
4 Click on the [Editing] button of the user map file to be edited in the file list on the [File
Operation] dialog.
The user map file to be edited is displayed.
5 Click on the [Edit User Map] button on the [File Operation] dialog box.
The map creation tools (drawing toolbar and the user map information bar) are displayed and
the cursor changes from the cross-hair cursor to the mark cursor.
Edit the user map by using the map creation tools. (Refer to "14.2 Using Map Creation Tools
(User Map Creation/Editing)").
14.1.4.1 Editing the user map that is currently displayed
1 Display a user map. (Refer to "14.1.5 Displaying a user map").
2 Click on the Write tool button on the left toolbar.
The map creation tools (drawing toolbar and the user map information bar) are displayed and
the cursor changes from the cross-hair cursor to the mark cursor.
3 Edit the user map by using the map creation tools. (Refer to "14.2 Using Map Creation
Tools (User Map Creation/Editing)").
[Edit User Map] button
[Editing] button
File list
14-9 Section 14 Creating a User Map/ Updating a Chart Manually
1
2
3
4
5
6
7
8
9
10
11
12
13
14
15
16
17
18
19
20
21
22
23
24
25
26
27
4 To edit another user map, click on the “File Operation” dialog display button on the
user map information bar. (Refer to "14.2 Using Map Creation Tools (User Map
Creation/Editing)").
The “File Operation” dialog box appears.
5 Click on the [Editing] button of the user map file to be edited in the file list on the “File
Operation” dialog box.
The selected user map is displayed.
14.1.5 Displaying a user map
1 Click on the [Menu] button on the left toolbar.
The menu is displayed.
2 Click on the [User Map] button on the menu.
3 Click on the [File Operation] button on the submenu.
The "File Operation" dialog box appears.
[Edit User Map] button
[Editing] button
File list
[Display] check box
File list

Section 14 Creating a User Map/ Updating a Chart Manually 14-10
4 Select the [Display] check box of the user map file to be displayed in the file list on the
[File Operation] dialog box.
The selected user map is displayed.
14.1.6 Operating a user map file
Manage the file at user map creation, merge user maps, or select a geodetic datum on the "File
Operation" dialog box.
14.1.6.1 Deleting a user map file
1 Click on the user map file to be deleted in the file list.
The user map file is selected.
2 Click on the [Delete] button.
The selected user map file is deleted.
14.1.6.2 Copying a user map file
1 Click on the file to be copied in the file list.
The user map file is selected.
2 Click on the [Copy] button.
The selected user map file is copied.
The copied file is named under "Copy of (copy source file name)".
Note
If the file name exceeds 64 characters including "Copy of", the file cannot be copied.
14-11 Section 14 Creating a User Map/ Updating a Chart Manually
1
2
3
4
5
6
7
8
9
10
11
12
13
14
15
16
17
18
19
20
21
22
23
24
25
26
27
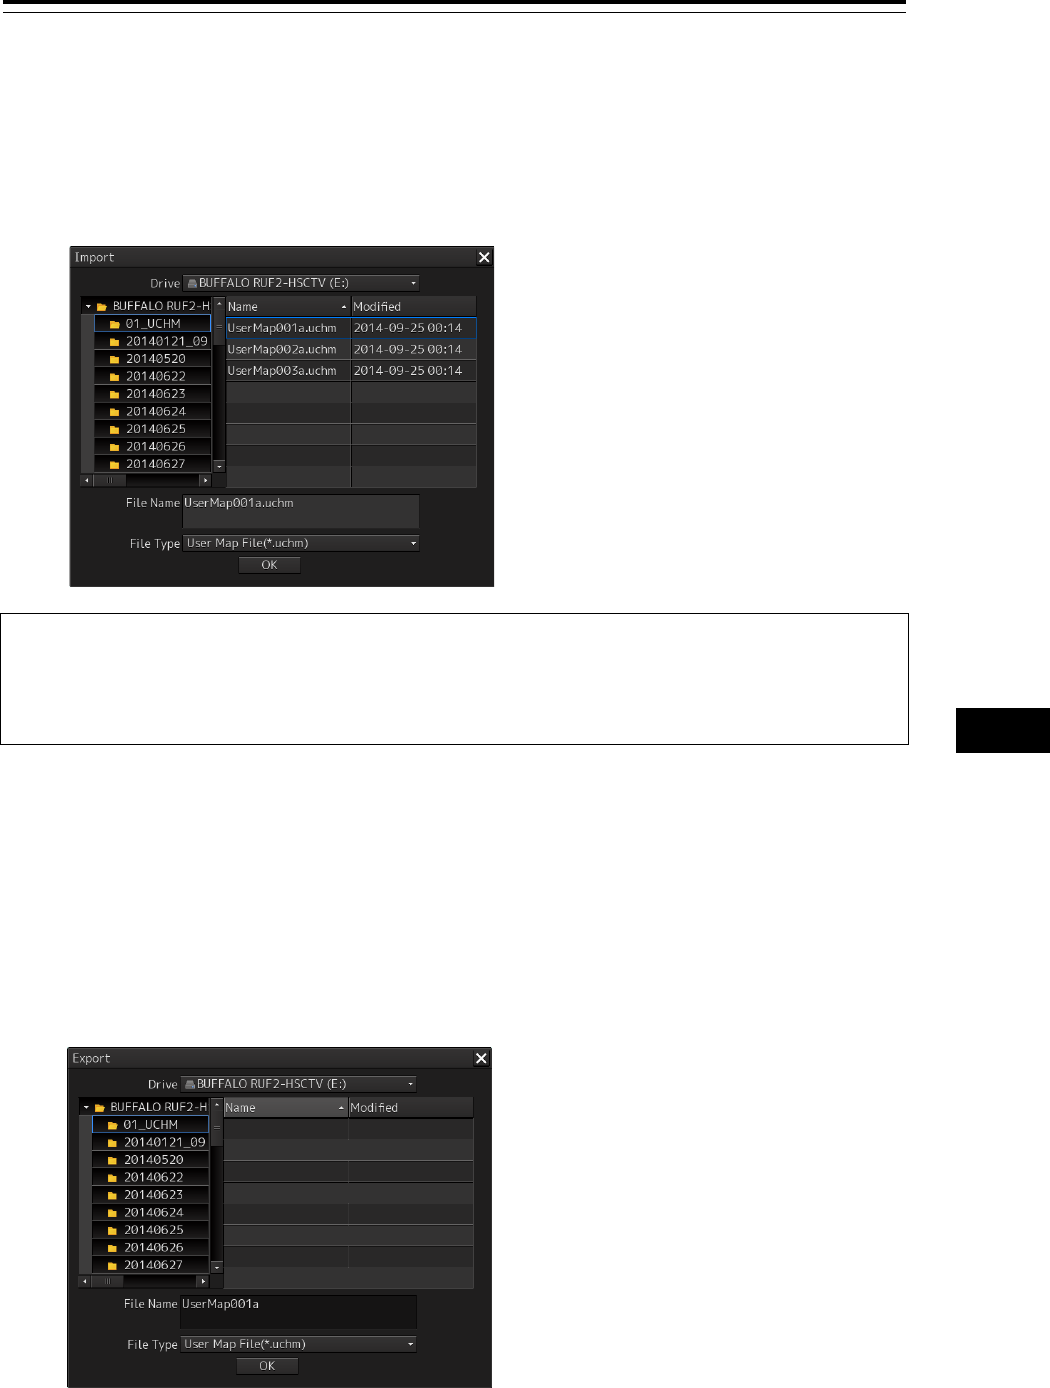
14.1.6.3 Importing a user map file
1 Click on the [Import] button.
A file selection window is displayed.
2 Select and import a user map file that is saved in the external medium on the file
selection window.
Note
When sufficient free storage space is not available in the import destination, a message dialog box
is displayed.
Change the import destination or import a file after securing sufficient free space.
14.1.6.4 Exporting a user map file
1 Click on the file to be exported from the file list.
2 Click on the [Export] button.
A file selection window is displayed.
3 Specify an export destination and export the selected file.
Section 14 Creating a User Map/ Updating a Chart Manually 14-12
When the export destination contains a file of the same name, a message dialog box is
displayed, prompting the verification of whether the existing file is to be overwritten.
When exporting the file by overwriting the existing one, click on the [OK] button.
Note
When sufficient free storage space is not available in the export destination, a message dialog box
is displayed.
Change the export destination or import a file after securing sufficient free space.
14.1.6.5 Merging multiple user map files
1 Select the [Display] check boxes of the files to be merged in the file list.
The user map files to be merged are displayed.
2 Click on the [Merge Display Files] button.
A user map file is created by merging the user maps that are being displayed. The user map file
is named under "Merged User Map Filexxx" (xxx: serial number starting from 001).
User Map
User Map
"USER-02"
User Map
"USER-01"
Two user maps can be merged
into one user map.
14-13 Section 14 Creating a User Map/ Updating a Chart Manually
1
2
3
4
5
6
7
8
9
10
11
12
13
14
15
16
17
18
19
20
21
22
23
24
25
26
27
14.1.6.6 Performing geodetic datum conversion
It is possible to use the preset datum or convert the datum by entering an offset value.
1 Click on the user map file whose geodetic datum is to be converted on the file list.
The user map file is selected.
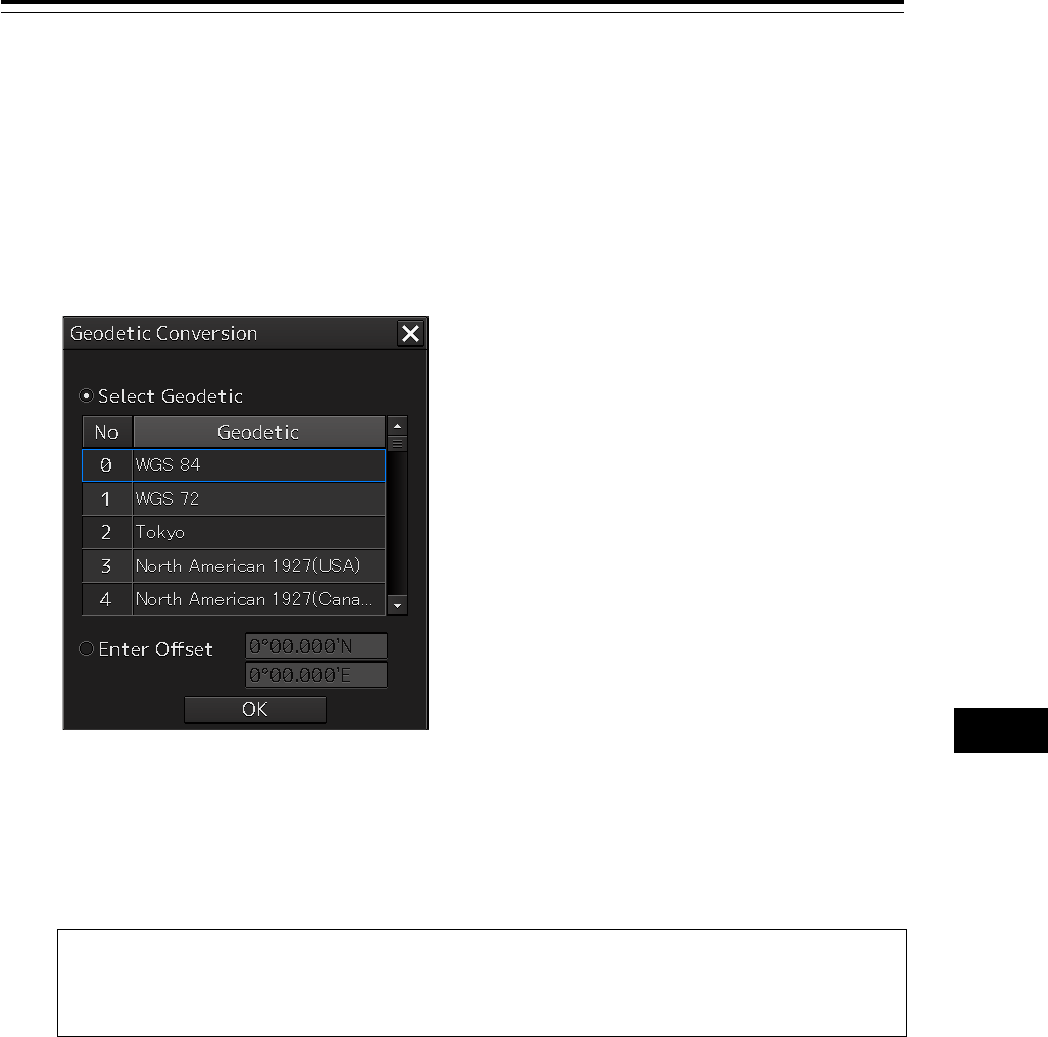
2 Click on the [Geodetic] button.
The "Geodetic Conversion" window appears.
3 To use the preset geodetic datum, click on the [Select Geodetic] button and click on
the geodetic datum on the list.
When entering an offset value, click on the [Enter Offset] button and enter a numeric
value.
Note
When [No Use] is selected on the [Select Geodetic] list, geodetic datum conversion is not
performed.
4 Click on the [OK] button.
Geodetic datum conversion is executed based on the setting in Step 3.
Section 14 Creating a User Map/ Updating a Chart Manually 14-14
14.2 Using Map Creation Tools (User Map
Creation/Editing)
Use the map creation tools to create/edit a user map or update a chart manually.
The following tools can be used for user map creation.
Note
The map creation tool configuration and functions vary depending on whether a chart is edited
manually or a user map is created.
For the details, refer to "14.4 How to Use the Map Creation Tools (for Manual Update)"
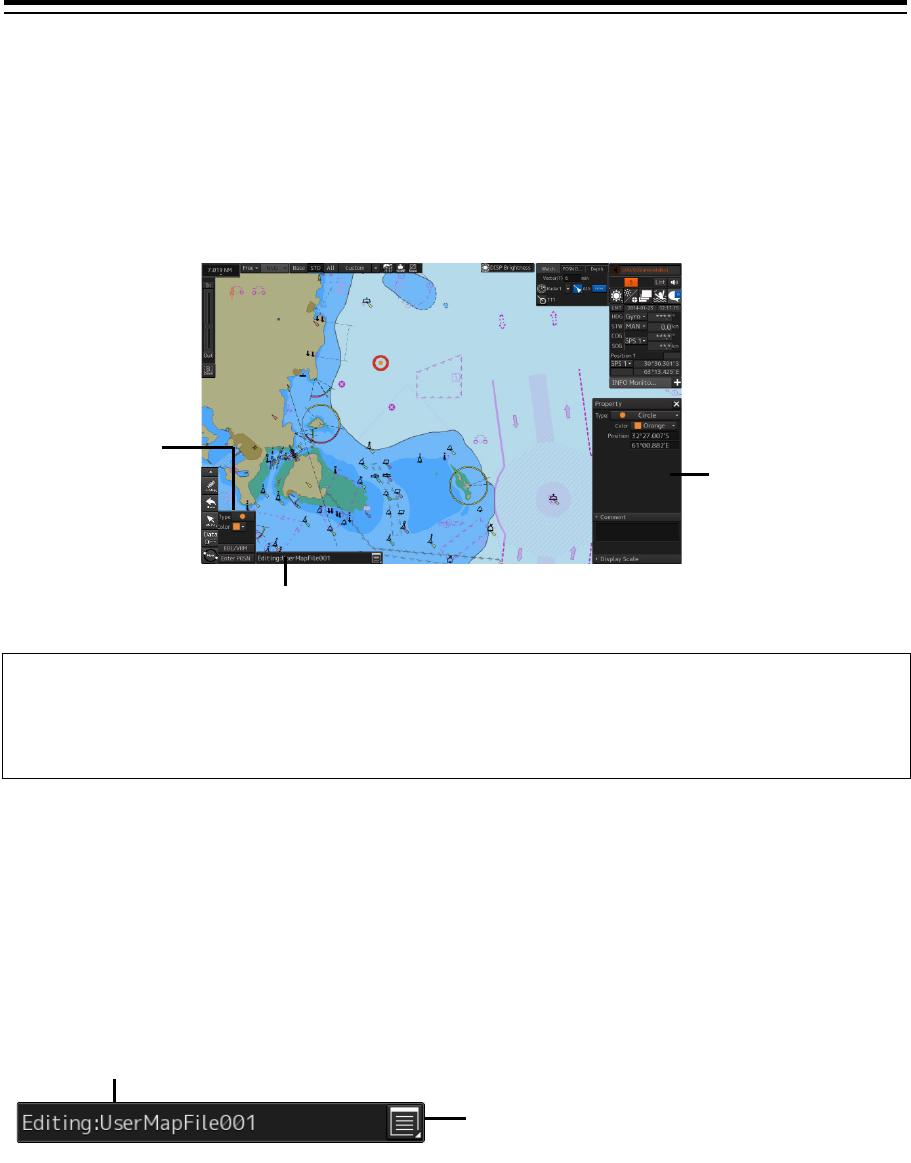
14.2.1 User map information bar
The user map information bar is located at the bottom right corner of the screen and displays the user
map name that is currently being created/edited.
The "File Operation" dialog box can be displayed by clicking on the "File Operation" dialog box display
button.
14.2.1.1 Displaying a user map information bar
1 Select [User Map] - [File Operation] on the menu.
2 Click on the [Edit User Map] button on the "File Operation" dialog box that is
displayed.
The user map information bar can also be displayed by clicking on the write tool button on the left
toolbar.
Object property
dialog box
User map information bar
Drawing toolbar
Name of user map currently edited
File Operation dialog box
display button
14-15 Section 14 Creating a User Map/ Updating a Chart Manually
1
2
3
4
5
6
7
8
9
10
11
12
13
14
15
16
17
18
19
20
21
22
23
24
25
26
27
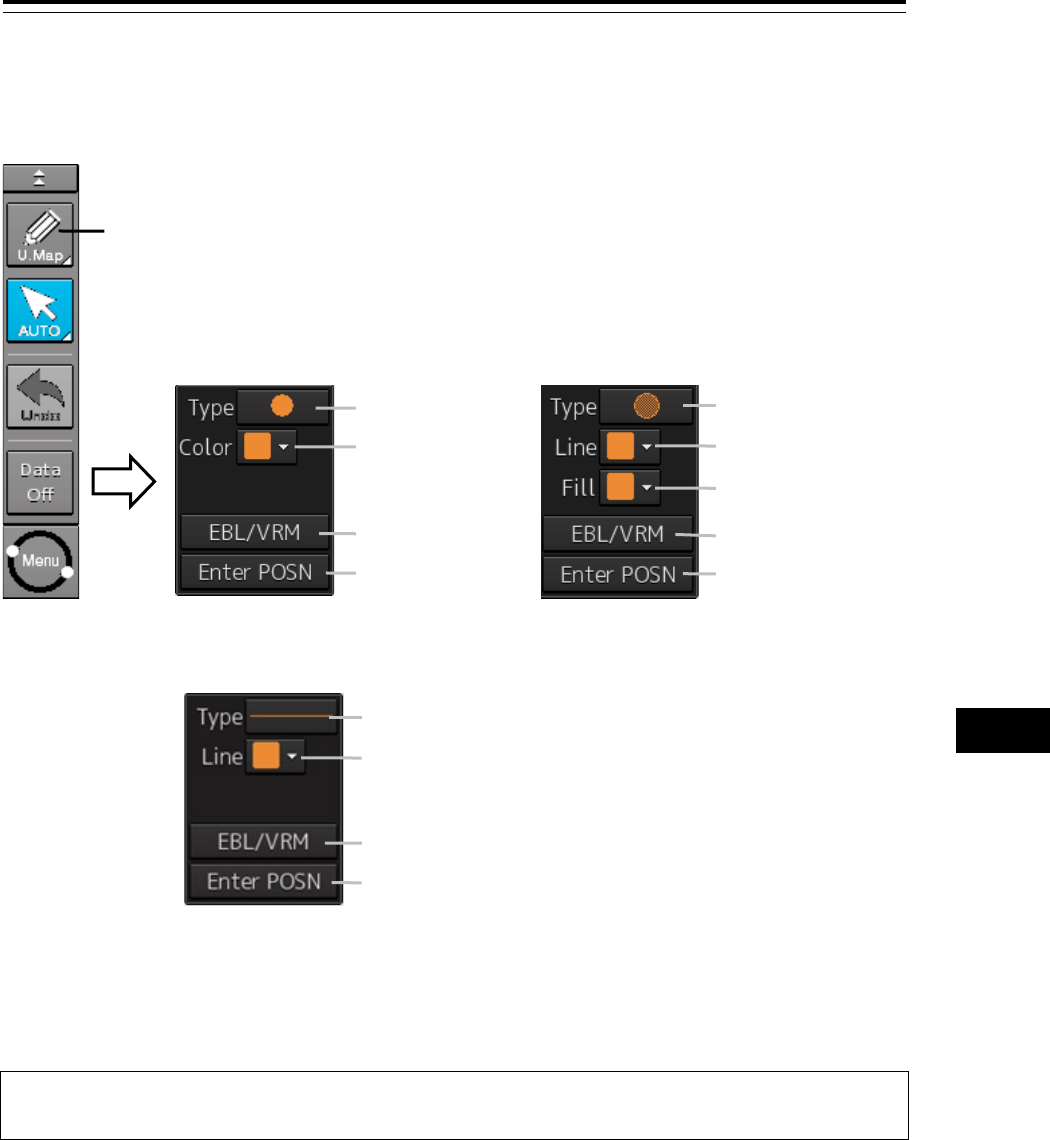
14.2.2 Drawing toolbar
Display a drawing toolbar by clicking on the drawing tool button on the left toolbar.
Note
At user map creation, the azimuth mode is fixed to the [N UP] mode.
The drawing toolbar comprises the following tool buttons. The buttons that are assigned vary according
to the object type (Symbol/Line/Area/Text) that is currently selected.
Drawing tool button
[Type] button
[Color] button
[EBL/VRM] button
[Enter POSN] button
[Type] button
[Line] button
[Fill] button
[EBL/VRM] button
[Enter POSN] button
Drawing toolbar when
symbol/text is selected
At creation of a user map, "U.Map" is displayed on the drawing tool button.
[Type] button
[Line] button
[EBL/VRM] button
[Enter POSN] button
Drawing toolbar when line
is selected.
Drawing toolbar when area
is selected
Section 14 Creating a User Map/ Updating a Chart Manually 14-16
Tool button Function
[Type] button Displays an icon list. (Refer to "14.2.3 Selecting an object type".).
[Color] button
(Symbol/text selection)
Select the color of the symbol/text. (Refer to "14.2.4 Selecting a
color of an object".).
[Line] button Enables selection of a color of the line that forms the object. (Refer
to "14.2.4 Selecting a color of an object".).
[Fill] button (at area selection
only)
Enables selection of a color of the area that forms the object.
(Refer to "14.2.4 Selecting a color of an object".).
[EBL/VRM] button Switches the cursor mode of the user map creation function to the
EBL/VRM mode. (Refer to "14.2.5 Creating an object in the
EBL/VRM mode".).
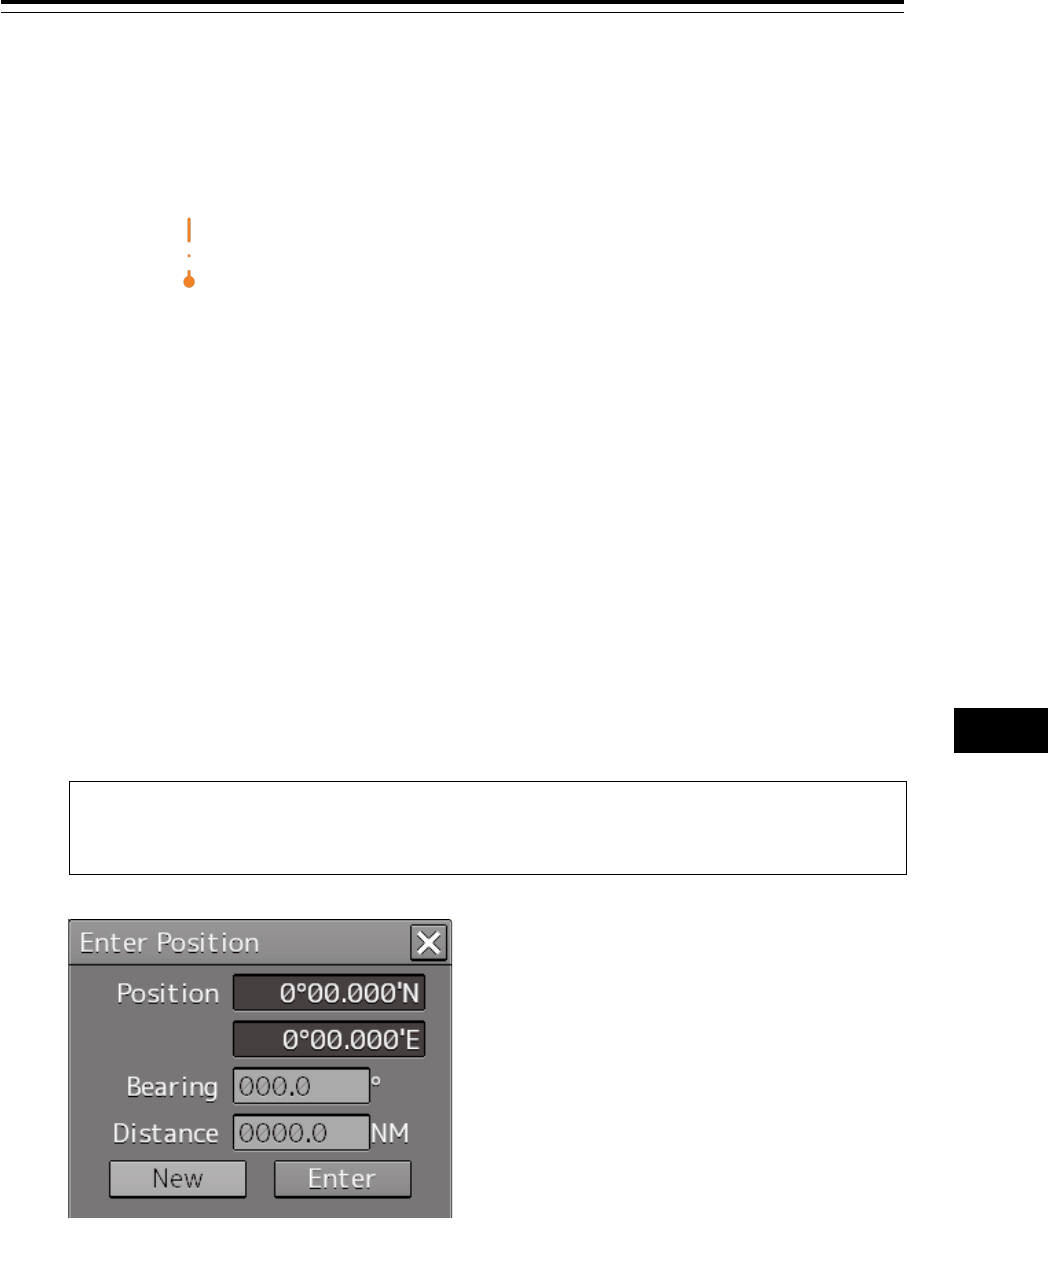
[Enter POSN] (“Enter Position”
dialog display) button
Displays the "Enter Position" dialog (Refer to "14.2.6 Creating an
object by specifying latitude and longitude".).
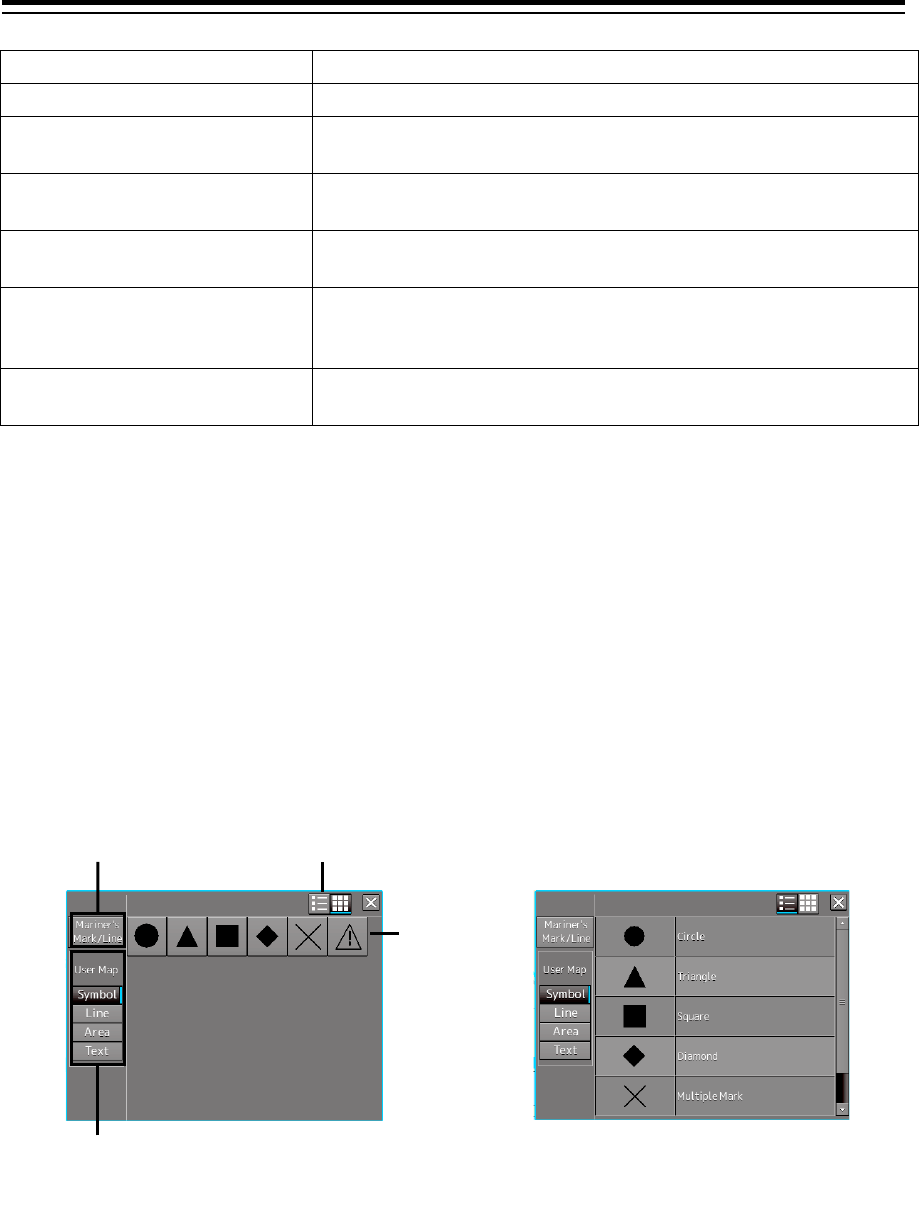
14.2.3 Selecting an object type
By displaying an icon list, the type of the Mariner's Mark/Line object or the user map object ([Symbol],
[Line], [Area], and [Text]) can be selected.
1 Click on the [Type] button on the drawing toolbar.
An icon list is displayed.
2 Select a type of the object by clicking on the icon in the icon list.
The icon list can be switched to thumbnail display or list display by clicking on the thumbnail/list
display switching button.
For the icons that can be selected from the icon list, refer to "Appendix D.5 Icon Button List for
User Map".
Icon list
Thumbnail/list display switching button
Mariner's Mark/Line menu
User map menu
Icon list (thumbnail display)
Icon list (list display)
14-17 Section 14 Creating a User Map/ Updating a Chart Manually
1
2
3
4
5
6
7
8
9
10
11
12
13
14
15
16
17
18
19
20
21
22
23
24
25
26
27
14.2.3.1 Using a user map object
Select a type of the object (symbol/line/area/text) to be displayed in the icon list by clicking on a user
map menu button.
The following objects are displayed.
Button Icons displayed
[Symbol] button Circle
Triangle
Square
Diamond
Multiple Mark
Warning symbol
[Line] button Simple line(solid line)
Simple line(dotted line)
Simple line(dashed line)
Circle(solid line)
Circle(dotted line)
Circle(dashed line)
Ellipse(solid line)
Ellipse(dotted line)
Ellipse(dashed line)
Arc(solid line)
Arc(dotted line)
Arc(dashed line)
Warning line
Arrow(Start To End/Small)
Arrow(Start To End/Medium)
Arrow(Start To End/Large)
Arrow(End To Start/Small)
Arrow(End To Start/Medium)
Arrow(End To Start/Large)
Arrow(Both Direct/Small)
Arrow(Both Direct/Medium)
Arrow(Both Direct/Large)
Section 14 Creating a User Map/ Updating a Chart Manually 14-18
Button Icons displayed
[Area] button Polygon(solid line)
Polygon(dotted line)
Polygon(dashed line)
Circle(solid line)
Circle(dotted line)
Circle(dashed line)
Ellipse(solid line)
Ellipse(dotted line)
Ellipse(dashed line)
Fan(solid line)
Fan(dotted line)
Fan(dashed line)
Warning area(solid line)
Warning area(dotted line)
Warning area(dashed line)
[Text] button Te xt
14.2.4 Selecting a color of an object
1 When selecting a color of the symbol/text object on the drawing toolbar, click on the
[Color] button.
To select a line color of an area object, click on the [Line] button.
To select a color for filling an area object, click on the [Fill] button.
2 Select and click on the required color on the list that is displayed. The following 10
colors are available.
• White/Black
(The color changes to White/Black under the following conditions.
RADAR screen: Always White
ECDIS screen: Day1/Day2: Black, Day3/Dusk/Night: White)
• Gray
• Amber
• Magenta
• Blue
• Cyan
• Green
• Yellow
• Orange
• Dark Red
14-19 Section 14 Creating a User Map/ Updating a Chart Manually
1
2
3
4
5
6
7
8
9
10
11
12
13
14
15
16
17
18
19
20
21
22
23
24
25
26
27
14.2.5 Creating an object in the EBL/VRM mode
1 Click on the [EBL/VRM] button on the drawing toolbar.
The user map creation function mode is switched from the cursor mode to the EBL/VRM mode.
When the mode is switched to the EBL/VRM mode, the cursor changes to the following state.
The EBL/VRM mode is switched to cursor mode when the right mouse button is clicked on the
chart or the [Enter POSN] button on the drawing toolbar is clicked on
14.2.6 Creating an object by specifying latitude and
longitude
Using the "Enter Position" dialog box, it is possible to create an object at the specified latitude and
longitude.
Displaying the "Enter Position" dialog box
1 Click on the [Enter POSN] button on the drawing toolbar.
Note
An object cannot be created with the cursor mode and EBL/VRM mode while this dialog
box is displayed.
EBL/VRM base point cursor
"Enter Position" dialog box

Section 14 Creating a User Map/ Updating a Chart Manually 14-20
14.2.6.1 Creating an object of symbol/circle/ellipse/arc/arrow/text
Enter latitude and longitude values of the object in the [Position] box and click on the [Enter] button.
The [Bearing] box, [Distance] box, and the [New] button are disabled.
14.2.6.2 Creating an object of simple line/polygon/highlight
Use the following procedure to create an object with vertices such as a simple line, polygon, and
highlight.
1 Enter latitude and longitude values of a vertex of the object in the [Position] box and
click on the [Enter] button.
The position of one of the vertices of the object is determined.
The [Bearing] box and the [Distance] box are enabled.
2 Enter latitude and longitude values of the next vertex in the [Position] box.
Alternatively, in the [Bearing] box and the [Distance] box, enter the bearing and
distance from the previous vertex that was determined.
3 Click on the [Enter] button.
4 Repeat Steps 2 and 3.
A simple line can be determined by two or more vertices and a polygon/highlight can be
determined by three or more vertices.
5 To create a next object continuously, click on the [New] button.
14.2.7 Deleting an object
1 Click on the eraser tool button on the left toolbar.
The cursor changes to the eraser cursor.
2 Place the cursor on the eraser cursor and click the mouse button.
When the right button is clicked on any position with the eraser cursor, the cursor mode is reset
to the cross-hairs cursor.
Objects of the same shape or color can be deleted collectively. For the details, refer to "14.6
Collective Deletion of Objects [Delete by Type/Color]".
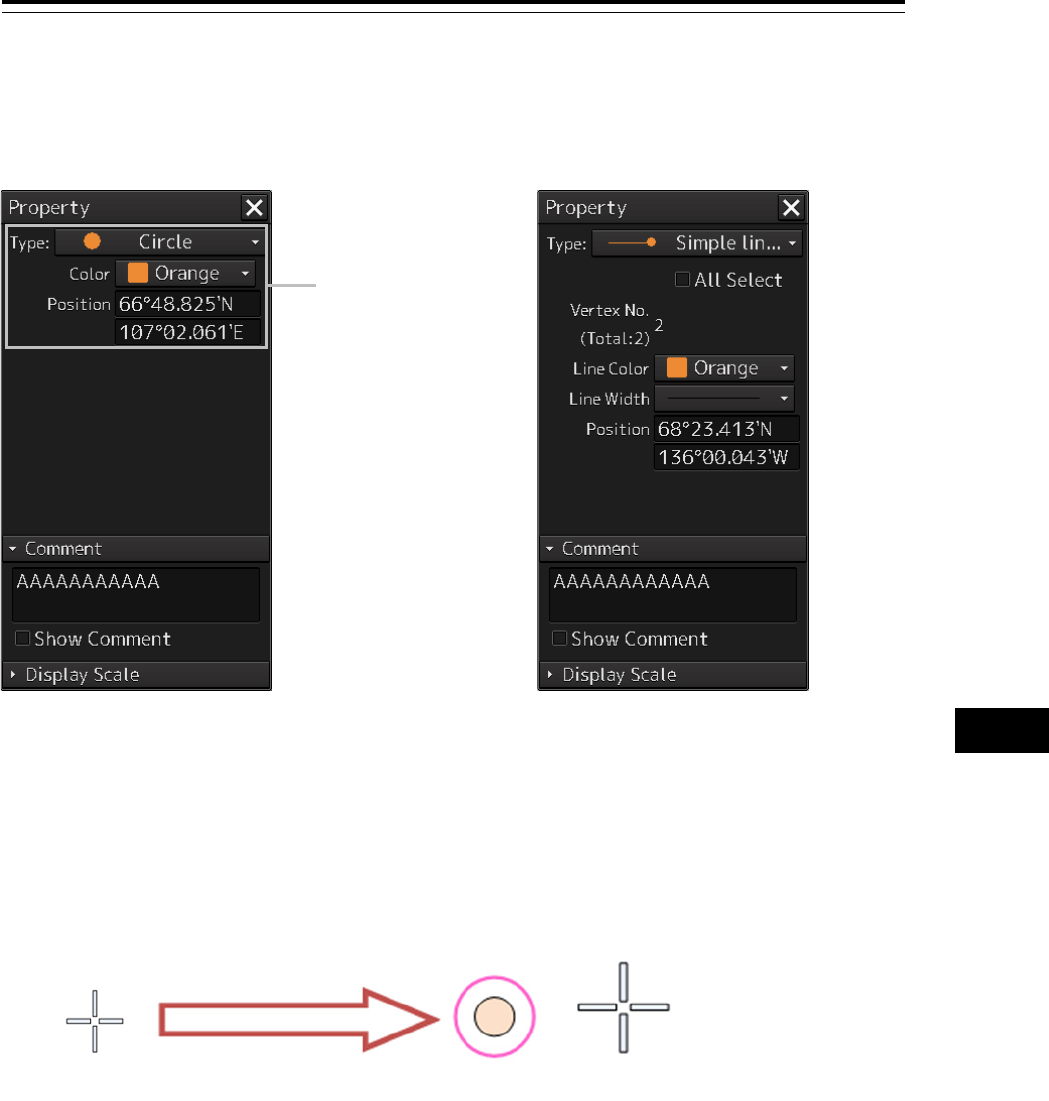
14-21 Section 14 Creating a User Map/ Updating a Chart Manually
1
2
3
4
5
6
7
8
9
10
11
12
13
14
15
16
17
18
19
20
21
22
23
24
25
26
27
14.2.8 Object property dialog box
An object property dialog box displays the properties of the object that is currently selected.
Parameter settings of the object can be verified/changed.
14.2.8.1 Selecting an object
1 Click on the object to be selected with the cross-hairs cursor.
The object is selected and the object property dialog box appears.
Parameter setting area
Object property dialog box
(Selecting Circle)
Object property dialog box
(Selecting Simple Line)
Click.
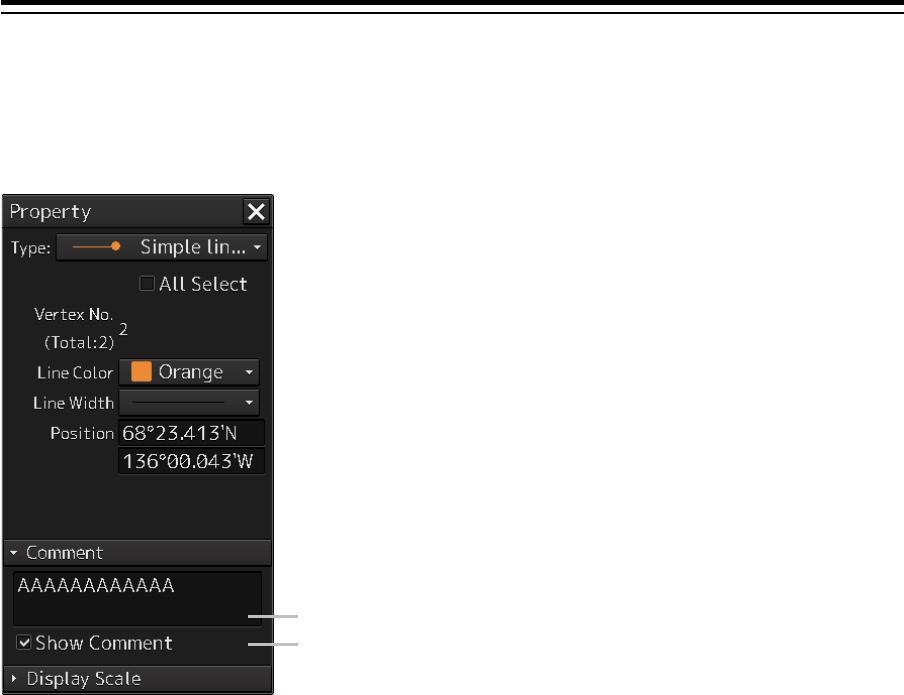
Section 14 Creating a User Map/ Updating a Chart Manually 14-22
14.2.8.2 Setting a comment
In the object property dialog box, a comment for the object can be entered. When the [Show Comment]
check box is selected, a comment can be displayed on the user map.
1 Enter a comment in the [Comment] box (up to 64 characters).
2 To display the comment that is input on the user map, select the [Show Comment]
check box.
[Comment] text box
[Show Comment] check box
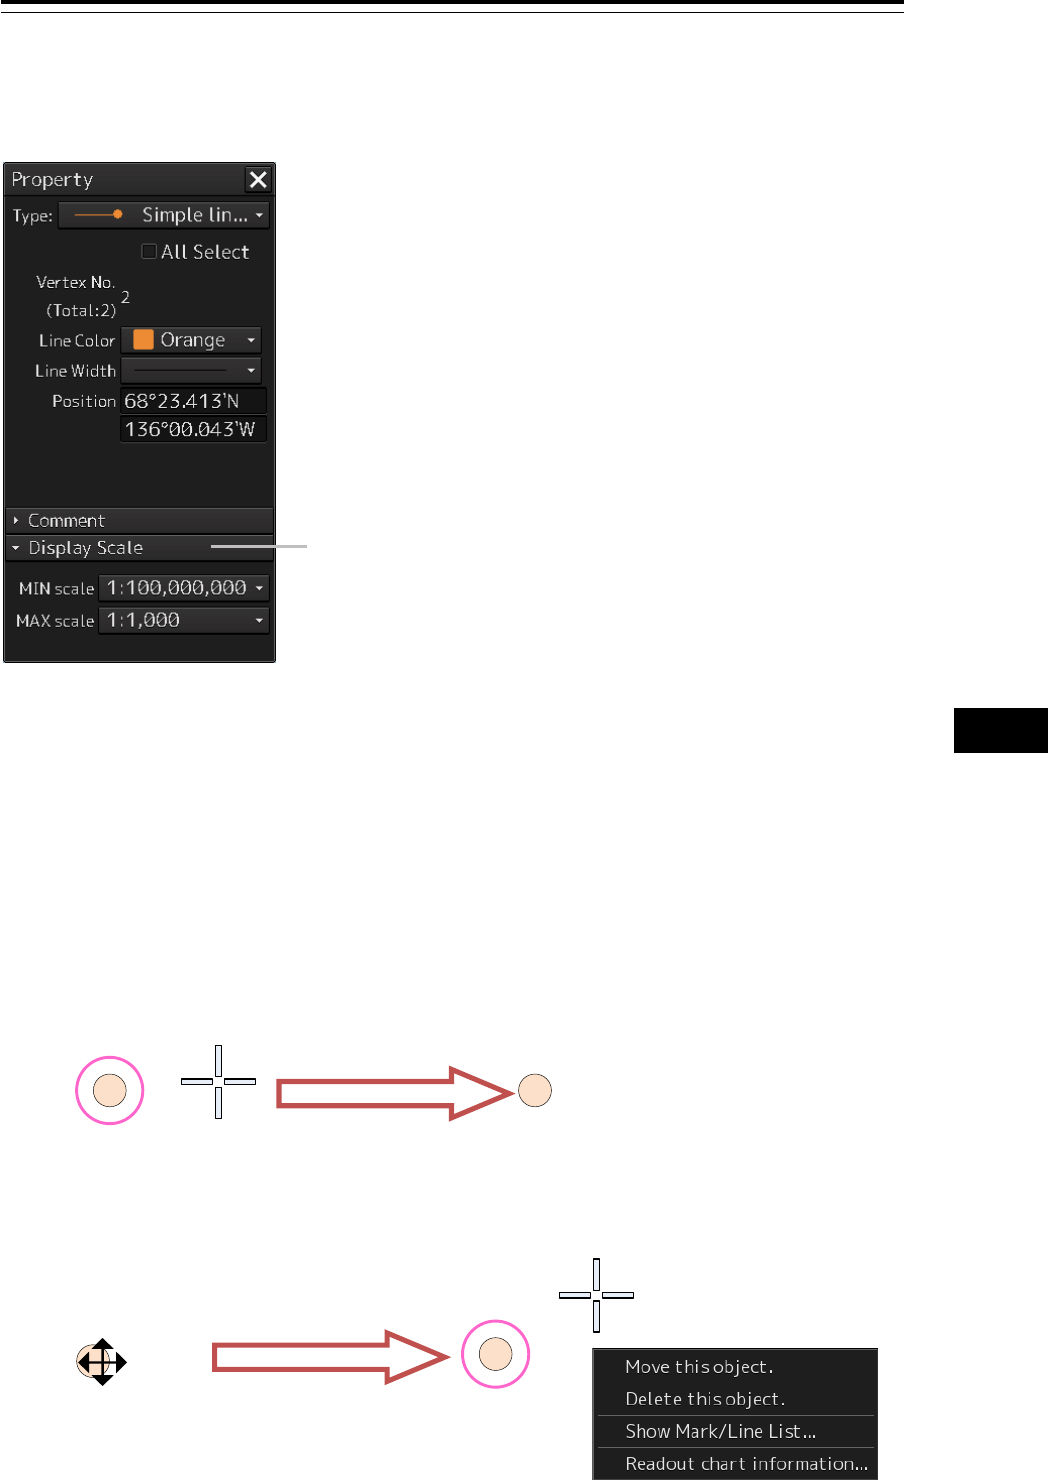
14-23 Section 14 Creating a User Map/ Updating a Chart Manually
1
2
3
4
5
6
7
8
9
10
11
12
13
14
15
16
17
18
19
20
21
22
23
24
25
26
27
14.2.9 Changing an object display scale range
An object display scale range (1:1 to 1:100,000,000) can be changed on the object property dialog box.
1 Select a minimum scale on the [MIN scale] combo box.
2 Select a maximum scale on the [MAX scale] combo box.
14.2.10 Moving an object
To move an object, use the context menu that is displayed by clicking the right button on the object.
1 When the object to be moved is in the selected state, unselect the object.
To unselect the object, click on a section without display or another object.
2 Click the right button on the object.
The object is selected and the context menu is displayed.
[Display Scale] setting section
Edit
Right-click

Section 14 Creating a User Map/ Updating a Chart Manually 14-24
3 Click on [Move this object].
4 Click on the position to which the object is to be moved.
The selected object moves to the position on which the button was clicked.
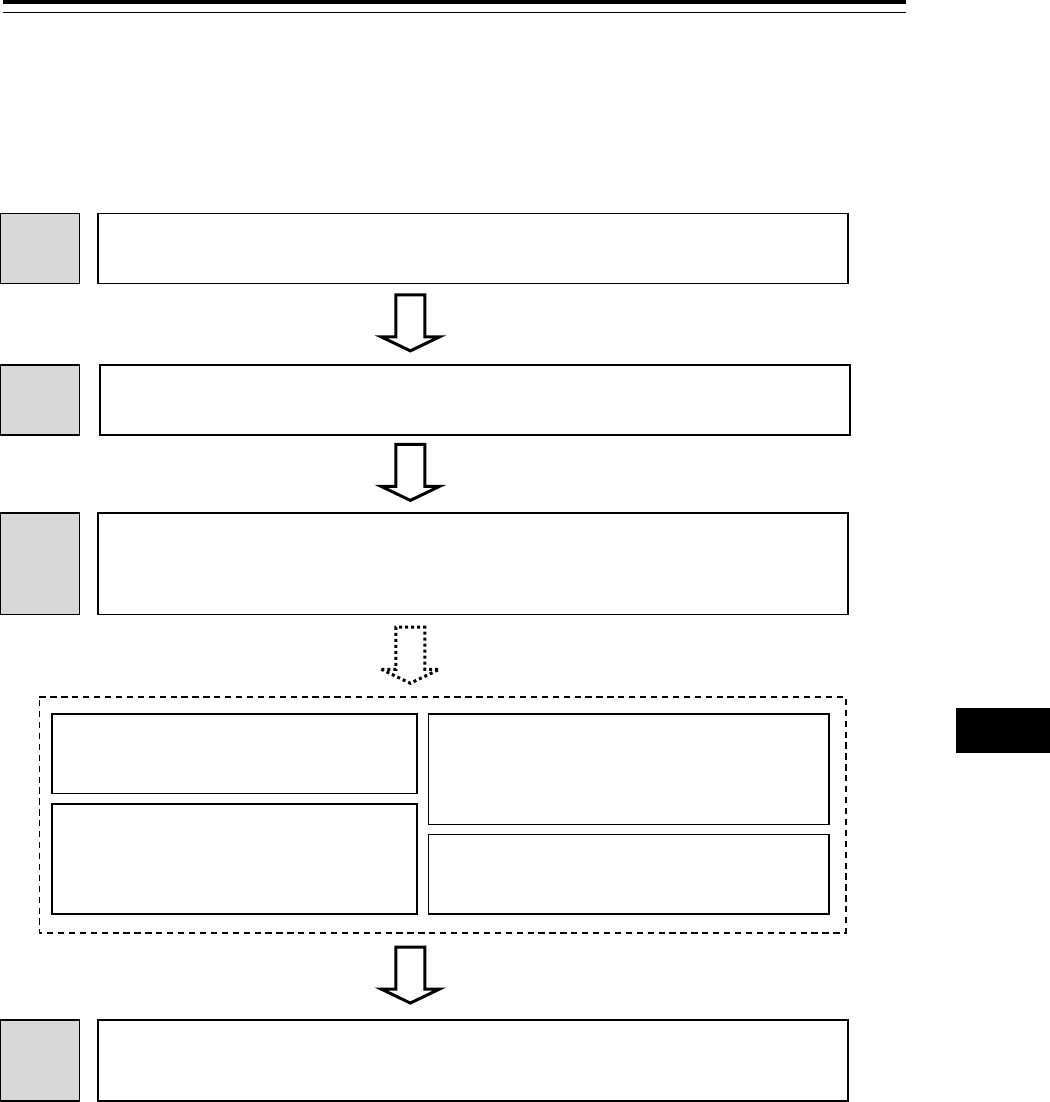
14-25 Section 14 Creating a User Map/ Updating a Chart Manually
1
2
3
4
5
6
7
8
9
10
11
12
13
14
15
16
17
18
19
20
21
22
23
24
25
26
27
14.3 Updating a Chart Manually (ECDIS
Screen Only)
Use the following procedure to update a chart.
1 Display the [Chart] - [Manual Update] menu.
Reference: "14.3.1 Displaying the Manual Update submenu"
2 Select a chart to be updated.
Reference: "14.3.2 Selecting a chart to be updated"
3 Update the chart manually by using the map creation tools.
Reference: "14.3.3 Updating a chart manually"
"14.4 How to Use the Map Creation Tools (for Manual Update)"
4 End manual updating or start route planning.
Reference: "Section 9 Route Planning"
Create an object.
Reference: "14.5 Creating an Object"
Select display/hide for the object.
Reference: "14.3.5 Selecting display/hide
for the object"
Manage/edit an object.
Reference: "14.7 Managing/Editing
Objects [Mark Line/List]"
Move an object.
Reference: "14.2.10 Moving an object"
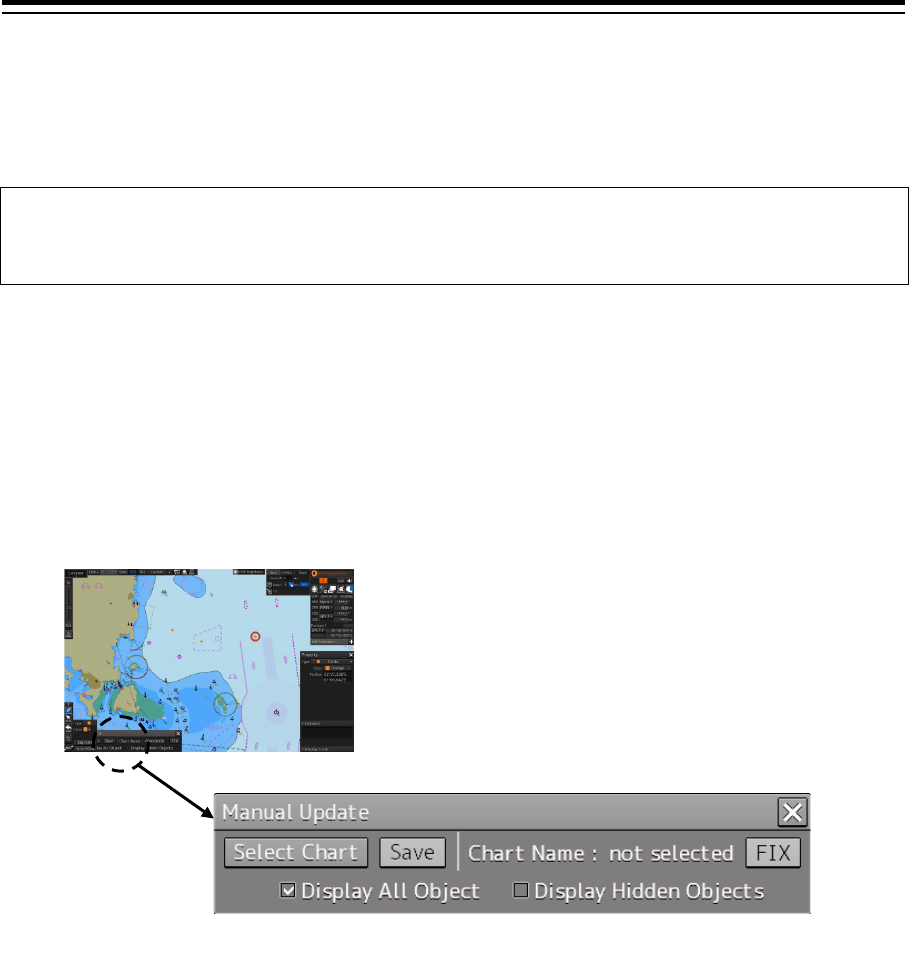
Section 14 Creating a User Map/ Updating a Chart Manually 14-26
14.3.1 Displaying the Manual Update submenu
By selecting [Menu] - [Chart] - [Manual Update], the selected chart can be updated manually.
Note
Since a dialog box requesting a Notice to Mariners issuing date is displayed when the updated
chart is saved, enter the issuing date.
1 Click on the [Menu] button on the left toolbar.
The menu is displayed.
2 Click on the [Chart] button on the menu.
3 Click on the [Manual Update] button on the submenu.
The "Manual Update" toolbar is displayed.
"Manual Update" toolbar
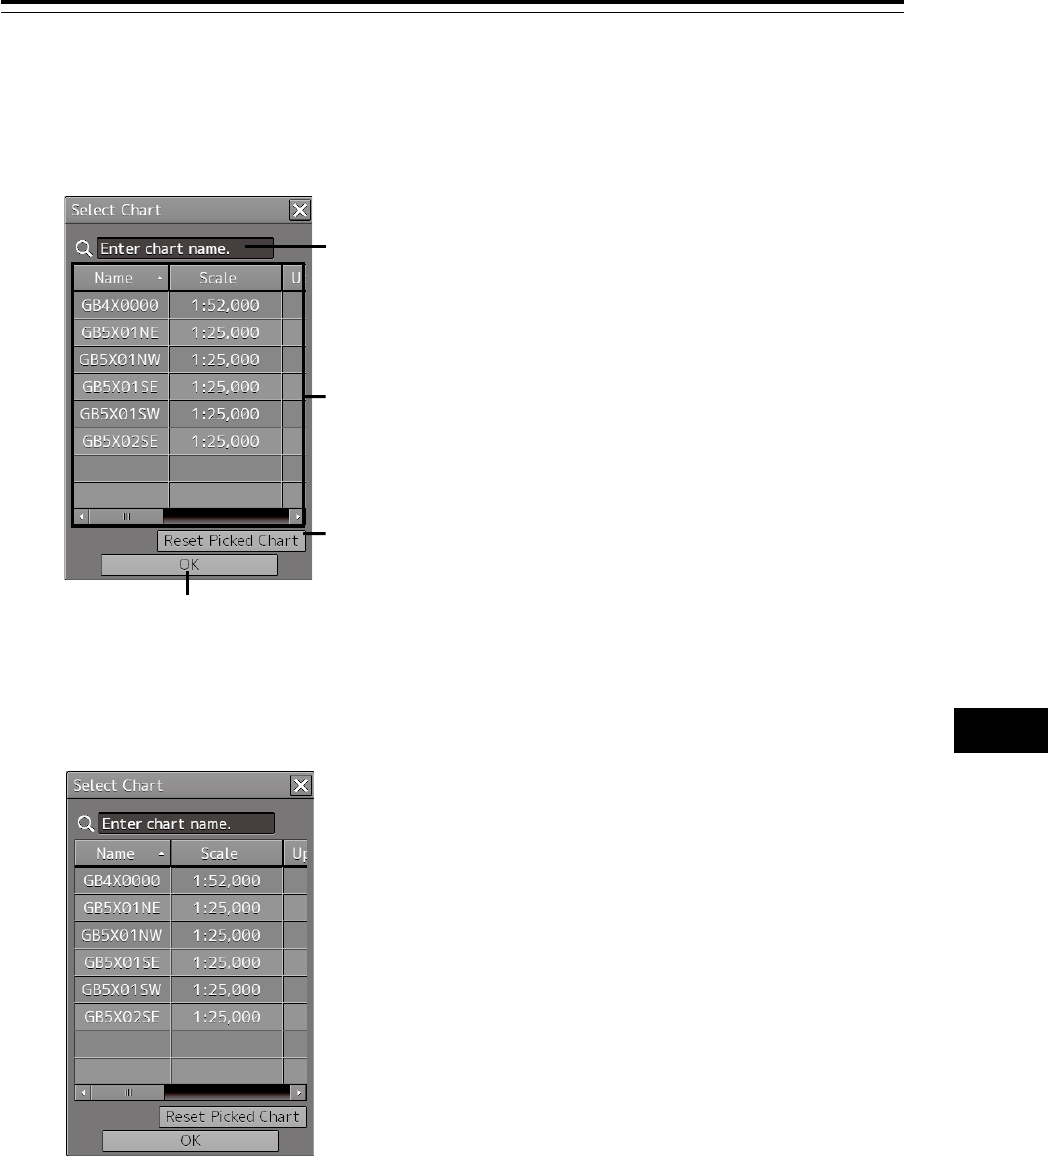
14-27 Section 14 Creating a User Map/ Updating a Chart Manually
1
2
3
4
5
6
7
8
9
10
11
12
13
14
15
16
17
18
19
20
21
22
23
24
25
26
27
14.3.2 Selecting a chart to be updated
1 Click on the [Select Chart] button on the Manual Update toolbar.
The "Select Chart" dialog box appears.
2 Select a chart file to be updated manually on the [Select Chart] dialog box.
3 Click on the [OK] button in the [Select Chart] dialog box.
A chart is selected.
Search box
[OK] button
Chart list
[Reset picked chart] button
"Select Chart" dialog box
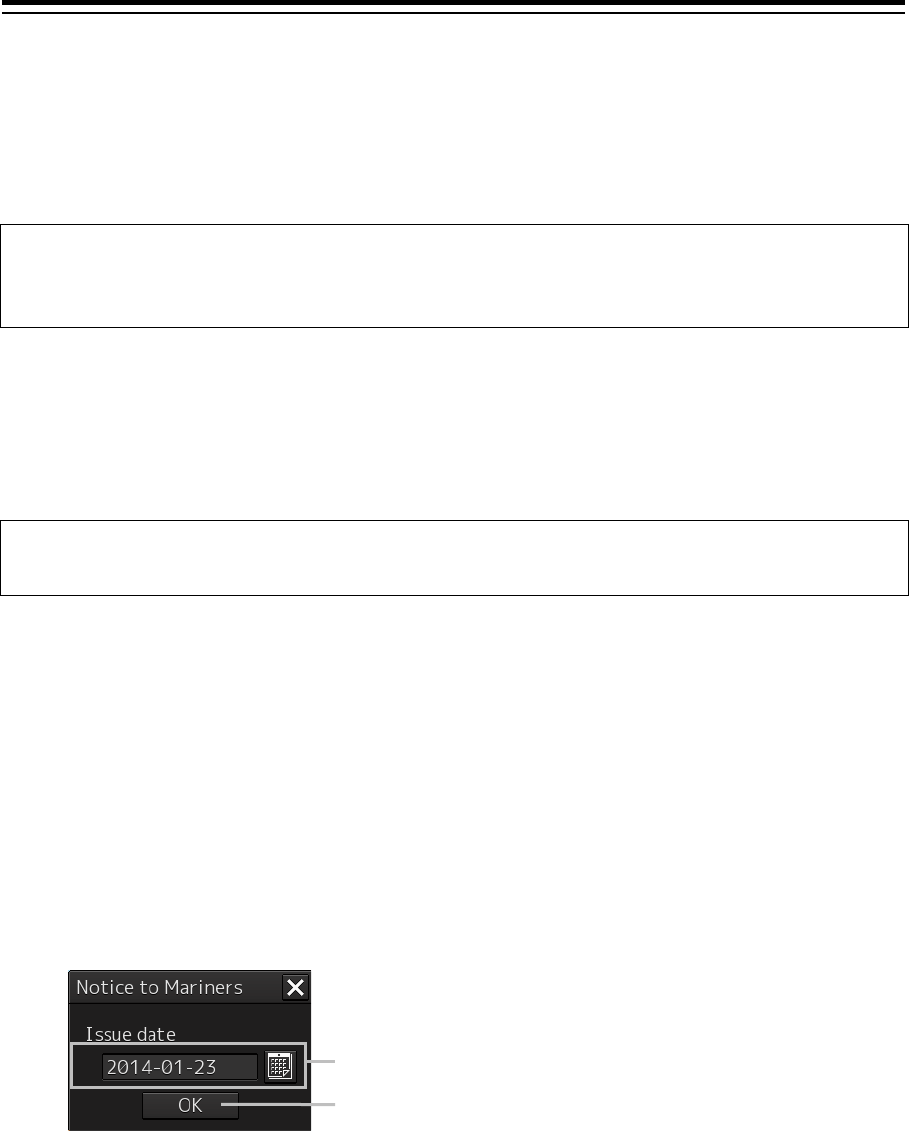
Section 14 Creating a User Map/ Updating a Chart Manually 14-28
14.3.2.1 Searching the position that is clicked on with the cursor
1 Move the cursor to the position where manual update is to be performed and click the
button.
The chart at the position on which the button was clicked is displayed in the S-57 chart list.
Memo
To clear the search result, click on the [Reset picked chart] (chart selection reset) button on the
[Select Chart] dialog box.
14.3.2.2 Searching a chart with the chart name
1 Enter a chart name in the search box on the [Select Chart] dialog box.
The applicable chart is displayed.
Memo
To clear the search result, clear the input in the search box.
14.3.3 Updating a chart manually
1 By using map creation tools, create/edit an object on a chart. (Refer to "14.2 Using
Map Creation Tools (User Map Creation/Editing)").
2 Delete an object or change the properties as required. (Refer to "14.5 Creating an
Object ").
3 Click on the [Save] button.
The [Notice to Mariners] dialog box appears.
4 Enter a notice to mariners issuing date in the [Issue date] input box on [Notice to
Mariners] dialog by using a software keyboard.
5 Click on the [OK] button in the [Notice to Mariners] dialog box.
The manually updated object is saved in the chart.
[lssue date] input box
[OK] button

14-29 Section 14 Creating a User Map/ Updating a Chart Manually
1
2
3
4
5
6
7
8
9
10
11
12
13
14
15
16
17
18
19
20
21
22
23
24
25
26
27
14.3.4 Displaying the selected chart only
1 Select a chart to be displayed according to the procedure described in "14.3.2
Selecting a chart to be updated".
2 Set the [FIX] button on the Manual Update toolbar to ON.
14.3.5 Displaying the object/redisplaying the hidden
object
To display all the objects that were created by chart manual update, select the [Display All Object]
check box on the Manual Update toolbar.
To redisplay the hidden objects, select the [Display Hidden Objects] check box on the Manual Update
toolbar.
ON
OFF

Section 14 Creating a User Map/ Updating a Chart Manually 14-30
14.4 How to Use the Map Creation Tools
(for Manual Update)
At chart manual update also, use the same map creation tools in the same way as that of user map
creation. (Refer to "14.2 Using Map Creation Tools (User Map Creation/Editing)"). However, there
are the following differences in the map creation tools
• The user map information bar is not displayed.
• The object that is saved cannot be deleted by the eraser tool (can be hidden).
• A Mariner's Mark/Line drawing object cannot be selected with the drawing tool.
• More icon types can be selected in the drawing tool.
When the chart is updated manually, "Update" is displayed on the Write tool button.
Note
At chart manual update, the bearing reference mode is fixed to [N UP] mode.
14.4.1 Deleting or hiding an object
1 Click on the eraser tool button.
The cursor changes to the eraser cursor.
2 Place the eraser cursor on the object and click the button.
At manual update, only pre-saved objects can be deleted by the eraser tool.
If the saved object is clicked on with the eraser tool, the object is hidden. All the property screens of the
object that has been set to hide are displayed as disable and cannot be edited.
The object that is created and saved by manual update can be redisplayed unless deleted even if it is
hidden.
If the chart that uses the hidden object is updated, the expiration date of the object is set (90 days from
the date on which the object is created).
The object will be deleted after the expiration date.
Also, the object property dialog box setting can be changed by using the Mark/Line List submenu.
For the details, refer to "14.7.4 Displaying a manual update list (ECDIS screen only)".
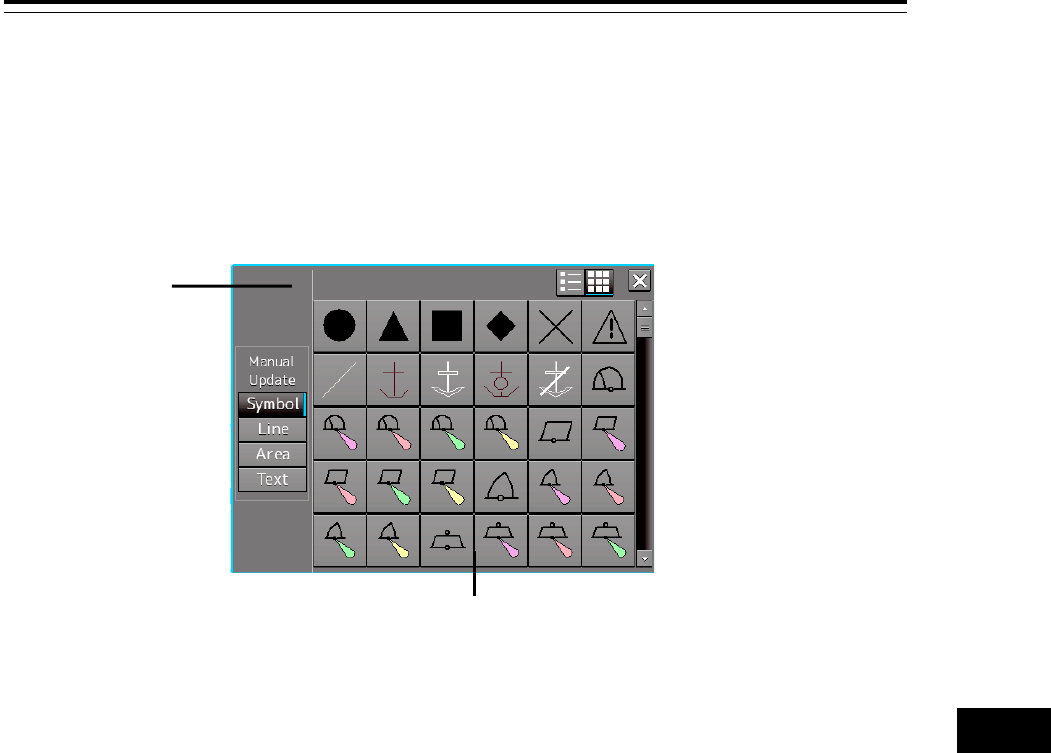
14-31 Section 14 Creating a User Map/ Updating a Chart Manually
1
2
3
4
5
6
7
8
9
10
11
12
13
14
15
16
17
18
19
20
21
22
23
24
25
26
27
14.4.2 Selecting an object type
1 Click on the [Type] button on the drawing toolbar.
An icon list is displayed.
2 Select an object type by clicking on the icon on the icon list.
At manual update, the following icon list is displayed.
The [Mariner's Mark/Line] button is not displayed on the icon list at manual update.
For the details of icons that can be selected from the icon list, refer to "Appendix D.6 Icon Button List
for Manual Update".
Icon list
Category display
Icon list at manual update
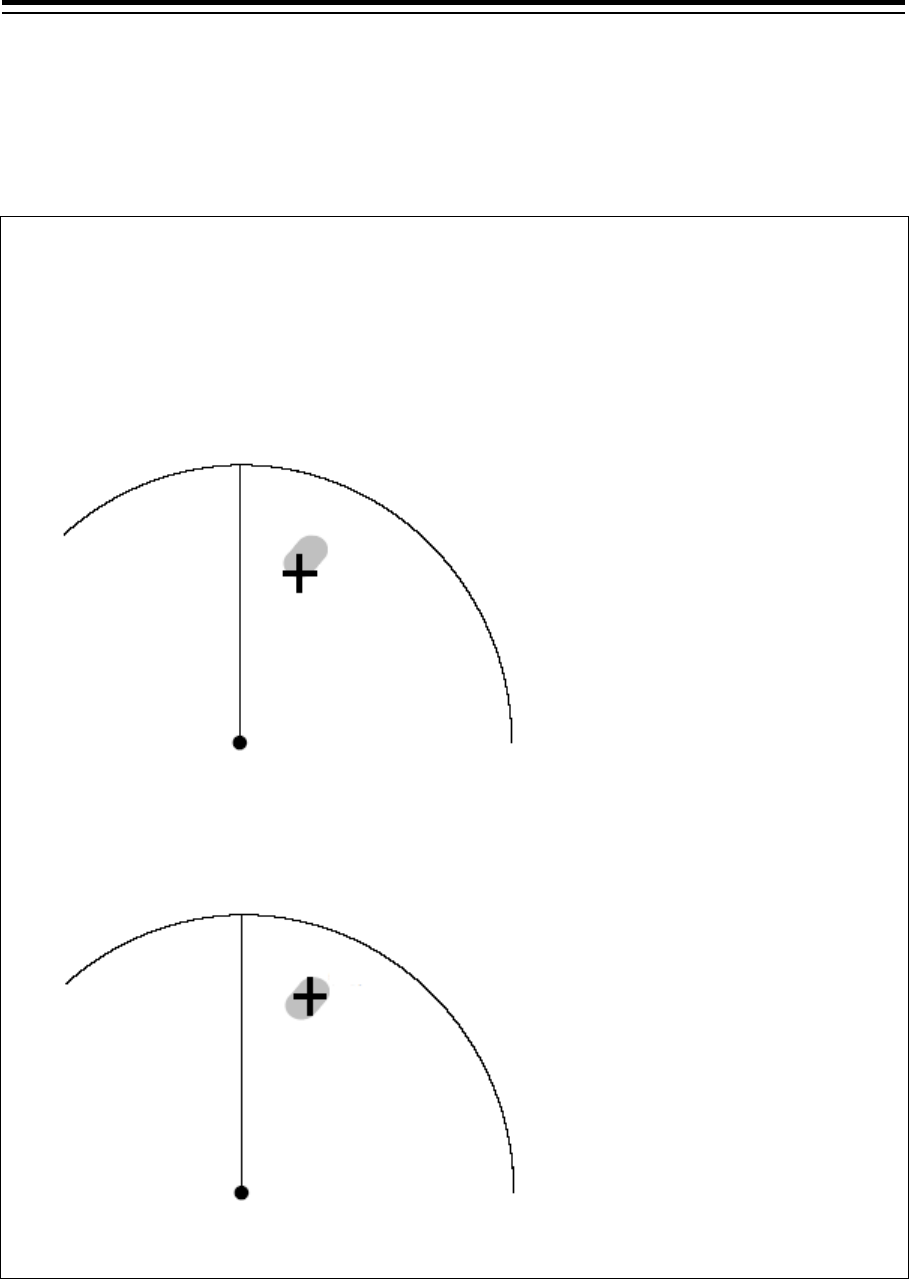
Section 14 Creating a User Map/ Updating a Chart Manually 14-32
14.5 Creating an Object
This section describes the procedures for changing the parameters of the object after creating the
object on the user map or chart during manual update.
Note
After automatic sailing, the mark/line may be shifted depending on how the cursor is placed on the
target at the input.
To prevent the shift, place the cursor on the front edge of the target.
• Input method that does not cause shift (place the cursor on the front edge of the target)
• Input method that causes shift (place the cursor on the center of the target)
SHM
Target
Cursor
Own ship's
position
SHM
Target
Cursor
Own ship's
position
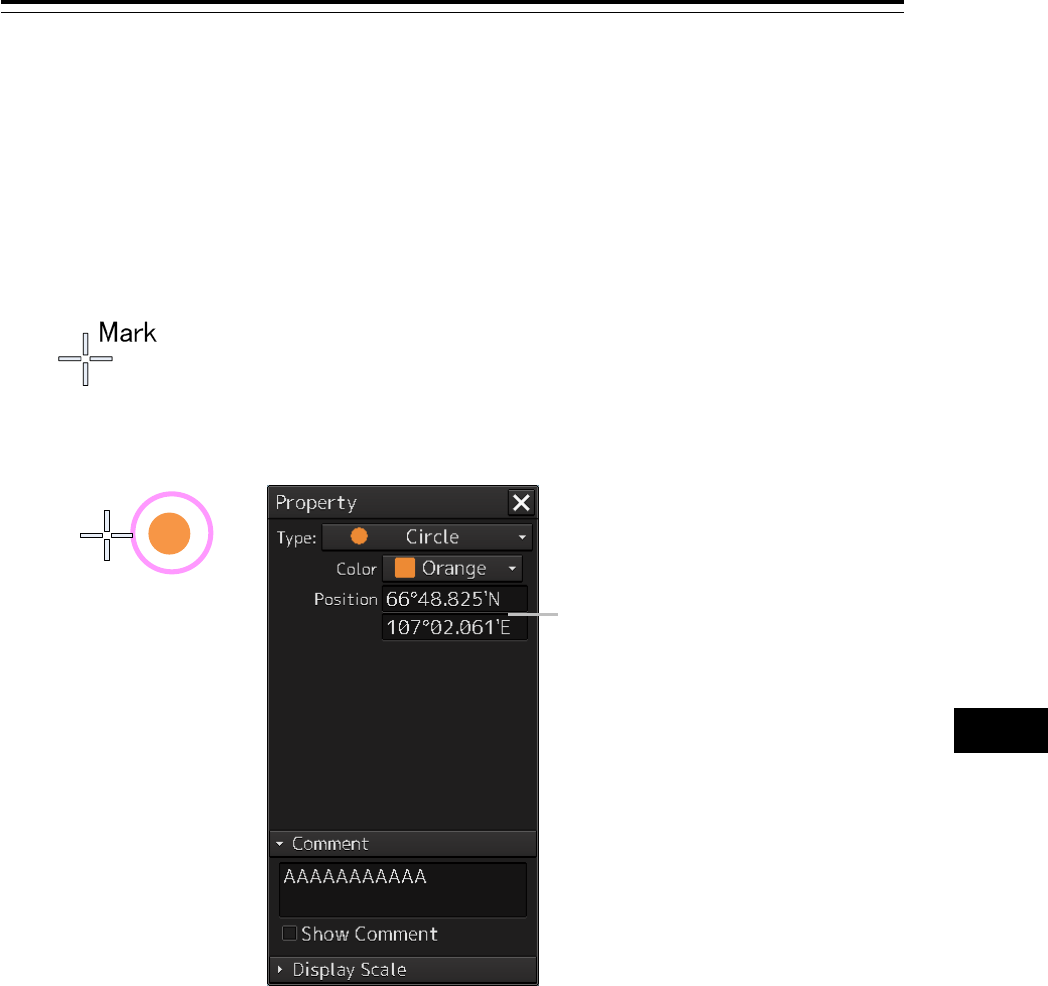
14-33 Section 14 Creating a User Map/ Updating a Chart Manually
1
2
3
4
5
6
7
8
9
10
11
12
13
14
15
16
17
18
19
20
21
22
23
24
25
26
27
14.5.1 Creating a symbol object (Symbol)
A symbol or a Warning symbol can be created by specifying the creation position with the cursor.
1 Click on the [Type] button on the drawing toolbar.
An icon list is opened.
Select a symbol or an icon of the Warning symbol. (Refer to "14.2.3 Selecting an object type").
2 Click on the position on which the symbol is to be created with the cursor.
The symbol is displayed on the position on which the button is clicked and the parameters of the
symbol that was created are displayed on the object property dialog box.
3 Adjust the parameters on the object property dialog box.
4 To create an object on another position continuously, repeat Steps 2 and 3.
14.5.1.1 Creating an object by specifying the latitude and longitude
1 Click on the [Enter POSN] button on the drawing toolbar.
The "Enter Position" dialog box appears (Refer to "14.2.6 Creating an object by specifying
latitude and longitude).
Mark
Latitude and longitude of the
symbol creation position
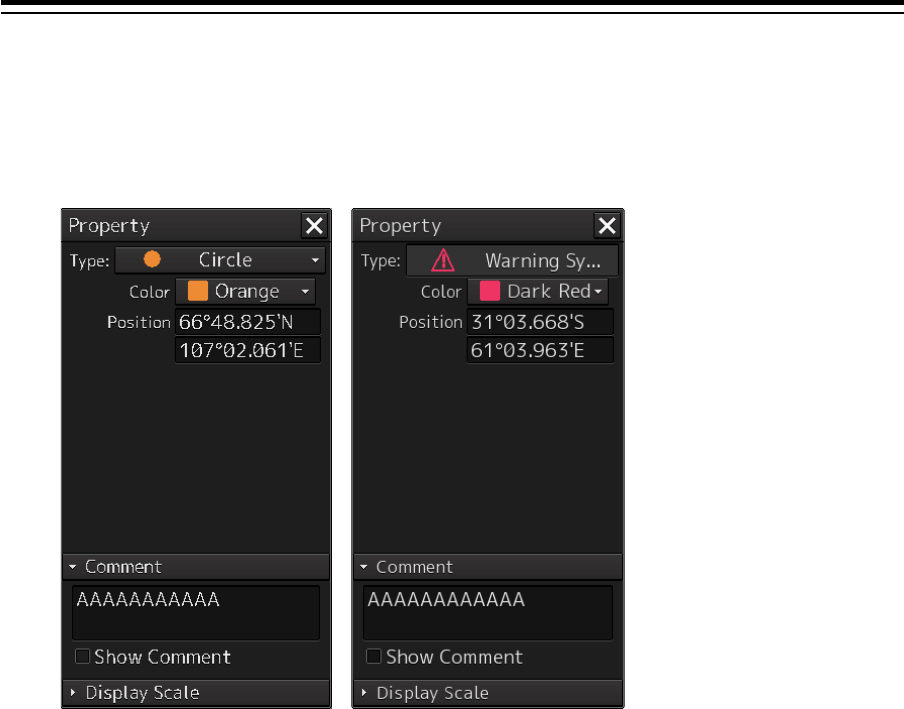
Section 14 Creating a User Map/ Updating a Chart Manually 14-34
2 Enter the latitude and longitude of the position on which an object is to be created and
click on the [Enter] button.
An object is created on the specified latitude and longitude and the property information is
reflected in the object property dialog box. (Refer to "14.2.8 Object property dialog box").
3 Adjust the parameters on the object property dialog box.
4 To create an object on another position continuously, repeat Steps 2 and 3.
At user map creation, the symbol size can be changed by selecting [Option] - [User Map] on the View
menu.
For the details, refer to "16.2.4 Setting up the Display of User Map".
14.5.1.2 Creating an object with EBL/VRM operation
1 Click on the [EBL/VRM] button on the drawing toolbar.
The cursor changes to the EBL/VRM reference point cursor. (Refer to "14.2.5 Creating an
object in the EBL/VRM mode").
2 Click on the position of the reference point of the EBL/VRM marker.
The EBL/VRM marker is displayed.
3 Place the EBL/VRM marker on the position on which the object is to be created and
click the button.
An object is created on the position on which the button was clicked and the property
information is reflected in the object property dialog box. (Refer to "14.2.8 Object property
dialog box").
4 Adjust the parameters on the object property dialog box.
5 To create an object on another position continuously, repeat Steps 2 to 4.
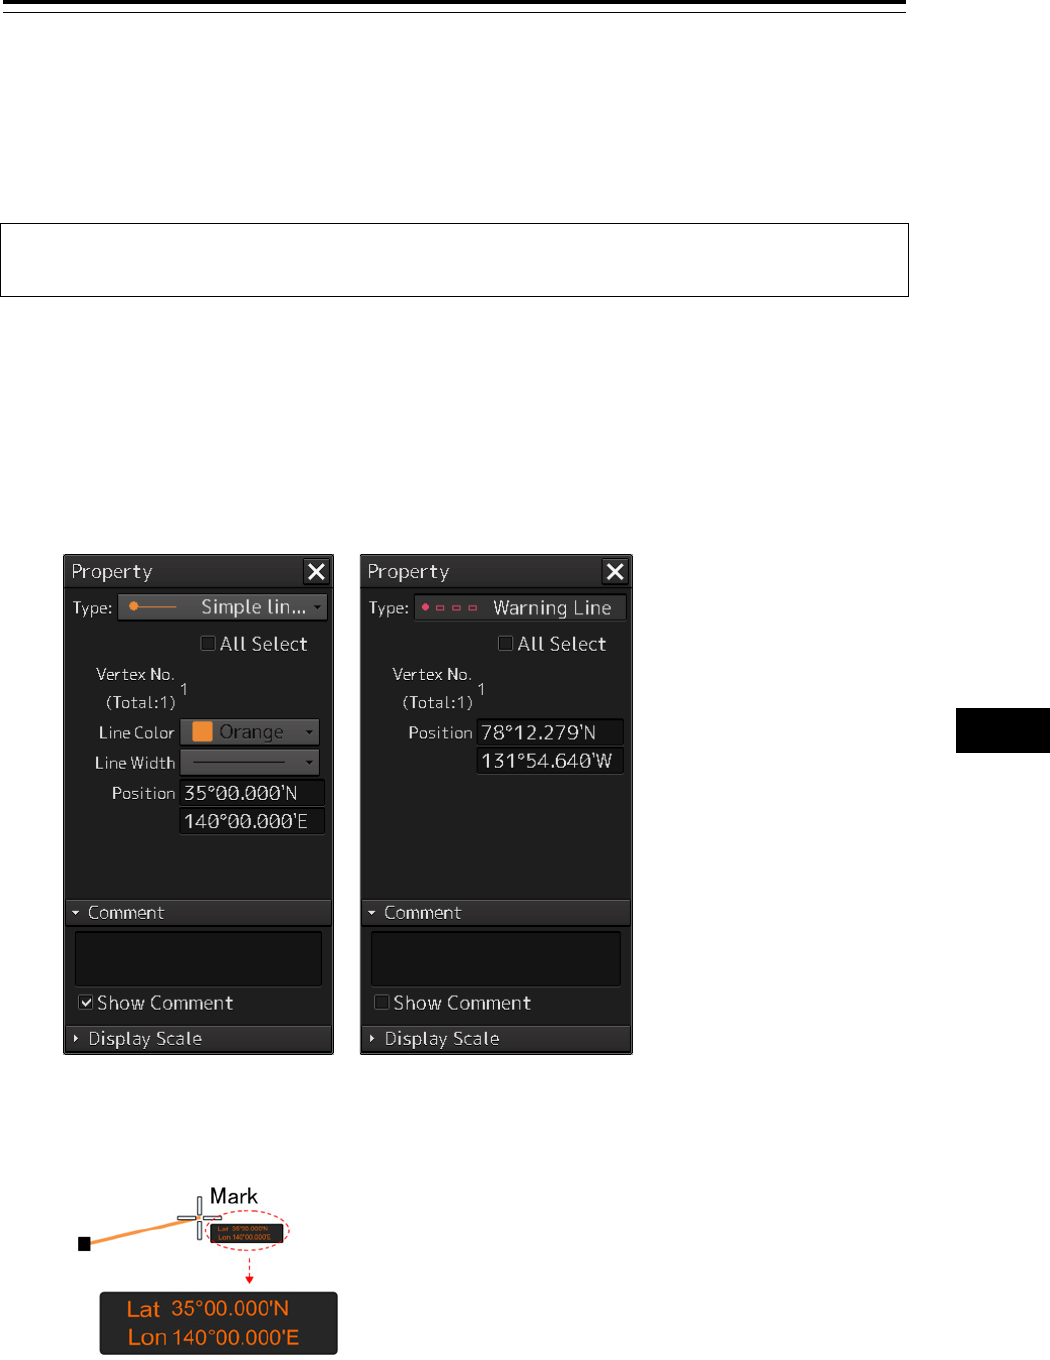
14-35 Section 14 Creating a User Map/ Updating a Chart Manually
1
2
3
4
5
6
7
8
9
10
11
12
13
14
15
16
17
18
19
20
21
22
23
24
25
26
27
14.5.2 Creating a simple line and a Warning line
(Line object)
A simple line and a Warning line are created by using one vertex as an object. A Warning line is a line
object that is detected as the warning target (danger line) of own ship.
Note
The color and width of a Warning line cannot be changed.
1 Click on the [Type] button on the drawing toolbar.
An icon list is opened.
Select an icon of a simple line or a Warning line. (Refer to "14.2.3 Selecting an object type").
2 Click on the starting point with the cursor.
A vertex is created and the property information of the vertex is displayed on the object property
dialog box.
3 Move the cursor to the next vertex.
The latitude and longitude of the cursor are displayed near the cursor.
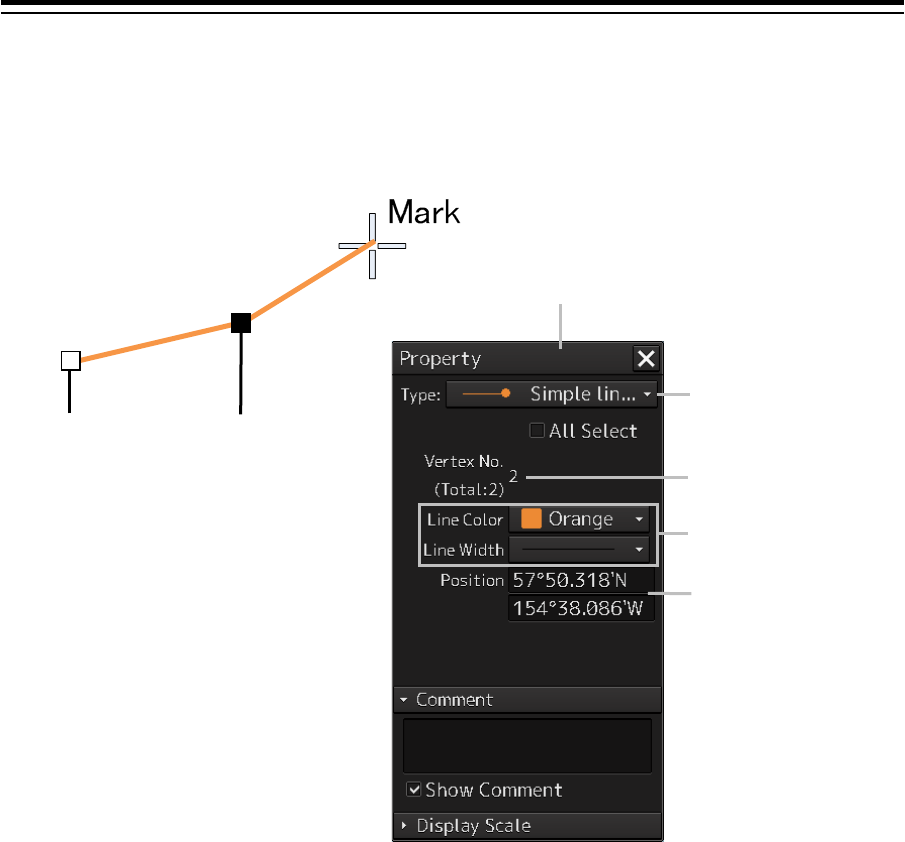
Section 14 Creating a User Map/ Updating a Chart Manually 14-36
4 Click on the position on which the 2nd vertex is to be created.
A vertex is created and the parameters of the 2nd vertex are displayed on the object property
dialog box.
Releasing
the starting
point
selection
state
Addition of 2nd point
The property screen is updated
after the 2nd position is added.
[Type] becomes the
medium point.
The number of
vertices becomes 2.
Editing of the line color
and width is enabled.
The coordinates of the
2nd point are entered.
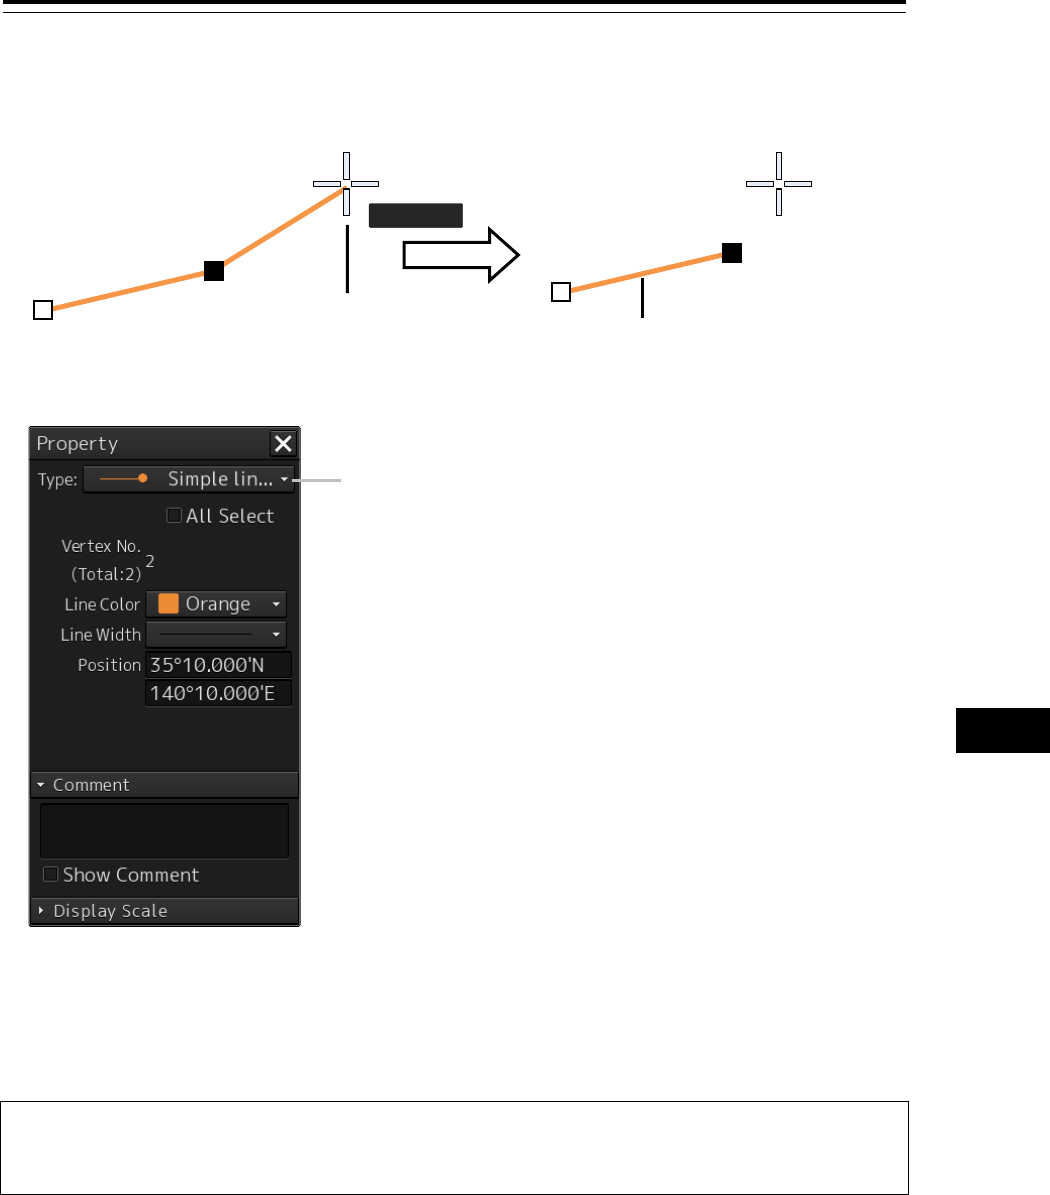
14-37 Section 14 Creating a User Map/ Updating a Chart Manually
1
2
3
4
5
6
7
8
9
10
11
12
13
14
15
16
17
18
19
20
21
22
23
24
25
26
27
5 Determine the line by double-click on the button or click the right button.
6 Adjust the parameters on the object property dialog box.
7 To create an object on another position continuously, repeat Steps 2 to 6.
Memo
The property screen for the vertex that was created can be edited in AUTO mode.
For the details of AUTO mode, refer to "3.12 Cursor AUTO Mode".
Double-click
Mark
Mark
Lon
Lat
140°00.000'E
35°00.000'N
Determined with the line up to
the last vertex that was set
After determining of drawing,
the last vertex changes to the
end point.

Section 14 Creating a User Map/ Updating a Chart Manually 14-38
14.5.2.1 Creating a vertex by entering the position
1 Click on the [Enter POSN] button on the drawing toolbar.
The "Enter Position" dialog box appears.
2 Enter the latitude and longitude of the vertex of the object in the [Position] box and
click on the [Enter] button.
The position of the vertex of the object is determined.
The [Bearing] box and the [Distance] box are enabled.
3 Enter the values of the latitude and the longitude of the next vertex in the [Position]
box. Alternatively, enter the bearing from the vertex that was determined immediately
previously in the [Bearing] box and the [Distance] input box.
4 Click on the [Enter] button.
5 Determine the positions of 3 or more vertices by repeating Steps 2 and 3.
6 Adjust the parameters on the object property dialog box.
7 To create an object in another position continuously, click on the [New] button of the
"Enter Position" dialog and repeat Steps from 2 to 6.
14.5.2.2 Creating an object with EBL/VRM operation
1 Click on the [EBL/VRM] button on the drawing toolbar.
The cursor changes to the EBL/VRM reference point cursor. (Refer to "14.2.5 Creating an
object in the EBL/VRM mode").
2 Click on the position of the reference point of the EBL/VRM marker.
The EBL/VRM marker is displayed.
3 Place the EBL/VRM marker on the starting point and click the button.
A vertex is created on the position on which the button was clicked and the information is
reflected in the object property dialog box. (Refer to "14.2.8 Object property dialog box").
Starting point
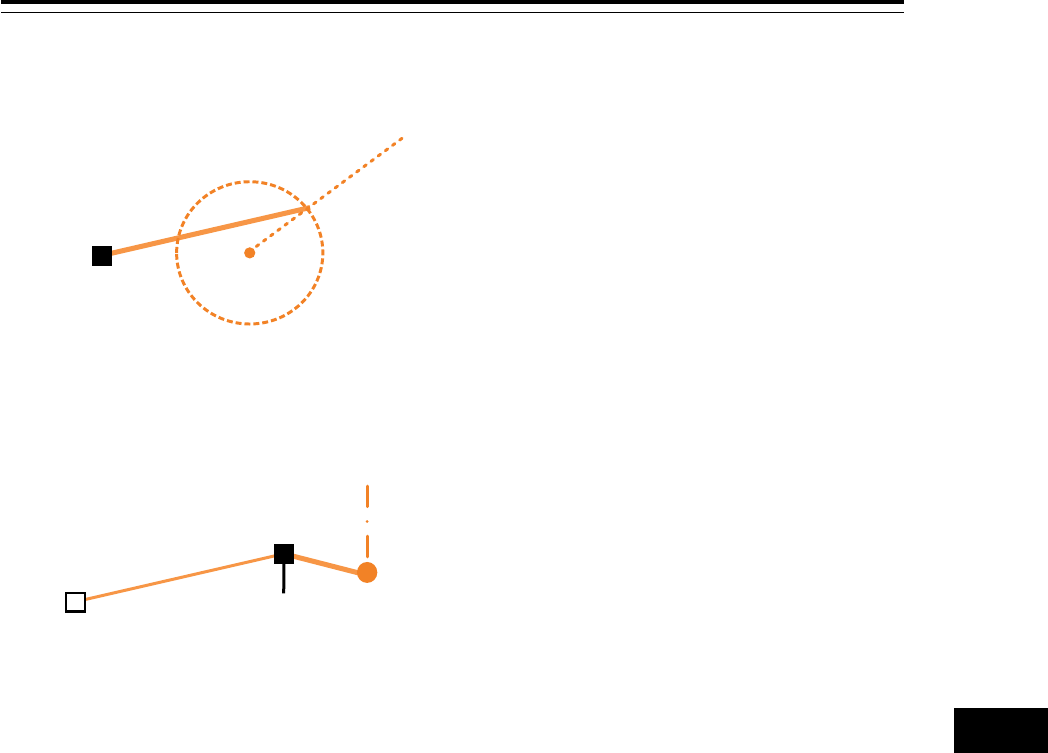
14-39 Section 14 Creating a User Map/ Updating a Chart Manually
1
2
3
4
5
6
7
8
9
10
11
12
13
14
15
16
17
18
19
20
21
22
23
24
25
26
27
4 Click on the position of the reference point.
The EBL/VRM marker that determines the 2nd point is displayed.
5 Place the EBL/VRM marker on the 2nd vertex and click the button.
A vertex is created on the position on which the button was clicked and the information is
reflected in the object property dialog box. (Refer to "14.2.8 Object property dialog box").
The EBL/VRM marker is reset to the EBL/VRM reference point cursor.
6 Adjust the parameters on the object property dialog box.
7 To create an object on another position continuously, repeat Steps 2 to 6.
2nd vertex
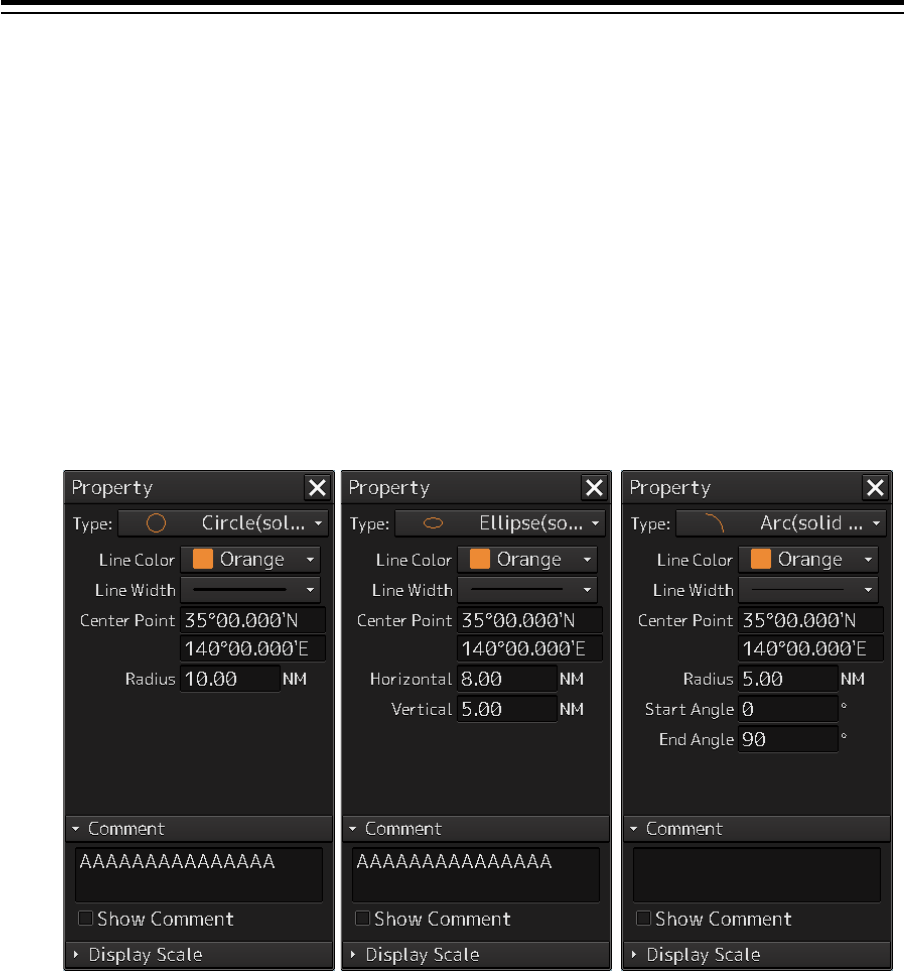
Section 14 Creating a User Map/ Updating a Chart Manually 14-40
14.5.3 Creating a circle, ellipse, and an arc (Line
object)
A circle, an ellipse, and arc can be drawn with the cursor by specifying the center.
1 Click on the [Type] button on the drawing toolbar.
An icon list is opened.
2 Select an icon of a circle, an ellipse, or an arc.
(Refer to "14.2.3 Selecting an object type").
3 Click on the position for the center with the cursor.
The center is created and the property information on the vertex is displayed on the object
property dialog box.
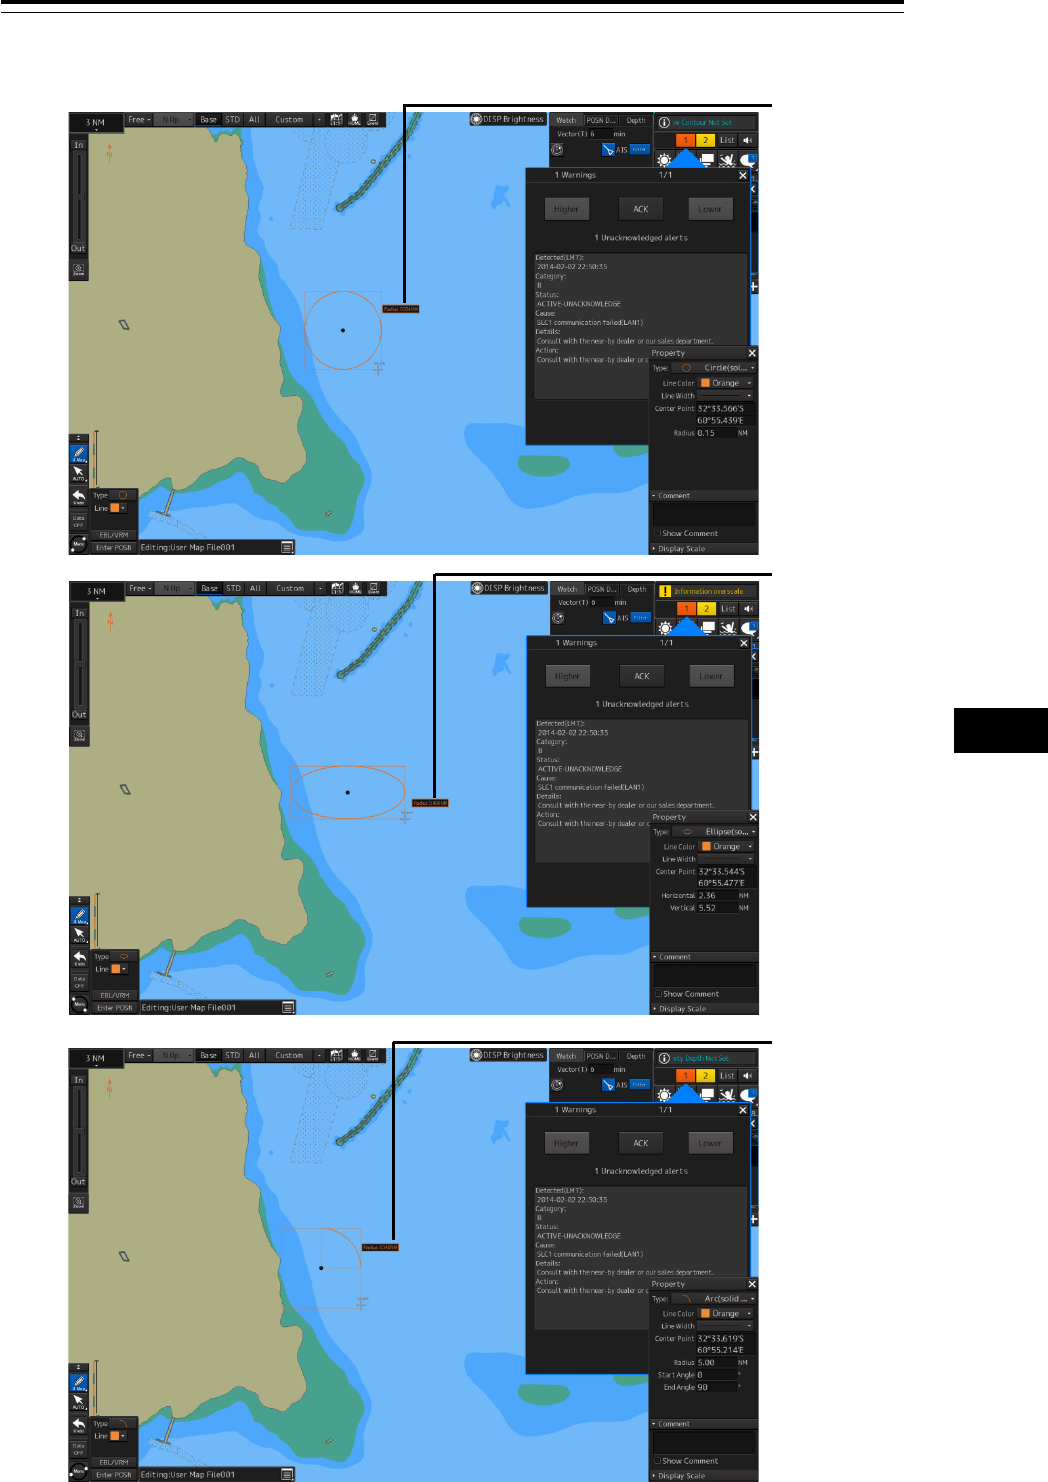
14-41 Section 14 Creating a User Map/ Updating a Chart Manually
1
2
3
4
5
6
7
8
9
10
11
12
13
14
15
16
17
18
19
20
21
22
23
24
25
26
27
4 Draw a circle, an ellipse, or an arc.
Display of
radius
Display of
radius
Display of
radius
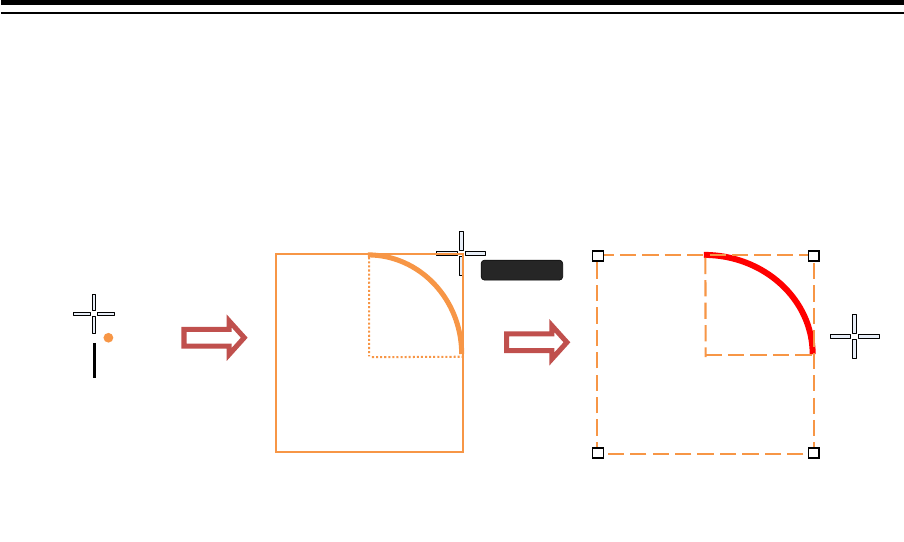
Section 14 Creating a User Map/ Updating a Chart Manually 14-42
At creation of an arc, the starting angle and the ending angle of the arc to be created are the
previous values or the initial values (starting angle: 0°, ending angle: 90°). To change the
starting angle and the ending angle, change the values in [Start Angle] and [End Angle] on the
object property dialog box.
5 Determine the object by clicking the button again.
6 Adjust the parameters on the object property dialog box.
7 To create an object on another position continuously, repeat Steps 3 to 6.
14.5.3.1 Creating an object by specifying a position for the center
and size of the object
1 Click on the [Enter POSN] button on the drawing toolbar.
The "Enter Position" dialog box appears (Refer to "14.2.6 Creating an object by specifying
latitude and longitude").
2 Enter the coordinate of the center of the circle, ellipse, or arc and click on the [Enter]
button of the [Enter Position] dialog box.
The center is created at the position of the specified coordinate and the property information is
reflected in the object property dialog box. (Refer to "14.2.8 Object property dialog box").
3 Set the parameters in the object property dialog box as indicated below.
⋅ Circle: Enter a value of [Radius].
⋅ Ellipse: Enter values of [Horizontal] and [Vertical].
⋅ Arc: Enter values of [Radius], [Start Angle], and [End Angle].
4 To create an object on another position continuously as required, repeat Steps 2 and
3.
Mark
10.0NM
Radius
Mark
Mark
Click on the position
for the center
After determination, the arc is selected and
the cursor moves to the center setting
mode of the next arc.
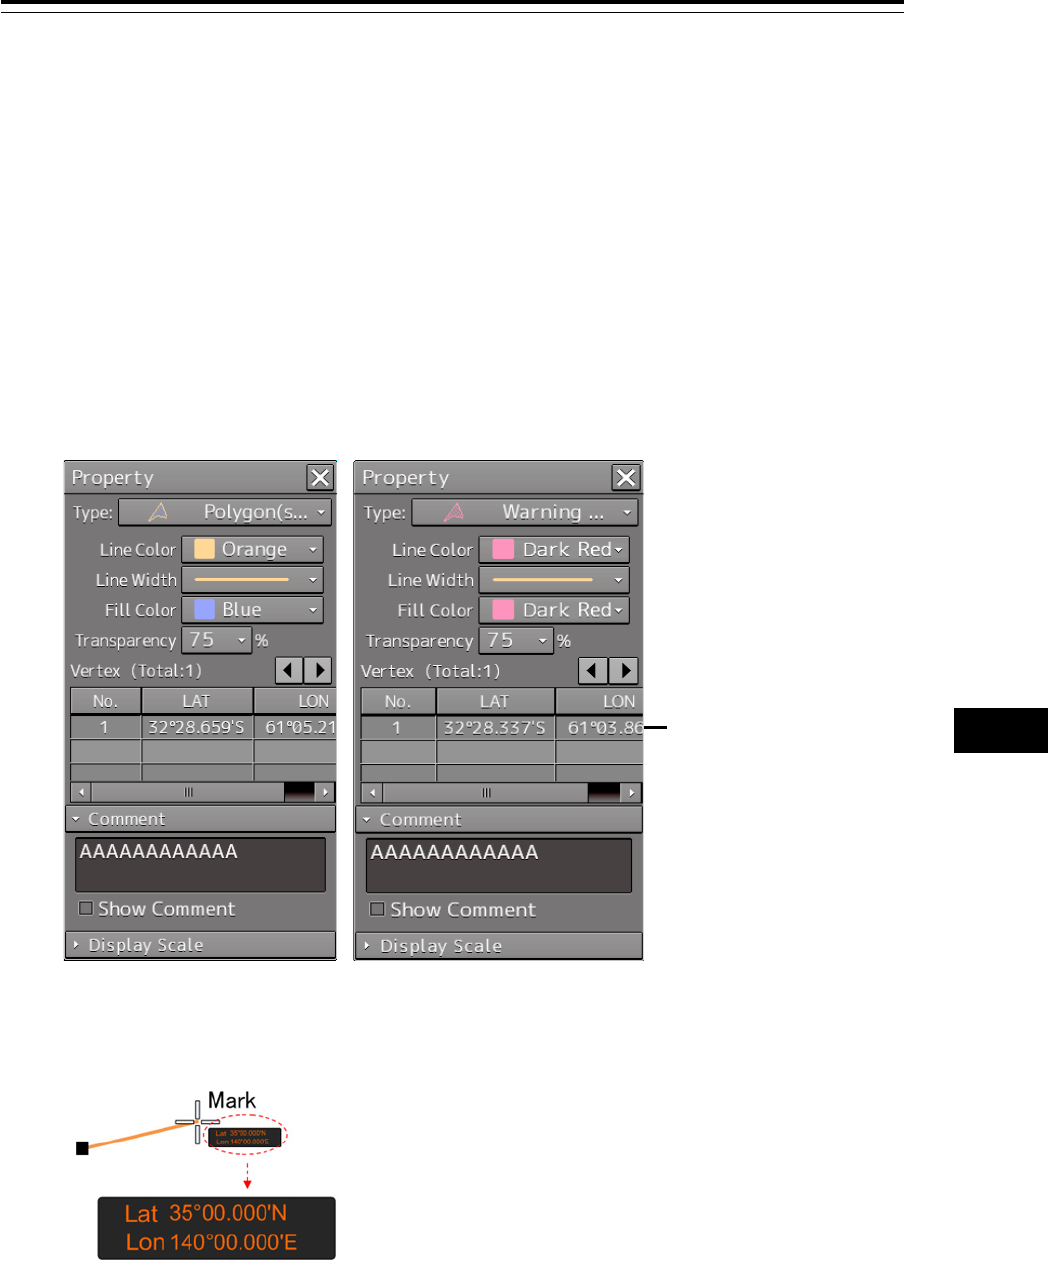
14-43 Section 14 Creating a User Map/ Updating a Chart Manually
1
2
3
4
5
6
7
8
9
10
11
12
13
14
15
16
17
18
19
20
21
22
23
24
25
26
27
14.5.4 Creating a polygon and a Warning area (Area
object)
Create a polygon using all the vertices (3 or more) as one object. A Warning area is an area object that
is detected as a warning target (danger area).
A polygon and a Warning area can be created in the same way as for simple line and Warning line
1 Click on the [Type] button on the drawing toolbar.
An icon list is opened.
Select an icon of a polygon or a Warning area. (Refer to "14.2.3 Selecting an object type").
2 Click on the starting point position with the cursor.
The starting point is created and the property information of vertex 1 is displayed on the object
property dialog box.
3 Move the cursor to the next vertex.
The latitude and longitude of the cursor are displayed near the cursor.
The latitude and
longitude of the starting
point (vertex 1) are
displayed.
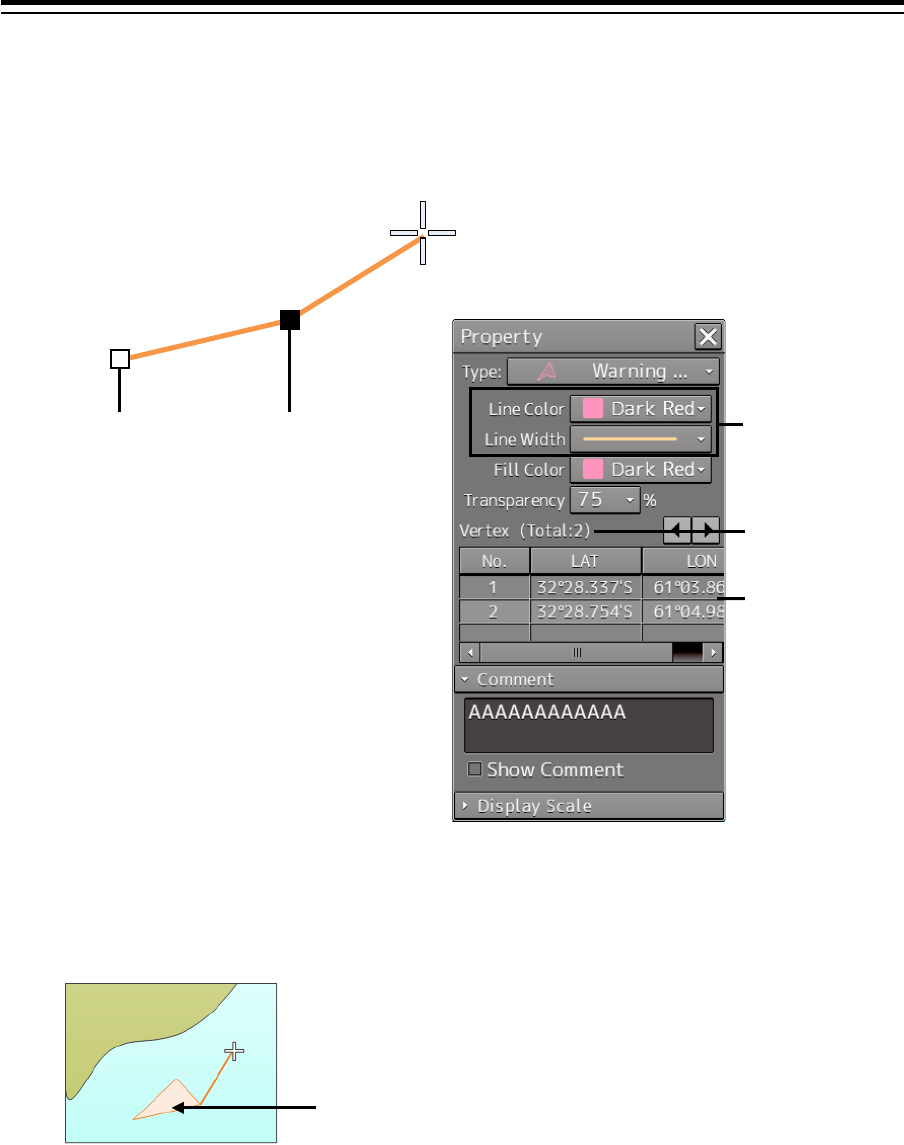
Section 14 Creating a User Map/ Updating a Chart Manually 14-44
4 Click on the position on which the 2nd vertex is to be created.
A vertex is created and the latitude and the longitude of the 2nd vertex are displayed on the
object property dialog box
5 Click on the position on which the 3rd vertex is to be created.
A triangle is created by connecting the three vertices. A preview screen is displayed, enabling
the checking of the fill statuses of the polygon and the Warning area.
The latitude and longitude of the 3rd vertex are displayed on the object property dialog box.
Editing of the line
color and width is
enabled.
Resetting the starting
point selection state
Mark
Add the 2nd point
The number of
vertices
becomes 2.
The coordinates
of the 2nd point
are entered.
The preview of the result of filling the area is displayed.
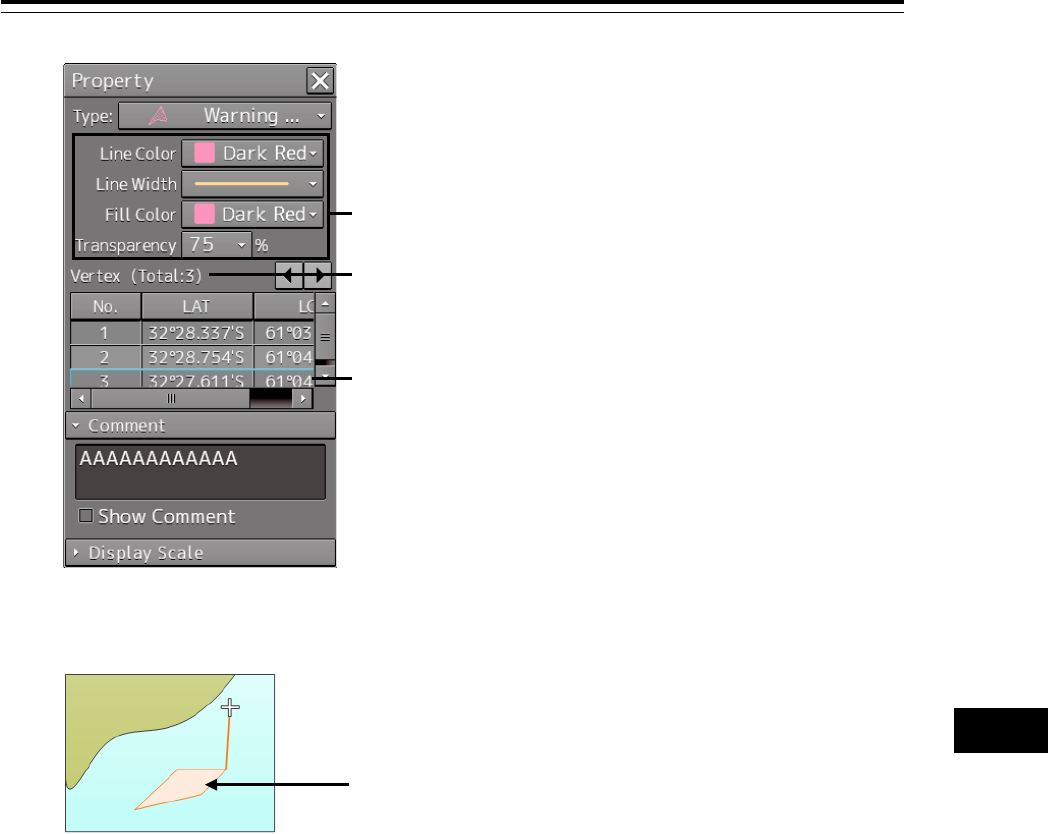
14-45 Section 14 Creating a User Map/ Updating a Chart Manually
1
2
3
4
5
6
7
8
9
10
11
12
13
14
15
16
17
18
19
20
21
22
23
24
25
26
27
6 To add another vertex continuously, click on the position on which the vertex is to be
created.
When not adding any further vertices, determine the polygon or the Warning area by
double-clicking the button or clicking the right button.
7 Adjust the parameters on the object property dialog box.
8 To create an object on another position continuously, repeat Steps 2 to 7.
14.5.4.1 Creating a vertex by entering the position
1 Click on the [Enter POSN] button on the drawing toolbar.
The "Enter Position" dialog box appears.
2 Enter the latitude and longitude of the vertex of the object in the [Position] box and
click on the [Enter] button.
The position of one vertex of the object is determined.
The [Bearing] box and the [Distance] box are enabled.
3 Enter the values of the latitude and the longitude of the next vertex in the [Position]
box. Alternatively, enter the bearing from the vertex that was determined immediately
previously in the [Bearing] box and the [Distance] input box.
4 Click on the [Enter] button.
5 Determine 3 or more vertices by repeating Steps 2 to 4.
The editing of the line color, line width, fill color, and transparency
is enabled.
The number of vertices becomes 3.
The coordinates of the 3rd vertex are entered.
When the 4th vertex is determined, the preview display
is updated.
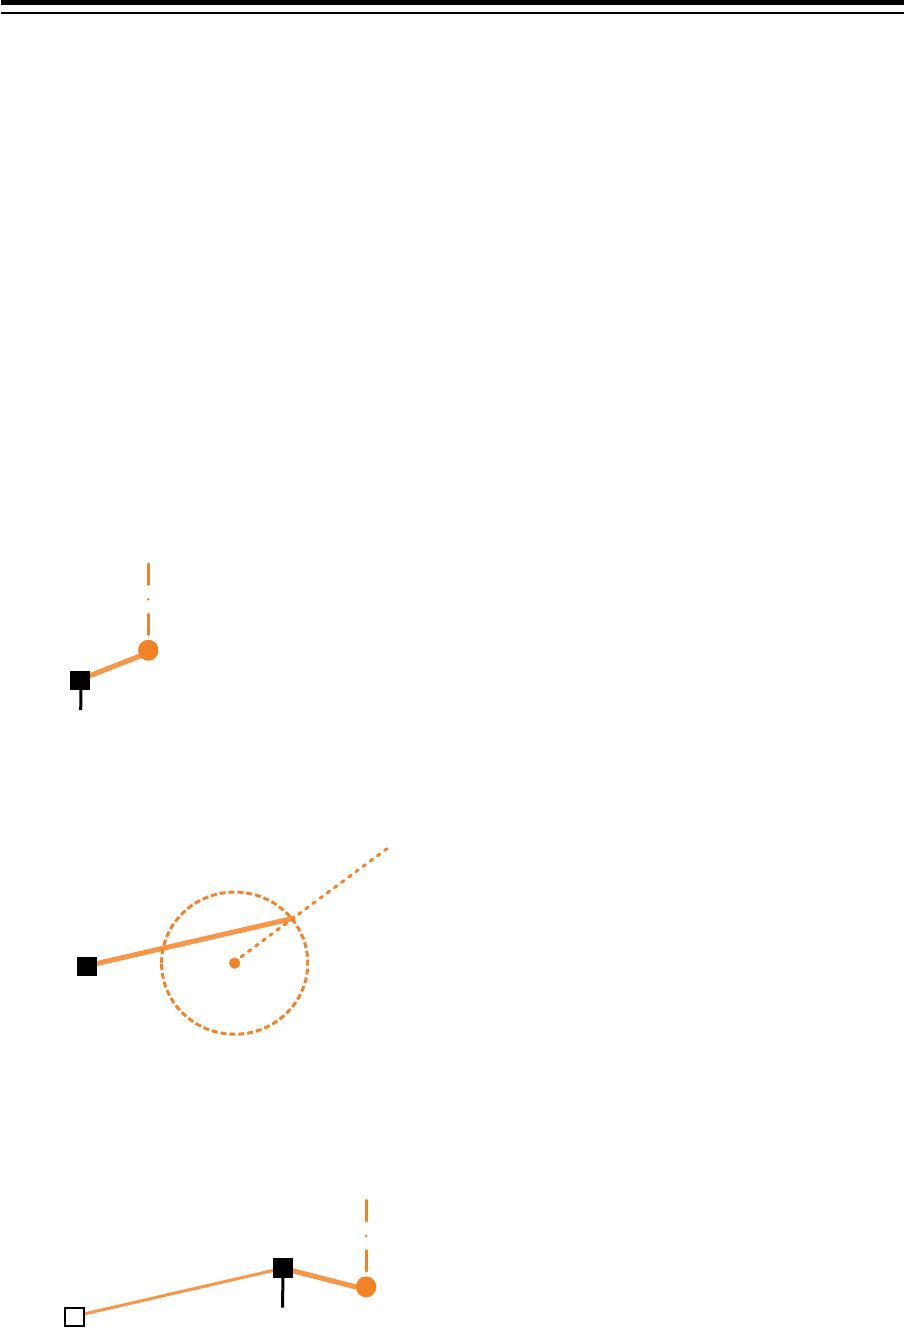
Section 14 Creating a User Map/ Updating a Chart Manually 14-46
6 Adjust the parameters on the object property dialog box.
7 To create an object on another position continuously, repeat Steps 2 to 6.
14.5.4.2 Creating an object with EBL/VRM operation
1 Click on the [EBL/VRM] button on the drawing toolbar.
The cursor changes to the EBL/VRM reference point cursor. (Refer to "14.2.5 Creating an
object in the EBL/VRM mode").
2 Click on the position of the reference point of the EBL/VRM marker.
The EBL/VRM marker is displayed.
3 Place the EBL/VRM marker on the starting position and click the mouse button.
A vertex is created on the position on which the button was clicked and the parameter
information is reflected on the object property dialog box. (Refer to "14.2.8 Object property
dialog box").
4 Click on the position of the reference point.
The EBL/VRM marker that determines the 2nd vertex is displayed.
5 Place the EBL/VRM marker on the 2nd vertex position and click the button.
A vertex is created on the position on which the button was clicked and the property information
is reflected in the object property dialog box. (Refer to "14.2.8 Object property dialog box").
The EBL/VRM marker is reset to the EBL/VRM reference point cursor.
Starting point
2nd vertex
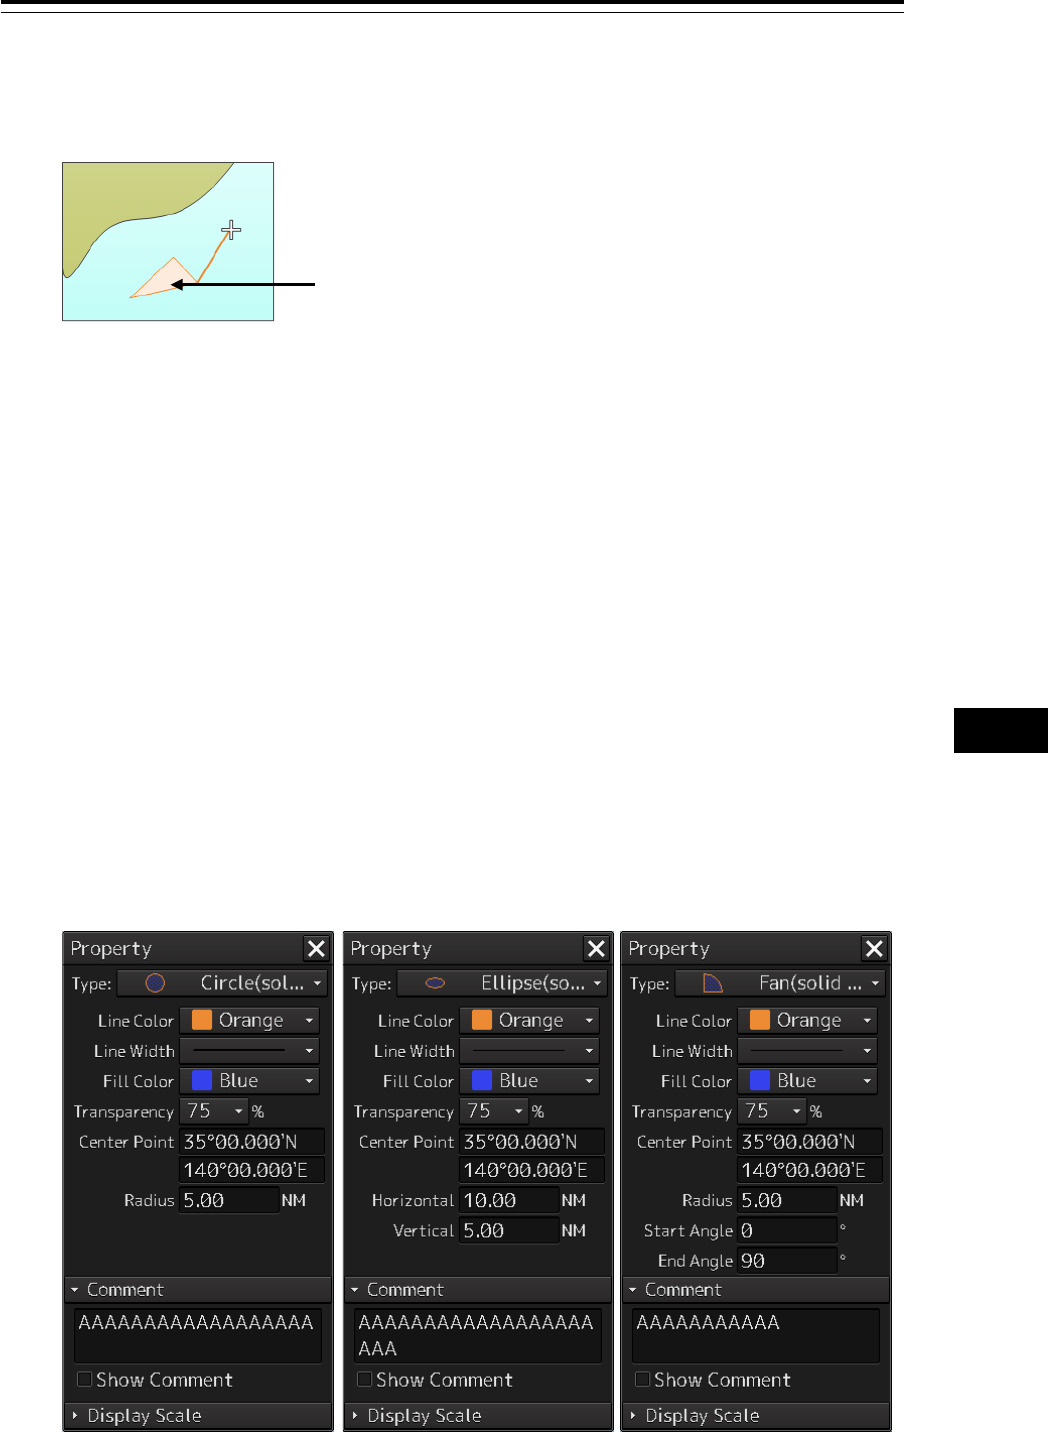
14-47 Section 14 Creating a User Map/ Updating a Chart Manually
1
2
3
4
5
6
7
8
9
10
11
12
13
14
15
16
17
18
19
20
21
22
23
24
25
26
27
6 Place the EBL/VRM marker on the position of the 3rd vertex and click the button.
A triangle is created by connecting the three vertices. The preview screen is displayed, enabling
the checking of the fill state of the polygon and Warning area.
7 Adjust the parameters on the object property dialog box.
8 To create an object on another position continuously, repeat Steps 1 to 7.
14.5.5 Creating circle, ellipse, and fan areas (Area
object)
Circle, ellipse, and fan areas can be created in the same way as for creating a circle, an ellipse, or an
arc of the Line object.
1 Click on the [Type] button on the drawing toolbar.
An icon list is opened.
2 Select an icon of circle, ellipse, or arc. (Refer to "14.2.3 Selecting an object type")
3 Click on the position to be the center with the cursor.
A center is created and the vertex property information is displayed on the object property
dialog box.
Preview of the area fill result is displayed.
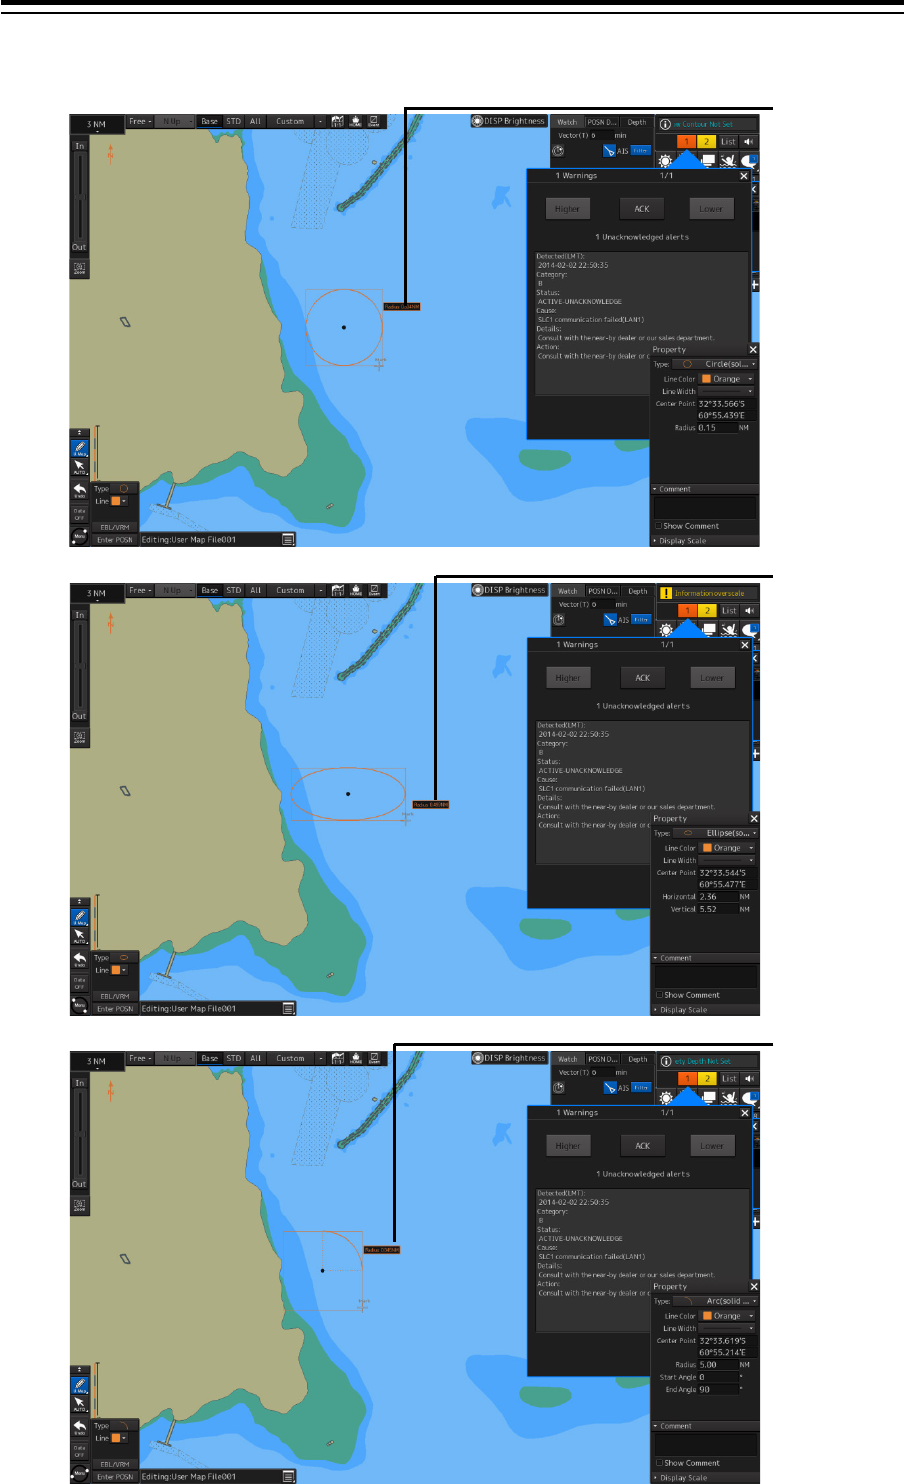
Section 14 Creating a User Map/ Updating a Chart Manually 14-48
4 Draw a circle, an ellipse, and an arc.
Display of
radius
Display of
major
axis/minor
axis
Display of
radius
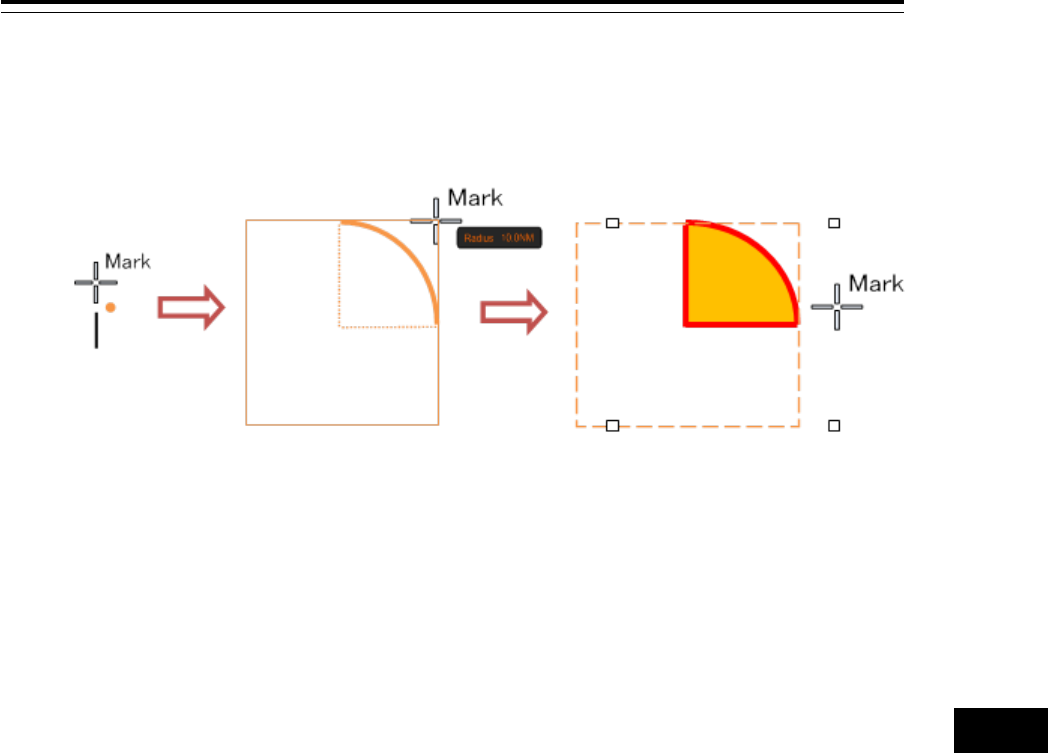
14-49 Section 14 Creating a User Map/ Updating a Chart Manually
1
2
3
4
5
6
7
8
9
10
11
12
13
14
15
16
17
18
19
20
21
22
23
24
25
26
27
At creation of an arc, the starting angle and the ending angle of the arc to be created are the
previous values or the initial values (starting angle: 0°, ending angle: 90°). To change the
starting angle and the ending angle, change the values in [Start Angle] and [End Angle] on the
object property dialog box.
5 Determine the object by clicking the button again.
6 Adjust the parameters on the object property dialog box.
7 To create an object on another position continuously, repeat Steps 3 to 6.
14.5.5.1 Creating an object by specifying the center position and
the object size
1 Click on the [Enter POSN] button on the drawing toolbar.
The "Enter Position" dialog box appears (Refer to "14.2.6 Creating an object by specifying
latitude and longitude").
2 Enter the coordinates of the center of the circle, ellipse, or arc and click on the [Enter]
button on the [Enter Position] dialog box.
A center point is created on the position of the specified coordinates and the property
information is reflected in the object property dialog box (Refer to "14.2.8 Object property dialog
box").
3 Set the following parameters on the object property dialog box.
- Circle: Enter a value of [Radius].
- Ellipse: Enter values of [Horizontal] and [Vertical].
- Arc: Enter values of [Radius], [Start Angle], and [End Angle].
4 To create an object on another position continuously as required, repeat Steps 2 and
3.
After determination, the arc is selected and the cursor
moves to the center setting mode for the next arc.
Click the center
position
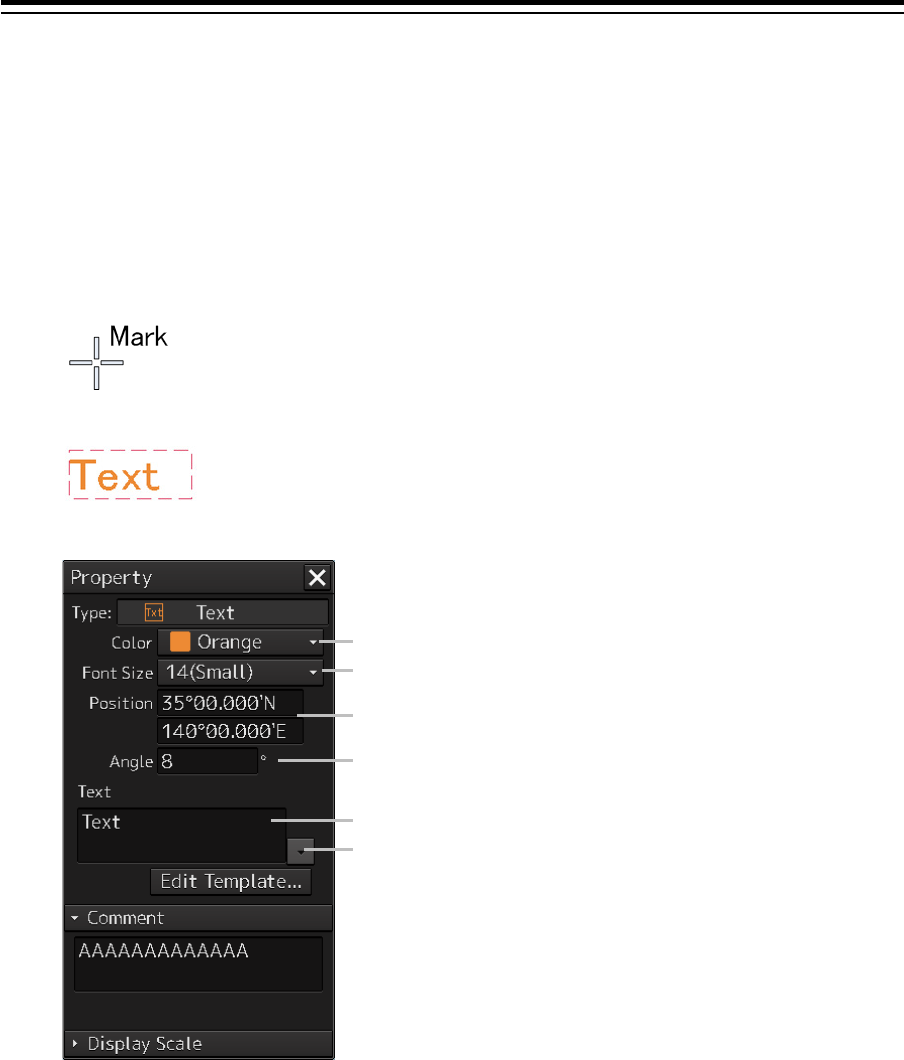
Section 14 Creating a User Map/ Updating a Chart Manually 14-50
14.5.6 Creating a text (Text object)
Any character information can be displayed on the user map.
1 Click on the [Type] button on the drawing toolbar.
An icon list is opened.
Select a text (Txt) icon. (Refer to "14.2.3 Selecting an object type").
2 With the cursor, click on the position on which an object is to be created.
A text box is created at the position on which the button was clicked and a text is displayed.
The parameters of the text that was created are displayed on the object property dialog box.
3 Adjust the parameters on the object property dialog box.
For the text input method, refer to "14.5.6.3 Editing a text", for the template usage method, refer
to "14.5.6.4 Editing a template", and for the text angling method, refer to "14.5.6.5 Changing a
text angle".
4 To create an object on another position continuously, repeat Steps 2 and 3.
Select a character color from the list.
Select a character size from the list.
Enter the coordinates of the text display position.
Enter the angle from the 12 O'clock bearing when angling the text.
Enter a text (up to 64 characters).
To use a template, select a template from the list by clicking the
button.

14-51 Section 14 Creating a User Map/ Updating a Chart Manually
1
2
3
4
5
6
7
8
9
10
11
12
13
14
15
16
17
18
19
20
21
22
23
24
25
26
27
14.5.6.1 Creating a text by specifying the latitude and longitude
1 Click on the [Enter POSN] button on the drawing toolbar.
The "Enter Position" dialog box appears (Refer to "14.2.6 Creating an object by specifying
latitude and longitude").
2 Enter the latitude and longitude of the object to be created and click on the [Enter]
button.
An object is created on the specified latitude and longitude and the property information is
reflected in the object property dialog box. (Refer to "14.2.8 Object property dialog box").
3 Adjust the parameters on the object property dialog box.
For the text input method, refer to "14.5.6.3 Editing a text", for the template usage method, refer
to "14.5.6.4 Editing a template", and for the text angling method, refer to "14.5.6.5 Changing a
text angle".
4 To create an object on another position continuously, repeat steps 2 and 3.
14.5.6.2 Creating a text with EBL/VRM operation
1 Click on the [EBL/VRM] button on the drawing toolbar.
The cursor changes to the EBL/VRM reference point cursor. (Refer to "14.2.5 Creating an
object in the EBL/VRM mode").
2 Click on the position of the reference point position of the EBL/VRM marker.
The EBL/VRM marker is displayed.
3 Place the EBL/VRM marker on the position on which an object is to be created and
click the button.
An object is created on the position on which the button was clicked and the property
information is reflected in the object property dialog box. (Refer to "14.2.8 Object property
dialog box").
4 Adjust the parameters on the object property dialog box.
For the text input method, refer to "14.5.6.3 Editing a text", for the template usage method, refer
to "14.5.6.4 Editing a template", and for the text angling method, refer to "14.5.6.5 Changing a
text angle".
5 To create an object on another position continuously, repeat Steps 2 to 4.
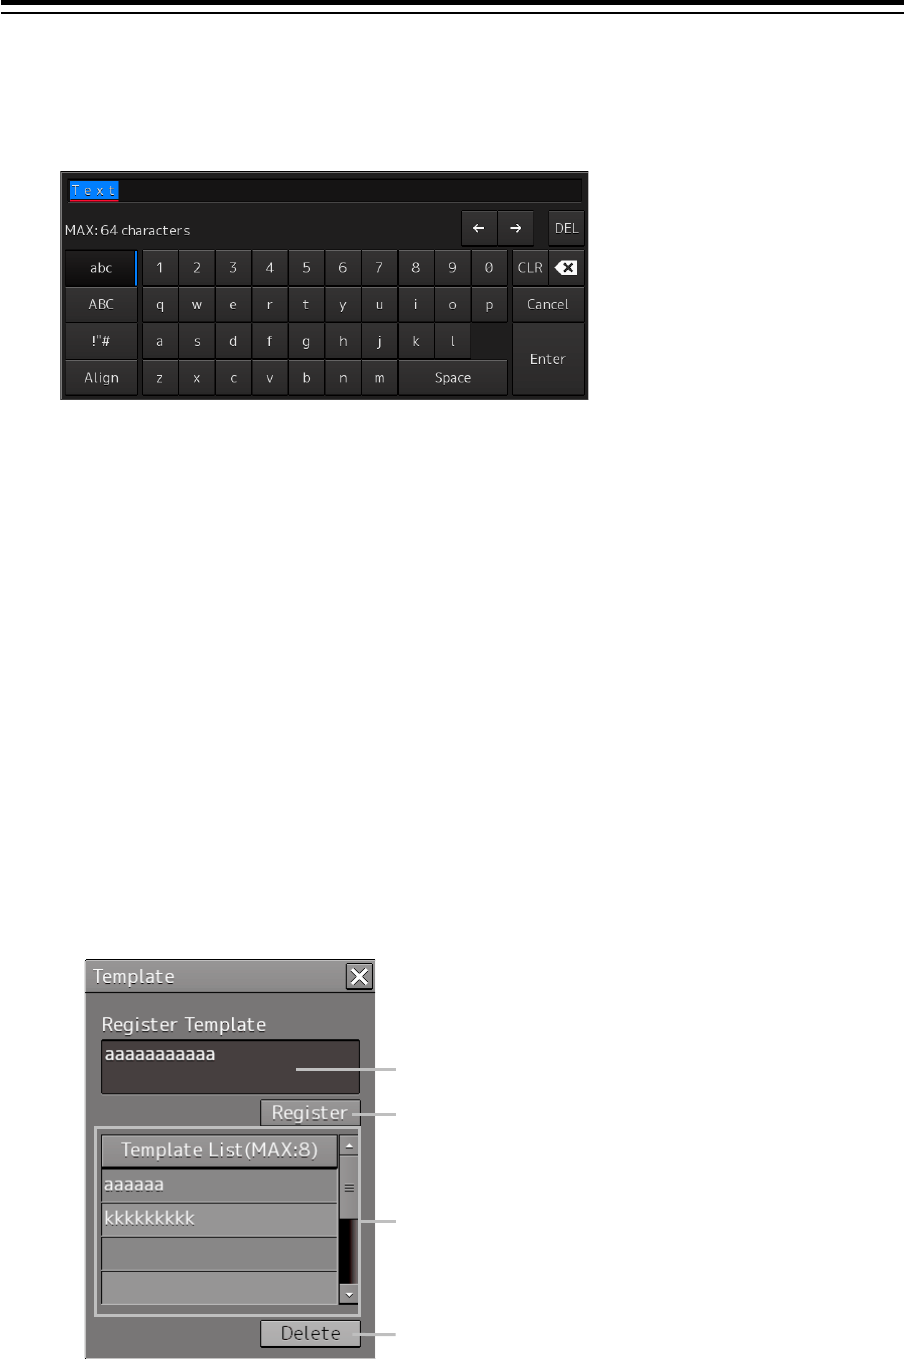
Section 14 Creating a User Map/ Updating a Chart Manually 14-52
14.5.6.3 Editing a text
1 Click on the [Text] input box
A character input full keyboard is displayed.
2 Create a text.
For the method of using the character input full keyboard, refer to "3.15.2 Name and function of
each section of the keyboard".
3 Close the character input full keyboard by clicking on the [Enter] key.
4 To change a character color, select a required character color from the [Color] combo
box.
5 To change a character size, select a required character size from the [Font size]
combo box.
14.5.6.4 Editing a template
By registering a frequently used text as a template, the template can be used at text creation.
1 Click on the [Edit Template] button.
The "Template" dialog box appears.
Text input area
[Register] button
Template List
[Delete] button
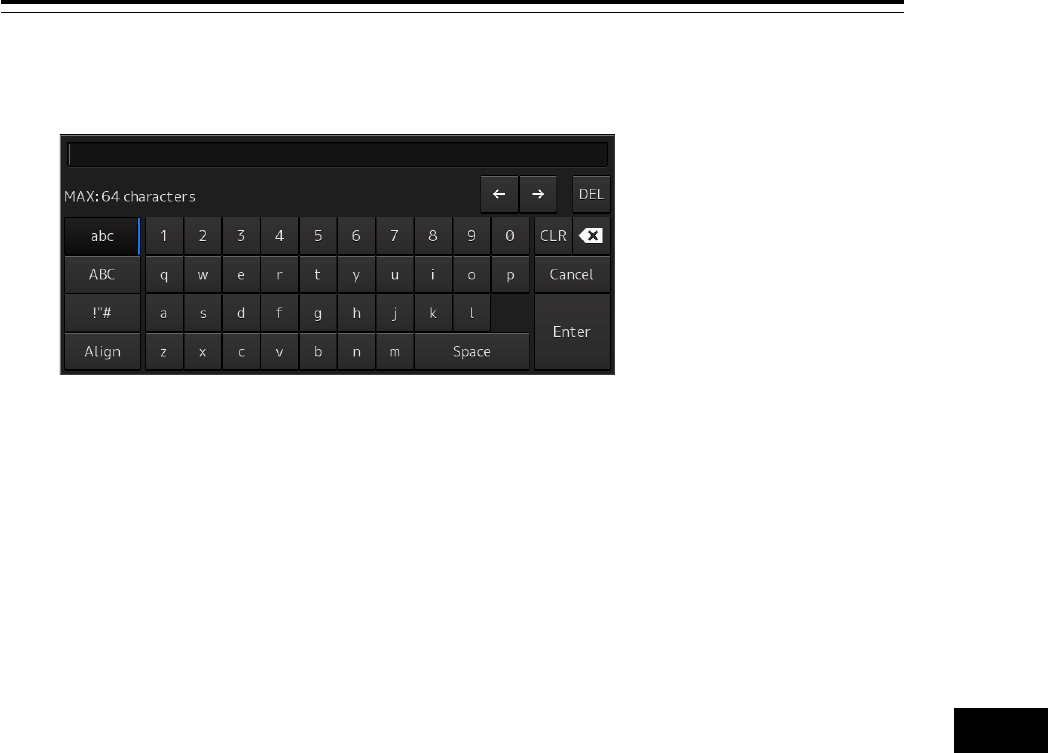
14-53 Section 14 Creating a User Map/ Updating a Chart Manually
1
2
3
4
5
6
7
8
9
10
11
12
13
14
15
16
17
18
19
20
21
22
23
24
25
26
27
2 Click on a text input area.
A character input full keyboard is displayed.
3 Create a text.
For the method of using the character input full keyboard, refer to "3.15.2 Name and function of
each section of the keyboard".
4 Close the character input full keyboard by clicking on the [Enter] key.
5 Click on the [Register] button.
6 Close the "Template" dialog and click on [
] on the right side of the text input area of
the object properties dialog.
[Template List] is displayed.
7 Select any template.
8 To delete unnecessary templates, select unnecessary templates in the [Template List]
and click on the [Delete] button.
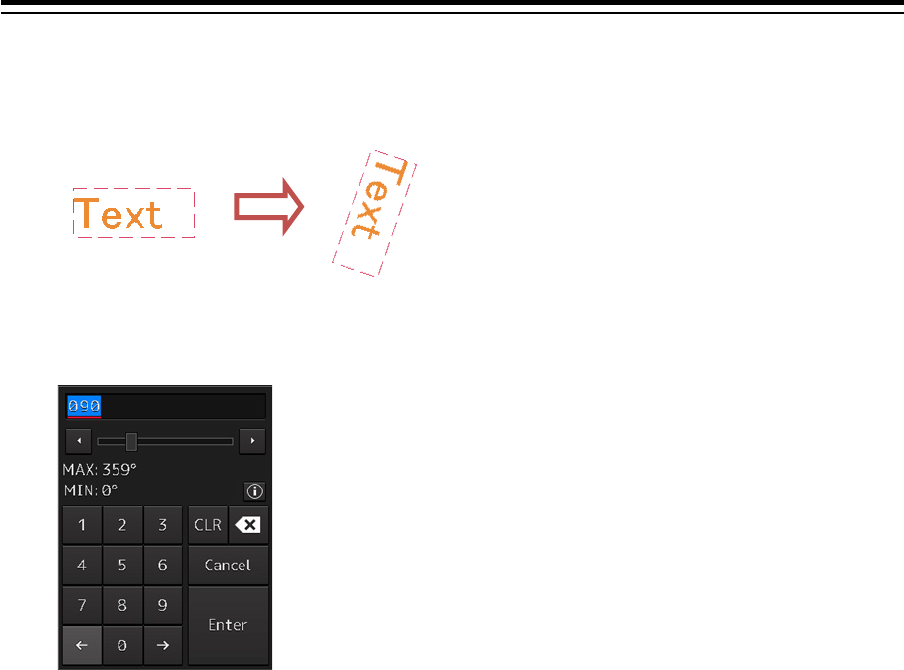
Section 14 Creating a User Map/ Updating a Chart Manually 14-54
14.5.6.5 Changing a text angle
Under the factory setting, a text is oriented horizontally. The text can be angled or inverted according to
the text creation position.
1 Click on the [Angle] input box.
A numeric value input keyboard is displayed.
2 Enter an angle.
Specify an angle in clockwise based on the direction of the 12 O'clock as 0°. Under the factory
setting, the angle is set to 90° (horizontal).
For the method of using the numeric value input keyboard, refer to "3.15.2 Name and function
of each section of the keyboard".