Cisco Systems 102075 Cisco Aironet 802.11n Dual Band Access Points User Manual Cisco Wireless LAN Controller Configuration Guide 9
Cisco Systems Inc Cisco Aironet 802.11n Dual Band Access Points Cisco Wireless LAN Controller Configuration Guide 9
Contents
- 1. User manual
- 2. Cisco Wireless LAN Controller Configuration Guide_1
- 3. Cisco Wireless LAN Controller Configuration Guide_2
- 4. Cisco Wireless LAN Controller Configuration Guide_3
- 5. Cisco Wireless LAN Controller Configuration Guide_4
- 6. Cisco Wireless LAN Controller Configuration Guide_5
- 7. Cisco Wireless LAN Controller Configuration Guide_6
- 8. Cisco Wireless LAN Controller Configuration Guide_7
- 9. Cisco Wireless LAN Controller Configuration Guide_8
- 10. Cisco Wireless LAN Controller Configuration Guide_9
- 11. Cisco Wireless LAN Controller Configuration Guide_10
- 12. Cisco Wireless LAN Controller Configuration Guide_11
- 13. User Manual
Cisco Wireless LAN Controller Configuration Guide_9
![C-8Cisco Wireless LAN Controller Configuration GuideOL-21524-02Appendix C End User License and Warranty Notices and Disclaimers3. All advertising materials mentioning features or use of this software must display the following acknowledgement:“This product includes cryptographic software written by Eric Young (eay@cryptsoft.com)”.The word ‘cryptographic’ can be left out if the routines from the library being used are not cryptography-related.4. If you include any Windows specific code (or a derivative thereof) from the apps directory (application code) you must include an acknowledgement: “This product includes software written by Tim Hudson (tjh@cryptsoft.com)”.THIS SOFTWARE IS PROVIDED BY ERIC YOUNG “AS IS” AND ANY EXPRESS OR IMPLIED WARRANTIES, INCLUDING, BUT NOT LIMITED TO, THE IMPLIED WARRANTIES OF MERCHANTABILITY AND FITNESS FOR A PARTICULAR PURPOSE ARE DISCLAIMED. IN NO EVENT SHALL THE AUTHOR OR CONTRIBUTORS BE LIABLE FOR ANY DIRECT, INDIRECT, INCIDENTAL, SPECIAL, EXEMPLARY, OR CONSEQUENTIAL DAMAGES (INCLUDING, BUT NOT LIMITED TO, PROCUREMENT OF SUBSTITUTE GOODS OR SERVICES; LOSS OF USE, DATA, OR PROFITS; OR BUSINESS INTERRUPTION) HOWEVER CAUSED AND ON ANY THEORY OF LIABILITY, WHETHER IN CONTRACT, STRICT LIABILITY, OR TORT (INCLUDING NEGLIGENCE OR OTHERWISE) ARISING IN ANY WAY OUT OF THE USE OF THIS SOFTWARE, EVEN IF ADVISED OF THE POSSIBILITY OF SUCH DAMAGE.The license and distribution terms for any publicly available version or derivative of this code cannot be changed. i.e. this code cannot simply be copied and put under another distribution license [including the GNU Public License].DisclaimersAll third party trademarks are the property of their respective owners.A](https://usermanual.wiki/Cisco-Systems/102075.Cisco-Wireless-LAN-Controller-Configuration-Guide-9/User-Guide-1514969-Page-2.png)
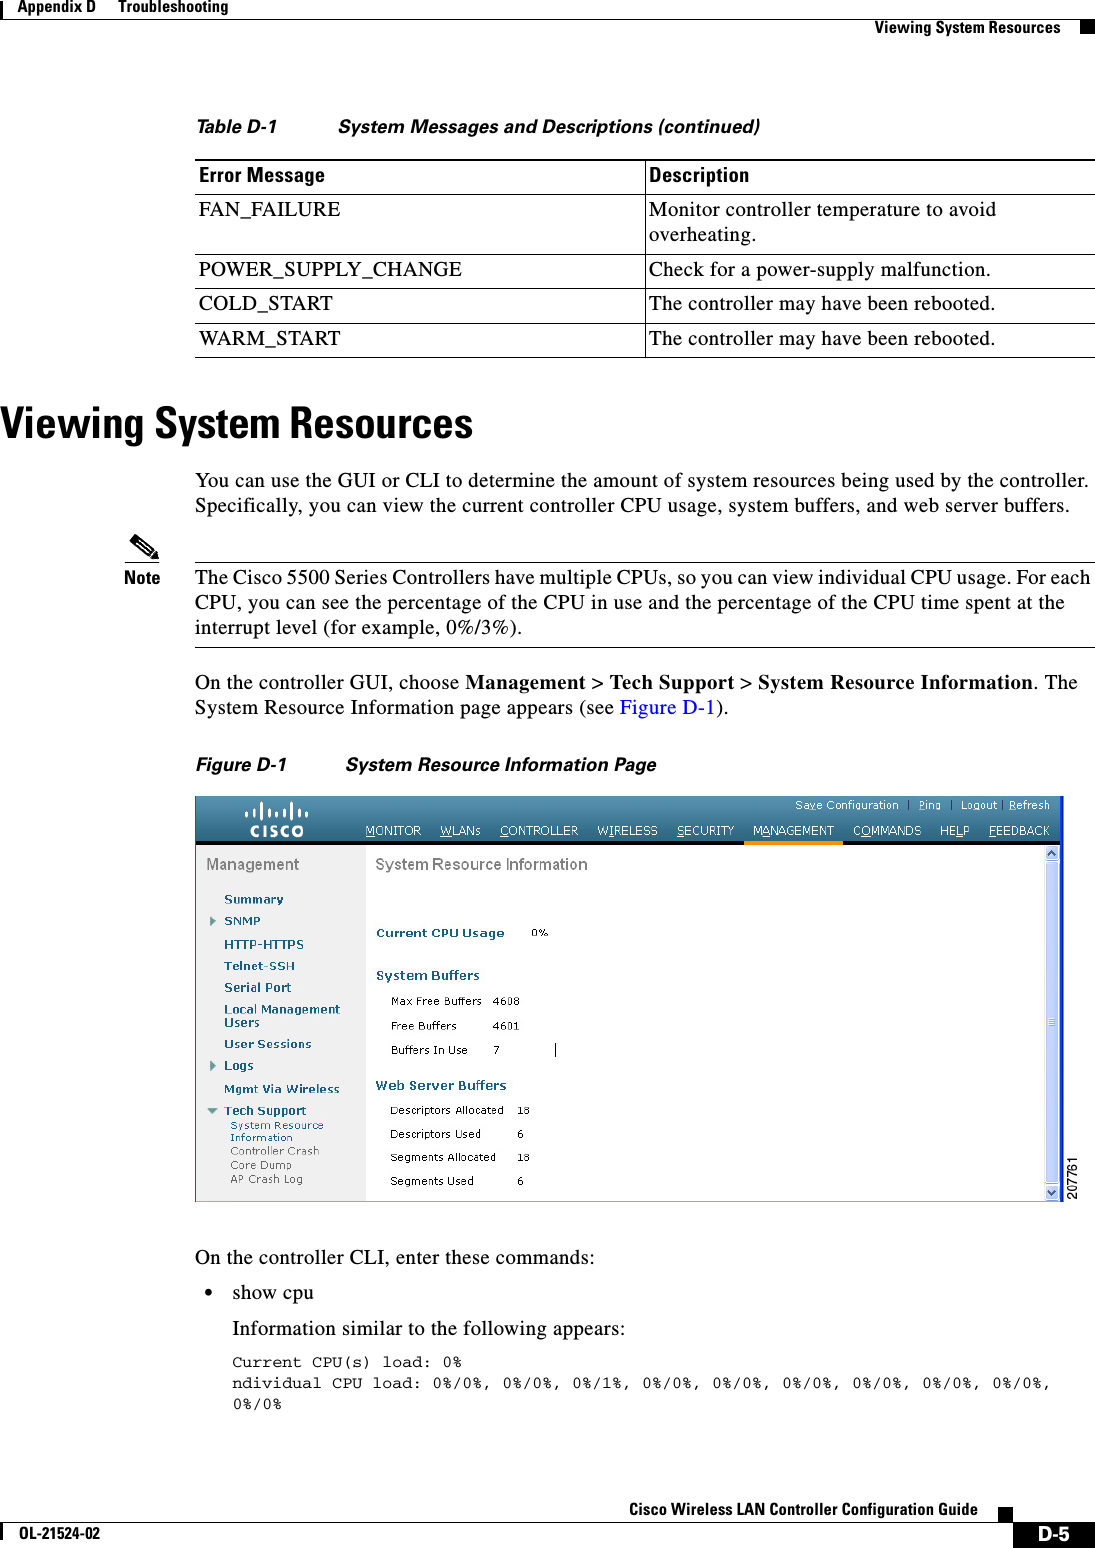
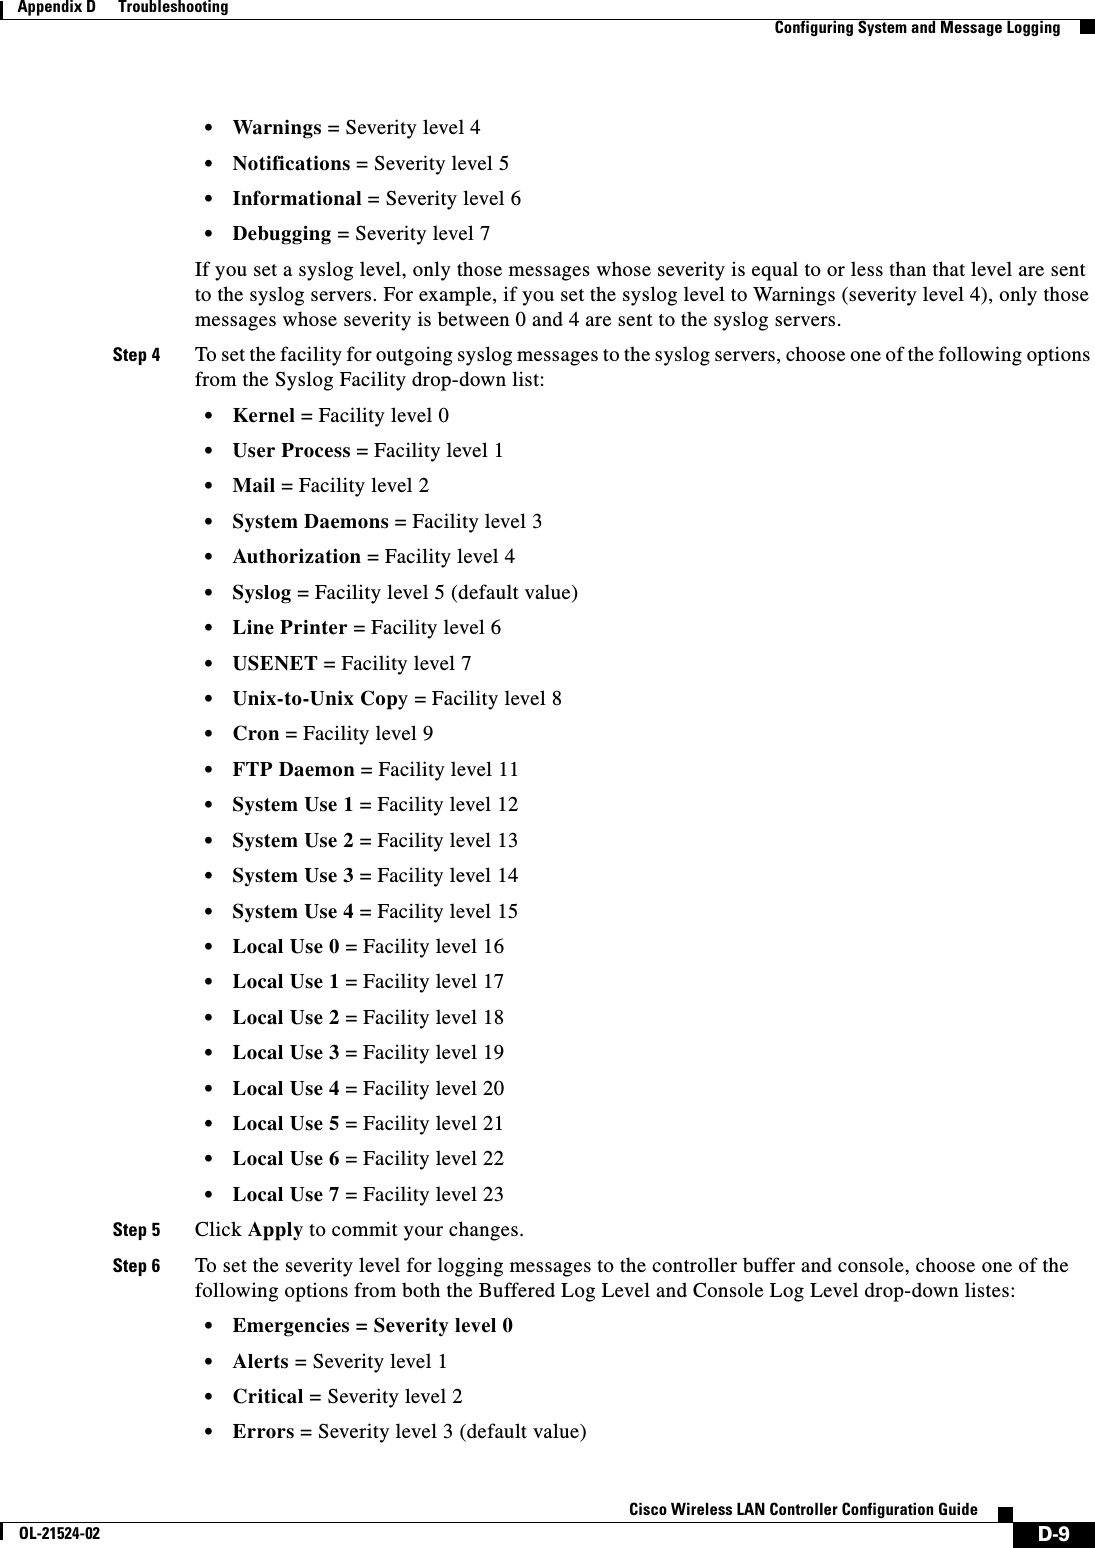
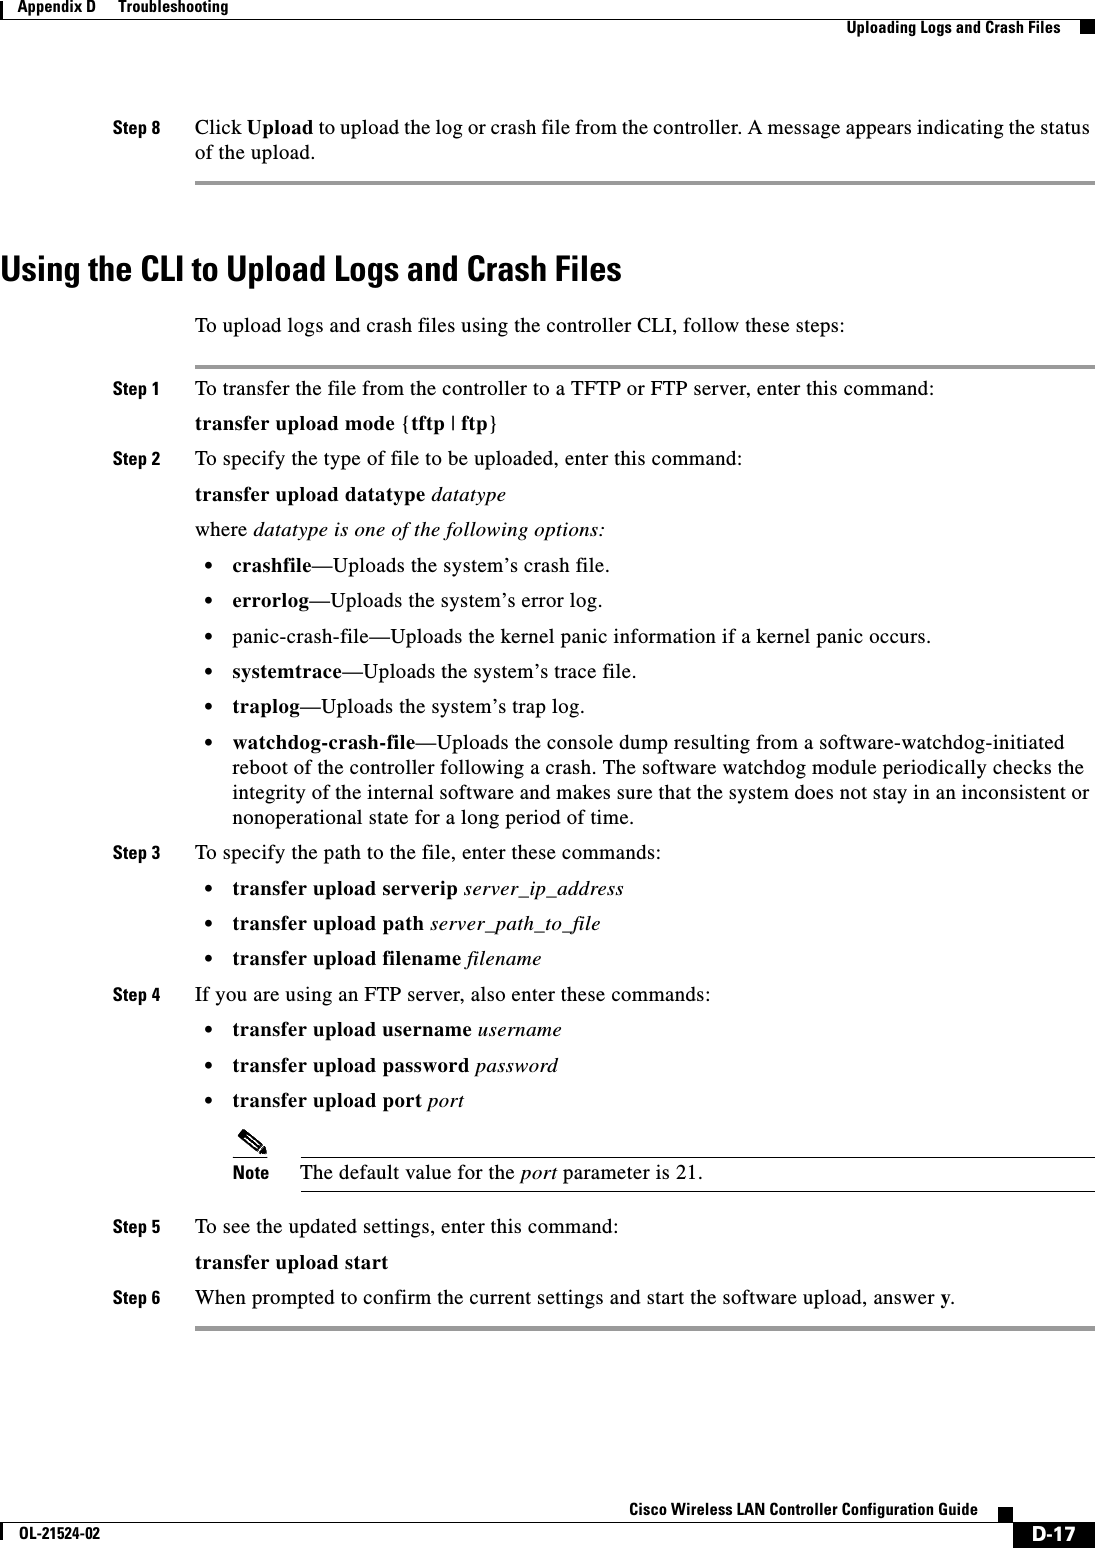
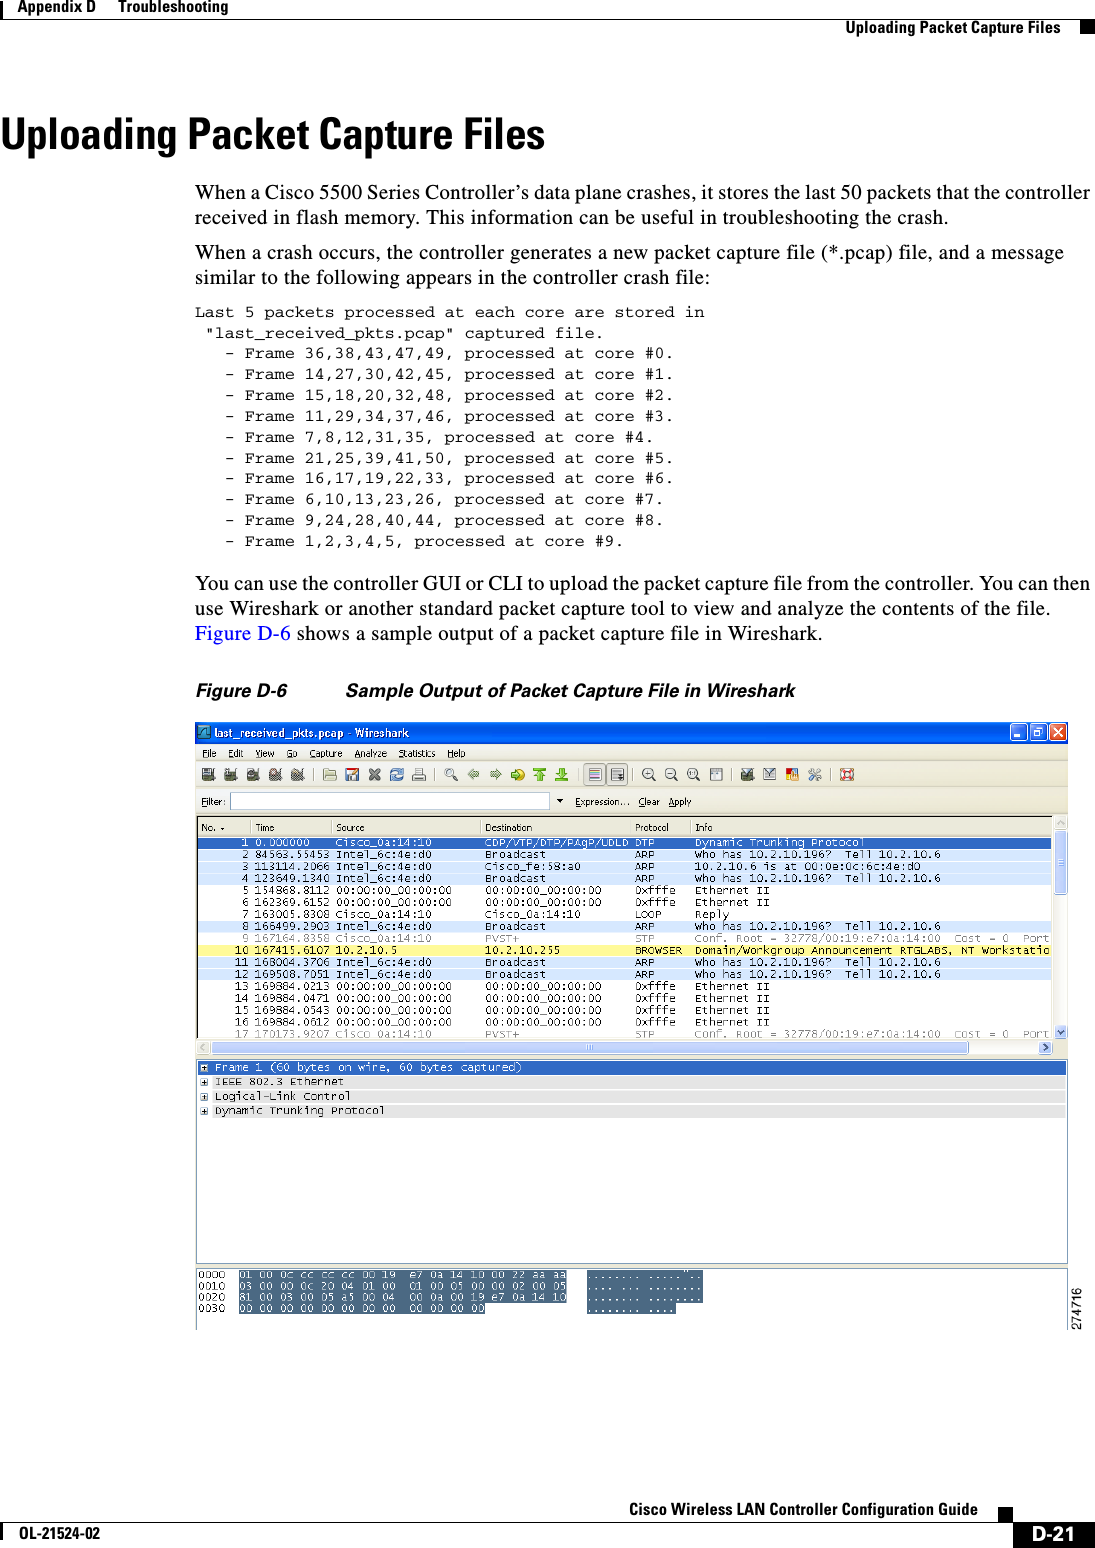
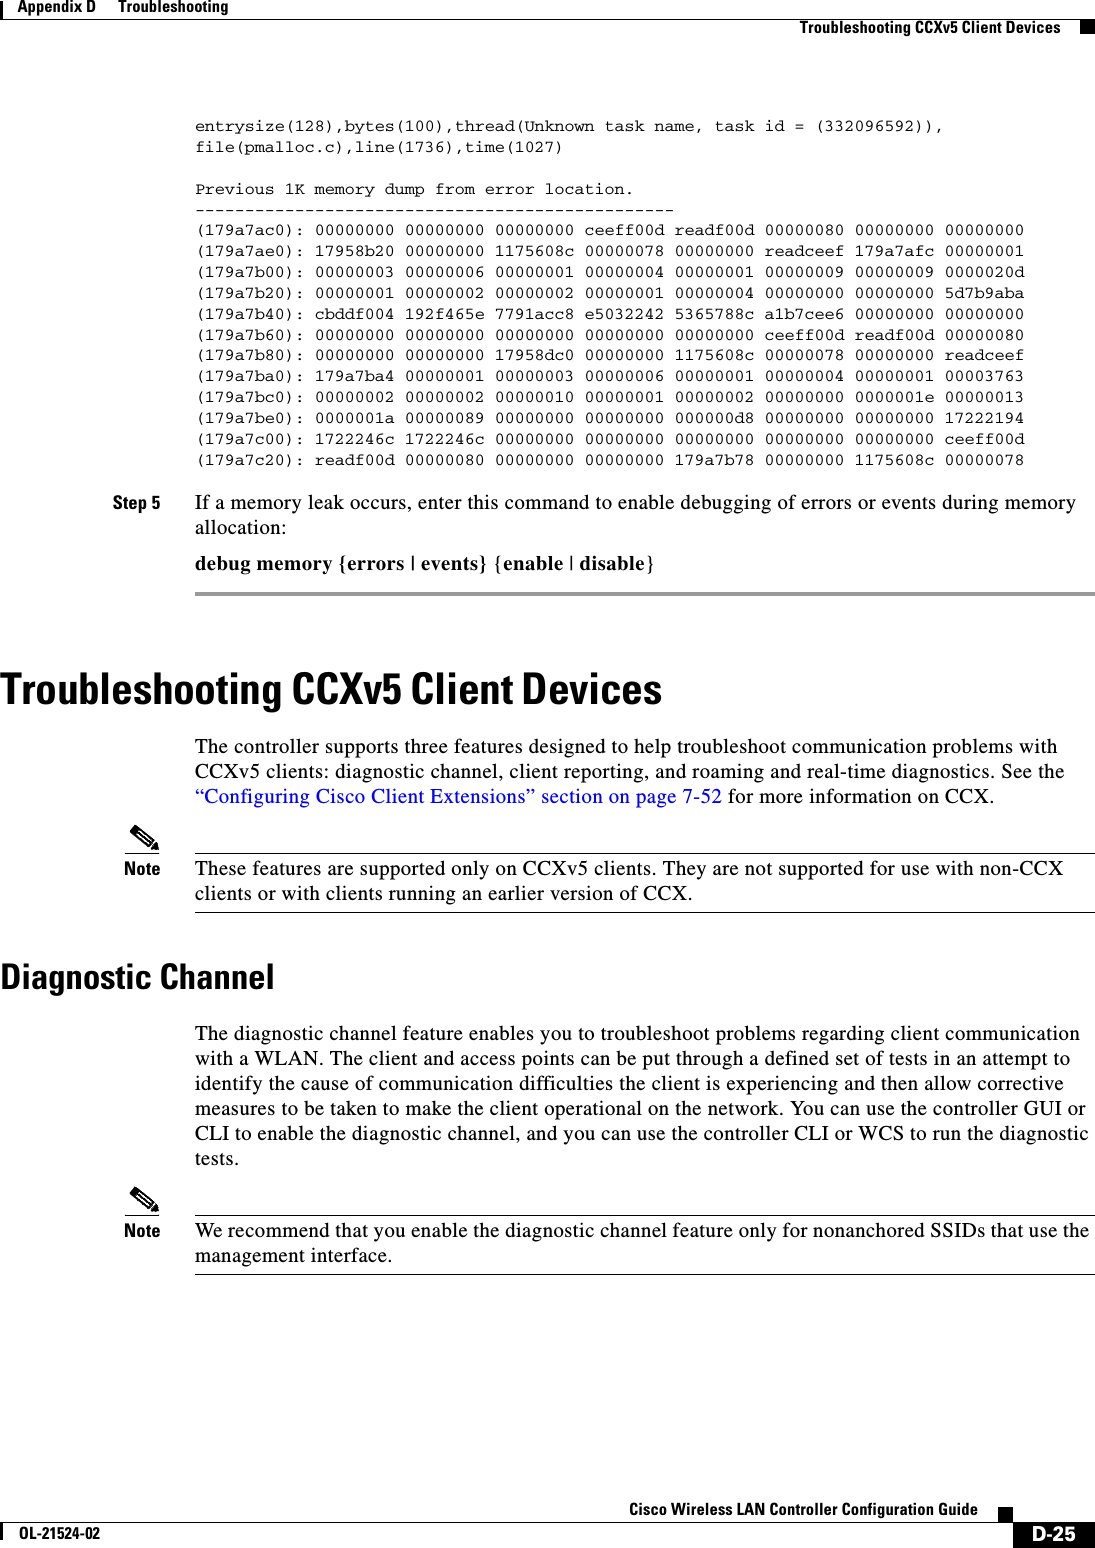
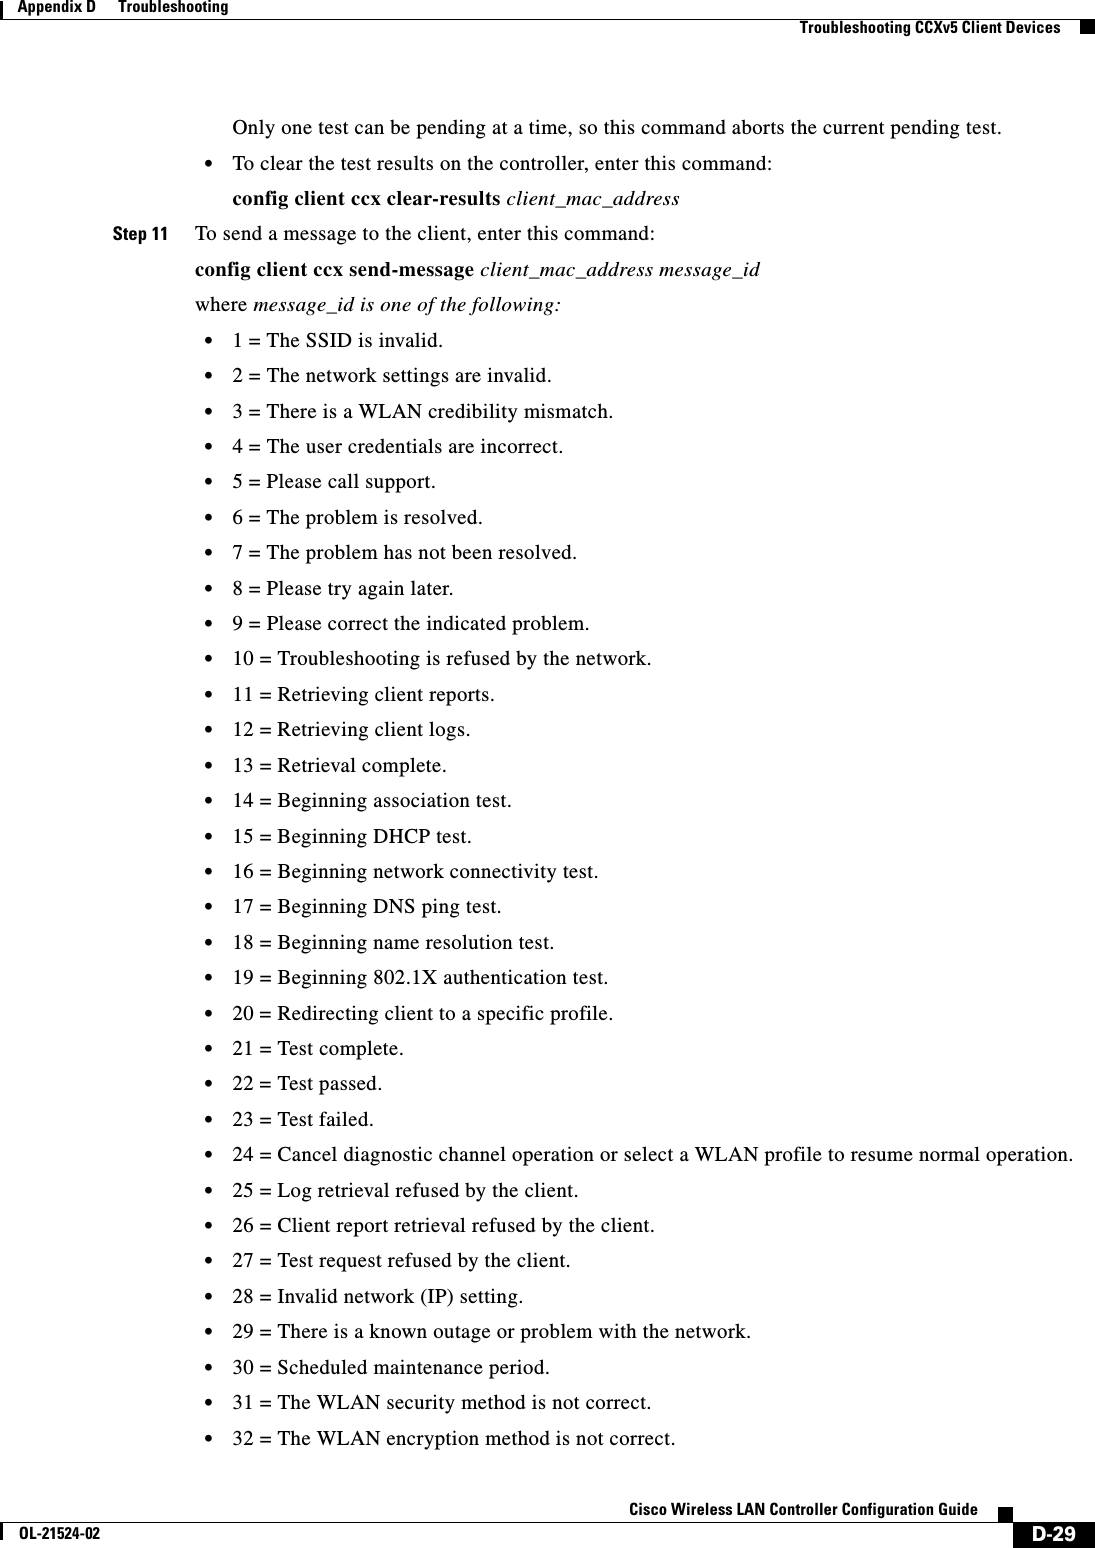
![D-35Cisco Wireless LAN Controller Configuration GuideOL-21524-02Appendix D Troubleshooting Troubleshooting CCXv5 Client DevicesStep 5 To clear the client reporting information, enter this command:config client ccx clear-reports client_mac_addressStep 6 To see the client profiles, enter this command:show client ccx profiles client_mac_addressInformation similar to the following appears:Number of Profiles............................... 1Current Profile.................................. 1Profile ID....................................... 1Profile Name..................................... wifiEAPSSID............................................. wifiEAPSecurity Parameters[EAP Method,Credential]....... EAP-TLS,Host OS Login CredentialsAuth Method...................................... EAPKey Management................................... WPA2+CCKMEncryption....................................... AES-CCMPPower Save Mode.................................. Constantly AwakeRadio Configuration:Radio Type....................................... DSSS Preamble Type.................................. Long preamble CCA Method..................................... Energy Detect + Carrier Detect/Correlation Data Retries................................... 6 Fragment Threshold............................. 2342 Radio Channels................................. 1 2 3 4 5 6 7 8 9 10 11 Tx Power Mode.................................. Automatic Rate List(MB).................................. 1.0 2.0 Radio Type....................................... HRDSSS(802.11b) Preamble Type.................................. Long preamble CCA Method..................................... Energy Detect + Carrier Detect/Correlation Data Retries................................... 6 Fragment Threshold............................. 2342 Radio Channels................................. 1 2 3 4 5 6 7 8 9 10 11 Tx Power Mode.................................. Automatic Rate List(MB).................................. 5.5 11.0 Radio Type....................................... ERP(802.11g) Preamble Type.................................. Long preamble CCA Method..................................... Energy Detect + Carrier Detect/Correlation Data Retries................................... 6 Fragment Threshold............................. 2342 Radio Channels................................. 1 2 3 4 5 6 7 8 9 10 11 Tx Power Mode.................................. Automatic Rate List(MB).................................. 6.0 9.0 12.0 18.0 24.0 36.0 48.0 54.0 Radio Type....................................... OFDM(802.11a) Preamble Type.................................. Long preamble CCA Method..................................... Energy Detect + Carrier Detect/Correlation Data Retries................................... 6 Fragment Threshold............................. 2342Radio Channels................................. 36 40 44 48 52 56 60 64 149 153 157 161 165 Tx Power Mode.................................. Automatic Rate List(MB).................................. 6.0 9.0 12.0 18.0 24.0 36.0 48.0 54.0Step 7 To see the client operating parameters, enter this command:show client ccx operating-parameters client_mac_address](https://usermanual.wiki/Cisco-Systems/102075.Cisco-Wireless-LAN-Controller-Configuration-Guide-9/User-Guide-1514969-Page-37.png)
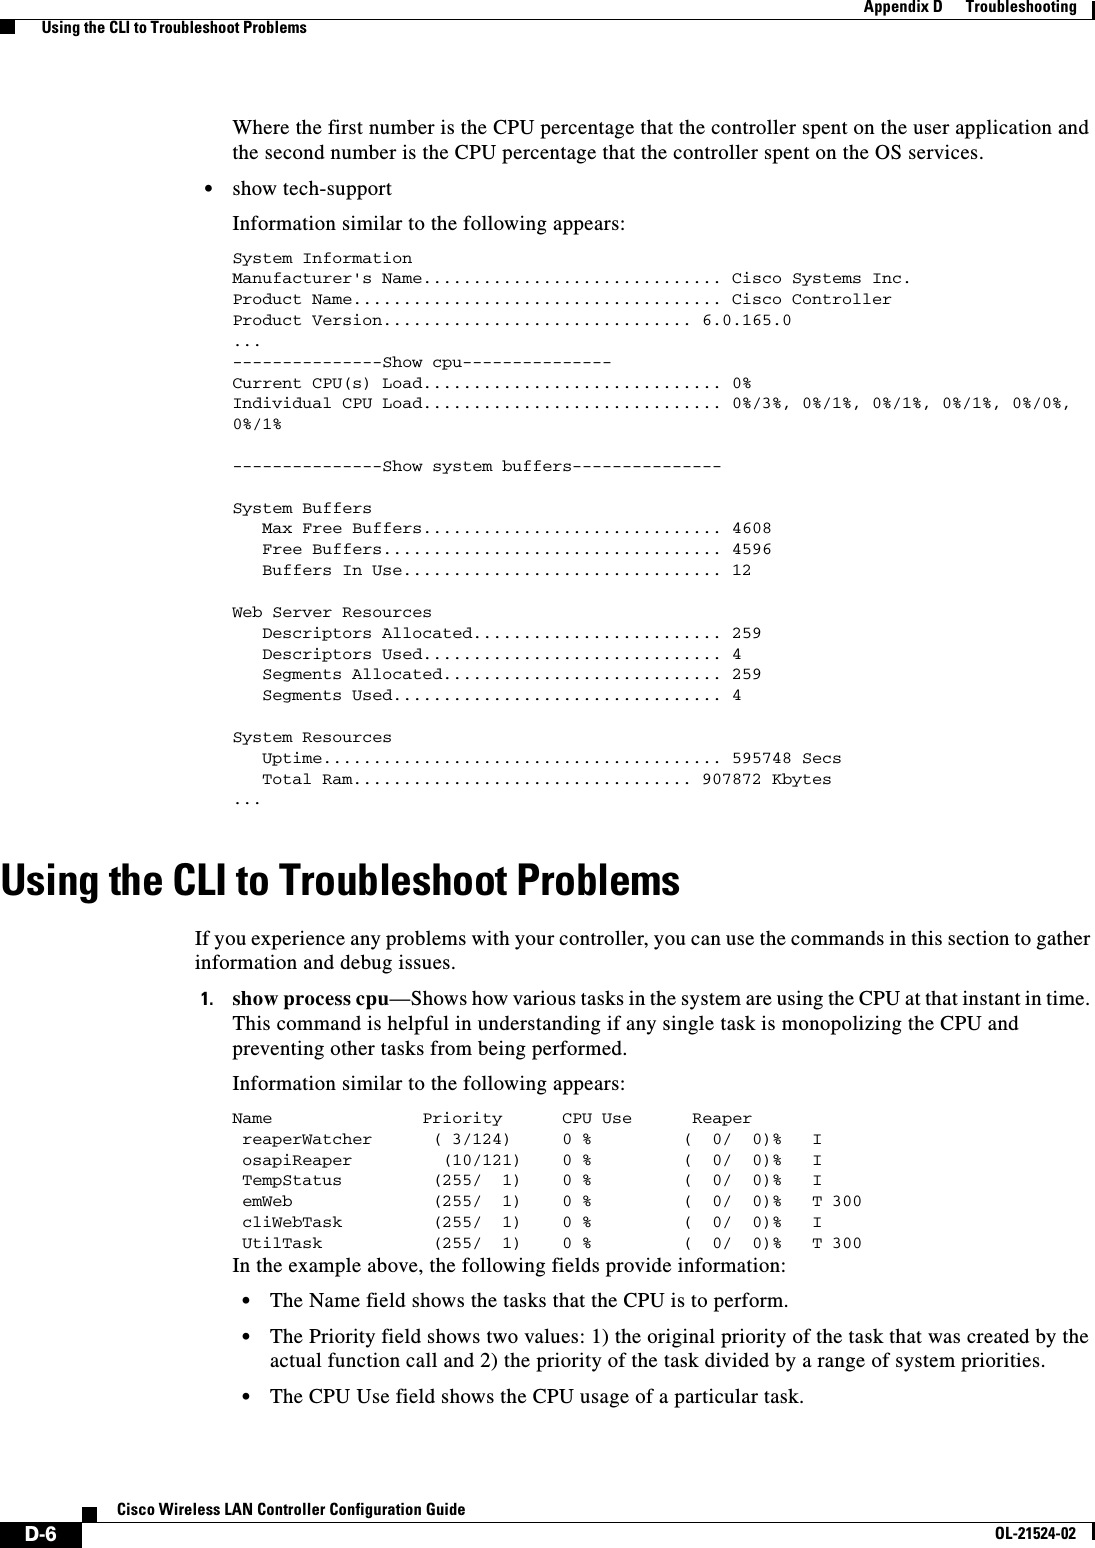
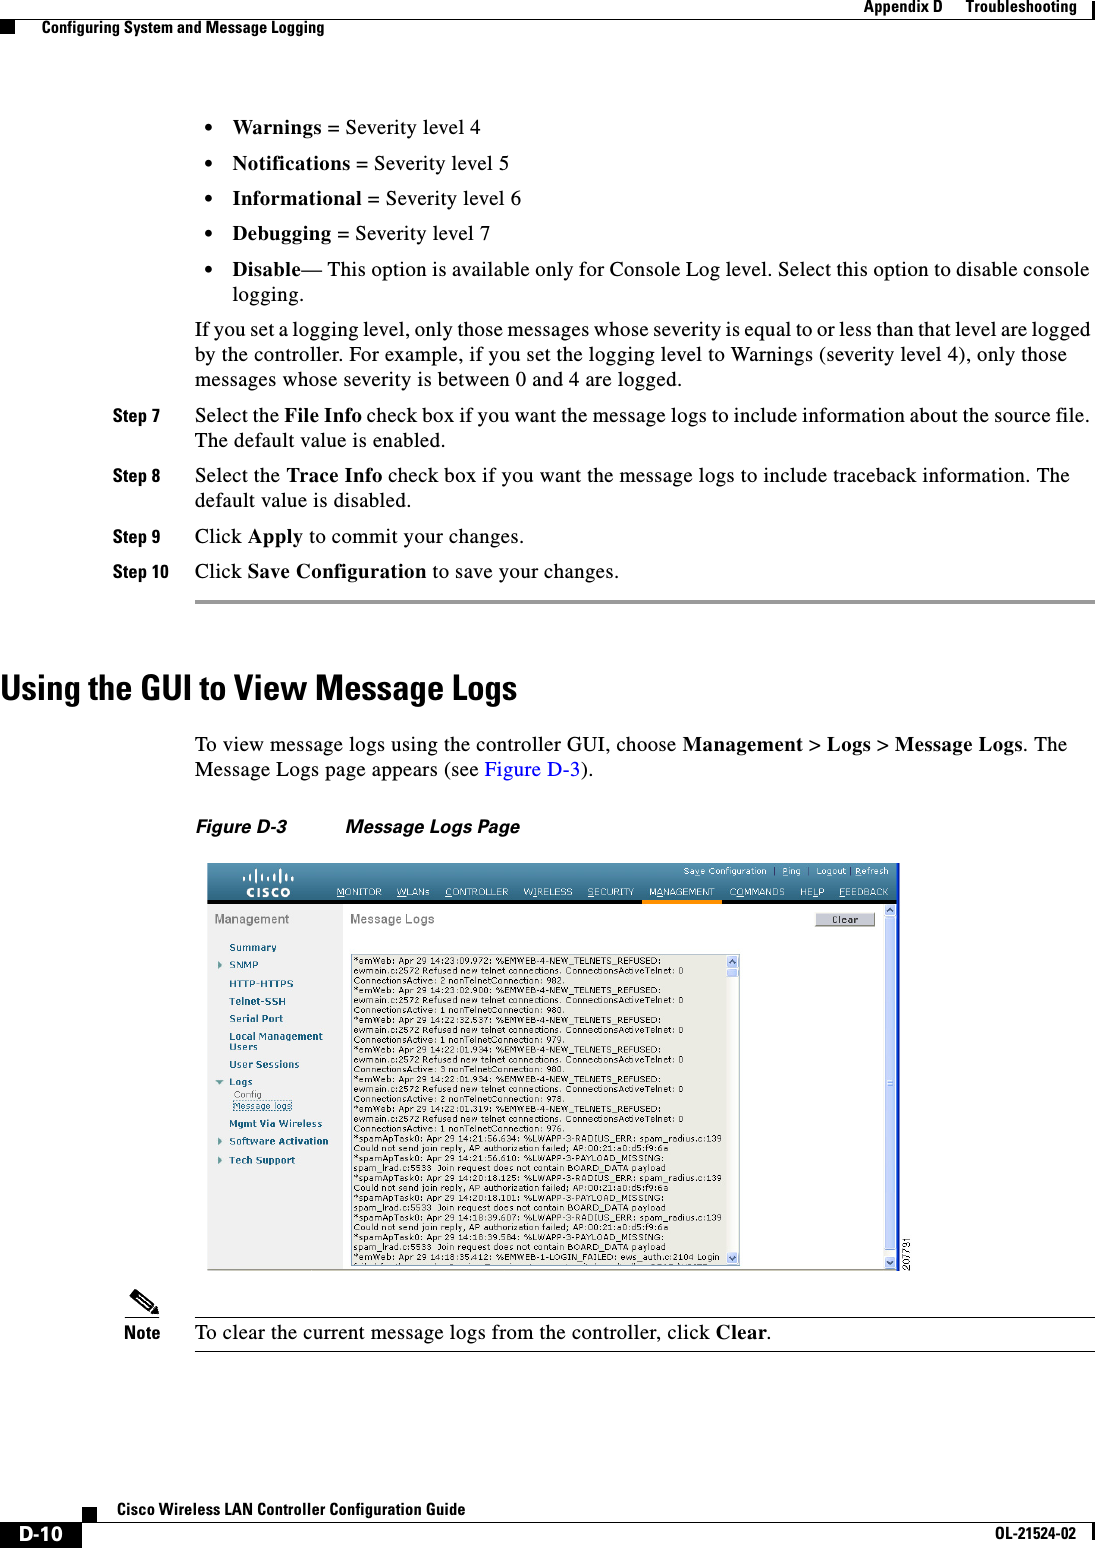
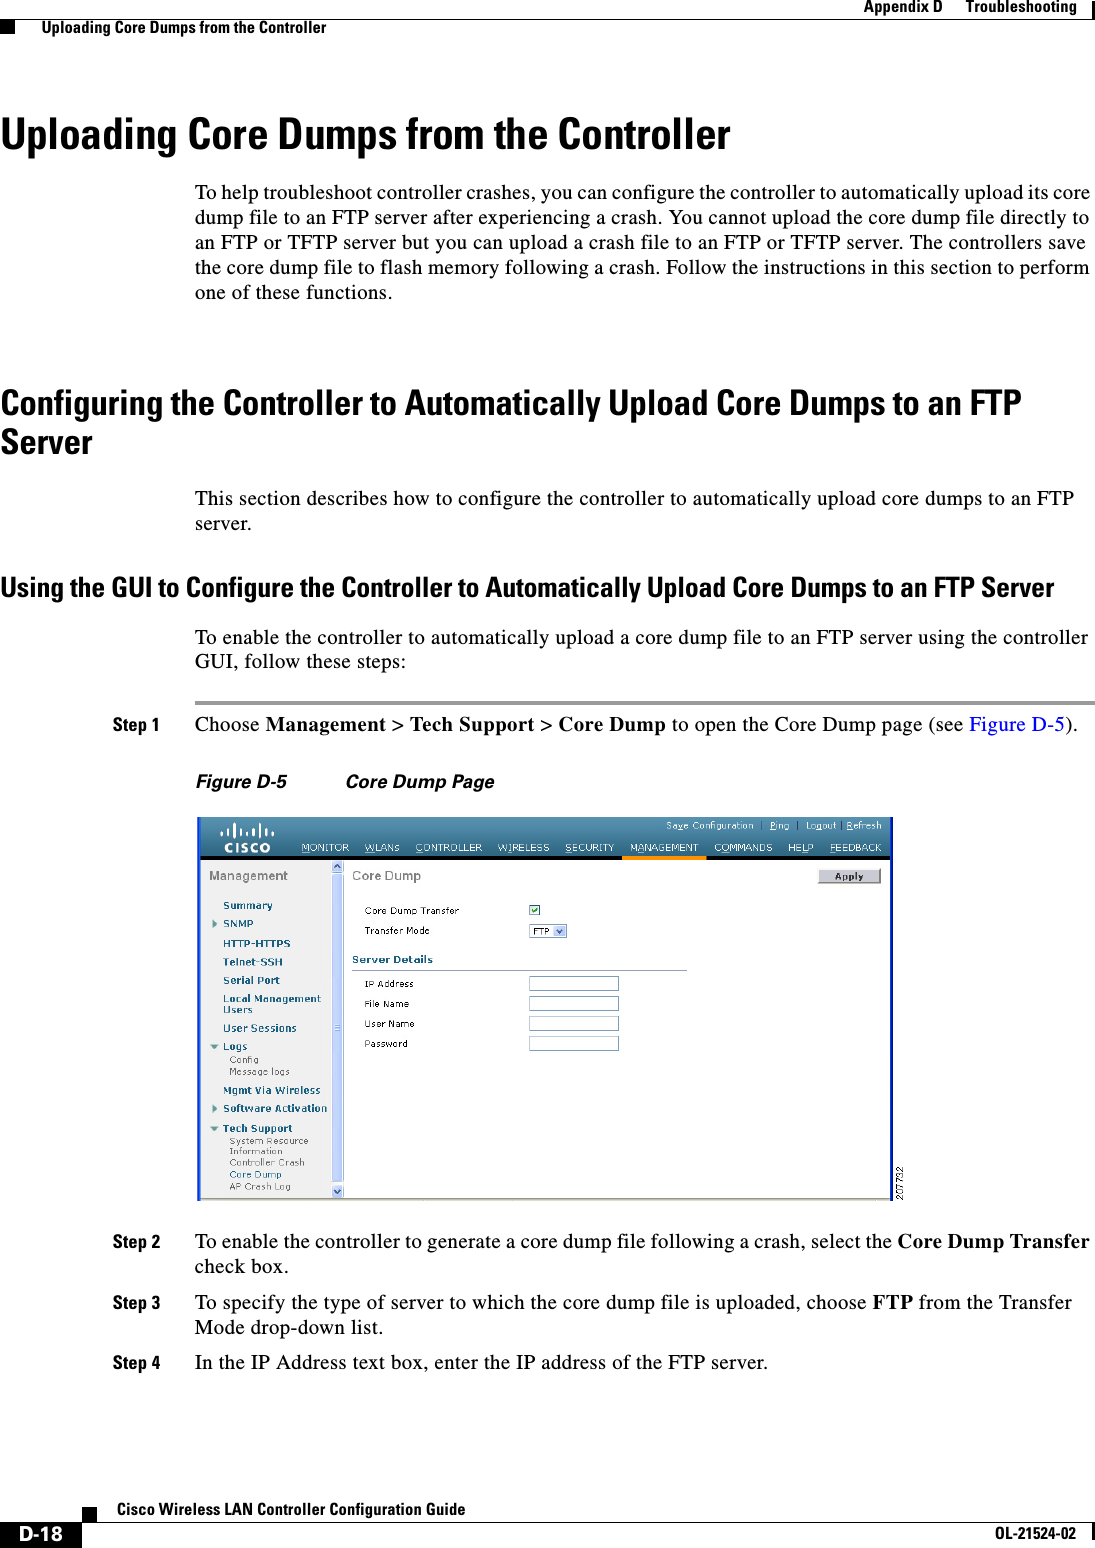
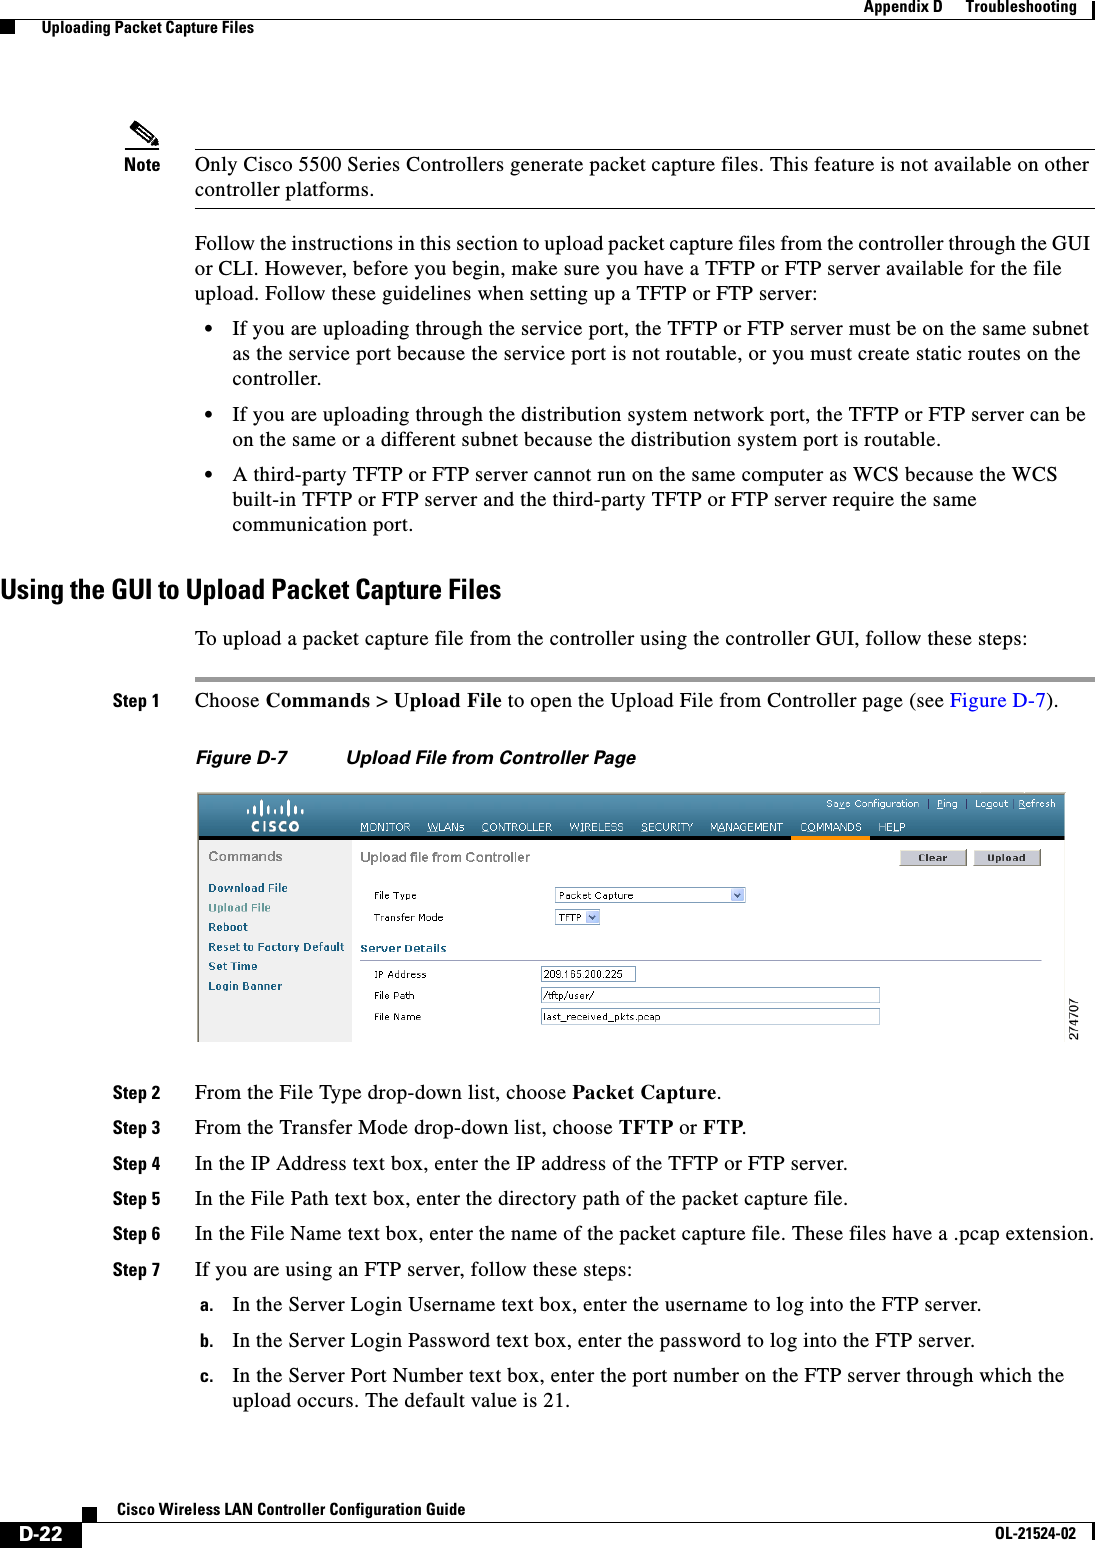
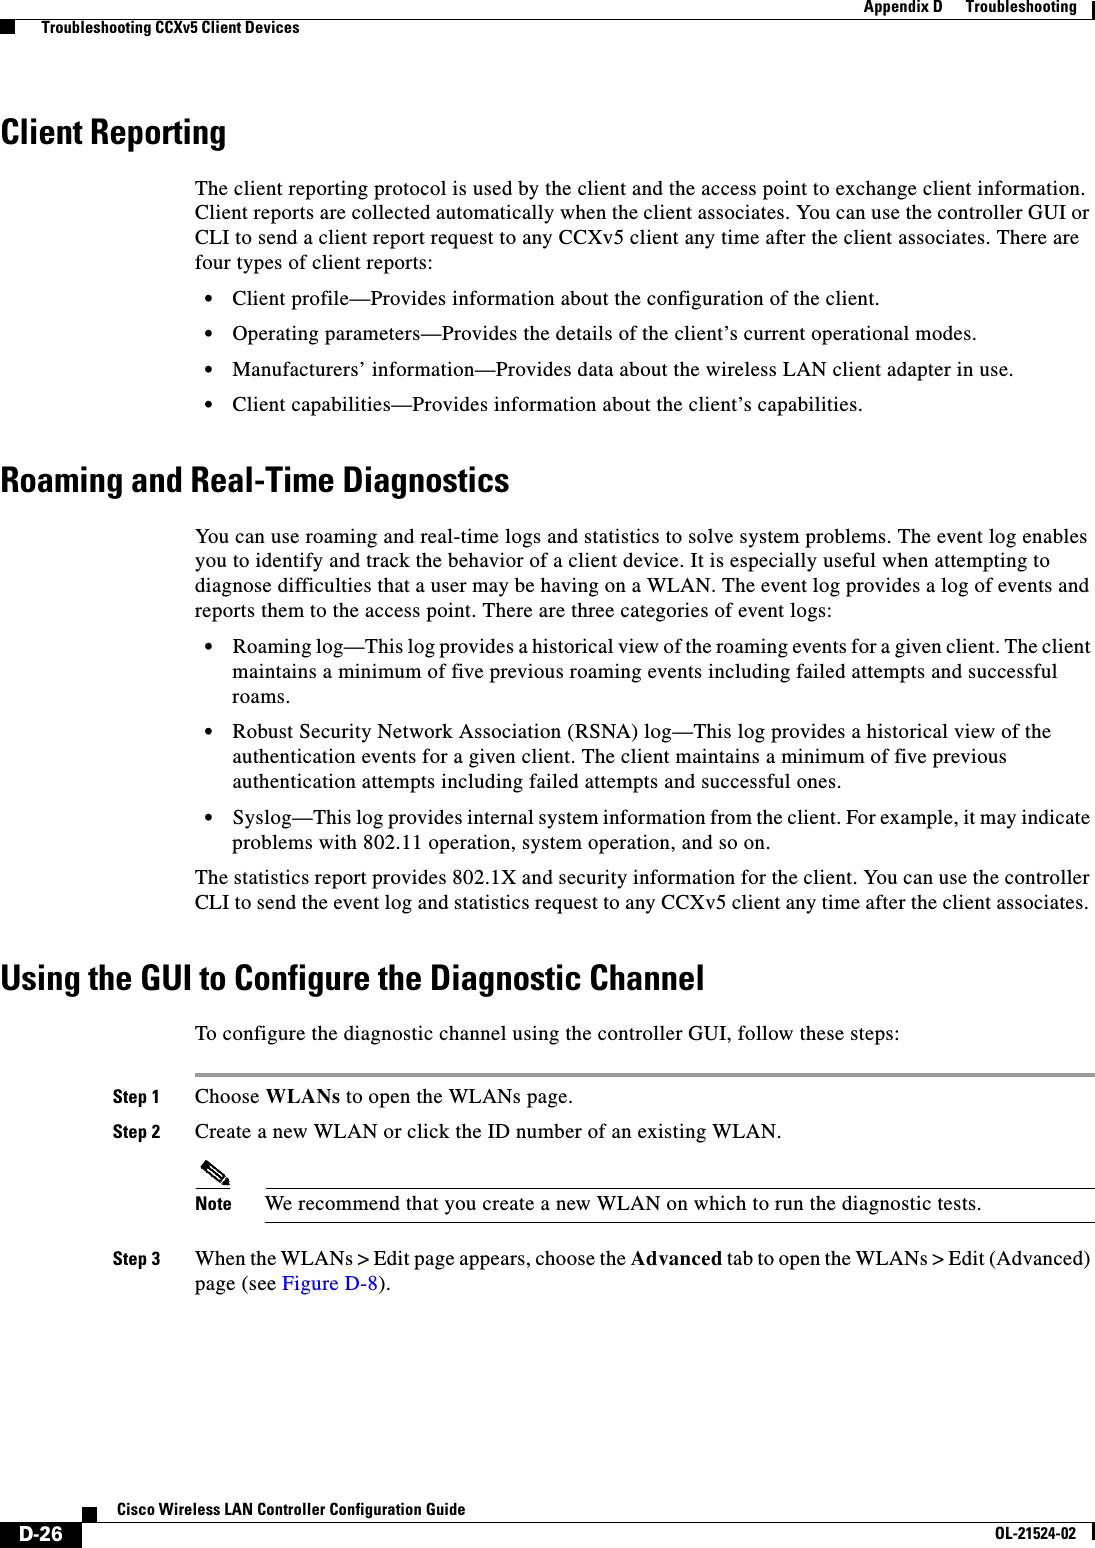
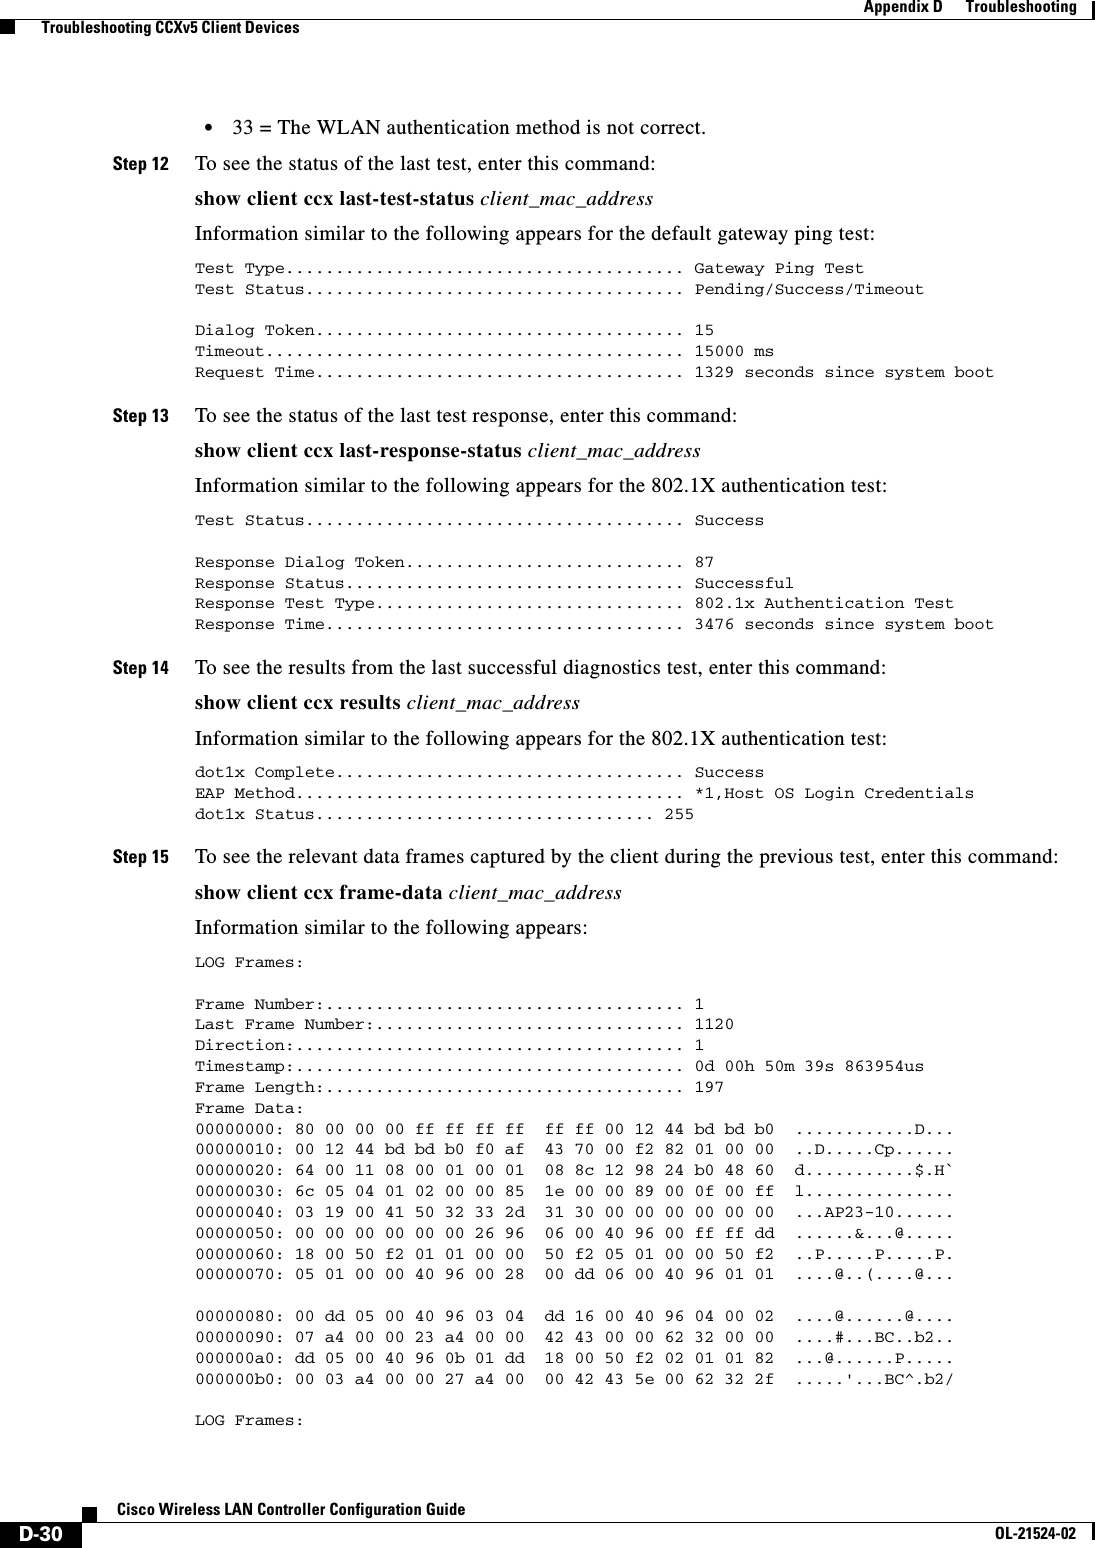
![D-36Cisco Wireless LAN Controller Configuration GuideOL-21524-02Appendix D Troubleshooting Troubleshooting CCXv5 Client DevicesInformation similar to the following appears:Client Mac....................................... 00:40:96:b2:8d:5eRadio Type....................................... OFDM(802.11a) Radio Type....................................... OFDM(802.11a) Radio Channels................................. 36 40 44 48 52 56 60 64 100 104 108 112 116 120 124 128 132 136 140 149 153 157 161 165 Tx Power Mode.................................. Automatic Rate List(MB).................................. 6.0 9.0 12.0 18.0 24.0 36.0 48.0 54.0 Power Save Mode.................................. Normal Power SaveSSID............................................. wifiSecurity Parameters[EAP Method,Credential]....... NoneAuth Method...................................... NoneKey Management................................... NoneEncryption....................................... NoneDevice Name...................................... Wireless Network Connection 15Device Type...................................... 0OS Id............................................ Windows XPOS Version....................................... 5.1.2600 Service Pack 2IP Type.......................................... DHCP addressIPv4 Address..................................... AvailableIP Address....................................... 70.0.4.66Subnet Mask...................................... 255.0.0.0Default Gateway.................................. 70.1.0.1IPv6 Address..................................... Not AvailableIPv6 Address..................................... 0: 0: 0: 0: 0: 0: 0: 0: 0: 0: 0: 0: 0: 0: 0: 0:IPv6 Subnet Mask................................. 0: 0: 0: 0: 0: 0: 0: 0: 0: 0: 0: 0: 0: 0: 0: 0:DNS Servers...................................... 103.0.48.0WINS Servers..................................... System Name...................................... URAVAL3777Firmware Version................................. 4.0.0.187Driver Version................................... 4.0.0.187Step 8 To see the client manufacturer information, enter this command:show client ccx manufacturer-info client_mac_addressInformation similar to the following appears:Manufacturer OUI................................. 00:40:96 Manufacturer ID.................................. Cisco Manufacturer Model............................... Cisco Aironet 802.11a/b/g Wireless Adapter Manufacturer Serial.............................. FOC1046N3SX Mac Address...................................... 00:40:96:b2:8d:5eRadio Type....................................... DSSS OFDM(802.11a) HRDSSS(802.11b) ERP(802.11g) Antenna Type..................................... Omni-directional diversityAntenna Gain..................................... 2 dBiRx Sensitivity:Radio Type....................................... DSSS Rx Sensitivity .................................. Rate:1.0 Mbps, MinRssi:-95, MaxRssi:-30Rx Sensitivity .................................. Rate:2.0 Mbps, MinRssi:-95, MaxRssi:-30Radio Type....................................... HRDSSS(802.11b) Rx Sensitivity .................................. Rate:5.5 Mbps, MinRssi:-95, MaxRssi:-30Rx Sensitivity .................................. Rate:11.0 Mbps, MinRssi:-95, MaxRssi:-30Radio Type....................................... ERP(802.11g) Rx Sensitivity .................................. Rate:6.0 Mbps, MinRssi:-95, MaxRssi:-30Rx Sensitivity .................................. Rate:9.0 Mbps, MinRssi:-95, MaxRssi:-30Rx Sensitivity .................................. Rate:12.0 Mbps, MinRssi:-95, MaxRssi:-30](https://usermanual.wiki/Cisco-Systems/102075.Cisco-Wireless-LAN-Controller-Configuration-Guide-9/User-Guide-1514969-Page-38.png)
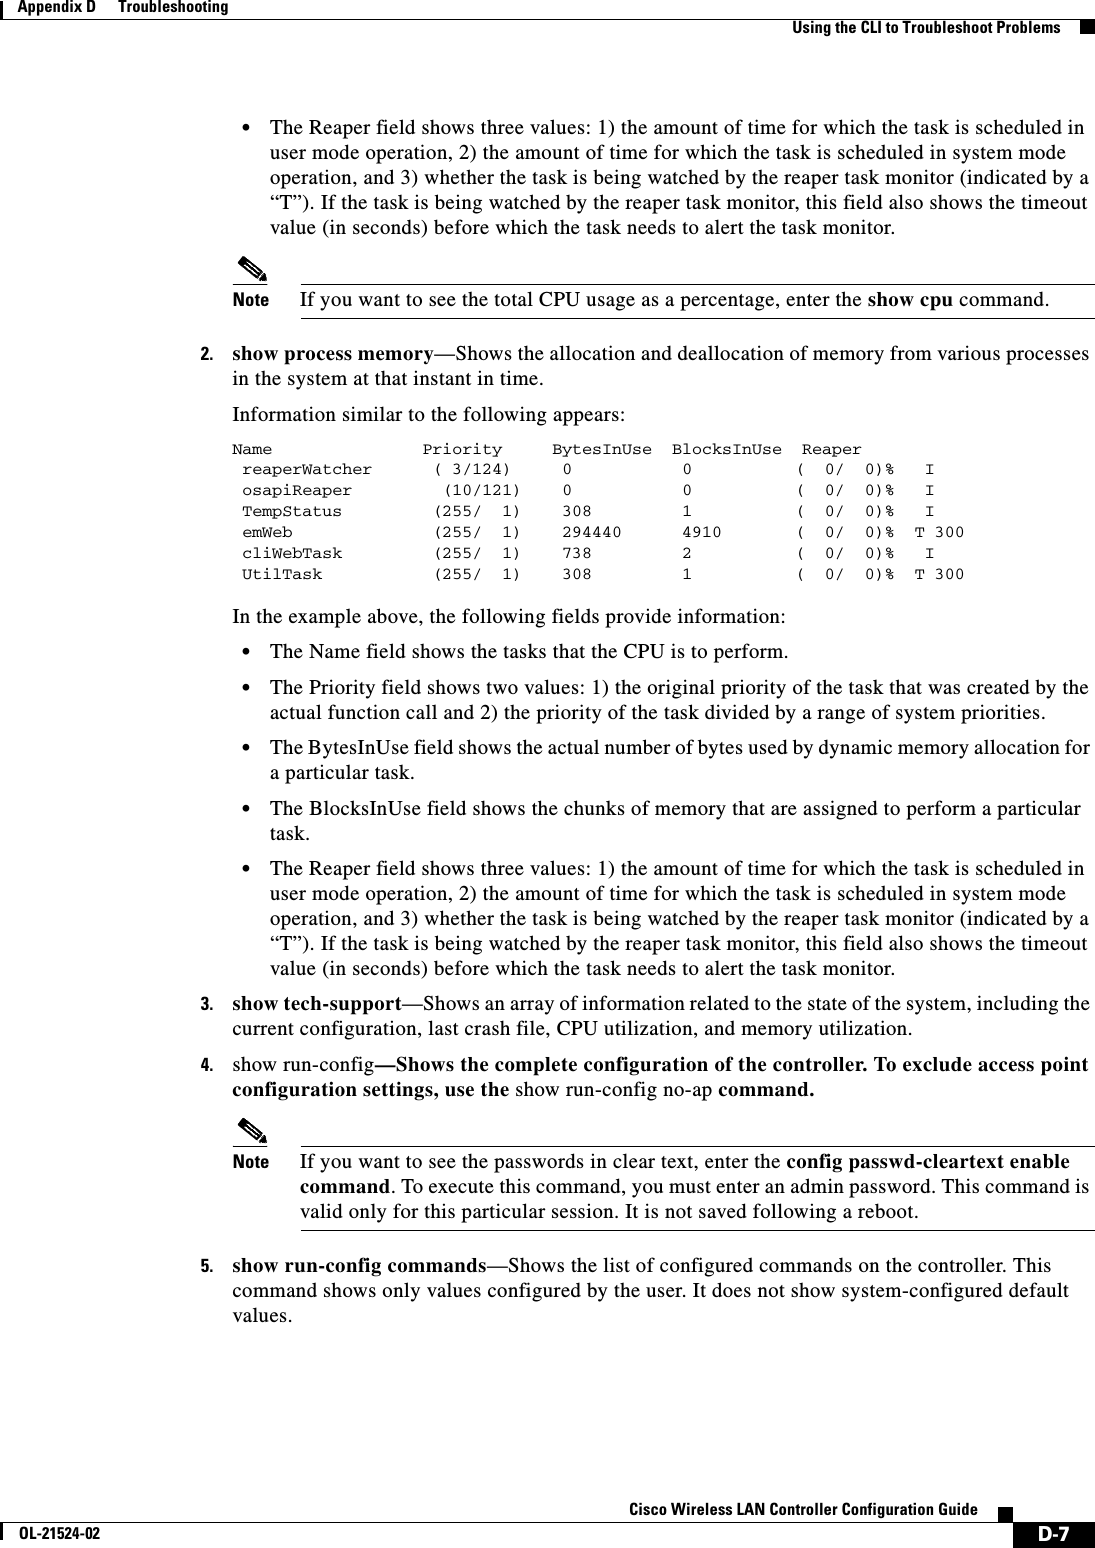
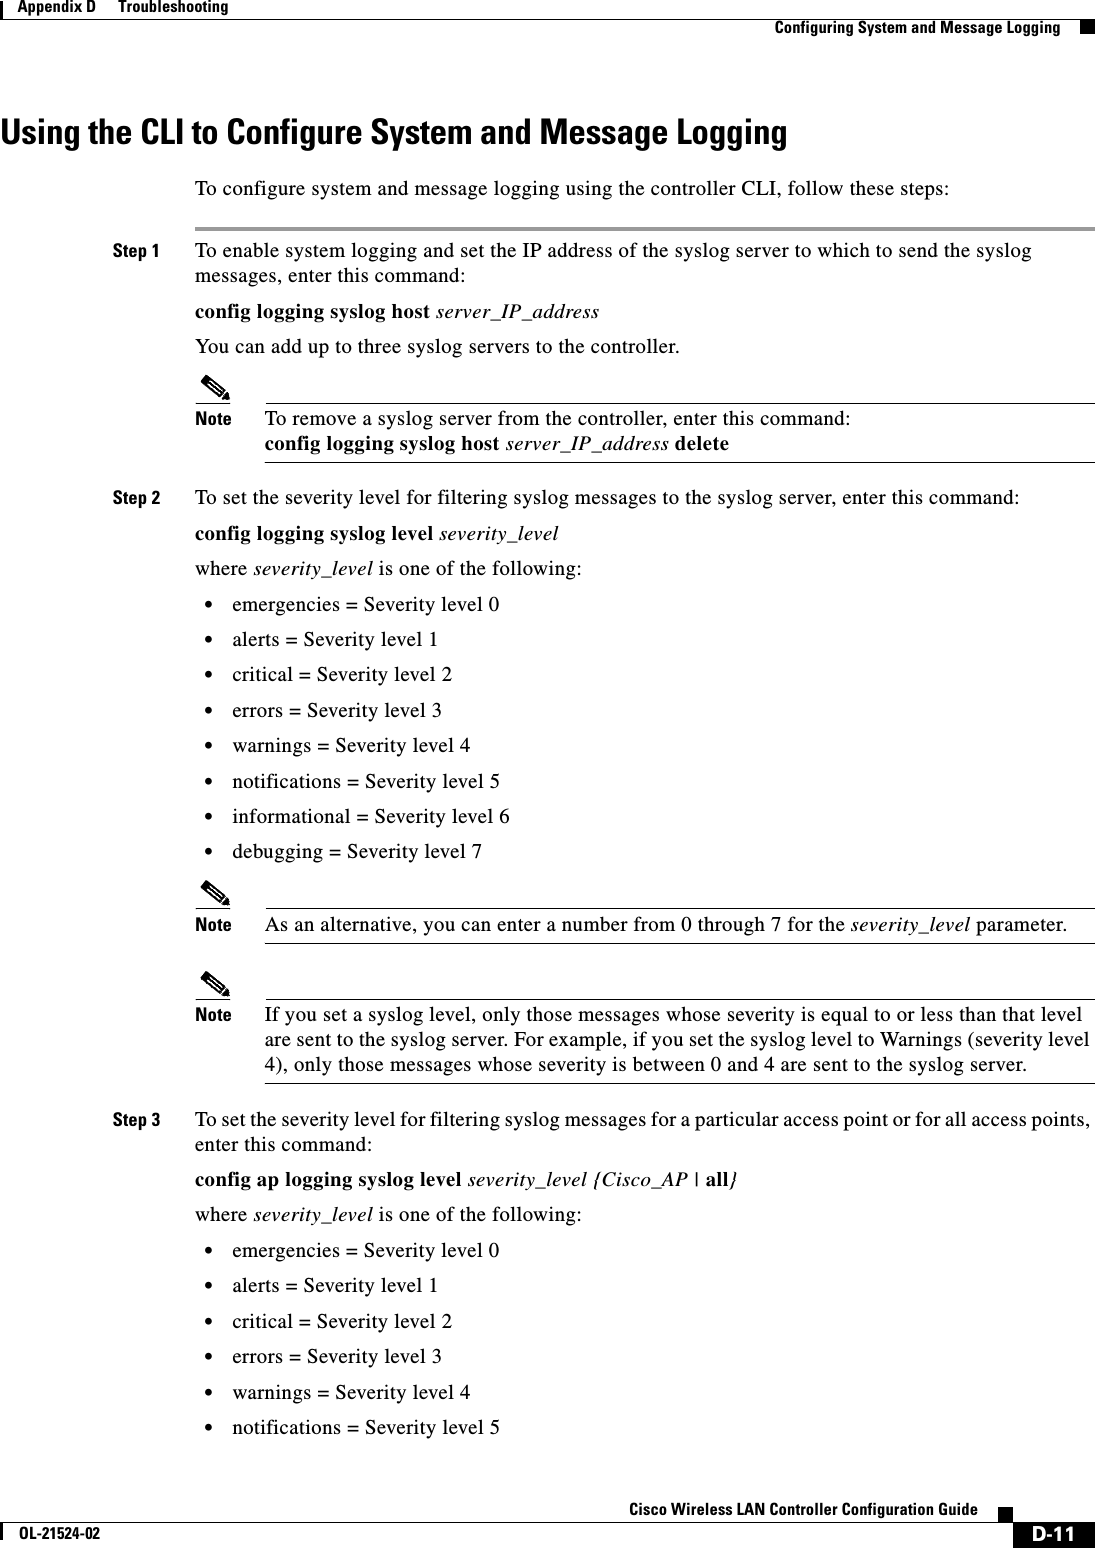
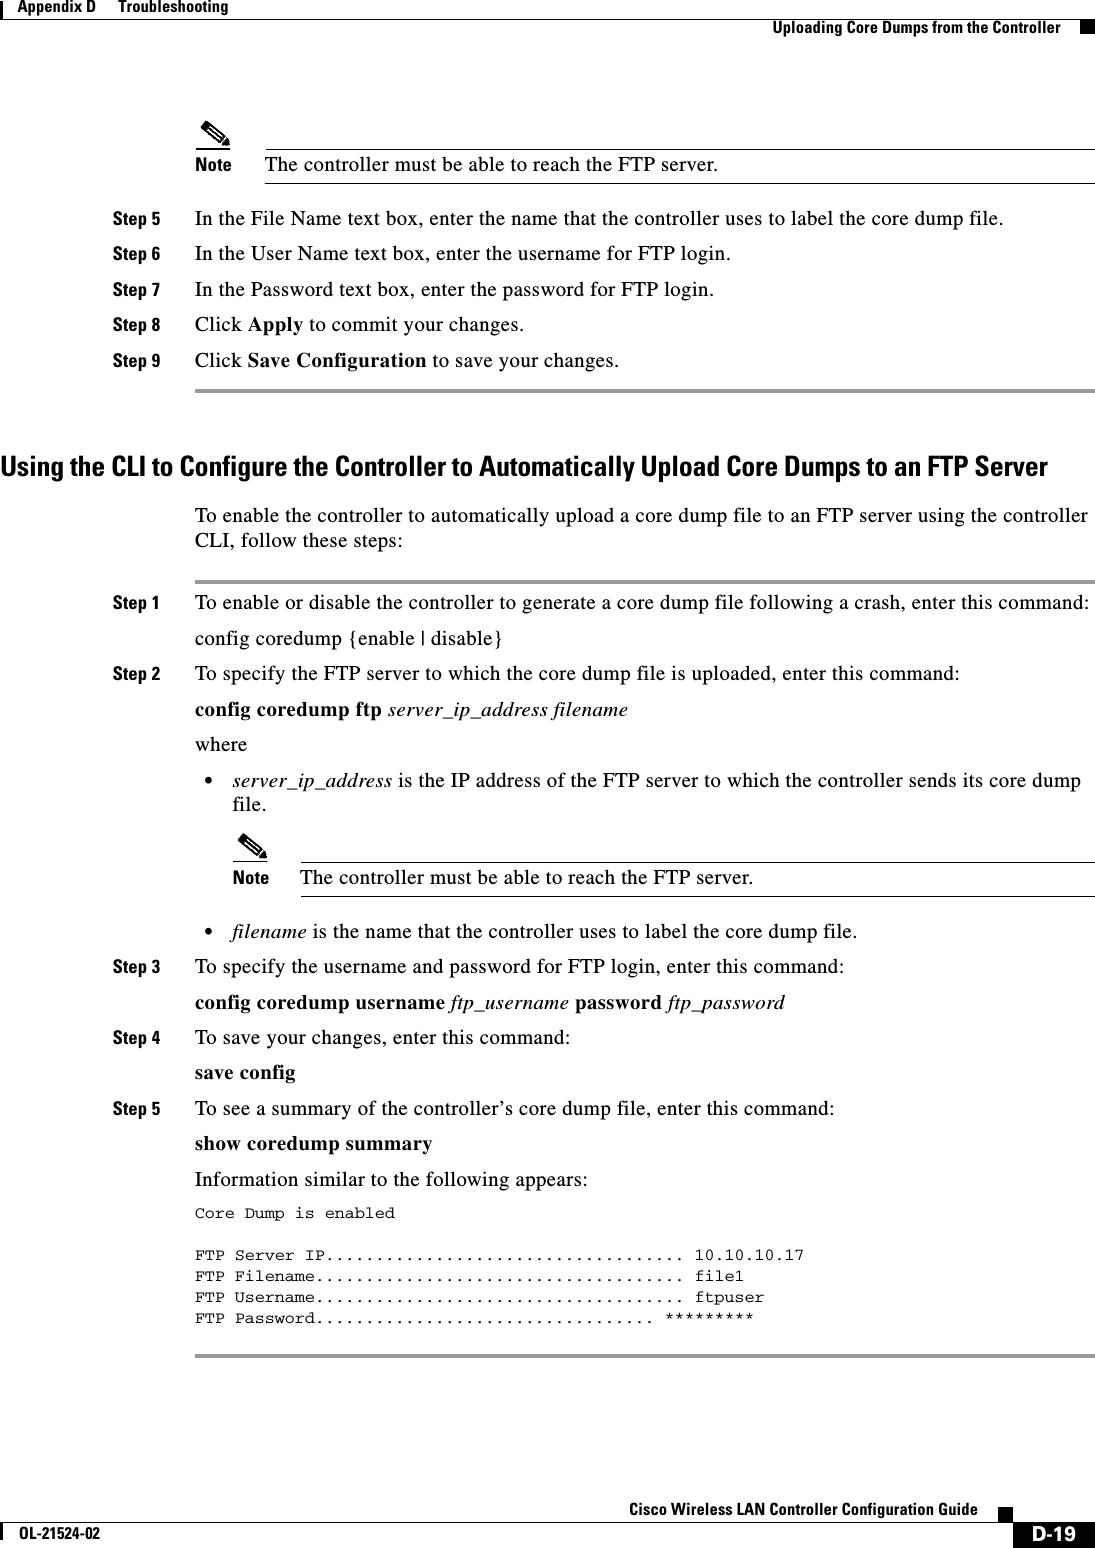
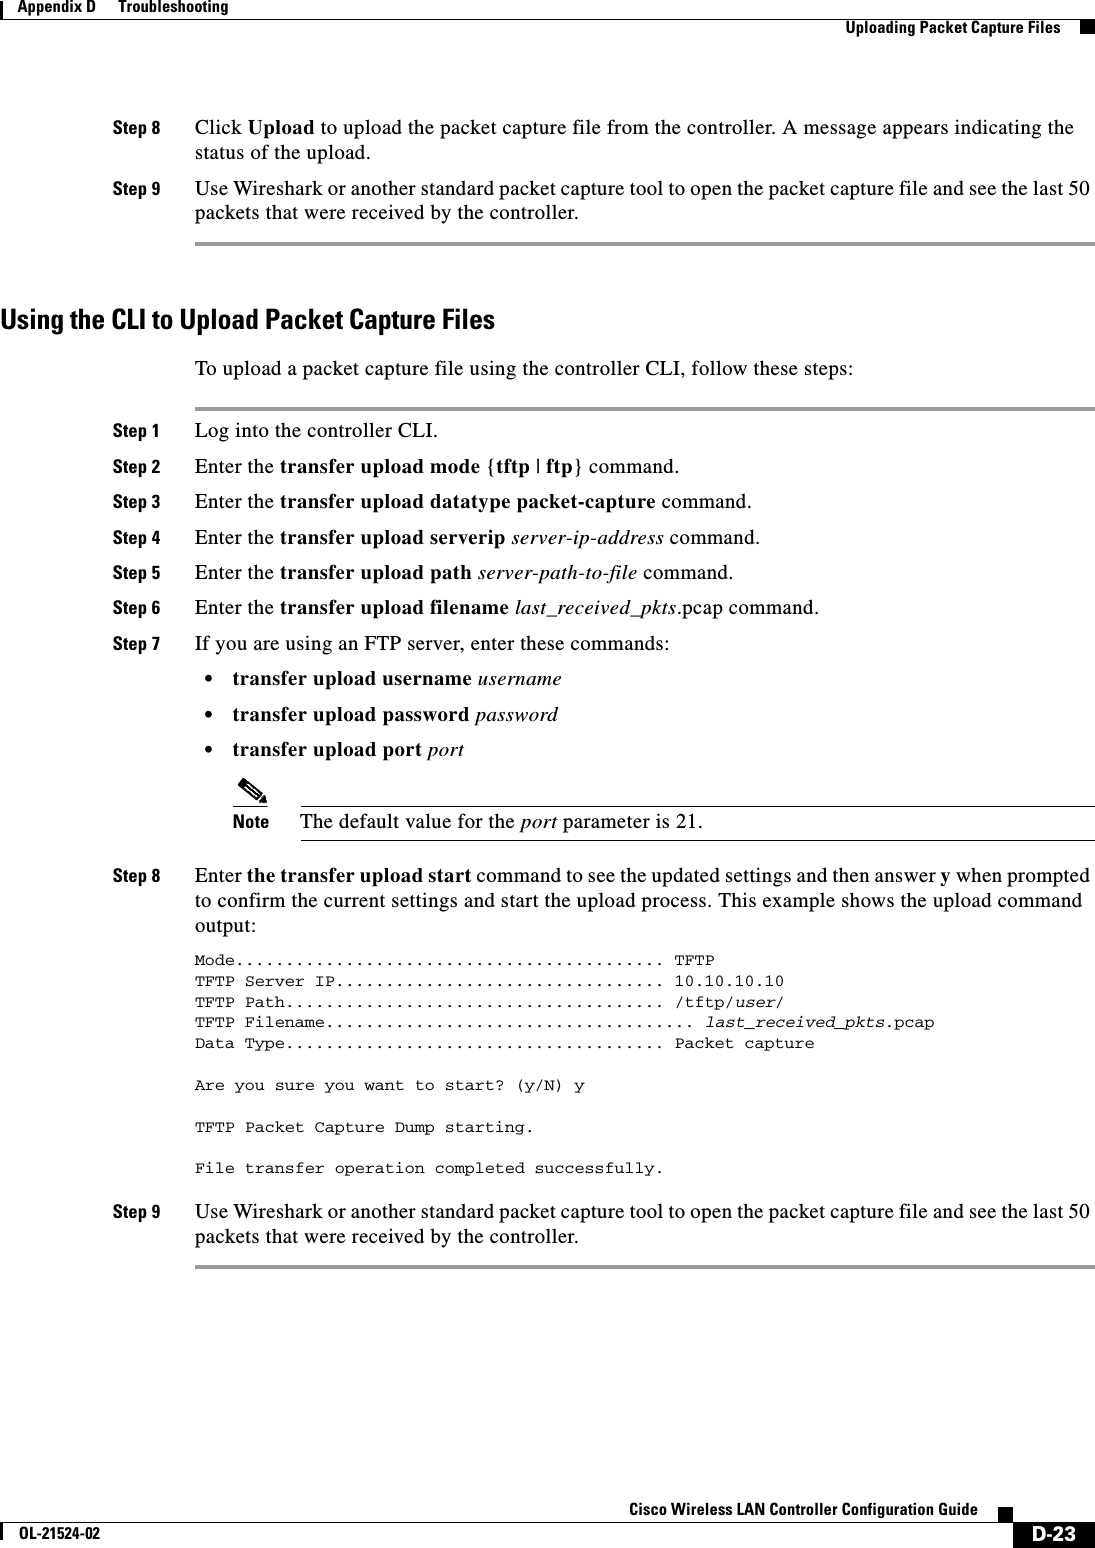
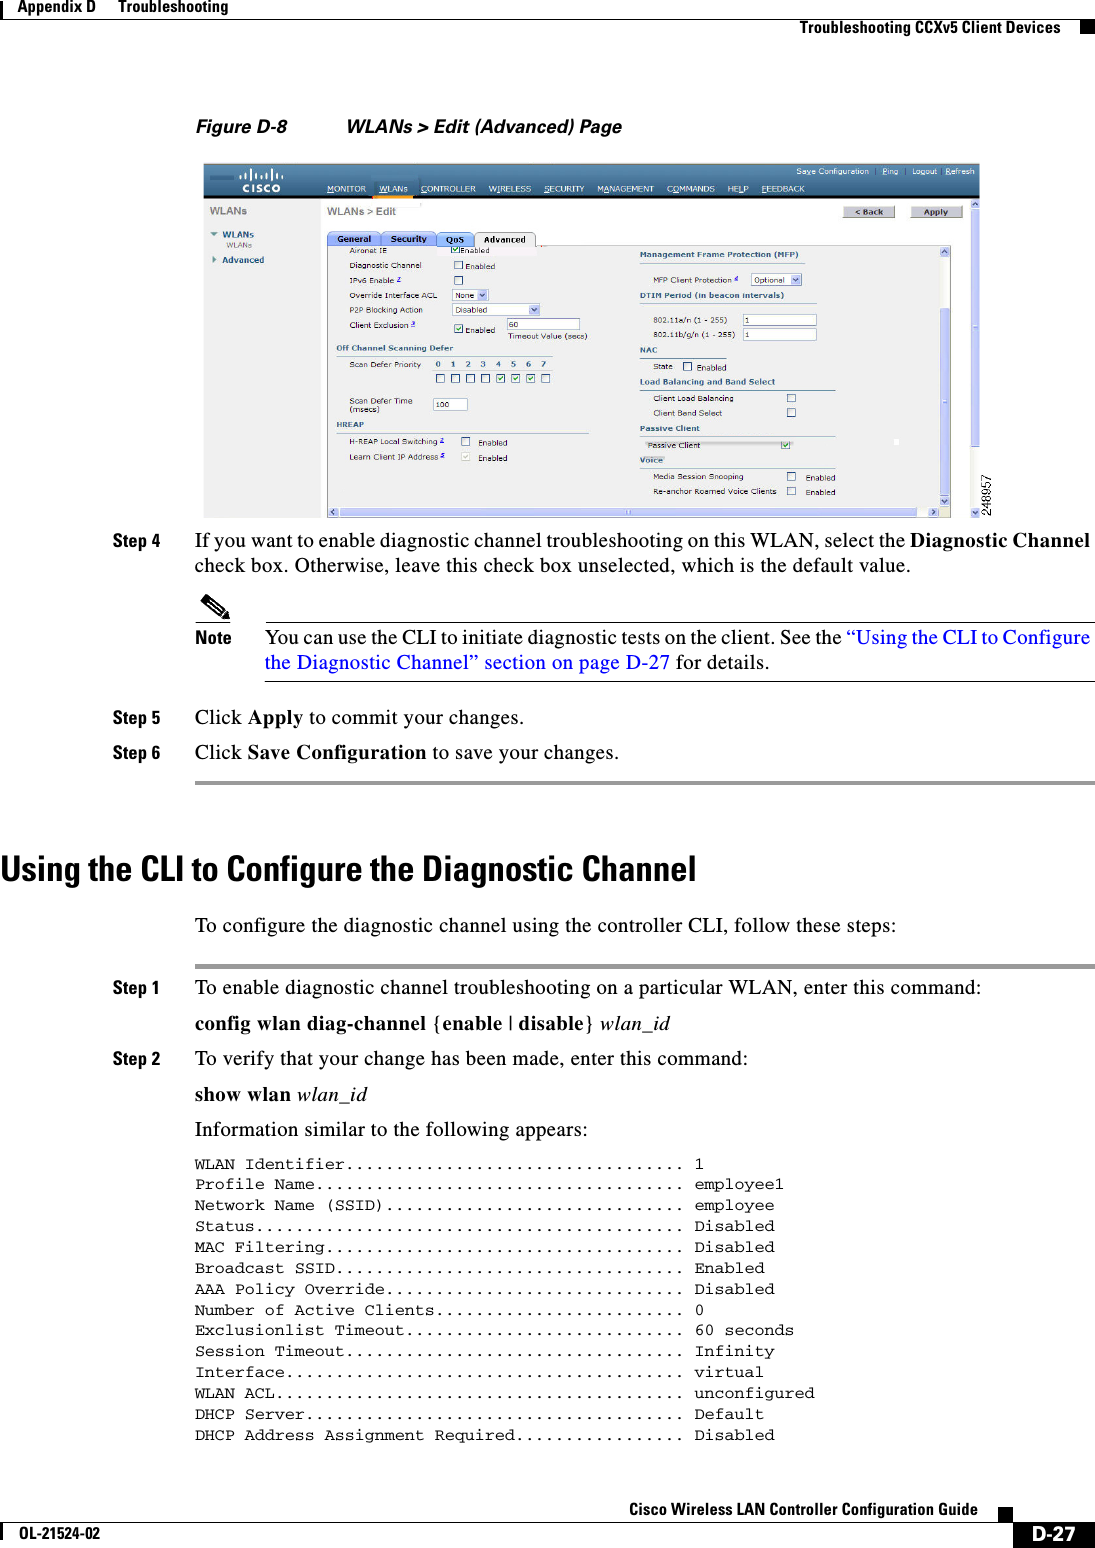
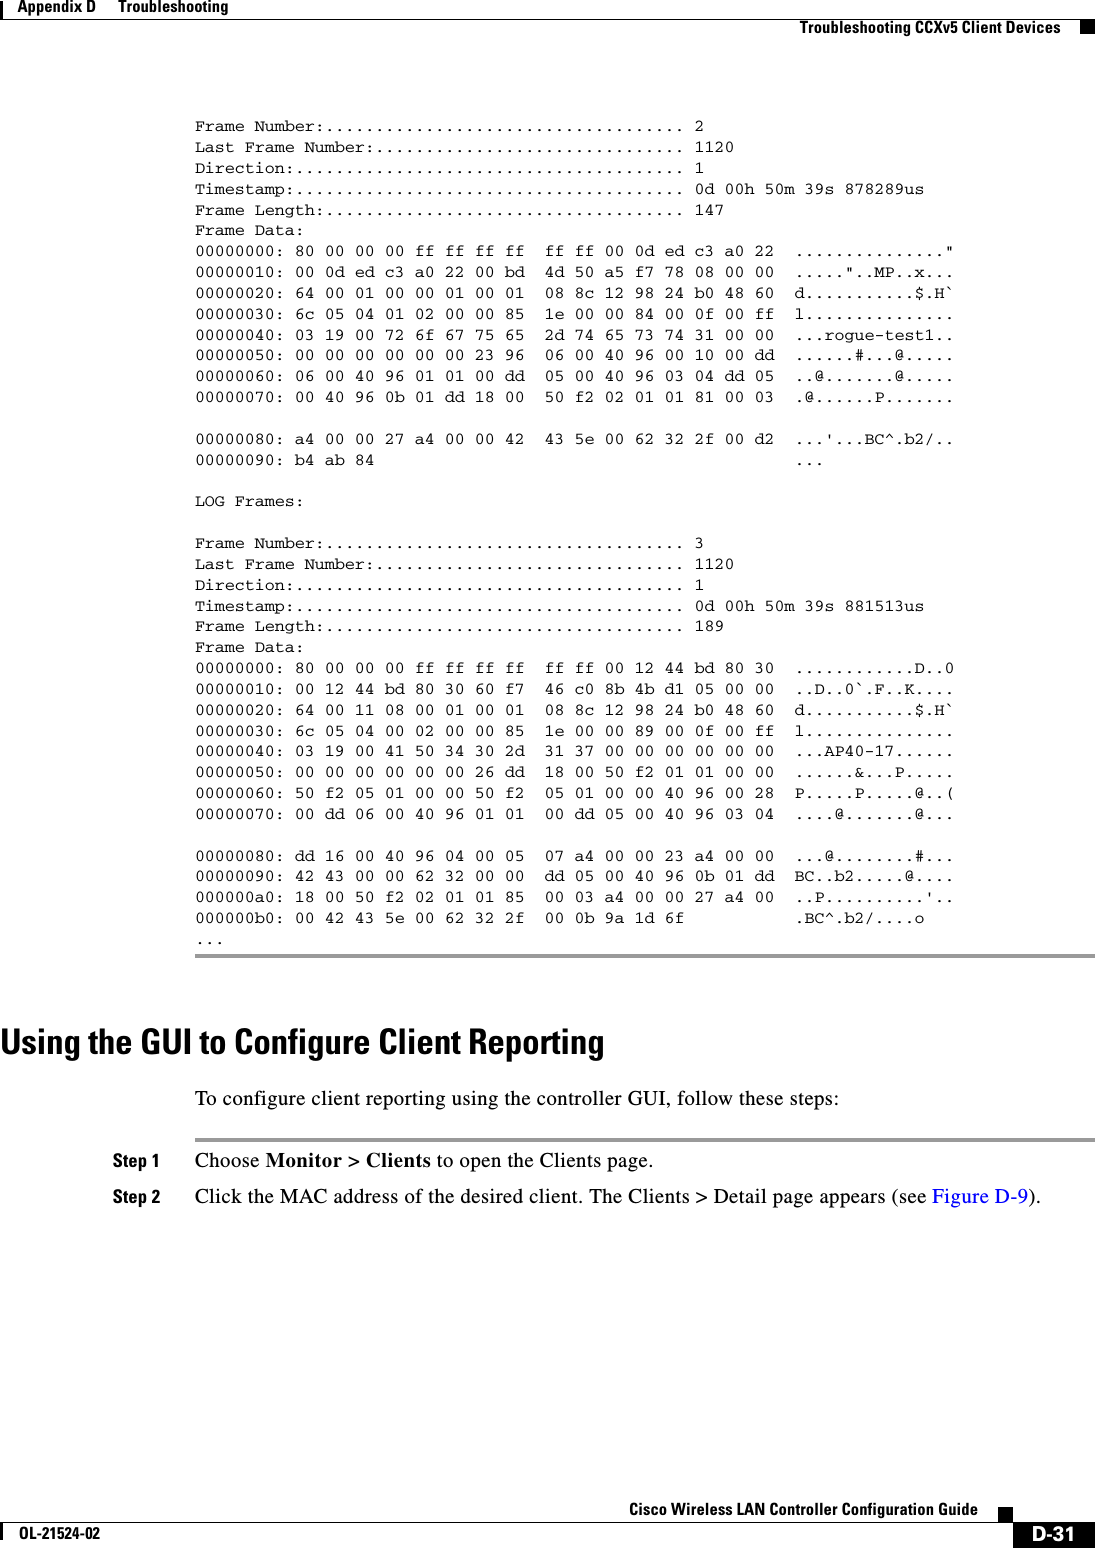
![D-43Cisco Wireless LAN Controller Configuration GuideOL-21524-02Appendix D Troubleshooting Using the Debug FacilityFigure D-12 Sample Hex2pcap OutputFigure D-13 Sample Text2pcap OutputStep 4 To determine why packets might not be displayed, enter this command:debug packet error {enable | disable}Step 5 To display the status of packet debugging, enter this command:show debug packetInformation similar to the following appears:Status........................................... disabledNumber of packets to display..................... 25Bytes/packet to display.......................... 0Packet display format............................ text2pcapDriver ACL: [1]: disabled [2]: disabled](https://usermanual.wiki/Cisco-Systems/102075.Cisco-Wireless-LAN-Controller-Configuration-Guide-9/User-Guide-1514969-Page-45.png)
![D-44Cisco Wireless LAN Controller Configuration GuideOL-21524-02Appendix D Troubleshooting Configuring Wireless Sniffing [3]: disabled [4]: disabled [5]: disabled [6]: disabled Ethernet ACL: [1]: disabled [2]: disabled [3]: disabled [4]: disabled [5]: disabled [6]: disabled IP ACL: [1]: disabled [2]: disabled [3]: disabled [4]: disabled [5]: disabled [6]: disabled EoIP-Ethernet ACL: [1]: disabled [2]: disabled [3]: disabled [4]: disabled [5]: disabled [6]: disabled EoIP-IP ACL: [1]: disabled [2]: disabled [3]: disabled [4]: disabled [5]: disabled [6]: disabled LWAPP-Dot11 ACL: [1]: disabled [2]: disabled [3]: disabled [4]: disabled [5]: disabled [6]: disabled LWAPP-IP ACL: [1]: disabled [2]: disabled [3]: disabled [4]: disabled [5]: disabled [6]: disabled Configuring Wireless SniffingThe controller enables you to configure an access point as a network “sniffer,” which captures and forwards all the packets on a particular channel to a remote machine that runs packet analyzer software. These packets contain information on time stamps, signal strength, packet sizes, and so on. Sniffers allow you to monitor and record network activity and to detect problems.Supported third-party network analyzer software applications are as follows: • Wildpackets Omnipeek or Airopeek • AirMagnet Enterprise Analyzer](https://usermanual.wiki/Cisco-Systems/102075.Cisco-Wireless-LAN-Controller-Configuration-Guide-9/User-Guide-1514969-Page-46.png)