Cisco Systems 102075 Cisco Aironet 802.11n Dual Band Access Points User Manual Cisco Wireless LAN Controller Configuration Guide 9
Cisco Systems Inc Cisco Aironet 802.11n Dual Band Access Points Cisco Wireless LAN Controller Configuration Guide 9
Contents
- 1. User manual
- 2. Cisco Wireless LAN Controller Configuration Guide_1
- 3. Cisco Wireless LAN Controller Configuration Guide_2
- 4. Cisco Wireless LAN Controller Configuration Guide_3
- 5. Cisco Wireless LAN Controller Configuration Guide_4
- 6. Cisco Wireless LAN Controller Configuration Guide_5
- 7. Cisco Wireless LAN Controller Configuration Guide_6
- 8. Cisco Wireless LAN Controller Configuration Guide_7
- 9. Cisco Wireless LAN Controller Configuration Guide_8
- 10. Cisco Wireless LAN Controller Configuration Guide_9
- 11. Cisco Wireless LAN Controller Configuration Guide_10
- 12. Cisco Wireless LAN Controller Configuration Guide_11
- 13. User Manual
Cisco Wireless LAN Controller Configuration Guide_9

C-7
Cisco Wireless LAN Controller Configuration Guide
OL-21524-02
Appendix C End User License and Warranty
Notices and Disclaimers
2. Redistributions in binary form must reproduce the above copyright notice, this list of conditions, and
the following disclaimer in the documentation and/or other materials provided with the distribution.
3. All advertising materials mentioning features or use of this software must display the following
acknowledgment: “This product includes software developed by the OpenSSL Project for use in the
OpenSSL Toolkit (http://www.openssl.org/)”.
4. The names “OpenSSL Toolkit” and “OpenSSL Project” must not be used to endorse or promote
products derived from this software without prior written permission. For written permission, please
contact openssl-core@openssl.org.
5. Products derived from this software may not be called “OpenSSL” nor may “OpenSSL” appear in
their names without prior written permission of the OpenSSL Project.
6. Redistributions of any form whatsoever must retain the following acknowledgment:
“This product includes software developed by the OpenSSL Project for use in the OpenSSL Toolkit
(http://www.openssl.org/)”.
THIS SOFTWARE IS PROVIDED BY THE OpenSSL PROJECT “AS IS”' AND ANY EXPRESSED OR
IMPLIED WARRANTIES, INCLUDING, BUT NOT LIMITED TO, THE IMPLIED WARRANTIES
OF MERCHANTABILITY AND FITNESS FOR A PARTICULAR PURPOSE ARE DISCLAIMED. IN
NO EVENT SHALL THE OpenSSL PROJECT OR ITS CONTRIBUTORS BE LIABLE FOR ANY
DIRECT, INDIRECT, INCIDENTAL, SPECIAL, EXEMPLARY, OR CONSEQUENTIAL DAMAGES
(INCLUDING, BUT NOT LIMITED TO, PROCUREMENT OF SUBSTITUTE GOODS OR
SERVICES; LOSS OF USE, DATA, OR PROFITS; OR BUSINESS INTERRUPTION) HOWEVER
CAUSED AND ON ANY THEORY OF LIABILITY, WHETHER IN CONTRACT, STRICT
LIABILITY, OR TORT (INCLUDING NEGLIGENCE OR OTHERWISE) ARISING IN ANY WAY
OUT OF THE USE OF THIS SOFTWARE, EVEN IF ADVISED OF THE POSSIBILITY OF SUCH
DAMAGE.
This product includes cryptographic software written by Eric Young (eay@cryptsoft.com). This product
includes software written by Tim Hudson (tjh@cryptsoft.com).
Original SSLeay License:
Copyright © 1995-1998 Eric Young (eay@cryptsoft.com). All rights reserved.
This package is an SSL implementation written by Eric Young (eay@cryptsoft.com).
The implementation was written so as to conform with Netscapes SSL.
This library is free for commercial and non-commercial use as long as the following conditions are
adhered to. The following conditions apply to all code found in this distribution, be it the RC4, RSA,
lhash, DES, etc., code; not just the SSL code. The SSL documentation included with this distribution is
covered by the same copyright terms except that the holder is Tim Hudson (tjh@cryptsoft.com).
Copyright remains Eric Young’s, and as such any Copyright notices in the code are not to be removed.
If this package is used in a product, Eric Young should be given attribution as the author of the parts of
the library used. This can be in the form of a textual message at program startup or in documentation
(online or textual) provided with the package.
Redistribution and use in source and binary forms, with or without modification, are permitted provided
that the following conditions are met:
1. Redistributions of source code must retain the copyright notice, this list of conditions and the
following disclaimer.
2. Redistributions in binary form must reproduce the above copyright notice, this list of conditions and
the following disclaimer in the documentation and/or other materials provided with the distribution.

C-8
Cisco Wireless LAN Controller Configuration Guide
OL-21524-02
Appendix C End User License and Warranty
Notices and Disclaimers
3. All advertising materials mentioning features or use of this software must display the following
acknowledgement:
“This product includes cryptographic software written by Eric Young (eay@cryptsoft.com)”.
The word ‘cryptographic’ can be left out if the routines from the library being used are not
cryptography-related.
4. If you include any Windows specific code (or a derivative thereof) from the apps directory
(application code) you must include an acknowledgement: “This product includes software written
by Tim Hudson (tjh@cryptsoft.com)”.
THIS SOFTWARE IS PROVIDED BY ERIC YOUNG “AS IS” AND ANY EXPRESS OR IMPLIED
WARRANTIES, INCLUDING, BUT NOT LIMITED TO, THE IMPLIED WARRANTIES OF
MERCHANTABILITY AND FITNESS FOR A PARTICULAR PURPOSE ARE DISCLAIMED. IN NO
EVENT SHALL THE AUTHOR OR CONTRIBUTORS BE LIABLE FOR ANY DIRECT, INDIRECT,
INCIDENTAL, SPECIAL, EXEMPLARY, OR CONSEQUENTIAL DAMAGES (INCLUDING, BUT
NOT LIMITED TO, PROCUREMENT OF SUBSTITUTE GOODS OR SERVICES; LOSS OF USE,
DATA, OR PROFITS; OR BUSINESS INTERRUPTION) HOWEVER CAUSED AND ON ANY
THEORY OF LIABILITY, WHETHER IN CONTRACT, STRICT LIABILITY, OR TORT
(INCLUDING NEGLIGENCE OR OTHERWISE) ARISING IN ANY WAY OUT OF THE USE OF
THIS SOFTWARE, EVEN IF ADVISED OF THE POSSIBILITY OF SUCH DAMAGE.
The license and distribution terms for any publicly available version or derivative of this code cannot be
changed. i.e. this code cannot simply be copied and put under another distribution license [including the
GNU Public License].
Disclaimers
All third party trademarks are the property of their respective owners.A

D-1
Cisco Wireless LAN Controller Configuration Guide
OL-21524-02
APPENDIX
D
Troubleshooting
This appendix lists system messages that can appear on the Cisco UWN solution interfaces, describes
the LED patterns on controllers and lightweight access points, and provides CLI commands that can be
used to troubleshoot problems on the controller. It contains these sections:
• Interpreting LEDs, page D-1
• System Messages, page D-2
• Viewing System Resources, page D-5
• Using the CLI to Troubleshoot Problems, page D-6
• Configuring System and Message Logging, page D-8
• Viewing Access Point Event Logs, page D-15
• Uploading Logs and Crash Files, page D-15
• Uploading Core Dumps from the Controller, page D-18
• Uploading Packet Capture Files, page D-21
• Monitoring Memory Leaks, page D-24
• Troubleshooting CCXv5 Client Devices, page D-25
• Using the Debug Facility, page D-40
• Configuring Wireless Sniffing, page D-44
• Troubleshooting Access Points Using Telnet or SSH, page D-48
• Debugging the Access Point Monitor Service, page D-50
• Troubleshooting OfficeExtend Access Points, page D-51
Interpreting LEDs
This section describes how to interpret controller LEDs and lightweight access point LEDs.
Interpreting Controller LEDs
See the quick start guide for your specific controller for a description of the LED patterns. You can find
the guides at this URL:
http://www.cisco.com/en/US/products/hw/wireless/index.html

D-2
Cisco Wireless LAN Controller Configuration Guide
OL-21524-02
Appendix D Troubleshooting
System Messages
Interpreting Lightweight Access Point LEDs
See the quick start guide or hardware installation guide for your specific access point for a description
of the LED patterns. You can find the guides at this URL:
http://www.cisco.com/en/US/products/hw/wireless/index.html
System Messages
Table D-1 lists some common system messages and their descriptions. For a complete list of system
messages, see the Cisco Wireless LAN Controller System Message Guide, Release 7.0.
Ta b l e D-1 System Messages and Descriptions
Error Message Description
apf_utils.c 680: Received a CIF field without the
protected bit set from mobile xx:xx:xx:xx:xx:xx
A client is sending an association request on a
security-enabled WLAN with the protected bit set
to 0 (in the Capability field of the association
request). As designed, the controller rejects the
association request, and the client sees an
association failure.
dtl_arp.c 480: Got an idle-timeout message from
an unknown client xx:xx:xx:xx:xx:xx
The controller’s network processing unit (NPU)
sends a timeout message to the central processing
unit (CPU) indicating that a particular client has
timed out or aged out. This situation typically
occurs when the CPU has removed a wireless
client from its internal database but has not
notified the NPU. Because the client remains in
the NPU database, it ages out on the network
processor and notifies the CPU. The CPU finds the
client that is not present in its database and then
sends this message.
STATION_DISASSOCIATE The client may have intentionally terminated
usage or may have experienced a service
disruption.
STATION_DEAUTHENTICATE The client may have intentionally terminated
usage or this message could indicate an
authentication issue.
STATION_AUTHENTICATION_FAIL Check disable, key mismatch, or other
configuration issues.
STATION_ASSOCIATE_FAIL Check load on the Cisco radio or signal quality
issues.
LRAD_ASSOCIATED The associated lightweight access point is now
managed by this controller.
LRAD_DISASSOCIATED The lightweight access point may have associated
to a different controller or may have become
completely unreachable.

D-3
Cisco Wireless LAN Controller Configuration Guide
OL-21524-02
Appendix D Troubleshooting
System Messages
LRAD_UP The lightweight access point is operational; no
action required.
LRAD_DOWN The lightweight access point may have a problem
or is administratively disabled.
LRADIF_UP The Cisco radio is UP.
LRADIF_DOWN The Cisco radio may have a problem or is
administratively disabled.
LRADIF_LOAD_PROFILE_FAILED The client density may have exceeded system
capacity.
LRADIF_NOISE_PROFILE_FAILED The non-802.11 noise has exceeded the configured
threshold.
LRADIF_INTERFERENCE_PROFILE_FAILED 802.11 interference has exceeded threshold on
channel; check channel assignments.
LRADIF_COVERAGE_PROFILE_FAILED A possible coverage hole has been detected.
Check the lightweight access point history to see
if it is a common problem and add lightweight
access points if necessary.
LRADIF_LOAD_PROFILE_PASSED The load is now within threshold limits.
LRADIF_NOISE_PROFILE_PASSED The detected noise is now less than threshold.
LRADIF_INTERFERENCE_PROFILE_PASSED The detected interference is now less than
threshold.
LRADIF_COVERAGE_PROFILE_PASSED The number of clients receiving a poor signal are
within threshold.
LRADIF_CURRENT_TXPOWER_CHANGED Informational message.
LRADIF_CURRENT_CHANNEL_CHANGED Informational message.
LRADIF_RTS_THRESHOLD_CHANGED Informational message.
LRADIF_ED_THRESHOLD_CHANGED Informational message.
LRADIF_FRAGMENTATION_THRESHOLD_
CHANGED
Informational message.
RRM_DOT11_A_GROUPING_DONE Informational message.
RRM_DOT11_B_GROUPING_DONE Informational message.
ROGUE_AP_DETECTED May be a security issue. Use maps and trends to
investigate.
ROGUE_AP_REMOVED A detected rogue access point has timed out. The
unit might have shut down or moved out of the
coverage area.
AP_MAX_ROGUE_COUNT_EXCEEDED The current number of active rogue access points
has exceeded system threshold.
LINK_UP Positive confirmation message.
LINK_DOWN A port may have a problem or is administratively
disabled.
Table D-1 System Messages and Descriptions (continued)
Error Message Description

D-4
Cisco Wireless LAN Controller Configuration Guide
OL-21524-02
Appendix D Troubleshooting
System Messages
LINK_FAILURE A port may have a problem or is administratively
disabled.
AUTHENTICATION_FAILURE An attempted security breech has occurred.
Investigate.
STP_NEWROOT Informational message.
STP_TOPOLOGY_CHANGE Informational message.
IPSEC_ESP_AUTH_FAILURE Check WLAN IPsec configuration.
IPSEC_ESP_REPLAY_FAILURE Check for an attempt to spoof an IP address.
IPSEC_ESP_POLICY_FAILURE Check for a IPsec configuration mismatch
between WLAN and client.
IPSEC_ESP_INVALID_SPI Informational message.
IPSEC_OTHER_POLICY_FAILURE Check for a IPsec configuration mismatch
between WLAN and client.
IPSEC_IKE_NEG_FAILURE Check for a IPsec IKE configuration mismatch
between WLAN and client.
IPSEC_SUITE_NEG_FAILURE Check for a IPsec IKE configuration mismatch
between WLAN and client.
IPSEC_INVALID_COOKIE Informational message.
RADIOS_EXCEEDED The maximum number of supported Cisco radios
has been exceeded. Check for a controller failure
in the same Layer 2 network or add another
controller.
SENSED_TEMPERATURE_HIGH Check fan, air conditioning, and/or other cooling
arrangements.
SENSED_TEMPERATURE_LOW Check room temperature and/or other reasons for
low temperature.
TEMPERATURE_SENSOR_FAILURE Replace temperature sensor as soon as possible.
TEMPERATURE_SENSOR_CLEAR The temperature sensor is operational.
POE_CONTROLLER_FAILURE Check ports; a possible serious failure has been
detected.
MAX_ROGUE_COUNT_EXCEEDED The current number of active rogue access points
has exceeded system threshold.
SWITCH_UP The controller is responding to SNMP polls.
SWITCH_DOWN The controller is not responding to SNMP polls;
check controller and SNMP settings.
RADIUS_SERVERS_FAILED Check network connectivity between RADIUS
and the controller.
CONFIG_SAVED The running configuration has been saved to flash;
it will be active after a reboot.
MULTIPLE_USERS Another user with the same username has logged
in.
Table D-1 System Messages and Descriptions (continued)
Error Message Description
D-5
Cisco Wireless LAN Controller Configuration Guide
OL-21524-02
Appendix D Troubleshooting
Viewing System Resources
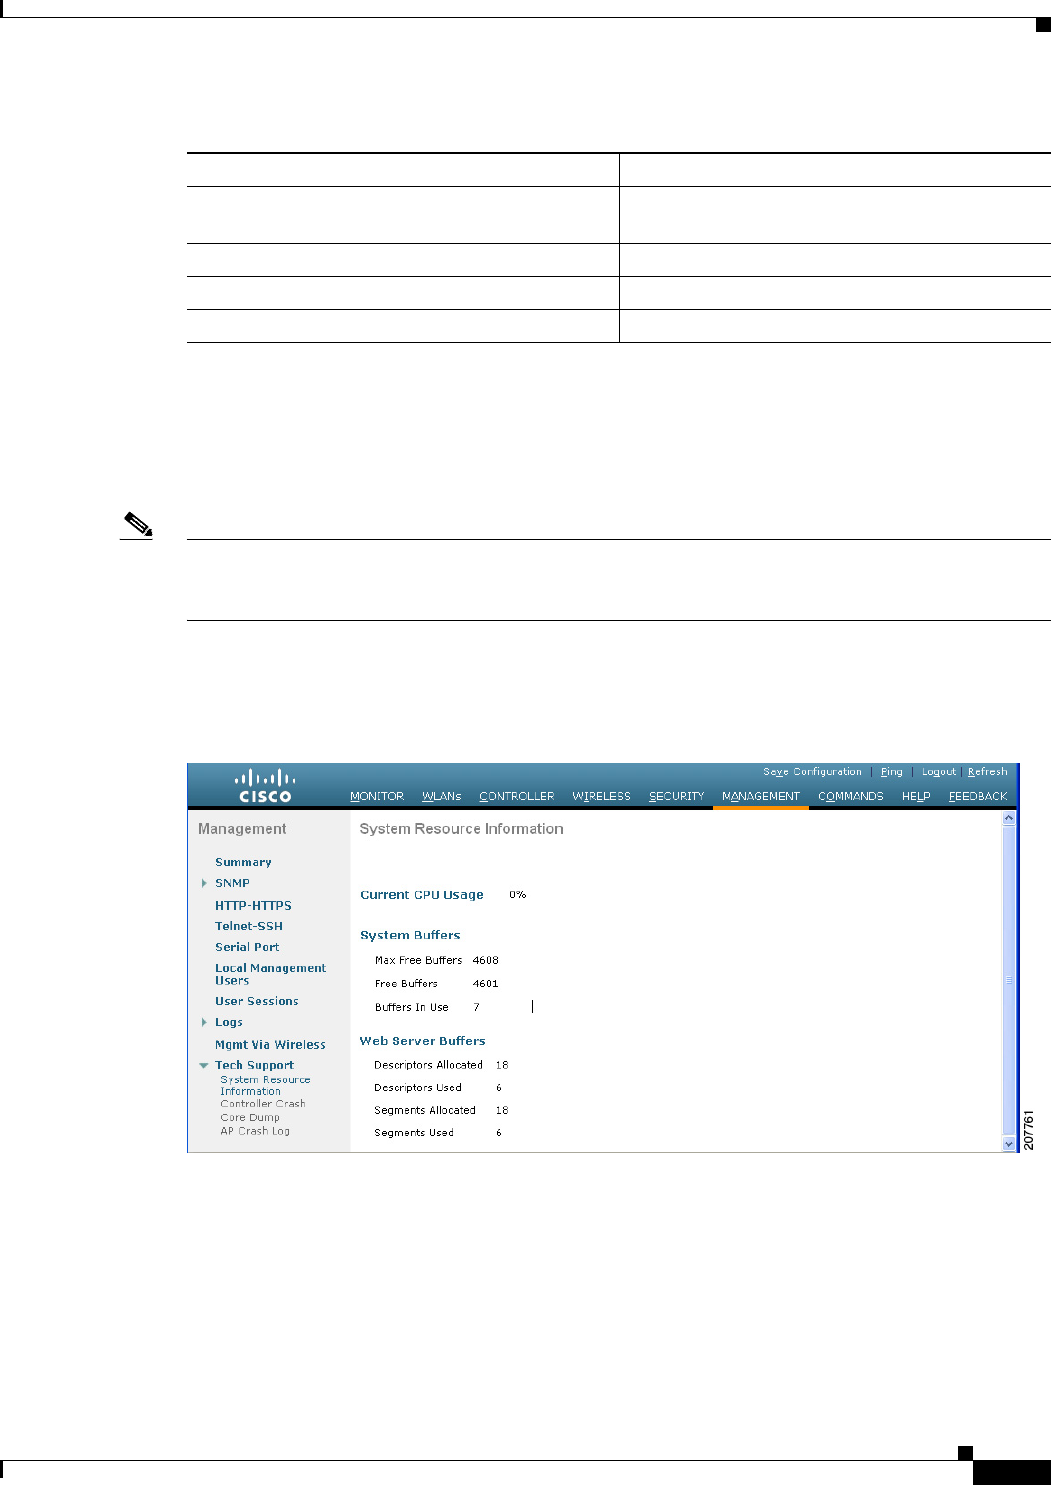
Viewing System Resources
You can use the GUI or CLI to determine the amount of system resources being used by the controller.
Specifically, you can view the current controller CPU usage, system buffers, and web server buffers.
Note The Cisco 5500 Series Controllers have multiple CPUs, so you can view individual CPU usage. For each
CPU, you can see the percentage of the CPU in use and the percentage of the CPU time spent at the
interrupt level (for example, 0%/3%).
On the controller GUI, choose Management > Tech Support > System Resource Information. The
System Resource Information page appears (see Figure D-1).
Figure D-1 System Resource Information Page
On the controller CLI, enter these commands:
• show cpu
Information similar to the following appears:
Current CPU(s) load: 0%
ndividual CPU load: 0%/0%, 0%/0%, 0%/1%, 0%/0%, 0%/0%, 0%/0%, 0%/0%, 0%/0%, 0%/0%,
0%/0%
FAN_FAILURE Monitor controller temperature to avoid
overheating.
POWER_SUPPLY_CHANGE Check for a power-supply malfunction.
COLD_START The controller may have been rebooted.
WA R M _ S TA RT The controller may have been rebooted.
Table D-1 System Messages and Descriptions (continued)
Error Message Description

D-6
Cisco Wireless LAN Controller Configuration Guide
OL-21524-02
Appendix D Troubleshooting
Using the CLI to Troubleshoot Problems
Where the first number is the CPU percentage that the controller spent on the user application and
the second number is the CPU percentage that the controller spent on the OS services.
• show tech-support
Information similar to the following appears:
System Information
Manufacturer's Name.............................. Cisco Systems Inc.
Product Name..................................... Cisco Controller
Product Version............................... 6.0.165.0
...
---------------Show cpu---------------
Current CPU(s) Load.............................. 0%
Individual CPU Load.............................. 0%/3%, 0%/1%, 0%/1%, 0%/1%, 0%/0%,
0%/1%
---------------Show system buffers---------------
System Buffers
Max Free Buffers.............................. 4608
Free Buffers.................................. 4596
Buffers In Use................................ 12
Web Server Resources
Descriptors Allocated......................... 259
Descriptors Used.............................. 4
Segments Allocated............................ 259
Segments Used................................. 4
System Resources
Uptime........................................ 595748 Secs
Total Ram.................................. 907872 Kbytes
...
Using the CLI to Troubleshoot Problems
If you experience any problems with your controller, you can use the commands in this section to gather
information and debug issues.
1. show process cpu—Shows how various tasks in the system are using the CPU at that instant in time.
This command is helpful in understanding if any single task is monopolizing the CPU and
preventing other tasks from being performed.
Information similar to the following appears:
Name Priority CPU Use Reaper
reaperWatcher ( 3/124) 0 % ( 0/ 0)% I
osapiReaper (10/121) 0 % ( 0/ 0)% I
TempStatus (255/ 1) 0 % ( 0/ 0)% I
emWeb (255/ 1) 0 % ( 0/ 0)% T 300
cliWebTask (255/ 1) 0 % ( 0/ 0)% I
UtilTask (255/ 1) 0 % ( 0/ 0)% T 300
In the example above, the following fields provide information:
• The Name field shows the tasks that the CPU is to perform.
• The Priority field shows two values: 1) the original priority of the task that was created by the
actual function call and 2) the priority of the task divided by a range of system priorities.
• The CPU Use field shows the CPU usage of a particular task.

D-7
Cisco Wireless LAN Controller Configuration Guide
OL-21524-02
Appendix D Troubleshooting
Using the CLI to Troubleshoot Problems
• The Reaper field shows three values: 1) the amount of time for which the task is scheduled in
user mode operation, 2) the amount of time for which the task is scheduled in system mode
operation, and 3) whether the task is being watched by the reaper task monitor (indicated by a
“T”). If the task is being watched by the reaper task monitor, this field also shows the timeout
value (in seconds) before which the task needs to alert the task monitor.
Note If you want to see the total CPU usage as a percentage, enter the show cpu command.
2. show process memory—Shows the allocation and deallocation of memory from various processes
in the system at that instant in time.
Information similar to the following appears:
Name Priority BytesInUse BlocksInUse Reaper
reaperWatcher ( 3/124) 0 0 ( 0/ 0)% I
osapiReaper (10/121) 0 0 ( 0/ 0)% I
TempStatus (255/ 1) 308 1 ( 0/ 0)% I
emWeb (255/ 1) 294440 4910 ( 0/ 0)% T 300
cliWebTask (255/ 1) 738 2 ( 0/ 0)% I
UtilTask (255/ 1) 308 1 ( 0/ 0)% T 300
In the example above, the following fields provide information:
• The Name field shows the tasks that the CPU is to perform.
• The Priority field shows two values: 1) the original priority of the task that was created by the
actual function call and 2) the priority of the task divided by a range of system priorities.
• The BytesInUse field shows the actual number of bytes used by dynamic memory allocation for
a particular task.
• The BlocksInUse field shows the chunks of memory that are assigned to perform a particular
task.
• The Reaper field shows three values: 1) the amount of time for which the task is scheduled in
user mode operation, 2) the amount of time for which the task is scheduled in system mode
operation, and 3) whether the task is being watched by the reaper task monitor (indicated by a
“T”). If the task is being watched by the reaper task monitor, this field also shows the timeout
value (in seconds) before which the task needs to alert the task monitor.
3. show tech-support—Shows an array of information related to the state of the system, including the
current configuration, last crash file, CPU utilization, and memory utilization.
4. show run-config—Shows the complete configuration of the controller. To exclude access point
configuration settings, use the show run-config no-ap command.
Note If you want to see the passwords in clear text, enter the config passwd-cleartext enable
command. To execute this command, you must enter an admin password. This command is
valid only for this particular session. It is not saved following a reboot.
5. show run-config commands—Shows the list of configured commands on the controller. This
command shows only values configured by the user. It does not show system-configured default
values.
D-8
Cisco Wireless LAN Controller Configuration Guide
OL-21524-02
Appendix D Troubleshooting
Configuring System and Message Logging
Configuring System and Message Logging
System logging allows controllers to log their system events to up to three remote syslog servers. The
controller sends a copy of each syslog message as it is logged to each syslog server configured on the
controller. Being able to send the syslog messages to multiple servers ensures that the messages are not
lost due to the temporary unavailability of one syslog server. Message logging allows system messages
to be logged to the controller buffer or console.
You can use the controller GUI or CLI to configure system and message logging.
Using the GUI to Configure System and Message Logging
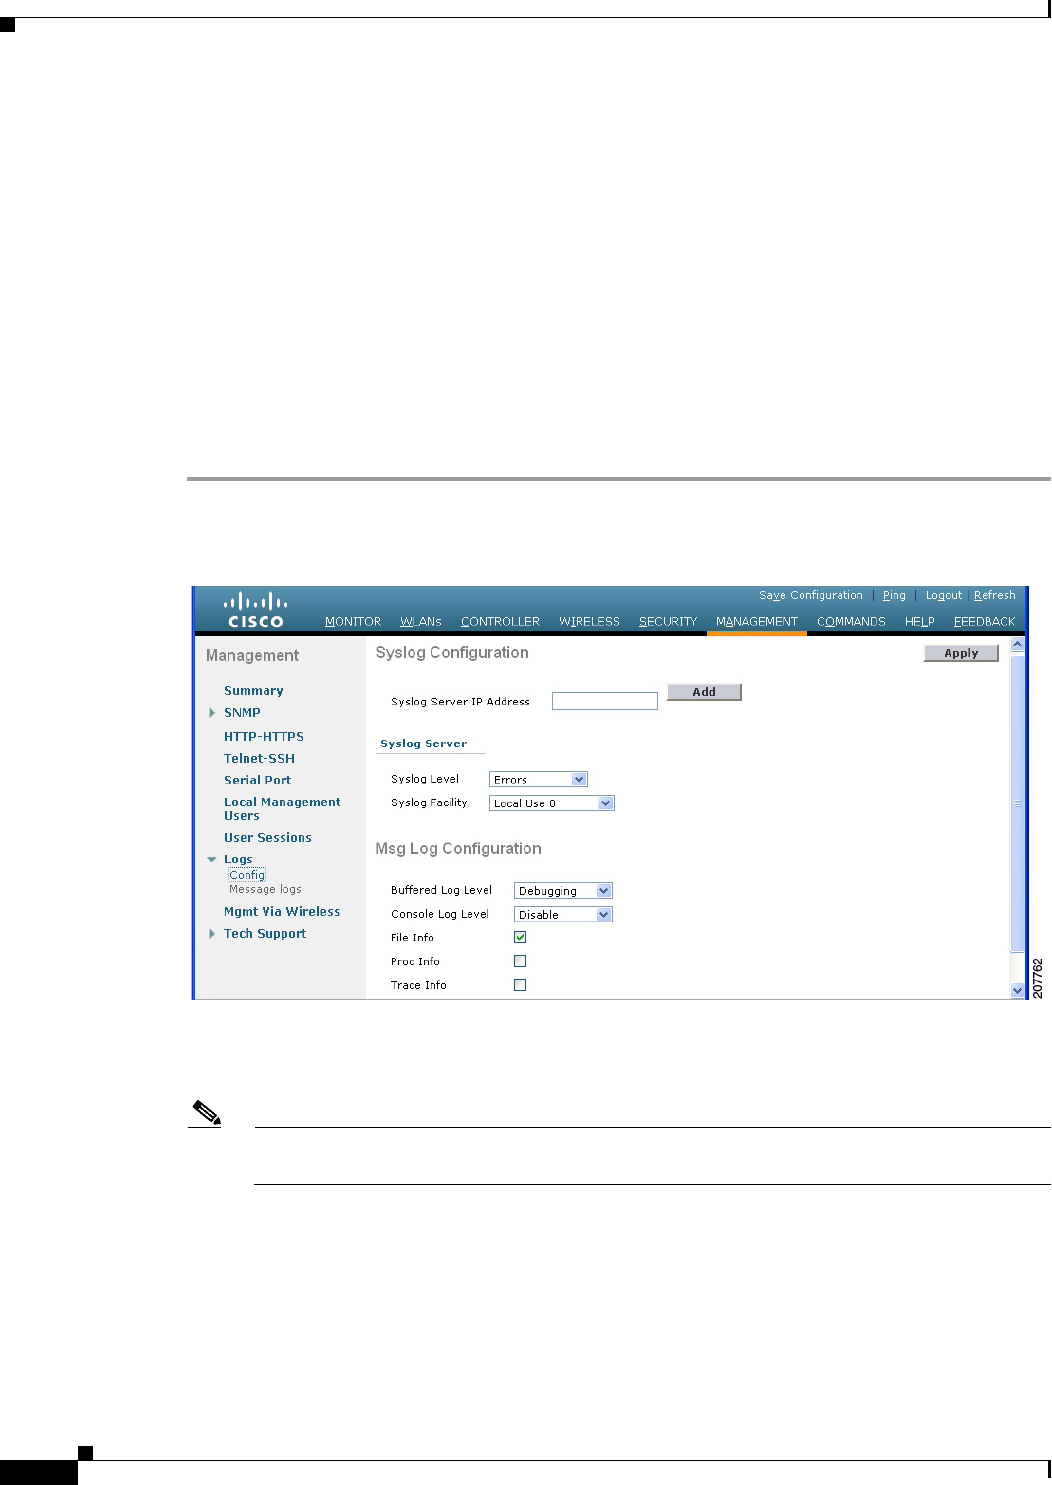
To configure system and message logging using the controller GUI, follow these steps:
Step 1 Choose Management > Logs > Config. The Syslog Configuration page appears (see Figure D-2).
Figure D-2 Syslog Configuration Page
Step 2 In the Syslog Server IP Address text box, enter the IP address of the server to which to send the syslog
messages and click Add. You can add up to three syslog servers to the controller. The list of syslog
servers that have already been added to the controller appears below this text box.
Note If you want to remove a syslog server from the controller, click Remove to the right of the
desired server.
Step 3 To set the severity level for filtering syslog messages to the syslog servers, choose one of the following
options from the Syslog Level drop-down list:
• Emergencies = Severity level 0
• Alerts = Severity level 1 (default value)
• Critical = Severity level 2
• Errors = Severity level 3

D-9
Cisco Wireless LAN Controller Configuration Guide
OL-21524-02
Appendix D Troubleshooting
Configuring System and Message Logging
• Warnings = Severity level 4
• Notifications = Severity level 5
• Informational = Severity level 6
• Debugging = Severity level 7
If you set a syslog level, only those messages whose severity is equal to or less than that level are sent
to the syslog servers. For example, if you set the syslog level to Warnings (severity level 4), only those
messages whose severity is between 0 and 4 are sent to the syslog servers.
Step 4 To set the facility for outgoing syslog messages to the syslog servers, choose one of the following options
from the Syslog Facility drop-down list:
• Kernel = Facility level 0
• User Process = Facility level 1
• Mail = Facility level 2
• System Daemons = Facility level 3
• Authorization = Facility level 4
• Syslog = Facility level 5 (default value)
• Line Printer = Facility level 6
• USENET = Facility level 7
• Unix-to-Unix Copy = Facility level 8
• Cron = Facility level 9
• FTP Daemon = Facility level 11
• System Use 1 = Facility level 12
• System Use 2 = Facility level 13
• System Use 3 = Facility level 14
• System Use 4 = Facility level 15
• Local Use 0 = Facility level 16
• Local Use 1 = Facility level 17
• Local Use 2 = Facility level 18
• Local Use 3 = Facility level 19
• Local Use 4 = Facility level 20
• Local Use 5 = Facility level 21
• Local Use 6 = Facility level 22
• Local Use 7 = Facility level 23
Step 5 Click Apply to commit your changes.
Step 6 To set the severity level for logging messages to the controller buffer and console, choose one of the
following options from both the Buffered Log Level and Console Log Level drop-down listes:
• Emergencies = Severity level 0
• Alerts = Severity level 1
• Critical = Severity level 2
• Errors = Severity level 3 (default value)

D-10
Cisco Wireless LAN Controller Configuration Guide
OL-21524-02
Appendix D Troubleshooting
Configuring System and Message Logging
• Warnings = Severity level 4
• Notifications = Severity level 5
• Informational = Severity level 6
• Debugging = Severity level 7
• Disable— This option is available only for Console Log level. Select this option to disable console
logging.
If you set a logging level, only those messages whose severity is equal to or less than that level are logged
by the controller. For example, if you set the logging level to Warnings (severity level 4), only those
messages whose severity is between 0 and 4 are logged.
Step 7 Select the File Info check box if you want the message logs to include information about the source file.
The default value is enabled.
Step 8 Select the Trace Info check box if you want the message logs to include traceback information. The
default value is disabled.
Step 9 Click Apply to commit your changes.
Step 10 Click Save Configuration to save your changes.
Using the GUI to View Message Logs
To view message logs using the controller GUI, choose Management > Logs > Message Logs. The
Message Logs page appears (see Figure D-3).
Figure D-3 Message Logs Page
Note To clear the current message logs from the controller, click Clear.

D-11
Cisco Wireless LAN Controller Configuration Guide
OL-21524-02
Appendix D Troubleshooting
Configuring System and Message Logging
Using the CLI to Configure System and Message Logging
To configure system and message logging using the controller CLI, follow these steps:
Step 1 To enable system logging and set the IP address of the syslog server to which to send the syslog
messages, enter this command:
config logging syslog host server_IP_address
You can add up to three syslog servers to the controller.
Note To remove a syslog server from the controller, enter this command:
config logging syslog host server_IP_address delete
Step 2 To set the severity level for filtering syslog messages to the syslog server, enter this command:
config logging syslog level severity_level
where severity_level is one of the following:
• emergencies = Severity level 0
• alerts = Severity level 1
• critical = Severity level 2
• errors = Severity level 3
• warnings = Severity level 4
• notifications = Severity level 5
• informational = Severity level 6
• debugging = Severity level 7
Note As an alternative, you can enter a number from 0 through 7 for the severity_level parameter.
Note If you set a syslog level, only those messages whose severity is equal to or less than that level
are sent to the syslog server. For example, if you set the syslog level to Warnings (severity level
4), only those messages whose severity is between 0 and 4 are sent to the syslog server.
Step 3 To set the severity level for filtering syslog messages for a particular access point or for all access points,
enter this command:
config ap logging syslog level severity_level {Cisco_AP | all}
where severity_level is one of the following:
• emergencies = Severity level 0
• alerts = Severity level 1
• critical = Severity level 2
• errors = Severity level 3
• warnings = Severity level 4
• notifications = Severity level 5

D-12
Cisco Wireless LAN Controller Configuration Guide
OL-21524-02
Appendix D Troubleshooting
Configuring System and Message Logging
• informational = Severity level 6
• debugging = Severity level 7
Note If you set a syslog level, only those messages whose severity is equal to or less than that level
are sent to the access point. For example, if you set the syslog level to Warnings (severity level
4), only those messages whose severity is between 0 and 4 are sent to the access point.
Step 4 To set the facility for outgoing syslog messages to the syslog server, enter this command:
config logging syslog facility facility_code
where facility_code is one of the following:
• authorization = Authorization system. Facility level = 4.
• auth-private = Authorization system (private). Facility level = 10.
• cron = Cron/at facility. Facility level = 9.
• daemon = System daemons. Facility level = 3.
• ftp = FTP daemon. Facility level = 11.
• kern = Kernel. Facility level = 0.
• local0 = Local use. Facility level = 16.
• local1 = Local use. Facility level = 17.
• local2 = Local use. Facility level = 18.
• local3 = Local use. Facility level = 19.
• local4 = Local use. Facility level = 20.
• local5 = Local use. Facility level = 21.
• local6 = Local use. Facility level = 22.
• local7 = Local use. Facility level = 23.
• lpr = Line printer system. Facility level = 6.
• mail = Mail system. Facility level = 2.
• news = USENET news. Facility level = 7.
• sys12 = System use. Facility level = 12.
• sys13 = System use. Facility level = 13.
• sys14 = System use. Facility level = 14.
• sys15 = System use. Facility level = 15.
• syslog = The syslog itself. Facility level = 5.
• user = User process. Facility level = 1.
• uucp = Unix-to-Unix copy system. Facility level = 8.
Step 5 To set the severity level for logging messages to the controller buffer and console, enter these commands:
• config logging buffered severity_level
• config logging console severity_level
where severity_level is one of the following:
• emergencies = Severity level 0

D-13
Cisco Wireless LAN Controller Configuration Guide
OL-21524-02
Appendix D Troubleshooting
Configuring System and Message Logging
• alerts = Severity level 1
• critical = Severity level 2
• errors = Severity level 3
• warnings = Severity level 4
• notifications = Severity level 5
• informational = Severity level 6
• debugging = Severity level 7
Note As an alternative, you can enter a number from 0 through 7 for the severity_level parameter.
Note If you set a logging level, only those messages whose severity is equal to or less than that level
are logged by the controller. For example, if you set the logging level to Warnings (severity level
4), only those messages whose severity is between 0 and 4 are logged.
Step 6 To save debug messages to the controller buffer, the controller console, or a syslog server, enter these
commands:
• config logging debug buffered {enable | disable}
• config logging debug console {enable | disable}
• config logging debug syslog {enable | disable}
By default, the console command is enabled, and the buffered and syslog commands are disabled.
Step 7 To cause the controller to include information about the source file in the message logs or to prevent the
controller from displaying this information, enter this command:
config logging fileinfo {enable | disable}
The default value is enabled.
Step 8 To cause the controller to include process information in the message logs or to prevent the controller
from displaying this information, enter this command:
config logging procinfo {enable | disable}
The default value is disabled.
Step 9 To cause the controller to include traceback information in the message logs or to prevent the controller
from displaying this information, enter this command:
config logging traceinfo {enable | disable}
The default value is disabled.
Step 10 To enable or disable timestamps in log messages and debug messages, enter these commands:
• config service timestamps log {datetime | disable}
• config service timestamps debug {datetime | disable}
where
–
datetime = Messages are timestamped with the standard date and time. This is the default value.
–
disable = Messages are not timestamped.
Step 11 To save your changes, enter this command:

D-14
Cisco Wireless LAN Controller Configuration Guide
OL-21524-02
Appendix D Troubleshooting
Configuring System and Message Logging
save config
Using the CLI to View System and Message Logs
To see the logging parameters and buffer contents, enter this command:
show logging
Information similar to the following appears:
Logging to buffer :
- Logging of system messages to buffer :
- Logging filter level.......................... errors
- Number of system messages logged.............. 8716
- Number of system messages dropped............. 2906
- Logging of debug messages to buffer ........... Disabled
- Number of debug messages logged............... 0
- Number of debug messages dropped.............. 0
Logging to console :
- Logging of system messages to console :
- Logging filter level.......................... errors
- Number of system messages logged.............. 0
- Number of system messages dropped............. 11622
- Logging of debug messages to console .......... Enabled
- Number of debug messages logged............... 0
- Number of debug messages dropped.............. 0
Logging to syslog :
- Syslog facility................................ local0
- Logging of system messages to syslog :
- Logging filter level.......................... errors
- Number of system messages logged.............. 8716
- Number of debug messages dropped............... 0
- Number of remote syslog hosts.................. 0
- Host 0....................................... Not Configured
- Host 1....................................... Not Configured
- Host 2....................................... Not Configured
Logging of traceback............................. Disabled
Logging of process information................... Disabled
Logging of source file informational............. Enabled
Timestamping of messages.........................
- Timestamping of system messages................ Enabled
- Timestamp format.............................. Date and Time
- Timestamping of debug messages................. Enabled
- Timestamp format.............................. Date and Time
Logging buffer (8722 logged, 2910 dropped)
*Mar 26 09:23:13.574: %MM-3-INVALID_PKT_RECVD: mm_listen.c:5508 Received an invalid packet
from 1.100.163.144. Source member:0.0.0.0. source member unknown.
*Mar 26 09:23:13.574: %MM-3-INVALID_PKT_RECVD: mm_listen.c:5508 Received an invalid packet
from 1.100.163.144. Source member:0.0.0.0. source member unknown.
Previous message occurred 2 times.
*Mar 26 09:22:44.925: %MM-3-INVALID_PKT_RECVD: mm_listen.c:5508 Received an invalid packet
from 1.100.163.144. Source member:0.0.0.0. source member unknown.
...

D-15
Cisco Wireless LAN Controller Configuration Guide
OL-21524-02
Appendix D Troubleshooting
Viewing Access Point Event Logs
Viewing Access Point Event Logs
Access points log all system messages (with a severity level greater than or equal to notifications) to the
access point event log. The event log can contain up to 1024 lines of messages, with up to 128 characters
per line. When the event log becomes filled, the oldest message is removed to accommodate a new event
message. The event log is saved in a file on the access point flash, which ensures that it is saved through
a reboot cycle. To minimize the number of writes to the access point flash, the contents of the event log
are written to the event log file during normal reload and crash scenarios only.
Use these CLI commands to view or clear the access point event log from the controller:
• To see the contents of the event log file for an access point that is joined to the controller, enter this
command:
show ap eventlog Cisco_AP
Information similar to the following appears:
AP event log download has been initiated
Waiting for download to complete
AP event log download completed.
======================= AP Event log Contents =====================
*Sep 22 11:44:00.573: %CAPWAP-5-CHANGED: CAPWAP changed state to IMAGE
*Sep 22 11:44:01.514: %LINEPROTO-5-UPDOWN: Line protocol on Interface Dot11Radio0,
changed state to down
*Sep 22 11:44:01.519: %LINEPROTO-5-UPDOWN: Line protocol on Interface Dot11Radio1,
changed state to down
*Sep 22 11:44:53.539: *** Access point reloading. Reason: NEW IMAGE DOWNLOAD ***
*Mar 1 00:00:39.078: %CAPWAP-3-ERRORLOG: Did not get log server settings from DHCP.
*Mar 1 00:00:42.142: %CDP_PD-4-POWER_OK: Full power - NEGOTIATED inline power source
*Mar 1 00:00:42.151: %LINK-3-UPDOWN: Interface Dot11Radio1, changed state to up
*Mar 1 00:00:42.158: %LINK-3-UPDOWN: Interface Dot11Radio0, changed state to up
*Mar 1 00:00:43.143: %LINEPROTO-5-UPDOWN: Line protocol on Interface Dot11Radio1,
changed state to up
*Mar 1 00:00:43.151: %LINEPROTO-5-UPDOWN: Line protocol on Interface Dot11Radio0,
changed state to up
*Mar 1 00:00:48.078: %CAPWAP-3-ERRORLOG: Could Not resolve CISCO-CAPWAP-CONTROLLER
*Mar 1 00:01:42.144: %CDP_PD-4-POWER_OK: Full power - NEGOTIATED inline power source
*Mar 1 00:01:48.121: %CAPWAP-3-CLIENTERRORLOG: Set Transport Address: no more AP
manager IP addresses remain
*Mar 1 00:01:48.122: %CAPWAP-5-CHANGED: CAPWAP changed state to JOIN
*Mar 1 00:01:48.122: %LINK-5-CHANGED: Interface Dot11Radio0, changed state to
administratively down
*Mar 1 00:01:48.122: %LINK-5-CHANGED: Interface Dot11Radio1, changed state to
administratively down
• To delete the existing event log and create an empty event log file for a specific access point or for
all access points joined to the controller, enter this command:
clear ap-eventlog {specific Cisco_AP | all}
Uploading Logs and Crash Files
Follow the instructions in this section to upload logs and crash files from the controller through the GUI
or CLI. However, before you begin, make sure you have a TFTP or FTP server available for the file
upload. Follow these guidelines when setting up a TFTP or FTP server:
D-16
Cisco Wireless LAN Controller Configuration Guide
OL-21524-02
Appendix D Troubleshooting
Uploading Logs and Crash Files
• If you are uploading through the service port, the TFTP or FTP server must be on the same subnet
as the service port because the service port is not routable, or you must create static routes on the
controller.
• If you are uploading through the distribution system network port, the TFTP or FTP server can be
on the same or a different subnet because the distribution system port is routable.
• A third-party TFTP or FTP server cannot run on the same computer as WCS because the WCS
built-in TFTP or FTP server and the third-party TFTP or FTP server require the same
communication port.
Using the GUI to Upload Logs and Crash Files
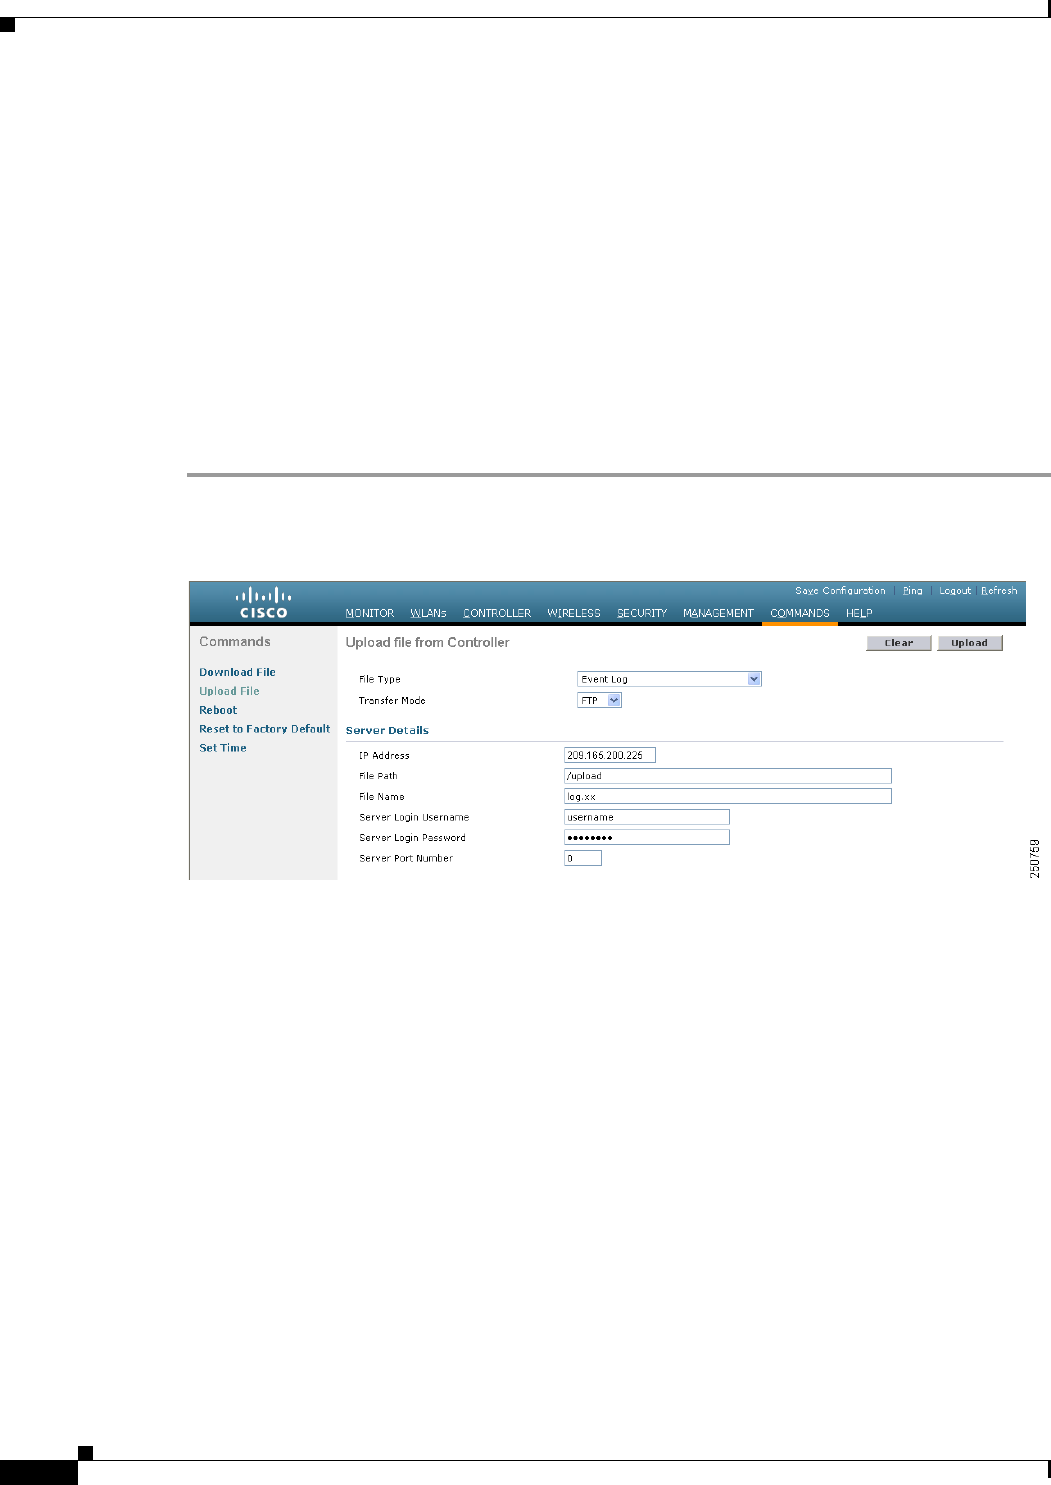
To upload logs and crash files using the controller GUI, follow these steps:
Step 1 Choose Command > Upload File. The Upload File from Controller page appears (see Figure D-4).
Figure D-4 Upload File from Controller Page
Step 2 From the File Type drop-down list, choose one of the following:
• Event Log
• Message Log
• Trap Log
• Crash File
Step 3 From the Transfer Mode drop-down list, choose TFTP or FTP.
Step 4 In the IP Address text box, enter the IP address of the TFTP or FTP server.
Step 5 In the File Path text box, enter the directory path of the log or crash file.
Step 6 In the File Name text box, enter the name of the log or crash file.
Step 7 If you chose FTP as the Transfer Mode, follow these steps:
a. In the Server Login Username text box, enter the FTP server login name.
b. In the Server Login Password text box, enter the FTP server login password.
c. In the Server Port Number text box, enter the port number of the FTP server. The default value for
the server port is 21.

D-17
Cisco Wireless LAN Controller Configuration Guide
OL-21524-02
Appendix D Troubleshooting
Uploading Logs and Crash Files
Step 8 Click Upload to upload the log or crash file from the controller. A message appears indicating the status
of the upload.
Using the CLI to Upload Logs and Crash Files
To upload logs and crash files using the controller CLI, follow these steps:
Step 1 To transfer the file from the controller to a TFTP or FTP server, enter this command:
transfer upload mode {tftp | ftp}
Step 2 To specify the type of file to be uploaded, enter this command:
transfer upload datatype datatype
where datatype is one of the following options:
• crashfile—Uploads the system’s crash file.
• errorlog—Uploads the system’s error log.
• panic-crash-file—Uploads the kernel panic information if a kernel panic occurs.
• systemtrace—Uploads the system’s trace file.
• traplog—Uploads the system’s trap log.
• watchdog-crash-file—Uploads the console dump resulting from a software-watchdog-initiated
reboot of the controller following a crash. The software watchdog module periodically checks the
integrity of the internal software and makes sure that the system does not stay in an inconsistent or
nonoperational state for a long period of time.
Step 3 To specify the path to the file, enter these commands:
• transfer upload serverip server_ip_address
• transfer upload path server_path_to_file
• transfer upload filename filename
Step 4 If you are using an FTP server, also enter these commands:
• transfer upload username username
• transfer upload password password
• transfer upload port port
Note The default value for the port parameter is 21.
Step 5 To see the updated settings, enter this command:
transfer upload start
Step 6 When prompted to confirm the current settings and start the software upload, answer y.
D-18
Cisco Wireless LAN Controller Configuration Guide
OL-21524-02
Appendix D Troubleshooting
Uploading Core Dumps from the Controller
Uploading Core Dumps from the Controller
To help troubleshoot controller crashes, you can configure the controller to automatically upload its core
dump file to an FTP server after experiencing a crash. You cannot upload the core dump file directly to
an FTP or TFTP server but you can upload a crash file to an FTP or TFTP server. The controllers save
the core dump file to flash memory following a crash. Follow the instructions in this section to perform
one of these functions.
Configuring the Controller to Automatically Upload Core Dumps to an FTP
Server
This section describes how to configure the controller to automatically upload core dumps to an FTP
server.
Using the GUI to Configure the Controller to Automatically Upload Core Dumps to an FTP Server
To enable the controller to automatically upload a core dump file to an FTP server using the controller
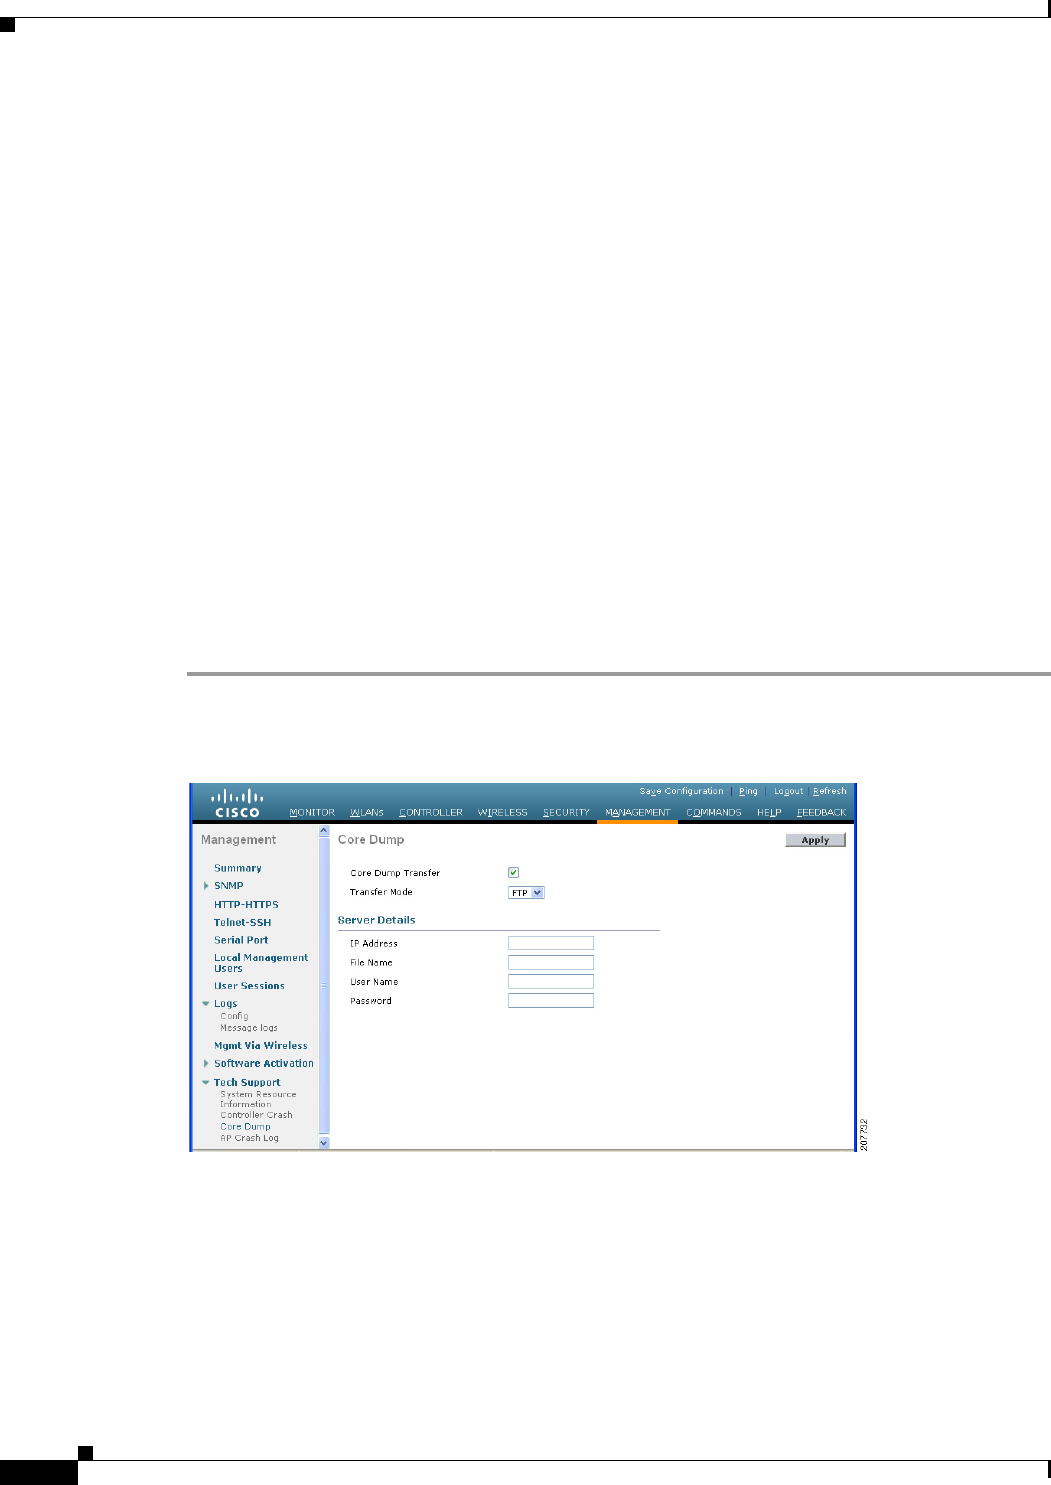
GUI, follow these steps:
Step 1 Choose Management > Tech Support > Core Dump to open the Core Dump page (see Figure D-5).
Figure D-5 Core Dump Page
Step 2 To enable the controller to generate a core dump file following a crash, select the Core Dump Transfer
check box.
Step 3 To specify the type of server to which the core dump file is uploaded, choose FTP from the Transfer
Mode drop-down list.
Step 4 In the IP Address text box, enter the IP address of the FTP server.

D-19
Cisco Wireless LAN Controller Configuration Guide
OL-21524-02
Appendix D Troubleshooting
Uploading Core Dumps from the Controller
Note The controller must be able to reach the FTP server.
Step 5 In the File Name text box, enter the name that the controller uses to label the core dump file.
Step 6 In the User Name text box, enter the username for FTP login.
Step 7 In the Password text box, enter the password for FTP login.
Step 8 Click Apply to commit your changes.
Step 9 Click Save Configuration to save your changes.
Using the CLI to Configure the Controller to Automatically Upload Core Dumps to an FTP Server
To enable the controller to automatically upload a core dump file to an FTP server using the controller
CLI, follow these steps:
Step 1 To enable or disable the controller to generate a core dump file following a crash, enter this command:
config coredump {enable | disable}
Step 2 To specify the FTP server to which the core dump file is uploaded, enter this command:
config coredump ftp server_ip_address filename
where
• server_ip_address is the IP address of the FTP server to which the controller sends its core dump
file.
Note The controller must be able to reach the FTP server.
• filename is the name that the controller uses to label the core dump file.
Step 3 To specify the username and password for FTP login, enter this command:
config coredump username ftp_username password ftp_password
Step 4 To save your changes, enter this command:
save config
Step 5 To see a summary of the controller’s core dump file, enter this command:
show coredump summary
Information similar to the following appears:
Core Dump is enabled
FTP Server IP.................................... 10.10.10.17
FTP Filename..................................... file1
FTP Username..................................... ftpuser
FTP Password.................................. *********

D-20
Cisco Wireless LAN Controller Configuration Guide
OL-21524-02
Appendix D Troubleshooting
Uploading Core Dumps from the Controller
Uploading Core Dumps from Controller to a TFTP or FTP Server
Note This procedure is not applicable for Cisco 2106 and 4400 controllers.
To upload the core dump file from the flash memory of a controller to a TFTP or FTP server using the
controller CLI, follow these steps:
Step 1 To see information about the core dump file in flash memory, enter this command:
show coredump summary
Information similar to the following appears:
Core Dump is disabled
Core Dump file is saved on flash
Sw Version.................................... 6.0.83.0
Time Stamp.................................... Wed Feb 4 13:23:11 2009
File Size..................................... 9081788
File Name Suffix........................... filename.gz
Step 2 To transfer the file from the controller to a TFTP or FTP server, enter these commands:
• transfer upload mode {tftp | ftp}
• transfer upload datatype coredump
• transfer upload serverip server_ip_address
• transfer upload path server_path_to_file
• transfer upload filename filename
Note After the file is uploaded, it ends with a .gz suffix. If desired, you can upload the same core
dump file multiple times with different names to different servers.
Step 3 If you are using an FTP server, also enter these commands:
• transfer upload username username
• transfer upload password password
• transfer upload port port
Note The default value for the port parameter is 21.
Step 4 To view the updated settings, enter this command:
transfer upload start
Step 5 When prompted to confirm the current settings and start the software upload, answer y.
D-21
Cisco Wireless LAN Controller Configuration Guide
OL-21524-02
Appendix D Troubleshooting
Uploading Packet Capture Files
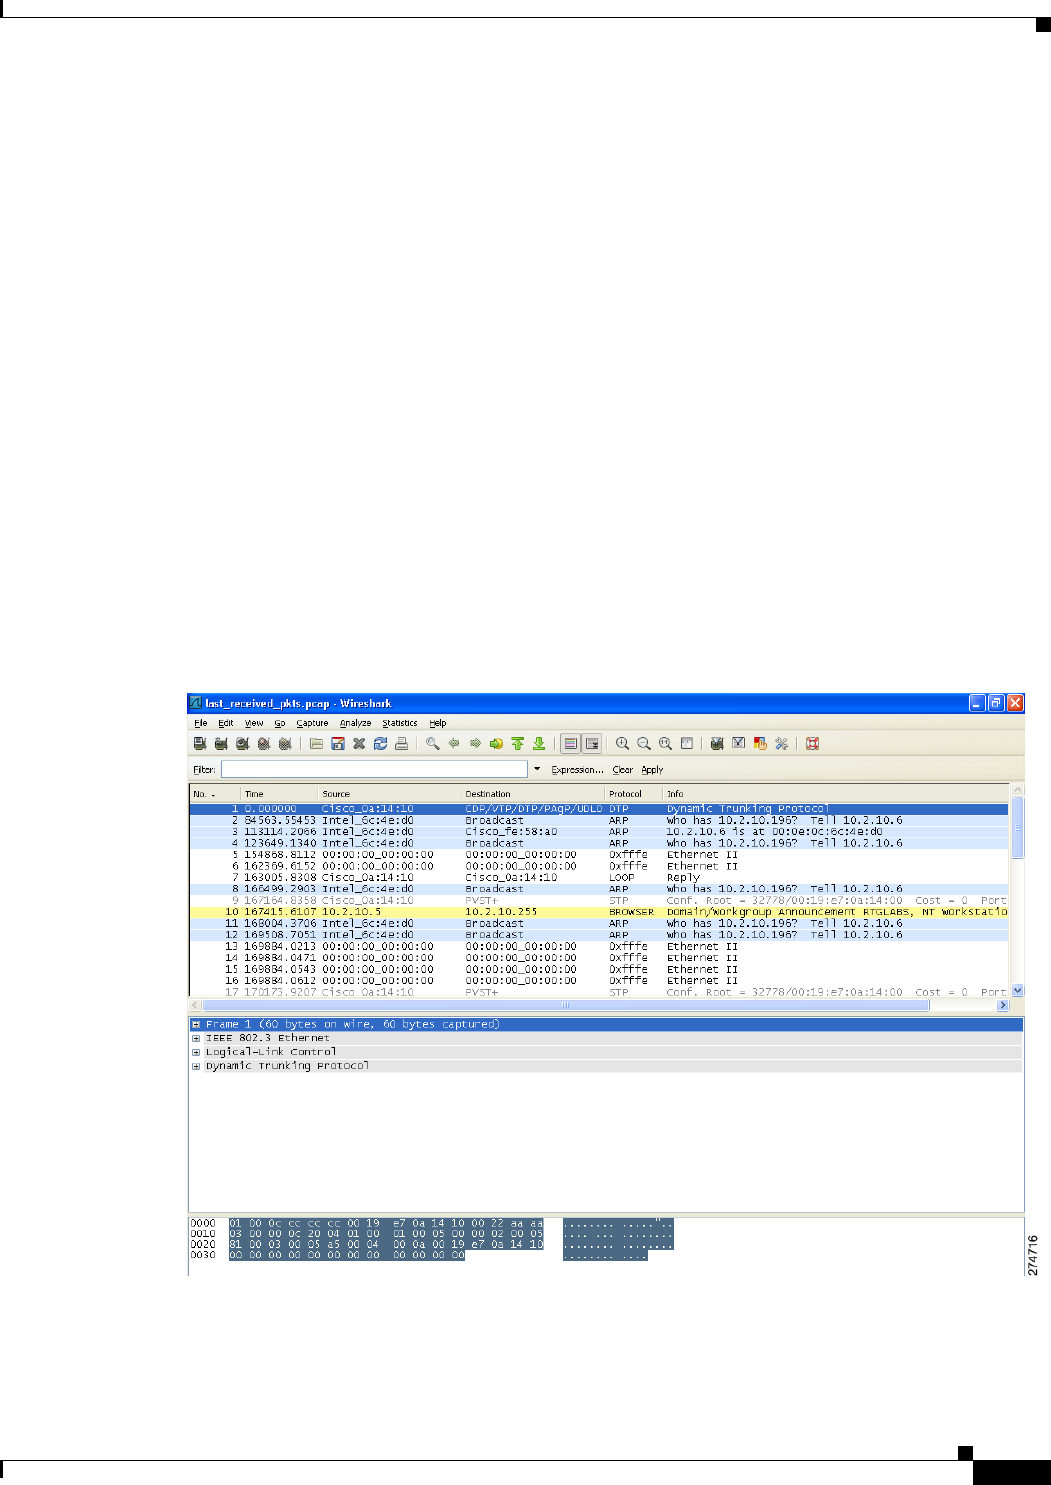
Uploading Packet Capture Files
When a Cisco 5500 Series Controller’s data plane crashes, it stores the last 50 packets that the controller
received in flash memory. This information can be useful in troubleshooting the crash.
When a crash occurs, the controller generates a new packet capture file (*.pcap) file, and a message
similar to the following appears in the controller crash file:
Last 5 packets processed at each core are stored in
"last_received_pkts.pcap" captured file.
- Frame 36,38,43,47,49, processed at core #0.
- Frame 14,27,30,42,45, processed at core #1.
- Frame 15,18,20,32,48, processed at core #2.
- Frame 11,29,34,37,46, processed at core #3.
- Frame 7,8,12,31,35, processed at core #4.
- Frame 21,25,39,41,50, processed at core #5.
- Frame 16,17,19,22,33, processed at core #6.
- Frame 6,10,13,23,26, processed at core #7.
- Frame 9,24,28,40,44, processed at core #8.
- Frame 1,2,3,4,5, processed at core #9.
You can use the controller GUI or CLI to upload the packet capture file from the controller. You can then
use Wireshark or another standard packet capture tool to view and analyze the contents of the file.
Figure D-6 shows a sample output of a packet capture file in Wireshark.
Figure D-6 Sample Output of Packet Capture File in Wireshark
D-22
Cisco Wireless LAN Controller Configuration Guide
OL-21524-02
Appendix D Troubleshooting
Uploading Packet Capture Files
Note Only Cisco 5500 Series Controllers generate packet capture files. This feature is not available on other
controller platforms.
Follow the instructions in this section to upload packet capture files from the controller through the GUI
or CLI. However, before you begin, make sure you have a TFTP or FTP server available for the file
upload. Follow these guidelines when setting up a TFTP or FTP server:
• If you are uploading through the service port, the TFTP or FTP server must be on the same subnet
as the service port because the service port is not routable, or you must create static routes on the
controller.
• If you are uploading through the distribution system network port, the TFTP or FTP server can be
on the same or a different subnet because the distribution system port is routable.
• A third-party TFTP or FTP server cannot run on the same computer as WCS because the WCS
built-in TFTP or FTP server and the third-party TFTP or FTP server require the same
communication port.
Using the GUI to Upload Packet Capture Files
To upload a packet capture file from the controller using the controller GUI, follow these steps:
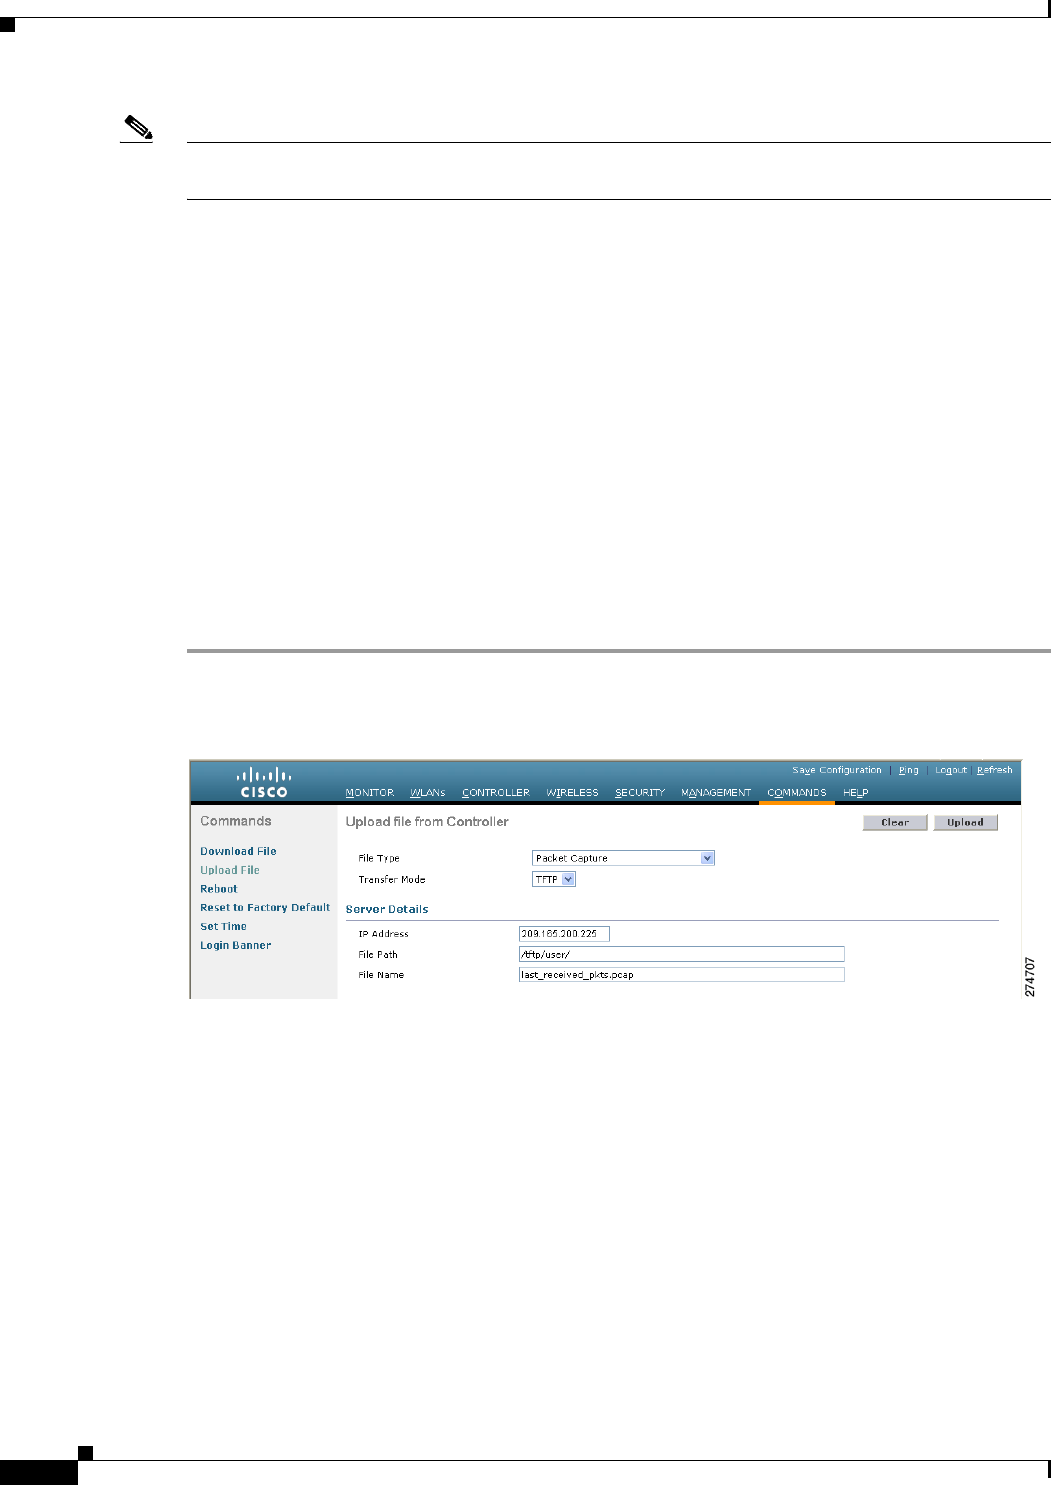
Step 1 Choose Commands > Upload File to open the Upload File from Controller page (see Figure D-7).
Figure D-7 Upload File from Controller Page
Step 2 From the File Type drop-down list, choose Packet Capture.
Step 3 From the Transfer Mode drop-down list, choose TFTP or FTP.
Step 4 In the IP Address text box, enter the IP address of the TFTP or FTP server.
Step 5 In the File Path text box, enter the directory path of the packet capture file.
Step 6 In the File Name text box, enter the name of the packet capture file. These files have a .pcap extension.
Step 7 If you are using an FTP server, follow these steps:
a. In the Server Login Username text box, enter the username to log into the FTP server.
b. In the Server Login Password text box, enter the password to log into the FTP server.
c. In the Server Port Number text box, enter the port number on the FTP server through which the
upload occurs. The default value is 21.

D-23
Cisco Wireless LAN Controller Configuration Guide
OL-21524-02
Appendix D Troubleshooting
Uploading Packet Capture Files
Step 8 Click Upload to upload the packet capture file from the controller. A message appears indicating the
status of the upload.
Step 9 Use Wireshark or another standard packet capture tool to open the packet capture file and see the last 50
packets that were received by the controller.
Using the CLI to Upload Packet Capture Files
To upload a packet capture file using the controller CLI, follow these steps:
Step 1 Log into the controller CLI.
Step 2 Enter the transfer upload mode {tftp | ftp} command.
Step 3 Enter the transfer upload datatype packet-capture command.
Step 4 Enter the transfer upload serverip server-ip-address command.
Step 5 Enter the transfer upload path server-path-to-file command.
Step 6 Enter the transfer upload filename last_received_pkts.pcap command.
Step 7 If you are using an FTP server, enter these commands:
• transfer upload username username
• transfer upload password password
• transfer upload port port
Note The default value for the port parameter is 21.
Step 8 Enter the transfer upload start command to see the updated settings and then answer y when prompted
to confirm the current settings and start the upload process. This example shows the upload command
output:
Mode........................................... TFTP
TFTP Server IP................................. 10.10.10.10
TFTP Path...................................... /tftp/user/
TFTP Filename..................................... last_received_pkts.pcap
Data Type...................................... Packet capture
Are you sure you want to start? (y/N) y
TFTP Packet Capture Dump starting.
File transfer operation completed successfully.
Step 9 Use Wireshark or another standard packet capture tool to open the packet capture file and see the last 50
packets that were received by the controller.

D-24
Cisco Wireless LAN Controller Configuration Guide
OL-21524-02
Appendix D Troubleshooting
Monitoring Memory Leaks
Monitoring Memory Leaks
This section provides instructions for troubleshooting hard-to-solve or hard-to-reproduce memory
problems.
Caution The commands in this section can be disruptive to your system and should be run only when you are
advised to do so by the Cisco Technical Assistance Center (TAC).
To monitor the controller for memory leaks using the controller CLI, follow these steps:
Step 1 To enable or disable monitoring for memory errors and leaks, enter this command:
config memory monitor errors {enable | disable}
The default value is disabled.
Note Your changes are not saved across reboots. After the controller reboots, it uses the default setting
for this feature.
Step 2 If you suspect that a memory leak has occurred, enter this command to configure the controller to
perform an auto-leak analysis between two memory thresholds (in kilobytes):
config memory monitor leaks low_thresh high_thresh
If the free memory is lower than the low_thresh threshold, the system crashes, generating a crash file.
The default value for this parameter is 10000 kilobytes, and you cannot set it below this value.
Set the high_thresh threshold to the current free memory level or higher so that the system enters
auto-leak-analysis mode. After the free memory reaches a level lower than the specified high_thresh
threshold, the process of tracking and freeing memory allocation begins. As a result, the debug memory
events enable command shows all allocations and frees, and the show memory monitor detail
command starts to detect any suspected memory leaks. The default value for this parameter is 30000
kilobytes.
Step 3 To see a summary of any discovered memory issues, enter this command:
show memory monitor
Information similar to the following appears:
Memory Leak Monitor Status:
low_threshold(10000), high_threshold(30000), current status(disabled)
-------------------------------------------
Memory Error Monitor Status:
Crash-on-error flag currently set to (disabled)
No memory error detected.
Step 4 To see the details of any memory leaks or corruption, enter this command:
show memory monitor detail
Information similar to the following appears:
Memory error detected. Details:
------------------------------------------------
- Corruption detected at pmalloc entry address: (0x179a7ec0)
- Corrupt entry:headerMagic(0xdeadf00d),trailer(0xabcd),poison(0xreadceef),

D-25
Cisco Wireless LAN Controller Configuration Guide
OL-21524-02
Appendix D Troubleshooting
Troubleshooting CCXv5 Client Devices
entrysize(128),bytes(100),thread(Unknown task name, task id = (332096592)),
file(pmalloc.c),line(1736),time(1027)
Previous 1K memory dump from error location.
------------------------------------------------
(179a7ac0): 00000000 00000000 00000000 ceeff00d readf00d 00000080 00000000 00000000
(179a7ae0): 17958b20 00000000 1175608c 00000078 00000000 readceef 179a7afc 00000001
(179a7b00): 00000003 00000006 00000001 00000004 00000001 00000009 00000009 0000020d
(179a7b20): 00000001 00000002 00000002 00000001 00000004 00000000 00000000 5d7b9aba
(179a7b40): cbddf004 192f465e 7791acc8 e5032242 5365788c a1b7cee6 00000000 00000000
(179a7b60): 00000000 00000000 00000000 00000000 00000000 ceeff00d readf00d 00000080
(179a7b80): 00000000 00000000 17958dc0 00000000 1175608c 00000078 00000000 readceef
(179a7ba0): 179a7ba4 00000001 00000003 00000006 00000001 00000004 00000001 00003763
(179a7bc0): 00000002 00000002 00000010 00000001 00000002 00000000 0000001e 00000013
(179a7be0): 0000001a 00000089 00000000 00000000 000000d8 00000000 00000000 17222194
(179a7c00): 1722246c 1722246c 00000000 00000000 00000000 00000000 00000000 ceeff00d
(179a7c20): readf00d 00000080 00000000 00000000 179a7b78 00000000 1175608c 00000078
Step 5 If a memory leak occurs, enter this command to enable debugging of errors or events during memory
allocation:
debug memory {errors | events} {enable | disable}
Troubleshooting CCXv5 Client Devices
The controller supports three features designed to help troubleshoot communication problems with
CCXv5 clients: diagnostic channel, client reporting, and roaming and real-time diagnostics. See the
“Configuring Cisco Client Extensions” section on page 7-52 for more information on CCX.
Note These features are supported only on CCXv5 clients. They are not supported for use with non-CCX
clients or with clients running an earlier version of CCX.
Diagnostic Channel
The diagnostic channel feature enables you to troubleshoot problems regarding client communication
with a WLAN. The client and access points can be put through a defined set of tests in an attempt to
identify the cause of communication difficulties the client is experiencing and then allow corrective
measures to be taken to make the client operational on the network. You can use the controller GUI or
CLI to enable the diagnostic channel, and you can use the controller CLI or WCS to run the diagnostic
tests.
Note We recommend that you enable the diagnostic channel feature only for nonanchored SSIDs that use the
management interface.

D-26
Cisco Wireless LAN Controller Configuration Guide
OL-21524-02
Appendix D Troubleshooting
Troubleshooting CCXv5 Client Devices
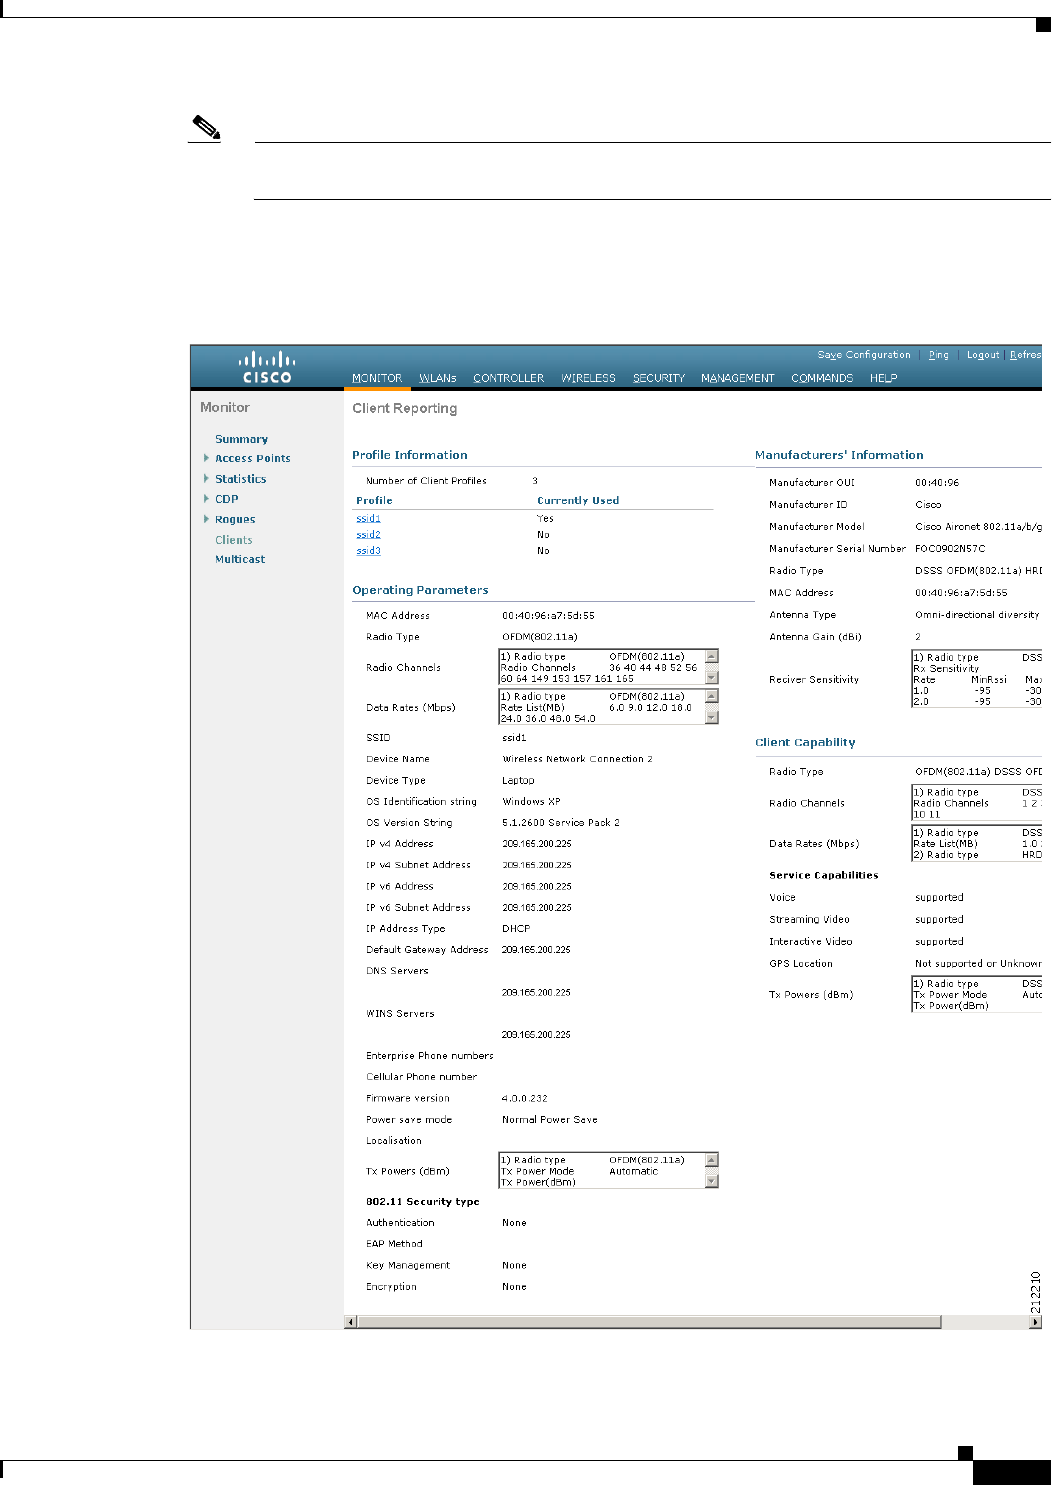
Client Reporting
The client reporting protocol is used by the client and the access point to exchange client information.
Client reports are collected automatically when the client associates. You can use the controller GUI or
CLI to send a client report request to any CCXv5 client any time after the client associates. There are
four types of client reports:
• Client profile—Provides information about the configuration of the client.
• Operating parameters—Provides the details of the client’s current operational modes.
• Manufacturers’ information—Provides data about the wireless LAN client adapter in use.
• Client capabilities—Provides information about the client’s capabilities.
Roaming and Real-Time Diagnostics
You can use roaming and real-time logs and statistics to solve system problems. The event log enables
you to identify and track the behavior of a client device. It is especially useful when attempting to
diagnose difficulties that a user may be having on a WLAN. The event log provides a log of events and
reports them to the access point. There are three categories of event logs:
• Roaming log—This log provides a historical view of the roaming events for a given client. The client
maintains a minimum of five previous roaming events including failed attempts and successful
roams.
• Robust Security Network Association (RSNA) log—This log provides a historical view of the
authentication events for a given client. The client maintains a minimum of five previous
authentication attempts including failed attempts and successful ones.
• Syslog—This log provides internal system information from the client. For example, it may indicate
problems with 802.11 operation, system operation, and so on.
The statistics report provides 802.1X and security information for the client. You can use the controller
CLI to send the event log and statistics request to any CCXv5 client any time after the client associates.
Using the GUI to Configure the Diagnostic Channel
To configure the diagnostic channel using the controller GUI, follow these steps:
Step 1 Choose WLANs to open the WLANs page.
Step 2 Create a new WLAN or click the ID number of an existing WLAN.
Note We recommend that you create a new WLAN on which to run the diagnostic tests.
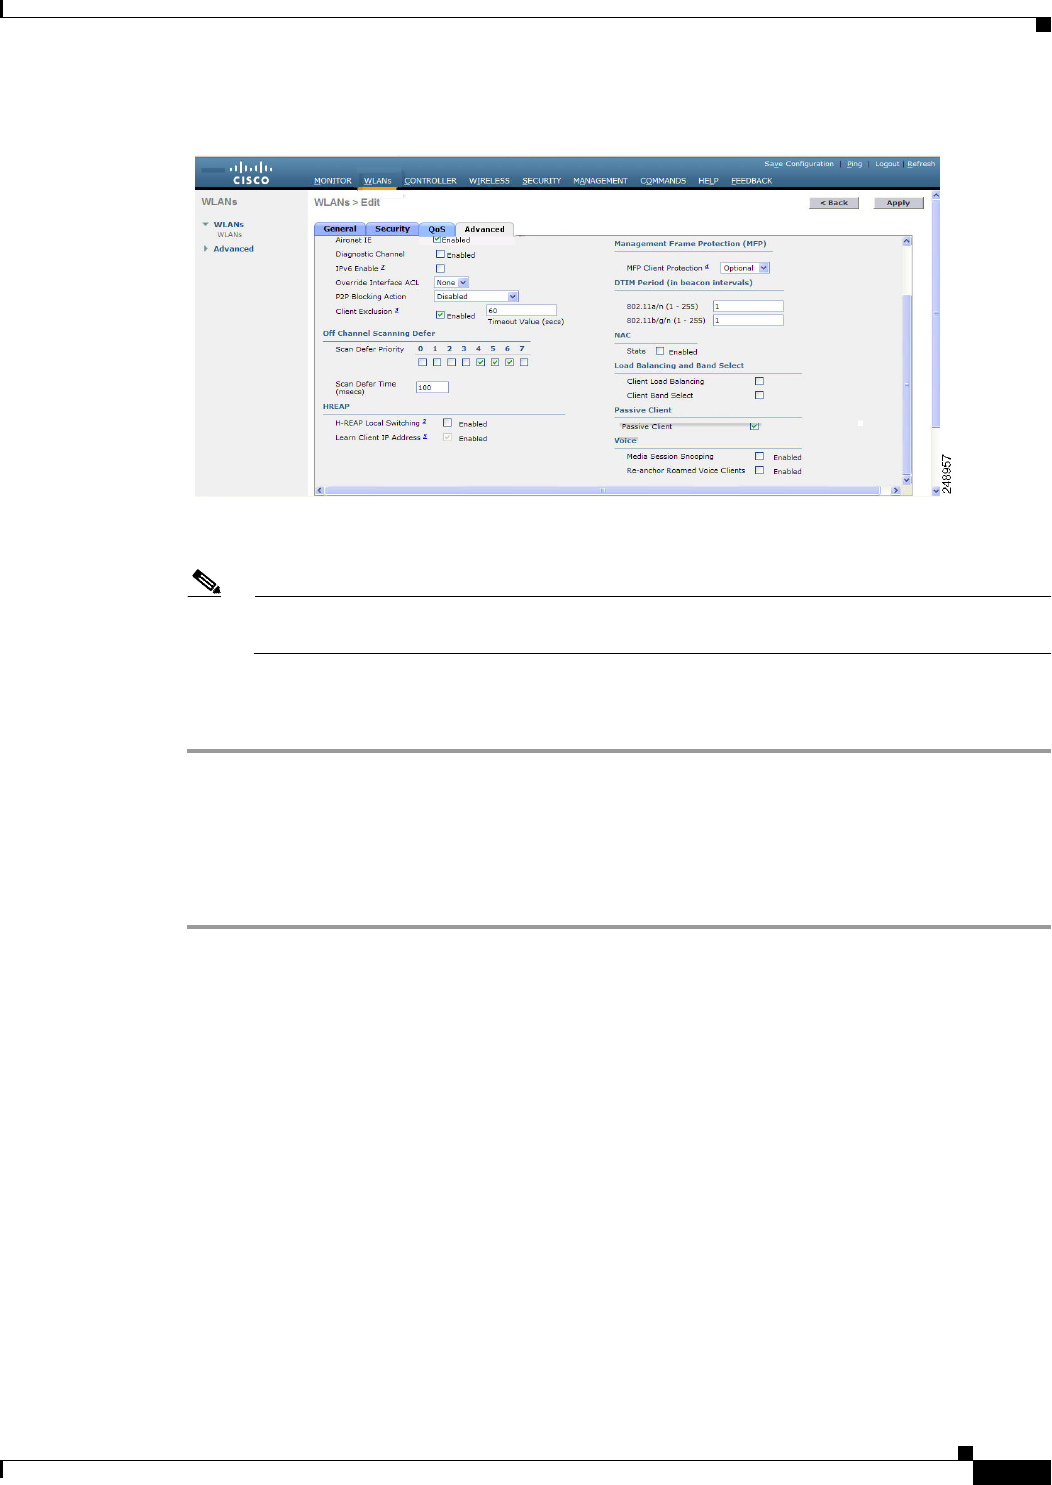
Step 3 When the WLANs > Edit page appears, choose the Advanced tab to open the WLANs > Edit (Advanced)
page (see Figure D-8).
D-27
Cisco Wireless LAN Controller Configuration Guide
OL-21524-02
Appendix D Troubleshooting
Troubleshooting CCXv5 Client Devices
Figure D-8 WLANs > Edit (Advanced) Page
Step 4 If you want to enable diagnostic channel troubleshooting on this WLAN, select the Diagnostic Channel
check box. Otherwise, leave this check box unselected, which is the default value.
Note You can use the CLI to initiate diagnostic tests on the client. See the “Using the CLI to Configure
the Diagnostic Channel” section on page D-27 for details.
Step 5 Click Apply to commit your changes.
Step 6 Click Save Configuration to save your changes.
Using the CLI to Configure the Diagnostic Channel
To configure the diagnostic channel using the controller CLI, follow these steps:
Step 1 To enable diagnostic channel troubleshooting on a particular WLAN, enter this command:
config wlan diag-channel {enable | disable} wlan_id
Step 2 To verify that your change has been made, enter this command:
show wlan wlan_id
Information similar to the following appears:
WLAN Identifier.................................. 1
Profile Name..................................... employee1
Network Name (SSID).............................. employee
Status........................................... Disabled
MAC Filtering.................................... Disabled
Broadcast SSID................................... Enabled
AAA Policy Override.............................. Disabled
Number of Active Clients......................... 0
Exclusionlist Timeout............................ 60 seconds
Session Timeout.................................. Infinity
Interface........................................ virtual
WLAN ACL......................................... unconfigured
DHCP Server...................................... Default
DHCP Address Assignment Required................. Disabled

D-28
Cisco Wireless LAN Controller Configuration Guide
OL-21524-02
Appendix D Troubleshooting
Troubleshooting CCXv5 Client Devices
Quality of Service............................... Silver (best effort)
WMM.............................................. Disabled
CCX - AironetIe Support.......................... Enabled
CCX - Gratuitous ProbeResponse (GPR)............. Disabled
CCX - Diagnostics Channel Capability............. Enabled
...
Step 3 To send a request to the client to perform the DHCP test, enter this command:
config client ccx dhcp-test client_mac_address
Note This test does not require the client to use the diagnostic channel.
Step 4 To send a request to the client to perform the default gateway ping test, enter this command:
config client ccx default-gw-ping client_mac_address
Note This test does not require the client to use the diagnostic channel.
Step 5 To send a request to the client to perform the DNS server IP address ping test, enter this command:
config client ccx dns-ping client_mac_address
Note This test does not require the client to use the diagnostic channel.
Step 6 To send a request to the client to perform the DNS name resolution test to the specified host name, enter
this command:
config client ccx dns-resolve client_mac_address host_name
Note This test does not require the client to use the diagnostic channel.
Step 7 To send a request to the client to perform the association test, enter this command:
config client ccx test-association client_mac_address ssid bssid {802.11a | 802.11b | 802.11g} channel
Step 8 To send a request to the client to perform the 802.1X test, enter this command:
config client ccx test-dot1x client_mac_address profile_id bssid {802.11a | 802.11b | 802.11g} channel
Step 9 To send a request to the client to perform the profile redirect test, enter this command:
config client ccx test-profile client_mac_address profile_id
The profile_id should be from one of the client profiles for which client reporting is enabled.
Note Users are redirected back to the parent WLAN, not to any other profile. The only profile shown
is the user’s parent profile. Note however that parent WLAN profiles can have one child
diagnostic WLAN.
Step 10 Use these commands if necessary to abort or clear a test:
• To send a request to the client to abort the current test, enter this command:
config client ccx test-abort client_mac_address

D-29
Cisco Wireless LAN Controller Configuration Guide
OL-21524-02
Appendix D Troubleshooting
Troubleshooting CCXv5 Client Devices
Only one test can be pending at a time, so this command aborts the current pending test.
• To clear the test results on the controller, enter this command:
config client ccx clear-results client_mac_address
Step 11 To send a message to the client, enter this command:
config client ccx send-message client_mac_address message_id
where message_id is one of the following:
• 1 = The SSID is invalid.
• 2 = The network settings are invalid.
• 3 = There is a WLAN credibility mismatch.
• 4 = The user credentials are incorrect.
• 5 = Please call support.
• 6 = The problem is resolved.
• 7 = The problem has not been resolved.
• 8 = Please try again later.
• 9 = Please correct the indicated problem.
• 10 = Troubleshooting is refused by the network.
• 11 = Retrieving client reports.
• 12 = Retrieving client logs.
• 13 = Retrieval complete.
• 14 = Beginning association test.
• 15 = Beginning DHCP test.
• 16 = Beginning network connectivity test.
• 17 = Beginning DNS ping test.
• 18 = Beginning name resolution test.
• 19 = Beginning 802.1X authentication test.
• 20 = Redirecting client to a specific profile.
• 21 = Test complete.
• 22 = Test passed.
• 23 = Test failed.
• 24 = Cancel diagnostic channel operation or select a WLAN profile to resume normal operation.
• 25 = Log retrieval refused by the client.
• 26 = Client report retrieval refused by the client.
• 27 = Test request refused by the client.
• 28 = Invalid network (IP) setting.
• 29 = There is a known outage or problem with the network.
• 30 = Scheduled maintenance period.
• 31 = The WLAN security method is not correct.
• 32 = The WLAN encryption method is not correct.

D-30
Cisco Wireless LAN Controller Configuration Guide
OL-21524-02
Appendix D Troubleshooting
Troubleshooting CCXv5 Client Devices
• 33 = The WLAN authentication method is not correct.
Step 12 To see the status of the last test, enter this command:
show client ccx last-test-status client_mac_address
Information similar to the following appears for the default gateway ping test:
Test Type........................................ Gateway Ping Test
Test Status...................................... Pending/Success/Timeout
Dialog Token..................................... 15
Timeout.......................................... 15000 ms
Request Time..................................... 1329 seconds since system boot
Step 13 To see the status of the last test response, enter this command:
show client ccx last-response-status client_mac_address
Information similar to the following appears for the 802.1X authentication test:
Test Status...................................... Success
Response Dialog Token............................ 87
Response Status.................................. Successful
Response Test Type............................... 802.1x Authentication Test
Response Time.................................... 3476 seconds since system boot
Step 14 To see the results from the last successful diagnostics test, enter this command:
show client ccx results client_mac_address
Information similar to the following appears for the 802.1X authentication test:
dot1x Complete................................... Success
EAP Method....................................... *1,Host OS Login Credentials
dot1x Status.................................. 255
Step 15 To see the relevant data frames captured by the client during the previous test, enter this command:
show client ccx frame-data client_mac_address
Information similar to the following appears:
LOG Frames:
Frame Number:.................................... 1
Last Frame Number:............................... 1120
Direction:....................................... 1
Timestamp:....................................... 0d 00h 50m 39s 863954us
Frame Length:.................................... 197
Frame Data:
00000000: 80 00 00 00 ff ff ff ff ff ff 00 12 44 bd bd b0 ............D...
00000010: 00 12 44 bd bd b0 f0 af 43 70 00 f2 82 01 00 00 ..D.....Cp......
00000020: 64 00 11 08 00 01 00 01 08 8c 12 98 24 b0 48 60 d...........$.H`
00000030: 6c 05 04 01 02 00 00 85 1e 00 00 89 00 0f 00 ff l...............
00000040: 03 19 00 41 50 32 33 2d 31 30 00 00 00 00 00 00 ...AP23-10......
00000050: 00 00 00 00 00 00 26 96 06 00 40 96 00 ff ff dd ......&...@.....
00000060: 18 00 50 f2 01 01 00 00 50 f2 05 01 00 00 50 f2 ..P.....P.....P.
00000070: 05 01 00 00 40 96 00 28 00 dd 06 00 40 96 01 01 ....@..(....@...
00000080: 00 dd 05 00 40 96 03 04 dd 16 00 40 96 04 00 02 ....@......@....
00000090: 07 a4 00 00 23 a4 00 00 42 43 00 00 62 32 00 00 ....#...BC..b2..
000000a0: dd 05 00 40 96 0b 01 dd 18 00 50 f2 02 01 01 82 ...@......P.....
000000b0: 00 03 a4 00 00 27 a4 00 00 42 43 5e 00 62 32 2f .....'...BC^.b2/
LOG Frames:

D-31
Cisco Wireless LAN Controller Configuration Guide
OL-21524-02
Appendix D Troubleshooting
Troubleshooting CCXv5 Client Devices
Frame Number:.................................... 2
Last Frame Number:............................... 1120
Direction:....................................... 1
Timestamp:....................................... 0d 00h 50m 39s 878289us
Frame Length:.................................... 147
Frame Data:
00000000: 80 00 00 00 ff ff ff ff ff ff 00 0d ed c3 a0 22 ..............."
00000010: 00 0d ed c3 a0 22 00 bd 4d 50 a5 f7 78 08 00 00 ....."..MP..x...
00000020: 64 00 01 00 00 01 00 01 08 8c 12 98 24 b0 48 60 d...........$.H`
00000030: 6c 05 04 01 02 00 00 85 1e 00 00 84 00 0f 00 ff l...............
00000040: 03 19 00 72 6f 67 75 65 2d 74 65 73 74 31 00 00 ...rogue-test1..
00000050: 00 00 00 00 00 00 23 96 06 00 40 96 00 10 00 dd ......#...@.....
00000060: 06 00 40 96 01 01 00 dd 05 00 40 96 03 04 dd 05 ..@.......@.....
00000070: 00 40 96 0b 01 dd 18 00 50 f2 02 01 01 81 00 03 .@......P.......
00000080: a4 00 00 27 a4 00 00 42 43 5e 00 62 32 2f 00 d2 ...'...BC^.b2/..
00000090: b4 ab 84 ...
LOG Frames:
Frame Number:.................................... 3
Last Frame Number:............................... 1120
Direction:....................................... 1
Timestamp:....................................... 0d 00h 50m 39s 881513us
Frame Length:.................................... 189
Frame Data:
00000000: 80 00 00 00 ff ff ff ff ff ff 00 12 44 bd 80 30 ............D..0
00000010: 00 12 44 bd 80 30 60 f7 46 c0 8b 4b d1 05 00 00 ..D..0`.F..K....
00000020: 64 00 11 08 00 01 00 01 08 8c 12 98 24 b0 48 60 d...........$.H`
00000030: 6c 05 04 00 02 00 00 85 1e 00 00 89 00 0f 00 ff l...............
00000040: 03 19 00 41 50 34 30 2d 31 37 00 00 00 00 00 00 ...AP40-17......
00000050: 00 00 00 00 00 00 26 dd 18 00 50 f2 01 01 00 00 ......&...P.....
00000060: 50 f2 05 01 00 00 50 f2 05 01 00 00 40 96 00 28 P.....P.....@..(
00000070: 00 dd 06 00 40 96 01 01 00 dd 05 00 40 96 03 04 ....@.......@...
00000080: dd 16 00 40 96 04 00 05 07 a4 00 00 23 a4 00 00 ...@........#...
00000090: 42 43 00 00 62 32 00 00 dd 05 00 40 96 0b 01 dd BC..b2.....@....
000000a0: 18 00 50 f2 02 01 01 85 00 03 a4 00 00 27 a4 00 ..P..........'..
000000b0: 00 42 43 5e 00 62 32 2f 00 0b 9a 1d 6f .BC^.b2/....o
...
Using the GUI to Configure Client Reporting
To configure client reporting using the controller GUI, follow these steps:
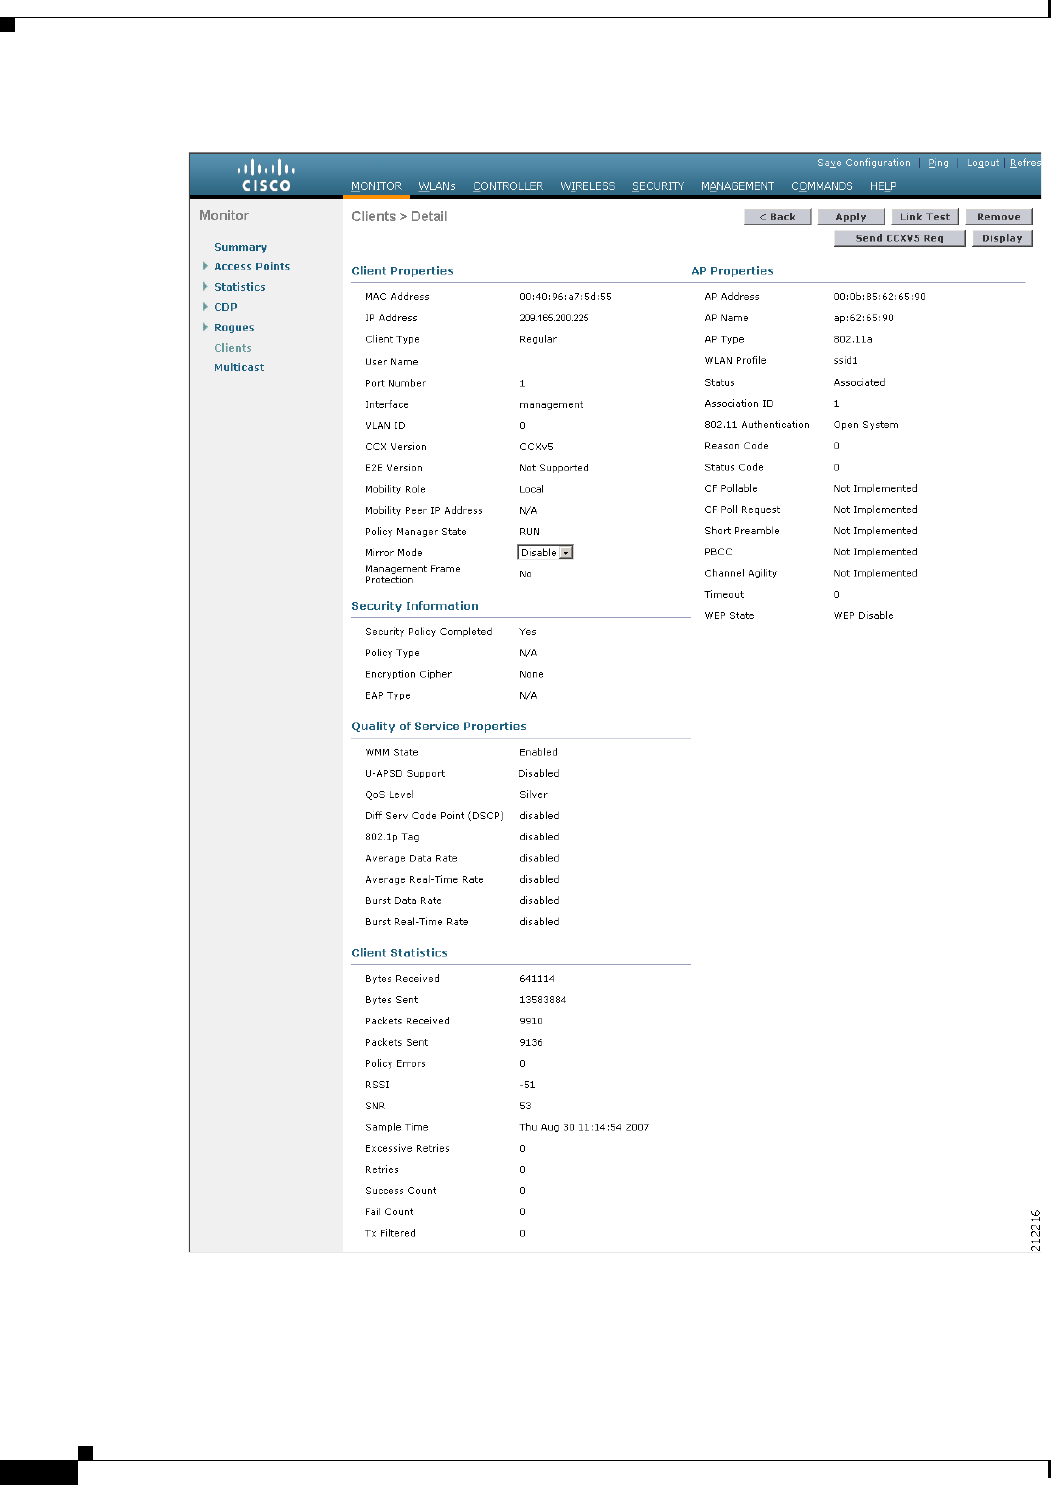
Step 1 Choose Monitor > Clients to open the Clients page.
Step 2 Click the MAC address of the desired client. The Clients > Detail page appears (see Figure D-9).
D-32
Cisco Wireless LAN Controller Configuration Guide
OL-21524-02
Appendix D Troubleshooting
Troubleshooting CCXv5 Client Devices
Figure D-9 Clients > Detail Page
Step 3 To send a report request to the client, click Send CCXV5 Req.
D-33
Cisco Wireless LAN Controller Configuration Guide
OL-21524-02
Appendix D Troubleshooting
Troubleshooting CCXv5 Client Devices
Note You must create a Trusted Profile using ACAU for Cisco CB21AG or equivalent software from
your CCXv5 vendor.
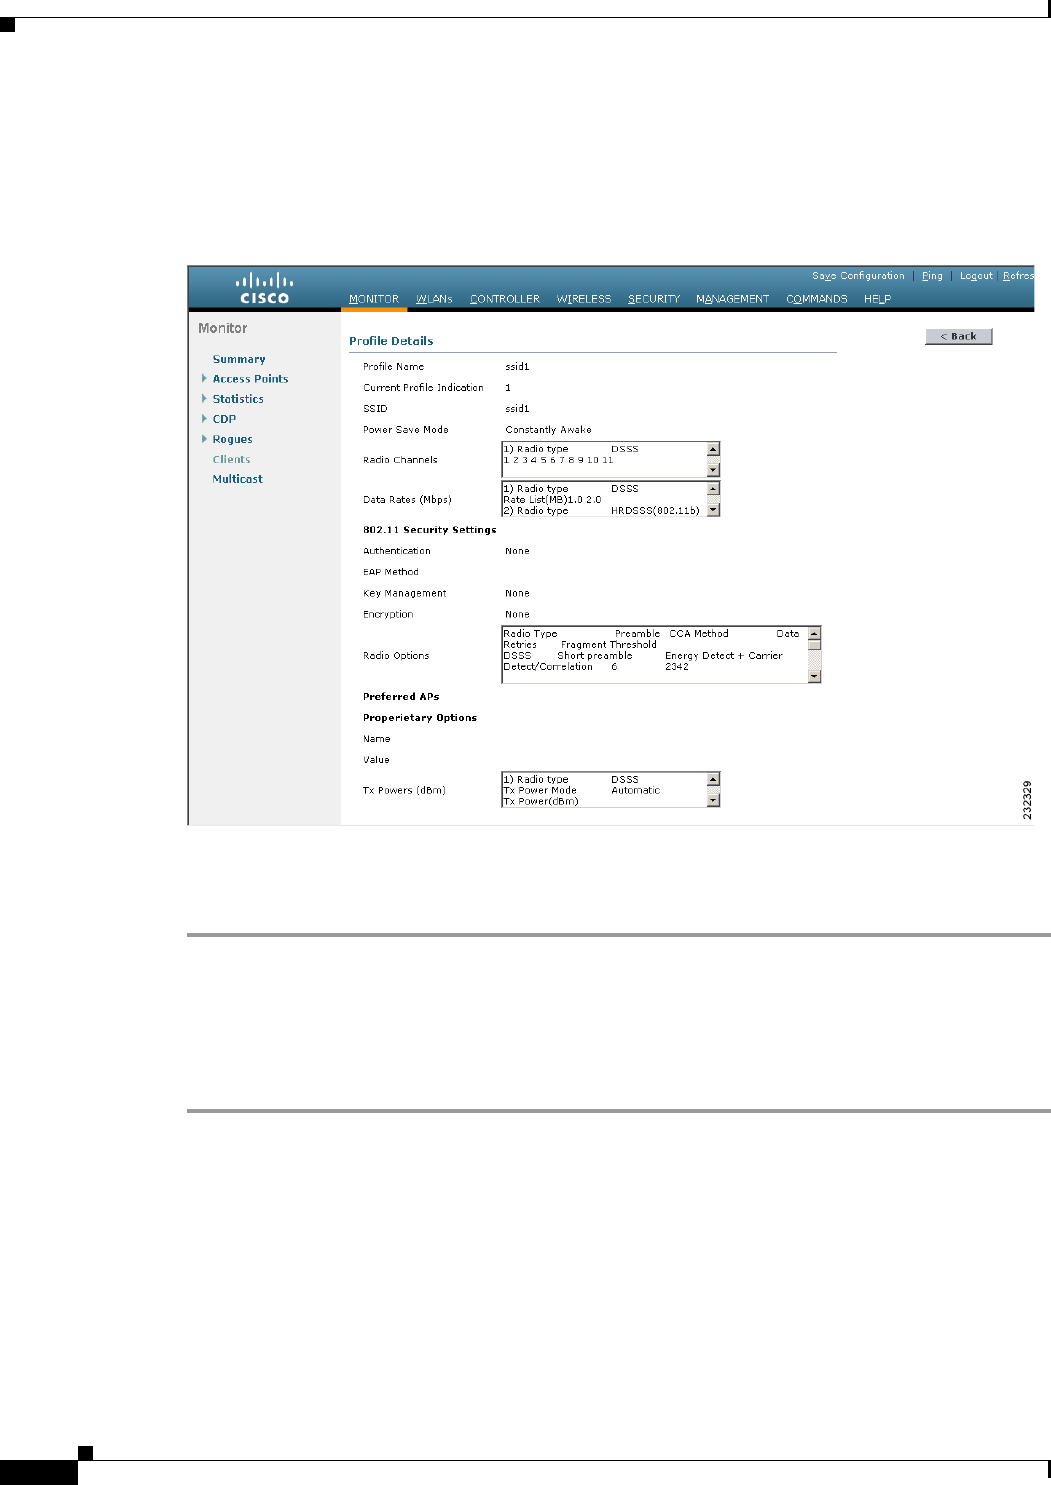
Step 4 To view the parameters from the client, click Display. The Client Reporting page appears (see
Figure D-10).
Figure D-10 Client Reporting Page
D-34
Cisco Wireless LAN Controller Configuration Guide
OL-21524-02
Appendix D Troubleshooting
Troubleshooting CCXv5 Client Devices
This page lists the client profiles and indicates if they are currently in use. It also provides information
on the client’s operating parameters, manufacturer, and capabilities.
Step 5 Click the link for the desired client profile. The Profile Details page appears (see Figure D-11).
Figure D-11 Profile Details Page
This page shows the client profile details, including the SSID, power save mode, radio channel, data
rates, and 802.11 security settings.
Using the CLI to Configure Client Reporting
To configure client reporting using the controller CLI, follow these steps:
Step 1 To send a request to the client to send its profiles, enter this command:
config client ccx get-profiles client_mac_address
Step 2 To send a request to the client to send its current operating parameters, enter this command:
config client ccx get-operating-parameters client_mac_address
Step 3 To send a request to the client to send the manufacturer’s information, enter this command:
config client ccx get-manufacturer-info client_mac_address
Step 4 To send a request to the client to send its capability information, enter this command:
config client ccx get-client-capability client_mac_address

D-35
Cisco Wireless LAN Controller Configuration Guide
OL-21524-02
Appendix D Troubleshooting
Troubleshooting CCXv5 Client Devices
Step 5 To clear the client reporting information, enter this command:
config client ccx clear-reports client_mac_address
Step 6 To see the client profiles, enter this command:
show client ccx profiles client_mac_address
Information similar to the following appears:
Number of Profiles............................... 1
Current Profile.................................. 1
Profile ID....................................... 1
Profile Name..................................... wifiEAP
SSID............................................. wifiEAP
Security Parameters[EAP Method,Credential]....... EAP-TLS,Host OS Login Credentials
Auth Method...................................... EAP
Key Management................................... WPA2+CCKM
Encryption....................................... AES-CCMP
Power Save Mode.................................. Constantly Awake
Radio Configuration:
Radio Type....................................... DSSS
Preamble Type.................................. Long preamble
CCA Method..................................... Energy Detect + Carrier
Detect/Correlation
Data Retries................................... 6
Fragment Threshold............................. 2342
Radio Channels................................. 1 2 3 4 5 6 7 8 9 10 11
Tx Power Mode.................................. Automatic
Rate List(MB).................................. 1.0 2.0
Radio Type....................................... HRDSSS(802.11b)
Preamble Type.................................. Long preamble
CCA Method..................................... Energy Detect + Carrier
Detect/Correlation
Data Retries................................... 6
Fragment Threshold............................. 2342
Radio Channels................................. 1 2 3 4 5 6 7 8 9 10 11
Tx Power Mode.................................. Automatic
Rate List(MB).................................. 5.5 11.0
Radio Type....................................... ERP(802.11g)
Preamble Type.................................. Long preamble
CCA Method..................................... Energy Detect + Carrier
Detect/Correlation
Data Retries................................... 6
Fragment Threshold............................. 2342
Radio Channels................................. 1 2 3 4 5 6 7 8 9 10 11
Tx Power Mode.................................. Automatic
Rate List(MB).................................. 6.0 9.0 12.0 18.0 24.0 36.0 48.0 54.0
Radio Type....................................... OFDM(802.11a)
Preamble Type.................................. Long preamble
CCA Method..................................... Energy Detect + Carrier
Detect/Correlation
Data Retries................................... 6
Fragment Threshold............................. 2342
Radio Channels................................. 36 40 44 48 52 56 60 64 149 153 157 161
165
Tx Power Mode.................................. Automatic
Rate List(MB).................................. 6.0 9.0 12.0 18.0 24.0 36.0 48.0 54.0
Step 7 To see the client operating parameters, enter this command:
show client ccx operating-parameters client_mac_address

D-36
Cisco Wireless LAN Controller Configuration Guide
OL-21524-02
Appendix D Troubleshooting
Troubleshooting CCXv5 Client Devices
Information similar to the following appears:
Client Mac....................................... 00:40:96:b2:8d:5e
Radio Type....................................... OFDM(802.11a)
Radio Type....................................... OFDM(802.11a)
Radio Channels................................. 36 40 44 48 52 56 60 64 100 104 108 112
116 120 124 128 132 136 140 149 153 157 161 165
Tx Power Mode.................................. Automatic
Rate List(MB).................................. 6.0 9.0 12.0 18.0 24.0 36.0 48.0 54.0
Power Save Mode.................................. Normal Power Save
SSID............................................. wifi
Security Parameters[EAP Method,Credential]....... None
Auth Method...................................... None
Key Management................................... None
Encryption....................................... None
Device Name...................................... Wireless Network Connection 15
Device Type...................................... 0
OS Id............................................ Windows XP
OS Version....................................... 5.1.2600 Service Pack 2
IP Type.......................................... DHCP address
IPv4 Address..................................... Available
IP Address....................................... 70.0.4.66
Subnet Mask...................................... 255.0.0.0
Default Gateway.................................. 70.1.0.1
IPv6 Address..................................... Not Available
IPv6 Address..................................... 0: 0: 0: 0: 0: 0: 0: 0: 0: 0: 0: 0: 0:
0: 0: 0:
IPv6 Subnet Mask................................. 0: 0: 0: 0: 0: 0: 0: 0: 0: 0: 0: 0: 0:
0: 0: 0:
DNS Servers...................................... 103.0.48.0
WINS Servers.....................................
System Name...................................... URAVAL3777
Firmware Version................................. 4.0.0.187
Driver Version................................... 4.0.0.187
Step 8 To see the client manufacturer information, enter this command:
show client ccx manufacturer-info client_mac_address
Information similar to the following appears:
Manufacturer OUI................................. 00:40:96
Manufacturer ID.................................. Cisco
Manufacturer Model............................... Cisco Aironet 802.11a/b/g Wireless
Adapter
Manufacturer Serial.............................. FOC1046N3SX
Mac Address...................................... 00:40:96:b2:8d:5e
Radio Type....................................... DSSS OFDM(802.11a) HRDSSS(802.11b)
ERP(802.11g)
Antenna Type..................................... Omni-directional diversity
Antenna Gain..................................... 2 dBi
Rx Sensitivity:
Radio Type....................................... DSSS
Rx Sensitivity .................................. Rate:1.0 Mbps, MinRssi:-95, MaxRssi:-30
Rx Sensitivity .................................. Rate:2.0 Mbps, MinRssi:-95, MaxRssi:-30
Radio Type....................................... HRDSSS(802.11b)
Rx Sensitivity .................................. Rate:5.5 Mbps, MinRssi:-95, MaxRssi:-30
Rx Sensitivity .................................. Rate:11.0 Mbps, MinRssi:-95, MaxRssi:-30
Radio Type....................................... ERP(802.11g)
Rx Sensitivity .................................. Rate:6.0 Mbps, MinRssi:-95, MaxRssi:-30
Rx Sensitivity .................................. Rate:9.0 Mbps, MinRssi:-95, MaxRssi:-30
Rx Sensitivity .................................. Rate:12.0 Mbps, MinRssi:-95, MaxRssi:-30

D-37
Cisco Wireless LAN Controller Configuration Guide
OL-21524-02
Appendix D Troubleshooting
Troubleshooting CCXv5 Client Devices
Rx Sensitivity .................................. Rate:18.0 Mbps, MinRssi:-95, MaxRssi:-30
Step 9 To see the client’s capability information, enter this command:
show client ccx client-capability client_mac_address
Note This command displays the client’s available capabilities, not current settings for the
capabilities.
Information similar to the following appears:
Service Capability............................... Voice, Streaming(uni-directional) Video,
Interactive(bi-directional) Video
Radio Type....................................... DSSS OFDM(802.11a) HRDSSS(802.11b)
ERP(802.11g)
Radio Type....................................... DSSS
Radio Channels................................. 1 2 3 4 5 6 7 8 9 10 11
Tx Power Mode.................................. Automatic
Rate List(MB).................................. 1.0 2.0
Radio Type....................................... HRDSSS(802.11b)
Radio Channels................................. 1 2 3 4 5 6 7 8 9 10 11
Tx Power Mode.................................. Automatic
Rate List(MB).................................. 5.5 11.0
Radio Type....................................... ERP(802.11g)
Radio Channels................................. 1 2 3 4 5 6 7 8 9 10 11
Tx Power Mode.................................. Automatic
Rate List(MB).................................. 6.0 9.0 12.0 18.0 24.0 36.0 48.0 54.0
Radio Type....................................... OFDM(802.11a)
Radio Channels................................. 36 40 44 48 52 56 60 64 100 104 108 112
116 120 124 128 132 136 140 149 153 157 161 165
Tx Power Mode.................................. Automatic
Rate List(MB).................................. 6.0 9.0 12.0 18.0 24.0 36.0 48.0 54.0
Using the CLI to Configure Roaming and Real-Time Diagnostics
To configure roaming and real-time diagnostics using the controller CLI, follow these steps:
Step 1 To send a log request, enter this command:
config client ccx log-request log_type client_mac_address
where log_type is roam, rsna, or syslog.
Step 2 To view a log response, enter this command:
show client ccx log-response log_type client_mac_address
where log_type is roam, rsna, or syslog.
Information similar to the following appears for a log response with a log_type of roam:
Tue Jun 26 18:28:48 2007 Roaming Response LogID=133: Status=Successful
Event Timestamp=0d 00h 00m 13s 322396us

D-38
Cisco Wireless LAN Controller Configuration Guide
OL-21524-02
Appendix D Troubleshooting
Troubleshooting CCXv5 Client Devices
Source BSSID=00:0b:85:81:06:c2, Target BSSID=00:0b:85:81:06:c2,
Transition Time=3125(ms)
Transition Reason: Normal roam, poor link
Transition Result: Success
Tue Jun 26 18:28:48 2007 Roaming Response LogID=133: Status=Successful
Event Timestamp=0d 00h 00m 16s 599006us
Source BSSID=00:0b:85:81:06:c2, Target BSSID=00:0b:85:81:06:c2,
Transition Time=3235(ms)
Transition Reason: Normal roam, poor link
Transition Result: Success
Event Timestamp=0d 00h 00m 19s 882921us
Source BSSID=00:0b:85:81:06:c2, Target BSSID=00:0b:85:81:06:c2,
Transition Time=3234(ms)
Transition Reason: Normal roam, poor link
Transition Result: Success
Tue Jun 26 18:28:48 2007 Roaming Response LogID=133: Status=Successful
Event Timestamp=0d 00h 00m 08s 815477us
Source BSSID=00:0b:85:81:06:c2, Target BSSID=00:0b:85:81:06:d2,
Transition Time=3281(ms)
Transition Reason: First association to WLAN
Transition Result: Success
Event Timestamp=0d 00h 00m 26s 637084us
Source BSSID=00:0b:85:81:06:d2, Target BSSID=00:0b:85:81:06:c2,
Transition Time=3313(ms)
Information similar to the following appears for a log response with a log_type of rsna:
Tue Jun 26 18:24:09 2007 RSNA Response LogID=132: Status=Successful
Event Timestamp=0d 00h 00m 00s 246578us
Target BSSID=00:14:1b:58:86:cd
RSNA Version=1
Group Cipher Suite=00-0f-ac-02
Pairwise Cipher Suite Count = 1
Pairwise Cipher Suite 0 = 00-0f-ac-04
AKM Suite Count = 1
AKM Suite 0 = 00-0f-ac-01
RSN Capability = 0x0
RSNA Result: Success
Tue Jun 26 18:24:09 2007 RSNA Response LogID=132: Status=Successful
Event Timestamp=0d 00h 00m 00s 246625us
Target BSSID=00:14:1b:58:86:cd
RSNA Version=1
Group Cipher Suite=00-0f-ac-02
Pairwise Cipher Suite Count = 1
Pairwise Cipher Suite 0 = 00-0f-ac-04
AKM Suite Count = 1
AKM Suite 0 = 00-0f-ac-01
RSN Capability = 0x0
RSNA Result: Success
Tue Jun 26 18:24:09 2007 RSNA Response LogID=132: Status=Successful
Event Timestamp=0d 00h 00m 01s 624375us
Target BSSID=00:14:1b:58:86:cd
RSNA Version=1
Group Cipher Suite=00-0f-ac-02
Pairwise Cipher Suite Count = 1
Pairwise Cipher Suite 0 = 00-0f-ac-04
AKM Suite Count = 1
AKM Suite 0 = 00-0f-ac-01
RSN Capability = 0x0
RSNA Result: Success
Information similar to the following appears for a log response with a log_type of syslog:

D-39
Cisco Wireless LAN Controller Configuration Guide
OL-21524-02
Appendix D Troubleshooting
Troubleshooting CCXv5 Client Devices
Tue Jun 26 18:07:48 2007 SysLog Response LogID=131: Status=Successful
Event Timestamp=0d 00h 19m 42s 278987us
Client SysLog = '<11> Jun 19 11:49:47 uraval3777 Mandatory
elements missing in the OID response'
Event Timestamp=0d 00h 19m 42s 278990us
Client SysLog = '<11> Jun 19 11:49:50 uraval3777 Mandatory
elements missing in the OID response'
Tue Jun 26 18:07:48 2007 SysLog Response LogID=131: Status=Successful
Event Timestamp=0d 00h 19m 42s 278993us
Client SysLog = '<11> Jun 19 11:49:53 uraval3777 Mandatory
elements missing in the OID response'
Event Timestamp=0d 00h 19m 42s 278996us
Client SysLog = '<11> Jun 19 11:49:56 uraval3777 Mandatory
elements missing in the OID response'
Tue Jun 26 18:07:48 2007 SysLog Response LogID=131: Status=Successful
Event Timestamp=0d 00h 19m 42s 279000us
Client SysLog = '<11> Jun 19 11:50:00 uraval3777 Mandatory
elements missing in the OID response'
Event Timestamp=0d 00h 19m 42s 279003us
Client SysLog = '<11> Jun 19 11:50:03 uraval3777 Mandatory
elements missing in the OID response'
Tue Jun 26 18:07:48 2007 SysLog Response LogID=131: Status=Successful
Event Timestamp=0d 00h 19m 42s 279009us
Client SysLog = '<11> Jun 19 11:50:09 uraval3777 Mandatory
elements missing in the OID response'
Event Timestamp=0d 00h 19m 42s 279012us
Client SysLog = '<11> Jun 19 11:50:12 uraval3777 Mandatory
elements missing in the OID response'
Step 3 To send a request for statistics, enter this command:
config client ccx stats-request measurement_duration stats_name client_mac_address
where stats_name is dot11 or security.
Step 4 To view the statistics response, enter this command:
show client ccx stats-report client_mac_address
Information similar to the following appears:
Measurement duration = 1
dot11TransmittedFragmentCount = 1
dot11MulticastTransmittedFrameCount = 2
dot11FailedCount = 3
dot11RetryCount = 4
dot11MultipleRetryCount = 5
dot11FrameDuplicateCount = 6
dot11RTSSuccessCount = 7
dot11RTSFailureCount = 8
dot11ACKFailureCount = 9
dot11ReceivedFragmentCount = 10
dot11MulticastReceivedFrameCount = 11
dot11FCSErrorCount = 12
dot11TransmittedFrameCount = 13

D-40
Cisco Wireless LAN Controller Configuration Guide
OL-21524-02
Appendix D Troubleshooting
Using the Debug Facility
Using the Debug Facility
The debug facility enables you to display all packets going to and from the controller CPU. You can
enable it for received packets, transmitted packets, or both. By default, all packets received by the debug
facility are displayed. However, you can define access control lists (ACLs) to filter packets before they
are displayed. Packets not passing the ACLs are discarded without being displayed.
Each ACL includes an action (permit, deny, or disable) and one or more fields that can be used to match
the packet. The debug facility provides ACLs that operate at the following levels and on the following
values:
• Driver ACL
–
NPU encapsulation type
–
Port
• Ethernet header ACL
–
Destination address
–
Source address
–
Ethernet type
–
VLAN ID
• IP header ACL
–
Source address
–
Destination address
–
Protocol
–
Source port (if applicable)
–
Destination port (if applicable)
• EoIP payload Ethernet header ACL
–
Destination address
–
Source address
–
Ethernet type
–
VLAN ID
• EoIP payload IP header ACL
–
Source address
–
Destination address
–
Protocol
–
Source port (if applicable)
–
Destination port (if applicable)
• CAPWAP payload 802.11 header ACL
–
Destination address
–
Source address
–
BSSID
–
SNAP header type

D-41
Cisco Wireless LAN Controller Configuration Guide
OL-21524-02
Appendix D Troubleshooting
Using the Debug Facility
• CAPWAP payload IP header ACL
–
Source address
–
Destination address
–
Protocol
–
Source port (if applicable)
–
Destination port (if applicable)
At each level, you can define multiple ACLs. The first ACL that matches the packet is the one that is
selected.
To use the debug facility, follow these steps:
Step 1 To enable the debug facility, enter this command:
debug packet logging enable {rx | tx | all} packet_count display_size
where
• rx displays all received packets, tx displays all transmitted packets, and all displays both transmitted
and received packets.
• packet_count is the maximum number of packets to log. You can enter a value between 1 and 65535
packets, and the default value is 25 packets.
• display_size is the number of bytes to display when printing a packet. By default, the entire packet
is displayed.
Note To disable the debug facility, enter this command: debug packet logging disable.
Step 2 Use these commands to configure packet-logging ACLs:
• debug packet logging acl driver rule_index action npu_encap port
where
–
rule_index is a value between 1 and 6 (inclusive).
–
action is permit, deny, or disable.
–
npu_encap specifies the NPU encapsulation type, which determines how packets are filtered.
The possible values include dhcp, dot11-mgmt, dot11-probe, dot1x, eoip-ping, iapp, ip, lwapp,
multicast, orphan-from-sta, orphan-to-sta, rbcp, wired-guest, or any.
–
port is the physical port for packet transmission or reception.
• debug packet logging acl eth rule_index action dst src type vlan
where
–
rule_index is a value between 1 and 6 (inclusive).
–
action is permit, deny, or disable.
–
dst is the destination MAC address.
–
src is the source MAC address.
–
type is the two-byte type code (such as 0x800 for IP, 0x806 for ARP). This parameter also
accepts a few common string values such as “ip” (for 0x800) or “arp” (for 0x806).
–
vlan is the two-byte VLAN ID.

D-42
Cisco Wireless LAN Controller Configuration Guide
OL-21524-02
Appendix D Troubleshooting
Using the Debug Facility
• debug packet logging acl ip rule_index action src dst proto src_port dst_port
where
–
proto is a numeric or any string recognized by getprotobyname(). The controller supports the
following strings: ip, icmp, igmp, ggp, ipencap, st, tcp, egp, pup, udp, hmp, xns-idp, rdp,
iso-tp4, xtp, ddp, idpr-cmtp, rspf, vmtp, ospf, ipip, and encap.
–
src_port is the UDP/TCP two-byte source port (for example, telnet, 23) or “any.” The controller
accepts a numeric or any string recognized by getservbyname(). The controller supports the
following strings: tcpmux, echo, discard, systat, daytime, netstat, qotd, msp, chargen, ftp-data,
ftp, fsp, ssh, telnet, smtp, time, rlp, nameserver, whois, re-mail-ck, domain, mtp, bootps, bootpc,
tftp, gopher, rje, finger, www, link, kerberos, supdup, hostnames, iso-tsap, csnet-ns,
3com-tsmux, rtelnet, pop-2, pop-3, sunrpc, auth, sftp, uucp-path, nntp, ntp, netbios-ns,
netbios-dgm, netbios-ssn, imap2, snmp, snmp-trap, cmip-man, cmip-agent, xdmcp, nextstep,
bgp, prospero, irc, smux, at-rtmp, at-nbp, at-echo, at-zis, qmtp, z3950, ipx, imap3, ulistserv,
https, snpp, saft, npmp-local, npmp-gui, and hmmp-ind.
–
dst_port is the UDP/TCP two-byte destination port (for example, telnet, 23) or “any.” The
controller accepts a numeric or any string recognized by getservbyname(). The controller
supports the same strings as those for the src_port.
• debug packet logging acl eoip-eth rule_index action dst src type vlan
• debug packet logging acl eoip-ip rule_index action src dst proto src_port dst_port
• debug packet logging acl lwapp-dot11 rule_index action dst src bssid snap_type
where
–
bssid is the Basic Service Set Identifier.
–
snap_type is the Ethernet type.
• debug packet logging acl lwapp-ip rule_index action src dst proto src_port dst_port
Note To remove all configured ACLs, enter this command: debug packet logging acl clear-all.
Step 3 To configure the format of the debug output, enter this command:
debug packet logging format {hex2pcap | text2pcap}
The debug facility supports two output formats: hex2pcap and text2pcap. The standard format used by
IOS supports the use of hex2pcap and can be decoded using an HTML front end. The text2pcap option
is provided as an alternative so that a sequence of packets can be decoded from the same console log file.
Figure D-12 shows an example of hex2pcap output, and Figure D-13 shows an example of text2pcap
output.
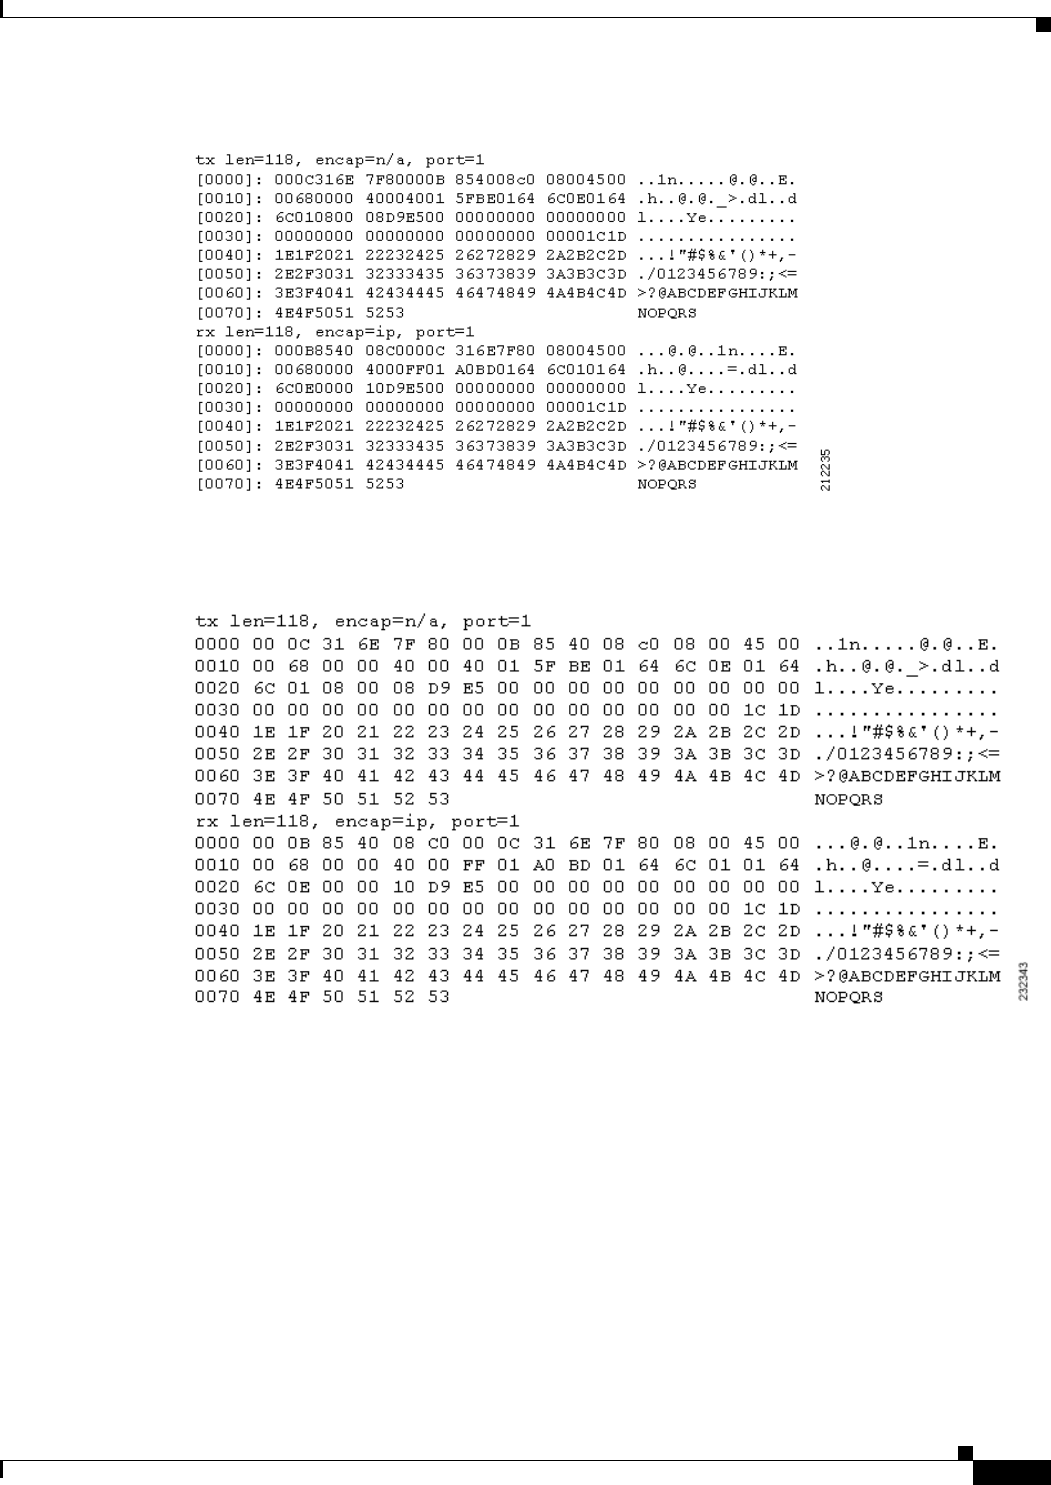
D-43
Cisco Wireless LAN Controller Configuration Guide
OL-21524-02
Appendix D Troubleshooting
Using the Debug Facility
Figure D-12 Sample Hex2pcap Output
Figure D-13 Sample Text2pcap Output
Step 4 To determine why packets might not be displayed, enter this command:
debug packet error {enable | disable}
Step 5 To display the status of packet debugging, enter this command:
show debug packet
Information similar to the following appears:
Status........................................... disabled
Number of packets to display..................... 25
Bytes/packet to display.......................... 0
Packet display format............................ text2pcap
Driver ACL:
[1]: disabled
[2]: disabled

D-44
Cisco Wireless LAN Controller Configuration Guide
OL-21524-02
Appendix D Troubleshooting
Configuring Wireless Sniffing
[3]: disabled
[4]: disabled
[5]: disabled
[6]: disabled
Ethernet ACL:
[1]: disabled
[2]: disabled
[3]: disabled
[4]: disabled
[5]: disabled
[6]: disabled
IP ACL:
[1]: disabled
[2]: disabled
[3]: disabled
[4]: disabled
[5]: disabled
[6]: disabled
EoIP-Ethernet ACL:
[1]: disabled
[2]: disabled
[3]: disabled
[4]: disabled
[5]: disabled
[6]: disabled
EoIP-IP ACL:
[1]: disabled
[2]: disabled
[3]: disabled
[4]: disabled
[5]: disabled
[6]: disabled
LWAPP-Dot11 ACL:
[1]: disabled
[2]: disabled
[3]: disabled
[4]: disabled
[5]: disabled
[6]: disabled
LWAPP-IP ACL:
[1]: disabled
[2]: disabled
[3]: disabled
[4]: disabled
[5]: disabled
[6]: disabled
Configuring Wireless Sniffing
The controller enables you to configure an access point as a network “sniffer,” which captures and
forwards all the packets on a particular channel to a remote machine that runs packet analyzer software.
These packets contain information on time stamps, signal strength, packet sizes, and so on. Sniffers
allow you to monitor and record network activity and to detect problems.
Supported third-party network analyzer software applications are as follows:
• Wildpackets Omnipeek or Airopeek
• AirMagnet Enterprise Analyzer