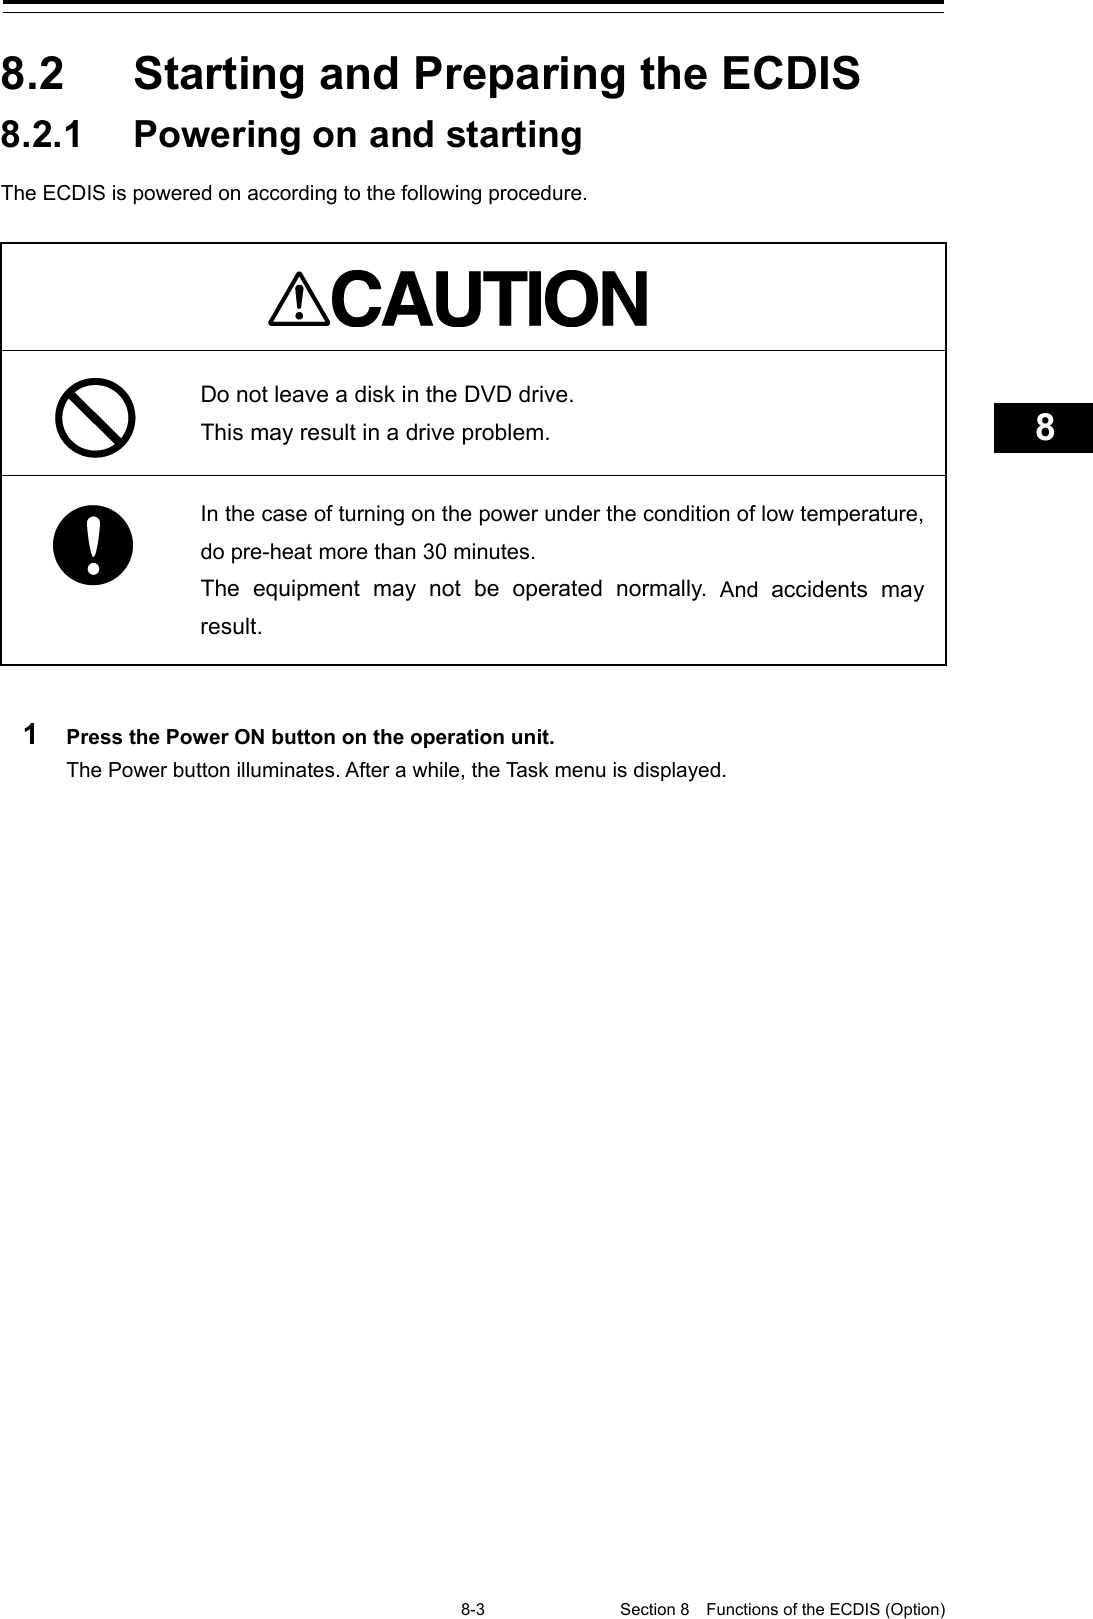
Japan Radio Co NKE2632 Solid State S-Band Marine Radar User Manual Instruction Manual Funtion Part 2
Japan Radio Co Ltd. Solid State S-Band Marine Radar Instruction Manual Funtion Part 2
Contents
- 1. Installation Manual Part 1
- 2. Installation Manual Part 2
- 3. Installation Manual Part 3
- 4. Installation Manual Part 4
- 5. Installation Manual Part 5
- 6. Installation Manual Part 6
- 7. Installation Manual Part 7
- 8. Installation Manual Part 8
- 9. Installation Manual Part 9
- 10. Installation Manual Part 10
- 11. Installation Manual Part 11
- 12. Instruction Manual Operation Part 1
- 13. Instruction Manual Operation Part 2
- 14. Instruction Manual Operation Part 3
- 15. Instruction Manual Operation Part 4
- 16. Instruction Manual Funtion Part 1
- 17. Instruction Manual Funtion Part 2
- 18. Instruction Manual Funtion Part 3
- 19. Instruction Manual Funtion Part 4
- 20. Instruction Manual Funtion Part 5
- 21. Instruction Manual Funtion Part 6
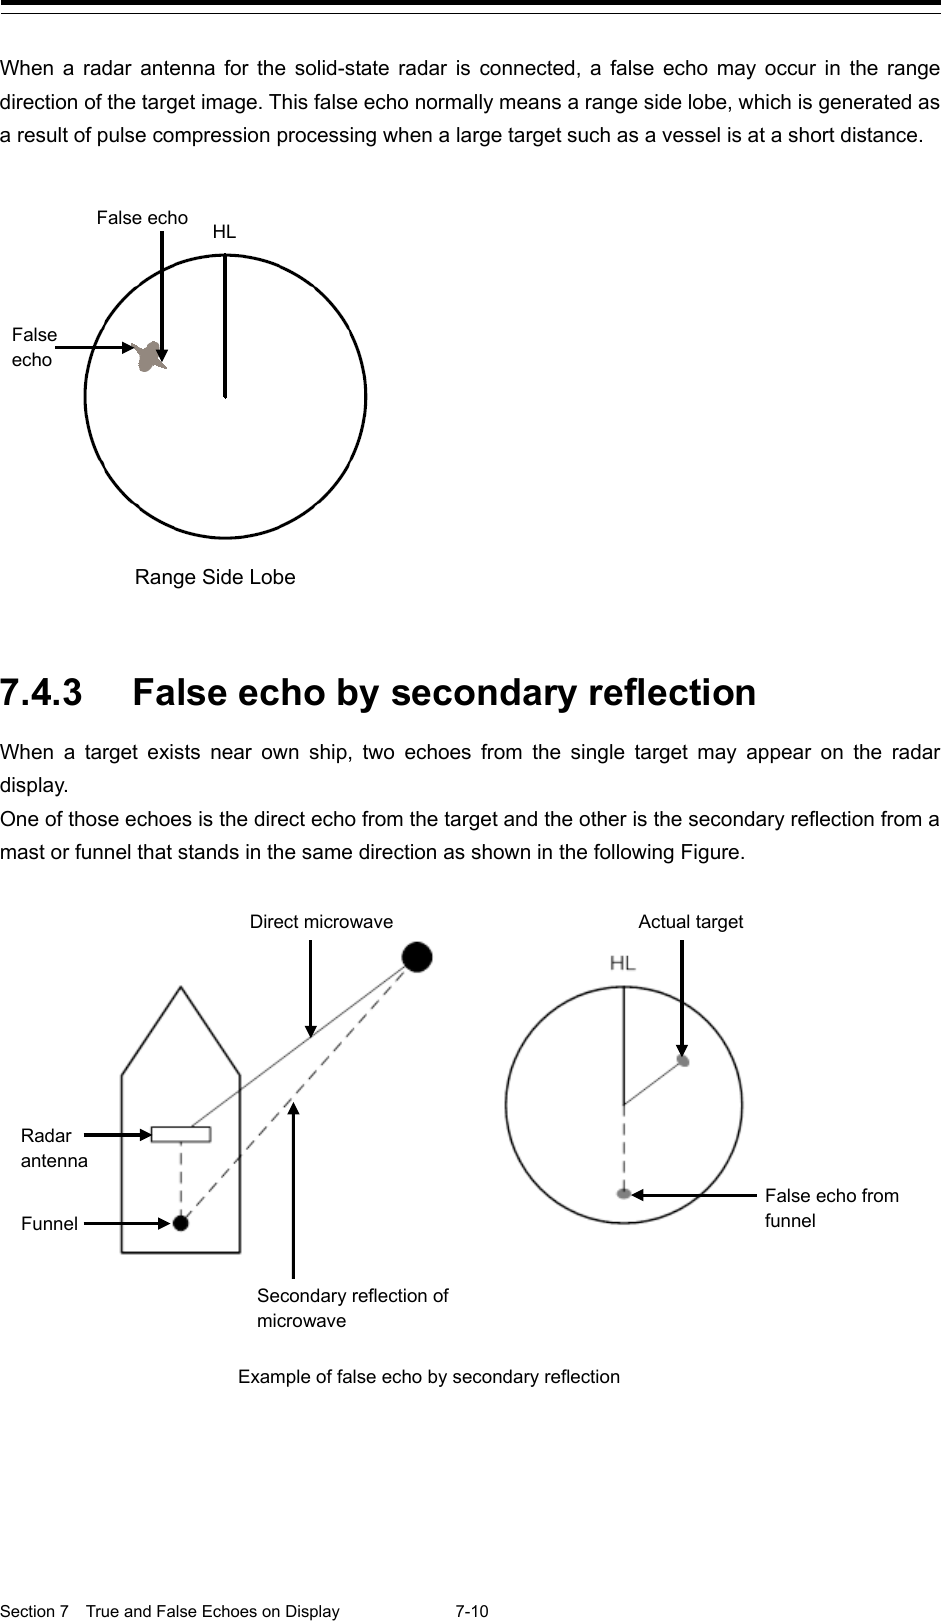
Instruction Manual Funtion Part 2
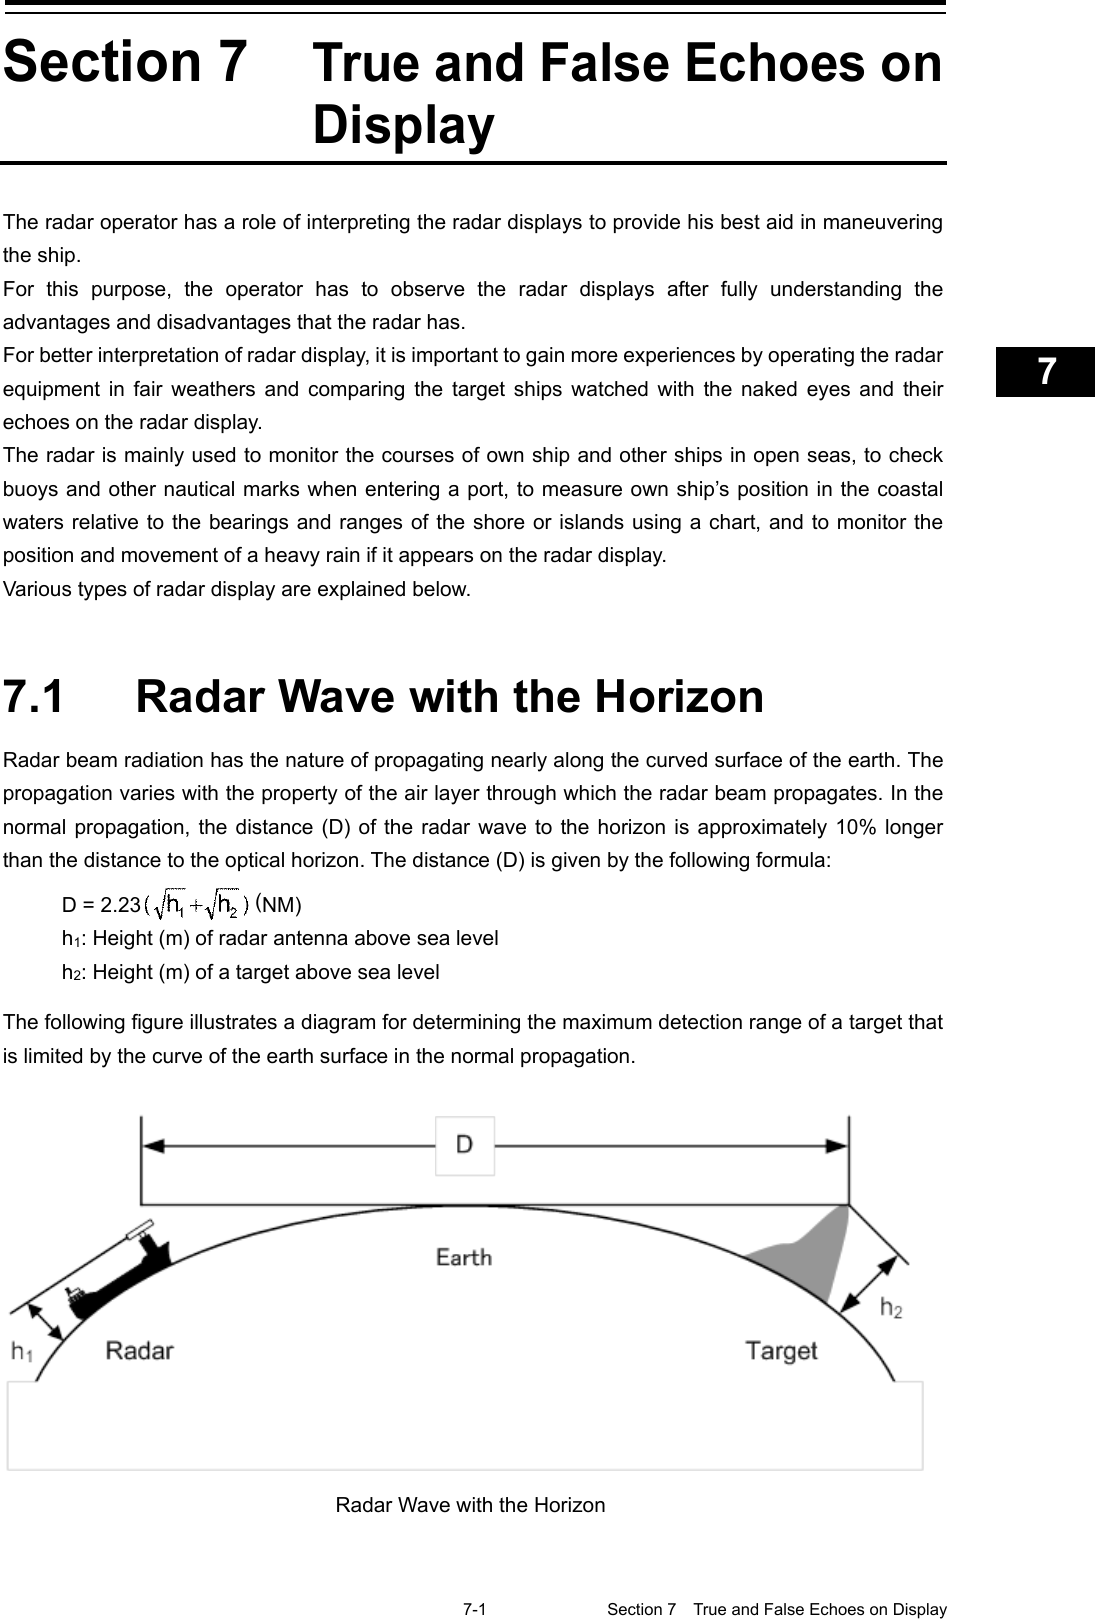
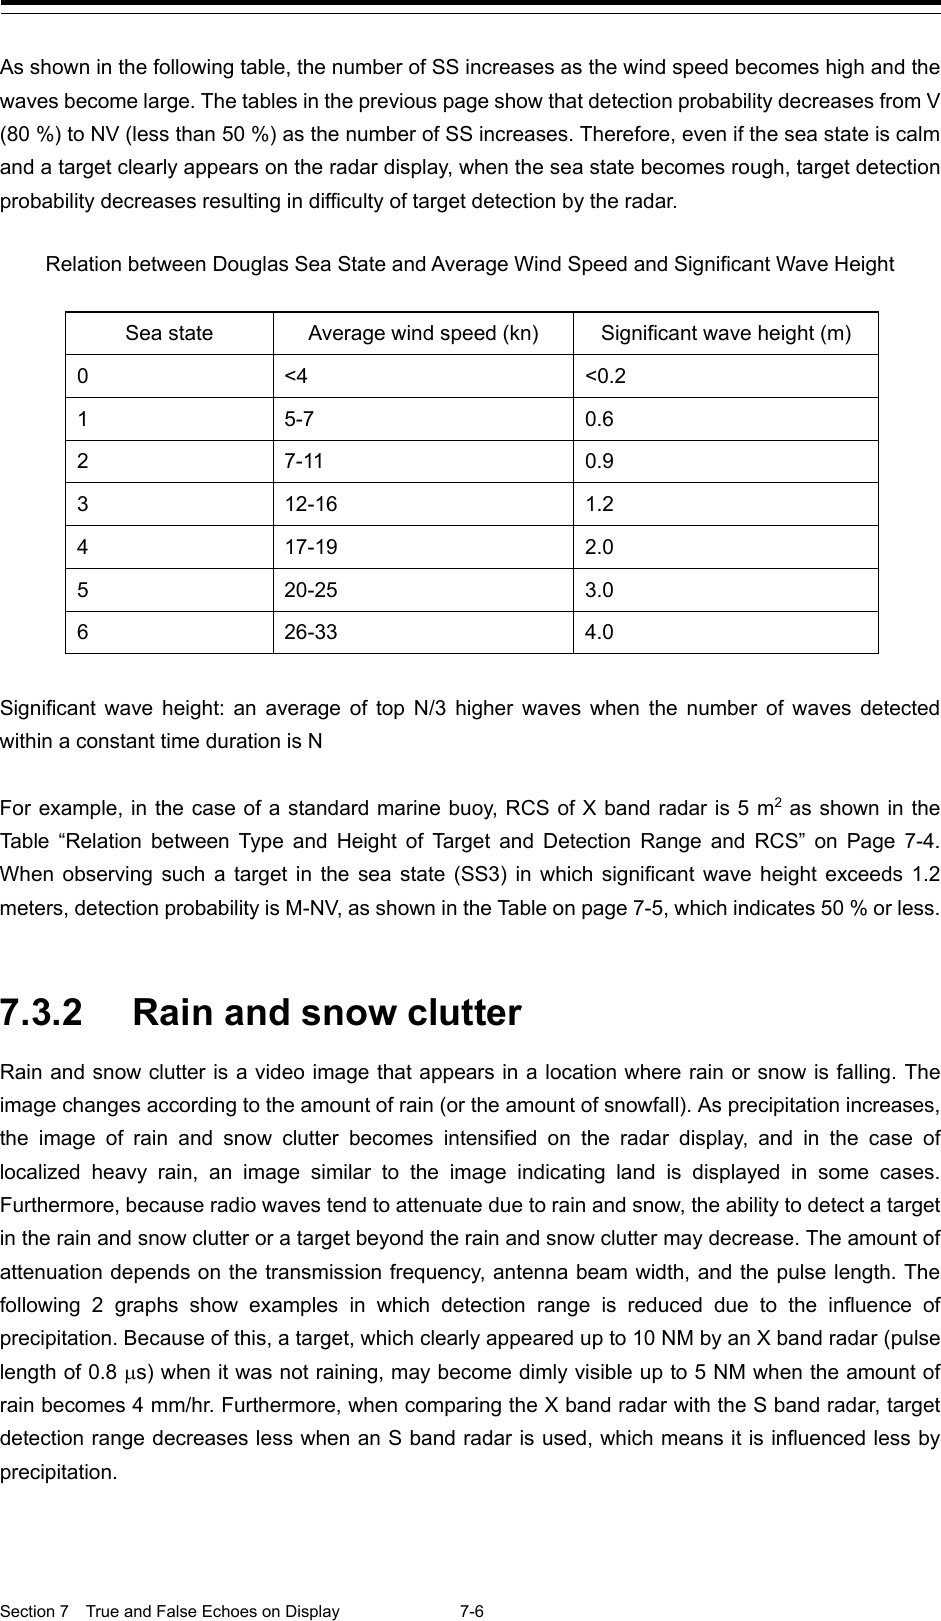
![7-5 Section 7 True and False Echoes on Display 1 2 3 4 5 6 7 8 9 10 11 12 13 14 15 16 17 18 19 20 21 22 23 24 25 26 27 付録 7.3 Sea Clutter and Rain/Snow Clutter In addition to the echo required for observing ships and land, radar video image also includes undesirable echo, such as reflection from waves on the sea surface and reflection from rain and snow. Reflection from the sea surface is called "sea clutter," and reflection from rain and snow is called "rain and snow clutter," and those spurious waves must be eliminated by the clutter rejection function ([Signal Process]-[Video Noise Rejection] in the Menu. (Refer to "18.3 Performing basic adjustments on the radar".) 7.3.1 Sea clutter Sea clutter appears as an image radiating outwardly from the center of the radar display and changing depending on the size and the shape of waves. Generally, as waves become larger, image level of the sea clutter is intensified and the clutter far away is also displayed. In this case, it is difficult to distinguish sea clutter from a small boat whose reflection intensity is weak. Accordingly, it is necessary to properly adjust the sea clutter rejection function. The following tables show the relation between the sea state (SS) showing the size of waves generated by wind and the radar's detection probability. Sea State and Probability of Target Detection RCS SS1 to 2 SS2 to 3 SS3 to 4 SS4 to 5 0.1 m2 V V-M M-NV 0.5 m2 V V V-M M-NV 1 m2 V V V V-M S band radar (probability to detect a target at a range of 0.4 NM) RCS SS1 to 2 SS2 to 3 SS3 to 4 SS4 to 5 1m2 V-M M-NV 5 m2 V V-M M-NV 10 m2 V V V V-M X band radar (probability to detect a target at a range of 0.7 NM) V: Detection probability of 80 % M: Detection probability of 50 % NV: Detection probability of less than 50 %](https://usermanual.wiki/Japan-Radio-Co/NKE2632.Instruction-Manual-Funtion-Part-2/User-Guide-2791061-Page-5.png)
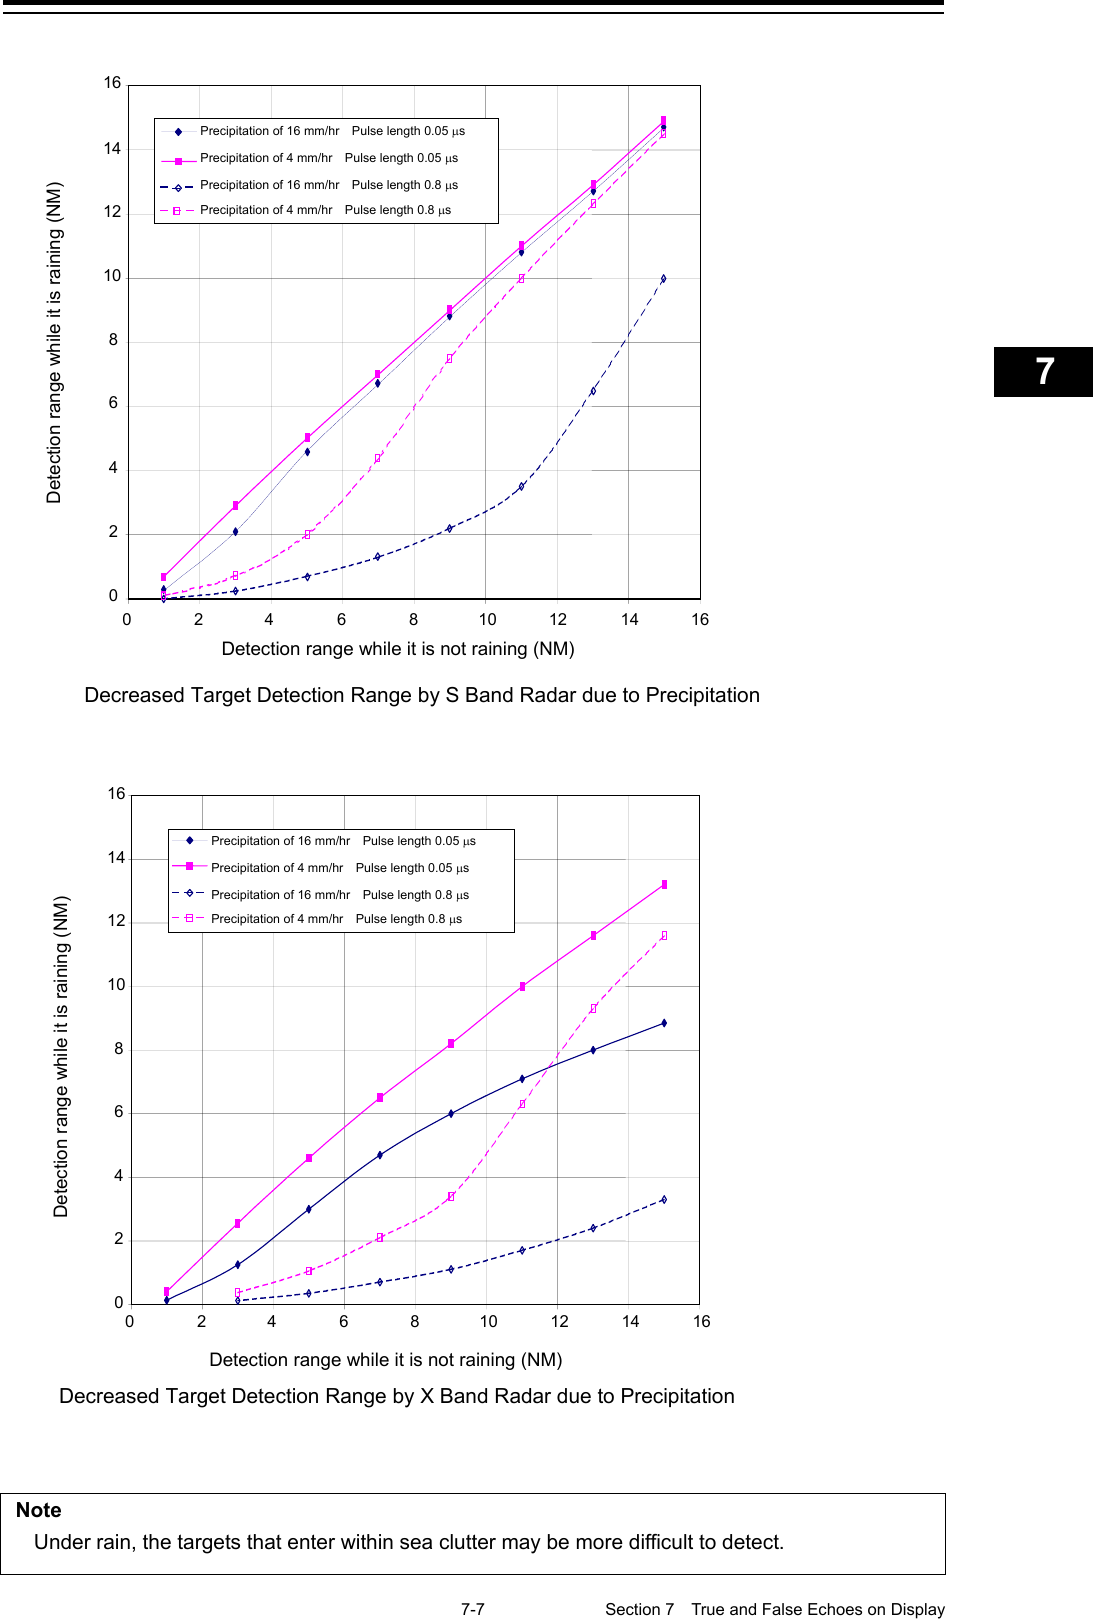
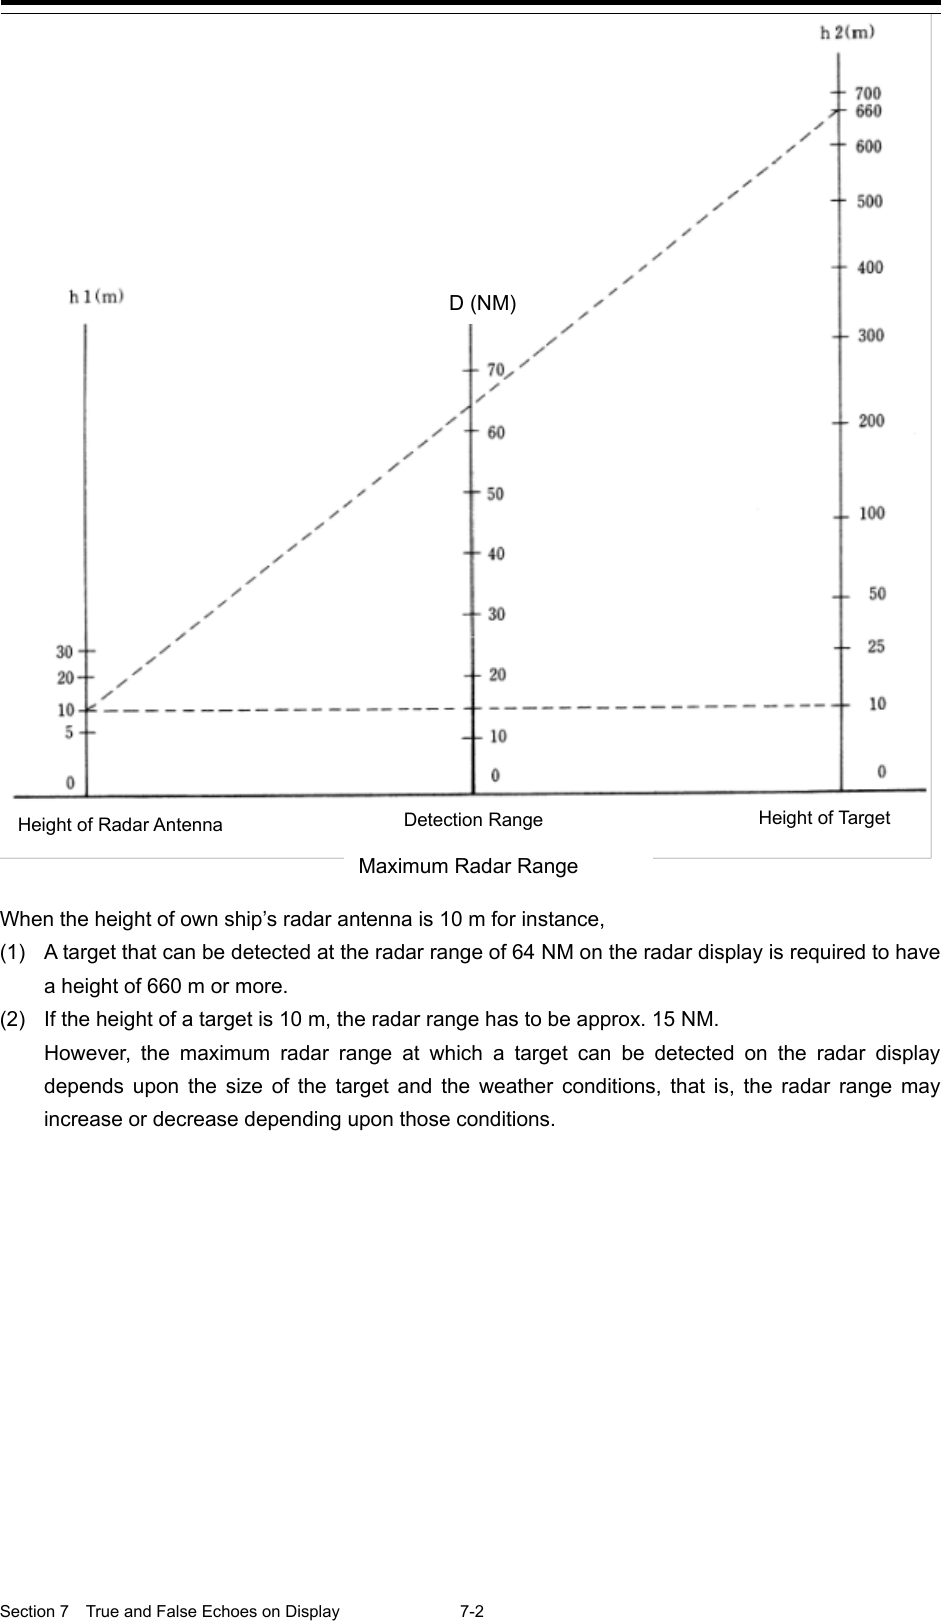
![7-11 Section 7 True and False Echoes on Display 1 2 3 4 5 6 7 8 9 10 11 12 13 14 15 16 17 18 19 20 21 22 23 24 25 26 27 付録 7.4.4 False echo by multiple reflection When there is a large structure or ship with a high vertical surface near own ship as shown in the following Figure, multiple refection may appear on the radar display. These echoes appear in the same intervals, of which the nearest echo is the true echo of the target. 7.4.5 Second time echoes The maximum radar detection range depends upon the height of the radar antenna and the height of a target as described in the section "7.1 Radar Wave with the Horizon". If a so-called "duct" occurs on the sea surface due to a certain weather condition, however, the radar beam may propagate to an abnormally long distance, at which a target may be detected by the radar. For instance, assuming that the transmitter pulse length is MP3 (on the repetition frequency of 1400 Hz), the primary pulse is reflected about 58 NM or more away from a target and received during the next pulse repetition time. In this case, a target image appears as a false echo (second time echo) at a position that is about 58 NM less than the actual range on the radar screen. If the false echo appears at 5 NM on the radar display, the true range of the target is 5 + 58 = 63 NM. On the transmitter pulse length is SP1 (on the repetition frequency of 2250 Hz), a false echo may appear at a position that is about 36 NM less than the actual range. This type of false echo can be discriminated by checking the change of the target range by switching the transmitted pulse length (the repetition frequency). False echoes can be suppressed by setting [Economy] to [TXRX] - [TXRX] - [PRF] on the Settings menu or setting ON in [TXRX] - [TXRX] - [Stagger Trigger]. (For the details, refer to "18.6 Setting up Radar Antennas".) False Eco by Multiple Reflection](https://usermanual.wiki/Japan-Radio-Co/NKE2632.Instruction-Manual-Funtion-Part-2/User-Guide-2791061-Page-11.png)
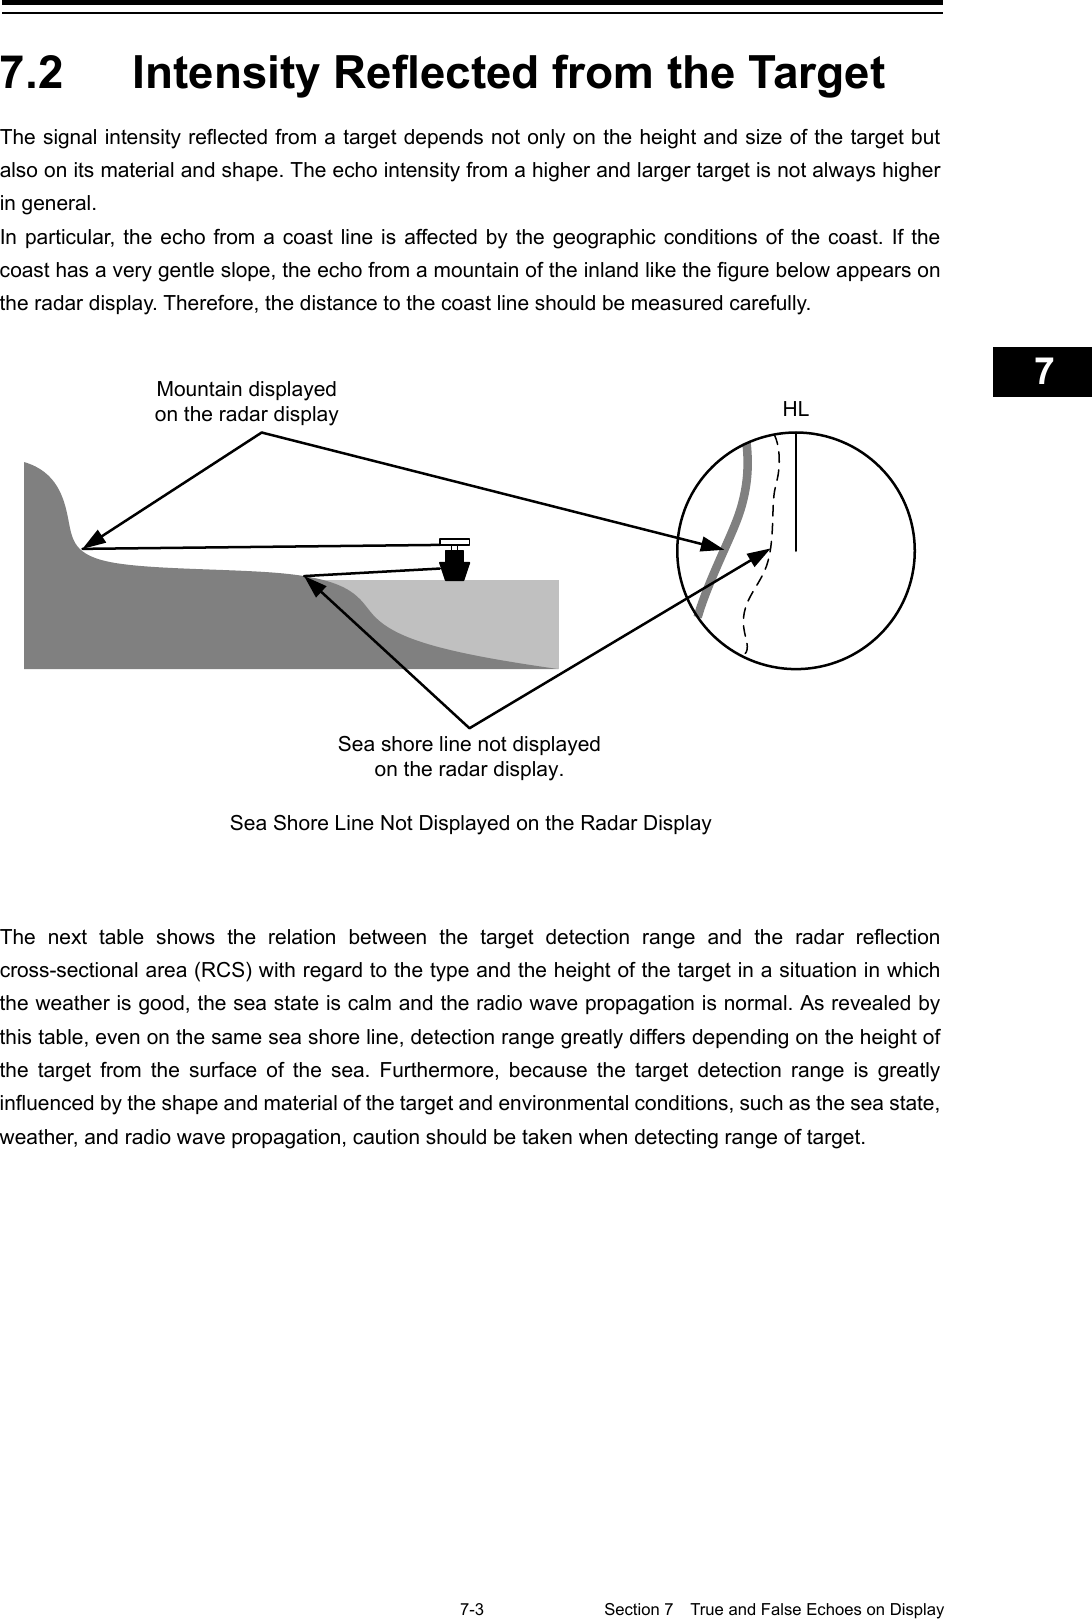
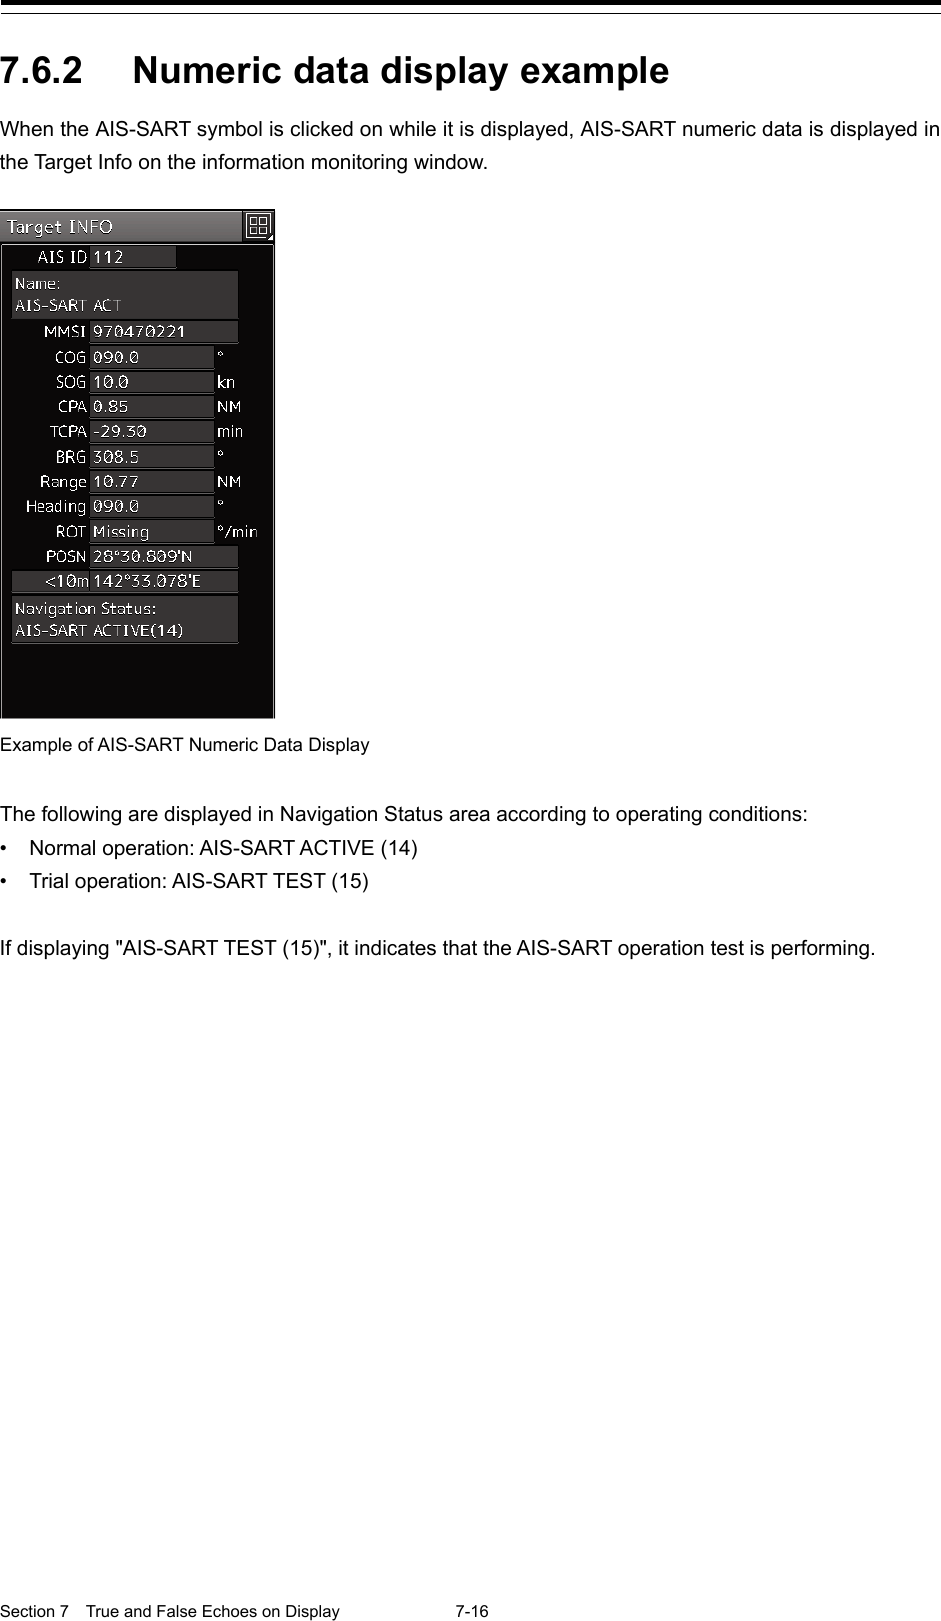
![7-13 Section 7 True and False Echoes on Display 1 2 3 4 5 6 7 8 9 10 11 12 13 14 15 16 17 18 19 20 21 22 23 24 25 26 27 付録 7.5 Radar Transponder (SART) Screen Display SART is life-saving equipment that was approved by GMDSS and is used for detecting positions of survivors who suffer from distress accidents. SART, which operates under the frequency band of 9GHz, receives a radar wave of 9GHz that is launched from the radar of the rescue boat or plane and generates a series of response signals to notify the accident position to the searchers. Set the equipment to the following in order to receive SART signals. Use the settings for SART reception for detecting beacons and target enhancers also. 1 Set the range scale to [6 NM] or [12 NM] by using the Range Scale button on the RADAR screen. 2 Set to ON the settings of [Echo]-[Signal Process]-[SART] in the Settings menu (Select the check box.). Note The SART setting check boxes are not displayed at connection of a solid-state radar antenna. The SART display mode is set to ON. In this case, the following items in the Settings menu are automatically changed to the values as indicated in the table below. For the settings of SART, refer to “18.3 Setting Radar Signal Processing” Setting item Setting value Sea (Sea clutter control) In MAN (manual) mode, the value is changed to 0 (minimum value) and in AUTO (automatic) mode, the mode is changed to MAN and the value is changed to 0 (minimum value). Rain (rain/snow clutter control) Manual Tune (Tuning) Off (Set tuning to Off to weaken clutter display) IR (Interference removal) Off Echo Process (Image processing) Process Off](https://usermanual.wiki/Japan-Radio-Co/NKE2632.Instruction-Manual-Funtion-Part-2/User-Guide-2791061-Page-13.png)
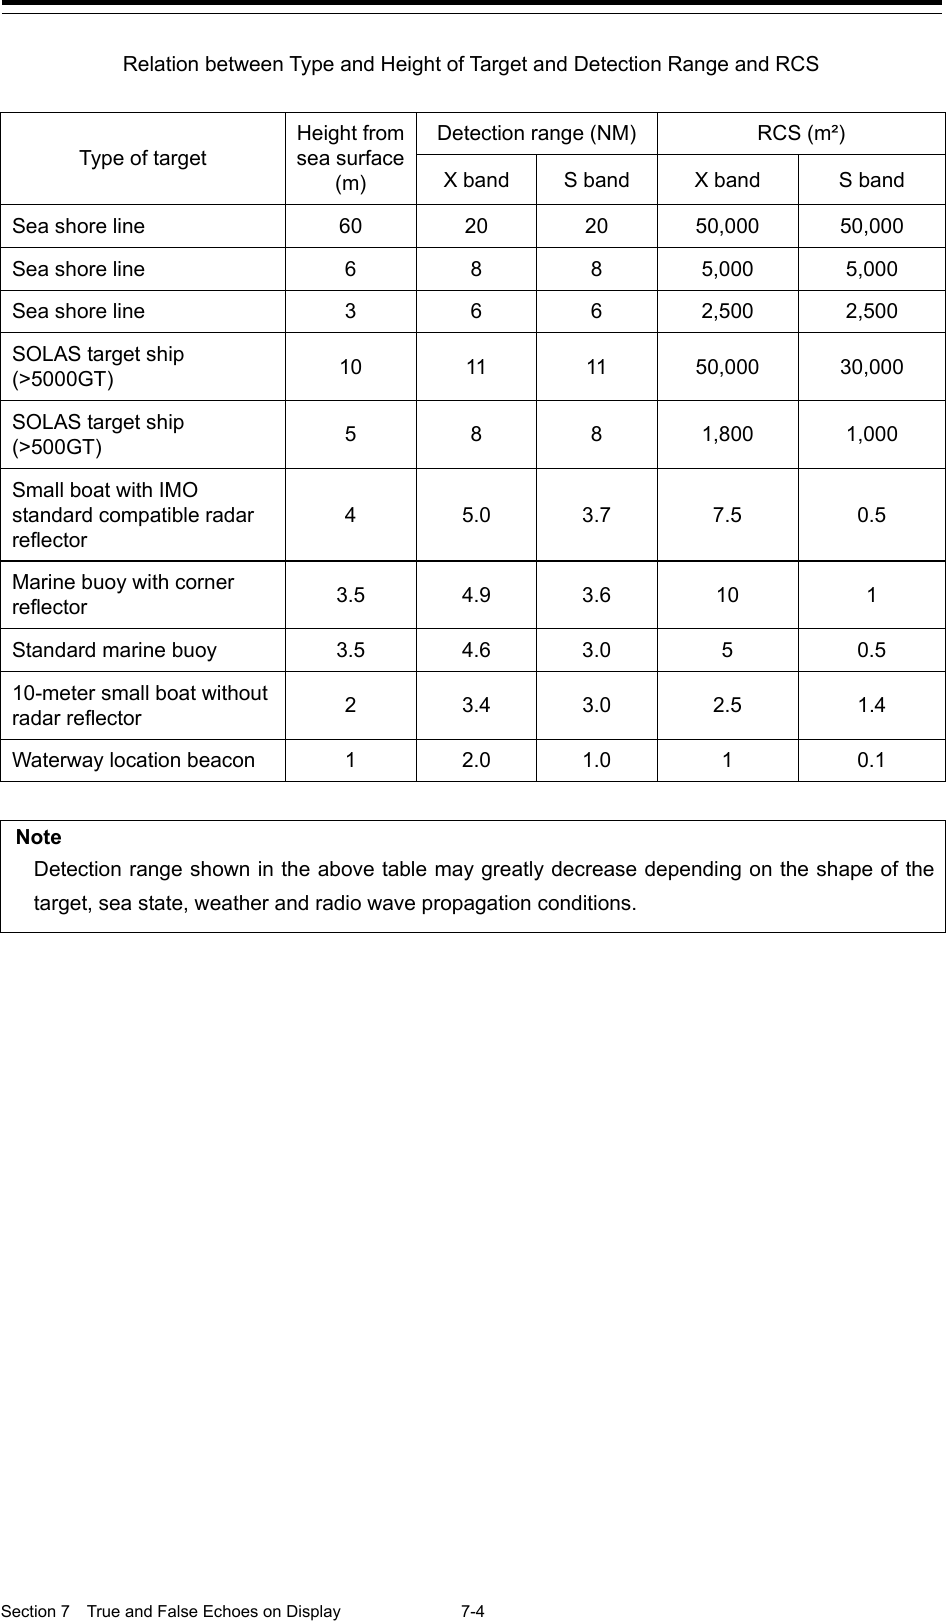
![Section 7 True and False Echoes on Display 7-14 Note • When the SART display mode is set to ON to detect SART signals, small targets around own ship may no longer be displayed on the radar screen. Therefore, implement sufficient monitoring for the periphery of own ship to prevent collision and grounding. When multiple radars are installed, use one 9GHz-band radar for detection of SART signals and use other radars as normal radars for collision prevention, monitoring of targets in periphery of own ship, prevention of grounding, and checking of own ship’s position. • After termination of SART signal detection, set the SART display mode to OFF (Uncheck the check boxes of [Echo]-[Signal Process]-[SART] in the Settings menu). The radar is reset to the normal navigation mode. Land Other ship SART signal (displayed as sequence of 12 spots) Position of search boat](https://usermanual.wiki/Japan-Radio-Co/NKE2632.Instruction-Manual-Funtion-Part-2/User-Guide-2791061-Page-14.png)
![8-1 Section 8 Functions of the ECDIS (Option) 1 2 3 4 5 6 7 8 9 10 11 12 13 14 15 16 17 18 19 20 21 22 23 24 25 26 27 Section 8 Functions of the ECDIS (Option) 8.1 General Flowchart A general flowchart of sailing using the ECDIS is shown. Select ECDIS from the Task menu ECDIS screen display Are route planning, user map preparation and chart import/update required? - Select [Route] - Select [To WPT] Route monitoring - Alert monitoring (Arrival, Route, etc.) End route monitoring Route Planning - Table editing - Graphical editing Required User chart editing Chart Maintenance - Import/update Refer to the following sections: - Section 9 Route Planning - Section 14 Creating a User Map/ Updating a Chart - 13.10 Maintaining a Chart Refer to "8.1.1 "Work Flowchart While Sailing" Adjustments - Screen brightness - Brightness of the operation unit - Sound volume - Radar video, etc. Start ECDIS (Power On) Shut down the ECDIS (power off) Click on “Route Planning Route Monitoring (ECDIS)”. Task menu](https://usermanual.wiki/Japan-Radio-Co/NKE2632.Instruction-Manual-Funtion-Part-2/User-Guide-2791061-Page-17.png)
![Section 8 Functions of the ECDIS (Option) 8-2 8.1.1 Work Flowchart While Sailing The “End of Track” alert is issued just before the arrival of the ship at the final destination. After confirming the content of the alert, click on the [ALERT ACK] button and stop the alert. Sailing start Display the "Route Monitoring" dialog box Select [Route] Select a waypoint Move own ship to the waypoint Route monitoring ("Arrived at WPT" alert is activated when arrived at the WPT.) Just before the arrival at the final destination (“End Of Track” alert is issued) Select [UNLOAD] from [Route] and finish route monitoring. Click [Route Monitoring] on the menu. End of sailing When the ship arrives at the WPT, an "Arrived at WPT" alert is activated and the next WPT is updated. After confirming the alert, click on the [ALERT ACK] (alert acknowledgment) button and stop the alert. Select the route to be used. (Initially, UNLOAD is being displayed.) Select a waypoint from [To WPT]. Navigate own ship along the route. Own ship's symbol TO WPT](https://usermanual.wiki/Japan-Radio-Co/NKE2632.Instruction-Manual-Funtion-Part-2/User-Guide-2791061-Page-18.png)
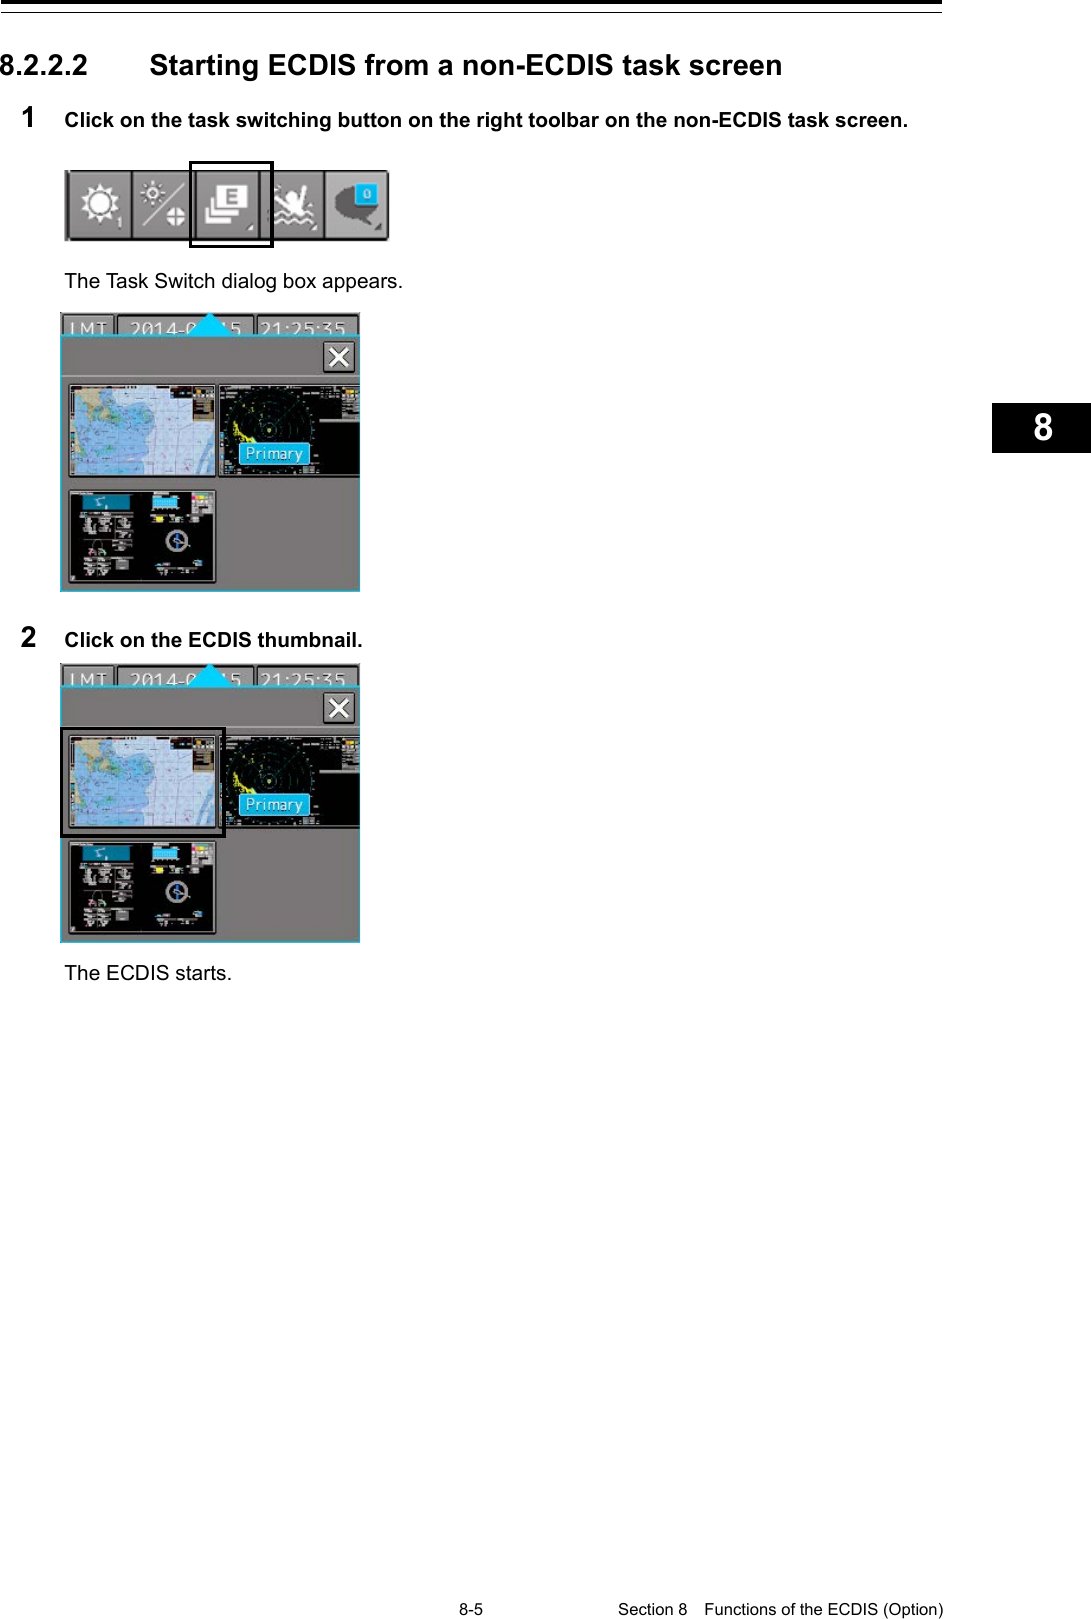
![Section 8 Functions of the ECDIS (Option) 8-4 8.2.2 Starting the ECDIS 8.2.2.1 Starting the ECDIS from the Task Menu When the ECDIS is started, the Task menu appears on the screen. Start the ECDIS from the Task Menu. 1 Click on the [Route Planning Route Monitoring (ECDIS)] button on the Task menu. The ECDIS screen is displayed.](https://usermanual.wiki/Japan-Radio-Co/NKE2632.Instruction-Manual-Funtion-Part-2/User-Guide-2791061-Page-20.png)
![Section 8 Functions of the ECDIS (Option) 8-6 8.2.3 Entering an ARCS PIN Number (ARCS Only) When ARCS charts have been imported, the ARCS PIN code input dialog box appears when the ECDIS is started. Since ARCS is restricted by the ARCS PIN number, ARCS is not displayed unless the correct ARCS PIN number is input. To use ARCS charts, be sure to perform the following operation. 1 Input a PIN number in [ARCS PIN] of the "ARCS PIN" dialog box 2 Click on the [OK] button. When the [X] button is clicked on, ECDIS starts without displaying ARCS. Note ARCS is not displayed when the contract has expired even if the correct ARCS PIN number is input. Memo It is necessary to enter an ARCS PIN code only when the ECDIS screen will be displayed for the first time.](https://usermanual.wiki/Japan-Radio-Co/NKE2632.Instruction-Manual-Funtion-Part-2/User-Guide-2791061-Page-22.png)
![8-7 Section 8 Functions of the ECDIS (Option) 1 2 3 4 5 6 7 8 9 10 11 12 13 14 15 16 17 18 19 20 21 22 23 24 25 26 27 8.3 Moving the Chart Charts can be moved by the following methods. • Moving by the [Home] button • Moving by the cross-hair cursor • Moving by the hand cursor • Switching display from the "My Port List" dialog box • Displaying by entering a position 8.3.1 Moving the chart with the [HOME] button Display can be moved to a position where the heading direction of own ship can be observed in a panoramic view. Use this feature if own ship is lost from charts. 1 Click on the [Home] button in Chart Information Area. Display moves to a position where the heading direction of own ship can be observed in a panoramic view. Own ship symbol Screen Display of Home Position](https://usermanual.wiki/Japan-Radio-Co/NKE2632.Instruction-Manual-Funtion-Part-2/User-Guide-2791061-Page-23.png)
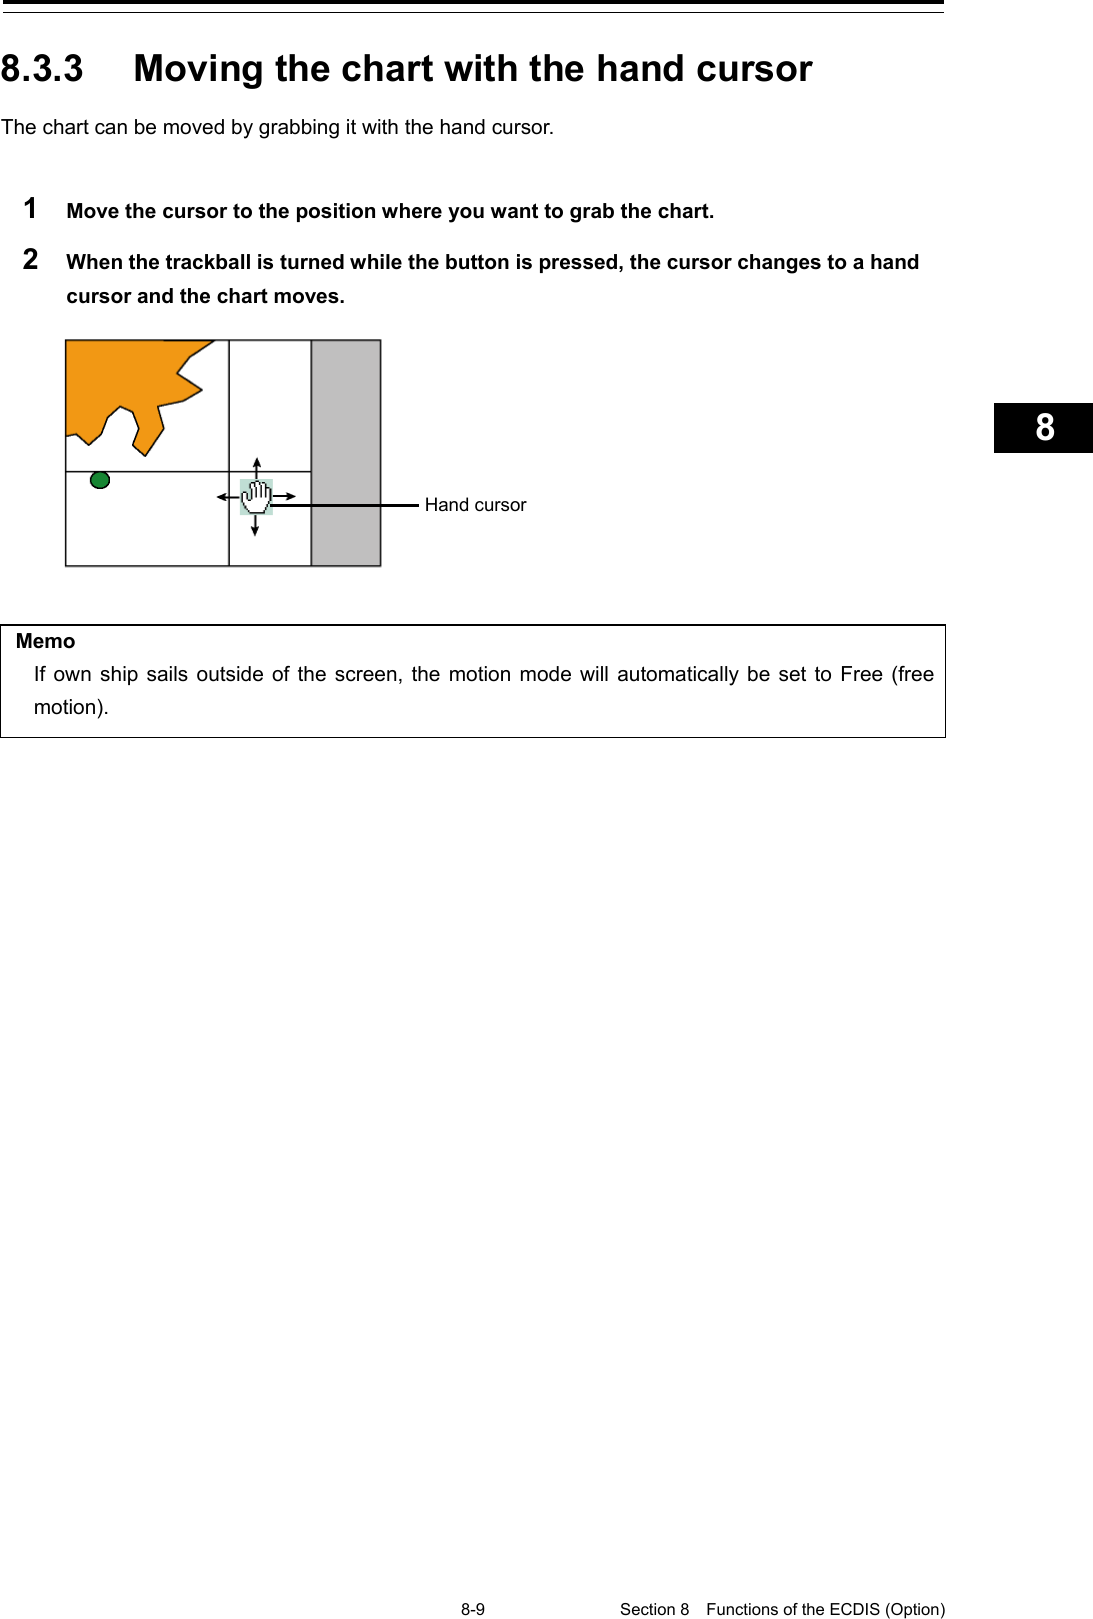
![Section 8 Functions of the ECDIS (Option) 8-8 8.3.2 Moving the chart with the cross-hair cursor When the cross-hair cursor is moved to an arbitrary position on the chart and then clicked, the chart can be moved. The chart moving position varies with the setting of the motion mode. For information about the motion mode, refer to "8.6 Selecting Motion/Bearing Mode". [When the motion mode is set to true motion] The position of the cross-hair cursor becomes the center of the screen. [When the motion mode is set to relative motion] The position of the cross-hair cursor becomes own ship's display position. Cross-hair cursor intersecting point Moving to the Center of the Screen Moving the position of own ship’s display](https://usermanual.wiki/Japan-Radio-Co/NKE2632.Instruction-Manual-Funtion-Part-2/User-Guide-2791061-Page-24.png)
![Section 8 Functions of the ECDIS (Option) 8-10 8.3.4 Switching a chart to be displayed by "My Port List" If port names are registered in My Port List in the "My Port List" dialog box, chart display can be switched to the one having the latitude and longitude of a registered port at the center of the chart. 1 Click on the [Menu] button on the left toolbar. The menu is displayed. 2 Click on [Chart] - [My Port List] on the menu. The "My Port List" dialog box appears. For how to register and delete ports, refer to "8.7 Registering and Displaying My Port List". 3 Click on a port in the list to select it. 4 Click on the [Jump] button. The chart is displayed having the latitude and longitude of the selected port at the center of the chart. Port list [Jump] button Example: Location registered as a port](https://usermanual.wiki/Japan-Radio-Co/NKE2632.Instruction-Manual-Funtion-Part-2/User-Guide-2791061-Page-26.png)
![8-11 Section 8 Functions of the ECDIS (Option) 1 2 3 4 5 6 7 8 9 10 11 12 13 14 15 16 17 18 19 20 21 22 23 24 25 26 27 8.3.5 Displaying the chart by entering the position By entering a position, the chart of a desired position can be displayed. 1 Click on the [Menu] button on the left toolbar. The menu is displayed. 2 Click on [Chart] - [Off Center by Entering Position] on the menu. The "Off Center by Entering Position" dialog box appears. The latitude and longitude of the center of the current screen is displayed in the latitude and longitude input boxes. 3 Click the latitude and longitude input boxes. 4 Enter the latitude and longitude of the chart you want to display with the software keyboard. 5 Click on the [Jump to the Following Position] button. The chart is displayed having the entered latitude and longitude at the center of the chart. [Jump to the following position] button Latitude and longitude input boxes](https://usermanual.wiki/Japan-Radio-Co/NKE2632.Instruction-Manual-Funtion-Part-2/User-Guide-2791061-Page-27.png)
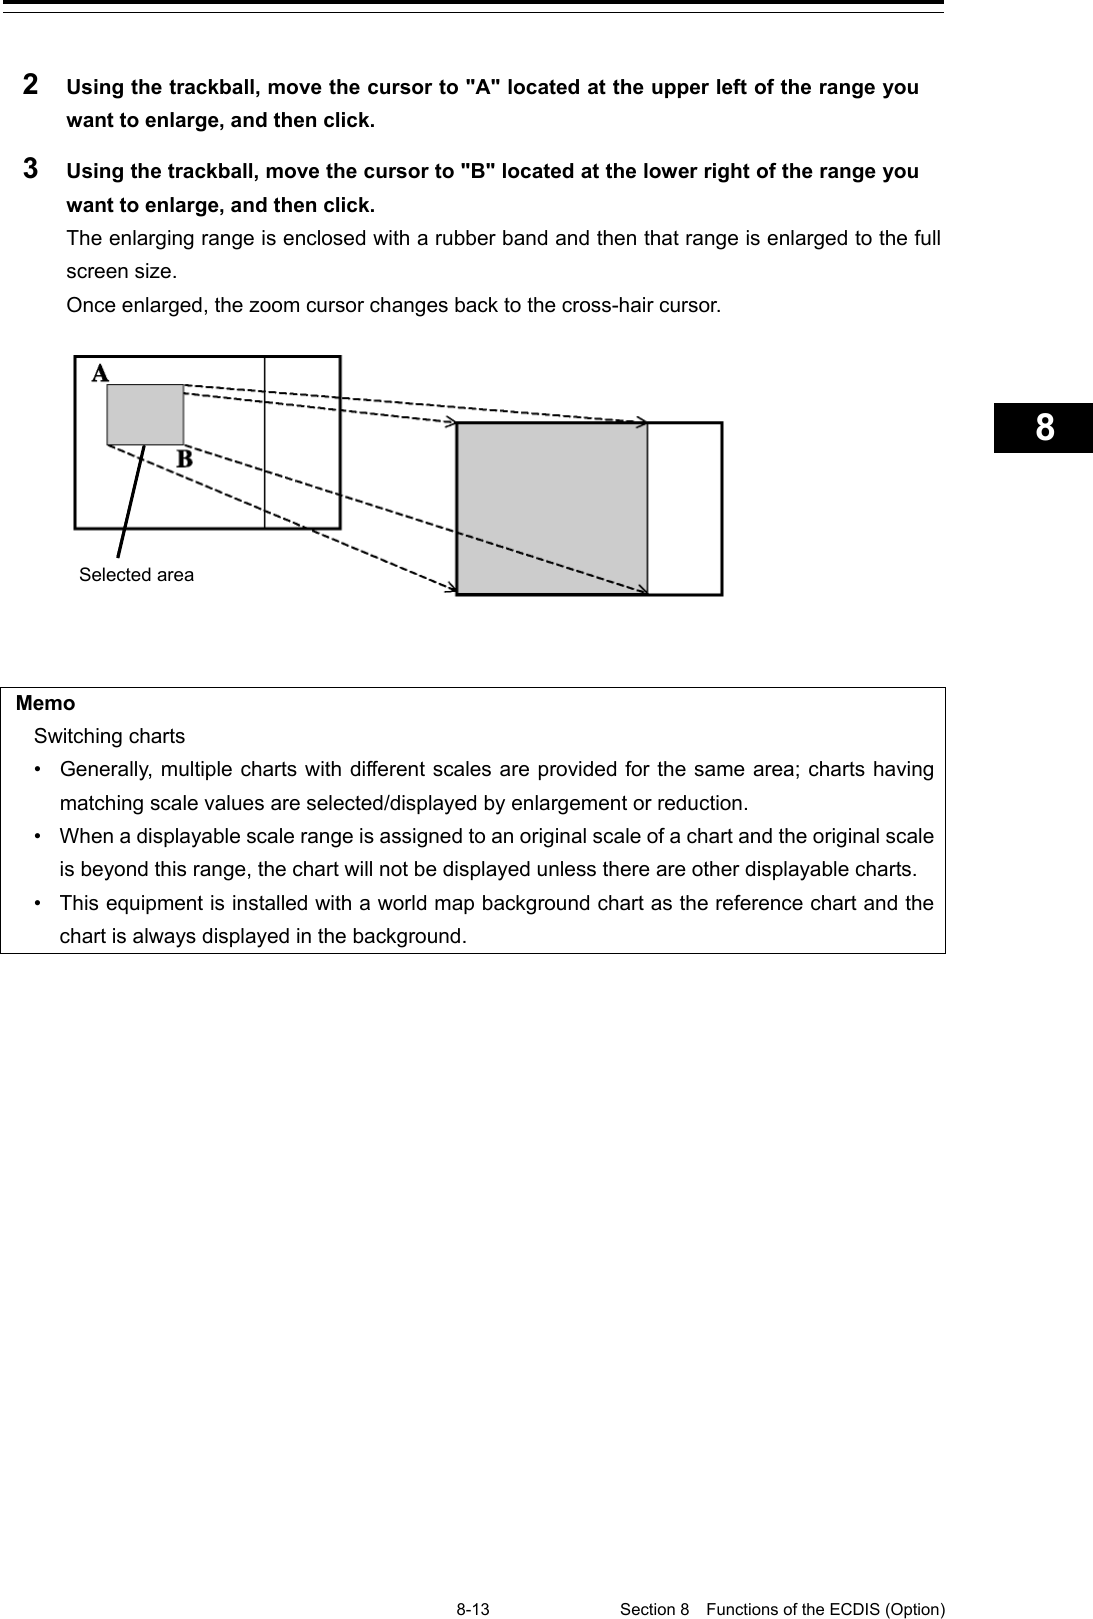
![Section 8 Functions of the ECDIS (Option) 8-12 8.4 Zooming In/Out the Chart The chart can be enlarged and reduced by the following methods. Item Related sections Enlarging a selected area 8.4.1 Enlarging a Selected Area (S-57/C-MAP Only) Enlarging/reducing with the [ZOOM IN]/[ZOOM OUT] key on the operation unit (S-57/C-MAP only) 8.4.2.1 Enlarging/reducing with the [ZOOM IN]/[ZOOM OUT] key on the trackball operation unit Enlarging/reducing with the zoom slider (S-57/C-MAP only) 8.4.2.2 Enlarging/reducing with the zoom slider (S-57/C-MAP only) Enlarging/reducing with the Large/Small buttons (RNC only) 8.4.2.3 Enlarging/reducing with the Large/Small buttons (RNC only) 8.4.1 Enlarging a Selected Area (S-57/C-MAP Only) A selected area can be enlarged to the full chart screen size. 1 Click on the [Zoom Area] button. The cross-hair cursor changes to a zoom cursor. [Zoom Area] button](https://usermanual.wiki/Japan-Radio-Co/NKE2632.Instruction-Manual-Funtion-Part-2/User-Guide-2791061-Page-28.png)
![Section 8 Functions of the ECDIS (Option) 8-14 8.4.2 Enlarging/reducing a chart with the Zoom function 8.4.2.1 Enlarging/reducing with the [ZOOM IN]/[ZOOM OUT] key on the trackball operation unit (S-57/C-MAP only) 1 Each time the [ZOOM IN] key is pressed, the chart is enlarged according to the range or scale that has been set up. Each time the [ZOOM OUT] key is pressed, the chart is reduced according to the range or scale that has been set up. For the details of switching between range and scale, refer to "8.4.3 Switching between scale and range (S-57/C-MAP only)". 8.4.2.2 Enlarging/reducing with the zoom slider (S-57/C-MAP only) 1 When the slider handle is clicked upward, display is enlarged. When it is clicked downward, display is reduced. Each time the [In] (zoom in) button is clicked on, the chart is enlarged according to the range or scale that has been set up. Each time the [Out] (zoom out) button is clicked on, the chart is reduced according to the range or scale that has been set up. [ZOOM IN]/[ZOOM OUT] key [In] button Slider [Out] button](https://usermanual.wiki/Japan-Radio-Co/NKE2632.Instruction-Manual-Funtion-Part-2/User-Guide-2791061-Page-30.png)
![8-15 Section 8 Functions of the ECDIS (Option) 1 2 3 4 5 6 7 8 9 10 11 12 13 14 15 16 17 18 19 20 21 22 23 24 25 26 27 For more information about switching between range and scale, refer to "8.4.3 Switching between scale and range (S-57/C-MAP only)". Memo Over scale notification • When the ship enters a different chart, an over-scale activated if the displayed chart is more than double in size than the original data. The vertical lines as seen in the figure below will be displayed on the "chart" to notify lower chart accuracy and clarity. The vertical lines will not be displayed if the size has been made larger (double or more) through proper operation. 8.4.2.3 Enlarging/reducing with the Large/Small buttons (RNC only) 1 Each time the [Large] button is clicked on, the chart is enlarged by one scale level (larger scale charts). Each time the [Small] button is clicked on, the chart is reduced by one scale level (smaller scale charts). Notification line at over scale [Large] button [Small] button](https://usermanual.wiki/Japan-Radio-Co/NKE2632.Instruction-Manual-Funtion-Part-2/User-Guide-2791061-Page-31.png)
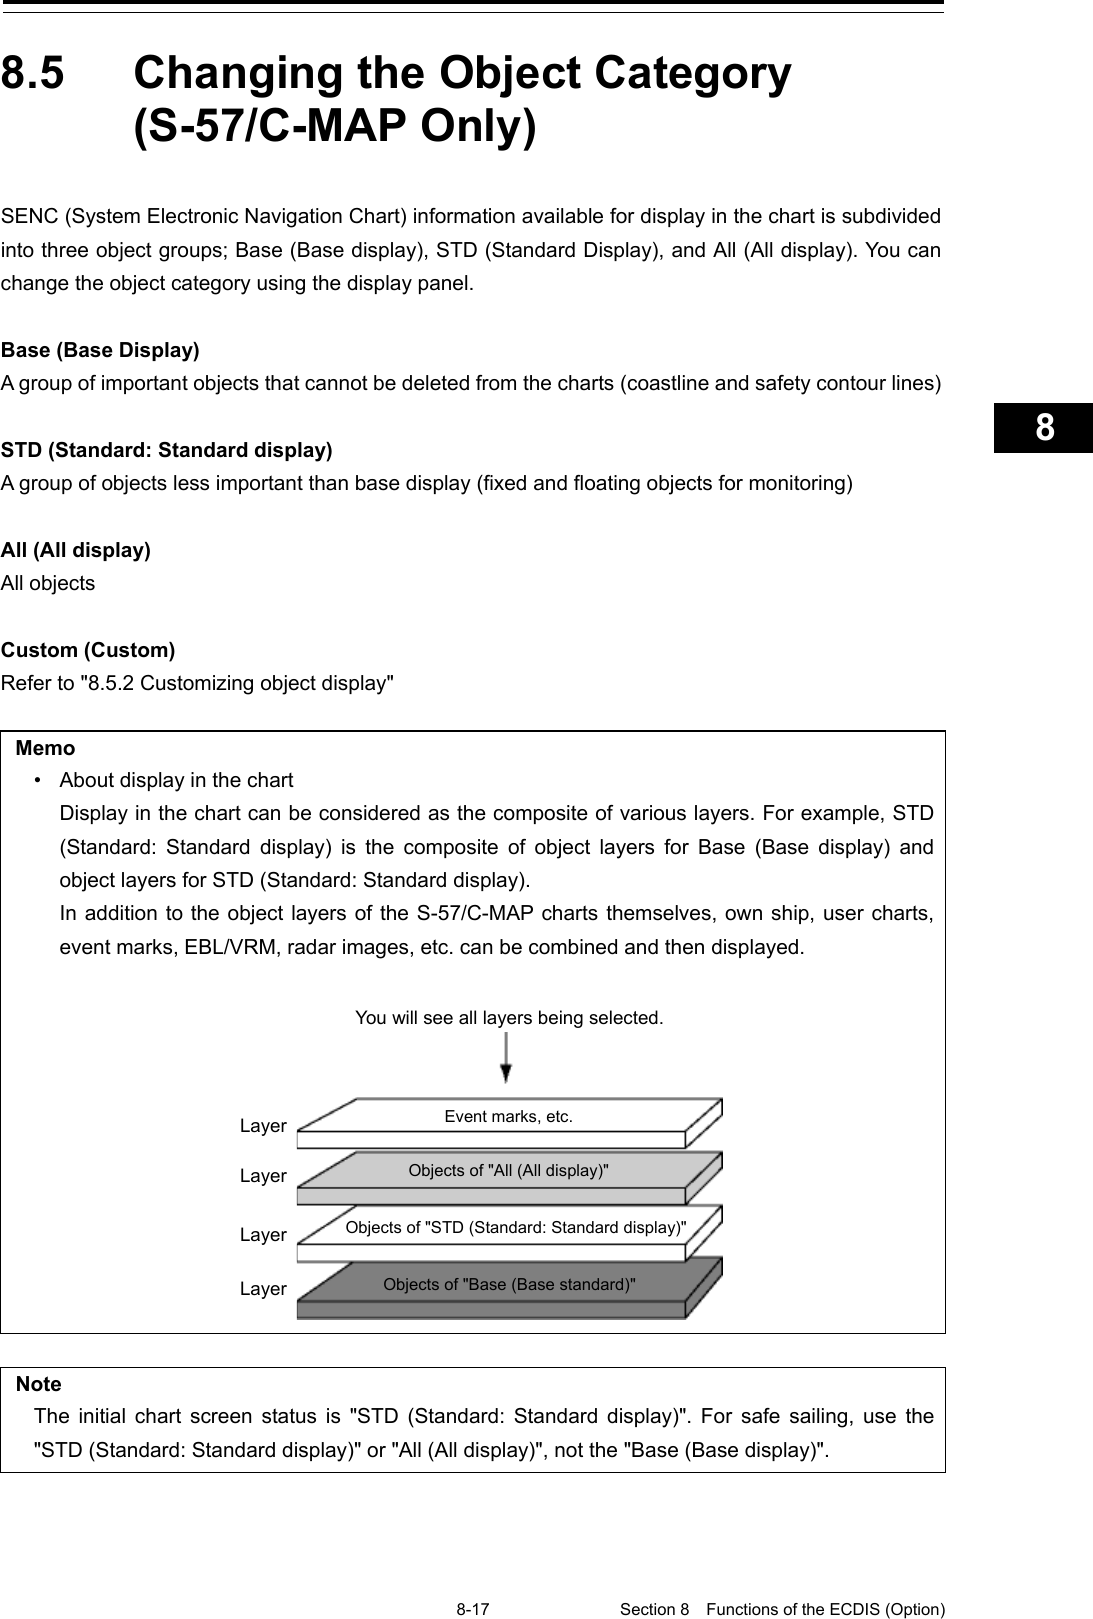
![8-19 Section 8 Functions of the ECDIS (Option) 1 2 3 4 5 6 7 8 9 10 11 12 13 14 15 16 17 18 19 20 21 22 23 24 25 26 27 Note The display will be in gray without displaying a chart when a corresponding chart does not exist in the display area, when a chart exists with only a part of data, or when the display scale does not match the chart scale. In this case, change the scale to check for a chart can be displayed. 8.5.2 Customizing object display When the [Custom] button of the Chart Information Area is clicked on, the object corresponding to the setting in the "Chart View" dialog is displayed. Any of the objects that are displayed on the "Chart View" dialog can be set. 1 Click on the Custom menu display button. The display changes as follows. "All (All display)" Example [Custom] button](https://usermanual.wiki/Japan-Radio-Co/NKE2632.Instruction-Manual-Funtion-Part-2/User-Guide-2791061-Page-35.png)
![Section 8 Functions of the ECDIS (Option) 8-20 2 Click on the [Chart view setting] button. [Chart View] dialog is displayed. The edit pane is divided into three dialogs. To advance to the next dialog: Click on the [Next] button. To return to the previous dialog: Click on the [Back] button. 3 Set the object to be displayed. For the setting of the [Chart View] dialog, refer to "16.2.11 Setting up the Display of ECDIS Chart". Memo The [Chart View] dialog can also be displayed by selecting [View] - [Options] - [Chart View] on the menu.](https://usermanual.wiki/Japan-Radio-Co/NKE2632.Instruction-Manual-Funtion-Part-2/User-Guide-2791061-Page-36.png)
![8-21 Section 8 Functions of the ECDIS (Option) 1 2 3 4 5 6 7 8 9 10 11 12 13 14 15 16 17 18 19 20 21 22 23 24 25 26 27 8.6 Selecting Motion/Bearing Mode Using the Motion/Bearing Mode combo box in Chart Information Area, set up the motion mode and the bearing mode on own ship's chart. The mode that can be selected varies with the chart type. S-57/C-MAP Ed.3 Charts [Selectable combinations in the motion mode and the bearing mode] Bearing mode Motion mode N UP H UP C UP WPT UP TM × × RM Free × × ARCS Charts *The bearing of the ARCS chart is fixed to N UP. Motion mode button Bearing mode button Motion mode button](https://usermanual.wiki/Japan-Radio-Co/NKE2632.Instruction-Manual-Funtion-Part-2/User-Guide-2791061-Page-37.png)
![Section 8 Functions of the ECDIS (Option) 8-22 8.6.1 Setting motion mode Set a motion mode with the Motion Mode combo box in Chart Information Area. 1 Click on the Motion Mode combo box. 2 Select a motion mode. Setting item Description Display image [TM] True Motion Mode • Land and other fixed objects are fixed on the display and only own ship moves on the display. When own ship reaches the predetermined limit, the chart is automatically shifted so that own ship always remains on the screen. [RM] Relative Motion Mode • Own ship is fixed at the center of the screen and the fixed objects such as land move relatively. [Free] Free • You can freely move the chart on the display regardless of the own ship’s direction. As the own ship goes, it disappears from the screen. Fixed Heading line Own ship Moves relatively Heading line Fixed on ship position Fixed Heading line Own ship](https://usermanual.wiki/Japan-Radio-Co/NKE2632.Instruction-Manual-Funtion-Part-2/User-Guide-2791061-Page-38.png)
![8-23 Section 8 Functions of the ECDIS (Option) 1 2 3 4 5 6 7 8 9 10 11 12 13 14 15 16 17 18 19 20 21 22 23 24 25 26 27 Mode change by the operation: In the following cases, the motion/bearing mode will be automatically changed from the current mode to another one. • From [TM] mode to [Free] mode: - When the own ship goes exceeding the display limit of the screen by scrolling the chart. - When an area outside of the own ship range was displayed by loading charts or clicking the [Jump] button in the "My Port List" dialog box. • From [RM] mode to [Free] mode: - When the own ship goes exceeding the display limit of the screen by scrolling the chart. - When an area outside of the own ship range was displayed by loading charts or clicking the [Jump] button in the "My Port List" dialog box. • From [Free] mode to [TM] mode: - When the [Home] button was clicked on, the rotation in the Free mode is retained after changing to the TM mode. Note H UP, WPT UP, C UP are valid only the chart scale is not lower than 1/5,000,000.](https://usermanual.wiki/Japan-Radio-Co/NKE2632.Instruction-Manual-Funtion-Part-2/User-Guide-2791061-Page-39.png)
![Section 8 Functions of the ECDIS (Option) 8-24 8.6.2 Setting Bearing mode (S-57/C-MAP only) Set a bearing mode with the Bearing Mode button in Chart Information Area. 1 Click on the Bearing Mode combo box. 2 Select a bearing mode. Setting item Description Display image [N UP] North up • The chart is always displayed towards true north. Fixed objects do not flicker and are easily identified on the chart, and the true bearing of the objects can readily be read out. [H UP] Head up The chart is displayed by orienting the ship's heading upward. Cannot be selected under TM (true motion). [C UP] Course up • At the setting of Course Up, the ship’s heading (HDG) is fixed and displayed immediately above the screen. [WPT UP] Way point up • The chart rotates automatically so that the screen is always oriented upward until the target WPT. Own ship Heading line Own ship Heading line Own ship Heading line Target WPT Own ship Heading line](https://usermanual.wiki/Japan-Radio-Co/NKE2632.Instruction-Manual-Funtion-Part-2/User-Guide-2791061-Page-40.png)
![8-25 Section 8 Functions of the ECDIS (Option) 1 2 3 4 5 6 7 8 9 10 11 12 13 14 15 16 17 18 19 20 21 22 23 24 25 26 27 Setting item Description Display image [C UP (Angle Setting)] Course UP by angle setting • When this item is selected, the "C UP (Angle Setting)" dialog box appears. The course angle that was set on the dialog is displayed right above the chart and fixed. - Input the angle of the ship’s heading in the [Angle] input box of the "C UP (Angle Setting)" dialog box. - The angle can be input (increase/decrease) by operating the angle input slider. - After completing the setting, click on the [X] button. Display changes according to the selected bearing mode. Heading line Own ship](https://usermanual.wiki/Japan-Radio-Co/NKE2632.Instruction-Manual-Funtion-Part-2/User-Guide-2791061-Page-41.png)
![Section 8 Functions of the ECDIS (Option) 8-26 8.7 Registering and Displaying My Port List 8.7.1 Registering to My Port List You can register any position on the chart to the "My Port List" dialog box. After registration, you can directly access to that position by selecting a port name from the My Port List. 1 Set the location to be registered. S-57/C-MAP Since the center position and the display scale of the screen that is currently displayed are registered in the port name list, move the location to be registered to the center of the screen in advance. To display another position, shift the chart area (refer to "8.3 Moving the Chart") or zoom in to/out from the chart. (Refer to "8.4 Zooming In/Out the Chart". ARCS Since the center position and the display scale of the screen that is currently displayed are registered in the port name list, move the location to be registered to the center of the screen in advance. To display another position, display the chart according to the procedures provided below. • 8.9.1 Selecting charts from all • 8.9.2 Changing active panels (ARCS only) 2 Click on the [Menu] button on the left toolbar. The menu is displayed. 3 Click [Chart] - [My Port List] on the menu. The "My Port List" dialog box appears. In the "My Port List" dialog, the Name, LAT (latitude), LON (longitude), and display Scale (scale) of the port that is currently registered are displayed. My port list](https://usermanual.wiki/Japan-Radio-Co/NKE2632.Instruction-Manual-Funtion-Part-2/User-Guide-2791061-Page-42.png)
![8-27 Section 8 Functions of the ECDIS (Option) 1 2 3 4 5 6 7 8 9 10 11 12 13 14 15 16 17 18 19 20 21 22 23 24 25 26 27 4 Enter the registration name of the port in the [My Port List] (port name) input box. 5 Click on the [Save] button. The coordinates (latitude and longitude) of the center of the chart display and the display scale according to the registration name designated in the step 4 are registered in the list as the port. 8.7.2 Deleting a port 1 Click on the [Menu] button on the left toolbar. The menu is displayed. 2 Click [Chart] - [My Port List] on the menu. The "My Port List" dialog box appears. 3 Click on the port to be deleted from the My Port List. The port is selected. 4 Click on the [Delete] button. The selected port is deleted from the My Port List.](https://usermanual.wiki/Japan-Radio-Co/NKE2632.Instruction-Manual-Funtion-Part-2/User-Guide-2791061-Page-43.png)
![Section 8 Functions of the ECDIS (Option) 8-28 8.8 Selecting a S-57 chart Because the chart of own ship's position is automatically called up after power on, generally route monitoring can be performed instantly. If you want to display charts other than the chart automatically called up, select a chart from those that are displayed by selecting [Chart] - [Select S-57 Chart] on the menu. For the details, refer to "13.2 Displaying/Searching an S-57 Chart [Select S-57 Chart] ".](https://usermanual.wiki/Japan-Radio-Co/NKE2632.Instruction-Manual-Funtion-Part-2/User-Guide-2791061-Page-44.png)
![8-29 Section 8 Functions of the ECDIS (Option) 1 2 3 4 5 6 7 8 9 10 11 12 13 14 15 16 17 18 19 20 21 22 23 24 25 26 27 8.9 Selecting an ARCS chart This section describes chart selection and the functions on the display, which are available on the ARCS chart. 8.9.1 Selecting charts from all You can select desired charts from all the charts stored in this system. 1 Click on the [Select] button in Chart Information Area. The "Select Chart" dialog box appears. 2 Select the desired chart in the list by clicking it and then click on the [OK] button. The selected chart is displayed on the screen. Chart selection button [OK] button](https://usermanual.wiki/Japan-Radio-Co/NKE2632.Instruction-Manual-Funtion-Part-2/User-Guide-2791061-Page-45.png)
![Section 8 Functions of the ECDIS (Option) 8-30 8.9.2 Changing active panels (ARCS only) The active panel on the chart can be changed. 1 Right-click on the chart The context menu is displayed. 2 On the Context menu, click on the [Change Active Panel]. The selectable active panel painted in blue is displayed. 3 Click on in the blue panel. The corresponding chart is then displayed. Blue square Selected chart](https://usermanual.wiki/Japan-Radio-Co/NKE2632.Instruction-Manual-Funtion-Part-2/User-Guide-2791061-Page-46.png)
![8-31 Section 8 Functions of the ECDIS (Option) 1 2 3 4 5 6 7 8 9 10 11 12 13 14 15 16 17 18 19 20 21 22 23 24 25 26 27 8.9.3 Changing a low resolution chart (ARCS only) 1 Right-click on the chart The context menu is displayed. 2 On the Context menu, click on the [Load Low Resolution]. The low resolution chart is displayed on the screen.](https://usermanual.wiki/Japan-Radio-Co/NKE2632.Instruction-Manual-Funtion-Part-2/User-Guide-2791061-Page-47.png)
![Section 8 Functions of the ECDIS (Option) 8-32 8.9.4 Changing a high resolution chart (ARCS only) 1 Right-click on the chart The context menu is displayed. 2 On the Context menu, click on the [High Resolution Area]. The cursor changes to the zoom cursor and an orange frame appears on the chart. 3 Move the cursor to the area to be expanded (the frame moves together with the cursor) and click the mouse button. The high-resolution chart in the area within the frame is displayed on the screen. Orange frame High resolution chart](https://usermanual.wiki/Japan-Radio-Co/NKE2632.Instruction-Manual-Funtion-Part-2/User-Guide-2791061-Page-48.png)
![8-33 Section 8 Functions of the ECDIS (Option) 1 2 3 4 5 6 7 8 9 10 11 12 13 14 15 16 17 18 19 20 21 22 23 24 25 26 27 8.9.5 Displaying the note and diagram (ARCS only) You can display the note and diagram list defined by the current chart. 1 Right-click on the chart The context menu is displayed. 2 On the Context menu, click on the [Note and Diagram]. The "Note and Diagram" dialog box appears. 3 Click on the item you want to display. The note or diagram on the corresponding chart is displayed. Clicking the [X] buttons, the dialog box is closed and the chart display returns to the original display position.](https://usermanual.wiki/Japan-Radio-Co/NKE2632.Instruction-Manual-Funtion-Part-2/User-Guide-2791061-Page-49.png)
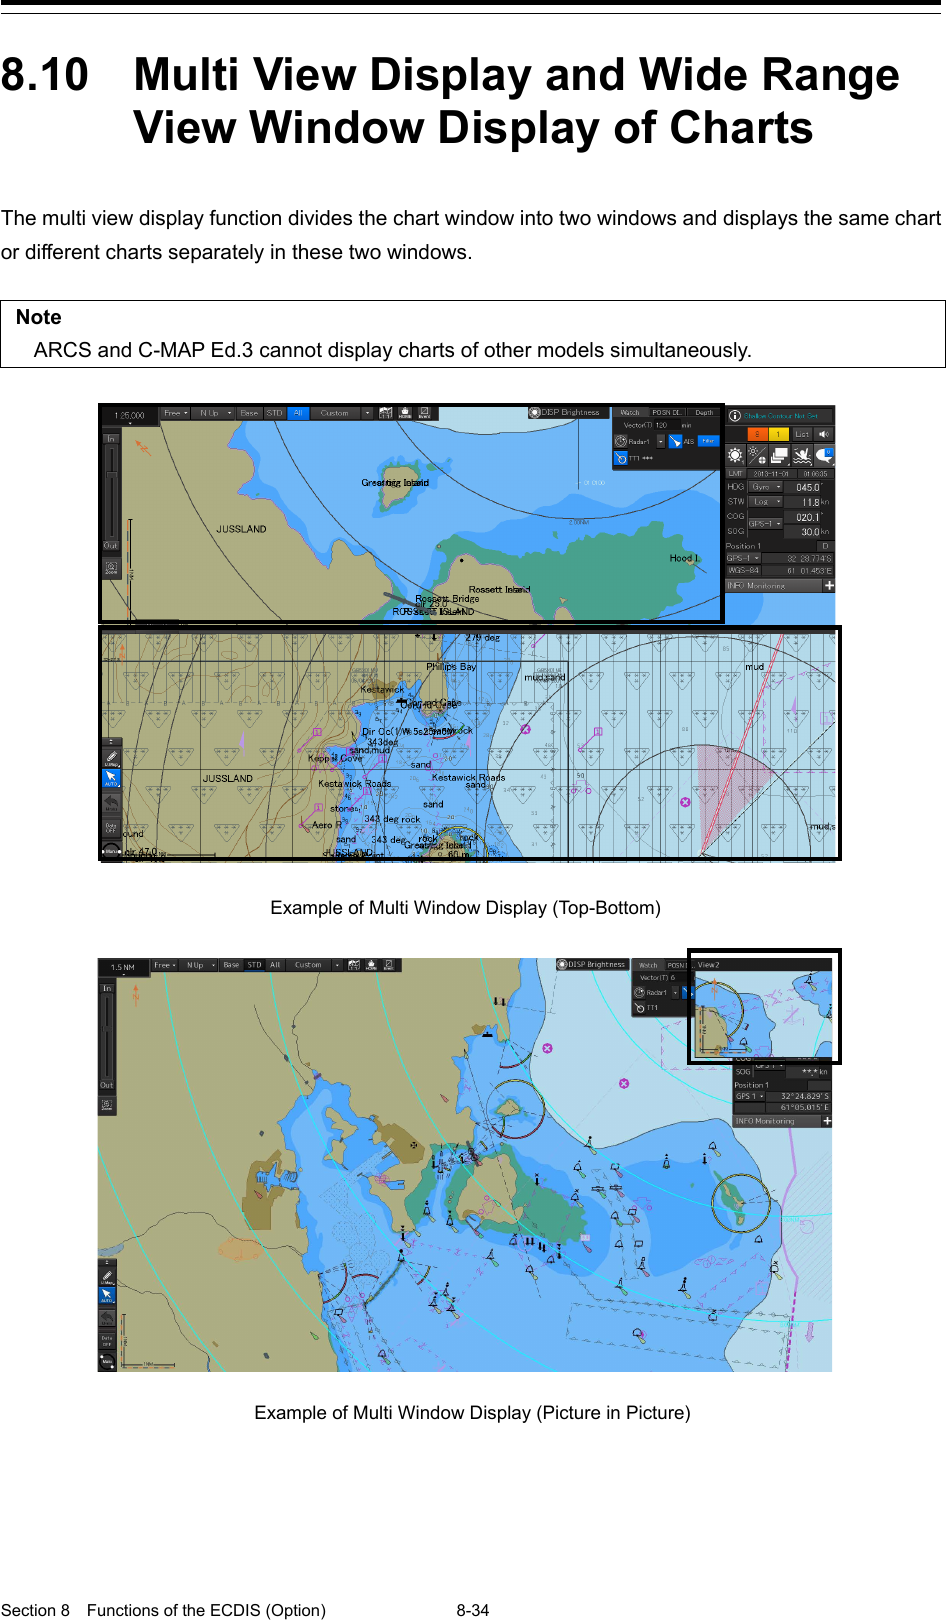
![8-35 Section 8 Functions of the ECDIS (Option) 1 2 3 4 5 6 7 8 9 10 11 12 13 14 15 16 17 18 19 20 21 22 23 24 25 26 27 8.10.1 Display of multi view 8.10.1.1 Displaying multi view 1 Click on the [Menu] button on the left toolbar. The menu is displayed. 2 Select [View] - [Multi View Mode] on the menu. The "Multi View Mode" dialog box appears. 3 Click on a multi view mode to select it. The selected multi view mode takes effect. Top-Bottom View modes View1 View2](https://usermanual.wiki/Japan-Radio-Co/NKE2632.Instruction-Manual-Funtion-Part-2/User-Guide-2791061-Page-51.png)
![8-37 Section 8 Functions of the ECDIS (Option) 1 2 3 4 5 6 7 8 9 10 11 12 13 14 15 16 17 18 19 20 21 22 23 24 25 26 27 8.10.1.2 Multi view operation procedure [Operation When Manipulating Multi View] • The same view is displayed in View1 and View2. • Except for the items that can be set up separately in View2, View1 and View2 are displayed by linking. • Rubber bands during create or edit operation (such as Route Planning) can only be displayed in active view. • EBL/VRM and EBL maneuvers are shared between View1 and View2 and the same contents are displayed (however, the contents may differ depending on the setting of the measurement reference point.). Note The bearing mode of View2 operates by interlocking with the bearing mode of View1. [Specifying an area to be displayed in View2] In View1, you can specify an area you want to display in View2. 1 Click on the [Select Area from View1 for View2] button in the "Multi View Mode" dialog. The button is displayed in reverse video. 2 Move the cursor to View1. The cursor changes to the range selection cursor.](https://usermanual.wiki/Japan-Radio-Co/NKE2632.Instruction-Manual-Funtion-Part-2/User-Guide-2791061-Page-53.png)
![Section 8 Functions of the ECDIS (Option) 8-38 3 Drag the cursor and specify an area you want to display in View2. 4 Click on. The specified range is displayed in View2. The [Select Area from View1 for View2] button is displayed in normal video.](https://usermanual.wiki/Japan-Radio-Co/NKE2632.Instruction-Manual-Funtion-Part-2/User-Guide-2791061-Page-54.png)
![8-39 Section 8 Functions of the ECDIS (Option) 1 2 3 4 5 6 7 8 9 10 11 12 13 14 15 16 17 18 19 20 21 22 23 24 25 26 27 [Selecting a View] Various operations can be performed in the selected view. 1 Click on the view you want to make active. The clicked view becomes the active view. Which view is active can be checked in active information display. Active information display area When View1 is active When View2 is active](https://usermanual.wiki/Japan-Radio-Co/NKE2632.Instruction-Manual-Funtion-Part-2/User-Guide-2791061-Page-55.png)
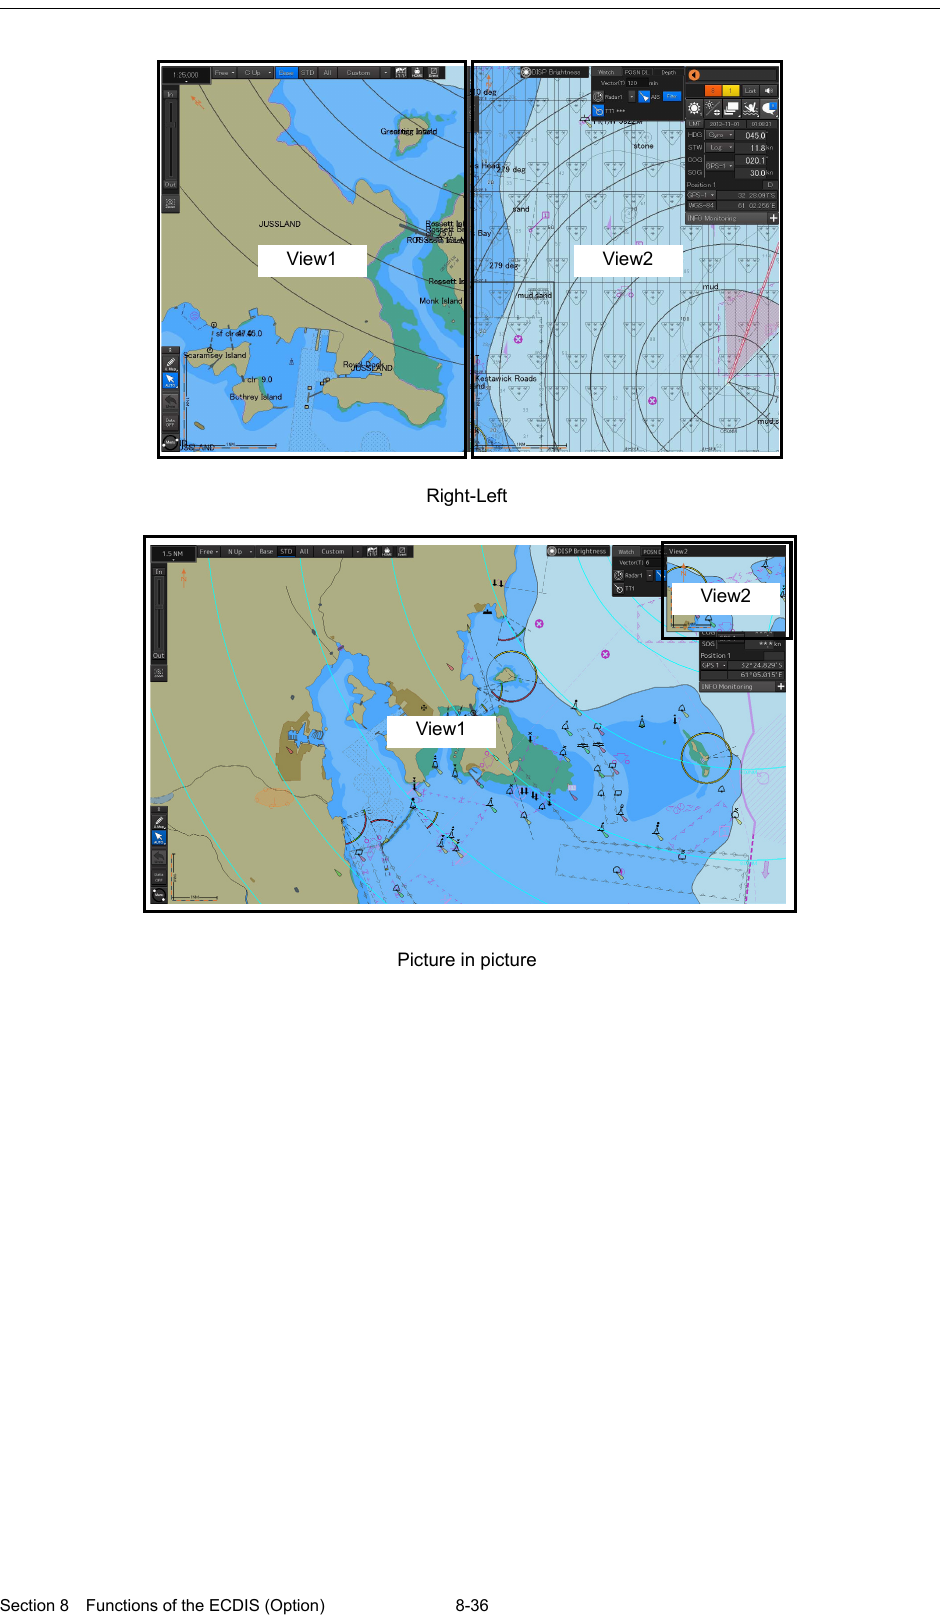
![Section 8 Functions of the ECDIS (Option) 8-40 [Moving the Boundary Line of View] When the view mode is either Top-Bottom or Right-Left, the boundary line of view can be moved. 1 To move the boundary line of view, click on the boundary line. 2 When the cursor changes to the arrow shape shown below, move the boundary by dragging the cursor to the arrow directions. [Moving View2] When the view mode is Picture in picture, the position of View2 can be moved. 1 Click on the title bar of View2 2 When the cursor changes to the arrow shape shown below, move View2 by dragging the cursor to the arrow directions.](https://usermanual.wiki/Japan-Radio-Co/NKE2632.Instruction-Manual-Funtion-Part-2/User-Guide-2791061-Page-56.png)
![Section 8 Functions of the ECDIS (Option) 8-42 2 Click on [Readout chart information] on the context menu. "Chart Information" dialog box appears. [Name] (Chart name display) When multiple charts exist at the chart position that was clicked on and a chart is selected from the list, the information on the chart is displayed. When [All] is selected from the list, the information on all the charts is displayed. Memo When Chart Legend or Update History is selected, the entire information is displayed regardless of the selection from the list. Display switching tab This tab switches the information that is displayed. When the [Object] (object information) tab is clicked on, object information is displayed. When the [Chart Legend] tab is clicked on, chart information is displayed. When the [Update History] tab is clicked on, chart update history is displayed. [Name] (Chart name) Display switching tab](https://usermanual.wiki/Japan-Radio-Co/NKE2632.Instruction-Manual-Funtion-Part-2/User-Guide-2791061-Page-58.png)
![8-43 Section 8 Functions of the ECDIS (Option) 1 2 3 4 5 6 7 8 9 10 11 12 13 14 15 16 17 18 19 20 21 22 23 24 25 26 27 8.11.1.2 Verifying Object Information When the [Object] tab on the display switching tab is clicked on, object information is displayed. Object list area The object within the pick cursor and its geometry are displayed in the object information area. [Display administrative information] When this item is selected, the attributes of the administrative information and the contents are displayed. [Display administrative information] Object List area Object information area](https://usermanual.wiki/Japan-Radio-Co/NKE2632.Instruction-Manual-Funtion-Part-2/User-Guide-2791061-Page-59.png)
![Section 8 Functions of the ECDIS (Option) 8-44 Object information area Information (attributes) of the object that was selected from the object list is displayed. Displaying an additional information file The additional information file on the object that was selected from the object list is displayed in [Value] in hyperlink format. Additional information [Value] (Attribute value) [Value] (Attribute value) [Attribute Name] (Attribute name) [View Table] button [Attribute] (Attribute name)](https://usermanual.wiki/Japan-Radio-Co/NKE2632.Instruction-Manual-Funtion-Part-2/User-Guide-2791061-Page-60.png)
![8-45 Section 8 Functions of the ECDIS (Option) 1 2 3 4 5 6 7 8 9 10 11 12 13 14 15 16 17 18 19 20 21 22 23 24 25 26 27 When Hyperlink is clicked on, the additional information file is displayed in a separate dialog box. [View Table] button When the [View Table] button of [Value] is clicked on, the data is displayed in a separate dialog box in the format that is specified as the attribute.](https://usermanual.wiki/Japan-Radio-Co/NKE2632.Instruction-Manual-Funtion-Part-2/User-Guide-2791061-Page-61.png)
![Section 8 Functions of the ECDIS (Option) 8-46 8.11.1.3 Verifying Chart Information When the [Chart Legend] tab of the display switching tab is clicked on, chart information is displayed. Chart information separator](https://usermanual.wiki/Japan-Radio-Co/NKE2632.Instruction-Manual-Funtion-Part-2/User-Guide-2791061-Page-62.png)