Cisco Systems BTS-R3 Broadband Data BTS User Manual Appendix Pt 2 40 00047 09 F I C TTA
Cisco Systems, Inc Broadband Data BTS Appendix Pt 2 40 00047 09 F I C TTA
Contents
Manual app 2
Navini Networks, Inc. Ripwave Base Station I&C Guide
Part #40-00047-00 Rev F v1.0 (TTA) 181
October 23, 2003
Appendix O: RFS System Test (Cable Sweeps)
Introduction
Before installing the Base Station at a site, the RFS and the associated cables must be tested, and
the results of the tests documented. This procedure applies to the full RFS sub-assembly and
associated cables: data/power cable, RF cables, and the RFS unit. All results are recorded in the
RFS System Test Form P/N 40-00093-00.
Procedures – Combo & Split Chassis Base Stations
RFS Data/Power Cable (Combo and Split BTS Configurations Only)
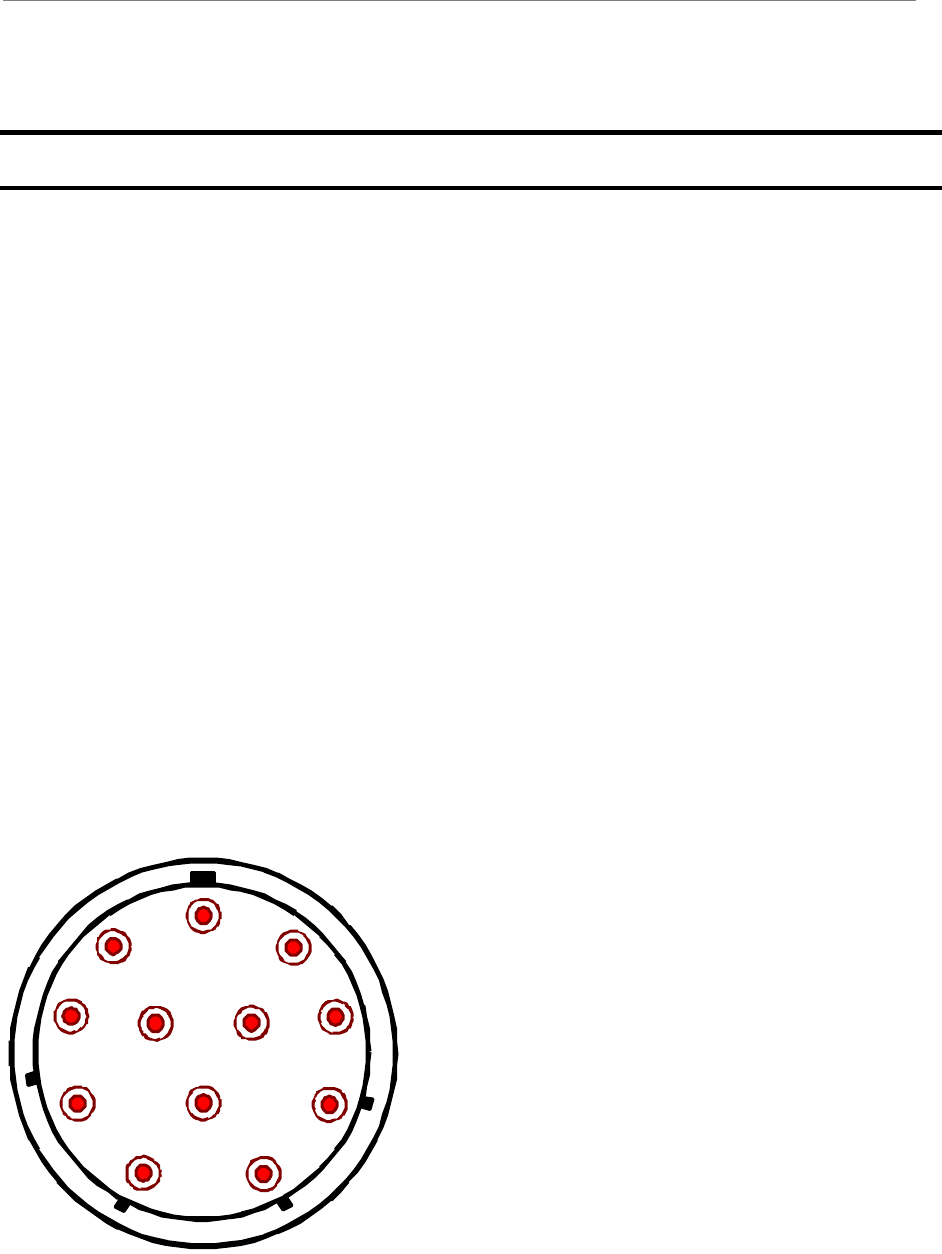
This test will check the integrity of the data/power cable. The cable being tested consists of six
twisted pairs of conductors. The conductors will be tested for continuity, opens, and shorts. Male
connectors are on both ends of the cable. Each connector is wired the same. You will need to
check all cables – the main cable from the RFS to the data/power cable surge protector, and the
jumper cable from the data/power cable surge protector to the BTS. The pin layout is shown in
Figure O1, looking at the connector face. Table O1 provides the pin layout details.
Figure O1: Pin Layout
A
B
C
D
E
F
G
H
J
K
L
M

Ripwave Base Station I&C Guide Navini Networks, Inc.
182 Part #40-00047-00 Rev F v1.0 (TTA)
October 23, 2003
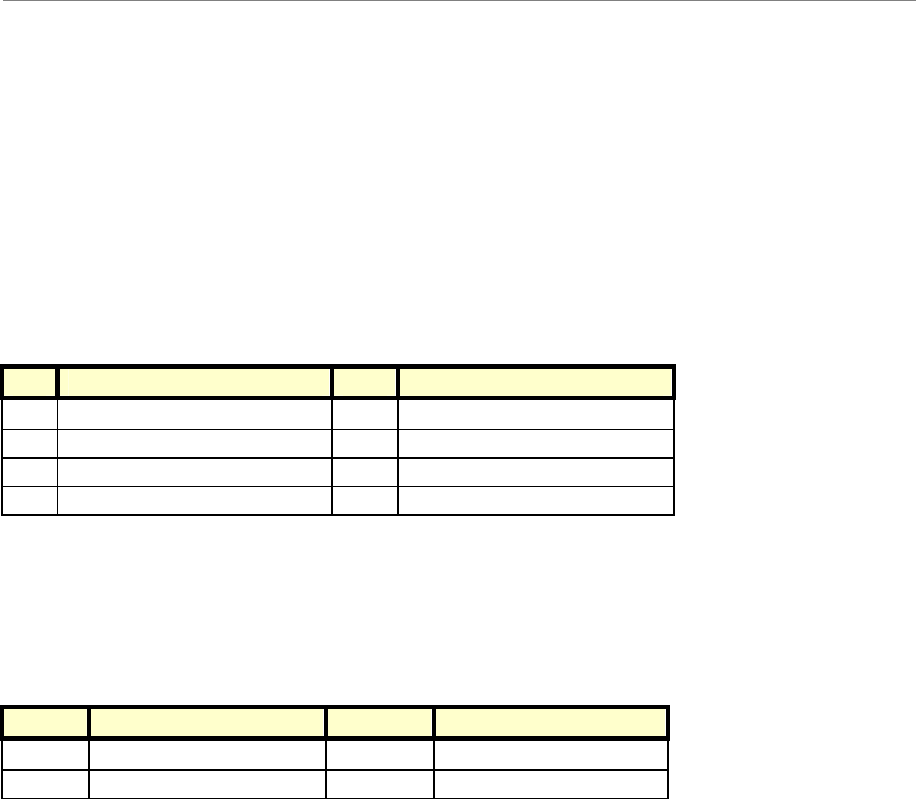
Table O1: Pin layout Details
Perform the continuity test with both the Volt Ohm Meter (VOM) and the power/data cable
tester. If the power/data cable tester is not available, perform the continuity test with the VOM.
Required Equipment
?? VOM – Continuity tester
?? Jumper for shorting pins
?? RFS power/data cable tester
Continuity Test With VOM
Step 1. On one end of the cable, short a pair of conductors using a shorting device.
Step 2. Using a VOM/Digital Volt Meter (DVM) set to ohms, verify a short is present on the
pair at the other end.
Step 3. Leaving one probe on one of the paired pins, contact all of the other pins with the other
probe, ensuring an open connection.
Step 4. Check all 6 pairs of wires in the same manner.
Step 5. Verify continuity from the connector case to the drain wire (pin D) on each end of the
cable and between each connector case.
Step 6. Verify an open circuit from the connector case to each individual wire, except to the
drain wire.
Wire Color Wire Color Signal Name
RED PAIR +12V A
BLACK +12V A RTN
BROWN Heater
DRAIN GND (Shield Wire)
BLACK PAIR RX_EN_B-
WHITE RX_EN_B+
BLUE PAIR RX_EN_A+
BLACK RX_EN_A-
BLACK PAIR Diagbus-
GREEN Diagbus+
BLACK PAIR +12V B Return
YELLOW +12V B
POWER CABLE PIN OUT
A
B
C
D
Circular
Connector(s)
J
K
L
M
E
F
G
H
Navini Networks, Inc. Ripwave Base Station I&C Guide
Part #40-00047-00 Rev F v1.0 (TTA) 183
October 23, 2003
Continuity Test With Power/Data Cable Tester
Step 1. Connect one end of the power/data cable to the connector on the power/data cable
tester.
Step 2. Using a VOM/DVM set to ohms, check resistance to ground on the other end of the
cable. Resistance is checked from the case of the connector to the individual pin.
Resistance readings (+/– 10 percent ) are shown in Table O2.
Table O2: Resistance to Ground
Pin Resistance Pin Resistance
A 1K ohms G 6.2K ohms
B 2K ohms H 8.2K ohms
E 3.3K ohms L 10K ohms
F 5.1K ohms M 12K ohms
Step 3. Using a VOM/DVM set to ohms, check resistance between the pairs on the other end
of the cable. Resistance should be the sum of the resistance of the two pairs, +/– 10
percent. Refer to Table O3.
Table O3: Resistance of Two Pairs
Pins Resistance Pins Resistance
A & B 3K ohms G & H 14.4K ohms
E & F 8.4K ohms L & M 22K ohms
Step 4. Remove the power/data cable tester from the power/data cable.
Sweep Test of RF Cables & RFS
Sweep testing of the RF cables and the RFS is performed in three separate steps.
?? Sweep of the cables
?? Sweep of the RFS
?? Sweep of the cables and the RFS together
All results will be entered in the RFS System Test Form, P/N 40-00093-00. The total of the
insertion loss for the cables and the RFS will be equal to the insertion loss of both parts swept
together.

Ripwave Base Station I&C Guide Navini Networks, Inc.
184 Part #40-00047-00 Rev F v1.0 (TTA)
October 23, 2003
Equipment Required
?? Signal Generator - Agilent 8648C, or suitable alternative, tunable to the RFS center
frequency
?? Spectrum Analyzer - Agilent E4402B, or equivalent
?? Signal Generator cable and Spectrum Analyzer cable – Gender can be changed using a
barrel connector
?? Male and Female barrel connectors for Signal Generator cable and Spectrum Analyzer
cable connections
?? Power/data test cable
?? Navini RFS Test Box
Equipment Settings
Spectrum Analyzer:
?? Span – 5 MHz
?? RBW – 100 KHz
?? VBW – 100 KHz
?? Sweep Time – Auto
?? Frequency (Provided in Table O4)
Signal Generator:
?? Amplitude – 0 dB
?? Frequency (Provided in Table O4)
Test Setup
When performing each type of sweep, the sweep has to be performed at certain frequency
intervals (Table C5). Perform the complete test at the first frequency. Go to the next frequency
and recalibrate the test setup. Perform the complete test again. Do the same for the third
frequency. Refer to Figure O2.
Table O4: Sweep Frequencies
System Sweep 1 Sweep 2 Sweep 3
2.3 GHz High band 2348.25 2352.50 2357.50
2.3 GHz Low band 2307.50 2312.50 2316.75
2.4 GHz 2400.00 2440.00 2473.50
2.5 GHz 2500.00 2548.00 2596.00
2.6 GHz 2602.00 2620.00 2641.00
2.6 GHz EFGH 2602.00 2641.00 2683.00
Navini Networks, Inc. Ripwave Base Station I&C Guide
Part #40-00047-00 Rev F v1.0 (TTA) 185
October 23, 2003
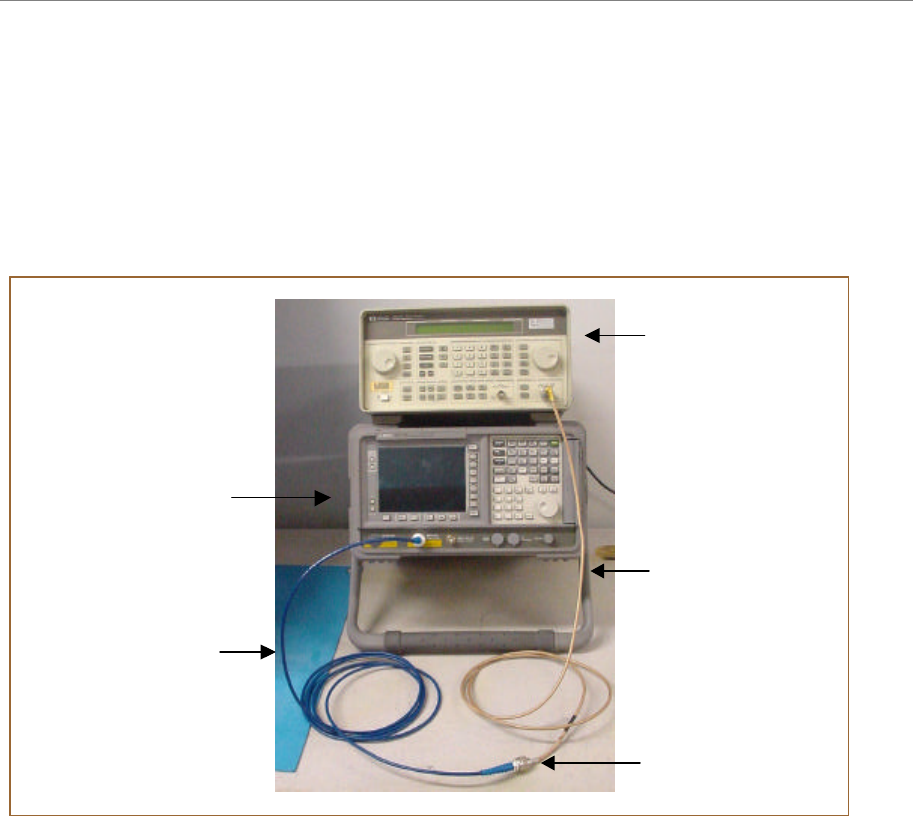
1. Connect the Signal Generator cable to the Signal Generator.
2. Connect the Spectrum Analyzer cable to the Spectrum Analyzer.
3. Connect the other end of the cables together. Use a barrel connector if needed.
Figure O2: Test Setup
Test Procedure
The following procedures are for the Agilent E4402B Spectrum Analyzer. If alternative
equipment is used, refer to the manufacturer’s calibration procedures. The key point is to make
accurate microwave frequency power measurements.
Step 1. Turn the Signal Generator and Spectrum Analyzer on. Allow the equipment to warm
up for 15 minutes for the output to stabilize.
Step 2. Set the Signal Generator frequency to the desired test frequency (Table O4) of the
RFS under test.
Step 3. Set the Signal Generator output amplitude to 0 dBm.
Step 4. Set the center frequency of the Spectrum Analyzer to the center frequency of the RFS
under test.
Step 5. Set the Spectrum Analyzer to Span = 5 MHz and Resolution Bandwidth = 100 kHz.
Spectrum Analyzer
Signal Generator
Barrel Connector
(if needed)
Signal Generator
Cable
Spectrum Analyzer
Cable
Spectrum Analyzer
Signal Generator
Barrel Connector
(if needed)
Signal Generator
Cable
Spectrum Analyzer
Cable
Ripwave Base Station I&C Guide Navini Networks, Inc.
186 Part #40-00047-00 Rev F v1.0 (TTA)
October 23, 2003
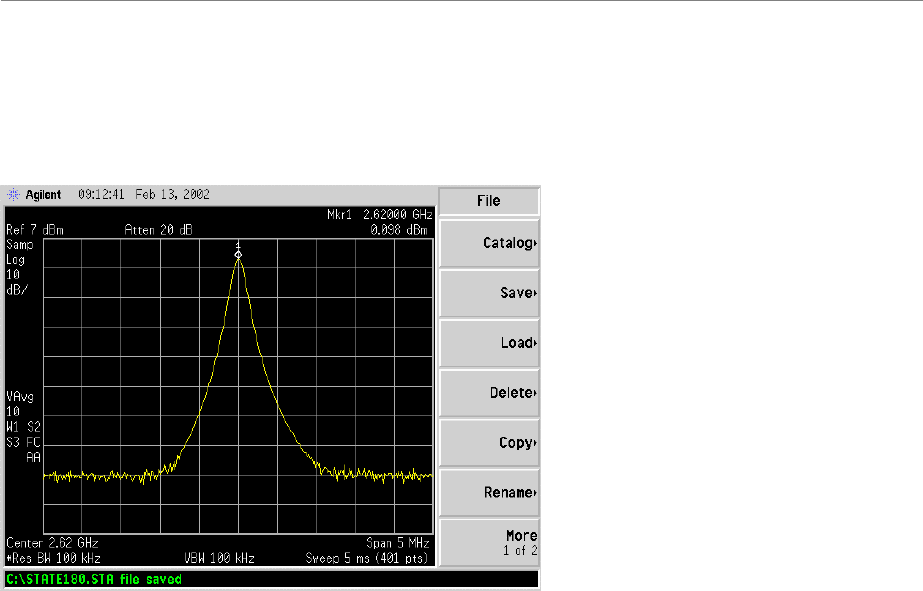
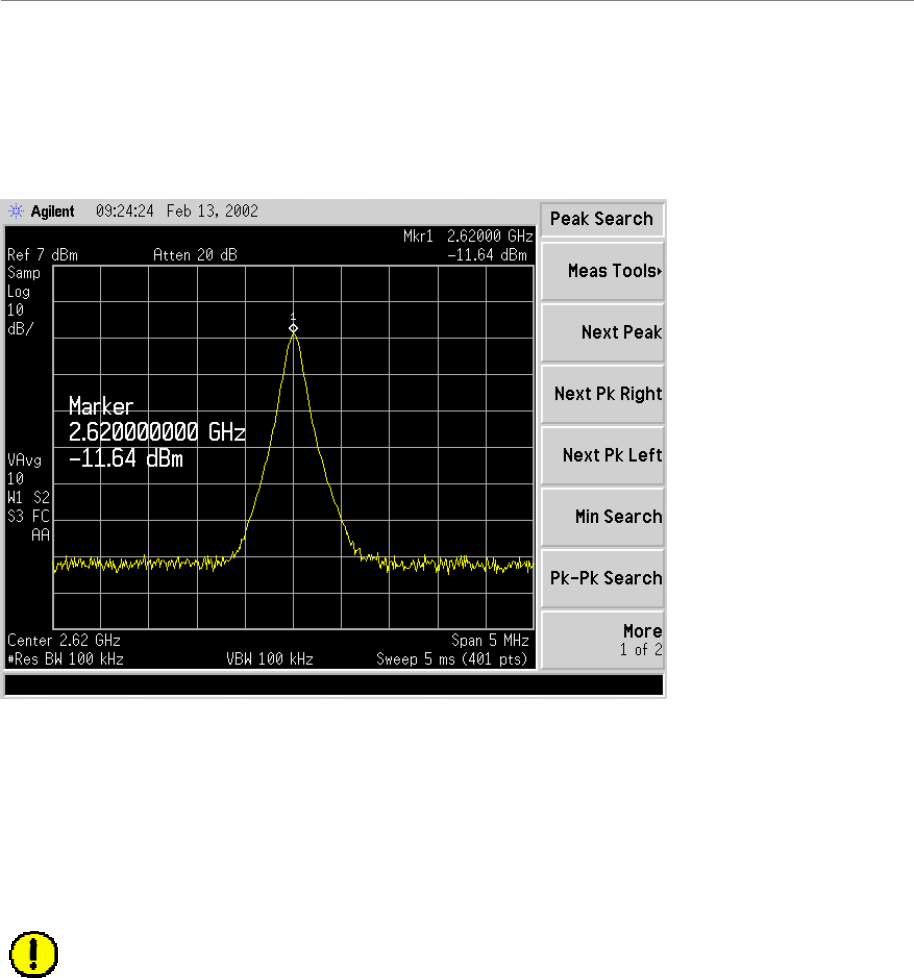
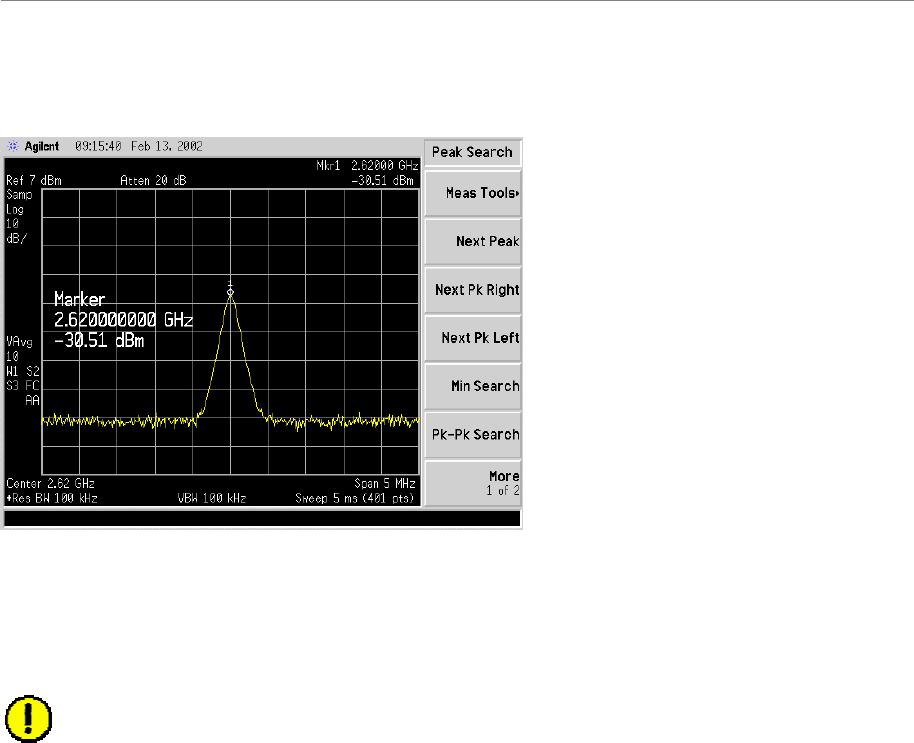
Step 6. Take a marker measurement on the Spectrum Analyzer by using the ‘marker to peak’
or the ‘peak search’ function. The screen on the Spectrum Analyzer should look
similar to that shown in Figure O3.
Figure O3: Sweep Test Marker Measurement Example
If the marker measurement doesn’t read 0.0 dBm, adjust the amplitude on the Signal Generator
until the Spectrum Analyzer marker reads 0.0 dBm, or as close to 0.0 dBm as possible. This will
remove all losses associated with the test cables. All measurement data should be recorded one
digit to the right of the decimal point, for example, 31.5dB.
Once the test setup is calibrated, these cables will remain in place and will be used
throughout the whole test. If the test cables are removed or changed, incorrect readings
will result.
RF Cable Insertion Loss
This test is performed on all RF cables that are installed in the system. This includes the eight
antenna cables, the system calibration cable, and all jumper cables. Follow the procedures for
either the cables on the ground or cables run up the tower.
Test Procedure For RF Cables on the Ground
Step 1. Ensure calibration of the test setup has been performed each time the test frequency is
changed.
Step 2. If present, remove the barrel connector from between the Signal Generator and
Spectrum Analyzer cables.
Step 3. Connect the cable from the Signal Generator to one end of the cable. Use a barrel
connector to change the gender, if required.
Step 4. Connect the cable from the Spectrum Analyzer to the other end of the cable. Use a
barrel connector to change the gender, if required.
Navini Networks, Inc. Ripwave Base Station I&C Guide
Part #40-00047-00 Rev F v1.0 (TTA) 187
October 23, 2003
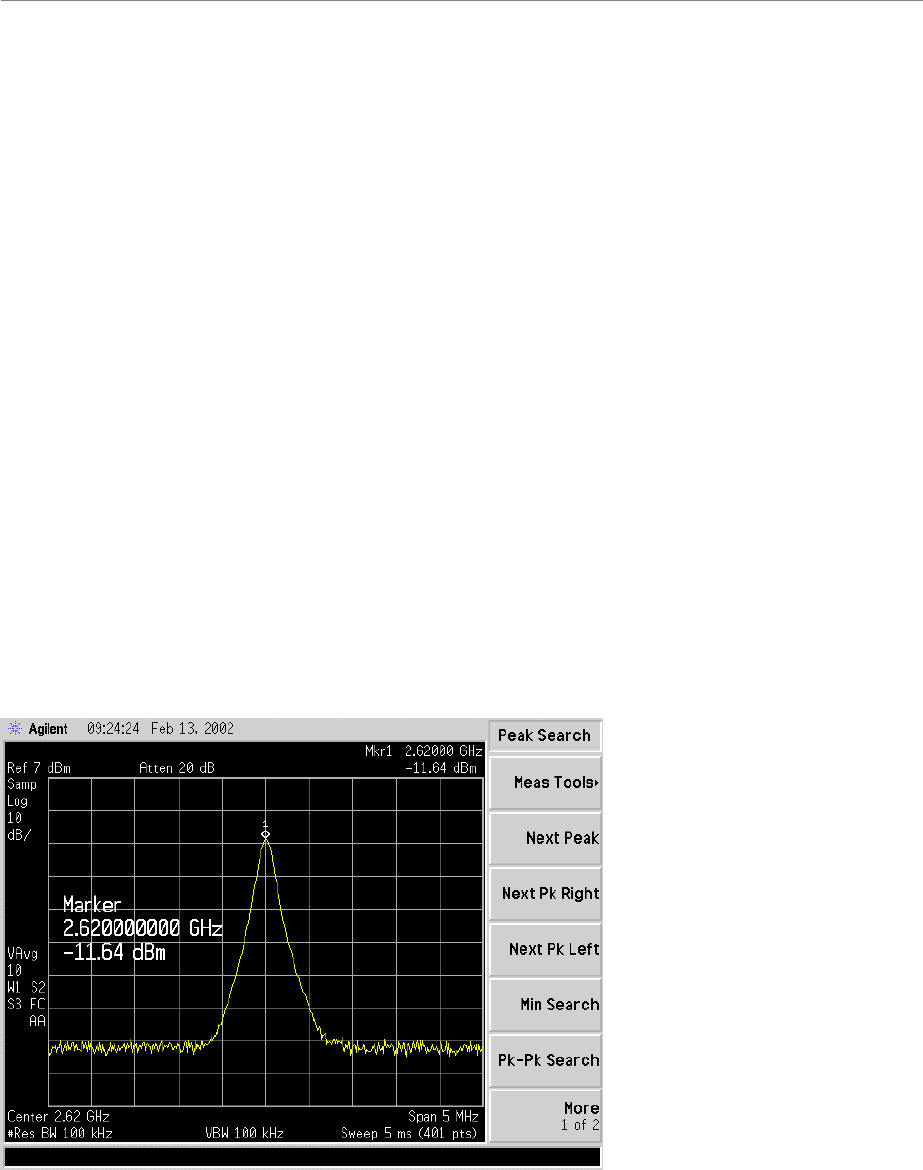
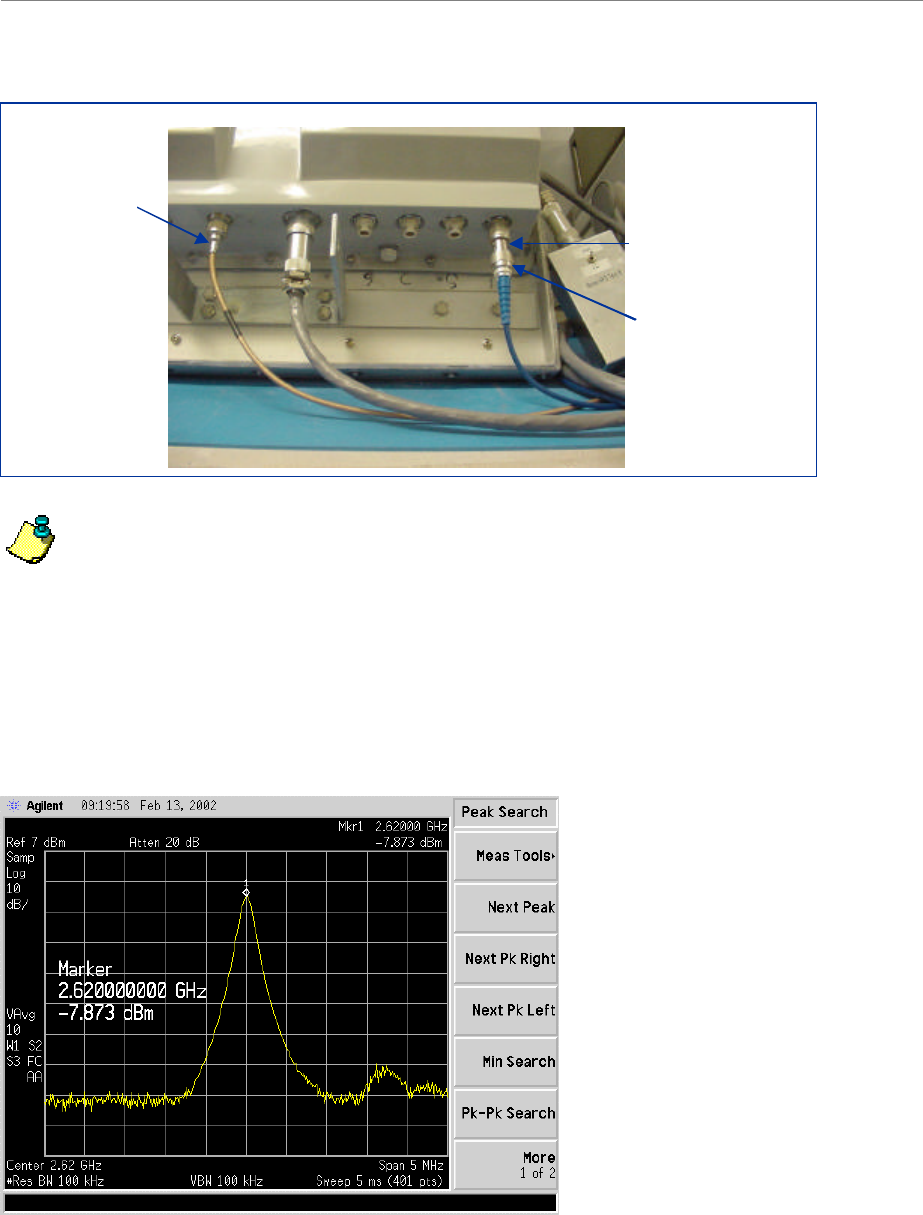
Step 5. Take a marker measurement on the Spectrum Analyzer by using the ‘marker to peak’
or the ‘peak search’ function. The screen on the Spectrum Analyzer should look similar
to the one shown in Figure O4.
Figure O4: Insertion Loss (Cables on Ground) Marker Measurement Example
Step 6. The result should be within +/– 0.5 dB of the calculated value. If the insertion loss
results do not agree with the manufacturer’s data, check the connectors for proper
connection to the cable, and check for kinks in the cable. If the Spectrum Analyzer has
a distance to fault (DTF) function, it can be used to help troubleshoot kinks in the
cable.
CAUTION! Cables with results greater than the specified limits (i.e., 2 or 3 dB high)
should not be installed, as a potential hardware fault exists.
Step 7. Record the data in the RFS System Test Form under “MAIN FEEDER LOSS” or
“JUMPER LOSS”. Ensure that the information is recorded under the channel number
that is on the cable label.
Step 8. Repeat steps 3 through 7 for all remaining cables and jumpers.
Step 9. Change the frequency to the next test frequency (refer back to the Test Setup section of
these procedures). Perform steps 1 through 8 until all cables have been successfully
tested at the frequencies shown in Table O4.
Ripwave Base Station I&C Guide Navini Networks, Inc.
188 Part #40-00047-00 Rev F v1.0 (TTA)
October 23, 2003
Test Procedure For RF Cables Already Run Up the Tower
Step 1. Ensure calibration of the test setup has been performed each time the test frequency is
changed.
Step 2. If present, remove the barrel connector from between the Signal Generator and
Spectrum Analyzer cables.
Step 3. Have a member of the tower crew positioned on the tower, at the upper end of the
cables, connect the calibration cable to antenna cable 1 with a barrel connector.
Step 4. At the lower end of the RF cables, connect the cable from the Signal Generator to the
calibration cable. Use a barrel connector to change the gender, if required.
Step 5. Connect the cable from the Spectrum Analyzer to antenna cable 1. Use a barrel
connector to change the gender, if required.
Step 6. Calculate the marker using the following formula: (the length of BOTH the calibration
cable and the antenna cable) x (loss per foot at the RFS center frequency for the type of
cable used).
Step 7. Take a marker measurement on the Spectrum Analyzer by using the ‘marker to peak’
or the ‘peak search’ function. The screen on the Spectrum Analyzer should look similar
to the one shown in Figure O5.
Figure O5: Insertion Loss (Cables on Tower) Marker Measurement Example
Step 8. The result should be within +/– 0.5 dB of the calculated value. If the insertion loss
results do not agree with the manufacturer’s data, check the cable connectors for proper
connection to the cable, and check for kinks in the cable. If the Spectrum Analyzer has
a distance to fault (DTF) function, this can be used to help troubleshoot kinks in the
cable.
Navini Networks, Inc. Ripwave Base Station I&C Guide
Part #40-00047-00 Rev F v1.0 (TTA) 189
October 23, 2003
Step 9. Divide this value in half and assign the result to the calibration cable and to the antenna
cable.
Caution: Cables with results greater than the specified limits (i.e., 2 or 3 dB high) should
not be installed, as a potential hardware fault exists.
Step 10. Record the data in the RFS System Test Form under “MAIN FEEDER LOSS”. Ensure
that the information is recorded under the channel number that is on the cable label.
Step 11. Repeat steps 3 through 10 for antenna cables 2 through 8.
Step 12. When finished, take the average of the eight values obtained for the calibration cable.
Use this value for the insertion loss of the calibration cable.
Step 13. Change the frequency to the next test frequency (refer back to Test Setup). Perform
steps 1 through 12 until all cables have been successfully tested at the frequencies
given in Table O4.
Step 14. Check the value of the nine jumpers at all three frequencies, per the procedure for
cables on the ground. Record the data in the RFS System Test Form under “JUMPER
LOSS”. Ensure that the information is recorded under the channel number that is on the
cable label.
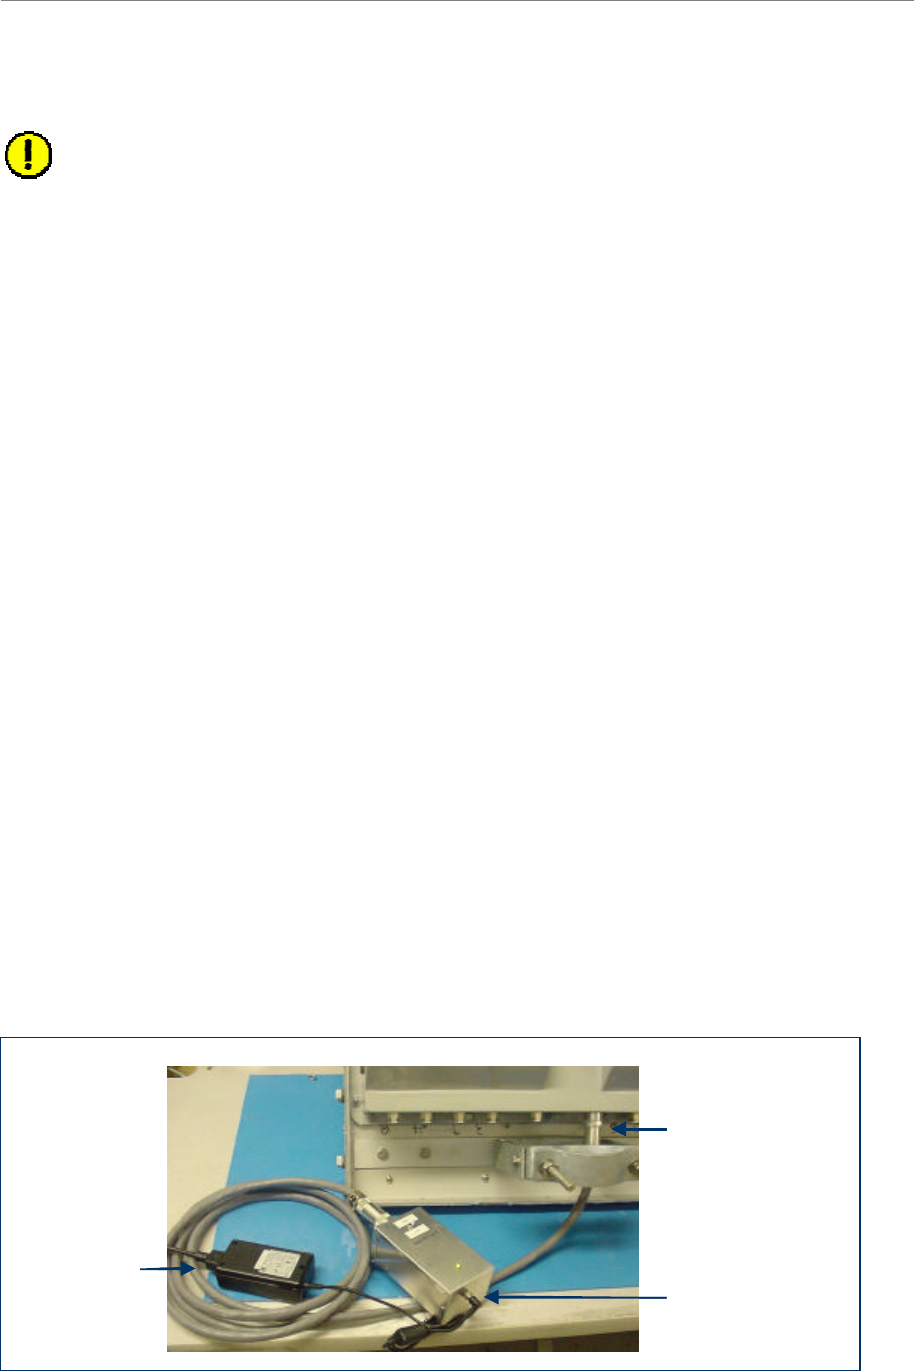
RFS Test Box Setup
Step 1. For RFS only testing, connect the power/data test cable to the data connector on the
RFS and to the RFS Test Box.
- OR -
For RFS and cable testing, connect the installation power/data cable to the data
connector on the RFS and to the RFS Test Box.
Refer to Figure O6.
Step 2. Connect the RFS Test Box power supply to the RFS Test Box.
Step 3. Plug the RFS Test Box power supply into a 110 VAC outlet.
Figure O6: RFS Only Testing Setup
Power/Data cable
connected to the RFS
RFS Test Box
RFS Test Box
power supply
Power/Data cable
connected to the RFS
RFS Test Box
RFS Test Box
power supply
Ripwave Base Station I&C Guide Navini Networks, Inc.
190 Part #40-00047-00 Rev F v1.0 (TTA)
October 23, 2003
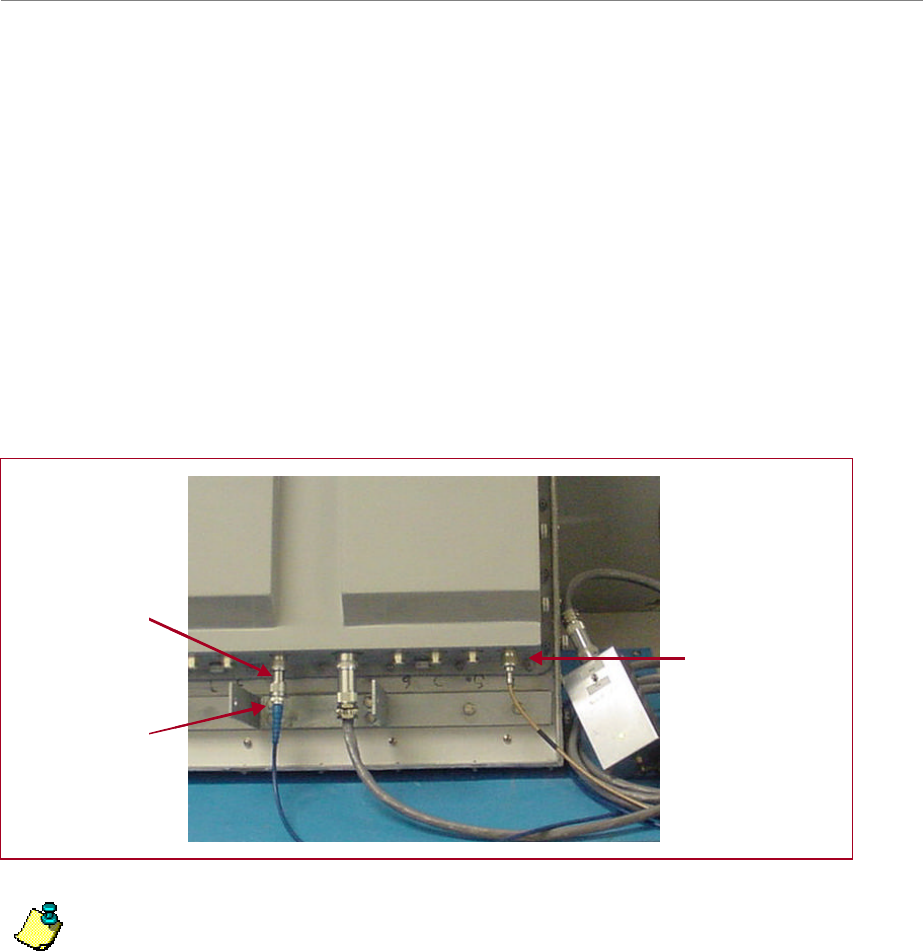
RFS Only Transmit Verification
Ensure that the calibration of the test setup and RFS Test Box setup for RFS Only has been
performed each time the test frequency is changed. Refer to Figure O7.
Step 1. Switch the RFS Test Box to the transmit (Tx) mode.
Step 2. Connect the cable from the Spectrum Analyzer to the RFS cal connector. Use a barrel
connector to change the gender, if required.
Step 3. Connect the cable from the Signal Generator to the RFS antenna input number 1. Use a
barrel connector to change the gender, if required.
Figure O7: RFS Only Tx Verification
Note: The position of the RFS will vary the sweep results due to reflections from the test
surface.
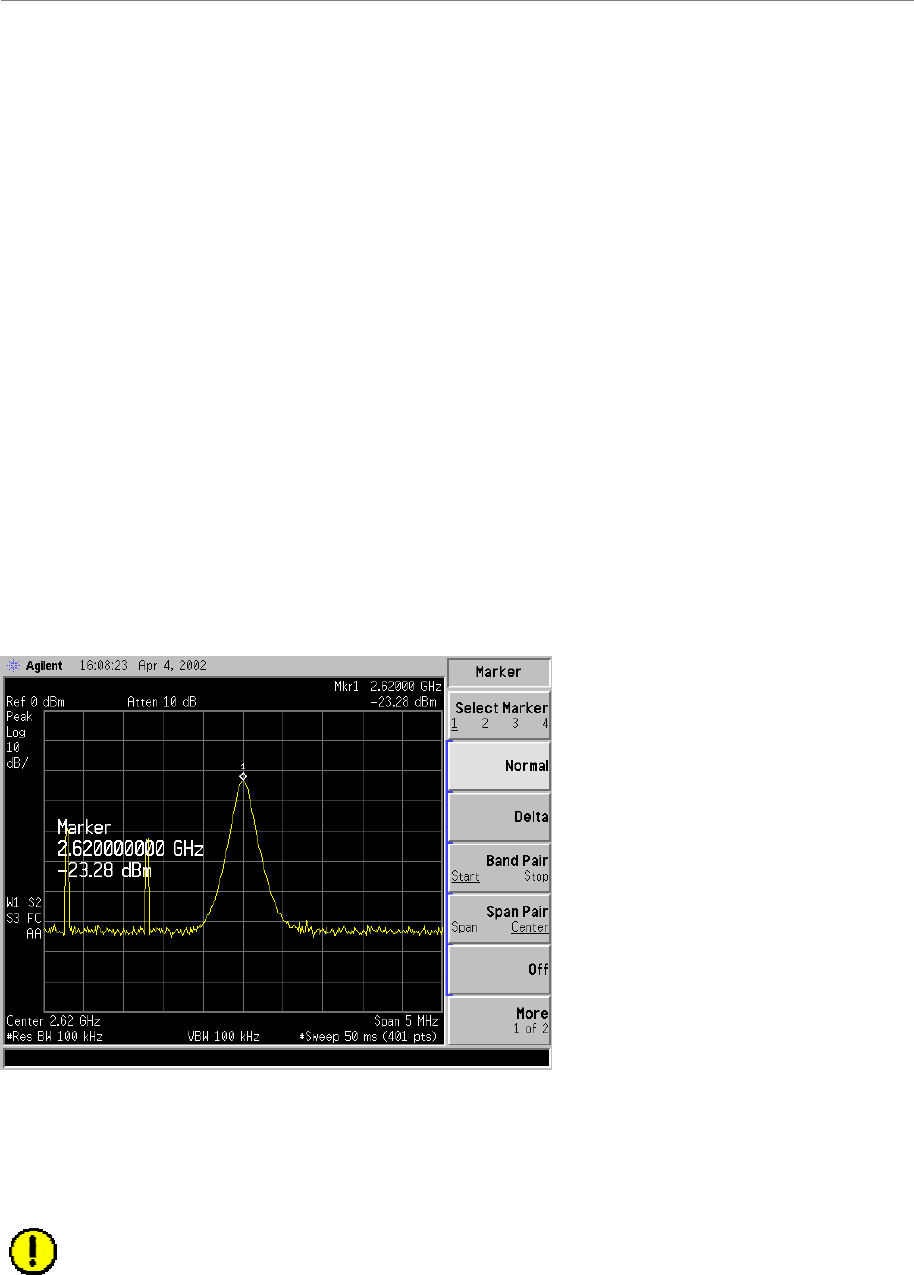
Step 4. Take a marker measurement on the Spectrum Analyzer by using the ‘marker to peak’
or the ‘peak search’ function. The screen on the Spectrum Analyzer should look similar
to the one shown in Figure O8.
Barrel connector
Signal Generator
cable to RFS
antenna 1 connector
Spectrum Analyzer
cable to RFS cal
connector
Barrel connector
Signal Generator
cable to RFS
antenna 1 connector
Spectrum Analyzer
cable to RFS cal
connector
Navini Networks, Inc. Ripwave Base Station I&C Guide
Part #40-00047-00 Rev F v1.0 (TTA) 191
October 23, 2003
Figure O8: RFS Only Tx Marker Measurement Example
Step 5. The marker value should be equal to the RFS Only Tx insertion loss within +/– 2.0 dB,
per the manufacturer’s data. If the insertion loss results do not agree with the
manufacturer’s data, check the test setup.
Caution: An RFS with results greater than the +/– 2.0 dB limits should not be installed,
as a potential hardware fault exists. Contact Navini Networks Technical Support.
Step 6. Record the data in the RFS System Test Form under “RFS TX PATH LOSS (RFS
ONLY)”. Ensure that the information is recorded under the channel number of the RFS
antenna that is being tested.
Step 7. Repeat steps 5 and 6 for the remaining seven antenna inputs on the RFS.
Step 8. Change to the next test frequency (refer back to Test Setup). Perform steps 1 through 8
until the RFS has been successfully tested at the frequencies shown in Table O4.
RFS Only Receive Verification
Step 1. Ensure calibration of the test setup and RFS Test Box setup for RFS Only has been
performed each time the test frequency is changed.
Step 2. Switch the RFS Test Box to the Receive (Rx) mode.
Step 3. Connect the cable from the Signal Generator to the RFS cal connector. Use a barrel
connector to change the gender, if required.
Step 4. Connect the cable from the Spectrum Analyzer to the RFS antenna input number 1.
Use a barrel connector to change the gender, if required. See Figure O9.
Ripwave Base Station I&C Guide Navini Networks, Inc.
192 Part #40-00047-00 Rev F v1.0 (TTA)
October 23, 2003
Figure O9: RFS Only Rx Verification
Note: The position of the RFS will vary the sweep results due to reflections from the test
surface.
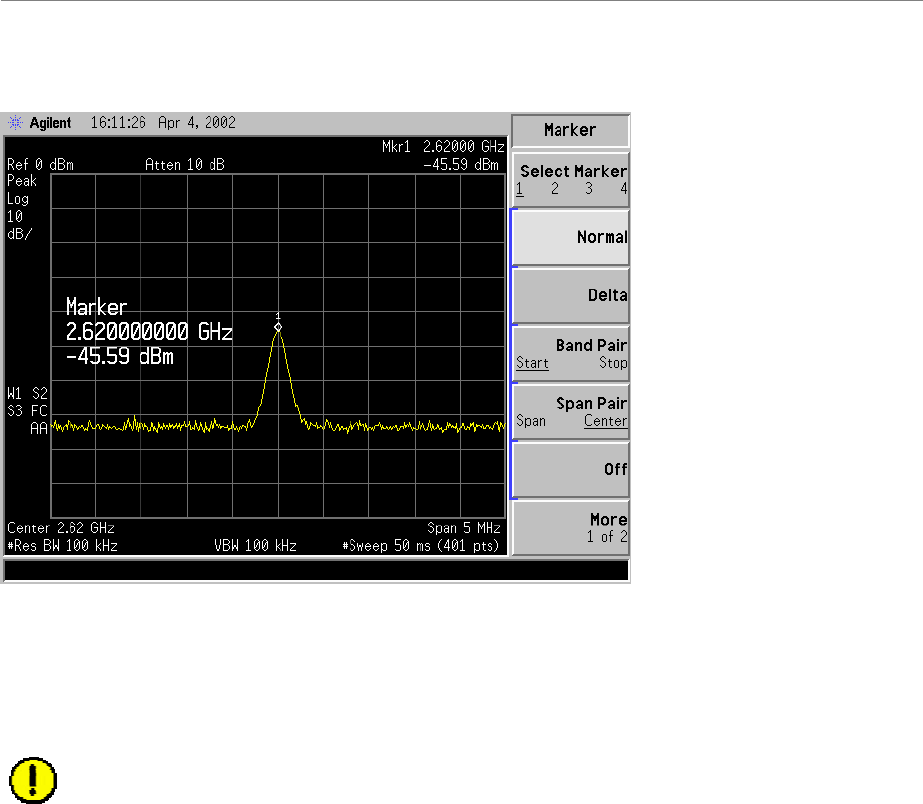
Step 5. Take a marker measurement on the Spectrum Analyzer by using the ‘marker to peak’
or the ‘peak search’ function. The screen on the Spectrum Analyzer should look similar
to the one shown in Figure O10.
Figure O10: RFS Only Rx Marker Measurement Example
Signal Generator
cable to RFS cal
connector
Barrel connector
Spectrum Analyzer
cable to RFS antenna
1 connector
Signal Generator
cable to RFS cal
connector
Barrel connector
Spectrum Analyzer
cable to RFS antenna
1 connector

Navini Networks, Inc. Ripwave Base Station I&C Guide
Part #40-00047-00 Rev F v1.0 (TTA) 193
October 23, 2003
Step 6. The marker value should be equal to the RFS Only Rx insertion loss within +/– 2.0 dB,
per the manufacturer’s data. If the insertion loss results do not agree with the
manufacturer’s data, check the test setup.
Caution: An RFS with results greater than the +/– 2.0 dB limits should not be installed,
as a potential hardware fault exists. Contact Navini Networks Technical Support.
Step 7. Record the data in the RFS System Test Form under “RFS RX PATH LOSS (RFS
ONLY)”. Ensure that the information is recorded under the channel number that is on
the RFS antenna that is being tested.
Step 8. Repeat steps 5 through 7 for the remaining seven antenna inputs on the RFS.
Step 9. Change the frequency to the next test frequency (refer back to Test Setup). Perform
steps 1 through 8 until the RFS has been successfully tested at the frequencies shown in
Table O4.
RFS & Cables Transmit Verification
This test is performed after the RFS is installed and the antenna cables, calibration cable, and
power/data cable are connected to the inputs on the RFS.
Step 1. Ensure calibration of the test setup and RFS Test Box setup for RFS and cables has
been performed each time the test frequency is changed.
Step 2. Switch the RFS Test Box to the Transmit (Tx) mode.
Step 3. Connect the cable from the Spectrum Analyzer to the RFS calibration cable connector.
Use a barrel connector to change the gender, if required.
Step 4. Connect the cable from the Signal Generator to the RFS antenna cable number 1
connector. Use a barrel connector to change the gender, if required.
Step 5. Take a marker measurement on the Spectrum Analyzer by using the ‘marker to peak’
or the ‘peak search’ function. The screen on the Spectrum Analyzer should look similar
to the one shown in Figure O11.
Ripwave Base Station I&C Guide Navini Networks, Inc.
194 Part #40-00047-00 Rev F v1.0 (TTA)
October 23, 2003
Figure O11: RFS & Cables Tx Marker Measurement Example
Step 6. The marker value should be equal to the RFS Only Tx insertion loss + calibration cable
loss + antenna cable loss + antenna cable jumper loss. Transmit insertion loss should be
within +/– 2.0 dB of the sum of the parts. If the insertion loss results do not agree with
the manufacturer’s data, check the test setup and the cable connections.
Caution: If RFS & cables test results are greater than the +/– 2.0 dB limits, they should
not be installed on a tower, as a potential hardware fault exists. Verify the connections
and contact Navini Networks Technical Support.
Step 7. Record the data in the RFS System Test Form under “TOTAL TX PATH LOSS
(CABLE-RFS)”. Ensure that the information is recorded under the channel number that
is on the cable label.
Step 8. Repeat steps 5 through 7 for the remaining seven antenna cable inputs on the RFS.
Step 9. Change the frequency to the next test frequency (refer to Test Setup). Perform steps 1
through 8 until the RFS has been successfully tested at the frequencies shown in Table
O4.
Navini Networks, Inc. Ripwave Base Station I&C Guide
Part #40-00047-00 Rev F v1.0 (TTA) 195
October 23, 2003
RFS & Cables Receive Verification
This test is performed after the RFS is installed and the antenna cables, calibration cable, and
power/data cable are connected to the inputs on the RFS.
Step 1. Ensure that the calibration of the test setup and RFS Test Box setup for RFS and
cables has been performed each time the test frequency is changed.
Step 2. Switch the RFS Test Box to the Receive (Rx) mode.
Step 3. If present, remove the barrel connector from between the Signal Generator and
Spectrum Analyzer cables.
Step 4. Connect the cable from the Signal Generator to the RFS calibration cable connector.
Use a barrel connector to change the gender, if required.
Step 5. Connect the cable from the Spectrum Analyzer to the RFS antenna cable number 1
connector. Use a barrel connector to change the gender, if required.
Take a marker measurement on the Spectrum Analyzer by using the ‘marker to peak’ or the
‘peak search’ function. The screen on the Spectrum Analyzer should look similar to the one
shown in Figure O12.
Figure O12: RFS & Cables Rx Marker Measurement Example
The marker value should be equal to the RFS Only RX Insertion Loss + Calibration Cable Loss
+ Antenna Cable Loss + Antenna Cable Jumper Loss. RX Insertion Loss should be within +/–
2.0 dB of the sum of the parts. If the Insertion Loss results do not agree with the manufacturers
data, check the test setup and the cable connections.
Caution: If RFS & cables test results are greater than the +/– 2.0 dB limits, they should
not be installed on a tower, as a potential hardware fault exists. Verify connections and
contact Navini Networks Technical Support.
Ripwave Base Station I&C Guide Navini Networks, Inc.
196 Part #40-00047-00 Rev F v1.0 (TTA)
October 23, 2003
Record the data in the RFS System Test Form under “TOTAL RX PATH LOSS (CABLE-
RFS)”. Ensure that the information is recorded under the channel number that is on the cable
label.
Repeat steps 5 through 8 for the remaining seven antenna cable inputs on the RFS.
Change the frequency to the next test frequency (refer to Test Setup). Perform steps 1 through 9
until the RFS has been successfully tested at the frequencies given in Table O4.
Procedures – TTA Base Station
Equipment Required
?? Signal Generator - Agilent 8648D, or suitable alternative, tunable to the RFS center
frequency
?? Spectrum Analyzer - Agilent E4404B, or equivalent
?? QMA female to SMA Female adapter
?? SMA male to N-type male test cable (Note: The cable can be changed but additional
adapters will be required.)
?? RFS test box for RFS tests only (not required for cable tests) – see Figure O13
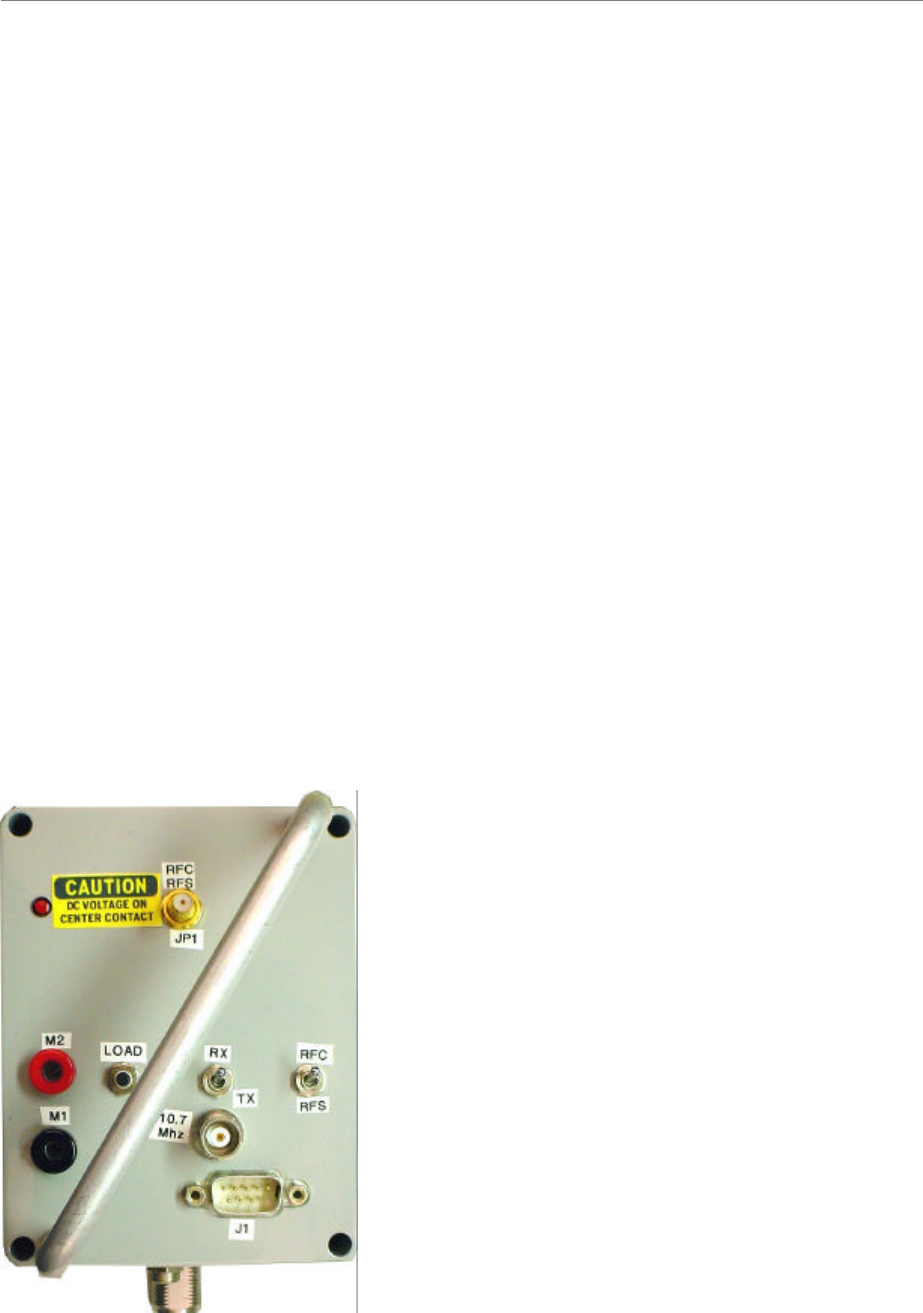
Figure O13: RFS & RFC Test Box
?? JP1 - Cable port to be connected to the RFC or the
RFS.
?? M1/M2 - RFC DC output test points.
?? Load Button - Tests RFC full Current load. Used
in conjunction with Power LED by JP1.
?? RX/TX switch - Supplies power to the RX or RX
circuit in the RFS.
?? RFC/RFS switch - Moved to the RFS for testing
of the RFS and to the RFC for testing of the RFC.
?? 10.7MHz - Test point to measure the 10.7 MHz
signal output of the RFC.
?? J1 - External control of switches. (Engineering
use only)
?? P1 - DC power supply connection. (Used for RFS
testing only)
?? JP2 - Connection point for test equipment (DC
blocked port)

Navini Networks, Inc. Ripwave Base Station I&C Guide
Part #40-00047-00 Rev F v1.0 (TTA) 197
October 23, 2003
Equipment Set-up
?? Spectrum Analyzer - connected to the test cable / QMA adapter on BTS end
Center Frequency: Set to frequency to be tested
Span: 10 MHz
Resolution Bandwidth: 100 KHz
Video Bandwidth: 100 KHz
Sweep Time: Auto
?? Signal Generator - connected to the RFS cable end
Frequency: Set to frequency to be tested
Signal Level: 0 dB
Equipment Calibration
Refer to Figure O14 to calibrate the test equipment.
Step 1. Perform “Equipment Set-Up”.
Step 2. Connect the test cable from the “RF Output” of the Signal Generator to the “RF input”
of the Spectrum Analyzer.
Step 3. Turn on the RF output of the Signal Generator.
Step 4. Perform a “peak search” on the Spectrum Analyzer.
Step 5. Set a Delta point. The Delta sets a zero point on the Spectrum Analyzer so that when
any additional cable or equipment is added to the link the new loss reading can be
recorded. (Note: If the Spectrum Analyzer does not have a Delta function, increase the
output of the Signal Generator until there is a 0 dB reading on the Spectrum
Analyzer.)
Figure O14: Calibrate Test Equipment
Signal Generator Spectrum Analyzer
Test cable

Ripwave Base Station I&C Guide Navini Networks, Inc.
198 Part #40-00047-00 Rev F v1.0 (TTA)
October 23, 2003
RF Cable Sweeps Procedure
This section provides step-by-step procedures for calibrating the test equipment and performing
insertion loss measurements of the RF cable. Refer to Figure O15.
Step 1. Calibrate the test equipment.
Step 2. Connect Signal Generator to cable 1 on the RFS side to the RF cable.
Step 3. Connect spectrum analyzer to cable 1 on BTS side of RF cable. This will be done with
the test cable and the QMA/SMA adapter.
Step 4. Enable the RF on the signal generator.
Step 5. From the Delta marker found in Step 1 take the loss reading in db. Record the results.
Step 6. Perform steps 2 through 5 for all cables.
Figure O15: RF Cable Test
RF Cable
BTS End RFS End
QMA N-Type
RFS Test Procedure
This procedure is performed twice for an installation. The first sweep is performed prior to
mounting the RFS on the tower. This test verifies that all the equipment is in tact from shipment.
These sweeps will need to be compared to the factory sweeps that are shipped with the RFS.
The second sweep is performed after the RFS has been mounted on the tower and the RF cables
have been connected. This sweep verifies that no damage was done to the RFS when hoisting it,
and that the RF cables are properly connected to the RFS.
Step 1. Perform the “Equipment Set-up”.
Note: When performing the transmit (TX) side tests on the RFS, the signal level from
the Signal Generator needs to be lowered to at least –20 dB. The RFS has protection
circuits built in and will disable the PAs in the RFS if the incoming signal is too high.
Step 2. Perform the “Equipment Calibration”.
Step 3. Configure the test equipment as shown in Figure O16.
?? Spectrum Analyzer to the Cal Port
?? Signal Generator to the test equipment port of the test box.
?? Test box RFC/RFS port to the antenna
Navini Networks, Inc. Ripwave Base Station I&C Guide
Part #40-00047-00 Rev F v1.0 (TTA) 199
October 23, 2003
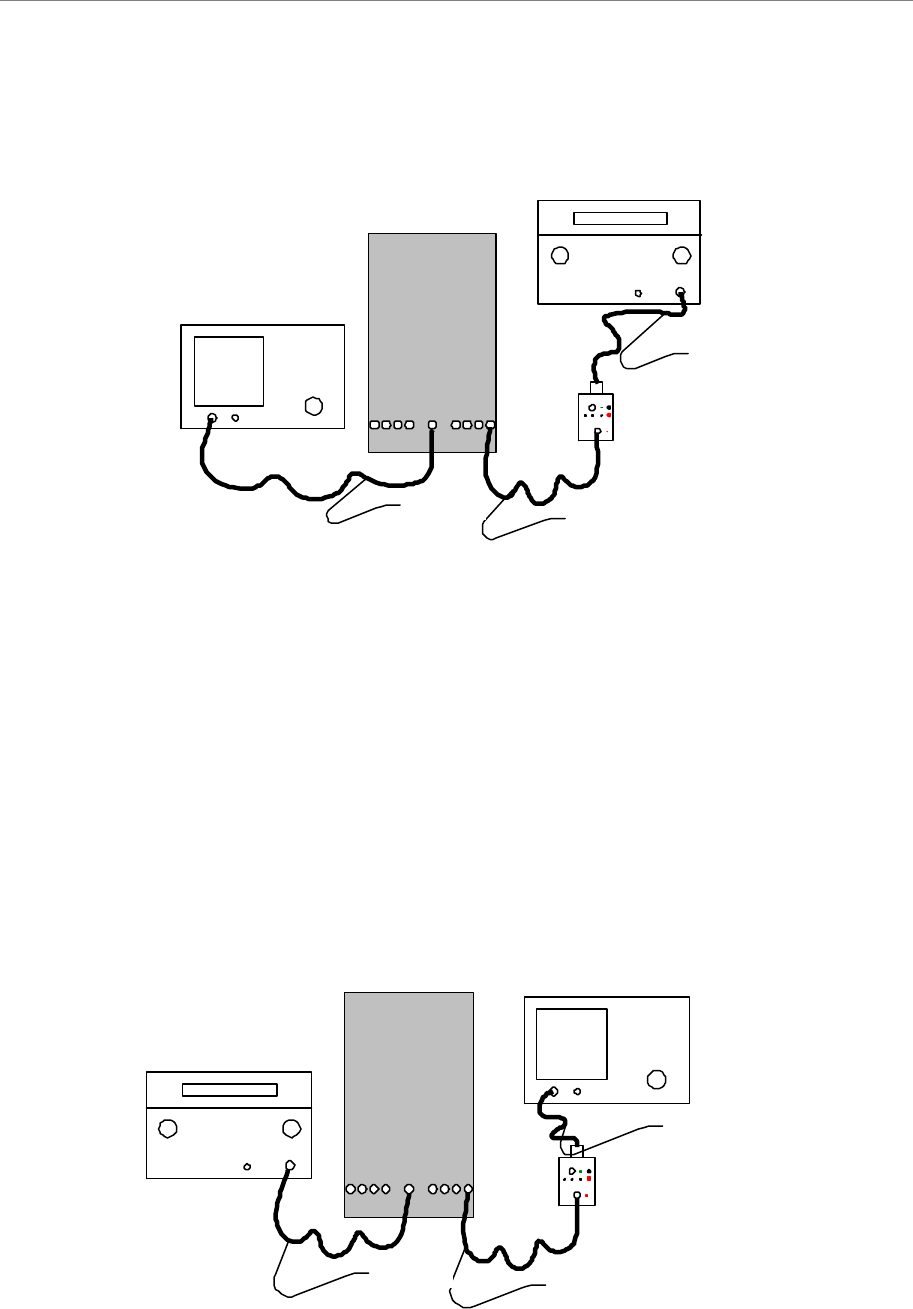
Figure O16: Transmit Side
Step 4. Set the test box to RFS and TX.
Step 5. From the Delta marker established during the calibration, record the insertion loss dB
level.
Step 6. Perform Step 5 for all eight antennas.
Step 7. Set the Signal Generator output level to 0 dB and recalibrate the test equipment.
Step 8. Configure the test equipment as shown in Figure O17.
?? Signal Generator to the Cal Port
?? Spectrum Analyzer to the test equipment port of the test box.
?? Test box RFC/RFS port to the antenna
Figure O17: Receive Side
Signal Generator
Spectrum Analyzer
Test cable
RFS
1234 5678
c
a
l
Test cable
Test cable
Signal Generator
Spectrum Analyzer
Test cable
RFS
1234 5678
c
a
l
Test cable
Test cable

Ripwave Base Station I&C Guide Navini Networks, Inc.
200 Part #40-00047-00 Rev F v1.0 (TTA)
October 23, 2003
Step 9. Set the test box to RX.
Step 10. From the Delta maker set on calibration, record the insertion loss value from the
Spectrum Analyzer.
Step 11. Repeat Step 10 for all eight antennas.
Compare all recorded TX and RX values with the factory sweep results that are shipped with the
RFS. If there is a mismatch, contact Navini Technical Support.

Navini Networks, Inc. Ripwave Base Station I&C Guide
Part #40-00047-00 Rev F v1.0 (TTA) 201
October 23, 2003
2.4 RFS System Test Form (Combo & Split Chassis)
RFS SN
NAME
DATE
MEASUREMENT DESCRIPTION
CHANNEL
RFS TX PATH LOSS (RFS ONLY)
1
-
-
-
-
0.00
RFS TX PATH LOSS (RFS ONLY)
2
-
-
-
-
0.00
RFS TX PATH LOSS (RFS ONLY)
3
-
-
-
-
0.00
RFS TX PATH LOSS (RFS ONLY)
4
-
-
-
-
0.00
RFS TX PATH LOSS (RFS ONLY)
5
-
-
-
-
0.00
RFS TX PATH LOSS (RFS ONLY)
6
-
-
-
-
0.00
RFS TX PATH LOSS (RFS ONLY)
7
-
-
-
-
0.00
RFS TX PATH LOSS (RFS ONLY)
8
-
-
-
-
0.00
RFS RX PATH LOSS (RFS ONLY)
1
-
-
-
-
0.00
RFS RX PATH LOSS (RFS ONLY)
2
-
-
-
-
0.00
RFS RX PATH LOSS (RFS ONLY)
3
-
-
-
-
0.00
RFS RX PATH LOSS (RFS ONLY)
4
-
-
-
-
0.00
RFS RX PATH LOSS (RFS ONLY)
5
-
-
-
-
0.00
RFS RX PATH LOSS (RFS ONLY)
6
-
-
-
-
0.00
RFS RX PATH LOSS (RFS ONLY)
7
-
-
-
-
0.00
RFS RX PATH LOSS (RFS ONLY)
8
-
-
-
-
0.00
JUMPER LOSS
1
-
-
-
-
0.00
JUMPER LOSS
2
-
-
-
-
0.00
JUMPER LOSS
3
-
-
-
-
0.00
JUMPER LOSS
4
-
-
-
-
0.00
JUMPER LOSS
5
-
-
-
-
0.00
JUMPER LOSS
6
-
-
-
-
0.00
JUMPER LOSS
7
-
-
-
-
0.00
JUMPER LOSS
8
-
-
-
-
0.00
JUMPER LOSS
CAL
-
-
-
-
0.00
MAIN FEEDER LOSS
1
-
-
-
-
0.00
MAIN FEEDER LOSS
2
-
-
-
-
0.00
MAIN FEEDER LOSS
3
-
-
-
-
0.00
MAIN FEEDER LOSS
4
-
-
-
-
0.00
MAIN FEEDER LOSS
5
-
-
-
-
0.00
MAIN FEEDER LOSS
6
-
-
-
-
0.00
MAIN FEEDER LOSS
7
-
-
-
-
0.00
MAIN FEEDER LOSS
8
-
-
-
-
0.00
MAIN FEEDER LOSS
CAL
-
-
-
-
0.00
TOTAL CABLE RUN LOSS
1
-
0.00
-
0.00
-
0.00
-
0.00
TOTAL CABLE RUN LOSS
2
-
0.00
-
0.00
-
0.00
-
0.00
TOTAL CABLE RUN LOSS
3
-
0.00
-
0.00
-
0.00
-
0.00
TOTAL CABLE RUN LOSS
4
-
0.00
-
0.00
-
0.00
-
0.00
TOTAL CABLE RUN LOSS
5
-
0.00
-
0.00
-
0.00
-
0.00
TOTAL CABLE RUN LOSS
6
-
0.00
-
0.00
-
0.00
-
0.00
TOTAL CABLE RUN LOSS
7
-
0.00
-
0.00
-
0.00
-
0.00
TOTAL CABLE RUN LOSS
8
-
0.00
-
0.00
-
0.00
-
0.00
TOTAL CABLE RUN LOSS
CAL
-
0.00
-
0.00
-
0.00
-
0.00
TOTAL TX PATH LOSS (CABLE-RFS)
1
-
-
-
-
0.00
TOTAL TX PATH LOSS (CABLE-RFS)
2
-
-
-
-
0.00
TOTAL TX PATH LOSS (CABLE-RFS)
3
-
-
-
-
0.00
TOTAL TX PATH LOSS (CABLE-RFS)
4
-
-
-
-
0.00
TOTAL TX PATH LOSS (CABLE-RFS)
5
-
-
-
-
0.00
TOTAL TX PATH LOSS (CABLE-RFS)
6
-
-
-
-
0.00
TOTAL TX PATH LOSS (CABLE-RFS)
7
-
-
-
-
0.00
TOTAL TX PATH LOSS (CABLE-RFS)
8
-
-
-
-
0.00
TOTAL RX PATH LOSS (CABLE-RFS)
1
-
-
-
-
0.00
TOTAL RX PATH LOSS (CABLE-RFS)
2
-
-
-
-
0.00
TOTAL RX PATH LOSS (CABLE-RFS)
3
-
-
-
-
0.00
TOTAL RX PATH LOSS (CABLE-RFS)
4
-
-
-
-
0.00
TOTAL RX PATH LOSS (CABLE-RFS)
5
-
-
-
-
0.00
2400MHz
2440MHz
2473MHz
AVERAGE
2.4 GHz RFS INSTALL
TEST RESULT FORM

Ripwave Base Station I&C Guide Navini Networks, Inc.
202 Part #40-00047-00 Rev F v1.0 (TTA)
October 23, 2003
2.6 RFS System Test Form
RFS SN
NAME
DATE
MEASUREMENT DESCRIPTION
CHANNEL
RFS TX PATH LOSS (RFS ONLY)
1
-
-
-
-
0.00
RFS TX PATH LOSS (RFS ONLY)
2
-
-
-
-
0.00
RFS TX PATH LOSS (RFS ONLY)
3
-
-
-
-
0.00
RFS TX PATH LOSS (RFS ONLY)
4
-
-
-
-
0.00
RFS TX PATH LOSS (RFS ONLY)
5
-
-
-
-
0.00
RFS TX PATH LOSS (RFS ONLY)
6
-
-
-
-
0.00
RFS TX PATH LOSS (RFS ONLY)
7
-
-
-
-
0.00
RFS TX PATH LOSS (RFS ONLY)
8
-
-
-
-
0.00
RFS RX PATH LOSS (RFS ONLY)
1
-
-
-
-
0.00
RFS RX PATH LOSS (RFS ONLY)
2
-
-
-
-
0.00
RFS RX PATH LOSS (RFS ONLY)
3
-
-
-
-
0.00
RFS RX PATH LOSS (RFS ONLY)
4
-
-
-
-
0.00
RFS RX PATH LOSS (RFS ONLY)
5
-
-
-
-
0.00
RFS RX PATH LOSS (RFS ONLY)
6
-
-
-
-
0.00
RFS RX PATH LOSS (RFS ONLY)
7
-
-
-
-
0.00
RFS RX PATH LOSS (RFS ONLY)
8
-
-
-
-
0.00
JUMPER LOSS (Measured)
1
-
-
-
-
0.00
JUMPER LOSS (Measured)
2
-
-
-
-
0.00
JUMPER LOSS (Measured)
3
-
-
-
-
0.00
JUMPER LOSS (Measured)
4
-
-
-
-
0.00
JUMPER LOSS (Measured)
5
-
-
-
-
0.00
JUMPER LOSS (Measured)
6
-
-
-
-
0.00
JUMPER LOSS (Measured)
7
-
-
-
-
0.00
JUMPER LOSS (Measured)
8
-
-
-
-
0.00
JUMPER LOSS (Measured)
CAL
-
-
-
-
0.00
MAIN FEEDER LOSS (Measured)
1
-
-
-
-
0.00
MAIN FEEDER LOSS (Measured)
2
-
-
-
-
0.00
MAIN FEEDER LOSS (Measured)
3
-
-
-
-
0.00
MAIN FEEDER LOSS (Measured)
4
-
-
-
-
0.00
MAIN FEEDER LOSS (Measured)
5
-
-
-
-
0.00
MAIN FEEDER LOSS (Measured)
6
-
-
-
-
0.00
MAIN FEEDER LOSS (Measured)
7
-
-
-
-
0.00
MAIN FEEDER LOSS (Measured)
8
-
-
-
-
0.00
MAIN FEEDER LOSS (Measured)
CAL
-
-
-
-
0.00
TOTAL CABLE RUN LOSS (Measured)
1
-
0.00
-
0.00
-
0.00
-
0.00
TOTAL CABLE RUN LOSS (Measured)
2
-
0.00
-
0.00
-
0.00
-
0.00
TOTAL CABLE RUN LOSS (Measured)
3
-
0.00
-
0.00
-
0.00
-
0.00
TOTAL CABLE RUN LOSS (Measured)
4
-
0.00
-
0.00
-
0.00
-
0.00
TOTAL CABLE RUN LOSS (Measured)
5
-
0.00
-
0.00
-
0.00
-
0.00
TOTAL CABLE RUN LOSS (Measured)
6
-
0.00
-
0.00
-
0.00
-
0.00
TOTAL CABLE RUN LOSS (Measured)
7
-
0.00
-
0.00
-
0.00
-
0.00
TOTAL CABLE RUN LOSS (Measured)
8
-
0.00
-
0.00
-
0.00
-
0.00
TOTAL CABLE RUN LOSS (Measured)
CAL
-
0.00
-
0.00
-
0.00
-
0.00
TOTAL TX PATH LOSS (CABLE-RFS)
1
-
-
-
-
0.00
TOTAL TX PATH LOSS (CABLE-RFS)
2
-
-
-
-
0.00
TOTAL TX PATH LOSS (CABLE-RFS)
3
-
-
-
-
0.00
TOTAL TX PATH LOSS (CABLE-RFS)
4
-
-
-
-
0.00
TOTAL TX PATH LOSS (CABLE-RFS)
5
-
-
-
-
0.00
TOTAL TX PATH LOSS (CABLE-RFS)
6
-
-
-
-
0.00
TOTAL TX PATH LOSS (CABLE-RFS)
7
-
-
-
-
0.00
TOTAL TX PATH LOSS (CABLE-RFS)
8
-
-
-
-
0.00
TOTAL RX PATH LOSS (CABLE-RFS)
1
-
-
-
-
0.00
TOTAL RX PATH LOSS (CABLE-RFS)
2
-
-
-
-
0.00
TOTAL RX PATH LOSS (CABLE-RFS)
3
-
-
-
-
0.00
TOTAL RX PATH LOSS (CABLE-RFS)
4
-
-
-
-
0.00
TOTAL RX PATH LOSS (CABLE-RFS)
5
-
-
-
-
0.00
2.6 GHz RFS INSTALL
TEST RESULT FORM
AVERAGE
Navini Networks, Inc. Ripwave Base Station I&C Guide
Part #40-00047-00 Rev F v1.0 (TTA) 203
October 23, 2003
Appendix P: Chassis Alarms
The chassis contains two connectors that are used to send alarm indications to the BTS. One of
the connectors, labeled CABINET ALARM, is used to trigger alarm conditions that occur within
the external chassis. The second connector, labeled BBU, is used to process alarms from the
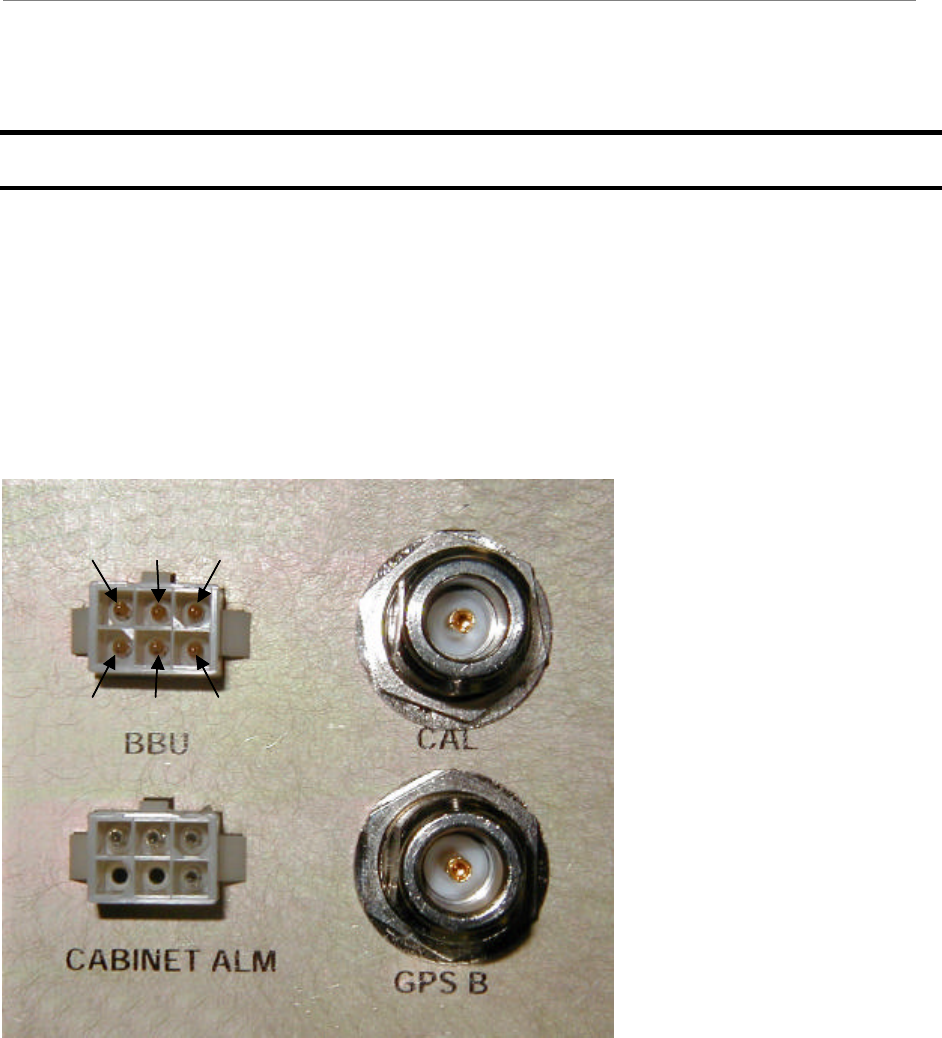
battery backup unit. Both connectors contain six pins, which are numbered as shown in Figure
P1. This figure also shows the CAL and GPS-B connectors for size reference.
Figure P1: Pin Orientation
1 2 3
456
1 2 3
456
Ripwave Base Station I&C Guide Navini Networks, Inc.
204 Part #40-00047-00 Rev F v1.0 (TTA)
October 23, 2003
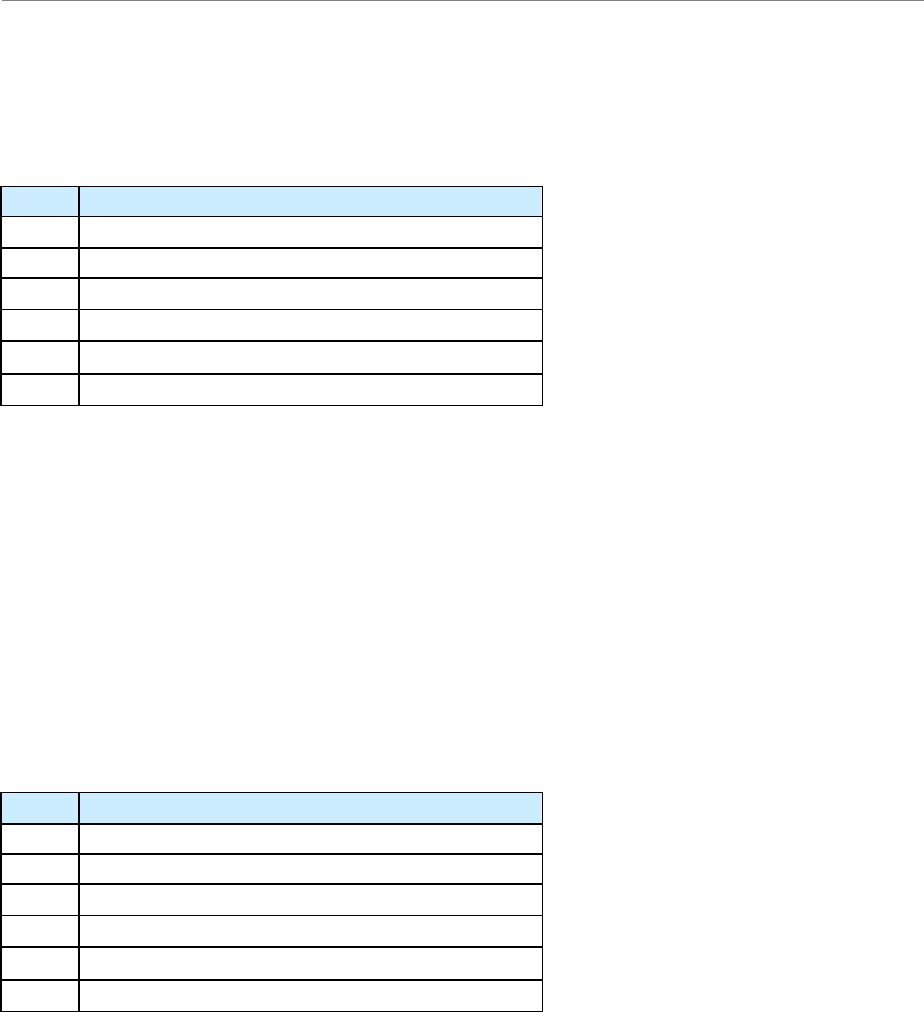
The alarm connector uses only four of the six pins. The pin names can be found in Table P1.
Table P1: Pin Names
Pin Name
1 General Fail Alarm
2 Ground reference for General Fail Alarm
3 Door Open Alarm
4 Ground reference for Door Open Alarm
5 Not Connected
6 Not Connected
The first pin of the alarm connector is the General Fail Alarm. This signal should be left open to
indicate an alarm condition from the HMC module located in the outdoor chassis. If no alarm
condition exists, this pin should be driven low. Pin 2 is used as the ground reference for this
alarm. The second alarm sent to the chassis is located on pin 3, Door Open Alarm. This signal
should be driven low when the door is closed. To indicate that the door of the outdoor chassis is
open, this signal should be left open. The associated ground reference for this signal is taken
from pin 4.
The BBU connector contains four alarm signals. These signal names are listed in Table P2.
Table P2: BBU Signal Names
Pin Name
1 Digital Ground Reference
2 BBU Battery Low
3 BBU Rectifier Fail
4 BBU AC Line Fail
5 BBU Charge Fail
6 Analog Ground Reference
The first alarm signal is located on pin 2, BBU Battery Low. If the BBUs battery is running low,
the signal on pin 2 should be left open. BBU Rectifier Fail alarm is the next alarm and is located
on pin 3. This signal should be left open to indicate a failure on the Battery Backup Unit’s
rectifier. The next alarm condition occurs if the AC Line to the BBU fails. In this condition,
signal BBU AC Line Fail on pin 4 should be left open. If the BBU is unable to hold a charge,
then the BBU Charge Fail signal on pin 5 should be left open. For non-alarm conditions (normal
operation), these signals should be driven low. The digital ground reference for these signals is
located on pin 3. The analog ground reference should be located on pin 4.
Navini Networks, Inc. Ripwave Base Station I&C Guide
Part #40-00047-00 Rev F v1.0 (TTA) 205
October 23, 2003
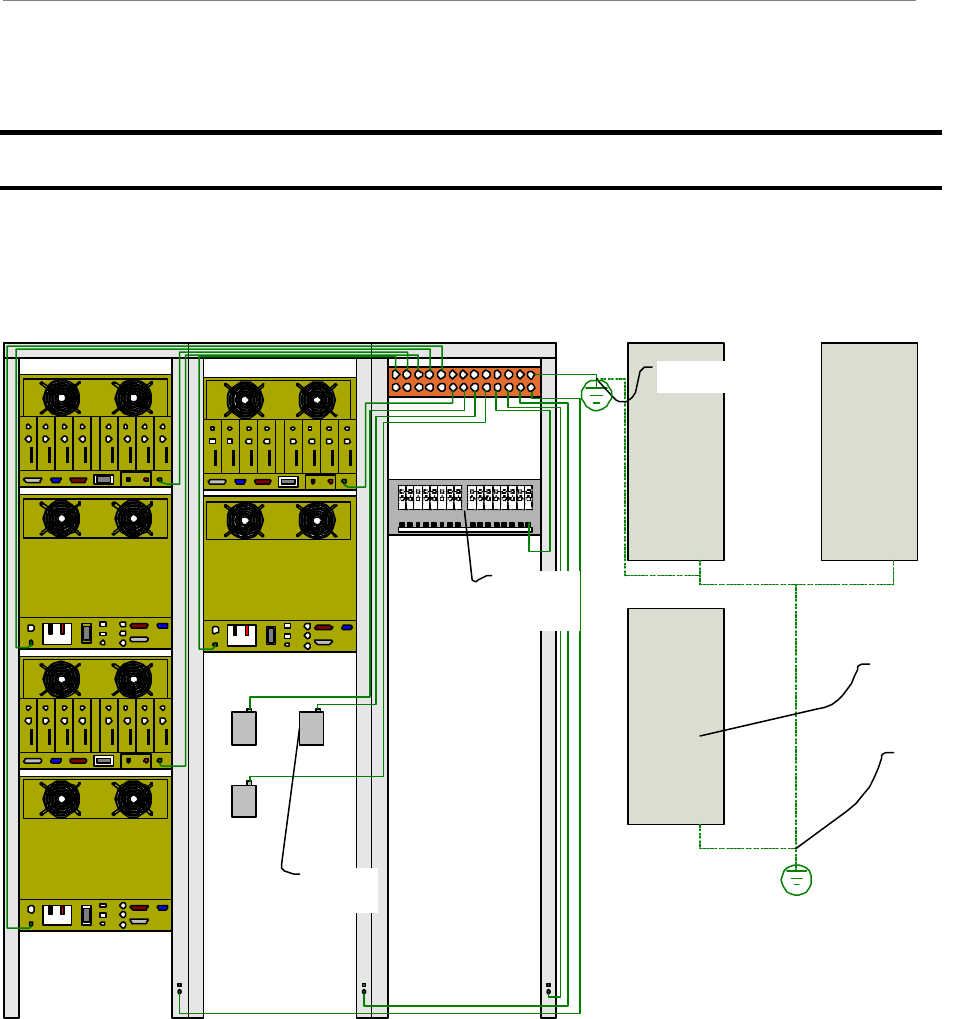
Appendix Q: Sample Tri-sector BTS Grounding
Refer to the Regulatory Information in Chapter 1, Page 8, regarding UL and NEC/CEC
compliance.
Power / Data
Cable Lightning
Protectors
Power System
Distribution Panel
(Will vary per
Manufacture)
Navini RFS
Building steel,
Centerpoise
ground, or tower
structure
Same Centerpoise
ground system <5 ohm
APPROXIMATE GROUND
LINE LUG TYPE AND
QUANTITY
#6AWG 1 HOLE = 12
#6AWG 2 HOLE = 20
#2AWG 2 HOLE = 2+
POWER RACK
SPACE AND
CONFIGURATION
WILL VARY PER
VENDOR

Ripwave Base Station I&C Guide Navini Networks, Inc.
206 Part #40-00047-00 Rev F v1.0 (TTA)
October 23, 2003
Navini Networks, Inc. Ripwave Base Station I&C Guide
Part #40-00047-00 Rev F v1.0 (TTA) 207
October 23, 2003
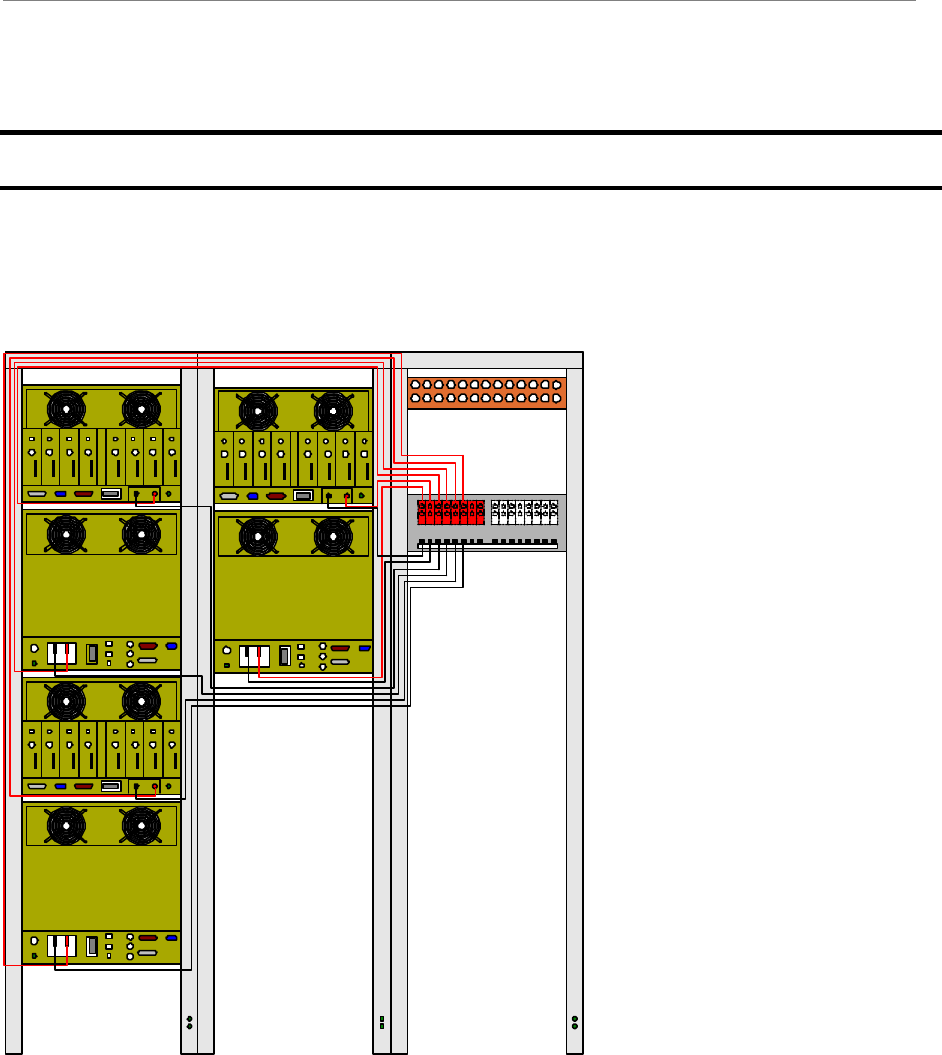
Appendix R: Sample Tri-sector BTS Power
Refer to the Regulatory Information in Chapter 1, Page 8, regarding UL and NEC/CEC
compliance.
REQUIRED DC BREAKER
AMPERAGE AND QUANTITY
3 X 50A - FOR RF SHELF
3 X 20A FOR DIGITAL SHELF
APROXIMATE DC LINE LUG
TYPE AND QUANTITY
#6AWG 1 HOLE = 12
#6AWG 2 HOLE = 12
POWER RACK
SPACE AND
CONFIGURATION
WILL VARY PER
VENDOR

Ripwave Base Station I&C Guide Navini Networks, Inc.
208 Part #40-00047-00 Rev F v1.0 (TTA)
October 23, 2003

Navini Networks, Inc. Ripwave Base Station I&C Guide
Part #40-00047-00 Rev F v1.0 (TTA) 209
October 23, 2003
Appendix S: Single Antenna Test Procedure
Objective
The object of the RFS Single Antenna Test Procedure is to verify the functionality of each
antenna element in the Ripwave Radio Frequency Subsystem (RFS). The 8 antenna elements
work together to create the beamforming that results from using a Smart Antenna - Phased Array
technology. Using 8 combined single antenna elements creates the beamed radiation that is part
of what constitutes the gain of up to 18 dB during transmission of data.
Each antenna element has an associated (and hard cabled) RF/Power Amplifier (PA) card in the
Base Transceiver Station (BTS). In order to verify the correct beamforming and that each single
antenna is working properly, we have to turn off the individual PA that controls each antenna
element, one at a time.
The Single Antenna Test should be performed after completing an equipment check and after
performing the Base Station Calibration Verification* procedure described in the Ripwave Base
Station Installation & Commissioning Guide. This test is necessary since an equipment check
does not check the functionality of the RFS, and the Calibration Verification only sweeps for
losses in the RFS, not RFS functionality.
*Note: The Calibration Verification, where you check both transmit power and receive
sensitivity, is also sometimes referred to as the RF Sanity test.
More specifically, the Single Antenna Test checks the following:
1. Low Noise Amplifier (LNA) at the RFS. LNAs are an integral part of the smart antenna
technology.
2. Power Amplifiers. Each PA is a module in the BTS RF shelf that creates the RF
transmission. With one per element, there are a total of 8 PAs in the shelf. The
transmission is measured in dBm. This is what makes possible the transfer of data over-
the-air.
3. Modulations. As each antenna element is checked, the variable modulations are tested.
The higher the modulation, the higher the power and the better the data rate. The test
ensures that all modulations possible, i.e., QPSK, 8PSK, and QAM16, are working
properly.

Ripwave Base Station I&C Guide Navini Networks, Inc.
210 Part #40-00047-00 Rev F v1.0 (TTA)
October 23, 2003
Panel Procedure
Overview
Assuming the equipment has been installed and you have performed the calibration verification,
if the results were erroneous this Single Antenna Test will not be valid. It is important to
complete those two steps successfully before continuing.
For this test you will need two people. One person will verify the reception (Rx) of each antenna
using the Constellation Debugger Tool and a Modem. The following summarizes what will
happen during this test:
1. Person A will stay where the BTS or EMS is located. This person will control each PA in
the BTS to be tested.
2. Person B will be in the field. This person will pick a complete Line of Sight (LOS) test
point to the RFS (antenna). Person B will use the Constellation Debugger software
supplied by Navini. This software allows the tester to verify functionality.
3. Once the two people are in place, start by turning all antennas off except for Antenna #1.
NOTE: It does not matter which antenna you start with as long as the tester can keep
track of which ones have been tested and each one’s results.
4. With only one antenna powered on, Person B verifies the transmission, modulation, and
signal strength of the single antenna. Person B verifies this information for at least 30
seconds.
5. When the first antenna is checked, Person A saves the file and waits for Person B to
power on Antenna #2.
6. Steps 3 through 5 are repeated for each antenna element.
Details
The following provides more detail for each step, and includes snapshots of what to change and
what to measure.
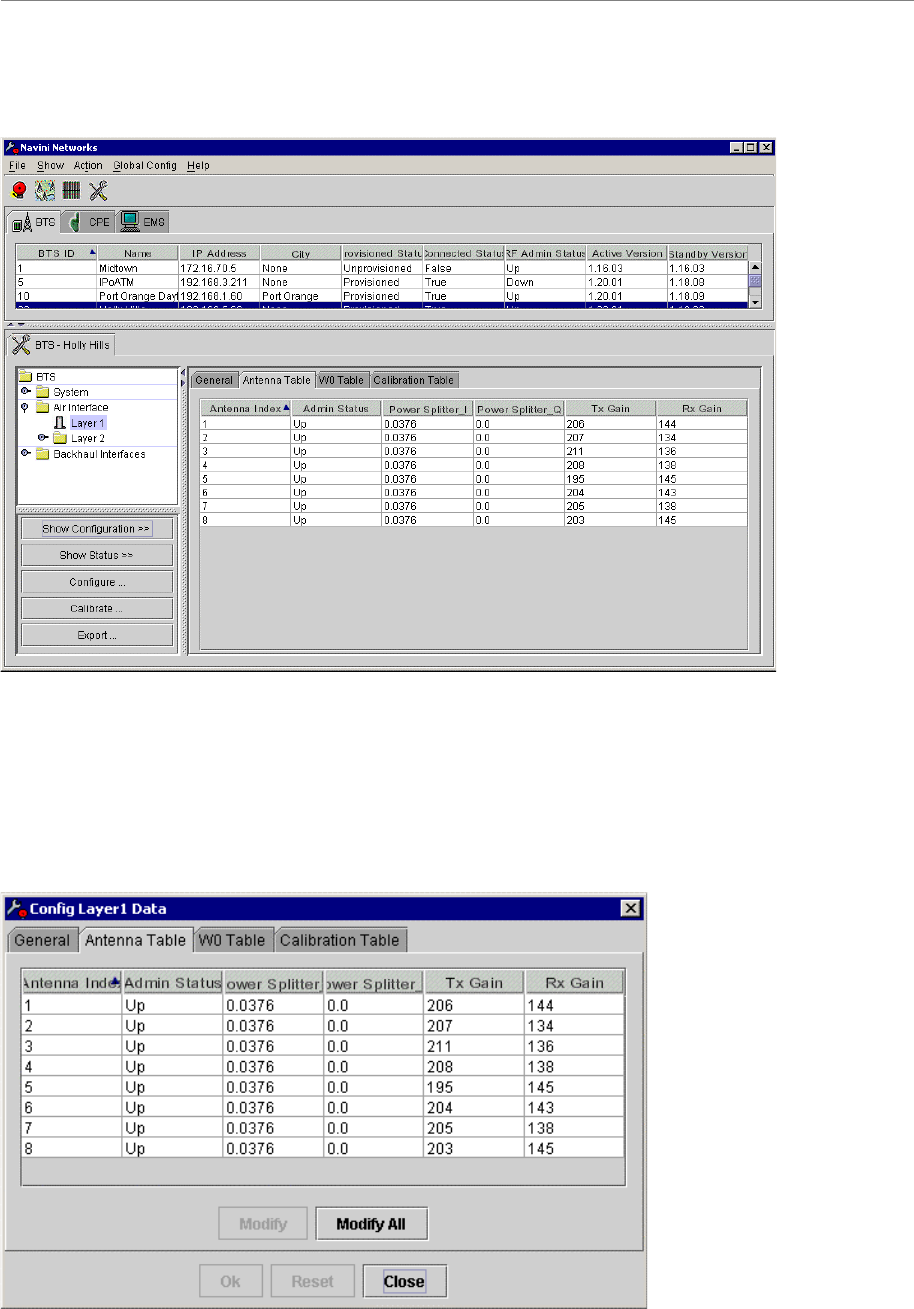
Step 1. After calibration verifications are successful, in EMS click on the BTS tab and
highlight the specific BTS. Go to Air Interface > Layer 1, and click on the
Antenna Table tab (Figure S1). This window will show all antennas and their PA
status.
Navini Networks, Inc. Ripwave Base Station I&C Guide
Part #40-00047-00 Rev F v1.0 (TTA) 211
October 23, 2003
Figure S1: Antenna Tab
Step 2. After checking that all PAs are up and running, next click on Configure (Figure
S2). This function will take you to the configuration mode of this particular
window.
Figure S2: Configure Antenna Table
Ripwave Base Station I&C Guide Navini Networks, Inc.
212 Part #40-00047-00 Rev F v1.0 (TTA)
October 23, 2003
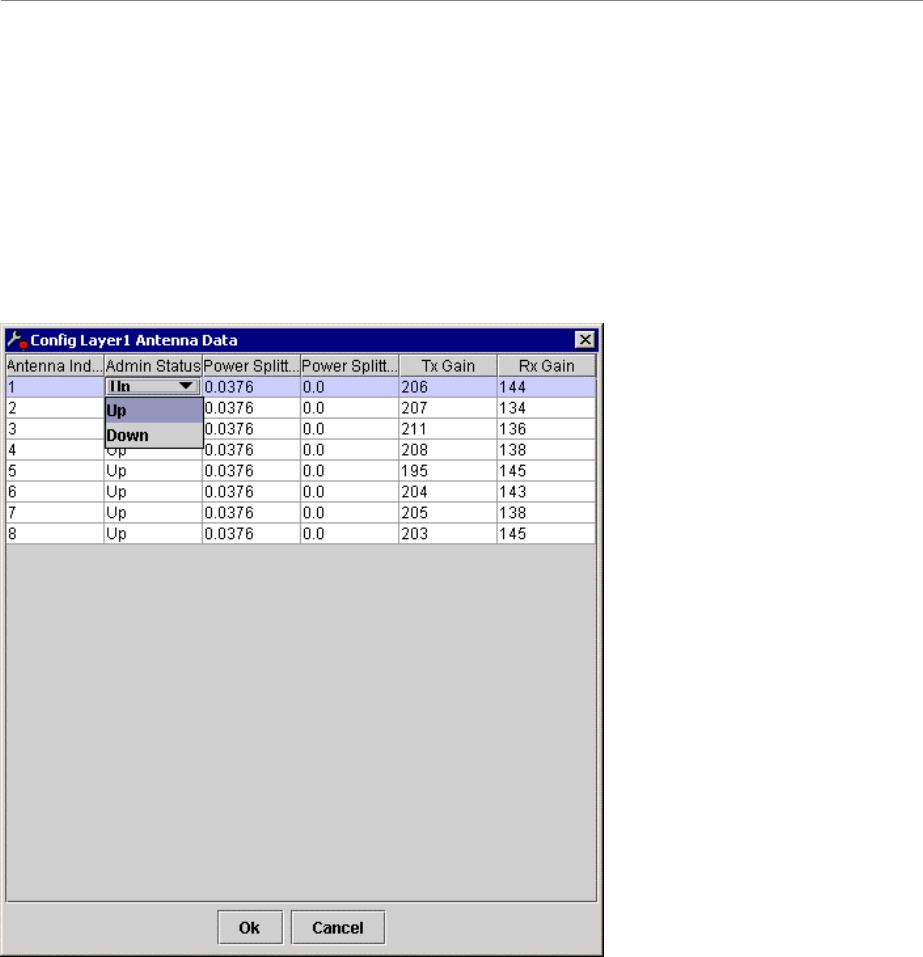
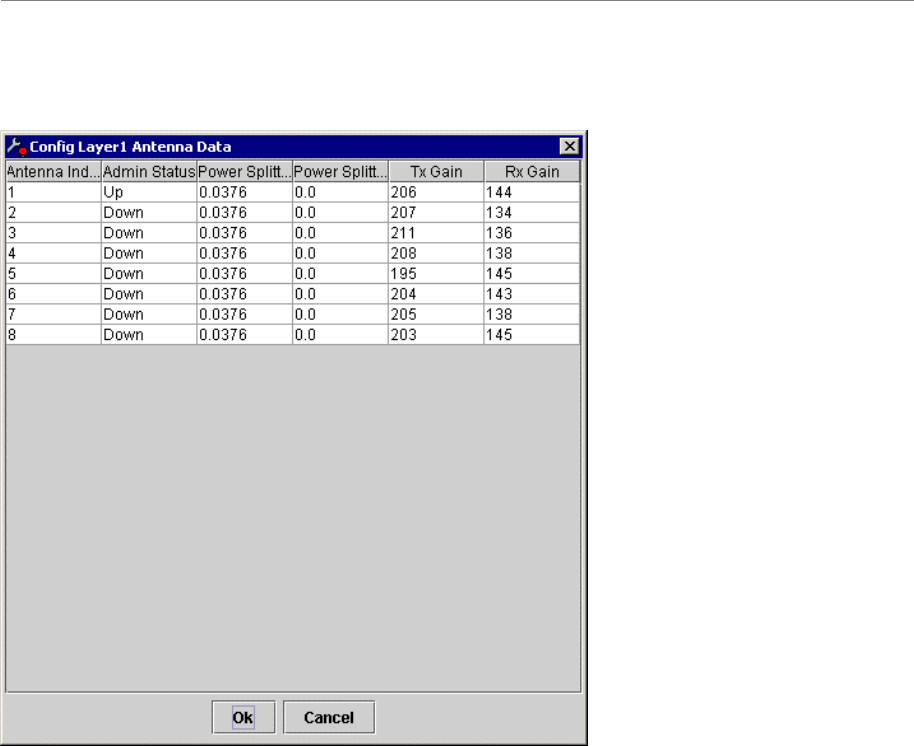
Step 3. Click on the button, Modify All. This function will allow you to modify all
antennas and PAs at the same time. Notice that this window allows you to
configure any column shown here. For our purpose we will only use the second
column, Admin Status (Figure S3). This column shows the state of each PA that
controls each antenna in the RFS. “Up” means the antenna and PA are on and
functioning. “Down” means the antenna and PA are off and not transmitting.
Figure S3: Modify All
Step 4. Next, turn off (no transmission) all of the antennas and PAs except for Antenna #1.
This begins the verification of this antenna. Refer to Figure S4. When only
Antenna #1 is powered up and transmitting, the second person will verify at the
other end that the antenna is actually transmitting information to the Modem. This
can be completed by doing a Ping at the Modem side.
Navini Networks, Inc. Ripwave Base Station I&C Guide
Part #40-00047-00 Rev F v1.0 (TTA) 213
October 23, 2003
Figure S4: Antenna #1 On
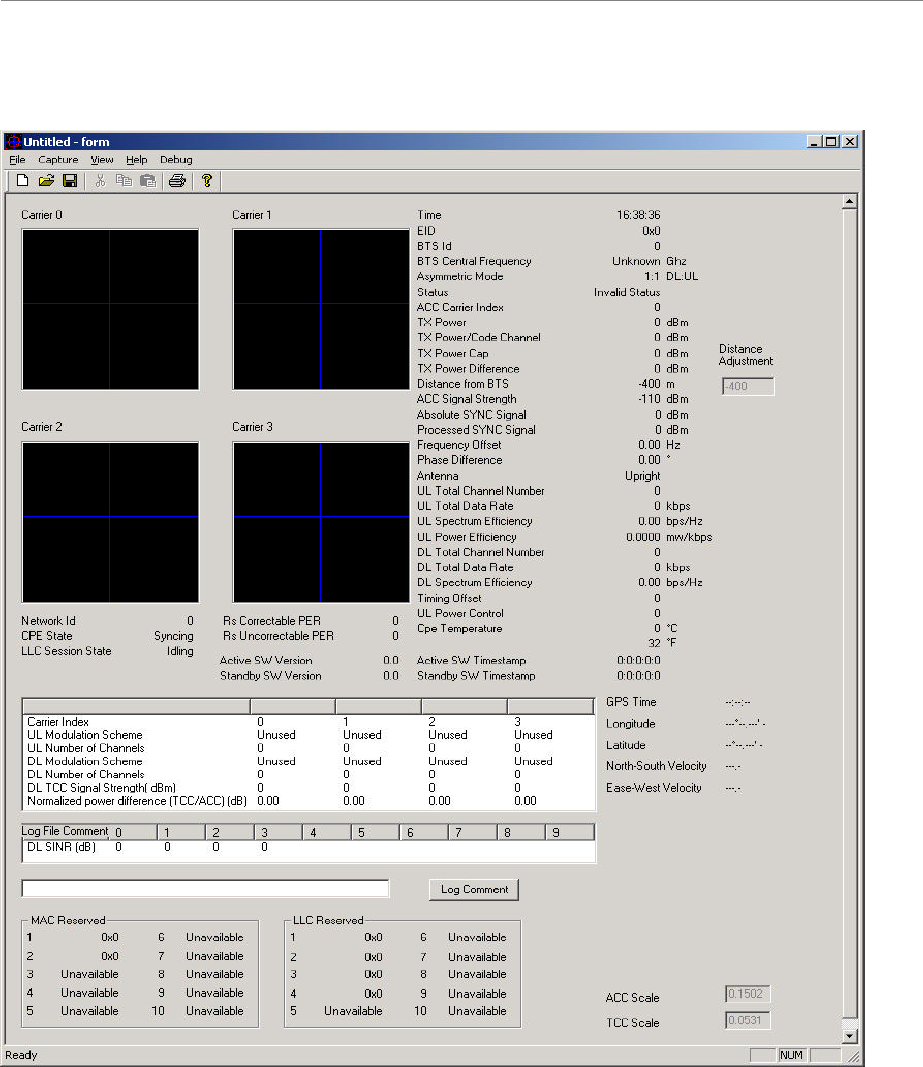
Step 5. Start a Ping with the Modem and PC performing the test, observing the
Constellation Debugger tool. Look for the following values:
?? ACC Signal Strength
?? Absolute Sync Signal
?? Processed Sync Signal
These values, an example of which is shown in Figure S5, give you an indication if
there is something wrong with the antenna. If the values are too low or you do not see a
response from your Ping, it means that the antenna and/or the PA are not functioning
properly.
Ripwave Base Station I&C Guide Navini Networks, Inc.
214 Part #40-00047-00 Rev F v1.0 (TTA)
October 23, 2003
Figure S5: Constellation Debugger Values
Step 6. Repeat Steps 4 and 5 to verify each one of the antennas and the PAs. The
verification of each antenna concludes the testing procedure.

Navini Networks, Inc. Ripwave Base Station I&C Guide
Part #40-00047-00 Rev F v1.0 (TTA) 215
October 23, 2003
Comments & Suggestions
1. Navini Smart Antenna technology uses all the 8 antenna elements for the optimum
performance of the system. It is recommended that all antennas are verified and working
properly. If one of the antennas or PAs malfunctions or it breaks, the RFS will still work.
It will not work at its optimum operation, but it will still be functioning equipment. It is
recommended that you change or swap the bad board or equipment.
2. For the testing of each antenna it is recommended that you pick only one spot to measure
the Rx side of the RFS. This spot must to be at a distance of 2-3 km with clear line-of-
sight.
3. A difference of more than 2 dB between the Absolute and Processed SYNC Signal
strength, typically indicates the presence of multipath in the environment.
Omni Procedure
<This info will be added at a later date>

Ripwave Base Station I&C Guide Navini Networks, Inc.
216 Part #40-00047-00 Rev F v1.0 (TTA)
October 23, 2003

Navini Networks, Inc. Ripwave Base Station I&C Guide
Part #40-00047-00 Rev F v1.0 (TTA) 217
October 23, 2003
Appendix T: Base Station Installation Certification
COMPANY
SITE NAME
SITE NO
LOCATION
SITE TYPE
ANTENNA TYPE
ANTENNA AZIMUTH
FREQUENCY BAND
BTS CENTER FREQUENCY
RFS ELECTRICAL DOWNTILT
RFS MECHANICAL TILT
RFS OVERALL DOWNTILT
BTS ENCLOSURE
A
1
Equipment Installed and Secured Per Plan
2
Roof/Ceiling/Wall Penetrations Patched, Sealed and Painted
3
Penetration(s) Inspected by Landowner Representative
B
1
Equipment Installed and Secured Per Plan
2
Structural Upgrades to Roof Installed Per Plan
3
Equipment Support Frame Installed
C
1
Equipment Installed and Secured Per Plan
2
Special Inspection for Foundation Steel Complete
3
Concrete Placed and Vibrated
4
Concrete Break Test Report Complete
D
1
Fencing Complete (Tie-In to Ground System) Per Plan
2
Gravel/Crushed Rock Placed over Weed Barrier
3
Above Ground Conduits Installed Plumb
4
Landscaping/ Erosion Control Complete Per Plan
5
Access Road Complete Per Plan
6
All Trash and Debris Hauled Off Site
7
Site Area restored to Original Condition
8
Unistruts, iron angles and Rods properly cold galvanized
9
RF Safety Signage Installed where Required
BTS SITE COMPLETION CERTIFICATION
Equipment Installed in Building
Equipment Installed on Roof
Equipment Installed on Grade
Civil/Site Work
YES
NO
N/A
YES
NO
N/A
YES
NO
N/A
YES
NO
YES
NO
N/A
YES
NO
N/A
YES
NO
N/A
YES
NO
YES
NO
N/A
YES
NO
N/A
YES
N/A
YES
NO
N/A
YES
NO
NO
N/A
YES
NO
N/A
YES
NO
N/A
YES
NO
N/A
YES
NO
N/A
YES
NO
N/A
YES
NO
N/A
YES
NO
N/A
YES
NO
N/A
YES
NO
MONOPOLE
CO-LOCATE
OMNI
SECTORIZED
INDOOR
OUTDOOR
OTHER
OTHER
2.4GHz
2.3GHz
2.5GHz
2.6GHz
0 Degree
2 Degree
4 Degree
6 Degree
Uptilt
Downtilt

Ripwave Base Station I&C Guide Navini Networks, Inc.
218 Part #40-00047-00 Rev F v1.0 (TTA)
October 23, 2003
E
1
Monopole/Tower Plumb, Torqued and Free of Visible Defects
2
Orientation of Monopole/Tower Per Plan
3
Safety Climb Installed and Tensioned per Manufacturer Spec.
4
Weep Hole Free of Obstructions
5
Step Bolts Installed/ Removed Below 30 feet
6Monopole/Tower Tie-In to Ground Ring Complete
F
1
Monopole/Tower Grounding Installed
2Ground Wire Types and Size meet construction Specs
3
Lightning Rod Provided and Installed Per Plan
4
5 Ohm Megger Ground Resistance Test Complete
5
Buss Bars Installed Per Plan
6
Surge Protector Installed Between RFS Antenna and Cable
7
Coax Ground Kits Installed at RFS Antenna Per Plan
8
Coax Ground Kits Installed at Tower Base Per Plan
9Coax Ground Kits Installed at Buss Bar Prior to BTS Per Plan
10
Double Lug Connectors Used at All Buss Bar Attachments
11
Cable Tray/Ice Bridge Bonded and Grounded to Buss Bar
12
Surge Protectors Mounted and Secured on ground Buss Bar
13 Master Ground Buss Bar Tied-In to Ground Ring
14
Equipment Rack Ground Per Plan
15
Power Supply/UPS, Rectifier Ground Per Plan
16
Meter and Telco box Ground Per Plan
17
Fence Work Grounded Per Plan
18
Additional Equipment Tied-In to BTS properly Grounded
G
1
Power and Telco Conduits Installed Per Plan
2
Conduits Are Labeled and Pull Strings are Provided
3
Meter and Telco Box are Installed Per Plan
4
Circuit Breakers Installed and Properly Labeled
5UPS Installed and All Internal Connections Made
6
Rectifier Installed, Output and Wiring to BTS Checked
7
Telco Tie-In to Source, Tested and Complete
8
Network/Telco Tie-In to BTS, Tested and Complete
9EMS Installed and Connected to Network
Electrical, Telco and Network
Grounding
Monopole/Tower
N/A
YES
NO
N/A
YES
NO
N/A
YES
NO
N/A
YES
NO
N/A
YES
NO
N/A
YES
NO
N/A
YES
NO
N/A
YES
NO
N/A
YES
NO
N/A
YES
NO
N/A
YES
NO
N/A
YES
NO
N/A
YES
NO
N/A
YES
NO
N/A
YES
NO
N/A
YES
NO
N/A
YES
NO
N/A
YES
NO
N/A
YES
NO
N/A
YES
NO
N/A
YES
NO
N/A
YES
NO
N/A
YES
NO
N/A
YES
NO
N/A
YES
NO
N/A
YES
NO
N/A
YES
NO
N/A
YES
NO
N/A
YES
NO
N/A
YES
NO
N/A
YES
NO
N/A
YES
NO
N/A
YES
NO
N/A
YES
NO

Navini Networks, Inc. Ripwave Base Station I&C Guide
Part #40-00047-00 Rev F v1.0 (TTA) 219
October 23, 2003
H
1
Cabinet is Positioned, Secured and Leveled Per Plan
2
Cabinet Outer Surfaces Free from scratches, dents, corrosion
3
All Hardware Connections within BTS are tightened/secured
4
RF/GPS Coax Connectors Securely Connected to BTS
5
Signal/Power Cable Securely Connected to BTS
6
Ethernet/T1 cables Dressed and Secured to BTS
7
Documents, License are Stored or Posted on BTS
J
1
RFS Antenna Height and Orientation Per Plan
2
RFS Antenna Mount Plumb Per Axis
3
GPS Antenna Mounted Per Plan
4
Zinc Cold Galvanizing compound used everywhere
5
Coaxial Cables Run Straight (Not Exceeding Bend Radius)
6
Coaxial Cables Tagged and Color Coded Per Plan
7
Connectors and Jumpers Installed and Weatherproofed
8
Cable Hangers, Bands or Ties Spaced up every 3 Feet
9
Antenna Power and Data Cable Continuity Tested
10
Antenna System Sweep Test Performed and Passed
11
SW and Hard Copy of Antenna Sweep Test Results Provided
Printed Name
Signature / Date
Company
Phone No.
Printed Name
Signature / Date
Company
Phone No.
Printed Name
Signature / Date
Company
Phone No.
BTS System
Antenna and Feeder System
NOTES
N/A
YES
NO
N/A
YES
NO
N/A
YES
NO
N/A
YES
NO
N/A
YES
NO
N/A
YES
NO
N/A
YES
NO
N/A
YES
NO
N/A
YES
NO
N/A
YES
NO
N/A
YES
NO
N/A
YES
NO
N/A
YES
NO
N/A
YES
NO
N/A
YES
NO
N/A
YES
NO
N/A
YES
NO
N/A
YES
NO
Ripwave Base Station I&C Guide Navini Networks, Inc.
220 Part #40-00047-00 Rev F v1.0 (TTA)
October 23, 2003
COMPANY
SITE NAME
SITE NO
LOCATION
CHP1 CHP2 MDM1 MDM2
0
0
0
0
BTS SN
RFS SN
0
0
0
0
0
0
0
0
0
0
0
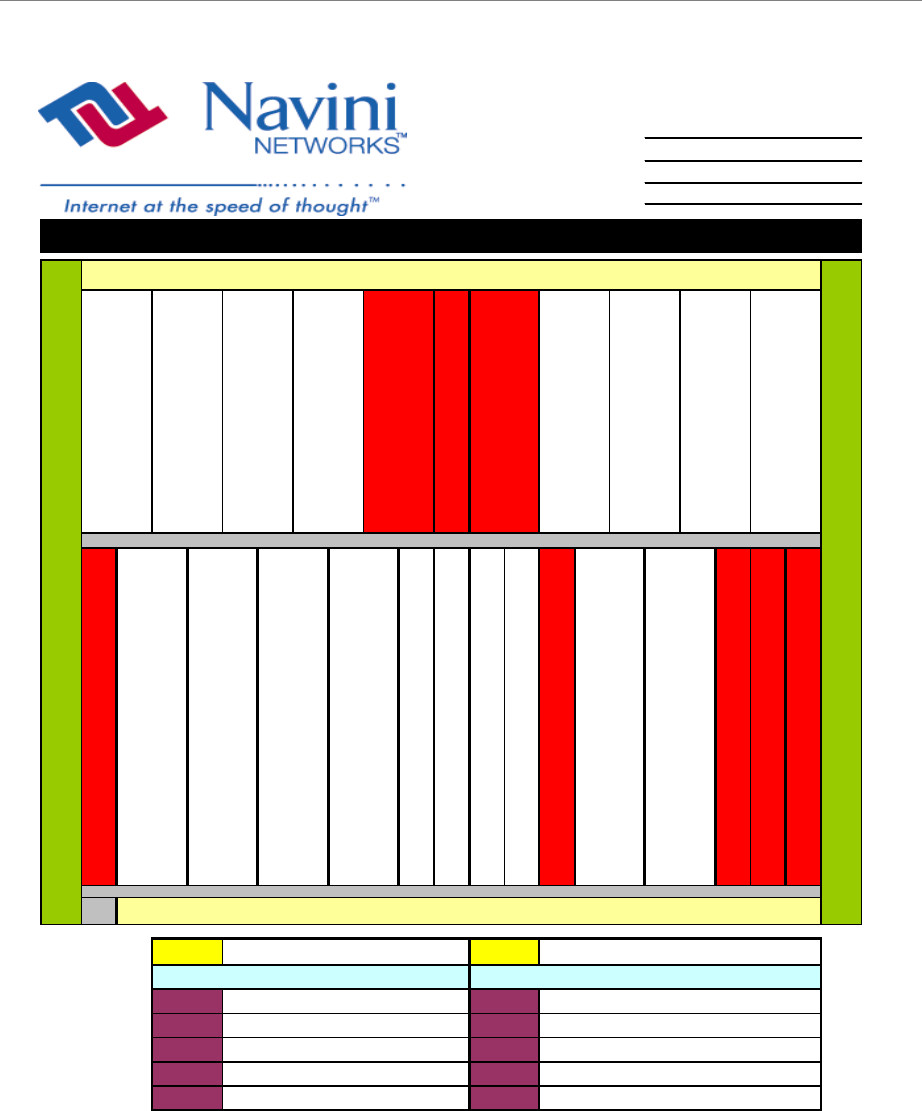
RF SHELF
DIGITAL SHELF
SYN1
PA4
PA5
IF1
IF2
CHP1
PA1
PA2
PA3
0
SYN2
PA7
PA8
SYN1 SYN2 IF1 IF2 CC1 CC2
0
0
PA2
PA4
PA5
Note : Please write all Card Serial Numbers in the Spreadsheet Below
PA1
PA3
PA6
0
0
0
0

Navini Networks, Inc. Ripwave Base Station I&C Guide
Part #40-00047-00 Rev F v1.0 (TTA) 221
October 23, 2003
Appendix U: Excel Configuration Form
The configuration forms are used to plan and design the operating parameters for the system. The
parameters for every system element are defined in the EMS Server.
**********
EMS Configuration Data Form
(To configure EMS Servers & Clients in the Ripwave System)
Company:__________________________________________________________
Your Name:______________________________________ Date:_____________
NOTE 1: Field Values in gray rows indicate data that ordinarily should not be changed or that is populated
automatically by the system.
NOTE 2: Default Field Values are underlined.
Field Name Values Description
EMS Id Unique identifier for this EMS.
Alarm AutoAck True True or False. If True, the EMS will automatically
acknowledge all alarms except alarms with a severity
level of Warning (blue). An Alarm Engineer will only see
current alarms on the system. However, all alarm activity
is logged to an alarm file.
Server Ip Address IP address of the EMS Server.
Database Schema
Version 01 (example) Version of the EMS server database schema.
Mib Version 1.19.01 (example) Version of the BTS Management Information Base
(MIB).
BTS/CPE SW Directory loads (example) Directory where BTS and CPE software loads are stored.
Used by the EMS to obtain the location of the software
loads during downloads. Copy BTS and CPE software
loads to this directory during initial installations or
upgrades. Otherwise, the EMS cannot download the
software to the BTS. This field is used in conjunction
with the FTP Server Root Path field by the EMS to
obtain the software loads. The full path the EMS searches
for software loads is <FTP Server Root Path>\<BTS/CPE
SW Directory>. Example - C:\naviniems \ftp\loads.
continued…

Ripwave Base Station I&C Guide Navini Networks, Inc.
222 Part #40-00047-00 Rev F v1.0 (TTA)
October 23, 2003
Field Name Values Description
FTP Server Root Path The Root directory where BTS and CPE software loads
are stored. This field must match what is configured in
the FTP Daemon. Otherwise, the EMS will not be able to
download BTS and CPE software loads to the BTS. This
path is used by the EMS to obtain the location of the
software loads during downloads. Copy BTS and CPE
software loads to this root directory during initial
installations or upgrades. This field is used in conjunction
with the BTS/CPE SW Directory field by the EMS to
obtain the software loads. The full path the EMS searches
for software loads is <FTP Server Root Path>\<BTS/CPE
SW Directory>. Example - C:\naviniems \ftp\loads.
Network ID Unique identifier for this Service Provider’s wireless
network. Intended to ensure other Service Providers’
CPEs cannot operate in the identified network. A CPE
with a different BTS network ID cannot be provided
service by that BTS.
Server Name Host name of the EMS Server machine.
EMS Version 1.19.01 (example) Version of the EMS Server software.
Idl Build Number 1.18.09 (example) CORBA networking software IDL version used by the
EMS Server.
BTS/CPE SW Ftp User
Name User name for downloading BTS and CPE software from
the EMS. This field must match what is configured in the
FTP Daemon. Otherwise, the EMS cannot download
BTS and CPE software loads to the BTS.
BTS/CPE SW Ftp
Password Password used when downloading BTS and CPE
software. This field must match what is configured in the
FTP Daemon. Otherwise, the EMS cannot download
BTS and CPE software loads to the BTS.
Confirm Password Password must be re-entered for security purposes.
CPE AutoProvisioning Disabled Enable or Disable. Determines if the EMS is in
AutoProvision mode during CPE registration. If enabled,
the EMS will allow unprovisioned CPEs to access the
system with minimum bandwidth for a short period of
time. The minimum bandwidth is defined by the first
entry in the CPE Descriptor table. Once the CPE is
allowed limited access to the system, it can connect to a
default web site to enter billing information and the CPE
can be provisioned automatically with the EMS. If
disabled, the EMS will NOT allow an unprovisioned
CPE to access the system.

Navini Networks, Inc. Ripwave Base Station I&C Guide
Part #40-00047-00 Rev F v1.0 (TTA) 223
October 23, 2003
BTS Configuration Form
Company:_________________________________________________________
Your Name:______________________________________ Date:____________
BTS ID/NAME:____________________________________________________
NOTE 1: Field Values in gray rows indicate data that ordinarily should not be changed or that is populated
automatically by the system.
NOTE 2: Default Field Values are underlined.
General Parameters
Status
Field Name Values Description
RF Admin Status Up or Down Determines if the BTS is transmitting Radio Frequency
(RF). Up means transmitting. Down means not
transmitting. To bring the RF Admin Status Up, execute
the Enable action. To bring it Down, execute the Disable
action.
Connected Status True or False Display only. The user cannot set this field. Indicates if
the EMS can communicate with the BTS. The EMS
Server sends a message to the BTS periodically. If the
BTS responds, the EMS sets this field to True. If the BTS
does not respond in a reasonable amount of time, the
EMS changes the Connected Status to false. If the
Connected Status is False, the EMS will not send any
configuration messages to the BTS because it cannot
communicate.
Provisioned Status Provisioned or
Unprovisioned
If Provisioned, the BTS has been configured and is ready
for use.
IP
Field Name Values Description
BTS IP Address Unique IP address for each BTS. Space bar used to
remove or skip existing digits.
EMS Server IP Address Unique IP address for an EMS. Defaults to the IP on
which the EMS Server is running. Space bar used to
remove or skip existing digits.
BTS Default Gateway Default Gateway used to route IP packets for a BTS.
BTS Subnet Mask Subnet Mask used to route IP packets for a BTS.
Street Address Physical location of this BTS.
City City in which BTS is located.
State State in which BTS is located.
Zip Zip code for location in which BTS is located
continued…

Ripwave Base Station I&C Guide Navini Networks, Inc.
224 Part #40-00047-00 Rev F v1.0 (TTA)
October 23, 2003
Field Name Values Description
BTS ID Unique numeric identification number for this BTS.
Cannot be changed once the BTS is created in the
system.
BTS Name Unique name given to this BTS. No two BTSs can have
the same name.
Suppress Alarms TRUE or FALSE To suppress alarms from BTS to EMS, set to TRUE until
problem is resolved. Useful if BTS is flooding EMS and
affecting its performance. To allow alarms to be sent, set
to FALSE.
Suppress CPE Registration TRUE or FALSE Determines if BTS can send CPE Registration messages
to EMS. Useful if BTS is flooding EMS and affecting its
performance. To allow messages to be sent, set to
FALSE.
Calibration Interval
(hours) 1 - 24 The interval of hours by which on-line calibration occurs.
Bridge Aging Timer
(minutes) 1 - 60 BTS Bridge Table timer that controls how long a PVC is
assigned to an EID (CPE). The PVC to EID association is
removed when no user traffic is received for the timer
interval. Applicable only when dynamic PVC assignment
is used.
Enable PVC Loopback TRUE or FALSE Determines if any PVC on this BTS can perform
loopback test.
BTS Contact Personnel Textual identification of a contact person for this BTS
and how to contact them.
BTS Configuration Source EMS or BTS Determines where the BTS obtains its configuration data
when reset. If provisioning BTS for first time, set to
EMS. After successful reset, defaults to BTS.
Interface Type Ethernet or ATM Indicates the backhaul to which the BTS is connected.
BTS Profile Type Unlicensed 2.4 GHz
MMDS 2.6 GHz
Select the correct system. 2.4 GHz is the only unlicensed
frequency. Any other system, 2.3, 2.5, and 2.6, select
MMDS.
Frequency 2.305 GHz - 2.359
GHz
2.40 GHz - 2.473
GHz
2.50 GHz - 2.595
GHz
2.602 - 2.686 GHz
Scroll bar that allows you to set the center frequency for
the BTS operation. The range depends on the type of
system, i.e., 2.3 GHz, 2.4 GHz, 2.5 GHz, 2.6 GHz. The
field is operated by dragging the slider of the center
frequency scroll bar left or right. The center frequency of
an MMDS band BTS must match what is hard-wired on
the RFS. During installation, the installers should check
that the configured center frequency is identical to the
center frequency labeled on the Channel Filter
component of the RFS.
CAUTION: Changing an MMDS BTS center
frequency may result in destruction of the PAs.

Navini Networks, Inc. Ripwave Base Station I&C Guide
Part #40-00047-00 Rev F v1.0 (TTA) 225
October 23, 2003
Diagnostics
Field Name Values Description
Enable Const Display True or False Determines if the BTS Constellation Display application
can be logged into and used on this BTS. If set to True,
this BTS can be logged into and its Constellation Display
viewed.
Max Beamform Displays 0-9 The maximum number of CPEs that can be viewed
simultaneously using the BTS Beamforming diagnostic
display.
User Name ems Authorized user of all diagnostic tools.
Password The password used to authenticate the login to all
diagnostic tools.
Enable Spec Analyzer
Display True or False Determines if the BTS Spectrum Analyzer (frequency)
application can be logged into and used on this BTS.
Confirm Password Confirms that the correct password is entered.
Performance
Field Name Values Description
Perf Log Server IP
Address IP address of the performance log collection server.
Perf Log Storage
Directory The name of the directory at the Performance Log server
where the performance logs are to be sent. Note: The
location of the log directory is “<ftp root directory>\<pm
data directory>”. Example: If the FTP root directory is set
to “d:\naviniems \ftp” and the pm data directory is set to
“performance”, the location of the log directory will be
“d:\naviniems \ftp\performance”. Therefore, when
configuring the FTP Daemon, set the FTP root directory
to “<ems install directory>\ftp”.
Upload Interval (minutes
or hours) Disable, 15 minutes, 30
minutes, 1 hour, 2
hours, etc.
The interval that the BTS uploads performance data to the
EMS.
Collection Interval
(minutes or hours) Disable, 15 minutes, 30
minutes, 1 hour The interval that the BTS collects the performance logs.
Perf Log FTP User
Name The FTP user name set in the FTP Daemon running on
the server where performance logs are captured.
Perf Log FTP Password The FTP password set in the FTP Daemon running on the
server capturing performance logs.
Confirm Password Re-enter password to confirm authorized access.

Ripwave Base Station I&C Guide Navini Networks, Inc.
226 Part #40-00047-00 Rev F v1.0 (TTA)
October 23, 2003
GPS
Field Name Values Description
GPS Latitude North or South
0 (deg) 0 (min) 0 (sec)
The latitude of the BTS in degrees, minutes, and seconds.
GPS Longitude East or West
0 (deg) 0 (min) 0 (sec)
The longitude of the BTS in degrees, minutes, and
seconds.
GPS Height (cm) 0 The height of the BTS in centimeters.
GPS Gmt Offset (min) -360 The difference in time (minutes) between Greenwich
Mean Time (GMT), which is zero, and the time zone
where the BTS is located. For example, if the BTS is
located in Dallas, Texas, the local time is 6 hours earlier
than GMT. In this example, you would enter -360, which
is 6 hrs x 60 min. If the local time is ahead of GMT, you
would enter a + in front of the number.
Neighbor BTS Frequency List
Field Name Values Description
Center Frequency (Scroll
Bar) 2.305 GHz - 2.359 GHz
2.40 GHz - 2.473 GHz
2.50 GHz - 2.595 GHz
2.602 - 2.686 GHz
The frequency at which the neighboring BTS is
transmitting.
Co-located Checkmark or blank Click to place a checkmark indicating that the
neighboring BTS is located on the same tower as the
current BTS.
CPE Ping Table
Field Name Values Description
Ping Sequence 0, 1, 2, 3, etc. Order in which the element with this IP address is
pinged.
IP Address IP address of the element being added to the Ping Table.
Display String Alphanumeric (up to 30
characters) User-assigned designation (name/string) for this element.

Navini Networks, Inc. Ripwave Base Station I&C Guide
Part #40-00047-00 Rev F v1.0 (TTA) 227
October 23, 2003
Air Interface Parameters
Layer 1 - General
Field Name Values Description
RFS Active or Passive Specifies whether the RFS has active or passive circuitry.
Gps Offset 0 This is the GPS timing offset to apply to the BTS in order
of chips (2.5us). The GPS offset must be different for
each BTS sharing the same frequency so they do not
interfere with each other.
Sync Scale 0.1125 The scale setting applied to the transmitted
synchronization signal.
Acc Scale 0.0557 The scale setting applied to the Access Channel.
Tcc Scale 0.0197 The scale setting applied to the Traffic Channel.
Max Scale 0.2516 The maximum allowable scale setting for each of the
above scales: Sync, ACC, TCC.
Rx Sensitivity
(–dBm)
100.0 The target Receiver sensitivity for each antenna. This
target is used during full calibration. If it is changed, full
calibration must be performed for it to take effect.
Antenna Power
(dBm)
30.0 The target antenna power for each antenna. This target is
used during full calibration.
Cal Cable Loss (dB) 0.0 Entered in the EMS during commissioning as one of
several inputs for performing full calibration. This value
is the measured calibration cable loss. If it is changed,
full calibration must be performed for it to take effect.
Cal Backplane Loss
(dB)
5.0 Calibration Backplane Loss (dB)
Cal Total Loss (dB) 0.0 Displays the total calibration loss, calculated from the
values in Cal Cable Loss and Cal Backplane Loss fields.
Synthesizer Tx Gain Displays the Transmitter gain setting for the Synthesizer
used during calibration. This field is a result that is
automatically returned from full calibration.
Synthesizer Rx Gain Displays the Receiver gain setting for the Synthesizer
used during calibration. This field is a result that is
automatically returned from full calibration.
Synthesizer Sc Gain Displays the Loopback gain setting for the Synthesizer
used during calibration. This field is a result that is
automatically returned from full calibration.
Synthesizer Level Displays the power level of the Synthesizer.

Ripwave Base Station I&C Guide Navini Networks, Inc.
228 Part #40-00047-00 Rev F v1.0 (TTA)
October 23, 2003
Layer 1 - Antenna Table
Field Name Values Description
Antenna Index 1-8 The number of the antenna (1-8) that maps to a specific
antenna element in the RFS.
Admin Status Up or Down Determines if the antenna is transmitting RF. Up means
transmitting; Down means not transmitting.
Power Splitter_I The real element of the calibrator board characteristics
that is found in the RFS. This information captures the
loss and phase information of the board. The Power
Splitter data is unique to each RFS. An RFS
Configuration CD ships with the equipment. It provides
an RFS script and instructions for selecting the correct
value to match the specific RFS that is physically
installed with the BTS.
Power Splitter_Q The imaginary element of the calibrator board that is
found in the RFS. This information captures the loss &
amplitude information of the board. The Power Splitter
data is unique to each RFS. An RFS Configuration CD
ships with the equipment. It provides an RFS script and
instructions for selecting the correct value to match the
specific RFS that is physically installed with the BTS.
RF Tx Gain 0-255 The Transmit gains for each antenna element, ranging
from 0-255, with 0 being the lowest gain. This data is
returned as a result of full calibration.
RF Rx Gain 0-255 The Receive gains for each antenna element, ranging
from 0-255, with 0 being the lowest gain. This data is
returned as a result of full calibration.
Layer 1 - w0 Table
Field Name Values Description
Sub Carrier Id 1-5 The number (ordinal) of the subcarrier pair.
Antenna Index 1-8 The number of the antenna element.
W0 Weight_I Real elements of the vector used to control ACC spatial
pattern.
W0 Weight_Q Imaginary elements of the vector used to control ACC
spatial pattern.

Navini Networks, Inc. Ripwave Base Station I&C Guide
Part #40-00047-00 Rev F v1.0 (TTA) 229
October 23, 2003
Layer 1 - Calibration Table
Field Name Values Description
Sub Carrier Id 1-10 The number (ordinal) of the subcarrier.
Antenna Index 1-8 The number of the antenna element.
Tx Weight_I Real elements of the vector used while transmitting to
control ACC spatial pattern. This data is returned as a
result of any of the calibration modes.
Tx Weight_Q Imaginary elements of the vector used while transmitting
to control ACC spatial pattern. This data is returned as a
result of any of the calibration modes.
Rx Weight_I Real elements of the vector used during Receive to
control ACC spatial pattern. This data is returned as a
result of any of the calibration modes.
Rx Weight_Q Imaginary elements of the vector used during Receive to
control ACC spatial pattern. This data is returned as a
result of any of the calibration modes.
Layer 2 - Carrier Data
Field Name Values Description
Sub Carrier Number
/ Sub Carrier
1-2, 3-4, 5-6, 7-8, 9-10 These two fields identify the 10 subcarriers. You can
click on the pair of subcarriers to be enabled for this
BTS. Subcarriers are assigned in pairs.
Access Channel Checkmark or blank Access Code Channels: The ACC Channel occupies the
Code Channel with Walsh Index 0 configured on a
specified subcarrier frequency. Each checkbox indicates
which pair of subcarriers contains an Access Channel.
Broadcast Channel Checkmark or blank Broadcast Code Channel (BCC): If the box is checked,
then a BCC will be transmitted in each pair of subcarriers
that already contains an ACC. The BCCs are used to
broadcast software upgrades to the Modems.
TDD Symmetry
Ratio
Symmetric or
Asymmetric Symmetric Ratio is 1:1. Asymmetric Ratio is 1:3. This
parameter determines the variable uplink and downlink
ratio in a TDD frame. If set to Asymmetric, the downlink
will have 3 times more bandwidth than the uplink. This is
sometimes desired due to the types of users on the
system, i.e., downloading files off the Internet.
Repeat Uplink Pkts Checkmark or blank If the box is checked, the Modems will repeat uplink
packets.
Frequency
(Scroll Bar)
2.305 GHz - 2.359 GHz
2.40 GHz - 2.473 GHz
2.50 GHz - 2.595 GHz
2.602 - 2.686 GHz
Indicates the center frequency of the BTS transmit signal.

Ripwave Base Station I&C Guide Navini Networks, Inc.
230 Part #40-00047-00 Rev F v1.0 (TTA)
October 23, 2003
Layer 2 - Bandwidth
Field Name Values Description
Underload Threshold
(%) 80% The threshold crossing in which a BTS changes its load
congestion state from Overload (either Positive Access
Overload or Negative Access Overload) to Underload.
Overload Threshold (%) 85% The threshold crossing in which a BTS changes its load
congestion state from Underload to Positive Access
Overload.
Positive Access Overload
Threshold (%) 90% The threshold crossing in which a BTS changes its load
congestion state from Negative Access Overload to
Positive Access Overload.
Negative Access
Overload Threshold (%) 95% The threshold crossing in which a BTS changes its load
congestion state from either Underload or Positive
Access Overload.
Reserved Channels for
Accesses 12 Number of channels reserved for access when in the
Underload state.
CPE Inactive Time (min) 15 When a CPE has not communicated with a BTS for the
set Inactive Time, the status of the CPE changes from
active to inactive, as expressed in minutes.
Bandwidth Adjust
Interval (10ms) 20 A user’s bandwidth (uplink or downlink) is adjusted
every Adjust Time if needed when on TCC. Expressed in
units of 10 milliseconds.
Realtime Session Hold
Time (10ms) 250 The length of time a user with realtime data holds RF
resources after the incoming packet queue is empty.
Expressed in units of 10 milliseconds.
Non-realtime Session
Hold Time (10ms) 250 The length of time a user with non-realtime data holds
RF resources after the incoming packet queue is empty.
Expressed in units of 10 milliseconds.
Non RT PreRelease BW
(Kbps) 0 - 2,048
Default is 32
The bandwidth a user is assigned while in Non-realtime
Session Hold Time. The Non RT PreRelease BW is in
units of MAC packets.
Denied Req Number 5 The number of consecutive times a user’s access request
fails due to lack of RF resources before access is denied.
Average LCC Q LEN
Factor 2 Factor used to determine the average LLC queue length.
Exponential For Average 1 Average exponent for all statistical variables but power.
Average Burst Time (ms) 50 Average time for a data burst, expressed in units of 10
milliseconds.
Max Bts Power (TCC
Power) 320 Maximum RF power a BTS has. It is in units of
maximum TCC power per channel. This field is not
configurable.
DL ACC Power Per
Channel (TCC Power) 8 Downlink ACC RF power per channel. It is expressed in
units of maximum TCC power per channel.
TCC Initial Setup Power
(%) 25% Initial setup power of a TCC channel. Expressed in units
of the percentage of the max. TCC power per channel.
Average Exponential
Factor 1 Average exponent for average power.
TCC Power per Channel
Range (dB) 19 Number of decibels the downlink TCC power per
channel can vary.
Min Realtime Data
Bandwidth (Kbps) 0 - 2,048
Default is 32 The minimum bandwidth a user with realtime data holds
that is not used for acknowledgement. Expressed in units
of MAC packets (data rate). continued…

Navini Networks, Inc. Ripwave Base Station I&C Guide
Part #40-00047-00 Rev F v1.0 (TTA) 231
October 23, 2003
Field Name Values Description
Supported Modulations QAM4
QAM4 QAM8
QAM4 QAM16
QAM4 QAM8 QAM16
The highest QAM Rank the BTS can process.
Total Priority Level
Num. 8 The total number of QoS classes the BTS can maintain.
Each class is associated with a priority.
Max Bandwidth for
Priority 1-8 (%) 1 default 85%
2 default 10%
3 default 5%
4-8 default 0%
The percentage of the total bandwidth a QoS class
associated with a certain priority is entitled to.
Layer 2 - WAN Congestion Control
Field Name Values Description
Average Queue Size
Weight (%) 100.0 For downlink, this value - expressed as a percentage -
indicates how much the current queue size contributes to
the calculation of the average queue size. The average
queue size is used by the BTS Resource Management
software to determine how many Code Channels to give a
CPE. The greater the weight, the greater influence the
current queue size has on the average queue size. The
lower the weight, the more the queue size is an actual
average of the current queue size over time.
Max Queue Size (KB) 512 For downlink, the maximum queue size - in kilobytes -
for each priority queue (high, low, voice). Once the
queue is full (at Min Drop Threshold) all packets are
dropped.
Min to Max Drop
Probability (%) 10 For downlink, the probability of a packet being dropped
when the Min Threshold has been reached. The higher
this number, the more likely a packet will be dropped
between the Min Threshold and the Max Threshold.
NOTE: All packets are dropped at the Max Threshold.
Realtime Min Drop
Threshold (%) 100 For downlink, the minimum queue size in which voice
priority packets are considered for being dropped. For
example, if set to 10%, once the queue size reaches 11%
or more, voice priority packets may be dropped. The
Max Drop Probability field determines if a packet is
dropped once the Min Threshold is exceeded.
High Priority Min Drop
Threshold (%) 100 For downlink, the minimum queue size in which high
priority packets are considered for being dropped. For
example, if set to 10%, once the queue size reaches 11%
or more, high priority packets may be dropped. The Max
Drop Probability field determines if a packet is dropped
once the Min Threshold is exceeded.
Low Priority Min Drop
Threshold (%) 100 For downlink, the minimum queue size in which low
priority packets are considered for being dropped. For
example, if set to 10%, once the queue size reaches 11%
or more, high priority packets may be dropped. The Max
Drop Probability field determines if a packet is dropped
once the Min Threshold is exceeded.

Ripwave Base Station I&C Guide Navini Networks, Inc.
232 Part #40-00047-00 Rev F v1.0 (TTA)
October 23, 2003
Layer 2 - CPE Uplink Congestion Control
Field Name Values Description
Avg Queue Size Weight
(%) 100.0 For the uplink, this value - expressed as a percentage -
indicates how much the current queue size contributes to
the calculation of average queue size. The average queue
size is used by the BTS Resource Management software
to determine how many Code Channels to give a CPE.
The greater the weight, the greater influence the current
queue size has on the average queue size. The lower the
weight, the more the average queue size is an actual
average of the current queue size over time.
Max Queue Size (KB) 512 For the uplink, the maximum queue size for each priority
queue (high, low, voice). Once the queue is full (at Min
Drop Threshold) all packets are dropped.
Min to Max Drop
Probability (%) 10 For the uplink, the probability of a packet being dropped
when the Min threshold has been reached. The higher this
number, the more likely a packet will be dropped
between the Min Threshold and Max Threshold. Note:
All packets are dropped at the Max Threshold.
Realtime Min Drop
Threshold (%) 100 For the uplink, the minimum queue size in which voice
priority packets are considered for being dropped. For
example, if set to 10% once the queue size reaches 11%
or more, voice priority packets may be dropped. The Max
Drop Probability field determines if a packet is dropped
once the Min Threshold is exceeded.
High Priority Min Drop
Threshold (%) 100 For the uplink, the minimum queue size in which high
priority packets are considered for being dropped. For
example, if set to 10% once the queue size reaches 11%
or more, high priority packets may be dropped. The Max
Drop Probability field determines if a packet is dropped
once the Min Threshold is exceeded.
Low Priority Min Drop
Threshold (%) 100 For the uplink, the minimum queue size in which low
priority packets are considered for being dropped. For
example, if set to 10% once the queue size reaches 11%
or more, low priority packets may be dropped. The Max
Drop Probability field determines if a packet is dropped
once the Min Threshold is exceeded.

Navini Networks, Inc. Ripwave Base Station I&C Guide
Part #40-00047-00 Rev F v1.0 (TTA) 233
October 23, 2003
Backhaul Interface Parameters
T1
Field Name Values Description
Admin Status Up Up or Down. Display only. The administrative
(operational) status of this T1. If Down, no traffic is able
to go through this interface. This field is not
configurable.
Line Type ESF or D4 Framing format
Send Code Send line code, Send No
Code, Send Payload
Code, Send Reset Code
Selection of codes used for far-end loopback tests
Signal Mode None Always None
Line Length (foot) 5000 Length of T1 cables from BTS to terminating equipment
Fdl None, Att54016,
AnsiT1403
Facility Data Link (FDL) signaling type
Line Status Change Trap Enabled or Disabled Enables generation of traps based on changes to the line
status
Line Index 1 The ATM IF index that this T1 is associated with
Line Coding B8ZS or AMI Type of coding used to encode bits on the line
Circuit Identifier Vendor’s transmission circuit identifier
Transmit Clock Source Loop timing or Local
Timing Source of the framer Transmit clock
Channelization Disabled Always Disabled (clear channel)
IMA Groups
Field Name Values Description
Admin Status Up Up or Down. This is the administration (operational)
status of the IMA group. If Down, no traffic is able to go
through this interface.
Symmetry Symmetric operation,
Symmetric &
Asymmetric, or
Asymmetric
Three options for the relationship of the Transmit and
Receive link throughput:
?? Symmetric operation - all links should be configured
in both directions. Tx and Rx must both be active to
use the disk.
?? Symmetric and Asymmetric operation - all links
should be configured in both directions. Transmitting
is allowed when Tx is active and Rx is not active.
?? Asymmetric operation - not required to configure the
IMA links in both Tx and Rx directions.
Min Num Rx Links 3 Minimum number of active Receive links that is
necessary for the IMA group to be active.
Tx Ima Id 0 Near-end (Transmit) IMA ID. continued…
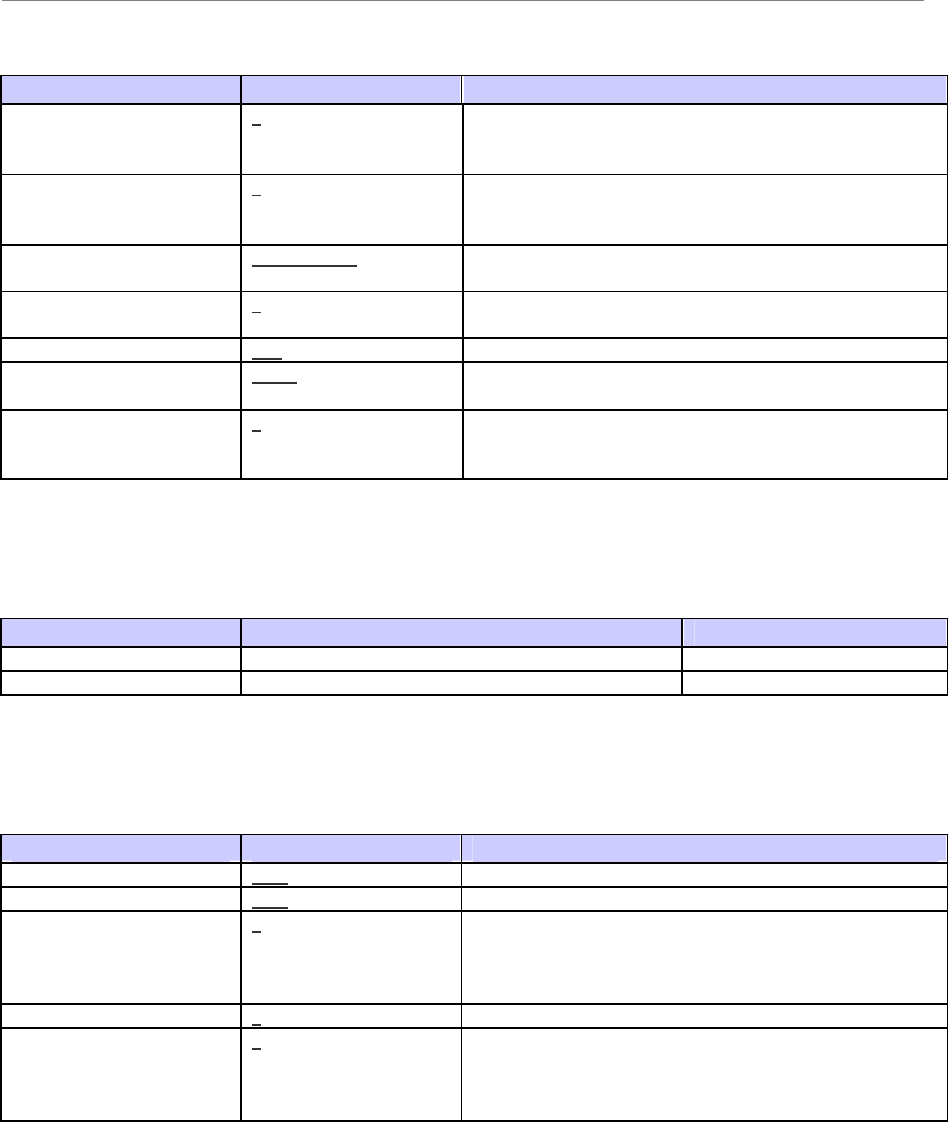
Ripwave Base Station I&C Guide Navini Networks, Inc.
234 Part #40-00047-00 Rev F v1.0 (TTA)
October 23, 2003
Field Name Values Description
Alpha Value 2 Used to specify the number of consecutive valid ICP
cells to be detected before moving to the IMA hunt state
from the IMA sync state.
Gamma Value 1 Used to specify the number of consecutive valid ICP
cells to be detected before moving to the IMA sync state
from the IMA pre-sync state.
Index IMA group 2 IMA Group 1 or 2. Unique sequence number of the IMA
group.
Min Num Tx Links 1 Minimum number of Transmission links that have to be
active for the IMA group to be active.
Ne Tx Clk Mode ITC Near-end Transmit clock mode.
Tx Frame Length M128 Length of IMA frame being transmitted. It is defined as
M consecutive cells.
Beta Value 2 Used to specify the number of consecutive ICP cells with
errors to be detected before moving to the IMA hunt state
from the IMA sync state.
Add T1s to IMA Groups
IMA Group T1s Associated With this IMA Group Notes
IMA 1
IMA 2
ATM
Field Name Values Description
If Index T1-1 (first T1 ID) Interface (IF) Index associated with this ATM interface.
Max Vccs 1001 Maximum Virtual Channel Circuits for this interface.
Max Active Vci Bits 9 The number of bits for Virtual Channel Identifier (VCI).
Determines the maximum VCI value allowed for this
interface. The Max Value is calculated by 2^ (max active
vci bits).
Max Vpcs 0 Maximum Virtual Private Circuits for this interface.
Max Active Vpi Bits 3 The number of bits for Virtual Private Identifier.
Determines the maximum VPI value allowed for this
interface. The max value is calculated by 2^ (max active
vpi bits).
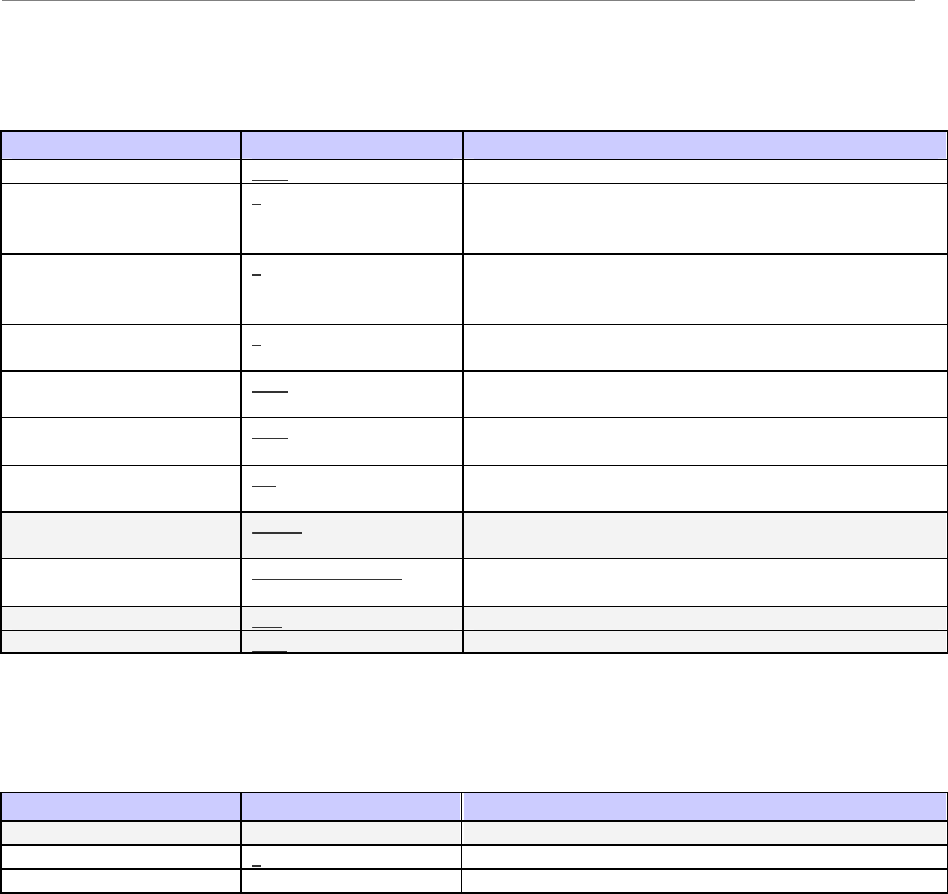
Navini Networks, Inc. Ripwave Base Station I&C Guide
Part #40-00047-00 Rev F v1.0 (TTA) 235
October 23, 2003
PVC
Field Name Values Description
if Index T1-1 The ATM IF index that this PVC is associated with.
Vpi (start and end) 0 Virtual Path Identifier. The VPI + VCI are in the cell
header and identify the next destination of a cell as it
passes through a series of ATM switches.
Vci (start and end) 0 Virtual Channel Identifier. The VPI + VCI are in the cell
header and identify the next destination of a cell as it
passes through a series of ATM switches.
Tr/Re Traffic Descr
Indexes 2 Index of the ATM Descriptor that applies to this PVC.
The Transmit and Receive Descriptors are the same.
AAL5 CPCS Tx SDU
Size (Byte) 1528 The maximum AAL5 CPCS SDU size, in bytes, that is
supported in the Transmit direction.
AAL5 CPCS Rx SDU
Size (Byte) 1528 The maximum AAL5 CPCS SDU size, in bytes, that is
supported in the Receive direction.
Admin Status Up Up or Down. The administrative (operational) state of the
PVC. If it is Down, this PVC may not be used for traffic.
AAL Type AAL5 (1-5) The type of ATM Adaptation Layer (AAL) used on this
PVC: AAL1, AAL2, AAL3, AAL4, or AAL5.
AAL5 Encap Type LLC encapsulation The type of data encapsulation used over the AAL5
SSCS layer.
Cast Type P2P The connection topology type.
Conn Kind PVC The type of VCL. This is always PVC.
Assign CPE to PVC
Field Name Values Description
PVC T1-1-1-100 (example) Identifies the PVC to be assigned to the specified CPE.
CPE 0 CPE assigned to specified PVC.
Data Denotes what type of PVC to assign.

Ripwave Base Station I&C Guide Navini Networks, Inc.
236 Part #40-00047-00 Rev F v1.0 (TTA)
October 23, 2003
Global Parameters Configuration Form
Company:__________________________________________________________
Your Name:______________________________________Date:______________
NOTE 1: Field Values in gray rows indicate data that ordinarily should not be changed or that is populated
automatically by the system.
NOTE 2: Default Field Values are underlined.
ATM Descriptor
Field Name Values Description
Index 0 Identifier for this ATM Descriptor
Type NOCLPNOSCR, NOCLPSCR,
CLPNOTAGGINGSCR,
CLPTAGGINGSCR,
CLPNOTAGGINGMCR,
CLPTRANSPARENTNOSCR,
CLPTRANSPARENTSCR,
NOCLPTAGGINGNOSCR
Type of ATM
Category CBR, RTVBR, NRTVBR,
ABR, UBR Category of this ATM (see parameters, below)
Frame Discard True True or False. If set to True, enables the ability to
discard ATM frames.
Param1 - Param5 0 Described below
CBR Parameters:
PCR
Peak Cell Rate
RTVBR Parameters:
PCR
SCR
MBS
Peak Cell Rate
Sustainable Cell Rate
Maximum Burst Size
NRTVBR
Parameters:
PCR
SCR
MBS
Peak Cell Rate
Sustainable Cell Rate
Maximum Burst Size
ABR Parameters:
PCR
MCR
ICR
RDF
RIF
CDF
Peak Cell Rate
Minimum Cell Rate
Initial Cell Rate
Rate Decrease Factor
Rate Increase Factor
Cutoff Decrease Factor
UBR Parameters:
PCR
Peak Cell Rate

Navini Networks, Inc. Ripwave Base Station I&C Guide
Part #40-00047-00 Rev F v1.0 (TTA) 237
October 23, 2003
CPE Descriptor
Field Name Values Description
Name Name given to this CPE Descriptor.
Index 1 (1-8) Unique index identifier for this CPE Descriptor.
Priority 0 The priority that a CPE with this assigned Descriptor
will receive from the BTS Resource Manager software
when requesting RF resources. This field maps to the
Layer 2 > Bandwidth Data component in the BTS.
UL Max Bandwidth
(Kbps) 0, 32, 64, 96, 128, 160,
192, 224, etc. Maximum uplink bandwidth allowable for a CPE with
this Descriptor. The maximum number of code channels
allocated for a CPE is directly related to this field.
UL Min Bandwidth
(Kbps) 0, 32, 64, 96, 128, 160,
192, 224, etc. Minimum uplink bandwidth allowable for a CPE. This
field determines the number of code channels allocated
when a CPE begins a data session. The larger this value,
the more code channels allocated at session startup.
DL Max Bandwidth
(Kbps) 0, 32, 64, 96, 128, 160,
192, 224, etc. Maximum downlink bandwidth allowable for a CPE.
The maximum number of code channels allocated for a
CPE is directly related to this field.
DL Min Bandwidth
(Kbps) 0, 32, 64, 96, 128, 160,
192, 224, etc.
Minimum downlink bandwidth allowable for a CPE.
This field determines the number of code channels
allocated when a CPE begins a data session. The larger
this value, the more code channels allocated at session
startup.
Avg Queue Size Weight
(%) 100.0 How much the current queue size contributes to the
calculation of average queue size. The average queue
size is used by the BTS Resource Manager to determine
how many resources (code channels) to give a CPE. The
greater the weight, the greater influence the current
queue size has on the average queue size. The lower the
weight, the more the average queue size is an actual
average of the current queue size over time.
Max Queue Size (KB) 512 Maximum queue size for each priority queue (high, low,
voice). Once full (Max Threshold) all packets are
dropped.
Min to Max Drop
Probability (%) 10 The probability of a packet being dropped when the Min
Threshold has been reached. The higher this number, the
more likely a packet will be dropped between the Min
and Max Threshold. All packets are dropped at Max
Threshold.
Realtime Min Drop
Threshold (%) 100 The minimum queue size at which voice-priority packets
are considered for being dropped. For example, if set to
10% once the queue size reaches 11% or more, voice
priority packets may be dropped. The Max Threshold
Probability field determines if a packet is dropped once
the Min Threshold is exceeded.
High Priority Min Drop
Threshold (%) 100 The minimum queue size at which high-priority packets
are considered for being dropped. For example, if set to
10%, once the queue size reaches 11% or more, high
priority packets may be dropped. The Max Threshold
Probability field determines if a packet is dropped once
the Min Threshold is exceeded. continued…

Ripwave Base Station I&C Guide Navini Networks, Inc.
238 Part #40-00047-00 Rev F v1.0 (TTA)
October 23, 2003
Field Name Values Description
Low Priority Min Drop
Threshold (%) 100 The minimum queue size at which low-priority packets
are considered for being dropped. For example, if set to
10%, once the queue size reaches 11% or more, low
priority packets may be dropped. The Max Threshold
Probability field determines if a packet is dropped once
the Min Threshold is exceeded.
DiffServ
Field Name Values Description
Code Point 0 Unique index (bit) to be mapped to a defined Differentiated
Service. The code point is structured as follows:
0 1 2 3 4 5 6 7
+---+---+---+---+---+---+---+---+
| DSCP | CU |
+---+---+---+---+---+---+---+---+
DSCP: Differentiated Services Code Point
CU: Currently Unused
The Type of Service (ToS) bits are included in the DSCP.
Priority Low, High, Voice Low, High, or Voice. This is the priority given to data
packets associated with this Code Point/Service. The BTS
processes data packets with Voice, then High priority before
Low priority packets.
DHCP Relay
Field Name Values Description
Relay Config Enabled (Checkbox) Enable or Disable. Clicking on the checkbox enables the
DHCP Relay feature.
Free Address Low Agent
Threshold 80
Free Address High Agent
Threshold 100
Relay Config MaxDhcp
Size 1488
Option 82 Tagging (Checkbox) Enable or Disable. Clicking on the checkbox enables the
inclusion of one or more of the following Relay
Information sub-options.
Remote Id (Checkbox) If checked (enabled), include the Modem EID as the
Remote ID Relay Information sub-option. It will be
formatted as a 6 octet string “0000<EID>”. This format
is often used in cable modem scenarios. continued…

Navini Networks, Inc. Ripwave Base Station I&C Guide
Part #40-00047-00 Rev F v1.0 (TTA) 239
October 23, 2003
Field Name Values Description
Circuit Id (Checkbox) If checked (enabled), include the BTS ID as the Circuit
ID Relay Information sub-option. It will be formatted as
a 4-octet string “<BTS ID>”. This format is often used
in cable modem scenarios.
VPN Id (Checkbox) If checked (enabled), include the Modem EID as the
VPN ID Relay Information sub-option. It will be
formatted as a text string “navini<EID>”. This format is
often used in DSL scenarios.
Subnet Selection/Addr (Checkbox) If checked (enabled), include the specified Subnet
Address as the Subnet Selection Relay Information sub-
option.
DOCSIS Device/Class (Checkbox) If checked (enabled), include the specified DOCSIS
Device Class as the DOCSIS Device Relay Information
sub-option.
ARP Proxy
Field Name Values Description
ARP Ingress Proxy (Checkbox) If clicked, this enables the BTS to respond to ARP
messages coming from the CPEs/Modems to the BTS.
ARP Egress Proxy (Checkbox) If clicked, this enables the BTS to respond to ARP
messages coming from the network (backhaul) to the
BTS on behalf of the CPEs/Modems.
Layer 3 Filter
Field Name Values Description
Dynamic Acl (Checkbox) If clicked, this enables the Dynamic Access Control List.
It provides the filtering rules for DHCP Relay - where a
BTS configured with these capabilities may add learned
addresses to the Modem’s Authenticated IP List (the
Modem’s Ingress Filter). When BTSs and Modems are
configured for this feature, any packet whose MAC
address cannot be found in the current Modem’s
Authenticated IP List will be discarded.
Egress Broadcast Filter (Checkbox) If clicked, this enables configured BTSs to drop all
Ethernet Broadcast packets.

Ripwave Base Station I&C Guide Navini Networks, Inc.
240 Part #40-00047-00 Rev F v1.0 (TTA)
October 23, 2003
CPE Configuration Data Form
Company:__________________________________________________________
Your Name:______________________________________Date:______________
NOTE 1: Field Values in gray rows indicate data that ordinarily should not be changed or that is populated
automatically by the system.
NOTE 2: Default Field Values are underlined.
Add CPE
Field Name Values Description
EID (hex) 0 Equipment Identifier unique to each CPE. This value is
determined during the manufacturing process and is
displayed on the case of the CPE hardware, as well as
entered and displayed as a hexadecimal number in this
field.
Descriptor Name CPE Descriptor-1 The name of the CPE Descriptor to be used with this
CPE. The CPE Descriptor level affects Quality-of-
Service (QoS) for this CPE’s data packets.
Collect Perf Data True True or False. Collect Performance Data. If True, this
CPE sends performance metrics to the BTS at the set
interval. The BTS then uploads the performance data to
the EMS at set intervals. The interval setting for
collection and upload from the BTS to the EMS is set in
the Performance fields for the BTS.
Nomadic Disabled Enabled or Disabled. If Enabled, this CPE can access any
BTS in the network that is defined in its Available Home
BTS list at the bottom of the screen. When enabled, the
Current Home BTS list is ignored. If disabled, this CPE
can only access a BTS in its Available Home BTS list.
Admin Status Active Active or Suspended. If suspended, the CPE cannot
access any BTS. A Service Provider may decide to make
the CPE suspended due to late service payments, security
concerns, etc., rather than deleting the CPE from the
system database.

Navini Networks, Inc. Ripwave Base Station I&C Guide
Part #40-00047-00 Rev F v1.0 (TTA) 241
October 23, 2003
Home BTS
Field Name Values Description
Available Home BTS Add or Remove BTS Names. A list of available BTSs to
include in the Current Home BTS list for this CPE.
Current Home BTS Add or Remove BTS Names. If Nomadic is disabled,
these are the only BTSs this CPE can access. If Nomadic
is enabled, this list is ignored.
Layer 3
Field Name Values Description
Ingress Acl (Checkbox) If checkbox is clicked “on” any incoming packet whose
MAC address cannot be found in the current CPE
Authenticated IP List will be discarded.
Ingress Broadcast (Checkbox) If checkbox is clicked “on” any incoming MAC
broadcast message will be discarded.
DHCP Relay
Field Name Values Description
Free Address High Drop
Policy Drop most recently
leased or Drop least
recently leased
Drop the most recently leased or least recently leased IP
addresses
Max Address Number Drop most recently
leased or Drop least
recently leased
Drop the most recently leased or least recently leased IP
addresses
IP Address
Field Name Values Description
Static Client IP Address 0.0.0.0 Use static, rather than dynamic, IP addressing for this
device. If static IP assignment is being made, add this IP
address to the Ingress Filter Authenticated IP List.
Otherwise, leave zeroes.
Hardware Address 0:0:0:0:0:0 Enter the Ethernet address of the host computer to which
the CPE is connected and that corresponds to the above
Client IP Address.

Ripwave Base Station I&C Guide Navini Networks, Inc.
242 Part #40-00047-00 Rev F v1.0 (TTA)
October 23, 2003

Navini Networks, Inc. Ripwave Base Station I&C Guide
Part #40-00047-00 Rev F v1.0 (TTA) 243
October 23, 2003
Appendix V: Base Station Calibration Verification
Objective
The objective of this procedure is to verify the transmit power and noise figure of the Base
Station using a Modem.
Test Equipment Required
?? Installed Base Station, powered on and calibrated
?? Navini Drive Test Box
?? PC with Beamforming Display tool installed
?? 4 Fixed Attenuators: two at 30 dB, two at 10 dB.
Low power attenuator acceptable.
?? RF cables and adaptors (3 ft or more)
?? N type Terminator for GPS
Test Procedure
Step 1. If not already done, calibrate the Base Station. Verify a successful calibration by
monitoring the console with “caldebugon”. Verify that the cal error equals zero. If
cal errors are not zero, troubleshoot the system before starting.
Step 2. Prepare the setup that is shown in Figure V1.
Step 3. Connect approximately 30-40 dB of attenuation to one end of the calibration cable.
Connect a 3-6 ft RF cable to the other end of the attenuation. Connect 40 dB of
attenuation to the end of that cable. Connect the attenuators to the Navini Drive
Test box.
Step 4. Put the Drive Test box as far away from the Base Station as possible. Terminate
the GPS connector. Calculate the path loss from the Drive Test box to the Cal
cable. In the EMS disable carriers 1-2, 3-4, and 9-10, leaving 5-6 and 7-8 enabled.
Also verify that the ACC for 5-6 is selected. This is found by clicking on the BTS
tab, highlighting the specific BTS, then selecting Air Interface > Layer 2 >
Carrier data. Refer to Figure V2.
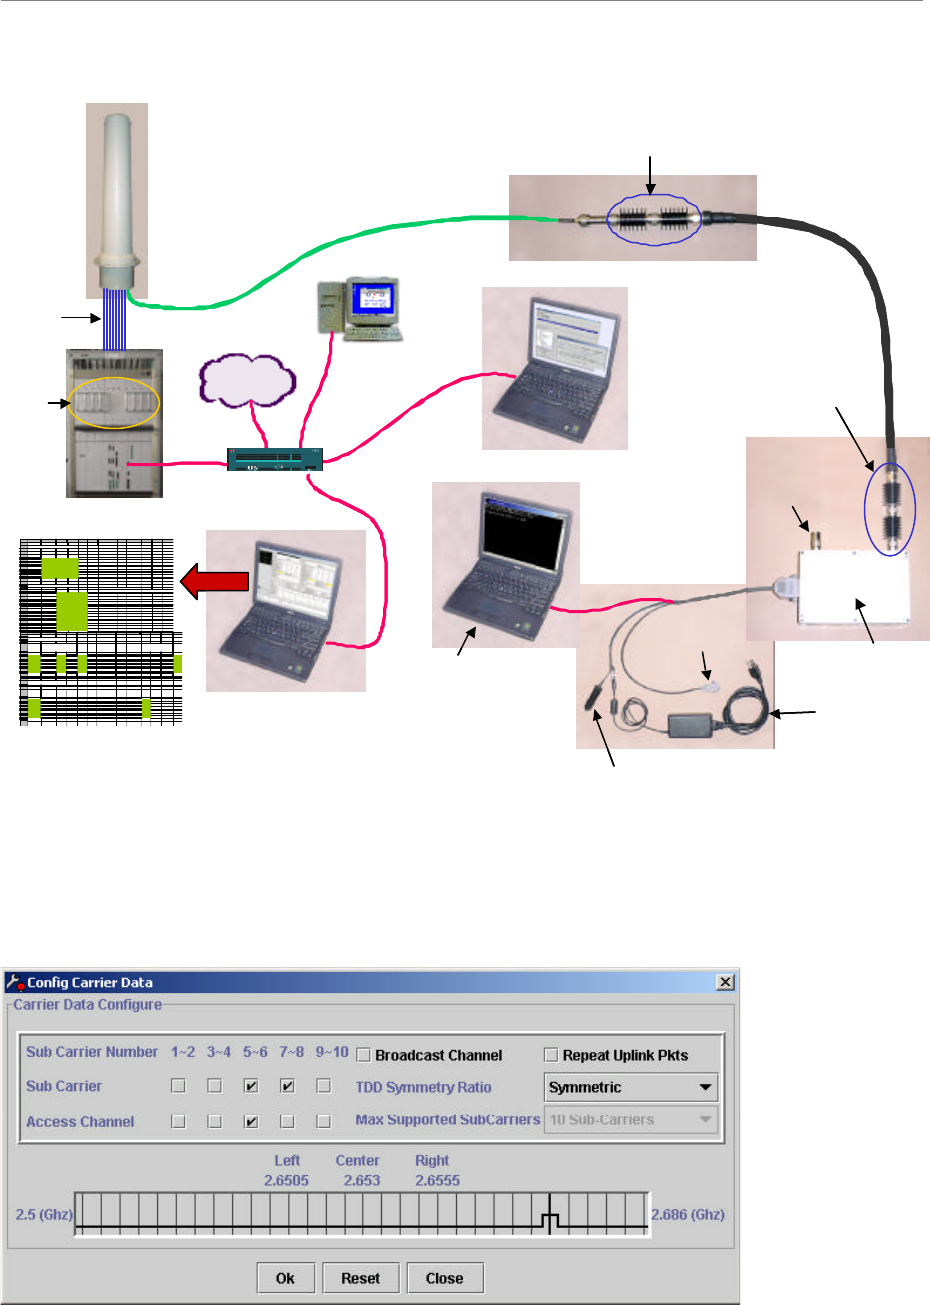
Ripwave Base Station I&C Guide Navini Networks, Inc.
244 Part #40-00047-00 Rev F v1.0 (TTA)
October 23, 2003
Figure V1: Test Setup
NOTE: The EMS Client (CAM) and the Beamforming Display may be run from the same laptop
Figure V2: Configure Carrier Data Window
Cal Cable –40
dB
RF
Cables
AC power
Beamforming
Display
Drive Test
Tool
Attenuation
-40 dB
Attenuation
-30 to -40 dB
Laptop creating
traffic through
FTP or pinging
continuously
GPS
(not used)
DC power (cigarette lighter)
GPS
antenna
port
Internet
EMS
Server
EMS Client (CAM)
A B C D EFGHIJKL
25
26 Cable and RFS performance
27
28 Cable Loss
29 Cable Low Mid High Avg. loss
30 1 -6.0 -6.0 -6.0 -6.0
31 2 -6.0 -6.0 -6.0 -6.0
32 3 -6.0 -6.0 -6.0 -6.0
33 4 -6.0 -6.0 -6.0 -6.0
34 5 -6.0 -6.0 -6.0 -6.0
35 6 -6.0 -6.0 -6.0 -6.0
36 7 -6.0 -6.0 -6.0 -6.0
37 8 -6.0 -6.0 -6.0 -6.0
38 cal -6.0 -6.0 -6.0 -6.0
39
40
41 Insertion loss thru cal cable and RFS
42
Cal path loss
LNA gain
43 Low Mid High Average (calculated) (calculated)
44
1
TX path
-40.0
-40.0
-40.0
-40.0
-31.0
45 RX path -18.0 -18.0 -18.0 -18.0 22.0 22.0 22.0
46 2TX path -40.0 -40.0 -40.0 -40.0 -31.0
47
RX path
-18.0
-18.0
-18.0
-18.0
22.0
22.0
22.0
48 3TX path -40.0 -40.0 -40.0 -40.0 -31.0
49
RX path
-18.0
-18.0
-18.0
-18.0
22.0
22.0
22.0
50
4
TX path
-40.0
-40.0
-40.0
-40.0
-31.0
51 RX path -18.0 -18.0 -18.0 -18.0 22.0 22.0 22.0
52
5
TX path
-40.0
-40.0
-40.0
-40.0
-31.0
53 RX path -18.0 -18.0 -18.0 -18.0 22.0 22.0 22.0
54 6TX path -40.0 -40.0 -40.0 -40.0 -31.0
55
RX path
-18.0
-18.0
-18.0
-18.0
22.0
22.0
22.0
56 7TX path -40.0 -40.0 -40.0 -40.0 -31.0
57
RX path
-18.0
-18.0
-18.0
-18.0
22.0
22.0
22.0
58 8TX path -40.0 -40.0 -40.0 -40.0 -31.0
59 RX path -18.0 -18.0 -18.0 -18.0 22.0 22.0 22.0
60
A B CDEFGHIJKLM
64
65 Receiver performance
66
67
Power
splitter loss UL Tcc Power UL SNR
Absolute Signal
strength Noise Level Noise Figure
RX Gain
(DAC
word)
68
69 0.0316 -8.00 12.00 -114.05 -126.05 5.95 145
70 0.0316 -8.00 12.00 -114.05 -126.05 5.95 145
71 0.0316 -8.00 12.00 -114.05 -126.05 5.95 145
72 0.0316 -8.00 12.00 -114.05 -126.05 5.95 145
73 0.0316 -8.00 12.00 -114.05 -126.05 5.95 145
74 0.0316 -8.00 12.00 -114.05 -126.05 5.95 145
75 0.0316 -8.00 12.00 -114.05 -126.05 5.95 145
76 0.0316 -8.00 12.00 -114.05 -126.05 5.95 145
77
78
79
80 Transmitter Performance
81
82 P out Transceiver
83
Absolute
Sync Level
Power
(RMS)
Power
(peak)
Power at
antenna
(RMS)
Radiated
power
(RMS)
TX Gain
(DAC
word)
84
85 -80.0 36.0 45.49 30.0 48.0 200
86 -80.0 36.0 45.49 30.0 48.0 200
87 -80.0 36.0 45.49 30.0 48.0 200
88 -80.0 36.0 45.49 30.0 48.0 200
89 -80.0 36.0 45.49 30.0 48.0 200
90 -80.0 36.0 45.49 30.0 48.0 200
91 -80.0 36.0 45.49 30.0 48.0 200
92 -80.0 36.0 45.49 30.0 48.0 200
93
94 Power
deviation 0.0 0.0 0.0
Spreadsheet
Switch
Turn
on
one
PA
at a
time
Cal Cable –40
dB
RF
Cables
AC power
Beamforming
Display
Drive Test
Tool
Attenuation
-40 dB
Attenuation
-30 to -40 dB
Laptop creating
traffic through
FTP or pinging
continuously
GPS
(not used)
DC power (cigarette lighter)
GPS
antenna
port
InternetInternet
EMS
Server
EMS Client (CAM)
A B C D EFGHIJKL
25
26 Cable and RFS performance
27
28 Cable Loss
29 Cable Low Mid High Avg. loss
30 1 -6.0 -6.0 -6.0 -6.0
31 2 -6.0 -6.0 -6.0 -6.0
32 3 -6.0 -6.0 -6.0 -6.0
33 4 -6.0 -6.0 -6.0 -6.0
34 5 -6.0 -6.0 -6.0 -6.0
35 6 -6.0 -6.0 -6.0 -6.0
36 7 -6.0 -6.0 -6.0 -6.0
37 8 -6.0 -6.0 -6.0 -6.0
38 cal -6.0 -6.0 -6.0 -6.0
39
40
41 Insertion loss thru cal cable and RFS
42
Cal path loss
LNA gain
43 Low Mid High Average (calculated) (calculated)
44
1
TX path
-40.0
-40.0
-40.0
-40.0
-31.0
45 RX path -18.0 -18.0 -18.0 -18.0 22.0 22.0 22.0
46 2TX path -40.0 -40.0 -40.0 -40.0 -31.0
47
RX path
-18.0
-18.0
-18.0
-18.0
22.0
22.0
22.0
48 3TX path -40.0 -40.0 -40.0 -40.0 -31.0
49
RX path
-18.0
-18.0
-18.0
-18.0
22.0
22.0
22.0
50
4
TX path
-40.0
-40.0
-40.0
-40.0
-31.0
51 RX path -18.0 -18.0 -18.0 -18.0 22.0 22.0 22.0
52
5
TX path
-40.0
-40.0
-40.0
-40.0
-31.0
53 RX path -18.0 -18.0 -18.0 -18.0 22.0 22.0 22.0
54 6TX path -40.0 -40.0 -40.0 -40.0 -31.0
55
RX path
-18.0
-18.0
-18.0
-18.0
22.0
22.0
22.0
56 7TX path -40.0 -40.0 -40.0 -40.0 -31.0
57
RX path
-18.0
-18.0
-18.0
-18.0
22.0
22.0
22.0
58 8TX path -40.0 -40.0 -40.0 -40.0 -31.0
59 RX path -18.0 -18.0 -18.0 -18.0 22.0 22.0 22.0
60
A B CDEFGHIJKLM
64
65 Receiver performance
66
67
Power
splitter loss UL Tcc Power UL SNR
Absolute Signal
strength Noise Level Noise Figure
RX Gain
(DAC
word)
68
69 0.0316 -8.00 12.00 -114.05 -126.05 5.95 145
70 0.0316 -8.00 12.00 -114.05 -126.05 5.95 145
71 0.0316 -8.00 12.00 -114.05 -126.05 5.95 145
72 0.0316 -8.00 12.00 -114.05 -126.05 5.95 145
73 0.0316 -8.00 12.00 -114.05 -126.05 5.95 145
74 0.0316 -8.00 12.00 -114.05 -126.05 5.95 145
75 0.0316 -8.00 12.00 -114.05 -126.05 5.95 145
76 0.0316 -8.00 12.00 -114.05 -126.05 5.95 145
77
78
79
80 Transmitter Performance
81
82 P out Transceiver
83
Absolute
Sync Level
Power
(RMS)
Power
(peak)
Power at
antenna
(RMS)
Radiated
power
(RMS)
TX Gain
(DAC
word)
84
85 -80.0 36.0 45.49 30.0 48.0 200
86 -80.0 36.0 45.49 30.0 48.0 200
87 -80.0 36.0 45.49 30.0 48.0 200
88 -80.0 36.0 45.49 30.0 48.0 200
89 -80.0 36.0 45.49 30.0 48.0 200
90 -80.0 36.0 45.49 30.0 48.0 200
91 -80.0 36.0 45.49 30.0 48.0 200
92 -80.0 36.0 45.49 30.0 48.0 200
93
94 Power
deviation 0.0 0.0 0.0
Spreadsheet
Switch
Turn
on
one
PA
at a
time

Navini Networks, Inc. Ripwave Base Station I&C Guide
Part #40-00047-00 Rev F v1.0 (TTA) 245
October 23, 2003
Step 5. Connect approximately 20-40 dB of attenuation to the end of the calibration cable.
Connect a 3-6 ft RF cable to the other end of the attenuation. Connect the
remaining attenuation to the end of that cable. Connect the attenuators to the
Navini Drive Test box.
Step 6. Put the Drive Test box as far away from the Base Station as possible. Terminate
the GPS connector. Calculate the path loss from the Drive Test box to the Cal
cable. In the EMS disable carriers 1-2, 3-4, and 9-10, leaving 5-6 and 7-8 enabled.
Also verify that the ACC for 5-6 is selected. This is found by clicking on the BTS
tab, highlighting the specific BTS, then selecting Air Interface > Layer 2 >
Carrier data. Refer to Figure V2.
Step 7. Disable all PAs except PA #1.
Step 8. From the Beamforming, verify that the Receive Sync from the Drive Test Tool is
approximately –80 dBm. If not, adjust the value of the attenuators accordingly.
Step 9. Start an upload of a large file or ping continuously with packets 3,000 bytes or
greater. You need to acquire at least 20 code channels in one sub-carrier. If the
number of code channels is less than 20, start an additional ping sessions.
ping <ip_address> –l 3200 –t
Step 10. Capture the following parameters from the BTS Beam-forming display. Refer to
Figure V3:
Downlink: SYNC Recv Sgl Strength (dBm)
Uplink: SNR (dB)
Uplink: TCC Recv Sgl Strength (dBm)
Step 11. Capture the same parameters as in Step 10 for each of the remaining PAs, one by
one. That is, with PA #2 turned on and all other PAs turned off ; then with PA #3
turned on and all other PAs turned off; etc.
Step 12. Use the spreadsheet and input all the captured parameters to calculate the Tx
power and Noise figure.
Step 13. Measure and record attenuation value.
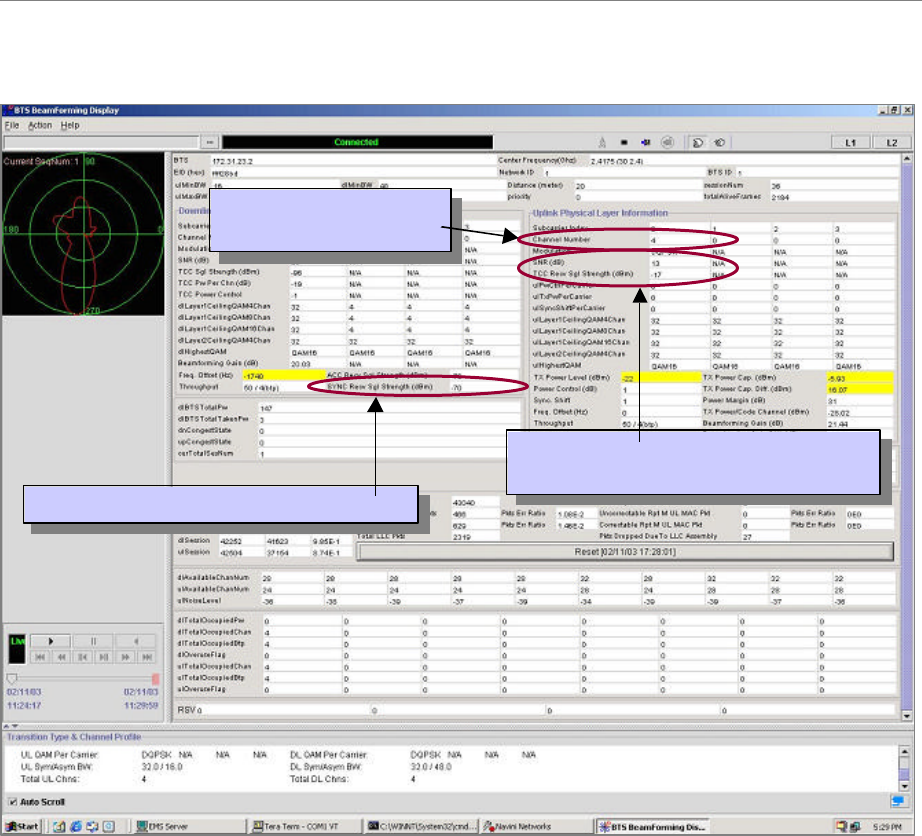
Ripwave Base Station I&C Guide Navini Networks, Inc.
246 Part #40-00047-00 Rev F v1.0 (TTA)
October 23, 2003
Figure V3: BTS Beamforming Display Window
Other Parameters to Capture
The following parameters should also be captured:
?? Calibration Sensitivity (set in EMS)
?? Path Loss (to be measured)
?? Cal Cable Loss (set in EMS)
?? Power Splitter Loss (set in EMS)
SYNC Recv Sgl Strength (dBm)
SYNC Recv Sgl Strength (dBm)
Number of channels
assigned to TCC
Number of channels
assigned to TCC
SNR (dB)
TCC Recv Sgl Strength (dBm)
SNR (dB)
TCC Recv Sgl Strength (dBm)
SYNC Recv Sgl Strength (dBm)
SYNC Recv Sgl Strength (dBm)
Number of channels
assigned to TCC
Number of channels
assigned to TCC
SNR (dB)
TCC Recv Sgl Strength (dBm)
SNR (dB)
TCC Recv Sgl Strength (dBm)
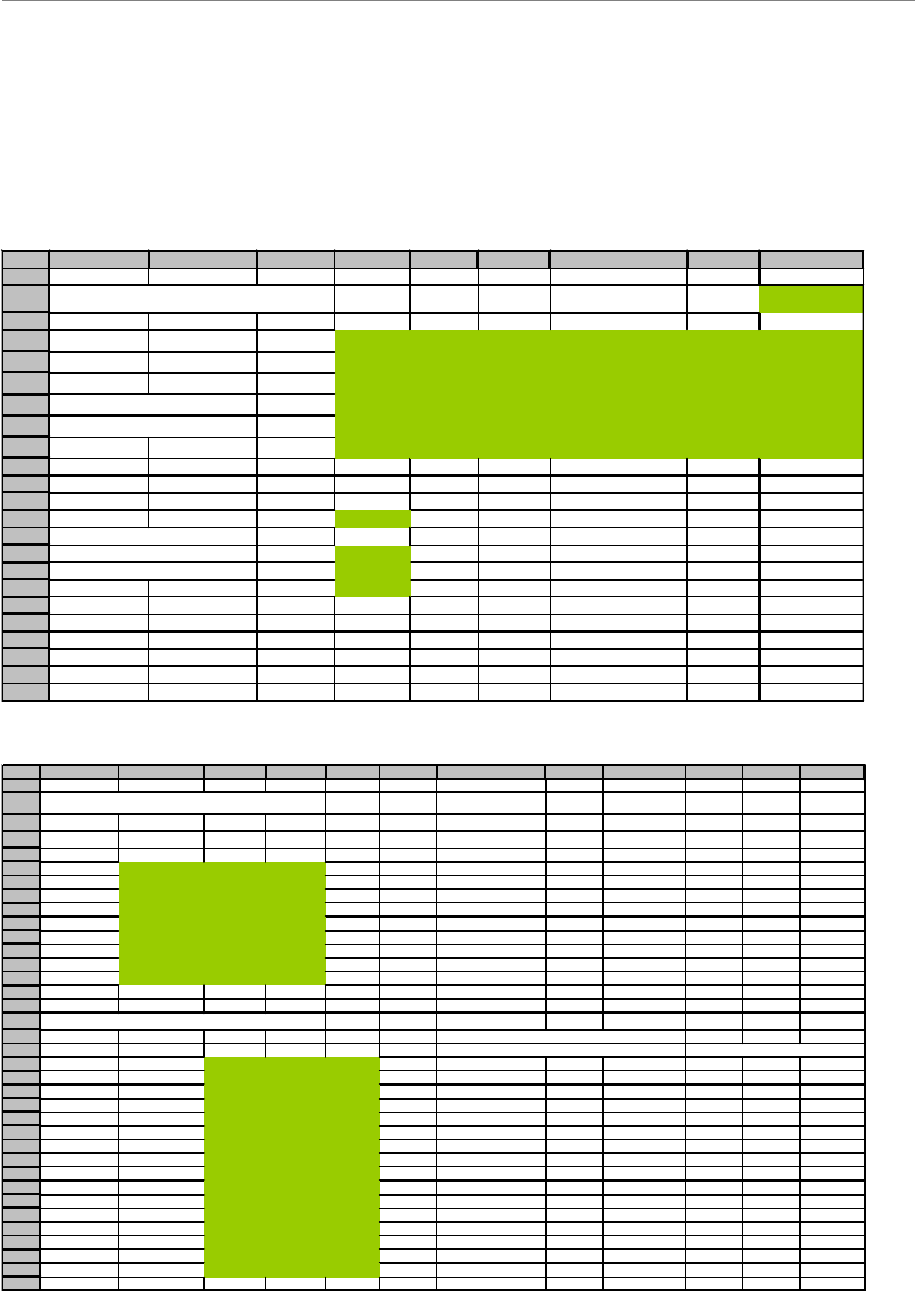
Navini Networks, Inc. Ripwave Base Station I&C Guide
Part #40-00047-00 Rev F v1.0 (TTA) 247
October 23, 2003
Results
Using the Base Station Calibration Verification form (Figure V4), submit your results to Navini
Networks for evaluation and sign-off.
Figure V4: Base Station Calibration Verification Form
A B C D EFGHI
1
2General information Data input by user
3
4Date 9/28/2003
5Site Name
6BTS ID
7Frequency (MHz)
8Software release
9Personnel
10
11
12 Cal cable loss
-6.0
13 Attenuation
70.0
14 Total Path loss
-76.0
15 RX sensitivity (set in EMS)
-90.0
16
Antenna power (in EMS)
30.0
17 Antenna gain
18.0
18
19
20
21
22
23
A B C D EFGHIJKL
25
26 Cable and RFS performance
27
28 Cable Loss
29
Cable
Low
Mid
High
Avg. loss
30 1 -6.0 -6.0 -6.0 -6.0
31 2 -6.0 -6.0 -6.0 -6.0
32 3 -6.0 -6.0 -6.0 -6.0
33 4 -6.0 -6.0 -6.0 -6.0
34 5 -6.0 -6.0 -6.0 -6.0
35 6 -6.0 -6.0 -6.0 -6.0
36 7 -6.0 -6.0 -6.0 -6.0
37 8 -6.0 -6.0 -6.0 -6.0
38 cal -6.0 -6.0 -6.0 -6.0
39
40
41 Insertion loss thru cal cable and RFS
42 Cal path loss LNA gain
43 Low Mid High Average (calculated) (calculated)
44 1TX path -40.0 -40.0 -40.0 -40.0 -31.0
45
RX path
-18.0
-18.0
-18.0
-18.0
22.0
22.0
22.0
46
2
TX path
-40.0
-40.0
-40.0
-40.0
-31.0
47
RX path
-18.0
-18.0
-18.0
-18.0
22.0
22.0
22.0
48
3
TX path
-40.0
-40.0
-40.0
-40.0
-31.0
49 RX path -18.0 -18.0 -18.0 -18.0 22.0 22.0 22.0
50 4TX path -40.0 -40.0 -40.0 -40.0 -31.0
51 RX path -18.0 -18.0 -18.0 -18.0 22.0 22.0 22.0
52
5
TX path
-40.0
-40.0
-40.0
-40.0
-31.0
53
RX path
-18.0
-18.0
-18.0
-18.0
22.0
22.0
22.0
54
6
TX path
-40.0
-40.0
-40.0
-40.0
-31.0
55 RX path -18.0 -18.0 -18.0 -18.0 22.0 22.0 22.0
56 7TX path -40.0 -40.0 -40.0 -40.0 -31.0
57 RX path -18.0 -18.0 -18.0 -18.0 22.0 22.0 22.0
58
8
TX path
-40.0
-40.0
-40.0
-40.0
-31.0
59
RX path
-18.0
-18.0
-18.0
-18.0
22.0
22.0
22.0
60
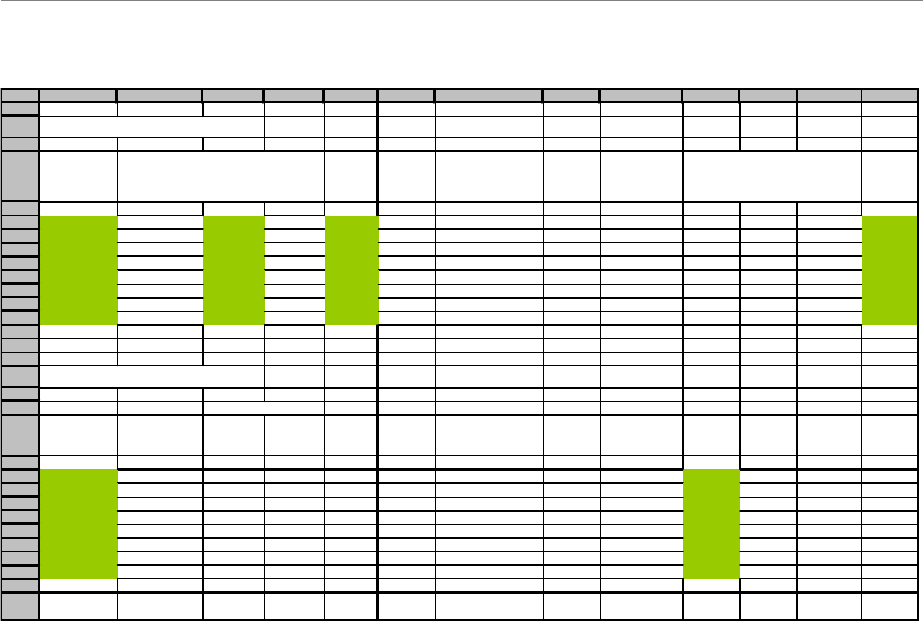
Ripwave Base Station I&C Guide Navini Networks, Inc.
248 Part #40-00047-00 Rev F v1.0 (TTA)
October 23, 2003
Test Form Instructions
These instructions explain how and what to enter into the Base Station Calibration Verification
spreadsheet, as well as define each cell’s function. The cells that need an entry are shown in
green on the spreadsheet. This document and form are to be used in conjunction with the Base
Station Installation & commissioning Guide P/N 40-00047-00.
I. Section 1: General Information
A. Date (D4)
Excel will enter the current date.
B. SITE NAME (D5)
Enter site name or customer designation.
C. BTS ID (D6)
Enter BTS identification number or customer description.
D. Frequency (D7)
Enter the system operating frequency that the customer has determined to use.
E. Software Release (D8)
Enter the release number of the software load being used.
F. Name (D9)
Enter your name.
G. Cal cable loss (D12)
Excel will enter averaged value of calibration cable loss from cell E38.
A B C D EFGHIJKLM
64
65 Receiver performance
66
67
Power
splitter loss
UL Tcc Power UL SNR
Absolute Signal
strength
Noise Level Noise Figure
RX Gain
(DAC
word)
68
69 0.0316 -8.00 12.00 -114.05 -126.05 5.95 145
70 0.0316 -8.00 12.00 -114.05 -126.05 5.95 145
71 0.0316 -8.00 12.00 -114.05 -126.05 5.95 145
72 0.0316 -8.00 12.00 -114.05 -126.05 5.95 145
73 0.0316 -8.00 12.00 -114.05 -126.05 5.95 145
74 0.0316 -8.00 12.00 -114.05 -126.05 5.95 145
75 0.0316 -8.00 12.00 -114.05 -126.05 5.95 145
76 0.0316 -8.00 12.00 -114.05 -126.05 5.95 145
77
78
79
80 Transmitter Performance
81
82 P out Transceiver
83 Absolute
Sync Level Power
(RMS) Power
(peak)
Power at
antenna
(RMS)
Radiated
power
(RMS)
TX Gain
(DAC
word)
84
85 -80.0 36.0 45.49 30.0 48.0 200
86 -80.0 36.0 45.49 30.0 48.0 200
87 -80.0 36.0 45.49 30.0 48.0 200
88 -80.0 36.0 45.49 30.0 48.0 200
89 -80.0 36.0 45.49 30.0 48.0 200
90 -80.0 36.0 45.49 30.0 48.0 200
91 -80.0 36.0 45.49 30.0 48.0 200
92 -80.0 36.0 45.49 30.0 48.0 200
93
94 Power
deviation
0.0 0.0 0.0

Navini Networks, Inc. Ripwave Base Station I&C Guide
Part #40-00047-00 Rev F v1.0 (TTA) 249
October 23, 2003
H. Attenuation (D13)
Enter the attenuation value inserted into calibration path.
I. Total Path loss (D14)
Excel will enter the calculated value of the total path loss.
J. Receiver sensitivity (in EMS) (D15)
Enter the same number entered in the EMS under Air Interface > Layer 1 > General
tab > RX sensitivity.
K. Antenna power (in EMS) (D16)
Enter the same number entered in the EMS under Air Interface > Layer 1 > General
tab > Antenna power.
L. Antenna gain (D17)
Enter gain value of antenna elements.
II. Section 2: Cable and RFS performance
A. Cable loss (B30-D38)
Enter the values measured during the cable sweeps. Include the minus sign on all
entries. Include jumpers and surge protectors.
B. Insertion loss through cal cable and RFS (C44-E59)
Enter values measured during the RF sweeps of the cables and the RFS. Include the
minus sign for all entries.
C. Cal path loss (calculated) (H44-H58)
Calculated value based on absolute loss measured during RF sweeps. The measured
cable loss for antenna 1 plus 3dB for inherent loss in RFS (internal cables and LNA
loss) is subtracted from the measured TX path loss to give absolute calibration path
loss. It is important to check this value to ensure that it does not exceed –45 dB.
D. LNA gain (calculated) (J45-L59)
Calculated value based on absolute loss measured during RF sweeps. The absolute
value of the difference between TX path loss and RX path loss equals LNA gain for
each antenna path.
III. Section 3: Receiver Performance
A. Power splitter loss (in EMS) (A69-A76)
Before calibrating, the script must have been run to enter the decimal values of the
calibration board loss for each path. Enter those same values here.
B. UL TCC power (C69-C76)
From Beamforming Display, enter the value from the "Tcc receive signal strength"
field. There should be only one carrier active. This is the relative power per code
channel, referenced to RX sensitivity, of that carrier, being received by the Base
Station.
C. UL SNR (E69-E76)
Enter the value from the Beamforming Display. This value can be found just above
the TCC value in the same carrier column.
D. Absolute Signal strength (G69-G76)
Calculated signal strength of the receive signal converted to 5 MHz BW. TCC power
per code channel is converted to absolute by adding RX sensitivity and then
subtracting spreading gain. Multiple antenna gain is then added to show receive

Ripwave Base Station I&C Guide Navini Networks, Inc.
250 Part #40-00047-00 Rev F v1.0 (TTA)
October 23, 2003
signal strength at each antenna. (RX sensitivity + UL TCC power - 10*LOG10(320)
+ 9).
E. Noise level (I69-I76)
Calculated digital noise floor of the system measured in a 5 MHz BW.
F. Noise Figure (K69-K76)
Calculated by adding the spreading gain of the individual carriers back in and
subtracting the thermal noise floor (KTB) in a 500 KHz BW.
G. RX gain (DAC word) (M69-M76)
The data word generated during calibration for the receiver gain DAC that controls
the IF attenuator. It is found in the EMS under Air interface > Layer 1 > Show
configuration > Antenna tab.
IV. Section 4: Transmitter Performance
A. Analyzer Readings (A90-B97)
1. Peak
The peak amplitude of the sync signal measured on the spectrum analyzer.
The measurement is taken with the spectrum analyzer in the time domain (0
Hz span) and RBW set for 5 MHz. Sweep time is typically between 10 and 20
ms. When taking the measurement, the sync signal will have peaks and
valleys associated with it. Make sure to measure the absolute peak.
2. RMS
This is a calculated value based on measurements taken on several occasions,
comparing peak power to RMS power on a Rhode & Schwartz spectrum
analyzer. It has been determined that the correction factor for peak to average
on a standard spectrum analyzer is 9.5 dB. This correction factor is the default
entry in this section. If it is possible to make the RMS measurement with the
proper equipment then that is the preferred method. The calculation is very
straightforward: peak power minus 9.5 dB = Power RMS.
B. P out transceiver (D90-E97)
Power peak and Power RMS are calculated values using the value from the spectrum
analyzer readings and the value entered for coupler/test cable loss (Cell H31).
C. Power at antenna (RMS) (G90-G97)
Calculated value using the Output Power (Pout) of the transceivers and the Cable Loss
plus the inherent loss of the RFS.
D. Radiated Power (RMS) (I90-I97)
Calculated value using Power at the antenna and the value entered for antenna gain
(Cell H32).
E. TX Gain (DAC word)
The hex data generated during calibration for the transmit gain DAC that controls the
IF attenuator. This is found in the EMS under Air interface > Layer 1 > Show
configuration > Antenna tab.
F. Max power deviation across all antennae (E99, G99, I99)
Calculated value showing the deviation between the lowest power antenna and the
highest power antenna for each column.
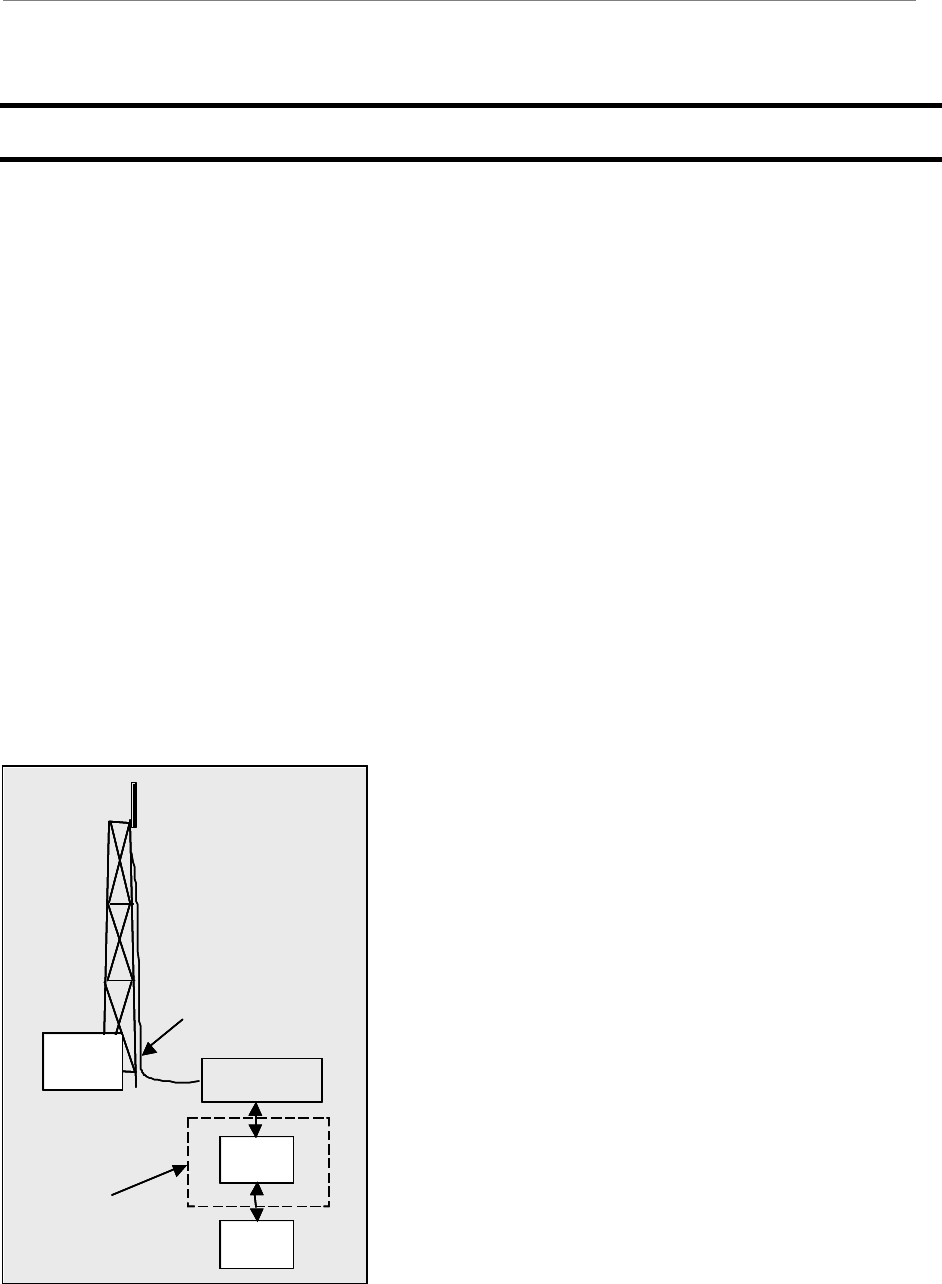
Navini Networks, Inc. Ripwave Base Station I&C Guide
Part #40-00047-00 Rev F v1.0 (TTA) 251
October 23, 2003
Appendix W: Local Modem Tests
Objective
Local Wired Modem Testing (then Over-The-Air Modem Testing) will verify that the Base
Station is working and able to transmit and receive data. Data rates are not being checked at this
time. Refer to Figure W1 when setting up and performing the Wired Modem procedures.
Wired Modem Test
Equipment Required
?? Modem
?? PC - Laptop with CPE debug tool. Connect to CPE with an Ethernet cable
?? Attenuator - 70dB fixed attenuation, plus 40 adjustable range with 1dB resolution
(cascade multiple attenuators)
?? Shielding box - Need to provide 80 dB isolation. Shielding box may not be needed if
the Modem cannot sync to BTS over-the-air at the test location.
Figure W1: Wired Modem Setup
CPE
PC
Attenuator
Shielding box
BTS
Calibration
cable
Modem
PC
Attenuator
Shielding box
BTS
Calibration
cable
CPE
PC
Attenuator
Shielding box
BTS
Calibration
cable
Modem
PC
Attenuator
Shielding box
BTS
Calibration
cable
Modem
PC
Attenuator
Shielding box
BTS
Calibration
cable

Ripwave Base Station I&C Guide Navini Networks, Inc.
252 Part #40-00047-00 Rev F v1.0 (TTA)
October 23, 2003
Equipment Settings
Part of the Test Procedures below.
Test Procedure Setup
Set up the test procedures, per the following.
Step 1. Calibrate the BTS and perform the Calibration Verification procedure.
Connect the Modem and the attenuators. The combined attenuation should be set roughly as
follows:
Total attenuation = PTX - 30 + 18 – Cal cable loss + 80
Where PTX is the Tx output power at antenna input port that is set in EMS during
calibration. Cal cable loss is the loss of the calibration cable.
The total attenuation should be partitioned between fixed and adjustable attenuators in
such a way that the adjustable attenuator is set to about 10 dB.
Disconnect the calibration cable from the back of the BTS shelf and connect it to the attenuator
as shown in the drawing
Ping the BTS continuously from the Modem.
Check the sync level at the CPE debug tool. The level should be about –80 dBm.
Test Procedure - Check Modem Sensitivity & Output Power
Follow the steps in the procedure below.
Step 1. Record the downlink TCC power level and SNR reading on the CPE debug tool.
Step 2. Calculate the effective noise floor: NF= SNRTCC – LevelTCC.
Where SNRTCC is the TCC SNR and LevelTCC is the received downlink TCC level.
NF should be close to –127 ±5.
Step 3. Check Modem output power cap difference. It should be greater than 0.
Step 4. Increase the attenuation by 10 dB (increase the attenuation of the adjustable
attenuator).
Step 5. Measure the effective noise floor and the output power cap difference gain.
Step 6. Increase the attenuation by another 10 dB and take the measurements again (if the link
is broken when the attenuation increases 10 dB, back off the attenuation by 10 dB and
then increase the attenuation with 1 dB steps until the link is broken. Then reduce the
attenuation by 4 dB).

Navini Networks, Inc. Ripwave Base Station I&C Guide
Part #40-00047-00 Rev F v1.0 (TTA) 253
October 23, 2003
Step 7. Calculate the maximum path allowed as follows:
Max loss = Attenuation total + Cal cable loss + 30
Where Attenuation total is the total attenuation of all attenuators (fixed + adjustable).
Test Procedure - Check BTS Sensitivity (Individual Antenna)
Step 1. Set the attenuation of the attenuator so the total attenuation is about
PTX – 30 – Cal cable loss + 80.
Step 2. Activate antenna #1 only.
Step 3. Record the uplink TCC power level and SNR reading on the BTS debug tool.
Step 4. Calculate the effective noise floor: NF = SNRTCC – LevelTCC.
Where SNRTCC is the TCC SNR and LevelTCC is the received downlink TCC level.
NF should be close to: SNR – BTS Sensitivity + 25 ±?5.
Where BTS sensitivity is the BTS sensitivity setting during calibration.
Step 5. Record the Modem output power.
Step 6. Increase the attenuation by 10 dB (increase the attenuation of the adjustable
attenuator).
Step 7. Measure BTS effective noise floor and Modem output power again.
Step 8. Increase the attenuation by another 10 dB and take the measurements again (if the link
is broken when the attenuation increases 10 dB, back off the attenuation by 10 dB and
then increase the attenuation with 1 dB steps until the link is broken. Then reduce the
attenuation by 4 dB. The same attenuation will be used for all antenna tests).
Step 9. Calculate the maximum path allowed as follows:
Max loss = Attenuation total + Cal cable loss + 30
Where Attenuation total is the total attenuation of all attenuators (fixed + adjustable).
Step 10. Repeat the steps for antennas 2 through 8.
Step 11. Average the Modem output power over antennas 1 through 8 for each attenuation
setting.
Test Procedure - Check BTS Sensitivity (Antenna Array)
Step 1. Set the initial attenuation the same as in the individual antenna testing procedure.
Step 2. Activate all antennas.
Step 3. Record the uplink TCC power level and SNR reading on BTS debug tool.

Ripwave Base Station I&C Guide Navini Networks, Inc.
254 Part #40-00047-00 Rev F v1.0 (TTA)
October 23, 2003
Step 4. Calculate the effective noise floor: NF = SNRTCC – LevelTCC.
Where SNRTCC is the TCC SNR and LevelTCC is the received uplink TCC level.
NF should be close to SNR – BTS Sensitivity + 25 ±?5.
Where BTS sensitivity is the BTS sensitivity setting during calibration.
Step 5. Record the CPE output power.
Step 6. Increase the attenuation by 10 dB (increase the attenuation of the adjustable
attenuator).
Step 7. Measure BTS effective noise floor and Modem output power again.
Step 8. Increase the attenuation by the same amount as in individual antenna tests and measure
the BTS effective noise floor and Modem output power.
Step 9. For each attenuation setting, the Modem output power should be 9 dB less compared to
those (average) in individual antenna tests.
Step 10. Increase the attenuation by another 18 dB. The link should be on.
Step 11. Calculate the maximum path allowed as follows:
Max loss = Attenuation total + Cal cable loss + 30
Where Attenuation total is the total attenuation of all attenuators (fixed + adjustable).
Test Procedure - Data Rate
Step 1. Set the attenuation of the attenuator so the total attenuation is about
PTX – 30 +18 – Cal cable loss + 80.
Step 2. Activate all antennas.
Step 3. FTP a file with size greater than 10 Mbps from Modem to BTS (uplink).
Step 4. Check the uplink data rate. It should be approximately 1 Mbps.
Step 5. FTP a file with size greater than 20 Mbps from BTS to Modem (downlink).
Step 6. Check the downlink data rate. It should be approximately 2 Mbps.
After the test is completed, reconnect the calibration cable back to the BTS and run the
calibration. The new calibration table should be the same as before (the changes in Tx and Rx
AGC should be within 2 bits).

Navini Networks, Inc. Ripwave Base Station I&C Guide
Part #40-00047-00 Rev F v1.0 (TTA) 255
October 23, 2003
Over-The-Air Modem Test
Equipment Required
Same as for Wired Modem Test.
Equipment Settings
Included in the Test Procedure.
Test Procedure
To set up a Modem for local over-the-air testing, follow the steps below.
Step 1. Connect a Modem to a test computer. Reference the Ripwave Modem User Guide, P/N
40-00026-00 for Modem setup procedures. The location of the test computer setup
needs to be close to the Base Station, within its coverage range.
Step 2. Ensure that the Modem is registered in the EMS. Refer to Ripwave Configuration
Guide for Modem registration procedures.
Step 3. Using FTP software, transfer a 2 Mb file over-the-air from the test computer to the
BTS. This is a system uplink transfer.
Step 4. Using FTP software, transfer a 10 Mb file over-the-air from the BTS to the test
computer. This is a system downlink transfer.
Step 5. Ensure that both files transferred during testing.

Ripwave Base Station I&C Guide Navini Networks, Inc.
256 Part #40-00047-00 Rev F v1.0 (TTA)
October 23, 2003
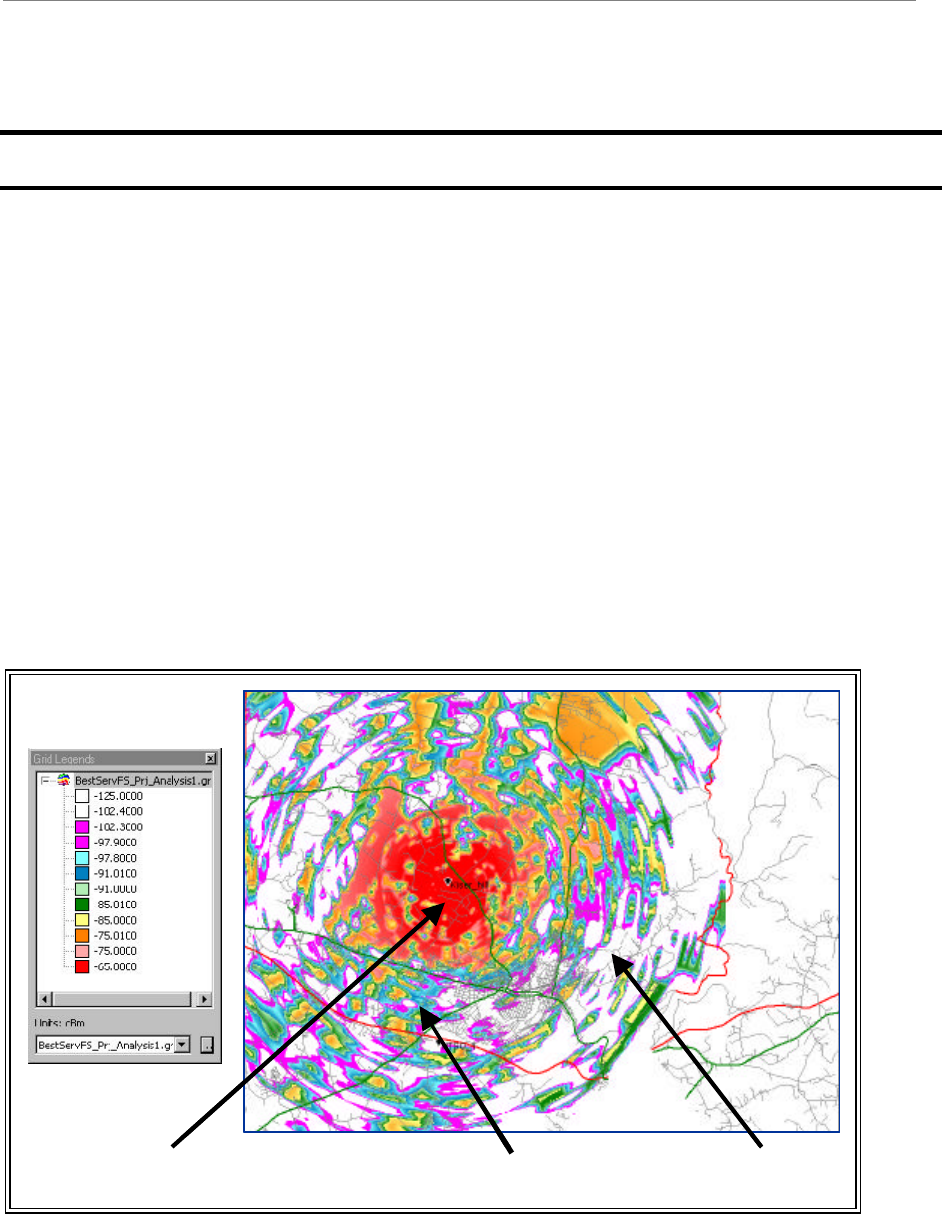
Navini Networks, Inc. Ripwave Base Station I&C Guide
Part #40-00047-00 Rev F v1.0 (TTA) 257
October 23, 2003
Appendix X: Drive Study
Overview
The Drive Study is performed to confirm Base Station coverage. It is used to validate that the
Base Station can be “seen” by a Modem throughout its predicted coverage area.
The RF coverage analysis displays areas of coverage from “good” to “bad” by the use of color-
coding. An RF coverage analysis and its legend may be seen in Figure X1. The legend on the left
displays the decibel strength for a given area, with red designating ‘good coverage’ and white
designating ‘bad coverage’. The RF coverage analysis is used to map out the Drive Study route
(Figure X2), along with geographic areas of concern. You should pay particular attention to null
(white) areas and the cell edges.
Figure X1: RF Coverage Analysis Example
Good coverage
area Medium
coverage area Bad coverage
area
Good coverage
area Medium
coverage area Bad coverage
area
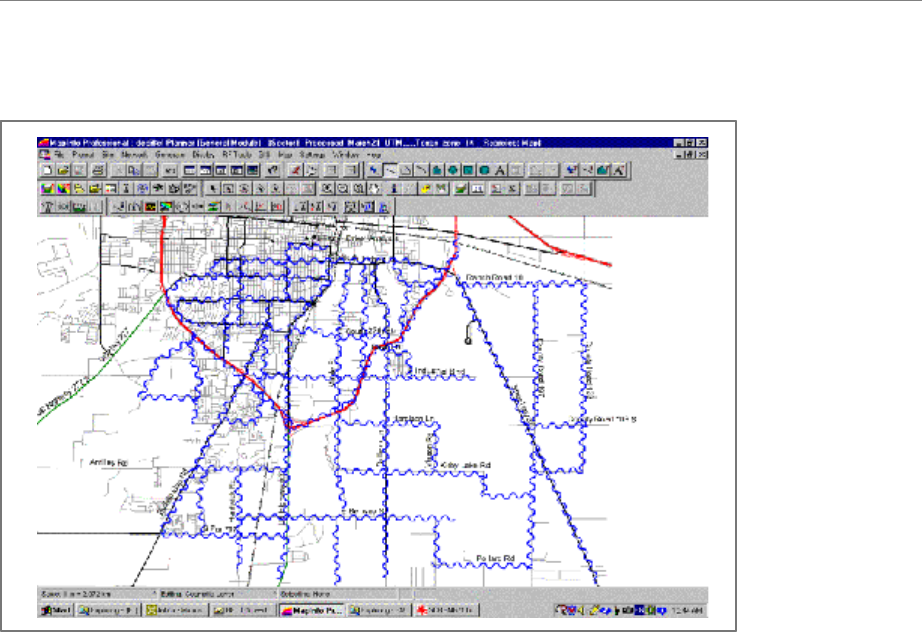
Ripwave Base Station I&C Guide Navini Networks, Inc.
258 Part #40-00047-00 Rev F v1.0 (TTA)
October 23, 2003
Figure X2: Drive Study Route Example
Equipment Required
?? Omni-directional antenna mounted outside vehicle
?? GPS with serial cable
?? Modem
?? Ethernet Cable
?? Modem power supply
?? DC to AC power converter
?? Laptop computer
?? Drive Study Form <shown later in this section>
Drive Test Procedure
While driving you will collect statistics to validate the coverage plot. The application takes a
reading every second and records the data in comma delimited file format. It is important to
ensure that the GPS is on and that you can see the GPS coordinates in the application.
Since the Ripwave system is not a mobile system, do not exceed 10 mph during the Drive Study.
Going any faster will negate the adaptive beamforming, as the vehicle will not be in the exact
position calculated by the Base Station.

Navini Networks, Inc. Ripwave Base Station I&C Guide
Part #40-00047-00 Rev F v1.0 (TTA) 259
October 23, 2003
Step 1. Ensure that the Base Station has successfully completed calibration and RF sanity
measurements at the frequency and TX/RX signal levels that were determined during
the site survey. Ensure that the Base Station is powered on and able to TX/RX data.
Step 2. Create a CPE Descriptor, and assign it to the Modems to be used for the Drive Study:
CPE Descriptor Parameters
Name: Drive Study
Index: Next available number
Priority: 1
UpLink Max Bandwidth: 64
UpLink Min Bandwidth: 32
DownLink Max Bandwidth: 96
DownLink Min Bandwidth: 64
Other parameters: Use defaults.
Step 3. Mount an omni-directional antenna on the roof of the vehicle. This will serve as the
antenna for the Modem.
Step 4. Bring the RF cable from the omni-directional antenna into the vehicle through the
window. Attach the antenna to the antenna input of the Modem. The rotating upright
antenna on the Modem needs to be removed to perform this step. You will also need to
disconnect the patch antennas inside (Figure X3).
Figure X3: Patch Antennas
<TO BE PROVIDED AT A LATER DATE>

Ripwave Base Station I&C Guide Navini Networks, Inc.
260 Part #40-00047-00 Rev F v1.0 (TTA)
October 23, 2003
Step 5. Connect the DC to AC power converter to the power port in the vehicle.
Step 6. If applicable, place the external antenna on the top of the vehicle.
Step 7. Connect the Modem power supply to the Modem and to the DC to AC power
converter.
Step 8. Connect the Ethernet cable to the Ethernet port on the laptop computer and to the
Ethernet port on the Modem.
Step 9. Connect the GPS to the serial port on the laptop computer.
Step 10. Optional: Connect the laptop power supply to the DC to AC power converter. (The
laptop can be run off of its battery.)
Step 11. Power on the GPS and the laptop computer.
Step 12. On the laptop computer, start the Navini Networks Drive Study application.
Step 13. Verify that the GPS location (latitude and longitude) and the GPS time are seen in the
application.
Step 14. Power on the Modem.
Step 15. Enter a memo into the log file comment field of the Constellation Debugger about the
route of the Drive Study being performed. When finished, click the log comment
button.
Step 16. Start driving along the Drive Study route determined during the RF coverage analysis.
Do not exceed 10 - 15 mph.
Step 17. When testing is completed, prepare the file(s) to be sent back to Navini for post-
processing and analysis.

Navini Networks, Inc. Ripwave Base Station I&C Guide
Part #40-00047-00 Rev F v1.0 (TTA) 261
October 23, 2003
Drive Study Form
Drive test area name
Date of Drive Test
Drive Tester Name
Standard Vehicle Name and Type
CPE EID
Frequency Band (ISM, MMDS)
CPE test device RF cable loss (dB)
CPE Test device Antenna gain (calibrated)
Drive Route (Map attached)
Drive test file name
BTS Transmit Power
BTS ID
BTS antenna height
BTS antenna Omni/Patch
Mounted on the top or side
Antenna Azimuth
Antenna downtilt
Drive Test Route Plan
Yes / No
Typical Clutter Height
High Density Urban Covered
Commercial/Industrial
Residential with Trees
Residential with Few Trees
Paved Areas
Grass/Agriculture
Open Area
Forested Areas
Water
Airports
Others
Things to pay attention to:
1. Make sure that the GPS data on the constellation debugger is updating all the time during the drive test.
2. Make sure that the antenna only selects the omni port all the time.
3. Make sure that the CPE is locked to the correct BTS by checking the BTS ID and frequency.
4. Make sure that the RF connections are good all the time. Check this by observing the stability of the RF signal strength in the LOS loca..
5. Please make proper log information in certain important locations.
Fill the site configuration
Navini Networks Drive Test Check list
Specify the following items before the drive test

Ripwave Base Station I&C Guide Navini Networks, Inc.
262 Part #40-00047-00 Rev F v1.0 (TTA)
October 23, 2003

Navini Networks, Inc. Ripwave Base Station I&C Guide
Part #40-00047-00 Rev F v1.0 (TTA) 263
October 23, 2003
Appendix Y: Location (FTP) Tests
Introduction
The Location, or FTP, Test is performed to check the Ripwave system operation through file
transfers between the Base Station and the Modem. The test measures the data rate performance
at various locations within the coverage area. Data throughput is measured by executing file
transfers using the FTP protocol for both upstream and downstream links. A file server must be
in place on the same subnet with the BTS to accurately perform the file transfer, and the CPE
User computer must be loaded with an FTP Client. As the file transfer is running, a data file is
captured by the Modem tool. Data rates are captured by the FTP program.
Data is recorded in a spreadsheet format. The spreadsheet lists the location, GPS, and other
information. As data rates are captured, the results are entered manually. An average SNR and
sync RSSI can be read from the debug tool, and recorded, for quick comparison to the acceptable
criteria (see “Acceptable Criteria” section of this appendix). For NLOS indoor locations, tests are
performed both outside the building and inside, so that the obstruction loss for the building can
be determined. Unless the customer can provide indoor access, all results will be LOS or Near
NLOS.
Planning the Locations
Before the actual testing is conducted, you will need to select the locations for the testing to
occur. The sites should meet specific criteria and include a mixture of the following
environments:
?? High Power (A), low clutter; close in, residential
?? High Power (A), high clutter; close in, commercial
?? Medium Power (B), low clutter; mid-range, residential
?? Medium Power (B), high clutter; mid-range, commercial
?? Low Power (C), low clutter; distant, residential
?? Lower Power (C), high clutter; distant, commercial
Where:
(A) High Power = Sync Value greater than –70 dBm
(B) Medium Power = Sync Value between –70 dBm and –85 dBm
(C) Low Power = Sync Value between –85 dBm, and –95 dBm
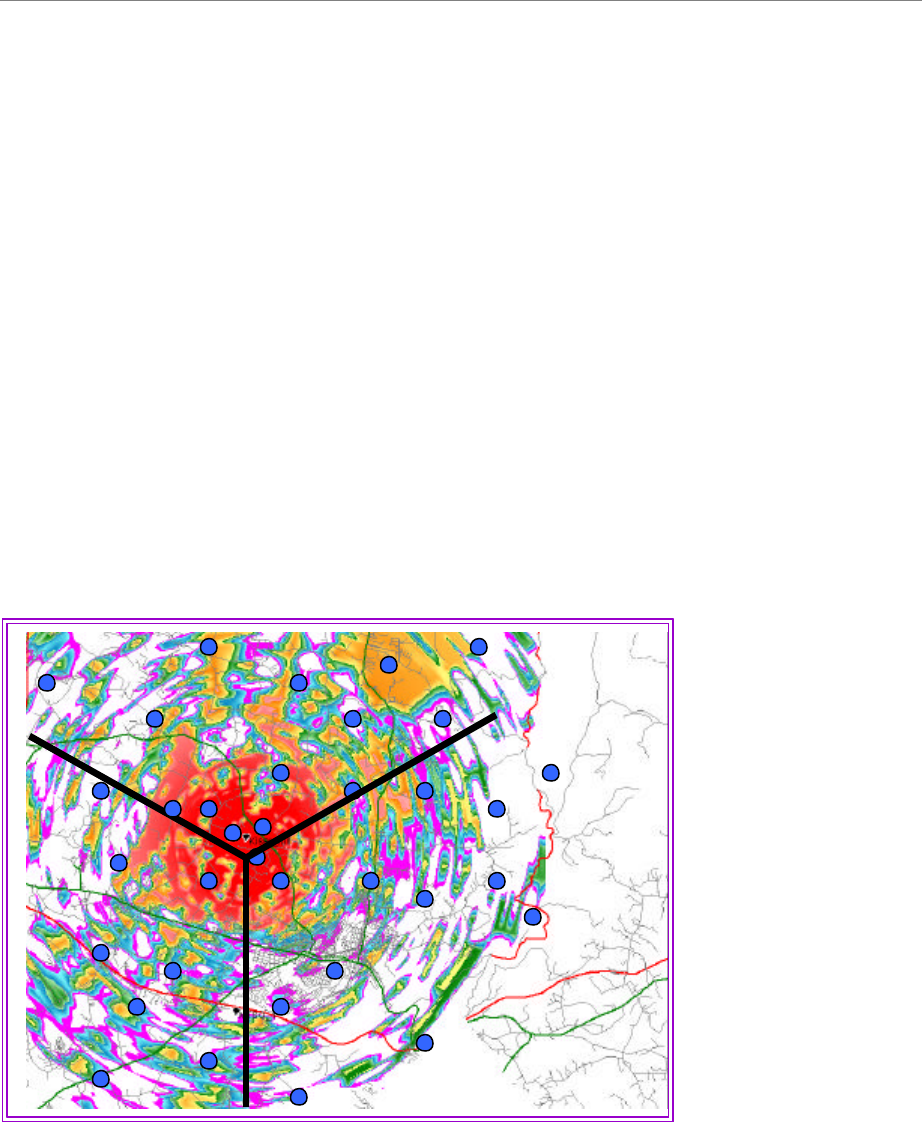
Ripwave Base Station I&C Guide Navini Networks, Inc.
264 Part #40-00047-00 Rev F v1.0 (TTA)
October 23, 2003
At least 5 test points for each type are attempted. This may be difficult, depending upon the
actual deployment scenario. Results may yield a very large percentage in one of the categories.
For selecting an even spread across a 120-degree sector for a panel antenna installation, divide
the 120 degrees into 6 even slices of 20 degrees each. Then divide each slice into 2 Km
segments. This spaces each location at an approximate even distance throughout the complete
sector and yields 36 test sites.
To select an even spread across a 360-degree cell for an omni antenna installation, divide the
360-degree cell into 12 even slices of 30 degrees each. Next, divide each slice into segments
based on distance (1 Km or 2 Km, depending upon propagation). This will approximately space
each location an even distance from each other throughout the complete cell, yielding
approximately 48 test sites (based on a 4 Km cell radius). To do this, split the cell into 4
quadrants. Using the RF coverage analysis, select up to 16 locations per quadrant (Figure H1).
Pay particular attention to null areas and the cell edges. At these locations you will perform a file
transfer to measure the data rates available. The FTP/Location Test Tool program and the BTS
Beamforming Display tool will be used to record RF parameters during each test. Figures Y1 and
Y2 provide examples of simple guidelines for selecting an even spread across a cell area.
Figure Y1: Example of a 3-sector Site
Navini Networks, Inc. Ripwave Base Station I&C Guide
Part #40-00047-00 Rev F v1.0 (TTA) 265
October 23, 2003
Figure Y2: Example of 120° of an Omni Site
Acceptable Criteria
In order to evaluate the test results, several criteria are reviewed. These criteria are valid for both
LOS and NLOS measurements.
?? Processed Sync Signal Strength: For a given test location, ± 2 dB variation during FTP
?? Absolute Sync Signal Strength – Processed Sync Signal Strength: not greater than 2 dB
variation during FTP
?? SNR values consistent during the FTP for all carriers used:
a. QPSK: at least 11 dB
b. 8 PSK: at least 14 dB
c. QAM16: at least 17 dB
?? UL and DL Packet Error Rates (PER) not greater than 1%. This will vary according to
interference levels, but may not render the system inoperable.
?? Uplink Beamforming Gain: between 16 dB and 21 dB. Perform a comparison of UL and DL,
Beamforming Gain differences should be not greater than 3 dB.
A
B
C D
E
F
A1
A2
A3
A4
A5
A6
A
B
C D
E
F
A1
A2
A3
A4
A5
A6
A
B
C D
E
F
A1
A2
A3
A4
A5
A6

Ripwave Base Station I&C Guide Navini Networks, Inc.
266 Part #40-00047-00 Rev F v1.0 (TTA)
October 23, 2003
?? Modem Transmit Power < 25 dBm; BTS Transmit Power < 0 dBm per code channel with
power control
?? Sync vs. Data Rate:
Absolute Sync (dBm) UL Data Rate (Mbps) DL Data Rate (Mbps)
(A) –55 to –70 0.6 to 1.0 1.5 to 2.0
(B) –70 to –85 0.5 to 1.0 1.2 to 2.0
(C) –85 to –95 0.10 to 0.5 0.3 to 1.0
Process
The recommended process for performing the Location (FTP) tests is described below.
First: Verify that a single Modem transmits and receives data at expected rates, as indicated
previously.
Second: Verify that multiple Modems simultaneously transmit and receive data at acceptable
rates, and the parameters listed above are being met. NOTE: The exact number of Modems is
determined by field conditions. The minimum is two.
Third: Verify operation at the full range of the system*. Include LOS Location Tests at cell
edges. The height of Modem and uplink and downlink data rates are recorded for each site. Data
rates are to be compared with expected results, as seen in the last item (Sync vs. Data Rate) of
Acceptance Criteria. For example:
*2.6 GHz : ~12 Km
*2.4 GHz: ~ 3 Km
Equipment Required
?? Laptop computer
?? GPS with serial cable
?? FTP/Location Test Tool application
?? BTS Beamforming diagnostic tool
?? Modem
?? Modem power supply
?? DC to AC power converter
?? Ethernet Cable

Navini Networks, Inc. Ripwave Base Station I&C Guide
Part #40-00047-00 Rev F v1.0 (TTA) 267
October 23, 2003
Location (FTP) Test Procedure
Two people are needed to perform this procedure. One will be in the car performing the location
test, and the other will be at the Base Station checking the operation using the BTS Beamforming
diagnostic tool.
1. Ensure that the Base Station has successfully completed calibration, RF sanity
measurements, and the Drive Study at the frequency and TX/RX signal levels that were
determined by the cell site survey. Also ensure that the Base Station is powered on and is
able to transmit and receive data.
2. Connect the DC to AC power converter to the power port in the vehicle.
3. Connect the Modem power supply to the CPE and to the DC to AC power converter.
4. Connect the Ethernet cable to the Ethernet port on the laptop computer and to the Ethernet
port on the Modem.
5. Connect the GPS to the serial port on the laptop computer.
6. Drive to one of the locations selected on the RF coverage analysis. Stop and turn off the
vehicle.
7. Power on the GPS, the Modem, and the laptop computer. Place the Modem on the roof of the
vehicle.
8. Start the Navini Networks FTP/Location Test Tool program.
9. Verify that the Base Station is transmitting and that the Modem establishes sync and can
communicate with the Base Station. Ping a device address on the network side of the Base
Station, and verify that a reply is received. While monitoring the Constellation Debugger,
position the Modem to reduce the difference between absolute sync and processed sync
levels to 2 or less.
10. Enter a memo into the comment field about which link of the test is being performed.
11. Verify that the GPS input is seen in the application.
12. Put the location number/site identifier into the comment field of the Navini Networks
Constellation Debugger, and press the Enter key. This will identify the site location.
13. On the EMS connected to the Base Station, start the BTS Beamforming diagnostic tool.
14. From the laptop computer with the Modem connected to it, start a downlink FTP file transfer.
Record the results on the site page or in the log.
15. On the EMS connected to the Base Station, using the BTS Beamforming diagnostic tool
verify the strength and direction of the beam during the file transfer. Record the results on the
site page or in the log.
16. Repeat the file transfer three times, stopping and starting the Debugger and Beamforming
tool for each transfer
17. Repeat steps 14-15, this time performing an uplink FTP transfer.

Ripwave Base Station I&C Guide Navini Networks, Inc.
268 Part #40-00047-00 Rev F v1.0 (TTA)
October 23, 2003
18. When finished, remove the Modem from the roof and secure equipment for travel.
19. Drive to the next location selected on the RF coverage analysis. Stop, and turn off the
vehicle.
20. Repeat steps 7 to 19 until all locations are tested. At this point send this data to the RF
Engineers to analyze, or continue until each quadrant in the cell is complete. When you send
the results depends upon the schedule or results from the file transfers.
Navini Networks, Inc. Ripwave Base Station I&C Guide
Part #40-00047-00 Rev F v1.0 (TTA) 269
October 23, 2003
Location (FTP) Test Form
The form for recording the Location (FTP) test results is an Excel spreadsheet. Shown in Table
Y1, the actual column headers go across the top of the form, but are broken into two sections
here for readability.
Table Y1: Location (FTP) Test Form
BTS ID Sector Software Release
Site name File name; CPE File name; BTS
Distance
(Km) LOS NLOS CPE
CPE w/
ext
FTP Data Rate
Downlink
(Kbps)
FTP Data
Rate Uplink
(Kbps)
Absolute
Sync (dB) Remarks
0 0
0
288
0
0.1
0.2
0.3
0.4
0.5
0.6
0.7
0.8
0.9
1
00.2 0.4 0.6 0.8 1
distance Km
data rate Mbps
Downlink
Uplink

Ripwave Base Station I&C Guide Navini Networks, Inc.
270 Part #40-00047-00 Rev F v1.0 (TTA)
October 23, 2003

Navini Networks, Inc. Ripwave Base Station I&C Guide
Part #40-00047-00 Rev F v1.0 (TTA) 271
October 23, 2003
Appendix Z: Site Installation Close-out Documentation
List of Documents
When performing a Ripwave Base Station installation, a number of tasks and forms are
completed during the process. The following is a list and a brief description of each of the
closing documents that are either required or optional for completing the Customer Acceptance
of the system once it is commissioned. If the item is designated as REQUIRED it must be sent
back to Navini Technical Services. If a required document cannot be obtained, you must retain
approval in advance from the Manager, Navini Technical Services.
_____ 1. Customer Contact List. REQUIRED (Project Manager & Customer)
_____ 2. Site Candidate Evaluation Form. REQUIRED Drawings/pictures from site.
_____ 3. Drive Instructions & Map to location. REQUIRED
_____ 4. Network Diagram. Optional.
_____ 5. Antenna Power and Cable Selection REQUIRED
_____ 6. Bill of Materials (BoM). REQUIRED This is a list of the physical materials
and their associated quantities that are used to build the site. This list includes
but is not limited to RF cable type and size, RF cable connectors, grounding,
racks, power supplies, RF cable hangers, RFS mounts, and so forth.
_____ 7. Excel Configuration Forms. REQUIRED These forms are created in Excel
spreadsheets and used to plan the system configuration parameters that must be
in place as part of the installation and commissioning of the system. The forms
are filled out according to how the EMS, BTS, Modems, and Global Parameters
are to be configured for this customer site.
_____ 8. RF Plot REQUIRED
_____ 9. Interference Data. Optional.
_____ 10. Interference Analysis Report. REQUIRED if Interfere Data Collected (RF
Planning)
Above information is required before departing to site
_____ 11. RFS System Test Form. REQUIRED This form contains the data that is
captured during the RF sweeps on the Ripwave RFS antenna and RF cables.
_____ 12. Base Station Installation Certification Form. REQUIRED This form
represents the close of a key milestone, the physical installation of the BTS and
RFS. It includes RFS antenna height, azimuth, downtilt, grounding,
weatherproofing, and other information about the site.
_____ 13. Export BTS Data. REQUIRED This is not a form that needs to be completed;
rather, it is data that is captured from the EMS once the Base Station and
Modems have been provisioned. This step should be completed prior to the
Drive Study, and then again prior to the Location (FTP) tests.

Ripwave Base Station I&C Guide Navini Networks, Inc.
272 Part #40-00047-00 Rev F v1.0 (TTA)
October 23, 2003
_____ 14. Export EMS Data. REQUIRED
_____ 15. Export CpeDescriptors (all). Optional.
_____ 16. Base Station Calibration Verification Form. REQUIRED Calibration
Verification is sometimes referred to as the Sanity Test. The form contains the
operational results of the Base Station transmit and receive tests after the
physical installation has been completed and the BTS has been turned on.
_____ 17. Drive Study Form & Data. REQUIRED Also referred to as Drive Test. The
form contains results of driving the coverage area of the installed Base Station
site and capturing sync data on a laptop. The information is provided to Navini
Networks to help tune the RF coverage model. Need Data Constellation Display.
_____ 18. RF Plot Tuned Model. REQUIRED
_____ 19. Location (FTP) Test Form. REQUIRED This form contains data rate
information that is captured during RF throughput testing. The data is captured
at both the EMS and at the Modem location on a laptop. The number of points to
capture is determined by Navini Networks and the customer. Need BTS
Beamforming and Constellation Display.
_____ 20. RMAs. REQUIRED if replaced cards from original shipment
_____ 21. Backup of Customer Deployed EMS Server. REQUIRED
List of Pictures
The following is a list and description of the REQUIRED pictures that Navini Networks
recommends capturing during the installation project. Additional pictures are acceptable.
_____ 1. RFS antenna mounted on the tower or rooftop
_____ 2. Weatherproofed connectors on the back of the RFS antenna
_____ 3. Cable Bend radius on the tower to the RFS
_____ 4. Jumper cable to RF main feeder connections weatherproofed
_____ 5. RF cable strap ground kit installation in all places as required for installation. RF
main feeder runs.
_____ 6. Lower buss bar with lightning protectors (weatherproofed if outside the shelter)
_____ 7. Main feeder to BTS jumper connections
_____ 8. BTS jumper connections to BTS
_____ 9. RFS antenna grounding connections
_____ 10. BTS grounding connections at BTS and buss bar
_____ 11. Power connections to the BTS

Navini Networks, Inc. Ripwave Base Station I&C Guide
Part #40-00047-00 Rev F v1.0 (TTA) 273
October 23, 2003
_____ 12. BTS split chassis cabling
_____ 13. Ground connections to earth ground or building steel
_____ 14. Tower or mount connections to ground
Checklist
This checklist should be completed and sent to Navini Networks along with the forms and data.
Closeout Documents Completed Date File Name
1.
Customer Contact List
2. Site Candidate Evaluation Form completed
3. Drive Instructions & Map
4. Network Diagram (optional)
5. Antenna Power & Cable Selection
6. Bill of Materials
7. Excel Configuration Forms
8. RF Plot
9. Interference Data (optional)
10.
Interference Analysis Report
11.
RFS System Test Form
12.
Base Station Installation Certification Form
13.
Exported BTS Data
14.
Exported EMS Data
15.
Exported CPE Descriptor Data (optional)
16.
Base Station Calibration Verification Form
17.
Drive Study Form & Data
18.
RF Plot Tuned Model
19.
Location (FTP) Test Form
20.
RMAs
21.
Backup from EMS
Closeout Pictures Completed Date File Name
1.
RFS mounted
2. Weatherproofed connectors on RFS
3. Cable Bend radius
4. Jumper cable to RF main feeder
5. Cable ground kits if needed
6. Shelter bus bar with lightning arrestors
7. Main feeder to BTS jumpers
8. BTS Jumpers to BTS
9. RFS grounded
10.
BTS grounding at BTS/buss bar

Ripwave Base Station I&C Guide Navini Networks, Inc.
274 Part #40-00047-00 Rev F v1.0 (TTA)
October 23, 2003
11.
Power connected to BTS
12.
Split chassis cabling
13.
Ground connections to earth ground
14.
Tower or mount connections to ground

Navini Networks, Inc. Ripwave Base Station I&C Guide
Part #40-00047-00 Rev F v1.0 (TTA) 275
October 23, 2003
Appendix AA: Customer Acceptance Form
Base Station Installation & Commissioning Services
Customer Acceptance Form
Customer Name:
Customer’s Authorized Representative:
Job Title:
Office Address:
Email Address:
Office Phone:
Cell Phone or Pager:
Site Name:
Site Description: ________
Site Physical Address:
INSTALLATION SECTION:
Date Installation Started: Completed: ________
Customer Acceptance By: _____________________ Title: ________________Date:
__________
COMMISSIONING SECTION:
Date Commissioning Started: Completed: _________
Customer Acceptance By: _____________________ Title: ________________Date:
______________________________
TEST ACCEPTANCE SECTION:
Date Testing Started: Completed:
Customer Acceptance By: _____________________ Title: ________________Date: ______________________________

Ripwave Base Station I&C Guide Navini Networks, Inc.
276 Part #40-00047-00 Rev F v1.0 (TTA)
October 23, 2003
This Customer Acceptance Form is subject to and governed by all of the terms and conditions set
forth in the Master Supply Agreement between the parties. The Customer acknowledges,
understands and agrees that when it’s Authorized Representative signs-off the Test Acceptance
Section of this Form, Customer has thoroughly inspected the installation and commissioning
services, and Customer’s sign-off means that completion of on-site verification that the
Equipment installed by Seller performs in accordance with the Acceptance Criteria set forth in
the Master Supply Agreement between the parties. The completed Navini Networks’ Site
Installation and Commissioning Documents referenced below and attached hereto are
incorporated by reference into this Customer Acceptance Form for all purposes.
Navini Networks Site Installation and Commissioning Documents (double-click on the box to
check or de-select a checkmark when completing the form):
Site Candidate Evaluation Report
Site Materials BoM
Site Drawings
Site Construction Specific Tests, as required – Grounding System Test Results, Concrete
Break Test Results, Tower Guy Tensioning Test Results, etc.
Site Specific Digital Photographs, as Required
RFS System Tests
Base Station Installation Certification
Base Station Calibration Verification
Location (FTP) Tests
Drive Studies
Coverage Predictions Maps
Soft Copies of Test Results, if Requested