Furuno USA 9ZWRTR104 Transceiver for Radar Sensor DRS4DL User Manual
Furuno USA Inc Transceiver for Radar Sensor DRS4DL
Contents
- 1. User Manual I
- 2. User Manual II Part 1
- 3. User Manual II Part 2
- 4. User Manual II Part 3
- 5. User Manual II Part 4
- 6. User Manual II Part 5
- 7. User Manual II Part 6
- 8. User Manual II Part 7
- 9. User Manual II Part 8
- 10. User Manual II Part 9
- 11. User Manual II Part 10
- 12. User Manual II Part 11
- 13. User Manual II Part 12
User Manual II Part 3
1. SYSTEM INTRODUCTION
1-23
1.13 Sounder (Fish Finder) Introduction
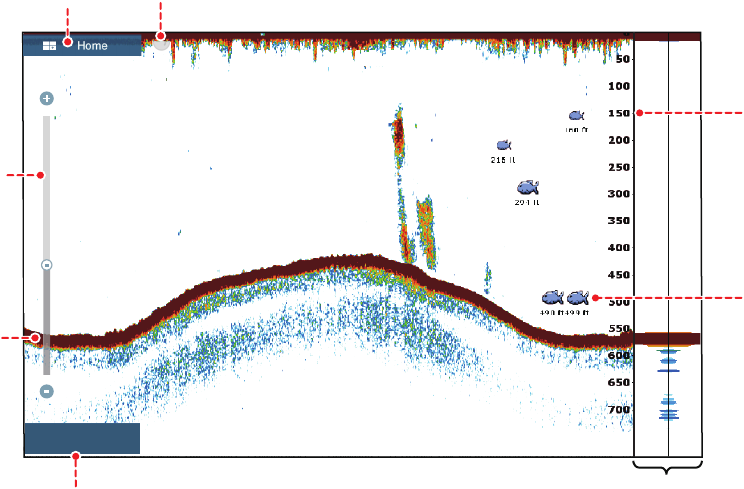
The sounder display provides a picture of the echoes found by the fish finder. Echoes
are scrolled across the screen from the right position to the left position.
The echoes at the right position are the current echoes. These echoes can be from
separate fish, a school of fish, or the bottom. Depth to the bottom is indicated always,
provided the gain is set correctly. You can scroll the echoes backward.
Both low and high TX frequencies are provided. (Frequencies depend on the trans-
ducer connected.) The low frequency has a wide detection area, which is for general
detection and understanding bottom conditions. The high frequency has a narrow
beam that helps you inspect fish.
The range, gain, clutter and TVG can be adjusted automatically according to your pur-
pose (cruising or fishing) to let you do other tasks.
Home icon
Bottom
echo
Depth
scale
Fish
mark*
A-scope
Frequency, depth
750-
m
556
Slider
bar
* Requires appropriate transducer.
Undo icon
ft
HF
556
1. SYSTEM INTRODUCTION
1-24
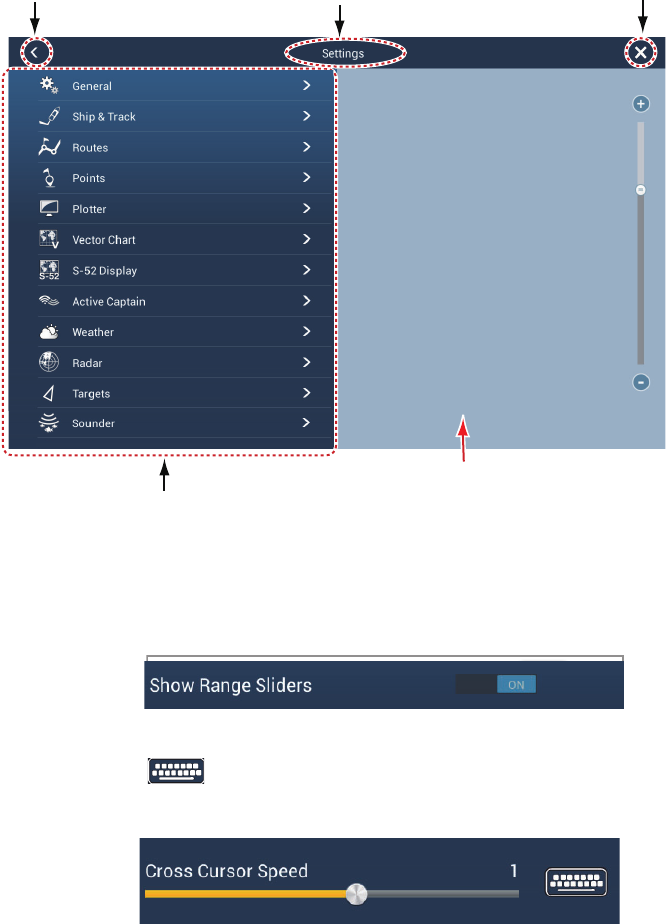
1.14 Settings Menu
The [Settings] menu provides the options for customizing your system. The [Settings]
menu, as well as all other items on the home screen, is automatically closed, and the
previous operation display restored, when no operation is detected for approx. one
minute.
1. Tap the [Home] icon to go to the home screen.
2. Tap [Settings].
3. Tap a sub menu. For example, tap the [General] sub menu.
4. Do one of the following according to the menu item:
• ON/OFF flipswitch: Tap the flipswitch to switch between [ON] and [OFF].
• Slider bar, keyboard: Set level by dragging the slider, or tapping the keyboard
icon ( ) to enter the level with the numeric software keyboard. (See the
next page for the appearance of the numeric keyboard.)
Sub menus
Menu name
Preview screen shows you the result
of certain selections.
Back button Close button
1. SYSTEM INTRODUCTION
1-25
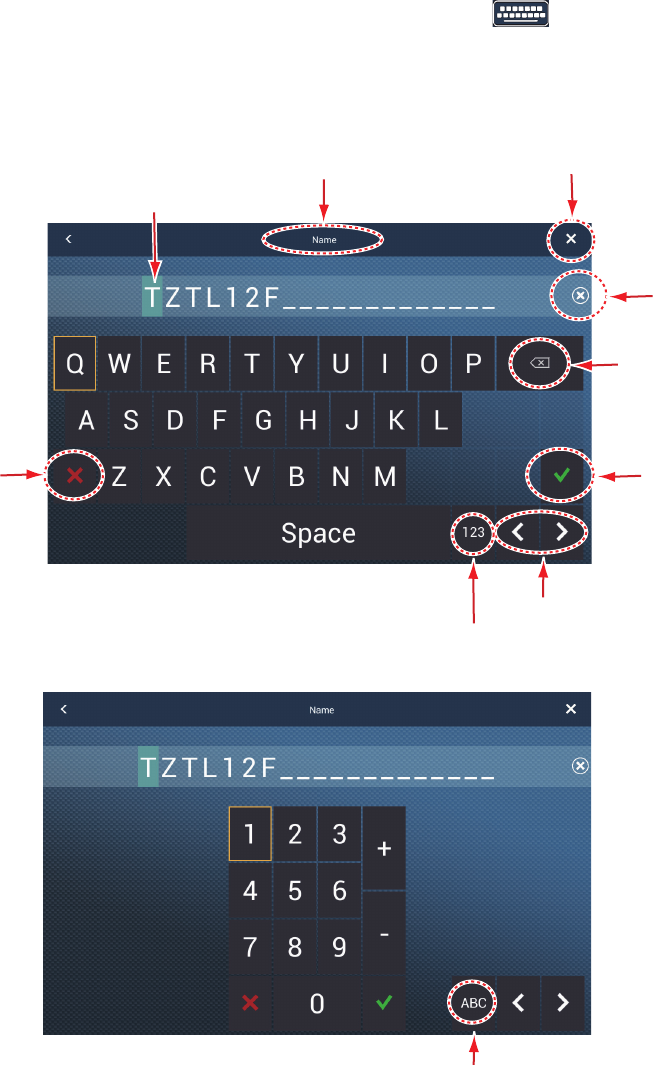
• Alphabet, numerical data entry: A menu item that requires entry of alphabet
and/or numerical data has a keyboard icon ( ). Tap the keyboard icon to
show the keyboard. (The keyboard displayed depends on the item selected.
Some items provide only the numeric keyboard.) Enter data, then tap to con-
firm.
Confirm
setting
Switch to numerical keyboard
Erase
line
Close window
Title
Delete selected
character
Cancel
Alphabet keyboard
Cursor (light blue)
Shift cursor
Numeric keyboard
Switch to alphabet keyboard
1. SYSTEM INTRODUCTION
1-26
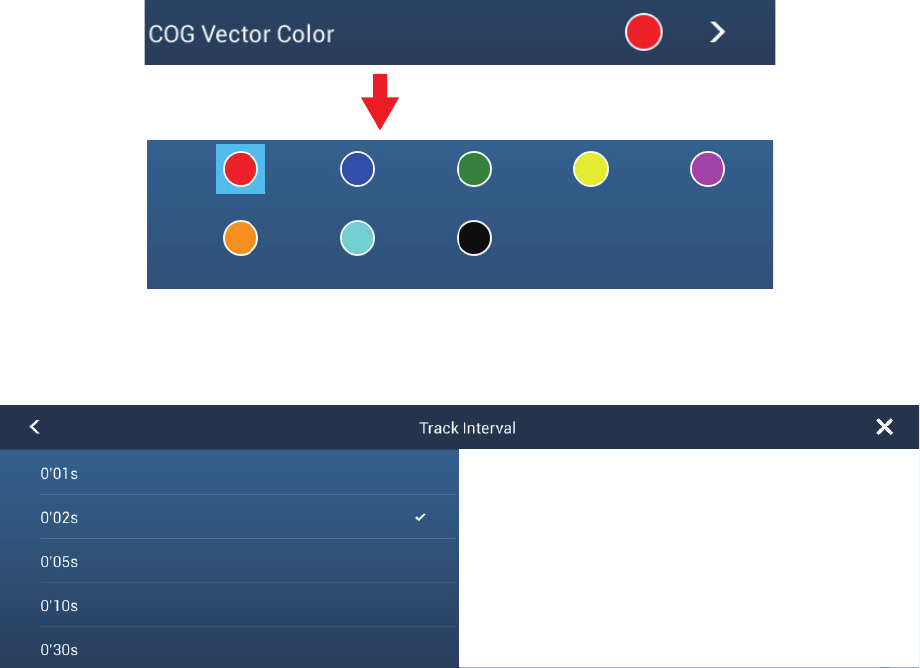
• Color selection: A menu item that requires selection of color shows the current
color selection on the menu page. Tap the color option desired. Current selec-
tion is highlighted with a light blue square.
• Option selection: A menu item that requires selection of an option shows the
current selection on the menu page Tap the option desired. Current selection
has a checkmark.
5. Tap the close button to finish.
Tap menu item.
1. SYSTEM INTRODUCTION
1-27
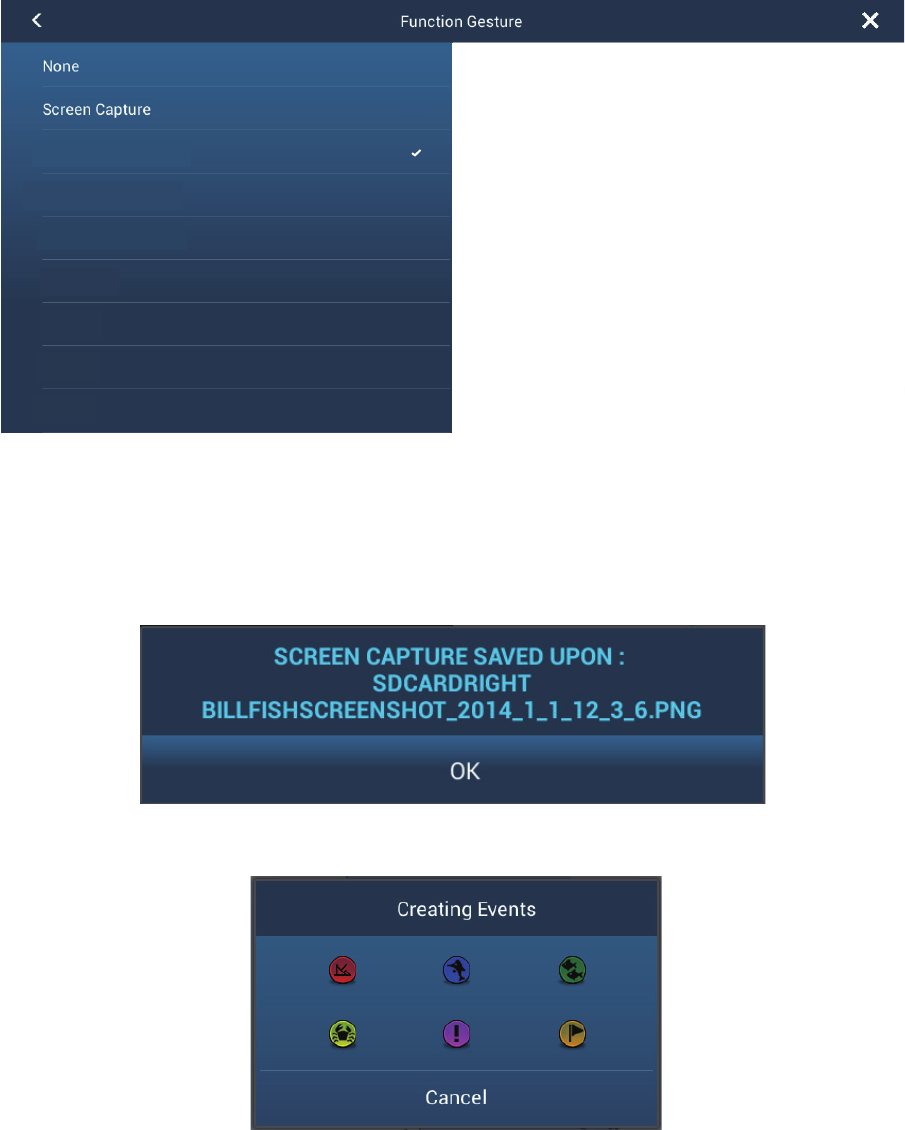
1.15 Function Gesture
The function gesture controls what occurs when you tap the screen with two fingers.
Select the function as below.
1. Open the home screen, then select [Settings] - [General].
2. Tap [Function Gesture].
3. Tap a function among the following:
[None]: Nothing happens.
[Screen Capture]: Capture the screen. The message shown below appears. Tap
OK to save the screen capture. The information following “BILLFISHSCREEN-
SHOT” is the year, month, day, hour, minute and second the screenshot was cap-
tured.
[Event]: Record an event to the logbook. The selected mark is put at the position
at the time the screen was tapped (see paragraph 4.2.2)
[Home]: Open the home screen (see section 1.6)
[Settings]: Open the [Settings] menu (see section 1.14).
[List]: Open the lists menu (see section 1.14 and section 4.8).
Event
Home
Settings
List
Tide
Fusion
Fusion Bar
1. SYSTEM INTRODUCTION
1-28
[Tide]: Open the tide graph (see section 1.14 and paragraph 3.2.4).
[Fusion]:Show full FUSION display.
[Fusion Bar]: Show the FUSION bar.
4. Tap the close button to finish.
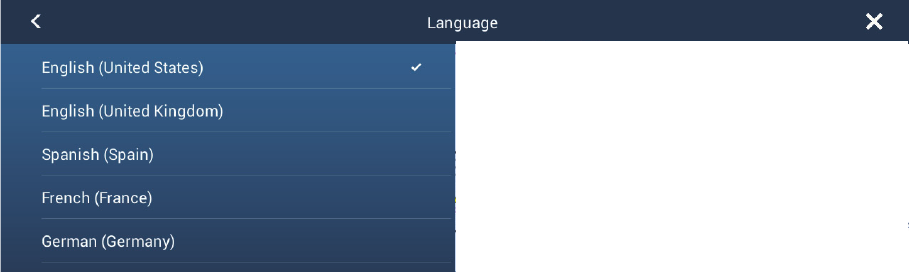
1.16 Language
The default interface language is English (United States). To select a different lan-
guage, do as follows:
1. Open the home screen, then tap [Settings] - [General].
2. Tap [Language].
3. Tap the language to use. The message "APPLICATION HAS TO RESTART
NOW! DO YOU WANT TO RESTART APPLICATION?" appears.
4. Tap [OK] then the equipment restarts.
1. SYSTEM INTRODUCTION
1-29
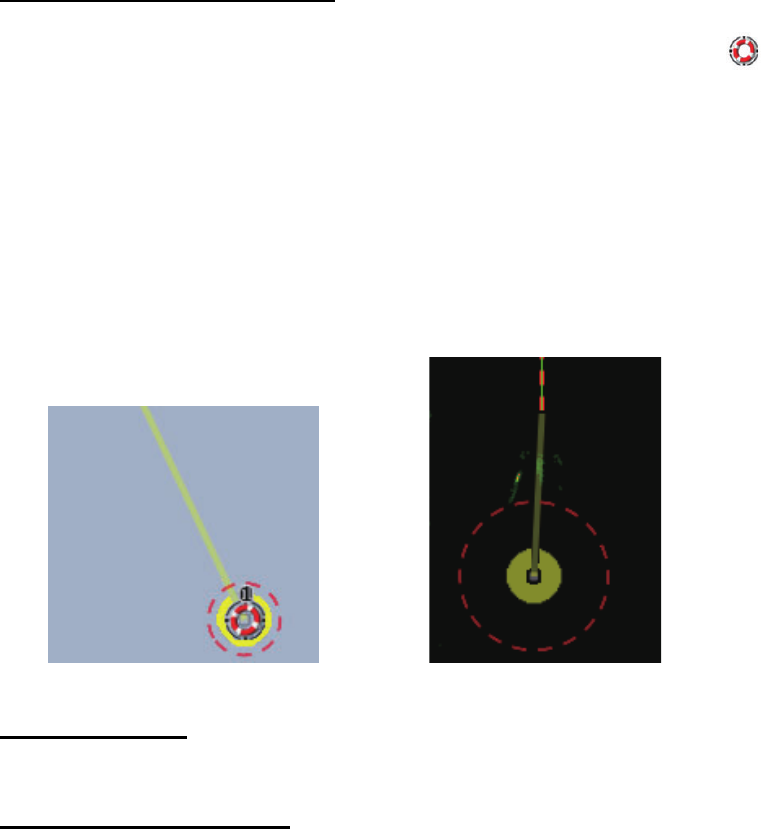
1.17 Man Overboard (MOB)
The MOB function is used to mark the location of man overboard. At the moment the
MOB function is activated, the MOB mark is put at the current position, on the plotter
and radar displays.
How to mark the MOB position
Tap [MOB] on the home screen. The plotter display opens, the MOB mark ( ) is at
the location at the moment MOB was activated, and the MOB location is automatically
set as destination. At the moment of activation the following occurs.
• The message"MOB" flashes in the status bar, yellow characters on a red back-
ground. The aural alarm sounds if it is enabled. Tap the status bar to stop the flash-
ing and silence the aural alarm.
• The MOB mark is highlighted.
• A yellow line connects between the MOB mark and current location. This line shows
the straightest course between own ship and the MOB mark.
MOB information
Tap a MOB mark to display the name, comment and depth (plotter display only).
How to delete a MOB mark
Inactive MOB mark: Tap a MOB mark to display the pop-up menu. Tap [Delete].
Active MOB mark: Before you erase an active MOB mark, you must stop navigation.
Tap the active MOB mark to display the pop-up menu then select [Stop Nav]. Tap the
MOB mark to display the pop-up menu, then tap [Delete].
MOB mark on the plotter display MOB mark on the radar display
1. SYSTEM INTRODUCTION
1-30
1.18 Wireless LAN Settings
You can connect to the internet with the wireless LAN signal to download weather in-
formation (see chapter 11) and to connect to an iPhone, iPod, iPad, or Android™ de-
vice. To download weather information, connect the existing LAN network. To connect
to an iPhone, iPod, iPad, or Android™ device, create a local wireless network.
About the wireless LAN
• The wireless LAN function is available only in the countries which have acquired ra-
dio wave certification. Turn this function off in countries which do not have radio
wave certification. Ocean-going vessels that have radio wave certification can use
the wireless LAN function in any country that has acquired radio wave certification.
Vessels with radio wave certification that enter a country that does not have radio
wave certification may use the wireless LAN function only onboard the vessel.
Available countries (as of 12/2014): USA, Canada, New Zealand, Australia, and Ja-
pan.
• The communication rate and effective range for the wireless LAN can be affected
by the electromagnetic wave, interfering object, or access point location.
• We strongly recommend using the wireless LAN with encrypted connection. Other-
wise unauthorized access by a third party can occur, which can cause loss of data
or system crash.
• We recommend changing the initial password when using a local wireless network.
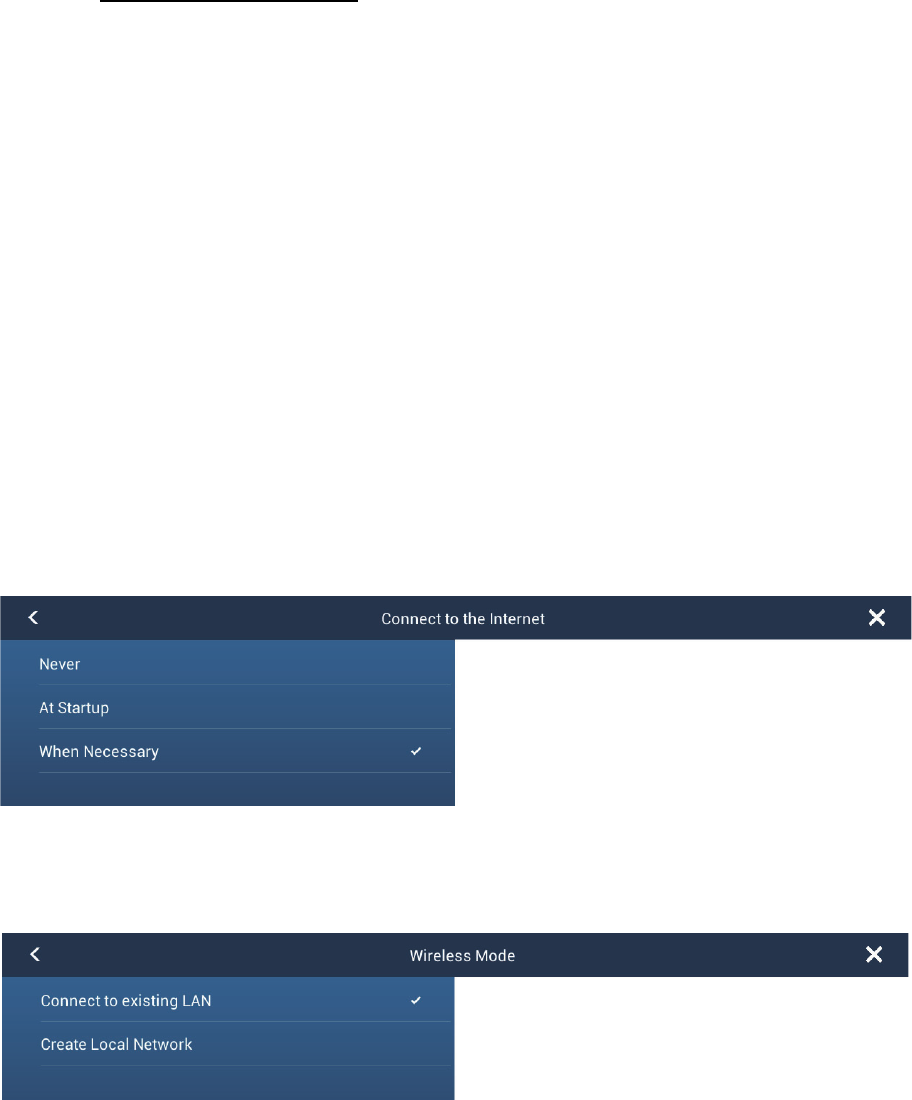
1.18.1 How to connect the existing LAN
1. Open the home screen, then tap [Settings] - [General].
2. Tap [Connect to the Internet].
3. Tap [When Necessary]. Tap “<“ to go back one layer.
4. Tap [Wireless LAN Settings].
5. Tap [Wireless Mode].
6. Tap [Connect to existing LAN]. Tap “<“ to go back one layer.
1. SYSTEM INTRODUCTION
1-31
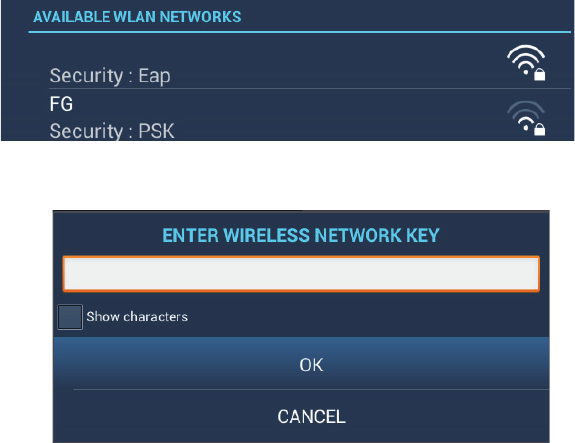
7. Turn on [Wireless] to see the available WILAN networks at the bottom of the
screen.
8. Tap the desired network to show the network key (password) entry screen.
9. Enter the network key, then tap [OK]. The IP address, security type and signal
strength of the WILAN are shown.
1.18.2 How to create a local wireless network
Note 1: Do the procedure with [Local Network] in [Wireless LAN Settings] turned off.
Note 2: It may not be possible to connect to a local network if the network is unstable.
In this case, turn [Wireless] off and on. Connect via existing LAN network.
Note 3: Confirm that [When Necessary] is selected in [Connect to the Internet] before
doing the procedure.
1. Follow steps 1-5 in paragraph 1.18.1.
2. Tap [Create Local Network] in [Wireless Mode]. Tap “<“.
3. Tap [Name].
4. Enter the name of the network, then tap [OK].
5. Tap [Password].
6. Enter the password, then tap . (If the password is wrong, an error message ap-
pears. Tap the [OK] button then reenter the password.)
7. Turn on [Local Network] in [Wireless LAN Settings] to connect to the network.
1.18.3 How to forget all wireless LAN
1. With [Connect to existing LAN] selected in [Wireless Mode] and [Wireless] turned
on, select [Forget all Networks].
2. You are asked if you are sure to delete all saved Wireless LAN networks. Tap
[Yes].
1. SYSTEM INTRODUCTION
1-32
1.18.4 Operation by wireless terminal
You can turn on or off the operation by a wireless terminal via wireless LAN (iPhone,
iPod, iPad, or Android™ device).
1. Open the home screen, then tap [Settings] - [General].
2. Tap [Allow Remote Control].
[Off]: Cannot operate this equipment by a wireless terminal.
[View Only]: Cannot operate this equipment but can display the data on the
screen of the wireless terminal.
[Full Control]: Can fully operate this equipment by a wireless terminal.
3. Tap the close button to finish and exit.

2-1
2. PLOTTER
This chapter shows you how to do the following:
• Use and prepare the plotter display
• Set plotter related alarms
• Control the track
2.1 Chart Type
A world map in raster chart format is included in your unit. A vector chart for the US
coastline (Alaska and Hawaii included) is provided also. To use this plotter as a navi-
gational aid, have electronic charts (stored in the internal memory) for the area you
navigate. Contact your dealer about charts for your area.
There are two types of charts available with this equipment.
[Raster]: Raster charts are digitized scans of NOAA paper charts. Raster charts have
information like notes, source diagrams, tidal diamonds, horizontal and vertical datum,
etc.
[HO]: HO charts are S-57 format vector charts (digital files) that contain marine fea-
tures and information created for marine navigation. These charts are made according
to the International Hydrographic Organization (IHO). HO charts are available from
Jeppensen, Navionics, Mapmedia, and NOAA (National Oceanic and Atmospheric
Administration).
How to select a chart type
1. Select the plotter display.
2. Open the [Layers] menu.
3. Tap the chart type from among [Auto], [Raster] or [HOs].
*: [Auto] automatically switches the chart type according to chart availability and prior-
ity.
2. PLOTTER
2-2
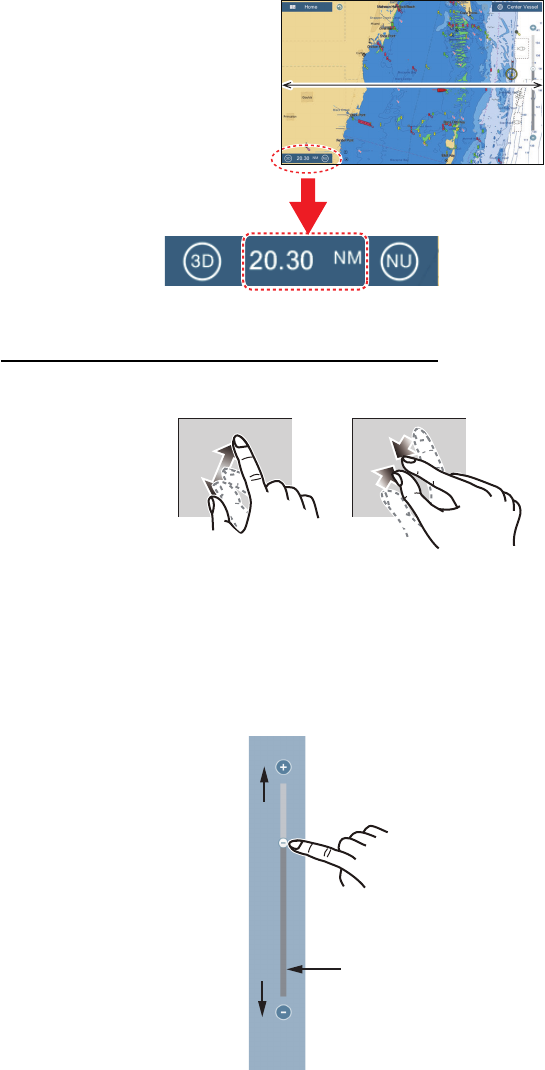
2.2 Display Range
You can change the display range to change the amount of information shown. The
selected range appears in the box at the bottom left-hand corner of the screen.
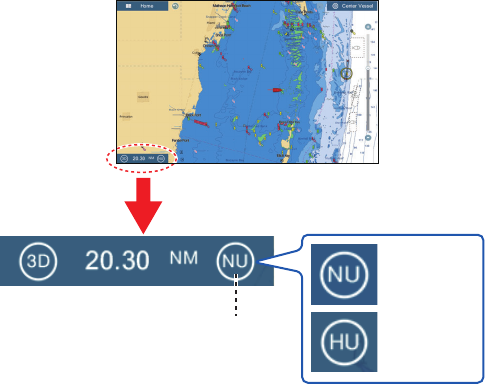
How to zoom in or out the display range
Method 1: Pinch the chart screen.
Method 2: Operate the range slider at the right side of the screen. Drag the slider or
tap the “+” or “-” icon (above and below the slider) to set the display range. (The slider
bar is shown in the default setting. The bar can be shown or hidden with [Show Range
Sliders] in the [Settings] - [General] menu.)
Note 1: You can judge the suitability of the range by the color of the range indication.
White: Range is appropriate; normal chart accuracy.
Red: Range is inappropriate; unsuitable chart accuracy.
Note 2: You can zoom in or out the display range on the preview screen.
Display range
Range area
Range area
Zoom in Zoom out
Drag the slider
to set the chart
scale.
Slider bar
Zoom in
Zoom out
2. PLOTTER
2-3
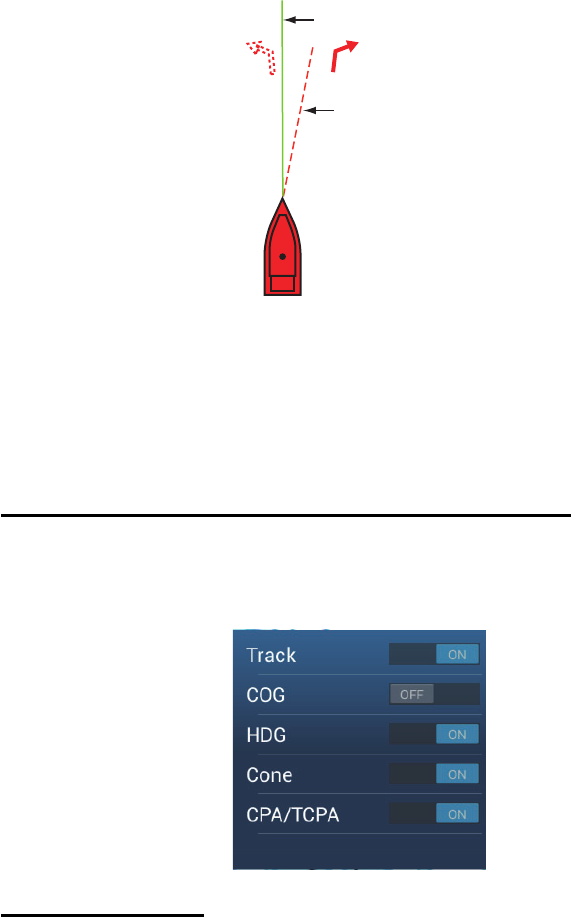
2.3 Orientation Mode
The chart can be shown in head-up or north-up orientation. Tap the orientation mode
switch, [HU] or [NU], whichever is shown, at the bottom left corner to change the ori-
entation mode.
North Up: North is at the top of the screen. When your heading changes, the boat icon
moves according to heading. This mode is for long-range navigation.
Head Up: Displays the chart with the current compass heading of your ship at the top
of the screen. The heading data from a compass is required. When the heading
changes, the boat icon remains fixed, and the chart picture rotates according to head-
ing.
2.4 How to Move the Chart
Move the chart in the following conditions.
• Your ship is not in the current area
• Take a look at another area
• Enter a point at another location
Do the following to move the chart:
• Change the display range (section 2.2).
• Tap [Center Vessel] at the top right-hand corner of the screen to return your ship to
the center of the screen.
• Switch to the 3D display by tapping the 3D icon at the bottom left corner.
Orientation
mode switch
: North-up
: Head-up
2. PLOTTER
2-4
2.5 The Boat Icon
The boat icon, colored red, appears at the current position. The boat icon has the func-
tions indicated below also.
• The Heading line is a straight line that runs from your position and this line shows
the current heading.
• The COG vector is a vector line that runs from the boat icon and points in the direc-
tion in which your ship is now moving. Also, a red arrow points in the direction the
ship is turning.
How to show or hide the COG vector or heading line
Tap the boat icon to show the pop-up menu. Turn [COG] or [HDG] on or off as re-
quired)
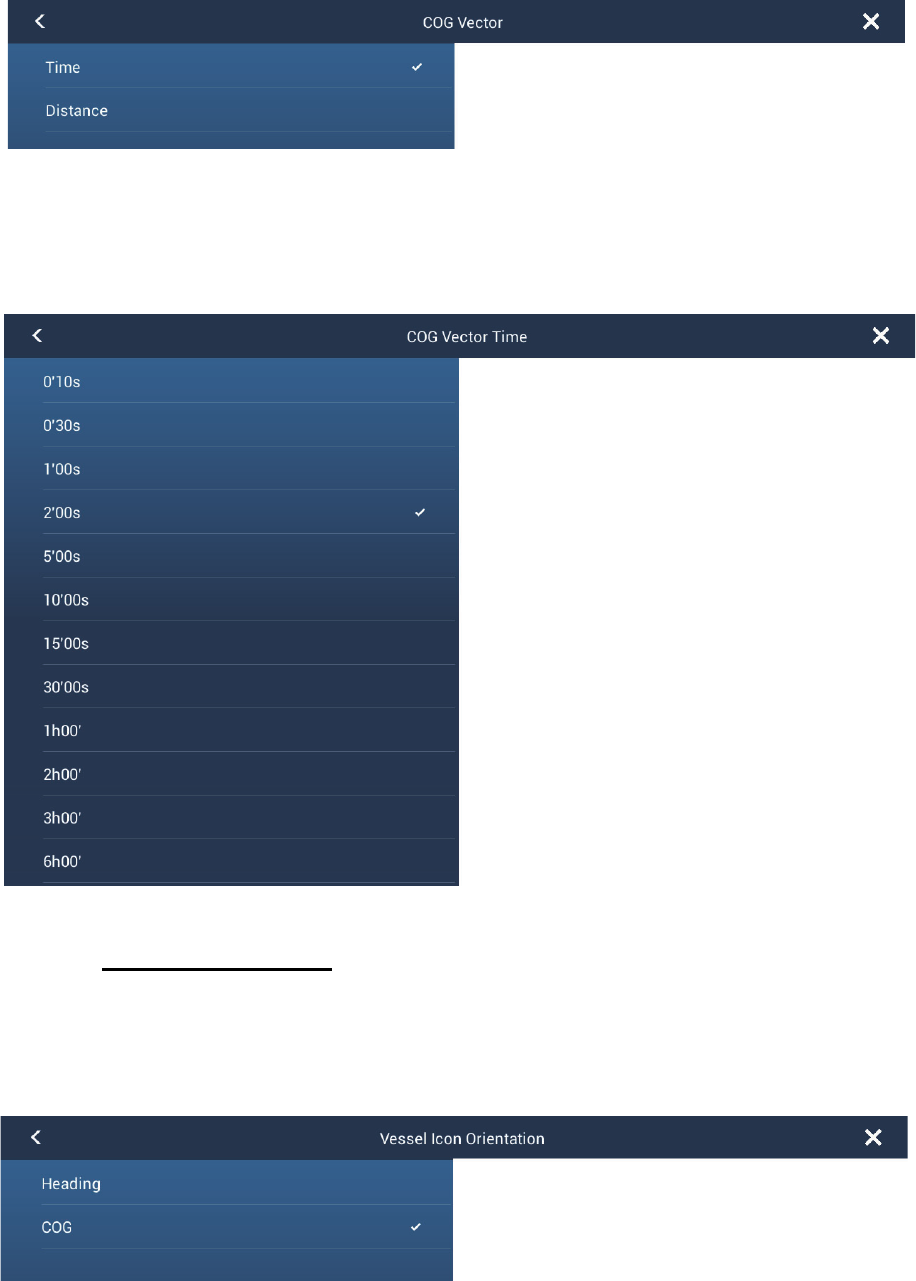
COG vector length
The COG vector shows estimated course and speed of your ship. This predictor is
displayed as the COG vector. The top of the predictor is the estimated position of your
ship at the end of the selected predictor time or distance (set on the menu). You can
increase the length of the predictor to find the estimated position of your ship in the
future on the current course and speed. You can set the COG/SOG predictor as fol-
lows. The greater the distance or the time, the longer the COG/SOG predictor.
1. Open the home screen, then tap [Settings] - [Ship & Track].
COG vector
Heading line
Turn direction
(Starboard)
Port
2. PLOTTER
2-5
2. Tap [COG Vector].
3. Tap [Distance] or [Time]. For [Distance], do steps 4 and 5. For [Time], go to step 6.
4. Tap [COG Vector Length] to display the software keyboard.
5. Set the length for the COG vector, then tap . Go to step 7.
6. Tap [COG Vector Time], then tap the time for the COG vector.
7. Tap the close button to finish.
Boat icon orientation
You can select the orientation of the boat icon.
1. Open the home screen, then tap [Settings] - [Ship & Track].
2. Tap [Vessel Icon Orientation].
3. Tap [Heading] or [COG].
2. PLOTTER
2-6
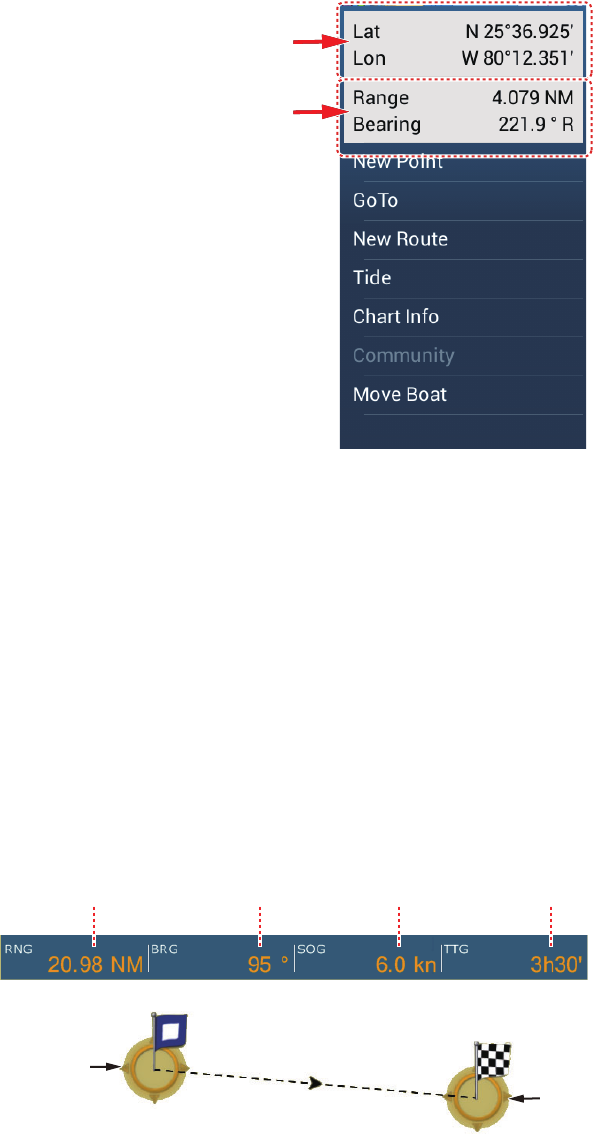
2.6 How to Find the Position, Range, Bearing of an
Object
Tap an object to show its position, and range and bearing from own ship.
2.7 How to Find the Range and Bearing Between
Two Locations
The [Distance] item in the slide-out menu measures the range and bearing between
any two locations on your chart. Range and bearing between the two locations are dig-
itally indicated on the screen.
1. Open the slide-out menu.
2. Tap [Distance].
A dashed line runs between the start location and the 2nd location. The range,
bearing, SOG, and TTG to the 2nd location is shown at the top of the screen.
3. To change the location of either point, drag and drop.
4. To quit the distance measurement, tap [Cancel Ruler] at the top right-hand corner
of the screen.
Latitude and longitude position
Range and bearing
Range Bearing
Speed Over the
Ground TTG
Starting location
2nd location
2. PLOTTER
2-7
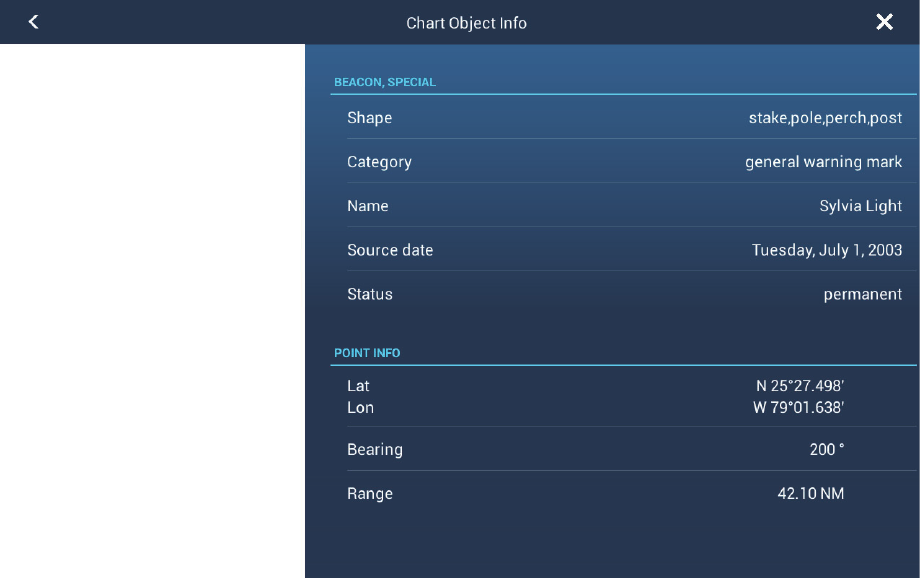
2.8 Chart Object Information
Vector charts show many objects, like buoys and lighthouses, for which you can find
the information. Port, tide and current information are available if the chart contains
this information
Tap any chart object to find the information.
2. PLOTTER
2-8
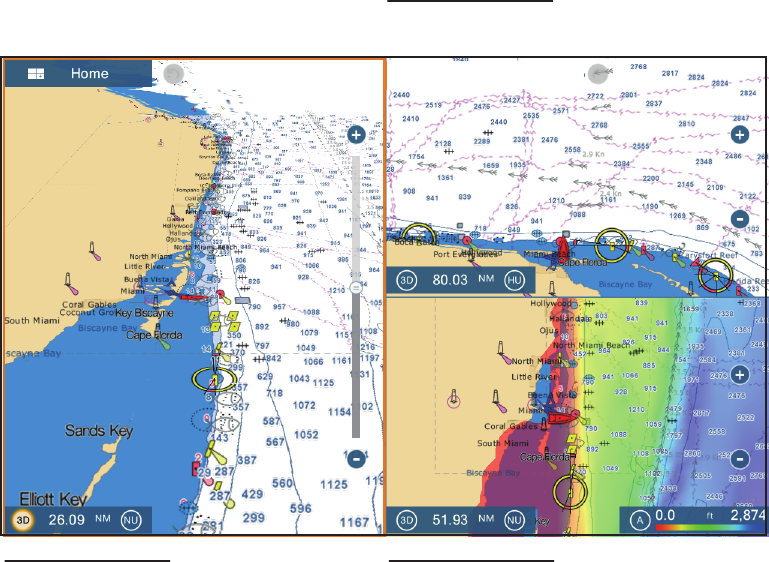
2.9 Multiple Plotter Displays
Two plotter displays can be shown on one screen.Wtih two plotter displays, you can
see the conditions around your ship on both short and long ranges. Also, you can see
how your ship moves toward your destination from more than one angle. For example,
you can show one display in 2D and another in 3D.
The following features can be adjusted individually.
• AIS • ARPA • Display range
• Chart orientation • Chart type • Scroll the chart
• Overlays (radar, sat photo, depth shading, tide icon, tidal current, ACCU-FISH™ (see
section 7.11), points, routes, tracks)
• 2D and 3D (For the 3D displays, the aerial view (pitch and orientation) are adjusted
together, but different orientation modes (north up and head up) are possible.)
Chart plotter display 1
Chart type: S-57 Display range: 40.01 NM
Orientation: North-up Perspective: 3D
Chart plotter display 3
Chart type: S-57 Display rnage: 64.05 NM
Orientation: North-up Perspective: 2D
Overlay: Depth shading
Chart plotter display 2
Chart type: S57 Display range: 80.03 NM
Orientation: Head-up Perspective: 2D
2. PLOTTER
2-9
2.10 Cartographic Text and Objects on Vector Charts
This section shows you how to show or hide the cartographic objects and text infor-
mation that appear on the vector charts.
2.10.1 Control visibility of text and object information in vector charts
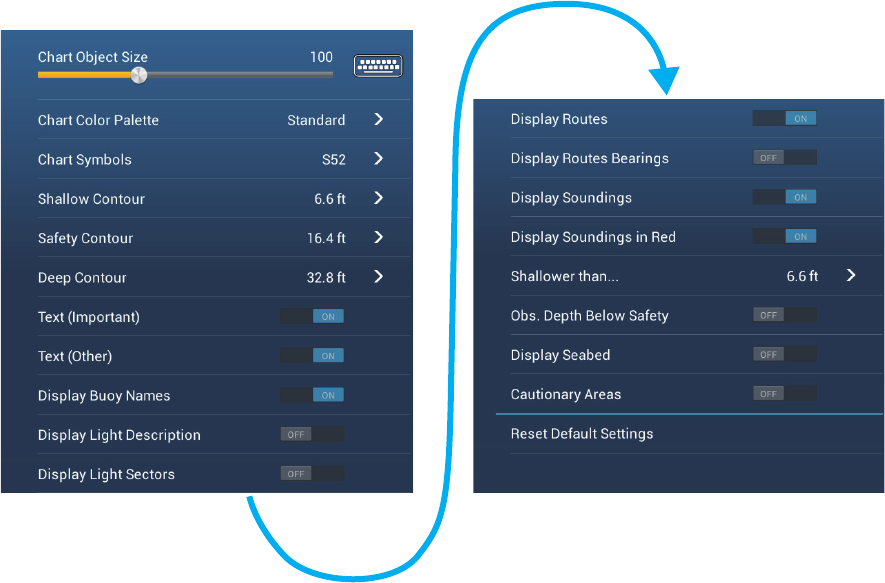
The [Settings] - [Vector Chart] menu controls the visibility of text and object informa-
tion, for example, buoy names and light description.
[Chart Object Size]: Drag the slider to set the chart object size (setting value: 50 to
200%).
[Chart Color Palette]: Set the chart color pattern. [Standard] is this equipment’s orig-
inal color palette, [S-52] complies with the official S-52 charts, and [Sunlight] provides
a high contrast palette.
[Chart Symbols]: Select the chart symbol type. [S-52] are the official IMO symbols
(also referred to as simplified symbols) library for ECDIS. [International] symbols are
the copy of paper chart symbols of IALA symbols library (US symbols library).
[Shallow Contour]: Set the shallow depth (setting range: 0.0, 3.0, 6.0, 9.0, 12.0, 15.0,
18.0, 21.0, 24.0, 27.0, 30.0 ft). Show shallow depth contours in dark blue.
[Safety Contour]: Set the safety depth (setting range: 0.0, 3.0, 6.0, 9.0, 12.0, 15.0,
18.0, 21.0, 24.0, 27.0, 30.0, 50.0, 70.0, 100, 200 ft). Show safety depth contours in
medium blue.
[Deep Contour]: Set the deep depth (setting range: 0.0, 3.0, 6.0, 9.0, 12.0, 15.0, 18.0,
21.0, 24.0, 27.0, 30.0, 50.0, 70.0, 100, 200, 300, 500, 1,000, 2,000 ft). Show deep-
depth contours in light blue. Depths greater than set here are shown in white.
[Text (Important)]: Show or hide the important text information.
6.0 ft
2. PLOTTER
2-10
[Text (Other)]: Show or hide the other text information.
[Display Buoy Names]: Show or hide the buoy names.
[Display Light Description]: Show or hide the light descriptions.
[Display Light Sectors]: Show or hide light sectors for fixed beacons.
[Display Routes]: Show or hide routes.
[Display Routes Bearings]: Show or hide route bearings.
[Display Soundings]: Show or hide depth soundings.
[Display Soundings in Red]: Spot soundings whose depths are lower than the value
selected on the [Shallower than...] menu are shown in red.
[Shallower than ...]: Select the value for the [Display Soundings in Red] menu (setting
range: 0.0, 3.0, 6.0, 9.0, 12.0, 15.0, 18.0, 21.0, 24.0, 27.0, 30.0, 50.0, 70.0, 100 ft).
[Obst. Depth Below Safety]: Show or hide obstruction depths under the safety
depths.
[Display Seabed]: Show or hide seabed composition indication, for example, mud,
sand, rock.
[Cautionary Areas]: Show or hide the cautionary areas that appear on the chart.
[Reset Default Settings]: Select this menu item to restore default settings for the
[Vector Chart] menu.
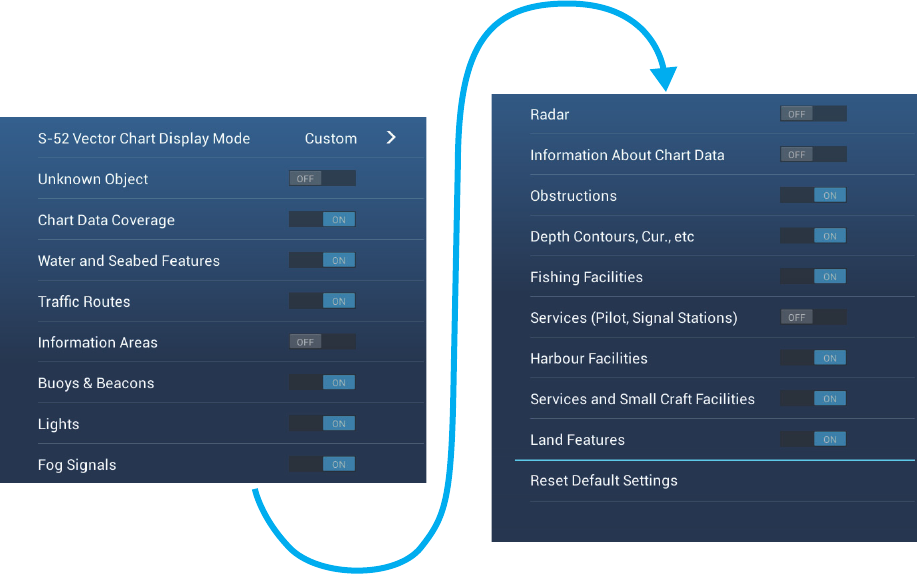
2.10.2 Control visibility of cartographic objects in S-52 charts
The [Settings] - [S-52 Display] menu controls the visibility of S-52 cartographic objects,
for example, lights, fog signals, etc.
2. PLOTTER
2-11
[S-52 Vector Chart Display Mode]: Set the level of information to show on the chart.
The selections are [Custom], [Base], [Standard], [Other], and [Fishing]. The chart fea-
tures are turned on or off according to setting.
Note: The following menu items except [Reset Default Settings] are unavailable when
you select the mode other than [Custom]
[Unknown Object]: Show or hide unknown objects that appear on the chart.
[Chart Data Coverage]: Show or hide the geographic names and geographic objects.
[Water and Seabed Features]: Show or hide the water and seabed presentation.
[Traffic Routes]: Show or hide the marine traffic routes.
[Information Areas]: Show or hide the information areas that appear on the chart.
[Buoys & Beacons]: Show or hide the buoys and beacons.
[Lights]: Show or hide the sector of light that a fixed beacon shines.
[Fog Signals]: Show or hide the structure that sends a fog signal.
[Radar]: Show or hide the radar buoy.
[Information About Chart Data]: Show or hide the chart data information.
[Obstructions]: Show or hide obstructions (wrecks, etc.)
[Depth Contours, Cur., etc]: Show or hide the depth contours, tidal currents and
magnetics.
[Fishing Facilities]: Show or hide the location of fishing facilities.
[Services (Pilot, Signal Stations)]: Show or hide the location of pilots and signal sta-
tions.
[Harbour Facilities]: Show or hide the location of harbour facilities.
[Services and Small Craft Facilities]: Show or hide the services for ship and small
craft.
[Land Features]: Show or hide the cartographic features that are shown on land.
[Reset Default Settings]: Select this menu item to restore default settings for the [S-
52 Display] menu.
2. PLOTTER
2-12
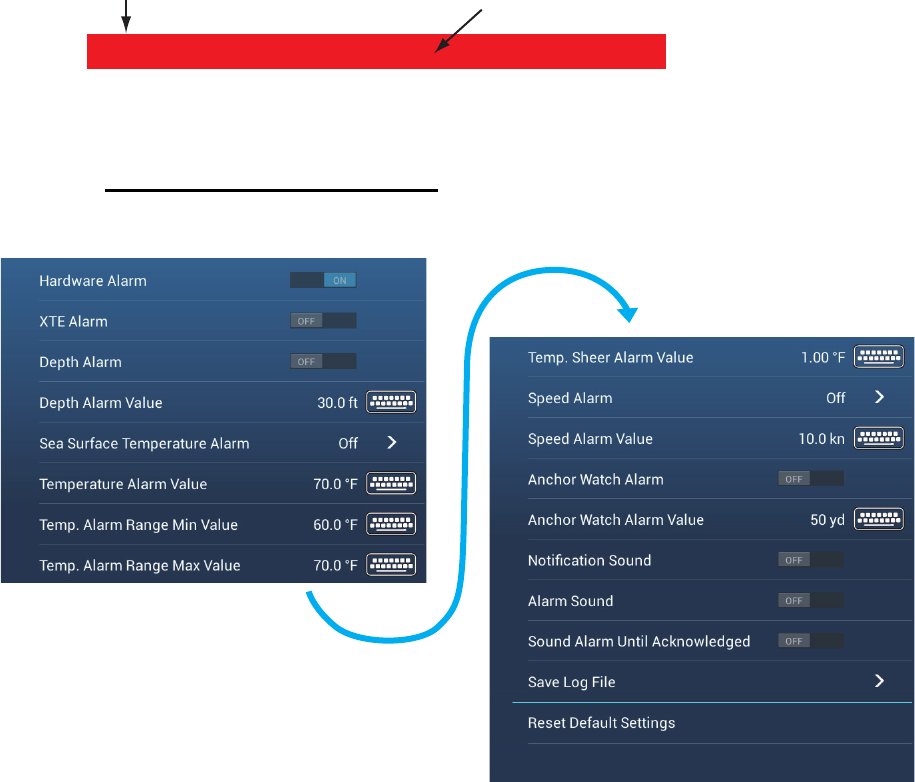
2.11 Alarms
The various plotter alarms alert you (with audiovisual alarms) when the conditions
specified are met. These alarms are:
When an alarm is generated, the name of the offending alarm appears in the status
bar at the top of the screen and flashes. If [Alarm Sound] is active, the unit beeps. To
stop the flashing and silence the audio alarm, tap the status bar. The indication re-
mains on the screen until the cause of the alarm is removed or the alarm itself is dis-
abled.
Note: If [Sound Alarm Until Acknowledged] is set for [OFF], the unit continues to beep
until the cause of the alarm is removed.
How to open the [Alarm] menu
1. Open the home screen, then tap [Settings] - [Alarm].
• Anchor watch alarm • Speed alarm
• Depth alarm • XTE alarm
• Sea surface temperature alarm
Anchor Alarm
Status bar Alarm indication (eg: anchor watch alarm)